Design Concept Conclusions End Results Materials and ...
12
Design Concept The purpose of this project was to find the ideal sieving process of a 50/50 mixture of Mt. Mazama ash and Portland cement which produced the best possible compression strength, as tested with standardized cubes. Conclusions With our test we were hoping to find that –16 sieved ash would provide us with the best strength of our three-testing amounts. These was – 16, -30, and –50. Though the difference in the average of –30 and –16 was not that great –16 was still the strongest. This is very different from the initial mix as it consisted of –50 ash, and now being able to use – 16, it will cut back a lot of the labor time and will provide us with a trail surface that is strong and ADA accessible. For better more accurate results in the future I would recommend testing more cubes to be able to set apart the outliers and get possibly more accurate results than we have collected. For further information [email protected] [email protected] End Results After testing the compression strength of each of our mortar cubes made from -16, -30, and – 50 sieved ash at the intervals of 7, 14, and 21 days we found the past 16 to be the strongest as well as the easiest to work with. Results shown in figures 2 and 3: Materials and Methods For our slurry mixture, we converted a mortar cube mixture that was pre-determined by the Mortar Cube Testing Standards (ASTM Standard) to suit a mixture with ash from Mt. Mazama. The mixture was made up of 883g Ash, 792g Sand, 250g Cement, and 242g (+75g/100g water, depending on ash percentage of sieve) Water. Analysis Throughout the testing process our group learned a lot about the process of making and testing mortar cubes. After reviewing the ASTM for mortar cube testing, we found there are a lot of specifications in how cubes are made. An example of this being that during the cube making process, the way in which cubes are compacted affects their strength during testing. We now know that when we are doing testing where we make an abundant number of cubes, it is important that we try to control as many variables as we can so that our data can be consistent as possible. See examples of mortar cubes in figure 4: ENGR102 – Introduction to Engineering II Mix Design Concrete Crew Austin Walters, Garret Ohta, Steven Luna, Aidan Duval, Isaiah Flores Oregon Institute of Technology, Klamath Falls, OR 97601 Figure 3 : Bar graph showing results of compressive strength tests on each of the cubes at 7, 14, and 21 days 0 200 400 600 800 1000 1200 -50 Ash -30 Ash -16 Ash Strength of Cubes (Avg PSI) # Sieve Ash Used Comparison of Mortar Cubes' Strengths After Set Cure Times 7 days 14 days 21 days Figure 2: The table above shows the results of the average PSI that each of the mortar cubes were able to withstand. Figure 4: Two -16 ash mortar cubes Figure 1: The image shows the concrete compression machine used to calculate the PSI that each cube could withstand Figure 1: Local wing watchers trail here in Klamath Falls
-
Upload
khangminh22 -
Category
Documents
-
view
0 -
download
0
Transcript of Design Concept Conclusions End Results Materials and ...

Design Concept
The purpose of this project was
to find the ideal sieving process
of a 50/50 mixture of Mt.
Mazama ash and Portland cement
which produced the best possible
compression strength, as tested
with standardized cubes.
ConclusionsWith our test we were hoping to find
that –16 sieved ash would provide
us with the best strength of our
three-testing amounts. These was –
16, -30, and –50. Though the
difference in the average of –30 and
–16 was not that great –16 was still
the strongest. This is very different
from the initial mix as it consisted of
–50 ash, and now being able to use –
16, it will cut back a lot of the labor
time and will provide us with a trail
surface that is strong and ADA
accessible. For better more accurate
results in the future I would
recommend testing more cubes to be
able to set apart the outliers and get
possibly more accurate results than
we have collected.For further information
End ResultsAfter testing the compressionstrength of each of our mortarcubes made from -16, -30, and –50 sieved ash at the intervals of7, 14, and 21 days we found thepast 16 to be the strongest aswell as the easiest to work with.Results shown in figures 2 and 3:
Materials and MethodsFor our slurry mixture, weconverted a mortar cube mixturethat was pre-determined by theMortar Cube Testing Standards(ASTM Standard) to suit a mixturewith ash from Mt. Mazama. Themixture was made up of 883g Ash,792g Sand, 250g Cement, and 242g(+75g/100g water, depending onash percentage of sieve) Water.
Analysis
Throughout the testing process
our group learned a lot about the
process of making and testing
mortar cubes. After reviewing the
ASTM for mortar cube testing,
we found there are a lot of
specifications in how cubes are
made. An example of this being
that during the cube making
process, the way in which cubes
are compacted affects
their strength during testing. We
now know that when we are
doing testing where we make an
abundant number of cubes, it is
important that we try to control
as many variables as we can so
that our data can be consistent as
possible. See examples of mortar
cubes in figure 4:
ENGR102 – Introduction to Engineering II Mix Design
Concrete CrewAustin Walters, Garret Ohta, Steven Luna, Aidan Duval, Isaiah Flores
Oregon Institute of Technology, Klamath Falls, OR 97601
Figure 3 : Bar graph showing results of compressive strength tests on each of the cubes at 7, 14, and 21 days
0
200
400
600
800
1000
1200
-50 Ash -30 Ash -16 Ash
Str
en
gth
of
Cu
be
s (
Av
g P
SI)
# Sieve Ash Used
Comparison of Mortar Cubes' Strengths After Set Cure Times
7 days 14 days 21 days
Figure 2: The table above shows the results of the average PSI that each of the mortar cubes were able to withstand.
Figure 4: Two -16 ash mortar cubes
Figure 1: The image shows the concrete compression machine used to calculate the PSI that each cube could withstand
Figure 1: Local wing watchers trail here in Klamath Falls

Design Concept
Our group was tasked with processing the raw materials supplied for construction of the trail. This requirement translated to sifting a large quantity of ash from Mount Mazama to certain specification.
We were tasked initially with finding the ideal grain of the ash sifted, of which we were asked to provide samples of grains pass 16, 30, and 50 for the mortar-cube testing and surface applicator groups respectively.
Acknowledgments
Funding for the project was provided by the Wingwatchersnonprofit organization.
Special thanks to the ENGR 102 staff for the support.
Conclusions
After finding out that the best course of action was to sift all material to a pass 16 the next step would be to create a larger sieve that could handle more material at a time.
For further informationGroup contacts:
Final Product
The project resulted in several samples being provided to groups of interest, and an acknowledgement of the restraints our materials imposed. Our project operated on a budget of $160, which we were planning on allocating to form a contraption out of two by four wooden frames, which we would attach a wire mesh using nails; however, implementation was unfortunately unviable due to the shipping inconveniences from the company we ordered mesh from.
Materials and MethodsOur group approached the
project in a task-based manner,
assigning weekly goals to retain
progress momentum.
Figure 1. Illustrates the Gantt chart
created by our group to map out
and keep pace with various aspects
of the project.
AnalysisThe pass 16 is the most optimal and realistic size to use for the volcanic ash. The pass 30 is ideal to use however, the issue lies in the amount that would be needed for the project. The amount of sieved ash that would gather from the pass 30 may not be enough material to complete the project. The pass 50 is too fine to be used and the amount produced will also not be enough. Therefore, we concluded from our testing that pass 16 will be most optimal. The sources of error that could have occurred are inconsistencies of the wire meshes, human error was introduced because different participants tested the other grades of meshes. Issues which still need to be resolved involve the storing of the ash, the sieving of the remainder of the ash, and lastly the transportation of the material to the site, of which will need to be figured out as well.
Figure 3. Chart describes the amount of different sized ash collected from a 5 lbs. sample
ENGR102 – Introduction to Engineering II Wing Watchers Trail
Mass Material HandlingGisele Garcia Lopez, Dylan Jackson, Benjamin Driggers, Aaron Sprouse
Oregon Institute of Technology, Klamath Falls, OR 97601
Sieve size Total Ash (lbs.)
Usable Ash (lbs.)
Waste (lbs.) Usable Ash Percentage
Waste Percentage
No. 16 5.0705 4.3310 0.6675 85.42 % 13.16%
No. 30 5.0130 3.460 1.4575 69.18% 29.07%
No. 50 5.0790 1.5490 3.3620 30.50% 66.19%
U.S. Sieve Size Opening in mm Opening in inches
No. 16 1.19 0.0469
No. 30 0.595 0.0234
No. 50 0.297 0.0117
Figure 2. Chart describes the different sizes of sieves and their opening measurements in different units.
The materials used consisted of approximately 16 cubic meters of Mount Mazama ash, which was processed utilizing an automated sifting machine, then our group shoveled several batches of the material on sheets of tarp to dry for more effective sifting.

Design Concept
The project goals were to
calculate the Embodied Carbon
of our project, and the
Sustainability of our project. The
project measured that by
comparing concrete with and
without ash.
This Project calculated carbon
emissions of the Wing Watcher
Trail project.
Embodied Carbon CalculationThis project calculated the
carbon emissions using the EC3
tool. This tool can take in input
variables and generate a boxplot.
Acknowledgments
Dr. Salem, Dr. Greer, Dr. Riley
Conclusions
This project has calculated the
efficiency and sustainability of the
project and total carbon count of
50% ash mix in the concrete mix.
This project discovered that this
method was very sustainable and
has reduced the embodied carbon
count compared to traditional
concrete mixes. This project results
prove that the work the project has
done can be built upon, which can
lead the world to reducing carbon
emissions in construction.
For further informationJoshua Moore
Tyler Leerhuber
Nicholas Costley
Final Product
The projects final mix was
calculated to be approximately
221 kgCO2E per cubic yard. The
Envision Sustainability Rating
have evaluated this project to be
Gold level (42% of the total
applicable points).
Materials and MethodsThis project used the EC3 tool
and the Envision Rating system
to evaluate our projects
sustainability. Present Gantt
chart.
This project tested concrete
mixes that used ash in the mix to
lower the carbon emissions of
concrete production.
Massachusetts Institute of
Technology has found that using
ash in concrete mixes leads to a
16% reduced carbon emission
count. This is how the projects
result was calculated.
Analysis
As the reader can see from figure
1, the project mix is below the
average carbon emissions for
traditional concrete mixes.
As seen in Figure 2, The
Envision Rating System has
evaluated the project at 42% total
applicable points, which returns
as a Gold award.
Figure 1. Boxplot of potential carbon emissions.
ENGR102 – Introduction to Engineering II Wing Watcher Trail
Embodied Carbon and SustainabilityJoshua Moore, Nicholas Costley, Tyler Leerhuber
Oregon Institute of Technology, Klamath Falls, OR 97601
Figure 2. Envision Rating System Results

ENGR102 – Introduction to Engineering II
Surface ApplicatorsJacob Murphy, Brian Sorto, Daniel Duyvestein, Clayton Appleby, Aidan Crowley
Oregon Institute of Technology, Klamath Falls, OR 97601
Components• 2” PVC pipe• 44 gal container• 2” bulk head fitting• 2” valve• Generator• Paint mixer• Fertilizer spreader
Design ConceptThe surface applicator consists of three main components; a trailer, an agitator, and the applicator. Our design uses gravity to pull the aggregate out of the agitator and into the applicator. The purpose of this device is to provide an even layer of concrete that will make the Wing Watchers Trail more ADA accessible.
MethodologyThe final product has changed greatly. We first started with a bucket that poured the aggregate into a PVC tube with holes, which clogged too easily. We then found that the fertilizer spreader did not clog and covered a much greater area.
AnalysisWith the knowledge that the fertilizer spreader worked, we went and tested it outside with the mix the previous professor made and found that the fertilizer spreader worked well in spreading the concrete.
Learning OutcomesWe learned how to prototype a new technology/device that has not been done before.
AcknowledgementsDr. Ashton Greer, Pat Kile, Dr. Charles Riley, Dr. Aboubakr Salem, Caroline SchulzeFigure 2. Final blueprints
Figure 1. Early prototype plans
Figure 3. Bucket and PVC tube test
Figure 4. Fertilizer spreader test
Figure 5. Before and after fertilizer spreader test
• Flex Seal™• Trailer
Final Test and ConclusionWe were finally able to conduct a full test on the last day of class and the results surprised everyone. It left behind a perfect, even layer of concrete in the gravel. From the testing, it looks to fulfill are needs in applying the concrete mixture.
Figure 6. Applicator in operation and surface after application
Figure 7. Final product

Design Concept
Original goals were to create surveys
for public input and end user reviews
while providing infographics on the
trail resurfacing.
The measurable aspect of this portion
is the data from the surveys, the
surveys themselves, and the
infographics, which includes a couple
of brochures and an interpretive sign.
Figure 3.
Acknowledgments
Thank you NITC for providing
funding and research for the trail
resurfacing
Conclusions• Main Goal
• Method of communication
with the trail users and
individual groups working
on related projects
• Corrections
• Implement surveys sooner
(physical copies and QR
code)
• Benefits
• Aid future projects
• Older data to base
estimations off of
For further information:Sadie Brackeen:
Yareli Ledezma:
Figure 1. A picture of the original trail before resurfacing
Final Product• Three surveys
• Two were created to gather
opinions before resurfacing
• Last was created to gather
opinions after resurfacing
• Survey drop box
• Designed for paper surveys
• Brochures
• Adult
• Children
• Adjustments
• QR Code
• Materials
• Metal drop box, screws,
wooden post
• Methods
• 2 sub-teams
• Build/implement
materials
• Develop
surveys/brochures
• Online survey/ physical
survey/ QR code
Analysis• Testing period
• Surveys presented to local
organizations
• Feedback
• Some see room for
improvements as seen below
on the two highlighted
questions
Figure 6. Shows how many times a person frequents the trail per year
ENGR102 – Introduction to Engineering II Trail Resurfacing
Brennan Mestas, Yareli Ledezma, Sadie Brackeen, Hussain Al DuwaysOregon Institute of Technology, Klamath Falls, OR 97601
Figure 2. The survey drop box.
Figure 7. Illustrates the accessibility of the trail to the public on a scale of 0 to 5
Figure 4 and 5.Both pictures are from one of the brochures that our group created from provided data and pictures
Figure 8. Details how safe people feel when walking on the trail at any moment in time
Materials and MethodsFigure 3.Picture of Brochure created by group, meant for a young audience

Design ConceptDesign and check for physical and
financial feasibility of an off-grid
PV system for lights and/or other
means of power delivery for the
Wing Watcher’s Trail(WWT) to
allow better trail conditions for the
public and those under the ADA.
Shadow Analysis/Site Survey
Shadow analysis conducted to
determine average annual efficiency
loss of the PV system. A calculation
method based on measured angles of
obstructions was used to measure
how many sun hours are lost due to
the surroundings every year. This
enabled us to determine if PVs were
physically feasible of being used
within the WWT area.
AcknowledgmentsAshton Greer, Aboubakr Salem,
Jennifer Berdyugin, Wingwatcher
team
ConclusionsAlthough it is feasible, putting any
sort of PV system with lighting on
this trail would not be reasonable. The
money going toward this project
would not be worth the outcome-
which is part of the reason it was not
funded. That being said, feasibility of
the use of PV panels to power an off-
grid system on the WWT was
confirmed. To improve our design, we
would consider consulting a
professional engineering firm on their
design choices and have the ability to
test different types of panels. After
having success with this project, there
is a possibility to provide an
alternative proposal with more
efficient power supplies and materials
that accounts for labor, shipping
costs, and cost of maintenance. Our
success with the lights and panels
could encourage other similar local
projects to lean towards using PVs as
a generation source.
For further [email protected]@oit.edu
Figure 1: WWT near most viable zone for project
Final ProductThe solar feasibility section of the
trail improvement did not require a
physical final product. We were
made aware that WW did not even
need lighting in this project. Based
on our own set target of $14k, we
successfully made a system with
material costs below this target.
Original plans had energy
requirements that would’ve exceed
our budget and had to be reworked
to an acceptable level.
Materials and MethodsA budget was based on the average
environmental grant award size of
$14,000. Costs of shipping was not
accounted for due to supply chain
issues with COVID-19, nor cost of
labor as the proposal could be turned
into a student project. System was
designed with a “bare-bones”
mentality to minimize price and a
15% additional cost was added to
account for incidentals. Materials
were chosen based on cheapest price
and system requirements. System
requirements were determined
through prior knowledge of topics,
like electricity and circuitry, and
through the plethora of online
calculators and off-grid design
websites freely available on the
internet.
AnalysisWe learned how expensive storage is
compared to PV panels, as well as
the requirements for sustaining
power when solar power is not
accessible. Our initial battery bank
size and days operating with no
sunlight was too much for our
budget.
ENGR102 – Introduction to Engineering II Trail Improvement
Solar Feasibility GroupEvan Narimatsu, Jose Ignacio, Owen Lien, Paige TeVelde, Walter Corthell, Alex Waryan
Oregon Institute of Technology, Klamath Falls, OR 97601
Figure 2. The clinometer used for shadow analysis
Figure 3: Resulting Solar Sun chart from clinometer
Figure 4. Basic PV System Schematic with
integral circuitry components
Figure 5. Simplified Bill of Materials for PV System

AcknowledgmentsDr. Ashton GreerDr. Aboubakr Salem
Design Concept● Our goals were to make a
functioning vibration sensor and outline the ADA requirements for the trail.
● Measurable aspects were the amount of vibration on the wheelchair and the required measurements for ADA access.
Vibration Calculation● We built a vibration sensor using
an arduino microcontroller.● We set a threshold amount of
vibration so that on smooth indoor concrete we would not pick up anything. Then on a rough surface we would sense a lot of vibration and this data would be displayed on our computer.
Materials and Methods● Our methodology was to build a
wheelchair mounted vibration sensor.
● Derek/Logan focused mainly on the sensor while Hunter/Tyler were on the ADA compliance side.
● Materials were selected for use based on cost and reliability.
● Electronic components were sourced to provide sufficient readings with minimal component connections, and tested for adequate survivability for field conditions.
● Data was collected by going over various surfaces with the wheelchair sensor.
● Results are as followedADA AssessmentWidth: Min 32 in., goal 36 in. min, 60 in. min for passing/turningSlope: Max 10% grade, goal 5% grade max for parallel; Max 3% grade for perpendicular
Final ProductOur finished product is a wheelchair vibration sensor to measure the smoothness of different surfaces to compare to Mazama Ash concrete. We deviated from our original plan slightly as there was supply chain issues and we were not able to obtain the case for the sensor, otherwise the original plan was followed through. Our budget was $100 while only $50 was used.
Analysis● We learned that most man made
surfaces have less vibration than natural ones.
● We learned this by looking at our results and seeing that outdoor concrete and indoor concrete and the gravel path had the least amount of vibration.
● Overall our analysis of data concludes the outdoor concrete of Mazama Ash/P cement would be safe for a wheelchair.
● Our Gantt Chart is below
For further [email protected]@[email protected]@oit.edu
Conclusions● Prototype is viable for field work.● Improvements can be made to the
casing and attachment to the wheelchair.
● Clear difference found in different surfaces.
● Concrete had a severe difference with testings then Grass and Gravel.
● Due to the degraded nature of the Geo-trail some testings were undeterminable.
● Trail is already ADA compliant, smoother surface needed.

Project GoalThe goal of the surveying and
mapping group is to accurately
survey the trail, as well as make a
topographical map and plot the
change of elevation we see
throughout the trail.
The measurable aspect that can
be defined, consists of the
elevation of the contour lines
Elevation Calculation
Using a differential leveling
method the team began the
survey. Recording the backsight
(BS) and foresight (FS) at each
tripod's location utilizing the
leveling rods and measuring the
height of the instrument (HS) the
data was put into the field notes
for later editing if the data from
the GPS was faulty. Once the trail
data was collected, it was
compared to data collected from
Google Earth and then put into
“Civil3D”.
AcknowledgmentsDylan Anspach, ENGR 102 TA
Jack Walker, Geomatics
Professor
Out observation can also be
confirmed by looking at the
change in elevation recorded
from differential leveling.
ConclusionsFrom the measurements of the
trail elevation recorded and
observed it does not seem like
slope will be a major
consideration when looking for
more ways to improve the Wing
Watcher’s trail. If this analysis
was done again it would be better
to ensure the GPS used provides
accurate measurements.
Additionally, looking for
topographic data that is fully
accurate, by taking the roads and
lake into account, could improve
the final topographic map.
For further [email protected]
Final Product
Using the data from Google Earth
and from the differential leveling a
topological map was made.
Figure 1: Wing Watcher’s Map
Figure 1 shows the resulting map
along with the trail highlighted in
green. From the differential leveling
a table of elevation values was made
and assessed for error.
Analysis
Looking at the topographic map
shows that the trails path does not
experience much change in
elevation. This observation can
be confirmed by looking at the
elevation profile generated from
the topographic map shown in
Figure 2.
Figure 3: Wing Watcher’s Profile
ENGR102 – Introduction to Engineering II WW TrailSurveying and Mapping
Calebe Farmer, Bryce Fernandez, Rylynn Root, Bennett Phelps, Donovan SchaferOregon Institute of Technology, Klamath Falls, OR 97601
STA BS (+) HI FS (-) ELEV. ADJ. ELEV
BM 4.65 4070
4074.65
TP1 2.78 4.1 4070.55 4070.56
4073.33
TP2 2.75 6.19 4067.14 4067.15
4069.89
TP3 5.29 2.63 4067.26 4067.27
4072.55
TP4 4.61 4.67 4067.88 4067.89
4072.49
TP5 3.93 3.86 4068.63 4068.64
4072.56
TP4 4.77 4.69 4067.87 4067.88
4072.64
TP3 2.96 5.4 4067.24 4067.25
4070.2
TP2 6.75 3.09 4067.11 4067.11
4073.86
TP1 4.83 3.35 4070.51 4070.52
4075.34
BM 5.46 4069.88 4069.89
Table 1: Differential Leveling
(Measured in Feet)
Figure 2: Illustration of Leveling

AbstractTask: Responsible for determining the
best methods of stormwater
management in the process of
resurfacing the Wingwatchers Trail
Goal: collect samples of the trail and
carry out tests that could produce
quantifiable measurements regarding
the rate of infiltration from the Old Trail
surface versus the New Trail Surface.
Method
Survey of the Trial site to collect
soil samples
Constant Head Permeability Test
to determine the permeability
coefficient and soil moisture content.
Runoff Calculations to calculate
peak flow
Develop a drainage infrastructure
plan
Figure 3. Calculating Peak Flow
Developing a SolutionConclusion: minimal drainage
infrastructure is required in this
section of the trail
Plan: implement a channel drain in
between sections of the paved trail.
● Allows water to easily run
across the trail without causing
stagnant water to build up and
lay in the middle of the trail
Impact: Ensures that the new top
coating being applied will last for
years to come
● Prevent future problems with
potholes or wet areas that
could inhibit those who are
disabled from using the trail.
For further [email protected]@oit.edu
Figure 5. Channel Drain Example
Runoff Calculations
Q=CiA
Where:
Q=Runoff in ft3/s
C=Runoff Coefficient
i=Rainfall Intensity in/hr
A=Area of Watershed
Analysis●In each location where data was
obtained the Coefficient of Permeability was very low and most of the soil will easily drain water overtop without soaking in (Figure 4).
●The peak flow calculations for before and after construction shows the minimal change that will occur as the trail is renovated (Figure 3).
Figure 4. Permeability Test Results
Figure 2. Process
Introduction to Engineering II Stormwater AnalysisMake it Rain
Yousef Alqahtani, Marla Goodspeed, Jenna Gorden, Doug Houser, Joanie MorrisOregon Institute of Technology, Klamath Falls, OR 97601
Time of Concentration
𝑡𝑐= 0. 0078𝐿0.77 [ (𝐸2 −𝐸,1) / 𝐿 ] 0.385
𝐸2 −𝐸,1 = Elevation Difference of
Farthest point of Watershed
𝐿 =Distance of Farthest point of
Watershed
𝑡𝑐 = Time of Concentration Figure 1. Map of Poor Drainage Areas
ft^3/s
ft^3/s
Analysis:
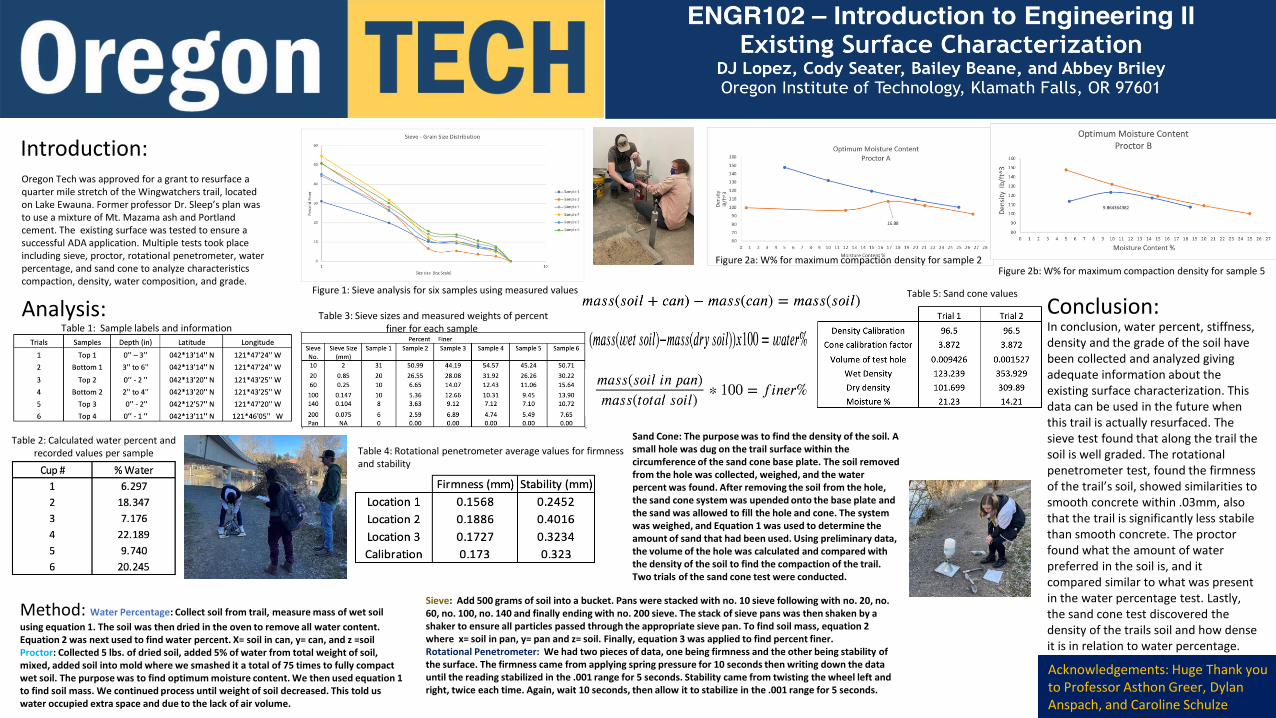
Oregon Tech was approved for a grant to resurface a quarter mile stretch of the Wingwatchers trail, located on Lake Ewauna. Former professor Dr. Sleep’s plan was to use a mixture of Mt. Mazama ash and Portland cement. The existing surface was tested to ensure a successful ADA application. Multiple tests took place including sieve, proctor, rotational penetrometer, water percentage, and sand cone to analyze characteristics compaction, density, water composition, and grade.
Introduction:
Table 2: Calculated water percent and recorded values per sample
Method: Water Percentage: Collect soil from trail, measure mass of wet soil
using equation 1. The soil was then dried in the oven to remove all water content. Equation 2 was next used to find water percent. X= soil in can, y= can, and z =soilProctor: Collected 5 lbs. of dried soil, added 5% of water from total weight of soil, mixed, added soil into mold where we smashed it a total of 75 times to fully compact wet soil. The purpose was to find optimum moisture content. We then used equation 1 to find soil mass. We continued process until weight of soil decreased. This told us water occupied extra space and due to the lack of air volume.
Figure 1: Sieve analysis for six samples using measured values
Table 1: Sample labels and informationTable 3: Sieve sizes and measured weights of percent
finer for each sample
Figure 2a: W% for maximum compaction density for sample 2Figure 2b: W% for maximum compaction density for sample 5
Table 5: Sand cone values
Table 4: Rotational penetrometer average values for firmness and stability
Sieve: Add 500 grams of soil into a bucket. Pans were stacked with no. 10 sieve following with no. 20, no. 60, no. 100, no. 140 and finally ending with no. 200 sieve. The stack of sieve pans was then shaken by a shaker to ensure all particles passed through the appropriate sieve pan. To find soil mass, equation 2 where x= soil in pan, y= pan and z= soil. Finally, equation 3 was applied to find percent finer.Rotational Penetrometer: We had two pieces of data, one being firmness and the other being stability of the surface. The firmness came from applying spring pressure for 10 seconds then writing down the data until the reading stabilized in the .001 range for 5 seconds. Stability came from twisting the wheel left and right, twice each time. Again, wait 10 seconds, then allow it to stabilize in the .001 range for 5 seconds.
Sand Cone: The purpose was to find the density of the soil. A small hole was dug on the trail surface within the circumference of the sand cone base plate. The soil removed from the hole was collected, weighed, and the water percent was found. After removing the soil from the hole, the sand cone system was upended onto the base plate and the sand was allowed to fill the hole and cone. The system was weighed, and Equation 1 was used to determine the amount of sand that had been used. Using preliminary data, the volume of the hole was calculated and compared with the density of the soil to find the compaction of the trail. Two trials of the sand cone test were conducted.
In conclusion, water percent, stiffness, density and the grade of the soil have been collected and analyzed giving adequate information about the existing surface characterization. This data can be used in the future when this trail is actually resurfaced. The sieve test found that along the trail the soil is well graded. The rotational penetrometer test, found the firmness of the trail’s soil, showed similarities to smooth concrete within .03mm, also that the trail is significantly less stabile than smooth concrete. The proctor found what the amount of water preferred in the soil is, and it compared similar to what was present in the water percentage test. Lastly, the sand cone test discovered the density of the trails soil and how dense it is in relation to water percentage.
Conclusion:
Acknowledgements: Huge Thank you to Professor Asthon Greer, Dylan Anspach, and Caroline Schulze

Design Concept
The goal was to create a functioning
pedestrian sensor which could
accurately and consistently count
people. The success of our project was
primarily based on whether our sensor
could count people or not.
The completed sensor would contribute
to measurable aspects of other projects,
such as the long-term durability of the
trail in use, or the possible effects the
updated trail has on community usage.
Acknowledgments
Thank you to the Wing Watchers
group for their help and
cooperation. Thank you to the
Engineering 102 professors and
teacher's assistants for helping with
the process.
Conclusions
The use of a camera instead of an infrared sensor would decrease error and could give more detailed readings. If we could this again, next time we would add a 3D printed protective case. As of right now if we were to put our sensor on the trail, it could easily be damaged by weather, humans, animals, etc. We believe that a 3D printed protective case would solve this problem.
For further information:
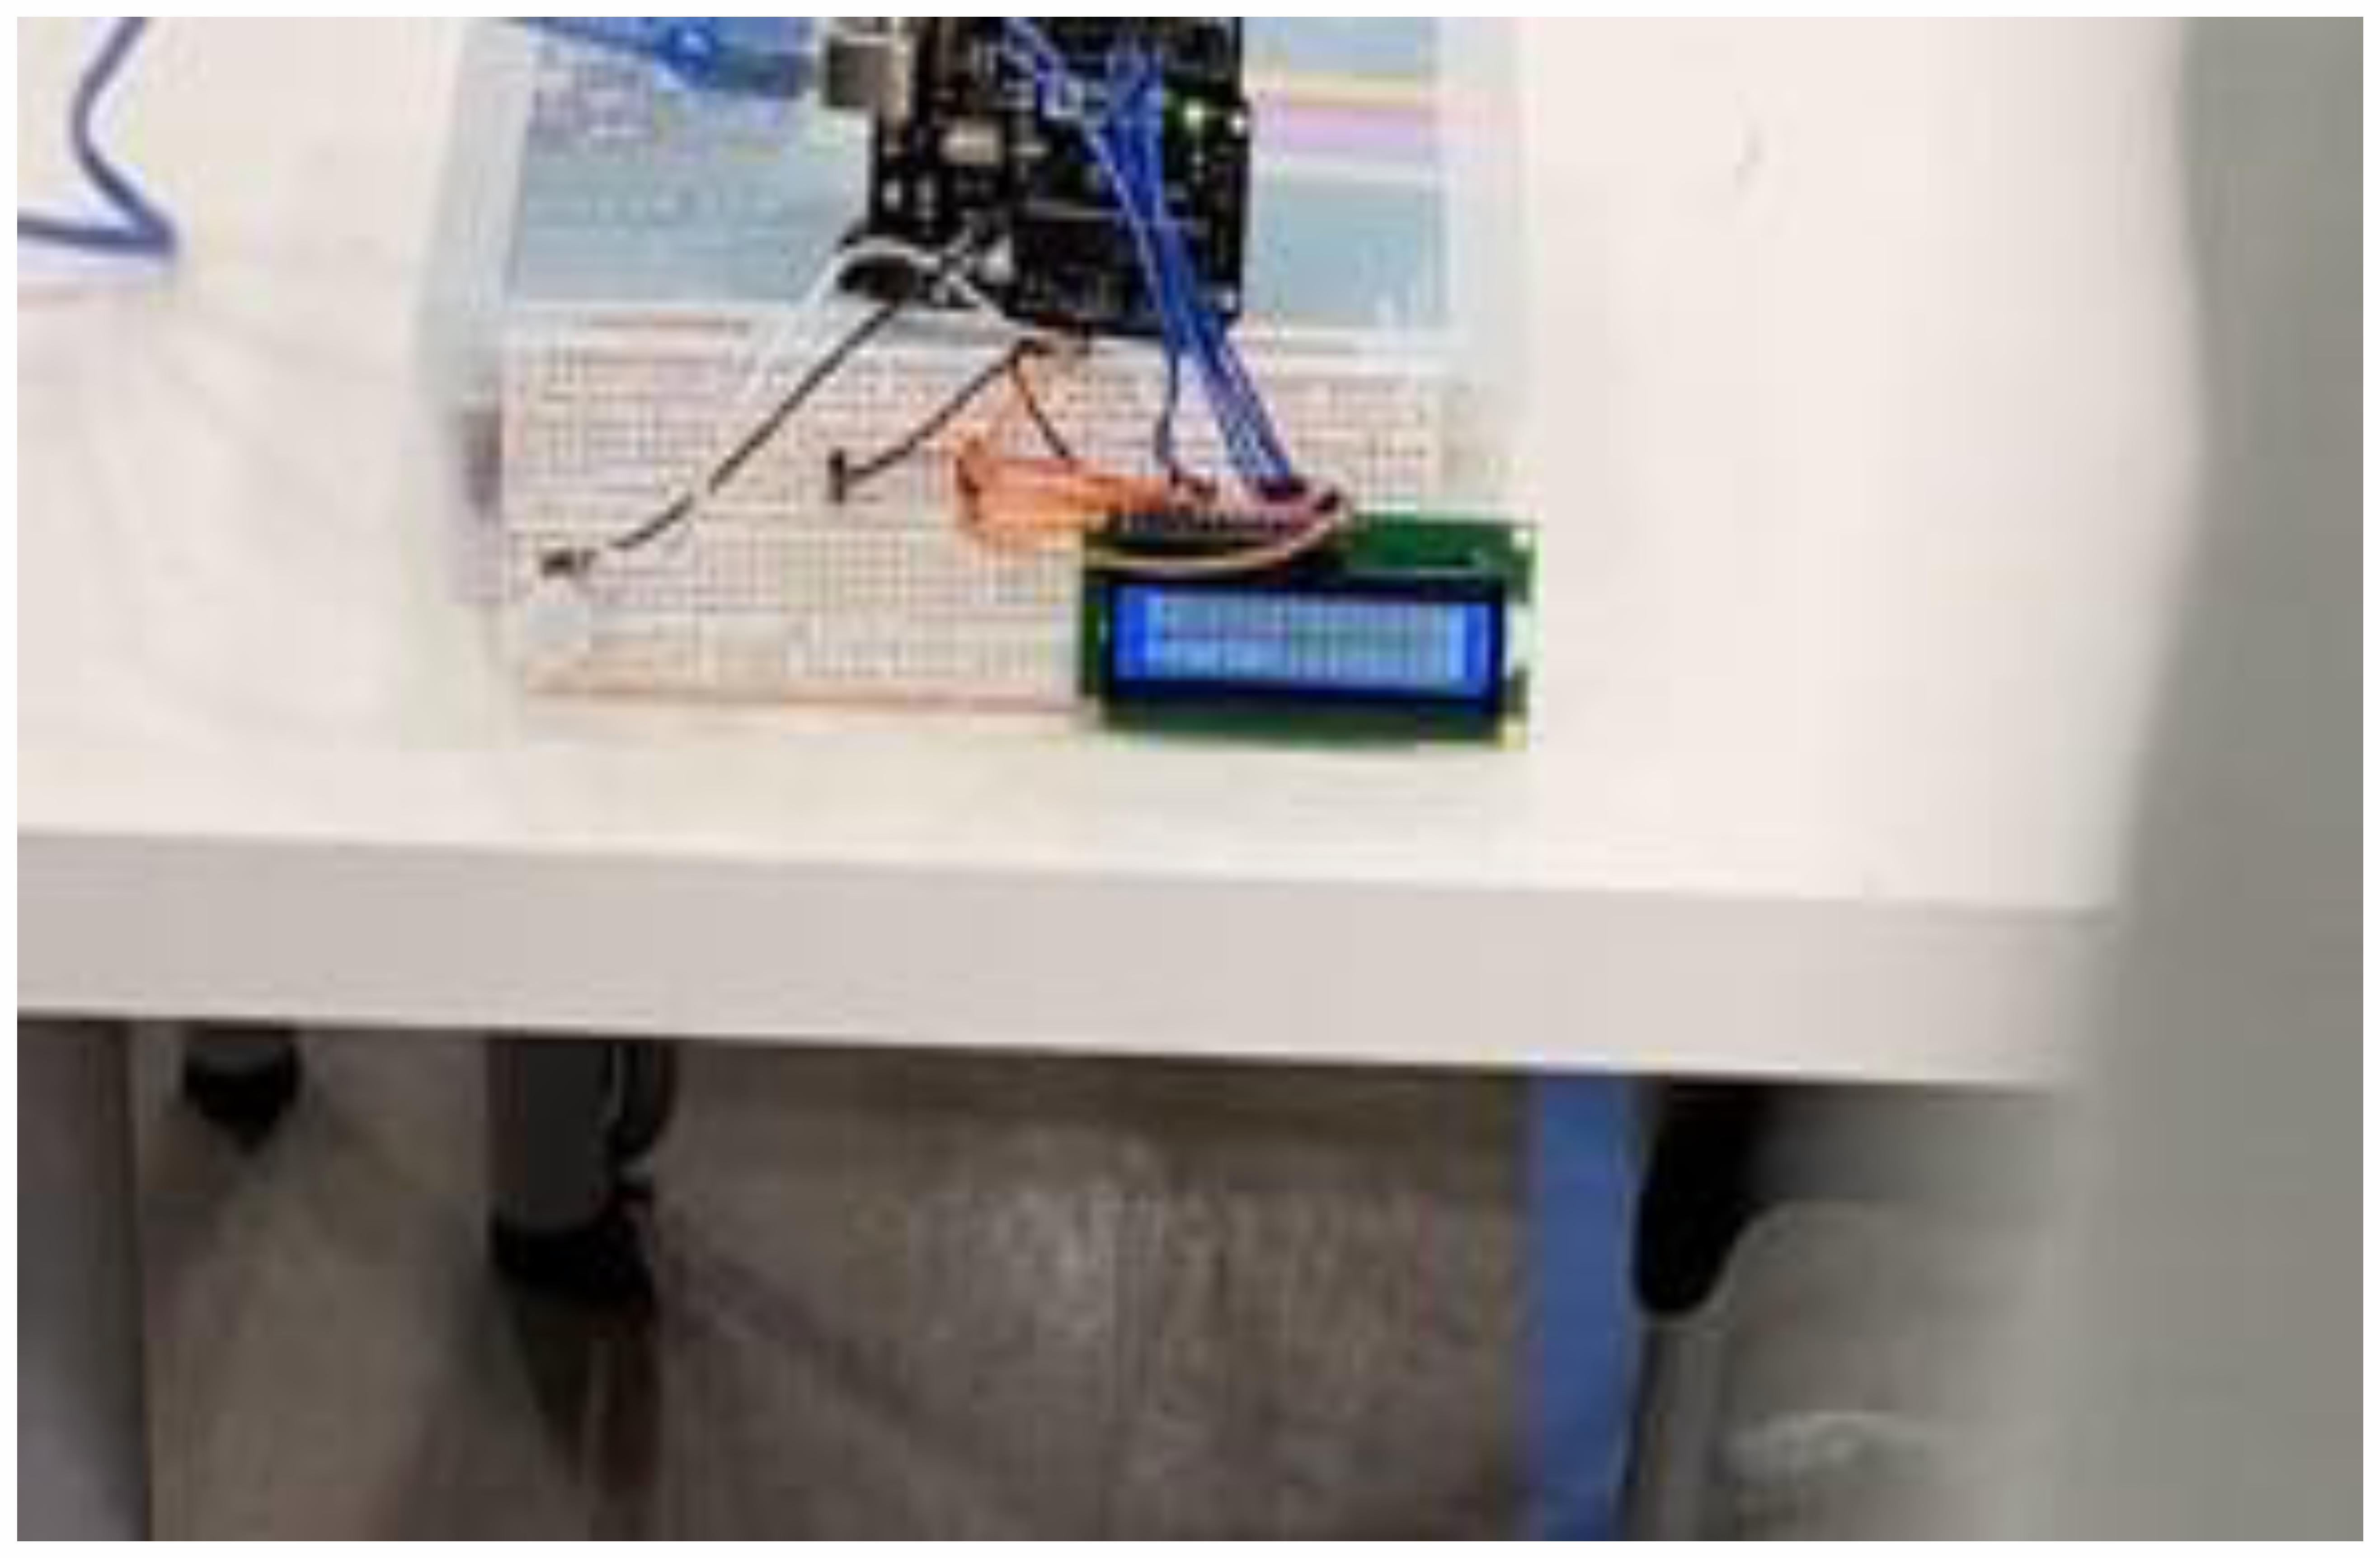
Final ProductOur final product is a pedestrian sensor
consisting or an infrared human sensor,
ELEGOO Uno R3 microcontroller, and an
LCD display screen that effectively counts
people walking in front of it. There were
no feasible changes to be made from our
original design.
Materials and Methods
We used a HiLetgo AM312 mini
pyroelectric infrared human sensor,
ELEGOO Uno R3, and an LCD
display
The sensor can detect a max of 3-5
meters, which is large enough to detect
the largest width of the trail, 5ft,
without infringing on the path.
AnalysisWe learned that counting the rising edge rather than when the sensor is active will give a more accurate result. We found that the sensor struggles to differentiate when two people walk in front of it and will often count only one person. This is simply beyond the capabilities of an infrared sensor and can almost only be resolved using a camera.
ENGR102 – Introduction to Engineering II Wingwatchers Trail
Pedestrian SensorChase Hedani, Griffin Thissell, Keora O’Meara
Oregon Institute of Technology, Klamath Falls, OR 97601
Figure 1. Original Schematic
Figure 3. Final sensor. Top left of circuit board, (HiLetgo AM312 mini pyroelectric infrared human sensor). Bottom left, (LCD Display screen). Right side, (ELEGOO Uno R3 microcontroller)
Figure 2. Gantt Chart. We used this to organize our due dates throughout the term
Figure 1. Original Schematic
Figure 4. Sensor in action. The sensor counts number 36 after we have moved in front of it 36 times.
Figure 5. Chart depicting the sensors functional capability.