CHAPTER SEVEN CONCLUSIONS AND FUTURE RESEARCH
29
CHAPTER SEVEN CONCLUSIONS AND FUTURE RESEARCH 117
-
Upload
khangminh22 -
Category
Documents
-
view
0 -
download
0
Transcript of CHAPTER SEVEN CONCLUSIONS AND FUTURE RESEARCH

C H A P T E R S E V E N
C O N C L U S I O N S A N D F U T U R E R E S E A R C H
117
UftJlViRSITY C F MORATUWA, SRI lAJi
CHAPTER SEVEN
CONCLUSIONS AND FUTURE RESEARCH
7.1 DISCUSSION
This research is aimed at formulating a frame work for computer aided cost model linked to
SMM (SLS 573 revised 1999). To establish a suitable model framework research investigated
topics such as design process (Chapter Two), cost control mechanism in design stages (Chapter
Three) and practice of approximate estimating in local organizations (Chapter Four).
With innovation of computers new opportunities came into being which have given high
potential to investigate, evaluate and synthesise any complex situation. The estimating practice is
no exception to this revolution. Cost planning software are commercially available in other
countries, specially UK. The use of computer aided models is, presently, low in the industry. The
justification can be that practitioners do not opt to accelerated changes in certain disciplines (eg:
estimating, electronic bidding) since which carry elements of risks not demonstrated or tested.
However, application of information technology is a major determinant in strategic planning of
departments of organizations.
7.2 CONCLUSIONS
7.2.1 Status of the current practice in local organizations
The survey executed to collect information on various approximate estimating related issues
revealed that local approximate estimating practice has not changed the pattern and methods of
approximate estimating other than introduction of general purpose computer software such as
Microsoft Excel, Lotus 123 etc.. Changing the mind set to shift to new wave of cost models is
not easy. In the context of approximate estimating, practitioners find solutions within commonly
7 5 1 2 2
practiced approximate estimating techniques. Accuracy is not a critical issue as revealed in
Chapter Five. Less attention to degree of accuracy can cause very abortive decisions. Cost
advisor with an unrealistic cost estimate and cost limit misguides both selection of most
competitive tenderer and Client. Therefore, study of approximate estimating approximate
estimating techniques, their limits and latest developments with computer applications are
considered contributory to find a promising solution.
In his presidential address Clive Lewis highlighted the need for surveyors (Quantity Surveyors)
to become more expert at forecasting (cited by Martin, 1994). A recent research revealed that
Simple model building, Non linear modeling, Econometrics, Linear programming, Delphic
method, Scenarios, Modern portfolios theory and Duration are the techniques/methods taught at
postgraduate levels in universities (Martin, 1994). The research stresses the importance of
forecasting skills. Suitable forecasting techniques are required to exercise forecasting skills. The
research cost model is an attempt to comply with this requirement thinking globally but acting
locally.
7.2.2 Cost advisors emerging role during the Briefing stage
All too often the cost advisor's involvement in the early stage of the design stage is minimal
(Smith, 1982). Very few clients seek cost advisor's assistance at feasibility stage. But important
design decisions are taken at this stage. Traditionally, the architect (Mostly private sector) is sole
information channel between client and design team. Other members of the design team such as
quantity surveyor, structural engineer and services engineer are appointed following the critical
stages (Briefing and Sketch plan) at which major parameters like structural, aesthetic, quality,
quantity and financial are fixed. This practice can result in design decisions which commit the
project to many intractable cost consequences. Good approximate estimating techniques create
confidence so that client and architect are compelled to check the cost consequences of design
alternatives. A good forecasting tool is thus an essential requirement. The research cost model
accomplishes this requirement since it can perform over Briefing stage, Sketch plan stage and
Working drawing stage, and facilitates to check cost elementally.
119
7.2.3 Benefits of the proposed cost model
The proposed cost model addresses specific requirements of a cost planner. These can be
unfolded as follows:
• Proposed cost model performs its tasks with the design process. Model is sensitive to
design decisions. Model allows adjusting quantities, cost and other design specifications
of the elected case to match new facility with latest information. Old information is
overridden by reliable information. The model only compliments the decisions of the cost
advisor. Cost advisor has no reason to fear with black box decisions.
• Model establishes first realistic cost estimate comparing historical data. This is the cost
limit and is distributed within building elements setting elemental cost targets. More
suitable building type is selected for this purpose referring to developed client's brief.
Once the cost limit is distributed within building elements, elemental targets are available
for cost control and checking. Necessary remedial actions are sought in case cost targets
are not met.
• The model stores new cases as new experience to the model. Such new information can
widen and deepen the spectrum of forecasting capability of the model.
• The design database of the model provides the cost advisor information which are not
readily available with past cost analysis. For example he can calculate no of WC units
and wash basins for selected level of occupancy. Design information is stored in the
design database of the model.
• The model produces general information summary, element specification notes, building
element cost summary, building element group cost plan, project specific element cost
summary, project specific element group cost plan, project cost plan, sub element BOQ
and bill of approximate quantities. The priced BOQ forms the basis of Engineers'
estimate in local practice.
120
• Client's brief plays a major role in the research cost model. Whole concept of the design
is anchored to Client's Brief. Quantity factors for elements and sub elements are
generated based on Client' brief.
7.2.4 Database management perspective of the model
The proposed research cost model use the power of relational database management system
(PvDBMS). The forms and reports are developed for data input and output. The present trend is to
develop integrated construction management systems using power of relational data base
techniques. The RIPAC system developed by Rider Hunts in Adelaide is an example of very
extensive construction management system which uses the power of relational database
management techniques. The relational data base technique used in the research model provides
robust methods of describing relationships without ambiguity. The advantage is that
organizations can develop their own models based on the concept of the research model
(relational) with the hope that such models can be linked to external systems in future. Therefore,
the data base concept of the research model addresses the current trend in data base management
in the quantity surveying and engineering professions.
7.2.5 Errors and biases in the proposed cost model
There are at least two groups of reasons which explain how errors and biases are crept into
estimates and forecasts in building economics. First group stems from common rules of thumb
and biases in cognitive processes of human beings making judgments and forecasts in any
situations. The second group stems from the tendency, in building economics, to make
unrealistic simplifying assumptions. The proposed research cost model uses professional
judgment extensively in assessing design and construction contingencies and predicting future
price levels. Therefore, two groups of reasons of errors and biases are likely to be present. The
solution to this problem is abstractly obvious although difficult to implement. The solution is that
forecasters should adopt methods which explicitly deal with both risk and exposure and risk
attitude.
121

There is a general agreement on three common rules of thumb (heuristics) used by forecasters in
making judgments (Mak and Raftery, 1992).
1. Representativeness
2. Availability
3. Anchoring and adjustment
Reprentativeness heuristics is the process of evaluating the probability of an event or a sample
by the degree to which it (1) is similar in essential properties to its parent population; and (11)
reflects the salient features of the process by which it is generated. It is in essence an assessment
of the degree of correspondence between model and its outcome.
Availability is a heuristics which makes use of retrievability of instances. For example an
estimator, who experienced an inadequate allowance for construction stage contingencies for
past three projects, is likely to overestimate construction contingencies in future projects.
Adjustment refers to the cases when the estimators make estimates by starting from a initial
value( for example cost of the upper floors are available from the appropriate case in the research
model as initial reference) and adjusting it to derive the required value. Anchoring refers to the
phenomenon where final results are usually biased toward the initial values.
The above explained three heuristics are likely to occur in the process of decision making with
the research cost model. The subject of risk attitude and systematic bias in estimating is beyond
the scope of the research cost model.
7.2.6 Limitations of the proposed model
The proposed cost model doesn't provide design solutions. It provides cost solutions to match
design solutions. Model works iteratively with the design development offering respective cost
solutions. Cost advisor is given facility to select most appropriate historical design as qualified
case from which to start. What actually designer does in developing the design is the same thing.
122
Very rarely a designer designs a completely innovative building. Majority of the building design
follows features in previous building designs. Accordingly, having historical design and cost
databases and referring them in new situations is a logical and practical approach. Model
accomplishes this objective.
7.2.7 Experiential learning in cost estimating
Research in pre-tender estimating practice indicates that 'experience' is a major factor in
determining the expertise of the estimator and, hence, the accuracy of resulting estimates. In a
major study involving 60 estimators in practice, Skitmore et al. (1990) have found that project
specific experience was the main factor associated with the accuracy of early stage
estimates(cited by Lowe and Skitmore, 1994).
Estimators should learn ways of improving their experiential learning. Improved experiential
learning leads to increased feedback and consequent estimating accuracy. Lowe and Skitmore
(1994) suggest several tasks to accomplish experiential learning as follows:
1. portfolios-a record of significant learning experiences;
2. journals-a record of self reflection
3. discussion with others;
4. debriefing-an opportunity for structured reflection and peer appraisal;
5. collaboration-to facilitate the examination and analysis of uncertainties and
dissatisfaction with others;
6. behaviour records-to enable the analysis of the learning situation;
7. reflective analysis-the use of check lists and self assessment;
8. convergent thinking- the reflection on divergent aspects and perspectives.
The research cost model allows the cost advisor to exercise his judgment on costs, quantities and
other design specifications of elements, sub elements and SMM items of the selected case to
match the new facility. Structured experience is very helpful in this exercise. Experiential
learning is thus emphasized in cost planning with the research cost model.
123

7.2.8 Implementation of research cost model
The research formulates a frame work for a computer aided cost model. The interfaces, forms
and reports required for the operation of the model have comprehensively been described in the
report. Formulation of the framework for a physical model is stage 1 of the research project.
Development of a physical model to demonstrate the model is stage II of the research project. It
was stated that VB6 and Microsoft Access software are suitable for development of a physical
model.
The model doesn't assume complete change of existing way of working. Model works through
elements, sub elements and SMM items. These are familiar to average quantity surveyor.
However, introduction of computer manipulation may accompany resistance from traditional
practitioners. Following factors are worthy to note in implementation:
a) People are naturally resistance to change. Involvement of the potential users from the
beginning of a new system should be encouraged.
b) Realistic goals should be set during the initial bedding in of a new system.
c) A new system should not force to change (drastically) the way of working.
d) A common user interface throughout a system will assist learning and consistent
operation.
The proposed computer aided research cost model meets above requirements. System
management is one of the primary factors influencing the expected performance of any selected
software.
124
7.3 FUTURE RESEARCH
The research cost model uses three parameters (keys) to select appropriate building type:
building type, quality level and number of storeys. Cost of a building correlates with many
design features such as plan shape, wall to floor ratio, spans etc. Research into these areas to
establish the relationship between design parameters and consequent costs is important. This
allows the cost advisor to equip with a technique to select appropriate building from a sample.
The proposed cost model generates quantities and relevant costs referring to a historical case in
the database. Improving the selection of appropriate case with more keys ensure that most
appropriate case in the case base is selected as initial reference.
The recent developments in the field of expert systems can offer more opportunities. For
example Artificial Neural Net Work (ANN) provides models to be trained with test data.
Developing ANN bases techniques can help the cost advisor in many respects. For example cost
advisor can instruct the model to select most appropriate case from the database against 50
parameters within a short time. This can reduce time which is spent on selection of the
appropriate case.
Numerous researchers (Barnes and Thomsoan, 1971; Ashworth, 1981; Seely,1981; Ashworth
and Skitmore, 1983; Harmer, 1983) have commented upon the fact that 20% of the measured bill
items contribute 80% of the total measured bill value( cited by Munns and Haimus,1999). These
findings conform to the 80/20 rule established by Vilfred Pareto and 20% of the items which
have the highest value are generally referred to as the cost significant items (Munns and Haimus,
1999). Quantifying and pricing cost significant items of a particular type of building can increase
the efficiency of the predicting without compromising accuracy.
The plan shape index calculated and included in the design database of the proposed cost model
is wall to floor ratio. Other plan shape indices are plan compactness ratio (POP), length/breath
ratio (LBI) etc. These plan shape indices have no reference to U (unit construction cost) and are
unlikely to be good predictors of U (Wing, 1998). Plan shape index based on reciprocal model
has been suggested to predict amount of floor area that can be constructed with a fixed sum of
125

money (Wing, 1998). It is proposed to include necessary data in the design database of the
proposed research cost model to calculate this plan shape index to cross check the cost of the
superstructure against the gross floor area. Knowledge of plan shape and consequent cost effect
is essential for cost advisors to advise design team.
Capability of the model to derive information based on client's brief can be improved with
Client's Requirements Processing Model (CRPM). The CRPM developed by Kamara et al.
(2000) provides a suitable frame work to accomplish this requirement. The said CRPM model is
based on quality function deployment (QFD). In QFD, multi-functional teams are used to
identify, incorporate and deploy the voice of the customer during the product development
process.
Research cost model intends to use ICTAD price indices to project present costs to future costs.
Based on the behaviour of the past cost indices future indices have to be judged. Akintoye and
Skitmore's reduced form model of construction price is a causal quantitative forecasting model
involving the identification of variables that related to construction price (Akintoye and
Skitmore, 1994). Similar model is proposed to forecast future price levels.
126
REFERENCES
AIQS-Australian Institute of Quantity Surveyors (2000), Australian cost Management
Manual, Volume 1, Australian Institute of Quantity Surveyors, Canberra
Akintoye,S.A., Skitmore,R.M. (1994) A comparative analysis of three macro price
forecasting models, Construction Management and Economics, volume 12, p 257-270.
Akintoye,A.S., Ajewole,0., 01omoaiye,P.O. (1992) Construction cost information
management in Nigeria, Construction Management and Economics, volume 10, pi07-116
Austin, S., Baldwin,A., Newton,A. (1994) Manipulating the flow of information to improve
the programming of building design, Construction Management and Economics, volume 12,
p 445-455. ^
Atkin,B. (1995) Concentrating on value for money, Chartered Surveyors Monthly, September
1995, p26-27.
Aygun,M. (2000) Comparative performance appraisal by multiple criteria for design
alternatives, Architectural Science Review, Vol 43, p31-36
Bedard,C. and Mokhtar,A. (1994) Towards integrated construction technical documents-A
new approach through modeling,Scherer,R.J (ed) product and Process Modelling in the
Building Industry
Edgill,B.,Kirkham,J. (1990)Integrated Database, in Quantity Surveying Techniques : New
Directions, Brandon,P.S (ed.),BSP Proferssional Books,Oxford, p 209-242.
Ferry,D.J. and Brandon, P.S. (1991) Cost planning of buildings,6th Edn, BSP professional
books, UK.
1 2 7

Flanagan, R., and Tate, B. (1997) Cost Control in Building Design, Black Well Science, UK
Fortune,C. and Lees,M. (1994),Chartered Surveyors Monthly, March, pi9-19.
Fortune,C, Hinks,J. (1999) Are quantity surveyors moving with times?, Chartered Surveyors
Monthly, March 1999, p 46-46.
Greenstreet, B. (1998) Surveyors should take a lead in building services ,Chartered Surveyors
Monthly, July/August 1998, p54-54
Gunner J., and Skitmore, M. (1999), Comparative analysis of Pre -Bid Forecasting of
Building prices based on Singapore Data, Construction Management & Economics, Volume
17, p635-646
Hunt,G. (1988) Micronotes, Chartered Quantity Surveyor, April, pi7.
Jaggar, D.M. (1987) The development of a database for use in the cost control of civil
engineering projects, Brandon, P.S. (ed.), Building Cost Modelling and computers, p309-
316, E&FN Spon, London.
Jayalath, C. (1992) Preliminary estimating as a Tool for Cost Forecasting, BSc dissertaton,
Department of Building Economics, University of Moratuwa, Sri Lanka.
Jayasuria, M C. (1995) Preliminary estimating practice and databases, BSc dissertaton,
Department of Building Economics, University of Moratuwa, Sri Lanka.
Jeremy,G., Skitmore,M (1989) A new approach to early stage Estimating. Chartered Quantity
Surveyors, May, p36-38
Kagioglou,M.,Cooper,R.,Aouad,G.,Sexton,M. (2000) Rethining construction:the Generic
Design and construction process protocol, Engineering, Construction and Architectural
Management.,VoI 7, No 02, p 141-153.
1 2 8

Kamara,J.rvl., Anumba, C.J.,Evbuomwan,N.F.O. (2000) Establishing and processing client
requirements-a key aspect of concurrent engineering in construction, Engineering
Construction and Architectural Management,Vol 7, No 01, pi5-28.
Khedro,T. (1999) Collaborative Distributed Building Engineering, Computer -Aided Civil
and Infrastructure Engineering, Vol 14, p69-79.
Lowe,D.,Skitmore,M. (1994) Experiential learning in cost estimating, Construction
Management and Economics, volume 12, p423-431.
Mak,S.,Raftery,J. (1992) Risk attitude and systematic bias in estimating and forecasting,
Construction Management and Economics, Vol 10, p 303-320.
Martin, J. (1994) Too little too late or too much too soon?, Chartered Surveyors Monthly,
September 1994, p 42
Martin, J. (2001b) Elemental my dear Egan, Chartered Surveyors Monthly, July/August,
2001,p36-37.
Martin, J . (2001a) Value engineering: Benchmarks for success, Chartered Surveyors
Monthly, January, 1994, p 42
Martin, J.(2000)How to provide best early cost advice to clients, Chartered Surveyors
Monthly, June 2000, p32-33.
Moore,P. (1988) Working along the right lines, Chartered Quantity surveyor, October,
p 28-29.
Munns, A.K. and Haimus, K.M. (1999)Estimating using cost significant global model,
Construction Management and Economics, volume 18, p 575-585
Newton, S. (1987) computers and cost modeling: what is the problem?, Brandon,P.S.(ed.),
Building Cost Modeling and computers, p41-48, E&FN Spon, London.
1 2 9

Perera, R.S. (1997), Case-Based Estimating and Design: Towards A Collaborative Approach,
PhD Thesis, Department of Surveying, University of Salford, Salford, UK.
Perera, A.A.D.A.J .(1989) cost effective designs, PhD Thesis, Loughhborouogh University of
Technology, UK.
Pittard,S.(1994) Going beyond software selection, Chartered Surveyors Monthly, September
1994, p35-36.
Raftery,J.(1987) The state of cost/price modeling in the UK construction industry: A
multicriteria approach, Brandon, P.S.(ed.), Building Cost Modelling and computers, p49-71,
E&FN Spon,London.
Reynolds, F.M (1993) Coceptual and Early Estimating Techniques for Building Heating,
Ventilating and Air Conditioninig system. Cost Engineering. Volume 35,Nol 1, p25-36.
RIBA-Royal Institute of British Architects (1980), Handbook of Architectural Practice and
Management, No 4,R1BA, Publications Ltd., London, UK.
Rumble,P. (1998) Measure the importance of services to cost planning, Chartered Surveyors
Monthly, March 1998, p 46-47.
Skitmore,M. (1987) The effect of project information on accuracy of building price forecasts,
Brandon, P.S.(ed.), Building Cost Modelling and computers, p327-336, E&FN Spon,
London.
Skitmore,M. and Patchell, B. (1990) Developments in Contract Price Forecasting and
Bidding Techniques, in Quantity Surveying Techniques : New Directions,Brandon,P.S
(ed.),BSP Proferssional Books,Oxford, p 75-120.
SLIA-Sri Lanka Institute of Architects (1998), Client/Architect Agreement over Rs 5.00
Million:BPA/003/08/98,3rd Edn, Sri Lanka Institute of Architects, Sri Lanka
1 3 0
Smith ,J. 1982) The Quantity Surveyor's Emerging role during the Briefing stage, Vol
20,No4, March, p 171-174
Smyth ,G. (1999) Dare surveyors ignore value management?, Chartered Surveyors Monthly,
February 1999, p 46-47.
Southgate,T. (1988) A New Approach, Chartered Quantity surveyor, December, p 25-25.
Standard Method of Measurement of Building Works: SLS 573 Revision 1999, Sri Lanka
Standards Institution, Sri Lanka.
Tabatabai.H., Diekmann,J.E. (1992) Judgemental forecasting in construction projects,
Construction Management and Economics, volume 10, p 19-30.
Tilakaratne, S. (1991) Construction cost Information Management , BSc dissertaton,
Department of Building Economics, University of Moratuwa, Sri Lanka
Wijesuriya, I. (1991) A Study of Pre Contract Cost Control Techniques in Sri Lanka, BSc
dissertaton, Department of Building Economics, University of Moratuwa, Sri Lanka
Wing,C.K. (1999) On the issue of pain shape complexity: plan shape indices revisited,
Construction Management and Economics, volume 17, p473-482
Zakieh,R.,Horner,M. (1996) Characteristic items-a New approach to pricing and controlling
construction projects. Construction Management and Economics, volume 14, p241-252.
1 3 1

APPENDIX A
DES-code DES-Speciality DES-Data
ARCH01 space office space per person(A)=5.00m2 person , within department circulation(B)=10% of A, inter department circulation(C) =15% of(A+B), support facilities to office areas(E)=2.2m2 per person, special facilities(F)=.75m2 per person , services core and columns(G)=20% of net usable areafNUA)
ARCH02 provision of fire stairs at least one fire stair is required in buildings with floors over 18.3m above ground level.
ARCH03 provision of staircases refer design table ARCH03
132
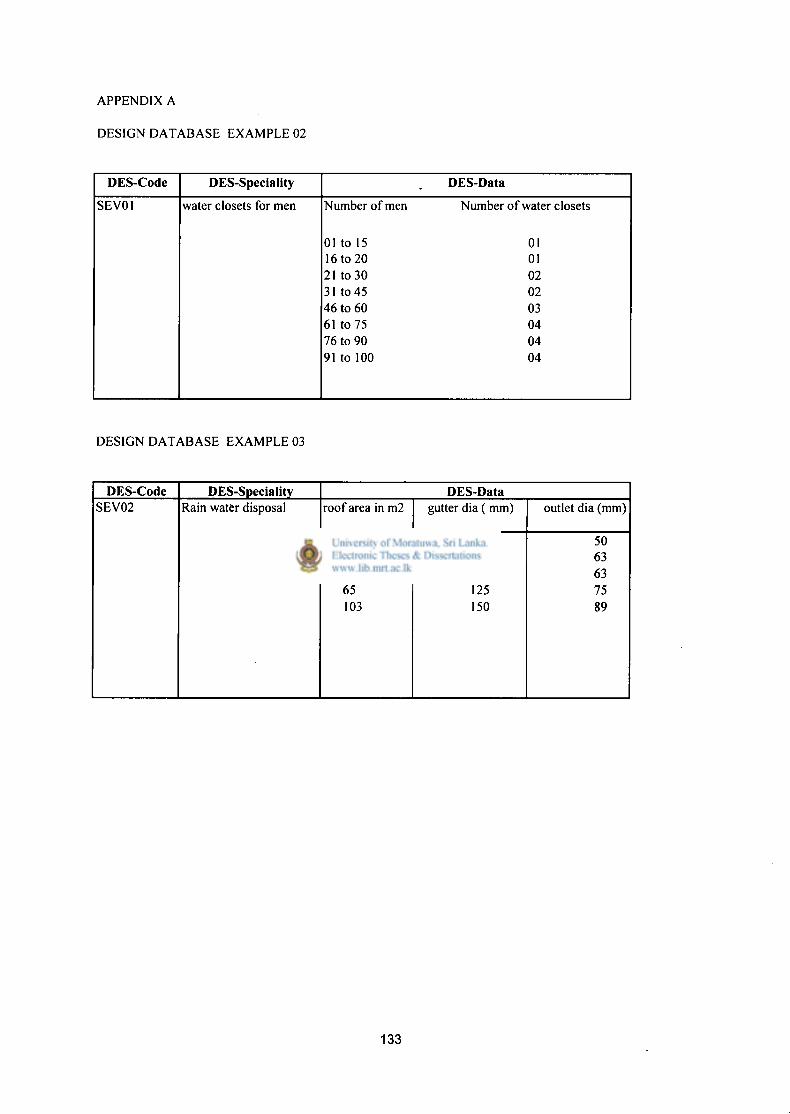
DESIGN DATABASE EXAMPLE 01
APPENDIX A
DES-Code DES-Speciality DES-Data
SEV01 water closets for men Number of men Number of water closets
01 to 15 01 16 to 20 01 21 to 30 02 31 to 45 02 46 to 60 03 61 to 75 04 76 to 90 04 91 to 100 04
DESIGN DATABASE EXAMPLE 03
DES-Code DES-Speciality DES-Data SEV02 Rain water disposal roof area in m2 gutter dia (mm) outlet dia (mm)
18 75 50 37 100 63 53 115 63 65 125 75 103 150 89
133
DESIGN DATABASE EXAMPLE 02
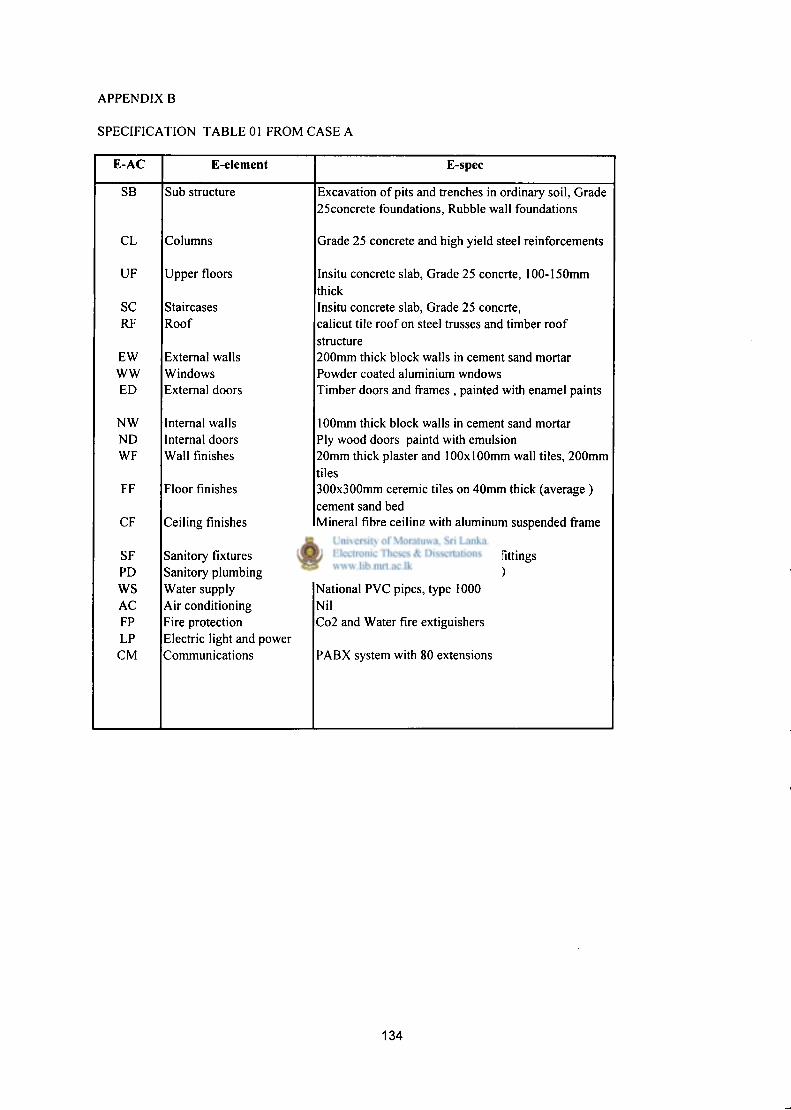
APPENDIX B
SPECIFICATION TABLE 01 FROM CASE A
E-AC E-element E-spec
SB Sub structure Excavation of pits and trenches in ordinary soil, Grade 25concrete foundations, Rubble wall foundations
CL Columns Grade 25 concrete and high yield steel reinforcements
UF Upper floors Insitu concrete slab, Grade 25 concrte, 100-150mm thick
SC Staircases Insitu concrete slab, Grade 25 concrte, RF Roof calicut tile roof on steel trusses and timber roof
structure EW External walls 200mm thick block walls in cement sand mortar WW Windows Powder coated aluminium wndows ED External doors Timber doors and frames , painted with enamel paints
NW Internal walls 100mm thick block walls in cement sand mortar ND Internal doors Ply wood doors paintd with emulsion WF Wall finishes 20mm thick plaster and 100x100mm wall tiles, 200mm
tiles FF Floor finishes 300x300mm ceremic tiles on 40mm thick (average )
cement sand bed CF Ceiling finishes Mineral fibre ceiling with aluminum suspended frame
work SF Sanitory fixtures Ceremic corporation fittings, Italy fittings PD Sanitory plumbing National PVC pipes, Type 400, 600 ws Water supply National PVC pipes, type 1000 AC Air conditioning Nil FP Fire protection Co2 and Water fire extiguishers LP Electric light and power CM Communications PABX system with 80 extensions
134

APPENDIX C SUB ELEMENT COST SUMMARY FOR SUBSTRUCTURE
SE-AC SE-ELEMENT SE-QTY SE-UNIT SE-RATE SE-AMOUNT(Rs)
SBXF Foundation excavation 100.00 m2 300.14 30,014.00
SBCP Column pads and pedestal 521.00 m2 273.82 142,661.60
SBSF Strip footings 0.00 m2 0.00 0.00
SBFB Foundation beams 521.00 m2 550.85 286,993.20
SBWG Walling 203.00 m2 820.74 166,610.00
SBFN External finishes 150.00 m2 342.00 51,300.00
SBGS Ground slab m2 126,072.00
SBES Open entrance step and ramps 0.00 m2 0.00 0.00
SBNE Not elsewhere included in SB pc 0.00
Total SB 803,650.80 Total SB
135
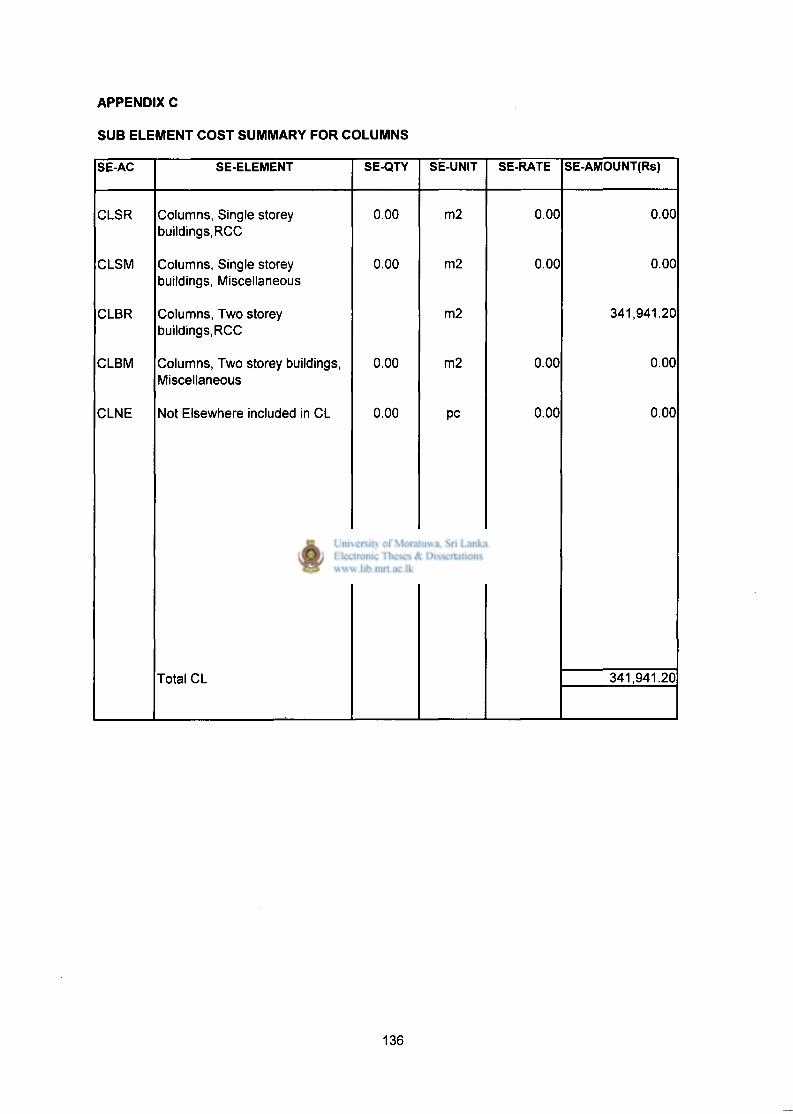
APPENDIX C SUB ELEMENT COST SUMMARY FOR COLUMNS SE-AC SE-ELEMENT SE-QTY SE-UNIT SE-RATE SE-AMOUNT(Rs)
CLSR Columns, Single storey 0.00 m2 0.00 0.00 buildings, RCC
CLSM Columns, Single storey 0.00 m2 0.00 0.00 buildings, Miscellaneous
CLBR Columns, Two storey m2 341,941.20 buildings.RCC
CLBM Columns, Two storey buildings, 0.00 m2 0.00 0.00 Miscellaneous
CLNE Not Elsewhere included in CL 0.00 pc 0.00 0.00
Total CL 341,941.20 Total CL
136

APPENDIX C SUB ELEMENT COST SUMMARY FOR UPPER FLOORS SE-AC SE-ELEMENT SE-QTY SE-UNIT SE-RATE SE-AMOUNT(Rs)
UFSB Insitu Slab and Beam m2 1,357,154.80 Construction
UFNE Not Elsewhere included in UF pc 0.00
Total UF 1,357,154.80 Total UF
137
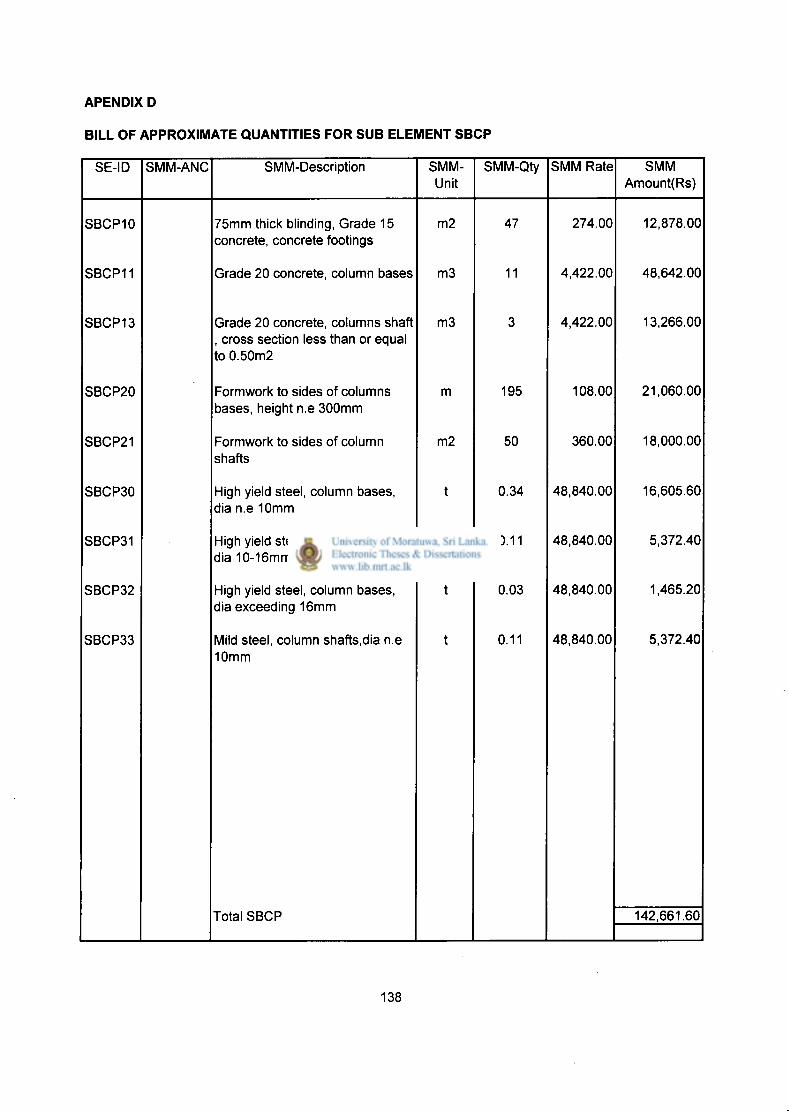
APENDIX D BILL OF APPROXIMATE QUANTITIES FOR SUB ELEMENT SBCP
SE-ID SMM-ANC SMM-Description SMM-Unit
SMM-Qty SMM Rate SMM Amount(Rs)
SBCP10 75mm thick blinding, Grade 15 concrete, concrete footings
m2 47 274.00 12,878.00
SBCP11 Grade 20 concrete, column bases m3 11 4,422.00 48,642.00
SBCP13 Grade 20 concrete, columns shaft , cross section less than or equal to 0.50m2
m3 3 4,422.00 13,266.00
SBCP20 Formwork to sides of columns bases, height n.e 300mm
m 195 108.00 21,060.00
SBCP21 Formwork to sides of column shafts
m2 50 360.00 18,000.00
SBCP30 High yield steel, column bases, dia n.e 10mm
t 0.34 48,840.00 16,605.60
SBCP31 High yield steel, column bases, dia 10-16mm
t 0.11 48,840.00 5,372.40
SBCP32 High yield steel, column bases, dia exceeding 16mm
t 0.03 48,840.00 1,465.20
SBCP33 Mild steel, column shafts.dia n.e 10mm
t 0.11 48,840.00 5,372.40
Total SBCP 142,661.60
138
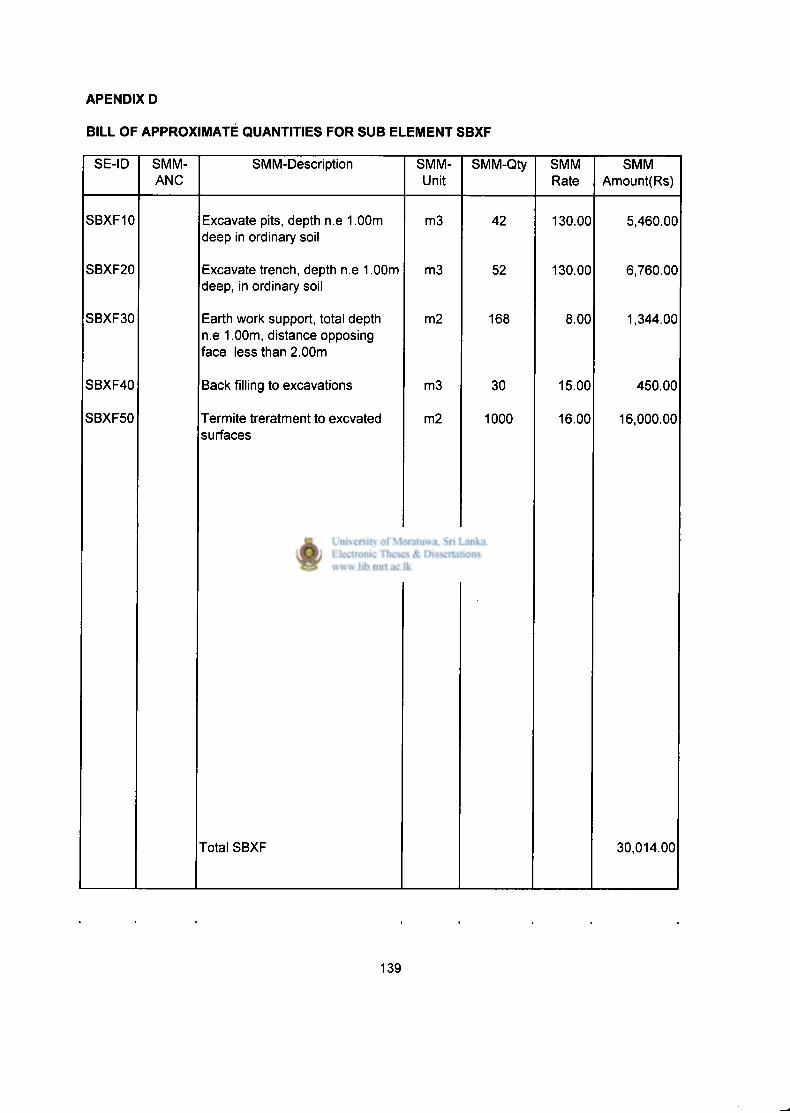
APENDIX D BILL OF APPROXIMATE QUANTITIES FOR SUB ELEMENT SBXF
SE-ID SMM- SMM-Description SMM- SMM-Qty SMM SMM ANC Unit Rate Amount(Rs)
SBXF10 Excavate pits, depth n.e 1.00m m3 42 130.00 5,460.00 deep in ordinary soil
SBXF20 Excavate trench, depth n.e 1.00m m3 52 130.00 6,760.00 deep, in ordinary soil
SBXF30 Earth work support, total depth m2 168 8.00 1,344.00 n.e 1.00m, distance opposing face less than 2.00m
SBXF40 Back filling to excavations m3 30 15.00 450.00
SBXF50 Termite treratment to excvated m2 1000 16.00 16,000.00 surfaces
Total SBXF 30,014.00
139
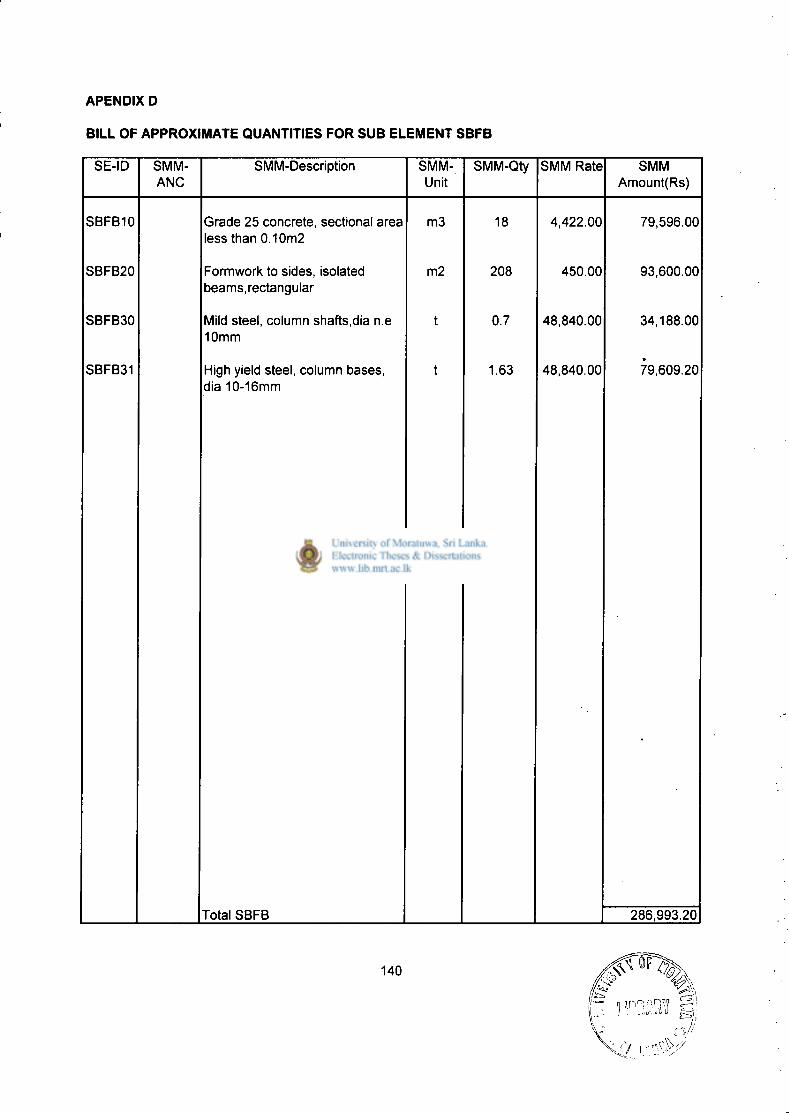
APENDIX D BILL OF APPROXIMATE QUANTITIES FOR SUB ELEMENT SBFB
SE-ID SMM-ANC
SMM-Description SMM-Unit
SMM-Qty SMM Rate SMM Amount(Rs)
SBFB10 Grade 25 concrete, sectional area less than 0.10m2
m3 18 4,422.00 79,596.00
SBFB20 Formwork to sides, isolated beams, rectangular
m2 208 450.00 93,600.00
SBFB30 Mild steel, column shafts,dia n.e 10mm
t 0.7 48,840.00 34,188.00
SBFB31 High yield steel, column bases, dia 10-16mm
t 1.63 48,840.00 79,609.20
Total SBFB 286,993.20
140

APENDIX D BILL OF APPROXIMATE QUANTITIES FOR SUB ELEMENT SBWG
SE-ID SMM- SMM-Description SMM- SMM-Qty SMM Rate SMM ANC Unit Amount(Rs)
SBWG10 Grade 15 concrete, 100mm thick, m2 88 548.00 48,224.00 wall foundation
SBWG20 Random rubble work,in cement m3 62 1,584.00 98,208.00 sand 1:5, wall foundation
SBWG30 DPC, 20mm thick, cement sand m 342 59.00 20,178.00 1:2, two coats of bitument paint, blinding with sand, n.e 300mm wide
-
Total SBWG 166,610.00

APENDIX D BILL OF APPROXIMATE QUANTITIES FOR SUB ELEMENT SBFN
SE-ID SMM- SMM-Description SMM- SMM-Qty SMM Rate SMM ANC Unit Amount(Rs)
SBFN10 20mm thick plinth plaster finished m2 150 198.00 29,700.00 semi rough.
SBFN20 One coat of primer and two coats m2 150 144.00 21,600.00 of weather proof paints on plastered surfaces.
Total SBFN 51,300.00
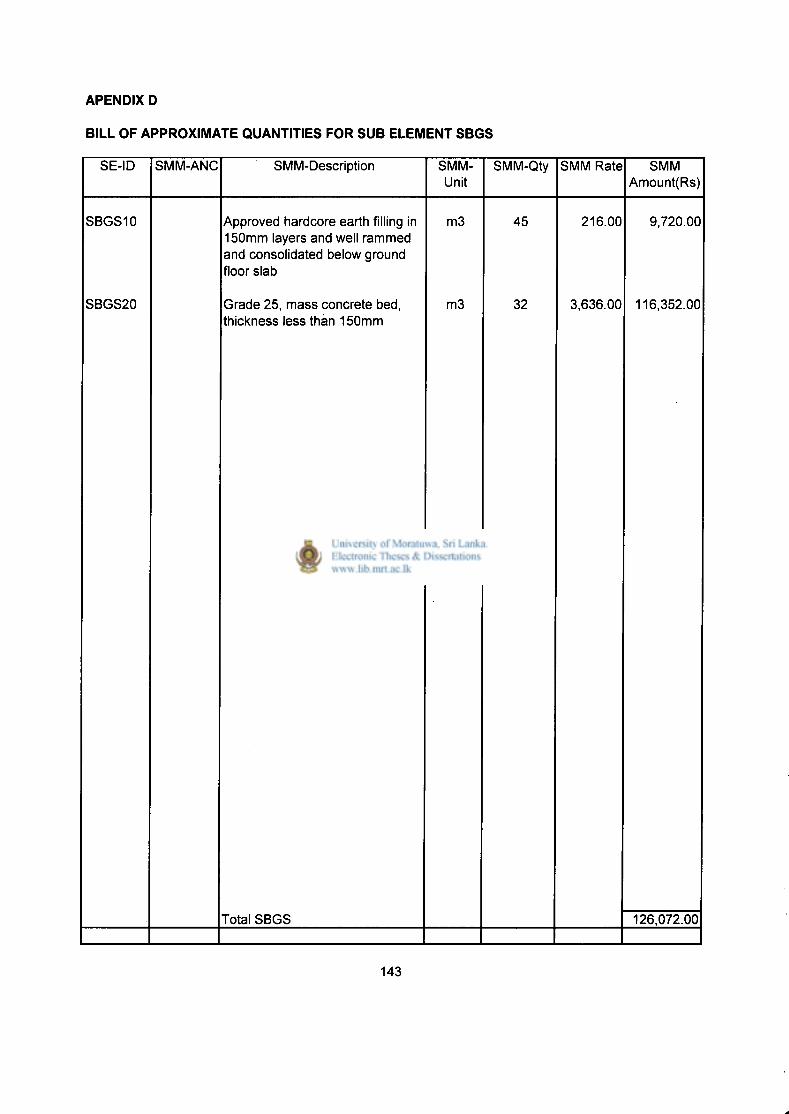
APENDIX D BILL OF APPROXIMATE QUANTITIES FOR SUB ELEMENT SBGS
SE-ID SMM-ANC SMM-Description SMM-Unit
SMM-Qty SMM Rate SMM Amount(Rs)
SBGS10 Approved hardcore earth filling in 150mm layers and well rammed and consolidated below ground floor slab
m3 45 216.00 9,720.00
SBGS20 Grade 25, mass concrete bed, thickness less than 150mm
m3 32 3,636.00 116,352.00
Total SBGS 126,072.00
143
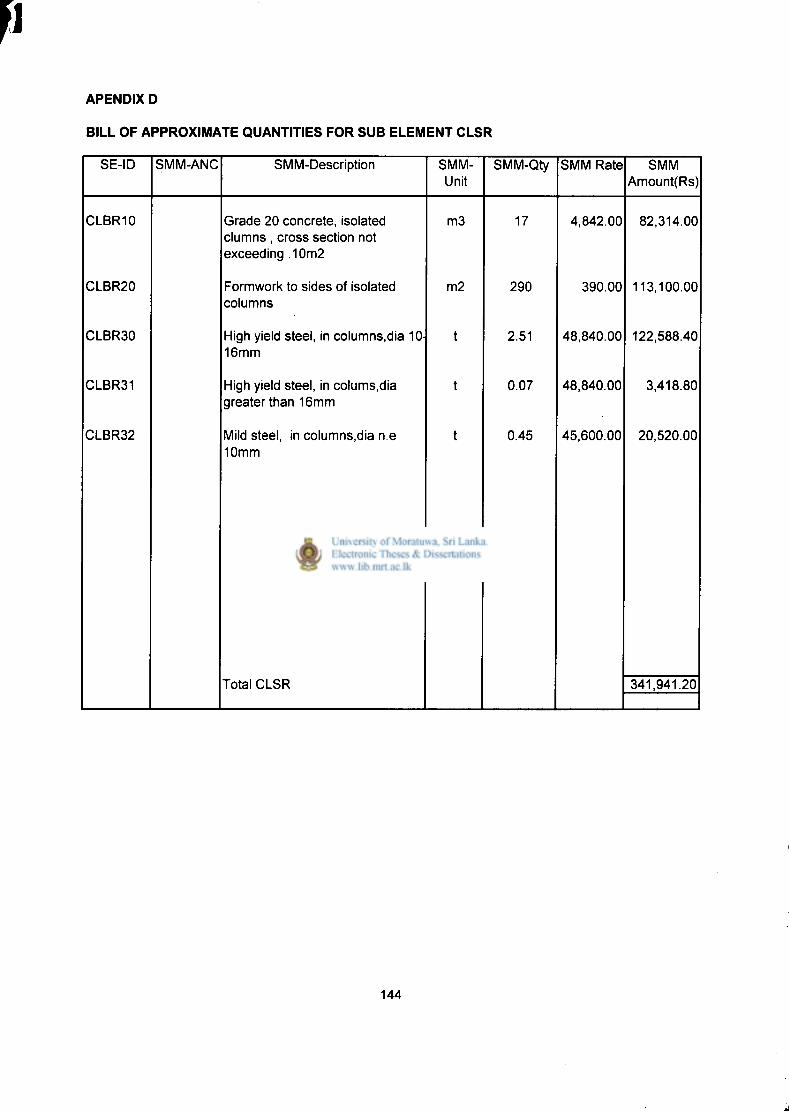
APENDIX D BILL OF APPROXIMATE QUANTITIES FOR SUB ELEMENT CLSR
SE-ID SMM-ANC SMM-Description SMM-Unit
SMM-Qty SMM Rate SMM Amount(Rs)
CLBR10 Grade 20 concrete, isolated clumns , cross section not exceeding 10m2
m3 17 4,842.00 82,314.00
CLBR20 Formwork to sides of isolated columns
m2 290 390.00 113,100.00
CLBR30 High yield steel, in columns.dia 10-16mm
t 2.51 48,840.00 122,588.40
CLBR31 High yield steel, in colums.dia greater than 16mm
t 0.07 48,840.00 3,418.80
CLBR32 Mild steel, in columns.dia n.e 10mm
t 0.45 45,600.00 20,520.00
Total CLSR 341,941.20
144

APENDIX D BILL OF APPROXIMATE QUANTITIES FOR SUB ELEMENT UFSB
SE-ID SMM-ANC
SMM-Description SMM-Unit
SMM-Qty SMM Rate SMM Amount(Rs)
UFSB10 Grade 20 concrete, suspended slabs, not exceeding 150mm thick
m3 27.00 4,842.00 130,734.00
UFSB11 Grade 20 concrete, attached beams, section not exceeding 0.10m2
m3 19.00 4,840.00 91,960.00
UFSB20 Formwork to soffit of slabs m2 246.00 450.00 110,700.00
UFSB21 Form work to edges of slabs, height not exceeding 300mm
m 120.00 136.00 16,320.00
UFSB22 Form work to sides and soffits of beams
m2 245.00 450.00 110,250.00
UFSB30 High yield steel, in beams, dia 10-16mm
t 2.23 48,840.00 108,913.20
UFSB31 High yield steel, in beams,dia greater than 16mm
t 1.15 48,840.00 56,166.00
UFSB32 High steel, in beams,dia n.e 10mm
t 1.20 48,840.00 58,608.00
UFSB33 Mild steel, in beams,dia n.e 10mm
t 0.76 48,840.00 37,118.40
UFSB34 High yield steel, in upper floor slabs.dia n.e 10mm
t 2.43 48,840.00 118,681.20
UFSB35 Mild steel, in beams,dia n.e 10mm
t 10.60 48,840.00 517,704.00
Total UFSB 1,357,154.80

![(1994) "Conclusions" [on the foreign policy of Zimbabwe]](https://static.fdokumen.com/doc/165x107/6337923f6f78ac31240ea390/1994-conclusions-on-the-foreign-policy-of-zimbabwe.jpg)