Numerical simulation of the sediment transport in the saltation regime
9
River Flow 2014 - Schleiss et al. (Eds) © 2014 Taylor & Francis Group, London, ISBN 978-1-1 38-02674-2 Numerical simulation of the sediment transport in the saltation regime R. Barati Tarbiat Modares University, Tehran, Iran S.A.A. Salchi Neyshabouri Water Engineering Research Center, Tarbiat Modares University, Tehran, Iran G. Ahmadi Clarkson University. Potsdam, New York, USA ABSTRACT: Saltation is the dominant mode of the sediment transport in rivers. Several factors such as the viscosity of the carrier liquid, size of the moving particles, the roughness of the river bed, initial conditions of the numerical procedure (i.e. lift-off angles and velocities, and initial angular velocity), and the accuracy of the empirical features of the governing equations (e.g. drag and lift coefficients) have sig¬ nificant effects on the accuracy of the numerical simulation of the sediment particle saltation. Numerous studies were considered various aspects of the numerical simulation of the sediment saltation, although no significant research has been conducted on how the simultaneous variations of the parameters of the model affect the accuracy of the simulation results. Therefore, in the present study, a systematic sensitivity analysis of some of the aforementioned input factors was performed through executing over 1,000 numer¬ ical experiments for single-step saltation. An accurate particle saltation model was developed for the range of sand to gravel in the Lagrangian approach. The model, which was verified using available experimental data, includes the non-linear drag force, the shear lift force, Magnus force, the buoyancy force, the added mass force, the history force and torque. The results indicated that the rankings of the importance of the input parameter errors on the output results for sand grain are: the viscosity of the carrier liquid, lift-off angle and velocity, the roughness of the river bed and initial angular velocity, whereas this rankings for gravel grain are: the roughness of the river bed, lift-off angle, initial angular velocity, lift-off velocity and the viscosity of the carrier liquid. 1 INTRODUCTION The sediment transport in rivers can generally be classified into three modes, namely, bed-load, sus¬ pended load and wash load. Bed-load transport consists of sliding, rolling, and saltating when bed-shear stress is low, while the combination of saltation and sheet flow dominates when bed- shear stress is high (Gao 2008). Of various sedi¬ ment transport modes, saltation is considered as the most typical motion of sediment grains along the bed (Lukerchenko et al. 2006, Lee et al. 2006, Nasrollahi et al. 2008, Bombardelli et al. 2008, Bialik 201 1). There are several studies about various aspects of the numerical simulation of the sediment sal¬ tation under Eulcrian-Lagrangian representation (Tsuchiya 1969, Van Rijn 1984, Wibcrg & Smith 1985, Sekinc& Kikkawa 1992,Niiio& Garcia 1994. Nino 1995, Krecic & Hanes 1996, Nino & Garcia 1998, Lee et al. 2000, 2002, 2006, Anccy et al. 2006, Lukerchenko et al. 2006, Lukerchenko et al. 2009, Bialik et al. 2012, Moreno & Bombardelli 2012, Czernuszenko & Bialik 2013). However, few stud¬ ies (if any) were focused on the sensitivity analysis of the input parameters of the numerical model on the saltation features. Insome studies such as Lee & Hsu (1994), Krecic & Hanes (1996), and Gonzalez (2008), the variation of some input parameters on the saltation length and height were analyzed although a systematic sensitivity analyses were not considered in none of them. A good understanding of the model's input- output dynamics is essential for a careful use of numerical models (Alzraicc & Garcia, 2013). Such information can be efficiently obtained by using sensitivity analysis. In essence, the sensitivity anal¬ ysis is a useful tool for making error analyses and for assessing the relative importance of causative factors (Akbari & Barati 2012, Barati et al. 2012). Therefore, the focus of the present study is on iden¬ tifying the most relevant parameters of the numer¬ ical simulation of the sediment transport under the saltation regime. 833
Transcript of Numerical simulation of the sediment transport in the saltation regime
River Flow 2014 -Schleiss et al. (Eds)© 2014 Taylor & Francis Group, London, ISBN978-1-138-02674-2
Numerical simulation of the sediment transport in the saltation regime
R. BaratiTarbiat Modares University, Tehran, Iran
S.A.A. Salchi NeyshabouriWater Engineering Research Center, Tarbiat Modares University, Tehran, Iran
G. AhmadiClarkson University. Potsdam, New York, USA
ABSTRACT: Saltation is the dominant mode of the sediment transport in rivers. Several factors suchas the viscosity of the carrier liquid, size of the moving particles, the roughness of the river bed, initialconditions of the numerical procedure (i.e. lift-off angles and velocities, and initial angular velocity), andthe accuracy of the empirical features of the governing equations (e.g. drag and lift coefficients) have sig¬nificant effects on the accuracy of the numerical simulation of the sediment particle saltation. Numerousstudies were considered various aspects of the numerical simulation of the sediment saltation, althoughno significant research has been conducted on how the simultaneous variations of the parameters of themodelaffect the accuracy of the simulation results. Therefore, in the present study, a systematic sensitivityanalysis of some of the aforementioned input factors was performed through executing over 1,000 numer¬icalexperiments for single-step saltation. An accurate particle saltation model was developed for the rangeof sand to gravel in the Lagrangian approach. The model, which was verified using available experimentaldata, includes the non-linear drag force, the shear lift force, Magnus force, the buoyancy force, the addedmass force, the history force and torque. The results indicated that the rankings of the importance of theinput parameter errors on the output results for sand grain are: the viscosity of the carrier liquid, lift-offangle and velocity, the roughness of the river bed and initial angular velocity, whereas this rankings forgravel grain are: the roughness of the river bed, lift-off angle, initial angular velocity, lift-off velocity andthe viscosity of the carrier liquid.
1 INTRODUCTION
The sediment transport in rivers can generally beclassified into three modes, namely, bed-load, sus¬pended load and wash load. Bed-load transportconsists of sliding, rolling, and saltating whenbed-shear stress is low, while the combinationof saltation and sheet flow dominates when bed-shear stress is high (Gao 2008). Of various sedi¬ment transport modes, saltation is considered asthe most typical motion of sediment grains alongthe bed (Lukerchenko et al. 2006, Lee et al. 2006,Nasrollahi et al. 2008, Bombardelli et al. 2008,Bialik 2011).
There are several studies about various aspectsof the numerical simulation of the sediment sal¬tation under Eulcrian-Lagrangian representation(Tsuchiya 1969, Van Rijn 1984, Wibcrg & Smith1985,Sekinc& Kikkawa 1992,Niiio& Garcia 1994.Nino 1995, Krecic & Hanes 1996, Nino & Garcia1998, Lee et al. 2000, 2002, 2006, Anccy et al. 2006,Lukerchenko et al. 2006, Lukerchenko et al. 2009,
Bialik et al. 2012, Moreno & Bombardelli 2012,Czernuszenko & Bialik 2013). However, few stud¬ies (if any) were focused on the sensitivity analysisof the input parameters of the numerical model onthe saltation features. Insome studies such as Lee&Hsu (1994), Krecic & Hanes (1996), and Gonzalez(2008), the variation of some input parameterson the saltation length and height were analyzedalthough a systematic sensitivity analyses were notconsidered in none of them.
A good understanding of the model's input-output dynamics is essential for a careful use ofnumerical models (Alzraicc & Garcia, 2013). Suchinformation can be efficiently obtained by usingsensitivity analysis. Inessence, the sensitivity anal¬ysis is a useful tool for making error analyses andfor assessing the relative importance of causativefactors (Akbari & Barati 2012, Barati et al. 2012).Therefore, the focus of the present study is on iden¬tifying the most relevant parameters of the numer¬icalsimulation of the sediment transport under thesaltation regime.
833
Inthe present study,at first step, an accurate par¬ticle saltation model was developed for the rangeof sand to gravel in the Lagrangian approach. Thismodel includes the non-linear drag force, the shearlift force, Magnus force, the buoyancy force, theadded mass force, the history force and torque. Thedeveloped model was verified using experimentaldata of Nino (1995). Then, a systematic sensitiv¬ity analyses of different combination of the inputparameters (i.e. viscosity of the carrier liquid, sizeof the moving particles, the roughness of the riverbed, lift-off angles and velocities, and initial angu¬lar velocity) was executed using over 1,000 numeri¬cal experiments for single-step saltation.
2 MODEL OF SEDIMENT PHASE
A set of ordinary differential equations (i.e. lin¬ear and angular momentum of the particle),which is an extension of the governing equationfor the motion of a small spherical particle in anunbounded fluid (Maxcy & Riley 1983, Mei et al.1991), were adopted for the sedimentary particletrajectory simulation:
dx~dt
du„
d(0„ -I--= Tp ill
ÿ + I'll+ + I'm + /'» + t],
I „ d -Fam ~ ~zPfCm rui2 pp dt
The drag force is given as (Wiberg and Smith1985):
Fp = -zPfCL)A u, ur (5)
where A is the particle projected area of sphereparticle, C(J is the drag coefficient which calculatedby the improved equation of Barati et al. (2014):
- 24C#j ---h" Re
4.2798 —(W
0.4769
(?)[ Rc_Yy 263000 )
1+f—T1263000 J
Re',0.8156 1
461000(6)
(1)
(2)
(3)
where Re = \ur\D/y is the particle Reynoldsnumber,D is the particlediameter and V is the kin¬ematic viscosity of the fluid. It is notable that theabove equation is valid for Re < 10s, including thetransient region from laminar to turbulent.
Fortheshear lift forceEq.(7),(Saffman 1965, 1968)and Eq. (8) (Wiberg and Smith 1985) were adoptedfor the sand and gravel particles, respectively:
where xp the particle position vector, up is theparticle velocity vector, t is the simulation time,mr is the particle mass, Fa is the gravity force, FAUis the added mass force, F„ is the drag force. F, isthe shear lift force, Fu is the Magnus force, Ft is theBasset force, Fa is the buoyancy force, /,, = 0.1mfi1is the particle momentum of inertia, is angularvelocity of the grain and T is the torque vector act¬ing on the particle.
For the estimation of the different Hydrody-namic forces acts on the particles the followingequations were used.
The added mass is given as (Nasrollahi et al.2008):
FL--\ÿLAlÿ\-[{Ur)\(7)
(8)
where dur/dy is the velocity gradient, the sub-indices T and B denote particle top and bottomand CL is the lift coefficient which was calibratedby Van Rijn ( 1984) for the first lift equation and byNino (1995) for the later.
For the Magnus force. Eq. (9) (Rubinow &Keller 1961) and Eq. (10) (Yamamoto et al. 2001)were adopted for the sand and gravel particles,respectively:
(4)
FU = C>, X "r
ÿM ~-.Pl "f ÿ *-LKur X 1—1
(9)
(10)
where p,and pp are the density of the fluid and par¬ticle, respectively, C„, (= 0.5) is the added mass coef¬ficient, «ris the relative velocity (= uf -up) and «/. isthe fluid velocity vector at the center of the particle.
where C,„ = min(0.5, 0.25 |) lift coeffi¬cient due to particle rotation and TO", is the particlerotational velocity relative to fluid vorticity.
834
The torque was calculated based on the Magnusforce equation. Eq. (11) (Rubinow & Keller 1961)and Eq. (12) (Yamamoto et al. 2001) were consid¬ered for the sand and gravel particles, respectively:
T =-jfuD\wr)
f =~C'T(f) 1*1*
(11)
(12)
where // is the dynamic viscosity of the fluid andCrisa non-dimensional coefficient which is a func¬tion of the Reynolds number for the rotationalmotion (Yamamoto et al. 2001).
The Basset force is given as (Mei 1993):
bn/A d/2)~ r Ji
ilu„ clu,
ell2 I t~~
<lrÿ i J-
where ris a dummy variable.The buoyancy force is given as
Fc=ÿr(/>p-/>/)gDi
(13)
(14)
uf(y) l, D—-=— In — + BII, k [KJ
(15)
S/(%)=o2 +o{)/
h-1l] xlOO (16)
where SI is the sensitivity index in percentage, /,,/,, are the smallest and the largest amount of inputparameters and O,, O, are output values corre¬sponding to /„ respectively.
It should be noted that the output value ofthe model decreases as the input value parameterincreases if a negative sensitivity index is reached.
Several criteria including the saltation height(H) and the corresponding length (L,) with it, thesaltation length ( L) and the ratio of LIL,were con¬sidered for the evaluation of the numerical results.Furthermore, for the evaluationof the contributionof the various hydrodynamics forces on results, thefollowing criterion was adopted:
PEC,I-
(17)
3 MODEL OF FLUID FLOW
Although the Navicr-Stokcs equations arc usu¬ally considered as the governing equations of fluidflow, the mean flow velocity in the longitudinaldirection can be obtained assuming the logarith¬mic law as:
where u. is the shear velocity, y is the distance fromthe bed, *"=0.41 is the von Karman constant, AT,is the effective roughness of the bed and B = 8.5 isa constant.
4 SENSITIVITY INDEX ANDPERFORMANCE EVALUATIONCRITERIA
The following sensitivity index was adopted(Akbari & Barati 2012, Barati et al. 2012) for sen¬sitivity analyses of the input parameters of thedeveloped model:
where Flllv_ is the average of the absolute value ofthe each hydrodynamics force in a single-step salta¬tion and F is the average of the buoyancy forceduring the saltation.
5 NUMERICAL EXPERIMENTS
Inorder to investigate the effects of input parametersof the saltation model on output results, more thanlOOOsimulating experiments were performed basedon different combinations of viscosity of the car¬rier liquid, size of the moving particles (from sand togravel), the roughness of the river bed, lift-off anglesand velocities, and initialangular velocity. The detailsof the numerical experiments are listed inTable 1.
Other input parameters are p.=\\g.r/cm1),pv = 2.65ÿgr/cm3), time step=0.0001(s)and u.=ur.u , is the critical shear velocity which was explicitlycalculated usingArchimedes number criterion for theincipient motion (Fredsoe & Deigaard 1992).
6 RESULTS AND DISCUSSION
6.1 Model verificationThe experimental data of Nino (1995) was usedfor the verification of the developed model. Theseexperiments consist of sand and gravel sediment.
Table 1. Summary of experiment setup.
Gravel particle diameter (cm) 0.5 2.5 5Sand particle diameter (cm) 0.0064 0.01 0.02Roughness/particle diameter 0.5 1 2Lift-off angles (degree) 20 45 60Lift-off velocities/!/. 1 2 3Initialangular velocity (rev/s) 5 10 15Viscosity of fluid (cm-/s) 0.008 0.01 0.018
835
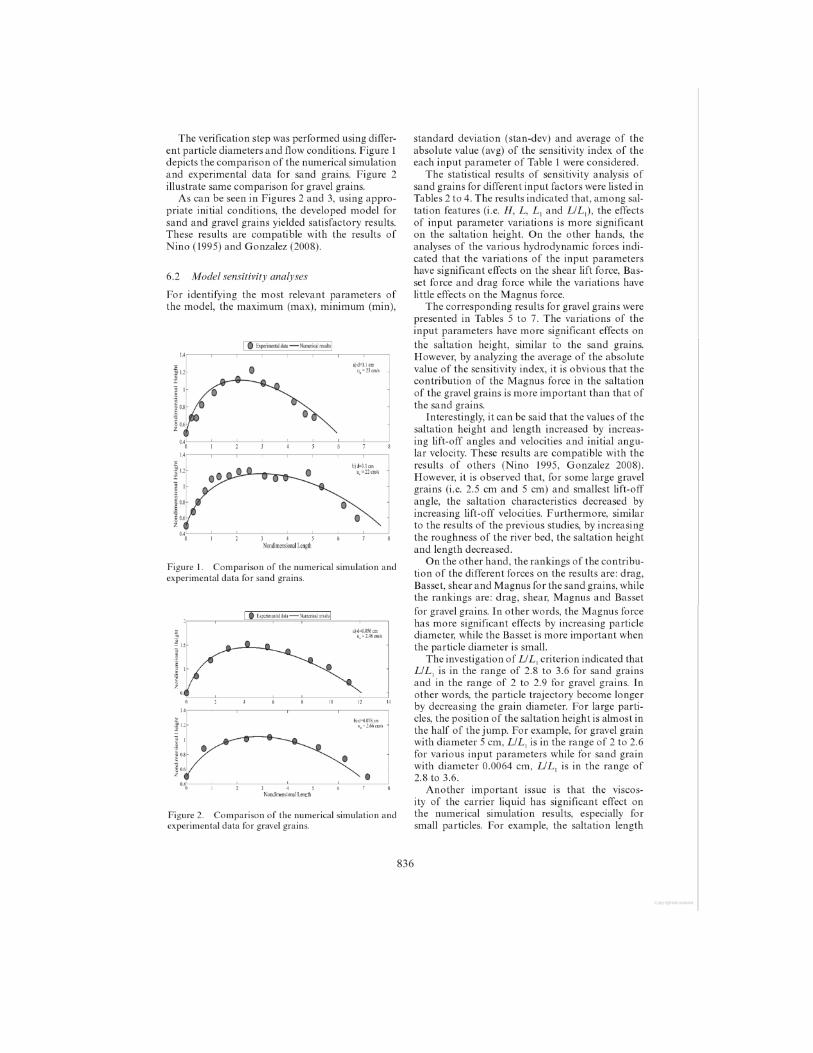
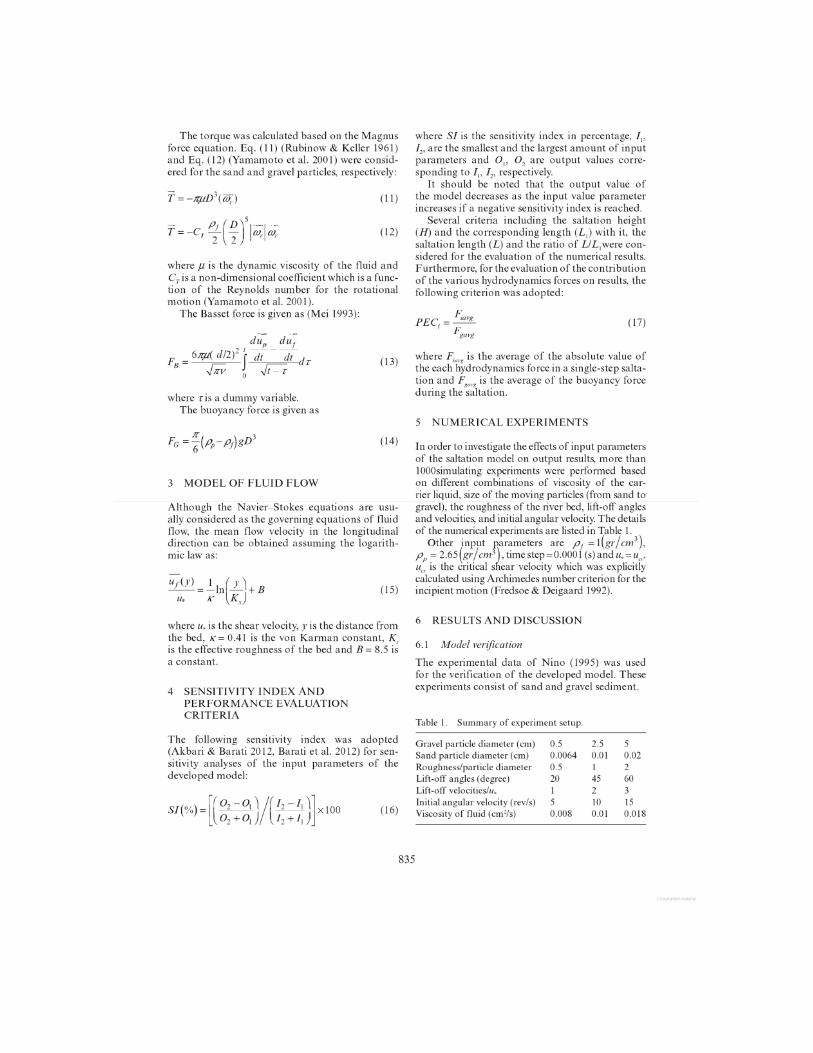
The verification step was performed usingdiffer¬ent particlediameters and flow conditions. Figure 1depicts the comparison of the numerical simulationand experimental data for sand grains. Figure 2illustrate same comparison for gravel grains.
As can be seen in Figures 2 and 3, using appro¬priate initial conditions, the developed model forsand and gravel grains yielded satisfactory results.These results are compatible with the results ofNino (1995) and Gonzalez (2008).
6.2 Mode!sensitivity analyses
For identifying the most relevant parameters ofthe model, the maximum (max), minimum (min),
standard deviation (stan-dev) and average of theabsolute value (avg) of the sensitivity index of theeach input parameter of Table 1 were considered.
The statistical results of sensitivity analysis ofsand grains for different input factors were listed inTables 2 to 4. The results indicated that, among sal¬tation features (i.e. H,L, L, and LILt), the effectsof input parameter variations is more significanton the saltation height. On the other hands, theanalyses of the various hydrodynamic forces indi¬cated that the variations of the input parametershave significant effects on the shear lift force. Bas¬set force and drag force while the variations havelittle effects on the Magnus force.
The corresponding results for gravel grains werepresented in Tables 5 to 7. The variations of theinput parameters have more significant effects on
the saltation height, similar to the sand grains.However, by analyzing the average of the absolutevalue of the sensitivity index, it is obvious that thecontribution of the Magnus force in the saltationof the gravel grains is more important than that ofthe sand grains.
Interestingly, it can be said that the values of thesaltation height and length increased by increas¬ing lift-off angles and velocities and initial angu¬lar velocity. These results are compatible with theresults of others (Nino 1995, Gonzalez 2008).However, it is observed that, for some large gravelgrains (i.e. 2.5 cm and 5 cm) and smallest lift-offangle, the saltation characteristics decreased byincreasing lift-off velocities. Furthermore, similarto the results of the previous studies, by increasingthe roughness of the river bed, the saltation heightand length decreased.
On the other hand, the rankings of the contribu¬tion of the different forces on the results are: drag,Basset, shear and Magnus for the sand grains,whilethe rankings are: drag, shear. Magnus and Bassetfor gravel grains. Inother words, the Magnus forcehas more significant effects by increasing particlediameter, while the Basset is more important whenthe particle diameter is small.
The investigationof L/L,criterion indicated thatL/L, is in the range of 2.8 to 3.6 for sand grainsand in the range of 2 to 2.9 for gravel grains. Inother words, the particle trajectory become longerby decreasing the grain diameter. For large parti¬cles. the positionof the saltation height is almost inthe half of the jump. For example, for gravel grainwith diameter 5 cm, UL: is in the range of 2 to 2.6for various input parameters while for sand grainwith diameter 0.0064 cm, LJL, is in the range of2.8 to 3.6.
Another important issue is that the viscos¬ity of the carrier liquid has significant effect onthe numerical simulation results, especially forsmall particles. For example, the saltation length
Length
Figure 1. Comparison of the numerical simulation andexperimental data for sand grains.
0Eipwtmldi N—imIiwmIb
N.wiirensiniul Lcnt-Di
Figure 2. Comparison of the numerical simulation andexperimental data for gravel grains.
836
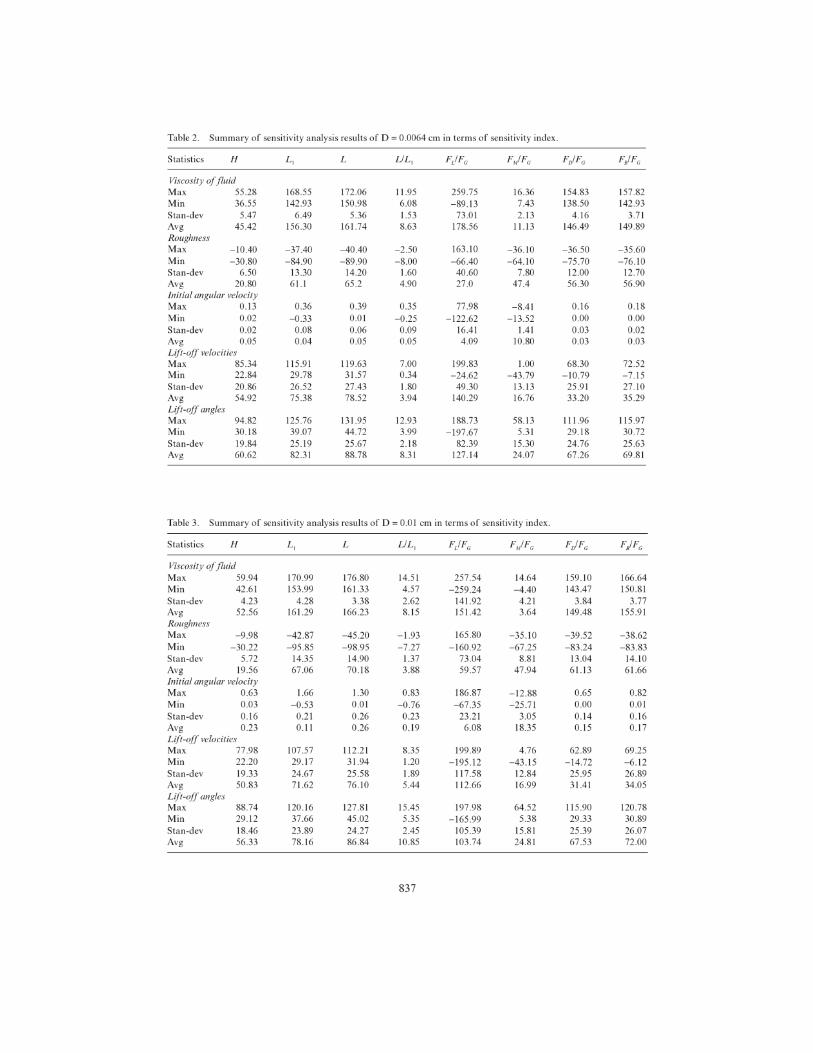
Table 2. Summary of sensitivity analysis results of D = 0.0064 cm in terms of sensitivity index.
Statistics H L, L LIL, FJFU fJfg F,JF„ FJFG
Viscosity offluidMax 55.28 168.55 172.06 11.95 259.75 16.36 154.83 157.82Min 36.55 142.93 150.98 6.08 -89.13 7.43 138.50 142.93Stan-dev 5.47 6.49 5.36 1.53 73.01 2.13 4.16 3.71Avg 45.42 156.30 161.74 8.63 178.56 11.13 146.49 149.89RoughnessMax -10.40 -37.40 -40.40 -2.50 163.10 -36.10 -36.50 -35.60Min -30.80 -84.90 -89.90 -8.00 -66.40 -64.10 -75.70 -76.10Stan-dev 6.50 13.30 14.20 1.60 40.60 7.80 12.00 12.70Avg 20.80 61.1 65.2 4.90 27.0 47.4 56.30 56.90Initialangular velocityMax 0.13 0.36 0.39 0.35 77.98 -8.41 0.16 0.18Min 0.02 -0.33 0.01 -0.25 -122.62 -13.52 0.00 0.00Stan-dev 0.02 0.08 0.06 0.09 16.41 1.41 0.03 0.02Avg 0.05 0.04 0.05 0.05 4.09 10.80 0.03 0.03
Lift-off velocitiesMax 85.34 115.91 119.63 7.00 199.83 1.00 68.30 72.52Min 22.84 29.78 31.57 0.34 -24.62 -43.79 -10.79 -7.15Stan-dev 20.86 26.52 27.43 1.80 49.30 13.13 25.91 27.10Avg 54.92 75.38 78.52 3.94 140.29 16.76 33.20 35.29Lift-off anglesMax 94.82 125.76 131.95 12.93 188.73 58.13 111.96 115.97Min 30.18 39.07 44.72 3.99 -197.67 5.31 29.18 30.72Stan-dev 19.84 25.19 25.67 2.18 82.39 15.30 24.76 25.63Avg 60.62 82.31 88.78 8.31 127.14 24.07 67.26 69.81
Table 3. Summary of sensitivity analy:sis results of D = 0.01 cm in terms of sensitivity index.
Statistics H L, L UL, FIFL G FJFa FJFa FJFaViscosity offluidMax 59.94 170.99 176.80 14.51 257.54 14.64 159.10 166.64Min 42.61 153.99 161.33 4.57 -259.24 -4.40 143.47 150.81Stan-dev 4.23 4.28 3.38 2.62 141.92 4.21 3.84 3.77Avg 52.56 161.29 166.23 8.15 151.42 3.64 149.48 155.91RoughnessMax -9.98 -42.87 -45.20 -1.93 165.80 -35.10 -39.52 -38.62Min -30.22 -95.85 -98.95 -111 -160.92 -67.25 -83.24 -83.83Stan-dev 5.72 14.35 14.90 1.37 73.04 8.81 13.04 14.10Avg 19.56 67.06 70.18 3.88 59.57 47.94 61.13 61.66Initialangular velocityMax 0.63 1.66 1.30 0.83 186.87 -12.88 0.65 0.82Min 0.03 -0.53 0.01 -0.76 -67.35 -25.71 0.00 0.01Stan-dev 0.16 0.21 0.26 0.23 23.21 3.05 0.14 0.16Avg 0.23 0.1 1 0.26 0.19 6.08 18.35 0.15 0.17Lift-off velocitiesMax 77.98 107.57 112.21 8.35 199.89 4.76 62.89 69.25Min 22.20 29.17 31.94 1.20 -195.12 -43.15 -14.72 -6.12Stan-dev 19.33 24.67 25.58 1.89 117.58 12.84 25.95 26.89Avg 50.83 71.62 76.10 5.44 112.66 16.99 31.41 34.05Lift-offanglesMax 88.74 120.16 127.81 15.45 197.98 64.52 115.90 120.78Min 29.12 37.66 45.02 5.35 -165.99 5.38 29.33 30.89Stan-dev 18.46 23.89 24.27 2.45 105.39 15.81 25.39 26.07Avg 56.33 78.16 86.84 10.85 103.74 24.81 67.53 72.00
837
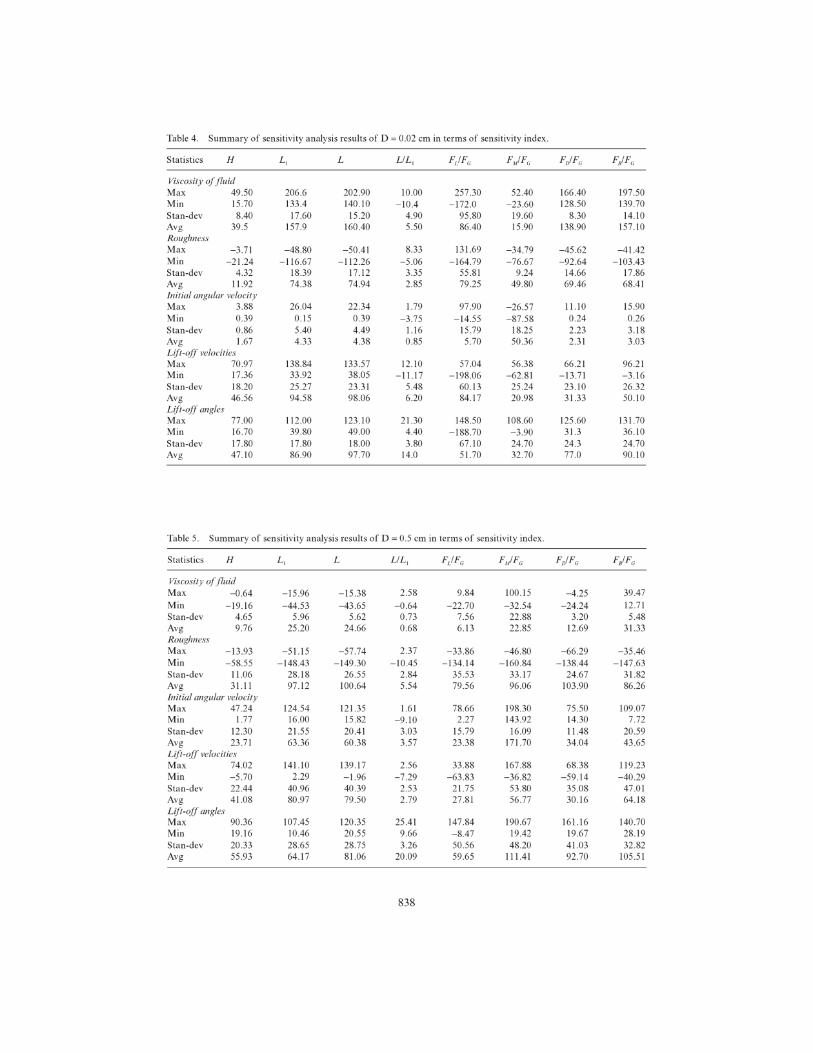
Table 4. Summary of sensitivity analysis results of D= 0.02 cm in terms of sensitivity index.
Statistics H L, L UL, FJF„ FJF„ F,JF„ FJFaViscosity offluidMax 49.50 206.6 202.90 10.00 257.30 52.40 166.40 197.50Min 15.70 133.4 140.10 -10.4 -172.0 -23.60 128.50 139.70Stan-dev 8.40 17.60 15.20 4.90 95.80 19.60 8.30 14.10Avg 39.5 157.9 160.40 5.50 86.40 15.90 138.90 157.10RoughnessMax -3.71 -48.80 -50.41 8.33 131.69 -34.79 -45.62 -41.42Min -21.24 -116.67 -112.26 -5.06 -164.79 -76.67 -92.64 -103.43Stan-dev 4.32 18.39 17.12 3.35 55.81 9.24 14.66 17.86Avg 11.92 74.38 74.94 2.85 79.25 49.80 69.46 68.41Initialangular velocityMax 3.88 26.04 22.34 1.79 97.90 -26.57 11.10 15.90Mill 0.39 0.15 0.39 -3.75 -14.55 -87.58 0.24 0.26Stan-dev 0.86 5.40 4.49 1.16 15.79 18.25 2.23 3.18Avg 1.67 4.33 4.38 0.85 5.70 50.36 2.31 3.03Lift-off velocitiesMax 70.97 138.84 133.57 12.10 57.04 56.38 66.21 96.21Min 17.36 33.92 38.05 -11.17 -198.06 -62.81 -13.71 -3.16Stan-dev 18.20 25.27 23.31 5.48 60.13 25.24 23.10 26.32Avg 46.56 94.58 98.06 6.20 84.17 20.98 31.33 50.10Lift-offanglesMax 77.00 1 12.00 123.10 21.30 148.50 108.60 125.60 131.70Min 16.70 39.80 49.00 4.40 -188.70 -3.90 31.3 36.10Stan-dev 17.80 17.80 18.00 3.80 67.10 24.70 24.3 24.70Avg 47.10 86.90 97.70 14.0 51.70 32.70 77.0 90.10
Table 5. Summary of sensitivity analysis results of D= 0.5 cm in terms of sensitivity index.
Statistics H A L UL, FJFq FJFa F,JF„ FJFg
Viscosity offluidMax -0.64 -15.96 -15.38 2.58 9.84 100.15 -4.25 39.47Min -19.16 -44.53 -43.65 -0.64 -22.70 -32.54 -24.24 12.71Stan-dev 4.65 5.96 5.62 0.73 7.56 22.88 3.20 5.48Avg 9.76 25.20 24.66 0.68 6.13 22.85 12.69 31.33RoughnessMax -13.93 -51.15 -57.74 2.37 -33.86 -46.80 -66.29 -35.46Min -58.55 -148.43 -149.30 -10.45 -134.14 -160.84 -138.44 -147.63Stan-dev 11.06 28.18 26.55 2.84 35.53 33.17 24.67 31.82Avg 31.11 97.12 100.64 5.54 79.56 96.06 103.90 86.26Initialtutgular velocityMax 47.24 124.54 121.35 1.61 78.66 198.30 75.50 109.07Min 1.77 16.00 15.82 -9.10 2.27 143.92 14.30 7.72Stan-dev 12.30 21.55 20.41 3.03 15.79 16.09 11.48 20.59Avg 23.71 63.36 60.38 3.57 23.38 171.70 34.04 43.65Lift-off velocitiesMax 74.02 141.10 139.17 2.56 33.88 167.88 68.38 119.23Min -5.70 2.29 -1.96 -7.29 -63.83 -36.82 -59.14 -40.29Stan-dev 22.44 40.96 40.39 2.53 21.75 53.80 35.08 47.01Avg 41.08 80.97 79.50 2.79 27.81 56.77 30.16 64.18Lift-offanglesMax 90.36 107.45 120.35 25.41 147.84 190.67 161.16 140.70Min 19.16 10.46 20.55 9.66 -8.47 19.42 19.67 28.19Stan-dev 20.33 28.65 28.75 3.26 50.56 48.20 41.03 32.82Avg 55.93 64.17 81.06 20.09 59.65 111.41 92.70 105.51
838
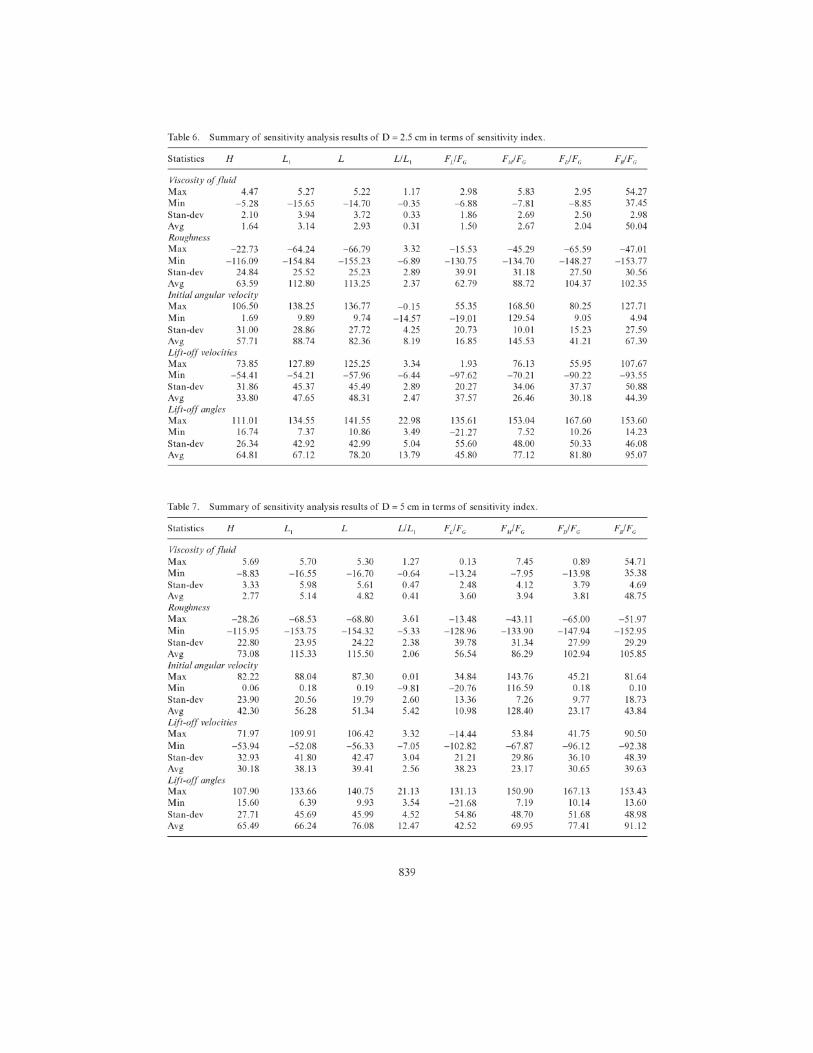
Table 6. Summary of sensitivity analysis results of D= 2.5 cm in terms of sensitivity index.
Statistics H L UL{ F,tF„ FJF„ F,JFt. FJF0Viscosity offluidMax 4.47 5.27 5.22 1.17 2.98 5.83 2.95 54.27Mill -5.28 -15.65 -14.70 -0.35 -6.88 -7.81 -8.85 37.45Stan-dcv 2.10 3.94 3.72 0.33 1.86 2.69 2.50 2.98Avg 1.64 3.14 2.93 0.31 1.50 2.67 2.04 50.04RoughnesMax -22.73 -64.24 -66.79 3.32 -15.53 -45.29 -65.59 -47.01Mill -116.09 -154.84 -155.23 -6.89 -130.75 -134.70 -148.27 -153.77Stan-dev 24.84 25.52 25.23 2.89 39.91 31.18 27.50 30.56Avg 63.59 112.80 113.25 2.37 62.79 88.72 104.37 102.35Initialangular velocityMax 106.50 138.25 136.77 -0.15 55.35 168.50 80.25 127.71Mill 1.69 9.89 9.74 -14.57 -19.01 129.54 9.05 4.94Stan-dev 31.00 28.86 27.72 4.25 20.73 10.01 15.23 27.59Avg 57.71 88.74 82.36 8.19 16.85 145.53 41.21 67.39Lift-off velocitiesMax 73.85 127.89 125.25 3.34 1.93 76.13 55.95 107.67Min -54.41 -54.21 -57.96 -6.44 -97.62 -70.21 -90.22 -93.55Stan-dev 31.86 45.37 45.49 2.89 20.27 34.06 37.37 50.88Avg 33.80 47.65 48.31 2.47 37.57 26.46 30.18 44.39Lift-offanglesMax 111.01 134.55 141.55 22.98 135.61 153.04 167.60 153.60Min 16.74 7.37 10.86 3.49 -21.27 7.52 10.26 14.23Stan-dev 26.34 42.92 42.99 5.04 55.60 48.00 50.33 46.08Avg 64.81 67.12 78.20 13.79 45.80 77.12 81.80 95.07
Table 7. Summary of sensitivity analysis results of D- 5 cm in terms of sensitivity index.
Statistics H L UL, FIFrL,rG FIFr\rr a FJF0 FJFg
Viscosity offluidMax 5.69 5.70 5.30 1.27 0.13 7.45 0.89 54.71Min -8.83 -16.55 -16.70 -0.64 -13.24 -7.95 -13.98 35.38Stan-dev 3.33 5.98 5.61 0.47 2.48 4.12 3.79 4.69Avg 2.77 5.14 4.82 0.41 3.60 3.94 3.81 48.75Roughnes.Max -28.26 -68.53 -68.80 3.61 -13.48 -43.11 -65.00 -51.97Min -115.95 -153.75 -154.32 -5.33 -128.96 -133.90 -147.94 -152.95Stan-dev 22.80 23.95 24.22 2.38 39.78 31.34 27.99 29.29Avg 73.08 115.33 115.50 2.06 56.54 86.29 102.94 105.85Initialangular velocityMax 82.22 88.04 87.30 0.01 34.84 143.76 45.21 81.64Min 0.06 0.18 0.19 -9.81 -20.76 116.59 0.18 0.10Stan-dev 23.90 20.56 19.79 2.60 13.36 7.26 9.77 18.73Avg 42.30 56.28 51.34 5.42 10.98 128.40 23.17 43.84Lift-off velocitiesMax 71.97 109.91 106.42 3.32 -14.44 53.84 41.75 90.50Min -53.94 -52.08 -56.33 -7.05 -102.82 -67.87 -96.12 -92.38Stan-dcv 32.93 41.80 42.47 3.04 21.21 29.86 36.10 48.39Avg 30.18 38.13 39.41 2.56 38.23 23.17 30.65 39.63Lift-offanglesMax 107.90 133.66 140.75 21.13 131.13 150.90 167.13 153.43Min 15.60 6.39 9.93 3.54 -21.68 7.19 10.14 13.60Stan-dcv 27.71 45.69 45.99 4.52 54.86 48.70 51.68 48.98Avg 65.49 66.24 76.08 12.47 42.52 69.95 77.41 91.12
839
changed up to 160 (%) when the viscosity of waterfor three temperature 0, 20 and 30 centigrade wasconsidered in the numerical experiments. This issuedemonstrated that the record of the temperature,which was not reported in the many experimentalstudies, is important.
7 CONCLUSIONS
In the present study, an accurate particle salta¬tion model was developed for the range of sandto gravel in the Lagrangian approach. The verifi¬cation of the model indicated that the proposedterms for the hydrodynamic forces in the modelcan accurately described the trajectory of theparticles. For the evaluation of the input parametererrors on the output results, a systematic sensitiv¬ity analyses of the input parameters of the modelwas performed. The results showed that the rank¬ings of the importance of the input parameters onthe output results for sand grain are: the viscos¬ity of the carrier liquid, lift-off angle and velocity,the roughness of the river bed and initial angularvelocity while this rankings for gravel grain are:the roughness of the river bed. lift-off angle, initialangular velocity, lift-off velocity and the viscosityof the carrier liquid.
REFERENCES
Akbari, G. & Barati, R. 2012. Comprehensive Analysisof flooding in Unmanaged Catchments. Proceedingsof the ICE— Water Management 165:229-238.
Alzraiee, A.II. & Garcia, L.A. 2013. Global SensitivityAnalysis of Variably Saturated Flow and TransportParameters and Its Implication for Crop Yield andRoot Zone Hydrosalinity. Journal of Irrigation andDrainage Engineering 139( 11): 889-897.
Anccy, C. Bigillon, F. Frcy R Lanier, J. & Ducret, R.2002. Saltating motion of a bead in a rapid waterstream. Physical Rev E66(3): 036306.
Barati, R. Rahimi, S. & Akbari, G. 2012. Analysis of thedynamic wave model for flood routing in natural riv¬ers. Water Science and Engineering 5(3): 243-258.
Barati, R. Salehi Neyshabouri, S.A.A. & Ahmadi G.2014. Sphere Drag Revisited Using Shuffled ComplexEvolution algorithm. In Proc. River Flow.
Bialik, R.J. 2011. Numerical study of saltation of non¬uniform grains. Journal of Hydraulic Research 49(5):697-701.
Bialik. R.J. Nikora, V.I. & Rowiriski, P.M. 2012. 3DLagrangian modelling of saltating particles diffu¬sion in turbulent water flow. Acta Geophysica 60(6):1639 1660.
Bombardelli, F.A. Gonzalez, A.E. & Nino, Y.I. 2008.Computation of the particle Basset force with afractional-derivative approach. Journal of HydraulicEngineering 134(10): 1513-1520.
Czernuszenko, W. & Bialik, R.J. 2013. Some Propertiesof Lagrangian Modeling of Saltating Grains OverMovable Bed. In Experimental and ComputationalSolutions of Hydraulic Problems, GeoPlanet: Earthand Planetary Sciences 273-283.
Frcdsoc, J. & Dcigaard, R. 1992. Mechanics of CoastalSediment Transport. World Scientific, Singapore.
Gao, P. 2008. Transition between Two Bed-Load Trans¬port Regimes: Saltation and Sheet Flow, Journal ofHydraulic Engineering 134< 3): 340-349.
Gonzalez, A.E. 2008. Numerical modeling of sedimenttransport near the bedusinga two-phaseflow approach.University of California, Davis.
Krecic, M R. & 1lanes, D M. 1996. An analysis ofparticle saltation dynamics. Coastal EngineeringProceedings, 1(25).
Lee, H.Y. & Hsu, I.S. 1994. Investigation of saltatingparticle motions. Journal of Hydraulic Engineering120(7): 831-845.
Lee, H.Y. Chen, Y.II.You, J.Y. & Lin, Y.T. 2000. Inves¬tigations of continuous bed load saltating process.Journalof Hydraulic Engineering 126(9): 691-700.
Lee, H.Y. You, J.Y. & Lin, Y.T. 2002. Continuous saltat¬ing process of multiple sediment particles. Journal ofHydraulic Engineering 128(4):443 450.
Lee, H.Y. Lin, Y.T. Yunyou, J. & Wcnwang, II.2006. Onthree-dimensional continuous saltating process ofsediment particles near the channel bed. Journal ofHydraulic Research 44(3): 374-389.
Lukerchenko, N. Piatsevich, S. Chara, Z. Vlasak, P.Chara, Z. & Vlasak. P. 2009. 3D numerical modelof the spherical particle saltation in a channelwith a rough Fixed bed. Journal of Hydrology andHydromechanics 57(2): 100-112.
Lukerchenko,N.Chara,Z.& Vlasak. P.2006.2D Numericalmodel of particle bed collision in fluid-particle flowsover bed. Journalof Hydraulic Research 44( 1): 70 78.
Maxey, M R. & Riley, J.J. 1983. Equation of motion fora small rigid sphere in a nonuniform flow. Physics ofFluids 26: 883.
Mei. R.. Adrian. J. & Hanratty, T. 1991. Particle disper¬sion in isotropic turbulence under Stokes drag andBasset force with gravitational settling. J. Fluid Meek225:481-495.
Mei, R. 1993. History force on a sphere due to a stepchange in the free-stream velocity. InternationalJournalof Multiphase Flow 19(3): 509-525.
Moreno, P.A.& Bombardelli, F.A.2012. 3D numerical sim¬ulation of particle-particle collisions in saltation modenear stream beds. Acta Geophysica 60(6): 1661-1688.
Nasrollahi,A. Salehi Neyshabouri,S.A.A. Ahmadi, G.&Namin, M.M. 2008. Numerical Simulation of ParticleSaltation Process. Particulate Science and Technology26(6): 529-550.
Nino,Y.& Garcia,M. 1994.Gravelsaltation:2. Modeling.Water Resources Research 30(6): 1915-1924.
Nino, Y. & Garcia, M. 1998. Using Lagrangian particlesaltation observations for bedload sediment transportmodelling. Hydrological Processes 12(8): 1197 1218.
Nino, Y. 1995. Particle motion in the near bedregion of aturbulent open channelflow: implications for bedloadtransport by saltation and sediment entrainment intosuspension. Doctoral dissertation, University of Illi¬nois at Urbana-Champaign.
840

Kubmuw, S i.& Keller,J.B. 1961. The transverseforte onaspinningsphere rnoviugiua viscous fluid.JournalofFhfdMechanics 11(03):447-459.
Safffitan, P.O. 1965. The lift on a small sphere in aslow shear flow. Journal of Fluid Mechanics 22 (2):385-400.
Saffmau, P.O. 1968. Corrigendum to:The '.jfton a *mai!sphere inaslow shearflow. JournalofFluidMechanics31:624.
Sekme,M.& Kiktawa,H. 1992. Mechanics of saltatiuggrains. II. Journal of Hydraulic Engineering UW4):536-558.
Tsuchiyu, Y. (1ÿ69). Mechanics of the successive salta-lionof a randparticleonagranular bed ina Ui:IhjIcu1stream. Sattetin of the Disaster Pretention ResearchInstitute 19(1):31 '44.
Van Rijr., L.C. (1984). Sediment transport, part I:tiedload transport. Journal of Hydraulic Engineering110(10}: 1431-1456.
Wiberg, I'.L. & Smith, J.D. 1985. A theoretical modelfor saltatiug grains in water. Journal of GeophysicalResearch: Oman!(1978-2612} S0(C4): 7341-T354.
Yamamoto, Y. Pottboff,M.Taoul-a, .1". Kajishimu, T.&Tsuji, Y. 2001. Large-eddy simulation of turbulentgas-particlc flow i» a vertical channel: effect of con¬sidering inter-particle collisions. Journal of FluidMechanics442: 303-534.