Numerical Sensing of Plastic Hinge Regions in Concrete ...
14
sensors Article Numerical Sensing of Plastic Hinge Regions in Concrete Beams with Hybrid (FRP and Steel) Bars Fang Yuan * and Mengcheng Chen School of Civil Engineering and Architecture, East China Jiaotong University, Nanchang 330013, China; [email protected] * Correspondence: [email protected]; Tel.: +86-188-7006-8621 Received: 4 September 2018; Accepted: 24 September 2018; Published: 27 September 2018 Abstract: Fibre-reinforced polymer (FRP)-reinforced concrete members exhibit low ductility due to the linear-elastic behaviour of FRP materials. Concrete members reinforced by hybrid FRP–steel bars can improve strength and ductility simultaneously. In this study, the plastic hinge problem of hybrid FRP–steel reinforced concrete beams was numerically assessed through finite element analysis (FEA). Firstly, a finite element model was proposed to validate the numerical method by comparing the simulation results with the test results. Then, three plastic hinge regions—the rebar yielding zone, concrete crushing zone, and curvature localisation zone—of the hybrid reinforced concrete beams were analysed in detail. Finally, the effects of the main parameters, including the beam aspect ratio, concrete grade, steel yield strength, steel reinforcement ratio, steel hardening modulus, and FRP elastic modulus on the lengths of the three plastic zones, were systematically evaluated through parametric studies. It is determined that the hybrid reinforcement ratio exerts a significant effect on the plastic hinge lengths. The larger the hybrid reinforcement ratio, the larger is the extent of the rebar yielding zone and curvature localisation zone. It is also determined that the beam aspect ratio, concrete compressive strength, and steel hardening ratio exert significant positive effects on the length of the rebar yielding zone. Keywords: plastic hinge length; hybrid reinforced; concrete beam; fibre-reinforced polymer; steel; finite element analysis 1. Introduction The corrosion of steel reinforcement ultimately causes the loss of serviceability or the strength failure of reinforced concrete (RC) structures. Noncorrosive fibre-reinforced polymer (FRP) is an alternative to steel reinforcement for concrete structures [1–9]. However, the linear-elastic property of FRP rebars results in the brittle structural behaviour of FRP-reinforced concrete structures. The design of the FRP-reinforced concrete flexural member must be aimed at achieving the concrete compression failure mode [10–13]. By experiencing concrete crushing prior to the tensile rupture of the FRP reinforcement, a flexural member exhibits a particular limited inelastic behaviour prior to failure. Alternatively, the structural performance of concrete beams can be improved by a combination of FRP and steel reinforcements. An improved durability compared with RC beams is also likely to be obtained by placing FRP rebars at the corners or near the extreme tension face [14]. Multiple tests have been conducted on hybrid FRP–steel reinforced concrete beams [14–22]. It has been reported that the strength and ductility can be improved simultaneously by appropriately designing the hybrid reinforcement ratio between FRP and steel [23]. Current research on hybrid reinforced beams focuses on crack-width calculation, deflection evaluation, or strength prediction; few studies concentrate on plastic hinge problems. Nevertheless, the length of the plastic hinge region is critical for structural retrofit and design [24]. On the one hand, the plastic hinge length determines the retrofitting area. Sensors 2018, 18, 3255; doi:10.3390/s18103255 www.mdpi.com/journal/sensors
-
Upload
khangminh22 -
Category
Documents
-
view
1 -
download
0
Transcript of Numerical Sensing of Plastic Hinge Regions in Concrete ...

sensors
Article
Numerical Sensing of Plastic Hinge Regions inConcrete Beams with Hybrid (FRP and Steel) Bars
Fang Yuan * and Mengcheng Chen
School of Civil Engineering and Architecture, East China Jiaotong University, Nanchang 330013, China;[email protected]* Correspondence: [email protected]; Tel.: +86-188-7006-8621
Received: 4 September 2018; Accepted: 24 September 2018; Published: 27 September 2018�����������������
Abstract: Fibre-reinforced polymer (FRP)-reinforced concrete members exhibit low ductility due tothe linear-elastic behaviour of FRP materials. Concrete members reinforced by hybrid FRP–steel barscan improve strength and ductility simultaneously. In this study, the plastic hinge problem of hybridFRP–steel reinforced concrete beams was numerically assessed through finite element analysis (FEA).Firstly, a finite element model was proposed to validate the numerical method by comparing thesimulation results with the test results. Then, three plastic hinge regions—the rebar yielding zone,concrete crushing zone, and curvature localisation zone—of the hybrid reinforced concrete beamswere analysed in detail. Finally, the effects of the main parameters, including the beam aspect ratio,concrete grade, steel yield strength, steel reinforcement ratio, steel hardening modulus, and FRPelastic modulus on the lengths of the three plastic zones, were systematically evaluated throughparametric studies. It is determined that the hybrid reinforcement ratio exerts a significant effecton the plastic hinge lengths. The larger the hybrid reinforcement ratio, the larger is the extent ofthe rebar yielding zone and curvature localisation zone. It is also determined that the beam aspectratio, concrete compressive strength, and steel hardening ratio exert significant positive effects on thelength of the rebar yielding zone.
Keywords: plastic hinge length; hybrid reinforced; concrete beam; fibre-reinforced polymer; steel;finite element analysis
1. Introduction
The corrosion of steel reinforcement ultimately causes the loss of serviceability or the strengthfailure of reinforced concrete (RC) structures. Noncorrosive fibre-reinforced polymer (FRP) is analternative to steel reinforcement for concrete structures [1–9]. However, the linear-elastic propertyof FRP rebars results in the brittle structural behaviour of FRP-reinforced concrete structures. Thedesign of the FRP-reinforced concrete flexural member must be aimed at achieving the concretecompression failure mode [10–13]. By experiencing concrete crushing prior to the tensile rupture of theFRP reinforcement, a flexural member exhibits a particular limited inelastic behaviour prior to failure.
Alternatively, the structural performance of concrete beams can be improved by a combinationof FRP and steel reinforcements. An improved durability compared with RC beams is also likely tobe obtained by placing FRP rebars at the corners or near the extreme tension face [14]. Multiple testshave been conducted on hybrid FRP–steel reinforced concrete beams [14–22]. It has been reportedthat the strength and ductility can be improved simultaneously by appropriately designing the hybridreinforcement ratio between FRP and steel [23]. Current research on hybrid reinforced beams focuseson crack-width calculation, deflection evaluation, or strength prediction; few studies concentrate onplastic hinge problems. Nevertheless, the length of the plastic hinge region is critical for structuralretrofit and design [24]. On the one hand, the plastic hinge length determines the retrofitting area.
Sensors 2018, 18, 3255; doi:10.3390/s18103255 www.mdpi.com/journal/sensors

Sensors 2018, 18, 3255 2 of 14
On the other hand, designing new structures also requires this knowledge in order to predict thedeformation capacity. This necessitates an extensive study of the plastic hinge problem of hybridFRP–steel reinforced members.
Numerous tests have been carried out on the plastic hinge of RC members, and many plastic hingelength models have been proposed [25–34]. Recently, three plastic hinge regions—the rebar yieldingzone, concrete crushing zone, and curvature localisation zone—have been proposed, in order to discussthe plastic hinge problems of RC members [24] and FRP-reinforced concrete members [35–37]. It wasdetermined that the concrete crushing length governs the seismic retrofitting region, whereas thelength of the curvature localisation zone determines the ultimate deformation.
This study is an attempt to assess the plastic hinge problem of hybrid reinforced beams throughfinite element analysis (FEA). Firstly, a finite element model is proposed, so as to validate the accuracyof the numerical method. The effect of the hybrid reinforcement ratio on the lengths of the three plastichinge regions is analysed in detail. Subsequently, the influence of the main parameters on the plastichinge lengths of hybrid reinforced beams is evaluated through parametric studies.
2. Finite Element Modelling and Implementation
The general finite element software ABAQUS [38] is used in this work. The constitutive modelsinvolve concrete, steel reinforcement, FRP reinforcement, and interfaces between concrete–steel andconcrete–FRP. Detailed modeling as well as the parameters are summarised below.
2.1. Modelling of Concrete
The four-node linear plane stress quadrilateral element CPS4R in ABAQUS is employed for theconcrete elements. The mesh size of the concrete element is 20 mm. Elements smaller than 20 mmmake little difference to the results, according to the mesh convergence model.
The damaged plasticity model is adopted to model the material behavior of concrete. Theascending section of the tensile relationship is assumed to be linear, and the softening is assumed tobe exponential, as shown in Figure 1a, where ft refers to the tensile strength; εt
cr indicates the strainat peak stress; Gf is the fracture energy of concrete; and hb is the crack band width and was taken tobe√
2A, where A is the total area of the element [39]. The fracture energy method is adopted for thepost-peak cracking of concrete. In the present work, εt
cr is assumed to be 0.0001 and Gf is expressed bythe following:
G f =(
0.0469d2a − 0.5da + 26
)( fco
10
)0.7(1)
where fco is the concrete compressive strength, and da is the maximum size of the coarse aggregate andis considered to be 20 mm in this work.
Sensors 2018, 18, x FOR PEER REVIEW 3 of 15
25.041037.9 coco f (5)
coocc
c
fE
Er
/ (6)
4730c coE f (7)
where σc and εc are the compressive stress and strain of concrete, respectively; fco is the peak stress; εco
is the strain at fco; and Ec is the elastic modulus of concrete.
(a) (b)
Figure 1. Stress–strain relationship of concrete: (a) tension model; (b) compression model.
Poisson’s ratio is assumed to be 0.2 and the dilation angle is selected to be 55° for concrete.
The following default plastic parameters are used for concrete in ABAQUS: 0.1 for eccentricity, 1.16
for the ratio of the initial equi-biaxial compressive yield stress to the initial uniaxial compressive
stress, and 0.6667 for the ratio of the second stress invariant on the tensile meridian to that on the
compressive meridian.
2.2. Modelling of Reinforcement
A two-node truss element, T3D2 in ABAQUS, is employed for the steel reinforcement and FRP
reinforcement. The bilinear model, which considers strain hardening, is adopted to model the
stress–strain relationship of the steel reinforcement (Figure 2). The stress–strain relationship can be
expressed as follows:
ysysshys
yssss
Ef
E
0 (8)
where σs and ɛs are the stress and strain of steel, respectively; ɛy is the yield strain of steel; Es is the
elastic modulus of steel; and Esh is the hardening modulus of steel. FRP reinforcement is treated as a
linear-elastic material, where the stress increases linearly with the increasing strain.
Figure 1. Stress–strain relationship of concrete: (a) tension model; (b) compression model.

Sensors 2018, 18, 3255 3 of 14
For concrete under compression, the widely used stress–strain model proposed by Popvics [40] isused in the present study (Figure 1b), as follows:
σc =fcoxr
r− 1 + xr (2)
in whichx =
ε
εco(3)
r =Ec
Ec − fco/εco(4)
εco = 9.37× 10⁻⁴ f 0.25co (5)
r =Ec
Ec − fco/εco(6)
Ec = 4730√
fco (7)
where σc and εc are the compressive stress and strain of concrete, respectively; fco is the peak stress; εco
is the strain at fco; and Ec is the elastic modulus of concrete.Poisson’s ratio is assumed to be 0.2 and the dilation angle is selected to be 55◦ for concrete.
The following default plastic parameters are used for concrete in ABAQUS: 0.1 for eccentricity,1.16 for the ratio of the initial equi-biaxial compressive yield stress to the initial uniaxial compressivestress, and 0.6667 for the ratio of the second stress invariant on the tensile meridian to that on thecompressive meridian.
2.2. Modelling of Reinforcement
A two-node truss element, T3D2 in ABAQUS, is employed for the steel reinforcement andFRP reinforcement. The bilinear model, which considers strain hardening, is adopted to model thestress–strain relationship of the steel reinforcement (Figure 2). The stress–strain relationship can beexpressed as follows: {
σs = Esεs 0 ≤ εs ≤ εy
σs = fy + Esh(εs − εy) εs > εy(8)
where σs and εs are the stress and strain of steel, respectively; εy is the yield strain of steel; Es is theelastic modulus of steel; and Esh is the hardening modulus of steel. FRP reinforcement is treated as alinear-elastic material, where the stress increases linearly with the increasing strain.Sensors 2018, 18, x FOR PEER REVIEW 4 of 15
Figure 2. Stress–strain relationship of steel reinforcement.
2.3. Bond–Slip Relationship
The Spring2 element is used to define the nonlinear bond–slip relationship between steel/FRP
reinforcements and concrete. The reinforcement nodes are connected with concrete nodes by a series
of springs. A very large stiffness is employed for the springs in the normal direction of the interface,
to ensure the same deformation in the direction of the reinforcements and the concrete. In the
tangential direction, the bond–slip relationship proposed by Wu and Zhao [41] is employed to
consider the nonlinear slip between the concrete and longitudinal reinforcement. The bond
stress–slip relationship can be transformed into the nonlinear spring force–relative displacement
relationship by the following:
sbldF (9)
where τ is the bond stress, and ls is the distance between the spring elements, which is the same as
the mesh size of 20 mm. It is noted that the nonlinear springs are used only for longitudinal
reinforcement. The transverse reinforcement is treated as the embedded elements in ABAQUS. For
more details, please refer to the previous literature by the first author [42,43].
3. Model Verification
Four concrete beams reinforced with hybrid FRP–steel bars are simulated. Table 1 presents
details of the beams [19,21]. Specimen A1 and G0.6-T1.0-A90 exhibit steel reinforcement ratios higher
than the FRP reinforcement ratio, whereas specimens A2 and B3 exhibit FRP reinforcement ratios
higher than the steel reinforcement ratio. Figure 3 shows the load–deformation curves of the
specimens. The simulated ultimate curvature of specimens A1 and A2 are 8.42% lower and 2.63%
higher, respectively, than the measured results, and the simulated load carrying capacity of specimen
B3 and G0.6-T1.0-A90 are 8.35% higher and 0.04% lower, respectively, than the measured ones.
Table 1. Details of beam specimens.
Specimen ID b (mm) h (mm) As (mm2) Af (mm2) A (mm2) fc (MPa) fy (MPa) Ef (GPa) Af (mm2)
A1 150 200 100.48 88.31 188.79 45.7 465 49 1674
A2 150 200 100.48 157 257.48 45.7 465 50.1 1366
B3 180 250 226.08 253.23 479.31 23.7 363 45 782
G0.6-T1.0-A90 280 380 981.7 567.1 1448.8 44.6 550 39.5 588
Figure 2. Stress–strain relationship of steel reinforcement.

Sensors 2018, 18, 3255 4 of 14
2.3. Bond–Slip Relationship
The Spring2 element is used to define the nonlinear bond–slip relationship between steel/FRPreinforcements and concrete. The reinforcement nodes are connected with concrete nodes by a seriesof springs. A very large stiffness is employed for the springs in the normal direction of the interface,to ensure the same deformation in the direction of the reinforcements and the concrete. In the tangentialdirection, the bond–slip relationship proposed by Wu and Zhao [41] is employed to consider thenonlinear slip between the concrete and longitudinal reinforcement. The bond stress–slip relationshipcan be transformed into the nonlinear spring force–relative displacement relationship by the following:
F = τ · π · dbls (9)
where τ is the bond stress, and ls is the distance between the spring elements, which is the same as themesh size of 20 mm. It is noted that the nonlinear springs are used only for longitudinal reinforcement.The transverse reinforcement is treated as the embedded elements in ABAQUS. For more details,please refer to the previous literature by the first author [42,43].
3. Model Verification
Four concrete beams reinforced with hybrid FRP–steel bars are simulated. Table 1 presents detailsof the beams [19,21]. Specimen A1 and G0.6-T1.0-A90 exhibit steel reinforcement ratios higher than theFRP reinforcement ratio, whereas specimens A2 and B3 exhibit FRP reinforcement ratios higher than thesteel reinforcement ratio. Figure 3 shows the load–deformation curves of the specimens. The simulatedultimate curvature of specimens A1 and A2 are 8.42% lower and 2.63% higher, respectively, than themeasured results, and the simulated load carrying capacity of specimen B3 and G0.6-T1.0-A90 are8.35% higher and 0.04% lower, respectively, than the measured ones.Sensors 2018, 18, x FOR PEER REVIEW 5 of 15
0 40 80 120 1600
10
20
30
Mo
men
t (k
Nm
)
Curvature
mm-1
Test
Simulation
0 40 80 120 1600
10
20
30
Mo
men
t (k
Nm
)
Curvature
mm-1
Test
Simulation
(a) (b)
0 10 20 300
40
80
120
160
Lo
ad (
kN
)
Displacement mm
Test
Simulation
0 40 80 1200
50
100
150
200
250
Lo
ad (
kN
)
Displacement mm
Test
Simulation
(c) (d)
Figure 3. Load–deformation curves: (a) A1, (b) A2, (c) B3, and (d) G0.6-T1.0-A90.
4. Plastic Hinge Analysis of Hybrid FRP–Steel Reinforced Beams
This section describes the analysis of the influence of the FRP reinforcement ratio on the
development of the plastic hinge regions for hybrid FRP–steel reinforced concrete beams. Four hybrid
reinforced beams with identical total reinforcement areas, albeit different hybrid reinforcement
ratios, are selected for the analysis. The hybrid reinforcement ratio defined by Qin et al. [23] is used
in the present study, and it is expressed by the following:
f
r
s
A
A (10)
where Af and As are the reinforcement areas of FRP and steel, respectively. Herein, the total tension
reinforcement ratio is fixed to be 1.6% of the four beams. The FRP reinforcement ratios are selected
as 0, 0.4%, 0.8%, and 1.2%, corresponding to the hybrid reinforcement ratios of 0, 0.33, 1, and 3,
respectively. All of the specimens exhibit identical geometric dimensions and material properties. A
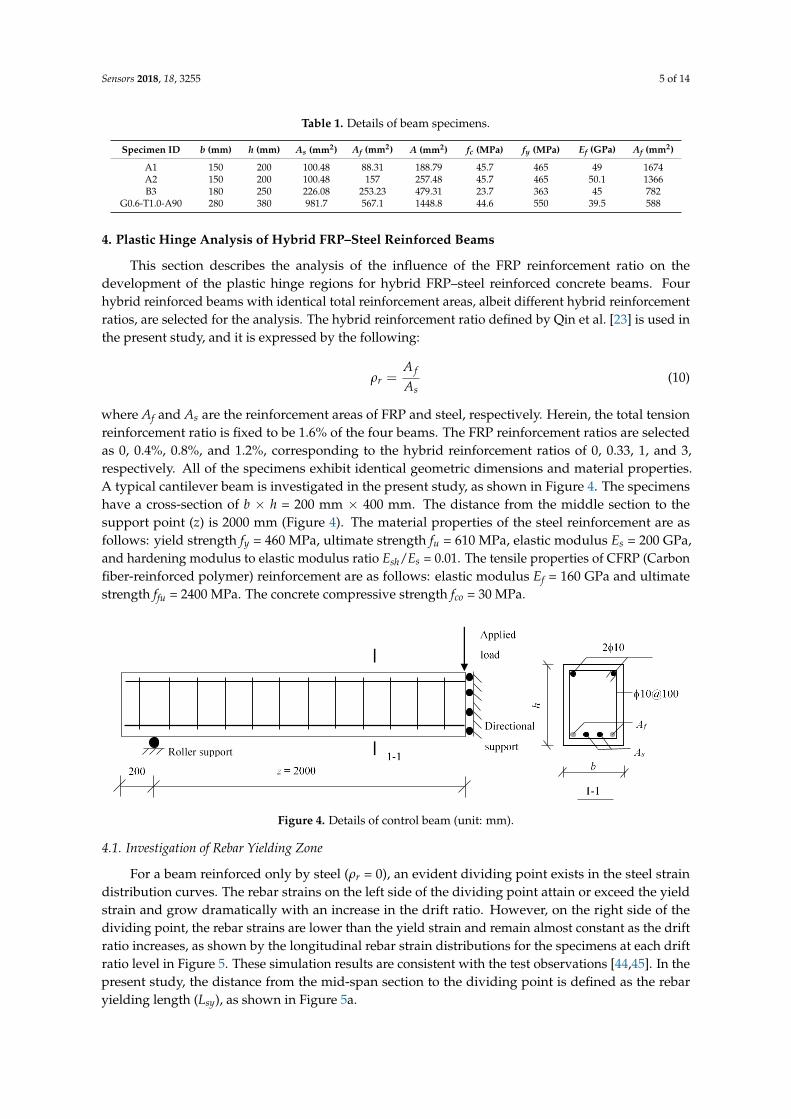
typical cantilever beam is investigated in the present study, as shown in Figure 4. The specimens have
a cross-section of b × h = 200 × 400 mm. The distance from the middle section to the support point (z)
is 2000 mm (Figure 4). The material properties of the steel reinforcement are as follows: yield strength
fy = 460 MPa, ultimate strength fu = 610 MPa, elastic modulus Es = 200 GPa, and hardening modulus
to elastic modulus ratio Esh/Es = 0.01. The tensile properties of CFRP (Carbon fiber-reinforced polymer)
reinforcement are as follows: elastic modulus Ef = 160 GPa and ultimate strength ffu = 2400 MPa. The
concrete compressive strength fco = 30 MPa.
Figure 3. Load–deformation curves: (a) A1, (b) A2, (c) B3, and (d) G0.6-T1.0-A90.
Sensors 2018, 18, 3255 5 of 14
Table 1. Details of beam specimens.
Specimen ID b (mm) h (mm) As (mm2) Af (mm2) A (mm2) fc (MPa) fy (MPa) Ef (GPa) Af (mm2)
A1 150 200 100.48 88.31 188.79 45.7 465 49 1674A2 150 200 100.48 157 257.48 45.7 465 50.1 1366B3 180 250 226.08 253.23 479.31 23.7 363 45 782
G0.6-T1.0-A90 280 380 981.7 567.1 1448.8 44.6 550 39.5 588
4. Plastic Hinge Analysis of Hybrid FRP–Steel Reinforced Beams
This section describes the analysis of the influence of the FRP reinforcement ratio on thedevelopment of the plastic hinge regions for hybrid FRP–steel reinforced concrete beams. Fourhybrid reinforced beams with identical total reinforcement areas, albeit different hybrid reinforcementratios, are selected for the analysis. The hybrid reinforcement ratio defined by Qin et al. [23] is used inthe present study, and it is expressed by the following:
ρr =A f
As(10)
where Af and As are the reinforcement areas of FRP and steel, respectively. Herein, the total tensionreinforcement ratio is fixed to be 1.6% of the four beams. The FRP reinforcement ratios are selectedas 0, 0.4%, 0.8%, and 1.2%, corresponding to the hybrid reinforcement ratios of 0, 0.33, 1, and 3,respectively. All of the specimens exhibit identical geometric dimensions and material properties.A typical cantilever beam is investigated in the present study, as shown in Figure 4. The specimenshave a cross-section of b × h = 200 mm × 400 mm. The distance from the middle section to thesupport point (z) is 2000 mm (Figure 4). The material properties of the steel reinforcement are asfollows: yield strength fy = 460 MPa, ultimate strength fu = 610 MPa, elastic modulus Es = 200 GPa,and hardening modulus to elastic modulus ratio Esh/Es = 0.01. The tensile properties of CFRP (Carbonfiber-reinforced polymer) reinforcement are as follows: elastic modulus Ef = 160 GPa and ultimatestrength ffu = 2400 MPa. The concrete compressive strength fco = 30 MPa.Sensors 2018, 18, x FOR PEER REVIEW 6 of 15
Figure 4. Details of control beam (unit: mm).
4.1. Investigation of Rebar Yielding Zone
For a beam reinforced only by steel (r = 0), an evident dividing point exists in the steel strain
distribution curves. The rebar strains on the left side of the dividing point attain or exceed the yield
strain and grow dramatically with an increase in the drift ratio. However, on the right side of the
dividing point, the rebar strains are lower than the yield strain and remain almost constant as the
drift ratio increases, as shown by the longitudinal rebar strain distributions for the specimens at each
drift ratio level in Figure5. These simulation results are consistent with the test observations [44,45].
In the present study, the distance from the mid-span section to the dividing point is defined as the
rebar yielding length (Lsy), as shown in Figure 5a.
The steel strain variation trend of the hybrid FRP–steel reinforced concrete beams are completely
different from that of the RC beam, as shown in Figure 5b–d. It is evident from these figures that the
steel strains continue to increase as the drift ratio increases. As a result, no fixed dividing point exists,
and Lsy continues to increase as the drift ratio increases. This can be explained as follows. For the
normal RC beam (r = 0), the difference between the maximum moment and the yield moment
remains constant after the load carrying capacity is attained. In this case, the distance from the yield
section to the maximum moment section (mid-span section in this study), which is known as Lsy,
remains constant after a specific displacement. However, for the hybrid reinforced concrete beams
(r > 0), the yield moment occurs at a fixed displacement, whereas the moment resistance continues
to increase, owing to the linear-elastic property of the FRP reinforcement. In this case, the gap
between the maximum moment and the yield moment continues to increase as the drift ratio
increases, resulting in an increasing Lsy. The higher the hybrid reinforcement ratio, r, the more
significant the increment of Lsy. On the one hand, the yield moment decreases with the increasing r,
owing to the smaller steel reinforcement layout. On the other hand, the maximum moment continues
to increase as r increases, owing to the higher tensile strength of the FRP reinforcement compared
with that of the steel reinforcement. As a result, the gap between the mid-span moment and the yield
moment grows larger, as illustrated in Figure 6. For example, Lsy increases by 265% at a drift ratio of
2% when r changes from zero to 0.33, compared with 308% and 351% when r varies from zero to
one and three, respectively [46,47].
RC with hybrid FRP–steel rebars guarantees a greater ultimate deformability and deflection than
RC with only steel rebars, but it does not guarantee more ductility. The reason the ultimate
displacement of the former is greater than that of the latter has not been explained by the authors,
which is a serious flaw. The reason is that when the behavior of the steel rebars is plastic, the behavior
of the FRP rebars is linear-elastic, so the inelastic part of the moment–curvature diagram is a steep
curve up to the final level. On the contrary, the inelastic part of the moment–curvature diagram of a
steel section is flat. Therefore, in the former case, the length of the plastic hinge is greater than in the
latter case, and the ultimate displacement is also greater. Nevertheless, that behavior consists of
deformability not ductility, as the beam with hybrid rebars does not dissipate more than the beam
with the steel rebars [46,47].
Figure 4. Details of control beam (unit: mm).
4.1. Investigation of Rebar Yielding Zone
For a beam reinforced only by steel (ρr = 0), an evident dividing point exists in the steel straindistribution curves. The rebar strains on the left side of the dividing point attain or exceed the yieldstrain and grow dramatically with an increase in the drift ratio. However, on the right side of thedividing point, the rebar strains are lower than the yield strain and remain almost constant as the driftratio increases, as shown by the longitudinal rebar strain distributions for the specimens at each driftratio level in Figure 5. These simulation results are consistent with the test observations [44,45]. In thepresent study, the distance from the mid-span section to the dividing point is defined as the rebaryielding length (Lsy), as shown in Figure 5a.

Sensors 2018, 18, 3255 6 of 14Sensors 2018, 18, x FOR PEER REVIEW 7 of 15
0 200 400 6000.000
0.005
0.010
0.015
0.020
Ste
el s
trai
n
Distance from mid-span (mm)
Yield
= 0.0125
= 0.015
= 0.0175
= 0.02
Lsy
0 200 400 600 800 1000
0.000
0.002
0.004
0.006
Ste
el s
trai
n
Distance from mid-span (mm)
Yield
= 0.0125
= 0.015
= 0.0175
= 0.02
(a) (b)
0 200 400 600 800 10000.000
0.002
0.004
0.006
Ste
el s
trai
n
Distance from mid-span (mm)
Yield
= 0.0125
= 0.015
= 0.0175
= 0.02
0 200 400 600 800 10000.000
0.002
0.004
0.006
Ste
el s
trai
n
Distance from mid-span (mm)
Yield
= 0.0125
= 0.015
= 0.0175
= 0.02
(c) (d)
Figure 5. Longitudinal steel strain distribution: (a) r = 0; (b) r = 0.33; (c) r = 1; (d) r = 3.
Figure 6. Schematic diagram of moment distributions for cases of r = 0 and r > 0.
4.2. Investigation of Concrete Crushing Zone
Figure 7 shows the concrete strain distribution at the extreme compression face of the beams at
each drift ratio level. It can be seen from Figure 7 that an evident dividing point exists for each beam.
On the left side of the dividing points, the concrete strains display an abrupt increase, whereas on the
Figure 5. Longitudinal steel strain distribution: (a) ρr = 0; (b) ρr = 0.33; (c) ρr = 1; (d) ρr = 3.
The steel strain variation trend of the hybrid FRP–steel reinforced concrete beams are completelydifferent from that of the RC beam, as shown in Figure 5b–d. It is evident from these figures thatthe steel strains continue to increase as the drift ratio increases. As a result, no fixed dividing pointexists, and Lsy continues to increase as the drift ratio increases. This can be explained as follows. Forthe normal RC beam (ρr = 0), the difference between the maximum moment and the yield momentremains constant after the load carrying capacity is attained. In this case, the distance from the yieldsection to the maximum moment section (mid-span section in this study), which is known as Lsy,remains constant after a specific displacement. However, for the hybrid reinforced concrete beams(ρr > 0), the yield moment occurs at a fixed displacement, whereas the moment resistance continues toincrease, owing to the linear-elastic property of the FRP reinforcement. In this case, the gap betweenthe maximum moment and the yield moment continues to increase as the drift ratio increases, resultingin an increasing Lsy. The higher the hybrid reinforcement ratio, ρr, the more significant the incrementof Lsy. On the one hand, the yield moment decreases with the increasing ρr, owing to the smallersteel reinforcement layout. On the other hand, the maximum moment continues to increase as ρr
increases, owing to the higher tensile strength of the FRP reinforcement compared with that of thesteel reinforcement. As a result, the gap between the mid-span moment and the yield moment growslarger, as illustrated in Figure 6. For example, Lsy increases by 265% at a drift ratio of 2% when ρr
changes from zero to 0.33, compared with 308% and 351% when ρr varies from zero to one and three,respectively [46,47].

Sensors 2018, 18, 3255 7 of 14
Sensors 2018, 18, x FOR PEER REVIEW 7 of 15
0 200 400 6000.000
0.005
0.010
0.015
0.020
Ste
el s
trai
n
Distance from mid-span (mm)
Yield
= 0.0125
= 0.015
= 0.0175
= 0.02
Lsy
0 200 400 600 800 1000
0.000
0.002
0.004
0.006
Ste
el s
trai
n
Distance from mid-span (mm)
Yield
= 0.0125
= 0.015
= 0.0175
= 0.02
(a) (b)
0 200 400 600 800 10000.000
0.002
0.004
0.006
Ste
el s
trai
n
Distance from mid-span (mm)
Yield
= 0.0125
= 0.015
= 0.0175
= 0.02
0 200 400 600 800 10000.000
0.002
0.004
0.006
Ste
el s
trai
n
Distance from mid-span (mm)
Yield
= 0.0125
= 0.015
= 0.0175
= 0.02
(c) (d)
Figure 5. Longitudinal steel strain distribution: (a) r = 0; (b) r = 0.33; (c) r = 1; (d) r = 3.
Figure 6. Schematic diagram of moment distributions for cases of r = 0 and r > 0.
4.2. Investigation of Concrete Crushing Zone
Figure 7 shows the concrete strain distribution at the extreme compression face of the beams at
each drift ratio level. It can be seen from Figure 7 that an evident dividing point exists for each beam.
On the left side of the dividing points, the concrete strains display an abrupt increase, whereas on the
Figure 6. Schematic diagram of moment distributions for cases of ρr = 0 and ρr > 0.
RC with hybrid FRP–steel rebars guarantees a greater ultimate deformability and deflectionthan RC with only steel rebars, but it does not guarantee more ductility. The reason the ultimatedisplacement of the former is greater than that of the latter has not been explained by the authors,which is a serious flaw. The reason is that when the behavior of the steel rebars is plastic, the behaviorof the FRP rebars is linear-elastic, so the inelastic part of the moment–curvature diagram is a steepcurve up to the final level. On the contrary, the inelastic part of the moment–curvature diagram ofa steel section is flat. Therefore, in the former case, the length of the plastic hinge is greater than inthe latter case, and the ultimate displacement is also greater. Nevertheless, that behavior consists ofdeformability not ductility, as the beam with hybrid rebars does not dissipate more than the beam withthe steel rebars [46,47].
4.2. Investigation of Concrete Crushing Zone
Figure 7 shows the concrete strain distribution at the extreme compression face of the beams ateach drift ratio level. It can be seen from Figure 7 that an evident dividing point exists for each beam.On the left side of the dividing points, the concrete strains display an abrupt increase, whereas on theright side of the dividing point, they almost remain constant as the drift ratio increases. The verticalco-ordinate of the dividing points is approximately at the strain value of 0.002. This is because, beyondthe compression strain of 0.002, concrete enters the compression softening period, and subsequently,strain localisation occurs. The simulation results are consistent with the test observations. To study theconcrete crushing zone, the length of the region where the concrete compression strain is larger thanthe strain of 0.002 (Lcs) was always selected for analysis [24,42,43].
Figure 7 also shows that the dividing points stay intact as the hybrid reinforcement ratio increases,which implies that Lcs is not affected by ρr. As ρr increases, the concrete strength remains constant andthe compression failure zone remains almost constant, resulting in a stable Lcs.
4.3. Investigation of Curvature Localisation Zone
Figure 8 shows the curvature distribution along the beam length for specimens at each drift ratiolevel. Herein, the curvature is defined by the following equation:
φ =εt − εc
h(11)
where εt and εc are the strains at the extreme tension fibre and extreme compression fibre, respectively,and h is the beam depth. It can be found from Figure 8 that, similar to the rebar yielding distributionin the RC beam (Figure 5a) and the concrete compressive strain distribution (Figure 7), a dividingpoint exists for each beam; the curvatures fluctuate dramatically beyond yielding from this point tothe mid-span section, whereas those on the left side of the dividing point remain almost constant.

Sensors 2018, 18, 3255 8 of 14
The simulation results are consistent with the test observations [48]. The distance from the criticalsection (mid-span section in this study) to the dividing point is always defined as the length of thecurvature localisation zone Lpc [24,42,43].
Sensors 2018, 18, x FOR PEER REVIEW 8 of 15
right side of the dividing point, they almost remain constant as the drift ratio increases. The vertical
co-ordinate of the dividing points is approximately at the strain value of 0.002. This is because,
beyond the compression strain of 0.002, concrete enters the compression softening period, and
subsequently, strain localisation occurs. The simulation results are consistent with the test
observations. To study the concrete crushing zone, the length of the region where the concrete
compression strain is larger than the strain of 0.002 (Lcs) was always selected for analysis [24,42,43].
Figure 7 also shows that the dividing points stay intact as the hybrid reinforcement ratio
increases, which implies that Lcs is not affected by r. As r increases, the concrete strength remains
constant and the compression failure zone remains almost constant, resulting in a stable Lcs.
0 100 200 300 4000.00
-0.01
-0.02
Concr
ete
stra
in
Distance from mid-span (mm)
c = -0.002
= 0.0125
= 0.015
= 0.0175
= 0.02
Lcs
0 100 200 300 400
0.00
-0.01
-0.02
Concr
ete
stra
in
Distance from mid-span (mm)
c = -0.002
= 0.0125
= 0.015
= 0.0175
= 0.02
Lcs
(a) (b)
0 100 200 300 4000.00
-0.01
-0.02
Concr
ete
stra
in
Distance from mid-span (mm)
c = -0.002
= 0.0125
= 0.015
= 0.0175
= 0.02
Lcs
0 100 200 300 4000.00
-0.01
-0.02
Co
ncr
ete
stra
in
Distance from mid-span (mm)
c = -0.002
= 0.0125
= 0.015
= 0.0175
= 0.02
Lcs
(c) (d)
Figure 7. Concrete compressive strain distribution: (a) r = 0; (b) r = 0.33; (c) r = 1; (d) r = 3.
4.3. Investigation of Curvature Localisation Zone
Figure 8 shows the curvature distribution along the beam length for specimens at each drift ratio
level. Herein, the curvature is defined by the following equation:
= t c
h
(11)
where t and c are the strains at the extreme tension fibre and extreme compression fibre,
respectively, and h is the beam depth. It can be found from Figure 8 that, similar to the rebar yielding
distribution in the RC beam (Figure 5a) and the concrete compressive strain distribution (Figure 7), a
dividing point exists for each beam; the curvatures fluctuate dramatically beyond yielding from this
point to the mid-span section, whereas those on the left side of the dividing point remain almost
constant. The simulation results are consistent with the test observations [48]. The distance from the
Figure 7. Concrete compressive strain distribution: (a) ρr = 0; (b) ρr = 0.33; (c) ρr = 1; (d) ρr = 3.
Figure 8 also shows the effect of the hybrid reinforcement ratio ρr on Lpc. It is evident that thedividing point shifts away from the mid-span section as ρr increases, indicating a larger Lpc for ahigher ρr. For example, Lpc increases from 82 mm to 142 mm when ρr changes from zero to three. It isinferred from Equation (11) that the curvature is associated with both the concrete compression strainand the tension strain. As a result, the curvature localisation is caused by concrete crushing as wellas steel yielding. As Lsy and Lcs increase with the increase in ρr, Lpc subsequently exhibits a similarincreasing trend.
At an identical drift ratio, the larger Lpc at a higher ρr is accompanied by the more uniformcurvature distributions. Figure 8 clearly shows that at an equivalent mid-span displacement, a beamwith a smaller Lpc exhibits a larger curvature in the mid-span section, and that a larger plastic hingelength yields a smaller mid-span curvature. For example, at the drift ratio of 2%, the mid-spancurvature of the beam with ρr = 0 is 0.000219, compared with 0.000176, 0.000157, and 0.000144 forρr = 0.25, ρr = 0.5, and ρr = 0.75, respectively. This implies that at an identical displacement level, thehybrid beam with a higher hybrid reinforcement ratio exhibits a smaller mid-span curvature demandthan that with a lower hybrid reinforcement ratio. Moreover, for a smaller curvature demand, theresidual displacements would be smaller for the hybrid beams with a higher hybrid reinforcementratio, owing to the self-centering behaviour of the FRP reinforcements; this results in an improvedreparability of structures after a severe seismic event.

Sensors 2018, 18, 3255 9 of 14
Sensors 2018, 18, x FOR PEER REVIEW 9 of 15
critical section (mid-span section in this study) to the dividing point is always defined as the length
of the curvature localisation zone Lpc [24,42,43].
0 100 200 300 4000.00000
0.00005
0.00010
0.00015
0.00020C
urv
atu
re (
mm
-1)
Distance from mid-span (mm)
Yield
= 0.0125
= 0.015
= 0.0175
= 0.02Lpc
0 100 200 300 4000.00000
0.00005
0.00010
0.00015
0.00020
Curv
ature
(m
m-1
)
Distance from mid-span (mm)
Yield
= 0.0125
= 0.015
= 0.0175
= 0.02
Lpc
(a) (b)
0 100 200 300 4000.00000
0.00005
0.00010
0.00015
0.00020
Cu
rvat
ure
(m
m-1
)
Distance from mid-span (mm)
Yield
= 0.0125
= 0.015
= 0.0175
= 0.02L
pc
0 100 200 300 4000.00000
0.00005
0.00010
0.00015
0.00020
Curv
ature
(m
m-1
)
Distance from mid-span (mm)
Yield
= 0.0125
= 0.015
= 0.0175
= 0.02L
pc
(c) (d)
Figure 8. Curvature distribution along beam length: (a) r = 0; (b) r = 0.33; (c) r = 1; (d) r = 3.
Figure 8 also shows the effect of the hybrid reinforcement ratio r on Lpc. It is evident that the
dividing point shifts away from the mid-span section as r increases, indicating a larger Lpc for a
higher r. For example, Lpc increases from 82 mm to 142 mm when r changes from zero to three. It is
inferred from Equation (11) that the curvature is associated with both the concrete compression strain
and the tension strain. As a result, the curvature localisation is caused by concrete crushing as well
as steel yielding. As Lsy and Lcs increase with the increase in r, Lpc subsequently exhibits a similar
increasing trend.
At an identical drift ratio, the larger Lpc at a higher r is accompanied by the more uniform
curvature distributions. Figure 8 clearly shows that at an equivalent mid-span displacement, a beam
with a smaller Lpc exhibits a larger curvature in the mid-span section, and that a larger plastic hinge
length yields a smaller mid-span curvature. For example, at the drift ratio of 2%, the mid-span
curvature of the beam with r = 0 is 0.000219, compared with 0.000176, 0.000157, and 0.000144 for
r = 0.25, r = 0.5, and r = 0.75, respectively. This implies that at an identical displacement level, the
hybrid beam with a higher hybrid reinforcement ratio exhibits a smaller mid-span curvature demand
than that with a lower hybrid reinforcement ratio. Moreover, for a smaller curvature demand, the
residual displacements would be smaller for the hybrid beams with a higher hybrid reinforcement
ratio, owing to the self-centering behaviour of the FRP reinforcements; this results in an improved
reparability of structures after a severe seismic event.
Figure 8. Curvature distribution along beam length: (a) ρr = 0; (b) ρr = 0.33; (c) ρr = 1; (d) ρr = 3.
The influences of the hybrid reinforcement ratio ρr on Lsy, Lcs, and Lpc are displayed togetherin Figure 9. It was reported that a concrete strain of approximately 0.05–0.008 could be selected asthe concrete ultimate strain [49]. Therefore, in the following sections, Lsy is determined when themaximum concrete compression strain attains 0.008 for hybrid FRP–steel reinforced concrete beams.It can clearly be seen from Figure 9 that Lcs remains almost constant, whereas both Lsy and Lpc exhibitincreasing trends when ρr increases. The growth rate of Lsy is more pronounced than that of Lpc.
Sensors 2018, 18, x FOR PEER REVIEW 10 of 15
The influences of the hybrid reinforcement ratio r on Lsy, Lcs, and Lpc are displayed together in
Figure 9. It was reported that a concrete strain of approximately 0.05–0.008 could be selected as the
concrete ultimate strain [49]. Therefore, in the following sections, Lsy is determined when the
maximum concrete compression strain attains 0.008 for hybrid FRP–steel reinforced concrete beams.
It can clearly be seen from Figure 9 that Lcs remains almost constant, whereas both Lsy and Lpc exhibit
increasing trends when r increases. The growth rate of Lsy is more pronounced than that of Lpc.
0
100
200
300
400
500
r = 3
r = 1
r = 0.33
Exte
nt
of
pla
stic
zones
(m
m)
Lsy
Lcs
Lpc
r = 0
Figure 9. Effect of hybrid reinforcement ratio on plastic hinge length.
5. Parametric Study
In order to gain a comprehensive understanding of the plastic hinge regions of hybrid FRP–steel
reinforced concrete beams, a systematic parametric study has been carried out. The main influential
parameters include the aspect ratio, z/h; concrete compressive strength, fco; yield strength of steel
reinforcement, fy; steel reinforcement ratio, s; steel hardening ratio, Esh; and elastic modulus of the
FRP reinforcement, Ef. The control beam has a steel reinforcement ratio of 0.8% and an FRP
reinforcement ratio of 0.8%. The geometric dimensions and material properties of the control beam
are identical to that provided in Section 4. When a factor is investigated, the other factors are
maintained at a constant.
5.1. Effect of Aspect Ratio
In the present study, the variation in z/h from three to eight was achieved by increasing the
effective length, z, while fixing the beam depth, h, at 400 mm. Figure 10a shows the effect of the aspect
ratio on the extent of the plastic hinge zones. It is evident that both Lsy and Lpc increase rapidly,
whereas Lcs remains almost constant as z/h increases. Theoretically, the distance from the maximum
moment section to the yield moment section, denoted as Lsy, is proportional to the beam length, as
shown in Figure 6.
Figure 9. Effect of hybrid reinforcement ratio on plastic hinge length.

Sensors 2018, 18, 3255 10 of 14
5. Parametric Study
In order to gain a comprehensive understanding of the plastic hinge regions of hybrid FRP–steelreinforced concrete beams, a systematic parametric study has been carried out. The main influentialparameters include the aspect ratio, z/h; concrete compressive strength, fco; yield strength of steelreinforcement, fy; steel reinforcement ratio, ρs; steel hardening ratio, Esh; and elastic modulus of the FRPreinforcement, Ef. The control beam has a steel reinforcement ratio of 0.8% and an FRP reinforcementratio of 0.8%. The geometric dimensions and material properties of the control beam are identical tothat provided in Section 4. When a factor is investigated, the other factors are maintained at a constant.
5.1. Effect of Aspect Ratio
In the present study, the variation in z/h from three to eight was achieved by increasing theeffective length, z, while fixing the beam depth, h, at 400 mm. Figure 10a shows the effect of the aspectratio on the extent of the plastic hinge zones. It is evident that both Lsy and Lpc increase rapidly, whereasLcs remains almost constant as z/h increases. Theoretically, the distance from the maximum momentsection to the yield moment section, denoted as Lsy, is proportional to the beam length, as shownin Figure 6.
5.2. Effect of Compressive Strength of Concrete
The numerical results in Figure 10b illustrate the effect of the compressive strength of the concrete,fco, on the lengths of the plastic hinge regions of the hybrid reinforced concrete beams. fco varies from20 MPa to 60 MPa. It is evident that Lsy exhibits an increasing trend, whereas Lcs exhibits a decreasingtrend as fco increases. As fco increases, the compression zone is strengthened; thus, a larger tensionresultant force is necessary to balance the increasing compression force, resulting in a larger maximummoment and thus a larger Lsy. Lpc increases marginally as fco increases, indicating that, in this case,Lpc is governed by the steel yielding zone. As the ultimate curvature, which is defined by the ratio ofthe ultimate compression strain (0.003–0.0035) to the height of the neutral axis, keeps almost constant,a larger plastic hinge region leads to a higher ultimate deformation.
5.3. Effect of Yield Strength of Steel Reinforcement
The yield strength of the steel reinforcement, fy, is considered to affect the plastic hinge zonesand was included in the most widely-used plastic hinge length model of the RC members, proposedby Paulay and Priestley [27]. The effect of fy on the plastic hinge lengths of the hybrid reinforcedconcrete beams is presented in Figure 10c. It is observed that Lsy decreases, whereas Lcs increases asfy increases. As fy increases, the tension zone is strengthened and the compression of concrete entersinto the ultimate state, as described earlier, resulting in a smaller Lsy. Meanwhile, the yield momentincreases as fy increases, which implies a lower ratio of the maximum moment to the yield moment,and thus a smaller Lsy. Owing to the coexisting effects of Lsy and Lcs, Lpc remains almost constant asfy increases.
5.4. Effect of Steel Reinforcement Ratio
Figure 10d shows the effect of the steel reinforcement ratio, ρs, on the extent of the plastic hingeregions for the hybrid reinforced concrete beams. The FRP reinforcement ratio is fixed to be 0.8%,whereas the steel reinforcement ratio varies from 0.2% to 1%. It can be found from Figure 10d that Lsy
decreases rapidly as ρs increases, whereas Lcs remains almost constant as ρs increases. On the one hand,the tension zone of the beam is strengthened as ρs increases, resulting in a smaller Lsy. On the otherhand, the larger ρs results in a smaller gap between the maximum moment and the yield moment,which further reduces Lsy. Lpc is determined by Lsy and thus exhibits a decreasing trend as ρs increases.

Sensors 2018, 18, 3255 11 of 14Sensors 2018, 18, x FOR PEER REVIEW 11 of 15
3 4 5 6 7 80
200
400
600
800
1000E
xte
nt
of
pla
stic
zon
es (
mm
)
z/h
Lsy
Lcs
Lpc
20 30 40 50 60
0
200
400
600
800
Exte
nt
of
pla
stic
zones
(m
m)
fco
(MPa)
Lsy
Lcs
Lpc
(a) (b)
300 400 5000
200
400
600
800
Exte
nt
of
pla
stic
zon
es (
mm
)
fy (MPa)
Lsy
Lcs
Lpc
0.2 0.4 0.6 0.8 1.00
200
400
600
800
1000
Exte
nt
of
pla
stic
zon
es (
mm
)
s (%)
Lsy
Lcs
Lpc
(c) (d)
0.000 0.005 0.010 0.015 0.0200
200
400
600
Exte
nt
of
pla
stic
zon
es (
mm
)
sh
/Es
Lsy
Lcs
Lpc
40 80 120 1600
200
400
600
Ex
ten
t o
f p
last
ic z
on
es (
mm
)
f (GPa)
Lsy
Lcs
Lpc
(e) (f)
Figure 10. Variation of plastic hinge zones: (a) effect of aspect ratio; (b) effect of compressive strength
of concrete; (c) effect of yield strength of steel reinforcement; (d) effect of steel reinforcement ratio;
(e) effect of hardening modulus of steel reinforcement; (f) elastic modulus of fibre-reinforced polymer
(FRP) reinforcement.
5.2. Effect of Compressive Strength of Concrete
The numerical results in Figure 10b illustrate the effect of the compressive strength of the
concrete, fco, on the lengths of the plastic hinge regions of the hybrid reinforced concrete beams. fco
Figure 10. Variation of plastic hinge zones: (a) effect of aspect ratio; (b) effect of compressive strengthof concrete; (c) effect of yield strength of steel reinforcement; (d) effect of steel reinforcement ratio;(e) effect of hardening modulus of steel reinforcement; (f) elastic modulus of fibre-reinforced polymer(FRP) reinforcement.
5.5. Effect of Steel Hardening Modulus
The effect of the steel hardening modulus Esh on the plastic hinge lengths of the hybrid reinforcedconcrete beams is shown in Figure 10e. It is evident that Lsy, Lc,s, and Lpc, exhibit increasing trendsas Esh/Es increases. The mechanism is extremely straightforward and can be explained as follows:as Esh increases, the yield moment remains constant, whereas the maximum moment increases, which
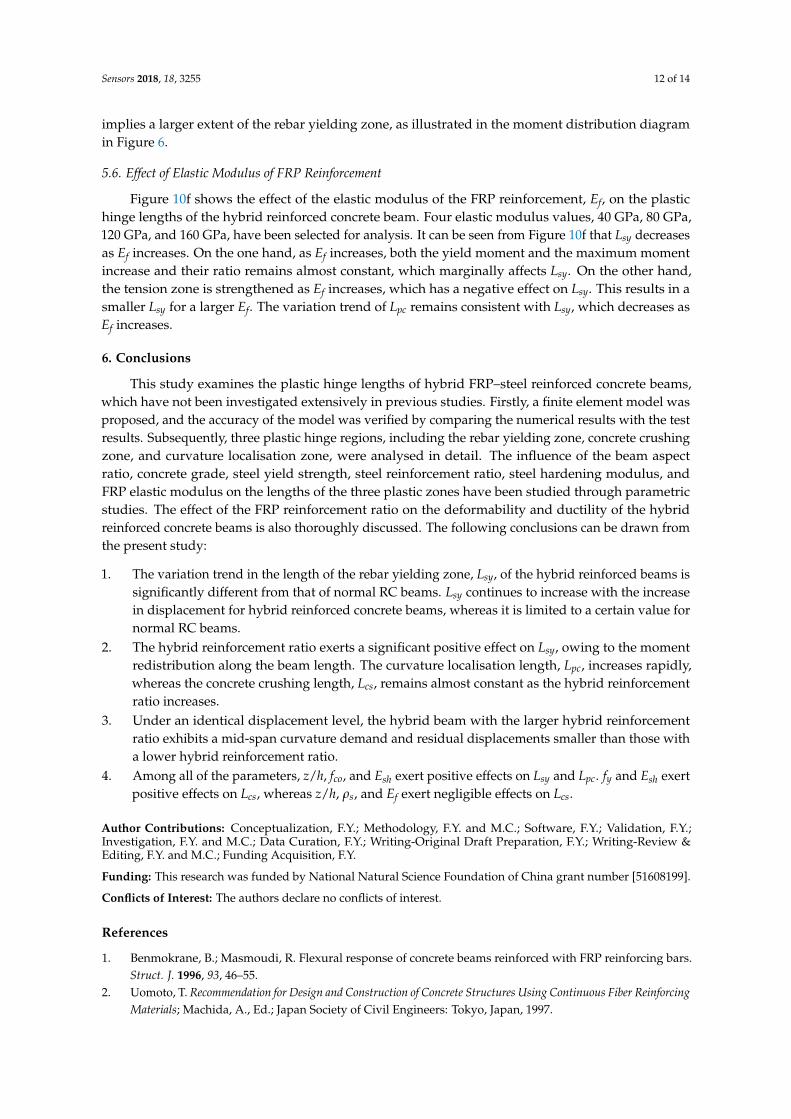
Sensors 2018, 18, 3255 12 of 14
implies a larger extent of the rebar yielding zone, as illustrated in the moment distribution diagramin Figure 6.
5.6. Effect of Elastic Modulus of FRP Reinforcement
Figure 10f shows the effect of the elastic modulus of the FRP reinforcement, Ef, on the plastichinge lengths of the hybrid reinforced concrete beam. Four elastic modulus values, 40 GPa, 80 GPa,120 GPa, and 160 GPa, have been selected for analysis. It can be seen from Figure 10f that Lsy decreasesas Ef increases. On the one hand, as Ef increases, both the yield moment and the maximum momentincrease and their ratio remains almost constant, which marginally affects Lsy. On the other hand,the tension zone is strengthened as Ef increases, which has a negative effect on Lsy. This results in asmaller Lsy for a larger Ef. The variation trend of Lpc remains consistent with Lsy, which decreases asEf increases.
6. Conclusions
This study examines the plastic hinge lengths of hybrid FRP–steel reinforced concrete beams,which have not been investigated extensively in previous studies. Firstly, a finite element model wasproposed, and the accuracy of the model was verified by comparing the numerical results with the testresults. Subsequently, three plastic hinge regions, including the rebar yielding zone, concrete crushingzone, and curvature localisation zone, were analysed in detail. The influence of the beam aspectratio, concrete grade, steel yield strength, steel reinforcement ratio, steel hardening modulus, andFRP elastic modulus on the lengths of the three plastic zones have been studied through parametricstudies. The effect of the FRP reinforcement ratio on the deformability and ductility of the hybridreinforced concrete beams is also thoroughly discussed. The following conclusions can be drawn fromthe present study:
1. The variation trend in the length of the rebar yielding zone, Lsy, of the hybrid reinforced beams issignificantly different from that of normal RC beams. Lsy continues to increase with the increasein displacement for hybrid reinforced concrete beams, whereas it is limited to a certain value fornormal RC beams.
2. The hybrid reinforcement ratio exerts a significant positive effect on Lsy, owing to the momentredistribution along the beam length. The curvature localisation length, Lpc, increases rapidly,whereas the concrete crushing length, Lcs, remains almost constant as the hybrid reinforcementratio increases.
3. Under an identical displacement level, the hybrid beam with the larger hybrid reinforcementratio exhibits a mid-span curvature demand and residual displacements smaller than those witha lower hybrid reinforcement ratio.
4. Among all of the parameters, z/h, fco, and Esh exert positive effects on Lsy and Lpc. fy and Esh exertpositive effects on Lcs, whereas z/h, ρs, and Ef exert negligible effects on Lcs.
Author Contributions: Conceptualization, F.Y.; Methodology, F.Y. and M.C.; Software, F.Y.; Validation, F.Y.;Investigation, F.Y. and M.C.; Data Curation, F.Y.; Writing-Original Draft Preparation, F.Y.; Writing-Review &Editing, F.Y. and M.C.; Funding Acquisition, F.Y.
Funding: This research was funded by National Natural Science Foundation of China grant number [51608199].
Conflicts of Interest: The authors declare no conflicts of interest.
References
1. Benmokrane, B.; Masmoudi, R. Flexural response of concrete beams reinforced with FRP reinforcing bars.Struct. J. 1996, 93, 46–55.
2. Uomoto, T. Recommendation for Design and Construction of Concrete Structures Using Continuous Fiber ReinforcingMaterials; Machida, A., Ed.; Japan Society of Civil Engineers: Tokyo, Japan, 1997.

Sensors 2018, 18, 3255 13 of 14
3. Benmokrane, B.; Rahman, H. Durability of fiber reinforced polymer (FRP) composites for construction.In Proceedings of the First International Conference on Composite for Construction, Montreal, QC, Canada,13–15 May 1998.
4. GangaRao, H.V.; Taly, N.; Vijay, P.V. Reinforced Concrete Design with FRP Composites; CRC Press, Taylor &Francis Group: Boca Raton, FL, USA, 2006.
5. Vijay, P.V.; GangaRao, H.V. Bending behavior and deformability of glass fiber-reinforced polymer reinforcedconcrete members. Struct. J. 2001, 98, 834–842.
6. Tang, Y.; Wu, Z. Distributed long-gauge optical fiber sensors based self-sensing FRP bar for concrete structure.Sensors 2016, 16, 286. [CrossRef] [PubMed]
7. Wang, H.T.; Wu, G.; Pang, Y.Y. Theoretical and Numerical Study on Stress Intensity Factors forFRP-Strengthened Steel Plates with Double-Edged Cracks. Sensors 2018, 18, 2356. [CrossRef] [PubMed]
8. Hawileh, R.A.; Naser, M.Z. Thermal-stress analysis of RC beams reinforced with GFRP bars. Compos. PartB-Eng. 2012, 43, 2135–2142. [CrossRef]
9. Jiang, C.; Wu, Y.F.; Dai, M.J. Degradation of steel-to-concrete bond due to corrosion. Constr. Build. Mater.2018, 158, 1073–1080. [CrossRef]
10. Nanni, A. Flexural behavior and design of RC members using FRP reinforcement. J. Struct. Eng. 1993, 119,3344–3359. [CrossRef]
11. GangaRao, H.V.S.; Vijay, P.V. Design of concrete members reinforced with GFRP bars. In Proceedings ofthe 3rd International Symposium on Fiber Reinforced Polymer Reinforcement for Reinforced ConcreteStructures, Tokyo, Japan, 11–13 January 1997; pp. 143–150.
12. Jaejer, L.G.; Mufti, A.A.; Tadros, G. The concept of the overall performance factor in rectangular-sectionreinforced concrete beams. In Proceedings of the 3rd International Symposium on Non-Metallic (FRP)Reinforcement for Concrete Structures, Sapporo, Japan, 14–16 October 1997; pp. 551–558.
13. Theriault, M.; Benmokrane, B. Effects of FRP reinforcement ratio and concrete strength on flexural behaviorof concrete beams. J. Compos. Constr. 1998, 2, 7–16. [CrossRef]
14. Qu, W.; Zhang, X.; Huang, H. Flexural behavior of concrete beams reinforced with hybrid (GFRP and steel)bars. J. Compos. Constr. 2009, 13, 350–359. [CrossRef]
15. Nanni, A.; Henneke, M.J.; Okamoto, T. Behaviour of concrete beams with hybrid reinforcement. Constr. Build.Mater. 1994, 8, 89–95. [CrossRef]
16. Tan, K.H. Behaviour of hybrid FRP-steel reinforced concrete beams. In Proceedings of the 3rd InternationalSymposium on Non-Metallic (FRP) Reinforcement for Concrete Structures, Sapporo, Japan, 14–16 October1997; pp. 487–494.
17. Newhook, J.P. Design of under-reinforced concrete T-sections with GFRP reinforcement. In Proceedings of the3rd International Conference on Advanced Composite Materials in Bridges and Structures, 2000; Canadian Societyfor Civil Engineering: Montreal, QC, Canada, 2000; pp. 153–160.
18. Bakis, C.E.; Nanni, A.; Terosky, J.A.; Koehler, S.W. Self-monitoring, pseudo-ductile, hybrid FRP reinforcementrods for concrete applications. Compos. Sci. Technol. 2001, 61, 815–823. [CrossRef]
19. Aiello, M.A.; Ombres, L. Structural performances of concrete beams with hybrid (fiber-reinforcedpolymer-steel) reinforcements. J. Compos. Constr. 2002, 6, 133–140. [CrossRef]
20. Jo, B.W.; Tae, G.H.; Kwon, B.Y. Ductility evaluation of prestressed concrete beams with CFRP tendons.J. Reinf. Plast. Compos. 2004, 23, 843–859. [CrossRef]
21. Lau, D.; Pam, H.J. Experimental study of hybrid FRP reinforced concrete beams. Eng. Struct. 2010, 32,3857–3865. [CrossRef]
22. Ge, W.; Zhang, J.; Cao, D.; Tu, Y. Flexural behaviors of hybrid concrete beams reinforced with BFRP bars andsteel bars. Constr. Build. Mater. 2015, 87, 28–37. [CrossRef]
23. Qin, R.; Zhou, A.; Lau, D. Effect of reinforcement ratio on the flexural performance of hybrid FRP reinforcedconcrete beams. Compos. Part B-Eng. 2017, 108, 200–209. [CrossRef]
24. Zhao, X.M.; Wu, Y.F.; Leung, A.Y.T. Analyses of plastic hinge regions in reinforced concrete beams undermonotonic loading. Eng. Struct. 2012, 34, 466–482. [CrossRef]
25. Baker, A.L.L. The Ultimate Load Theory Applied to the Design of Reinforced & Prestressed Concrete Frames; ConcretePublications Ltd.: London, UK, 1956.
26. Priestley, M.J.N.; Park, R. Strength and ductility of concrete bridge columns under seismic loading.ACI Struct. J. 1987, 84, 61–76.

Sensors 2018, 18, 3255 14 of 14
27. Paulay, T.; Priestley, M.J.N. Seismic Design of Reinforced Concrete and Masonry Buildings; John Wiley & Sons:New York, NY, USA, 1992.
28. Sheikh, S.A.; Khoury, S.S. Confined concrete columns with stubs. ACI Struct. J. 1993, 90, 414–431.29. Coleman, J.; Spacone, E. Localization issues in force-based frame elements. J Struct. Eng. 2001, 127, 1257–1265.
[CrossRef]30. Panagiotakos, T.B.; Fardis, M.N. Deformations of reinforced concrete members at yielding and ultimate.
ACI Struct. J. 2001, 98, 135–148.31. Ho, C.M. Inelastic Design of Reinforced Concrete Beams and Limited Ductile High-Strength Concrete
Columns. Ph.D. Thesis, University of Hong Kong, Hong Kong, China, 2003.32. Berry, M.P. Performance Modeling Strategies for Modern Reinforced Concrete Bridge Columns. Ph.D. Thesis,
University of Washington, Seattle, DC, USA, 2006.33. Bae, S.; Bayrak, O. Plastic hinge length of reinforced concrete columns. ACI Struct. J. 2008, 105, 290–300.34. Biskinis, D.; Fardis, M.N. Flexure-controlled ultimate deformations of members with continuous
orlap-spliced bars. Struct. Concr. 2010, 11, 93–108. [CrossRef]35. Jiang, C.; Wu, Y.F.; Wu, G. Plastic hinge length of FRP-confined square RC columns. J. Compos. Constr. 2014,
18, 04014003. [CrossRef]36. Jiang, C.; Wu, Y.F. Discussion of “Modified plastic-hinge method for circular RC bridge columns” by Jason C.
Goodnight; Mervyn J. Kowalsky; and James M. Nau. J. Struct. Eng. 2017, 143, 07017003. [CrossRef]37. Jiang, C.; Wu, Y.F.; Wu, G. Effect of interfacial bond on the plastic hinge length of FRP confined RC columns.
J. Compos. Constr. 2018. accepted.38. ABAQUS. ABAQUS Analysis User’s Manual, Version 6.10; ABAQUS: Palo Alto, CA, USA, 2010.39. Wu, Y.F.; Wang, Z.; Liu, K.; He, W. Numerical analyses of hybrid-bonded FRP strengthened concrete beams.
Comput.-Aided Civ. Inf. Eng. 2009, 24, 371–384. [CrossRef]40. Popovics, S. A numerical approach to the complete stress-strain curve of concrete. Cem. Concr. Res. 1973, 3,
583–599. [CrossRef]41. Wu, Y.F.; Zhao, X.M. Unified bond stress-slip model for reinforced concrete. J. Struct. Eng. 2012, 139,
1951–1962. [CrossRef]42. Yuan, F.; Wu, Y.F.; Li, C.Q. Modelling plastic hinge of FRP-confined RC columns. Eng. Struct. 2017, 131,
651–668. [CrossRef]43. Yuan, F.; Wu, Y.F. Effect of load cycling on plastic hinge length in RC columns. Eng. Struct. 2017, 147, 90–102.
[CrossRef]44. Cashell, K.A.; Elghazouli, A.Y.; Izzuddin, B.A. Experimental and analytical assessment of ductility in lightly
reinforced concrete members. Eng. Struct. 2010, 32, 2729–2743. [CrossRef]45. Goodnight, J.C.; Kowalsky, M.J.; Nau, J.M. Modified plastic hinge method for circular RC bridge columns.
J. Struct. Eng. 2016, 142, 04016103. [CrossRef]46. Foraboschi, P. Effectiveness of novel methods to increase the FRP-masonry bond capacity. Compos. Part
B-Eng. 2016, 107, 214–232. [CrossRef]47. Foraboschi, P. Shear strength computation of reinforced concrete beams strengthened with composite
materials. Mech. Comput. Appl. Int. J. 2012, 3, 227–252. [CrossRef]48. Hines, E.M.; Restrepo, J.I.; Seible, F. Force-displacement characterization of well-confined bridge piers.
ACI Struct. J. 2004, 101, 537–548.49. Wu, Y.F. Theorems for flexural design of RC members. J. Struct. Eng. 2016, 142, 04015172. [CrossRef]
© 2018 by the authors. Licensee MDPI, Basel, Switzerland. This article is an open accessarticle distributed under the terms and conditions of the Creative Commons Attribution(CC BY) license (http://creativecommons.org/licenses/by/4.0/).