Notch Signaling as Gatekeeper of Rat Acinar-to-β-Cell Conversion in Vitro
24
Notch Signaling as Gatekeeper of Rat Acinar-to--Cell Conversion in Vitro LUC BAEYENS,* ,‡ STEFAN BONNÉ,* TOMAS BOS, § ILSE ROOMAN,* ,‡ CINDY PELEMAN, TONY LAHOUTTE, MICHAEL GERMAN, ¶ HARRY HEIMBERG,* and LUC BOUWENS* ,‡ *Diabetes Research Center, ‡ Cell Differentiation Unit, § Department of Hematology and Immunology, and In Vivo Cellular and Molecular Imaging Laboratory, Vrije Universiteit Brussel, Brussels; and ¶ Hormone Research Institute and Department of Medicine, University of California San Francisco, San Francisco, California See editorial on page 1499. Background & Aims: Exocrine acinar cells in the pancreas are highly differentiated cells that retain a remarkable degree of plasticity. After isolation and an initial phase of dedifferentiation in vitro, rodent acinar cells can convert to endocrine -cells when cultured in the presence of appropriate factors. The mechanisms regulating this phenotypic conversion are largely unknown. Methods: Using rat acinar cell cultures, we studied the role of Notch signaling in a model of acinar-to--cell conversion. Results: We report a novel lectin-based cell labeling method to demonstrate the acinar origin of newly formed insu- lin-expressing -cells. This method allows for specific tracing of the acinar cells. We demonstrate that growth factor-induced conversion of adult acinar cells to -cells is negatively regulated by Notch1 sig- naling. Activated Notch1 signaling prevents the reex- pression of the proendocrine transcription factor Neurogenin-3, the key regulator of endocrine devel- opment in the embryonic pancreas. Interfering with Notch1 signaling allows modulating the acinar cell susceptibility to the differentiation-inducing factors. Its inhibition significantly improves -cell neoforma- tion with approximately 30% of acinar cells that con- vert to -cells. The newly formed -cells mature when transplanted ectopically and are capable of restor- ing normal blood glycemia in diabetic recipients. Conclusions: We report for the first time an efficient way to reprogram one third of the acinar cells to -cells by adult cell type conversion. This could find application in cell replacement therapy of type 1 di- abetes, provided that it can be translated from rodent to human models. R eplacement therapy under the form of islet cell transplantation is an interesting option for treat- ment of type 1 diabetes, but it is seriously hampered by the shortage of donor material. 1 This has initiated a search for alternative sources such as stem cells or expan- sion of preexisting -cells. 2 Here, we focus on the exo- crine pancreas as a source of -cell neogenesis. Acinar cells display a remarkable plasticity and reportedly are able to convert their phenotype in vitro to duct, 3,4 hepa- tocyte, 5,6 and -cells. 7,8 We already showed that, under appropriate culture conditions, epidermal growth factor (EGF) and leukemia inhibitory factor (LIF) can induce dedifferentiated acinar cells to become respecified to in- sulin-expressing cells via a transient expression of the proendocrine transcription factor Neurogenin-3 (Ngn3). 9 During embryogenesis, Ngn3 is transiently expressed by the precursors of endocrine cells, 10,11 and introduction of exogenous Ngn3 can initiate proendocrine differentia- tion. 12 Notch signaling, one of the key pathways for tissue patterning and pancreatic cell fate determina- tion, 13,14 is directly involved in the control of endocrine differentation by antagonizing Ngn3 expression. 15 Our findings reveal that signals of the Notch-signaling path- way also limit acino-insular conversion in vitro. By inhib- iting the Notch pathway, we obtain an efficient model for the reprogramming of acinar cells to -cells suitable for correcting glycemia in diabetic animals. We also devel- oped a new method of cell tracing based on specific incorporation of lectin to demonstrate the conversion of acinar to -cells. Materials and Methods Animals Pancreatic acinar cells were isolated from male 10- to 12-week-old Wistar rats (Charles River Laboratories, L’Arbresle Cedex, France) as described. 4 Eight-week-old BALB/cAnNCrl-nuBR nude mice (Charles River Labora- tories) weighing 18 –22 g were used as recipients for transplantation. All animal experimentation was ap- proved by the Ethical Committee of the Free University of Brussels. Abbreviations used in this paper: EGF, epidermal growth factor; LIF, leukemia inhibitory factor; Ngn3, Neurogenin-3; Notch1-EC, Notch1 extracellular domain; WGN, wheat germ agglutinin. © 2009 by the AGA Institute 0016-5085/09/$36.00 doi:10.1053/j.gastro.2009.01.047 BASIC–LIVER, PANCREAS, AND BILIARY TRACT GASTROENTEROLOGY 2009;136:1750 –1760
-
Upload
independent -
Category
Documents
-
view
3 -
download
0
Transcript of Notch Signaling as Gatekeeper of Rat Acinar-to-β-Cell Conversion in Vitro

Ni
LM
*U
BpraacmacmrdltgcnpNoNsItvtiCw�aat
Rmts
BA
SIC–LIV
ER,
PA
NCREA
S,A
ND
BILIA
RY
TRA
CT
GASTROENTEROLOGY 2009;136:1750–1760
otch Signaling as Gatekeeper of Rat Acinar-to-�-Cell Conversionn Vitro
UC BAEYENS,*,‡ STEFAN BONNÉ,* TOMAS BOS,§ ILSE ROOMAN,*,‡ CINDY PELEMAN,� TONY LAHOUTTE,�
ICHAEL GERMAN,¶ HARRY HEIMBERG,* and LUC BOUWENS*,‡
Diabetes Research Center, ‡Cell Differentiation Unit, §Department of Hematology and Immunology, and �In Vivo Cellular and Molecular Imaging Laboratory, Vrije
niversiteit Brussel, Brussels; and ¶Hormone Research Institute and Department of Medicine, University of California San Francisco, San Francisco, Californiasccata(dspDtetttdfiwitcoia
tLBttpo
le
See editorial on page 1499.
ackground & Aims: Exocrine acinar cells in theancreas are highly differentiated cells that retain aemarkable degree of plasticity. After isolation andn initial phase of dedifferentiation in vitro, rodentcinar cells can convert to endocrine �-cells whenultured in the presence of appropriate factors. Theechanisms regulating this phenotypic conversion
re largely unknown. Methods: Using rat acinar cellultures, we studied the role of Notch signaling in aodel of acinar-to-�-cell conversion. Results: We
eport a novel lectin-based cell labeling method toemonstrate the acinar origin of newly formed insu-
in-expressing �-cells. This method allows for specificracing of the acinar cells. We demonstrate thatrowth factor-induced conversion of adult acinarells to �-cells is negatively regulated by Notch1 sig-aling. Activated Notch1 signaling prevents the reex-ression of the proendocrine transcription factoreurogenin-3, the key regulator of endocrine devel-
pment in the embryonic pancreas. Interfering withotch1 signaling allows modulating the acinar cell
usceptibility to the differentiation-inducing factors.ts inhibition significantly improves �-cell neoforma-ion with approximately 30% of acinar cells that con-ert to �-cells. The newly formed �-cells mature whenransplanted ectopically and are capable of restor-ng normal blood glycemia in diabetic recipients.onclusions: We report for the first time an efficientay to reprogram one third of the acinar cells to-cells by adult cell type conversion. This could findpplication in cell replacement therapy of type 1 di-betes, provided that it can be translated from rodento human models.
eplacement therapy under the form of islet celltransplantation is an interesting option for treat-
ent of type 1 diabetes, but it is seriously hampered byhe shortage of donor material.1 This has initiated a
earch for alternative sources such as stem cells or expan-ion of preexisting �-cells.2 Here, we focus on the exo-rine pancreas as a source of �-cell neogenesis. Acinarells display a remarkable plasticity and reportedly areble to convert their phenotype in vitro to duct,3,4 hepa-ocyte,5,6 and �-cells.7,8 We already showed that, underppropriate culture conditions, epidermal growth factorEGF) and leukemia inhibitory factor (LIF) can induceedifferentiated acinar cells to become respecified to in-ulin-expressing cells via a transient expression of theroendocrine transcription factor Neurogenin-3 (Ngn3).9
uring embryogenesis, Ngn3 is transiently expressed byhe precursors of endocrine cells,10,11 and introduction ofxogenous Ngn3 can initiate proendocrine differentia-ion.12 Notch signaling, one of the key pathways forissue patterning and pancreatic cell fate determina-ion,13,14 is directly involved in the control of endocrineifferentation by antagonizing Ngn3 expression.15 Ourndings reveal that signals of the Notch-signaling path-ay also limit acino-insular conversion in vitro. By inhib-
ting the Notch pathway, we obtain an efficient model forhe reprogramming of acinar cells to �-cells suitable fororrecting glycemia in diabetic animals. We also devel-ped a new method of cell tracing based on specific
ncorporation of lectin to demonstrate the conversion ofcinar to �-cells.
Materials and MethodsAnimalsPancreatic acinar cells were isolated from male 10-
o 12-week-old Wistar rats (Charles River Laboratories,’Arbresle Cedex, France) as described.4 Eight-week-oldALB/cAnNCrl-nuBR nude mice (Charles River Labora-
ories) weighing 18 –22 g were used as recipients forransplantation. All animal experimentation was ap-roved by the Ethical Committee of the Free Universityf Brussels.
Abbreviations used in this paper: EGF, epidermal growth factor; LIF,eukemia inhibitory factor; Ngn3, Neurogenin-3; Notch1-EC, Notch1xtracellular domain; WGN, wheat germ agglutinin.
© 2009 by the AGA Institute0016-5085/09/$36.00
doi:10.1053/j.gastro.2009.01.047

tBpbBitp
tcLCsJlbbEataB
mru
pDPpfmc
C(anf(pbsQ(
itmsIDEHsvap2AtsfTsv
pa
mrmmd
T(LSpfN
lccmpt
BA
SIC–L
IVER
,PA
NCREA
S,A
ND
BIL
IARY
TRA
CT
May 2009 NOTCH1 CONTROLS ACINAR CELL REPROGRAMMING 1751
Lectin LabelingThe lectin wheat germ agglutinin (WGA), coupled
o fluorescein-isothiocyanate (Invitrogen S.A., Merelbeke,elgium), was microinjected directly into the pancreaticarenchyma at multiple sites, at a dose of 150-mg/kgody weight in 350 �L physiologic fluid (Baxter S.A.,russels, Belgium). The lectin was given 72 hours before
solating the different cell types to allow binding to itsarget N-acetyl glucosamine and internalization in cyto-lasmic storage compartments.
Experimental ModelBeta-cell neogenesis was induced in acinar cell cul-
ures that had dedifferentiated during 4-day suspensionulture and then were treated as monolayers with EGF andIF as described (Supplementary Materials and Methods).ontrol cultures did not contain EGF and LIF. Notch
ignaling was stimulated with recombinant human ligandagged1 (2 �g/mL; R&D Systems, Abingdon, UK) or Delta-ike ligand (Dll) 4 (5 �g/mL, R&D Systems) coated on theottom of multiwell plates. Notch signaling was inhibitedy recombinant rat Notch1 extracellular domain (Notch1-C, 10 �g/mL; R&D Systems). Monolayers were analyzedfter 3 days of culture with these factors. No toxic effects ofhe recombinant proteins were noted. Proliferation was ex-mined by bromo-deoxyuridin (BrdU) (Sigma-Aldrich,ornem, Belgium) pulse labeling of 6 hours.
Reverse-Transcription Polymerase ChainReactionTotal RNA was isolated using the GenElute Mam-
alian Total RNA miniprep kit (Sigma-Aldrich) and waseversed transcribed and amplified as described by the man-facturer (Invitrogen) with blanks in each assay.For quantitative polymerase chain reaction (qPCR), com-
lementary DNA was prepared from total RNA followingNase treatment, and 10 ng RNA equivalent was used forCR with selected primers (Supplementary Table 5) in theresence of SYBR Green. A melt curve analysis was per-ormed for each reaction. The expression levels were nor-
alized to �-actin (RNA input control) and to startingonditions (0 hour treatment) (reference sample).
Western BlottingCellular proteins were extracted in Laemmli buffer.
oncentrations were determined by the Quant-It methodInvitrogen). Proteins were separated on SDS-polyacryl-mide gels and electroblotted to low-fluorescence polyvi-ylidene difluoride membranes. Western blotting was per-
ormed with the Qdot Western Blotting Kit protocolInvitrogen). Loading of equal amount of proteins (25-�ger sample) was evaluated by detection of actin in the samelot. Comparison for the same protein between 2 differentamples is always shown on the same gel. Visualization ofdot signals was done by the Kodak GelLogic 100 system
Kodak, Zaventem, Belgium). M
Viral ConstructsSpecific RNAi target sequences were developed us-
ng dedicated software available from the Whitehead Insti-ute for Biomedical Research.16 Corresponding oligo DNA
olecules (Invitrogen) were cloned in the BglII and HindIIIites of the pSuper.basic vector (Oligoengine, Seattle, WA).nsert-containing clones were PCR selected and sequenced.NA from clones containing correct inserts was cut with
coRI-ClaI, which released a DNA fragment containing the1 promoter and the cloned oligo duplex, which was sub-
equently subcloned in the EcoRI-ClaI sites of the pTripector containing a DsRed reporter.17 Screening for RNAictivity of the constructs was performed in AR42J-B13 cellslated at 70% confluency in 24-well plates and transfected4 hours later with 500 ng DNA of the pTrip constructs.fter 24 hours, cells were processed for quantitative reverse-
ranscription (RT)-PCR (qRT-PCR). Constructs displayingufficient RNAi activity were used for lentivirus generationollowing standard techniques17 (Supplementary Table 7).wo constructs of each target, shNotch1 and shHes1, were
elected for use in the RNAi experiments, generating lenti-irus Le-shNotch1 and Le-shHes1.
ImmunostainingImmunocytochemistry was performed in the 24-well
lates, and immunohistochemistry was performed on par-ffin sections.18
In Vitro FunctionalityCellular insulin content and release in the culture
edium were measured by radioimmunoassay.19 Insulinelease was measured after a 4-hour incubation in 2.5
mol/L glucose, followed by a 4-hour incubation in 20mol/L glucose (serum- and glutamine-free HAM-10 me-
ium; Invitrogen).20
MicroscopyHistologic images were acquired with a Nikon
E2000E microscope using NIS AR2.30 Imaging SoftwareNikon France SAS, Champigny-Sur-Marne, France) or aeica TCS SP confocal microscope (Leica Camera AG,olms, Germany) using Volocity LE Imaging Software (Im-rovision, Coventry, UK). Electron microscopy was per-ormed on a Tecnai 10 microscope (Philips, Eindhoven, Theetherlands).
TransplantationCells cultured on collagen S (type I; Roche Molecu-
ar Biochemicals, Vilvoorde, Belgium) were detached withollagenase P (Roche Molecular Biochemicals), and 300,000ells were implanted under the kidney capsule21 of nudeice injected intravenously with 70 mg/kg alloxan 48 hours
rior to transplantation. Blood glucose levels were moni-ored in tail vein samples (Glucocard Memory strips; A.
enarini Diagnostics Benelux, Zarentem, Belgium).

St�vi
woh(loo
w
tor(�
aifPw(�btw
tpfd
BA
SIC–LIV
ER,
PA
NCREA
S,A
ND
BILIA
RY
TRA
CT
1752 BAEYENS ET AL GASTROENTEROLOGY Vol. 136, No. 5
Statistical AnalysesIn vitro data were analyzed by 2-tailed, paired
tudent t test; in vivo data by 2-way ANOVA; and statis-ical significance was accepted at a confidence interval
0.05 (Prism v4.0; Graphpad Prism, La Jolla, CA). Meanalues are given � SEM. Number of independent exper-ments is indicated in the text.
ResultsInhibition of Notch Signaling Promotes �-CellNeogenesisTo examine the involvement of the Notch path-
ay, we first analyzed expression of its components inur culture model. The exocrine cell cultures containedigh levels of messenger RNA (mRNA) encoding Notch1
Figure 1A) and its target Hes1 (Figure 1B), transcriptevels of the ligands Jagged1 and Dll4 (Figure 1C and 1D)ver a period of 72 hours, and also a marked expressionf the Hes1-inhibitor Hes6 after 24 hours (Figure 1E).
To assess further the contribution of the Notch1 path-ay, activating ligands (Dll4 and Jagged1) were added to
he culture. These ligands strongly inhibited expressionf Ngn3 (Figure 2A), Pdx1 (Figure 2C), and insulin andeduced the number of newly formed �-cells by 80%Figure 2E). This indicates that Notch activation restricts-cell neogenesis.Relief of the Notch inhibitory signal was obtained by
dding excess Notch1-EC to the medium. This resultedn a marked increase in the proportion of cells positiveor Ngn3 (Figure 2A and B) (Supplementary Table 1),dx1 (Figure 2C and D), and insulin (Figure 2E and F)ith a 3-fold higher number of insulin-positive cells
Supplementary Table 1), thus significantly improving-cell neogenesis. The observed effect could be explainedy Notch1-EC acting as a competitive inhibitor reducinghe interaction of endogenous ligands on cultured cellsith the Notch receptor.When analyzing the effects of Notch on the dedifferen-
iated acinar phenotype, we observed an increase in therotein expression of the duct cell marker cytokeratin-20ollowing Notch stimulation by Jagged1 or Dll4 and aecrease following inhibition with Notch1-EC (Supplemen-
Figure 1. Notch pathway ex-pression in EGF/LIF treated aci-nar cells. (A–E) Expression ofNotch1-related genes relative to�-actin at various culture timesanalyzed by qRT-PCR. Ct valueswere between 30 and 27 (A), 30and 27.5 (B), 29 and 25 (C), 30.5and 28 (D), 38 and 29 (E). (n � 4).
*P � .05.
tNNba
vaTveieitpa
p
sspp
cwusd�cia
FnJ(pimtcaJ((c#
tNa(Dt
BA
SIC–L
IVER
,PA
NCREA
S,A
ND
BIL
IARY
TRA
CT
May 2009 NOTCH1 CONTROLS ACINAR CELL REPROGRAMMING 1753
ary Figure 1). In addition, stimulation of endogenousotch signaling further increased the transcript levels ofotch1 and Hes1. In contrast, Notch1-EC-mediated inhi-
ition of the signal transduction led to a drop in Notch1nd Hes1 transcripts (Supplementary Figure 2).
To elucidate the underlying mechanism, the effects ofirally delivered short hairpin RNA (shRNA) directedgainst either Notch1 or its effector Hes1 were evaluated.he efficiency of transduction did not differ between thearious conditions, with approximately 25% of the cellsxpressing the reporter (Supplementary Figure 3). Silenc-ng Notch1 or Hes1 rendered the cells insensitive both tondogenous Notch signaling and recombinant ligand-nduced signaling and resulted in an increased propor-ion of the acinar cells adopting a �-cell phenotype com-ared with control shRNA-treated conditions (Figure 3And 3B; Supplementary Figure 4A–4C).
The effect of silencing the Notch pathway was most
igure 2. Modulation of �-celleogenesis by Notch1-EC,agged1, and Delta-like ligandsDll) 4. Percentage of cells ex-ressing Ngn3 (A), Pdx1 (C), and
nsulin (E) as determined by im-unocytochemistry at various
ime points in culture. Differentonditions were compared:ddition of exogenous ligandsagged1 (black columns), Dll4grey columns), or Notch1-ECextracellular domain of the re-eptor; blue columns) (n � 7;P � .05 compared with con-rols). Micrographs illustrate theotch1-EC condition for Ngn3t 48 hours (B), Pdx1 at 72 hoursD), and insulin at 72 hours (F).ouble staining for cytokera-
in-20 (B). Scale bar, 15 �m.
ronounced when the cells were first exposed to Notch- t
timulating ligands and subsequently transduced withhRNA. Over 75% of the transduced cells adopted a �-cellhenotype in the latter condition (Figure 3C and 3D) (Sup-lementary Tables 2 and 3, 6).
The role of Ngn3 as key regulator of the acino-insularonversion in cells treated with EGF, LIF, and Notch1-ECas confirmed using shRNA directed against Ngn3 (Fig-re 3E; Supplementary Figure 4D and 4E). Cells with atable silencing of Ngn3 mRNA did not undergo �-cellifferentiation, resulting in a down-regulation of the-cell number (Supplementary Table 4). These findingsonfirm our hypothesis that Notch signaling acts as annhibitor of induced �-cell differentiation in primarycinar cell cultures.
The Newly Formed �-Cells Are of AcinarOriginAddition of Notch1-EC to our differentiation pro-
ocol resulted in 30% of the cells adopting a �-cell phe-

nubgigso
SfoaWt(
FdiksPtDcNsa mpar
BA
SIC–LIV
ER,
PA
NCREA
S,A
ND
BILIA
RY
TRA
CT
1754 BAEYENS ET AL GASTROENTEROLOGY Vol. 136, No. 5
otype, compared with 0.5% in control conditions (Fig-re 2). However, the acinar origin of these cells needed toe demonstrated. For this purpose, we developed a non-enetic lineage tracing based on the intraparenchymalnjection of fluorescent lectins. WGA binds to N-acetyllucosamine.22 Because of the higher expression of thisugar on acinar cells,22 combined with the specific route
igure 3. Effects of Notch modulation by RNA interference on acinairected against either Notch1 (A) or Hes1 (B) on the proportion of �-ce
ncrease in the proportion of �-cells (n � 4; #P � .041 compared with snockdown emphasized the effect of the RNA interference (shNotchhScrambled condition). In conditions treated with Notch1-EC, subseqercentage of transduced cells identified by the reporter DsRed, coexp
o a significant increase in transduced �-cells (n � 4; #P � .035 compall4 reduced the proportion of shScrambled transduced �-cells severelear protective effect against the action of Notch ligands (n � 4; #Potch1-EC, no difference in the proportion of transduced �-cells after inhRNA (n � 4; P � .059). (E) Evaluation of the role of Ngn3 in differentbrogates the coexpression of the reporter eGFP with Ngn3 protein co
f injection, WGA lectin labels only the acinar cells. t
eventy-two hours after injection, WGA fluorescence wasound in the cytoplasm of acinar cells only and was neverbserved in centroacinar, duct, or islet cells (Figure 4And B, Supplementary Figure 5A). After cell isolation,GA fluorescence was found in approximately 60% of
he acinar cells, whereas all other cell types were negativeFigure 4C and D, Supplementary Figure 5B–5E). When
-cell conversion. (A and B) Effect of lentiviral transduction of shRNAansduction of the cells with shNotch1 or shHes1 induced a significantambled condition). Treatment with the ligands Jagged1 or Dll4 prior toshHes1) on �-cell differentiation (n � 4; #P � .009 compared withRNA interference has no additional effect (n � 4; P � .12). (C and D)g insulin. Transduction of the cells with shNotch1 (C) or shHes1 (D) ledith shScrambled condition). Prior exposure to the ligands Jagged1 orereas specific Notch pathway silencing (shNotch1 or shHes1) gave a5 compared with shScrambled condition). In conditions treated with
rence with Notch1 or Hes1 was observed when compared with controlconditions treated with Notch1-EC. The silencing of Ngn3 completelyed with controls (H) (n � 3; #P � .007).
r-to-�lls. TrhScr1 oruent
ressinred wly, wh� .00terfe
iation
he labeled acinar cells were treated in vitro with EGF,

LacdsttcWn
iwliita
i
F�d(ahjse4pnvt1saasaoSttpbsahedlhaos2plc(Wmasa(
BA
SIC–L
IVER
,PA
NCREA
S,A
ND
BIL
IARY
TRA
CT
May 2009 NOTCH1 CONTROLS ACINAR CELL REPROGRAMMING 1755
IF, and Notch1-EC to induce acino-insular conversion,pproximately 60% of the insulin-positive cells displayedytoplasmic WGA positivity (Figure 4E and 4F). Thisemonstrates that acinar cells underwent a phenotypicalwitch toward �-cells. The contribution of proliferationo this process was limited because only 0.3% � 0.1% ofhe Ngn3-positive and 0.5% � 0.2% of the insulin-positiveells incorporated BrdU (n � 3). Redistribution of the
GA lectin from dying acinar cells to the few contami-
igure 4. Newly generated-cells are of acinar origin asemonstrated by lectin tracing.
A and B) WGA label specificitynd efficiency in the pancreas 72ours after intraparenchymal in-
ection of the lectin. WGA labelspecifically acinar cells with anfficiency of 59.7% � 0.3% (n �) and is not found in any otherancreatic cell type (A). Immu-ostaining for amylase (red) re-eals coexpression with the lec-in label (green) (B). Scale bar,00 �m. (C and D) WGA labelpecificity and efficiency evalu-ted after isolation of the pancre-tic acini. WGA label was ob-erved in 62.8% � 2.2% of thecinar cells and was absent inther pancreatic cell types (C).taining for the acinar transcrip-
ion factor Mist1 (red) shows thathe WGA lectin (green) is onlyresent in acinar cells (D). Scalear, 15 �m. (E and F) WGA labelpecificity and efficiency evalu-ted after suspension culture (96ours) to induce acinar dediffer-ntiation, followed by the �-cellifferentiation treatment on mono-
ayer cultures (72 hours). Cellsave lost their acinar phenotypend gained a duct-like morphol-gy (characterized by expres-ion of cytokeratin 20). 63.5% �.3% (n � 4) Of the cytokeratin-ositive fraction contained the
ectin label, and, after proendo-rine treatment, 62.1% � 1.7%
n � 4) of the �-cells containedGA (E). Staining for the ductalarker cytokeratin 20 (blue)
nd �-cell marker insulin (red)howed a coexpression with thecinar cell tracer WGA (green)F). Scale bar, 15 �m.
ating islet cells is excluded by performing WGA labeling t
n vitro at the moment when proendocrine specificationas already initiated, ie, when Ngn3 starts to appear. No
ectin label could be found in Ngn3-positive cells or innsulin-positive cells at 3 hours and 24 hours after label-ng (Supplementary Table 5). This observation excludeshe possibility of in vitro uptake of released WGA by cellslready committed to an endocrine fate.
To exclude further the in vitro contribution of preex-sting �-cells to the observed neogenesis of insulin-posi-
ive cells, we labeled islet �-cells in vitro using another
lt(tdplptic
wsPaGmd25fEo�fi
aAnwrigtpatmLLtNtri(iti
eiFp
ttGC
Faaa(�pIic(cbimai(
BA
SIC–LIV
ER,
PA
NCREA
S,A
ND
BILIA
RY
TRA
CT
1756 BAEYENS ET AL GASTROENTEROLOGY Vol. 136, No. 5
ectin, Concanavalin A22; these cells were then mixed withhe WGA-labeled acinar cells at the start of the cultureSupplementary Figure 5F). As in the other experiments,he cells had been treated with alloxan to selectivelyestroy contaminating �-cells before the start of theroendocrine treatment. In this experiment, only WGA
ectin could be found in the newly formed �-cells (Sup-lementary Figure 5G). The absence of Concanavalin A athe end of the culture demonstrates that no contaminat-ng �-cells escaped the alloxan toxicity and thus did notontribute to the observed neogenesis.
The Newly Formed �-Cells Are RelativelyImmatureTo evaluate the maturity of the new �-cells, they
ere immunostained for typical �-cell markers. Ninety-even percent of the insulin-expressing cells coexpresseddx1, C-peptide, and synaptophysin. However, onlypproximately 25%–30% of these cells expressed MafA,lut2, IAPP, and Chromogranin A, suggesting their im-aturity (Figure 5A). Although cellular insulin content
id not differ between new and islet �-cells (respectively,6.1 � 0.9 pg and 28.0 � 0.9 pg, n � 4, P � .14) (FigureB), glucose-stimulated insulin secretion by the newlyormed �-cells was 50% of islet �-cell capacity (Figure 5C).lectron microscopic analysis revealed the predominancef atypical secretory granules in these acinar-derived-cells in vitro (Supplementary Figure 8A and 8C), con-rming their immature state.
New �-Cells Mature in Vivo and RestoreNormoglycemiaFunction of the new �-cells was further examined
fter transplantation in diabetic immunodeficient mice.graft containing 100,000 insulin-positive cells restored
ormoglycemia in initially hyperglycemic recipient miceithin 4 days (Figure 6A). When the engrafted kidney was
emoved, animals reverted to hyperglycemia, demonstrat-ng that the graft was directly responsible for bloodlucose control (Figure 6A). Animals implanted with con-rol grafts (no �-cell induction treatment) remained hy-erglycemic (Figure 6A). The mean body weight of thenimals did not differ between the 2 groups (Supplemen-ary Figure 6A). Graft survival was monitored via biolu-
inescent in vivo imaging. Cells were transduced withenti-pCMV-Luciferase23 48 hours before implantation.uciferase expression of both control cells and cells ob-ained by our differentiation protocol supplemented withotch1-EC did not differ significantly prior to implan-
ation (Supplementary Figure 6B). Noninvasive imagingevealed a stable luciferase activity and thus no markedncrease in graft size following �-cell induction treatmentFigure 6B and 6C), with the modest increase in signalntensity related to vascularization of the graft. In con-rast, control grafts rapidly decreased in luciferase activ-
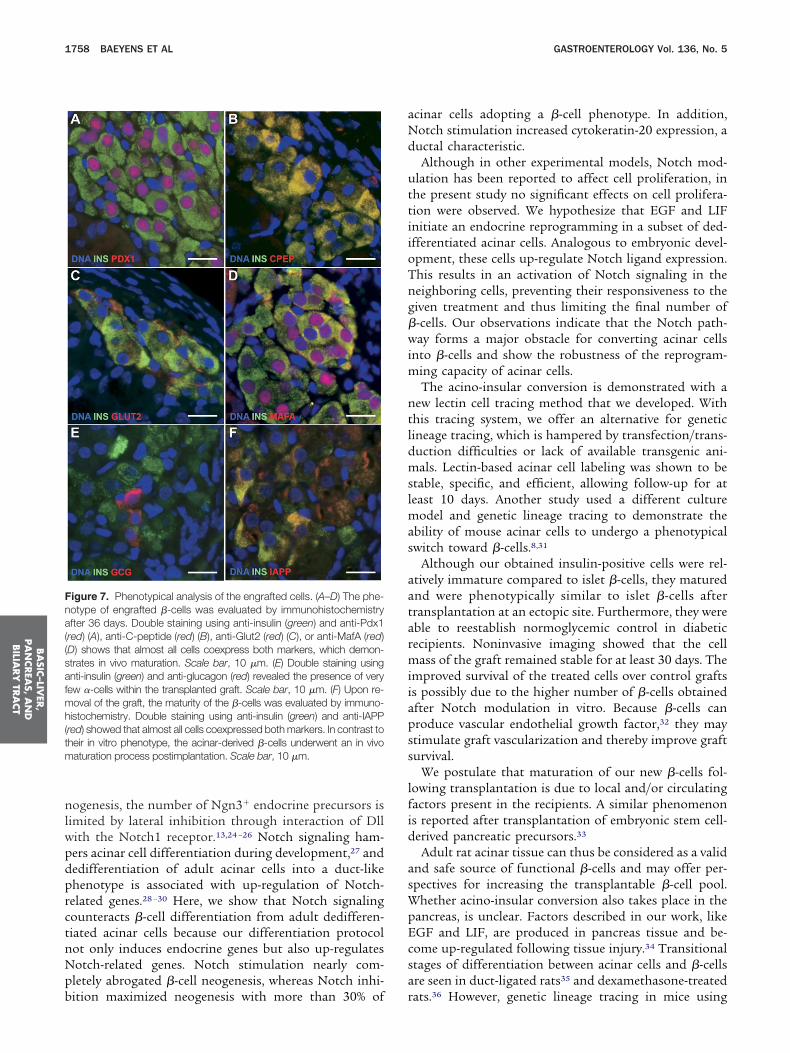
ty, indicating a loss in graft size (Figure 6B). Histologic ixamination showed coexpression of insulin and luciferasen the differentiation factor-treated grafts (Supplementaryigure 7A). No sign of endogenous �-cell recovery in theancreas was found (Supplementary Figure 7B).
Histologic analyses of the graft showed further matura-ion of the insulin-positive cells because the majority ofhese cells now did coexpress the functional �-cells markerslut2 (Figure 7C), MafA (Figure 7D), IAPP (Figure 7F), andhromogranin A (Supplementary Figure 7C) while continu-
igure 5. In vitro maturity profile of newly formed �-cells. (A) Percent-ge of insulin expressing cells that coexpress other �-cell markersnalyzed by immunocytochemistry. Comparison among in vitro gener-ted �-cells, engrafted �-cells, and mature islet �-cells. New �-cells
white columns) express Pdx1 and C-peptide at the same level as islet-cells (black columns) (n � 4; P � .32), but a significantly lower pro-ortion of the �-cells expressed other maturity markers such as Glut2,
APP, Chromogranin A, and MafA (n � 4; #P � .006 compablack withslet �-cells). After transplantation of the cells, the engrafted �-cells (grayolumns) matured to the level of islet �-cells (n � 4; P � .45).B) Comparison of the cellular insulin content of new �-cells (whiteolumns) and islet �-cells (black columns). No significant differenceetween both groups was detected (n � 3; P � .28). (C) Secreted
nsulin as a percentage of total cellular insulin after stimulation with 20mol/L glucose. Comparison between new �-cells (white columns)
nd islet �-cells (black columns); a lower capacity for glucose-inducednsulin secretion is seen in new �-cells as compared with mature �-cellsn � 3; #P � .023).
ng to express Pdx1 (Figure 7A), C-peptide (Figure 7B), and

scsFgr
te
Fidrh4gdlN lanta
BA
SIC–L
IVER
,PA
NCREA
S,A
ND
BIL
IARY
TRA
CT
May 2009 NOTCH1 CONTROLS ACINAR CELL REPROGRAMMING 1757
ynaptophysin (Supplementary Figure 7D). Electron mi-roscopy confirmed the presence of typical, mature �-cellecretory granules in the engrafted cells (Supplementaryigure 8B and 8D). Very few �-cells were detected in theraft (Figure 7E). Thus, acinar-derived �-cells are capable to
igure 6. Beta cells from acinar origin are capable to revert hyperglycaenjected with alloxan at day �2 to induce �-cell destruction and hyperifferentiation protocol with Notch1-EC (solid line) under the kidney cestored (yellow area). Nephrectomy of the graft-bearing kidney on day 3ad restored normoglycemia. Mice transplanted with control grafts (no; #P � .037). (B) Lentivirus-mediated Luciferase-labeling of the transprafts with a stable mass when they were generated by our differentiateterioration in the intensity of the luminescent signal. By day 4, the sign
ine) (n � 4; #P � .031). (C) Visualization of the luminescent signal in aotch1-EC. Luminescent signals correspond to the ectopic site of imp
estore normoglycemia in diabetic recipients. L
Discussion
We previously reported the transient expression ofhe proendocrine transcription factor Ngn3 in dediffer-ntiated acinar cell cultures stimulated with EGF and
pon transplantation in diabetic animals. (A) Immunodeficient mice weremia. Upon transplantation of acinar-derived �-cells generated by oure on day 0 (1 � 10 E5 new �-cells per animal), normoglycemia wasulted in acute reversal to the diabetic state, proving that the grafted cellsndocrine treatment in vitro) remained hyperglycemic (dashed line) (n �d cells allowed for noninvasive imaging and revealed the formation ofotocol with Notch1-EC (solid line). Control grafts displayed immediates almost completely abrogated, indicative for loss of the graft (dashedse engrafted with cells generated by our differentiation protocol with
tion and display stable signal intensity until the graft was removed.
mia uglyceapsul1 resproelante
ion pral wamou
IF, in approximately 9% of the cells.9 In pancreas orga-
nlwpdprctnNpb
aNd
uttiioTng�wim
ntldmslmas
aatarmiiapss
lfid
asWpEcsa
Fna((safmh(tm
BA
SIC–LIV
ER,
PA
NCREA
S,A
ND
BILIA
RY
TRA
CT
1758 BAEYENS ET AL GASTROENTEROLOGY Vol. 136, No. 5
ogenesis, the number of Ngn3� endocrine precursors isimited by lateral inhibition through interaction of Dllith the Notch1 receptor.13,24 –26 Notch signaling ham-ers acinar cell differentiation during development,27 andedifferentiation of adult acinar cells into a duct-likehenotype is associated with up-regulation of Notch-elated genes.28 –30 Here, we show that Notch signalingounteracts �-cell differentiation from adult dedifferen-iated acinar cells because our differentiation protocolot only induces endocrine genes but also up-regulatesotch-related genes. Notch stimulation nearly com-letely abrogated �-cell neogenesis, whereas Notch inhi-
igure 7. Phenotypical analysis of the engrafted cells. (A–D) The phe-otype of engrafted �-cells was evaluated by immunohistochemistryfter 36 days. Double staining using anti-insulin (green) and anti-Pdx1
red) (A), anti-C-peptide (red) (B), anti-Glut2 (red) (C), or anti-MafA (red)D) shows that almost all cells coexpress both markers, which demon-trates in vivo maturation. Scale bar, 10 �m. (E) Double staining usingnti-insulin (green) and anti-glucagon (red) revealed the presence of veryew �-cells within the transplanted graft. Scale bar, 10 �m. (F) Upon re-
oval of the graft, the maturity of the �-cells was evaluated by immuno-istochemistry. Double staining using anti-insulin (green) and anti-IAPP
red) showed that almost all cells coexpressed both markers. In contrast toheir in vitro phenotype, the acinar-derived �-cells underwent an in vivoaturation process postimplantation. Scale bar, 10 �m.
ition maximized neogenesis with more than 30% of r
cinar cells adopting a �-cell phenotype. In addition,otch stimulation increased cytokeratin-20 expression, auctal characteristic.Although in other experimental models, Notch mod-
lation has been reported to affect cell proliferation, inhe present study no significant effects on cell prolifera-ion were observed. We hypothesize that EGF and LIFnitiate an endocrine reprogramming in a subset of ded-fferentiated acinar cells. Analogous to embryonic devel-pment, these cells up-regulate Notch ligand expression.his results in an activation of Notch signaling in theeighboring cells, preventing their responsiveness to theiven treatment and thus limiting the final number of-cells. Our observations indicate that the Notch path-ay forms a major obstacle for converting acinar cells
nto �-cells and show the robustness of the reprogram-ing capacity of acinar cells.The acino-insular conversion is demonstrated with a
ew lectin cell tracing method that we developed. Withhis tracing system, we offer an alternative for geneticineage tracing, which is hampered by transfection/trans-uction difficulties or lack of available transgenic ani-als. Lectin-based acinar cell labeling was shown to be
table, specific, and efficient, allowing follow-up for ateast 10 days. Another study used a different culture
odel and genetic lineage tracing to demonstrate thebility of mouse acinar cells to undergo a phenotypicalwitch toward �-cells.8,31
Although our obtained insulin-positive cells were rel-tively immature compared to islet �-cells, they maturednd were phenotypically similar to islet �-cells afterransplantation at an ectopic site. Furthermore, they wereble to reestablish normoglycemic control in diabeticecipients. Noninvasive imaging showed that the cell
ass of the graft remained stable for at least 30 days. Themproved survival of the treated cells over control graftss possibly due to the higher number of �-cells obtainedfter Notch modulation in vitro. Because �-cells canroduce vascular endothelial growth factor,32 they maytimulate graft vascularization and thereby improve grafturvival.
We postulate that maturation of our new �-cells fol-owing transplantation is due to local and/or circulatingactors present in the recipients. A similar phenomenons reported after transplantation of embryonic stem cell-erived pancreatic precursors.33
Adult rat acinar tissue can thus be considered as a validnd safe source of functional �-cells and may offer per-pectives for increasing the transplantable �-cell pool.
hether acino-insular conversion also takes place in theancreas, is unclear. Factors described in our work, likeGF and LIF, are produced in pancreas tissue and be-ome up-regulated following tissue injury.34 Transitionaltages of differentiation between acinar cells and �-cellsre seen in duct-ligated rats35 and dexamethasone-treated
ats.36 However, genetic lineage tracing in mice using
sbsarn
bpicePcpwta
aG1
1
1
1
1
1
1
1
1
1
1
2
2
2
2
2
2
2
2
2
2
3
3
3
3
BA
SIC–L
IVER
,PA
NCREA
S,A
ND
BIL
IARY
TRA
CT
May 2009 NOTCH1 CONTROLS ACINAR CELL REPROGRAMMING 1759
everal pancreas injury models could not reveal a contri-ution of acinar cells to the �-cell mass.37 It could be thatpecies differences or differences in experimental modelsre responsible for this discrepancy. Alternatively, acinareprogramming to �-cells might represent a tissue engi-eering “artefact.”So far, transdifferentiation of acinar cells to �-cells has
een studied in rats and mice, but no reports have beenublished on human cells. For translational purpose, it
s important that human acinar cells have retained thisapacity of transdifferentiation, even if species differ-nces may exist at the level of regulatory molecules.revious studies have already revealed that human acinarells show differentiation plasticity and can undergo ahenotypic switch to duct-like cells,38 – 40 a feature sharedith rodent acinar cells. This leaves open the possibility
hat this or other types of cell reprogramming may findpplications in therapies for pancreatic diseases.
Supplementary Data
Note: To access the supplementary materialccompanying this article, visit the online version ofastroenterology at www.gastrojournal.org, and at doi:0.1053/j.gastro.2009.01.047.
References
1. Rother KI, Harlan DM. Challenges facing islet transplantation forthe treatment of type 1 diabetes mellitus. J Clin Invest 2004;114:877–883.
2. Bonner-Weir S, Weir GC. New sources of pancreatic �-cells. NatBiotechnol 2005;23:857–861.
3. Means AL, Meszoely IM, Suzuki K, et al. Pancreatic epithelialplasticity mediated by acinar cell transdifferentiation and gener-ation of nestin-positive intermediates. Development 2005;132:3767–3776.
4. Rooman I, Heremans Y, Heimberg H, et al. Modulation of ratpancreatic acinoductal transdifferentiation and expression ofPDX-1 in vitro. Diabetologia 2000;43:907–914.
5. Lardon J, De Break S, Rooman I, et al. Plasticity in the adult ratpancreas: transdifferentiation of exocrine to hepatocyte-like cellsin primary culture. Hepatology 2004;39:1499–1507.
6. Tosh D, Shen CN, Slack JM. Differentiated properties of hepatocytesinduced from pancreatic cells. Hepatology 2002;36:534–543.
7. Baeyens L, De Break S, Lardon J, et al. In vitro generation ofinsulin-producing �-cells from adult exocrine pancreatic cells.Diabetologia 2005;48:49–57.
8. Minami K, Okuno M, Miyawaki K, et al. Lineage tracing andcharacterization of insulin-secreting cells generated from adultpancreatic acinar cells. Proc Natl Acad Sci U S A 2005;102:15116–15121.
9. Baeyens L, Bonne S, German MS, et al. Ngn3 expression duringpostnatal in vitro �-cell neogenesis induced by the JAK/STATpathway. Cell Death Differ 2006;13:1892–1899.
0. Schwitzgebel VM, Scheel DW, Conners JR, et al. Expression ofneurogenin3 reveals an islet cell precursor population in thepancreas. Development 2000;127:3533–3542.
1. Gu GQ, Dubauskaite J, Melton DA. Direct evidence for the pan-creatic lineage: NGN3�cells are islet progenitors and are distinctfrom duct progenitors. Development 2002;129:2447–2457.
2. Heremans Y, Van de Casteele M, In’t Veld P, et al. Recapitulation ofembryonic neuroendocrine differentiation in adult human pancreatic
duct cells expressing neurogenin 3. J Cell Biol 2002;159:303–312.3. Apelqvist A, Li H, Sommer L, et al. Notch signalling controlspancreatic cell differentiation. Nature 1999;400:877–881.
4. Murtaugh LC, Stanger BZ, Kwan KM, et al. Notch signaling con-trols multiple steps of pancreatic differentiation. Proc Natl AcadSci U S A 2003;100:14920–14925.
5. Lee JC, Smith SB, Watada H, et al. Regulation of the pancreaticpro-endocrine gene neurogenin3. Diabetes 2001;50:928–936.
6. Yuan B, Latek R, Hossbach M, et al. siRNA selection server: anautomated siRNA oligonucleotide prediction server. Nucleic AcidsRes 2004;32:W130–W134.
7. Wiznerowicz M, Trono D. Conditional suppression of cellulargenes: lentivirus vector-mediated drug-inducible RNA interfer-ence. J Virol 2003;77:8957–8961.
8. Bouwens L, Wang RN, De Binkel E, et al. Cytokeratins as markersof ductal cell differentiation and islet neogenesis in the neonatalrat pancreas. Diabetes 1994;43:1279–1283.
9. Pipeleers DG, In’t Veld PA, Van De Wlay M, et al. A new in vitromodel for the study of pancreatic A and B cells. Endocrinology1985;117:806–816.
0. Lobner K, Steinbrenner H, Roberts GA, et al. Different regulatedexpression of the tyrosine phosphatase-like proteins IA-2 andphogrin by glucose and insulin in pancreatic islets: relationship todevelopment of insulin secretory responses in early life. Diabetes2002;51:2982–2988.
1. Keymeulen B, Korbutt G, De Paepe M, et al. Long-term metaboliccontrol by rat islet grafts depends on the composition of theimplant. Diabetes 1996;45:1814–1821.
2. Maylie-Pfenninger MF, Jamieson JD. Distribution of cell surface sac-charides on pancreatic cells. II. Lectin-labeling patterns on matureguinea pig and rat pancreatic cells. J Cell Biol 1979;80:77–95.
3. Branchini BR, Ablamsky DM, Murtiashaw MH, et al. Thermostablered and green light-producing firefly luciferase mutants for biolu-minescent reporter applications. Anal Biochem 2007;361:253–262.
4. Esni F, Ghosh B, Biankin AV, et al. Notch inhibits Ptf1 functionand acinar cell differentiation in developing mouse and zebrafishpancreas. Development 2004;131:4213–4224.
5. Hart A, Papadopoulou S, Edlund H. Fgf10 maintains notch acti-vation, stimulates proliferation, and blocks differentiation of pan-creatic epithelial cells. Dev Dyn 2003;228:185–193.
6. Jensen J, Heller RS, Funder-Nielsen T, et al. Independent devel-opment of pancreatic �- and �-cells from Neurogenin3-expressingprecursors: a role for the notch pathway in repression of prema-ture differentiation. Diabetes 2000;49:163–176.
7. Hald J, Hjorth JP, German MS, et al. Activated Notch1 preventsdifferentiation of pancreatic acinar cells and attenuate endocrinedevelopment. Dev Biol 2003;260:426–437.
8. Rooman I, De Medts N, Baeyens L, et al. Expression of the Notchsignaling pathway and effect on exocrine cell proliferation in adultrat pancreas. Am J Pathol 2006;169:1206–1214.
9. Jensen JN, Cameron E, Garay MVR, et al. Recapitulation ofelements of embryonic development in adult mouse pancreaticregeneration. Gastroenterology 2005;128:728–741.
0. Siveke JT, Lubeseder-Martellato C, Lee M, et al. Notch signalingis required for exocrine regeneration after acute pancreatitis.Gastroenterology 2008;134:544–555.
1. Okuno M, Minami K, Okumachi A, et al. Generation of insulin-secreting cells from pancreatic acinar cells of animal models oftype 1 diabetes. Am J Physiol Endocrinol Metab 2007;292:E158–E165.
2. Rooman I, Schuit F, Bouwens L. Effect of vascular endothelialgrowth factor on growth and differentiation of pancreatic ductalepithelium. Lab Invest 1997;76:225–232.
3. Kroon E, Martinson LA, Kadoya K, et al. Pancreatic endodermderived from human embryonic stem cells generates glucose-responsive insulin-secreting cells in vivo. Nat Biotechnol 2008;
26:443–452.
3
3
3
3
3
3
4
R
B
Ue
A
KspPh
C
F
D(FA3PFw
BA
SIC–LIV
ER,
PA
NCREA
S,A
ND
BILIA
RY
TRA
CT
1760 BAEYENS ET AL GASTROENTEROLOGY Vol. 136, No. 5
4. De BS, Baeyens L, Bouwens L. Expression and function of leu-kaemia inhibitory factor and its receptor in normal and regener-ating rat pancreas. Diabetologia 2006;49:108–116.
5. Bertelli E, Bendayan M. Intermediate endocrine-acinar pancreaticcells in duct ligation conditions. Am J Physiol 1997;273:C1641–C1649.
6. Lardon J, Huyens N, Rooman I, et al. Exocrine cell transdifferen-tiation in dexamethasone-treated rat pancreas. Virchows Arch2004;444:61–65.
7. Desai BM, Oliver-Krasinski J, De Leon DD, et al. Preexistingpancreatic acinar cells contribute to acinar cell, but not islet�-cell, regeneration. J Clin Invest 2007;117:971–977.
8. Hall PA, Lemoine NR. Rapid acinar to ductal transdifferentiation incultured human exocrine pancreas. J Pathol 1992;166:97–103.
9. Vila MR, Lloreta J, Real FX. Normal human pancreas cultures displayfunctional ductal characteristics. Lab Invest 1994;71:423–431.
0. Gmyr V, Kerr-Conte J, Belaich S, et al. Adult human cytokeratin19-positive cells reexpress insulin promoter factor 1 in vitro:further evidence for pluripotent pancreatic stem cells in humans.Diabetes 2000;49:1671–1680.
Received May 08, 2008. Accepted January 16, 2009.
eprint requestsAddress requests for reprints to: Luc Bouwens, PhD, Professor of
iology, Cell Differentiation Unit, Diabetes Research Center, Free t
niversity Brussels, Laarbeeklaan 103, B-1090, Brussels, Belgium.-mail: [email protected]; fax: (32) 2-4774405.
cknowledgmentsThe authors thank E. Deblay, W. Rabiot, M. Baekelandt, and M.
eyaerts for assistance; D. Pipeleers and K. Thielemans for logisticupport; Dr. O. Madsen, Dr. T. Sudo, and Dr. S. F. Konieczny forroviding the antibodies for respectively Pdx1, Hes1, and Mist1; and. Van der Smissen for electron microscopy; and J. K. Mfopou forelpful discussions.
onflicts of interestThe authors disclose no conflicts.
undingSupported by grants from EFSD/JDRF/Novo Nordisk Type I
iabetes Research Project, the Fund for Scientific Research-FlandersFWO-grant G.0480.06) (to L.B.), Fund for Scientific Research-landers (FWO-grant G.0064.02) (to H.H.), and the Interuniversityttraction Poles Program of the Belgian Science Policy (IUAP6 P6/8) (to T.L.). L.B. is a research fellow of the Institute for theromotion of Innovation through Science and Technology inlanders (IWT-Vlaanderen), S.B. and I.R. are postdoctoral fellowsith the FWO-Vlaanderen. T.L. is a senior clinical investigator with
he FWO-Vlaanderen.

tm(UsoScse1spgm
bf1NcbaA
bk1v(
GCmN(c5p
pp
obp
CsCff
csHcmma(pcCabmnw
1bo(2wvwplcidtnTt4iiefvnsm
May 2009 NOTCH1 CONTROLS ACINAR CELL REPROGRAMMING 1760.e1
Supplementary Materials and Methods
Exocrine Cell Differentiation ProtocolExocrine cells were pre-cultured for 4 days in bac-
eriological Petri dishes (Nunc in RPMI-1640 Glutamax-Iedium supplemented with 10% fetal bovine serum
FBS, Invitrogen), and antibiotics (Sigma, St Louis, Mo.,SA). Geneticin Sulphate (50 �g/ml) (Sigma) was used to
uppress fibroblast overgrowth in the culture. At the endf the pre-culture, cells were treated with alloxan (10 mM,igma) for 10 min at 37°C to remove contaminating betaells, and transferred to 24-well plates (Falcon, BD Bio-ciences) to form adherent cultures. Adherent monolay-rs were further cultured with RPMI supplemented with% FBS and antibiotics (controls). For growth factortimulation of neogenesis, RPMI-1640 medium was sup-lemented with 50 ng/ml human recombinant epidermalrowth factor (EGF) (Sigma,) and 40 ng/ml recombinantouse leukemia inhibitory factor (LIF) (Sigma).1
RT-PCRThe cycling profile was: 1.5 min at 94°C followed
y 0.5 min at 94°C, 0.5 min at 60°C and 1 min at 72°Cor 10 cycles and 0.5 min at 94°C, 0.5 min at 58°C and
min at 72°C for 16 to 20 cycles (total of 30 cycles forotch1, 28 cycles for Hes1, 30 cycles for Jagged1, 30
ycles for Dll4, 30 cycles for Hes6 and 25 cycles for-actin). Analysis of the amplified fragments was done ongarose gels stained with GelRed (VWR International).ll analyses were performed at least three times.
Western BlottingAntibodies were used as follows: monoclonal anti-
-actin: 1/1000 (MP Biomedicals); monoclonal anti-cyto-eratin-20: 1/500 (Novocastra)2,3; polyclonal anti-Sox9:/150 (Chemicon)4; donkey anti-rabbit-Qdot605 (In-itrogen): 1/1000; donkey anti-mouse-Qdot525: 1/1000Invitrogen).
Viral ConstructsThe shNotch1 target sequence is GGAAGGCUAU-
ACCAUGGA and shHes1 target sequence is AGAU-AACGCCAUGACCUA. The selected target sequencesatch 100% with rat Notch1 and Hes1 mRNA sequences.egative control RNAi construct was shScrambled
GGUAUCUACUAGAUGUACU). Primary acinar exocrineells were infected prior to monolayer formation at MOI0 (n � 3). Transduction efficiency is presented in Sup-lementary Figure 1.pLVTHM Ngn3 shRNA construct and negative control
LVTHM Scrambled shRNA were designed as describedreviously.5
Thermostabile red-shifted Firefly Luciferase was cutut of pGex_Ppy_TS_Red (kind gift from B. Branchini)6
y BamHI-XhoI and subcloned in BamHI-XhoI sites of
HR’Trip-CMV-IRES-tNGFR-SIN, generating pHR’Trip- rMV-TS_FLuc_Red-IRES-tNGFR-SIN. This construct waselected for further use, generating lentivirus Le-pHR’Trip-MV-TS_FLuc_Red-IRES-tNGFR-SIN. Control- or dif-
erentiation factor-treated acinar exocrine cells were in-ected prior to implantation at MOI 50 (n � 4).
ImmunocytochemistryPrimary antibodies used in this study are poly-
lonal anti-insulin (C. Van Schravendijk, VUB, Brus-els)2,3, polyclonal anti-rat C-peptide-I (O.D. Madsen,agedorn Research Institute, Gentofte, Denmark),7 poly-
lonal anti-Pdx1 (O.D. Madsen),8 polyclonal anti-Ngn3,9
onoclonal anti-cytokeratin-20 (CK20) (Novocastra),2,3
onoclonal anti-synaptophysin (Novocastra), polyclonalnti-MafA (Bethyl Laboratories),10 polyclonal anti-Glut2Wak-Chemie), polyclonal anti-Mist1 (SF Konieczny),11
olyclonal anti-luciferase (Promega Benelux B.V.), poly-lonal anti-IAPP (Advanced Chemtech), polyclonal anti-hromograninA (Tebu-Bio), anti-BrdU (MP Biomedicals)nd polyclonal anti-�-amylase (Sigma). Secondary anti-odies conjugated with fluorescein isothiocyanate, tetra-ethylrodamine isothiocyanate or Cy5 (Jackson Immu-
oresearch) were used as described previously (11). DNAas visualized using Hoechst 33342 (Invitrogen).
In Vivo ImagingMice were imaged in prone position on day 1, 4, 7,
5 and 30 after grafting and after removal of the graft-earing kidney. Mice were anesthetized with a mixture ofxygen/isoflurane using an Inhalation Anesthesia SystemVetTech solutions LTD), 5% isoflurane for induction,.5% isoflurane for maintenance. D-luciferin (Promega)as injected at 150 mg/kg mouse body weight via the tail
ein. Immediately after D-luciferin administration, miceere imaged using the Photo Imager (Biospace). Thehoton emission was measured dynamically using the
arge field of view setting and registered using the photonounting technology (Biospace) during 600 seconds. Formage analysis an elliptical region of interest (ROI) wasrawn over the graft location. A background ROI wasaken on the supporting table (calculation of aspecificoise), and was substracted from the specific graft signal.he area of the ROI was kept constant. For calculation of
he mean graft photon emission (PEmean) per group (n �) for every timepoint analyzed, the AUC of 5-second-
nterval counts over 600 seconds after substrate admin-stration was calculated per individual animal. This wasxpressed as photons/s/steredian using the conversionactor 1 cpm � 28 photons/s/steredian (ph/s/sr), pro-ided by the camera manufacturer (Biospace). Biolumi-escent pseudocolour images displayed in Figure 6 arehown superimposed on photographic images of the
ouse, with the most intense luciferase signal shown as
ed and the weakest signal shown as blue.
1
1
1760.e2 BAEYENS ET AL GASTROENTEROLOGY Vol. 136, No. 5
Reference List
1. Baeyens L, De BS, Lardon J, Mfopou JK, Rooman I, Bouwens L.In vitro generation of insulin-producing beta cells from adult exo-crine pancreatic cells. Diabetologia 2005;48:49–57.
2. Bouwens L, Wang RN, De BE, Pipeleers DG, Kloppel G. Cytoker-atins as markers of ductal cell differentiation and islet neogene-sis in the neonatal rat pancreas. Diabetes 1994;43:1279–1283.
3. Bouwens L, De BE. Islet morphogenesis and stem cell markers inrat pancreas. J Histochem Cytochem 1996;44:947–951.
4. Seymour PA, Freude KK, Tran MN, Mayes EE, Jensen J, Kist R,Scherer G, Sander M. SOX9 is required for maintenance of thepancreatic progenitor cell pool. Proceedings of the National Acad-emy of Sciences of the United States of America 2007;104:1865–1870.
5. Baeyens L, Bonne S, German MS, Ravassard P, Heimberg H,Bouwens L. Ngn3 expression during postnatal in vitro beta cellneogenesis induced by the JAK/STAT pathway. Cell Death Differ2006;13:1892–1899.
6. Branchini BR, Ablamsky DM, Murtiashaw MH, Uzasci L, Fraga H,
Southworth TL. Thermostable red and green light-producing fireflyluciferase mutants for bioluminescent reporter applications. AnalBiochem 2007;361:253–262.
7. Blume N, Petersen JS, Andersen LC, Kofod H, Dyrberg T, Mich-elsen BK, Serup P, Madsen OD. Immature transformed rat isletbeta-cells differentially express C-peptides derived from thegenes coding for insulin I and II as well as a transfected humaninsulin gene. Mol Endocrinol 1992;6:299–307.
8. Rooman I, Heremans Y, Heimberg H, Bouwens L. Modulation ofrat pancreatic acinoductal transdifferentiation and expression ofPDX-1 in vitro. Diabetologia 2000;43:907–914.
9. Schwitzgebel VM, Scheel DW, Conners JR, Kalamaras J, Lee JE,Anderson DJ, Sussel L, Johnson JD, German MS. Expression ofneurogenin3 reveals an islet cell precursor population in thepancreas. Development 2000;127:3533–3542.
0. Nishimura W, Kondo T, Salameh T, El K, I, Dodge R, Bonner-WeirS, Sharma A. A switch from MafB to MafA expression accompa-nies differentiation to pancreatic beta-cells. Dev Biol 2006;293:526–539.
1. Pin CL, Bonvissuto AC, Konieczny SF. Mist1 expression is acommon link among serous exocrine cells exhibiting regulated
exocytosis. Anat Rec 2000;259:157–167.
S
UEE
UEE
TitFE
Steati0pPt
May 2009 NOTCH1 CONTROLS ACINAR CELL REPROGRAMMING 1760.e3
upplementary Table 1. Absolute Number of Insulin- andNeurogenin3-Positive Cells AfterTreatment of the Acinar Cells withDifferent Differentiation Factors
Analysis after 72hof treatment
Number ofinsulin-positive cells
(Mean � SEM)n � 7
Total cell number(Mean � SEM)
n � 7
ntreated controls 20.71 � 4.35 4071.43 � 94.83GF�LIF treated 469.86 � 15.16 4887.57 � 100.15GF�LIF�Notch1-ECtreated
1579.00 � 57.04 4952.71 � 149.39
Analysis after 48h oftreatment
Number ofneurogenin3-positivecells (Mean � SEM)
n � 5
Total cell number(Mean � SEM)
n � 5
ntreated controls 3.46 � 0.68 4430.00 � 180.86GF�LIF treated 489.33 � 34.76 5002.05 � 237.36GF�LIF�Notch1-ECtreated
1461.67 � 75.46 5112.67 � 84.13
he data represent the primary analysis of the absolute number ofnsulin- and neurogenin-positive cells in the different conditionsested. Epidermal growth factor (EGF, 10 ng/ml); Leukemia Inhibitoryactor (LIF, 40 ng/ml); Extracellular part of Notch1 receptor (Notch1-C, 10 mg/ml).
D
upplementary Figure 1. Effect of modulating Notch signaling onhe exocrine cell population. (A) Expression pattern (relative to endog-nous actin) of the ductal marker cytokeratin-20 (CK20) in dedifferenti-ted acinar cells cultured in the presence of EGF and LIF (1), or addi-ionally exposed to Jagged1 (2), Dll4 (3) or Notch1-EC (4). A significantncrease in CK20 expression is seen following Notch stimulation (#P �.05; n � 4), whereas inhibiting Notch signaling decreases CK20 ex-ression (*P � 0.05; n � 4) compared to EGF/LIF treated controls. (B)rotein expression pattern of cytokeratin-20 (CK20) in EGF and LIF
reated cultures (1) and cultures additionally exposed to Jagged1 (2),
ll4 (3) or Notch1-EC (4). Actin is used as internal loading control.
SiaNt
1760.e4 BAEYENS ET AL GASTROENTEROLOGY Vol. 136, No. 5
upplementary Figure 2. Effect of modulating Notch signaling on Notch signaling. Gene transcript analysis by real-time RT-PCR of Notch1 (A) orts downstream target Hes1 (B). Relative fold change in Notch1 or Hes1 transcript levels in the presence of EGF and LIF (1), or in conditionsdditionally exposed to Jagged1 (2), Dll4 (3) or Notch1-EC (4). A significant increase in both Notch1 and Hes1 mRNA expression is seen followingotch stimulation (#P � 0.01; n � 5), whereas inhibiting Notch signaling decreases Notch1 and Hes1 mRNA expression (*P � 0.05; n � 5) compared
o EGF/LIF treated controls. Error bars represent mean � s.e.m.

SsiNeclrteLEs
May 2009 NOTCH1 CONTROLS ACINAR CELL REPROGRAMMING 1760.e5
upplementary Figure 3. Transduction efficiency of the differentilencing viruses. (A and B) Proportion of cells transduced after
nfection with lentivirus containing shRNA directed against eitherotch1 (A) or Hes1 (B). No significant differences in transductionfficiency was noted between the different viruses (n � 3; P � 0.05ompared to shScrambled condition). Additional treatment with the
igands Jagged1 or Dll4 or with the extracellular part of the Notch1eceptor (Notch1-EC) induced no difference in the proportion ofransduced cells (n � 3; P � 0.05). (C) Evaluation of the transductionfficiency after infection with lentiviruses Le-shScrambled-eGFP ande-shNgn3-eGFP in conditions treated with EGF, LIF and Notch1-C. No significant differences between both conditions were ob-
erved (n � 3; P � 0.05).
Srdcpb
1760.e6 BAEYENS ET AL GASTROENTEROLOGY Vol. 136, No. 5
upplementary Figure 4. Lentivirus-mediated RNA interference. (A–C) Illustration of co-expression of the beta cell marker insulin and DsRedeporter protein in conditions transduced with Le-shNotch1-DsRed (A), Le-shHes1-DsRed (B) or Le-Scrambled-DsRed (C) and treated with theifferentiation factors. More insulin/reporter co-expression was observed after specific silencing of the Notch pathway (A and B) compared toontrols (C). Scale bar � 10 �m. (D–E) Immunocytochemical analysis revealed the presence of Ngn3/reporter co-expressing cells after 48h ofro-endocrine treatment in the shScrambled condition (D), contrasted by the complete absence of these cells after specific Ngn3 silencing (E). Scale
ar � 10 �m.
S
EEEEEEEE
Ts(
S
EEEEEEEE
TsFactor (LIF, 40 ng/ml); Extracellular part of Notch1 receptor (Notch1-EC, 10 mg/ml); Jagged1 and Dll4 (Notch ligands).
May 2009 NOTCH1 CONTROLS ACINAR CELL REPROGRAMMING 1760.e7
upplementary Table 3. RNAi Mediated Inhibition of Hes1 in Acinar Differentiation to Beta Cells
Number ofinsulin-positive cells
(Mean � SEM)n � 4
Number ofDsRed-positive cells
(Mean � SEM)n � 4
Number of insulin/DsRed-positive cells
(Mean � SEM)n � 4
Total cell number(Mean � SEM)
n � 4
GF�LIF treated Le-Scrambled 618.33 � 24.74 1347.67 � 47.68 140.00 � 9.02 5962.00 � 52.79GF�LIF treated Le-shHes1 1235.00 � 112.37 1554.67 � 74.73 493.00 � 37.07 6078.67 � 171.20GF�LIF�Jagged1 treated Le-Scrambled 116.00 � 8.72 1174.00 � 43.96 25.67 � 3.48 5140.33 � 89.19GF�LIF�Jagged1 treated Le-shHes1 1078.33 � 123.14 1501.33 � 19.89 1020.33 � 127.57 5809.00 � 160.07GF�LIF�Dll4 treated Le-Scrambled 155.33 � 12.47 1198.33 � 85.60 34.67 � 2.18 5191.33 � 265.02GF�LIF�Dll4 treated Le-shHes1 1043.33 � 21.67 1554.00 � 24.79 988.67 � 12.34 6001.67 � 104.32GF�LIF�Notch1-EC treated Le-Scrambled 1941.00 � 73.57 1309.67 � 43.21 402.33 � 25.11 6231.33 � 97.40GF�LIF�Notch1-EC treated Le-shHes1 2131.67 � 60.36 1463.00 � 97.18 599.33 � 8.45 6179.00 � 109.16
he data represent the primary analysis of the absolute number of insulin-positive cells after transduction with control virus (Le-Scrambled) orpecific Hes1 silencing virus (Le-shHes1) in the different conditions tested. Epidermal growth factor (EGF, 10 ng/ml); Leukemia Inhibitory Factor
upplementary Table 2. RNAi Mediated Inhibition of Notch1 in Acinar Differentiation to Beta Cells
Number ofinsulin-positive cells
(Mean � SEM)n � 4
Number ofDsRed-positive cells
(Mean � SEM)n � 4
Number of insulin/DsRed-positive cells
(Mean � SEM)n � 4
Total cell number(Mean � SEM)
n � 4
GF�LIF treated Le-Scrambled 575.00 � 12.34 1384.00 � 66.53 130.67 � 3.84 5753.67 � 96.07GF�LIF treated Le-shNotch1 1234.00 � 21.96 1447.33 � 33.33 493.00 � 2.08 5895.00 � 63.54GF�LIF�Jagged1 treated Le-Scrambled 109.00 � 8.96 1148.67 � 27.67 26.00 � 1.53 4995.67 � 181.67GF�LIF�Jagged1 treated Le-shNotch1 1030.67 � 32.42 1243.00 � 42.22 1011.33 � 30.94 5330.33 � 220.53GF�LIF�Dll4 treated Le-Scrambled 165.33 � 4.91 1239.33 � 64.33 39.66 � 1.20 5061.33 � 139.93GF�LIF�Dll4 treated Le-shNotch1 1034.00 � 69.51 1322.00 � 75.08 1004.00 � 65.68 5667.33 � 184.76GF�LIF�Notch1-EC treated Le-Scrambled 1758.33 � 61.60 1309.67 � 43.21 409.33 � 21.40 5600.67 � 172.85GF�LIF�Notch1-EC treated Le-shNotch1 2072.67 � 29.17 1396.33 � 55.57 607.33 � 9.35 5969.00 � 82.35
he data represent the primary analysis of the absolute number of insulin-positive cells after transduction with control virus (Le-Scrambled) orpecific Notch1 silencing virus (Le-shNotch1) in the different conditions tested. Epidermal growth factor (EGF, 10 ng/ml); Leukemia Inhibitory
LIF, 40 ng/ml); Extracellular part of Notch1 receptor (Notch1-EC, 10 mg/ml); Jagged1 and Dll4 (Notch ligands).

S
II
TcNi(
S
EE
Ts(LIF, 40 ng/ml).
1760.e8 BAEYENS ET AL GASTROENTEROLOGY Vol. 136, No. 5
upplementary Table 5. Comparison of In Vivo and In VitroWGA Lectin Labeling
% WGA labeled cells
Neurogenin3-positivecells
(Mean � SEM)n � 4
Insulin positivecells
(Mean � SEM)n � 4
n vivo labeling 60.82 � 2.68 62.07 � 1.72n vitro labeling (after 48h
pro-endocrine treatment)0.32 � 0.24 0.19 � 0.16
he data represent the proportion of neurogenin3- and insulin-positiveells positive for the lectin label after treatment with EGF, LIF andotch1-EC. Epidermal growth factor (EGF, 10 ng/ml); Leukemia Inhib-
tory Factor (LIF, 40 ng/ml); Extracellular part of Notch1 receptor
upplementary Table 4. RNAi Mediated Inhibition of Ngn3
Analysis after 72h oftreatment
Number ofinsulin-positive cells
(Mean � SEM)n � 3
Number ofeGFP-positive cells
(Mean � SEM)n � 3
Number of insulin/eGFP-positive cells
(Mean � SEM)n � 3
Total cell number(Mean � SEM)
n � 3
GF�LIF treated Le-Scrambled 1574.00 � 26.54 1189.33 � 33.71 368.33 � 23.38 4929.67 � 88.72GF�LIF treated Le-shNgn3 1162.33 � 32.99 1142.67 � 57.49 6.00 � 1.53 5065.33 � 105.92
he data represent the primary analysis of the absolute number of insulin-positive cells after transduction with control virus (Le-Scrambled) orpecific Ngn3 silencing virus (Le-shNgn3) after treatment with EGF and LIF. Epidermal growth factor (EGF, 10 ng/ml); Leukemia Inhibitory Factor
Notch1-EC, 10 mg/ml).

S
RRRRRR
S
LLL
Tvft
May 2009 NOTCH1 CONTROLS ACINAR CELL REPROGRAMMING 1760.e9
upplementary Table 6. List of Primer Sequences
Sequence sense primer Sequence anti-sense primer
at NOTCH1 CACACCAACGTGGTCTTCAAGC TAGACAATGGAGCCACGGATGTat HES1 TTCAGCGAGTGCATGAACGA TAGGTCATGGCGTTGATCTGGat JAGGED1 ACCACCTGCGAAGTGATTGAC TGAATTTGCCTCCCGACTGat DLL4 GGCAAACTGCAGAACCACACA GACATGCCGGCTTTTCACTGTat HES6 GCTGCCATCCTTAAGTTTGC GGTCATCAGGGTTACCATACAA
at ACTIN ACTATCGGCAATGAGCGGTTC AGAGCCACCAATCCACACAGAupplementary Table 7. Knockdown Efficiency of theDifferent shRNA Virusses
Notch1 mRNAexpression
(Mean � SEM)n � 3
Hes1 mRNAexpression
(Mean � SEM)n � 3
e-Scrambled-DsRed 100.0 � 0.0 100.0 � 0.0e-shNotch1-DsRed 19.7 � 5.2 108.8 � 5.4e-shHes1-DsRed 107.2 � 4.9 21.8 � 6.3
he data represent the efficiency of knockdown of the different shRNAiruses, measured by quantitative RT-PCR. All samples are correctedor RNA input (endogenous control: actin) and normalized to condi-
ions transduced with control virus (Le-Scrambled-DsRed).
SifeS�co1dwb
1760.e10 BAEYENS ET AL GASTROENTEROLOGY Vol. 136, No. 5
upplementary Figure 5. Wheat Germ Agglutinin specificity after injection and isolation. (A) WGA label specificity and efficiency in the pancreas 72h afterntraparenchymal micro-injection of the lectin. Co-localization of the fluorescent lectin with beta cells was never observed in this condition (n � 4). Immunostainingor insulin (red) reveals the expression of the lectin label (green) is separated from the beta cell population. Scale bar � 100 �m. (B) WGA label specificity andfficiency evaluated after partial dissociation and isolation of the pancreatic acini. WGA label was observed in the acinar cells, but not in ductal or centro-acinar cells.taining for the duct/centro-acinar phenotypical marker cytokeratin 20 (CK20) (red) indicated that the WGA lectin (green) was only present in acinar cells. Scale bar25 �m. (C) After dissociation of the pancreas, pancreatic islets were isolated, dissociated and the beta cells were purified using FACS. Fluorescence-activated
ell sortingrevealedasubpopulation (2.4%of the totalcellpopulation) thatdisplayed lectinpositivitybasedonfluorescein intensity. (D) Immunocytochemicalanalysisf this subpopulation using staining for the beta cell marker insulin (red) showed no co-expression of beta cells with the acinar cell tracer WGA (green). Scale bar �5 �m (E) WGA label localisation after partial dissociation and isolation of the pancreatic acini. WGA label (green) is localized in the cytoplasm pf the acinar cells, asemonstrated by E-cadherin staining (red). Scale bar � 15 �m. (F) Freshly isolated acinar cells labeled with WGA (red) were mixed with isolated beta cells labeledithConA(green).Scalebar�20�m. (G)Afteralloxanandpro-endocrine treatmentof themixedacinarandbetacell cultures,only theacinarWGAlabel (red)could
e detected in the insulin-expressing cells (blue) present in the monolayer culture. Scale bar � 10 �m.
Swt(U
May 2009 NOTCH1 CONTROLS ACINAR CELL REPROGRAMMING 1760.e11
upplementary Figure 6. Luminescent intensity of the pre-implantation graft and animal body weight during in vivo experiments. (A) The bodyeight of animals transplanted with a control graft (dotted line) did not differ significantly from animals transplanted with a treated graft (full line) at any
ime point (n � 4; P � 0.12). (B) No significant difference was observed between control grafts and grafts pre-treated with EGF, LIF and Notch1-ECindicated as ELrN) prior to implantation under the kidney capsule, when comparing luminescent signal intensity (expressed as Relative Luminescent
nits) (n � 4; P � 0.05). Cells untransduced with the luciferase overexpression construct displayed only minimal luminescence.
S3et(c
1760.e12 BAEYENS ET AL GASTROENTEROLOGY Vol. 136, No. 5
upplementary Figure 7. Phenotypical maturity of the graft. (A) Staining using anti-Luciferase (green) confirmed Luciferase expression in about0% of the insulin-positive cells (red). Scale bar � 10 �m. (B) Histological analysis of control pancreas (B1) or pancreas from alloxan-treated,ngrafted mice (B2). Insulin-positive cells were nearly totally absent after alloxan- treatment. Scale bar � 500 �m. (C–D) Upon removal of the graft,he maturity of the beta cells was evaluated by immunohistochemistry. Double staining using anti-chromograninA (red) (C) or anti-synaptophysin (red)D) showed that almost all insulin-expressing cells (green) co-expressed both markers. In contrast to their in vitro phenotype, the acinar-derived beta
ells underwent an in vivo maturation process post-implantation. Scale bar � 10 �m.
StnbDt
May 2009 NOTCH1 CONTROLS ACINAR CELL REPROGRAMMING 1760.e13
upplementary Figure 8. Electron microscopy of acinar-derived beta cells. (A) Acinar-derived beta cells (BC) 72h after initiating the pro-endocrinereatment in vitro. Scale bar � 5 �m. (B) Acinar-derived beta cells (BC) 31 days after engraftment of these cells under the kidney capsule of diabeticude mice. KTE: Kidney Tubular Epithelium; EC: Endothelial cell. Scale bar � 5 �m. (C) Detailed picture of the secretory granules of acinar-derivedeta cells in vitro (panel A). In this condition, the granules exhibit an atypical appearance indicative of the immaturity of these cells. Scale bar � 200 nm. (D)etailed picture of the secretory granules of acinar-derived beta cells after transplantation under the kidney capsule (panel B). The secretory granules show
he typical characteristics of mature insulin granules, with a dense core surrounded by a halo. Scale bar � 200 nm.