Northeast Corridor Market Study - The City of San Antonio
148
The Dynamic Northeast Corridor Market Study Prepared for the City of San Antonio Department of Planning and Community Development Prepared by Wendell Davis & Associates October 2013
-
Upload
khangminh22 -
Category
Documents
-
view
0 -
download
0
Transcript of Northeast Corridor Market Study - The City of San Antonio
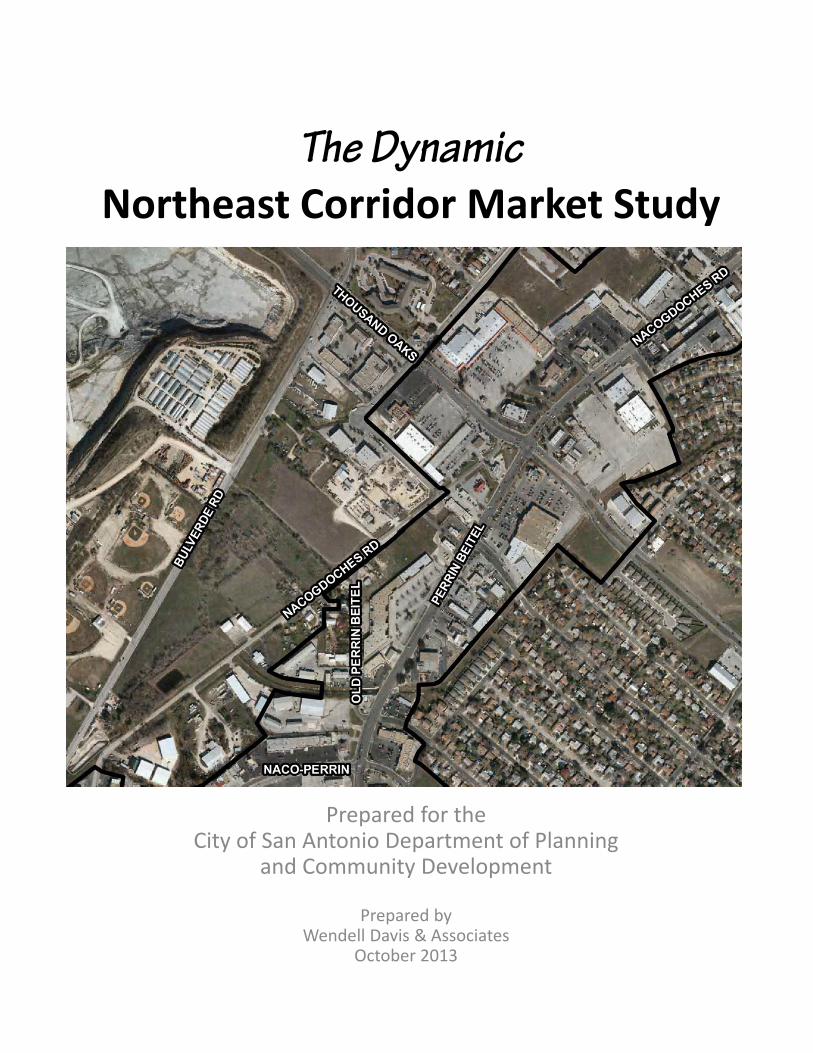
The Dynamic Northeast Corridor Market Study
Prepared for the City of San Antonio Department of Planning
and Community Development
Prepared by Wendell Davis & Associates
October 2013
NortheastCorridorMarketStudy i
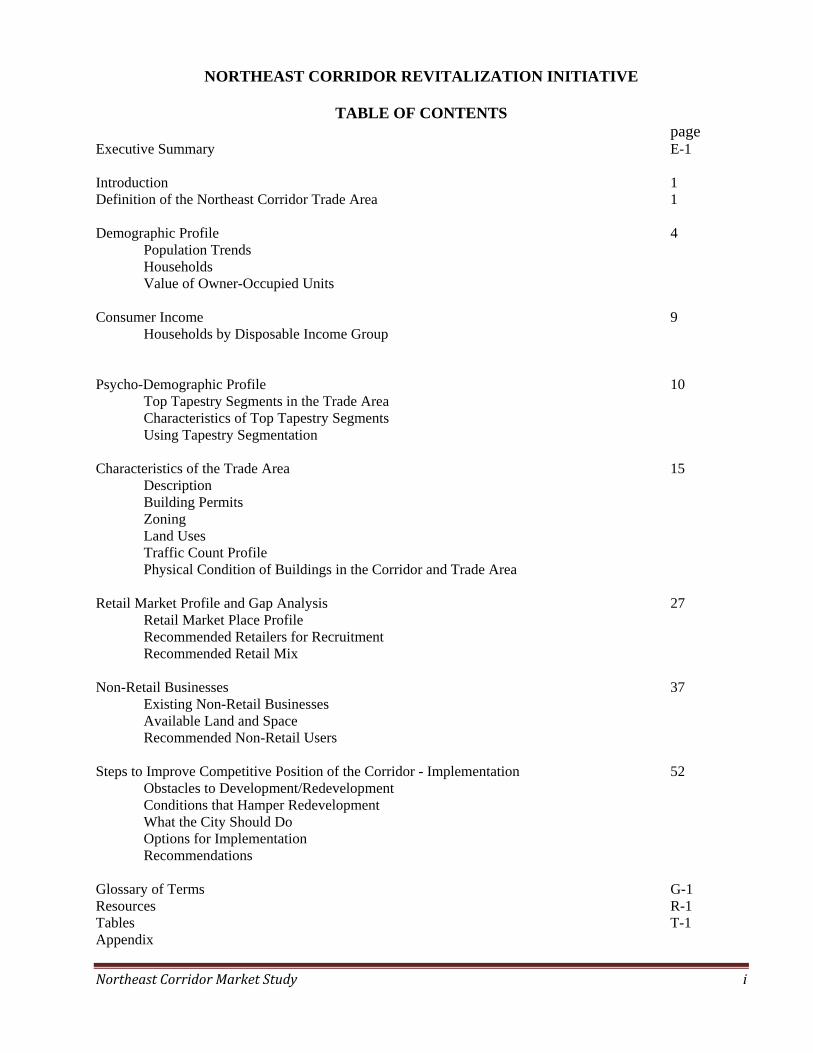
NORTHEAST CORRIDOR REVITALIZATION INITIATIVE
TABLE OF CONTENTS page
Executive Summary E-1 Introduction 1 Definition of the Northeast Corridor Trade Area 1 Demographic Profile 4 Population Trends Households Value of Owner-Occupied Units Consumer Income 9 Households by Disposable Income Group Psycho-Demographic Profile 10
Top Tapestry Segments in the Trade Area Characteristics of Top Tapestry Segments Using Tapestry Segmentation
Characteristics of the Trade Area 15 Description
Building Permits Zoning Land Uses
Traffic Count Profile Physical Condition of Buildings in the Corridor and Trade Area Retail Market Profile and Gap Analysis 27 Retail Market Place Profile Recommended Retailers for Recruitment Recommended Retail Mix Non-Retail Businesses 37 Existing Non-Retail Businesses Available Land and Space Recommended Non-Retail Users Steps to Improve Competitive Position of the Corridor - Implementation 52
Obstacles to Development/Redevelopment Conditions that Hamper Redevelopment What the City Should Do Options for Implementation Recommendations
Glossary of Terms G-1 Resources R-1 Tables T-1 Appendix
Northeast Corridor Market Study ii
NORTHEAST CORRIDOR REVITALIZATION INITIATIVE LIST OF TABLES
Demographic Profile page
1. Population Trends: 2000-2018 4, T-1 2. Population by Age Group 2013 T-2 3. Population by Age Group 2018 T-3 4. Median Age: 2000, 2010, 2013, 2018 T-4 5. Population by Race/Ethnicity2013,2018 T-5 6. Educational Attainment 2013 T-6 7. Employment by Occupation 2013 T-7 8. Employment by Industry 2013 T-8 9. Trends in Households: 2000-2018 T-9 10. Population 15+ by Marital Status 2013 6, T-10 11. Trends in Household Size T-11 12. Median Household Income T-12 13. Households by Income Group 2013, 2018 T-13 14. Value of Owner-Occupied Housing Units 2013, 2018 T-14 15. Households by Tenure 2013, 2018 T-15 16. Households by Number of Persons 2010 T-16 17. Households by Tenure and Mortgage Status 2010 T-17 18. Households by Disposable Income Group 2012 9, T-17 19. Disposable Income by Age of Householder 2012 T-18 20. Consumer Spending by Type 2012 T-19 Psycho Demographic Profile
21. Top Tapestry Segments in the Trade Area T-20 22. Characteristics of Top Tapestry Segments, LifeMode and Urbanization Groups T-21 23. Characteristics of Top Tapestry Segments, Age, Income & Household Type T-21 24. Characteristics of Top Tapestry Segments, Race/Ethnicity, Diversity and Description T-22
Trade Area and Corridor Characteristics
25. Summary of Building Permits Issued: 2008-2013 T-22 26. Building Permits Issued for Existing Structures: 2008-2013 16, T-23 27. Building Permits Issued for New Structures: 2008-2013 17, T-24 28. Zoning Summary for the Trade Area 19, T-25 29. Zoning Summary for the Corridor 20, T-25 30. Land Uses and Property Values in the Trade Area 21, T-26 31. Land Uses and Property Values in the Corridor 22, T-26 32. Trends in North East ISD Kindergarten Enrollment in Trade Area Schools 24, T-27 33. Traffic Counts in the Corridor and Comparable Corridors 25, T-28 34. Physical Condition of Buildings in the Trade Area 26, T-29
Northeast Corridor Market Study ii
Retail MarketPlace Gap and Leakage Analysis page 35. Retail MarketPlace Profile in the Trade Area 27, T-29 36. Industry Groups With Significant Surplus 28, T-30 37. Industry Groups With Significant Leakage 29, T-30 38. Recommended Retail Mix 35, T-31 39. Projected Retail Profile: 2018 36, T-32 Non-Retail Businesses 40. Commercial Property Inventory in the Corridor: 2013 T-33 41. Inventory of Land and Building Space 38, T-33 42. Vacant Land & Improvements for Sale or Lease in the RETAIL Segment 39, T-34 43. Vacant Land & Improvements for Sale or Lease in the MIXED USE Segment T-34 44. Vacant Land for Sale or Lease 39, T-34 45. Vacant Land for Sale or Lease – RETAIL Segment T-35 46. Vacant Land for Sale or Lease – MIXED USE Segment T-35 47. Vacant Building Space for Lease – RETAIL Segment T-36 48. Vacant Building Space for Lease – MIXED USE Segment T-36 49. Vacant Space for Lease Multi-purpose/Non-Retail
Northeast Corridor Market Study iii
NORTHEAST CORRIDOR REVITALIZATION INITIATIVE LIST OF GRAPHS
Demographic Profile page 1. Population Trends: 2000-2018 2. Population by Age Group 2013 3. Population by Race/Ethnicity 2013 4. Educational Attainment (No HS Diploma) 5 5. Employment by Occupation 2013 6 6. Employment by Industry 2013 6 7. Trends in Household Size: 2000, 2010, 2013, 2018 8. Median Household Income: 2000, 2010, 2013, 2018 7 9. Households by Income Group 2013, 2018 7 10. Value of Owner-Occupied Housing Units: 2013, 2018 8 11. Households by Tenure: 2013, 2018 12. Households by Tenure and Mortgage Status: 2010 8
Consumer Income 13. Households by Disposable Income Group: 2012 9
Psycho Demographic Profile 14. Top Tapestry Segment Comparison 10
Retail MarketPlace Gap and Leakage Analysis 15. First Tier Industry Groups with Leakage 29 16. Other General Merchandise Stores Leakage 30 17. Department Stores Leakage 31 18. Apparel Stores Leakage 32 19. Shoe Stores Leakage 33 20. Book, Periodical & Music Stores Leakage 34 21. Second Tier Retailers Leakage
LIST OF MAPS Map Number
1. San Antonio and the Trade Area 2 2. Northeast Corridor Trade Area 3 3. Northeast Corridor Trade Area 15 4. Residential Building Permits 17 5. Retail Building Permits 17 6. Non-Retail Building Permits 18 7. Zoning in the Trade Area 19 8. Zoning in the Corridor 20 9. Land Uses in the Trade Area 21 10. Land Uses in the Corridor 22 11. Vacant Land in the Trade Area 23 12. Vacant Land in the Corridor 24 13. Traffic Counts in the Corridor 25 14. Physical Condition of Buildings in the Corridor 26 15. Recommended Properties for Revitalization 61
The Dynamic Northeast Corridor Market Study
Prepared for the City of San Antonio Department of Planning
and Community Development
Prepared by Wendell Davis & Associates
October 2013
Executive Summary
NortheastCorridorRevitalizationStudy PageE‐1
NORTHEAST CORRIDOR REVITALIZATION INITIATIVE MARKET STUDY
Executive Summary
In July, Wendell Davis & Associates was selected to conduct the market study for the North East Corridor (NEC) Revitalization Initiative. Elements of the scope of services include Trade Area definition and Trade Area summaries of the demographic profile, consumer income and spending profile and the psycho-demographic profile. In addition, this report includes a description of retail and service businesses (“retail businesses”) in the NEC most likely to succeed, industries other than retail (“non-retail businesses”) that would be most likely to succeed, a description of current obstacles to development/ redevelopment, and recommendations on steps that should be taken to improve the competitive position of the NEC and its marketability.
This report includes summaries of the research conducted to meet requirements of the scope of services, along with observations, analysis and recommendations of the consultant.
Definition of the Northeast Corridor Trade Area
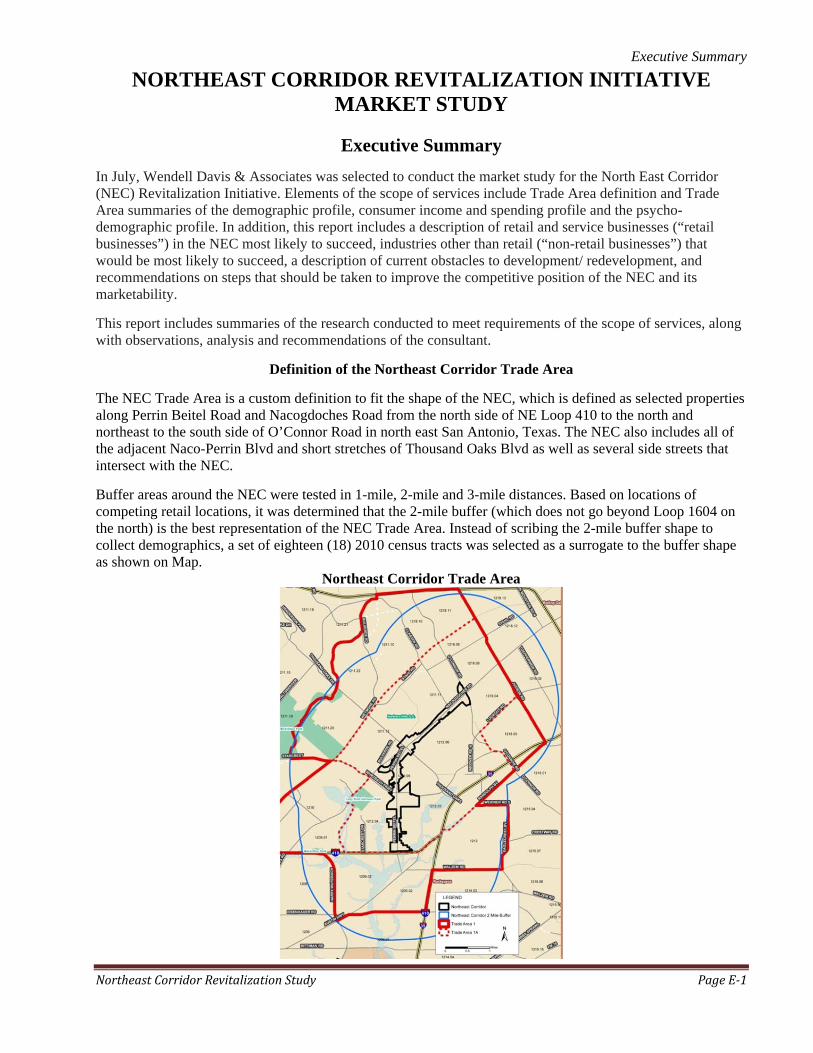
The NEC Trade Area is a custom definition to fit the shape of the NEC, which is defined as selected properties along Perrin Beitel Road and Nacogdoches Road from the north side of NE Loop 410 to the north and northeast to the south side of O’Connor Road in north east San Antonio, Texas. The NEC also includes all of the adjacent Naco-Perrin Blvd and short stretches of Thousand Oaks Blvd as well as several side streets that intersect with the NEC.
Buffer areas around the NEC were tested in 1-mile, 2-mile and 3-mile distances. Based on locations of competing retail locations, it was determined that the 2-mile buffer (which does not go beyond Loop 1604 on the north) is the best representation of the NEC Trade Area. Instead of scribing the 2-mile buffer shape to collect demographics, a set of eighteen (18) 2010 census tracts was selected as a surrogate to the buffer shape as shown on Map.
Northeast Corridor Trade Area
Executive Summary
NortheastCorridorRevitalizationStudy PageE‐2
Demographic Profile
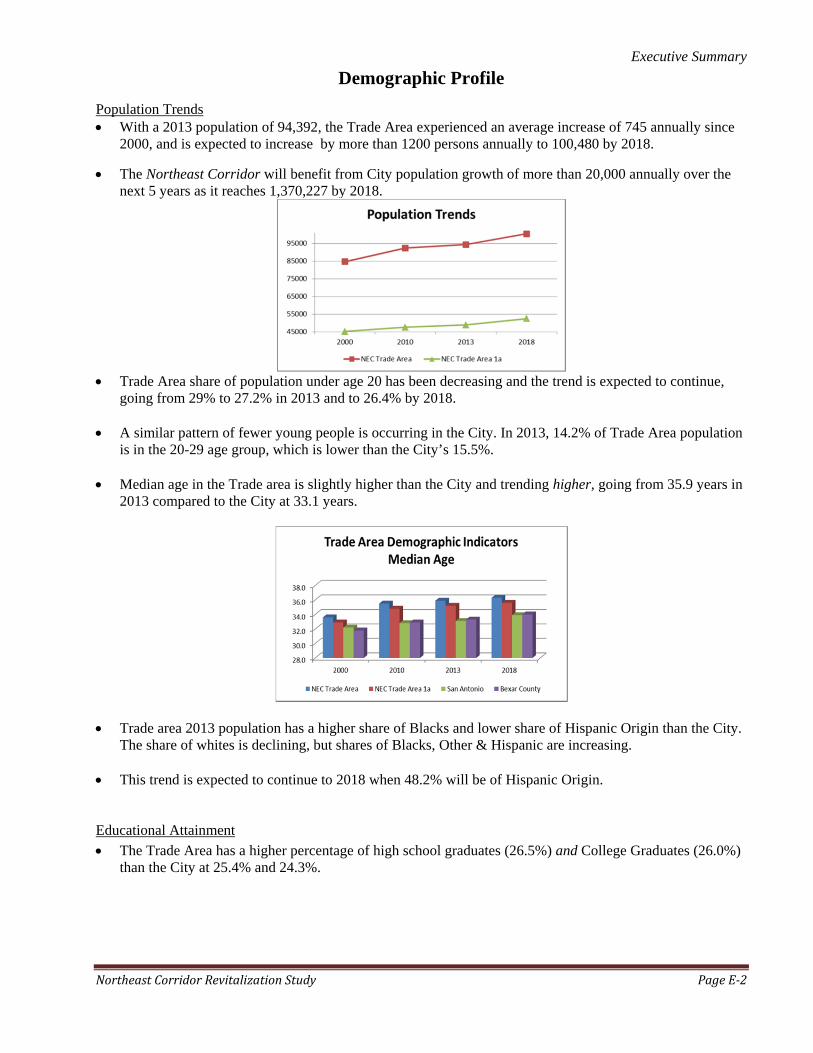
Population Trends With a 2013 population of 94,392, the Trade Area experienced an average increase of 745 annually since
2000, and is expected to increase by more than 1200 persons annually to 100,480 by 2018.
The Northeast Corridor will benefit from City population growth of more than 20,000 annually over the next 5 years as it reaches 1,370,227 by 2018.
Trade Area share of population under age 20 has been decreasing and the trend is expected to continue,
going from 29% to 27.2% in 2013 and to 26.4% by 2018. A similar pattern of fewer young people is occurring in the City. In 2013, 14.2% of Trade Area population
is in the 20-29 age group, which is lower than the City’s 15.5%. Median age in the Trade area is slightly higher than the City and trending higher, going from 35.9 years in
2013 compared to the City at 33.1 years.
Trade area 2013 population has a higher share of Blacks and lower share of Hispanic Origin than the City.
The share of whites is declining, but shares of Blacks, Other & Hispanic are increasing. This trend is expected to continue to 2018 when 48.2% will be of Hispanic Origin. Educational Attainment
The Trade Area has a higher percentage of high school graduates (26.5%) and College Graduates (26.0%) than the City at 25.4% and 24.3%.
Executive Summary
NortheastCorridorRevitalizationStudy PageE‐3
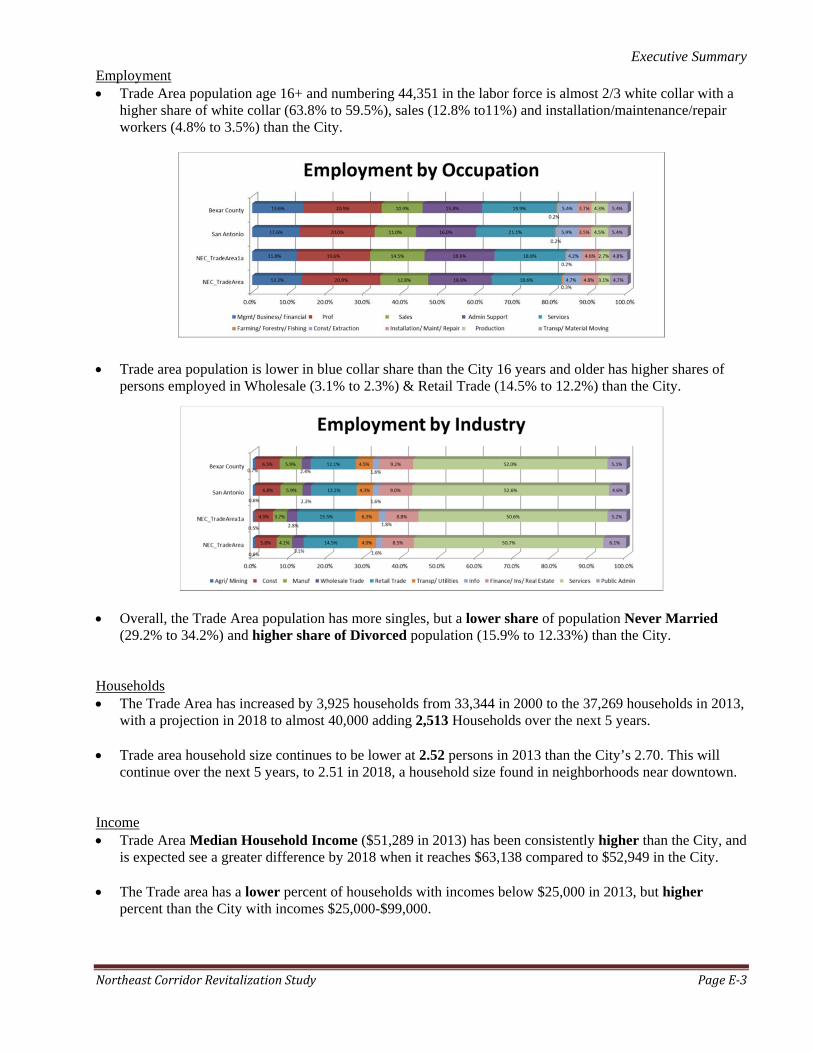
Employment Trade Area population age 16+ and numbering 44,351 in the labor force is almost 2/3 white collar with a
higher share of white collar (63.8% to 59.5%), sales (12.8% to11%) and installation/maintenance/repair workers (4.8% to 3.5%) than the City.
Trade area population is lower in blue collar share than the City 16 years and older has higher shares of persons employed in Wholesale (3.1% to 2.3%) & Retail Trade (14.5% to 12.2%) than the City.
Overall, the Trade Area population has more singles, but a lower share of population Never Married
(29.2% to 34.2%) and higher share of Divorced population (15.9% to 12.33%) than the City. Households The Trade Area has increased by 3,925 households from 33,344 in 2000 to the 37,269 households in 2013,
with a projection in 2018 to almost 40,000 adding 2,513 Households over the next 5 years. Trade area household size continues to be lower at 2.52 persons in 2013 than the City’s 2.70. This will
continue over the next 5 years, to 2.51 in 2018, a household size found in neighborhoods near downtown. Income Trade Area Median Household Income ($51,289 in 2013) has been consistently higher than the City, and
is expected see a greater difference by 2018 when it reaches $63,138 compared to $52,949 in the City. The Trade area has a lower percent of households with incomes below $25,000 in 2013, but higher
percent than the City with incomes $25,000-$99,000.
Executive Summary
NortheastCorridorRevitalizationStudy PageE‐4
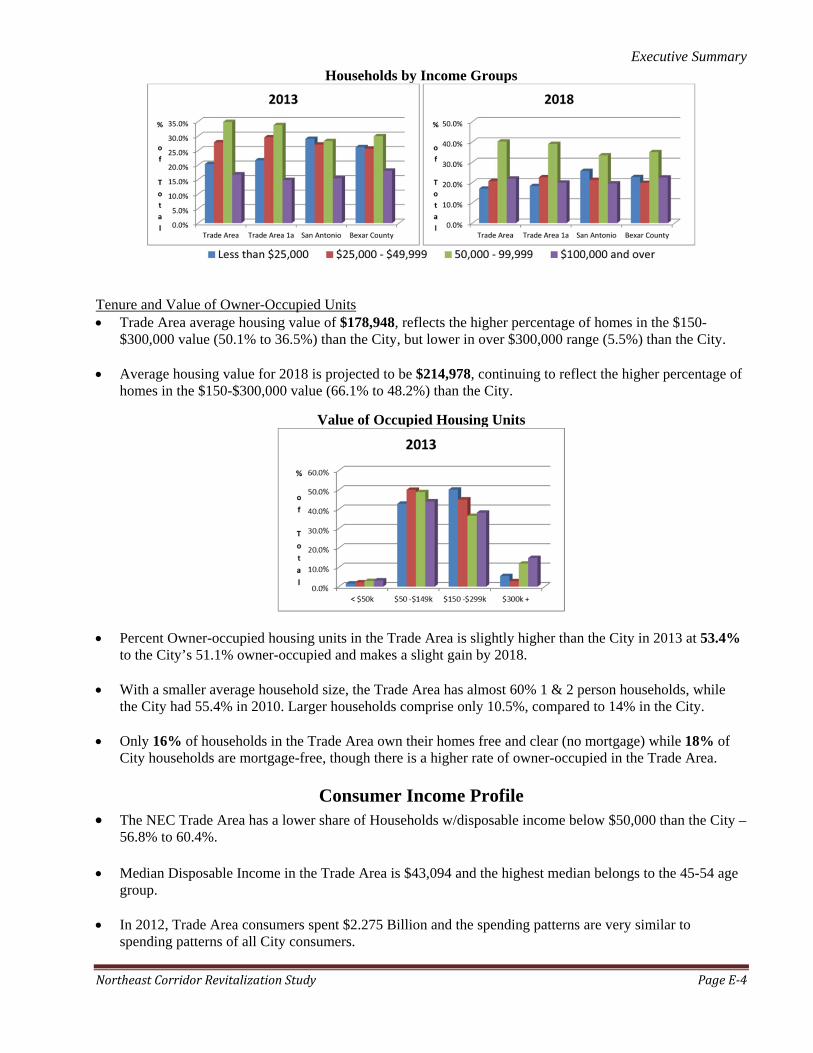
Households by Income Groups
Tenure and Value of Owner-Occupied Units Trade Area average housing value of $178,948, reflects the higher percentage of homes in the $150-
$300,000 value (50.1% to 36.5%) than the City, but lower in over $300,000 range (5.5%) than the City. Average housing value for 2018 is projected to be $214,978, continuing to reflect the higher percentage of
homes in the $150-$300,000 value (66.1% to 48.2%) than the City.
Value of Occupied Housing Units
Percent Owner-occupied housing units in the Trade Area is slightly higher than the City in 2013 at 53.4%
to the City’s 51.1% owner-occupied and makes a slight gain by 2018. With a smaller average household size, the Trade Area has almost 60% 1 & 2 person households, while
the City had 55.4% in 2010. Larger households comprise only 10.5%, compared to 14% in the City. Only 16% of households in the Trade Area own their homes free and clear (no mortgage) while 18% of
City households are mortgage-free, though there is a higher rate of owner-occupied in the Trade Area.
Consumer Income Profile
The NEC Trade Area has a lower share of Households w/disposable income below $50,000 than the City – 56.8% to 60.4%.
Median Disposable Income in the Trade Area is $43,094 and the highest median belongs to the 45-54 age group.
In 2012, Trade Area consumers spent $2.275 Billion and the spending patterns are very similar to
spending patterns of all City consumers.
Executive Summary
NortheastCorridorRevitalizationStudy PageE‐5
Psycho-Demographic Profile
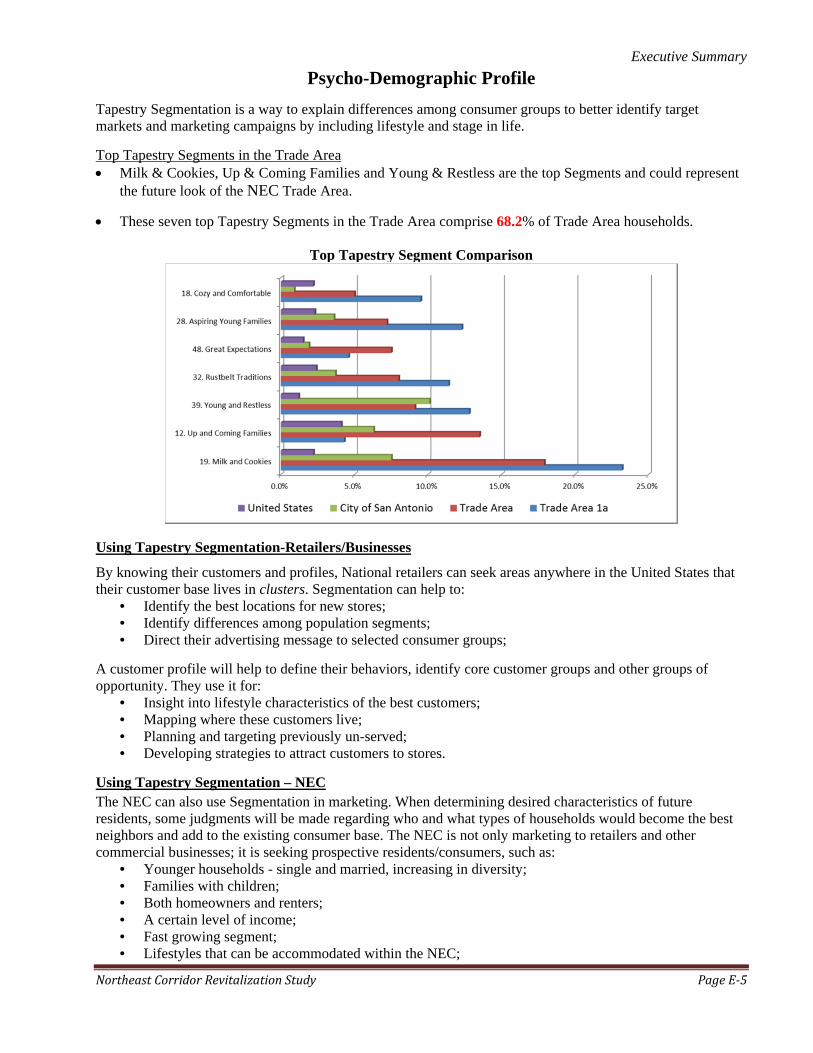
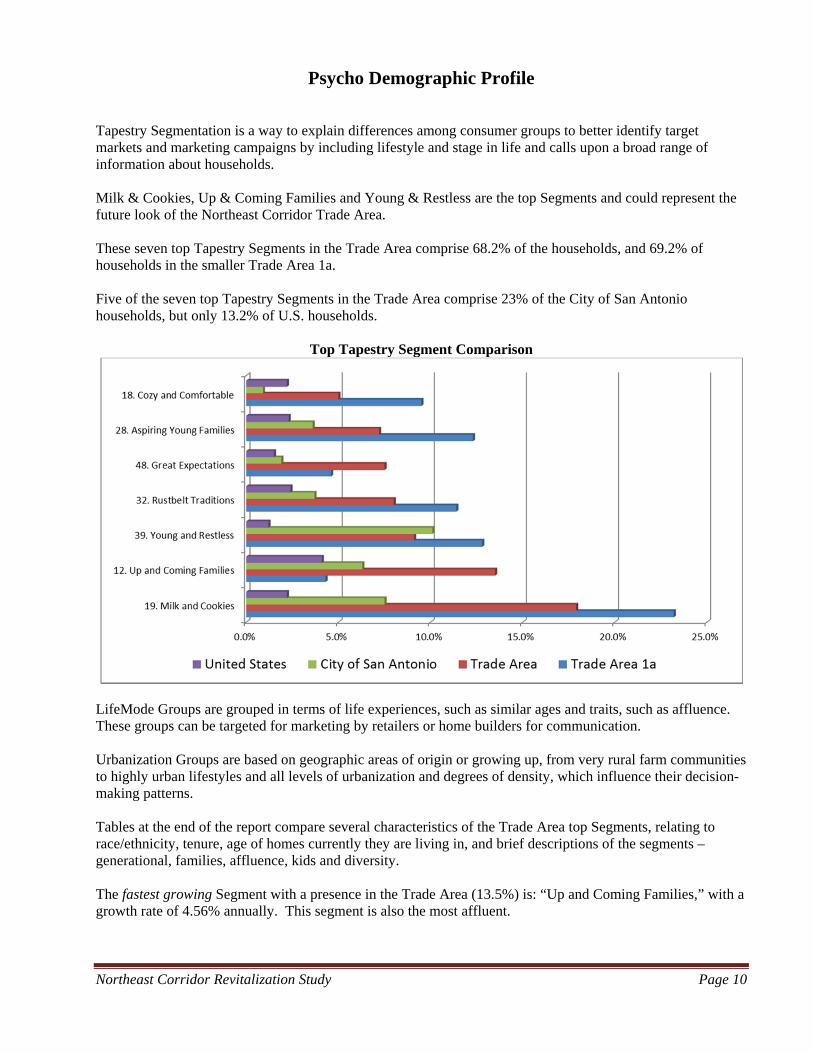
Tapestry Segmentation is a way to explain differences among consumer groups to better identify target markets and marketing campaigns by including lifestyle and stage in life.
Top Tapestry Segments in the Trade Area Milk & Cookies, Up & Coming Families and Young & Restless are the top Segments and could represent
the future look of the NEC Trade Area.
These seven top Tapestry Segments in the Trade Area comprise 68.2% of Trade Area households.
Top Tapestry Segment Comparison
Using Tapestry Segmentation-Retailers/Businesses
By knowing their customers and profiles, National retailers can seek areas anywhere in the United States that their customer base lives in clusters. Segmentation can help to:
• Identify the best locations for new stores; • Identify differences among population segments; • Direct their advertising message to selected consumer groups;
A customer profile will help to define their behaviors, identify core customer groups and other groups of opportunity. They use it for:
• Insight into lifestyle characteristics of the best customers; • Mapping where these customers live; • Planning and targeting previously un-served; • Developing strategies to attract customers to stores.
Using Tapestry Segmentation – NEC The NEC can also use Segmentation in marketing. When determining desired characteristics of future residents, some judgments will be made regarding who and what types of households would become the best neighbors and add to the existing consumer base. The NEC is not only marketing to retailers and other commercial businesses; it is seeking prospective residents/consumers, such as:
• Younger households - single and married, increasing in diversity; • Families with children; • Both homeowners and renters; • A certain level of income; • Fast growing segment; • Lifestyles that can be accommodated within the NEC;
Executive Summary
NortheastCorridorRevitalizationStudy PageE‐6
Characteristics of the Trade Area
The 2-mile buffer is the best representation of the NEC Trade Area and included in the buffer is a set of eighteen (18) 2010 census tracts selected to collect demographics as shown on Map 3.
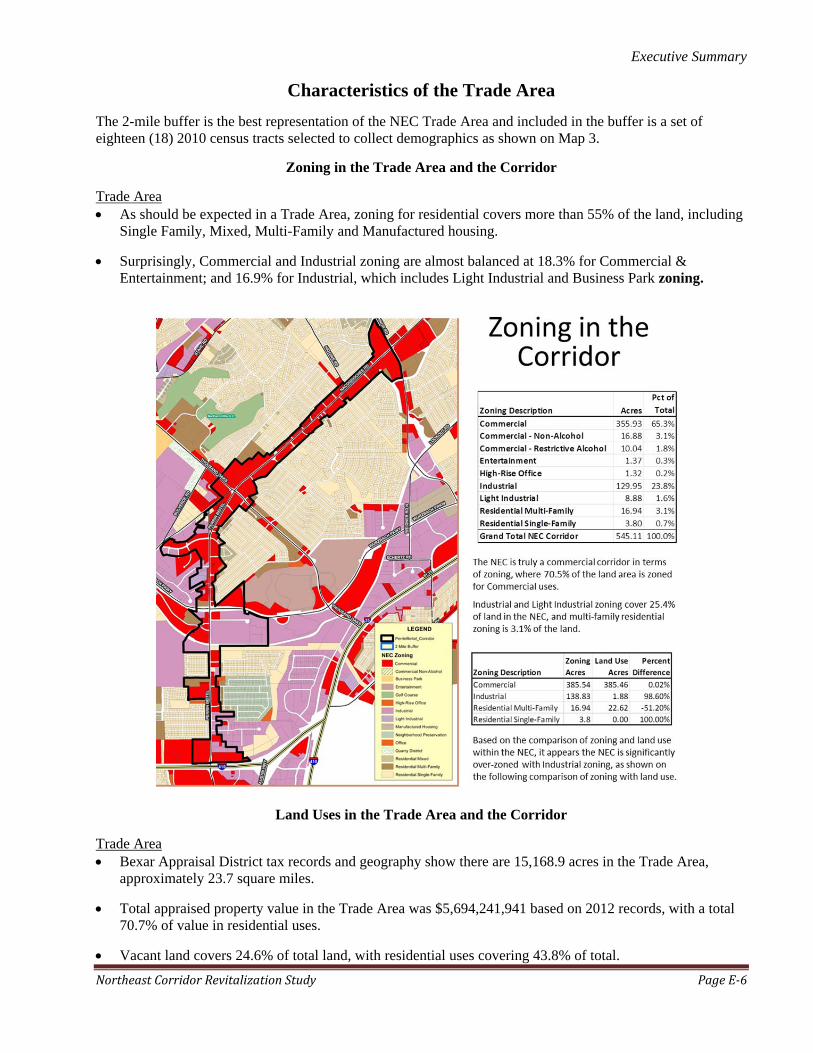
Zoning in the Trade Area and the Corridor
Trade Area As should be expected in a Trade Area, zoning for residential covers more than 55% of the land, including
Single Family, Mixed, Multi-Family and Manufactured housing.
Surprisingly, Commercial and Industrial zoning are almost balanced at 18.3% for Commercial & Entertainment; and 16.9% for Industrial, which includes Light Industrial and Business Park zoning.
Land Uses in the Trade Area and the Corridor
Trade Area Bexar Appraisal District tax records and geography show there are 15,168.9 acres in the Trade Area,
approximately 23.7 square miles.
Total appraised property value in the Trade Area was $5,694,241,941 based on 2012 records, with a total 70.7% of value in residential uses.
Vacant land covers 24.6% of total land, with residential uses covering 43.8% of total.
Executive Summary
NortheastCorridorRevitalizationStudy PageE‐7
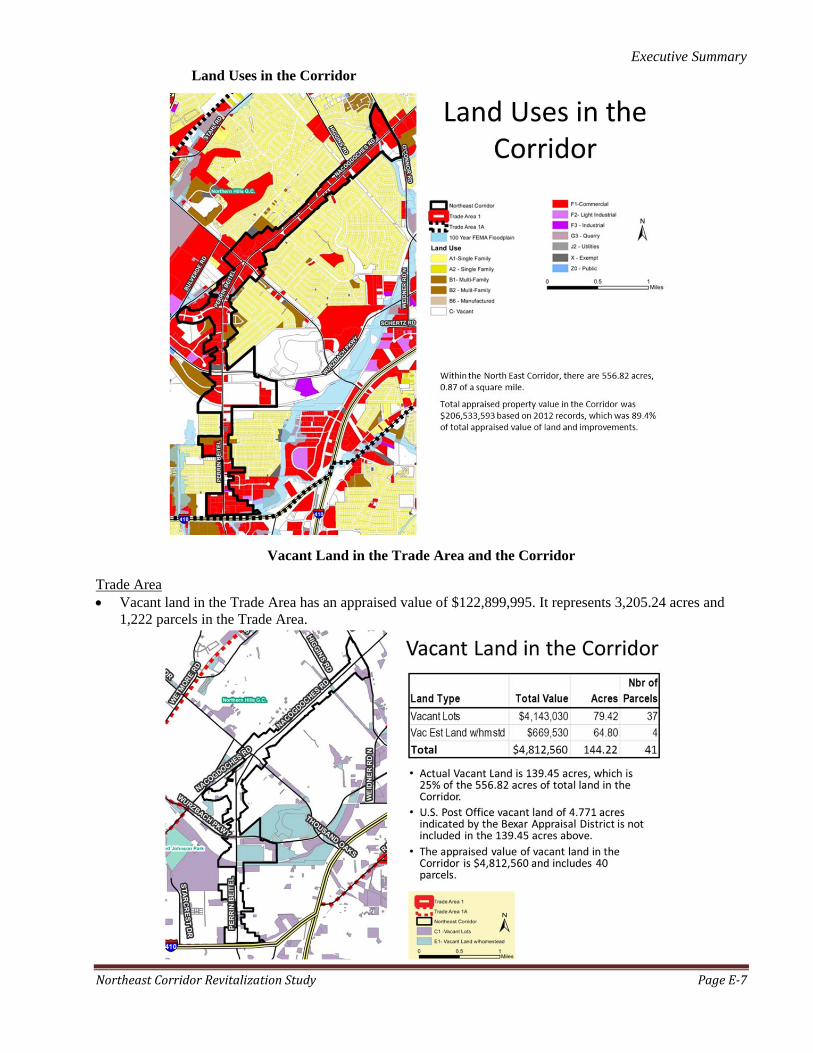
Land Uses in the Corridor
Vacant Land in the Trade Area and the Corridor
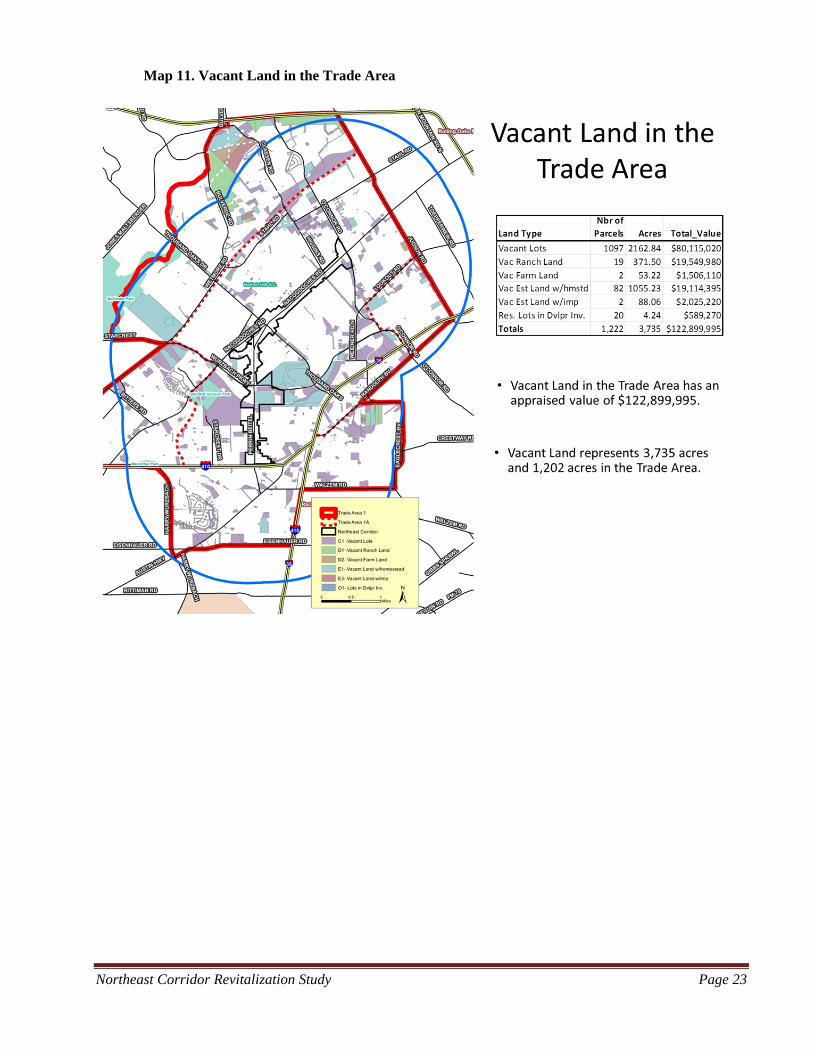
Trade Area Vacant land in the Trade Area has an appraised value of $122,899,995. It represents 3,205.24 acres and
1,222 parcels in the Trade Area.
Executive Summary
NortheastCorridorRevitalizationStudy PageE‐8
Trends in Kindergarten Enrollment
North East ISD kindergarten enrollment has increased by 15% over the ten years, but kindergarten enrollment in the Trade Area has decreased by 59% and the smaller Trade Area 1a decreased by 6%.
Traffic Counts in the Corridor While traffic counts have declined between10% and 20% over the past several years, the NEC can hold its
own against other corridors in the City with counts ranging from 35,000 to 37,000 on the lower part of Perrin Beitel to over 28,000 ADT along Nacogdoches between Thousand Oaks and O’Connor.
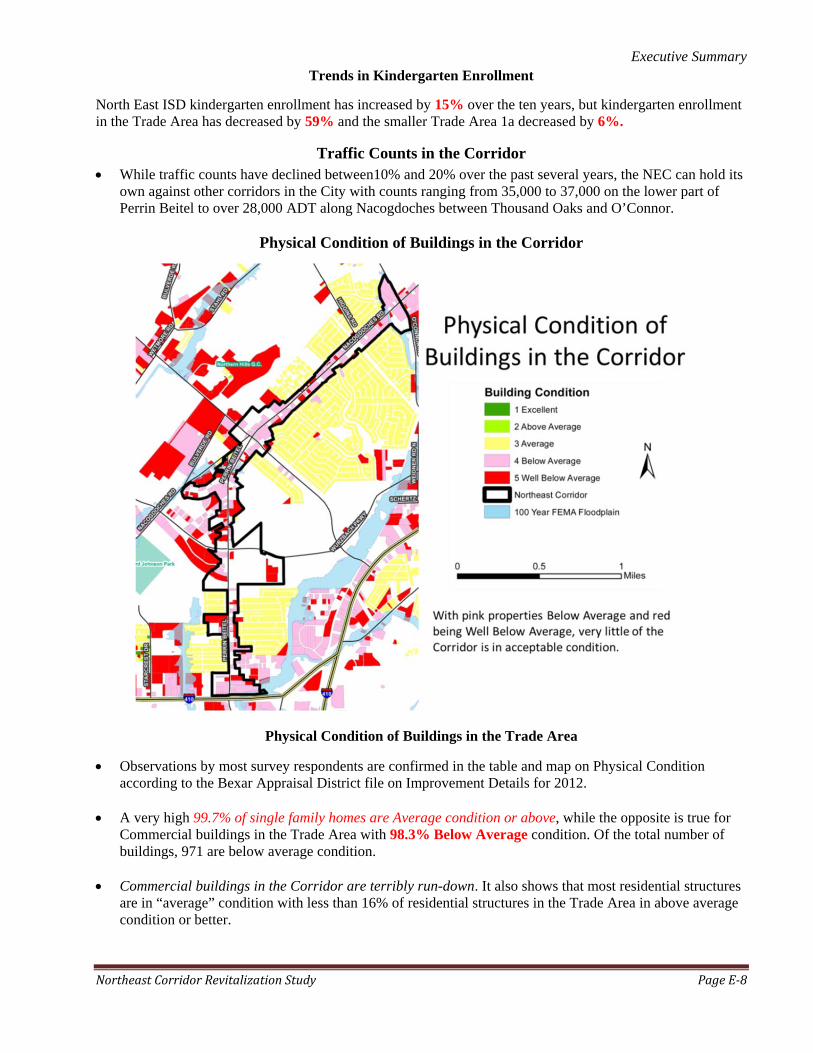
Physical Condition of Buildings in the Corridor
Physical Condition of Buildings in the Trade Area
Observations by most survey respondents are confirmed in the table and map on Physical Condition according to the Bexar Appraisal District file on Improvement Details for 2012.
A very high 99.7% of single family homes are Average condition or above, while the opposite is true for
Commercial buildings in the Trade Area with 98.3% Below Average condition. Of the total number of buildings, 971 are below average condition.
Commercial buildings in the Corridor are terribly run-down. It also shows that most residential structures
are in “average” condition with less than 16% of residential structures in the Trade Area in above average condition or better.
Executive Summary
NortheastCorridorRevitalizationStudy PageE‐9
Retail Market Profile and Gap Analysis
A positive gap represents a LEAKAGE gap of sales to other locations outside the subject area and sales is less than demand by households within the trade area. For merchants in industry groups that have leakage, it indicates that households in the trade area are shopping elsewhere and presents an opportunity for those merchants to increase sales. In the case of the NEC, it means opportunity for additional stores in the industry groups showing a LEAKAGE gap. Retail Market Place Profile The Trade Area retail market in 2012 experienced more than $970 million in retail trade, food & drink
sales through 804 establishments.
Consumer households in the Trade Area spent more than $955 million during the same year, leaving a retail Surplus Gap of ($14,604,768).
Industry Groups with Significant SURPLUS Gap
Industry Groups in the Trade Area show a Significant Surplus Gap of sales totaled more than $193 million in 257 establishments with households demand at only $72 million, leaving a gap of $120,931,479.
Industry Groups with Significant LEAKAGE Gap
LEAKAGE is experienced when there is more in SPENDING in an area than sales by establishments in that area. Thus, “leakage” of dollars is going outside the Trade Area.
Almost half of the Retail Leakage Gap of $95,058,747 occurred in “Other General Merchandise Stores” Group. However, a new Wal-Mart in the Trade Area will capture at least $50 million of those sales.
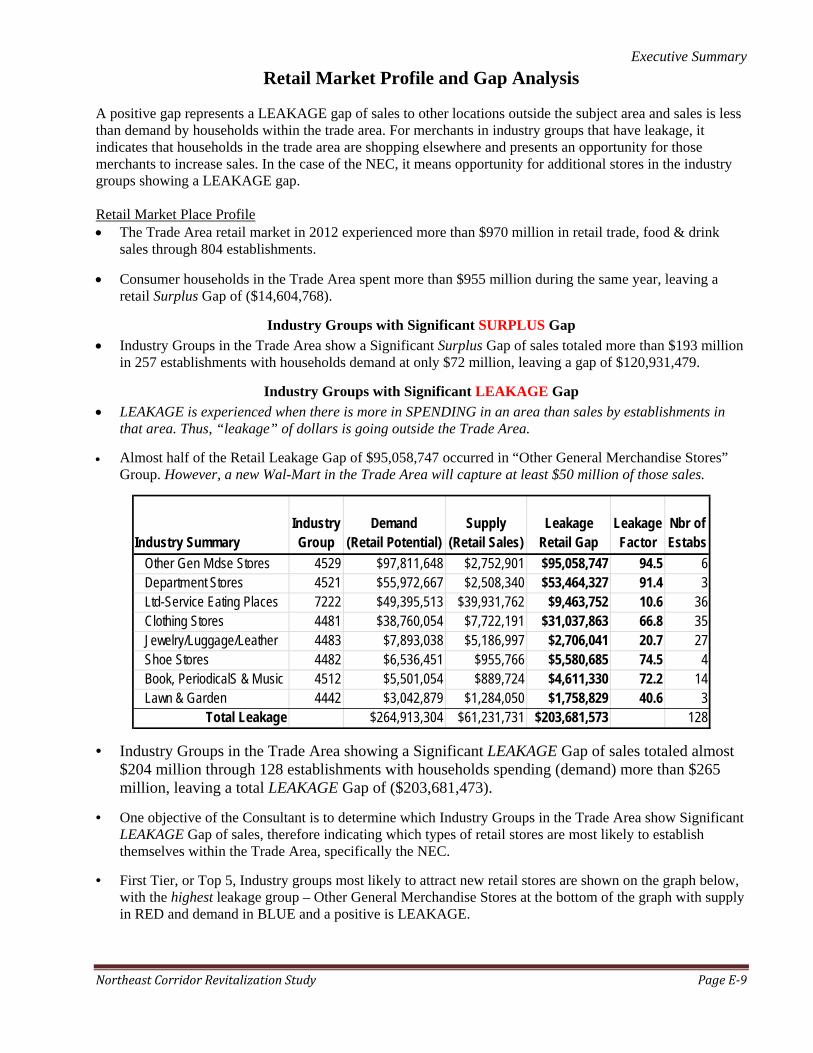
• Industry Groups in the Trade Area showing a Significant LEAKAGE Gap of sales totaled almost $204 million through 128 establishments with households spending (demand) more than $265 million, leaving a total LEAKAGE Gap of ($203,681,473).
• One objective of the Consultant is to determine which Industry Groups in the Trade Area show Significant LEAKAGE Gap of sales, therefore indicating which types of retail stores are most likely to establish themselves within the Trade Area, specifically the NEC.
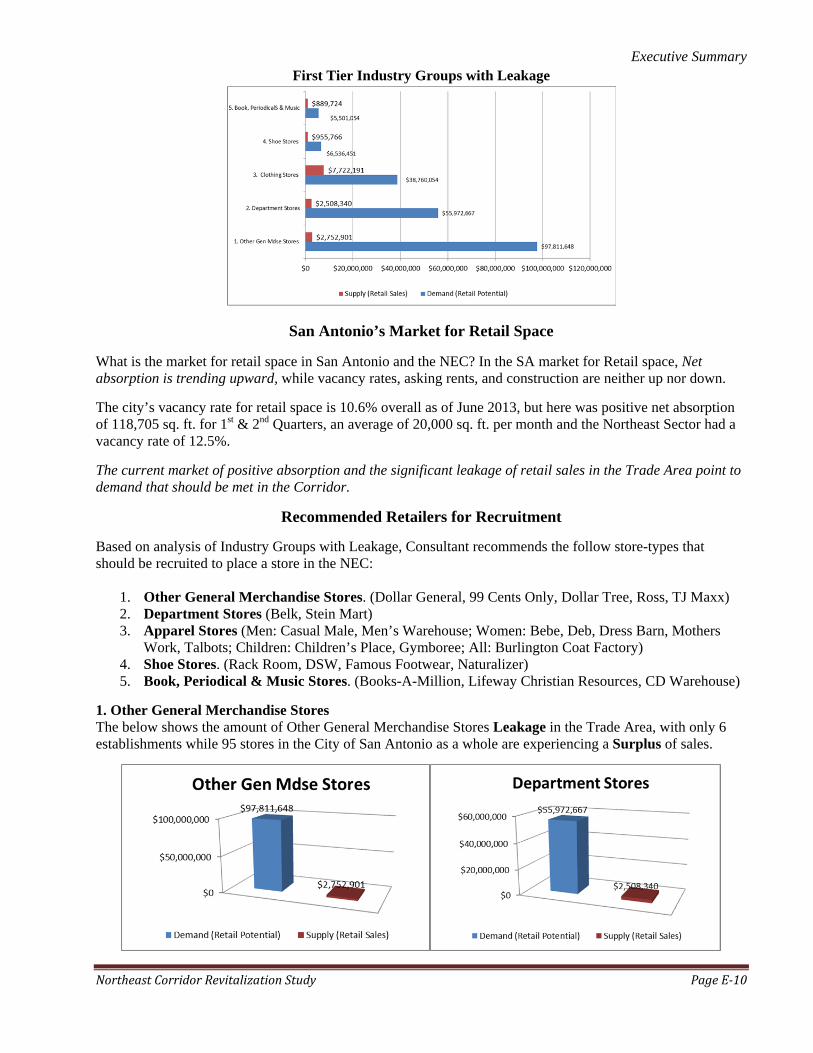
• First Tier, or Top 5, Industry groups most likely to attract new retail stores are shown on the graph below, with the highest leakage group – Other General Merchandise Stores at the bottom of the graph with supply in RED and demand in BLUE and a positive is LEAKAGE.
Industry SummaryIndustry Group
Demand (Retail Potential)
Supply (Retail Sales)
Leakage Retail Gap
Leakage Factor
Nbr of Estabs
Other Gen Mdse Stores 4529 $97,811,648 $2,752,901 $95,058,747 94.5 6 Department Stores 4521 $55,972,667 $2,508,340 $53,464,327 91.4 3 Ltd-Service Eating Places 7222 $49,395,513 $39,931,762 $9,463,752 10.6 36 Clothing Stores 4481 $38,760,054 $7,722,191 $31,037,863 66.8 35 Jewelry/Luggage/Leather 4483 $7,893,038 $5,186,997 $2,706,041 20.7 27 Shoe Stores 4482 $6,536,451 $955,766 $5,580,685 74.5 4 Book, PeriodicalS & Music 4512 $5,501,054 $889,724 $4,611,330 72.2 14 Lawn & Garden 4442 $3,042,879 $1,284,050 $1,758,829 40.6 3
Total Leakage $264,913,304 $61,231,731 $203,681,573 128
Executive Summary
NortheastCorridorRevitalizationStudy PageE‐10
First Tier Industry Groups with Leakage
San Antonio’s Market for Retail Space
What is the market for retail space in San Antonio and the NEC? In the SA market for Retail space, Net absorption is trending upward, while vacancy rates, asking rents, and construction are neither up nor down.
The city’s vacancy rate for retail space is 10.6% overall as of June 2013, but here was positive net absorption of 118,705 sq. ft. for 1st & 2nd Quarters, an average of 20,000 sq. ft. per month and the Northeast Sector had a vacancy rate of 12.5%.
The current market of positive absorption and the significant leakage of retail sales in the Trade Area point to demand that should be met in the Corridor.
Recommended Retailers for Recruitment
Based on analysis of Industry Groups with Leakage, Consultant recommends the follow store-types that should be recruited to place a store in the NEC:
1. Other General Merchandise Stores. (Dollar General, 99 Cents Only, Dollar Tree, Ross, TJ Maxx) 2. Department Stores (Belk, Stein Mart) 3. Apparel Stores (Men: Casual Male, Men’s Warehouse; Women: Bebe, Deb, Dress Barn, Mothers
Work, Talbots; Children: Children’s Place, Gymboree; All: Burlington Coat Factory) 4. Shoe Stores. (Rack Room, DSW, Famous Footwear, Naturalizer) 5. Book, Periodical & Music Stores. (Books-A-Million, Lifeway Christian Resources, CD Warehouse)
1. Other General Merchandise Stores The below shows the amount of Other General Merchandise Stores Leakage in the Trade Area, with only 6 establishments while 95 stores in the City of San Antonio as a whole are experiencing a Surplus of sales.
Executive Summary
NortheastCorridorRevitalizationStudy PageE‐11
2. Department Stores The graph below shows the amount of Department Stores Leakage in the Trade Area, with only 3 establishments while 107 stores in the City of San Antonio as a whole are experiencing a Surplus of sales.
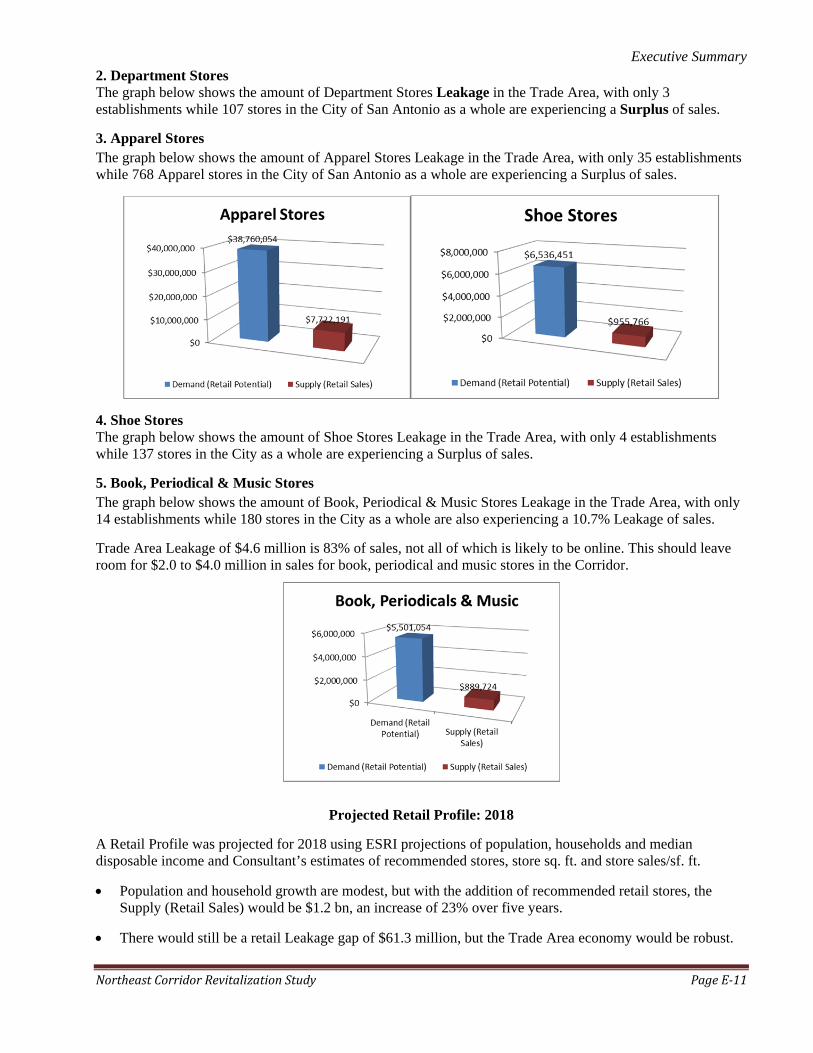
3. Apparel Stores The graph below shows the amount of Apparel Stores Leakage in the Trade Area, with only 35 establishments while 768 Apparel stores in the City of San Antonio as a whole are experiencing a Surplus of sales.
4. Shoe Stores The graph below shows the amount of Shoe Stores Leakage in the Trade Area, with only 4 establishments while 137 stores in the City as a whole are experiencing a Surplus of sales.
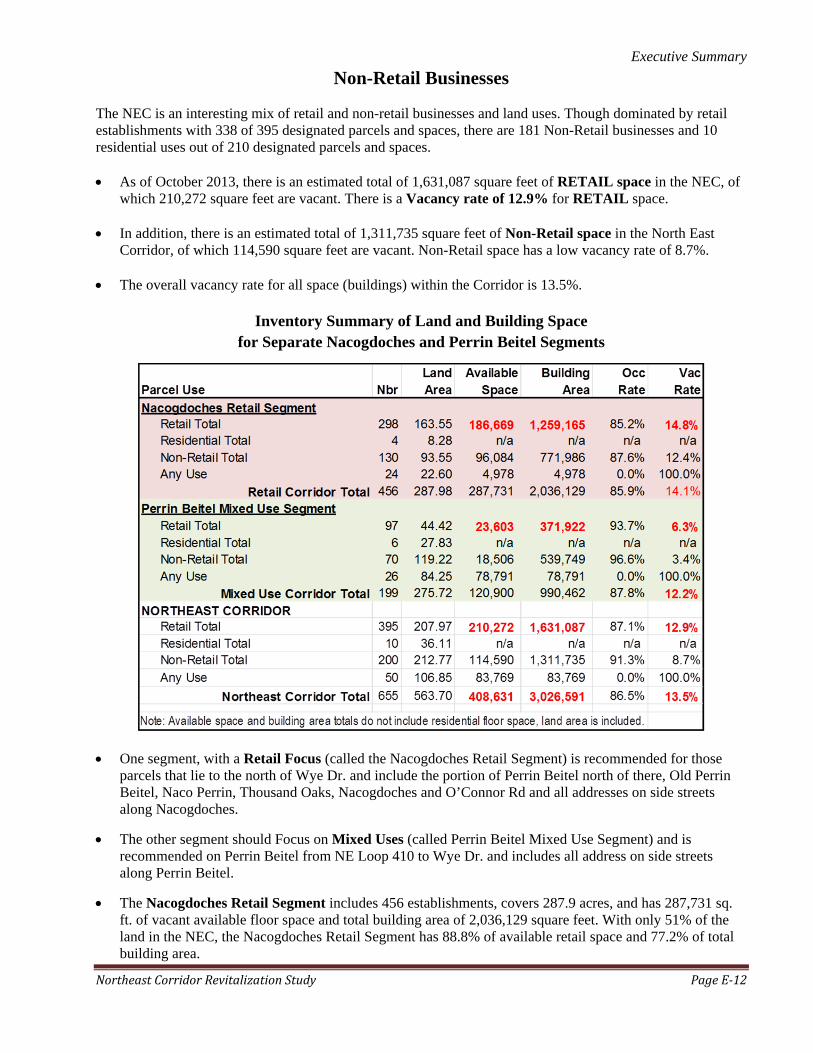
5. Book, Periodical & Music Stores The graph below shows the amount of Book, Periodical & Music Stores Leakage in the Trade Area, with only 14 establishments while 180 stores in the City as a whole are also experiencing a 10.7% Leakage of sales.
Trade Area Leakage of $4.6 million is 83% of sales, not all of which is likely to be online. This should leave room for $2.0 to $4.0 million in sales for book, periodical and music stores in the Corridor.
Projected Retail Profile: 2018
A Retail Profile was projected for 2018 using ESRI projections of population, households and median disposable income and Consultant’s estimates of recommended stores, store sq. ft. and store sales/sf. ft.
Population and household growth are modest, but with the addition of recommended retail stores, the Supply (Retail Sales) would be $1.2 bn, an increase of 23% over five years.
There would still be a retail Leakage gap of $61.3 million, but the Trade Area economy would be robust.
Executive Summary
NortheastCorridorRevitalizationStudy PageE‐12
Non-Retail Businesses
The NEC is an interesting mix of retail and non-retail businesses and land uses. Though dominated by retail establishments with 338 of 395 designated parcels and spaces, there are 181 Non-Retail businesses and 10 residential uses out of 210 designated parcels and spaces. As of October 2013, there is an estimated total of 1,631,087 square feet of RETAIL space in the NEC, of
which 210,272 square feet are vacant. There is a Vacancy rate of 12.9% for RETAIL space. In addition, there is an estimated total of 1,311,735 square feet of Non-Retail space in the North East
Corridor, of which 114,590 square feet are vacant. Non-Retail space has a low vacancy rate of 8.7%. The overall vacancy rate for all space (buildings) within the Corridor is 13.5%.
Inventory Summary of Land and Building Space
for Separate Nacogdoches and Perrin Beitel Segments
One segment, with a Retail Focus (called the Nacogdoches Retail Segment) is recommended for those
parcels that lie to the north of Wye Dr. and include the portion of Perrin Beitel north of there, Old Perrin Beitel, Naco Perrin, Thousand Oaks, Nacogdoches and O’Connor Rd and all addresses on side streets along Nacogdoches.
The other segment should Focus on Mixed Uses (called Perrin Beitel Mixed Use Segment) and is recommended on Perrin Beitel from NE Loop 410 to Wye Dr. and includes all address on side streets along Perrin Beitel.
The Nacogdoches Retail Segment includes 456 establishments, covers 287.9 acres, and has 287,731 sq. ft. of vacant available floor space and total building area of 2,036,129 square feet. With only 51% of the land in the NEC, the Nacogdoches Retail Segment has 88.8% of available retail space and 77.2% of total building area.
Executive Summary
NortheastCorridorRevitalizationStudy PageE‐13
Non-Retail Markets in San Antonio
• Industrial – Call Center Industry
• Community College, Tech or Trade School • Medical Office • Office • Apartments
San Antonio’s Real Estate Markets The North East Corridor is not suitable for Distribution Warehouse space, and tends to be a better market for Service Center/Flex space although the current market demand and near future do not favor the NEC.
The NEC is a location where most medical office space is Class C. Generally, the current market for Medical Office space and near future do not favor the Corridor for demand of this type of space.
The current market for Office Space and that of the near future are not favorable for the NEC with demand for this type of space.
Current positive trends in the apartment market are favorable to the NEC with demand for more housing all over.
Recommended Non-Retail Users
Consultant is charged with recommending up to three Non-Retail Users for possible recruitment to locate in the Corridor. The recommendations are Apartments for Millennials (under 35 years), a Call Center and a campus/center for a community college or Trade School. Apartment Opportunities The Corridor and its Trade Area are expected to experience growth up to 2,500 households over the next 5 years. There is vacant and under-used land within the NEC and too much retail space.
Call Center Opportunity In addition to the property at 13526 Nacogdoches, there is a possible site for a small call center at 8531 Perrin Beitel. This building is approximately 47,000 sq. ft. could accommodate a small call center of between 200 and 250 employees or agents. Community College, Technical or Trade School Opportunity There are also two potential locations for a community college, technical or trade school in the Corridor. Both buildings are mentioned above with regard to a call center. The location at 13526 Nacogdoches with 67,546 sq. ft. could provide space for 450 to 750 students. The former Lack’s furniture store with 47,000 sq. ft. could space for 350 to 500 students. This building has never been used for anything but furniture retail and would need to be remodeled and properly equipped.
Executive Summary
NortheastCorridorRevitalizationStudy PageE‐14
Steps to Improve Competitive Position of the Corridor IMPLEMENTATION
Obstacles to Development/Redevelopment • Owner asking price and for lease only key properties • Attitude of status quo • Lack of cooperation among business owners, landlords, land owners and neighborhood associations; • Perrin Oaks Plaza – the fenced, “sinking brown building.” • Level of commitment by the City to redevelopment • Unwillingness of owners/landlords to tolerate “dark space;” • Time and cost in obtaining approvals to code; • NIMBY reactions (VIA Transit Station and multifamily); • Political uncertainty (city can influence the developers’ perception by being friendly toward proposals); • Consumer confidence in Corridor businesses; • Lack of appropriate space/location for selected retailers;
Conditions that Hamper Redevelopment • Lack of trust or loyalty between business owners and neighbors; • Lack of consistent, passionate leadership within the business community; • Lack of design standards, appearance of corridor; • Lack of maintenance (buildings, public areas, vacant lots); • Crime (arson, graffiti, theft, robbery); • No incentive for owners/landlords to plan for the long-term – rent to marginal tenants now to avoid
maintaining “dark” space for better tenants later; • Projected increases in long-term interest rates and anticipated reluctance of lenders to finance projects.
PRO-ACTIVE Revitalization Tools
Take advantage of Pro-Active revitalization tools such as Public Improvement Districts (PID) and Tax Increment Reinvestment Zones (TIRZ).
Public Improvement Districts (PID): • PIDs offer an alternative means for financing public improvement projects needed for economic growth. • Can provide means to fund supplemental services and improvements to meet community needs which
could not otherwise be constructed or provided and be paid by those who benefit the most from them; • Financed through assessment (say 0.08 to 0.17 per $100 valuation) against all property owners in District;
Tax Increment Reinvestment Zone (TIRZ) • Create a TIRZ when sufficient improvements in the Zone are known, including subdivisions with approved
plans or commercial area with new construction activity; • TIRZ can be empowered to borrow against future revenue, but funds cannot be used for maintenance; • TIRZ funds CAN be used in ways not allowed by other types of Districts, such as façade preservation,
acquisition of property, demolition of private improvements, etc.; • TIRZ can be empowered to condemn and acquire private property; • Projected revenue for the TIRZ with only the Sky Mine included as tax base is $570,000 annually.
Neighborhood Empowerment Zone (NEZ): Neighborhood Empowerment Zones are allowed by the State of Texas for potential economic
development, to promote housing, affordable housing, increase economic development, increase quality of social services, education, public safety or rehab affordable housing within a designated zone.
A NEZ can refund building fees, refund and abate sales taxes, abate property taxes and achieve environmental goals in order to benefit the zone.
Executive Summary
NortheastCorridorRevitalizationStudy PageE‐15
Recommendations Steps to Improve the NEC Competitive Position
General Recommendations Adopt a pro-active attitude and provide the tools for successful revitalization;
Encourage strong pro-active leadership in the Corridor Business Community to focus on redevelopment;
Create an entity with condemnation powers and funding that can/will redevelop the Corridor;
Provide an entity with borrowing powers to take advantage of guaranteed revenue from known projects;
Prepare design guidelines for façade preservation, signage and landscaping to allow rather than to impose on owners of marginal properties in both the Retail and the Mixed Use Segments of the Corridor;
Convince property owners and businesses to follow adopted guidelines them in order to improve overall business and consider establishing a RETAIL Segment north of Wye Drive and a MIXED USE Segment south of Wye Drive for administrative, maintenance and marketing purposes;
Monitor, define and measure success for both Segments of the Corridor.
Provide design assistance to all property owners in the Corridor to make sketches that illustrate what their facades will look like when applying the design guidelines;
Create a village theme around the intersection of Thousand Oaks & Nacogdoches in the Retail Segment, make it walkable for at least the village, if not entire retail corridor;
Retailers and Retail
Begin recruiting the retailers from the following RETAIL Industry Groups as discussed above that represent significant LEAKAGE of retail sales from the Corridor: 1) Other General Merchandise Stores, including Discount Stores; 2) Department Stores; 3) Apparel Stores; 4) Shoe Stores; and 5) Book Stores.
Non-Retail to Pursue and To Do 1) Begin recruiting developers for apartments for selected sites or other suitable locations; 2) recruit call
centers; and 3) entice Alamo Colleges to place a community college campus within the Corridor, recruit technical schools and trade schools by promoting existing vacant buildings and space.
Create a PID to address the needs of a mixed-use non-retail Corridor Segment;
Residential in the Corridor Assist and facilitate the addition of 1,000 multi-family units over the next five years to supplement the
existing market.
Residential in Trade Area neighborhoods Establish a Neighborhood Empowerment Zone to promote and revitalize housing, affordable housing,
economic development and quality services within the designated area. Revitalization
Create a TIRZ and add the following properties to the Corridor TIRZ: 1) Sky Mine on old Bulverde Rd; 2) vacant land between Bulverde Rd and Old Nacogdoches Rd; and 3) Bell Dr very poor residential area
Develop and implement a plan throughout the Corridor for state-of-the-art exterior lighting;
Marketing Incorporate effective marketing that will give property owners, business owners and investors the
confidence the proposed redevelopment will happen;
Establish a Public Improvement District for each Segment of the Corridor to focus attention on marketing, events, maintenance of public areas, watering of trees and vegetation. (this would complement the TIRZ);
Maintain an inventory of active listings of for sale or lease when overall vacancy rate of both retail and non-retail space is 10% or greater; provide map of locations; lease rates and asking prices where available.
Northeast Corridor Revitalization Study Page 1
NORTHEAST CORRIDOR REVITALIZATION INITIATIVE MARKET STUDY
Introduction
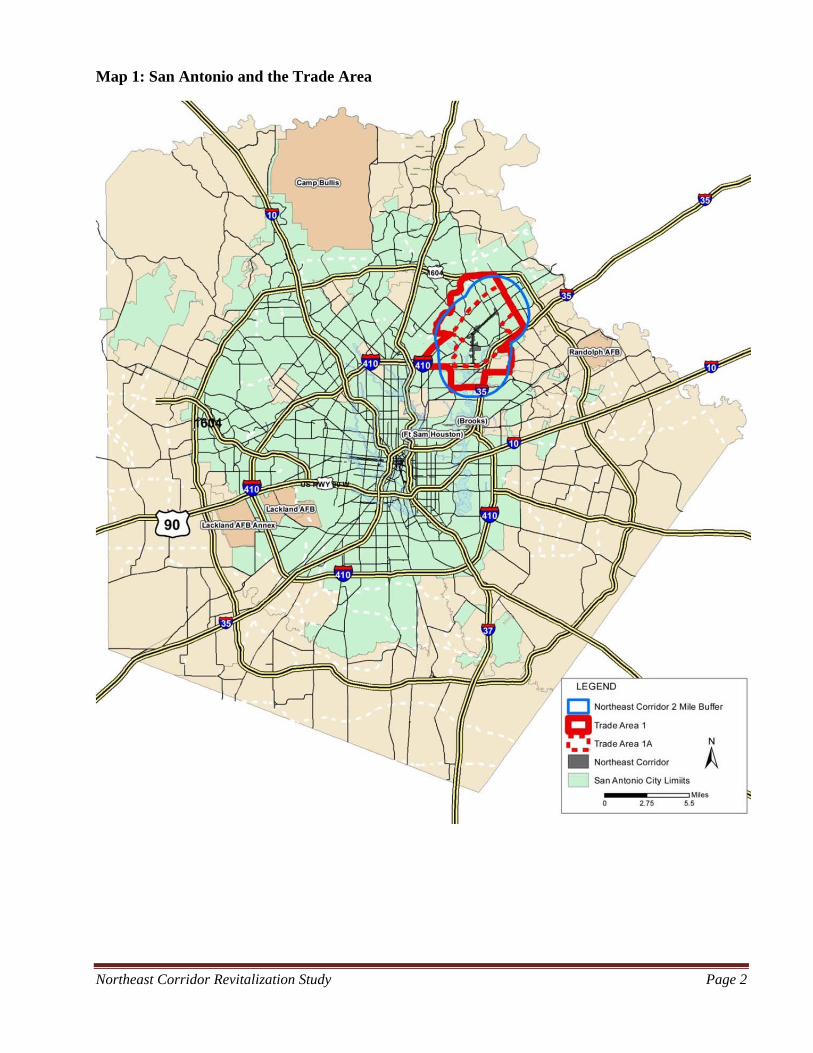
In May of 2013, the City of San Antonio Department of Planning & Community Development issued a Request for Proposals to complete a market study for the Northeast Corridor (NEC) Revitalization Initiative. The Department included NEC background information and a detailed scope of services. The Background Information included the statement: “ . . . the NEC Revitalization Initiative will work to restore vitality to the Perrin Beitel and Nacogdoches corridors. Today, these corridors are suffering from declining property values, a glut of vacant and underutilized properties, resident dissatisfaction with retail offerings, poor aesthetics, and an unsustainable mix of uses. This initiative will include a place-based program of service delivery enhancements and targeted investments that will result in an incremental reversal of these current conditions. Revitalizing the Northeast Corridor will require tactical partnerships, strategic planning, and swift implementation.” The position of the Northeast Corridor within the City of San Antonio and Bexar County is illustrated on Map 1. In July, Wendell Davis & Associates was selected to conduct the market study for the Northeast Corridor (NEC) Revitalization Initiative. Elements of the scope of services include Trade Area definition and Trade Area summaries of the demographic profile, consumer income and spending profile and the psycho-demographic profile. In addition, this report includes a description of retail and service businesses (“retail businesses”) in the NEC most likely to succeed, industries other than retail (“non-retail businesses”) that would be most likely to succeed, a description of current obstacles to development/ redevelopment, and recommendations on steps that should be taken to improve the competitive position of the NEC and its marketability. This report includes summaries of the research conducted to meet requirements of the scope of services, along with observations, analysis and recommendations of the consultant.
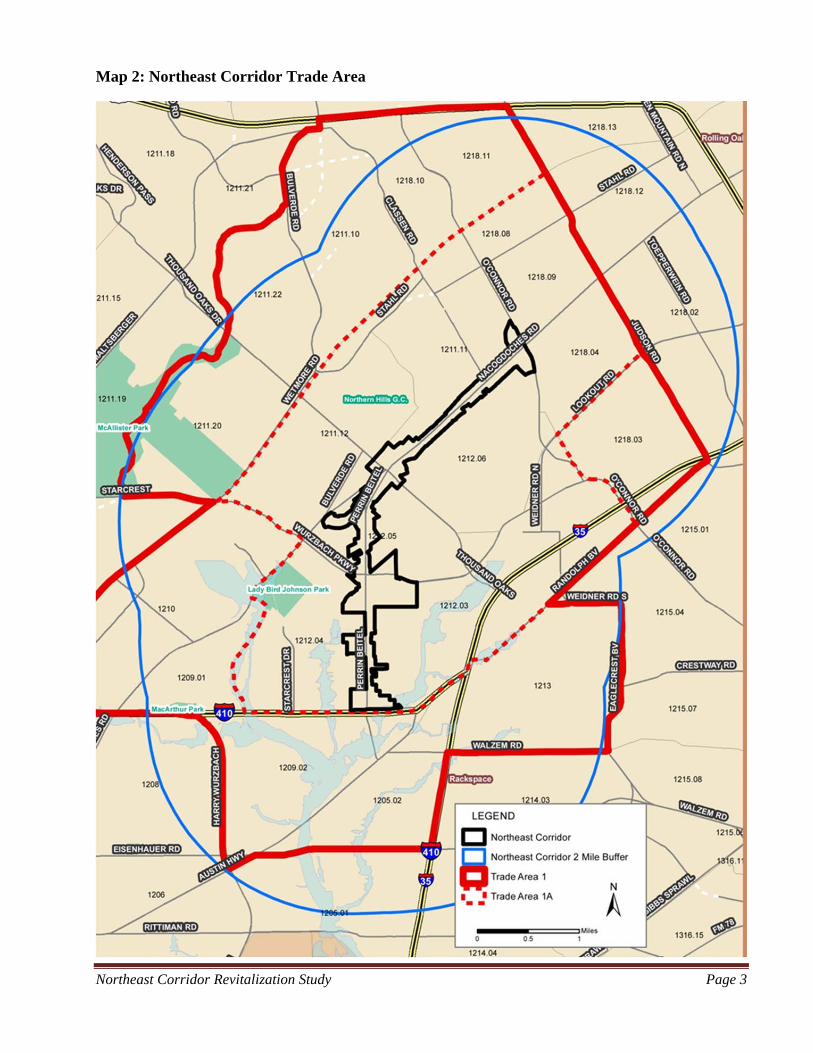
Definition of the Northeast Corridor Trade Area Most market studies are conducted around an existing or potential site and the trade area is often defined as a 3 to 5 mile radius. The Northeast Corridor Trade Area became a custom definition to fit the shape of the corridor, which is defined as selected properties along Perrin Beitel Road and Nacogdoches Road from the north side of NE Loop 410 north and northeastward to the south side of O’Connor Road in north east San Antonio, Texas. The NEC also includes all of the adjacent Naco-Perrin Blvd and short stretches of Thousand Oaks Blvd as well as several side streets that intersect with the Corridor. Buffer areas around the Corridor were tested in 1-mile, 2-mile and 3-mile distances. Based on locations of competing retail locations and it was determined that the 3-mile radius included much more of the surrounding neighborhoods than was likely to frequent the subject corridor. The 1-mile buffer was much too small to represent a trade area for more than 1,500,000 square feet of retail space. Therefore, the 2-mile buffer, which does not go beyond Loop 1604 on the north, is the best representation of the NEC Trade Area. Instead of scribing the 2-mile buffer shape to collect demographics, a set of eighteen (18) 2010 census tracts was selected as a surrogate to the buffer shape as shown on Map 2. The additional detail potential of census tract data proved to be useful in later defining a smaller trade area consisting of only those 9 census tracts that abut Perrin Beitel and Nacogdoches. This smaller inner trade area is designated as Trade Area 1a and offers additional insight to the households that makeup the Trade Area.
Northeast Corridor Revitalization Study Page 2
Map 1: San Antonio and the Trade Area
Northeast Corridor Revitalization Study Page 3
Map 2: Northeast Corridor Trade Area
Northeast Corridor Revitalization Study Page 4
Demographic Profile
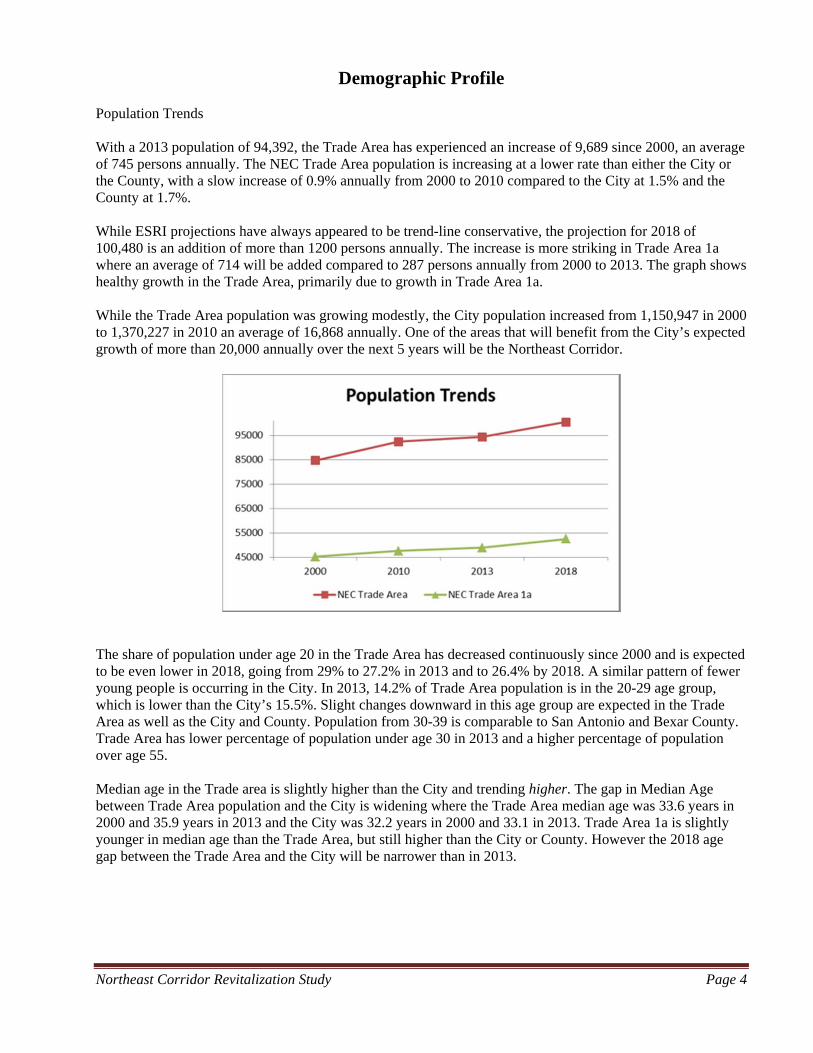
Population Trends With a 2013 population of 94,392, the Trade Area has experienced an increase of 9,689 since 2000, an average of 745 persons annually. The NEC Trade Area population is increasing at a lower rate than either the City or the County, with a slow increase of 0.9% annually from 2000 to 2010 compared to the City at 1.5% and the County at 1.7%. While ESRI projections have always appeared to be trend-line conservative, the projection for 2018 of 100,480 is an addition of more than 1200 persons annually. The increase is more striking in Trade Area 1a where an average of 714 will be added compared to 287 persons annually from 2000 to 2013. The graph shows healthy growth in the Trade Area, primarily due to growth in Trade Area 1a. While the Trade Area population was growing modestly, the City population increased from 1,150,947 in 2000 to 1,370,227 in 2010 an average of 16,868 annually. One of the areas that will benefit from the City’s expected growth of more than 20,000 annually over the next 5 years will be the Northeast Corridor.
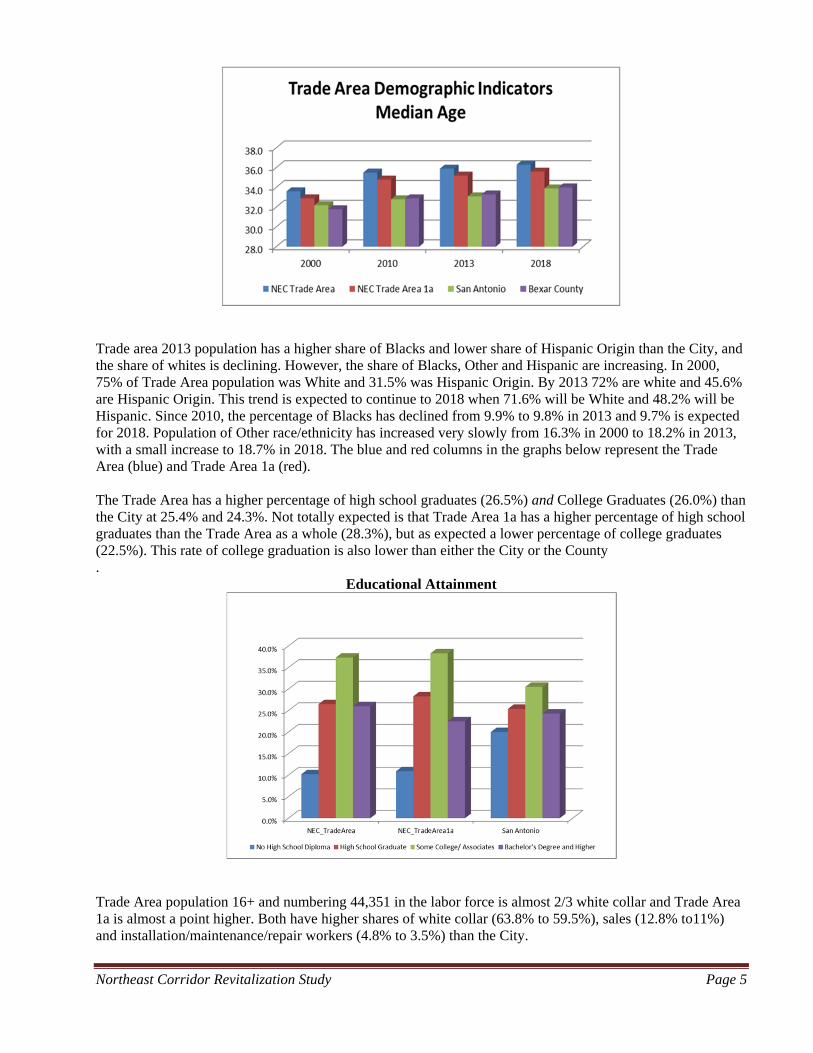
The share of population under age 20 in the Trade Area has decreased continuously since 2000 and is expected to be even lower in 2018, going from 29% to 27.2% in 2013 and to 26.4% by 2018. A similar pattern of fewer young people is occurring in the City. In 2013, 14.2% of Trade Area population is in the 20-29 age group, which is lower than the City’s 15.5%. Slight changes downward in this age group are expected in the Trade Area as well as the City and County. Population from 30-39 is comparable to San Antonio and Bexar County. Trade Area has lower percentage of population under age 30 in 2013 and a higher percentage of population over age 55. Median age in the Trade area is slightly higher than the City and trending higher. The gap in Median Age between Trade Area population and the City is widening where the Trade Area median age was 33.6 years in 2000 and 35.9 years in 2013 and the City was 32.2 years in 2000 and 33.1 in 2013. Trade Area 1a is slightly younger in median age than the Trade Area, but still higher than the City or County. However the 2018 age gap between the Trade Area and the City will be narrower than in 2013.
Northeast Corridor Revitalization Study Page 5
Trade area 2013 population has a higher share of Blacks and lower share of Hispanic Origin than the City, and the share of whites is declining. However, the share of Blacks, Other and Hispanic are increasing. In 2000, 75% of Trade Area population was White and 31.5% was Hispanic Origin. By 2013 72% are white and 45.6% are Hispanic Origin. This trend is expected to continue to 2018 when 71.6% will be White and 48.2% will be Hispanic. Since 2010, the percentage of Blacks has declined from 9.9% to 9.8% in 2013 and 9.7% is expected for 2018. Population of Other race/ethnicity has increased very slowly from 16.3% in 2000 to 18.2% in 2013, with a small increase to 18.7% in 2018. The blue and red columns in the graphs below represent the Trade Area (blue) and Trade Area 1a (red). The Trade Area has a higher percentage of high school graduates (26.5%) and College Graduates (26.0%) than the City at 25.4% and 24.3%. Not totally expected is that Trade Area 1a has a higher percentage of high school graduates than the Trade Area as a whole (28.3%), but as expected a lower percentage of college graduates (22.5%). This rate of college graduation is also lower than either the City or the County .
Educational Attainment
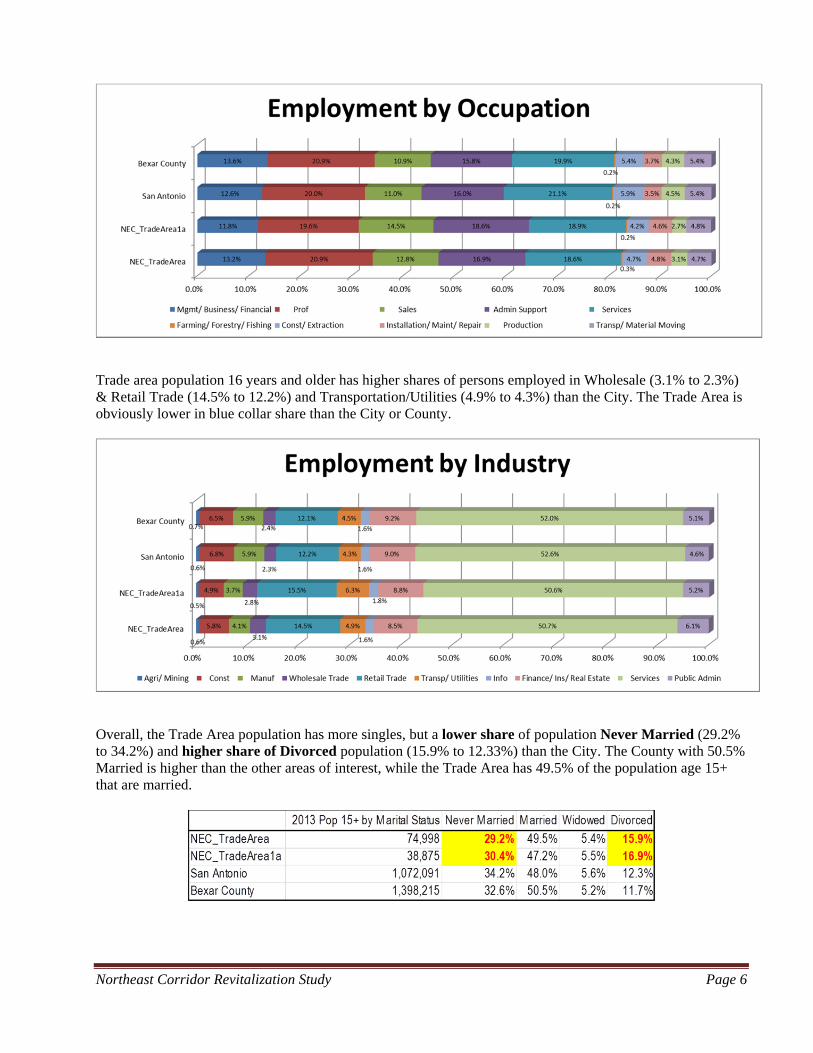
Trade Area population 16+ and numbering 44,351 in the labor force is almost 2/3 white collar and Trade Area 1a is almost a point higher. Both have higher shares of white collar (63.8% to 59.5%), sales (12.8% to11%) and installation/maintenance/repair workers (4.8% to 3.5%) than the City.
Northeast Corridor Revitalization Study Page 6
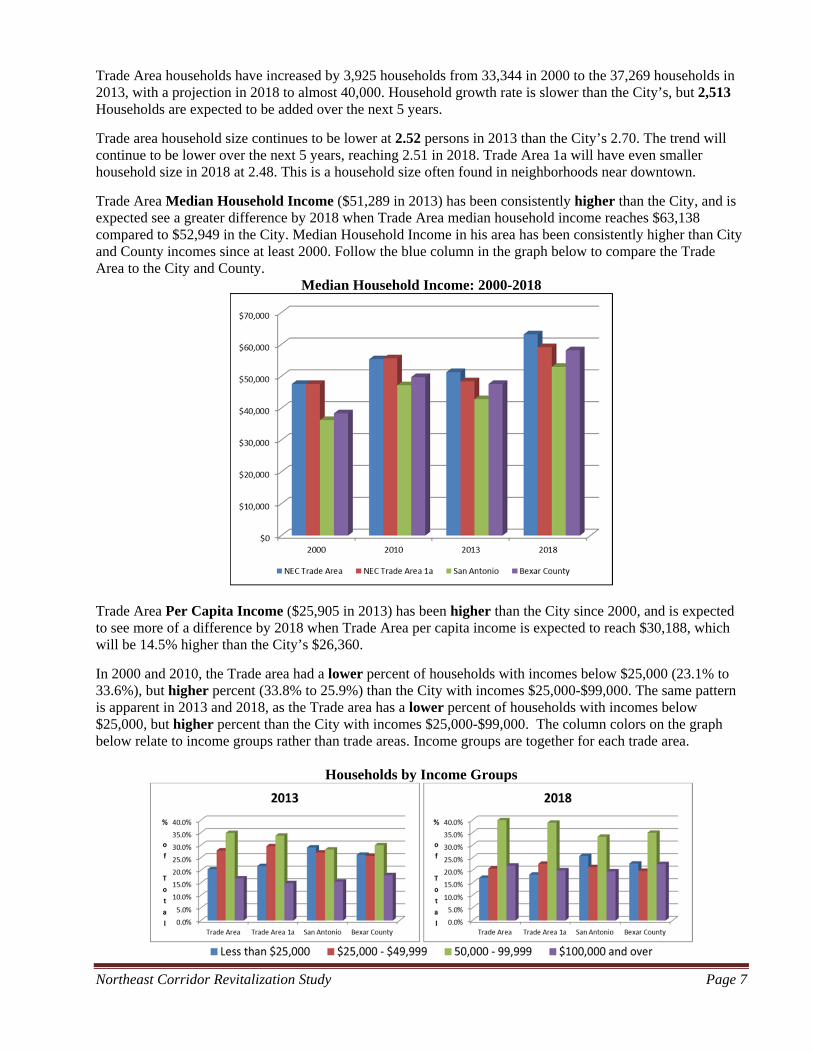
Trade area population 16 years and older has higher shares of persons employed in Wholesale (3.1% to 2.3%) & Retail Trade (14.5% to 12.2%) and Transportation/Utilities (4.9% to 4.3%) than the City. The Trade Area is obviously lower in blue collar share than the City or County.
Overall, the Trade Area population has more singles, but a lower share of population Never Married (29.2% to 34.2%) and higher share of Divorced population (15.9% to 12.33%) than the City. The County with 50.5% Married is higher than the other areas of interest, while the Trade Area has 49.5% of the population age 15+ that are married.
Northeast Corridor Revitalization Study Page 7
Trade Area households have increased by 3,925 households from 33,344 in 2000 to the 37,269 households in 2013, with a projection in 2018 to almost 40,000. Household growth rate is slower than the City’s, but 2,513 Households are expected to be added over the next 5 years.
Trade area household size continues to be lower at 2.52 persons in 2013 than the City’s 2.70. The trend will continue to be lower over the next 5 years, reaching 2.51 in 2018. Trade Area 1a will have even smaller household size in 2018 at 2.48. This is a household size often found in neighborhoods near downtown.
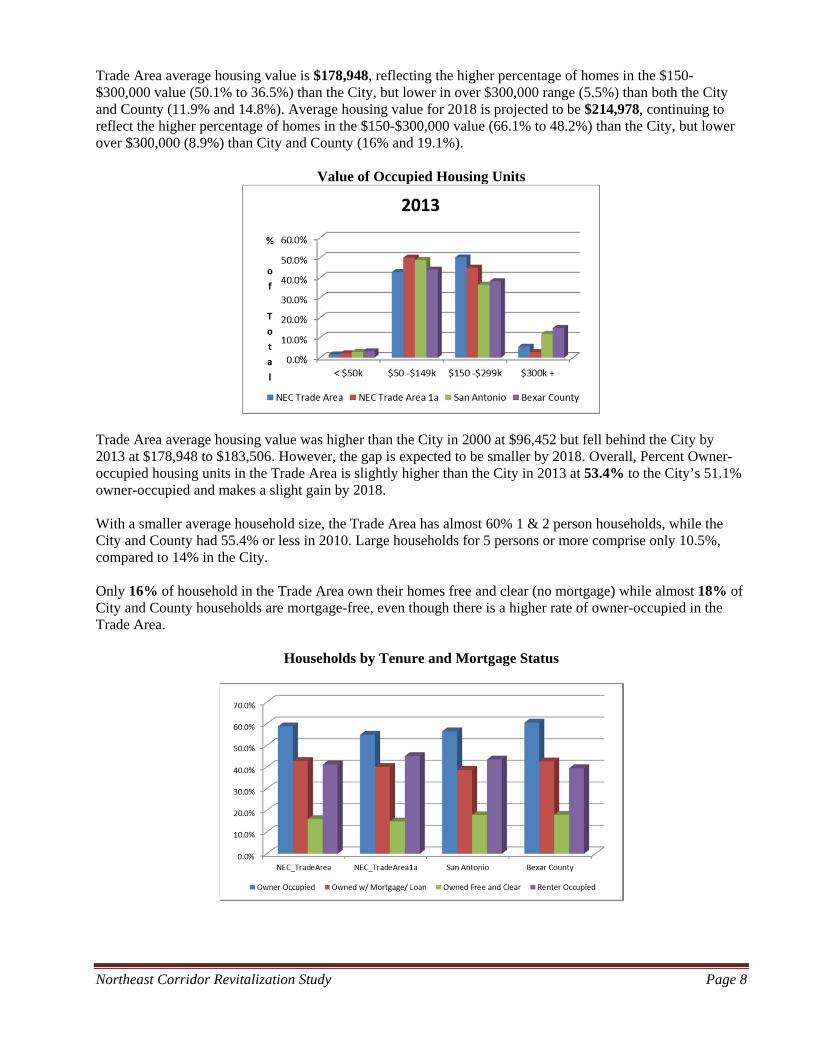
Trade Area Median Household Income ($51,289 in 2013) has been consistently higher than the City, and is expected see a greater difference by 2018 when Trade Area median household income reaches $63,138 compared to $52,949 in the City. Median Household Income in his area has been consistently higher than City and County incomes since at least 2000. Follow the blue column in the graph below to compare the Trade Area to the City and County.
Median Household Income: 2000-2018
Trade Area Per Capita Income ($25,905 in 2013) has been higher than the City since 2000, and is expected to see more of a difference by 2018 when Trade Area per capita income is expected to reach $30,188, which will be 14.5% higher than the City’s $26,360.
In 2000 and 2010, the Trade area had a lower percent of households with incomes below $25,000 (23.1% to 33.6%), but higher percent (33.8% to 25.9%) than the City with incomes $25,000-$99,000. The same pattern is apparent in 2013 and 2018, as the Trade area has a lower percent of households with incomes below $25,000, but higher percent than the City with incomes $25,000-$99,000. The column colors on the graph below relate to income groups rather than trade areas. Income groups are together for each trade area.
Households by Income Groups
Northeast Corridor Revitalization Study Page 8
Trade Area average housing value is $178,948, reflecting the higher percentage of homes in the $150-$300,000 value (50.1% to 36.5%) than the City, but lower in over $300,000 range (5.5%) than both the City and County (11.9% and 14.8%). Average housing value for 2018 is projected to be $214,978, continuing to reflect the higher percentage of homes in the $150-$300,000 value (66.1% to 48.2%) than the City, but lower over $300,000 (8.9%) than City and County (16% and 19.1%).
Value of Occupied Housing Units
Trade Area average housing value was higher than the City in 2000 at $96,452 but fell behind the City by 2013 at $178,948 to $183,506. However, the gap is expected to be smaller by 2018. Overall, Percent Owner-occupied housing units in the Trade Area is slightly higher than the City in 2013 at 53.4% to the City’s 51.1% owner-occupied and makes a slight gain by 2018. With a smaller average household size, the Trade Area has almost 60% 1 & 2 person households, while the City and County had 55.4% or less in 2010. Large households for 5 persons or more comprise only 10.5%, compared to 14% in the City. Only 16% of household in the Trade Area own their homes free and clear (no mortgage) while almost 18% of City and County households are mortgage-free, even though there is a higher rate of owner-occupied in the Trade Area.
Households by Tenure and Mortgage Status
Northeast Corridor Revitalization Study Page 9
Consumer Income Profile
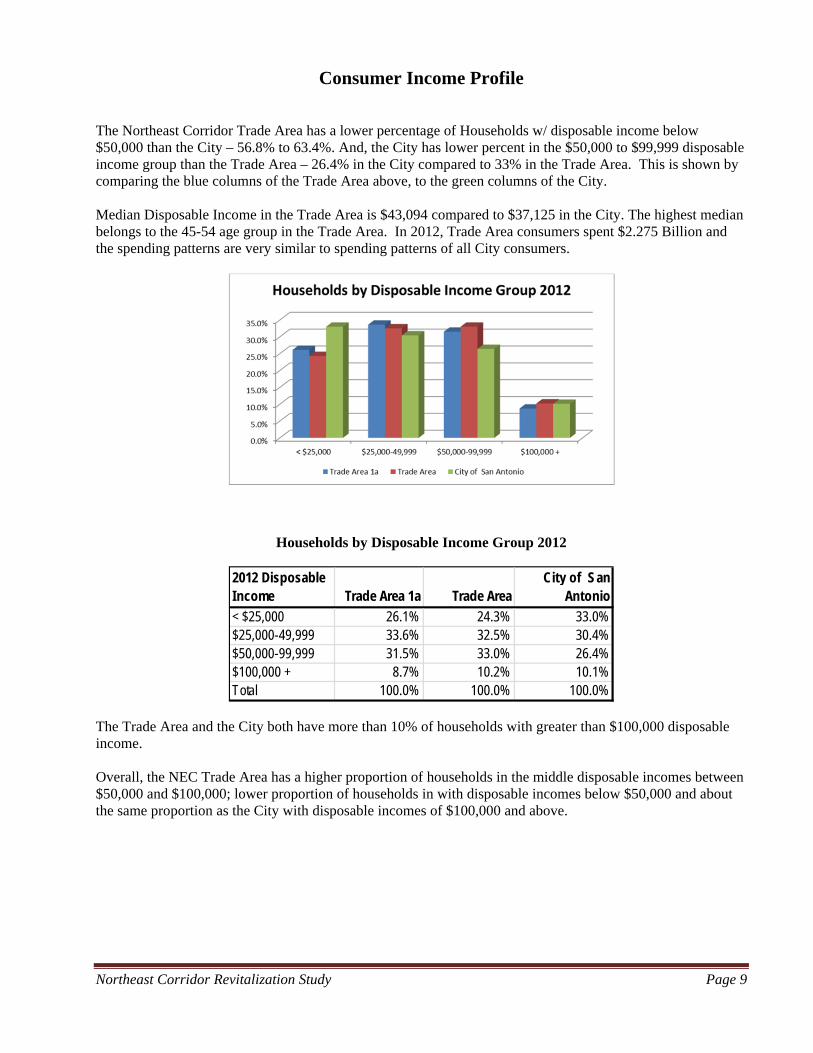
The Northeast Corridor Trade Area has a lower percentage of Households w/ disposable income below $50,000 than the City – 56.8% to 63.4%. And, the City has lower percent in the $50,000 to $99,999 disposable income group than the Trade Area – 26.4% in the City compared to 33% in the Trade Area. This is shown by comparing the blue columns of the Trade Area above, to the green columns of the City. Median Disposable Income in the Trade Area is $43,094 compared to $37,125 in the City. The highest median belongs to the 45-54 age group in the Trade Area. In 2012, Trade Area consumers spent $2.275 Billion and the spending patterns are very similar to spending patterns of all City consumers.
Households by Disposable Income Group 2012
The Trade Area and the City both have more than 10% of households with greater than $100,000 disposable income. Overall, the NEC Trade Area has a higher proportion of households in the middle disposable incomes between $50,000 and $100,000; lower proportion of households in with disposable incomes below $50,000 and about the same proportion as the City with disposable incomes of $100,000 and above.
2012 Disposable Income Trade Area 1a Trade Area
City of San Antonio
< $25,000 26.1% 24.3% 33.0%$25,000-49,999 33.6% 32.5% 30.4%$50,000-99,999 31.5% 33.0% 26.4%$100,000 + 8.7% 10.2% 10.1%Total 100.0% 100.0% 100.0%
Northeast Corridor Revitalization Study Page 10
Psycho Demographic Profile
Tapestry Segmentation is a way to explain differences among consumer groups to better identify target markets and marketing campaigns by including lifestyle and stage in life and calls upon a broad range of information about households.
Milk & Cookies, Up & Coming Families and Young & Restless are the top Segments and could represent the future look of the Northeast Corridor Trade Area.
These seven top Tapestry Segments in the Trade Area comprise 68.2% of the households, and 69.2% of households in the smaller Trade Area 1a. Five of the seven top Tapestry Segments in the Trade Area comprise 23% of the City of San Antonio households, but only 13.2% of U.S. households.
Top Tapestry Segment Comparison
LifeMode Groups are grouped in terms of life experiences, such as similar ages and traits, such as affluence. These groups can be targeted for marketing by retailers or home builders for communication.
Urbanization Groups are based on geographic areas of origin or growing up, from very rural farm communities to highly urban lifestyles and all levels of urbanization and degrees of density, which influence their decision-making patterns.
Tables at the end of the report compare several characteristics of the Trade Area top Segments, relating to race/ethnicity, tenure, age of homes currently they are living in, and brief descriptions of the segments – generational, families, affluence, kids and diversity.
The fastest growing Segment with a presence in the Trade Area (13.5%) is: “Up and Coming Families,” with a growth rate of 4.56% annually. This segment is also the most affluent.
Northeast Corridor Revitalization Study Page 11
Using Tapestry Segmentation-Retailers/Businesses National retailers often make database-driven decisions. By knowing their customers and profiles, they can seek areas anywhere in the United States where their customer base lives in clusters. Segmentation can help to: • Identify the best locations for new stores; • Evaluate existing stores; • Identify differences among population segments; • Select lines of merchandise; • Direct advertising messages to selected consumer groups; A customer profile will help to define their behaviors, identify core customer groups and other groups of opportunity. They use it for: • Insight into lifestyle characteristics of the best customers; • Map where these customers live by using a national data provider; • Planning and targeting previously un-served or under-served neighborhoods; • Exploring new opportunities for products, services & customers; and • Developing strategies to attract customers to stores/businesses and to purchase their products and services. Top Tapestry Segment Descriptions
Characteristics of “Milk and Cookies” (17.9% of Trade Area, 23.2% of TA1a) These households are mostly young affluent married couples starting families, of which ½ have children and ¼ are ages 45-54. • Median Age: 34.1 years • Growth rate: Stable • College degree: 20% • Housing type: > 70% Single Family • Median Household income: $57,170 • Tenure: high • Age of homes: < 30 years • Diversity: same as U.S. Characteristics of “Up and Coming Families” (15.5% of Trade Area, 4.3% of TA1a) These households are young affluent families with young kids, a mix of Gen-Xers and Baby Boomers. • Median Age: 32.6 years • Growth rate: High (4.56% annually) • College degree: 20% • Housing type: > 80% Single Family • Median Household income: $69,522 • Tenure: High (80% homeownership) • Age of homes: < 10 years • Diversity: Mostly white, but increasing in diversity.
Northeast Corridor Revitalization Study Page 12
Characteristics of “Young and Restless” (9.1% of Trade Area, 12.8% of TA1a) These households are the young on-the-go population, career-oriented; 58% single or shared and 23% of households have kids. • Median Age: 28.9 years • Growth rate: Moderate • College degree: 36% • Housing type: 85% Multi-Family • Median Household income: $39,765 • Tenure: Low (mostly renters) • Age of homes: < 30 years • Diversity: 56% white, high diversity Characteristics of “Rustbelt Traditions” (8.0% of Trade Area, 11.4% of TA1a) These households are a mix of married couple families, single parents and singles alone. • Median Age: 35.9 years • Growth rate: Slow • College degree: 15% • Housing type: > 70% Single Family • Median Household income: $42,337 • Tenure: High (70% homeownership) • Age of homes: < 54 years • Diversity: Mostly white, low diversity Characteristics of “Great Expectations” (7.5% of Trade Area, 4.6% of TA1a) These households are singles living alone and married couple families beginning careers or family life. • Median Age: 33.1 years • Growth rate: Moderate • College degree: 18% • Housing type: 50% Single Family • Median Household income: $35,406 • Tenure: Low (mostly renters) • Age of homes: < 54 years • Diversity: Very diverse, same as U.S.
Characteristics of “Aspiring Young Families” (7.2% of Trade Area, 12.3% of TA1a) These households are young start-up families, married couple with or without kids where 2/3 of households are families, 37% are single person, and 9% are shared households. • Median Age: 31.1 years • Growth rate: Slow (1.13% annually) • College degree: not available • Housing type: 50% Single Family • Median Household income: $46,275 • Tenure: Low (47% homeowners) • Age of homes: not available • Diversity: Mix of households, same as U.S.
Northeast Corridor Revitalization Study Page 13
Characteristics of “Cozy and Comfortable” (6.0% of Trade Area, 9.5% of TA 1a) These households are middle-age married couples with or without kids, single family homes in older neighborhoods. • Median Age: 41.7 years • Growth rate: Slow (0.48% annually) • College degree: not available • Housing type: 88% Single Family • Median Household income: $59,287 • Tenure: High (84% homeowners) • Age of homes: < 44 years • Diversity: Mostly white.
Using Tapestry Segmentation – NEC The Northeast Corridor can also use Segmentation in marketing. When determining desired characteristics of future residents, some judgments will be made regarding who and what types of households would become the best neighbors and add to the existing consumer base. The NEC is not only marketing to retailers and other commercial businesses; it is seeking prospective residents/consumers, such as:
• Younger households - single and married, increasing in diversity; • Families with children; • Both homeowners and renters; • A certain level of income; • Fast growing segment; • Lifestyles that can be accommodated within the Corridor; • Something more in the middle of the LifeMode and Urbanization Groups;
As the Northeast Corridor is marketed to businesses, there is a need for additional consumers. In a way, consumers of housing need to be sought out or recruited. The following Tapestry Segments might be considered as future residents and consumers in the Corridor. These have been selected based on a combination of a possible “fit” with the proposed housing, growth potential and median income.
Characteristics of “Boomburbs” (0.0 % of Trade Area, 3.8% of City of San Antonio) These households are middle-age married couples with or without kids, single family homes in older neighborhoods. • Median Age: 36.1 years • Growth rate: 4.51% annually • College degree: 50% • Housing type: 85%+ Single Family • Median Household income: $104,395 • Tenure: High (87% homeowners) • Age of homes: < 25 years • Diversity: Mostly white.
Northeast Corridor Revitalization Study Page 14
Characteristics of “Prosperous Empty Nesters” (4.1% of Trade Area, 3.8% of City of San Antonio) These households are middle-age married couples with or without kids, single family homes in older neighborhoods. • Median Age: 47.6 years • Growth rate: 0.53% annually • College degree: 39% (of 25 years & older) • Housing type: 75%+ Single Family • Median Household income: $63,682 • Tenure: High • Age of homes: > 33 years • Diversity: 90% white. Characteristics of “Crossroads” (1.4% of Trade Area, 1.4% of City of San Antonio) These households are middle-age married couples with or without kids, single family homes in older neighborhoods. • Median Age: 33.6 years • Growth rate: 1.4% annually • College degree: 39% of 25 years & older have attended • Housing type: 36% Single Family, 50%+ in mobile homes • Median Household income: $37,185 • Tenure: High (69%) • Age of homes: < 44 years • Diversity: < 80% white.
Northeast Corridor Revitalization Study Page 15
Characteristics of the Trade Area
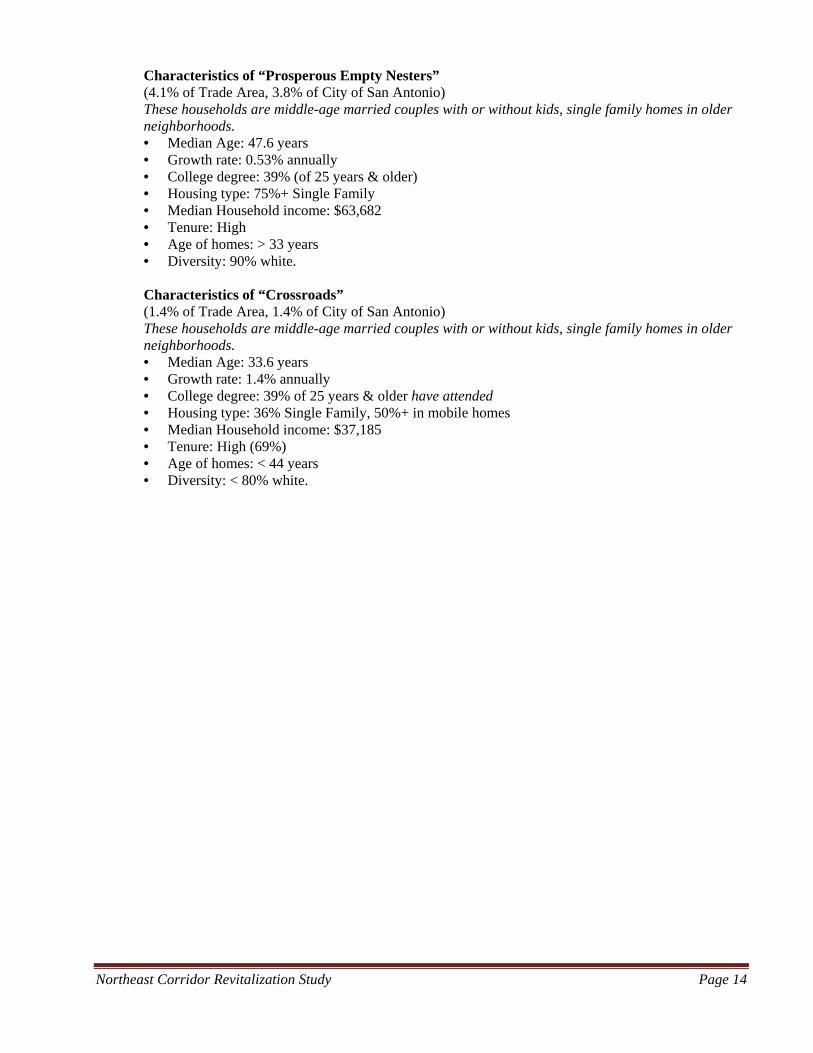
Description. Rather than being defined as a 3 to 5 mile radius from the intersection of Thousand Oaks and Nacogdoches, the Northeast Corridor (NEC) Trade Area is custom definition to fit the shape of the corridor. It is defined as selected properties along Perrin Beitel Road and Nacogdoches Road from the north side of NE Loop 410 north and northeastward to the south side of O’Connor Road in north east San Antonio, Texas. The NEC also includes all of the adjacent Naco-Perrin Blvd and short stretches of Thousand Oaks Blvd as well as several side streets that intersect with the Corridor. The 2-mile buffer (blue line), which does not go beyond Loop 1604 on the north, is the best representation of the NEC Trade Area. Instead of scribing the 2-mile buffer shape to collect demographics, a set of eighteen (18) 2010 census tracts (heavy red line) was selected as a surrogate to the buffer shape as shown on Map 3. The additional detail potential of census tract data proved to be useful in later defining a smaller trade area consisting of only those 9 census tracts (dashed red line) that abut Perrin Beitel and Nacogdoches. This smaller inner trade area is designated as Trade Area 1a and offers additional insight to the households that makeup the Trade Area. Map 3. Northeast Corridor Trade Area
Northeast Corridor Revitalization Study Page 16
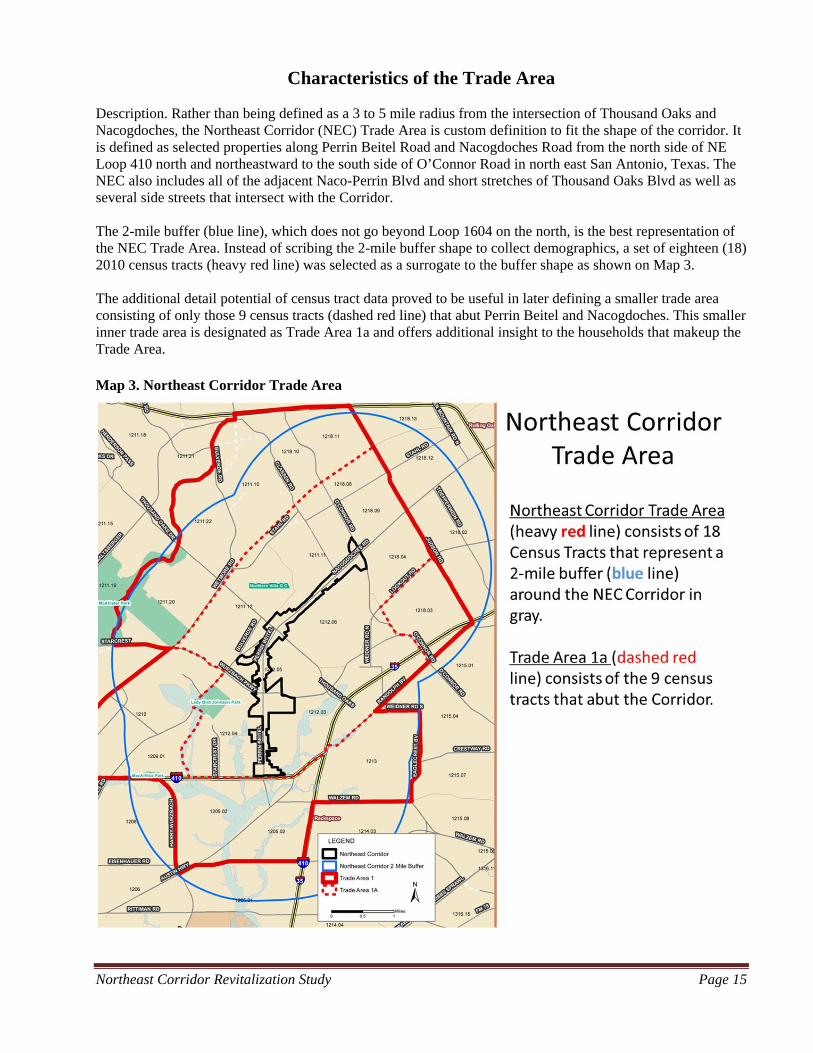
Building Permit Activity in the Trade Area Considerably more Building Permits have been issued for existing structures over the past 5 ½ years than for new structures, which represent approximately one-third, or 267 versus 519 for existing structures. Since 2008, there have been 786 permits issued in the Trade Area. Permits for 2013 are through June. The best year for existing building permits was 2009, with 115 while 2011 was best for new structures with 68.
With only 99 permits for new homes since 2008, the Trade Area would be considered a slow growth area. In the retail sector, new service structures have led the way with 34 of 47 retail building permits and only 10 retail building permits were issued. The Trade area has experienced fairly significant additions and alterations to Existing Structures. There have been almost twice as many Residential permits for Existing Structures as for new housing units with 184 permits since 2008. Permits for existing Retail structures have averaged only 23 per year, representing almost 25% of permits for additions and alterations to Existing Structures in the Trade Area over the last 5 ½ years. Existing Non-Retail structures permits accounted for 206 permits, or 40% of Existing Structure permits. After a very low year in 2008, there were two much better years to make up for that and leveling off at an average of 36 permits annually for Non-Retail additions & alterations.
Northeast Corridor Revitalization Study Page 17
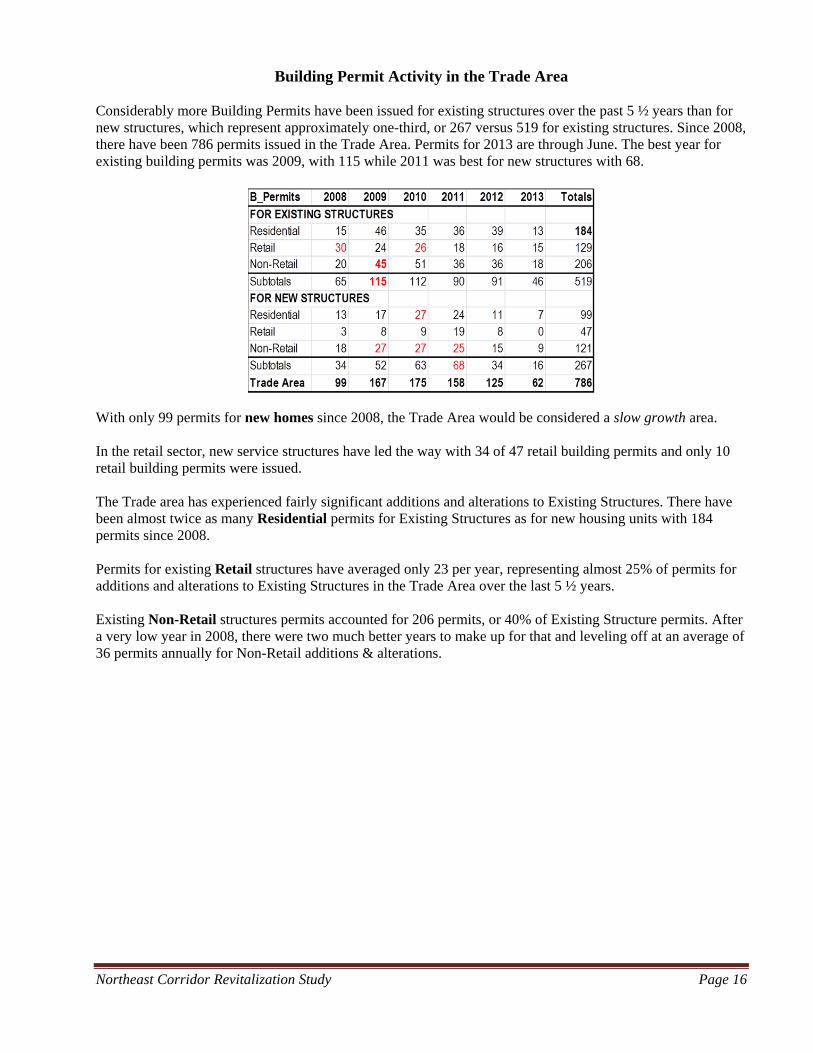
Map 4. Residential Building Permits
Map 5. Retail Building Permits
Northeast Corridor Revitalization Study Page 18
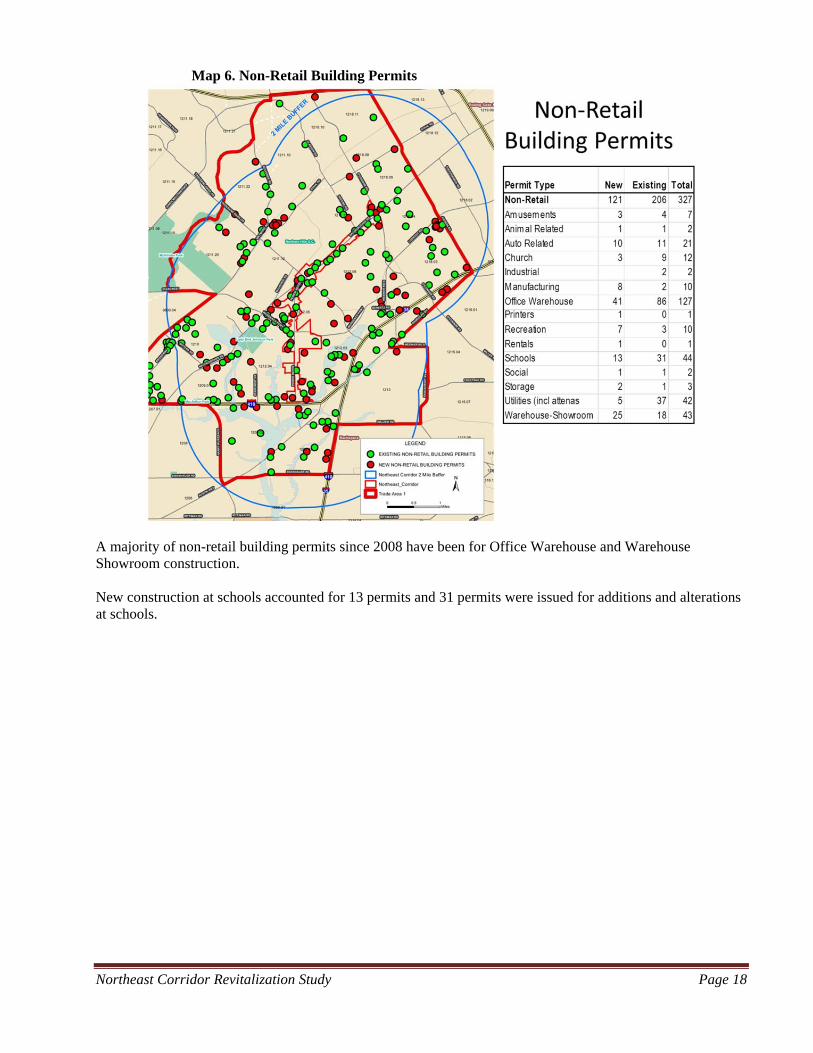
Map 6. Non-Retail Building Permits
A majority of non-retail building permits since 2008 have been for Office Warehouse and Warehouse Showroom construction. New construction at schools accounted for 13 permits and 31 permits were issued for additions and alterations at schools.
Northeast Corridor Revitalization Study Page 19
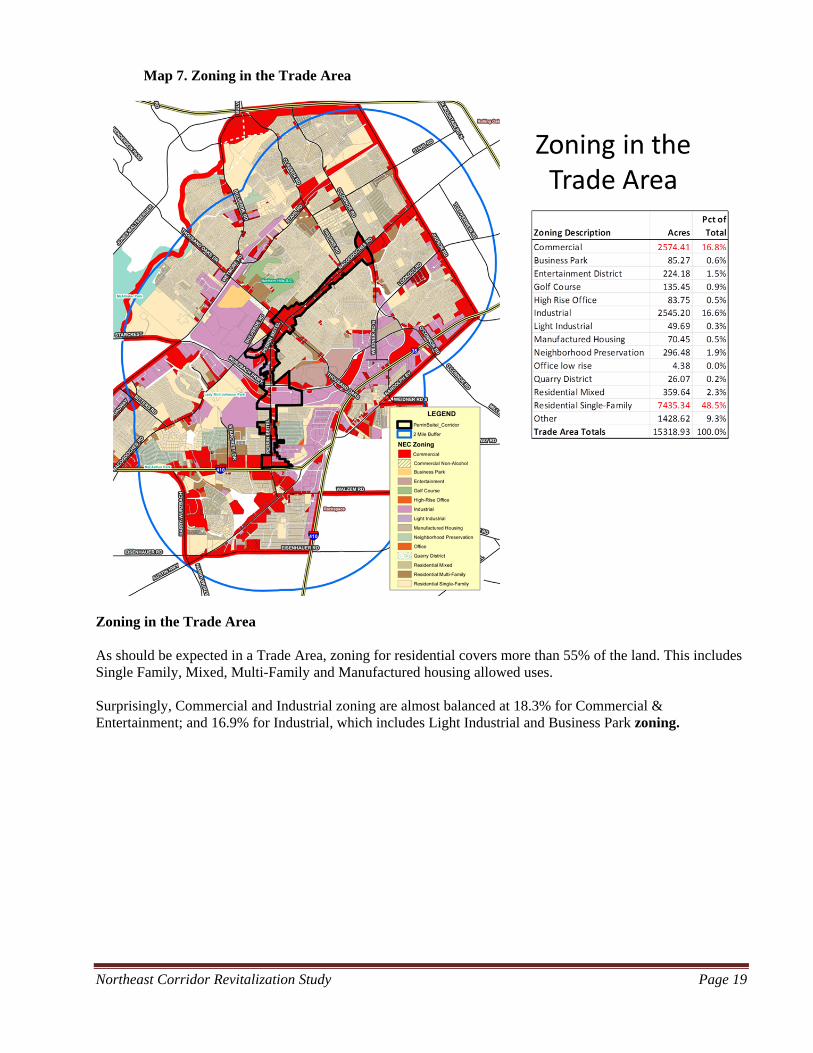
Map 7. Zoning in the Trade Area
Zoning in the Trade Area As should be expected in a Trade Area, zoning for residential covers more than 55% of the land. This includes Single Family, Mixed, Multi-Family and Manufactured housing allowed uses. Surprisingly, Commercial and Industrial zoning are almost balanced at 18.3% for Commercial & Entertainment; and 16.9% for Industrial, which includes Light Industrial and Business Park zoning.
Northeast Corridor Revitalization Study Page 20
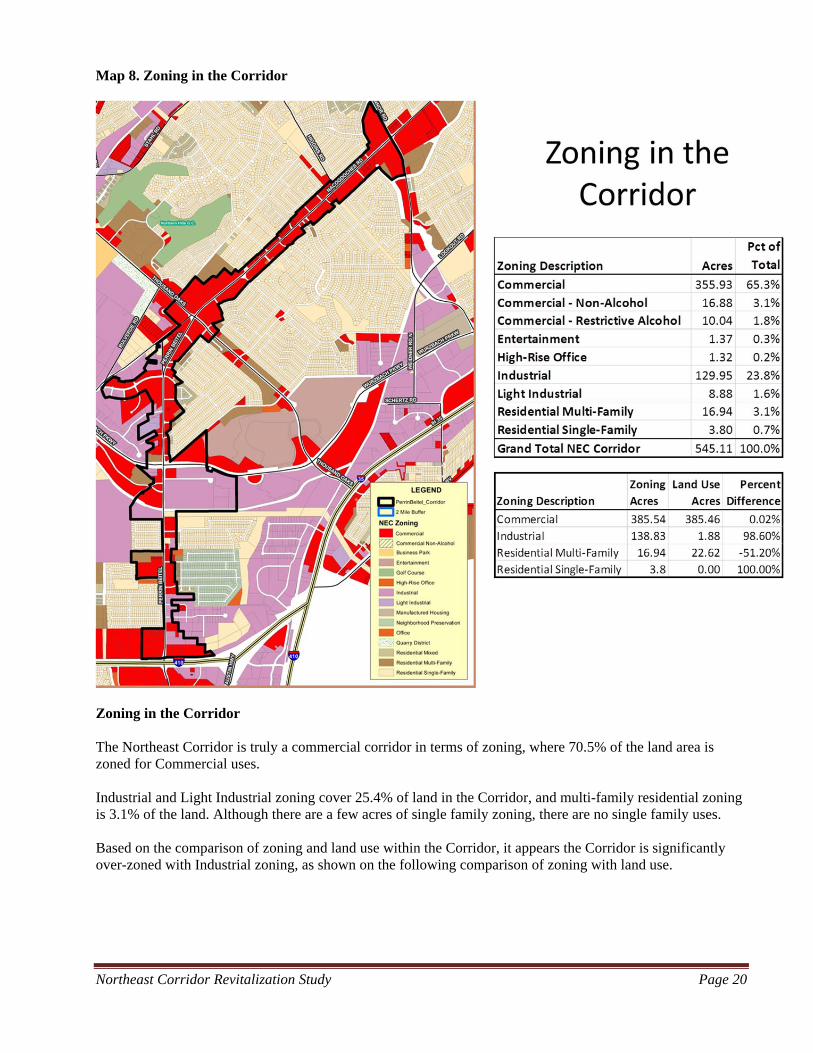
Map 8. Zoning in the Corridor
Zoning in the Corridor
The Northeast Corridor is truly a commercial corridor in terms of zoning, where 70.5% of the land area is zoned for Commercial uses. Industrial and Light Industrial zoning cover 25.4% of land in the Corridor, and multi-family residential zoning is 3.1% of the land. Although there are a few acres of single family zoning, there are no single family uses. Based on the comparison of zoning and land use within the Corridor, it appears the Corridor is significantly over-zoned with Industrial zoning, as shown on the following comparison of zoning with land use.
Northeast Corridor Revitalization Study Page 21
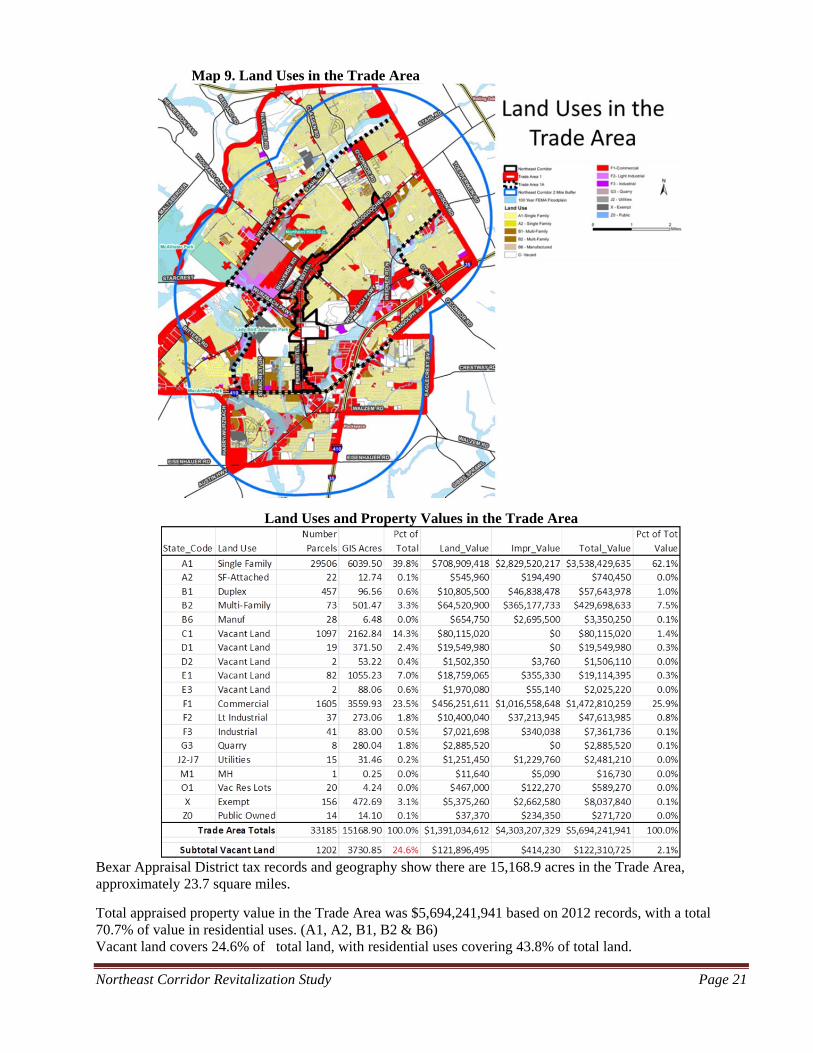
Map 9. Land Uses in the Trade Area
Land Uses and Property Values in the Trade Area
Bexar Appraisal District tax records and geography show there are 15,168.9 acres in the Trade Area, approximately 23.7 square miles.
Total appraised property value in the Trade Area was $5,694,241,941 based on 2012 records, with a total 70.7% of value in residential uses. (A1, A2, B1, B2 & B6) Vacant land covers 24.6% of total land, with residential uses covering 43.8% of total land.
Northeast Corridor Revitalization Study Page 22
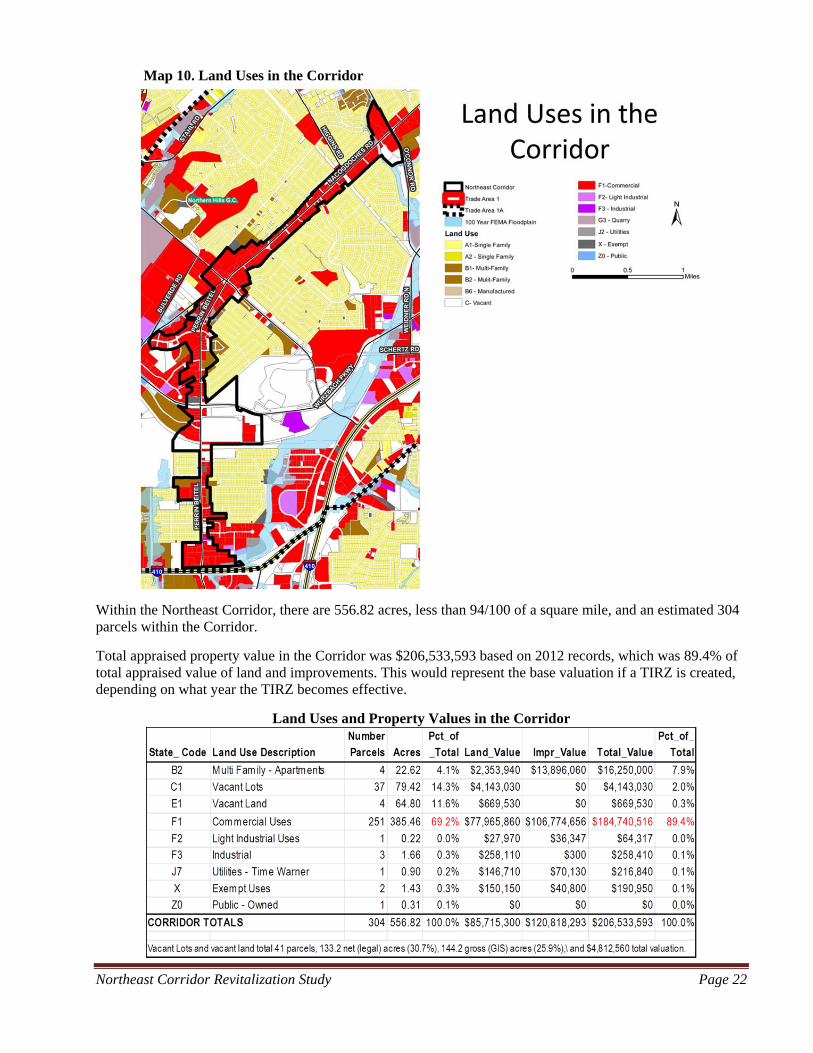
Map 10. Land Uses in the Corridor
Within the Northeast Corridor, there are 556.82 acres, less than 94/100 of a square mile, and an estimated 304 parcels within the Corridor.
Total appraised property value in the Corridor was $206,533,593 based on 2012 records, which was 89.4% of total appraised value of land and improvements. This would represent the base valuation if a TIRZ is created, depending on what year the TIRZ becomes effective.
Land Uses and Property Values in the Corridor
Northeast Corridor Revitalization Study Page 23
Map 11. Vacant Land in the Trade Area
Northeast Corridor Revitalization Study Page 24
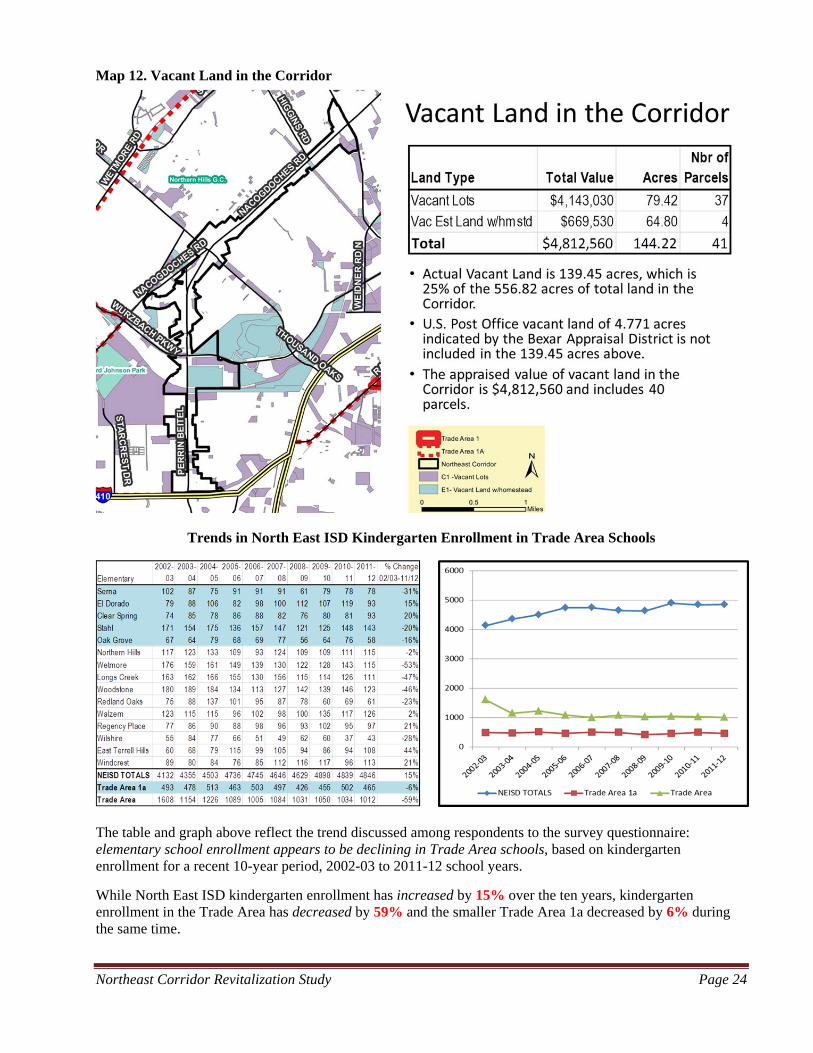
Map 12. Vacant Land in the Corridor
Trends in North East ISD Kindergarten Enrollment in Trade Area Schools
The table and graph above reflect the trend discussed among respondents to the survey questionnaire: elementary school enrollment appears to be declining in Trade Area schools, based on kindergarten enrollment for a recent 10-year period, 2002-03 to 2011-12 school years.
While North East ISD kindergarten enrollment has increased by 15% over the ten years, kindergarten enrollment in the Trade Area has decreased by 59% and the smaller Trade Area 1a decreased by 6% during the same time.
Northeast Corridor Revitalization Study Page 25
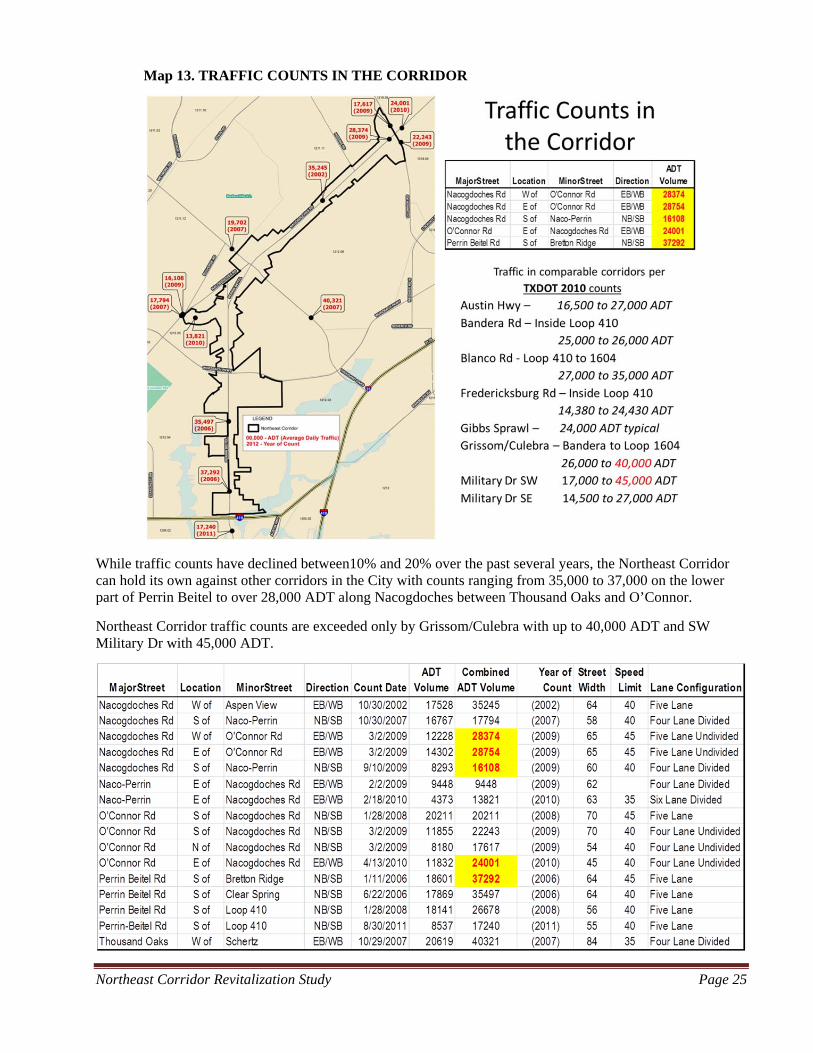
Map 13. TRAFFIC COUNTS IN THE CORRIDOR
While traffic counts have declined between10% and 20% over the past several years, the Northeast Corridor can hold its own against other corridors in the City with counts ranging from 35,000 to 37,000 on the lower part of Perrin Beitel to over 28,000 ADT along Nacogdoches between Thousand Oaks and O’Connor.
Northeast Corridor traffic counts are exceeded only by Grissom/Culebra with up to 40,000 ADT and SW Military Dr with 45,000 ADT.
Northeast Corridor Revitalization Study Page 26
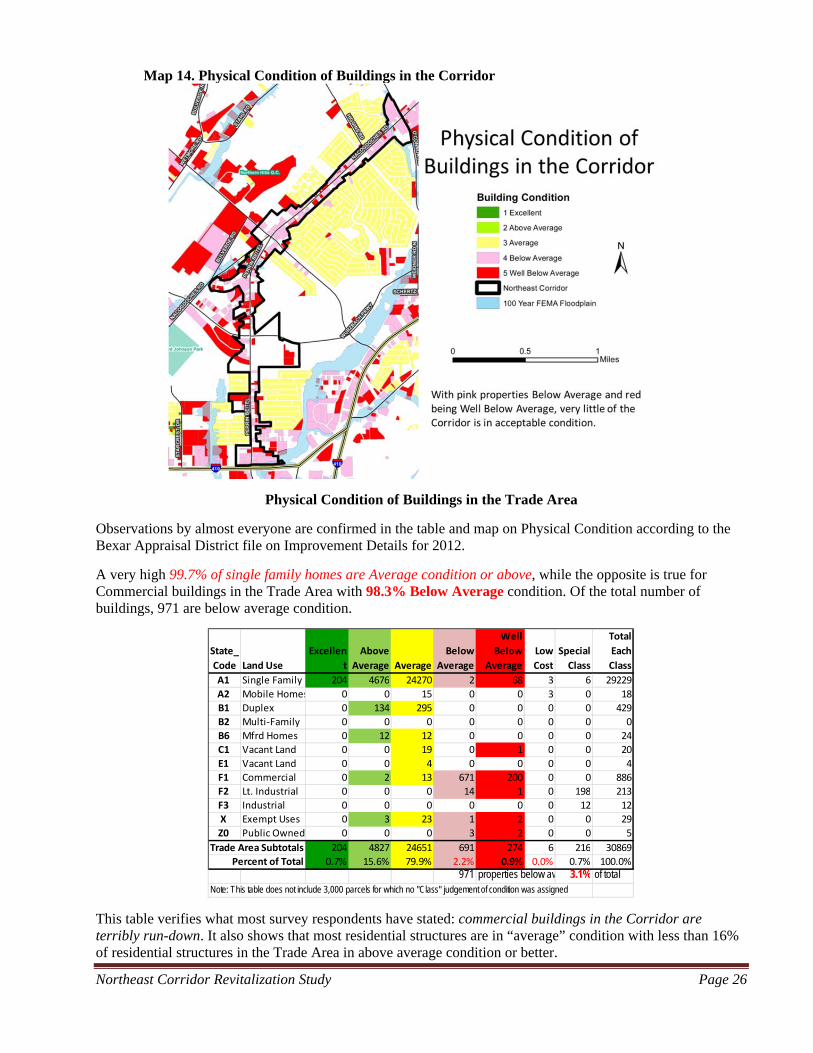
Map 14. Physical Condition of Buildings in the Corridor
Physical Condition of Buildings in the Trade Area
Observations by almost everyone are confirmed in the table and map on Physical Condition according to the Bexar Appraisal District file on Improvement Details for 2012.
A very high 99.7% of single family homes are Average condition or above, while the opposite is true for Commercial buildings in the Trade Area with 98.3% Below Average condition. Of the total number of buildings, 971 are below average condition.
This table verifies what most survey respondents have stated: commercial buildings in the Corridor are terribly run-down. It also shows that most residential structures are in “average” condition with less than 16% of residential structures in the Trade Area in above average condition or better.
State_
Code Land Use
Excellen
t
Above
Average Average
Below
Average
Well
Below
Average
Low
Cost
Special
Class
Total
Each
Class
A1 Single Family 204 4676 24270 2 68 3 6 29229
A2 Mobile Homes 0 0 15 0 0 3 0 18
B1 Duplex 0 134 295 0 0 0 0 429
B2 Multi‐Family 0 0 0 0 0 0 0 0
B6 Mfrd Homes 0 12 12 0 0 0 0 24
C1 Vacant Land 0 0 19 0 1 0 0 20
E1 Vacant Land 0 0 4 0 0 0 0 4
F1 Commercial 0 2 13 671 200 0 0 886
F2 Lt. Industrial 0 0 0 14 1 0 198 213
F3 Industrial 0 0 0 0 0 0 12 12
X Exempt Uses 0 3 23 1 2 0 0 29
Z0 Public Owned 0 0 0 3 2 0 0 5
Trade Area Subtotals 204 4827 24651 691 274 6 216 30869
Percent of Total 0.7% 15.6% 79.9% 2.2% 0.9% 0.0% 0.7% 100.0%971 properties below av 3.1% of total
Note: This table does not include 3,000 parcels for which no "Class" judgement of condition was assigned
Northeast Corridor Revitalization Study Page 27
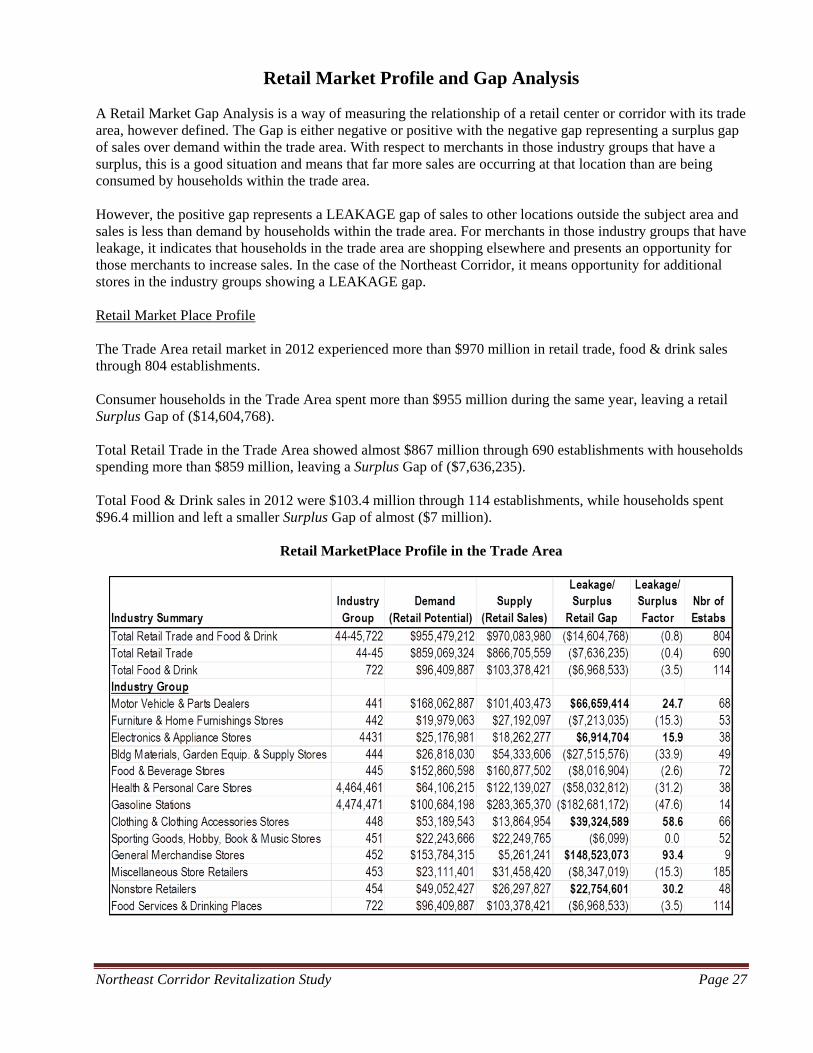
Retail Market Profile and Gap Analysis
A Retail Market Gap Analysis is a way of measuring the relationship of a retail center or corridor with its trade area, however defined. The Gap is either negative or positive with the negative gap representing a surplus gap of sales over demand within the trade area. With respect to merchants in those industry groups that have a surplus, this is a good situation and means that far more sales are occurring at that location than are being consumed by households within the trade area. However, the positive gap represents a LEAKAGE gap of sales to other locations outside the subject area and sales is less than demand by households within the trade area. For merchants in those industry groups that have leakage, it indicates that households in the trade area are shopping elsewhere and presents an opportunity for those merchants to increase sales. In the case of the Northeast Corridor, it means opportunity for additional stores in the industry groups showing a LEAKAGE gap. Retail Market Place Profile The Trade Area retail market in 2012 experienced more than $970 million in retail trade, food & drink sales through 804 establishments.
Consumer households in the Trade Area spent more than $955 million during the same year, leaving a retail Surplus Gap of ($14,604,768).
Total Retail Trade in the Trade Area showed almost $867 million through 690 establishments with households spending more than $859 million, leaving a Surplus Gap of ($7,636,235).
Total Food & Drink sales in 2012 were $103.4 million through 114 establishments, while households spent $96.4 million and left a smaller Surplus Gap of almost ($7 million).
Retail MarketPlace Profile in the Trade Area
Northeast Corridor Revitalization Study Page 28
Industry Groups in the Trade Area showing a Significant Surplus Gap of sales totaled more than $193 million through 257 establishments with households spending more than $72 million, leaving a gap of $120,931,479.
Surplus is experienced when there are more in sales in an area than purchases by consumers of that area.
Almost half of the Retail Gap ($52,928,053) occurred in Auto Parts, Accessories & Tires Industry Group.
Industry Groups with a Significant SURPLUS Gap
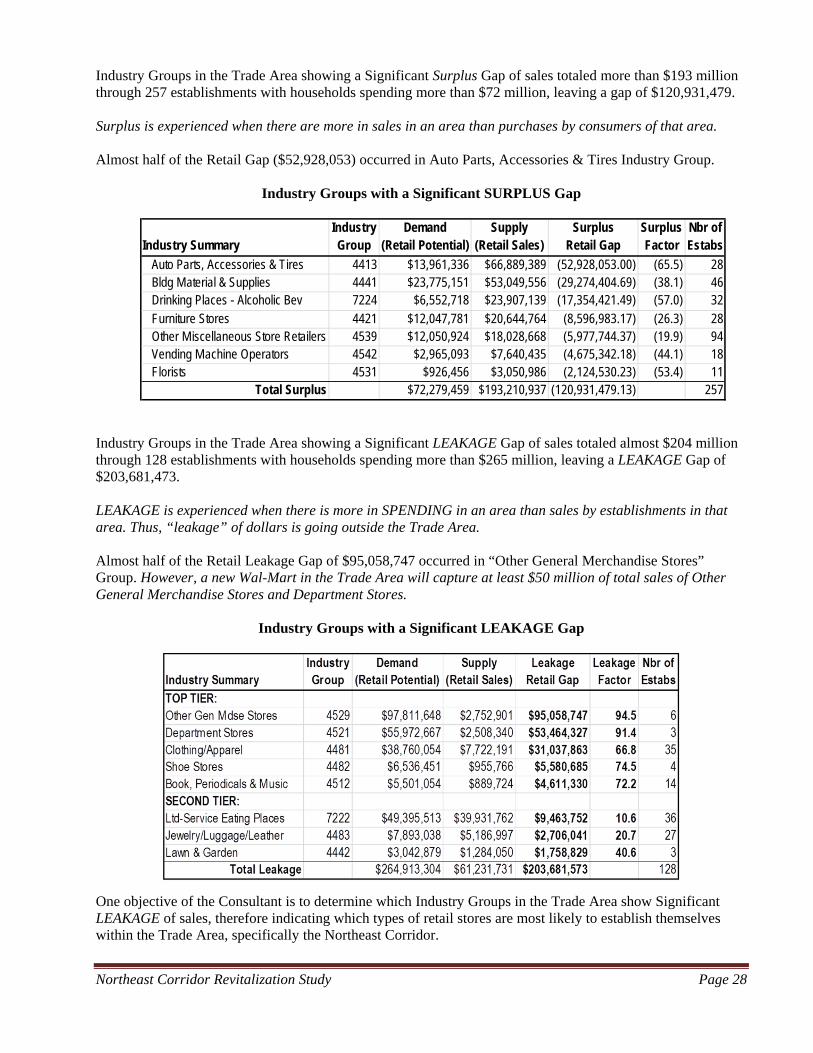
Industry Groups in the Trade Area showing a Significant LEAKAGE Gap of sales totaled almost $204 million through 128 establishments with households spending more than $265 million, leaving a LEAKAGE Gap of $203,681,473.
LEAKAGE is experienced when there is more in SPENDING in an area than sales by establishments in that area. Thus, “leakage” of dollars is going outside the Trade Area. Almost half of the Retail Leakage Gap of $95,058,747 occurred in “Other General Merchandise Stores” Group. However, a new Wal-Mart in the Trade Area will capture at least $50 million of total sales of Other General Merchandise Stores and Department Stores.
Industry Groups with a Significant LEAKAGE Gap
One objective of the Consultant is to determine which Industry Groups in the Trade Area show Significant LEAKAGE of sales, therefore indicating which types of retail stores are most likely to establish themselves within the Trade Area, specifically the Northeast Corridor.
Industry SummaryIndustry Group
Demand (Retail Potential)
Supply (Retail Sales)
Surplus Retail Gap
Surplus Factor
Nbr of Estabs
Auto Parts, Accessories & Tires 4413 $13,961,336 $66,889,389 (52,928,053.00) (65.5) 28 Bldg Material & Supplies 4441 $23,775,151 $53,049,556 (29,274,404.69) (38.1) 46 Drinking Places - Alcoholic Bev 7224 $6,552,718 $23,907,139 (17,354,421.49) (57.0) 32 Furniture Stores 4421 $12,047,781 $20,644,764 (8,596,983.17) (26.3) 28 Other Miscellaneous Store Retailers 4539 $12,050,924 $18,028,668 (5,977,744.37) (19.9) 94 Vending Machine Operators 4542 $2,965,093 $7,640,435 (4,675,342.18) (44.1) 18 Florists 4531 $926,456 $3,050,986 (2,124,530.23) (53.4) 11
Total Surplus $72,279,459 $193,210,937 (120,931,479.13) 257
Northeast Corridor Revitalization Study Page 29
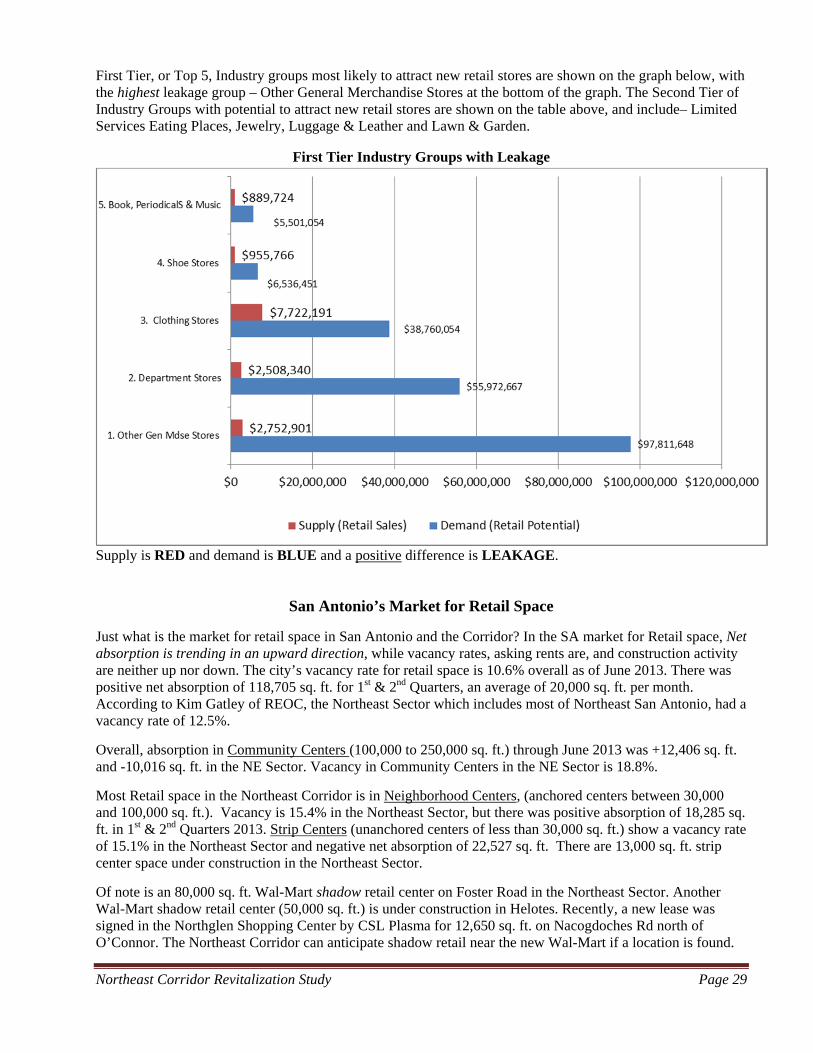
First Tier, or Top 5, Industry groups most likely to attract new retail stores are shown on the graph below, with the highest leakage group – Other General Merchandise Stores at the bottom of the graph. The Second Tier of Industry Groups with potential to attract new retail stores are shown on the table above, and include– Limited Services Eating Places, Jewelry, Luggage & Leather and Lawn & Garden.
First Tier Industry Groups with Leakage
Supply is RED and demand is BLUE and a positive difference is LEAKAGE.
San Antonio’s Market for Retail Space
Just what is the market for retail space in San Antonio and the Corridor? In the SA market for Retail space, Net absorption is trending in an upward direction, while vacancy rates, asking rents are, and construction activity are neither up nor down. The city’s vacancy rate for retail space is 10.6% overall as of June 2013. There was positive net absorption of 118,705 sq. ft. for 1st & 2nd Quarters, an average of 20,000 sq. ft. per month. According to Kim Gatley of REOC, the Northeast Sector which includes most of Northeast San Antonio, had a vacancy rate of 12.5%.
Overall, absorption in Community Centers (100,000 to 250,000 sq. ft.) through June 2013 was +12,406 sq. ft. and -10,016 sq. ft. in the NE Sector. Vacancy in Community Centers in the NE Sector is 18.8%.
Most Retail space in the Northeast Corridor is in Neighborhood Centers, (anchored centers between 30,000 and 100,000 sq. ft.). Vacancy is 15.4% in the Northeast Sector, but there was positive absorption of 18,285 sq. ft. in 1st & 2nd Quarters 2013. Strip Centers (unanchored centers of less than 30,000 sq. ft.) show a vacancy rate of 15.1% in the Northeast Sector and negative net absorption of 22,527 sq. ft. There are 13,000 sq. ft. strip center space under construction in the Northeast Sector.
Of note is an 80,000 sq. ft. Wal-Mart shadow retail center on Foster Road in the Northeast Sector. Another Wal-Mart shadow retail center (50,000 sq. ft.) is under construction in Helotes. Recently, a new lease was signed in the Northglen Shopping Center by CSL Plasma for 12,650 sq. ft. on Nacogdoches Rd north of O’Connor. The Northeast Corridor can anticipate shadow retail near the new Wal-Mart if a location is found.
Northeast Corridor Revitalization Study Page 30
The current market of positive absorption and the significant leakage of retail sales in the Trade Area point to demand that should be met in the Corridor.
Recommended Retailers for Recruitment
Based on analysis of Industry Groups with Leakage, Consultant recommends the following store-types that should be recruited to place a store in the Northeast Corridor:
1. Other General Merchandise Stores. (Dollar General, 99 Cents Only, Dollar Tree, Ross, TJ Maxx) 2. Department Stores (Belk, Stein Mart) 3. Apparel Stores (Men: Casual Male, Men’s Warehouse; Women: Bebe, Deb, Dress Barn, Mothers
Work, Talbots; Children: Children’s Place, Gymboree; All: Burlington Coat Factory) 4. Shoe Stores. (Rack Room, DSW, Famous Footwear, Naturalizer) 5. Book, Periodical & Music Stores. (Books-A-Million, Lifeway Christian Resources, CD Warehouse)
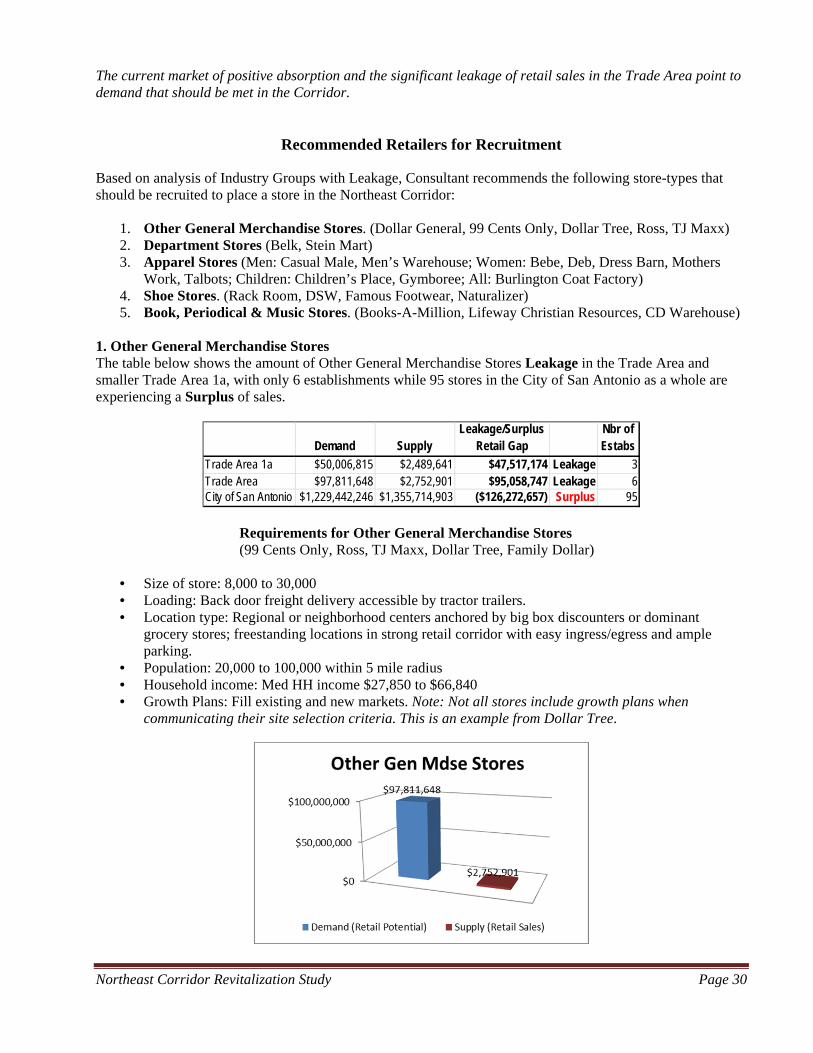
1. Other General Merchandise Stores The table below shows the amount of Other General Merchandise Stores Leakage in the Trade Area and smaller Trade Area 1a, with only 6 establishments while 95 stores in the City of San Antonio as a whole are experiencing a Surplus of sales.
Requirements for Other General Merchandise Stores (99 Cents Only, Ross, TJ Maxx, Dollar Tree, Family Dollar)
• Size of store: 8,000 to 30,000 • Loading: Back door freight delivery accessible by tractor trailers. • Location type: Regional or neighborhood centers anchored by big box discounters or dominant
grocery stores; freestanding locations in strong retail corridor with easy ingress/egress and ample parking.
• Population: 20,000 to 100,000 within 5 mile radius • Household income: Med HH income $27,850 to $66,840 • Growth Plans: Fill existing and new markets. Note: Not all stores include growth plans when
communicating their site selection criteria. This is an example from Dollar Tree.
Demand SupplyLeakage/Surplus
Retail GapNbr of Estabs
Trade Area 1a $50,006,815 $2,489,641 $47,517,174 Leakage 3Trade Area $97,811,648 $2,752,901 $95,058,747 Leakage 6City of San Antonio $1,229,442,246 $1,355,714,903 ($126,272,657) Surplus 95
Northeast Corridor Revitalization Study Page 31
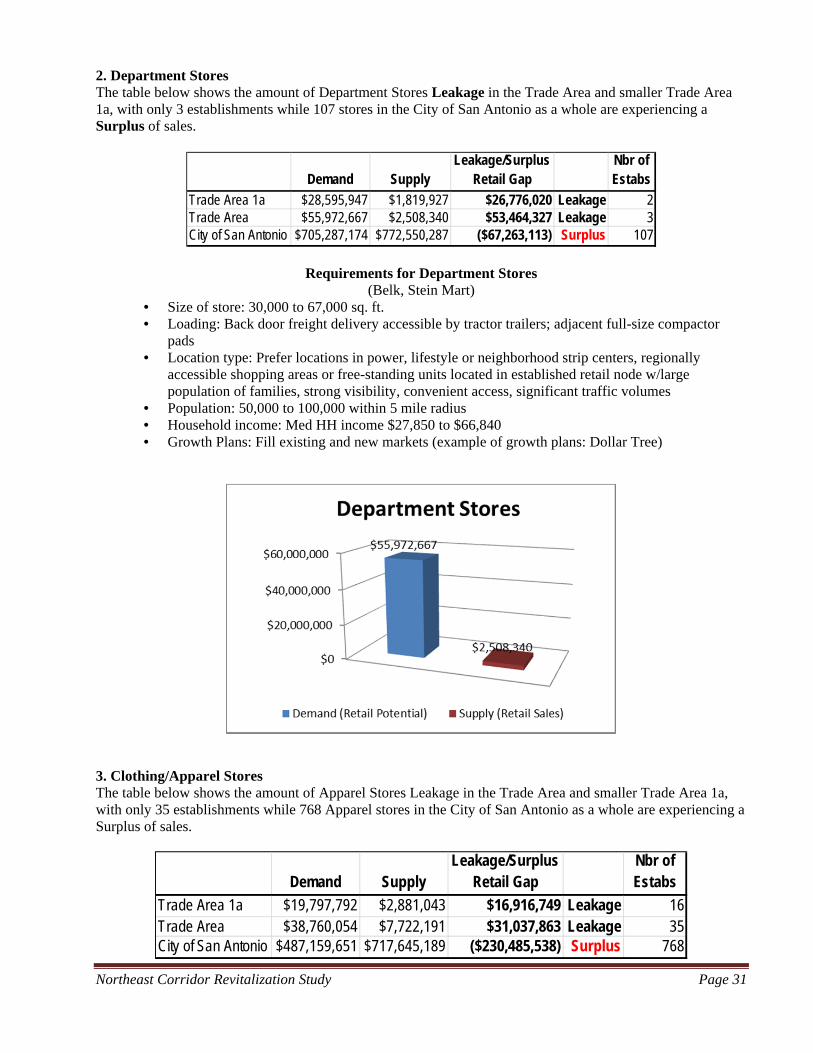
2. Department Stores The table below shows the amount of Department Stores Leakage in the Trade Area and smaller Trade Area 1a, with only 3 establishments while 107 stores in the City of San Antonio as a whole are experiencing a Surplus of sales.
Requirements for Department Stores (Belk, Stein Mart)
• Size of store: 30,000 to 67,000 sq. ft. • Loading: Back door freight delivery accessible by tractor trailers; adjacent full-size compactor
pads • Location type: Prefer locations in power, lifestyle or neighborhood strip centers, regionally
accessible shopping areas or free-standing units located in established retail node w/large population of families, strong visibility, convenient access, significant traffic volumes
• Population: 50,000 to 100,000 within 5 mile radius • Household income: Med HH income $27,850 to $66,840 • Growth Plans: Fill existing and new markets (example of growth plans: Dollar Tree)
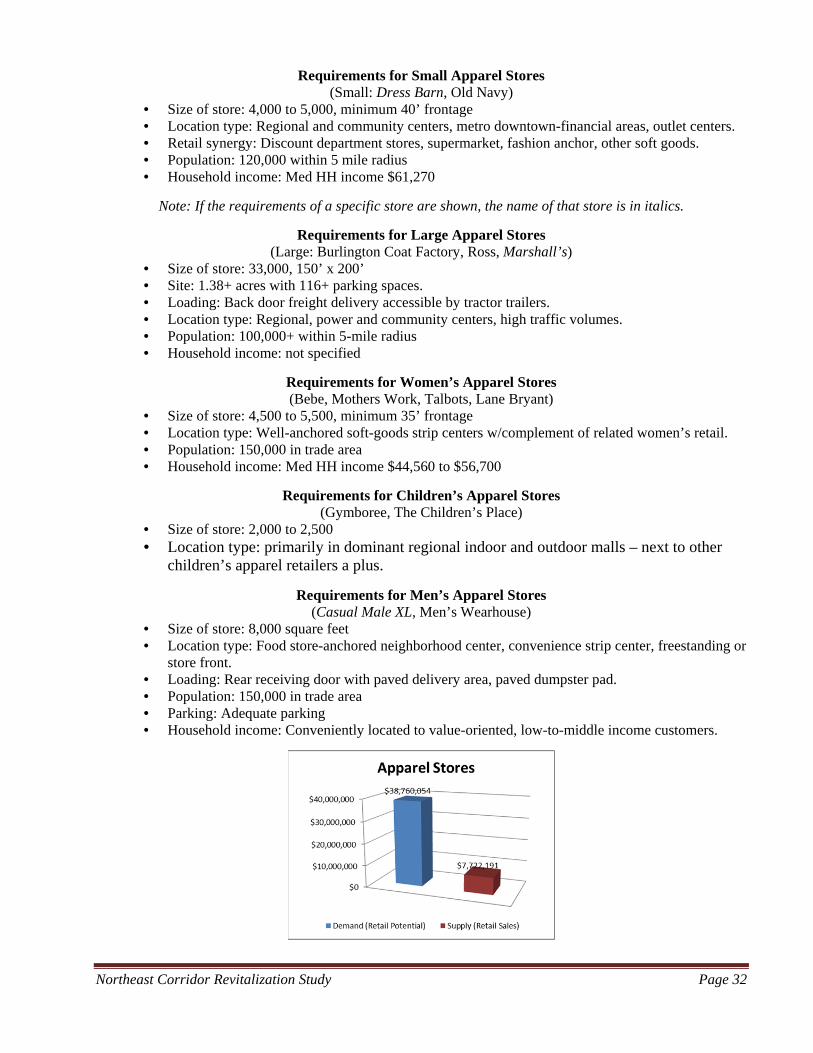
3. Clothing/Apparel Stores The table below shows the amount of Apparel Stores Leakage in the Trade Area and smaller Trade Area 1a, with only 35 establishments while 768 Apparel stores in the City of San Antonio as a whole are experiencing a Surplus of sales.
Demand SupplyLeakage/Surplus
Retail GapNbr of Estabs
Trade Area 1a $28,595,947 $1,819,927 $26,776,020 Leakage 2Trade Area $55,972,667 $2,508,340 $53,464,327 Leakage 3City of San Antonio $705,287,174 $772,550,287 ($67,263,113) Surplus 107
Demand SupplyLeakage/Surplus
Retail GapNbr of Estabs
Trade Area 1a $19,797,792 $2,881,043 $16,916,749 Leakage 16Trade Area $38,760,054 $7,722,191 $31,037,863 Leakage 35City of San Antonio $487,159,651 $717,645,189 ($230,485,538) Surplus 768
Northeast Corridor Revitalization Study Page 32
Requirements for Small Apparel Stores (Small: Dress Barn, Old Navy)
• Size of store: 4,000 to 5,000, minimum 40’ frontage • Location type: Regional and community centers, metro downtown-financial areas, outlet centers. • Retail synergy: Discount department stores, supermarket, fashion anchor, other soft goods. • Population: 120,000 within 5 mile radius • Household income: Med HH income $61,270
Note: If the requirements of a specific store are shown, the name of that store is in italics.
Requirements for Large Apparel Stores (Large: Burlington Coat Factory, Ross, Marshall’s)
• Size of store: 33,000, 150’ x 200’ • Site: 1.38+ acres with 116+ parking spaces. • Loading: Back door freight delivery accessible by tractor trailers. • Location type: Regional, power and community centers, high traffic volumes. • Population: 100,000+ within 5-mile radius • Household income: not specified
Requirements for Women’s Apparel Stores (Bebe, Mothers Work, Talbots, Lane Bryant)
• Size of store: 4,500 to 5,500, minimum 35’ frontage • Location type: Well-anchored soft-goods strip centers w/complement of related women’s retail. • Population: 150,000 in trade area • Household income: Med HH income $44,560 to $56,700
Requirements for Children’s Apparel Stores (Gymboree, The Children’s Place)
• Size of store: 2,000 to 2,500 • Location type: primarily in dominant regional indoor and outdoor malls – next to other
children’s apparel retailers a plus.
Requirements for Men’s Apparel Stores (Casual Male XL, Men’s Wearhouse)
• Size of store: 8,000 square feet • Location type: Food store-anchored neighborhood center, convenience strip center, freestanding or
store front. • Loading: Rear receiving door with paved delivery area, paved dumpster pad. • Population: 150,000 in trade area • Parking: Adequate parking • Household income: Conveniently located to value-oriented, low-to-middle income customers.
Northeast Corridor Revitalization Study Page 33
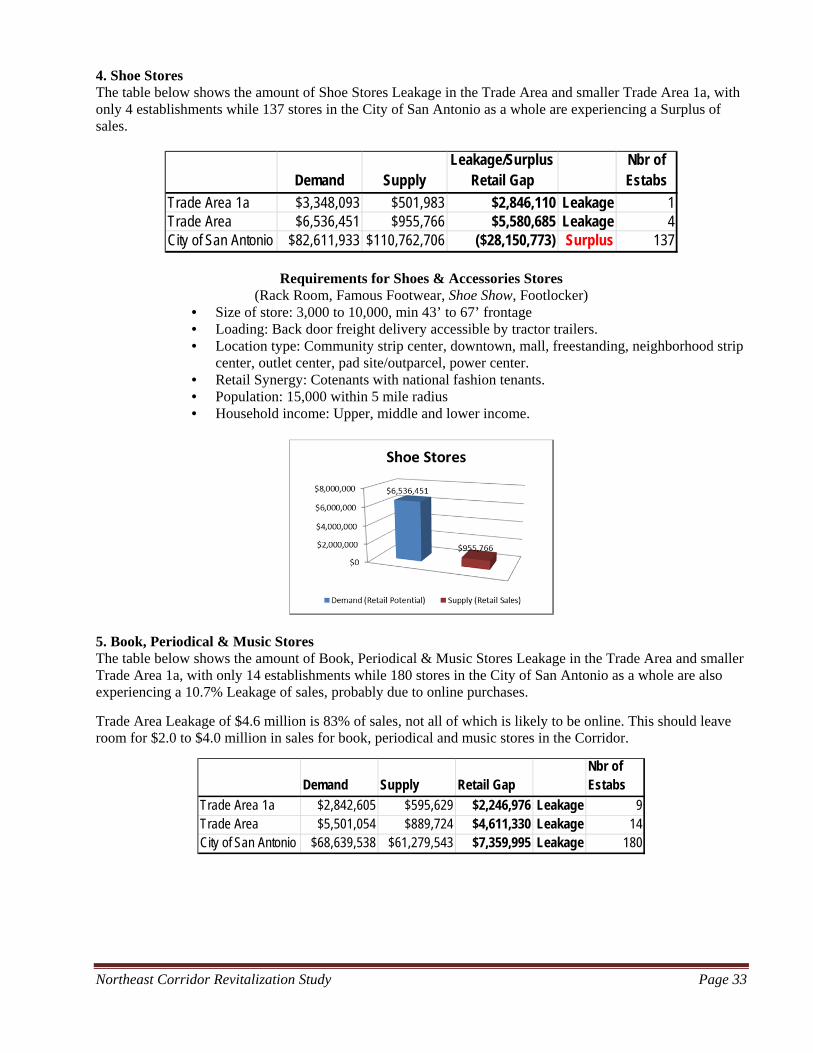
4. Shoe Stores The table below shows the amount of Shoe Stores Leakage in the Trade Area and smaller Trade Area 1a, with only 4 establishments while 137 stores in the City of San Antonio as a whole are experiencing a Surplus of sales.
Requirements for Shoes & Accessories Stores (Rack Room, Famous Footwear, Shoe Show, Footlocker)
• Size of store: 3,000 to 10,000, min 43’ to 67’ frontage • Loading: Back door freight delivery accessible by tractor trailers. • Location type: Community strip center, downtown, mall, freestanding, neighborhood strip
center, outlet center, pad site/outparcel, power center. • Retail Synergy: Cotenants with national fashion tenants. • Population: 15,000 within 5 mile radius • Household income: Upper, middle and lower income.
5. Book, Periodical & Music Stores The table below shows the amount of Book, Periodical & Music Stores Leakage in the Trade Area and smaller Trade Area 1a, with only 14 establishments while 180 stores in the City of San Antonio as a whole are also experiencing a 10.7% Leakage of sales, probably due to online purchases.
Trade Area Leakage of $4.6 million is 83% of sales, not all of which is likely to be online. This should leave room for $2.0 to $4.0 million in sales for book, periodical and music stores in the Corridor.
Demand SupplyLeakage/Surplus
Retail GapNbr of Estabs
Trade Area 1a $3,348,093 $501,983 $2,846,110 Leakage 1Trade Area $6,536,451 $955,766 $5,580,685 Leakage 4City of San Antonio $82,611,933 $110,762,706 ($28,150,773) Surplus 137
Demand Supply Retail GapNbr of Estabs
Trade Area 1a $2,842,605 $595,629 $2,246,976 Leakage 9Trade Area $5,501,054 $889,724 $4,611,330 Leakage 14City of San Antonio $68,639,538 $61,279,543 $7,359,995 Leakage 180
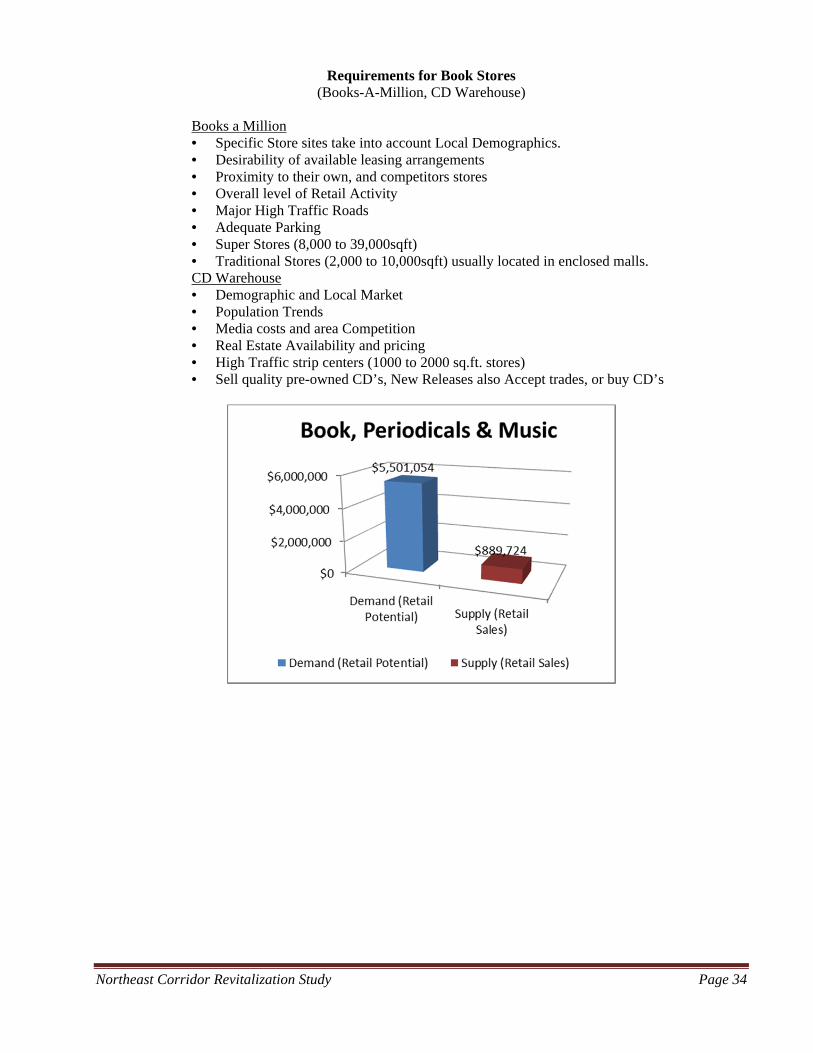
Northeast Corridor Revitalization Study Page 34
Requirements for Book Stores (Books-A-Million, CD Warehouse)
Books a Million • Specific Store sites take into account Local Demographics. • Desirability of available leasing arrangements • Proximity to their own, and competitors stores • Overall level of Retail Activity • Major High Traffic Roads • Adequate Parking • Super Stores (8,000 to 39,000sqft) • Traditional Stores (2,000 to 10,000sqft) usually located in enclosed malls. CD Warehouse • Demographic and Local Market • Population Trends • Media costs and area Competition • Real Estate Availability and pricing • High Traffic strip centers (1000 to 2000 sq.ft. stores) • Sell quality pre-owned CD’s, New Releases also Accept trades, or buy CD’s
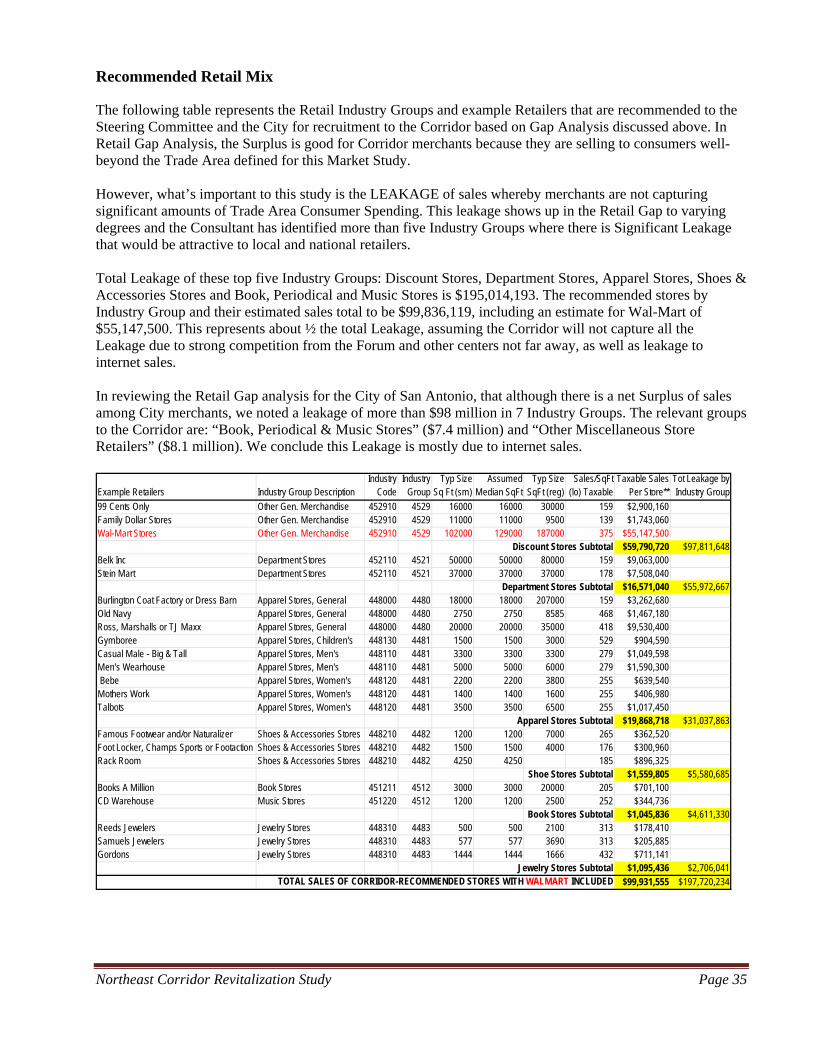
Northeast Corridor Revitalization Study Page 35
Recommended Retail Mix
The following table represents the Retail Industry Groups and example Retailers that are recommended to the Steering Committee and the City for recruitment to the Corridor based on Gap Analysis discussed above. In Retail Gap Analysis, the Surplus is good for Corridor merchants because they are selling to consumers well-beyond the Trade Area defined for this Market Study. However, what’s important to this study is the LEAKAGE of sales whereby merchants are not capturing significant amounts of Trade Area Consumer Spending. This leakage shows up in the Retail Gap to varying degrees and the Consultant has identified more than five Industry Groups where there is Significant Leakage that would be attractive to local and national retailers. Total Leakage of these top five Industry Groups: Discount Stores, Department Stores, Apparel Stores, Shoes & Accessories Stores and Book, Periodical and Music Stores is $195,014,193. The recommended stores by Industry Group and their estimated sales total to be $99,836,119, including an estimate for Wal-Mart of $55,147,500. This represents about ½ the total Leakage, assuming the Corridor will not capture all the Leakage due to strong competition from the Forum and other centers not far away, as well as leakage to internet sales. In reviewing the Retail Gap analysis for the City of San Antonio, that although there is a net Surplus of sales among City merchants, we noted a leakage of more than $98 million in 7 Industry Groups. The relevant groups to the Corridor are: “Book, Periodical & Music Stores” ($7.4 million) and “Other Miscellaneous Store Retailers” ($8.1 million). We conclude this Leakage is mostly due to internet sales.
Example Retailers Industry Group DescriptionIndustry
CodeIndustry
GroupTyp Size
Sq Ft (sm)Assumed
Median SqFtTyp Size
SqFt (reg)Sales/SqFt
(lo) TaxableTaxable Sales
Per Store**Tot Leakage by Industry Group
99 Cents Only Other Gen. Merchandise 452910 4529 16000 16000 30000 159 $2,900,160Family Dollar Stores Other Gen. Merchandise 452910 4529 11000 11000 9500 139 $1,743,060Wal-Mart Stores Other Gen. Merchandise 452910 4529 102000 129000 187000 375 $55,147,500
Discount Stores Subtotal $59,790,720 $97,811,648Belk Inc Department Stores 452110 4521 50000 50000 80000 159 $9,063,000Stein Mart Department Stores 452110 4521 37000 37000 37000 178 $7,508,040
Department Stores Subtotal $16,571,040 $55,972,667Burlington Coat Factory or Dress Barn Apparel Stores, General 448000 4480 18000 18000 207000 159 $3,262,680Old Navy Apparel Stores, General 448000 4480 2750 2750 8585 468 $1,467,180Ross, Marshalls or TJ Maxx Apparel Stores, General 448000 4480 20000 20000 35000 418 $9,530,400Gymboree Apparel Stores, Children's 448130 4481 1500 1500 3000 529 $904,590Casual Male - Big & Tall Apparel Stores, Men's 448110 4481 3300 3300 3300 279 $1,049,598Men's Wearhouse Apparel Stores, Men's 448110 4481 5000 5000 6000 279 $1,590,300 Bebe Apparel Stores, Women's 448120 4481 2200 2200 3800 255 $639,540Mothers Work Apparel Stores, Women's 448120 4481 1400 1400 1600 255 $406,980Talbots Apparel Stores, Women's 448120 4481 3500 3500 6500 255 $1,017,450
Apparel Stores Subtotal $19,868,718 $31,037,863Famous Footwear and/or Naturalizer Shoes & Accessories Stores 448210 4482 1200 1200 7000 265 $362,520Foot Locker, Champs Sports or Footaction Shoes & Accessories Stores 448210 4482 1500 1500 4000 176 $300,960Rack Room Shoes & Accessories Stores 448210 4482 4250 4250 185 $896,325
Shoe Stores Subtotal $1,559,805 $5,580,685Books A Million Book Stores 451211 4512 3000 3000 20000 205 $701,100CD Warehouse Music Stores 451220 4512 1200 1200 2500 252 $344,736
Book Stores Subtotal $1,045,836 $4,611,330Reeds Jewelers Jewelry Stores 448310 4483 500 500 2100 313 $178,410Samuels Jewelers Jewelry Stores 448310 4483 577 577 3690 313 $205,885Gordons Jewelry Stores 448310 4483 1444 1444 1666 432 $711,141
Jewelry Stores Subtotal $1,095,436 $2,706,041TOTAL SALES OF CORRIDOR-RECOMMENDED STORES WITH WALMART INCLUDED $99,931,555 $197,720,234
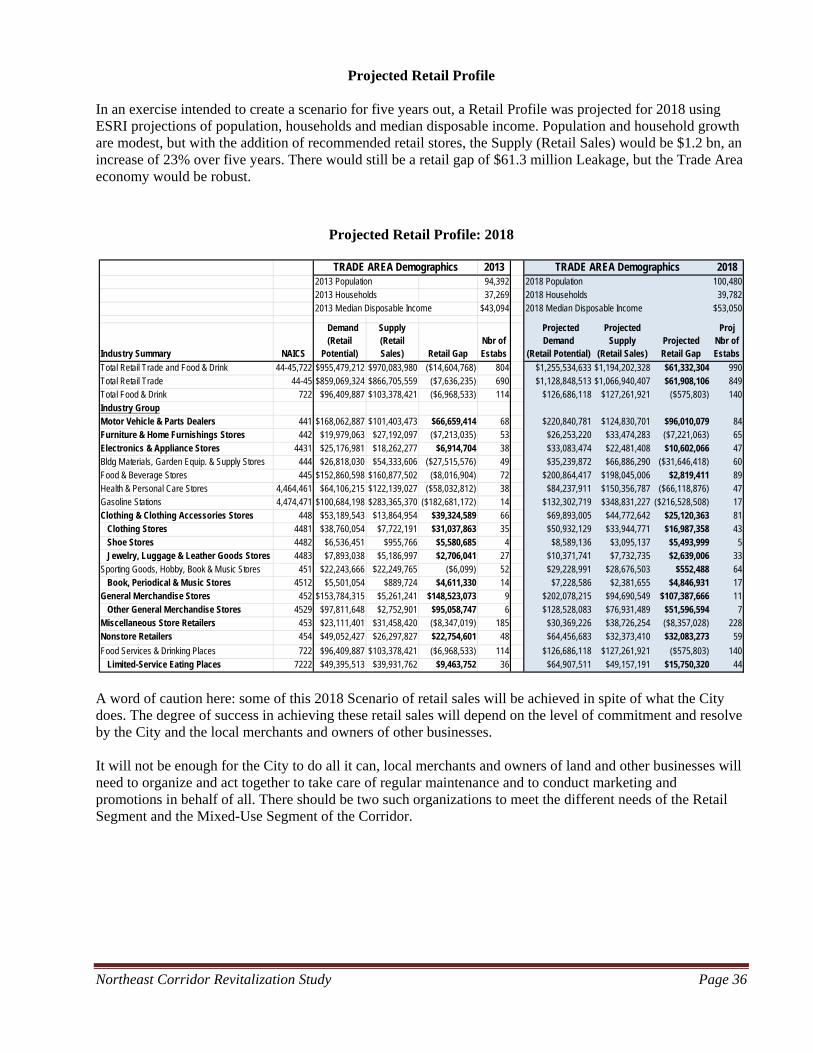
Northeast Corridor Revitalization Study Page 36
Projected Retail Profile In an exercise intended to create a scenario for five years out, a Retail Profile was projected for 2018 using ESRI projections of population, households and median disposable income. Population and household growth are modest, but with the addition of recommended retail stores, the Supply (Retail Sales) would be $1.2 bn, an increase of 23% over five years. There would still be a retail gap of $61.3 million Leakage, but the Trade Area economy would be robust.
Projected Retail Profile: 2018
A word of caution here: some of this 2018 Scenario of retail sales will be achieved in spite of what the City does. The degree of success in achieving these retail sales will depend on the level of commitment and resolve by the City and the local merchants and owners of other businesses. It will not be enough for the City to do all it can, local merchants and owners of land and other businesses will need to organize and act together to take care of regular maintenance and to conduct marketing and promotions in behalf of all. There should be two such organizations to meet the different needs of the Retail Segment and the Mixed-Use Segment of the Corridor.
2013 20182013 Population 94,392 2018 Population 100,4802013 Households 37,269 2018 Households 39,7822013 Median Disposable Income $43,094 2018 Median Disposable Income $53,050
Industry Summary NAICS
Demand (Retail
Potential)
Supply (Retail Sales) Retail Gap
Nbr of Estabs
Projected Demand
(Retail Potential)
Projected Supply
(Retail Sales)Projected Retail Gap
Proj Nbr of Estabs
Total Retail Trade and Food & Drink 44-45,722 $955,479,212 $970,083,980 ($14,604,768) 804 $1,255,534,633 $1,194,202,328 $61,332,304 990Total Retail Trade 44-45 $859,069,324 $866,705,559 ($7,636,235) 690 $1,128,848,513 $1,066,940,407 $61,908,106 849Total Food & Drink 722 $96,409,887 $103,378,421 ($6,968,533) 114 $126,686,118 $127,261,921 ($575,803) 140Industry GroupMotor Vehicle & Parts Dealers 441 $168,062,887 $101,403,473 $66,659,414 68 $220,840,781 $124,830,701 $96,010,079 84Furniture & Home Furnishings Stores 442 $19,979,063 $27,192,097 ($7,213,035) 53 $26,253,220 $33,474,283 ($7,221,063) 65Electronics & Appliance Stores 4431 $25,176,981 $18,262,277 $6,914,704 38 $33,083,474 $22,481,408 $10,602,066 47Bldg Materials, Garden Equip. & Supply Stores 444 $26,818,030 $54,333,606 ($27,515,576) 49 $35,239,872 $66,886,290 ($31,646,418) 60Food & Beverage Stores 445 $152,860,598 $160,877,502 ($8,016,904) 72 $200,864,417 $198,045,006 $2,819,411 89Health & Personal Care Stores 4,464,461 $64,106,215 $122,139,027 ($58,032,812) 38 $84,237,911 $150,356,787 ($66,118,876) 47Gasoline Stations 4,474,471 $100,684,198 $283,365,370 ($182,681,172) 14 $132,302,719 $348,831,227 ($216,528,508) 17Clothing & Clothing Accessories Stores 448 $53,189,543 $13,864,954 $39,324,589 66 $69,893,005 $44,772,642 $25,120,363 81 Clothing Stores 4481 $38,760,054 $7,722,191 $31,037,863 35 $50,932,129 $33,944,771 $16,987,358 43 Shoe Stores 4482 $6,536,451 $955,766 $5,580,685 4 $8,589,136 $3,095,137 $5,493,999 5 Jewelry, Luggage & Leather Goods Stores 4483 $7,893,038 $5,186,997 $2,706,041 27 $10,371,741 $7,732,735 $2,639,006 33Sporting Goods, Hobby, Book & Music Stores 451 $22,243,666 $22,249,765 ($6,099) 52 $29,228,991 $28,676,503 $552,488 64 Book, Periodical & Music Stores 4512 $5,501,054 $889,724 $4,611,330 14 $7,228,586 $2,381,655 $4,846,931 17General Merchandise Stores 452 $153,784,315 $5,261,241 $148,523,073 9 $202,078,215 $94,690,549 $107,387,666 11 Other General Merchandise Stores 4529 $97,811,648 $2,752,901 $95,058,747 6 $128,528,083 $76,931,489 $51,596,594 7Miscellaneous Store Retailers 453 $23,111,401 $31,458,420 ($8,347,019) 185 $30,369,226 $38,726,254 ($8,357,028) 228Nonstore Retailers 454 $49,052,427 $26,297,827 $22,754,601 48 $64,456,683 $32,373,410 $32,083,273 59
Food Services & Drinking Places 722 $96,409,887 $103,378,421 ($6,968,533) 114 $126,686,118 $127,261,921 ($575,803) 140 Limited-Service Eating Places 7222 $49,395,513 $39,931,762 $9,463,752 36 $64,907,511 $49,157,191 $15,750,320 44
TRADE AREA DemographicsTRADE AREA Demographics
Northeast Corridor Revitalization Study Page 37
Non-Retail Businesses
The Northeast Corridor is an interesting mix of retail and non-retail businesses and land uses. Though dominated by retail establishments with 338 of 395 designated parcels and spaces, there are 181 Non-Retail businesses and 10 residential uses out of 210 designated parcels and spaces. Retail uses are typically designated as a use that might be found in a retail center. Non-Retail uses are typically those not found in retail centers. However, some non-retail uses do appear in centers because of their versatility, ability to pay higher rents and their low impact on adjacent uses. Many non-retailers will be part of an industrial park or free-standing operation because of the need for less parking, less air-conditioned space, loading docks and other factors. Light Industrial-related uses such as office-showroom, office-warehouse and “flex-space” typically budget for lower rents and cannot justify the rent of a retail center. Existing Non-Retail Businesses • Apartments, condominiums (6) • Child care and pre-schools (8) • Churches (6) • Cleaners, laundry (7) • Consumer loans, payday loans and check cashing (14) • Copying, printing (6) • Construction related (9) • Event centers (5) • Financial Services - banks, credit unions (6) • Fitness and martial arts (9) • Funeral home (1) • Government offices (5) • Lodging - corporate and long-term (4) • Medical Services (clinics, labs, physicians, surgeons, psychologists, mental health, psychotherapists,
dentists) (30) • Moving companies (4) • Pet care (3) • Professional Services (attorneys, tax prep, real estate, insurance, environmental, security, investigations,
web design, marketing, advertising) (49) • Social services - adoption, abortion, senior (4) • Storage (5) • Tattoo artists (6) • Ungrouped non-retail (18)
Inventory Summary of Land and Building Space The list above indicates the character of 200 non-retail businesses in the NEC. In land use, the dominant category is residential, while Professional and Medical services have the highest number of establishments with 79. There is an estimated total of 1,311,735 square feet of Non-Retail space in the Northeast Corridor, of which 114,590 square feet are vacant, resulting in a Non-Retail space vacancy rate of 8.7%. There are 212.77 acres considered to be in Non-Retail use. Another 106.85 acres and 83,769 sq. ft. of building floor space that could be either non-retail or retail uses.
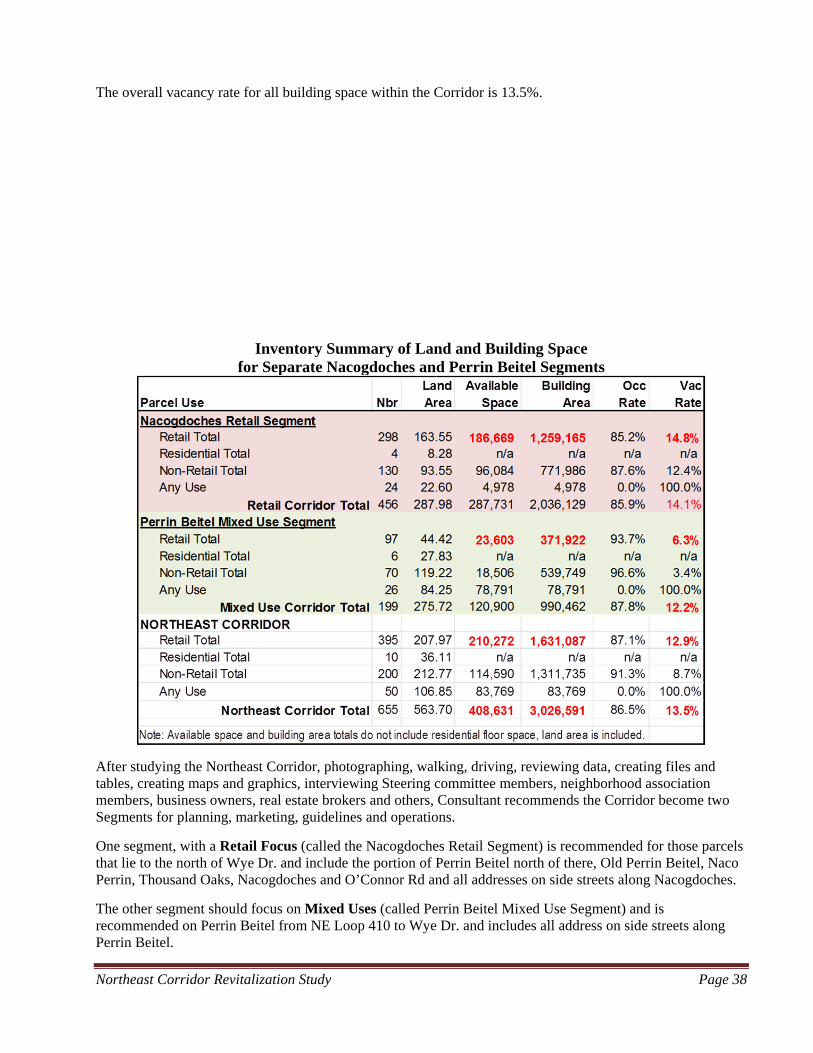
Northeast Corridor Revitalization Study Page 38
The overall vacancy rate for all building space within the Corridor is 13.5%.
Inventory Summary of Land and Building Space for Separate Nacogdoches and Perrin Beitel Segments
After studying the Northeast Corridor, photographing, walking, driving, reviewing data, creating files and tables, creating maps and graphics, interviewing Steering committee members, neighborhood association members, business owners, real estate brokers and others, Consultant recommends the Corridor become two Segments for planning, marketing, guidelines and operations.
One segment, with a Retail Focus (called the Nacogdoches Retail Segment) is recommended for those parcels that lie to the north of Wye Dr. and include the portion of Perrin Beitel north of there, Old Perrin Beitel, Naco Perrin, Thousand Oaks, Nacogdoches and O’Connor Rd and all addresses on side streets along Nacogdoches.
The other segment should focus on Mixed Uses (called Perrin Beitel Mixed Use Segment) and is recommended on Perrin Beitel from NE Loop 410 to Wye Dr. and includes all address on side streets along Perrin Beitel.
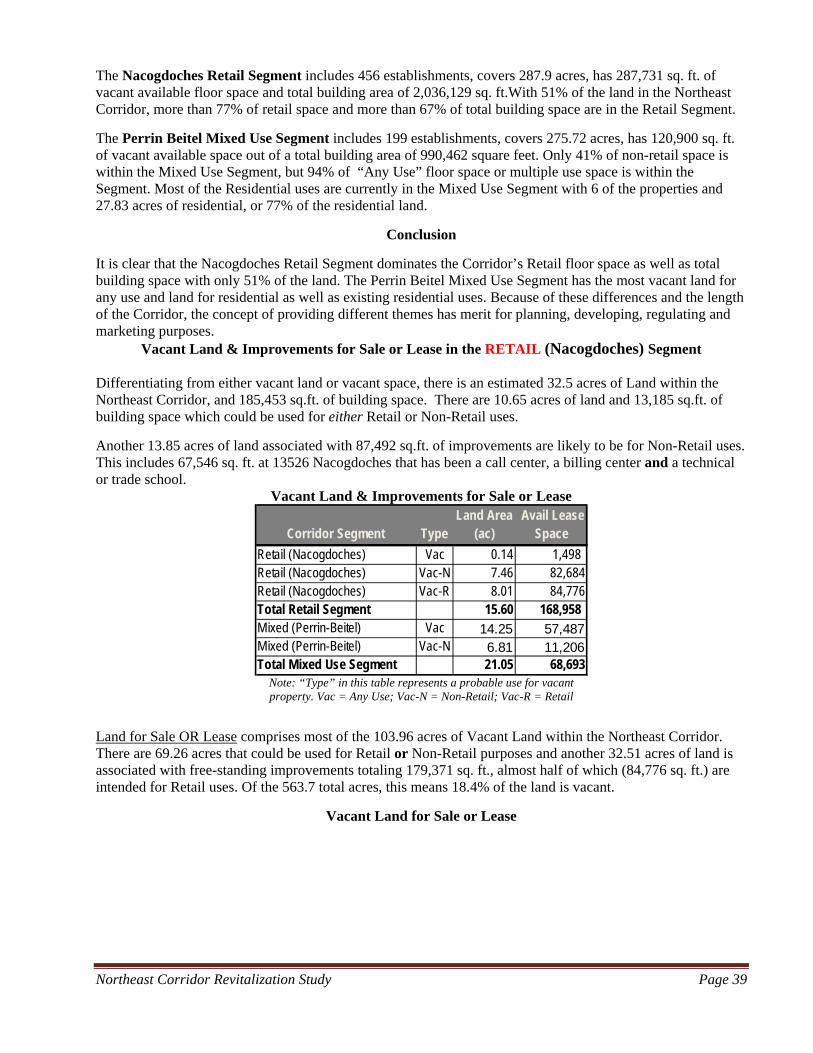
Northeast Corridor Revitalization Study Page 39
The Nacogdoches Retail Segment includes 456 establishments, covers 287.9 acres, has 287,731 sq. ft. of vacant available floor space and total building area of 2,036,129 sq. ft.With 51% of the land in the Northeast Corridor, more than 77% of retail space and more than 67% of total building space are in the Retail Segment.
The Perrin Beitel Mixed Use Segment includes 199 establishments, covers 275.72 acres, has 120,900 sq. ft. of vacant available space out of a total building area of 990,462 square feet. Only 41% of non-retail space is within the Mixed Use Segment, but 94% of “Any Use” floor space or multiple use space is within the Segment. Most of the Residential uses are currently in the Mixed Use Segment with 6 of the properties and 27.83 acres of residential, or 77% of the residential land.
Conclusion
It is clear that the Nacogdoches Retail Segment dominates the Corridor’s Retail floor space as well as total building space with only 51% of the land. The Perrin Beitel Mixed Use Segment has the most vacant land for any use and land for residential as well as existing residential uses. Because of these differences and the length of the Corridor, the concept of providing different themes has merit for planning, developing, regulating and marketing purposes.
Vacant Land & Improvements for Sale or Lease in the RETAIL (Nacogdoches) Segment Differentiating from either vacant land or vacant space, there is an estimated 32.5 acres of Land within the Northeast Corridor, and 185,453 sq.ft. of building space. There are 10.65 acres of land and 13,185 sq.ft. of building space which could be used for either Retail or Non-Retail uses.
Another 13.85 acres of land associated with 87,492 sq.ft. of improvements are likely to be for Non-Retail uses. This includes 67,546 sq. ft. at 13526 Nacogdoches that has been a call center, a billing center and a technical or trade school.
Vacant Land & Improvements for Sale or Lease
Note: “Type” in this table represents a probable use for vacant property. Vac = Any Use; Vac-N = Non-Retail; Vac-R = Retail
Land for Sale OR Lease comprises most of the 103.96 acres of Vacant Land within the Northeast Corridor. There are 69.26 acres that could be used for Retail or Non-Retail purposes and another 32.51 acres of land is associated with free-standing improvements totaling 179,371 sq. ft., almost half of which (84,776 sq. ft.) are intended for Retail uses. Of the 563.7 total acres, this means 18.4% of the land is vacant.
Vacant Land for Sale or Lease
Corridor Segment TypeLand Area
(ac) Avail Lease
Space
Retail (Nacogdoches) Vac 0.14 1,498 Retail (Nacogdoches) Vac-N 7.46 82,684Retail (Nacogdoches) Vac-R 8.01 84,776Total Retail Segment 15.60 168,958 Mixed (Perrin-Beitel) Vac 14.25 57,487Mixed (Perrin-Beitel) Vac-N 6.81 11,206Total Mixed Use Segment 21.05 68,693
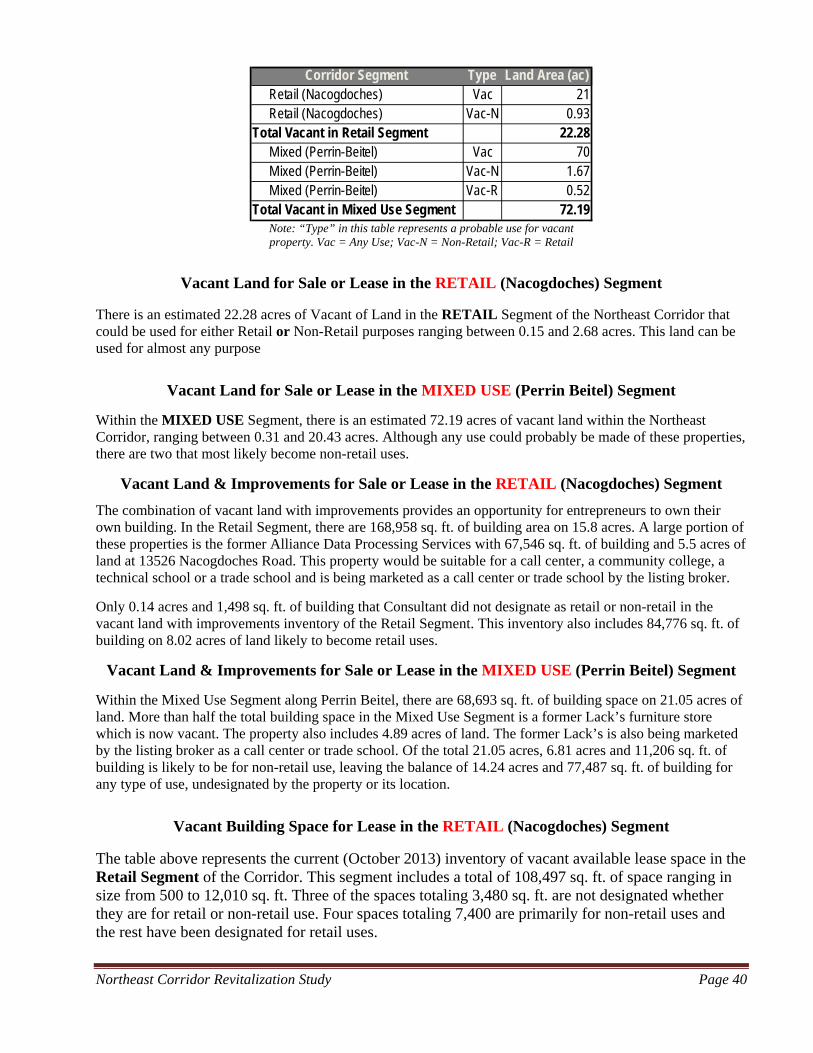
Northeast Corridor Revitalization Study Page 40
Note: “Type” in this table represents a probable use for vacant property. Vac = Any Use; Vac-N = Non-Retail; Vac-R = Retail
Vacant Land for Sale or Lease in the RETAIL (Nacogdoches) Segment
There is an estimated 22.28 acres of Vacant of Land in the RETAIL Segment of the Northeast Corridor that could be used for either Retail or Non-Retail purposes ranging between 0.15 and 2.68 acres. This land can be used for almost any purpose
Vacant Land for Sale or Lease in the MIXED USE (Perrin Beitel) Segment
Within the MIXED USE Segment, there is an estimated 72.19 acres of vacant land within the Northeast Corridor, ranging between 0.31 and 20.43 acres. Although any use could probably be made of these properties, there are two that most likely become non-retail uses.
Vacant Land & Improvements for Sale or Lease in the RETAIL (Nacogdoches) Segment
The combination of vacant land with improvements provides an opportunity for entrepreneurs to own their own building. In the Retail Segment, there are 168,958 sq. ft. of building area on 15.8 acres. A large portion of these properties is the former Alliance Data Processing Services with 67,546 sq. ft. of building and 5.5 acres of land at 13526 Nacogdoches Road. This property would be suitable for a call center, a community college, a technical school or a trade school and is being marketed as a call center or trade school by the listing broker.
Only 0.14 acres and 1,498 sq. ft. of building that Consultant did not designate as retail or non-retail in the vacant land with improvements inventory of the Retail Segment. This inventory also includes 84,776 sq. ft. of building on 8.02 acres of land likely to become retail uses.
Vacant Land & Improvements for Sale or Lease in the MIXED USE (Perrin Beitel) Segment
Within the Mixed Use Segment along Perrin Beitel, there are 68,693 sq. ft. of building space on 21.05 acres of land. More than half the total building space in the Mixed Use Segment is a former Lack’s furniture store which is now vacant. The property also includes 4.89 acres of land. The former Lack’s is also being marketed by the listing broker as a call center or trade school. Of the total 21.05 acres, 6.81 acres and 11,206 sq. ft. of building is likely to be for non-retail use, leaving the balance of 14.24 acres and 77,487 sq. ft. of building for any type of use, undesignated by the property or its location.
Vacant Building Space for Lease in the RETAIL (Nacogdoches) Segment
The table above represents the current (October 2013) inventory of vacant available lease space in the Retail Segment of the Corridor. This segment includes a total of 108,497 sq. ft. of space ranging in size from 500 to 12,010 sq. ft. Three of the spaces totaling 3,480 sq. ft. are not designated whether they are for retail or non-retail use. Four spaces totaling 7,400 are primarily for non-retail uses and the rest have been designated for retail uses.
Corridor Segment Type Land Area (ac) Retail (Nacogdoches) Vac 21 Retail (Nacogdoches) Vac-N 0.93Total Vacant in Retail Segment 22.28 Mixed (Perrin-Beitel) Vac 70 Mixed (Perrin-Beitel) Vac-N 1.67 Mixed (Perrin-Beitel) Vac-R 0.52Total Vacant in Mixed Use Segment 72.19
Northeast Corridor Revitalization Study Page 41
Vacant Building Space for Lease in the MIXED USE (Perrin Beitel) Segment
The table below represents the current (October 2013) inventory of vacant available lease space in the Mixed Use Segment of the Corridor. This segment includes a total of only 17,128 sq. ft. of space ranging in size from 300 to 4,000 sq. ft. Three of the spaces totaling 7,500 sq. ft. are not designated as to whether they are for retail or non-retail use. Five spaces totaling 7,300 are primarily for non-retail uses and the rest are designated for retail uses.
Vacant Building Space for Lease MULTI-PURPOSE/NON-RETAIL
There is an estimated 74,572 sq.ft. of Vacant multi-purpose floor space within the Northeast Corridor, that could be used for either Retail or Non-Retail purposes, including the 63,292 sq.ft. former Lack's Furniture Store space at 8611 Perrin Beitel. This space is recommended for either a Call Center or a Tech/Trade School. Another 22,498 sq.ft. of space is available in the Corridor, ranging from 500 sq.ft. to 4,000 sq.ft. associated with Non-Retail uses (mostly office).
Conclusions on Inventory
Overall within the Corridor, there is an inventory of vacant land with improvements that includes 237,651 sq. ft. of building space situated on a total of 36.66 acres of land.
Non-Retail Markets in San Antonio
In leading up to a set of non-retail uses to be recommended for the NEC, each of the real estate markets is reviewed based on surveys conducted for year by REOC Partners, a commercial real estate firm and specific research directed toward the call center industry and the technical/trade school industry.
• Industrial – Call Center Industry – Tech/Trade School Industry
• Medical Office • Office • Apartments
San Antonio’s Industrial Market In the SA market for Industrial space, vacancy rates are trending downward (a good thing), Net absorption and asking rents are trending upward, but construction is neither up nor down.
The city vacancy rate was 8.1% overall as of June 2013 and trending downward as positive net absorption was 850,000 square feet for 1st & 2nd Quarters, an average of 142,000 square feet per month. Service Center/Flex space in the City is 13.4% vacant with positive net absorption of 291,117 sq. ft.
Overall, 291,117 sq. ft. (48,500 sq. ft./month) of Service Center/Flex space was absorbed through June 2013 with 52,937 sq. ft. absorbed in REOC San Antonio’s Northeast Sector. Vacancy in the NE Sector is 14.1%. Construction was recently completed in the Northeast Corridor Trade Area at Thousand Oaks Business Park 3 near Wetmore Rd on 66,170 sq. ft. of speculative Showroom/Warehouse space.
The Northeast Corridor is not suitable for Distribution Warehouse space, and tends to be a better market for Service Center/Flex space. However, the current market and near future do not favor the Corridor for demand of this type of space.
Northeast Corridor Revitalization Study Page 42
Call Centers Industry Call Centers are a way for businesses to outsource their customer service, although not all companies do. An inbound call center is operated by a company to communicate product support or to field other inquiries with consumers. Outbound call centers are used for telemarketing, market research, fundraising and debt collection. A Call Center is usually a large open workspace with workstations for each employee to have a computer and a telephone.
Trends: answering emails and calls; social media, mobile aps, video calling require more personalization. The recession over the past 5 years has slowed the growth of the call center industry and some major companies have relocated their call centers overseas. Call center . . . “work flows can be routed to different geographic locations, organizations or employees within the same organization and has allowed companies to shift service delivery from local interactions to more remote ones.” An estimated 30% of call centers serve local markets, with 56% serving their own national market. Call center agents typically earn between $25,000 and $29,000 annually with managers typically earning $49,500 to 60,000 annually. Centers are operated by 22,647 businesses, employ 475,275 persons and generate $18bn of revenue;
The Call Center industry is expected to grow by 10% annually through 2017.
Recently, Ibex Global Solutions will open a Call-Center at the former Scooter Store site in New Braunfels and the City will spend $450,000 for generator and electrical equipment to ensure no power loss. New Braunfels Industrial Development Corp. will retain ownership of the Generator and Electrical Equipment. Ibex Global will hire AT LEAST 600 people by the end of 2014. However, the current plan is to have 250-300 employees by end of 2013, 600-800 by end of 2014, and 1000 by end of 2015. Incentives for Ibex include 3 payments of $200,000 by the City if Ibex keeps payroll above 600 employees in 2014, 2015 and 2016. San Antonio Express News, October 9, 2013. Technical and Trade School Industry
Enrollment in technical and trade schools typically increases when there is high unemployment as people go to school for more training. Recent growth during the last recession will continue for at least the next 5 years. The Technical and Trade School industry generates revenue of $16bn annually with low capital outlay.
According to Sageworks, annual growth in employment in professional skills and performance training in the technical and trade school industry is expected to be 4.7% annually through 2016. The net pre-tax profit for technical and trade schools in 2010 was 10.66%, and industry sales grew by 8% in 2009 and 15% in 2010.
According to IBIS World, estimated annual growth from 2008 to 2011 averaged 6.2% and annual growth is projected to be 5.3% through 2016.
San Antonio’s Medical Office Market In the SA market for Medical Office space, vacancy rates are trending downward, Net absorption, construction and asking rents are trending upward. The city vacancy rate is 16.8% overall as of June 2013 compared to 19% last year. There was positive net absorption of 201,400 square feet for 1st & 2nd Quarters, an average of 33,600 square feet per month.
Overall, -7,856 sq. ft. of Class C Medical Office space was absorbed through June 2013 with -438 sq. ft. absorbed in the Northeast Sector which is much larger than the Corridor or Trade Area. Vacancy in the NE Sector is 40.6% for Class C space and 23.5% for all Medical Office space in the NE.
Northeast Corridor Revitalization Study Page 43
Construction is underway for Baptist Emergency Hospital office building in the NE at I-35 and Schertz Parkway. However, most of the 325,000 sq. ft. of other space under construction in the City is in the Far North, Northwest, Far West and New Braunfels.
The Northeast Corridor is a location where most medical office space is Class C. Generally, the current market for Medical Office space and near future do not favor the Corridor for demand of this type of space. San Antonio’s Office Market In the SA market for Office space, vacancy rates are trending downward, Net absorption and asking rents are trending upward, but construction activity is neither up nor down. The city occupancy rate for office space is 18.6% overall as of June 2013 compared to 21.3% last year. There was positive net absorption of 376,051 sq. ft. for 1st & 2nd Quarters, an average of 62,675 square feet per month.
Overall, -13,301 sq. ft. of Class C Office space was absorbed through June 2013 with a positive 5,726 sq. ft. absorbed in the Northeast Sector. Vacancy in the NE Sector is 16.4% for Class C space and 13.4% for all Office space in the NE. Most Office space in the Northeast Corridor is Class C which is older buildings in secondary locations with very few amenities.
The current market for Office Space and that of the near future are not favorable for the Corridor with demand for this type of space.
San Antonio’s Apartment Market In the SA market for Apartments, vacancy rates are trending downward (a good thing), asking rents, construction activity and Net absorption are all trending upward. The city occupancy rate for Apartments 92.9% overall as of September 2013 compared to 92.6% last year. This occupancy rate is the highest in more than a decade. There was positive net absorption of 3,747 units for first three quarters of 2013, compared to 4,931 in four quarters of 2012.
As rental rates and absorption increase, developers are inclined to build more apartments. The average rental rate for new apartments in 2013 is $0.95/sq. ft. up from $0.92 in 2012 and $0.88 in 2011. Most apartments in the Northeast Corridor are Class B or C which are older complexes in secondary locations.
There are several projects in the pipeline, 3 of which are inside Loop 410 and one “on hold” project on Perrin Beitel, but no construction is underway in the Northeast Sector.
Current positive trends in the apartment market are favorable to the Corridor with demand for more housing all over.
Potential Non-Retail Users/Tenants
• Apartments for persons under 35 years old (Millennials) • Call center • Community college • Trade School (barber, technical, bartending, lab, medical, dental, driving, other) • Data center • Financial institutions • Health/medical services • Fitness center • VIA bus information/transfer station. Potential Office Space Users/Tenants
Northeast Corridor Revitalization Study Page 44
• Professional Offices (law, accounting, architecture, landscape architecture, interior design, engineering, advertising, graphic arts, crafts,
• Medical & dental, • Financial advisors, insurance, real estate, • Computer & internet consultants, • Governmental office, • Consultants in all fields, • Art gallery & museum, counselors, • Charitable organizations, • Social services, • Market research, • Business & trade organizations.
Recommended Non-Retail Users
Based on our review of the real estate markets and the specific submarkets for call centers and technical/trade schools, the first three of the non-retail uses shown below are recommended:
• Apartments, rental • Call Center • Community College/Trade School • Medical Clinic • Financial Institution
Consultant is charged with recommending up to three Non-Retail Users for possible recruitment to locate in the Corridor. The recommendations are Apartments for Millennials (under 35 years), Call Center and a campus/center for a community college or Trade School. Following are criteria/requirements that apply to these proposed non-retail users and suggested locations for each type of use.
Requirements for apartments
• Land: 7+ acres • Zoning: MF33, MF40 or MF50 (or allow 50 units/acre and 4 stories) • Frontage on Major thoroughfare • Available public transportation • Retail amenities and entertainment nearby • Cost effective rental market • Proximity to job centers • Strong renter demand from workers in service jobs • Limited multifamily supply • Ongoing redevelopment efforts
Apartment Opportunities
The Corridor and its Trade Area are expected to experience growth up to 2,500 households over the next 5 years. Single family housing units will probably not fulfill this need because of the lack of available land within the Trade Area. There is vacant and under-used land within the corridor and those who believe there is excessive zoning for retail use, as well as too much retail space. Following are opportunities for adding between 2,000 and 2,500 units.
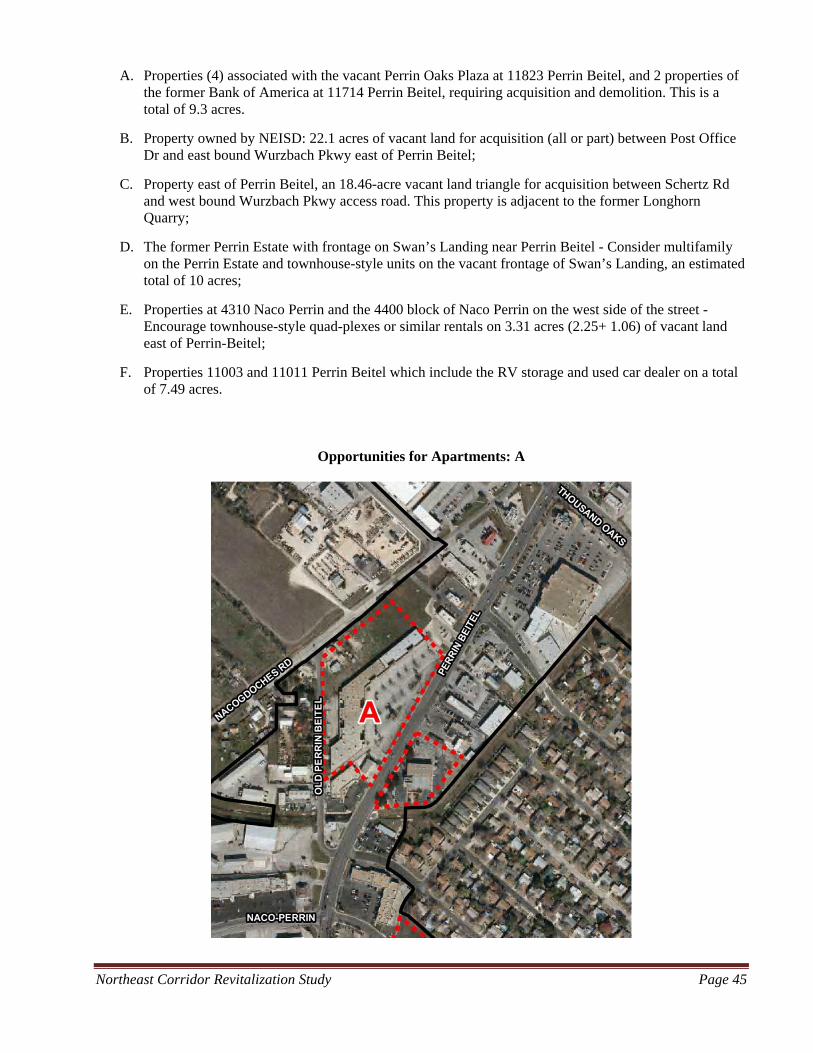
Northeast Corridor Revitalization Study Page 45
A. Properties (4) associated with the vacant Perrin Oaks Plaza at 11823 Perrin Beitel, and 2 properties of the former Bank of America at 11714 Perrin Beitel, requiring acquisition and demolition. This is a total of 9.3 acres.
B. Property owned by NEISD: 22.1 acres of vacant land for acquisition (all or part) between Post Office Dr and east bound Wurzbach Pkwy east of Perrin Beitel;
C. Property east of Perrin Beitel, an 18.46-acre vacant land triangle for acquisition between Schertz Rd and west bound Wurzbach Pkwy access road. This property is adjacent to the former Longhorn Quarry;
D. The former Perrin Estate with frontage on Swan’s Landing near Perrin Beitel - Consider multifamily on the Perrin Estate and townhouse-style units on the vacant frontage of Swan’s Landing, an estimated total of 10 acres;
E. Properties at 4310 Naco Perrin and the 4400 block of Naco Perrin on the west side of the street - Encourage townhouse-style quad-plexes or similar rentals on 3.31 acres (2.25+ 1.06) of vacant land east of Perrin-Beitel;
F. Properties 11003 and 11011 Perrin Beitel which include the RV storage and used car dealer on a total of 7.49 acres.
Opportunities for Apartments: A
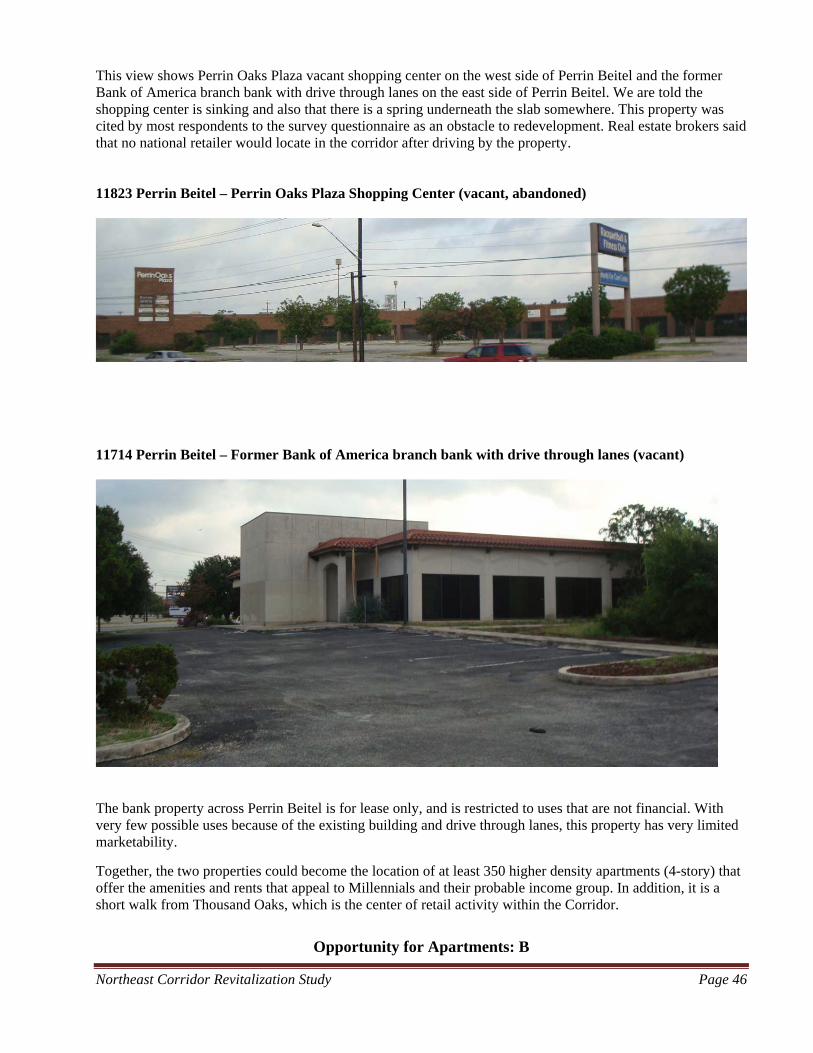
Northeast Corridor Revitalization Study Page 46
This view shows Perrin Oaks Plaza vacant shopping center on the west side of Perrin Beitel and the former Bank of America branch bank with drive through lanes on the east side of Perrin Beitel. We are told the shopping center is sinking and also that there is a spring underneath the slab somewhere. This property was cited by most respondents to the survey questionnaire as an obstacle to redevelopment. Real estate brokers said that no national retailer would locate in the corridor after driving by the property. 11823 Perrin Beitel – Perrin Oaks Plaza Shopping Center (vacant, abandoned)
11714 Perrin Beitel – Former Bank of America branch bank with drive through lanes (vacant)
The bank property across Perrin Beitel is for lease only, and is restricted to uses that are not financial. With very few possible uses because of the existing building and drive through lanes, this property has very limited marketability.
Together, the two properties could become the location of at least 350 higher density apartments (4-story) that offer the amenities and rents that appeal to Millennials and their probable income group. In addition, it is a short walk from Thousand Oaks, which is the center of retail activity within the Corridor.
Opportunity for Apartments: B
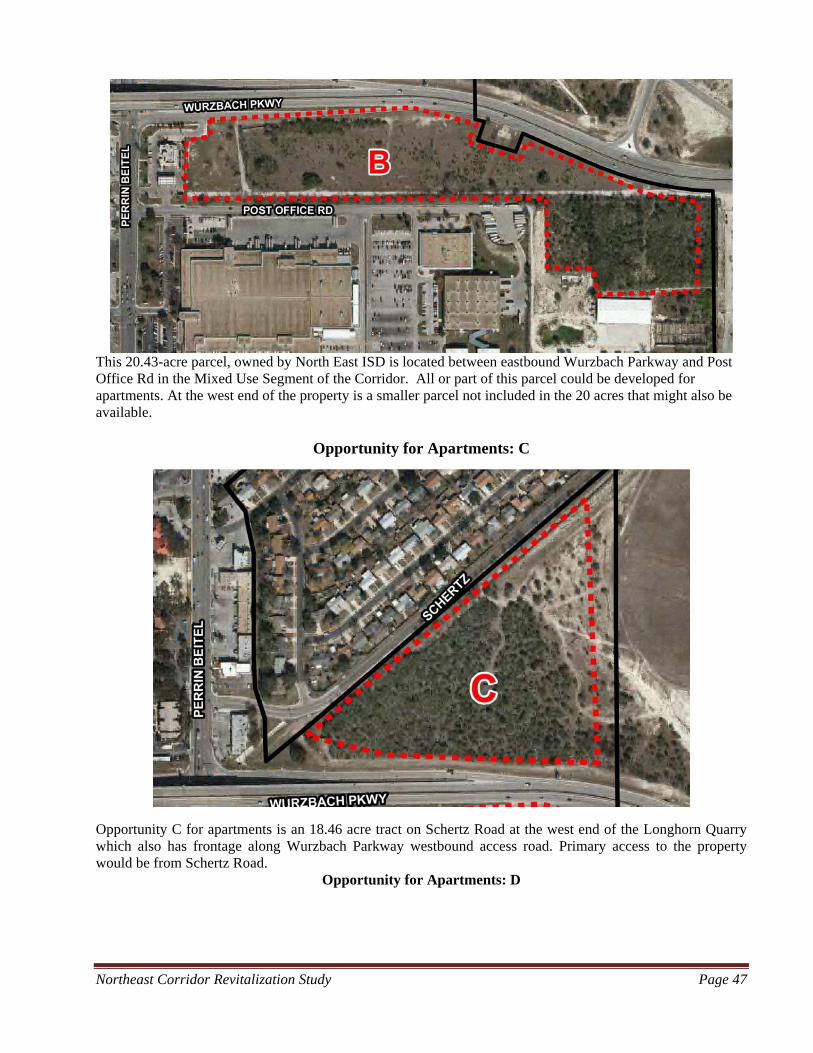
Northeast Corridor Revitalization Study Page 47
This 20.43-acre parcel, owned by North East ISD is located between eastbound Wurzbach Parkway and Post Office Rd in the Mixed Use Segment of the Corridor. All or part of this parcel could be developed for apartments. At the west end of the property is a smaller parcel not included in the 20 acres that might also be available.
Opportunity for Apartments: C
Opportunity C for apartments is an 18.46 acre tract on Schertz Road at the west end of the Longhorn Quarry which also has frontage along Wurzbach Parkway westbound access road. Primary access to the property would be from Schertz Road.
Opportunity for Apartments: D
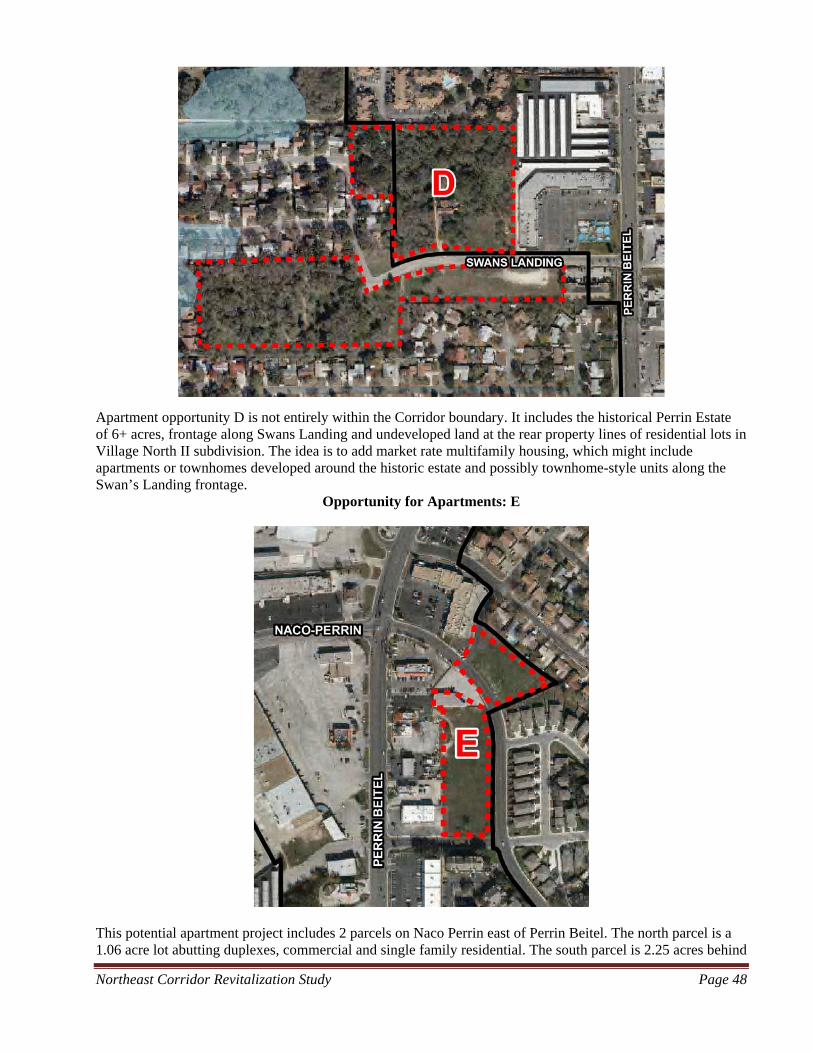
Northeast Corridor Revitalization Study Page 48
Apartment opportunity D is not entirely within the Corridor boundary. It includes the historical Perrin Estate of 6+ acres, frontage along Swans Landing and undeveloped land at the rear property lines of residential lots in Village North II subdivision. The idea is to add market rate multifamily housing, which might include apartments or townhomes developed around the historic estate and possibly townhome-style units along the Swan’s Landing frontage.
Opportunity for Apartments: E
This potential apartment project includes 2 parcels on Naco Perrin east of Perrin Beitel. The north parcel is a 1.06 acre lot abutting duplexes, commercial and single family residential. The south parcel is 2.25 acres behind
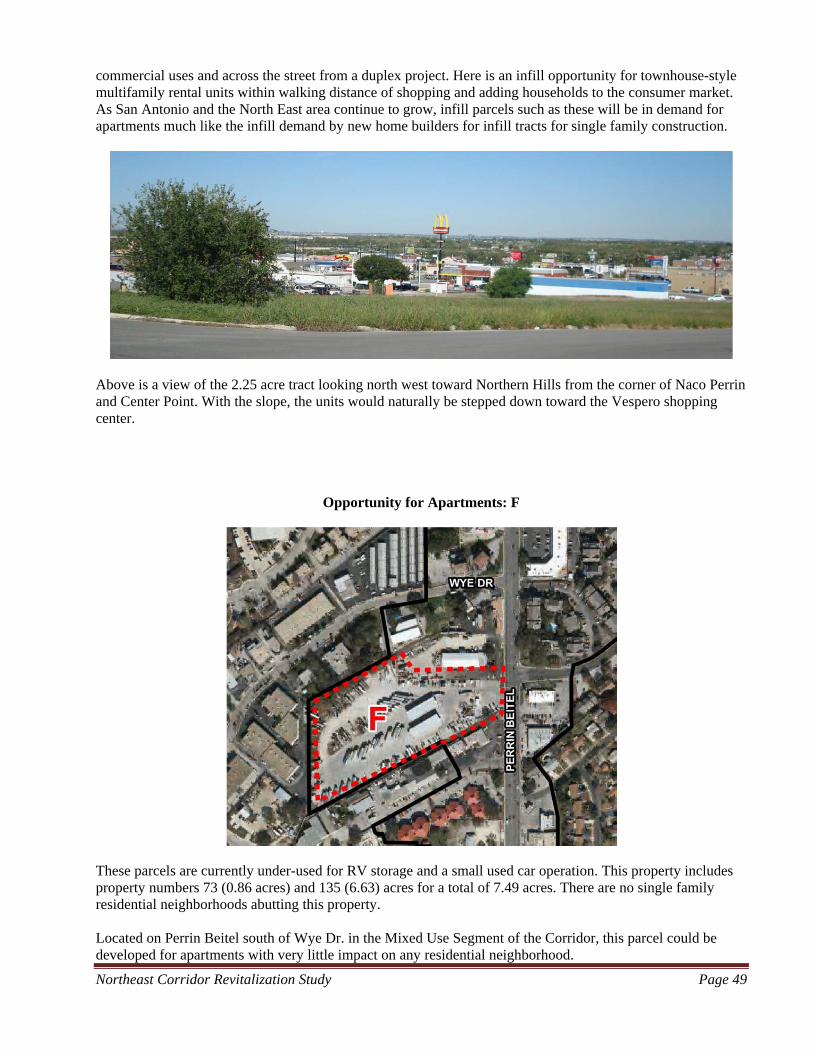
Northeast Corridor Revitalization Study Page 49
commercial uses and across the street from a duplex project. Here is an infill opportunity for townhouse-style multifamily rental units within walking distance of shopping and adding households to the consumer market. As San Antonio and the North East area continue to grow, infill parcels such as these will be in demand for apartments much like the infill demand by new home builders for infill tracts for single family construction.
Above is a view of the 2.25 acre tract looking north west toward Northern Hills from the corner of Naco Perrin and Center Point. With the slope, the units would naturally be stepped down toward the Vespero shopping center.
Opportunity for Apartments: F
These parcels are currently under-used for RV storage and a small used car operation. This property includes property numbers 73 (0.86 acres) and 135 (6.63) acres for a total of 7.49 acres. There are no single family residential neighborhoods abutting this property. Located on Perrin Beitel south of Wye Dr. in the Mixed Use Segment of the Corridor, this parcel could be developed for apartments with very little impact on any residential neighborhood.
Northeast Corridor Revitalization Study Page 50
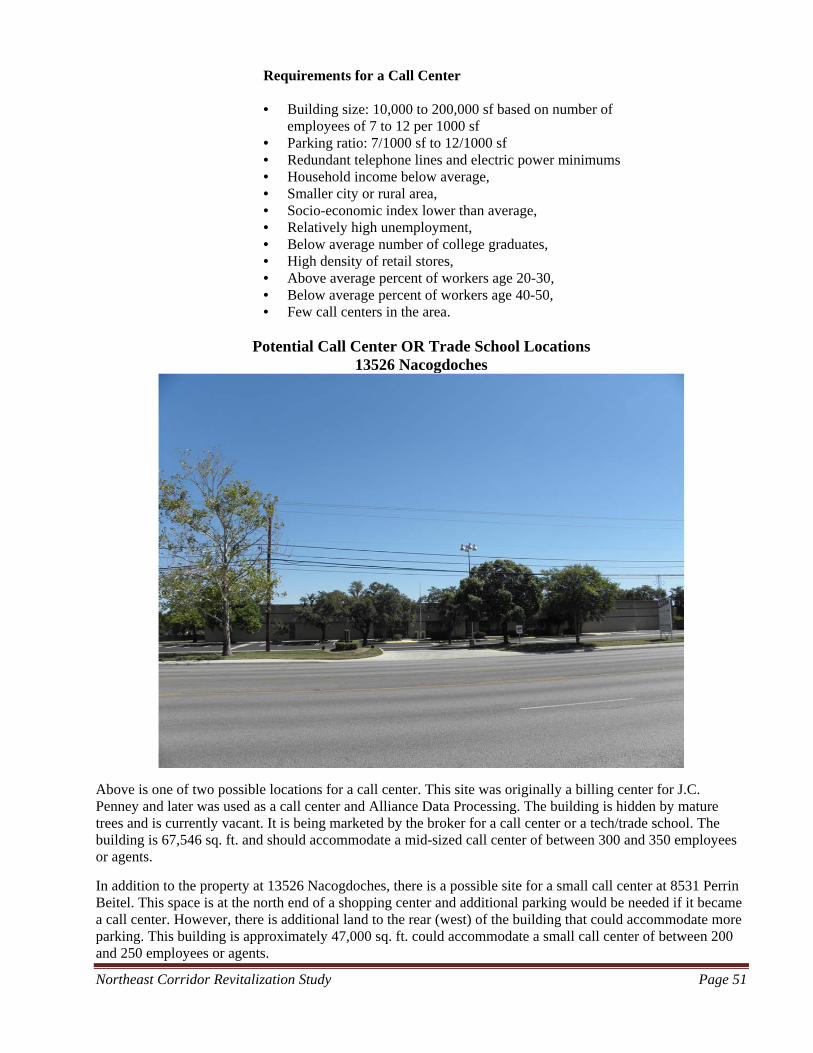
Northeast Corridor Revitalization Study Page 51
Requirements for a Call Center • Building size: 10,000 to 200,000 sf based on number of
employees of 7 to 12 per 1000 sf • Parking ratio: 7/1000 sf to 12/1000 sf • Redundant telephone lines and electric power minimums • Household income below average, • Smaller city or rural area, • Socio-economic index lower than average, • Relatively high unemployment, • Below average number of college graduates, • High density of retail stores, • Above average percent of workers age 20-30, • Below average percent of workers age 40-50, • Few call centers in the area.
Potential Call Center OR Trade School Locations
13526 Nacogdoches
Above is one of two possible locations for a call center. This site was originally a billing center for J.C. Penney and later was used as a call center and Alliance Data Processing. The building is hidden by mature trees and is currently vacant. It is being marketed by the broker for a call center or a tech/trade school. The building is 67,546 sq. ft. and should accommodate a mid-sized call center of between 300 and 350 employees or agents.
In addition to the property at 13526 Nacogdoches, there is a possible site for a small call center at 8531 Perrin Beitel. This space is at the north end of a shopping center and additional parking would be needed if it became a call center. However, there is additional land to the rear (west) of the building that could accommodate more parking. This building is approximately 47,000 sq. ft. could accommodate a small call center of between 200 and 250 employees or agents.
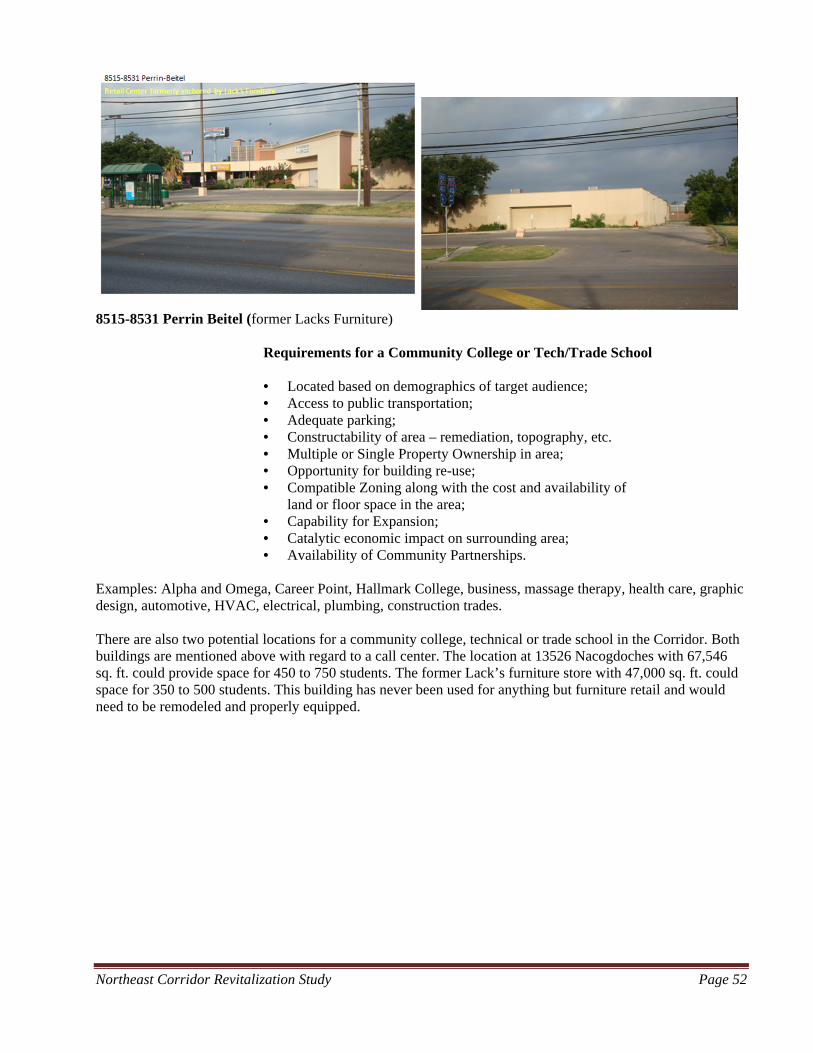
Northeast Corridor Revitalization Study Page 52
8515-8531 Perrin Beitel (former Lacks Furniture)
Requirements for a Community College or Tech/Trade School • Located based on demographics of target audience; • Access to public transportation; • Adequate parking; • Constructability of area – remediation, topography, etc. • Multiple or Single Property Ownership in area; • Opportunity for building re-use; • Compatible Zoning along with the cost and availability of
land or floor space in the area; • Capability for Expansion; • Catalytic economic impact on surrounding area; • Availability of Community Partnerships.
Examples: Alpha and Omega, Career Point, Hallmark College, business, massage therapy, health care, graphic design, automotive, HVAC, electrical, plumbing, construction trades. There are also two potential locations for a community college, technical or trade school in the Corridor. Both buildings are mentioned above with regard to a call center. The location at 13526 Nacogdoches with 67,546 sq. ft. could provide space for 450 to 750 students. The former Lack’s furniture store with 47,000 sq. ft. could space for 350 to 500 students. This building has never been used for anything but furniture retail and would need to be remodeled and properly equipped.
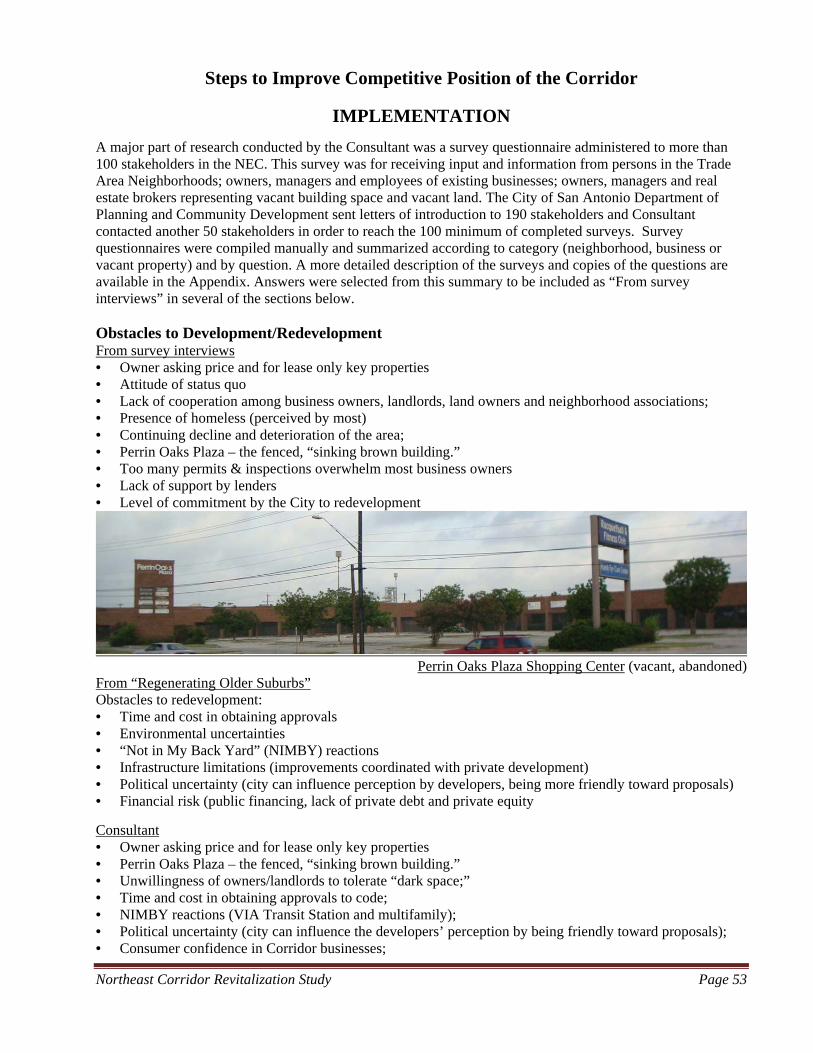
Northeast Corridor Revitalization Study Page 53
Steps to Improve Competitive Position of the Corridor
IMPLEMENTATION
A major part of research conducted by the Consultant was a survey questionnaire administered to more than 100 stakeholders in the NEC. This survey was for receiving input and information from persons in the Trade Area Neighborhoods; owners, managers and employees of existing businesses; owners, managers and real estate brokers representing vacant building space and vacant land. The City of San Antonio Department of Planning and Community Development sent letters of introduction to 190 stakeholders and Consultant contacted another 50 stakeholders in order to reach the 100 minimum of completed surveys. Survey questionnaires were compiled manually and summarized according to category (neighborhood, business or vacant property) and by question. A more detailed description of the surveys and copies of the questions are available in the Appendix. Answers were selected from this summary to be included as “From survey interviews” in several of the sections below. Obstacles to Development/Redevelopment From survey interviews • Owner asking price and for lease only key properties • Attitude of status quo • Lack of cooperation among business owners, landlords, land owners and neighborhood associations; • Presence of homeless (perceived by most) • Continuing decline and deterioration of the area; • Perrin Oaks Plaza – the fenced, “sinking brown building.” • Too many permits & inspections overwhelm most business owners • Lack of support by lenders • Level of commitment by the City to redevelopment
Perrin Oaks Plaza Shopping Center (vacant, abandoned)
From “Regenerating Older Suburbs” Obstacles to redevelopment: • Time and cost in obtaining approvals • Environmental uncertainties • “Not in My Back Yard” (NIMBY) reactions • Infrastructure limitations (improvements coordinated with private development) • Political uncertainty (city can influence perception by developers, being more friendly toward proposals) • Financial risk (public financing, lack of private debt and private equity
Consultant • Owner asking price and for lease only key properties • Perrin Oaks Plaza – the fenced, “sinking brown building.” • Unwillingness of owners/landlords to tolerate “dark space;” • Time and cost in obtaining approvals to code; • NIMBY reactions (VIA Transit Station and multifamily); • Political uncertainty (city can influence the developers’ perception by being friendly toward proposals); • Consumer confidence in Corridor businesses;
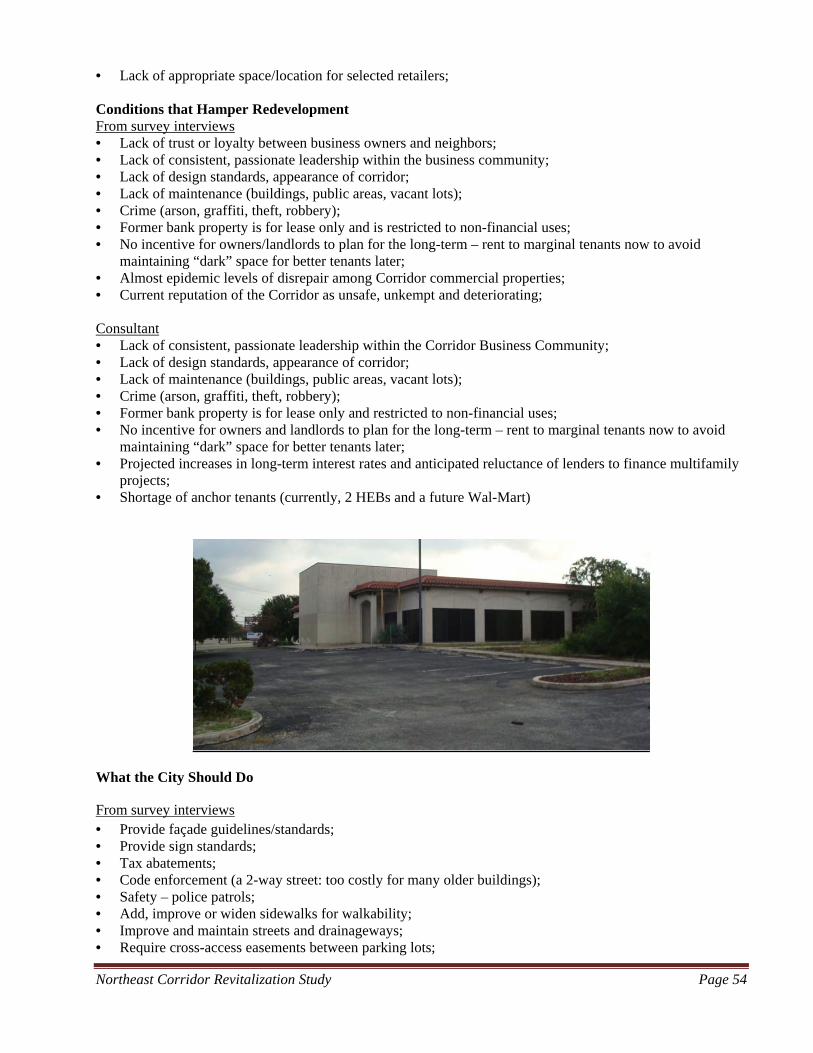
Northeast Corridor Revitalization Study Page 54
• Lack of appropriate space/location for selected retailers; Conditions that Hamper Redevelopment From survey interviews • Lack of trust or loyalty between business owners and neighbors; • Lack of consistent, passionate leadership within the business community; • Lack of design standards, appearance of corridor; • Lack of maintenance (buildings, public areas, vacant lots); • Crime (arson, graffiti, theft, robbery); • Former bank property is for lease only and is restricted to non-financial uses; • No incentive for owners/landlords to plan for the long-term – rent to marginal tenants now to avoid
maintaining “dark” space for better tenants later; • Almost epidemic levels of disrepair among Corridor commercial properties; • Current reputation of the Corridor as unsafe, unkempt and deteriorating; Consultant • Lack of consistent, passionate leadership within the Corridor Business Community; • Lack of design standards, appearance of corridor; • Lack of maintenance (buildings, public areas, vacant lots); • Crime (arson, graffiti, theft, robbery); • Former bank property is for lease only and restricted to non-financial uses; • No incentive for owners and landlords to plan for the long-term – rent to marginal tenants now to avoid
maintaining “dark” space for better tenants later; • Projected increases in long-term interest rates and anticipated reluctance of lenders to finance multifamily
projects; • Shortage of anchor tenants (currently, 2 HEBs and a future Wal-Mart)
What the City Should Do
From survey interviews • Provide façade guidelines/standards; • Provide sign standards; • Tax abatements; • Code enforcement (a 2-way street: too costly for many older buildings); • Safety – police patrols; • Add, improve or widen sidewalks for walkability; • Improve and maintain streets and drainageways; • Require cross-access easements between parking lots;
Northeast Corridor Revitalization Study Page 55
• Create an organization to coordinate revitalization, maintenance and marketing; • Provide information and materials for marketing; • Conduct engineering studies for infrastructure to determine needs; • Demolish selected structures; • Provide public parks and gathering areas; • Clean the streets, sidewalks; • Pass a resolution of commitment to corridor revitalization. • Incorporate trees and landscaping with means to maintain/water; • Communicate with neighborhoods; • Make information and funding available to small businesses for landscaping, building maintenance,
enhancing storefronts; • Provide incentives for the addition of new housing units within the Corridor; • Provide a new plan for state-of-the-art street and other exterior lighting; • Develop a plan to minimize the impact of truck traffic from the Sky Mine.
From “Regenerating Older Suburbs” • Provide bold vision for the Corridor; • Become a risk-taking catalyst; • Adopt design guidelines and financial structures; • Offer parking and streetscape assistance; • Coordinate promotion and management; and; • Maintain financial support for residential development.
Consultant – See Recommendations under Pro-Active Revitalization Tools beginning on page 59.
Observations and Conclusions
Millennials are rejecting home ownership due to student loan debt and a desire for flexibility; With new amenities offered and rising interest rates for home mortgages, apartments will be an effective choice for housing;
Residential growth in the corridor will include very little traditional single family detached due to availability of developable residential land and vacant developed lot inventory; Demands of tenants are prompting developers to get creative;
Retailers can benefit from being near a larger center without being part of it;
Companies may choose not to locate in areas with inadequate streets or other inferior public facilities/services;
Existing businesses do not prosper where there are poor public infrastructure and services;
The traditional way of generating capital for public improvements may not be enough to accommodate all the infrastructure needs.
Many areas along the corridor appear to have continuous driveways with no curb cuts for defining turn-ins; Sidewalks appear to get lost along the retail corridor where there are few curbs and landscaping and trees requiring water are often neglected due to cost and lack of attention;
Sky Mine. According to the San Antonio Business Journal of June 28, 2013, there is a $128 Million carbon-capture operation under construction by Skyonic Corporation, HB Zachry/Capitol Cement. The Sky Mine will curb Carbon Dioxide Emissions (chemicals) from the Capitol Aggregates cement plant will be turned into usable products, such as Hydrochloric acid and Sodium Bicarbonate (baking soda); Sky Mine construction will employ 200 people with 50 full time employees needed to run the facility by end of 2014. The operation will result in a 15% (83,000 tons) reduction of airborne emissions from the plant quarry.
Northeast Corridor Revitalization Study Page 56
Steps to Improve the NEC Competitive Position
Options for Implementation
The City of San Antonio and the Northeast Corridor Revitalization Initiative Steering Committee have several options for implementation of a revitalization plan. • Pro-active Revitalization requires a high level of commitment from the City and creation of special area;
• To Facilitate Revitalization can be somewhat effective by applying existing tools available;
• No Action would be when the City continues its regular maintenance and enforcement activities, allowing
market forces to take their course, and possibly revitalizing the corridor.
PRO-ACTIVE Revitalization Tools
Public Improvement Districts (PID):
• PIDs offer an alternative means for financing public improvement projects needed for economic growth. • Provide tool to allocate costs according to benefits received; • Can provide means to fund supplemental services and improvements to meet community needs which
could not otherwise be constructed or provided and be paid by those who benefit the most from them; • Petition-driven, requires signatures of 50% of tax value owners within District; • Difficult to create large PIDs; work best with small areas & clearly defined goals/objectives; • Works on large undeveloped tracts with 1 or 2 owners; and • Financed through assessment (say 0.08 to 0.17 per $100 valuation) against all property owners in District; • Works in residential, commercial or mixed-use areas. Municipal Management Districts (MMD): • Created to “promote, develop, encourage, and maintain employment, commerce, transportation, housing,
tourism, recreation, arts, entertainment, economic development, safety, and the public welfare within a defined geographic area;”
• More than 2/3 of the Municipal Management Districts in Texas (more than 40) have been created in the greater Houston area; (e.g. Downtown, Brays Oaks, Sharpstown and League City);
• Commercial property owners create a MMD to enhance a defined business area to finance facilities, infrastructure and services beyond those provided by the City, using the same creation requirements as a PID;
• Public improvement projects and services may be paid for by a combination of self-imposed ad valorem taxes, impact fees or special assessments upon those property owners that benefit;
• Depending on its priorities based on community needs, it may also provide supplemental services for advertising, business recruitment, promote of health & sanitation, traffic control, landscaping, lighting, signs, walkways, drainage, water, waste water, solid waste, streets, power facilities, parks, parking facilities, transit systems and other similar improvements.
Neighborhood Empowerment Zone (NEZ): The Texas Legislature approved a statute in 1999 that would allow cities to create Neighborhood Empowerment Zones for potential economic development. It is created to promote housing, affordable housing, increase economic development, increase quality of social services, education, public safety or rehab affordable housing within a designated zone. Cities have power within the zone to do the following:
Northeast Corridor Revitalization Study Page 57
• Refund Building Fees. Allows the City to waive or adopt fees related to construction of buildings in the zone, including impact fees and fees for the inspection of buildings;
• Refund and Abatement of Sales Taxes. City may agree to refund and abate sales taxes on sales made within the zone for up to 10 years in order to benefit the zone.
• Abatement of Property Taxes. City can enter into agreements for up to ten years for the abatement of City property taxes on property in the zone.
• Achieve Environmental Goals. City can set performance standards to encourage the use of alternative building materials that address environmental concerns or to the building costs, maintenance or energy consumption.
• City Council adopts a resolution determining that creation of a zone would: promote an increase in economic development; promote an increase in the quality of social services, education or public safety; promote creation of affordable housing; OR promote rehabilitation of affordable housing.
Tax Increment Reinvestment Zone (TIRZ) Create a TIRZ to help finance the cost of redevelopment and encourage development in areas that would otherwise not attract sufficient market development in a timely manner.
• Create the Zone when sufficient improvements within the Zone are a known factor: include Wal-Mart (by the end of 2013) and the Sky Mine (by end of 2014);
• Set aside taxes attributable only to new development (tax increments) over a base year amount, in a fund to finance public improvements within the boundaries of the proposed zone;
• Use TIRZ funds in ways not allowed by other types of Districts, such as façade preservation, acquisition of property, demolition of private improvements, etc.;
• Empower the TIRZ to condemn and acquire private property and to borrow against future revenue. Potential Revenue from a Corridor TIRZ
Assuming the TIRZ created by the City in 2014. If the TIRZ is established in 2014 before the Sky Mine (the known factor) is on the Tax Rolls, it would generate an estimated $8,550,000, or $570,000 annually for operating revenue and debt service based on the City’s tax rate of $0.57/$100 assessed valuation. The projected investment at the Sky Mine is $125,000,000; our assumption for the Tax Increment is $100,000,000. Proposed term of the TIRZ is 15years with a collection rate of 100%.
Projected revenue for the TIRZ with only the Sky Mine included as tax base is $570,000 annually.
Tools to FACILITATE Revitalization • Tax Abatements:
– Current City policy ties tax abatements to permanent new job creation; – City has had policy of no tax abatements for retail projects;
• Chapter 380 Agreements (loans/grants for urgent or highly desirable projects); • Code enforcement (Take advantage of “Existing Structure” Code); • Expedite approvals; • Waive fees (building permits, plat applications, demolition, moving, zoning, easement vacation
application, impact fee, inspection, sign permit); • Release of City liens (weed, demolition, board-up/open structure, paving); • Coordinate infrastructure improvements w/developers; • Provide Regular Maintenance; • Grants from the City’s Annual Budget; • Capital Improvements designated Bond Issue; • Urban Design ; • Monitor and Measure success.
Northeast Corridor Revitalization Study Page 58
Urban Design • Conceive new relationships between existing areas too isolated from each other and the rest of the City • Conceive the nature of the parts themselves (pedestrian zones, work/live, multi-modal interfaces, and
housing for non-traditional demographic groups usually housed in higher density parts of the City) • Transforming the character might require multifunction zones; reduction of the lines between landscape in
commercial areas and residential areas; integration of parks, gardens and foliage into commercial areas; the addition of more mixed uses; and more density of development. Mixed use could mean a variety of building sizes, scales and open space as well as uses.
Monitor and Measure success • When the number of properties under redevelopment in the Corridor reaches a threshold, it becomes more
attractive to would-be developers – what is the threshold? • The number of residences that are renovated or built each year; • Compare the Total square feet of commercial space renovated or built each year; • The increase in appraised value each year; • Ratio of private investment to public investment in dollars at the end of each year; • Momentum and ability to generate additional private investment (w/out incentives) • Conclusions from Case Studies
• Adopt a redevelopment strategy and theme; • Identify and establish a new focus; • Follow-through on redevelopment efforts to achieve success and credibility; • Be realistic regarding market demand; • General strategies:
– Build on core assets (i.e. Perrin Estate) – Offer different housing types (single family, multifamily, townhomes, market rent, affordable) – Create a walkable retail environment & allow apartments in areas of too much retail zoning. – Be ready for transportation options (walking, bicycles, trails to special places, bus, auto) – Facilitate new land use patterns (some higher densities and Transit-Oriented Development) – Take advantage of growing diversity and benefit from it as a wave of the future – Form partnerships and coalitions for success
• Make improvements in fabric of Corridor - function, architecture, accessibility and environment; • Increase the number of households through added housing units (apartments); • Bring new shoppers to the Corridor with housing to replace those that have abandoned it; • Don’t hesitate to completely reposition all or part of the Corridor through unheard of changes (adaptive
reuses, reduction, demolition, conversion); and • Generate new excitement so the strategies can be achieved through momentum.
Northeast Corridor Revitalization Study Page 59
Recommendations
Steps to Improve the NEC Competitive Position General Recommendations 1. Adopt a pro-active attitude and provide the tools for successful revitalization;
2. Encourage strong pro-active leadership from within the Corridor Business Community to help focus on
redevelopment;
3. Divide the NEC into two segments: a RETAIL (Nacogdoches) Segment north of Wye Drive and a
MIXED USE (Perrin Beitel) Segment south of Wye Drive.
4. Prepare design guidelines for façade preservation, signage and landscaping to allow, rather than to impose,
on owners of marginal properties in both the Retail and Mixed Use Segments of the Corridor.
5. Provide design assistance to all property owners in the NEC to make sketches that illustrate what their
facades could look like when applying the design guidelines;
6. Create a village theme around the intersection of Thousand Oaks & Nacogdoches in the Retail Segment,
make it walkable for at least the village, if not entire retail corridor; 7. Create a Tax Increment Reinvestment Zone (TIRZ) to help finance the cost of redevelopment and
encourage development in areas that would otherwise not attract sufficient market development in a timely
manner.
a. Create the Zone when sufficient improvements within the Zone are a known factor: include Wal-Mart (by the end of 2013) and the Sky Mine (by end of 2014);
b. Set aside taxes attributable only to new development (tax increments) over a base year amount, in a fund to finance public improvements within the boundaries of the proposed zone;
c. Use TIRZ funds in ways not allowed by other types of Districts, such as façade preservation, acquisition of property, demolition of private improvements, etc.;
d. Empower the TIRZ to condemn and acquire private property and to borrow against future revenue. Note: Projected revenue for the TIRZ with only the Sky Mine included as tax base is $570,000 annually.
8. Establish a Public Improvement District (PID) for each Segment of the Corridor to focus attention on
marketing, events, maintenance of public areas and watering of trees and vegetation.
9. Establish NEC Trade Area census tracts as a Neighborhood Empowerment Zone, which is authorized by
the State of Texas to:
a. Promote and revitalize housing, b. Promote and revitalize affordable housing, c. Promote economic development; d. Promote quality services; and e. Achieve environmental goals.
Northeast Corridor Revitalization Study Page 60
Retailers and Retail
10. As basic tools have been selected and a plan adopted to revitalize the Corridor, begin recruiting the
retailers from the following RETAIL Industry Groups as discussed above that represent significant
LEAKAGE of retail sales from the Corridor: 1) Other General Merchandise Stores, including Discount
Stores; 2) Department Stores; 3) Apparel Stores; 4) Shoe Stores; and 5) Book, Periodical & Music Stores.
11. Focus retail on the Corridor segment between Wye Drive and O’Connor, and revitalize Perrin-Beitel as a
mixed-use, mostly non-retail Corridor segment;
12. Provide incentives for owners/landlords to holdout for higher quality tenants in the long-term, and dis-
incentives to short-term revenue concerns in order to reverse the attitude toward maintenance of “dark”
space;
13. Update traffic counts at key locations;
14. Create a parking plan to provide the accessible parking so necessary to retail success.
Non-Retail to Pursue and To Do
15. Begin recruiting developers for apartments to place appropriate apartments on the selected sites or other
suitable locations; 2) recruit call centers; and 3) woo Alamo Colleges to place a community college
campus or center within the Corridor and at the same time recruit technical schools and trade schools for
the Corridor by promoting existing vacant buildings and space.
16. Revitalize Perrin Beitel south of Wye Drive as a mixed-use, primarily non-retail Corridor Segment;
17. Create a Public Improvement District (PID) to address the needs of a mixed-use non-retail Corridor
Segment;
18. Leverage the anchor-type traffic generated by the Post Office by directing motorists to shop beyond
Wurzbach Pkwy and on Nacogdoches;
19. Recruit additional personal and business service-types (child care, Laundromat, urgent care and
professionals) and even fast food retailers to the mixed-use corridor segment;
20. Provide “gathering” places and landscaping in each segment;
Residential in the Corridor
21. Assist and facilitate the addition of 1,000 multi-family units (3-6 projects) over the next 5 years to
supplement the existing market. To develop 1,000 units or more, consider the following priorities:
A. Properties (4) associated with the vacant Perrin Oaks Plaza at 11823 Perrin Beitel, and 2 properties of former Bank of America at 11714 Perrin Beitel, requiring acquisition and demolition. Total: 9.3 ac.
B. Property owned by NEISD: 22.1 acres of vacant land for acquisition (all or part) between Post Office Dr and east bound Wurzbach Pkwy east of Perrin Beitel;
C. Property east of Perrin Beitel, an 18.46-acre vacant land triangle for acquisition between Schertz Rd and west bound Wurzbach Pkwy access road. This property is adjacent to former Longhorn Quarry;
D. The former Perrin Estate with frontage on Swan’s Landing near Perrin Beitel - Consider multifamily on the Estate and townhouse-style units on vacant frontage of Swan’s Landing, estimated total: 10 ac;
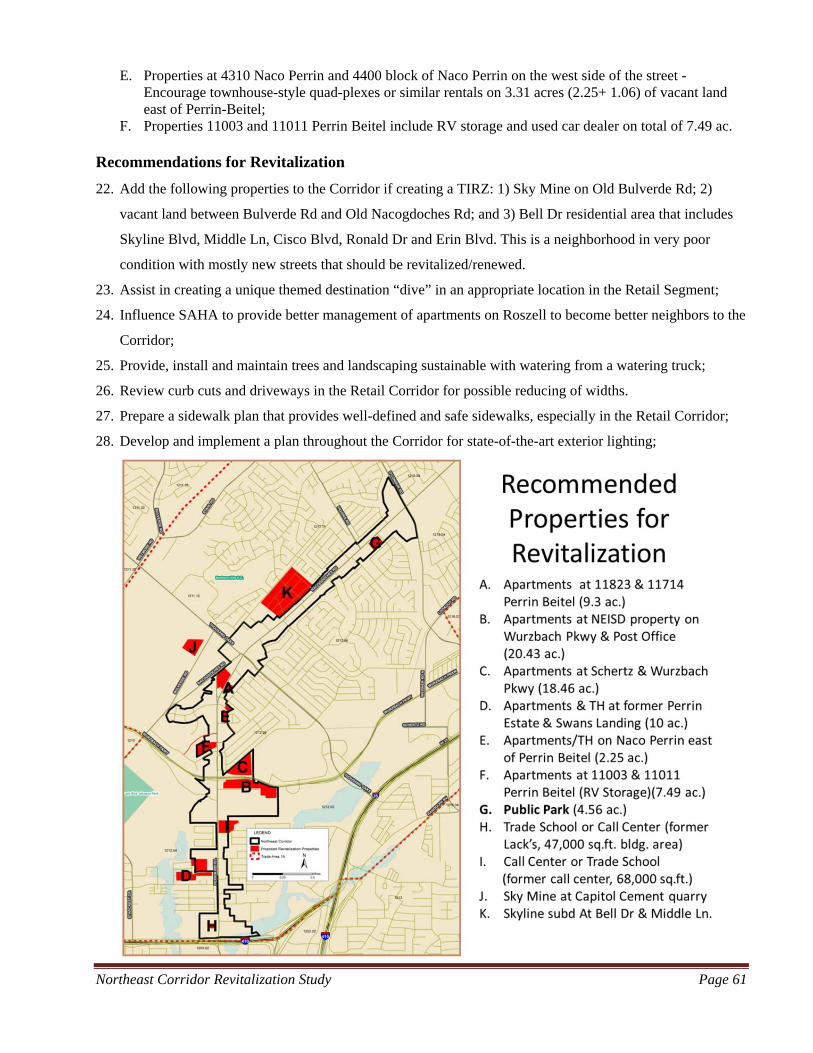
Northeast Corridor Revitalization Study Page 61
E. Properties at 4310 Naco Perrin and 4400 block of Naco Perrin on the west side of the street - Encourage townhouse-style quad-plexes or similar rentals on 3.31 acres (2.25+ 1.06) of vacant land east of Perrin-Beitel;
F. Properties 11003 and 11011 Perrin Beitel include RV storage and used car dealer on total of 7.49 ac.
Recommendations for Revitalization
22. Add the following properties to the Corridor if creating a TIRZ: 1) Sky Mine on Old Bulverde Rd; 2)
vacant land between Bulverde Rd and Old Nacogdoches Rd; and 3) Bell Dr residential area that includes
Skyline Blvd, Middle Ln, Cisco Blvd, Ronald Dr and Erin Blvd. This is a neighborhood in very poor
condition with mostly new streets that should be revitalized/renewed.
23. Assist in creating a unique themed destination “dive” in an appropriate location in the Retail Segment;
24. Influence SAHA to provide better management of apartments on Roszell to become better neighbors to the
Corridor;
25. Provide, install and maintain trees and landscaping sustainable with watering from a watering truck;
26. Review curb cuts and driveways in the Retail Corridor for possible reducing of widths.
27. Prepare a sidewalk plan that provides well-defined and safe sidewalks, especially in the Retail Corridor;
28. Develop and implement a plan throughout the Corridor for state-of-the-art exterior lighting;
Northeast Corridor Revitalization Study Page 62
Property Acquisition
Consultant recommends that the properties shown on the following map be considered by the TIRZ for
acquisition and disposition.
29. Acquire and demolish the obstacle of Perrin Oaks Plaza shopping center that is the number one deterrent
to attracting other national retailers which is in the Retail (Nacogdoches) Segment;
30. Acquire and demolish the bank structure that is for lease only, but restricted from use as a financial
institution and is also in the Retail (Nacogdoches) Segment; (Because of the restrictions, Bexar Appraisal
District has the bank improvements valued at $100.)
31. Acquire vacant lots and substandard houses in the Bell Drive/Middle Lane area and make available to
builders in order to revitalize the neighborhood and add consumer households. (There are 137 houses &
lots with median total appraised value of $47,370 and more than 1/3 are valued below $40,000.)
32. Code compliance should require that the fire-gutted 2-story building (former Playmates) at 11203 Wye Dr.
at Perrin-Beitel be razed.
33. Acquire 2 properties at 9834 Perrin Beitel for use as a public park. (The property currently includes the
only Curandero/fortune teller in the Corridor, but most is vacant land. Owner is using part for storage of
landscaping materials and part of the vacant land is outside the Corridor boundary. The south east corner
of the property abuts Clear Springs Elementary and would also have access to Clear Springs. It is as
centrally located within the Corridor as any vacant property fronting on Perrin Beitel or Nacogdoches.)
34. Acquire Commerce Business Park and relocate existing businesses to other locations and demolish the
structures to achieve an aesthetic quality at that corner.
Marketing
35. Incorporate effective marketing that will give property owners, business owners and investors the
confidence the proposed redevelopment will happen;
36. Establish a Public Improvement District (PID) for each Segment of the NEC and form an association to
focus attention on marketing, events, maintenance of public areas and watering of trees and vegetation.
37. Team up with property owners, brokers and agents with a current interest in the NEC;
38. Make presentations to all business & property owners, local real estate developers, investors, management
companies and brokers in order to communicate current market conditions and plans for the NEC;
39. Designate and support an area to accommodate “incubator” and “start-up” businesses (baby boomers are
becoming entrepreneurs);
40. Provide incentives for owners/landlords to holdout for higher quality tenants in the long-term, and provide
dis-incentives to short-term revenue concerns in order to reverse attitudes toward maintenance of “dark”
space.
Northeast Corridor Revitalization Study Page 63
41. Maintain an inventory of active listings of for sale or lease when the overall vacancy rate of both retail and
non-retail space is 10% or greater; provide a map of locations; lease rates and asking prices as available;
42. Provide a billboard or other method south of Wurzbach Pkwy near Post Office to direct motorists exiting
the Post Office to shop farther north along the Nacogdoches Retail Segment.
43. Monitor, define and measure success for both the RETAIL (Nacogdoches) and MIXED-USE (Perrin
Beitel) Segments of the Northeast Corridor.
a. When the number properties revitalized reach a set threshold; b. The number of homes rehabilitated each year; c. Amount of increase in appraised value each year.
In summary, the most important recommendations and over-arching tasks for the NEC Steering Committee
and the City to undertake are the following:
Adopt a pro-active attitude and provide the tools for successful revitalization;
Encourage strong pro-active leadership from within the Corridor Business Community to
help focus on redevelopment;
Create a Tax Increment Reinvestment Zone (TIRZ) to help finance the cost of redevelopment
and encourage development in areas that would otherwise not attract sufficient market
development in a timely manner.
Establish a Public Improvement District (PID) or a business association for the Corridor or
each Segment to focus attention on marketing, events, maintenance of public areas and
watering of trees and vegetation.
Establish NEC Trade Area census tracts as a Neighborhood Empowerment Zone, which is
authorized by the State of Texas.
Successful implementation of these recommendations will assure successful revitalization in both the short-
term and the long-term.
GlossaryofTerms G‐1
GLOSSARY OF TERMS Average Daily Traffic- The average number of vehicles passing a selected location on a street, going both directions during a 24-hour period. Absorption (Net)- The change in occupied space in a given time period. Available Square Footage- Net rentable area considered available for lease; excludes sublease space. Baby Boomers- Those born after World War II between 1946 and 1964. Building Class A- includes those prestigious buildings situated in prime locations offering high quality standard finish, excellent amenities and commanding premium rental rates. Building Class B- includes well-located but perhaps older buildings with average standard finish and some amenities. Building Class C- Usually older buildings in secondary locations with few, if any, amenities Building Permit- A document provided by a government allowing a structure to be built. Call Center- A consolidated location for incoming or outgoing calls employing upwards of 100 people and usually related to solving customer service issues. Code Enforcement- Efforts by a government to uphold its building laws. Community Center- Generally ranging between 100,000 – 250,000 square feet and usually anchored by
grocery store tenant.
Core Assets- Items that are essential to the profitability and success of any given enterprise.
Cross-Access Easement- A way to accommodate vehicular traffic going from one parcel to another without reentering the street. Consumer Spending- The monetary expenditures by groups within a given economy.
Demand- The need or desire to buy more goods or services Disposable Income- Money left over to spend on consumer goods that are left over after taxes and other expenses. Diversity- The variation of ethnicity and/or race within a certain area. Diversity Index- A quantitative measure that reflects how many different types such as species there are in a dataset and simultaneously takes into account how evenly the basic entities such as individuals are distributed among those types. Ethnicity- Self-Identified group that involves similar cultural values and/or race. Flex- new generation of service center product designed with flexibility to serve as either office or warehouse space based on use of windows versus overhead doors. The majority of flex space in San Antonio market has been built since the late 1990’s and is finished as 100% office space.
GlossaryofTerms G‐2
Gen-Xers- Those born in the late 1960’s to early 1980’s after the baby boomers. Generation Y/Millennials- Those born from the early 1980’s to around 2000. Design Standards- A predetermined set of requirements regarding the appearance and layout of properties. Households- More then one person occupying a housing unit. Entitlements- Privileges or rights guaranteed by a certain government entity. Industry Code- A number assigned to a certain classification or type of industry. Infrastructure- All the services and facilities including roads, sewer, power, emergency, etc., provided by either public or private entities. Industry Group- A classification for certain businesses that have related fields of sales. Land Use- The presumed, actual, or required use of a parcel of land. Retail Leakage- Spendable income lost to other trade areas. Life Mode Group- Market segments that share common traits such as income, and age; this will allow for tailored retail mixes in certain areas. Light Industrial- This is a classification of industrial use that has generally low environmental impact and can involve offices, or warehouses, with minimal retail. Median Household Income- The average amount earned by those within a given household.
Municipal Management Districts- Special districts set up to promote various economic improvements in a certain area. Neighborhood Center- Anchored centers generally ranging between 30,000 – 100,000 square feet. Neighborhood Empowerment Zone- An area set up to promote affordable housing, economic development or improved social services. Northeast Corridor- Areas bounding Perrin-Beitel, Nacogdoches, and Naco-Perrin from IH 410 to O’Connor in San Antonio, Texas. N.I.M.B.Y. - An acronym meaning Not In My Back Yard that is usually employed by opponents of proposed developments. Overall Vacancy- Al unoccupied lease space including direct and sublease. Psychographics- A type of demographic analysis that takes into consideration various psychological attributes. Public Improvement Districts (PID) - Special districts set up to promote improvements to the public infrastructure. Retail Gap- The amount of leakage within a certain area compared to the amount that could be attained.
GlossaryofTerms G‐3
Retail Mix- A variety of retail meant to satisfy a certain market and provide options for consumers. Retail Synergy- The extent of which retail stores feed off each other within a given area. Renovation- Improvement to the appearance and/or use of a structure. Revitalization- Improvements to the economy, aesthetics, or health of a destitute area. Senior Services- Amenities provided to those over 60 years of age to assist in basic living needs. Service Center- office showroom or light manufacturing space consisting of 30% or more office finish/air conditioned space and featuring optional grade/dock loading, attractive landscaping, generous parking and generally 12’ – 18’ clear heights. Strip Center- Unanchored centers less than 30,000 square feet. Supply- In economics, the amount of goods available to the consumer. Retail Surplus- The amount of retail is greater than the potential sales in a trade area. Tapestry Segments- Customer diversity in terms of lifestyle, and behavioral attributes. Tenant Mix- Various types and categories of tenants within a leased building. Tax Increment Reinvestment Zone (TIRZ) – In Texas, an area set up to facilitate improvements through captured taxes that are accrued through resulting higher land values. Tenure- The range of households that either rent or own thus an indication of the length of stay within a certain area. Trade Area- An area where most of the customers come from and prefer to do business. Tax Abatement- A decrease in tax requirement meant to incentivize development. Trade School- A public or private institution focused directly on a specific field of work. Urbanization Group- Market segments sharing the same locale. Vocational School- A public or private institution focused on content related to a certain field of study. Walkability- The extent of which a certain area can be accessed and used by pedestrians.
Resources R - 1
RESOURCES 1. All City of Dallas Incentives http://www.dalas-ecodev.org/incentives/abatements-grants/ 2. Austin Investor Interests. “Construction Activity Summary”. 4th Quarter 2011. 3. BizStats.com. “Average Sales per Store.” 2003. 4. Deborah L. Brett and Adrienne Schmitz. “Real Estate Market Analysis; Methods and Case Studies”.
Urban Land Institute 2009. 5. Economic Development – Fort Worth http://fortworth.gov/hed/business/ 6. Economic Development Programs & Incentives - Brays Oaks http://www.braysoaksmd.ort/areas-of-
focus/economic-development/programs-incentives/ 7. Environmental Systems Research Institute (ESRI). “Tapestry Segmentation Reference Guide.” 8. The HDL Companies. “2007 Retail Store Taxable Sales Estimates.” December 2007. 9. Houston Tax Abatement Policy www.houstontx.gov/ecodevel/abatements/html 10. Municipal Management Districts – Rowlett .http://www.ci.rowlett.tx.us/index.aspx?nid=1122 11. Municipal Management Districts - Sharpstown http://www.sharpstowndistrict.com/municipal-
management-districts 12. Neighborhood Empowerment Zones (NEZs)http://fortworth.gov/hed/business/ 13. Jack W. Plunkett. “Plunkett’s Retail Industry Almanac.” 2001-2002. 14. Jack W. Plunkett. “Plunkett’s Retail Industry Almanac.” 2007 15. Plunkett Research, Ltd. “Industry List with Codes.” 16. Public Improvement Districts (PIDs) – Fort Worth http://fortworthtexas.gov/hed/business/pid/ 17. Purdue Research Foundation. “Improving Call Center Performance through Optimized Site Selection.”
2002. 18. REOC San Antonio. “San Antonio Retail Report.” Second Quarter 2013. 19. REOC San Antonio. “San Antonio Office Report.” Second Quarter 2013. 20. REOC San Antonio. “San Antonio Medical Report.” Second Quarter 2013. 21. REOC San Antonio. “San Antonio Industrial Report.” Second Quarter 2013. 22. San Antonio Express-News. “Workers expecting to retire later.” October 15, 2013. 23. San Antonio Express-News. “Housing Inventory Down.” October 16, 2013.
Resources R - 2
24. San Antonio Express-News. “Carbon-capture firm Skyonic lands funding for San Antonio facility.” June
28, 2013. 25. San Antonio Express-News. “Baby boomers fueling a wave of entrepreneurship across nation.” October
14, 2013. 26. Tax Increment Reinvestment Zones – Houston www.houstontx.gov/ecode/tirz/html, 27. Urban Land Institute. “Dollars & Cents of Shopping Centers/ The Score 2006.” 28. Urban Land Institute. “Regenerating Older Suburbs.” Edited by Richard B. Peiser and Adrienne Schmitz.
2007. 29. Urban Land Institute. “Retail Development, Fourth Edition.” 2008
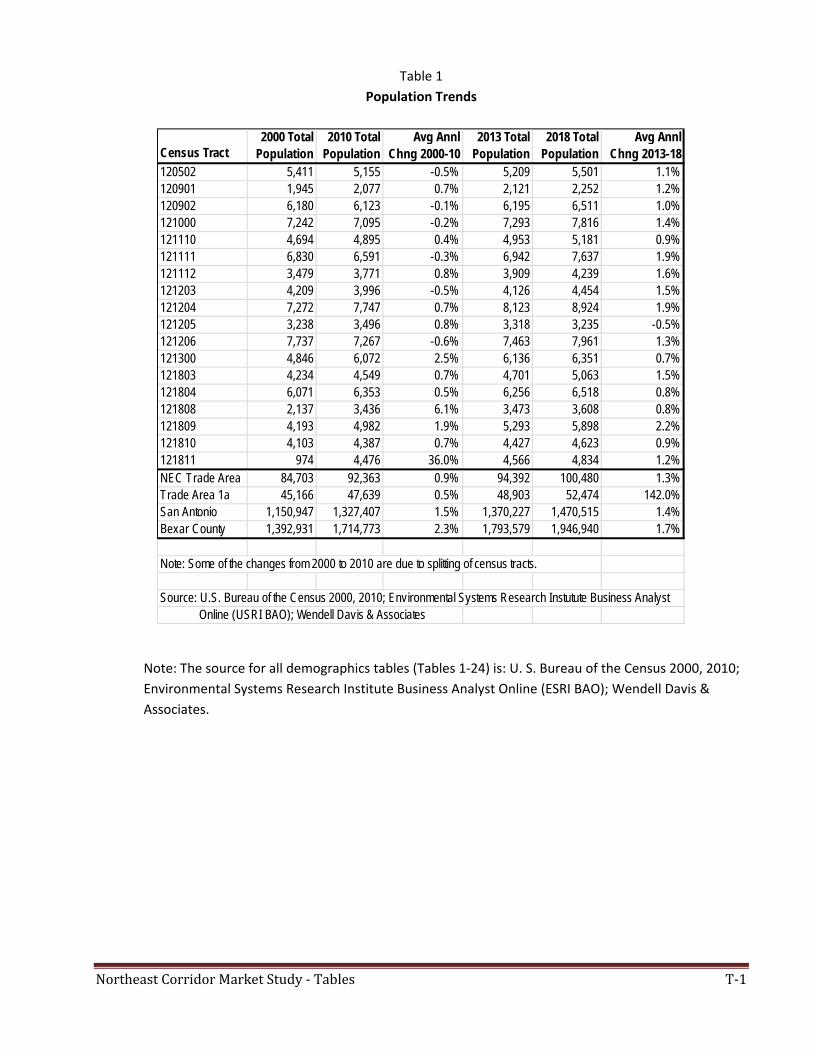
Northeast Corridor Market Study - Tables T-1
Table 1
Population Trends
Note: The source for all demographics tables (Tables 1‐24) is: U. S. Bureau of the Census 2000, 2010;
Environmental Systems Research Institute Business Analyst Online (ESRI BAO); Wendell Davis &
Associates.
Census Tract2000 Total
Population2010 Total
PopulationAvg Annl
Chng 2000-102013 Total
Population2018 Total
PopulationAvg Annl
Chng 2013-18120502 5,411 5,155 -0.5% 5,209 5,501 1.1%120901 1,945 2,077 0.7% 2,121 2,252 1.2%120902 6,180 6,123 -0.1% 6,195 6,511 1.0%121000 7,242 7,095 -0.2% 7,293 7,816 1.4%121110 4,694 4,895 0.4% 4,953 5,181 0.9%121111 6,830 6,591 -0.3% 6,942 7,637 1.9%121112 3,479 3,771 0.8% 3,909 4,239 1.6%121203 4,209 3,996 -0.5% 4,126 4,454 1.5%121204 7,272 7,747 0.7% 8,123 8,924 1.9%121205 3,238 3,496 0.8% 3,318 3,235 -0.5%121206 7,737 7,267 -0.6% 7,463 7,961 1.3%121300 4,846 6,072 2.5% 6,136 6,351 0.7%121803 4,234 4,549 0.7% 4,701 5,063 1.5%121804 6,071 6,353 0.5% 6,256 6,518 0.8%121808 2,137 3,436 6.1% 3,473 3,608 0.8%121809 4,193 4,982 1.9% 5,293 5,898 2.2%121810 4,103 4,387 0.7% 4,427 4,623 0.9%121811 974 4,476 36.0% 4,566 4,834 1.2%NEC Trade Area 84,703 92,363 0.9% 94,392 100,480 1.3%Trade Area 1a 45,166 47,639 0.5% 48,903 52,474 142.0%San Antonio 1,150,947 1,327,407 1.5% 1,370,227 1,470,515 1.4%Bexar County 1,392,931 1,714,773 2.3% 1,793,579 1,946,940 1.7%
Note: Some of the changes from 2000 to 2010 are due to splitting of census tracts.
Source: U.S. Bureau of the Census 2000, 2010; Environmental Systems Research Instutute Business Analyst Online (USRI BAO); Wendell Davis & Associates
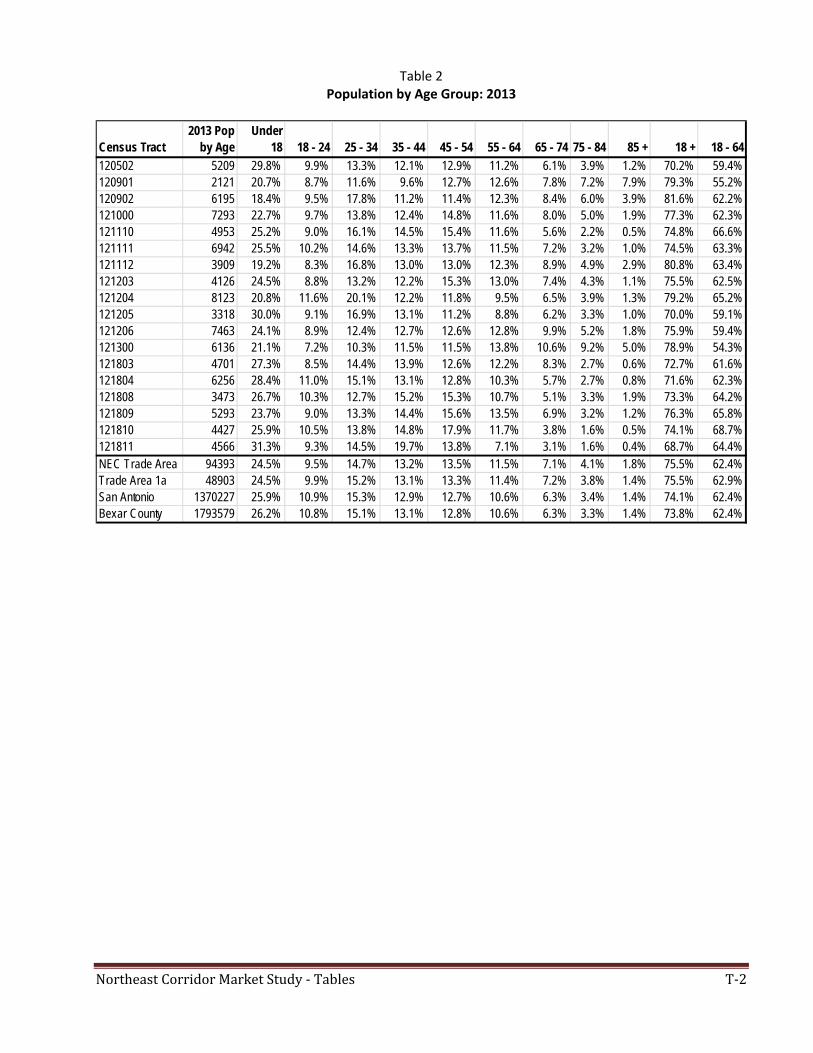
Northeast Corridor Market Study - Tables T-2
Table 2 Population by Age Group: 2013
Census Tract2013 Pop
by AgeUnder
18 18 - 24 25 - 34 35 - 44 45 - 54 55 - 64 65 - 74 75 - 84 85 + 18 + 18 - 64
120502 5209 29.8% 9.9% 13.3% 12.1% 12.9% 11.2% 6.1% 3.9% 1.2% 70.2% 59.4%120901 2121 20.7% 8.7% 11.6% 9.6% 12.7% 12.6% 7.8% 7.2% 7.9% 79.3% 55.2%120902 6195 18.4% 9.5% 17.8% 11.2% 11.4% 12.3% 8.4% 6.0% 3.9% 81.6% 62.2%121000 7293 22.7% 9.7% 13.8% 12.4% 14.8% 11.6% 8.0% 5.0% 1.9% 77.3% 62.3%121110 4953 25.2% 9.0% 16.1% 14.5% 15.4% 11.6% 5.6% 2.2% 0.5% 74.8% 66.6%121111 6942 25.5% 10.2% 14.6% 13.3% 13.7% 11.5% 7.2% 3.2% 1.0% 74.5% 63.3%121112 3909 19.2% 8.3% 16.8% 13.0% 13.0% 12.3% 8.9% 4.9% 2.9% 80.8% 63.4%121203 4126 24.5% 8.8% 13.2% 12.2% 15.3% 13.0% 7.4% 4.3% 1.1% 75.5% 62.5%121204 8123 20.8% 11.6% 20.1% 12.2% 11.8% 9.5% 6.5% 3.9% 1.3% 79.2% 65.2%121205 3318 30.0% 9.1% 16.9% 13.1% 11.2% 8.8% 6.2% 3.3% 1.0% 70.0% 59.1%121206 7463 24.1% 8.9% 12.4% 12.7% 12.6% 12.8% 9.9% 5.2% 1.8% 75.9% 59.4%121300 6136 21.1% 7.2% 10.3% 11.5% 11.5% 13.8% 10.6% 9.2% 5.0% 78.9% 54.3%121803 4701 27.3% 8.5% 14.4% 13.9% 12.6% 12.2% 8.3% 2.7% 0.6% 72.7% 61.6%121804 6256 28.4% 11.0% 15.1% 13.1% 12.8% 10.3% 5.7% 2.7% 0.8% 71.6% 62.3%121808 3473 26.7% 10.3% 12.7% 15.2% 15.3% 10.7% 5.1% 3.3% 1.9% 73.3% 64.2%121809 5293 23.7% 9.0% 13.3% 14.4% 15.6% 13.5% 6.9% 3.2% 1.2% 76.3% 65.8%121810 4427 25.9% 10.5% 13.8% 14.8% 17.9% 11.7% 3.8% 1.6% 0.5% 74.1% 68.7%121811 4566 31.3% 9.3% 14.5% 19.7% 13.8% 7.1% 3.1% 1.6% 0.4% 68.7% 64.4%NEC Trade Area 94393 24.5% 9.5% 14.7% 13.2% 13.5% 11.5% 7.1% 4.1% 1.8% 75.5% 62.4%Trade Area 1a 48903 24.5% 9.9% 15.2% 13.1% 13.3% 11.4% 7.2% 3.8% 1.4% 75.5% 62.9%San Antonio 1370227 25.9% 10.9% 15.3% 12.9% 12.7% 10.6% 6.3% 3.4% 1.4% 74.1% 62.4%Bexar County 1793579 26.2% 10.8% 15.1% 13.1% 12.8% 10.6% 6.3% 3.3% 1.4% 73.8% 62.4%
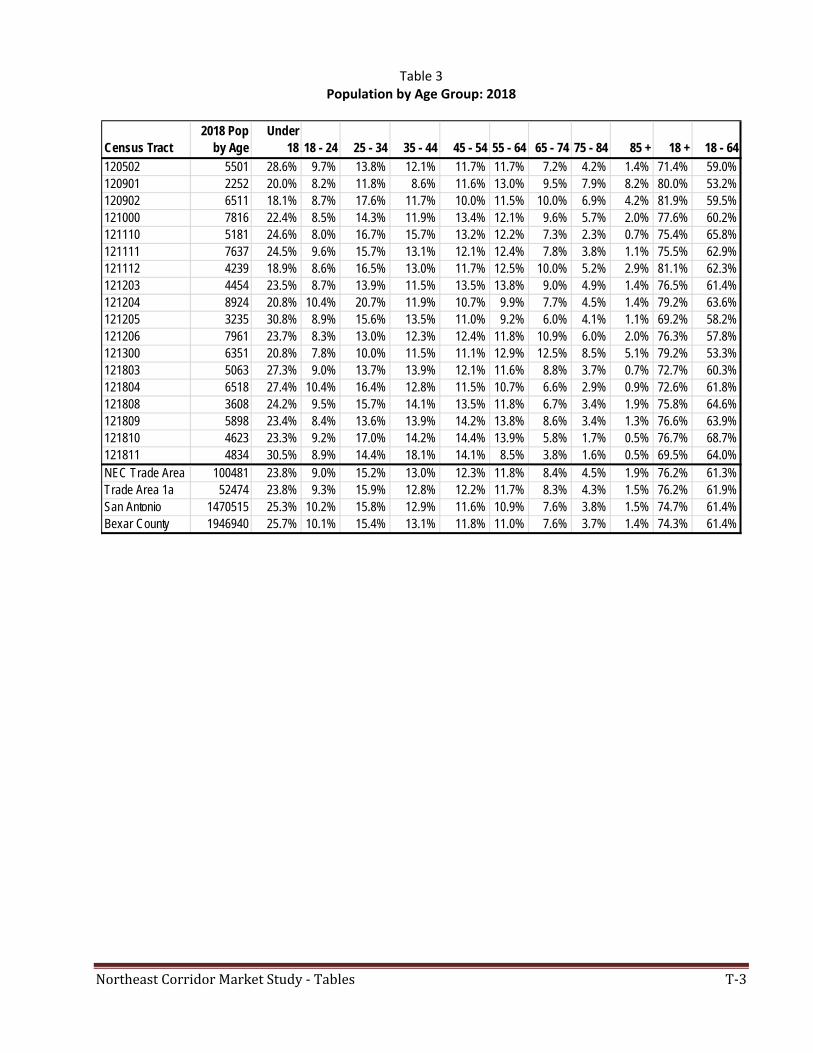
Northeast Corridor Market Study - Tables T-3
Table 3 Population by Age Group: 2018
Census Tract2018 Pop
by AgeUnder
18 18 - 24 25 - 34 35 - 44 45 - 54 55 - 64 65 - 74 75 - 84 85 + 18 + 18 - 64
120502 5501 28.6% 9.7% 13.8% 12.1% 11.7% 11.7% 7.2% 4.2% 1.4% 71.4% 59.0%120901 2252 20.0% 8.2% 11.8% 8.6% 11.6% 13.0% 9.5% 7.9% 8.2% 80.0% 53.2%120902 6511 18.1% 8.7% 17.6% 11.7% 10.0% 11.5% 10.0% 6.9% 4.2% 81.9% 59.5%121000 7816 22.4% 8.5% 14.3% 11.9% 13.4% 12.1% 9.6% 5.7% 2.0% 77.6% 60.2%121110 5181 24.6% 8.0% 16.7% 15.7% 13.2% 12.2% 7.3% 2.3% 0.7% 75.4% 65.8%121111 7637 24.5% 9.6% 15.7% 13.1% 12.1% 12.4% 7.8% 3.8% 1.1% 75.5% 62.9%121112 4239 18.9% 8.6% 16.5% 13.0% 11.7% 12.5% 10.0% 5.2% 2.9% 81.1% 62.3%121203 4454 23.5% 8.7% 13.9% 11.5% 13.5% 13.8% 9.0% 4.9% 1.4% 76.5% 61.4%121204 8924 20.8% 10.4% 20.7% 11.9% 10.7% 9.9% 7.7% 4.5% 1.4% 79.2% 63.6%121205 3235 30.8% 8.9% 15.6% 13.5% 11.0% 9.2% 6.0% 4.1% 1.1% 69.2% 58.2%121206 7961 23.7% 8.3% 13.0% 12.3% 12.4% 11.8% 10.9% 6.0% 2.0% 76.3% 57.8%121300 6351 20.8% 7.8% 10.0% 11.5% 11.1% 12.9% 12.5% 8.5% 5.1% 79.2% 53.3%121803 5063 27.3% 9.0% 13.7% 13.9% 12.1% 11.6% 8.8% 3.7% 0.7% 72.7% 60.3%121804 6518 27.4% 10.4% 16.4% 12.8% 11.5% 10.7% 6.6% 2.9% 0.9% 72.6% 61.8%121808 3608 24.2% 9.5% 15.7% 14.1% 13.5% 11.8% 6.7% 3.4% 1.9% 75.8% 64.6%121809 5898 23.4% 8.4% 13.6% 13.9% 14.2% 13.8% 8.6% 3.4% 1.3% 76.6% 63.9%121810 4623 23.3% 9.2% 17.0% 14.2% 14.4% 13.9% 5.8% 1.7% 0.5% 76.7% 68.7%121811 4834 30.5% 8.9% 14.4% 18.1% 14.1% 8.5% 3.8% 1.6% 0.5% 69.5% 64.0%NEC Trade Area 100481 23.8% 9.0% 15.2% 13.0% 12.3% 11.8% 8.4% 4.5% 1.9% 76.2% 61.3%Trade Area 1a 52474 23.8% 9.3% 15.9% 12.8% 12.2% 11.7% 8.3% 4.3% 1.5% 76.2% 61.9%San Antonio 1470515 25.3% 10.2% 15.8% 12.9% 11.6% 10.9% 7.6% 3.8% 1.5% 74.7% 61.4%Bexar County 1946940 25.7% 10.1% 15.4% 13.1% 11.8% 11.0% 7.6% 3.7% 1.4% 74.3% 61.4%
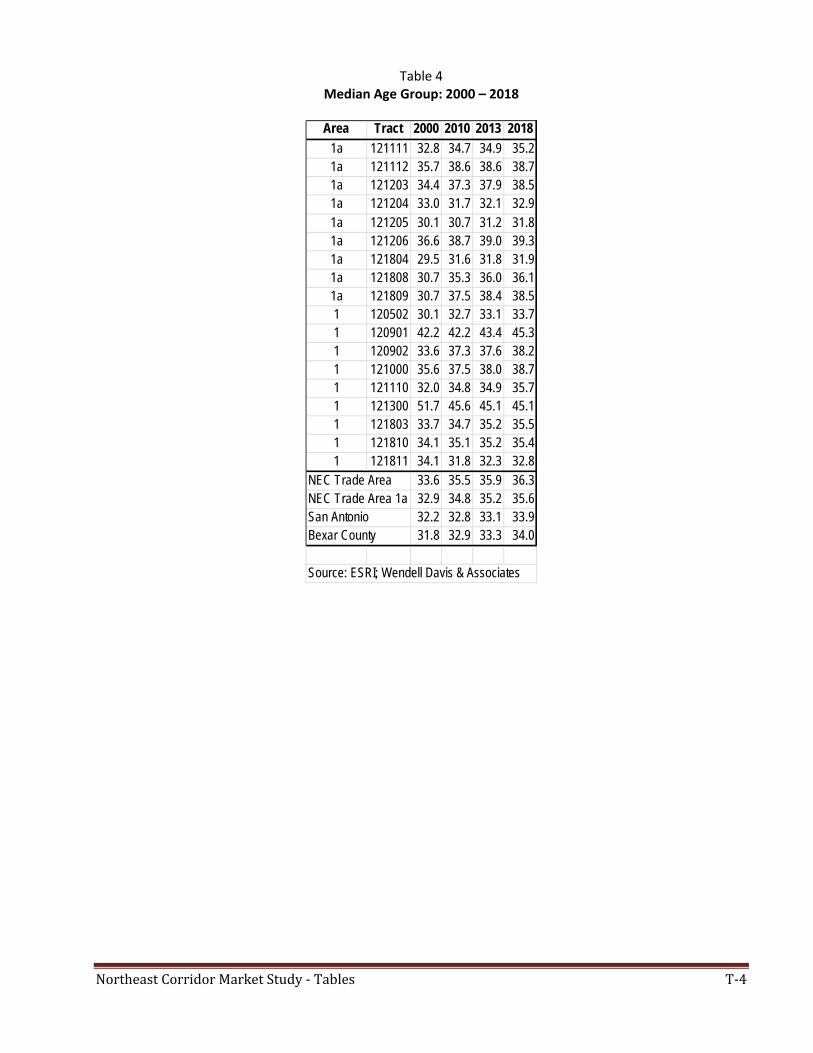
Northeast Corridor Market Study - Tables T-4
Table 4 Median Age Group: 2000 – 2018
Area Tract 2000 2010 2013 2018
1a 121111 32.8 34.7 34.9 35.21a 121112 35.7 38.6 38.6 38.71a 121203 34.4 37.3 37.9 38.51a 121204 33.0 31.7 32.1 32.91a 121205 30.1 30.7 31.2 31.81a 121206 36.6 38.7 39.0 39.31a 121804 29.5 31.6 31.8 31.91a 121808 30.7 35.3 36.0 36.11a 121809 30.7 37.5 38.4 38.51 120502 30.1 32.7 33.1 33.71 120901 42.2 42.2 43.4 45.31 120902 33.6 37.3 37.6 38.21 121000 35.6 37.5 38.0 38.71 121110 32.0 34.8 34.9 35.71 121300 51.7 45.6 45.1 45.11 121803 33.7 34.7 35.2 35.51 121810 34.1 35.1 35.2 35.41 121811 34.1 31.8 32.3 32.8
NEC Trade Area 33.6 35.5 35.9 36.3NEC Trade Area 1a 32.9 34.8 35.2 35.6San Antonio 32.2 32.8 33.1 33.9Bexar County 31.8 32.9 33.3 34.0
Source: ESRI; Wendell Davis & Associates
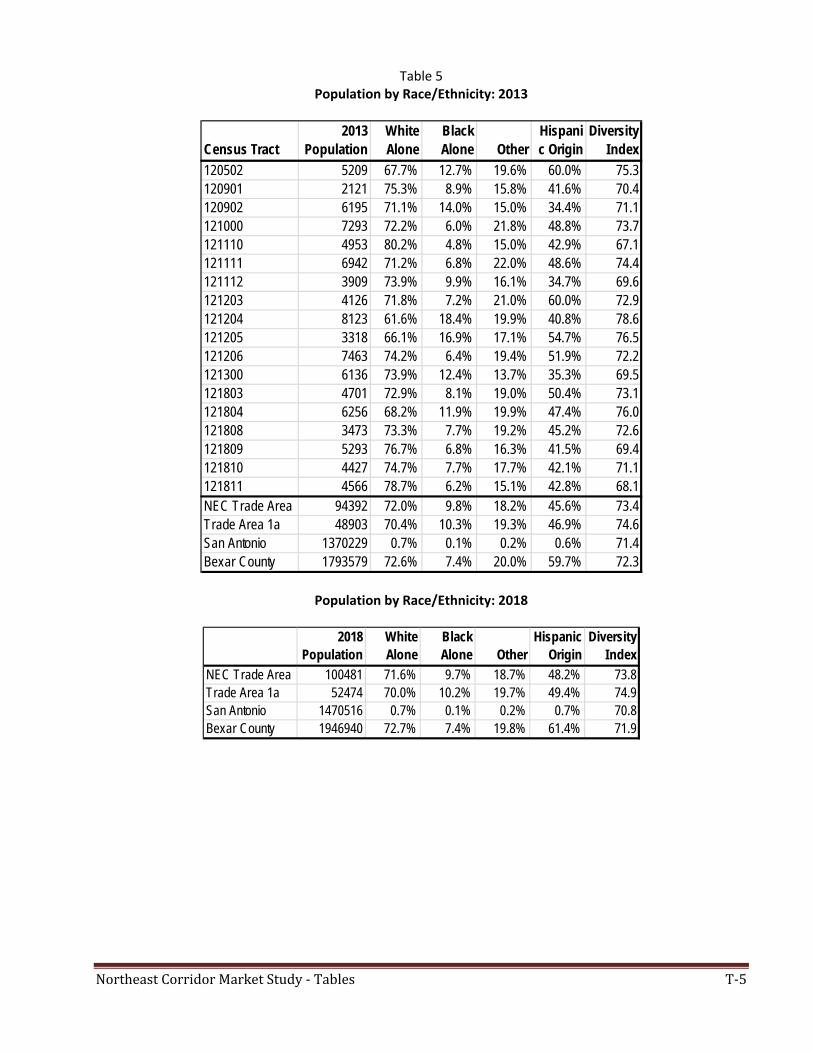
Northeast Corridor Market Study - Tables T-5
Table 5 Population by Race/Ethnicity: 2013
Population by Race/Ethnicity: 2018
Census Tract2013
Population White Alone
Black Alone Other
Hispanic Origin
Diversity Index
120502 5209 67.7% 12.7% 19.6% 60.0% 75.3120901 2121 75.3% 8.9% 15.8% 41.6% 70.4120902 6195 71.1% 14.0% 15.0% 34.4% 71.1121000 7293 72.2% 6.0% 21.8% 48.8% 73.7121110 4953 80.2% 4.8% 15.0% 42.9% 67.1121111 6942 71.2% 6.8% 22.0% 48.6% 74.4121112 3909 73.9% 9.9% 16.1% 34.7% 69.6121203 4126 71.8% 7.2% 21.0% 60.0% 72.9121204 8123 61.6% 18.4% 19.9% 40.8% 78.6121205 3318 66.1% 16.9% 17.1% 54.7% 76.5121206 7463 74.2% 6.4% 19.4% 51.9% 72.2121300 6136 73.9% 12.4% 13.7% 35.3% 69.5121803 4701 72.9% 8.1% 19.0% 50.4% 73.1121804 6256 68.2% 11.9% 19.9% 47.4% 76.0121808 3473 73.3% 7.7% 19.2% 45.2% 72.6121809 5293 76.7% 6.8% 16.3% 41.5% 69.4121810 4427 74.7% 7.7% 17.7% 42.1% 71.1121811 4566 78.7% 6.2% 15.1% 42.8% 68.1NEC Trade Area 94392 72.0% 9.8% 18.2% 45.6% 73.4Trade Area 1a 48903 70.4% 10.3% 19.3% 46.9% 74.6San Antonio 1370229 0.7% 0.1% 0.2% 0.6% 71.4Bexar County 1793579 72.6% 7.4% 20.0% 59.7% 72.3
2018 Population
White Alone
Black Alone Other
Hispanic Origin
Diversity Index
NEC Trade Area 100481 71.6% 9.7% 18.7% 48.2% 73.8Trade Area 1a 52474 70.0% 10.2% 19.7% 49.4% 74.9San Antonio 1470516 0.7% 0.1% 0.2% 0.7% 70.8Bexar County 1946940 72.7% 7.4% 19.8% 61.4% 71.9
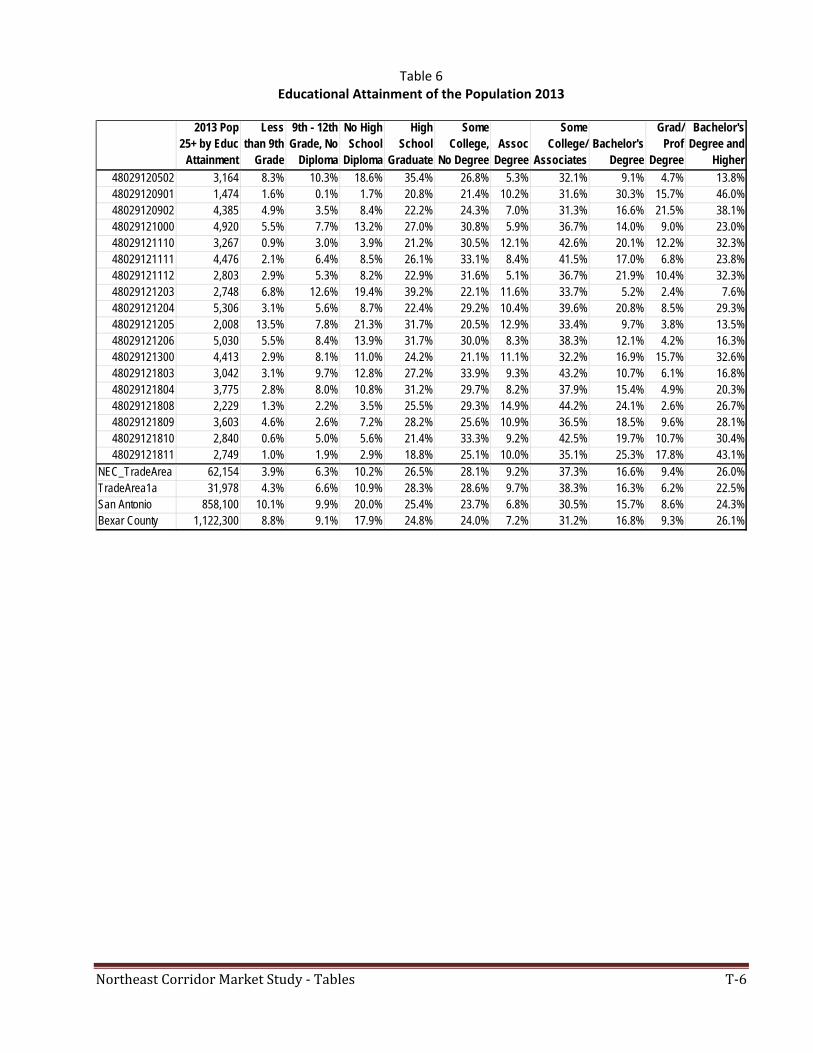
Northeast Corridor Market Study - Tables T-6
Table 6 Educational Attainment of the Population 2013
2013 Pop 25+ by Educ
Attainment
Less than 9th
Grade
9th - 12th Grade, No
Diploma
No High School
Diploma
High School
Graduate
Some College,
No DegreeAssoc
Degree
Some College/
AssociatesBachelor's
Degree
Grad/ Prof
Degree
Bachelor's Degree and
Higher
48029120502 3,164 8.3% 10.3% 18.6% 35.4% 26.8% 5.3% 32.1% 9.1% 4.7% 13.8%48029120901 1,474 1.6% 0.1% 1.7% 20.8% 21.4% 10.2% 31.6% 30.3% 15.7% 46.0%48029120902 4,385 4.9% 3.5% 8.4% 22.2% 24.3% 7.0% 31.3% 16.6% 21.5% 38.1%48029121000 4,920 5.5% 7.7% 13.2% 27.0% 30.8% 5.9% 36.7% 14.0% 9.0% 23.0%48029121110 3,267 0.9% 3.0% 3.9% 21.2% 30.5% 12.1% 42.6% 20.1% 12.2% 32.3%48029121111 4,476 2.1% 6.4% 8.5% 26.1% 33.1% 8.4% 41.5% 17.0% 6.8% 23.8%48029121112 2,803 2.9% 5.3% 8.2% 22.9% 31.6% 5.1% 36.7% 21.9% 10.4% 32.3%48029121203 2,748 6.8% 12.6% 19.4% 39.2% 22.1% 11.6% 33.7% 5.2% 2.4% 7.6%48029121204 5,306 3.1% 5.6% 8.7% 22.4% 29.2% 10.4% 39.6% 20.8% 8.5% 29.3%48029121205 2,008 13.5% 7.8% 21.3% 31.7% 20.5% 12.9% 33.4% 9.7% 3.8% 13.5%48029121206 5,030 5.5% 8.4% 13.9% 31.7% 30.0% 8.3% 38.3% 12.1% 4.2% 16.3%48029121300 4,413 2.9% 8.1% 11.0% 24.2% 21.1% 11.1% 32.2% 16.9% 15.7% 32.6%48029121803 3,042 3.1% 9.7% 12.8% 27.2% 33.9% 9.3% 43.2% 10.7% 6.1% 16.8%48029121804 3,775 2.8% 8.0% 10.8% 31.2% 29.7% 8.2% 37.9% 15.4% 4.9% 20.3%48029121808 2,229 1.3% 2.2% 3.5% 25.5% 29.3% 14.9% 44.2% 24.1% 2.6% 26.7%48029121809 3,603 4.6% 2.6% 7.2% 28.2% 25.6% 10.9% 36.5% 18.5% 9.6% 28.1%48029121810 2,840 0.6% 5.0% 5.6% 21.4% 33.3% 9.2% 42.5% 19.7% 10.7% 30.4%48029121811 2,749 1.0% 1.9% 2.9% 18.8% 25.1% 10.0% 35.1% 25.3% 17.8% 43.1%
NEC_TradeArea 62,154 3.9% 6.3% 10.2% 26.5% 28.1% 9.2% 37.3% 16.6% 9.4% 26.0%TradeArea1a 31,978 4.3% 6.6% 10.9% 28.3% 28.6% 9.7% 38.3% 16.3% 6.2% 22.5%San Antonio 858,100 10.1% 9.9% 20.0% 25.4% 23.7% 6.8% 30.5% 15.7% 8.6% 24.3%Bexar County 1,122,300 8.8% 9.1% 17.9% 24.8% 24.0% 7.2% 31.2% 16.8% 9.3% 26.1%
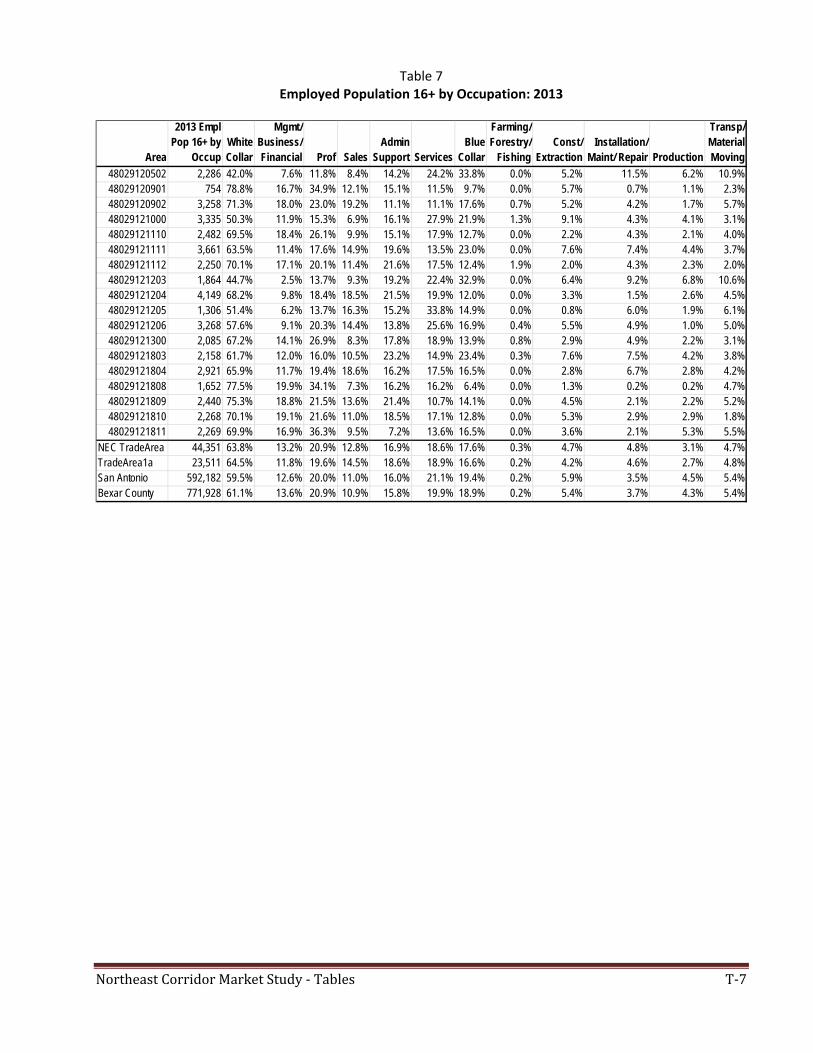
Northeast Corridor Market Study - Tables T-7
Table 7 Employed Population 16+ by Occupation: 2013
Area
2013 Empl Pop 16+ by
OccupWhite Collar
Mgmt/ Business/ Financial
Prof
Sales
Admin Support
Services
Blue Collar
Farming/ Forestry/
FishingConst/
ExtractionInstallation/
Maint/ Repair
Production
Transp/ Material Moving
48029120502 2,286 42.0% 7.6% 11.8% 8.4% 14.2% 24.2% 33.8% 0.0% 5.2% 11.5% 6.2% 10.9%48029120901 754 78.8% 16.7% 34.9% 12.1% 15.1% 11.5% 9.7% 0.0% 5.7% 0.7% 1.1% 2.3%48029120902 3,258 71.3% 18.0% 23.0% 19.2% 11.1% 11.1% 17.6% 0.7% 5.2% 4.2% 1.7% 5.7%48029121000 3,335 50.3% 11.9% 15.3% 6.9% 16.1% 27.9% 21.9% 1.3% 9.1% 4.3% 4.1% 3.1%48029121110 2,482 69.5% 18.4% 26.1% 9.9% 15.1% 17.9% 12.7% 0.0% 2.2% 4.3% 2.1% 4.0%48029121111 3,661 63.5% 11.4% 17.6% 14.9% 19.6% 13.5% 23.0% 0.0% 7.6% 7.4% 4.4% 3.7%48029121112 2,250 70.1% 17.1% 20.1% 11.4% 21.6% 17.5% 12.4% 1.9% 2.0% 4.3% 2.3% 2.0%48029121203 1,864 44.7% 2.5% 13.7% 9.3% 19.2% 22.4% 32.9% 0.0% 6.4% 9.2% 6.8% 10.6%48029121204 4,149 68.2% 9.8% 18.4% 18.5% 21.5% 19.9% 12.0% 0.0% 3.3% 1.5% 2.6% 4.5%48029121205 1,306 51.4% 6.2% 13.7% 16.3% 15.2% 33.8% 14.9% 0.0% 0.8% 6.0% 1.9% 6.1%48029121206 3,268 57.6% 9.1% 20.3% 14.4% 13.8% 25.6% 16.9% 0.4% 5.5% 4.9% 1.0% 5.0%48029121300 2,085 67.2% 14.1% 26.9% 8.3% 17.8% 18.9% 13.9% 0.8% 2.9% 4.9% 2.2% 3.1%48029121803 2,158 61.7% 12.0% 16.0% 10.5% 23.2% 14.9% 23.4% 0.3% 7.6% 7.5% 4.2% 3.8%48029121804 2,921 65.9% 11.7% 19.4% 18.6% 16.2% 17.5% 16.5% 0.0% 2.8% 6.7% 2.8% 4.2%48029121808 1,652 77.5% 19.9% 34.1% 7.3% 16.2% 16.2% 6.4% 0.0% 1.3% 0.2% 0.2% 4.7%48029121809 2,440 75.3% 18.8% 21.5% 13.6% 21.4% 10.7% 14.1% 0.0% 4.5% 2.1% 2.2% 5.2%48029121810 2,268 70.1% 19.1% 21.6% 11.0% 18.5% 17.1% 12.8% 0.0% 5.3% 2.9% 2.9% 1.8%48029121811 2,269 69.9% 16.9% 36.3% 9.5% 7.2% 13.6% 16.5% 0.0% 3.6% 2.1% 5.3% 5.5%
NEC TradeArea 44,351 63.8% 13.2% 20.9% 12.8% 16.9% 18.6% 17.6% 0.3% 4.7% 4.8% 3.1% 4.7%TradeArea1a 23,511 64.5% 11.8% 19.6% 14.5% 18.6% 18.9% 16.6% 0.2% 4.2% 4.6% 2.7% 4.8%San Antonio 592,182 59.5% 12.6% 20.0% 11.0% 16.0% 21.1% 19.4% 0.2% 5.9% 3.5% 4.5% 5.4%Bexar County 771,928 61.1% 13.6% 20.9% 10.9% 15.8% 19.9% 18.9% 0.2% 5.4% 3.7% 4.3% 5.4%
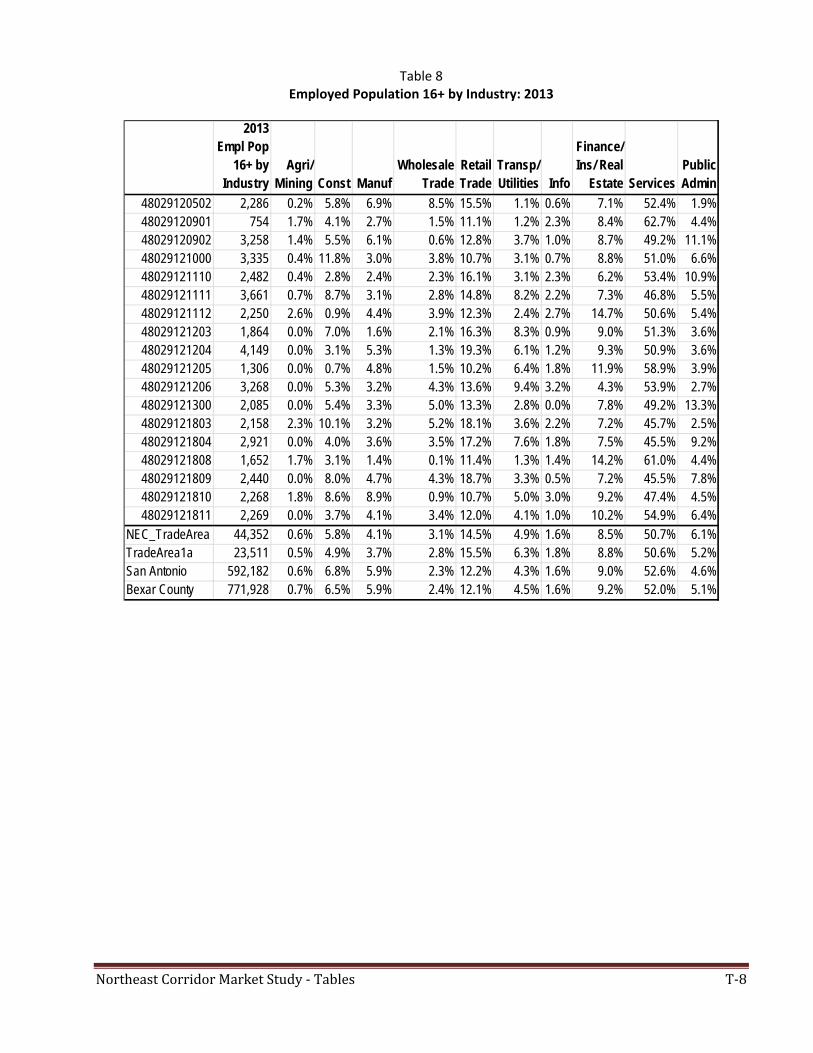
Northeast Corridor Market Study - Tables T-8
Table 8 Employed Population 16+ by Industry: 2013
2013 Empl Pop
16+ by Industry
Agri/ Mining
Const
Manuf
Wholesale Trade
Retail Trade
Transp/ Utilities Info
Finance/ Ins/ Real
Estate
ServicesPublic Admin
48029120502 2,286 0.2% 5.8% 6.9% 8.5% 15.5% 1.1% 0.6% 7.1% 52.4% 1.9%48029120901 754 1.7% 4.1% 2.7% 1.5% 11.1% 1.2% 2.3% 8.4% 62.7% 4.4%48029120902 3,258 1.4% 5.5% 6.1% 0.6% 12.8% 3.7% 1.0% 8.7% 49.2% 11.1%48029121000 3,335 0.4% 11.8% 3.0% 3.8% 10.7% 3.1% 0.7% 8.8% 51.0% 6.6%48029121110 2,482 0.4% 2.8% 2.4% 2.3% 16.1% 3.1% 2.3% 6.2% 53.4% 10.9%48029121111 3,661 0.7% 8.7% 3.1% 2.8% 14.8% 8.2% 2.2% 7.3% 46.8% 5.5%48029121112 2,250 2.6% 0.9% 4.4% 3.9% 12.3% 2.4% 2.7% 14.7% 50.6% 5.4%48029121203 1,864 0.0% 7.0% 1.6% 2.1% 16.3% 8.3% 0.9% 9.0% 51.3% 3.6%48029121204 4,149 0.0% 3.1% 5.3% 1.3% 19.3% 6.1% 1.2% 9.3% 50.9% 3.6%48029121205 1,306 0.0% 0.7% 4.8% 1.5% 10.2% 6.4% 1.8% 11.9% 58.9% 3.9%48029121206 3,268 0.0% 5.3% 3.2% 4.3% 13.6% 9.4% 3.2% 4.3% 53.9% 2.7%48029121300 2,085 0.0% 5.4% 3.3% 5.0% 13.3% 2.8% 0.0% 7.8% 49.2% 13.3%48029121803 2,158 2.3% 10.1% 3.2% 5.2% 18.1% 3.6% 2.2% 7.2% 45.7% 2.5%48029121804 2,921 0.0% 4.0% 3.6% 3.5% 17.2% 7.6% 1.8% 7.5% 45.5% 9.2%48029121808 1,652 1.7% 3.1% 1.4% 0.1% 11.4% 1.3% 1.4% 14.2% 61.0% 4.4%48029121809 2,440 0.0% 8.0% 4.7% 4.3% 18.7% 3.3% 0.5% 7.2% 45.5% 7.8%48029121810 2,268 1.8% 8.6% 8.9% 0.9% 10.7% 5.0% 3.0% 9.2% 47.4% 4.5%48029121811 2,269 0.0% 3.7% 4.1% 3.4% 12.0% 4.1% 1.0% 10.2% 54.9% 6.4%
NEC_TradeArea 44,352 0.6% 5.8% 4.1% 3.1% 14.5% 4.9% 1.6% 8.5% 50.7% 6.1%TradeArea1a 23,511 0.5% 4.9% 3.7% 2.8% 15.5% 6.3% 1.8% 8.8% 50.6% 5.2%San Antonio 592,182 0.6% 6.8% 5.9% 2.3% 12.2% 4.3% 1.6% 9.0% 52.6% 4.6%Bexar County 771,928 0.7% 6.5% 5.9% 2.4% 12.1% 4.5% 1.6% 9.2% 52.0% 5.1%
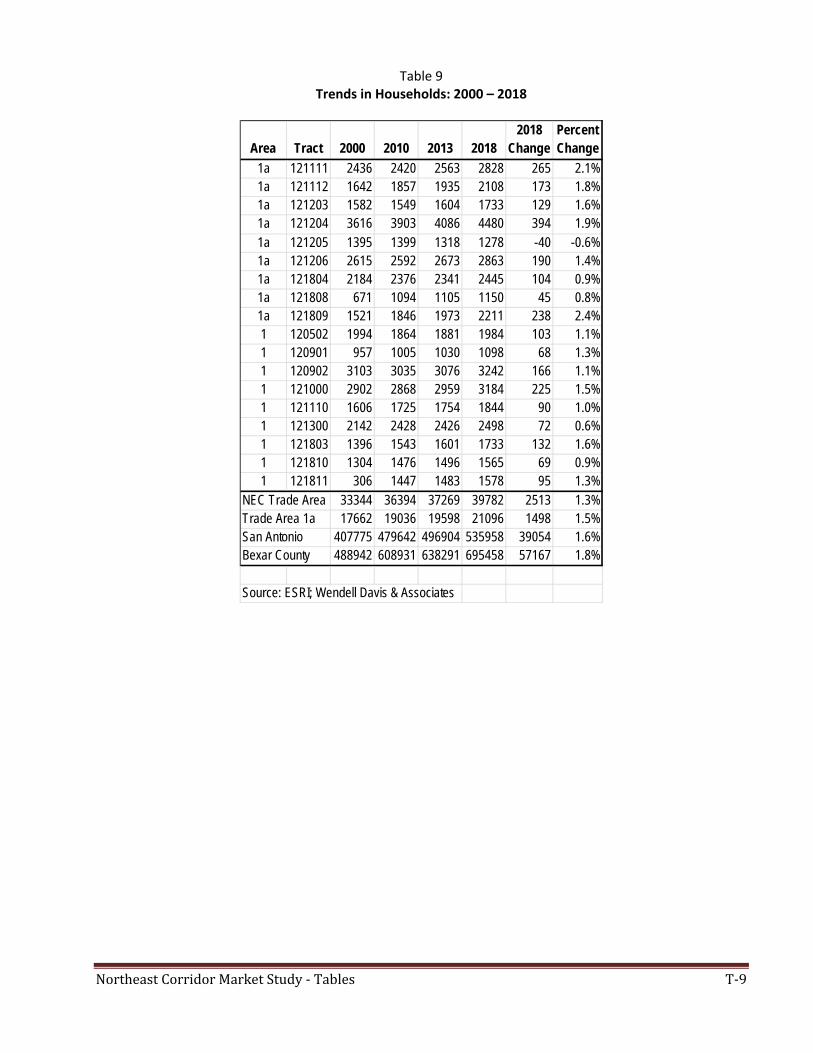
Northeast Corridor Market Study - Tables T-9
Table 9 Trends in Households: 2000 – 2018
Area Tract 2000 2010 2013 20182018
ChangePercent Change
1a 121111 2436 2420 2563 2828 265 2.1%1a 121112 1642 1857 1935 2108 173 1.8%1a 121203 1582 1549 1604 1733 129 1.6%1a 121204 3616 3903 4086 4480 394 1.9%1a 121205 1395 1399 1318 1278 -40 -0.6%1a 121206 2615 2592 2673 2863 190 1.4%1a 121804 2184 2376 2341 2445 104 0.9%1a 121808 671 1094 1105 1150 45 0.8%1a 121809 1521 1846 1973 2211 238 2.4%1 120502 1994 1864 1881 1984 103 1.1%1 120901 957 1005 1030 1098 68 1.3%1 120902 3103 3035 3076 3242 166 1.1%1 121000 2902 2868 2959 3184 225 1.5%1 121110 1606 1725 1754 1844 90 1.0%1 121300 2142 2428 2426 2498 72 0.6%1 121803 1396 1543 1601 1733 132 1.6%1 121810 1304 1476 1496 1565 69 0.9%1 121811 306 1447 1483 1578 95 1.3%
NEC Trade Area 33344 36394 37269 39782 2513 1.3%Trade Area 1a 17662 19036 19598 21096 1498 1.5%San Antonio 407775 479642 496904 535958 39054 1.6%Bexar County 488942 608931 638291 695458 57167 1.8%
Source: ESRI; Wendell Davis & Associates
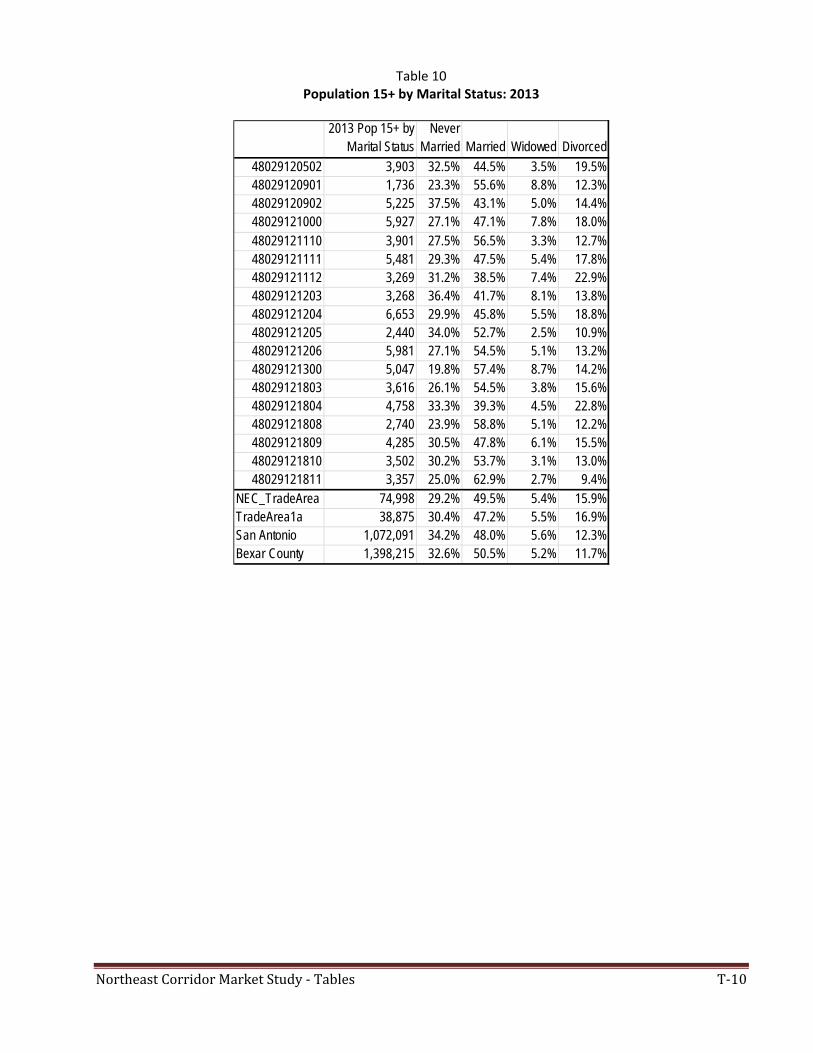
Northeast Corridor Market Study - Tables T-10
Table 10 Population 15+ by Marital Status: 2013
2013 Pop 15+ by Marital Status
Never Married Married Widowed Divorced
48029120502 3,903 32.5% 44.5% 3.5% 19.5%48029120901 1,736 23.3% 55.6% 8.8% 12.3%48029120902 5,225 37.5% 43.1% 5.0% 14.4%48029121000 5,927 27.1% 47.1% 7.8% 18.0%48029121110 3,901 27.5% 56.5% 3.3% 12.7%48029121111 5,481 29.3% 47.5% 5.4% 17.8%48029121112 3,269 31.2% 38.5% 7.4% 22.9%48029121203 3,268 36.4% 41.7% 8.1% 13.8%48029121204 6,653 29.9% 45.8% 5.5% 18.8%48029121205 2,440 34.0% 52.7% 2.5% 10.9%48029121206 5,981 27.1% 54.5% 5.1% 13.2%48029121300 5,047 19.8% 57.4% 8.7% 14.2%48029121803 3,616 26.1% 54.5% 3.8% 15.6%48029121804 4,758 33.3% 39.3% 4.5% 22.8%48029121808 2,740 23.9% 58.8% 5.1% 12.2%48029121809 4,285 30.5% 47.8% 6.1% 15.5%48029121810 3,502 30.2% 53.7% 3.1% 13.0%48029121811 3,357 25.0% 62.9% 2.7% 9.4%
NEC_TradeArea 74,998 29.2% 49.5% 5.4% 15.9%TradeArea1a 38,875 30.4% 47.2% 5.5% 16.9%San Antonio 1,072,091 34.2% 48.0% 5.6% 12.3%Bexar County 1,398,215 32.6% 50.5% 5.2% 11.7%
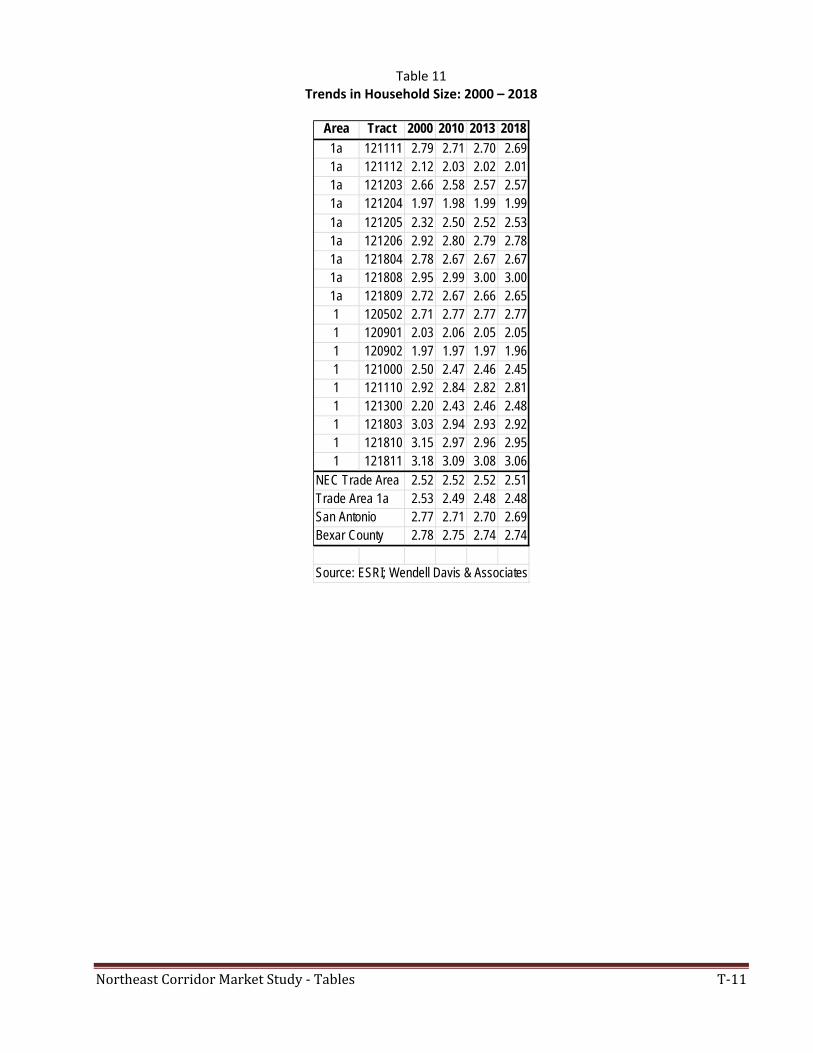
Northeast Corridor Market Study - Tables T-11
Table 11 Trends in Household Size: 2000 – 2018
Area Tract 2000 2010 2013 2018
1a 121111 2.79 2.71 2.70 2.691a 121112 2.12 2.03 2.02 2.011a 121203 2.66 2.58 2.57 2.571a 121204 1.97 1.98 1.99 1.991a 121205 2.32 2.50 2.52 2.531a 121206 2.92 2.80 2.79 2.781a 121804 2.78 2.67 2.67 2.671a 121808 2.95 2.99 3.00 3.001a 121809 2.72 2.67 2.66 2.651 120502 2.71 2.77 2.77 2.771 120901 2.03 2.06 2.05 2.051 120902 1.97 1.97 1.97 1.961 121000 2.50 2.47 2.46 2.451 121110 2.92 2.84 2.82 2.811 121300 2.20 2.43 2.46 2.481 121803 3.03 2.94 2.93 2.921 121810 3.15 2.97 2.96 2.951 121811 3.18 3.09 3.08 3.06
NEC Trade Area 2.52 2.52 2.52 2.51Trade Area 1a 2.53 2.49 2.48 2.48San Antonio 2.77 2.71 2.70 2.69Bexar County 2.78 2.75 2.74 2.74
Source: ESRI; Wendell Davis & Associates
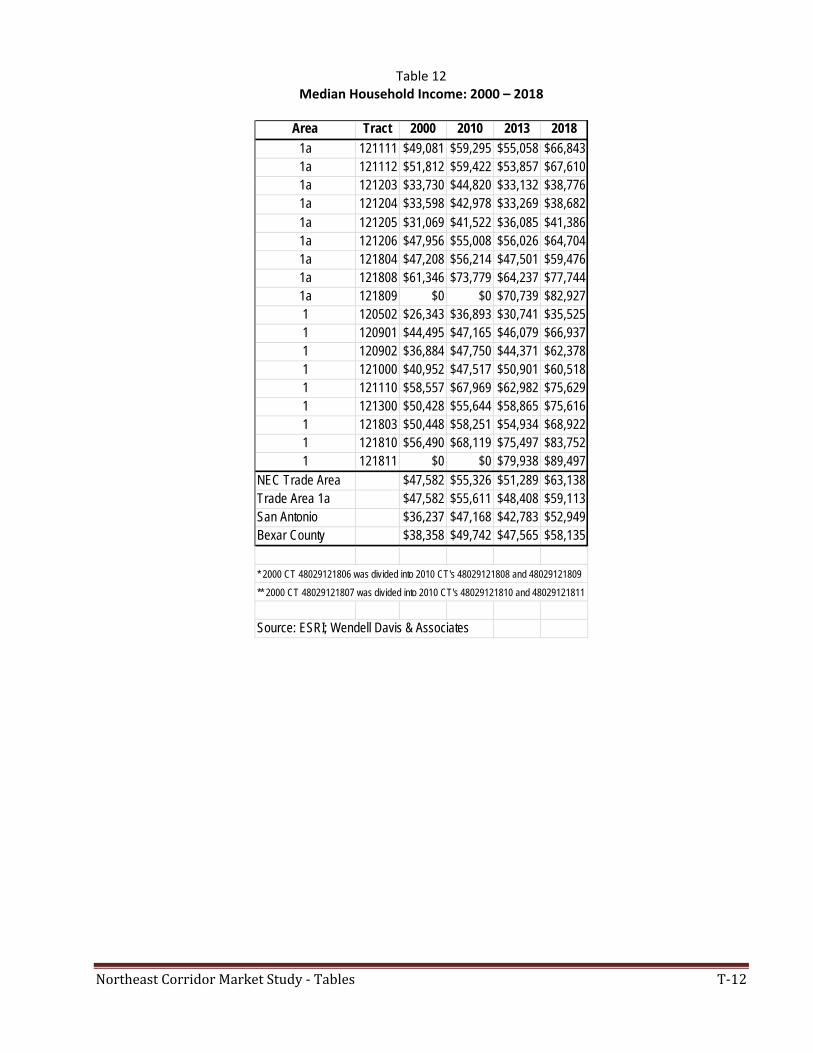
Northeast Corridor Market Study - Tables T-12
Table 12 Median Household Income: 2000 – 2018
Area Tract 2000 2010 2013 2018
1a 121111 $49,081 $59,295 $55,058 $66,8431a 121112 $51,812 $59,422 $53,857 $67,6101a 121203 $33,730 $44,820 $33,132 $38,7761a 121204 $33,598 $42,978 $33,269 $38,6821a 121205 $31,069 $41,522 $36,085 $41,3861a 121206 $47,956 $55,008 $56,026 $64,7041a 121804 $47,208 $56,214 $47,501 $59,4761a 121808 $61,346 $73,779 $64,237 $77,7441a 121809 $0 $0 $70,739 $82,9271 120502 $26,343 $36,893 $30,741 $35,5251 120901 $44,495 $47,165 $46,079 $66,9371 120902 $36,884 $47,750 $44,371 $62,3781 121000 $40,952 $47,517 $50,901 $60,5181 121110 $58,557 $67,969 $62,982 $75,6291 121300 $50,428 $55,644 $58,865 $75,6161 121803 $50,448 $58,251 $54,934 $68,9221 121810 $56,490 $68,119 $75,497 $83,7521 121811 $0 $0 $79,938 $89,497
NEC Trade Area $47,582 $55,326 $51,289 $63,138Trade Area 1a $47,582 $55,611 $48,408 $59,113San Antonio $36,237 $47,168 $42,783 $52,949Bexar County $38,358 $49,742 $47,565 $58,135
Source: ESRI; Wendell Davis & Associates
* 2000 CT 48029121806 was divided into 2010 CT's 48029121808 and 48029121809
** 2000 CT 48029121807 was divided into 2010 CT's 48029121810 and 48029121811
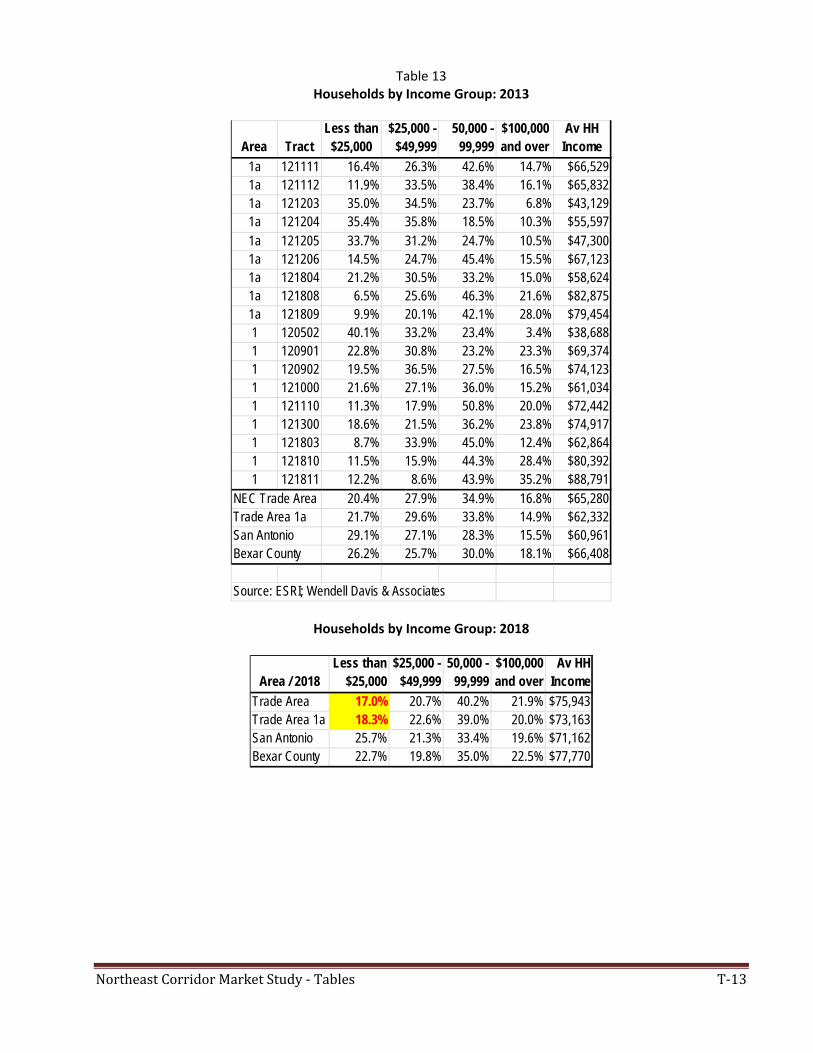
Northeast Corridor Market Study - Tables T-13
Table 13 Households by Income Group: 2013
Households by Income Group: 2018
Area TractLess than
$25,000$25,000 -
$49,99950,000 -
99,999$100,000 and over
Av HH Income
1a 121111 16.4% 26.3% 42.6% 14.7% $66,5291a 121112 11.9% 33.5% 38.4% 16.1% $65,8321a 121203 35.0% 34.5% 23.7% 6.8% $43,1291a 121204 35.4% 35.8% 18.5% 10.3% $55,5971a 121205 33.7% 31.2% 24.7% 10.5% $47,3001a 121206 14.5% 24.7% 45.4% 15.5% $67,1231a 121804 21.2% 30.5% 33.2% 15.0% $58,6241a 121808 6.5% 25.6% 46.3% 21.6% $82,8751a 121809 9.9% 20.1% 42.1% 28.0% $79,4541 120502 40.1% 33.2% 23.4% 3.4% $38,6881 120901 22.8% 30.8% 23.2% 23.3% $69,3741 120902 19.5% 36.5% 27.5% 16.5% $74,1231 121000 21.6% 27.1% 36.0% 15.2% $61,0341 121110 11.3% 17.9% 50.8% 20.0% $72,4421 121300 18.6% 21.5% 36.2% 23.8% $74,9171 121803 8.7% 33.9% 45.0% 12.4% $62,8641 121810 11.5% 15.9% 44.3% 28.4% $80,3921 121811 12.2% 8.6% 43.9% 35.2% $88,791
NEC Trade Area 20.4% 27.9% 34.9% 16.8% $65,280Trade Area 1a 21.7% 29.6% 33.8% 14.9% $62,332San Antonio 29.1% 27.1% 28.3% 15.5% $60,961Bexar County 26.2% 25.7% 30.0% 18.1% $66,408
Source: ESRI; Wendell Davis & Associates
Area / 2018Less than
$25,000$25,000 -
$49,99950,000 -
99,999$100,000 and over
Av HH Income
Trade Area 17.0% 20.7% 40.2% 21.9% $75,943Trade Area 1a 18.3% 22.6% 39.0% 20.0% $73,163San Antonio 25.7% 21.3% 33.4% 19.6% $71,162Bexar County 22.7% 19.8% 35.0% 22.5% $77,770
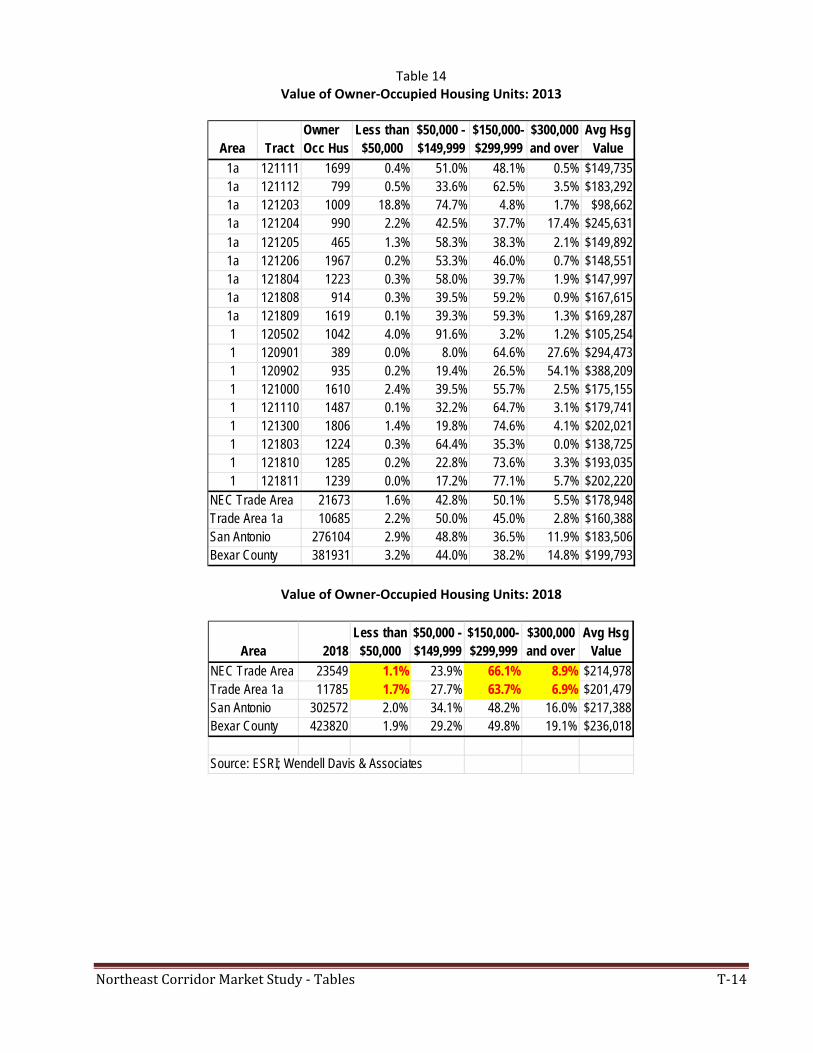
Northeast Corridor Market Study - Tables T-14
Table 14 Value of Owner‐Occupied Housing Units: 2013
Value of Owner‐Occupied Housing Units: 2018
Area TractOwner Occ Hus
Less than $50,000
$50,000 - $149,999
$150,000-$299,999
$300,000 and over
Avg Hsg Value
1a 121111 1699 0.4% 51.0% 48.1% 0.5% $149,7351a 121112 799 0.5% 33.6% 62.5% 3.5% $183,2921a 121203 1009 18.8% 74.7% 4.8% 1.7% $98,6621a 121204 990 2.2% 42.5% 37.7% 17.4% $245,6311a 121205 465 1.3% 58.3% 38.3% 2.1% $149,8921a 121206 1967 0.2% 53.3% 46.0% 0.7% $148,5511a 121804 1223 0.3% 58.0% 39.7% 1.9% $147,9971a 121808 914 0.3% 39.5% 59.2% 0.9% $167,6151a 121809 1619 0.1% 39.3% 59.3% 1.3% $169,2871 120502 1042 4.0% 91.6% 3.2% 1.2% $105,2541 120901 389 0.0% 8.0% 64.6% 27.6% $294,4731 120902 935 0.2% 19.4% 26.5% 54.1% $388,2091 121000 1610 2.4% 39.5% 55.7% 2.5% $175,1551 121110 1487 0.1% 32.2% 64.7% 3.1% $179,7411 121300 1806 1.4% 19.8% 74.6% 4.1% $202,0211 121803 1224 0.3% 64.4% 35.3% 0.0% $138,7251 121810 1285 0.2% 22.8% 73.6% 3.3% $193,0351 121811 1239 0.0% 17.2% 77.1% 5.7% $202,220
NEC Trade Area 21673 1.6% 42.8% 50.1% 5.5% $178,948Trade Area 1a 10685 2.2% 50.0% 45.0% 2.8% $160,388San Antonio 276104 2.9% 48.8% 36.5% 11.9% $183,506Bexar County 381931 3.2% 44.0% 38.2% 14.8% $199,793
Area 2018Less than
$50,000$50,000 - $149,999
$150,000-$299,999
$300,000 and over
Avg Hsg Value
NEC Trade Area 23549 1.1% 23.9% 66.1% 8.9% $214,978Trade Area 1a 11785 1.7% 27.7% 63.7% 6.9% $201,479San Antonio 302572 2.0% 34.1% 48.2% 16.0% $217,388Bexar County 423820 1.9% 29.2% 49.8% 19.1% $236,018
Source: ESRI; Wendell Davis & Associates
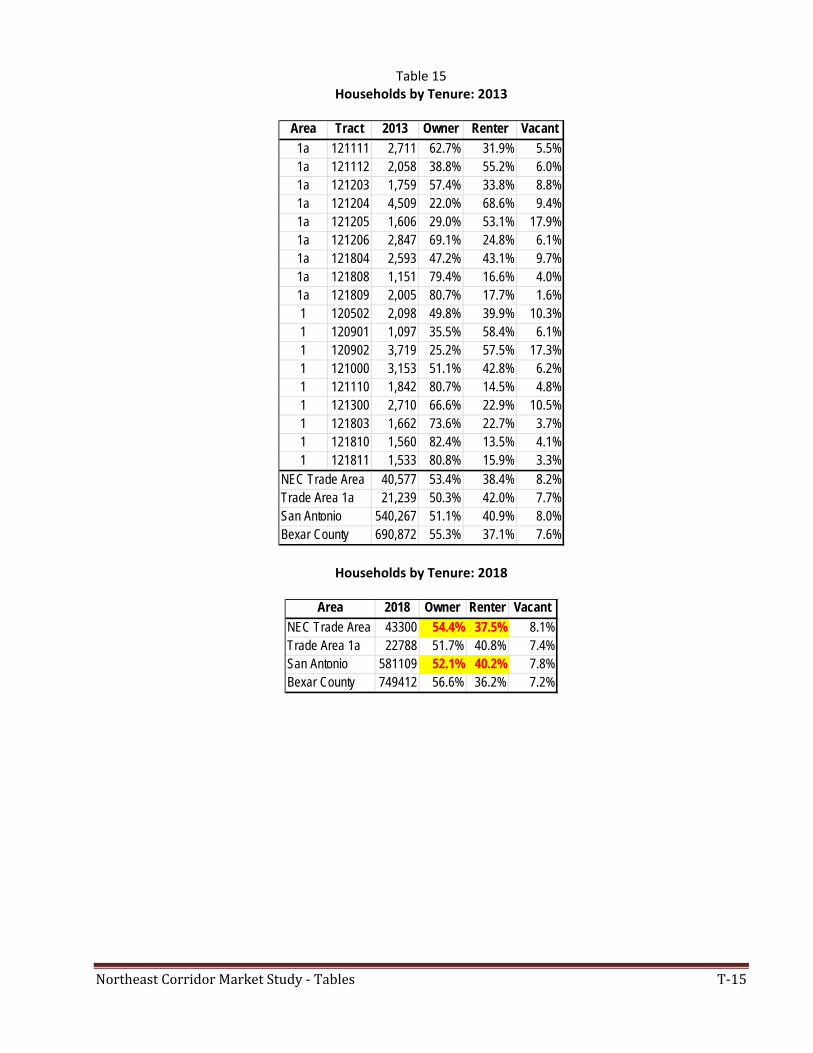
Northeast Corridor Market Study - Tables T-15
Table 15 Households by Tenure: 2013
Households by Tenure: 2018
Area Tract 2013 Owner Renter Vacant
1a 121111 2,711 62.7% 31.9% 5.5%1a 121112 2,058 38.8% 55.2% 6.0%1a 121203 1,759 57.4% 33.8% 8.8%1a 121204 4,509 22.0% 68.6% 9.4%1a 121205 1,606 29.0% 53.1% 17.9%1a 121206 2,847 69.1% 24.8% 6.1%1a 121804 2,593 47.2% 43.1% 9.7%1a 121808 1,151 79.4% 16.6% 4.0%1a 121809 2,005 80.7% 17.7% 1.6%1 120502 2,098 49.8% 39.9% 10.3%1 120901 1,097 35.5% 58.4% 6.1%1 120902 3,719 25.2% 57.5% 17.3%1 121000 3,153 51.1% 42.8% 6.2%1 121110 1,842 80.7% 14.5% 4.8%1 121300 2,710 66.6% 22.9% 10.5%1 121803 1,662 73.6% 22.7% 3.7%1 121810 1,560 82.4% 13.5% 4.1%1 121811 1,533 80.8% 15.9% 3.3%
NEC Trade Area 40,577 53.4% 38.4% 8.2%Trade Area 1a 21,239 50.3% 42.0% 7.7%San Antonio 540,267 51.1% 40.9% 8.0%Bexar County 690,872 55.3% 37.1% 7.6%
Area 2018 Owner Renter Vacant
NEC Trade Area 43300 54.4% 37.5% 8.1%Trade Area 1a 22788 51.7% 40.8% 7.4%San Antonio 581109 52.1% 40.2% 7.8%Bexar County 749412 56.6% 36.2% 7.2%
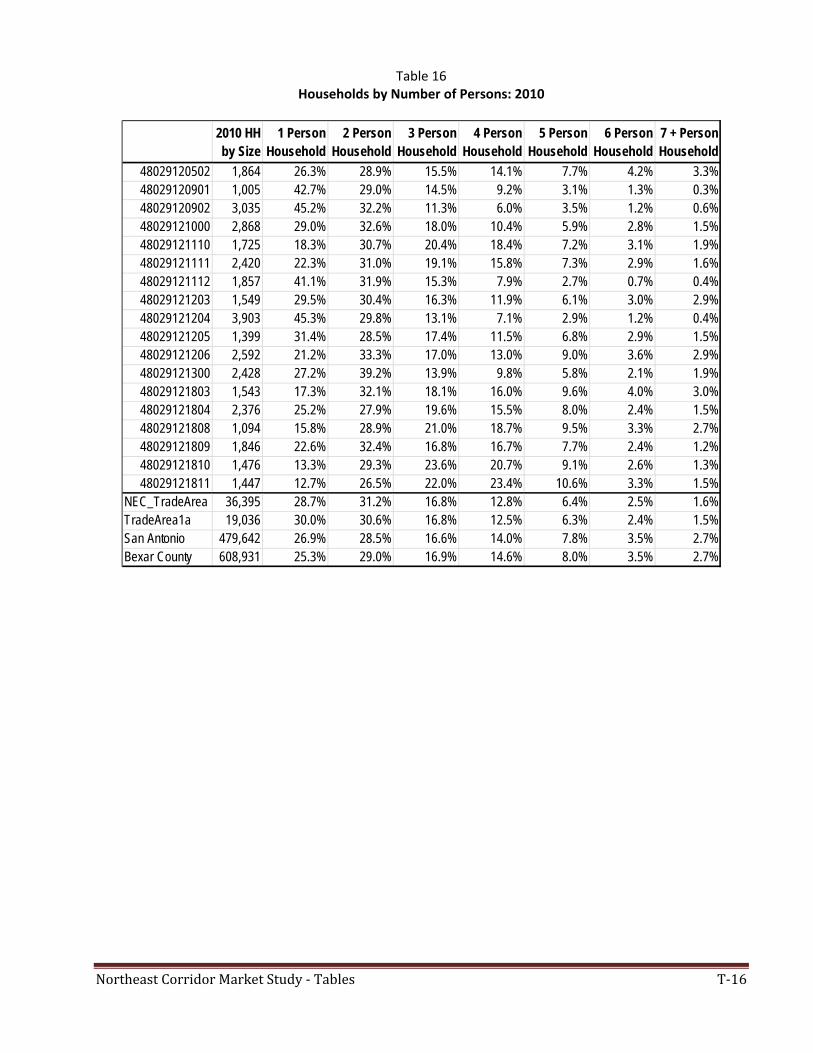
Northeast Corridor Market Study - Tables T-16
Table 16 Households by Number of Persons: 2010
2010 HH by Size
1 Person Household
2 Person Household
3 Person Household
4 Person Household
5 Person Household
6 Person Household
7 + Person Household
48029120502 1,864 26.3% 28.9% 15.5% 14.1% 7.7% 4.2% 3.3%48029120901 1,005 42.7% 29.0% 14.5% 9.2% 3.1% 1.3% 0.3%48029120902 3,035 45.2% 32.2% 11.3% 6.0% 3.5% 1.2% 0.6%48029121000 2,868 29.0% 32.6% 18.0% 10.4% 5.9% 2.8% 1.5%48029121110 1,725 18.3% 30.7% 20.4% 18.4% 7.2% 3.1% 1.9%48029121111 2,420 22.3% 31.0% 19.1% 15.8% 7.3% 2.9% 1.6%48029121112 1,857 41.1% 31.9% 15.3% 7.9% 2.7% 0.7% 0.4%48029121203 1,549 29.5% 30.4% 16.3% 11.9% 6.1% 3.0% 2.9%48029121204 3,903 45.3% 29.8% 13.1% 7.1% 2.9% 1.2% 0.4%48029121205 1,399 31.4% 28.5% 17.4% 11.5% 6.8% 2.9% 1.5%48029121206 2,592 21.2% 33.3% 17.0% 13.0% 9.0% 3.6% 2.9%48029121300 2,428 27.2% 39.2% 13.9% 9.8% 5.8% 2.1% 1.9%48029121803 1,543 17.3% 32.1% 18.1% 16.0% 9.6% 4.0% 3.0%48029121804 2,376 25.2% 27.9% 19.6% 15.5% 8.0% 2.4% 1.5%48029121808 1,094 15.8% 28.9% 21.0% 18.7% 9.5% 3.3% 2.7%48029121809 1,846 22.6% 32.4% 16.8% 16.7% 7.7% 2.4% 1.2%48029121810 1,476 13.3% 29.3% 23.6% 20.7% 9.1% 2.6% 1.3%48029121811 1,447 12.7% 26.5% 22.0% 23.4% 10.6% 3.3% 1.5%
NEC_TradeArea 36,395 28.7% 31.2% 16.8% 12.8% 6.4% 2.5% 1.6%TradeArea1a 19,036 30.0% 30.6% 16.8% 12.5% 6.3% 2.4% 1.5%San Antonio 479,642 26.9% 28.5% 16.6% 14.0% 7.8% 3.5% 2.7%Bexar County 608,931 25.3% 29.0% 16.9% 14.6% 8.0% 3.5% 2.7%
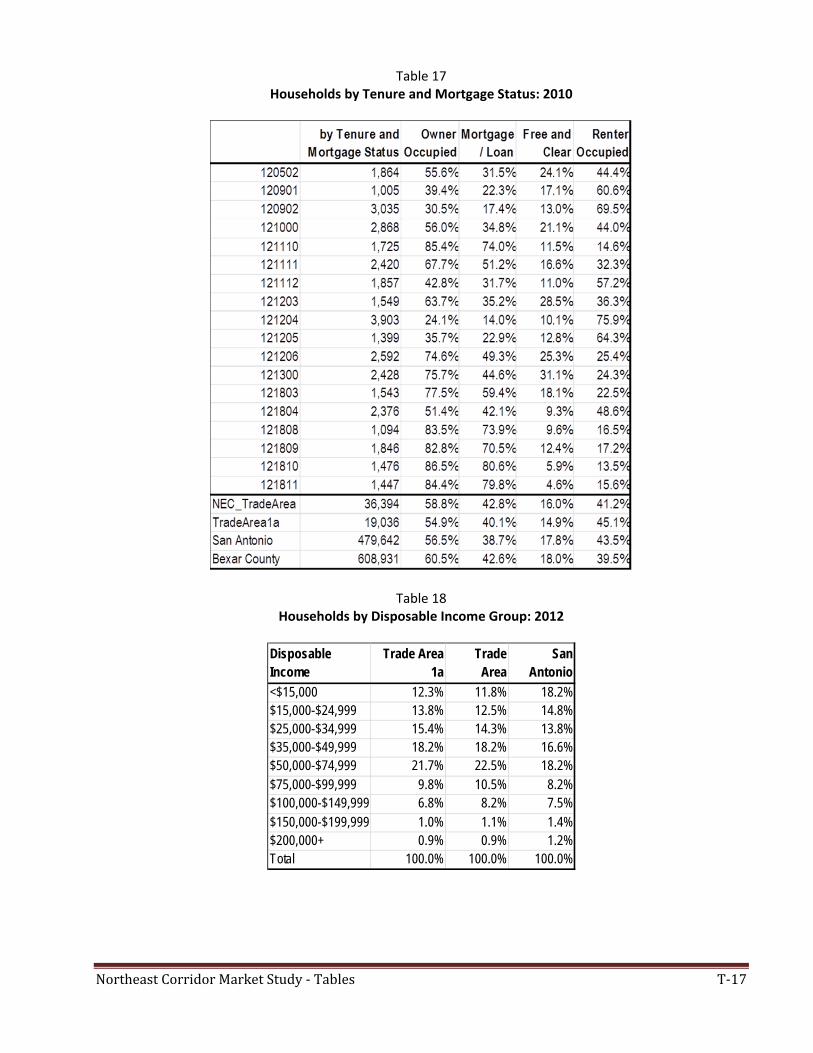
Northeast Corridor Market Study - Tables T-17
Table 17 Households by Tenure and Mortgage Status: 2010
Table 18 Households by Disposable Income Group: 2012
Disposable Income
Trade Area 1a
Trade Area
San Antonio
<$15,000 12.3% 11.8% 18.2%$15,000-$24,999 13.8% 12.5% 14.8%$25,000-$34,999 15.4% 14.3% 13.8%$35,000-$49,999 18.2% 18.2% 16.6%$50,000-$74,999 21.7% 22.5% 18.2%$75,000-$99,999 9.8% 10.5% 8.2%$100,000-$149,999 6.8% 8.2% 7.5%$150,000-$199,999 1.0% 1.1% 1.4%$200,000+ 0.9% 0.9% 1.2%Total 100.0% 100.0% 100.0%
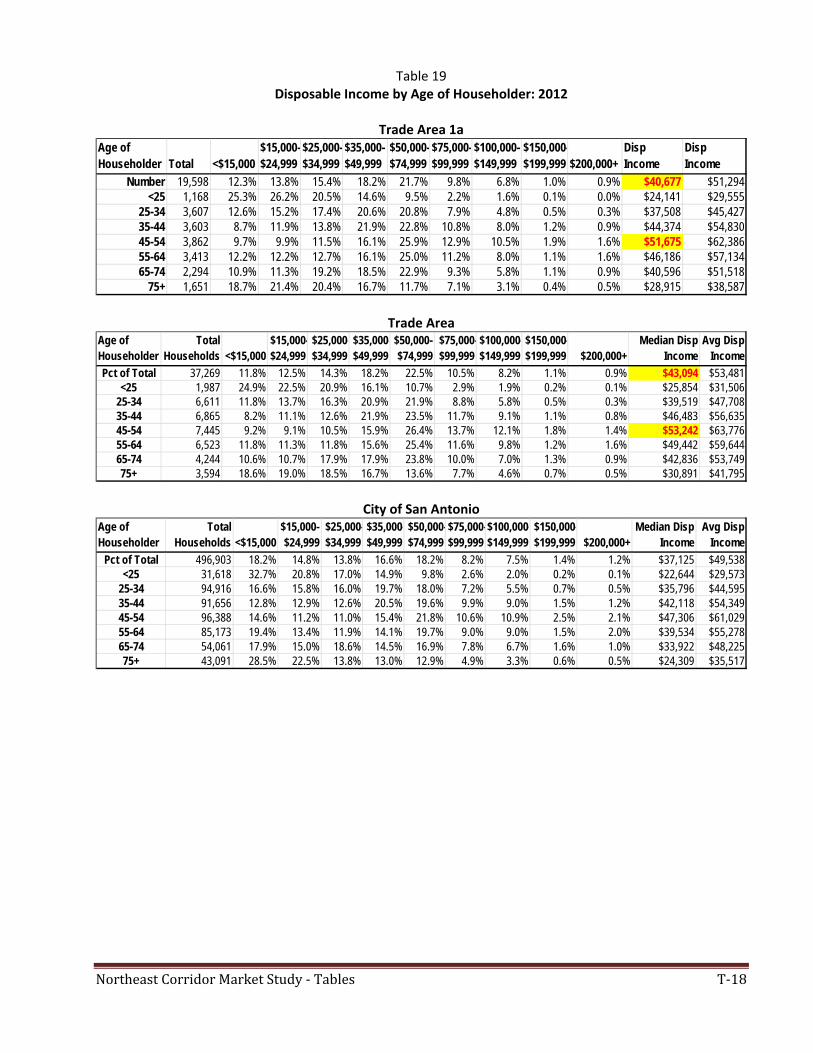
Northeast Corridor Market Study - Tables T-18
Table 19 Disposable Income by Age of Householder: 2012
Trade Area 1a
Trade Area
City of San Antonio
Age of Householder Total <$15,000
$15,000-$24,999
$25,000-$34,999
$35,000-$49,999
$50,000-$74,999
$75,000-$99,999
$100,000-$149,999
$150,000-$199,999 $200,000+
Disp Income
Disp Income
Number 19,598 12.3% 13.8% 15.4% 18.2% 21.7% 9.8% 6.8% 1.0% 0.9% $40,677 $51,294<25 1,168 25.3% 26.2% 20.5% 14.6% 9.5% 2.2% 1.6% 0.1% 0.0% $24,141 $29,555
25-34 3,607 12.6% 15.2% 17.4% 20.6% 20.8% 7.9% 4.8% 0.5% 0.3% $37,508 $45,42735-44 3,603 8.7% 11.9% 13.8% 21.9% 22.8% 10.8% 8.0% 1.2% 0.9% $44,374 $54,83045-54 3,862 9.7% 9.9% 11.5% 16.1% 25.9% 12.9% 10.5% 1.9% 1.6% $51,675 $62,38655-64 3,413 12.2% 12.2% 12.7% 16.1% 25.0% 11.2% 8.0% 1.1% 1.6% $46,186 $57,13465-74 2,294 10.9% 11.3% 19.2% 18.5% 22.9% 9.3% 5.8% 1.1% 0.9% $40,596 $51,518
75+ 1,651 18.7% 21.4% 20.4% 16.7% 11.7% 7.1% 3.1% 0.4% 0.5% $28,915 $38,587
Age of Householder
Total Households <$15,000
$15,000-$24,999
$25,000-$34,999
$35,000-$49,999
$50,000-$74,999
$75,000-$99,999
$100,000-$149,999
$150,000-$199,999 $200,000+
Median Disp Income
Avg Disp Income
Pct of Total 37,269 11.8% 12.5% 14.3% 18.2% 22.5% 10.5% 8.2% 1.1% 0.9% $43,094 $53,481<25 1,987 24.9% 22.5% 20.9% 16.1% 10.7% 2.9% 1.9% 0.2% 0.1% $25,854 $31,506
25-34 6,611 11.8% 13.7% 16.3% 20.9% 21.9% 8.8% 5.8% 0.5% 0.3% $39,519 $47,70835-44 6,865 8.2% 11.1% 12.6% 21.9% 23.5% 11.7% 9.1% 1.1% 0.8% $46,483 $56,63545-54 7,445 9.2% 9.1% 10.5% 15.9% 26.4% 13.7% 12.1% 1.8% 1.4% $53,242 $63,77655-64 6,523 11.8% 11.3% 11.8% 15.6% 25.4% 11.6% 9.8% 1.2% 1.6% $49,442 $59,64465-74 4,244 10.6% 10.7% 17.9% 17.9% 23.8% 10.0% 7.0% 1.3% 0.9% $42,836 $53,74975+ 3,594 18.6% 19.0% 18.5% 16.7% 13.6% 7.7% 4.6% 0.7% 0.5% $30,891 $41,795
Age of Householder
Total Households <$15,000
$15,000-$24,999
$25,000-$34,999
$35,000-$49,999
$50,000-$74,999
$75,000-$99,999
$100,000-$149,999
$150,000-$199,999 $200,000+
Median Disp Income
Avg Disp Income
Pct of Total 496,903 18.2% 14.8% 13.8% 16.6% 18.2% 8.2% 7.5% 1.4% 1.2% $37,125 $49,538<25 31,618 32.7% 20.8% 17.0% 14.9% 9.8% 2.6% 2.0% 0.2% 0.1% $22,644 $29,573
25-34 94,916 16.6% 15.8% 16.0% 19.7% 18.0% 7.2% 5.5% 0.7% 0.5% $35,796 $44,59535-44 91,656 12.8% 12.9% 12.6% 20.5% 19.6% 9.9% 9.0% 1.5% 1.2% $42,118 $54,34945-54 96,388 14.6% 11.2% 11.0% 15.4% 21.8% 10.6% 10.9% 2.5% 2.1% $47,306 $61,02955-64 85,173 19.4% 13.4% 11.9% 14.1% 19.7% 9.0% 9.0% 1.5% 2.0% $39,534 $55,27865-74 54,061 17.9% 15.0% 18.6% 14.5% 16.9% 7.8% 6.7% 1.6% 1.0% $33,922 $48,22575+ 43,091 28.5% 22.5% 13.8% 13.0% 12.9% 4.9% 3.3% 0.6% 0.5% $24,309 $35,517
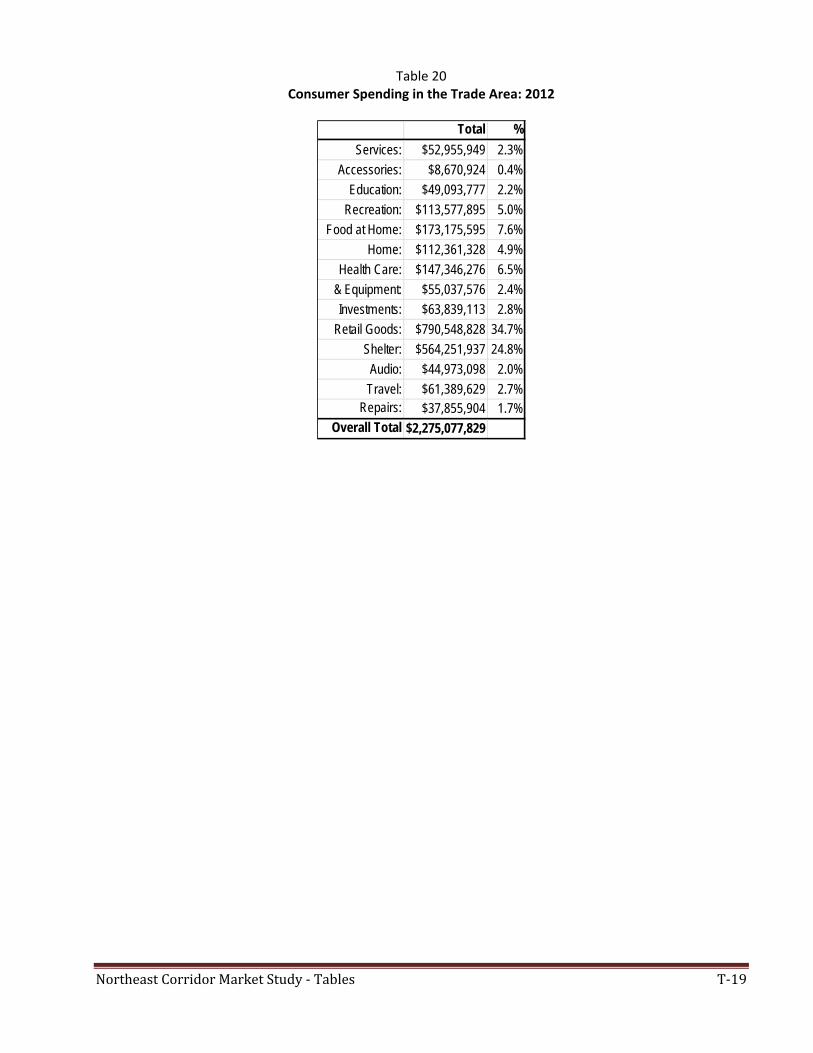
Northeast Corridor Market Study - Tables T-19
Table 20 Consumer Spending in the Trade Area: 2012
Total %
Services: $52,955,949 2.3%
Accessories: $8,670,924 0.4%
Education: $49,093,777 2.2%
Recreation: $113,577,895 5.0%
Food at Home: $173,175,595 7.6%
Home: $112,361,328 4.9%
Health Care: $147,346,276 6.5%
& Equipment: $55,037,576 2.4%
Investments: $63,839,113 2.8%
Retail Goods: $790,548,828 34.7%
Shelter: $564,251,937 24.8%
Audio: $44,973,098 2.0%
Travel: $61,389,629 2.7%Repairs: $37,855,904 1.7%
Overall Total $2,275,077,829
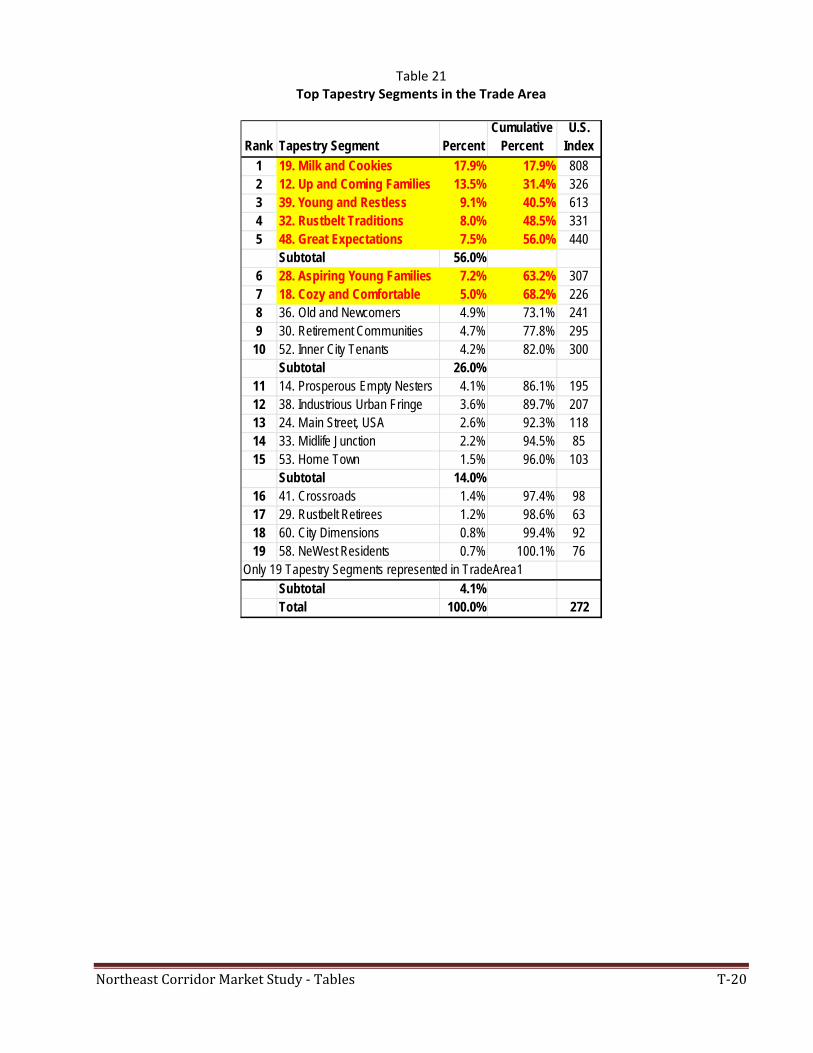
Northeast Corridor Market Study - Tables T-20
Table 21 Top Tapestry Segments in the Trade Area
Rank Tapestry Segment PercentCumulative
PercentU.S.
Index
1 19. Milk and Cookies 17.9% 17.9% 8082 12. Up and Coming Families 13.5% 31.4% 3263 39. Young and Restless 9.1% 40.5% 6134 32. Rustbelt Traditions 8.0% 48.5% 3315 48. Great Expectations 7.5% 56.0% 440
Subtotal 56.0%6 28. Aspiring Young Families 7.2% 63.2% 3077 18. Cozy and Comfortable 5.0% 68.2% 2268 36. Old and Newcomers 4.9% 73.1% 2419 30. Retirement Communities 4.7% 77.8% 295
10 52. Inner City Tenants 4.2% 82.0% 300Subtotal 26.0%
11 14. Prosperous Empty Nesters 4.1% 86.1% 19512 38. Industrious Urban Fringe 3.6% 89.7% 20713 24. Main Street, USA 2.6% 92.3% 11814 33. Midlife Junction 2.2% 94.5% 8515 53. Home Town 1.5% 96.0% 103
Subtotal 14.0%16 41. Crossroads 1.4% 97.4% 9817 29. Rustbelt Retirees 1.2% 98.6% 6318 60. City Dimensions 0.8% 99.4% 9219 58. NeWest Residents 0.7% 100.1% 76
Only 19 Tapestry Segments represented in TradeArea1Subtotal 4.1%Total 100.0% 272
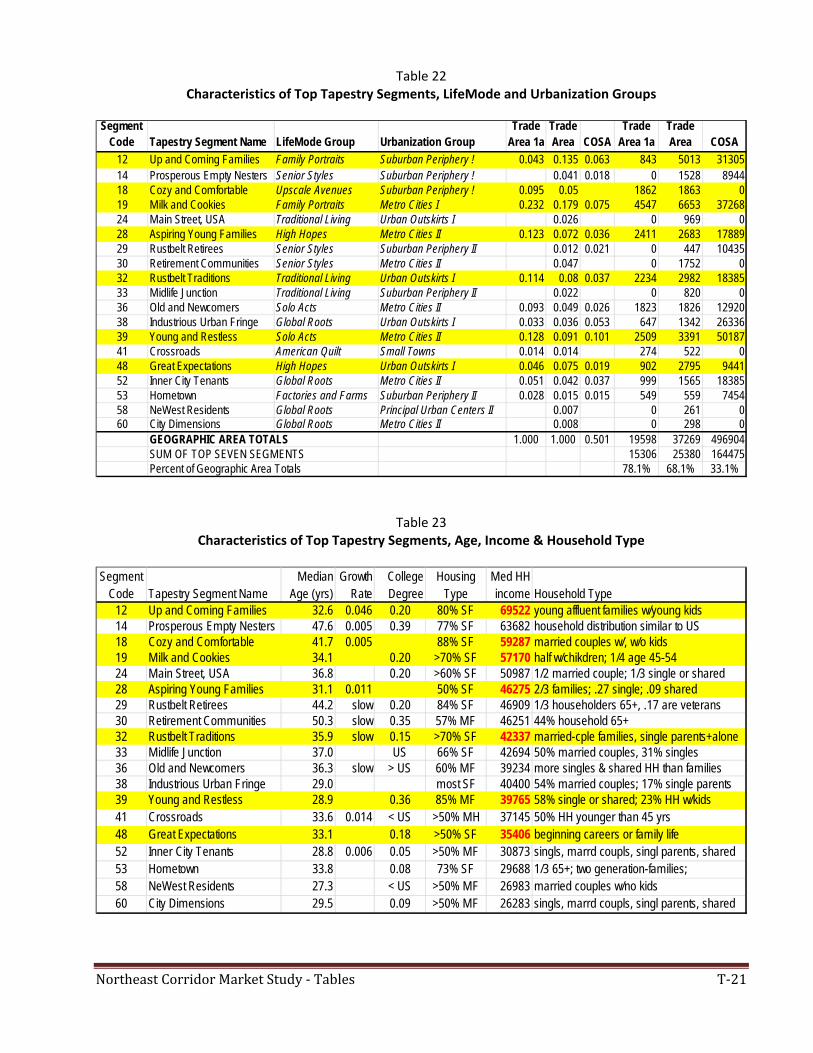
Northeast Corridor Market Study - Tables T-21
Table 22 Characteristics of Top Tapestry Segments, LifeMode and Urbanization Groups
Table 23 Characteristics of Top Tapestry Segments, Age, Income & Household Type
Segment Code Tapestry Segment Name LifeMode Group Urbanization Group
Trade Area 1a
Trade Area COSA
Trade Area 1a
Trade Area COSA
12 Up and Coming Families Family Portraits Suburban Periphery ! 0.043 0.135 0.063 843 5013 3130514 Prosperous Empty Nesters Senior Styles Suburban Periphery ! 0.041 0.018 0 1528 894418 Cozy and Comfortable Upscale Avenues Suburban Periphery ! 0.095 0.05 1862 1863 019 Milk and Cookies Family Portraits Metro Cities I 0.232 0.179 0.075 4547 6653 3726824 Main Street, USA Traditional Living Urban Outskirts I 0.026 0 969 028 Aspiring Young Families High Hopes Metro Cities II 0.123 0.072 0.036 2411 2683 1788929 Rustbelt Retirees Senior Styles Suburban Periphery II 0.012 0.021 0 447 1043530 Retirement Communities Senior Styles Metro Cities II 0.047 0 1752 032 Rustbelt Traditions Traditional Living Urban Outskirts I 0.114 0.08 0.037 2234 2982 1838533 Midlife Junction Traditional Living Suburban Periphery II 0.022 0 820 036 Old and Newcomers Solo Acts Metro Cities II 0.093 0.049 0.026 1823 1826 1292038 Industrious Urban Fringe Global Roots Urban Outskirts I 0.033 0.036 0.053 647 1342 2633639 Young and Restless Solo Acts Metro Cities II 0.128 0.091 0.101 2509 3391 5018741 Crossroads American Quilt Small Towns 0.014 0.014 274 522 048 Great Expectations High Hopes Urban Outskirts I 0.046 0.075 0.019 902 2795 944152 Inner City Tenants Global Roots Metro Cities II 0.051 0.042 0.037 999 1565 1838553 Hometown Factories and Farms Suburban Periphery II 0.028 0.015 0.015 549 559 745458 NeWest Residents Global Roots Principal Urban Centers II 0.007 0 261 060 City Dimensions Global Roots Metro Cities II 0.008 0 298 0
GEOGRAPHIC AREA TOTALS 1.000 1.000 0.501 19598 37269 496904SUM OF TOP SEVEN SEGMENTS 15306 25380 164475Percent of Geographic Area Totals 78.1% 68.1% 33.1%
Segment Code Tapestry Segment Name
Median Age (yrs)
Growth Rate
College Degree
Housing Type
Med HH income Household Type
12 Up and Coming Families 32.6 0.046 0.20 80% SF 69522 young affluent families w/young kids14 Prosperous Empty Nesters 47.6 0.005 0.39 77% SF 63682 household distribution similar to US18 Cozy and Comfortable 41.7 0.005 88% SF 59287 married couples w/, w/o kids19 Milk and Cookies 34.1 0.20 >70% SF 57170 half w/chikdren; 1/4 age 45-5424 Main Street, USA 36.8 0.20 >60% SF 50987 1/2 married couple; 1/3 single or shared28 Aspiring Young Families 31.1 0.011 50% SF 46275 2/3 families; .27 single; .09 shared29 Rustbelt Retirees 44.2 slow 0.20 84% SF 46909 1/3 householders 65+, .17 are veterans30 Retirement Communities 50.3 slow 0.35 57% MF 46251 44% household 65+32 Rustbelt Traditions 35.9 slow 0.15 >70% SF 42337 married-cple families, single parents+alone33 Midlife Junction 37.0 US 66% SF 42694 50% married couples, 31% singles36 Old and Newcomers 36.3 slow > US 60% MF 39234 more singles & shared HH than families38 Industrious Urban Fringe 29.0 most SF 40400 54% married couples; 17% single parents39 Young and Restless 28.9 0.36 85% MF 39765 58% single or shared; 23% HH w/kids41 Crossroads 33.6 0.014 < US >50% MH 37145 50% HH younger than 45 yrs48 Great Expectations 33.1 0.18 >50% SF 35406 beginning careers or family life52 Inner City Tenants 28.8 0.006 0.05 >50% MF 30873 singls, marrd coupls, singl parents, shared53 Hometown 33.8 0.08 73% SF 29688 1/3 65+; two generation-families;58 NeWest Residents 27.3 < US >50% MF 26983 married couples w/no kids60 City Dimensions 29.5 0.09 >50% MF 26283 singls, marrd coupls, singl parents, shared
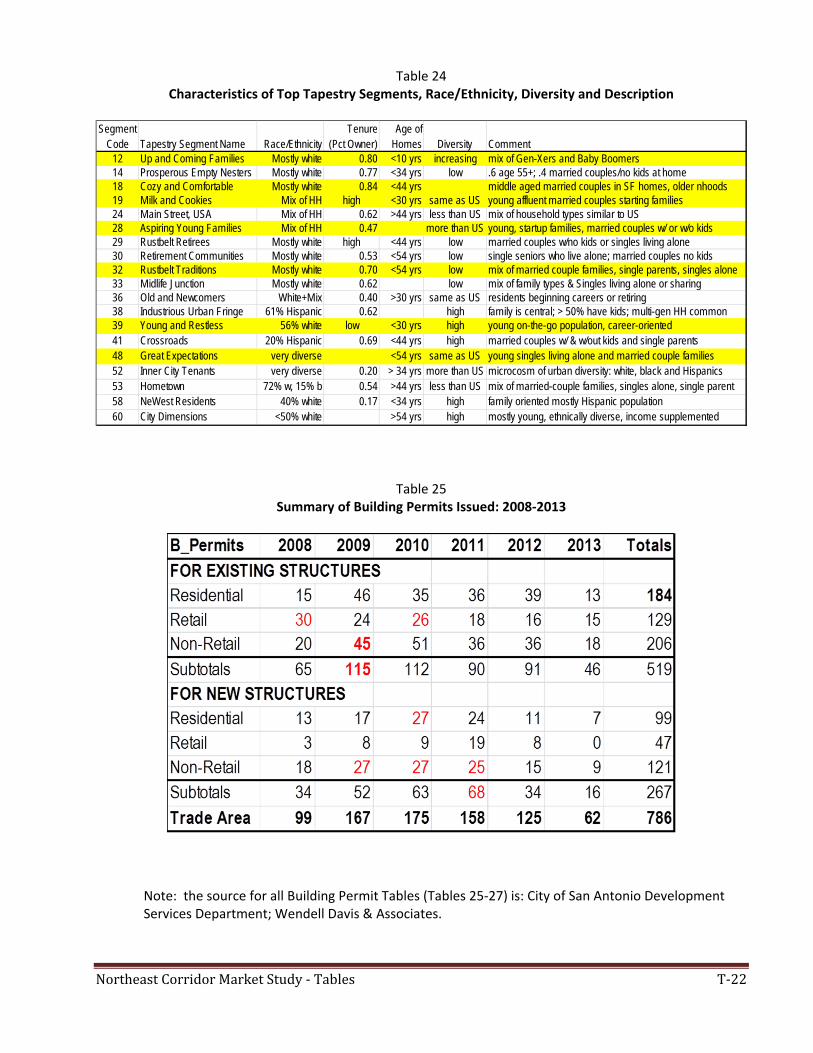
Northeast Corridor Market Study - Tables T-22
Table 24 Characteristics of Top Tapestry Segments, Race/Ethnicity, Diversity and Description
Table 25 Summary of Building Permits Issued: 2008‐2013
Note: the source for all Building Permit Tables (Tables 25‐27) is: City of San Antonio Development Services Department; Wendell Davis & Associates.
Segment Code Tapestry Segment Name Race/Ethnicity
Tenure (Pct Owner)
Age of Homes Diversity Comment
12 Up and Coming Families Mostly white 0.80 <10 yrs increasing mix of Gen-Xers and Baby Boomers14 Prosperous Empty Nesters Mostly white 0.77 <34 yrs low .6 age 55+; .4 married couples/no kids at home18 Cozy and Comfortable Mostly white 0.84 <44 yrs middle aged married couples in SF homes, older nhoods19 Milk and Cookies Mix of HH high <30 yrs same as US young affluent married couples starting families24 Main Street, USA Mix of HH 0.62 >44 yrs less than US mix of household types similar to US28 Aspiring Young Families Mix of HH 0.47 more than US young, startup families, married couples w/ or w/o kids29 Rustbelt Retirees Mostly white high <44 yrs low married couples w/no kids or singles living alone30 Retirement Communities Mostly white 0.53 <54 yrs low single seniors who live alone; married couples no kids32 Rustbelt Traditions Mostly white 0.70 <54 yrs low mix of married couple families, single parents, singles alone33 Midlife Junction Mostly white 0.62 low mix of family types & Singles living alone or sharing36 Old and Newcomers White+Mix 0.40 >30 yrs same as US residents beginning careers or retiring38 Industrious Urban Fringe 61% Hispanic 0.62 high family is central; > 50% have kids; multi-gen HH common39 Young and Restless 56% white low <30 yrs high young on-the-go population, career-oriented41 Crossroads 20% Hispanic 0.69 <44 yrs high married couples w/ & w/out kids and single parents48 Great Expectations very diverse <54 yrs same as US young singles living alone and married couple families52 Inner City Tenants very diverse 0.20 > 34 yrs more than US microcosm of urban diversity: white, black and Hispanics53 Hometown 72% w, 15% b 0.54 >44 yrs less than US mix of married-couple families, singles alone, single parent58 NeWest Residents 40% white 0.17 <34 yrs high family oriented mostly Hispanic population60 City Dimensions <50% white >54 yrs high mostly young, ethnically diverse, income supplemented
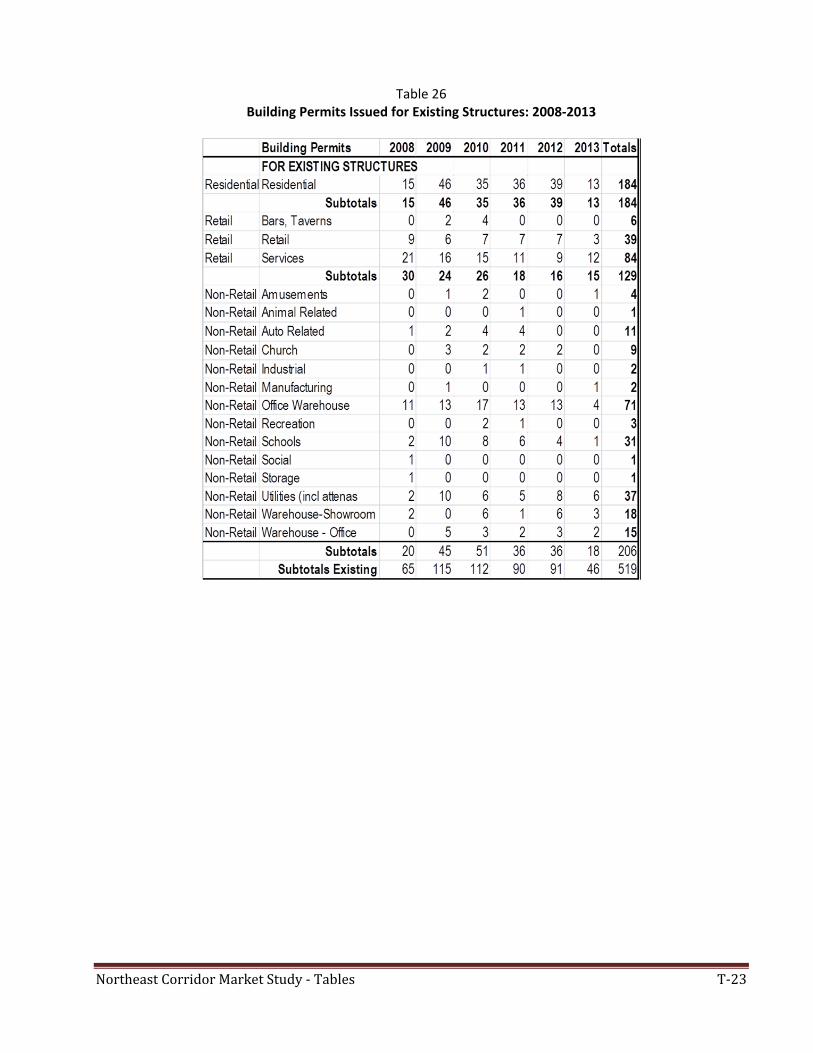
Northeast Corridor Market Study - Tables T-23
Table 26
Building Permits Issued for Existing Structures: 2008‐2013
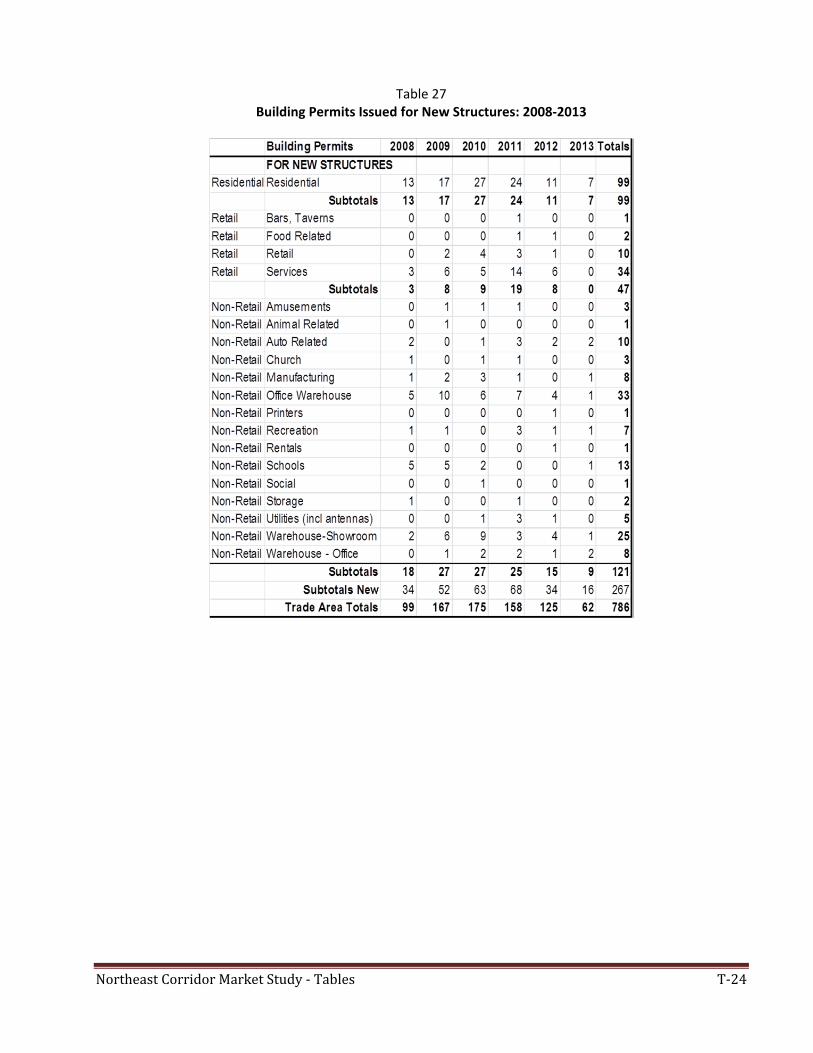
Northeast Corridor Market Study - Tables T-24
Table 27
Building Permits Issued for New Structures: 2008‐2013
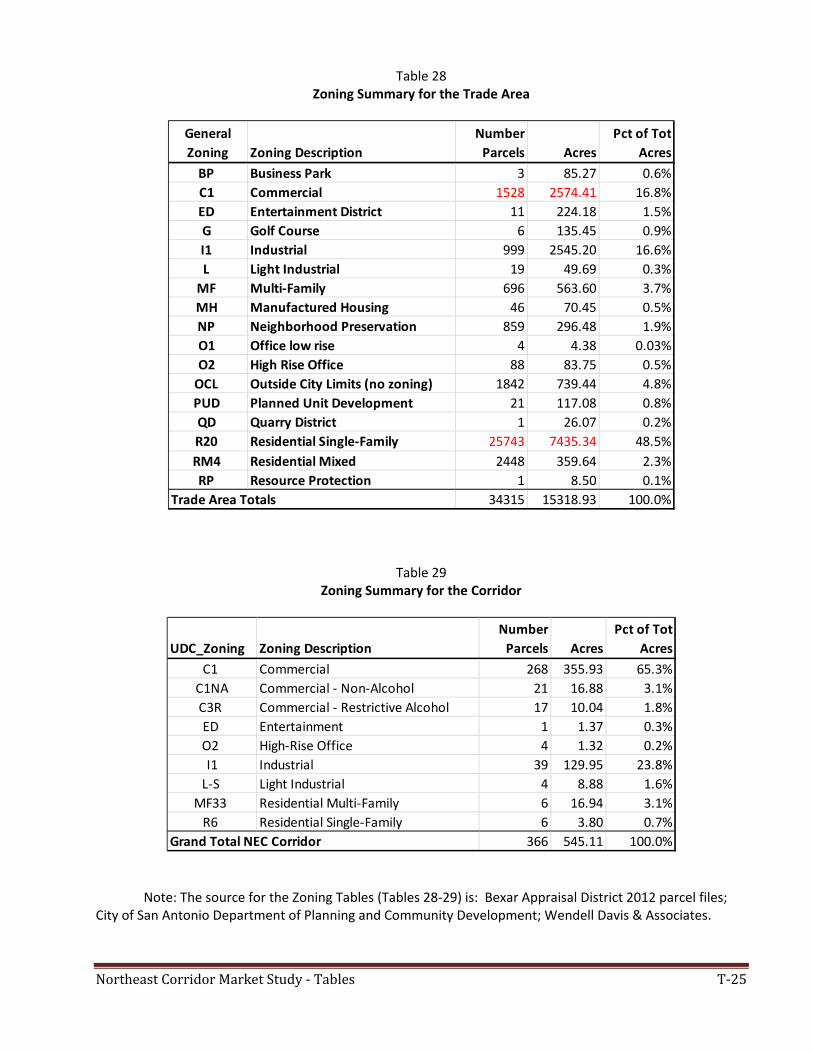
Northeast Corridor Market Study - Tables T-25
Table 28 Zoning Summary for the Trade Area
Table 29 Zoning Summary for the Corridor
Note: The source for the Zoning Tables (Tables 28‐29) is: Bexar Appraisal District 2012 parcel files; City of San Antonio Department of Planning and Community Development; Wendell Davis & Associates.
General
Zoning Zoning Description
Number
Parcels Acres
Pct of Tot
Acres
BP Business Park 3 85.27 0.6%
C1 Commercial 1528 2574.41 16.8%
ED Entertainment District 11 224.18 1.5%
G Golf Course 6 135.45 0.9%
I1 Industrial 999 2545.20 16.6%
L Light Industrial 19 49.69 0.3%
MF Multi‐Family 696 563.60 3.7%
MH Manufactured Housing 46 70.45 0.5%
NP Neighborhood Preservation 859 296.48 1.9%
O1 Office low rise 4 4.38 0.03%
O2 High Rise Office 88 83.75 0.5%
OCL Outside City Limits (no zoning) 1842 739.44 4.8%
PUD Planned Unit Development 21 117.08 0.8%
QD Quarry District 1 26.07 0.2%
R20 Residential Single‐Family 25743 7435.34 48.5%
RM4 Residential Mixed 2448 359.64 2.3%
RP Resource Protection 1 8.50 0.1%
Trade Area Totals 34315 15318.93 100.0%
UDC_Zoning Zoning Description
Number
Parcels Acres
Pct of Tot
Acres
C1 Commercial 268 355.93 65.3%
C1NA Commercial ‐ Non‐Alcohol 21 16.88 3.1%
C3R Commercial ‐ Restrictive Alcohol 17 10.04 1.8%
ED Entertainment 1 1.37 0.3%
O2 High‐Rise Office 4 1.32 0.2%
I1 Industrial 39 129.95 23.8%
L‐S Light Industrial 4 8.88 1.6%
MF33 Residential Multi‐Family 6 16.94 3.1%
R6 Residential Single‐Family 6 3.80 0.7%
Grand Total NEC Corridor 366 545.11 100.0%
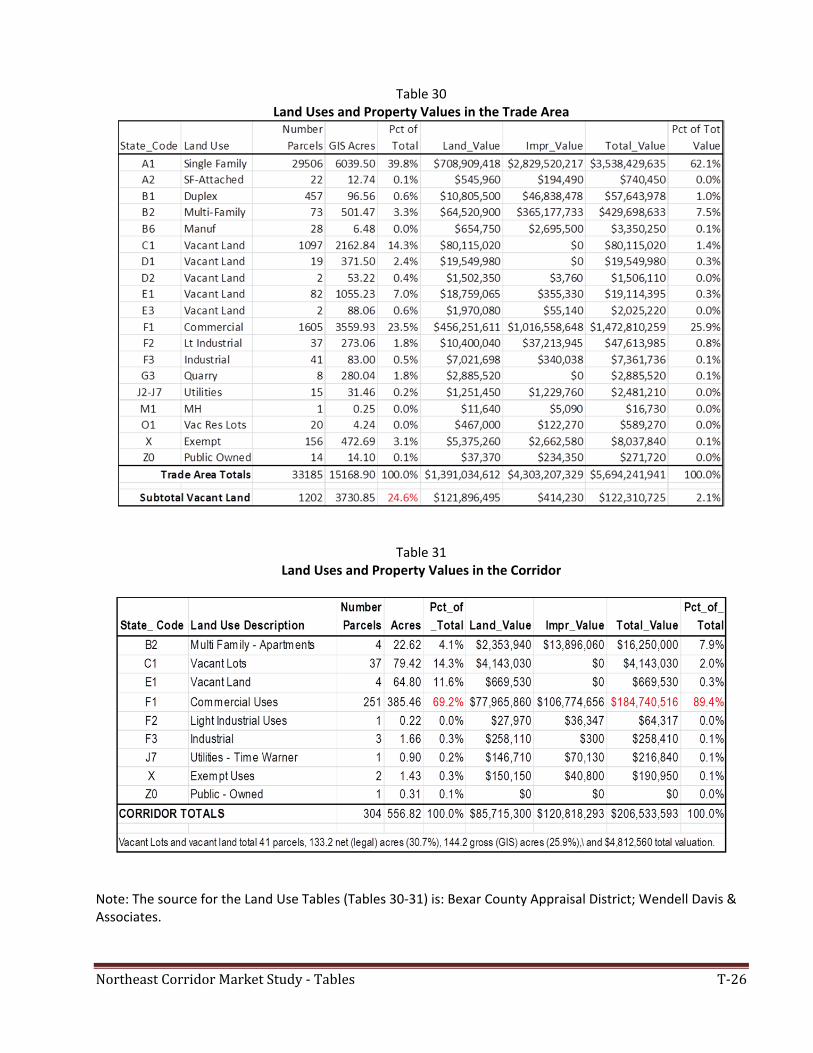
Northeast Corridor Market Study - Tables T-26
Table 30
Land Uses and Property Values in the Trade Area
Table 31 Land Uses and Property Values in the Corridor
Note: The source for the Land Use Tables (Tables 30‐31) is: Bexar County Appraisal District; Wendell Davis & Associates.
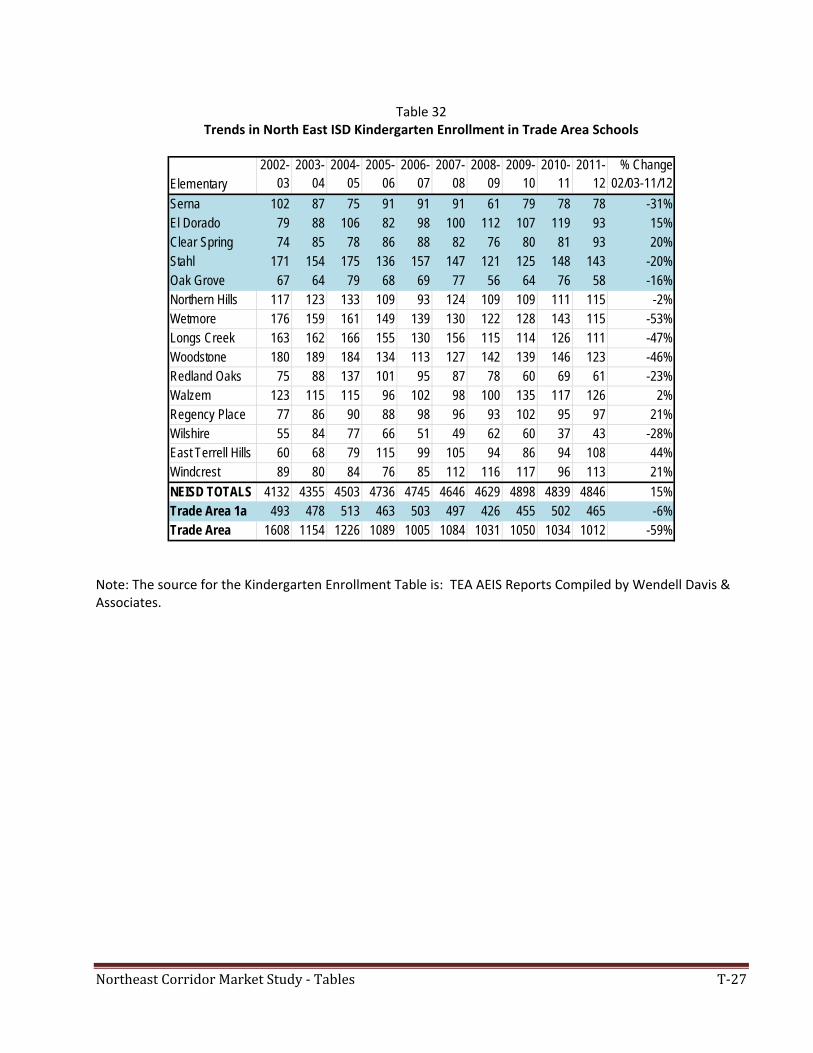
Northeast Corridor Market Study - Tables T-27
Table 32 Trends in North East ISD Kindergarten Enrollment in Trade Area Schools
Note: The source for the Kindergarten Enrollment Table is: TEA AEIS Reports Compiled by Wendell Davis & Associates.
Elementary2002-
032003-
042004-
052005-
062006-
072007-
082008-
092009-
102010-
112011-
12% Change
02/03-11/12
Serna 102 87 75 91 91 91 61 79 78 78 -31%El Dorado 79 88 106 82 98 100 112 107 119 93 15%Clear Spring 74 85 78 86 88 82 76 80 81 93 20%Stahl 171 154 175 136 157 147 121 125 148 143 -20%Oak Grove 67 64 79 68 69 77 56 64 76 58 -16%Northern Hills 117 123 133 109 93 124 109 109 111 115 -2%Wetmore 176 159 161 149 139 130 122 128 143 115 -53%Longs Creek 163 162 166 155 130 156 115 114 126 111 -47%Woodstone 180 189 184 134 113 127 142 139 146 123 -46%Redland Oaks 75 88 137 101 95 87 78 60 69 61 -23%Walzem 123 115 115 96 102 98 100 135 117 126 2%Regency Place 77 86 90 88 98 96 93 102 95 97 21%Wilshire 55 84 77 66 51 49 62 60 37 43 -28%East Terrell Hills 60 68 79 115 99 105 94 86 94 108 44%Windcrest 89 80 84 76 85 112 116 117 96 113 21%
NEISD TOTALS 4132 4355 4503 4736 4745 4646 4629 4898 4839 4846 15%Trade Area 1a 493 478 513 463 503 497 426 455 502 465 -6%Trade Area 1608 1154 1226 1089 1005 1084 1031 1050 1034 1012 -59%
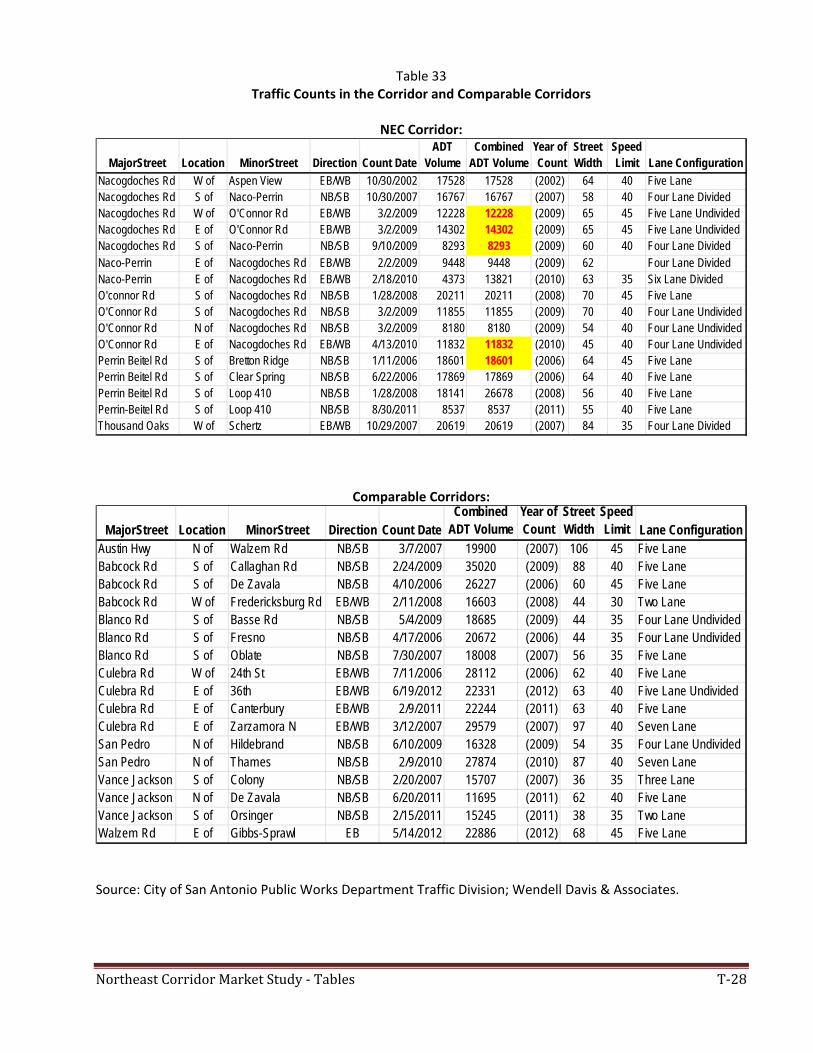
Northeast Corridor Market Study - Tables T-28
Table 33 Traffic Counts in the Corridor and Comparable Corridors
NEC Corridor:
Comparable Corridors:
Source: City of San Antonio Public Works Department Traffic Division; Wendell Davis & Associates.
MajorStreet Location MinorStreet Direction Count DateADT
VolumeCombined
ADT VolumeYear of Count
Street Width
Speed Limit Lane Configuration
Nacogdoches Rd W of Aspen View EB/WB 10/30/2002 17528 17528 (2002) 64 40 Five LaneNacogdoches Rd S of Naco-Perrin NB/SB 10/30/2007 16767 16767 (2007) 58 40 Four Lane DividedNacogdoches Rd W of O'Connor Rd EB/WB 3/2/2009 12228 12228 (2009) 65 45 Five Lane UndividedNacogdoches Rd E of O'Connor Rd EB/WB 3/2/2009 14302 14302 (2009) 65 45 Five Lane UndividedNacogdoches Rd S of Naco-Perrin NB/SB 9/10/2009 8293 8293 (2009) 60 40 Four Lane DividedNaco-Perrin E of Nacogdoches Rd EB/WB 2/2/2009 9448 9448 (2009) 62 Four Lane DividedNaco-Perrin E of Nacogdoches Rd EB/WB 2/18/2010 4373 13821 (2010) 63 35 Six Lane DividedO'connor Rd S of Nacogdoches Rd NB/SB 1/28/2008 20211 20211 (2008) 70 45 Five LaneO'Connor Rd S of Nacogdoches Rd NB/SB 3/2/2009 11855 11855 (2009) 70 40 Four Lane UndividedO'Connor Rd N of Nacogdoches Rd NB/SB 3/2/2009 8180 8180 (2009) 54 40 Four Lane UndividedO'Connor Rd E of Nacogdoches Rd EB/WB 4/13/2010 11832 11832 (2010) 45 40 Four Lane UndividedPerrin Beitel Rd S of Bretton Ridge NB/SB 1/11/2006 18601 18601 (2006) 64 45 Five LanePerrin Beitel Rd S of Clear Spring NB/SB 6/22/2006 17869 17869 (2006) 64 40 Five LanePerrin Beitel Rd S of Loop 410 NB/SB 1/28/2008 18141 26678 (2008) 56 40 Five LanePerrin-Beitel Rd S of Loop 410 NB/SB 8/30/2011 8537 8537 (2011) 55 40 Five LaneThousand Oaks W of Schertz EB/WB 10/29/2007 20619 20619 (2007) 84 35 Four Lane Divided
MajorStreet Location MinorStreet Direction Count DateCombined
ADT VolumeYear of Count
Street Width
Speed Limit Lane Configuration
Austin Hwy N of Walzem Rd NB/SB 3/7/2007 19900 (2007) 106 45 Five LaneBabcock Rd S of Callaghan Rd NB/SB 2/24/2009 35020 (2009) 88 40 Five LaneBabcock Rd S of De Zavala NB/SB 4/10/2006 26227 (2006) 60 45 Five LaneBabcock Rd W of Fredericksburg Rd EB/WB 2/11/2008 16603 (2008) 44 30 Two LaneBlanco Rd S of Basse Rd NB/SB 5/4/2009 18685 (2009) 44 35 Four Lane UndividedBlanco Rd S of Fresno NB/SB 4/17/2006 20672 (2006) 44 35 Four Lane UndividedBlanco Rd S of Oblate NB/SB 7/30/2007 18008 (2007) 56 35 Five LaneCulebra Rd W of 24th St EB/WB 7/11/2006 28112 (2006) 62 40 Five LaneCulebra Rd E of 36th EB/WB 6/19/2012 22331 (2012) 63 40 Five Lane UndividedCulebra Rd E of Canterbury EB/WB 2/9/2011 22244 (2011) 63 40 Five LaneCulebra Rd E of Zarzamora N EB/WB 3/12/2007 29579 (2007) 97 40 Seven LaneSan Pedro N of Hildebrand NB/SB 6/10/2009 16328 (2009) 54 35 Four Lane UndividedSan Pedro N of Thames NB/SB 2/9/2010 27874 (2010) 87 40 Seven LaneVance Jackson S of Colony NB/SB 2/20/2007 15707 (2007) 36 35 Three LaneVance Jackson N of De Zavala NB/SB 6/20/2011 11695 (2011) 62 40 Five LaneVance Jackson S of Orsinger NB/SB 2/15/2011 15245 (2011) 38 35 Two LaneWalzem Rd E of Gibbs-Sprawl EB 5/14/2012 22886 (2012) 68 45 Five Lane
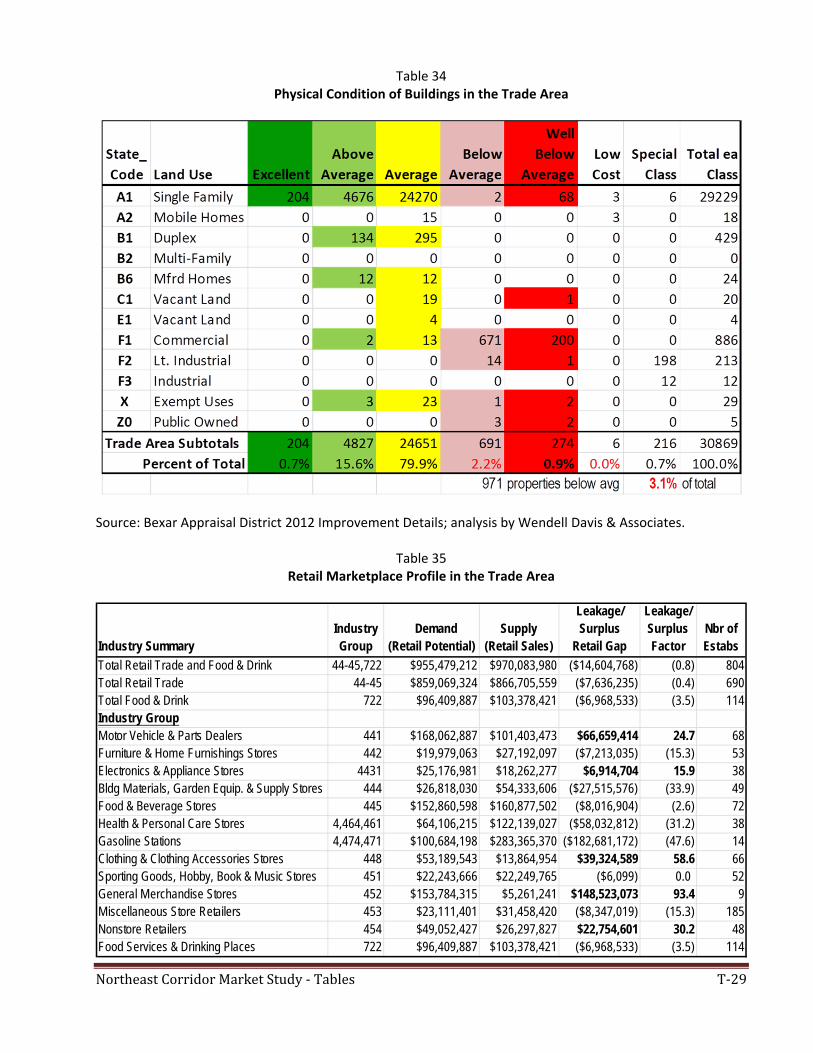
Northeast Corridor Market Study - Tables T-29
Table 34 Physical Condition of Buildings in the Trade Area
Source: Bexar Appraisal District 2012 Improvement Details; analysis by Wendell Davis & Associates.
Table 35 Retail Marketplace Profile in the Trade Area
Industry SummaryIndustry Group
Demand (Retail Potential)
Supply (Retail Sales)
Leakage/ Surplus
Retail Gap
Leakage/ Surplus Factor
Nbr of Estabs
Total Retail Trade and Food & Drink 44-45,722 $955,479,212 $970,083,980 ($14,604,768) (0.8) 804Total Retail Trade 44-45 $859,069,324 $866,705,559 ($7,636,235) (0.4) 690Total Food & Drink 722 $96,409,887 $103,378,421 ($6,968,533) (3.5) 114Industry GroupMotor Vehicle & Parts Dealers 441 $168,062,887 $101,403,473 $66,659,414 24.7 68Furniture & Home Furnishings Stores 442 $19,979,063 $27,192,097 ($7,213,035) (15.3) 53Electronics & Appliance Stores 4431 $25,176,981 $18,262,277 $6,914,704 15.9 38Bldg Materials, Garden Equip. & Supply Stores 444 $26,818,030 $54,333,606 ($27,515,576) (33.9) 49Food & Beverage Stores 445 $152,860,598 $160,877,502 ($8,016,904) (2.6) 72Health & Personal Care Stores 4,464,461 $64,106,215 $122,139,027 ($58,032,812) (31.2) 38Gasoline Stations 4,474,471 $100,684,198 $283,365,370 ($182,681,172) (47.6) 14Clothing & Clothing Accessories Stores 448 $53,189,543 $13,864,954 $39,324,589 58.6 66Sporting Goods, Hobby, Book & Music Stores 451 $22,243,666 $22,249,765 ($6,099) 0.0 52General Merchandise Stores 452 $153,784,315 $5,261,241 $148,523,073 93.4 9Miscellaneous Store Retailers 453 $23,111,401 $31,458,420 ($8,347,019) (15.3) 185Nonstore Retailers 454 $49,052,427 $26,297,827 $22,754,601 30.2 48Food Services & Drinking Places 722 $96,409,887 $103,378,421 ($6,968,533) (3.5) 114
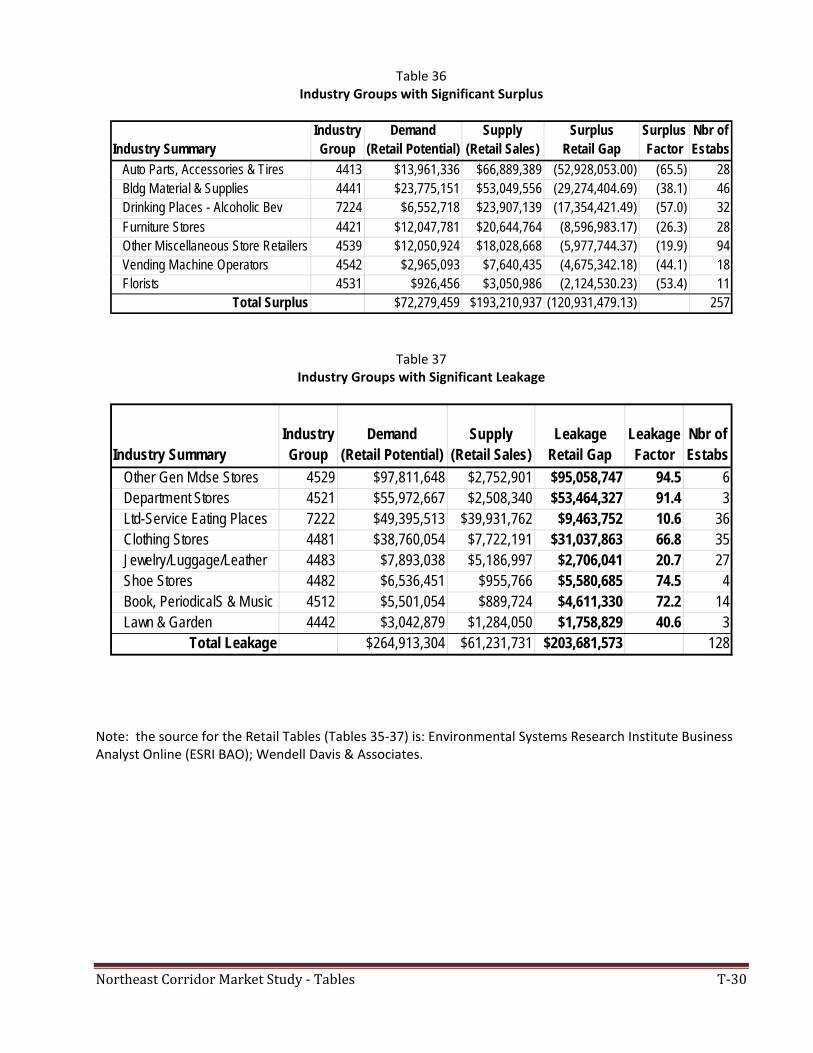
Northeast Corridor Market Study - Tables T-30
Table 36 Industry Groups with Significant Surplus
Table 37
Industry Groups with Significant Leakage
Note: the source for the Retail Tables (Tables 35‐37) is: Environmental Systems Research Institute Business Analyst Online (ESRI BAO); Wendell Davis & Associates.
Industry SummaryIndustry Group
Demand (Retail Potential)
Supply (Retail Sales)
Surplus Retail Gap
Surplus Factor
Nbr of Estabs
Auto Parts, Accessories & Tires 4413 $13,961,336 $66,889,389 (52,928,053.00) (65.5) 28 Bldg Material & Supplies 4441 $23,775,151 $53,049,556 (29,274,404.69) (38.1) 46 Drinking Places - Alcoholic Bev 7224 $6,552,718 $23,907,139 (17,354,421.49) (57.0) 32 Furniture Stores 4421 $12,047,781 $20,644,764 (8,596,983.17) (26.3) 28 Other Miscellaneous Store Retailers 4539 $12,050,924 $18,028,668 (5,977,744.37) (19.9) 94 Vending Machine Operators 4542 $2,965,093 $7,640,435 (4,675,342.18) (44.1) 18 Florists 4531 $926,456 $3,050,986 (2,124,530.23) (53.4) 11
Total Surplus $72,279,459 $193,210,937 (120,931,479.13) 257
Industry SummaryIndustry Group
Demand (Retail Potential)
Supply (Retail Sales)
Leakage Retail Gap
Leakage Factor
Nbr of Estabs
Other Gen Mdse Stores 4529 $97,811,648 $2,752,901 $95,058,747 94.5 6 Department Stores 4521 $55,972,667 $2,508,340 $53,464,327 91.4 3 Ltd-Service Eating Places 7222 $49,395,513 $39,931,762 $9,463,752 10.6 36 Clothing Stores 4481 $38,760,054 $7,722,191 $31,037,863 66.8 35 Jewelry/Luggage/Leather 4483 $7,893,038 $5,186,997 $2,706,041 20.7 27 Shoe Stores 4482 $6,536,451 $955,766 $5,580,685 74.5 4 Book, PeriodicalS & Music 4512 $5,501,054 $889,724 $4,611,330 72.2 14 Lawn & Garden 4442 $3,042,879 $1,284,050 $1,758,829 40.6 3
Total Leakage $264,913,304 $61,231,731 $203,681,573 128
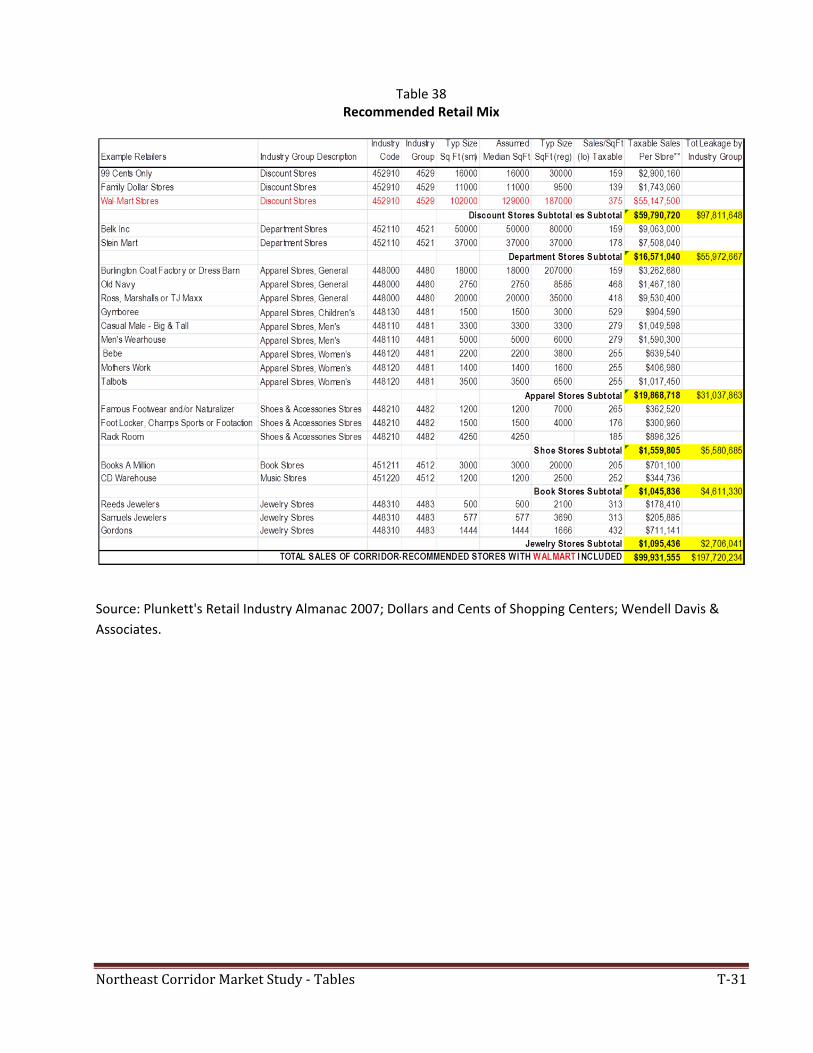
Northeast Corridor Market Study - Tables T-31
Table 38
Recommended Retail Mix
Source: Plunkett's Retail Industry Almanac 2007; Dollars and Cents of Shopping Centers; Wendell Davis &
Associates.
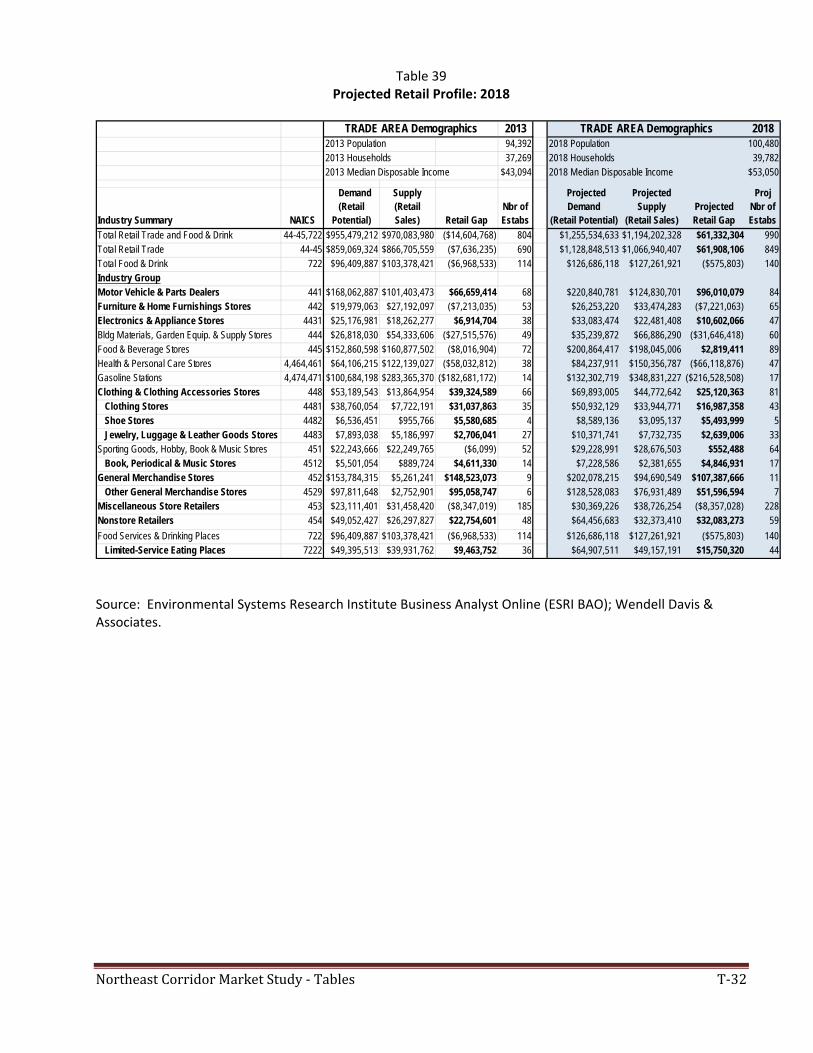
Northeast Corridor Market Study - Tables T-32
Table 39 Projected Retail Profile: 2018
Source: Environmental Systems Research Institute Business Analyst Online (ESRI BAO); Wendell Davis & Associates.
2013 20182013 Population 94,392 2018 Population 100,4802013 Households 37,269 2018 Households 39,7822013 Median Disposable Income $43,094 2018 Median Disposable Income $53,050
Industry Summary NAICS
Demand (Retail
Potential)
Supply (Retail Sales) Retail Gap
Nbr of Estabs
Projected Demand
(Retail Potential)
Projected Supply
(Retail Sales)Projected Retail Gap
Proj Nbr of Estabs
Total Retail Trade and Food & Drink 44-45,722 $955,479,212 $970,083,980 ($14,604,768) 804 $1,255,534,633 $1,194,202,328 $61,332,304 990Total Retail Trade 44-45 $859,069,324 $866,705,559 ($7,636,235) 690 $1,128,848,513 $1,066,940,407 $61,908,106 849Total Food & Drink 722 $96,409,887 $103,378,421 ($6,968,533) 114 $126,686,118 $127,261,921 ($575,803) 140Industry GroupMotor Vehicle & Parts Dealers 441 $168,062,887 $101,403,473 $66,659,414 68 $220,840,781 $124,830,701 $96,010,079 84Furniture & Home Furnishings Stores 442 $19,979,063 $27,192,097 ($7,213,035) 53 $26,253,220 $33,474,283 ($7,221,063) 65Electronics & Appliance Stores 4431 $25,176,981 $18,262,277 $6,914,704 38 $33,083,474 $22,481,408 $10,602,066 47Bldg Materials, Garden Equip. & Supply Stores 444 $26,818,030 $54,333,606 ($27,515,576) 49 $35,239,872 $66,886,290 ($31,646,418) 60Food & Beverage Stores 445 $152,860,598 $160,877,502 ($8,016,904) 72 $200,864,417 $198,045,006 $2,819,411 89Health & Personal Care Stores 4,464,461 $64,106,215 $122,139,027 ($58,032,812) 38 $84,237,911 $150,356,787 ($66,118,876) 47Gasoline Stations 4,474,471 $100,684,198 $283,365,370 ($182,681,172) 14 $132,302,719 $348,831,227 ($216,528,508) 17Clothing & Clothing Accessories Stores 448 $53,189,543 $13,864,954 $39,324,589 66 $69,893,005 $44,772,642 $25,120,363 81 Clothing Stores 4481 $38,760,054 $7,722,191 $31,037,863 35 $50,932,129 $33,944,771 $16,987,358 43 Shoe Stores 4482 $6,536,451 $955,766 $5,580,685 4 $8,589,136 $3,095,137 $5,493,999 5 Jewelry, Luggage & Leather Goods Stores 4483 $7,893,038 $5,186,997 $2,706,041 27 $10,371,741 $7,732,735 $2,639,006 33Sporting Goods, Hobby, Book & Music Stores 451 $22,243,666 $22,249,765 ($6,099) 52 $29,228,991 $28,676,503 $552,488 64 Book, Periodical & Music Stores 4512 $5,501,054 $889,724 $4,611,330 14 $7,228,586 $2,381,655 $4,846,931 17General Merchandise Stores 452 $153,784,315 $5,261,241 $148,523,073 9 $202,078,215 $94,690,549 $107,387,666 11 Other General Merchandise Stores 4529 $97,811,648 $2,752,901 $95,058,747 6 $128,528,083 $76,931,489 $51,596,594 7Miscellaneous Store Retailers 453 $23,111,401 $31,458,420 ($8,347,019) 185 $30,369,226 $38,726,254 ($8,357,028) 228Nonstore Retailers 454 $49,052,427 $26,297,827 $22,754,601 48 $64,456,683 $32,373,410 $32,083,273 59
Food Services & Drinking Places 722 $96,409,887 $103,378,421 ($6,968,533) 114 $126,686,118 $127,261,921 ($575,803) 140 Limited-Service Eating Places 7222 $49,395,513 $39,931,762 $9,463,752 36 $64,907,511 $49,157,191 $15,750,320 44
TRADE AREA DemographicsTRADE AREA Demographics
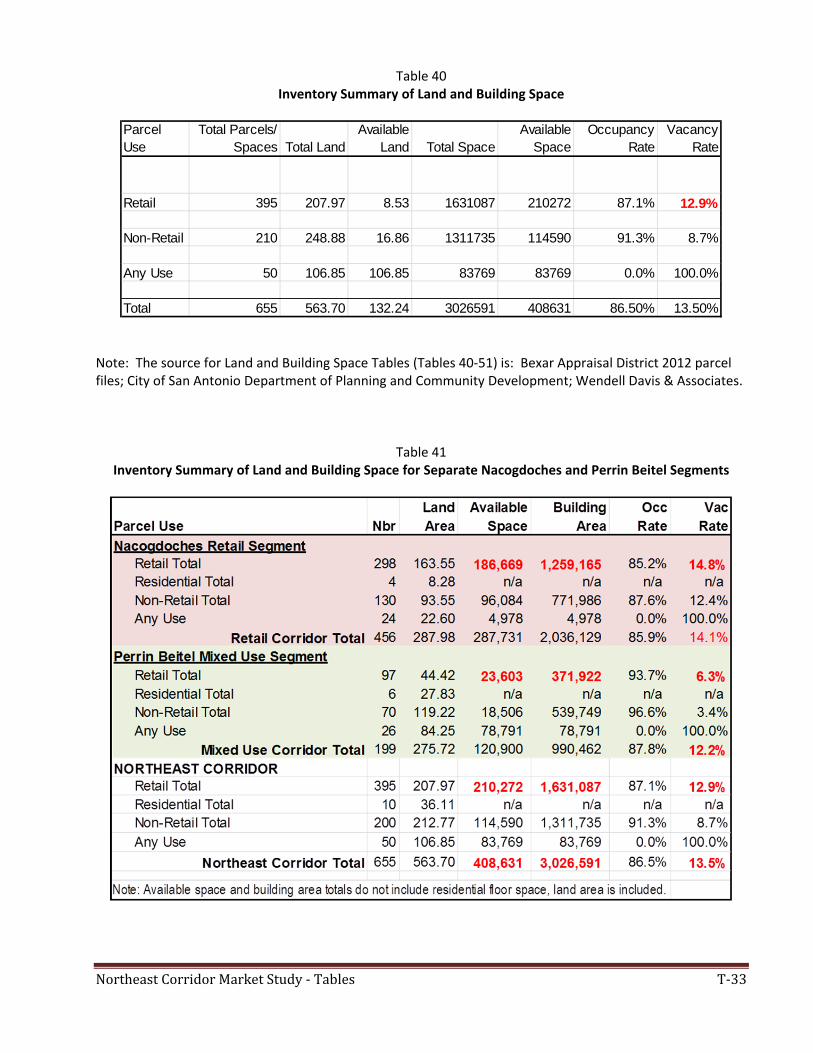
Northeast Corridor Market Study - Tables T-33
Table 40 Inventory Summary of Land and Building Space
Note: The source for Land and Building Space Tables (Tables 40‐51) is: Bexar Appraisal District 2012 parcel files; City of San Antonio Department of Planning and Community Development; Wendell Davis & Associates.
Table 41 Inventory Summary of Land and Building Space for Separate Nacogdoches and Perrin Beitel Segments
Parcel Use
Total Parcels/ Spaces Total Land
Available Land Total Space
Available Space
Occupancy Rate
Vacancy Rate
Retail 395 207.97 8.53 1631087 210272 87.1% 12.9%
Non-Retail 210 248.88 16.86 1311735 114590 91.3% 8.7%
Any Use 50 106.85 106.85 83769 83769 0.0% 100.0%
Total 655 563.70 132.24 3026591 408631 86.50% 13.50%
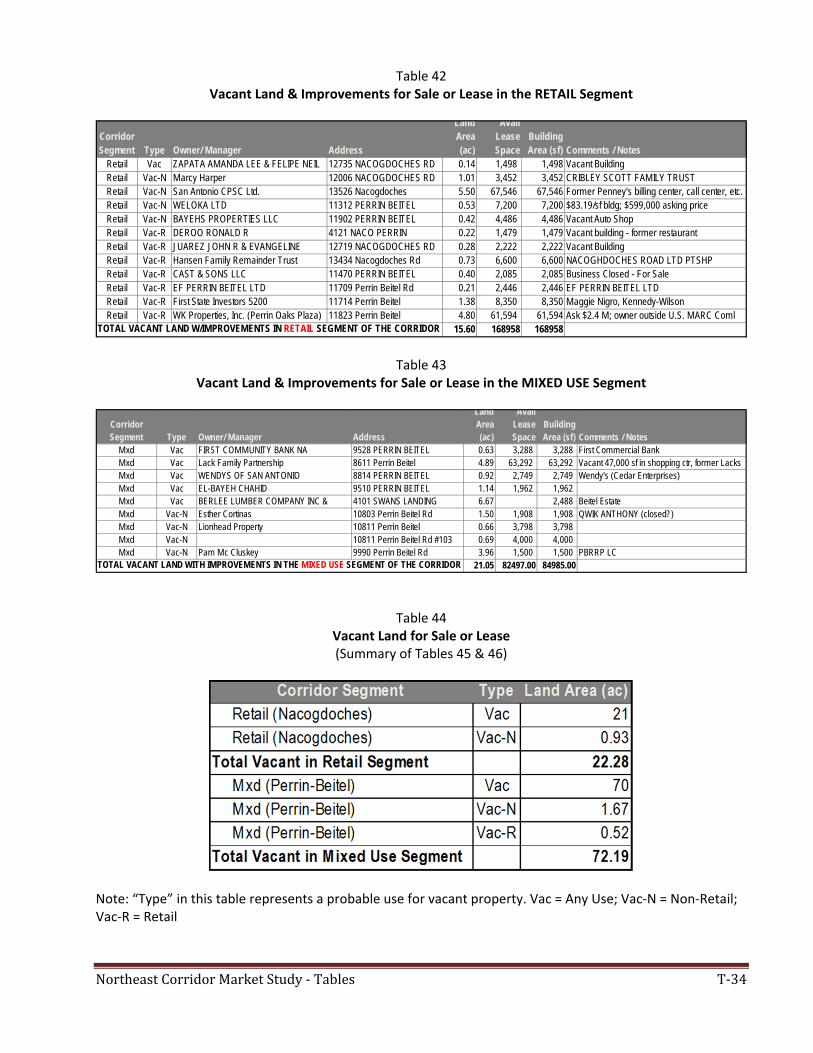
Northeast Corridor Market Study - Tables T-34
Table 42 Vacant Land & Improvements for Sale or Lease in the RETAIL Segment
Table 43 Vacant Land & Improvements for Sale or Lease in the MIXED USE Segment
Table 44 Vacant Land for Sale or Lease (Summary of Tables 45 & 46)
Note: “Type” in this table represents a probable use for vacant property. Vac = Any Use; Vac‐N = Non‐Retail; Vac‐R = Retail
Corridor Segment Type Owner/ Manager Address
Land Area (ac)
Avail Lease Space
Building Area (sf) Comments / Notes
Retail Vac ZAPATA AMANDA LEE & FELIPE NEIL 12735 NACOGDOCHES RD 0.14 1,498 1,498 Vacant BuildingRetail Vac-N Marcy Harper 12006 NACOGDOCHES RD 1.01 3,452 3,452 CRIBLEY SCOTT FAMILY TRUSTRetail Vac-N San Antonio CPSC Ltd. 13526 Nacogdoches 5.50 67,546 67,546 Former Penney's billing center, call center, etc.Retail Vac-N WELOKA LTD 11312 PERRIN BEITEL 0.53 7,200 7,200 $83.19/sf bldg; $599,000 asking priceRetail Vac-N BAYEHS PROPERTIES LLC 11902 PERRIN BEITEL 0.42 4,486 4,486 Vacant Auto ShopRetail Vac-R DEROO RONALD R 4121 NACO PERRIN 0.22 1,479 1,479 Vacant building - former restaurantRetail Vac-R JUAREZ JOHN R & EVANGELINE 12719 NACOGDOCHES RD 0.28 2,222 2,222 Vacant BuildingRetail Vac-R Hansen Family Remainder Trust 13434 Nacogdoches Rd 0.73 6,600 6,600 NACOGHDOCHES ROAD LTD PTSHPRetail Vac-R CAST & SONS LLC 11470 PERRIN BEITEL 0.40 2,085 2,085 Business Closed - For SaleRetail Vac-R EF PERRIN BEITEL LTD 11709 Perrin Beitel Rd 0.21 2,446 2,446 EF PERRIN BEITEL LTDRetail Vac-R First State Investors 5200 11714 Perrin Beitel 1.38 8,350 8,350 Maggie Nigro, Kennedy-WilsonRetail Vac-R WK Properties, Inc. (Perrin Oaks Plaza) 11823 Perrin Beitel 4.80 61,594 61,594 Ask $2.4 M; owner outside U.S. MARC Coml
TOTAL VACANT LAND W/IMPROVEMENTS IN RETAIL SEGMENT OF THE CORRIDOR 15.60 168958 168958
Corridor Segment Type Owner/ Manager Address
Land Area (ac)
Avail Lease Space
Building Area (sf) Comments / Notes
Mxd Vac FIRST COMMUNITY BANK NA 9528 PERRIN BEITEL 0.63 3,288 3,288 First Commercial BankMxd Vac Lack Family Partnership 8611 Perrin Beitel 4.89 63,292 63,292 Vacant 47,000 sf in shopping ctr, former LacksMxd Vac WENDYS OF SAN ANTONIO 8814 PERRIN BEITEL 0.92 2,749 2,749 Wendy's (Cedar Enterprises)Mxd Vac EL-BAYEH CHAHID 9510 PERRIN BEITEL 1.14 1,962 1,962 Mxd Vac BERLEE LUMBER COMPANY INC & 4101 SWANS LANDING 6.67 2,488 Beitel EstateMxd Vac-N Esther Cortinas 10803 Perrin Beitel Rd 1.50 1,908 1,908 QWIK ANTHONY (closed?)Mxd Vac-N Lionhead Property 10811 Perrin Beitel 0.66 3,798 3,798 Mxd Vac-N 10811 Perrin Beitel Rd #103 0.69 4,000 4,000 Mxd Vac-N Pam Mc Cluskey 9990 Perrin Beitel Rd 3.96 1,500 1,500 PBRRP LC
TOTAL VACANT LAND WITH IMPROVEMENTS IN THE MIXED USE SEGMENT OF THE CORRIDOR 21.05 82497.00 84985.00
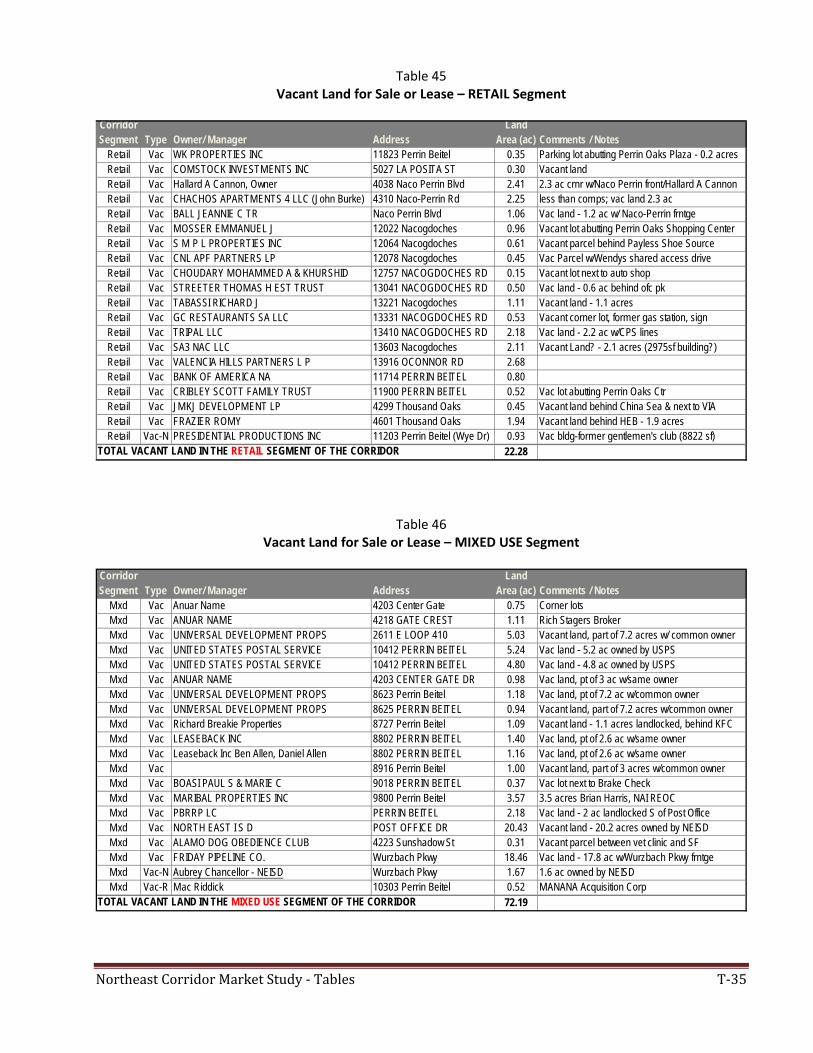
Northeast Corridor Market Study - Tables T-35
Table 45 Vacant Land for Sale or Lease – RETAIL Segment
Table 46 Vacant Land for Sale or Lease – MIXED USE Segment
Corridor Segment Type Owner/ Manager Address
Land Area (ac) Comments / Notes
Retail Vac WK PROPERTIES INC 11823 Perrin Beitel 0.35 Parking lot abutting Perrin Oaks Plaza - 0.2 acresRetail Vac COMSTOCK INVESTMENTS INC 5027 LA POSITA ST 0.30 Vacant landRetail Vac Hallard A Cannon, Owner 4038 Naco Perrin Blvd 2.41 2.3 ac crnr w/Naco Perrin front/Hallard A CannonRetail Vac CHACHOS APARTMENTS 4 LLC (John Burke) 4310 Naco-Perrin Rd 2.25 less than comps; vac land 2.3 acRetail Vac BALL JEANNIE C TR Naco Perrin Blvd 1.06 Vac land - 1.2 ac w/ Naco-Perrin frntgeRetail Vac MOSSER EMMANUEL J 12022 Nacogdoches 0.96 Vacant lot abutting Perrin Oaks Shopping CenterRetail Vac S M P L PROPERTIES INC 12064 Nacogdoches 0.61 Vacant parcel behind Payless Shoe SourceRetail Vac CNL APF PARTNERS LP 12078 Nacogdoches 0.45 Vac Parcel w/Wendys shared access driveRetail Vac CHOUDARY MOHAMMED A & KHURSHID 12757 NACOGDOCHES RD 0.15 Vacant lot next to auto shopRetail Vac STREETER THOMAS H EST TRUST 13041 NACOGDOCHES RD 0.50 Vac land - 0.6 ac behind ofc pkRetail Vac TABASSI RICHARD J 13221 Nacogdoches 1.11 Vacant land - 1.1 acresRetail Vac GC RESTAURANTS SA LLC 13331 NACOGDOCHES RD 0.53 Vacant corner lot, former gas station, signRetail Vac TRIPAL LLC 13410 NACOGDOCHES RD 2.18 Vac land - 2.2 ac w/CPS linesRetail Vac SA3 NAC LLC 13603 Nacogdoches 2.11 Vacant Land? - 2.1 acres (2975sf building?)Retail Vac VALENCIA HILLS PARTNERS L P 13916 OCONNOR RD 2.68Retail Vac BANK OF AMERICA NA 11714 PERRIN BEITEL 0.80Retail Vac CRIBLEY SCOTT FAMILY TRUST 11900 PERRIN BEITEL 0.52 Vac lot abutting Perrin Oaks CtrRetail Vac JMKJ DEVELOPMENT LP 4299 Thousand Oaks 0.45 Vacant land behind China Sea & next to VIARetail Vac FRAZIER ROMY 4601 Thousand Oaks 1.94 Vacant land behind HEB - 1.9 acresRetail Vac-N PRESIDENTIAL PRODUCTIONS INC 11203 Perrin Beitel (Wye Dr) 0.93 Vac bldg-former gentlemen's club (8822 sf)
TOTAL VACANT LAND IN THE RETAIL SEGMENT OF THE CORRIDOR 22.28
Corridor Segment Type Owner/ Manager Address
Land Area (ac) Comments / Notes
Mxd Vac Anuar Name 4203 Center Gate 0.75 Corner lotsMxd Vac ANUAR NAME 4218 GATE CREST 1.11 Rich Stagers BrokerMxd Vac UNIVERSAL DEVELOPMENT PROPS 2611 E LOOP 410 5.03 Vacant land, part of 7.2 acres w/ common ownerMxd Vac UNITED STATES POSTAL SERVICE 10412 PERRIN BEITEL 5.24 Vac land - 5.2 ac owned by USPSMxd Vac UNITED STATES POSTAL SERVICE 10412 PERRIN BEITEL 4.80 Vac land - 4.8 ac owned by USPSMxd Vac ANUAR NAME 4203 CENTER GATE DR 0.98 Vac land, pt of 3 ac w/same ownerMxd Vac UNIVERSAL DEVELOPMENT PROPS 8623 Perrin Beitel 1.18 Vac land, pt of 7.2 ac w/common ownerMxd Vac UNIVERSAL DEVELOPMENT PROPS 8625 PERRIN BEITEL 0.94 Vacant land, part of 7.2 acres w/common ownerMxd Vac Richard Breakie Properties 8727 Perrin Beitel 1.09 Vacant land - 1.1 acres landlocked, behind KFCMxd Vac LEASEBACK INC 8802 PERRIN BEITEL 1.40 Vac land, pt of 2.6 ac w/same ownerMxd Vac Leaseback Inc Ben Allen, Daniel Allen 8802 PERRIN BEITEL 1.16 Vac land, pt of 2.6 ac w/same ownerMxd Vac 8916 Perrin Beitel 1.00 Vacant land, part of 3 acres w/common ownerMxd Vac BOASI PAUL S & MARIE C 9018 PERRIN BEITEL 0.37 Vac lot next to Brake CheckMxd Vac MARIBAL PROPERTIES INC 9800 Perrin Beitel 3.57 3.5 acres Brian Harris, NAI REOCMxd Vac PBRRP LC PERRIN BEITEL 2.18 Vac land - 2 ac landlocked S of Post OfficeMxd Vac NORTH EAST I S D POST OFFICE DR 20.43 Vacant land - 20.2 acres owned by NEISDMxd Vac ALAMO DOG OBEDIENCE CLUB 4223 Sunshadow St 0.31 Vacant parcel between vet clinic and SFMxd Vac FRIDAY PIPELINE CO. Wurzbach Pkwy 18.46 Vac land - 17.8 ac w/Wurzbach Pkwy frntgeMxd Vac-N Aubrey Chancellor - NEISD Wurzbach Pkwy 1.67 1.6 ac owned by NEISDMxd Vac-R Mac Riddick 10303 Perrin Beitel 0.52 MANANA Acquisition Corp
TOTAL VACANT LAND IN THE MIXED USE SEGMENT OF THE CORRIDOR 72.19
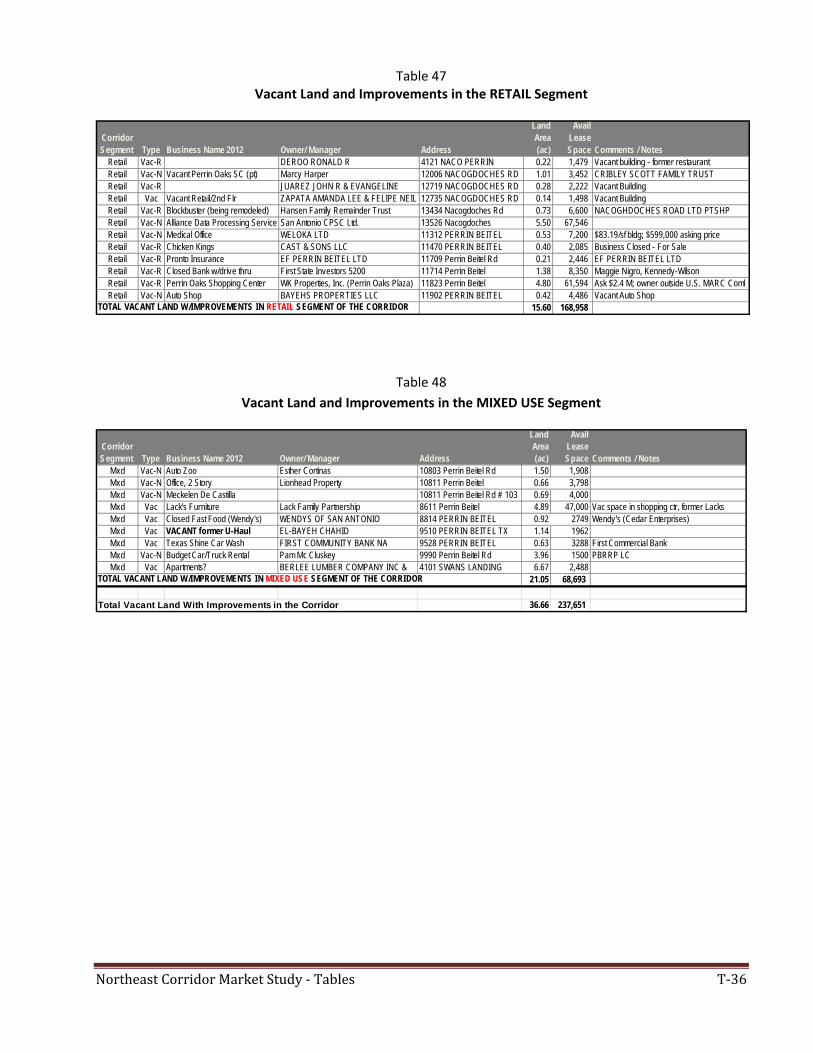
Northeast Corridor Market Study - Tables T-36
Table 47 Vacant Land and Improvements in the RETAIL Segment
Table 48
Vacant Land and Improvements in the MIXED USE Segment
Corridor Segment Type Business Name 2012 Owner/ Manager Address
Land Area (ac)
Avail Lease Space Comments / Notes
Retail Vac-R DEROO RONALD R 4121 NACO PERRIN 0.22 1,479 Vacant building - former restaurantRetail Vac-N Vacant Perrin Oaks SC (pt) Marcy Harper 12006 NACOGDOCHES RD 1.01 3,452 CRIBLEY SCOTT FAMILY TRUSTRetail Vac-R JUAREZ JOHN R & EVANGELINE 12719 NACOGDOCHES RD 0.28 2,222 Vacant BuildingRetail Vac Vacant Retail/2nd Flr ZAPATA AMANDA LEE & FELIPE NEIL 12735 NACOGDOCHES RD 0.14 1,498 Vacant BuildingRetail Vac-R Blockbuster (being remodeled) Hansen Family Remainder Trust 13434 Nacogdoches Rd 0.73 6,600 NACOGHDOCHES ROAD LTD PTSHPRetail Vac-N Alliance Data Processing Service San Antonio CPSC Ltd. 13526 Nacogdoches 5.50 67,546 Retail Vac-N Medical Office WELOKA LTD 11312 PERRIN BEITEL 0.53 7,200 $83.19/sf bldg; $599,000 asking priceRetail Vac-R Chicken Kings CAST & SONS LLC 11470 PERRIN BEITEL 0.40 2,085 Business Closed - For SaleRetail Vac-R Pronto Insurance EF PERRIN BEITEL LTD 11709 Perrin Beitel Rd 0.21 2,446 EF PERRIN BEITEL LTDRetail Vac-R Closed Bank w/drive thru First State Investors 5200 11714 Perrin Beitel 1.38 8,350 Maggie Nigro, Kennedy-WilsonRetail Vac-R Perrin Oaks Shopping Center WK Properties, Inc. (Perrin Oaks Plaza) 11823 Perrin Beitel 4.80 61,594 Ask $2.4 M; owner outside U.S. MARC ComlRetail Vac-N Auto Shop BAYEHS PROPERTIES LLC 11902 PERRIN BEITEL 0.42 4,486 Vacant Auto Shop
TOTAL VACANT LAND W/IMPROVEMENTS IN RETAIL SEGMENT OF THE CORRIDOR 15.60 168,958
Corridor Segment Type Business Name 2012 Owner/ Manager Address
Land Area (ac)
Avail Lease Space Comments / Notes
Mxd Vac-N Auto Zoo Esther Cortinas 10803 Perrin Beitel Rd 1.50 1,908Mxd Vac-N Office, 2 Story Lionhead Property 10811 Perrin Beitel 0.66 3,798Mxd Vac-N Meckelen De Castilla 10811 Perrin Beitel Rd # 103 0.69 4,000Mxd Vac Lack's Furniture Lack Family Partnership 8611 Perrin Beitel 4.89 47,000 Vac space in shopping ctr, former LacksMxd Vac Closed Fast Food (Wendy's) WENDYS OF SAN ANTONIO 8814 PERRIN BEITEL 0.92 2749 Wendy's (Cedar Enterprises)Mxd Vac VACANT former U-Haul EL-BAYEH CHAHID 9510 PERRIN BEITEL TX 1.14 1962Mxd Vac Texas Shine Car Wash FIRST COMMUNITY BANK NA 9528 PERRIN BEITEL 0.63 3288 First Commercial BankMxd Vac-N Budget Car/Truck Rental Pam Mc Cluskey 9990 Perrin Beitel Rd 3.96 1500 PBRRP LCMxd Vac Apartments? BERLEE LUMBER COMPANY INC & 4101 SWANS LANDING 6.67 2,488
TOTAL VACANT LAND W/IMPROVEMENTS IN MIXED USE SEGMENT OF THE CORRIDOR 21.05 68,693
Total Vacant Land With Improvements in the Corridor 36.66 237,651
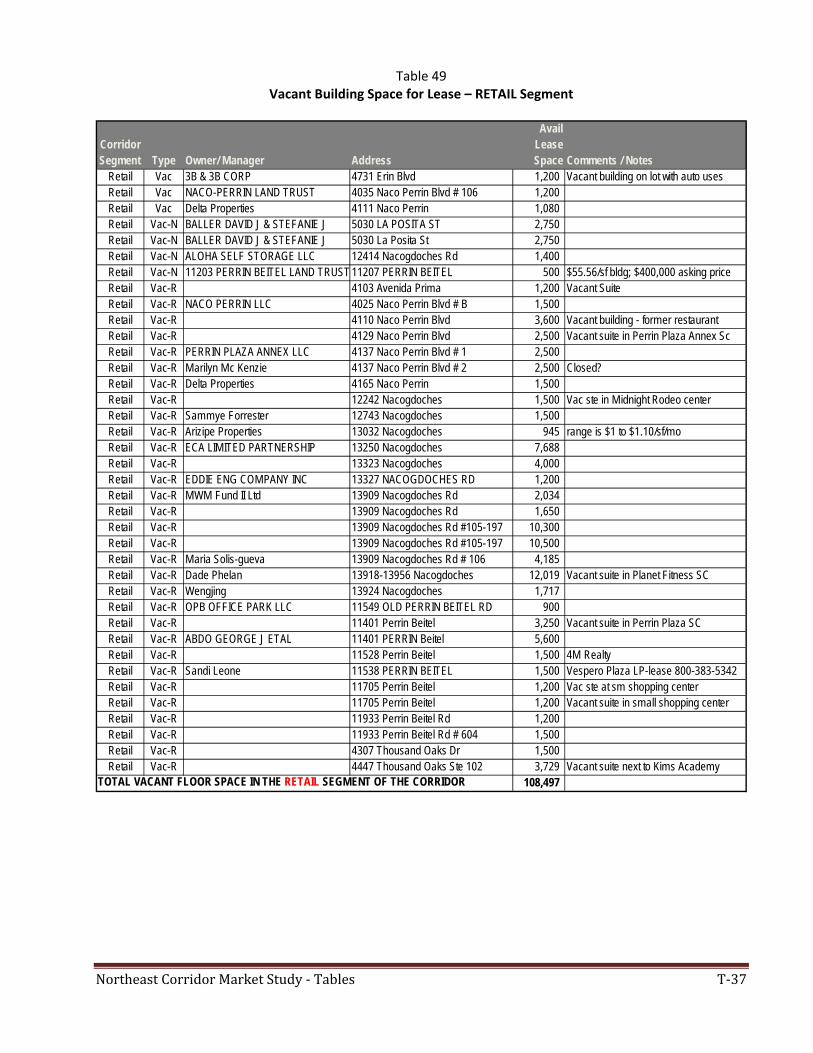
Northeast Corridor Market Study - Tables T-37
Table 49 Vacant Building Space for Lease – RETAIL Segment
Corridor Segment Type Owner/ Manager Address
Avail Lease Space Comments / Notes
Retail Vac 3B & 3B CORP 4731 Erin Blvd 1,200 Vacant building on lot with auto usesRetail Vac NACO-PERRIN LAND TRUST 4035 Naco Perrin Blvd # 106 1,200 Retail Vac Delta Properties 4111 Naco Perrin 1,080 Retail Vac-N BALLER DAVID J & STEFANIE J 5030 LA POSITA ST 2,750 Retail Vac-N BALLER DAVID J & STEFANIE J 5030 La Posita St 2,750 Retail Vac-N ALOHA SELF STORAGE LLC 12414 Nacogdoches Rd 1,400 Retail Vac-N 11203 PERRIN BEITEL LAND TRUST 11207 PERRIN BEITEL 500 $55.56/sf bldg; $400,000 asking priceRetail Vac-R 4103 Avenida Prima 1,200 Vacant SuiteRetail Vac-R NACO PERRIN LLC 4025 Naco Perrin Blvd # B 1,500 Retail Vac-R 4110 Naco Perrin Blvd 3,600 Vacant building - former restaurantRetail Vac-R 4129 Naco Perrin Blvd 2,500 Vacant suite in Perrin Plaza Annex ScRetail Vac-R PERRIN PLAZA ANNEX LLC 4137 Naco Perrin Blvd # 1 2,500 Retail Vac-R Marilyn Mc Kenzie 4137 Naco Perrin Blvd # 2 2,500 Closed?Retail Vac-R Delta Properties 4165 Naco Perrin 1,500 Retail Vac-R 12242 Nacogdoches 1,500 Vac ste in Midnight Rodeo centerRetail Vac-R Sammye Forrester 12743 Nacogdoches 1,500 Retail Vac-R Arizipe Properties 13032 Nacogdoches 945 range is $1 to $1.10/sf/moRetail Vac-R ECA LIMITED PARTNERSHIP 13250 Nacogdoches 7,688 Retail Vac-R 13323 Nacogdoches 4,000 Retail Vac-R EDDIE ENG COMPANY INC 13327 NACOGDOCHES RD 1,200 Retail Vac-R MWM Fund II Ltd 13909 Nacogdoches Rd 2,034 Retail Vac-R 13909 Nacogdoches Rd 1,650 Retail Vac-R 13909 Nacogdoches Rd #105-197 10,300 Retail Vac-R 13909 Nacogdoches Rd #105-197 10,500 Retail Vac-R Maria Solis-gueva 13909 Nacogdoches Rd # 106 4,185 Retail Vac-R Dade Phelan 13918-13956 Nacogdoches 12,019 Vacant suite in Planet Fitness SCRetail Vac-R Wengjing 13924 Nacogdoches 1,717 Retail Vac-R OPB OFFICE PARK LLC 11549 OLD PERRIN BEITEL RD 900 Retail Vac-R 11401 Perrin Beitel 3,250 Vacant suite in Perrin Plaza SCRetail Vac-R ABDO GEORGE J ETAL 11401 PERRIN Beitel 5,600 Retail Vac-R 11528 Perrin Beitel 1,500 4M Realty Retail Vac-R Sandi Leone 11538 PERRIN BEITEL 1,500 Vespero Plaza LP-lease 800-383-5342Retail Vac-R 11705 Perrin Beitel 1,200 Vac ste at sm shopping centerRetail Vac-R 11705 Perrin Beitel 1,200 Vacant suite in small shopping centerRetail Vac-R 11933 Perrin Beitel Rd 1,200 Retail Vac-R 11933 Perrin Beitel Rd # 604 1,500 Retail Vac-R 4307 Thousand Oaks Dr 1,500 Retail Vac-R 4447 Thousand Oaks Ste 102 3,729 Vacant suite next to Kims Academy
TOTAL VACANT FLOOR SPACE IN THE RETAIL SEGMENT OF THE CORRIDOR 108,497
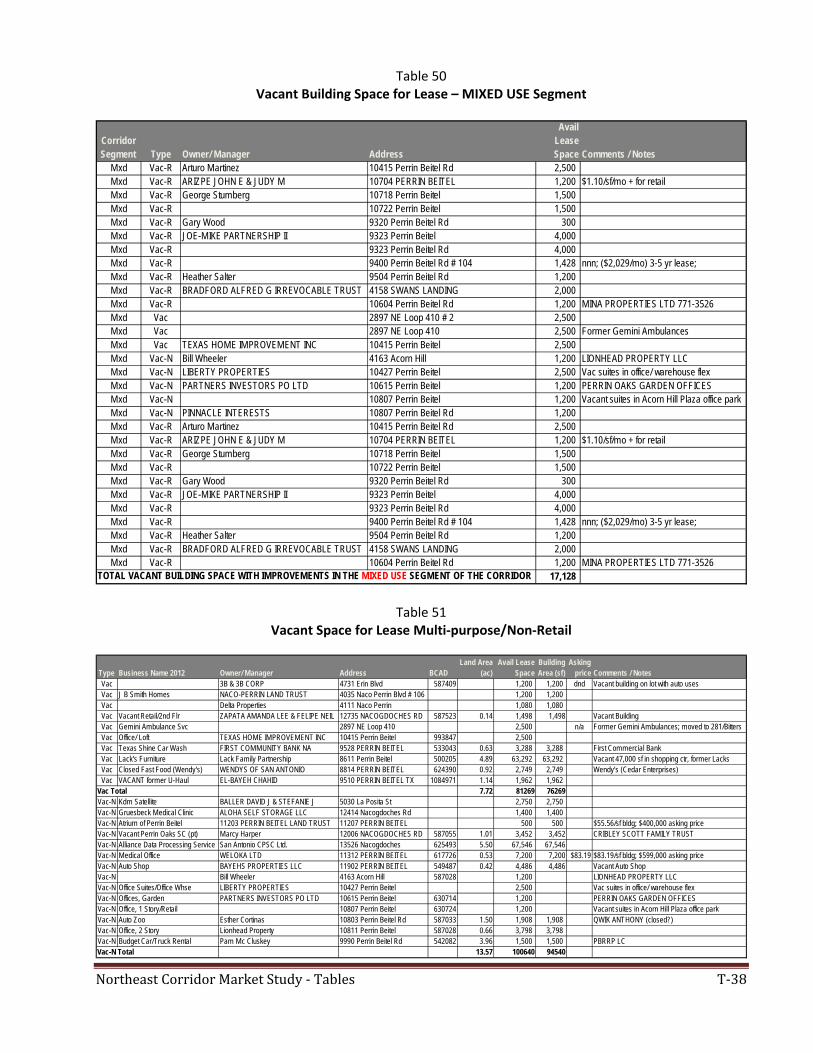
Northeast Corridor Market Study - Tables T-38
Table 50 Vacant Building Space for Lease – MIXED USE Segment
Table 51 Vacant Space for Lease Multi‐purpose/Non‐Retail
Corridor Segment Type Owner/ Manager Address
Avail Lease Space Comments / Notes
Mxd Vac-R Arturo Martinez 10415 Perrin Beitel Rd 2,500 Mxd Vac-R ARIZPE JOHN E & JUDY M 10704 PERRIN BEITEL 1,200 $1.10/sf/mo + for retailMxd Vac-R George Stumberg 10718 Perrin Beitel 1,500 Mxd Vac-R 10722 Perrin Beitel 1,500 Mxd Vac-R Gary Wood 9320 Perrin Beitel Rd 300 Mxd Vac-R JOE-MIKE PARTNERSHIP II 9323 Perrin Beitel 4,000 Mxd Vac-R 9323 Perrin Beitel Rd 4,000 Mxd Vac-R 9400 Perrin Beitel Rd # 104 1,428 nnn; ($2,029/mo) 3-5 yr lease;Mxd Vac-R Heather Salter 9504 Perrin Beitel Rd 1,200 Mxd Vac-R BRADFORD ALFRED G IRREVOCABLE TRUST 4158 SWANS LANDING 2,000 Mxd Vac-R 10604 Perrin Beitel Rd 1,200 MINA PROPERTIES LTD 771-3526Mxd Vac 2897 NE Loop 410 # 2 2,500 Mxd Vac 2897 NE Loop 410 2,500 Former Gemini AmbulancesMxd Vac TEXAS HOME IMPROVEMENT INC 10415 Perrin Beitel 2,500 Mxd Vac-N Bill Wheeler 4163 Acorn Hill 1,200 LIONHEAD PROPERTY LLCMxd Vac-N LIBERTY PROPERTIES 10427 Perrin Beitel 2,500 Vac suites in office/ warehouse flexMxd Vac-N PARTNERS INVESTORS PO LTD 10615 Perrin Beitel 1,200 PERRIN OAKS GARDEN OFFICESMxd Vac-N 10807 Perrin Beitel 1,200 Vacant suites in Acorn Hill Plaza office parkMxd Vac-N PINNACLE INTERESTS 10807 Perrin Beitel Rd 1,200 Mxd Vac-R Arturo Martinez 10415 Perrin Beitel Rd 2,500 Mxd Vac-R ARIZPE JOHN E & JUDY M 10704 PERRIN BEITEL 1,200 $1.10/sf/mo + for retailMxd Vac-R George Stumberg 10718 Perrin Beitel 1,500 Mxd Vac-R 10722 Perrin Beitel 1,500 Mxd Vac-R Gary Wood 9320 Perrin Beitel Rd 300 Mxd Vac-R JOE-MIKE PARTNERSHIP II 9323 Perrin Beitel 4,000 Mxd Vac-R 9323 Perrin Beitel Rd 4,000 Mxd Vac-R 9400 Perrin Beitel Rd # 104 1,428 nnn; ($2,029/mo) 3-5 yr lease;Mxd Vac-R Heather Salter 9504 Perrin Beitel Rd 1,200 Mxd Vac-R BRADFORD ALFRED G IRREVOCABLE TRUST 4158 SWANS LANDING 2,000 Mxd Vac-R 10604 Perrin Beitel Rd 1,200 MINA PROPERTIES LTD 771-3526
TOTAL VACANT BUILDING SPACE WITH IMPROVEMENTS IN THE MIXED USE SEGMENT OF THE CORRIDOR 17,128
Type Business Name 2012 Owner/ Manager Address BCADLand Area
(ac) Avail Lease
Space Building Area (sf)
Asking price Comments / Notes
Vac 3B & 3B CORP 4731 Erin Blvd 587409 1,200 1,200 dnd Vacant building on lot with auto usesVac J B Smith Homes NACO-PERRIN LAND TRUST 4035 Naco Perrin Blvd # 106 1,200 1,200 Vac Delta Properties 4111 Naco Perrin 1,080 1,080 Vac Vacant Retail/2nd Flr ZAPATA AMANDA LEE & FELIPE NEIL 12735 NACOGDOCHES RD 587523 0.14 1,498 1,498 Vacant BuildingVac Gemini Ambulance Svc 2897 NE Loop 410 2,500 n/a Former Gemini Ambulances; moved to 281/BittersVac Office/ Loft TEXAS HOME IMPROVEMENT INC 10415 Perrin Beitel 993847 2,500 Vac Texas Shine Car Wash FIRST COMMUNITY BANK NA 9528 PERRIN BEITEL 533043 0.63 3,288 3,288 First Commercial BankVac Lack's Furniture Lack Family Partnership 8611 Perrin Beitel 500205 4.89 63,292 63,292 Vacant 47,000 sf in shopping ctr, former LacksVac Closed Fast Food (Wendy's) WENDYS OF SAN ANTONIO 8814 PERRIN BEITEL 624390 0.92 2,749 2,749 Wendy's (Cedar Enterprises)Vac VACANT former U-Haul EL-BAYEH CHAHID 9510 PERRIN BEITEL TX 1084971 1.14 1,962 1,962
Vac Total 7.72 81269 76269Vac-N Kdm Satellite BALLER DAVID J & STEFANIE J 5030 La Posita St 2,750 2,750 Vac-N Gruesbeck Medical Clinic ALOHA SELF STORAGE LLC 12414 Nacogdoches Rd 1,400 1,400 Vac-N Atrium of Perrin Beitel 11203 PERRIN BEITEL LAND TRUST 11207 PERRIN BEITEL 500 500 $55.56/sf bldg; $400,000 asking priceVac-N Vacant Perrin Oaks SC (pt) Marcy Harper 12006 NACOGDOCHES RD 587055 1.01 3,452 3,452 CRIBLEY SCOTT FAMILY TRUSTVac-N Alliance Data Processing Service San Antonio CPSC Ltd. 13526 Nacogdoches 625493 5.50 67,546 67,546Vac-N Medical Office WELOKA LTD 11312 PERRIN BEITEL 617726 0.53 7,200 7,200 $83.19 $83.19/sf bldg; $599,000 asking priceVac-N Auto Shop BAYEHS PROPERTIES LLC 11902 PERRIN BEITEL 549487 0.42 4,486 4,486 Vacant Auto ShopVac-N Bill Wheeler 4163 Acorn Hill 587028 1,200 LIONHEAD PROPERTY LLCVac-N Office Suites/Office Whse LIBERTY PROPERTIES 10427 Perrin Beitel 2,500 Vac suites in office/ warehouse flexVac-N Offices, Garden PARTNERS INVESTORS PO LTD 10615 Perrin Beitel 630714 1,200 PERRIN OAKS GARDEN OFFICESVac-N Office, 1 Story/Retail 10807 Perrin Beitel 630724 1,200 Vacant suites in Acorn Hill Plaza office parkVac-N Auto Zoo Esther Cortinas 10803 Perrin Beitel Rd 587033 1.50 1,908 1,908 QWIK ANTHONY (closed?)Vac-N Office, 2 Story Lionhead Property 10811 Perrin Beitel 587028 0.66 3,798 3,798 Vac-N Budget Car/Truck Rental Pam Mc Cluskey 9990 Perrin Beitel Rd 542082 3.96 1,500 1,500 PBRRP LCVac-N Total 13.57 100640 94540
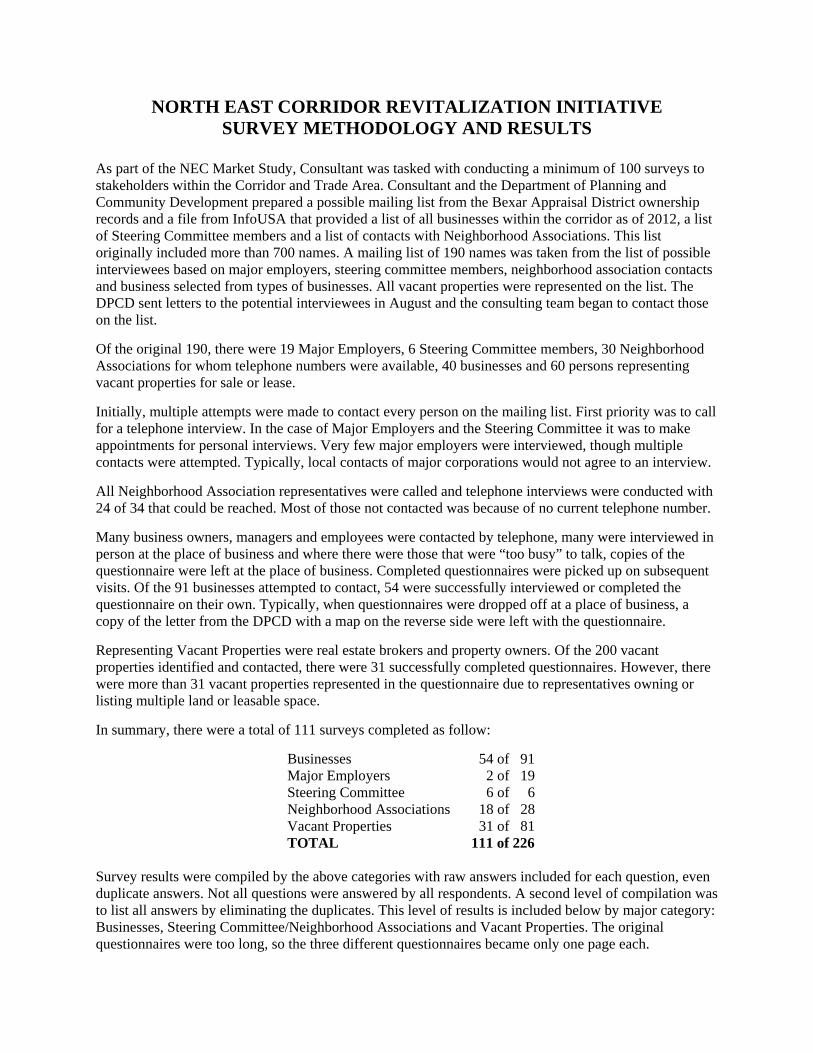
NORTH EAST CORRIDOR REVITALIZATION INITIATIVE SURVEY METHODOLOGY AND RESULTS
As part of the NEC Market Study, Consultant was tasked with conducting a minimum of 100 surveys to stakeholders within the Corridor and Trade Area. Consultant and the Department of Planning and Community Development prepared a possible mailing list from the Bexar Appraisal District ownership records and a file from InfoUSA that provided a list of all businesses within the corridor as of 2012, a list of Steering Committee members and a list of contacts with Neighborhood Associations. This list originally included more than 700 names. A mailing list of 190 names was taken from the list of possible interviewees based on major employers, steering committee members, neighborhood association contacts and business selected from types of businesses. All vacant properties were represented on the list. The DPCD sent letters to the potential interviewees in August and the consulting team began to contact those on the list.
Of the original 190, there were 19 Major Employers, 6 Steering Committee members, 30 Neighborhood Associations for whom telephone numbers were available, 40 businesses and 60 persons representing vacant properties for sale or lease.
Initially, multiple attempts were made to contact every person on the mailing list. First priority was to call for a telephone interview. In the case of Major Employers and the Steering Committee it was to make appointments for personal interviews. Very few major employers were interviewed, though multiple contacts were attempted. Typically, local contacts of major corporations would not agree to an interview.
All Neighborhood Association representatives were called and telephone interviews were conducted with 24 of 34 that could be reached. Most of those not contacted was because of no current telephone number.
Many business owners, managers and employees were contacted by telephone, many were interviewed in person at the place of business and where there were those that were “too busy” to talk, copies of the questionnaire were left at the place of business. Completed questionnaires were picked up on subsequent visits. Of the 91 businesses attempted to contact, 54 were successfully interviewed or completed the questionnaire on their own. Typically, when questionnaires were dropped off at a place of business, a copy of the letter from the DPCD with a map on the reverse side were left with the questionnaire.
Representing Vacant Properties were real estate brokers and property owners. Of the 200 vacant properties identified and contacted, there were 31 successfully completed questionnaires. However, there were more than 31 vacant properties represented in the questionnaire due to representatives owning or listing multiple land or leasable space.
In summary, there were a total of 111 surveys completed as follow:
Businesses 54 of 91 Major Employers 2 of 19 Steering Committee 6 of 6 Neighborhood Associations 18 of 28 Vacant Properties 31 of 81 TOTAL 111 of 226
Survey results were compiled by the above categories with raw answers included for each question, even duplicate answers. Not all questions were answered by all respondents. A second level of compilation was to list all answers by eliminating the duplicates. This level of results is included below by major category: Businesses, Steering Committee/Neighborhood Associations and Vacant Properties. The original questionnaires were too long, so the three different questionnaires became only one page each.
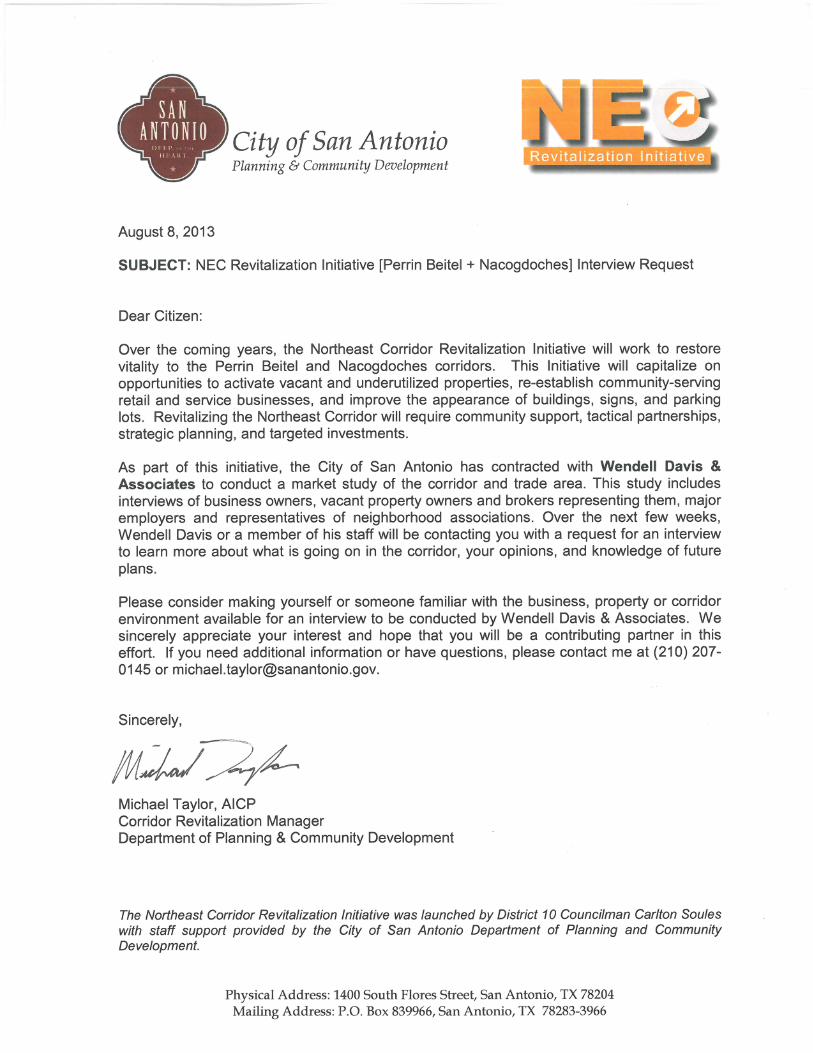
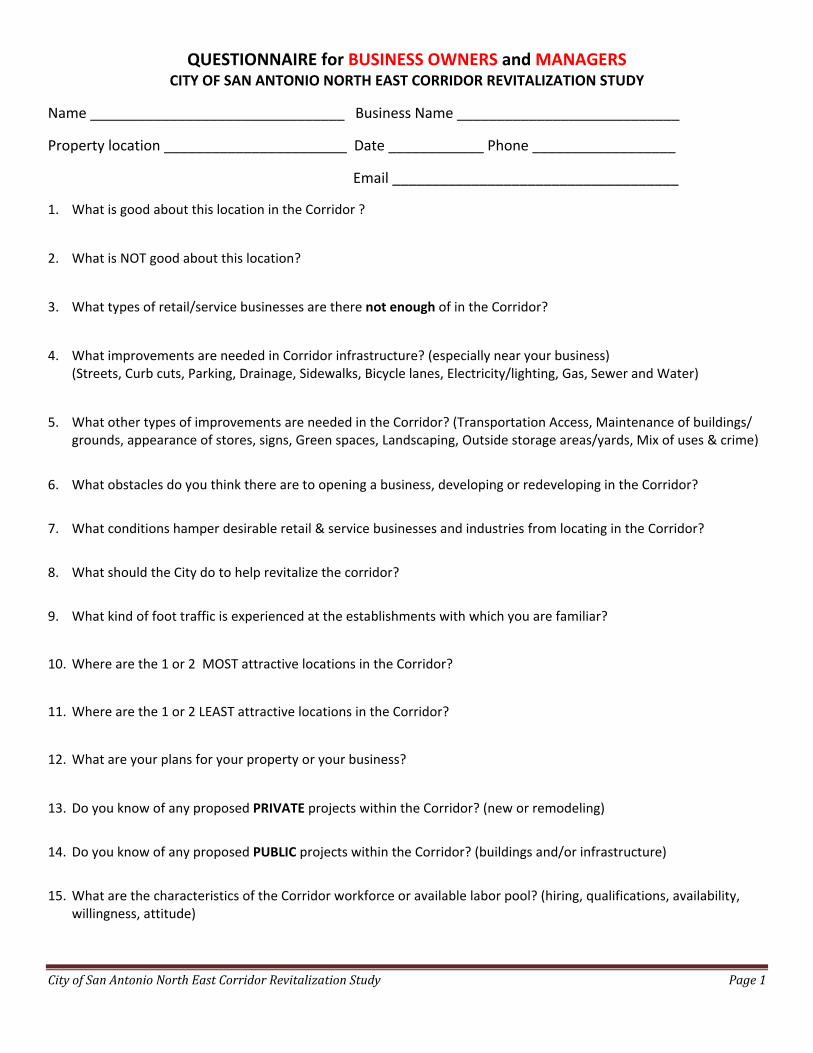
CityofSanAntonioNorthEastCorridorRevitalizationStudy Page1
QUESTIONNAIRE for BUSINESS OWNERS and MANAGERS CITY OF SAN ANTONIO NORTH EAST CORRIDOR REVITALIZATION STUDY
Name ________________________________ Business Name ____________________________
Property location _______________________ Date ____________ Phone __________________
Email ____________________________________
1. What is good about this location in the Corridor ?
2. What is NOT good about this location?
3. What types of retail/service businesses are there not enough of in the Corridor?
4. What improvements are needed in Corridor infrastructure? (especially near your business)
(Streets, Curb cuts, Parking, Drainage, Sidewalks, Bicycle lanes, Electricity/lighting, Gas, Sewer and Water)
5. What other types of improvements are needed in the Corridor? (Transportation Access, Maintenance of buildings/
grounds, appearance of stores, signs, Green spaces, Landscaping, Outside storage areas/yards, Mix of uses & crime)
6. What obstacles do you think there are to opening a business, developing or redeveloping in the Corridor?
7. What conditions hamper desirable retail & service businesses and industries from locating in the Corridor?
8. What should the City do to help revitalize the corridor?
9. What kind of foot traffic is experienced at the establishments with which you are familiar?
10. Where are the 1 or 2 MOST attractive locations in the Corridor?
11. Where are the 1 or 2 LEAST attractive locations in the Corridor?
12. What are your plans for your property or your business?
13. Do you know of any proposed PRIVATE projects within the Corridor? (new or remodeling)
14. Do you know of any proposed PUBLIC projects within the Corridor? (buildings and/or infrastructure)
15. What are the characteristics of the Corridor workforce or available labor pool? (hiring, qualifications, availability, willingness, attitude)
CityofSanAntonioNorthEastCorridorRevitalizationStudy Page1
QUESTIONNAIRE for MAJOR EMPLOYERS CITY OF SAN ANTONIO NORTH EAST CORRIDOR REVITALIZATION STUDY
Name ________________________________ Business Name ____________________________
Property location _______________________ Date ____________ Phone __________________
How many employees _________________ Email ____________________________________
1. In your opinion, what is good about this location within the Corridor or within San Antonio?
2. What is NOT good about this location?
3. What improvements are needed in Corridor infrastructure, especially near your business?
(Streets, Curb cuts, Parking, Drainage, Sidewalks, Bicycle lanes, Electricity/ lighting, Gas, Sewer and Water)
4. What other types of improvements are needed in the Corridor?
(Transportation, Maintenance of buildings/grounds, Appearance of stores, signs, Green spaces, Landscaping, Outside storage areas/yards, Mix of uses and crime)
5. What obstacles do you think there are to opening a business, developing or redeveloping in the Corridor? 6. What conditions hamper desirable retail & service businesses and industries from locating in the Corridor? 7. What should the City do to help revitalize the corridor? 8. What kind of foot traffic is experienced at the establishments with which you are familiar?
9. Where are the 1 or 2 MOST attractive locations in the Corridor?
10. Where are the 1 or 2 LEAST attractive locations in the Corridor?
11. What are your plans for your business? 12. Do you know of any proposed PRIVATE projects within the Corridor? (new or remodeling)
13. Do you know of any proposed PUBLIC projects within the Corridor? (buildings and/or infrastructure)
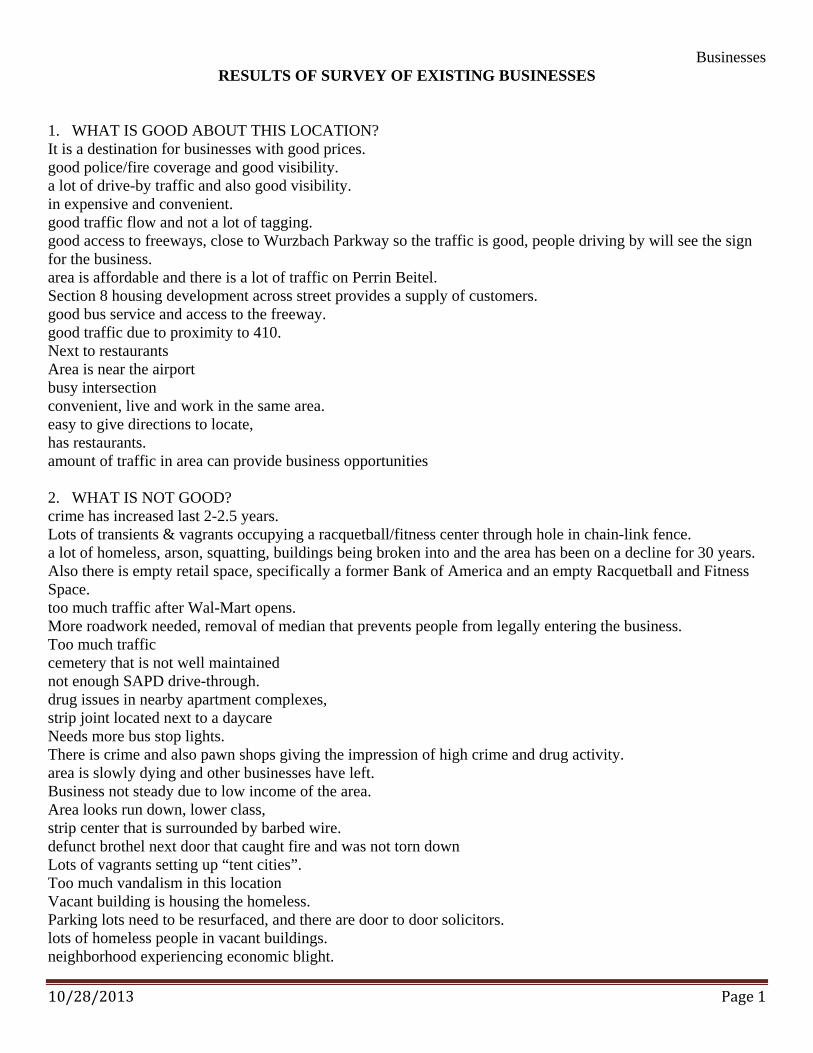
Businesses
10/28/2013 Page 1
RESULTS OF SURVEY OF EXISTING BUSINESSES 1. WHAT IS GOOD ABOUT THIS LOCATION? It is a destination for businesses with good prices. good police/fire coverage and good visibility. a lot of drive-by traffic and also good visibility. in expensive and convenient. good traffic flow and not a lot of tagging. good access to freeways, close to Wurzbach Parkway so the traffic is good, people driving by will see the sign for the business. area is affordable and there is a lot of traffic on Perrin Beitel. Section 8 housing development across street provides a supply of customers. good bus service and access to the freeway. good traffic due to proximity to 410. Next to restaurants Area is near the airport busy intersection convenient, live and work in the same area. easy to give directions to locate, has restaurants. amount of traffic in area can provide business opportunities 2. WHAT IS NOT GOOD? crime has increased last 2-2.5 years. Lots of transients & vagrants occupying a racquetball/fitness center through hole in chain-link fence. a lot of homeless, arson, squatting, buildings being broken into and the area has been on a decline for 30 years. Also there is empty retail space, specifically a former Bank of America and an empty Racquetball and Fitness Space. too much traffic after Wal-Mart opens. More roadwork needed, removal of median that prevents people from legally entering the business. Too much traffic cemetery that is not well maintained not enough SAPD drive-through. drug issues in nearby apartment complexes, strip joint located next to a daycare Needs more bus stop lights. There is crime and also pawn shops giving the impression of high crime and drug activity. area is slowly dying and other businesses have left. Business not steady due to low income of the area. Area looks run down, lower class, strip center that is surrounded by barbed wire. defunct brothel next door that caught fire and was not torn down Lots of vagrants setting up “tent cities”. Too much vandalism in this location Vacant building is housing the homeless. Parking lots need to be resurfaced, and there are door to door solicitors. lots of homeless people in vacant buildings. neighborhood experiencing economic blight.
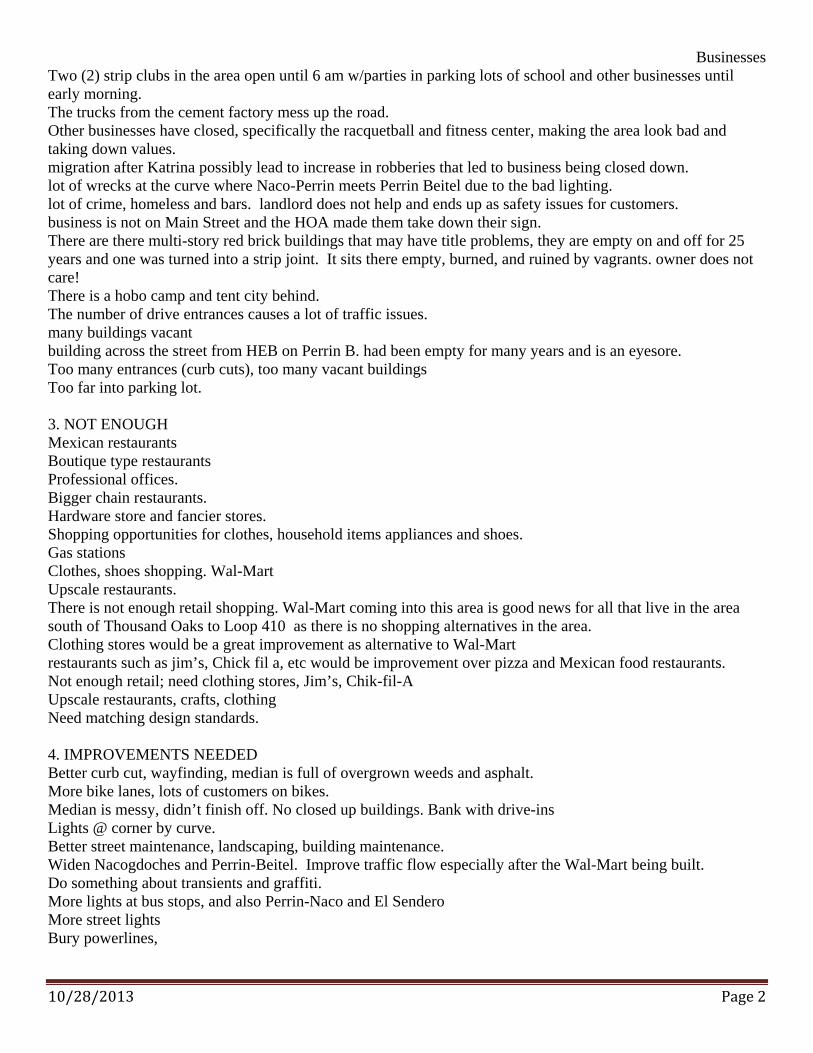
Businesses
10/28/2013 Page 2
Two (2) strip clubs in the area open until 6 am w/parties in parking lots of school and other businesses until early morning. The trucks from the cement factory mess up the road. Other businesses have closed, specifically the racquetball and fitness center, making the area look bad and taking down values. migration after Katrina possibly lead to increase in robberies that led to business being closed down. lot of wrecks at the curve where Naco-Perrin meets Perrin Beitel due to the bad lighting. lot of crime, homeless and bars. landlord does not help and ends up as safety issues for customers. business is not on Main Street and the HOA made them take down their sign. There are there multi-story red brick buildings that may have title problems, they are empty on and off for 25 years and one was turned into a strip joint. It sits there empty, burned, and ruined by vagrants. owner does not care! There is a hobo camp and tent city behind. The number of drive entrances causes a lot of traffic issues. many buildings vacant building across the street from HEB on Perrin B. had been empty for many years and is an eyesore. Too many entrances (curb cuts), too many vacant buildings Too far into parking lot. 3. NOT ENOUGH Mexican restaurants Boutique type restaurants Professional offices. Bigger chain restaurants. Hardware store and fancier stores. Shopping opportunities for clothes, household items appliances and shoes. Gas stations Clothes, shoes shopping. Wal-Mart Upscale restaurants. There is not enough retail shopping. Wal-Mart coming into this area is good news for all that live in the area south of Thousand Oaks to Loop 410 as there is no shopping alternatives in the area. Clothing stores would be a great improvement as alternative to Wal-Mart restaurants such as jim’s, Chick fil a, etc would be improvement over pizza and Mexican food restaurants. Not enough retail; need clothing stores, Jim’s, Chik-fil-A Upscale restaurants, crafts, clothing Need matching design standards. 4. IMPROVEMENTS NEEDED Better curb cut, wayfinding, median is full of overgrown weeds and asphalt. More bike lanes, lots of customers on bikes. Median is messy, didn’t finish off. No closed up buildings. Bank with drive-ins Lights @ corner by curve. Better street maintenance, landscaping, building maintenance. Widen Nacogdoches and Perrin-Beitel. Improve traffic flow especially after the Wal-Mart being built. Do something about transients and graffiti. More lights at bus stops, and also Perrin-Naco and El Sendero More street lights Bury powerlines,
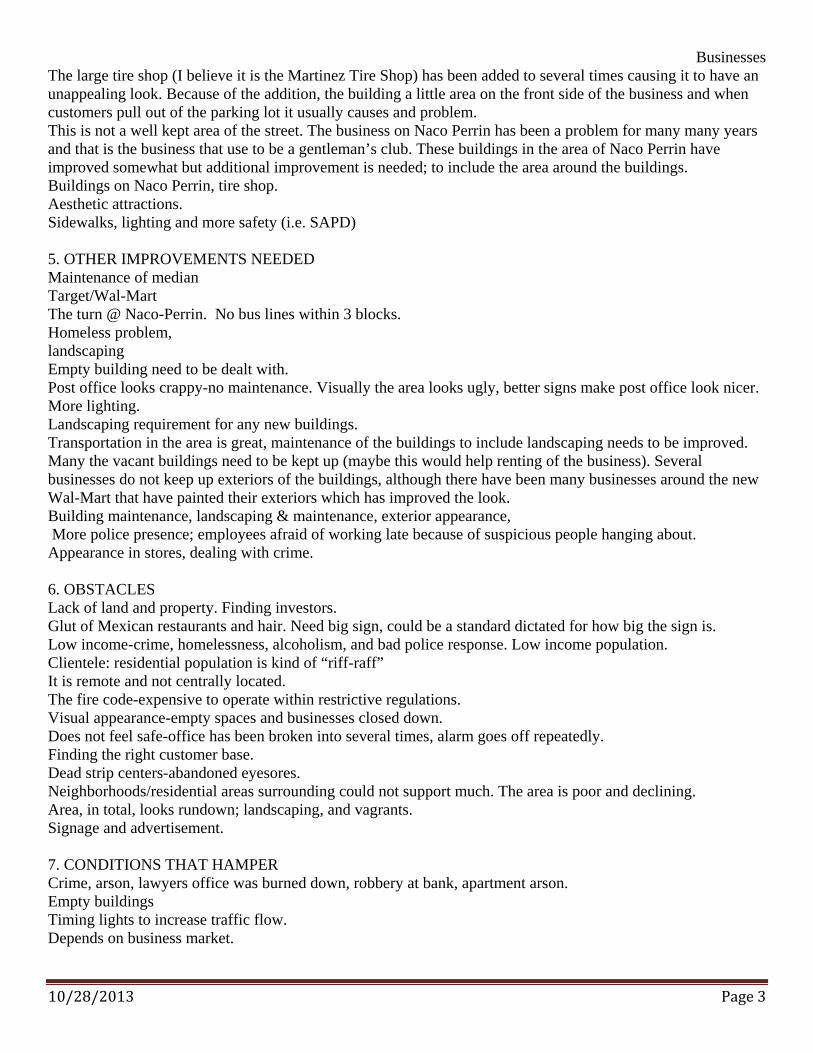
Businesses
10/28/2013 Page 3
The large tire shop (I believe it is the Martinez Tire Shop) has been added to several times causing it to have an unappealing look. Because of the addition, the building a little area on the front side of the business and when customers pull out of the parking lot it usually causes and problem. This is not a well kept area of the street. The business on Naco Perrin has been a problem for many many years and that is the business that use to be a gentleman’s club. These buildings in the area of Naco Perrin have improved somewhat but additional improvement is needed; to include the area around the buildings. Buildings on Naco Perrin, tire shop. Aesthetic attractions. Sidewalks, lighting and more safety (i.e. SAPD) 5. OTHER IMPROVEMENTS NEEDED Maintenance of median Target/Wal-Mart The turn @ Naco-Perrin. No bus lines within 3 blocks. Homeless problem, landscaping Empty building need to be dealt with. Post office looks crappy-no maintenance. Visually the area looks ugly, better signs make post office look nicer. More lighting. Landscaping requirement for any new buildings. Transportation in the area is great, maintenance of the buildings to include landscaping needs to be improved. Many the vacant buildings need to be kept up (maybe this would help renting of the business). Several businesses do not keep up exteriors of the buildings, although there have been many businesses around the new Wal-Mart that have painted their exteriors which has improved the look. Building maintenance, landscaping & maintenance, exterior appearance, More police presence; employees afraid of working late because of suspicious people hanging about. Appearance in stores, dealing with crime. 6. OBSTACLES Lack of land and property. Finding investors. Glut of Mexican restaurants and hair. Need big sign, could be a standard dictated for how big the sign is. Low income-crime, homelessness, alcoholism, and bad police response. Low income population. Clientele: residential population is kind of “riff-raff” It is remote and not centrally located. The fire code-expensive to operate within restrictive regulations. Visual appearance-empty spaces and businesses closed down. Does not feel safe-office has been broken into several times, alarm goes off repeatedly. Finding the right customer base. Dead strip centers-abandoned eyesores. Neighborhoods/residential areas surrounding could not support much. The area is poor and declining. Area, in total, looks rundown; landscaping, and vagrants. Signage and advertisement. 7. CONDITIONS THAT HAMPER Crime, arson, lawyers office was burned down, robbery at bank, apartment arson. Empty buildings Timing lights to increase traffic flow. Depends on business market.
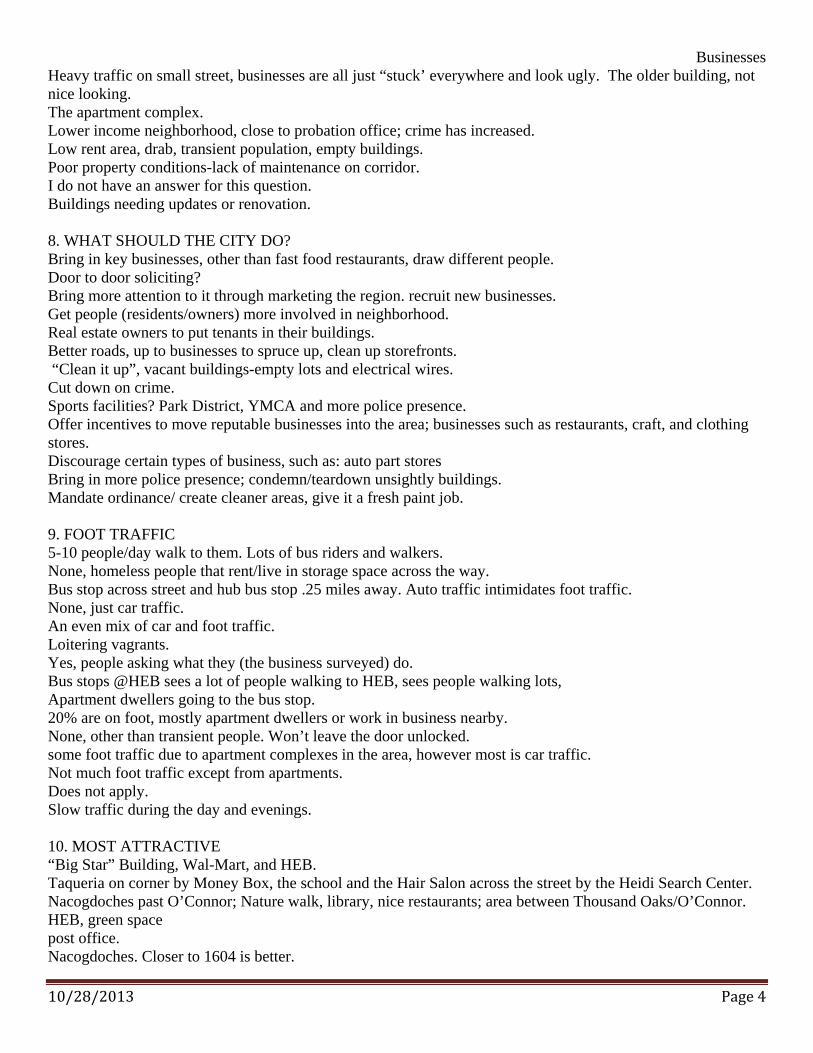
Businesses
10/28/2013 Page 4
Heavy traffic on small street, businesses are all just “stuck’ everywhere and look ugly. The older building, not nice looking. The apartment complex. Lower income neighborhood, close to probation office; crime has increased. Low rent area, drab, transient population, empty buildings. Poor property conditions-lack of maintenance on corridor. I do not have an answer for this question. Buildings needing updates or renovation. 8. WHAT SHOULD THE CITY DO? Bring in key businesses, other than fast food restaurants, draw different people. Door to door soliciting? Bring more attention to it through marketing the region. recruit new businesses. Get people (residents/owners) more involved in neighborhood. Real estate owners to put tenants in their buildings. Better roads, up to businesses to spruce up, clean up storefronts. “Clean it up”, vacant buildings-empty lots and electrical wires. Cut down on crime. Sports facilities? Park District, YMCA and more police presence. Offer incentives to move reputable businesses into the area; businesses such as restaurants, craft, and clothing stores. Discourage certain types of business, such as: auto part stores Bring in more police presence; condemn/teardown unsightly buildings. Mandate ordinance/ create cleaner areas, give it a fresh paint job. 9. FOOT TRAFFIC 5-10 people/day walk to them. Lots of bus riders and walkers. None, homeless people that rent/live in storage space across the way. Bus stop across street and hub bus stop .25 miles away. Auto traffic intimidates foot traffic. None, just car traffic. An even mix of car and foot traffic. Loitering vagrants. Yes, people asking what they (the business surveyed) do. Bus stops @HEB sees a lot of people walking to HEB, sees people walking lots, Apartment dwellers going to the bus stop. 20% are on foot, mostly apartment dwellers or work in business nearby. None, other than transient people. Won’t leave the door unlocked. some foot traffic due to apartment complexes in the area, however most is car traffic. Not much foot traffic except from apartments. Does not apply. Slow traffic during the day and evenings. 10. MOST ATTRACTIVE “Big Star” Building, Wal-Mart, and HEB. Taqueria on corner by Money Box, the school and the Hair Salon across the street by the Heidi Search Center. Nacogdoches past O’Connor; Nature walk, library, nice restaurants; area between Thousand Oaks/O’Connor. HEB, green space post office. Nacogdoches. Closer to 1604 is better.
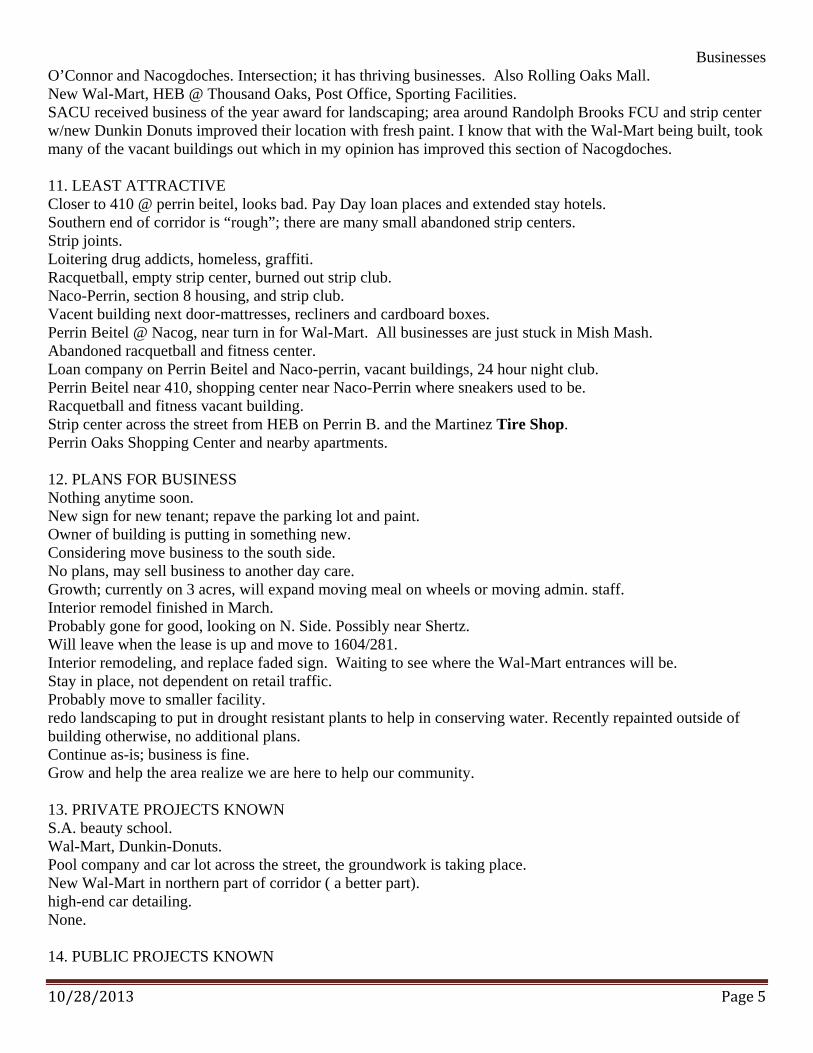
Businesses
10/28/2013 Page 5
O’Connor and Nacogdoches. Intersection; it has thriving businesses. Also Rolling Oaks Mall. New Wal-Mart, HEB @ Thousand Oaks, Post Office, Sporting Facilities. SACU received business of the year award for landscaping; area around Randolph Brooks FCU and strip center w/new Dunkin Donuts improved their location with fresh paint. I know that with the Wal-Mart being built, took many of the vacant buildings out which in my opinion has improved this section of Nacogdoches. 11. LEAST ATTRACTIVE Closer to 410 @ perrin beitel, looks bad. Pay Day loan places and extended stay hotels. Southern end of corridor is “rough”; there are many small abandoned strip centers. Strip joints. Loitering drug addicts, homeless, graffiti. Racquetball, empty strip center, burned out strip club. Naco-Perrin, section 8 housing, and strip club. Vacent building next door-mattresses, recliners and cardboard boxes. Perrin Beitel @ Nacog, near turn in for Wal-Mart. All businesses are just stuck in Mish Mash. Abandoned racquetball and fitness center. Loan company on Perrin Beitel and Naco-perrin, vacant buildings, 24 hour night club. Perrin Beitel near 410, shopping center near Naco-Perrin where sneakers used to be. Racquetball and fitness vacant building. Strip center across the street from HEB on Perrin B. and the Martinez Tire Shop. Perrin Oaks Shopping Center and nearby apartments. 12. PLANS FOR BUSINESS Nothing anytime soon. New sign for new tenant; repave the parking lot and paint. Owner of building is putting in something new. Considering move business to the south side. No plans, may sell business to another day care. Growth; currently on 3 acres, will expand moving meal on wheels or moving admin. staff. Interior remodel finished in March. Probably gone for good, looking on N. Side. Possibly near Shertz. Will leave when the lease is up and move to 1604/281. Interior remodeling, and replace faded sign. Waiting to see where the Wal-Mart entrances will be. Stay in place, not dependent on retail traffic. Probably move to smaller facility. redo landscaping to put in drought resistant plants to help in conserving water. Recently repainted outside of building otherwise, no additional plans. Continue as-is; business is fine. Grow and help the area realize we are here to help our community. 13. PRIVATE PROJECTS KNOWN S.A. beauty school. Wal-Mart, Dunkin-Donuts. Pool company and car lot across the street, the groundwork is taking place. New Wal-Mart in northern part of corridor ( a better part). high-end car detailing. None. 14. PUBLIC PROJECTS KNOWN
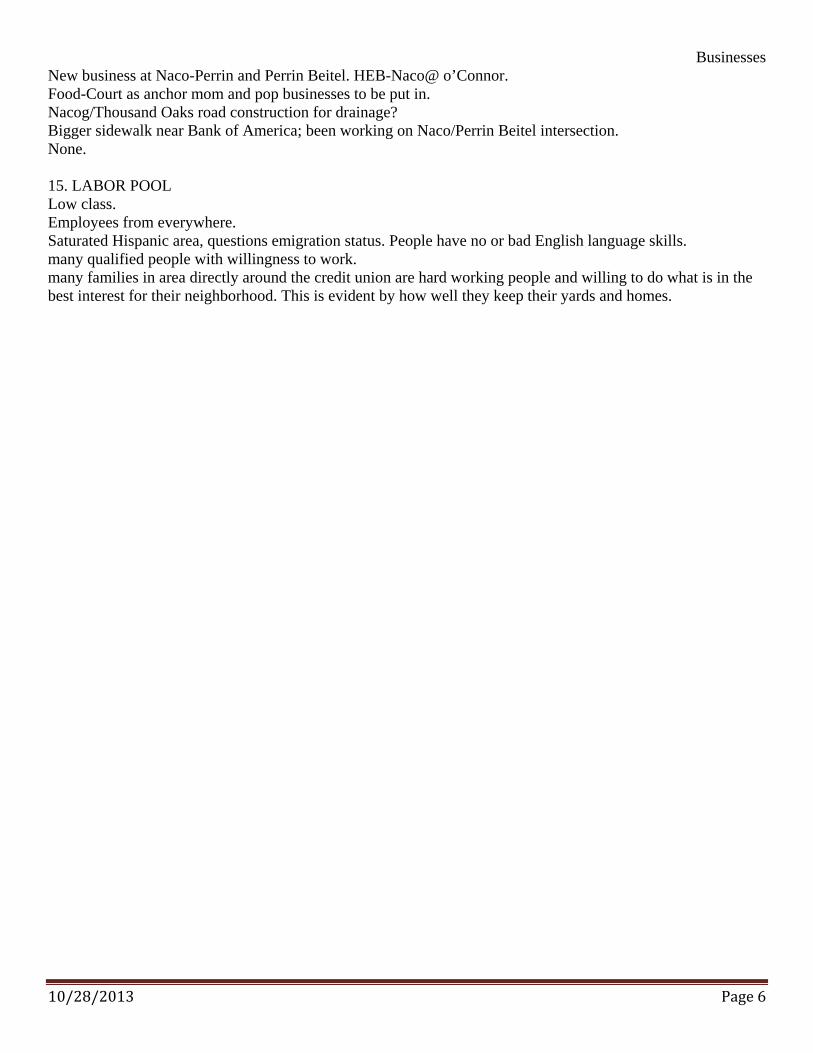
Businesses
10/28/2013 Page 6
New business at Naco-Perrin and Perrin Beitel. HEB-Naco@ o’Connor. Food-Court as anchor mom and pop businesses to be put in. Nacog/Thousand Oaks road construction for drainage? Bigger sidewalk near Bank of America; been working on Naco/Perrin Beitel intersection. None. 15. LABOR POOL Low class. Employees from everywhere. Saturated Hispanic area, questions emigration status. People have no or bad English language skills. many qualified people with willingness to work. many families in area directly around the credit union are hard working people and willing to do what is in the best interest for their neighborhood. This is evident by how well they keep their yards and homes.
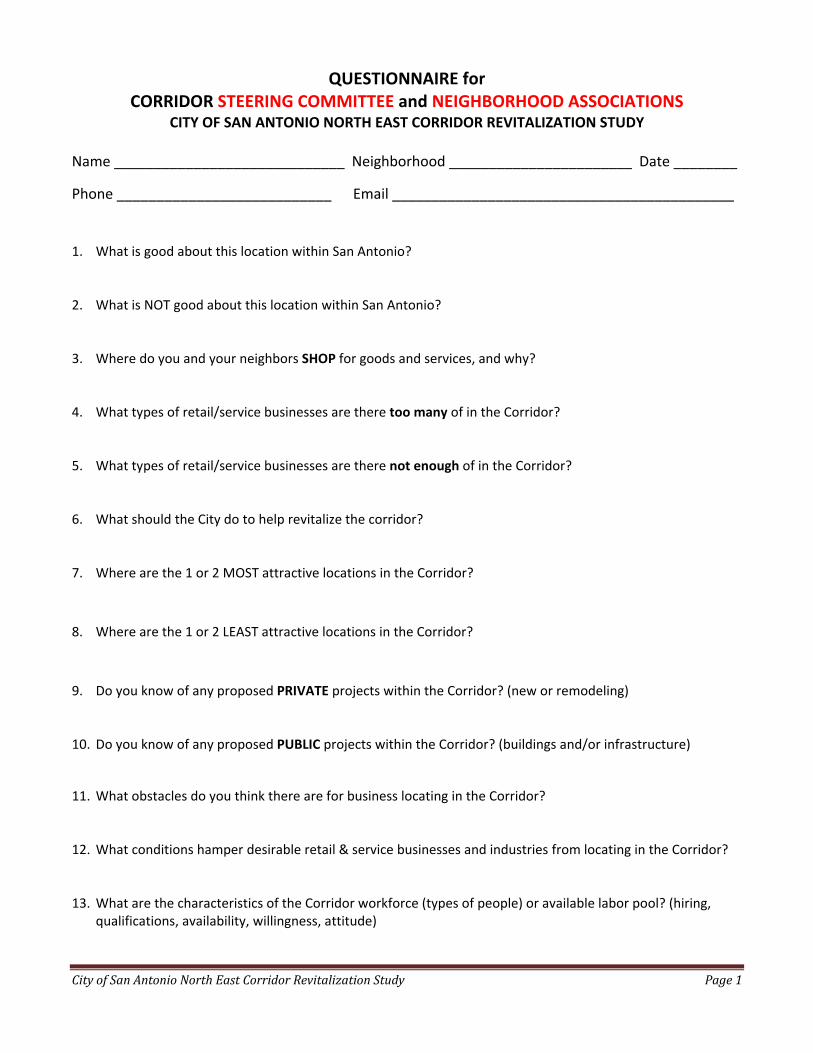
CityofSanAntonioNorthEastCorridorRevitalizationStudy Page1
QUESTIONNAIRE for CORRIDOR STEERING COMMITTEE and NEIGHBORHOOD ASSOCIATIONS
CITY OF SAN ANTONIO NORTH EAST CORRIDOR REVITALIZATION STUDY
Name _____________________________ Neighborhood _______________________ Date ________
Phone ___________________________ Email ___________________________________________
1. What is good about this location within San Antonio? 2. What is NOT good about this location within San Antonio? 3. Where do you and your neighbors SHOP for goods and services, and why?
4. What types of retail/service businesses are there too many of in the Corridor? 5. What types of retail/service businesses are there not enough of in the Corridor? 6. What should the City do to help revitalize the corridor? 7. Where are the 1 or 2 MOST attractive locations in the Corridor?
8. Where are the 1 or 2 LEAST attractive locations in the Corridor?
9. Do you know of any proposed PRIVATE projects within the Corridor? (new or remodeling)
10. Do you know of any proposed PUBLIC projects within the Corridor? (buildings and/or infrastructure)
11. What obstacles do you think there are for business locating in the Corridor? 12. What conditions hamper desirable retail & service businesses and industries from locating in the Corridor? 13. What are the characteristics of the Corridor workforce (types of people) or available labor pool? (hiring,
qualifications, availability, willingness, attitude)
NA Representatives
9/17/2013 Page 1
RESULTS OF SURVEY OF NEIGHBORHOOD ASSOCIATION REPRESENTATIVES 1.WHAT’S GOOD ABOUT LOCATION It is home and it has good access. Businesses have been there before in the well traveled main corridor.’ Lived there for 30 years, convenient to interstate. Living there for 50 years, raised nearby, convenient. Good north/south traffic flow. Some merchants are conscientious about beautification. Dist. 10 alliance gives awards for good landscaping. 2006, tried to start an initiative to clean up area. Near interstate, good for transport, likes access to other areas of town. Wurzbach Pkwy, wife travels it to go to work. Newly renovated areas, city restriction o homeowners, but businesses are not held to the same restrictions. It’s home and it is easy to get around. Has been there for over 30 years. Schools, people, wants to see it get back to how it was. Lived there for 30 years, easy access to highways, looked like developing into nice neighborhood in S.A. It collapsed in the 1980’s. Tax base is pretty good, wal-mart is coming in. Easy access to freeways, linear trails which eventually will take you all over the city. MacArthur Park is lovely too. The freeway system is also attractive. Los patios, Tobin park and Lady Bird Johnson parks are lovely. Lady Bird can stand some improvement. Transportation access to everywhere (SC) Morgan’s Wonderland, access to Loop 410 & Wurzbach Parkway (SC) Good schools (SC) Located in the middle and ripe for development, some major retailers (SC) 2.NOT GOOD Too many fast food restaurants, no curb appeal, would benefit from tasteful landscaping, more access for people to walk or ride their bikes, boutiques, art galleries, more ethnic restaurants. A place where people can get out and see their neighbors, less cars. gone downhill and moved in during 1970’s. Condos not built in the 1980’s vacant land is empty. public housing areas, section 8. Three fires in the least 4 years and to build 8ft. fence to separate. Empty buildings. Shabby looking, run-down, business and vacant buildings. Vacant building across from HEB ( the racquetball and fitness center). Could use trees and beatification. “Perrin Oaks” with fence around it. Owners that not interested. Should have shelter at VIA bus transfer station. Perrin Beitel completely fell apart after certain hours, did not want to get near the whole corridor. Not enough clothing stores, family oriented places like churches, shopping; not even a thrift store. Too many day loans and tattoo parlors. Run Down, not pleasant place to drive-could look better. Traffic is bad, lights not synchronized panhandlers. graffiti. Businesses rundown and dirty. Lots of tagging, poor or no maintenance. Empty buildings everywhere, RV parking, and code enforcement. Need to widen road; there is a lot of traffic during rush hours. Last four years it went downhill. Austin hwy and Walzem rds got cleaned up. Crime, blight, pawn shops, money box element. Poor regulations, no regulations-businesses. Lacking shopping, there is traffic, and run down homes.
NA Representatives
9/17/2013 Page 2
no landscaping, but opposed to median with trees because of lack of access for fire and emergency services. Deterioration of the area (SC) Poverty rate is double, near east side only 30% homeowner rate, signs (SC) Pawn shops, loan sharks, tattoo parlors, adult entertainment (SC) 3. WHERE DO YOU SHOP? At the pawn shops, tattoo, bars and payday loans. Within the corridor. CVS, HEB@ Nacogdoches and N. New Braunfels. The Forum. Target in the Forum; Wal-Mart on Nacog., HEB on O’Connor, The Quarry, not Perrin B. West along 410 and south along Nacog. Target, Wal-Mart on Austin Hwy. shoes from Payless on Perrin B. because to keep from business from closing Costco, HEB. HEB at Thousand Oaks and Nacog. Wal-Mart at 1604 or Austin Hwy. Ice House on Perrin B. past El Sendero. Buys gas at Wal-Mart. Gets fast food from nearby. The Forum, Rolling Oaks mall. Used to go to HEB in corridor, goes to the Forum, will probably go to Wal-Mart. Central Market. Sprouts and sometimes CVS. Not a large variety of retail in our neighborhood. Sprouts is a bet seedy but does have some organic; likes to buy bulk w/o packaging. Small businesses, restaurants, auto-related (SC) WalMart, HEB, Lowe’s, Home Depot and Sam’s have what we need (SC) 4.RETAIL TOO MANY fast food restaurants and only 2 other restaurants, Need restaurants that are not chains. Auto, used car, mechanics, title loan, money box and gentlemen’s club. Fast Food (variety might be good). Pawn shops. Loan, Title/Payday. Pawn shops, abandoned buildings/strip malls. Auto repair shops, Auto body shops, taco trucks spread everywhere. High turnover of tenants; fast food, auto shops. Title loans, pawn shops, section 8 housing, plasma center. Consumer friendly; bealls, books. Gentlemen’s clubs (SC) Pawn shops, loan sharks, tattoo parlors, adult entertainment and Mexican restaurants (SC) 5. NOT ENOUGH OF Homecare Small businesses. Clothes and shoe shops. Health related restaurants-too many fast food franchises being sold. Variety (like at the forum) shoes, and clothing shopping. Grocery Store closer to 410. Large shopping centers not necessary. Small business, office buildings, mom and pop retail merchants, Office Max, Hardware store and medical/doctor space. doctors and chiropractor are far away. Hardware stores, grocery store diversity, only 1 decent restaurant (could be more).
NA Representatives
9/17/2013 Page 3
Crafts stores, fabrics stores. Better grocery store. large supermarket near Loop 410 Sustainable businesses. Medical supply; hospitals, doctors, elderly care and rehab center for pain management. Post office has good workforce, if another big employer like that was added it improves the corridor. Day laborers; business next to army recruiting place. Jobs for MacArthur HS students and large population in need of work in an uplifting environment. Sushi Bar and art gallery!!! Hotels, Alamo College Campus (SC) Light industry, cold storage, commercial warehouse, educational, vocational schools, barber college, DRHorton homes. (SC) specialty boutiques. Have a variety of shops like the Forum, places for clothes and shoes shopping. Book shops and a variety of restaurants. 6. WHAT SHOULD CITY DO Incorporate more landscaping and trees to shade the walkways access for walking and biking along our roads Utilize the abandoned buildings or tear them down. Storefront, parking lot beautification, green spaces or parks. Widen sidewalks, better lines on streets and crosswalks. Get rid of loan businesses and tattoo parlors and the vacant racquetball and fitness center. Give grants for enhancing storefronts. Not in favor of rules/ordinance that dictate colors of paint as they restrict choices but some way to encourage enhancement. Also redo the driveways. Make info available to small businesses (not pawn shops) for funding for landscaping, building, maintenance, facelifts/renovations and lighting. These could be in the form of grants or loans, etc. Resurface street/ improvement, re synchronize the lights. Local DARE officer program is a good program. Cellular Police officer on Patrol. Have a plan similar to the Austin Hwy and Walzem Hwy corridors. Establish maintenance and up keep standards and / or enforce with a as much vigilance as residential areas. Require businesses to maintain their sidewalks as Neighborhoods are City let is go originally, maybe create a 501c3 to coordinate the revitalization. Have visual/curb appeal by codes or standards to make things match; revitalize in the manner of Austin Hwy. Infrastructure studies, public works, parks landscaping, program support (facelift), TIF, branding, new traffic counts, develop lookout as destination, notify adjacent HOAs, lighting (CPS), Perrin Homestead. (SC) Provide facts/Market actionable material for sales pitch, revitalize the neighborhood, allow no more crap. (SC) Revitalize like Pat Booker: berm, trees, NE Lakeview College; and Vienna VA, develop a theme. (SC) remove campsites off Thousand Oaks and behind Midnight Rodeo, deal with crime at apartment on O’Connor. (SC) Provide street lights in neighborhoods, slow buses on El Sendero, provide street maintenance (Avenida Prima), drainage; encourage maintenance of buildings and grounds improve signs, enforce code on outside storage (dead cars near El Sendero/Thousand Oaks), add green spaces enforce code to clean up Playmates and Players Club Improve the image, help to gain momentum (SC)
NA Representatives
9/17/2013 Page 4
7. MOST ATTRACTIVE Thousand Oaks and Nacog. Intersection where HEB used to be. The post office. Near post office, north to Wurzback Pkwy, good access and important corner as good entrance to the corridor. Taco Cabana looks nice and the Wendy’s has good landscaping. Los Patios, Tobin park, MacArthur Park, linear trail & some neighborhoods off Nacogdoches are lovely. 8.LEAST ATTRACTIVE Nacogdoches and Perrin Beitel are both eye sores. No landscaping and store fronts are unattractive. shopping center across the street from CVS is an embarrassment. Perrin B. strip is not great Thousand Oaks/Perrin B. near the payless, a series of run down shops; vacant Bank of America. The Building across from Perrin B. and Thousand Oaks, also many other vacant buidings and run down properties such as the Racquetball and Fitness building. Yellow garage and paint shop across the street near nacog and bell. Bell rd. and Higgin Cordoba tire shop, taco truck, noise, bright colors, looks like border town. All the vacant buildings. All is depressing. Perrin B and 410 is “gangland”. Infrastructure issues; streets ok, sidewalks too close to curb, need new median on Perrin b, drainage ok, no bike lanes. Playmates, triangle across from HEB, Perrin Oaks Plaza (SC) Burned-down Playmates, Perrin Oaks Plaza, triangle across from HEB at Thousand Oaks (SC) Tire shop (Cordoba) (SC) 9. PRIVATE PROJECTS KNOWN Beautification; buildings are in bad shape, signage, paint assistance; code compliance. Wal-Mart and Dunkin Donuts; fought off developer trying to build an apartment complex near neighborhood because there are not jobs for them. McDonalds remodel, and Wal-mart. new commercial buildings outside 410 on Nacogdoches that are appealing with nice landscaping. (SC) Rumored HEB expansion (SC) 10. PUBLIC PROJECTS KNOWN The hike and bike trails are a huge improvement to our area. Community Center off Judson Rd @ Lookout. Code enforcement, proactive effort to cooperate with businesses and property owners. Senior Center on Thousand Oaks at Northern Hills (SC) Post Office rehab (SC) 11. OBSTACLES No uniformity; yellow and purple storefronts not matching. Lack of vacant land. Run Down and empty buildings, gang signs .Neighborhood is getting old and this could hamper new businesses from coming to the corridor. Undesirables moving in and crime. Infrastructure, Abandoned Building (such as the racquetball and fitness center) burnt out players club. Money is advantageous for them to move in and spend money to re do buildings that should be razed.
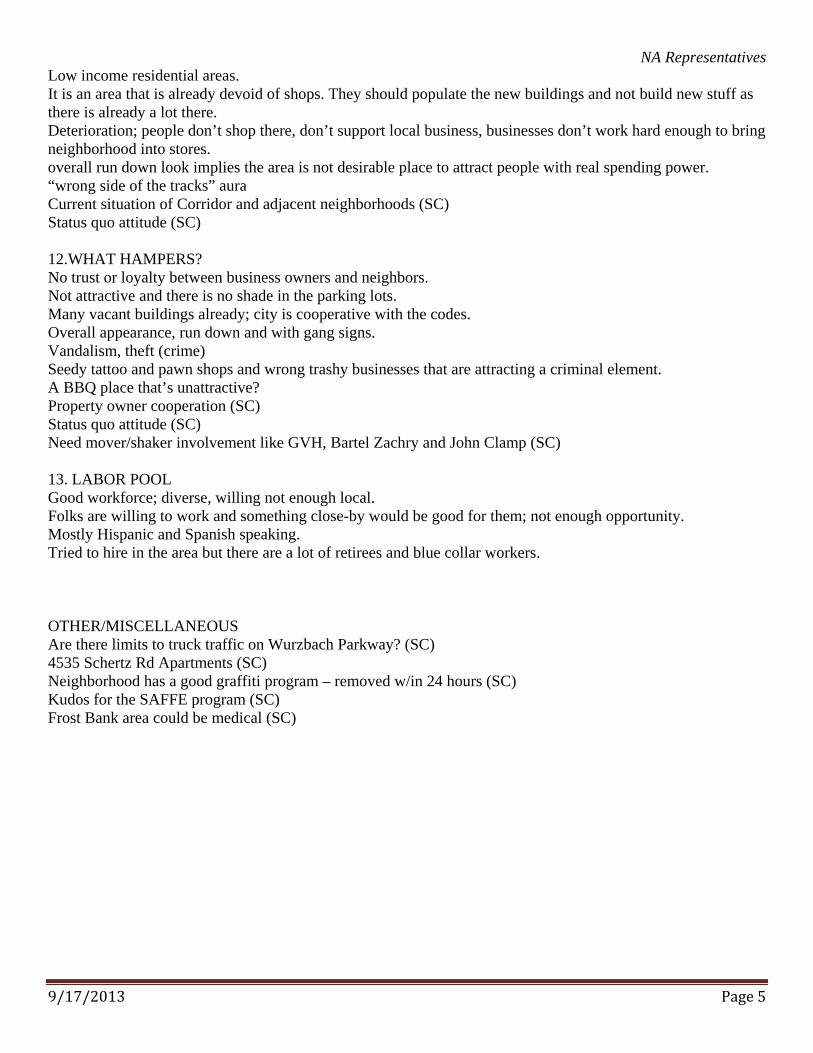
NA Representatives
9/17/2013 Page 5
Low income residential areas. It is an area that is already devoid of shops. They should populate the new buildings and not build new stuff as there is already a lot there. Deterioration; people don’t shop there, don’t support local business, businesses don’t work hard enough to bring neighborhood into stores. overall run down look implies the area is not desirable place to attract people with real spending power. “wrong side of the tracks” aura Current situation of Corridor and adjacent neighborhoods (SC) Status quo attitude (SC) 12.WHAT HAMPERS? No trust or loyalty between business owners and neighbors. Not attractive and there is no shade in the parking lots. Many vacant buildings already; city is cooperative with the codes. Overall appearance, run down and with gang signs. Vandalism, theft (crime) Seedy tattoo and pawn shops and wrong trashy businesses that are attracting a criminal element. A BBQ place that’s unattractive? Property owner cooperation (SC) Status quo attitude (SC) Need mover/shaker involvement like GVH, Bartel Zachry and John Clamp (SC) 13. LABOR POOL Good workforce; diverse, willing not enough local. Folks are willing to work and something close-by would be good for them; not enough opportunity. Mostly Hispanic and Spanish speaking. Tried to hire in the area but there are a lot of retirees and blue collar workers. OTHER/MISCELLANEOUS Are there limits to truck traffic on Wurzbach Parkway? (SC) 4535 Schertz Rd Apartments (SC) Neighborhood has a good graffiti program – removed w/in 24 hours (SC) Kudos for the SAFFE program (SC) Frost Bank area could be medical (SC)
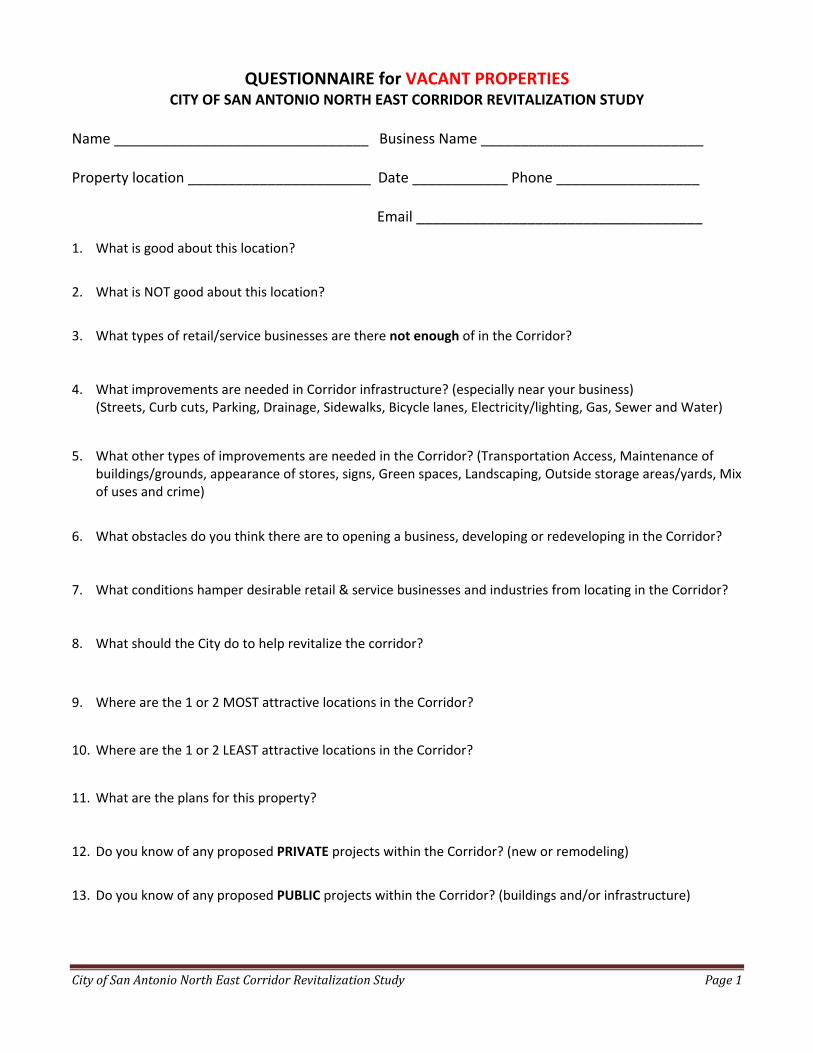
CityofSanAntonioNorthEastCorridorRevitalizationStudy Page1
QUESTIONNAIRE for VACANT PROPERTIES CITY OF SAN ANTONIO NORTH EAST CORRIDOR REVITALIZATION STUDY
Name ________________________________ Business Name ____________________________ Property location _______________________ Date ____________ Phone __________________
Email ____________________________________
1. What is good about this location?
2. What is NOT good about this location?
3. What types of retail/service businesses are there not enough of in the Corridor? 4. What improvements are needed in Corridor infrastructure? (especially near your business)
(Streets, Curb cuts, Parking, Drainage, Sidewalks, Bicycle lanes, Electricity/lighting, Gas, Sewer and Water)
5. What other types of improvements are needed in the Corridor? (Transportation Access, Maintenance of
buildings/grounds, appearance of stores, signs, Green spaces, Landscaping, Outside storage areas/yards, Mix of uses and crime)
6. What obstacles do you think there are to opening a business, developing or redeveloping in the Corridor? 7. What conditions hamper desirable retail & service businesses and industries from locating in the Corridor? 8. What should the City do to help revitalize the corridor?
9. Where are the 1 or 2 MOST attractive locations in the Corridor?
10. Where are the 1 or 2 LEAST attractive locations in the Corridor?
11. What are the plans for this property? 12. Do you know of any proposed PRIVATE projects within the Corridor? (new or remodeling)
13. Do you know of any proposed PUBLIC projects within the Corridor? (buildings and/or infrastructure)
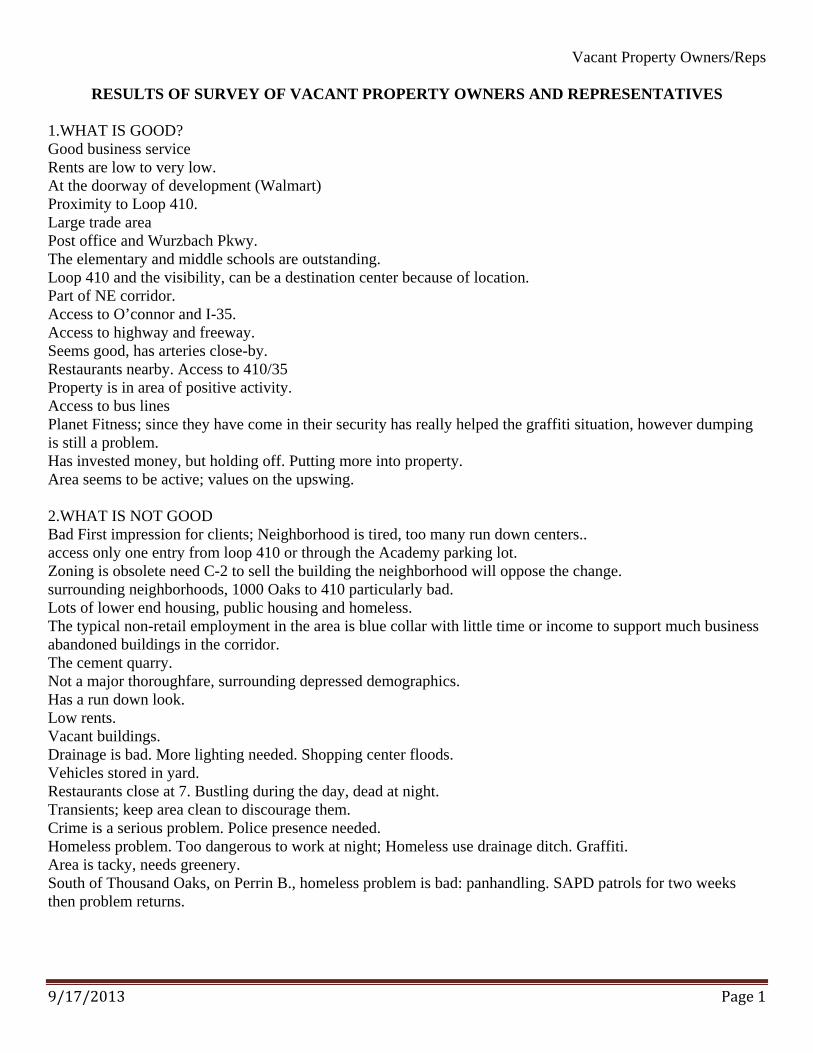
Vacant Property Owners/Reps
9/17/2013 Page 1
RESULTS OF SURVEY OF VACANT PROPERTY OWNERS AND REPRESENTATIVES
1.WHAT IS GOOD? Good business service Rents are low to very low. At the doorway of development (Walmart) Proximity to Loop 410. Large trade area Post office and Wurzbach Pkwy. The elementary and middle schools are outstanding. Loop 410 and the visibility, can be a destination center because of location. Part of NE corridor. Access to O’connor and I-35. Access to highway and freeway. Seems good, has arteries close-by. Restaurants nearby. Access to 410/35 Property is in area of positive activity. Access to bus lines Planet Fitness; since they have come in their security has really helped the graffiti situation, however dumping is still a problem. Has invested money, but holding off. Putting more into property. Area seems to be active; values on the upswing. 2.WHAT IS NOT GOOD Bad First impression for clients; Neighborhood is tired, too many run down centers.. access only one entry from loop 410 or through the Academy parking lot. Zoning is obsolete need C-2 to sell the building the neighborhood will oppose the change. surrounding neighborhoods, 1000 Oaks to 410 particularly bad. Lots of lower end housing, public housing and homeless. The typical non-retail employment in the area is blue collar with little time or income to support much business abandoned buildings in the corridor. The cement quarry. Not a major thoroughfare, surrounding depressed demographics. Has a run down look. Low rents. Vacant buildings. Drainage is bad. More lighting needed. Shopping center floods. Vehicles stored in yard. Restaurants close at 7. Bustling during the day, dead at night. Transients; keep area clean to discourage them. Crime is a serious problem. Police presence needed. Homeless problem. Too dangerous to work at night; Homeless use drainage ditch. Graffiti. Area is tacky, needs greenery. South of Thousand Oaks, on Perrin B., homeless problem is bad: panhandling. SAPD patrols for two weeks then problem returns.
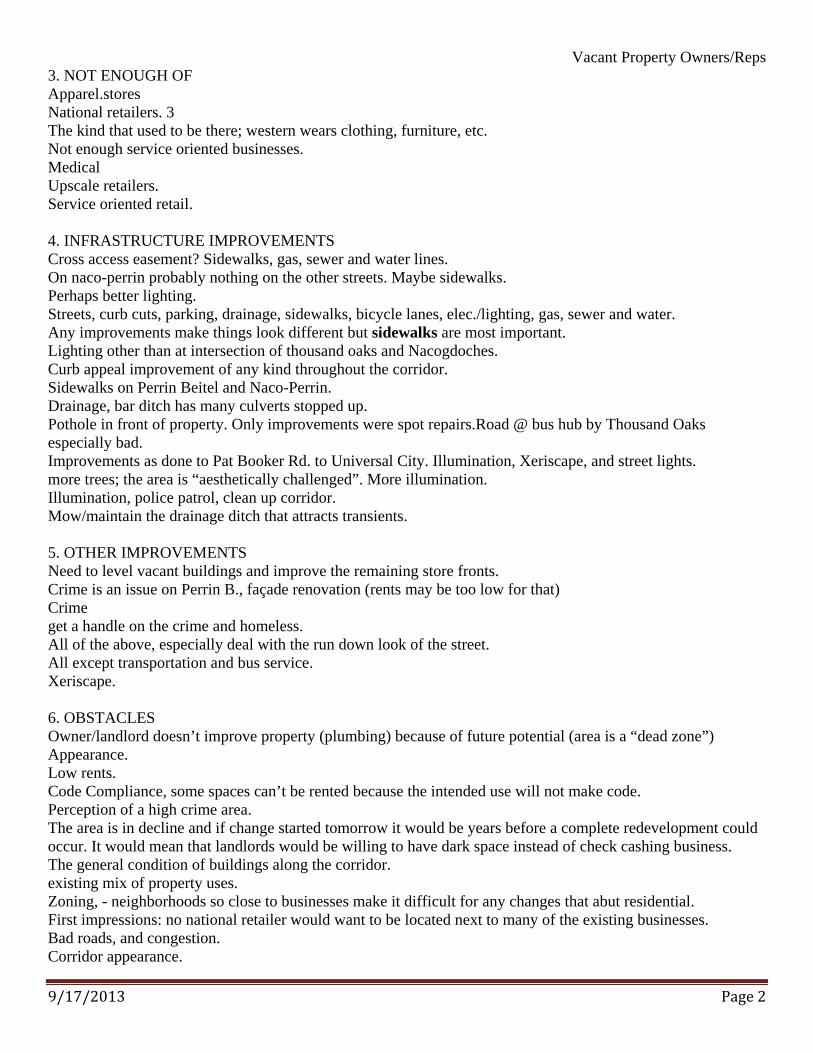
Vacant Property Owners/Reps
9/17/2013 Page 2
3. NOT ENOUGH OF Apparel.stores National retailers. 3 The kind that used to be there; western wears clothing, furniture, etc. Not enough service oriented businesses. Medical Upscale retailers. Service oriented retail. 4. INFRASTRUCTURE IMPROVEMENTS Cross access easement? Sidewalks, gas, sewer and water lines. On naco-perrin probably nothing on the other streets. Maybe sidewalks. Perhaps better lighting. Streets, curb cuts, parking, drainage, sidewalks, bicycle lanes, elec./lighting, gas, sewer and water. Any improvements make things look different but sidewalks are most important. Lighting other than at intersection of thousand oaks and Nacogdoches. Curb appeal improvement of any kind throughout the corridor. Sidewalks on Perrin Beitel and Naco-Perrin. Drainage, bar ditch has many culverts stopped up. Pothole in front of property. Only improvements were spot repairs.Road @ bus hub by Thousand Oaks especially bad. Improvements as done to Pat Booker Rd. to Universal City. Illumination, Xeriscape, and street lights. more trees; the area is “aesthetically challenged”. More illumination. Illumination, police patrol, clean up corridor. Mow/maintain the drainage ditch that attracts transients. 5. OTHER IMPROVEMENTS Need to level vacant buildings and improve the remaining store fronts. Crime is an issue on Perrin B., façade renovation (rents may be too low for that) Crime get a handle on the crime and homeless. All of the above, especially deal with the run down look of the street. All except transportation and bus service. Xeriscape. 6. OBSTACLES Owner/landlord doesn’t improve property (plumbing) because of future potential (area is a “dead zone”) Appearance. Low rents. Code Compliance, some spaces can’t be rented because the intended use will not make code. Perception of a high crime area. The area is in decline and if change started tomorrow it would be years before a complete redevelopment could occur. It would mean that landlords would be willing to have dark space instead of check cashing business. The general condition of buildings along the corridor. existing mix of property uses. Zoning, - neighborhoods so close to businesses make it difficult for any changes that abut residential. First impressions: no national retailer would want to be located next to many of the existing businesses. Bad roads, and congestion. Corridor appearance.
Vacant Property Owners/Reps
9/17/2013 Page 3
7. CONDITIONS THAT HAMPER First impressions no national retailer would want to be located next to many of the existing businesses. Crime The existing property use mix. The general condition of the buildings along the corridor. National retailers will not move into any area of no or stagnant residential growth. People don’t stop to use businesses they use the corridor or transportation from here to there. The condition of many of the buildings are not attractive to “desirable” users. Area demographics, not a lot of disposable dollars. Current tenant mix (needs to be upgraded). Homeless, the lighting, and the general tacky appearance of the corridor. - 8. WHAT SHOULD CITY DO Any appearance enhancement would help; still about 3-5 years to recovery. Police patrols. Follow-up on graffiti and dumping violations because it is not happening now. Safety: illumination and police patrols. Ordinance with façade standards. There is a stigma of high crime, financial incentives for office (day-time) users with disposable income. Financial incentives are always the answer.2 Incentives to building owners to revitalize their properties. Tax abatements and code enforcement. Sidewalks in Perrin B. More police for crime issues. Time should take up slack. Glad to sell building. General appearance with consistent signage. 9.FOOT TRAFFIC 10. MOST ATTRACTIVE Lp 410, Thousand Oaks and Nacogdoches and O’Conner and Nacogdoches. 1000 Oaks at Nacog. 1000 Oaks intersection. The whole area from 410 past 1000 oaks is in a state of slow decline. Nacog./O’Connor 11. LEAST ATTRACTIVE The tire shops, and tattoo parlors. Also the pawn shops. Perrin B. from Chacho’s to Wurzbach Pkwy and Naco Perrin. Naco Perrin x 3 410 to 1000 oaks. The quarry Wurzbach Pkwy and Perrin B. and Naco Perrin. Quarry and Wurzbach Pkwy. 12. PLANS FOR PROPERTY Rent it at market rates and wait out tough times. May build on lot. Has owned the lot since 1995. Selling soon.
Vacant Property Owners/Reps
9/17/2013 Page 4
Selling or Leasing. Possible dollar store or gym. Continue to lease building. Owner will not spend finish out dollars in this location. Tenants must fix up space themselves. Lease space as users become available. Property is for lease not for sale and although the property is a bank w/drive thru lanes it will not be sold or leased for financial institution. former Lacks store will end up as a call center or trade school. In the past, space in the center has been rented to a smoke shop, bar and tattoo parlor. Quality retailers will not rent near these types of users. Remove 12,000 sq. ft. of existing strip center adjacent to Gold’s Gym and two pad sites between the bank and the DarQue Tan center. one of the pads will be a Whataburger. property has a price on it but it is high enough to preclude offers. Seller has a window for selling the property but is still about three years out. Building is for sale, have had offers, but all require rezoning, which is impossible. 75,000 sq. ft. with 44,000 leased, owner will not subdivide into small spaces - large leases only. Owner will supply finish-out dollars. Building is for lease and owner will subdivide. Looking at two strong tenants for entire building. Showed building to several Charter Schools both indicated that it might not be a safe area for children. Continue to operate. 13. PRIVATE PROJECTS KNOWN Wal-Mart (8) and Skymine (3) ITT training institute is doing well and may need more space. Whataburger (2) Possibly a Dollar store. 14. PUBLIC PROJECTS KNOWN Everyone said “none” or “no”. 15.LABOR POOL It is definitely a blue collar area.