15. I-5 Highway Corridor (Seattle–Vancouver)
33
406 15. I-5 Highway Corridor (Seattle–Vancouver) Richard McAlary 15.1 INTRODUCTION This chapter examines one of the newest global metropolitan mega- regions, the Interstate 5 (I-5) highway corridor, stretching some 500km in the Pacific Northwest of North America. The economic and urban planning challenges facing the corridor are examined, as well as some policy and planning oversights. The corridor starts in Vancouver, Canada, and transverses the entire state of Washington, running south through metro Seattle to Portland, Oregon (Figure 15.1). This study concentrates on the northern Seattle to Vancouver section, some 180km of the I-5 corridor, as it has many transborder issues to solve and some clear bilateral and APEC related trade opportunities that require United States and Canadian governmental action. The corridor, with 2015 estimated population of 9,630,000, 711 is on the verge of mega-region status as the population approaches the 10 million mark. True global cities and urban corridors set the agenda, shape the trade culture and even create global fads. 712 Seattle and Vancouver are both showing signs of becoming true global cities. Depth of the technical, research and other ‘green’ industries is a feature of the region, which was previously focused on the export of raw products from the now declining forestry and mining sectors. The fact that the region has been able to adapt and create a multi-nodal urban corridor of growth along the I-5 corridor is testimony to Figure 15.1 Map of the I-5 Corridor (Seattle– Vancouver) Note: Built-up urban areas are shaded yellow; national parks or conservation areas are shaded green; the I-5 highway corridor is shown in red. Source: Wikipedia Commons / Citynoise.
-
Upload
khangminh22 -
Category
Documents
-
view
4 -
download
0
Transcript of 15. I-5 Highway Corridor (Seattle–Vancouver)

406
15. I-5 Highway Corridor (Seattle–Vancouver)
Richard McAlary
15.1 INTRODUCTION
This chapter examines one of the
newest global metropolitan mega-
regions, the Interstate 5 (I-5) highway
corridor, stretching some 500km in the
Pacific Northwest of North America.
The economic and urban planning
challenges facing the corridor are
examined, as well as some policy and
planning oversights. The corridor starts
in Vancouver, Canada, and transverses
the entire state of Washington, running
south through metro Seattle to
Portland, Oregon (Figure 15.1).
This study concentrates on the northern
Seattle to Vancouver section, some
180km of the I-5 corridor, as it has
many transborder issues to solve and
some clear bilateral and APEC related
trade opportunities that require United
States and Canadian governmental
action.
The corridor, with 2015 estimated
population of 9,630,000,711 is on the
verge of mega-region status as the
population approaches the 10 million
mark. True global cities and urban
corridors set the agenda, shape the
trade culture and even create global
fads.712 Seattle and Vancouver are both
showing signs of becoming true global
cities. Depth of the technical, research
and other ‘green’ industries is a feature
of the region, which was previously
focused on the export of raw products
from the now declining forestry and
mining sectors. The fact that the region
has been able to adapt and create a
multi-nodal urban corridor of growth
along the I-5 corridor is testimony to
Figure 15.1 Map of the I-5 Corridor (Seattle–
Vancouver)
Note: Built-up urban areas are shaded yellow; national
parks or conservation areas are shaded green; the I-5
highway corridor is shown in red.
Source: Wikipedia Commons / Citynoise.
407
the success of creating a strong diversified economy able to sustain itself and grow, even
in times of economic recession.713 This chapter examines some of the key areas and
challenges of economic, social and environmental sustainability in a multi-nodal mega-
region that crosses an international border.
15.1.1 Population Base
The I-5 corridor is geographically clearly defined by the mountains to the north of
Vancouver, British Columbia; by the metropolitan area of Portland, Oregon, to the south;
by the Pacific Ocean to the west; and by the Cascade Range to the east. The populations
of the respective state and provincial areas in 2014 were: Washington (7,062,000),
Oregon (3,970,000) and British Columbia (4,629,000).
The I-5 corridor is the fastest-growing population and economic area of the states of
Washington and Oregon and the province of British Columbia. Annual population growth
within the corridor is projected to be an average of 135,000 persons per year: between
30,000–35,000 in Metro Vancouver and Metro Portland and upwards of 70,000 in the
nine counties along the I-5 catchment area in Washington State. (Population catchment
areas in Oregon along the I-5 highway south of Portland are not included in this study
and do not form part of the analysis.) Two out of every three residents in British Columbia
and Washington State depend on this ‘corridor of trade’ every day of their lives. The
condition of the I-5 Highway directly affects approximately 8 million of their combined
population of nearly 12 million.
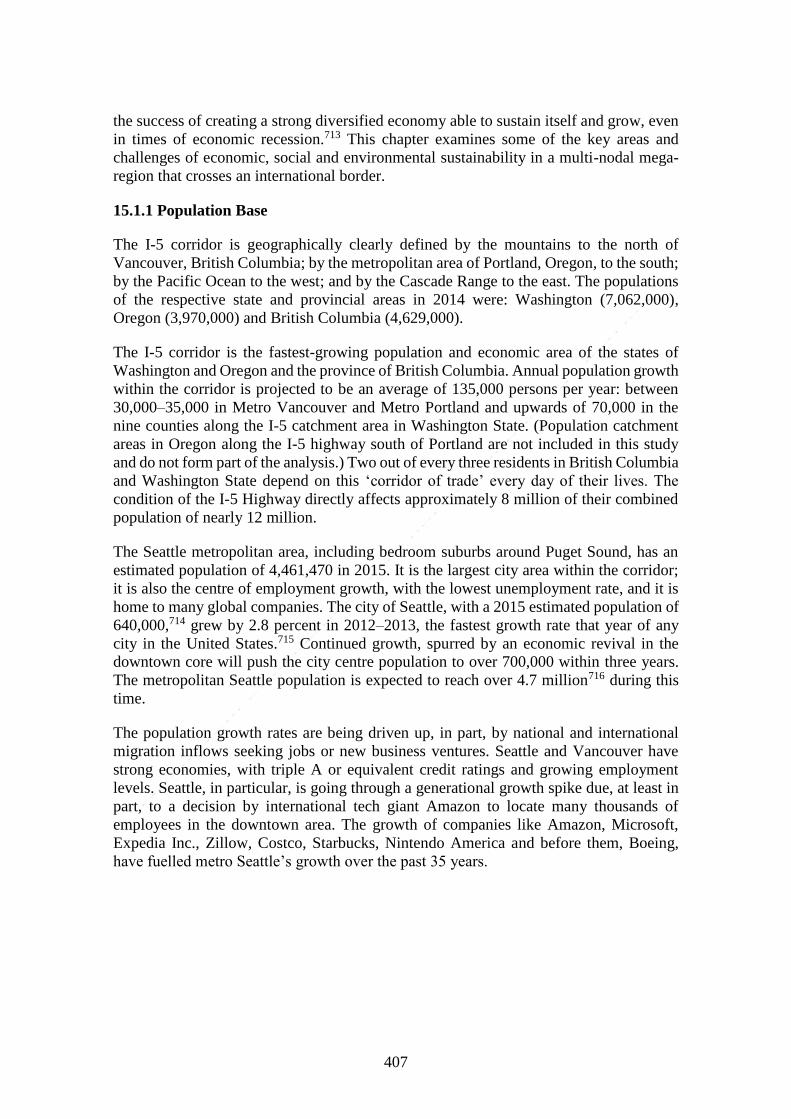
The Seattle metropolitan area, including bedroom suburbs around Puget Sound, has an
estimated population of 4,461,470 in 2015. It is the largest city area within the corridor;
it is also the centre of employment growth, with the lowest unemployment rate, and it is
home to many global companies. The city of Seattle, with a 2015 estimated population of
640,000,714 grew by 2.8 percent in 2012–2013, the fastest growth rate that year of any
city in the United States.715 Continued growth, spurred by an economic revival in the
downtown core will push the city centre population to over 700,000 within three years.
The metropolitan Seattle population is expected to reach over 4.7 million716 during this
time.
The population growth rates are being driven up, in part, by national and international
migration inflows seeking jobs or new business ventures. Seattle and Vancouver have
strong economies, with triple A or equivalent credit ratings and growing employment
levels. Seattle, in particular, is going through a generational growth spike due, at least in
part, to a decision by international tech giant Amazon to locate many thousands of
employees in the downtown area. The growth of companies like Amazon, Microsoft,
Expedia Inc., Zillow, Costco, Starbucks, Nintendo America and before them, Boeing,
have fuelled metro Seattle’s growth over the past 35 years.

408
Table 15.1 Population of the Pacific Northwest Metro Area, 2015
City 2015 estimated metro population
Seattle 4,461,470 (including Puget Sound suburbs)
Vancouver 2,870,000 (lower mainland British Columbia)
Portland 2,383,470 (including Washington State suburbs)
Source: Statistics Canada and US Census base figures, May 2015
15.1.2 Economic Base
The economic base of the corridor is heavily dependent on healthy world trade and
tourism, specifically from APEC member economies. Both Washington State and British
Columbia are export-driven economies.717 Nearly 50 percent of their combined
economies are affected by foreign trade; approximately one out of every two jobs in the
corridor has a link to either bilateral trade between the United States and Canada or
foreign trade, mostly in the Asia-Pacific.
Export of raw materials. The export of raw materials from the corridor remains very
important to the development of the US and Canadian economies. It has, in part, given
way to international trade from the new generation of companies like Microsoft, Intel and
Amazon but remains a key economic factor for the Asia-Pacific gateway ports of
Vancouver and Seattle.
Bilateral trade. Bilateral trade and short-stay visitors between the United States and
Canada also make a significant contribution to income and employment generation in the
destination cities, as do the shiploads of cargo or planeloads of tourists from overseas.718
With better transportation, the trade links between Port Metro Vancouver and the Puget
Sound twin ports of Seattle and Tacoma will strengthen. The volume of shipping and the
economic significance of the ports to the region and the continent will increase.
Emerging sectors. The traditional Pacific Northwest economic core sectors of forestry,
fishing and mining have been in either real or relative decline for more than a
generation.719 While the export of raw products from the region remains important, it will
be employment by the new sectors of the economy that will fuel further growth. The
booming tech sector, the creative film and television sector, the financial sector which is
long overdue for expansion, the health and education sectors and the rapidly growing
tourism sector should all outperform (both in economic and employment terms) the
growth of the more traditional sectors of the economy over the coming years within the
corridor.

409
15.2 ECONOMIC DYNAMICS
15.2.1 Economic History of the Region
Historically, social isolation from the rest of the continent, rich natural resources,
relatively easy primary export markets and limited road and rail corridors through the
various west coast mountain ranges helped form the Pacific Northwest economic and
social culture around the major population centres of Seattle and Vancouver. In the early
1900s, the two cities were linked by rail, road, boat and even frequent float plane
connections. In the 1950s, the road infrastructure was enhanced by a ‘superhighway’
between the two cities, which included the building of Deas Island, now known as the
George Massey Tunnel, under an arm of the Fraser River, near Vancouver City in 1957–
1959.
During the 1960–1980 period, the Boeing Company dominated the manufacturing sector
of the economy within the corridor. The primary forestry, mining, fishing and agricultural
sectors were still all relatively strong. Microsoft, Intel, Amazon and even Starbucks had
yet to enter the scene. The cruise ship tourism market had yet to emerge and tourism from
the Asia-Pacific had yet to develop. Seattle hosted the Century 21 Exposition, better
known as the 1962 Seattle World’s Fair. Seattle was positioning itself to become a world
city with ultra-modern transport systems. The World’s Fair was a ‘defining moment in
the history of Seattle’.720
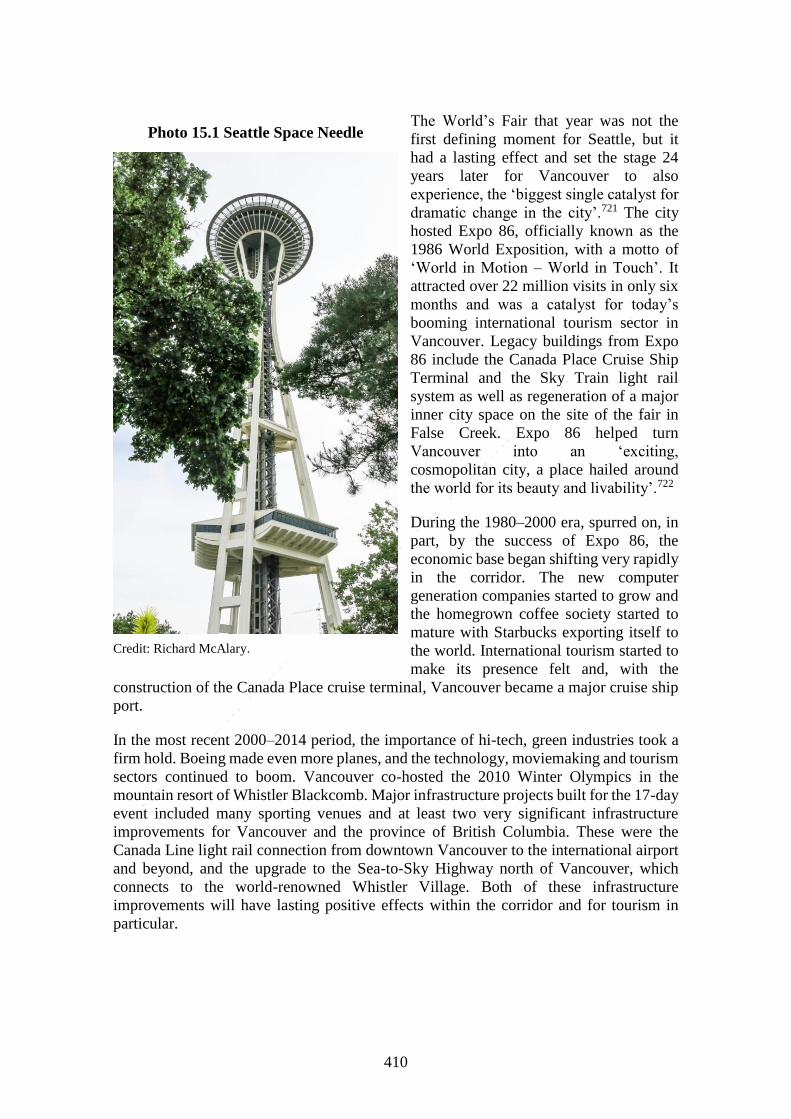
The 1962 fair attracted almost 10 million persons through the gate during the six months
it was open and left a legacy of landmark buildings and infrastructure, including the
downtown monorail and the Seattle Space Needle, which has been the main identifying
icon of Seattle ever since.
410
The World’s Fair that year was not the
first defining moment for Seattle, but it
had a lasting effect and set the stage 24
years later for Vancouver to also
experience, the ‘biggest single catalyst for
dramatic change in the city’.721 The city
hosted Expo 86, officially known as the
1986 World Exposition, with a motto of
‘World in Motion – World in Touch’. It
attracted over 22 million visits in only six
months and was a catalyst for today’s
booming international tourism sector in
Vancouver. Legacy buildings from Expo
86 include the Canada Place Cruise Ship
Terminal and the Sky Train light rail
system as well as regeneration of a major
inner city space on the site of the fair in
False Creek. Expo 86 helped turn
Vancouver into an ‘exciting,
cosmopolitan city, a place hailed around
the world for its beauty and livability’.722
During the 1980–2000 era, spurred on, in
part, by the success of Expo 86, the
economic base began shifting very rapidly
in the corridor. The new computer
generation companies started to grow and
the homegrown coffee society started to
mature with Starbucks exporting itself to
the world. International tourism started to
make its presence felt and, with the
construction of the Canada Place cruise terminal, Vancouver became a major cruise ship
port.
In the most recent 2000–2014 period, the importance of hi-tech, green industries took a
firm hold. Boeing made even more planes, and the technology, moviemaking and tourism
sectors continued to boom. Vancouver co-hosted the 2010 Winter Olympics in the
mountain resort of Whistler Blackcomb. Major infrastructure projects built for the 17-day
event included many sporting venues and at least two very significant infrastructure
improvements for Vancouver and the province of British Columbia. These were the
Canada Line light rail connection from downtown Vancouver to the international airport
and beyond, and the upgrade to the Sea-to-Sky Highway north of Vancouver, which
connects to the world-renowned Whistler Village. Both of these infrastructure
improvements will have lasting positive effects within the corridor and for tourism in
particular.
Photo 15.1 Seattle Space Needle
Credit: Richard McAlary.
411
15.2.2 Key Economic Indicators
A stable, well-educated and growing workforce, combined with the excellent seaports
and airports, plus a focused external trade culture, has been key to the corridor’s economic
strength. The foundation for continuing economic growth remains very strong.
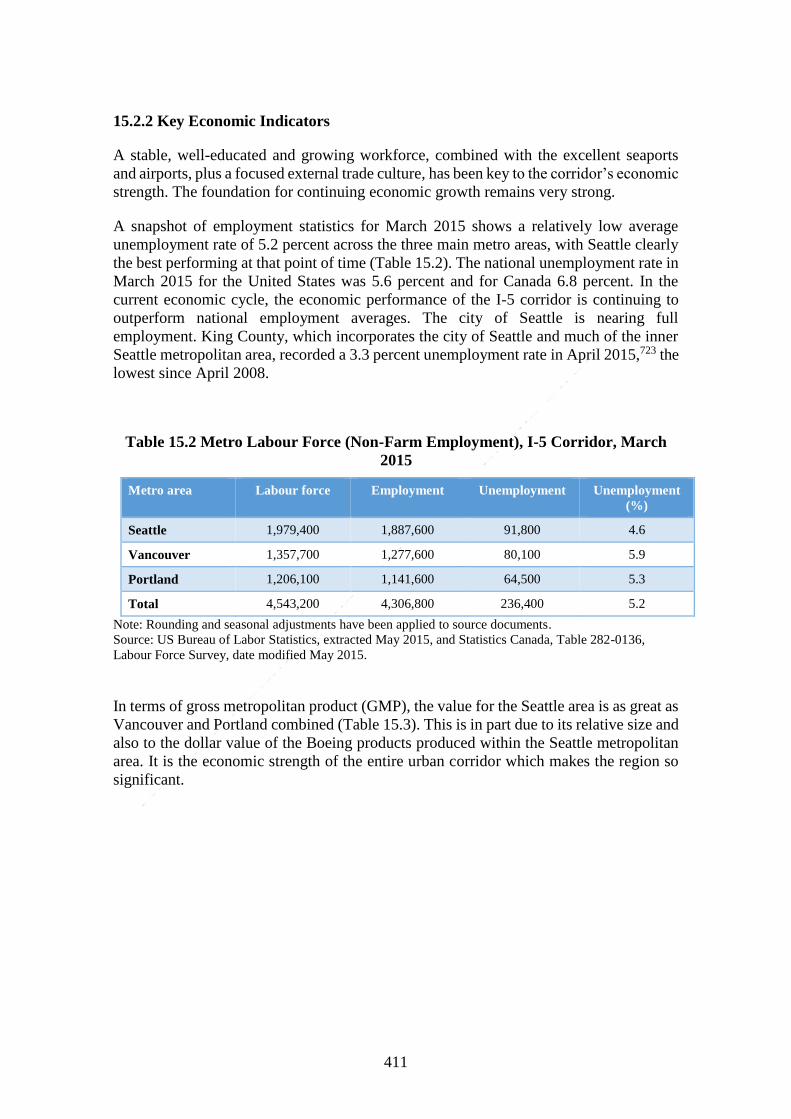
A snapshot of employment statistics for March 2015 shows a relatively low average
unemployment rate of 5.2 percent across the three main metro areas, with Seattle clearly
the best performing at that point of time (Table 15.2). The national unemployment rate in
March 2015 for the United States was 5.6 percent and for Canada 6.8 percent. In the
current economic cycle, the economic performance of the I-5 corridor is continuing to
outperform national employment averages. The city of Seattle is nearing full
employment. King County, which incorporates the city of Seattle and much of the inner
Seattle metropolitan area, recorded a 3.3 percent unemployment rate in April 2015,723 the
lowest since April 2008.
Table 15.2 Metro Labour Force (Non-Farm Employment), I-5 Corridor, March
2015
Metro area Labour force Employment Unemployment Unemployment
(%)
Seattle 1,979,400 1,887,600 91,800 4.6
Vancouver 1,357,700 1,277,600 80,100 5.9
Portland 1,206,100 1,141,600 64,500 5.3
Total 4,543,200 4,306,800 236,400 5.2
Note: Rounding and seasonal adjustments have been applied to source documents.
Source: US Bureau of Labor Statistics, extracted May 2015, and Statistics Canada, Table 282-0136,
Labour Force Survey, date modified May 2015.
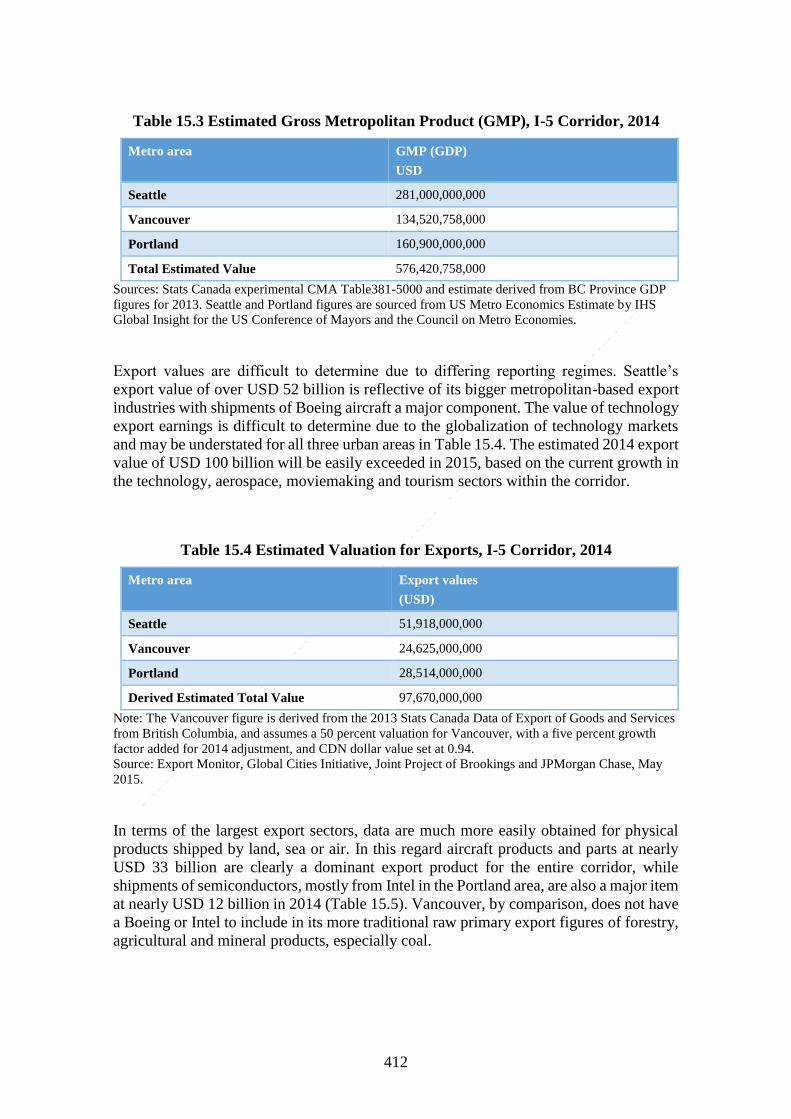
In terms of gross metropolitan product (GMP), the value for the Seattle area is as great as
Vancouver and Portland combined (Table 15.3). This is in part due to its relative size and
also to the dollar value of the Boeing products produced within the Seattle metropolitan
area. It is the economic strength of the entire urban corridor which makes the region so
significant.
412
Table 15.3 Estimated Gross Metropolitan Product (GMP), I-5 Corridor, 2014
Metro area GMP (GDP)
USD
Seattle 281,000,000,000
Vancouver 134,520,758,000
Portland 160,900,000,000
Total Estimated Value 576,420,758,000
Sources: Stats Canada experimental CMA Table381-5000 and estimate derived from BC Province GDP
figures for 2013. Seattle and Portland figures are sourced from US Metro Economics Estimate by IHS
Global Insight for the US Conference of Mayors and the Council on Metro Economies.
Export values are difficult to determine due to differing reporting regimes. Seattle’s
export value of over USD 52 billion is reflective of its bigger metropolitan-based export
industries with shipments of Boeing aircraft a major component. The value of technology
export earnings is difficult to determine due to the globalization of technology markets
and may be understated for all three urban areas in Table 15.4. The estimated 2014 export
value of USD 100 billion will be easily exceeded in 2015, based on the current growth in
the technology, aerospace, moviemaking and tourism sectors within the corridor.
Table 15.4 Estimated Valuation for Exports, I-5 Corridor, 2014
Metro area Export values
(USD)
Seattle 51,918,000,000
Vancouver 24,625,000,000
Portland 28,514,000,000
Derived Estimated Total Value 97,670,000,000
Note: The Vancouver figure is derived from the 2013 Stats Canada Data of Export of Goods and Services
from British Columbia, and assumes a 50 percent valuation for Vancouver, with a five percent growth
factor added for 2014 adjustment, and CDN dollar value set at 0.94.
Source: Export Monitor, Global Cities Initiative, Joint Project of Brookings and JPMorgan Chase, May
2015.
In terms of the largest export sectors, data are much more easily obtained for physical
products shipped by land, sea or air. In this regard aircraft products and parts at nearly
USD 33 billion are clearly a dominant export product for the entire corridor, while
shipments of semiconductors, mostly from Intel in the Portland area, are also a major item
at nearly USD 12 billion in 2014 (Table 15.5). Vancouver, by comparison, does not have
a Boeing or Intel to include in its more traditional raw primary export figures of forestry,
agricultural and mineral products, especially coal.
413
Table 15.5 Largest Export Sector by Metro Area, I-5 Corridor, 2014
Metro Area Sector/Sectors Value
(USD)
Seattle Aircraft products and parts 32,814,200,000
Vancouver Primary products, including forestry 12,382,902
Portland Semiconductors 11,729,200,000
Source: Derived from 2013 BC Stats, Statistics Canada and Export Monitor, Global Cities Initiative,
retrieved May 2015.
The interlocking economic and social bonds within the corridor include a common
language and cultural development, geographical proximity, shared values, military
alliances including the North American Aerospace Defense Command (NORAD, the
joint military command to defend both economies from external attack) and millions of
cross-border family ties. Both economies are commercial partners with economies that
are integrally bound together in the world’s largest bilateral trading relationship.724 The
Pacific Northwest is North America’s closest air and sea gateway to the Asia-Pacific
region.
Table 15.6 Key Economic Facts – United States and Canada, April 2015
United States Canada
GDP growth rate 0.2% -0.1%
Inflation -0.2% 0.8%
Interest rate (US Federal Reserve / Bank of Canada) 0.25% 0.75%
Unemployment 5.4% 6.8%
Labour force participation 62.8% 65.8%
Source: Statistics Canada, May 2015; US Department. of Labor, May 2015.
15.2.3 Key Industry Growth Sectors
15.2.3.1 Tourism
Tourism, be it international, regional or national, is a big business within the corridor.
The expansion of the cruise ship traffic to Alaska out of Vancouver or Seattle, the new
cruise market to Hawaii, the international ski destinations and the booming scenic train
business through the Rocky Mountains all contribute to the rapid growth in this sector.
Tourism employs tens of thousands within the region and generates billions of dollars of
trade; much of the trade is international.
In the 2015 MasterCard Global Destination Cities Index (based on 2014–2015 data),
Vancouver is estimated to have 3.76 million international visitors staying at least
414
overnight, having arrived through the Vancouver International Airport. These visitors
spent an estimated USD 2.7 billion dollars, ranking Vancouver’s ‘export earnings’ from
this sector the highest in Canada and third highest on the west coast of North America
after Los Angeles and San Francisco.725 This survey does not cover land-based
international tourists arriving via train, boat or road but does give an indication of just
how valuable international tourism can be to a local economy. Tourism, being, for the
most part, a ‘clean’ industry, is encouraged throughout the region and is seen by the
federal, state and provincial governments as a major growth sector in the years ahead.
One relative weakness in regional tourism is the delays evident in cross-border
automobile traffic between Canada and the United States on the I-5 at the Blaine border
crossings. The I-5 north to Vancouver has the second busiest passenger vehicle crossings
(Blaine border crossings) along the United States–Canada border and the fourth busiest
commercial crossing (Douglas border crossing).726 There are almost constant calls from
virtually every advocacy group involved in international trade and bilateral US–Canada
trade for improved border procedures for what is geographically and historically one of
the most open borders in the world. However, despite many attempts to improve the
processing time per automobile or truck, the wait time has actually increased steadily
since the last round of major improvements in 2010–2011.727
Some serious policy rethink is needed by the relevant United States and Canadian
agencies as to how to make the I-5 border crossings more efficient and not a deterrent to
the growth of both the product and services trade, including the all-important tourism
market. It would seem, from an outside observer, that at least during the peak tourism
times, more inspection lanes could be facilitated by having temporary inspection stations
either in front or behind the permanent structures. Longer term solutions could include
extending the port of entry to allow more inspection lanes or use of new technology.
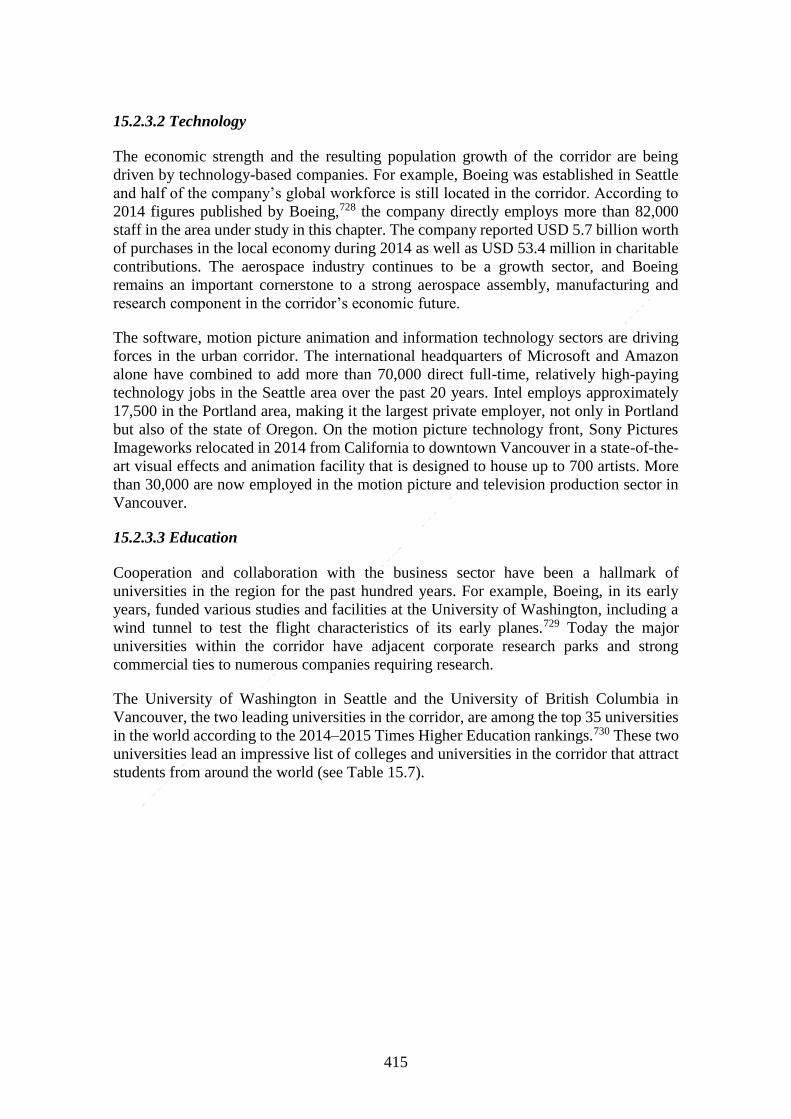
Photo 15.2 False Creek, Vancouver
Credit: Richard McAlary.
415
15.2.3.2 Technology
The economic strength and the resulting population growth of the corridor are being
driven by technology-based companies. For example, Boeing was established in Seattle
and half of the company’s global workforce is still located in the corridor. According to
2014 figures published by Boeing,728 the company directly employs more than 82,000
staff in the area under study in this chapter. The company reported USD 5.7 billion worth
of purchases in the local economy during 2014 as well as USD 53.4 million in charitable
contributions. The aerospace industry continues to be a growth sector, and Boeing
remains an important cornerstone to a strong aerospace assembly, manufacturing and
research component in the corridor’s economic future.
The software, motion picture animation and information technology sectors are driving
forces in the urban corridor. The international headquarters of Microsoft and Amazon
alone have combined to add more than 70,000 direct full-time, relatively high-paying
technology jobs in the Seattle area over the past 20 years. Intel employs approximately
17,500 in the Portland area, making it the largest private employer, not only in Portland
but also of the state of Oregon. On the motion picture technology front, Sony Pictures
Imageworks relocated in 2014 from California to downtown Vancouver in a state-of-the-
art visual effects and animation facility that is designed to house up to 700 artists. More
than 30,000 are now employed in the motion picture and television production sector in
Vancouver.
15.2.3.3 Education
Cooperation and collaboration with the business sector have been a hallmark of
universities in the region for the past hundred years. For example, Boeing, in its early
years, funded various studies and facilities at the University of Washington, including a
wind tunnel to test the flight characteristics of its early planes.729 Today the major
universities within the corridor have adjacent corporate research parks and strong
commercial ties to numerous companies requiring research.
The University of Washington in Seattle and the University of British Columbia in
Vancouver, the two leading universities in the corridor, are among the top 35 universities
in the world according to the 2014–2015 Times Higher Education rankings.730 These two
universities lead an impressive list of colleges and universities in the corridor that attract
students from around the world (see Table 15.7).

416
Table 15.7 Enrolment of Selected Universities within the I-5 Corridor, 2014–2015
Name of university Student enrolment
2014–2015
University of Washington (Seattle) 45,000
University of British Columbia (Vancouver) 43,000 full-time
16,000 part-time
Simon Fraser University (Metro Vancouver) 17,000 full-time
13,000 part-time
Washington State University (Pullman and other campuses) 26,000
Oregon State University (Metro Portland) 23,000
University of Oregon (Eugene) 21,000
University of Victoria (Victoria, BC) 16,500 full-time
5,000 part-time
Source: University websites (2015).
In the 2014–2015 university year, the University of Washington and the University of
British Columbia together had more the 25,000 graduate students enrolled, with a
teaching faculty of more than 10,000.731 Seattle, Vancouver and Portland all have highly
educated workforces with an estimated 300,000 students enrolled in post-secondary
education in 2014. The close working relationships between universities and colleges and
the private sector, plus the aggressive worldwide recruitment efforts of the technology
sector located in the three cities, will ensure a competitive economic edge for the
education sector in the region for many years to come.
15.2.4 City/Region Economic Competitiveness
15.2.4.1 Seattle
Seattle is in the heart of the corridor and is a metropolitan area that is benefiting from a
renewed interest in its harbourfront downtown core. The annual US Census figures for
2012–2013 showed the city of Seattle growing by 2.8 percent, the fastest population
growth rate of any major city in the US. According to Seattle’s Office of Economic
Development, the city is currently adding approximately 15,000 new jobs a year.
Amazon, already with an estimated 15,000 employees located in the city of Seattle out of
its global workforce of over 100,000, is expanding with a new global headquarters
precinct in downtown Seattle. This one company could have upwards of 30,000 staff
working in downtown Seattle within three years. As a direct result of the Amazon plans,
other development in Seattle is occurring. For example, Seattle issued more residential
building permits in 2014 than at any time in the past 30 years. Many of these new
apartments are within walking or biking distance of the Amazon buildings. Starbucks,
another well-known Seattle-based ‘internationally focused company’, is opening yet
more stores to cater to the influx of new workers.

417
Microsoft, another global technology company, has its headquarters in the Seattle suburb
of Redmond. It has more than 42,000 employees in the Seattle metropolitan area, plus a
significant presence in Vancouver, BC. Boeing, long a major employer in metro Seattle,
had over 82,000 direct employees in 2014, plus another 55,000 retirees in the area.
Microsoft, like Boeing did before it, has attracted many companies to the corridor area.
Spinoff Microsoft companies such as Expedia Inc. and Zillow have remained in the
Seattle area; and they are growing into global technology companies with thousands of
employees.
The Bill and Melinda Gates Foundation, established in 2000, has Seattle as its global
administrative home. The philanthropic organization has become the largest private
foundation in the world, having trust endowments in 2015 of USD 42.9 billion.732
15.2.4.2 Vancouver
Quality of life remains a strong positive in terms of attracting commerce and retaining
trained workforces. Metro Vancouver accounts for more than 50 percent of British
Columbia’s population and more than 50 percent of the province’s economic output. The
metro economy is well on its way in transitioning from a resource-based economy to a
knowledge-driven economy. Goods production accounts for only 20 percent of regional
employment; the bulk of employment is in services production. The city’s economy is
diversified and comprises mainly thousands of small business enterprises; 60 percent
have between one and four employees.
Compared to Seattle and Portland, Vancouver has fewer larger publicly traded firms and
more government and privately owned enterprises. In recent years, it has been the tech
companies and the motion picture and television sectors which have been diversifying the
Vancouver economy. Microsoft and Sony Pictures Imageworks are expanding into the
same downtown Vancouver location in 2015.
Other major employers in Vancouver include: the Jim Pattison Group, Tech Corp, Telus
Corp, HSBC Bank Canada and BC Hydro. Unlike Seattle or Portland, the list does not
include any well-known international technology, product or retail companies. The billion
dollar plus moviemaking business is big and growing with 2015 expected to be the
strongest yet.733
The Vancouver Economic Commission is the city’s economic development agency with
responsibility for the city’s economic development strategy. The strategy has identified
clean technology and digital media as the major growth sectors for the next two decades
and contends that targeted incentives focused on these sectors will lead to exceptional
growth.734 Moving forward, the commission cites the need to enhance economic
development tools, including significant incentives, to be competitive with other cities.
15.2.4.3 Portland
Portland has a highly specialized export economy with Intel dominating export product
value. The earnings from the export-focused economy support 8.6 percent of the
workforce in Portland.735 Intel has around 17,500 employees in the metro area and with
418
it’s soon to be completed Development Fabrication Facility, the number of employees is
expected to increase significantly.736
Another internationally well-known company in the Portland area is Nike, with nearly
9,000 employees. The Providence Health System is also a large local employer along with
various government agencies.
15.2.5 Innovation, Creativity and Business Entrepreneurship
The corridor has a history of innovation, creativity and business entrepreneurship.
Innovator organizations such as Microsoft, Amazon and Boeing have developed a climate
of creativity which has influenced the entire economic development of the corridor.
International trade and private-sector business entrepreneurship appear to be the core
economic driving forces in the corridor. Financial incentives from state and provincial
government are used to attract selected new businesses or to retain key new investments.
The tax regimes of Washington State, the province of British Columbia and the state of
Oregon are all quite different. Each government, through taxation and provision of
services, plays a crucial role in the economic and social health of the corridor. The
effectiveness of the different tax regimes and industry incentives is worthy of a study in
its own right. At the very high level of taxation difference, Washington State has no state
personal income tax and Oregon has no state sales tax. British Columbia has both sales
tax and income tax but has free state-supplied medical care for all. Both Oregon and
British Columbia appear on the surface to offer tax breaks for selected industries to offset
other perceived economic benefits offered by other jurisdictions.
In the final analysis, all three sub-federal governments in the corridor are globally
competitive in providing favourable economic and taxation conditions and their major
cities continue to grow and prosper through the innovation, creativity and business
entrepreneurship of the organizations that have chosen to locate there.
15.2.6 Economic Development Partnerships
15.2.6.1 Seaport Alliance Agreement
Every year brings new partnerships of some form or another to the corridor. Some of the
more significant in recent years include the 2015 Seaport Alliance Agreement that will
unify the operations of the marine cargo terminals and related functions of the Port of
Seattle and the Port of Tacoma.737 While the two adjacent ports in Puget Sound will
continue to retain existing port commission governance and ownership, the Seaport
Alliance is a major achievement and will undoubtedly add to the 48,000 jobs in the Seattle
area that depend on the two ports.
Washington State is the most trade-dependent state in the United States, with
approximately 40 percent of all jobs related to international trade.738 The efficiencies that
will ensue from this alliance of two historically competing ports cannot be overstated.
This ‘in the public interest” act backed by a USD 2.2 billion capital improvement budget
will increase trade and economic activity through Puget Sound. The Commissioners of
419
the two ports jointly received the 2015 Public Sector Economic Development Champion
Award for their role in forming the alliance.
15.2.6.2 International Mobility and Trade Corridor Project
Another example of economic partnership is the International Mobility and Trade
Corridor Project, a United States–Canada coalition of government and business formed
in 1997. It has directed approximately USD 40 million from government and the private
sector toward projects aimed at decongesting the border and improving mobility in the
British Columbia and Washington State Cascade gateways.739
The project is led by the Whatcom Council of Governments, based in the Washington
State I-5 corridor border city of Bellingham. It publishes a book of annual statistics on
border-crossing traffic that is funded by the US Federal Highway Administration. The
project has also received funding from the Bill and Melinda Gates Foundation.740
The International Mobility and Trade Corridor Project is perhaps the best source of data
on border crossings within the corridor. As a forum for over 70 organizations, its strength
lies in its ability to identify effectively, prioritize and raise funds for cross-border mobility
improvements; and it could be a model for other cross-border projects.
15.3 STRATEGIC INFRASTRUCTURE
15.3.1 Roads
The elongated rectangular nature of the Pacific Northwest as a defined geographic area
means that as a region, the north/south transportation links are essential. The inclusion of
the key highway, the I -5, in the title of this chapter underscores the importance of this
highway corridor to the region. The I-5 and the British Columbia Highway 99 road
infrastructure within the corridor were built in the 1950s as a joint United States–Canada
infrastructure project.
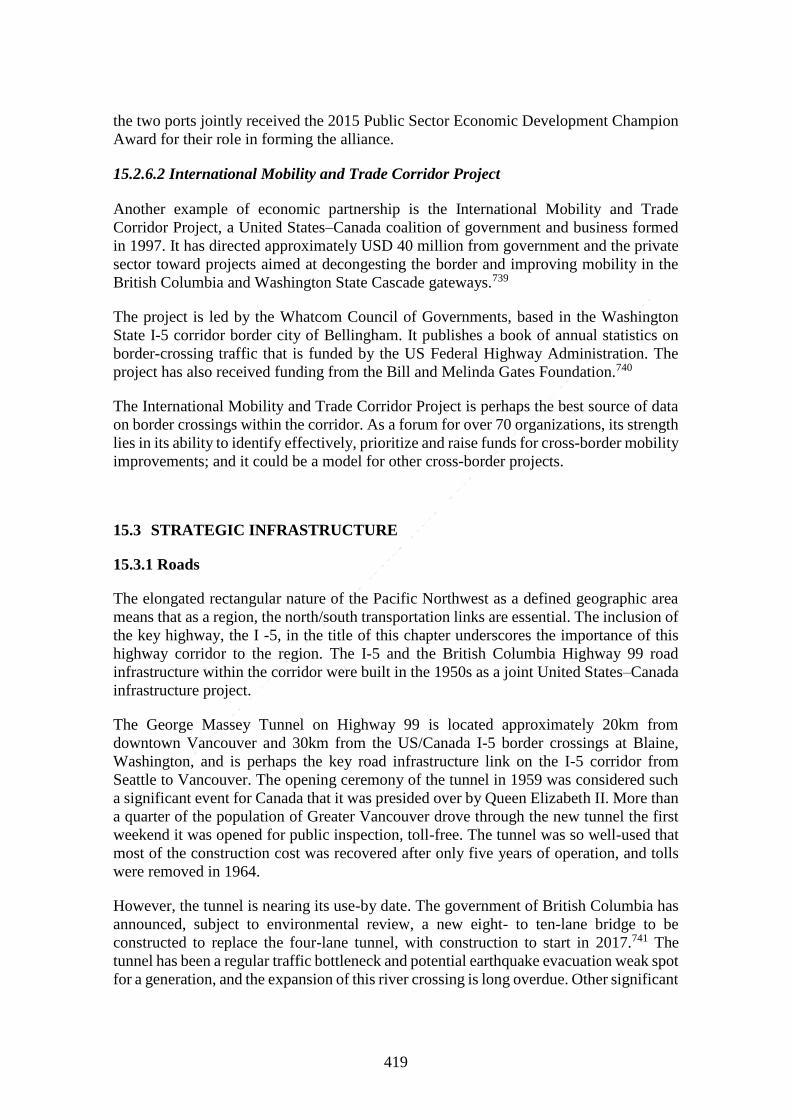
The George Massey Tunnel on Highway 99 is located approximately 20km from
downtown Vancouver and 30km from the US/Canada I-5 border crossings at Blaine,
Washington, and is perhaps the key road infrastructure link on the I-5 corridor from
Seattle to Vancouver. The opening ceremony of the tunnel in 1959 was considered such
a significant event for Canada that it was presided over by Queen Elizabeth II. More than
a quarter of the population of Greater Vancouver drove through the new tunnel the first
weekend it was opened for public inspection, toll-free. The tunnel was so well-used that
most of the construction cost was recovered after only five years of operation, and tolls
were removed in 1964.
However, the tunnel is nearing its use-by date. The government of British Columbia has
announced, subject to environmental review, a new eight- to ten-lane bridge to be
constructed to replace the four-lane tunnel, with construction to start in 2017.741 The
tunnel has been a regular traffic bottleneck and potential earthquake evacuation weak spot
for a generation, and the expansion of this river crossing is long overdue. Other significant

420
bottlenecks along the route are at the Blaine border crossings, as previously identified in
Section 15.2.3.1, and along the section of the highway traversing through metropolitan
Seattle, where traffic regularly comes to a standstill.
When completed, the new bridge will increase cross-border traffic and will certainly
stimulate housing growth and provide lower commute times to the city centre within the
southwest section of metropolitan Vancouver. It will also have a direct economic impact
on Whatcom County, WA. The next step will be to upgrade the other substandard sections
of the highway to bring the road network it back to its original, superhighway status and
better support economic growth within the entire corridor into the future.
15.3.2 Rail
The I-5 corridor is served by Amtrak Cascades, a passenger train service between Seattle
and Vancouver. This service is one of 11 federally designated rail corridors in the United
States which receives federal funding. It runs for 483km in Washington State, 53km in
British Columbia and 215km in Oregon. Amtrak Cascades carried approximately 232,000
passengers in 2014.742 The service operates on BNSF Railway’s tracks. Upgrades on the
privately owned BNSF tracks to accommodate improvements in passenger service are
funded by the US federal government and the state of Washington.
Work has commenced on upgrades to the rail line from Seattle to Vancouver, with
funding from federal and state sources. A major contribution comes from a USD 794
million grant from the US Federal Rail Administration to the state of Washington in
2010.743 This funding was provided under the US 2009 American Recovery and
Reinvestment Act;744 and has the aim of upgrading passenger rail in the state to encourage
more high-speed train services in the United States as a nation.
One example of the current upgrades is the USD 8 million track upgrade at the Blaine-
Swift Customs Facility in Washington State on the Canadian border that was constructed
in 2015. The realignment of tracks and creation of a second siding allow a better flow of
passenger train traffic in the congested freight train inspection area at the border. The cost
of improvements like this is sourced from the USD 792 million US Federal High-Speed
Intercity Passenger Rail Grant that Washington State received for the Amtrak Cascades
service. In Washington State, this programme is administered by the State Department of
Transportation. Additional federal funding, if highway realignments are necessary, can
be sourced from the Federal Highway Administration. The breakdown for the work at the
Blaine border crossing area is as follows: Federal Rail Grant funds, USD 7 million;
Washington State, USD 3.5 million; and Federal Highway funding of US 4.7 million.745
These long overdue upgrades are significantly improving the rail link through the entire
length of the corridor. A major challenge is that the rail tracks along the Seattle–
Vancouver corridor are used primarily for freight carriage, not passenger traffic. The
Amtrak Cascades service and the private Vancouver train tour operator, Rocky
Mountaineer, operate by agreement with BNSF on the BNSF tracks. The existing conflict
between passenger and freight trains operating on the same track (exacerbated by the
historic right-of-way for freight traffic) will continue and increase as passenger and
freight traffic increases. BNSF is very clear that their first priority is freight.746 BNSF and
Amtrak have, however, reached numerous agreements on sharing and upgrading the

421
tracks between Seattle and Vancouver in the last few years. This includes the construction
of a 3.35km long siding within the boundaries of Metro Vancouver at a cost of USD 7
million.
The Roberts Bank Rail Corridor also may have a role to play in the future of passenger
train movements between Seattle and Vancouver. Roberts Bank is a major coal terminal
within Metro Vancouver only a few kilometres from the I-5 and the United States border.
The Roberts Bank Rail Corridor was completed in 2014, at a cost of over USD 300
million.747 The 70km stretch of rail and road involved cost-sharing by 12 partners,
including railway companies (BNSF Railway, Canadian National Railway, BC Rail and
Canadian Pacific Railway), the Canadian government and local municipalities. The
Canadian federal government allocated funding of USD 75 million. This model of
collaborative funding could be a forerunner of what will be needed to address future
improvements to passenger train operations within Metro Vancouver.
15.3.3 Seaports and Airports
The combined marine cargo operations, passenger ship operations, air traffic freight, air
passenger uplifts and road and rail infrastructure operations in the I-5 corridor now rival,
indeed surpass, Los Angeles as the busiest ports and transit points on the North American
west coast.
When the annual passenger boarding numbers of international airports operating in the I-
5 corridor are combined, they exceed the Los Angeles International Airport’s figures. The
Los Angeles International Airport is the second busiest airport in the United States after
the Hartfield-Jackson International Airport in Atlanta. The Seattle-Tacoma International
Airport on its own is ranked the 15th busiest airport in the United States, just after Orlando
International Airport in Florida.748
The legal operation and ownership structure of the port and airport facilities in Vancouver
differs significantly from Seattle and Portland. In Canada, the organizations, while
operated locally, are owned by the Canadian federal government. In Seattle, it is the local
government who owns the infrastructure, while in Portland it is the state of Oregon. The
manner of appointments to the controlling Boards also differs significantly.
15.3.3.1 Vancouver International Airport
Vancouver International Airport is operated by the community-based, not-for-profit
Vancouver Airport Authority. The authority’s 10-member board is appointed by various
organizations that were selected by Transport Canada when the airport operations were
assigned to the then newly created Vancouver Airport Authority in 1992. The airport is
owned by the Canadian government although the federal government has only one
permanent member on the board. The governing department is the Federal Ministry of
Transport, known as Transport Canada.
Sea Island in Richmond, just a few kilometres south of the Vancouver central business
district (CBD) was chosen as an airport site in 1930 and expanded in the 1940s when
Boeing opened an aircraft manufacturing facility onsite.

422
The airport is a key element in the economic strength of Metro Vancouver, generating an
estimated USD 7.4 billion to the local economy in 2015.749 It serves as a core component
of the tourism sector and has been a key player in the growth and development of both
cruise ship traffic and the Rocky Mountaineer scenic train service. The airport estimates
that more than 26,000 people work in a variety of aviation industries at the airport, helping
to move freight, service aircraft and transport more than 19 million passengers in 2014.750
The airport, like Port Metro Vancouver, is a major employer in the metro area.
Vancouver International Airport has the second highest passenger traffic to the Asian and
Pacific markets among airports in North America, after Los Angeles International
Airport. The Seattle-Tacoma International Airport has far more North American air traffic
than Vancouver but fewer international flights. In the 2015 Skytrax World Airport
Awards, Vancouver International Airport was voted Best Airport in the World in the 10–
20 million passenger category and Best Airport in North America for the sixth straight
year. Currently, 53 airlines serve the airport, covering more than 110 non-stop
destinations worldwide.751
Photo 15.3 Aerial View of Vancouver
Credit: Richard McAlary.
15.3.3.2 Port Metro Vancouver
Port Metro Vancouver is Canada’s most important and largest port. In terms of tonnage
shipped, it ranks among the top five largest ports in North America. Port Metro
Vancouver is linked to three North American rail lines: the BNSF Railway south to
Seattle and then throughout North America; the Canadian National Railway east through
the Rocky Mountains and then to the rest of North America; and the Canadian Pacific
423
Railway also east through the mountains and then to the rest of Canada and the United
States.
Port Metro Vancouver operates as a financially independent corporation established by
the government of Canada pursuant to the Canada Marine Act, and is accountable to the
federal Minister of Transport. Despite the common ownership, Vancouver International
Airport, Port Metro Vancouver and Vancouver International Airport operate quite
separately from one another. The Vancouver Fraser Port Authority, now doing business
as Port Metro Vancouver, was created in 2008 through the amalgamation of three local
port authorities which had been operating for nearly 150 years in separate operations.
An economic impact study commissioned by Port Metro Vancouver in 2013 estimated
that the port generated USD 9.7 billion in GDP. It was responsible for creating 75,000
jobs in the local area, and 98,000 jobs overall. The flow-on effects include USD 1.3 billion
in tax revenues and USD 20.3 billion in economic output.
In 2015, the port traded over USD 172 billion in goods to more than 160 trading
economies.752 Some 140 million tons of cargo were shipped through the port in 2014. It
claims to be the most diversified port in North America. According to Port Metro
Vancouver 2014 data, the three source economies with the most inbound tonnage of cargo
are, in order, China, United States and Korea. In terms of outbound cargo, China, Japan
and Korea are the main destinations.
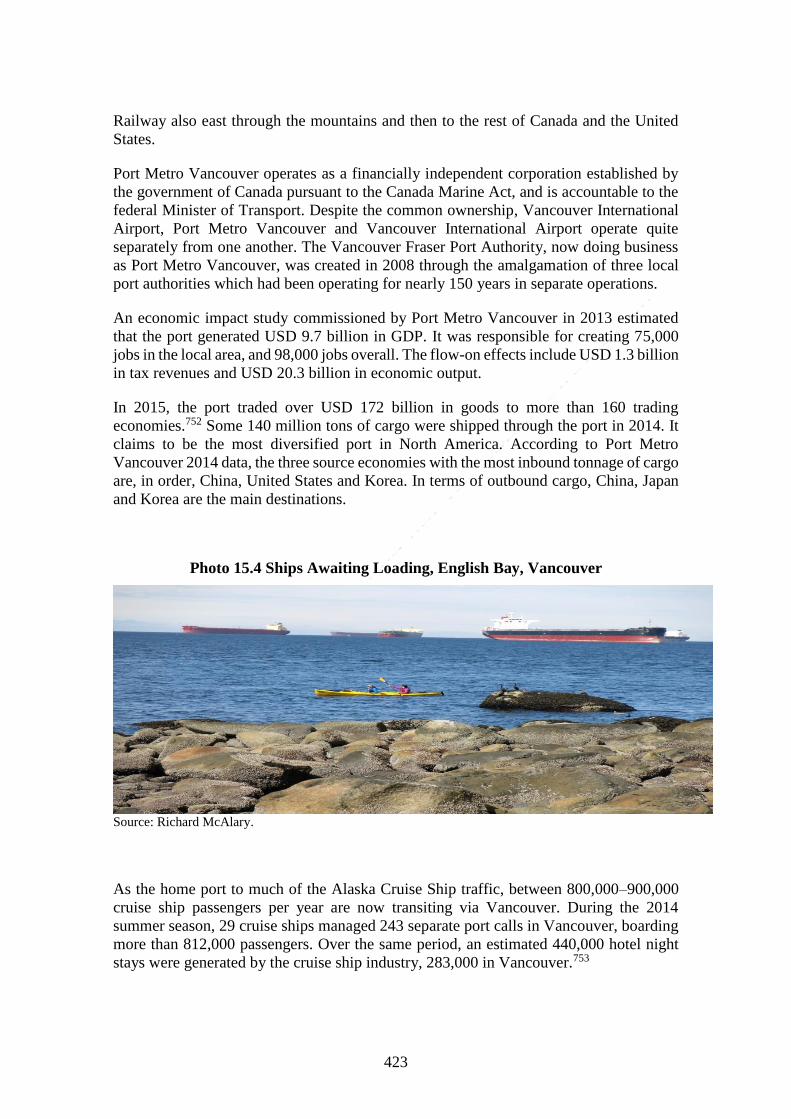
Photo 15.4 Ships Awaiting Loading, English Bay, Vancouver
Source: Richard McAlary.
As the home port to much of the Alaska Cruise Ship traffic, between 800,000–900,000
cruise ship passengers per year are now transiting via Vancouver. During the 2014
summer season, 29 cruise ships managed 243 separate port calls in Vancouver, boarding
more than 812,000 passengers. Over the same period, an estimated 440,000 hotel night
stays were generated by the cruise ship industry, 283,000 in Vancouver.753
424
15.3.3.3 Seattle-Tacoma International Airport
The Seattle-Tacoma International Airport was built between 1942 and 1944, after a grant
was offered by the US Civilian Aviation Authority to any local government that would
build a new ‘super airport’ in the Seattle-Tacoma area. The capacity of the existing
Boeing Field, at that time, was completely being used for military purposes.754 The airport
is operated by the Port of Seattle Commission, a local government agency owned by the
taxpayers of King County (which includes Seattle). The airport is governed by a five-
member Commissioner Board, who is elected at-large to a four-year term by voters of
King County.755 According to the Port of Seattle Commission, the airport operation had
an estimated economic impact in 2013 of over USD 13.2 billion, and generated over
138,000 indirect and 89,902 direct jobs in the Seattle area.756
While the airport is a significantly larger operation on a domestic basis than Vancouver
International Airport, it has fewer airlines and fewer international flights than Vancouver.
Twenty-four scheduled passenger airlines serve the airport, less than half of the carriers
currently landing at Vancouver. Alaska Airlines uses the airport as a hub for their
operations and has the most air traffic through the airport, with 51.7 percent of all
passengers on their planes. International flights are dominated by those to Vancouver at
26.8 percent and Victoria, BC at 10.7 percent.757 Flights to Vancouver and especially
Victoria are in relatively small aircraft compared to long-haul flights to Asia. In 2014, the
airport recorded 37,497,941 air passengers and more than 319,000 metric tons of air
cargo. Passenger and air cargo grew by 7.7 percent and 9.1 percent respectively over 2013
levels.758
The capital budget for the airport in the period 2015–2020 is USD 1.9 billion.759 In 2015,
the airport was named by Fodor’s Travel as one of the 10 most high-tech airports in the
USA. In keeping with the high-tech employment base of Seattle, some of the
improvements to the main passenger terminal are impressive. For example, over 2,400
additional power outlets, including USB points for electronic devices, have been installed.
There are also standing and sit-down areas at departure gates for passengers using the
airport’s free Wifi service. A new Mobile Passport Control app for Customs has also been
introduced, the third airport in the USA to introduce such an innovation.
15.3.3.4 Port of Tacoma and Port of Seattle
The Port of Tacoma and the Port of Seattle are both located on Puget Sound, and are often
referred to as the Puget Sound ports. They are owned by their respective municipalities
and operated through separate Port Commissions. (The Port of Seattle Commission also
operates the Seattle-Tacoma International Airport.)
The Puget Sound ports are linked by rail to the rest of North America by the BNSF
Railway, north to Vancouver, south to Portland, and east through the mountains.
America’s largest railway, the Union Pacific, also serves the ports, operating on BNSF
tracks south to Portland. This agreement to use the Seattle to Portland BNSF tracks dates
from 1910.760
Competitors for generations, the commissions operating the two ports announced in late
2014 that they plan to form a Seaport Alliance to unify management of the two ports’
425
marine cargo terminals and related functions, as referred to previously in Section 15.2.6.1.
The two ports will retain existing port commission governance and asset ownership under
the agreement.
The combined Tacoma and Seattle ports in 2014 were the third largest container gateway
in North America and the two marine cargo operations support more than 48,000 jobs in
the local area.761 The merger of operations is expected to position better the Puget Sound
Ports for the competitive challenges ahead. The two ports have to submit a detailed
agreement to the US Federal Maritime Commission in June 2015. At present, they are
operating under an Inter-Local Agreement which came into effect on 1 December 2014.
Formal due diligence continues through 2015.
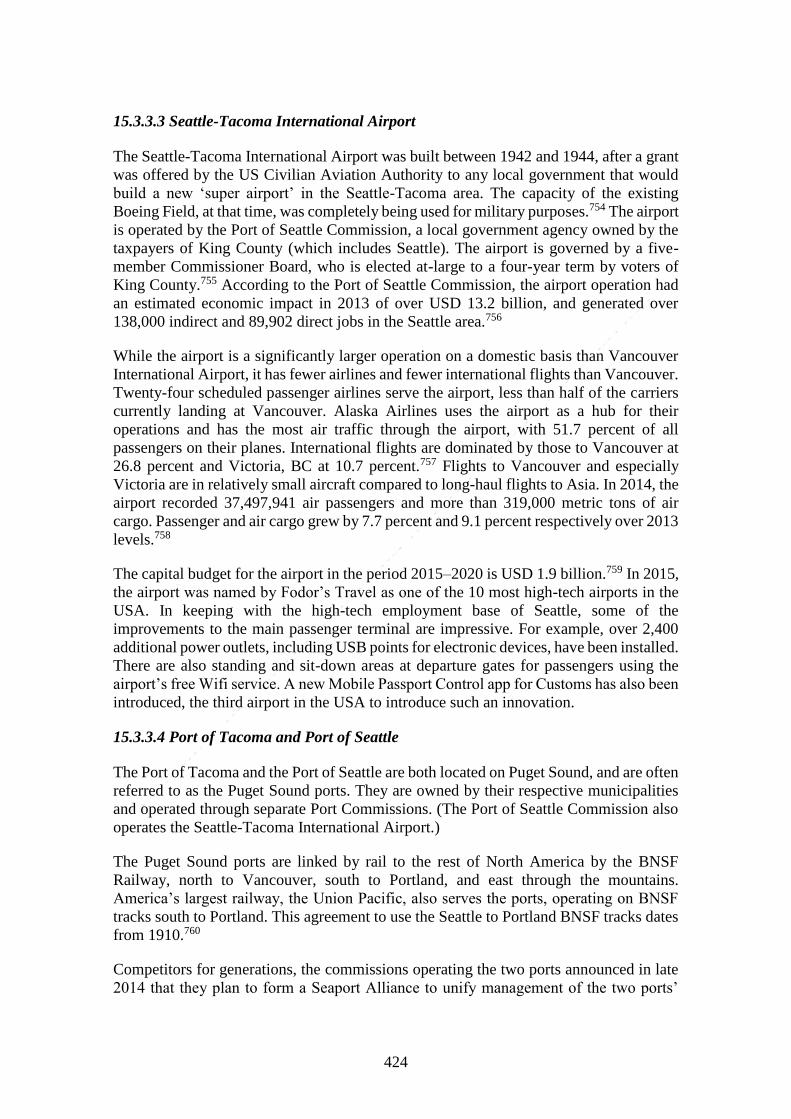
Photo 15.5 Seatle Waterfront
Credit: Richard McAlary.
With an estimated 40 percent of Washington State’s economy impacted by the two ports,
the formation of what will effectively be one operation is considered a major step forward
in trade and has received much local and national praise within the United States. Forward
economic impact estimates provided by the Port of Seattle predict that 100,000 new jobs
will be created over the next 25 years by having effective and growing port operations.
The new port structure is also expected to reduce the environmental footprint of the two
ports’ operations.
The Port of Seattle, having reached a merger of sorts with the Port of Tacoma, remains in
commercial competition with Port Metro Vancouver. However, the three ports are
working together on shared environmental issues. Most noticeable on the cooperation
side is the clean air strategy that is shared by all three ports and sets a goal of a 75 percent
reduction in diesel emissions by 2015 and 80 percent by 2020.762 While cooperation
between the Puget Sound ports and Port Metro Vancouver is ongoing and increasing, so
is the competition, none so fierce than in the cruise ship business. The Port of Seattle
426
operates two cruise ship terminals and some 192 sailings from the port, with upwards of
900,000 passengers expected in 2015.763
15.3.3.5 Portland International Airport
The Portland International Airport was built in the 1940s, and is operated by the Port of
Portland Commission, a regional government agency of the state of Oregon. The
commission has nine members who are appointed by the Governor of Oregon and ratified
by the State Senate prior to serving four-year renewable terms of office.764 The
commission is responsible for the airport and marine ports.
While designated an international airport, the Portland International Airport has few
international flights and only a single Asia-Pacific service to Tokyo. Despite this lack of
direct international air connections, the airport recorded almost 16 million passenger
movements in 2014,765 and has won several domestic airport travel awards. Like the
Seattle-Tacoma International Airport, the major air carrier is Alaska Airlines and its
subsidiary Horizon Air. The busiest international routing is to Vancouver, and the most
frequent domestic destination is Seattle, not surprising given the significance of the
economic corridor. Some of this passenger traffic would be through-traffic on connecting
or stopover Alaska Airlines flights.
15.3.3.6 Port of Portland
The governance structure of the Port of Portland is the same as for the Portland
International Airport. The port’s marine terminals, unlike at Puget Sound or Vancouver
Harbour which are ocean harbours, are located along the banks of the Willamette and
Columbia Rivers. The terminals are served by two railway networks, the Union Pacific
and BNSF. BNSF also serves Vancouver, BC and Seattle. Major exports include grain,
soda ash, potash, automobiles and hay. The major import category is automobiles.
Portland, like Vancouver, is a major port for the export of farm products especially wheat.
15.3.4 High-Speed Train Service
A high-speed passenger train service on a dedicated line between Portland, Seattle and
Vancouver could bring enormous economic benefit to the I-5 corridor. High-speed trains
are considered normal infrastructure in many areas, and especially in Europe and Japan,
and is on the drawing boards for the I-5 corridor and in other areas of the United States.
Within the corridor, there is local government support from the mayors of Seattle,
Vancouver and Portland and a private group, Cascade High-Speed Rail based in Portland;
they are promoting the idea of a high-speed passenger service to support future tourism
and economic growth.
Until a new high-speed rail link is established, the existing 100-year-old railway track
bed needs to be continually upgraded in conjunction with BNSF to facilitate increased
rail freight traffic between the Puget Sound ports and Metro Port Vancouver and to allow
the limited passenger service on the same tracks to function efficiently.
427
15.3.5 Seattle Transport Infrastructure
The Seattle transportation system received a big boost in 2004 when voters passed a
referendum to raise the local sales tax so that an extra USD 17.8 billion could be raised
for a new light rail and to expand express bus lanes and the Tacoma–Seattle commuter
rail capacity. That referendum passed with a 57 percent ‘Yes’ vote.
The airport connects to central Seattle by a light rail line. By 2020, it is estimated that
3,000 people per day will board at the airport station.
A significant modernization and expansion programme for the airport is underway and
includes new, expanded and renovated terminals, a third runway and taxiway system,
roadways and parking structures, an upgraded baggage system, an upgraded and
expanded people mover system, and an improved light rail interface.
15.3.6 Vancouver Transport Infrastructure
Between 16 March and 29 May 2015, the Metro Vancouver Transportation and Transit
Plebiscite was undertaken by the provincial government through Election BC, a non-
partisan Office of the Provincial Legislature.766 The referendum was on the question of
increasing the provincial sales tax in Metro Vancouver by half a percentage point to set
aside dedicated funds to help solve the area’s ‘significant’ transportation challenges as a
result of continued population and economic growth. There was a voter response rate of
approximately 45 percent of eligible voters on the 10-year USD 7.5 billion transportation
plan. The result was a 61.7 percent ‘No’ vote. This has put planned transportation
infrastructure projects on hold until alternative funding solutions can be found. The need
for expanded transportation infrastructure remains.
This was a unique event for Vancouver voters as no prior referendum had ever been held
in Canada on a transportation infrastructure tax, let alone through a mail-in ballot. The
referendum was modelled, in part, on the 4 November 2004 Seattle Mass Transit
Referendum.
15.3.7 Portland Transport Infrastructure
Portland has developed an extensive rail system, intended to transfer travel demand from
cars to transit. Six rail lines (five light rail) radiate toward the urban periphery, from the
downtown CBD.767 The city also supports cycling and has developed a bicycle
transportation system of nearly 500km.
15.4 SOCIAL AND ENVIRONMENTAL SUSTAINABILITY
Agencies in the Pacific Northwest have been recognized as early adopters of climate
change planning, in terms of both climate change mitigation and adaptation. Key
challenges include better integration of Climate Action Plans and long-range
transportation planning documents.
428
15.4.1 The Changing Face of the Pacific Northwest
The Asian, especially Chinese, influence is clearly evident in the streets and businesses
of Vancouver and Seattle. Based on the 2011 census in Canada, Metro Vancouver has
achieved the distinction of being the most Asian ‘major city’ outside of Asia.768 What that
means in terms of economic or social development is not clear. Starbucks is still selling
lots of coffee, and the local professional ice hockey games are still sold out.
The ‘Asian-ification’ of Metro Vancouver and a few suburbs of metro Seattle is
pronounced and will increase, according to the figures produced by Statistics Canada.769
The trend of the past 20 years or so of an increasing number of Metro Vancouver residents
having Asian roots will continue; and the Asian population is expected to grow at a faster
rate than the non-Asian population over the coming years.
The Asian population in Metro Vancouver, like Asia itself, is made up of many different
groups. The largest population groupings in Metro Vancouver in the 2011 census were
ethnic Chinese, followed by Indians and Filipinos, then by a much smaller number of
residents identifying themselves as coming from Korea, Pakistan, Iran, Viet Nam,
Afghanistan and elsewhere.770 The ethnic mix of Seattle and Portland is also different
from that of most major USA cities.
15.4.2 Relative Isolation of the Region
The Pacific Northwest and the I-5 corridor are geographically separated from the rest of
North America by mountain ranges to the north, east and south. This physical separation
has contributed to a culture and racial mix different from that of the rest of the United
States or Canada. The economic and social ties to Asia of this area should contribute to
an increase in trade with the Asia Pacific region.
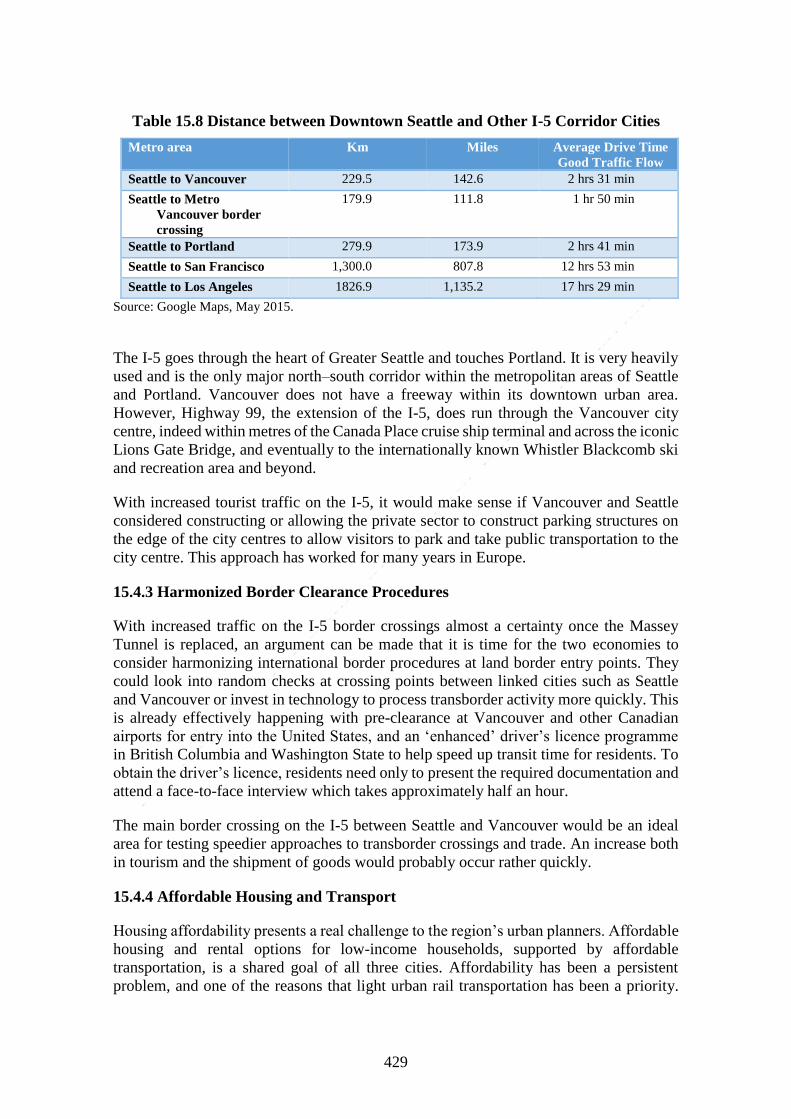
In terms of nearby major cities, Vancouver and Portland only have Seattle (Table 15.8).
Vancouver, separated by a series of mountain ranges to the east, is a 10- to 11-hour drive
away from Calgary, the nearest city other than Seattle. Similarly, San Francisco, the
closest West Coast major city to Portland, is between a 10- and 11-hour drive away from
it, or more than 1,000km to the south. By comparison, Vancouver’s southern suburbs are
less than two hours’ drive, or 160km, away from the northern urban area of Seattle. As a
point of reference, the US/Canada I-5 border crossing is located a mere 40- to 45-minute
drive, or 50km, away from downtown Vancouver. Virtually the entire population of the
corridor lives within a one-hour commute to the I-5 or the connecting BC Highway 99.
(Highway 99 was originally signposted to correspond with US Route 99.)
429
Table 15.8 Distance between Downtown Seattle and Other I-5 Corridor Cities
Metro area Km Miles Average Drive Time
Good Traffic Flow
Seattle to Vancouver 229.5 142.6 2 hrs 31 min
Seattle to Metro
Vancouver border
crossing
179.9 111.8 1 hr 50 min
Seattle to Portland 279.9 173.9 2 hrs 41 min
Seattle to San Francisco 1,300.0 807.8 12 hrs 53 min
Seattle to Los Angeles 1826.9 1,135.2 17 hrs 29 min
Source: Google Maps, May 2015.
The I-5 goes through the heart of Greater Seattle and touches Portland. It is very heavily
used and is the only major north–south corridor within the metropolitan areas of Seattle
and Portland. Vancouver does not have a freeway within its downtown urban area.
However, Highway 99, the extension of the I-5, does run through the Vancouver city
centre, indeed within metres of the Canada Place cruise ship terminal and across the iconic
Lions Gate Bridge, and eventually to the internationally known Whistler Blackcomb ski
and recreation area and beyond.
With increased tourist traffic on the I-5, it would make sense if Vancouver and Seattle
considered constructing or allowing the private sector to construct parking structures on
the edge of the city centres to allow visitors to park and take public transportation to the
city centre. This approach has worked for many years in Europe.
15.4.3 Harmonized Border Clearance Procedures
With increased traffic on the I-5 border crossings almost a certainty once the Massey
Tunnel is replaced, an argument can be made that it is time for the two economies to
consider harmonizing international border procedures at land border entry points. They
could look into random checks at crossing points between linked cities such as Seattle
and Vancouver or invest in technology to process transborder activity more quickly. This
is already effectively happening with pre-clearance at Vancouver and other Canadian
airports for entry into the United States, and an ‘enhanced’ driver’s licence programme
in British Columbia and Washington State to help speed up transit time for residents. To
obtain the driver’s licence, residents need only to present the required documentation and
attend a face-to-face interview which takes approximately half an hour.
The main border crossing on the I-5 between Seattle and Vancouver would be an ideal
area for testing speedier approaches to transborder crossings and trade. An increase both
in tourism and the shipment of goods would probably occur rather quickly.
15.4.4 Affordable Housing and Transport
Housing affordability presents a real challenge to the region’s urban planners. Affordable
housing and rental options for low-income households, supported by affordable
transportation, is a shared goal of all three cities. Affordability has been a persistent
problem, and one of the reasons that light urban rail transportation has been a priority.

430
The mass gentrification of the inner-city core of Vancouver and now Seattle and Portland
is leading to a greener, more environmentally sound development in all three cities.
However, inner-city high-rise developments are pushing up prices and completely
changing many inner-city neighbourhoods. The housing affordability issue is not new,
and it continues to be a major economic and social challenge, especially in Vancouver
and increasingly so in Seattle.
15.4.5 Environmental Sustainability
The Pacific Northwest is renowned for its pristine environmental assets. This includes
significant forested areas, wilderness and the world’s largest temperate rainforest. Water
is a significant environmental regional resource. The Pacific Northwest bioregion covers
less than 10 percent of the continent but contributes between 20 and 25 percent of total
surface runoff. Whatever the future pressures on economic development are, the natural
resources of the region need to be protected for the ecological wellbeing of the continent.
The region is a highly active geologic area in proximity to the Cascadia Subduction Zone
– a fault that stretches from northern California to mid-Vancouver Island, located to the
west of the city of Vancouver. It is a seismically active region and an area of damaging
earthquakes, volcanic activity and landslides.771
The issues associated with the natural environment and those relating to future seismic
activity are significant factors in the region and may have implications for future planning
and economic development.
15.5 URBAN GOVERNANCE AND PLANNING
The metropolitan areas of Vancouver, Seattle and Portland all provide leading examples
of planning for urban growth management and sustainability in a North American and
APEC context. This is linked to the existence of effective governance arrangements at the
metropolitan level in each urban area. The core cities of Seattle, Vancouver and Portland
are all relatively small within their respective metro census areas, with population bases
of between 600,000–650,000 people. The involvement of numerous local governments
and federal and state level governments in urban issues means that urban governance
arrangements are important and raise many challenges. Growth management and urban
transportation issues are very important as the increasing residential urban sprawl needs
to be managed, and people need to travel to employment located in the urban core.
15.5.1 Metro Vancouver
The Vancouver metropolitan area has a long history of regional planning and governance
going back to the 1940s following devastating flooding in the Fraser River delta. The
Greater Vancouver Regional District was established in 1968; and in 2007, it became
known as Metro Vancouver. Metro Vancouver is a regional-level government which
operates as a federation of local municipalities. It includes 21 municipalities, one Treaty
First Nation and one Electoral Area. Municipalities appoint directors onto the Metro
431
Vancouver Board. The board has 38 directors, and each is allowed one vote for every
20,000 residents, up to a maximum of five votes.772
Metro Vancouver has statutory powers773 to provide a wide range of regional and urban
services. These have been mandated up from municipalities or down from the British
Columbia provincial government and include: water supply, sewerage, environmental
regulation, regional parks and regional planning. They do not include regional
transportation planning and services that are the responsibility of Translink, a separate
statutory authority.
The Greater Vancouver Regional District (and later Metro Vancouver) has been a world
leader in planning for liveability and growth management. In the 1970s, the Greater
Vancouver Regional District developed and operationalized the concept of Vancouver as
a ‘Liveable Region’ based on an innovative and interactive process of community
engagement involving the public, planners and politicians.774 These ideas have informed
and inspired planning and plans in the region ever since and have underpinned
Vancouver’s recognition as one of the world’s most liveable cities.775 They are expressed
in the Metro Vancouver 2040 plan776 adopted in 2011 in terms of five goals and strategies,
as follows:
Create a compact urban area
Support a sustainable economy
Protect the environment and respond to climate change impacts
Develop complete communities
Support sustainable transportation choices.
The Metro Vancouver approach has several key strengths. One is active collaboration by
municipalities at the regional level. Members also benefit from joint borrowing on
collective credit; the region respects local municipal autonomy where not in conflict with
the regional purpose; and the regional arrangement allows for a united front in dealing
with senior (provincial and national) governments.
Challenges777 include: local municipal interests overriding the regional interest; failure to
deal effectively with regional economic and social issues; lack of involvement by the
provincial government; and a fragmented approach to planning and funding regional
transportation.
15.5.2 Puget Sound Regional Council
The Seattle metropolitan area is governed by the Puget Sound Regional Council.778 The
council is a regional-level government established in 1991 by an inter-local agreement
signed by all member governments. It includes four county governments (King, Kitsap,
Pierce and Snohomish) and 76 cities, towns and tribal councils. An Executive Board of
32 representatives meets monthly. All mayors and elected representatives meet annually
in a General Assembly to pass the budget and elect office holders.
The council exercises some powers (e.g. land use) devolved upwards from local
governments, and a wide variety of powers delegated down from the state of Washington
432
and the US federal government. These include powers in relation to urban growth
management, air quality management and economic development. The council is also a
federally mandated metropolitan planning organization for transportation planning and
funding.
The Washington State Growth Management Act applies to Seattle and sets out directions
for metropolitan governance. It covers:
designation and conservation of natural resource lands of long-term commercial
significance
designation and preservation of environmentally critical areas
directing new growth to urban growth areas
ensuring new developments are contingent on transportation and other public facilities
requiring local governments to include essential public facilities or affordable housing
in their jurisdictions.
Under the Growth Management Act, the Puget Sound Regional Council has prepared a
comprehensive growth management strategy called Vision 2040,779 which was adopted in
2008. Vision 2040 is a strategy and growth pattern for accommodating the 5 million
people expected to live in the region by 2040. ‘People, prosperity, and planet’780 provide
the central themes for the strategy and indicate that leaders of the Council will take into
account social, cultural, economic and environmental aspects when making decisions.
Some key strengths of the approach taken by the Puget Sound Regional Council include
involvement in regional issues by member local governments and transport agencies;
integration of land-use and transport planning and funding; and a regional approach to
economic development. Some weaknesses and challenges include: continuing low-
density urban sprawl outside of the urban growth boundary, failure to deal effectively
with environmental and social issues, and growing urban traffic and freight congestion.
15.5.3 Portland Metro
The Portland metropolitan area consists of Portland, Oregon, and across the Columbia
River, Vancouver, Washington. Portland, Oregon is governed by Portland Metro
Council,781 an elected regional-level government established by the state of Oregon in
1979. A major difference, therefore, between it and Metro Vancouver or the Puget Sound
Regional Council is that the six members of the Portland Metro Council and its President
are directly elected by the public.

433
The Portland Metro area incorporates three county governments (Clackamas, Multnomah
and Washington) and 25 municipalities as well as unincorporated areas. The council has
its own statutory powers in relation to land use, growth management, transport, solid
waste, parks and open space. It also has powers delegated from the US federal
government as a metropolitan planning organization for transportation planning and
funding.
Oregon has been a leader in urban growth management in the USA. It introduced the first
state-wide urban growth boundary policy in the early 1970s aimed at protecting the state’s
natural environment and beauty. This required the preparation of long-range plans
addressing urban growth. In 1995, Portland Metro adopted a 50-year plan called the 2040
Growth Concept. Policies in the plan encourage:782
Compact development that uses land and money efficiently
A healthy economy that generates jobs and business opportunities
Protection of farms, forests, rivers, streams and natural areas
A balanced transportation system to move people and goods
Housing for people of all incomes in every community.
Some key strengths of the Portland Metro approach include: integration of land-use and
transport planning and funding; a regional approach to economic development and the
natural environment; and a clear regional focus and mandate by elected members.
Members are elected to serve renewable four-year terms.
Photo 15.6 Portland Waterfront
Credit: Richard McAlary.
434
15.6 PARTNERSHIPS FOR SUSTAINABLE DEVELOPMENT
There are many well-developed partnerships between governments, business and
communities in the urban centres supporting the development of the corridor. The
following describes some that demonstrate good practice elements of sustainability.
15.6.1 Federal Partnerships
The most significant recent example of partnerships for development in the corridor is
the 4 February 2011 ‘shared vision’ document released by President Barack Obama and
Prime Minister Stephen Harper entitled ‘Beyond the Border’. This declaration articulated
how the United States and Canada would work together to address threats while at the
same time ‘facilitating the legitimate movement of people, goods, and services across our
shared border’. To further strengthen the trade aspect of the shared vision, the White
House released the declaration with the subheading ‘A shared vision for perimeter
security and economic competitiveness’.783
The Civilian Extraterritorial Jurisdiction Act was also introduced to the US Congress in
2011 but failed to be enacted. This bill was reintroduced on 14 July 2014, but as of May
2015, had yet to pass the US Congress. Despite this lengthy process, the US Secretary of
Homeland Security and the Canadian Public Safety Minister, on 16 March 2015, signed
a new Preclearance Agreement which covers marine and rail, in addition to the existing
air transport, among other enhancements to pre-clearance and joint or co-location of
border security in small areas.
The Preclearance Agreement specifically lists improvements at the British Columbia and
Washington State border area, including enhancements to the rail link between Seattle
and Vancouver. In the accompanying press statement released by the US Embassy in
Ottawa, the US Secretary of Homeland Security described the agreement as ‘a major
achievement that will produce benefits for the United States and Canada’.784 His Canadian
counterpart stated that ‘it will enhance security at our border and create jobs and growth
in Canada by improving the flow of legitimate goods and people between our two
countries’.785
15.6.2 State- and Provincial-Level Partnerships
At the state level, there are also numerous agreements that try to improve the restricted
trade within the corridor. One such agreement is a memorandum signed on 9 October
2009 between Washington State and British Columbia entitled ‘Action on Regional
Transportation Planning and Coordination’. This memorandum also refers to other
agreements such as the 2006 British Columbia–Washington State Transportation Protocol
and the 2008 British Columbia–Washington State Action Plan for Border
Management.786
15.6.3 Municipal-Level Partnerships
At the municipal level, there are also very positive signs of wanting to achieve greater
inter-corridor linkages. The mayors of Vancouver, Seattle and Portland signed a ‘pact’ to
lobby other levels of government to secure a high-speed railway service through the
435
Pacific Northwest.787 The mayors also lobbied for a second Seattle to Vancouver Amtrak
Cascades service to remain in place following its temporary approval for the Vancouver
2010 Winter Olympics. This lobbying effort was successful and the second daily train
service is now operating on a permanent basis.
The Whatcom Council of local governments in north western Washington State shares
the border with metropolitan Vancouver. As previously highlighted in Section 15.2.6.2,
the council provides coordination and secretariat services on behalf of the International
Mobility and Trade Corridor Program. It produces an annual Resource Manual that is a
statistical compilation of cross-border activity within the I-5 corridor. The council
receives funds from a wide range of sponsors and is credited with having lobbied for some
USD 40 million dollars’ worth of service and infrastructure improvements in the border
area of the I-5 corridor since its establishment in 1997.788
15.6.4 Joint Federal Authority for the Trans-Border Section of the I-5 Corridor
There is no shortage of interested parties trying to improve bilateral trade and tourism in
the I-5 corridor. What appears to be needed is a bilateral federal administrative body that
has the authority and budget to make infrastructure and service improvements happen
more efficiently and in a more timely manner.
When a span of the I-5 bridge collapsed into the Skagit River in Washington State in
2013, a ‘State of Emergency’ was declared by the Governor of Washington.789 The
bridge, located not far from the Canadian border and the I-5, was deemed to be a vital
transportation link between Vancouver and Seattle, and in the national interest, needed to
be repaired quickly. The total cost to repair the bridge was USD 19,844,383. The US
federal government reimbursed USD 18,773,638 or nearly 95 percent of the total cost to
Washington State, given the national economic importance of the bridge.790
This sort of federal fiscal intervention for the I-5 is an example of what could happen, and
should be happening, from a preventative perspective, on both sides of the border to
upgrade and enhance the I-5 corridor.
15.6.5 Strategy for the Development of Partnerships
Given that the three main cities within the I-5 corridor are all striving to be world leaders
in sustainable city culture, the sharing of information on ways to achieve this from some
of the larger urban populated areas of the Asia-Pacific would seem an excellent start to a
new form of city-to-city relationship, and could potentially be facilitated by APEC.
Vancouver, for example, through its ‘Greenest City 2020: A Bright Green Future’
initiative, plans to become fully sustainable and the greenest city in the world within five
years. The city planners refer to Vancouver’s international reputation as a ‘Mecca of
green enterprise’.791 From Portland’s and Seattle’s planning documents, all three cities
appear to be after similar accolades.
Seattle and Vancouver have existing sister city relationships. However, neither Seattle
nor Vancouver has had any new activity for almost 20 years, and neither are seeking to

436
enter into any new agreements.792 There also appears to be little ongoing activity in the
sister city programme of Seattle or Vancouver in 2015.
Portland does have an active programme, with nine sister city relationships and one
‘friendship city’ agreement. In a unique arrangement, all sister city associations must be
operated through community non-profit organizations and be independently funded by
donors and grants. No funding is provided by the city, but sister city associations must
maintain at least USD 10,000 in their bank accounts, hold regular meetings and submit
financial reports to the city through the Director of International Relations, who works in
the Mayor’s office. The City Ordinance states these associations are ‘financially
independent’ yet accountable to the Mayor of Portland.793
The funding issue may have been a factor in limiting the number of such agreements in
other cities within the region, perhaps the Portland model could overcome this funding
and sustainability issue.
15.6.6 Action Agenda for the Corridor
The airports and seaports within the region have received billions of dollars in investment
and are well-positioned for future increase in trade across the Pacific. On the other hand,
there has been some neglect of the intra-corridor road and rail infrastructure compounded
by more restrictive border security protocols since 2001.
Truck and rail bilateral declared trade value through the I-5 corridor between Seattle and
Vancouver in 2013 was USD 17.3 billion, excluding trans-shipment of goods between
ports and the value of tourism expenditure. Given this, the governments of the United
States and Canada need to find a way to resolve the border issues. The state of Washington
and province of British Columbia, working with their respective federal governments,
need to upgrade the road and rail infrastructure. Earthquake tolerant bridges and roadways
should be a priority if only from a health, safety and disaster planning perspective.
The 60-year-old I-5 and associated 100-year-old rail link infrastructure are critical to the
future development of both US and Canadian bilateral and international trade in the Asia-
Pacific. Without a clear funded focus or a vision to improve this critical intra-corridor
infrastructure, billions of dollars in the Asia-Pacific and intra-corridor trade and tourism
will be foregone.
The two Blaine ports of entry are designed to handle the I-5 traffic. Due to congestion at
one entry, the Peace Arch border crossing has been limited to cars only and is the main
tourist entry point. Together, the Blaine border crossings, approximately one mile from
each other, handle the second largest volume of commercial and private automobile traffic
between the two economies. The largest volume is the Detroit crossings, thousands of
miles to the east.
This section of the I-5 on either side of the border could be designated a ‘federal gateway
secure highway’. For a distance of say 10km either side of the border, the highway could
be controlled jointly by US and Canadian border services. Enhanced security screening
could begin before an automobile reaches the actual border. Suspect vehicles could be
pulled over for selected or random screening before reaching the traditional inspection

437
lanes operational at present. This pre-screening and video and physical screening of traffic
prior to the actual border crossing could significantly speed up the border crossing process
while enhancing security.
Taking a page from airport duty-free shopping zones, a commercial, shopping and
tourism complex could be created adjacent to the Peace Arch crossing. The revenues
could go toward offsetting the cost of border highway improvements. The section of
roadway designated as a secure gateway to enter the United States or Canada could also
be subject to tolls collected either before entering or within the zone, with revenue shared
between the US and Canadian authorities. The development of a Border Zone Highway
Precinct could work financially, eventually self-funding border crossing improvements,
and providing much more efficiency in handling security and screening than is currently
possible.
15.6.7 Potential APEC Partnerships
With so many of the world’s leading companies operating in this corridor, and the larger
state and provincial economies so dependent on trade, there would appear to be almost
unlimited opportunities for commercial partnerships.
With the value of just the top ten publicly traded technology companies within the
corridor already exceeding USD 600 billion,794 and the thousands of technology start-up
companies there, no scale of project would seem too large (or too small). Consultations
with Japan Railway to assist on costings for a new high-speed rail link between Seattle
and Vancouver is but one of the many hundreds of opportunities for joint commercial
ventures between APEC member economies and the I-5 corridor economic area.
Tourism development could be another area for potential APEC partnerships, especially
as the fastest growing source of international tourism is from APEC member economies.
Tourist spend in the west coast of North America by visitors from China and Japan alone
is estimated to exceed USD 3 billion in 2015.795
15.7 CONCLUSIONS
Blessed with a temperate climate, stunning scenery and ample job opportunities, the
region is currently experiencing rapid growth, and the ties to the Asia-Pacific are real and
growing. The cities in the region, relatively speaking, are well-run, safe and
environmentally clean. Strong planning regulations have been in place for many years in
the core cities. The innovativeness of local industry and commitment to a sustainable
urban environment are well established within the population. Goals of being the
‘greenest’ business or ‘most liveable city’ have been achieved and are being built upon
by citizens and all levels of government. The provision of basic needs such as electricity
and clean water are not currently an issue. Ample water supplies and renewable
hydroelectric generation are a feature of the region. The region does however still have
areas to be addressed, including urban sprawl issues such as affordable housing, increase
in traffic congestion and other social issues such as homelessness.
438
Billions of dollars in new infrastructure for seaports and airports in the corridor have also
been invested, and the economy of the region is reaping the financial benefits. Among all
these positive developments in economic and environmental sustainability, the glaring
weakness is the relative lack of attention given to the inter-regional road and rail
infrastructure between Seattle and Vancouver. The railway right of way for freight is
founded on a former economic base, and even the rail beds are over 100 years old in
places. The I-5/BC Highway 99 infrastructure was built between 1954 and 1959, making
the design, construction and load forecasts 60 years old. Immediate attention and billions
of dollars will need to be spent on this critical infrastructure. A shared federal vision is
needed to better link Seattle and Vancouver.
Other than the obvious replacement and updating of existing I-5 corridor infrastructure,
the demand for better transportation methods is also real. A high-speed rail link along the
corridor would enhance the region’s development beyond the predictions of any current
economic model.
Finally, there is the reality that the enhanced security procedures at the border between
the United States and Canada implemented over the past 15 years are proving
economically harmful and a detriment to both trade and tourism in the area. New
innovative ways need to be found to satisfy the necessary security issues at the I-5 fixed
border crossings and the handling of inter-port transfer of goods within the Seattle and
Vancouver economic zone. This is not just a local issue but a challenge of economic
significance to the national economies of the United States and Canada.