Noninvasive Estimation of the Rate of Relaxation by the Analysis of Intraventricular Pressure...
12
Noninvasive Estimation of the Rate of Relaxation by the Analysis of Intraventricular Pressure Gradients Raquel Yotti, MD, PhD; Javier Bermejo, MD, PhD; Yolanda Benito, DCS, DVM; J. Carlos Antoranz, PhD; M. Mar Desco, MD, PhD; Daniel Rodríguez-Pe ´rez, PhD; Cristina Cortina, MD; Teresa Mombiela, MD; Alicia Barrio, DCS, MBiol; Jaime Elízaga, MD, PhD; Francisco Ferna ´ndez-Avile ´s, MD, PhD Background—During late ejection, myocardial relaxation causes systolic flow to decelerate and stop, and this phenomenon is coupled with the generation of a pressure gradient inside the left ventricle (LV). We hypothesized that the peak reverse ejection intraventricular pressure difference (REIVPD) between the LV apex and the outflow tract could be a useful method to improve the assessment of LV relaxation using Doppler echocardiography. Methods and Results—Three sets of animal experiments and 1 clinical study were designed. In 6 pigs, a close relationship between REIVPD and the intensity of the relaxation wave (R rm 0.89) was demonstrated using wave intensity analysis of high-fidelity pressure-volume-velocity data. In 19 animals, REIVPD sensitively detected modifications of the lusotropic state and closely correlated with the time constant of LV relaxation () within animals (R rm 0.93). Load-dependence analysis in 5 pigs showed that REIVPD remained stable up to values of 35% to 40% acute preload reduction. Clinical validation was tested in 50 patients (23 with normal systolic function) undergoing simultaneous Doppler echocardiography and high-fidelity LV pressure measurements on the same beat. REIVPD and tissue Doppler mitral annulus velocity (e) were independently related to , but the REIVPD e product correlated better with than either variable separately (bootstrap-corrected correlation coefficients: R0.84 versus 0.71, and 0.70, respec- tively, P0.05). Area under the receiver operating characteristic curve to predict impaired relaxation (50 ms) for e REIVPD was 0.96 (95% confidence interval, 0.85 to 0.99). Conclusions—The Doppler-derived REIVPD provides a sensitive, reliable, reproducible, and relatively load-independent index of the rate of LV relaxation. Combined with tissue Doppler measurements of longitudinal function, this method improves noninvasive assessment of LV relaxation in the clinical setting. (Circ Cardiovasc Imaging. 2011;4:94-104.) Key Words: echocardiography hemodynamics imaging pressure diastole M ore than one-third of patients with heart failure have normal left ventricular (LV) systolic function. 1 In these patients, symptoms are caused by impaired diastolic filling due to abnormal ventricular relaxation, impaired diastolic suction, increased myocardial stiffness, or a combination of these. Because classic clinical signs and symptoms are not enough to establish the diagnosis of heart failure with normal LV systolic function, the need of an objective evidence of diastolic dysfunction has been emphasized. 2 Doppler echo- cardiography is the technique used to assess relaxation in the clinical setting, and current guidelines recommend measuring early diastolic longitudinal lengthening velocity of the mitral annulus (e velocity) for this purpose. However, recent studies have demonstrated the limited accuracy of these Doppler-derived methods, 3 and a reliable noninvasive method to characterize the state of LV relaxation is still an unsolved issue. 4,5 Clinical Perspective on p 104 At the chamber integration level, myocardial relaxation generates an expansion wave inside the LV that travels from the apex to the aorta decreasing pressure and causing ejection flow to decelerate and stop. 6 As anticipated by fluid-dynamic principles, flow deceleration is coupled to a reversed pressure gradient inside the ventricle, pressure becoming lower at the apex than at the LV outflow tract (LVOT) during the last third of ejection. On this background, we hypothesized that the reverse ejection intraventricular pressure difference (REIVPD) is determined by the rate of LV relaxation. Because ejection intraventricular pressure gradients can be Received July 8, 2010; accepted January 10, 2011. From the Department of Cardiology (R.Y., J.B., Y.B., C.C., T.M., A.B., J.E., F.F.-A.), Hospital General Universitario Gregorio Maran ˜o ´n, Madrid, Spain; and the Department of Mathematical Physics and Fluids (C.A., M.M.D., D.R.-P.), Facultad de Ciencias, Universidad Nacional de Educacio ´n a Distancia, Madrid, Spain. Presented in part at the 56th American College of Cardiology Scientific Sessions, New Orleans. LA, March 24 to 27, 2007, and published in abstract form (J Am Coll Cardiol. 2007;49[Suppl A]:107A), and at the European Society of Cardiology Congress, Munich, August 30 to September 3, 2008 (Eur Heart J 2008;29 [Abstract Suppl]:878). Correspondence to Javier Bermejo, MD, Department of Cardiology, Hospital General Universitario Gregorio Maran ˜o ´n, Dr. Esquerdo 46, 28007 Madrid. Spain. E-mail [email protected] © 2011 American Heart Association, Inc. Circ Cardiovasc Imaging is available at http://circimaging.ahajournals.org DOI: 10.1161/CIRCIMAGING.110.960369 94 by guest on March 12, 2016 http://circimaging.ahajournals.org/ Downloaded from
-
Upload
independent -
Category
Documents
-
view
2 -
download
0
Transcript of Noninvasive Estimation of the Rate of Relaxation by the Analysis of Intraventricular Pressure...

Noninvasive Estimation of the Rate of Relaxation by theAnalysis of Intraventricular Pressure Gradients
Raquel Yotti, MD, PhD; Javier Bermejo, MD, PhD; Yolanda Benito, DCS, DVM; J. Carlos Antoranz, PhD;M. Mar Desco, MD, PhD; Daniel Rodríguez-Perez, PhD; Cristina Cortina, MD; Teresa Mombiela, MD;
Alicia Barrio, DCS, MBiol; Jaime Elízaga, MD, PhD; Francisco Fernandez-Aviles, MD, PhD
Background—During late ejection, myocardial relaxation causes systolic flow to decelerate and stop, and this phenomenonis coupled with the generation of a pressure gradient inside the left ventricle (LV). We hypothesized that the peak reverseejection intraventricular pressure difference (REIVPD) between the LV apex and the outflow tract could be a usefulmethod to improve the assessment of LV relaxation using Doppler echocardiography.
Methods and Results—Three sets of animal experiments and 1 clinical study were designed. In 6 pigs, a close relationshipbetween REIVPD and the intensity of the relaxation wave (Rrm�0.89) was demonstrated using wave intensity analysisof high-fidelity pressure-volume-velocity data. In 19 animals, REIVPD sensitively detected modifications of thelusotropic state and closely correlated with the time constant of LV relaxation (�) within animals (Rrm��0.93).Load-dependence analysis in 5 pigs showed that REIVPD remained stable up to values of 35% to 40% acute preloadreduction. Clinical validation was tested in 50 patients (23 with normal systolic function) undergoing simultaneousDoppler echocardiography and high-fidelity LV pressure measurements on the same beat. REIVPD and tissue Dopplermitral annulus velocity (e�) were independently related to �, but the REIVPD � e� product correlated better with � thaneither variable separately (bootstrap-corrected correlation coefficients: R��0.84 versus �0.71, and �0.70, respec-tively, P�0.05). Area under the receiver operating characteristic curve to predict impaired relaxation (��50 ms) for e� �REIVPD was 0.96 (95% confidence interval, 0.85 to 0.99).
Conclusions—The Doppler-derived REIVPD provides a sensitive, reliable, reproducible, and relatively load-independentindex of the rate of LV relaxation. Combined with tissue Doppler measurements of longitudinal function, this methodimproves noninvasive assessment of LV relaxation in the clinical setting. (Circ Cardiovasc Imaging. 2011;4:94-104.)
Key Words: echocardiography � hemodynamics � imaging � pressure � diastole
More than one-third of patients with heart failure havenormal left ventricular (LV) systolic function.1 In these
patients, symptoms are caused by impaired diastolic fillingdue to abnormal ventricular relaxation, impaired diastolicsuction, increased myocardial stiffness, or a combination ofthese. Because classic clinical signs and symptoms are notenough to establish the diagnosis of heart failure with normalLV systolic function, the need of an objective evidence ofdiastolic dysfunction has been emphasized.2 Doppler echo-cardiography is the technique used to assess relaxation in theclinical setting, and current guidelines recommend measuringearly diastolic longitudinal lengthening velocity of the mitralannulus (e� velocity) for this purpose. However, recentstudies have demonstrated the limited accuracy of theseDoppler-derived methods,3 and a reliable noninvasive method
to characterize the state of LV relaxation is still an unsolvedissue.4,5
Clinical Perspective on p 104At the chamber integration level, myocardial relaxation
generates an expansion wave inside the LV that travels fromthe apex to the aorta decreasing pressure and causing ejectionflow to decelerate and stop.6 As anticipated by fluid-dynamicprinciples, flow deceleration is coupled to a reversed pressuregradient inside the ventricle, pressure becoming lower at theapex than at the LV outflow tract (LVOT) during the last thirdof ejection. On this background, we hypothesized that thereverse ejection intraventricular pressure difference(REIVPD) is determined by the rate of LV relaxation.Because ejection intraventricular pressure gradients can be
Received July 8, 2010; accepted January 10, 2011.From the Department of Cardiology (R.Y., J.B., Y.B., C.C., T.M., A.B., J.E., F.F.-A.), Hospital General Universitario Gregorio Maranon, Madrid,
Spain; and the Department of Mathematical Physics and Fluids (C.A., M.M.D., D.R.-P.), Facultad de Ciencias, Universidad Nacional de Educacion aDistancia, Madrid, Spain.
Presented in part at the 56th American College of Cardiology Scientific Sessions, New Orleans. LA, March 24 to 27, 2007, and published in abstractform (J Am Coll Cardiol. 2007;49[Suppl A]:107A), and at the European Society of Cardiology Congress, Munich, August 30 to September 3, 2008 (EurHeart J 2008;29 [Abstract Suppl]:878).
Correspondence to Javier Bermejo, MD, Department of Cardiology, Hospital General Universitario Gregorio Maranon, Dr. Esquerdo 46, 28007Madrid. Spain. E-mail [email protected]
© 2011 American Heart Association, Inc.
Circ Cardiovasc Imaging is available at http://circimaging.ahajournals.org DOI: 10.1161/CIRCIMAGING.110.960369
94 by guest on March 12, 2016http://circimaging.ahajournals.org/Downloaded from

accurately measured by Doppler echocardiography,7,8 thishypothesis could be the basis for a new method to measurethe relaxation rate noninvasively.
The present study is designed to comprehensively assessthe role of noninvasively measured REIVPDs to characterizeLV relaxation. First, an animal high-fidelity pressure andconductance setup is used with a 3-fold purpose: (1) tovalidate the hypothesis of a direct relationship of REIVPDswith the phenomenon of relaxation using wave-intensityanalysis (WIA); (2) to quantify the sensitivity of REIVPDs toexperimentally induced changes in lusotropic state and test itscorrelation with the time constant of relaxation (�) withinanimals; and (3) to analyze preload dependence of REIVPDs.Finally, in the clinical setting, the additional value of this newmethod to estimate � is assessed in 50 patients undergoingsimultaneous Doppler echocardiography and high-fidelity LVpressure measurements.
MethodsBoth in animal and clinical studies, color Doppler and high-fidelitycatheterization data were acquired simultaneously. To guaranteesame-beat measurements of color Doppler and pressure data, across-correlation algorithm was applied on a synchronicity signalstored simultaneously on the ultrasound scanner and the signalacquisition system.7,8
Animal Experimental ProtocolsAdult minipigs (weight, 60�10 kg) were used for all experiments.Study protocols were approved by the local Institutional AnimalCare Committee. Animals were preanesthetized with ketamine andxylazine and mechanically ventilated. Complete anesthesia andrelaxation were maintained by propofol infusion (0.2 mg/kg/min) aswell as repetitive boluses of pentobarbital (15 mg/kg i.v.�5 mg/kg/15 minutes) and pancuronium (0.2 mg/kg/15 minutes). Throughthe right carotid artery, a 5F pigtail 12-pole multielectrodeconductance-pressure catheter (Millar Instruments, Houston, TX, orCD-Leycom, Zoetermeer, The Netherlands) was placed into the LVand connected to a dual-field conductance processor (Sigma 5DF,CD-Leycom). Catheter balance and calibration was performed aspreviously described.8 Animals were euthanized at the end of allexperiments.
Experimental Study 1: WIASix pigs underwent median sternotomy without opening the pericar-dium, and the heart was cradled. A snare was placed around theinferior vena cava for preload manipulation. Animals were studied atbaseline (n�6), during dobutamine (1 to 10 �g/kg/min; n�5), andesmolol (25 to 200 �g/kg/min; n�3) infusions, as well as after leftmain coronary microembolization of polystyrene microspheres(mean diameter, 45 �m; Polysciences, Warrington, PA; n�2).Immediately after data acquisition, a transient caval occlusion wasperformed. This acquisition process was repeated 3 times for eachstate, waiting for stabilization periods �5 minutes. B-mode (4- and2-chamber views) and color-Doppler M-mode (CDMM) images ofLV outflow velocity were recorded in each hemodynamic state.
Experimental Study 2: Lusotropic SensitivityA total of 19 animals were used: (1) the 6 animals from study 1; (2)7 animals in a closed-chest setup, undergoing esmolol and dobuta-mine infusion (same doses as above) as well as right ventricularpacing (100, 120, and 150 bpm); and (3) 6 open-chest closed-pericardium pigs undergoing left anterior descending coronary arteryligation (n�5) and/or volume overload (n�4; saline, 0.9% 500 to1000 mL). Images for measuring flow propagation velocity (FPV)and septal and lateral mitral annulus pulsed-wave Doppler (e�septaland e�lateral, respectively) were also obtained in the latter group.
Experimental Study 3: Load DependenceFive closed-chest pigs were studied during infusion of dobutamineand esmolol, at baseline, and during 10 seconds of caval occlusion.8
Consecutive beat-to-beat data obtained during caval occlusion wereused to assess the degree of preload dependence of REIVPDs and �.
Clinical StudyFifty patients in sinus rhythm undergoing left heart catheterizationwere included. Indications for the catheterization procedures were(1) ruling out coronary artery disease in patients with dilatedcardiomyopathy (n�25), (2) chest pain of unknown etiology (n�8),and (3) non–ST-segment elevation acute coronary syndrome (n�17).In 27 patients, global systolic function was impaired (ejectionfraction �50%). Significant coronary artery disease was demon-strated in 20 patients. All catheterization procedures were performedeither through the left radial (n�37) or femoral approach (n�13),using a high-fidelity micromanometer 5F pig-tail catheter (MillarInstruments). ECG, pressure signals, and echocardiographic imageswere obtained simultaneously in left lateral decubitus position. Thestudy protocol was approved by the local institutional reviewcommittee, and all subjects provided written informed consent forthis study.
Echocardiographic Image Acquisition and AnalysisBroadband 2.0- to 4.0-MHz transducers were used either on aSequoia C-256 (Siemens AG) or a Vivid-7 (General Electric Health-care) system. LV volumes and ejection fraction were calculatedusing biplane Simpson method. Additional echo Doppler measure-ments, including transmitral E-wave velocity, mitral annulus e� wavelengthening velocity (averaged values of septal and lateral annuluspositions), and FPV were performed as recommended.9
Color Doppler M-mode images were obtained from the 5-chamberview.7 The method for image processing has been previouslyreported10 and validated to obtain the waveform of the LV apex–LVOT instantaneous pressure difference.7 Briefly, if the M-modecursor closely approximates a flow streamline, the spatiotemporalvelocity distribution of a discrete blood sample is provided by thevalue of its corresponding pixel color: v(s,t), where v representsvelocity, s represents the linear dimension of the streamline, and t is
Figure 1. Example of WIA (experimental study 1). Simultaneoustracings are shown for ECG (top in black), LV volume (V, black,panel A), LV pressure (P, red, panel A), LVOT velocity (U, green,panel A), LV elastance (E, blue, panel A), the power of the aspi-rating relaxation wave (dIw/dt, black, panel B), ejection intraven-tricular pressure difference (EIVPD, blue, panel B), and the1-dimensional LV pressure gradient field (C). The energy of theaspirating wave (Iw�relax) is represented by the shadowed area.Temporal markers are shown for ejection onset and end.
Yotti et al Pressure Gradients to Estimate Relaxation 95
by guest on March 12, 2016http://circimaging.ahajournals.org/Downloaded from

time. Thus, the color Doppler M-mode recording provides the datanecessary to solve the Euler momentum equation:
�p
�s������v
�t�v�
�v
�s� ,
where p designates pressure and � is blood density. The first andsecond terms in the right side of the equation account for inertial andconvective acceleration, respectively. The pressure difference curveis calculated by spatial integration between the apex and the LVOTof pressure gradient maps. From each curve, the systolic peak andreverse peak were automatically obtained and confirmed visually.
Intraobserver, interobserver, and beat-to-beat variabilities ofREIVPD measurements (20 unselected patients referred for a con-ventional echocardiographic examination; independently and blindlyacquired CDMM recordings) were 0.1�0.3 mm Hg (5�11%;Ric�0.99), 0.2�0.6 mm Hg (6�24%; Ric�0.96), and0.2�0.3 mm Hg (4�15%; Ric�0.98), respectively.
Pressure Data AnalysisAll signals were digitized at 1000 Hz. To estimate �, the zeroasymptote model was adjusted using a nonlinear Levenberg-Marquardt fitting algorithm.11 This method was chosen because it isless sensitive to noise at low pressure than logarithmic lineariza-tion.12 Additionally, the nonzero asymptote (�nonzero) and the logistic(�logist) models were fitted in the clinical study using the samemethod.13 Beat-to-beat reproducibility of invasive methods wasassessed from 2 consecutive beats from 20 patients. Values of �,dP/dt, peak-systolic, and pre-A LV diastolic pressures were blindlycomputed for the same beat processed noninvasively.
Wave-Intensity AnalysisWIA was performed by combination of invasive and echo Dopplerdata, replicating previous methodology.6 In a first step, ventricularelastance (E) was calculated as a function of time (t) by usingsimultaneous pressure (P) and volume (V) measurements providedby the conductance catheter as
E�t�P�t
V�t�V0,
where V0 is the zero pressure intercept calculated from the family ofpressure-volume loops obtained during caval occlusion. Wave speed(c) was then calculated as
c�t��E�t�3
2V�t�
�.
The instantaneous power (per unit of cross-sectional area) of theexpansion wave traveling from the LV (dIw�[W/m2]) was calcu-lated as
d�Iw�/dt���4��1 �dP/dt��cdU/dt2,
where dP/dt is the incremental difference in LV pressure during a5-ms sampling interval, and dU is the difference in outflow velocity.For this purpose, U was measured by decoding color DopplerM-mode data at the level of the LVOT, as validated.10 The totalenergy (per unit cross-sectional area) transported by the expansionwave during LV relaxation (Iw�relax [J/m2]) was calculated as theintegral under this part of dIw� waveform. Because LV inflowvelocity was not considered for this analysis, Iw�relax did not include
Figure 2. Results of the WIA (experimental study 1). A, Nonlinear relationship between the energy of the expansion wave (Iw�relax) withthe time constant of relaxation (�) in each of the 6 animals, fitted to a nonlinear mixed-effects exponential model as Iw�relax�a�b � ec�t.B, Linear relationship between Iw�relax and REIVPD.
96 Circ Cardiovasc Imaging March 2011
by guest on March 12, 2016http://circimaging.ahajournals.org/Downloaded from

Tabl
e1.
Hem
odyn
amic
Data
Obta
ined
atBa
selin
ean
dDu
ring
Hem
odyn
amic
Inte
rven
tions
for
Expe
rimen
talS
tudy
2
Base
line
Esm
olol
Dobu
tam
ine
Righ
tVe
ntric
ular
Paci
ngVo
lum
eLe
ftAn
terio
rDe
scen
ding
Arte
ryOc
clus
ion
Coro
nary
Embo
lizat
ion
Anim
als,
n19
1012
74
52
Beat
s,n
111
5884
5219
6216
Hear
tra
te,
bpm
99(9
4to
105)
89(8
3to
95)†
108
(102
to11
4)†
115
(109
to12
2)†
90(8
1to
98)
88(8
1to
94)†
86(7
7to
94)†
LVSP
,m
mHg
110
(99
to12
0)96
(86
to10
7)†
129
(119
to14
0)†
115
(104
to12
6)99
(86
to11
1)†
88(7
7to
99)†
82(7
0to
95)†
LVED
P,m
mHg
13(1
0to
17)
13(9
to16
)18
(14
to21
)†8
(2to
15)
22(1
8to
26)†
15(1
1to
19)
23(1
8to
27)†
(dP/
dt) m
ax,
mm
Hg/s
1866
(158
6to
2147
)12
53(9
40to
1566
)†35
98(3
297
to39
00)†
1982
(164
7to
2318
)14
74(1
056
to18
93)
1492
(115
1to
1833
)67
5(2
24to
1126
)†
(dP/
dt) m
in,
mm
Hg/s
�18
24(�
2149
to�
1499
)�
1593
(�19
28to
�12
58)†
�22
21(�
2553
to�
1889
)†�
2373
(�27
14to
�20
31)†
�14
27(�
1799
to�
1055
)†�
1148
(�14
94to
�80
1)†
�65
6(�
1040
to�
272)
†
�,m
s45
(40
to49
)49
(44
to53
)†41
(37
to46
)†41
(36
to46
)56
(51
to62
)†56
(51
to61
)†79
(73
to85
)†
Peak
REIV
PD,
mm
Hg3.
5(2
.9to
4.2)
2.4
(1.7
to3.
2)†
4.3
(3.6
to5)
†3.
1(2
.3to
3.8)
2.6
(1.8
to3.
5)†
2.4
(1.7
to3.
2)†
2.1
(1.2
to3.
1)†
FPV,
cm/s
*61
(40
to83
)50
(24
to76
)62
(41
to84
)61
(39
to83
)
e�S
eptu
m,c
m/s
*6
(5to
7)6
(4to
8)8
(6to
9)5
(4to
6)†
e�La
tera
l,cm
/s*
13(1
0to
15)
10(7
to13
)†12
(10
to15
)9
(7to
12)†
LVSP
indi
cate
sLV
peak
syst
olic
pres
sure
;LV
EDP,
LVen
d-di
asto
licpr
essu
re;
FVP,
flow
prop
agat
ion
velo
city
.Va
lues
are
pres
ente
das
fixed
effe
cts
(95%
conf
iden
cein
terv
als)
.†P
�0.
05ve
rsus
base
line.
*n�
6An
imal
sea
chw
ithth
e4
hem
odyn
amic
stat
es.
Yotti et al Pressure Gradients to Estimate Relaxation 97
by guest on March 12, 2016http://circimaging.ahajournals.org/Downloaded from

the additional 10% of energy of the expansion wave that extendsinto early filling.6
Statistical AnalysisValues are expressed as mean�standard deviation, except whereindicated otherwise. Linear and nonlinear mixed-effects models(S-Plus v.8.0, Tibco) were used for analysis considering animals asrandom effects. Significant models were followed by simulationcontrasts against baseline measurements.14 For experimental study 1,Iw�relax was related to � using an exponential model.6 The associ-ation between Iw�relax and � and REIVPD was addressed usingwithin-animal correlation coefficients accounting for repeated mea-sures (Rrm).15 For animal studies 2 and 3, the effects of interventionson hemodynamic variables were calculated as the fixed-effectestimates and their 95% confidence intervals. Fixed-effect coeffi-cients account for the mean expected values of variables once thesource of variation resulting from the animal sampling random effectis omitted. For animal study 2, Rrm coefficients were calculated forthe relationship between the noninvasive predictors and �. In theclinical study, between-subject relationship was assessed using the
Pearson correlation coefficient (R) after natural log transformation ofREIVPD. Data from 3 consecutive beats were averaged. R coeffi-cients were compared using Hotelling t tests. Variables from normaland abnormal ejection fraction clinical groups were compared usingeither a Welch-modified 2-sample t test or a �2 test, where appro-priate. Adjusted R2 values were used to compare multivariateregression models. Correlation coefficients in the clinical studywere corrected to avoid overfitting by bootstrap validation of1000 repetitions (Rboot). The Bland-Altman analysis and intra-class correlation coefficients (Ric) were used to assess reproduc-ibility. Receiver operating characteristic (ROC) curve analysiswas performed using MedCalc. Values of P�0.05 were consid-ered significant.
ResultsExperimental Study 1: WIAEjection intraventricular differences became negative duringend-ejection, reaching its minimal value during early isovolu-mic relaxation (5�11 ms after end-ejection
Figure 3. Results of the within-animalvalidation study (experimental study 2).Values are shown individually for each ofthe 19 animals. The linear fitting follows��A � loge(REIVPD)�B, where B is therandom animal effect.
98 Circ Cardiovasc Imaging March 2011
by guest on March 12, 2016http://circimaging.ahajournals.org/Downloaded from
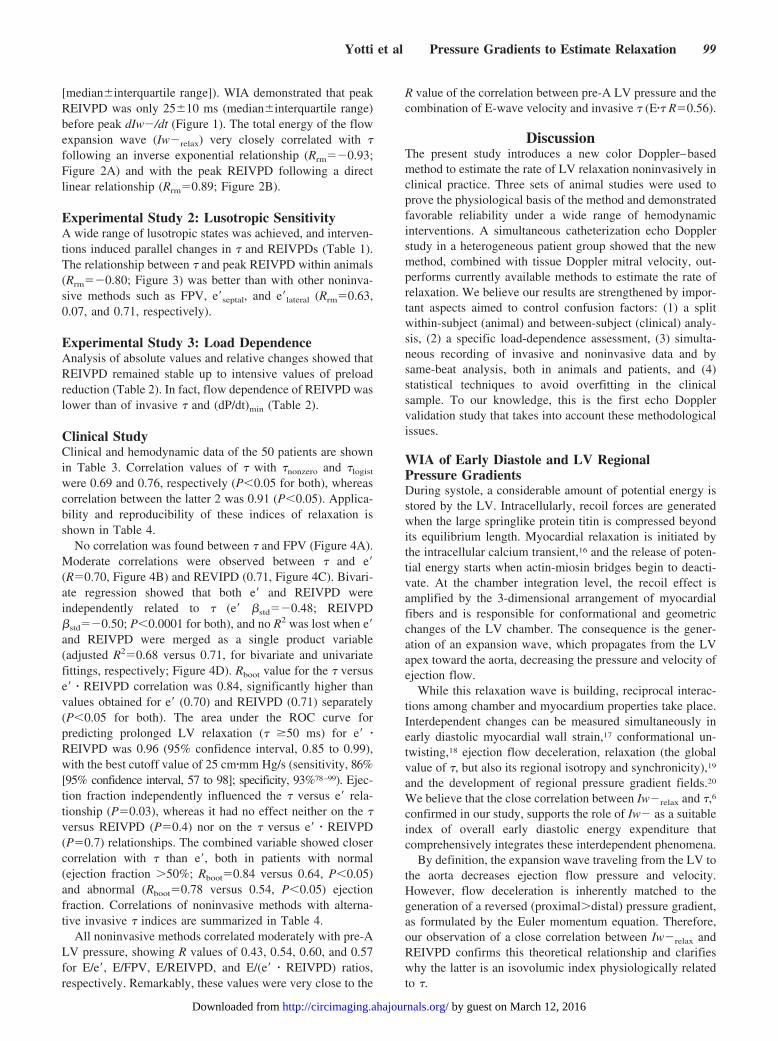
[median�interquartile range]). WIA demonstrated that peakREIVPD was only 25�10 ms (median�interquartile range)before peak dIw�/dt (Figure 1). The total energy of the flowexpansion wave (Iw�relax) very closely correlated with �following an inverse exponential relationship (Rrm��0.93;Figure 2A) and with the peak REIVPD following a directlinear relationship (Rrm�0.89; Figure 2B).
Experimental Study 2: Lusotropic SensitivityA wide range of lusotropic states was achieved, and interven-tions induced parallel changes in � and REIVPDs (Table 1).The relationship between � and peak REIVPD within animals(Rrm��0.80; Figure 3) was better than with other noninva-sive methods such as FPV, e�septal, and e�lateral (Rrm�0.63,0.07, and 0.71, respectively).
Experimental Study 3: Load DependenceAnalysis of absolute values and relative changes showed thatREIVPD remained stable up to intensive values of preloadreduction (Table 2). In fact, flow dependence of REIVPD waslower than of invasive � and (dP/dt)min (Table 2).
Clinical StudyClinical and hemodynamic data of the 50 patients are shownin Table 3. Correlation values of � with �nonzero and �logist
were 0.69 and 0.76, respectively (P�0.05 for both), whereascorrelation between the latter 2 was 0.91 (P�0.05). Applica-bility and reproducibility of these indices of relaxation isshown in Table 4.
No correlation was found between � and FPV (Figure 4A).Moderate correlations were observed between � and e�(R�0.70, Figure 4B) and REVIPD (0.71, Figure 4C). Bivari-ate regression showed that both e� and REIVPD wereindependently related to � (e� �std��0.48; REIVPD�std��0.50; P�0.0001 for both), and no R2 was lost when e�and REIVPD were merged as a single product variable(adjusted R2�0.68 versus 0.71, for bivariate and univariatefittings, respectively; Figure 4D). Rboot value for the � versuse� � REIVPD correlation was 0.84, significantly higher thanvalues obtained for e� (0.70) and REIVPD (0.71) separately(P�0.05 for both). The area under the ROC curve forpredicting prolonged LV relaxation (� �50 ms) for e� �REIVPD was 0.96 (95% confidence interval, 0.85 to 0.99),with the best cutoff value of 25 cm�mm Hg/s (sensitivity, 86%[95% confidence interval, 57 to 98]; specificity, 93%78–99). Ejec-tion fraction independently influenced the � versus e� rela-tionship (P�0.03), whereas it had no effect neither on the �versus REIVPD (P�0.4) nor on the � versus e� � REIVPD(P�0.7) relationships. The combined variable showed closercorrelation with � than e�, both in patients with normal(ejection fraction �50%; Rboot�0.84 versus 0.64, P�0.05)and abnormal (Rboot�0.78 versus 0.54, P�0.05) ejectionfraction. Correlations of noninvasive methods with alterna-tive invasive � indices are summarized in Table 4.
All noninvasive methods correlated moderately with pre-ALV pressure, showing R values of 0.43, 0.54, 0.60, and 0.57for E/e�, E/FPV, E/REIVPD, and E/(e� � REIVPD) ratios,respectively. Remarkably, these values were very close to the
R value of the correlation between pre-A LV pressure and thecombination of E-wave velocity and invasive � (E�� R�0.56).
DiscussionThe present study introduces a new color Doppler–basedmethod to estimate the rate of LV relaxation noninvasively inclinical practice. Three sets of animal studies were used toprove the physiological basis of the method and demonstratedfavorable reliability under a wide range of hemodynamicinterventions. A simultaneous catheterization echo Dopplerstudy in a heterogeneous patient group showed that the newmethod, combined with tissue Doppler mitral velocity, out-performs currently available methods to estimate the rate ofrelaxation. We believe our results are strengthened by impor-tant aspects aimed to control confusion factors: (1) a splitwithin-subject (animal) and between-subject (clinical) analy-sis, (2) a specific load-dependence assessment, (3) simulta-neous recording of invasive and noninvasive data and bysame-beat analysis, both in animals and patients, and (4)statistical techniques to avoid overfitting in the clinicalsample. To our knowledge, this is the first echo Dopplervalidation study that takes into account these methodologicalissues.
WIA of Early Diastole and LV RegionalPressure GradientsDuring systole, a considerable amount of potential energy isstored by the LV. Intracellularly, recoil forces are generatedwhen the large springlike protein titin is compressed beyondits equilibrium length. Myocardial relaxation is initiated bythe intracellular calcium transient,16 and the release of poten-tial energy starts when actin-miosin bridges begin to deacti-vate. At the chamber integration level, the recoil effect isamplified by the 3-dimensional arrangement of myocardialfibers and is responsible for conformational and geometricchanges of the LV chamber. The consequence is the gener-ation of an expansion wave, which propagates from the LVapex toward the aorta, decreasing the pressure and velocity ofejection flow.
While this relaxation wave is building, reciprocal interac-tions among chamber and myocardium properties take place.Interdependent changes can be measured simultaneously inearly diastolic myocardial wall strain,17 conformational un-twisting,18 ejection flow deceleration, relaxation (the globalvalue of �, but also its regional isotropy and synchronicity),19
and the development of regional pressure gradient fields.20
We believe that the close correlation between Iw�relax and �,6
confirmed in our study, supports the role of Iw� as a suitableindex of overall early diastolic energy expenditure thatcomprehensively integrates these interdependent phenomena.
By definition, the expansion wave traveling from the LV tothe aorta decreases ejection flow pressure and velocity.However, flow deceleration is inherently matched to thegeneration of a reversed (proximal�distal) pressure gradient,as formulated by the Euler momentum equation. Therefore,our observation of a close correlation between Iw�relax andREIVPD confirms this theoretical relationship and clarifieswhy the latter is an isovolumic index physiologically relatedto �.
Yotti et al Pressure Gradients to Estimate Relaxation 99
by guest on March 12, 2016http://circimaging.ahajournals.org/Downloaded from

REIVPD for the Noninvasive Estimation of �Classic measurements derived from pulsed-wave Doppler ofmitral inflow are conditioned by loading conditions21 andshow a very poor correlation with reference invasive param-eters of LV diastolic function.22 For this reason, mitralannulus velocity during the early filling phase obtained byDTI (e� velocity)23 and FPV24 have been proposed as load-independent indices of LV relaxation, and its routine usage isrecommended in current practice guidelines.2 However, theseindices are known to depend on preload25–29 and are influ-enced by systolic function.30,31 Correlation values of e�velocity with � as low as R�0.30 have been demonstrated inpatients with normal systolic function.32,33 Factors known toaffect the value of e� velocity are mitral valve disease, annularcalcification, regional wall motion abnormalities, or conduc-tion disturbances, among others. It is recognized that theclinical value of e� to assess relaxation in a given patient islimited.5 Our study, showing only moderate correlation dur-ing simultaneous acquisitions, corroborates this finding.
Peak REIVPD is reached during the isovolumic relaxationperiod, just after aortic valve closure, therefore justifyingrelative flow stability. Indices based on global LV flowdynamics account for global chamber performance, instead oflocal myocardial deformation or lengthening parameters.Therefore, regional wall motion or local structural abnormal-ities should only modify this index when the global chamberrelaxation rate is affected. On a similar basis, we havepreviously demonstrated that intraventricular pressure differ-ences provide useful surrogates of other chamber indices suchas peak systolic elastance8 and diastolic suction.34
Recent animal studies have demonstrated that e� is condi-tioned by restoring forces and lengthening load, in addition toLV relaxation.35 LV restoring forces are responsible fordiastolic suction during early filling and are a mechanismrelated to REIVPD during late ejection, as suggested by ourWIA analysis. Because these factors are very closely related,probably, correcting for this effect explains the advantage ofe��REVIPD over e� to estimate � in a wide group of patientswith normal and abnormal systolic function. Remarkably, thee��REVIPD product also improved noninvasive estimation of
�nonzero and �logist, currently proposed as more robust indicesof global chamber relaxation than �.13
Limitations for Estimating LV Filling PressuresAll methods tested were suboptimal to estimate LV fillingpressure, in agreement with recent studies in patients withnormal3 and abnormal36 systolic LV function. The rationalefor using noninvasive relaxation surrogates to estimatingfilling pressures is based on the assumption that E-wavevelocity is determined by left atrial pressure and the rate ofrelaxation.37 However, the fact that E-wave velocity correctedby measured invasive � did not perform better suggests thatE-wave velocity is probably influenced by additional vari-ables beyond atrial pressure and �. In this context, the role ofdiastolic suction and intraventricular vorticity deserves fur-ther exploration. Additionally, whether passive diastolicproperties can also be derived from intraventricular flowdynamic parameters should be investigated.
Study LimitationsThe 3-dimensional nature of intraventricular flows is awell-known limitation of the CDMM approach to measurepressure gradients and has been extensively addressed anddiscussed elsewhere.8 Although limitations of applying a1-dimensional WIA to study LV filling are recognized,6 webelieve that they do not invalidate the results of our study.Because simultaneous velocity locations were not recorded atthe LV inflow and outflow, WIA was not extended to theearly filling period, and the Iw� component related to mitralfilling was not measured. However, this contribution to totalaspirating energy is �10% and constant over different luso-tropic states. Thus, we believe that Iw�relax is a suitable indexfor the WIA performed in our study. The fact that echocar-diographic studies were performed during simultaneous cath-eterization may be a limitation for image quality. However,74% of clinical studies were performed in the left lateraldecubitus using a radial approach, and we believe this a slightreduction in image quality is outweighed by abolishing thesource of variability due to changing adrenergic tone andhemodynamic conditions when studies are performed indifferent scenarios.
Table 2. Hemodynamic Data During Preload Reduction by Caval Occlusion for Experimental Study 3
Relative Change EDV, %
Preocclusion 0–5 5–10 10–15
Beats, n 24 42 40 21
LV end-diastolic volume, mL 63 (60 to 67) 62 (59 to 65) 59 (55 to 62)* 55 (52 to 58)*
LV end-diastolic pressure, mm Hg 15 (14 to 16) 11 (9 to 12)* 7 (6 to 8)* 5 (4 to 6)*
(dP/dt)min, mm Hg/s �1598 (�1787 to �1409) �1536 (�1722 to �1351)* �1465 (�1650 to �1280)* �1344 (�1535 to �1153)*
�, ms 53 (49 to 58) 52 (47 to 56) 51 (46 to 55) 50 (46 to 54)
Peak REIVPD, mm Hg 1.8 (1.4 to 2.2) 1.8 (1.4 to 2.2) 1.7 (1.2 to 2.1) 1.9 (1.5 to 2.3)
Relative change (dP/dt)min, % . . . 1 (�4 to 5) �3 (�8 to 1) �12 (�17 to �7)*
Relative change �, % . . . �2 (�6 to 1) �4 (�8 to 0) �5 (�10 to �1)
Relative change REIVPD, % . . . �3 (�18 to 12) 3 (�12 to 19) �9 (�26 to 8)
*P�0.05 versus preocclusion.Data from 5 closed-chest animals. Values are presented as fixed effects (95% confidence intervals).
100 Circ Cardiovasc Imaging March 2011
by guest on March 12, 2016http://circimaging.ahajournals.org/Downloaded from

Potential Clinical ApplicationsAnimal experiments demonstrated relative flow stability ofREIVPDs. In clinical terms, this translated into an improvedestimation of relaxation both in patients with normal systolic
function and those with abnormal systolic function. Correla-tion with � for the e� � REIVPD index was 31% and 45%higher than for e�. Because relaxation is usually impaired inpatients with abnormal systolic function, a more reliable
Table 2. Continued
P15–20 20–25 25–30 30–35 35–40
21 21 20 19 16
52 (49 to 55)* 49 (46 to 52)* 46 (43 to 49)* 42 (39 to 46)* 38 (35 to 42)* �0.001
3 (2 to 5)* 3 (2 to 4)* 2 (1 to 4)* 1 (0 to 3)* 1 (�1 to 2)* �0.001
�1269 (�1460 to �1078)* �1158 (�1349 to �967)* �1065 (�1257 to �873)* �1030 (�1223 to �837)* �1054 (�1250 to �858)* �0.001
50 (46 to 55) 50 (46 to 55) 49 (45 to 54)* 50 (46 to 55) 48 (43 to 53)* 0.01
1.8 (1.4 to 2.2) 1.8 (1.3 to 2.2) 1.7 (1.2 to 2.1) 1.6 (1.2 to 2.0) 1.4 (0.9 to 1.8)* 0.02
�19 (�24 to �14)* �26 (�31 to �20)* �31 (�36 to �25)* �35 (�40 to �30)* �34 (�39 to �28)* �0.001
�4 (�9 to 0) �5 (�9 to 0) �7 (�11 to �2)* �5 (�10 to �1) �7 (�12 to �2)* 0.07
�5 (�21 to 12) �5 (�22 to 12) �4 (�21 to 13) �3 (�21 to 14) 7 (�11 to 26) 0.55
Table 3. Demographic, Catheterization, and Doppler Echocardiography Data for the Clinical Study
TotalEjection
Fraction �50%Ejection
Fraction �50% P
n 50 27 23
Age, y 58�13 59�11 57�15 0.6
Sex, male/female 37/13 21/6 16/7 0.5
Heart rate 72�13 77�12 65�13 0.004
QRS �120 ms 21 15 6 0.03
Invasive
Peak LV pressure, mm Hg 131�31 126�30 136�33 0.3
Pre-A LV filling pressure, mm Hg 13�6 14�6 11�5 0.04
(dP/dt)min, mm Hg/s �1495�427 �1249�353 �1783�312 �0.001
�, ms 57�12 61�11 52�11 0.006
�nonzero, ms 94�32 102�32 86�32 0.001
�logistic, ms 38�16 44�17 32�12 0.008
Doppler echocardiography
End-diastolic volume, mL 109�43 130�44 85�26 �0.001
End-systolic volume, mL 65�43 93�41 34�15 �0.001
Ejection fraction 0.45�0.19 0.31�0.10 0.63�0.08 �0.001
LV mass, g/m2 94�32 102�32 86�32 0.1
Mitral regurgitation class III or IV/IV 9 5 4 0.9
Isovolumetric relaxation time, ms 100�33 96�39 104�27 0.4
E, cm/s 66�23 65�28 67�16 0.7
Deceleration time, ms 169�68 148�69 190�62 0.04
E/A 1.0�0.5 1.1�0.7 0.9�0.3 0.26
e� septal, cm/s 6�3 5�2 7�3 0.02
e� lateral, cm/s 9�3 8�3 10�3 0.03
e� average, cm/s 8�3 7�3 8�3 0.02
E/e� 10�5 11�7 8�2 0.07
Flow propagation velocity, cm/s 49�14 46�14 52�12 0.13
REIVPD, mm Hg 2.8�1.5 2.2�1.0 3.6�1.6 0.002
log(e��REIVPD), cm�mm Hg/s 2.9�0.7 2.6�0.6 3.3�0.7 �0.001
Values are expressed as mean�SD.
Yotti et al Pressure Gradients to Estimate Relaxation 101
by guest on March 12, 2016http://circimaging.ahajournals.org/Downloaded from

index for patients with this condition could be particularlyuseful in the clinical setting. Other specific scenarios wherethe e� � REIVPD index would be preferred are those in whichthe e� velocity is known to be unreliable. Typical situationsare patients with regional wall motion abnormalities, conduc-tion disturbances, or mitral valve disease. In the future,
integration into the scanner software, as well as semiauto-matic CDMM image processing38 and 2D extensions of themethod,39 are promising technological developments thatcould facilitate widespread generalization of noninvasivemeasurements of intracardiac flow dynamics in clinicalpractice.
ConclusionsDoppler-derived measurements of REIVPDs provide a sen-sitive, reliable, reproducible, and relatively load-independentindex of the rate of LV relaxation. When combined with earlymyocardial lengthening velocity, this method improves theassessment of LV relaxation in the clinical setting.
Clinical SummaryRecent studies have shown the limitations of Doppler-derivedmethods to evaluate ventricular relaxation in the clinicalsetting. In the present study, we propose and validate a newnoninvasive index that improves the assessment of LVrelaxation in patients. At end-systole, myocardial relaxationcauses flow deceleration and a reversed pressure gradientinside the LV that can be measured using Doppler echocar-diography. In an animal model, we demonstrate, for the firsttime, the physiological basis of the Doppler-derived peakREIVPD to assess relaxation and its reliability under a widerange of hemodynamic interventions and loading conditions.A clinical validation study in 50 patients undergoing simul-
Figure 4. Results of the clinical validation study. A, Correlation between � and flow propagation velocity (FPV). B, Correlation between �and mitral annulus e� wave-lengthening velocity. C, Correlation between � and REIVPD. D, Correlation between � and the product vari-able e� � REIVPD. � indicates ejection fraction �0.5; E, ejection fraction �0.5; and SEE, standard error of the estimate.
Table 4. Applicability and Reproducibility Data for InvasiveMethods of Estimating Relaxation in the Clinical Study andCorrelation With Noninvasive Methods
� �nonzero �logistic
Applicability andreproducibility
Patients withoutconvergence of fittingalgorithm, n (%)
0 (0%) 3 (6%) 1 (2%)
Absolute beat-to-beatvariability, ms (Ric)
2�3 (0.98) 1�13 (0.97) 2�8 (0.87)
Relative beat-to-beatvariability, %
3�5% 1�13% 5�25%
Correlation withnoninvasive indices
E�, R 0.70* 0.52* 0.54*
log(REIVPD), R 0.71* 0.59* 0.67*
log(e� � REIVPD), R 0.84* 0.67* 0.74*
Ric indicates intraclass correlation coefficient; R, Pearson correlation coefficient.*P�0.05.
102 Circ Cardiovasc Imaging March 2011
by guest on March 12, 2016http://circimaging.ahajournals.org/Downloaded from

taneous Doppler echocardiography and high-fidelity LV pres-sure measurements shows that the new method combinedwith tissue Doppler mitral-annulus velocity (e�) outperformscurrently available methods to estimate the rate of relaxation.This new method might be preferred in clinical scenarioswhere e� is known to be unreliable, such as mitral valvedisease, annular calcification, regional wall motion abnormal-ities, or conduction disturbances.
AcknowledgmentsWe thank the personnel of the Echocardiography and CatheterizationLaboratories of the Hospital General Universitario Gregorio Mara-non for their support of patient recruitment and data collection. Wealso thank all the personnel of the Unit of Experimental Medicineand Surgery of the same institution for their help withanimal experiments.
Sources of FundingThis study was supported by grants PI061101, CM06/00085 (to DrCortina), PIS09/02603, and RD06/0014/0046 (RECAVA) from thePlan Nacional de Investigacion Científica, Desarrollo e InnovacionTecnologica (I�D�I), Instituto de Salud Carlos III–Ministerio deCiencia e Innovacion, Spain. Dr Mombiela was supported by a grantfrom the Fundacion para Investigacion Biomedica Gregorio Mara-non, Spain.
DisclosuresNone.
References1. Vasan RS, Benjamin EJ, Levy D. Prevalence, clinical features and
prognosis of diastolic heart failure: an epidemiologic perspective. J AmColl Cardiol. 1995;26:1565–1574.
2. Paulus WJ, Tschope C, Sanderson JE, Rusconi C, Flachskampf FA,Rademakers FE, Marino P, Smiseth OA, De Keulenaer G, Leite-MoreiraAF, Borbely A, Edes I, Handoko ML, Heymans S, Pezzali N, Pieske B,Dickstein K, Fraser AG, Brutsaert DL. How to diagnose diastolic heartfailure: a consensus statement on the diagnosis of heart failure withnormal left ventricular ejection fraction by the Heart Failure and Echo-cardiography Associations of the European Society of Cardiology. EurHeart J. 2007;28:2539–2550.
3. Geske JB, Sorajja P, Nishimura RA, Ommen SR. Evaluation of leftventricular filling pressures by Doppler echocardiography in patients withhypertrophic cardiomyopathy: correlation with direct left atrial pressuremeasurement at cardiac catheterization. Circulation. 2007;116:2702–2708.
4. Maurer MS, Spevack D, Burkhoff D, Kronzon I. Diastolic dysfunction:can it be diagnosed by Doppler echocardiography? J Am Coll Cardiol.2004;44:1543–1549.
5. Tschope C, Paulus WJ. Is echocardiographic evaluation of diastolicfunction useful in determining clinical care? Doppler echocardiographyyields dubious estimates of left ventricular diastolic pressures.Circulation. 2009;120:810–820.
6. Wang Z, Jalali F, Sun YH, Wang JJ, Parker KH, Tyberg JV. Assessmentof left ventricular diastolic suction in dogs using wave-intensity analysis.Am J Physiol Heart Circ Physiol. 2005;288:H1641–H1651.
7. Yotti R, Bermejo J, Antoranz JC, Rojo-Alvarez JL, Allue C, Silva J,Desco MM, Moreno M, Garcia-Fernandez MA. Noninvasive assessmentof ejection intraventricular pressure gradients. J Am Coll Cardiol. 2004;43:1654–1662.
8. Yotti R, Bermejo J, Desco MM, Antoranz JC, Rojo-Alvarez JL, CortinaC, Allue C, Rodriguez-Abella H, Moreno M, Garcia-Fernandez MA.Doppler-derived ejection intraventricular pressure gradients provide areliable assessment of left ventricular systolic chamber function.Circulation. 2005;112:1771–1779.
9. Quinones MA, Otto CM, Stoddard M, Waggoner A, Zoghbi WA. Rec-ommendations for quantification of Doppler echocardiography: a reportfrom the Doppler Quantification Task Force of the Nomenclature andStandards Committee of the American Society of Echocardiography.J Am Soc Echocardiogr. 2002;15:167–184.
10. Bermejo J, Antoranz JC, Yotti R, Moreno M, Garcia-Fernandez MA.Spatio-temporal mapping of intracardiac pressure gradients: a solution toEuler’s equation from digital postprocessing of color Doppler M-modeechocardiograms. Ultrasound Med Biol. 2001;27:621–630.
11. Weiss JL, Frederiksen JW, Weisfeldt ML. Hemodynamic determinants ofthe time-course of fall in canine left ventricular pressure. J Clin Invest.1976;58:751–760.
12. De Mey S, Thomas JD, Greenberg NL, Vandervoort PM, Verdonck PR.Assessment of the time constant of relaxation: insights from simulationsand hemodynamic measurements. Am J Physiol Heart Circ Physiol.2001;280:H2936–H2943.
13. Senzaki H, Kass DA. Analysis of isovolumic relaxation in failing heartsby monoexponential time constants overestimates lusitropic change andload dependence: mechanisms and advantages of alternative logistic fit.Circ Heart Fail. 2010;3:268–276.
14. Edwards D, Berry JJ. The efficiency of simulation-based multiple com-parisons. Biometrics. 1987;43:913–928.
15. Bland JM, Altman DG. Calculating correlation coefficients with repeatedobservations: part 1, correlation within subjects. BMJ. 1995;310:446.
16. Janssen PM, de Tombe PP. Uncontrolled sarcomere shortening increasesintracellular Ca2� transient in rat cardiac trabeculae. Am J Physiol.1997;272:H1892–H1897.
17. Wang J, Khoury DS, Thohan V, Torre-Amione G, Nagueh SF. Globaldiastolic strain rate for the assessment of left ventricular relaxation andfilling pressures. Circulation. 2007;115:1376–1383.
18. Dong S-J, Hees PS, Siu CO, Weiss JL, Shapiro EP. MRI assessment ofLV relaxation by untwisting rate: a new isovolumic phase measure of tau.Am J Physiol Heart Circ Physiol. 2001;281:H2002–H2009.
19. Steine K, Stugaard M, Smiseth O. Mechanisms of diastolic intraventric-ular regional pressure differences and flow in the inflow and outflowtracts. J Am Coll Cardiol. 2002;40:983–990.
20. Notomi Y, Martin-Miklovic MG, Oryszak SJ, Shiota T, Deserranno D,Popovic ZB, Garcia MJ, Greenberg NL, Thomas JD. Enhanced ventric-ular untwisting during exercise: a mechanistic manifestation of elasticrecoil described by Doppler tissue imaging. Circulation. 2006;113:2524–2533.
21. Thomas JD, Choong CY, Flachskampf FA, Weyman AE. Analysis of theearly transmitral Doppler velocity curve: effect of primary physiologicchanges and compensatory preload adjustment. J Am Coll Cardiol. 1990;16:644–655.
22. Aurigemma GP, Zile MR, Gaasch WH. Lack of relationship betweenDoppler indices of diastolic function and left ventricular pressure tran-sients in patients with definite diastolic heart failure. Am Heart J. 2004;148:E12.
23. Sohn DW, Chai IH, Lee DJ, Kim HC, Kim HS, Oh BH, Lee MM, ParkYB, Choi YS, Seo JD, Lee YW. Assessment of mitral annulus velocity byDoppler tissue imaging in the evaluation of left ventricular diastolicfunction. J Am Coll Cardiol. 1997;30:474–480.
24. Garcia MJ, Smedira NG, Greenberg NL, Main M, Firstenberg MS,Odabashian J, Thomas JD. Color M-mode Doppler flow propagationvelocity is a preload insensitive index of left ventricular relaxation:animal and human validation. J Am Coll Cardiol. 2000;35:201–208.
25. Nagueh SF, Sun H, Kopelen HA, Middleton KJ, Khoury DS. Hemody-namic determinants of the mitral annulus diastolic velocities by tissueDoppler. J Am Coll Cardiol. 2001;37:278–285.
26. Firstenberg MS, Greenberg NL, Main ML, Drinko JK, Odabashian JA,Thomas JD, Garcia MJ. Determinants of diastolic myocardial tissueDoppler velocities: influences of relaxation and preload. J Appl Physiol.2001;90:299–307.
27. Agmon Y, Oh JK, McCarthy JT, Khandheria BK, Bailey KR, Seward JB.Effect of volume reduction on mitral annular diastolic velocities in hemo-dialysis patients. Am J Cardiol. 2000;85:665–668.
28. Seo Y, Ishimitsu T, Ishizu T, Obara K, Moriyama N, Sakane M, MaedaH, Watanabe S, Yamaguchi I. Preload-dependent variation of the prop-agation velocity in patients with congestive heart failure. J Am SocEchocardiogr. 2004;17:432–438.
29. Jacques DC, Pinsky MR, Severyn D, Gorcsan J III. Influence of alter-ations in loading on mitral annular velocity by tissue Doppler echocar-diography and its associated ability to predict filling pressures. Chest.2004;126:1910–1918.
30. Ohte N, Narita H, Akita S, Kurokawa K, Hayano J, Kimura G. Strikingeffect of left ventricular systolic performance on propagation velocity ofleft ventricular early diastolic filling flow. J Am Soc Echocardiogr.2001;14:1070–1074.
Yotti et al Pressure Gradients to Estimate Relaxation 103
by guest on March 12, 2016http://circimaging.ahajournals.org/Downloaded from

31. Rivas-Gotz C, Manolios M, Thohan V, Nagueh SF. Impact of left ven-tricular ejection fraction on estimation of left ventricular filling pressuresusing tissue Doppler and flow propagation velocity. Am J Cardiol. 2003;91:780–784.
32. Ommen SR, Nishimura RA, Appleton CP, Miller FA, Oh JK, RedfieldMM, Tajik AJ. Clinical utility of Doppler echocardiography and tissueDoppler imaging in the estimation of left ventricular filling pressures: acomparative simultaneous Doppler-catheterization study. Circulation.2000;102:1788–1794.
33. Kasner M, Westermann D, Steendijk P, Gaub R, Wilkenshoff U,Weitmann K, Hoffmann W, Poller W, Schultheiss HP, Pauschinger M,Tschope C. Utility of Doppler echocardiography and tissue Dopplerimaging in the estimation of diastolic function in heart failure with normalejection fraction: a comparative Doppler-conductance catheterizationstudy. Circulation. 2007;116:637–647.
34. Yotti R, Bermejo J, Antoranz JC, Desco MM, Cortina C, Rojo-AlvarezJL, Allue C, Martin L, Moreno M, Serrano JA, Munoz R, Garcia-Fernandez MA. A noninvasive method for assessing impaired diastolicsuction in patients with dilated cardiomyopathy. Circulation. 2005;112:2921–2929.
35. Opdahl A, Remme EW, Helle-Valle T, Lyseggen E, Vartdal T, PettersenE, Edvardsen T, Smiseth OA. Determinants of left ventricular early-dia-
stolic lengthening velocity: independent contributions from left ventric-ular relaxation, restoring forces, and lengthening load. Circulation. 2009;119:2578–2586.
36. Mullens W, Borowski AG, Curtin RJ, Thomas JD, Tang WH. TissueDoppler imaging in the estimation of intracardiac filling pressure indecompensated patients with advanced systolic heart failure. Circulation.2009;119:62–70.
37. Nagueh SF, Middleton KJ, Kopelen HA, Zoghbi WA, Quinones MA.Doppler tissue imaging: a noninvasive technique for evaluation of leftventricular relaxation and estimation of filling pressures. J Am CollCardiol. 1997;30:1527–1533.
38. Rojo-Alvarez JL, Bermejo J, Juarez-Caballero VM, Yotti R, Cortina C,Garcia-Fernandez MA, Antoranz JC. Support vector analysis of color-Doppler images: a new approach for estimating indices of left ventricularfunction. IEEE Trans Med Imaging. 2006;25:1037–1043.
39. Garcia D, Del Alamo JC, Tanne D, Yotti R, Cortina C, Bertrand E,Antoranz JC, Perez-David E, Rieu R, Fernandez-Aviles F, Bermejo J.Two-dimensional intraventricular flow mapping by digital processingconventional color-Doppler echocardiography images. IEEE Trans MedImaging. 2010;29:1701–1713.
CLINICAL PERSPECTIVERecent studies have shown the limitations of Doppler-derived methods to evaluate ventricular relaxation in the clinicalsetting. In the present study, we propose and validate a new noninvasive index that improves the assessment of LVrelaxation in patients. At end-systole, myocardial relaxation causes flow deceleration and a reversed pressure gradientinside the LV that can be measured using Doppler echocardiography. In an animal model, we demonstrate, for the firsttime, the physiological basis of the Doppler-derived peak reversed ejection intraventricular pressure difference (REIVPD)to assess relaxation, and its reliability under a wide range of hemodynamic interventions and loading conditions. A clinicalvalidation study in 50 patients undergoing simultaneous Doppler-echocardiography and high-fidelity LV pressuremeasurements shows that the new method combined with tissue Doppler mitral-annulus velocity (e�) outperforms currentlyavailable methods to estimate the rate of relaxation. This new method might be preferred in clinical scenarios where e� isknown to be unreliable, such as mitral valve disease, annular calcification, regional wall motion abnormalities orconduction disturbances.
104 Circ Cardiovasc Imaging March 2011
by guest on March 12, 2016http://circimaging.ahajournals.org/Downloaded from

Francisco Fernández-AvilésRodríguez-Pérez, Cristina Cortina, Teresa Mombiela, Alicia Barrio, Jaime Elízaga and
Raquel Yotti, Javier Bermejo, Yolanda Benito, J. Carlos Antoranz, M. Mar Desco, DanielPressure Gradients
Noninvasive Estimation of the Rate of Relaxation by the Analysis of Intraventricular
Print ISSN: 1941-9651. Online ISSN: 1942-0080 Copyright © 2011 American Heart Association, Inc. All rights reserved.
Dallas, TX 75231is published by the American Heart Association, 7272 Greenville Avenue,Circulation: Cardiovascular Imaging
doi: 10.1161/CIRCIMAGING.110.9603692011;4:94-104; originally published online January 18, 2011;Circ Cardiovasc Imaging.
http://circimaging.ahajournals.org/content/4/2/94World Wide Web at:
The online version of this article, along with updated information and services, is located on the
http://circimaging.ahajournals.org//subscriptions/
is online at: Circulation: Cardiovascular Imaging Information about subscribing to Subscriptions:
http://www.lww.com/reprints Information about reprints can be found online at: Reprints:
document. Permissions and Rights Question and Answer information about this process is available in the
requested is located, click Request Permissions in the middle column of the Web page under Services. FurtherCenter, not the Editorial Office. Once the online version of the published article for which permission is being
can be obtained via RightsLink, a service of the Copyright ClearanceCirculation: Cardiovascular Imagingin Requests for permissions to reproduce figures, tables, or portions of articles originally publishedPermissions:
by guest on March 12, 2016http://circimaging.ahajournals.org/Downloaded from