Noise Filtering Strategies in Adaptive Biochemical Signaling Networks
15
Journal of Statistical Physics manuscript No. (will be inserted by the editor) Pablo Sartori · Yuhai Tu Noise filtering strategies of adaptive signaling networks Application to E. coli chemotaxis Received: 1st December, 2010 / Accepted: 1st December, 2010 Abstract Two distinct mechanisms for filtering noise in an input signal are identified in a class of adaptive sensory networks. We find that the high frequency noise is filtered by the output degradation process through time- averaging; while the low frequency noise is damped by adaptation through negative feedback. Both filtering processes themselves introduce intrinsic noises, which are found to be unfiltered and can thus amount to a signif- icant internal noise floor even without signaling. These results are applied to E. coli chemotaxis. We show unambiguously that the molecular mecha- nism for the Berg-Purcell time-averaging scheme is the dephosphorylation of the response regulator CheY-P, not the receptor adaptation process as previously suggested. The high frequency noise due to the stochastic ligand binding-unbinding events and the random ligand molecule diffusion is aver- aged by the CheY-P dephosphorylation process to a negligible level in E.coli. We identify a previously unstudied noise source caused by the random mo- tion of the cell in a ligand gradient. We show that this random walk induced signal noise has a divergent low frequency component, which is only ren- dered finite by the receptor adaptation process. For gradients within the E. coli sensing range, this dominant external noise can be comparable to the significant intrinsic noise in the system. The dependence of the response and its fluctuations on the key time scales of the system are studied systemati- cally. We show that the chemotaxis pathway may have evolved to optimize gradient sensing, strong response, and noise control in different time scales. P. Sartori Max Planck Institute of Complex Systems E-mail: [email protected] Y. Tu IBM T.J. Watson Research Center Tel.: +123-45-678910 E-mail: [email protected] arXiv:1104.4092v1 [q-bio.CB] 20 Apr 2011
-
Upload
independent -
Category
Documents
-
view
1 -
download
0
Transcript of Noise Filtering Strategies in Adaptive Biochemical Signaling Networks
Journal of Statistical Physics manuscript No.(will be inserted by the editor)
Pablo Sartori · Yuhai Tu
Noise filtering strategies of adaptivesignaling networks
Application to E. coli chemotaxis
Received: 1st December, 2010 / Accepted: 1st December, 2010
Abstract Two distinct mechanisms for filtering noise in an input signal areidentified in a class of adaptive sensory networks. We find that the highfrequency noise is filtered by the output degradation process through time-averaging; while the low frequency noise is damped by adaptation throughnegative feedback. Both filtering processes themselves introduce intrinsicnoises, which are found to be unfiltered and can thus amount to a signif-icant internal noise floor even without signaling. These results are appliedto E. coli chemotaxis. We show unambiguously that the molecular mecha-nism for the Berg-Purcell time-averaging scheme is the dephosphorylationof the response regulator CheY-P, not the receptor adaptation process aspreviously suggested. The high frequency noise due to the stochastic ligandbinding-unbinding events and the random ligand molecule diffusion is aver-aged by the CheY-P dephosphorylation process to a negligible level in E.coli.We identify a previously unstudied noise source caused by the random mo-tion of the cell in a ligand gradient. We show that this random walk inducedsignal noise has a divergent low frequency component, which is only ren-dered finite by the receptor adaptation process. For gradients within the E.coli sensing range, this dominant external noise can be comparable to thesignificant intrinsic noise in the system. The dependence of the response andits fluctuations on the key time scales of the system are studied systemati-cally. We show that the chemotaxis pathway may have evolved to optimizegradient sensing, strong response, and noise control in different time scales.
P. SartoriMax Planck Institute of Complex SystemsE-mail: [email protected]
Y. TuIBM T.J. Watson Research CenterTel.: +123-45-678910E-mail: [email protected]
arX
iv:1
104.
4092
v1 [
q-bi
o.C
B]
20
Apr
201
1
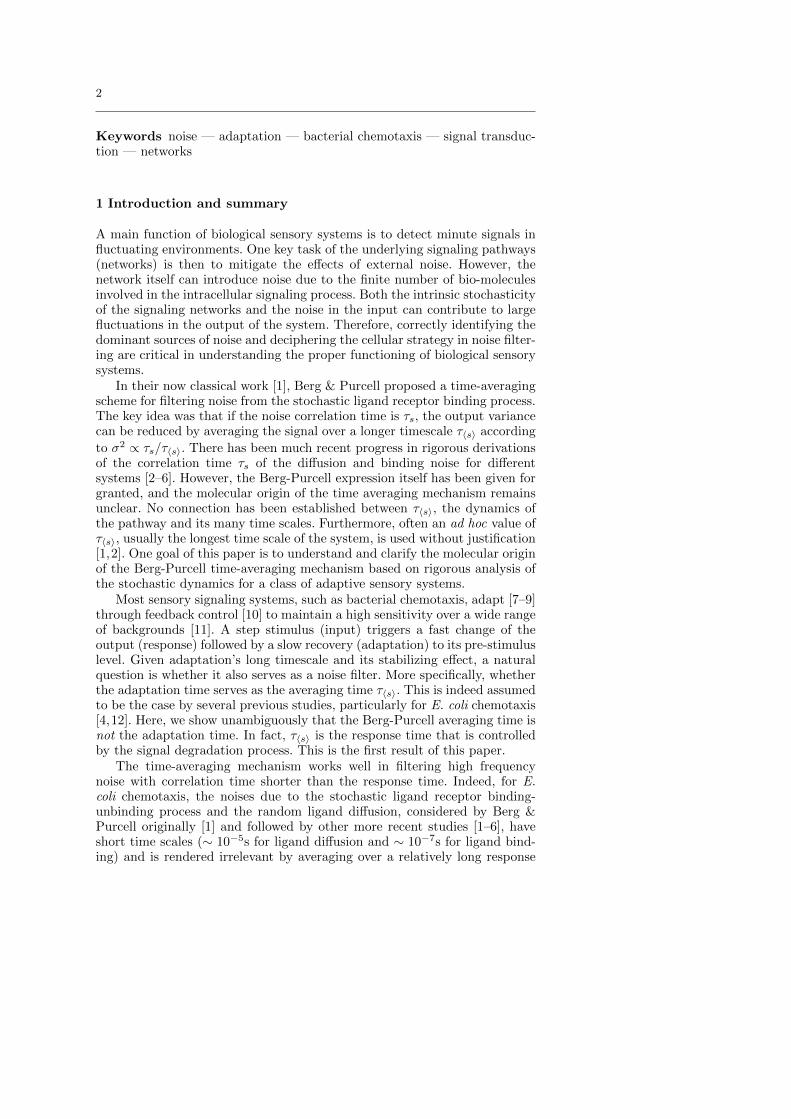
2
Keywords noise — adaptation — bacterial chemotaxis — signal transduc-tion — networks
1 Introduction and summary
A main function of biological sensory systems is to detect minute signals influctuating environments. One key task of the underlying signaling pathways(networks) is then to mitigate the effects of external noise. However, thenetwork itself can introduce noise due to the finite number of bio-moleculesinvolved in the intracellular signaling process. Both the intrinsic stochasticityof the signaling networks and the noise in the input can contribute to largefluctuations in the output of the system. Therefore, correctly identifying thedominant sources of noise and deciphering the cellular strategy in noise filter-ing are critical in understanding the proper functioning of biological sensorysystems.
In their now classical work [1], Berg & Purcell proposed a time-averagingscheme for filtering noise from the stochastic ligand receptor binding process.The key idea was that if the noise correlation time is τs, the output variancecan be reduced by averaging the signal over a longer timescale τ〈s〉 according
to σ2 ∝ τs/τ〈s〉. There has been much recent progress in rigorous derivationsof the correlation time τs of the diffusion and binding noise for differentsystems [2–6]. However, the Berg-Purcell expression itself has been given forgranted, and the molecular origin of the time averaging mechanism remainsunclear. No connection has been established between τ〈s〉, the dynamics ofthe pathway and its many time scales. Furthermore, often an ad hoc value ofτ〈s〉, usually the longest time scale of the system, is used without justification[1,2]. One goal of this paper is to understand and clarify the molecular originof the Berg-Purcell time-averaging mechanism based on rigorous analysis ofthe stochastic dynamics for a class of adaptive sensory systems.
Most sensory signaling systems, such as bacterial chemotaxis, adapt [7–9]through feedback control [10] to maintain a high sensitivity over a wide rangeof backgrounds [11]. A step stimulus (input) triggers a fast change of theoutput (response) followed by a slow recovery (adaptation) to its pre-stimuluslevel. Given adaptation’s long timescale and its stabilizing effect, a naturalquestion is whether it also serves as a noise filter. More specifically, whetherthe adaptation time serves as the averaging time τ〈s〉. This is indeed assumedto be the case by several previous studies, particularly for E. coli chemotaxis[4,12]. Here, we show unambiguously that the Berg-Purcell averaging time isnot the adaptation time. In fact, τ〈s〉 is the response time that is controlledby the signal degradation process. This is the first result of this paper.
The time-averaging mechanism works well in filtering high frequencynoise with correlation time shorter than the response time. Indeed, for E.coli chemotaxis, the noises due to the stochastic ligand receptor binding-unbinding process and the random ligand diffusion, considered by Berg &Purcell originally [1] and followed by other more recent studies [1–6], haveshort time scales (∼ 10−5s for ligand diffusion and ∼ 10−7s for ligand bind-ing) and is rendered irrelevant by averaging over a relatively long response
3
time (τ〈s〉 ∼ 0.1s). For E. coli chemotaxis the dominant signal fluctuation,we find, comes from the random motion of the cell. In a ligand gradient, thisrandom motion introduces an unbounded low frequency fluctuation in theinput signal. Such random walk induced signal noise has not been studiedbefore, even in recent works regarding chemotaxis noise in a ligand gradi-ent [4]. Here, we show that random walk noise is not filtered by the time-averaging mechanism. Instead, this low frequency noise is suppressed by thereceptor adaptation process by a mechanism general to adaptive networkswhich we call feedback control. The frequency (or time) dependence in thefiltering function in the case of adaptive control is opposite to that of thetime-averaging mechanism. This is the second result of this paper.
However, these intracellular biochemical noise filtering mechanisms, time-averaging through output degradation and feedback control through receptoradaptation, also introduce fluctuations in the output themselves due to thefinite number of molecules involved in these processes. Here, we derive theexpressions of these intrinsic noises from the stochastic pathway dynamics.We show that both these intrinsic noises are not filtered (suppressed) by thepathway itself and can thus contribute to a significant intrinsic noise flooreven in the absence of any signal. This is the third result of this paper.
Finally, we verify these analytical results by simulating the propagation ofsignal noise in the nonlinear E. coli chemotaxis pathway dynamics for bacte-rial cells moving in an attractant gradient. Using biologically relevant param-eters, we show that the random-walk induced noise is the main source of sig-nal noise, while the ligand diffusion and binding noises are irrelevant. We alsosystematically study the dependence of the response and its fluctuation (dueto both extrinsic and intrinsic noises) on the two key time scales (responsetime and adaptation time). Form our analysis, we argue that the chemotaxispathway has evolved to optimize gradient sensing, strong response, and noisecontrol in different time scales.
2 Two noise filtering strategies of adaptive signaling networks
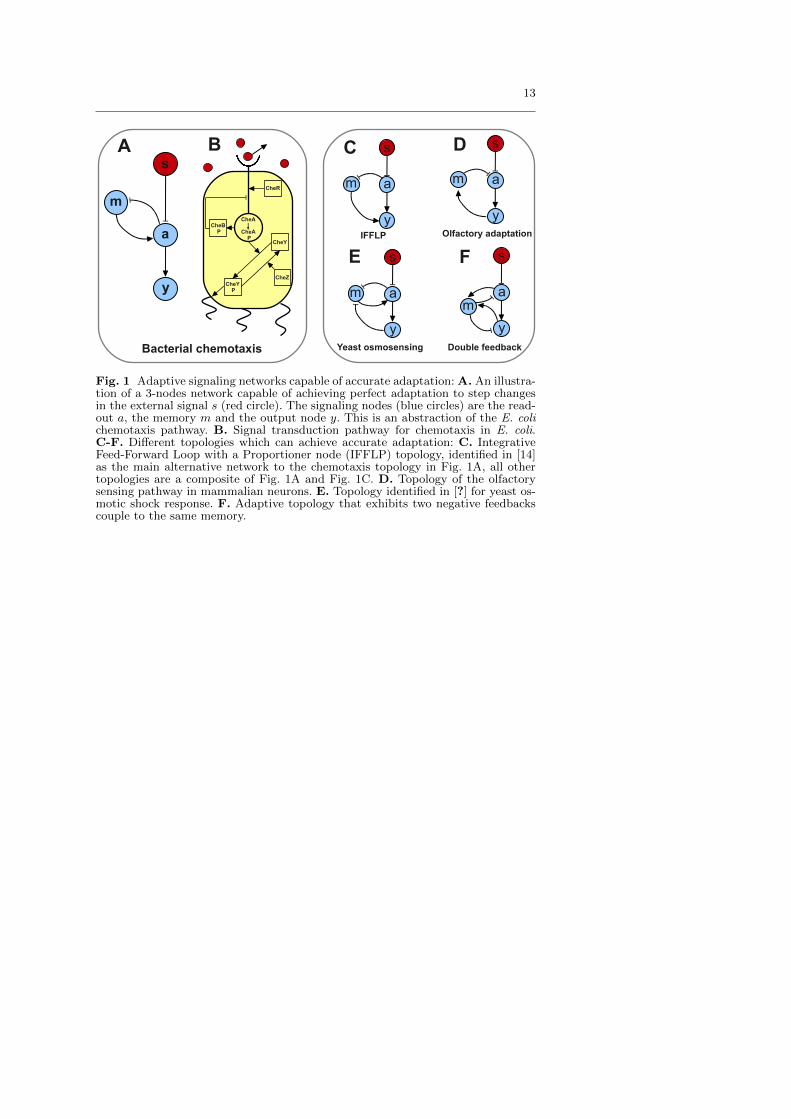
We study noise in a generic three-node adaptive network (Fig. 1A, see [13,14]) that abstracts the E. coli chemotaxis pathway (Fig. 1B). We will thenshow that the results can be further generalized to other related adaptivesignaling network topologies shown in Fig. 1C-F.
In Fig. 1A, the signal s is sensed by the fast “activity” node a, whichcontrols the output y. The “memory” m, which depends on a, carries outadaptation by feeding back to control the activity a. The noisy dynamics ofthis adaptive network can be described by the Langevin equations:
Activityda
dt= fa(a,m, s+ ηs) + ηa;
Adaptationdm
dt= fm(a,m) + ηm;
Outputdy
dt= fy(a, y) + ηy. (1)
4
where η represents different noise sources: ηa, ηm and ηy are the internalwhite noises caused by the stochastic biochemical reactions; the spectrum ofthe signal noise ηs depends on its origin as described later.
The interactions among the nodes are characterized in Eq. (1) by thefunctions f , whose exact forms can be obtained from the detailed kinetics ofthe system. The network topology (Fig. 1A) constrains these interactions inthe following way. The feedback mechanism requires fa,mfm,a < 0; the sta-bility of the system requires fa,a ≤ 0, fy,y ≤ 0 and fm,m ≤ 0; and accurateadaptation is achieved by choosing fm,m = 0 [15]. With these constrains,Eq. 1 generally defines an adaptive system with response rate ωy = |fy,y|and adaptation rate ωm = |fa,mfm,a/fa,a|. Here ,x stands for derivative withrespect to x. Also, for each characteristic frequency ωx we define a charac-teristic time as τx ≡ 1/ωx.
There are two types of signal related noise. The first is caused by thestochasticity of the discrete signal sensing events such as ligand binding-unbinding, which was considered originally by Berg and Purcell [1]. Thisligand binding noise exists even for constant signals. The second signal noiseis caused by the random temporal variations of the external signal, e. g., airpressure fluctuations for ear hair cells, diffusion of ligand around a chemore-ceptor, or fluctuations in attractant concentration sensed by a bacteriumdue to the cell’s random motion up an attractant concentration gradient.This latter case will be studied in detail in the next section. In general, wemodel the signal noise ηs as exponentially correlated with strength 〈η2s〉 andcorrelation time τs.
For relatively small noise, Eq. 1 can be linearized around its steady stateand the transfer function for each of the noise sources can be determinedanalytically in frequency (ω) space. For example, for signal noise one hasδy(ω) = χ(ω)ηs(ω), where
χ(ω) = iAsωωy/[(iω + ωm)(iω + ωy)] (2)
is the transfer function for small signals, with As dependent on the inter-action functions [13]. The output y in a single cell fluctuates due to bothexternal signal noise and intrinsic pathway noise. The strength of the outputfluctuation can be characterized by its variance, which can be calculated byσ2Y = (2π)−1
∫∞−∞〈δy(ω)2〉dω. Summing up contributions from all the noise
sources, we obtain a compact expression of the total variance for the outputy:
σ2Y = Cs ×
τsτ〈s〉
+ Ca ×τaτ〈a〉
+ Cm ×τmτ〈m〉
+ Cy ×τyτ〈y〉
, (3)
where each contribution, originating from a separate node in the network,has been written in the form of a dimensionless noise amplitude, definedas Cx = A2
x〈η2x〉τx/2 with Ax the corresponding transfer function ampli-tude; multiplying the ratio of the characteristic time of the node τx over anode-specific averaging-time τ〈x〉 which depends on the key timescales of the
5
system. The times for the signal noise and the internal noises are
τ〈s〉 = (τy + τm)(τy + τs)(τm + τs)/τ2m; (4)
τ〈a〉 = τy(τm + τy)/τm;
τ〈m〉 = τy + τm;
τ〈y〉 = τy.
Eq. (3) presents a comprehensive picture of the different sources of noisein the system and their contributions to the output variance. The forms of theaveraging times reveal the underlying mechanisms for filtering different formsof noise. From the explicit expression of the signal averaging time τ〈s〉 (Eq.4), two distinct noise filtering mechanisms and their responsible underlyingbiochemical processes are revealed.
1) Time averaging: For high frequency noise (τs � τy, τm) one has τ〈s〉 ≈τy(1 + τy/τm) ≈ τy. The last approximation is justified since in most adap-tive sensory systems the initial response to a signal is much faster than theadaptation τy � τm (examples in [8,9] all substantially more than ten fold).Therefore, we have
σ2Y ≈ Csτs/τy, (5)
which follows exactly the Berg-Purcell time-averaging scheme. More impor-tantly, through the rigorous derivation of the time-averaging scheme, its un-derlying molecular mechanism is revealed. From Eq. 5, the averaging timeis τy, the response time, which is essentially the decay time of the output.Our finding here unambiguously shows that the underlying mechanism foraveraging high frequency noise is the output degradation process. The slowadaptation dynamics does not play any role in time-averaging, contrary towhat was proposed before [4,12]. For E. Coli, we will see that output degra-dation is slow enough as to render irrelevant ligand diffusion and bindingnoise.
2) Adaptive control: For low frequency noise (τs � τm, τy) one has τ〈s〉 ≈τ2s (1 + τy/τm)/τm ≈ τ2s /τm, which is no longer an averaging time. Indeed,the output variance takes the form
σ2Y ≈ Csτm/τs, (6)
fundamentally different from the Berg-Purcell scheme. σ2Y is now inversely
proportional to τs and proportional to τm: faster adaptation leads to smalleroutput fluctuation. This noise filtering mechanism, which we call adaptivenoise control, is carried out by the adaptation process and it only applieswhen adaptation is faster than the correlation time of the noise. Later, wewill show how this mechanism controls the effects of signal noise caused bythe random walk (run-tumble) motion of E. coli cells.
In addition to the noise introduced by the signal s, each internal node ofthe network (a, m and y) contributes to the output fluctuation due to the
6
intrinsic stochasticity of the intracellular biochemical reactions. The time-averaging picture (Eq. 3) is useful to characterize internal noises. As the read-out of the signal s by a is fast, τ〈a〉 ∼ τy � τa, and the activity noise is heavily
damped. The noise from the adaptation node m goes as ∼ (1 + τy/τm)−1,which is almost unfiltered since τm � τy in sensory systems. The noise fromthe output node is always unfiltered, as τ〈y〉 = τy. These two unfiltered in-ternal noise sources, which exist even in the absence of the external signal,constitute the noise floor of the signaling network. Their absolute and rel-ative strengths depend on the details of the system, and will be discussedlater in the case of E. coli chemotaxis.
So far we have focused on the network of Fig. 1A, which is an abstractionof the E. coli chemotaxis pathway (Fig. 1B). We now proceed to extend ourresults to other adaptive topologies (Fig. 1C-F). It has recently been shownthat the main three-node network topologies that can exhibit robust perfectadaptation are the one of chemotaxis shown in Fig. 1A, and that in Fig. 1C[14]. The topology in Fig. 1C is named Incoherent Feedforward Loop with aProportioner Node (IFFLP) in [14]. For the chemotaxis topology, the condi-tion for accurate adaptation is simply fm,m = 0 as shown before, whereasthe IFFLP network requires a more stringent condition fy,mfm,a = fy,afm,m.If the perfect adaptation condition is satisfied by the IFFLP network, it isnot hard to show that the transfer function has the same form as that of thechemotaxis topology. The only difference is that the adaptation and responserates for the IFFLP network are given by ωm = |fm,m| and ωy = |fy,y| respec-tively. Since the transfer function determines the signal filtering propertiesof the system, the two noise filtering strategies here described hold exactlyfor the alternative IFFLP topology.
In general, any adaptive three-node topology that exhibits accurate adap-tation will do so by satisfying either the condition of the IFFLP network orthat of the chemotaxis network [14]. For example the Yeast osmosensing andthe olfactory adaptation topologies (Figs. 1D&E) have to satisfy the chemo-taxis condition (fm,m = 0) to exhibit accurate adaptation. On the otherhand, the topology in Fig. 1F exhibits accurate adaptation if it satisfies theIFFLP condition (fy,mfm,a = fy,afm,m). When any of these topologies sat-isfies the adequate condition and exhibits perfect adaptation, the transferfunction has the form of the chemotaxis transfer function. As a consequence,the two noise filtering strategies found in this paper hold true for any three-node topology that exhibits accurate adaptation.
3 E. coli chemotaxis: noise, filtering, and design trade-offs
We now apply the general results of the previous section to the case of E. colichemotaxis pathway, where the interaction functions and the noise strengthscan determined based on the underlying biochemical reactions. In the follow-ing we present a simple model for bacterial chemotaxis following the recentwork by Tu, Shimizu and Berg [13] before addressing the noise effects in thesystem.
Over a wide range of ligand attractant concentration [L], the signal anE. coli cell senses depends logarithmically on [L]: s = ln([L]/KI), with a
7
characteristic dissociation constant KI (KI ≈ 18µM for MeAsp as consideredin this paper). The kinase activity of the chemoreceptor complex is given bya, and m is the methylation level of the chemoreceptor. The output y isthe number of CheY-P molecules. A coarse-grained model of the chemotaxispathway was proposed [13] and verified [16] with interaction functions givenby:
fa(a,m, s) = −ωa
(a− 1
1 + eE(m,s)
)(7)
with ωa = 50Hz, and E(m, s) = N [α(m − m0) − s] the free energy of aN -receptors cluster with N = 6, α = 2, and m0 = 1;
fm(a,m) = F (a) (8)
has a root at a0 = 1/3 and a negative slope which results in an adaptationtime of τm = 10s; and
fy(a, y) = kNa(yT − y)− ωzy (9)
with N = 600 independent receptor units with a phosphate transfer ratek = 3× 10⁻³Hz from CheA-P to the pool of yT = 104 CheY molecules, anda CheY-P decay rate assisted by the phosphatase CheZ of ωz = 1.3Hz whichresults in a response time of τy = 0.5s.
The noise strengths can be obtained by summing the rates in the masterequation underlying the Langevin dynamics [17]. For the activity switch-ing dynamics, the noise is binomial and its strength is given as 〈η2a〉 =2a(1−a)ωa/N . For the methylation/demethylation processes, 〈η2m〉 = 2a(1−a)F ′(a)/N because the adaptation dynamics depends only on the activity.Since the fluctuation of the number of CheY-P molecules in a cell is due toan underlying Poisson process, we have 〈η2y〉 = 2yωz.
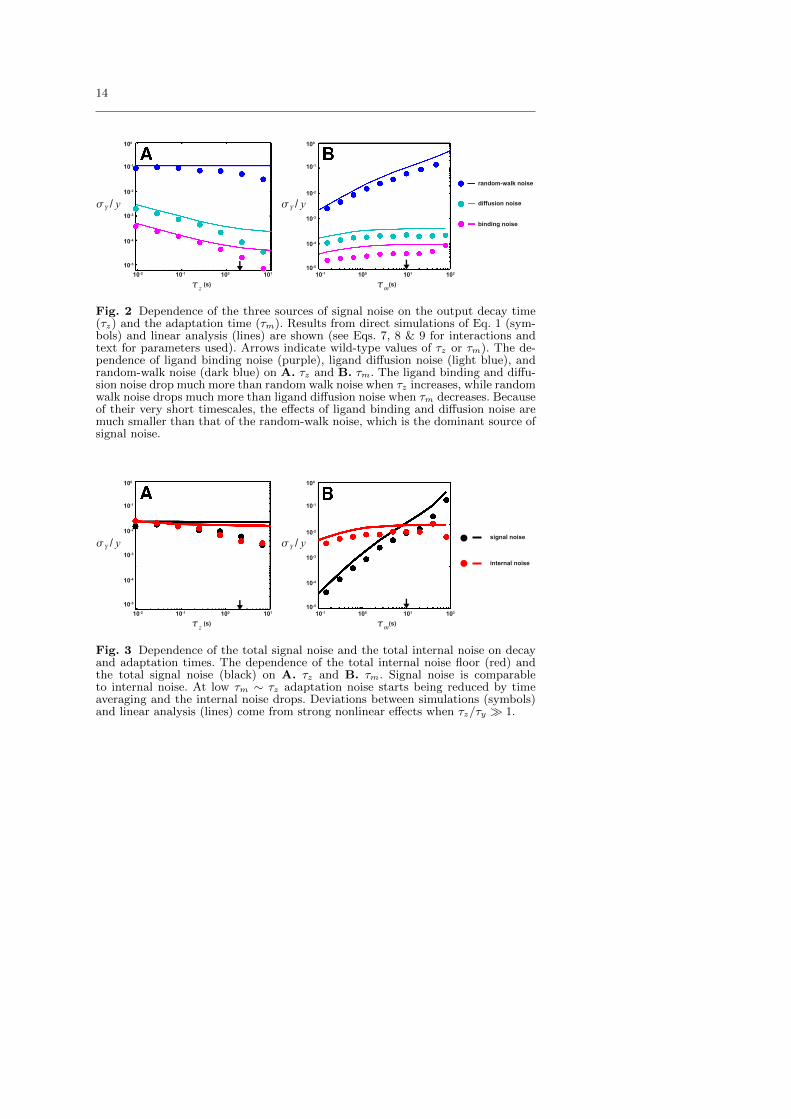
By using both the general analytical results from last section and directsimulations of the Langevin equation (Eq. (1)), we have studied the contribu-tions to CheY-P level fluctuation from different noise sources (external andinternal). Different noise contributions and their dependence on the two keytime scales of the system τm and τz are summarized in Figure 2.
We first consider the high frequency noise from ligand binding and diffu-sion, which have been the focus of most previous works [1–4]. The signal noiseηd caused by the diffusion of ligand molecules around a unit of N receptors ofsize l can be modeled [2,18]. It is not hard to show that the ligand diffusionnoise ηd can be characterized by a strength 〈η2d〉 ≈ 4(2π)5/2/(τd[L](Nl)3)and a correlation time τd ≈ (Nl)2/D ∼ 10−5s, where the ligand diffusionconstant D ≈ 10−5cm2/s is used for MeAsp, and l ≈ 0.01µm is used forreceptor Tar [1,19]). For E. coli chemo-receptors, the signal noise ηb can alsobe characterized by its strength 〈η2b 〉 ≈ (1 − a)(Ki + [L])2/(τbKi[L]) fromthe stochastic binding-unbinding process with an even shorter time scaleτb ≈ (DNl(Ki + [L]))−1 ∼ 10−7s. According to our analysis, these high fre-quency noises are averaged over the response time τz, but not the adaptationtime τm. These general predictions (solid lines in Fig. 2) are confirmed bydirect simulations (symbols in Fig. 2) of the pathway dynamics (Eqs. 7-9).
8
As shown in Fig. 2A, the contribution to the output fluctuation from theligand diffusion noise (light blue symbols and line) and ligand binding noise(purple symbols and line) decreases with τz; while they are independent ofτm as shown in Fig. 2B. Given that the averaging time is much longer thanthe ligand binding and diffusion times τy = 0.5s � τd,b, the effects of theligand binding and diffusion noise are negligible in E. coli chemotaxis, ordersof magnitude smaller than the internal noise floor (red symbols and lines inFig. 3). Hence, these high frequency noises are unlikely the limiting factorsfor sensing accuracy in E. coli as usually assumed [4,12]. However, in othersystems such as in eukaryotic chemotaxis, the binding time can be compa-rable to the response time τb ∼ τy [20,21], so the ligand binding-unbindingnoise ηb can be significant. The ligand diffusion noise ηd can also be morerelevant for systems with relatively large receptors, which lead to a longercorrelation time τd of ligand diffusion noise.
As we have shown above, the effect of the high frequency signal noisedue to ligand binding and diffusion on the output fluctuation is negligible.The dominant source of signal noise is the low-frequency signal fluctuationthat originates from the random motion of the cell in a ligand gradient.Here, we characterize this previously unstudied signal noise. In an exponentialattractant gradient [L] = [L]0erx, a cell moves in a biased random walk witha constant drift velocity vd plus a random-walk velocity ηv with correlationtime τv, variance σ2
v and the spectrum 〈η2v(ω)〉 = 2ωvσ2v/(ω
2 + ω2v) [22–24].
The random displacement (position) ηx =∫ηvdt of the cell due to its random
walk leads to a signal fluctuation ηrw = rηx, which diverges as ηrw ∼ ω−1
at low frequency ω → 0. This strong signal fluctuation at low frequency isattenuated by the transfer function which goes as χ ∼ iω at ω → 0 due toadaptation’s additional role as a low frequency controller. As a result, therandom-walk induced output variance remains finite:
σ2Y,rw = [Ny(1− a)]2(rσvτv)2 × τm
τv. (10)
The adaptive control of the random-walk induced signal noise is evident fromthe above expression. In Eq. 10, (rσvτv)2 is the signal variance during onerandom-walk step. The variance of the signal increases linearly with time∼ t/τv due to the random-walk nature of the cell motion. For t ≥ τm, theincrease in signal variation is stopped by the adaptation process, and thevariation of the output saturates to be proportional to τm/τv.
Direct simulations of Eq. 1 using the pathway interactions (Eqs. 7-9)and random-walk induced signal noise confirm this analysis. As shown in inFig. 2A&B (blue symbols and lines), the effects of the random-walk inducednoise are independent of τz, but increase with τm, exactly as predicted fromEq. (10). Depending on the ligand concentration gradient, the effects of thisrandom-walk noise can be quite significant. For a exponential gradient r =1mm−1, the drift velocity is vd ≈ 2µm/s [23], and the cell velocity fluctuationcan be estimated from a pathway-based simulation [24] σv ≈ 9µm/s and τv ≈0.5s. From Eq. (10), the resulting relative output fluctuation is σY,rw/y ∼10−1, which is much larger than the ligand binding and diffusion noise (seeFig. 2A&B), and comparable to the internal noise (see Fig. 3). The cell’s

9
rotational diffusion also contributes to this noise. However, this contribution[12,25] is relatively small because the rotational diffusion time τrd ∼ 10s ismuch longer than τv ≈ 0.5s.
The internal noises have been analyzed quantitatively for E. coli chemo-taxis to compare with the signal noise (Fig. 3). Both internal noise filteringprocesses, adaptation (node m) and output degradation (node y), contributesignificantly to the total intrinsic noise. The adaptation process causes alarger output fluctuation σY,m/y ∼ 10−1, because its timescale is muchlonger than the response time τm � τy. Note that a low-frequency noiseof this magnitude is required to explain the observed 1/f noise in the switch-ing dynamics [26,27]. It was shown in [27] that increasing the amount ofthe methyltransferase CheR reduces the output noise. This observation wasexplained in [28] by the possible ultra-sensitive dependence of kinase activitya on CheR, which in our model translates to a change in the prefactor Cm
of the adaptation induced noise. However, our study reveals an additionalmechanism: increasing CheR reduces the adaptation time τm, and thereforethe noise is averaged by τy more effectively as shown in Fig. 3B. The othermain intrinsic noise source is the output node y, and its contribution to σYis smaller σY,y/y ∼ 10−2. Since the underlying molecular process is CheY-Pde-phosphorylation, this intrinsic noise is a Poisson-type noise, its strengthonly depends on the number of molecules (CheY-P level). This analytical re-sult, as seen in Fig. 3A, is consistent with the experimental observation thatover-expressing CheZ and CheY together keeps the output variance constant[29].
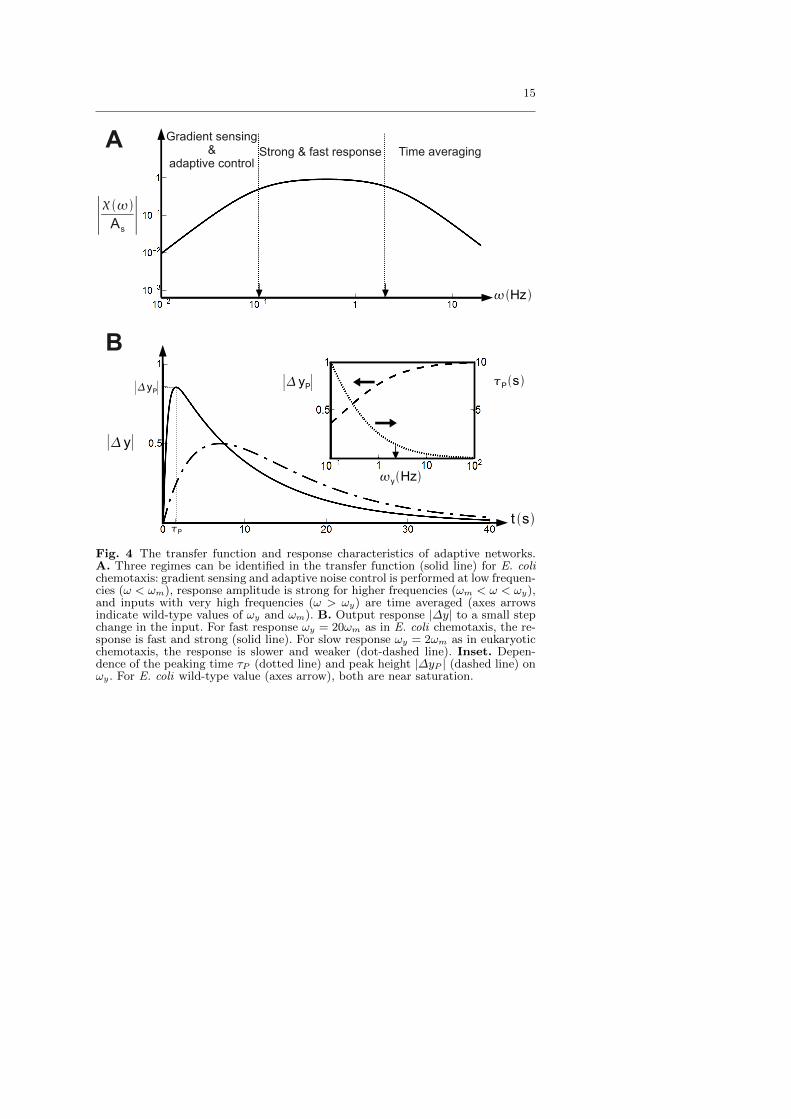
The topology of a biological network and the choices of the key biochem-ical constants determine its functions. For the chemotaxis network, differentfunctions can be identified in different frequency regimes of the transfer func-tion χ(ω) as shown in Fig. 4A. At low frequencies (ω < ωm) random-walknoise is controlled and the gradient of the signal is computed (see [13,16]). Atvery high frequencies (ω > ωy) ligand diffusion and binding noise are aver-aged out. With ωm � ωy, there is also an intermediate region ωy < ω < ωm,wherein the responses to external signal are kept fast and strong as shownin Fig. 4B. The E. coli chemotaxis network may have evolved to optimizethese critical functions in different frequency regimes. The general trade-offs of changing ωm and ωy become clear from our analysis. Reducing ωm
increases the sensitivity for gradient sensing since the CheY-P change in re-sponse to an exponential ligand gradient is ∝ ω−1m [13,16]. But smaller ωm
reduces the range of gradient sensing (see Fig. 4A, and [13,16]), and reducesthe low-frequency noise control ability which is crucial for suppressing therandom-walk induced noise. Reducing ωy enhances the cell’s ability in fil-tering high frequency noise. On the other hand, increasing ωy increases theresponse speed and response strength. As shown in Fig. 4B, the response(CheY-P level) to a step change in ligand concentration exhibits a peakedresponse ∆yP at a time τP . The dependence of the peak response ∆yP andthe peak time τP on the output degradation rate ωy can be analytically de-rived, and are plotted in the inset of Fig. 4B. As one can see, increasing ωy
reduces the peak time and increases the peak height.
10
4 Conclusions and Discussions
That noise can be a limiting factor for the correct behavior of a cell is an ideathat dates back to Berg & Purcell[1], who first proposed the time-averagingmechanism to reduce the effect of ligand diffusion noise in receptors. Theirwork has recently been extended and made more rigorous by several groups[2,5,3]. However, the exact molecular nature of the time-averaging mecha-nism remained unclear. Here, by studying the dynamics of a typical adaptivesignaling network, we show unambiguously that the time-averaging mecha-nism for the high frequency ligand binding and diffusion noise is the outputdecay process, not the receptor adaptation as previously suggested[4,12].This result is common to all adaptive sensory systems, independent of thenetwork topology.
For the particular case of E. coli chemotaxis, various aspects of noise inthe signaling pathway have been studied in recent studies[4,30]. We discusssome of these works in light of our findings in this paper. In [30], a signal-to-noise ratio study was carried out, with the “signal” taken to be the responseto a white noise [31]. This unrealistic assumption of the signal leads to theconclusion that information was best encoded at very high frequencies[30].However, it is well known that the chemotaxis pathway enables cells to de-tect deterministic changes (e.g., gradients) in chemo-effector concentrationinstead of random signals. As shown in this paper, the useful information re-sides at low (for ligand gradients) and intermediate (for ligand step change)frequencies (Fig. 4A). The noises caused by ligand binding and diffusion dohave high frequencies, but they do not contain any useful information andare filtered out effectively by the Purcell-Berg time-averaging mechanism. Inanother recent work [4], a linear ligand gradient was considered as the inputsignal. However, this study claimed that the adaptation time is the noise-averaging time, probably because it considered the unrealistic case of havingresponse time and adaptation time being the same. Moreover, although alinear ligand gradient was considered in [4], it did not identify the signalnoise from the random-walk of the cell in a ligand gradient. As shown herein this paper, the randomness of in E. coli motion is in fact the main sourceof signal noise in a ligand gradient, while the signal noises caused by liganddiffusion and ligand binding considered before [3,4,12] are much smaller incomparison (Fig. 2). This dominant random-walk induced signal noise has adivergent low-frequency spectrum, which is fundamentally different from thesimple white noise considered in previous studies [4,31]. We have shown thatthis previously un-characterized low-frequency noise is controlled by receptoradaptation.
For all adaptive networks, the low frequency noise is controlled by adap-tation, while the high frequency noise is filtered by time-averaging. The char-acteristics of these two noise filtering strategies are fundamentally different.Time averaging works better for longer response times (Fig. 2A), but adap-tive control works better for shorter adaptation times (Fig. 2B). However,the effectiveness in noise filtering, e.g., by reducing the adaptation time andincreasing the response time, comes at the expense of the systems’s ability torespond and sense. For instance, reducing the adaptation time gives a weaker
11
response for gradient-sensing [13], and increasing the response time gives aweaker and slower response to a step change in input. These tradeoffs, partlyidentified in previous works [12], are balanced in bacterial chemotaxis sothat all the desired functionalities of the pathway come into play in differentfrequency domains as shown in Fig. 4A. At low frequencies ω < ωm, adap-tation allows gradient sensing and is also crucial in controlling the divergentrandom-walk induced signal noise. The speed and strength of step responsesremains optimum for a range of intermediate frequencies (ωm < ω < ωy).The high frequency (ω > ωy) noise, such as the ligand binding and diffusionnoise, are heavily suppressed by the Berg-Purcell time-averaging mechanismthrough output degradation.
Acknowledgements This work was partially supported by a NIH grant (R01GM081747)to YT and a Cajamadrid fellowship to PS. We thank Dr. Ganhui Lan and Dr. TomShimizu for useful discussions, and Prof. Howard Berg for his careful reading of thefirst manuscript.
References
1. Berg, H. C & Purcell, E. M. (1977) Biophys. J. 20, 193–219.2. Bialek, W & Setayeshgar, S. (2005) Proc. Natl. Acad. Sci. U.S.A. 102, 10040–
10045.3. Endres, R. G & Wingreen, N. S. (2009) Phys. Rev. Lett. 103, 158101.4. Mora, T & Wingreen, N. S. (2010) Phys. Rev. Lett. 104, 248101.5. Wang, K, Rappel, W. J, Kerr, R, & Levine, H. (2007) Phys Rev E Stat Nonlin
Soft Matter Phys 75, 061905.6. Endres, R. G & Wingreen, N. S. (2008) Proc. Natl. Acad. Sci. U.S.A. 105,
15749–15754.7. Berg, C., H, & Brown, D. A. (1972) Nature 239, 500–504.8. Torre, V, Ashmore, J. F, Lamb, T. D, & Menini, A. (1995) J. Neurosci. 15,
7757–7768.9. Muzzey, D, Gmez-Uribe, C. A, Mettetal, J. T, & van Oudenaarden, A. (2009)
Cell 138, 160–171.10. Yi, T. M, Huang, Y, Simon, M. I, & Doyle, J. (2000) Proc. Natl. Acad. Sci.
U.S.A. 97, 4649–4653.11. Mello, B. A & Tu, Y. (2007) Biophys. J. 92, 2329–2337.12. Andrews, B. W, Yi, T. M, & Iglesias, P. A. (2006) PLoS Comput. Biol. 2,
e154.13. Tu, Y, Shimizu, T. S, & Berg, H. C. (2008) Proc. Natl. Acad. Sci. U.S.A. 105,
14855–14860.14. Ma, W, Trusina, A, El-Samad, H, Lim, W. A, & Tang, C. (2009) Cell 138,
760–773.15. Mello, B. A & Tu, Y. (2003) Biophys. J. 84, 2943–2956.16. Shimizu, T. S, Tu, Y, & Berg, H. C. (2010) Mol. Sys. Biol. 6, 382.17. van Kampen, N. G. (2007) Stochastic processes in physics and chemistry.
(Noth-Holland, Amsterdam).18. Landau, L. D & Lifshitz, E. M. (1980) Statistical Physics: Part II. (Pergamon
Press, Oxford).19. Kim, K. K, Yokota, H, & Kim, S. H. (1999) Nature 400, 787–792.20. Ueda, M, Sako, Y, Tanaka, T, Devreotes, P, & Yanagida, T. (2001) Science
294, 864–867.21. Funamoto, S, Meili, R, Lee, S, Parry, L, & Firtel, R. A. (2002) Cell 109,
611–623.22. Berg, H. C. (1993) Random walks in Biology. (Princeton University Press).23. Yevgeniy, V, Jiang, L, Tu, Y, & Wu, M. (2009) Biophys. J. 96, 2439–2448.

12
24. Jiang, L, Ouyang, Q, & Tu, Y. (2010) PLoS Comput. Biol. 6, e1000735.25. Strong, S. P, Freedman, B, Bialek, W, & Koberle, R. (1998) Phys. Rev. E 57,
4604–4617.26. Tu, Y & Grinstein, G. (2005) Phys. Rev. Lett. 94, 208101.27. Korobkova, E, Emonet, T, Vilar, J. M, Shimizu, T. S, & Cluzel, P. (2004)
Nature 428, 574–578.28. Emonet, T & Cluzel, P. (2008) Proc. Natl. Acad. Sci. U.S.A. 105, 3304–3309.29. Kollmann, M, Lvdok, L, K., B, Timmer, J, & Sourjik, V. (2005) Nature 438,
504–507.30. Tostevin, F & Ten Wolde, P. R. (2009) Phys. Rev. Lett. 102, 218101.31. Tanase-Nicola, S, Warren, P. B, & Ten Wolde, P. R. (2006) Phys. Rev. Lett.
97, 068102.
13
CheR
CheY P
CheY
CheZ
CheA
CheA P
CheB Pa
A
y
s
m
Bacterial chemotaxis
F
a
y
m
s
C
a
y
m
s
E
a
y
s
m
Yeast osmosensing
Olfactory adaptation
B D
a
y
s
m
IFFLP
Double feedback
Fig. 1 Adaptive signaling networks capable of accurate adaptation: A. An illustra-tion of a 3-nodes network capable of achieving perfect adaptation to step changesin the external signal s (red circle). The signaling nodes (blue circles) are the read-out a, the memory m and the output node y. This is an abstraction of the E. colichemotaxis pathway. B. Signal transduction pathway for chemotaxis in E. coli.C-F. Different topologies which can achieve accurate adaptation: C. IntegrativeFeed-Forward Loop with a Proportioner node (IFFLP) topology, identified in [14]as the main alternative network to the chemotaxis topology in Fig. 1A, all othertopologies are a composite of Fig. 1A and Fig. 1C. D. Topology of the olfactorysensing pathway in mammalian neurons. E. Topology identified in [?] for yeast os-motic shock response. F. Adaptive topology that exhibits two negative feedbackscouple to the same memory.
14
(s)
10-2 10-1 100 101
10-5
10-4
10-3
10-2
10-1
100
z
Y / y
10-5
10-4
10-3
10-2
10-1
100
10-1 100 101 102
(s)m
Y / y
random-walk noise
diffusion noise
binding noise
Fig. 2 Dependence of the three sources of signal noise on the output decay time(τz) and the adaptation time (τm). Results from direct simulations of Eq. 1 (sym-bols) and linear analysis (lines) are shown (see Eqs. 7, 8 & 9 for interactions andtext for parameters used). Arrows indicate wild-type values of τz or τm). The de-pendence of ligand binding noise (purple), ligand diffusion noise (light blue), andrandom-walk noise (dark blue) on A. τz and B. τm. The ligand binding and diffu-sion noise drop much more than random walk noise when τz increases, while randomwalk noise drops much more than ligand diffusion noise when τm decreases. Becauseof their very short timescales, the effects of ligand binding and diffusion noise aremuch smaller than that of the random-walk noise, which is the dominant source ofsignal noise.
(s)
10-2 10-1 100 101
10-5
10-4
10-3
10-2
10-1
100
z
Y / y
10-5
10-4
10-3
10-2
10-1
100
10-1 100 101 102
(s)m
Y / ysignal noise
internal noise
Fig. 3 Dependence of the total signal noise and the total internal noise on decayand adaptation times. The dependence of the total internal noise floor (red) andthe total signal noise (black) on A. τz and B. τm. Signal noise is comparableto internal noise. At low τm ∼ τz adaptation noise starts being reduced by timeaveraging and the internal noise drops. Deviations between simulations (symbols)and linear analysis (lines) come from strong nonlinear effects when τz/τy � 1.
15
A Gradient sensing&
adaptive controlStrong & fast response Time averaging
Hz
t sP
∣yP∣
∣y∣
∣
As∣
∣ yP∣
B
yHz
Ps
Fig. 4 The transfer function and response characteristics of adaptive networks.A. Three regimes can be identified in the transfer function (solid line) for E. colichemotaxis: gradient sensing and adaptive noise control is performed at low frequen-cies (ω < ωm), response amplitude is strong for higher frequencies (ωm < ω < ωy),and inputs with very high frequencies (ω > ωy) are time averaged (axes arrowsindicate wild-type values of ωy and ωm). B. Output response |∆y| to a small stepchange in the input. For fast response ωy = 20ωm as in E. coli chemotaxis, the re-sponse is fast and strong (solid line). For slow response ωy = 2ωm as in eukaryoticchemotaxis, the response is slower and weaker (dot-dashed line). Inset. Depen-dence of the peaking time τP (dotted line) and peak height |∆yP | (dashed line) onωy. For E. coli wild-type value (axes arrow), both are near saturation.