NLSN 2Q 2012 Investor Presentation
29
NLSN 2Q 2012 Investor Presentation
-
Upload
khangminh22 -
Category
Documents
-
view
5 -
download
0
Transcript of NLSN 2Q 2012 Investor Presentation

NLSN
2Q 2012
Investor
Presentation
Copyright © 2012 Nielsen Holdings N.V. 2Q 2012 Investor Presentation
Forward Looking Statements
The following discussion contains forward-looking statements, including those about Nielsen’s outlook
and prospects, in the meaning of the Private Securities Litigation Reform Act of 1995. Forward-looking
statements are those which are not historical facts. These and other statements that relate to future
results and events are based on Nielsen’s current expectations.
Our actual results in future periods may differ materially from those currently expected because of a
number of risks and uncertainties. The risks and uncertainties that we believe are material are outlined
in our disclosure filings and materials, which you can find on http://ir.nielsen.com. Please consult these
documents for a more complete understanding of these risks and uncertainties. We disclaim any
intention or obligation to update or revise any forward-looking statements, whether as a result of new
information, future events or otherwise, except as may be required by law.
Our outlook is provided as of July 25, 2012 for the purpose of providing information about current
expectations for 2012. This information may not be appropriate for other purposes.
2
Copyright © 2012 Nielsen Holdings N.V. 2Q 2012 Investor Presentation
3
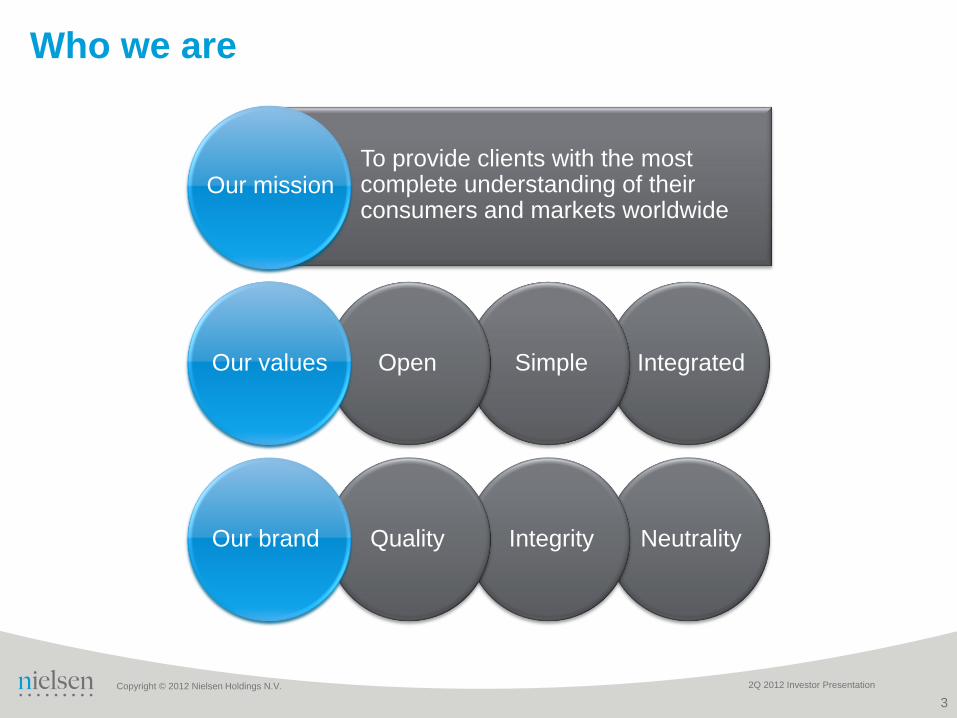
Who we are
To provide clients with the most complete understanding of their consumers and markets worldwide
Open Simple Integrated Our values
Quality Integrity Neutrality Our brand
Our mission
Copyright © 2012 Nielsen Holdings N.V. 2Q 2012 Investor Presentation
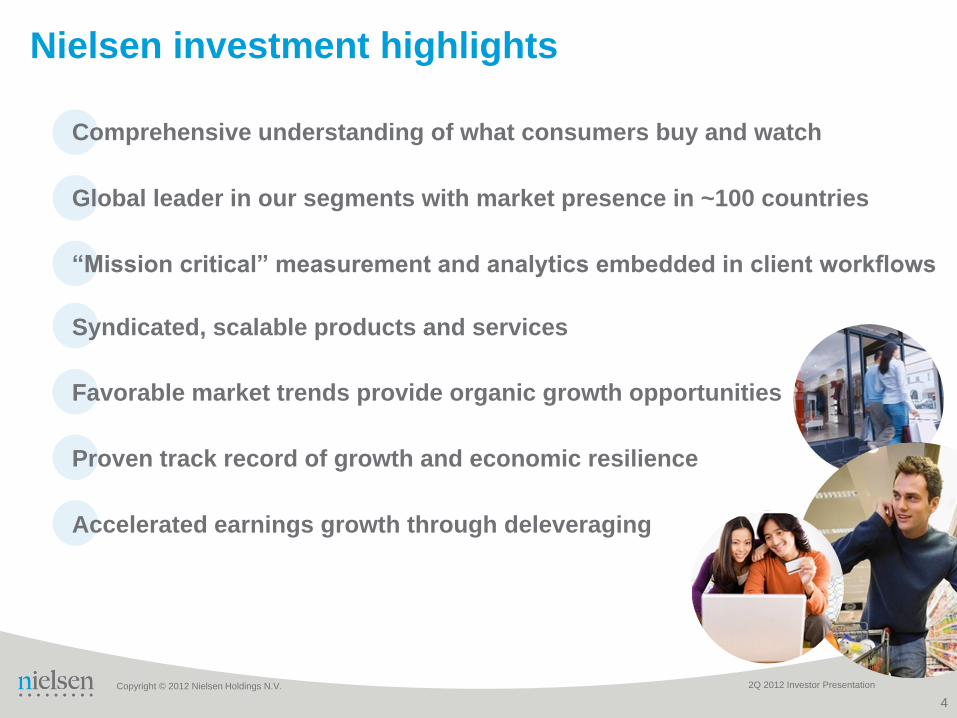
Nielsen investment highlights
Comprehensive understanding of what consumers buy and watch
“Mission critical” measurement and analytics embedded in client workflows
Favorable market trends provide organic growth opportunities
Proven track record of growth and economic resilience
Accelerated earnings growth through deleveraging
Global leader in our segments with market presence in ~100 countries
Syndicated, scalable products and services
4

Copyright © 2012 Nielsen Holdings N.V. 2Q 2012 Investor Presentation
An example…
> Engagement in 80
markets worldwide
> 50+ year relationship
> Multi-year contract
> 70+ year relationship
5
Nielsen’s business model
We provide…
Retail sale measurement
of consumer goods in stores
Measurement of TV viewing,
online and mobile phone activity
We help…
Consumer packaged goods clients
Media clients
What Consumers Buy What Consumers Watch
Our measurement and analytics are embedded in our clients’ operating disciplines
Copyright © 2012 Nielsen Holdings N.V. 2Q 2012 Investor Presentation
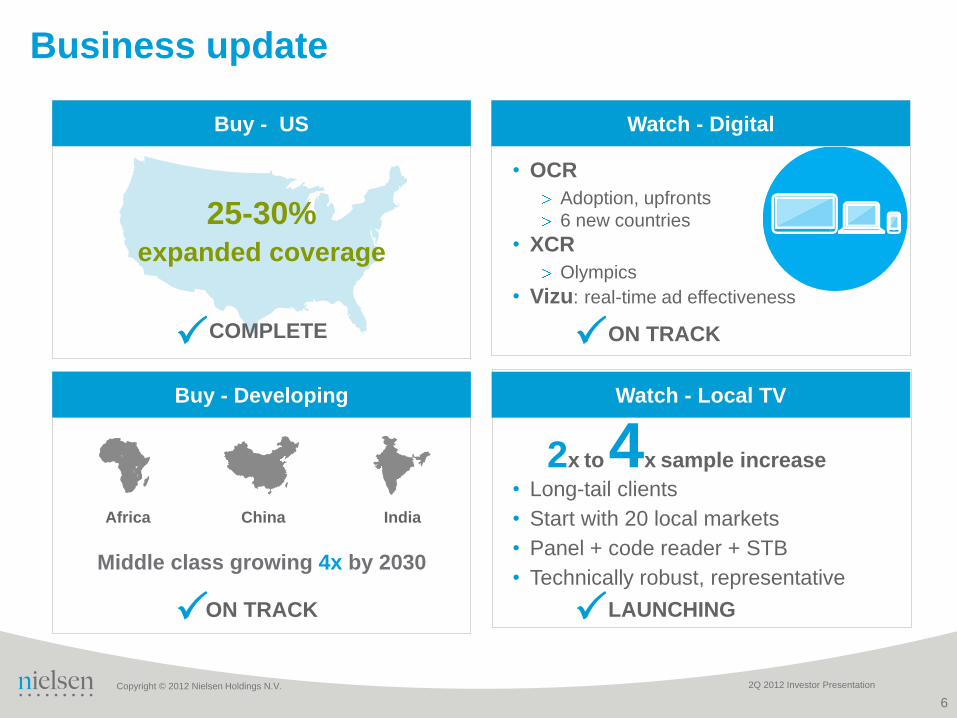
• OCR
Adoption, upfronts
6 new countries
• XCR
Olympics
• Vizu: real-time ad effectiveness
Watch - Digital Buy - US
• Long-tail clients
• Start with 20 local markets
• Panel + code reader + STB
• Technically robust, representative
Watch - Local TV
Middle class growing 4x by 2030
Buy - Developing
ON TRACK
Africa China India
2x to 4x sample increase
25-30% expanded coverage
COMPLETE ON TRACK
LAUNCHING
6
Business update
Copyright © 2012 Nielsen Holdings N.V. 2Q 2012 Investor Presentation
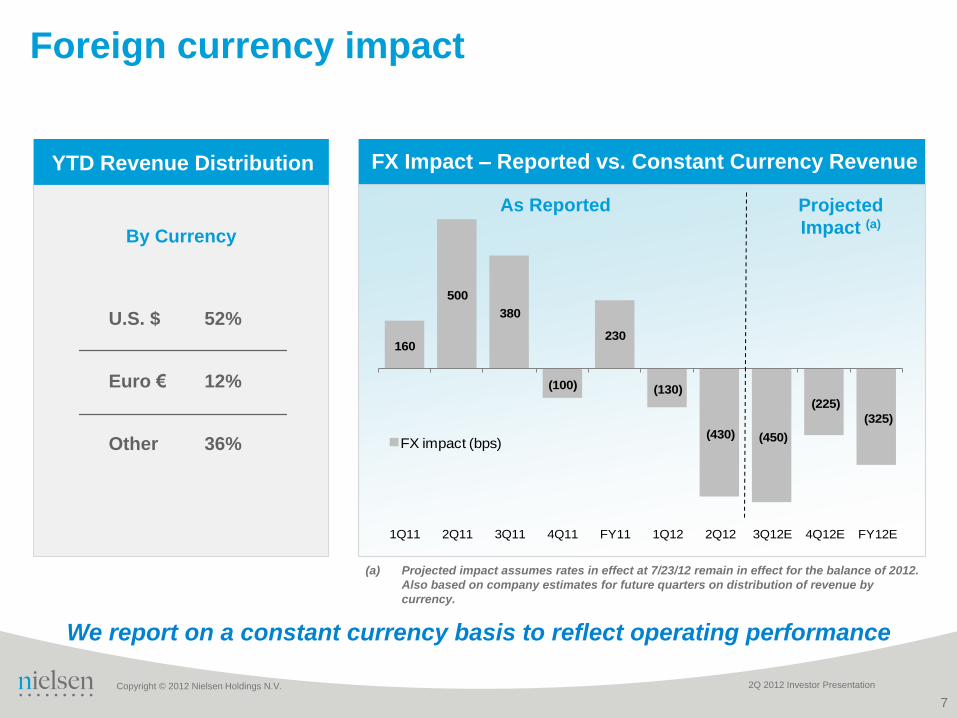
160
500
380
(100)
230
(130)
(430) (450)
(225)
(325)
1Q11 2Q11 3Q11 4Q11 FY11 1Q12 2Q12 3Q12E 4Q12E FY12E
FX impact (bps)
Foreign currency impact
As Reported Projected
Impact (a)
YTD Revenue Distribution
By Currency
U.S. $ 52%
Euro € 12%
Other 36%
FX Impact – Reported vs. Constant Currency Revenue
(a) Projected impact assumes rates in effect at 7/23/12 remain in effect for the balance of 2012.
Also based on company estimates for future quarters on distribution of revenue by
currency.
We report on a constant currency basis to reflect operating performance
7

Copyright © 2012 Nielsen Holdings N.V. 2Q 2012 Investor Presentation
Resilient financial performance
Revenue Adjusted EBITDA
Note: Revenue and EBITDA growth rates derived on a constant currency basis; figures are as reported
2008 2009 2010 2011 2008 2009 2010 2011
6.1% 4.0% 6.1%
Constant currency growth
25.1% 27.3% 27.5%
Adjusted EBITDA Margin
27.9% 5.6%
$4,806 $5,126
$1,205
$1,411 $1,312
($ millions) ($ millions) CAGR = 5.2% CAGR = 8.7%
$4,808
$5,532 $1,546
8

Copyright © 2012 Nielsen Holdings N.V. 2Q 2012 Investor Presentation
Buy segment
9
> Long term contracts
> Proprietary data sets
> ~100 countries
> Coverage expansion:
> Developing markets
> Additional channels in US/other
> Insights opportunities and analytical
capabilities
Revenue
2.7%(a) 7.6%(b)
Constant currency growth
6.7%(b)
2009 2010 2011
$2,861 $3,108
$3,409
($ millions)
Business Drivers
CAGR = 7.2%
(a) Prior to change in segmentation made at end of 2011
(b) Revenue growth rates derived on a constant currency basis; figures are as reported 2009 constant currency growth by segment is unavailable
due to re-segmenting completed in December 2011

Copyright © 2012 Nielsen Holdings N.V. 2Q 2012 Investor Presentation
Increasing coverage is a Nielsen priority
Nielsen presence
Past: West East
Future: West East
Our global breadth and depth enables us to fulfill client needs
10
Client Trends

Copyright © 2012 Nielsen Holdings N.V. 2Q 2012 Investor Presentation
Trends shaping What Consumers Buy
11
> Driven by developing markets
(a) The Emerging Middle Class in Developing Countries, Organization for Economic Cooperation and Development 2010.
Projected increase in global middle class
population and spending(a)
Growth of middle class Demographic shifts
Clients need to understand new consumers in developing markets
> Major changes in global population
1.9B 3.3B
5B
$22B
$35B
$55B
2009 2020E 2030E
Spending
by middle
class
Population
of middle
class

Copyright © 2012 Nielsen Holdings N.V. 2Q 2012 Investor Presentation
2006 2011
12
Developing markets growth and expansion
Developing markets revenue Expansion of market coverage
$575
$1,125
60%
90%
95%
45%
45%
85%
2007 2012
CAGR = 13.6%
Nielsen’s position in developing markets provides deep opportunity for growth as population of middle class further expands
Africa
China
India
Population coverage
Note: Revenue growth rate derived on a constant currency basis
($ millions)

Copyright © 2012 Nielsen Holdings N.V. 2Q 2012 Investor Presentation
Watch segment
Revenue
4.6%(b)
Constant currency growth
3.8%(b)
2009 2010 2011
$1,767 $1,850
$1,944
($ millions) > Long term contracts
> Proprietary data sets
> Content monetization across platforms
and devices
> Online Campaign Ratings
> Cross-Platform Ratings
> Extended Screen
> Advertiser solutions
> Global opportunities
Business Drivers
CAGR = 4.1%
11.5%(a)
13
(a) Prior to change in segmentation made at end of 2011
(b) Revenue growth rates derived on a constant currency basis; figures are as reported 2009 constant currency growth by segment is unavailable
due to re-segmenting completed in December 2011
Copyright © 2012 Nielsen Holdings N.V. 2Q 2012 Investor Presentation
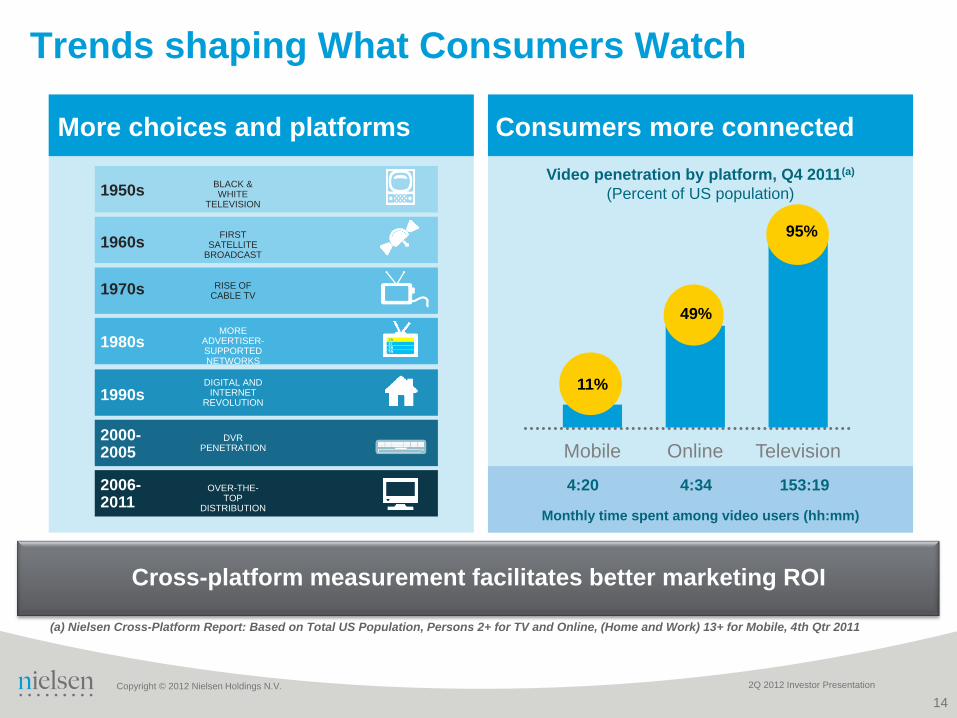
Cross-platform measurement facilitates better marketing ROI
Trends shaping What Consumers Watch
More choices and platforms Consumers more connected
1950s
RISE OF CABLE TV
MORE ADVERTISER-SUPPORTED NETWORKS
FIRST SATELLITE
BROADCAST
DIGITAL AND INTERNET
REVOLUTION
DVR PENETRATION
BLACK & WHITE
TELEVISION
1960s
1970s
1980s
1990s
2000-2005
2006-2011
OVER-THE-TOP
DISTRIBUTION
(a) Nielsen Cross-Platform Report: Based on Total US Population, Persons 2+ for TV and Online, (Home and Work) 13+ for Mobile, 4th Qtr 2011
Video penetration by platform, Q4 2011(a)
(Percent of US population)
Monthly time spent among video users (hh:mm)
4:34 4:20 153:19
Mobile Online Television
11%
49%
95%
14

Copyright © 2012 Nielsen Holdings N.V. 2Q 2012 Investor Presentation
Nielsen measures the true audience for online
and cross-platform campaigns
Overnight audience ratings, consistent
with TV
Delivery against
campaign objectives
Ad resonance and recall, fully integrated
with campaign reach
TV
Unduplicated ratings from Online and
TV campaigns, by demographic
Built from Nielsen TV ratings and Online
Campaign Ratings inputs
Initial release is Live; Q4 2012
commercial release
Online
Verification, including
Brand Safety and
Viewability metrics Provided by
15
Online Campaign Ratings Cross-Platform Campaign Ratings
Vizu: Real-time online ad effectiveness
measurement
Copyright © 2012 Nielsen Holdings N.V. 2Q 2012 Investor Presentation
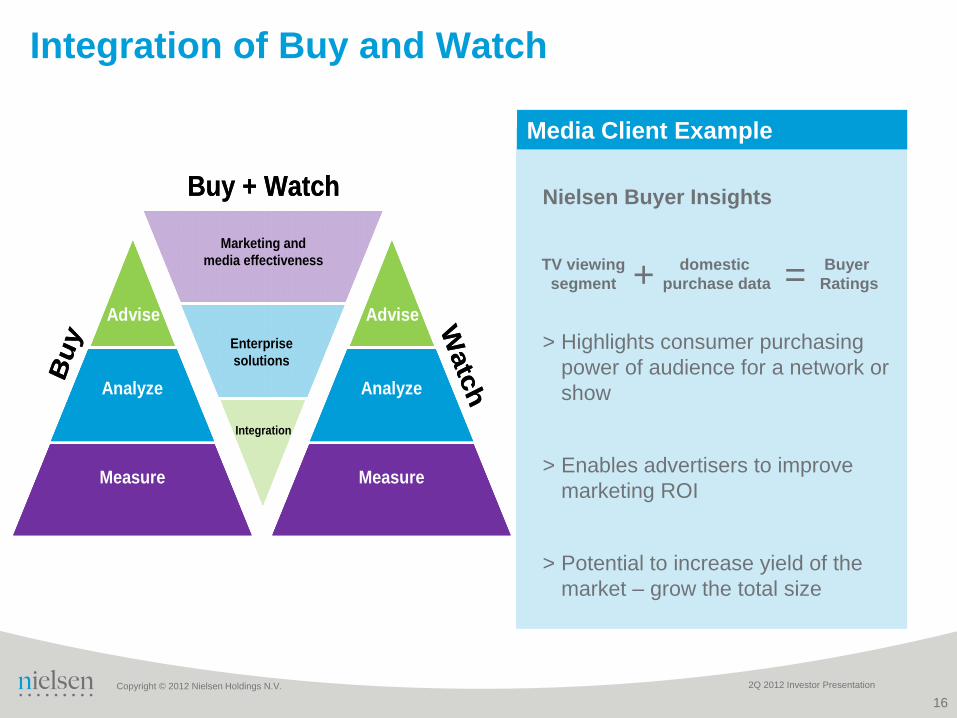
Integration of Buy and Watch
16
Media Client Example
Nielsen Buyer Insights
> Highlights consumer purchasing
power of audience for a network or
show
> Enables advertisers to improve
marketing ROI
> Potential to increase yield of the
market – grow the total size
TV viewing
segment
domestic
purchase data
Buyer
Ratings + =
Watc
hBu
y
Measure Measure
Analyze
Advise
Analyze
Advise
Measure
Analyze
Advise
Integration
Enterprise
solutions
Marketing and
media effectiveness
Buy + Watch
Watc
hBu
y
Measure Measure
Analyze
Advise
Analyze
Advise
Measure
Analyze
Advise
Integration
Enterprise
solutions
Marketing and
media effectiveness
Buy + Watch

Copyright © 2012 Nielsen Holdings N.V. 2Q 2012 Investor Presentation
Looking ahead…
17
Provide clients with cross-platform solutions to optimize
performance of advertising campaigns
Leverage Nielsen’s Buy & Watch capabilities to provide innovative
solutions in a fragmented consumer landscape
Continue investment of resources in developing markets to increase
the depth and breadth of Nielsen’s coverage
Copyright © 2012 Nielsen Holdings N.V. 2Q 2012 Investor Presentation
Appendix
Copyright © 2012 Nielsen Holdings N.V. 2Q 2012 Investor Presentation
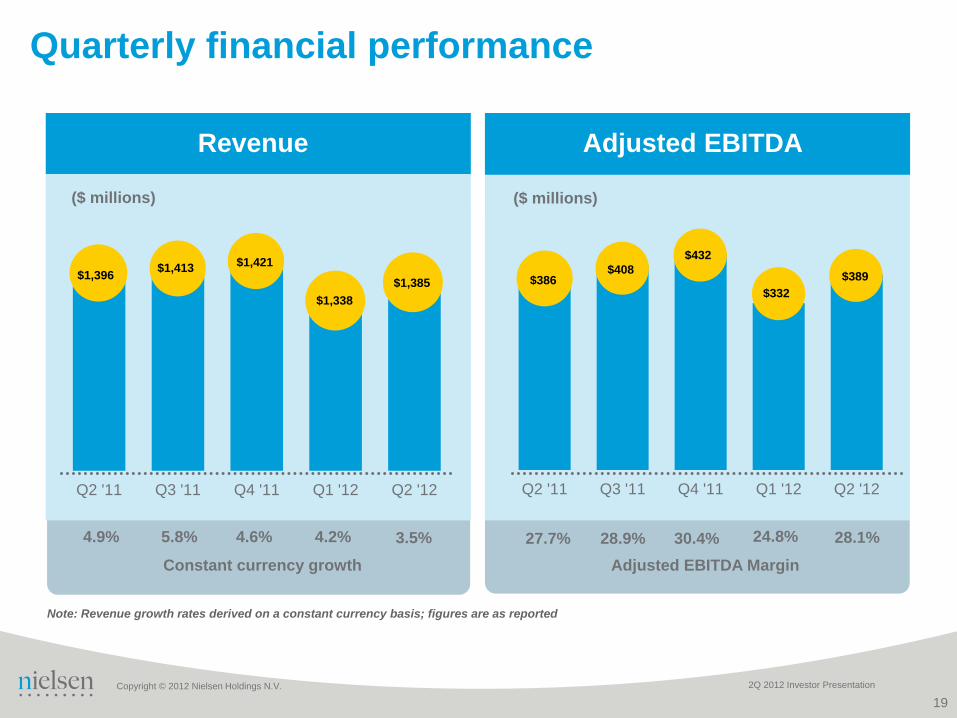
Quarterly financial performance
Revenue Adjusted EBITDA
Note: Revenue growth rates derived on a constant currency basis; figures are as reported
Q2 '11 Q3 '11 Q4 '11 Q1 '12 Q2 '12 Q2 '11 Q3 '11 Q4 '11 Q1 '12 Q2 '12
4.9%
Constant currency growth
27.7%
Adjusted EBITDA Margin
28.9% 5.8%
$1,396 $386
($ millions) ($ millions)
$1,413 $408
4.6% 30.4%
$1,421 $432
24.8% 4.2%
$1,338
3.5% 28.1%
$1,385 $389
19
$332
Copyright © 2012 Nielsen Holdings N.V. 2Q 2012 Investor Presentation
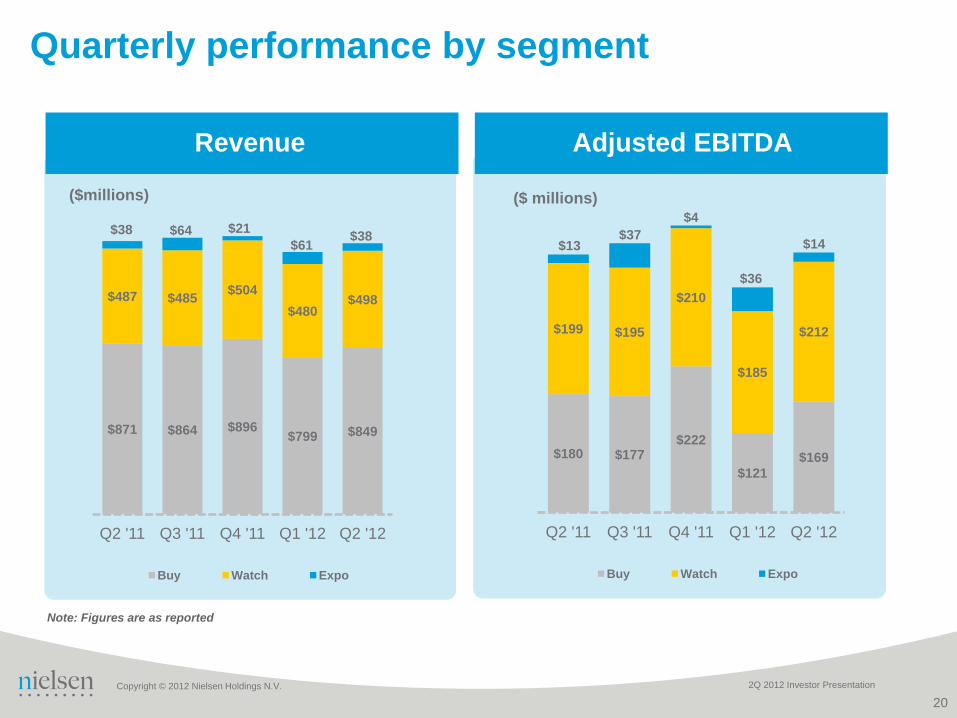
Quarterly performance by segment
Revenue
Note: Figures are as reported
$871 $864 $896 $799 $849
$487 $485 $504
$480 $498
$38 $64 $21
$61 $38
Q2 '11 Q3 '11 Q4 '11 Q1 '12 Q2 '12
Buy Watch Expo
($millions)
Adjusted EBITDA
$180 $177 $222
$121
$169
$199 $195
$210
$185
$212
$13 $37
$4
$36
$14
Q2 '11 Q3 '11 Q4 '11 Q1 '12 Q2 '12
Buy Watch Expo
($ millions)
20

Copyright © 2012 Nielsen Holdings N.V. 2Q 2012 Investor Presentation
$2,861 $3,108
$3,409
$1,767 $1,850
$1,944
$180
$168
$179
2009 2010 2011
Buy Watch Expo
Annual performance by segment
Revenue Adjusted EBITDA(a)
(a) The representation by segment does not include Corporate, which contributes to the full view of total Adjusted EBITDA for the Company
Note: Figures are as reported
($ millions)
$595 $656 $699
$672 $704
$781
$63
$78
$87
2009 2010 2011
Buy Watch Expo
($ millions)
21

Copyright © 2012 Nielsen Holdings N.V. 2Q 2012 Investor Presentation
Selected cash flow & balance sheet items
Cash Flow –
2Q 12
Free Cash Flow $46
Capex $70
Cash Taxes $39
Restructuring $26
Balance Sheet –
6/30/12
Gross Debt (a) $6,555
Cash $283
Net Debt (a) $6,272
Net Debt Ratio (b) 4.0x
(a) Does not include $288 million of mandatory convertible subordinated bonds; weighted avg. interest rate calculated based on amount outstanding at end of quarter
(b) Reflects Net Debt divided by Adjusted EBITDA calculated on last twelve months basis. See Appendix for detail
Capital Table
3/31/12 6/30/12 Change
Loan Debt (secured) $ 4,781 $4,835 $54
11.625% Sr. Notes 205 206 1
11.5% Sr. Notes 307 308 1
7.75% Sr. Notes 1,084 1,084 --
EMTNs 67 -- (67)
Capital lease/misc. debt 124 122 (2)
Total Debt (a) $ 6,568 $6,555 (13)
Less Cash 295 283 (12)
Net Debt $ 6,273 $6,272 (1)
Net Debt Ratio (b) 4.0x 4.0x --
Weighted avg. interest rate (a) 5.60% 5.61% 1 bp
($ in millions)
22
Copyright © 2012 Nielsen Holdings N.V. 2Q 2012 Investor Presentation
Certain non-GAAP measures
Overview of Non-GAAP Presentations
We consistently use the below non-GAAP financial measures to evaluate the results of our operations. We believe that the presentation of these non-GAAP measures provides useful information to investors regarding financial and business trends related to our results of operations and that when this non-GAAP financial information is viewed with our GAAP financial information, investors are provided with a more meaningful understanding of our ongoing operating performance. None of the non-GAAP measures presented should be considered as an alternative to net income or loss, operating income or loss, cash flows from operating activities or any other performance measures of operating performance or liquidity derived in accordance with GAAP. These non-GAAP measures have important limitations as analytical tools and should not be considered in isolation or as substitutes for an analysis of our results as reported under GAAP.
Constant Currency Presentation
We evaluate our results of operations on both an as reported and a constant currency basis. The constant currency presentation, which is a non-GAAP measure, excludes the impact of fluctuations in foreign currency exchange rates. We believe providing constant currency information provides valuable supplemental information regarding our results of operations, consistent with how we evaluate our performance. We calculate constant currency percentages by converting our prior-period local currency financial results using the current period exchange rates and comparing these adjusted amounts to our current period reported results.
23

Copyright © 2012 Nielsen Holdings N.V. 2Q 2012 Investor Presentation
Adjusted net income reconciliation: Q2
(a) (b) See footnotes on next page
Quarter ended June 30 (Unaudited)
2012 2011
Net income/(loss) $ 103 $ 69
Interest expense, net 106 112
Provision for income taxes 38 39
Depreciation and amortization 127 135
EBITDA 374 355
Equity in net income of affiliates (4) (3)
Other non-operating (income)/expense, net (6) 1
Restructuring charges 16 23
Stock-based compensation expense 6 6
Other items (a) 3 4
Adjusted EBITDA 389 386
Interest expense, net (106) (112)
Depreciation and amortization (127) (135)
Depreciation and amortization of acquisition-related tangible and intangible assets 40 49
Cash paid for income taxes (39) (32)
Stock-based compensation expense (6) (6)
Interest expense attributable to mandatory convertible bonds 6 5
Adjusted net income $ 157 $ 155
Adjusted net income per share of common stock, diluted (b) $0.42 $0.41
($ in millions except per share amounts)
24
Copyright © 2012 Nielsen Holdings N.V. 2Q 2012 Investor Presentation
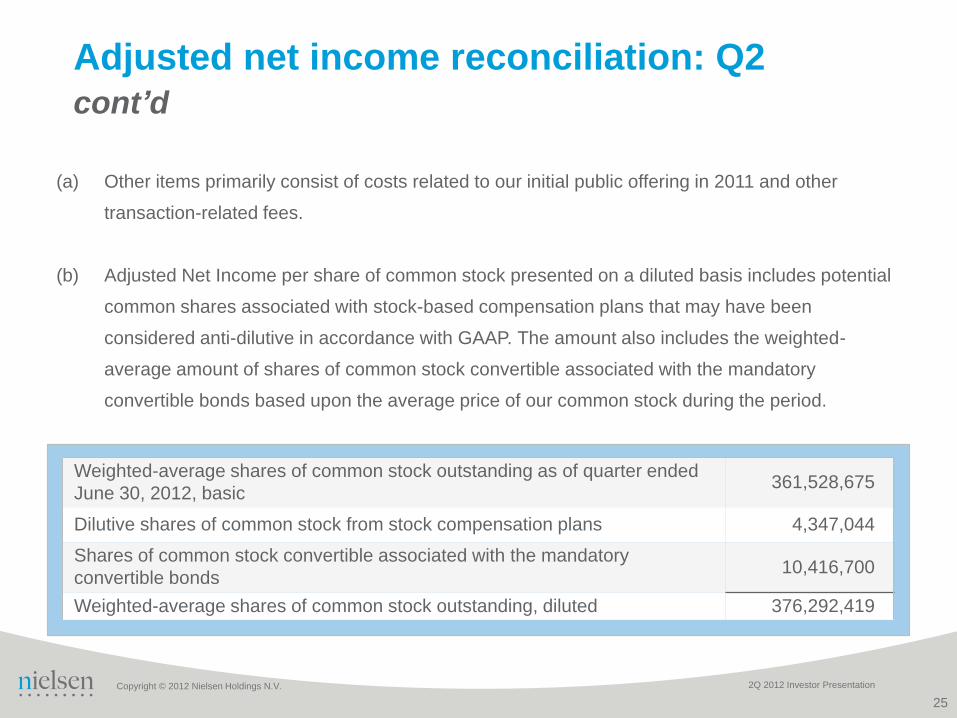
(a) Other items primarily consist of costs related to our initial public offering in 2011 and other
transaction-related fees.
(b) Adjusted Net Income per share of common stock presented on a diluted basis includes potential
common shares associated with stock-based compensation plans that may have been
considered anti-dilutive in accordance with GAAP. The amount also includes the weighted-
average amount of shares of common stock convertible associated with the mandatory
convertible bonds based upon the average price of our common stock during the period.
Adjusted net income reconciliation: Q2
cont’d
Weighted-average shares of common stock outstanding as of quarter ended
June 30, 2012, basic 361,528,675
Dilutive shares of common stock from stock compensation plans 4,347,044
Shares of common stock convertible associated with the mandatory
convertible bonds 10,416,700
Weighted-average shares of common stock outstanding, diluted 376,292,419
25
Copyright © 2012 Nielsen Holdings N.V. 2Q 2012 Investor Presentation
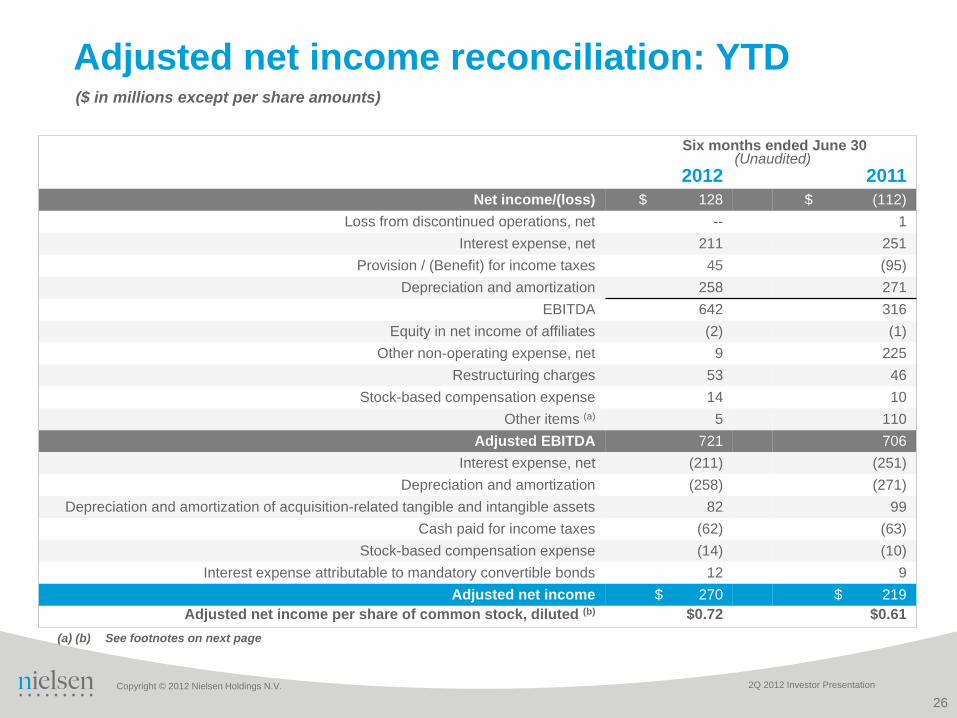
Adjusted net income reconciliation: YTD
Six months ended June 30 (Unaudited)
2012 2011
Net income/(loss) $ 128 $ (112)
Loss from discontinued operations, net -- 1
Interest expense, net 211 251
Provision / (Benefit) for income taxes 45 (95)
Depreciation and amortization 258 271
EBITDA 642 316
Equity in net income of affiliates (2) (1)
Other non-operating expense, net 9 225
Restructuring charges 53 46
Stock-based compensation expense 14 10
Other items (a) 5 110
Adjusted EBITDA 721 706
Interest expense, net (211) (251)
Depreciation and amortization (258) (271)
Depreciation and amortization of acquisition-related tangible and intangible assets 82 99
Cash paid for income taxes (62) (63)
Stock-based compensation expense (14) (10)
Interest expense attributable to mandatory convertible bonds 12 9
Adjusted net income $ 270 $ 219
Adjusted net income per share of common stock, diluted (b) $0.72 $0.61
($ in millions except per share amounts)
(a) (b) See footnotes on next page
26
Copyright © 2012 Nielsen Holdings N.V. 2Q 2012 Investor Presentation
(a) Other items primarily consist of Sponsor Advisory Fees in 2011, costs related to our initial public
offering and other transaction-related fees.
(b) Adjusted Net Income per share of common stock presented on a diluted basis includes potential
common shares associated with stock-based compensation plans that may have been
considered anti-dilutive in accordance with GAAP. The amount also includes the weighted-
average amount of shares of common stock convertible associated with the mandatory
convertible bonds based upon the average price of our common stock during the period.
Adjusted net income reconciliation: YTD
cont’d
27
Copyright © 2012 Nielsen Holdings N.V. 2Q 2012 Investor Presentation
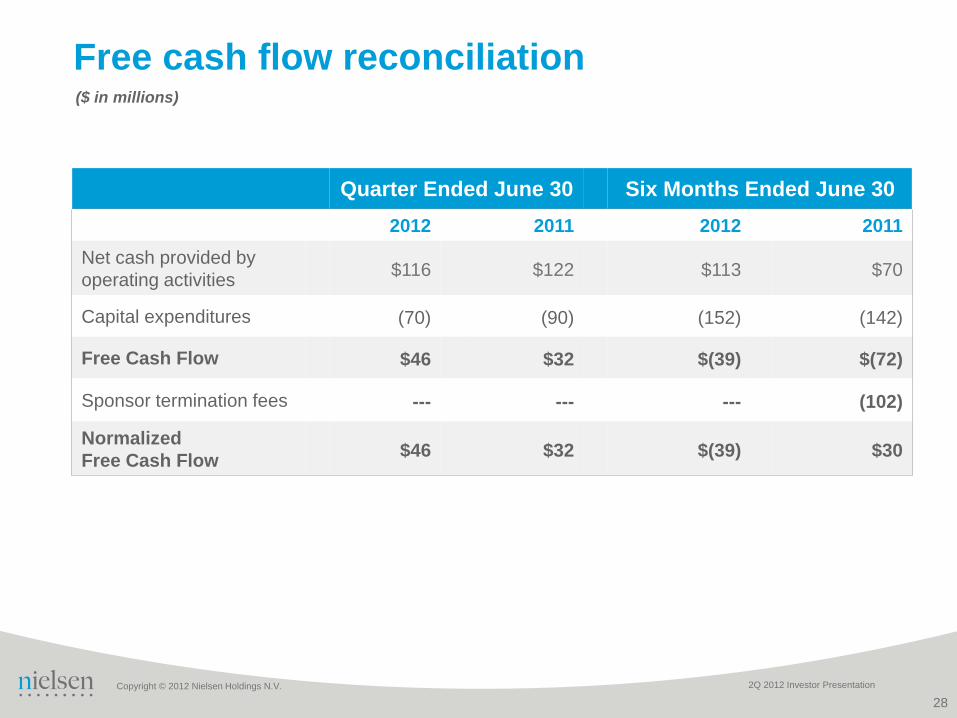
Free cash flow reconciliation
Quarter Ended June 30 Six Months Ended June 30
2012 2011 2012 2011
Net cash provided by
operating activities $116 $122 $113 $70
Capital expenditures (70) (90) (152) (142)
Free Cash Flow $46 $32 $(39) $(72)
Sponsor termination fees --- --- --- (102)
Normalized
Free Cash Flow $46 $32 $(39) $30
($ in millions)
28