New Facility for Membrane Fouling Investigations ... - MDPI
14
Citation: Bert, R.; Manes, C.; Tiraferri, A. New Facility for Membrane Fouling Investigations under Customizable Hydrodynamics: Validation and Preliminary Experiments with Pulsating Cross-Flow. Membranes 2022, 12, 334. https://doi.org/10.3390/ membranes12030334 Academic Editor: Frank Lipnizki Received: 30 January 2022 Accepted: 14 March 2022 Published: 17 March 2022 Publisher’s Note: MDPI stays neutral with regard to jurisdictional claims in published maps and institutional affil- iations. Copyright: © 2022 by the authors. Licensee MDPI, Basel, Switzerland. This article is an open access article distributed under the terms and conditions of the Creative Commons Attribution (CC BY) license (https:// creativecommons.org/licenses/by/ 4.0/). membranes Article New Facility for Membrane Fouling Investigations under Customizable Hydrodynamics: Validation and Preliminary Experiments with Pulsating Cross-Flow Roberto Bert 1,2, *, Costantino Manes 1,2 and Alberto Tiraferri 1,2 1 Department of Environmental Land and Infrastructure Engineering (DIATI), Politecnico di Torino, Corso Duca degli Abruzzi 24, 10129 Torino, Italy; [email protected] (C.M.); [email protected] (A.T.) 2 CleanWaterCenter@PoliTo, Politecnico di Torino, Corso Duca degli Abruzzi 24, 10129 Torino, Italy * Correspondence: [email protected] Abstract: Flux reduction induced by fouling is arguably the most adverse phenomenon in membrane- based separation systems. In this respect, many laboratory-scale filtration studies have shown that an appropriate use of hydrodynamic perturbations can improve both performance and durability of the membrane; however, to fully understand and hence appropriately exploit such effects, it is necessary to understand the underpinning flow processes. Towards this end, in this work we propose and validate a new module-scale laboratory facility with the aim of investigating, at very well-controlled flow conditions, how hydrodynamics affects mass transport phenomena at the feed/membrane interface. The proposed facility was designed to obtain a fully developed and uniform flow inside the test section and to impose both steady and pulsating flow conditions. The walls of the facility were made transparent to grant optical accessibility to the flow. In this paper, we discuss data coming from particle image velocimetry (PIV) measurements and preliminary ultrafiltration tests both under steady and pulsating flow conditions. PIV data indicate that the proposed facility allows for excellent flow control from a purely hydrodynamic standpoint. Results from filtration tests provide promising results pointing towards pulsating flows as a viable technique to reduce fouling in membrane systems. Keywords: membranes; ultrafiltration; fouling; fouling reduction; filtration rate; channel flow; pulsating flow; PIV 1. Introduction Water management is a highly topical issue and will be even more so in the near future. According to the United Nations Water Resources Report 2021, the use of freshwater has increased six-fold in the last 100 years and demand continues to grow by 1% per year [1]. In this perspective, desalination plants offer an economically viable solution for the production of drinking water. Starting from 326 m 3 /day produced worldwide in 1945, the use of this technology based on membrane systems has increased exponentially to over 80 million m 3 /day in 2013 [2,3] and even more today. Moreover, thanks to their versatility, membranes have also found increasing use in other processes related to the food, medical and chemical sectors and more generally in the treatment of wastewater from industrial plants [4–6]. In relation to the importance acquired, due to the vastness of the possible uses, there has also been a natural expansion of the research-related sector with a strong increase in the number of studies and publications [7] relating to process optimization and new applications. Although technological development [8,9] and process intensification efforts have improved membrane separation processes significantly, fouling still represents a major issue, as it causes a decrease in productivity resulting from the accumulation of particles, microorganisms and macromolecules on the membrane surface with consequent negative Membranes 2022, 12, 334. https://doi.org/10.3390/membranes12030334 https://www.mdpi.com/journal/membranes
-
Upload
khangminh22 -
Category
Documents
-
view
0 -
download
0
Transcript of New Facility for Membrane Fouling Investigations ... - MDPI

�����������������
Citation: Bert, R.; Manes, C.;
Tiraferri, A. New Facility for
Membrane Fouling Investigations
under Customizable Hydrodynamics:
Validation and Preliminary
Experiments with Pulsating
Cross-Flow. Membranes 2022, 12, 334.
https://doi.org/10.3390/
membranes12030334
Academic Editor: Frank Lipnizki
Received: 30 January 2022
Accepted: 14 March 2022
Published: 17 March 2022
Publisher’s Note: MDPI stays neutral
with regard to jurisdictional claims in
published maps and institutional affil-
iations.
Copyright: © 2022 by the authors.
Licensee MDPI, Basel, Switzerland.
This article is an open access article
distributed under the terms and
conditions of the Creative Commons
Attribution (CC BY) license (https://
creativecommons.org/licenses/by/
4.0/).
membranes
Article
New Facility for Membrane Fouling Investigations underCustomizable Hydrodynamics: Validation and PreliminaryExperiments with Pulsating Cross-FlowRoberto Bert 1,2,*, Costantino Manes 1,2 and Alberto Tiraferri 1,2
1 Department of Environmental Land and Infrastructure Engineering (DIATI), Politecnico di Torino,Corso Duca degli Abruzzi 24, 10129 Torino, Italy; [email protected] (C.M.);[email protected] (A.T.)
2 CleanWaterCenter@PoliTo, Politecnico di Torino, Corso Duca degli Abruzzi 24, 10129 Torino, Italy* Correspondence: [email protected]
Abstract: Flux reduction induced by fouling is arguably the most adverse phenomenon in membrane-based separation systems. In this respect, many laboratory-scale filtration studies have shown that anappropriate use of hydrodynamic perturbations can improve both performance and durability of themembrane; however, to fully understand and hence appropriately exploit such effects, it is necessaryto understand the underpinning flow processes. Towards this end, in this work we propose andvalidate a new module-scale laboratory facility with the aim of investigating, at very well-controlledflow conditions, how hydrodynamics affects mass transport phenomena at the feed/membraneinterface. The proposed facility was designed to obtain a fully developed and uniform flow insidethe test section and to impose both steady and pulsating flow conditions. The walls of the facilitywere made transparent to grant optical accessibility to the flow. In this paper, we discuss data comingfrom particle image velocimetry (PIV) measurements and preliminary ultrafiltration tests both understeady and pulsating flow conditions. PIV data indicate that the proposed facility allows for excellentflow control from a purely hydrodynamic standpoint. Results from filtration tests provide promisingresults pointing towards pulsating flows as a viable technique to reduce fouling in membrane systems.
Keywords: membranes; ultrafiltration; fouling; fouling reduction; filtration rate; channel flow;pulsating flow; PIV
1. Introduction
Water management is a highly topical issue and will be even more so in the nearfuture. According to the United Nations Water Resources Report 2021, the use of freshwaterhas increased six-fold in the last 100 years and demand continues to grow by 1% peryear [1]. In this perspective, desalination plants offer an economically viable solution forthe production of drinking water. Starting from 326 m3/day produced worldwide in 1945,the use of this technology based on membrane systems has increased exponentially to over80 million m3/day in 2013 [2,3] and even more today. Moreover, thanks to their versatility,membranes have also found increasing use in other processes related to the food, medicaland chemical sectors and more generally in the treatment of wastewater from industrialplants [4–6]. In relation to the importance acquired, due to the vastness of the possibleuses, there has also been a natural expansion of the research-related sector with a strongincrease in the number of studies and publications [7] relating to process optimization andnew applications.
Although technological development [8,9] and process intensification efforts haveimproved membrane separation processes significantly, fouling still represents a majorissue, as it causes a decrease in productivity resulting from the accumulation of particles,microorganisms and macromolecules on the membrane surface with consequent negative
Membranes 2022, 12, 334. https://doi.org/10.3390/membranes12030334 https://www.mdpi.com/journal/membranes

Membranes 2022, 12, 334 2 of 14
outcomes in terms of permeate quality and increased energy consumption. Mitigatingsuch fouling effects essentially means finding ways to minimize deposition at the fluid–membrane interface while granting a reasonable amount of filtrate flux. This may beachieved by maximizing mixing in the feed while minimizing energy expenditure togenerate it. Towards this end, the so called “hydrodynamic methods” offer an interestingopportunity. In a recent review paper, Jaffrin [10] (and references therein) provides anappraisal of all such methods and highlights that an appropriate use of hydrodynamicperturbations can improve the performance of membrane filtration at low energetic costsquite significantly. For example, in addition to the classical retro-filtration approach,applications of helicoidal flows, vibrating and rotating systems and pulsating flows arereported and deemed to be promising.
While the potential of these techniques is not in doubt, the physics underpinning theprocesses leading to the observed reduction in fouling is not well understood and resultsprovided by the literature are often presented in dimensional form [11–14], which makesthem have no general validity and only a (weak) support for an empirical, and henceunreliable, design of anti-fouling hydrodynamic techniques.
The aim of the present paper is to propose, test and validate a novel experimentalfacility designed and built with the intention of providing data that will help bridge thisknowledge gap. The proposed facility was designed considering similarity principles andallowing for state-of-the-art laser diagnostics techniques to measure flow velocities andmass transfer process occurring at the membrane-feed interface. Aside from steady flows,the current version of the experimental set-up allows for the generation of pulsating flows,which are identified by the authors as a hydrodynamic method that combines a goodpotential for fouling reduction with ease of implementation and installation in industrialapplications. Some preliminary results are presented in support of this hypothesis.
The paper is organized as follows: Section 2 is devoted to the accurate descriptionof the facility as well as its design rationale. Section 3 describes the equipment andexperimental procedures adopted in the tests. Section 4 presents results with a view todemonstrate that: (i) the facility was well-designed from a fluid-dynamics stand-pointand allows for the generation of nicely controllable canonical channel flows that can beinvestigated by means of laser diagnostic techniques; (ii) filtration tests are responsive tochanges in flow conditions and provide repeatable and encouraging results especially forwhat concerns pulsating flow conditions. Section 5 presents overall conclusions from thepresent study.
2. Experimental Methods2.1. Overall Description of the Facility
The hydraulic plant shown in Figure 1a, mainly made in stainless steel 316L to ensuredurability, is a recirculating facility whereby the feed is drawn from a 1 m3 (constant-head)main tank by a pumping system consisting of two in-parallel multistage pumps, witha maximum total flow rate of 2.4 L/s. The two pumps are mounted on two separatedpipe-branches equipped with in-line ball valves for sectioning the circuit and imposinga wide range of flow rates to cover laminar, transitional and turbulent flow regimes inthe test section. Just further downstream, the system splits into a main pipeline and aby-pass line that returns a selected fraction of the feed directly to the reservoir. Along theformer, after a few meters, a divergent allows for connection to a flow conditioning systemmade of a settling chamber and a contraction that minimizes incoming turbulence andallows for the undisturbed development of boundary layers within the test section (theflow conditioning section is described in detail below). At the downstream end of this testsection, a sensor records hydraulic pressure in real-time and a short stretch of pipe closesthe hydraulic circuit. Where possible, small diameters have been used, partly to reduce thetotal volume and partly to better control the flow rate in the main line. Details about pipediameters, tanks capacity (i.e., both the main tank and the collecting thanks), test section

Membranes 2022, 12, 334 3 of 14
and pump types with three points of the flow vs. pressure curve are provided in Table S1in the Supplementary Material.
The desired conditions in terms of pressure and flow rate are achieved through thecombined regulation of pump frequency and control devices. A computer-programmableinverter allows us to fix the rotational speed of the pump shaft. The two globe valves onthe delivery line are used to set the amount of water in each branch and one valve on thereturn line, downstream of the test section, acts as a back-pressure valve. Two self-closingair release valves are then installed at the highest elevations of the pressurized part ofthe circuit to allow for air removal. Right below the test section, three small trays collectthe filtrate.
Figure 1. Overview of the proposed setup: (a) Rendering of the entire hydraulic facility. (b) Sketchof test section used for the fluid-dynamic validation of the system. (c) Sketch of the test sectionused for membrane tests. (d) Representation of the system used to generate the pulsating flow,where rs is the rotation speed and k is the distance of the rod in respect to the elbow. The outflowarea (red) varies during each cycle as a function of the angle of the truncated rod (in this setup setat 45◦). Panel (b) also shows the reference system used in the present study; the origin is chosenat the right-bottom entrance of the test section and x, y, z coordinates correspond to streamwise,wall-normal and spanwise directions, respectively.

Membranes 2022, 12, 334 4 of 14
Their emptying is regulated automatically by ultrasonic level sensors that control theon/off sequences of the bilge pumps. The filtrate then returns, via recirculation tubes, tothe main tank to maintain a constant water volume in the whole system. The overheadtank is equipped with a thermocouple that allows for the monitoring of water temperature.An ultrasonic flow meter is mounted on the main line and a pressure sensor at the endof the test section. These were chosen with an appropriate level of accuracy, namely, 2%for u > 0.3 m/s for the AcquaTrans™ AT600 flow meter manufactured by Panametrics,and 0.008 bar for the Wika P-30 pressure sensor. Flow rate and pressure data, acquiredat whatever desired frequency, are transmitted with a 4–20 mA signal to a National In-struments data acquisition card by means of a Labview program. To avoid changes inwater density and in membrane hydraulic conductivity, temperature is kept constant bymeans of a 5 kW chiller. For a better and more detailed understanding of the overall systemoperation, reference should be made to the “Piping and instrumentation diagram” (P&ID)available in Figure S1 of the Supplementary Material.
2.2. Description of the Test Section
The main part of the system is the test section (test section is often used as fluiddynamicists’ jargon, while the community pertaining to membrane science often refers toit as housing cell or simply cell; all these names are herein used interchangeably), whichhouses the flat-sheet membrane. The section consists of a rectangular channel (1.45 m long,0.2 m wide and 0.01 m high) made entirely of transparent plexiglass, which allows foroptical access to cameras and lasers, hence assessment of membrane surface alteration andvelocity measurements at any location (e.g., for measurements by means of particle imagevelocimetry, PIV, as presented herein).
Figure 1b shows the configuration of the housing cell hosting an impermeable smoothsurface that was used for checking flow development under canonical channel flow condi-tions and as a benchmark for comparison with flows developing over porous membranes.Figure 1c provides details of the cells when equipped with the flat-sheet membrane. Theupper wall of the housing is the same as in Figure 1b. The lower part is made of a rigidstainless steel porous medium (3.175 mm thick, 316LSS porous medium with uniformlydistributed 10 µm pores) providing support for different types of flat-sheet membrane. Themedium leans over a plexiglass bed that was subdivided into three separate compartmentsto collect the filtrate from different locations along the direction of the flow and hence tocheck for spatial uniformity of filtration rates during an experiment. Towards this end, thebed of each compartment has five bottom holes connected to drainage pipes that conveywater to the underlying trays where level meters allow for the monitoring of filtrated watervolumes over time and hence of filtrate flow rates as sought.
The design of the test section was carried out to accommodate the following requirements:
(i) The development of a so-called “canonical” channel flow (i.e., a rectangular channelflow as largely investigated within the remit of the literature pertaining to fluid dynam-ics) allowing for full control and extensive validation of flow properties. Following therecommendations from the literature, the channel was designed with a large aspectratio (i.e., ratio between width and depth) of 20, which allows flow properties inthe mid cross section to be independent of lateral walls and hence comparable totheoretical predictions as well as measured or numerically modeled data [15];
(ii) The length, L, of the channel had to be minimized to avoid working with very largevolumes of water while allowing for fully developed and self-similar flows (i.e., flowswhose velocity statistics, once appropriately scaled, are independent of the longitudi-nal coordinate) to form. This put constraints on the height H of the channel, becausethe higher the H the longer is the required L to obtain fully developed flows [16].
Requirements (i) and (ii) were nicely met with the test section having the followinggeometry: L = 1.45 m, H = 0.01 m and width B = 0.2 m. It is worth mentioning that theproposed facility was designed to investigate, at a fundamental level, how mass trans-fer processes occurring at the feed–membrane interface respond to a range of imposed
Membranes 2022, 12, 334 5 of 14
(and well controllable) flow conditions, and not to replicate geometric features as encoun-tered in industrial applications. The latter goal would indeed require working with complexgeometries (see, e.g., spiral wound or pressurized hollow-fiber modules) that would makethis job extremely challenging. Nevertheless, it was deemed necessary to design the testsection to allow for dynamic and kinematic similarity with industrial flows. To the authors’opinion, the two non-dimensional numbers that dictate the achievement of the soughtsimilarity are the already mentioned Reynolds number, Re = Uh/ν, and the so-calledsuction coefficient, Γ = v/U [17], where v is the vertical velocity at the feed–membraneinterface and U is the bulk mean velocity of the overlying channel flow. Whenever thesetwo numbers have each an equivalent value in different systems (e.g., our lab setup andan industrial setup, or two lab setups), the systems may be considered equivalent from ahydrodynamics standpoint. The chosen system of pipes and test section geometry permitsto impose a wide range of feed–flow velocities, U, and internal pressures to be explored.These conditions result in the possibility to impose a wide range of Re (1000 ÷ 20,000)and achieve a large range of Γ (covering up to two orders of magnitude) in relation to thepermeability of the installed membrane sheet and applied pressure. Indeed, the proposedsetup nicely covers typical hydrodynamics conditions used in industrial settings spanningfrom microfiltration to nanofiltration applications.
2.3. Description of the Flow-Conditioning Unit and Pulsating Flow System
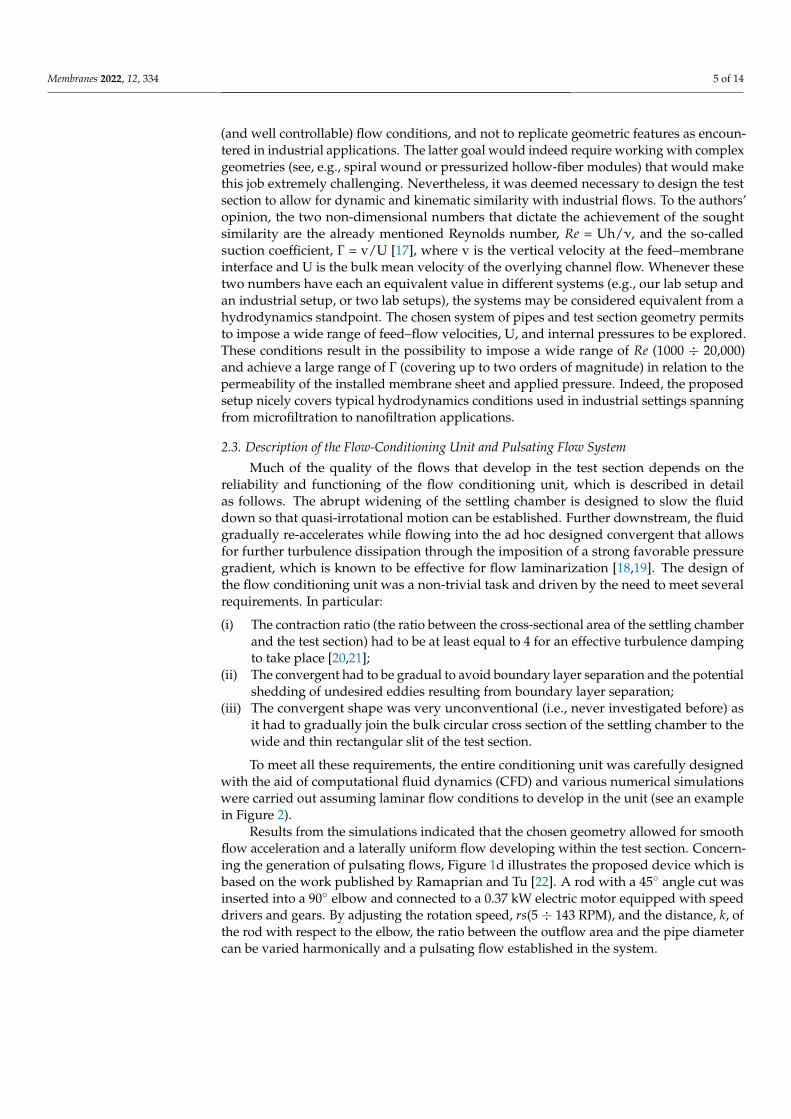
Much of the quality of the flows that develop in the test section depends on thereliability and functioning of the flow conditioning unit, which is described in detailas follows. The abrupt widening of the settling chamber is designed to slow the fluiddown so that quasi-irrotational motion can be established. Further downstream, the fluidgradually re-accelerates while flowing into the ad hoc designed convergent that allowsfor further turbulence dissipation through the imposition of a strong favorable pressuregradient, which is known to be effective for flow laminarization [18,19]. The design ofthe flow conditioning unit was a non-trivial task and driven by the need to meet severalrequirements. In particular:
(i) The contraction ratio (the ratio between the cross-sectional area of the settling chamberand the test section) had to be at least equal to 4 for an effective turbulence dampingto take place [20,21];
(ii) The convergent had to be gradual to avoid boundary layer separation and the potentialshedding of undesired eddies resulting from boundary layer separation;
(iii) The convergent shape was very unconventional (i.e., never investigated before) asit had to gradually join the bulk circular cross section of the settling chamber to thewide and thin rectangular slit of the test section.
To meet all these requirements, the entire conditioning unit was carefully designedwith the aid of computational fluid dynamics (CFD) and various numerical simulationswere carried out assuming laminar flow conditions to develop in the unit (see an examplein Figure 2).
Results from the simulations indicated that the chosen geometry allowed for smoothflow acceleration and a laterally uniform flow developing within the test section. Concern-ing the generation of pulsating flows, Figure 1d illustrates the proposed device which isbased on the work published by Ramaprian and Tu [22]. A rod with a 45◦ angle cut wasinserted into a 90◦ elbow and connected to a 0.37 kW electric motor equipped with speeddrivers and gears. By adjusting the rotation speed, rs(5 ÷ 143 RPM), and the distance, k, ofthe rod with respect to the elbow, the ratio between the outflow area and the pipe diametercan be varied harmonically and a pulsating flow established in the system.

Membranes 2022, 12, 334 6 of 14
Figure 2. (a) Geometry of the convergent section and (b) result of a CFD simulation performed insidethe fluid-dynamic convergent, connection and test section.
3. Experimental Procedure and Measuring Equipment
This section describes the measuring systems and procedures used to carry out theexperiments. The section is divided in two parts. Section 3.1 is devoted to the descriptionof the (herein called) fluid dynamic tests, which were carried out with the unit equippedwith an impermeable plexiglass floor with the goal to test the development of canonicalchannel flows. Section 3.2. reports how filtration tests were carried out and describes theexperimental technique used to monitor membrane fouling.
3.1. Fluid Dynamic Tests
Velocity measurements were carried out by means of a PIV system. This techniqueemploys a series of image pairs, acquired at predefined time intervals, to evaluate thedisplacement of individual seeding particles illuminated by a planar laser sheet. Imagepairs are compared using a cross-correlation algorithm, providing a two-dimensional veloc-ity field with a spatial accuracy of 16 × 16 pixels, herein corresponding to approximately0.19 × 0.19 mm. The equipment used in this study is a PIV Dantec system consisting of a200 mJ YAG laser (wavelength of 532 nm corresponding to green light) that can be shot ata maximum frequency of 15 Hz. Images were acquired by means of an IMPEREX c-4080camera (sensor size 18.8 × 14.1 mm) coupled to a 200 mm Nikon lens. The laser beam isconveyed through an optic-fiber cable into a mechanical arm ending with an optical unitmade of cylindrical and spherical lens that allow for laser sheet generation and control interms of width and focusing. Both optical unit and camera were mounted on a structure ofmodular aluminum profiles that allowed for very precise positioning and control of thealignment and parallelism between the camera, the main flow direction and the laser plane,whose thickness in the present experiments was set between 1 and 2 mm. Acquired imageswere then calibrated using a custom-built calibration plate inserted within the unit andthen analyzed with DynamicStudio 6.4 to work out the velocity field.
Measurements aiming at checking flow uniformity within the test section were takenat three different longitudinal positions and a fixed distance from the channel side wall(i.e., z = 5 cm). In particular, with reference to the coordinate system presented in (Figure 1b)the laser sheet was first placed in the cross section identified by longitudinal coordinatex = 82.5, then at an upstream (x = 34.5) and finally at a downstream cross section (x = 130.5),respectively. Each of the three PIV acquisitions was conducted at the same dimensionlessReynolds number Re = Uh/ν = 4000 (U is the mean velocity, h is the semi-height of thechannel and ν is the kinematic viscosity) or equivalently, Re* = u*h/ν = 70 (u* is the frictionvelocity defined as u* =
√τ0/ρ, where ρ is the fluid density and τ0 is the wall shear stress,
namely, the friction forces per unit area acting at the bottom wall), to achieve dynamicsimilarity with flows typically established in traditional membrane systems [23,24]. Since atthis Re the flow is turbulent, 2000 image pairs were acquired, in order to estimate both firstand second-order velocity statistics, with good confidence. A summary of experimental

Membranes 2022, 12, 334 7 of 14
acquisitions is given in Table 1 in which we want to point out that the small differences inthe Reynolds numbers are attributable to experimental variability.
Table 1. Summary of the chosen hydraulic conditions to perform the flow-dynamic tests. Thecolumns indicates: the Reynolds number, Re = Uh/ν, the viscous Reynolds number, Re∗ = u*h/ν, themaximum speed, Um and the friction velocity, u* =
√τ0/ρ . For all tests, 2000 image pairs (window
size 34.5 mm × 5 mm) were analyzed with a grid step size of 16 × 16 pixels and a spatial accuracy of0.19 × 0.19 mm.
Test Name Symbol Coordinates [cm] Re [-] Re∗ [-] Um [m/s] u∗ [m/s]
F-1 x = 82.5, z = 5 3981 70 0.267 0.0148F-2 x = 34.5, z = 5 3981 70 0.267 0.0144F-3 x = 130.5, z = 5 4038 68 0.265 0.0145
3.2. Filtration Tests
Experimental findings were obtained from pulsating and steady-state flow tests. Inboth cases, 5 g of kaolin (D50 = 1.5 µm) and 10 g of green clay (D50 = 0.2 µm), whichrepresent the main colloidal foulants in this application, were added to 555 l of tap water(feed concentration c = 27 ppm and feed viscosity ν = 10 −6 m2/s), in order to reproducethe same total suspended solids (TSS) concentrations and similar particle composition asencountered in a nearby river (Po River [25,26]), which is currently used as main sourceof water for the city of Turin, and whose water will be soon potabilized by means ofa new ultrafiltration plant, which is currently being installed by the water provider. Anew polyethersulfone (PES) Synder-LY ultrafiltration flat-sheet membrane with a molec-ular weight cut-off (MWCO) of 100,000 Da and a nominal permeance between 80 and123 L/m2/h/bar was mounted in the housing section for each test. An average Re of 4000was maintained in all tests with a constant fluid temperature (in the range of 18 ÷ 20 ◦C)and the applied pressure, P, was chosen between 1 and 1.5 bar. At these conditions, thesuction parameter Γ varied between 1.37 × 10⁻⁴ and 1.84 × 10⁻⁴. In order to also obtainpreliminary data about potential fouling reduction under pulsating flow conditions, oneexperiment was carried out under the same hydraulic conditions as per the steady filtrationtests (i.e., Re = 4000 and Γ 1.37 ÷ 1.84 × 10⁻⁴) but, this time, forcing the flow rate andpressure to undergo oscillations induced by the pulsed flow system described in Section 2.3(see also Figure 1d). Towards this end, the distance between the rod and the elbow, k, wasset to 13.3 cm and the rotation frequency equal to 0.09 Hz. This corresponds to variationsof pressure and flow rate contained between 1.51 ± 0.04 and 0.42 ± 0.035, respectively. Thefrequency of the imposed oscillations sets the dimensionless frequency ω+ = 2π f ν / u*2 tobe equal to 0.0025, which, according to the literature pertaining to turbulent pulsating flows,corresponds to a regime whereby turbulence time scales are much smaller than the period,1/f, of the oscillations [27]. In terms of particle mass transport, it was hypothesized thatthis condition might be favorable to diminish particle depositions with respect to a steadyflow condition. This because the high shear associated with the acceleration phase of anoscillation has the time to develop into enhanced turbulence (i.e., enhanced mixing) beforeit is damped by the decelerating phase. This “high-intensity” turbulent bursts should,in principle, increase the probability of particles to be entrained in the feed rather thandepositing over the membrane surface. A summary of experimental conditions is given inTable 2.
In order to obtain a significant and measurable drop in the filtration rate over time,each test was carried out for a duration of 23 h. During all the filtration tests, the surface ofthe membrane was monitored by a series of photographs taken at 15 min intervals using acamera (Canon EOS 700) controlled by digiCamControl software. The camera was carefullymounted horizontally (i.e., parallel to the membrane) and was placed above the test sectionat a sufficient distance to capture its entire extent. A dark room was built around thisportion of the system and 11 spotlights of 600 LM each were placed inside it in a fixed

Membranes 2022, 12, 334 8 of 14
position to ensure uniform and constant light during the tests. An initial white balancewas carried out for all the images and then the variation of the yellow band (which is thedominant one in the measured spectrum) was calculated with respect to the initial valueof the corresponding area, providing the % of color variation in time at different locationsover the membrane. This system allows to monitor the chromatic change of the membranesurface induced by colloidal fouling in time and, even more interestingly, in space to checkfor particle deposition uniformity over the entire cell unit.
Table 2. Provides a summary of all experimental conditions for filtration tests. The columns indicate:the Reynolds number, Re = Uh/ν, the pressure, P, the suction coefficient, Γ = v/U and the non-dimensional frequency, ω+ = 2π f ν / u*2
Test Name Symbol Re [-] P [bar] Γ [10−4] ω+ [-]
S-4_1 4005 1.00 1.37 -S-4_1r 4013 1.00 1.38 -S-4_1.5 3983 1.52 1.63 -
P-4_1.5_2.5 3974 1.51 1.84 0.0025
4. Results
This section is split in two parts. Sections 4.1 and 4.2 provide results obtained fromthe fluid dynamic and filtration tests, respectively.
4.1. Fluid Dynamic Tests
This section contains the experimental results of the fluid dynamic tests carried outin the three different longitudinal positions within the test section, whose parameters arereported in Table 1. Figure 3a shows the mean flow field, superimposed to a PIV snapshotand the contour plot of the longitudinal velocity obtained from the time averaging of2000 flow resolutions, obtained from PIV in the F-1 test.
The contour plot shows quite uniform flow conditions, thus indicating that the laserwas positioned correctly and parallel to the flow. This gives confidence about measurementsquality when assessing the standard “family portrait” of velocity statistics profiles reportedin the other panels of the figure. These were obtained by further averaging flow propertiesobtained locally (i.e., for each PIV interrogation areas) over lines parallel to the wall toachieve enhanced statistical robustness. The vertical coordinate and the velocity statisticsprofiles presented in panels (b–f) of Figure 3 are plotted following a conventional normal-ization, employing the channel half-height, h, the maximum speed, Um, and the frictionvelocity, u*=
√τ0/ρ (τ0 is the wall shear stress and ρ is the water density). As is common in
turbulent channel flows, τ0 was estimated, for each of the three cases, from the linear ex-trapolation to the bottom wall of the total shear stresses, τ, defined as τ(y) = ρνdu
dy − ρu′v′,where ν is the kinematic viscosity, u is the longitudinal velocity component, u′ and v′ arethe longitudinal and vertical velocity (time) fluctuations, respectively, and overbar denotestime-averaging [28]. Results from the extrapolation are reported in Figure 3b, which showshow profiles of τ as obtained from PIV measurements are reasonably linear as expected inuniform turbulent channel flows.
Figure 3c–f demonstrate that all the measured vertical profiles of mean velocities(panels (c) and (d)) and velocity variance (panel (e)) and covariance (panel (f)) collapse well,thus indicating the flow to be self-similar. Moreover, since all the scaling parameters used inFigure 3 are reasonably constant for each test (i.e., at each different longitudinal coordinate)the flow can be considered uniform and hence fully developed. Further support aboutthe quality of the data comes from the comparison with the direct numerical simulationsof Tsukara et al. [29], performed at similar Re∗, whose data collapse very well with thosepresented herein, thus further demonstrating that the flows conform to canonical, turbulentchannel flows, as sought. Further evidence for the occurrence of fully developed turbulence(and not transitional behavior) can be found in the Supplementary Information where, for

Membranes 2022, 12, 334 9 of 14
both velocity fluctuations u′ (longitudinal) and v′ (wall-normal), a time series at a fixedpoint in space (Figure S2) and a contour plot within the measurement window (Figure S3)are presented. Both figures show that the flow presents a chaotic and irregular continuouspattern without the occurrence of intermittent laminar vs. turbulent behavior that istypically encountered in transitional conditions.
Figure 3. Velocity statistics obtained from PIV measurements in the lower half of the test section forthree different streamwise positions; h is the channel semi-height, u+ = u / u* is the normalized veloc-
ity; y+ = y u*/ν is the normalized distance from the wall, Um is the maximum speed, σv =√
v′2/u*
and σu =√
u′2/u* are the non-dimensional root squares of the variance for wall-normal and longitu-dinal velocity fluctuations, respectively, and σuv =
√v′u′/u* is the non-dimensional root square of
the covariance. (a) Flow field and contour plot for test F-1; (b) total shear stress for all tests; (c) non-dimensional mean-velocity profiles (outer scaling); (d) non-dimensional mean-velocity profiles (innerscaling), the dashed line represent the linear law u+ = y+, characterizing wall flows for y+ . 5 (seee.g., Pope (2000) [30]); (e,f) non-dimensional profiles of velocity variances. Symbols and experimentalconditions for all the tests are reported in Table 1, with the exception for ♦ that refers to the data fromthe DNS by Tsukara (2005).
4.2. Filtration Tests
Figure 4 provides results of test S-4_1.5, which was conducted at steady flow conditionsand an applied pressure of 1.5 bar.

Membranes 2022, 12, 334 10 of 14
Figure 4. Results of S-4_1.5 filtration test with a feed pressure of 1.5 bar; (a) fill levels of the threefiltrate collection tanks vs. time; (b) total water flux and flux measured from the individual portions.In both panels, blue, green and red lines/symbols refer to, up, mid and down collection tanks,respectively (see Figure 1). Orange squares in panel (b) refer to the cumulative flux.
The filtrate corresponding to each third of the membrane area, identified as “up”, “mid”and “down”, along the longitudinal direction of motion, is conveyed into the respectivecollection tray, which is then automatically emptied when a predefined value is reached(Figure 4a). The integral of these values, for each of the three areas, gives the respectivecumulate from used to derive the flux associated with the test, as illustrated by Figure 4b.Since the global slope of the curves related to each section is almost the same, it is possibleto infer that there is no evident longitudinal spatial variation in the filtrate flux. Notethat in the filtration tests, part of the discharge is progressively lost along the direction ofmotion through the membrane (in our case a value between 1.9% and 2.5%), hence a slightnon-uniformity of flow conditions should be expected. Our results indicate that such aslight non-uniformity has a negligible effect on the bulk flux of filtrate, which is essentiallythe same for the up, mid and down sections.
More spatially resolved information about the uniformity of the fouling rate is pro-vided by the analysis of the photographs taken with the overhead camera, which is pre-sented in figure Figure 5 for one experimental condition (the other tests showed a similarbehavior as can be seen from Figure S4 of the Supplementary Material).
Here, panel (a) reports examples of the images taken over different time steps (notethat full optical access to the surface of the membrane is prevented due to the presence ofbraces that were used to avoid water leakage), while panel (b) shows the variation in yellowband color as detected by the camera over the 11 boxes highlighted in red in panel (a).
Panel (b) indicates that differences in yellow band variations (and hence the foulingrate) are minimal over the entire length of the channel at any point in time (differencesbetween the upstream and downstream section are contained within 2% and 8.5%). Hence,it can be safely stated that fouling rates can be considered uniform over the membranesurface as inferred from filtrate flux measurements. These results are important from anexperimental point of view for mainly two reasons. Firstly, they demonstrate that thefouling rates measured within the facility can be directly associated with quasi-uniformand hence well-definable flow conditions, hence paving the way to establish clear cause–effect relations between flow and mass-transfer processes. Secondly, thanks to uniformity,measurements performed by means of conventional flow/particle-measurement devices,which are local (or quasi-local as per PIV) in nature, can be considered representative ofthe whole system and hence directly relatable to integral quantities such as filtrate fluxes,without the need of lengthy and costly flow characterization over the entire unit. Figure 5balso provides some insights about the fouling behavior over time, which is clearly non-linear, as expected [31]. Indeed, variations in the yellow-band color were faster at thebeginning of the experiment and slower towards the end. This observation is consistentwith the data presented in Figure 6, representing the behavior in terms of filtrate fluxes vs.time (it should be noted that the initial flux rate is consistent with the values of permeanceindicated by the manufacturer), which, as expected, displayed a faster drop during theinitial part of the experiment and a slower reduction towards the end.

Membranes 2022, 12, 334 11 of 14
Figure 5. Data related to colloidal fouling of the membrane. (a) Photographs from the overhead cam-era taken over the entire span of the test section and at different times, t (test S-4_1.5); (b) percentagevariation of the membrane color (yellow band) measured at different longitudinal positions along themembrane surface (i.e., in each of the red boxes highlighted in panel (a) as a function of time).
Figure 6. Dimensional (panel (a)) and non-dimensional (panel (b)) filtrate fluxes vs. time for allexperimental conditions (symbols as indicated in Table 2). In Panel (b), filtrate fluxes are normalizedby their initial value.
Initially, at higher flux value, colloidal deposition is faster and particles interacted withthe membrane surface, possibly causing direct pore clogging, thus resulting in a higher fluxreduction rate. Later during the tests, particle deposition slowed down due to a reduction inpermeate flux (i.e., reduction in convective flow toward the membrane surface) and particlesstarted depositing on a layer of pre-deposited particles, thus increasing the resistance ofthe cake layer but causing less direct pore clogging. More consistently with the objectivesof the present study, Figure 6 provides evidence for the following important points:

Membranes 2022, 12, 334 12 of 14
(i) Filtration tests carried out in the channel facility are controllable and repeatablebecause tests carried out at essentially identical experimental conditions displayoverlapping curves of filtrate vs. time (blue and green symbols).
(ii) The pulsed flow case (red triangles, see Table 2) provided much improved filtrate fluxbehavior over time when compared to its steady flow counterpart (orange squares),as hypothesized in Section 3.2. Note that flux differences are much greater than thoseassociated with experimental uncertainty, as supported by the previous point aboutexperimental repeatability. Specifically, flux values were maintained always largerthan 130 L/m2/h in the pulsed flow case and a final normalized flux of 0.9 wasachieved, thus halving the fouling-related flux reduction compared to the stead flowcase. This observation suggests the potential of hydrodynamic methods to reducecolloidal fouling in ultrafiltration membrane systems.
5. Concluding Remarks
In this work, we presented and validated a new module-scale lab facility designed toinvestigate interlinks between hydrodynamics and fouling in membrane flow systems. Thefacility is rather innovative as it allows for the development of turbulent flow conditions(often encountered in membrane systems) at an unprecedented quality and controllabilityat least when compared to past studies pertaining to the membrane science literature [32,33].In this respect, PIV measurements indicated that fully developed turbulent channel flowswere generated within the test section. These can also be considered canonical, in thesense that their velocity statistics compared very well with datasets presented in theliterature and normally used as benchmark for quality check. Regarding filtration tests,these were carried out with waters containing a prescribed level of suspended colloids(clay) mimicking conditions of interest for the ultrafiltration of relevant surface waters.Results showed that tests were repeatable and displayed filtrate flux vs. time curves inagreement with those previously reported in the relevant literature. Despite the inherent(but slight) flow non-uniformity characterizing the filtration tests, fouling proved to occurrather uniformly along the whole unit. This was demonstrated from the measurementsof filtrate fluxes at three different longitudinal sections of the unit, which proved to benicely uniform and from the measurements of membrane color variations (as observed bymeans of an overhead camera and indicative of fouling), which also proved to be uniform.Finally, a pulsed flow test carried out by imposing pressure (and flow rate) variations at adimensionless frequency, ω+ italics font removed of 0.0025, showed a significant reductionin colloidal fouling when compared to its steady counterpart, thus providing encouraging,albeit preliminary, results about pulsations as a viable hydrodynamic technique to reducefouling in membrane systems. In this regard, ongoing work is focused to identify whichpulsed-flow conditions, in terms of non-dimensional frequency and wave amplitudes, resultin maximum fouling reductions within the context of applications in the water industry.
Supplementary Materials: The following are available at https://www.mdpi.com/article/10.3390/membranes12030334/s1, Figure S1: Pipes and instrumentation diagram (i.e., P & ID Diagram) of theoverall facility, Figure S2: Time series of the longitudinal u′ and wall-normal v′ velocity fluctuationsdeduced by PIV measurement at the position F-2 and coordinates x = 17 mm and y = 2.5, Figure S3:Contour plot of the longitudinal u′ and wall-normal v′ velocity fluctuations deduced by PIV measure-ment at the position F-2 at fixed time T = 4.8 s, Figure S4: Results of filtration test S-4.1: (a) Total waterflux measured from the individual portions (Where blue, green and red symbols refer to up, mid anddown collection tanks respectively and orange squares refer to the cumulative flux) and (b) percentagevariation of the membrane colour (yellow band) measured at different longitudinal positions along themembrane surface, Table S1: Geometries and properties of the main hydraulic components.
Author Contributions: Conceptualization, R.B., C.M. and A.T.; methodology, R.B. and C.M.; software,R.B.; validation, R.B.; formal analysis, R.B.; investigation, R.B.; data curation, R.B.; writing and editing,R.B.; review, C.M. and A.T.; visualization, R.B.; supervision, C.M. and A.T.; project administration,C.M. and A.T.; funding acquisition, A.T. All authors have read and agreed to the published version ofthe manuscript.

Membranes 2022, 12, 334 13 of 14
Funding: This research received no external funding.
Institutional Review Board Statement: Not applicable.
Informed Consent Statement: Not applicable.
Data Availability Statement: The data presented in this study are available on request from thecorresponding author.
Acknowledgments: The study was supported by Politecnico di Torino and the CleanWaterCenter@PoliTo(01_TRIN_CI_CWC).
Conflicts of Interest: The authors declare that they have no known competing financial interest orpersonal relationships that could have appeared to influence the work reported in this paper.
References1. Water, U. The United Nations World Water Development Report 2021: Valuing Water; UNESCO: Paris, France, 2021.2. Zotalis, K.; Dialynas, E.G.; Mamassis, N.; Angelakis, A.N. Desalination technologies: Hellenic experience. Water 2014, 6, 1134–1150.
[CrossRef]3. Caldera, U.; Bogdanov, D.; Breyer, C. Local cost of seawater RO desalination based on solar PV and wind energy: A global estimate.
Desalination 2016, 385, 207–216. [CrossRef]4. Van der Bruggen, B.; Cornelis, G.; Vandecasteele, C.; Devreese, I. Fouling of nanofiltration and ultrafiltration membranes applied
for wastewater regeneration in the textile industry. Desalination 2005, 175, 111–119. [CrossRef]5. Allen, S.; Holena, D.; McCunn, M.; Kohl, B.; Sarani, B. A review of the fundamental principles and evidence base in the use of
extracorporeal membrane oxygenation (ECMO) in critically ill adult patients. J. Intensive Care Med. 2011, 26, 13–26. [CrossRef][PubMed]
6. Daufin, G.; Escudier, J.P.; Carrère, H.; Bérot, S.; Fillaudeau, L.; Decloux, M. Recent and emerging applications of membraneprocesses in the food and dairy industry. Food Bioprod. Process. 2001, 79, 89–102. [CrossRef]
7. Al Aani, S.; Mustafa, T.N.; Hilal, N. Ultrafiltration membranes for wastewater and water process engineering: A comprehensivestatistical review over the past decade. J. Water Process Eng. 2020, 35, 101241. [CrossRef]
8. Wang, F.; He, M.; Gao, K.; Su, Y.; Zhang, R.; Liu, Y.; Shen, J.; Jiang, Z.; Kasher, R. Constructing membrane surface with synergisticpassive antifouling and active antibacterial strategies through organic-inorganic composite modifier. J. Membr. Sci. 2019, 576,150–160. [CrossRef]
9. Lu, X.; Arias Chavez, L.H.; Romero-Vargas Castrillon, S.; Ma, J.; Elimelech, M. Influence of active layer and support layersurface structures on organic fouling propensity of thin-film composite forward osmosis membranes. Environ. Sci. Technol. 2015,49, 1436–1444. [CrossRef] [PubMed]
10. Jaffrin, M.Y. Hydrodynamic techniques to enhance membrane filtration. Annu. Rev. Fluid Mech. 2012, 44, 77–96. [CrossRef]11. Gupta, B.; Blanpain, P.; Jaffrin, M. Permeate flux enhancement by pressure and flow pulsations in microfiltration with mineral
membranes. J. Membr. Sci. 1992, 70, 257–266. [CrossRef]12. Howell, J.; Field, R.; Wu, D. Yeast cell microfiltration: flux enhancement in baffled and pulsatile flow systems. J. Membr. Sci. 1993,
80, 59–71. [CrossRef]13. Al-haj Ali, M.; Ajbar, A.; Ali, E.; Alhumaizi, K. Optimization-based periodic forcing of RO desalination process for improved
performance. Desalin. Water Treat. 2013, 51, 6961–6969. [CrossRef]14. Saremirad, P.; Gomaa, H.; Zhu, J. Effect of flow oscillations on mass transfer in electrodialysis with bipolar membrane. J. Membr.
Sci. 2012, 405, 158–166. [CrossRef]15. Vinuesa, R.; Noorani, A.; Lozano-Durán, A.; Khoury, G.K.E.; Schlatter, P.; Fischer, P.F.; Nagib, H.M. Aspect ratio effects in
turbulent duct flows studied through direct numerical simulation. J. Turbul. 2014, 15, 677–706. [CrossRef]16. Çengel, Y.; Cimbala, J. Fluid Mechanics: Fundamentals and Applications; McGraw-Hill Education: New York, NY, USA, 2018.17. Ferro, M. Experimental Study on Turbulent Boundary-Layer Flows with Wall Transpiration. Ph.D. Thesis, KTH Royal Institute of
Technology, Stockholm, Sweden, 2017.18. Piomelli, U.; Balaras, E.; Pascarelli, A. Turbulent structures in accelerating boundary layers. J. Turbul. 2000, 1, 001. [CrossRef]19. Finnicum, D.S.; Hanratty, T.J. Effect of favorable pressure gradients on turbulent boundary layers. AIChE J. 1988, 34, 529–540.
[CrossRef]20. Eckert, W.T.; Mort, K.W.; Jope, J. Aerodynamic Design Guidelines and Computer Program for Estimation of Subsonic Wind Tunnel
Performance; National Aeronautics and Space Administration: Washington, DC, USA, 1976.21. Nedyalkov, I. Design of Contraction, Test Section, and Diffuser for a High-Speed Water Tunnel. Master’s Thesis, Chalmers
University of Technology, Gothenburg, Sweden, 2012.22. Ramaprian, B.; Tu, S.W. An experimental study of oscillatory pipe flow at transitional Reynolds numbers. J. Fluid Mech. 1980,
100, 513–544. [CrossRef]23. Ahn, K.H.; Cha, H.Y.; Yeom, I.T.; Song, K.G. Application of nanofiltration for recycling of paper regeneration wastewater and
characterization of filtration resistance. Desalination 1998, 119, 169–176. [CrossRef]

Membranes 2022, 12, 334 14 of 14
24. Nikolova, J.; Islam, M. Contribution of adsorbed layer resistance to the flux-decline in an ultrafiltration process. J. Membr. Sci.1998, 146, 105–111. [CrossRef]
25. Davide, V.; Pardos, M.; Diserens, J.; Ugazio, G.; Thomas, R.; Dominik, J. Characterisation of bed sediments and suspension of theriver Po (Italy) during normal and high flow conditions. Water Res. 2003, 37, 2847–2864. [CrossRef]
26. Arpa Piemonte. Water Quality in Torino (2009–2017). 2020. Available online: http://webgis.arpa.piemonte.it/monitoraggio_qualita_acque/indexp.php?numcodice=001095 (accessed on 22 November 2021).
27. He, S.; Jackson, J. An experimental study of pulsating turbulent flow in a pipe. Eur. J. Mech. B/Fluids 2009, 28, 309–320. [CrossRef]28. Peruzzi, C.; Poggi, D.; Ridolfi, L.; Manes, C. On the scaling of large-scale structures in smooth-bed turbulent open-channel flows.
J. Fluid Mech. 2020, 889. [CrossRef]29. Tsukahara, T.; Seki, Y.; Kawamura, H.; Tochio, D. DNS of turbulent channel flow at very low Reynolds numbers. In Proceedings
of the Fourth International Symposium on Turbulence and Shear Flow Phenomen, Williamsburg, VA, USA, 27–29 June 2005;Begel House Inc.: Danbury, CT, USA, 2005.
30. Pope, S.B. Turbulent Flows; Cambridge University Press: Cambridge, UK, 2011.31. Tang, C.Y.; Chong, T.; Fane, A.G. Colloidal interactions and fouling of NF and RO membranes: a review. Adv. Colloid Interface Sci.
2011, 164, 126–143. [CrossRef] [PubMed]32. Kastl, A.; Bar-Zeev, E.; Spinnler, M.; Sattelmayer, T. Impact of pulsating flows on particle deposition in forward osmosis with
spacers. J. Membr. Sci. 2021, 635, 119444. [CrossRef]33. Bogler, A.; Kastl, A.; Spinnler, M.; Sattelmayer, T.; Be’er, A.; Bar-Zeev, E. Where, when and why? Quantifying the relation of
particle deposition to crossflow velocity and permeate water flux in forward osmosis. J. Membr. Sci. 2020, 604, 118055. [CrossRef]