New Data Link Test and Comparison With VDL-2 - NASA ...
17
Daryl C. Robinson Glenn Research Center, Cleveland, Ohio Dual Purpose Simulation: New Data Link Test and Comparison With VDL-2 NASA/TM—2005-213385 February 2005
-
Upload
khangminh22 -
Category
Documents
-
view
0 -
download
0
Transcript of New Data Link Test and Comparison With VDL-2 - NASA ...

Daryl C. RobinsonGlenn Research Center, Cleveland, Ohio
Dual Purpose Simulation: New Data LinkTest and Comparison With VDL-2
NASA/TM—2005-213385
February 2005

The NASA STI Program Office . . . in Profile
Since its founding, NASA has been dedicated tothe advancement of aeronautics and spacescience. The NASA Scientific and TechnicalInformation (STI) Program Office plays a key partin helping NASA maintain this important role.
The NASA STI Program Office is operated byLangley Research Center, the Lead Center forNASA’s scientific and technical information. TheNASA STI Program Office provides access to theNASA STI Database, the largest collection ofaeronautical and space science STI in the world.The Program Office is also NASA’s institutionalmechanism for disseminating the results of itsresearch and development activities. These resultsare published by NASA in the NASA STI ReportSeries, which includes the following report types:
• TECHNICAL PUBLICATION. Reports ofcompleted research or a major significantphase of research that present the results ofNASA programs and include extensive dataor theoretical analysis. Includes compilationsof significant scientific and technical data andinformation deemed to be of continuingreference value. NASA’s counterpart of peer-reviewed formal professional papers buthas less stringent limitations on manuscriptlength and extent of graphic presentations.
• TECHNICAL MEMORANDUM. Scientificand technical findings that are preliminary orof specialized interest, e.g., quick releasereports, working papers, and bibliographiesthat contain minimal annotation. Does notcontain extensive analysis.
• CONTRACTOR REPORT. Scientific andtechnical findings by NASA-sponsoredcontractors and grantees.
• CONFERENCE PUBLICATION. Collectedpapers from scientific and technicalconferences, symposia, seminars, or othermeetings sponsored or cosponsored byNASA.
• SPECIAL PUBLICATION. Scientific,technical, or historical information fromNASA programs, projects, and missions,often concerned with subjects havingsubstantial public interest.
• TECHNICAL TRANSLATION. English-language translations of foreign scientificand technical material pertinent to NASA’smission.
Specialized services that complement the STIProgram Office’s diverse offerings includecreating custom thesauri, building customizeddatabases, organizing and publishing researchresults . . . even providing videos.
For more information about the NASA STIProgram Office, see the following:
• Access the NASA STI Program Home Pageat http://www.sti.nasa.gov
• E-mail your question via the Internet [email protected]
• Fax your question to the NASA AccessHelp Desk at 301–621–0134
• Telephone the NASA Access Help Desk at301–621–0390
• Write to: NASA Access Help Desk NASA Center for AeroSpace Information 7121 Standard Drive Hanover, MD 21076

Daryl C. RobinsonGlenn Research Center, Cleveland, Ohio
Dual Purpose Simulation: New Data LinkTest and Comparison With VDL-2
NASA/TM—2005-213385
February 2005
National Aeronautics andSpace Administration
Glenn Research Center
Prepared for the21st Digital Avionics Systems Conference (DASC 2002)cosponsored by the American Institute of Aeronautics and Astronauticsand the Institute of Electrical and Electronics EngineersIrvine, California, October 27, 2002

Acknowledgments
I acknowledge Mr. Robert Kerczewski for recruiting me for this area of research and for funding it. I alsoacknowledge the efforts of my summer interns, Proloy Bhattacharyya, University of California, Irvine,
and Steve Drescher, Ohio State University. Proloy built the network used in these simulationsaccording to my specifications. Steve researched and generated, according to my
specifications, all of the aircraft trajectories used in the simulations.They wrote process models and C programs to validate their very
good work, thereby allowing me to concentrate on writingall of the process models used in the simulation.
Available from
NASA Center for Aerospace Information7121 Standard DriveHanover, MD 21076
National Technical Information Service5285 Port Royal RoadSpringfield, VA 22100
Available electronically at http://gltrs.grc.nasa.gov

DUAL PURPOSE SIMULATION: NEW DATA LINK TESTAND COMPARISON WITH VDL-2
AbstractWhile the results of this paper are similar to
those of previous research [1], in this papertechnical difficulties present there [1] areeliminated, producing better results, enabling one tomore readily see the benefits of Prioritized CSMA(PCSMA). A new analysis section also helps togeneralize this research so that it is not limited toexploration of the new concept of PCSMA.Commercially available network simulationsoftware, OPNET version 7.0, simulations arepresented involving an important application of theAeronautical Telecommunications Network (ATN),Controller Pilot Data Link Communications(CPDLC) over the Very High Frequency Data LinkMode 2 (VDL-2). Communication is modeled foressentially all incoming and outgoing nonstop airtraffic for just three United States cities: Cleveland,Cincinnati, and Detroit. The simulation involves111 Air Traffic Control (ATC) ground stations,32 airports distributed throughout the U.S., whichare either sources or destinations for the air trafficlanding or departing from the three cities, and also1,235 equally equipped aircraft—taking off, flyingrealistic free-flight trajectories, and landing in a24-hr period. Collision-less PCSMA is successfullytested and compared with the traditional CSMAtypically associated with VDL-2. The performancemeasures include latency, throughput, and packetloss. As expected, PCSMA is much quicker andmore efficient than traditional CSMA. Thesesimulation results show the potency of PCSMA forimplementing low latency, high throughput andefficient connectivity. Moreover, since PCSMAoutperforms traditional CSMA, by simulating withit, we can determine the limits of performancebeyond which traditional CSMA may not pass.We are testing a new and better data link that couldreplace CSMA with relative ease. Work isunderway to drastically expand the number offlights to make the simulation more representativeof the National Aerospace System.
IntroductionDue to a lack of surveillance and
communications coverage, in many parts of theworld, aircraft are forced to fly routes and maintainseparations that are inefficient from both a fuel andscheduling perspective. The total loss to airlines dueto these inefficiencies is measured in billions ofdollars. The problem is expected to rapidlymushroom given the expected user demand forscheduled air service. The Advanced AirTransportation Technologies (AATT) Program hasbeen instituted to develop new technologies thatenable free-flight, an operating system in whichpilots have the freedom to select their path andspeed in real-time [2].
To implement free-flight, CPDLC is viewedas very important for the new aeronauticalcommunications infrastructure. CPDLC willeliminate voice-only communications.
In the simulations of this paper, realisticground-to-air and air-to-ground communications areachieved by assuming an effective, intact terrestrialnetwork and by treating planes as traffic generatorsand sinks, in a manner analogous to the transparentusage of a traffic injector or “sniffer” in a network.Further, the idea of PCSMA is reintroduced andsuccessfully tested through simulation. PCSMAtrades off the use of an additional radio frequencyin order to implement efficient CSMA withoutcollisions. The benefit gained of efficient, collision-less CSMA is that the inefficiencies introduced bywasted time division multiple access (TDMA) timeslots may be avoided.
Simulation FocusThe primary focus of the simulations is to
examine the behavior of ATC communications overVDL-2 in an aviation scenario involving asubstantial amount of air and communicationstraffic. Both weather and terrain were ignored, and
Daryl C. Robinson National Aeronautics and Space Administration
Glenn Research Center Cleveland, Ohio 44135
NASA/TM—2005-213385 1

the simulation assumes a spherical earth. Indirectcommunication is not implemented in this“OPNET” (network simulation software tool)simulation. Two nodes may communicate onlywhen they are in direct line-of-sight, so extendingthe range of ground stations by bouncing signalsoff of the ionosphere is not permitted here. Allincoming and outgoing nonstop air traffic for threecities was simulated. Given the time constraints forthis research and the scope of this simulation, itwas not desirable to simulate the communicationsarchitecture for the entire OSI stack. Since themedia access control layer (MAC) layer isespecially important in broadcast media, largelydetermining the limit of performance, heavyemphasis was placed upon the data link layer,VDL-2. These simulations do not model thepresentation, session, transport, or network layers,as it was of most interest to simulate the VDL-2data link layer, which is being deployed. The mostimportant use of these simulations is to testPCSMA.
Simulation OverviewAs pr ev i ou sl y s ta te d , th e s imul a ti on in vo lv e s
1 ,2 35 f l ig ht s , 11 1 ATC t r an sc ei v er s o r gr ou n ds ta ti on s , an d 3 2 ai r po rt s . Th e t ak e o ff , ar r iv al , a nd f li gh t t imes fo r on e d ay we re b a se d o n re al fl ig h tp la ns o b ta in e d fr om th e a ir po rt s . In s te ad o f a ct u al ly mod el in g t he fa ct t h at o n e pl an e may ma ke s e ve ra l f li gh ts , a s e pa ra te OPNET mob il e a ir p la ne n o de i s u se d fo r e ac h f li gh t . Fo r r ea so n s di s cu ss ed la te r ,CPDLC me ss ag e s in t h es e s imul at i on s h av e a5 ,0 00 b i t me a n fi le si ze . CPDLC fi le si ze s a re c h os en a cc or di n g to th e no r ma l d is tr ib u ti on . CPDLCmes sa ge s h av e a v ar i an ce of 2 ,5 0 0 bi t s. The y h av e a mea n in t er ar r iv al t i me o f 6 min , u si n g th ee xp on en t ia l d is tr ib u ti on . All CPDLC t ra ns ce i ve rs o pe ra te at 1 3 6 MHz wit h a 1 0 KHz b an d wi dt h.
Message LengthThe maximum CPDLC packet size is
8,312 bits. In these simulations, however, weuse a 5,000 bit message length and compensateby increasing the frequency of CPDLCcommunication. However, for many years, it isunlikely that CPDLC messages will use packets aslong as 8,312 bits. The most probable packet lengthis subject to determination. Since that precise value
was not known at the time of these simulations, wesettled on the mean value of 5,000 bits.
Ground StationsIt was not intended to perfectly replicate the
National Aerospace System (NAS) in thesesimulations, but to provide a data communicationsenvironment in the simulation similar to that in theNAS. Consequently we did not require an exactdistribution of ground stations. Instead, for researchpurposes, we distributed them uniformly throughoutthe United States. A 100 m ground station maymaintain direct line-of-sight communication with anairplane having an average altitude of 3.43 mi. forabout 300 km. We used an average spacing of290 km between adjacent ground stations to ensurecontinuous air to ground and ground to aircommunications. The ATC tower at Hopkins is199 ft = 60.93 m in height. The simulationapproximates the altitude of typical VDL groundstations as half that value, 30.47 m. There are111 ground stations in the simulation. Additionally,there is an air traffic control tower at each of the32 airports. Figure 1 shows a view of the 32 airportsand 111 ground stations involved in the simulation.The ground stations are capable of detecting thepresence of a plane and only send CPDLCmessages if there is a plane within its 290 kmairspace to receive them. Due to the functioning ofPCSMA, the ground stations are coordinated andproduce no uplink interference.
DetailsEach airport is initially stocked with many
planes, which will take off for one of the remaining31 airports during the course of the 24 hrsimulation. Again, all simulated flights are nonstop.Each ground station, including air traffic controltowers, consists of a CPDLC transceiver. Eachairplane has identical communications architecture.CPDLC exists only between aircraft and groundstations. The CPDLC transmission nodearchitecture is shown in fig. 2.
I n fi g. 2, “ g en ” is a cl o ck ed g e ne ra t or o fp ac ke ts . “ q _1 ” is a qu e ue t o b uf fe r t he p a ck et s .“ p _0 ” is a pr o ce ss or mo du l e, whi c h de c id es wh et he r t o le av e t he pa ck et s i n t he q ue u e or to f or war d t he mo n to t h e ra d io t ra n smit t er t hr o ug h p t_ 0.
NASA/TM—2005-213385 2
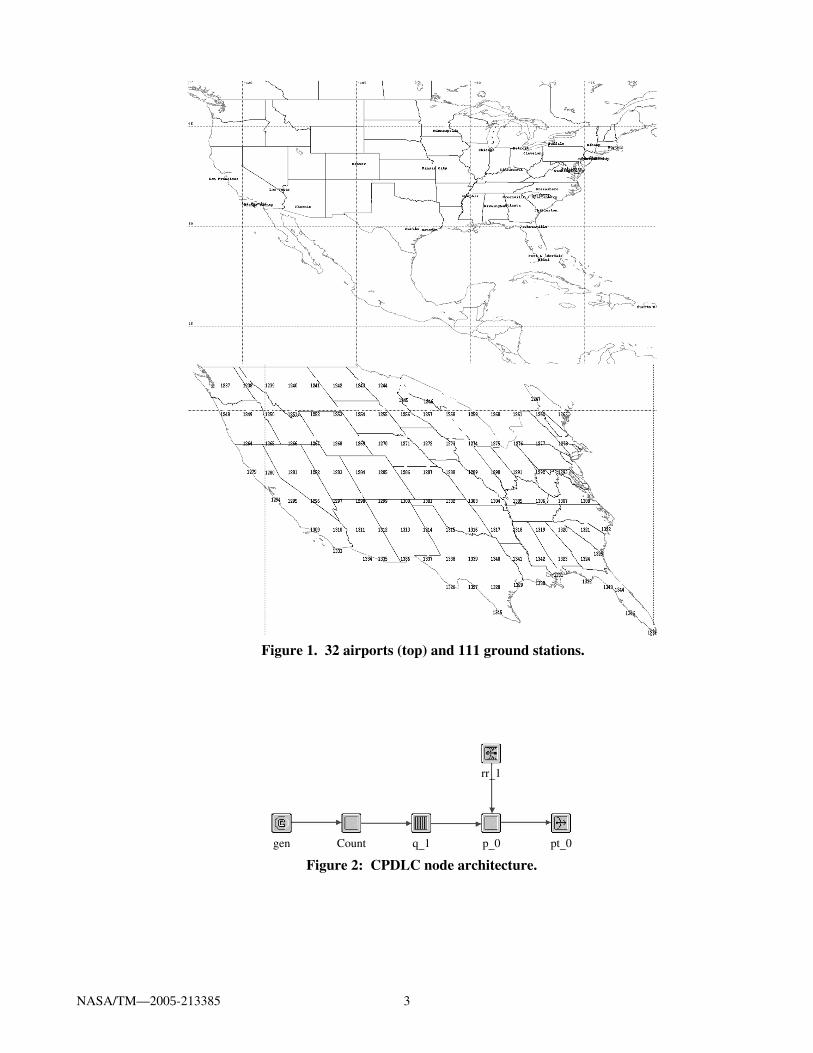
Figure 1. 32 airports (top) and 111 ground stations.
pt–0p–0q–1gen Count
rr–1
Figure 2: CPDLC node architecture.
NASA/TM—2005-213385 3

Airline officials provided us with typical flightaltitudes as a function of distance traveled forvarious ranges. A typical plot of a trajectory profileis shown in fig. 3.
Cruise altitudes used in the simulation dependon the range of the flight. The histogram, in fig. 4,of the number of planes in flight, as a function ofsimulation time in minutes is based on the actualdata from the airports and is not an output ofsimulation. This histogram can be used tounderstand traffic loading in the simulation. Airtraffic begins 1 hr 10 min into the simulation andcontinues throughout the 24 hr simulation. From theairport data, the average number of planes flying is90.8. The peak traffic is at (60 s/min) (910 min) =54,600 s or 3:10 p.m.
1000
30 000
35 000
25 000
20 000
15 000
10 000
5000
0200 300 400 500
Figure 3: Flight trajectory profile: Cleveland to Albany. Altitude (ft) vs. time (sec/10).
200
150
100
50
250 500 750 17501000 1250 150000
Figure 4: Number of planes aloft vs. time (min).
CSMA DiscussionA single communications frequency is used for
radio frequency conservation. Just as in CB radio,one party communicates at a time. Just as east coasttruckers may talk without interference from westcoast truckers, in these simulations, different line-of-sight groups can communicate on the samefrequency simultaneously without interference.
CSMA is contention-based. All parties listen tothe channel. When the channel is free, many partiescontend for it until after a random back-off time.Eventually, one party gains control of the channelfor uninterrupted usage. Because of the contentionprocess, collisions can be inefficient.
PCSMAIn PCSMA, each communications party is
assigned a priority for transmission, based on itsneed to transmit. In these simulations, transmissionpriority is granted on a first come, first served basis.If the medium is busy, each transmitter receives awaiting ticket. When its number comes up, thetransmitter takes its turn. When the channel is free,instead of a random back-off time elapsing beforeone node gains usage of the channel, in PCSMA,the node with the next higher priority beginsuninterrupted transmission immediately in anorderly fashion, without contention. In studyingPCSMA, we simultaneously accomplish twopurposes. We can test this new idea and also obtainthe upper bound for performance of VDL-2 with thegiven traffic of the simulation. Because of itsretransmissions and random back-off time, VDL-2should not perform as well as PCSMA.
DetailsIt is assumed that in a real implementation of
the idea of PCSMA, both planes and groundstations include a connection transmission(cnctrans) transmitter. Much like an AutomaticDependent Surveillance-Broadcast Mode (ADS-B)transmitter, this transmitter would broadcastcnctrans packets at regular intervals on a separatefrequency. The cnctrans packets are nearly lengthzero and contain the unique source identificationcode (srcid) of the transmitting node. They mayalso contain a time stamp and the transmission timeremaining for that node. When a node receives a
NASA/TM—2005-213385 4

cnctrans packet, it updates an array of cnctransinformation from its neighbors. If a cnctrans packethas not been received from a node in ∆t, it isassumed unreachable. When a node seizes thechannel, all nodes wait until it is finished. Eachnode waits until the farthest neighbor of the lasttransmitting node has received the transmission.When the transmission is finished, the next nodebegins orderly transmission. In these simulations,the cnctrans packets do not collide since they areof zero length.
Simulation Results and Analysis
ResultsThere were six simulation runs. I and IV,
6 min mean CPDLC interarrival time; II and V,3 min mean CPDLC interarrival time; and III andVI, 1.5 min mean CPDLC interarrival time.
Run AccessScheme
D (T, R)
I X 0.3182 (38412, 34012)
II X 0.3184 (77760, 61807)
III X 0.3188 (156512, 104252)
IV PCSMA 0.3582 (38529, 38529)
V PCSMA 0.4039 (77140, 77140)
VI PCSMA 0.5772 (154304, 154304)
where all transceivers are set at 31.5 Kbps [1],
X = No access scheme
D = Mean end-to-end (ETE) delay of CPDLCpackets
T = Number of CPDLC messages transmitted
R= Number of CPDLC messages received
Plots of CPDLC transmitted and receivedpackets for Runs I to VI are shown in figs. 5 to 10.Included in those figures are plots of ETE delaysfor each run.
Only the runs using PCSMA successfullytransmitted all CPDLC packets with zero packetloss. These results show that this implementation ofthe idea of prioritized, collision-less CSMA works.Moreover, a comparison between the performance
latencies in these simulations and the 95thpercentile ETE delay requirement of 3 sec [1]shows that PCSMA is remarkably quick andefficient.
0.0
0.1
0.2
0.3
0.40
10 000
20 000
30 000
40 0000
10 000
20 000
40 000
30 000
0 4 8 12h
Figure 5: CPDLC packet reception and delay, I.
16 20 24
CPDLC trans pkts
CPDLC received pkts
Traffic sink 1. CPDLC end-to-end delay (seconds)
0.0
0.1
0.2
0.3
0.40
10 000
20 000
30 000
40 0000
10 000
20 000
40 000
30 000
0 4 8 12h
Figure 6: CPDLC packet reception and delay, IV.
16 20 24
CPDLC trans pkts
CPDLC received pkts
Traffic sink 1. CPDLC end-to-end delay (seconds)
NASA/TM—2005-213385 5

0.0
0.1
0.2
0.3
0.40
20 000
40 000
60 000
80 0000
20 000
40 000
80 000
60 000
0 4 8 12h
Figure 7: CPDLC packet reception and delay, II.
16 20 24
CPDLC trans pkts
CPDLC received pkts
Traffic sink 1. CPDLC end-to-end delay (seconds)
0.0
0.1
0.2
0.3
0.40
50 000
100 000
150 0000
50 000
100 000
200 000
150 000
0 4 8 12h
Figure 8: CPDLC packet reception and delay, III.
16 20 24
CPDLC trans pkts
CPDLC received pkts
Traffic sink 1. CPDLC end-to-end delay (seconds)
0.0
0.1
0.2
0.3
0.4
0.50
20 000
40 000
60 000
80 000
0
20 000
40 000
80 000
60 000
0 4 8 12h
Figure 9: CPDLC packet reception and delay, V.
16 20 24
CPDLC trans pkts
CPDLC received pkts
Traffic sink 1. CPDLC end-to-end delay (seconds)
0.0
0.5
1.0
1.50
50 000
100 000
150 000
200 0000
50 000
100 000
200 000
150 000
0 4 8 12h
Figure 10: CPDLC packet reception and delay, VI.
16 20 24
CPDLC trans pkts
CPDLC received pkts
Traffic sink 1. CPDLC end-to-end delay (seconds)
NASA/TM—2005-213385 6

Retransmission AnalysisIn this section, we derive a relationship
bounding the performance of traditional VDL-2involving retransmissions with that of a freelytransmitting (FT) network (one in which no accessscheme is used). Let p be the probability of acollision occurring in the simulation. For example,in Run III, 156,512 messages were transmitted,while 104,252 were received. The probability ofcollision for the simulation is therefore1 – 104,252/156,512 = 33.4 percent. Let D’ and Dbe the average ETE delays encountered by amessage in a traditional VDL-2 network involvingretransmissions, and in an FT network, respectively.Let “RT” represent “retransmission,” and “RTDi,”“retransmission delay for exactly i collisions or,equivalently, retransmissions before successfultransmission.” Then
(1) D’ = (D + Ds ) (1 – p) + RTD1 p(#RT = 1) +RTD2 p(#RT = 2) + RTD3 p(#RT = 3) + …,
where
(2) p(#RT = 1) + p(#RT = 2) + p(#RT = 3) + …= p = p(#coll = 1) + p(#coll = 2) + p(#coll = 3)+ …
Ds is defined below.
We may verify (2) as follows:
Let Q = p (1- p) + p2 (1 – p) + p3 (1 – p) + … =(1 – p) (p + p2 + p3 + …) = (1 – p) s.s = p/(1 – p). So Q = p, as expected.
In terms of performance measurement, we willbe conservative for PCSMA and generous withrespect to VDL-2. That is to say, to account for thedelays of VDL-2, we will include only these delays:startup delay, processing delay, exponential back-off delay, and propagation delay. Much to the creditof PCSMA, there are other VDL-2 delays such asTM1, T1, and T2 [3], but since they complicate theperformance assessment calculation, they will notbe included. Here we will define and quantify thestartup delay, Ds. The startup delay exists in aVDL-2 network because of the p-persistent CSMAthat it uses. When a frame is created, it is
transmitted with probability p’ and deferred withprobability 1 – p’. To quantify the average delayexperienced by a frame before it is actuallytransmitted, we perform the following calculation:
Let T be the frame transmission time.
The expected time that the frame is deferred beforetransmission is:
Ds = T (1 – p’) + 2 T (1 – p’)2 + 3 T (1 – p’)3 +…. = T Sum[j (1 – p’)j ,{j,1,Infinity}]
Let p’’ = 1 – p’. Then
Ds = T p’’ + 2 T p’’2 + 3 T p’’3 + …
This is an arithmetic-geometric series, whichmay be summed by integrating with respect to p’’,summing, and then differentiating with respect top’’ (all summations herein are Mathematica-friendly and may be verified by cutting and pastingthem into Mathematica, using the carat (^) torepresent exponentiation instead of a superscript,and “unpriming” primed variables):
Ds = T p’’ Sum[i p’’i - 1 ,{i,1,Infinity}] =T p’’ d[p’’/(1 – p’’)]/dp’’ = T p’’/(1 – p’’)2 =T (1 – p’)/p’2.
According to [4] the frame transmission time Tis 5.5 ms. The final value of p’ is not yet firmlydecided. Directly based on [5] and discussions withengineers at ARINC, the manufacturers of VDL-2radios, we use p’ = 3 (13/256) = 39/256 = 0.152, avalue three times higher than that proposed in theSARPS for VDL-2. This value appears bestaccording to the broad consensus of currentresearch [5]. Consequently, Ds = 0.202 s.
Let “pd” represent the processing delayencountered by a message and d the propagationdelay experienced by that same message.
If the number of collisions, coll, is coll = 1, theexpected exponential backoff delay, BD, is2 T/2 = T.
If coll = 2, BD = 4 T/2 = 2 T. If coll = 3, BD = 8T/2 = 4 T.
NASA/TM—2005-213385 7

RTD1 = Ds + pd + d + pd + d + T +Ds + pd + d + pd
RTD2 = Ds + pd + d + pd + d + T +Ds + pd + d + pd + d + 2 TDs + pd + d + pd
RTDi = i (Ds + pd + d + pd + d ) + Ds
+ pd + d + pd + T Sum[2j - 1,{j,1,i)}]
D’ = (D + Ds) (1 – p) + Sum[RTDi pi (1 – p),{i,1,Infinity}].D = 2 pd + d.
RTDi > i (D + Ds) + D + Ds + T Sum[2j – 1,{j,1,i)}] =i (D + Ds) + D + Ds + (2i – 1) T
D’ > = (D + Ds) (1 – p) + Sum[( (i + 1) (D + Ds) pi
(1 – p),{i,1,Infinity}] +Sum[(2i – 1) T pi (1 – p), {i,1,Infinity}] =
(D + Ds) (1 – p) [1 + Sum[(i + 1) pi,{i,1,Infinity}] +(1 – p) T Sum[ (2i – 1) pi , {i,1,Infinity}] =
(D + Ds) (1 – p) (1 + s’) + (1 – p) T [2 p/(1 – 2 p) –p/(1 – p)] =(D + Ds) (1 – p) (1 + s’) + T [p/(1 – 2 p)]
This sum s’ is also an arithmetic-geometricseries and may be handled as before:
s’ = d[Sum[pi,{i,1,Infinity}] ]/dp = d[p/(1 – p) –p]/dp = 1/(1 – p)2 – 1.
(3) D’ > (D + Ds) (1 – p)/(1 – p)2 + T [p/(1 – 2 p)] =(D + Ds)/(1 – p) + T [p/(1 – 2 p)],
the final term due to exponential back-off is sosmall as to be negligible.
Since we used the expected binary exponentialback-off and expected startup delays, while (3) maybe true more than on average, we are only permittedto say that (3) is obeyed on average. The questionhas been raised as to whether the increase inperformance of PCSMA over VDL-2 is due to anunfair comparison between a PCSMA network
utilizing two channels versus a VDL-2 networkusing just one. With the foregoing analysis, it ispossible to determine whether there is still aperformance gain if we assume the PCSMAnetwork utilizing two channels (data + cnctrans)competes with a VDL-2 network using just twoVDL-2 data channels as well. In that case, ourinequality (3) still applies, but with a smaller valueof p. Since the simulations were performed so thatthe mean traffic doubles, the value of p for a priorsimulation will apply for the next simulation withdouble the mean traffic. Unfortunately, we mayonly compare performance for the last two sets ofsimulations.
Retransmission Analysis Conclusions• Retransmission analysis reveals that if D
is the mean ETE delay for a FT network,then D’ > (D + Ds)/(1 – p) is the meanETE delay for a CSMA (VDL-2)network, where “p” is the overallprobability of a collision.
• “p” for simulations (I – III) is 11.4,20.5, and 33.4 percent, which in thelast two sets yields respective delayimprovements over a comparableVDL-2 simulation of at least 31.2 and11.9 percent. While this improvementmay seem modest, it is important toremember that the calculation ofPCSMA’s performance is conservativewhile that of VDL-2’s is generous. Basedon other’s research, the author estimatesthat given the traffic load of thissimulation, CPDLC latencies usingVDL-2 in this simulation would bebetween 2.5 and 3 seconds. In this paper,we were just trying to show that PCSMAdoes perform better in terms of latency.
Although it may seem counterintuitive thata single PCSMA data channel can outperformtwo VDL-2 data channels, it is not surprising giventhat the efficiency of a single CSMA link is onlyabout 33%, while the PCSMA data channel ishighly efficient. The usage of two or moreVDL-2 channels will increase as VDL-2 is furtherdeployed. PCSMA will perform even better whenthree or more PCSMA data channels share thesingle lowly-utilized cnctrans channel.
NASA/TM—2005-213385 8

ConclusionsOne thing is obvious from a comparison of
Runs I through III with IV through VI: PCSMAworks. PCSMA would serve the same purpose foraeronautical communications traffic as the trafficlight does for automobile traffic—to preventcollisions. In the event that it is critical to receivemessages without many retransmissions or withminimum latency, PCSMA may be very useful.Acknowledgments and retransmissions increase theamount of traffic, increasing the number ofcollisions and worsening communicationsthroughput.
Currently there is an average of 12,000 flightsper day in the NAS. Forecasts suggest that airtraffic will triple over the next 20 years. Simulationstudies have been performed that show that there isan upper limit to the number of aircraft that may besupported using VDL-2, i.e., traditional CSMA [4].The limitation exists because of the inherentinefficiencies present in contentious, disorderlyCSMA. Plans are underway to replace VDL-2(which has barely been deployed) as the nationalaviation data link scheme with VDL-3, referred toas NEXCOM, based on time division multipleaccess (TDMA). This transition may be mostexpensive and somewhat sudden. However, smalladd-on modules could be manufactured to matewith existing VDL-2 radios to implement PCSMA,thereby extending the lifetime of VDL-2. Moreover,engineers now have great experience in buildingCSMA-based aeronautical subsystems.
An operational requirement for VDL-2 is that95% of the CPDLC messages must be receivedwithin 3 seconds after they are generated. If thisrequirement is unmet, this failure represents abreakdown in VDL-2. Since PCSMA may be usedto determine breakdown traffic conditions for large-scale simulations, it appears as though thissimulation method could be used to obtain an upperlimit for the performance of CSMA or asjustification for further research into the use ofPCSMA. The number of frequencies needed tosupport VDL-2 or VDL-3 traffic within ageographic region is dependent upon a number offactors including the amount of communicationstraffic and the desired one-way transit time [6]. Forexample, it is generally acknowledged that not justone, but several frequencies (channels) (perhaps as
many as 7, as are being used to support the fewexisting newly VDL-2 equipped planes in Floridatoday) must be allocated for a practical, nationwideimplementation of VDL-2. Currently, no researchhas been performed to determine the frequencyallocation adequacy for VDL-2 for supporting theNAS (1 x NAS) or twice the data/air-traffic volumeof the NAS (2 x NAS) or 3 x NAS. The simulationsthat have been conducted herein are significantbecause in them the communications of 10% of theair traffic in the NAS was supported using just twofrequencies! Also, this paper should establish thatwe can obtain bounds for the average delays foraggregate traffic in 1, 2 or 3 x NAS. The results ofthese OPNET simulations may be compared to theoutput of Task Order 14 of NASA Contract No.NAS3–99165, the Future Aeronautical SubnetworkTraffic Emulator for Communications, Navigation,Surveillance (FASTE-CNS), which calculates theVDL-2 and VDL-3 frequency requirements neededto support the geographical regions defined in aspecified air traffic density profile that can includethe entire NAS [6].
A large network has been constructed for thissimulation. It may also be used for a simulation ofVDL-3, which may be compared to these baselinesimulations of PCSMA. Moreover, once we have alarge-scale network including nearly 12,000 flightsper day, we can see the improvement made as aresult of augmenting the air traffic managementusing satellite communications. With the newacquisition of much greater computing power forsimulation, plans are underway to expand thenumber of daily flights to between 5,000 and10,000, and to use more precise message sizes andfrequencies. We intend using versions of thisnetwork as a foundation for simulations involvingground station gap analysis and resolution throughsatellite communications. Such large-scale,aggregate-realistic networks would never bepossible if we were to model every detail of theprotocol stack. Indeed, most OPNET ATNsimulations model only a small number of aircraft.If they do model more aircraft, often they arestationary, depicting a snapshot in time. Moreover,each aircraft in our simulations has an activetransmitter and receiver, adding to realism. Underthe VAMS program, agency-wide plans areunderway at NASA to create a realistic, detailed,runway-to-runway simulation of an entire day in the
NASA/TM—2005-213385 9

NAS, with aircraft flying realistic trajectories andbeing represented as software agents. Thesimulations are intended to facilitate design andtradeoff studies of system level concepts withinthe NAS [7]. This High Level Architecture(HLA)-based national simulation will not be in theOPNET environment. However, it appears asthough using the approach of this paper, we will beable to collect aggregate results in OPNET to whichthe results of the new national simulation may becompared. It appears that only by adopting themethodology shown in this paper will we ever beable to acquire meaningful aggregate results in alarge-scale OPNET simulation that runs in a weekor less on a reasonably powerful computer.
It is admitted that communication on thecnctrans reservation channel was not sufficientlymodeled. In the simulations it is assumed that thecnctrans packets have size zero. In reality, theyhave payload on the order of one byte, which isvery small compared to the traffic on the datachannel. Moreover, no access scheme had beenspecified for communication on the reservationchannel since the probability of collision there waszero. Actually, the author believes that ordinaryCSMA would be a good access scheme for thereservation channel due to its low traffic volumeand probability of collision. Hence, the name“Prioritized CSMA” may be retained.
The simulation of communication was effectedwithout the complexity involved in the aeronauticaltelecommunications network. It is desirable toidentify communications systems that work and canbe proven through simulation. Presently, there islittle simulation research supporting nationwideusage of the VDL modes. In this research,continuous communication was achieved in arealistic nationwide aviation scenario. It is difficultto even begin to convincingly do this forcommunications based on the ATN stack. Theresults from PCSMA simulations were related to
those of corresponding would-be VDL-2simulations through modeling relations because theauthor believes that to implement accurate,corresponding VDL-2 simulations would involveundue effort resulting in unbearably long simulationrun times. An important result of this research is notjust the aggregate outputs gathered, but the merefact that this new data link architecture appears towork in a fairly realistic and robust simulatedenvironment. Actually, simulating a design beforedeploying it is really what should have been done inthe NAS rather than simply choosing anarchitecture without testing it on future as well ascurrent load, manufacturing it, deploying it, andthen simulating it after committing to it. Thisresearch is justified because there is no similarresearch involving the simulation in a nationwidescenario of a new, or, for that matter, of anyaviation data link.
References[1] Daryl C. Robinson, “CSMA versus PrioritizedCSMA for Air Traffic Control Improvement,” IEEEAerospace Conference, January 2002.
[2] Final Report of RTCA Task Force 3 on FreeFlight Implementation, October 26, 1995.
[3] ICAO VDL-2 Standards and RecommendedPractices [SARPS].
[4] Brian T. Hung, “Modeling and Simulation of anAeronautical CSMA Subnetwork,” OPNETWORK2001, August 2001.
[5] Bob Eberlein and Mike Shorthose, “EuropeanATN Simulation VDL Mode 2 Simulation Report,”EUROCONTROL, April 2000.
[6] Computer Networks & Software, Inc., SystemSpecification to NASA Glenn Research Center forthe FASTE-CNS, May 2002.
[7] VAMS Project Plan v8.0, 11/20/2001.
NASA/TM—2005-213385 10

This publication is available from the NASA Center for AeroSpace Information, 301–621–0390.
REPORT DOCUMENTATION PAGE
2. REPORT DATE
19. SECURITY CLASSIFICATION OF ABSTRACT
18. SECURITY CLASSIFICATION OF THIS PAGE
Public reporting burden for this collection of information is estimated to average 1 hour per response, including the time for reviewing instructions, searching existing data sources,gathering and maintaining the data needed, and completing and reviewing the collection of information. Send comments regarding this burden estimate or any other aspect of thiscollection of information, including suggestions for reducing this burden, to Washington Headquarters Services, Directorate for Information Operations and Reports, 1215 JeffersonDavis Highway, Suite 1204, Arlington, VA 22202-4302, and to the Office of Management and Budget, Paperwork Reduction Project (0704-0188), Washington, DC 20503.
NSN 7540-01-280-5500 Standard Form 298 (Rev. 2-89)Prescribed by ANSI Std. Z39-18298-102
Form ApprovedOMB No. 0704-0188
12b. DISTRIBUTION CODE
8. PERFORMING ORGANIZATION REPORT NUMBER
5. FUNDING NUMBERS
3. REPORT TYPE AND DATES COVERED
4. TITLE AND SUBTITLE
6. AUTHOR(S)
7. PERFORMING ORGANIZATION NAME(S) AND ADDRESS(ES)
11. SUPPLEMENTARY NOTES
12a. DISTRIBUTION/AVAILABILITY STATEMENT
13. ABSTRACT (Maximum 200 words)
14. SUBJECT TERMS
17. SECURITY CLASSIFICATION OF REPORT
16. PRICE CODE
15. NUMBER OF PAGES
20. LIMITATION OF ABSTRACT
Unclassified Unclassified
Technical Memorandum
Unclassified
National Aeronautics and Space AdministrationJohn H. Glenn Research Center at Lewis FieldCleveland, Ohio 44135–3191
1. AGENCY USE ONLY (Leave blank)
10. SPONSORING/MONITORING AGENCY REPORT NUMBER
9. SPONSORING/MONITORING AGENCY NAME(S) AND ADDRESS(ES)
National Aeronautics and Space AdministrationWashington, DC 20546–0001
Available electronically at http://gltrs.grc.nasa.gov
February 2005
NASA TM—2005-213385
E–14893
WBS–22–727–01–06
16
Dual Purpose Simulation: New Data Link Test and Comparison With VDL-2
Daryl C. Robinson
Aeronautical simulation; Datalink; NAS; VDL–2; PCSMA; CPDLC; CSMA; TDMA
Unclassified -UnlimitedSubject Categories: 04 and 32 Distribution: Nonstandard
Prepared for the 21st Digital Avionics Systems Conference (DASC 2002) cosponsored by the American Instituteof Aeronautics and Astronautics and the Institute of Electrical and Electronics Engineers, Irvine, California,October 27, 2002. Responsible person, Daryl C. Robinson, organization code 5610, 216–433–3553.
While the results of this paper are similar to those of previous research, in this paper technical difficulties present there are elimi-nated, producing better results, enabling one to more readily see the benefits of Prioritized CSMA (PCSMA). A new analysissection also helps to generalize this research so that it is not limited to exploration of the new concept of PCSMA. Commerciallyavailable network simulation software, OPNET version 7.0, simulations are presented involving an important application of theAeronautical Telecommunications Network (ATN), Controller Pilot Data Link Communications (CPDLC) over the Very HighFrequency Data Link Mode 2 (VDL-2). Communication is modeled for essentially all incoming and outgoing nonstop air traffic forjust three United States cities: Cleveland, Cincinnati, and Detroit. The simulation involves 111 Air Traffic Control (ATC) groundstations, 32 airports distributed throughout the U.S., which are either sources or destinations for the air traffic landing or departingfrom the three cities, and also 1,235 equally equipped aircraft—taking off, flying realistic free-flight trajectories, and landing in a24-hr period. Collision-less PCSMA is successfully tested and compared with the traditional CSMA typically associated with VDL-2. The performance measures include latency, throughput, and packet loss. As expected, PCSMA is much quicker and more efficientthan traditional CSMA. These simulation results show the potency of PCSMA for implementing low latency, high throughput andefficient connectivity. Moreover, since PCSMA outperforms traditional CSMA, by simulating with it, we can determine the limits ofperformance beyond which traditional CSMA may not pass. We are testing a new and better data link that could replace CSMAwith relative ease. Work is underway to drastically expand the number of flights to make the simulation more representative of theNational Aerospace System.