Neuronal Synchronization along the Dorsal Visual Pathway Reflects the Focus of Spatial Attention
11
Neuron Article Neuronal Synchronization along the Dorsal Visual Pathway Reflects the Focus of Spatial Attention Markus Siegel, 1,2,3, * Tobias H. Donner, 1,2,4 Robert Oostenveld, 2 Pascal Fries, 2 and Andreas K. Engel 1 1 Department of Neurophysiology and Pathophysiology, Center of Experimental Medicine, University Medical Center Hamburg-Eppendorf, University of Hamburg, Martinistrasse 52, 20246 Hamburg, Germany 2 Donders Institute for Brain, Cognition and Behaviour, Radboud University Nijmegen, 6525 EN Nijmegen, The Netherlands 3 The Picower Institute for Learning and Memory, Department of Brain and Cognitive Sciences, Massachusetts Institute of Technology, Cambridge, MA 02139, USA 4 Department of Psychology and Center for Neural Science, New York University, New York, NY 10003, USA *Correspondence: [email protected] DOI 10.1016/j.neuron.2008.09.010 SUMMARY Oscillatory neuronal synchronization, within and between cortical areas, may mediate the selection of attended visual stimuli. However, it remains unclear at and between which processing stages visuospatial attention modulates oscillatory syn- chronization in the human brain. We thus combined magnetoencephalography (MEG) in a spatially cued motion discrimination task with source-reconstruc- tion techniques and characterized attentional effects on neuronal synchronization across key stages of the human dorsal visual pathway. We found that visuospatial attention modulated oscillatory syn- chronization between visual, parietal, and prefrontal cortex in a spatially selective fashion. Furthermore, synchronized activity within these stages was selec- tively modulated by attention, but with markedly distinct spectral signatures and stimulus depen- dence between regions. Our data indicate that regionally specific oscillatory synchronization at most stages of the human dorsal visual pathway may enhance the processing of attended visual stim- uli and suggest that attentional selection is mediated by frequency-specific synchronization between prefrontal, parietal, and early visual cortex. INTRODUCTION When confronted with cluttered visual scenes, visuospatial attention adaptively devotes the brain’s processing capacity to the information relevant for the task at hand. It has been sug- gested that oscillatory synchronization of neuronal activity within and between cortical areas acts as a flexible mechanism of attentional selection by regulating the gain of information trans- mission between neuronal populations (Engel et al., 2001; Fries, 2005; Salinas and Sejnowski, 2001). Recent studies in monkeys and humans have provided principle support of this hypothesis (Bichot et al., 2005; Buschman and Miller, 2007; Doesburg et al., 2008; Fan et al., 2007; Fries et al., 2001; Gruber et al., 1999; Ha ¨ ndel et al., 2008; Saalmann et al., 2007; Taylor et al., 2005; Thut et al., 2006; Worden et al., 2000; Wyart and Tallon-Baudry, 2008). However, evidence as to the extent to which visuospatial attention modulates oscillatory synchronization in the primate brain remains sparse. Specifically, it remains unclear within and between which processing stages visuospatial attention modulates oscillatory synchronization. On the one hand, invasive studies in monkeys typically sample activity only from small neuronal populations and thus far have demonstrated spatially selective attentional effects on synchro- nization only in areas V4 and LIP (Bichot et al., 2005; Fries et al., 2001; Saalmann et al., 2007; Taylor et al., 2005). On the other hand, human electroencephalography (EEG) and magnetoence- phalography (MEG) studies showing spatially selective atten- tional effects on oscillatory activity have been restricted to the sensor level (Doesburg et al., 2008; Gruber et al., 1999; Thut et al., 2006; Worden et al., 2000; Wyart and Tallon-Baudry, 2008) and thus have provided only limited information about the corti- cal regions involved. As a consequence, it remains unclear whether visuospatial attention modulates oscillatory synchroni- zation in early visual areas suggested to express the effect of top-down signals on sensory processing (Hopfinger et al., 2000; Kastner et al., 1999; Ress et al., 2000), as well as in regions commonly implicated in the control of attention such as parietal cortex and the frontal eye fields (FEF) (Corbetta and Shulman, 2002; Donner et al., 2000; Kastner and Ungerleider, 2000; Moore et al., 2003; Serences and Yantis, 2006). In particular, it is un- known whether selective attention has regionally specific effects on oscillatory synchronization within these areas, which might help to strengthen the case for their functional specialization in mediating attentional selection. Furthermore, it is currently not known whether and how selective attention modulates the rhyth- mic synchronization between frontal, parietal, and early visual regions in the human brain. To address these questions, we combined MEG with novel source-reconstruction techniques. This allowed us to simulta- neously investigate oscillatory activity within, and synchroniza- tion between, several well-defined cortical regions across the entire human brain. Subjects performed a spatially cued motion discrimination task (Figure 1). Correspondingly, we focused on five key regions involved in visual motion processing and spatial attention: pericalcarine cortex (V1/V2), human motion complex (MT+), ventral and posterior intraparietal sulcus (vIPS and Neuron 60, 709–719, November 26, 2008 ª2008 Elsevier Inc. 709
-
Upload
independent -
Category
Documents
-
view
2 -
download
0
Transcript of Neuronal Synchronization along the Dorsal Visual Pathway Reflects the Focus of Spatial Attention

Neuron
Article
Neuronal Synchronization along the Dorsal VisualPathway Reflects the Focus of Spatial AttentionMarkus Siegel,1,2,3,* Tobias H. Donner,1,2,4 Robert Oostenveld,2 Pascal Fries,2 and Andreas K. Engel11Department of Neurophysiology and Pathophysiology, Center of Experimental Medicine, University Medical Center Hamburg-Eppendorf,
University of Hamburg, Martinistrasse 52, 20246 Hamburg, Germany2Donders Institute for Brain, Cognition and Behaviour, Radboud University Nijmegen, 6525 EN Nijmegen, The Netherlands3The Picower Institute for Learning and Memory, Department of Brain and Cognitive Sciences, Massachusetts Institute of Technology,
Cambridge, MA 02139, USA4Department of Psychology and Center for Neural Science, New York University, New York, NY 10003, USA
*Correspondence: [email protected] 10.1016/j.neuron.2008.09.010
SUMMARY
Oscillatory neuronal synchronization, within andbetween cortical areas, may mediate the selectionof attended visual stimuli. However, it remainsunclear at and between which processing stagesvisuospatial attention modulates oscillatory syn-chronization in the human brain. We thus combinedmagnetoencephalography (MEG) in a spatially cuedmotion discrimination task with source-reconstruc-tion techniques and characterized attentional effectson neuronal synchronization across key stages ofthe human dorsal visual pathway. We found thatvisuospatial attention modulated oscillatory syn-chronization between visual, parietal, and prefrontalcortex in a spatially selective fashion. Furthermore,synchronized activity within these stages was selec-tively modulated by attention, but with markedlydistinct spectral signatures and stimulus depen-dence between regions. Our data indicate thatregionally specific oscillatory synchronization atmost stages of the human dorsal visual pathwaymay enhance the processing of attended visual stim-uli and suggest that attentional selection is mediatedby frequency-specific synchronization betweenprefrontal, parietal, and early visual cortex.
INTRODUCTION
When confronted with cluttered visual scenes, visuospatial
attention adaptively devotes the brain’s processing capacity to
the information relevant for the task at hand. It has been sug-
gested that oscillatory synchronization of neuronal activity within
and between cortical areas acts as a flexible mechanism of
attentional selection by regulating the gain of information trans-
mission between neuronal populations (Engel et al., 2001; Fries,
2005; Salinas and Sejnowski, 2001). Recent studies in monkeys
and humans have provided principle support of this hypothesis
(Bichot et al., 2005; Buschman and Miller, 2007; Doesburg et al.,
2008; Fan et al., 2007; Fries et al., 2001; Gruber et al., 1999;
Handel et al., 2008; Saalmann et al., 2007; Taylor et al., 2005;
Thut et al., 2006; Worden et al., 2000; Wyart and Tallon-Baudry,
2008). However, evidence as to the extent to which visuospatial
attention modulates oscillatory synchronization in the primate
brain remains sparse. Specifically, it remains unclear within
and between which processing stages visuospatial attention
modulates oscillatory synchronization.
On the one hand, invasive studies in monkeys typically sample
activity only from small neuronal populations and thus far have
demonstrated spatially selective attentional effects on synchro-
nization only in areas V4 and LIP (Bichot et al., 2005; Fries et al.,
2001; Saalmann et al., 2007; Taylor et al., 2005). On the other
hand, human electroencephalography (EEG) and magnetoence-
phalography (MEG) studies showing spatially selective atten-
tional effects on oscillatory activity have been restricted to the
sensor level (Doesburg et al., 2008; Gruber et al., 1999; Thut
et al., 2006; Worden et al., 2000; Wyart and Tallon-Baudry, 2008)
and thus have provided only limited information about the corti-
cal regions involved. As a consequence, it remains unclear
whether visuospatial attention modulates oscillatory synchroni-
zation in early visual areas suggested to express the effect of
top-down signals on sensory processing (Hopfinger et al., 2000;
Kastner et al., 1999; Ress et al., 2000), as well as in regions
commonly implicated in the control of attention such as parietal
cortex and the frontal eye fields (FEF) (Corbetta and Shulman,
2002; Donner et al., 2000; Kastner and Ungerleider, 2000; Moore
et al., 2003; Serences and Yantis, 2006). In particular, it is un-
known whether selective attention has regionally specific effects
on oscillatory synchronization within these areas, which might
help to strengthen the case for their functional specialization in
mediating attentional selection. Furthermore, it is currently not
known whether and how selective attention modulates the rhyth-
mic synchronization between frontal, parietal, and early visual
regions in the human brain.
To address these questions, we combined MEG with novel
source-reconstruction techniques. This allowed us to simulta-
neously investigate oscillatory activity within, and synchroniza-
tion between, several well-defined cortical regions across the
entire human brain. Subjects performed a spatially cued motion
discrimination task (Figure 1). Correspondingly, we focused on
five key regions involved in visual motion processing and spatial
attention: pericalcarine cortex (V1/V2), human motion complex
(MT+), ventral and posterior intraparietal sulcus (vIPS and
Neuron 60, 709–719, November 26, 2008 ª2008 Elsevier Inc. 709

Neuron
Neural Synchrony and Visual Spatial Attention
pIPS), and FEF. In all of these regions, attention modulated local
oscillatory activity in a spatially selective fashion, but attentional
modulations exhibited a remarkably different spectral signature
and stimulus dependence between cortical areas. Importantly,
the spatial selectivity of attentional modulations allowed for
unequivocal dissociation of neural correlates of visuospatial
attention from nonspecific processes such as arousal or task
preparation. Furthermore, we found that spatial attention also
selectively modulated the oscillatory synchronization between
MT+, posterior IPS, and FEF in a relatively stimulus-independent
fashion.
Our data suggest that oscillatory synchronization serves as
a mechanism of visuospatial attention along the entire human
dorsal visual pathway, including early visual processing stages
as well as frontoparietal regions implicated in the control of at-
tention. Our data indicate that the spectral profile of correspond-
ing attentional modulations is not homogenous but varies
substantially between regions. Furthermore, our data provide
strong evidence that the enhanced routing of attended visual
information across processing stages is mediated by fre-
quency-specific synchronization between these regions.
RESULTS
We recorded whole-head MEG while subjects (n = 8) performed
a spatially cued motion discrimination task (Figure 1). Subjects
ignored a stimulus in the uncued hemifield while discriminating
the motion direction of a random dot pattern in the cued hemi-
field. The motion coherence of stimuli was adjusted to the
subjects’ individual discrimination threshold. Performance was
on average 78% correct (SD 3%) at 18% motion coherence
(SD 5%) with a median response latency of 1.1 s (SD 0.2 s).
We characterized frequency-specific activity at the sensor
level by pooling responses within anterior, lateral, and posterior
Figure 1. Spatially Cued Motion Discrimination Task
(A) Schematic illustration of the stimulus display.
(B) Time course of the fixation cross, cue, and stimulus presentation through-
out one trial. Trials started with onset of a central fixation cross. After a variable
delay (1–1.5 s), a small dot presented for 100 ms directly to the left or right of
the fixation cross cued subjects to covertly shift attention to the left or right
visual field. After another random delay (1–1.5 s), two dynamic random dot
stimuli were displayed in circular apertures in the left and right visual hemifield.
Subjects reported the perceived motion direction of the cued stimulus by
pressing one of two response keys, while ignoring the stimulus in the
other hemifield. Stimulation was terminated with the subject’s response, or if
no response was given within a 3 s time period.
710 Neuron 60, 709–719, November 26, 2008 ª2008 Elsevier Inc.
sensors (Figure 2). We observed a brief low (10–20 Hz) and high
(70–140 Hz) frequency response to cue presentation followed by
a tonic and widespread suppression from about 10 to 50 Hz.
Onset of the dynamic random dot stimuli was followed by a
transient and then tonic high-frequency response (50–100 Hz)
primarily localized at posterior sensors. This high-frequency
response was complemented by a strong and widespread de-
crease of activity below 50 Hz. This characteristic antagonistic
spectral profile of responses to visual stimuli closely resembles
previous MEG data employing dynamic random dot stimuli
presented in the center of the visual field (Donner et al., 2007;
Siegel et al., 2007).
Cortical Pattern of Attentional Modulation of RhythmicNeuronal ActivityBefore and during stimulus presentation, attention modulated
population activity along the entire dorsal visual pathway in a
spatially selective fashion (Figure 3). We estimated neural activity
at the cortical source level using a linear spatial filtering tech-
nique (‘‘beamforming’’; see Experimental Procedures). We sep-
arately investigated the stimulation-free delay interval (750–0 ms
before stimulus onset), the stimulus interval (100–500 ms after
stimulus onset), and four contiguous frequency ranges roughly
Figure 2. Rhythmic Neuronal Activity Induced by Visual Stimulation
and Spatial Attention
Time-frequency representation of the response in magnetoencephalography
(MEG) amplitude averaged across three groups of anterior (A), lateral (B),
and posterior (C) sensors. These sensors are marked in black dots in the
topographies on the right. Responses are characterized as the percentage
change in signal amplitude relative to the blank precue baseline (500 ms before
cue onset). Solid white lines mark the time of cue and stimulus onset; the time
of response onset is marked by the black triangle. Because of the variable
delays between cue onset, stimulus onset, and response, the data were
realigned to these points in time. Note that the time axis is displayed relative
to these three events. The dotted white lines mark the temporal boundaries
of the realigned data.

Neuron
Neural Synchrony and Visual Spatial Attention
corresponding to classical EEG bands: 5–15 Hz (‘‘alpha’’),
15–35 Hz (‘‘beta’’), 35–60 Hz (‘‘low gamma’’), and 60–100 Hz
(‘‘high gamma’’). To isolate spatially selective attention from
unspecific effects (such as arousal), we contrasted activity
between ‘‘attend left’’ and ‘‘attend right’’ trials.
In accordance with previous reports (Thut et al., 2006; Worden
et al., 2000; Wyart and Tallon-Baudry, 2008), attention induced
a relative suppression of alpha band activity in the hemisphere
representing the attended hemifield before stimulus onset.
However, in contrast to these reports, we also found widespread
attentional baseline suppressions in the beta band and, more
surprisingly, in the low (right hemisphere) and high (bilateral)
gamma band, specifically around the calcarine. By contrast, in
the stimulus interval, we observed an attentional enhancement
of low gamma band activity in extrastriate areas, which accords
with previous sensor-level data (Gruber et al., 1999; Wyart and
Tallon-Baudry, 2008). However, unlike these reports, during
stimulation we observed further attentional modulations in the
alpha, beta, and high gamma bands.
These effects were not attributable to phase-locked event-
related fields (ERFs), which are also modulated by visuospatial
attention (Hillyard and Anllo-Vento, 1998). We repeated the
Figure 3. Cortical Pattern of Spatially Selective
Attentional Modulations
The images display the difference in neural activity during the
delay (A) and stimulus (B) interval between trials when atten-
tion was directed to the left or right visual hemifield. Effects
are separately shown for four different frequency bands
(rows) and are displayed on the reconstructed and inflated
cortical surface of the Montreal Neurological Institute template
brain. Hemispheres are viewed from the posterior and are
rotated slightly to enhance readability. Dark and light gray
shadings indicate sulci and gyri, respectively. The locations
of the central sulcus (CS) and intraparietal sulcus (IPS) are
marked for orientation. All functional maps display pooled z
scores thresholded at p < 0.05 (corrected; random effects).
above analyses after subtracting the average signal
components phase locked to cue or stimulus on-
set, thus removing any ERFs. This analysis yielded
results nearly identical to the data described above
(see Figure S1 available online). These attentional
modulations thus reflect rhythmic neuronal activity
not phase locked to external events.
Dissociation between AttentionalModulations across the Dorsal VisualPathwayBoth the spectral signature and stimulus depen-
dence of attentional modulations differed markedly
between subsequent processing stages of the dor-
sal visual pathway. We compared spatially selec-
tive attentional effects between five key stages:
V1/V2, MT+, vIPS, pIPS, and FEF. For each region
of interest (ROI), we computed a predictive index of
the focus of attention using receiver operating
characteristic (ROC) analysis (Figure 4) (Green
and Swets, 1966). Ranging between 0 and 1, this index can be
interpreted as the probability of an ideal observer to predict
the subject’s focus of attention from the hemispheric
lateralization of activity on a single trial. Values larger or smaller
than 0.5 (chance level) correspond to an attentional enhance-
ment or suppression, respectively.
We observed the strongest spectral dissociation in the
beta band during stimulation (Figure 4B): while such activity
was enhanced in V1/V2, it was suppressed in the FEF (direct
comparison between regions: p < 0.01; corrected). We
observed further strong regional differences: during the delay
interval (Figure 4A), attention suppressed beta band activity
in the IPS but not in V1/V2 (direct comparison: p < 0.01;
corrected). By contrast, high gamma band activity was sup-
pressed in V1/V2, but not in pIPS and FEF (direct compari-
sons: p < 0.01; corrected). During stimulus presentation
(Figure 4B), we found an enhancement of beta band activity
specifically in V1/V2, while vIPS and pIPS showed predomi-
nantly an increase of gamma band activity (direct compari-
sons: p < 0.01; corrected). Furthermore, alpha band activity
was suppressed in pIPS, but not in FEF and V1/V2 (direct
comparisons: p < 0.01; corrected).
Neuron
60, 709–719, November 26, 2008 ª2008 Elsevier Inc. 711
Neuron
Neural Synchrony and Visual Spatial Attention
The comparison of attentional effects between the delay and
stimulus intervals revealed a remarkable difference in the stimu-
lus dependence of these effects between posterior and frontal
regions. V1/V2, MT+, vIPS, and pIPS showed a strong stimulus
dependence with even opposite significant attentional modula-
tions before and during stimulation (direct comparisons between
intervals: p < 0.01 for all of these regions and bands; corrected).
By contrast, in the FEF we found no stimulus dependence with
the same attentional beta band suppression in both intervals
(direct comparisons: p > 0.1 for all bands). A direct comparison
revealed significantly lower stimulus dependence in FEF than
in the four posterior regions (p < 0.001; corrected). Thus, atten-
tional modulation was strongly stimulus dependent in V1/V2,
MT+, and the IPS, as predicted for brain areas expressing the
effect of attention. By contrast, attentional modulation was
stimulus independent in the FEF, as predicted for a region con-
trolling the deployment of attention.
Consistency across Individual SubjectsThese effects were remarkably consistent across individuals. We
repeated the above ROC analysis for the two strongest atten-
tional modulations in the high- and low-frequency range during
the delay (alpha band: pIPS; gamma band: V1/V2) and stimulus
(beta band: V1/V2; gamma band: pIPS) interval as well as the
stimulus-independent beta band effect in FEF (Figure 5). All of
these effects were consistently observed in individual subjects,
with many effects being statistically significant even on the
single-subject level.
We also consistently observed the dissociation of the spectral
pattern and stimulus dependence of attentional modulations in
individual subjects. For the spectral dissociation, 86% of the
Figure 4. Strength of Attentional Modulations
Attentional modulations are displayed separately for the delay (A) and stimulus
(B) interval. Each row corresponds to one region of interest (ROI), the location
of which is marked on the inflated right hemisphere displayed in the left column
(FEF, frontal eye field; pIPS, posterior intraparietal sulcus; vIPS, ventral
intraparietal sulcus; MT+, human motion complex; V1/V2, pericalcarine cor-
tex). For each ROI, frequency band, and temporal interval, the predictive index
displays the probability with which an ideal observer can predict the direction
of attention from the lateralization of the respective response between the left
and right hemispheres. Predictive indices larger or smaller than chance level
(0.5) correspond to an attentional enhancement or suppression of activity,
respectively, in the hemisphere contralateral to the attended hemifield.
Asterisks indicate the level of significance: */**/***p < 0.05/0.01/0.001
(corrected); (*)p < 0.05 (uncorrected).
Figure 5. Strength of Attentional Modulations in Single Subjects
Receiver operating characteristic (ROC) analysis of attentional modulations
during the delay (A) and stimulus (B) interval for all individual subjects. Bar plots
display for each subject the predictive index of attentional lateralization for the
strongest attention effects in the low- and high-frequency range in each
temporal interval and beta band activity in FEF. Asterisks indicate the level
of significance: */**/***p < 0.05/0.01/0.001 (uncorrected).
712 Neuron 60, 709–719, November 26, 2008 ª2008 Elsevier Inc.
Neuron
Neural Synchrony and Visual Spatial Attention
single-subject comparisons between regions showed the same
sign of difference as the group-level comparison. 46% of these
consistent interregional differences were statistically significant
(p < 0.05) even on the single-subject level. The stimulus depen-
dence showed a similar consistency: 86% of the temporal
comparisons that showed a significant stimulus dependence
on the group level (V1/V2, MT+, vIPS, and pIPS) displayed the
same sign of difference for single subjects. 62% of these
differences were statistically significant (p < 0.05) for individual
subjects. Furthermore, we found a significantly lower stimulus
dependence in FEF compared to the posterior regions in 63%
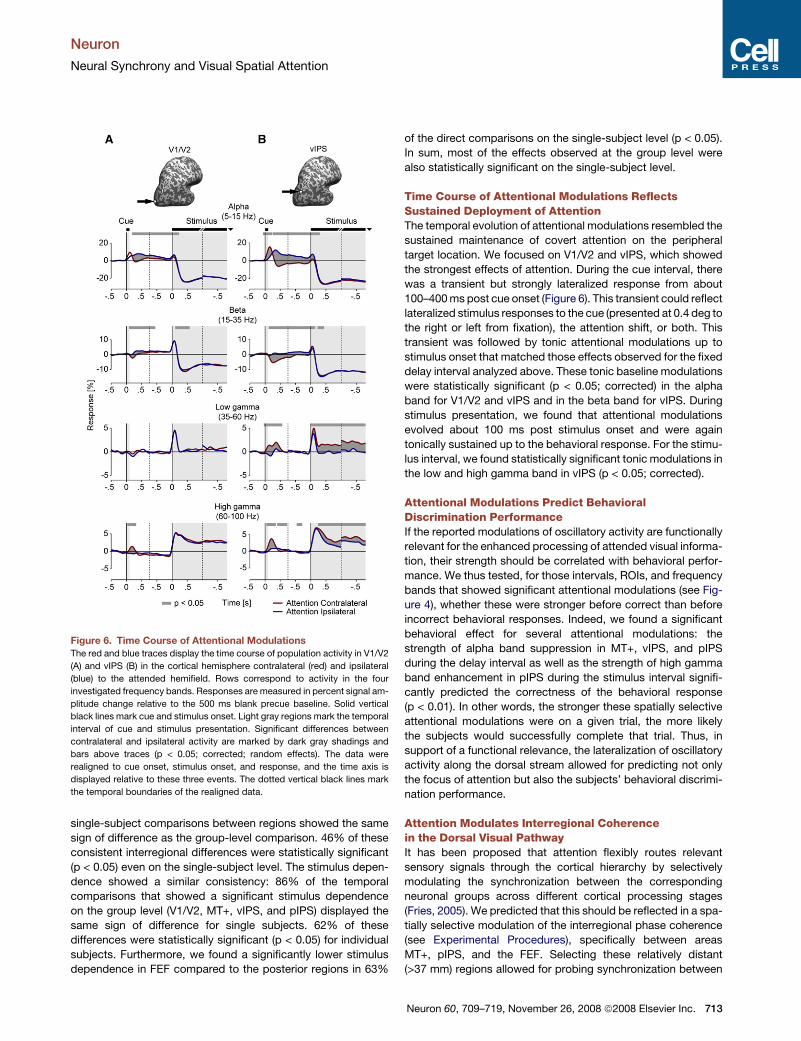
Figure 6. Time Course of Attentional Modulations
The red and blue traces display the time course of population activity in V1/V2
(A) and vIPS (B) in the cortical hemisphere contralateral (red) and ipsilateral
(blue) to the attended hemifield. Rows correspond to activity in the four
investigated frequency bands. Responses are measured in percent signal am-
plitude change relative to the 500 ms blank precue baseline. Solid vertical
black lines mark cue and stimulus onset. Light gray regions mark the temporal
interval of cue and stimulus presentation. Significant differences between
contralateral and ipsilateral activity are marked by dark gray shadings and
bars above traces (p < 0.05; corrected; random effects). The data were
realigned to cue onset, stimulus onset, and response, and the time axis is
displayed relative to these three events. The dotted vertical black lines mark
the temporal boundaries of the realigned data.
of the direct comparisons on the single-subject level (p < 0.05).
In sum, most of the effects observed at the group level were
also statistically significant on the single-subject level.
Time Course of Attentional Modulations ReflectsSustained Deployment of AttentionThe temporal evolution of attentional modulations resembled the
sustained maintenance of covert attention on the peripheral
target location. We focused on V1/V2 and vIPS, which showed
the strongest effects of attention. During the cue interval, there
was a transient but strongly lateralized response from about
100–400 ms post cue onset (Figure 6). This transient could reflect
lateralized stimulus responses to the cue (presented at 0.4 deg to
the right or left from fixation), the attention shift, or both. This
transient was followed by tonic attentional modulations up to
stimulus onset that matched those effects observed for the fixed
delay interval analyzed above. These tonic baseline modulations
were statistically significant (p < 0.05; corrected) in the alpha
band for V1/V2 and vIPS and in the beta band for vIPS. During
stimulus presentation, we found that attentional modulations
evolved about 100 ms post stimulus onset and were again
tonically sustained up to the behavioral response. For the stimu-
lus interval, we found statistically significant tonic modulations in
the low and high gamma band in vIPS (p < 0.05; corrected).
Attentional Modulations Predict BehavioralDiscrimination PerformanceIf the reported modulations of oscillatory activity are functionally
relevant for the enhanced processing of attended visual informa-
tion, their strength should be correlated with behavioral perfor-
mance. We thus tested, for those intervals, ROIs, and frequency
bands that showed significant attentional modulations (see Fig-
ure 4), whether these were stronger before correct than before
incorrect behavioral responses. Indeed, we found a significant
behavioral effect for several attentional modulations: the
strength of alpha band suppression in MT+, vIPS, and pIPS
during the delay interval as well as the strength of high gamma
band enhancement in pIPS during the stimulus interval signifi-
cantly predicted the correctness of the behavioral response
(p < 0.01). In other words, the stronger these spatially selective
attentional modulations were on a given trial, the more likely
the subjects would successfully complete that trial. Thus, in
support of a functional relevance, the lateralization of oscillatory
activity along the dorsal stream allowed for predicting not only
the focus of attention but also the subjects’ behavioral discrimi-
nation performance.
Attention Modulates Interregional Coherencein the Dorsal Visual PathwayIt has been proposed that attention flexibly routes relevant
sensory signals through the cortical hierarchy by selectively
modulating the synchronization between the corresponding
neuronal groups across different cortical processing stages
(Fries, 2005). We predicted that this should be reflected in a spa-
tially selective modulation of the interregional phase coherence
(see Experimental Procedures), specifically between areas
MT+, pIPS, and the FEF. Selecting these relatively distant
(>37 mm) regions allowed for probing synchronization between
Neuron 60, 709–719, November 26, 2008 ª2008 Elsevier Inc. 713
Neuron
Neural Synchrony and Visual Spatial Attention
the key processing stages involved in the spatially cued motion
discrimination task (Sapir et al., 2005) while minimizing con-
founding effects of volume conduction between nearby areas.
We estimated the coherence between these regions at the cor-
tical source level (see Experimental Procedures) and isolated
spatially selective effects of attention by contrasting coherence
in the hemispheres ipsilateral and contralateral to the attended
hemifield.
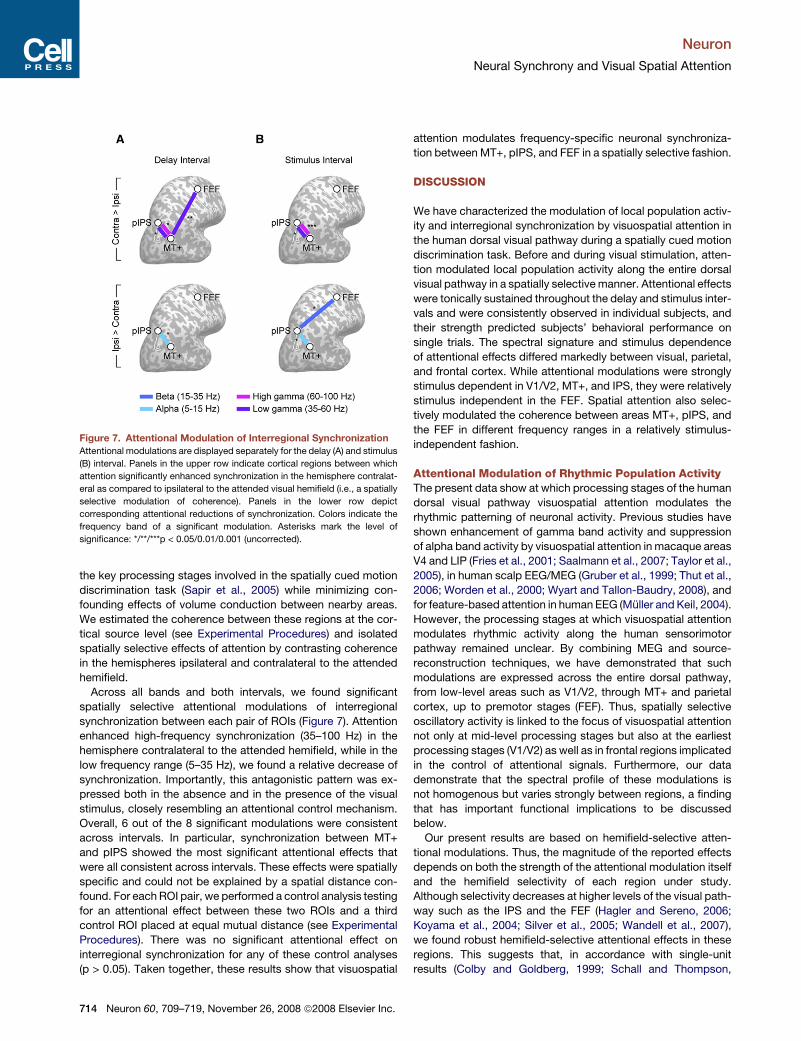
Across all bands and both intervals, we found significant
spatially selective attentional modulations of interregional
synchronization between each pair of ROIs (Figure 7). Attention
enhanced high-frequency synchronization (35–100 Hz) in the
hemisphere contralateral to the attended hemifield, while in the
low frequency range (5–35 Hz), we found a relative decrease of
synchronization. Importantly, this antagonistic pattern was ex-
pressed both in the absence and in the presence of the visual
stimulus, closely resembling an attentional control mechanism.
Overall, 6 out of the 8 significant modulations were consistent
across intervals. In particular, synchronization between MT+
and pIPS showed the most significant attentional effects that
were all consistent across intervals. These effects were spatially
specific and could not be explained by a spatial distance con-
found. For each ROI pair, we performed a control analysis testing
for an attentional effect between these two ROIs and a third
control ROI placed at equal mutual distance (see Experimental
Procedures). There was no significant attentional effect on
interregional synchronization for any of these control analyses
(p > 0.05). Taken together, these results show that visuospatial
Figure 7. Attentional Modulation of Interregional Synchronization
Attentional modulations are displayed separately for the delay (A) and stimulus
(B) interval. Panels in the upper row indicate cortical regions between which
attention significantly enhanced synchronization in the hemisphere contralat-
eral as compared to ipsilateral to the attended visual hemifield (i.e., a spatially
selective modulation of coherence). Panels in the lower row depict
corresponding attentional reductions of synchronization. Colors indicate the
frequency band of a significant modulation. Asterisks mark the level of
significance: */**/***p < 0.05/0.01/0.001 (uncorrected).
714 Neuron 60, 709–719, November 26, 2008 ª2008 Elsevier Inc.
attention modulates frequency-specific neuronal synchroniza-
tion between MT+, pIPS, and FEF in a spatially selective fashion.
DISCUSSION
We have characterized the modulation of local population activ-
ity and interregional synchronization by visuospatial attention in
the human dorsal visual pathway during a spatially cued motion
discrimination task. Before and during visual stimulation, atten-
tion modulated local population activity along the entire dorsal
visual pathway in a spatially selective manner. Attentional effects
were tonically sustained throughout the delay and stimulus inter-
vals and were consistently observed in individual subjects, and
their strength predicted subjects’ behavioral performance on
single trials. The spectral signature and stimulus dependence
of attentional effects differed markedly between visual, parietal,
and frontal cortex. While attentional modulations were strongly
stimulus dependent in V1/V2, MT+, and IPS, they were relatively
stimulus independent in the FEF. Spatial attention also selec-
tively modulated the coherence between areas MT+, pIPS, and
the FEF in different frequency ranges in a relatively stimulus-
independent fashion.
Attentional Modulation of Rhythmic Population ActivityThe present data show at which processing stages of the human
dorsal visual pathway visuospatial attention modulates the
rhythmic patterning of neuronal activity. Previous studies have
shown enhancement of gamma band activity and suppression
of alpha band activity by visuospatial attention in macaque areas
V4 and LIP (Fries et al., 2001; Saalmann et al., 2007; Taylor et al.,
2005), in human scalp EEG/MEG (Gruber et al., 1999; Thut et al.,
2006; Worden et al., 2000; Wyart and Tallon-Baudry, 2008), and
for feature-based attention in human EEG (Muller and Keil, 2004).
However, the processing stages at which visuospatial attention
modulates rhythmic activity along the human sensorimotor
pathway remained unclear. By combining MEG and source-
reconstruction techniques, we have demonstrated that such
modulations are expressed across the entire dorsal pathway,
from low-level areas such as V1/V2, through MT+ and parietal
cortex, up to premotor stages (FEF). Thus, spatially selective
oscillatory activity is linked to the focus of visuospatial attention
not only at mid-level processing stages but also at the earliest
processing stages (V1/V2) as well as in frontal regions implicated
in the control of attentional signals. Furthermore, our data
demonstrate that the spectral profile of these modulations is
not homogenous but varies strongly between regions, a finding
that has important functional implications to be discussed
below.
Our present results are based on hemifield-selective atten-
tional modulations. Thus, the magnitude of the reported effects
depends on both the strength of the attentional modulation itself
and the hemifield selectivity of each region under study.
Although selectivity decreases at higher levels of the visual path-
way such as the IPS and the FEF (Hagler and Sereno, 2006;
Koyama et al., 2004; Silver et al., 2005; Wandell et al., 2007),
we found robust hemifield-selective attentional effects in these
regions. This suggests that, in accordance with single-unit
results (Colby and Goldberg, 1999; Schall and Thompson,

Neuron
Neural Synchrony and Visual Spatial Attention
1999), attentional modulations are particularly strong in these
areas. Our findings on oscillatory activity accord well with recent
functional magnetic resonance imaging (fMRI) data that show
spatially selective attentional modulations of the blood oxygena-
tion level-dependent (BOLD) signal in early visual areas as well
as in the IPS and FEF (Sylvester et al., 2007).
Role of Rhythmic Population Activity in Attentive VisualProcessingCortical activity engages in rhythmic population activity over
a broad range of spectral scales (Buzsaki and Draguhn, 2004;
Steriade, 2000), but the functional role of this rhythmic patterning
of activity remains debated. In the visual system, population ac-
tivity in the gamma band has been linked to stimulus properties
(Gray et al., 1989; Liu and Newsome, 2006; Siegel et al., 2007;
Siegel and Konig, 2003), selective attention (Fries et al., 2001;
Gruber et al., 1999; Muller and Keil, 2004; Taylor et al., 2005),
working memory (Pesaran et al., 2002), and visual awareness
(Rodriguez et al., 1999; Wyart and Tallon-Baudry, 2008). Gamma
band activity has also been attributed to selective attention in the
auditory and somatosensory domain (Bauer et al., 2006; Ray
et al., 2008). The gamma power of population measures such
as the local field potential (LFP) seems tightly correlated with
synaptic drive and average firing in a neuronal population (Henrie
and Shapley, 2005) and presumably reflects local neuronal
synchronization, which has been suggested to enhance the
functional impact of spiking activity on postsynaptic processing
stages (Engel et al., 2001; Konig et al., 1996; Salinas and
Sejnowski, 2001). By contrast, population activity in the alpha
band has traditionally been thought to reflect reduced thalamo-
cortical transmission (Steriade, 2000) and cortical ‘‘deactivation’’
(Pfurtscheller et al., 1996; Thut et al., 2006; Worden et al., 2000).
Our observations of an attentional gamma band enhancement in
extrastriate and parietal cortex during stimulus presentation and
a widespread baseline suppression of alpha band activity are in
line with these hypotheses. The strength of these modulations
was positively correlated with perceptual discrimination perfor-
mance, ensuring that subjects maintained attention on the
peripheral target throughout the trial and that the reported
modulations reflect this shift. More importantly, and in accor-
dance with previous reports (Thut et al., 2006; Wyart and
Tallon-Baudry, 2008), this behavioral correlation provides strong
evidence that the demonstrated modulations of rhythmic activity
play a functional role in the preferential processing of the
attended stimulus.
Gamma Band Suppression and Beta Band Enhancementwith AttentionIn light of the above concept of the functional role of gamma
band activity, it is surprising that spatial attention consistently
suppressed gamma band activity in V1/V2 before stimulus
onset. However, this counterintuitive finding accords with
single-unit data demonstrating a relative suppression of spiking
activity by visuospatial attention in macaque area V4 before
stimulus onset (Ghose and Maunsell, 2002). The gamma band
suppression may thus reflect a gain regulation at the first cortical
processing stage that reduces baseline firing in the absence of
sensory drive. Surprisingly, this prestimulus gamma band
suppression and the beta band enhancement during stimulation
in V1/V2 (see below) were observed not only at the ROI location
corresponding to the stimulated peripheral visual field but also at
the foveal representation near the occipital pole (see Figure 3).
Thus, further invasive studies are needed to investigate the exact
spatial extent and profile of these attentional modulations
relative to the focus of visuospatial attention.
We found dissociated attentional modulations of beta band
activity between early visual and premotor areas. During stimu-
lus processing, attention specifically enhances such activity in
primary visual cortex. This adds to a recent body of evidence
pointing toward a positive correlation between beta band activity
and active processing in the visual system. Beta band activity in
macaque V1 correlates with perceptual dominance during bin-
ocular rivalry (Gail et al., 2004) and generalized flash suppression
(Wilke et al., 2006). Beta band activity in ventral (Tallon-Baudry
et al., 2001) and dorsal (Donner et al., 2007; Gross et al., 2004;
Pesaran et al., 2002) extrastriate areas correlates with behavioral
performance in various visual tasks requiring visual attention
and/or short-term memory. In accordance with these findings,
our data suggest that in primary visual cortex, beta band activity
serves to facilitate processing of attended visual locations. By
contrast, in the FEF we observed an attentional suppression of
beta band activity. This suppression accords well with the
contralateral beta band suppression observed in primary motor
cortex preceding voluntary limb movements (Crone et al.,
1998). Beta band suppression may thus be a common spectral
signature of neural activation in the primary motor cortex and
FEF.
Taken together, these observations challenge a simple antag-
onistic concept of the role of low- and high-frequency population
activity in visual attention. The dissociated spectral profile of
attentional modulations along the dorsal pathway suggests
that the mechanisms and the functional role of such rhythmic
activity may differ between cortical areas.
Attentional Modulation of Interregional SynchronizationInterregional synchronization may control the communication
between cortical areas (Womelsdorf et al., 2007). Top-down
visual attention is thought to be mediated by large-scale neural
interactions between frontoparietal and visual cortex (Corbetta
and Shulman, 2002; Kastner and Ungerleider, 2000; Serences
and Yantis, 2006). It has been proposed that attention routes
selected sensory information through the cortical hierarchy by
dynamically altering the coherence between neuronal groups
across distant cortical areas (Buzsaki and Draguhn, 2004; Fries,
2005). Recent monkey (Buschman and Miller, 2007; Saalmann
et al., 2007) and human (Doesburg et al., 2008; Gross et al.,
2004) MEG/EEG studies support this hypothesis but did not
simultaneously investigate spatially selective attentional effects
on synchronization between early visual, parietal, and prefrontal
areas. The present data show that before and during stimulus
presentation, synchronization between these processing stages
is modulated by attention in a spatially selective fashion. Further-
more, in contrast to local population activity, the attentional
modulation of interregional coherence showed little stimulus
dependence. In particular, attention enhanced the coherence
between MT+ and LIP in the gamma band and suppressed it in
Neuron 60, 709–719, November 26, 2008 ª2008 Elsevier Inc. 715

Neuron
Neural Synchrony and Visual Spatial Attention
the alpha band both before and during visual stimulation. Com-
parison of the power and coherence effects observed here
clearly suggests that the attentional effects on coherence do
not simply reflect modulations of local oscillatory activity but
rather reflect genuine changes of interregional synchronization.
For instance, during the delay interval, gamma band coherence
between MT+ and LIP shows an attention enhancement, while
local gamma band activity in these regions shows no modulation
or even an attentional reduction. This also indicates that distinct
mechanisms might underlie local, as compared to interregional,
neuronal communication. In summary, the present data suggest
that frequency-specific synchronization of extrastriate, parietal,
and frontal regions subserves the selective routing of attended
visual information in the human brain.
Control and Effects of AttentionInvasive and noninvasive studies suggest dissociated substrates
for the control and effect of attentional signals in frontoparietal
and visual cortex, respectively. Human imaging studies have
identified a frontoparietal network of regions along the IPS and
the FEF as a potential attentional control network (Corbetta
et al., 1993; Corbetta and Shulman, 2002; Kastner and Unger-
leider, 2000; Serences and Yantis, 2006). More recently, this
hypothesis has received further support from invasive studies
in monkeys (Buschman and Miller, 2007; Moore et al., 2003).
However, direct physiological evidence for a strict dissociation
of attentional control and effects remained sparse. Prestimulus
enhancements of the BOLD signal were observed not only in
frontoparietal regions (Corbetta et al., 2000; Hopfinger et al.,
2000; Kastner et al., 1999; Sapir et al., 2005) but also, albeit
more weakly, in early visual areas (Hopfinger et al., 2000; Kastner
et al., 1999; Ress et al., 2000; Sapir et al., 2005). Furthermore,
attention effects in the firing rates of frontoparietal regions are
not stimulus independent but are modulated by visual input
(Colby and Goldberg, 1999; Schall and Thompson, 1999).
The present data provide two new lines of evidence in support
of a functional dissociation. First, we demonstrate that the spec-
tral signature of attentional effects differs widely between frontal,
parietal, and early visual areas. This dissociation may reflect dis-
tinct neuronal mechanisms underlying the control and effect of
attention within these regions. Second, we show differences in
the stimulus dependence of attentional effects between areas.
While many attentional modulations even reversed between
the delay and stimulus intervals in V1/V2, MT+, and the IPS,
this stimulus dependence was absent in FEF. In other words,
the stimulus independence in FEF matches precisely the type
of effect predicted for an attentional control region. By contrast,
the stimulus dependence of effects in posterior cortex suggests
that it expresses the effects of attentional top-down signals on
incoming sensory signals. Moreover, a purely additive model of
bottom-up and top-down factors would predict attentional
effects to be independent of the sensory input. Thus, rhythmic
population activity in early visual and parietal cortex likely
reflects a complex nonadditive interaction between bottom-up
and top-down signals. These effects on rhythmic population
activity accord well with fMRI evidence demonstrating stimulus
dependence and independence of attentional BOLD modula-
tions in IPS and FEF, respectively (Shulman et al., 2003).
716 Neuron 60, 709–719, November 26, 2008 ª2008 Elsevier Inc.
Together, these data indicate that attentional effects along the
IPS are incompatible with pure attentional control but suggest
that rather than being strictly segregated, control and effects
of attention are implemented in a functional continuum along
the fronto-occipital axis (Serences and Yantis, 2006; Silver
et al., 2005). However, it should be noted that MEG, like fMRI,
cannot separate different neuronal populations or layer-specific
effects within the same region. Thus, invasive studies are
required to investigate the microstructure of attentional effects
and test the possibility that in regions like the IPS, stimulus-
driven signals are locally segregated from endogenous atten-
tional signals.
In contrast to locally synchronized oscillatory activity,
visuospatial attention established a selective pattern of interre-
gional coherence in the dorsal visual pathway that was only
weakly influenced by the visual input. Thus, interregional
synchronization across multiple stages of the cortical hierarchy
might specifically reflect the top-down control of attention.
ConclusionsWe have demonstrated in humans that, in the presence and
absence of visual stimuli, visuospatial attention profoundly mod-
ulates locally synchronized oscillatory activity as well as interre-
gional synchronization along the entire dorsal visual pathway
from early visual up to prefrontal regions. Importantly, we found
an unanticipated dissociation of the spectral signatures and
stimulus dependencies of attentional effects between different
processing stages. Our data indicate that regionally and
spectrally specific synchronization within most stages of the
human dorsal visual pathway may underlie the enhanced
processing of attended visual stimuli. Furthermore, our results
provide strong evidence for the hypothesis that attentional
selection is mediated by frequency-specific synchronization
between prefrontal, parietal, and early visual cortex.
EXPERIMENTAL PROCEDURES
Subjects and Experimental Design
Eight subjects (7 male, 1 female; age range 23–32 years; 2 authors, 6 naive)
participated in the study, which was conducted in accordance with the
Declaration of Helsinki and approved by the local ethics committee (CMO
Regio Arnhem-Nijmegen). Informed consent was obtained from all subjects
prior to the measurements. All subjects were in good health, had no past
history of psychiatric or neurological illness, and had normal or corrected-to-
normal vision.
We used a spatially cued two-alternative forced-choice motion discrimina-
tion paradigm. Each trial was started by the onset of a red fixation cross on
a uniform black background. After a random baseline (1000–1500 ms), a
visual cue instructed subjects to covertly shift their visual attention to either
the left or right visual hemifield. A small green dot of 0.1 deg diameter
presented randomly for 100 ms at 0.4 deg eccentricity to the left or right of
the fixation cross served as the cue. Cue presentation was followed by a vari-
able (1000–1500 ms) delay interval during which only the fixation cross was
presented. Then, two dynamic random dot patterns were simultaneously
displayed in circular apertures in the left and right visual hemifield (22.4 deg
diameter; 14.4 deg eccentricity). In each trial, the coherent fraction of dots in
each aperture independently moved either upward or downward with equal
probability. For each frame, the level of motion coherence determined the
fraction of dots that was displaced according to a common motion vector,
while all other dots were displaced randomly (dot diameter �0.2 deg; dot
density 1.7 deg�2; motion speed 11.5 deg/s; local dot contrast 100%). The

Neuron
Neural Synchrony and Visual Spatial Attention
coherently moving dots were randomly selected anew on each frame.
Subjects were instructed to covertly shift their attention to the cued visual
hemifield directly following cue presentation and to report the perceived direc-
tion of motion in the cued aperture by button press with either the left or right
index finger. Stimulus response mapping was counterbalanced across
subjects. Stimuli were turned off immediately after the subject’s response,
or 3 s after onset if no response had been delivered by then. Auditory feedback
(a beep) was provided after each incorrect response via plastic tubes and
earpieces. Following the response, subjects were allowed to make eye move-
ments or blinks during an intertrial interval of 1500 ms duration. Each of the
eight subjects participated in six recording sessions with 480 trials, resulting
in a total number of 23,040 recorded trials.
The level of motion coherence was adjusted to each subject’s individual
motion discrimination threshold based on a psychophysical recording session
prior to the MEG recording: subjects performed the task in the MEG setup at
six constant levels of motion coherence, and thresholds were determined by
fitting a Weibull function to the psychophysical data.
All stimuli were constructed offline using MATLAB (The MathWorks, Inc.),
and stimulus presentation was controlled using Presentation software
(NeuroBehavioral Systems). All stimuli were presented via a mirror system
on a back-projection screen using a calibrated LCD projector (60 Hz refresh
rate).
Data Acquisition and Preprocessing
MEG was recorded using a 151-channel whole-head system (Omega 2000,
CTF Systems Inc.) in a magnetically shielded room. The electrooculogram
(EOG) was recorded simultaneously for offline artifact rejection. Head position
relative to the MEG sensors was measured before and after each recording
session. For all analyzed data sets, head displacements were below 5 mm.
MEG signals were low-pass filtered online (cutoff 300 Hz) and sampled at
1200 Hz.
Trials containing eye blinks, eye movements, muscle artifacts, or signal
jumps were rejected offline from further analysis using semiautomatic
procedures. Line noise removal was performed by selecting data segments
of 10 s length with the epochs of interest in the center. These segments
were Fourier transformed; the 50, 100, 150, and 200 Hz components of the
spectra were zeroed; the time courses were reconstructed by inverse Fourier
transformation; and epochs of interest were cut out of these denoised 10 s
data segments.
T1-weighted structural MRIs were recorded for all subjects. For source
reconstruction, individual single-shell models (Nolte, 2003) were derived
from the segmentation of these structural MRIs.
Data Analyses
All analyses were performed in MATLAB using the ‘‘FieldTrip’’ open-source
toolbox (http://www.ru.nl/fcdonders/fieldtrip) and custom software. Cortical
segmentation and surface reconstruction were performed using BrainVoyager
QX (Brain Innovation B.V.) and SPM2 (http://www.fil.ion.ucl.ac.uk/spm).
Spatial alignment of structural MRIs and functional maps was performed using
SPM2.
Spectral Analyses and Response Quantification
Spectral analyses of the MEG data were performed using ‘‘multitaper’’ spectral
estimates based on discrete prolate spheroidal sequences. Transformations
to the frequency domain were performed on the single-trial level before
averaging across trials. We characterized oscillatory responses as the per-
centage change R in signal amplitude (square root of power) relative to the
blank prestimulus baseline.
Time-frequency transformation was performed by a sliding-window multi-
taper analysis (250 ms length; 25 ms step size; ±12 Hz spectral smoothing;
5 Slepian tapers) after realigning all data to cue onset, stimulus onset, and
the behavioral response.
Source Reconstruction
To estimate the spectral amplitude of responses at the cortical source level, we
used the ‘‘beamforming’’ adaptive linear spatial filtering technique (Gross
et al., 2001; Van Veen et al., 1997) as described previously (Donner et al.,
2007; Siegel et al., 2007). In short, for each frequency and source location, a
linear filter was computed that passes activity from that location with unit gain
while maximally suppressing activity from other sources. All source-level
analyses were independently performed for four frequency bands: 5–15 Hz,
15–25 Hz, 35–60 Hz, and 60–100 Hz. For each recording session, forward
models were computed using individual single-shell volume conductor models
and the measured head positions. Whole-brain source reconstructions were
performed on a regular 3D grid of 6 mm resolution and linearly interpolated
to 1 mm resolution.
For each subject and session, differences of source-level activity across
conditions were quantified as z scores in the individual head space. These
z score maps were nonlinearly aligned to a template brain (Montreal Neurolog-
ical Institute) based on the individual structural MRIs and pooled across
subjects by taking their sum normalized by the square root of the number of
subjects. To test the resulting statistical map for a significant deviation from
zero across subjects (random effects), we applied a nonparametric permuta-
tion test based on spatial clustering: The sign of each subject’s statistical
maps was randomly flipped, resulting in a set of 256 permuted statistical
maps that approximated the distribution of measured z score maps under
the null hypothesis. For each of these permuted maps as well as the measured
map, spatial clusters were defined as continuous volumes of absolute pooled
z scores > 1.96. z scores were summed within each cluster, and the p value of
each cluster of the measured map was computed as the probability of obtain-
ing a cluster with a larger summed z score in the distribution of the maximum
summed z scores across the permuted maps. This procedure conservatively
accounts for multiple comparisons across space. All statistical maps were
thresholded at p < 0.05 (corrected) and displayed on the reconstructed and
inflated cortical surface of the template brain.
Region of Interest Analyses
We defined the following ROIs based on anatomical criteria on the template
brain and nonlinearly aligned their position to the individual subjects’ anatom-
ical MRIs. The V1/V2 position was defined at the calcarine representation of
the stimulated peripheral visual field halfway between the occipital pole and
the parieto-occipital sulcus (Wandell et al., 2007). The MT+ position was
defined at the junction of the inferior temporal sulcus and the lateral occipital
sulcus (Dumoulin et al., 2000). Functional definitions of MT+ obtained from
standard fMRI localizers were available for four subjects and were in close cor-
respondence with the anatomical criteria. The vIPS position was defined at the
junction of the intraparietal sulcus with the transverse occipital sulcus. When
tracing the horizontal ramus of the IPS in the posterior-anterior direction,
one typically encounters a sharp transition from a deep and poorly truncated
segment to a shallower and more extensively truncated segment. The pIPS
position was defined halfway between this transition and the vIPS location.
The FEF position was defined at the junction of the precentral sulcus and
the superior frontal sulcus.
We used beamforming to reconstruct single-trial responses for each ROI
and computed a lateralization index L by subtracting the response in the right
hemisphere from the response in the left hemisphere. We then used receiver
operating characteristic (ROC) analysis to compute a ‘‘predictive index’’ I
that approximates the probability with which an ideal observer can predict
the direction of attention from the hemispheric lateralization of the neural
response on a single trial (Green and Swets, 1966). I was estimated as the
area under the ROC curve for the distributions of L for ‘‘attend right’’ and
‘‘attend left’’ trials. For data pooled across subjects, L was independently
z-transformed for each subject and session. We tested for a significant devia-
tion of I from chance level (0.5) using a nonparametric permutation test (Efron
and Tibshirani, 1998) with 106 permutations randomly shuffling trials between
attentional conditions. p values were false discovery rate (FDR) corrected for
multiple comparisons across regions, bands, and intervals.
To compare attentional modulations between intervals and regions, we
computed an attentional index M for each trial as the average difference in
response R between the hemispheres contralateral and ipsilateral to the focus
of attention. In analogy to the above analysis, we used ROC analysis to test for
a difference in M between regions and temporal intervals. p values for these
comparisons were FDR corrected. To compare the stimulus dependence of
attentional modulations between regions, we computed, for each trial, band,
and region, the difference of M between the stimulus and delay intervals. We
then computed, for each region, the normalized stimulus dependence by
averaging the absolute values of the z-transformed differences of M across
Neuron 60, 709–719, November 26, 2008 ª2008 Elsevier Inc. 717
Neuron
Neural Synchrony and Visual Spatial Attention
bands. To test for differences in normalized stimulus dependence between
regions, we performed a permutation test (106 permutations) randomly
shuffling M between regions. The resulting p values were FDR corrected.
Time Course of Band-Limited Source-Level Activity
For each frequency band, the sensor-level data were band-pass filtered using
a 4th-order zero-phase forward-reverse digital Butterworth filter, and source-
level time courses of these band-limited signals were reconstructed using the
time-domain implementation of the beamforming technique (Van Veen et al.,
1997). Time courses were derived along the dominant dipole direction, and
the band-limited activity was computed as the absolute of the Hilbert trans-
form, smoothed with a Hanning window of 150 ms full width at half maximum.
The difference between time courses contralateral and ipsilateral to attention
was tested across subjects (random effects) in analogy to the analysis in the
spatial domain based on a temporally clustered permutation test. Temporal
clusters of significant differences were thresholded at p < 0.05 (corrected).
Source-Level Coherence
For the standard beamforming technique, highly coherent sources that are
relatively distant or closely separated can cancel out or merge, respectively
(Van Veen et al., 1997). We thus estimated source-level coherence with
a two-dipole beamformer that explicitly models the leadfields of two sources.
This technique allows the reliably estimation of source-level coherence even
under conditions of very high source correlation (Schoffelen et al., 2008). For
the two-dipole beamformer, the spatial filter was computed using a combined
leadfield Lc = [L(r1);L(r2)], with r1 and r2 as the locations between which
coherence was estimated. We used singular-value decomposition to project
estimated dipole moments for both locations in their dominant spatial
direction. From the resulting two-by-two source-level cross-spectral density
matrix S0, we derived the source-level coherence for each condition (attend
left or right) according to the equation
Cohðr1; r2Þ=
���S01;2���
ffiffiffiffiffiffiffiffiffiffiffiffiffiffiffiffiffiS01;1 S02;2
q :
Coherence is biased by degrees of freedom. We thus stratified the data to
the same number of tapers for both conditions. We then tested across all
recording sessions (n = 48) for a significant difference between coherence in
the hemispheres contralateral and ipsilateral to the focus of attention using
paired t statistics. To rule out a simple distance confound, for each of the three
pairs of ROIs, we placed a control ROI with the same distance to both ROIs as
between the original two ROIs ventrally within the gray matter at the same
cortical depth as the original pair of ROIs. The control ROIs were located
near the dorsal superior temporal sulcus (control for MT-pIPS interaction), in
the ventrolateral prefrontal cortex (control for MT-FEF interaction), and in the
lateral temporal cortex (control for pIPS-FEF interaction).
SUPPLEMENTAL DATA
Supplemental Data include one figure and can be found online at http://www.
neuron.org/supplemental/S0896-6273(08)00757-5.
ACKNOWLEDGMENTS
We thank Thilo Womelsdorf for helpful discussions. This study was supported
by grants from the Deutsche Forschungsgemeinschaft (A.K.E.), the European
Commission (A.K.E., projects IST-027268 ‘‘Perception on Purpose’’ and
NEST-043457 ‘‘Mindbridge’’; P.F. and A.K.E., project HEALTH-F2-2008-
200728 ‘‘BrainSync’’), the Volkswagen Foundation (A.K.E., project ‘‘Represen-
tation’’), the BMBF (A.K.E., project 01GO0510 ‘‘NeuroImage Nord’’), University
Medical Center Hamburg-Eppendorf (M.S., T.H.D., and A.K.E.), the Nether-
lands Organization for Scientific Research (P.F.), the Human Frontier Science
Program (P.F.), the European Young Investigator Award program of the Euro-
pean Science Foundation (P.F.), and the Hans-Lungwitz-Foundation (M.S.,
T.H.D., and A.K.E.).
Accepted: September 4, 2008
Published: November 25, 2008
718 Neuron 60, 709–719, November 26, 2008 ª2008 Elsevier Inc.
REFERENCES
Bauer, M., Oostenveld, R., Peeters, M., and Fries, P. (2006). Tactile spatial
attention enhances gamma-band activity in somatosensory cortex and
reduces low-frequency activity in parieto-occipital areas. J. Neurosci. 26,
490–501.
Bichot, N.P., Rossi, A.F., and Desimone, R. (2005). Parallel and serial neural
mechanisms for visual search in macaque area V4. Science 308, 529–534.
Buschman, T.J., and Miller, E.K. (2007). Top-down versus bottom-up control
of attention in the prefrontal and posterior parietal cortices. Science 315,
1860–1862.
Buzsaki, G., and Draguhn, A. (2004). Neuronal oscillations in cortical networks.
Science 304, 1926–1929.
Colby, C.L., and Goldberg, M.E. (1999). Space and attention in parietal cortex.
Annu. Rev. Neurosci. 22, 319–349.
Corbetta, M., and Shulman, G.L. (2002). Control of goal-directed and stimulus-
driven attention in the brain. Nat. Rev. Neurosci. 3, 201–215.
Corbetta, M., Miezin, F.M., Shulman, G.L., and Petersen, S.E. (1993). A PET
study of visuospatial attention. J. Neurosci. 13, 1202–1226.
Corbetta, M., Kincade, J.M., Ollinger, J.M., McAvoy, M.P., and Shulman, G.L.
(2000). Voluntary orienting is dissociated from target detection in human
posterior parietal cortex. Nat. Neurosci. 3, 292–297.
Crone, N.E., Miglioretti, D.L., Gordon, B., Sieracki, J.M., Wilson, M.T.,
Uematsu, S., and Lesser, R.P. (1998). Functional mapping of human sensori-
motor cortex with electrocorticographic spectral analysis. I. Alpha and beta
event-related desynchronization. Brain 121, 2271–2299.
Doesburg, S.M., Roggeveen, A.B., Kitajo, K., and Ward, L.M. (2008). Large-
scale gamma-band phase synchronization and selective attention. Cereb.
Cortex 18, 386–396.
Donner, T., Kettermann, A., Diesch, E., Ostendorf, F., Villringer, A., and Brandt,
S.A. (2000). Involvement of the human frontal eye field and multiple parietal
areas in covert visual selection during conjunction search. Eur. J. Neurosci.
12, 3407–3414.
Donner, T.H., Siegel, M., Oostenveld, R., Fries, P., Bauer, M., and Engel, A.K.
(2007). Population activity in the human dorsal pathway predicts the accuracy
of visual motion detection. J. Neurophysiol. 98, 345–359.
Dumoulin, S.O., Bittar, R.G., Kabani, N.J., Baker, C.L., Jr., Le Goualher, G.,
Bruce Pike, G., and Evans, A.C. (2000). A new anatomical landmark for reliable
identification of human area V5/MT: a quantitative analysis of sulcal patterning.
Cereb. Cortex 10, 454–463.
Efron, B., and Tibshirani, R. (1998). An Introduction to the Bootstrap, 1st CRC
Press Reprint (Boca Raton, FL, USA: Chapman & Hall/CRC).
Engel, A.K., Fries, P., and Singer, W. (2001). Dynamic predictions: oscillations
and synchrony in top-down processing. Nat. Rev. Neurosci. 2, 704–716.
Fan, J., Byrne, J., Worden, M.S., Guise, K.G., McCandliss, B.D., Fossella, J.,
and Posner, M.I. (2007). The relation of brain oscillations to attentional
networks. J. Neurosci. 27, 6197–6206.
Fries, P. (2005). A mechanism for cognitive dynamics: neuronal communica-
tion through neuronal coherence. Trends Cogn. Sci. 9, 474–480.
Fries, P., Reynolds, J.H., Rorie, A.E., and Desimone, R. (2001). Modulation of
oscillatory neuronal synchronization by selective visual attention. Science 291,
1560–1563.
Gail, A., Brinksmeyer, H.J., and Eckhorn, R. (2004). Perception-related
modulations of local field potential power and coherence in primary visual
cortex of awake monkey during binocular rivalry. Cereb. Cortex 14, 300–313.
Ghose, G.M., and Maunsell, J.H. (2002). Attentional modulation in visual cortex
depends on task timing. Nature 419, 616–620.
Gray, C.M., Konig, P., Engel, A.K., and Singer, W. (1989). Oscillatory
responses in cat visual cortex exhibit inter-columnar synchronization which
reflects global stimulus properties. Nature 338, 334–337.
Green, D.M., and Swets, J.A. (1966). Signal Detection Theory and
Psychophysics (New York: Wiley).

Neuron
Neural Synchrony and Visual Spatial Attention
Gross, J., Kujala, J., Hamalainen, M., Timmermann, L., Schnitzler, A., and
Salmelin, R. (2001). Dynamic imaging of coherent sources: Studying neural
interactions in the human brain. Proc. Natl. Acad. Sci. USA 98, 694–699.
Gross, J., Schmitz, F., Schnitzler, I., Kessler, K., Shapiro, K., Hommel, B., and
Schnitzler, A. (2004). Modulation of long-range neural synchrony reflects
temporal limitations of visual attention in humans. Proc. Natl. Acad. Sci. USA
101, 13050–13055.
Gruber, T., Muller, M.M., Keil, A., and Elbert, T. (1999). Selective visual-spatial
attention alters induced gamma band responses in the human EEG. Clin. Neu-
rophysiol. 110, 2074–2085.
Hagler, D.J., Jr., and Sereno, M.I. (2006). Spatial maps in frontal and prefrontal
cortex. Neuroimage 29, 567–577.
Handel, B., Lutzenberger, W., Thier, P., and Haarmeier, T. (2008). Selective
attention increases the dependency of cortical responses on visual motion
coherence in man. Cereb. Cortex. Published online April 18, 2008. 10.1093/
cercor/bhn049.
Henrie, J.A., and Shapley, R. (2005). LFP power spectra in V1 cortex: the
graded effect of stimulus contrast. J. Neurophysiol. 94, 479–490.
Hillyard, S.A., and Anllo-Vento, L. (1998). Event-related brain potentials in the
study of visual selective attention. Proc. Natl. Acad. Sci. USA 95, 781–787.
Hopfinger, J.B., Buonocore, M.H., and Mangun, G.R. (2000). The neural mech-
anisms of top-down attentional control. Nat. Neurosci. 3, 284–291.
Kastner, S., and Ungerleider, L.G. (2000). Mechanisms of visual attention in the
human cortex. Annu. Rev. Neurosci. 23, 315–341.
Kastner, S., Pinsk, M.A., De Weerd, P., Desimone, R., and Ungerleider, L.G.
(1999). Increased activity in human visual cortex during directed attention in
the absence of visual stimulation. Neuron 22, 751–761.
Konig, P., Engel, A.K., and Singer, W. (1996). Integrator or coincidence detec-
tor? The role of the cortical neuron revisited. Trends Neurosci. 19, 130–137.
Koyama, M., Hasegawa, I., Osada, T., Adachi, Y., Nakahara, K., and Miyashita,
Y. (2004). Functional magnetic resonance imaging of macaque monkeys per-
forming visually guided saccade tasks: comparison of cortical eye fields with
humans. Neuron 41, 795–807.
Liu, J., and Newsome, W.T. (2006). Local field potential in cortical area MT:
stimulus tuning and behavioral correlations. J. Neurosci. 26, 7779–7790.
Moore, T., Armstrong, K.M., and Fallah, M. (2003). Visuomotor origins of covert
spatial attention. Neuron 40, 671–683.
Muller, M.M., and Keil, A. (2004). Neuronal synchronization and selective color
processing in the human brain. J. Cogn. Neurosci. 16, 503–522.
Nolte, G. (2003). The magnetic lead field theorem in the quasi-static approxi-
mation and its use for magnetoencephalography forward calculation in realis-
tic volume conductors. Phys. Med. Biol. 48, 3637–3652.
Pesaran, B., Pezaris, J.S., Sahani, M., Mitra, P.P., and Andersen, R.A. (2002).
Temporal structure in neuronal activity during working memory in macaque
parietal cortex. Nat. Neurosci. 5, 805–811.
Pfurtscheller, G., Stancak, A., Jr., and Neuper, C. (1996). Event-related
synchronization (ERS) in the alpha band–an electrophysiological correlate of
cortical idling: a review. Int. J. Psychophysiol. 24, 39–46.
Ray, S., Niebur, E., Hsiao, S.S., Sinai, A., and Crone, N.E. (2008). High-
frequency gamma activity (80-150Hz) is increased in human cortex during
selective attention. Clin. Neurophysiol. 119, 116–133.
Ress, D., Backus, B.T., and Heeger, D.J. (2000). Activity in primary visual cor-
tex predicts performance in a visual detection task. Nat. Neurosci. 3, 940–945.
Rodriguez, E., George, N., Lachaux, J.P., Martinerie, J., Renault, B., and
Varela, F.J. (1999). Perception’s shadow: long-distance synchronization of
human brain activity. Nature 397, 430–433.
Saalmann, Y.B., Pigarev, I.N., and Vidyasagar, T.R. (2007). Neural
mechanisms of visual attention: how top-down feedback highlights relevant
locations. Science 316, 1612–1615.
Salinas, E., and Sejnowski, T.J. (2001). Correlated neuronal activity and the
flow of neural information. Nat. Rev. Neurosci. 2, 539–550.
Sapir, A., d’Avossa, G., McAvoy, M., Shulman, G.L., and Corbetta, M. (2005).
Brain signals for spatial attention predict performance in a motion discrimina-
tion task. Proc. Natl. Acad. Sci. USA 102, 17810–17815.
Schall, J.D., and Thompson, K.G. (1999). Neural selection and control of
visually guided eye movements. Annu. Rev. Neurosci. 22, 241–259.
Schoffelen, J.M., Oostenveld, R., and Fries, P. (2008). Imaging the human
motor system’s beta-band synchronization during isometric contraction.
Neuroimage 41, 437–447.
Serences, J.T., and Yantis, S. (2006). Selective visual attention and perceptual
coherence. Trends Cogn. Sci. 10, 38–45.
Shulman, G.L., McAvoy, M.P., Cowan, M.C., Astafiev, S.V., Tansy, A.P.,
d’Avossa, G., and Corbetta, M. (2003). Quantitative analysis of attention and
detection signals during visual search. J. Neurophysiol. 90, 3384–3397.
Siegel, M., and Konig, P. (2003). A functional gamma-band defined by stimu-
lus-dependent synchronization in area 18 of awake behaving cats. J. Neurosci.
23, 4251–4260.
Siegel, M., Donner, T.H., Oostenveld, R., Fries, P., and Engel, A.K. (2007).
High-frequency activity in human visual cortex is modulated by visual motion
strength. Cereb. Cortex 17, 732–741.
Silver, M.A., Ress, D., and Heeger, D.J. (2005). Topographic maps of visual
spatial attention in human parietal cortex. J. Neurophysiol. 94, 1358–1371.
Steriade, M. (2000). Corticothalamic resonance, states of vigilance and
mentation. Neuroscience 101, 243–276.
Sylvester, C.M., Shulman, G.L., Jack, A.I., and Corbetta, M. (2007). Asymmetry
of anticipatory activity in visual cortex predicts the locus of attention and
perception. J. Neurosci. 27, 14424–14433.
Tallon-Baudry, C., Bertrand, O., and Fischer, C. (2001). Oscillatory synchrony
between human extrastriate areas during visual short-term memory mainte-
nance. J. Neurosci. 21, RC177.
Taylor, K., Mandon, S., Freiwald, W.A., and Kreiter, A.K. (2005). Coherent os-
cillatory activity in monkey area v4 predicts successful allocation of attention.
Cereb. Cortex 15, 1424–1437.
Thut, G., Nietzel, A., Brandt, S.A., and Pascual-Leone, A. (2006). Alpha-band
electroencephalographic activity over occipital cortex indexes visuospatial at-
tention bias and predicts visual target detection. J. Neurosci. 26, 9494–9502.
Van Veen, B.D., van Drongelen, W., Yuchtman, M., and Suzuki, A. (1997).
Localization of brain electrical activity via linearly constrained minimum
variance spatial filtering. IEEE Trans. Biomed. Eng. 44, 867–880.
Wandell, B.A., Dumoulin, S.O., and Brewer, A.A. (2007). Visual field maps in
human cortex. Neuron 56, 366–383.
Wilke, M., Logothetis, N.K., and Leopold, D.A. (2006). Local field potential
reflects perceptual suppression in monkey visual cortex. Proc. Natl. Acad.
Sci. USA 103, 17507–17512.
Womelsdorf, T., Schoffelen, J.M., Oostenveld, R., Singer, W., Desimone, R.,
Engel, A.K., and Fries, P. (2007). Modulation of neuronal interactions through
neuronal synchronization. Science 316, 1609–1612.
Worden, M.S., Foxe, J.J., Wang, N., and Simpson, G.V. (2000). Anticipatory bi-
asing of visuospatial attention indexed by retinotopically specific alpha-band
electroencephalography increases over occipital cortex. J. Neurosci. 20,
RC63.
Wyart, V., and Tallon-Baudry, C. (2008). Neural dissociation between visual
awareness and spatial attention. J. Neurosci. 28, 2667–2679.
Neuron 60, 709–719, November 26, 2008 ª2008 Elsevier Inc. 719