Neuromechanics of the lower limb - Implications for ACL injury ...
480
Neuromechanics of the Lower Limb: Implications for ACL Injury Prevention Aaron S. Fox Bachelor of Exercise and Sports Science (Honours) Submitted in fulfilment of the requirements for the degree of Doctor of Philosophy Deakin University June, 2016
-
Upload
khangminh22 -
Category
Documents
-
view
2 -
download
0
Transcript of Neuromechanics of the lower limb - Implications for ACL injury ...
Neuromechanics of the Lower Limb: Implications for ACL Injury Prevention
Aaron S. Fox Bachelor of Exercise and Sports Science (Honours)
Submitted in fulfilment of the requirements for the degree of Doctor of Philosophy
Deakin University June, 2016
parisr
Redacted stamp

parisr
Redacted stamp

i
Acknowledgements
There are a number of people I wish to thank and acknowledge for their
contribution to the undertaking and completion of this thesis.
Special thanks must go to the coaches and players from clubs in the Geelong
Netball League (Geelong West St. Peters, Grovedale, Newtown and Chilwell,
and St. Mary’s) and Geelong District Netball League (Bannockburn, Bell Post
Hill, Geelong West and Thomson) who willingly gave their time to participate
in this research.
I would like to thank our laboratory technicians Mr. David Gleadon and Mr.
Ryan Pane for their technical assistance during data collection. The phrases
“Hey Dave / Ryan …” coupled with “X is broken” or “X isn’t working” became
consistent parts of my vocabulary over the last four years. Without your
assistance on a number of technical issues I would likely still be stuck
collecting data rather than acknowledging you here. I would also like to thank
Mr. Daniel Brown, Ms. Emily Gleeson and Ms. Alex Bauer for giving up their
time to help with data collection.
The time spent completing this thesis would not have been the same without
the group of fellow postgraduate students at Deakin. Even during stressful
times or setbacks, a simple chat over coffee or lunch was enough to reset and
keep going. Thank you for giving me a number of memorable moments over
the last four years.
I would like to express my sincerest gratitude towards my supervisors for their
expertise, guidance and support over the last four years. I have been lucky
enough to be surrounded by a supervisory team that has provided numerous
opportunities to continually learn and improve.

ii
To Dr. Scott McLean, thank you for the opportunity to visit and work with the
team in the Human Performance Laboratory at the University of Michigan.
The knowledge and skills I gained in the four months I spent working at
Michigan was vital in shaping this thesis.
To Dr. Jason Bonacci, your assistance during the last four years has been
invaluable. Thank you for sharing your knowledge and expertise in all things
biomechanics. Your persistence for perfection in a number of areas has made
me a better researcher, and for that I will always be grateful. Most of all, I will
never again write a cover letter without hearing your voice in the back of my
mind.
Lastly, to Dr. Natalie Saunders, had I not made the decision to work with you
on a simple Honours project years ago I would not be the same person I am
today. You have always encouraged me to meet challenges head on and given
me a sense of belief in what I can achieve. I am certain this thesis would not
have been the same without your supervision and guidance. I cannot thank
you enough for the investment you have made in me over the years.
iii
List of Publications
Fox AS, Bonacci J, McLean SG, Saunders N. Efficacy of ACL injury risk
screening methods in identifying high-risk landing patterns during a sport-
specific task. Scand J Med Sci Sports. doi: 10.1111/sms.12715.
Fox AS, Bonacci J, McLean SG, Spittle M, Saunders N. A systematic evaluation
of field-based screening methods for the assessment of anterior cruciate
ligament (ACL) injury risk. Sports Med. 2016; 46(5): 715-35.
Fox AS, Bonacci J, McLean SG, Spittle M, Saunders N. What is normal? Female
lower limb kinematic profiles during athletic tasks used to examine ACL
injury risk: A systematic review. Sports Med. 2014; 44(6): 815-32.
iv
List of Conference Presentations Presenter Underlined
Fox A, Bonacci J, McLean S, Saunders N. Exploring individual adaptations to
an anterior cruciate ligament injury prevention program. Paper accepted for
presentation at the 2016 Sports Medicine Australia Conference, 12th – 15th October
2015, Melbourne, Victoria, Australia.
Fox A, Bonacci J, McLean S, Spittle M, Saunders N. Detecting biomechanical
adaptations in sport-specific landing patterns using field-based ACL injury
risk screening methods. Paper presented at the 2015 Australian Conference of
Science and Medicine in Sport, 21st – 24th October 2015, Sanctuary Cove,
Queensland, Australia.
Fox A, Bonacci J, McLean S, Spittle M, Saunders N. The relationship between
performance on a single-leg squat and leap landing task: Moving towards a
netball-specific ACL injury risk screening method. Paper presented at the XXV
Congress of the International Society of Biomechanics, 12th – 16th July 2015,
Glasgow, Scotland.
Fox A, Bonacci J, McLean S, Spittle M, Saunders N. Assessing the effectiveness
of field-based ACL injury risk screening methods in identifying high-risk
landing patterns during a sport-specific task. Paper presented at the XXV
Congress of the International Society of Biomechanics, 12th – 16th July 2015,
Glasgow, Scotland.
v
Fox A, Bonacci J, McLean S, Spittle M, Saunders N. The influence of muscular
activation profiles on lower limb biomechanics during a sport-specific task.
Paper presented at the 33rd International Conference on Biomechanics in Sports, 29th
June– 3rd July 2015, Poitiers, France.
Fox A, Bonacci J, Spittle M, Saunders N. A systematic evaluation of field-based
screening tools for anterior cruciate ligament injury risk. Paper presented at the
Asics Conference of Science and Medicine in Sport, 22nd – 25th October 2013, Phuket,
Thailand.

vi
Preface
The major components of this thesis have been presented as a compilation of
studies arranged into chapters (Chapters Four to Nine). A number of the
methods used across these studies are similar. Detailed descriptions of the
methods used can be found in the Methodology Overview chapter (Chapter
Three). To improve the overall readability and avoid repeating redundant
information, the individual study chapters only include a brief description of
the experimental procedures, and data collection and analysis methods used.
Where these brief descriptions are given, readers will be referred back to the
relevant section of the Methodology Overview chapter where the detailed
description can be found.
Readers viewing the electronic version of this thesis may take advantage of the
hyperlinks provided throughout. Where a section, page, table or figure is
referred to, this reference will contain a link to the relevant page.
Across the study chapters, limitations that apply specifically to the present
study will be discussed at the end of the respective chapter. Conversely,
limitations that are relevant across the majority of studies will be discussed
within the General Discussion chapter (Chapter Ten).

vii
Table of Contents
Acknowledgements ................................................................................................... i
List of Publications ................................................................................................ iii
List of Conference Presentations ......................................................................... iv
Preface ....................................................................................................................... vi
List of Tables ............................................................................................................. x
List of Figures ........................................................................................................ xiv
List of Abbreviations and Acronyms ................................................................. xxi
Abstract ................................................................................................................. xxiv
Chapter One: Introduction ..................................................................................... 1
1.1 Purpose ............................................................................................................. 5
1.2 Specific Aims and Hypotheses ...................................................................... 5
1.3 Significance of Research ................................................................................. 8
Chapter Two: Review of Literature ....................................................................... 9
2.1 Anterior Cruciate Ligament (ACL) Injuries................................................. 9
2.2 ACL Injury Risk Factors ............................................................................... 14
2.3 ACL Injury Prevention Programs ............................................................... 22
2.4 ACL Injury Risk Screening ........................................................................... 26
2.5 Netball ............................................................................................................. 27
2.6 Summary ......................................................................................................... 30
Chapter Three: Methodology Overview ............................................................ 33
3.1 Ethical Approval ............................................................................................ 33
3.2 Participants ..................................................................................................... 33
3.3 Experimental Procedures ............................................................................. 35
3.4 Data Collection and Analysis ...................................................................... 53
3.5 Statistical Analysis ......................................................................................... 79
viii
Chapter Four: Intra-Individual Anomalies in Muscle Activation during a
Landing Task ........................................................................................................... 89
4.1 Introduction .................................................................................................... 89
4.2 Methodology .................................................................................................. 91
4.3 Results ............................................................................................................. 96
4.4 Discussion ..................................................................................................... 103
4.5 Conclusions .................................................................................................. 114
Chapter Five: The Influence of Muscle Activation Profiles on Lower Limb
Biomechanics during a Landing Task .............................................................. 115
5.1 Introduction .................................................................................................. 115
5.2 Methodology ................................................................................................ 117
5.3 Results ........................................................................................................... 123
5.4 Discussion ..................................................................................................... 149
5.5 Conclusions .................................................................................................. 159
Chapter Six: Exploring Individual Adaptations to an Anterior Cruciate
Ligament Injury Prevention Program ............................................................... 160
6.1 Introduction .................................................................................................. 160
6.2 Methodology ................................................................................................ 163
6.3 Results ........................................................................................................... 173
6.4 Discussion ..................................................................................................... 199
6.5 Conclusions .................................................................................................. 214
Chapter Seven: A Systematic Evaluation of Field-Based Screening Methods
for the Assessment of Anterior Cruciate Ligament Injury Risk ................. 215
7.1 Introduction .................................................................................................. 215
7.2 Methodology ................................................................................................ 218
7.3 Results ........................................................................................................... 223
7.4 Discussion ..................................................................................................... 239
7.5 Conclusions .................................................................................................. 258
ix
Chapter Eight: Efficacy of Field-Based Anterior Cruciate Ligament Injury
Risk Screening Methods in Identifying High-Risk Landing Postures during
a Sport-Specific Task ........................................................................................... 260
8.1 Introduction .................................................................................................. 260
8.2 Methodology ................................................................................................ 263
8.3 Results ........................................................................................................... 273
8.4 Discussion ..................................................................................................... 282
8.5 Conclusions .................................................................................................. 290
Chapter Nine: The Relationship between Performance of a Single-Leg Squat
and Leap Landing Task: Moving Towards a Netball-Specific Anterior
Cruciate Ligament Injury Risk Screening Method ........................................ 291
9.1 Introduction .................................................................................................. 291
9.2 Methodology ................................................................................................ 295
9.3 Results ........................................................................................................... 300
9.4 Discussion ..................................................................................................... 307
9.5 Conclusions .................................................................................................. 313
Chapter Ten: General Discussion ..................................................................... 314
10.1 Summary ..................................................................................................... 314
10.2 Neuromuscular Contributions to ACL Injury Risk .............................. 317
10.3 ACL Injury Prevention Programs ........................................................... 318
10.4 Field-Based Screening Methods for ACL Injury Risk .......................... 320
10.5 Limitations .................................................................................................. 321
10.6 Conclusions ................................................................................................ 324
References .............................................................................................................. 326
Appendices ............................................................................................................ 368

x
List of Tables
Table 2.1 Internal knee moments produced by the major muscles
surrounding the knee joint at flexion angles between 20 and 50
degrees. ............................................................................................... 17
Table 3.1 Guidelines used for surface electrode placement. ........................ 59
Table 4.1 Summary of the number of 'normal' and anomalous trials across
individual participants. .................................................................... 99
Table 5.1 Information criterion indices used for model selection in the latent
profile analysis. ................................................................................ 121
Table 5.2 Summary of muscle activation profiles employed by individual
participants across trials. ................................................................ 125
Table 5.3 Effect sizes for statistically significant overall differences in
activation between muscles within muscle synergy one. .......... 128
Table 5.4 Effect sizes for statistically significant overall differences in
activation between muscles within muscle synergy two. ......... 129
Table 5.5 Effect sizes for statistically significant overall differences in
activation between muscles within muscle synergy three. ....... 130
Table 5.6 Mean (± SD) muscle synergy weighing coefficient values for the
three muscle activation profiles identified. ................................. 140
Table 5.7 Summary of differences identified by SPM1D post-hoc analyses
for hip joint rotations between the three muscle activation
profiles. .............................................................................................. 143

xi
Table 5.8 Summary of differences identified by SPM1D post-hoc analyses
for knee joint rotations between the three muscle activation
profiles. .............................................................................................. 144
Table 5.9 Summary of differences identified by SPM1D post-hoc analyses
for hip joint moments between the three muscle activation
profiles. .............................................................................................. 147
Table 5.10 Summary of differences identified by SPM1D post-hoc analyses
for knee joint moments between the three muscle activation
profiles. .............................................................................................. 148
Table 6.1 Characteristics of participants allocated to control and training
groups. .............................................................................................. 164
Table 6.2 Reported attendance to the injury prevention program for
participants in the training group. ................................................ 174
Table 6.3 Description of principal patterns (PPs) extracted from hip and
knee joint rotation data from the leap landing task. .................. 178
Table 6.4 Description of principal patterns (PPs) extracted from hip and
knee joint moment data from the leap landing task. .................. 179
Table 6.5 Mean (± SD) muscle synergy weighing coefficient values from the
leap landing task for the control and training groups from
baseline to six-weeks. ...................................................................... 182
Table 6.6 Effect sizes (Cohen’s d) for individual changes of participants in
the training group from baseline to six-weeks for muscle
weighing coefficient values in muscle synergy one. .................. 189
xii
Table 6.7 Effect sizes (Cohen’s d) for individual changes of participants in
the training group from baseline to six-weeks for muscle
weighing coefficient values in muscle synergy two. .................. 190
Table 6.8 Effect sizes (Cohen’s d) for individual changes of participants in
the training group from baseline to six-weeks for muscle
weighing coefficient values in muscle synergy three. ............... 191
Table 6.9 Effect sizes (Cohen’s d) for individual changes of participants in
the training group from baseline to six-weeks for hip and knee
joint rotation principal pattern (PP) scores. ................................. 192
Table 6.10 Effect sizes (Cohen’s d) for individual changes of participants in
the training group from baseline to six-weeks for hip and knee
joint moment principal pattern (PP) scores. ................................ 193
Table 6.11 Standard deviations of individual change scores from baseline to
six-weeks for the control and training groups across muscle
synergies one, two and three. ........................................................ 194
Table 6.12 Standard deviations of individual change scores from baseline to
six-weeks for the control and training groups for joint rotation
principal pattern scores. ................................................................. 195
Table 6.13 Standard deviations of individual change scores from baseline to
six-weeks for the control and training groups for joint moment
principal pattern scores. ................................................................. 196
Table 6.14 Effect sizes (Cohen’s d) for changes of ‘high-’ and ‘low-risk’ sub-
groups within the control and training groups from baseline to
six-weeks for knee abduction/adduction moment principal
pattern (PP) scores. .......................................................................... 198
xiii
Table 7.1 Considerations and questions for evaluating identified screening
methods. ............................................................................................ 222
Table 7.2 Search terms used and search results of the secondary literature
search. ................................................................................................ 224
Table 7.3 Extracted data for the identified field-based screening
methods. ............................................................................................ 234
Table 8.1 Operational definitions for Landing Error Scoring System
items. ................................................................................................. 268
Table 8.2 Operational definitions for Tuck Jump Assessment items. ....... 269
Table 8.3 Characteristics of participants allocated to ‘high-’ and ‘low-risk’
groups based on Landing Error Scoring System (LESS)
score. .................................................................................................. 275
Table 8.4 Characteristics of participants distributed to ‘high-’ and ‘low-risk’
groups based on Tuck Jump Assessment score. ......................... 279
Table 9.1 Descriptions of principal patterns (PPs) extracted from single-leg
squat hip, knee and ankle joint rotation data. ............................. 302
Table 9.2 Descriptions of principal patterns (PPs) extracted from leap
landing hip and knee joint rotation data. ..................................... 303
Table 9.3 Descriptions of principal patterns (PPs) extracted from leap
landing hip and knee joint moment data. .................................... 304
Table 9.4 Summary of correlations between single-leg squat joint rotation
and leap landing joint rotation principal patterns (PPs). .......... 305
Table 9.5 Summary of correlations between single-leg squat joint rotation
and leap landing joint moment principal patterns (PPs). .......... 306
xiv
List of Figures
Figure 3.1 Diagrammatic representation of the experimental flow of
recruited participants. ..................................................................... 35
Figure 3.2 Sagittal view of the leap landing task. .......................................... 36
Figure 3.3 Diagrammatic representation of the laboratory set-up and
instrumentation used for the leap landing task. ......................... 39
Figure 3.4 Sagittal view of the bilateral drop vertical jump-landing
task. .................................................................................................... 40
Figure 3.5 Diagrammatic representation of the laboratory set-up and
instrumentation used for the drop vertical jump-landing task. 41
Figure 3.6 Sagittal view of the tuck jump task. .............................................. 42
Figure 3.7 Diagrammatic representation of the laboratory set-up and
instrumentation used for the tuck jump task. ............................. 43
Figure 3.8 Starting position for the single-leg squat task. ............................ 43
Figure 3.9 Sagittal view of the single-leg squat task. .................................... 44
Figure 3.10 Diagrammatic representation of the laboratory set-up and
instrumentation used for the single-leg squat task. .................... 45
Figure 3.11 Visual feedback guidelines for safe and effective landing
technique used within the ‘Down 2 Earth’ injury prevention
program. ............................................................................................ 47
Figure 3.12 Variations in stationary jump-landing exercises used within the
‘Down 2 Earth’ injury prevention program. ................................ 49
Figure 3.13 Variations in directional jump-landing exercises used within the
‘Down 2 Earth’ injury prevention program. ................................ 50

xv
Figure 3.14 Variations in lunging exercises used within the ‘Down 2 Earth’
injury prevention program. ............................................................ 51
Figure 3.15 Variations in sport-specific landing exercises used within the
‘Down 2 Earth’ injury prevention program. ................................ 52
Figure 3.16 Image of Delsys Trigno parallel-bar surface electrode with
specially tailored adhesive skin interface attached. .................... 58
Figure 3.17 Locations of EMG surface electrodes for an example
participant. ........................................................................................ 58
Figure 3.18 Example processing framework for EMG data. .......................... 62
Figure 3.19 Illustration of muscle synergies. .................................................... 64
Figure 3.20 Marker locations and the stationary calibration pose used to
define a kinematic model comprised of seven skeletal segments
(pelvis; right and left thigh; right and left shank; and right and
left feet). ............................................................................................. 69
Figure 3.21 Illustration of sign conventions used to represent hip, knee and
ankle joint rotations about three rotational degrees of
freedom. ............................................................................................ 73
Figure 3.22 Illustration of the DBSCAN cluster analysis algorithm using a
minimum points value of one. ....................................................... 82
Figure 3.23 Examples of SPM curves. ................................................................ 86
Figure 4.1 Sagittal view of the leap landing task. .......................................... 92
Figure 4.2 A) Mean total variance accounted for ( ) relative to the
number of extracted muscle synergies. B) relative to
the number of extracted muscle synergies. .................................. 97

xvi
Figure 4.3 Normalised activation coefficients of the three muscle synergies
extracted from the factorisation of EMG data. ............................ 98
Figure 4.4 Mean and standard deviation of approach speeds across 'normal'
and anomalous trials. .................................................................... 100
Figure 4.5 Mean hip and knee joint rotations of ‘normal’ and anomalous
trials from initial contact (IC) to 150 ms post IC during the leap
landing task. ................................................................................... 101
Figure 4.6 Mean hip and knee joint moments of ‘normal’ and anomalous
trials from initial contact (IC) to 150 ms post IC during the leap
landing task. ................................................................................... 102
Figure 4.7 Individual participant example of muscle synergy weighing
coefficients from ‘normal’ and anomalous trials. ...................... 108
Figure 4.8 Individual participant example of muscle activation waveform
data from ‘normal’ and anomalous trials. .................................. 109
Figure 5.1 Sagittal view of the leap landing task. ........................................ 118
Figure 5.2 Normalised activation coefficients of the three muscle synergies
extracted from the factorisation of EMG data. .......................... 124
Figure 5.3 Mean electromyography (EMG) waveform data of the three
muscle activation profiles from 150 milliseconds (ms) prior to
initial contact (IC) through to 300ms post IC during the leap
landing task. ................................................................................... 126
Figure 5.4 Muscle synergy weighing coefficient values for MAP-1. ........ 131
Figure 5.5 Muscle synergy weighing coefficient values for MAP-2. ........ 133
Figure 5.6 Muscle synergy weighing coefficient values for MAP-3. ........ 135

xvii
Figure 5.7 Muscle synergy weighing coefficient values for the three muscle
activation profiles identified. ....................................................... 139
Figure 5.8 Mean and standard deviation of approach speed for the three
muscle activation profiles. ............................................................ 141
Figure 5.9 Mean hip and knee joint rotations of the three muscle activation
profiles from initial contact (IC) through to 150 milliseconds (ms)
post IC during the leap landing task........................................... 142
Figure 5.10 Mean hip and knee joint moments of the three muscle activation
profiles from initial contact (IC) through to 150 milliseconds (ms)
post IC during the leap landing task........................................... 146
Figure 6.1 Sagittal view of the leap landing task. ........................................ 165
Figure 6.2 Visual feedback guidelines for safe and effective landing
technique used within the ‘Down 2 Earth’ injury prevention
program. .......................................................................................... 166
Figure 6.3 A) Mean total variance accounted for ( ) relative to the
number of extracted muscle synergies. B) relative to
the number of extracted muscle synergies. ................................ 175
Figure 6.4 Normalised activation coefficients of the three muscle synergies
extracted from the factorisation of EMG data. .......................... 176
Figure 6.5 Mean (± SD) muscle synergy weighing coefficient values from
the leap landing task for the control and training groups from
baseline to six-weeks. .................................................................... 181
Figure 6.6 Mean EMG waveform data from 150 ms prior through to 300 ms
post initial contact (IC) during the leap landing task for the
control and training groups at baseline and six-weeks. ........... 183
xviii
Figure 6.7 Mean hip and knee joint rotations from initial contact (IC)
through to 150 ms post IC during the leap landing task for the
control and training groups at baseline and six-weeks. ........... 185
Figure 6.8 Mean hip and knee joint moments from initial contact (IC)
through to 150 ms post IC during the leap landing task for the
control and training groups at baseline and six-weeks. ........... 186
Figure 6.9 Individual changes of participants in the training group from
baseline to six-weeks for gastrocnemius weighing coefficient
values from muscle synergy one. ................................................ 203
Figure 6.10 Individual changes of participants in the training group from
baseline to six-weeks for medial hamstrings weighing coefficient
values from muscle synergy three. ............................................. 205
Figure 6.11 Individual changes of participants in the training group from
baseline to six-weeks for hip internal (IR) / external (ER) rotation
principal pattern (PP) two PP-Scores. ......................................... 207
Figure 6.12 Mean knee abduction / adduction moment from initial contact
(IC) through to 150 ms post IC during the leap landing task for
the ‘high-’ and ‘low-risk’ sub-groups from the training group at
baseline and six-weeks. ................................................................. 209
Figure 7.1 Diagrammatic representation of search strategy results and
study selection process. ................................................................. 226
Figure 7.2 Demonstration of the jump-landing task used for the Landing
Error Scoring System. .................................................................... 227
Figure 7.3 A) Specifically developed nomogram sheet for use with the
Clinic-Based Algorithm. B) Completed example of nomogram to
predict probability of high knee loads. ....................................... 230

xix
Figure 7.4 Example of trials deemed as “high-risk” (left) and “low-risk” as
per the Observational Screening of Dynamic Knee Valgus
(OSDKV) method guidelines. ...................................................... 231
Figure 7.5 Demonstration of the jump-landing task used for the Tuck Jump
Assessment. .................................................................................... 232
Figure 8.1 Sagittal view of bilateral drop vertical jump-landing task. ..... 265
Figure 8.2 Sagittal view of the tuck jump task. ............................................ 265
Figure 8.3 Sagittal view of the leap landing task. ........................................ 265
Figure 8.4 Histogram illustrating the distribution of Landing Error Scoring
System (LESS) scores across the participants examined. ......... 273
Figure 8.5 Relationship between Landing Error Scoring System (LESS)
score and knee flexion during the leap landing task. ............... 274
Figure 8.6 Mean hip and knee joint rotations from initial contact (IC)
through to 150 milliseconds (ms) post IC during the leap landing
task of participants allocated as ‘high-’ and ‘low-risk’ based on
Landing Error Scoring System (LESS) score. ............................. 276
Figure 8.7 Mean normalised hip and knee joint moments from initial
contact (IC) through to 150 milliseconds (ms) post IC during the
leap landing task of participants allocated as ‘high-‘ and ‘low-
risk’ based on Landing Error Scoring System (LESS) score. ... 277
Figure 8.8 Histogram illustrating the distribution of Tuck Jump Assessment
scores across the participants examined..................................... 278

xx
Figure 8.9 Mean hip and knee joint rotations from initial contact (IC)
through to 150 milliseconds (ms) post IC during the leap landing
task of participants allocated as ‘high-’ and ‘low-risk’ based on
Tuck Jump Assessment (TJA) score. ........................................... 280
Figure 8.10 Mean normalised hip and knee joint moments from initial
contact (IC) through to 150 milliseconds (ms) post IC during the
leap landing task of participants allocated as ‘high-’ and ‘low-
risk’ based on Tuck Jump Assessment (TJA) score. .................. 281
Figure 8.11 Histogram illustrating the distribution of values for A) knee
flexion at initial contact; B) peak knee flexion; C) knee abduction
at initial contact; D) peak knee abduction; E) peak knee
abduction moment; and E) peak knee internal rotation moment
during the leap landing task. ....................................................... 286
Figure 9.1 Sagittal view of the single-leg squat task. .................................. 296
Figure 9.2 Sagittal view of the leap landing task. ........................................ 296
xxi
List of Abbreviations and Acronyms
1D One-dimensional
2D Two-dimensional
3D Three-dimensional
6W Six-weeks
% MVC Percentage of maximal voluntary contraction
ABD Abduction
ACL Anterior cruciate ligament
ADD Adduction
AIC Akaike information criterion
ANOVA Analysis of variance
ATS Anterior tibial shear
BIC Bayesian information criterion
BL Baseline
CCA Canonical correlations analysis
d Cohen’s d effect size
D2E Down 2 Earth
DBSCAN Density-based spatial clustering of applications with noise
DoF Degrees of freedom
EMG Electromyography
ER External rotation
EXT Extension
FLEX Flexion
xxii
FMS Functional Movement Screen
FPPA Frontal plane projection angle
GAS Gastrocnemius
GMAX Gluteus maximus
GMED Gluteus medius
GRF Ground reaction force
HSD Honest Significant Difference test
IC Initial contact
ICC Intra-class correlation coefficient
iLESS i-Landing Error Scoring System
IR Internal Rotation
JCS Joint coordinate system
κ Kappa statistic
LESS Landing Error Scoring System
LESS-RT Landing Error Scoring System Real-Time
LHAM Lateral hamstrings
LPA Latent profile analysis
MANOVA Multivariate analysis of variance
MAP Muscle activation profile
MHAM Medial hamstrings
MVICs Maximal voluntary isometric contractions
η2 Eta-squared effect size
NMF Non-negative matrix factorisation
NPV Negative predictive value
xxiii
OA Osteoarthritis
OSDKV Observational Screening of Dynamic Knee Valgus
PCA Principal component analysis
PEA Percentage of exact agreement
pKAM Peak knee abduction moment
PPV Positive predictive value
QuadHam Quadriceps-to-hamstrings strength ratio
r Pearson’s correlation coefficient
RF Rectus femoris
RMSE Root mean square error
ROM Range of motion
SEM Standard error of the mean
SPM Statistical Parametric Mapping
SPM1D One-dimensional Statistical Parametric Mapping
VAF Variance accounted for
VL Vastus lateralis
VM Vastus medialis

xxiv
Abstract
Injuries to the anterior cruciate ligament (ACL) occur most frequently during
sports which require the performance of high-risk tasks, such as landing and
side-step cutting. These injuries occur at a disproportionate rate in females
compared to males. ACL injuries are associated with a number of adverse
short- and long-term consequences. Understanding the underlying
mechanisms and modifiable risk factors surrounding ACL injury, with the
ultimate objective to promote prevention, is imperative. The overall purpose
of this thesis was to explore three inter-related areas relating to ACL injury
prevention in a cohort of sub-elite female netball players. Neuromuscular
contributions to ACL injury risk during the performance of a high-risk landing
task, the effect of an ACL injury prevention program on individual
neuromuscular and biomechanical adaptations, and the efficacy of field-based
ACL injury risk screening methods were explored.
Poor or inadequate neuromuscular control (i.e. the interaction between the
neural and muscle systems which coordinate and control movement) is often
considered a primary risk factor for ACL injury. Neuromuscular control can
be modified via training, hence an improved understanding of neuromuscular
contributions to ACL injury risk can assist in the design of targeted injury
prevention programs. The first two studies of this thesis focused on this area.
Electromyography and biomechanical data from the lower limb were collected
during repeat performances of a high-risk landing task. The findings from
these studies further the notion that neuromuscular control can vary from one
performance to the next. Anomalies in neuromuscular control (i.e. deviations
from an individual’s typical or usual muscle activation profile) were found
across repeat trials of the high-risk landing task, while the use of different
Abstract
xxv
muscle activation profiles across trials was also identified. In general, the
presence of neuromuscular anomalies did not influence lower limb
biomechanics during landing. Specific activation characteristics within each of
the profiles identified were linked to biomechanical deficits associated with
ACL loading and injury risk. Tailored injury prevention programs targeting
these deficits in muscle activation may induce more beneficial neuromuscular
adaptations for reducing ACL injury risk.
Variable neuromuscular and biomechanical adaptations have been shown to
occur across individuals subsequent to neuromuscular training. Despite this,
individual responses to ACL injury prevention programs have received little
attention. The third study of this thesis focused on the individual
neuromuscular and biomechanical responses to an ACL injury prevention
program. Electromyography and biomechanical data from the lower limb
were collected during repeat performances of a high-risk landing task at two
testing sessions, separated by a six-week period. During the six-week period,
a control group continued their regular training practices while a training
group undertook a six-week injury prevention program. The training program
induced a number of neuromuscular and biomechanical adaptations during
the high-risk landing task. However, examination of individual data revealed
dissimilar and inconsistent responses to the training. Despite the inconsistent
responses, individuals demonstrating a pre-existing high-risk movement
strategy (large peak knee abduction moments) demonstrated the largest
changes in frontal plane knee moments during landing. This likely stemmed
from the injury prevention program specifically targeting movement
strategies associated with frontal plane knee moments. These findings
provided further evidence that tailored injury prevention programs targeting
Abstract
xxvi
high-risk neuromuscular or biomechanical strategies may be the most effective
in reducing ACL injury risk.
The ability to identify athletes at-risk of ACL injury appears to be an important
step in maximising the effectiveness of targeted ACL injury prevention
programs. Screening methods that can be completed in field or clinical settings
offer the most viable option for ACL injury risk screening in the wider
community. The final three studies of this thesis focused on identifying the
optimal method(s) for field-based evaluation of ACL injury risk. A systematic
review conducted as part of this thesis found minimal evidence supporting
the use of field-based ACL injury risk screening methods for predicting future
ACL injuries. In addition, it was noted that the ability of field-based screening
methods to detect high-risk lower limb biomechanics during sport-specific
tasks known to cause ACL injuries was yet to be explored. The following study
subsequently explored the efficacy of two field-based ACL injury risk
screening methods (the Landing Error Scoring System and Tuck Jump
Assessment) in identifying lower limb biomechanics consistent with increased
ACL loading or injury risk during a high-risk sport-specific landing task.
Athletes were screened using the two aforementioned methods, while lower
limb biomechanical data were collected during the high-risk sport-specific
landing task. Minimal relationships were evident between scores obtained
from the screening methods and lower limb biomechanics from the sport-
specific landing task. These findings suggested that the screening methods
examined may not be effective in identifying ACL injury risk in the sport-
specific context (i.e. netball) examined. It was proposed that the bilateral
nature of the athletic tasks used within the screening methods contributed to
these findings. Therefore, the final study of this thesis explored the
relationship between performance of a unilateral movement and a high-risk
Abstract
xxvii
netball-specific landing task. For this study, a single-leg squat was used as the
unilateral screening movement in order to examine its utility within netball-
specific ACL injury risk screening protocols. Lower limb biomechanical data
were collected during performance of a single-leg squat and netball-specific
landing task (leap landing). Performance during the single-leg squat was
linked to a number of biomechanical factors proposed to increase ACL loads
or injury risk during the netball-specific landing task. These findings
highlighted the potential of a single-leg squat to be incorporated within field-
based netball-specific ACL injury risk screening protocols. Identifying
movements that have better associations to sport-specific tasks associated with
ACL injuries may further aid in the development of appropriate ACL injury
risk screening methods across different sports and sporting populations.
The experimental and review studies undertaken as part of this thesis have
produced novel findings that can contribute to ACL injury prevention
practices. A number of findings across this thesis highlight the need for
tailored ACL injury prevention programs targeting neuromuscular and
biomechanical deficits that are relevant to the individual. Identifying
screening methods that are capable of detecting these deficits during sporting
tasks known to cause ACL injuries is a vital step in improving the design of
targeted ACL injury prevention programs. The single-leg squat was identified
as a potentially useful movement to be incorporated within netball-specific
ACL injury risk screening protocols. Further examination of simplistic
unilateral movements against other sport-specific tasks associated with ACL
injury may aid in ascertaining the optimal method(s) for ACL injury risk
screening across different sports or sporting populations.

1
Chapter One: Introduction
Anterior cruciate ligament (ACL) injury is a traumatic sports-related injury
that often occurs in the absence of contact with another player (i.e. noncontact).
Injuries to the ACL occur more frequently in sports which require frequent
high-risk sporting tasks, such as landing and cutting movements.[1] Further,
adolescent (e.g. high school) and adult females are frequently shown to incur
a higher rate of ACL injury than male counterparts.[2-7] A number of short- and
long-term consequences are associated with ACL injuries, including surgical
intervention, lengthy absence from competitive sport, and reduced
participation in or premature retirement from high-risk sports.[8-11] Even more
concerning are the risks of re-injury[12-14] and osteoarthritis (OA)
development[15-17] subsequent to sustaining an ACL injury. Previous injury
dramatically increases the risk of future ACL injury in both the previously
injured and uninjured limb.[12-14] Early onset OA (athletes aged 30-50 years)
often presents in athletes who have sustained an injury to the ACL, with
associated pain, functional limitations and decreased quality of life.[16-19]
Understanding the underlying mechanisms and risk factors surrounding ACL
injury, with the ultimate objective to promote prevention, is imperative.
Extensive studies[20-29] have elucidated biomechanical mechanisms that load
the ACL and subsequently increase the potential for ACL injury during high-
risk sporting tasks.[30] Collectively, these works demonstrate that increases in
ACL loads can occur from biomechanical deficits in the sagittal, frontal and
transverse planes. However, multi-planar loading of the knee results in the
largest increases in ACL loads.[20-22, 31, 32] ACL injuries are therefore considered
to occur from altered biomechanics across multiple planes rather than
Introduction
2
biomechanical deficiencies in a singular plane alone.[33] In contrast, less is
known regarding the underlying neuromuscular contributions to ACL injury
risk or injury occurrences. The extensive knowledge of lower limb
biomechanics that contribute to increased ACL loading and injury provides a
useful framework to investigate neuromuscular control and ACL injury.
Neuromuscular control refers to the interaction between the neural and
muscle systems which coordinate and control movement. Detecting muscle
activation characteristics that result in high-risk lower limb biomechanics
during sporting movements can aid in identifying potential neuromuscular
risk factors for ACL injury. Given muscle activation characteristics can be
altered via neuromuscular training,[34-45] the identification of neuromuscular
risk factors provides a basis for targeted ACL injury prevention strategies.[15]
A perplexing factor associated with noncontact ACL injuries is the ‘one-off’
nature in which they occur, where injuries are often sustained during sporting
tasks athletes have replicated safely countless times.[46] Given the
neuromuscular system’s role in controlling lower limb motion,[15, 47] it is
conceivable that a random intrinsic dysfunction within the neuromuscular
system contributes to the phenomenon of ‘one-off’ ACL injuries. The inherent
variability of the neuromuscular system[48-53] suggests that anomalies in
neuromuscular control may occur. The presence of these neuromuscular
anomalies during a high-risk task could render an athlete at-risk of ACL
injury. The concept of neuromuscular anomalies and their relation to lower
limb biomechanics and ACL injury risk is yet to be explored. Further, little is
known about the combined muscle activation characteristics (i.e. the overall
muscle activation profile) that contribute to the presence of lower limb
biomechanics linked to increased ACL loading and injury risk. Previous
studies attempting to link neuromuscular factors to lower limb biomechanics
Introduction
3
associated with ACL loading have tended to focus on discrete muscle
activation characteristics of specific muscles.[54-64] Further understanding of the
link between neuromuscular control and movement strategies consistent with
increase ACL loads or injury risk may aid in identifying neuromuscular
targets for ACL injury prevention programs.
Current injury prevention practice has proven successful in reducing ACL
injury rates[65-67] and altering biomechanical and neuromuscular factors
associated with ACL injury.[36, 39, 40, 43, 68-80] Despite the repeated success of injury
prevention programs, overall ACL injury rates have remained relatively
unchanged over time.[1, 2] ACL injury prevention programs appear effective in
reducing injury risk in the short-term, but seem to lack effectiveness in the
long-term.[81] Current consensus is that further research is required to enhance
our understanding and maximise the effectiveness of ACL injury prevention
practices.[30] While a plethora of studies have examined neuromuscular and
biomechanical responses to ACL injury prevention programs, the effect of
these programs on individual adaptations is often overlooked. The success of
ACL injury prevention programs is generally defined by an overall change in
the training group, in isolation or relative to a control group, with little
attention paid to individual responses. Non-uniform neuromuscular and
biomechanical adaptations have been found across individuals in response to
the same training stimulus.[71, 82, 83] Failure to examine responses at the
individual level may mask beneficial or detrimental adaptations obtained by
certain individuals,[82] impacting our knowledge of effective injury prevention
practice. Understanding how different individuals respond to ACL injury
prevention programs will maximise our ability to implement interventions
that provide a benefit to all involved.

Introduction
4
Identifying athletes’ at-risk of ACL injury appears to be an important step in
maximising the effectiveness of ACL injury prevention programs. Female
athletes deemed as ‘high-risk’ have been found to receive a greater
prophylactic effect from neuromuscular training compared to ‘low-risk’
athletes.[84] Laboratory-based measures provide an accurate method to explore
biomechanical and neuromuscular deficiencies that may predispose an athlete
to ACL injury. This approach, however, requires extensive laboratory-based
equipment and training to complete, and is likely prohibitive to the majority
of the wider community. Field-based screening methods provide a more
accessible option for identifying dysfunctions that may lead to ACL injury.
Various field-based screening methods have been proposed for identifying
those at-risk of future ACL injury.[85-92] These methods vary in complexity from
the visual assessment of athletic tasks,[85, 86, 91, 92] to the use of a combination of
measures and algorithms[87, 88, 90] to predict ACL injury risk. While these
methods are designed for use by clinicians or the wider community, their
applicability for use in these settings is yet to be examined. The majority of
field-based screening methods show good agreement with laboratory-based
measures in identifying movement strategies that may contribute to increased
ACL injury risk.[87-91, 93, 94] However, generic bilateral athletic tasks (e.g. drop
vertical jump landings) have been used to validate these methods.[88, 90, 91, 93, 94]
The specificity of these movements to ACL injury risk could be considered
questionable. Previous work has shown generic athletic tasks do not
adequately represent those seen in a competitive sporting environment,[95, 96]
and nearly all noncontact ACL injuries occur during unilateral landing or
plant-and-cut manoeuvres.[97-100] In addition, ACL injuries appear to occur
during varying game situations and tasks across different sports.[5, 101-103]
Considering these factors, it is important that screening methods can identify
athletes’ who utilise high-risk movement strategies during unilateral sport-
Introduction
5
specific manoeuvres associated with ACL injuries. Examination of current
field-based screening methods against sport-specific movements known to
cause ACL injuries is therefore required. Further, there is evidence to suggest
that the predictive validity of screening methods varies across different
sporting populations.[104, 105] The development of sport-specific screening
methods may be an important consideration in improving ACL injury risk
screening protocols. Investigation of these areas will improve our
understanding of the optimal field-based methods for identifying athletes’ at-
risk of ACL injury in wider community settings.
1.1 Purpose
The overall purpose of this thesis was to explore three inter-related areas
relating to ACL injury prevention. First, the concepts of neuromuscular
anomalies and muscle activation profiles during the performance of a high-
risk sporting task were investigated. Second, the effect of an ACL injury
prevention program on individual neuromuscular and biomechanical
responses was explored. Finally, examination of existing field-based ACL
injury risk screening methods and a proposed sport-specific screening
movement was undertaken to determine their applicability for use in wider
community and sport-specific settings.
1.2 Specific Aims and Hypotheses
Specifically, the aims of each study included:
i. Determining whether intra-individual anomalies in muscle
activation profiles occurred during repeat performance of a high-risk
landing task, and if so, whether these neuromuscular anomalies
influenced lower limb biomechanics (Chapter Four).

Introduction
6
ii. Identifying the muscle activation profiles employed during a high-
risk landing task and their subsequent impact on lower limb
biomechanics linked to ACL loading or injury risk (Chapter Five).
iii. a. Investigating the effects of an ACL injury prevention program on
neuromuscular control and lower limb biomechanics during a
high-risk landing task at the group and individual level (Chapter
Six); and
b. Determining whether individuals’ deemed as ‘high-risk’ prior to
commencing training received a greater prophylactic benefit
from the ACL injury prevention program (Chapter Six).
iv. Systematically evaluating and comparing current field-based
screening methods for ACL injury risk to determine their efficacy of
use in wider community settings (Chapter Seven).
v. Examining the efficacy of two field-based screening methods for
ACL injury risk in identifying lower limb biomechanics consistent
with increased ACL loading or injury risk during a high-risk sport-
specific landing task (Chapter Eight).
vi. Determining the relationship between performance of a unilateral
task and a netball-specific landing task that has been associated with
ACL injuries, in order to examine the utility of including a single-leg
squat movement within netball-specific ACL injury risk screening
protocols (Chapter Nine).
It was hypothesised that:
i. Intra-individual anomalies in muscle activation profiles would
occur, and that anomalous activation profiles would result in lower
limb biomechanics consistent with increased ACL loads or injury
risk when compared to the remaining typical (i.e. ‘normal’) trials.

Introduction
7
ii. A number of different muscle activation profiles would be identified,
and that certain profiles would result in lower limb biomechanics
consistent with increased ACL loading and injury risk.
iii. a. The training group overall would benefit from the injury
prevention program as indicated by improvements in
neuromuscular and biomechanical risk factors associated with
ACL injury. However, variable responses to the program would
be observed across individuals within the training group; and
b. Individuals deemed as ‘high-risk’ for ACL injury would receive
a greater prophylactic benefit from the training.
iv. Current screening methods would include criteria appropriate for
identifying movement strategies associated with ACL injury risk,
however, would have a limited ability to predict future ACL injuries.
Some of the screening methods would be more applicable for use in
wider community settings than others due to having minimal
equipment and time requirements to complete.
v. Due to the generic bilateral nature of the screening movements,
scores obtained from the screening methods examined would have
no relationship to the lower limb biomechanics from the sport-
specific high-risk landing task.
vi. Lower limb biomechanical patterns from the unilateral task would
be associated with hip and knee biomechanical patterns from the
netball-specific landing task.
Introduction
8
1.3 Significance of Research
This research will further knowledge surrounding the neuromuscular
contributions to ACL injury risk by identifying the muscle activation
characteristics that contribute to the presence of lower limb biomechanics
known to increase ACL loads and injury risk. Identification of these
neuromuscular factors will aid in the design of ACL injury prevention
programs that target deficits in neuromuscular control. Currently, the effect of
ACL injury prevention programs at the individual level is not well
understood, particularly with regard to adaptations in muscle activation
characteristics. It is possible that athletes do not respond similarly to injury
prevention programs and analysis of group data may mask this.
Understanding how different individuals respond to an identical ACL injury
prevention program will enhance our ability to design programs that provide
a benefit for all involved. While laboratory-based measures provide the ability
to identify biomechanical and neuromuscular risk factors for ACL injury, these
are not as applicable or accessible to the wider community. It is important that
screening methods applicable for wider community use can identify athletes
who employ movement strategies that increase ACL loads or injury risk
during high-risk sporting tasks. Identifying optimal field-based methods for
detecting high-risk movement strategies during sporting tasks associated with
ACL injury will provide evidence for the use of screening methods in wider
community settings.
9
Chapter Two: Review of Literature
2.1 Anterior Cruciate Ligament (ACL) Injuries
2.1.1 Consequences of ACL Injury
Injury to the ACL results in adverse short- and long-term consequences.
Surgical repair, comprehensive rehabilitation, and a lengthy absence from
sport are common short-term consequences experienced by athletes.[16, 106, 107]
Proposed long-term consequences of an ACL injury include reduced
participation rates in high-risk sports and a high rate of early athletic
retirement.[11] More concerning, however, is the elevated risk of developing
early onset osteoarthritis (OA) following an ACL injury.[16, 17, 108, 109] While sports
participation in itself increases the risk of developing OA later in life, previous
joint injury further enhances this risk.[110] Injury to the ACL increases joint
instability and alters movement at the knee, placing the individual at risk for
development of OA.[111]
A 12-year follow-up of 67 ACL-injured female soccer players found that 82%
of players had developed osteoarthritic changes.[17] Similarly, Maletius and
Mesner[112] reported that 84% of patients presented with radiographic changes
equivalent to OA 20-years post ACL rupture. Recent reviews by Oiestad et
al.[113] and Claes et al.[19] suggest these percentages may overestimate the
prevalence of knee OA following ACL injury or reconstruction. Oiestad et
al.[113] reported a prevalence of 26% for patellofemoral osteoarthritis 12-years
after ACL injury. This value, however, may underestimate the prevalence of
OA as only patellofemoral OA was reported. The inclusion of tibiofemoral OA,
which has also been shown to present in ACL-injured individuals,[17, 114] may

Review of Literature
10
increase this prevalence. A meta-analysis including a total of 1554 subjects
found knee OA in 16.4% of subjects who underwent ACL reconstruction, and
increased to 50.4% in subjects who underwent combined ACL reconstruction
and meniscectomy.[19] These values, again, may underestimate the overall
prevalence of OA as only individuals treated surgically were included.
Conservative, non-surgical treatment is also an option following ACL
injury,[115] and those who opt for this treatment may also experience OA later
in life.[114] Whether or not past reported values have overestimated the
prevalence of OA following ACL injury, the development of knee OA has been
identified in athletes as young as 30 years of age, and by the age of 50 many
athletes require knee osteotomy or arthroplasty to repair the damage.[17] These
long-term consequences can lead to pain and functional limitations, resulting
in a decreased quality of life.[16-18, 116, 117]
An additional consequence surrounding ACL injuries is the associated risk of
re-injury.[14, 118] Paterno et al.[12-14] examined the incidence of ACL re-injury and
found the risk was 15 times greater in those with a history of ACL
reconstruction compared to matched controls. This effect appeared to be
magnified in females, with the risk of a second ACL injury approximately four
times greater for females compared to males.[14] The increased risk of re-injury
is not only limited to the initially affected limb. After an initial injury, the
contralateral limb appears to be at an even greater risk than the previously
injured limb.[13, 14] The risk of suffering a contralateral ACL injury has been
reported as being greater than that of sustaining a first time ACL injury.[12]
Primary prevention of injury is the most effective means for avoiding the
future disabilities associated with ACL injuries.[15] Given the adverse
consequences and high-risk of re-injury associated with injuries to the ACL,
Review of Literature
11
there is a need to understand and develop effective injury prevention
strategies.
2.1.2 Sex Bias in ACL Injury Rates
A sex bias exists in the rate of noncontact ACL injuries, with adolescent (e.g.
high school) and adult females consistently experiencing this type of injury at
a higher rate than male counterparts.[1, 2, 4-7, 119] Despite the vast amount of
targeted research and injury prevention initiatives, ACL injury rates and the
associated sex disparity have not changed in recent times.[1, 2] Agel et al.[2]
found the rate of noncontact ACL injuries experienced by female collegiate
basketball and soccer athletes remained consistent over a 13-year period.
Similarly, Hootman et al.[1] found the yearly rate of ACL injuries to be
consistent across 16-years of collegiate injury data from 15 sports.
A number of studies have compared sexes during high-risk sporting tasks in
an attempt to understand why females are at greater risk of ACL injury.[59, 120-
135] Compared to males, females often exhibit different neuromuscular and
biomechanical strategies during cutting and landing tasks, including; greater
activation of the quadriceps relative to the hamstrings,[129, 130] greater lateral to
medial quadriceps activation,[131] reduced preparatory activation of the
hamstrings,[120] reduced muscle activity durations,[132] reduced hip and knee
flexion,[121, 133, 134, 136-138] greater knee abduction angles[122, 135, 137-148] and moments,[59,
122, 149] greater energy absorption in the frontal plane,[150] and greater peak tibial
rotations.[129, 151] While it is tempting to hypothesise that the sex-bias in ACL
injury risk could be diminished by shifting females towards male
neuromuscular and biomechanical strategies, the underlying assumption that
the male strategy is ‘ideal’ for protection against injury may be erroneous.[152]
Various structural differences exist between males and females, particularly

Review of Literature
12
through the lower limb, and females may need to employ adapted
neuromuscular or biomechanical strategies to accommodate these structural
differences.[152] While altered neuromuscular control and movement strategies
in females may contribute to their increased risk of injury, it is plausible that
they represent a compensatory mechanism to accommodate for joint
mechanical variations.[152] Rather than drawing conclusions from sex
comparisons, future research should have an isolated focus on sex to identify
the sex-specific factors underpinning ACL injury risk. While both sexes
experience ACL injuries, an emphasis on females may be more imperative due
to their higher rate of ACL injury.[1, 2, 4-7, 119] Increasing our understanding of
sex-specific factors relating to ACL injury risk and prevention may aid in
bridging the gap in ACL injury rates between sexes.
2.1.3 Sporting Movements Associated with ACL Injury
Landing and/or performing a directional change have been identified as the
primary sporting movements associated with noncontact ACL injury.[5, 97-100, 102,
103] Visual observation of ACL injuries have identified side-step cutting or
landing following a jump as the predominant tasks being performed when
injuries occur.[5, 98-100, 102, 103] The rapid deceleration associated with these high-
risk tasks is thought to be a contributing factor to the injury.[55, 153] Taking this
into consideration, it is not surprising that the highest incidence of ACL
injuries are seen in sports that incorporate these movements, such as American
football, Australian Rules football, basketball, handball, and netball.
While the mechanism for noncontact ACL injuries appear similar across
sports,[98, 99] the tasks being performed in the lead up or at the injury event may
differ. Myklebust et al.[5] reported 19 of 23 noncontact ACL injuries observed
over three consecutive handball seasons occurred during faking or cutting

Review of Literature
13
movements while in possession of the ball. In contrast, ACL injuries in netball
and basketball have been more frequently observed during landing rather
than cutting manoeuvres.[98, 103] Within Australian Rules football, a
combination of landing and cutting movements contribute to the majority of
noncontact ACL injuries.[102] The different tasks that result in ACL injuries
across sports likely share similar characteristics regarding the position and
joint loading of the lower limb, however, the goals of the athlete and lead up
to the task being performed are inherently different. Sport-specific variations
in athletic manoeuvres can have a modulating effect on lower limb
biomechanics.[154, 155] In addition, simplistic athletic tasks (such as bilateral drop
landings and drop vertical jumps) do not reflect the lower limb biomechanical
demands of sport-specific tasks.[95, 96] Considering these factors, examining
sport-specific tasks that contribute to ACL injuries appears pertinent to
increasing our understanding of ACL injury mechanisms and risk factors
across a range of sports.
2.1.4 The ‘One-Off’ Phenomenon
A perplexing factor associated with noncontact ACL injuries is the ‘one-off’
nature in which they occur, where injuries are sustained during sporting tasks
athletes have replicated safely countless times.[46] High-risk sporting tasks
associated with ACL injury are frequently performed during sports in which
ACL injuries are known to occur,[156, 157] yet ACL injuries occur at a much lower
rate. It is conceivable that a random intrinsic dysfunction is the inciting event
for these ‘one-off’ ACL injury occurrences. Considering the neuromuscular
system’s role in controlling the lower limb,[15, 47] anomalies in neuromuscular
control may be a contributing factor to these ‘one-off’ injury occurrences.
Understanding whether anomalies in neuromuscular control occur, and if so,
whether they influence lower limb biomechanics during high-risk sporting
Review of Literature
14
tasks may yield valuable information regarding neuromuscular contributions
to ACL injury risk.
2.2 ACL Injury Risk Factors
There is consensus that ACL injuries are multifactorial in nature,[30, 153] with risk
factors generally categorised as non-modifiable (e.g. anatomical/structural,
hormonal, and genetic risk factors) or modifiable (skill-level, shoe-surface
interaction, biomechanical, and neuromuscular risk factors). Although ACL
injuries likely result from an interaction between multiple factors, research
should be directed towards those that have the potential to be modified.[15] The
following section will focus on the biomechanical and neuromuscular factors
associated with ACL injury risk, as these offer the most modifiable means for
injury prevention strategies.[15, 158]
2.2.1 Biomechanical Risk Factors
Injuries to the ACL occur when forces applied to the ligament are greater than
the loads it can withstand.[158] A number of biomechanical factors related to
lower limb motions and loads have been linked to increases in ACL loading
or noncontact ACL injury risk.[20-29]. ACL injuries have been observed to occur
with a forceful valgus collapse and tibial rotation with the knee in a relatively
extended position.[98, 99, 159] Experimental studies support these observations,
where knee valgus and internal rotation moments,[20-23] reduced knee flexion,[20,
24, 25] and large anterior tibial shear forces[26] have all been shown to increase
ACL loads.
‘Dynamic valgus’ and peak knee abduction moments during landing have
been identified as predictors of ACL injury in adolescent female athletes.[160] In
a prospective study of 205 athletes, those who went on to suffer an ACL injury
Review of Literature
15
exhibited greater knee valgus angles and peak knee abduction moments
during a bilateral drop vertical jump.[160] Positions of ‘dynamic valgus’ stem
from knee abduction (i.e. abduction of the tibia relative to the femur) combined
with hip adduction and internal rotation,[160-162] all of which have been
associated with peak knee moments during athletic tasks.[149, 163, 164] The
contribution of the hip to dynamic valgus positions suggests proximal joint
biomechanics also play an important role in the ACL injury mechanism. A
more erect lower limb posture (i.e. reduced hip and knee flexion) reduces the
capacity to attenuate or absorb forces at the knee.[165-167] Where insufficient
flexion is present, the passive joint restraints (e.g. the ACL) are required to take
up a greater portion of counteracting and stabilising joint loads.[20] During
jump landings, peak ACL strain occurs when knee flexion angles are lowest,[25]
and cadaveric data and simulations show greater increases in ACL loads in
response to external moments when knee flexion angles are reduced.[20, 24]
Large increases in ACL strain have also been reported with internal tibial
rotation.[20, 21] Although external tibial rotation results in minimal increases in
ACL strain,[20, 21] rotation in this direction has also been observed during ACL
injury occurrences.[99] Although distal mechanics may also have the potential
to influence motion at the knee, there is minimal evidence[168, 169] linking specific
ankle motions to increased ACL loading or injury risk.
While isolated sagittal, frontal and transverse plane factors are suggested to
increase ACL injury risk, combined knee loading across multiple planes
results in the largest ACL loads.[20-22, 31, 32] Due to this, ACL injuries are thought
to occur via a multi-planar mechanism.[33] A focus on this multi-planar
mechanism is required for the development of optimal injury prevention
strategies.[32] It is also important to acknowledge that while certain
biomechanical risk factors have been implicated in ACL injury, they are not

Review of Literature
16
the underlying causative factor. The neuromuscular system is fundamental in
controlling lower limb biomechanics,[15, 47] whereby the muscles provide
support against external loads[170-172] and contribute to joint stability during
dynamic tasks.[47, 173] Therefore, adequate muscle activation is essential in
counteracting potentially injurious loads being applied to the lower limb. The
presence of altered or poor neuromuscular control is likely to contribute to
lower limb biomechanics that increase ACL loads or injury risk during high-
risk sporting tasks. These resultant lower limb biomechanics should not be
considered as the underlying cause of ACL injury, but as a consequence of
neuromuscular dysfunction. Considering lower limb biomechanics are the
outcome of a given movement, they provide a means for which to link
neuromuscular dysfunction with potential increased ACL injury risk. Linking
neuromuscular dysfunctions to lower limb biomechanics known to increase
ACL loads or injury can aid in identifying neuromuscular contributions to
ACL injury and provide a practical target for injury prevention strategies.
2.2.2 Neuromuscular Risk Factors
As highlighted in the previous section, there is extensive knowledge
surrounding the movement strategies that contribute to ACL injury risk.
Considerable effort has also been applied to identifying the underlying
neuromuscular factors that contribute to the presence of potentially injurious
biomechanics during athletic tasks.[44, 56, 131, 134, 171, 174-181] Neuromuscular control
refers to the interaction between the neural and muscle systems which
coordinate and control movement. Altered or poor neuromuscular control of
the lower limb is recognised as a primary risk factor for ACL injury,
particularly in females.[15, 30, 47] The musculature surrounding the hip and knee
act to stabilise the lower extremity joints and provide support against external
loads.[171, 172] Based on their orientation and attachment sites, muscles in the
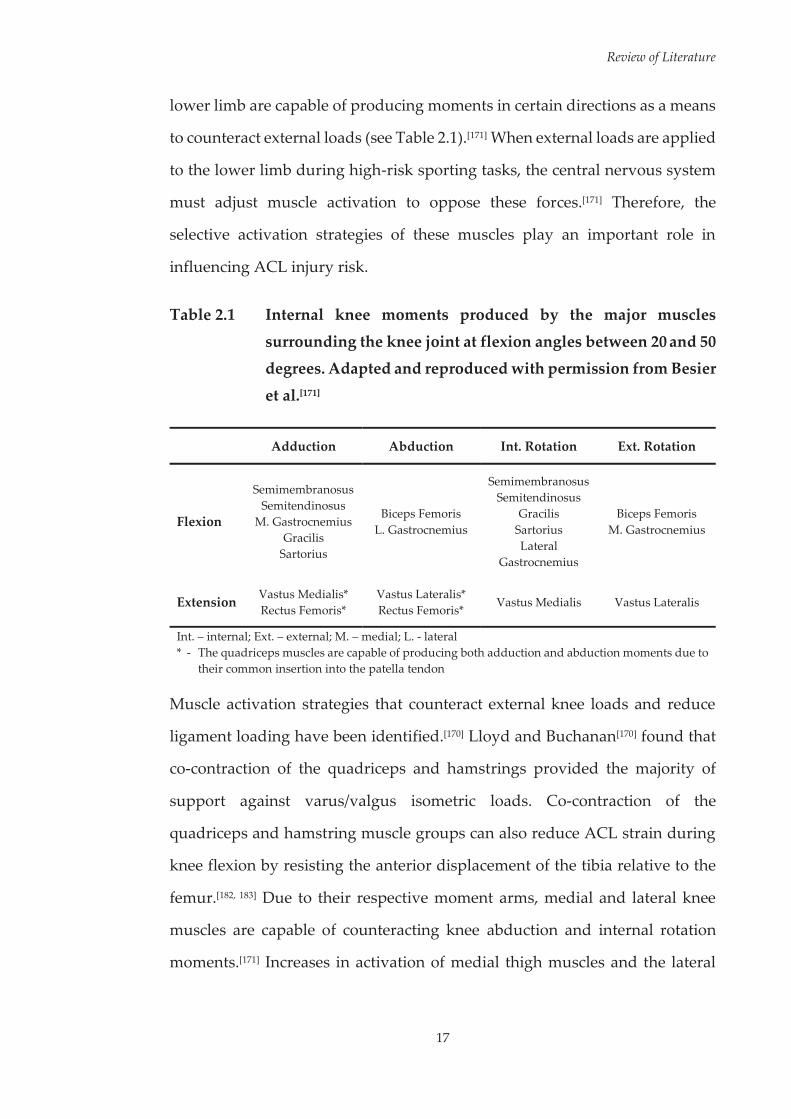
Review of Literature
17
lower limb are capable of producing moments in certain directions as a means
to counteract external loads (see Table 2.1).[171] When external loads are applied
to the lower limb during high-risk sporting tasks, the central nervous system
must adjust muscle activation to oppose these forces.[171] Therefore, the
selective activation strategies of these muscles play an important role in
influencing ACL injury risk.
Table 2.1 Internal knee moments produced by the major muscles
surrounding the knee joint at flexion angles between 20 and 50 degrees. Adapted and reproduced with permission from Besier
et al.[171]
Adduction Abduction Int. Rotation Ext. Rotation
Flexion
Semimembranosus Semitendinosus
M. Gastrocnemius Gracilis
Sartorius
Biceps Femoris L. Gastrocnemius
Semimembranosus Semitendinosus
Gracilis Sartorius Lateral
Gastrocnemius
Biceps Femoris M. Gastrocnemius
Extension Vastus Medialis* Rectus Femoris*
Vastus Lateralis* Rectus Femoris* Vastus Medialis Vastus Lateralis
Int. – internal; Ext. – external; M. – medial; L. - lateral * - The quadriceps muscles are capable of producing both adduction and abduction moments due to
their common insertion into the patella tendon
Muscle activation strategies that counteract external knee loads and reduce
ligament loading have been identified.[170] Lloyd and Buchanan[170] found that
co-contraction of the quadriceps and hamstrings provided the majority of
support against varus/valgus isometric loads. Co-contraction of the
quadriceps and hamstring muscle groups can also reduce ACL strain during
knee flexion by resisting the anterior displacement of the tibia relative to the
femur.[182, 183] Due to their respective moment arms, medial and lateral knee
muscles are capable of counteracting knee abduction and internal rotation
moments.[171] Increases in activation of medial thigh muscles and the lateral
Review of Literature
18
hamstrings have been observed during pre-planned side-step cutting to
counteract the large abduction and internal rotation moments, respectively,
experienced at the knee.[171] As the gastrocnemii are biarticular and span the
knee joint, selective activation of these muscles may also play a role in
protecting the knee and ACL.[184, 185] During unilateral landing simulations,
Morgan et al.[185] found elevated gastrocnemius forces were associated with
increased joint compression and reduced ACL forces. While a primary
function of the gastrocnemii is to produce plantarflexion, these findings
suggest its secondary function may be to co-contract with the quadriceps to
elevate joint compression and protect the ACL from external joint loading.[185]
The presence of selective activation strategies suggests the central nervous
system can alter muscle activation patterns as a means to protect the knee joint
from high external loads.[171]
Various elements of neuromuscular control have also been implicated in
increased ACL injury risk or linked to biomechanical factors associated with
ACL loading.[131, 174, 177, 178, 186-191] The preparatory activation strategies of lower
limb muscles appear important in modulating ACL injury risk, as dysfunction
in this area has been linked to ACL injuries[177, 186] and lower limb postures
associated with increased ACL loads.[174, 178] Individuals’ who demonstrate an
activation pattern of elevated preparatory activation of the vastus lateralis in
conjunction with reduced preparatory activation of the semitendinosus during
a side-step cutting manoeuvre are at increased risk of sustaining an ACL
injury.[177] Elevated preparatory activation of the lateral quadriceps and
hamstrings has also been linked to greater knee abduction angles during
landing.[187] Brown et al.[174] found during single-leg landings, greater
preparatory activation of the rectus femoris resulted in increased peak anterior
tibial shear force, while greater preparatory activation of the lateral hamstrings

Review of Literature
19
was associated with a reduction in knee flexion angle. A muscle activation
strategy of greater vastus medialis and gluteus maximus preparatory
activation, in conjunction with reduced biceps femoris and gastrocnemius
preparatory activation has also been linked to smaller knee flexion angles
during landing.[178] Greater preparatory and peak activations of the quadriceps
have been associated with increases in anterior tibial translation and shear
forces.[26, 174, 188] However, increased quadriceps forces in the preparatory phase
of landing may increase joint stability and limit ACL strains during the impact
phase.[192] Quadriceps preparatory activation could therefore be vital in
enhancing knee joint stability during dynamic single-leg tasks, and reducing
quadriceps activation may be an erroneous training goal within injury
prevention programs.[174] Targeting the degree and timing of hamstring muscle
activation may be a more appropriate method for reducing anterior tibial shear
forces and ACL strain during landing. Co-contraction of the hamstrings with
the quadriceps can reduce the forces experienced in the ACL by limiting
anterior tibial translations relative to the femur across a range of knee flexion
angles commonly experience during cutting and landing tasks.[182, 183] Reduced
preparatory activation of the hamstrings may result in lower hamstrings
contraction forces during the initial portion of ground contact, reducing knee
stability.[120] Hamstring muscle recruitment closer to initial landing contact
may also allow peak muscle activity to better coincide with peak tibial shear
forces, thereby protecting the ACL.[55]
In addition to preparatory activation strategies, muscle activation during the
landing or cutting phases of athletic tasks have also been linked to high-risk
lower limb biomechanics.[131, 189-191] A lateral or medial imbalance of the vastii
can generate frontal plane knee moments, owing to their respective frontal
plane moment arms.[170, 171] Compared to males, females have been shown to
Review of Literature
20
activate their vastus lateralis to a greater extent than their vastus medialis
during unanticipated cutting manoeuvres.[131] This activation strategy may be
a factor in the greater knee abduction angles and moments experienced by
females during cutting manoeuvres.[59, 131, 193] In addition; female athletes who
exhibit greater peak activity of the vastus lateralis, combined with a lower
medial to lateral quadriceps activity ratio during the landing phase of a drop
vertical jump have been found to exhibit reduced hip and knee flexion, and
higher peak knee abduction moments.[189] The proximal muscles of the lower
limb also play an important role in protecting the ACL during athletic tasks.
Hip muscle strength and neuromuscular control are cited as important factors
in limiting knee abduction angles and moments during cutting and landing
tasks.[57, 194-198] Lower hip abduction and external rotation isometric strength
have also been prospectively linked to an increased risk of ACL injury.[198]
These findings have relevant links to biomechanical factors associated with
ACL loading and injury risk. An inability to limit hip adduction and internal
rotation can result in a position of ‘dynamic valgus’ during landing.[162] The
gluteus maximus and medius play a role in controlling hip adduction and
internal rotation, therefore inadequate activation of these muscles may
contribute to a lower limb posture consistent with increased ACL injury
risk.[199] This is supported by experimental observations, where reduced levels
of gluteus maximus activation have been associated with greater knee
abduction during athletic tasks.[190, 191]
The combined activation strategies of lower limb muscles appears critical in
protecting the ACL from external loading during high-risk sporting tasks. The
muscles of the lower limb must therefore function in an appropriate manner
each time these tasks are performed to prevent ACL injuries from occurring.
High-risk tasks, such as landing and side-step cutting, are regularly performed
Review of Literature
21
during sports in which ACL injuries are known to occur.[156, 157] Muscle
activation may not be consistent across all of these performances, as a number
of activation patterns can be used when performing the same task.[200]
Considering the role of the neuromuscular system in protecting the ACL,
variations in an individual’s muscle activation profile may leave them
susceptible to injury. It is possible that unexpected alterations or ‘anomalies’
in muscle activation may be a contributing factor to the ‘one-off’ nature in
which noncontact ACL injuries occur. The presence of anomalies in muscle
activation profiles and their subsequent impact on lower limb biomechanics
during high-risk sporting tasks is yet to be investigated. Detecting whether
these neuromuscular anomalies present within repeat trials of a high-risk
sporting task and their influence on lower limb biomechanics could reveal
important information surrounding neuromuscular contributions to ACL
injury risk. Should these anomalies in muscle activation occur and contribute
to the presence of lower limb biomechanics linked to increased ACL loads, this
would provide a target for neuromuscular training protocols within ACL
injury prevention programs.
Furthermore, the link between the overall muscle activation profiles employed
during high-risk sporting tasks and their relation to lower limb biomechanics
is not well understood. Previous studies that have linked neuromuscular
factors to lower limb biomechanics associated with ACL loading have tended
to focus on discrete muscle activation characteristics. These studies examine
selective temporal and/or amplitude features of muscle activation data; such
as muscle onset timing,[54-56, 58] the timing and/or amplitude of peak muscle
activity,[55, 59, 63, 64] and muscle burst duration;[54, 55] with these data points often
isolated to individual muscles or muscle groups. An isolated approach on
specific activation characteristics of individual muscles or muscle groups fails
Review of Literature
22
to acknowledge the relationship between multiple muscles and their
combined activation characteristics. As there is no single muscle crossing the
knee capable of supporting the joint against injurious loads, activation
strategies comprising multiple muscles are required to reduce ACL injury risk
during athletic tasks.[161] Understanding the activation characteristics of
multiple muscles is therefore a key factor in preventing ACL injuries during
high-risk sporting tasks.[161] A comprehensive analysis of multiple lower limb
muscles will aid in identifying the specific muscle activation profiles
employed by athletes’ during high-risk sporting tasks. Concurrent
examination of how different activation profiles impact on lower limb
biomechanics known to increase ACL loads may provide valuable knowledge
regarding neuromuscular contributions to ACL injury risk. Multiple studies
have demonstrated the capacity of neuromuscular control to be modified via
neuromuscular training.[34-45] Therefore, an improved understanding of
neuromuscular contributions to ACL injury risk can assist in the design of
targeted and effective injury prevention programs.
2.3 ACL Injury Prevention Programs
Injury prevention programs aimed at reducing the incidence of ACL injuries
or modifying neuromuscular and biomechanical risk factors are prominent
throughout the literature.[5, 34-45, 65-69, 71-75, 79, 83, 166, 201-217] There is some evidence to
suggest that injury prevention programs can reduce ACL injury rates[5, 65-67] and
substantial support for the use of these programs in inducing neuromuscular
and biomechanical adaptations proposed to reduce ACL injury
risk.[34-45, 68, 69, 71-75, 79, 166, 201, 213-217] A recent meta-analysis[218] incorporating 14
studies[5, 65-67, 202-211] supported the use of neuromuscular training and
educational interventions, suggesting these programs have the capacity to
Review of Literature
23
reduce ACL injuries in female athletes by 51%. However, the estimated effect
of programs largely varied across studies, with the authors unable to explain
the variability observed.[218] Less conclusive results were reported in a review
by Stevenson et al.[219], where only two[65, 206] of ten studies reviewed
demonstrated a statistically significant reduction in ACL injuries following a
neuromuscular training program. While certain studies showed a significant
decrease in injuries within certain subgroups[5, 204] or a trend towards reduced
ACL injuries following training,[67, 205, 207, 212] two studies[208, 209] found an increase
in ACL injuries within the groups receiving the prevention program.[219] While
injury prevention programs can have a beneficial effect on reducing ACL
injury rates, this effect appears to be inconsistent across the literature.
Athlete compliance,[209, 212, 220, 221] intervention exposure,[209, 210] and the specificity
of the training program[212, 222] are cited as factors that may impact on the
effectiveness of injury prevention programs in reducing ACL injury rates.
Compliance with training protocols appears to be a key factor in determining
the success of an ACL injury prevention program.[205-207, 221] Sugimoto et al.[223]
found a potential inverse dose-response relationship between athlete
compliance and program success, where attending and completing prescribed
training sessions was directly related to the reduction of ACL injuries in young
female athletes. Supervision of training sessions may also be a key factor in
determining a program’s success.[223, 224] Fortington et al.[225] found many
players participating in a coach-led injury prevention program did not
perform exercises as prescribed, and this may have an impact on the benefits
received from the training. Without supervision and an emphasis on proper
technique, limited or poor adaptations to training exercises becomes a
possibility and may result in no decrease or an increased rate of injury in
program participants.[223]
Review of Literature
24
The inconsistent results surrounding injury prevention programs and ACL
injury rates highlights the need to examine changes in lower limb
biomechanics and neuromuscular control following training.[161] This
approach may allow us to ascertain the biomechanical or neuromuscular
mechanisms by which training influences ACL injury risk.[161] A number of
injury prevention programs incorporating plyometric, balance, resistance
and/or technique focused training have proven effective in increasing
hip[39, 213, 214] and knee flexion[39, 41, 68-70, 72, 74, 75, 79, 83, 213-215]; reducing hip
adduction,[71, 74, 80] hip internal rotation,[71] and knee abduction angles;[70, 72, 80, 214]
decreasing anterior tibial shear forces;[213] decreasing knee
abduction[37, 68, 69, 166, 216] and internal rotation[216, 217] moments; increasing
hamstrings strength;[72] increasing preparatory activation of the hip[36, 39] and
hamstrings[40, 41] muscles; increasing overall activation of the hip[39] and
hamstrings[40] muscles; and increasing hamstrings-to-quadriceps co-
contraction[69] during cutting and landing tasks. These results demonstrate
injury prevention programs can be effective in altering an individuals’
movement or neuromuscular strategies during high-risk landing or cutting
tasks.
Despite the apparent success of injury prevention programs in recent times,
ACL injury rates have remained relatively unchanged[1, 2] with the associated
sex bias remaining a concern in high-risk sports.[2-7] In addition, the effect of
injury prevention programs on ACL injury rates is inconsistent, with certain
studies finding no effect on injury rates with training.[208, 209] A limited
understanding of how different individuals respond to ACL injury prevention
programs may be a factor that is restricting our understanding of the
mechanisms underpinning success or failure. Success of ACL injury
prevention programs are often dictated by an overall improvement in the

Review of Literature
25
training group, in isolation or relative to a control group, with little attention
paid to individual responses. However, it may be erroneous to expect that
everyone will respond in the same manner when given the same training
stimulus. There has been limited examination of individual responses to ACL
injury prevention programs. Of those studies that have considered the
individual, variations have been observed in the responses to training.[71, 82, 83]
Cowling et al.[82] found individuals displayed non-uniform adaptations in
quadriceps and hamstrings muscle activation characteristics during a sport-
specific landing task, despite completing identical training programs. No
differences were found from pre- to post-training when examining group data,
highlighting the potential of individual responses to be masked when
examining data in this manner. Similarly, Dempsey et al.[83] found no
differences in torso postures during a side-step cutting manoeuvre following
training, however examination of individual changes found certain
individuals had large favourable responses with regard to torso rotation. The
authors hypothesised that these individuals may have displayed a more at-
risk technique at baseline, and hence obtained a greater benefit from the
training.[83] In contrast to these two studies, Pollard et al.[71] found a beneficial
effect of training on frontal and transverse plane hip motion when performing
a jump-landing task. When examining individual data, however, certain
individuals showed greater improvements in one plane versus the other.[71] It
was suggested that individuals may have exhibited greater changes in the
plane in which they demonstrated a pre-existing at-risk pattern.[71]
Interestingly, detrimental adaptations following training were observed in
certain individuals suggesting that not all responded favourably to the
training program.[71] These studies highlight how examining group data in
isolation can vary our interpretation as to how individuals gain a benefit, or
lack thereof, from ACL injury prevention programs. Failure to consider

Review of Literature
26
individual responses may therefore be impacting our current understanding
of what constitutes effective ACL injury prevention practice.
2.4 ACL Injury Risk Screening
Laboratory-based measures (e.g. motion analysis, force plates,
electromyography) provide an accurate method to explore segment motions,
joint kinetics and muscle activation patterns during sporting movements.
These tools provide an option to evaluate neuromuscular or biomechanical
strategies that may predispose an athlete to ACL injury. However, the use of
laboratory-based equipment for ACL injury risk screening comes with high
financial and time costs. Extensive training is required to operate this
equipment, and the cost of three-dimensional motion analysis has been
reported in the range of $1000 per athlete per test.[87] A recent simulation study
found incorporating current injury risk screening practices within ACL injury
prevention efforts is a less cost-effective strategy than universal
neuromuscular training.[226] However, potential barriers to implementing
universal neuromuscular training exist. Although ACL injury prevention
programs are often associated with successful outcomes, the level of adoption
and compliance is low,[227, 228] and their deployment may not be effective in
“real-world” situations.[229-231] Current injury prevention programs often
involve the whole team, require considerable time investment and may detract
from sport-specific skill training.[84] These factors may deter coaches from
implementing such programs within their pre-season or in-season training.[84,
229] Screening methods that identify high-risk athletes may improve coach
intent to implement prevention programs for these athletes.[84] In addition, the
ability to identify individuals ‘at-risk’ of ACL injury appears to be an
important step in maximising the effectiveness of injury prevention programs.

Review of Literature
27
Myer et al.[84] found female athletes deemed as ‘high-risk’ (knee abduction
moment > 25.25 Nm during a drop vertical jump) received a greater
prophylactic effect from neuromuscular training compared to ‘low-risk’
athletes. Considering these factors, there is an important place for accessible,
cost-effective ACL injury risk screening protocols in ACL injury prevention
efforts.
Similar to injury prevention programs, injury risk screening also requires time
investment from coaches and athletes. However, there may be a role for
coupling screening with more targeted and intensive injury prevention
programs if the screening methods used have high accuracy with minimal
cost.[226] Screening methods that can be completed in a field or clinical setting
may meet these demands, and also be more applicable for wider community
use. Identification of screening methods that are predictive of injury, valid in
identifying high-risk movement strategies, while remaining cost-effective
with regard to equipment and time may provide further support for the
integration of screening within ACL injury prevention efforts. Field-based
screening methods for identifying ACL injury risk are emerging,[85-88, 90-92]
however assessment of their applicability for use in wider community and
sport-specific settings is yet to be undertaken. Evaluating the capacity of
current field-based ACL injury risk screening methods to be used within wider
community and sport-specific contexts will assist in identifying the most
appropriate method(s) to be used in these settings.
2.5 Netball
Netball is a sport played among Commonwealth countries, and has one of the
highest participation rates for team sports in Australia.[232] It is a sport that
covers all ages and skill levels, but is predominantly played by females.[232, 233]

Review of Literature
28
Netball requires sudden changes of direction and rapid decelerations, in
combination with leaps to perform attacking or defensive manoeuvres.[234]
These manoeuvres place considerable loads on the lower limb, particularly at
the knee joint, with netball readily acknowledged as a high-risk sport for lower
limb and ACL injuries.[234-236] Netball provides a convenient cohort, particularly
in Australia, for research examining ACL injury risk and prevention strategies.
2.5.1 Injury and Netball
Injury surveillance data reveals lower limb injuries, particularly to the knee
and ankle, are the most commonly injured areas in netball.[237-243] Hopper et
al.[238] found a total of 608 injuries occurred during competitive netball
tournaments over a five-year period, with 92.6% of these injuries involving the
lower limb. Similarly, Otago and Peake[244] found that 85.3% of netball related
injuries from 12-months of insurance claims data were to the lower limb.
Netball has also gained a reputation for the occurrence of ACL injuries.[245]
While acknowledged as a problem injury within the sport, the rate of ACL
injury in netball is quite low. Only 1.8% (n = 11) of all injuries across the five-
year period examined by Hopper et al.[238] involved the ACL. A low-rate of
ACL injuries relative to the total number of injuries is not uncommon across
high-risk sports. In other female high-risk sports (such as basketball, lacrosse,
soccer and volleyball), Hootman et al.[1] found that the contribution of ACL
injuries to total injuries ranged from 2.0 – 5.0%. Despite the low relative rate
of ACL injuries in netball, these injuries tend to be the most severe experienced
by players and often require a lengthy rehabilitation process.[238] There is
currently no data available examining the long-term consequences specifically
for netball-related ACL injuries. However, it is likely that players suffer the
same debilitating conditions later in life as athletes’ from other sports.
Review of Literature
29
2.5.2 High-Risk Sporting Tasks in Netball
Side-step cutting and landing are the primary sporting tasks observed during
noncontact ACL injuries.[5, 98, 99, 102, 103, 159] Due to the specific demands of netball,
players perform a high frequency of cutting and landing manoeuvres
throughout a match.[156, 157, 246] While both tasks are frequently performed,
landings are often implicated as the high-risk task for lower limb injuries
within the sport.[103, 245] Landing is commonly cited as the inciting event when
lower limb and ACL injuries occur in netball.[103, 238-240, 243] In a video analysis of
ACL injuries from elite female netball competition; 13 of the 16 ACL injuries
observed occurred during landing manoeuvres, while only one was observed
during a side-step cutting movement.[103] In particular, the ‘leap’ landing
technique employed by netball players is a known mechanism of ACL injuries
within the sport.[245] Although unplanned sporting tasks have been found to
incur lower limb biomechanics linked to greater ACL loading,[247] these do not
play a major role for ACL injuries within netball. Even within competitive
environments leap landings appear highly planned, often used as part of
attacking manoeuvres in order to receive passes after breaking free from
defenders.[157] During unplanned tasks, unexpected movements or
perturbations are proposed to contribute to the higher risk of ACL injury.[247]
In contrast, it is likely that the specific motions and lower limb postures
associated with leap landings contribute to a higher risk of ACL injuries
during this manoeuvre. A leap landing involves a run-up, followed by a single
limb take-off and land on the contralateral limb.[157, 245] In netball, players are
often required to decelerate abruptly upon landing. Deceleration with one step
and the leg near full extension are characteristic of leap landing performances,
and places a high load on the knee and ACL.[245] The leap landing technique
also results in distinct peak knee abduction moments early after initial landing
Review of Literature
30
contact.[248] Laboratory analysis examining the risk of ACL injury in netball
should focus on this landing technique due to its relationship with movement
strategies known to increase ACL loads and capacity to cause injury within
the sport.
2.6 Summary
Noncontact ACL injuries are a traumatic sports related injury that occur most
frequently during landing and cutting tasks.[5, 98, 99, 102, 103, 159] A perplexing factor
associated with noncontact ACL injuries is the ‘one-off’ nature in which they
occur, where injuries are sustained during sporting tasks athletes have
replicated safely countless times.[46] A number of debilitating short- and long-
term consequences are associated with ACL injuries, including an increased
risk of early onset osteoarthritis and re-injury.[9, 12, 14, 16, 17, 109, 112] Primary
prevention of injury is the most effective means for avoiding these future
disabilities.[15] Therefore, there is a need to understand and develop effective
injury prevention strategies.
The biomechanical factors that contribute to increases in ACL load and injury
risk are well understood. It is accepted that ACL injuries occur through a
multi-planar mechanism[33] and a focus on this is required for the development
of optimal injury prevention strategies.[32] Altered or poor neuromuscular
control of the lower limb is recognised as a primary risk factor for ACL injury,
particularly in females.[15, 47] The selective activation strategies of lower limb
muscles play an important role in influencing ACL injury risk. It is possible
that ‘anomalies’ in muscle activation may be a contributing factor to the ‘one-
off’ nature in which noncontact ACL injuries occur. The overall muscle
activation profile employed during high-risk sporting tasks may also influence
lower limb biomechanics, and subsequently, ACL injury risk. Examining
Review of Literature
31
whether neuromuscular anomalies and different muscle activation profiles
present during high-risk sporting tasks and their subsequent impact on lower
limb biomechanics could reveal important information surrounding
neuromuscular contributions to ACL injury risk.
There is some evidence to suggest that injury prevention programs can reduce
ACL injury rates[5, 65-67] and substantial support for the use of these programs
in inducing neuromuscular and biomechanical adaptations proposed to
reduce ACL injury risk.[34-45, 68, 69, 71-75, 79, 166, 201, 213-217] Despite this, ACL injury rates
have remained relatively unchanged in recent years.[1, 2] Few studies[71, 82, 83]
have explored the individual neuromuscular and biomechanical responses to
ACL injury prevention programs, and this may be limiting our capacity to
understand what constitutes effective ACL injury prevention practice.
Laboratory-based measures frequently used to identify athletes’ at-risk of ACL
injury are not cost-effective and prohibitive to the majority of the wider
community.[87] Accurate and cost-effective screening methods that can be
coupled with more targeted and intensive injury prevention programs are
likely to be beneficial in reducing the rate of ACL injuries.[226] Field-based
screening methods are a more cost-effective and applicable option for wider
community use. A number of ACL injury risk screening methods that can be
completed in field or clinical settings have been developed,[85-88, 91-93] however
assessment of their applicability for use in wider community and sport-
specific settings is yet to be undertaken. Evaluating the capacity of current
field-based ACL injury risk screening methods to be used within wider
community and sport-specific contexts will assist in identifying the most
appropriate method(s) to be used in these settings
Review of Literature
32
In Australia, netball provides an ideal cohort to study noncontact ACL
injuries. Netball is predominantly played by females and involves the
performance of high-risk sporting tasks that are associated with ACL injuries.
In particular, the leap landing technique is often associated with ACL injuries
within the sport. Research focusing on this cohort and high-risk task can yield
valuable information relating to ACL injury risk and prevention.
33
Chapter Three: Methodology Overview
This chapter serves as an overview of the general methods employed within
this thesis. Details regarding the general methodology used to examine
neuromuscular control and lower limb biomechanics, and experimental
procedures that are common across studies are presented herein. Within
subsequent chapters, readers will be referred back to the appropriate sections
of this chapter where applicable.
3.1 Ethical Approval
Project approval was given by the Deakin University Human Research Ethics
Committee (Project No. 2013-007; see Appendix A, Page 369). Prior to testing,
all participants were informed of the research and potential hazards via a plain
language statement. Participants volunteered and provided written consent
prior to any involvement in the research or laboratory testing sessions (see
Appendix B, Page 370).
3.2 Participants
Sub-elite female netball players were recruited for all studies within this thesis.
The players included in this research were from a community-level open-age
female netball competition which teams play one match per week. In addition
to matches, players on average trained 1.74 ± 0.85 times per week (range = 1 –
4) for an average of 71.71 ± 14.14 minutes (range = 45 – 100). Players had on
average 12.40 ± 4.42 years of netball experience (range = 2 – 21). Prior to testing,
participants completed an injury history questionnaire (see Appendix C, Page
378) and were excluded if they had: (i) a current lower limb/back injury; (ii)
Methodology
34
previous history of serious knee injury or lower limb/back surgery; or (iii)
suffered an injury to the lower limb/back in the past six weeks. Participants
were also required to have had no previous exposure to an ACL injury
prevention program as part of their training history. These exclusion criteria
were in line with similar studies in this area.[125, 249-252] Participants were also
required to be free of any neuromuscular or musculoskeletal disorders that
affected the lower limb. The details of specific participant demographics for
each study are presented in their respective chapters.
Upon recruitment, participants were asked whether any foreseeable
circumstances would limit their ability to complete the follow-up testing
session (i.e. testing session two) six-weeks after baseline testing. Where this
was the case, these participants were allocated to a ‘singular’ testing group
where their only commitment was attending a single testing session. As there
were single-time point studies included in this thesis, an inability to attend the
follow-up testing session did not exclude participants from this research.
Participants whom reported as eligible to attend both testing sessions were
subsequently randomised to either the control or training group. All
participants completed an initial testing session, with participants allocated to
the control and training groups returning six-weeks later to complete an
identical follow-up testing session. In this six-week period participants within
the control group continued their regular training practices, while those in the
training group undertook a six-week ACL injury prevention program (see
Figure 3.1, Page 35).
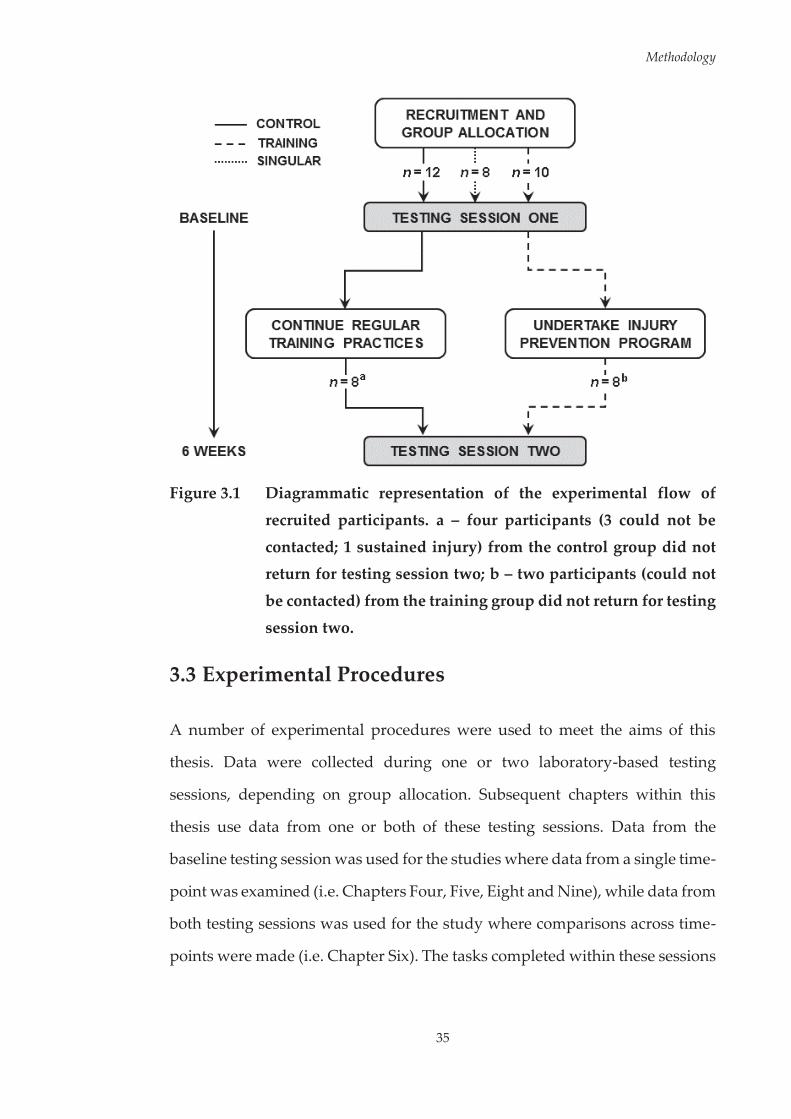
Methodology
35
Figure 3.1 Diagrammatic representation of the experimental flow of
recruited participants. a – four participants (3 could not be
contacted; 1 sustained injury) from the control group did not return for testing session two; b – two participants (could not
be contacted) from the training group did not return for testing
session two.
3.3 Experimental Procedures
A number of experimental procedures were used to meet the aims of this
thesis. Data were collected during one or two laboratory-based testing
sessions, depending on group allocation. Subsequent chapters within this
thesis use data from one or both of these testing sessions. Data from the
baseline testing session was used for the studies where data from a single time-
point was examined (i.e. Chapters Four, Five, Eight and Nine), while data from
both testing sessions was used for the study where comparisons across time-
points were made (i.e. Chapter Six). The tasks completed within these sessions
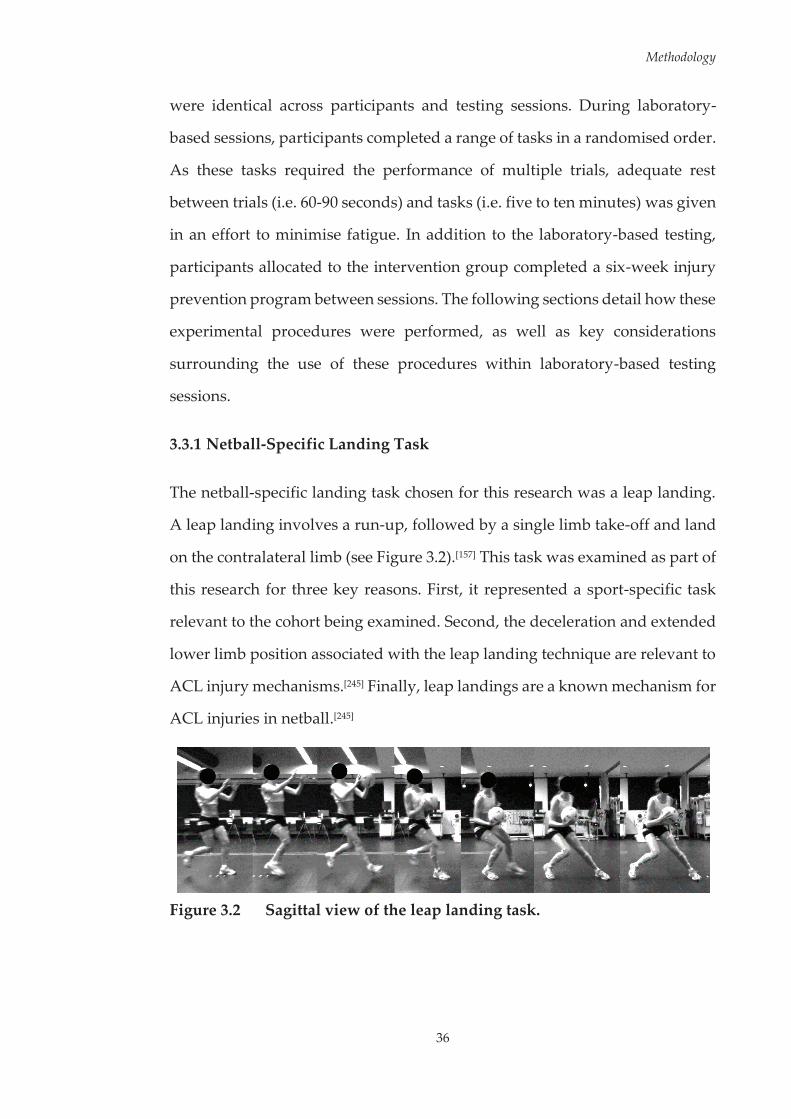
Methodology
36
were identical across participants and testing sessions. During laboratory-
based sessions, participants completed a range of tasks in a randomised order.
As these tasks required the performance of multiple trials, adequate rest
between trials (i.e. 60-90 seconds) and tasks (i.e. five to ten minutes) was given
in an effort to minimise fatigue. In addition to the laboratory-based testing,
participants allocated to the intervention group completed a six-week injury
prevention program between sessions. The following sections detail how these
experimental procedures were performed, as well as key considerations
surrounding the use of these procedures within laboratory-based testing
sessions.
3.3.1 Netball-Specific Landing Task
The netball-specific landing task chosen for this research was a leap landing.
A leap landing involves a run-up, followed by a single limb take-off and land
on the contralateral limb (see Figure 3.2).[157] This task was examined as part of
this research for three key reasons. First, it represented a sport-specific task
relevant to the cohort being examined. Second, the deceleration and extended
lower limb position associated with the leap landing technique are relevant to
ACL injury mechanisms.[245] Finally, leap landings are a known mechanism for
ACL injuries in netball.[245]
Figure 3.2 Sagittal view of the leap landing task.
Methodology
37
Leap landings are often performed in games when catching a pass,[157] and the
inclusion of a ball in laboratory-based testing can influence lower limb
neuromuscular and biomechanical measures.[54, 154, 155] Therefore, participants
were required to catch a pass distributed with a flat trajectory while
completing the landing task.[248, 253] Each trial was initiated by breaking and
accelerating from a static defender (model skeleton) from a position six-metres
from the landing area, followed by a run-up and leap landing whilst catching
a pass. Passes were received from 2.5 metres in front of the landing area at a
30 degree angle on both the left and right sides (see Figure 3.3, Page 39). To
ensure consistency the pass was completed by the same experienced player
for all trials, with the passer instructed to pass between waist and head height.
The quality of the pass was observed by an investigator during each trial, and
trials were excluded if the pass fell outside of the height range or was not
within half a metre of the participant. Trials were also excluded if the
participant failed to catch the pass.
During testing, participants performed 20 successful leap landing trials on a
designated ‘landing limb.’ The landing limb was determined prior to data
collection by asking participants which limb they would be more comfortable
landing on when catching a pass during a game. Further to this, players were
given an opportunity to trial landing on each limb to identify which they were
more comfortable landing on. Of the 20 successful trials recorded; ten landings
each were performed with the participant receiving passes from their left and
right (see Figure 3.3, Page 39), with the order of these randomised throughout
trials. Preliminary analysis of data revealed no difference between the side the
pass was received from for neuromuscular and biomechanical variables. All
trials, irrespective of the pass side, were subsequently analysed together. A
successful trial was characterised by: (1) performing the leap landing on the

Methodology
38
designated landing limb with the entire foot landing within the borders of the
force plate; (2) successfully catching a pass thrown between chest and head
height; and (3) coming to a complete stop within one step after landing.
Participants were instructed to perform the run-up and landing at ‘game-
pace.’ Approach speeds were monitored using photoelectric timing gates
(SpeedLight, Swift Performance Equipment, Carole Park, Queensland,
Australia) placed at one metre intervals over the three metres prior to the
landing. Approach speeds within a 3.5 – 5.5 m·s-1 range have been observed
for leap landings performed within a game setting,[254] therefore trials
performed outside of this range were excluded from analysis. Further details
on approach speed data collection and analysis are outlined in Section 3.4.4 of
this chapter. Video recordings and force plate data were used to inspect
landings to ensure a leap landing was performed and the criteria for a
successful trial was met. Trials were repeated until the 20 successful trials were
recorded. The average number of trials performed by participants across all
sessions was 27 ± 4. Participants were allocated 60-90 seconds rest between
trials in an effort to minimise fatigue.[134, 255] The laboratory set-up and
instrumentation used to record leap landing performances is illustrated in
Figure 3.3 (see Page 39).

Methodology
39
Figure 3.3 Diagrammatic representation of the laboratory set-up and
instrumentation used for the leap landing task.
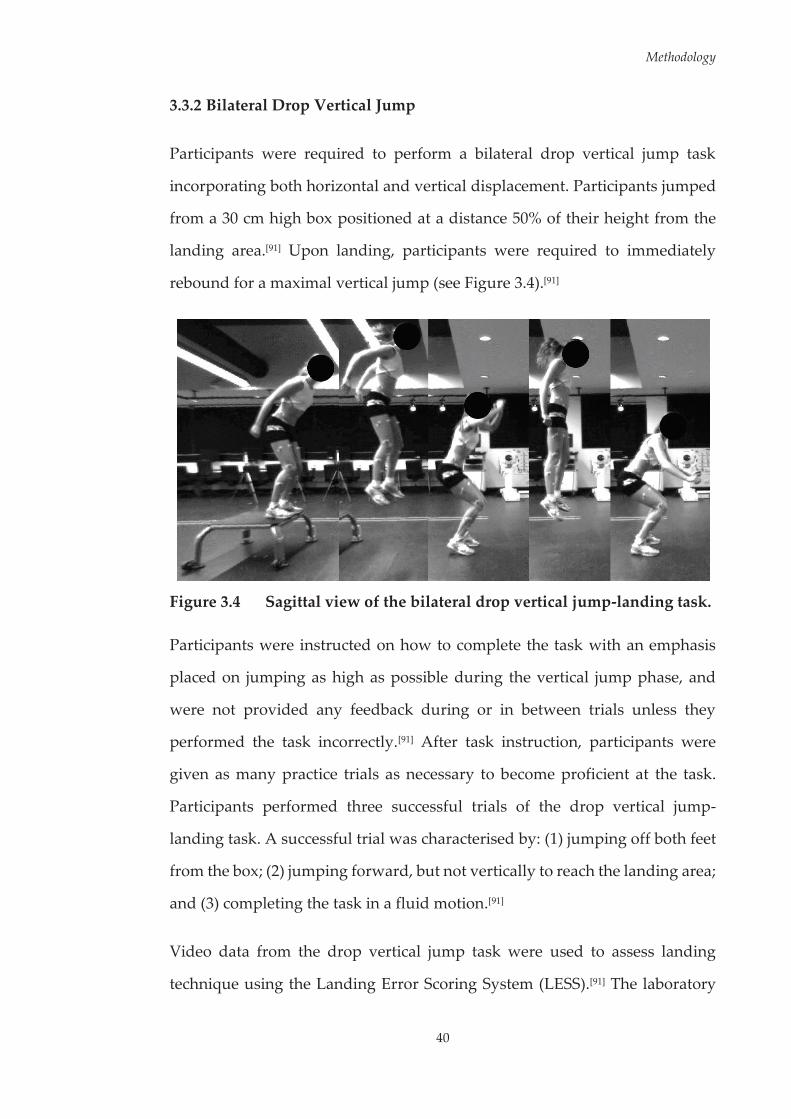
Methodology
40
3.3.2 Bilateral Drop Vertical Jump
Participants were required to perform a bilateral drop vertical jump task
incorporating both horizontal and vertical displacement. Participants jumped
from a 30 cm high box positioned at a distance 50% of their height from the
landing area.[91] Upon landing, participants were required to immediately
rebound for a maximal vertical jump (see Figure 3.4).[91]
Figure 3.4 Sagittal view of the bilateral drop vertical jump-landing task.
Participants were instructed on how to complete the task with an emphasis
placed on jumping as high as possible during the vertical jump phase, and
were not provided any feedback during or in between trials unless they
performed the task incorrectly.[91] After task instruction, participants were
given as many practice trials as necessary to become proficient at the task.
Participants performed three successful trials of the drop vertical jump-
landing task. A successful trial was characterised by: (1) jumping off both feet
from the box; (2) jumping forward, but not vertically to reach the landing area;
and (3) completing the task in a fluid motion.[91]
Video data from the drop vertical jump task were used to assess landing
technique using the Landing Error Scoring System (LESS).[91] The laboratory

Methodology
41
set-up and instrumentation used to record bilateral drop vertical jump trials is
illustrated in Figure 3.5. The limb of interest during the drop vertical jump task
was the ‘landing limb’ used for the leap landing task. Therefore, the lateral
video camera was moved to the left of the landing area for participants who
identified their left leg as the ‘landing limb.’
Figure 3.5 Diagrammatic representation of the laboratory set-up and
instrumentation used for the drop vertical jump-landing task.
Positioning of the lateral video camera is representative of a
participant who identified their right side as their preferred ‘landing limb.’
3.3.3 Tuck Jumps
Participants were required to perform a repeat tuck jump task, attempting to
bring the knees to the chest during each jump, for a period of ten
seconds.[86, 256] Participants were instructed to begin in a starting position with
feet shoulder width apart and initiate the jump with a slight downward crouch
while extending their arms behind them; bring the knees up as high as possible

Methodology
42
during the jump; and on landing immediately begin the next jump (see Figure
3.6).
Figure 3.6 Sagittal view of the tuck jump task.
Participants received further basic instructions and goals for the performance
of tuck jumps, including; attempting to lift the thighs to a parallel height,
aiming to minimise the time in contact with the ground after each jump, and
trying to land on the same spot after each jump.[256] Participants performed one
successful trial of the tuck jump task. Successful trials were characterised by
the participant maintaining the performance of tuck jumps for the ten second
period. Video data from the tuck jump task were used to assess the
participants landing technique using the Tuck Jump Assessment.[86] The
laboratory set-up and instrumentation used to record tuck jump trials is
illustrated in Figure 3.7 (see Page 43).
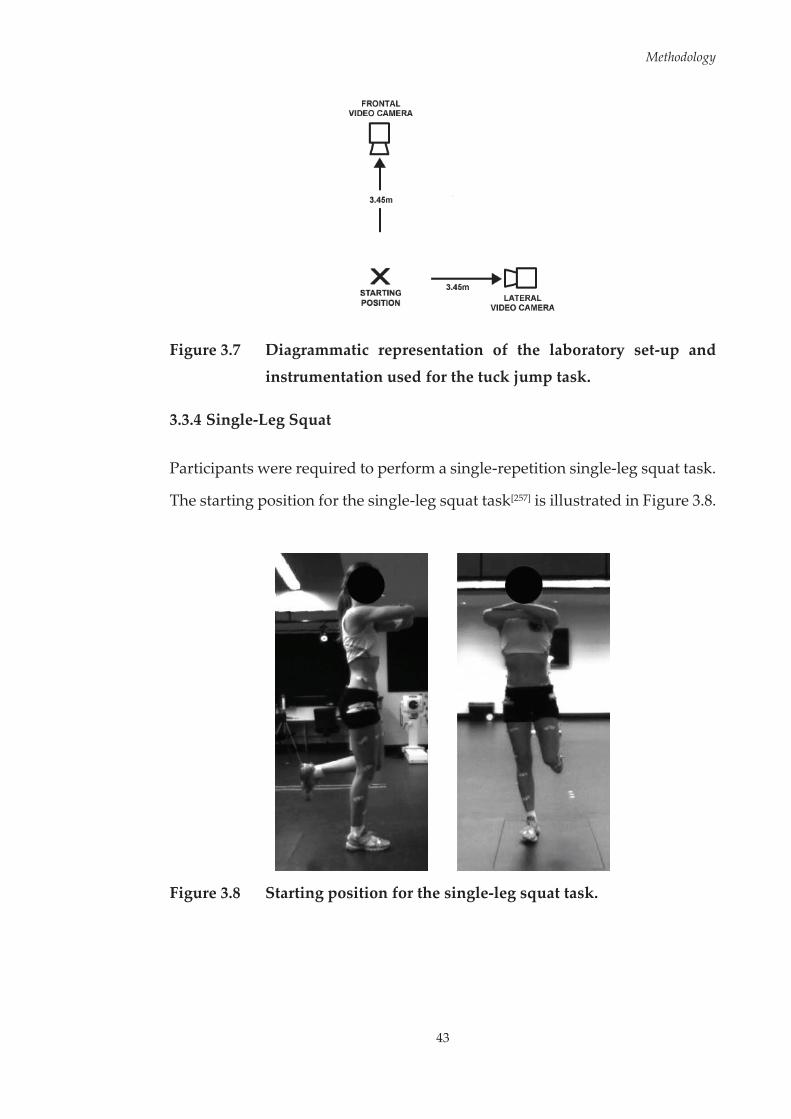
Methodology
43
Figure 3.7 Diagrammatic representation of the laboratory set-up and
instrumentation used for the tuck jump task.
3.3.4 Single-Leg Squat
Participants were required to perform a single-repetition single-leg squat task.
The starting position for the single-leg squat task[257] is illustrated in Figure 3.8.
Figure 3.8 Starting position for the single-leg squat task.
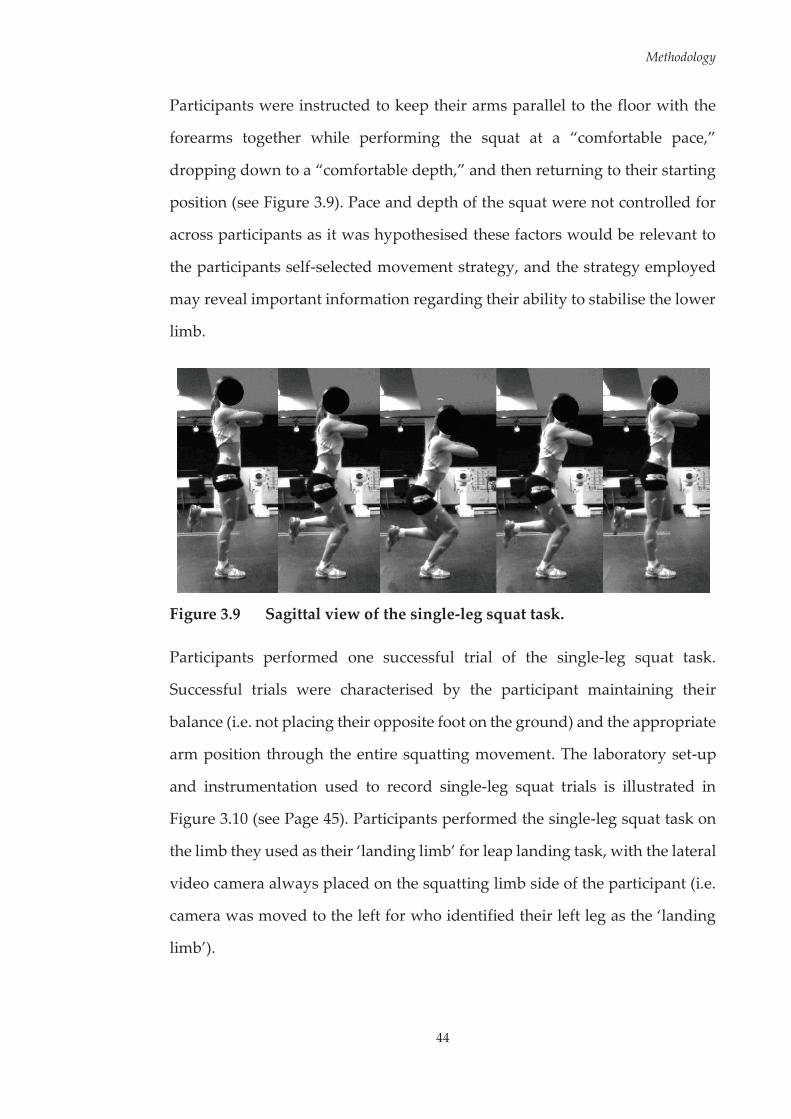
Methodology
44
Participants were instructed to keep their arms parallel to the floor with the
forearms together while performing the squat at a “comfortable pace,”
dropping down to a “comfortable depth,” and then returning to their starting
position (see Figure 3.9). Pace and depth of the squat were not controlled for
across participants as it was hypothesised these factors would be relevant to
the participants self-selected movement strategy, and the strategy employed
may reveal important information regarding their ability to stabilise the lower
limb.
Figure 3.9 Sagittal view of the single-leg squat task.
Participants performed one successful trial of the single-leg squat task.
Successful trials were characterised by the participant maintaining their
balance (i.e. not placing their opposite foot on the ground) and the appropriate
arm position through the entire squatting movement. The laboratory set-up
and instrumentation used to record single-leg squat trials is illustrated in
Figure 3.10 (see Page 45). Participants performed the single-leg squat task on
the limb they used as their ‘landing limb’ for leap landing task, with the lateral
video camera always placed on the squatting limb side of the participant (i.e.
camera was moved to the left for who identified their left leg as the ‘landing
limb’).

Methodology
45
Figure 3.10 Diagrammatic representation of the laboratory set-up and
instrumentation used for the single-leg squat task. Positioning of the lateral video camera is representative of a participant
who identified their right side as their preferred ‘landing
limb.’

Methodology
46
3.3.5 Injury Prevention Program
Participants allocated to the training group undertook a six-week injury
prevention program between testing sessions. The injury prevention program
used was the ‘Down 2 Earth’ program.[258] ‘Down 2 Earth’ (D2E) is an
established netball-specific injury prevention program targeting lower limb
injuries by encouraging safe and effective landing technique.[258, 259] The
program involved a total of three sessions per week; where one session was
completed under supervision of a research team member, and the remaining
two conducted as ‘home-based’ sessions completed by the participant
individually. The same researcher completed the supervised training sessions
across all weeks for all participants. The home-based sessions were designed
to replicate the training sessions conducted under supervision, with some
modifications where applicable.[254] For each participant, attendance at the
supervised sessions was recorded. Participants were given a booklet that
guided them through each session, and also contained a diary page to monitor
attendance to training sessions (see Appendix D, Page 379). The exercises used
within the program were based on those used in injury prevention programs
shown to reduce the risk of ACL injury,[37, 212] with necessary adaptations to
make the exercises applicable to netball.[254] The D2E program includes
guidelines for safe and effective landing technique, progressive exercises with
specified sets and repetitions, and instructions for providing/receiving
feedback during sessions.[258, 259]

Methodology
47
The main tenet of the program is that improved landing technique can be
facilitated via a feedback schedule, directing focus to three key guidelines for
safe and effective landing technique,[258] those being; (i) control the hip and the
knee when landing, do not allow the hip and knee to swing inward or
outward on landing; (ii) keep the knee and toe direction the same; and (iii)
ensure a ‘soft’ and slightly bent knee on landing. During supervised testing
sessions, verbal feedback was received from the supervisor surrounding these
three key landing features. Participants were provided with a visual iteration
of these guidelines within the program booklet (see Figure 3.11), which they
used to facilitate feedback during the home-based sessions.
Figure 3.11 Visual feedback guidelines for safe and effective landing
technique used within the ‘Down 2 Earth’ injury prevention
program. Adapted and reproduced with permission from Saunders et al.[258]
The program incorporated a core set of exercises around this feedback
protocol; involving stationary jump-landings, directional jump-landings,
lunging, and netball-specific landing movements.[258] These core exercises were
progressed throughout the six-week program by adding to or varying the
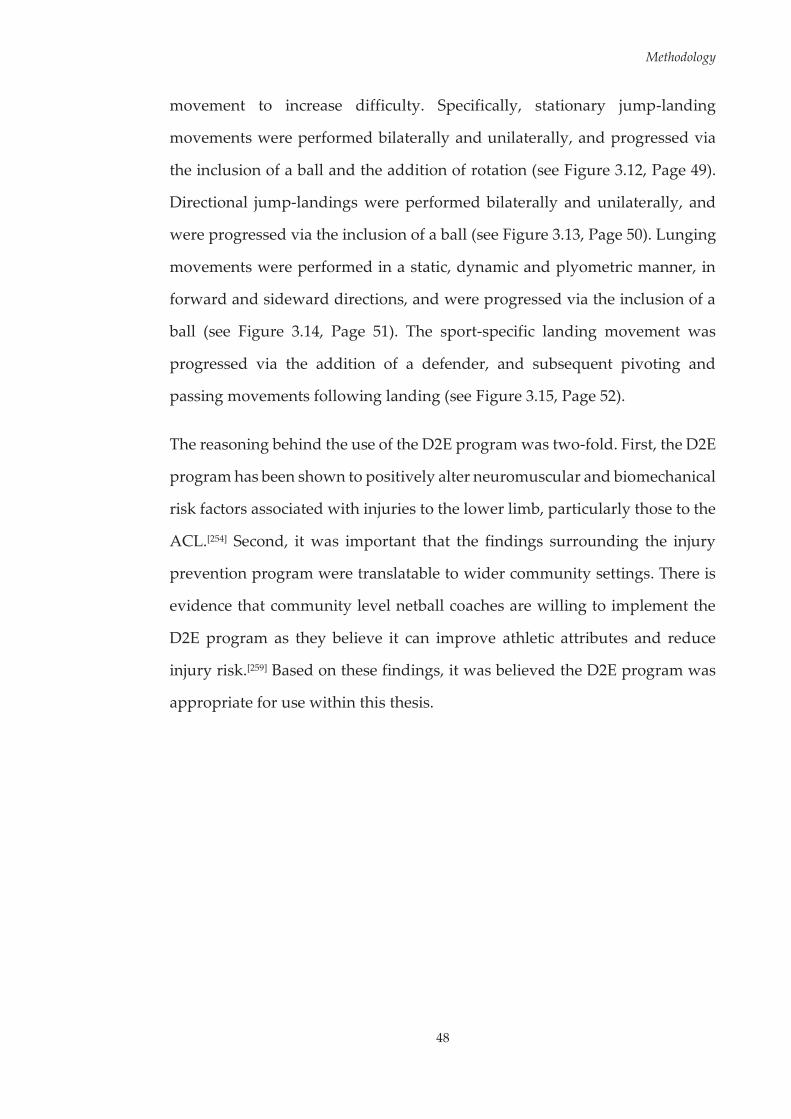
Methodology
48
movement to increase difficulty. Specifically, stationary jump-landing
movements were performed bilaterally and unilaterally, and progressed via
the inclusion of a ball and the addition of rotation (see Figure 3.12, Page 49).
Directional jump-landings were performed bilaterally and unilaterally, and
were progressed via the inclusion of a ball (see Figure 3.13, Page 50). Lunging
movements were performed in a static, dynamic and plyometric manner, in
forward and sideward directions, and were progressed via the inclusion of a
ball (see Figure 3.14, Page 51). The sport-specific landing movement was
progressed via the addition of a defender, and subsequent pivoting and
passing movements following landing (see Figure 3.15, Page 52).
The reasoning behind the use of the D2E program was two-fold. First, the D2E
program has been shown to positively alter neuromuscular and biomechanical
risk factors associated with injuries to the lower limb, particularly those to the
ACL.[254] Second, it was important that the findings surrounding the injury
prevention program were translatable to wider community settings. There is
evidence that community level netball coaches are willing to implement the
D2E program as they believe it can improve athletic attributes and reduce
injury risk.[259] Based on these findings, it was believed the D2E program was
appropriate for use within this thesis.

Methodology
49
Figure 3.12 Variations in stationary jump-landing exercises used within
the ‘Down 2 Earth’ injury prevention program. A) Bilateral
stationary jump-landing; B) Unilateral stationary jump-
landing; C) Bilateral stationary jump-landing with catch; D) Unilateral stationary jump-landing with catch; E) Unilateral
stationary jump-landing with rotation. Adapted and
reproduced with permission from Saunders et al.[258]

Methodology
50
Figure 3.13 Variations in directional jump-landing exercises used within
the ‘Down 2 Earth’ injury prevention program. A) Bilateral directional jump-landing task; B) Unilateral directional jump-
landing task; C) Bilateral directional jump-landing task with catch. ‘NSEW’ is used to describe a sequence that involves
jumping in a forward, backward, left and right pattern.
Adapted and reproduced with permission from Saunders et al.[258]

Methodology
51
Figure 3.14 Variations in lunging exercises used within the ‘Down 2 Earth’
injury prevention program. A) Stationary lunging exercise; B)
Step lunging exercise; C) Stationary lunging exercise with catch; D) Side-step lunging exercise; E) Stationary jump-
landing exercise; F) Stationary jump-lunging exercise with catch. Adapted and reproduced with permission from
Saunders et al.[258]
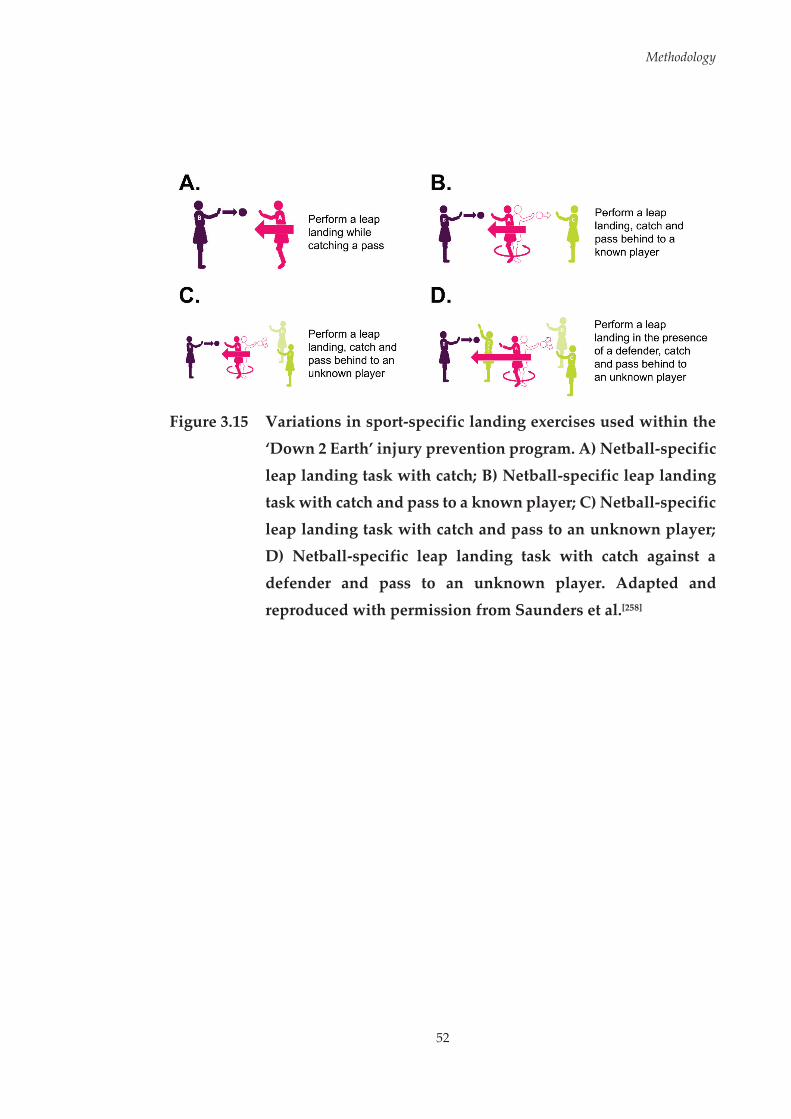
Methodology
52
Figure 3.15 Variations in sport-specific landing exercises used within the
‘Down 2 Earth’ injury prevention program. A) Netball-specific
leap landing task with catch; B) Netball-specific leap landing task with catch and pass to a known player; C) Netball-specific
leap landing task with catch and pass to an unknown player; D) Netball-specific leap landing task with catch against a
defender and pass to an unknown player. Adapted and
reproduced with permission from Saunders et al.[258]

Methodology
53
3.4 Data Collection and Analysis
Within testing sessions, electromyography, kinematic and kinetic data were
collected from participants. Participants were also monitored using video
footage from frontal and sagittal views. The following sections discuss key
considerations regarding the use of these procedures in biomechanical
research, provide a detailed outline of how these procedures were
implemented, and outline the general processing methods used to analyse
collected data. Throughout chapters, readers will be informed as to which data
were used within each study.
3.4.1 Electromyography (EMG)
The complex movement patterns associated with dynamic sporting and
landing manoeuvres are produced by forces generated by the muscular
system.[260] The electrical signal associated with motorneuron depolarisation
causing contraction of a muscle can be measured via electromyography
(EMG).[261] EMG provides a valuable tool for assessing neural control of human
movement.[262] The eventual signal recorded via EMG originates within the
central nervous system. Motor units, which contain an alpha motor neuron
connected to a number of muscle fibres via motor end plates, form the basic
functional unit for excitation and contraction of skeletal muscle.[263] Motor
units are recruited in an orderly fashion by the central nervous system to
produce skeletal muscle contractions.[261] The activation of a motor neuron
results in the conduction of an excitatory signal along the motor nerve.[263] As
this signal reaches the muscle fibres at the motor end plates, the diffusion
characteristics of the muscle fibre membranes are briefly modified causing
membrane depolarisation.[261, 263] This depolarisation results in a ‘wave’ along
the direction of the muscle fibres.[261] It is this depolarisation and subsequent

Methodology
54
repolarisation wave that is recorded by EMG electrodes.[261] The EMG signal
gives information regarding which muscle(s) are active during certain
movements.[261] Therefore, EMG affords the opportunity to measure the
electrical activity associated with muscle activation and identify the neural
contribution of muscles to human movement.
Although EMG provides valuable information surrounding the neural control
of human movement, it is not without limitations. A major limitation of EMG
is that it does not provide information about muscle force.[262] As the EMG
signal is a measure of electrical and not mechanical events, it does not provide
a direct measure of the force or torque being produced from the muscle
contraction.[261] The physiological characteristics of a muscle can also alter the
interpretation of EMG signals. At the same activation level, a given muscle can
produce more force if it has a larger cross-sectional area, or is operating at a
more optimal length and/or velocity.[262] An additional limitation associated
with EMG recordings is the inherent electromechanical delay between the
electrical signal and subsequent mechanical effect of the muscle
contraction.[262] To assume that when a muscle is activated it instantly provides
a mechanical effect is erroneous. This delay must therefore be considered
when attempting to identify the muscle activation characteristics that support
against external loads during high-risk sporting tasks. In order to be effective,
the muscle must be activated prior to when support against external loading
is required to ensure the muscle is mechanically effective. Despite the
limitations, EMG provides an option for identifying neuromuscular
contributions to ACL injury risk due to the link between neural and muscular
systems. As the muscular system is responsible for driving movement,
abnormalities or variation in muscle activation may be the underlying
mechanism behind undesirable lower limb biomechanics during high-risk

Methodology
55
sporting tasks. The association of muscle activation characteristics to these
undesirable lower limb biomechanics provides a basis for identifying
neuromuscular risk factors. Multiple studies have highlighted our ability to
alter muscle activation patterns through injury prevention programs.[34-45] As
the neuromuscular system is modifiable, identification of neuromuscular risk
factors is pertinent to ACL injury prevention research. Within this thesis EMG
was used to measure the activity of lower limb muscles, and the subsequent
links between activation of these muscles and lower limb biomechanics during
the netball-specific landing task. Preparation of electrode sites, location of
electrodes, signal processing, and reporting of EMG data were in line with
standardised procedures.[264-266]
3.4.1.1 Electrode Properties
Surface electrodes are commonly used within biomechanical research
examining jump-landing or sport-specific tasks,[44, 56, 131, 133, 134, 171, 178, 181, 267-269] as
they are non-invasive and easily applied. Surface electrodes provide a gross
representation of muscle activity underlying the placement area.[270, 271] This
type of electrode is often preferable to record the activity of large superficial
muscles as it ensures the EMG recording is representative of the activity of
many muscle fibres. Due to the large recording area of surface electrodes, there
is the potential for crosstalk in contaminating the recorded signal from
muscles near the muscle of interest.[272] Surface electrodes have shown good
reliability both within- and between-sessions for lower limb EMG recordings
during a range of dynamic tasks.[273-278] However, selecting the appropriate
electrode size and location of electrodes must be carefully planned to avoid
crosstalk.[266]

Methodology
56
The configuration, size, material, and inter-electrode distance all may affect
the quality of EMG recordings when using surface electrodes. Wireless
parallel-bar electrodes (Delsys Trigno, Delsys Incorporation, Boston, MA,
United States) were used for the studies within this thesis. Large contact areas
and inter-electrode distances contribute to a greater risk of crosstalk from
adjacent and underlying muscles, while contamination of the EMG signal can
occur from movement of cables connecting electrodes to an amplifier.[272] The
wireless parallel-bar electrodes used within this research are advantageous in
minimising these effects by providing a small and consistent inter-electrode
distance (10mm) and eliminating the need for cables connecting the electrode
to an amplifier.[279]
3.4.1.2 Surface Electrode Placement and Fixation
EMG data were collected unilaterally from eight lower limb muscles.
Appropriate skin preparation ensured adequate electrode-skin contact,
reducing noise and artificial artefact, thereby improving the quality of EMG
recordings.[264] Prior to electrode attachment, the skin was prepared using a
standardised procedure in accordance with published recommendations.[264]
Placement sites were dry shaven (if required) to remove any hair using a
disposable razor, followed by gentle abrasion and sterilisation of the area
using Nuprep® skin preparation gel (Weaver and Company, Aurora, CO,
United States) and isopropyl alcohol applied via non-sterile gauze swabs
(Sentry Medical, Wetherill Park DC, New South Wales, Australia). Following
skin preparation, electrodes were affixed to the skin at the muscle sites of
interest. Tuf-Skin® adhesive spray (Cramer Sports Medicine, Cramer Products
Inc., Gardner, KS, United States) was applied to improve electrode adherence,
with the electrode affixed to the skin via a specially tailored adhesive interface
(Delsys Trigno, Delsys Incorporation) (see Figure 3.16, Page 58). Electrodes
Methodology
57
were further affixed with stretchable, adhesive, non-woven tape (Fixomull®
Stretch, Smith & Nephew, London, England) and variable-sized elastic net
bandage (Surgifix®, Smith & Nephew) applied over electrodes to improve
adherence and reduce movement on the skin.
Data were collected from the gluteus maximus, gluteus medius, rectus
femoris, vastus medialis, vastus lateralis, medial hamstrings, lateral
hamstrings, and lateral gastrocnemius. These muscles were chosen as they all
have the ability to influence motion at the hip and/or knee joint, and have been
studied in the context of neuromuscular control and ACL injury risk during
athletic tasks.[56, 131, 134, 171, 178, 184-187, 269, 280-282] Electrodes were orientated parallel to
the direction of the muscle fibres and positioned relative to anatomical
landmarks for optimal signal quality and avoidance of innervation zone
locations in accordance with established procedures (see Figure 3.17, Page 58
and Table 3.1, Page 59).[265, 283] Palpation and requesting the participant to
voluntarily contract the desired muscle were used to confirm correct electrode
placement on the muscle belly. Electrode placement and manual muscle
testing were performed by the same investigator on every participant during
testing sessions.

Methodology
58
Figure 3.16 Image of Delsys Trigno parallel-bar surface electrode with
specially tailored adhesive skin interface attached.
Figure 3.17 Locations of EMG surface electrodes for an example
participant (right leg as landing limb). The view of the gluteus maximus (GMAX) and gluteus medius (GMED) locations are
obstructed by the participant’s shorts.

Methodology
59
Table 3.1 Guidelines used for surface electrode placement.[265, 283]
Muscle Electrode Placement Guidelines
Gluteus Maximus (GMAX) Placed on the posterior aspect of the buttocks, 55% of the distance along a line from the second sacral vertebrae to the greater trochanter.
Gluteus Medius (GMED) Placed on the lateral aspect of the buttocks, 50% of the distance along a line from the iliac crest to the greater trochanter.
Medial Hamstrings (MHAM) Placed on the posterior-medial aspect of the thigh, 50% of the distance along a line from the ischial tuberosity to the medial side of the popliteus.
Lateral Hamstrings (LHAM) Placed on the posterior-lateral aspect of the thigh, 50% of the distance along a line from the ischial tuberosity to the lateral side of the popliteus.
Rectus Femoris (RF)
Placed on the anterior aspect of the thigh, 130 mm from the superior aspect of the patella, along a line from the superior aspect of the patella to the anterior superior iliac spine.
Vastus Lateralis (VL)
Placed on the anterior-lateral aspect of the thigh, 120 mm from the superior-lateral aspect of the patella, along a line from the superior-lateral aspect of the patella to the anterior superior iliac spine.
Vastus Medialis (VM)
Placed on the anterior-medial aspect of the thigh, 37 mm from the superior-medial aspect of the patella, along a line from the superior-medial aspect of the patella to the anterior superior iliac spine.
Lateral Gastrocnemius (GAS) Placed on the posterior-lateral aspect of the shank, 25% of the distance along a line from the lateral knee joint line to the lateral malleolus.
Methodology
60
3.4.1.3 EMG Data Acquisition and Signal Processing
EMG data were collected digitally through Vicon Nexus (Vicon, Oxford
Metrics Limited, Oxford, United Kingdom) sampling at 2000 Hz, and online
bandpass filtered between 10 and 500 Hz. It is recommended that the sampling
rate for EMG data be at or higher than the frequency of the online bandpass
filter,[266] therefore the sampling rate of 2000 Hz was deemed appropriate. Prior
to movement trials, a 30 second baseline file with the participant standing
quietly was collected to determine baseline EMG levels. Following this,
maximal voluntary isometric contractions (MVICs) were performed for the
muscles/muscle groups of interest with participants placed in standardised
positions (see Appendix E, Page 390) in accordance with established
procedures and guidelines.[263, 264, 266] Three maximal effort contractions were
performed against manual resistance for each muscle/muscle group. For each
contraction, participants increased muscle tension over three seconds,
maintained tension for three seconds, and released tension over three seconds.
Collected EMG data were exported from Vicon Nexus and processed offline
using custom MATLAB (version R2014a) (The Mathworks Incorporated,
Natick, MA, United States) programs. Prior to processing, all signals were
checked for artefacts or artificial noise. Some trials (less than one per
participant per testing session) were lost due to significant impact artefacts
contributing noise to or saturating the signal. Raw EMG signals were corrected
for bias by subtracting the mean of each participants’ baseline recording for
the respective muscle. Signals were submitted to a fourth-order, zero-lag
Butterworth digital high-pass filter ( = 20 Hz) to minimise movement
artefact.[82, 284, 285] The filtered EMG data were then full-wave rectified and
converted to a linear envelope via a fourth-order, zero-lag Butterworth digital
low-pass filter ( = 6 Hz).[171, 269] The linear envelopes of EMG signals were
Methodology
61
subsequently used in providing an indication of the activation patterns of the
muscles.[261]
Amplitude normalisation of EMG signals was undertaken to account for
variability among recording factors (e.g. changes in skin-electrode impedance,
subcutaneous tissue thickness, and variations in electrode placement) and to
facilitate comparisons between individuals and muscles. Studies examining
athletic tasks have normalised EMG data to the maximum activation level
achieved during MVICs,[59, 62, 63, 120, 131, 178, 180, 286, 287] the maximum activation level
achieved during movement trials,[171] or a combination of whichever value is
higher from either MVICs or movement trials.[282, 288, 289] Within this research,
dynamic EMG data recorded during movement trials were amplitude
normalised (% MVC) to the larger of the peak value recorded during the
MVICs or the peak EMG activity recorded during any movement trials, similar
to existing studies.[282, 288, 289] A 10 millisecond (ms) moving window was used
to identify peak EMG activity across each movement trial. Using this method
results in all normalised EMG data being at or below 100% of maximal
activation.[288] Following signal processing, the area of interest in the EMG
waveform was extracted from the overall trial and used for subsequent
analyses. For example, EMG data was extracted from the leap landing task
over the period of 150 ms prior through to 300 ms post initial landing contact.
This time window was chosen as previous research examining a similar single-
limb catch and land task has shown lower limb muscle onsets occur up to 150
ms prior to landing and remain active for a period of up to 380 ms.[54] A
schematic representation of the EMG processing framework is presented in
Figure 3.18 (see Page 62).
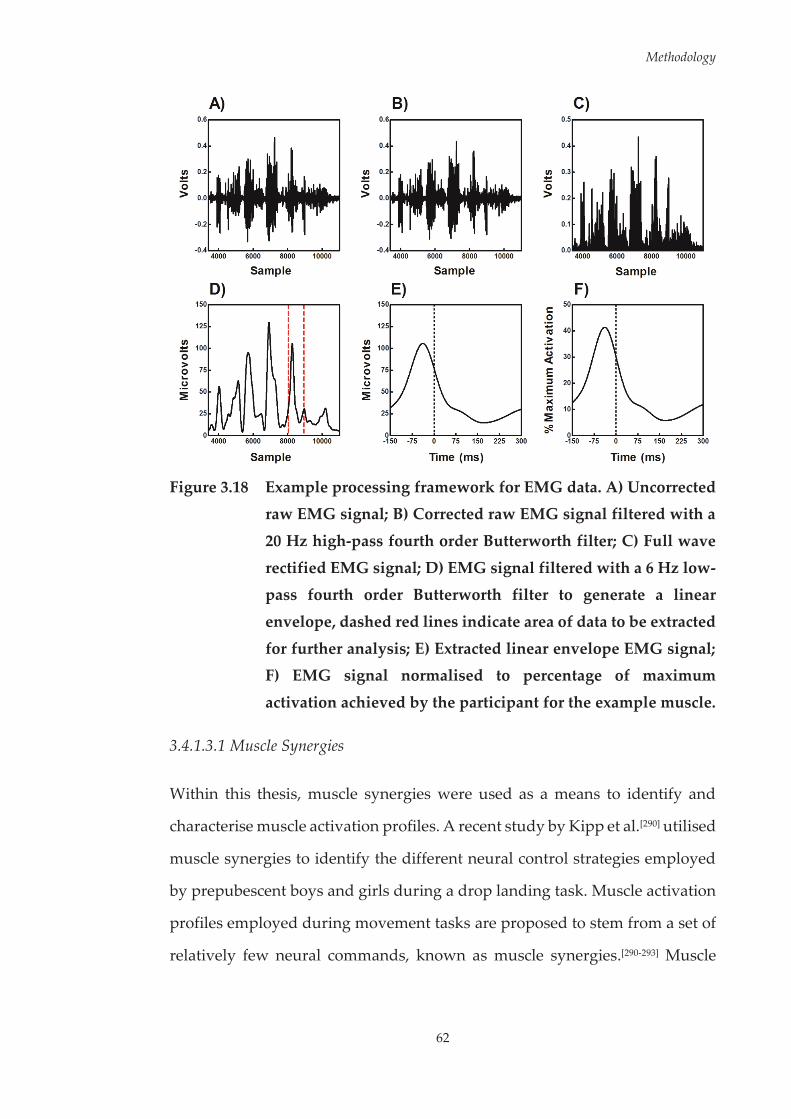
Methodology
62
Figure 3.18 Example processing framework for EMG data. A) Uncorrected
raw EMG signal; B) Corrected raw EMG signal filtered with a
20 Hz high-pass fourth order Butterworth filter; C) Full wave
rectified EMG signal; D) EMG signal filtered with a 6 Hz low-pass fourth order Butterworth filter to generate a linear
envelope, dashed red lines indicate area of data to be extracted
for further analysis; E) Extracted linear envelope EMG signal; F) EMG signal normalised to percentage of maximum
activation achieved by the participant for the example muscle.
3.4.1.3.1 Muscle Synergies
Within this thesis, muscle synergies were used as a means to identify and
characterise muscle activation profiles. A recent study by Kipp et al.[290] utilised
muscle synergies to identify the different neural control strategies employed
by prepubescent boys and girls during a drop landing task. Muscle activation
profiles employed during movement tasks are proposed to stem from a set of
relatively few neural commands, known as muscle synergies.[290-293] Muscle
Methodology
63
synergies are the activation patterns of individual or multiple muscles by a
single neural command, and can provide meaningful physiological
information about the control of muscle activation.[290, 292, 293] The hypothesis
that synergistic neural control of muscles is employed within biomechanical
tasks is well supported.[48-50, 290-294] Analysis of muscle synergies provides an
approach to study how these neural commands translate to muscle
activation.[291] Muscle synergies provide a useful strategy for the control of
complex movements as it reduces the number of output patterns the
neuromuscular system must specify for a large number of muscles.[49] For
example, it has been shown that five and three muscle synergies account for
the majority of activation of lower limb muscles during walking[293] and
landing[290] movements, respectively. In addition, muscle synergies are often
associated with the major kinematic and kinetic events of the movements
being analysed.[48, 49, 290, 293] A muscle synergy consists of a time-variant
activation coefficient (hereby referred to as “activation coefficients”), which
represents the relative contribution of the muscle synergy to the overall
activation; and time-invariant weighing coefficients (hereby referred to as
“muscle weighing coefficients”), which represent the relative weighting of
activation for each of the muscles of interest within the synergy (see Figure
3.19, Page 64).[48, 49, 290, 295, 296]

Methodology
64
Figure 3.19 Illustration of muscle synergies. The activation of individual
muscles (M1 – M6) is determined by the sum of the product of
the weighing coefficient (labelled as ‘W’) and activation coefficient (labelled as ‘c’) across all muscle synergies. The
weighing coefficients determine how many muscles are
recruited within each synergy along with how much the muscles are activated. The activation coefficients capture when
these muscles are active. Three muscle synergies (black, dark gray and light gray shading) contributing to overall muscle
activation are illustrated. Reproduced with permission from
Kipp et al.[290]
Factor analysis, independent component analysis, and non-negative matrix
factorisation have all been used in previous research to extract muscle
synergies from EMG data.[49] Although each of these analytical approaches
place different restrictions on the outcomes, they all result in a similar solution
relating to the temporal structure of the muscle activation patterns.[297] Non-
negative matrix factorisation (NMF) is the most common method used for the
extraction of muscle synergies from EMG data.[48-50, 296] Unlike other
decomposition methods, NMF results in positive values being obtained for
both the muscle activation and weighing coefficients, which leads to a simpler
and more physiologically accurate interpretation.[296] For these reasons, NMF
was used as the analytical approach for extracting muscle synergies within this
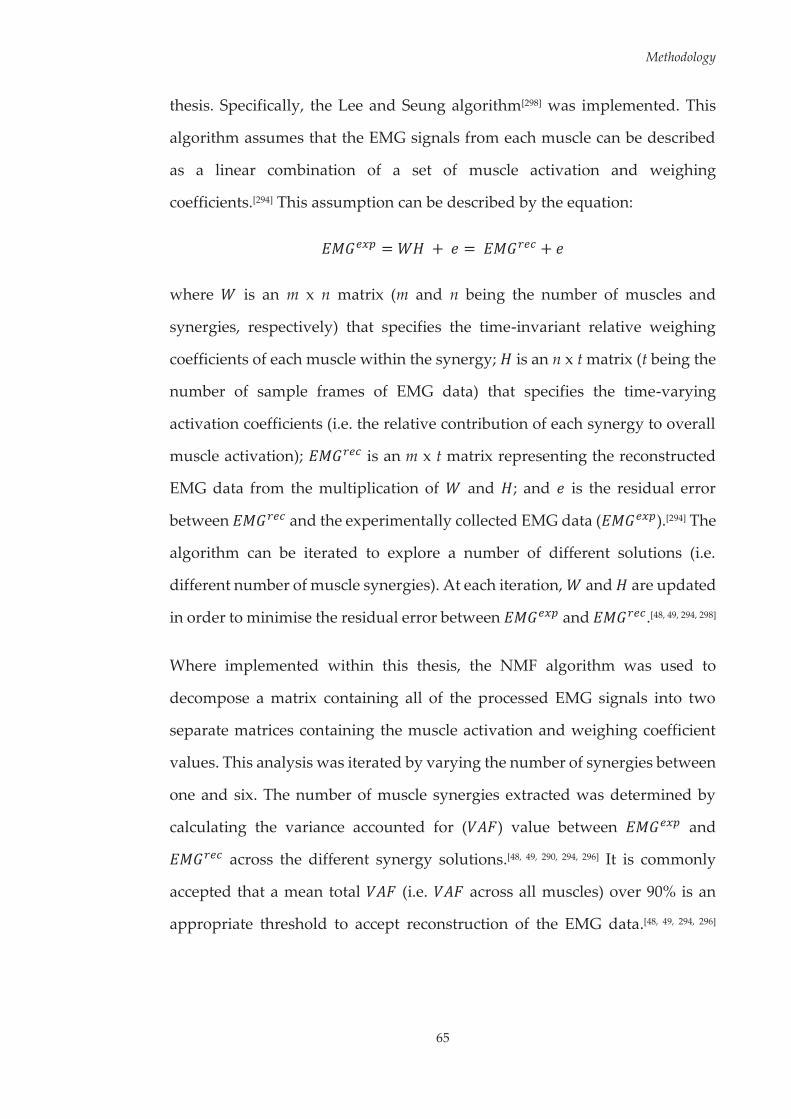
Methodology
65
thesis. Specifically, the Lee and Seung algorithm[298] was implemented. This
algorithm assumes that the EMG signals from each muscle can be described
as a linear combination of a set of muscle activation and weighing
coefficients.[294] This assumption can be described by the equation:
where is an m x n matrix (m and n being the number of muscles and
synergies, respectively) that specifies the time-invariant relative weighing
coefficients of each muscle within the synergy; is an n x t matrix (t being the
number of sample frames of EMG data) that specifies the time-varying
activation coefficients (i.e. the relative contribution of each synergy to overall
muscle activation); is an m x t matrix representing the reconstructed
EMG data from the multiplication of and ; and is the residual error
between and the experimentally collected EMG data ( ).[294] The
algorithm can be iterated to explore a number of different solutions (i.e.
different number of muscle synergies). At each iteration, and are updated
in order to minimise the residual error between and .[48, 49, 294, 298]
Where implemented within this thesis, the NMF algorithm was used to
decompose a matrix containing all of the processed EMG signals into two
separate matrices containing the muscle activation and weighing coefficient
values. This analysis was iterated by varying the number of synergies between
one and six. The number of muscle synergies extracted was determined by
calculating the variance accounted for ( ) value between and
across the different synergy solutions.[48, 49, 290, 294, 296] It is commonly
accepted that a mean total (i.e. across all muscles) over 90% is an
appropriate threshold to accept reconstruction of the EMG data.[48, 49, 294, 296]

Methodology
66
Therefore, the least number of synergies that accounted for a mean total
> 90% was used as the final solution.[49] Mean total was calculated as:[49, 294]
where m and t represent the number of muscles and frames of the extracted
EMG data, respectively. The for individual muscles ( ) was also
calculated to ensure that each muscles activity patterns were accounted for by
the retained synergies (i.e. > 75%).[48] was calculated as:[296]
Where and represent the reconstructed and experimental
EMG signals at n frames of time (t) of the extracted EMG data, respectively.
Following factorisation, the muscle activation coefficients were normalised to
their maximum value (i.e. each muscle activation coefficient had a maximum
value of 1), with the muscle weighing coefficients within each of the muscle
synergies scaled by the same respective factor.[49, 294] This ensured that
comparisons of muscle weighing coefficients could be made between trials
and participants both within and between muscle synergies. These normalised
muscle weighing coefficients from muscle synergies were used in subsequent
analyses to characterise muscle activation profiles.
3.4.2 Kinematics and Kinetics
Present computer aided optical motion capture systems currently provide the
most accurate method for quantifying kinematics during human
movement,[261] and are commonly used for the examination of athletic
tasks.[126, 131, 138, 149, 166, 167, 299-304] The relative angular rotations of individual body
Methodology
67
segments can be estimated from the positional data of retro-reflective markers
placed on anatomical landmarks and segments using established
musculoskeletal models and techniques.[305-308] Force platform technologies can
accurately quantify the external forces being distributed over an area of the
body (e.g. ground reaction forces under the area of the foot).[261] These forces
are often represented as vectors originating from a central point of pressure,
and are used in conjunction with kinematic data in inverse dynamics
calculations to determine moments of force acting upon segments of the
body.[261] Within this thesis, joint kinematics of the lower limb were measured
to describe the patterns of motion during the movement tasks examined. In
addition, ground reaction force data were collected to determine and calculate
the external forces and joint moments acting on the lower limb.
3.4.2.1 Kinematic Data Acquisition
Three-dimensional (3D) kinematics of the lower limb were measured using an
eight-camera Vicon MX motion analysis system (Vicon, Oxford Metrics
Limited) sampling at 250 Hz. Eight cameras were used to monitor a capture
volume of five by three metres, with the minimisation of marker dropout the
primary factor in determining camera height and placement. Prior to data
collection, a two-part calibration procedure was undertaken in accordance
with standard Vicon procedures. First, a dynamic calibration was performed
by moving a 5-marker L-frame wand throughout the capture volume. The
same wand was then used for a static calibration to define the origin (i.e. X-Y-
Z coordinates of 0-0-0) of the capture volume and orientation of the global
coordinate system (X, Y and Z representing anterior-posterior, medial-lateral
and vertical directions, respectively). The dynamic calibration calculated
camera residuals providing reconstruction accuracy for each individual
camera. Camera residuals of less than 0.3 pixels (< one millimetre) were
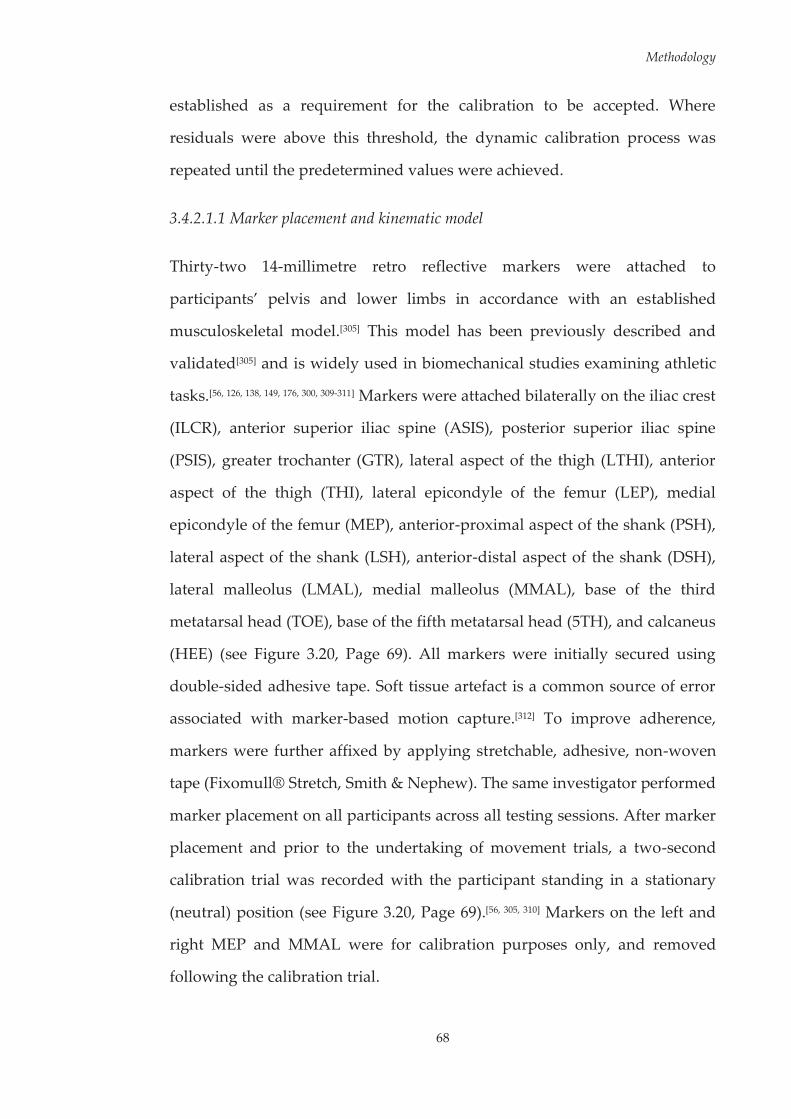
Methodology
68
established as a requirement for the calibration to be accepted. Where
residuals were above this threshold, the dynamic calibration process was
repeated until the predetermined values were achieved.
3.4.2.1.1 Marker placement and kinematic model
Thirty-two 14-millimetre retro reflective markers were attached to
participants’ pelvis and lower limbs in accordance with an established
musculoskeletal model.[305] This model has been previously described and
validated[305] and is widely used in biomechanical studies examining athletic
tasks.[56, 126, 138, 149, 176, 300, 309-311] Markers were attached bilaterally on the iliac crest
(ILCR), anterior superior iliac spine (ASIS), posterior superior iliac spine
(PSIS), greater trochanter (GTR), lateral aspect of the thigh (LTHI), anterior
aspect of the thigh (THI), lateral epicondyle of the femur (LEP), medial
epicondyle of the femur (MEP), anterior-proximal aspect of the shank (PSH),
lateral aspect of the shank (LSH), anterior-distal aspect of the shank (DSH),
lateral malleolus (LMAL), medial malleolus (MMAL), base of the third
metatarsal head (TOE), base of the fifth metatarsal head (5TH), and calcaneus
(HEE) (see Figure 3.20, Page 69). All markers were initially secured using
double-sided adhesive tape. Soft tissue artefact is a common source of error
associated with marker-based motion capture.[312] To improve adherence,
markers were further affixed by applying stretchable, adhesive, non-woven
tape (Fixomull® Stretch, Smith & Nephew). The same investigator performed
marker placement on all participants across all testing sessions. After marker
placement and prior to the undertaking of movement trials, a two-second
calibration trial was recorded with the participant standing in a stationary
(neutral) position (see Figure 3.20, Page 69).[56, 305, 310] Markers on the left and
right MEP and MMAL were for calibration purposes only, and removed
following the calibration trial.

Methodology
69
Figure 3.20 Marker locations and the stationary calibration pose used to
define a kinematic model comprised of seven skeletal
segments (pelvis; right and left thigh; right and left shank; and right and left feet). The medial epicondyle (MEP) and medial
malleoli (MMAL) markers (red) were removed for the
recording of movement trials. Adapted and reproduced with permission from McLean and Samorezov.[310]
A kinematic model[305, 310] consisting of seven skeletal segments (pelvis; right
and left thigh; right and left shank; and right and left feet) and 24 degrees of
freedom (DoF) was defined within Visual 3D software (C-Motion, Rockville,
MD, United States) from the participant’s stationary (neutral) trial. The pelvis
was assigned three translation and rotational DoF relative to the global
(laboratory) coordinate system, with the proximal and distal ends of the
segment defined by markers placed on the iliac crest and greater trochanters,
respectively.[56, 310] The hip, knee and ankle joints were defined locally and each
assigned three rotational DoF.[56, 310] Rotations of the hip joint were defined
about three orthogonal axes passing through a fixed joint centre defined
according to Bell et al.[306]. Knee joint motion was described by rotation about

Methodology
70
a fixed flexion-extension axis,[176] passing through a joint centre defined by the
midpoint between the lateral and medial epicondyle markers in accordance
with Vaughan et al.[308]. Ankle joint motion occurred around a joint centre
defined as the midpoint between the lateral and medial malleoli, with the
plantarflexion-dorsiflexion axis extending laterally from this point.[176, 307]
3.4.2.2 Kinetic Data Acquisition
Ground reaction force (GRF) data was collected using a single 600 x 900
millimetre in-ground AMTI force plate (Advanced Mechanical Technology
Incorporated, Watertown, MA, United States) sampling at 1000 Hz. To avoid
deterioration of the signal over the testing session, the force plate was zeroed
between trials for all tasks. Participants were made aware of the position of
the force plate and were instructed to position their ‘landing limb’ within the
boundaries of the force plate during relevant landing movements. Visual
targeting of force plates has been investigated as a potential confounding
factor in biomechanical studies where ground reaction force measures are
taken.[313, 314] While visual targeting strategies (e.g. adjusting stride pattern or
increasing gaze towards force plate) have been identified within laboratory-
based sessions incorporating a force plate, there appears to be no effect on
kinematic or kinetic outcomes when these strategies are adopted.[313, 314]
3.4.2.3 Signal Processing
Three-dimensional marker trajectory data during movement trials were
reconstructed and labelled within Vicon Nexus (Vicon, Oxford Metrics
Limited). Any gaps in marker trajectories were filled using either a cubic spline
or pattern fill method. The method used was determined by visual
examination of the proposed fill trajectory and selection of the best fit. Where
the pattern fill was used, a marker on the same segment was used as the source
Methodology
71
to construct the fill trajectory. Trials where large gaps (i.e. > 25 frames)
occurred were discarded. The appropriate placement of cameras ensured this
rarely occurred, with less than one trial per participant on average being lost
for this reason. Following these steps, marker trajectory and GRF data were
exported to Visual 3D (C-Motion) for further analyses.
There is a need to low-pass filter marker trajectory and GRF data when
examining high-impact athletic or sporting movements to remove excessive or
random noise.[315, 316] While marker trajectory data is generally filtered with a
5-20 Hz cut-off frequency, GRF data has been filtered using higher cut-off
frequencies.[315] However, recent research has shown that using difference cut-
off frequencies for marker trajectory and GRF data within inverse dynamics
calculations results in variations in the magnitude of peak joint moments, as
opposed to matched cut-off frequencies.[315, 317] The variations in joint moment
data are proposed to be a result of impact artefacts that present during rapid,
high impact athletic activities.[315, 318] Applying the same filter and cut-off
frequency to both marker trajectory and GRF data can reduce the possibility
of artefacts in joint moment data.[319] Inaccuracies in the reporting of joint
moment data can influence conclusions of studies examining risk factors for
ACL injury.[320] Therefore, for all analyses within this thesis, an identical low-
pass filter and cut-off frequency was used to process marker trajectory and
GRF data, with the optimal cut-off frequency determined from analysis of
marker trajectory data.[315, 318, 320]
Raw marker trajectory and GRF data from movement trials were low-pass
filtered with a cubic smoothing spline.[321] A number of methods have been
proposed for determining the optimal cut-off frequency for filtering kinematic
and kinetic data.[261, 322] Residual analysis[261] is a common technique used in
biomechanical studies.[83, 166, 167, 255] This technique involves plotting the residual
Methodology
72
between the filtered and unfiltered signal at a range of cut-off frequencies.[261]
In general, the optimal cut-off frequency is determined by finding the point
that balances the magnitude of signal distortion and noise present following
low-pass filtering at various cut-off frequencies.[261] For all analyses within this
thesis, the optimal cut-off frequency for the low-pass filter was determined via
a combination of residual analysis of marker trajectory data and visual
inspection of kinematic and kinetic data filtered at varying levels.[83, 166, 167, 255]
Data from different movement tasks were filtered at variable levels depending
on the optimal cut-off frequency determined for that task. The specific cut-off
frequencies used are outlined in the methodology sections of each study.
Hip, knee and ankle joint rotations from the participants’ landing limb were
calculated from the filtered marker trajectories from each movement trial. Joint
rotations were calculated using an X-Y-Z Cardan angles sequence; with the X,
Y and Z axes representing joint rotations in the sagittal, frontal and transverse
planes, respectively.[138] Kinematic data were expressed relative to each
participant’s stationary (neutral) trial.[56, 310, 311] Positive values represented
positions of hip flexion, adduction, and internal rotation; knee extension,
adduction (i.e. abduction of the tibia relative to the femur), and internal
rotation (i.e. internal rotation of the tibia relative to the femur); and ankle
dorsiflexion, inversion, and internal rotation. Negative values represented
positions of hip extension, abduction, and external rotation; knee flexion,
abduction (i.e. abduction of the tibia relative to the femur), and external
rotation (i.e. external rotation of the tibia relative to the femur); and ankle
plantarflexion, eversion, and external rotation (see Figure 3.21, Page 73).

Methodology
73
Figure 3.21 Illustration of sign conventions used to represent hip, knee
and ankle joint rotations about three rotational degrees of
freedom. Reproduced with permission from McLean and
Samorezov.[310]
Three-dimensional intersegmental forces and moments were obtained by
submitting the filtered marker trajectory and GRF data to a conventional
inverse dynamics analysis.[261] The choice of reference frame in which to
express lower limb joint moments can affect the results obtained, particularly
during high-impact landing movements.[318, 323] Projection to the joint
coordinate system (JCS) is the only method where joint moments correspond
to muscle and ligament loading, and thus is a natural choice for a standard of
joint moment reporting.[318] Joint moments were therefore expressed in the
reference frame of the hip, knee and ankle JCSs. For each JCS, the sagittal axis
was defined as the medio-lateral axis of the proximal segment; the transverse

Methodology
74
axis as the longitudinal axis of the distal segment; and the frontal axis as the
cross product of the sagittal and transverse axes.[318] Normalisation of joint
moment data has been highlighted as a key step when comparisons are being
made across individuals of different masses and heights.[324, 325] To ensure
appropriate comparisons could be made across participants, joint moments
were normalised by dividing the total joint moment (Nm) by the product of
the participant’s weight and height (kgm). Joint moments within this thesis
represent the external loads applied at each joint. For example, knee abduction
moments refer to an external load that moves the knee into an abducted
position. Positive values represented hip extension, abduction, and external
rotation; knee flexion, abduction, and external rotation; and ankle
plantarflexion, eversion, and external rotation moments. Negative values
represented hip flexion, adduction, and internal rotation; knee extension,
adduction, and internal rotation; and ankle dorsiflexion, inversion, and
internal rotation moments.
3.4.2.3.1 Principal Component Analysis (PCA)
Principal component analysis (PCA) is often applied as a means for data
reduction.[326] The main purpose of PCA is to summarise the key information
in the data, and represent the observations/variables simultaneously in a
limited number of principal components.[326] Mathematically, PCA consists of
an orthogonal transformation, converting n variables ( ) into n
principal components ( ).[326] The principal components are
arranged in decreasing order of the variance in the data they explain, where
the initial principal components explain the largest variations in the data.[326]
The number of components retained is often guided by this magnitude of
variance, where the principal components that sum to explain a
predetermined percentage are retained. Cut-off points of 85-100% of variance
Methodology
75
explained have been used within biomechanical research.[327-334] The principal
component model also contains principal component loading vectors (
), which are the eigenvectors of the covariance matrix of .[326]
The use of PCA in biomechanical studies as a means to identify patterns in
continuous kinematic and kinetic data has increased in popularity over recent
years.[250, 326, 328, 329, 331, 332, 335] PCA has been used to identify neuromuscular and
biomechanical differences between sexes during high-risk cutting
manoeuvres.[250, 328, 329, 336] However, outside of these studies there has been
minimal use of this technique for processing biomechanical data within the
context of ACL injury risk and prevention. When applied to continuous data
(i.e. kinematic and kinetic waveforms), the variables ( ) refer to individual
temporal data points of the waveform.[326] PCA is applied to a p x n matrix,
where p (rows) equals the number of trials/subjects and n (columns) the
number of data points. The principal component loading vectors ( ) are an
orthogonal basis set for the waveform data, and each principal component
represents specific features of the waveform data.[326] Each individual
waveform is allocated a score for the extracted principal components ( ), with
this score measuring the degree to which the shape of a given waveform
corresponds to the equivalent principal component.[326] The extracted principal
components, often labelled as ‘principal patterns,’[276, 327] must be interpreted to
identify the feature of the waveform the pattern describes. Interpretation of
principal patterns obtained from waveform data is often accomplished by
examining the shape of the loading vector ( ), and the individual waveforms
that correspond to high and low principal pattern scores.[326, 327, 337] The principal
pattern can also be interpreted by examining the waveforms obtained by
adding and subtracting a suitable multiple of the components loading vectors
( ) to the mean of the relevant waveform.[333]

Methodology
76
Using functional data analysis methods, such as PCA, to analyse
biomechanical data in a continuous fashion has multiple benefits over discrete
point analysis techniques. Overall, using a discrete point style of analysis can
often discard the majority of data in a waveform.[338] PCA views the entire
waveform as a function, preserving the main features and patterns of the
curve.[333] Using discrete point methods also involves the pre-selection of
features thought to make up the important components of a given
waveform.[338] This pre-selection process is strongly dependent on previous
knowledge or research within the area, and has the potential to discard
important information contained within the waveform.[333, 338, 339] In addition,
examining discrete points does not always take into account the timing of the
points of interest.[338] For example; the amplitude of a peak joint angle across
two trials may be identical, however this peak may occur with substantially
different timing. Simply comparing the peaks between these two trials may
result in inaccurate conclusions being drawn from the data. Lastly, using
discrete point analysis does not allow for the examination of features that
occur over a specific duration of time.[338] Specific phases may hold key
information regarding the pattern of the waveform, with these phases unable
to be captured using a discrete time point approach.[338]
3.4.3 Video Footage
3.4.3.1 Video Data Collection
Two commercial digital video cameras (Mini DV MD225, Canon, Macquarie
Park, Sydney, Australia) recording at 30 frames per second were used to
capture frontal and sagittal plane views of the movement tasks performed
during laboratory testing sessions. Both the frontal and sagittal cameras were
initially positioned 3.54 metres from the landing area. For the most part, this
Methodology
77
distance ensured the full body of participants could be viewed throughout all
movement tasks. However, if the entire body of the participant could not be
viewed, cameras were repositioned to a point where this was achieved. The
sagittal plane video camera was always placed on the side that could view the
participant’s predetermined ‘landing limb.’ The main purpose of video data
was to complete the screening protocols for the Landing Error Scoring System
and Tuck Jump Assessment, as these methods required visual observation of
the drop vertical jump and tuck jump tasks, respectively. Video footage was
also used to ensure the criteria for successful trials were met across movement
tasks.
3.4.4 Approach Speed
Approach speed is important to consider when examining sporting
movements that incorporate a run-up approach. It is particularly pertinent to
do so for the netball-specific landing task examined within this thesis, as
previous work has shown approach speed variations can influence GRF
magnitudes during this task.[340] Studies examining sporting manoeuvres with
a run-up approach often limit trials to a specific approach speed range.[131, 134,
138, 250, 309, 341] However, it is important to initially consider approach speed as a
continuous variable in order to examine its potential effect on lower limb
biomechanics. The procedures used to measure approach speed during testing
sessions, and the means with which approach speed was assessed and
accounted for within subsequent chapters of this thesis are outlined in the
following sections.
3.4.4.1 Approach Speed Data Collection
Approach speed was measured during the netball-specific landing task using
photoelectric timing gates (SpeedLight, Swift Performance Equipment, Carole

Methodology
78
Park, Queensland, Australia). Timing gates were placed at one metre intervals
to monitor speed over the three metres prior to the landing (see Figure 3.3,
Page 39). Approach speed was calculated as the average speed over this
distance.
3.4.4.2 Approach Speed Data Analysis
The 20 successful landing trials from all participants who underwent
laboratory testing were used for approach speed analysis. As not all
participants completed both testing sessions, data from the baseline session
was used. Previous work has shown that approach speed can have a
modulating effect on biomechanical measures during netball-specific
landing.[340] Subsequently, the effect of approach speed on hip and knee joint
rotations and moments was examined. One-dimensional statistical parametric
mapping (SPM1D) canonical correlations analysis and linear regression were
used to examine whether changes in approach speed influenced hip and knee
joint rotations and moments (see Section 3.5.2 within this chapter for a
description of SPM1D procedures). Approach speed was found to have a
statistically significant effect along the majority of hip and knee kinematic and
kinetic waveforms (see Appendix F, Page 391 for full results). Based on these
results, efforts were made to counteract the potentially confounding influence
of approach speed. First; only trials that fell within a 3.5 – 5.5 m·s-1 range were
utilised for analysis. This range was chosen as studies examining the netball-
specific landing task used within this thesis have reported approach speed
values that fall within these ranges.[245, 254] Second; where comparisons of
kinematic and kinetic data were made between groups (i.e. Chapters Four,
Five and Six), approach speeds were initially compared across these groups to
determine whether differences in speed may have influenced the conclusions
drawn from these group comparisons.
Methodology
79
3.5 Statistical Analysis
In addition to the analytical methods outlined in the previous sections, a
number of statistical methods were used across the studies within this thesis.
This section details the statistical methods used and considerations in
applying these methods to neuromuscular and biomechanical data. The
specific application of statistical analysis methods are detailed in their relevant
chapters.
3.5.1 Cluster Analysis
Statistical analyses within neuromuscular and biomechanical research are
generally performed using group-based designs (e.g. males vs. females; trials
from one task vs. trials from another task).[342] In single-group designs, it is
often assumed that movement strategies are similar across cohorts.[343]
However, neuromuscular and biomechanical strategies differ across
individuals,[342] and the intra-individual variability observed in
neuromuscular and biomechanical measures during athletic tasks[344-347]
suggests the same individual may employ a number of different strategies.
Drawing conclusions from a single-group design without accounting for
variations in neuromuscular or biomechanical strategies, particularly those at
the individual level may mask important factors relating to the different
strategies used. An alternative to single-group analysis is sub-group analysis,
which classifies similar movement strategies based on patterns (e.g. EMG or
kinematic waveform patterns) into sub-groups or clusters.[348] An optimal
clustering of trials or individuals maximises the ability to identify outcomes
stemming from the differing strategies utilised within a single-cohort
design.[348] A sub-group approach may elicit more relevant outcomes when, for

Methodology
80
example, examining the neuromuscular contributions to lower limb
biomechanics during high-risk sporting tasks.
Cluster analysis is a statistical method for identifying homogenous cases and
grouping these into clusters. Cases within clusters are closely related and share
many characteristics, while also being dissimilar to cases belonging to other
clusters.[343] Cluster analysis has been used to examine movement strategies
employed during human gait,[331, 349-352] as well as in identifying muscle
activation strategies and their subsequent effect on biomechanical
outcomes.[353, 354] A number of different clustering algorithms exist, with these
algorithms varying in their purpose, strengths and weaknesses. Different
clustering approaches were employed for analyses within this thesis. The
determination of the clustering approach was based on the aims of the study,
as well as the strengths and weaknesses of the clustering algorithms. The
following section details the strengths and weaknesses, and considerations of
use for the clustering algorithms used.
3.5.1.1 Density-Based Spatial Clustering (DBSCAN)
Density-based spatial clustering of applications with noise (DBSCAN) is a
clustering algorithm that groups data points that are close together (i.e. points
with many neighbours in high density regions), while marking data points
that lie in low-density regions as outliers (i.e. anomalies). The DBSCAN
algorithm requires three input parameters, those being: the data being
clustered; Epsilon (ε; the distance radius required for two points to be
considered neighbours) and the minimum number of points reachable by a
data point (minPts) using the distance ε for it to be considered part of a
cluster.[355] The latter two of these parameters must be determined based on the
input data and aims of the clustering. The minimum number of points
Methodology
81
reachable by a data point for it to be considered part of a cluster (i.e. minPts)
can be chosen based on the goals of the analysis. For example, isolated data
points with no reachable neighbours could be considered as outliers or
anomalies. In this case, the minPts parameter would be set to one and data
points would not be considered as outliers or anomalies if they had at least
one neighbouring data point. Analytical approaches can be used to calculate
the ε parameter. Daszykowski et al.[355] and Karami and Johansson[356] present
an equation that can be used to calculate ε based on the minPts parameter and
input data used for clustering. Utilising this analytical approach ensures an
objective ε parameter is chosen specific to the data being clustered.
The DBSCAN algorithm assesses each point in a dataset using these
parameters, with data points allocated to clusters when they are within a
distance of ε to the minPts (see Figure 3.22, Page 82).[355] If a point does not
meet these conditions, it is labelled as an outlier.[355, 357] This is the main strength
of clustering using the DBSCAN algorithm. Other clustering approaches are
sensitive to outliers and include these data points within clusters.[343] As the
aim of study one (i.e. Chapter Four) was to identify anomalies in participant
data, the DBSCAN approach was considered appropriate for this study. The
specific application of the DBSCAN algorithm to this data is outlined in the
relevant chapter.

Methodology
82
Figure 3.22 Illustration of the DBSCAN cluster analysis algorithm using a
minimum points value of one. The radius of the large circles
represent Epsilon (i.e. the distance radius required for two
points to be considered neighbours). The green and blue points, respectively, are within this distance to the number of
minimum points required and hence form clusters. The grey
point is not within this distance to any points and is thus considered an outlier.
3.5.1.2 Latent Profile Analysis (LPA)
Latent profile analysis (LPA) is a multivariate, model-based clustering
technique using a general approach of finite mixture modelling.[358] Model-
based clustering techniques assign data points to clusters based on their fit to
a given mathematical model, with the most common used being a Gaussian
mixture model.[343] The Gaussian clustering model is based on the assumption
that the distribution from the examined data is generated by multiple
probability distributions,[343, 359] with the clustering algorithm aiming to detect
these underlying distributions. In a neuromechanical context, the idea of
Gaussian mixture modelling is that different neuromuscular or biomechanical

Methodology
83
strategies can be represented by a specific probability distribution, among the
overall probability distribution of the data.[343, 359] Hence, neuromuscular or
biomechanical strategies can be presented as a cluster with its own probability
distribution.[343] Maximum likelihood estimation, employing the Expectation-
Maximisation algorithm,[359] is the most popular and common method for
identifying these underlying probability distributions. The Expectation-
Maximisation algorithm starts by generating n random probability
distributions, and subsequently calculates the probability of membership for
each data point to one of the n estimated probability distributions.[343] The
calculated probability of membership is used to update (or re-estimate) the
mean and standard deviation of the generated n probability distributions.[343]
This process is repeated until the mean and standard deviation of the
probability distributions converge,[359] with this being the final clustering
solution.
Determining the optimal number of clusters or profiles is an important step
when employing LPA. A common approach is to fit models with a different
number of components (i.e. clusters or profiles) to the data, and evaluate the
fit of each model using evaluation criterion.[360] The Akaike (AIC) and Bayesian
(BIC) information criterion are the most commonly used indices for model
evaluation.[358, 360] The AIC and BIC compare the fit of a range of statistical
models to data based on maximum likelihood estimates.[360] Lower AIC and
BIC values indicate a better fit, therefore the optimal number of model
components can be determined by finding the minimum AIC and BIC
values.[358, 360] The ability to utilise these information criterion as a measure of
model fit and accurately estimate the number of clusters within the data is a
key strength of LPA and model-based clustering.[360] The aim of study two (i.e.
Chapter Five) was to cluster landing trials into sub-groups based on the

Methodology
84
muscle activation profiles employed. No previous studies have examined
muscle activation profiles in this manner, therefore no direction as to the
number of profiles to expect or extract was available. The ability to use
objective metrics to quantify the number of profiles to be extracted from the
data was a key reason for LPA being considered appropriate for this study.
Further, LPA was recently used to identify biomechanical profiles used by
athletes during a side-step cutting manoeuvre.[358] The specific application of
the LPA algorithm is outlined in the relevant chapter.
3.5.2 One-Dimensional Statistical Parametric Mapping (SPM1D)
One-dimensional statistical parametric mapping (SPM1D) is a statistical
technique designed specifically for continuous field analysis.[361] Within
biomechanical research, EMG and kinematic/kinetic data are often manifested
as one-dimensional (1D) scalar trajectories (i.e. continuous waveforms) in the
form of ; where represents a particular muscle’s activation level or a
given joint rotation/moment, and represents 1D time or space.[362] However,
these data are often examined discretely by extracting summary metrics from
specific points or regions of the waveform (e.g. peak muscle activation, peak
joint angles).[361] As these discrete measures only encapsulate a small portion
of the waveform, this regional focus bias can result in important information
relating to other points in the data to be missed. SPM1D is designed
specifically for non-directed hypothesis testing of continuous scalar
trajectories, and can partially offset the limitations of discrete point analyses
by providing a framework for the continuous statistical analysis of waveform
data.[361, 363] Another potential source of bias that can be overcome by SPM1D is
covariance among the components being examined.[362] Separate analysis of
individual vector components (e.g. sagittal, frontal and transverse plane joint
rotations in isolation) assumes independence between the components, which
Methodology
85
may be unjustified in particular instances.[362] For example, joint rotations are
unlikely to be independent as muscle lines of action are generally not parallel
to defined joint axes.[362] This inter-component covariance bias can be
overcome by using SPM1D to examine data as a multi-component vector-
field.[362] SPM1D has been highlighted as a superior technique for non-directed
biomechanical hypothesis testing by overcoming the potential regional focus
and inter-component covariance biases associated with a priori selection of
specific points within a waveform.[362] Recent studies have utilised SPM1D to
identify variations in landing strategies between sub-groups.[364, 365] SPM1D has
also been used to identify movement strategies that predict high-risk knee
joint moments during an unplanned side-step cutting manoeuvre.[366]
SPM1D results in the calculation of an SPM statistic, a continuous scalar
trajectory represented as a function of time.[361, 362, 367] It is worth noting that
‘SPM1D’ refers to the overall methodological approach, while the SPM statistic
refers to the calculated scalar trajectory variable.[367] The scalar trajectory
indicates the magnitude of difference or relationship between the waveforms
of interest.[367] Random field theory[368] is used to assess the field-wide
significance of an SPM statistic.[361] To accept or reject the null hypothesis, a
critical threshold at which only (e.g. 5% for an alpha level of 0.05) of
smooth random curves would be expected to traverse is calculated.[367]
Calculation of this critical threshold is based upon estimates of trajectory
smoothness via temporal gradients, and based on this smoothness, random
field theory expectations regarding the field-wide maximum.[361, 363, 367, 368] As
with traditional hypotheses tests, SPM1D produces type I error at a rate of
alpha,[367] thus the critical threshold level must be corrected when multiple
comparisons are made. While SPM1D does not prevent type I error, it does
tightly control its rate of occurrence.[367] Statistical significance, and thus
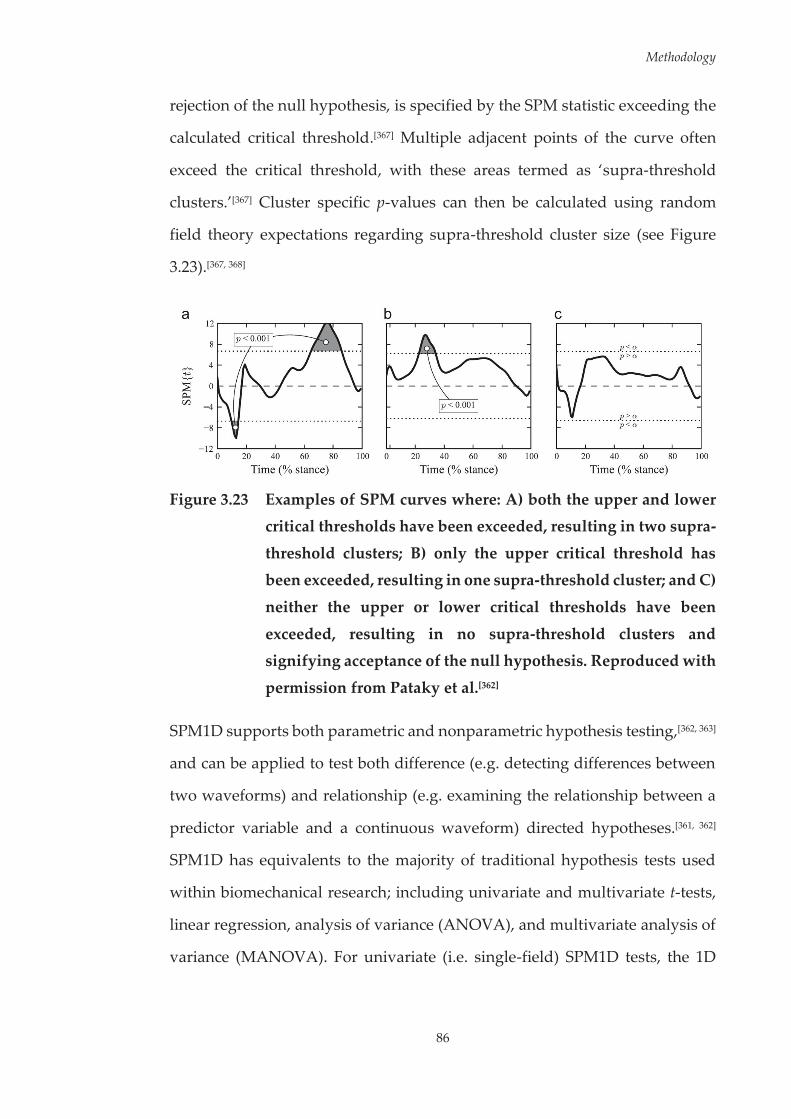
Methodology
86
rejection of the null hypothesis, is specified by the SPM statistic exceeding the
calculated critical threshold.[367] Multiple adjacent points of the curve often
exceed the critical threshold, with these areas termed as ‘supra-threshold
clusters.’[367] Cluster specific p-values can then be calculated using random
field theory expectations regarding supra-threshold cluster size (see Figure
3.23).[367, 368]
Figure 3.23 Examples of SPM curves where: A) both the upper and lower
critical thresholds have been exceeded, resulting in two supra-
threshold clusters; B) only the upper critical threshold has been exceeded, resulting in one supra-threshold cluster; and C)
neither the upper or lower critical thresholds have been
exceeded, resulting in no supra-threshold clusters and signifying acceptance of the null hypothesis. Reproduced with
permission from Pataky et al.[362]
SPM1D supports both parametric and nonparametric hypothesis testing,[362, 363]
and can be applied to test both difference (e.g. detecting differences between
two waveforms) and relationship (e.g. examining the relationship between a
predictor variable and a continuous waveform) directed hypotheses.[361, 362]
SPM1D has equivalents to the majority of traditional hypothesis tests used
within biomechanical research; including univariate and multivariate t-tests,
linear regression, analysis of variance (ANOVA), and multivariate analysis of
variance (MANOVA). For univariate (i.e. single-field) SPM1D tests, the 1D

Methodology
87
scalar trajectory (e.g. frontal plane knee moment) is used as the input for the
relevant test. Multivariate (i.e. vector-field) SPM1D tests combine the 1D scalar
trajectories of interest to form the multi-component vector-field.[362] For
example, sagittal (MX), frontal (MY) and transverse (MZ) plane knee moment
vectors are combined to represent the knee moment vector-field MXYZ.[366]
The outputs obtained and interpretation of results is similar across tests. Each
test outputs a continuous scalar trajectory that lie directly in the original 1D
sampled continua.[361] Statistical significance is identified as per the methods
discussed above; where a critical threshold based on a specified alpha level is
calculated, and where the scalar trajectory exceeds this threshold (i.e. supra-
threshold clusters) the null hypothesis is rejected.[361, 362, 367, 369] The choice of
SPM1D statistical test, like with traditional hypotheses testing, is based on the
nature of the hypothesis being examined. Where the aim is to examine
differences between two waveforms, the single- or vector-field SPM1D
equivalent of a t-test (paired or two-sample) can be conducted. Supra-
threshold clusters resulting from this test indicate a statistically significant
difference between the two waveforms being tested at the points along the 1D
continua where these clusters lie.[361, 362, 367] SPM1D linear regression or
canonical correlations analysis (CCA) can be used to determine the strength of
the relationship between a discrete variable at specific points along a
continuous 1D or vector-field trajectory, respectively.[362, 366, 370] In this case; a
statistically significant increase in the waveform is predicted by an increase or
decrease in the discrete variable where the SPM statistic exceeds the upper or
lower critical thresholds, respectively, along the 1D continua. A key advantage
of SPM1D is the ease of which statistical outputs can be interpreted. The SPM
statistic lies directly in the original 1D sampled continua, meaning it is the
same length as the original waveforms and is represented on an identical time-

Methodology
88
scale.[361] This allows investigators to easily identify where differences or
relationships lie along the waveforms by examining the supra-threshold
clusters against the originally sampled time-scale.
It is important to acknowledge the limitations associated with SPM1D post-
hoc analyses. Post-hoc analyses of waveform pairs assumes the post-hoc tests
are independent, which is usually not the case, and also involves separate
smoothness assessments for each test.[371] Limitations also exist for post-hoc
analyses of multivariate SPM1D tests. Where a statistically significant result is
found from a vector-field test, post-hoc analysis of the individual vector
components can be undertaken using single-field SPM1D tests.[362, 371] This
approach may indicate which vector components contribute to the statistically
significant result, however it neglects the inter-component covariance between
vectors.[371] While the resulting errors associated with these limitations are
expected to be small,[371] interpretation of post-hoc results from individual
waveform pairs and vector components should be made with caution.
Although these limitations exist, the advantages and recent work highlighting
the applicability of SPM1D in examining biomechanical research
hypotheses[361, 362, 364, 366, 367, 370] highlights this method as a useful tool for the
analysis of complex neuromuscular and biomechanical datasets.[362]
89
Chapter Four: Intra-Individual Anomalies in Muscle Activation during a Landing Task
4.1 Introduction
A perplexing factor associated with noncontact anterior cruciate ligament
(ACL) injuries is the ‘one-off’ nature in which they occur, where injuries are
often sustained during sporting tasks athletes have replicated safely countless
times.[46] The manner with which these injuries occur suggests a random,
multifaceted intrinsic dysfunction may play a role in injury events. Injuries to
the ACL occur when forces applied to the ligament are greater than the loads
it can withstand.[158] An athlete’s biomechanical technique during high-risk
sporting tasks directly influence the external loads applied to the lower
limb.[149, 164, 304, 372] Subsequently, the musculature surrounding the hip and knee
must act to stabilise the knee joint and provide support against these external
loads,[170-172] minimising the forces applied to soft tissue structures (e.g. the
ACL). ACL injuries likely occur when there is a mismatch between external
loading and muscular support. Therefore, both biomechanical technique and
activation profiles of lower limb muscles are vital in protecting the ACL
during high-risk sporting tasks. Despite both biomechanical and
neuromuscular factors playing a role in the ACL injury events, this study
focuses on the potential neuromuscular aspect of this dysfunction.
Given the high frequency with which high-risk tasks are performed within
competitive sporting environments,[156, 157] the muscles of the lower limb must
repeatedly function in an appropriate manner during these tasks to prevent
ACL injuries from occurring. Research has shown inter-trial variability in
Neuromuscular Anomalies during Landing
90
muscle activation characteristics across a range of tasks.[48-50, 254] This suggests
that a number of muscle activation profiles may be utilised during the
performance of a given movement. Previous studies have identified
neuromuscular risk factors for ACL injury by linking characteristics from an
individual’s mean muscle activation profile to future ACL injuries or lower
limb biomechanics known to increase ACL loads.[131, 174, 177, 178, 186-191] These
approaches fail to acknowledge the inherent variability present in the
neuromuscular system and the potential relationship of this to the ‘one-off’
nature in which noncontact ACL injuries occur. It is conceivable that a random
intrinsic dysfunction within the neuromuscular system is the inciting event for
these ‘one-off’ injury occurrences. Deviations from an individual’s usual or
‘normal’ muscle activation profile (i.e. intra-individual neuromuscular
anomalies) during high-risk sporting tasks may embody this dysfunction, and
could induce changes in lower limb biomechanics that place the ACL at
greater risk of injury. The concept of neuromuscular ‘anomalies’ and their
impact on lower limb biomechanics and ACL injury risk is yet to be examined.
No studies have determined whether intra-individual anomalies in muscle
activation profiles occur during repeat performance of a high-risk sporting
task, and if so, how these anomalies impact on lower limb biomechanics
associated with increased ACL loading and injury risk.
The purpose of this study was to determine whether intra-individual
anomalies in muscle activation profiles occurred during repeat performance
of a high-risk landing task, and if so, whether these neuromuscular anomalies
influenced lower limb biomechanics. It was hypothesised that intra-individual
anomalies in muscle activation profiles would occur, and that anomalous
activation profiles would result in lower limb biomechanics consistent with

Neuromuscular Anomalies during Landing
91
increased ACL loads or injury risk when compared to the remaining typical
(i.e. ‘normal’) trials.
4.2 Methodology
The majority of the methods employed in this study are comprehensively
outlined in Chapter Three. The following methods are an abridged version of
the sections specific to this chapter.
4.2.1 Participants
Thirty-two healthy sub-elite female netball players (age = 23.1 ± 3.0 years;
height = 171.4 ± 7.8 cm; mass = 67.8 ± 8.2 kg; netball experience = 12.45 ± 4.54
years) volunteered and provided written consent to participate in this study.
All participants met the inclusion/exclusion criteria detailed in Section 3.2 of
Chapter Three.
4.2.2 Experimental Procedures
Data from the netball-specific landing task (i.e. the leap landing) as described
in Section 3.3.1 of Chapter Three, performed during testing session one (i.e.
baseline) were used within this study. Participants performed 20 successful
trials of the leap landing on a predetermined ‘landing limb.’ The landing limb
was determined by asking participants which limb they would be more
comfortable landing on when catching a pass during a game. Further to this,
players were given an opportunity to trial landing on each limb to identify
which they were more comfortable landing on. Each landing trial was initiated
by breaking and accelerating from a static defender (model skeleton) from a
position six-metres from the landing area, followed by a run-up and leap
landing whilst catching a pass (see Figure 4.1, Page 92). Trials were repeated

Neuromuscular Anomalies during Landing
92
until the 20 successful trials were recorded. Participants were allocated 60-90
seconds rest between trials in an effort to minimise fatigue.[134, 255]
Electromyography, kinematic and kinetic data collected from the participants
‘landing limb’ during all landing trials were used within this study.
Figure 4.1 Sagittal view of the leap landing task.
4.2.3 Data Collection and Analysis
Electromyography (EMG), kinematic and kinetic data from the leap landing
task were collected and analysed as per the procedures outlined in Section
3.4.1 and 3.4.2, respectively, of Chapter Three. Briefly, surface EMG data were
collected unilaterally from eight lower limb muscles (gluteus maximus
[GMAX], gluteus medius [GMED], medial hamstrings [MHAM], lateral
hamstrings [LHAM], rectus femoris [RF], vastus lateralis [VL], vastus medialis
[VM], and lateral gastrocnemius [GAS]) on the participants’ ‘landing limb’
using wireless parallel-bar electrodes (Delsys Trigno, Delsys Incorporation,
Boston, MA, United States). All EMG data were processed using custom
MATLAB (version R2014a) (The Mathworks Incorporated, Natick, MA,
United States) programs. Raw EMG signals were online processed using a
bandpass filter between 10 and 500 Hz, and later offline processed using a 20
Hz high-pass fourth-order zero-lag Butterworth digital filter to reduce the
effects of movement artefact; full-wave rectified; and converted to a linear
envelope via a 6 Hz low-pass fourth-order zero-lag Butterworth digital filter.
The EMG data was then amplitude normalised (% MVC) to the larger of the
Neuromuscular Anomalies during Landing
93
peak value recorded during maximal voluntary isometric contractions or the
peak EMG activity during landing trials.[282, 288] EMG data were extracted from
150 ms prior through to 300 ms post initial contact (IC) across all landing trials
for subsequent analyses. This window was chosen as previous research
examining a similar single-limb catch and land task has shown lower limb
muscle onsets occur up to 150 ms prior to landing and remain active for a
period of up to 380 ms.[54]
This study used muscle synergies to represent muscle activation profiles
during the leap landing task. The extracted EMG data were factorised by
applying a non-negative matrix factorisation (NMF) algorithm[298] (as outlined
in Section 3.4.1.3.1 of Chapter Three) to obtain the muscle synergy
components, those being the time-variant muscle activation coefficients and
time-invariant muscle weighing coefficients. The NMF algorithm was iterated
by varying the number of synergies between one and six, with the number of
synergies that resulted in greater than 90% mean total variance accounted for
( ) between experimental and reconstructed EMG data retained. was
also calculated across individual muscles ( ) to ensure patterns were
accounted for by the retained synergies (i.e. > 75%).[48] Following
factorisation, the muscle activation coefficients were normalised to their
maximum value (i.e. each activation coefficient had a maximum value of 1),
with the muscle weighing coefficients within each of the muscle synergies
scaled by the same respective factor.[49, 294]
Three-dimensional (3D) kinematics and kinetics of the lower limb were
computed using an established musculoskeletal model.[305, 310] An eight camera
3D motion capture system (Vicon, Oxford Metrics Limited, Oxford, United
Kingdom) sampling at 250 Hz, synchronised with a 600 x 900 millimetre in
ground force plate (Advanced Medical Technology Incorporated, Watertown,

Neuromuscular Anomalies during Landing
94
MA, United States) sampling at 1000 Hz collected marker trajectory and
ground reaction force (GRF) data. Marker trajectory and GRF data were low-
pass filtered using a cubic smoothing spline with a cut-off frequency of 12 Hz.
Three-dimensional hip and knee joint rotations were calculated from filtered
marker trajectory data using an X-Y-Z Cardan angles sequence; with the X, Y
and Z axes representing joint rotations in the sagittal, frontal and transverse
planes, respectively.[138] Kinematic data were expressed relative to each
participant’s stationary (neutral) trial.[56, 310, 311] Three-dimensional hip and knee
external joint moments were calculated by submitting the filtered marker
trajectory and GRF data to a conventional inverse dynamics analysis.[261] Joint
moments were expressed in the reference frames of the joint coordinate
systems and were normalised by dividing the total joint moment (Nm) by the
product of the participant’s weight and height (kgm). Joint rotation and
moment data were extracted from the instance of IC to 150 ms post IC across
all landing trials. This time window was chosen for biomechanical variables
as ACL injuries are thought to occur within the early deceleration phase of
landing.[161]
4.2.4 Statistical Analysis
The muscle weighing coefficients of all muscle synergies from each
participants’ 20 leap landing trials were extracted into separate matrices for
further analyses. A density-based spatial clustering of applications with noise
(DBSCAN) algorithm (as outlined in Section 3.5.1.1 of Chapter Three)[357] was
applied to each participants’ data to identify trials that employed their typical
or usual (hereby referred to as ‘normal’) muscle activation profile(s), while
also identifying where outlier trials (i.e. intra-individual anomalies in muscle
activation profiles) were present. The DBSCAN algorithm grouped data points
that were close together (i.e. points with many neighbours in high-density

Neuromuscular Anomalies during Landing
95
regions), while also marking data points that lied in low-density regions as
outliers (i.e. anomalies).[355, 357] Prior to clustering, the muscle weighing
coefficient values of each participant were normalised to their correlation
matrix, as this can result in better classification of waveform data when using
partitional classification techniques.[348] The correlation matrix was created by
calculating the Pearson’s r value for the extracted muscle weighing
coefficients, quantifying the relationship between individual landing trials.
The correlation matrix was subsequently used as the input data for the
DBSCAN algorithm. The additional parameters for the DBSCAN algorithm,
Epsilon (ε) and the minimum number of points reachable by a data point
(minPts) for it to be considered part of a cluster were determined using
established procedures.[355-357] The individual muscle weighing coefficient
correlation matrices from each participant were used as the data inputs in the
equation presented by Daszykowski et al.[355] and Karami and Johansson[356],
resulting in participant-specific ε parameters being calculated. This study
considered isolated data points with no reachable neighbours as anomalies,
therefore the minPts was set at one across all participants. Trials partitioned to
clusters were considered to represent a participant’s selective ‘normal’ muscle
activation profile or profiles, while trials labelled as outliers were deemed as
intra-individual anomalies in muscle activation.
Trials considered as ‘normal’ and anomalous were grouped, exported and
further analysed via open source code[369, 371] in Python 2.7 using Canopy 1.5
(Enthought Incorporated, Austin, TX, United States). One-dimensional
statistical parametric mapping (SPM1D) was used to compare mean hip and
knee joint angles and moments between ‘normal’ and anomalous trials. A
hierarchical process was used to identify multi- and single-planar differences
in lower limb biomechanics between ‘normal’ and anomalous trials. The mean

Neuromuscular Anomalies during Landing
96
hip and knee joint rotation (RXYZ) and joint moment (MXYZ) vector-fields were
compared between groups using a SPM1D paired Hotelling’s T2 test. Post-hoc
comparisons of the joint rotation (RXY, RXZ, RYZ) and moment (MXY, MXZ, MYZ)
couples using paired Hotelling’s T2 tests and individual joint rotation (RX, RY,
RZ) and moment (MX, MY, MZ) components using paired t-tests between
groups were also conducted. As a paired statistical design was used to
compare ‘normal’ vs. ‘anomalous’ trials, participants who did not exhibit any
anomalous trials were excluded from these analyses. To retain a Type I family-
wise error rate of alpha = 0.05, a corrected threshold based on the number of
vector components (i.e. joints = 2, planes = 3) was calculated,[362] resulting in a
corrected alpha level of 0.0083. Subsequently, for each SPM statistic a critical
threshold was calculated at the corrected alpha level to determine where
statistically significant differences were present. A statistically significant
difference was identified where the SPM statistical curve exceeded this critical
threshold. Based on the corrected alpha level, a supra-threshold cluster
indicated that the same result would be produced by random curves in only
0.83% of repeated tests. The subsequent probabilities (i.e. p-values) with which
supra-threshold regions of the SPM statistical curve could have resulted from
repeated samplings of equally smooth random curves were then calculated.
4.3 Results
Using the criteria previously described in Chapter Three (i.e. overall >
90% and > 75%), three muscle synergies were retained from the
extracted EMG data (see Figure 4.2, Page 97). Inspection of the activation
coefficients associated with each muscle synergy (see Figure 4.3, Page 98)
indicated that the first synergy captured muscle activation around initial
contact (i.e. at landing), the second captured muscle activation after initial
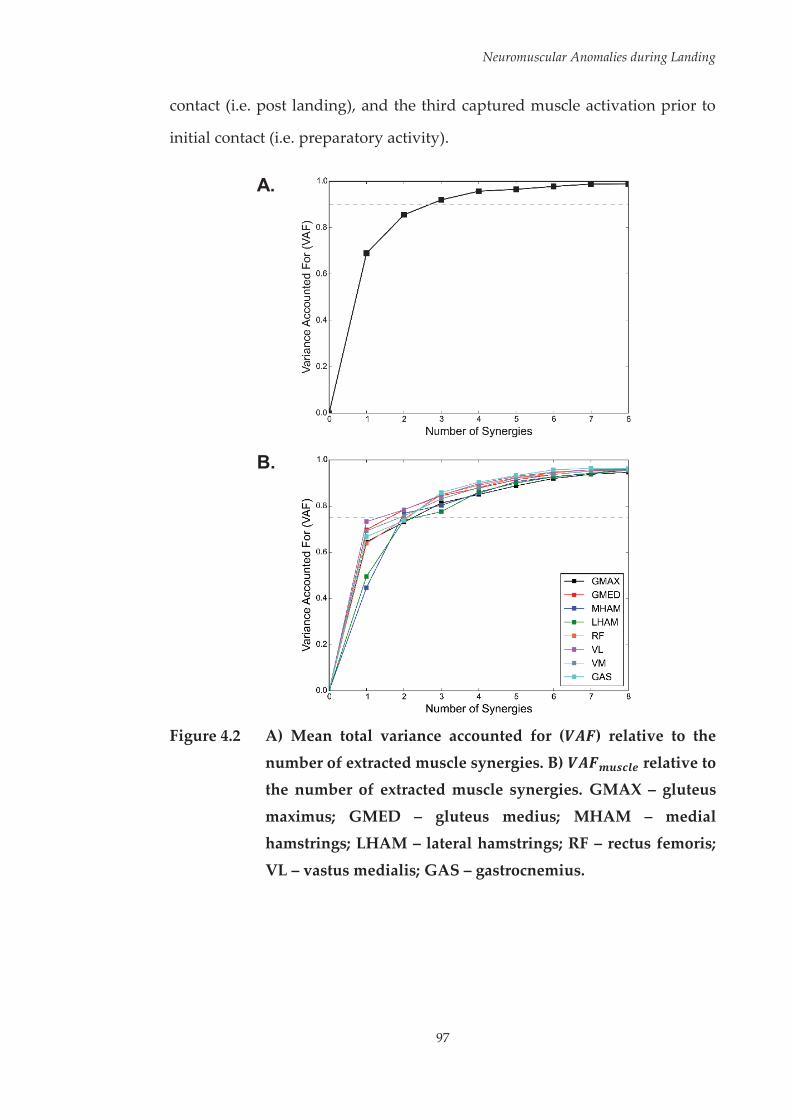
Neuromuscular Anomalies during Landing
97
contact (i.e. post landing), and the third captured muscle activation prior to
initial contact (i.e. preparatory activity).
A.
B.
Figure 4.2 A) Mean total variance accounted for ( ) relative to the
number of extracted muscle synergies. B) relative to the number of extracted muscle synergies. GMAX – gluteus
maximus; GMED – gluteus medius; MHAM – medial hamstrings; LHAM – lateral hamstrings; RF – rectus femoris;
VL – vastus medialis; GAS – gastrocnemius.

Neuromuscular Anomalies during Landing
98
Figure 4.3 Normalised activation coefficients of the three muscle
synergies extracted from the factorisation of EMG data. Dashed vertical line represents initial landing contact (IC).
The DBSCAN algorithm identified trials with anomalous muscle activation
profiles in the majority of participants (27 out of 32). Specifically; six
participants recorded one anomalous trial, 17 participants recorded two
anomalous trials, and four participants recorded three anomalous trials (see
Table 4.1, Page 99). This resulted in 52 anomalous from 640 total trials (8.1%).
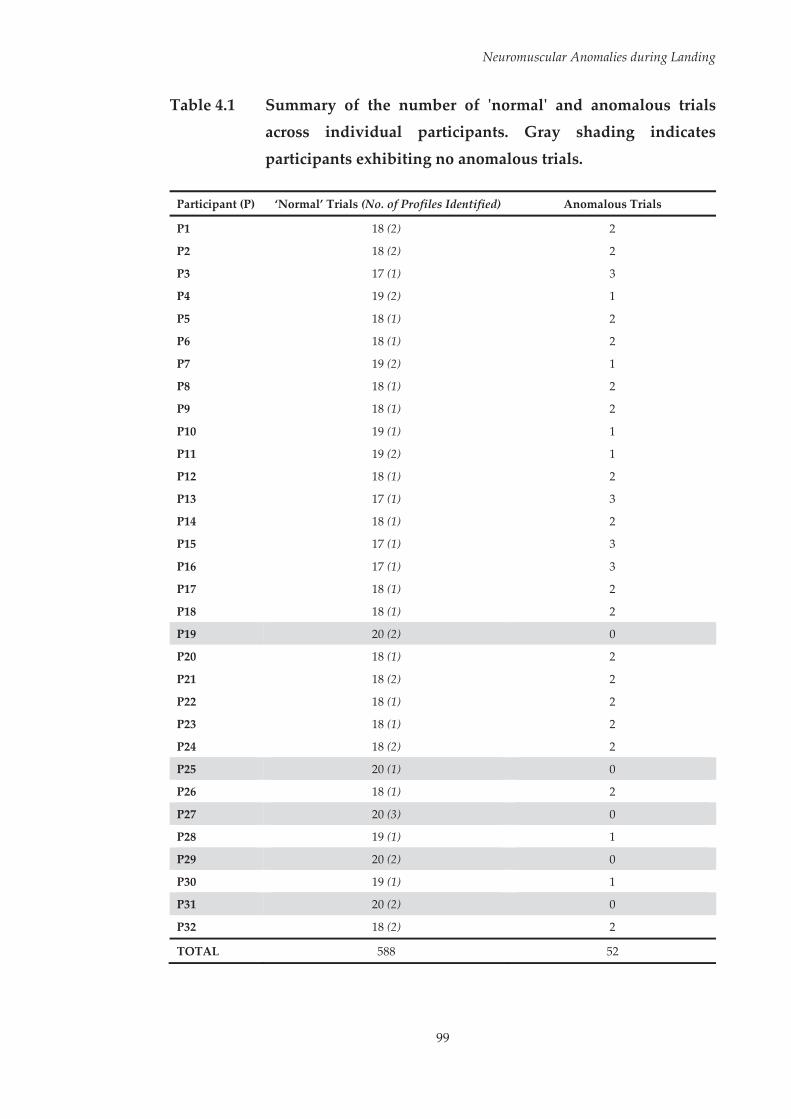
Neuromuscular Anomalies during Landing
99
Table 4.1 Summary of the number of 'normal' and anomalous trials across individual participants. Gray shading indicates
participants exhibiting no anomalous trials.
Participant (P) ‘Normal’ Trials (No. of Profiles Identified) Anomalous Trials
P1 18 (2) 2
P2 18 (2) 2
P3 17 (1) 3
P4 19 (2) 1
P5 18 (1) 2
P6 18 (1) 2
P7 19 (2) 1
P8 18 (1) 2
P9 18 (1) 2
P10 19 (1) 1
P11 19 (2) 1
P12 18 (1) 2
P13 17 (1) 3
P14 18 (1) 2
P15 17 (1) 3
P16 17 (1) 3
P17 18 (1) 2
P18 18 (1) 2
P19 20 (2) 0
P20 18 (1) 2
P21 18 (2) 2
P22 18 (1) 2
P23 18 (1) 2
P24 18 (2) 2
P25 20 (1) 0
P26 18 (1) 2
P27 20 (3) 0
P28 19 (1) 1
P29 20 (2) 0
P30 19 (1) 1
P31 20 (2) 0
P32 18 (2) 2
TOTAL 588 52
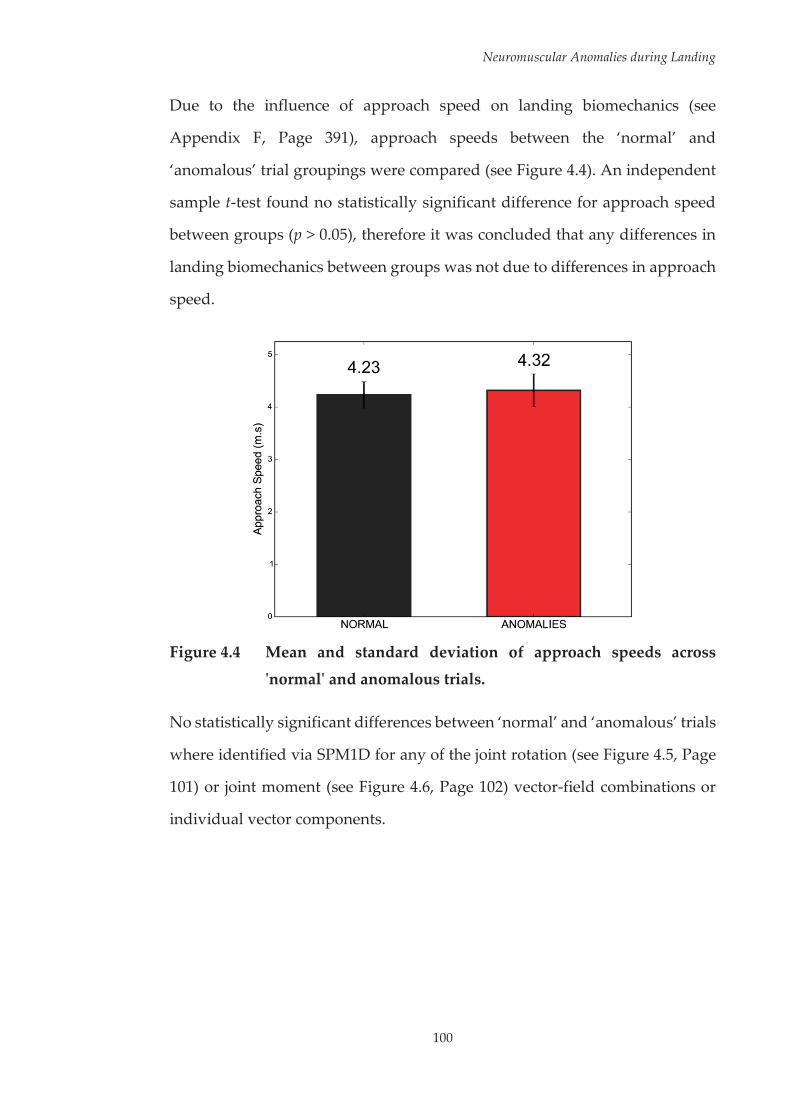
Neuromuscular Anomalies during Landing
100
Due to the influence of approach speed on landing biomechanics (see
Appendix F, Page 391), approach speeds between the ‘normal’ and
‘anomalous’ trial groupings were compared (see Figure 4.4). An independent
sample t-test found no statistically significant difference for approach speed
between groups (p > 0.05), therefore it was concluded that any differences in
landing biomechanics between groups was not due to differences in approach
speed.
Figure 4.4 Mean and standard deviation of approach speeds across
'normal' and anomalous trials.
No statistically significant differences between ‘normal’ and ‘anomalous’ trials
where identified via SPM1D for any of the joint rotation (see Figure 4.5, Page
101) or joint moment (see Figure 4.6, Page 102) vector-field combinations or
individual vector components.
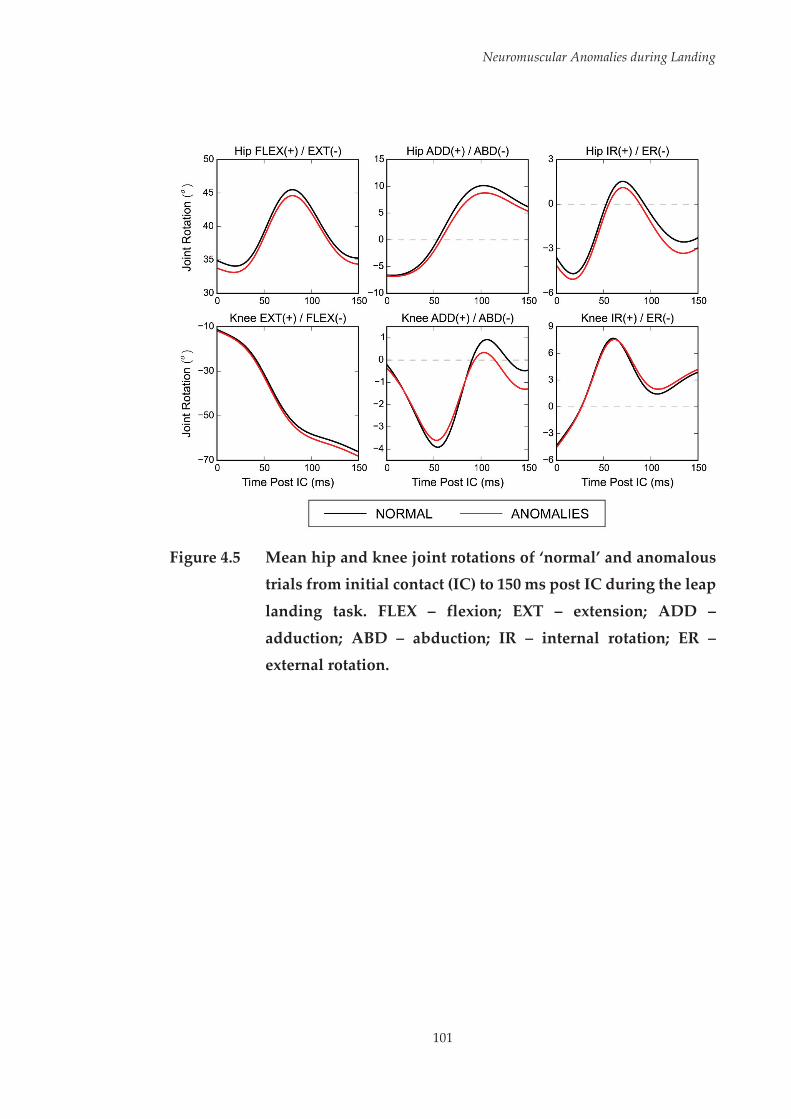
Neuromuscular Anomalies during Landing
101
Figure 4.5 Mean hip and knee joint rotations of ‘normal’ and anomalous
trials from initial contact (IC) to 150 ms post IC during the leap
landing task. FLEX – flexion; EXT – extension; ADD –
adduction; ABD – abduction; IR – internal rotation; ER – external rotation.
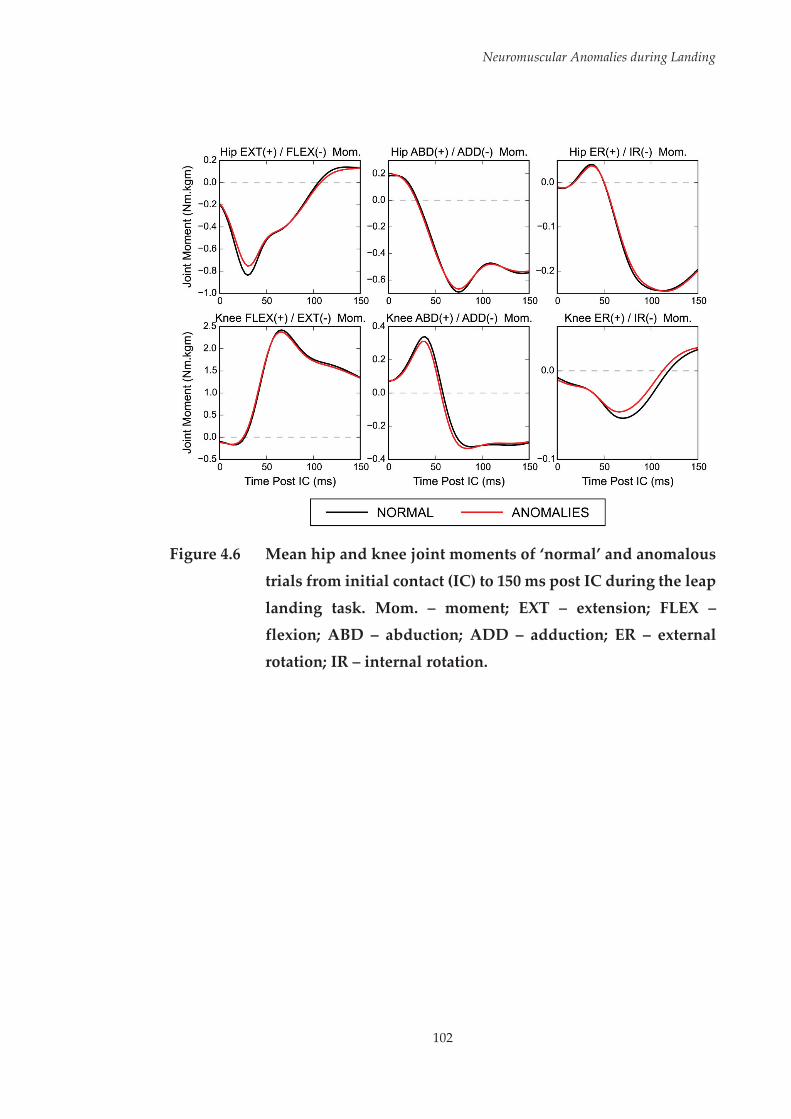
Neuromuscular Anomalies during Landing
102
Figure 4.6 Mean hip and knee joint moments of ‘normal’ and anomalous
trials from initial contact (IC) to 150 ms post IC during the leap
landing task. Mom. – moment; EXT – extension; FLEX – flexion; ABD – abduction; ADD – adduction; ER – external
rotation; IR – internal rotation.

Neuromuscular Anomalies during Landing
103
4.4 Discussion
The ‘one-off’ nature in which ACL injuries occur suggests a random intrinsic
dysfunction may play a role in injury events. Given the neuromuscular
system’s role in protecting the lower limb from hazardous postures and loads,
‘anomalies’ in muscle activation profiles could leave athletes susceptible to
ACL injury. The purpose of this study was to determine whether intra-
individual anomalies in muscle activation profiles occurred during repeat
performance of a high-risk landing task, and if so, whether these
neuromuscular anomalies influenced lower limb biomechanics. The findings
of this study suggest that anomalies in muscle activation can occur when
performing repetitions of a high-risk landing task within laboratory-based
testing, however there is no consistent effect on lower limb biomechanics
when these occur.
Within this study, the majority of participants (27 out of 32) demonstrated at
least one anomalous trial across all of their landings (see Table 4.1, Page 99).
However, the presence of these anomalies in general did not induce changes
in lower limb biomechanics consistent with increased ACL loads or injury risk.
No differences were observed when comparing hip and knee joint rotations
and moments from the anomalous to the remaining ‘normal’ trials. It is well
documented that the neuromuscular system is highly redundant, meaning a
single movement task can be performed in many ways with a similar
result.[49, 200, 274, 373] Variability within the neuromuscular system has been
established across a range of movements, even when the task is kept
consistent.[49, 50, 274] The redundancy of the neuromuscular system,[373] allowing
multiple muscle activation solutions to be utilised for the same task may be a
factor in why no differences were observed between ‘normal’ and ‘anomalous’
Neuromuscular Anomalies during Landing
104
trials. Contrary to the hypothesis, anomalies in muscle activation profiles may
have the capacity to protect athletes’ from ACL injury by maintaining
consistent task performance. Perturbations during high-risk sporting tasks
performed within competitive environments may play an important role in
ACL injuries.[103] Reacting to a stimulus has been frequently shown to influence
athlete’s biomechanics.[138, 171, 193, 302, 374, 375] Side-step cutting movements have
been associated with ACL injuries within competitive sporting
environments.[5, 102] These injuries may occur due to excessive knee loads
stemming from an unplanned or late decision to initiate the change of
direction movement in response to a sudden external stimulus, such as
another athlete or movement of the ball,[101, 247, 302] or as an instantaneous
manoeuvre to gain a better position within the playing area.[247, 376] Sports that
include a focus on controlling and moving the ball with the feet, such as soccer,
may also present an obstacle in the planning of change of direction
movements.[101] Landing movements are also often cited as the task being
performed when ACL injuries occur.[98, 99, 103] In many team sports where ACL
injuries are observed during landings, players may be required to pre-empt
subsequent movements to the landing prior to completing the movement.[103]
Noncontact ACL injuries have been observed during landings where athletes’
appear to alter the alignment of the trunk in preparation for subsequent
movements.[103] Changes in trunk position during high-risk sporting tasks
have been linked to ACL injuries[159, 377] and can increase joint moments at the
knee that place a load on the ACL.[166, 167, 372] These varying circumstances
experienced within competitive sporting environments may necessitate
alterations to the muscle activation profile to keep task performance consistent
and avoid high knee loads that could cause ACL injury. Neuromuscular
anomalies may therefore not represent a dysfunction of the neuromuscular
system, rather these may be required to adapt to the different external loading
Neuromuscular Anomalies during Landing
105
environments presented during competitive sporting environments. As the
landing task examined within this study was kept consistent across trials and
did not encompass anticipatory factors found within competitive sporting
environments, these concepts cannot be examined. A focus on unplanned
high-risk sporting tasks with external perturbations may yield valuable
information surrounding the role of neuromuscular anomalies in modulating
ACL injury risk.
While the results of this study support the theory that consistent task
performance can be achieved with anomalies in muscle activation profiles, it
may be unwise to dismiss the potential role of neuromuscular anomalies in
ACL injuries. The ‘one-off’ nature in which noncontact ACL injuries occur,[46]
combined with the neuromuscular system’s role in counteracting potentially
hazardous lower limb postures and loads[170-172] does support the theory that a
random intrinsic neuromuscular dysfunction may play a role in the ACL
injury mechanism. Abnormal knee joint postures and loading places the ACL
at risk of rupture.[138, 378] Anomalous muscle activation characteristics could
potentially increase the risk of injury to the ACL by increasing the likelihood
of an abnormal and possibly hazardous performance occurring. As discussed
earlier, neuromuscular anomalies in certain situations may represent a
mechanism to keep task performance consistent and protect from injury.
However, in other situations where variations in muscle activation profiles are
not required, neuromuscular anomalies may invoke abnormal and potentially
hazardous lower limb postures that increase the risk of injury.
It may also be that specific contrasting anomalies in muscle activation induce
desirable and undesirable changes, respectively, with regard to lower limb
biomechanics associated with ACL loading or injury risk. For example,
increasing activation of the medial quadriceps and hamstrings is considered
Neuromuscular Anomalies during Landing
106
an appropriate strategy for protecting the ACL by supporting against external
knee abduction moments.[161, 170] Anomalous muscle activation characteristics
representing reduced versus over activation of these medial knee muscles
could therefore have opposing effects, increasing and decreasing the load
placed on the ACL, respectively. Examination of participants’ individual
anomalies compared to their ‘normal’ activation profile(s) revealed a diverse
range of anomalies across different trials, muscles and participants.
Anomalous trials were identified via both increases and decreases in the
activation of muscles within the different muscle synergies. Further, large
variations in the timing of peak muscle activation also appeared to trigger the
identification of anomalous activation profiles. The identification of
anomalous activation profiles can be best explained by inspection of an
example of a participant’s ‘normal’ versus anomalous trials. The muscle
synergy weighing coefficient and EMG waveform data of a sample
participants (P22) ‘normal’ and anomalous trials are presented in Figure 4.7
(see Page 108) and Figure 4.8 (see Page 109), respectively. Figure 4.7 can be
used to determine where the anomalies in muscle activation lie relative to the
identified muscle synergies. For the first identified anomalous trial (indicated
in red), the main anomalies compared to the ‘normal’ profile (indicated in
black) are present in the muscle weighing coefficients of gluteus maximus in
synergy one; as well as the medial and lateral hamstrings, and gastrocnemius
in synergy three. These results would suggest that this trial had a substantial
increase in activation of the gluteus maximus around initial contact; while also
having large increase in medial and lateral hamstrings, and gastrocnemius
preparatory activation relative to ‘normal’ trials. For the second identified
anomalous trial (indicated in blue), the main anomalies can be seen in the
muscle weighing coefficients of the gluteus medius and lateral hamstrings in
synergies one and three, respectively. These results would suggest that this

Neuromuscular Anomalies during Landing
107
trial had a substantial increase in gluteus medius activation around initial
contact and a large reduction in preparatory activation of the lateral
hamstrings. These interpretations can be confirmed by examination of the
EMG waveform data (see Figure 4.8), comparing the mean data from the
‘normal’ trials to data from the anomalous trials.

Neuromuscular Anomalies during Landing
108
Fi
gure
4.7
In
divi
dual
par
ticip
ant (
P22)
exa
mpl
e of
mus
cle
syne
rgy
wei
ghin
g co
effi
cien
ts fr
om ‘n
orm
al’ a
nd a
nom
alou
s tr
ials
.

Neuromuscular Anomalies during Landing
109
Figure 4.8 Individual participant (P22) example of muscle activation
waveform data from ‘normal’ and anomalous trials.
It is possible that the grouping of dissimilar anomalies for comparison to the
participants’ ‘normal’ trials influenced the ability to detect differences in lower
limb biomechanical outcomes. Opposing effects on lower limb biomechanics
compared to ‘normal’ trials may arise from contrasting anomalies. The
investigation of specific anomalies in muscle activation was, however, outside
the scope of this study. The experimental design limited the ability to isolate
and test the effect of specific anomalies in muscle activation on lower limb
biomechanics. Only 52 anomalous trials were observed across 640 total trials.
Splitting these trials based on the type of anomaly that occurred would result
Neuromuscular Anomalies during Landing
110
in minimal numbers across the various specific anomalies, and it would be
difficult to draw conclusions from such small samples.
Musculoskeletal modelling and computer simulation methods may be a viable
approach for examining the influence of specific muscle activation anomalies
on lower limb biomechanics across various sporting situations where ACL
injuries occur. Studies have utilised modelling and simulation methods to
identify how alterations in muscle activation can impact human
movement.[379-381] The findings of the present study suggest that it may be
important to consider anomalies in muscle activation profiles within
modelling and simulation studies examining the relationship between
neuromuscular control and ACL injury risk during high-risk sporting tasks.
Simulation-based methods could allow for specific neuromuscular anomalies
to be investigated in isolation and replicated across a range of different
muscles, individuals or tasks. Environmental related perturbations that have
been associated with ACL injuries could also be included within these
simulations to understand the potential protective or injurious effects of
variations in muscle activation profiles. Future studies in these areas may
allow for a greater understanding of the differential effects of various
neuromuscular anomalies on lower limb biomechanics associated with ACL
loading during high-risk sporting tasks across a range of situations.
Interestingly, a select number of participants did not exhibit any anomalous
trials (see Table 4.1, Page 99). This could be an indication that certain
participants were more consistent in the activation profiles they used in
completing the landing task. Consistent muscle activation could ensure that
the landing task is repeatedly performed in a safe manner, preventing injuries
from occurring. However, if the individual’s muscle activation profile were
insufficient to produce a landing technique that protected the ACL from high
Neuromuscular Anomalies during Landing
111
loads, this consistency may result in the individual being frequently placed at-
risk of injury. In addition, the inability to adapt their muscle activation profile
to varying situations may also place the individual at increased risk of injury
when unexpected perturbations to the movement are experienced. The need
to utilise consistent or varying muscle activation profiles may be an important
component to consider for ACL injury prevention programs. ACL injury
prevention programs incorporating repetitive exercises in a controlled
environment may only encourage a single neuromuscular solution for the
high-risk task being trained. Should more variable neuromuscular control be
deemed important for protecting athletes from ACL injury, injury prevention
programs must reflect this need. Further research on the impact of varying
muscle activation profiles on lower limb biomechanics during high-risk
sporting tasks may determine whether injury prevention programs should
encourage consistent or variable neuromuscular strategies.
The lack of anomalies for certain participants could also have been reflective
of the number of trials collected (n = 20). By definition, an anomaly is
something that deviates from what is normal or expected. Therefore, many
trials may be necessary for this to occur within individuals who display more
consistent muscle activation. This need for a large number of trials could be a
limitation for examining this phenomenon using data collected from
experimental methods alone. Collecting a substantial number of trials of a
high-risk sporting task within laboratory settings may be impractical due to
the time required, but may also impact the merit of results. Alterations in
muscle activation characteristics have been observed during high-risk
sporting tasks under fatigued conditions.[382] Performing an extensive number
of trials could induce fatigue, therefore it may be difficult to discern if the
Neuromuscular Anomalies during Landing
112
anomalies in neuromuscular control were due to an intrinsic dysfunction or
the presence of fatigue.
The grouping of ‘normal’ muscle activation profiles may have been another
limiting factor in this study. While certain participants’ ‘normal’ trials were
grouped in a single muscle activation profile and could be considered
homogenous, other participants exhibited multiple ‘normal’ activation
profiles. This is not surprising, as studies have shown different neuromuscular
solutions can be utilised for performance of the same task.[48-50, 254] Grouping the
various ‘normal’ activation profiles identified and comparing each of these to
the anomalous trials may have resulted in certain differences in lower limb
biomechanics being identified. Nonetheless, the focus of this study was to
examine the impact of anomalies in muscle activation on lower limb
biomechanics during a high-risk landing task, and this was achievable by
grouping trials considered as ‘normal’ for comparison. It is important to note
that ‘normal’ muscle activation within this study was only representative of
the individuals’ typical or usual muscle activation profile(s). It may be
erroneous to assume that these ‘normal’ activation profiles incorporated
adequate muscle activation to prevent lower limb postures that would
increase ACL loading or injury risk. The identification of multiple ‘normal’
profiles does, however, open up further avenues for exploring neuromuscular
contributions to ACL injury risk. It is possible that different muscle activation
profiles result in different lower limb biomechanics, and thus impact on ACL
injury risk. Linking specific muscle activation profiles to lower limb
biomechanics consistent with increased ACL loads may further our
understanding of neuromuscular contributions to ACL injury risk. This area
will be explored within Chapter Five of this thesis.
Neuromuscular Anomalies during Landing
113
It is important to acknowledge that this study focused solely on muscle
activation during the high-risk sporting task. The physiological characteristics
and strength of muscles are likely to be key factors in protecting the knee and
ACL during high-risk landing tasks, and thus also require consideration in
identifying neuromuscular contributions to ACL injury risk. A recent
prospective study found that reduced isometric hip abduction and external
rotation strength was predictive of future noncontact ACL injury in
athletes,[198] highlighting the importance of adequate muscle strength in
reducing ACL injury risk. A muscle with a larger physiological cross-section
area will produce greater force at the same activation level compared to a
smaller muscle.[262] Similarly, higher muscle forces can be produced at the same
activation level if the muscle is operating at a more optimal length or
velocity.[262] Individuals with differences in muscle strength, size or length may
have variable capacities to cope with anomalies in muscle activation profiles.
Neuromusculoskeletal modelling approaches allow the inclusion of muscle
strength and length parameters, while also calculating muscle forces during
task performances. The use of these approaches in conjunction with the
assessment of neuromuscular anomalies may assist in achieving a greater
overall understanding of neuromuscular contributions to ACL injury risk, and
how this may vary across individuals with different muscle physiology.

Neuromuscular Anomalies during Landing
114
4.5 Conclusions
This study identified the presence of anomalies in muscle activation profiles
during repeat performance of a high-risk landing task within a laboratory
environment. However, the presence of neuromuscular anomalies did not
result in lower limb biomechanics consistent with increased ACL loads or
injury risk. These findings suggest that consistent performance of a high-risk
landing task can be achieved even with anomalies in neuromuscular control.
Investigating the differential effects of specific neuromuscular anomalies may
elicit further understanding regarding their influence on ACL injury risk.
Multiple ‘normal’ muscle activation profiles were identified within a number
of participants. A greater understanding of neuromuscular contributions to
ACL injury risk may be achieved by examining the influence of these different
normal profiles on lower limb biomechanics during high-risk landing tasks.

115
Chapter Five: The Influence of Muscle Activation Profiles on Lower Limb Biomechanics during a Landing Task
5.1 Introduction
Neuromuscular control is often acknowledged as a key modifiable risk factor
for anterior cruciate ligament (ACL) injuries.[15, 47] Various elements of
neuromuscular control have been implicated in increasing ACL injury risk or
linked to biomechanical factors associated with increased ACL loads.[131, 174, 177,
178, 186-191] Targeting these muscle activation characteristics within injury
prevention programs is likely an effective means for reducing ACL injury risk.
However, previous work linking neuromuscular factors to lower limb
biomechanics associated with ACL loading has tended to focus on discrete
muscle activation characteristics of specific muscles.[54-64] This approach fails to
acknowledge the relationship between multiple muscles and their combined
activation characteristics. As no single muscle crossing the knee is capable of
supporting the joint against injurious loads alone, adequate activation of
multiple muscles is required to protect the ACL from external loading during
high-risk sporting tasks.[161] The combined activation characteristics of lower
limb muscles (i.e. the overall muscle activation profile) may therefore be key
in reducing ACL injury risk. Understanding how the overall muscle activation
profile contributes to lower limb biomechanics associated with ACL loading
during high-risk sporting tasks may improve our understanding of
neuromuscular contributions to ACL injury risk.
Muscle Activation Profiles during Landing
116
Determining how the overall muscle activation profile varies across repeat
task performances within and between individuals is also of importance. The
neuromuscular system is capable of employing different muscle activation
profiles for a given movement.[48-50, 254] The use of different muscle activation
profiles within individuals was evident in the previous study, where a number
of participants employed multiple activation profiles across landing trials.
While the previous chapter focused on intra-individual variation within
muscle activation profiles, the use of muscle activation profiles across
individuals must also be considered. Understanding whether individuals
utilise shared or different activation profiles and how these relate to potential
ACL injury risk is an important factor in ensuring ACL injury prevention
programs are providing a benefit to all involved. Current ACL injury
prevention programs tend to be applied in a universal manner, where the
same neuromuscular deficits are targeted across all individuals.[358] The
identification of different activation profiles within or across individuals
would question whether generic ACL injury prevention programs are
appropriate. Different activation profiles may encompass various
neuromuscular deficits that contribute to ACL injury risk. This may infer to
need for varied injury prevention programs to ensure these neuromuscular
deficits are targeted.
The purpose of this study was to identify the muscle activation profiles
employed during a high-risk landing task and their subsequent impact on
lower limb biomechanics linked to ACL loading or injury risk. It was
hypothesised that individuals would utilise a number of different muscle
activation profiles, and that certain profiles would result in lower limb
biomechanics consistent with increased ACL loading and injury risk.
Muscle Activation Profiles during Landing
117
5.2 Methodology
The majority of the methods employed in this study are comprehensively
outlined in Chapter Three. The following methods are an abridged version of
the sections specific to this chapter.
5.2.1 Participants
Thirty-two healthy sub-elite female netball players (age = 23.1 ± 3.0 years;
height = 171.4 ± 7.8 cm; mass = 67.8 ± 8.2 kg; netball experience = 12.45 ± 4.54
years) volunteered and provided written consent to participate in this study.
All participants met the inclusion/exclusion criteria detailed in Section 3.2 of
Chapter Three.
5.2.2 Experimental Procedures
Data from the netball-specific landing task (i.e. the leap landing), as described
in Section 3.3.1 of Chapter Three, performed during testing session one (i.e.
baseline) were used within this study. Participants performed 20 successful
trials of the leap landing on a predetermined ‘landing limb.’ The landing limb
was determined by asking participants which limb they would be more
comfortable landing on when catching a pass during a game. Further to this,
players were given an opportunity to trial landing on each limb to identify
which they were more comfortable landing on. Each landing trial was initiated
by breaking and accelerating from a static defender (model skeleton) from a
position six-metres from the landing area, followed by a run-up and leap
landing whilst catching a pass (see Figure 5.1, Page 118). Trials were repeated
until the 20 successful trials were recorded. Participants were allocated 60-90
seconds rest between trials in an effort to minimise fatigue.[134, 255]

Muscle Activation Profiles during Landing
118
Electromyography, kinematic and kinetic data collected from the participants
‘landing limb’ during all landing trials were used within this study.
Figure 5.1 Sagittal view of the leap landing task.
5.2.3 Data Collection and Analysis
Electromyography (EMG), kinematic and kinetic data from the leap landing
task were collected and analysed as per the procedures outlined in Section
3.4.1 and 3.4.2, respectively, of Chapter Three. Briefly, surface EMG data were
collected unilaterally from eight lower limb muscles (gluteus maximus
[GMAX], gluteus medius [GMED], medial hamstrings [MHAM], lateral
hamstrings [LHAM], rectus femoris [RF], vastus lateralis [VL], vastus medialis
[VM], and lateral gastrocnemius [GAS]) on the participants’ ‘landing limb’
using wireless parallel-bar electrodes (Delsys Trigno, Delsys Incorporation,
Boston, MA, United States). All EMG data were processed using custom
MATLAB (version R2014a) (The Mathworks Incorporated, Natick, MA,
United States) programs. Raw EMG signals were online processed using a
bandpass filter between 10 and 500 Hz, and later offline processed using a 20
Hz high-pass fourth-order zero-lag Butterworth digital filter to reduce the
effects of movement artefact; full-wave rectified; and converted to a linear
envelope via a 6 Hz low-pass fourth-order zero-lag Butterworth digital filter.
The EMG data was then amplitude normalised (% MVC) to the larger of the
peak value recorded during maximal voluntary isometric contractions or the
peak EMG activity during landing trials.[282, 288] EMG data were extracted from

Muscle Activation Profiles during Landing
119
150 ms prior through to 300 ms post initial contact (IC) across all landing trials
for subsequent analyses. This window was chosen as previous research
examining a similar single-limb catch and land task has shown lower limb
muscle onsets occur up to 150 ms prior to landing and remain active for a
period of up to 380 ms.[54]
As in the previous study, muscle synergies were used to represent muscle
activation profiles during the landing task. The extracted EMG data were
factorised by applying a non-negative matrix factorisation (NMF)
algorithm[298] (as outlined in Section 3.4.1.3.1 of Chapter Three) to obtain the
muscle synergy components, those being the time-variant muscle activation
coefficients and time-invariant muscle weighing coefficients. The NMF
algorithm was iterated by varying the number of synergies between one and
six, with the number of synergies that resulted in greater than 90% mean total
variance accounted for ( ) between experimental and reconstructed EMG
data retained. was also calculated across individual muscles ( )
to ensure that each muscle’s activity patterns were accounted for by the
retained synergies (i.e. > 75%).[48] Following factorisation, the muscle
activation coefficients were normalised to their maximum value (i.e. each
activation coefficient had a maximum value of 1), with the muscle weighing
coefficients within each of the muscle synergies scaled by the same respective
factor.[49, 294]
Three-dimensional (3D) kinematics and kinetics of the lower limb were
computed using an established musculoskeletal model.[305, 310] An eight camera
3D motion capture system (Vicon, Oxford Metrics Limited, Oxford, United
Kingdom) sampling at 250 Hz, synchronised with a 600 x 900 mm in ground
force plate (Advanced Medical Technology Incorporated, Watertown, MA,
United States) sampling at 1000 Hz collected marker trajectory and ground
Muscle Activation Profiles during Landing
120
reaction force (GRF) data. Marker trajectory and GRF data were low-pass
filtered using a cubic smoothing spline with a cut-off frequency of 12 Hz.
Three-dimensional hip and knee joint rotations were calculated from filtered
marker trajectory data using an X-Y-Z Cardan angles sequence; with the X, Y
and Z axes representing joint rotations in the sagittal, frontal and transverse
planes, respectively.[138] Kinematic data were expressed relative to each
participant’s stationary (neutral) trial.[56, 310, 311] Three-dimensional hip and knee
external joint moments were calculated by submitting the filtered marker
trajectory and GRF data to a conventional inverse dynamics analysis.[261] Joint
moments were expressed in the reference frames of the joint coordinate
systems and were normalised by dividing the total joint moment (Nm) by the
product of the participant’s weight and height (kgm). Joint rotation and
moment data were extracted from the instance of IC to 150 ms post IC across
all landing trials. This time window was chosen for biomechanical variables
as ACL injuries are thought to occur within the early deceleration phase of
landing.[161]
5.2.4 Statistical Analysis
Latent profile analysis (LPA) (as outlined in Section 3.5.1.2 of Chapter Three)
was used to classify landing trials with similar muscle activation
characteristics into subgroups (i.e. muscle activation profiles). The normalised
muscle weighing coefficients obtained from the factorisation of EMG data
were used as the input variables for the LPA. These variables represented the
muscle activation characteristics of each landing trial and were therefore
deemed as the most applicable for profile identification. Models with a
different number of profiles (two through to eight) were fit to establish the
number of subgroups that provided the optimal fit for the data.[360] The Akaike
(AIC) and Bayesian (BIC) information criterion indices were used for model

Muscle Activation Profiles during Landing
121
selection.[358, 360] Based on these criterion the three component model was
deemed to provide the best fit, therefore three muscle activation profiles
(MAPs) were identified. Although a higher number of profile solutions were
statistically supported by the AIC criterion, solutions above three profiles
resulted in substantial increases in BIC suggesting a poorer fit (see Table 5.1).
Solutions above the three component model also resulted in profiles being
split into subgroups containing a small number of trials (i.e. less than 30 trials).
Table 5.1 Information criterion indices used for model selection in the
latent profile analysis.
Model Components AIC BIC
2 40,398 43,972
3 39,627 43,294
4 38,940 44,735
5 38,232 45,478
6 38,217 46,912
7 38,153 48,298
8 37,795 49,391
AIC – Akaike Information Criteria; BIC – Bayesian Information Criteria Lower values indicate a superior model
Following profile identification, group differences in the muscle weighing
coefficients across all muscle synergies were assessed. Normality of data
distribution within profiles and equality of variance between profiles for the
muscle weighing coefficients was confirmed via non-significant (p > 0.05)
Shapiro-Wilk and Levene statistics, respectively. As the assumptions of
normality and equality of variance were not violated, within- and between-
profile comparisons across the factors of interest were undertaken using
parametric tests. A three-way factorial analysis of variance (ANOVA) with the

Muscle Activation Profiles during Landing
122
muscle weighing coefficient values as the dependent variable was used to
examine the main and interaction effects of profile (n = 3), muscle synergy (n =
3) and muscle (n = 8). Partial eta squared (η2) was used as a measure of effect
size for main and interaction effects, with the interpretation of effect size
values guided by Miles and Shevlin[383] (small η2 = 0.01; medium η2 = 0.06; large
η2 = 0.14). Where statistically significant main and interaction effects were
identified (p < 0.05), post-hoc analyses of simple main effects within- and
between-factors were undertaken using Tukey’s honest significant difference
tests to identify where specific differences occurred. A Bonferroni correction
was applied to an initial alpha level of 0.05 for post-hoc tests based on the
number of comparisons being made within a simple main effects test. Cohen’s
d effect sizes were calculated for post-hoc tests, with the interpretation guided
by Cohen[384] (small d = 0.2; medium d = 0.5; large d = 0.8).
To test the effect of different MAPs on lower limb biomechanics, extracted hip
and knee joint rotation and moment waveform data were exported and
analysed via open source code[369, 371] in Python 2.7 using Canopy 1.5
(Enthought Incorporated, Austin, TX, United States). Comparisons of
kinematic and kinetic waveform data across the different MAPs were made
using one-dimensional statistical parametric mapping (SPM1D). A
hierarchical process was used to identify multi- and single-planar differences
in lower limb biomechanics between MAPs. The mean hip and knee joint
rotation (RXYZ) and joint moment (MXYZ) vector-fields were compared across all
profiles using a SPM1D multivariate ANOVA (MANOVA). Where MANOVA
revealed a statistically significant difference, post-hoc comparisons of the joint
rotation (RXYZ) and moment (MXYZ) vector-fields between the individual MAPs
were made using a SPM1D Hotelling’s T2 test. Post-hoc comparisons between
the individual MAPs of the joint rotation (RXY, RXZ, RYZ) and moment (MXY,
Muscle Activation Profiles during Landing
123
MXZ, MYZ) couples using SPM1D Hotelling’s T2 tests and individual joint
rotation (RX, RY, RZ) and moment (MX, MY, MZ) components using SPM1D two-
sample t-tests were also conducted. To retain a Type I family-wise error rate
of alpha = 0.05, a corrected threshold based on the number of profiles and
vector components (i.e. profiles = 3; joints = 2; planes = 3) was calculated.[362]
This resulted in a corrected alpha level of 0.0028 being used for subsequent
critical threshold calculations and identification of statistically significant
differences. Subsequently, for each SPM statistic a critical threshold was
calculated at the corrected alpha level to determine where statistically
significant results were present. A statistically significant difference was
identified where the SPM statistical curve exceeded this critical threshold.
Supra-threshold clusters indicated the same result would be produced by
random curves in only 0.28% of repeated tests. The subsequent probabilities
(i.e. p-values) with which supra-threshold regions of the SPM statistical curve
could have resulted from repeated samplings of equally smooth random
curves were then calculated.
5.3 Results
As this study used the same data as Chapter Four, the same three muscle
synergies representing muscle activation around IC (i.e. at landing) (muscle
synergy 1), muscle activation after IC (i.e. post landing) (muscle synergy 2),
and activation prior to IC (i.e. preparatory activity) (muscle synergy 3) were
identified by NMF (see Figure 5.2, Page 124).
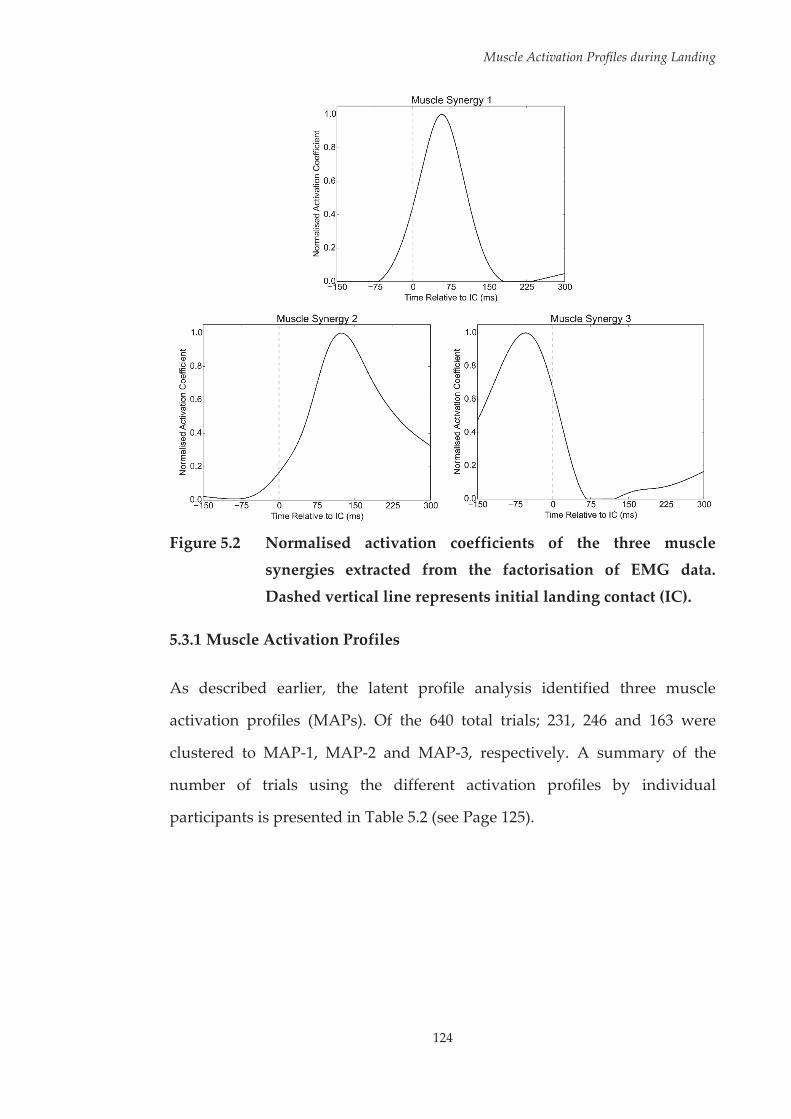
Muscle Activation Profiles during Landing
124
Figure 5.2 Normalised activation coefficients of the three muscle synergies extracted from the factorisation of EMG data.
Dashed vertical line represents initial landing contact (IC).
5.3.1 Muscle Activation Profiles
As described earlier, the latent profile analysis identified three muscle
activation profiles (MAPs). Of the 640 total trials; 231, 246 and 163 were
clustered to MAP-1, MAP-2 and MAP-3, respectively. A summary of the
number of trials using the different activation profiles by individual
participants is presented in Table 5.2 (see Page 125).

Muscle Activation Profiles during Landing
125
Table 5.2 Summary of muscle activation profiles employed by individual participants across trials.
Participant (P) MAP-1 MAP-2 MAP-3
P1 20 0 0
P2 6 1 13
P3 0 19 1
P4 0 1 19
P5 0 5 15
P6 4 1 15
P7 0 20 0
P8 20 0 0
P9 1 1 18
P10 2 18 0
P11 0 20 0
P12 1 19 0
P13 20 0 0
P14 20 0 0
P15 19 1 0
P16 0 0 20
P17 1 0 19
P18 11 0 9
P19 20 0 0
P20 20 0 0
P21 0 0 20
P22 0 19 1
P23 0 20 0
P24 17 0 3
P25 19 0 1
P26 0 20 0
P27 0 20 0
P28 0 20 0
P29 10 1 9
P30 20 0 0
P31 0 20 0
P32 0 20 0
MAP – muscle activation profile
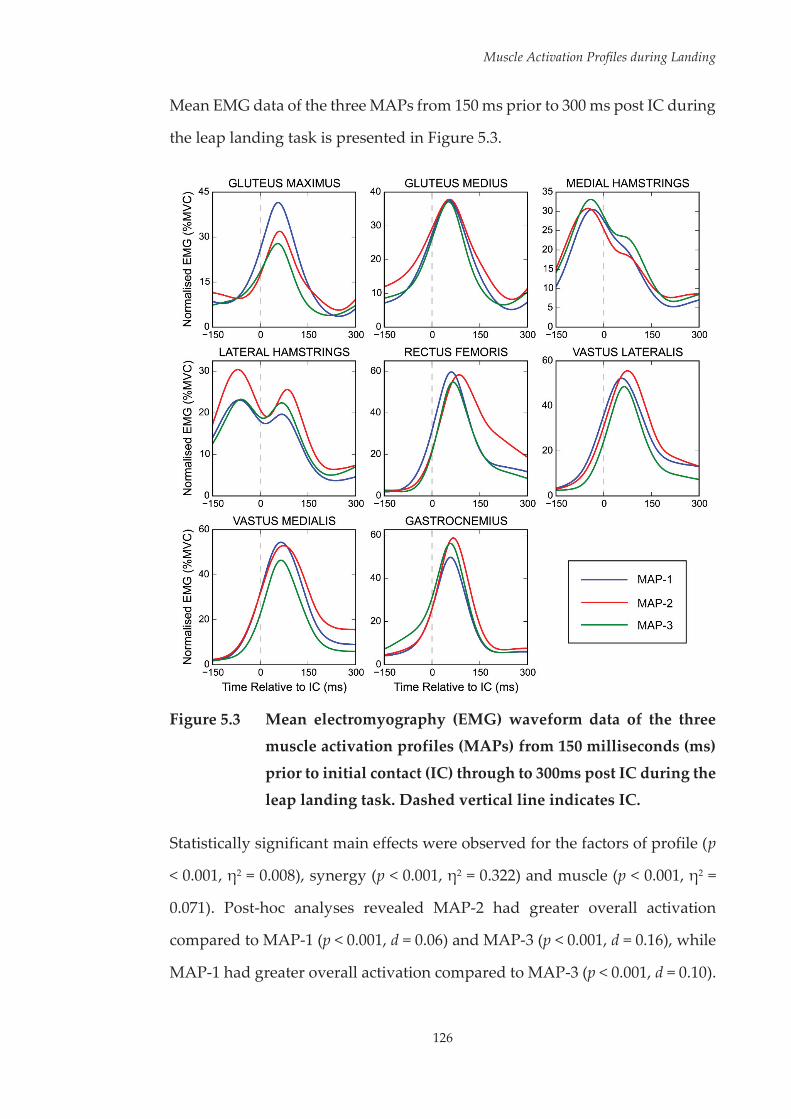
Muscle Activation Profiles during Landing
126
Mean EMG data of the three MAPs from 150 ms prior to 300 ms post IC during
the leap landing task is presented in Figure 5.3.
Figure 5.3 Mean electromyography (EMG) waveform data of the three
muscle activation profiles (MAPs) from 150 milliseconds (ms)
prior to initial contact (IC) through to 300ms post IC during the leap landing task. Dashed vertical line indicates IC.
Statistically significant main effects were observed for the factors of profile (p
< 0.001, η2 = 0.008), synergy (p < 0.001, η2 = 0.322) and muscle (p < 0.001, η2 =
0.071). Post-hoc analyses revealed MAP-2 had greater overall activation
compared to MAP-1 (p < 0.001, d = 0.06) and MAP-3 (p < 0.001, d = 0.16), while
MAP-1 had greater overall activation compared to MAP-3 (p < 0.001, d = 0.10).
Muscle Activation Profiles during Landing
127
Greater overall activation was observed in muscle synergy one (i.e. at landing)
compared to muscle synergies two (i.e. post landing) (p < 0.001, d = 0.92) and
three (i.e. prior to landing) (p < 0.001, d = 1.10), while muscle synergy two
encompassed greater overall activation compared to muscle synergy three (p
< 0.001, d = 0.18). The highest overall activations were observed for the RF, VL,
VM and GAS compared to all other muscles (p < 0.001 and d = 0.16 – 0.54 across
comparisons). Greater overall activation of GMED and MHAM compared to
LHAM (p < 0.001, d = 0.26 and p < 0.001, d = 0.13, respectively) and GMAX (p <
0.001, d = 0.24 and p < 0.001, d = 0.12, respectively) was also observed.
A statistically significant synergy x muscle interaction was found (p < 0.001, η2
= 0.338). Post-hoc analyses revealed statistically significant differences in
overall activation between muscles within muscle synergies one (see Table 5.3,
Page 128) two (see Table 5.4, Page 129) and three (see Table 5.5, Page 130).
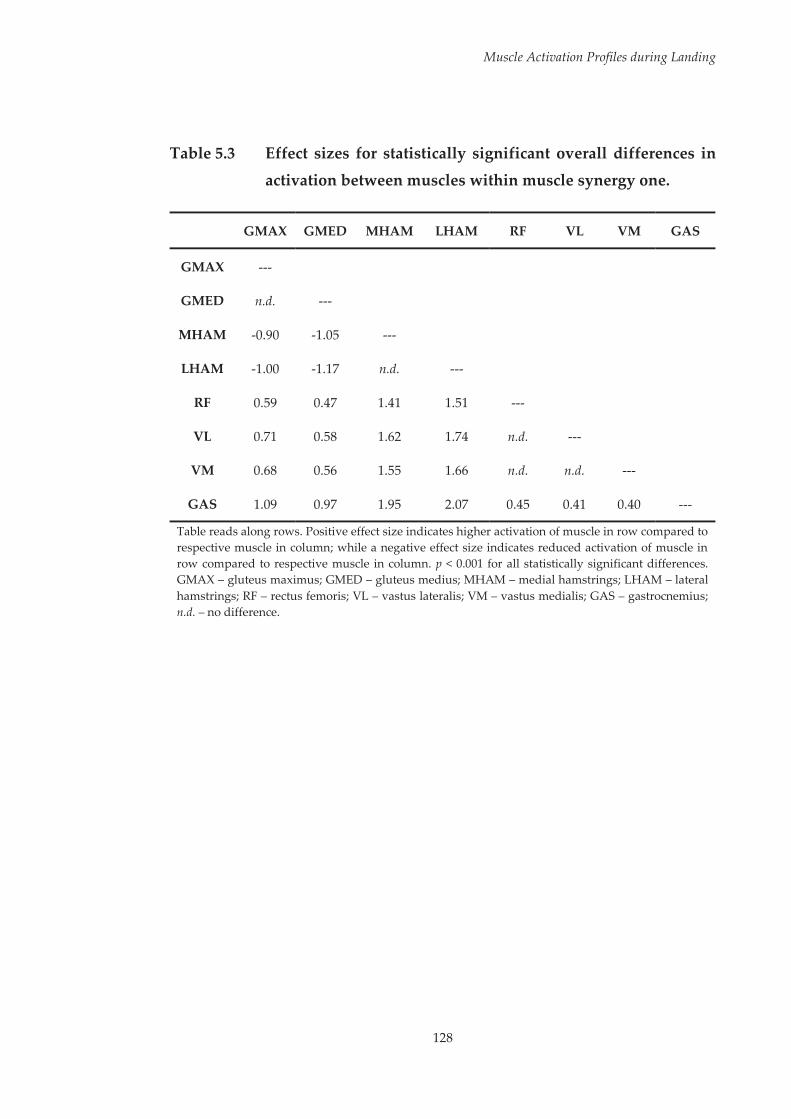
Muscle Activation Profiles during Landing
128
Table 5.3 Effect sizes for statistically significant overall differences in
activation between muscles within muscle synergy one.
GMAX GMED MHAM LHAM RF VL VM GAS
GMAX ---
GMED n.d. ---
MHAM -0.90 -1.05 ---
LHAM -1.00 -1.17 n.d. ---
RF 0.59 0.47 1.41 1.51 ---
VL 0.71 0.58 1.62 1.74 n.d. ---
VM 0.68 0.56 1.55 1.66 n.d. n.d. ---
GAS 1.09 0.97 1.95 2.07 0.45 0.41 0.40 ---
Table reads along rows. Positive effect size indicates higher activation of muscle in row compared to respective muscle in column; while a negative effect size indicates reduced activation of muscle in row compared to respective muscle in column. p < 0.001 for all statistically significant differences. GMAX – gluteus maximus; GMED – gluteus medius; MHAM – medial hamstrings; LHAM – lateral hamstrings; RF – rectus femoris; VL – vastus lateralis; VM – vastus medialis; GAS – gastrocnemius; n.d. – no difference.

Muscle Activation Profiles during Landing
129
Table 5.4 Effect sizes for statistically significant overall differences in
activation between muscles within muscle synergy two.
GMAX GMED MHAM LHAM RF VL VM GAS
GMAX ---
GMED 0.36 ---
MHAM n.d. -0.43 ---
LHAM n.d. -0.32 n.d. ---
RF 1.52 1.26 1.60 1.51 ---
VL 1.36 1.03 1.48 1.35 -0.40 ---
VM 1.33 1.02 1.44 1.33 -0.38 n.d. ---
GAS n.d. n.d. n.d. n.d. -1.37 -1.18 -1.16 ---
Table reads along rows. Positive effect size indicates higher activation of muscle in row compared to respective muscle in column; while a negative effect size indicates reduced activation of muscle in row compared to respective muscle in column. p < 0.001 for all statistically significant differences. GMAX – gluteus maximus; GMED – gluteus medius; MHAM – medial hamstrings; LHAM – lateral hamstrings; RF – rectus femoris; VL – vastus lateralis; VM – vastus medialis; GAS – gastrocnemius; n.d. – no difference.

Muscle Activation Profiles during Landing
130
Table 5.5 Effect sizes for statistically significant overall differences in
activation between muscles within muscle synergy three.
GMAX GMED MHAM LHAM RF VL VM GAS
GMAX ---
GMED 0.59 ---
MHAM 1.83 1.36 ---
LHAM 1.42 0.93 -0.41 ---
RF -0.88 -1.60 -2.73 -2.32 ---
VL n.d. -0.85 -2.13 -1.70 0.86 ---
VM n.d. -1.10 -2.33 -1.90 0.57 n.d. ---
GAS n.d. -0.82 -2.00 -1.60 0.57 n.d. n.d. ---
Table reads along rows. Positive effect size indicates higher activation of muscle in row compared to respective muscle in column; while a negative effect size indicates reduced activation of muscle in row compared to respective muscle in column. p < 0.001 for all statistically significant differences. GMAX – gluteus maximus; GMED – gluteus medius; MHAM – medial hamstrings; LHAM – lateral hamstrings; RF – rectus femoris; VL – vastus lateralis; VM – vastus medialis; GAS – gastrocnemius; n.d. – no difference.
5.3.1.1 Within-Profile Comparisons
Statistically significant profile x synergy (p < 0.001, η2 = 0.048), profile x muscle
(p < 0.001, η2 = 0.018) and profile x synergy x muscle (p < 0.001, η2 = 0.046)
interactions were also observed.
5.3.1.1.1 Muscle Activation Profile 1 (MAP-1)
The muscle synergy weighing coefficient values for MAP-1 are presented in
Figure 5.4 (see Page 131).

Muscle Activation Profiles during Landing
131
Figure 5.4 Muscle synergy weighing coefficient values for MAP-1.
Within MAP-1, greater overall activation was observed in muscle synergy one
compared to synergies two (p < 0.001, d = 1.31) and three (p < 0.001, d = 1.30).
No overall differences were observed between muscle synergies two and
three. Greater overall activation of RF, VL and VM was recorded compared to
GMAX, GMED, MHAM, LHAM and GAS (p < 0.001 and d = 0.24 – 0.79 across
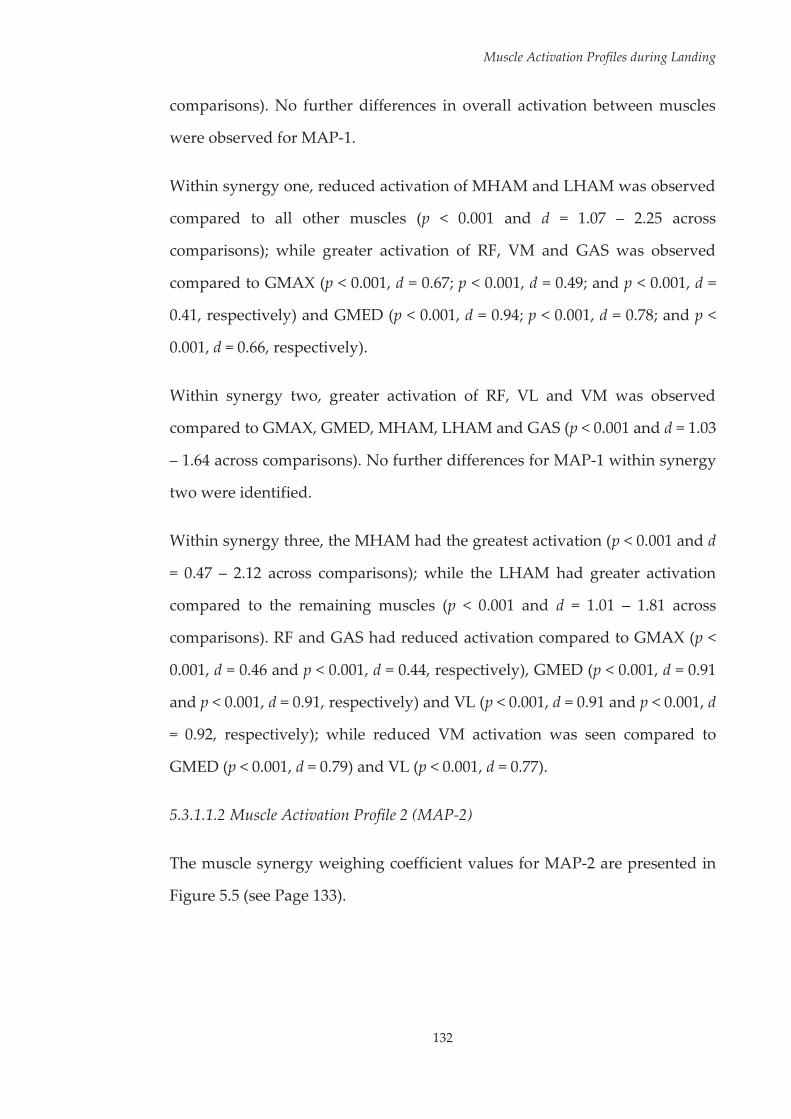
Muscle Activation Profiles during Landing
132
comparisons). No further differences in overall activation between muscles
were observed for MAP-1.
Within synergy one, reduced activation of MHAM and LHAM was observed
compared to all other muscles (p < 0.001 and d = 1.07 – 2.25 across
comparisons); while greater activation of RF, VM and GAS was observed
compared to GMAX (p < 0.001, d = 0.67; p < 0.001, d = 0.49; and p < 0.001, d =
0.41, respectively) and GMED (p < 0.001, d = 0.94; p < 0.001, d = 0.78; and p <
0.001, d = 0.66, respectively).
Within synergy two, greater activation of RF, VL and VM was observed
compared to GMAX, GMED, MHAM, LHAM and GAS (p < 0.001 and d = 1.03
– 1.64 across comparisons). No further differences for MAP-1 within synergy
two were identified.
Within synergy three, the MHAM had the greatest activation (p < 0.001 and d
= 0.47 – 2.12 across comparisons); while the LHAM had greater activation
compared to the remaining muscles (p < 0.001 and d = 1.01 – 1.81 across
comparisons). RF and GAS had reduced activation compared to GMAX (p <
0.001, d = 0.46 and p < 0.001, d = 0.44, respectively), GMED (p < 0.001, d = 0.91
and p < 0.001, d = 0.91, respectively) and VL (p < 0.001, d = 0.91 and p < 0.001, d
= 0.92, respectively); while reduced VM activation was seen compared to
GMED (p < 0.001, d = 0.79) and VL (p < 0.001, d = 0.77).
5.3.1.1.2 Muscle Activation Profile 2 (MAP-2)
The muscle synergy weighing coefficient values for MAP-2 are presented in
Figure 5.5 (see Page 133).

Muscle Activation Profiles during Landing
133
Figure 5.5 Muscle synergy weighing coefficient values for MAP-2.
Within MAP-2, greater overall activation was observed in muscle synergy one
compared to synergies two (p < 0.001, d = 0.43) and three (p < 0.001, d = 0.89);
while synergy two had greater overall activation compared to synergy three
(p < 0.001, d = 0.48). RF, VL and VM had the highest overall activation (p < 0.001
and d = 0.25 – 0.72 across comparisons) within MAP-2. Greater activation of
GAS was found compared to GMAX (p < 0.001, d = 0.47), MHAM (p < 0.001, d
Muscle Activation Profiles during Landing
134
= 0.34) and LHAM (p < 0.001, d = 0.29); while GMED had greater overall
activation compared to GMAX (p < 0.001, d = 0.47). No differences in overall
activation between GMAX, MHAM and LHAM were observed for MAP-2.
Within synergy one, GAS had the greatest activation (p < 0.001 and d = 0.57 –
2.39 across comparisons); while VL and VM were found to have greater
activation than the remaining muscles (p < 0.001 and d = 0.51 – 1.80 across
comparisons). Reduced activation of MHAM and LHAM compared to GMAX
(p < 0.001, d = 0.84 and p < 0.001, d = 0.73, respectively), GMED (p < 0.001, d =
1.21 and p < 0.001, d = 1.10, respectively) and RF (p < 0.001, d = 1.11 and p <
0.001, d = 1.01, respectively) was observed. No further differences for MAP-2
within synergy one were identified.
Within synergy two, RF had the highest activation (p < 0.001 and d = 0.94 – 2.56
across comparisons); while VL and VM had greater activation than the
remaining muscles (p < 0.001 and d = 1.04 – 2.20 across comparisons). Reduced
activation of GMAX and MHAM compared to GMED (p < 0.001, d = 0.45 and
p < 0.001, d = 0.65, respectively), LHAM (p < 0.001, d = 0.17 and p < 0.001, d =
0.35, respectively) and GAS (p < 0.001, d = 0.40 and p < 0.001, d = 0.60,
respectively) was observed. No further differences for MAP-2 within synergy
two were identified.
Within synergy three, MHAM and LHAM had the greatest activation (p <
0.001 and d = 1.01 – 3.45 across comparisons); while GMED was found to have
greater activation than the remaining muscles (p < 0.001 and d = 1.11 – 2.47
across comparisons). Greater activation of GMAX was observed compared to
RF (p < 0.001, d = 1.16) and GAS (p < 0.001, d = 0.53). No further differences for
MAP-2 within synergy three were identified.
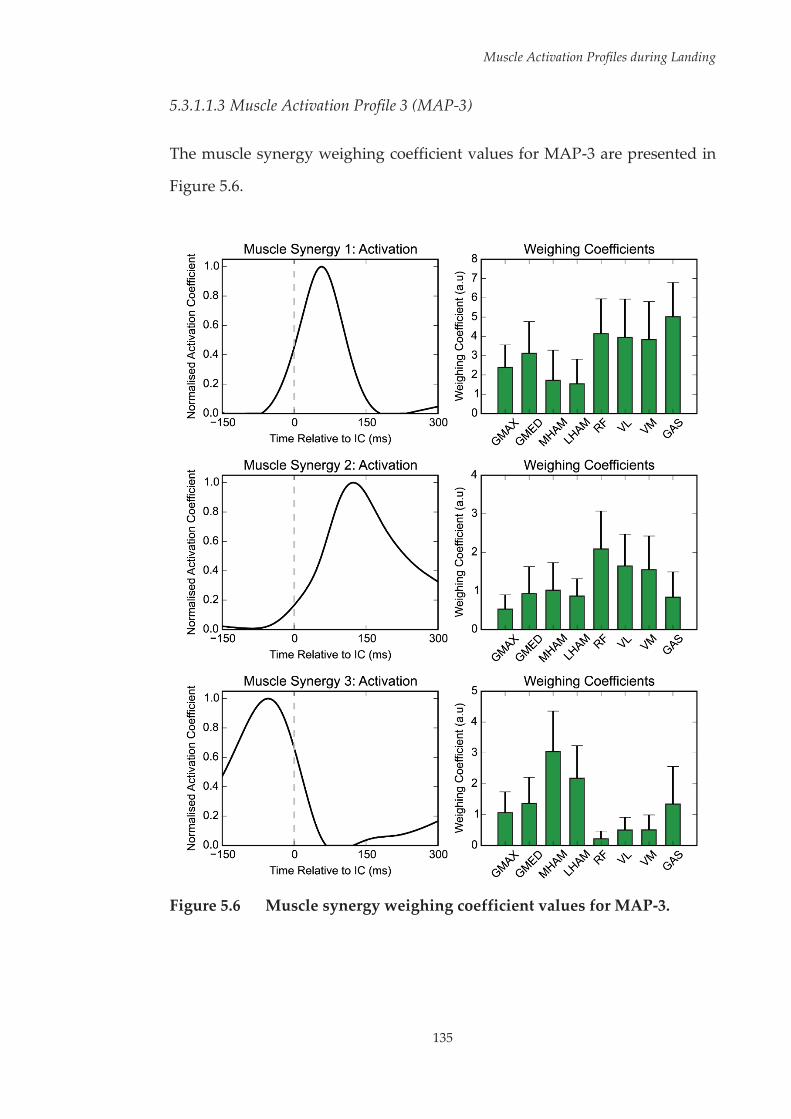
Muscle Activation Profiles during Landing
135
5.3.1.1.3 Muscle Activation Profile 3 (MAP-3)
The muscle synergy weighing coefficient values for MAP-3 are presented in
Figure 5.6.
Figure 5.6 Muscle synergy weighing coefficient values for MAP-3.
Muscle Activation Profiles during Landing
136
Within MAP-3, greater overall activation was observed in muscle synergy one
compared to synergies two (p < 0.001, d = 1.30) and three (p < 0.001, d = 1.15).
No overall differences were observed between muscle synergies two and
three. GAS had greater overall activation compared to GMAX (p < 0.001, d =
0.60), GMED (p < 0.001, d = 0.31), MHAM (p < 0.001, d = 0.24) and LHAM (p <
0.001, d = 0.49) within MAP-3. Reduced overall activity of GMAX was observed
compared to GMED (p < 0.001, d = 0.36), MHAM (p < 0.001, d = 0.45), RF (p <
0.001, d = 0.51), VL (p < 0.001, d = 0.45) and VM (p < 0.001, d = 0.41); while
reduced activity of LHAM was observed compared to RF (p < 0.001, d = 0.38)
and VL (p < 0.001, d = 0.32). No further differences in overall activation between
muscles were observed for MAP-3.
Within synergy one, GAS recorded the highest activation (p < 0.001 and d =
0.49 – 2.24 across comparisons). Reduced activation of MHAM and LHAM
were observed compared to all other muscles (p < 0.001 and d = 0.48 – 1.65
across comparisons). RF, VL and VM had greater activation than GMAX (p <
0.001, d = 1.14; p < 0.001, d = 0.95 and p < 0.001, d = 0.89, respectively); while RF
and VL recorded greater activation than GMED (p < 0.001, d = 0.58 and p <
0.001, d = 0.45, respectively). No further differences for MAP-3 within synergy
one were identified.
Within synergy two, RF had the greatest activation (p < 0.001 and d = 0.49 –
2.09 across comparisons); while VL and VM were found to have greater
activation compared to the remaining muscles (p < 0.001 and d = 0.66 – 1.74
across comparisons). Greater activation of GMED and MHAM compared to
GMAX (p < 0.001, d = 0.71 and p < 0.001, d = 0.85, respectively) was observed.
No further differences for MAP-3 within synergy two were identified.

Muscle Activation Profiles during Landing
137
Within synergy three, MHAM had the greatest activation (p < 0.001 and d =
0.72 – 2.98 across comparisons); while LHAM had greater activation compared
to all remaining muscles (p < 0.001 and d = 0.72 – 2.55 across comparisons).
GMAX, GMED and GAS had greater activation than RF (p < 0.001, d = 1.65; p <
0.001, d = 1.83 and p < 0.001, d = 1.28, respectively), VL (p < 0.001, d = 1.00; p <
0.001, d = 1.29 and p < 0.001, d = 0.92, respectively) and VM (p < 0.001, d = 0.95;
p < 0.001, d = 1.24 and p < 0.001, d = 0.90, respectively). No further differences
for MAP-3 within synergy two were identified.
5.3.1.2 Between-Profile Comparisons
Comparisons of the muscle weighing coefficient values for the three profiles
across the three muscle synergies are presented in Figure 5.7 (see Page 139)
and Table 5.6 (see Page 140).
A number of differences were found between the profiles across the three
muscle synergies. Within synergy one, MAP-1 exhibited greater activation of
RF compared to MAP-2 (p < 0.001, d = 1.14) and MAP-3 (p < 0.001, d = 0.39);
while MAP-2 exhibited reduced activation of RF compared to MAP-3 (p <
0.001, d = 0.74). Within synergy two, MAP-2 exhibited greater activation of VL
and VM compared to MAP-1 (p < 0.001, d = 0.62 and p < 0.001, d = 0.74,
respectively) and MAP-3 (p < 0.001, d = 1.32 and p < 0.001, d = 1.52, respectively);
while MAP-1 exhibited greater activation of VL and VM compared to MAP-3
(p < 0.001, d = 0.55 and p < 0.001, d = 0.60, respectively). Within synergy three,
MAP-1 exhibited greater activation of VL compared to MAP-2 (p < 0.001, d =
0.61) and MAP-3 (p < 0.001, d = 1.58); while MAP-2 exhibited greater activation
of VL compared to MAP-3 (p < 0.001, d = 0.84).
Further, specific differences between the three muscle activation profiles were
observed across the muscle synergies. Compared to MAP-2 and MAP-3, MAP-

Muscle Activation Profiles during Landing
138
1 exhibited greater GMAX activity within synergy one (p < 0.001, d = 0.81 and
p < 0.001, d = 0.89, respectively), and reduced MHAM activity within synergy
two (p < 0.001, d = 0.50 and p < 0.001, d = 0.52, respectively). Compared to MAP-
1 and MAP-3, MAP-2 exhibited reduced MHAM activity within synergy one
(p < 0.001, d = 0.38 and p < 0.001, d = 0.35, respectively); greater GMED (p <
0.001, d = 0.53 and p < 0.001, d = 0.72, respectively), LHAM (p < 0.001, d = 0.77
and p < 0.001, d = 0.56, respectively), RF (p < 0.001, d = 1.80 and p < 0.001, d =
1.78, respectively) and GAS (p < 0.001, d = 0.80 and p < 0.001, d = 0.80,
respectively) activity within synergy two; and greater GMED (p < 0.001, d =
0.69 and p < 0.001, d = 0.63, respectively) and LHAM (p < 0.001, d = 0.59 and p <
0.001, d = 0.62, respectively) activity within synergy three. Compared to MAP-
1 and MAP-2, MAP-3 exhibited reduced GMAX activity within synergy two
(p < 0.001, d = 0.61 and p < 0.001, d = 0.88, respectively), reduced activity of VM
within synergy three (p < 0.001, d = 0.51 and p < 0.001, d = 0.81, respectively),
and greater GAS activity within synergy three (p < 0.001, d = 0.64 and p < 0.001,
d = 0.69, respectively).

139
Muscle Activation Profiles during Landing
Fi
gure
5.7
M
uscl
e sy
nerg
y w
eigh
ing
coef
fici
ent
valu
es
for
the
thre
e m
uscl
e ac
tivat
ion
prof
iles
(MA
Ps)
iden
tifie
d.
* - s
tatis
tical
ly s
igni
fica
nt d
iffe
renc
e be
twee
n al
l pro
file
s; #
- st
atis
tical
ly s
igni
fica
nt d
iffe
renc
e be
twee
n M
AP-
1 an
d
rem
aini
ng p
rofi
les;
¥ -
sta
tistic
ally
sig
nifi
cant
dif
fere
nce
betw
een
MA
P-2
and
rem
aini
ng p
rofi
les;
¢ -
sta
tistic
ally
si
gnif
ican
t dif
fere
nce
betw
een
MA
P-3
and
rem
aini
ng p
rofi
les.
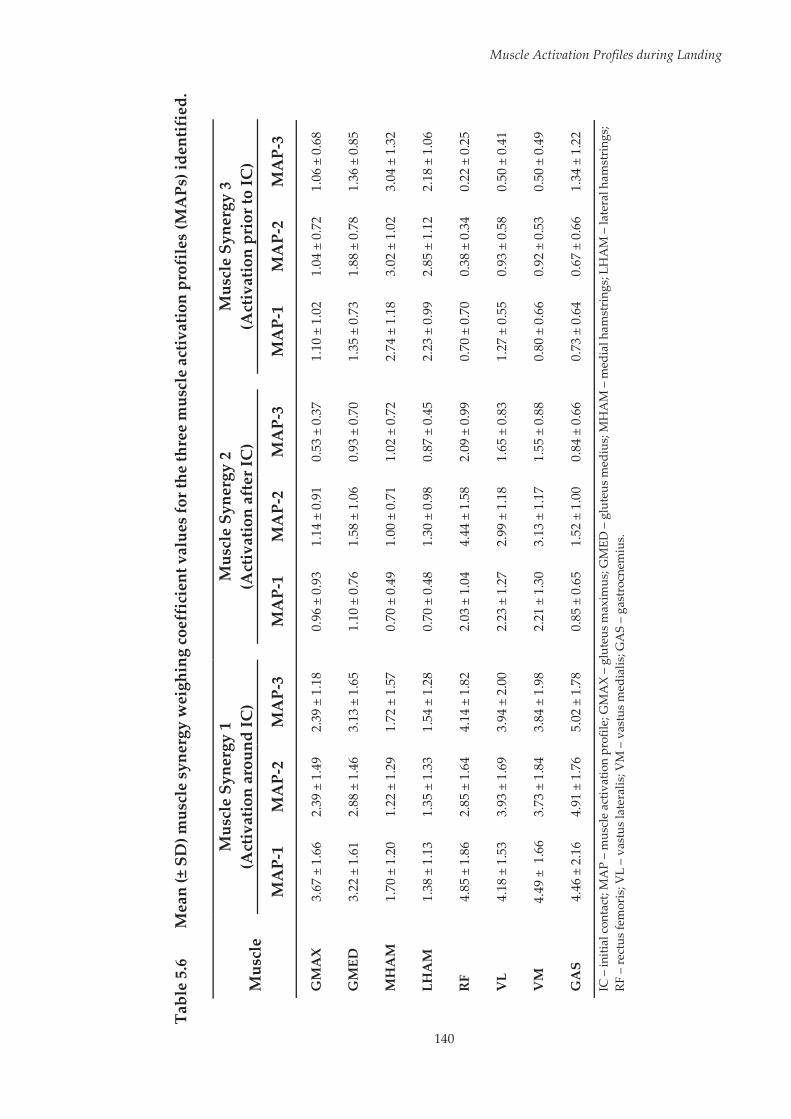
140
Muscle Activation Profiles during Landing
Tabl
e 5.
6 M
ean
(± S
D) m
uscl
e sy
nerg
y w
eigh
ing
coef
fici
ent v
alue
s for
the
thre
e m
uscl
e ac
tivat
ion
prof
iles
(MA
Ps) i
dent
ifie
d.
Mus
cle
Mus
cle
Syne
rgy
1 (A
ctiv
atio
n ar
ound
IC)
M
uscl
e Sy
nerg
y 2
(Act
ivat
ion
afte
r IC
)
Mus
cle
Syne
rgy
3 (A
ctiv
atio
n pr
ior t
o IC
)
MA
P-1
MA
P-2
MA
P-3
M
AP-
1 M
AP-
2 M
AP-
3
MA
P-1
MA
P-2
MA
P-3
GM
AX
3.
67 ±
1.6
6 2.
39 ±
1.4
9 2.
39 ±
1.1
8
0.96
± 0
.93
1.14
± 0
.91
0.53
± 0
.37
1.
10 ±
1.0
2 1.
04 ±
0.7
2 1.
06 ±
0.6
8
GM
ED
3.22
± 1
.61
2.88
± 1
.46
3.13
± 1
.65
1.
10 ±
0.7
6 1.
58 ±
1.0
6 0.
93 ±
0.7
0
1.35
± 0
.73
1.88
± 0
.78
1.36
± 0
.85
MH
AM
1.
70 ±
1.2
0 1.
22 ±
1.2
9 1.
72 ±
1.5
7
0.70
± 0
.49
1.00
± 0
.71
1.02
± 0
.72
2.
74 ±
1.1
8 3.
02 ±
1.0
2 3.
04 ±
1.3
2
LHA
M
1.38
± 1
.13
1.35
± 1
.33
1.54
± 1
.28
0.
70 ±
0.4
8 1.
30 ±
0.9
8 0.
87 ±
0.4
5
2.23
± 0
.99
2.85
± 1
.12
2.18
± 1
.06
RF
4.85
± 1
.86
2.85
± 1
.64
4.14
± 1
.82
2.
03 ±
1.0
4 4.
44 ±
1.5
8 2.
09 ±
0.9
9
0.70
± 0
.70
0.38
± 0
.34
0.22
± 0
.25
VL
4.18
± 1
.53
3.93
± 1
.69
3.94
± 2
.00
2.
23 ±
1.2
7 2.
99 ±
1.1
8 1.
65 ±
0.8
3
1.27
± 0
.55
0.93
± 0
.58
0.50
± 0
.41
VM
4.
49 ±
1.6
6 3.
73 ±
1.8
4 3.
84 ±
1.9
8
2.21
± 1
.30
3.13
± 1
.17
1.55
± 0
.88
0.
80 ±
0.6
6 0.
92 ±
0.5
3 0.
50 ±
0.4
9
GA
S 4.
46 ±
2.1
6 4.
91 ±
1.7
6 5.
02 ±
1.7
8
0.85
± 0
.65
1.52
± 1
.00
0.84
± 0
.66
0.
73 ±
0.6
4 0.
67 ±
0.6
6 1.
34 ±
1.2
2
IC –
initi
al c
onta
ct; M
AP
– m
uscl
e ac
tivat
ion
prof
ile; G
MA
X –
glut
eus m
axim
us; G
MED
– g
lute
us m
ediu
s; M
HA
M –
med
ial h
amst
ring
s; LH
AM
– la
tera
l ham
stri
ngs;
RF –
rect
us fe
mor
is; V
L –
vast
us la
tera
lis; V
M –
vas
tus
med
ialis
; GA
S –
gast
rocn
emiu
s.

Muscle Activation Profiles during Landing
141
Due to the influence of approach speed on landing biomechanics (see
Appendix F, Page 391), approach speeds from trials clustered to the different
profiles were compared (see Figure 5.8). A one-way ANOVA revealed no
overall statistically significant difference for approach speed between the
profiles (p > 0.05), therefore it was concluded that any differences in landing
biomechanics between profiles was not due to differences in approach speed.
Figure 5.8 Mean and standard deviation of approach speed for the three
muscle activation profiles (MAPs).
The mean hip and knee joint rotations from the three MAPs from IC through
to 150 ms post IC during the leap landing task are presented in Figure 5.9 (see
Page 142). SPM1D MANOVA revealed a statistically significant (p < 0.0001)
overall difference across the three profiles for both the hip and knee joint
rotation vector-fields (RXYZ). Summary results of the pairwise comparisons
made between profiles for the hip and knee joint rotation vector-fields (RXYZ),
joint rotation couples (RXY, RXZ, RYZ) and individual joint rotation components
(RX, RY, RZ) are presented in Table 5.7 and Table 5.8 (see Pages 143 and 144),
respectively.
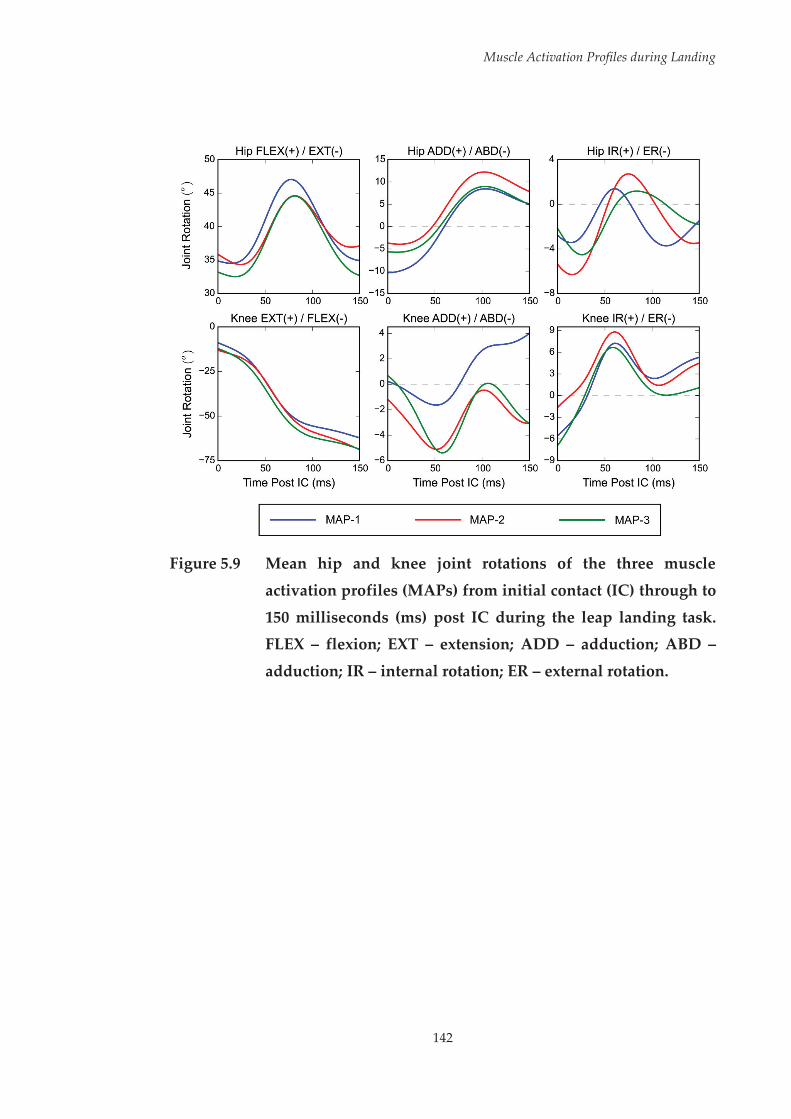
Muscle Activation Profiles during Landing
142
Figure 5.9 Mean hip and knee joint rotations of the three muscle
activation profiles (MAPs) from initial contact (IC) through to
150 milliseconds (ms) post IC during the leap landing task. FLEX – flexion; EXT – extension; ADD – adduction; ABD –
adduction; IR – internal rotation; ER – external rotation.
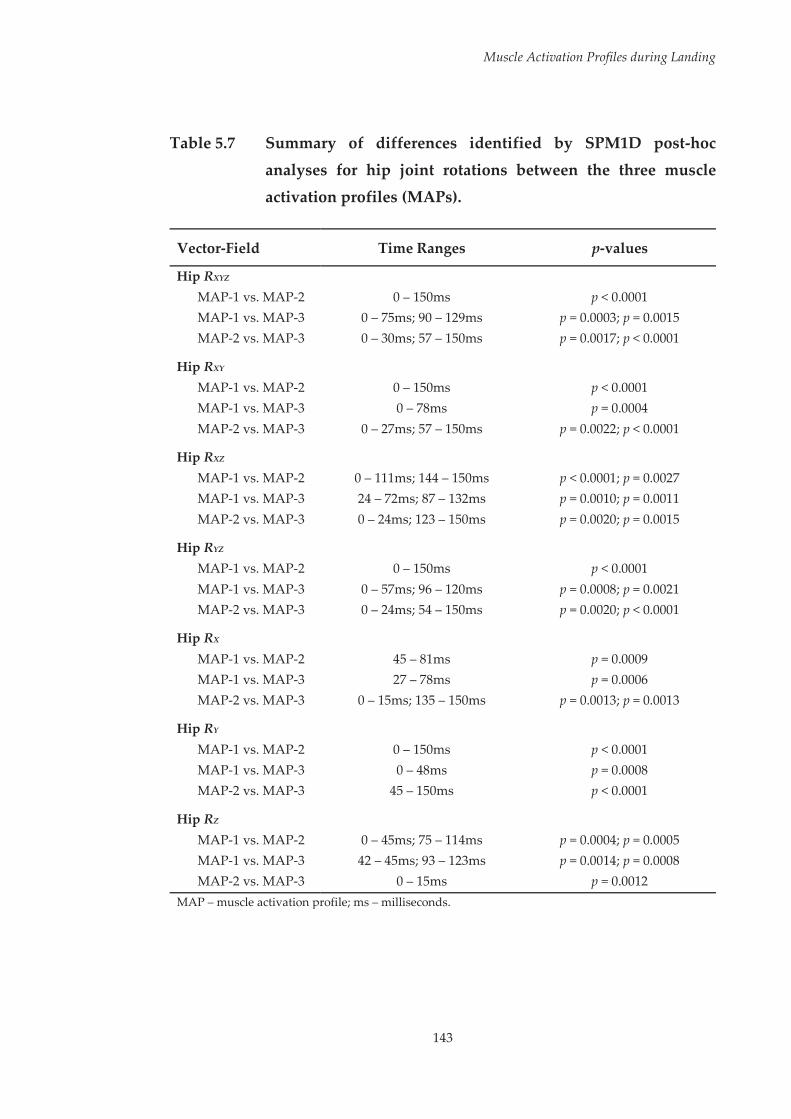
Muscle Activation Profiles during Landing
143
Table 5.7 Summary of differences identified by SPM1D post-hoc
analyses for hip joint rotations between the three muscle
activation profiles (MAPs).
Vector-Field Time Ranges p-values
Hip RXYZ MAP-1 vs. MAP-2 0 – 150ms p < 0.0001 MAP-1 vs. MAP-3 0 – 75ms; 90 – 129ms p = 0.0003; p = 0.0015 MAP-2 vs. MAP-3 0 – 30ms; 57 – 150ms p = 0.0017; p < 0.0001
Hip RXY MAP-1 vs. MAP-2 0 – 150ms p < 0.0001 MAP-1 vs. MAP-3 0 – 78ms p = 0.0004 MAP-2 vs. MAP-3 0 – 27ms; 57 – 150ms p = 0.0022; p < 0.0001
Hip RXZ MAP-1 vs. MAP-2 0 – 111ms; 144 – 150ms p < 0.0001; p = 0.0027 MAP-1 vs. MAP-3 24 – 72ms; 87 – 132ms p = 0.0010; p = 0.0011 MAP-2 vs. MAP-3 0 – 24ms; 123 – 150ms p = 0.0020; p = 0.0015
Hip RYZ MAP-1 vs. MAP-2 0 – 150ms p < 0.0001 MAP-1 vs. MAP-3 0 – 57ms; 96 – 120ms p = 0.0008; p = 0.0021 MAP-2 vs. MAP-3 0 – 24ms; 54 – 150ms p = 0.0020; p < 0.0001
Hip RX MAP-1 vs. MAP-2 45 – 81ms p = 0.0009 MAP-1 vs. MAP-3 27 – 78ms p = 0.0006 MAP-2 vs. MAP-3 0 – 15ms; 135 – 150ms p = 0.0013; p = 0.0013
Hip RY MAP-1 vs. MAP-2 0 – 150ms p < 0.0001 MAP-1 vs. MAP-3 0 – 48ms p = 0.0008 MAP-2 vs. MAP-3 45 – 150ms p < 0.0001
Hip RZ MAP-1 vs. MAP-2 0 – 45ms; 75 – 114ms p = 0.0004; p = 0.0005 MAP-1 vs. MAP-3 42 – 45ms; 93 – 123ms p = 0.0014; p = 0.0008 MAP-2 vs. MAP-3 0 – 15ms p = 0.0012
MAP – muscle activation profile; ms – milliseconds.
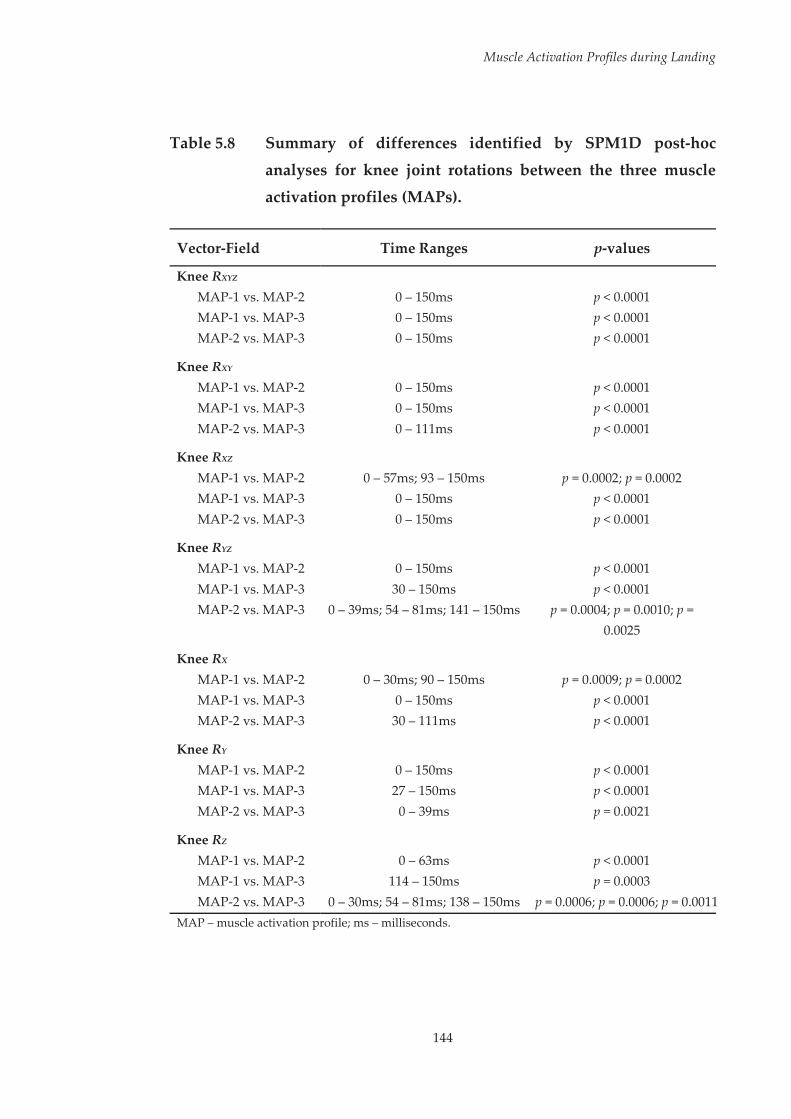
Muscle Activation Profiles during Landing
144
Table 5.8 Summary of differences identified by SPM1D post-hoc
analyses for knee joint rotations between the three muscle
activation profiles (MAPs).
Vector-Field Time Ranges p-values
Knee RXYZ MAP-1 vs. MAP-2 0 – 150ms p < 0.0001 MAP-1 vs. MAP-3 0 – 150ms p < 0.0001 MAP-2 vs. MAP-3 0 – 150ms p < 0.0001
Knee RXY MAP-1 vs. MAP-2 0 – 150ms p < 0.0001 MAP-1 vs. MAP-3 0 – 150ms p < 0.0001 MAP-2 vs. MAP-3 0 – 111ms p < 0.0001
Knee RXZ MAP-1 vs. MAP-2 0 – 57ms; 93 – 150ms p = 0.0002; p = 0.0002 MAP-1 vs. MAP-3 0 – 150ms p < 0.0001 MAP-2 vs. MAP-3 0 – 150ms p < 0.0001
Knee RYZ MAP-1 vs. MAP-2 0 – 150ms p < 0.0001 MAP-1 vs. MAP-3 30 – 150ms p < 0.0001 MAP-2 vs. MAP-3 0 – 39ms; 54 – 81ms; 141 – 150ms p = 0.0004; p = 0.0010; p =
0.0025
Knee RX MAP-1 vs. MAP-2 0 – 30ms; 90 – 150ms p = 0.0009; p = 0.0002 MAP-1 vs. MAP-3 0 – 150ms p < 0.0001 MAP-2 vs. MAP-3 30 – 111ms p < 0.0001
Knee RY MAP-1 vs. MAP-2 0 – 150ms p < 0.0001 MAP-1 vs. MAP-3 27 – 150ms p < 0.0001 MAP-2 vs. MAP-3 0 – 39ms p = 0.0021
Knee RZ MAP-1 vs. MAP-2 0 – 63ms p < 0.0001 MAP-1 vs. MAP-3 114 – 150ms p = 0.0003 MAP-2 vs. MAP-3 0 – 30ms; 54 – 81ms; 138 – 150ms p = 0.0006; p = 0.0006; p = 0.0011
MAP – muscle activation profile; ms – milliseconds.
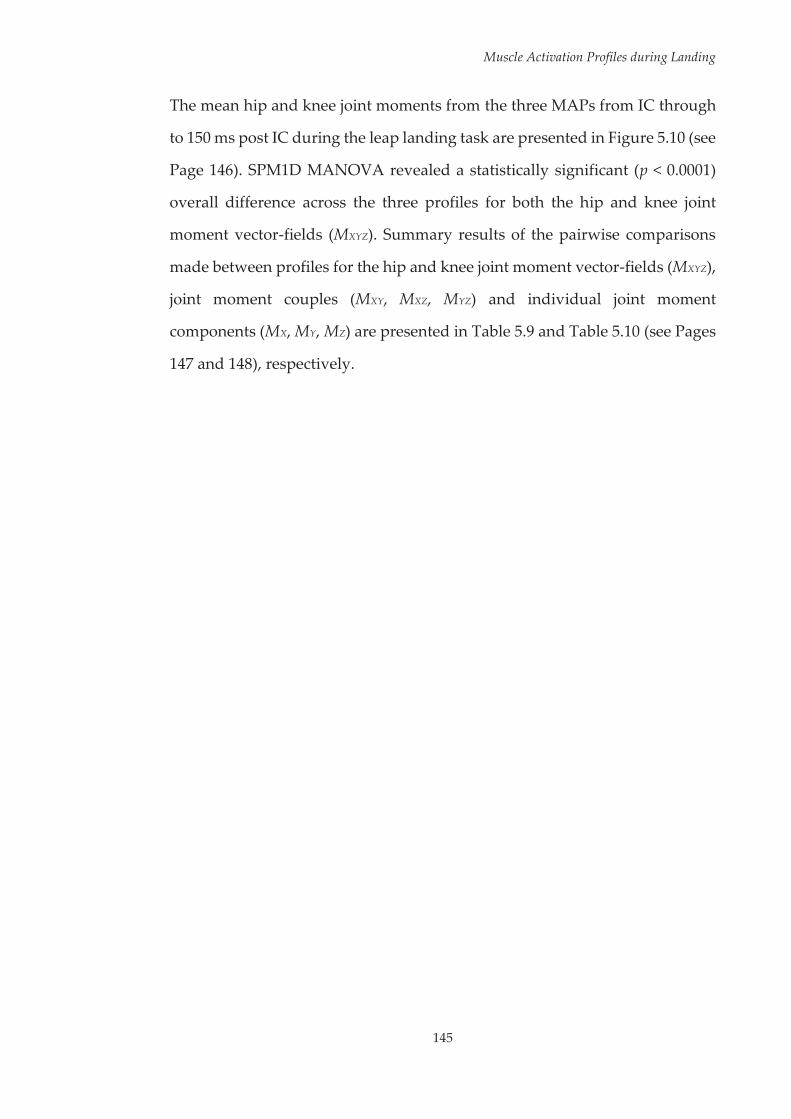
Muscle Activation Profiles during Landing
145
The mean hip and knee joint moments from the three MAPs from IC through
to 150 ms post IC during the leap landing task are presented in Figure 5.10 (see
Page 146). SPM1D MANOVA revealed a statistically significant (p < 0.0001)
overall difference across the three profiles for both the hip and knee joint
moment vector-fields (MXYZ). Summary results of the pairwise comparisons
made between profiles for the hip and knee joint moment vector-fields (MXYZ),
joint moment couples (MXY, MXZ, MYZ) and individual joint moment
components (MX, MY, MZ) are presented in Table 5.9 and Table 5.10 (see Pages
147 and 148), respectively.
Muscle Activation Profiles during Landing
146
Figure 5.10 Mean hip and knee joint moments of the three muscle
activation profiles (MAPs) from initial contact (IC) through to 150 milliseconds (ms) post IC during the leap landing task.
Mom. – moment; EXT – extension; FLEX – flexion; ABD –
abduction; ADD – adduction; ER – external rotation; IR – internal rotation.

Muscle Activation Profiles during Landing
147
Table 5.9 Summary of differences identified by SPM1D post-hoc
analyses for hip joint moments between the three muscle
activation profiles (MAPs).
Vector-Field Time Ranges p-values
Hip MXYZ MAP-1 vs. MAP-2 0 – 150ms p < 0.0001 MAP-1 vs. MAP-3 0 – 150ms p < 0.0001 MAP-2 vs. MAP-3 0 – 120ms p < 0.0001
Hip MXY MAP-1 vs. MAP-2 0 – 150ms p < 0.0001 MAP-1 vs. MAP-3 0 – 75ms; 117 – 150ms p < 0.0001; p = 0.0002 MAP-2 vs. MAP-3 12 – 114ms p < 0.0001
Hip MXZ MAP-1 vs. MAP-2 0 – 150ms p < 0.0001 MAP-1 vs. MAP-3 15 – 48ms; 54 – 150ms p = 0.0002; p < 0.0001 MAP-2 vs. MAP-3 0 – 9ms; 15 – 99ms p = 0.0024; p < 0.0001
Hip MYZ MAP-1 vs. MAP-2 0 – 21ms; 42 – 150ms p = 0.0011; p < 0.0001 MAP-1 vs. MAP-3 0 – 48ms; 60 – 150ms p < 0.0001; p < 0.0001 MAP-2 vs. MAP-3 0 – 9ms; 27 – 87ms p = 0.0023; p < 0.0001
Hip MX MAP-1 vs. MAP-2 0 – 48ms p < 0.0001 MAP-1 vs. MAP-3 51 – 78ms; 129 – 150ms p = 0.0002; p = 0.0004 MAP-2 vs. MAP-3 12 – 96ms p < 0.0001
Hip MY MAP-1 vs. MAP-2 0 – 24ms; 48 – 150ms p = 0.0006; p < 0.0001 MAP-1 vs. MAP-3 0 – 48ms; 117 – 150ms p < 0.0001; p = 0.0002 MAP-2 vs. MAP-3 30 – 78ms p < 0.0001
Hip MZ MAP-1 vs. MAP-2 3 – 21ms; 42 – 150ms p = 0.0007; p < 0.0001 MAP-1 vs. MAP-3 15 – 45ms; 66 – 150ms p = 0.0002; p < 0.0001 MAP-2 vs. MAP-3 0 – 9ms; 24 – 90ms p < 0.0001; p = 0.0012
MAP – muscle activation profile; ms – milliseconds.
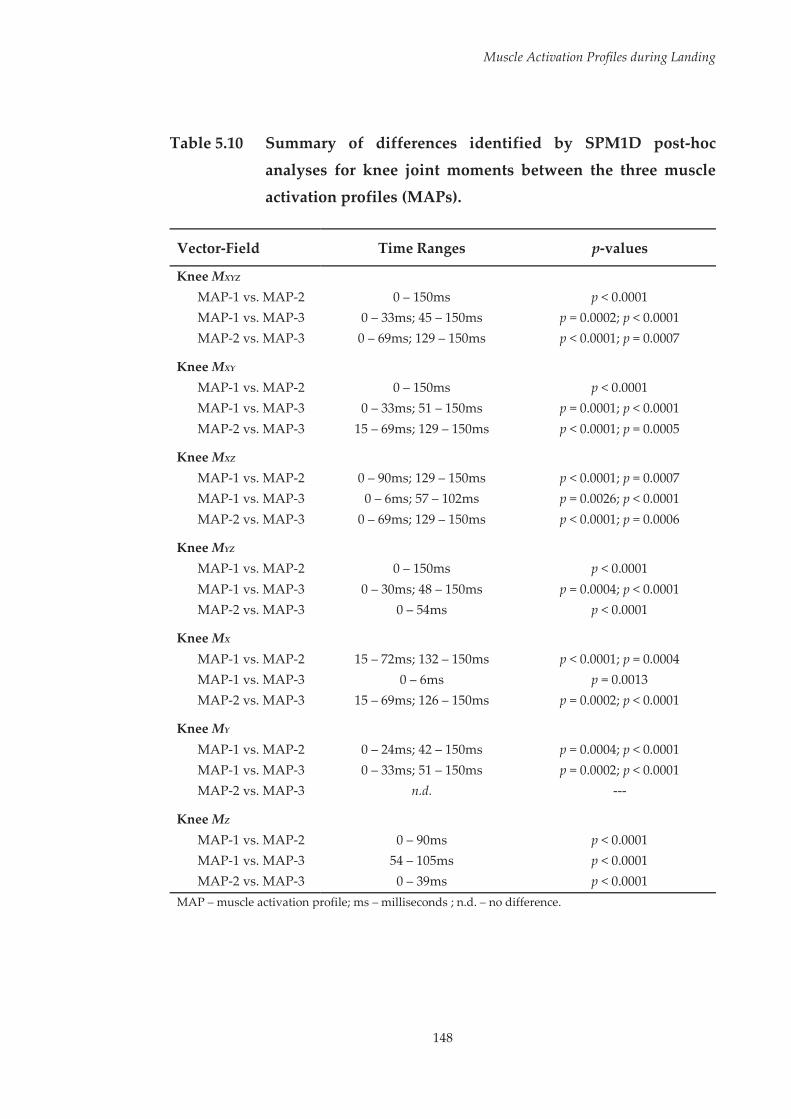
Muscle Activation Profiles during Landing
148
Table 5.10 Summary of differences identified by SPM1D post-hoc
analyses for knee joint moments between the three muscle
activation profiles (MAPs).
Vector-Field Time Ranges p-values
Knee MXYZ MAP-1 vs. MAP-2 0 – 150ms p < 0.0001 MAP-1 vs. MAP-3 0 – 33ms; 45 – 150ms p = 0.0002; p < 0.0001 MAP-2 vs. MAP-3 0 – 69ms; 129 – 150ms p < 0.0001; p = 0.0007
Knee MXY MAP-1 vs. MAP-2 0 – 150ms p < 0.0001 MAP-1 vs. MAP-3 0 – 33ms; 51 – 150ms p = 0.0001; p < 0.0001 MAP-2 vs. MAP-3 15 – 69ms; 129 – 150ms p < 0.0001; p = 0.0005
Knee MXZ MAP-1 vs. MAP-2 0 – 90ms; 129 – 150ms p < 0.0001; p = 0.0007 MAP-1 vs. MAP-3 0 – 6ms; 57 – 102ms p = 0.0026; p < 0.0001 MAP-2 vs. MAP-3 0 – 69ms; 129 – 150ms p < 0.0001; p = 0.0006
Knee MYZ MAP-1 vs. MAP-2 0 – 150ms p < 0.0001 MAP-1 vs. MAP-3 0 – 30ms; 48 – 150ms p = 0.0004; p < 0.0001 MAP-2 vs. MAP-3 0 – 54ms p < 0.0001
Knee MX MAP-1 vs. MAP-2 15 – 72ms; 132 – 150ms p < 0.0001; p = 0.0004 MAP-1 vs. MAP-3 0 – 6ms p = 0.0013 MAP-2 vs. MAP-3 15 – 69ms; 126 – 150ms p = 0.0002; p < 0.0001
Knee MY MAP-1 vs. MAP-2 0 – 24ms; 42 – 150ms p = 0.0004; p < 0.0001 MAP-1 vs. MAP-3 0 – 33ms; 51 – 150ms p = 0.0002; p < 0.0001 MAP-2 vs. MAP-3 n.d. ---
Knee MZ MAP-1 vs. MAP-2 0 – 90ms p < 0.0001 MAP-1 vs. MAP-3 54 – 105ms p < 0.0001 MAP-2 vs. MAP-3 0 – 39ms p < 0.0001
MAP – muscle activation profile; ms – milliseconds ; n.d. – no difference.

Muscle Activation Profiles during Landing
149
5.4 Discussion
Various elements of neuromuscular control have been implicated in ACL
injury risk or linked to biomechanical factors associated with increased ACL
loads.[131, 174, 177, 178, 186-191] However, these studies have tended to focus on isolated
muscle activation characteristics rather than the combined activation
characteristics of multiple muscles (i.e. the muscle activation profile). The
purpose of this study was to identify the muscle activation profiles employed
during a high-risk landing task and their subsequent impact on lower limb
biomechanics linked to ACL loading or injury risk. A number of muscle
activation profiles were identified, with each profile contributing to the
presence of different biomechanical deficits associated with ACL loading or
injury risk.
The first hypothesis that a number of different muscle activation profiles
would be utilised during the landing task was confirmed. The final model
selected from the latent profile analysis consisted of three muscle activation
profiles (MAPs), with these profiles exhibiting a number of differences in
muscle activation. The magnitude of overall activation, irrespective of muscle
synergy or individual muscles, was found to be different between profiles.
Overall, MAP-2 exhibited the highest levels of activation, followed by MAP-1
and MAP-3. However, these differences had the smallest effect sizes across the
statistically significant comparisons within this study. Larger effect sizes were
observed for the differences within the muscle synergies and individual
muscles between profiles, suggesting profile separation was more so defined
by these specific muscle activation characteristics. MAP-1 was characterised
by elevated preparatory activation of the vastus lateralis, elevated activation
of the gluteus maximus and rectus femoris early after initial contact, and

Muscle Activation Profiles during Landing
150
reduced activation of the medial hamstrings during the latter stage of landing.
MAP-2 demonstrated high levels of gluteus medius and lateral hamstrings
activation prior to landing, and low levels of medial hamstrings and rectus
femoris activation early after initial contact. MAP-2 also exhibited higher
activations of multiple muscles in the later stages of landing, including the
gluteus medius, lateral hamstrings, quadriceps muscles, and gastrocnemius.
MAP-3 was characterised by low and high levels of preparatory activation of
the vastus medialis and gastrocnemius, respectively. Low levels of gluteus
maximus activation in the latter stage of landing were also observed within
MAP-3. The fact that these varying activation profiles were identified is not
surprising, as previous studies have found multiple neuromuscular solutions
can be utilised within a range of movement tasks.[48-50, 254]
Examining the MAPs at an individual level revealed that certain participants
utilised multiple activation profiles across their trials (see Table 5.2, Page 125).
While this occurred, it appeared that the majority of participants had a
preferred or ‘dominant’ activation profile. The utilisation of a single activation
profile across all 20 trials was the most common observation (17 out of 32
participants). Similarly, 12 out of 32 participants exhibited a ‘dominant’
activation profile, with at least 15 of the 20 trials being classified to this single
profile. Only three participants (i.e. P2, P18 and P29) demonstrated a more
balanced selection with regard to the activation profiles utilised. However, this
balance tended to be spread across two profiles, with a third rarely or never
being employed. It appears that even though various activation profiles can
be utilised within the landing task examined, individuals tend to persevere
with a preferred neuromuscular strategy. This has implications with regard to
the use of generic or universal neuromuscular training as a method to alter
muscle activation characteristics in an effort to reduce ACL injury risk.

Muscle Activation Profiles during Landing
151
Universal neuromuscular training refers to the prescription of an identical
injury prevention program across all individuals, and often attempts to target
specific neuromuscular or biomechanical risk factors associated with ACL
injury.[358] The application of universal neuromuscular training has been
proposed as an effective and efficient method for reducing ACL injury
rates.[226] However, the tendency for preferential neuromuscular strategies
demonstrated by participants within this study may highlight the need for
more targeted injury prevention programs. Varied programs targeting the
specific neuromuscular deficits within the individual’s preferential activation
profile may be more effective in eliciting changes in neuromuscular control
that reduce ACL injury risk.
The selective activation strategies of the musculature around the hip and knee
play an important role in counteracting potentially hazardous joint postures
and external loads.[170-172] The presence of inadequate or poor neuromuscular
control is likely to contribute to lower limb biomechanics that increase ACL
loads or injury risk during high-risk sporting tasks. It was hypothesised that
certain profiles would result in lower limb biomechanics consistent with
increased ACL loading and injury risk, representing a ‘high-risk’ activation
profile; while other profiles would not, representing a ‘safe’ activation profile.
However, this was not the case as various biomechanical deficits were
identified across all profiles. Reduced knee flexion and larger internal rotation
moments at the knee were associated with MAP-1; yet greater hip flexion and
smaller hip adduction and knee abduction angles were also present for this
profile. MAP-2 resulted in the largest hip adduction, hip internal rotation and
knee internal rotation angles, and highest knee abduction moments; but also
demonstrated large knee flexion angles at initial contact. Lastly, limited hip
flexion at initial contact and the largest knee abduction angles were seen with
Muscle Activation Profiles during Landing
152
MAP-3; however large knee flexion angles and the lowest knee abduction
moments were associated with this profile. The participants included within
this study were currently injury free and had no history of serious lower limb
injury. As such, the different profiles identified and resultant lower limb
biomechanics may represent normal and safe variations for the landing task
examined. However, considering lower limb biomechanics are the outcome of
a given movement, they provide a means for which to link neuromuscular
control with potential increased injury risk. While ‘high-risk’ and ‘safe’
activation profiles were not identified, investigating the biomechanical
outcomes stemming from the different profiles can assist in improving our
understanding of how the overall activation profile, or aspects of the activation
profile, contribute or prevent lower limb biomechanics consistent with
increased ACL loading or injury risk.
Frontal plane knee postures and moments are acknowledged as the primary
biomechanical risk factors for ACL injury.[20-23, 28, 160] A ‘dynamic valgus’ or
abducted knee position (i.e. abduction of the tibia relative to the femur) and
higher knee abduction moments have been linked to future ACL injury
occurrences[160] and substantially increase the load placed on the ACL during
landing movements.[20-23, 28] During netball leap landings, external knee
abduction moments are observed in the early stages after initial contact, with
these shifting to an external knee adduction moment later in the landing
phase.[248] Athletes must therefore employ adequate activation strategies at
specific periods of the landing phase to counteract these frontal plane
moments. Activation of muscles with appropriate moment arms has been
proposed as a method for counteracting external knee abduction/adduction
moments.[170, 171, 385] As the knee flexes the medial hamstrings have the capacity
to counteract external knee abduction moments, while the lateral hamstrings
Muscle Activation Profiles during Landing
153
and lateral gastrocnemius work to counteract external knee adduction
moments.[171] The selective activation of these muscles during the phases of the
landing where knee abduction and adduction moments are present may
therefore be an effective strategy in limiting their magnitude. This notion was
partially supported by the results of this study. MAP-2 exhibited the highest
peak knee abduction moments in the early stages of landing, with this profile
exhibiting lower levels of medial hamstrings activation around the time where
peak knee abduction moments occurred. Increasing the activation of the
medial hamstrings within this profile may have reduced the peak knee
abduction moments to a similar level to that seen with the other profiles. The
largest external knee adduction moments during the latter stages of landing
were seen with MAP-1. Surprisingly, this profile did not exhibit lower levels
of activation for muscles that counteract knee adduction moments, nor did it
exhibit higher levels of activation for muscles known to produce knee
adduction moments. Additional muscles, such as the medial gastrocnemius,
gracilis and sartorius, also have the capacity to counteract external knee
adduction moments.[171] The activation of these muscles may have been
insufficient within MAP-1, leading to the larger knee adduction moments.
However, this cannot be confirmed as these additional muscles were not
assessed in this study.
Preparatory muscle activation has been acknowledged as an important factor
in controlling frontal plane knee motion during landing tasks.[187] Higher peak
knee abduction angles have been associated with increased preparatory
activation of the vastus lateralis and lateral hamstrings.[187] In addition,
elevated preparatory activation of the vastus medialis has been linked to lower
peak knee abduction angles.[187] In the present study, both MAP-2 and MAP-3
recorded higher peak knee abduction angles compared to MAP-1. MAP-2
Muscle Activation Profiles during Landing
154
exhibited the highest preparatory activation of the lateral hamstrings. In
addition, low levels of medial hamstrings activation in the early stages of
landing and high levels of lateral hamstrings activation in the later stages of
landing were seen with MAP-2. The combination of these factors may have
impeded the ability of this profile to limit knee abduction during landing.
MAP-3 demonstrated the lowest levels of vastus medialis activity prior to
landing. This low activation of the medial quadriceps may have contributed
to the large degree of knee abduction displacement seen during the first 50-
75ms after initial contact, leading to a large peak knee abduction angle.
Interestingly, MAP-1 recorded the highest levels of preparatory vastus
lateralis activity, yet had the lowest degree of initial contact and peak knee
abduction. While the muscles acting directly at the knee are the most
influential,[187, 386] other muscles may also be relevant in supporting against
excessive frontal plane knee motion.
There are suggestions that the hip abductor and adductor musculature assist
in controlling frontal plane motion at the knee.[170, 387] This notion is supported
by the fact that excessive hip motion, specifically hip adduction and internal
rotation, has the capacity to shift the knee to an abducted position.[149, 162] MAP-
2 exhibited high levels of preparatory gluteus medius activation, however this
did not appear to be protective in limiting the degree of peak knee abduction
experienced. This is in line with previous work, where preparatory activation
of gluteus medius was also found to have no influence on peak knee abduction
angles during landing.[187] Muscles at the hip other than gluteus medius may
also be useful in providing this support. While the gluteus maximus primarily
functions as a hip extensor, it can function like the gluteus medius during
dynamic tasks[178] and may therefore assist in controlling frontal plane motion
at the knee. High activation of the gluteus maximus at initial contact and

Muscle Activation Profiles during Landing
155
during the early deceleration phase of landing was observed with MAP-1. This
activation strategy may have been a factor in this profile demonstrating the
lowest hip adduction across the profiles, while also exhibiting minimal hip
internal rotation. Subsequently, the elevated activation of the gluteus
maximus may have served as a compensatory factor for the high levels of
preparatory vastus lateralis activity seen with MAP-1, to avoid an abducted
knee posture by controlling frontal and transverse plane motion at the hip.
Appropriate preparatory activation of muscles at the knee, combined with
appropriate activation of the hip muscles during landing may serve as a useful
neuromuscular strategy for limiting frontal plane knee motion.
Transverse plane rotations and moments at the knee are also often implicated
in ACL injury risk.[20-22, 99] Internal or external rotation at the knee (i.e. internal
or external rotation of the tibia relative to the femur) is frequently observed
during ACL injury occurrences,[99] while large increases in ACL loads are seen
when internal rotation moments are applied at the knee.[20-22] Differences in the
magnitude of transverse plane rotations and moments were found between
the three activation profiles. With regard to transverse plane rotations at the
knee, each profile exhibited certain high-risk characteristics. While MAP-2
displayed minimal transverse plane rotation at initial contact, this profile
demonstrated the largest peak knee internal rotation angles. In contrast, MAP-
2 and MAP-3 landed in a position of external rotation at the knee. These two
profiles also exhibited a degree of internal rotation at the knee throughout the
landing. Based on this data, it appears none of the activation profiles provided
sufficient support against potentially high-risk transverse plane movement
strategies at the knee. With regard to transverse plane moments at the knee,
MAP-1 exhibited larger knee internal rotation moments than the remaining
profiles. While these differences were present, the magnitude of the transverse
Muscle Activation Profiles during Landing
156
plane knee moments experienced during the landing task were small and
negligible relative to knee moments in the remaining planes. It is unlikely that
this small difference (~ 0.04 Nm kgm-1) substantially increased the level of ACL
injury risk for this profile. The small magnitude of transverse plane knee
moments seen in this study is not surprising, as comparable values have been
observed in previous work examining a similar netball-specific landing
task.[253]
Limited knee flexion during landing has been linked to higher ACL loads[25]
and ACL injuries often occur with the knee in a relatively extended position.[97-
99] As ACL injuries are proposed to occur within the first 50 ms of landing[98]
and peak ACL loads occur during the deceleration phase of landing,[27] knee
flexion at initial contact and during the early stages of landing is an important
biomechanical strategy for reducing ACL injury risk. Smaller knee flexion
angles at initial contact and through the first 30ms after initial contact were
seen with MAP-1. Greater preparatory activation of the quadriceps relative to
the hamstrings has been linked to a reduction in initial contact knee flexion
angles during landing.[178] While all of the activation profiles exhibited greater
preparatory activation of the hamstrings relative to the quadriceps; MAP-1
tended to exhibit the highest preparatory activation of the quadriceps muscles,
while also exhibiting lower preparatory activation of the hamstrings. In
addition, MAP-1 exhibited the greatest activation of rectus femoris, a primary
knee extensor, during the early stages of landing. These activation
characteristics may have been a contributing factor to the less flexed posture
at the knee at initial contact and through the early stages of landing seen with
this profile.
Despite the differences between profiles, a number of similar neuromuscular
strategies were also observed. Across all profiles, the quadriceps and

Muscle Activation Profiles during Landing
157
gastrocnemius muscles tended to be the highest activated muscles within
muscle synergy one, while the quadriceps were also highly activated within
muscle synergy two. The external knee flexion moment was the largest of all
moments measured during the leap landing task. Activation of the quadriceps
would be required to counteract these external loads and decelerate the shank,
with this being a potential reason for the high levels of activation seen in this
muscle group during landing across all profiles. Further, recent work has
suggested the plantarflexors play an important role in unloading the ACL,[184]
and co-contraction of the gastrocnemius and quadriceps may serve to elevate
joint compression and protect the knee from external joint loading during
single-leg landing.[185] Considering these factors, the higher levels of activation
seen in the quadriceps and gastrocnemius at and after initial contact may
represent a requirement rather than a selective activation strategy to ensure
the knee is protected from the external loads experienced during the landing
task. An additional similarity across the profiles was the ratio of quadriceps to
hamstrings activation. The quadriceps and hamstrings tended to be the
highest and lowest activated muscles, respectively, within muscle synergies
one and two (i.e. around and after initial contact). This imbalance may stem
from the female cohort used for this study. Studies comparing the muscle
activation patterns of males and females during landing tasks have found
females tend to exhibit a ‘quadriceps dominant’ activation strategy.[59, 120, 129, 130]
The favoured activation of the quadriceps over the hamstrings may therefore
be an inherent trait of all muscle activation profiles employed by females
during landing tasks. The need to balance hamstrings and quadriceps
activation is important within female athletes, as a high quadriceps-hamstring
activation ratio has been linked to biomechanical factors associated with ACL
loading and injury risk.[177] The presence of an imbalance between quadriceps
and hamstring activation regardless of the activation profile used suggests
Muscle Activation Profiles during Landing
158
ACL injury prevention programs targeting female athletes may require a
general goal of increasing hamstrings muscle activation.
As in the previous chapter, it is important to acknowledge that this study
focused solely on muscle activation during the high-risk sporting task. The
physiological characteristics and strength of muscles are likely to be key
factors in protecting the knee and ACL during high-risk landing tasks, and
thus also require consideration in identifying neuromuscular contributions to
ACL injury risk. Individuals with differences in muscle physiology may need
to utilise different activation profiles to protect the ACL from potentially
hazardous joint postures and loads. Neuromusculoskeletal modelling
approaches allow the inclusion of muscle strength and length parameters,
while also calculating muscle forces during task performances. The use of
these approaches in conjunction with the assessment of muscle activation
profiles may assist in achieving a greater overall understanding of
neuromuscular contributions to ACL injury risk, and how this may vary across
individuals with different muscle physiology.
An additional limitation of this study was that data pertaining to trunk
biomechanics, and subsequently the centre of mass position were not
collected. Positioning of the centre of mass plays an important role in
modulating ACL injury risk.[167, 255, 372] Furthermore, the landing task examined
encompassed a flight phase where centre of mass position may have varied
from trial-to-trial. The positioning of centre of mass during the flight phase of
the movement may play an important role in dictating the muscle activation
profile required to perform the landing manoeuvre in a safe manner. Variable
centre of mass positions during the preparatory or flight phase of high-risk
sporting tasks may require different muscle activation profiles in order to
prevent lower limb biomechanical postures linked to ACL loading or injury
Muscle Activation Profiles during Landing
159
risk. Future work examining muscle activation profiles during high-risk
sporting tasks should also consider the relationship between preparatory
biomechanics and neuromuscular control.
5.5 Conclusions
This study found multiple muscle activation profiles were utilised during
repeat performances of a high-risk landing task. While multiple activation
profiles were identified, individual’s tended to persevere with a preferred
profile through the majority of landing trials. ‘Safe’ and ‘high-risk’ activation
profiles were not identified. Rather, specific muscle activation characteristics
or combinations of activation characteristics within profiles were linked with
the presence of biomechanical deficits linked to ACL loading or injury risk.
Injury prevention programs directed at improving neuromuscular control
during high-risk landing tasks may need to target these specific muscle
activation characteristics in order to reduce ACL injury risk. As different
activation profiles were seen across individuals, implementing injury
prevention programs in a universal manner may not be appropriate. Tailored
injury prevention programs targeting the specific neuromuscular deficits
relevant to the individual may induce more beneficial neuromuscular
adaptations for reducing ACL injury risk.

160
Chapter Six: Exploring Individual Adaptations to an Anterior Cruciate Ligament Injury Prevention Program
6.1 Introduction
Numerous studies have highlighted the benefits of anterior cruciate ligament
(ACL) injury prevention programs in altering neuromuscular and
biomechanical factors associated with ACL injury risk.[34-45, 68, 69, 71-75, 79, 166, 201, 213-
217] The success of ACL injury prevention programs is generally defined by a
reduction in the total number or rate of ACL injuries, or by a change in
neuromuscular or biomechanical factors associated with ACL loading or
injury risk. Regardless of the outcome of interest, an overall improvement in
the training group (in isolation or relative to a control group) is deemed
successful, with little attention paid to the individual responses. Despite the
apparent success of injury prevention programs in recent times, ACL injury
rates have remained relatively unchanged.[1, 2] A focus on group results limits
our understanding of how different individuals respond to training, and this
may be a factor that is restricting our understanding of the mechanisms that
underpin failure or success of ACL injury prevention programs. Certain
individuals have been shown to exhibit detrimental responses to training,
even when an overall improvement has been observed at the group level.[71] It
may therefore be erroneous to expect that everyone will gain similar benefits
from the same training stimulus. Despite this, individual responses to ACL
injury prevention programs have received little attention.
Individual Adaptations to ACL Injury Prevention
161
Certain studies have considered the individual responses to ACL injury
prevention programs.[71, 82, 83] Where this has been examined, non-uniform
neuromuscular and biomechanical adaptations have been observed.[71, 82, 83]
Cowling et al.[82] found individuals displayed non-uniform adaptations in
quadriceps and hamstrings muscle activation strategies during a unilateral
netball-specific landing task, despite completing identical training programs.
No differences were found from pre- to post-training when examining the
group, highlighting the potential of individual responses to be masked when
focusing on data at the group level. Variable adaptations to lower limb
biomechanics have also been observed following ACL injury prevention
programs.[71, 83, 84] Pollard et al.[71] concluded an in-season injury prevention
program had a beneficial effect on frontal and transverse plane hip motion
when performing a jump-landing task. Upon examination of individual data,
some athletes were found to have greater improvements in the frontal versus
transverse plane, and vice versa.[71] It was suggested that athletes exhibited
greater changes in the plane they demonstrated a pre-existing high-risk
pattern.[71] However, certain athletes exhibited detrimental adaptations
following training, suggesting that not all responded favourably to the
training program.[71] Further, Dempsey et al.[83] found certain athletes exhibited
large favourable responses in torso rotation during a side-step cutting
manoeuvre following training, while others did not. The authors also
hypothesised that these athletes may have displayed a more high-risk
technique at baseline, and hence obtained a greater benefit from training.
There is evidence to support the hypothesis that the level of ACL injury risk
prior to commencing an injury prevention program is a modulating factor in
the magnitude of response to training.[84] Myer et al.[84] saw a greater decrease
in knee abduction moments during a bilateral drop vertical jump task in
‘high-‘ (knee abduction moment > 22.5 Nm during a drop vertical jump) versus
Individual Adaptations to ACL Injury Prevention
162
‘low-risk’ athletes. It is, however, yet to be established whether this effect
exists for high-risk sport-specific tasks associated with ACL injuries.
Of the studies which have examined individual changes following an ACL
injury prevention program, there appears to be a consensus that not all athletes
respond in a similar manner to the same training stimulus.
While a large number of studies have assessed biomechanical
and neuromuscular adaptations following an injury prevention
program,[34-36, 38-45, 68, 69, 71-75, 79, 83, 166, 201, 213-217] very few of these have specifically
focused on the variable responses of individuals within the training group.
Failure to examine these individual responses may impact on our
understanding of what does or does not constitute effective ACL injury
prevention practice. For example; where an injury prevention program has
been shown to produce favourable responses at the group level, we may
conclude that this program is effective. However, it may be that not all
individuals who complete the program receive the perceived benefits, and
thus may still be at-risk of ACL injury. A greater understanding of how
different individuals respond to an identical training stimulus can allow for
better development of ACL injury prevention programs that provide a benefit
to all involved. In addition, examining individual responses and the
characteristics of participants exhibiting different responses may maximise
our ability to provide targeted or individualised injury prevention programs.
The purpose of this study was to examine the effects of an ACL injury
prevention program on neuromuscular control and lower limb biomechanics
during a high-risk landing task at the group and individual level. Specifically,
this study aimed to: (i) investigate the effects of an ACL injury prevention
program on neuromuscular control and lower limb biomechanics during a
high-risk landing task at the group level by comparing the overall responses
Individual Adaptations to ACL Injury Prevention
163
between a control and training group; (ii) investigate the effects of an ACL
injury prevention program at the individual level by examining the individual
neuromuscular and biomechanical responses of athletes within a training
group; and (iii) determine whether individuals’ deemed as ‘high-risk’ at
baseline based on peak knee abduction moments during a high-risk landing
task received a greater prophylactic benefit from the ACL injury prevention
program. It was hypothesised that the training group overall would benefit
from the injury prevention program as indicated by improvements in
neuromuscular and biomechanical risk factors associated with ACL injury;
however, variable responses to the program would be observed across
individuals within the training group. In addition, individuals deemed as
‘high-risk’ for ACL injury would receive a greater prophylactic benefit from
the training.
6.2 Methodology
The majority of the methods employed in this study are comprehensively
outlined in Chapter Three. The following methods are an abridged version of
the sections specific to this chapter.
6.2.1 Participants
Sixteen healthy sub-elite female netball players (age = 22.7 ± 2.7 years; height
= 171.8 ± 7.4 cm; mass = 68.6 ± 8.1) volunteered and provided written consent
to participate in this study. All participants met the inclusion/exclusion criteria
detailed in Section 3.2 of Chapter Three. Upon study enrolment, participants
were randomly allocated to a control or training group. Participant
characteristics of the groups are presented in Table 6.1 (see Page 164). No
statistically significant differences (p > 0.05) were present for age, height,
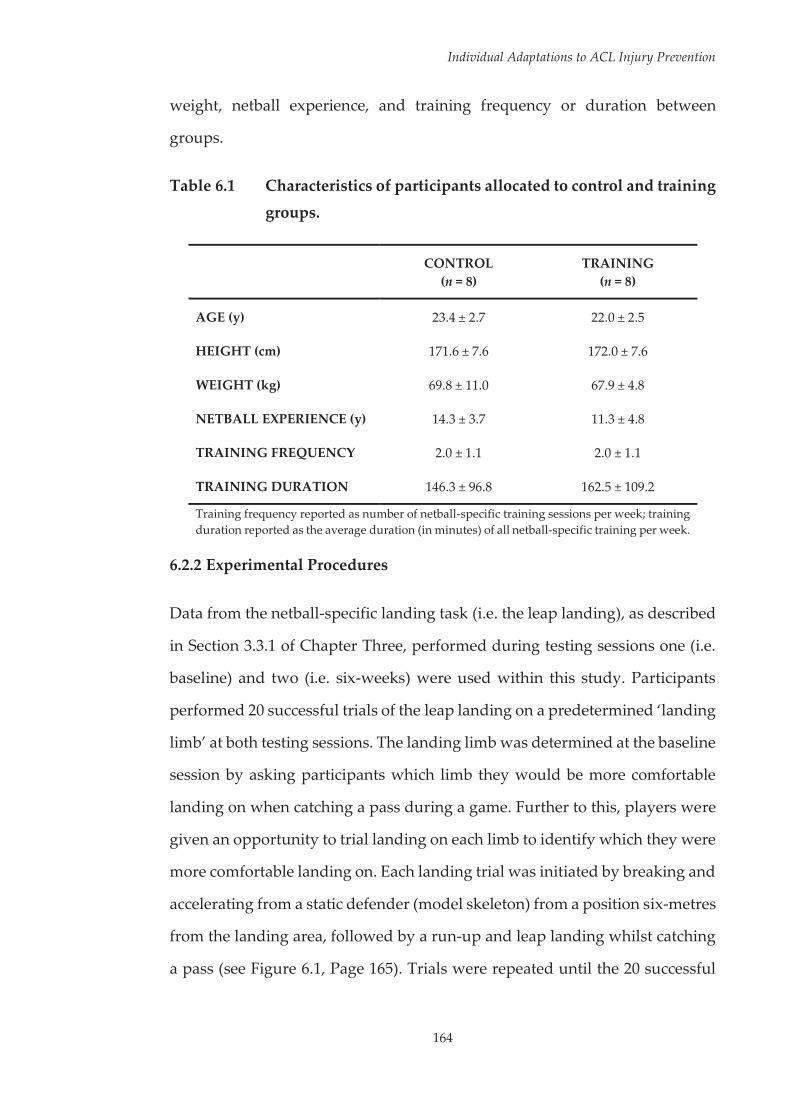
Individual Adaptations to ACL Injury Prevention
164
weight, netball experience, and training frequency or duration between
groups.
Table 6.1 Characteristics of participants allocated to control and training groups.
CONTROL (n = 8)
TRAINING (n = 8)
AGE (y) 23.4 ± 2.7 22.0 ± 2.5
HEIGHT (cm) 171.6 ± 7.6 172.0 ± 7.6
WEIGHT (kg) 69.8 ± 11.0 67.9 ± 4.8
NETBALL EXPERIENCE (y) 14.3 ± 3.7 11.3 ± 4.8
TRAINING FREQUENCY 2.0 ± 1.1 2.0 ± 1.1
TRAINING DURATION 146.3 ± 96.8 162.5 ± 109.2
Training frequency reported as number of netball-specific training sessions per week; training duration reported as the average duration (in minutes) of all netball-specific training per week.
6.2.2 Experimental Procedures
Data from the netball-specific landing task (i.e. the leap landing), as described
in Section 3.3.1 of Chapter Three, performed during testing sessions one (i.e.
baseline) and two (i.e. six-weeks) were used within this study. Participants
performed 20 successful trials of the leap landing on a predetermined ‘landing
limb’ at both testing sessions. The landing limb was determined at the baseline
session by asking participants which limb they would be more comfortable
landing on when catching a pass during a game. Further to this, players were
given an opportunity to trial landing on each limb to identify which they were
more comfortable landing on. Each landing trial was initiated by breaking and
accelerating from a static defender (model skeleton) from a position six-metres
from the landing area, followed by a run-up and leap landing whilst catching
a pass (see Figure 6.1, Page 165). Trials were repeated until the 20 successful
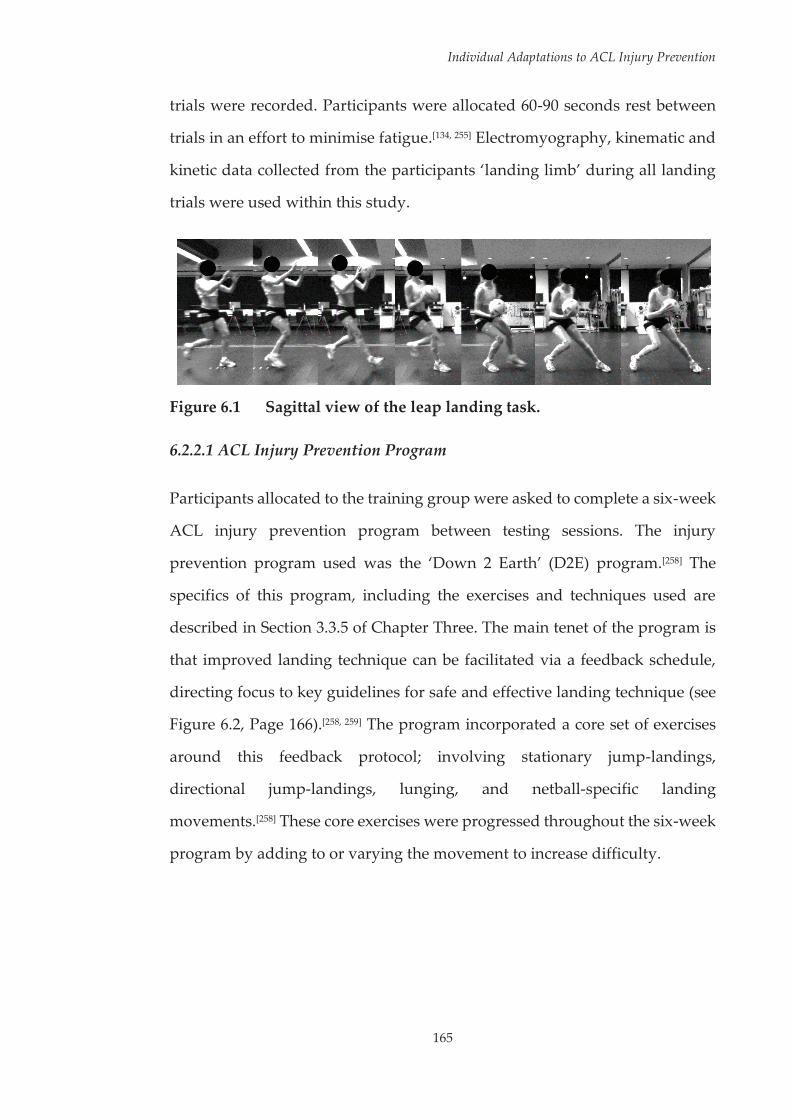
Individual Adaptations to ACL Injury Prevention
165
trials were recorded. Participants were allocated 60-90 seconds rest between
trials in an effort to minimise fatigue.[134, 255] Electromyography, kinematic and
kinetic data collected from the participants ‘landing limb’ during all landing
trials were used within this study.
Figure 6.1 Sagittal view of the leap landing task.
6.2.2.1 ACL Injury Prevention Program
Participants allocated to the training group were asked to complete a six-week
ACL injury prevention program between testing sessions. The injury
prevention program used was the ‘Down 2 Earth’ (D2E) program.[258] The
specifics of this program, including the exercises and techniques used are
described in Section 3.3.5 of Chapter Three. The main tenet of the program is
that improved landing technique can be facilitated via a feedback schedule,
directing focus to key guidelines for safe and effective landing technique (see
Figure 6.2, Page 166).[258, 259] The program incorporated a core set of exercises
around this feedback protocol; involving stationary jump-landings,
directional jump-landings, lunging, and netball-specific landing
movements.[258] These core exercises were progressed throughout the six-week
program by adding to or varying the movement to increase difficulty.
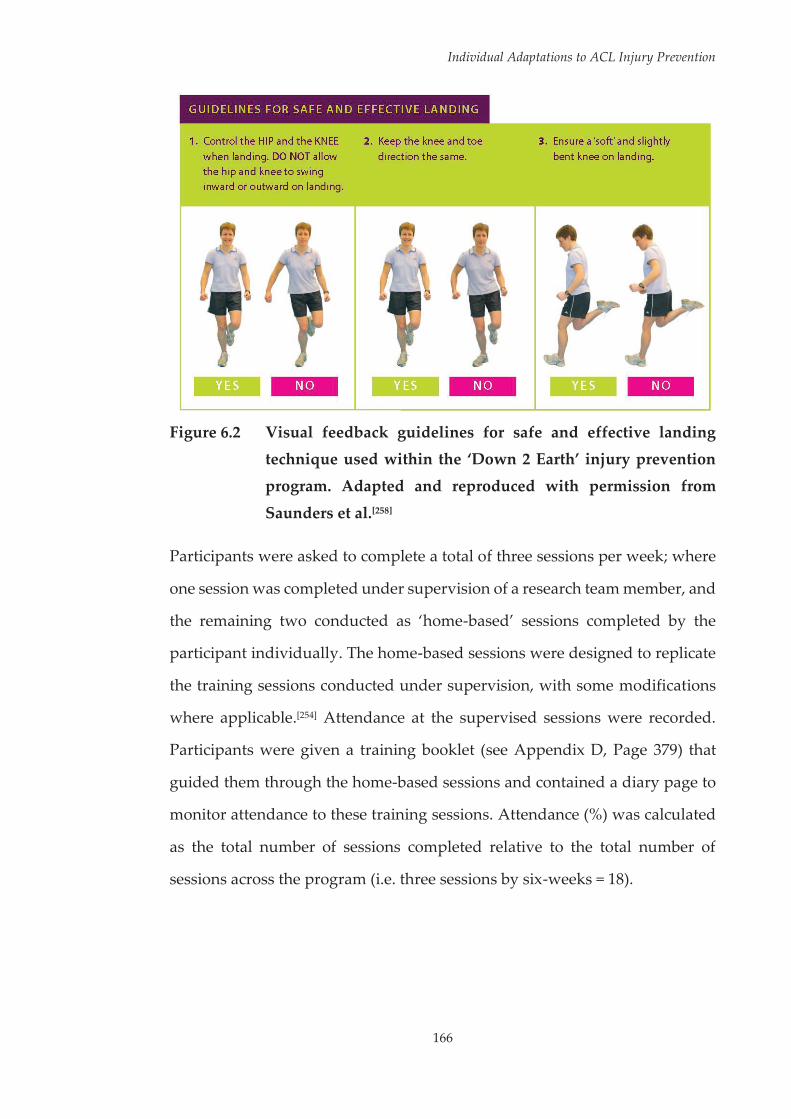
Individual Adaptations to ACL Injury Prevention
166
Figure 6.2 Visual feedback guidelines for safe and effective landing
technique used within the ‘Down 2 Earth’ injury prevention
program. Adapted and reproduced with permission from
Saunders et al.[258]
Participants were asked to complete a total of three sessions per week; where
one session was completed under supervision of a research team member, and
the remaining two conducted as ‘home-based’ sessions completed by the
participant individually. The home-based sessions were designed to replicate
the training sessions conducted under supervision, with some modifications
where applicable.[254] Attendance at the supervised sessions were recorded.
Participants were given a training booklet (see Appendix D, Page 379) that
guided them through the home-based sessions and contained a diary page to
monitor attendance to these training sessions. Attendance (%) was calculated
as the total number of sessions completed relative to the total number of
sessions across the program (i.e. three sessions by six-weeks = 18).

Individual Adaptations to ACL Injury Prevention
167
6.2.3 Data Collection and Analysis
Electromyography (EMG), and kinematic and kinetic data from the leap
landing task were collected and analysed as per the procedures outlined in
Section 3.4.1 and 3.4.2, respectively, of Chapter Three. Briefly, surface EMG
data were collected unilaterally from eight lower limb muscles (gluteus
maximus [GMAX], gluteus medius [GMED], medial hamstrings [MHAM],
lateral hamstrings [LHAM], rectus femoris [RF], vastus lateralis [VL], vastus
medialis [VM], and lateral gastrocnemius [GAS]) on the participants’ ‘landing
limb’ using wireless parallel-bar electrodes (Delsys Trigno, Delsys
Incorporation, Boston, MA, United States). All EMG data were processed
using custom MATLAB (version R2014a) (The Mathworks Incorporated,
Natick, MA, United States) programs. Raw EMG signals were online
processed using a bandpass filter between 10 and 500 Hz, and later offline
processed using a 20 Hz high-pass fourth-order zero-lag Butterworth digital
filter to reduce the effects of movement artefact; full-wave rectified; and
converted to a linear envelope via a 6 Hz low-pass fourth-order zero-lag
Butterworth digital filter. EMG data recorded during landing trials were
amplitude normalised (% MVC) to the larger of the peak value recorded
during maximal voluntary isometric contractions or the peak EMG activity
during landing trials.[282, 288] EMG data were extracted from 150 ms prior
through to 300 ms post initial contact (IC) across all landing trials for
subsequent analyses. This window was chosen as previous research
examining a similar single-limb catch and land task has shown lower limb
muscle onsets occur up to 150 ms prior to landing and remain active for a
period of up to 380 ms.[54]
As in the previous two studies, muscle synergies were used to represent
muscle activation during the landing task. The extracted EMG data from both

Individual Adaptations to ACL Injury Prevention
168
groups and time points were collated and factorised by applying a non-
negative matrix factorisation (NMF) algorithm[298] (as outlined in Section
3.4.1.3.1 of Chapter Three) to obtain the muscle synergy components, those
being the time-variant muscle activation coefficients and time-invariant
muscle weighing coefficients. The NMF algorithm was iterated by varying the
number of synergies between one and six, with the number of synergies that
resulted in greater than 90% mean total variance accounted for ( ) between
experimental and reconstructed EMG data retained. was also calculated
across individual muscles ( ) to ensure that each muscle’s activity
patterns were accounted for by the retained synergies (i.e. > 75%).[48]
Following factorisation, the muscle activation coefficients were normalised to
their maximum value (i.e. each activation coefficient had a maximum value of
1), with the muscle weighing coefficients within each of the muscle synergies
scaled by the same respective factor.[49, 294] The muscle weighing coefficients
from individual muscles across the identified synergies were treated as
separate dependent variables within this study. This was done as it was
deemed important that specific changes in muscle activation characteristics
stemming from the ACL injury prevention program could be detected.
Three-dimensional (3D) kinematics and kinetics of the lower limb were
computed using an established musculoskeletal model.[305, 310] An eight camera
3D motion capture system (Vicon, Oxford Metrics Limited, Oxford, United
Kingdom) sampling at 250 Hz, synchronised with a 600 x 900 mm in ground
force plate (Advanced Medical Technology Incorporated, Watertown, MA,
United States) sampling at 1000 Hz collected marker trajectory and ground
reaction force (GRF) data. Marker trajectory and GRF data were low-pass
filtered using a cubic smoothing spline with a cut-off frequency of 12 Hz.
Three-dimensional hip and knee joint rotations were calculated from filtered
Individual Adaptations to ACL Injury Prevention
169
marker trajectory data using an X-Y-Z Cardan angles sequence; with the X, Y
and Z axes representing joint rotations in the sagittal, frontal and transverse
planes, respectively.[138] Kinematic data were expressed relative to each
participant’s stationary (neutral) trial.[56, 310, 311] Three-dimensional hip and knee
external joint moments were calculated by submitting the filtered marker
trajectory and GRF data to a conventional inverse dynamics analysis.[261] Joint
moments were expressed in the reference frames of the joint coordinate
systems and were normalised by dividing the total joint moment (Nm) by the
product of the participant’s weight and height (kgm). Joint rotation and
moment data were extracted from the instance of IC to 150 ms post IC across
all landing trials. This time window was chosen for biomechanical variables
as ACL injuries are thought to occur within the early deceleration phase of
landing.[161]
Previous studies within this thesis have used one-dimensional statistical
parametric mapping (SPM1D) to assess differences in joint rotations and
moments, and have therefore not required any further reduction of the
waveform data. Within this study, a repeated measures approach was used
across statistical tests. Current SPM1D repeated measures procedures only
support balanced designs (i.e. same number of observations for all possible
combinations of factors).[371] As different participants made up the control and
training groups, the criteria for a balanced design was not met and SPM1D
could not be used. When applied to continuous waveforms, such as joint
rotation and moment data, principal component analysis (PCA) has a number
of similar benefits to SPM1D. PCA can be used to view an entire waveform as
function, preserving the main features and patterns of the curve.[333] This
ensures the majority of the data along the waveform is considered in
subsequent analyses. Further, PCA removes the need to pre-select discrete
Individual Adaptations to ACL Injury Prevention
170
features from the waveform, removing the potential for regional focus bias.[338]
With these factors in mind, PCA was used in place of SPM1D within this study
to reduce the joint rotation and moment waveform data to discrete values that
could be input as dependent variables for repeated measures analyses.
Kinematic and kinetic data were exported to MATLAB and submitted to PCA
to identify the lower limb biomechanical patterns from the leap landing task.
Patterns were extracted for hip flexion/extension (HFLEX/EXT),
adduction/abduction (HADD/ABD), and internal/external rotation (HIR/ER); knee
flexion/extension (KEXT/FLEX), adduction/abduction (KADD/ABD), and
internal/external rotation (KIR/ER); hip extension/flexion moments (HEXT/FLEX
Mom.), abduction/adduction moments (HABD/ADD Mom.), and external/internal
rotation moments (HER/IR Mom.); and knee flexion/extension moments
(KFLEX/EXT Mom.); abduction/adduction moments (KABD/ADD Mom.); and
external/internal rotation moments (HER/IR Mom.). The n number of principal
patterns (PP) that summed to explain at least 90% of the variation in the
waveform were retained and referred to as PP1, PP2, …, PPn.[276, 327] The 90%
criterion was chosen as this value has been previously used when examining
lower limb biomechanical waveforms.[326, 335] Principal pattern scores (PP-
Scores) were then computed for each biomechanical pattern across each joint
rotation and moment variable. Principal pattern interpretation was achieved
by examining the waveforms obtained by adding and subtracting a suitable
multiple of the patterns loading vector to the mean of the relevant
waveform.[333]
Due to its relationship to future ACL injury,[160] the peak knee abduction
moment (pKAM) was used as the dependent variable for categorising
participants as ‘high-’ or ‘low-risk’.[84] Participants who recorded an average
normalised pKAM greater than 0.66 Nm kgm-1 were classified as ‘high-risk,’

Individual Adaptations to ACL Injury Prevention
171
with the remainder classified as ‘low-risk.’ This value represented the 66th
percentile cut-off for pKAM in the examined cohort, thus the ‘high-risk’ group
consisted of the top third of participants for pKAM. While participants below
this threshold may have exhibited pKAMs that could still place them at-risk
of injury, the percentile cut-off identified the highest risk individuals relative
to the remainder of the cohort.
6.2.4 Statistical Analysis
Normality of data distribution within groups and time points, and equality of
variance between groups and time points was confirmed for all of the
dependent variables via non-significant (p > 0.05) Shapiro-Wilk and Levene
statistics, respectively. As the assumptions of normality and equality of
variance were not violated, parametric tests were utilised.
A series of statistical tests were conducted as follows. First; two separate two-
way factorial analysis of variance (ANOVAs) tests (group x time and
participant x time) were conducted using approach speed as the dependent
variable, to determine whether approach speed was required as a covariate for
subsequent analyses.
Second; separate 2 x 2 (group x time) repeated measures ANOVA were used
to test for the main and interaction effects of group (control vs. training) and
time (baseline vs. six-weeks) on all dependent variables (i.e. muscle synergy
weighing coefficients and biomechanical PP-Scores). This analysis determined
whether there was an effect of the injury prevention program at the group
level. Where statistically significant main or interaction effects were identified,
post-hoc analyses of simple main effects within and between groups and time
points were undertaken using Tukey’s honest significant difference (HSD)
tests to identify where specific differences occurred.
Individual Adaptations to ACL Injury Prevention
172
Third; data from the training group was isolated and used in separate 8 x 2
(participant x time) repeated measures ANOVA to test for the main and
interaction effects of participant and time (baseline vs. six-weeks) on all
dependent variables. This analysis determined whether there were differences
in the response to the injury prevention program within the training group.[388]
No post-hoc tests were conducted on individual data. Rather, when a
statistically significant participant x time interaction was observed, effect sizes
(Cohen’s d) were used to examine the magnitude of the effect of the injury
prevention program across individuals. Effect sizes (Cohen’s d) were
calculated based on the change in the dependent variable from baseline to six-
weeks across individuals. In addition, individual change scores from baseline
to six-weeks were calculated across all dependent variables for both control
and training group participants. The standard deviation of these change scores
for each group were descriptively compared to examine the magnitude of
individual variation of each group. This analysis helped establish whether any
variability in individual responses observed was a result of the training
program rather than simply test-retest variation.
Fourth; separate 2 x 2 x 2 (group x time x risk level) repeated measures
ANOVA were used to test for the main and interaction effects of group
(control vs. training), time (baseline vs. six-weeks) and risk level (‘high-‘ vs.
‘low-risk’) on all dependent variables. This analysis determined whether
individuals deemed as ‘high-risk’ received a greater benefit from training in
comparison to ‘low-risk’ individuals.[84] As above, statistically significant main
or interaction effects were followed by post-hoc analyses of simple main
effects within and between factors using Tukey’s HSD tests to identify where
specific differences occurred. Non-significant post-hoc tests were expected
due to the limited sample within each group and risk level combination.
Individual Adaptations to ACL Injury Prevention
173
Cohen’s d was therefore used to estimate the effect sizes for all non-significant
post-hoc comparisons.[269]
An exploratory alpha level of 0.05 was used to determine statistical
significance for the main and interaction effects within all ANOVA tests.[84, 388]
Across all tests, partial eta squared (η2) was used as a measure of effect size for
main and interaction effects, with the interpretation of effect size values
guided by Miles and Shevlin[383] (small η2 = 0.01; medium η2 = 0.06; large η2 =
0.14). A Bonferroni correction was applied to an initial alpha level of 0.05
across all post-hoc analyses based on the number of comparisons being made
within a simple main effects test. Effect sizes (Cohen’s d) for post-hoc
difference tests were calculated based on the change in the dependent variable
from baseline to six-weeks. Interpretation of effect sizes was guided by
Cohen[384] (small d = 0.2; medium d = 0.5; large d = 0.8).
6.3 Results
All participants from the control and training groups completed the baseline
and six-weeks testing sessions. No participants from the training group were
excluded based on their reported attendance to the training program (see
Table 6.2, Page 174). However, as these values varied across participants they
were taken into account when interpreting potential differences in individual
responses.
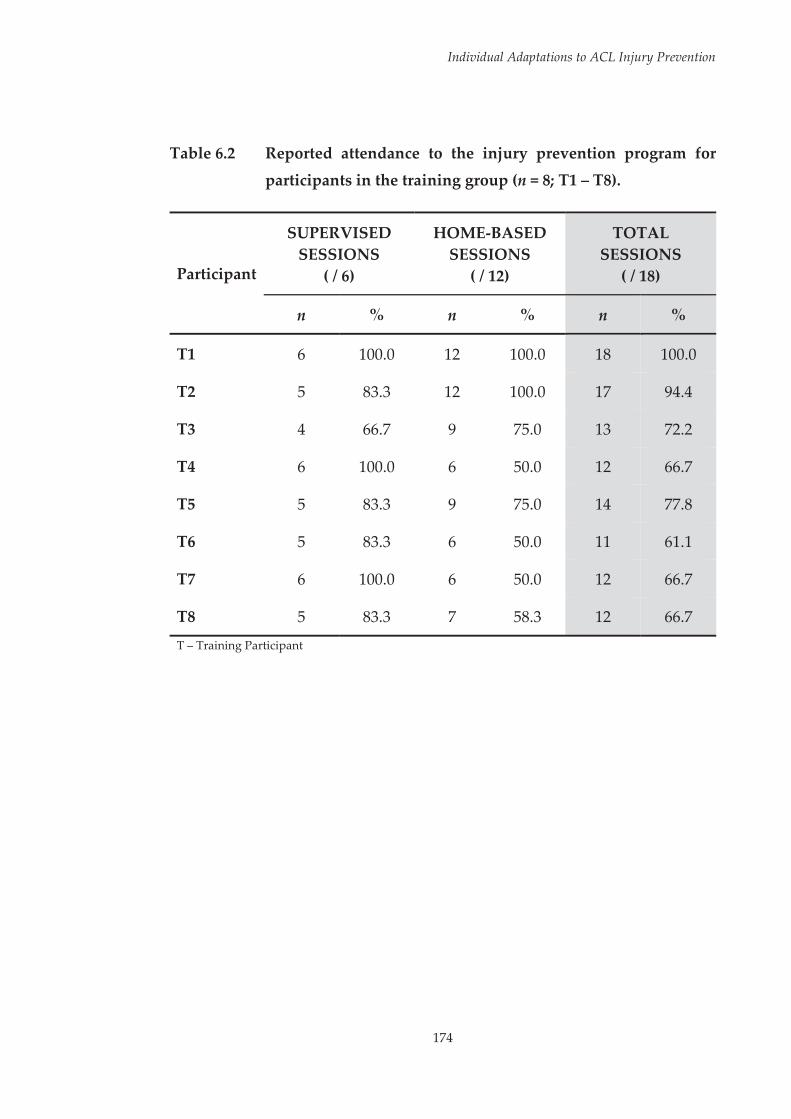
Individual Adaptations to ACL Injury Prevention
174
Table 6.2 Reported attendance to the injury prevention program for
participants in the training group (n = 8; T1 – T8).
Participant
SUPERVISED SESSIONS
( / 6)
HOME-BASED SESSIONS
( / 12)
TOTAL SESSIONS
( / 18)
n % n % n %
T1 6 100.0 12 100.0 18 100.0
T2 5 83.3 12 100.0 17 94.4
T3 4 66.7 9 75.0 13 72.2
T4 6 100.0 6 50.0 12 66.7
T5 5 83.3 9 75.0 14 77.8
T6 5 83.3 6 50.0 11 61.1
T7 6 100.0 6 50.0 12 66.7
T8 5 83.3 7 58.3 12 66.7
T – Training Participant
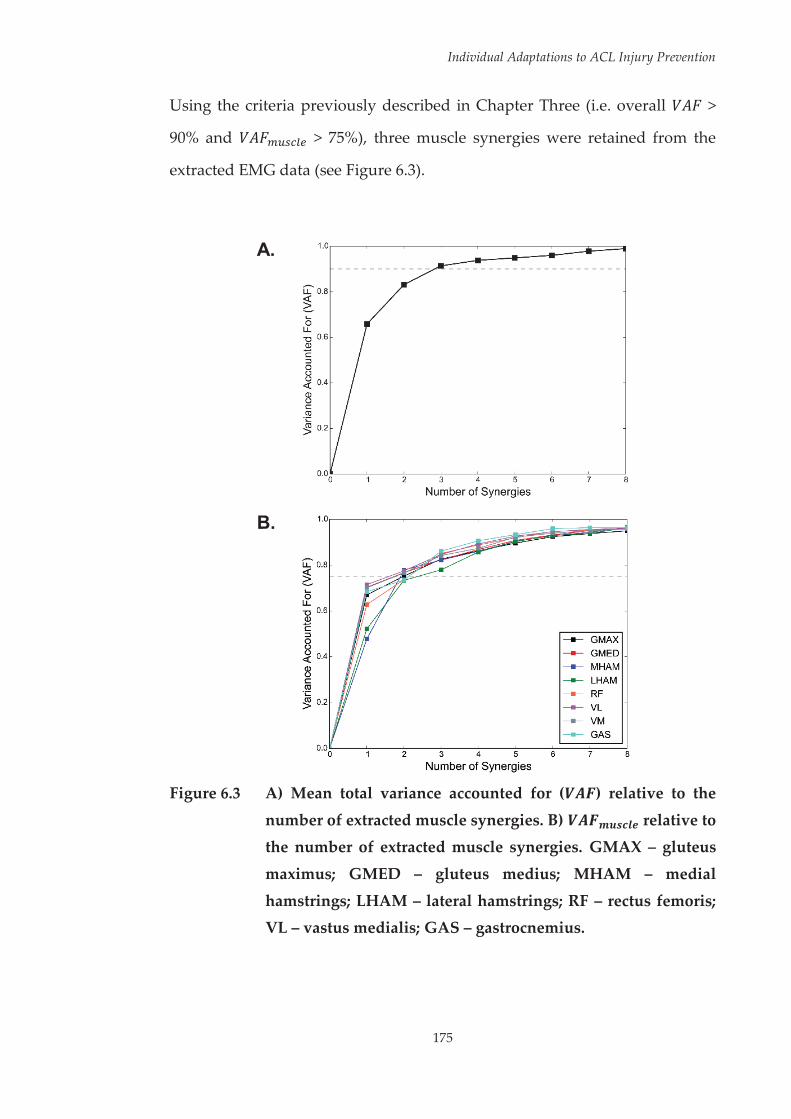
Individual Adaptations to ACL Injury Prevention
175
Using the criteria previously described in Chapter Three (i.e. overall >
90% and > 75%), three muscle synergies were retained from the
extracted EMG data (see Figure 6.3).
A.
B.
Figure 6.3 A) Mean total variance accounted for ( ) relative to the
number of extracted muscle synergies. B) relative to the number of extracted muscle synergies. GMAX – gluteus
maximus; GMED – gluteus medius; MHAM – medial
hamstrings; LHAM – lateral hamstrings; RF – rectus femoris; VL – vastus medialis; GAS – gastrocnemius.

Individual Adaptations to ACL Injury Prevention
176
Despite additional data from testing session two being included in this
analysis, the muscle synergies identified were almost identical to those of the
previous studies (i.e. Chapters Four and Five). Inspection of the activation
coefficients associated with each muscle synergy (see Figure 6.4) indicated that
the first synergy captured muscle activation around initial contact (i.e. at
landing), the second captured muscle activation after initial contact (i.e. post
landing), and the third captured muscle activation prior to initial contact (i.e.
preparatory activity).
Figure 6.4 Normalised activation coefficients of the three muscle
synergies extracted from the factorisation of EMG data. Dashed vertical line represents initial landing contact (IC).

Individual Adaptations to ACL Injury Prevention
177
Principal patterns were extracted for leap landing joint rotations and moments
via PCA (see Table 6.3, Page 178 and Table 6.4, Page 179, respectively). A
graphical display of the patterns associated with high and low PP-Scores for
each PP is provided in Appendix G (see Page 396).

178
Individual Adaptations to ACL Injury Prevention
Tabl
e 6.
3 D
escr
iptio
n of
pri
ncip
al p
atte
rns
(PPs
) ext
ract
ed fr
om h
ip a
nd k
nee
join
t rot
atio
n da
ta fr
om th
e le
ap la
ndin
g ta
sk.
Join
t Rot
atio
n PP
D
escr
iptio
n V
aria
nce
Expl
aine
d
HFL
EX/E
XT
1 2 G
ener
al s
hape
and
ove
rall
mag
nitu
de –
hig
her s
core
= g
reat
er o
vera
ll hi
p fle
xion
M
agni
tude
of h
ip fl
exio
n fr
om IC
to ~
50 m
s po
st IC
– h
ighe
r sco
re =
gre
ater
hip
flex
ion
82.4
%
10.6
%
HA
DD
/ABD
1 2
Gen
eral
sha
pe a
nd o
vera
ll m
agni
tude
– h
ighe
r sco
re =
gre
ater
ove
rall
hip
addu
ctio
n M
agni
tude
of f
ront
al p
lane
hip
ang
ular
dis
plac
emen
t – h
ighe
r sco
re =
redu
ced
angu
lar d
ispl
acem
ent
84.6
%
10.0
%
HIR
/ER
1 2 3
Gen
eral
sha
pe a
nd o
vera
ll m
agni
tude
– h
ighe
r sco
re =
gre
ater
ove
rall
hip
inte
rnal
rota
tion
Mag
nitu
de o
f hip
ext
erna
l rot
atio
n fr
om IC
to ~
30 m
s po
st IC
– h
ighe
r sco
re =
redu
ced
hip
exte
rnal
rota
tion
Mag
nitu
de o
f pea
k hi
p in
tern
al ro
tatio
n at
~60
-90
ms p
ost I
C –
hig
her s
core
= g
reat
er h
ip in
tern
al ro
tatio
n pe
ak
73.0
%
16.1
%
7.1%
K
EXT/
FLEX
1 2
Gen
eral
sha
pe a
nd o
vera
ll m
agni
tude
– h
ighe
r sco
re =
redu
ced
over
all k
nee
flexi
on
Mag
nitu
de o
f sag
ittal
pla
ne k
nee
angu
lar d
ispl
acem
ent –
hig
her s
core
= re
duce
d an
gula
r dis
plac
emen
t 83
.3%
8.
9%
KA
DD
/ABD
1 2
Gen
eral
sha
pe a
nd o
vera
ll m
agni
tude
– h
ighe
r sco
re =
redu
ced/
grea
ter o
vera
ll kn
ee a
bduc
tion/
addu
ctio
n Ph
ase
shift
in ti
min
g –
high
er sc
ore
= ea
rlie
r kne
e ad
duct
ion
peak
79
.2%
11
.0%
K
IR/E
R
1 2 3
Gen
eral
sha
pe a
nd o
vera
ll m
agni
tude
– h
ighe
r sco
re =
gre
ater
ove
rall
knee
inte
rnal
rota
tion
Mag
nitu
de o
f kne
e ex
tern
al ro
tatio
n fr
om IC
to ~
30 m
s po
st IC
– h
ighe
r sco
re =
redu
ced
knee
ext
erna
l rot
atio
n M
agni
tude
of p
eak
– hi
gher
sco
re =
gre
ater
pea
k kn
ee in
tern
al ro
tatio
n
58.0
%
22.6
%
13.4
%
HFL
EX/E
XT
– hi
p fle
xion
/ext
ensi
on;
HA
DD
/ABD
– h
ip a
dduc
tion/
abdu
ctio
n; H
IR/E
R –
hip
int
erna
l/ext
erna
l ro
tatio
n; K
EXT/
FLEX
– k
nee
flexi
on/e
xten
sion
; K
AD
D/A
BD –
kne
e ad
duct
ion/
abdu
ctio
n; K
IR/E
R –
kne
e in
tern
al/e
xter
nal r
otat
ion;
PP
– pr
inci
pal p
atte
rn; m
s –
mill
isec
onds
; IC
– in
itial
con
tact
.
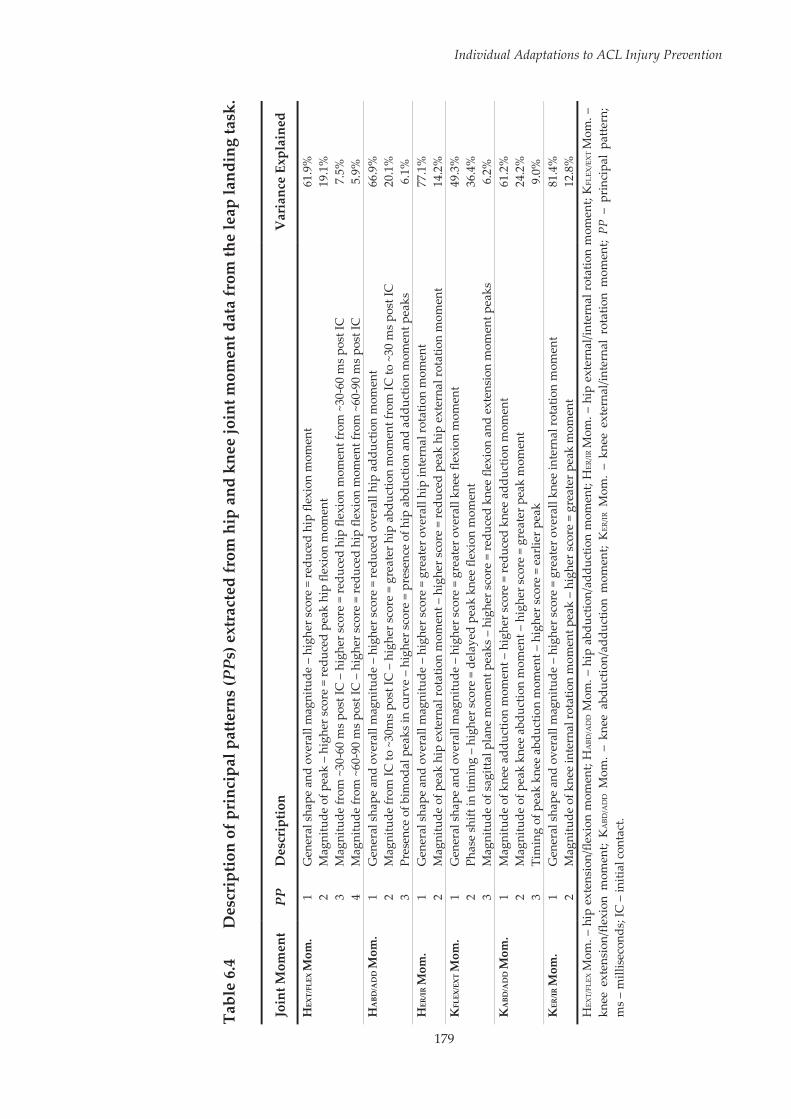
179
Individual Adaptations to ACL Injury Prevention
Tabl
e 6.
4 D
escr
iptio
n of
pri
ncip
al p
atte
rns
(PPs
) ext
ract
ed fr
om h
ip a
nd k
nee
join
t mom
ent d
ata
from
the
leap
land
ing
task
.
Join
t Mom
ent
PP
Des
crip
tion
Var
ianc
e Ex
plai
ned
HEX
T/FL
EX M
om.
1 2 3 4
Gen
eral
sha
pe a
nd o
vera
ll m
agni
tude
– h
ighe
r sco
re =
redu
ced
hip
flexi
on m
omen
t M
agni
tude
of p
eak
– hi
gher
sco
re =
redu
ced
peak
hip
flex
ion
mom
ent
Mag
nitu
de fr
om ~
30-6
0 m
s pos
t IC
– h
ighe
r sco
re =
redu
ced
hip
flexi
on m
omen
t fro
m ~
30-6
0 m
s po
st IC
M
agni
tude
from
~60
-90
ms p
ost I
C –
hig
her s
core
= re
duce
d hi
p fle
xion
mom
ent f
rom
~60
-90
ms
post
IC
61.9
%
19.1
%
7.5%
5.
9%
HA
BD/A
DD
Mom
. 1 2 3
Gen
eral
sha
pe a
nd o
vera
ll m
agni
tude
– h
ighe
r sco
re =
redu
ced
over
all h
ip a
dduc
tion
mom
ent
Mag
nitu
de fr
om IC
to ~
30m
s po
st IC
– h
ighe
r sco
re =
gre
ater
hip
abd
uctio
n m
omen
t fro
m IC
to ~
30 m
s po
st IC
Pr
esen
ce o
f bim
odal
pea
ks in
cur
ve –
hig
her s
core
= p
rese
nce
of h
ip a
bduc
tion
and
addu
ctio
n m
omen
t pea
ks
66.9
%
20.1
%
6.1%
H
ER/I
R M
om.
1 2 G
ener
al s
hape
and
ove
rall
mag
nitu
de –
hig
her s
core
= g
reat
er o
vera
ll hi
p in
tern
al ro
tatio
n m
omen
t M
agni
tude
of p
eak
hip
exte
rnal
rota
tion
mom
ent –
hig
her s
core
= re
duce
d pe
ak h
ip e
xter
nal r
otat
ion
mom
ent
77.1
%
14.2
%
KFL
EX/E
XT M
om.
1 2 3
Gen
eral
sha
pe a
nd o
vera
ll m
agni
tude
– h
ighe
r sco
re =
gre
ater
ove
rall
knee
flex
ion
mom
ent
Phas
e sh
ift in
tim
ing
– hi
gher
scor
e =
dela
yed
peak
kne
e fle
xion
mom
ent
Mag
nitu
de o
f sag
ittal
pla
ne m
omen
t pea
ks –
hig
her s
core
= re
duce
d kn
ee fl
exio
n an
d ex
tens
ion
mom
ent p
eaks
49.3
%
36.4
%
6.2%
K
ABD
/AD
D M
om.
1 2 3
Mag
nitu
de o
f kne
e ad
duct
ion
mom
ent –
hig
her s
core
= re
duce
d kn
ee a
dduc
tion
mom
ent
Mag
nitu
de o
f pea
k kn
ee a
bduc
tion
mom
ent –
hig
her s
core
= g
reat
er p
eak
mom
ent
Tim
ing
of p
eak
knee
abd
uctio
n m
omen
t – h
ighe
r sco
re =
ear
lier p
eak
61.2
%
24.2
%
9.0%
K
ER/IR
Mom
. 1 2
Gen
eral
sha
pe a
nd o
vera
ll m
agni
tude
– h
ighe
r sco
re =
gre
ater
ove
rall
knee
inte
rnal
rota
tion
mom
ent
Mag
nitu
de o
f kne
e in
tern
al ro
tatio
n m
omen
t pea
k –
high
er s
core
= g
reat
er p
eak
mom
ent
81.4
%
12.8
%
HEX
T/FL
EX M
om. –
hip
ext
ensi
on/fl
exio
n m
omen
t; H
ABD
/AD
D M
om. –
hip
abd
uctio
n/ad
duct
ion
mom
ent;
HER
/IR M
om. –
hip
ext
erna
l/int
erna
l rot
atio
n m
omen
t; K
FLEX
/EX
T M
om. –
kn
ee e
xten
sion
/flex
ion
mom
ent;
KA
BD/A
DD M
om.
– kn
ee a
bduc
tion/
addu
ctio
n m
omen
t; K
ER/IR
Mom
. –
knee
ext
erna
l/int
erna
l ro
tatio
n m
omen
t; PP
– p
rinc
ipal
pat
tern
; m
s –
mill
isec
onds
; IC
– in
itial
con
tact
.
Individual Adaptations to ACL Injury Prevention
180
The following sections detail the results of the statistical tests undertaken.
6.3.1 Approach Speed
The group x time factorial ANOVA revealed no main effect for group (p =
0.421, η2 = 0.004) or time (p = 0.232, η2 = 0.008). Similarly, no group x time
interaction was observed (p = 0.301, η2 = 0.011). This finding required no
further consideration of approach speed for the analyses conducted at the
group level, and indicated that any changes were not due to differences in
approach speed between the two groups or testing sessions. In contrast, the
participant x time factorial ANOVA revealed a statistically significant main
effect for participant (p < 0.001, η2 = 0.618), indicating that approach speed
differed between individuals. Based on these results, approach speed was
included as a covariate for the repeated measures analyses that used
participant as a factor. No main effect was observed for time (p = 0.231, η2 =
0.009) or for the participant x time interaction (p = 0.363, η2 = 0.012), indicating
that any individual changes over time were not due to differences in approach
speed between the two testing sessions.
6.3.2 Group Analysis
The mean muscle synergy weighing coefficient data for the control and
training groups across the two testing sessions are presented in Figure 6.5 (see
Page 181) and Table 6.5 (see Page 182). Mean EMG waveform data from 150
ms prior through to 300 ms post IC during the leap landing task for the control
and training groups across the two testing sessions are presented in Figure 6.6
(see Page 183).
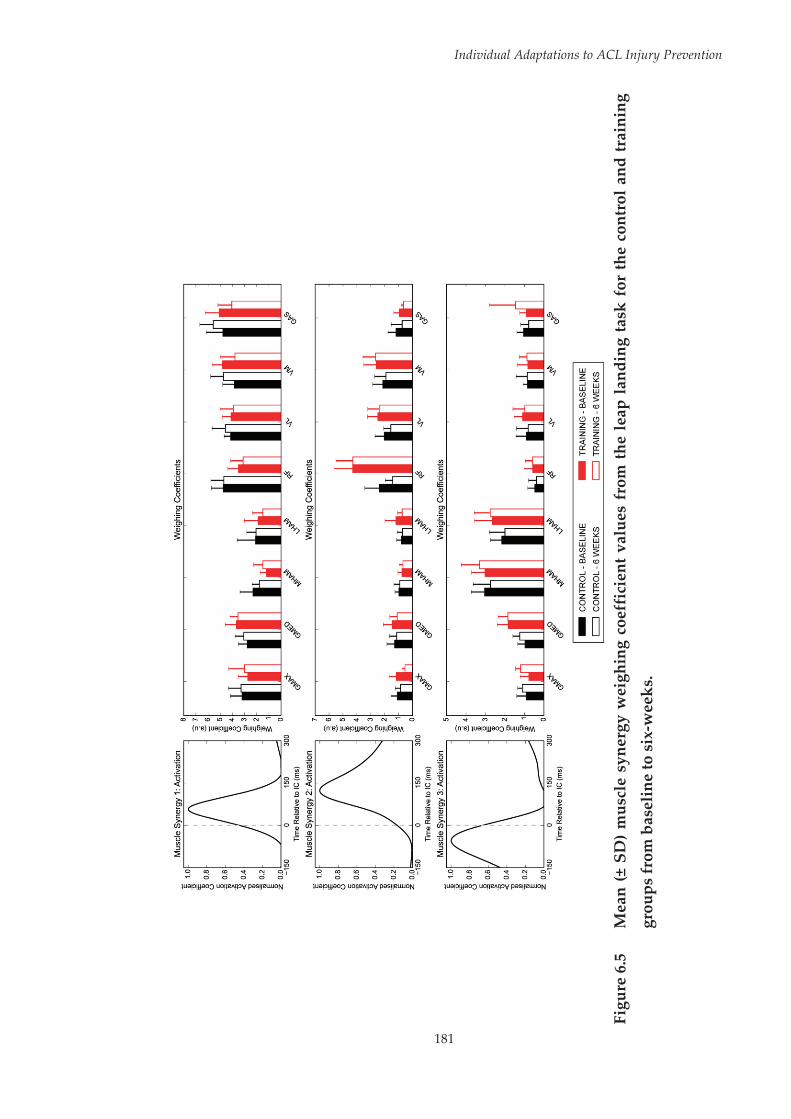
181
Individual Adaptations to ACL Injury Prevention
Fi
gure
6.5
M
ean
(± S
D)
mus
cle
syne
rgy
wei
ghin
g co
effi
cien
t val
ues
from
the
leap
land
ing
task
for
the
cont
rol a
nd tr
aini
ng
grou
ps fr
om b
asel
ine
to s
ix-w
eeks
.
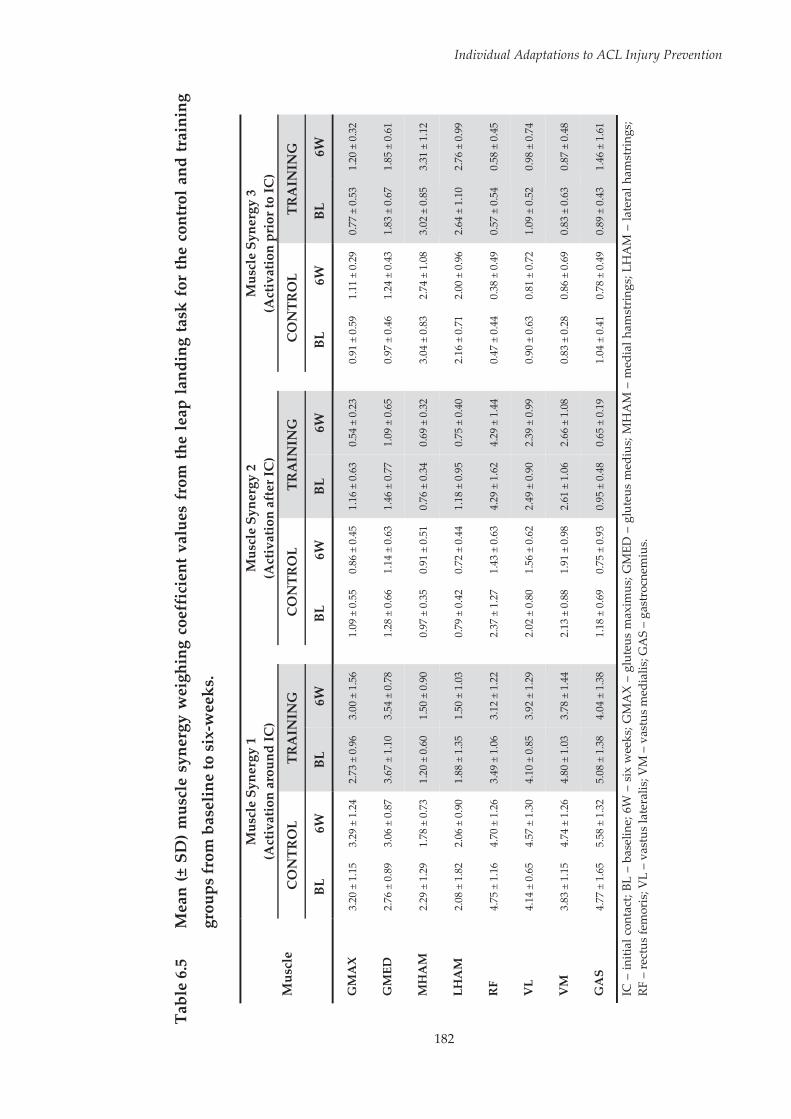
182
Individual Adaptations to ACL Injury Prevention
Tabl
e 6.
5 M
ean
(± S
D) m
uscl
e sy
nerg
y w
eigh
ing
coef
fici
ent v
alue
s fr
om t
he le
ap la
ndin
g ta
sk f
or th
e co
ntro
l and
trai
ning
grou
ps fr
om b
asel
ine
to s
ix-w
eeks
.
Mus
cle
Mus
cle
Syne
rgy
1 (A
ctiv
atio
n ar
ound
IC)
M
uscl
e Sy
nerg
y 2
(Act
ivat
ion
afte
r IC
)
Mus
cle
Syne
rgy
3 (A
ctiv
atio
n pr
ior t
o IC
)
CO
NTR
OL
TRA
ININ
G
C
ON
TRO
L TR
AIN
ING
CO
NTR
OL
TRA
ININ
G
BL
6W
BL
6W
BL
6W
BL
6W
BL
6W
BL
6W
GM
AX
3.
20 ±
1.1
5 3.
29 ±
1.2
4 2.
73 ±
0.9
6 3.
00 ±
1.5
6
1.09
± 0
.55
0.86
± 0
.45
1.16
± 0
.63
0.54
± 0
.23
0.
91 ±
0.5
9 1.
11 ±
0.2
9 0.
77 ±
0.5
3 1.
20 ±
0.3
2
GM
ED
2.76
± 0
.89
3.06
± 0
.87
3.67
± 1
.10
3.54
± 0
.78
1.
28 ±
0.6
6 1.
14 ±
0.6
3 1.
46 ±
0.7
7 1.
09 ±
0.6
5
0.97
± 0
.46
1.24
± 0
.43
1.83
± 0
.67
1.85
± 0
.61
MH
AM
2.
29 ±
1.2
9 1.
78 ±
0.7
3 1.
20 ±
0.6
0 1.
50 ±
0.9
0
0.97
± 0
.35
0.91
± 0
.51
0.76
± 0
.34
0.69
± 0
.32
3.
04 ±
0.8
3 2.
74 ±
1.0
8 3.
02 ±
0.8
5 3.
31 ±
1.1
2
LHA
M
2.08
± 1
.82
2.06
± 0
.90
1.88
± 1
.35
1.50
± 1
.03
0.
79 ±
0.4
2 0.
72 ±
0.4
4 1.
18 ±
0.9
5 0.
75 ±
0.4
0
2.16
± 0
.71
2.00
± 0
.96
2.64
± 1
.10
2.76
± 0
.99
RF
4.75
± 1
.16
4.70
± 1
.26
3.49
± 1
.06
3.12
± 1
.22
2.
37 ±
1.2
7 1.
43 ±
0.6
3 4.
29 ±
1.6
2 4.
29 ±
1.4
4
0.47
± 0
.44
0.38
± 0
.49
0.57
± 0
.54
0.58
± 0
.45
VL
4.14
± 0
.65
4.57
± 1
.30
4.10
± 0
.85
3.92
± 1
.29
2.
02 ±
0.8
0 1.
56 ±
0.6
2 2.
49 ±
0.9
0 2.
39 ±
0.9
9
0.90
± 0
.63
0.81
± 0
.72
1.09
± 0
.52
0.98
± 0
.74
VM
3.
83 ±
1.1
5 4.
74 ±
1.2
6 4.
80 ±
1.0
3 3.
78 ±
1.4
4
2.13
± 0
.88
1.91
± 0
.98
2.61
± 1
.06
2.66
± 1
.08
0.
83 ±
0.2
8 0.
86 ±
0.6
9 0.
83 ±
0.6
3 0.
87 ±
0.4
8
GA
S 4.
77 ±
1.6
5 5.
58 ±
1.3
2 5.
08 ±
1.3
8 4.
04 ±
1.3
8
1.18
± 0
.69
0.75
± 0
.93
0.95
± 0
.48
0.65
± 0
.19
1.
04 ±
0.4
1 0.
78 ±
0.4
9 0.
89 ±
0.4
3 1.
46 ±
1.6
1
IC –
initi
al c
onta
ct; B
L –
base
line;
6W
– s
ix w
eeks
; GM
AX
– gl
uteu
s m
axim
us; G
MED
– g
lute
us m
ediu
s; M
HA
M –
med
ial h
amst
ring
s; LH
AM
– la
tera
l ham
stri
ngs;
RF
– re
ctus
fem
oris
; VL
– va
stus
late
ralis
; VM
– v
astu
s m
edia
lis; G
AS
– ga
stro
cnem
ius.
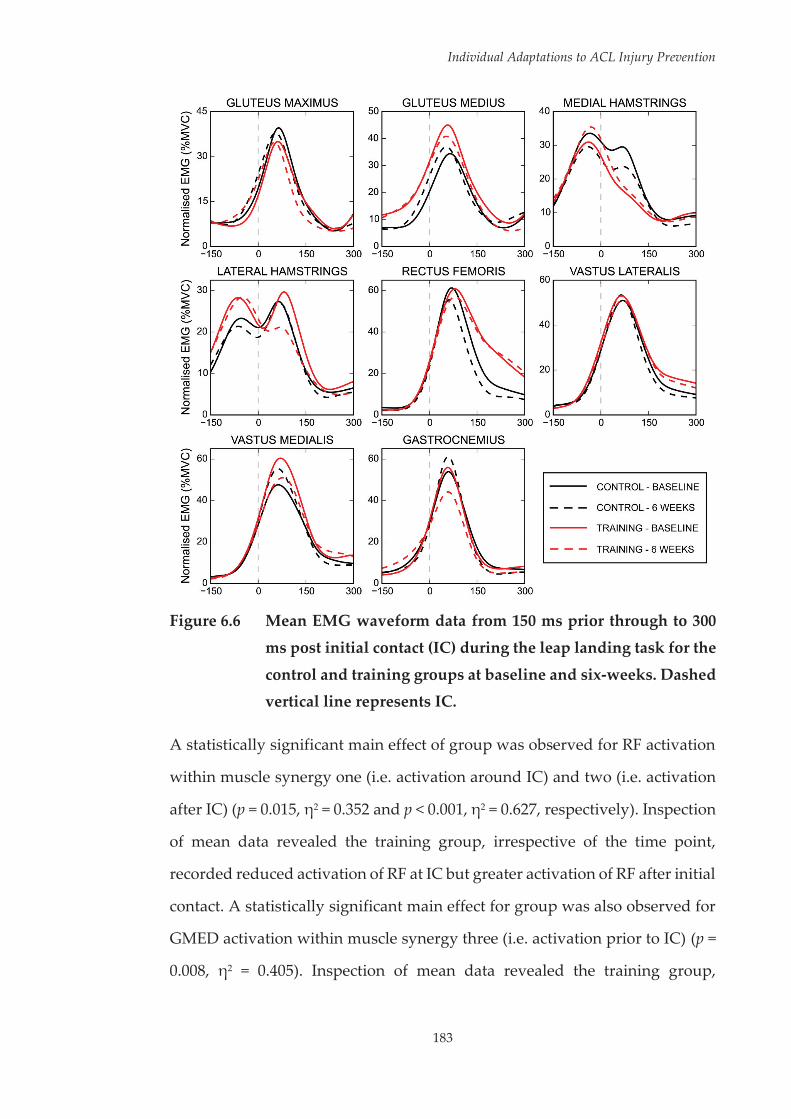
Individual Adaptations to ACL Injury Prevention
183
Figure 6.6 Mean EMG waveform data from 150 ms prior through to 300
ms post initial contact (IC) during the leap landing task for the
control and training groups at baseline and six-weeks. Dashed vertical line represents IC.
A statistically significant main effect of group was observed for RF activation
within muscle synergy one (i.e. activation around IC) and two (i.e. activation
after IC) (p = 0.015, η2 = 0.352 and p < 0.001, η2 = 0.627, respectively). Inspection
of mean data revealed the training group, irrespective of the time point,
recorded reduced activation of RF at IC but greater activation of RF after initial
contact. A statistically significant main effect for group was also observed for
GMED activation within muscle synergy three (i.e. activation prior to IC) (p =
0.008, η2 = 0.405). Inspection of mean data revealed the training group,

Individual Adaptations to ACL Injury Prevention
184
irrespective of the time point, exhibited greater GMED preparatory activation.
A statistically significant main effect of time was observed for GMAX
activation within muscle synergy two (p = 0.008, η2 = 0.408). Irrespective of the
group, GMAX activation after IC was higher at baseline compared to six-
weeks. A statistically significant group x time effect was observed for GAS
activation with muscle synergy one (p = 0.035, η2 = 0.282) and MHAM
activation within muscle synergy three (p = 0.019, η2 = 0.333). With regard to
GAS activation at IC, no difference was observed between the training and
control group at baseline (p = 0.143, d = 0.164). However, at six-weeks the
training group exhibited reduced GAS activation at IC compared to the control
group (p < 0.001, d = 0.812). This difference stemmed from a statistically
significant increase in GAS activation at IC within the control group (p < 0.001,
d = 0.426) in conjunction with a statistically significant decrease in GAS
activation at IC within the training group (p < 0.001, d = 0.549). With regard to
preparatory MHAM activation, no difference was observed between the
training and control group at baseline (p = 0.870, d = 0.024). However, at six-
weeks the training group exhibited higher preparatory MHAM activation
compared to the control group (p < 0.001, d = 0.521). This difference stemmed
from a statistically significant increase in preparatory MHAM activation
within the training group only (p < 0.001, d = 0.264). No further statistically
significant main or interaction effects were observed across muscle activation
variables.
The mean hip and knee joint rotations and moments, respectively, from IC
through to 150 ms post IC during the leap landing task for the control and
training groups across the two testing sessions are presented in Figure 6.7 (see
Page 185) and Figure 6.8 (see Page 186).
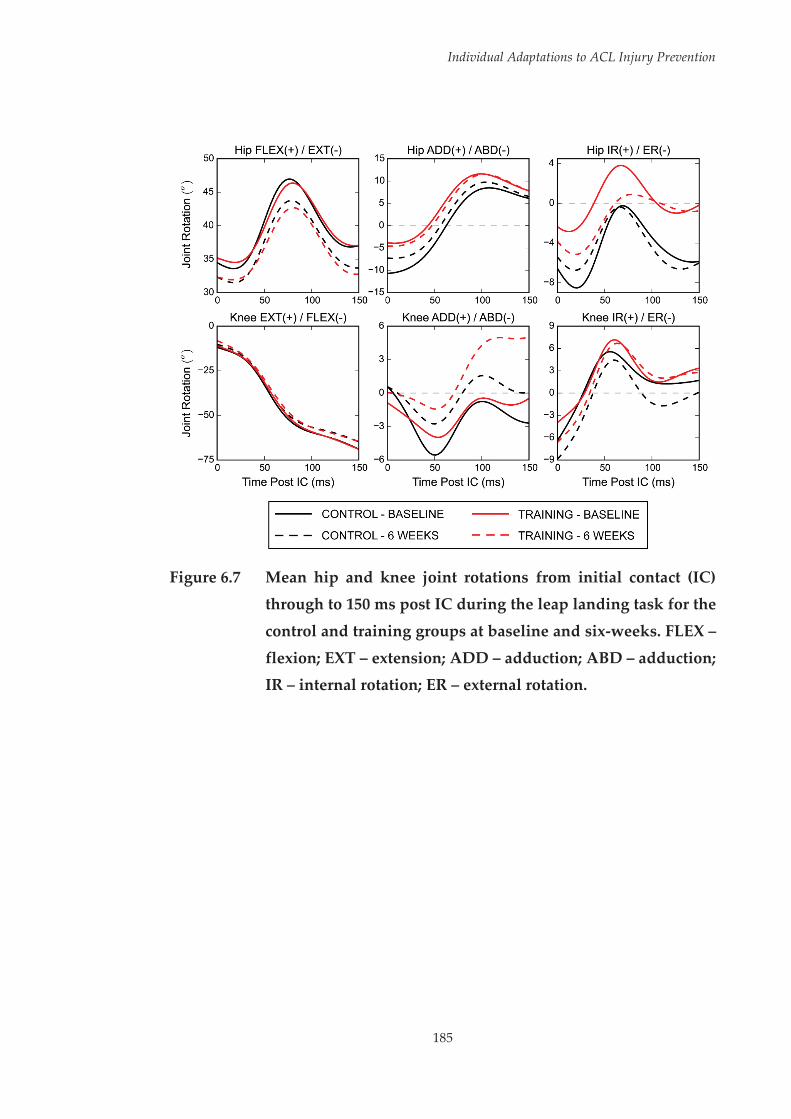
Individual Adaptations to ACL Injury Prevention
185
Figure 6.7 Mean hip and knee joint rotations from initial contact (IC)
through to 150 ms post IC during the leap landing task for the
control and training groups at baseline and six-weeks. FLEX –
flexion; EXT – extension; ADD – adduction; ABD – adduction; IR – internal rotation; ER – external rotation.
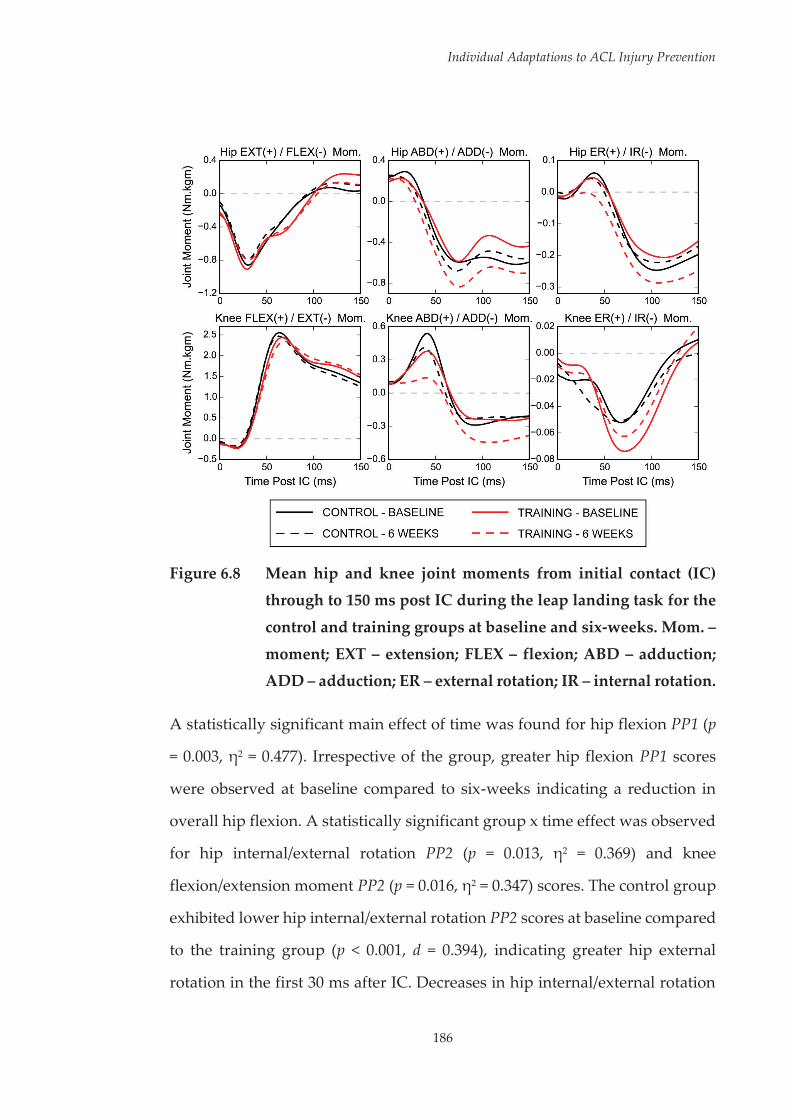
Individual Adaptations to ACL Injury Prevention
186
Figure 6.8 Mean hip and knee joint moments from initial contact (IC)
through to 150 ms post IC during the leap landing task for the
control and training groups at baseline and six-weeks. Mom. –
moment; EXT – extension; FLEX – flexion; ABD – adduction; ADD – adduction; ER – external rotation; IR – internal rotation.
A statistically significant main effect of time was found for hip flexion PP1 (p
= 0.003, η2 = 0.477). Irrespective of the group, greater hip flexion PP1 scores
were observed at baseline compared to six-weeks indicating a reduction in
overall hip flexion. A statistically significant group x time effect was observed
for hip internal/external rotation PP2 (p = 0.013, η2 = 0.369) and knee
flexion/extension moment PP2 (p = 0.016, η2 = 0.347) scores. The control group
exhibited lower hip internal/external rotation PP2 scores at baseline compared
to the training group (p < 0.001, d = 0.394), indicating greater hip external
rotation in the first 30 ms after IC. Decreases in hip internal/external rotation
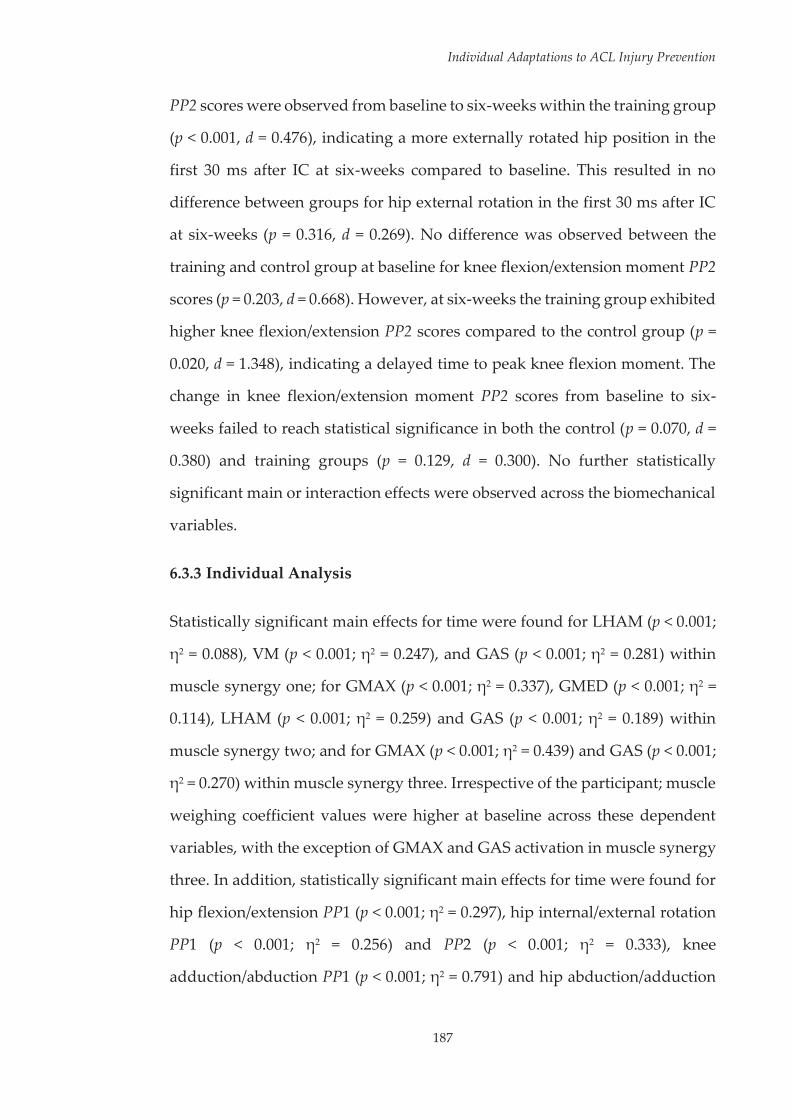
Individual Adaptations to ACL Injury Prevention
187
PP2 scores were observed from baseline to six-weeks within the training group
(p < 0.001, d = 0.476), indicating a more externally rotated hip position in the
first 30 ms after IC at six-weeks compared to baseline. This resulted in no
difference between groups for hip external rotation in the first 30 ms after IC
at six-weeks (p = 0.316, d = 0.269). No difference was observed between the
training and control group at baseline for knee flexion/extension moment PP2
scores (p = 0.203, d = 0.668). However, at six-weeks the training group exhibited
higher knee flexion/extension PP2 scores compared to the control group (p =
0.020, d = 1.348), indicating a delayed time to peak knee flexion moment. The
change in knee flexion/extension moment PP2 scores from baseline to six-
weeks failed to reach statistical significance in both the control (p = 0.070, d =
0.380) and training groups (p = 0.129, d = 0.300). No further statistically
significant main or interaction effects were observed across the biomechanical
variables.
6.3.3 Individual Analysis
Statistically significant main effects for time were found for LHAM (p < 0.001;
η2 = 0.088), VM (p < 0.001; η2 = 0.247), and GAS (p < 0.001; η2 = 0.281) within
muscle synergy one; for GMAX (p < 0.001; η2 = 0.337), GMED (p < 0.001; η2 =
0.114), LHAM (p < 0.001; η2 = 0.259) and GAS (p < 0.001; η2 = 0.189) within
muscle synergy two; and for GMAX (p < 0.001; η2 = 0.439) and GAS (p < 0.001;
η2 = 0.270) within muscle synergy three. Irrespective of the participant; muscle
weighing coefficient values were higher at baseline across these dependent
variables, with the exception of GMAX and GAS activation in muscle synergy
three. In addition, statistically significant main effects for time were found for
hip flexion/extension PP1 (p < 0.001; η2 = 0.297), hip internal/external rotation
PP1 (p < 0.001; η2 = 0.256) and PP2 (p < 0.001; η2 = 0.333), knee
adduction/abduction PP1 (p < 0.001; η2 = 0.791) and hip abduction/adduction
Individual Adaptations to ACL Injury Prevention
188
moment PP1 (p < 0.001; η2 = 0.765). Irrespective of the participant; reduced hip
flexion (hip flexion/extension PP1), reduced hip internal and external rotation
peaks (hip internal/external rotation PP1 and PP2), reduced knee abduction
but greater knee adduction (knee adduction/abduction PP1), and larger
overall hip adduction moments (hip abduction/adduction moment PP1) were
observed at six-weeks compared to baseline.
Statistically significant main effects for participant (p < 0.001; η2 = 0.394 – 0.852)
and participant x time interactions (p < 0.001; η2 = 0.190 – 0.714) were seen
across all muscle activation (i.e. muscle weighing coefficient values) and
biomechanical (i.e. PP-Scores) dependent variables. Effect sizes were
calculated for changes from baseline to six-weeks for participants in the
training group across the muscle activation (see Table 6.6, Page 189; Table 6.7,
Page 190; and Table 6.8, Page 191) and biomechanical (see Table 6.9, Page 192
and Table 6.10, Page 193) dependent variables. Larger standard deviations for
change scores were seen within the training group across the majority of
dependent variables (see Table 6.11, Page 194; Table 6.12, Page 195; and Table
6.13, Page 196). The differing effect sizes between participants across the
majority of dependent variables indicated dissimilar adaptations to the
training program with regard to the direction and magnitude of the response.
Further, the larger standard deviations for changes scores observed in the
training group compared to the control group suggests the variation in
responses were outside the limits of test-retest variation for the majority of
dependent variables.

Individual Adaptations to ACL Injury Prevention
189
Table 6.6 Effect sizes (Cohen’s d) for individual changes of participants
in the training group (n = 8; T1 – T8) from baseline to six-weeks for muscle weighing coefficient values in muscle synergy one.
Participant
Muscle Synergy 1 (Activation around IC)
GMAX GMED MHAM LHAM RF VL VM GAS
T1 2.07 -1.42 0.31 0.30 -0.59 -0.14 -0.47 0.24
T2 0.89 -0.52 -1.05 -2.60 -0.63 0.49 2.17 -1.94
T3 2.16 0.36 1.40 -1.49 -0.13 0.60 -1.49 0.01
T4 -1.21 -0.14 0.74 -1.91 -1.10 -1.61 -1.90 -1.85
T5 -0.63 0.24 0.92 0.73 1.83 -0.05 0.01 -0.56
T6 -0.70 1.07 -0.99 0.63 -0.58 0.80 -1.99 -0.56
T7 -0.97 -0.81 0.32 -0.06 -0.64 -0.07 -1.68 -1.98
T8 -0.98 0.98 0.65 0.54 -0.33 -1.31 -0.79 -1.22
IC – initial contact; GMAX – gluteus maximus; GMED – gluteus medius; MHAM – medial hamstrings; LHAM – lateral hamstrings; RF – rectus femoris; VL – vastus lateralis; VM – vastus medialis; GAS – gastrocnemius. ≤ -0.8 Large Decrease ≥ 0.8 Large Increase > -0.8 ≤ -0.5 Moderate to Large Decrease ≥ 0.5 < 0.8 Moderate to Large Increase > -0.5 ≤ -0.2 Small to Moderate Decrease ≥ 0.2 < 0.5 Small to Moderate Increase

Individual Adaptations to ACL Injury Prevention
190
Table 6.7 Effect sizes (Cohen’s d) for individual changes of participants
in the training group (n = 8; T1 – T8) from baseline to six-weeks
for muscle weighing coefficient values in muscle synergy two.
Participant
Muscle Synergy 2 (Activation after IC)
GMAX GMED MHAM LHAM RF VL VM GAS
T1 -1.65 -0.74 -0.75 1.07 -0.83 0.13 -0.09 1.27
T2 -1.59 -2.76 0.09 -3.38 -1.34 -2.03 -2.00 -0.31
T3 -0.43 -0.74 0.60 -1.02 -0.89 -0.26 -0.06 -1.73
T4 -1.15 -0.04 0.06 -0.63 2.56 1.32 3.72 -1.56
T5 -0.51 1.03 -0.22 -0.67 -1.93 -1.71 -1.07 -1.70
T6 -1.65 -0.80 0.35 -0.34 1.08 -1.26 -2.02 -0.54
T7 -0.67 -1.47 -1.04 0.39 -1.61 1.80 1.60 -0.98
T8 -0.94 1.08 -0.60 0.12 2.96 -0.14 1.18 1.04
IC – initial contact; GMAX – gluteus maximus; GMED – gluteus medius; MHAM – medial hamstrings; LHAM – lateral hamstrings; RF – rectus femoris; VL – vastus lateralis; VM – vastus medialis; GAS – gastrocnemius. ≤ -0.8 Large Decrease ≥ 0.8 Large Increase > -0.8 ≤ -0.5 Moderate to Large Decrease ≥ 0.5 < 0.8 Moderate to Large Increase > -0.5 ≤ -0.2 Small to Moderate Decrease ≥ 0.2 < 0.5 Small to Moderate Increase

Individual Adaptations to ACL Injury Prevention
191
Table 6.8 Effect sizes (Cohen’s d) for individual changes of participants
in the training group (n = 8; T1 – T8) from baseline to six-weeks
for muscle weighing coefficient values in muscle synergy three.
Participant
Muscle Synergy 3 (Activation prior to IC)
GMAX GMED MHAM LHAM RF VL VM GAS
T1 -0.12 -1.37 0.07 1.05 -0.87 -0.34 -3.14 -1.93
T2 -0.19 0.06 -0.39 -1.11 1.96 -1.39 -1.37 2.51
T3 3.22 1.16 0.07 0.02 -0.39 0.02 -0.67 -2.14
T4 2.99 1.81 -0.12 0.19 1.42 -1.47 2.93 4.56
T5 2.93 0.40 0.76 0.48 -0.35 -3.25 5.41 -1.31
T6 4.27 -1.37 1.11 -0.69 -0.18 1.27 1.93 -0.75
T7 0.60 0.29 1.90 2.02 -0.20 4.34 1.11 0.52
T8 -1.36 -0.32 -0.06 0.35 0.23 -2.38 -1.18 1.01
IC – initial contact; GMAX – gluteus maximus; GMED – gluteus medius; MHAM – medial hamstrings; LHAM – lateral hamstrings; RF – rectus femoris; VL – vastus lateralis; VM – vastus medialis; GAS – gastrocnemius. ≤ -0.8 Large Decrease ≥ 0.8 Large Increase > -0.8 ≤ -0.5 Moderate to Large Decrease ≥ 0.5 < 0.8 Moderate to Large Increase > -0.5 ≤ -0.2 Small to Moderate Decrease ≥ 0.2 < 0.5 Small to Moderate Increase
192
Individual Adaptations to ACL Injury Prevention
Tabl
e 6.
9 Ef
fect
siz
es (C
ohen
’s d
) for
indi
vidu
al c
hang
es o
f par
ticip
ants
in th
e tr
aini
ng g
roup
(n =
8; T
1 –
T8) f
rom
bas
elin
e to
six-
wee
ks fo
r hip
and
kne
e jo
int r
otat
ion
prin
cipa
l pat
tern
(PP)
sco
res.
Part
icip
ant
HFL
EX/E
XT
H
AD
D/A
BD
H
IR/E
R
K
EXT/
FLEX
KA
DD
/ABD
KIR
/ER
PP1
PP2
PP
1 PP
2
PP1
PP2
PP3
PP
1 PP
2
PP1
PP2
PP
1 PP
2 PP
3
T1
-0.5
9 0.
03
-0
.34
-1.1
1
-1.7
3 -0
.26
-0.0
4
0.99
1.
04
2.
40
0.79
0.53
-1
.76
0.17
T2
-2.2
8 0.
90
-1
.37
0.43
-1.0
3 0.
04
-2.8
7
1.16
3.
34
3.
99
-3.9
1
-0.2
0 0.
05
0.58
T3
-0.2
5 -0
.26
-0
.58
-0.3
6
-0.8
1 -1
.65
-0.4
3
1.94
-1
.64
3.
87
-1.1
7
-0.3
0 1.
40
0.21
T4
-1.3
3 -1
.72
1.
21
-1.7
7
-0.6
7 -2
.78
-1.8
8
0.62
-1
.66
2.
12
0.63
1.12
-1
.53
0.28
T5
-0.5
8 1.
79
-0
.62
0.12
-3.0
0 -0
.28
-1.3
3
0.08
0.
86
-0
.18
-2.0
6
-1.9
4 0.
25
-1.9
2
T6
-2.0
3 0.
22
-0
.67
0.74
0.26
-0
.06
0.01
1.27
-0
.85
5.
75
1.10
-1.1
0 -1
.94
-1.3
4
T7
0.17
0.
42
0.
20
0.14
-0.5
0 0.
47
-0.0
4
0.73
-0
.03
0.
30
0.71
-1.0
0 -0
.55
0.59
T8
0.16
-1
.09
0.
72
-0.6
4
3.02
-2
.04
-1.3
2
0.19
-1
.21
4.
75
-2.2
7
0.04
0.
58
2.64
HFL
EX/E
XT
– hi
p fle
xion
/ext
ensi
on; H
AD
D/A
BD –
hip
add
uctio
n/ab
duct
ion;
HIR
/ER –
hip
int
erna
l/ext
erna
l ro
tatio
n; K
EXT/
FLEX
– k
nee
flexi
on/e
xten
sion
; KA
DD
/ABD
– k
nee
addu
ctio
n/ab
duct
ion;
KIR
/ER –
kne
e in
tern
al/e
xter
nal r
otat
ion;
PP
– pr
inci
pal p
atte
rn.
≤
-0.8
La
rge
Dec
reas
e
≥
0.8
Larg
e In
crea
se
> -0
.8 ≤
-0.5
M
oder
ate
to L
arge
Dec
reas
e
≥
0.5
< 0.
8 M
oder
ate
to L
arge
Incr
ease
>
-0.5
≤ -0
.2
Smal
l to
Mod
erat
e D
ecre
ase
≥ 0.
2 <
0.5
Smal
l to
Mod
erat
e In
crea
se

193
Individual Adaptations to ACL Injury Prevention
Tabl
e 6.
10
Effe
ct s
izes
(Coh
en’s
d) f
or in
divi
dual
cha
nges
of p
artic
ipan
ts in
the
trai
ning
gro
up (n
= 8
; T1
– T8
) fro
m b
asel
ine
to
six-
wee
ks fo
r hip
and
kne
e jo
int m
omen
t pri
ncip
al p
atte
rn (P
P) s
core
s.
Part
icip
ant
HEX
T/FL
EX M
om.
H
ABD
/AD
D M
om.
H
ER/I
R M
om.
K
FLEX
/EX
T Mom
.
KA
BD/A
DD M
om.
K
ER/I
R M
om.
PP1
P
P2
PP3
P
P4
P
P1
PP2
P
P3
P
P1
PP2
PP1
P
P2
PP3
PP1
P
P2
PP3
PP1
P
P2
T1
-0.7
9 0.
51
-0.9
7 0.
52
-0
.87
1.16
1.
34
1.
06
-0.6
1
-0.6
7 0.
01
0.82
-1.4
2 1.
27
-0.5
7
-0.2
2 -0
.30
T2
2.75
1.
25
-0.5
3 1.
34
-3
.03
1.21
3.
27
2.
23
3.64
2.66
-0
.29
2.48
-1.1
1 -1
.96
-1.6
0
0.47
0.
33
T3
-1.6
6 0.
71
-0.0
9 0.
26
-6
.78
-0.5
7 -0
.13
5.
35
1.18
0.06
-0
.27
-0.9
0
-6.8
5 -0
.16
-2.2
3
-1.9
9 -0
.06
T4
-0.1
7 2.
73
-2.4
2 1.
76
-6
.95
0.96
-4
.27
3.
30
1.16
-1.1
9 -1
.92
3.28
-5.9
8 -2
.16
-3.9
8
-1.4
8 1.
36
T5
-0.3
7 -0
.29
0.33
-0
.42
-0
.63
1.71
-1
.95
1.
93
-2.0
6
-0.2
7 -1
.07
0.37
-1.0
1 2.
14
-1.8
8
0.72
-0
.89
T6
0.69
-1
.19
1.35
1.
55
0.
69
0.24
-0
.30
-3
.02
-0.0
9
-2.6
3 0.
71
0.23
-2.0
2 -0
.06
1.47
-0.1
9 2.
12
T7
-0.0
9 -0
.08
-0.5
4 0.
32
-0
.67
0.23
-0
.40
0.
84
-0.1
0
-0.2
1 -0
.83
0.51
-0.5
1 -0
.38
-0.4
1
0.24
-0
.94
T8
-0.8
3 0.
80
-0.3
9 0.
42
-0
.84
-0.1
0 -0
.12
0.
93
0.57
1.25
-0
.64
0.61
-1.9
6 0.
03
-2.0
8
0.65
-1
.44
HEX
T/FL
EX M
om.
– hi
p ex
tens
ion/
flexi
on m
omen
t; H
ABD
/AD
D M
om.
– hi
p ab
duct
ion/
addu
ctio
n m
omen
t; H
ER/IR
Mom
. –
hip
exte
rnal
/inte
rnal
rot
atio
n m
omen
t; K
FLEX
/EX
T M
om. –
kne
e ex
tens
ion/
flexi
on m
omen
t; K
ABD
/AD
D M
om. –
kne
e ab
duct
ion/
addu
ctio
n m
omen
t; K
ER/IR
Mom
. – k
nee
exte
rnal
/inte
rnal
rot
atio
n m
omen
t; PP
– p
rinc
ipal
pat
tern
.
≤
-0.8
La
rge
Dec
reas
e
≥
0.8
Larg
e In
crea
se
> -0
.8 ≤
-0.5
M
oder
ate
to L
arge
Dec
reas
e
≥
0.5
< 0.
8 M
oder
ate
to L
arge
Incr
ease
>
-0.5
≤ -0
.2
Smal
l to
Mod
erat
e D
ecre
ase
≥ 0.
2 <
0.5
Smal
l to
Mod
erat
e In
crea
se
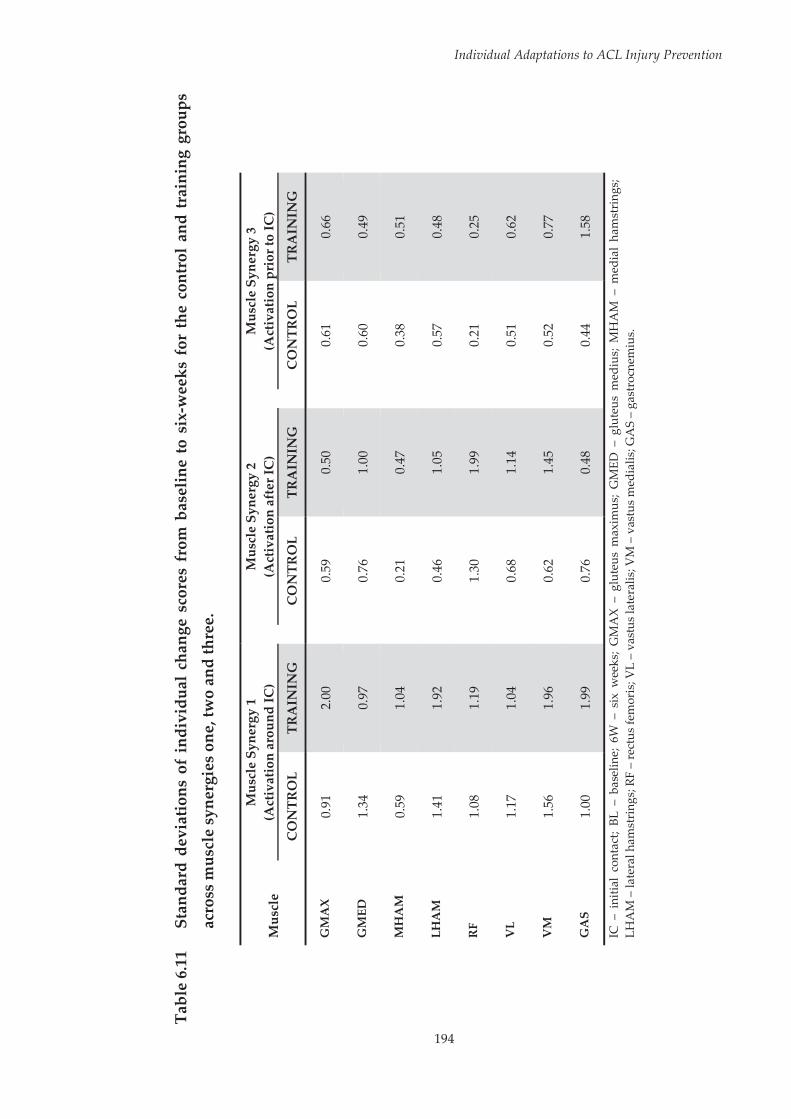
194
Individual Adaptations to ACL Injury Prevention
Tabl
e 6.
11
Stan
dard
dev
iatio
ns o
f in
divi
dual
cha
nge
scor
es f
rom
bas
elin
e to
six
-wee
ks f
or t
he c
ontr
ol a
nd t
rain
ing
grou
ps
acro
ss m
uscl
e sy
nerg
ies
one,
two
and
thre
e.
Mus
cle
Mus
cle
Syne
rgy
1 (A
ctiv
atio
n ar
ound
IC)
M
uscl
e Sy
nerg
y 2
(Act
ivat
ion
afte
r IC
)
Mus
cle
Syne
rgy
3 (A
ctiv
atio
n pr
ior t
o IC
)
CO
NTR
OL
TRA
ININ
G
C
ON
TRO
L TR
AIN
ING
CO
NTR
OL
TRA
ININ
G
GM
AX
0.
91
2.00
0.59
0.
50
0.
61
0.66
GM
ED
1.34
0.
97
0.
76
1.00
0.60
0.
49
MH
AM
0.
59
1.04
0.21
0.
47
0.
38
0.51
LHA
M
1.41
1.
92
0.
46
1.05
0.57
0.
48
RF
1.08
1.
19
1.
30
1.99
0.21
0.
25
VL
1.17
1.
04
0.
68
1.14
0.51
0.
62
VM
1.
56
1.96
0.62
1.
45
0.
52
0.77
GA
S 1.
00
1.99
0.76
0.
48
0.
44
1.58
IC –
ini
tial
cont
act;
BL –
bas
elin
e; 6
W –
six
wee
ks;
GM
AX
– gl
uteu
s m
axim
us;
GM
ED –
glu
teus
med
ius;
MH
AM
– m
edia
l ha
mst
ring
s; LH
AM
– la
tera
l ham
stri
ngs;
RF
– re
ctus
fem
oris
; VL
– va
stus
late
ralis
; VM
– v
astu
s m
edia
lis; G
AS
– ga
stro
cnem
ius.

Individual Adaptations to ACL Injury Prevention
195
Table 6.12 Standard deviations of individual change scores from baseline to six-weeks for the control and training groups for joint
rotation principal pattern scores.
Joint Rotation PP CONTROL TRAINING
HFLEX/EXT PP1 17.61 28.95
PP2 9.06 11.08
HADD/ABD PP1 18.66 19.19
PP2 6.74 14.62
HIR/ER PP1 23.42 36.41
PP2 7.48 15.62
KEXT/FLEX PP1 11.92 8.66
PP2 11.67 19.46
KADD/ABD PP1 8.79 18.19
PP2 21.86 43.68
KIR/ER
PP1 5.65 8.71
PP2 13.51 20.15
PP3 10.48 15.78 HFLEX/EXT – hip flexion/extension; HADD/ABD – hip adduction/abduction; HIR/ER – hip internal/external rotation; KEXT/FLEX – knee flexion/extension; KADD/ABD – knee adduction/abduction; KIR/ER – knee internal/external rotation; PP – principal pattern.
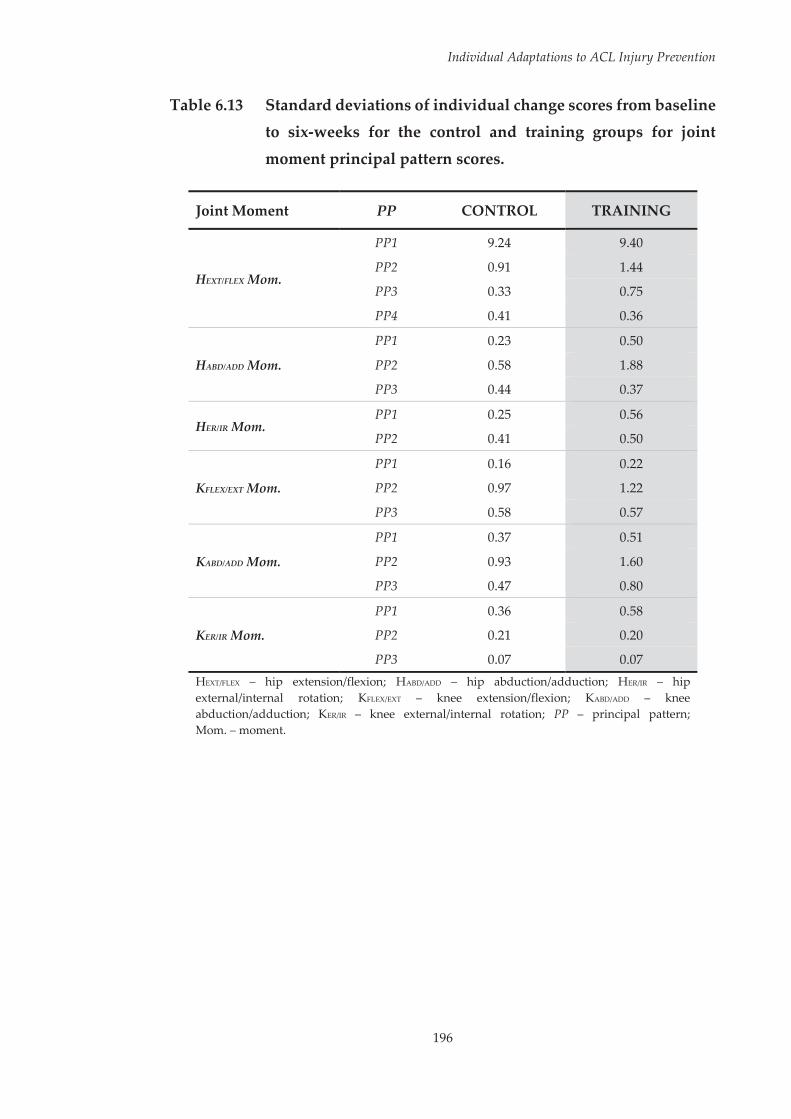
Individual Adaptations to ACL Injury Prevention
196
Table 6.13 Standard deviations of individual change scores from baseline to six-weeks for the control and training groups for joint
moment principal pattern scores.
Joint Moment PP CONTROL TRAINING
HEXT/FLEX Mom.
PP1 9.24 9.40
PP2 0.91 1.44
PP3 0.33 0.75
PP4 0.41 0.36
HABD/ADD Mom.
PP1 0.23 0.50
PP2 0.58 1.88
PP3 0.44 0.37
HER/IR Mom. PP1 0.25 0.56
PP2 0.41 0.50
KFLEX/EXT Mom.
PP1 0.16 0.22
PP2 0.97 1.22
PP3 0.58 0.57
KABD/ADD Mom.
PP1 0.37 0.51
PP2 0.93 1.60
PP3 0.47 0.80
KER/IR Mom.
PP1 0.36 0.58
PP2 0.21 0.20
PP3 0.07 0.07 HEXT/FLEX – hip extension/flexion; HABD/ADD – hip abduction/adduction; HER/IR – hip external/internal rotation; KFLEX/EXT – knee extension/flexion; KABD/ADD – knee abduction/adduction; KER/IR – knee external/internal rotation; PP – principal pattern; Mom. – moment.
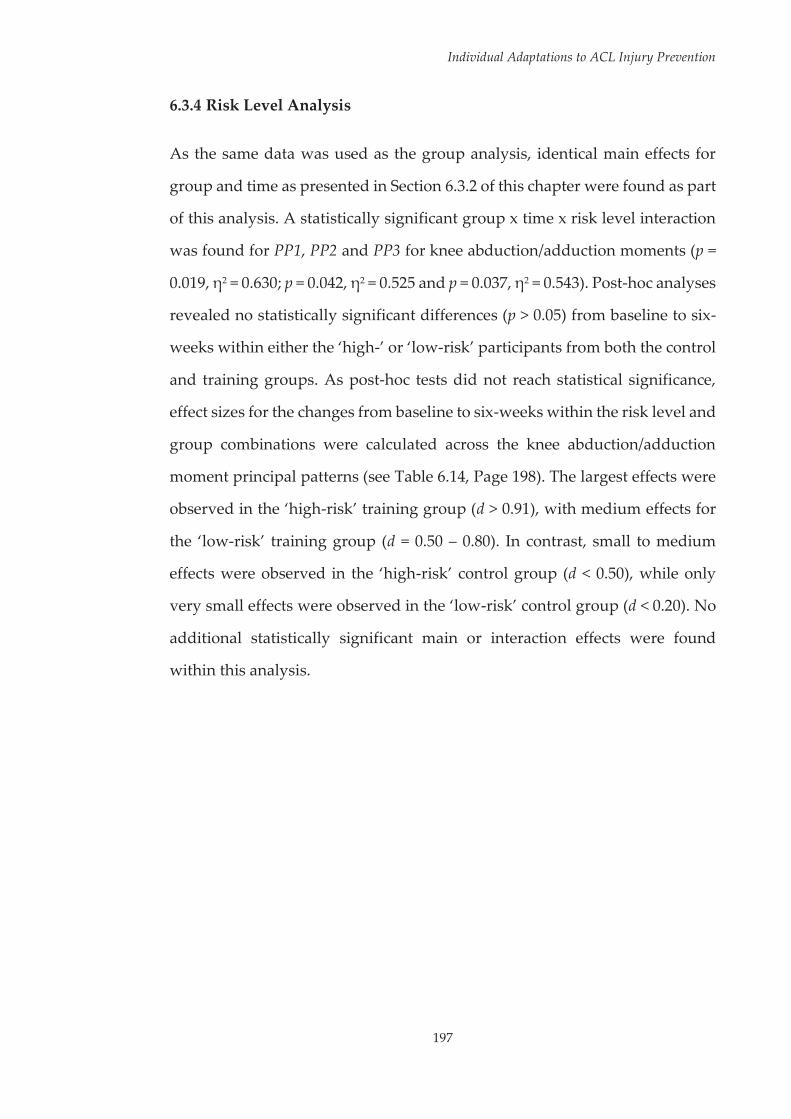
Individual Adaptations to ACL Injury Prevention
197
6.3.4 Risk Level Analysis
As the same data was used as the group analysis, identical main effects for
group and time as presented in Section 6.3.2 of this chapter were found as part
of this analysis. A statistically significant group x time x risk level interaction
was found for PP1, PP2 and PP3 for knee abduction/adduction moments (p =
0.019, η2 = 0.630; p = 0.042, η2 = 0.525 and p = 0.037, η2 = 0.543). Post-hoc analyses
revealed no statistically significant differences (p > 0.05) from baseline to six-
weeks within either the ‘high-’ or ‘low-risk’ participants from both the control
and training groups. As post-hoc tests did not reach statistical significance,
effect sizes for the changes from baseline to six-weeks within the risk level and
group combinations were calculated across the knee abduction/adduction
moment principal patterns (see Table 6.14, Page 198). The largest effects were
observed in the ‘high-risk’ training group (d > 0.91), with medium effects for
the ‘low-risk’ training group (d = 0.50 – 0.80). In contrast, small to medium
effects were observed in the ‘high-risk’ control group (d < 0.50), while only
very small effects were observed in the ‘low-risk’ control group (d < 0.20). No
additional statistically significant main or interaction effects were found
within this analysis.
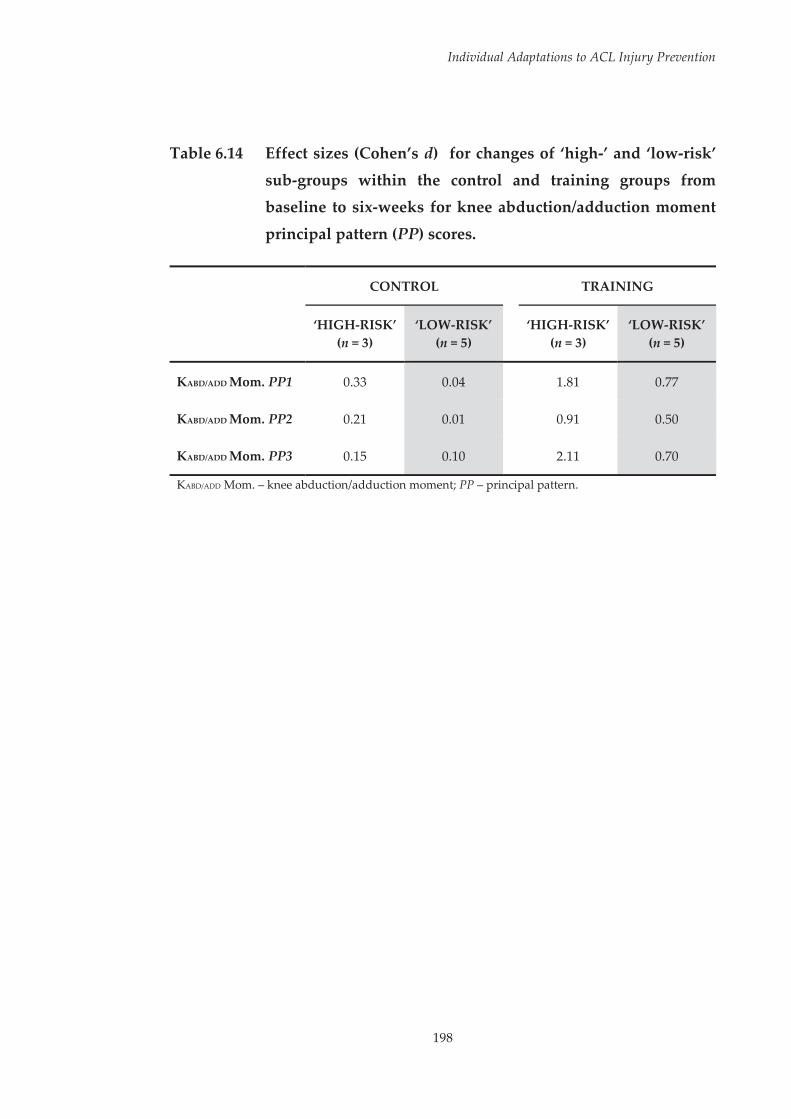
Individual Adaptations to ACL Injury Prevention
198
Table 6.14 Effect sizes (Cohen’s d) for changes of ‘high-’ and ‘low-risk’
sub-groups within the control and training groups from baseline to six-weeks for knee abduction/adduction moment
principal pattern (PP) scores.
CONTROL TRAINING
‘HIGH-RISK’ (n = 3)
‘LOW-RISK’ (n = 5)
‘HIGH-RISK’ (n = 3)
‘LOW-RISK’ (n = 5)
KABD/ADD Mom. PP1 0.33 0.04 1.81 0.77
KABD/ADD Mom. PP2 0.21 0.01 0.91 0.50
KABD/ADD Mom. PP3 0.15 0.10 2.11 0.70
KABD/ADD Mom. – knee abduction/adduction moment; PP – principal pattern.
Individual Adaptations to ACL Injury Prevention
199
6.4 Discussion
Numerous studies have highlighted the ability of ACL injury prevention
programs in altering neuromuscular and biomechanical factors associated
with ACL injury risk.[34-45, 68, 69, 71-75, 79, 166, 201, 213-217] Throughout these studies, there
has been limited examination[71, 82, 83] of individual responses to ACL injury
prevention programs. The purpose of this study was to examine the effects of
an ACL injury prevention program on neuromuscular control and lower limb
biomechanics during a high-risk landing task at the group and individual
level. Overall effects of the injury prevention program were found at the group
level for neuromuscular and biomechanical variables. However, further
examination revealed dissimilar responses to the training program across
individuals.
An overall effect of the injury prevention program at the group level was
observed for a number of neuromuscular and biomechanical variables. The
training group was found to have decreased their gastrocnemius activation
around initial contact, while the control group increased activation of the
gastrocnemius around initial contact following the six-week period. Fleming
et al.[389] found co-contraction of the gastrocnemius with the quadriceps
elevated ACL strain at low knee flexion angles. However, this was identified
under static loading conditions at fixed knee angles. Recent work focusing on
a dynamic landing task suggests that the gastrocnemius may in fact work with
the quadriceps to elevate joint compression and protect the ACL from external
loading.[185] The reduction in gastrocnemius activation at landing seen within
the training group may therefore represent a shift to a more high-risk
neuromuscular strategy, representing a potential negative effect of the injury
prevention program. It is unclear why an increase in gastrocnemius activation

Individual Adaptations to ACL Injury Prevention
200
was observed in the control group following the six-week period. This study
was undertaken during participant’s competitive netball season, hence players
in the control group continued their regular in-season training practices.
Donnelly et al.[269] found in-season Australian Rules football training produced
changes in muscle activation during a side-step cutting task. These findings
suggest standard in-season training alone is capable of altering muscle
activation characteristics during high-risk sporting tasks, and could be why
these changes in muscle activation were seen within the control group in this
study.
The remaining changes seen from baseline to six-weeks within the training
group appeared favourable in reducing potential ACL injury risk. An increase
in preparatory activation of the medial hamstrings was observed in the
training group compared to controls following the six-week period.
Appropriate preparatory muscle activation is thought to prevent joint collapse
immediately after initial landing contact, thereby protecting the joint during
deceleration.[187] This appears especially pertinent to the hamstrings, as
inadequate preparatory activation may result in lower hamstrings contraction
forces during the initial portion of ground contact and subsequently reduce
knee stability.[120] Reduced preparatory activity of the medial hamstrings has
also been identified as an important factor in elevating ACL injury risk.[177] The
increase in preparatory activation of the medial hamstrings stemming from
the injury prevention program may therefore be useful in reducing ACL injury
risk during landing. The training group was found to exhibit greater external
rotation at the hip during the early stages of landing following the six-week
period. Excessive internal rotation at the hip when the foot is fixed to the floor
can contribute to a position of ‘dynamic valgus’,[162] and greater hip internal
rotation has been linked to larger peak knee abduction moments during

Individual Adaptations to ACL Injury Prevention
201
landing.[149] A more externally rotated hip position may therefore serve to
protect the knee and ACL by avoiding lower limb postures consistent with
increased ACL loading and injury risk.
Examination of the participants within the training group revealed large
variation in the individual responses to the injury prevention program.
Statistically significant participant by time interactions within the training
group were found across all of the neuromuscular and biomechanical
dependent variables examined. These findings and the effect sizes calculated
for the changes in individual participant data from baseline to six-weeks
highlight the largely variable neuromuscular and biomechanical responses
observed. There did not appear to be a consistent trend with regard to the
individual responses across the neuromuscular and biomechanical variables
examined. Differential effects were observed across the majority of the
dependent variables examined. Where these differential effects were
observed, there did not appear to be a consistent trend across participants. It
could be expected that participants reporting higher attendance to the training
program would consistently receive the largest responses to the training
program, while those reporting a lesser attendance may exhibit opposing
responses. However, this did not appear to be the case. Although certain
participants reported a higher attendance, there did not appear to be a
consistent effect stemming from this. Using a simple measure of attendance to
gauge the degree of participation in the training program may have limited
this interpretation. Recent work has shown that while athletes may attend
injury prevention program sessions, they do not always perform exercises
appropriately to gain a protective benefit.[225] Although this study involved one
session per week led by a researcher, there was minimal control as to how
participants performed the exercises at home. Examining individual responses
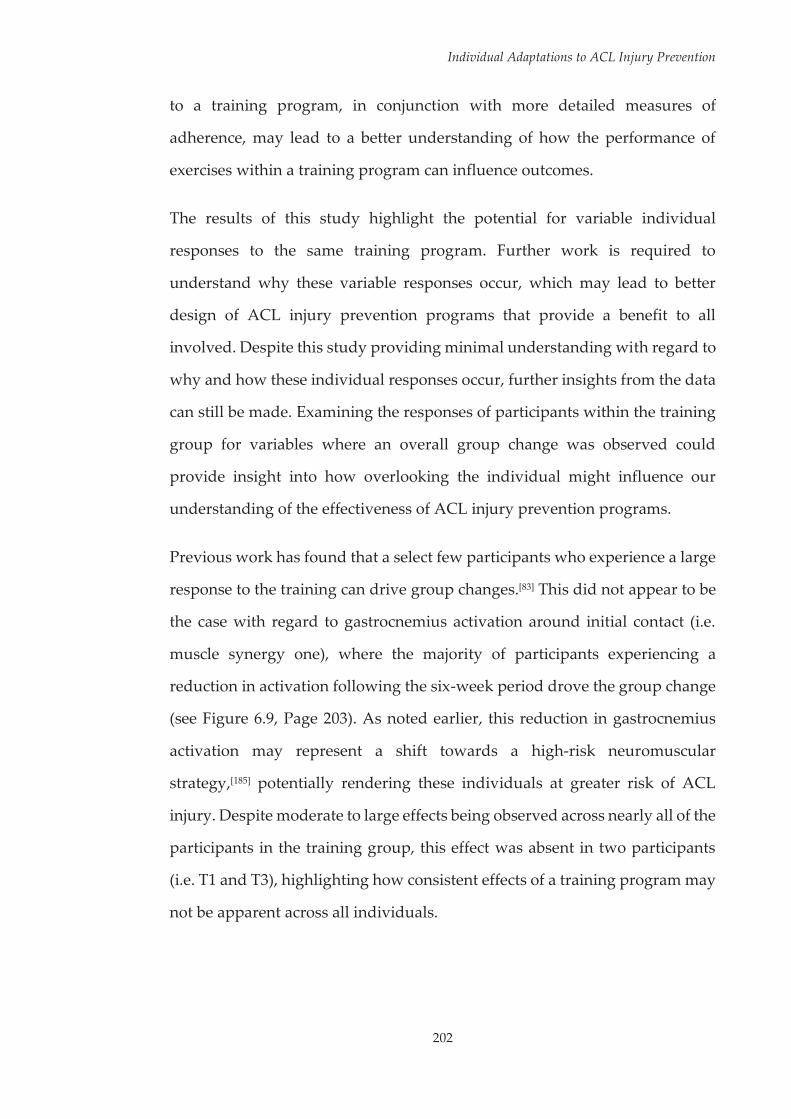
Individual Adaptations to ACL Injury Prevention
202
to a training program, in conjunction with more detailed measures of
adherence, may lead to a better understanding of how the performance of
exercises within a training program can influence outcomes.
The results of this study highlight the potential for variable individual
responses to the same training program. Further work is required to
understand why these variable responses occur, which may lead to better
design of ACL injury prevention programs that provide a benefit to all
involved. Despite this study providing minimal understanding with regard to
why and how these individual responses occur, further insights from the data
can still be made. Examining the responses of participants within the training
group for variables where an overall group change was observed could
provide insight into how overlooking the individual might influence our
understanding of the effectiveness of ACL injury prevention programs.
Previous work has found that a select few participants who experience a large
response to the training can drive group changes.[83] This did not appear to be
the case with regard to gastrocnemius activation around initial contact (i.e.
muscle synergy one), where the majority of participants experiencing a
reduction in activation following the six-week period drove the group change
(see Figure 6.9, Page 203). As noted earlier, this reduction in gastrocnemius
activation may represent a shift towards a high-risk neuromuscular
strategy,[185] potentially rendering these individuals at greater risk of ACL
injury. Despite moderate to large effects being observed across nearly all of the
participants in the training group, this effect was absent in two participants
(i.e. T1 and T3), highlighting how consistent effects of a training program may
not be apparent across all individuals.
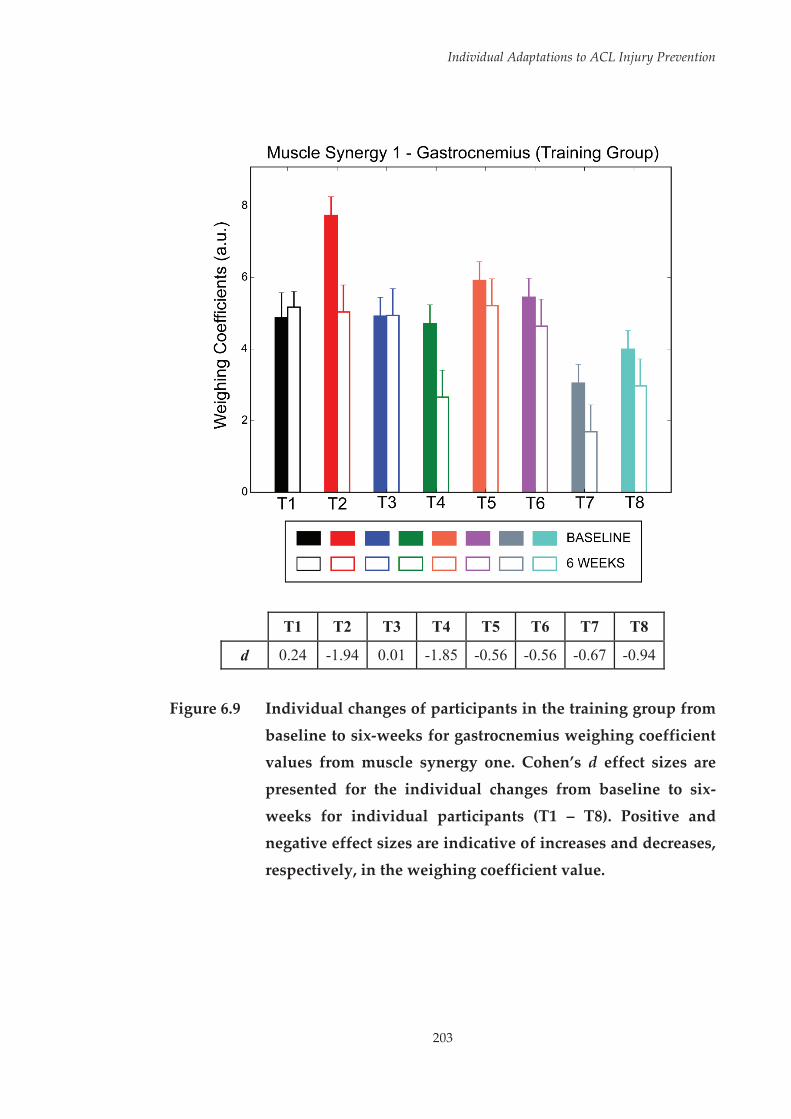
Individual Adaptations to ACL Injury Prevention
203
T1 T2 T3 T4 T5 T6 T7 T8
d 0.24 -1.94 0.01 -1.85 -0.56 -0.56 -0.67 -0.94
Figure 6.9 Individual changes of participants in the training group from
baseline to six-weeks for gastrocnemius weighing coefficient values from muscle synergy one. Cohen’s d effect sizes are
presented for the individual changes from baseline to six-
weeks for individual participants (T1 – T8). Positive and negative effect sizes are indicative of increases and decreases,
respectively, in the weighing coefficient value.

Individual Adaptations to ACL Injury Prevention
204
In contrast, inspection of the individual responses for medial hamstrings
preparatory activation (see Figure 6.10, Page 205) suggested that the group
improvement was mainly driven by three of the eight participants (i.e. T5, T6
and T7). These three participants demonstrated large increases in medial
hamstrings preparatory activation relative to the remainder of the group.
Interestingly, two of the three participants that received a large effect for
improvements in preparatory medial hamstrings activation (i.e. T5 and T6)
had the highest values for this variable at baseline. In contrast, the two
participants who recorded the lowest medial hamstrings preparatory
activation at baseline (i.e. T1 and T4) received minimal to no effect in this area
from the training. This is potentially problematic, as low preparatory
activation of the medial hamstrings may represent a high-risk neuromuscular
strategy.[120, 177] Although the group results suggested the program had a
beneficial effect on preparatory medial hamstrings activation, it appears this
effect was limited or diminished in those participants that may have required
it the most.
Individual Adaptations to ACL Injury Prevention
205
T1 T2 T3 T4 T5 T6 T7 T8
d 0.07 -0.33 0.06 -0.12 0.95 1.41 1.97 -0.06
Figure 6.10 Individual changes of participants in the training group from baseline to six-weeks for medial hamstrings weighing
coefficient values from muscle synergy three. Cohen’s d effect
sizes are presented for the individual changes from baseline to six-weeks for individual participants (T1 – T8). Positive and
negative effect sizes are indicative of increases and decreases,
respectively, in the weighing coefficient value.

Individual Adaptations to ACL Injury Prevention
206
A similar pattern was observed when examining individual responses for hip
internal/external rotation PP2, whereby the group reduction also appeared to
be driven by three participants (i.e. T3, T4 and T8) (see Figure 6.11, Page 207).
In this scenario, however, two of the three participants (T4 and T8) who
experienced large effects exhibited the highest PP-Scores at baseline. Higher
scores for this biomechanical pattern represented larger hip internal rotation,
which could be considered a high-risk biomechanical strategy in the early
deceleration phase of landing.[162] Therefore, experiencing a large reduction
could be considered beneficial, as it represents a shift to a more externally
rotated hip position during this phase of landing. In contrast, the third
participant to receive a large effect for this variable (T3) exhibited the lowest
scores across all participants at baseline, suggesting they already
demonstrated a large degree of hip external rotation prior to the training. The
remaining participants only exhibited small to no response for this variable,
with one participant (T7) demonstrating a moderate increase following the six-
week period. Despite demonstrating a similar, potentially high-risk score to
the participants who received the largest beneficial effects from the training,
the opposite effect was observed for this individual. The increase in score
indicates an increase in hip internal rotation during the early deceleration
phase of landing following training, which could potentially increase the risk
of ACL injury by contributing to a ‘dynamic valgus’ position or large knee
abduction moments.[149, 162]

Individual Adaptations to ACL Injury Prevention
207
T1 T2 T3 T4 T5 T6 T7 T8
d -0.26 0.04 -1.65 -2.78 -0.28 -0.06 0.47 -2.04
Figure 6.11 Individual changes of participants in the training group from
baseline to six-weeks for hip internal (IR) / external (ER)
rotation principal pattern (PP) two PP-Scores. Cohen’s d effect sizes are presented for the individual changes from baseline to
six-weeks for individual participants (T1 – T8). Positive and
negative effect sizes are indicative of increases and decreases, respectively, in the PP-Score.
Individual Adaptations to ACL Injury Prevention
208
It has been proposed that individuals who demonstrate a pre-existing high-
risk pattern at baseline receive the greatest improvements in these areas
following training.[71, 83, 84] This appeared to be the case in this study, as ‘high-
risk’ individuals (as deemed by higher peak knee abduction moments during
the landing task) were found to respond more favourably to the injury
prevention program as demonstrated by reductions in frontal plane knee
moments. Knee abduction/adduction moment patterns were the only
variables where a statistically significant group by time by risk level
interaction was identified. While this was the case, post-hoc analyses revealed
no statistically significant differences from baseline to six-weeks across any of
the groupings. These non-significant results were to be expected due to the
limited sample sizes within each of the group and risk level combinations.
Examination of effect sizes from baseline to six-weeks across the three knee
abduction/adduction moment patterns revealed the largest effects were seen
for participants deemed as ‘high-risk’ within the training group, followed by
the ‘low-risk’ participants from the training group, with small effects seen for
either risk levels within the control group. The changes in knee
abduction/adduction moment patterns seen within the training group were
largely favourable, particularly for ‘high-risk’ individuals (see Figure 6.12,
Page 209). At six-weeks, ‘high-risk’ individuals within the training group were
able to reduce the knee abduction moments experienced during landing to the
same levels ‘low-risk’ individuals exhibited at baseline. ‘Low-risk’ individuals
within the training group also saw a reduction in knee abduction moments
during landing, albeit smaller.
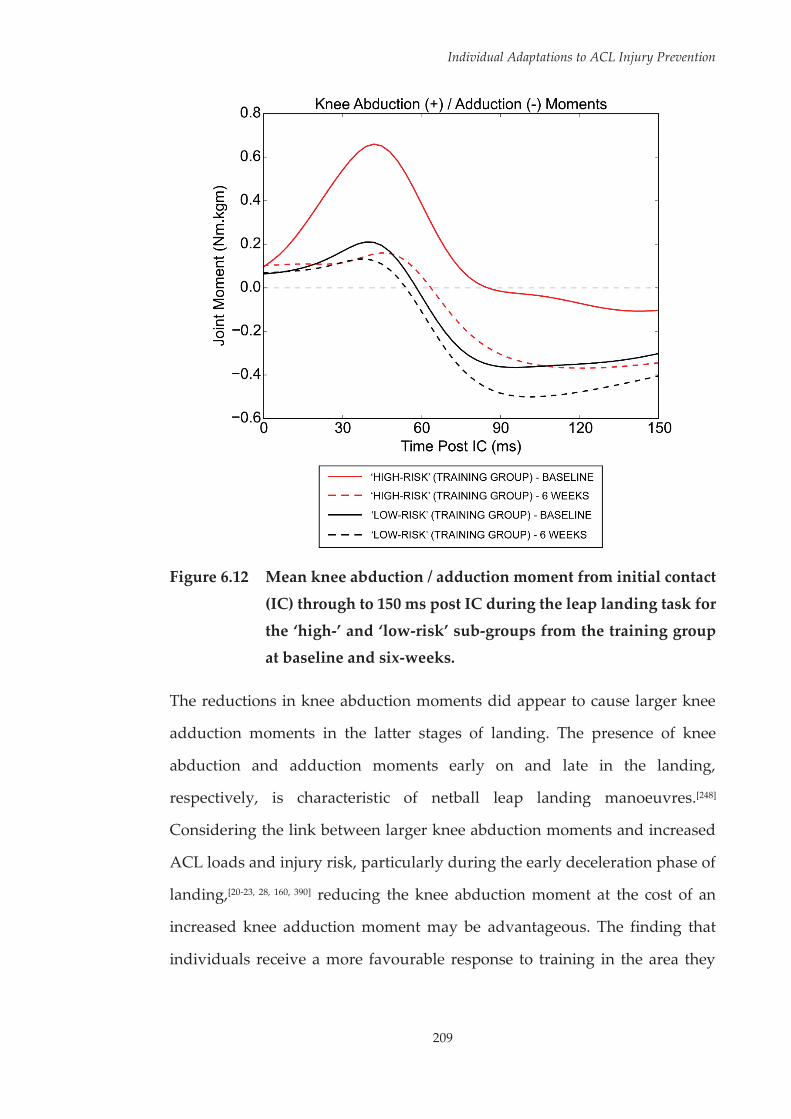
Individual Adaptations to ACL Injury Prevention
209
Figure 6.12 Mean knee abduction / adduction moment from initial contact
(IC) through to 150 ms post IC during the leap landing task for
the ‘high-’ and ‘low-risk’ sub-groups from the training group at baseline and six-weeks.
The reductions in knee abduction moments did appear to cause larger knee
adduction moments in the latter stages of landing. The presence of knee
abduction and adduction moments early on and late in the landing,
respectively, is characteristic of netball leap landing manoeuvres.[248]
Considering the link between larger knee abduction moments and increased
ACL loads and injury risk, particularly during the early deceleration phase of
landing,[20-23, 28, 160, 390] reducing the knee abduction moment at the cost of an
increased knee adduction moment may be advantageous. The finding that
individuals receive a more favourable response to training in the area they
Individual Adaptations to ACL Injury Prevention
210
exhibit a pre-existing high-risk biomechanical strategy (i.e. peak knee
abduction moments) fits with the findings of previous work.[71, 83, 84] However,
this may only be applicable to certain biomechanical or neuromuscular factors.
Individuals exhibiting low levels of preparatory medial hamstrings activation
exhibited minimal to no increases in activation, while one participant
demonstrating potentially high-risk transverse plane hip motion did not
improve in this area following training. The differing effects could be due to
the high-risk movement strategies targeted by the injury prevention program
used in this study. A heavy focus of the D2E programs feedback schedule is
on landing ‘softly’ while keeping the hip and knee aligned in the frontal
plane.[258] Successful application of these movement strategies should result in
minimised landing forces and ‘dynamic valgus’ postures. These
biomechanical factors have been linked to knee abduction moments during
high-risk sporting tasks.[149, 164, 304] Addressing these biomechanical deficits
would subsequently have a beneficial effect in reducing the knee abduction
moments experienced during landing. The combination of a pre-existing risk
pattern at baseline in conjunction with an injury prevention program targeting
frontal plane alignment may have been why larger responses in frontal plane
knee moments were observed within the ‘high-risk’ individuals of the training
group.
The broad implications of this study are that a generic approach to ACL injury
prevention programs may not be effective across all individuals. A potential
shortcoming of current injury prevention programs is that they focus on a
select number of biomechanical deficits, or simultaneously attempt to address
a variety of possible biomechanical deficits across all individuals.[358] The
injury prevention program used within this study focused on movement
strategies that would reduce frontal plane knee moments, as these have been
Individual Adaptations to ACL Injury Prevention
211
associated with increased ACL loading and injury risk.[20-23, 28, 160, 390]
Subsequently, individuals who demonstrated a pre-existing risk pattern in this
area (i.e. high peak knee abduction moments) received a greater benefit in
reducing frontal plane knee moments during the leap landing task. Additional
variations in individual responses were observed, however there did not
appear to be a consistent trend with regard to these responses. Tailored injury
prevention programs that target the high-risk neuromuscular or
biomechanical strategies of the individual may be the most effective in
reducing an individual’s level of ACL injury risk.
Despite the results of this study, it is important not to discount generic ACL
injury prevention programs applied in a universal manner. While possibly
having a smaller prophylactic effect, universal neuromuscular training may
mitigate the potential increase in injury risk associate with season-long
participation in high-risk sports.[269] Further, while targeted programs may be
more effective in reducing ACL injury risk the cost-effectiveness of this
approach could be considered questionable. Implementing specifically
tailored injury prevention programs across individuals is unlikely to be a cost-
effective strategy, particularly within wider community settings where time
and staff resources may be limited. Striking a balance between the generic and
individualised approaches may be optimal. A recent study by Pappas et al[358]
found that individuals could be categorised into specific sub-groups, with
each group demonstrating a combination of biomechanical deficits during a
side-step cutting task. Tests that could categorise individuals to these deficit
profiles may be useful for prescribing targeted ACL injury prevention
programs.[358] This sub-group approach to tailoring injury prevention
programs may be more effective and efficient than current generic injury
prevention program practices,[358] and may minimise some of the practicality

Individual Adaptations to ACL Injury Prevention
212
issues stemming from highly individualised program design. Screening
methods that are practical and cost-effective to implement, while also having
the capacity to identify individuals who demonstrate high-risk movement
strategies therefore become an important component in the design of targeted
ACL injury prevention programs. The applicability of current ACL injury risk
screening methods to wider community settings, as well as their capacity to
identify high-risk movement strategies during a high-risk sport-specific task
will subsequently be explored in the following chapters of this thesis.
This study is not without limitations. First, a small sample size was used for
both the control and training groups. Previous studies investigating
neuromuscular and biomechanical responses to an ACL injury prevention
program have used a larger cohort.[40, 68, 76, 213, 216] However, smaller sample sizes
have been used in studies that have investigated group[41, 44, 74, 77-80, 391] and
individual[82, 83] responses to training. Despite the small sample, statistically
significant differences were observed suggesting there was sufficient power to
observe changes in certain neuromuscular and biomechanical variables. The
limitation of sample size was particularly evident within the risk level
analysis, with only three participants able to be allocated to the ‘high-risk’
groups. This limited the capacity of the study to identify statistically
significant differences for this particular analysis. Future investigations
employing this type of analysis would likely benefit from a larger sample size
to ensure adequate participant numbers across sub-groups. A larger sample
size may also allow for stratification into additional sub-groups, which may
provide a better understanding of how individuals with certain characteristics
respond differently to training. Second, the duration of the injury prevention
program used may have limited the generalised training effects observed.
‘Down 2 Earth’ is designed as a six-week ACL injury prevention program.[258]
Individual Adaptations to ACL Injury Prevention
213
This program was used in this study as it was specifically developed for ACL
injury prevention within a netball-specific cohort.[254, 258] However, it is
important to acknowledge that the duration and subsequent volume of this
program may have impacted on the generalised training effects observed.
While a training effect was seen with certain neuromuscular and
biomechanical variables, these may have been more extensive with an injury
prevention program of longer duration. A review by Bien[392] suggested injury
prevention programs should be eight or more weeks to ensure sufficient
neuromuscular training effects. Despite this, it was acknowledged that limited
evidence exists regarding optimal training duration for obtaining the most
effective results.[392] Shorter duration programs (i.e. six-weeks or less) have
been shown to have a protective effect against ACL injuries or injury risk
factors.[44, 65, 166, 393] Nonetheless, future studies investigating individual
adaptations to ACL injury prevention programs may benefit from utilising
training programs of longer duration (e.g. eight-weeks or longer) where more
generalised training effects may be observed. Lastly, strength and
performance measures were not collected prior to and after the training
program. Understanding how lower limb strength measures changed
subsequent to the training may have provided further assistance in
interpreting changes in muscle activation data.
Individual Adaptations to ACL Injury Prevention
214
6.5 Conclusions
This study found an ACL injury prevention program induced neuromuscular
and biomechanical adaptations during the performance of a high-risk landing
task. However, examination of individual data revealed dissimilar responses
to the training program. The findings of this study in conjunction with
previous work[71, 82, 83] suggest that variation across individual responses to
training may be inevitable. Future studies investigating the effects of ACL
injury prevention programs must therefore include a focus on the individual
to fully understand the effectiveness, or lack thereof, of the training program.
Individuals displaying a pre-existing high-risk strategy may receive a greater
benefit from ACL injury prevention programs. However, this may only be
applicable if the program targets the relevant high-risk strategy. Further
efforts must be made to ensure that ACL injury prevention programs are
providing a benefit to all involved, particularly in the areas where they
demonstrate neuromuscular or biomechanical strategies that may increase
their risk of ACL injury. Injury prevention programs that target
neuromuscular or biomechanical deficits relevant to the individual may be
useful in ensuring beneficial responses across all involved.
215
Chapter Seven: A Systematic Evaluation of Field-Based Screening Methods for the Assessment of Anterior Cruciate Ligament Injury Risk
Adapted from: Fox AS, Bonacci J, McLean SG, Spittle M, Saunders N. A systematic
evaluation of field-based screening methods for the assessment of anterior cruciate
ligament (ACL) injury risk. Sports Med. 2016; 46(5): 715-35.
7.1 Introduction
There is substantial support for the use of neuromuscular training as part of
anterior cruciate ligament (ACL) injury prevention programs in reducing ACL
injury rates[5, 65-67] and inducing biomechanical and neuromuscular adaptations
proposed to reduce ACL injury risk.[34-45, 68, 69, 71-75, 79, 166, 201, 213-217] A recent cost-
effective modelling study predicted universal neuromuscular training of all
athletes could reduce the incidence of ACL injury from 3% to 1.1% per season;
and would be more cost-effective than no training or screening combined with
training for high-risk athletes.[226] However, potential barriers to implementing
universal neuromuscular training exist. While ACL injury prevention
programs have proved successful, the level of adoption and compliance is
low[227, 228] and their deployment may not be effective in “real-world”
situations.[223, 229-231] Current neuromuscular training programs often involve
the whole team, require considerable time investment and may detract from
sport-specific skill training.[84] These factors may deter coaches from
implementing such programs within their pre-season or in-season
Field-Based Screening Methods for ACL Injury Risk
216
training.[84, 229] Screening methods that identify athletes at-risk of ACL injury
may improve coach intent to implement ACL injury prevention programs for
these athletes.[84] In addition, the ability to identify individuals ‘at-risk’ of ACL
injury appears to be an important step in maximising the effectiveness of ACL
injury prevention programs. Myer et al.[84] found female athletes deemed as
‘high-risk’ (knee abduction moment > 25.25 Nm during a drop vertical jump)
received a greater prophylactic effect from neuromuscular training compared
to ‘low-risk’ athletes. Similar to prevention programs, injury risk screening
also requires time investment from coaches and athletes. It has been suggested
that the equipment and time costs associated with screening for high-risk
athletes is not cost-effective.[226] However, there may be a role for coupling
screening with more targeted and intensive neuromuscular training programs
if the screening methods used have high accuracy with minimal cost.[226]
Identification of screening methods that are both predictive of injury and cost-
effective may provide further support for the integration of screening within
ACL injury prevention efforts.
A screening method must be appropriate and relevant to its selected purpose
and it is imperative that the constructs or criteria examined align with the
constructs of interest.[394] Screening methods for ACL injury risk should
therefore be linked with the mechanical aetiology of ACL injuries in order to
be effective in identifying ‘at-risk’ athletes. Therefore, screening methods that
identify athletes who employ movement strategies linked to increased ACL
loading are likely to be the most effective in classifying ACL injury risk.
Laboratory-based measures (e.g. three-dimensional motion analysis, force
plates) can accurately estimate segment motions and joint kinetics during
athletic tasks, providing an option to evaluate movement strategies or
techniques that may predispose an athlete to ACL injury. This approach,
Field-Based Screening Methods for ACL Injury Risk
217
however, requires extensive laboratory-based equipment and training to
complete. The cost of three-dimensional motion analysis is in the range of
$1000 per athlete per test.[87] The cost-effectiveness of this approach is therefore
questionable, and is likely prohibitive to the majority of the wider community.
Screening methods that can be completed in a field or clinical setting may be
more cost-effective and applicable for wider community use in identifying
dysfunction that may lead to an ACL injury. Field-based screening methods
for identifying ACL injury risk are emerging,[85-88, 91] however assessment of
their applicability for use in wider community settings is yet to be undertaken.
This is required to identify the most appropriate method(s) for field-based
evaluation of ACL injury risk.
The purpose of this systematic review was to evaluate and compare field-
based screening methods for ACL injury risk to determine their efficacy of use
in wider community settings. Specifically, this review aimed to: (i) examine
whether the identified screening methods are appropriate for their intended
use based on whether the method aligns with the constructs of interest, has
theoretical and empirical support, and is designed for the population of
interest; (ii) examine the technical adequacy of the identified screening
methods based on their reliability and predictive validity; and (iii) determine
the usability of the identified screening methods based on the balance of the
costs and benefits, feasibility of administration, and utility of outcomes
associated with the method. It was hypothesised that current field-based
screening methods would include scoring criteria appropriate for identifying
high-risk movement strategies associated with ACL injury risk, however,
would have a limited ability to predict future ACL injuries. In addition, some
of the screening methods would be more applicable for use in wider

Field-Based Screening Methods for ACL Injury Risk
218
community settings than others due to having minimal equipment and time
requirements to complete.
7.2 Methodology
7.2.1 Literature Search
A literature search was performed to retrieve articles pertaining to field-based
screening or assessment methods used to evaluate ACL injury risk. An
electronic search was conducted on SportDISCUSTM, Medline, AMED and
CINAHL (January 1990 – July 2015) databases. Searches were limited to
English language results only to minimise time and costs related to translation.
The following search term groups were used: group (i) “ACL”, “anterior
cruciate ligament”, “knee injur*” and “ACL injur*”; and group (ii)
“screening”, “injury risk”, “screening tool”, “screening test”, “clinical
screening tool”, “field* screening”, “risk screening”, “preseason screening”,
“mass screening”, “team screening”, “risk assessment” and “evaluation tool”.
Within groups; search terms were connected with OR, and between groups
with AND. All terms were searched for in the titles and abstracts of articles.
The results of all searches were taken together and duplicates removed.
Once the initial literature selection process was complete and screening
methods identified, a secondary search was undertaken to identify any further
studies relevant to each of the screening methods. A search of the same
databases over the same time period using key words included in the name or
description of the screening methods identified (see Table 7.2, Page 224). All
terms were searched for in the titles and abstracts of articles. All studies
identified by the secondary literature search were screened against the same
inclusion/exclusion criteria applied to initially identified studies. Once all

Field-Based Screening Methods for ACL Injury Risk
219
relevant literature from database searching was identified, the reference lists
of all included articles were examined to identify any further studies for
inclusion in the review.
7.2.2 Literature Selection
The titles and abstracts of all studies identified by the search strategy were
reviewed for potential relevance. If sufficient information was not contained
in the title and abstract to determine relevance, the full text was evaluated. The
full text of potentially relevant articles were independently analysed by two
reviewers for final inclusion, based on the following inclusion criteria: (i) the
screening method was developed as a means to determine ACL injury risk;
and (ii) the screening method could be undertaken outside of a laboratory
setting (i.e. field and clinical settings). Articles were excluded from the review
if: (i) the article was only in abstract form; or (ii) the screening method was not
applied in an effort to identify injury risk. Any discrepancies between the two
reviewers were resolved with a consensus meeting. If consensus could not be
reached, a third reviewer was consulted. Following the literature selection
process, included studies were grouped according to the specific screening
method they examined.
7.2.3 Methodological Quality Assessment
Included studies were examined for methodological quality using a modified
version of the Cochrane Group on Screening and Diagnostic Test
Methodology quality assessment tool.[395] Eleven criteria (subject
inclusion/exclusion criteria described; information to identify setting
described; study design; age and sex reported; screening method sufficiently
described and reported; groups comparable at baseline; blinding of
investigators to confounding/prognostic factors; mean and variance of
Field-Based Screening Methods for ACL Injury Risk
220
variables reported; reliability reported; missing data reported or explained;
and outcome clearly defined with methods explained) which logically applied
to the majority of studies included in this review were used, resulting in a
maximum score of eleven. No study was excluded and no additional analysis
was undertaken on the basis of the assessment of study quality. A full
summary of the methodological quality assessment undertaken on included
studies is presented in Appendix H (see Page 415).
Using relevant articles, an overall description of each screening method,
including the criteria used for scoring, was acquired. Screening methods were
evaluated against the relevant criteria surrounding ‘appropriateness for the
intended use,’ ‘technical adequacy’ and ‘usability’ from Glover and Albers[394]
(see Table 7.1, Page 222). In order to examine each screening method against
these criteria, the following data were extracted pertaining to each method:
1. Has the screening method been prospectively evaluated against ACL
injury occurrences, and if so, was the method successful in identifying
future ACL injuries?
2. Has the screening method been assessed for validity, and if so, how has
this been undertaken?
3. Has intra- and inter-rater reliability for the screening method been
assessed and established?
4. What cut-off value, if any, has been identified for labelling an
individual as ‘at-risk’?
5. What additional, if any, equipment is required to undertake the
screening method?
Field-Based Screening Methods for ACL Injury Risk
221
6. What additional, if any, training is required for an individual or group
to capably perform the screening method?
7. Approximately how long does it take to screen one athlete?
8. Is the screening method applicable across multiple sports and athletes?
These criteria were chosen to ensure the identified ACL field-based screening
methods could be evaluated based on their accuracy in identifying future ACL
injury risk, validity in identifying high-risk movements and injury risk factors,
reliability of the method within and between users, and how well the method
could be applied across various settings. Extracted data were used to evaluate
and compare the identified ACL field-based screening methods for their use
in wider community settings.

Field-Based Screening Methods for ACL Injury Risk
222
Table 7.1 Considerations and questions for evaluating identified screening methods. Reproduced with permission from Glover
and Albers.[394]
Consideration Questions
Appropriateness for intended use Alignment with constructs of interest
Are the criteria measured as a part of the screening method relevant for determining an individual’s risk status?
Theoretical and empirical support
Have the format and content of the screening method been validated in previous research?
Population fit Is the screening method designed for the population of interest?
Technical adequacy Test-retest (intra-rater) reliability Is the screening method consistent over
time? Inter-rater reliability Is the screening method consistent across
raters? Predictive validity
Sensitivity Of those actually at risk, what proportion is correctly identified?
Specificity Of those actually not at risk, what proportion is correctly identified?
Positive predictive value Of those identified as at risk, what proportion is correctly identified?
Negative predictive value Of those identified as not at risk, what proportion is correctly identified?
Usability Balance of costs and benefits Are the costs associated with the screening
method reasonable? Feasibility of administration Are personnel able to administer the
screening method? Utility of outcomes Can stakeholders understand the
implications associated with the screening methods outcomes? Are the outcomes useful for guiding instruction/intervention?

Field-Based Screening Methods for ACL Injury Risk
223
7.3 Results
7.3.1 Search Findings and Study Selection
The electronic search yielded 1,077 citations (SportDISCUSTM – 286, Medline –
499, AMED – 68, CINAHL – 224). Following the removal of duplicates,
elimination of studies on the basis of title and abstract, 25 studies were
identified as potentially relevant and screened against the inclusion/exclusion
criteria. A total of 13 studies[396-408] were excluded due to not meeting the
inclusion/exclusion criteria, resulting in 12 included studies[85, 86, 88-94, 104, 105, 409]
meeting all relevant criteria. Included studies were then grouped according to
the screening method they examined. Five ACL screening methods were
identified via the literature search, those being the Landing Error Scoring
System (LESS),[91, 94, 104, 105, 409] Clinic-Based Algorithm,[88-90, 93] Observational
Screening of Dynamic Knee Valgus (OSDKV),[85] 2D-Cam Method[92] and Tuck
Jump Assessment.[86]
Following the initial literature search and selection process, the secondary
search using the key words and terms deemed relevant to the identified
screening methods (see Table 7.2, Page 224) was undertaken.

Field-Based Screening Methods for ACL Injury Risk
224
Table 7.2 Search terms used and search results of the secondary literature search.
Screening Method Search Terms Search Results
Landing Error Scoring System
“landing error scoring system” 27 total citations
SportDISCUSTM – 19
MedLine – 20
AMED – 4
CINAHL – 9
Clinic-Based Algorithm “clinic-based nomogram” OR “clinic-based prediction tool” OR “clinic-based algorithm” OR “clinic-based measurements” OR “clinic based nomogram” OR “clinic based prediction tool” OR “clinic based algorithm” OR “clinic based measurements”
13 total citations
SportDISCUSTM – 3
MedLine – 10
AMED – 0
CINAHL – 2
Observational Screening of Dynamic Knee Valgus
“observ* risk screening” AND “dynamic knee valgus” OR “knee valgus”
1 total citations
SportDISCUSTM – 1
MedLine – 1
AMED – 0
CINAHL – 1
2D-Cam Method “two-dimensional cam* method” OR “2D cam method” OR “two dimensional cam* method” OR “2D-cam method”
1 total citations
SportDISCUSTM – 1
MedLine – 1
AMED – 0
CINAHL – 1
Tuck Jump Assessment “tuck jump assessment” 6 total citations
SportDISCUSTM – 7
MedLine – 3
AMED – 1
CINAHL – 5
Field-Based Screening Methods for ACL Injury Risk
225
From the secondary literature search, eight further studies that met all criteria
were included in the review. Specifically, one study relating to the LESS,[410]
three studies relating to the Clinic-Based Algorithm,[87, 411, 412] and three studies
relating to the Tuck Jump Assessment.[256, 413, 414] No relevant studies pertaining
to the OSDKV or 2D-Cam Method were identified via the secondary literature
search. A search of all included studies’ reference lists resulted in one study
relating to the Tuck Jump Assessment[415] being added to the review. Therefore,
a final total of 20 studies[85-94, 104, 105, 256, 409-415] were included in the review. A
diagrammatic representation of the search strategy and study selection
process is shown in Figure 7.1 (see Page 226).

Field-Based Screening Methods for ACL Injury Risk
226
Figure 7.1 Diagrammatic representation of search strategy results and study selection process. 1 = [396, 398, 399, 402, 408] 2 = [401, 403, 404, 406] 3 = [397,
405] 4 = [407] 5 = [91, 94, 104, 105, 409] 6 = [88-90, 93] 7 = [85] 8 = [92] 9 = [86] 10 = [410] 11
= [87, 411, 412] 12 = [256, 413, 415, 416]. LESS – Landing Error Scoring System; ACL – anterior cruciate ligament.

Field-Based Screening Methods for ACL Injury Risk
227
7.3.2 Screening Methods Identified
7.3.2.1 Landing Error Scoring System (LESS)
The Landing Error Scoring System (LESS) involves the assessment of an
individual’s jump-landing technique based on ‘errors’ identified during the
performance of a bilateral drop vertical jump task.[91] The drop vertical jump
task is performed from a height of 30 cm, with athletes required to land at a
distance of 50% of their height from the box and immediately perform a
maximal vertical jump (see Figure 7.2).[91]
Figure 7.2 Demonstration of the jump-landing task used for the Landing Error Scoring System. Reproduced with permission from
Padua et al.[91]
The LESS involves 17 scored items or ‘errors’, with items dedicated to the
assessment of: lower extremity and trunk position at initial ground contact
(trunk, hip, knee, and ankle flexion angles at initial contact; knee valgus angle
at initial contact; lateral trunk flexion angle at initial contact); foot position at
initial contact and the time between initial contact and maximum knee flexion
(stance width – wide or narrow; foot position – toe in or out; symmetry of
initial foot contact); lower extremity and trunk movements between initial
contact and maximum knee flexion (knee flexion and valgus displacement;
Field-Based Screening Methods for ACL Injury Risk
228
trunk and hip flexion at maximum knee flexion); overall sagittal plane
movement; and the general perception of landing quality.[91] Lower LESS
scores are indicative of better jump-landing technique and is taken as an
indication of reduced ACL injury risk.[91] Three trials are performed with
landings recorded using digital video cameras placed 3.54m from the landing
area in frontal and sagittal views.[91] These trials are then assessed using the
scoring items to determine the individuals LESS score out of a total of 19.[91]
An ‘error’ is given when the criteria is met on two of the three trials, with the
individual’s total LESS score out of 19 attained by summing these errors.[91]
A real-time version of the LESS (LESS-RT) was also identified.[410] The jump-
landing task used for the LESS-RT is identical to the originally developed
LESS, however, scoring is undertaken without the assistance of video cameras
and with an additional fourth landing trial completed.[410] Trials one and two
are assessed from a frontal view, while trials three and four are assessed from
a sagittal view.[410] The four trials are used to assess ten scoring items relating
to stance width, foot rotation, symmetry of feet contact, knee and trunk frontal
plane motion, foot contact pattern, knee and trunk sagittal plane motion, and
overall impression of sagittal and frontal plane motion.[410] As with the LESS,
a lower LESS-RT score is indicative of better jump-landing technique and
taken as an indication of reduced ACL injury risk.[410]
A further, more simplified version of the LESS was also identified.[409] The i-
Landing Error Scoring System (iLESS) involves the performance of a single
drop vertical jump task identical to that used in the LESS / LESS-RT, with this
landing allocated to one of two movement classifications.[409] Athletes are
deemed ‘low-risk’ if they exhibit a “good movement pattern,” characterised
by no knee valgus at initial foot contact, no knee valgus displacement from
initial contact to maximum knee flexion, landing with greater than 30 degrees
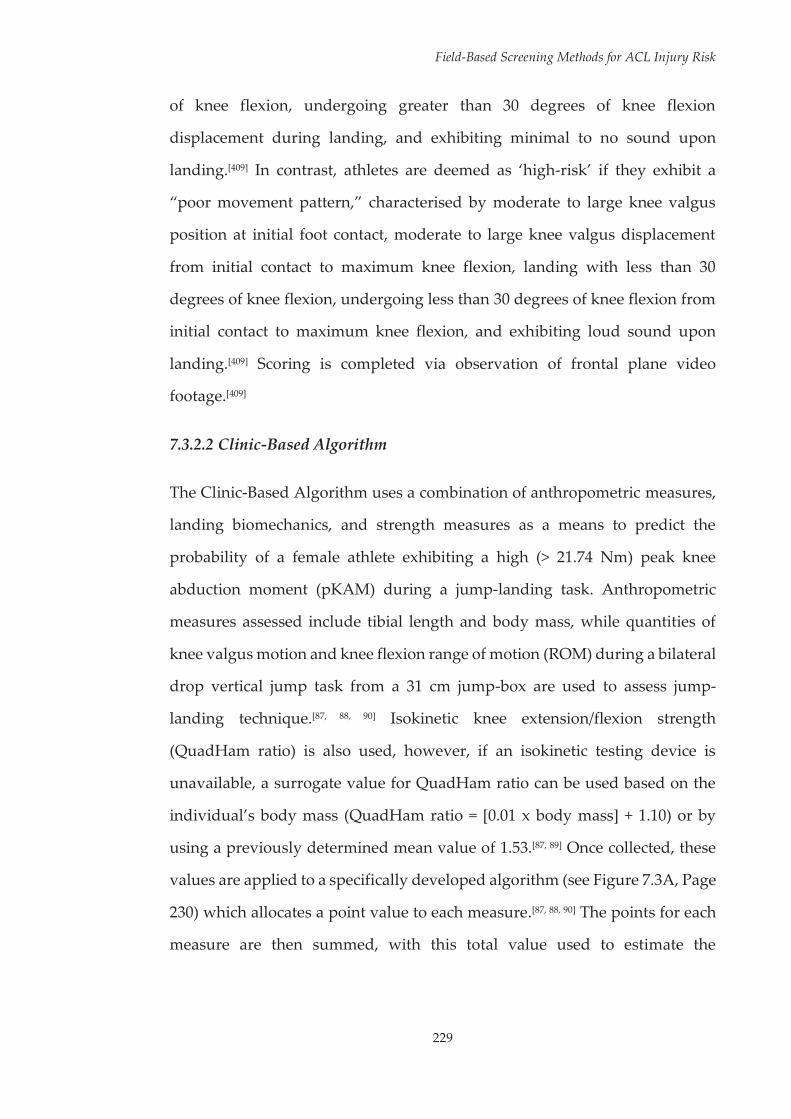
Field-Based Screening Methods for ACL Injury Risk
229
of knee flexion, undergoing greater than 30 degrees of knee flexion
displacement during landing, and exhibiting minimal to no sound upon
landing.[409] In contrast, athletes are deemed as ‘high-risk’ if they exhibit a
“poor movement pattern,” characterised by moderate to large knee valgus
position at initial foot contact, moderate to large knee valgus displacement
from initial contact to maximum knee flexion, landing with less than 30
degrees of knee flexion, undergoing less than 30 degrees of knee flexion from
initial contact to maximum knee flexion, and exhibiting loud sound upon
landing.[409] Scoring is completed via observation of frontal plane video
footage.[409]
7.3.2.2 Clinic-Based Algorithm
The Clinic-Based Algorithm uses a combination of anthropometric measures,
landing biomechanics, and strength measures as a means to predict the
probability of a female athlete exhibiting a high (> 21.74 Nm) peak knee
abduction moment (pKAM) during a jump-landing task. Anthropometric
measures assessed include tibial length and body mass, while quantities of
knee valgus motion and knee flexion range of motion (ROM) during a bilateral
drop vertical jump task from a 31 cm jump-box are used to assess jump-
landing technique.[87, 88, 90] Isokinetic knee extension/flexion strength
(QuadHam ratio) is also used, however, if an isokinetic testing device is
unavailable, a surrogate value for QuadHam ratio can be used based on the
individual’s body mass (QuadHam ratio = [0.01 x body mass] + 1.10) or by
using a previously determined mean value of 1.53.[87, 89] Once collected, these
values are applied to a specifically developed algorithm (see Figure 7.3A, Page
230) which allocates a point value to each measure.[87, 88, 90] The points for each
measure are then summed, with this total value used to estimate the
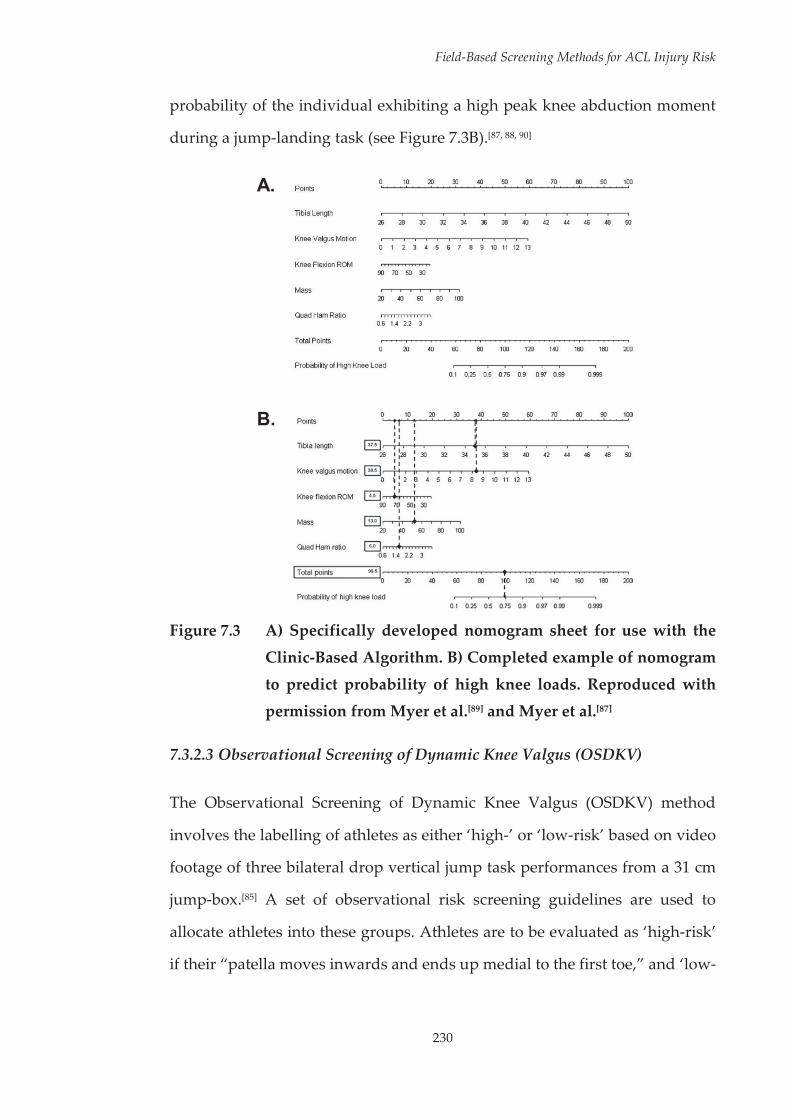
Field-Based Screening Methods for ACL Injury Risk
230
probability of the individual exhibiting a high peak knee abduction moment
during a jump-landing task (see Figure 7.3B).[87, 88, 90]
A.
B.
Figure 7.3 A) Specifically developed nomogram sheet for use with the
Clinic-Based Algorithm. B) Completed example of nomogram
to predict probability of high knee loads. Reproduced with permission from Myer et al.[89] and Myer et al.[87]
7.3.2.3 Observational Screening of Dynamic Knee Valgus (OSDKV)
The Observational Screening of Dynamic Knee Valgus (OSDKV) method
involves the labelling of athletes as either ‘high-’ or ‘low-risk’ based on video
footage of three bilateral drop vertical jump task performances from a 31 cm
jump-box.[85] A set of observational risk screening guidelines are used to
allocate athletes into these groups. Athletes are to be evaluated as ‘high-risk’
if their “patella moves inwards and ends up medial to the first toe,” and ‘low-
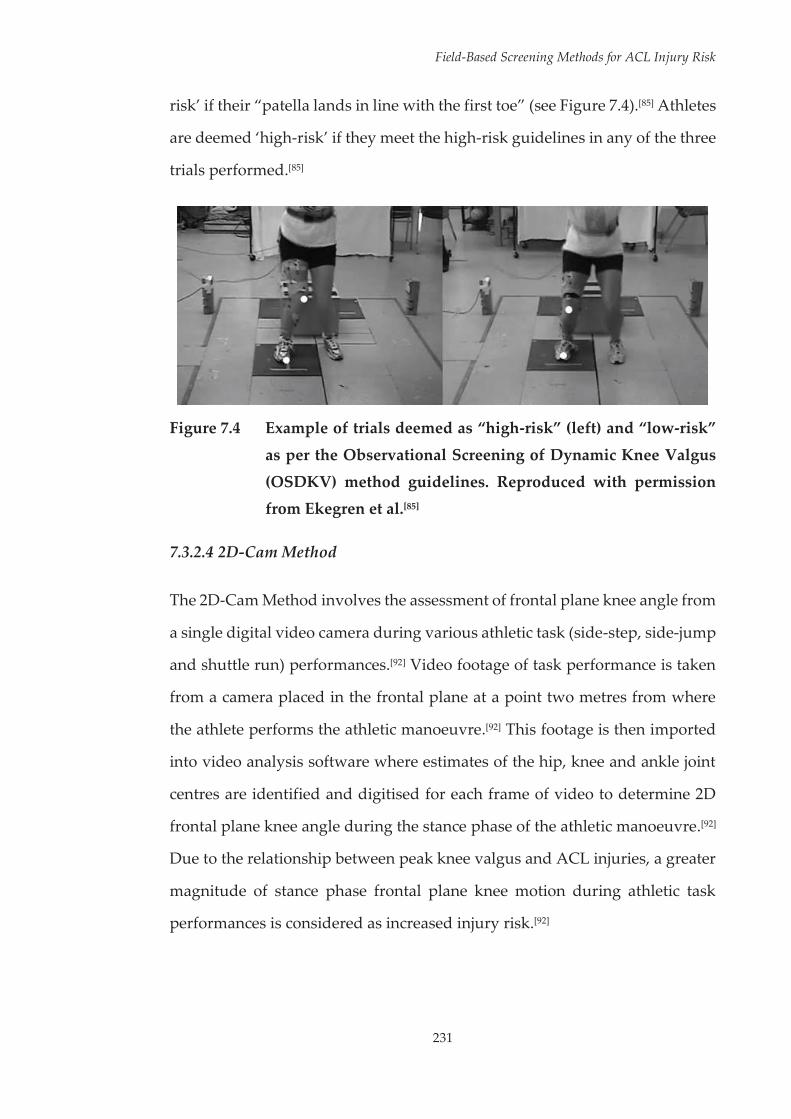
Field-Based Screening Methods for ACL Injury Risk
231
risk’ if their “patella lands in line with the first toe” (see Figure 7.4).[85] Athletes
are deemed ‘high-risk’ if they meet the high-risk guidelines in any of the three
trials performed.[85]
Figure 7.4 Example of trials deemed as “high-risk” (left) and “low-risk”
as per the Observational Screening of Dynamic Knee Valgus
(OSDKV) method guidelines. Reproduced with permission from Ekegren et al.[85]
7.3.2.4 2D-Cam Method
The 2D-Cam Method involves the assessment of frontal plane knee angle from
a single digital video camera during various athletic task (side-step, side-jump
and shuttle run) performances.[92] Video footage of task performance is taken
from a camera placed in the frontal plane at a point two metres from where
the athlete performs the athletic manoeuvre.[92] This footage is then imported
into video analysis software where estimates of the hip, knee and ankle joint
centres are identified and digitised for each frame of video to determine 2D
frontal plane knee angle during the stance phase of the athletic manoeuvre.[92]
Due to the relationship between peak knee valgus and ACL injuries, a greater
magnitude of stance phase frontal plane knee motion during athletic task
performances is considered as increased injury risk.[92]
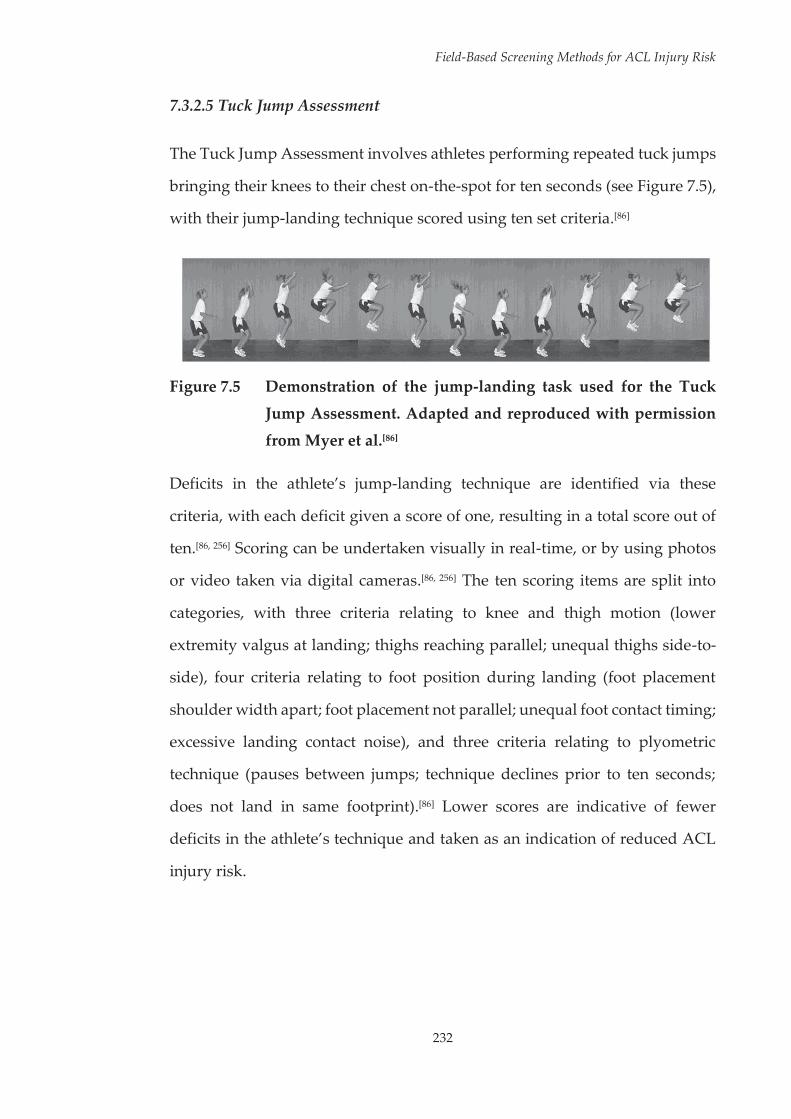
Field-Based Screening Methods for ACL Injury Risk
232
7.3.2.5 Tuck Jump Assessment
The Tuck Jump Assessment involves athletes performing repeated tuck jumps
bringing their knees to their chest on-the-spot for ten seconds (see Figure 7.5),
with their jump-landing technique scored using ten set criteria.[86]
Figure 7.5 Demonstration of the jump-landing task used for the Tuck
Jump Assessment. Adapted and reproduced with permission
from Myer et al.[86]
Deficits in the athlete’s jump-landing technique are identified via these
criteria, with each deficit given a score of one, resulting in a total score out of
ten.[86, 256] Scoring can be undertaken visually in real-time, or by using photos
or video taken via digital cameras.[86, 256] The ten scoring items are split into
categories, with three criteria relating to knee and thigh motion (lower
extremity valgus at landing; thighs reaching parallel; unequal thighs side-to-
side), four criteria relating to foot position during landing (foot placement
shoulder width apart; foot placement not parallel; unequal foot contact timing;
excessive landing contact noise), and three criteria relating to plyometric
technique (pauses between jumps; technique declines prior to ten seconds;
does not land in same footprint).[86] Lower scores are indicative of fewer
deficits in the athlete’s technique and taken as an indication of reduced ACL
injury risk.

Field-Based Screening Methods for ACL Injury Risk
233
7.3.3 Extracted Data
Table 7.3 (see Page 234) presents a summary of the data extracted for each of
the screening methods.

234
Field-Based Screening Methods for ACL Injury Risk
Tabl
e 7.
3 Ex
trac
ted
data
for t
he id
entif
ied
fiel
d-ba
sed
scre
enin
g m
etho
ds.
Cri
teri
a LE
SS /
LESS
-RT
/ iL
ESS
Clin
ic-B
ased
A
lgor
ithm
O
bser
vatio
nal S
cree
ning
of
Dyn
amic
Kne
e V
algu
s 2D
-Cam
M
etho
d Tu
ck Ju
mp
Ass
essm
ent
Pros
pect
ive
eval
uatio
n of
ab
ility
to
pred
ict A
CL
inju
ries
LESS
sco
res
did
not
dist
ingu
ish
betw
een
mat
ched
AC
L- a
nd n
on-
inju
red
mal
e an
d fe
mal
e hi
gh sc
hool
and
col
legi
ate
leve
l ath
lete
s.[1
05] L
ESS
scor
es
of fi
ve a
nd a
bove
pre
dict
ed
AC
L in
juri
es w
ith sp
ecifi
city
an
d se
nsiti
vity
val
ues
of 8
6%
and
64%
, res
pect
ivel
y; a
nd
resu
lted
in P
PVs a
nd N
PVs
of 1
.4%
and
99.
8%,
resp
ectiv
ely
in a
you
th
fem
ale
popu
latio
n.[1
04] N
o pr
ospe
ctiv
e ev
alua
tion
of th
e ca
paci
ty o
f the
LES
S-RT
or
iLES
S to
pre
dict
AC
L in
juri
es w
as id
entif
ied.
Ass
ocia
tion
betw
een
pKA
M
dete
rmin
ed b
y th
e C
linic
-Ba
sed
Pred
ictio
n To
ol a
nd
AC
L in
jury
ass
esse
d us
ing
mat
ched
AC
L- a
nd n
on-
inju
red
fem
ale
high
sch
ool
and
colle
ge a
thle
tes.
No
asso
ciat
ion
betw
een
pred
icte
d pK
AM
and
AC
L in
jury
was
iden
tifie
d.[4
12]
No
pros
pect
ive
eval
uatio
n of
th
e ca
paci
ty o
f the
OSD
KV
m
etho
d to
pre
dict
AC
L in
juri
es w
as id
entif
ied.
No
pros
pect
ive
eval
uatio
n of
th
e ca
paci
ty o
f the
2D
-Cam
M
etho
d to
pre
dict
AC
L in
juri
es w
as id
entif
ied.
No
pros
pect
ive
eval
uatio
n of
th
e ca
paci
ty o
f the
Tuc
k Ju
mp
Ass
essm
ent m
etho
d to
pr
edic
t AC
L in
juri
es w
as
iden
tifie
d.
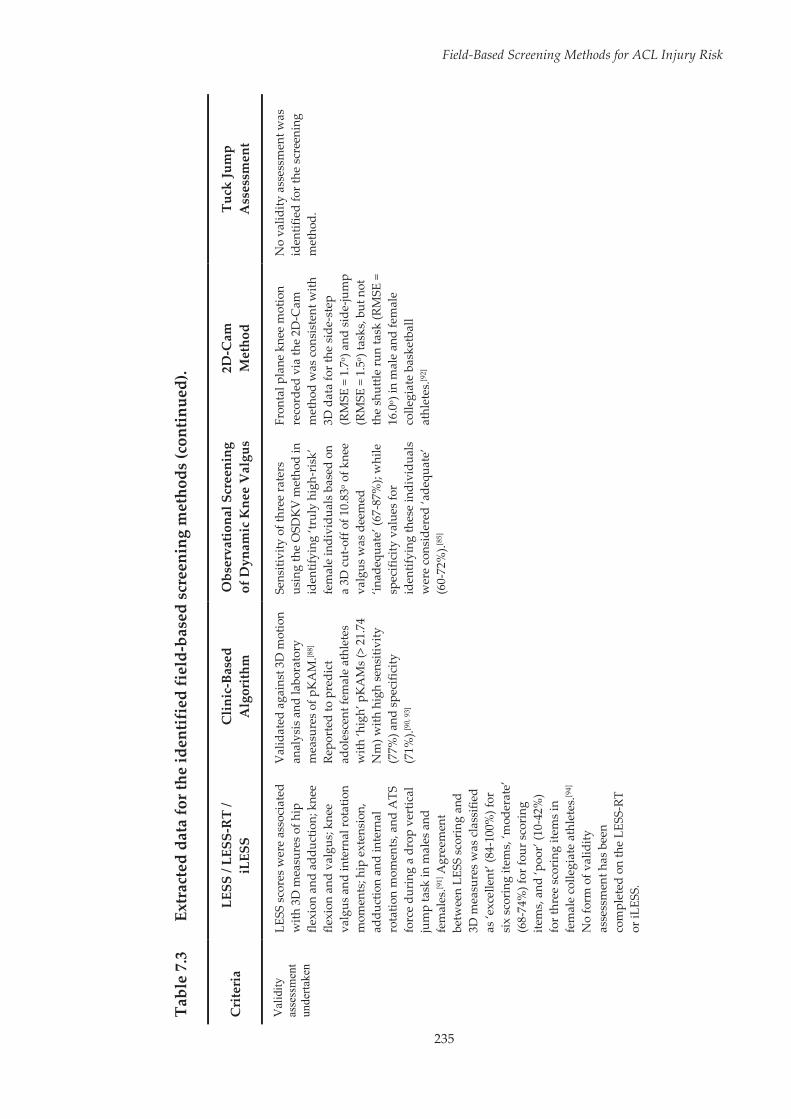
235
Field-Based Screening Methods for ACL Injury Risk
Tabl
e 7.
3 Ex
trac
ted
data
for t
he id
entif
ied
fiel
d-ba
sed
scre
enin
g m
etho
ds (c
ontin
ued)
.
Cri
teri
a LE
SS /
LESS
-RT
/ iL
ESS
Clin
ic-B
ased
A
lgor
ithm
O
bser
vatio
nal S
cree
ning
of
Dyn
amic
Kne
e V
algu
s 2D
-Cam
M
etho
d Tu
ck Ju
mp
Ass
essm
ent
Val
idity
as
sess
men
t un
derta
ken
LESS
sco
res
wer
e as
soci
ated
w
ith 3
D m
easu
res o
f hip
fle
xion
and
add
uctio
n; k
nee
flexi
on a
nd v
algu
s; kn
ee
valg
us a
nd in
tern
al ro
tatio
n m
omen
ts; h
ip e
xten
sion
, ad
duct
ion
and
inte
rnal
ro
tatio
n m
omen
ts, a
nd A
TS
forc
e du
ring
a d
rop
vert
ical
ju
mp
task
in m
ales
and
fe
mal
es.[9
1] A
gree
men
t be
twee
n LE
SS s
cori
ng a
nd
3D m
easu
res
was
cla
ssifi
ed
as ‘e
xcel
lent
’ (84
-100
%) f
or
six
scor
ing
item
s, ‘m
oder
ate’
(6
8-74
%) f
or fo
ur s
cori
ng
item
s, a
nd ‘p
oor’
(10-
42%
) fo
r thr
ee s
cori
ng it
ems
in
fem
ale
colle
giat
e at
hlet
es.[9
4]
No
form
of v
alid
ity
asse
ssm
ent h
as b
een
com
plet
ed o
n th
e LE
SS-R
T or
iLES
S.
Val
idat
ed a
gain
st 3
D m
otio
n an
alys
is a
nd la
bora
tory
m
easu
res
of p
KA
M.[8
8]
Repo
rted
to p
redi
ct
adol
esce
nt fe
mal
e at
hlet
es
with
‘hig
h’ p
KA
Ms
(> 2
1.74
N
m) w
ith h
igh
sens
itivi
ty
(77%
) and
spe
cific
ity
(71%
).[90,
93]
Sens
itivi
ty o
f thr
ee ra
ters
us
ing
the
OSD
KV
met
hod
in
iden
tifyi
ng ‘t
ruly
hig
h-ri
sk’
fem
ale
indi
vidu
als b
ased
on
a 3D
cut
-off
of 1
0.83
o of k
nee
valg
us w
as d
eem
ed
‘inad
equa
te’ (
67-8
7%);
whi
le
spec
ifici
ty v
alue
s fo
r id
entif
ying
thes
e in
divi
dual
s w
ere
cons
ider
ed ‘a
dequ
ate’
(6
0-72
%).[8
5]
Fron
tal p
lane
kne
e m
otio
n re
cord
ed v
ia th
e 2D
-Cam
m
etho
d w
as c
onsi
sten
t with
3D
dat
a fo
r the
sid
e-st
ep
(RM
SE =
1.7
o ) a
nd s
ide-
jum
p (R
MSE
= 1
.5o )
task
s, bu
t not
th
e sh
uttle
run
task
(RM
SE =
16
.0o )
in m
ale
and
fem
ale
colle
giat
e ba
sket
ball
athl
etes
.[92]
No
valid
ity a
sses
smen
t was
id
entif
ied
for t
he s
cree
ning
m
etho
d.

236
Field-Based Screening Methods for ACL Injury Risk
Tabl
e 7.
3 Ex
trac
ted
data
for t
he id
entif
ied
fiel
d-ba
sed
scre
enin
g m
etho
ds (c
ontin
ued)
.
Cri
teri
a LE
SS /
LESS
-RT
/ iL
ESS
Clin
ic-B
ased
A
lgor
ithm
O
bser
vatio
nal S
cree
ning
of
Dyn
amic
Kne
e V
algu
s 2D
-Cam
M
etho
d Tu
ck Ju
mp
Ass
essm
ent
Relia
bilit
y as
sess
men
t un
dert
aken
Repo
rted
as
havi
ng
‘exc
elle
nt’ (
ICC
= 0
.91;
SEM
=
0.42
) int
ra- a
nd ‘g
ood’
(IC
C =
0.
84; S
EM =
0.7
1) in
ter-
rate
r re
liabi
lity;
[91]
and
‘exc
elle
nt’
intr
a- (I
CC
= 0
.97)
and
inte
r-
(ICC
= 0
.92)
rate
r rel
iabi
lity
for m
ale
and
fem
ale
athl
etes
.[105
] Int
er-r
ater
av
erag
e pe
rcen
tage
ag
reem
ent b
etw
een
‘nov
ice’
(o
ne h
our o
f tra
inin
g) a
nd
‘exp
ert’
(five
yea
rs’
expe
rien
ce u
sing
the
LESS
) ra
ters
rang
ed fr
om 6
5-10
0%
acro
ss s
cori
ng c
rite
ria
in
fem
ale
colle
giat
e at
hlet
es.[9
4]
‘Goo
d’ in
ter-
rate
r rel
iabi
lity
(ICC
= 0
.72-
0.81
; SEM
= 0
.69-
0.76
) was
repo
rted
for t
he
LESS
-RT
for h
ealth
y m
ales
an
d fe
mal
es.[4
10]
‘Exc
elle
nt’ i
ntra
-rat
er
relia
bilit
y re
port
ed fo
r rat
ing
of k
nee
valg
us (I
CC
= 0
.997
) an
d kn
ee fl
exio
n ra
nge
of
mot
ion
ICC
= 0
.952
) dur
ing
the
jum
p-la
ndin
g ta
sk
perf
orm
ed b
y ad
oles
cent
fe
mal
es.[4
12] N
o da
ta
pert
aini
ng to
intr
a-ra
ter
relia
bilit
y ac
ross
oth
er
vari
able
s or
inte
r-ra
ter
relia
bilit
y w
as id
entif
ied.
Intr
a- (κ
= 0
.75-
0.85
) and
in
ter-
rate
r (κ
= 0.
77-0
.80)
ag
reem
ent b
etw
een
thre
e ra
ters
for s
cori
ng fe
mal
e in
divi
dual
s w
as re
port
ed a
s ‘s
ubst
antia
l.’[8
5]
No
asse
ssm
ent o
f int
ra- o
r in
ter-
rate
r rel
iabi
lity
of th
e sc
reen
ing
met
hod
was
id
entif
ied.
Intr
a-ra
ter r
elia
bilit
y w
as
initi
ally
repo
rted
as ‘
high
’.[86]
A
vera
ge p
erce
ntag
e in
tra-
an
d in
ter-
rate
r agr
eem
ent
was
foun
d to
rang
e fr
om 7
5-10
0% a
cros
s sc
orin
g cr
iteri
a fo
r mal
e an
d fe
mal
e at
hlet
es.[2
56] I
n co
ntra
st, i
ntra
-ra
ter r
elia
bilit
y be
twee
n th
ree
rate
rs fo
r ass
essi
ng
mal
es a
nd fe
mal
es h
as b
een
show
n to
rang
e fr
om ‘p
oor’
to
‘mod
erat
e’ (I
CC
= 0
.44-
0.72
); an
d in
ter-
rate
r re
liabi
lity
has b
een
repo
rted
as
‘poo
r’ (I
CC
= 0
.47)
but
did
im
prov
e in
a s
econ
d sc
orin
g se
ssio
n (I
CC
= 0
.69)
.[414
]
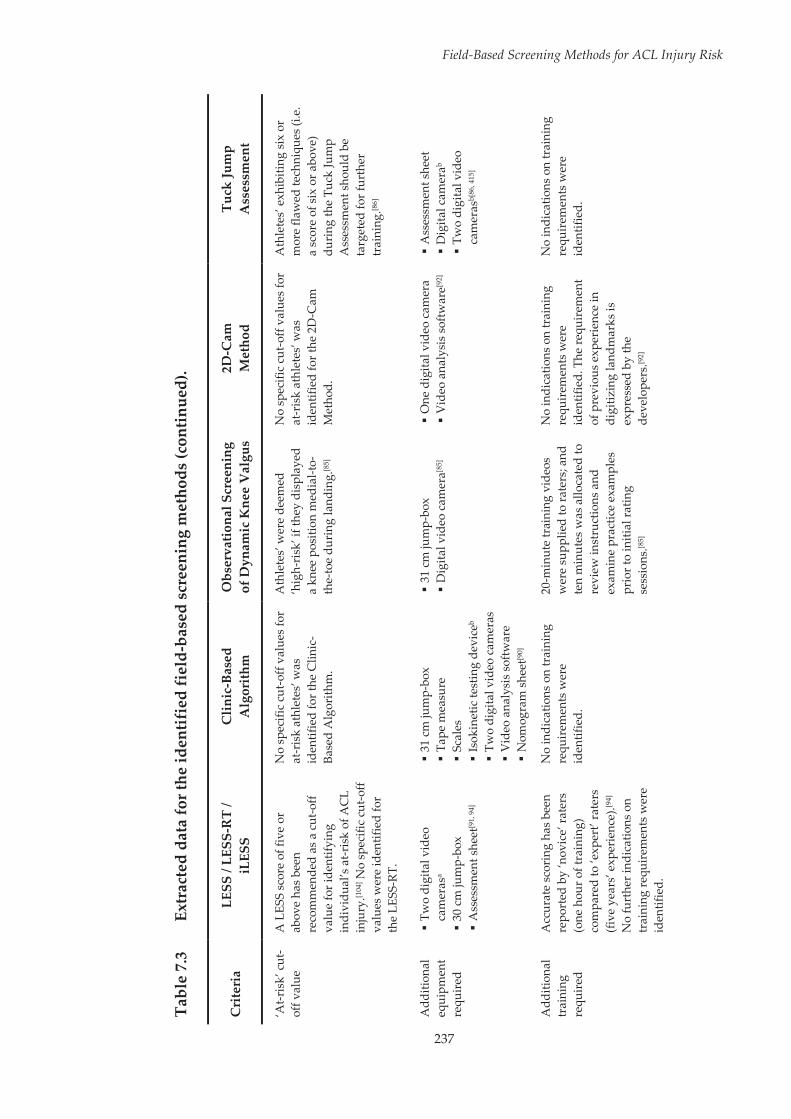
237
Field-Based Screening Methods for ACL Injury Risk
Tabl
e 7.
3 Ex
trac
ted
data
for t
he id
entif
ied
fiel
d-ba
sed
scre
enin
g m
etho
ds (c
ontin
ued)
.
Cri
teri
a LE
SS /
LESS
-RT
/ iL
ESS
Clin
ic-B
ased
A
lgor
ithm
O
bser
vatio
nal S
cree
ning
of
Dyn
amic
Kne
e V
algu
s 2D
-Cam
M
etho
d Tu
ck Ju
mp
Ass
essm
ent
‘At-r
isk’
cut
-of
f val
ue
A L
ESS
scor
e of
five
or
abov
e ha
s be
en
reco
mm
ende
d as
a c
ut-o
ff va
lue
for i
dent
ifyin
g in
divi
dual
’s a
t-ris
k of
AC
L in
jury
.[104
] No
spec
ific
cut-o
ff va
lues
wer
e id
entif
ied
for
the
LESS
-RT.
No
spec
ific
cut-
off v
alue
s fo
r at
-ris
k at
hlet
es’ w
as
iden
tifie
d fo
r the
Clin
ic-
Base
d A
lgor
ithm
.
Ath
lete
s’ w
ere
deem
ed
‘hig
h-ri
sk’ i
f the
y di
spla
yed
a kn
ee p
ositi
on m
edia
l-to-
the-
toe
duri
ng la
ndin
g.[8
5]
No
spec
ific
cut-
off v
alue
s fo
r at
-ris
k at
hlet
es’ w
as
iden
tifie
d fo
r the
2D
-Cam
M
etho
d.
Ath
lete
s’ e
xhib
iting
six
or
mor
e fla
wed
tech
niqu
es (i
.e.
a sc
ore
of s
ix o
r abo
ve)
duri
ng th
e Tu
ck Ju
mp
Ass
essm
ent s
houl
d be
ta
rget
ed fo
r fur
ther
tr
aini
ng.[8
6]
Add
ition
al
equi
pmen
t re
quir
ed
Tw
o di
gita
l vid
eo
cam
eras
a 3
0 cm
jum
p-bo
x A
sses
smen
t she
et[9
1, 9
4]
31
cm ju
mp-
box
Tap
e m
easu
re
Sca
les
Isok
inet
ic te
stin
g de
vice
b T
wo
digi
tal v
ideo
cam
eras
V
ideo
ana
lysi
s so
ftwar
e N
omog
ram
she
et[9
0]
31
cm ju
mp-
box
Dig
ital v
ideo
cam
era[8
5]
One
dig
ital v
ideo
cam
era
Vid
eo a
naly
sis
softw
are[9
2]
Ass
essm
ent s
heet
D
igita
l cam
erab
Tw
o di
gita
l vid
eo
cam
eras
b[86
, 415
]
Add
ition
al
trai
ning
re
quir
ed
Acc
urat
e sc
orin
g ha
s be
en
repo
rted
by
‘nov
ice’
rate
rs
(one
hou
r of t
rain
ing)
co
mpa
red
to ‘e
xper
t’ ra
ters
(fi
ve y
ears
’ exp
erie
nce)
.[94]
N
o fu
rthe
r ind
icat
ions
on
trai
ning
requ
irem
ents
wer
e id
entif
ied.
No
indi
catio
ns o
n tr
aini
ng
requ
irem
ents
wer
e id
entif
ied.
20-m
inut
e tr
aini
ng v
ideo
s w
ere
supp
lied
to ra
ters
; and
te
n m
inut
es w
as a
lloca
ted
to
revi
ew in
stru
ctio
ns a
nd
exam
ine
prac
tice
exam
ples
pr
ior t
o in
itial
ratin
g se
ssio
ns.[8
5]
No
indi
catio
ns o
n tr
aini
ng
requ
irem
ents
wer
e id
entif
ied.
The
requ
irem
ent
of p
revi
ous
expe
rien
ce in
di
gitiz
ing
land
mar
ks is
ex
pres
sed
by th
e de
velo
pers
.[92]
No
indi
catio
ns o
n tr
aini
ng
requ
irem
ents
wer
e id
entif
ied.
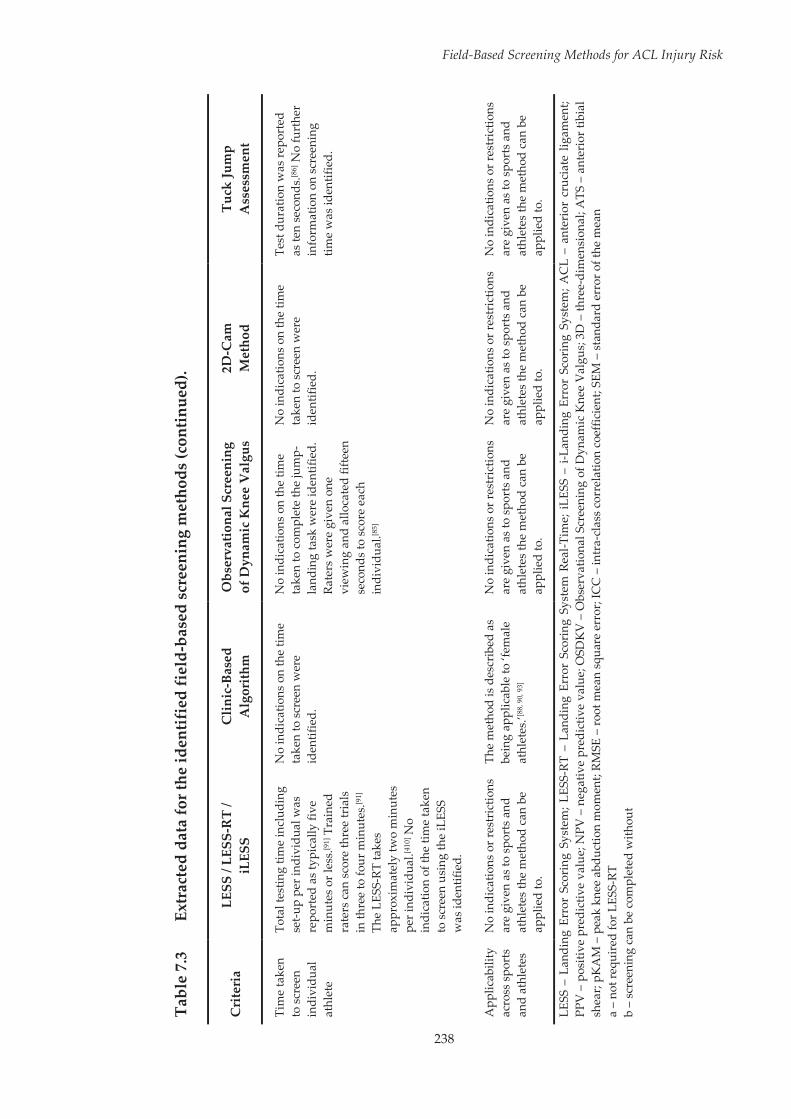
238
Field-Based Screening Methods for ACL Injury Risk
Tabl
e 7.
3 Ex
trac
ted
data
for t
he id
entif
ied
fiel
d-ba
sed
scre
enin
g m
etho
ds (c
ontin
ued)
.
Cri
teri
a LE
SS /
LESS
-RT
/ iL
ESS
Clin
ic-B
ased
A
lgor
ithm
O
bser
vatio
nal S
cree
ning
of
Dyn
amic
Kne
e V
algu
s 2D
-Cam
M
etho
d Tu
ck Ju
mp
Ass
essm
ent
Tim
e ta
ken
to s
cree
n in
divi
dual
at
hlet
e
Tota
l tes
ting
time
incl
udin
g se
t-up
per i
ndiv
idua
l was
re
port
ed a
s ty
pica
lly fi
ve
min
utes
or l
ess.
[91]
Tra
ined
ra
ters
can
sco
re th
ree
tria
ls
in th
ree
to fo
ur m
inut
es.[9
1]
The
LESS
-RT
take
s ap
prox
imat
ely
two
min
utes
pe
r ind
ivid
ual.[4
10] N
o in
dica
tion
of th
e tim
e ta
ken
to s
cree
n us
ing
the
iLES
S w
as id
entif
ied.
No
indi
catio
ns o
n th
e tim
e ta
ken
to s
cree
n w
ere
iden
tifie
d.
No
indi
catio
ns o
n th
e tim
e ta
ken
to c
ompl
ete
the
jum
p -la
ndin
g ta
sk w
ere
iden
tifie
d.
Rate
rs w
ere
give
n on
e vi
ewin
g an
d al
loca
ted
fifte
en
seco
nds
to s
core
eac
h in
divi
dual
.[85]
No
indi
catio
ns o
n th
e tim
e ta
ken
to s
cree
n w
ere
iden
tifie
d.
Test
dur
atio
n w
as re
port
ed
as te
n se
cond
s.[8
6] N
o fu
rthe
r in
form
atio
n on
scr
eeni
ng
time
was
iden
tifie
d.
App
licab
ility
ac
ross
spo
rts
and
athl
etes
No
indi
catio
ns o
r res
tric
tions
ar
e gi
ven
as to
spo
rts
and
athl
etes
the
met
hod
can
be
appl
ied
to.
The
met
hod
is d
escr
ibed
as
bein
g ap
plic
able
to ‘f
emal
e at
hlet
es.’[8
8, 9
0, 9
3]
No
indi
catio
ns o
r res
tric
tions
ar
e gi
ven
as to
spo
rts
and
athl
etes
the
met
hod
can
be
appl
ied
to.
No
indi
catio
ns o
r res
tric
tions
ar
e gi
ven
as to
spo
rts
and
athl
etes
the
met
hod
can
be
appl
ied
to.
No
indi
catio
ns o
r res
tric
tions
ar
e gi
ven
as to
spo
rts
and
athl
etes
the
met
hod
can
be
appl
ied
to.
LESS
– L
andi
ng E
rror
Sco
ring
Sys
tem
; LES
S-RT
– L
andi
ng E
rror
Sco
ring
Sys
tem
Rea
l-Tim
e; i
LESS
– i
-Lan
ding
Err
or S
cori
ng S
yste
m; A
CL
– an
teri
or c
ruci
ate
ligam
ent;
PPV
– p
ositi
ve p
redi
ctiv
e va
lue;
NPV
– n
egat
ive
pred
ictiv
e va
lue;
OSD
KV
– O
bser
vatio
nal S
cree
ning
of D
ynam
ic K
nee
Val
gus;
3D
– th
ree-
dim
ensi
onal
; ATS
– a
nter
ior t
ibia
l sh
ear;
pKA
M –
pea
k kn
ee a
bduc
tion
mom
ent;
RMSE
– ro
ot m
ean
squa
re e
rror
; IC
C –
intr
a-cl
ass
corr
elat
ion
coef
ficie
nt; S
EM –
sta
ndar
d er
ror o
f the
mea
n a
– no
t req
uire
d fo
r LES
S-RT
b
– sc
reen
ing
can
be c
ompl
eted
with
out
Field-Based Screening Methods for ACL Injury Risk
239
7.4 Discussion
The ability to identify athletes at-risk for future ACL injury is of great
importance across all levels of sport. Screening methods that can be completed
in a field setting provide a valuable option for those in the wider community
without access to laboratory-based equipment. The purpose of this review was
to evaluate and compare current field-based screening methods for ACL
injury risk to determine their applicability of use in wider community settings.
Field-based screening methods had limited predictive validity in identifying
athletes at-risk of ACL injury. Differences between screening methods
surrounding the equipment required, time taken to screen athletes, and
applicability across varying sports and athletes were identified. The data
presented within this review can be used to determine which screening
method may be the best option or more applicable for use in field or clinical
settings, or with specific athlete populations
7.4.1 Appropriateness for Intended Use
7.4.1.1 Alignment with Constructs of Interest
An important consideration when evaluating a screening method is that the
constructs or criteria assessed align with the constructs of interest.[394] In the
context of screening for ACL injury risk, effective screening methods will
target movement strategies or techniques that contribute to increases in ACL
load or injury risk. All identified versions of the LESS included a number of
screening criteria related to movement strategies or techniques that have been
proposed to increase ACL injury risk. These scoring criteria include reduced
sagittal plane joint motion (e.g. reduced trunk, hip and knee flexion); and
increases in knee abduction, lateral trunk motion and internal/external
Field-Based Screening Methods for ACL Injury Risk
240
rotation of the shank; all of which have been linked to increases in ACL
loading or injury risk.[20-23, 25, 160, 372] Additional criteria, such as altered stance
width and symmetry of foot contact, while less clearly linked to increases in
ACL loading or injury risk may still provide relevant information pertaining
to an individuals’ injury risk. A wider stance has been shown to increase knee
valgus moments during side-step cutting manoeuvres,[167, 304] and may be
applicable in identifying ACL injury risk. However, this effect has only been
identified in unilateral cutting manoeuvres and may not be present in the
bilateral drop vertical jump task used within the LESS. An asymmetrical foot
contact is proposed to place a greater load on the initial landing limb and may
be indicative of an out-of control or off-balance landing,[410] a factor associated
with ACL injury occurrences.[99] Importantly, the LESS screening criteria
attempts to acknowledge the multiplanar mechanism of ACL injury[33] by
including criteria pertaining to sagittal, frontal and transverse plane
biomechanics.[91]
The Clinic-Based Algorithm predicts the probability for high peak knee
abduction moments during landing as an indication of injury risk.[87, 90] The
individual measures used to calculate this appear well supported through the
literature.[89, 90, 149, 160, 304, 417-419] High peak knee abduction moments during
landing have been prospectively identified as a predictor of ACL injuries,[160]
therefore field-based measures that can estimate this are relevant to
identifying ACL injury risk. Tibial length, knee valgus and knee flexion range
of motion during landing, body mass, and QuadHam ratio make up the values
used to calculate the probability of high knee loading.[87, 88, 90] In isolation, these
measures have been proposed as mechanisms for ACL injury, or linked to
increases in knee abduction moments or ACL loads during landing or cutting
movements. [90, 149, 160, 304, 417-419] Importantly, the combination of these measures
Field-Based Screening Methods for ACL Injury Risk
241
within the algorithm has been shown to predict knee abduction moments
during landing with high sensitivity and specificity.[90, 93] It must be noted that
the Clinic-Based Algorithm was established to identify the increase in peak
knee abduction moments associated with pubertal female development.[90]
Particular maladaptations that occur during puberty, such as deficits in
strength and power relative to growth and development are more evident in
females than males.[418, 420] The application of the Clinic-Based Algorithm to a
male cohort is, therefore, not recommended.[88]
Both the OSDKV and 2D-Cam methods focus on a single factor in measuring
injury risk, namely ‘dynamic valgus’ or frontal plane knee motion.[85, 92] This is
likely due to the notion that ‘dynamic valgus’ positions have been shown to
significantly increase ACL loads,[20-23] are often associated with ACL injury
occurrences,[98, 99, 159] and have been identified as a significant predictor of ACL
injuries.[160] While ‘dynamic valgus’ is an important contributor to ACL injury
risk,[160] this is only one factor in a complex problem. Evidence suggests ACL
injuries occur via a multiplanar mechanism,[33] and motion from more
proximal segments (i.e. the trunk and hip) are important when considering
ACL injury risk.[166, 167, 372, 421] The use of two-dimensional methods in
quantifying ‘dynamic valgus’ should also be interpreted with caution.
Dynamic valgus can stem from a combination of three-dimensional
movements at the trunk, hip, knee and ankle.[160, 162, 372] Increased frontal plane
knee motion or a knee position medial-to-the-toe can result from hip
adduction and internal rotation, and do not necessarily indicate greater valgus
positions.[422, 423] The use of two-dimensional measures focused solely on the
knee may be inadequate in evaluating ‘dynamic valgus.’
The scoring criteria used within the Tuck Jump Assessment are proposed to
identify landing technique deficiencies relating to ligament dominance,

Field-Based Screening Methods for ACL Injury Risk
242
quadriceps dominance, leg dominance or residual injury deficits, trunk
dominance, and technique perfection.[413] Deficiencies in these areas are
indicative of neuromuscular imbalances that can lead to increases in knee joint
loads and subsequently increase ACL injury risk.[424] Ligament dominance
manifests in an inability to control dynamic knee valgus when landing and
cutting, and is therefore a factor in ACL injury risk.[424] The high effort required
in the tuck jump movement may reveal technique deficiencies and the
magnitude of frontal plane knee motion may be useful in identifying ligament
dominant athletes.[424] There appears to be a disconnect between the remaining
scoring criteria and the technique deficiencies they target. No empirical
support was found for the use of the proposed scoring criteria in identifying
quadriceps dominance (i.e. excessive landing contact noise), leg dominance or
residual injury deficits (i.e. unequal thighs side-to-side; foot placement not
parallel; and unequal foot contact timing), or trunk dominance (i.e. thighs
reaching parallel; pauses between jumps; and does not land in the same
footprint) in athletes. Further, no suggested link between maintaining perfect
tuck jump technique across the ten seconds and ACL injury risk was
identified. Validation linking tuck jump technique deficiencies to ACL injury
risk factors is required before this method can be recommended for ACL injury
risk screening purposes.
7.4.1.2 Theoretical and Empirical Support
Another important consideration when determining the efficacy of screening
methods is whether the format and content of the screening method have been
validated.[394] A number of the identified screening methods had been
evaluated against 3D laboratory-based measures to validate their use. Poor
LESS scores (i.e. indication of increased injury risk) were associated with
reduced hip and knee flexion; greater knee abduction and hip adduction
Field-Based Screening Methods for ACL Injury Risk
243
angles; greater hip and knee internal rotation, hip extension and adduction,
and knee abduction moments; and greater anterior tibial shear forces during
the performance of a bilateral drop vertical jump task.[91] These results support
the use of the LESS as an ACL injury risk screening method, as all of these
biomechanical variables have been proposed as risk factors for ACL
injury.[20-22, 26, 29, 121, 149, 160, 162, 167, 191, 425]
Both the OSDKV and 2D-Cam Method were assessed against 3D measures of
knee valgus. The validity of the OSDKV method was determined by
comparing the allocation of individuals to high- and low-risk groups between
3D motion analysis and three raters using the screening method.[85] Compared
to 3D analysis, raters were able to allocate individuals to these groups with
sensitivity and specificity values of 67-87% and 60-72%, respectively.[85] While
specificity values were considered adequate for screening purposes, the
sensitivity of raters was considered inadequate, with up to a third of truly
high-risk individuals being missed.[85] A knee position medial-to-the-toe is not
always indicative of 3D knee abduction[422] and this may be why some truly
high-risk individuals were missed. The 2D-Cam Method showed good
agreement with laboratory-based measures of frontal plane knee motion
during the side-step and side-jump, but not the shuttle run task.[92] The
developers suggested this may be due to the positioning of the athlete relative
to the camera used to digitise joint centres.[92] During both the side-step and
side-jump tasks, the frontal plane of the athlete’s body remains relatively
parallel to the camera during the stance phase of the movement; with this not
being the case during the shuttle run task.[92] This highlights a limitation of the
2D-Cam Method, with this method likely only applicable to athletic tasks
where the frontal plane remains in full view of the camera through the analysis
phase of the motion.

Field-Based Screening Methods for ACL Injury Risk
244
While certain screening methods showed good agreement with laboratory-
based measures, these studies tended to utilise generic athletic tasks
performed bilaterally (e.g. drop vertical jump landings) to validate the
method.[88, 90, 91, 93, 94] This potentially stems from the majority of the screening
methods using generic bilateral jump-landing tasks (e.g. drop vertical jump-
landings, repeat tuck jumps) in assessing ACL injury risk.[85-87, 91, 94, 409] The
specificity of these movements to ACL injury risk could be considered
questionable, with previous research showing these generic tasks do not
adequately represent those seen in a competitive sporting environment,[95, 96]
and noncontact ACL injuries are more common during unilateral landing or
plant-and-cut manoeuvres.[97-99] In addition, injuries occur more frequently in
competitive match environments compared to in training.[1] Considering these
factors, it is important that screening methods for ACL injury risk can identify
athletes who perform unilateral sporting manoeuvres with high-risk lower
limb biomechanics. The incorporation of more ecologically valid or unilateral
movement tasks within injury risk screening protocols may achieve this. For
example, unplanned side-stepping more closely emulates a competitive
environment and the potential ACL injury mechanism by limiting decision
time and increasing knee loading.[247] Screening of this movement task could
yield more valuable information pertaining to an individuals’ level of ACL
injury risk. However, a number of factors pertaining to technique can
influence important biomechanical measures of injury risk during more sport-
specific movements.[166, 167, 304] The need to examine these additional factors may
increase the complexity of screening, increasing the analysis and time burdens
involved. Exposing athletes’ to a potentially high-risk task for the purpose of
injury risk screening may also be undesirable for coaches. Simplistic
movement tasks that better replicate the biomechanics of sport-specific
movements may be the most applicable for injury risk screening. It is yet to be

Field-Based Screening Methods for ACL Injury Risk
245
determined whether any of the screening methods examined within this
review are valid in identifying athletes who perform more sport-specific
movements in a way that may influence their level of injury risk. Future
examination against laboratory-based measures acquired from sport-specific
movements known to cause ACL injury may aid in identifying whether certain
screening methods are more appropriate for specific sports or sporting
movements.
7.4.1.3 Population Fit
It is helpful to examine whether a screening method is designed for the
population of interest.[394] Screening methods for ACL injury risk should be
most applicable to athletes participating in sports which involve a high
frequency of cutting and landing tasks, as these sports tend to incur the highest
rates of injury.[1] For the majority of screening methods examined, very few
restrictions on the sports or athletes to which they could be applied to were
identified. Both the LESS and Tuck Jump Assessment were accompanied by
general descriptions, such as; an “assessment tool for detecting poor jump-
landing mechanics,”[91] and an assessment for the “identification of lower
extremity landing technique flaws,”[86] respectively. This suggests these
methods may be applicable for screening athletes in sports where any form of
high risk jump-landing movements are present. There is evidence to support
the use of the LESS in a wide range of athlete populations, with the method
being utilised in both male and female military cadets,[91, 426] and collegiate[94]
and youth athletes[427] of varying sports. The LESS may be more effective in a
youth athlete population, where it appears to have some predictive value in
identifying future ACL injuries.[104] The same was not found for an older group
of high school and collegiate athletes,[105] suggesting this screening method
may not be as effective across different populations. While the Tuck Jump

Field-Based Screening Methods for ACL Injury Risk
246
Assessment has been used to examine both male and female athletes,[256] the
method has not been as widely applied to a range of populations. It is therefore
difficult to assess whether this method is more or less effective across a range
of populations. The 2D-Cam method had only been applied to a cohort of
collegiate male and female basketball athletes, and was only successful in
measuring the side-step and side-jump tasks.[92] While these are general
athletic tasks, caution may be required if applying this method to athlete
cohorts or sports where athletic manoeuvres differ from those examined.
Two of the screening methods identified, the OSDKV and Clinic-Based
Algorithm, had only been used to examine female athletes.[85, 87, 88, 90] This is
likely due to the sex bias associated with ACL injuries, and thus the
subsequent focus on female athletes in research examining ACL injury risk.
While the Clinic-Based Algorithm had only been applied to female athletes, it
is important to highlight that the method was specifically designed for and is
only applicable to this sex.[87, 88, 90] The method has been utilised to examine
athletes across multiple sports,[88-90, 412] however, the focus has tended to be on
a youth athlete population.[88-90] Considering this method was developed and
validated using a cohort of female adolescent athletes (aged 14.0 ± 2.5 years),[88]
it appears application of the Clinic-Based Algorithm outside of this population
may be unwarranted. The evidence suggests different screening methods may
be more or less applicable to different populations. Consideration must
therefore be given to the specific population being examined to determine
which screening method may be the most applicable in a given situation.
Field-Based Screening Methods for ACL Injury Risk
247
7.4.2 Technical Adequacy
7.4.2.1 Test-Retest (Intra-Rater) and Inter-Rater Reliability
The test-retest (intra-rater) and inter-rater reliability of screening methods are
important to ensure accurate screening can be undertaken over time and by
different assessors.[394] The majority of screening methods examined reported
acceptable levels of intra- and inter-rater reliability.[85, 86, 91, 94, 105, 256, 410, 412] An
exception to this were the reliability values reported by Dudley et al.[414] for the
Tuck Jump Assessment method, with intra- and inter-rater reliability ranging
from ‘poor’ to ‘moderate.’ Reliability values did, however, improve upon a
second scoring session suggesting there may be a learning effect with the Tuck
Jump Assessment screening method. Additional information or training may
also be required for accurate Tuck Jump Assessment scores to be assessed. This
could be a reason why the reliability values reported by Herrington et al.[256]
were much higher, as the testers within this study may have had greater
experience or knowledge in using the screening method. Both intra- and inter-
rater reliability are important features for injury risk screening methods.
Screening methods can be used to monitor changes in injury risk over time,
therefore consistency in interpretation and scoring is required to ensure
variations represent true differences and not errors in application. This
becomes especially pertinent if various raters are performing subsequent
analyses on an athlete, where variation between raters may result in erroneous
interpretation of injury risk. The distinct and specific scoring criteria used
within the majority of the screening methods examined[85, 86, 91, 409, 410] is likely to
play a role in the acceptable levels of reliability reported. Giving users specific
instructions and/or scoring criteria leaves less room for subjective
interpretation, thus creating less error between subsequent analyses or
different raters. Screening methods which incorporate clear and easy to

Field-Based Screening Methods for ACL Injury Risk
248
understand scoring/rating criteria will be more applicable for use in wider
community settings.
7.4.2.2 Predictive Validity
The most important indicator of a screening methods technical adequacy is the
ability to accurately distinguish between those who will and will not sustain
an injury.[394] Of the screening methods included in this review, only the Clinic-
Based Algorithm and LESS had been prospectively evaluated against future
ACL injury occurrences.[104, 105, 412] Goetschius et al.[412] applied the Clinic-Based
Algorithm to a population of female high school and college athletes, and
determined there was no relationship between the risk of suffering an ACL
injury and the predicted peak knee abduction moment obtained from the
screening method. However, the developers of the screening method
expressed concerns regarding this study, suggesting factors such as the jump-
landing protocol utilised, the lack of use of shoes during testing, and the
absence of control over foot/ankle separation during the jump-landing task
may invalidate these results.[411] Another factor to consider may be the
population examined by Goetschius et al.[412]. As the Clinic-Based Algorithm
was developed and validated against a youth female athlete population (aged
14.0 ± 2.5 years),[88] the inclusion of older female athletes (high school and
collegiate athletes; age range 15-22) may have influenced its predictive ability.
While the Clinic-Based Algorithm was unsuccessful in predicting future ACL
injuries, it has been shown to predict high peak knee abduction moments (>
21.74 Nm) with high sensitivity (77%) and specificity (71%) in female athletes
during a bilateral drop vertical jump task.[87, 93] As previously mentioned, a
higher peak knee abduction moment is a significant predictor of future ACL
injury.[160] The ability to distinguish between female athletes demonstrating
‘high’ and ‘low’ peak knee abduction moment during landing via a field-based
Field-Based Screening Methods for ACL Injury Risk
249
screening method may be useful in identifying athletes at-risk of sustaining an
ACL injury. It is, however, important to note that the Clinic-Based Algorithm
has only been shown to predict high peak knee abduction moments in the
same cohort from which the algorithm was developed. Validation against
multiple relevant cohorts is an important step in establishing the efficacy of
screening methods.[428] Further validation of this method may be required
before more widespread use can be recommended.
Results from the LESS have also been shown to have no relation to future ACL
injury status in a population of female high school and collegiate athletes.[105]
In contrast, the LESS may have some capacity to identify athletes at-risk for
future ACL injury in a youth soccer population.[104] Padua et al.[104] found a
LESS score of five or above identified athletes who went on to incur an ACL
injury with sensitivity and specificity values of 86% and 64%, respectively. The
positive and negative predictive values for the LESS in identifying ACL
injuries were low (1.4%) and high (99.8%), respectively.[104] The positive
predictive value (PPV) of any ACL screening method is likely to be low due to
rate of ACL injuries being quite low, even among high-risk populations.[104]
This low PPV would result in a number of low-risk individuals labelled as
high-risk. Considering the consequences associated with ACL injuries and that
low-risk individuals may also benefit from neuromuscular training, the
benefits of identifying all truly high-risk individuals likely outweighs the costs
associated with misclassification of those who are at a low-risk of ACL injury.
The conflicting results with regard to the predictive validity of the LESS when
applied to different age groups and sporting populations is further evidence
that different screening methods may be more or less applicable to different
populations or sports. Examination of screening methods across a range of
populations of different ages and sports appears necessary.

Field-Based Screening Methods for ACL Injury Risk
250
7.4.3 Usability
7.4.3.1 Balance of Costs and Benefits
The main costs associated with employing screening methods in wider
community settings pertains to the equipment and time requirements. An
important aspect in ensuring screening methods are applicable for wider
community use is the requirement for minimal equipment. The need for
minimal equipment is an important element for coach and athlete compliance
to ACL injury prevention programs,[392] and is likely a key factor in promotion
and compliance of injury risk screening as well. Nearly all of the screening
methods identified required minimal additional equipment to complete. The
need for a single or two digital video cameras in combination with a jump-
landing box was a requirement of the LESS/iLESS[91, 409] and OSDKV[85]
methods; while the 2D-Cam Method required a single digital video camera
and video analysis software to analyse results.[92] While not required, the use
of a digital camera or digital video cameras to capture the athlete’s jump-
landing technique is suggested and have been used for the Tuck Jump
Assessment.[86, 256, 413] The use of cameras to capture an athlete’s jump-landing
technique during screening may improve the accuracy and consistency of the
screening method, as it allows the assessor to view the technique multiple
times and pause or slow down the movement. However, while digital cameras
have become more affordable in recent years, the need for this piece of
equipment may still present access issues, particularly within youth or
community level sport. Considering the growth in mobile technologies (i.e.
smart phones, tablets) and digital applications as a means to promote injury
prevention strategies,[429, 430] the development or incorporation of screening
methods with these mobile technologies may provide an opportunity to
extend the scope of injury risk screening. Two of the screening methods

Field-Based Screening Methods for ACL Injury Risk
251
identified, the real-time version of the LESS (LESS-RT)[410] and Tuck Jump
Assessment[86] combat the need for digital cameras by the assessor performing
the screening in real-time. While this may increase difficulty; these real-time
screening methods may also be a valid option in settings where access to
equipment, in particular to digital video cameras, is limited.
In comparison to the other methods identified, the Clinic-Based Algorithm has
a much greater reliance on additional equipment. This is not surprising, as the
Clinic-Based Algorithm employs a greater number of measures to determine
an athlete’s level of injury risk. While this may enhance the ability of the
method to identify at-risk athletes, it may be impractical for users in certain
settings. One aspect that may limit the use of this screening method is the need
for an isokinetic device to assess quadriceps-to-hamstring strength
(QuadHam) ratio.[87, 88, 90] It was noted that where an isokinetic device is
unavailable, an equation is provided incorporating the athlete’s mass to attain
a surrogate value for the QuadHam ratio.[87, 89] However, it is suggested that
the prediction algorithm is best utilised with QuadHam ratios achieved via
direct measurement.[87] Whether the surrogate value is used or not, the extra
equipment and number of measures recorded may make the Clinic-Based
Algorithm a less valid option in settings where minimal equipment or time is
available for athlete screening.
Another important feature of field-based screening methods is the time
required to screen athletes. In many cases, athlete screening is undertaken
during group sessions with a number of athletes present. Screening methods
that can be completed quickly and implemented into large scale team
screening sessions may be more beneficial. The LESS was the only screening
method examined which reported a specific time frame in which athlete
screening may be completed. Testing time (including set-up) for the originally
Field-Based Screening Methods for ACL Injury Risk
252
developed LESS, utilising video footage for scoring, was reported as taking
five minutes or less per subject.[91] A trained rater was reported as being able
to score an athlete’s trials in approximately three to four minutes.[91] With this
added to the testing time, the total time to screen an athlete using the LESS
appears to be approximately ten minutes. The LESS-RT requires less time to
complete, with the real-time method reportedly taking approximately two
minutes per athlete.[410] No indication was given for the time taken using the
iLESS format. Considering this variation was developed to simplify and
shorten the screening process and only requires the evaluation of one jump-
landing trial,[409] it could be assumed that this method would take less time to
complete than the other LESS variations.
The developers of the 2D-Cam method acknowledge there are relatively
lengthy processing requirements inherent in this approach,[92] suggesting this
method may be impractical where time constraints are present. With regard to
the OSDKV method, raters were given a single viewing of the athlete’s jump-
landing technique, followed by 15-seconds to give their rating.[85] While this is
relatively fast, it does not take into account the more time consuming process
of filming athletes performing the jump-landing task. Considering the ratings
can be given at a later stage, the two processes could be blocked and performed
separately (i.e. viewing footage and rating a group of athletes together at a
later time). Thus, this method could be practical for use when screening a large
group of athletes. The Clinic-Based Algorithm is suggested to simplify the
time associated with laboratory analysis for determining peak knee abduction
moment.[87, 89] However, considering the additional number of measures
required, it is likely this method would take longer to complete than the other
screening methods examined in this review. The Clinic-Based Algorithm may
be more practical in a setting where little to no time constraints are placed on
Field-Based Screening Methods for ACL Injury Risk
253
injury risk screening, or where individual screening is being undertaken.
Lastly, the simplistic manner in which the Tuck Jump Assessment can be
undertaken and scored in real-time suggests it could be completed in a short
time frame. Considering athletes can be observed and scored while
performing repeat tuck jumps for ten seconds,[86] it is quite possible this
method could be completed in one or two minutes per athlete. An increase in
the time taken to complete the Tuck Jump Assessment would be seen if digital
cameras were used to screen the athlete’s jump-landing technique. As there is
considerable variation in the time required for each of the screening methods,
this may be an important factor in determining the most appropriate method
to employ in a given setting.
7.4.3.2 Feasibility of Administration
In a wider community context, screening for ACL injury risk is likely to be
undertaken by individuals with a broad range of qualifications. Instructions,
examples, or the training accompanying the screening method should
therefore be clear for the user to ensure accurate application.[394] Many of the
screening methods identified presented no specific guidelines for the type or
amount of training required, with some simply claiming the method was easy
to employ. No specific training guidelines were identified for the 2D-Cam
Method, however it was suggested that previous experience in digitising
landmarks may be necessary,[92] potentially rendering the method impractical
in certain settings. No guidelines for training were also identified for the Tuck
Jump Assessment. This method, however, did claim to be ‘clinician/coach
friendly’[86, 415] implying limited previous knowledge or training is required to
complete the screening protocol. While for the most part, the scoring criteria
relating to the Tuck Jump Assessment is simplistic, certain terminology (such
as ‘lower extremity valgus’) may be difficult to interpret by those

Field-Based Screening Methods for ACL Injury Risk
254
inexperienced in screening jump-landing technique. The visual aid provided
with this screening tool, containing images of mistakes to look for in jump-
landing technique[86, 413] could assist in rectifying any confusion surrounding
terminology. The Clinic-Based Algorithm also provided no guidelines for
additional training, however, many of the measures used within this method
are simplistic and would be familiar to the majority of clinicians (e.g. height,
body mass, tibia length). Others, such as QuadHam ratio, and knee valgus and
flexion motion, may again be difficult for coaches inexperienced in injury risk
screening of athletes to easily understand and complete. It is important to note
that an attempt to employ the Clinic-Based Algorithm by a group outside of
the developers[412] was highlighted as having methodological errors that
would likely have influenced results.[411] If certain aspects of the method are
difficult to perform, and the accuracy of the algorithm relies on all aspects
being undertaken correctly, further instructions or training guidelines may be
beneficial to assist those wishing to use this method for athlete screening.
Indications as to the level of training required to be competent in the LESS and
OSDKV methods were identified. Onate et al.[94] compared the scoring
responses between an ‘expert’ (co-developer of the screening method) and
‘novice’ rater using the LESS. The ‘novice’ was provided with a one-hour
training session, which consisted of reviewing each of the LESS scoring items
and conducting a practice analysis of an athlete with the help of an ‘expert’
rater.[94] This one-hour session was sufficient for producing excellent reliability
between ‘novice’ and ‘expert’ LESS scores.[94] While it is likely not feasible for
an ‘expert’ rater to provide training to everyone who wishes to use the LESS,
the fact that a short period of training can produce reliable scores is
encouraging. If this information could be successfully transferred to a more
widespread communicable medium (such as a web-based training video),
Field-Based Screening Methods for ACL Injury Risk
255
there is the potential for uptake and accurate use of the LESS in wider
community settings. The use of video for training purposes is not a foreign
concept for ACL injury risk screening, with this technique employed to train
raters on how to undertake the OSDKV method.[85] Raters were provided with
a 20-minute training video that included background information on ACL
injury risk factors, detailed rating instructions and footage of athletes for
practice analyses.[85] In addition, prior to the rating session, ten-minutes was
spent reviewing the rating instructions and performing additional practice
ratings.[85] While sensitivity targets (> 80%) for identification of ‘high-risk’
athletes were rarely met by the three raters; consistent agreement was seen
between raters, and the specificity of ratings was considered adequate for field
screening purposes (60-72%).[85] It is important to note that the three raters
used in this study were physiotherapists with at least five years of experience,
and a high level of sports and orthopaedic expertise.[85] It may be the case that
additional training or instruction is required when inexperienced users are
performing the injury risk screening. Nonetheless, there is promising evidence
that competency in injury risk screening can be achieved via a short (e.g. one-
hour) training period. Providing this training in an easily accessible and
readily available form may increase the uptake and use of screening methods
via improved understanding and knowledge.
7.4.3.3 Utility of Outcomes
Perhaps the most important factor when determining the usability of a
screening method is whether the outcomes and implications from the method
can be clearly understood and used to guide further intervention.[394]
Dichotomous classification systems (i.e. ‘high-risk’ or ‘low-risk’), such as those
seen within the OSDKV and iLESS methods,[85, 409] could be considered the
simplest outcome with regard to ACL injury risk screening. The simplicity of
Field-Based Screening Methods for ACL Injury Risk
256
this classification presents certain benefits, particularly in wider community
settings. First, a simple decision of ‘high-’ or ‘low-risk’ reduces the analysis
burden on those undertaking screening. Second, the implications and
subsequent intervention associated with these outcomes are easily understood
(e.g. all individuals classified as ‘high-risk’ require subsequent intervention).
However, this simplicity may create issues in accurately classifying difficult
cases. With only two categories available, those individuals deemed as
borderline ‘high-risk’ may be incorrectly classified resulting in reduced
sensitivity. This was identified as a potential limitation by the developers of
the OSDKV method, and it may be beneficial to err on the side of caution by
allocating borderline cases to the ‘high-risk’ group.[85] As mentioned earlier,
the benefits of identifying all truly high-risk individuals likely outweigh the
costs associated with misclassification of certain low-risk individuals.
In contrast, the majority of screening methods (i.e. LESS, LESS-RT, Clinic-
Based Algorithm, 2D-Cam Method and Tuck Jump Assessment) used
continuous measures in classifying an individuals’ level of ACL injury risk.[86,
87, 90-92, 410] These included the use of scores (LESS, LESS-RT and Tuck Jump
Assessment),[86, 91, 410] risk probabilities (Clinic-Based Algorithm)[87, 90] and joint
angles (2D-Cam Method).[92] These continuous measures allow individuals to
be classified on a risk continuum, counteracting one of the limitations
associated with a dichotomous classification system. Of those that used these
continuous measures, higher values/scores were suggested to indicate greater
ACL injury risk.[86, 87, 90-92, 410] This is useful in a comparative context, where
athletes’ receiving higher scores can be identified as at greater risk of injury. It
is important that these measures are coupled with recommendations as to
what the results signify or at what stage intervention is required. The LESS
and Tuck Jump Assessment methods were accompanied with such

Field-Based Screening Methods for ACL Injury Risk
257
recommendations, where scores of five or above[104] and six or above[86] on the
respective methods are given as points where intervention is required. The
Clinic-Based Algorithm provides a probability percentage of whether the
individual will exhibit a high knee abduction moment during landing,[87, 88, 90]
however there is no indication as to what point on this probability scale
intervention is required. While a percentage is an easy value to understand,
the interpretation of what is classified as ‘high-risk’ and where to intervene
appears to remain up to the user. Similarly, the 2D-Cam Method indicates that
greater frontal plane knee angles are indicative of increased risk,[92] but also
provides no indication as to when this is reaching high-risk levels. The need
for subjective interpretation of results may make these methods less applicable
in certain wider community contexts where limited knowledge about what
constitutes high-risk performance is present.
It is important to acknowledge that only screening methods specific to ACL
injury risk were included within this review. It is possible that other field-
based screening methods developed for lower limb injury or injuries to the
knee in general may also be useful in screening for ACL injury risk. Two
studies[397, 405] that examined screening methods for general lower limb injury
were excluded from this review. Chorba et al.[397] examined whether the
Functional Movement Screen (FMSTM) could be used to predict injuries in a
population of female collegiate athletes. A FMSTM score of 14 or less resulted
in a 4-fold increase in lower limb injury risk.[397] The specific types of lower
limb injuries sustained were not reported, therefore it is difficult to determine
the application of this method to ACL injuries specifically. Brumitt et al.[405]
examined the utility of standing long jump, single-leg hop for distance, and
lower extremity functional tests in identifying collegiate athletes at higher risk
of injury. Female athletes who completed the lower extremity functional test
Field-Based Screening Methods for ACL Injury Risk
258
with a higher score were six times more likely to sustain a thigh or knee injury,
and were four times more likely to suffer a foot or ankle injury if they exhibited
greater than a 10% side-to-side asymmetry between single-leg hop
distances.[405] The specifics of knee injuries sustained were also not reported in
this study, again making it difficult to determine the application to ACL injury.
Nonetheless, it appears there is some validity in utilising screening methods
to identify general lower limb or area specific injury risk. Screening for lower
limb injury or injuries to the knee in general may also be a viable and time
efficient option for injury risk screening in wider community settings.
However, given the traumatic nature and consequences associated with ACL
injuries, it remains important to be able to identify the individuals at greater
risk for this specific injury.
7.5 Conclusions
This study found limited evidence supporting the predictive ability of field-
based screening methods in identifying future ACL injuries. The LESS was
predictive of ACL injuries in a youth athlete population,[104] however this result
did not transfer to a high school and collegiate athlete cohort.[105] The Clinic-
Based Algorithm was validated against a biomechanical measure that has been
identified as a significant predictor of ACL injuries (i.e. peak knee abduction
moment). However, this method requires extensive additional equipment and
time to complete and has only been validated in young (14-15 years old)
female athletes. The Clinic-Based Algorithm may be limited in its application
to a range of settings and athlete populations. The variants of the LESS appear
to be the most applicable community wide screening methods as the scoring
criteria target movement strategies associated with increases in ACL load or
injury risk, and minimal equipment and set-up/analysis time is required.
Field-Based Screening Methods for ACL Injury Risk
259
While the Tuck Jump Assessment requires minimal equipment and time to
undertake, further research linking deficiencies in tuck jump technique to
movement strategies that increase ACL loading or injury risk is required
before this method can be recommended. Limited studies were available
pertaining to the OSDKV and 2D-Cam Method, thus it is difficult to
recommend the use of these screening methods in evaluating ACL injury risk.
Differences between screening methods surrounding the equipment required,
time taken to screen athletes, and applicability across varying sports and
athletes were identified. These are important factors in determining the most
appropriate screening method to use in various situations. Further research is
required to determine the predictive ability of these screening methods in
identifying injuries, as well as their ability to identify athletes who perform
more sport-specific movements with high-risk lower limb biomechanics. This
may allow for a better identification as to which screening methods may be
more applicable to certain athletes, sports or athletic manoeuvres. The data
presented within this review can be used to determine which screening
method may be the best option or more applicable for use in certain settings,
or with specific athlete populations.

260
Chapter Eight: Efficacy of Field-Based Anterior Cruciate Ligament Injury Risk Screening Methods in Identifying High-Risk Landing Postures during a Sport-Specific Task
Adapted from: Fox AS, Bonacci J, McLean SG, Saunders N. Efficacy of ACL injury
risk screening methods in identifying high-risk landing patterns during a sport-
specific task. Scand J Med Sci Sports. doi: 10.1111/sms.12715.
8.1 Introduction
Laboratory-based measures (e.g. three-dimensional motion analysis, force
plates) are capable of estimating segment motions and joint kinetics during
athletic tasks, providing an option to evaluate movement strategies that may
predispose an athlete to anterior cruciate ligament (ACL) injury. This
approach requires extensive laboratory-based equipment and training to
complete, thus is likely inaccessible for the majority of the wider community.
To combat this, field-based screening methods for identifying ACL injury risk
have emerged.[431] The field-based screening methods examined in the
previous chapter, namely the variants of the Landing Error Scoring System
(LESS);[91, 409, 410] Clinic-Based Algorithm;[87, 90] Observational Screening of
Dynamic Knee Valgus (OSDKV);[85] 2D-Cam Method;[92] and Tuck Jump
Assessment;[86] propose to offer a simplistic method to identify dysfunction in
an individual that may lead to ACL injury. Limited research was available
pertaining to the OSDKV and 2D-Cam methods, while the significant
Screening and High-Risk Landing Postures
261
equipment required for the Clinic-Based Algorithm suggests this method may
not be applicable for use across all settings. In contrast, the LESS and Tuck
Jump Assessment have received significant attention in recent
literature,[86, 91, 94, 104, 256, 410, 413, 414] and have minimal equipment and time costs
associated with their use. These methods appear applicable for the majority of
wider community settings and will therefore be the focus of this chapter.
In order for an ACL injury risk screening method to be effective, it must be
linked to the mechanical aetiology of ACL injuries. Noncontact ACL injuries
are most frequently observed during unilateral sporting manoeuvres, such as
side-step cutting or landing.[97-99, 103, 432] Screening methods that are efficacious
in identifying athletes who employ movement strategies that increase ACL
loading and injury risk during these high-risk sporting tasks are likely to be
the most effective in detecting athletes at-risk of ACL injury. Both the LESS
and Tuck Jump Assessment appear to address key biomechanical components
of ACL injury risk in evaluating jump-landing technique.[86, 91, 94, 413] Despite this,
there is conflicting evidence regarding the predictive validity of ACL injury
risk screening methods in identifying ACL injuries.[431] While no prospective
studies have incorporated the Tuck Jump Assessment method, two
studies[104, 105] have examined the predictive ability of the LESS in identifying
future ACL injuries. LESS scores were capable of identifying elite youth soccer
athletes at-risk of future ACL injury with 86% and 64% sensitivity and
specificity, respectively.[104] In contrast, no relationship between future ACL
injury occurrences and LESS scores was found within a cohort of high school
and collegiate athletes from a range of sports.[105] The populations examined
across these studies differed in age, gender and the sports played, suggesting
these may be important factors in the ability of screening methods to identify
athletes at-risk of ACL injury. Currently, the design and validation of the LESS

Screening and High-Risk Landing Postures
262
and Tuck Jump Assessment screening methods have focused on identifying
high-risk movement strategies during generic, non-sport-specific bilateral
athletic tasks that are not typically associated with ACL injury
occurrences.[86, 91, 94] Previous work has shown these generic tasks do not
adequately represent those seen in a competitive sporting environment.[95, 96]
In addition, noncontact ACL injuries occur almost exclusively during
unilateral landing or plant-and-cut manoeuvres.[97, 99, 103] The efficacy of an ACL
injury risk screening method may be dependent on its capacity to identify
those who perform unilateral sporting manoeuvres associated with ACL
injuries with high-risk lower limb biomechanics. Currently, neither the LESS
or Tuck Jump Assessment have been evaluated for their ability to identify
lower limb biomechanics associated with increases in ACL loads or injury risk
during sport-specific manoeuvres known to cause ACL injury. Understanding
the efficacy of these screening methods in identifying athletes who are
potentially at greater risk of ACL injury during the performance of high-risk
sporting tasks will aid in determining the applicability of these methods to
specific sports or sporting movements.
The purpose of this study was to examine the efficacy of two field-based
screening methods for ACL injury risk in identifying lower limb biomechanics
consistent with increased ACL loading or injury risk during a high-risk sport-
specific landing task. Specifically, this study aimed to: (i) examine whether
increases in LESS/Tuck Jump Assessment scores were associated with the
presence of lower limb biomechanics associated with ACL loading and injury
risk; and (ii) examine the applicability of previously recommended LESS/Tuck
Jump Assessment cut-off scores for identifying ‘high-risk’ athletes in
identifying lower limb biomechanics consistent with increased ACL loading
and injury risk. Due to the generic bilateral nature of the screening

Screening and High-Risk Landing Postures
263
movements, it was hypothesised that the scores obtained would have no
relationship to the lower limb biomechanics from the sport-specific high-risk
sporting task. Subsequently, the cut-off scores would not be successful in
identifying ‘high-risk’ athletes.
8.2 Methodology
The majority of the methods employed in this study are comprehensively
outlined in Chapter Three. The following methods are an abridged version of
the sections specific to this chapter.
8.2.1 Participants
Thirty-two female netball players (age = 23.2 ± 3.1 years; height = 170.9 ± 7.7
cm; mass = 67.6 ± 8.2 kg; netball experience = 12.47 ± 4.58 years) volunteered
and provided written consent to participate in this study. All participants met
the inclusion/exclusion criteria detailed in Section 3.2 of Chapter Three.
8.2.2 Experimental Procedures
Data from the bilateral drop vertical jump, tuck jump and netball-specific
landing task (i.e. the leap landing) as described in Section 3.3.2, 3.3.3 and 3.3.1,
respectively, performed during testing session one (i.e. baseline) were used
within this study. The order of these tasks were randomised within the testing
session across participants. Participants performed three successful trials of
the bilateral drop vertical jump task as per the LESS protocol (see Figure 8.1,
Page 265),[91] and one successful trial of the repeat tuck jump task as per the
Tuck Jump Assessment protocol (see Figure 8.2, Page 265).[86] The netball leap
landing was used as the high-risk sport-specific task within this study.
Participants performed 20 successful trials of the leap landing on a
Screening and High-Risk Landing Postures
264
predetermined ‘landing limb.’ The landing limb was determined by asking
participants which limb they would be more comfortable landing on when
catching a pass during a game. Further to this, players were given an
opportunity to trial landing on each limb to identify which they were more
comfortable landing on. Each landing trial was initiated by breaking and
accelerating from a static defender (model skeleton) from a position six-metres
from the landing area, followed by a run-up and leap landing whilst catching
a pass (see Figure 8.3, Page 265). Trials were repeated until the 20 successful
trials were recorded. Participants were allocated 60-90 seconds rest between
trials in an effort to minimise fatigue.[134, 255] Kinematic and kinetic data
collected from the participants ‘landing limb’ during all landing trials were
used within this study.

Screening and High-Risk Landing Postures
265
Figure 8.1 Sagittal view of bilateral drop vertical jump-landing task.
Figure 8.2 Sagittal view of the tuck jump task.
Figure 8.3 Sagittal view of the leap landing task.
Screening and High-Risk Landing Postures
266
8.2.3 Data Collection and Analysis
For the LESS and Tuck Jump Assessment, video data were collected as per the
procedures outlined in Section 3.4.3 of Chapter Three. Briefly, two commercial
digital video cameras (30 Hz, Mini DV MD225, Canon, Macquarie Park,
Sydney, Australia) placed 3.54 metres from a designated landing area
simultaneously recorded frontal and sagittal views of the bilateral drop
vertical jump and tuck jump tasks. Cameras were repositioned if the entire
body of the participant could not be viewed throughout the task from this
distance. The sagittal plane video camera was always placed on the side that
could view the participant’s predetermined ‘landing limb.’ Scoring for both
LESS and Tuck Jump Assessments were undertaken using ImageJ video
analysis software (US National Institutes of Health, Bethesda, MD, United
States). The same individual performed scoring for all participants.
Procedures and results for determining intra- and inter-rater reliability for
both scoring methods are outlined in a later section of this chapter (see Section
8.2.4.1, Page 272).
To score the LESS, frontal and sagittal video footage of participants’ drop
vertical jump-landing trials were assessed for movement ‘errors’ using the
LESS scoring criteria.[91, 104] The LESS involves 17 score items or ‘errors,’ with
19 being the maximum attainable score (see Table 8.1, Page 268).[91] Scoring
items are dedicated to the assessment of: lower extremity and trunk position
at initial ground contact; foot position at initial contact and the time between
initial contact and maximum knee flexion; lower extremity and trunk
movements between initial contact and maximum knee flexion; overall sagittal
plane movement; and the general perception of landing quality.[91] ‘Errors’
were allocated if the criteria was met on at least two of the three trials, and
were summed to calculate each participants’ LESS score.[91] Higher LESS scores

Screening and High-Risk Landing Postures
267
were representative of poorer jump-landing technique and used as an
indication of increased ACL injury risk.[91] Individuals who receive a LESS
score of five and above are proposed to be at greater risk of ACL injury.[104]
Therefore, participants were placed in a ‘high-’ or ‘low-risk’ group based on
whether their total LESS score met this threshold.
To score the Tuck Jump Assessment, frontal and sagittal video footage of
participants’ repeat tuck jump trial were assessed using the Tuck Jump
Assessment scoring criteria.[86, 256] Deficits in tuck jump technique are identified
via ten scoring items relating to knee and thigh motion, foot position during
landing, and plyometric technique (see Table 8.2, Page 269).[86] The number of
technique deficiencies were summed to give the participants’ Tuck Jump
Assessment score, resulting in a maximum attainable score of ten.[86] Higher
Tuck Jump Assessment scores were representative of more deficiencies in
jump-landing technique and used as an indication of increased ACL injury
risk.[86] Individuals who demonstrate six or more deficits in jump-landing
technique are proposed to be at greater risk of ACL injury.[86] Therefore,
participants were placed in a ‘high-’ or ‘low-risk’ group based on whether their
total Tuck Jump Assessment score met this threshold.
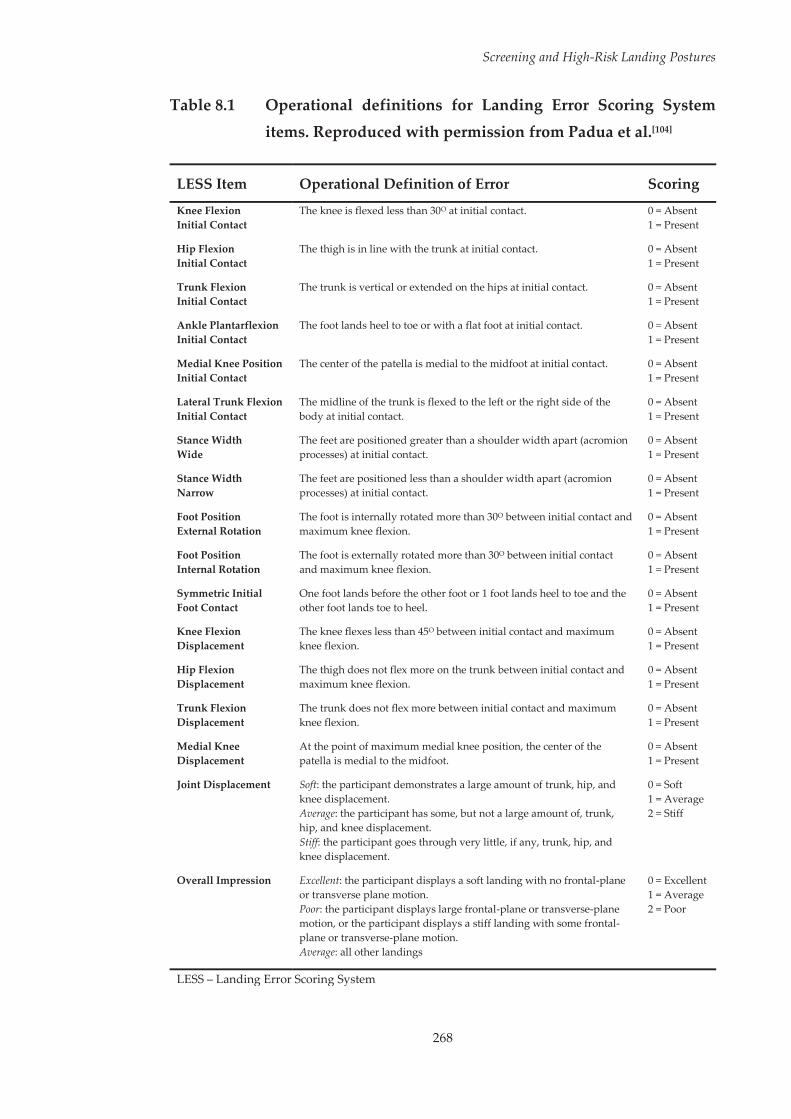
Screening and High-Risk Landing Postures
268
Table 8.1 Operational definitions for Landing Error Scoring System items. Reproduced with permission from Padua et al.[104]
LESS Item Operational Definition of Error Scoring
Knee Flexion Initial Contact
The knee is flexed less than 30O at initial contact. 0 = Absent 1 = Present
Hip Flexion Initial Contact
The thigh is in line with the trunk at initial contact. 0 = Absent 1 = Present
Trunk Flexion Initial Contact
The trunk is vertical or extended on the hips at initial contact. 0 = Absent 1 = Present
Ankle Plantarflexion Initial Contact
The foot lands heel to toe or with a flat foot at initial contact. 0 = Absent 1 = Present
Medial Knee Position Initial Contact
The center of the patella is medial to the midfoot at initial contact. 0 = Absent 1 = Present
Lateral Trunk Flexion Initial Contact
The midline of the trunk is flexed to the left or the right side of the body at initial contact.
0 = Absent 1 = Present
Stance Width Wide
The feet are positioned greater than a shoulder width apart (acromion processes) at initial contact.
0 = Absent 1 = Present
Stance Width Narrow
The feet are positioned less than a shoulder width apart (acromion processes) at initial contact.
0 = Absent 1 = Present
Foot Position External Rotation
The foot is internally rotated more than 30O between initial contact and maximum knee flexion.
0 = Absent 1 = Present
Foot Position Internal Rotation
The foot is externally rotated more than 30O between initial contact and maximum knee flexion.
0 = Absent 1 = Present
Symmetric Initial Foot Contact
One foot lands before the other foot or 1 foot lands heel to toe and the other foot lands toe to heel.
0 = Absent 1 = Present
Knee Flexion Displacement
The knee flexes less than 45O between initial contact and maximum knee flexion.
0 = Absent 1 = Present
Hip Flexion Displacement
The thigh does not flex more on the trunk between initial contact and maximum knee flexion.
0 = Absent 1 = Present
Trunk Flexion Displacement
The trunk does not flex more between initial contact and maximum knee flexion.
0 = Absent 1 = Present
Medial Knee Displacement
At the point of maximum medial knee position, the center of the patella is medial to the midfoot.
0 = Absent 1 = Present
Joint Displacement Soft: the participant demonstrates a large amount of trunk, hip, and knee displacement. Average: the participant has some, but not a large amount of, trunk, hip, and knee displacement. Stiff: the participant goes through very little, if any, trunk, hip, and knee displacement.
0 = Soft 1 = Average 2 = Stiff
Overall Impression Excellent: the participant displays a soft landing with no frontal-plane or transverse plane motion. Poor: the participant displays large frontal-plane or transverse-plane motion, or the participant displays a stiff landing with some frontal-plane or transverse-plane motion. Average: all other landings
0 = Excellent 1 = Average 2 = Poor
LESS – Landing Error Scoring System

Screening and High-Risk Landing Postures
269
Table 8.2 Operational definitions for Tuck Jump Assessment items. Reproduced with permission from Myer et al.[86]
Tuck Jump Assessment Scoring Items Scoring
Is there knee valgus on landing? Are the hip, knee and foot aligned with no inward knee collapse?
0 = No Valgus 1 = Valgus Present
Do the thighs reach parallel at the peak of the jump? 0 = Parallel Thighs 1 = Thighs not Parallel
Are the thighs equal side-to-side during the flight phase of the jump? 0 = Equal Thighs 1 = Unequal Thighs
Are the feet placed shoulder width apart? 0 = Shoulder Width 1 = Narrow
Are the feet placed parallel front-to-back? 0 = Feet Parallel 1 = Feet not Parallel
Is foot contact timing equal? 0 = Symmetrical Contact 1 = Asymmetrical Contact
Is there a consistent point of landing? Does landing occur in the same foot print? 0 = Consistent 1 = Inconsistent
Is there excessive landing contact noise? 0 = Minimal Noise 1 = Excessive Noise
Is there a pause between jumps? 0 = No Pause 1 = Pause
Does technique decline over the 10 second period? 0 = Consistent Technique 1 = Technique Declines
Kinematic and kinetic data from the leap landing task were collected and
analysed as per the procedures outlined in Section 3.4.2 of Chapter Three.
Briefly, three-dimensional (3D) kinematics and kinetics of the lower limb were
computed using an established musculoskeletal model.[305, 310] An eight camera
3D motion capture system (Vicon, Oxford Metrics Limited, Oxford, United
Kingdom) sampling at 250 Hz, synchronised with a 600 mm by 900 mm in
ground force plate (Advanced Medical Technology Incorporated, Watertown,
MA, United States) sampling at 1000 Hz collected marker trajectory and
ground reaction force (GRF) data. Marker trajectory and GRF data were low-
pass filtered using a cubic smoothing spline with a cut-off frequency of 12 Hz.
Three-dimensional hip and knee joint rotations were calculated from filtered
marker trajectory data using an X-Y-Z Cardan angles sequence; with the X, Y
Screening and High-Risk Landing Postures
270
and Z axes representing joint rotations in the sagittal, frontal and transverse
planes, respectively.[138] Kinematic data were expressed relative to each
participant’s stationary (neutral) trial.[56, 310, 311] Three-dimensional hip and knee
external joint moments were calculated by submitting the filtered marker
trajectory and GRF data to a conventional inverse dynamics analysis.[261] Joint
moments were expressed in the reference frames of the joint coordinate
systems and were normalised by dividing the total joint moment (Nm) by the
product of the participant’s weight and height (kgm). Joint rotation and
moment data were extracted from the instance of initial contact (IC) through
to 150 ms post IC across all landing trials. This time window was chosen for
biomechanical variables as ACL injuries are thought to occur within the early
deceleration phase of landing.[161]
8.2.4 Statistical Analysis
A waveform analysis, using one-dimensional statistical parametric mapping
(SPM1D) was implemented via open source code[369, 371] in Python 2.7 using
Canopy 1.5 (Enthought Incorporated, Austin, TX, United States). Specifically,
canonical correlations analysis (CCA),[362] the vector-field equivalent of SPM1D
linear regression, was used to examine the relationships between total
LESS/Tuck Jump Assessment scores and the 3D joint rotation and moment
waveform data extracted from the leap landing task. This analysis determined
the strength of the predictor variable, in this case LESS/Tuck Jump Assessment
score, at each time node across the joint rotation and moment waveforms.
Correlations between screening method scores were examined for the mean
hip and knee joint rotation (RXYZ) and joint moment (MXYZ) vector-fields from
each participants’ successful sport-specific landing trials. Planned post-hoc
analyses of joint rotation (RXY, RXZ, RYZ) and joint moment (MXY, MXZ, MYZ)
vector-field couples using CCA; and the individual joint rotation (RX, RY, RZ)

Screening and High-Risk Landing Postures
271
and joint moment (MX, MY, MZ) components using SPM1D linear regression
were also conducted.
The 3D kinematic and kinetic waveforms between ‘high-’ and ‘low-risk’
groups identified via both the LESS and Tuck Jump Assessment score
thresholds were compared using two-sample Hotelling’s T2 tests.[362]
Comparisons of ‘high-’ and ‘low-risk’ groups were undertaken for the mean
hip and knee joint rotation (RXYZ) and joint moment (MXYZ) vector-fields from
each participants’ successful landing trials. Planned post-hoc comparisons of
joint rotation (RXY, RXZ, RYZ) and joint moment (MXY, MXZ, MYZ) vector-field
couples using Hotelling’s T2 tests; and of the individual joint rotation (RX, RY,
RZ) and joint moment (MX, MY, MZ) components using SPM1D two-sample t-
tests were also conducted.
A Type I family-wise error rate of alpha = 0.05 was retained by calculating a
corrected threshold based on the number of vector components (i.e. joints = 2
and planes = 3) used for analysis.[362, 370] This correction resulted in an alpha
level of 0.0083 being used for all analyses. Subsequently, for each SPM statistic
a critical threshold was calculated at the corrected alpha level to determine
where statistically significant results were present. A statistically significant
result was identified where the SPM statistical curve exceeded this critical
threshold. A supra-threshold cluster indicated that the same result would be
produced by random curves in only 0.83% of repeated tests. The subsequent
probabilities (i.e. p-values) with which supra-threshold regions of the SPM
statistical curve could have resulted from repeated samplings of equally
smooth random curves were then calculated.

Screening and High-Risk Landing Postures
272
8.2.4.1 Intra- and Inter-Rater Reliability
High levels of intra- and inter-rater reliability have been previously
established for both the LESS and Tuck Jump Assessment methods.[86, 91, 94, 105,
256] Within this study, the same process was followed in assessing reliability for
both screening methods. A subset of ten participants’ videos were reviewed at
two time points, separated by one week to determine intra-rater (i.e. within
rater) reliability. A separate investigator also reviewed these ten participants’
videos, with scores compared across investigators to determine inter-rater (i.e.
between rater) reliability. Reliability for the individual scoring items/criterion
was assessed by calculating Cohen’s kappa (κ) in conjunction with the
percentage of exact agreement (PEA), using the equation:
Reliability of the total scores was assessed by calculating the mean difference
with 95% limits of agreement between raters.[433] For the LESS, the average PEA
and Cohen’s κ across all scoring criterion was 97.0% (κ = 0.933) (PEA range =
80.0 – 100.0%; κ range = 0.524 – 1.000) and 90.0% (κ = 0.745) (PEA range = 70.0
– 100.0%; κ range = 0.286 – 1.000) within- and between-raters, respectively. The
mean difference and 95% limits of agreement for total LESS scores were
calculated as 0.50 ± 1.03 and 0.40 ± 1.01 within- and between-raters,
respectively. For the Tuck Jump Assessment, the average PEA and Cohen’s κ
across all scoring criterion was 97.0% (κ = 0.940) (PEA range = 90.0 – 100.0%; κ
range = 0.737 – 1.000) and 84.0% (κ = 0.689) (PEA range = 70.0 – 100.0%; κ range
= 0.400 – 1.000) within- and between-raters, respectively. The mean difference
and 95% limits of agreement for total Tuck Jump Assessment scores were
calculated as 0.30 ± 0.94 and 1.00 ± 1.30 within- and between-raters,
respectively. The reliability values for both screening methods were similar to

Screening and High-Risk Landing Postures
273
those previously reported and accepted as reliable.[91, 94, 256] A full summary of
results from intra- and inter-rater reliability testing are presented in Appendix
I (see Page 417).
8.3 Results
8.3.1 LESS Results
The average LESS score across participants was 4.9 ± 2.3 (range = 0 – 9) (see
Figure 8.4). LESS scores were related to sagittal plane knee joint rotations (RX)
at 30 – 57 ms post IC (p = 0.003; see Figure 8.5, Page 274). Higher LESS scores
were associated with reduced knee flexion during this phase of the leap
landing task. CCA and SPM1D linear regression revealed no further
statistically significant relationships between LESS scores and the hip or knee
joint rotation or moment vector-field combinations or individual waveforms
from the leap landing task.
Figure 8.4 Histogram illustrating the distribution of Landing Error
Scoring System (LESS) scores across the participants
examined.
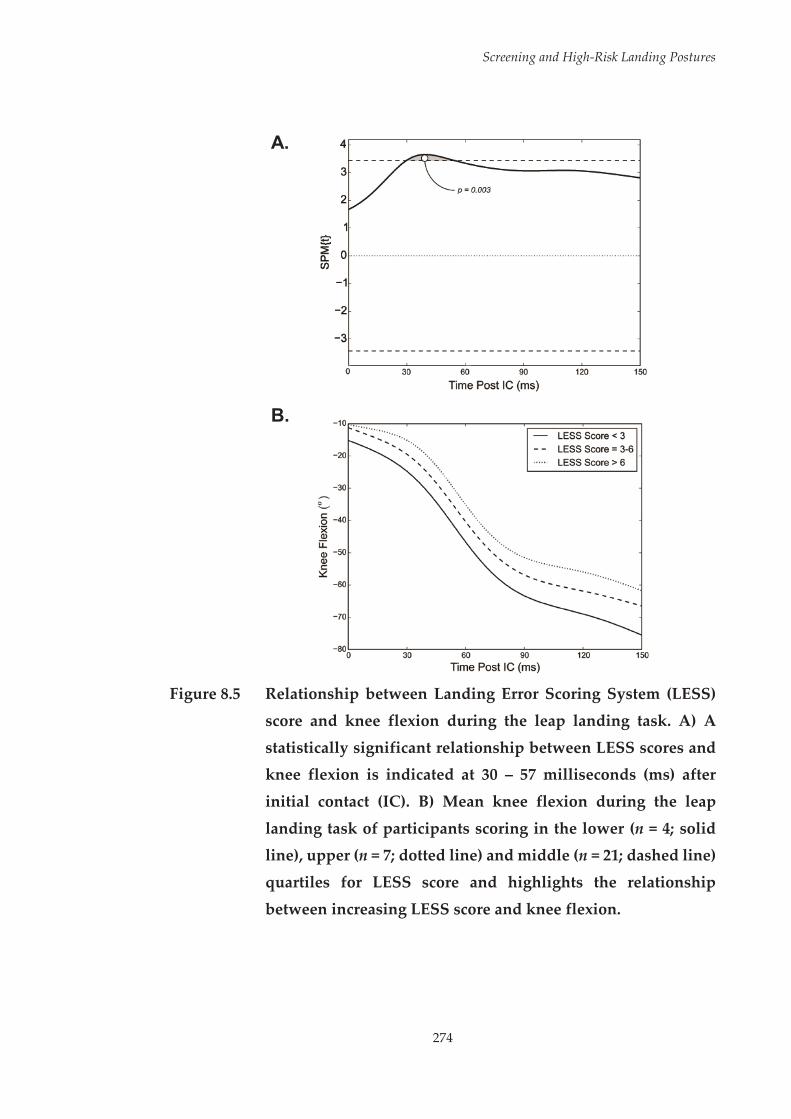
Screening and High-Risk Landing Postures
274
A.
B.
Figure 8.5 Relationship between Landing Error Scoring System (LESS)
score and knee flexion during the leap landing task. A) A
statistically significant relationship between LESS scores and knee flexion is indicated at 30 – 57 milliseconds (ms) after
initial contact (IC). B) Mean knee flexion during the leap
landing task of participants scoring in the lower (n = 4; solid line), upper (n = 7; dotted line) and middle (n = 21; dashed line)
quartiles for LESS score and highlights the relationship
between increasing LESS score and knee flexion.
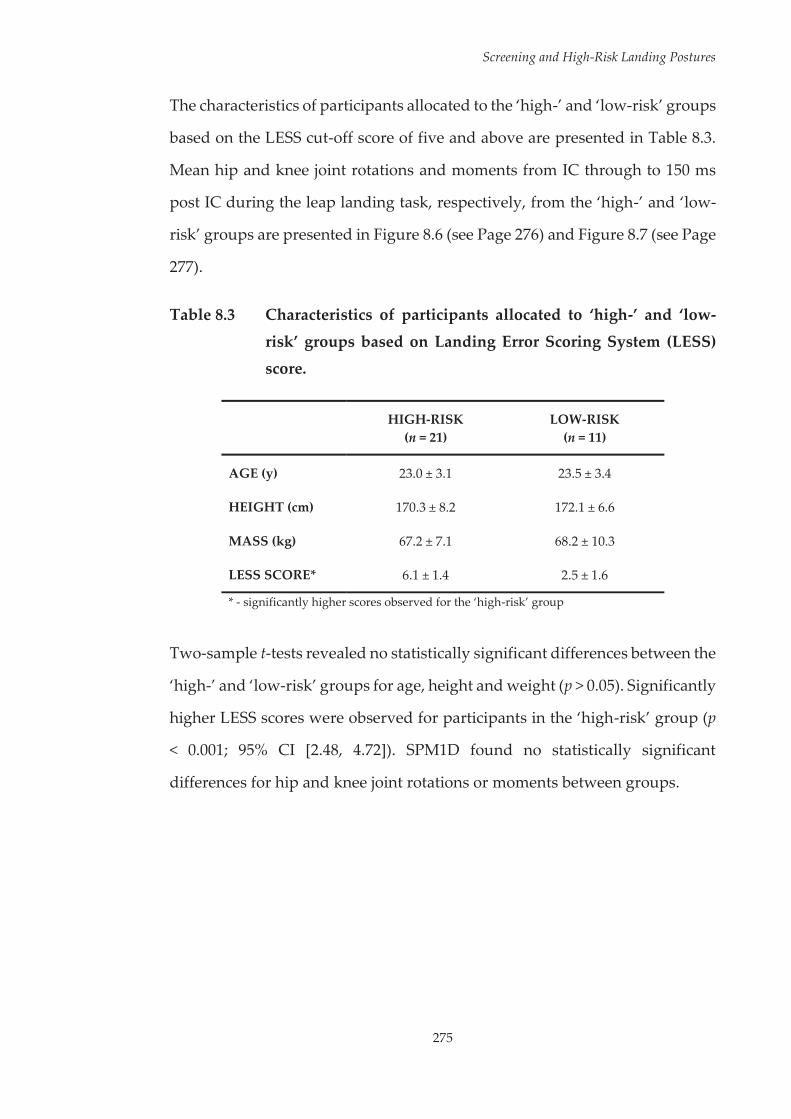
Screening and High-Risk Landing Postures
275
The characteristics of participants allocated to the ‘high-’ and ‘low-risk’ groups
based on the LESS cut-off score of five and above are presented in Table 8.3.
Mean hip and knee joint rotations and moments from IC through to 150 ms
post IC during the leap landing task, respectively, from the ‘high-’ and ‘low-
risk’ groups are presented in Figure 8.6 (see Page 276) and Figure 8.7 (see Page
277).
Table 8.3 Characteristics of participants allocated to ‘high-’ and ‘low-
risk’ groups based on Landing Error Scoring System (LESS) score.
HIGH-RISK (n = 21)
LOW-RISK (n = 11)
AGE (y) 23.0 ± 3.1 23.5 ± 3.4
HEIGHT (cm) 170.3 ± 8.2 172.1 ± 6.6
MASS (kg) 67.2 ± 7.1 68.2 ± 10.3
LESS SCORE* 6.1 ± 1.4 2.5 ± 1.6
* - significantly higher scores observed for the ‘high-risk’ group
Two-sample t-tests revealed no statistically significant differences between the
‘high-’ and ‘low-risk’ groups for age, height and weight (p > 0.05). Significantly
higher LESS scores were observed for participants in the ‘high-risk’ group (p
< 0.001; 95% CI [2.48, 4.72]). SPM1D found no statistically significant
differences for hip and knee joint rotations or moments between groups.

Screening and High-Risk Landing Postures
276
Figure 8.6 Mean hip and knee joint rotations from initial contact (IC)
through to 150 milliseconds (ms) post IC during the leap landing task of participants allocated as ‘high-’ and ‘low-risk’
based on Landing Error Scoring System (LESS) score. FLEX –
flexion; EXT – extension; ADD – adduction; ABD – adduction; IR – internal rotation; ER – external rotation.

Screening and High-Risk Landing Postures
277
Figure 8.7 Mean normalised hip and knee joint moments from initial
contact (IC) through to 150 milliseconds (ms) post IC during the leap landing task of participants allocated as ‘high-‘ and
‘low-risk’ based on Landing Error Scoring System (LESS)
score. Mom. – moment; EXT – extension; FLEX – flexion; ABD – abduction; ADD – adduction; ER – external rotation; IR –
internal rotation.
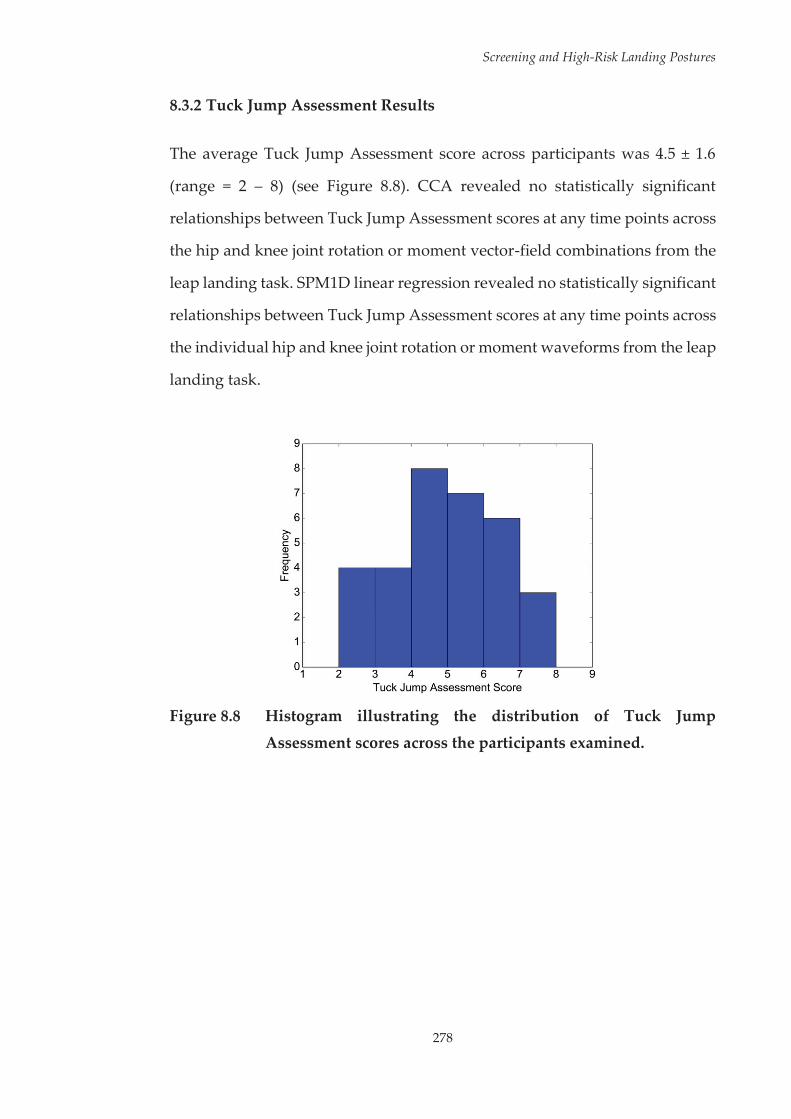
Screening and High-Risk Landing Postures
278
8.3.2 Tuck Jump Assessment Results
The average Tuck Jump Assessment score across participants was 4.5 ± 1.6
(range = 2 – 8) (see Figure 8.8). CCA revealed no statistically significant
relationships between Tuck Jump Assessment scores at any time points across
the hip and knee joint rotation or moment vector-field combinations from the
leap landing task. SPM1D linear regression revealed no statistically significant
relationships between Tuck Jump Assessment scores at any time points across
the individual hip and knee joint rotation or moment waveforms from the leap
landing task.
Figure 8.8 Histogram illustrating the distribution of Tuck Jump
Assessment scores across the participants examined.

Screening and High-Risk Landing Postures
279
The characteristics of participants allocated to the ‘high-’ and ‘low-risk’ groups
based on the Tuck Jump Assessment cut-off score of six and above are
presented in Table 8.4. Mean hip and knee joint rotations and moments from
IC through to 150 ms post IC during the leap landing task, respectively, from
the ‘high-‘ and ‘low-risk’ groups are presented in Figure 8.9 (see Page 280) and
Figure 8.10 (see Page 281).
Table 8.4 Characteristics of participants distributed to ‘high-’ and ‘low-
risk’ groups based on Tuck Jump Assessment score.
HIGH-RISK (n = 9)
LOW-RISK (n = 23)
AGE (y) 21.6 ± 2.0 23.8 ± 3.3
HEIGHT (cm) 169.1 ± 4.9 171.6 ± 8.5
MASS (kg) 67.2 ± 10.7 67.7 ± 7.3
TUCK JUMP SCORE* 6.4 ± 0.7 3.8 ± 1.1
* - significantly higher scores observed for the ‘high-risk’ group
Two-sample t-tests revealed no statistically significant differences between the
‘high-’ and ‘low-risk’ groups for age, height and weight (p > 0.05). Significantly
higher Tuck Jump Assessment scores were observed for participants in the
‘high-risk’ group (p < 0.001; 95% CI [1.86, 3.47]). SPM1D found no statistically
significant differences for hip and knee joint rotations or moments between
groups.

Screening and High-Risk Landing Postures
280
Figure 8.9 Mean hip and knee joint rotations from initial contact (IC)
through to 150 milliseconds (ms) post IC during the leap
landing task of participants allocated as ‘high-’ and ‘low-risk’
based on Tuck Jump Assessment (TJA) score. FLEX – flexion; EXT – extension; ADD – adduction; ABD – abduction; IR –
internal rotation; ER – external rotation.

Screening and High-Risk Landing Postures
281
Figure 8.10 Mean normalised hip and knee joint moments from initial
contact (IC) through to 150 milliseconds (ms) post IC during
the leap landing task of participants allocated as ‘high-’ and
‘low-risk’ based on Tuck Jump Assessment (TJA) score. Mom. – moment; EXT – extension; FLEX – flexion; ABD – abduction;
ADD – adduction; ER – external rotation; IR – internal rotation.

Screening and High-Risk Landing Postures
282
8.4 Discussion
Screening methods that can identify individuals who employ high-risk
movement strategies during sporting tasks associated with ACL injuries are
likely to be the most effective in detecting those at-risk of ACL injury. The
purpose of this study was to examine the efficacy of the Landing Error Scoring
System (LESS) and Tuck Jump Assessment screening methods in identifying
high-risk lower limb biomechanics consistent with increased or ACL loading
or injury risk during a high-risk sport-specific landing task. Minimal
relationships between lower limb biomechanics during the leap landing and
scores received from either screening method were identified, suggesting
these screening methods may not be applicable for identifying ACL injury risk
within the netball-specific context examined.
This study found no relationships between participants’ hip and knee joint
biomechanics during a netball leap landing task linked with ACL injuries and
the scores they received from the Tuck Jump Assessment screening method.
Currently there are no studies that have validated the Tuck Jump Assessment
against ACL injury occurrences or laboratory-based 3D measures. The results
of this study and the paucity of literature validating the predictive ability of
the Tuck Jump Assessment makes it difficult to recommend this method for
ACL injury risk screening purposes.
A significant relationship between LESS scores and knee flexion during the
leap landing task was identified in this study. Higher LESS scores (i.e.
suggestive of increased ACL injury risk) were associated with reduced knee
flexion during an early portion (30 – 57 ms post IC) of the landing. Limited
knee flexion during landing has been linked to higher ACL loads[25] and ACL
injuries often occur with a more extended knee.[97, 99] In addition; ACL injuries
Screening and High-Risk Landing Postures
283
are thought to occur within the early deceleration phase of landing,[161]
highlighting the importance of sufficient knee flexion during this phase. The
link between higher LESS scores and reduced knee flexion identified within
this study suggests this screening method may have some utility in identifying
high-risk movement strategies during high-risk sporting tasks. However, no
additional relationships were identified between LESS scores and hip and
knee joint rotations or moments across other planes. Injuries to the ACL are
proposed to occur via a multiplanar mechanism,[33] with frontal and transverse
plane biomechanics acknowledged as key factors in modulating ACL
loads.[20-23, 28, 32, 160] Therefore, a screening method that detects biomechanical
deficits during high-risk sporting tasks in a single plane alone may not be
efficacious in identifying athletes at greater risk of ACL injury.
The relationship between LESS scores and knee flexion is consistent with
earlier work,[91] however the absence of a relationship across other joint
rotations and moments is in contrast to the findings of others.[91, 94] Lower LESS
scores have been associated with decreased hip flexion; increased hip
adduction and knee valgus angles and moments; and increased hip and knee
internal rotation angles during bilateral drop vertical jump-landings.[91] These
contrasting findings may have resulted from the different tasks used to
evaluate the ability of LESS scores to identify high-risk landing biomechanics.
Generic bilateral landing tasks may not adequately represent the lower limb
biomechanics experienced during high-risk sport-specific manoeuvres,[95, 96]
particularly those important for evaluating ACL injury risk. Kristianslund and
Krosshaug[96] found poor correlations for knee abduction moments between
bilateral drop vertical jumps and sport-specific side-step cutting. Knee
abduction angles during bilateral drop vertical jumps were also poorly
correlated to knee abduction moments during the side-step cutting task.[96]

Screening and High-Risk Landing Postures
284
Comparison of a bilateral drop landing to a sport-specific volleyball spike
jump-landing revealed differences in landing forces and lower limb motion
and alignment.[95] Even when applied to a bilateral sporting task, generic
landing movements still may not represent what is experienced in a
competitive sporting environment.[95]
The different measurement methods used across tasks within this study may
have also played a role in the limited relationships between screening method
scores and lower limb biomechanics from the leap landing task. Three-
dimensional methods, such as those used to monitor leap landing
performance, are more reliable and sensitive to high-risk lower limb
biomechanics in comparison to the two-dimensional observational
assessments used as part of the LESS and Tuck Jump Assessment.[85] It may be
that application of three-dimensional methods to the scoring criteria of the
LESS and Tuck Jump Assessment would improve their relationship to lower
limb biomechanics from the leap landing task. As the purpose of this study
was to test the efficacy of these screening methods in the manner in which they
are intended to be used (i.e. with two-dimensional visual observation), three-
dimensional data from the bilateral drop vertical jump and tuck jump tasks
was not used. Therefore, this study cannot confirm whether the different
measurement methods used across tasks was a factor in the limited
relationships found. However, as previous work has shown that LESS scores
are sensitive to three-dimensional measures during drop vertical jump-
landings,[91, 94] it is likely that the different landing task used in this study
played a major role in the findings. Nonetheless, the limited ability of generic
bilateral landing tasks to predict lower limb postures during high-risk sport-
specific manoeuvres poses the question as to whether these tasks are
appropriate for validating ACL injury risk screening methods. Examining
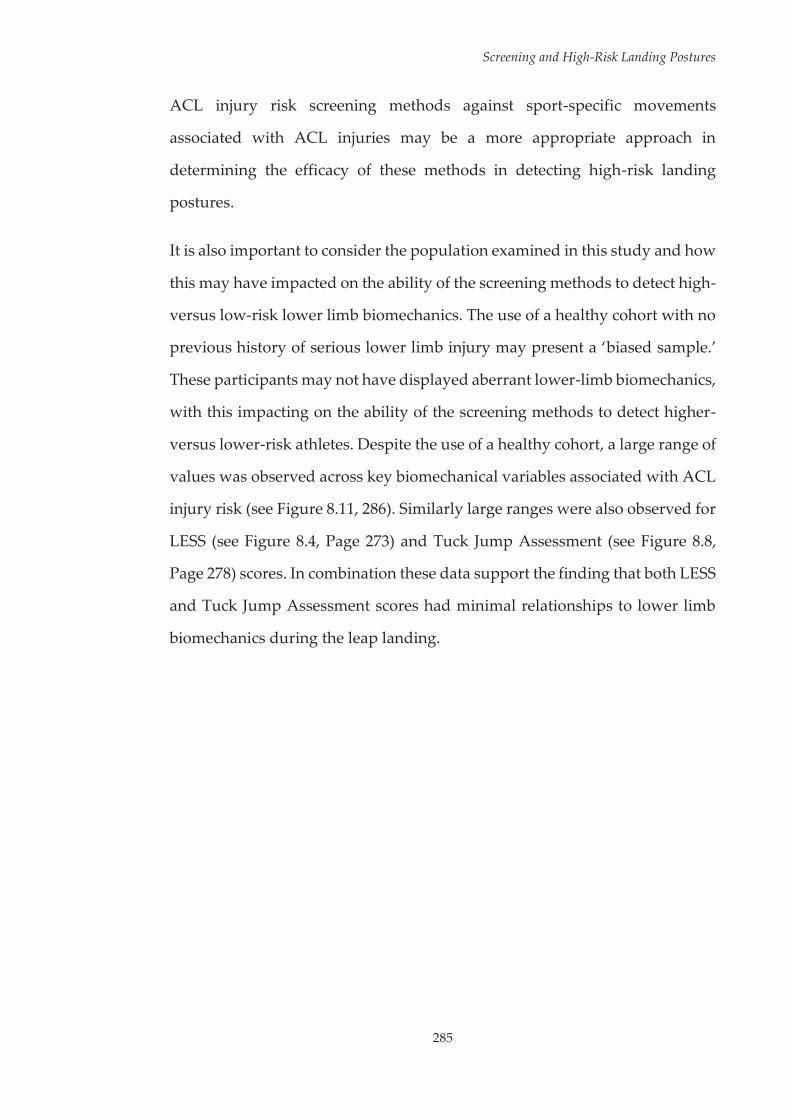
Screening and High-Risk Landing Postures
285
ACL injury risk screening methods against sport-specific movements
associated with ACL injuries may be a more appropriate approach in
determining the efficacy of these methods in detecting high-risk landing
postures.
It is also important to consider the population examined in this study and how
this may have impacted on the ability of the screening methods to detect high-
versus low-risk lower limb biomechanics. The use of a healthy cohort with no
previous history of serious lower limb injury may present a ‘biased sample.’
These participants may not have displayed aberrant lower-limb biomechanics,
with this impacting on the ability of the screening methods to detect higher-
versus lower-risk athletes. Despite the use of a healthy cohort, a large range of
values was observed across key biomechanical variables associated with ACL
injury risk (see Figure 8.11, 286). Similarly large ranges were also observed for
LESS (see Figure 8.4, Page 273) and Tuck Jump Assessment (see Figure 8.8,
Page 278) scores. In combination these data support the finding that both LESS
and Tuck Jump Assessment scores had minimal relationships to lower limb
biomechanics during the leap landing.
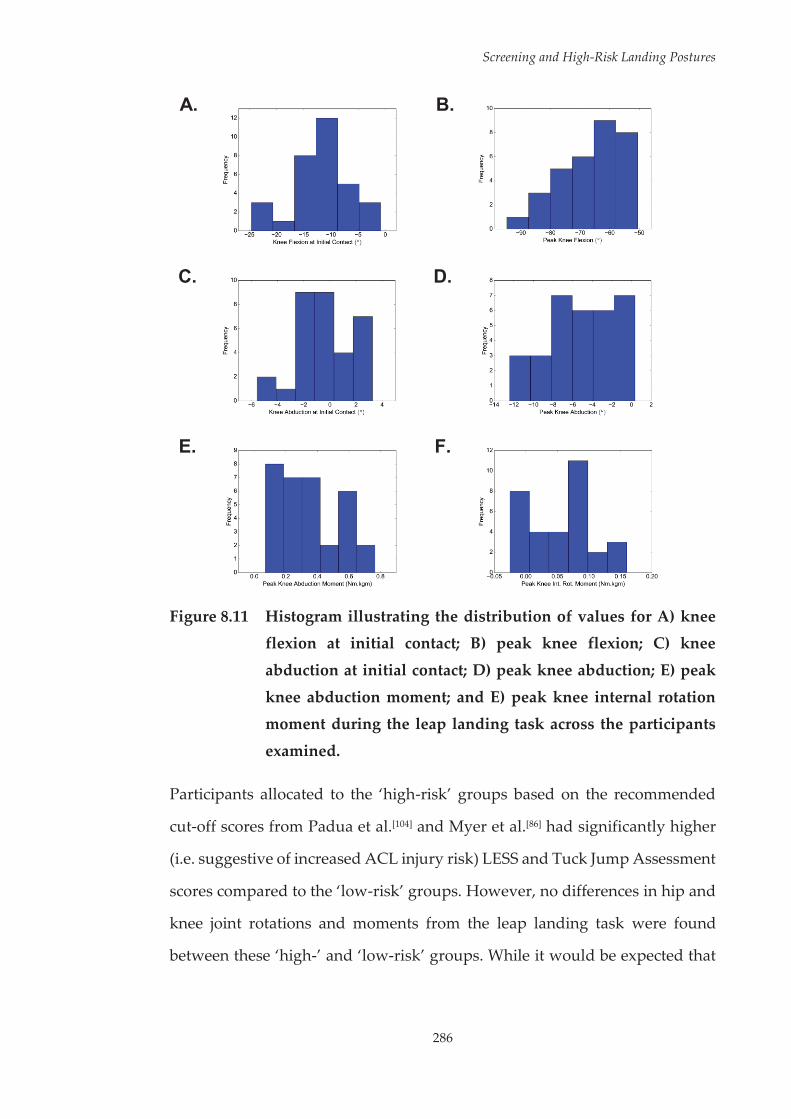
Screening and High-Risk Landing Postures
286
A.
B.
C.
D.
E.
F.
Figure 8.11 Histogram illustrating the distribution of values for A) knee flexion at initial contact; B) peak knee flexion; C) knee
abduction at initial contact; D) peak knee abduction; E) peak
knee abduction moment; and E) peak knee internal rotation moment during the leap landing task across the participants
examined.
Participants allocated to the ‘high-risk’ groups based on the recommended
cut-off scores from Padua et al.[104] and Myer et al.[86] had significantly higher
(i.e. suggestive of increased ACL injury risk) LESS and Tuck Jump Assessment
scores compared to the ‘low-risk’ groups. However, no differences in hip and
knee joint rotations and moments from the leap landing task were found
between these ‘high-’ and ‘low-risk’ groups. While it would be expected that
Screening and High-Risk Landing Postures
287
those in the ‘high-risk’ groups would exhibit biomechanical deficits associated
with ACL loading or injury risk, the cross-sectional nature of this study is a
limiting factor in determining whether the ‘high-risk’ individuals as
determined by the LESS and Tuck Jump Assessment methods were truly at a
greater risk of ACL injury. As no follow-up data pertaining to ACL injuries
was collected, these results cannot confirm that the screening methods
examined do not identify athletes’ at-risk of future ACL injury. Interestingly,
a substantially different proportion of participants were allocated to the ‘high-
’ and ‘low-risk’ groups for the two different screening methods. While almost
two-thirds of participants were considered ‘high-risk’ based on their LESS
score, a similar number of participants were deemed ‘low-risk’ based on their
Tuck Jump Assessment score (see Table 8.3, Page 275 and Table 8.4, Page 279,
respectively). Further examination revealed that agreement between the
methods for ‘high-’ and ‘low-risk’ was only found for six and eight
participants, respectively. The large number of participants deemed as ‘high-
risk’ by the LESS could suggest the cut-off value used was overly sensitive,
while the small number of participants deemed ‘high-risk’ by the Tuck Jump
Assessment could indicate the cut-off value was not sensitive enough. It may
also be that the screening methods and cut-off values used were not applicable
to the population examined. Padua et al.[104] found that LESS scores were
capable of identifying elite youth soccer athletes at-risk of future ACL injury
with 86% and 64% sensitivity and specificity, respectively. In contrast, Smith
et al.[105] found no relationship between future ACL injury occurrences and
LESS scores within a cohort of high school and collegiate athletes from a range
of sports. The populations examined across these previous studies and the
current study differ in age, gender and the sports played. This may be an
important factor in the efficacy of a screening method in identifying athletes
at-risk of ACL injury. While the mechanism for noncontact ACL injuries

Screening and High-Risk Landing Postures
288
appears consistent across sports, the tasks being performed in the lead up or
at the injury event may differ.[5, 101-103] Sport-specific variations in athletic
manoeuvres can also have a modulating effect on lower limb biomechanics.[154,
155] A ‘one-size fits all’ approach with regard to the use of screening methods,
and how cut-off values for determining injury risk are applied, across different
populations and sports may not be appropriate. A screening methods efficacy
in identifying high-risk movement strategies and/or individuals may vary
across different high-risk sport-specific tasks. Examination of screening
methods against a range of sport-specific tasks associated with ACL injuries
may be valid for identifying the most appropriate method(s) across different
sports.
Evaluating an athlete’s movement technique during more ecologically valid
tasks relevant to their sport, comparable to those seen in competitive
environments when injuries occur, is a potential strategy for improving the
efficacy of ACL injury risk screening. There are, however, advantages and
disadvantages to consider regarding this approach. Movements such as
unplanned side-stepping more closely emulate a competitive environment
and the potential ACL injury mechanism by limiting decision time and
increasing knee loading.[247] The inclusion of sport-specific factors, such as
carrying or catching a ball, have also been shown to influence knee angles and
moments during athletic manoeuvres.[154, 155] Screening athletes’ movement
technique in these more game-like situations could theoretically yield greater
details regarding their ability to avoid an injurious event in a competitive
context. However, exposing athletes’ to a potentially high-risk task for the
purpose of injury risk screening may be undesirable for coaches. In addition,
a number of factors pertaining to technique can influence important
biomechanical measures of injury risk during these tasks[304] which could

Screening and High-Risk Landing Postures
289
increase the analysis and time burdens associated with screening. Movements
that are safe to perform, and simplistic to observe and evaluate may be the
most applicable for injury risk screening. Investigating the relationships
between movement tasks that fit these criteria and high-risk sport-specific
manoeuvres could identify relevant movements for field-based ACL injury
risk screening protocols. This will be undertaken in the following chapter,
exploring the relationship between a simplistic unilateral task and a netball
leap landing in order to examine the utility of including a unilateral movement
within netball-specific ACL injury risk screening protocols.
It is important to acknowledge that this study focused on one sport-specific
manoeuvre associated with ACL injuries, namely, a netball leap landing. The
findings from this study, therefore, are only applicable to ACL injury risk
screening in the netball-specific context examined. The different landing task
examined within this study may be a potential reason for the dissimilar
findings to previous works[91, 94] that have examined the validity of screening
methods in identifying high-risk landing postures. This does, however,
highlight the need to explore the validity of screening methods against a range
of high-risk sporting tasks.
Screening and High-Risk Landing Postures
290
8.5 Conclusions
This study identified minimal relationships between lower limb biomechanics
during a netball leap landing and scores received from the LESS and Tuck
Jump Assessment ACL injury risk screening methods. These findings suggest
the LESS and Tuck Jump Assessment may not be applicable for ACL injury
risk screening in the netball-specific context examined. Exploring the
relationships between additional movement tasks and leap landings may
reveal more applicable approaches for identifying athletes’ at-risk of ACL
injury within this sport. Considering the unilateral nature of leap landings and
that the majority of noncontact ACL injuries occur via a unilateral mechanism,
screening methods incorporating unilateral movements may be more
appropriate for field-based ACL injury risk screening protocols.
291
Chapter Nine: The Relationship between Performance of a Single-Leg Squat and Leap Landing Task: Moving Towards a Netball-Specific Anterior Cruciate Ligament Injury Risk Screening Method
9.1 Introduction
Identifying athletes’ at-risk of anterior cruciate ligament (ACL) injury appears
to be an important step in effective and efficient ACL injury prevention
practice.[84] Athletes’ who demonstrate high-risk movement strategies appear
to receive the greatest improvements in biomechanical factors associated with
ACL injury following neuromuscular training.[71, 83, 84] Screening methods that
are capable of detecting athletes who utilise high-risk movement strategies
may therefore be useful in identifying those who will benefit the most from
intervention. Further, screening methods may be useful in identifying specific
biomechanical deficits that require targeting within ACL injury prevention
programs.[358] Noncontact ACL injuries occur at the highest rate in sports
which require frequent cutting and landing movements.[1] Therefore, the need
for effective ACL injury risk screening protocols within these sports is
imperative.
Netball is often recognised as a particularly high-risk sport for ACL
injuries.[234-236] Within netball, landings are often implicated as the high-risk
task for ACL injuries.[103, 238, 245] In particular, a leap landing while catching a
pass is a common task associated with noncontact ACL injuries within the
Single-Leg Squat and Leap Landings
292
sport.[103, 245] Screening methods that identify athletes who employ movement
strategies associated with ACL loading and injury risk during this type of
landing manoeuvre are likely to be the most effective in detecting netball
players at-risk of ACL injury. The previous study found two established field-
based screening methods for ACL injury risk, the Landing Error Scoring
System (LESS) and Tuck Jump Assessment, were ineffective in identifying
lower limb biomechanics consistent with increased ACL loading during a
netball-specific leap landing manoeuvre performed while catching a pass. It
was proposed that the bilateral athletic tasks (i.e. drop vertical jump-landing
and repeated tuck jumps) used within these screening methods were not
associated with the high-risk landing task examined, and was a contributing
factor to the results. The effectiveness of field-based screening methods for
ACL injury risk appears to vary across different sports and sporting
populations.[104, 105] Therefore, a ‘one-size fits all’ approach to the use of
screening methods across different sports and populations may not be
appropriate. The limited effectiveness of the LESS and Tuck Jump Assessment
methods highlighted in the previous study indicates that further exploration
of ACL injury risk screening methods in a netball-specific context is required.
Investigating athletic tasks that are better linked to leap landings may identify
more optimal movements for ACL injury risk screening within a netball-
specific context.
The single-leg squat is a simplistic, commonly used movement for assessing
lower limb function across a range of clinical contexts.[257, 434, 435] Numerous
studies have highlighted the ease of use and reliability of visual assessment of
the single-leg squat.[400, 422, 423, 434, 436, 437] Substantial agreement is often reported
within- and between-raters for visual rating criteria across a range of
movement characteristics, such as medio-lateral knee motion;[422, 437] frontal
Single-Leg Squat and Leap Landings
293
plane knee angle and alignment;[400, 423, 436] pelvis motion and alignment;[423]
frontal plane foot motion;[437] and general overall movement quality.[434, 437] A
key factor in the reliability and ease of use for visual ratings of single-leg squat
performance may be the speed of movement.[423] Faster movements, such as
drop vertical jump-landings, are more difficult to visually rate.[438] Therefore,
the speed at which the single-leg squat is performed makes it an easy
movement to visually observe. This highlights a beneficial aspect of using the
single-leg squat as a potential screening movement for field-based assessment
of ACL injury risk.
There is also evidence that movement characteristics during single-leg squats
are related to lower limb biomechanics during unilateral cutting and landing
tasks.[439, 440] Strong correlations (Pearson’s r > 0.50) have been observed
between the magnitude of frontal and transverse plane knee angular
displacement between a single-leg squat and single-leg drop landing task.[439]
Further, moderate to strong associations (r = 0.38 – 0.76) between peak hip
flexion, hip internal rotation, knee flexion and knee abduction angles between
a single-leg squat and side-step cutting task have also been observed.[440]
However, in direct contrast to these results, Stensrud et al.[441] found poor
correlations for knee abduction angle between a single-leg squat and single-
leg drop vertical jump task. Marshall et al.[439] also found no association
between hip and knee biomechanical variables when examining the
relationship between a single-leg squat and side-step cut. Methodological
inconsistencies may be a reason for these conflicting findings. The landing and
cutting tasks examined largely varied across studies, ranging from single-leg
drop vertical jumps[441] and drop landings,[439] to side-step cutting tasks
performed at 75[439] and 90 degree angles.[440] Screening for ACL injury risk
Single-Leg Squat and Leap Landings
294
using a single-leg squat may therefore only be relevant to sports where the
high-risk task(s) are associated with single-leg squat performance.
The relationship between single-leg squat performance and lower limb
biomechanics during a netball leap landing are yet to be examined. The single-
leg squat may be a particularly relevant movement for ACL injury risk
screening within a netball context. The hip and knee motion experienced
during the initial deceleration phase of leap landings, where unilateral weight
acceptance is required, closely resembles the lower limb positioning
experienced during the descent phase of a single-leg squat. Due to this,
movement dysfunctions that present during single-leg squat performance
may also present during leap landings. Should this be the case, the single-leg
squat may be a useful movement to incorporate within netball-specific field-
based ACL injury risk screening protocols.
The purpose of this study was to determine the relationship between the
performance of a single-leg squat and a netball-specific leap landing task, in
order to examine the utility of including a single-leg squat movement within
netball-specific ACL injury risk screening protocols. Specifically, this study
aimed to identify whether lower limb biomechanical patterns from a single-
leg squat task were associated with hip and knee lower limb biomechanical
patterns from a leap landing. Due to the similarities in lower limb postures
between tasks, it was hypothesised that lower limb biomechanical patterns
from the single-leg squat would be associated with hip and knee lower limb
biomechanical patterns from the leap landing task.
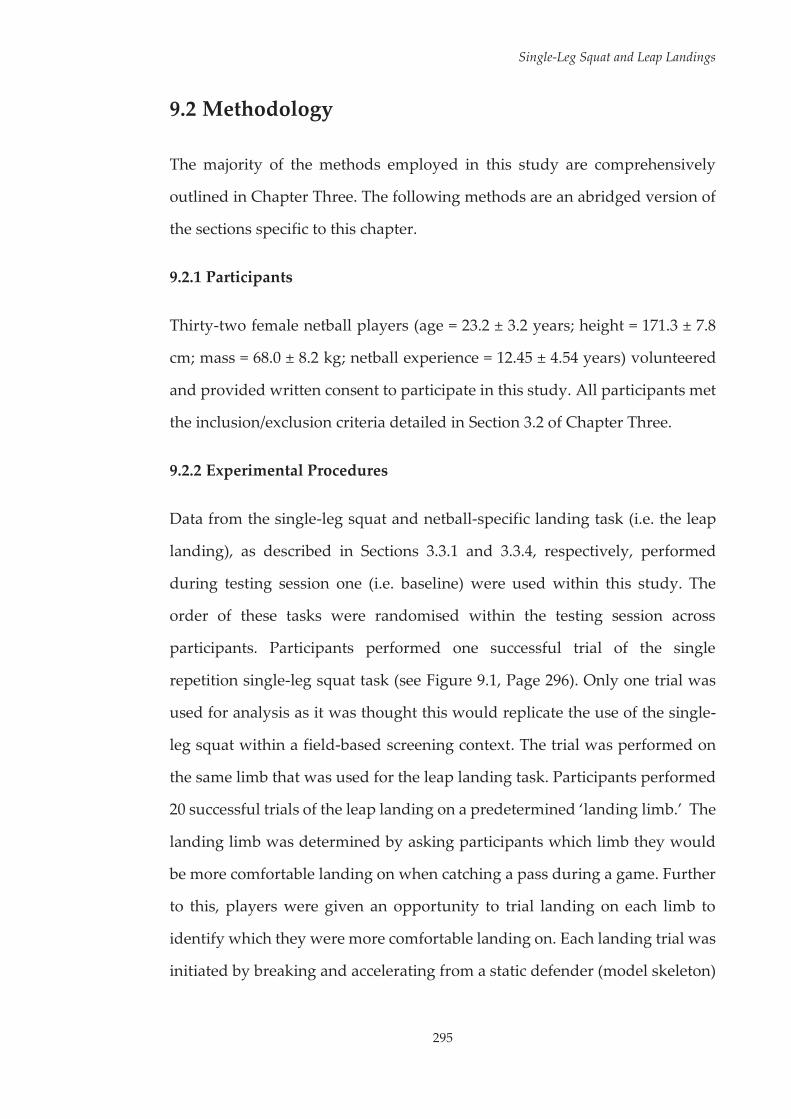
Single-Leg Squat and Leap Landings
295
9.2 Methodology
The majority of the methods employed in this study are comprehensively
outlined in Chapter Three. The following methods are an abridged version of
the sections specific to this chapter.
9.2.1 Participants
Thirty-two female netball players (age = 23.2 ± 3.2 years; height = 171.3 ± 7.8
cm; mass = 68.0 ± 8.2 kg; netball experience = 12.45 ± 4.54 years) volunteered
and provided written consent to participate in this study. All participants met
the inclusion/exclusion criteria detailed in Section 3.2 of Chapter Three.
9.2.2 Experimental Procedures
Data from the single-leg squat and netball-specific landing task (i.e. the leap
landing), as described in Sections 3.3.1 and 3.3.4, respectively, performed
during testing session one (i.e. baseline) were used within this study. The
order of these tasks were randomised within the testing session across
participants. Participants performed one successful trial of the single
repetition single-leg squat task (see Figure 9.1, Page 296). Only one trial was
used for analysis as it was thought this would replicate the use of the single-
leg squat within a field-based screening context. The trial was performed on
the same limb that was used for the leap landing task. Participants performed
20 successful trials of the leap landing on a predetermined ‘landing limb.’ The
landing limb was determined by asking participants which limb they would
be more comfortable landing on when catching a pass during a game. Further
to this, players were given an opportunity to trial landing on each limb to
identify which they were more comfortable landing on. Each landing trial was
initiated by breaking and accelerating from a static defender (model skeleton)
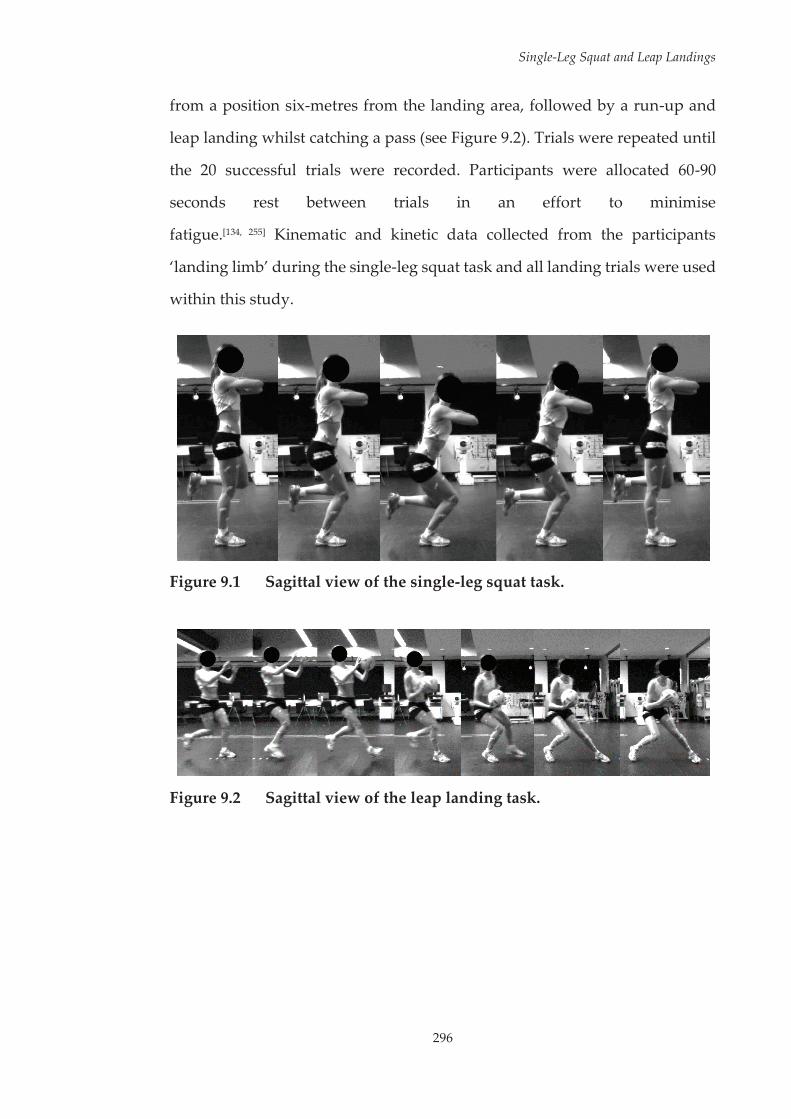
Single-Leg Squat and Leap Landings
296
from a position six-metres from the landing area, followed by a run-up and
leap landing whilst catching a pass (see Figure 9.2). Trials were repeated until
the 20 successful trials were recorded. Participants were allocated 60-90
seconds rest between trials in an effort to minimise
fatigue.[134, 255] Kinematic and kinetic data collected from the participants
‘landing limb’ during the single-leg squat task and all landing trials were used
within this study.
Figure 9.1 Sagittal view of the single-leg squat task.
Figure 9.2 Sagittal view of the leap landing task.
Single-Leg Squat and Leap Landings
297
9.2.3 Data Collection and Analysis
Kinematic and kinetic data from the single-leg squat and leap landing tasks
were collected and analysed as per the procedures outlined in Section 3.4.2 of
Chapter Three. Briefly, three-dimensional (3D) kinematics and kinetics of the
lower limb were computed using an established musculoskeletal model.[305, 310]
An eight camera 3D motion capture system (Vicon, Oxford Metrics Limited,
Oxford, United Kingdom) sampling at 250 Hz, synchronised with a 600 x 900
mm in ground force plate (Advanced Medical Technology Incorporated,
Watertown, MA, United States) sampling at 1000 Hz collected marker
trajectory and ground reaction force (GRF) data. Marker trajectory and GRF
data from the single-leg squat and leap landing tasks were low-pass filtered
using a cubic smoothing spline with cut-off frequencies of 9 and 12 Hz,
respectively. As this study aimed to identify biomechanical patterns from the
single-leg squat task that were relevant for use within a netball-specific field-
based screening method for ACL injury risk, only biomechanical patterns that
could be visually observed in this task were deemed applicable. Hence, only
kinematic data were extracted and examined from the single-leg squat task.
Three-dimensional hip, knee and ankle joint rotations were calculated for the
single-leg squat task from filtered marker trajectory data using an X-Y-Z
Cardan angles sequence; with the X, Y and Z axes representing joint rotations
in the sagittal, frontal and transverse planes, respectively.[138] Kinematic data
were expressed relative to each participant’s stationary (neutral) trial.[56, 310, 311]
Joint rotation data were extracted from the ‘squatting phase’ of the task. The
points where the musculoskeletal models centre of mass began descending
and returned to its original position defined the start and end points of the
‘squatting phase.’ These points tended to correspond with the initiation and
completion of hip and/or knee flexion, hence they were deemed as applicable

Single-Leg Squat and Leap Landings
298
points for defining the squatting movement. Extracted data from the single-
leg squat task were time-normalised to 101 data points (i.e. 0-100% of the
squatting phase). Three-dimensional hip and knee joint rotations were
calculated for the leap landing task as per the methods outlined above. In
addition, three-dimensional hip and knee external joint moments from the
leap landing task were calculated by submitting the filtered marker trajectory
and GRF data to a conventional inverse dynamics analysis.[261] Joint moments
were expressed in the reference frames of the joint coordinate systems and
were normalised by dividing the total joint moment (Nm) by the product of
the participant’s weight and height (kgm). Joint rotation and moment data
were extracted from the instance of initial contact (IC) to 150 ms post IC across
all landing trials. This time window was chosen for biomechanical variables
as ACL injuries are thought to occur within the early deceleration phase of
landing.[161]
Both one-dimensional statistical parametric mapping (SPM1D) and principal
component analysis (PCA) have been used within previous studies of this
thesis to examine joint rotation and moment data. The purpose of this study
was to examine the relationship between lower limb biomechanical patterns
from the single-leg squat and leap landing task. As PCA takes into account
features that occur over specific phases of the waveform, it was deemed as the
more appropriate choice for identifying and correlating patterns across the
two tasks. Data were exported to MATLAB (The Mathworks Incorporated,
Natick, MA, United States) for further analyses. Kinematic waveform data
extracted from the single-leg squat task were submitted to PCA to identify
lower limb biomechanical patterns during squatting performance. Patterns
were extracted for hip flexion/extension (HFLEX/EXT), adduction/abduction
(HADD/ABD), and internal/external rotation (HIR/ER); knee extension/flexion
Single-Leg Squat and Leap Landings
299
(KEXT/FLEX), adduction/abduction (KADD/ABD), and internal/external rotation
(KIR/ER); and ankle dorsiflexion/plantarflexion (ADF/PF), inversion/eversion
(AINV/EVE), and internal/external rotation (AIR/ER) joint rotations. The n number
of principal patterns (PP) that summed to explain at least 90% of the variation
in the waveform were retained and referred to as PP1, PP2, …, PPn.[276, 327] The
90% criterion was chosen as this value has been previously used when
examining lower limb biomechanical waveforms.[326, 335] Principal pattern
scores (PP-Scores) were then computed for each biomechanical pattern across
each joint rotation variable. Principal pattern interpretation was achieved by
examining the waveforms obtained by adding and subtracting a suitable
multiple of the patterns loading vector to the mean of the relevant
waveform.[333] An identical process was then followed to identify the principal
hip and knee biomechanical patterns from the leap landing task, where PCA
was applied to the extracted kinematic and kinetic data.
9.2.4 Statistical Analysis
Pearson’s correlation coefficients (r) were calculated between the PP-Scores
from the single-leg squat and leap landing to identify relationships between
the two tasks. As a number of associations were tested, a stricter alpha level of
0.01 was set for identifying statistically significant correlations.[89] The strength
of correlations was guided by Cohen[384] (weak r = 0.1; moderate r = 0.3; strong
r = 0.5). PP-Scores that were statistically significant (p < 0.01) and strongly
correlated (r > 0.50) were considered indicative of a relationship between the
two tasks.
Single-Leg Squat and Leap Landings
300
9.3 Results
Principal patterns were extracted for single-leg squat joint rotations, and leap
landing joint rotations and moments via PCA (see Table 9.1, Page 302; Table
9.2, Page 303; and Table 9.3, Page 304, respectively). A graphical display of the
patterns associated with high and low PP-scores for each PP from the single-
leg squat and leap landing tasks are provided in Appendix J (see Page 419)
and Appendix K (see Page 432), respectively. The Pearson’s correlation values
(r) between the kinematic principal patterns from the single-leg squat, and the
kinematic and kinetic principal patterns, respectively, from the leap landing
task are presented in Table 9.4 (see Page 305) and Table 9.5 (see Page 306). For
ease of interpretation, the strong statistically significant (i.e. r > 0.50; p < 0.01)
correlations are highlighted.
Hip internal rotation during the squat was associated with greater overall hip
internal rotation during landing, while hip external rotation during the squat
was associated with greater overall hip external rotation during landing. The
overall magnitude of knee flexion was related across the two tasks, whereby
greater knee flexion during the squat was associated with greater knee flexion
during landing. The timing of peak knee flexion during the squat was
associated with prolonged hip flexion and the magnitude of transverse plane
hip motion during landing. Earlier onset of peak knee flexion during the squat
was related to a shortened duration of hip flexion and greater overall hip
external rotation during landing. In contrast, delayed peak knee flexion during
the squat was related to prolonged hip flexion and greater overall hip internal
rotation. Knee abduction during the squat was associated with greater overall
knee abduction and reduced knee external rotation from IC to 30 ms post IC
during landing; while knee adduction during the squat was associated with
Single-Leg Squat and Leap Landings
301
reduced knee abduction but greater knee adduction and greater knee internal
rotation from IC to 30 ms post IC. Knee internal rotation during the squat was
associated with greater overall knee internal rotation and greater knee
adduction moments during landing. Further, greater transverse plane knee
motion during the squat was associated with reduced knee external rotation
from IC to approximately 30 ms post IC, reduced hip abduction moments from
IC to approximately 30 ms post IC, and a delayed and reduced peak knee
abduction moment during landing. Greater overall ankle dorsiflexion during
the squat was associated with greater overall knee flexion during landing;
while reduced ankle dorsiflexion range of motion and delayed time to peak
ankle dorsiflexion during the squat was associated with prolonged hip flexion
and greater overall hip internal rotation during landing. Reduced ankle
eversion during the squat was associated with greater overall knee abduction,
greater overall knee internal rotation, and reduced knee adduction moments
during landing. In contrast, greater overall ankle eversion during the squat
was associated with reduced and greater overall knee adduction, respectively,
reduced overall knee internal rotation, and greater knee adduction moments
during landing.

302
Single-Leg Squat and Leap Landings
Tabl
e 9.
1 D
escr
iptio
ns o
f pri
ncip
al p
atte
rns
(PPs
) ext
ract
ed fr
om s
ingl
e-le
g sq
uat h
ip, k
nee
and
ankl
e jo
int r
otat
ion
data
.
Join
t Rot
atio
n PP
D
escr
iptio
n V
aria
nce
Expl
aine
d
HFL
EX/E
XT
1 2 G
ener
al s
hape
and
ove
rall
mag
nitu
de –
hig
her s
core
= g
reat
er o
vera
ll hi
p fle
xion
Ph
ase
shift
in ti
min
g –
high
er sc
ore
= de
laye
d pe
ak h
ip fl
exio
n 79
.3%
14
.9%
H
AD
D/A
BD
1 2 3
Gen
eral
sha
pe a
nd o
vera
ll m
agni
tude
– h
ighe
r sco
re =
gre
ater
ove
rall
hip
addu
ctio
n M
agni
tude
at ~
0-25
% a
nd ~
75-1
00%
of s
quat
– h
ighe
r sco
re =
gre
ater
hip
add
uctio
n at
~0-
25%
and
~75
-100
%
Phas
e sh
ift in
tim
ing
– hi
gher
scor
e =
earl
ier p
eak
hip
addu
ctio
n
77.8
%
10.7
%
5.9%
H
IR/E
R
1 2 G
ener
al s
hape
and
ove
rall
mag
nitu
de –
hig
her s
core
= re
duce
d ov
eral
l hip
ext
erna
l rot
atio
n M
agni
tude
of p
eaks
– h
ighe
r sco
re =
gre
ater
hip
inte
rnal
and
ext
erna
l rot
atio
n pe
aks
81.3
%
9.9%
K
EXT/
FLEX
1 2
Gen
eral
sha
pe a
nd o
vera
ll m
agni
tude
– h
ighe
r sco
re =
redu
ced
over
all k
nee
flexi
on
Phas
e sh
ift in
tim
ing
– hi
gher
scor
e =
dela
yed
peak
kne
e fle
xion
72
.9%
17
.2%
K
AD
D/A
BD
1 2 G
ener
al s
hape
and
ove
rall
mag
nitu
de –
hig
her s
core
= g
reat
er o
vera
ll kn
ee a
dduc
tion
Mag
nitu
de o
f pea
ks –
hig
her s
core
= g
reat
er k
nee
addu
ctio
n an
d ab
duct
ion
peak
s 87
.3%
5.
7%
KIR
/ER
1 2 G
ener
al s
hape
and
ove
rall
mag
nitu
de –
hig
her s
core
= g
reat
er o
vera
ll kn
ee in
tern
al ro
tatio
n M
agni
tude
of t
rans
vers
e pl
ane
knee
ang
ular
dis
plac
emen
t – h
ighe
r sco
re =
gre
ater
ang
ular
dis
plac
emen
t 84
.9%
9.
3%
AD
F/PF
1 2 3
Gen
eral
sha
pe a
nd o
vera
ll m
agni
tude
– h
ighe
r sco
re =
gre
ater
ove
rall
ankl
e do
rsifl
exio
n D
orsi
flexi
on R
OM
and
tim
e to
pea
k do
rsifl
exio
n –
high
er s
core
= re
duce
d RO
M a
nd d
elay
ed p
eak
Dor
sifle
xion
RO
M a
nd ti
me
to p
eak
dors
iflex
ion
– hi
gher
sco
re =
redu
ced
ROM
and
ear
lier p
eak
71.0
%
16.0
%
8.7%
A
INV
/EV
E 1
Gen
eral
sha
pe a
nd o
vera
ll m
agni
tude
– h
ighe
r sco
re =
redu
ced
over
all a
nkle
eve
rsio
n 91
.6%
A
IR/E
R
1 2 3 4
Gen
eral
sha
pe a
nd o
vera
ll m
agni
tude
– h
ighe
r sco
re =
redu
ced
over
all a
nkle
ext
erna
l rot
atio
n M
agni
tude
at ~
0-20
% o
f squ
at –
hig
her s
core
= re
duce
d an
kle
exte
rnal
rota
tion
at ~
0-20
%
Mag
nitu
de a
t ~75
-100
% o
f squ
at –
hig
her s
core
= re
duce
d an
kle
exte
rnal
rota
tion
at ~
75-1
00%
M
agni
tude
at ~
60-7
5% o
f squ
at –
hig
her s
core
= g
reat
er a
nkle
ext
erna
l rot
atio
n at
~60
-75%
61.3
%
13.4
%
9.1%
7.
0%
HFL
EX/E
XT
– hi
p fle
xion
/ext
ensi
on;
HA
DD
/ABD
– h
ip a
dduc
tion/
abdu
ctio
n; H
IR/E
R –
hip
int
erna
l/ext
erna
l ro
tatio
n; K
EXT/
FLEX
– k
nee
exte
nsio
n/fle
xion
; K
AD
D/A
BD –
kne
e ad
duct
ion/
abdu
ctio
n; K
IR/E
R –
kne
e in
tern
al/e
xter
nal r
otat
ion;
AD
F/PF
– a
nkle
dor
sifle
xion
/pla
ntar
flexi
on; A
INV
/EV
E –
ankl
e in
vers
ion/
ever
sion
; AIR
/ER –
ank
le in
tern
al/e
xter
nal
rota
tion;
PP
– pr
inci
pal p
atte
rn; R
OM
– ra
nge
of m
otio
n.
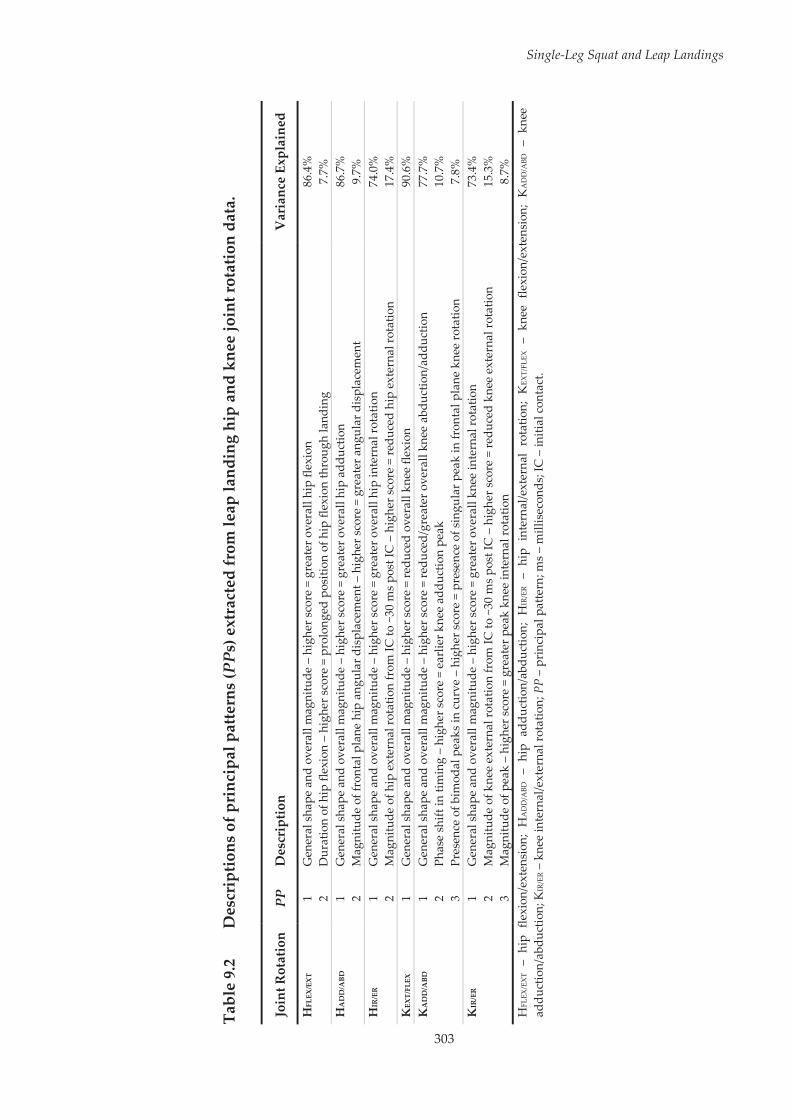
303
Single-Leg Squat and Leap Landings
Tabl
e 9.
2 D
escr
iptio
ns o
f pri
ncip
al p
atte
rns
(PPs
) ext
ract
ed fr
om le
ap la
ndin
g hi
p an
d kn
ee jo
int r
otat
ion
data
.
Join
t Rot
atio
n PP
D
escr
iptio
n V
aria
nce
Expl
aine
d
HFL
EX/E
XT
1 2 G
ener
al s
hape
and
ove
rall
mag
nitu
de –
hig
her s
core
= g
reat
er o
vera
ll hi
p fle
xion
D
urat
ion
of h
ip fl
exio
n –
high
er s
core
= p
rolo
nged
pos
ition
of h
ip fl
exio
n th
roug
h la
ndin
g 86
.4%
7.
7%
HA
DD
/ABD
1 2
Gen
eral
sha
pe a
nd o
vera
ll m
agni
tude
– h
ighe
r sco
re =
gre
ater
ove
rall
hip
addu
ctio
n M
agni
tude
of f
ront
al p
lane
hip
ang
ular
dis
plac
emen
t – h
ighe
r sco
re =
gre
ater
ang
ular
dis
plac
emen
t 86
.7%
9.
7%
HIR
/ER
1 2 G
ener
al s
hape
and
ove
rall
mag
nitu
de –
hig
her s
core
= g
reat
er o
vera
ll hi
p in
tern
al ro
tatio
n M
agni
tude
of h
ip e
xter
nal r
otat
ion
from
IC to
~30
ms
post
IC –
hig
her s
core
= re
duce
d hi
p ex
tern
al ro
tatio
n 74
.0%
17
.4%
K
EXT/
FLEX
1
Gen
eral
sha
pe a
nd o
vera
ll m
agni
tude
– h
ighe
r sco
re =
redu
ced
over
all k
nee
flexi
on
90.6
%
KA
DD
/ABD
1 2 3
Gen
eral
sha
pe a
nd o
vera
ll m
agni
tude
– h
ighe
r sco
re =
redu
ced/
grea
ter o
vera
ll kn
ee a
bduc
tion/
addu
ctio
n Ph
ase
shift
in ti
min
g –
high
er sc
ore
= ea
rlie
r kne
e ad
duct
ion
peak
Pr
esen
ce o
f bim
odal
pea
ks in
cur
ve –
hig
her s
core
= p
rese
nce
of s
ingu
lar p
eak
in fr
onta
l pla
ne k
nee
rota
tion
77.7
%
10.7
%
7.8%
K
IR/E
R
1 2 3
Gen
eral
sha
pe a
nd o
vera
ll m
agni
tude
– h
ighe
r sco
re =
gre
ater
ove
rall
knee
inte
rnal
rota
tion
Mag
nitu
de o
f kne
e ex
tern
al ro
tatio
n fr
om IC
to ~
30 m
s po
st IC
– h
ighe
r sco
re =
redu
ced
knee
ext
erna
l rot
atio
n M
agni
tude
of p
eak
– hi
gher
sco
re =
gre
ater
pea
k kn
ee in
tern
al ro
tatio
n
73.4
%
15.3
%
8.7%
H
FLEX
/EX
T –
hip
flexi
on/e
xten
sion
; H
AD
D/A
BD –
hip
add
uctio
n/ab
duct
ion;
HIR
/ER –
hip
int
erna
l/ext
erna
l ro
tatio
n; K
EXT/
FLEX
– k
nee
flexi
on/e
xten
sion
; K
AD
D/A
BD –
kne
e ad
duct
ion/
abdu
ctio
n; K
IR/E
R –
kne
e in
tern
al/e
xter
nal r
otat
ion;
PP
– pr
inci
pal p
atte
rn; m
s –
mill
isec
onds
; IC
– in
itial
con
tact
.
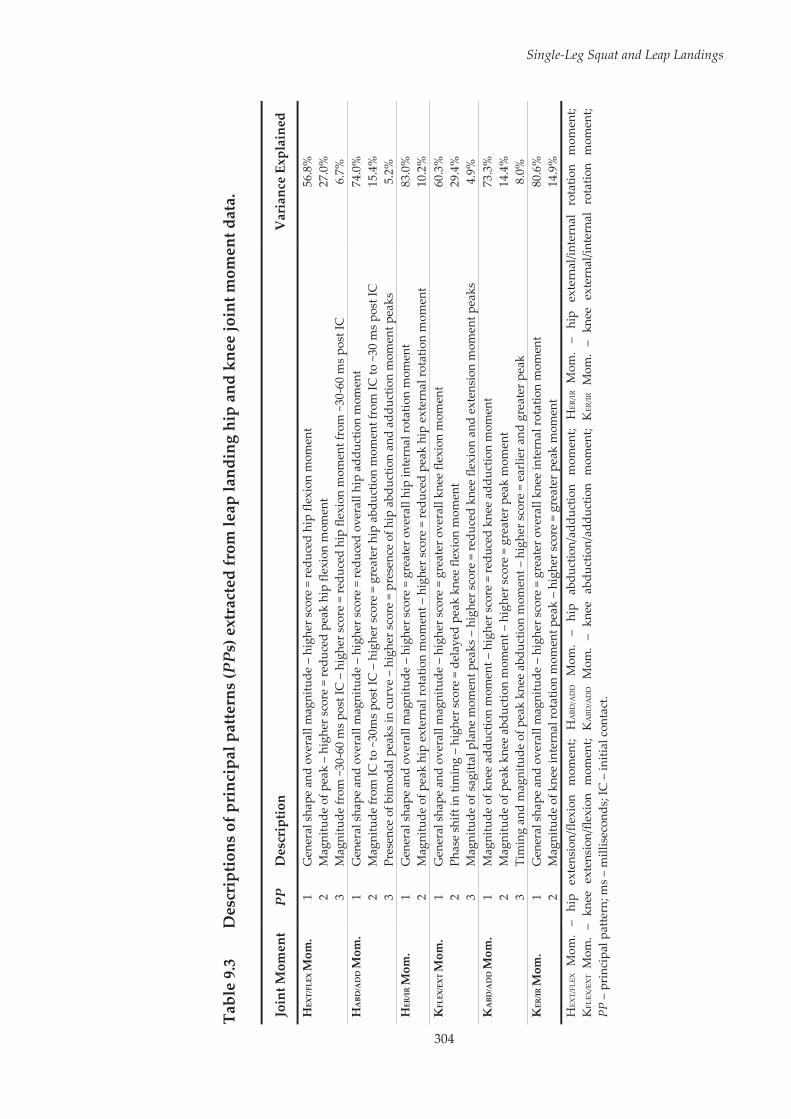
304
Single-Leg Squat and Leap Landings
Tabl
e 9.
3 D
escr
iptio
ns o
f pri
ncip
al p
atte
rns
(PPs
) ext
ract
ed fr
om le
ap la
ndin
g hi
p an
d kn
ee jo
int m
omen
t dat
a.
Join
t Mom
ent
PP
Des
crip
tion
Var
ianc
e Ex
plai
ned
HEX
T/FL
EX M
om.
1 2 3
Gen
eral
sha
pe a
nd o
vera
ll m
agni
tude
– h
ighe
r sco
re =
redu
ced
hip
flexi
on m
omen
t M
agni
tude
of p
eak
– hi
gher
sco
re =
redu
ced
peak
hip
flex
ion
mom
ent
Mag
nitu
de fr
om ~
30-6
0 m
s pos
t IC
– h
ighe
r sco
re =
redu
ced
hip
flexi
on m
omen
t fro
m ~
30-6
0 m
s po
st IC
56.8
%
27.0
%
6.7%
H
ABD
/AD
D M
om.
1 2 3
Gen
eral
sha
pe a
nd o
vera
ll m
agni
tude
– h
ighe
r sco
re =
redu
ced
over
all h
ip a
dduc
tion
mom
ent
Mag
nitu
de fr
om IC
to ~
30m
s po
st IC
– h
ighe
r sco
re =
gre
ater
hip
abd
uctio
n m
omen
t fro
m IC
to ~
30 m
s po
st IC
Pr
esen
ce o
f bim
odal
pea
ks in
cur
ve –
hig
her s
core
= p
rese
nce
of h
ip a
bduc
tion
and
addu
ctio
n m
omen
t pea
ks
74.0
%
15.4
%
5.2%
H
ER/I
R M
om.
1 2 G
ener
al s
hape
and
ove
rall
mag
nitu
de –
hig
her s
core
= g
reat
er o
vera
ll hi
p in
tern
al ro
tatio
n m
omen
t M
agni
tude
of p
eak
hip
exte
rnal
rota
tion
mom
ent –
hig
her s
core
= re
duce
d pe
ak h
ip e
xter
nal r
otat
ion
mom
ent
83.0
%
10.2
%
KFL
EX/E
XT M
om.
1 2 3
Gen
eral
sha
pe a
nd o
vera
ll m
agni
tude
– h
ighe
r sco
re =
gre
ater
ove
rall
knee
flex
ion
mom
ent
Phas
e sh
ift in
tim
ing
– hi
gher
scor
e =
dela
yed
peak
kne
e fle
xion
mom
ent
Mag
nitu
de o
f sag
ittal
pla
ne m
omen
t pea
ks –
hig
her s
core
= re
duce
d kn
ee fl
exio
n an
d ex
tens
ion
mom
ent p
eaks
60.3
%
29.4
%
4.9%
K
ABD
/AD
D M
om.
1 2 3
Mag
nitu
de o
f kne
e ad
duct
ion
mom
ent –
hig
her s
core
= re
duce
d kn
ee a
dduc
tion
mom
ent
Mag
nitu
de o
f pea
k kn
ee a
bduc
tion
mom
ent –
hig
her s
core
= g
reat
er p
eak
mom
ent
Tim
ing
and
mag
nitu
de o
f pea
k kn
ee a
bduc
tion
mom
ent –
hig
her s
core
= e
arlie
r and
gre
ater
pea
k
73.3
%
14.4
%
8.0%
K
ER/IR
Mom
. 1 2
Gen
eral
sha
pe a
nd o
vera
ll m
agni
tude
– h
ighe
r sco
re =
gre
ater
ove
rall
knee
inte
rnal
rota
tion
mom
ent
Mag
nitu
de o
f kne
e in
tern
al ro
tatio
n m
omen
t pea
k –
high
er s
core
= g
reat
er p
eak
mom
ent
80.6
%
14.9
%
HEX
T/FL
EX
Mom
. –
hip
exte
nsio
n/fle
xion
m
omen
t; H
ABD
/AD
D
Mom
. –
hip
abdu
ctio
n/ad
duct
ion
mom
ent;
HER
/IR
Mom
. –
hip
exte
rnal
/inte
rnal
ro
tatio
n m
omen
t; K
FLEX
/EX
T M
om.
– kn
ee e
xten
sion
/flex
ion
mom
ent;
KA
BD/A
DD M
om.
– kn
ee a
bduc
tion/
addu
ctio
n m
omen
t; K
ER/IR
Mom
. –
knee
ext
erna
l/int
erna
l ro
tatio
n m
omen
t; PP
– p
rinc
ipal
pat
tern
; ms
– m
illis
econ
ds; I
C –
initi
al c
onta
ct.
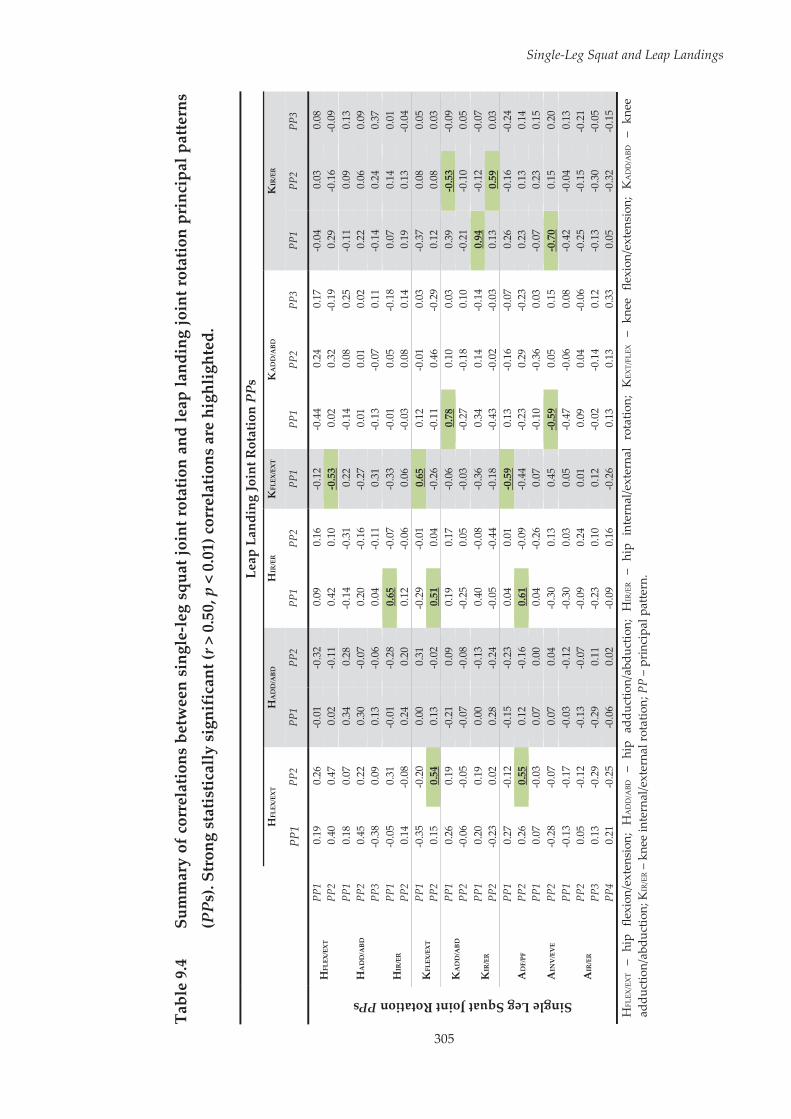
305
Single-Leg Squat and Leap Landings
Tabl
e 9.
4 Su
mm
ary
of c
orre
latio
ns b
etw
een
sing
le-le
g sq
uat j
oint
rot
atio
n an
d le
ap la
ndin
g jo
int r
otat
ion
prin
cipa
l pat
tern
s
(PPs
). St
rong
sta
tistic
ally
sig
nifi
cant
(r >
0.5
0, p
< 0
.01)
cor
rela
tions
are
hig
hlig
hted
.
Le
ap L
andi
ng Jo
int R
otat
ion
PPs
H
FLEX
/EXT
H
AD
D/A
BD
HIR
/ER
KFL
EX/E
XT
KA
DD
/ABD
K
IR/E
R
PP
1 PP
2 PP
1 PP
2 PP
1 PP
2 PP
1 PP
1 PP
2 PP
3 PP
1 PP
2 PP
3
Single Leg Squat Joint Rotation PPs
HFL
EX/E
XT
PP1
0.1
9 0
.26
-0.0
1 -0
.32
0.0
9 0
.16
-0.1
2 -0
.44
0.2
4 0
.17
-0.0
4 0
.03
0.0
8 PP
2 0
.40
0.4
7 0
.02
-0.1
1 0
.42
0.1
0 -0
.53
0.0
2 0
.32
-0.1
9 0
.29
-0.1
6 -0
.09
HA
DD
/ABD
PP
1 0
.18
0.0
7 0
.34
0.2
8 -0
.14
-0.3
1 0
.22
-0.1
4 0
.08
0.2
5 -0
.11
0.0
9 0
.13
PP2
0.4
5 0
.22
0.3
0 -0
.07
0.2
0 -0
.16
-0.2
7 0
.01
0.0
1 0
.02
0.2
2 0
.06
0.0
9 PP
3 -0
.38
0.0
9 0
.13
-0.0
6 0
.04
-0.1
1 0
.31
-0.1
3 -0
.07
0.1
1 -0
.14
0.2
4 0
.37
HIR
/ER
PP1
-0.0
5 0
.31
-0.0
1 -0
.28
0.6
5 -0
.07
-0.3
3 -0
.01
0.0
5 -0
.18
0.0
7 0
.14
0.0
1 PP
2 0
.14
-0.0
8 0
.24
0.2
0 0
.12
-0.0
6 0
.06
-0.0
3 0
.08
0.1
4 0
.19
0.1
3 -0
.04
KFL
EX/E
XT
PP1
-0.3
5 -0
.20
0.0
0 0
.31
-0.2
9 -0
.01
0.6
5 0
.12
-0.0
1 0
.03
-0.3
7 0
.08
0.0
5 PP
2 0
.15
0.5
4 0
.13
-0.0
2 0
.51
0.0
4 -0
.26
-0.1
1 0
.46
-0.2
9 0
.12
0.0
8 0
.03
KA
DD
/ABD
PP
1 0
.26
0.1
9 -0
.21
0.0
9 0
.19
0.1
7 -0
.06
0.7
8 0
.10
0.0
3 0
.39
-0.5
3 -0
.09
PP2
-0.0
6 -0
.05
-0.0
7 -0
.08
-0.2
5 0
.05
-0.0
3 -0
.27
-0.1
8 0
.10
-0.2
1 -0
.10
0.0
5
KIR
/ER
PP1
0.2
0 0
.19
0.0
0 -0
.13
0.4
0 -0
.08
-0.3
6 0
.34
0.1
4 -0
.14
0.9
4 -0
.12
-0.0
7 PP
2 -0
.23
0.0
2 0
.28
-0.2
4 -0
.05
-0.4
4 -0
.18
-0.4
3 -0
.02
-0.0
3 0
.13
0.5
9 0
.03
AD
F/PF
PP
1 0
.27
-0.1
2 -0
.15
-0.2
3 0
.04
0.0
1 -0
.59
0.1
3 -0
.16
-0.0
7 0
.26
-0.1
6 -0
.24
PP2
0.2
6 0
.55
0.1
2 -0
.16
0.6
1 -0
.09
-0.4
4 -0
.23
0.2
9 -0
.23
0.2
3 0
.13
0.1
4 PP
1 0
.07
-0.0
3 0
.07
0.0
0 0
.04
-0.2
6 0
.07
-0.1
0 -0
.36
0.0
3 -0
.07
0.2
3 0
.15
AIN
V/E
VE
PP2
-0.2
8 -0
.07
0.0
7 0
.04
-0.3
0 0
.13
0.4
5 -0
.59
0.0
5 0
.15
-0.7
0 0
.15
0.2
0
AIR
/ER
PP1
-0.1
3 -0
.17
-0.0
3 -0
.12
-0.3
0 0
.03
0.0
5 -0
.47
-0.0
6 0
.08
-0.4
2 -0
.04
0.1
3 PP
2 0
.05
-0.1
2 -0
.13
-0.0
7 -0
.09
0.2
4 0
.01
0.0
9 0
.04
-0.0
6 -0
.25
-0.1
5 -0
.21
PP3
0.1
3 -0
.29
-0.2
9 0
.11
-0.2
3 0
.10
0.1
2 -0
.02
-0.1
4 0
.12
-0.1
3 -0
.30
-0.0
5 PP
4 0
.21
-0.2
5 -0
.06
0.0
2 -0
.09
0.1
6 -0
.26
0.1
3 0
.13
0.3
3 0
.05
-0.3
2 -0
.15
HFL
EX/E
XT
– hi
p fle
xion
/ext
ensi
on;
HA
DD
/ABD
– h
ip a
dduc
tion/
abdu
ctio
n; H
IR/E
R –
hip
inte
rnal
/ext
erna
l ro
tatio
n; K
EXT/
FLEX
– k
nee
flexi
on/e
xten
sion
; K
AD
D/A
BD –
kne
e ad
duct
ion/
abdu
ctio
n; K
IR/E
R –
kne
e in
tern
al/e
xter
nal r
otat
ion;
PP
– pr
inci
pal p
atte
rn.
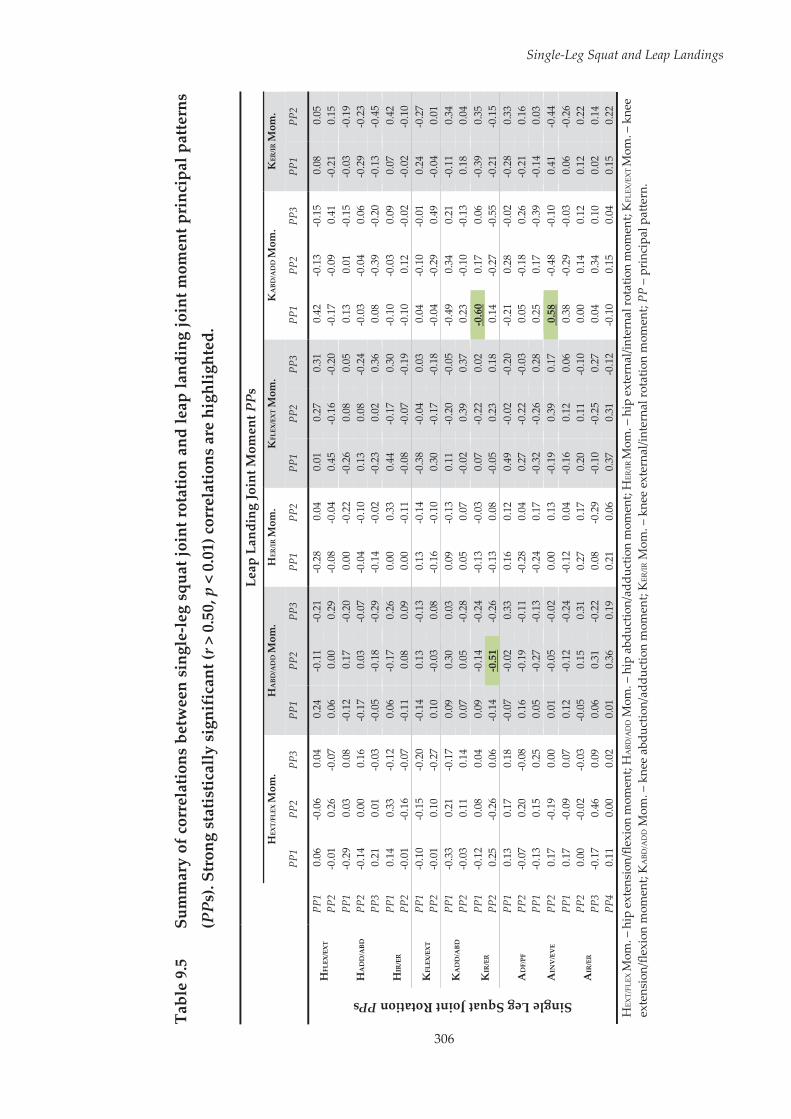
306
Single-Leg Squat and Leap Landings
Tabl
e 9.
5 Su
mm
ary
of c
orre
latio
ns b
etw
een
sing
le-le
g sq
uat j
oint
rota
tion
and
leap
land
ing
join
t mom
ent p
rinc
ipal
pat
tern
s
(PPs
). St
rong
sta
tistic
ally
sig
nifi
cant
(r >
0.5
0, p
< 0
.01)
cor
rela
tions
are
hig
hlig
hted
.
Le
ap L
andi
ng Jo
int M
omen
t PPs
H
EXT/
FLEX
Mom
. H
ABD
/AD
D M
om.
HER
/IR M
om.
KFL
EX/E
XT M
om.
KA
BD/A
DD
Mom
. K
ER/IR
Mom
.
PP
1 PP
2 PP
3 PP
1 PP
2 PP
3 PP
1 PP
2 PP
1 PP
2 PP
3 PP
1 PP
2 PP
3 PP
1 PP
2
Single Leg Squat Joint Rotation PPs
HFL
EX/E
XT
PP1
0.0
6 -0
.06
0.0
4 0
.24
-0.1
1 -0
.21
-0.2
8 0
.04
0.0
1 0
.27
0.3
1 0
.42
-0.1
3 -0
.15
0.0
8 0
.05
PP2
-0.0
1 0
.26
-0.0
7 0
.06
0.0
0 0
.29
-0.0
8 -0
.04
0.4
5 -0
.16
-0.2
0 -0
.17
-0.0
9 0
.41
-0.2
1 0
.15
HA
DD
/ABD
PP
1 -0
.29
0.0
3 0
.08
-0.1
2 0
.17
-0.2
0 0
.00
-0.2
2 -0
.26
0.0
8 0
.05
0.1
3 0
.01
-0.1
5 -0
.03
-0.1
9 PP
2 -0
.14
0.0
0 0
.16
-0.1
7 0
.03
-0.0
7 -0
.04
-0.1
0 0
.13
0.0
8 -0
.24
-0.0
3 -0
.04
0.0
6 -0
.29
-0.2
3 PP
3 0
.21
0.0
1 -0
.03
-0.0
5 -0
.18
-0.2
9 -0
.14
-0.0
2 -0
.23
0.0
2 0
.36
0.0
8 -0
.39
-0.2
0 -0
.13
-0.4
5
HIR
/ER
PP1
0.1
4 0
.33
-0.1
2 0
.06
-0.1
7 0
.26
0.0
0 0
.33
0.4
4 -0
.17
0.3
0 -0
.10
-0.0
3 0
.09
0.0
7 0
.42
PP2
-0.0
1 -0
.16
-0.0
7 -0
.11
0.0
8 0
.09
0.0
0 -0
.11
-0.0
8 -0
.07
-0.1
9 -0
.10
0.1
2 -0
.02
-0.0
2 -0
.10
KFL
EX/E
XT
PP1
-0.1
0 -0
.15
-0.2
0 -0
.14
0.1
3 -0
.13
0.1
3 -0
.14
-0.3
8 -0
.04
0.0
3 0
.04
-0.1
0 -0
.01
0.2
4 -0
.27
PP2
-0.0
1 0
.10
-0.2
7 0
.10
-0.0
3 0
.08
-0.1
6 -0
.10
0.3
0 -0
.17
-0.1
8 -0
.04
-0.2
9 0
.49
-0.0
4 0
.01
KA
DD
/ABD
PP
1 -0
.33
0.2
1 -0
.17
0.0
9 0
.30
0.0
3 0
.09
-0.1
3 0
.11
-0.2
0 -0
.05
-0.4
9 0
.34
0.2
1 -0
.11
0.3
4 PP
2 -0
.03
0.1
1 0
.14
0.0
7 0
.05
-0.2
8 0
.05
0.0
7 -0
.02
0.3
9 0
.37
0.2
3 -0
.10
-0.1
3 0
.18
0.0
4
KIR
/ER
PP1
-0.1
2 0
.08
0.0
4 0
.09
-0.1
4 -0
.24
-0.1
3 -0
.03
0.0
7 -0
.22
0.0
2 -0
.60
0.1
7 0
.06
-0.3
9 0
.35
PP2
0.2
5 -0
.26
0.0
6 -0
.14
-0.5
1 -0
.26
-0.1
3 0
.08
-0.0
5 0
.23
0.1
8 0
.14
-0.2
7 -0
.55
-0.2
1 -0
.15
AD
F/PF
PP
1 0
.13
0.1
7 0
.18
-0.0
7 -0
.02
0.3
3 0
.16
0.1
2 0
.49
-0.0
2 -0
.20
-0.2
1 0
.28
-0.0
2 -0
.28
0.3
3 PP
2 -0
.07
0.2
0 -0
.08
0.1
6 -0
.19
-0.1
1 -0
.28
0.0
4 0
.27
-0.2
2 -0
.03
0.0
5 -0
.18
0.2
6 -0
.21
0.1
6 PP
1 -0
.13
0.1
5 0
.25
0.0
5 -0
.27
-0.1
3 -0
.24
0.1
7 -0
.32
-0.2
6 0
.28
0.2
5 0
.17
-0.3
9 -0
.14
0.0
3 A
INV
/EV
E PP
2 0
.17
-0.1
9 0
.00
0.0
1 -0
.05
-0.0
2 0
.00
0.1
3 -0
.19
0.3
9 0
.17
0.5
8 -0
.48
-0.1
0 0
.41
-0.4
4
AIR
/ER
PP1
0.1
7 -0
.09
0.0
7 0
.12
-0.1
2 -0
.24
-0.1
2 0
.04
-0.1
6 0
.12
0.0
6 0
.38
-0.2
9 -0
.03
0.0
6 -0
.26
PP2
0.0
0 -0
.02
-0.0
3 -0
.05
0.1
5 0
.31
0.2
7 0
.17
0.2
0 0
.11
-0.1
0 0
.00
0.1
4 0
.12
0.1
2 0
.22
PP3
-0.1
7 0
.46
0.0
9 0
.06
0.3
1 -0
.22
0.0
8 -0
.29
-0.1
0 -0
.25
0.2
7 0
.04
0.3
4 0
.10
0.0
2 0
.14
PP4
0.1
1 0
.00
0.0
2 0
.01
0.3
6 0
.19
0.2
1 0
.06
0.3
7 0
.31
-0.1
2 -0
.10
0.1
5 0
.04
0.1
5 0
.22
HEX
T/FL
EX M
om. –
hip
ext
ensi
on/fl
exio
n m
omen
t; H
ABD
/AD
D M
om. –
hip
abd
uctio
n/ad
duct
ion
mom
ent;
HER
/IR M
om. –
hip
ext
erna
l/int
erna
l rot
atio
n m
omen
t; K
FLEX
/EX
T M
om. –
kne
e ex
tens
ion/
flexi
on m
omen
t; K
ABD
/AD
D M
om. –
kne
e ab
duct
ion/
addu
ctio
n m
omen
t; K
ER/IR
Mom
. – k
nee
exte
rnal
/inte
rnal
rota
tion
mom
ent;
PP –
pri
ncip
al p
atte
rn.
Single-Leg Squat and Leap Landings
307
9.4 Discussion
Identifying athletic tasks that are linked to sporting manoeuvres associated
with ACL injuries may reveal more optimal movements for ACL injury risk
screening within sport-specific contexts. The purpose of this study was to
determine the relationship between the performance of a single-leg squat and
a netball-specific leap landing task, in order to examine the utility of including
a single-leg squat movement within netball-specific ACL injury risk screening
protocols. A number of associations were found between biomechanical
patterns from the single-leg squat and leap landing task. Biomechanical
patterns from the single-leg squat were linked to a number of biomechanical
factors that have been proposed to increase ACL loads or injury risk during
landing movements. These findings suggest that a single-leg squat may be a
useful screening movement for identifying athletes’ who utilise movement
strategies associated with ACL loading or injury risk during high-risk netball-
specific landing manoeuvres.
The strongest associations between the single-leg squat and leap landing tasks
were evident in matching joint rotation patterns, particularly at the knee.
Participants who performed the single-leg squat with greater hip internal
rotation, knee flexion, knee abduction and knee internal rotation exhibited
these same biomechanical characteristics during the leap landing task. These
findings are similar to previous studies that have found a relationship between
single-leg squat and landing or cutting tasks, where similar biomechanical
characteristics were shared across the two movements.[439, 440] A limitation of
these previous studies is that they have only examined relationships between
corresponding biomechanical variables within the same joints and planes of
movement across the two tasks. In addition to examining associations between
Single-Leg Squat and Leap Landings
308
corresponding biomechanical patterns, the present study identified further
relationships outside of the corresponding joint and/or movement plane. For
example, sagittal plane biomechanical patterns at the hip and ankle during the
single-leg squat were related to the magnitude of knee flexion during the leap
landing task. Further, sagittal plane movement strategies at the knee during
the single-leg squat were associated with sagittal plane hip motion during the
leap landing task. These results, combined with the direct relationship
between the magnitude of knee flexion between the two tasks, suggests the
overall sagittal plane movement strategies of the lower limb between the
single-leg squat and leap landing task are closely related. Cross-planar
relationships were also apparent between the two tasks, whereby frontal and
transverse plane knee motion during the single-leg squat was related to
transverse and frontal plane knee biomechanics, respectively, during the leap
landing task. Similarly, the magnitude of frontal plane ankle motion during
the single-leg squat was related to frontal and transverse plane biomechanical
patterns at the knee during the leap landing task.
The large number of associations observed between the two tasks likely stems
from the similarities in lower limb positioning. The hip and knee motion
experienced during the initial deceleration phase of netball leap landings,
where unilateral weight acceptance is required, closely resemble the lower
limb positioning experienced during the descent phase of a single-leg squat.
Due to the similarities between the tasks, biomechanical deficits that have the
potential to increase ACL injury risk could manifest across both movements.
Biomechanical patterns from the single-leg squat task were associated with a
number of factors linked to increased ACL loading and injury risk during the
leap landing task. ‘Dynamic valgus’ during landing has been identified as a
significant predictor of ACL injuries in female athletes,[160] and a valgus
Single-Leg Squat and Leap Landings
309
collapse is often seen when ACL injuries occur.[97-99] Internal rotation at the hip,
combined with knee abduction and knee internal rotation is thought to
contribute to a ‘dynamic valgus’ position.[160, 162] Considering these
biomechanical patterns were directly related between the two tasks examined,
an individual displaying a ‘dynamic valgus’ position during the single-leg
squat may also do so during leap landing performances. Reduced knee flexion
has been linked to increases in ACL loads[20, 24, 25] and is also frequently
observed during ACL injuries.[97, 99] Earlier peak hip flexion, and reduced
overall knee flexion and ankle dorsiflexion during the single-leg squat were
all associated with reduced knee flexion during the leap landing task. The
presence of this sagittal plane movement strategy during a single-leg squat
may therefore be a useful indicator of individuals’ who perform leap landings
with reduced knee flexion. The peak knee abduction moment experienced
during athletic tasks is often acknowledged as a primary risk factor for ACL
injury due to larger peak moments being linked prospectively to future ACL
injuries[160] and higher ACL loads.[20-23, 28] Greater ankle eversion during the
single-leg squat tended to be associated with earlier and larger peak knee
abduction moments during landing, thus the degree of frontal plane ankle
motion during a single-leg squat may be a useful indicator of ACL injury risk
during leap landing performances.
The single-leg squat appears to be an appropriate movement screen for ACL
injury risk in the netball-specific context examined. Hip internal rotation; knee
flexion, abduction and internal rotation; and ankle eversion during the single-
leg squat were all linked to biomechanical factors associated with ACL loading
or injury risk during the leap landing task. The development of visual rating
criteria that accurately assess or identify these biomechanical patterns during
a single-leg squat may provide a simplistic method for identifying athletes
Single-Leg Squat and Leap Landings
310
who employ high-risk movement strategies during leap landing
performances. These criteria could subsequently be used within a movement
screening protocol to identify netball players at potentially greater risk of ACL
injury.
Although a number of associations between single-leg squat and leap landing
performance were identified, these were obtained using laboratory-based
techniques (i.e. motion capture). Three-dimensional measures were used in
the identification of lower limb biomechanical patterns during the single-leg
squat, and as mentioned throughout this thesis, these methods are not
applicable to the majority of the wider community. Field-based injury risk
screening methods must function without the need for these laboratory-based
techniques. Visual rating using video-based or live observational methods are
commonly used within field-based movement assessments,[85, 86, 91, 410] as the
equipment (or lack thereof) required for these methods is minimal and often
readily available. Visual rating of single-leg squat performance must be
reliable and comparative to three-dimensional measures to ensure it is
appropriate for use within a netball-specific field-based ACL injury risk
screening method. Studies investigating visual rating of single-leg squat
performance have found encouraging results for reliability across a range of
different grading criteria.[422, 423, 434, 437] High levels of intra- and inter-rater
agreement have been reported for ratings of medio-lateral knee motion (i.e.
knee position medial to the toe),[422, 423, 437] frontal plane knee angle and
alignment,[400, 423, 436] and general overall movement quality[434, 437] during single-
leg squat performance. It appears that single-leg squat performance can be
reliably assessed from visual observation, which provides promise for its
incorporation within field-based ACL injury risk screening protocols.
However, it is also important that ratings obtained from visual observation are
Single-Leg Squat and Leap Landings
311
valid against laboratory-based measures to ensure they are accurate in
measuring the construct of interest.
The majority of studies validating visual rating criteria against three-
dimensional measures during single-leg squat performance have focused on
frontal and transverse plane motion,[422, 423, 435, 442] with mixed findings across the
literature. Ageberg et al.[422] investigated the validity of observational rating of
medio-lateral knee motion during single-leg squat performance. Raters
graded whether or not participants displayed a knee position medial to their
toe during the single-leg squat. When compared against three-dimensional
measures, the hip was more internally rotated in those with a knee position
medial to the foot compared to those with a knee-over-foot position.[422]
However, no differences in three-dimensional knee abduction/adduction
angles were identified between the knee-medial-to-foot and knee-over-toe
groups.[422] Similarly, Whatman et al.[423] found a knee position medial to the
toe as deemed by video observation was indicative of greater hip adduction
and internal rotation, but not knee abduction when compared to three-
dimensional measures. In contrast, Mauntel et al.[442] found participants who
displayed a knee position medial to the toe determined from visual
observation during a single-leg squat demonstrated greater three-dimensional
knee abduction, with no differences in hip adduction or internal rotation.
Similar definitions for medial knee motion were used across these studies,
however different protocols relating to the single-leg squat task were
apparent. Differences in the control of squat depth and pace, and the number
of consecutive squat repetitions were noted between studies.[422, 423, 442] Careful
consideration surrounding the single-leg squat movement protocols may be
required if using visually observed medial knee motion as an indication of
three-dimensional hip and knee motion in the frontal and transverse planes.
Single-Leg Squat and Leap Landings
312
The frontal plane projection angle (FPPA) at the knee (i.e. the angle formed at
the intersection of the thigh and shank segments)[443] has also been investigated
in visual rating of single-leg squat performance.[400, 435, 436] Willson and Davis[435]
found that the FPPA was associated with three-dimensional measures of hip
adduction, hip internal rotation and knee external rotation, but not frontal
plane knee angle during single-leg squat performance. Inconsistencies exist
across the literature with regard to the validity of visual ratings of single-leg
squat performance comparative to three-dimensional measures. Movement
screening protocols that incorporate visual assessment of a single-leg squat
must therefore carefully develop and validate the criteria used to grade
performance.
The use of only one successful single-leg squat trial for analysis in this study
is an important factor to consider. Studies examining the validity of single-leg
squat movements for screening purposes have often used multiple squat
repetitions or movement trials for performance measures.[422, 434, 435] The
purpose of this study was to investigate the potential of the single-leg squat to
be incorporated into field-based ACL injury risk screening protocols. Hence,
it was deemed important that the screening movement be simple and involve
minimal time to complete. A single repetition of the single-leg squat met these
criteria and was subsequently used. It is possible that an individual’s single-
leg squat performance would vary over multiple repetitions or trials, hence
these additions may have captured further information regarding their
performance of the task. However, the numerous strong associations observed
in this study suggests a single repetition of the single-leg squat may provide
sufficient information on an individual’s ability to control the lower limb
during a high-risk netball-specific landing task. Further work investigating the
relationship between simplistic movements and high-risk sporting tasks may
Single-Leg Squat and Leap Landings
313
wish to include additional trials of the movement screening task. The added
time costs surrounding collection and analysis of these extra trials within
screening protocols must, however, also be considered.
9.5 Conclusions
This study found numerous strong associations for lower limb biomechanical
patterns between a single-leg squat and netball-specific leap landing task.
Lower limb motion during the single-leg squat was linked to a number of
biomechanical factors that have been proposed to increase ACL loads or injury
risk during landing movements. Specifically, hip internal rotation; knee
flexion, abduction and internal rotation; and ankle eversion during the single-
leg squat were linked to high-risk movement strategies during the leap
landing task. This study has provided the first step in the development of a
netball-specific ACL injury risk screening method incorporating a single-leg
squat, by establishing the key biomechanical patterns that should be observed
and rated due to their links to a high-risk landing task within the sport.
Validation of a set of visual rating criterion relating to the key biomechanical
patterns from the single-leg squat identified in this study will ensure they are
related to the three-dimensional measures they are targeting. These rating
criterion may then be evaluated against three-dimensional measures from the
leap landing task to ensure visual observation of the single-leg squat
movement is also related to leap landing performance. Further work linking
single-leg squat movement strategies to ACL injury occurrences may also
provide insight on the ability of a single-leg squat movement screen to
prospectively identify athletes’ at-risk of ACL injury.
314
Chapter Ten: General Discussion
10.1 Summary
This thesis aimed to explore three inter-related areas relating to anterior
cruciate ligament (ACL) injury prevention. The concepts of neuromuscular
anomalies and muscle activation profiles during the performance of a high-
risk landing task were investigated. In addition, the effect of an ACL injury
prevention program on individual neuromuscular and biomechanical
responses was explored. Lastly, examination of existing field-based ACL
injury risk screening methods and a proposed sport-specific screening
movement was undertaken to determine their applicability for use in wider
community and sport-specific settings. The experimental and review studies
undertaken have produced several key and novel findings that can contribute
to ACL injury prevention practices.
Study one (Chapter Four) examined the concept of intra-individual anomalies
in muscle activation profiles during a high-risk sporting task. Anomalies in
muscle activation profiles were found to occur during repeat performances of
the high-risk landing task examined. However, in contrast to the hypothesis,
these neuromuscular anomalies did not induce changes to lower limb
biomechanics consistent with increased ACL loads or injury risk. While the
results of this study support the theory that consistent task performance can
be achieved with anomalies in muscle activation profiles, it may be unwise to
dismiss the potential role of neuromuscular anomalies in ACL injuries.
Investigating the differential effects of specific neuromuscular anomalies may
elicit further understanding regarding their influence on ACL injury risk.
General Discussion
315
Findings from study one also demonstrated that some individuals utilised
multiple typical or ‘normal’ muscle activation profiles during the high-risk
landing task. Subsequently, study two (Chapter Five) explored this concept
and found participants’ utilised different muscle activation profiles across
repeat performance of the high-risk landing task. While these different profiles
were identified, individuals tended to persevere with a preferred profile
throughout the majority of landing trials. This study failed to identify ‘safe’ or
‘high-risk’ muscle activation profiles. Rather, specific muscle activation
characteristics or combinations of activation characteristics within profiles
were linked to the presence of biomechanical deficits associated with ACL
injury risk. Tailored injury prevention programs targeting these specific
muscle activation characteristics may induce more beneficial neuromuscular
adaptations for reducing ACL injury risk.
Study three (Chapter Six) examined the effects of an ACL injury prevention
program at the group and individual level. The injury prevention program
induced neuromuscular and biomechanical adaptations at the group level.
However, examination of individual data revealed dissimilar responses to the
training program within the training group. Individuals who display a pre-
existing high-risk neuromuscular or biomechanical strategy may receive
greater benefits from the ACL injury prevention program only if the program
targets the relevant high-risk strategy. Injury prevention programs targeting
the specific neuromuscular or biomechanical deficits of the individual may
therefore be optimal for reducing ACL injury risk.
Study four (Chapter Seven) provided an extensive review of current field-
based screening methods for ACL injury risk and evaluated their applicability
for use in wider community settings. There was limited evidence supporting
the predictive validity of field-based screening methods for identifying future
General Discussion
316
ACL injuries. Furthermore, the capacity of screening methods to identify
athletes at-risk of ACL injury may vary across different sports or sporting
populations. Differences between screening methods surrounding the
equipment required, time taken to screen athletes, and applicability across
varying sports and athletes were identified. It was concluded that these are
important factors in determining the most appropriate screening method to
use in various situations. The Landing Error Scoring System and Tuck Jump
Assessment were deemed as two field-based screening methods that were
applicable for use in wider community settings, and were subsequently
examined in the following study.
Study five (Chapter Eight) examined the efficacy of the Landing Error Scoring
System (LESS) and Tuck Jump Assessment screening methods in identifying
lower limb biomechanics consistent with increased ACL loading or injury risk
during a high-risk sport-specific task, namely, a netball leap landing. Minimal
relationships between lower limb biomechanics during the leap landing and
scores received from the LESS and Tuck Jump Assessment were identified. It
was concluded that the LESS and Tuck Jump Assessment are unlikely to be
effective in identifying ACL injury risk in the netball-specific context
examined. It was proposed the bilateral nature of the movements used within
these screening methods were a contributing factor to these results. Due to
this, the final study of this thesis explored the potential for including a
unilateral movement within netball-specific ACL injury risk screening
protocols.
Study six (Chapter Nine) investigated the relationships between performance
of a single-leg squat and a netball-specific leap landing task that has been
associated with ACL injuries. Lower limb motion during the single-leg squat
was linked to a number of biomechanical factors that have been proposed to
General Discussion
317
increase ACL loads or injury risk during landing movements. These findings
highlighted the potential of a single-leg squat movement to be incorporated
within netball-specific ACL injury risk screening protocols.
When considering these findings collectively, there are several overarching
topics that warrant further discussion. These will be highlighted, along with
recommendations for future research, in the following sections.
10.2 Neuromuscular Contributions to ACL Injury Risk
Many studies have attempted to link neuromuscular contributions to lower
limb biomechanics associated with ACL loading and injury
risk.[44, 56, 131, 134, 171, 174-181] Despite the variable nature of neuromuscular control
during biomechanical tasks,[48-50, 254] there has been very little focus on the
impact of trial-to-trial differences in muscle activation characteristics on ACL
injury risk. The findings of this thesis further the notion that neuromuscular
control can vary from one performance to the next. Anomalies in
neuromuscular control were found across repeat trials of the high-risk landing
task examined, while the use of different muscle activation profiles across
trials was also identified. Future work examining neuromuscular
contributions to ACL injury risk may benefit from a greater focus on these
specific trial-to-trial differences. The ‘one-off’ nature with which ACL injuries
occur suggests a random neuromuscular dysfunction may play a role in these
injury occurrences. To truly understand these injuries, we need to identify the
underlying causes that lead to these isolated events. Further examination of
changes in neuromuscular control from a trial-to-trial basis, and linking these
with lower limb postures associated with increased ACL loads and injury risk
may assist in achieving this. Musculoskeletal modelling and computer
simulation methods are a viable approach for further examination of
General Discussion
318
neuromuscular contributions to ACL injury risk. These methods have been
used to identify how alterations in muscle activation and forces can impact
human movement,[379-381] calculate ACL loads during high-risk sporting
tasks,[419, 444] and identify potential mechanisms of ligament rupture via injury
simulations.[176, 309] Together, these methods may be used to investigate how
specific alterations in neuromuscular control contribute to ACL loading and
potentially cause ACL injury.
10.3 ACL Injury Prevention Programs
When combined with previous work, a number of findings across this thesis
further the argument that a generic universal approach to ACL injury
prevention may not be optimal. The level of adoption and compliance of
current ACL injury prevention programs is low[227, 228] and their deployment in
“real-world” situations may not be effective.[223, 229-231] Further to these practical
issues, generic ACL injury prevention programs may not be the most effective
approach in providing a benefit to all involved.
This thesis found that a number of different muscle activation profiles can be
utilised by individuals during performance of a high-risk sporting task. While
certain individuals showed a tendency to vary the activation profile
employed, the majority tended to persevere with a preferred profile
throughout repeat landing trials. Specific muscle activation characteristics
within each of these profiles were linked to biomechanical deficits associated
with ACL loading and injury risk. Therefore, a reduction in ACL injury risk
may be achieved with injury prevention programs that target these potentially
high-risk activation characteristics. Injury prevention programs tailored to the
relevant high-risk muscle activation characteristics of the individual’s
preferred profile may be optimal for inducing beneficial neuromuscular

General Discussion
319
adaptations and reducing ACL injury risk. In addition, these results support
the notion of previous studies[71, 82, 83] that variable individual responses to ACL
injury prevention programs are to be expected. Within this thesis, inconsistent
neuromuscular and biomechanical adaptations to the training program were
apparent across individuals. However, those who exhibited a pre-existing
high-risk movement strategy (i.e. large peak knee abduction moments)
received the largest benefits in reducing frontal plane knee moments during
landing. It was proposed that this stemmed from the injury prevention
program specifically targeting movement strategies associated with the pre-
existing risk pattern of large peak knee abduction moments. This provides
further evidence that tailored injury prevention programs targeting the high-
risk neuromuscular or biomechanical strategies of the individual may be the
most effective in reducing ACL injury risk.
While evidence points towards more beneficial outcomes with tailored ACL
injury prevention programs, the cost-effectiveness of this approach must be
considered. Highly individualised ACL injury prevention programs are
unlikely to be feasible from an implementation and economical perspective,
particularly within wider community settings where time and staff resources
may be limited. A sub-group approach to tailoring injury prevention
programs, whereby the training targets the high-risk characteristics relevant
to the individuals within the sub-group, has been suggested as a more effective
and efficient option over generic approaches.[358] Studies directly comparing
generic versus tailored injury prevention programs may determine whether
or not this approach is a better option. Furthermore; while multiple
studies[71, 82, 83] have shown that individual responses to injury prevention
programs differ, there is little understanding as to why this is the case. The
presence of a pre-existing high-risk neuromuscular or biomechanical strategy
General Discussion
320
may have a modulating effect on the response, whereby greater benefits are
received in the area these high-risk strategies exist.[71, 83, 84] Apart from this,
there is a limited understanding of what dictates the adaptations an individual
will exhibit following participation in an ACL injury prevention program.
There is large scope for future research investigating potential factors that
contribute to this phenomenon. Future work in these areas will aid in
improving the design of ACL injury prevention programs that provide a
benefit for all involved.
10.4 Field-Based Screening Methods for ACL Injury Risk
The results of this thesis emphasise the need for sport-specific ACL injury risk
screening methods. A key finding of the systematic review of field-based ACL
injury risk screening methods was their limited predictive validity in
identifying ACL injuries. While certain work has shown field-based screening
methods can identify athletes at-risk of future ACL injury, this appears to vary
across different sports or sporting populations.[104, 105] Furthermore; the two
field-based screening methods examined in this thesis, the Landing Error
Scoring System (LESS) and Tuck Jump Assessment, were unable to identify
high-risk movement strategies during a sport-specific task associated with
ACL injuries. It is important to note that only one sport-specific task, a netball
leap landing, was examined. The LESS and Tuck Jump Assessment screening
methods should not be disregarded based on these findings. While they
appear ineffective in the netball-specific context examined, these methods may
be applicable to other sports or sporting populations. Future studies
examining the capacity of field-based screening methods in identifying high-
risk movement strategies across a range of high-risk sport-specific tasks may
aid in determining the optimal method(s) across different sports or sporting

General Discussion
321
populations. The associations between the single-leg squat and netball leap
landing tasks found within this thesis also suggest the investigation and
development of sport-specific ACL injury risk screening methods is justified.
The generic bilateral movements used in current field-based ACL injury risk
screening methods[85, 87, 90, 91] have minimal relationships to lower limb
biomechanics experienced during sport-specific manoeuvres associated with
ACL injury.[95, 96] Simplistic movements that can be easily observed and reflect
the lower limb postures experienced during high-risk sport-specific tasks may
be the most viable options for investigation and inclusion with field-based
screening methods for ACL injury risk. Identifying movements that better
replicate sport-specific movements associated with ACL injuries may further
aid in the development of appropriate ACL injury risk screening methods.
10.5 Limitations
There are a number of limitations to this thesis that must be acknowledged
and considered when interpreting the findings. The cross-sectional nature of
studies may have been a limitation in identifying neuromuscular or
biomechanical factors that contributed to ACL injury risk. Prospective studies
provide the strongest evidence in detecting neuromuscular or biomechanical
factors that contribute to ACL injury risk[160, 177] or evaluating the capacity of
screening methods in identifying athletes at-risk of ACL injury.[104, 105, 412]
However, prospective studies investigating ACL injury risk require a large
cohort to achieve meaningful outcomes. The capacity to recruit such a cohort
was deemed to be outside the scope of this thesis. Prospective studies
investigating ACL injury risk often recruit upwards of 200 participants in
order to attain meaningful results.[105, 160, 412] Due to the limited participant pool
in the population examined (i.e. local community netball), these participant
General Discussion
322
numbers could not be achieved for these studies. Lower limb biomechanical
factors that have been linked to ACL loading were used as a surrogate measure
for identifying potential ACL injury risk across the studies in this thesis. While
this approach is commonly used for investigating potential neuromuscular
and biomechanical risk factors for ACL injury,[44, 56, 131, 134, 171, 174-181] it is important
to acknowledge this as a limitation. Prospective longitudinal studies are
needed to confirm current findings and further understand the underlying
neuromuscular and biomechanical risk factors for ACL injury. Multicentre
investigations may improve the feasibility of these studies by providing access
to larger participant cohorts, leading to more robust findings.[445]
Neuromuscular and biomechanical data from the trunk were not collected as
part of the studies in this thesis. ACL injuries often occur with a lateral and
extended trunk position,[159, 377] and trunk rotation and lateral flexion have been
shown to influence frontal and transverse plane knee moments during landing
and cutting tasks.[166, 167, 255, 372] These recent findings have confirmed that trunk
control plays an important role in ACL injury risk. Despite this, studies
investigating the biomechanics of netball leap landings with regard to ACL
injury risk have not included a focus on the trunk.[245, 248, 253] The leap landing
task performed within the studies in this thesis involved a straight running
approach with a pass received directly out in front of the body. Hence, it was
thought that minimal frontal and/or transverse plane motion of the trunk
would occur during landing performances and the inclusion of trunk-related
factors would not substantially improve the outcomes associated with this
research. Nonetheless, the inclusion of trunk-related factors could have
strengthened certain findings within this thesis. For example, activation
characteristics of trunk muscles may be an important aspect of the overall
muscle activation profile that contributes to ACL injury risk. In addition, the

General Discussion
323
efficacy of the screening methods examined in this thesis may have improved
with the inclusion of trunk biomechanics from the leap landing task. The LESS
includes criteria related to trunk motion during landing,[91] while certain
criteria within the Tuck Jump Assessment are purportedly linked to a ‘trunk-
dominant’ movement strategy proposed to increase ACL injury risk.[413] As
these methods consider trunk-related factors in their evaluation of ACL injury
risk, they could have an association to three-dimensional measures of trunk
biomechanics during high-risk landing tasks. Further relationships between
the single-leg squat and netball leap landing tasks may have also been
identified with the inclusion of trunk biomechanics from the single-leg squat.
If this were the case, trunk movement may be an additional component to
consider when evaluating single-leg squat performance in the context of a
netball-specific ACL injury risk screening method. Future investigations
pertaining to ACL injury risk or prevention should consider inclusion of
neuromuscular control and biomechanics of the trunk in addition to the lower
limb. This is particularly important for tasks where frontal and transverse
plane trunk movements are more prominent, such as side-step cutting or
overhead catch-and-land tasks,[166, 255, 372, 446] and may subsequently impact
loading at the knee.
It is also important to acknowledge that this study focused on one population
(i.e. female netball athletes) and sport-specific manoeuvre associated with
ACL injuries (i.e. a netball leap landing). The findings from this thesis,
therefore, are most applicable to ACL injury risk and prevention in the netball-
specific context examined. Applying similar methods to those used in this
thesis to additional high-risk populations or sporting tasks may further our
understanding of ACL injury risk and prevention across a range of settings.
Examining whether neuromuscular anomalies and multiple muscle activation
General Discussion
324
profiles occur in different populations and sporting tasks, and if so, how they
influence lower limb biomechanics may yield greater knowledge surrounding
neuromuscular contributions to ACL injury risk. It may be the case that
different neuromuscular risk factors present across different high-risk
populations or sporting tasks. If so, ACL injury prevention programs specific
to these settings may be required to effectively target neuromuscular control
and reduce ACL injury risk. Examining the efficacy of ACL injury risk
screening methods in different sports or sporting populations would also aid
in identifying the most applicable method(s) across these variable settings.
10.6 Conclusions
The findings of this thesis highlight the need for tailored ACL injury
prevention programs targeting neuromuscular and biomechanical deficits that
are relevant to the individual. It is apparent that the neuromuscular system
employs multiple muscle activation profiles to perform the same landing task,
and the neuromuscular and biomechanical adaptations to an ACL injury
prevention program vary across individuals. Importantly, it appears that
high-risk movement strategies can be targeted with appropriately designed
ACL injury prevention programs.
Identifying screening methods that are capable of detecting those at-risk of
injury during sporting tasks known to cause ACL injuries is a vital step in
improving the design of targeted ACL injury prevention programs. The single-
leg squat was identified as a potentially useful movement to be incorporated
within netball-specific ACL injury risk screening protocols. The single-leg
squat appears to be more effective in identifying high-risk lower limb
biomechanics during a netball-specific landing task than existing ACL injury
risk screening methods. Further examination of simplistic unilateral
General Discussion
325
movements against other sport-specific tasks associated with ACL injury may
aid in ascertaining the optimal method(s) for ACL injury risk screening across
different sports or sporting populations.
326
References
1. Hootman JM, Dick R, Agel J. Epidemiology of collegiate injuries for 15 sports: Summary and recommendations for injury prevention initiatives. J Athl Train. 2007; 42(2): 311-9.
2. Agel J, Arendt EA, Bershadsky B. Anterior cruciate ligament injury in National Collegiate Athletic Association basketball and soccer: A 13-year review. Am J Sports Med. 2005; 33(4): 524-30.
3. Arendt E, Dick R. Knee injury patterns among men and women in collegiate basketball and soccer: NCAA data and review of literature. Am J Sports Med. 1995; 23(6): 694-701.
4. Borowski LA, Yard EE, Fields SK, Comstock RD. The epidemiology of US high school basketball injuries, 2005-2007. Am J Sports Med. 2008; 36(12): 2328-35.
5. Myklebust G, Maehlum S, Holm I, Bahr R. A prospective cohort study of anterior cruciate ligament injuries in elite Norwegian team handball. Scand J Med Sci Sports. 1998; 8(3): 149-53.
6. Powell JW, Barber-Foss KD. Sex-related injury patterns among selected high school sports. Am J Sports Med. 2000; 28(3): 385-91.
7. Waldén M, Hägglund M, Magnusson H, Ekstrand J. Anterior cruciate ligament injury in elite football: A prospective three-cohort study. Knee Surg Sports Traumatol Arthrosc. 2011; 19(1): 11-9.
8. Bjordal JM, Arnoy F, Hannestad B, Strand T. Epidemiology of anterior cruciate ligament in soccer. Am J Sports Med. 1997; 25(3): 341-5.
9. Roos H, Ornell M, Gardsell P, Lohmander LS, Lindstrand A. Soccer after anterior cruciate ligament injury - An incompatible combination? A national survey of incidence and risk factors and a 7-year follow-up of 310 players. Acta Orthop Scand. 1995; 66(2): 107-12.
10. Kvist J. Rehabilitation following anterior cruciate ligament injury: Current recommendations for sports participation. Sports Med. 2004; 34(4): 269-80.
11. Myklebust G, Bahr R. Return to play guidelines after anterior cruciate ligament surgery. Br J Sports Med. 2005; 39(3): 127-31.

References
327
12. Swärd P, Kostogiannis I, Roos H. Risk factors for a contralateral anterior cruciate ligament injury. Knee Surg Sports Traumatol Arthrosc. 2010; 18(3): 277-91.
13. Wright RW, Magnussen RA, Dunn WR, Spindler KP. Ipsilateral graft and contralateral ACL rupture at five years or more following ACL reconstruction: A systematic review. J Bone Joint Surg. 2011; 93(12): 1159-65.
14. Paterno MV, Rauh MJ, Schmitt LC, Ford KR, Hewett TE. Incidence of contralateral and ipsilateral anterior cruciate ligament (ACL) injury after primary ACL reconstruction and return to sport. Clin J Sport Med. 2012; 22(2): 116-21.
15. Hewett T, Myer G, Ford K, Paterno M, Quatman C. The 2012 ABJS Nicolas Andry Award: The sequence of prevention: A systematic approach to prevent anterior cruciate ligament injury. Clin Orthop Relat Res. 2012; 470(10): 1-11.
16. Lohmander LS, Englund PM, Dahl LL, Roos EM. The long-term consequence of anterior cruciate ligament and meniscus injuries. Am J Sports Med. 2007; 35(10): 1756-69.
17. Lohmander LS, Östenberg A, Englund M, Roos H. High prevalence of knee osteoarthritis, pain, and functional limitations in female soccer players twelve years after anterior cruciate ligament injury. Arthritis Rheum. 2004; 50(10): 3145-52.
18. Øiestad BE, Holm I, Engebretsen L, Risberg MA. The association between radiographic knee osteoarthritis and knee symptoms, function and quality of life 10–15 years after anterior cruciate ligament reconstruction. Br J Sports Med. 2011; 45(7): 583-8.
19. Claes S, Hermie L, Verdonk R, Bellemans J, Verdonk P. Is osteoarthritis an inevitable consequence of anterior cruciate ligament reconstruction? A meta-analysis. Knee Surg Sports Traumatol Arthrosc. 2013; 21(9): 1967-76.
20. Markolf KL, Burchfield DM, Shapiro MM, Shephard MF, Finerman GAM, Slauterback JL. Combined knee loading states that generate high anterior cruciate ligament forces. J Orthop Res. 1995; 13(6): 930-5.
21. Oh YK, Lipps DB, Ashton-Miller JA, Wojtys EM. What strains the anterior cruciate ligament during a pivot landing? Am J Sports Med. 2012; 40(3): 574-83.

References
328
22. Shin CS, Chaudhari AM, Andriacchi TP. Valgus plus internal rotation moments increase anterior cruciate ligament strain more than either alone. Med Sci Sports Exerc. 2011; 43(8): 1484-91.
23. Withrow TJ, Huston LJ, Wojtys EM, Ashton-Miller JA. The effect of an impulsive knee valgus moment on in vitro relative ACL strain during a simulated jump landing. Clin Biomech. 2006; 21(9): 977-83.
24. Mizuno K, Andrish JT, van den Bogert AJ, McLean SG. Gender dimorphic ACL strain in response to combined dynamic 3D knee joint loading: Implications for ACL injury risk. Knee. 2009; 16(6): 432-40.
25. Taylor KA, Terry ME, Utturkar GM, Spritzer CE, Queen RM, Irribarra LA, Garrett WE, DeFrate LE. Measurement of in vivo anterior cruciate ligament strain during dynamic jump landing. J Biomech. 2011; 44(3): 365-71.
26. DeMorat G, Weinhold P, Blackburn T, Chudik S, Garrett Jr W. Aggressive quadriceps loading can induce noncontact anterior cruciate ligament injury. Am J Sports Med. 2004; 32(2): 477-83.
27. Cerulli G, Benoit DL, Lamontagne M, Caraffa A, Liti A. In vivo anterior cruciate ligament strain behaviour during a rapid deceleration movement: Case report. Knee Surg Sports Traumatol Arthrosc. 2003; 11(5): 307-11.
28. Kiapour AM, Quatman CE, Goel VK, Wordeman SC, Hewett TE, Demetropoulos CK. Timing sequence of multi-planar knee kinematics revealed by physiologic cadaveric simulation of landing: Implications for ACL injury mechanism. Clin Biomech. 2014; 29(1): 75-82.
29. Berns GS, Hull ML, Patterson HA. Strain in the anteriomedial bundle of the anterior cruciate ligament under combination loading. J Orthop Res. 1992; 10(2): 167-76.
30. Shultz SJ, Schmitz RJ, Benjaminse A, Collins M, Ford K, Kulas AS. ACL Research Retreat VII: An update on anterior cruciate ligament injury risk factor identification, screening, and prevention. J Athl Train. 2015; 50(10): 1076-93.
31. Quatman CE, Kiapour AM, Demetropoulos CK, Kiapour A, Wordeman SC, Levine JW, Goel VK, Hewett TE. Preferential loading of the ACL compared with the MCL during landing: A novel in sim approach yields the multiplanar mechanism of dynamic valgus during ACL injuries. Am J Sports Med. 2014; 42(1): 177-86.
References
329
32. Kiapour AM, Kiapour A, Goel VK, Quatman CE, Wordeman SC, Hewett TE, Demetropoulos CK. Uni-directional coupling between tibiofemoral frontal and axial plane rotation supports valgus collapse mechanism of ACL injury. J Biomech. 2015; 48(10): 1745-51.
33. Quatman CE, Quatman-Yates CC, Hewett TE. A 'plane' explanation of anterior cruciate ligament injury mechanisms: A systematic review. Sports Med. 2010; 40(9): 729-46.
34. Wojtys EM, Huston LJ, Taylor PD, Bastian SD. Neuromuscular adaptations in isokinetic, isotonic, and agility training programs. Am J Sports Med. 1996; 24(2): 187-92.
35. Cochrane J, Lloyd D, Besier T, Ackland T, Elliot B. The effect of lower limb training programs on muscular support of the knee and prevention of ACL injury. J Sci Med Sport. 2003; 6(S1): 89.
36. Chimera NJ, Swanik KA, Swanik CB, Straub SJ. Effects of plyometric training on muscle-activation strategies and performance in female athletes. J Athl Train. 2004; 39(1): 24-31.
37. Hewett TE, Stroupe AL, Nance TA, Noyes FR. Plyometric training in female athletes: Decreased impact forces and increased hamstring torques. Am J Sports Med. 1996; 24(6): 765-73.
38. Wilkerson GB, Colston MA, Short NI, Neal KL, Hoewischer PE, Pixley JJ. Neuromuscular changes in female collegiate athletes resulting from a plyometric jump-training program. J Athl Train. 2004; 39(1): 17-23.
39. Lephart SM, Abt JP, Ferris CM, Sell TC, Nagai T, Myers JB, Irrgang JJ. Neuromuscular and biomechanical characteristic changes in high school athletes: A plyometric versus basic resistance program. Br J Sports Med. 2005; 39(12): 932-8.
40. Zebis MK, Bencke J, Andersen LL, Døssing S, Alkjaer T, Magnusson SP, Kjaer M, Aagaard P. The effects of neuromuscular training on knee joint motor control during sidecutting in female elite soccer and handball players. Clin J Sport Med. 2008; 18(4): 329-37.
41. Nagano Y, Hirofumi I, Akai M, Fukubayashi T. Effects of jump and balance training on knee kinematics and electromyography of female basketball athletes during a single limb drop landing: Pre-post intervention study. Sports Med Arthrosc Rehabil Ther Tech. 2011; 3(1): 14-21.
References
330
42. Tsang KKW, DiPasquale AA. Improving the Q:H strength ratio in women using plyometric exercises. J Strength Cond Res. 2011; 25(10): 2740-5.
43. Hurd WJ, Chmielewski TL, Snyder-Mackler L. Perturbation-enhanced neuromuscular training alters muscle activity in female athletes. Knee Surg Sports Traumatol Arthrosc. 2006; 14(1): 60-9.
44. Wilderman DR, Ross SE, Padua DA. Thigh muscle activity, knee motion, and impact force during side-step pivoting in agility-trained female basketball players. J Athl Train. 2009; 44(1): 14-25.
45. Holcomb WR, Rubley MD, Lee HJ, Guadagnoli MA. Effect of hamstring-emphasized resistance training on hamstring:quadriceps strength ratios. J Strength Cond Res. 2007; 21(1): 41-7.
46. Hashemi J, Chandrashekar N, Jang T, Karpat F, Oseto M, Ekwaro-Osire S. An alternative mechanism of non-contact anterior cruciate ligament injury during jump-landing: In-vitro simulation. Exp Mech. 2007; 47(3): 347-54.
47. Griffin LY, Agel J, Albohm MJ, Arendt EA, Dick RW, Garrett WE, Garrick JG, Hewett TE, Huston L, Ireland ML, Johnson RJ, Kibler WB, Lephart S, Lewis JL, Lindenfeld TN, Mandelbaum BR, Marchak P, Teitz CC, Wojtys EM. Noncontact anterior cruciate ligament injuries: Risk factors and prevention strategies. J Am Acad Orthop Surg. 2000; 8(3): 141-50.
48. Hug F, Turpin NA, Couturier A, Dorel S. Consistency of muscle synergies during pedaling across different mechanical constraints. J Neurophysiol. 2011; 106(1): 91-103.
49. Hug F, Turpin NA, Guével A, Dorel S. Is interindividual variability of EMG patterns in trained cyclists related to different muscle synergies? J Appl Physiol. 2010; 108(6): 1727-36.
50. Frère J, Hug F. Between-subject variability of muscle synergies during a complex motor skill. Front Comput Neurosci. 2012; 6: 99.
51. Latash ML, Scholz JP, Schoener G. Motor control strategies revealed in the structure of motor variability. Exerc Sport Sci Rev. 2002; 30(1): 26-31.
52. Slifkin AB, Newell KM. Is variability in human performance a reflection of system noise? Curr Dir Psychol Sci. 1998; 7(6): 170-7.
References
331
53. Winter DA, Yack HA. EMG profiles during normal human walking: Stride-to-stride and inter-subject variability. Electroencephalogr Clin Neurophysiol. 1987; 67(5): 402-11.
54. Cowling EJ, Steele JR. The effect of upper-limb motion on lower-limb muscle synchrony. J Bone Joint Surg. 2001; 83(1): 35-41.
55. Cowling EJ, Steele JR. Is lower limb muscle synchrony during landing affected by gender? Implications for variations in ACL injury rates. J Electromyogr Kinesiol. 2001; 11(4): 263-8.
56. McLean SG, Borotikar B, Lucey SM. Lower limb muscle pre-motor time measures during a choice reaction task associate with knee abduction loads during dynamic single leg landings. Clin Biomech. 2010; 25(6): 563-9.
57. Carcia C, Eggen J, Shultz S. Hip-abductor fatigue, frontal-plane landing angle, and excursion during a drop jump. J Sport Rehabil. 2005; 14(4): 321-31.
58. Simonsen EB, Magnusson SP, Bencke J, Nasborg H, Havkrog M, Ebstrup JF, Sorensen H. Can the hamstring muscles protect the anterior cruciate ligament during a side-cutting maneuver? Scand J Med Sci Sports. 2000; 10(2): 78-84.
59. Sigward SM, Powers CM. The influence of gender on knee kinematics, kinetics and muscle activation patterns during side-step cutting. Clin Biomech. 2006; 21(1): 41-8.
60. Myer GD, Ford KR, Hewett TE. The effects of gender on quadriceps muscle activation strategies during a maneuver that mimics a high ACL injury risk position. J Electromyogr Kinesiol. 2005; 15(2): 181-9.
61. DeMont RG, Lephart SM, Giraldo JL, Swanik CB, Fu FH. Muscle preactivity of anterior cruciate ligament-deficient and -reconstructed females during functional activities. J Athl Train. 1999; 34(2): 115-20.
62. Shultz SJ, Carcia CR, Perrin DH. Knee joint laxity affects muscle activation patterns in the healthy knee. J Electromyogr Kinesiol. 2004; 14(4): 475-83.
63. Chappell JD, Creighton A, Giuliani C, Yu B, Garrett WE. Kinematics and electromyography of landing preparation in vertical stop-jump: Risks for noncontact anterior cruciate ligament injury. Am J Sports Med. 2007; 35(2): 235-41.
References
332
64. Colby S, Francisco A, Yu B, Kirkendall D, Finch M, Garrett W. Electromyographic and kinematic analysis of cutting maneuvers: Implications for anterior cruciate ligament injury. Am J Sports Med. 2000; 28(2): 234-40.
65. Mandelbaum BR, Silvers HJ, Watanabe DS, Knarr JF, Thomas SD, Griffin LY, Kirkendall DT, Garrett Jr W. Effectiveness of a neuromuscular and proprioceptive training program in preventing anterior cruciate ligament injuries in female athletes: 2-year follow-up. Am J Sports Med. 2005; 33(7): 1003-10.
66. Olsen OE, Myklebust G, Engebretsen L, Holm I, Bahr R. Exercises to prevent lower limb injuries in youth sports: Cluster randomised controlled trial. Br Med J. 2005; 330: 449.
67. Petersen W, Braun C, Bock W, Schmidt K, Weimann A, Drescher W, Eiling E, Stange R, Fuchs T, Hedderich J, Zantop T. A controlled prospective case control study of a prevention training program in female team handball players: The German experience. Arch Orthop Trauma Surg. 2005; 125(9): 614-21.
68. Chappell JD, Limpisvasti O. Effect of a neuromuscular training program on the kinetics and kinematics of jumping tasks. Am J Sports Med. 2008; 36(6): 1081-6.
69. Lim BO, Lee YS, Kim JG, An KO, Yoo J, Kwon YH. Effects of sports injury prevention training on the biomechanical risk factors of anterior cruciate ligament injury in high school female basketball players. Am J Sports Med. 2009; 37(9): 1728-34.
70. Myer GD, Ford KR, Palumbo JP, Hewett TE. Neuromuscular training improves performance and lower-extremity biomechanics in female athletes. J Strength Cond Res. 2005; 19(1): 51-60.
71. Pollard CD, Sigward SM, Ota S, Langford K, Powers CM. The influence of in-season injury prevention training on lower-extremity kinematics during landing in female soccer players. Clin J Sport Med. 2006; 16(3): 223-7.
72. Myer GD, Ford KR, McLean SG, Hewett TE. The effects of plyometric versus dynamic stabilization and balance training on lower extremity biomechanics. Am J Sports Med. 2006; 34(3): 445-55.
73. Onate JA, Guskiewicz KM, Marshall SW, Giuliani C, Yu B, Garrett WE. Instruction of jump-landing technique using videotape feedback: Altering lower extremity motion patterns. Am J Sports Med. 2005; 33(6): 831-42.

References
333
74. Brown TN, Palmieri-Smith RM, McLean SG. Comparative adaptations of lower limb biomechanics during unilateral and bilateral landings after different neuromuscular-based ACL injury prevention protocols. J Strength Cond Res. 2014; 28(10): 2859-71.
75. Celebrini RG, Eng JJ, Miller WC, Ekegren CL, Johnston JD, Depew TA, Maclntyre DL. Effect of a novel movement strategy in decreasing ACL risk factors in female adolescent soccer players: A randomized controlled trial. Clin J Sport Med. 2014; 24(2): 134-41.
76. de Marche Baldon R, Moreira Lobato DF, Yoshimatsu AP, dos Santos AF, Francisco AL, Santiago PRP, Serrãp FV. Effect of plyometric training on lower limb biomechanics in females. Clin J Sport Med. 2014; 24(1): 44-50.
77. Bell DR, Oates DC, Clark MA, Padua DA. Two- and 3-dimensional knee valgus are reduced after an exercise intervention in young adults with demonstrable valgus during squatting. J Athl Train. 2013; 48(4): 442-9.
78. Pfile KR, Hart JM, Herman DC, Hertel J, Kerrigan DC, Ingersoll CD. Different exercise training interventions and drop landing biomechanics in high school female athletes. J Athl Train. 2013; 48(4): 450-62.
79. Tate JJ, Milner CE, Fairbrother JT, Zhang S. The effects of a home-based instructional program aimed at improving frontal plane knee biomechanics during a jump-landing task. J Orthop Sports Phys Ther. 2013; 43(7): 486-94.
80. Greska EK, Cortes N, Van Lunen BL, Oñate JA. A feedback inclusive neuromuscular training program alters frontal plane kinematics. J Strength Cond Res. 2012; 26(6): 1609-19.
81. Benjaminse A, Gokeler A, Dowling AV, Faigenbaum A, Ford KR, Hewett TE, Onate JA, Otten B, Myer GD. Optimization of the anterior cruciate ligament injury prevention paradigm: Novel feedback techniques to enhance motor learning and reduce injury risk. J Orthop Sports Phys Ther. 2015; 45(3): 170-82.
82. Cowling E, Steele J, McNair P. Training quadriceps-hamstring muscle synchrony: Do group data mask individual lower limb muscle coordination strategies? J Sci Med Sport. 2003; 6(S1): 90.
83. Dempsey AR, Elliott BC, Munro BJ, Steele JR, Lloyd DG. Can technique modification training reduce knee moments in a landing task? J Appl Biomech. 2014; 30(2): 231-6.
References
334
84. Myer GD, Ford KR, Brent JL, Hewett TE. Differential neuromuscular training effects on ACL injury risk factors in "high-risk" versus "low-risk" athletes. BMC Musc Disord. 2007; 8: 39-45.
85. Ekegren CL, Miller WC, Celebrini RG, Eng JJ, MacIntyre DL. Reliability and validity of observational risk screening in evaluating dynamic knee valgus. J Orthop Sports Phys Ther. 2009; 39(9): 665-74.
86. Myer GD, Ford KR, Hewett TE. Tuck jump assessment for reducing anterior cruciate ligament injury risk. Athl Ther Today. 2008; 13(5): 39-44.
87. Myer GD, Ford KR, Hewett TE. New method to identify athletes at high risk of ACL injury using clinic-based measurements and freeware computer analysis. Br J Sports Med. 2011; 45(4): 238-44.
88. Myer GD, Ford KR, Khoury J, Succop P, Hewett TE. Development and validation of a clinic-based prediction tool to identify female athletes at high risk for anterior cruciate ligament injury. Am J Sports Med. 2010; 38(10): 2025-33.
89. Myer GD, Ford KR, Khoury J, Succop P, Hewett TE. Clinical correlates to laboratory measures for use in non-contact anterior cruciate ligament injury risk prediction algorithm. Clin Biomech. 2010; 25(7): 693-9.
90. Myer GD, Ford KR, Khoury J, Succop P, Hewett TE. Biomechanics laboratory-based prediction algorithm to identify female athletes with high knee loads that increase risk of ACL injury. Br J Sports Med. 2011; 45(4): 245-52.
91. Padua DA, Marshall SW, Boling MC, Thigpen CA, Garrett Jr WE, Beutler AI. The Landing Error Scoring System (LESS) is a valid and reliable clinical assessment tool of jump-landing biomechanics: The JUMP-ACL study. Am J Sports Med. 2009; 37(10): 1996-2002.
92. McLean SG, Walker K, Ford KR, Myer GD, Hewett TE, van den Bogert AJ. Evaluation of a two dimensional analysis method as a screening and evaluation tool for anterior cruciate ligament injury. Br J Sports Med. 2005; 39(6): 355-62.
93. Myer GD, Ford KR, Khoury J, Hewett TE. Three-dimensional motion analysis validation of a clinic-based nomogram designed to identify high ACL injury risk in female athletes. Physician Sportsmed. 2011; 39(1): 19-28.
References
335
94. Onate J, Cortes N, Welch C, van Lunen B. Expert versus novice interrater reliability and criterion validity of the Landing Error Scoring System. J Sport Rehabil. 2010; 19(1): 41-56.
95. Edwards S, Steele JR, McGhee DE. Does a drop landing represent a whole skill landing and is this moderated by fatigue? Scand J Med Sci Sports. 2010; 20(3): 516-23.
96. Kristianslund E, Krosshaug T. Comparison of drop jumps and sport-specific sidestep cutting: Implications for anterior cruciate ligament injury risk screening. Am J Sports Med. 2013; 41(3): 684-8.
97. Boden BP, Dean GS, Feagin Jr JA, Garrett Jr WE. Mechanisms of anterior cruciate ligament injury. Orthopedics. 2000; 23(6): 573-8.
98. Krosshaug T, Nakamae A, Boden BP, Engebretsen L, Smith G, Slauterback JR, Hewett TE, Bahr R. Mechanisms of anterior cruciate ligament injury in basketball: Video analysis of 39 cases. Am J Sports Med. 2007; 35(3): 359-67.
99. Olsen OE, Myklebust G, Engebretsen L, Bahr R. Injury mechanisms for anterior cruciate ligament injuries in team handball: A systematic video analysis. Am J Sports Med. 2004; 32(4): 1002-12.
100. Waldén M, Krosshaug T, Bjørneboe J, Einar Andersen T, Faul O, Hägglund M. Three distinct mechanisms predominate in noncontact anterior cruciate ligament injuries in male professional football players: A systematic video analysis of 39 cases. Br J Sports Med. 2015; 49(22): 1452-60.
101. Monfort SM, Comstock RD, Collins CL, Onate JA, Best TM, Chaudhari AMW. Association between ball-handling versus defending actions and acute noncontact lower extremity injuries in high school basketball and soccer. Am J Sports Med. 2015; 43(4): 802-7.
102. Cochrane J, Lloyd D, Buttfield A, Seward H, McGivern J. Characteristics of anterior cruciate ligament injuries in Australian football. J Sci Med Sport. 2007; 10(2): 96-104.
103. Stuelcken MC, Mellifont DB, Gorman AD, Sayers MGL. Mechanisms of anterior cruciate ligament injuries in elite women's netball: A systematic video analysis. J Sports Sci. 2016; 34(16): 1516-22.

References
336
104. Padua DA, DiStefano LJ, Beutler AI, de la Motte SJ, DiStefano MJ, Marshall SW. The Landing Error Scoring System as a screening tool for an anterior cruciate ligament injury-prevention program in elite-youth soccer athletes. J Athl Train. 2015; 50(6): 589-95.
105. Smith HC, Johnson RJ, Shultz SJ, Tourville T, Holterman LA, Slauterbeck J, Vacek PM, Beynnon BD. A prospective evaluation of the Landing Error Scoring System (LESS) as a screening tool for anterior cruciate ligament injury risk. Am J Sports Med. 2012; 40(3): 521-6.
106. Hewett TE, Ford KR, Hoogenboom BJ, Myer GD. Understanding and preventing ACL injuries: Current biomechanical and epidemiologic considerations - Update 2010. N Am J Sports Phys Ther. 2010; 5(4): 234-51.
107. Hewett TE, Myer GD, Ford KR. Anterior cruciate ligament injuries in female athletes Part 1: Mechanisms and risk factors. Am J Sports Med. 2006; 34(2): 299-311.
108. Gillquist J, Messner K. Anterior cruciate ligament reconstruction and the long term incidence of gonarthrosis. Sports Med. 1999; 27(3): 143-56.
109. Barenius B, Ponzer S, Shalabi A, Bujak R, Norlén L, Eriksson K. Increased risk of osteoarthritis after anterior cruciate ligament reconstruction: A 14-year follow-up study of a randomized controlled trial. Am J Sports Med. 2014; 42(5): 1049-57.
110. Conaghan PG. Update on osteoarthritis, Part 1: Current concepts and the relation to exercise. Br J Sports Med. 2002; 36(5): 330-3.
111. Andriacchi TP, Dyrby CO. Interactions between kinematics and loading during walking for the normal and ACL deficient knee. J Biomech. 2005; 38(2): 293-8.
112. Maletius W, Messner K. Eighteen- to twenty-four-year follow-up after complete rupture of the anterior cruciate ligament. Am J Sports Med. 1999; 27(6): 711-7.
113. Øiestad B, Holm I, Engebretsen L, Aune A, Gunderson R, Risberg M. The prevalence of patellofemoral osteoarthritis 12 years after anterior cruciate ligament reconstruction. Knee Surg Sports Traumatol Arthrosc. 2013; 21(4): 942-9.
References
337
114. Harris KP, Driban JB, Sitler MR, Cattano NM, Balasubramanian E, Hootman JM. Tibiofemoral osteoarthritis after surgical or nonsurgical treatment of anterior cruciate ligament rupture: A systematic review. J Athl Train. 2015; In Press.
115. Grindem H, Eitzen I, Engebretsen L, Snyder-Mackler L, Risberg MA. Nonsurgical or surgical treatment of ACL injuries: Knee function, sports participation, and knee reinjury. J Bone Joint Surg. 2014; 96(15): 1233-41.
116. Filbay SR, Ackerman IN, Russell TG, Macri EM, Crossley KM. Health-related quality of life after anterior cruciate ligament reconstruction: A systematic review. Am J Sports Med. 2014; 42(5): 1247-55.
117. Filbay SR, Culvenor AG, Ackerman IN, Russell TG, Crossley KM. Quality of life in anterior cruciate ligament-deficient individuals: A systematic review and meta-analysis. Br J Sports Med. 2015; 49(16): 1033-41.
118. Paterno MV, Rauh MJ, Schmitt LC, Ford KR, Hewett TE. Incidence of second ACL injuries 2 years after primary ACL reconstruction and return to sport. Am J Sports Med. 2014; 42(7): 1567-73.
119. Flood L, Harrison JE. Epidemiology of basketball and netball injuries that resulted in hospital admission in Australia, 2000-2004. Med J Aust. 2009; 190(2): 87-90.
120. Bencke J, Zebis MK. The influence of gender on neuromuscular pre-activity during side-cutting. J Electromyogr Kinesiol. 2011; 21(2): 371-5.
121. Decker MJ, Torry MR, Wyland DJ, Sterett WI, Richard Steadman J. Gender differences in lower extremity kinematics, kinetics and energy absorption during landing. Clin Biomech. 2003; 18(7): 662-9.
122. Ford KR, Shapiro R, Myer GD, van den Bogert AJ, Hewett TE. Longitudinal sex differences during landing in knee abduction in young athletes. Med Sci Sports Exerc. 2010; 42(10): 1923-31.
123. Garrison JC, Hart JM, Palmieri RM, Kerrigan DC, Ingersoll CD. Comparison of knee-joint moments in male and female college soccer players during a single-leg landing. J Sport Rehabil. 2005; 14(4): 332-7.
124. Garrison JC, Hart JM, Palmieri RM, Kerrigan DC, Ingersoll CD. Lower extremity EMG in male and female college soccer players during single-leg landing. J Sport Rehabil. 2005; 14(1): 48-57.

References
338
125. James CR, Sizer PS, Starch DW, Lockhart TE, Slauterbeck J. Gender differences among sagittal plane knee kinematic and ground reaction force characteristics during a rapid sprint and cut maneuver. Res Q Exerc Sport. 2004; 75(1): 31-8.
126. McLean SG, Walker KB, van den Bogert AJ. Effect of gender on lower extremity kinematics during rapid direction changes: An integrated analysis of three sports movements. J Sci Med Sport. 2005; 8(4): 411-22.
127. Schmitz RJ, Kulas AS, Perrin DH, Riemann BL, Shultz SJ. Sex differences in lower extremity biomechanics during single leg landings. Clin Biomech. 2007; 22(6): 681-8.
128. Hughes G, Watkins J, Owen N. Differences between the sexes in knee kinetics during landing from volleyball block jumps. Eur J Sport Sci. 2010; 10(1): 1-11.
129. Nagano Y, Ida H, Akai M, Fukubayashi T. Gender differences in knee kinematics and muscle activity during single limb drop landing. Knee. 2007; 14: 218-23.
130. Hughes G, Dally N. Gender difference in lower limb muscle activity during landing and rapid change of direction. Sci Sports. 2015; 30(3): 163-8.
131. Beaulieu ML, Lamontagne M, Xu L. Lower limb muscle activity and kinematics of an unanticipated cutting manoeuvre: A gender comparison. Knee Surg Sports Traumatol Arthrosc. 2009; 17(8): 968-76.
132. Kibler WB, Chandler TJ, Cabell L, Shapiro R. Gender differences in muscle activation around the hip, knee, and ankle in cutting maneuvers. Clin Biomech. 2001; 16(10): 945.
133. Iguchi J, Tateuchi H, Taniguchi M, Ichihashi N. The effect of sex and fatigue on lower limb kinematics, kinetics and muscle activity during unanticipated side-step cutting. Knee Surg Sports Traumatol Arthrosc. 2014; 22(1): 41-8.
134. Beaulieu ML, Lamontagne M, Xu L. Gender differences in time-frequency EMG analysis of unanticipated cutting maneuvers. Med Sci Sports Exerc. 2008; 40(10): 1795-804.
135. Kernozek TW, Torry MR, Van Hoof H, Cowley H, Tanner S. Gender differences in frontal and sagittal plane biomechanics during drop landings. Med Sci Sports Exerc. 2005; 37(6): 1003-12.

References
339
136. Miranda DL, Fadale PD, Hulstyn MJ, Shalvoy RM, Machan JT, Fleming BC. Knee biomechanics during a jump-cut maneuver: Effects of sex and ACL surgery. Med Sci Sports Exerc. 2013; 45(5): 942-51.
137. Hughes G, Watkins J, Owen N. Gender differences in lower limb frontal plane kinematics during landing. Sports Biomech. 2008; 7(3): 333-41.
138. McLean SG, Lipfert SW, van den Bogert AJ. Effect of gender and defensive opponent on the biomechanics of sidestep cutting. Med Sci Sports Exerc. 2004; 36(6): 1008-16.
139. Kernozek TW, Torry MR, Iwasaki M. Gender differences in lower extremity landing mechanics caused by neuromuscular fatigue. Am J Sports Med. 2008; 36(3): 554-65.
140. Schmitz RJ, Shultz SJ, Anh-Dung N. Dynamic valgus alignment and functional strength in males and females during maturation. J Athl Train. 2009; 44(1): 26-32.
141. Ford KR, Myer GD, Hewett TE. Valgus knee motion during landing in high school female and male basketball players. Med Sci Sports Exerc. 2003; 35(10): 1745-50.
142. Gehring D, Melnyk M, Gollhofer A. Gender and fatigue have influence on knee joint control strategies during landing. Clin Biomech. 2009; 24(1): 82-7.
143. Hughes G, Watkins J, Owen N. The effects of opposition and gender on knee kinematics and ground reaction force during landing from volleyball block jumps. Res Q Exerc Sport. 2010; 81(4): 384-91.
144. Pappas E, Sheikhzadeh A, Hagins M, Nordin M. The effect of gender and fatigue on the biomechanics of bilateral landings from a jump: Peak values. J Sports Sci Med. 2007; 6(1): 77-84.
145. Russell KA, Palmieri RM, Zinder SM, Ingersoll CD. Sex differences in valgus knee angle during a single-leg drop jump. J Athl Train. 2006; 41(2): 166-71.
146. Walsh MS, Waters J, Kersting UG. Gender bias on the effects of instruction on kinematic and kinetic jump parameters of high-level athletes. Res Sports Med. 2007; 15(4): 283-95.
References
340
147. Pollard CD, Davis IM, Hamill J. Influence of gender on hip and knee mechanics during a randomly cued cutting maneuver. Clin Biomech. 2004; 19(10): 1022-31.
148. Orishimo KF, Liederbach M, Kremenic IJ, Hagins M, Pappas E. Comparison of landing biomechanics between male and female dancers and athletes, Part 1: Influence of sex on risk of anterior cruciate ligament injury. Am J Sports Med. 2014; 42(5): 1082-8.
149. McLean SG, Huang X, van den Bogert AJ. Association between lower extremity posture at contact and peak knee valgus moment during sidestepping: Implications for ACL injury. Clin Biomech. 2005; 20(8): 863-70.
150. Norcross MF, Lewek MD, Padua DA, Shultz SJ, Weinhold PS, Blackburn JT. Lower extremity energy absorption and biomechanics during landing, Part II: Frontal-plane energy analyses and interplanar relationships. J Athl Train. 2013; 48(6): 757-63.
151. Kiriyama S, Sato H, Takahira N. Gender differences in rotation of the shank during single-legged drop landing and its relation to rotational muscle strength of the knee. Am J Sports Med. 2009; 37(1): 167-74.
152. McLean SG. The ACL injury enigma: We can't prevent what we don't understand. J Athl Train. 2008; 43(5): 538-40.
153. Kirkendall DT, Garrett Jr WE. The anterior cruciate ligament enigma: Injury mechanisms and prevention. Clin Orthop Relat Res. 2000; 372: 64-8.
154. Chaudhari AM, Hearn BK, Andriacchi TP. Sport-dependent variations in arm position during single-limb landing influence knee loading: Implications for anterior cruciate ligament injury. Am J Sports Med. 2005; 33(6): 824-30.
155. Fedie R, Carlstedt K, Willson JD, Kernozek TW. Effect of attending to a ball during a side-cut maneuver on lower extremity biomechanics in male and female athletes. Sports Biomech. 2010; 9(3): 165-77.
156. Fox A, Spittle M, Otago L, Saunders N. Offensive agility techniques performed during international netball competition. Int J Sports Sci Coach. 2014; 9(3): 543-52.
157. Fox AS, Spittle M, Otago L, Saunders N. Descriptive analysis of landings during international netball competition: Enhancing ecological validity of laboratory testing environments. Int J Perform Anal Sport. 2013; 13(3): 690-702.
References
341
158. Lloyd DG. Rationale for training programs to reduce anterior cruciate ligament injuries in Australian football. J Orthop Sports Phys Ther. 2001; 31(11): 645-54.
159. Hewett TE, Torg JS, Boden BP. Video analysis of trunk and knee motion during non-contact anterior cruciate ligament injury in female athletes: Lateral trunk and knee abduction motion are combined components of the injury mechanism. Br J Sports Med. 2009; 43(6): 417-22.
160. Hewett TE, Myer GD, Ford KR, Heidt Jr RS, Colosimo AJ, McLean SG, van den Bogert AJ, Paterno MV, Succop P. Biomechanical measures of neuromuscular control and valgus loading of the knee predict anterior cruciate ligament injury risk in female athletes: A prospective study. Am J Sports Med. 2005; 33(4): 492-501.
161. Donnelly CJ, Elliott BC, Ackland TR, Doyle TLA, Beiser TF, Finch CF, Cochrane JL, Dempsey AR, Lloyd DG. An anterior cruciate ligament injury prevention framework: Incorporating the recent evidence. Res Sports Med. 2012; 20(3-4): 239-62.
162. Powers CM. The influence of abnormal hip mechanics on knee injury: A biomechanical perspective. J Orthop Sports Phys Ther. 2010; 40(2): 42-51.
163. Kipp K, McLean SG, Palmieri-Smith RM. Patterns of hip flexion motion predict frontal and transverse plane knee torques during a single-leg land-and-cut maneuver. Clin Biomech. 2011; 26(5): 504-8.
164. Jones PA, Herrington LC, Graham-Smith P. Technique determinants of knee joint loads during cutting in female soccer players. Hum Movement Sci. 2015; 42: 203-11.
165. Brown TN, Palmieri-Smith RM, McLean SG. Knee kinematics during single- and double-legged jump landings following six weeks of neuromuscular training. J Athl Train. 2010; 45(5): 530.
166. Dempsey AR, Lloyd DG, Elliott BC, Steele JR, Munro BJ. Changing sidestep cutting technique reduces knee valgus loading. Am J Sports Med. 2009; 37(11): 2194-200.
167. Dempsey AR, Lloyd DG, Elliott BC, Steele JR, Munro BJ, Russo KA. The effect of technique change on knee loads during sidestep cutting. Med Sci Sports Exerc. 2007; 39(10): 1765-73.
References
342
168. Sigward SM, Ota S, Powers CM. Predictors of frontal plane knee excursion during a drop land in young female soccer players. J Orthop Sports Phys Ther. 2008; 38(11): 661-7.
169. Wahlstedt C, Rasmussen-Barr E. Anterior cruciate ligament injury and ankle dorsiflexion. Knee Surg Sports Traumatol Arthrosc. 2015; 23(11): 3202-7.
170. Lloyd DG, Buchanan TS. Strategies of muscular support of varus and valgus isometric loads at the human knee. J Biomech. 2001; 34(10): 1257-67.
171. Besier TF, Lloyd DG, Ackland TR. Muscle activation strategies at the knee during running and cutting maneuvers. Med Sci Sports Exerc. 2003; 35(1): 119-27.
172. Neptune RR, Wright IC, van den Bogert AJ. Muscle coordination and function during cutting movements. Med Sci Sports Exerc. 1999; 31(2): 294-302.
173. Zhang SN, Bates BT, Dufek JS. Contributions of lower extremity joints to energy dissipation during landings. Med Sci Sports Exerc. 2000; 32(4): 812-9.
174. Brown TN, McLean SG, Palmieri-Smith RM. Associations between lower limb muscle activation strategies and resultant multi-planar knee kinetics during single leg landings. J Sci Med Sport. 2014; 17(4): 408-13.
175. Padua DA, Bell DR, Clark MA. Neuromuscular characteristics of individuals displaying excessive medial knee displacement. J Athl Train. 2012; 47(5): 525-36.
176. McLean SG, Huang X, van den Bogert AJ. Investigating isolated neuromuscular control contributions to non-contact anterior cruciate ligament injury risk via computer simulation methods. Clin Biomech. 2008; 23(7): 926-36.
177. Zebis MK, Andersen LL, Bencke J, Kjær M, Aagaard P. Identification of athletes at future risk of anterior cruciate ligament ruptures by neuromuscular screening. Am J Sports Med. 2009; 37(10): 1967-73.
178. Walsh M, Boling MC, McGrath M, Blackburn JT, Padua DA. Lower extremity muscle activation and knee flexion during a jump-landing task. J Athl Train. 2012; 47(4): 406-13.
179. Lee S, Chang J, Choi Y. Low limb muscle activation and joint angle in the sagittal plane during drop landing from various heights. J Phys Ther Sci. 2011; 23(2): 303-5.
References
343
180. Peng HT, Kernozek TW, Song CY. Quadricep and hamstring activation during drop jumps with changes in drop height. Phys Ther Sport. 2011; 12(3): 127-32.
181. Hanson AM, Padua DA, Blackburn JT, Prentice WE, Hirth CJ. Muscle activation during side-step cutting maneuvers in male and female soccer athletes. J Athl Train. 2008; 43(2): 133-43.
182. Li G, Rudy TW, Sakane M, Kanamori A, Ma CB, Woo SL. The importance of quadriceps and hamstring muscle loading on knee kinematics and in-situ forces in the ACL. J Biomech. 1999; 32(4): 395-400.
183. Withrow TJ, Huston LJ, Wojtys EM, Ashton-Miller JA. Effect of varying hamstring tension on anterior cruciate ligament strain during in vitro impulsive knee flexion and compression loading. J Bone Joint Surg. 2008; 90(4): 815-23.
184. Mokhtarzadeh H, Chen Hua Y, Goh JCH, Oetomo D, Malekipour F, Lee PVS. Contributions of the soleus and gastrocnemius muscles to the anterior cruciate ligament loading during single-leg landing. J Biomech. 2013; 46(11): 1913-20.
185. Morgan KD, Donnelly CJ, Reinbolt JA. Elevated gastrocnemius forces compensate for decreased hamstrings forces during the weight-acceptance phase of single-leg jump landing: Implications for anterior cruciate ligament injury risk. J Biomech. 2014; 47(13): 3295-302.
186. Saunders N, McLean SG, Fox AS, Otago L. Neuromuscular dysfunction that may predict ACL injury risk: A case report. Knee. 2014; 21(3): 789-92.
187. Palmieri-Smith RM, Wojtys EM, Ashton-Miller JA. Association between preparatory muscle activation and peak valgus knee angle. J Electromyogr Kinesiol. 2008; 18(6): 973-9.
188. Shultz SJ, Nguyen A, Leonard MD, Schmitz RJ. Thigh strength and activation as predictors of knee biomechanics during a drop jump task. Med Sci Sports Exerc. 2009; 41(4): 857-66.
189. Malfait B, Dingenen B, Staes F, Vanrenterghem J, Verschueren S. Differences in neuromuscular activity of quadriceps and hamstrings with respect to different landing patterns in female athletes. Br J Sports Med. 2014; 48(7): 631.

References
344
190. Hollman JH, Galardi CM, Lin IH, Voth BC, Whitmarsh CL. Frontal and transverse plane hip kinematics and gluteus maximus recruitment correlate with frontal plane knee kinematics during single-leg squat tests in women. Clin Biomech. 2014; 29(4): 468-74.
191. Hollman JH, Ginos BE, Kozuchowski J, Vaughn AS, Krause DA, Youdas JW. Relationships between knee valgus, hip-muscle strength, and hip-muscle recruitment during a single-limb step-down. J Sport Rehabil. 2009; 18(1): 104-17.
192. Hashemi J, Breighner R, Jang T-H, Chandrashekar N, Ekwaro-Osire S, Slauterbeck JR. Increasing pre-activation of the quadriceps muscle protects the anterior cruciate ligament during the landing phase of a jump: An in vitro simulation. Knee. 2010; 17(3): 235-41.
193. Ford KR, Myer GD, Toms HE, Hewett TE. Gender differences in the kinematics of unanticipated cutting in young athletes. Med Sci Sports Exerc. 2005; 37(1): 124-9.
194. Steams KM, Powers CM. The influence of hip abductor muscle performance on the knee valgus moment during landing: A gender comparison. J Athl Train. 2012; 47(5): e4.
195. Stearns KM, Powers CM. Improvements in hip muscle performance result in increased use of the hip extensors and abductors during a landing task. Am J Sports Med. 2014; 42(3): 602-9.
196. Hollman JH, Hohl JM, Kraft JL, Strauss JD, Traver KJ. Effects of hip extensor fatigue on lower extremity kinematics during a jump-landing task in women: A controlled laboratory study. Clin Biomech. 2012; 27(9): 903-9.
197. Hollman JH, Hohl JM, Kraft JL, Strauss JD, Traver KJ. Modulation of frontal-plane knee kinematics by hip-extensor strength and gluteus maximus recruitment during a jump-landing task in healthy women. J Sport Rehabil. 2013; 22(3): 184-90.
198. Khayambashi K, Ghoddosi N, Straub RK, Powers CM. Hip muscle strength predicts noncontact anterior cruciate ligament injury in male and female athletes: A prospective study. Am J Sports Med. 2016; 44(2): 355-61.
199. Zazulak BT, Ponce PL, Straub SJ, Medvecky MJ, Avedisian L, Hewett TE. Gender comparison of hip muscle activity during single-leg landing. J Orthop Sports Phys Ther. 2005; 35(5): 292-9.
References
345
200. Simpson CS, Sohn MH, Allen JL, Ting LH. Feasible muscle activation ranges based on inverse dynamics analyses of human walking. J Biomech. 2015; 48(12): 2990-7.
201. Myer GD, Ford KR, Brent JL, Hewett TE. The effects of plyometric versus dynamic stabilization and balance training on power, balance, and landing force in female athletes. J Strength Cond Res. 2006; 20(2): 345-53.
202. Caraffa A, Cerulli G, Projetti M, Aisa G, Rizzo A. Prevention of anterior cruciate ligament injuries in soccer. Knee Surg Sports Traumatol Arthrosc. 1996; 4(1): 19-21.
203. Ettlinger CF, Johnson RJ, Shealy JE. A method to help reduce the risk of serious knee sprains incurred in alpine skiing. Am J Sports Med. 1995; 23(5): 531-7.
204. Gilchrist J, Mandelbaum BR, Melancon H, Ryan GW, Silvers HJ, Griffin LY, Watanabe DS, Dick RW, Dvorak J. A randomized controlled trial to prevent non contact anterior cruciate ligament injury in female collegiate soccer players. Am J Sports Med. 2008; 36(8): 1476-83.
205. Heidt Jr RS, Sweeterman LM, Carlonas RL, Traub JA, Tekulve FX. Avoidance of soccer injuries with preseason conditioning. Am J Sports Med. 2000; 28(5): 659-62.
206. Hewett TE, Lindenfeld TN, Riccobene JV, Noyes FR. The effect of neuromuscular training on the incidence of knee injury in female athletes: A prospective study. Am J Sports Med. 1999; 27(6): 699-706.
207. Kiani A, Hellquist E, Ahlqvist K, Gedeborg R, Michaëlsson K, Byberg L. Prevention of soccer-related knee injuries in teenaged girls. Arch Intern Med. 2010; 170(1): 43-9.
208. Pfeiffer RP, Shea KG, Roberts D, Grandstrand S, Bond L. Lack of effect of a knee ligament injury prevention program on the incidence of noncontact anterior cruciate ligament injury. J Bone Joint Surg. 2006; 88(8): 1769-74.
209. Soderman K, Werner S, Pietila T, Engstrom B, Alfredson H. Balance board training: Prevention of traumatic injuries of the lower extremities in female soccer players? A prospective randomized intervention study. Knee Surg Sports Traumatol Arthrosc. 2000; 8(6): 356-63.

References
346
210. Steffen K, Myklebust G, Olsen OE, Holme I, Bahr R. Preventing injuries in female youth football: A cluster-randomized controlled trial. Scand J Med Sci Sports. 2008; 18(5): 605-14.
211. Pasanen K, Parkkani J, Pasanen M, Hiilloskorpi H, Mäkinen T, Järvinen M, Kannus P. Neuromuscular training and the risk of leg injuries in female floorball players: Cluster randomised controlled study. Br J Sports Med. 2008; 42(10): 502-5.
212. Myklebust G, Engebretsen L, Braekken IH, Skjolbert A, Olsen OE, Bahr R. Prevention of anterior cruciate ligament injuries in female team handball players: A prospective intervention study over three seasons. Clin J Sport Med. 2003; 13(2): 71-8.
213. Herman DC, Oñate JA, Weinhold PS, Guskiewicz KM, Garrett WE, Yu B, Padua DA. The effects of feedback with and without strength training on lower extremity biomechanics. Am J Sports Med. 2009; 37(7): 1301-8.
214. Aerts I, Cumps E, Verhagen E, Wuyts B, Van De Gucht S, Meeusen R. The effect of a 3-month prevention program on the jump-landing technique in basketball: A randomized controlled trial. J Sport Rehabil. 2015; 24(1): 21-30.
215. McCurdy K, Walker J, Saxe J, Woods J. The effect of short-term resistance training on hip and knee kinematics during vertical drop jumps. J Strength Cond Res. 2012; 26(5): 1257-64.
216. Cochrane JL, Lloyd DG, Besier TF, Elliott BC, Doyle TLA, Ackland TR. Training affects knee kinematics and kinetics in cutting maneuvers in sport. Med Sci Sports Exerc. 2010; 42(8): 1535-44.
217. Donnelly CJ, Elliott BC, Doyle TLA, Finch CF, Dempsey AR, Lloyd DG. Changes in knee joint biomechanics following balance and technique training and a season of Australian football. Br J Sports Med. 2012; 46(13): 917-22.
218. Gagnier JJ, Morgenstern H, Chess L. Interventions designed to prevent anterior cruciate ligament injuries in adolescents and adults: A systematic review and meta-analysis. Am J Sports Med. 2013; 41(8): 1952-62.
219. Stevenson JH, Beattie CS, Schwartz JB, Busconi BD. Assessing the effectiveness of neuromuscular training programs in reducing the incidence of anterior cruciate ligament injuries in female athletes: A systematic review. Am J Sports Med. 2015; 43(2): 482-90.
References
347
220. Steffen K, Emery CA, Romiti M, Jian K, Bizzini M, Dvorak J, Finch CF, Meeuwisse WH. High adherence to a neuromuscular injury prevention programme (FIFA 11+) improves functional balance and reduces injury risk in Canadian youth female football players: A cluster randomised trial. Br J Sports Med. 2013; 47(12): 794-802.
221. Hägglund M, Atroshi I, Wagner P, Waldén M. Superior compliance with a neuromuscular training programme is associated with fewer ACL injuries and fewer acute knee injuries in female adolescent football players: Secondary analysis of an RCT. Br J Sports Med. 2013; 47(15): 974-9.
222. Junge A, Roesch D, Peterson L, Graf-Baumann T, Dvorak J. Prevention of soccer injuries: A prospective intervention study in youth amateur players. Am J Sports Med. 2002; 30(5): 652-9.
223. Sugimoto D, Myer GD, Bush HM, Klugman MF, McKeon JMM, Hewett TE. Compliance with neuromuscular training and anterior cruciate ligament injury risk reduction in female athletes: A meta-analysis. J Athl Train. 2012; 47(6): 714-23.
224. Carow SD, Haniuk EM, Cameron KL, DiStefano LJ, Padua DA, Marshall SW, Beutler AI, Gerber JP. Risk of knee sprain following the implementation of an injury prevention program is associated with level of supervision. J Athl Train. 2012; 47(5): e8.
225. Fortington LV, Donaldson A, Lathlean T, Young WB, Gabbe BJ, Lloyd D, Finch CF. When ‘just doing it’ is not enough: Assessing the fidelity of player performance of an injury prevention exercise program. J Sci Med Sport. 2015; 18(3): 272-7.
226. Swart E, Redler L, Fabricant PD, Mandelbaum BR, Ahmad CS, Wang YC. Prevention and screening programs for anterior cruciate ligament injuries in young athletes: A cost-effectiveness analysis. J Bone Joint Surg. 2014; 96(9): 705-11.
227. Joy EA, Taylor JR, Novak MA, Chen M, Fink BP, Porucznik CA. Factors influencing the implementation of anterior cruciate ligament injury prevention strategies by girls soccer coaches. J Strength Cond Res. 2013; 27(8): 2263-9.
228. Keats MR, Emery CA, Finch CF. Are we having fun yet? Fostering adherence to injury preventive exercise recommendations in young athletes. Sports Med. 2012; 42(3): 175-84.
References
348
229. Frank B, Register-Mihalik J, Marshall S, Padua D. A coaching workshop improves coach intention but does not translate to implementation of a ACL injury prevention program. Br J Sports Med. 2014; 48(7): 595.
230. Myklebust G, Skjølberg A, Bahr R. ACL injury incidence in female handball 10 years after the Norwegian ACL prevention study: Important lessons learned. Br J Sports Med. 2013; 47(8): 476-9.
231. Renström PA. Eight clinical conundrums relating to anterior cruciate ligament (ACL) injury in sport: Recent evidence and a personal reflection. Br J Sports Med. 2013; 47(6): 1-7.
232. Australian Bureau of Statistics. Participation in sports and physical recreation, Australia, 2009-10. Canberra: ABS; 2010.
233. McGrath AC, Ozanne-Smith J. Attacking the goal of netball injury prevention: A review of the literature. Victoria: Monash University - Accident Research Centre, 1998.
234. Steele JR. Biomechanical factors affecting performance in netball: Implications for improving performance and injury reduction. Sports Med. 1990; 10(2): 88-102.
235. Hume PA, Steele JR. A preliminary investigation of injury prevention strategies in netball: Are players heeding the advice? J Sci Med Sport. 2000; 4(3): 406-13.
236. Hohmann E, Bryant A, Livingstone E, Reaburn P, Tetsworth K, Imhoff A, Bryant AL. Tibial acceleration profiles during the menstrual cycle in female athletes. Arch Orthop Trauma Surg. 2015; 135(10): 1419-27.
237. Hopper D, Elliott B. Lower-limb and back injury patterns of elite netball players. Sports Med. 1993; 16(2): 148-62.
238. Hopper D, Elliott B, Lalor J. A descriptive epidemiology of netball injuries during competition: A five year study. Br J Sports Med. 1995; 29(4): 223-8.
239. Otago L, Saunders N. An injury report to Netball Australia on the Commonwealth Bank Trophy competition 2006. University of Ballarat, 2007.
240. Otago L, Saunders N. An injury report to Netball Australia on the Commonwealth Bank Trophy competition 2007. University of Ballarat, 2009.
241. Otago L, Saunders N. An injury report to Netball Australia on the ANZ Championship competition 2008. University of Ballarat, 2010.
References
349
242. Saunders N, Otago L. Elite netball injury surveillance: Implications for injury prevention. J Sci Med Sport. 2009; 12(S1): S63.
243. Saunders N, Otago L. 2010 ANZ Championships injury report. University of Ballarat, 2010.
244. Otago L, Peake J. The role of insurance data in setting priorities for netball injury prevention strategies. J Sci Med Sport. 2007; 10(2): 105-9.
245. Otago L. Kinetic analysis of landings in netball: is a footwork rule change required to decrease ACL injuries? J Sci Med Sport. 2004; 7(1): 85-95.
246. Hopper D, Lo SK, Kirkham C, Elliott B. Landing patterns in netball: analysis of an international game. Br J Sports Med. 1992; 26(2): 101-6.
247. Brown S, Brughelli M, Hume P. Knee mechanics during planned and unplanned sidestepping: A systematic review and meta-analysis. Sports Med. 2014; 44(11): 1573-88.
248. Stuelcken M, Greene A, Smith R, Vanwanseele B. Knee loading patterns in a simulated netball landing task. Eur J Sport Sci. 2013; 13(5): 475-82.
249. Milner CE, Fairbrother JT, Srivatsan A, Zhang S. Simple verbal instruction improves knee biomechanics during landing in female athletes. Knee. 2012; 19(4): 399-403.
250. O'Connor KM, Bottum MC. Differences in cutting knee mechanics based on Principal Components Analysis. Med Sci Sports Exerc. 2009; 41(4): 867-78.
251. Sanna G, O'Connor KM. Fatigue-related changes in stance leg mechanics during sidestep cutting maneuvers. Clin Biomech. 2008; 23(7): 946-54.
252. Weinhandl JT, Joshi M, O'Connor KM. Gender comparisons between unilateral and bilateral landings. J Appl Biomech. 2010; 26(4): 444-53.
253. Vanwanseele B, Stuelcken M, Greene A, Smith R. The effect of external ankle support on knee and ankle joint movement and loading in netball players. J Sci Med Sport. 2014; 17(5): 511-5.
254. Saunders N. Characteristics of the female landing pattern. University of Ballarat: Ballarat, Victoria, Australia; 2006.
255. Dempsey AR, Elliott BC, Munro BJ, Steele JR, Lloyd DG. Whole body kinematics and knee moments that occur during an overhead catch and landing task in sport. Clin Biomech. 2012; 27(5): 466-74.

References
350
256. Herrington L, Myer GD, Munro A. Intra and inter-tester reliability of the tuck jump assessment. Phys Ther Sport. 2013; 14(3): 152-5.
257. Perrott MA, Pizzari T, Opar M, Cook J. Development of clinical rating criteria for tests of lumbopelvic stability. Rehabil Res Pract. 2012; 2012: 803637-43.
258. Saunders N, Otago L, Peoples J. Down to Earth: A practical guide to safe and effective landing in netball. University of Ballarat: School of Human Movement and Sport Sciences, 2006.
259. Saunders N, Otago L, Romiti M, Donaldson A, White P, Finch CF. Coaches' perspectives on implementing an evidence-informed injury prevention programme in junior community netball. Br J Sports Med. 2010; 44(15): 1128-32.
260. Enoka RM. Neuromechanics of Human Movement. 5th ed. Human Kinetics: Champaign, IL; 2015.
261. Winter DA. Biomechanics and Motor Control of Human Movement. 4th ed. John Wiley & Sons: New Jersey; 2009.
262. Hug F, Hodges PW, Tucker K. Muscle force cannot be directly inferred from muscle activation: Illustrated by the proposed imbalance of force between the vastus medialis and vastus lateralis in people with patellofemoral pain. J Orthop Sports Phys Ther. 2015; 45(5): 360-5.
263. Konrad P. The ABC of EMG: A practical introduction to kinesiological electromyography. 2005.
264. Hermens HJ, Freriks B, Disselhorst-Klug C, Rau G. Development of recommendations for SEMG sensors and sensor placement procedures. J Electromyogr Kinesiol. 2000; 10(5): 361-74.
265. Rainoldi A, Melchiorri G, Caruso I. A method for positioning electrodes during surface EMG recordings in lower limb muscles. J Neurosci Methods. 2004; 134(1): 37-43.
266. Standards for reporting EMG data. J Electromyogr Kinesiol. 2016; 28(6): I-II.
267. Cowling EJ, Steele JR, McNair PJ. Effect of verbal instructions on muscle activity and risk of injury to the anterior cruciate ligament during landing. Br J Sports Med. 2003; 37(2): 126-30.
References
351
268. Russell PJ, Croce RV, Swartz EE, Decoster LC. Knee-muscle activation during landings: Developmental and gender comparisons. Med Sci Sports Exerc. 2007; 39(1): 159-69.
269. Donnelly CJ, Elliott BC, Doyle TLA, Finch CF, Dempsey AR, Lloyd DG. Changes in muscle activation following balance and technique training and a season of Australian football. J Sci Med Sport. 2015; 18(3): 348-52.
270. Cram JR, Kasman GS, Holtz J. Introduction to Surface Electromyography. Aspen Publishers, Inc.: Gaithersburg; 1998.
271. Soderberg GL, Knutson LM. A guide for use and interpretation of kinesiologic electromyographic data. Phys Ther. 2000; 80(5): 485-98.
272. Chowdhury RH, Reaz MBI, Ali MABM, Bakar AAA, Chellappan K, Chang TG. Surface electromyography signal processing and classification techniques. Sensors. 2013; 13(9): 12432-66.
273. Kadaba MP, Ramakrishnan HK, Wootten ME, Gainey J, Gorton G, Cochran GV. Repeatability of kinematic, kinetic, and electromyographic data in normal adult gait. J Orthop Res. 1989; 7(6): 849-60.
274. Chapman A, Vicenzino B, Blanch P, Hodges P. Do differences in muscle recruitment between novice and elite cyclists reflect different movement patterns or less skilled muscle recruitment? J Sci Med Sport. 2009; 12(1): 31-4.
275. Fauth ML, Petushek EJ, Feldmann CR, Hsu BE, Garceau LR, Lutsch BN, Ebben WP. Reliability of surface electromyography during maximal voluntary isometric contractions, jump landings, and cutting. J Strength Cond Res. 2010; 24(4): 1131-7.
276. Hubley-Kozey CL, Robbins SM, Rutherford DJ, Stanish WD. Reliability of surface electromyographic recordings during walking in individuals with knee osteoarthritis. J Electromyogr Kinesiol. 2013; 23(2): 334-41.
277. Murley GS, Menz HB, Landorf KB, Bird AR. Reliability of lower limb electromyography during overground walking: a comparison of maximal- and sub-maximal normalisation techniques. J Biomech. 2010; 43(4): 749-56.
278. Bogey R, Cerny K, Mohammed O. Repeatability of wire and surface electrodes in gait. Am J Phys Med Rehabil. 2003; 82(5): 338-44.

References
352
279. Reaz MBI, Hussain MS, Mohd-Yasin F. Techniques of EMG signal analysis: Detection, processing, classification and applications. Biol Proced. 2006; 8(1): 11-35.
280. Homan KJ, Norcross MF, Goerger BM, Prentice WE, Blackburn JT. The influence of hip strength on gluteal activity and lower extremity kinematics. J Electromyogr Kinesiol. 2013; 23(2): 411-5.
281. Carcia CR, Martin RL. The influence of gender on gluteus medius activity during a drop jump. Phys Ther Sport. 2007; 8(4): 169-76.
282. Palmieri-Smith RM, McLean SG, Ashton-Miller JA, Wojtys EM. Association of quadriceps and hamstrings cocontraction patterns with knee joint loading. J Athl Train. 2009; 44(3): 256-63.
283. Perotto AO. Anatomical guide for the electromyographer: The limbs and trunk. Charles C. Thomas: Springfield, IL; 1994.
284. Edwards S, Steele JR, Cook JL, Purdam C, McGhee DE. Lower limb movement symmetry cannot be assumed when investigating the stop-jump landing. Med Sci Sports Exerc. 2012; 44(6): 1123-30.
285. Edwards S, Steele JR, Purdam CR, Cook JL, McGhee DE. Alterations to landing technique and patellar tendon loading in response to fatigue. Med Sci Sports Exerc. 2014; 46(2): 330-40.
286. Ambegaonkar JP, Shultz SJ, Perrin DH. A subsequent movement alters lower extremity muscle activity and kinetics in drop jumps vs. drop landings. J Strength Cond Res. 2011; 25(10): 2781-8.
287. Urabe Y, Kobayashi R, Sumida S, Tanaka K, Yoshida N, Nishiwaki GA, Tsutsumi E, Ochi M. Electromyographic analysis of the knee during jump landing in male and female athletes. Knee. 2005; 12(2): 129-34.
288. Lepley LK, Thomas AC, McLean SG, Palmieri-Smith RM. Fatigue's lack of effect on thigh-muscle activity in anterior cruciate ligament-reconstructed patients during a dynamic-landing task. J Sport Rehabil. 2013; 22(2): 83-92.
289. Tsai LC, McLean S, Colletti PM, Powers CM. Greater muscle co-contraction results in increased tibiofemoral compressive forces in females who have undergone anterior cruciate ligament reconstruction. J Orthop Res. 2012; 30(12): 2007-14.
References
353
290. Kipp K, Pfeiffer R, Sabick M, Harris C, Sutter J, Kuhlman S, Shea K. Muscle synergies during a single-leg drop-landing in boys and girls. J Appl Biomech. 2014; 30(2): 262-8.
291. Cappellini G, Ivanenko YP, Poppele RE, Lacquaniti F. Motor patterns in human walking and running. J Neurophysiol. 2006; 95(6): 3426-37.
292. Ivanenko YP, Cappellini G, Dominici N, Poppele RE, Lacquaniti F. Coordination of locomotion with voluntary movements in humans. J Neurosci. 2005; 25(31): 7238-53.
293. Ivanenko YP, Poppele RE, Lacquaniti F. Five basic muscle activation patterns account for muscle activity during human locomotion. J Physiol. 2004; 556(1): 267-82.
294. Barroso FO, Torricelli D, Moreno JC, Taylor J, Gomez-Soriano J, Bravo-Esteban E, Piazza S, Santos C, Pons JL. Shared muscle synergies in human walking and cycling. J Neurophysiol. 2014; 112(8): 1984-98.
295. Hug F. Can muscle coordination be precisely studied by surface electromyography? J Electromyogr Kinesiol. 2011; 21(1): 1-12.
296. Serrancoli G, Monllau JC, Font-Llagunes JM. Analysis of muscle synergies and activation-deactivation patterns in subjects with anterior cruciate ligament deficiency during walking. Clin Biomech. 2016; 31(1): 65-73.
297. Tresch MC, Cheung VC, d'Avella A. Matrix factorization algorithms for the identification of muscle synergies: evaluation on simulated and experimental data sets. J Neurophysiol. 2006; 95(4): 2199-212.
298. Lee DD, Seung HS. Algorithms for nonnegative matrix factorization. Advances in Neural Processing Systems; 2001; Cambridge, MA.
299. Beaulieu ML, McLean SG. Sex-dimorphic landing mechanics and their role within the noncontact ACL injury mechanism: Evidence, limitations and directions. Sports Med Arthrosc Rehabil Ther Tech. 2012; 4(1): 10-22.
300. McLean SG, Felin RE, Suedekum N, Calabrese G, Passerallo A, Joy S. Impact of fatigue on gender-based high-risk landing strategies. Med Sci Sports Exerc. 2007; 39(3): 502-14.
301. McLean SG, van den Bogert AJ. Knee kinematics during sidestep cutting: Potential for ACL injury in females. Clin Biomech. 2001; 16(10): 954-5.
References
354
302. Besier TF, Lloyd DG, Ackland TR, Cochrane JL. Anticipatory effects on knee joint loading during running and cutting maneuvers. Med Sci Sports Exerc. 2001; 33(7): 1176-81.
303. Besier TF, Lloyd DG, Cochrane JL, Ackland TR. External loading of the knee joint during running and cutting maneuvers. Med Sci Sports Exerc. 2001; 33(7): 1168-75.
304. Kristianslund E, Faul O, Bahr R, Myklebust G, Krosshaug T. Sidestep cutting technique and knee abduction loading: Implications for ACL prevention exercises. Br J Sports Med. 2014; 48(9): 779-83.
305. McLean SG, Su A, van den Bogert AJ. Development and validation of a 3-D model to predict knee joint loading during dynamic movement. J Biomech Eng. 2003; 125(6): 864-74.
306. Bell AL, Pedersen DR, Brand RA. A comparison of the accuracy of several hip center location prediction methods. J Biomech. 1990; 23(6): 617-21.
307. van den Bogert AJ, Smith GD, Nigg BM. In vivo determination of the anatomical axes of the ankle joint complex: An optimization approach. J Biomech. 1994; 27(12): 1477-88.
308. Vaughan CL, Davis BL, O'Connor JC. Dynamics of Human Gait. Human Kinetics: Champaign, IL; 1990.
309. McLean SG, Huang X, Su A, van den Bogert AJ. Sagittal plane biomechanics cannot injure the ACL during sidestep cutting. Clin Biomech. 2004; 19(8): 828-38.
310. McLean SG, Samorezov JE. Fatigue-induced ACL injury risk stems from a degradation in central control. Med Sci Sports Exerc. 2009; 41(8): 1661-72.
311. Borotikar BS, Newcomer R, Koppes R, McLean SG. Combined effects of fatigue and decision making on female lower limb landing postures: Central and peripheral contributions to ACL injury risk. Clin Biomech. 2008; 23(1): 81-92.
312. Leardini A, Chiari L, Croce UD, Cappozzo A. Human movement analysis using stereophotogrammetry, Part 3: Soft tissue artifact assessment and compensation. Gait Posture. 2005; 21(2): 212-25.

References
355
313. Wearing SC, Urry SR, Smeathers JE. The effect of visual targeting on ground reaction force and temporospatial parameters of gait. Clin Biomech. 2000; 15(8): 583-91.
314. Verniba D, Vergara ME, Gage WH. Force plate targeting has no effect on spatiotemporal gait measures and their variability in young and healthy population. Gait Posture. 2015; 41(2): 551-6.
315. Kristianslund E, Krosshaug T, van den Bogert AJ. Effect of low pass filtering on joint moments from inverse dynamics: Implications for injury prevention. J Biomech. 2012; 45(4): 666-71.
316. Chiari L, Croce UD, Leardini A, Cappozzo A. Human movement analysis using stereophotogrammetry, Part 2: Instrumental errors. Gait Posture. 2005; 21(2): 197-211.
317. Roewer BD, Ford KR, Myer GD, Hewett TE. The 'impact' of force filtering cut-off frequency on the peak knee abduction moment during landing: Artefact or 'artifiction'? Br J Sports Med. 2014; 48(6): 464-8.
318. Kristianslund E, Krosshaug T, Kam-Ming M, McLean S, van den Bogert AJ. Expressing the joint moments of drop jumps and sidestep cutting in different reference frames - does it matter? J Biomech. 2014; 47(1): 193-9.
319. Lee MJC, Lloyd DG, Lay BS, Bourke PD, Alderson JA. Effects of different visual stimuli on postures and knee moments during sidestepping. Med Sci Sports Exerc. 2013; 45(9): 1740-8.
320. Kristianslund E, Krosshaug T, van den Bogert AJ. Artefacts in measuring joint moments may lead to incorrect clinical conclusions: The nexus between science (biomechanics) and sports injury prevention! Br J Sports Med. 2013; 47(8): 470-3.
321. Woltring HJ. A Fortran package for generalized, cross-validatory spline smoothing and differentiation. Adv Eng Softw. 1986; 8(2): 104-13.
322. Yu B, Gabriel D, Noble L, An KN. Estimate of the optimum cutoff frequency for the Butterworth low-pass digital filter. J Appl Biomech. 1999; 15(3): 318-29.
323. Schache AG, Baker R. On the expression of joint moments during gait. Gait Posture. 2007; 25(3): 440-52.

References
356
324. Moisio KC, Sumner DR, Shott S, Hurwitz DE. Normalization of joint moments during gait: A comparison of two techniques. J Biomech. 2003; 36(4): 599-603.
325. Wannop JW, Worobets JT, Stefanyshyn DJ. Normalization of ground reaction forces, joint moments, and free moments in human locomotion. J Appl Biomech. 2012; 28(6): 665-76.
326. Deluzio KJ, Astephen JL. Biomechanical features of gait waveform data associated with knee osteoarthritis: An application of principal component analysis. Gait Posture. 2007; 25(1): 86-93.
327. Hubley-Kozey CL, Deluzio KJ, Landry SC, McNutt JS, Stanish WD. Neuromuscular alterations during walking in persons with moderate knee osteoarthritis. J Electromyogr Kinesiol. 2006; 16(4): 365-78.
328. Landry SC, McKean KA, Hubley-Kozey CL, Stanish WD, Deluzio KJ. Neuromuscular and lower limb biomechanical differences exist between male and female elite adolescent soccer players during an unanticipated run and crosscut maneuver. Am J Sports Med. 2007; 35(11): 1901-11.
329. Landry SC, McKean KA, Hubley-Kozey CL, Stanish WD, Deluzio KJ. Neuromuscular and lower limb biomechanical differences exist between male and female elite adolescent soccer players during an unanticipated side-cut maneuver. Am J Sports Med. 2007; 35(11): 1888-900.
330. Rutherford DJ, Hubley-Kozey CL, Stanish WD. Changes in knee joint muscle activation patterns during walking associated with increased structural severity in knee osteoarthritis. J Electromyogr Kinesiol. 2013; 23(3): 704-11.
331. Phinyomark A, Osis S, Hettinga BA, Ferber R. Kinematic gait patterns in healthy runners: A hierarchical cluster analysis. J Biomech. 2015; 48(14): 3897-904.
332. Phinyomark A, Hettinga BA, Osis S, Ferber R. Do intermediate- and higher-order principal components contain useful information to detect subtle changes in lower extremity biomechanics during running? Hum Movement Sci. 2015; 44: 91-101.
333. Donoghue OA, Harrison AJ, Coffey N, Hayes K. Functional data analysis of running kinematics in chronic Achilles tendon injury. Med Sci Sports Exerc. 2008; 40(7): 1323-35.
References
357
334. Foch E, Milner CE. The influence of iliotibial band syndrome history on running biomechanics examined via principal components analysis. J Biomech. 2014; 47(1): 81-6.
335. Astephen JL, Deluzio KJ. Changes in frontal plane dynamics and the loading response phase of the gait cycle are characteristic of severe knee osteoarthritis application of a multidimensional analysis technique. Clin Biomech. 2005; 20(2): 209-17.
336. Landry SC, McKean KA, Hubley-Kozey CL, Stanish WD, Deluzio KJ. Gender differences exist in neuromuscular control patterns during the pre-contact and early stance phase of an unanticipated side-cut and cross-cut maneuver in 15-18 years old adolescent soccer players. J Electromyogr Kinesiol. 2009; 19(5): e370-e9.
337. Astephen JL, Deluzio KJ, Caldwell GE, Dunbar MJ, Hubley-Kozey CL. Gait and neuromuscular pattern changes are associated with differences in knee osteoarthritis severity levels. J Biomech. 2008; 41(4): 868-76.
338. Richter C, O'Connor NE, Marshall B, Moran K. Comparison of discrete-point vs. dimensionality-reduction techniques for describing performance-related aspects of maximal vertical jumping. J Biomech. 2014; 47(12): 3012-7.
339. Donà G, Preatoni E, Cobelli C, Rodano R, Harrison AJ. Application of functional principal component analysis in race walking: An emerging methodology. Sports Biomech. 2009; 8(4): 284-301.
340. Neal RJ, Sydney-Smith M. The effects of footfall pattern and passing height on ground reaction forces in netball. Aust J Sci Med Sport. 1992; 24(3): 73-8.
341. O'Connor KM, Monteiro SK, Hoelker IA. Comparison of selected lateral cutting activities used to assess ACL injury risk. J Appl Biomech. 2009; 25(1): 9-21.
342. Bates BT. Single-subject methodology: An alternative approach. Med Sci Sports Exerc. 1996; 28(5): 631-8.
343. Richter C. The search for performance related factors in biomechanics. Dublin City University: Dublin, Ireland; 2014.
344. Brown C, Bowser B, Simpson KJ. Movement variability during single leg jump landings in individuals with and without chronic ankle instability. Clin Biomech. 2012; 27(1): 52-63.
References
358
345. Brown CN, Padua DA, Marshall SW, Guskiewicz KM. Variability of motion in individuals with mechanical or functional ankle instability during a stop jump maneuver. Clin Biomech. 2009; 24(9): 762-8.
346. Kipp K, Palmieri-Smith RM. Principal component based analysis of biomechanical inter-trial variability in individuals with chronic ankle instability. Clin Biomech. 2012; 27(7): 706-10.
347. Pollard CD, Heiderscheit BC, van Emmerik REA, Hamill J. Gender differences in lower extremity coupling variability during an unanticipated cutting maneuver. J Appl Biomech. 2005; 21(2): 143-52.
348. Richter C, O'Connor NE, Marshall B, Moran K. Clustering vertical ground reaction force curves produced during countermovement jumps. J Biomech. 2014; 47(10): 2385-90.
349. Carriero A, Zavatsky A, Stebbins J, Theologis T, Shefelbine SJ. Determination of gait patterns in children with spastic diplegic cerebral palsy using principal components. Gait Posture. 2009; 29(1): 71-5.
350. O'Byrne JM, Jenkinson A, O'Brien TM. Quantitative analysis and classification of gait patterns in cerebral palsy using a three-dimensional motion analyzer. J Child Neurol. 1998; 13(3): 101-8.
351. Toro B, Nester CJ, Farren PC. Cluster analysis for the extraction of sagittal gait patterns in children with cerebral palsy. Gait Posture. 2007; 25(2): 157-65.
352. O'Malley MJ, Abel MF, Damiano DL, Vaughan CL. Fuzzy clustering of children with cerebral palsy based on temporal-distance gait parameters. IEEE Trans Rehabil Eng. 1997; 5(4): 300-9.
353. Staudenmann D, Kingma I, Daffertshofer A, Stegeman DF, van Dieën JH. Heterogeneity of muscle activation in relation to force direction: A multi-channel surface electromyography study on the triceps surae muscle. J Electromyogr Kinesiol. 2009; 19(5): 882-95.
354. Cheung VCK, Piron L, Agostini M, Silvoni S, Turolla A, Bizzi E. Stability of muscle synergies for voluntary actions after cortical stroke in humans. Proc Natl Acad Sci USA. 2009; 106(46): 19563-8.
355. Daszykowski M, Walczak B, Massart DL. Looking for natural patterns in data. Part 1: Density-based approach. Chemometr Intell Lab. 2001; 56(2): 83-92.
References
359
356. Karami A, Johansson R. Choosing DBSCAN parameters automatically using differential evolution. Int J Comput Appl. 2014; 91(7).
357. Ester M, Kriegel HP, Sander J, Xu X. A density-based algorithm for discovering clusters in large spatial databases with noise. 2nd International Conference on Knowledge Discovery and Data Mining; 1996; Portland, OR, United States.
358. Pappas E, Shiyko MP, Ford KR, Myer GD, Hewett TE. Biomechanical deficit profiles associated with ACL injury risk in female athletes. Med Sci Sports Exerc. 2016; 48(1): 107-13.
359. Han J, Kamber M, Pei J. Data Mining: Concepts and Techniques. Morgan Kaufmann: Burlington, MA; 2006.
360. Fraley C, Raftery AE. How many clusters? Which clustering method? Answers via model-based cluster analysis. Comput J. 1998; 41(8): 578-88.
361. Pataky TC. Generalized n-dimensional biomechanical field analysis using statistical parametric mapping. J Biomech. 2010; 43(10): 1976-82.
362. Pataky TC, Robinson MA, Vanrenterghem J. Vector field statistical analysis of kinematic and force trajectories. J Biomech. 2013; 46(14): 2394-401.
363. Friston KJ, Ashburner JT, Kiebel SJ, Nichols TE, Penny WD. Statistical Parametric Mapping: The Analysis of Functional Brain Images. Elsevier Academic Press: Amsterdam; 2007.
364. De Ridder R, Willems T, Vanrenterghem J, Robinson MA, Roosen P. Lower limb landing biomechanics in subjects with chronic ankle instability. Med Sci Sports Exerc. 2015; 47(6): 1225-31.
365. De Ridder R, Willems T, Vanrenterghem J, Robinson MA, Palmans T, Roosen P. Multi-segment foot landing kinematics in subjects with chronic ankle instability. Clin Biomech. 2015; 30(6): 585-92.
366. Robinson MA, Donnelly C, Vanrenterghem J, Pataky T. Sagittal plane knee kinematics predict non-sagittal knee joint moments in unplanned sidestepping. XXV Congress of the International Society of Biomechanics; 2015; Glasgow, Scotland.
367. Robinson MA, Vanrenterghem J, Pataky TC. Statistical Parametric Mapping (SPM) for alpha-based statistical analyses of multi-muscle EMG time-series. J Electromyogr Kinesiol. 2015; 25(1): 14-9.

References
360
368. Adler RJ, Taylor JE. Random Fields and Geometry. Springer-Verlag: New York; 2007.
369. Pataky TC. One-dimensional statistical parametric mapping in Python. Comput Methods Biomech Biomed Engin. 2012; 15(3): 295-301.
370. Dingenen B, Malfait B, Vanrenterghem J, Robinson MA, Verschueren SMP, Staes FF. Can two-dimensional measured peak sagittal plane excursions during drop vertical jumps help identify three-dimensional measured joint moments? Knee. 2015; 22(2): 73-9.
371. Pataky T. SPM1D. 2015. Available from: spm1d.org.
372. Donnelly CJ, Lloyd DG, Elliott BC, Reinbolt JA. Optimizing whole-body kinematics to minimize valgus knee loading during sidestepping: Implications for ACL injury risk. J Biomech. 2012; 45(8): 1491-7.
373. Bernstein N. Coordination and regulation of movements. Pergamon: New York; 1967.
374. Houck JR, Duncan A, Haven KED. Comparison of frontal plane trunk kinematics and hip and knee moments during anticipated and unanticipated walking and side step cutting tasks. Gait Posture. 2006; 24(3): 314-22.
375. Pollard CD, Sigward SM, Powers CM. Gender differences in hip joint kinematics and kinetics during side-step cutting maneuver. Clin J Sport Med. 2007; 17(1): 38-42.
376. Kaila R. Influence of modern studded and bladed soccer boots and sidestep cutting on knee loading during match play conditions. Am J Sports Med. 2007; 35(9): 1528-36.
377. Sheehan FT, Sipprell WH, Boden BP. Dynamic sagittal plane trunk control during anterior cruciate ligament injury. Am J Sports Med. 2012; 40(5): 1068-74.
378. McLean SG, Neal RJ, Myers PT, Walters MR. Knee joint kinematics during the sidestep cutting maneuver: Potential for injury in women. Med Sci Sports Exerc. 1999; 31(7): 959-68.
379. Thompson JA, Chaudhari AMW, Schmitt LC, Best TM, Siston RA. Gluteus maximus and soleus compensate for simulated quadriceps atrophy and activation failure during walking. J Biomech. 2013; 46(13): 2165-72.
References
361
380. Reinbolt JA, Fox MD, Arnold AS, Õunpuu S, Delp SL. Importance of preswing rectus femoris activity in stiff-knee gait. J Biomech. 2008; 41(11): 2362-9.
381. Piazza SJ, Delp SL. The influence of muscles on knee flexion during the swing phase of gait. J Biomech. 1996; 29(6): 723-33.
382. Zebis MK, Bencke J, Andersen LL, Alkjær T, Suetta C, Mortensen P, Kjær M, Aagaard P. Acute fatigue impairs neuromuscular activity of anterior cruciate ligament-agonist muscles in female team handball players. Scand J Med Sci Sports. 2011; 21(6): 833-40.
383. Miles J, Shevlin M. Applying Regression and Correlation: A Guide for Students and Researchers. Sage Academic Press: London, United Kingdom; 2001.
384. Cohen J. Statistical Power Analysis for the Behavioral Sciences. 2nd ed. Lawrence Erlbaum Associates: Hillsdale, NJ; 1988.
385. Lloyd DG, Buchanan TS. A model of load sharing between muscles and soft tissues at the human knee during static tasks. J Biomech Eng. 1996; 118(3): 367-76.
386. Lloyd DG, Buchanan TS, Besier TF. Neuromuscular biomechanical modeling to understand knee ligament loading. Med Sci Sports Exerc. 2005; 37(11): 1939-47.
387. Claiborne TL, Armstrong CW, Gandhi V, Pincivero DM. Relationship between hip and knee strength and knee valgus during a single leg squat. J Appl Biomech. 2006; 22(1): 41-50.
388. Müller S, Brenton J, Dempsey AR, Harbaugh AG, Reid C. Individual differences in highly skilled visual perceptual-motor striking skill. Atten Percept Psychophys. 2015; 77(5): 1726-36.
389. Fleming BC, Renstrom PA, Ohlen G, Johnson RJ, Peura GD, Beynnon BD, Badger GJ. The gastrocnemius muscle is an antagonist of the anterior cruciate ligament. J Orthop Res. 2001; 19(6): 1178-84.
390. Shin CS, Chaudhari AM, Andriacchi TP. The influence of deceleration forces on ACL strain during single-leg landing: A simulation study. J Biomech. 2007; 40(5): 1145-52.
References
362
391. Celebrini RG, Eng JJ, Miller WC, Ekegren CL, Johnston JD, MacIntyre DL. The effect of a novel movement strategy in decreasing ACL risk factors in female adolescent soccer players. J Strength Cond Res. 2012; 26(12): 3406-17.
392. Bien DP. Rationale and implementation of anterior cruciate ligament injury prevention warm-up programs in female athletes. J Strength Cond Res. 2011; 25(1): 271-85.
393. Paterno MV, Myer GD, Ford KR, Hewett TE. Neuromuscular training improves single-limb stability in young female athletes. J Orthop Sports Phys Ther. 2004; 34(6): 305-16.
394. Glover TA, Albers CA. Considerations for evaluating universal screening assessments. J School Psychol. 2007; 45(2): 117-35.
395. Devillé WL, Buntinx F, Bouter LM, Montori VM, De Vet HCW, Van der Windt DAWM, Bezemer PD. Conducting systematic reviews of diagnostic studies: Didactic guidelines. BMC Med Res Methodol. 2002; 3: 2-9.
396. Barber-Westin SD, Smith ST, Campbell T, Noyes FR. The drop-jump video screening test: Retention of improvement in neuromuscular control in female volleyball players. J Strength Cond Res. 2010; 24(11): 3055-62.
397. Chorba RS, Chorba DJ, Bouillon LE, Overmyer CA, Landis JA. Use of a functional movement screening tool to determine injury risk in female collegiate athletes. N Am J Sports Phys Ther. 2010; 5(2): 47-54.
398. Dowling AV, Favre J, Andriacchi TP. A wearable system to assess risk for anterior cruciate ligament injury during jump landing: Measurements of temporal events, jump height, and sagittal plane kinematics. J Biomech Eng. 2011; 133(7): 071008.
399. Hamilton M, Velasquez JR. Ankle flexibility and jump landing mechanics: Implications for ACL injury risk. Int J Athl Ther Training. 2011; 16(6): 14-6.
400. Munro A, Herrington L, Carolan M. Reliability of 2-dimensional video assessment of frontal-plane dynamic knee valgus during common athletic screening tasks. J Sport Rehabil. 2012; 21(1): 7-11.
401. Nilstad A, Kristianslund E, Krosshaug T, Steffen K, Myklebust G, Bahr R, Andersen TE. A simple clinical screening test can identify elite female football players with increased knee valgus angles. Br J Sports Med. 2011; 45(4): 310.
References
363
402. Noyes FR, Barber-Westin SD, Fleckenstein C, Walsh C, West J. The drop-jump screening test: Difference in lower limb control by gender and effect of neuromuscular training in female athletes. Am J Sports Med. 2005; 33(2): 197-207.
403. Padua DA, Marshall SW, Beutler AI, DiStefano LJ, DiStefano MJ, de la Motte SJ, Goss D. The Landing Error Scoring System (LESS) prospectively identifies ACL injury. J Athl Train. 2010; 45(5): 539.
404. Steffen K, Nilstad A, Kristianslund E, Krosshaug T, Myklebust G, Bahr R. A comparison between the star excursion balance test and subjective assessment of knee stability in a single-leg squat. Br J Sports Med. 2011; 45(4): 375.
405. Brumitt J, Heiderscheit BC, Manske RC, Niemuth PE, Rauh MJ. Lower extremity functional tests and risk of injury in Division III collegiate athletes. Int J Sports Phys Ther. 2013; 8(3): 216-27.
406. Jöllenbeck T, Neuhaus D, Beck K, Wojtowicz S, Röckel M. Screening test for the potential risk of ACL rupture of female and male soccer players. 28th International Symposium on Biomechanics in Sports; 2010; Marquette, United States.
407. Markbreiter JG, Sagon BK, McLeod TCV, McCarty CW. Clinician scoring of the Landing Error Scoring System is reliable to assess jump-landing movement patterns. J Sport Rehabil. 2015; 24(2): 214-8.
408. Petushek EJ, Cokely ET, Ward P, Durocher JJ, Wallace SJ, Myer GD. Injury risk estimation expertise: Assessing the ACL injury risk estimation quiz. Am J Sports Med. 2015; 43(7): 1640-7.
409. Cortes N, Onate J. Clinical assessment of drop-jump landing for determination of risk for knee injury. Int J Athl Ther Training. 2013; 18(3): 10-3.
410. Padua DA, Boling MC, DiStefano LJ, Onate JA, Beutler AI, Marshall SW. Reliability of the Landing Error Scoring System-real time, a clinical assessment tool of jump-landing biomechanics. J Sport Rehabil. 2011; 20(2): 145-56.
411. Myer GD, Khoury J, Succop P, Hewett TE, Goetschius J, Smith HC, Vacek PM, Holterman LA, Tourville TW, Slauterbeck J, Johnson RJ, Beynnon BD, Shultz SJ. Clinic-based algorithm to identify female athletes at risk for anterior cruciate ligament injury: Letter to the editor. Am J Sports Med. 2013; 41(1): NP1-NP6.

References
364
412. Goetschius J, Smith HC, Vacek PM, Holterman LA, Shultz SJ, Tourville TW, Slauterbeck J, Johnson RJ, Beynnon BD. Application of a clinic-based algorithm as a tool to identify female athletes at risk for anterior cruciate ligament injury: A prospective cohort study with a nested, matched case-control analysis. Am J Sports Med. 2012; 40(9): 1978-84.
413. Stroube BW, Myer GD, Brent JL, Ford KR, Heidt Jr RS, Hewett TE. Effects of task-specific augmented feedback on deficit modification during performance of the tuck-jump exercise. J Sport Rehabil. 2013; 22(1): 7-18.
414. Dudley LA, Smith CA, Olson BK, Chimera NJ, Schmitz B, Warren M. Interrater and intrarater reliability of the tuck jump assessment by health professionals of varied educational backgrounds. J Sports Med. 2013; 2013: 483503.
415. Myer GD, Brent JL, Ford KR, Hewett TE. Real-time assessment and neuromuscular training feedback techniques to prevent anterior cruciate ligament injury in female athletes. Strength Cond J. 2011; 33(3): 21-35.
416. Ekegren C, Donaldson A, Gabbe B, Finch C. Implementing injury surveillance systems alongside injury prevention programs: Evaluation of an online surveillance system in a community setting. Inj Epidemiol. 2014; 1(19): 1-15.
417. Myer GD, Ford KR, Barber Foss KD, Chunyan L, Nick TG, Hewett TE. The relationship of hamstrings and quadriceps strength to anterior cruciate ligament injury in female athletes. Clin J Sport Med. 2009; 19(1): 3-8.
418. Hewett TE, Myer GD, Ford KR. Decrease in neuromuscular control about the knee with maturation in female athletes. J Bone Joint Surg. 2004; 86(8): 1601-8.
419. Weinhandl JT, Earl-Boehm JE, Ebersole KT, Huddleston WE, Armstrong BSR, O'Connor KM. Reduced hamstring strength increases anterior cruciate ligament loading during anticipated sidestep cutting. Clin Biomech. 2014; 29(7): 752-9.
420. Quatman-Yates CC, Myer GD, Ford KR, Hewett TE. A longitudinal evaluation of maturational effects on lower extremity strength in female adolescent athletes. Pediatr Phys Ther. 2013; 25(3): 271-6.
421. Frank B, Bell DR, Norcross MF, Blackburn JT, Goerger BM, Padua DA. Trunk and hip biomechanics influence anterior cruciate loading mechanisms in physically active participants. Am J Sports Med. 2013; 41(11): 2676-83.
References
365
422. Ageberg E, Bennell KL, Hunt MA, Simic M, Roos EM, Creaby MW. Validity and inter-rater reliability of medio-lateral knee motion observed during a single-limb mini squat. BMC Musc Disord. 2010; 11: 265.
423. Whatman C, Hume P, Hing W. The reliability and validity of physiotherapist visual rating of dynamic pelvis and knee alignment in young athletes. Phys Ther Sport. 2013; 14(3): 168-74.
424. Myer GD, Ford KR, Hewett TE. Rationale and clinical techniques for anterior cruciate ligament injury prevention among female athletes. J Athl Train. 2004; 39(4): 352-.
425. Sigward SM, Powers CM. Loading characteristics of females exhibiting excessive valgus moments during cutting. Clin Biomech. 2007; 22(7): 827-33.
426. Theiss JL, Gerber JP, Cameron KL, Beutler AI, Marshall SW, Distefano LJ, Padua DA, de la Motte SJ, Miller JM, Yunker CA. Jump-landing differences between varsity, club, and intramural athletes: The jump-ACL study. J Strength Cond Res. 2014; 28(4): 1164-71.
427. Padua DA, DiStefano LJ, Marshall SW, Beutler AI, de la Motte SJ, DiStefano MJ. Retention of movement pattern changes after a lower extremity injury prevention program is affected by program duration. Am J Sports Med. 2012; 40(2): 300-6.
428. Bahr R. Why screening tests to predict injury do not work - and probably never will...: A critical review. Br J Sports Med. 2016; 50(13): 776-80.
429. Lee H, Sullivan SJ, Schneiders AG, Ahmed OH, Balasundaram AP, Williams D, Meeuwisse WH, McCrory P. Smartphone and tablet apps for concussion road warriors (team clinicians): A systematic review for practical users. Br J Sports Med. 2015; 49(8): 499-505.
430. van Mechelen DM, van Mechelen W, Verhagen EALM. Sports injury prevention in your pocket?! Prevention apps assessed against the available scientific evidence: A review. Br J Sports Med. 2014; 48(11): 871-7.
431. Fox AS, Bonacci J, McLean SG, Spittle M, Saunders N. A systematic evaluation of field-based screening methods for the assessment of anterior cruciate ligament (ACL) injury risk. Sports Med. 2016; 46(5): 715-35.
432. Waldén M, Atroshi I, Magnusson H, Wagner P, Hägglund M. Prevention of acute knee injuries in adolescent female football players: Cluster randomised controlled trial. Br Med J. 2012; 344: e3042.

References
366
433. Bland JM, Altman DG. Statistical methods for assessing agreement between two methods of clinical measurement. Lancet. 1986; i: 307-10.
434. Crossley KM, Zhang WJ, Schache AG, Bryant A, Cowan SM. Performance on the single-leg squat task indicates hip abductor muscle function. Am J Sports Med. 2011; 39(4): 866-73.
435. Willson JD, Davis IS. Utility of the frontal plane projection angle in females with patellofemoral pain. J Orthop Sports Phys Ther. 2008; 38(10): 606-15.
436. Tate J, Dale B, Baker C. Expert versus novice interrater and intrarater reliability of the frontal plane projection angle during a single-leg squat. Int J Athl Ther Training. 2015; 20(4): 23-7.
437. Whatman C, Hing W, Hume P. Physiotherapist agreement when visually rating movement quality during lower extremity functional screening tests. Phys Ther Sport. 2012; 13(2): 87-96.
438. Knudson D. What can professionals qualitatively analyze? J Phys Educ Recreation Dance. 2000; 71(2): 19-23.
439. Marshall BM, Franklyn-Miller AD, Moran KA, King EA, Strike SC, Falvey EC. Can a single-legged squat provide insight into movement control and loading during dynamic sporting actions in athletic groin pain patients? J Sport Rehabil. 2016; 25(2): 117-25.
440. Alenezi F, Herrington L, Jones P, Jones R. Relationships between lower limb biomechanics during single leg squat with running and cutting tasks: A preliminary investigation. Br J Sports Med. 2014; 48(7): 560-1.
441. Stensrud S, Myklebust G, Kristianslund E, Bahr R, Krosshaug T. Correlation between two-dimensional video analysis and subjective assessment in evaluating knee control among elite female team handball players. Br J Sports Med. 2011; 45(7): 589-95.
442. Mauntel TC, Frank BS, Begalle RL, Blackburn JT, Padua DA. Kinematic differences between those with and without medial knee displacement during a single-leg squat. J Appl Biomech. 2014; 30(6): 707-12.
443. Jones D, Tillman SM, Tofte K, Mizner RL, Greenberg S, Moser MW, Chmielewski TL. Observational ratings of frontal plane knee position are related to the frontal plane projection angle but not the knee abduction angle during a step-down task. J Orthop Sports Phys Ther. 2014; 44(12): 973-8.
References
367
444. Weinhandl JT, Earl-Boehm JE, Ebersole KT, Huddleston WE, Armstrong BSR, O'Connor KM. Anticipatory effects on anterior cruciate ligament loading during sidestep cutting. Clin Biomech. 2013; 28(6): 655-63.
445. Hewett TE, Roewer B, Ford K, Myer G. Multicenter trial of motion analysis for injury risk prediction: Lessons learned from prospective longitudinal large cohort combined biomechanical - epidemiological studies. Braz J Phys Ther. 2015; 19(5): 398-409.
446. Jamison ST, Pan X, Chaudhari AMW. Knee moments during run-to-cut maneuvers are associated with lateral trunk positioning. J Biomech. 2012; 45(11): 1881-5.

368
Appendices
Appendix A Statement of Ethical Approval ................................................ 369
Appendix B Plain Language Statement and Consent ................................ 370
Appendix C Injury History Questionnaire .................................................. 378
Appendix D Down 2 Earth (D2E) Player Booklet ....................................... 379
Appendix E Maximal Voluntary Isometric Contraction (MVIC)
Procedures. Adapted from Konrad.[263]. ................................. 390
Appendix F Approach Speed Data Analysis Results ................................ 391
Appendix G Descriptions of the Principal Patterns Extracted from the
Netball-Specific Landing Task used in Chapter Six ............. 396
Appendix H Methodological Quality Assessment for Studies Included in
Chapter Seven ............................................................................ 415
Appendix I Full Results of Intra- and Inter-Rater Reliability Analyses for
the Landing Error Scoring System (LESS) and Tuck Jump
Assessment ................................................................................. 417
Appendix J Descriptions of the Principal Patterns Extracted from the
Single-Leg Squat Task used in Chapter Nine ....................... 419
Appendix K Descriptions of the Principal Patterns Extracted from the
Netball-Specific Landing Task used in Chapter Nine ......... 432

369
Appendix A Statement of Ethical Approval

370
Appendix B Plain Language Statement and Consent
PLAIN LANGUAGE STATEMENT AND CONSENT FORM To: Female netball players (aged 18 and above)
Plain Language Statement
Date:
Full Project Title: Neuromechanical control of the lower limb: Implications for ACL injury risk and prevention
Principal Researcher: Dr. Natalie Saunders Associate Researcher(s): Mr. Aaron Fox, Dr. Jason Bonacci, Dr. Scott McLean, Assoc. Prof. Michael Spittle Thank you for taking the time to read this Information Statement. This Participant Information Statement contains detailed information about the research project. Its purpose is to explain to you as clearly as possible all the procedures involved in the project before you decide whether or not to take part in it. Please read this information carefully. Feel free to ask questions about anything in the document, and discuss the project with relatives or friends. Once you understand what is involved in the project and if you agree to take part in it, you will be asked to sign the Consent Form. By signing the Consent Form, you indicate that you understand the information and that you give your consent to participate in the project. You will be given a copy of the Participant Information Sheet and Consent Form to keep as a record. Participation in this study is voluntary. If you do not wish to take part you are not obliged to. If you decide to take part and later change your mind, you are free to withdraw from the project at any stage. Your decision whether or not to participate will not affect your relationship with Deakin University.
Appendix B
371
1. What is the reason for this project?
The anterior cruciate ligament (ACL) is one of the major stabilising ligaments of the knee. Sports-related ACL injuries are a traumatic experience and often occur in the absence of contact with another player (i.e. noncontact). Sports that require frequent changes of direction, landing from jumps and/or rapid deceleration (such as netball) often incur the greatest incidence of noncontact ACL injuries. While this type of injury is not exclusive to a specific population, females incur a higher rate of injury in comparison to male counterparts. Despite extensive attempts, the mechanisms responsible for ACL injury remain elusive. Recently, research has begun to focus on how the muscles of the lower limb control the knee during sporting tasks, and whether dysfunctional patterns of muscle activation may influence ACL injury risk. Identifying these patterns that increase the risk of injury will aid in further explaining the mechanisms responsible for ACL injuries. An important aspect of injury prevention is the ability to identify athletes who are at-risk of future injury. With regard to ACL injuries, various clinical screening tools have been designed that attempt to identify those at-risk for future ACL injury. These screening tools are relatively new and further examination to confirm their accuracy and sensitivity for use in the wider community setting is required. In addition, injury intervention programs are also an essential aspect of injury prevention. It is possible that different individuals do not respond similarly to the same intervention program. Gaining a greater understanding of individual responses will aid in the design of targeted intervention programs that maximise the benefits for all athletes. 2. What will I be asked to do?
When you accept to participate in this study, you will be screened by one of the investigators to ensure that you meet all the criteria as a participant in this study.
You will be invited to participate in this study if: You are currently participating in competitive netball and complete at least
one training session for this per week. You are above 18 years of age. You do not currently have an injury to either lower limb. You have no previous history of a serious knee injury or lower limb surgery. You are free from any neuromuscular or musculoskeletal disorders that
affect the lower limb. Participation in this study will involve a familiarisation session and two laboratory testing sessions, and may require you to participate in a six-week injury intervention program (see below for details).
Appendix B
372
Location All testing sessions will be conducted at Deakin University (Waurn Ponds campus) Biomechanics Laboratory. Testing Sessions Participation will involve attending the Deakin University Biomechanics Laboratory at the Waurn Ponds campus on three separate occasions for one familiarisation and two testing sessions. At the familiarisation session, all tasks and analysis techniques being performed in the subsequent testing sessions will be described to you and you will also be given the opportunity to ask any questions of the researchers. Individual demographics (i.e. age, height, weight) will be collected at both testing sessions. The two testing sessions will be identical and involve the performance of a range of tasks, those being (1) a series of maximum effort voluntary muscle contractions of the leg against resistance; (2) multiple trials of a netball landing task; (3) two ACL clinical screening tools involving jump-landing tasks; and (4) three athletic performance measures (see below for details). All tasks will be observed by a trained researcher and recorded using digital video cameras. Prior to actual testing you will be given time to familiarise yourself with and practice the tasks required of you. If at any stage during laboratory testing you begin to feel uncomfortable or feel you may be developing an injury you should instruct the researcher and testing will stop. During the performance of all tasks during the laboratory testing sessions you will be monitored using kinematic and electromyography (EMG) analysis techniques. Thirty-four reflective markers will be attached to your lower limbs via tape and tracked using high speed cameras for kinematic analysis. EMG measures the level of activation of specific muscles via wireless surface electrodes placed on the lower limbs. Prior to the placement of the surface electrodes on the skin, each attachment site will be shaven to remove any hair, followed by gentle abrasion and sterilisation of the area with alcohol swabs. All preparation and analysis techniques are completely painless and non-invasive.
The familiarisation sessions will last for approximately 30 minutes. You will attend and perform your two laboratory testing sessions at the same time as one of your team mates. The laboratory testing sessions will run for approximately two to two-and-a-half hours, with testing procedures/tasks interspersed over this time period.
Maximal Effort Voluntary Muscle Contractions At each testing sessions, five separate maximal voluntary muscle contraction tasks will be performed. The maximal contractions will be performed against a resistance band, and each of the five contraction tasks will be repeated three times. The performance of these tasks requires you to apply maximal effort against the applied
Appendix B
373
resistance for a period of five seconds. Netball Landing Task The netball landing task you will be required to perform at both testing sessions is one you would commonly perform during netball matches. During laboratory testing you will perform ten ‘leap’ landing trials on each leg. The leap landing involves a run-up and single leg landing on the opposite foot used for take-off. You will be required to catch a chest height pass while performing the land. ACL Clinical Screening Tools Two clinical screening tools for ACL injury risk will be performed at each of the testing sessions, those being the Landing Error Scoring System (LESS) and Tuck Jump Assessment. The LESS involves the performance of a jump-landing task off a 30-cm high box. You will be required to perform a horizontal jump off the box to a distance 50% of your height and then immediately rebound off the ground performing a maximal vertical jump. Six repetitions of this task will be undertaken during testing. The Tuck Jump Assessment involves the performance of repeated tuck jumps on a spot for a ten-second period. Tuck jumps involve pulling the knees up as high as possible during each jump. Two ten-second repetitions of this task will be undertaken during testing. Athletic Performance Measures Three athletic performance measures will be performed at both testing sessions, those being a vertical jump test, single leg squat test and cross-over hop for distance test. The vertical jump test is a standard measure of lower limb muscular power. Two types of vertical jump tests will be performed, those being a stationary and in-motion test. The stationary test will involve the performance of a vertical jump, reaching for maximum height with no run-up. The in-motion test is identical with the exception of a two-step run-up being allowed. You will be given three attempts for both tests to reach your maximal jump height. The single leg squat test will involve the performance of five single leg squat repetitions while being observed by a researcher. During the test you will be required to keep your arms crossed in front of your body at chest height. The five repetitions will be undertaken on both the left and right legs. The cross-over hop for distance test involves the performance of four diagonal hops with the goal of travelling the greatest distance forward from the starting point.
Appendix B
374
Each hop must cross over a 20 centimetre zone marked out on the floor. The test will be performed on both the left and right legs. You will be given three attempts for both legs to reach your maximal hop distance. Training Program A random selection of participants will also be required to participate in a six-week injury intervention program between the two laboratory testing sessions. The injury intervention program being used in this research is the ‘Down to Earth’ program, which aims to teach netball specific safe and effective landing technique, and is promoted as a coaching resource by Netball Australia. The injury intervention program involves the performance of balance, strength, plyometric and agility based exercises three times per week (one training and two home-based sessions). You will be required to fill out a training diary detailing when you completed each of the training sessions. While completing the training program you will also be required to fill in an activity diary detailing any physical activity you complete over the six-week period. This is to monitor for any activities that may have an influence on the results of the intervention program. NOTE: participants who do not complete the training program are also required to complete a physical activity diary over the six-week period between laboratory testing sessions. 3. What will I gain by participating?
By participating in this research you are contributing to an improved understanding of ACL injury risk and prevention within the sport of netball. You may also gain a greater understanding of your risk for future ACL injury, where researchers will be happy to provide you with any of your results (see Section 6) or ask any questions you may have. If required you may be provided with further information on how to reduce the chance of sustaining an ACL injury in the future. Participants who complete the injury intervention program may in fact reduce their risk of future injury via the training program. 4. Are there any risks involved?
There is minimal risk associated with participation in this research. As all jump-landing tasks have the ability to cause injury there is the risk of incurring a lower limb injury during laboratory testing. The sporting tasks that you will be required to perform are performed in a controlled laboratory environment and present the same, if not lower risk of injury than those performed in a normal netball game. The research team includes an accredited exercise physiologist and physiotherapist, and in the unlikely event of an injury occurring research staff will provide initial care. However, accessing ongoing care and any treatment relating to the injury will be at your expense.

Appendix B
375
5. Will the information I provide be kept private?
Any information obtained in connection with this research project that can identify you will remain confidential and will only be used for the purpose of this research project. Information will only be disclosed with your permission, except as required to by law. If you give us permission by signing the Consent Form, we plan to publish the results at conferences and in scientific journals. In any publication or presentation, your information will be provided in such a way that you cannot be identified. 6. Results of the Project
Results of this project will be available to you by mail or e-mail, at your request. 7. Further Information or Any Problems
If you require further information or if you have any problems concerning this project you can contact one of the principal researchers. The researchers responsible for this project are:
Dr. Natalie Saunders 9246-8284 Mr. Aaron Fox 9251-7783 or 0411-962-169
Complaints If you have any complaints about any aspect of the project, the way it is being conducted or any questions about your rights as a research participant, then you may contact:
The Manager, Research Integrity, Deakin University, 221 Burwood Highway, Burwood Victoria 3125, Telephone: 9251 7129, Facsimile: 9244 6581; [email protected]
Please quote project number [2013-007].

Appendix B
376
PLAIN LANGUAGE STATEMENT AND CONSENT FORM To: Female netball players (aged 18 and above)
Consent Form
Date:
Full Project Title: Neuromechanical control of the lower limb: Implications for ACL injury risk and prevention
Reference Number: 2013-007
I have read and I understand the attached Plain Language Statement.
I freely agree to participate in this project according to the conditions in the Plain Language Statement.
I have been given a copy of the Plain Language Statement and Consent Form to keep.
The researcher has agreed not to reveal my identity and personal details, including where information about this project is published, or presented in any public form.
Participant’s Name (printed) ……………………………………………………………………
Signature ……………………………………………………… Date …………………………

Appendix B
377
PLAIN LANGUAGE STATEMENT AND CONSENT FORM To: Female netball players (aged 18 and above)
Revocation of Consent Form
(To be used for participants who wish to withdraw from the project)
Date:
Full Project Title: Neuromechanical control of the lower limb: Implications for ACL injury risk and prevention
Reference Number: 2013-007
I hereby wish to WITHDRAW my consent to participate in the above research project and understand that such withdrawal WILL NOT jeopardise my relationship with Deakin University.
Participant’s Name (printed) ……………………………………………………. Signature ………………………………………………………………. Date …………………… Please mail this form to: Dr. Natalie Saunders Centre for Exercise and Sport Science School of Exercise and Nutrition Sciences Deakin University, Melbourne Campus 221 Burwood Hwy, Burwood, VIC 3125 Telephone: +61 3 9246-8284

378
App
endi
x C
In
jury
His
tory
Que
stio
nnai
re
Plea
se fi
ll in
you
r inj
ury
hist
ory
for t
he fo
llow
ing
body
sect
ions
: N
ame:
___
____
____
____
____
____
____
____
____
____
____
____
Pa
rtic
ipan
t ID:
___
____
____
____
_ Bo
dy
Sect
ion
Type
of i
njur
y
(e.g
. mus
cle st
rain
, sp
rain
, fra
ctur
e)
Mon
th &
yea
r of
you
r inj
ury
(e.g
. Nov
201
2)
Was
you
r inj
ury
sust
aine
d pl
ayin
g ne
tbal
l?
(YES
/ N
O)
Did
your
inju
ry p
reve
nt y
ou fr
om p
layi
ng
or tr
aini
ng (i
f YES
, app
rox.
for h
ow lo
ng?)
(e
.g. Y
ES –
2 tr
aini
ng se
ssio
ns)
Low
er
Back
…
……
……
……
……
……
. …
……
……
……
……
……
. …
……
……
……
……
……
.
……
……
……
……
. …
……
……
……
….
……
……
……
……
.
……
……
……
……
……
……
……
……
……
……
……
……
……
…
……
……
……
……
……
……
……
……
……
……
……
……
…
……
……
……
……
……
……
……
……
……
……
……
……
……
……
……
……
……
……
……
……
……
……
……
……
……
...
……
……
……
……
……
……
……
……
……
……
……
……
...
……
……
……
……
……
……
……
……
……
……
……
……
...
Hip
……
……
……
……
……
….
……
……
……
……
……
….
……
……
……
……
……
….
……
……
……
……
. …
……
……
……
….
……
……
……
……
.
……
……
……
……
……
……
……
……
……
……
……
……
……
…
……
……
……
……
……
……
……
……
……
……
……
……
…
……
……
……
……
……
……
……
……
……
……
……
……
……
……
……
……
……
……
……
……
……
……
……
……
……
...
……
……
……
……
……
……
……
……
……
……
……
……
...
……
……
……
……
……
……
……
……
……
……
……
……
...
Knee
…
……
……
……
……
……
. …
……
……
……
……
……
. …
……
……
……
……
……
.
……
……
……
……
. …
……
……
……
….
……
……
……
……
.
……
……
……
……
……
……
……
……
……
……
……
……
……
…
……
……
……
……
……
……
……
……
……
……
……
……
…
……
……
……
……
……
……
……
……
……
……
……
……
……
……
……
……
……
……
……
……
……
……
……
……
……
...
……
……
……
……
……
……
……
……
……
……
……
……
...
……
……
……
……
……
……
……
……
……
……
……
……
...
Ankl
e …
……
……
……
……
……
. …
……
……
……
……
……
. …
……
……
……
……
……
.
……
……
……
……
. …
……
……
……
….
……
……
……
……
.
……
……
……
……
……
……
……
……
……
……
……
……
……
…
……
……
……
……
……
……
……
……
……
……
……
……
…
……
……
……
……
……
……
……
……
……
……
……
……
……
……
……
……
……
……
……
……
……
……
……
……
……
...
……
……
……
……
……
……
……
……
……
……
……
……
...
……
……
……
……
……
……
……
……
……
……
……
……
...
Foot
…
……
……
……
……
……
. …
……
……
……
……
……
. …
……
……
……
……
……
.
……
……
……
……
. …
……
……
……
….
……
……
……
……
.
……
……
……
……
……
……
……
……
……
……
……
……
……
…
……
……
……
……
……
……
……
……
……
……
……
……
…
……
……
……
……
……
……
……
……
……
……
……
……
……
……
……
……
……
……
……
……
……
……
……
……
……
...
……
……
……
……
……
……
……
……
……
……
……
……
...
……
……
……
……
……
……
……
……
……
……
……
……
...

379
Appendix D Down 2 Earth (D2E) Player Booklet
Appendix D
380

Appendix D
381

Appendix D
382
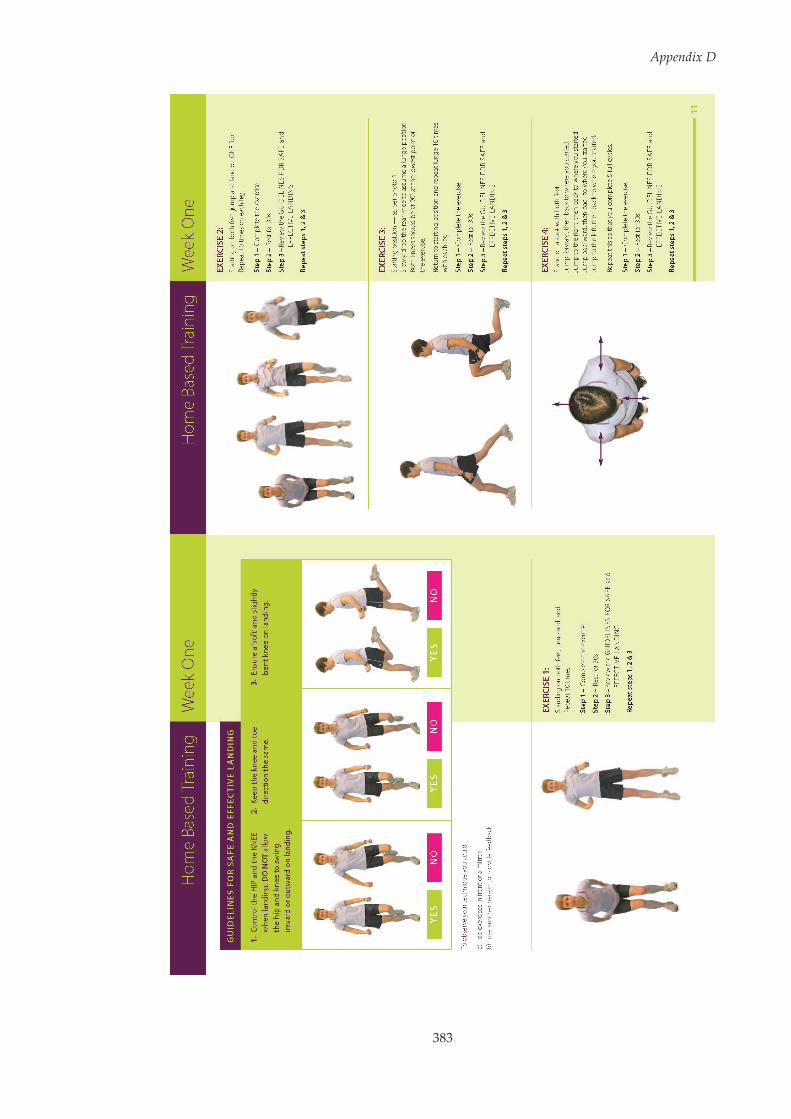
Appendix D
383
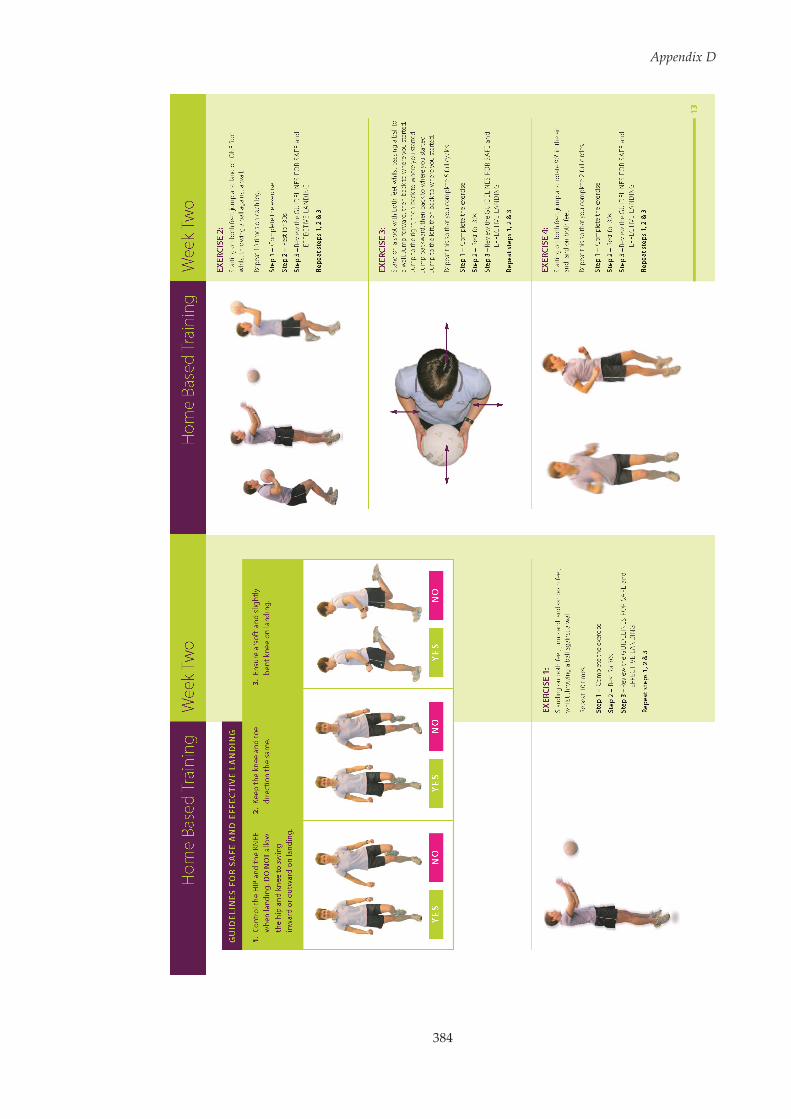
Appendix D
384

Appendix D
385

Appendix D
386
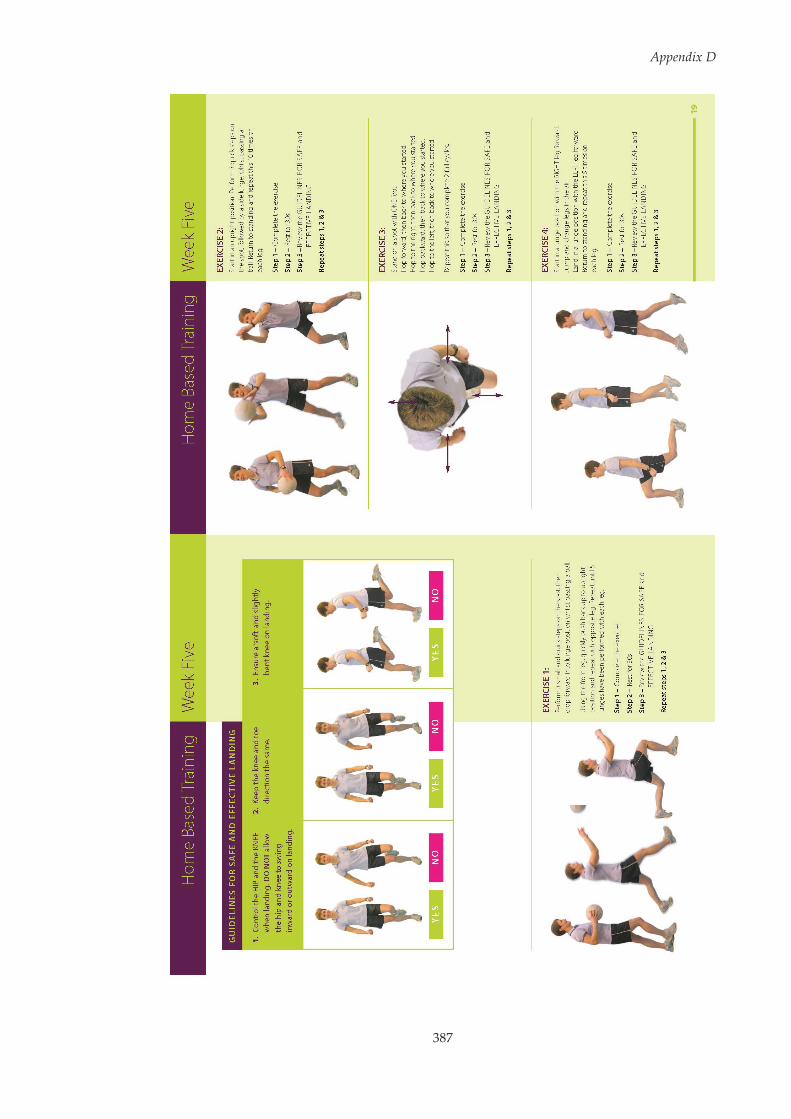
Appendix D
387
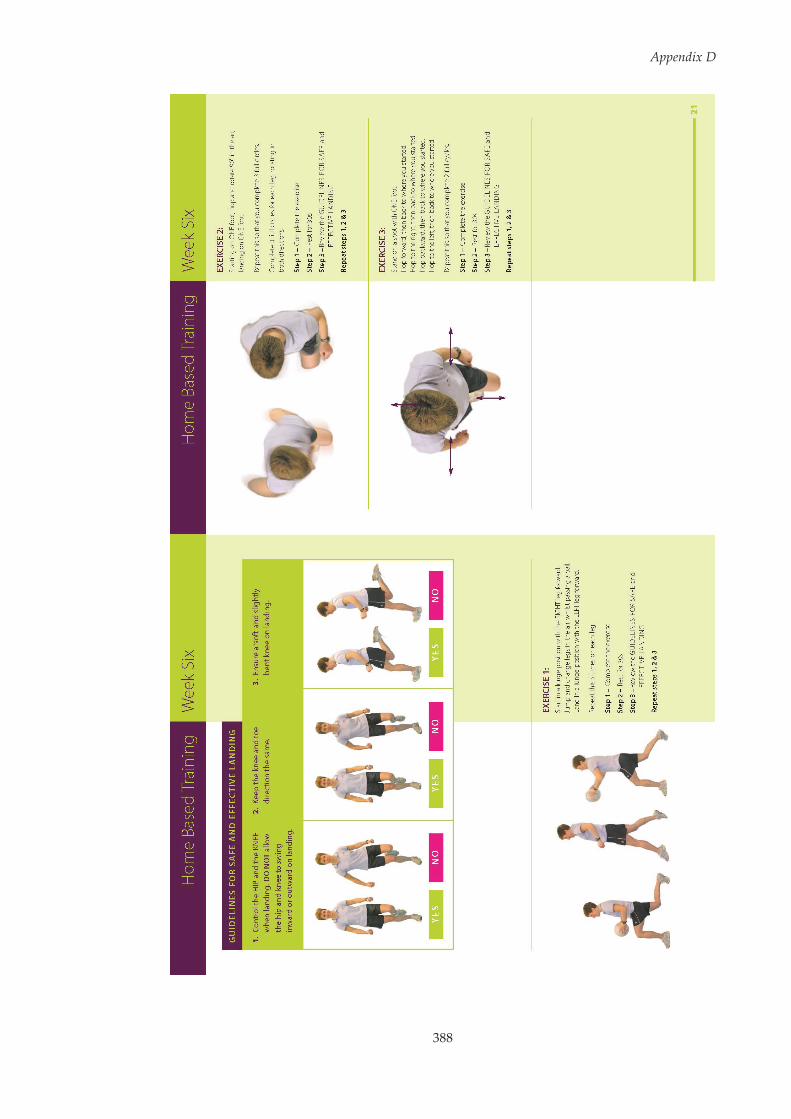
Appendix D
388

Appendix D
389

390
Appendix E Maximal Voluntary Isometric
Contraction (MVIC) Procedures. Adapted from
Konrad.[263]
Muscles Tested MVIC Set Position Procedure
Rectus Femoris Vastus Medialis
Perform a single leg knee extension
against resistance between 70 and
90 of knee flexion.
Biceps Femoris Medial Hamstrings
Arrange a good fixation of the hip
and perform a unilateral knee
flexion against resistance at
approximately 20 and 30 of knee
flexion.
Gluteus Maximus
Perform a single leg hip extension
against resistance with the hip
positioned at approximately 20 of
hyperextension.
Gluteus Medius
Perform a single leg hip abduction
against resistance in a side laying
position.
Gastrocnemius
Perform a single leg plantar flexion
against very rigid resistance with
the knees in full extension and
ankle positioned at 90 .

391
Appendix F Approach Speed Data Analysis Results
One-dimensional statistical parametric mapping (SPM1D) canonical
correlations analysis and linear regression was used to examine whether
changes in approach speed influenced hip and knee joint rotations and
moments (see Section 3.5.2 within this thesis for a description of SPM1D
procedures). Approach speed was found to have a statistically significant
effect at certain points along the hip and knee kinematic (see Appendix Figure
F.1, Page 392 and Appendix Figure F.2, Page 393, respectively) and kinetic (see
Appendix Figure F.3, Page 394 and Appendix Figure F.4, Page 395,
respectively) waveforms.
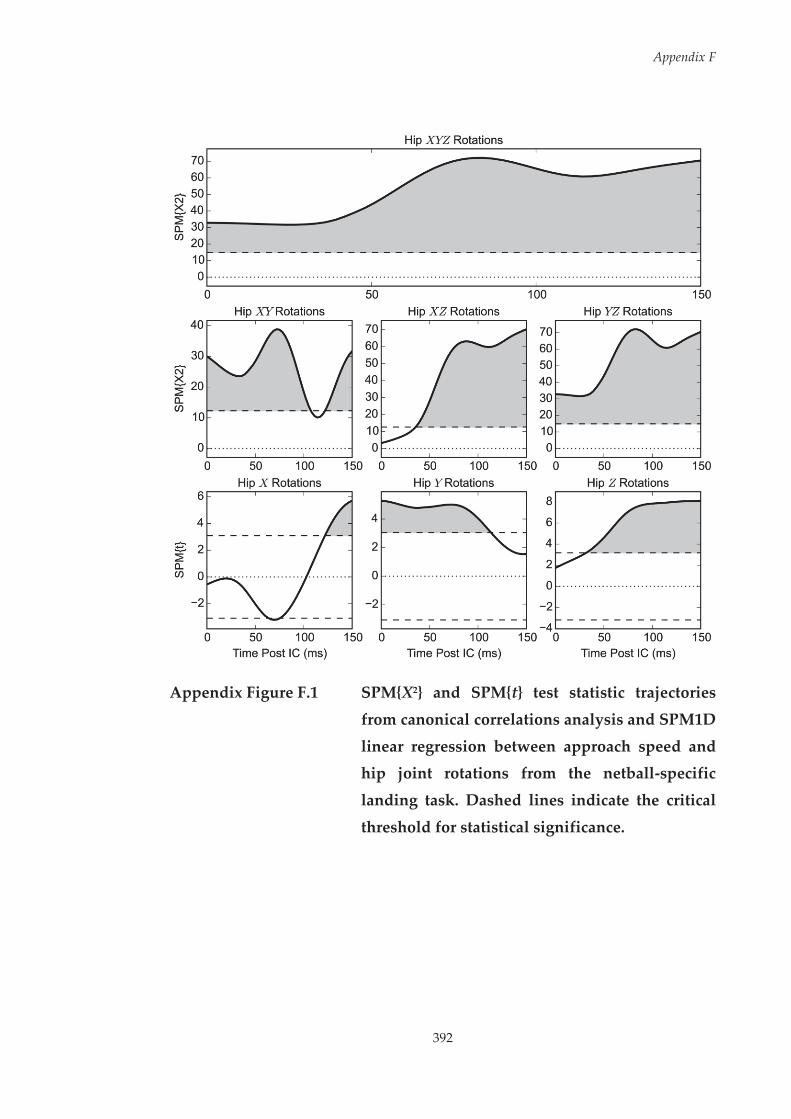
Appendix F
392
Appendix Figure F.1 SPM{X2} and SPM{t} test statistic trajectories
from canonical correlations analysis and SPM1D
linear regression between approach speed and hip joint rotations from the netball-specific
landing task. Dashed lines indicate the critical
threshold for statistical significance.

Appendix F
393
Appendix Figure F.2 SPM{X2} and SPM{t} test statistic trajectories
from canonical correlations analysis and SPM1D linear regression between approach speed and
knee joint rotations from the netball-specific landing task. Dashed lines indicate the critical
threshold for statistical significance.

Appendix F
394
Appendix Figure F.3 SPM{X2} and SPM{t} test statistic trajectories
from canonical correlations analysis and SPM1D linear regression between approach speed and
hip joint moments from the netball-specific landing task. Dashed lines indicate the critical
threshold for statistical significance.

Appendix F
395
Appendix Figure F.4 SPM{X2} and SPM{t} test statistic trajectories
from canonical correlations analysis and SPM1D
linear regression between approach speed and knee joint moments from the netball-specific
landing task. Dashed lines indicate the critical
threshold for statistical significance.
396
Appendix G Descriptions of the Principal Patterns
Extracted from the Netball-Specific Landing Task used
in Chapter Six
Within Chapter Six, principal component analysis (PCA) was applied to the
extracted kinematic and kinetic data from the netball-specific landing task to
identify and calculate the principal patterns (PP) and PP-Scores, respectively.
This appendix provides a comprehensive description and interpretation of
these PPs. The figures included in this appendix provide a graphical display
of the patterns associated with high (‘+’ symbols) and low (‘–’ symbols) PP-
Scores for each PP.

Appendix G
397
G.1 Kinematic Data
G.1.1 Hip Flexion (FLEX) / Extension (EXT) Principal Patterns
Appendix Figure G.1 Mean hip FLEX/EXT kinematic data (solid line)
from the netball-specific landing task with the
effect of adding and subtracting a multiple of hip FLEX/EXT PP1 and PP2 to the mean curve shown
by the plus and minus symbols, respectively.
Hip FLEX/EXT PP1 explained 82.4% of the variance in hip FLEX/EXT
kinematic data, and was representative of the general shape and overall
magnitude. Higher PP-Scores indicated greater overall hip flexion, while
lower PP-Scores indicated reduced overall hip flexion. Hip FLEX/EXT PP2
explained 10.6% of the variance in hip FLEX/EXT kinematic data, and was
representative of the magnitude of hip flexion from initial contact (IC) to 50
milliseconds post IC. Higher PP-Scores indicated greater hip flexion, while
lower PP-Scores indicated reduced hip flexion.
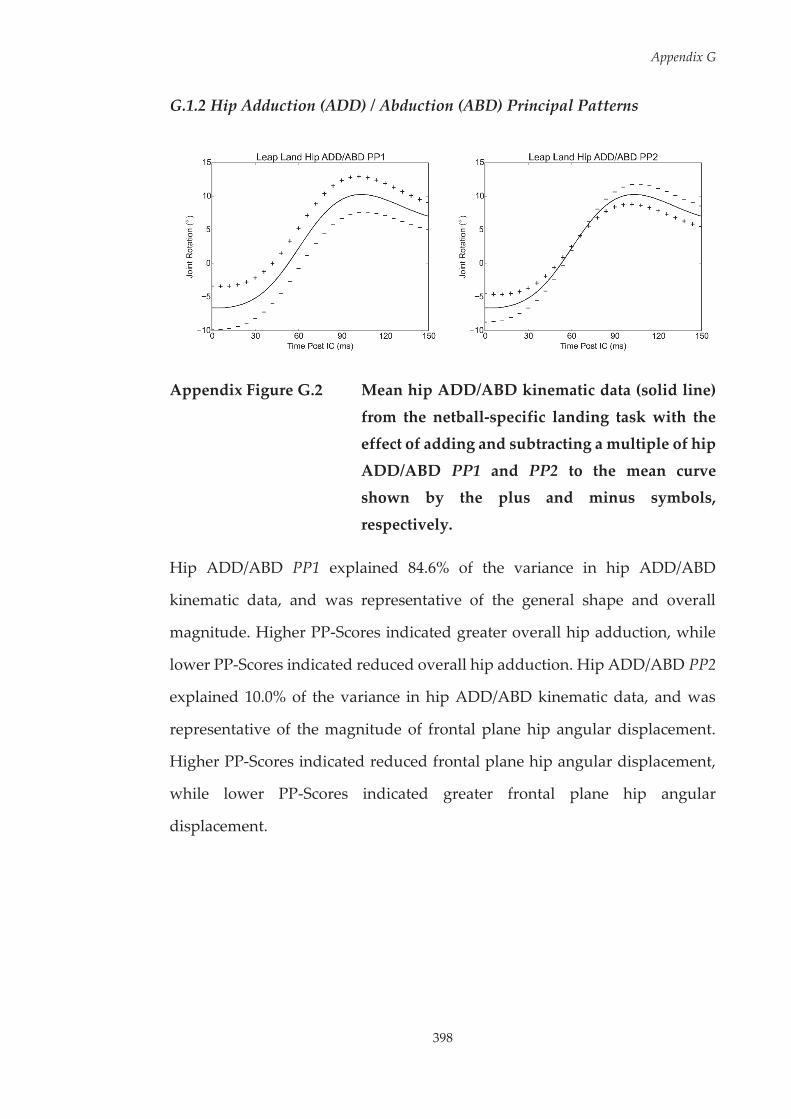
Appendix G
398
G.1.2 Hip Adduction (ADD) / Abduction (ABD) Principal Patterns
Appendix Figure G.2 Mean hip ADD/ABD kinematic data (solid line)
from the netball-specific landing task with the effect of adding and subtracting a multiple of hip
ADD/ABD PP1 and PP2 to the mean curve shown by the plus and minus symbols,
respectively.
Hip ADD/ABD PP1 explained 84.6% of the variance in hip ADD/ABD
kinematic data, and was representative of the general shape and overall
magnitude. Higher PP-Scores indicated greater overall hip adduction, while
lower PP-Scores indicated reduced overall hip adduction. Hip ADD/ABD PP2
explained 10.0% of the variance in hip ADD/ABD kinematic data, and was
representative of the magnitude of frontal plane hip angular displacement.
Higher PP-Scores indicated reduced frontal plane hip angular displacement,
while lower PP-Scores indicated greater frontal plane hip angular
displacement.

399
Appendix G
G.1
.3 H
ip In
tern
al (I
R) /
Ext
erna
l (ER
) Rot
atio
n Pr
inci
pal P
atte
rns
App
endi
x Fi
gure
G.3
M
ean
hip
IR/E
R k
inem
atic
dat
a (s
olid
lin
e) f
rom
the
netb
all-
spec
ific
land
ing
task
with
the
effe
ct o
f
addi
ng a
nd su
btra
ctin
g a
mul
tiple
of h
ip IR
/ER
PP1
, PP2
and
PP3
to th
e m
ean
curv
e sh
own
by th
e pl
us
and
min
us s
ymbo
ls, r
espe
ctiv
ely.

Appendix G
400
Hip IR/ER PP1 explained 73.0% of the variance in hip IR/ER kinematic data,
and was representative of the general shape and overall magnitude. Higher
PP-Scores indicated greater overall hip internal rotation, while lower PP-
Scores indicated greater overall hip external rotation. Hip IR/ER PP2 explained
16.1% of the variance in hip IR/ER kinematic data, and was representative of
the magnitude of hip external rotation from initial contact (IC) to 30
milliseconds post IC. Higher PP-Scores indicated reduced hip external
rotation, while lower PP-Scores indicated greater hip external rotation. Hip
IR/ER PP3 explained 7.1% of the variance in hip IR/ER kinematic data, and
was representative of the magnitude of peak hip internal rotation around 60 –
90 ms after IC. Higher PP-Scores indicated a greater hip internal rotation peak,
while lower PP-Scores indicated a reduced hip internal rotation peak.

Appendix G
401
G.1.4 Knee Extension (EXT) / Flexion (FLEX) Principal Patterns
Appendix Figure G.4 Mean knee EXT/FLEX kinematic data (solid line)
from the netball-specific landing task with the effect of adding and subtracting a multiple of
knee EXT/FLEX PP1 and PP2 to the mean curve shown by the plus and minus symbols,
respectively.
Knee EXT/FLEX PP1 explained 83.3% of the variance in knee EXT/FLEX
kinematic data, and was representative of the general shape and overall
magnitude. Higher PP-Scores indicated reduced overall knee flexion, while
lower PP-Scores indicated greater overall knee flexion. Knee EXT/FLEX PP2
explained 8.9% of the variance in knee EXT/FLEX kinematic data, and was
representative of the magnitude of sagittal plane knee angular displacement.
Higher PP-Scores indicated reduced sagittal plane knee angular displacement,
while lower PP-Scores indicated greater sagittal plane knee angular
displacement.
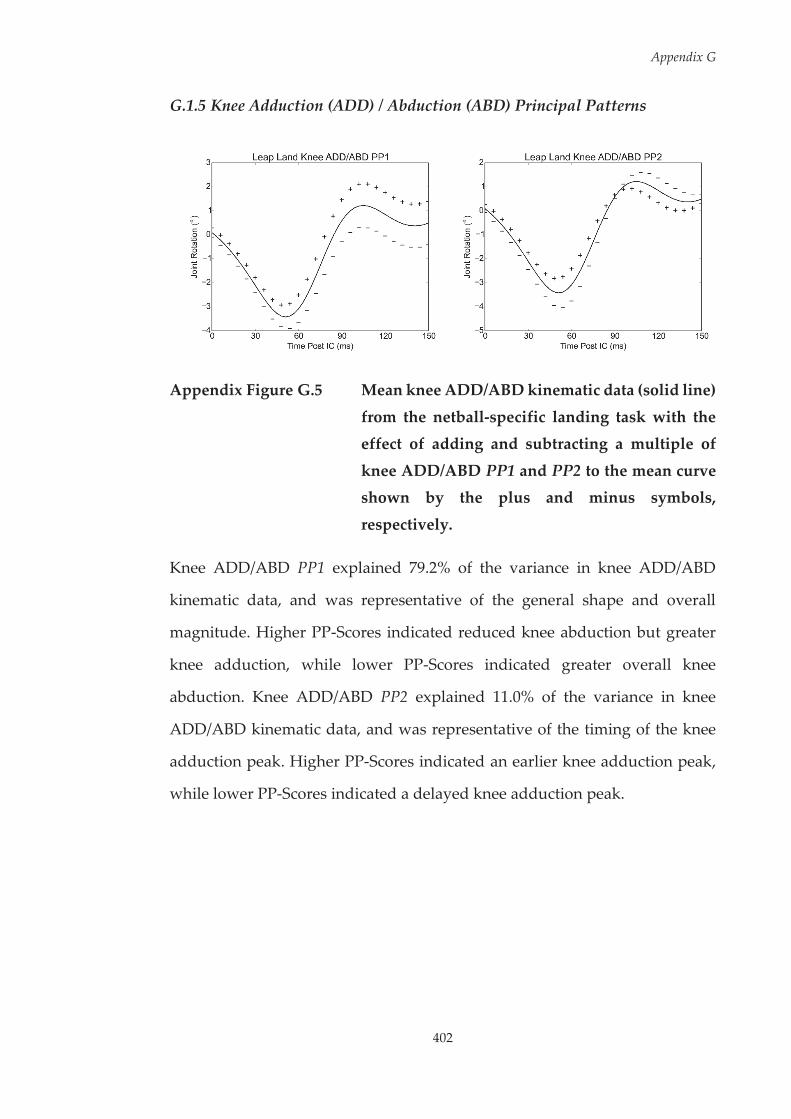
Appendix G
402
G.1.5 Knee Adduction (ADD) / Abduction (ABD) Principal Patterns
Appendix Figure G.5 Mean knee ADD/ABD kinematic data (solid line)
from the netball-specific landing task with the effect of adding and subtracting a multiple of
knee ADD/ABD PP1 and PP2 to the mean curve shown by the plus and minus symbols,
respectively.
Knee ADD/ABD PP1 explained 79.2% of the variance in knee ADD/ABD
kinematic data, and was representative of the general shape and overall
magnitude. Higher PP-Scores indicated reduced knee abduction but greater
knee adduction, while lower PP-Scores indicated greater overall knee
abduction. Knee ADD/ABD PP2 explained 11.0% of the variance in knee
ADD/ABD kinematic data, and was representative of the timing of the knee
adduction peak. Higher PP-Scores indicated an earlier knee adduction peak,
while lower PP-Scores indicated a delayed knee adduction peak.
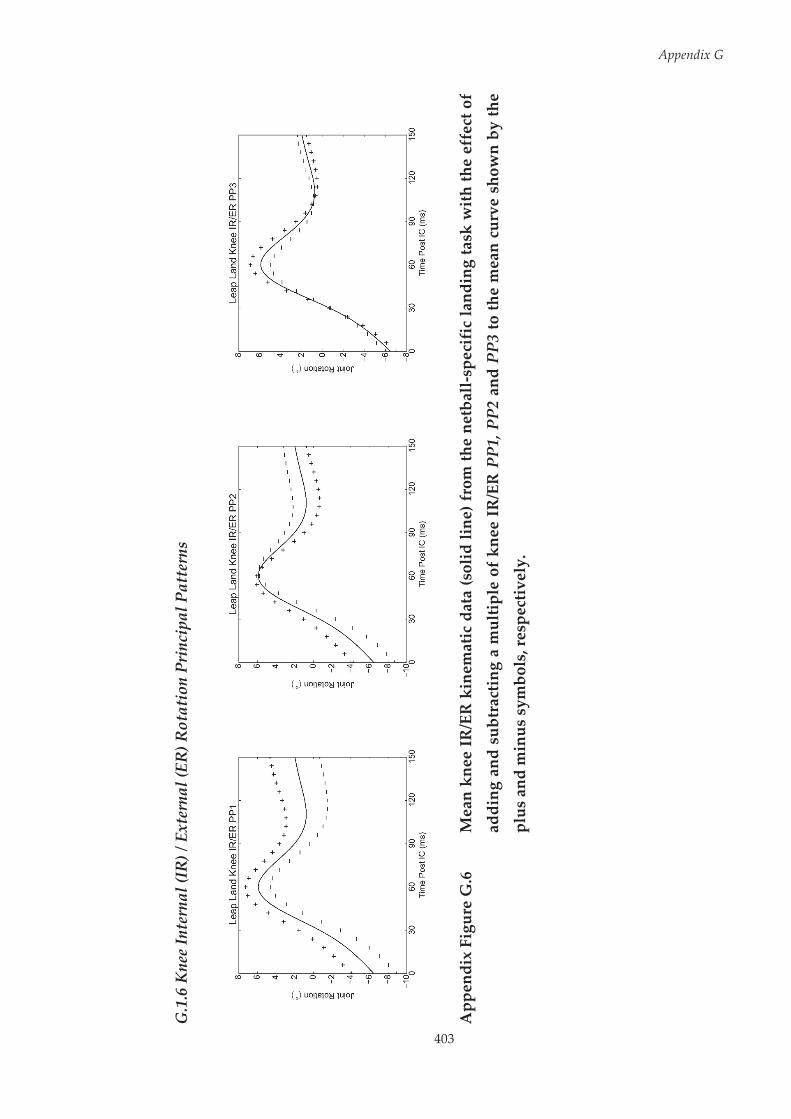
403
Appendix G
G.1
.6 K
nee
Inte
rnal
(IR
) / E
xter
nal (
ER) R
otat
ion
Prin
cipa
l Pat
tern
s
App
endi
x Fi
gure
G.6
M
ean
knee
IR
/ER
kin
emat
ic d
ata
(sol
id li
ne) f
rom
the
netb
all-
spec
ific
land
ing
task
wit
h th
e ef
fect
of
addi
ng a
nd s
ubtr
actin
g a
mul
tiple
of
knee
IR
/ER
PP1
, PP2
and
PP3
to th
e m
ean
curv
e sh
own
by th
e
plus
and
min
us s
ymbo
ls, r
espe
ctiv
ely.
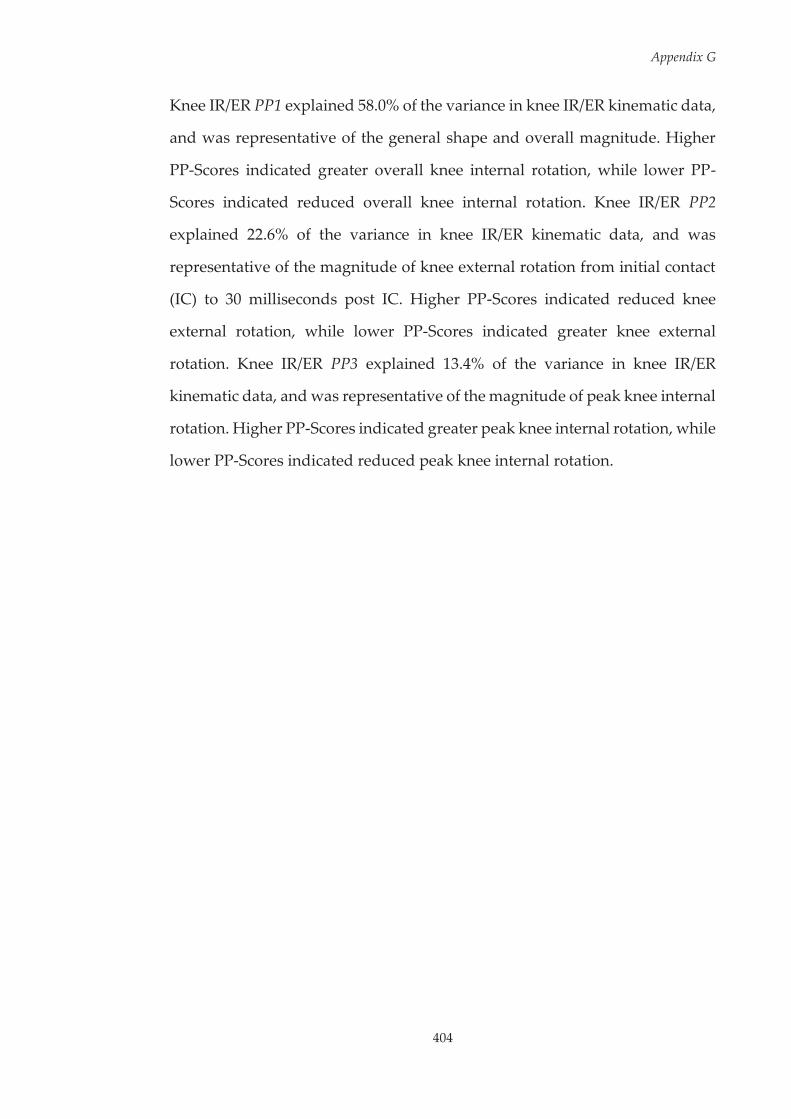
Appendix G
404
Knee IR/ER PP1 explained 58.0% of the variance in knee IR/ER kinematic data,
and was representative of the general shape and overall magnitude. Higher
PP-Scores indicated greater overall knee internal rotation, while lower PP-
Scores indicated reduced overall knee internal rotation. Knee IR/ER PP2
explained 22.6% of the variance in knee IR/ER kinematic data, and was
representative of the magnitude of knee external rotation from initial contact
(IC) to 30 milliseconds post IC. Higher PP-Scores indicated reduced knee
external rotation, while lower PP-Scores indicated greater knee external
rotation. Knee IR/ER PP3 explained 13.4% of the variance in knee IR/ER
kinematic data, and was representative of the magnitude of peak knee internal
rotation. Higher PP-Scores indicated greater peak knee internal rotation, while
lower PP-Scores indicated reduced peak knee internal rotation.
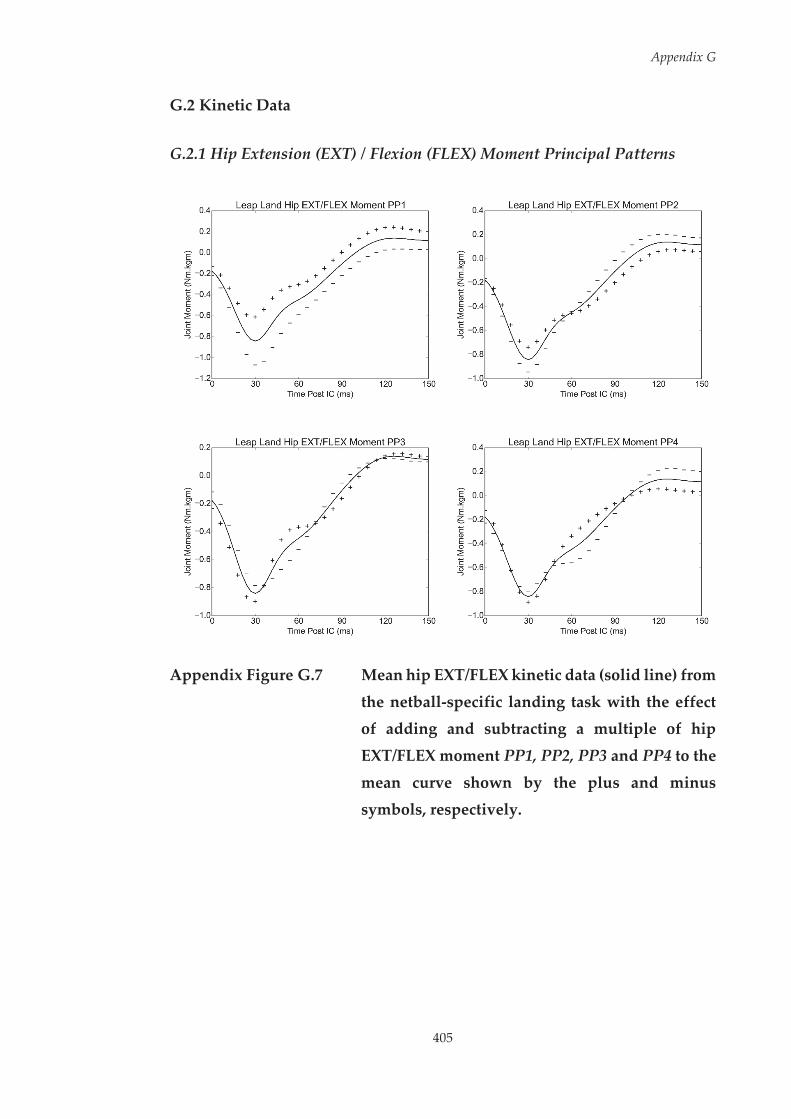
Appendix G
405
G.2 Kinetic Data
G.2.1 Hip Extension (EXT) / Flexion (FLEX) Moment Principal Patterns
Appendix Figure G.7 Mean hip EXT/FLEX kinetic data (solid line) from
the netball-specific landing task with the effect of adding and subtracting a multiple of hip
EXT/FLEX moment PP1, PP2, PP3 and PP4 to the
mean curve shown by the plus and minus symbols, respectively.
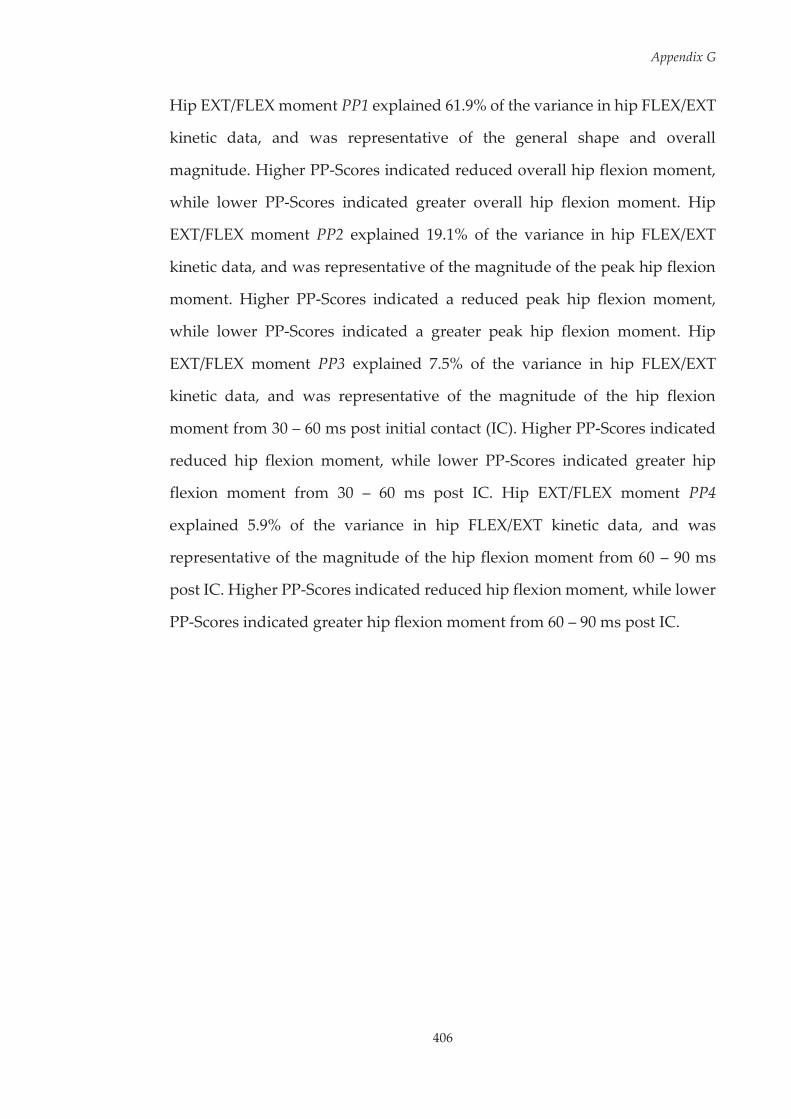
Appendix G
406
Hip EXT/FLEX moment PP1 explained 61.9% of the variance in hip FLEX/EXT
kinetic data, and was representative of the general shape and overall
magnitude. Higher PP-Scores indicated reduced overall hip flexion moment,
while lower PP-Scores indicated greater overall hip flexion moment. Hip
EXT/FLEX moment PP2 explained 19.1% of the variance in hip FLEX/EXT
kinetic data, and was representative of the magnitude of the peak hip flexion
moment. Higher PP-Scores indicated a reduced peak hip flexion moment,
while lower PP-Scores indicated a greater peak hip flexion moment. Hip
EXT/FLEX moment PP3 explained 7.5% of the variance in hip FLEX/EXT
kinetic data, and was representative of the magnitude of the hip flexion
moment from 30 – 60 ms post initial contact (IC). Higher PP-Scores indicated
reduced hip flexion moment, while lower PP-Scores indicated greater hip
flexion moment from 30 – 60 ms post IC. Hip EXT/FLEX moment PP4
explained 5.9% of the variance in hip FLEX/EXT kinetic data, and was
representative of the magnitude of the hip flexion moment from 60 – 90 ms
post IC. Higher PP-Scores indicated reduced hip flexion moment, while lower
PP-Scores indicated greater hip flexion moment from 60 – 90 ms post IC.

407
Appendix G
G.2
.2 H
ip A
bduc
tion
(ABD
) / A
dduc
tion
(AD
D) M
omen
t Pri
ncip
al P
atte
rns
App
endi
x Fi
gure
G.8
M
ean
hip
ABD
/AD
D k
inet
ic d
ata
(sol
id li
ne) f
rom
the
netb
all-
spec
ific
land
ing
task
with
the
effe
ct o
f
addi
ng a
nd s
ubtr
actin
g a
mul
tiple
of
hip
ABD
/AD
D m
omen
t PP
1, P
P2 a
nd P
P3 t
o th
e m
ean
curv
e
show
n by
the
plus
and
min
us s
ymbo
ls, r
espe
ctiv
ely.
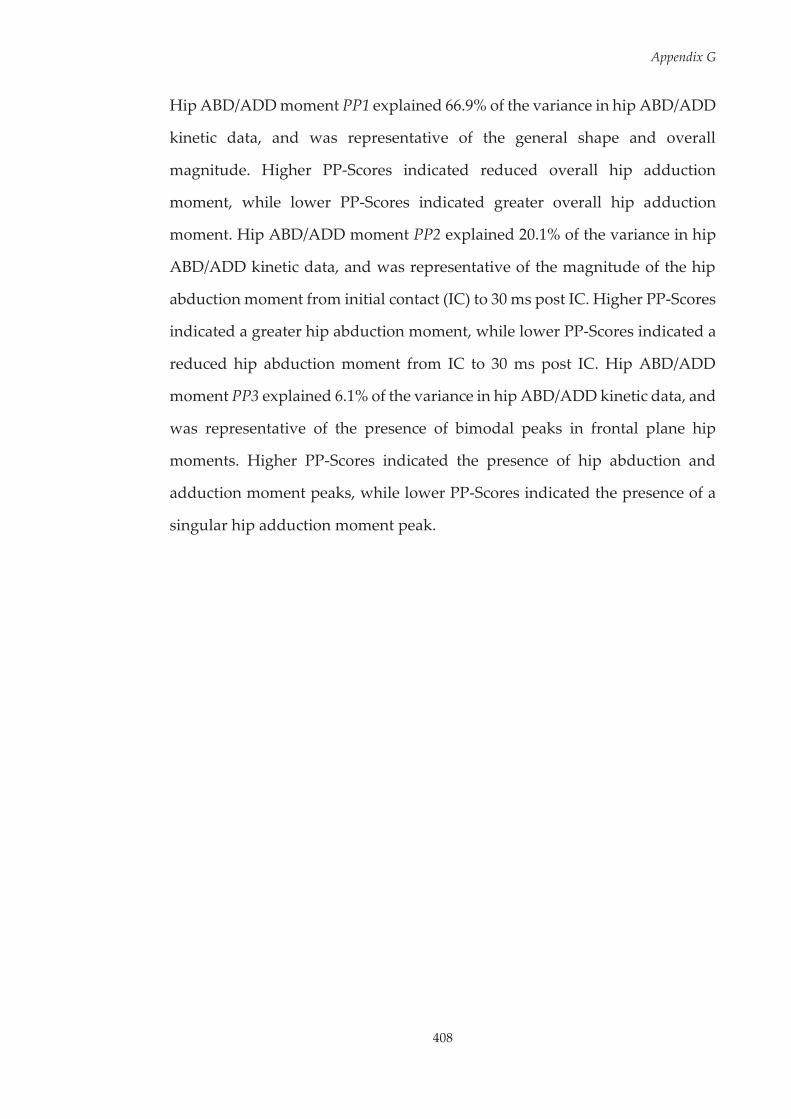
Appendix G
408
Hip ABD/ADD moment PP1 explained 66.9% of the variance in hip ABD/ADD
kinetic data, and was representative of the general shape and overall
magnitude. Higher PP-Scores indicated reduced overall hip adduction
moment, while lower PP-Scores indicated greater overall hip adduction
moment. Hip ABD/ADD moment PP2 explained 20.1% of the variance in hip
ABD/ADD kinetic data, and was representative of the magnitude of the hip
abduction moment from initial contact (IC) to 30 ms post IC. Higher PP-Scores
indicated a greater hip abduction moment, while lower PP-Scores indicated a
reduced hip abduction moment from IC to 30 ms post IC. Hip ABD/ADD
moment PP3 explained 6.1% of the variance in hip ABD/ADD kinetic data, and
was representative of the presence of bimodal peaks in frontal plane hip
moments. Higher PP-Scores indicated the presence of hip abduction and
adduction moment peaks, while lower PP-Scores indicated the presence of a
singular hip adduction moment peak.

Appendix G
409
G.2.3 Hip External (ER) / Internal (IR) Rotation Moment Principal Patterns
Appendix Figure G.9 Mean hip ER/IR kinetic data (solid line) from the
netball-specific landing task with the effect of adding and subtracting a multiple of hip ER/IR
moment PP1 and PP2 to the mean curve shown
by the plus and minus symbols, respectively.
Hip ER/IR moment PP1 explained 77.1% of the variance in hip ER/IR kinetic
data, and was representative of the general shape and overall magnitude.
Higher PP-Scores indicated greater overall hip internal rotation moment,
while lower PP-Scores indicated reduced overall hip internal rotation
moment. Hip ER/IR moment PP2 explained 14.2% of the variance in hip ER/IR
kinetic data, and was representative of the magnitude of the peak hip external
rotation moment. Higher PP-Scores indicated a reduced peak hip external
rotation moment, while lower PP-Scores indicated a greater peak hip external
rotation moment.
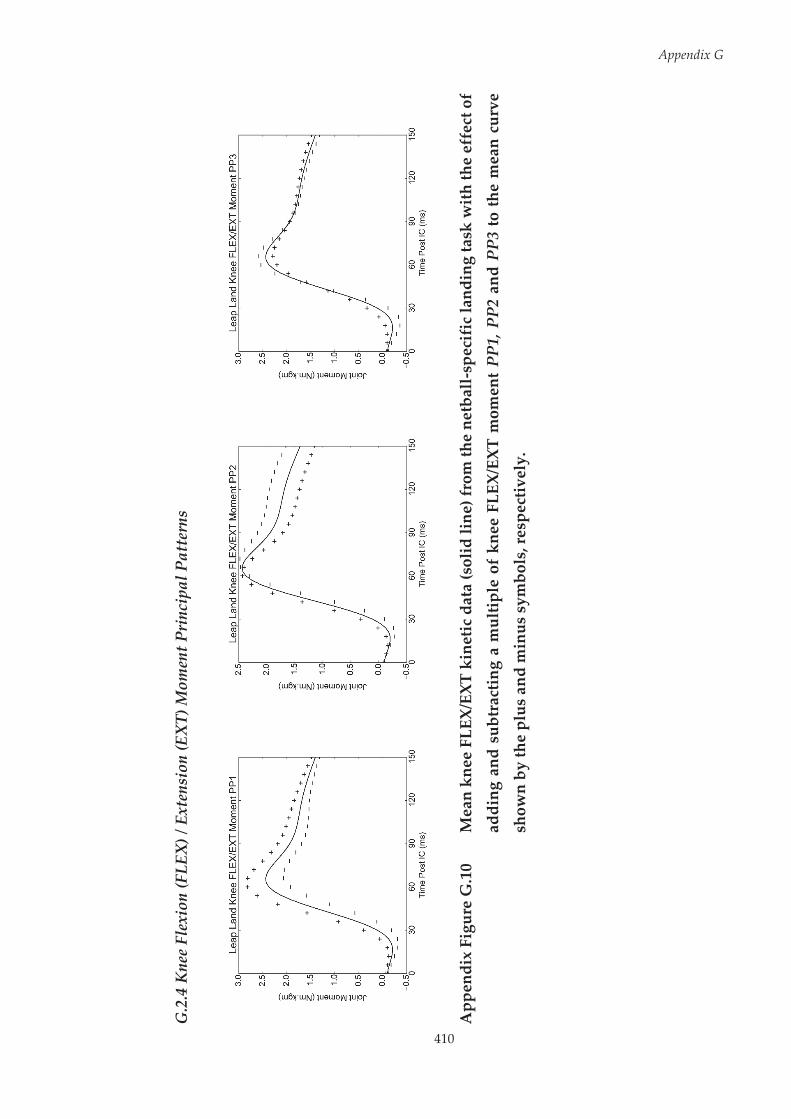
410
Appendix G
G.2
.4 K
nee
Flex
ion
(FLE
X) /
Ext
ensi
on (E
XT)
Mom
ent P
rinc
ipal
Pat
tern
s
App
endi
x Fi
gure
G.1
0 M
ean
knee
FLE
X/EX
T ki
netic
dat
a (s
olid
line
) fro
m th
e ne
tbal
l-sp
ecif
ic la
ndin
g ta
sk w
ith
the
effe
ct o
f
addi
ng a
nd s
ubtr
actin
g a
mul
tiple
of
knee
FLE
X/EX
T m
omen
t PP
1, P
P2 a
nd P
P3 to
the
mea
n cu
rve
show
n by
the
plus
and
min
us s
ymbo
ls, r
espe
ctiv
ely.
Appendix G
411
Knee FLEX/EXT moment PP1 explained 49.3% of the variance in knee
FLEX/EXT kinetic data, and was representative of the general shape and
overall magnitude. Higher PP-Scores indicated greater overall knee flexion
moment, while lower PP-Scores indicated reduced overall knee flexion
moment. Knee FLEX/EXT moment PP2 explained 36.4% of the variance in
knee FLEX/EXT kinetic data, and was representative of the timing of peak knee
flexion moment. Higher PP-Scores indicated delayed peak knee flexion
moment, while lower PP-Scores indicated earlier peak knee flexion moment.
Knee FLEX/EXT moment PP3 explained 6.2% of the variance in knee
FLEX/EXT kinetic data, and was representative of magnitude of sagittal plane
knee moment peaks. Higher PP-Scores indicated reduced knee flexion and
extension peak moments, while lower PP-Scores indicated greater knee flexion
and extension peak moments.
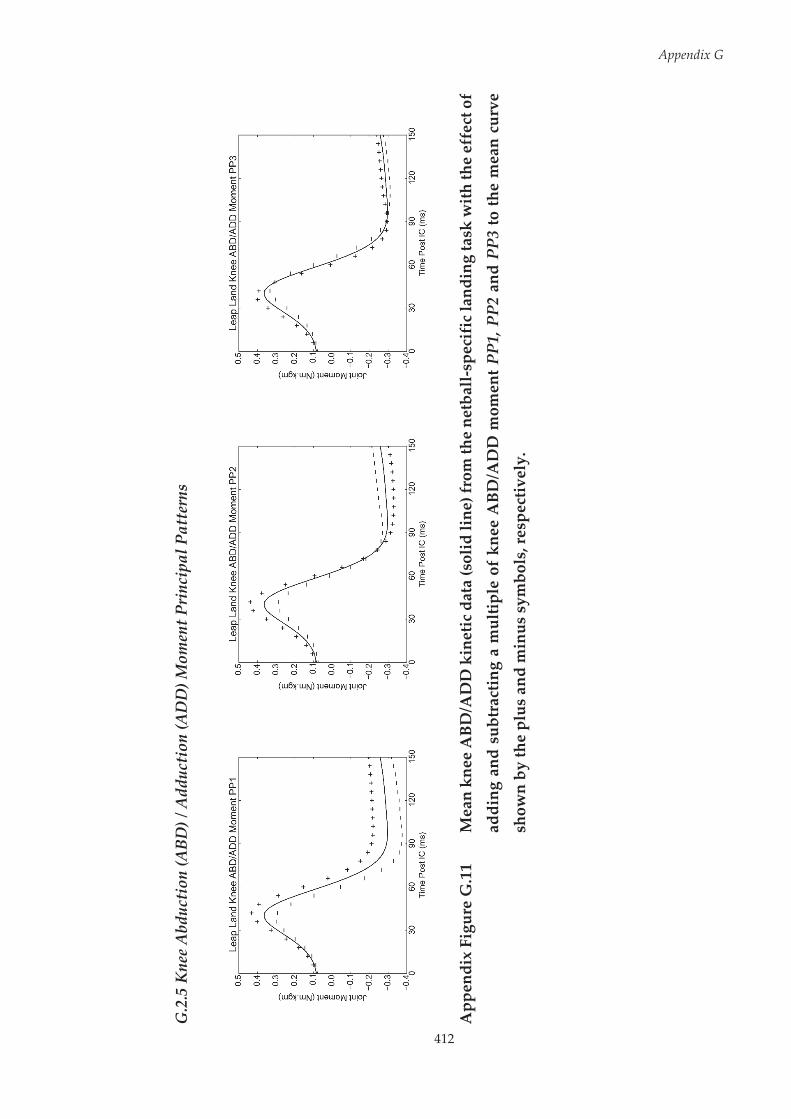
412
Appendix G
G.2
.5 K
nee
Abd
ucti
on (A
BD) /
Add
ucti
on (A
DD
) Mom
ent P
rinc
ipal
Pat
tern
s
App
endi
x Fi
gure
G.1
1 M
ean
knee
ABD
/AD
D k
inet
ic d
ata
(sol
id li
ne) f
rom
the
netb
all-s
peci
fic
land
ing
task
with
the
effe
ct o
f
addi
ng a
nd s
ubtr
actin
g a
mul
tiple
of
knee
ABD
/AD
D m
omen
t PP1
, PP2
and
PP3
to th
e m
ean
curv
e
show
n by
the
plus
and
min
us s
ymbo
ls, r
espe
ctiv
ely.
Appendix G
413
Knee ABD/ADD moment PP1 explained 61.2% of the variance in knee
ABD/ADD kinetic data, and was representative of magnitude of knee
adduction moment. Higher PP-Scores indicated reduced knee adduction
moment, while lower PP-Scores indicated greater knee adduction moment.
Knee ABD/ADD moment PP2 explained 24.2% of the variance in knee
ABD/ADD kinetic data, and was representative of magnitude of peak knee
abduction moment. Higher PP-Scores indicated greater peak knee abduction
moment, while lower PP-Scores indicated reduced peak knee abduction
moment. Knee ABD/ADD moment PP3 explained 9.0% of the variance in knee
ABD/ADD kinetic data, and was representative of the timing of peak knee
abduction moment. Higher PP-Scores indicated earlier and greater peak knee
abduction moment, while lower PP-Scores indicated delayed and reduced
peak knee abduction moment.
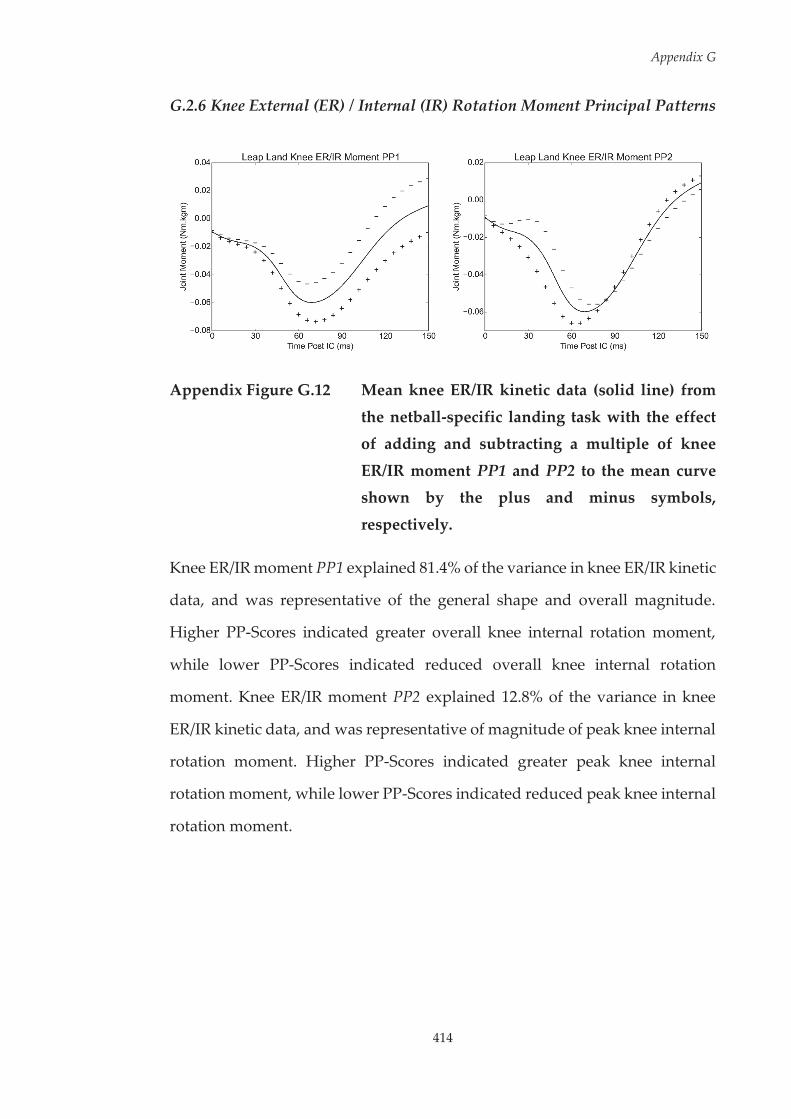
Appendix G
414
G.2.6 Knee External (ER) / Internal (IR) Rotation Moment Principal Patterns
Appendix Figure G.12 Mean knee ER/IR kinetic data (solid line) from
the netball-specific landing task with the effect of adding and subtracting a multiple of knee
ER/IR moment PP1 and PP2 to the mean curve shown by the plus and minus symbols,
respectively.
Knee ER/IR moment PP1 explained 81.4% of the variance in knee ER/IR kinetic
data, and was representative of the general shape and overall magnitude.
Higher PP-Scores indicated greater overall knee internal rotation moment,
while lower PP-Scores indicated reduced overall knee internal rotation
moment. Knee ER/IR moment PP2 explained 12.8% of the variance in knee
ER/IR kinetic data, and was representative of magnitude of peak knee internal
rotation moment. Higher PP-Scores indicated greater peak knee internal
rotation moment, while lower PP-Scores indicated reduced peak knee internal
rotation moment.
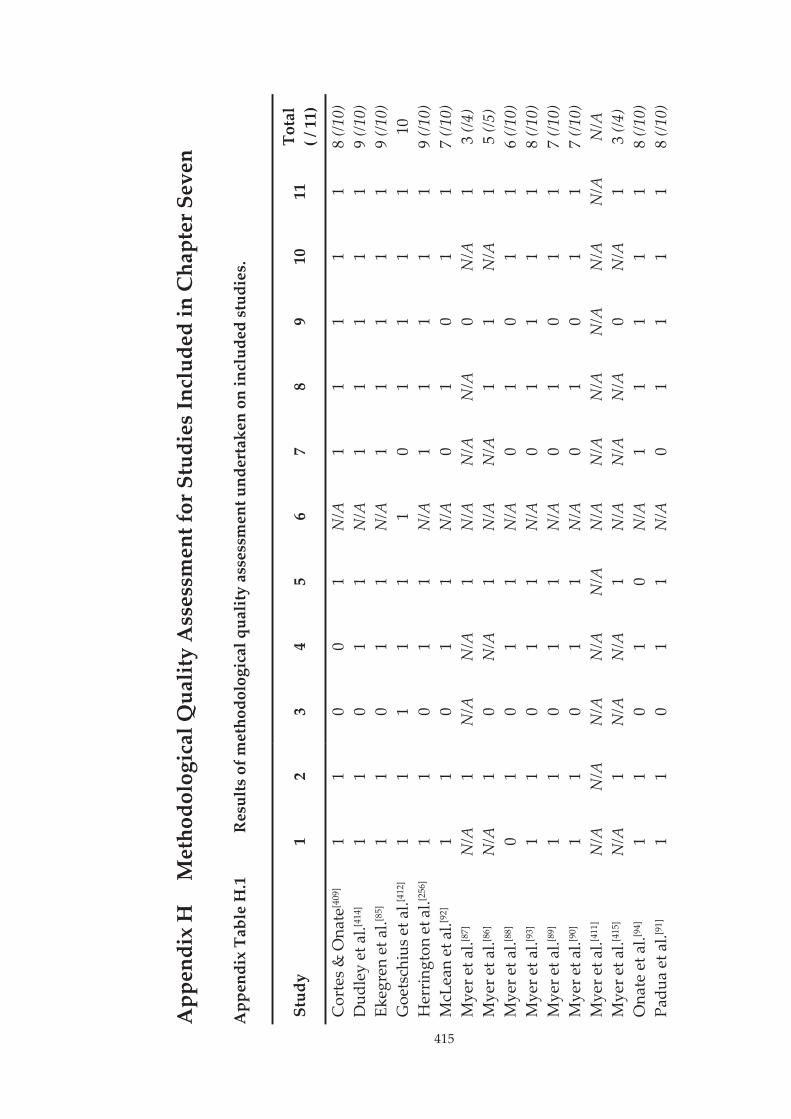
415
App
endi
x H
M
etho
dolo
gica
l Qua
lity
Ass
essm
ent f
or S
tudi
es In
clud
ed in
Cha
pter
Sev
en
App
endi
x Ta
ble
H.1
R
esul
ts o
f met
hodo
logi
cal q
ualit
y as
sess
men
t und
erta
ken
on in
clud
ed s
tudi
es.
Stud
y 1
2 3
4 5
6 7
8 9
10
11
Tota
l ( /
11)
Cor
tes
& O
nate
[409
] 1
1 0
0 1
N/A
1
1 1
1 1
8 (/1
0)
Dud
ley
et a
l.[414
] 1
1 0
1 1
N/A
1
1 1
1 1
9 (/1
0)
Ekeg
ren
et a
l.[85]
1 1
0 1
1 N
/A
1 1
1 1
1 9
(/10)
G
oets
chiu
s et a
l.[412
] 1
1 1
1 1
1 0
1 1
1 1
10
Her
ring
ton
et a
l.[256
] 1
1 0
1 1
N/A
1
1 1
1 1
9 (/1
0)
McL
ean
et a
l.[92]
1 1
0 1
1 N
/A
0 1
0 1
1 7
(/10)
M
yer e
t al.[8
7]
N/A
1
N/A
N
/A
1 N
/A
N/A
N
/A
0 N
/A
1 3
(/4)
Mye
r et a
l.[86]
N/A
1
0 N
/A
1 N
/A
N/A
1
1 N
/A
1 5
(/5)
Mye
r et a
l.[88]
0 1
0 1
1 N
/A
0 1
0 1
1 6
(/10)
M
yer e
t al.[9
3]
1 1
0 1
1 N
/A
0 1
1 1
1 8
(/10)
M
yer e
t al.[8
9]
1 1
0 1
1 N
/A
0 1
0 1
1 7
(/10)
M
yer e
t al.[9
0]
1 1
0 1
1 N
/A
0 1
0 1
1 7
(/10)
M
yer e
t al.[4
11]
N/A
N
/A
N/A
N
/A
N/A
N
/A
N/A
N
/A
N/A
N
/A
N/A
N
/A
Mye
r et a
l.[415
] N
/A
1 N
/A
N/A
1
N/A
N
/A
N/A
0
N/A
1
3 (/4
) O
nate
et a
l.[94]
1 1
0 1
0 N
/A
1 1
1 1
1 8
(/10)
Pa
dua
et a
l.[91]
1 1
0 1
1 N
/A
0 1
1 1
1 8
(/10)
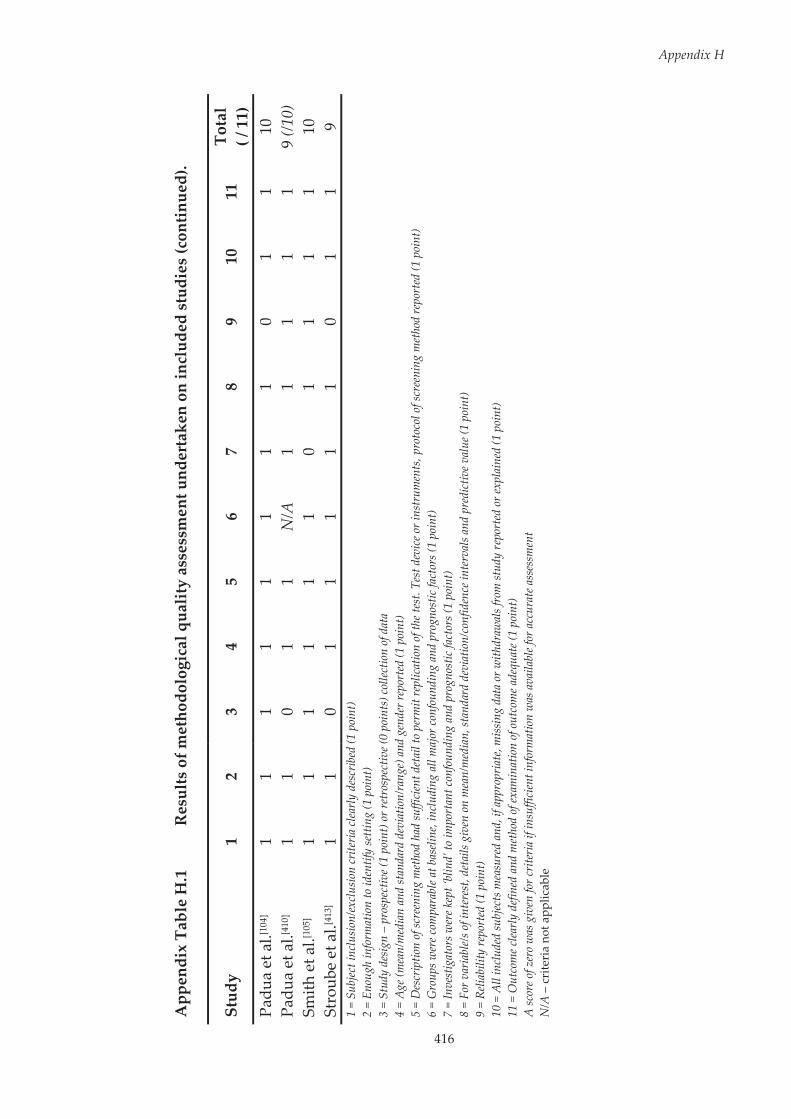
416
Appendix H
App
endi
x Ta
ble
H.1
R
esul
ts o
f met
hodo
logi
cal q
ualit
y as
sess
men
t und
erta
ken
on in
clud
ed s
tudi
es (c
ontin
ued)
.
Stud
y 1
2 3
4 5
6 7
8 9
10
11
Tota
l ( /
11)
Pa
dua
et a
l.[104
] 1
1 1
1 1
1 1
1 0
1 1
10
Padu
a et
al.[4
10]
1 1
0 1
1 N
/A
1 1
1 1
1 9
(/10)
Sm
ith e
t al.[1
05]
1 1
1 1
1 1
0 1
1 1
1 10
St
roub
e et
al.[4
13]
1 1
0 1
1 1
1 1
0 1
1 9
1 =
Subj
ect i
nclu
sion/
excl
usio
n cr
iteria
clea
rly d
escr
ibed
(1 p
oint
) 2
= En
ough
info
rmat
ion
to id
entif
y se
tting
(1 p
oint
) 3
= St
udy
desig
n –
pros
pect
ive (
1 po
int)
or re
tros
pect
ive (
0 po
ints
) col
lectio
n of
dat
a 4
= A
ge (m
ean/
med
ian
and
stan
dard
dev
iatio
n/ra
nge)
and
gen
der r
epor
ted
(1 p
oint
) 5
= D
escr
iptio
n of
scre
enin
g m
etho
d ha
d su
ffici
ent d
etai
l to
perm
it re
plic
atio
n of
the t
est.
Test
dev
ice o
r ins
trum
ents
, pro
toco
l of s
cree
ning
met
hod
repo
rted
(1 p
oint
) 6
= G
roup
s wer
e com
para
ble a
t bas
eline
, inc
ludi
ng a
ll m
ajor
conf
ound
ing
and
prog
nost
ic fa
ctor
s (1
poin
t)
7 =
Inve
stig
ator
s wer
e kep
t ‘bl
ind’
to im
port
ant c
onfo
undi
ng a
nd p
rogn
ostic
fact
ors (
1 po
int)
8
= Fo
r var
iabl
e/s o
f int
eres
t, de
tails
giv
en o
n m
ean/
med
ian,
stan
dard
dev
iatio
n/co
nfid
ence
inte
rval
s and
pre
dict
ive v
alue
(1 p
oint
) 9
= Re
liabi
lity
repo
rted
(1 p
oint
) 10
= A
ll in
clud
ed su
bjec
ts m
easu
red
and,
if a
ppro
pria
te, m
issin
g da
ta o
r with
draw
als f
rom
stud
y re
port
ed o
r exp
lain
ed (1
poi
nt)
11 =
Out
com
e clea
rly d
efine
d an
d m
etho
d of
exam
inat
ion
of o
utco
me a
dequ
ate (
1 po
int)
A
scor
e of z
ero
was
giv
en fo
r crit
eria
if in
suffi
cien
t inf
orm
atio
n w
as a
vaila
ble f
or a
ccur
ate a
sses
smen
t N
/A –
cri
teri
a no
t app
licab
le
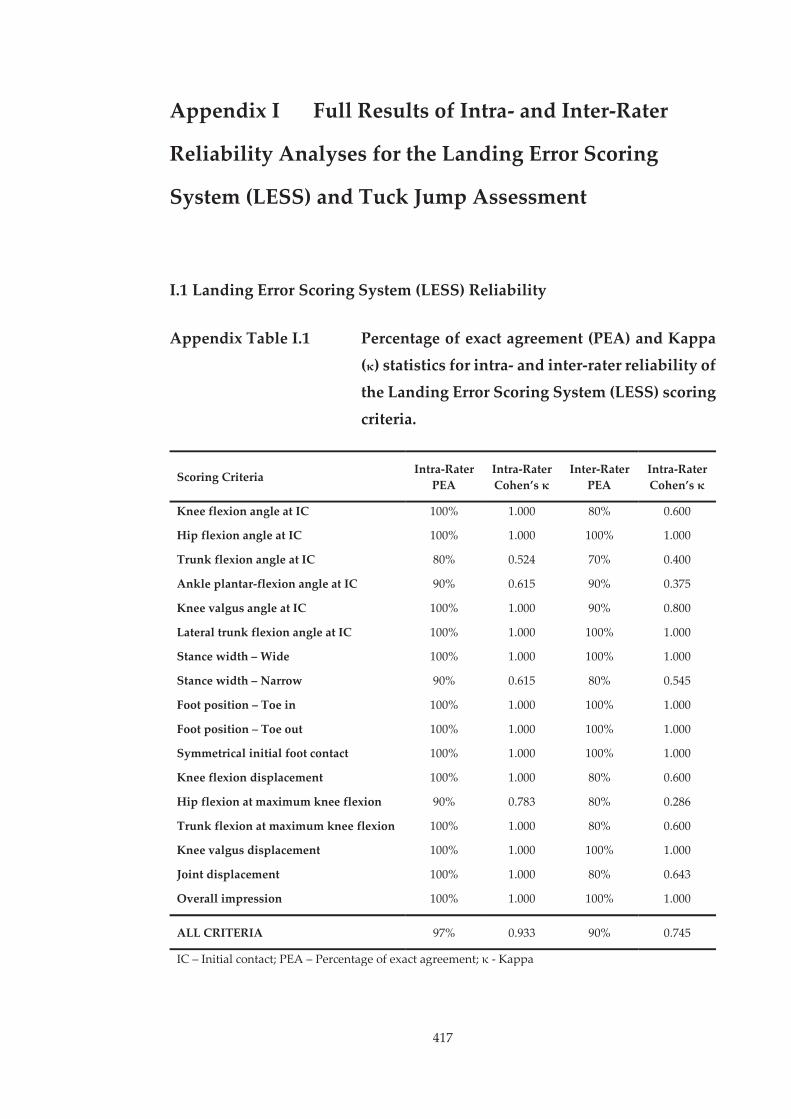
417
Appendix I Full Results of Intra- and Inter-Rater
Reliability Analyses for the Landing Error Scoring
System (LESS) and Tuck Jump Assessment
I.1 Landing Error Scoring System (LESS) Reliability
Appendix Table I.1 Percentage of exact agreement (PEA) and Kappa (κ) statistics for intra- and inter-rater reliability of
the Landing Error Scoring System (LESS) scoring
criteria.
Scoring Criteria Intra-Rater PEA
Intra-Rater Cohen’s κ
Inter-Rater PEA
Intra-Rater Cohen’s κ
Knee flexion angle at IC 100% 1.000 80% 0.600
Hip flexion angle at IC 100% 1.000 100% 1.000
Trunk flexion angle at IC 80% 0.524 70% 0.400
Ankle plantar-flexion angle at IC 90% 0.615 90% 0.375
Knee valgus angle at IC 100% 1.000 90% 0.800
Lateral trunk flexion angle at IC 100% 1.000 100% 1.000
Stance width – Wide 100% 1.000 100% 1.000
Stance width – Narrow 90% 0.615 80% 0.545
Foot position – Toe in 100% 1.000 100% 1.000
Foot position – Toe out 100% 1.000 100% 1.000
Symmetrical initial foot contact 100% 1.000 100% 1.000
Knee flexion displacement 100% 1.000 80% 0.600
Hip flexion at maximum knee flexion 90% 0.783 80% 0.286
Trunk flexion at maximum knee flexion 100% 1.000 80% 0.600
Knee valgus displacement 100% 1.000 100% 1.000
Joint displacement 100% 1.000 80% 0.643
Overall impression 100% 1.000 100% 1.000
ALL CRITERIA 97% 0.933 90% 0.745
IC – Initial contact; PEA – Percentage of exact agreement; κ - Kappa
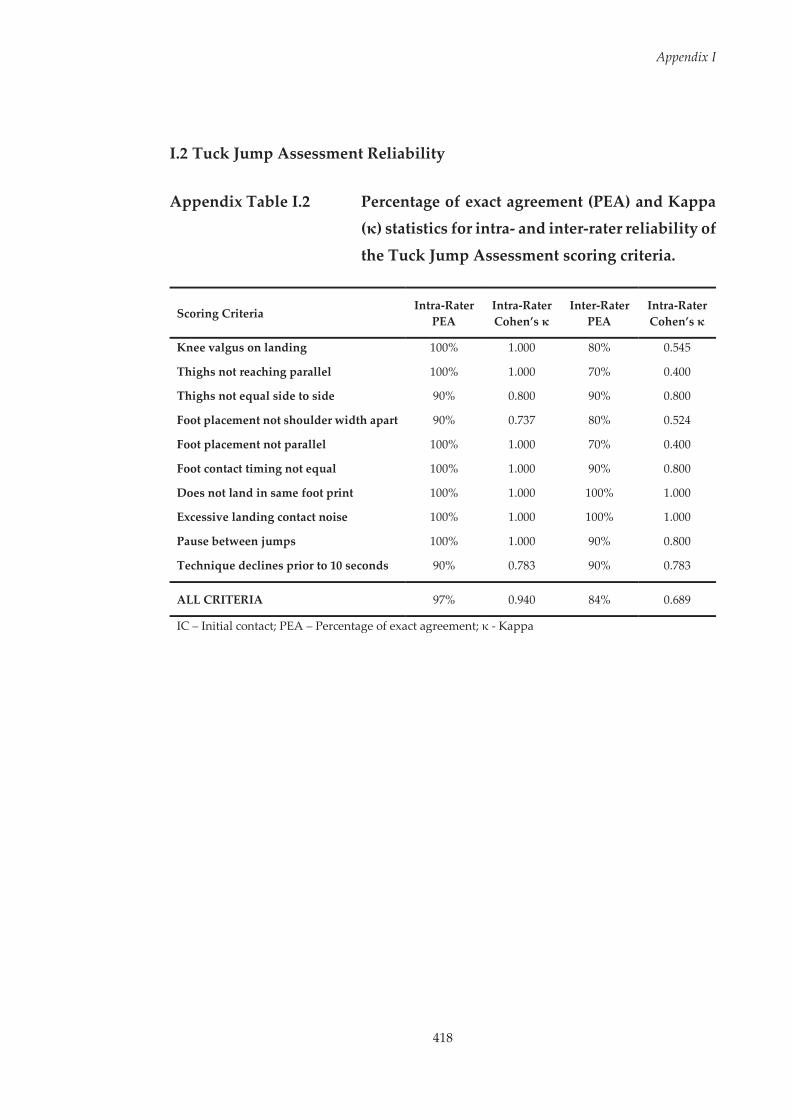
Appendix I
418
I.2 Tuck Jump Assessment Reliability
Appendix Table I.2 Percentage of exact agreement (PEA) and Kappa (κ) statistics for intra- and inter-rater reliability of
the Tuck Jump Assessment scoring criteria.
Scoring Criteria Intra-Rater
PEA Intra-Rater Cohen’s κ
Inter-Rater PEA
Intra-Rater Cohen’s κ
Knee valgus on landing 100% 1.000 80% 0.545
Thighs not reaching parallel 100% 1.000 70% 0.400
Thighs not equal side to side 90% 0.800 90% 0.800
Foot placement not shoulder width apart 90% 0.737 80% 0.524
Foot placement not parallel 100% 1.000 70% 0.400
Foot contact timing not equal 100% 1.000 90% 0.800
Does not land in same foot print 100% 1.000 100% 1.000
Excessive landing contact noise 100% 1.000 100% 1.000
Pause between jumps 100% 1.000 90% 0.800
Technique declines prior to 10 seconds 90% 0.783 90% 0.783
ALL CRITERIA 97% 0.940 84% 0.689
IC – Initial contact; PEA – Percentage of exact agreement; κ - Kappa
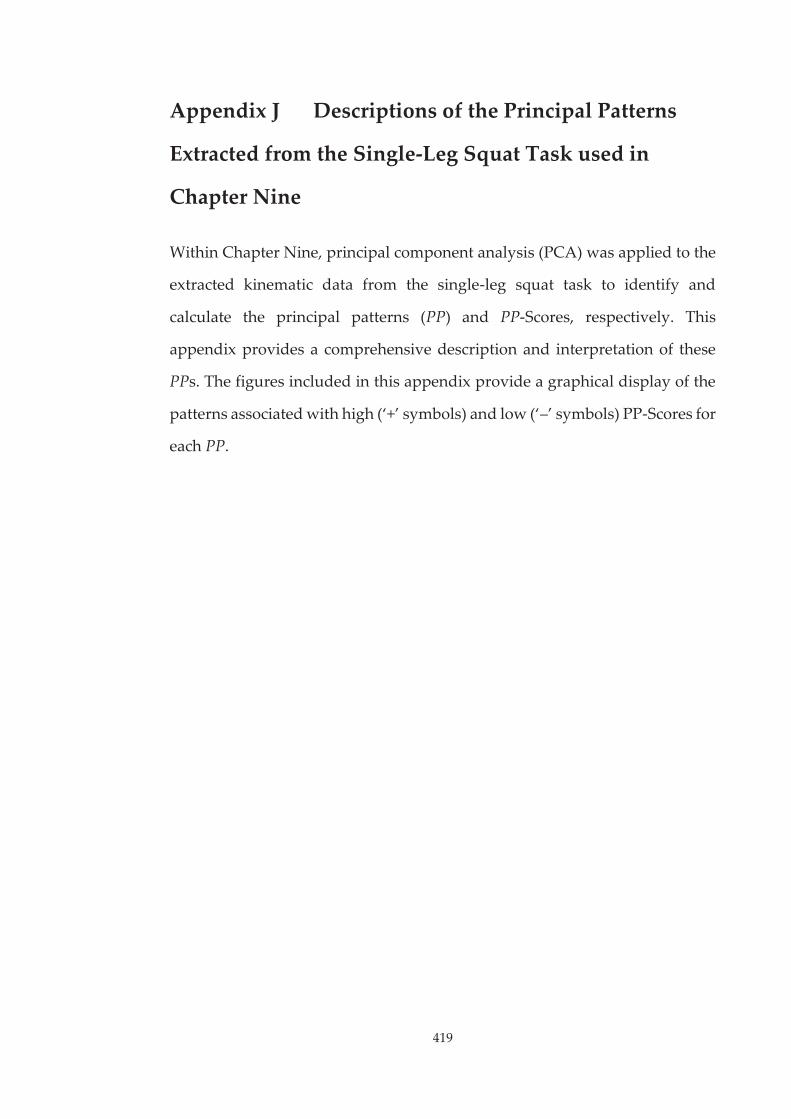
419
Appendix J Descriptions of the Principal Patterns
Extracted from the Single-Leg Squat Task used in
Chapter Nine
Within Chapter Nine, principal component analysis (PCA) was applied to the
extracted kinematic data from the single-leg squat task to identify and
calculate the principal patterns (PP) and PP-Scores, respectively. This
appendix provides a comprehensive description and interpretation of these
PPs. The figures included in this appendix provide a graphical display of the
patterns associated with high (‘+’ symbols) and low (‘–’ symbols) PP-Scores for
each PP.
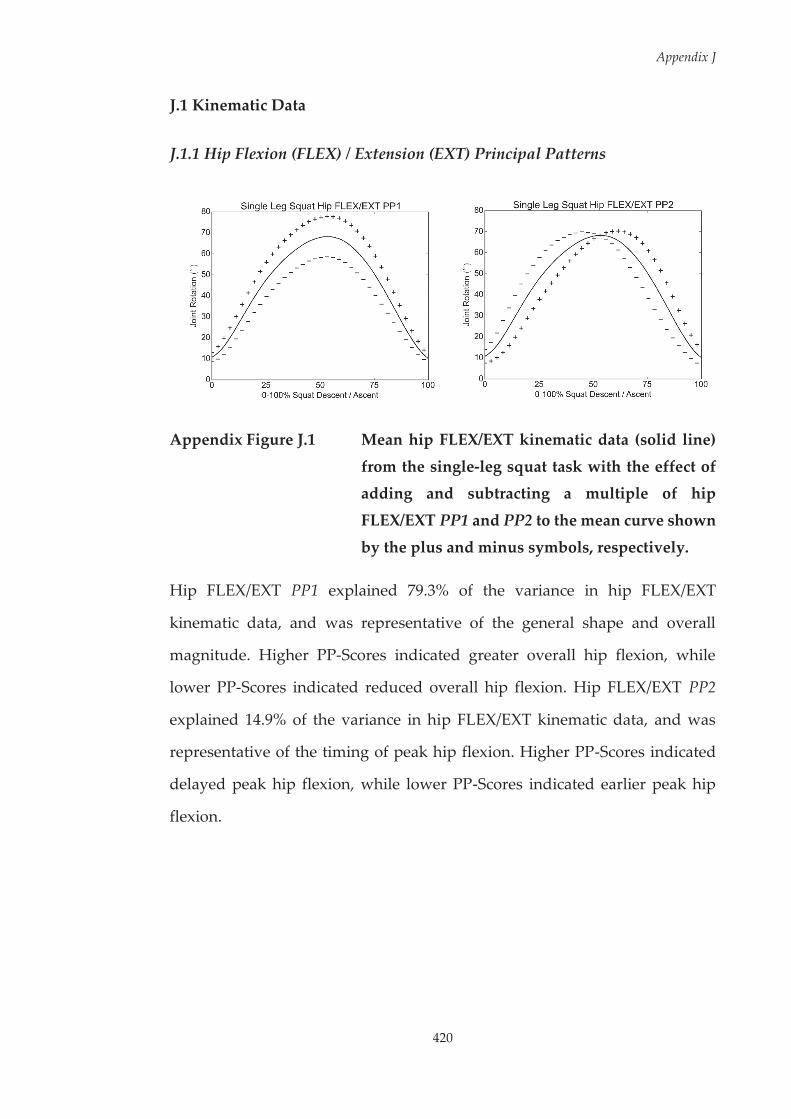
Appendix J
420
J.1 Kinematic Data
J.1.1 Hip Flexion (FLEX) / Extension (EXT) Principal Patterns
Appendix Figure J.1 Mean hip FLEX/EXT kinematic data (solid line)
from the single-leg squat task with the effect of adding and subtracting a multiple of hip
FLEX/EXT PP1 and PP2 to the mean curve shown
by the plus and minus symbols, respectively.
Hip FLEX/EXT PP1 explained 79.3% of the variance in hip FLEX/EXT
kinematic data, and was representative of the general shape and overall
magnitude. Higher PP-Scores indicated greater overall hip flexion, while
lower PP-Scores indicated reduced overall hip flexion. Hip FLEX/EXT PP2
explained 14.9% of the variance in hip FLEX/EXT kinematic data, and was
representative of the timing of peak hip flexion. Higher PP-Scores indicated
delayed peak hip flexion, while lower PP-Scores indicated earlier peak hip
flexion.
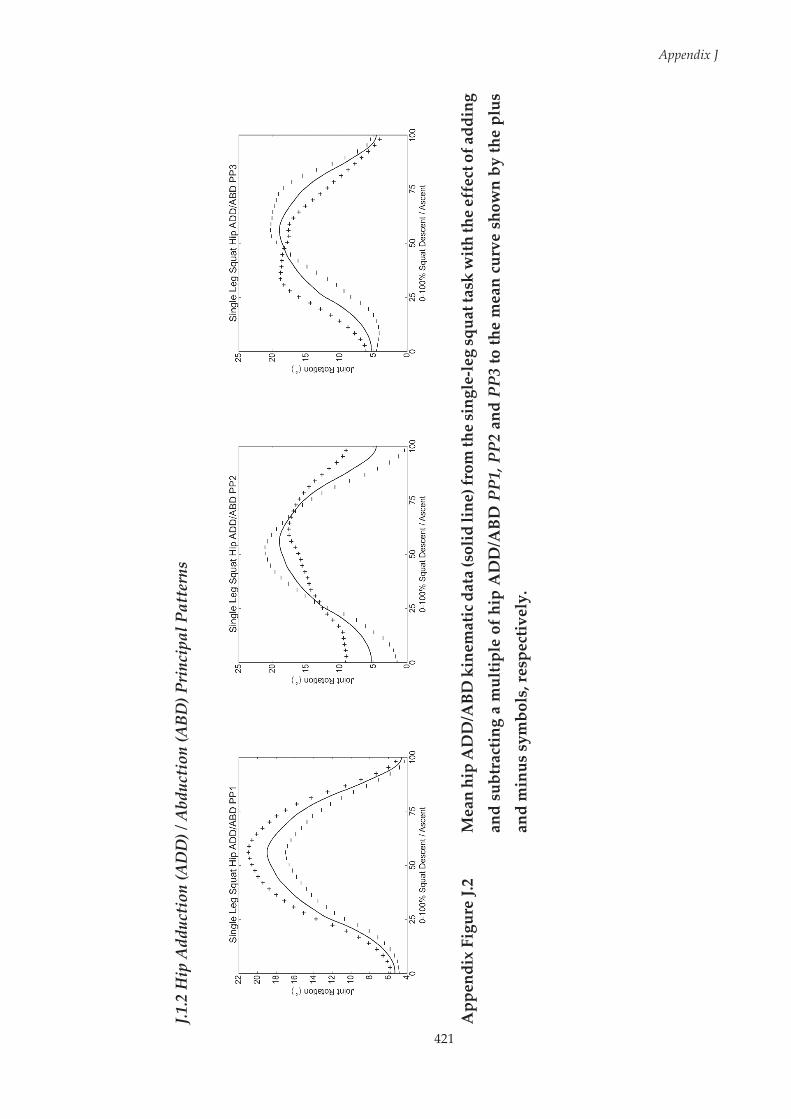
421
Appendix J
J.1.2
Hip
Add
ucti
on (A
DD
) / A
bduc
tion
(ABD
) Pri
ncip
al P
atte
rns
App
endi
x Fi
gure
J.2
Mea
n hi
p A
DD
/ABD
kin
emat
ic d
ata
(sol
id li
ne) f
rom
the
sing
le-le
g sq
uat t
ask
with
the
effe
ct o
f add
ing
and
subt
ract
ing
a m
ultip
le o
f hip
AD
D/A
BD P
P1, P
P2 a
nd P
P3 to
the
mea
n cu
rve
show
n by
the
plus
an
d m
inus
sym
bols
, res
pect
ivel
y.

Appendix J
422
Hip ADD/ABD PP1 explained 77.8% of the variance in hip ADD/ABD
kinematic data, and was representative of the general shape and overall
magnitude. Higher PP-Scores indicated greater overall hip adduction, while
lower PP-Scores indicated reduced overall hip adduction. Hip ADD/ABD PP2
explained 10.7% of the variance in hip ADD/ABD kinematic data, and was
representative of the magnitude of hip adduction at ~0-25% and ~75-100% of
the squat. Higher PP-Scores indicated greater hip adduction, while lower PP-
Scores indicated reduced hip adduction at ~0-25% and ~75-100% of the squat.
Hip ADD/ABD PP3 explained 5.9% of the variance in hip ADD/ABD
kinematic data, and was representative of the timing of peak hip adduction.
Higher PP-Scores indicated earlier peak hip adduction, while lower PP-Scores
indicated delayed peak hip adduction.
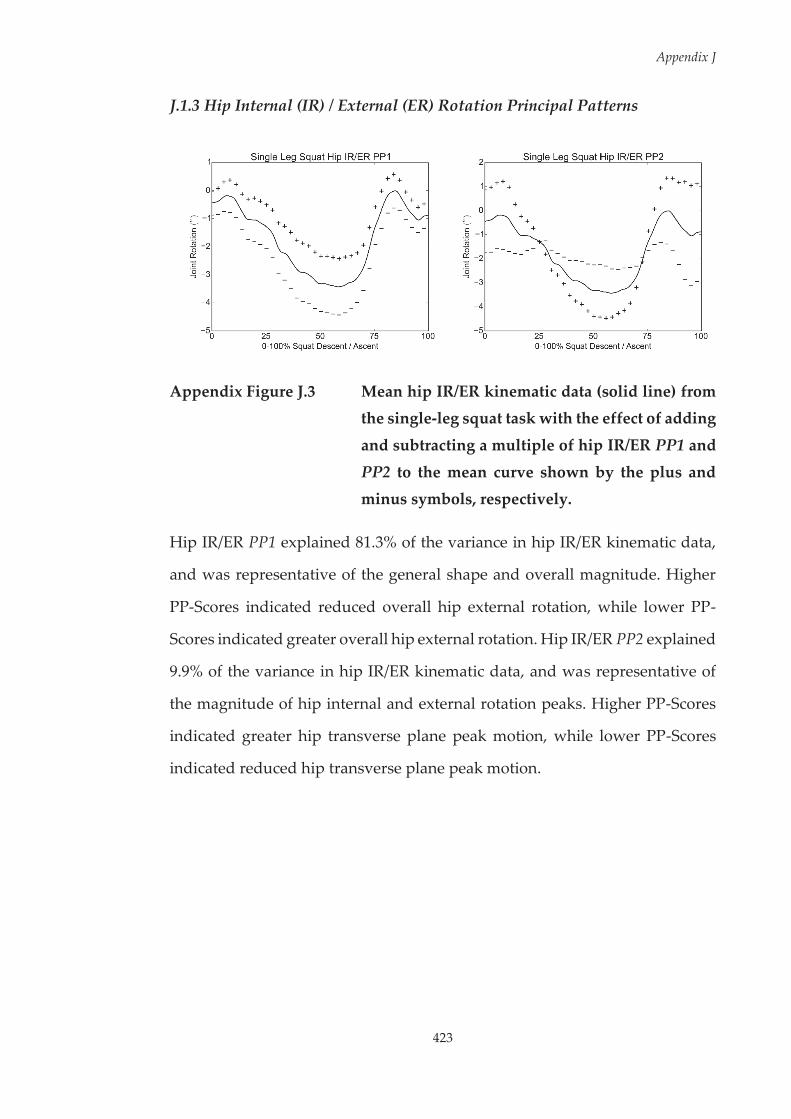
Appendix J
423
J.1.3 Hip Internal (IR) / External (ER) Rotation Principal Patterns
Appendix Figure J.3 Mean hip IR/ER kinematic data (solid line) from the single-leg squat task with the effect of adding
and subtracting a multiple of hip IR/ER PP1 and
PP2 to the mean curve shown by the plus and minus symbols, respectively.
Hip IR/ER PP1 explained 81.3% of the variance in hip IR/ER kinematic data,
and was representative of the general shape and overall magnitude. Higher
PP-Scores indicated reduced overall hip external rotation, while lower PP-
Scores indicated greater overall hip external rotation. Hip IR/ER PP2 explained
9.9% of the variance in hip IR/ER kinematic data, and was representative of
the magnitude of hip internal and external rotation peaks. Higher PP-Scores
indicated greater hip transverse plane peak motion, while lower PP-Scores
indicated reduced hip transverse plane peak motion.
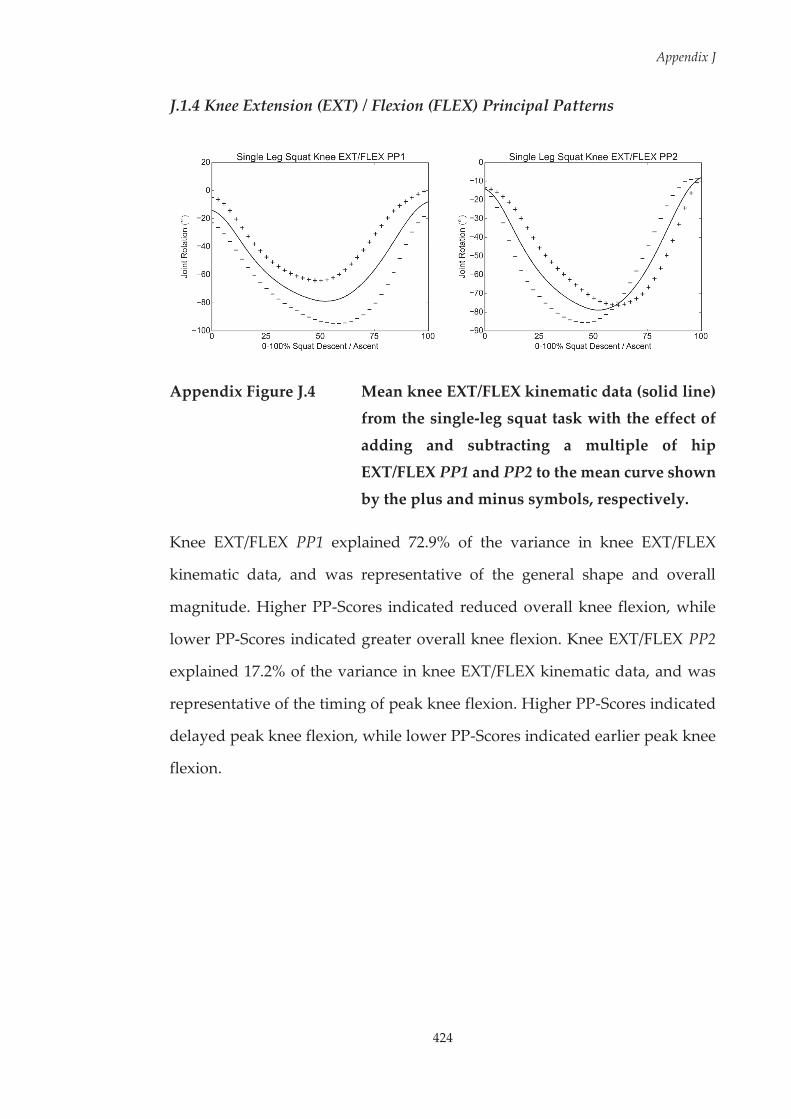
Appendix J
424
J.1.4 Knee Extension (EXT) / Flexion (FLEX) Principal Patterns
Appendix Figure J.4 Mean knee EXT/FLEX kinematic data (solid line) from the single-leg squat task with the effect of
adding and subtracting a multiple of hip
EXT/FLEX PP1 and PP2 to the mean curve shown by the plus and minus symbols, respectively.
Knee EXT/FLEX PP1 explained 72.9% of the variance in knee EXT/FLEX
kinematic data, and was representative of the general shape and overall
magnitude. Higher PP-Scores indicated reduced overall knee flexion, while
lower PP-Scores indicated greater overall knee flexion. Knee EXT/FLEX PP2
explained 17.2% of the variance in knee EXT/FLEX kinematic data, and was
representative of the timing of peak knee flexion. Higher PP-Scores indicated
delayed peak knee flexion, while lower PP-Scores indicated earlier peak knee
flexion.

Appendix J
425
J.1.5 Knee Adduction (ADD) / Abduction (ABD) Principal Patterns
Appendix Figure J.5 Mean knee ADD/ABD kinematic data (solid line) from the single-leg squat task with the effect of
adding and subtracting a multiple of knee
ADD/ABD PP1 and PP2 to the mean curve shown by the plus and minus symbols,
respectively.
Knee ADD/ABD PP1 explained 87.3% of the variance in knee ADD/ABD
kinematic data, and was representative of the general shape and overall
magnitude. Higher PP-Scores indicated greater overall knee adduction, while
lower PP-Scores indicated greater overall knee abduction. Knee ADD/ABD
PP2 explained 5.7% of the variance in knee ADD/ABD kinematic data, and was
representative of the magnitude of knee adduction and abduction peaks.
Higher PP-Scores indicated greater knee frontal plane peak motion, while
lower PP-Scores indicated reduced knee frontal plane peak motion.
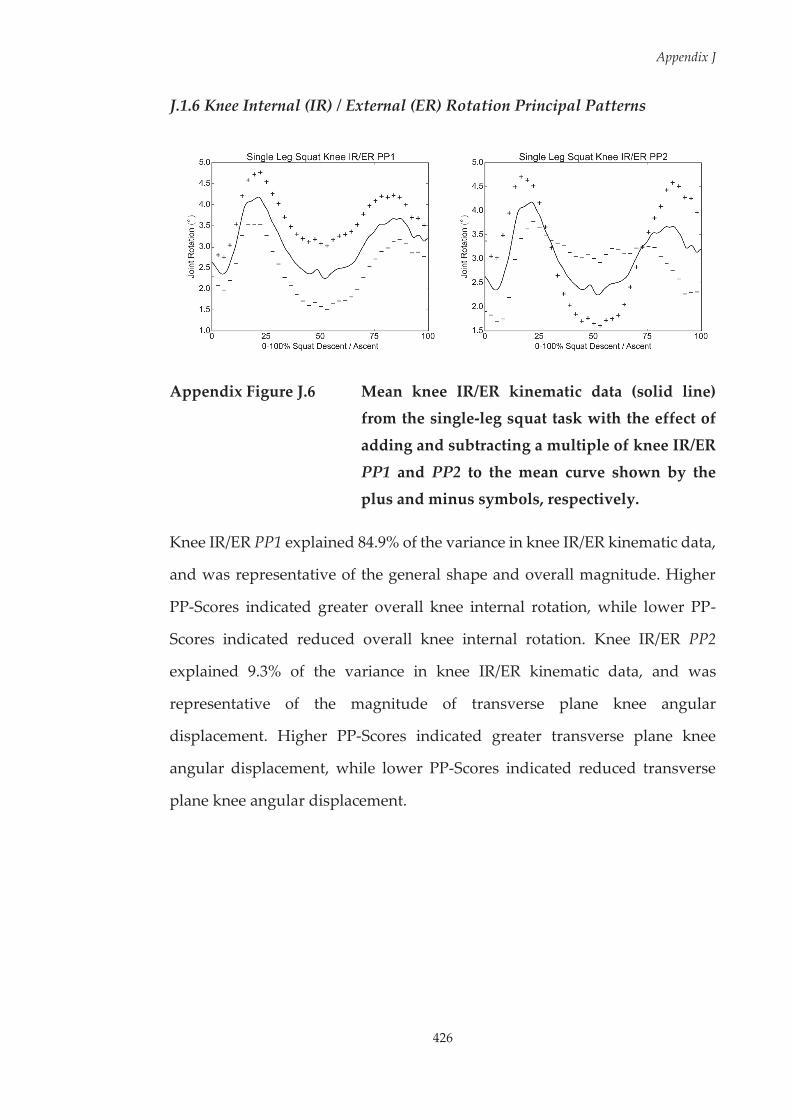
Appendix J
426
J.1.6 Knee Internal (IR) / External (ER) Rotation Principal Patterns
Appendix Figure J.6 Mean knee IR/ER kinematic data (solid line) from the single-leg squat task with the effect of
adding and subtracting a multiple of knee IR/ER
PP1 and PP2 to the mean curve shown by the plus and minus symbols, respectively.
Knee IR/ER PP1 explained 84.9% of the variance in knee IR/ER kinematic data,
and was representative of the general shape and overall magnitude. Higher
PP-Scores indicated greater overall knee internal rotation, while lower PP-
Scores indicated reduced overall knee internal rotation. Knee IR/ER PP2
explained 9.3% of the variance in knee IR/ER kinematic data, and was
representative of the magnitude of transverse plane knee angular
displacement. Higher PP-Scores indicated greater transverse plane knee
angular displacement, while lower PP-Scores indicated reduced transverse
plane knee angular displacement.
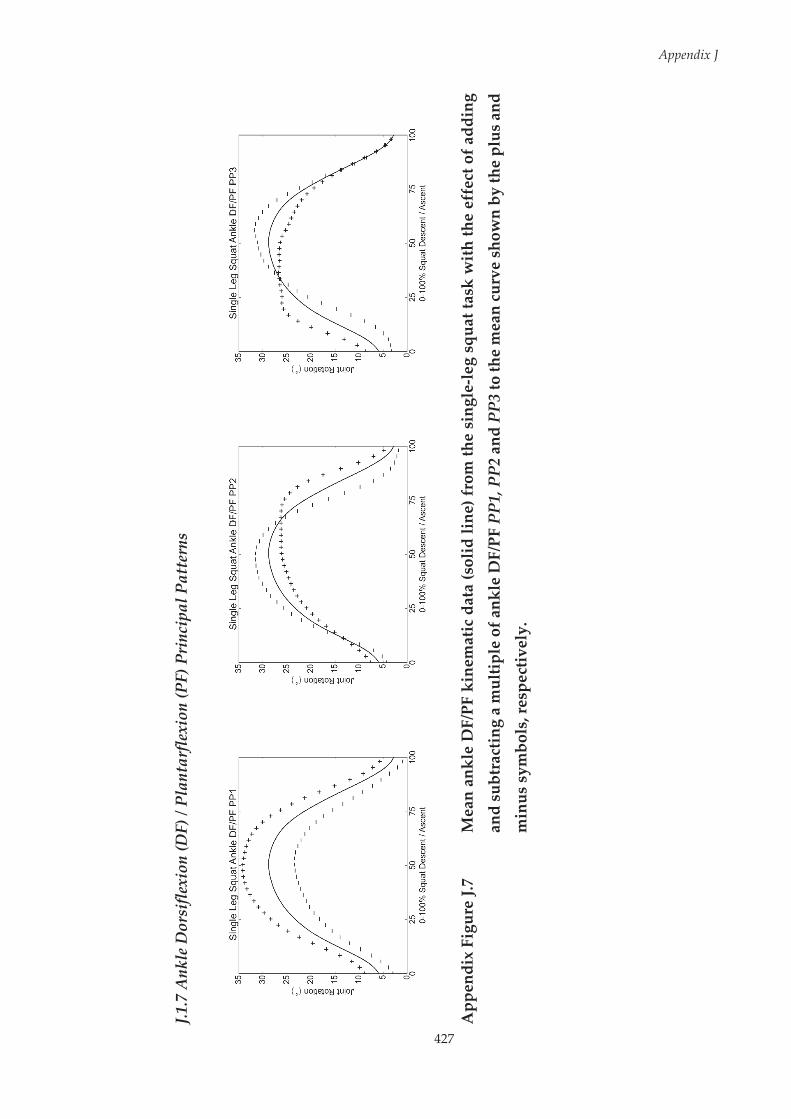
427
Appendix J
J.1.7
Ank
le D
orsi
flexi
on (D
F) /
Plan
tarf
lexi
on (P
F) P
rinc
ipal
Pat
tern
s
App
endi
x Fi
gure
J.7
Mea
n an
kle
DF/
PF k
inem
atic
dat
a (s
olid
line
) fro
m th
e si
ngle
-leg
squa
t tas
k w
ith th
e ef
fect
of a
ddin
g
and
subt
ract
ing
a m
ultip
le o
f ank
le D
F/PF
PP1
, PP2
and
PP3
to th
e m
ean
curv
e sh
own
by th
e pl
us a
nd
min
us s
ymbo
ls, r
espe
ctiv
ely.
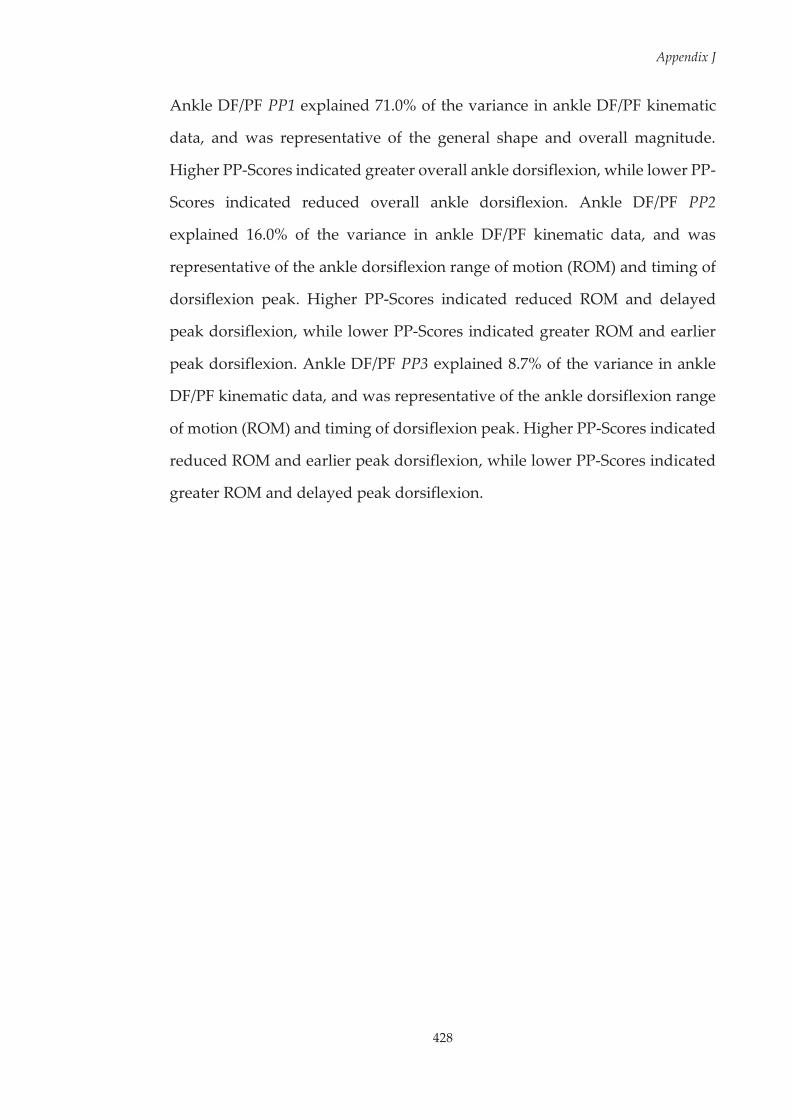
Appendix J
428
Ankle DF/PF PP1 explained 71.0% of the variance in ankle DF/PF kinematic
data, and was representative of the general shape and overall magnitude.
Higher PP-Scores indicated greater overall ankle dorsiflexion, while lower PP-
Scores indicated reduced overall ankle dorsiflexion. Ankle DF/PF PP2
explained 16.0% of the variance in ankle DF/PF kinematic data, and was
representative of the ankle dorsiflexion range of motion (ROM) and timing of
dorsiflexion peak. Higher PP-Scores indicated reduced ROM and delayed
peak dorsiflexion, while lower PP-Scores indicated greater ROM and earlier
peak dorsiflexion. Ankle DF/PF PP3 explained 8.7% of the variance in ankle
DF/PF kinematic data, and was representative of the ankle dorsiflexion range
of motion (ROM) and timing of dorsiflexion peak. Higher PP-Scores indicated
reduced ROM and earlier peak dorsiflexion, while lower PP-Scores indicated
greater ROM and delayed peak dorsiflexion.
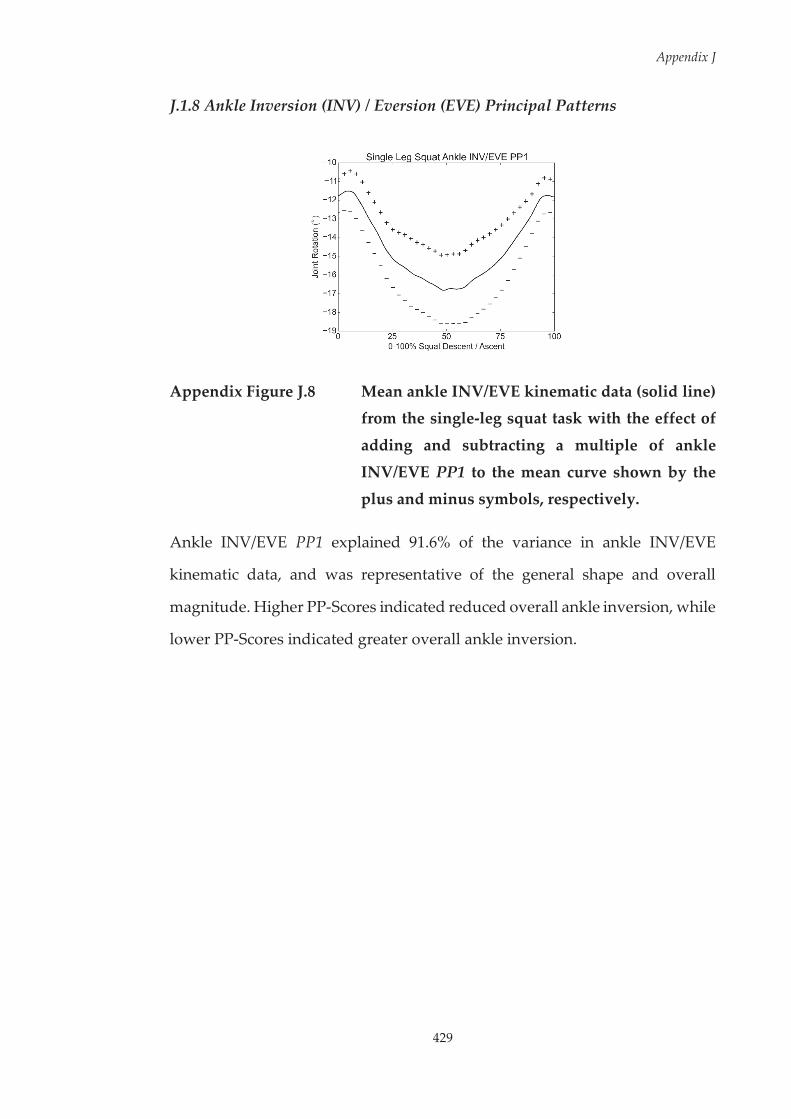
Appendix J
429
J.1.8 Ankle Inversion (INV) / Eversion (EVE) Principal Patterns
Appendix Figure J.8 Mean ankle INV/EVE kinematic data (solid line) from the single-leg squat task with the effect of
adding and subtracting a multiple of ankle
INV/EVE PP1 to the mean curve shown by the plus and minus symbols, respectively.
Ankle INV/EVE PP1 explained 91.6% of the variance in ankle INV/EVE
kinematic data, and was representative of the general shape and overall
magnitude. Higher PP-Scores indicated reduced overall ankle inversion, while
lower PP-Scores indicated greater overall ankle inversion.
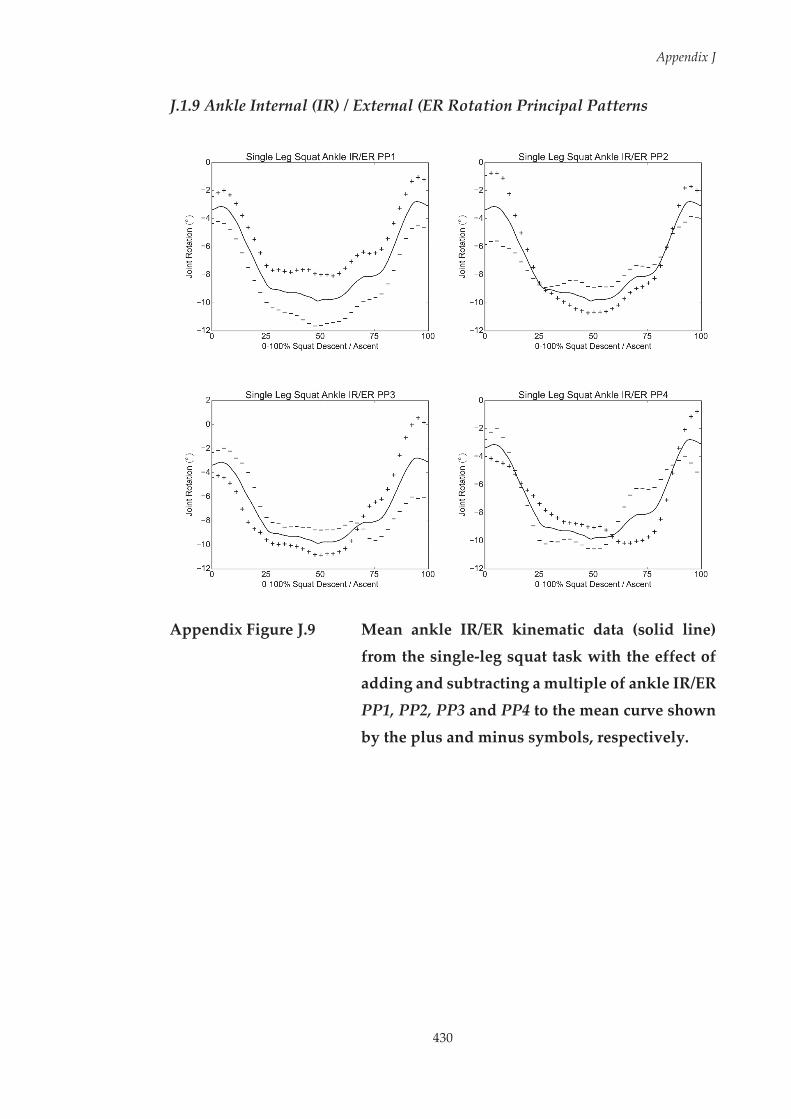
Appendix J
430
J.1.9 Ankle Internal (IR) / External (ER Rotation Principal Patterns
Appendix Figure J.9 Mean ankle IR/ER kinematic data (solid line)
from the single-leg squat task with the effect of adding and subtracting a multiple of ankle IR/ER
PP1, PP2, PP3 and PP4 to the mean curve shown
by the plus and minus symbols, respectively.
Appendix J
431
Ankle IR/ER PP1 explained 61.3% of the variance in ankle IR/ER kinematic
data, and was representative of the general shape and overall magnitude.
Higher PP-Scores indicated reduced overall ankle external rotation, while
lower PP-Scores indicated greater overall ankle external rotation. Ankle IR/ER
PP2 explained 13.4% of the variance in ankle IR/ER kinematic data, and was
representative of the magnitude of ankle external rotation at ~0-20% of the
squat. Higher PP-Scores indicated reduced ankle external rotation, while
lower PP-Scores indicated greater ankle external rotation at ~0-20% of the
squat. Ankle IR/ER PP3 explained 9.1% of the variance in ankle IR/ER
kinematic data, and was representative of the magnitude of ankle external
rotation at ~75-100% of the squat. Higher PP-Scores indicated reduced ankle
external rotation, while lower PP-Scores indicated greater ankle external
rotation at ~75-100% of the squat. Ankle IR/ER PP4 explained 7.0% of the
variance in ankle IR/ER kinematic data, and was representative of the
magnitude of ankle external rotation at ~60-75% of the squat. Higher PP-Scores
indicated greater ankle external rotation, while lower PP-Scores indicated
reduced ankle external rotation at ~60-75% of the squat.
432
Appendix K Descriptions of the Principal Patterns
Extracted from the Netball-Specific Landing Task used
in Chapter Nine
Within Chapter Nine, principal component analysis (PCA) was applied to the
extracted kinematic and kinetic data from the netball-specific landing task to
identify and calculate the principal patterns (PP) and PP-Scores, respectively.
This appendix provides a comprehensive description and interpretation of
these PPs. The figures included in this appendix provide a graphical display
of the patterns associated with high (‘+’ symbols) and low (‘–’ symbols) PP-
Scores for each PP.
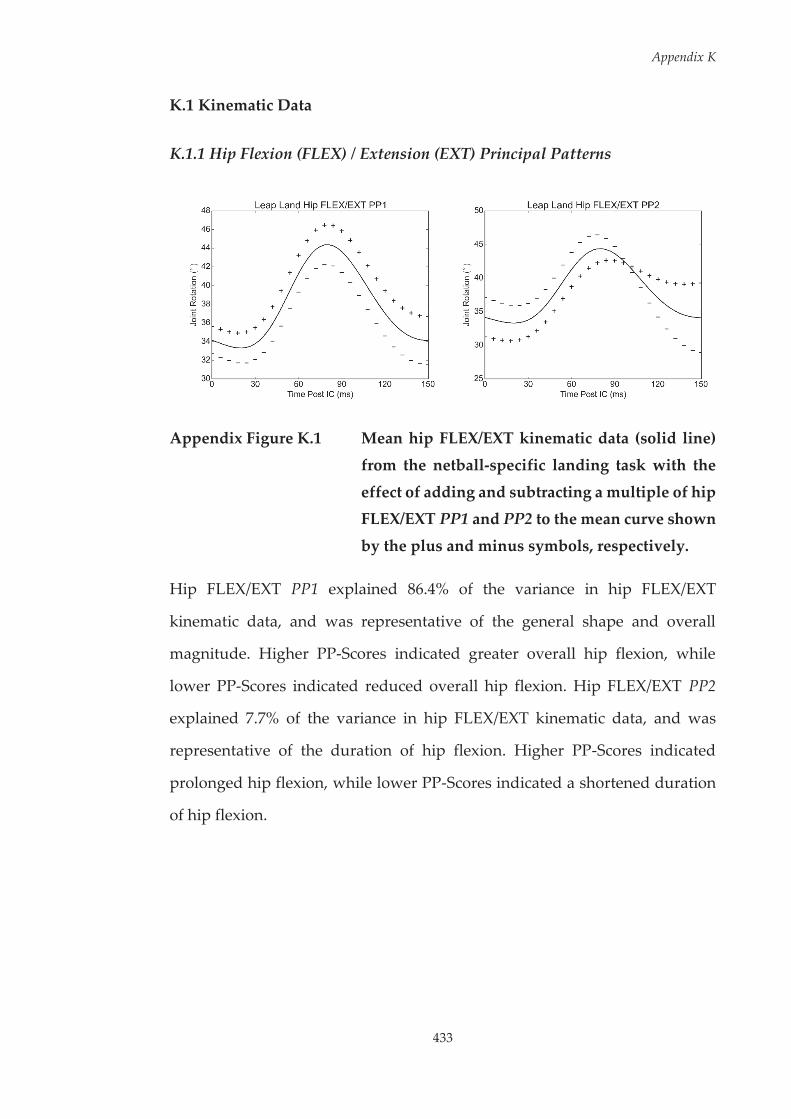
Appendix K
433
K.1 Kinematic Data
K.1.1 Hip Flexion (FLEX) / Extension (EXT) Principal Patterns
Appendix Figure K.1 Mean hip FLEX/EXT kinematic data (solid line)
from the netball-specific landing task with the
effect of adding and subtracting a multiple of hip FLEX/EXT PP1 and PP2 to the mean curve shown
by the plus and minus symbols, respectively.
Hip FLEX/EXT PP1 explained 86.4% of the variance in hip FLEX/EXT
kinematic data, and was representative of the general shape and overall
magnitude. Higher PP-Scores indicated greater overall hip flexion, while
lower PP-Scores indicated reduced overall hip flexion. Hip FLEX/EXT PP2
explained 7.7% of the variance in hip FLEX/EXT kinematic data, and was
representative of the duration of hip flexion. Higher PP-Scores indicated
prolonged hip flexion, while lower PP-Scores indicated a shortened duration
of hip flexion.

Appendix K
434
K.1.2 Hip Adduction (ADD) / Abduction (ABD) Principal Patterns
Appendix Figure K.2 Mean hip ADD/ABD kinematic data (solid line)
from the netball-specific landing task with the effect of adding and subtracting a multiple of hip
ADD/ABD PP1 and PP2 to the mean curve shown by the plus and minus symbols,
respectively.
Hip ADD/ABD PP1 explained 86.7% of the variance in hip ADD/ABD
kinematic data, and was representative of the general shape and overall
magnitude. Higher PP-Scores indicated greater overall hip adduction, while
lower PP-Scores indicated reduced overall hip adduction. Hip ADD/ABD PP2
explained 9.7% of the variance in hip ADD/ABD kinematic data, and was
representative of the magnitude of frontal plane hip angular displacement.
Higher PP-Scores indicated greater frontal plane hip angular displacement,
while lower PP-Scores indicated reduced frontal plane hip angular
displacement.
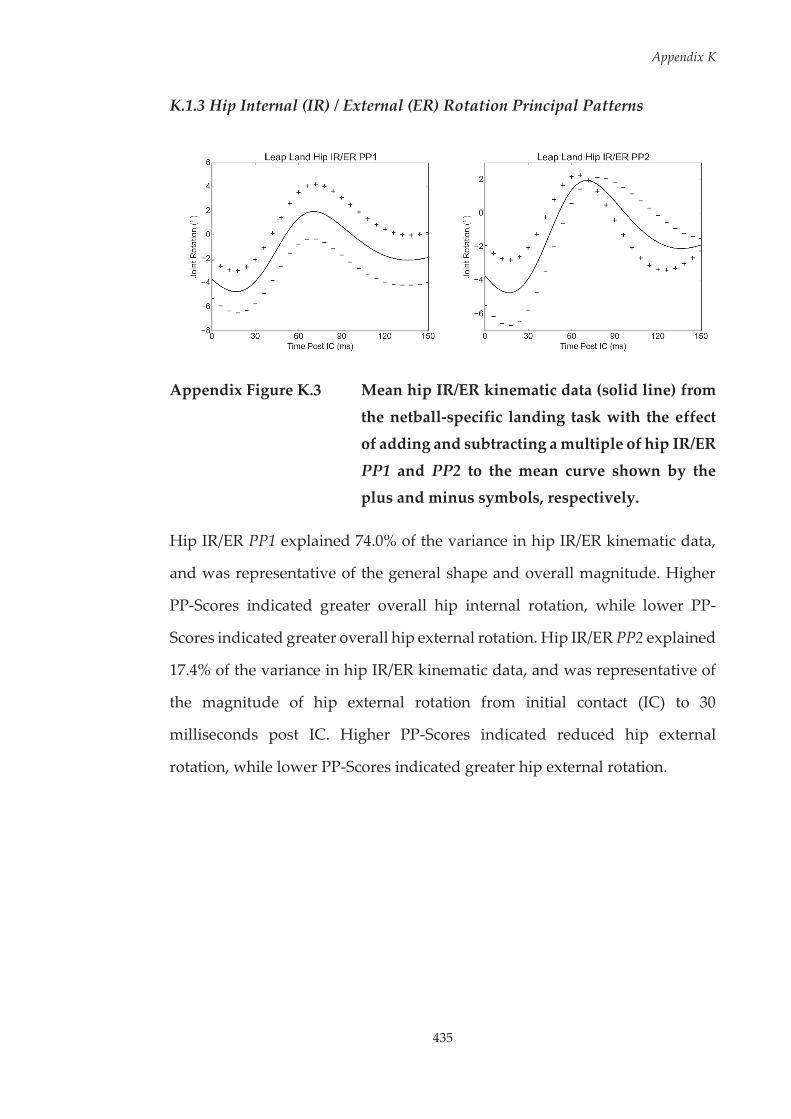
Appendix K
435
K.1.3 Hip Internal (IR) / External (ER) Rotation Principal Patterns
Appendix Figure K.3 Mean hip IR/ER kinematic data (solid line) from
the netball-specific landing task with the effect of adding and subtracting a multiple of hip IR/ER
PP1 and PP2 to the mean curve shown by the plus and minus symbols, respectively.
Hip IR/ER PP1 explained 74.0% of the variance in hip IR/ER kinematic data,
and was representative of the general shape and overall magnitude. Higher
PP-Scores indicated greater overall hip internal rotation, while lower PP-
Scores indicated greater overall hip external rotation. Hip IR/ER PP2 explained
17.4% of the variance in hip IR/ER kinematic data, and was representative of
the magnitude of hip external rotation from initial contact (IC) to 30
milliseconds post IC. Higher PP-Scores indicated reduced hip external
rotation, while lower PP-Scores indicated greater hip external rotation.

Appendix K
436
K.1.4 Knee Extension (EXT) / Flexion (FLEX) Principal Patterns
Appendix Figure K.4 Mean knee EXT/FLEX kinematic data (solid line)
from the netball-specific landing task with the effect of adding and subtracting a multiple of
knee EXT/FLEX PP1 and PP2 to the mean curve shown by the plus and minus symbols,
respectively.
Knee EXT/FLEX PP1 explained 90.6% of the variance in knee EXT/FLEX
kinematic data, and was representative of the general shape and overall
magnitude. Higher PP-Scores indicated reduced overall knee flexion, while
lower PP-Scores indicated greater overall knee flexion.

437
Appendix K
K.1
.5 K
nee
Add
ucti
on (A
DD
) / A
bduc
tion
(ABD
) Pri
ncip
al P
atte
rns
App
endi
x Fi
gure
K.5
M
ean
knee
AD
D/A
BD k
inem
atic
dat
a (s
olid
line
) fro
m th
e ne
tbal
l-spe
cifi
c lan
ding
task
with
the
effe
ct
of a
ddin
g an
d su
btra
ctin
g a
mul
tiple
of
knee
AD
D/A
BD P
P1, P
P2 a
nd P
P3 to
the
mea
n cu
rve
show
n
by th
e pl
us a
nd m
inus
sym
bols
, res
pect
ivel
y.
Appendix K
438
Knee ADD/ABD PP1 explained 77.7% of the variance in knee ADD/ABD
kinematic data, and was representative of the general shape and overall
magnitude. Higher PP-Scores indicated reduced knee abduction but greater
knee adduction, while lower PP-Scores indicated greater overall knee
abduction. Knee ADD/ABD PP2 explained 10.7% of the variance in knee
ADD/ABD kinematic data, and was representative of the timing of the knee
adduction peak. Higher PP-Scores indicated an earlier knee adduction peak,
while lower PP-Scores indicated a delayed knee adduction peak. Knee
ADD/ABD PP3 explained 7.8% of the variance in knee ADD/ABD kinematic
data, and was representative of the presence of bimodal peaks in frontal plane
knee motion. Higher PP-Scores indicated a singular knee abduction peak,
while lower PP-Scores indicated knee abduction and adduction peaks.
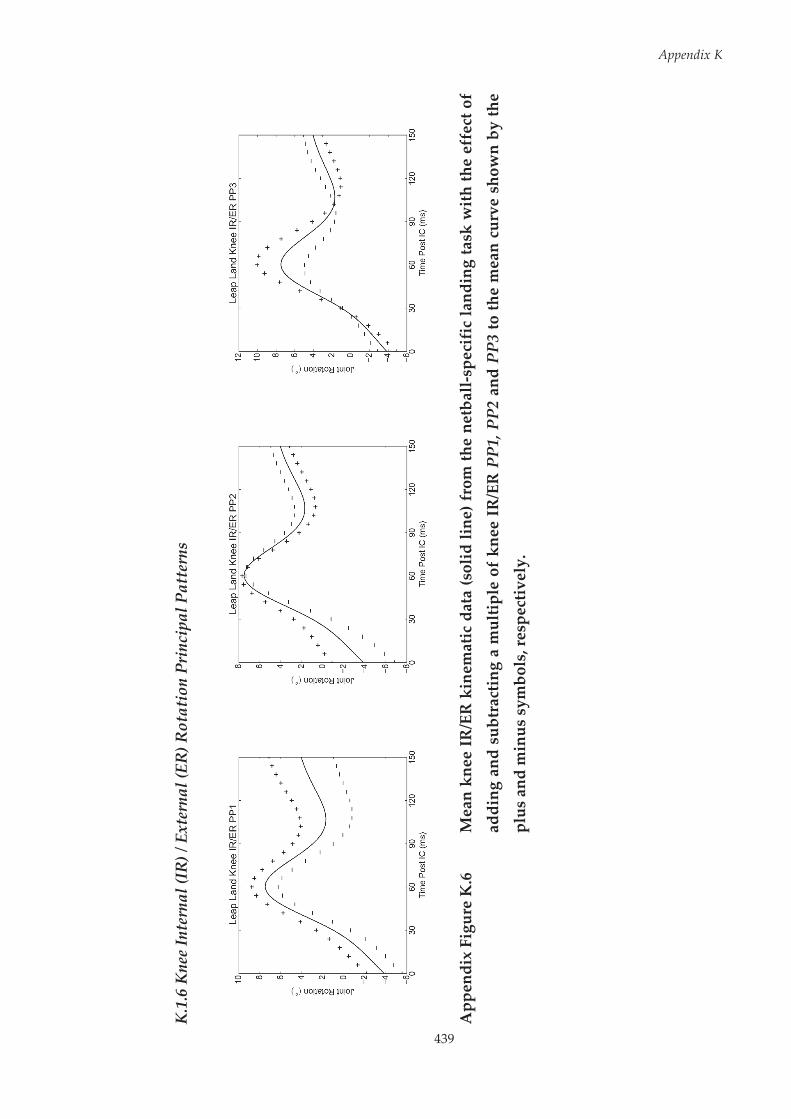
439
Appendix K
K.1
.6 K
nee
Inte
rnal
(IR
) / E
xter
nal (
ER) R
otat
ion
Prin
cipa
l Pat
tern
s
App
endi
x Fi
gure
K.6
M
ean
knee
IR
/ER
kin
emat
ic d
ata
(sol
id li
ne) f
rom
the
netb
all-s
peci
fic
land
ing
task
wit
h th
e ef
fect
of
addi
ng a
nd s
ubtr
actin
g a
mul
tiple
of
knee
IR
/ER
PP1
, PP2
and
PP3
to th
e m
ean
curv
e sh
own
by th
e
plus
and
min
us s
ymbo
ls, r
espe
ctiv
ely.

Appendix K
440
Knee IR/ER PP1 explained 73.4% of the variance in knee IR/ER kinematic data,
and was representative of the general shape and overall magnitude. Higher
PP-Scores indicated greater overall knee internal rotation, while lower PP-
Scores indicated reduced overall knee internal rotation. Knee IR/ER PP2
explained 15.3% of the variance in knee IR/ER kinematic data, and was
representative of the magnitude of knee external rotation from initial contact
(IC) to 30 milliseconds post IC. Higher PP-Scores indicated reduced knee
external rotation, while lower PP-Scores indicated greater knee external
rotation. Knee IR/ER PP3 explained 8.7% of the variance in knee IR/ER
kinematic data, and was representative of the magnitude of peak knee internal
rotation. Higher PP-Scores indicated greater peak knee internal rotation, while
lower PP-Scores indicated reduced peak knee internal rotation.

441
Appendix K
K.2
Kin
etic
Dat
a
K.2
.1 H
ip E
xten
sion
(EX
T) /
Flex
ion
(FLE
X) M
omen
t Pri
ncip
al P
atte
rns
App
endi
x Fi
gure
K.7
M
ean
hip
EXT/
FLEX
kin
etic
dat
a (s
olid
line
) fro
m th
e ne
tbal
l-sp
ecif
ic la
ndin
g ta
sk w
ith th
e ef
fect
of
addi
ng a
nd s
ubtr
acti
ng a
mul
tiple
of
hip
EXT/
FLEX
mom
ent
PP1,
PP2
and
PP3
to
the
mea
n cu
rve
show
n by
the
plus
and
min
us s
ymbo
ls, r
espe
ctiv
ely.
.

Appendix K
442
Hip EXT/FLEX moment PP1 explained 56.8% of the variance in hip FLEX/EXT
kinetic data, and was representative of the general shape and overall
magnitude. Higher PP-Scores indicated reduced overall hip flexion moment,
while lower PP-Scores indicated greater overall hip flexion moment. Hip
EXT/FLEX moment PP2 explained 27.0% of the variance in hip FLEX/EXT
kinetic data, and was representative of the magnitude of the peak hip flexion
moment. Higher PP-Scores indicated a reduced peak hip flexion moment,
while lower PP-Scores indicated a greater peak hip flexion moment. Hip
EXT/FLEX moment PP3 explained 6.7% of the variance in hip FLEX/EXT
kinetic data, and was representative of the magnitude of the hip flexion
moment from 30 – 60 ms post initial contact (IC). Higher PP-Scores indicated
reduced hip flexion moment, while lower PP-Scores indicated greater hip
flexion moment from 30 – 60 ms post IC.

443
Appendix K
K.2
.2 H
ip A
bduc
tion
(ABD
) / A
dduc
tion
(AD
D) M
omen
t Pri
ncip
al P
atte
rns
App
endi
x Fi
gure
K.8
M
ean
hip
ABD
/AD
D k
inet
ic d
ata
(sol
id li
ne) f
rom
the
netb
all-s
peci
fic
land
ing
task
with
the
effe
ct o
f
addi
ng a
nd s
ubtr
actin
g a
mul
tiple
of
hip
ABD
/AD
D m
omen
t PP
1, P
P2 a
nd P
P3 t
o th
e m
ean
curv
e
show
n by
the
plus
and
min
us s
ymbo
ls, r
espe
ctiv
ely.
.
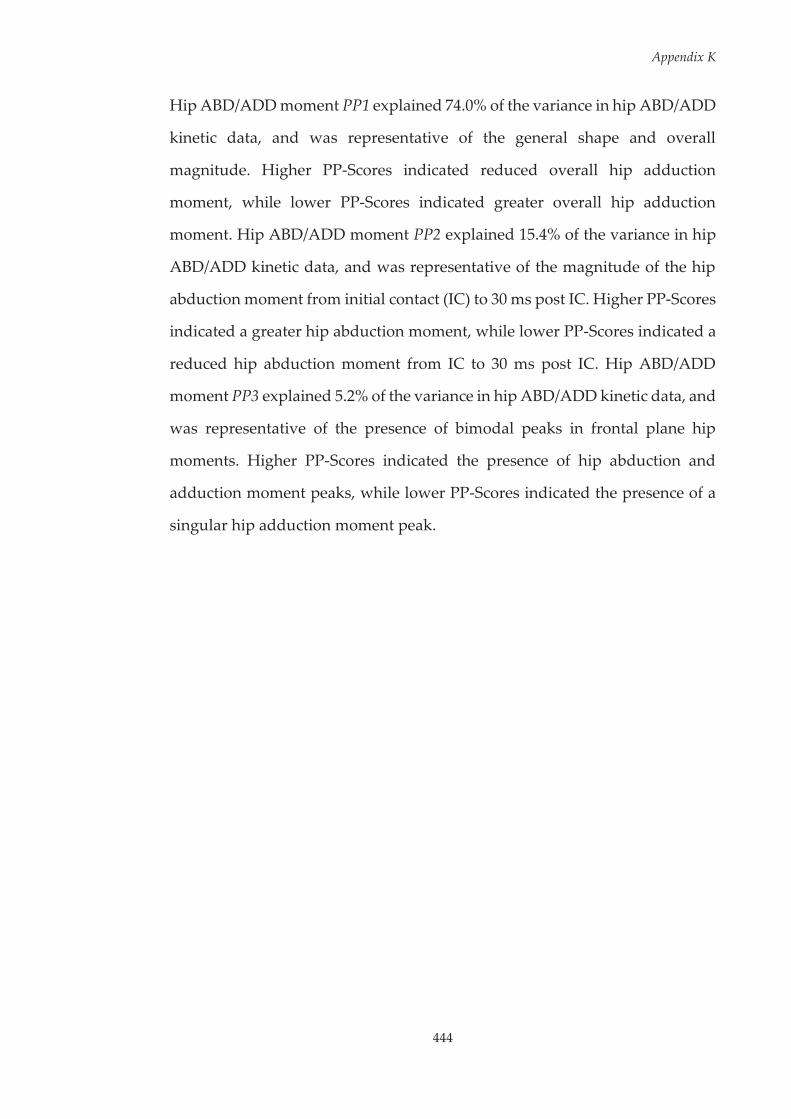
Appendix K
444
Hip ABD/ADD moment PP1 explained 74.0% of the variance in hip ABD/ADD
kinetic data, and was representative of the general shape and overall
magnitude. Higher PP-Scores indicated reduced overall hip adduction
moment, while lower PP-Scores indicated greater overall hip adduction
moment. Hip ABD/ADD moment PP2 explained 15.4% of the variance in hip
ABD/ADD kinetic data, and was representative of the magnitude of the hip
abduction moment from initial contact (IC) to 30 ms post IC. Higher PP-Scores
indicated a greater hip abduction moment, while lower PP-Scores indicated a
reduced hip abduction moment from IC to 30 ms post IC. Hip ABD/ADD
moment PP3 explained 5.2% of the variance in hip ABD/ADD kinetic data, and
was representative of the presence of bimodal peaks in frontal plane hip
moments. Higher PP-Scores indicated the presence of hip abduction and
adduction moment peaks, while lower PP-Scores indicated the presence of a
singular hip adduction moment peak.
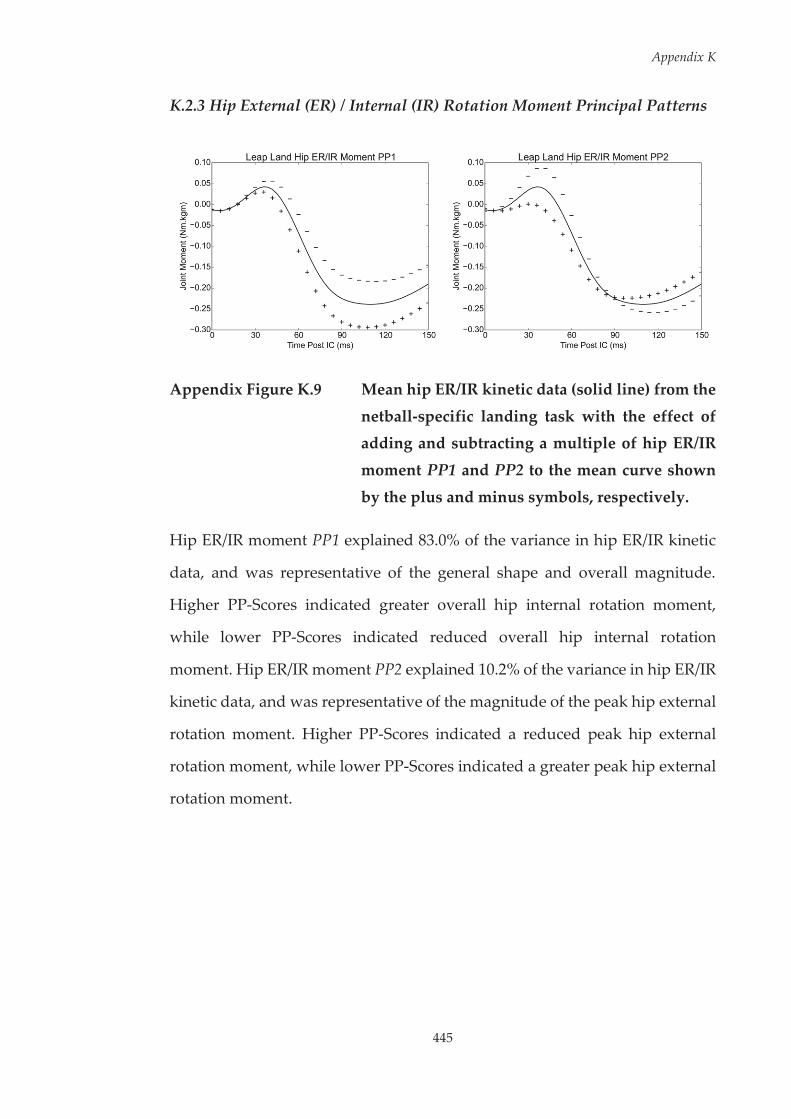
Appendix K
445
K.2.3 Hip External (ER) / Internal (IR) Rotation Moment Principal Patterns
Appendix Figure K.9 Mean hip ER/IR kinetic data (solid line) from the
netball-specific landing task with the effect of adding and subtracting a multiple of hip ER/IR
moment PP1 and PP2 to the mean curve shown
by the plus and minus symbols, respectively.
Hip ER/IR moment PP1 explained 83.0% of the variance in hip ER/IR kinetic
data, and was representative of the general shape and overall magnitude.
Higher PP-Scores indicated greater overall hip internal rotation moment,
while lower PP-Scores indicated reduced overall hip internal rotation
moment. Hip ER/IR moment PP2 explained 10.2% of the variance in hip ER/IR
kinetic data, and was representative of the magnitude of the peak hip external
rotation moment. Higher PP-Scores indicated a reduced peak hip external
rotation moment, while lower PP-Scores indicated a greater peak hip external
rotation moment.
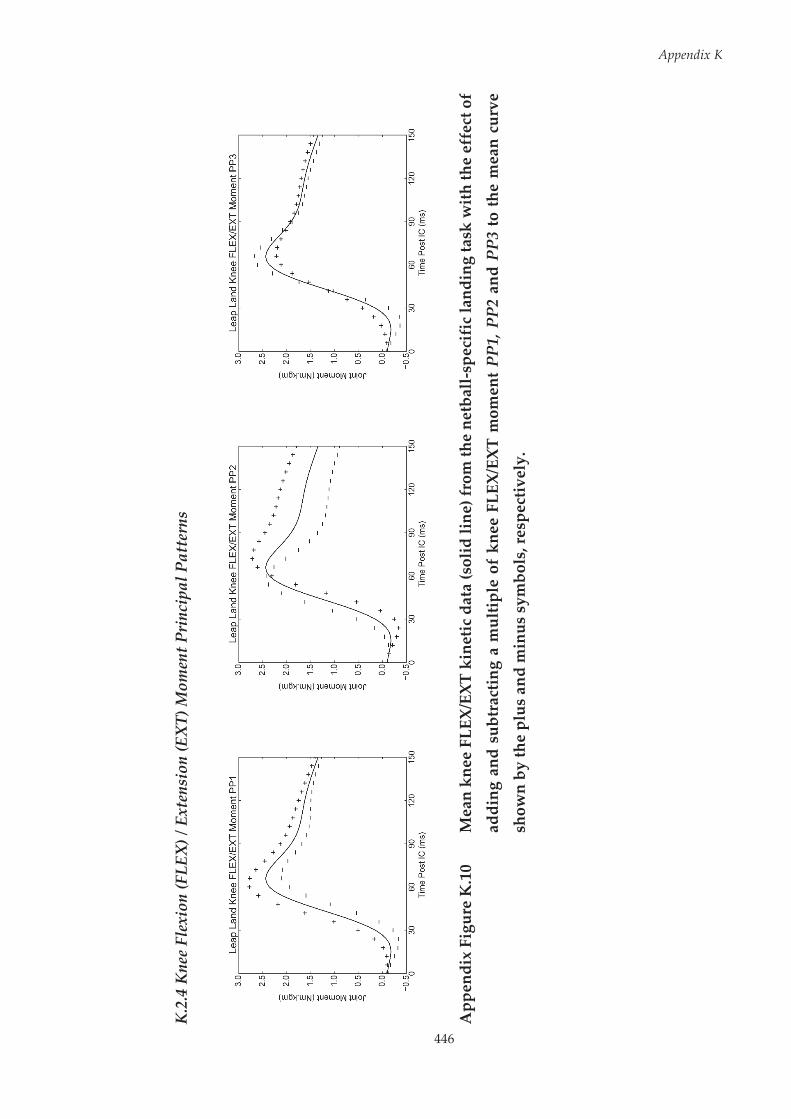
446
Appendix K
K.2
.4 K
nee
Flex
ion
(FLE
X) /
Ext
ensi
on (E
XT)
Mom
ent P
rinc
ipal
Pat
tern
s
App
endi
x Fi
gure
K.1
0 M
ean
knee
FLE
X/EX
T ki
netic
dat
a (s
olid
line
) fro
m th
e ne
tbal
l-sp
ecif
ic la
ndin
g ta
sk w
ith
the
effe
ct o
f
addi
ng a
nd s
ubtr
actin
g a
mul
tiple
of
knee
FLE
X/EX
T m
omen
t PP1
, PP2
and
PP3
to th
e m
ean
curv
e
show
n by
the
plus
and
min
us s
ymbo
ls, r
espe
ctiv
ely.

Appendix K
447
Knee FLEX/EXT moment PP1 explained 60.3% of the variance in knee
FLEX/EXT kinetic data, and was representative of the general shape and
overall magnitude. Higher PP-Scores indicated greater overall knee flexion
moment, while lower PP-Scores indicated reduced overall knee flexion
moment. Knee FLEX/EXT moment PP2 explained 29.4% of the variance in
knee FLEX/EXT kinetic data, and was representative of the timing of peak knee
flexion moment. Higher PP-Scores indicated delayed peak knee flexion
moment, while lower PP-Scores indicated earlier peak knee flexion moment.
Knee FLEX/EXT moment PP3 explained 4.9% of the variance in knee
FLEX/EXT kinetic data, and was representative of magnitude of sagittal plane
knee moment peaks. Higher PP-Scores indicated reduced knee flexion and
extension peak moments, while lower PP-Scores indicated greater knee flexion
and extension peak moments.
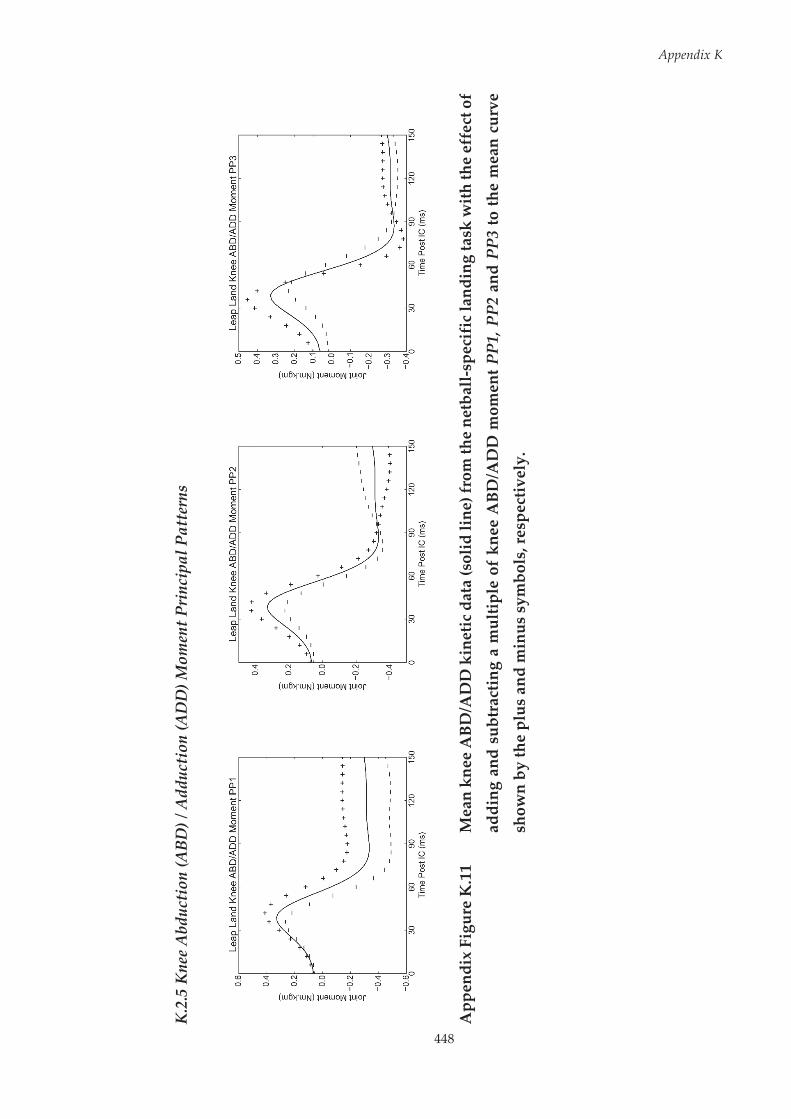
448
Appendix K
K.2
.5 K
nee
Abd
ucti
on (A
BD) /
Add
ucti
on (A
DD
) Mom
ent P
rinc
ipal
Pat
tern
s
App
endi
x Fi
gure
K.1
1 M
ean
knee
ABD
/AD
D k
inet
ic d
ata
(sol
id li
ne) f
rom
the
netb
all-s
peci
fic
land
ing
task
with
the
effe
ct o
f
addi
ng a
nd s
ubtr
actin
g a
mul
tiple
of
knee
ABD
/AD
D m
omen
t PP1
, PP2
and
PP3
to th
e m
ean
curv
e
show
n by
the
plus
and
min
us s
ymbo
ls, r
espe
ctiv
ely.
Appendix K
449
Knee ABD/ADD moment PP1 explained 73.3% of the variance in knee
ABD/ADD kinetic data, and was representative of magnitude of knee
adduction moment. Higher PP-Scores indicated reduced knee adduction
moment, while lower PP-Scores indicated greater knee adduction moment.
Knee ABD/ADD moment PP2 explained 14.4% of the variance in knee
ABD/ADD kinetic data, and was representative of magnitude of peak knee
abduction moment. Higher PP-Scores indicated greater peak knee abduction
moment, while lower PP-Scores indicated reduced peak knee abduction
moment. Knee ABD/ADD moment PP3 explained 8.0% of the variance in knee
ABD/ADD kinetic data, and was representative of the timing and magnitude
of peak knee abduction moment. Higher PP-Scores indicated earlier and
greater peak knee abduction moment, while lower PP-Scores indicated
delayed and reduced peak knee abduction moment.
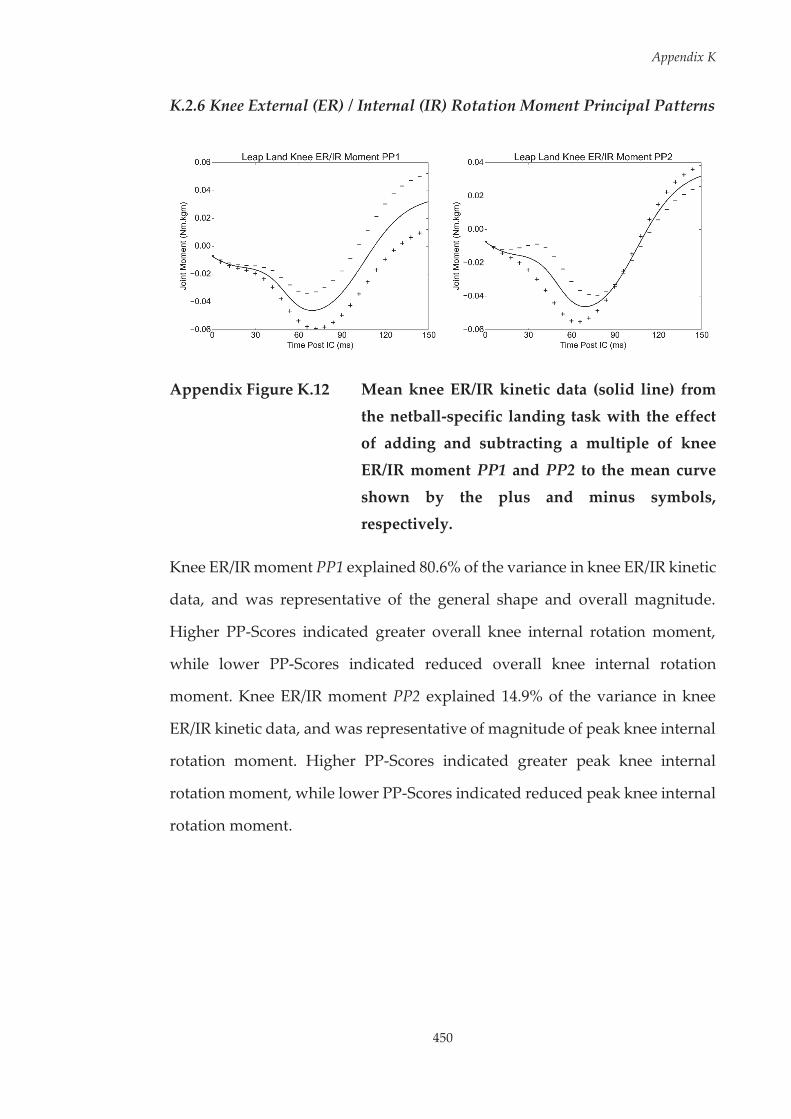
Appendix K
450
K.2.6 Knee External (ER) / Internal (IR) Rotation Moment Principal Patterns
Appendix Figure K.12 Mean knee ER/IR kinetic data (solid line) from
the netball-specific landing task with the effect of adding and subtracting a multiple of knee
ER/IR moment PP1 and PP2 to the mean curve
shown by the plus and minus symbols, respectively.
Knee ER/IR moment PP1 explained 80.6% of the variance in knee ER/IR kinetic
data, and was representative of the general shape and overall magnitude.
Higher PP-Scores indicated greater overall knee internal rotation moment,
while lower PP-Scores indicated reduced overall knee internal rotation
moment. Knee ER/IR moment PP2 explained 14.9% of the variance in knee
ER/IR kinetic data, and was representative of magnitude of peak knee internal
rotation moment. Higher PP-Scores indicated greater peak knee internal
rotation moment, while lower PP-Scores indicated reduced peak knee internal
rotation moment.