Nonlinear System Identification Using Exponential Swept-Sine Signal
Upload
independentCategory
view
6download
0
Journal of Biomedical Optics 16(2), 026010 (February 2011)
Swept-source optical coherence tomography of lowerlimb wound healing with histopathological correlation
Ananya Barui,a Provas Banerjee,b Rusha Patra,a Raunak Kumar Das,a Santanu Dhara,a
Pranab K Dutta,a and Jyotirmoy ChatterjeeaaIIT Kharagpur, School of Medical Science and Technology, Kharagpur, West Bengal 721302 IndiabBanerjee’s Biomedical Research Foundation, 700 005 India
Abstract. Direct noninvasive visualization of wound bed with depth information is important to understandthe tissue repair. We correlate skin swept-source–optical coherence tomography (OCT) with histopathologicaland immunohistochemical evaluation on traumatic lower limb wounds under honey dressing to compare andassess the tissue repair features acquired noninvasively and invasively. Analysis of optical biopsy identifies anuppermost brighter band for stratum corneum with region specific thickness (p < 0.0001) and gray-level intensity(p < 0.0001) variation. Below the stratum corneum, variation in optical intensities is remarkable in differentregions of the wound bed. Correlation between OCT and microscopic observations are explored especiallyin respect to progressive growth and maturation of the epithelial and subepithelial components. Characteristictransition of uniform hypolucid band in OCT image for depigmented zone to wavy highly lucid band in thepigmented zone could be directly correlated with the microscopic findings. The transformation of prematuredepithelium of depigmented area, with low expression of E-cadherin, to matured epithelium with higher E-cadherinexpression in pigmented zone, implicated plausible change in their optical properties as depicted in OCT. Thiscorrelated evaluation of multimodal images demonstrates applicability of swept-source-OCT in wound researchand importance of integrated approach in validation of new technology. C©2011 Society of Photo-Optical InstrumentationEngineers (SPIE). [DOI: 10.1117/1.3535593]
Keywords: lower limb wounds; honey dressings; swept-source optical coherence tomography; lucidity; histopathology; E-cadherin.
Paper 10339RR received Jun. 21, 2010; revised manuscript received Dec. 6, 2010; accepted for publication Dec. 17, 2010; publishedonline Feb. 1, 2011.
1 IntroductionInvasive histopathological evaluation is the gold standard formonitoring progress of multistep but overlapping wound heal-ing phases.1 However, follow-up of this repair process by fre-quent collection of biopsies after therapeutic intervention is notalways feasible.2 Hence, noninvasive assessment of repairingtissue, especially in full-thickness cutaneous wounds, deservesspecial attention in regenerative medicine.3 In this direction,real-time optical coherence tomography (OCT) imaging (theoptical biopsy) is gaining popularity with its efficacy in deeper,faster elucidation of epidermal and dermal structures4–6 at higherresolution in cross sections. It also gets further importance indrawing correlation with histopathological possibilities7, 8 forintegrated evaluation. In recent years, the swept-source-OCT(SS-OCT) has emerged to perform tomographic subsurface skintissue imaging at micron scale and field of view to cover severalmillimeters. Accordingly, SS-OCT finds an appropriate choicein tomographic imaging of cutaneous wounds because it cangenerate a high-speed depth profile (up to 2 mm) of the healingbed with micron-level resolution at a sweeping rate of laser withan optimum coherence length of 5–6 mm.9, 10
In the description of an OCT image, based on relative signalintensity, the term “lucidity” is used analogously to “echogenic-ity” of ultrasound images. Actually, less hydrated componentsof tissues reflect more light and are depicted as brighter
Address all correspondence to: Ananya Barui, IIT Kharagpur, School of Med-ical Science and Technology Kharagpur, West Bengal 721302. Tel: + 91-9733388223; Fax: + 91–3222-255303; E-mail: [email protected].
areas (high lucidity) in contrast to darker areas (low lucidity)with high content of water or fat.11 Furthermore, the multilayerstructure of skin depicts different optical properties according todifference in refractive index, relative thickness, and variationin organic/inorganic components (viz. keratin, water, fat,etc.) of the anatomical sites and regeneration phases.12–15
Thus, the relatively dehydrated outermost layer of epidermis[i.e., stratum corneum (SC)] reflects more light and forms asharp demarcation line in comparison to the deeper hydratedepidermal layers. In general, the variations in refractive indexcause more random scattering and decreases the extent of lightpenetration into tissues.2
Therefore, evaluation of tissue integrity in different regionsof the wound bed could be better performed if gray-level inten-sities of OCT images are assessed through appropriate appli-cation of image-processing techniques.16 Furthermore, due tohigh resolution and efficacy to reflect the compositional aspectsof the tissue in terms of optical properties, these tomographscould be correlated with the histopathological gold standard2, 17
to assess specific biological status of the tissue in health anddisease. There are several reports regarding quantitative/semi-quantitative processing of OCT images to achieve meaningfulcorrelation between clinical/histopathological observations. Inthis regard, Thilo et al.18 proposed a method for measuringepithelial thickness from OCT and microscopic images. Cobbet al.19 successfully used an OCT image-based scoring system
1083-3668/2011/16(2)/026010/8/$25.00 C© 2011 SPIE
Journal of Biomedical Optics February 2011 � Vol. 16(2)026010-1

Barui et al.: Swept-source optical coherence tomography of lower limb wound...
in comparison to conventional clinical scoring to define mucosalinflammatory situations.
Furthermore, examining the plausible association of OCTobservation with immunohistochemical findings especially inthe context of expression of molecules related to the maturationof repairing tissues could be of immense value in evaluatinghealing stages. In this respect, correlated observation on ep-ithelial expression of E-cadherin, a prime molecule for cell-celladhesion,20, 21 could be considered in understanding the integrityof regenerated epithelium and the state of maturation.
In this direction, the present study performs in vivo SS-OCTimaging on lower limb wound (LLW) regions and analysisthereof. Here, the tomographs are analyzed through the image-processing technique in respect to region-specific variation inthe thickness and optical intensity of the SC as well as opti-cal intensity variation in the bands along the vertical direction.Furthermore, it draws a correlation among OCT findings andclinical, histopathological as well as immunohistochemical ob-servations on the wound margin biopsies.
2 Materials and Methods2.1 Study DesignIn this study, 20 patients of both gender (age group of 15–60 years) having traumatic leg wounds from laceration, bluntinjury, etc. (nonresponding to conventional treatments) were in-cluded under their informed written consent. Clinical examina-tion noted exsudation with pus, foul smell, and necrotic tissuesin the wound beds. Wounds were treated with occlusive dress-ing of honey (i.e., the wound and surrounding inflamed areawere covered with honey-soaked sterile cotton gauge, size asper wound bed area, followed by a layer of dry cotton tied witha crepe bandage) on LLW. The redressing was initially per-formed at 24 h interval for 7–8 days having exsudation and foulodor from the wounds and the duration was further increased to48–72 h with the healing progression (i.e., formation of gran-ulation tissues, reepithelialization, etc.). The wound beds werephotographed before and after 15, 20, and 60 days of interventionby digital camera (Nikon COOLPIX, P80, Japan) to record thedebridement of necrotic tissue, granulation tissue formation, andepithelialization in the wound bed. This study was performedunder ethical clearance of the institutional ethical committee asper the Helsinki declaration.
2.2 OCT InstrumentationSS-OCT (OCM1300SS, Thorlabs Incorporated, Newton,New Jersey) incorporates a high-speed frequency-swept exter-nal cavity laser (1325-nm central wavelength) with 3-dB spec-tral bandwidth (BW) (>100 nm) and an average output power of10 mW. It comprises of a Michelson interferometer and a built-inMach-Zehnder interferometer (MZI, Thorlabs INT-MZI-1300),which provides a frequency clock of the laser. The output laserof Mach-Zehnder interferometer is coupled with a Michelsoninterferometer to split into the sample and reference path by abroadband coupler (Thorlabs, FC1310–70-50-APC).
In practice, light is focused onto the sample surface by a long-distance objective while maintaining a clearance (>25 mm)between optics and sample. An aiming beam (660 nm) is coupled
with the sample arm to locate the scanning trace of the laser.This OCT system could produce high-resolution cross-sectionalimages for different cutaneous layers with axial and transverseresolutions of 9 and 15 μm, respectively. In this system, the axialscans (A-scans) are performed at a sweeping frequency9, 22 of16 kHz of laser (100 nm) to construct the depth profile (∼2 mm)at high speed.23 The interference signal is finally detected usinga high-transimpedence gain balanced photodetector having aprovision for noise correction. The fast Fourier transform (FFT)is used to convert the time to frequency of the interference signalin yielding a depth-depended profile of OCT images.
2.3 SS-OCT Imaging and AnalysisThe OCT scanning (with a 10-mm imaging width) at differentregions of the wound bed was performed with a pixel resolutionof 8.42 μm (i.e., axial resolution = 12/1.4 = 8.42 μm; where12 μm is the axial resolution in air and 1.4 is the refractive in-dex of skin) before and after therapeutic intervention. Initially,the OCT gray-scale images [Fig. 1(a)] were converted to bi-nary form using a threshold determined from the histogram.16
Subsequently, median filtering of size 3×3 and morphologicaloperations (i.e., the opening of A by B is the erosion of A by B,followed by a dilation of the result by B; the erosion and dilationwere implemented with a rectangular operator of a 3×3 matrix)were applied.16 Therein, the connected components were la-beled, and the brightest continuous layer was extracted as an SC[Fig. 1(a), panel ii]. The orientation of the extracted SC was fur-ther determined using principal component analysis (PCA),24
which revealed the internal structure of the data in a way thatbest explains the variance. Finally, the segmented SC was ro-tated accordingly in the clockwise direction parallel to its x-axis[Fig. 1(a), panel iii]. The vertical thickness for each pixel wascalculated and then the average was taken to give the overallthickness of the SC. The intensity was also calculated in a sim-ilar way by taking the average of intensity values of each pixelin the SC. In assessing the variation in lucidity along the depthof the SC subtracted images, two distinct regions [i.e., region 1(25 pixel = 25×8.42 = 210.5 μm, i.e., viable epidermis andupper dermis) and region 2 (50 pixel = 50×8.42 = 421 μm,i.e., rest of the visible dermis)],16 vertically downward were ana-lyzed in respect to their optical intensity distribution [Fig. 1(b)].Accordingly, SC segmentation was followed by detection of theupper edge of the SC-subtracted image and, subsequently theabove-mentioned regions were demarcated. To study intensitydistribution of both the regions, the histograms (Fig. 2) of gray-scale intensity values were plotted for a different area of woundbed. The skewness of the intensity distribution had been assessedby calculating the 50% BW (i.e., 50% fall of the peak value)and 10% BW (i.e., 90% fall of the peak value). Furthermore,for each bandwidth measurement, the deviation of the centralvalue from the peak was calculated. The relative position of thecenter of 10% BW and 50% BW with respect to peak occurrencecharacterized the response of the histogram in a robust fashion.
2.4 Histological and Immunohistochemical Studiesof Biopsies
Incision biopsies were collected from peripheral tissues ofthe wound bed under local anesthesia, before and after (i.e.,on days 15 and 20) occlusive dressing (honey) intervention.
Journal of Biomedical Optics February 2011 � Vol. 16(2)026010-2

Barui et al.: Swept-source optical coherence tomography of lower limb wound...
Fig. 1 (a) Panel i shows the original SS-OCT image of healed wound bed area with upper-most bright layer corresponds to SC followed by region 1(475 μm) for upper epidermis and region 2 (950 μm) for lower epidermis and upper dermis, panel ii shows the segmented out SC, and panel iiishows the rotated SC. (b) Flow diagram of OCT image-processing stages.
The specimens were fixed in 10% phosphate buffered for-malin and 4-μm-thick paraffin sections were obtained onpoly-L-lysine (Catalog No. P 8920, Sigma-Aldrich, St. Louis,Missouri) coated glass slides for histological (H&E) andimmunohistochemical (E-cadherin) studies. In brief, tissuesections were deparaffinized (baking at 60◦C) and hydrated forantigen retrieval in a 10-mM citrate buffer (pH 6.0) using theEZ-Retriever System V.2 (BioGenex, San Ramon, California).Sections were blocked using the kit (i.e., Super SensitiveTM
Polymer-HRP IHC Detection System Catalog No. QD400–60K
BioGenex, San Ramon, California) and incubated overnight atroom temperature with primary antibody (E-Cadherin, cloneEP700Y, Catalog No. ab40772, Abcam, Cambridge, UnitedKingdom). Primary binding of antibody was visualized by aHRP conjugated secondary antibody using the chromogen 3,3′-diaminobenzidine and counterstained with hematoxylin.
Microscopic imaging. The images were grabbed digitally(1388×1040 pixels) by a Zeiss Observer, Z1 microscope(Carl Zeiss, Germany) under 20× (NA 0.8) objectives with0.31- μm resolution.
Fig. 2 Graphical representation of bandwidth for the assessment for skewness of gray-scale intensity distribution in SS-OCT images.
Journal of Biomedical Optics February 2011 � Vol. 16(2)026010-3
Barui et al.: Swept-source optical coherence tomography of lower limb wound...
Statistical evaluation. The OCT image analysis data werefurther evaluated to assess their statistical significance usingStudent’s t test.25
3 ResultsClinically, it was recorded that the traumatic LLWs progres-sively healed [Fig. 3(i)–3(iv)] through gradual debridement andoptimal granulation tissue formation [Fig. 3(iii)] as well asreepithelialization [Fig. 3(iv)] under honey dressing. Here, itmay be noted that the honey facilitates autolytic debridementof the necrotic tissue of the wound bed.26 Under naked-eyeobservation, the wound beds could be differentiated into re-gions such as the unhealed area (with or without necrotic tis-sues), healed area having depigmented and pigmented zones,and intact skin.
The SS-OCT demonstrated the wound bed region-specificproperties of the repaired epithelium (viz. varied opticalintensities—lucidity, thickness, appearance of rete-pegs, der-mal papillae, etc.) and subepithelial tissue. The unhealed area
demonstrated absence of any epithelial feature but depicted tis-sues with differential lucidity [Fig. 3(a1)]. Whereas, in the depig-mented zone, below a highly lucid SC, a uniform low-intensityband of newly formed epithelium was depicted, and this corre-sponded as the viable epidermis. Below this, a comparativelyhigh lucid zone was observed, representing subepithelial tis-sues [Fig. 3(b1)]. Through transition of depigmented to pig-mented regions, this low-intensity band was gradually reduced[Fig. 3(c1)] and epithelium became comparatively thicker andlucid along with the appearance of rete-pegs and dermal papillae[Fig. 3(d1)]. However, in the intact skin, the contrast betweenthe epithelial and subepithelial zone was reduced in terms oflucidity [Fig. 3(e1)]. The roughness, lucidity, and thickness ofthe SC layer were maximum in intact skin and minimum in thehealed depigmented zone.
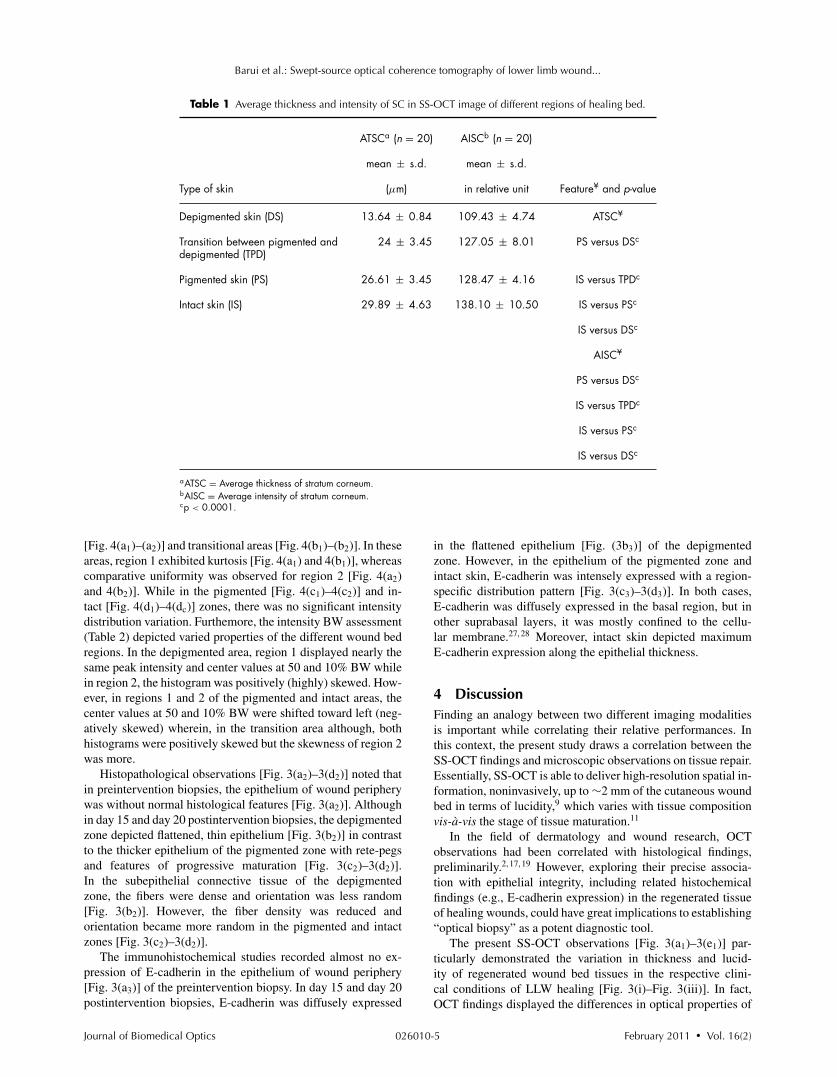
The analysis of OCT images, in respect to the SC layerthickness and optical intensities, demonstrated a significant (p< 0.0001) interzonal variation (Table 1). The intensity anal-ysis for regions 1 and 2 of the SC-subtracted OCT imagesdemonstrated different intensity distribution in depigmented
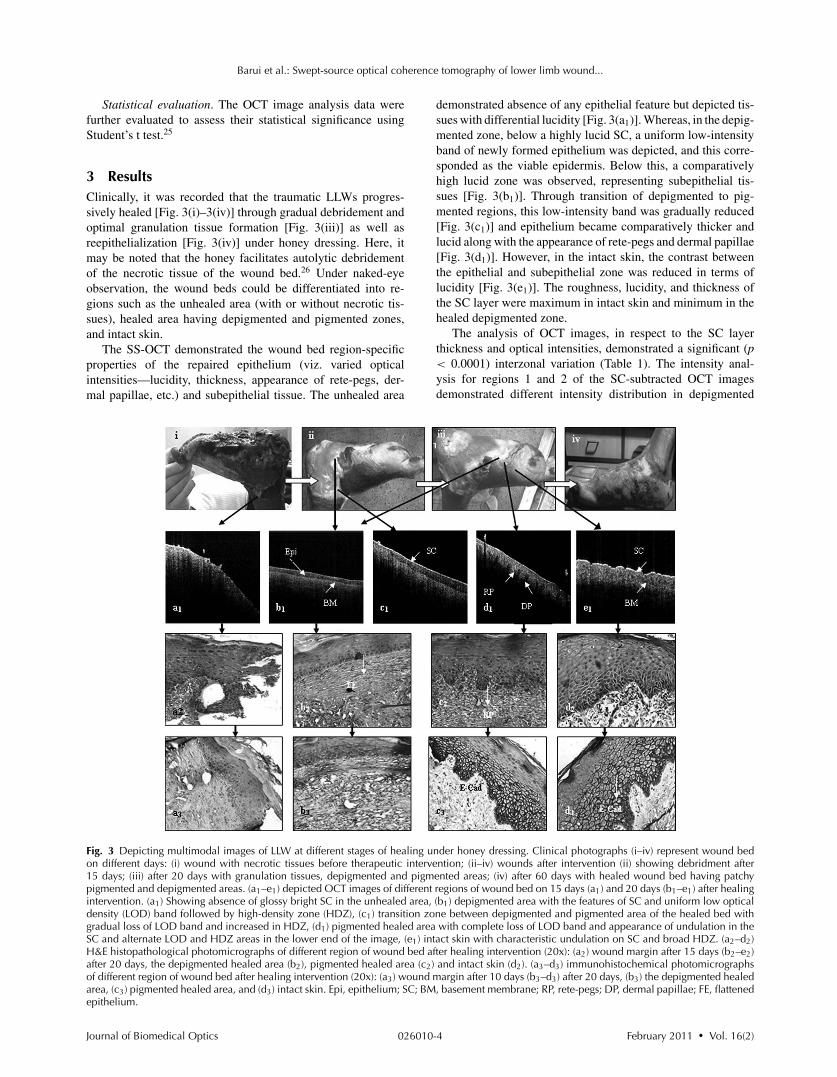
Fig. 3 Depicting multimodal images of LLW at different stages of healing under honey dressing. Clinical photographs (i–iv) represent wound bedon different days: (i) wound with necrotic tissues before therapeutic intervention; (ii–iv) wounds after intervention (ii) showing debridment after15 days; (iii) after 20 days with granulation tissues, depigmented and pigmented areas; (iv) after 60 days with healed wound bed having patchypigmented and depigmented areas. (a1–e1) depicted OCT images of different regions of wound bed on 15 days (a1) and 20 days (b1–e1) after healingintervention. (a1) Showing absence of glossy bright SC in the unhealed area, (b1) depigmented area with the features of SC and uniform low opticaldensity (LOD) band followed by high-density zone (HDZ), (c1) transition zone between depigmented and pigmented area of the healed bed withgradual loss of LOD band and increased in HDZ, (d1) pigmented healed area with complete loss of LOD band and appearance of undulation in theSC and alternate LOD and HDZ areas in the lower end of the image, (e1) intact skin with characteristic undulation on SC and broad HDZ. (a2–d2)H&E histopathological photomicrographs of different region of wound bed after healing intervention (20x): (a2) wound margin after 15 days (b2–e2)after 20 days, the depigmented healed area (b2), pigmented healed area (c2) and intact skin (d2). (a3–d3) immunohistochemical photomicrographsof different region of wound bed after healing intervention (20x): (a3) wound margin after 10 days (b3–d3) after 20 days, (b3) the depigmented healedarea, (c3) pigmented healed area, and (d3) intact skin. Epi, epithelium; SC; BM, basement membrane; RP, rete-pegs; DP, dermal papillae; FE, flattenedepithelium.
Journal of Biomedical Optics February 2011 � Vol. 16(2)026010-4
Barui et al.: Swept-source optical coherence tomography of lower limb wound...
Table 1 Average thickness and intensity of SC in SS-OCT image of different regions of healing bed.
ATSCa (n = 20) AISCb (n = 20)
mean ± s.d. mean ± s.d.
Type of skin (μm) in relative unit Feature¥ and p-value
Depigmented skin (DS) 13.64 ± 0.84 109.43 ± 4.74 ATSC¥
Transition between pigmented anddepigmented (TPD)
24 ± 3.45 127.05 ± 8.01 PS versus DSc
Pigmented skin (PS) 26.61 ± 3.45 128.47 ± 4.16 IS versus TPDc
Intact skin (IS) 29.89 ± 4.63 138.10 ± 10.50 IS versus PSc
IS versus DSc
AISC¥
PS versus DSc
IS versus TPDc
IS versus PSc
IS versus DSc
aATSC = Average thickness of stratum corneum.bAISC = Average intensity of stratum corneum.cp < 0.0001.
[Fig. 4(a1)–(a2)] and transitional areas [Fig. 4(b1)–(b2)]. In theseareas, region 1 exhibited kurtosis [Fig. 4(a1) and 4(b1)], whereascomparative uniformity was observed for region 2 [Fig. 4(a2)and 4(b2)]. While in the pigmented [Fig. 4(c1)–4(c2)] and in-tact [Fig. 4(d1)–4(dc)] zones, there was no significant intensitydistribution variation. Furthemore, the intensity BW assessment(Table 2) depicted varied properties of the different wound bedregions. In the depigmented area, region 1 displayed nearly thesame peak intensity and center values at 50 and 10% BW whilein region 2, the histogram was positively (highly) skewed. How-ever, in regions 1 and 2 of the pigmented and intact areas, thecenter values at 50 and 10% BW were shifted toward left (neg-atively skewed) wherein, in the transition area although, bothhistograms were positively skewed but the skewness of region 2was more.
Histopathological observations [Fig. 3(a2)–3(d2)] noted thatin preintervention biopsies, the epithelium of wound peripherywas without normal histological features [Fig. 3(a2)]. Althoughin day 15 and day 20 postintervention biopsies, the depigmentedzone depicted flattened, thin epithelium [Fig. 3(b2)] in contrastto the thicker epithelium of the pigmented zone with rete-pegsand features of progressive maturation [Fig. 3(c2)–3(d2)].In the subepithelial connective tissue of the depigmentedzone, the fibers were dense and orientation was less random[Fig. 3(b2)]. However, the fiber density was reduced andorientation became more random in the pigmented and intactzones [Fig. 3(c2)–3(d2)].
The immunohistochemical studies recorded almost no ex-pression of E-cadherin in the epithelium of wound periphery[Fig. 3(a3)] of the preintervention biopsy. In day 15 and day 20postintervention biopsies, E-cadherin was diffusely expressed
in the flattened epithelium [Fig. (3b3)] of the depigmentedzone. However, in the epithelium of the pigmented zone andintact skin, E-cadherin was intensely expressed with a region-specific distribution pattern [Fig. 3(c3)–3(d3)]. In both cases,E-cadherin was diffusely expressed in the basal region, but inother suprabasal layers, it was mostly confined to the cellu-lar membrane.27, 28 Moreover, intact skin depicted maximumE-cadherin expression along the epithelial thickness.
4 DiscussionFinding an analogy between two different imaging modalitiesis important while correlating their relative performances. Inthis context, the present study draws a correlation between theSS-OCT findings and microscopic observations on tissue repair.Essentially, SS-OCT is able to deliver high-resolution spatial in-formation, noninvasively, up to ∼2 mm of the cutaneous woundbed in terms of lucidity,9 which varies with tissue compositionvis-a-vis the stage of tissue maturation.11
In the field of dermatology and wound research, OCTobservations had been correlated with histological findings,preliminarily.2, 17, 19 However, exploring their precise associa-tion with epithelial integrity, including related histochemicalfindings (e.g., E-cadherin expression) in the regenerated tissueof healing wounds, could have great implications to establishing“optical biopsy” as a potent diagnostic tool.
The present SS-OCT observations [Fig. 3(a1)–3(e1)] par-ticularly demonstrated the variation in thickness and lucid-ity of regenerated wound bed tissues in the respective clini-cal conditions of LLW healing [Fig. 3(i)–Fig. 3(iii)]. In fact,OCT findings displayed the differences in optical properties of
Journal of Biomedical Optics February 2011 � Vol. 16(2)026010-5

Barui et al.: Swept-source optical coherence tomography of lower limb wound...
Fig. 4 Intensity distribution of (a1) region 1, (a2) region 2 of depigmented skin; (b1) region 1 and (b2) region 2 of transitional skin; (c1) region 1 and(c2) region 2 of pigmented skin; and (d1) region 1 and (d2) region 2 of intact skin.
Table 2 Intensity value of maximum occurrence in different regions of wound bed (see Fig. 2)
Intensity values of different BW
Intensity value Center value Center valueHealing bed area OCT image region of max. occurrence 50% BW of 50% BW 10% BW of 10% BW
Depigmented 1 57 54 54 87 53
2 22 60 39 84 51
Transition between depigmentedand pigmented
1 49 64 50 94 56
2 26 52 35 86 52
Pigmented 1 75 44 53 97 64
2 70 66 61 108 63
Intact 1 82 48 74 109 66
2 67 58 59 103 61
Journal of Biomedical Optics February 2011 � Vol. 16(2)026010-6
Barui et al.: Swept-source optical coherence tomography of lower limb wound...
unhealed [Fig. 3(a1)], depigmented [Fig. 3(b1)] and pigmentedzones [Fig. 3(d1)] as well as intact skin [Fig. 3(e1)] correspond-ing to their variation in composition and tissue integrity. Like-wise, the OCT image [Fig. 3(a1)] depicted absence and pres-ence of the SC in the unhealed and intact skin [Fig. 3(i)], re-spectively. Although less matured depigmented and transitionalareas exhibited the appearance of hypolucid and less thick SC[Fig. 3(b1)–3(c1)] in comparison to matured tissue, i.e., pig-mented/intact skin [Fig. 3(d1)–3(e1)]. These were corroborativewith the proposition of Ziolkowska et al. that the newly formedand matured cutaneous components possess lower and higher lu-cidity, respectively, due to their corresponding higher and lowerhydration states.11 Perhaps, the presence of hypolucid band inthe depigmented area [Fig. 3(b1)], its gradual reduction in thetransitional zones [Fig. 3(c1)] and complete disappearance inpigmented [Fig. 3(d1)] as well as in intact skin [Fig. 3(e1)] man-ifested a direct correlation between the stage of cutaneous tissuematuration and its optical behavior. The hypolucid band actuallyindicated newly formed flattened epithelium in the regenerateddepigmented region with less matured cells, which were re-placed by matured cells through healing progression. This factwas further corroborative with SS-OCT findings on the differ-ential optical properties [Fig. 3(d1)] of the epithelial rete-ridges(with higher lucidity) and dermal papillae (with lower lucidity)because water and fat contents are less in the former than in thelater.11
The explicitness of such image properties was further real-ized through analysis of their optical intensity distribution andrelated morphology. The unique revelation by SS-OCT was asignificant alteration in SC (Table 1) thickness (p < 0.0001),optical intensity (p < 0.0001), and surface roughness throughthe transition of depigmented to pigmented and to intact skin[Fig. 3(a1)–3(e1)]. In this context, the findings of Cobb et al.19
may be noted where the ultrahigh-resolution OCT was used forevaluating cutaneous wound repair in a mice model for assessingthe time-dependent structural and histological changes duringhealing. The maximum intensity of OCT signals at the tissuesurface, noted in their study, was also similar to the current ob-servations. Furthermore, in this work, the intensity histogramsof OCT images showed that regions 1 and 2 in depigmented skinwere distinct within 75-pixel (i.e., 631.5-μm) depth in contrastto the pigmented and intact skin with more uniformity within thesame depth profile. In this direction, the BW analysis of OCTimages further revealed the differences between depigmentedand pigmented areas in respect to their optical properties (Ta-ble 2 and Fig. 4). The kurtosis in region 1 of depigmented andtransitional areas [Fig. 4(a1) and 4(b1)] indicated that both theimmature regions contained biological components of closelysimilar optical properties. However, in region 2 of these zones[Fig. 4(a2) and 4(b2)], there was a bias toward lower values(positively skewed), which indicated the presence of mostly hy-drated components. Whereas, with comparatively mature areassuch as pigmented and intact skin, the overall optical intensitiesincreased (were more lucid) in both regions 1 and 2 [Fig. 4(c1c2)and 4(d1d2)] in comparison to the immature zones, but the in-tensity distribution was biased toward higher values (negativelyskewed), which indicated the presence of more dehydrated com-ponents. Thus, such findings distinctly demonstrated the differ-ences in the optical properties of the tissues as per the healingprogression and were corroborative with the concept that healed
but immature tissues were more hydrated and less reflective(hypolucid) than the mature but dehydrated one.
In drawing correlations between the findings of opticalbiopsy and incision biopsy, the extent of lucidity and allied mor-phology in the former could be associated with the microscopicstructural and molecular information. Hence, the disappearanceof the hypolucid band in OCT vis-a-vis the appearance of epithe-lial maturation features, such as rete-pegs, dermal papillae, andSC roughness in the pigmented zone of the healing bed, founddirect resemblance with histological and immunohistochemicalobservations. The histological feature of the depigmented zonedemonstrated an immature flattened epithelium [Fig. 3(b2)] withlow and diffused expression of E-cadherin [Fig. 3(b3)]. Whereasthe pigmented and intact skin exhibited a thicker epitheliumwith microscopic features of progressive maturation and the ap-pearance of rete-pegs [Fig. 3c2) and 3(d2)] as well as a moremembranous expression of E-cadherin [Fig. 3(c3) and 3(d3)].
Thus, the recognizable analogy between the OCT and micro-scopic observations demonstrated the suitability of SS-OCT asa noninvasive imaging tool to explore the maturation stages ofdifferent regions of the wound bed as well as the integrity of theregenerated tissues.
5 ConclusionsTherefore, it may be concluded that the SS-OCT images of thedifferent regions of the healing bed could have meaningfullydepicted the histopathological possibilities that are confirmedby microscopic evaluation of the wound margin biopsies. Per-haps by exploring the differential optical intensities of repairingtissues, SS-OCT added certain new dimensions regarding in-tegrity of regenerated tissues. This study also demonstrated theexploratory research potential of such an imaging system in un-derstanding the correlation among the morphological feature,optical behavior, and molecular expression of the tissues for abetter definition of such biological states. Further studies in thisdirection may become effective in upholding OCT findings asan alternative to the invasive histopathological observations inwound research.
AcknowledgmentsWe appreciate ISIRD, SRIC, IIT Kharagpur (IIT/SRIC/ISIRD/2007–08, 02.01.2008) for providing financial support for thiswork under necessary ethical clearance.
References1. F. Strodtbeck, “Physiology of wound healing,” Newborn Infant Nursing
Rev. 1, 43–52 (2001).2. R. Steiner, U. Kunzi-rapp, and K. K. Scharffetter, “Optical coherence
tomography: clinical applications in dermatology,” Med. Laser Appl.18, 249–259 (2003).
3. G. C. Gurtner, S. Werner, Y. Barrandon, M. T. Longaker, “Woundrepair and regeneration,” Nature 453, 314–321 (2008).
4. T. Gambichler, G. Moussa, M. Sand, D. Sand, P. Altmeyer, K. Hoff-mann, “Applications of optical coherence tomography in dermatology,”J. Dermatol. Sci. 40, 85–94 (2005).
5. P. Hrynchak and T. Simpson, “Optical coherence tomography: an in-troduction to the technique and its use,” Optom. Vis. Sci. 77, 347–356(2000).
Journal of Biomedical Optics February 2011 � Vol. 16(2)026010-7
Barui et al.: Swept-source optical coherence tomography of lower limb wound...
6. J. Welzel, “Optical coherence tomography in dermatology: a review,”Skin Res. Technol. 7, 1–9 (2001).
7. M. C. Pierce, J. Strasswimmer, B. H. Park, B. Cense, J. F. Boer,“Advances in optical coherence tomography imaging for dermatology,”J. Invest. Dermatol. 123, 458–463 (2004).
8. J. Welzel, M. Bruhns, and H. H. Wolff, “Optical coherence tomographyin contact dermatitis and psoriasis,” Arch. Dermatol. Res. 295, 50–55(2003).
9. W. C. Kuo, C. H. Chan, C. H. Cho, J. C. H. Cheng, “Swept sourceoptical coherence tomography for radiation-enhanced hepatocellularcarcinoma cell invasion imaging,” Phys. Med. Biol. 54, 4289–4297(2009).
10. R. K. Manapuram, V. G. R. Manne, and K. V. Larin, “Development ofphase-stabilized swept-source OCT for the ultrasensitive quantificationof microbubbles,” Laser Phys. 18, 1080–1086 (2008).
11. M. Ziolkowska, C. M. Philipp, J. Liebscher, H. P. Berlien, “OCTof healthy skin, actinic skin and NMSC lesions,” Med. Laser Appl. 24,256–264 (2009).
12. M. A. Calin and S. V. Parasca, “In vivo study of age-related changesin the optical properties of the skin,” Lasers Med. Sci. 25, 269–274(2010).
13. M. Huzaira, F. Rius, M. Rajadhyaksha, R. R. Anderson, S. Gonzalez,“Topographic variations in normal skin, as viewed by in vivo re-flectance confocal microscopy,” J. Invest. Dermatol. 116, 846–852(2001).
14. K. P. Nielsen, L. Zhao, J. J. Stamnes, K. Stamnes, J. Moan, “Theoptics of human skin: aspects important for human health,” Norw. Acad.Sci. Lett. 35–46 (2008).
15. J. Welzel, C. Reinhardt, E. Lankenau, C. Winter, H. H. Wolff,“Changes in function and morphology of normal human skin: Evalua-tion using optical coherence tomography,” Br. J. Dermatol. 150, 220–225 (2004).
16. R. C. Gonzalez and R. E. Woods, Digital Image Processing, PrenticeHall, Englewood Cliffs, NJ (2002).
17. S. C. Whiteman, Y. Yang, and G. D. Pittiu, “Optical coherence to-mography: real-time imaging of bronchial airways microstructure anddetection of inflammatory/neoplastic morphologic changes,” Clin. Can-cer Res. 12(3), 813–818 (2006).
18. G. Thilo, B. Stefanie, S. Markus, K. Alexander, S. Michael, M. Georg,A. Peter, H. Klaus. “Comparison of histometric data 455 obtained byoptical coherence tomography and routine histology,” J. of Biomed.Opt. 10, 44008 (2005).
19. M. J. Cobb, Y. Chen, R. A. Underwood, M. L. Usui, X. Li, “Noninva-sive assessment of cutaneous wound healing using ultrahigh-resolutionoptical coherence tomography,” J. Biomed. Opt. 11, (2006).
20. K. F. Becker and B. Luber, “E-cadherin,” UCSD-Nature Molecule(2010).
21. T. Jakob, M. J. Brown, and M. C. Udey, “Characterization ofE-cadherin-containing junctions involving skin-derived dendritic cells,”J. Invest. Dermatol. 112, 102–108 (1999).
22. R. Huber, M. Wojtkowski, J. G. Fujimoto et al. “Three-dimensional andC-mode OCT imaging with a compact, frequency swept laser source at1300 nm,” Opt. Express 13, 10523–10538 (2005).
23. <http://www.thorlabs.com/>(date accessed 1 February 2010).24. R. Duda, P. Hart, and D. Stork, Pattern Classification, Wiley, Hoboken,
NJ (2007).25. A. M. Gun, M. K. Gupta, and B. Dasgupta, An Outline of Statistical
Theory, World Press, Kolkata (2005).26. M. Subrahmanyam, “Honey dressing for burns—an appraisal,” Ann.
Burns Fire Disasters, IX, 33–35 (1996).27. C. C. Yates, D. Whaley, S. Hooda, P. A. Hebda, R. J. Bodnar,
A. Wells, “Delayed re-epithelialization and basement membraneregeneration after wounding in mice lacking CXCR3,” Wound RepairRegen. 17, 34–41 (2009).
28. L. G. Hudson, K. M. Newkirk, H. L. Chandler, C.Choi, S. L. Fosseye,A. E. Parente, D. F. Kusewittf, “Cutaneous wound re-epithelializationis compromised in mice lacking functional Slug (Snai2),” J. Dermatol.Sci. 56, 19–26 (2009).
Journal of Biomedical Optics February 2011 � Vol. 16(2)026010-8
Copyright © 2022 FDOKUMEN