Vascularised Scaffolds for Cutaneous Wound Reconstruction ...
176
1 Vascularised Scaffolds for Cutaneous Wound Reconstruction Using Stem/Progenitor Cells Mr Daniel Markeson, MBBS, BSc (Hons) MRCS Restore Research Fellow University College London Supervisor: Professor Alexander Seifalian Co-supervisor: Professor Suzanne Watt Thesis submitted for the degree: Doctor of Medicine (MD) Res
-
Upload
khangminh22 -
Category
Documents
-
view
0 -
download
0
Transcript of Vascularised Scaffolds for Cutaneous Wound Reconstruction ...

1
Vascularised Scaffolds for Cutaneous Wound
Reconstruction
Using Stem/Progenitor Cells
Mr Daniel Markeson, MBBS, BSc (Hons) MRCS
Restore Research Fellow
University College London
Supervisor: Professor Alexander Seifalian
Co-supervisor: Professor Suzanne Watt
Thesis submitted for the degree: Doctor of Medicine (MD) Res

2
Declaration
I, Daniel Markeson, confirm that the work presented in this thesis is my own. Where information
has been derived from other sources, I confirm that this has been indicated in the thesis.
3
Abstract
The synthetic replacement of full thickness skin is suboptimal both aesthetically and functionally. One approach to improve existing dermal substitutes is to pre-vascularise them to facilitate incorporation. In so doing, the aim is to improve the trajectory of wound healing. More expeditious maturation has been suggested to improve outcomes.
Endothelial colony forming cells (ECFCs), specialised progenitor cells required for vasculogenesis, were isolated from cord (CBECFC) and peripheral (PBECFC) blood. Mesenchymal stromal cells were separated from adipose tissue (AdMSCs). Using a proprietary device (µ-chemotaxis 3D), human umbilical vein endothelial cells, and CBECFC- and PBECFC-derived cells were compared for chemokinetic and chemotactic movement within collagen I gels, with or without fibronectin. PBECFC-derived cells migrated further than CBECFC-derived cells and HUVECs towards the chemoattractant.
These data informed the fabrication of collagen I gels containing co-cultures of ECFC-derived cells with MSCs. An attempt was made to compress these gels to facilitate handling, but vascular tubule formation was not amenable to compression. HUVECs seeded as a monoculture within compressed gels also had a 100% mortality rate, although 62.5% AdMSCs and 66.4% human dermal fibroblasts survived the compression process.
Since pre-formed tubules did not survive the compression process, various concentrations of ECFC-derived cells and MSCs were seeded within uncompressed collagen I gels in order to obtain an optimised vascular network. AdMSCs were compared to BMMSCs. PBECFC-derived cells were compared to CBECFC-derived cells and HUVECs. Optimised gels containing tubules formed by adult derived PBECFC-derived cells and AdMSCs were then scaled up and implanted into an in vivo immunodeficient mouse model. Host incorporation of the construct within this pre-vascularised gel was significantly improved compared to an empty gel control (p=0.04).
In summary, it was possible to fabricate a pre-vascularised collagen I scaffold, using adult-derived stem/progenitor cells, increasing the rate of host incorporation in an in vivo murine model.

4
Publications and conferences
Publications
Watt SM, Gullo F, van der Garde M, Markeson D, Camicia R, Khoo CP, Zwaginga
JJ. The angiogenic properties of mesenchymal stem/stromal cells and their
therapeutic potential. Br Med Bull. 2013;108:25-53.
Markeson D, Pleat JM, Sharpe JR, Harris AL, Seifalian AM, Watt SM. Scarring,
stem cells, scaffolds and skin repair; J Tissue Eng Regen Med. Oct 2013; epub
ahead of print.
Watt SM, Leeson P, Cai S, Markeson D, Khoo CP, Newton L, Zhang YY, Sourri S,
Channon K. Cord and cord blood derived endothelial cells; In: Umbilical Cord
Blood Stem Cells and Regenerative Medicine. Chapter 5. Stavropoulos C,
Navarette C, Charron D. Eds. Elsevier Press, Amsterdam. The Netherlands. 2014
(in press)
Presentations
Markeson D, Seifalian A, Watt SM. Adipose mesenchymal stem/stromal cells
(AdMSCs) and peripheral blood endothelial colony forming cells (ECFCs) for
tissue engineering; European Society for Plastic Reconstructive and Aesthetic
Surgery, Jul 2014. Edinburgh, Scotland.
Markeson D, Seifalian A, Watt SM. Tissue engineering for wound healing –
endothelial colony forming cell (ecfc) migration, 3d tubule formation and
expansion; Society of Academic and Research Surgery, Patey Prize session, Jan
2014. Cambridge, UK.
Markeson D, Sweeney D, Khoo CP, Watt SM. The role of endothelial colony
forming cells for tissue engineering – chemotaxis, 3D tubule formation and
enhanced expansion using bioreactors; NHS Blood and Transplant Annual
Meeting, Oct 2013. Oxford, UK

5
Acknowledgements
First of all I would like to acknowledge the stem cell research group in Oxford as a whole.
The atmosphere within the lab made it very easy for me to make the transition from the
clinical environment of a hospital to the laboratory bench.
Certain individuals must also be singled out for their particular contributions to my MD.
Professors Alexander Seifalian and Suzanne Watt as my supervisor and co-supervisor,
guided me and advised me throughout on how to best approach my project and ensured
that I stayed on track throughout. For their guidance and encouragement I am very
grateful. In addition, Jon Pleat, Michael Tyler and all the team at Restore for not only
sponsoring me and providing me with my adipose tissue but for also constantly giving
me ideas and keeping me on the right path in my first foray into post-graduate research.
My neighbours Laura Newton/David Cook and in particular Dominic Sweeney – thank
you for putting up with me! I’ll be the first to admit that I have the concentration span
of a goldfish (it is a wonder I finished this MD!) and I appreciated the chats about
everything from football to cricket (and even rarely science). Even if you were just
humouring me with my constant distracting chats, thank you.
Sandy Britt and Jan Walton, thank you for supplying me with more cord blood than I
knew what to do with and for the banter around the lab and in the coffee room.
Dom – in addition to keeping me sane chatting about football thank you for teaching me
to (almost) be a scientist. Without your help in getting started I would never have learnt
how to isolate and expand stem cells and both you and Enca have helped me a great
deal with reagents, the lentiviral vector and with general advice throughout my MD!
Cheen, Anna, Sarah and Emma – you have also helped massively with the scientific side
of things and I have enjoyed spending time with you over tea, coffee and cakes!
Brenda – it has been good chatting with you about all things American as well as your
busy social life!
Fra, Mark, Youyi, Pat, Hua-Jun, Christine and Tao – it has been great getting to know you
all and I hope we stay in touch.
Rosalba – grazie mille per tutto che mi hai insegnato - Io non lo dimentichero mai. Spero
ci incontreremo ancora in futura. Tvb a

6
Fadi, I only used your expertise briefly at the end of my thesis but nevertheless you were
invaluable in helping me to complete the in vivo work and were good to have around to
deflect attention at the (rather frequent) Restore meetings!
Last but not least I want to thank my wife Laura and two gorgeous kids Seth and Alice
for putting up with my erratic timetable, stressing about my write-up and endless job
applications, and having to come in at random times to ‘look after my cells!?’. I could
not have achieved this MD without your help and encouragement.

7
List of abbreviations
FTSG: Full thickness skin graft
STSG: Split thickness skin graft
BM: Bone marrow
HFSC: Hair follicle stem cells
SGSC: Sweat gland stem cells
PDGF: Platelet-derived growth factor
TGF-β: Transforming growth factor beta
ECM: Extracellular matrix
DCD: Decellularised cadaveric dermis
VAC: Vacuum assisted closure
ECFC: Endothelial colony forming cell
EC: Endothelial cell
CFU-EC: Colony forming unit-endothelial cell
BOEC: Blood outgrowth endothelial cell
FN: Fibronectin
FBS/FCS: Fetal bovine/calf serum
vWF: vonWillebrand Factor
MNC: Mononuclear cell
pHPL: Pooled human platelet lysate
CB: Cord blood
PB: Peripheral blood
MSC: Mesenchymal stem cell
BMMSC: Bone marrow derived MSC
HUVEC: Human umbilical vein endothelial cell
VEGF: Vascular endothelial growth factor
bFGF: Basic fibroblast growth factor
HIF-1α: Hypoxia inducible factor-1α
SVSMC: Saphenous vein smooth muscle cell
HDMEC: Human dermal microvasular endothelial cell
hDF: Human dermal fibroblast

8
hPASMC: Human pulmonary artery smooth muscle cell
GMP: Good medical practice
FACS: Flow activated cell sorting
EBM-2/EGM-2: Endothelial basal/growth medium-2
hEGF: Human epidermal growth factor
EDTA: Ethylenediaminetetraacetic acid
D-PBS: Dulbecco’s phosphate buffered saline
DMSO: Dimethyl sulfoxide
MEM: Modified Eagle Medium
LV: Lentivirus
eGFP: Enhanced green fluorescent protein
MOI: Multiplicity of infection
VT: Viral titre
LN: Liquid nitrogen
RT: Room temperature
PFA: Paraformaldehyde
AdMSC: Adipose derived MSC
WJ: Whartons Jelly
MSC-GM: MSC growth medium
FMI: Forward migration index
SDF-1α: Stromal-cell derived factor 1α
IL-3: Interleukin 3
SCF: Stem cell factor
RBC: Red blood cell
PLGA: Poly(lactide-co-glycolide
TLS: Tubule-like structure

9
Table of Contents Abstract .................................................................................................................... 3
1 Background .......................................................................................................... 12
1.1 Introduction ........................................................................................................... 12
1.2 The structure of human skin ................................................................................. 13
1.3 The stem cell niche and its role in skin renewal .................................................... 17
1.4 Mammalian wound healing – regeneration versus scarring ................................. 19
1.5 The tissue engineering challenge for full thickness wound repair ........................ 21
1.6 Clinically available dermal scaffolds that mimic the niche.................................... 22
1.7 Revascularisation of engineered grafts ................................................................. 27
1.8 Endothelial progenitor cells and vessel formation ................................................ 28
1.9 Isolation and culturing of endothelial colony forming cells .................................. 30
1.10 Developing the next generation vascularised scaffolds and smart biomaterials 34
1.11 Perspectives ......................................................................................................... 41
1.12 Aims and objectives of this thesis ....................................................................... 43
2 Methods .............................................................................................................. 45
2.1 Reagents ................................................................................................................ 45
2.2 Cells
2.2.1 Pooled human umblicial vein endothelial cells (pHUVECs) ............................ 48
2.2.2 Bone marrow mesenchymal stem/stromal cells (BMMSCs)/human dermal fibroblasts (hDFs) ..................................................................................................... 49
2.2.3 Mononuclear cells from umbilical cord blood (MNCs) ................................... 52
2.2.4 Endothelial cells from umbilical cord blood (CBECs) ...................................... 53
2.2.5 Peripheral blood endothelial cells (PBECs) ..................................................... 58
2.2.6 Adipose derived mesenchymal stem cells (Ad MSCs) ................................... 63
2.2.7 Differentiation of Ad MSCs ............................................................................. 67
2.2.7.1 Adipogenesis culture protocol ................................................................ 67
2.2.7.2 Chondrogenesis culture protocol............................................................ 69
2.2.7.3 Osteogenesis culture protocol ................................................................ 70
2.2.8 Cell passage, counting and freezing procedures ............................................ 71
2.3 Fluorescence-activated cell sorter (FACS) analysis ............................................... 72
2.4 µ-chemotaxis 3D assay .......................................................................................... 76
2.5 Lentiviral transduction of cells
2.5.1 Human embryonic kidney (HEK) 293 FT cells ................................................. 79

10
2.5.2 Titration of lentiviral vector stocks ................................................................. 79
2.5.3 eGFP lentiviral transduction ........................................................................... 81
2.6 Compressed collagen gels
2.6.1 Optimisation of compressed collagen gels ..................................................... 82
2.6.2 Compressed collagen I gels with ECs .............................................................. 84
2.6.3 Compressed collagen I gels with hDFs, BMMSCs or AdMSCs ........................ 85
2.6.4 LIVE/DEAD® stain protocol ............................................................................. 85
2.7 Uncompressed collagen gels …………………….………………………………………………………………86
2.7.1 Upscaling to a 12 and 24 well plate ................................................................ 89
2.8 Fixing of gels
2.8.1 Making 4% paraformaldehyde (PFA) .............................................................. 91
2.9 In vivo: uncompressed PBECFC/AdMSC gel in a humanized mouse model…………..……91
2.11 Statistics………………………………………………….………………………………………………………………92
3 Fabrication of a pre-vascularised scaffold ............................................................. 94
3.1 Migration of endothelial cells: µ-Chemotaxis 3D .................................................. 94
3.1.1 Aims and objectives for the µ-chemotaxis 3D assay ...................................... 97
3.1.2 Results: µ-chemotaxis assay ........................................................................... 91
3.1.3 µ-chemotaxis findings ................................................................................... 107
3.2 Compressed collagen gels
3.2.1 Rationale and aims for use of compressed collagen gels ............................. 108
3.2.2 Prevascularising uncompressed gels prior to compression ......................... 110
3.2.3 Results for compressed gels ......................................................................... 111
3.2.4 Compressed gels – summary ........................................................................ 115
3.3 Uncompressed collagen gels
3.3.1 Aims for use of uncompressed collagen I gels ............................................. 116
3.3.2 Results for uncompressed gels – Pilot experiments using HUVECs and BMMSCs ................................................................................................................. 116
3.3.3 Will TLSs form with 3 different batches of PB ECFCs/CB ECFCs/HUVECs ..... 119
3.3.4 Will TLSs form with 3 different batches of AdMSCs/BMMSCs ..................... 129
3.4 Discussion ............................................................................................................ 138
4 Scaling up of pre-vascularised collagen I gels and their in vivo application .......... 142
4.1 Introduction ......................................................................................................... 142
4.2 Results

11
4.2.1 Scaling up pre-vascularised collagen I gels ................................................... 143
4.2.2 Implantation of gels in immunodeficient murine model ............................. 143
4.3 Discussion ............................................................................................................ 151
5 Discussion and future perspectives .................................................................... 153
5.1 Introduction ......................................................................................................... 153
5.2 Scarring ................................................................................................................ 153
5.3 Stem/progenitor cells and vasculogenesis .......................................................... 154
5.4 From bench to bedside ........................................................................................ 156
5.4.1 Can a suitable scaffold be produced on a large enough scale to be clinically viable? .................................................................................................................... 157
5.4.2 What are the safety barriers to producing such a product? ........................ 158
5.4.3 Can this pre-vascularised scaffold be used in humans? ............................... 158
APPENDICES ......................................................................................................... 160
REFERENCES………………………………………………………………………………………………………… 164

12
Chapter 1
Background
1.1 Introduction
Geoffrey Chaucer famously stated ‘as tyme hem hurt, a tyme doth hem cure’ (‘time
heals all wounds’) (1). However, those with visible scars, whether small and seemingly
insignificant to a neutral observer, or considerably more extensive, may disagree with
this statement. An unsightly appearance can stigmatise and marginalise an individual
from society, preventing social interaction and engendering psychological illness and
low self-esteem (2). Over £1 billion is spent in the United Kingdom every year on the
management of chronic wounds and scarring (3), with much larger amounts spent
annually in the United States of America and worldwide. From the personal to the
societal viewpoint, it is vital that scientists and clinicians continue to work towards
methods to reduce the physical and psychological consequences of scarring.
Burns are the main causative factor for substantial body surface area scars. Despite
improvements to health and safety standards in the United Kingdom, the most recent
published data suggest that over 250,000 people are burnt every year with 13,000
admitted to hospital and 300 deaths recorded (4). In 2004, nearly 11 million people
worldwide were burned severely enough to require medical attention and although no
recent studies have identified current incidence rates, it is likely that at least this many
are still being affected. The average cost of treating an individual adult burn in 2012 was
estimated to be as high as US $73,552 (5).
Skin autografts are the current gold standard for burns and other full thickness defects
including trauma, abnormal development of skin in utero and infection. The obvious
advantages for an autograft include immunological acceptance, and colour and texture
match. However, they may provide a less than satisfactory outcome if the wound is too
large to use a full thickness skin graft (FTSG) or because of the many recognised
complications associated with split thickness skin grafting (STSG) where the epidermis
and only part of the dermis are harvested. These include donor and recipient site
scarring and a lack of full sensation and thermoregulation in grafted skin. In addition,
contracture and reduced pliability are common side-effects, particularly in meshed

13
STSGs where fenestrations are made to reduce haematoma formation and to allow the
graft to expand over a wider area. These interstices of the mesh may take several weeks
to re-epithelialise, thereby increasing the risk of developing a hypertrophic scar (6). An
additional problem arises when treating full thickness burns of 40% total body surface
area or more. In these patients, there may be insufficient donor skin to cover the
patients’ wounds. Even if sufficient donor skin exists, in harvesting the unburned donor
site the size of the wound may be increased to almost 100% of the body surface area.
This has profound and dangerous consequences including massive fluid shifts and an
increase in the risk of developing bacterial sepsis. Additionally, in extensive full thickness
burns, regenerative elements from the wound edge or deeper dermal adnexal
structures are destroyed, thereby retarding repair. Such cases may necessitate the use
of temporary cadaveric or xenograft skin coverage, bioengineered skin in the form of
cultured keratinocytes (epidermal autografts) or a first generation artificial dermal
substitute. Each of these options has limitations including an inability to use epidermal
grafts alone in full thickness defects, high cost, pigmentation mismatch, lack of reliable
engraftment with dermal substitutes, lack of thermoregulation, the temporary nature
of xeno- and allo-grafts and failure to restore relevant adnexal skin structures (pigment,
sweat glands, hair) and hence fully functional skin (7).
1.2 The structure of human skin
The structure of skin, the largest human organ, varies in different locations, but is
essentially composed of three basic layers ranging from superficial to deep - the
‘epidermis’, the ‘dermis’ and the subcutaneous fatty layer or ‘hypodermis’ (8). The
components and function of normal skin are outlined in Table 1.1 and Figure 1.1.
The epidermis is the outermost layer and ranges in thickness from 0.04 mm (eyelids) to
1.6 mm (soles of the feet and palms of the hands). It is thin, avascular and consists of
multiple epithelial layers, the interfollicular epidermis, adnexal structures and a limited
number of non-epithelial cell types, e.g. Merkel cells. The specialised epithelial cells of
the epidermis, the keratinocytes, gradually differentiate and mature by moving from the
lowest layer, the stratum basale, through stereotypically organised layers which include
the stratum spinosum and the stratum granulosum to the uppermost layer, the stratum
14
corneum. Keratinocytes are continually shed from the skin surface. In thick epidermis,
the stratum lucidum is a structurally discrete layer between the stratum granulosum and
the stratum corneum.
The dermis, lying below the epidermis, is thicker (ranging from 1-4mm in depth) and rich
in connective tissue elements collagen (70% of the dermis), elastin and proteoglycans
such as hyaluronic acid. It contains several cellular structures including nerves, blood
vessels, lymphatics, muscle fibres and, depending on the location, hair follicles and
sweat glands. It is self-evident that species diversity exists in skin structures. For
example, although used as a basis for human studies, genetically distinct mice display
diversity in the distribution of hair follicles throughout the skin, while, in the human, hair
follicles are located mainly on the scalp for terminal hair growth and generate vellus hair
on the face/trunk.
The dermis is partitioned into an upper papillary dermis that interdigitates with the
overlying epidermis and a thicker, denser reticular dermis that extends to subcutaneous
fat and contains irregular elastin fibres interspersed with large collagen fibres (9). In-
between the dermis and the epidermis lies a basement membrane, an integral part of
skin containing several laminins as well as type IV collagen, perlecan, heparan sulphate
proteoglycans, fibronectin (FN) and nidogens 1 and 2 (10). The basement membrane
(BM) assists with water retention, adds thickness to the skin and anchors the epidermal
appendages (hair follicles, sweat glands).

15
Table 1.1 The components and functions of skin and the fibrin clot
Components Functions
Normal skin Epidermis
0.04-1.6mm
Avascular
95% Keratinocytes (cells in lowest layer [Stratum Basale] divide and rise through Stratum Spinosum, Granulosum, Lucidum and Corneum] regulated by TGFα/KGF
Metabolic (Vitamin D production) (11); rradiation (UV) and physical (pathogens) protection; thermoregulation and regulation of water loss (lipids arranged between cells of S.Corneum).
Merkel cells (S.Basale) Light touch sensation
Langerhans cells (S.Spinosum) Immunological surveillance
Melanocytes (S.Basale) Skin colour
Basement membrane Fibronectin; Collagen (Type IV); Laminins (332, α5); Perlecan; Heparan sulphate proteoglycans; Nidogens 1 and 2 (10)
Water retention, anchoring of epidermal appendages and secures epidermis to dermis
Dermis
1-4mm
Superficial and deep vascular plexus
Collagen (Type III papillary dermis; Type I reticular dermis) Tensile strength
Elastin Elasticity/pliability, reduces wound contracture after injury
Ground substance (glycosaminoglycans & acid mucopolysaccharides) Fills space between collagen/elastin fibres. Diffusion of nutrients & waste
Mast cells Inflammation and allergic reactions (12)
Adnexal structures (hair follicles, sebaceous/eccrine/apocrine glands) House stem cell populations including hair follicular & interfollicular SCs
The fibrin clot
Inflammatory phase
Tissue factor (released by damaged tissue) Begins clotting cascade ending in formation of Fibrin clot
Platelets (enter through leaky vessels) Degranulate releasing PDGF and TGF-β
Neutrophils and macrophages Phagocytosis of debris and bacteria. Attraction of fibroblasts and ECs
Keratinocytes Migrate over clot re-epithelialising wound
Proliferative phase Fibroblasts Lay down ECM. Replace fibrin clot with type III Collagen then later type I.
Endothelial cells Neovascularisation
Remodelling phase Myofibroblasts Wound contraction

16
Figure 1.1 – The components and functions of skin and the fibrin clot: 1. Necrotic tissue; 2. Platelets; 3. Neutrophils; 4. Stratum basale; 5. Basement membrane; 6. Superficial dermal plexus; 7. Eccrine gland; 8. Sebaceous gland; 9. Hair follicle; 10. Elastic fibres; 11. Collagen fibres; 12. Fibroblasts; 13. Deep dermal plexus; 14. Keratinocytes migrating over fibrin clot; 15. Endothelial cells migrate to edge of clot and participate in neovascularisation; 16. Macrophages and neutrophils digest necrotic tissue; 17. Fibroblasts secrete ECM and myofibroblasts induce wound contraction.

17
1.3 The stem cell niche and its role in skin renewal
Cells which constantly renew, such as within blood and the skin, are sustained and
repaired by a small population of resident stem cells. The ability of stem cells to self-
renew is thought to be intrinsic to the regenerative capacity of the epidermis and
adnexal structures throughout normal post-natal life (13–15). The basal layer of the
murine epidermis houses two populations of self-renewing epidermal stem cells
differing in their proliferative capacities and their ability to repair the epidermis after
injury. One consists of slow cycling stem cells with high longevity and represents the
stem cell reservoir that contributes to wound repair. These cells give rise to actively
dividing committed progenitor cells, which undergo several cell divisions before
eventually generating differentiated cells and may also give rise to transit amplifying
cells (16). While the committed progenitors purportedly contribute to short term
wound repair, the more quiescent epidermal stem cells persist throughout the animal’s
lifetime and contribute to repair and long-term regeneration of the epidermis (16).
Whether these high and low turnover self-renewing populations occur in the human is
unclear.
Stem cells that can generate epidermis are also found around hair follicles and
sebaceous glands (13,14,17). In particular, the bulge region of the outer root sheath of
the hair follicle houses hair follicular stem cells (HFSCs) that can produce epidermis,
sebaceous glands and hair follicles (18,19) as demonstrated in murine genetic models
and stem cell grafting into immunodeficient mice. Lineage tracing and clonal analysis
studies suggest that the potentiality of these bulge resident stem cells differs during
normal homeostasis and in wound repair or when grafting to alternative sites. Under
normal homeostatic conditions, bulge stem cells become cyclically activated and can
differentiate into all hair follicle lineages but not interfollicular epidermal cells. However,
within the wound healing or grafting environment, the bulge resident stem cells can also
give rise to interfollicular epidermal cells (20). Negative feedback loops allow lineage
specific progeny to regulate the quiescence of the HFSCs by modulating their activation
or cycling (15), while the dermal papilla can act as a temporary niche for HFSCs during
distinct phases of the hair follicle cycle (13,14). Stem cells with different potencies are
reported to exist within different regions of the bulge, with the Lgr6+ isthmus stem cells

18
in mice generating sebaceous gland cells under normal homeostatic conditions, but also
giving rise to interfollicular epidermal cells when provoked by wound healing (15,20,21).
Eccrine sweat glands are the most abundant glandular structures in the human body
reaching densities of 200-700/cm2. They assist in regulating body temperature in hot
climates and secrete salt-enriched sweat fluids in response to emotional stimuli. The
possible existence of sweat gland stem cells has recently been addressed by Lu et al.
(22). This group characterised three adult progenitor cell types in the murine sweat
gland and duct using elegant lineage tracing technologies. Each of these progenitors
demonstrates a selective response when exposed to different injuries in the skin or on
transplantation into different environments in vivo. It is of interest that, at least in the
murine environment, these stem/progenitor cells appear to be unipotent in response to
wound healing, but exhibit multipotency when grafted into different skin locations. The
applicability of studies in the rodent to the location and potentiality of stem cell types
found in the human skin however remains to be more fully defined.
In addition to this work examining the murine sweat gland, several groups have also
noted the presence of epidermal stem cells within the human eccrine sweat gland.
Biedermann et al. (23) directly compared human eccrine sweat gland cells to epidermal
keratinocytes in terms of their ability to form multi-layered epithelia on collagen
hydrogels in vitro and in vivo and showed that they could indeed provide an additional
source of keratinocytes to generate a stratified epidermis. This raises the possibility that,
rather than only epidermal and more specifically hair follicle stem cells being responsible
for all homeostatic renewal of epidermis following injury as previously suspected,
human skin may also be repaired and/or permanently renewed by eccrine sweat glands.
Regardless of the site of harvest (scalp, axilla, abdomen and retro-auricular areas)
(23,24), eccrine sweat gland stem cells (SGSC) acquire the properties of epidermal
keratinocytes in engineered dermo-epidermal substitutes. In an alternative approach to
placing scaffolds onto full thickness defects, Rittié et al (25) showed that in partial
thickness human wounds, eccrine sweat glands and pilosebaceous units contributed
more than hair follicles to re-epithelialisation by generating keratinocyte outgrowths
that ultimately form new epidermis. Although the outgrowths expand at a similar rate,
whether derived from sweat glands or pilosebaceous units, the former outnumber the

19
latter by around 3 to 1 indicating a major contribution of SGSCs to reepithelialisation of
human wounds.
Two potential explanations for the transformation of sweat gland-derived epithelial cells
exist. The first argues that a multipotent stem cell population proliferates and the new
cells then differentiate in response to their epidermal environment. The other
explanation states that sweat gland cells de-differentiate into a more naïve state after
which they differentiate into a new phenotype, i.e., epidermal keratinocytes. As the
newly created sweat gland-derived epidermis reaches a state of homeostasis in vivo
(23), it is likely that both re-programmed sweat-gland derived cells and SGSCs are
involved in forming and maintaining the epidermis.
Human SGSCs, in addition to helping to create and maintain epidermis have also been
shown to adhere to polystyrene with a fibroblast-like morphology, proliferate rapidly
(doubling time 4.3d) and when seeded on Matrigel, acquire an endothelial-like
behaviour forming capillary-like structures and migrating across a scratch assay. Further,
when implanted to rats, scaffolds seeded with SGSCs form widespread vascular
networks compared to control (non-seeded) scaffolds outlining another function for
these cells in addition to their role in homeostasis of the epidermis (24).
1.4 Mammalian wound healing – regeneration versus scarring
Wound healing involves a dynamic balance between the regeneration of the original
tissue type versus the production of scar tissue, usually in response to a physical
disruption of normal architecture. The equilibrium shifts depend on the specific tissue
injured, the species involved and the stage of development of the organism. For
example, post-natal bone and liver frequently heal by regeneration whilst central
nervous system injury normally reverts to scar tissue. The enormous variability in
species-specific healing is demonstrated by tail amputation in a newt (Salamandridae)
with complete regeneration of structure as the rule. However in the mammalian limb,
an amputation heals predominantly through scarring (26).
Normal mammalian wound healing involves three phases, which alter the intrinsic
microenvironment (26). First, the inflammatory phase is characterised by a clearance of
microbial contamination and removal of devitalised tissue. This is followed by a

20
proliferative phase where scar formation and tissue regeneration take place to varying
degrees. Finally, a remodelling phase supervenes where the strength and structural
integrity of the wound are optimised. After injury, platelets enter the wound through
damaged blood vessels and initiate the inflammatory phase by degranulating to release,
amongst other mediators, platelet-derived growth factor (PDGF) and transforming
growth factor beta (TGF-β). Concurrently, the clotting cascade begins when tissue factor
is released by damaged tissue and culminates in the formation of a fibrin clot which
provides the scaffold for migrating cells to repair the wound (Figure 1.1). These cells
include neutrophils, keratinocytes and macrophages that phagocytose debris and
bacteria. With time, keratinocytes migrate over the fibrin gel to provide a new epidermal
layer. Simultaneously, fibroblastic or mesenchymal cells proliferate to produce
extracellular matrix (ECM) and endothelial cells (ECs) create new blood vessels, with
both of these latter cells having been attracted by factors released by earlier cells such
as macrophages. Over time, the fibrin matrix is gradually replaced with type III and,
subsequently, type I collagen and covered by a layer of keratinocytes.
Changes in the skin microenvironment, during wound healing or where stem cells are
transplanted to alternate locations, appear to alter their fate or differentiation along
alternate lineage pathways. Superficial wounds heal by epithelialisation with
keratinocyte growth and differentiation resulting in the resurfacing of the wound. The
hair follicular, sweat gland and interfollicular stem cells are particularly important here
as they enable reconstitution of the top layers of the skin without the need for grafting.
Laminin α5 produced by pericytes has been demonstrated to regulate keratinocyte
proliferation and migration and hence to promote epidermal regeneration and wound
healing (27). If wounds cannot be re-approximated and are so deep as to have destroyed
sweat glands and HFSCs, then re-epithelialisation can only occur from the wound
margins, significantly delaying healing and leading to higher degrees of scarring and
contracture (6).
The extent of the primary defect and time to healing are the predominant factors in
determining the degree of scarring, although there are, additionally, clear genetic
influences. Examples of the latter include a clear racial predisposition to certain forms
of fibroproliferative scarring and the association of keloid scarring with specific gene
signatures (28). When producing the optimal skin substitute, investigators need to be

21
aware of the wide spectrum of cells involved in wound healing in order to understand
and replicate the wealth of functions imparted by such cells and their products.
1.5 The tissue engineering challenge for full thickness wound repair
Variability in skin thickness, and the type and density of adnexal structures determines
the size of the reserve pool of stem cells and their progeny and this in turn allows skin
in certain parts of the body to heal more readily than others. To enhance superficial
wound healing, several keratinocyte preparations either in the form of a sheet (Myskin;
Epicel) or a spray (Recell) have been developed (29,30), although they have limited use
in full thickness defects lacking an in situ dermal component. There are also biological
(31) and synthetic (32) proprietary materials that can be placed onto superficial/mixed
depth wounds, that protect the wound bed and encourage healing, although these
cannot be used for the treatment of full thickness wounds. These deeper wounds, where
the epidermal and dermal layers, including the hair follicles and sweat glands, are
destroyed, will attempt to heal from the peripheries. In the clinical setting, if, as a result
of an extensive wound, healing is likely to take more than two weeks, skin grafting
becomes advisable to minimise scarring (6). Whilst the depth and location of the insult
determines whether or not skin grafting is required, the thickness of the applied skin
graft is a key determinant of the final outcome. It has been suggested that collagen and
ECM proteins in the dermis reduce wound contracture associated with myofibroblast
infiltration (33). In contrast, healed skin with minimal dermal support is friable and
susceptible to mechanical damage.
Despite significant advances in the treatment of full thickness wounds (in particular
burns) to reduce their tendency to scar, improvements continue to be sought. One
major target for tissue engineering is to create a composite layered skin substitute that
replicates a standard FTSG, thereby negating the deleterious effect of creating a new
wound at the donor site. A more practical alternative may be to produce a dermal
substitute which, when co-applied with a standard STSG, significantly improves the final
result comparable to a conventional FTSG. Significant limitations exist in the ability to
recreate such a structure especially where this involves very large, acute full thickness
wounds (29,34,35). Thus, in wounds where dermal preservation is not possible due to
extensive full thickness skin loss that cannot be closed directly or because of a paucity

22
of donor sites for a FTSG, acellular skin substitutes have attempted to satisfy the need
for a substantive dermal layer thereby aiming to limit any potential contraction and to
improve the overall structural integrity of the healed wound (29). This approach is
particularly important for burns and for the elderly and paediatric populations as thin
STSGs are often used in the former because of a suboptimal recipient bed and in the
latter because they have thin skin and a thick STSG would contribute to a significant
delay in donor site healing.
1.6 Clinically available dermal scaffolds that mimic the niche
In developing the optimal skin substitute, Shevchenko et al. have highlighted the three
most important requirements as patient safety, clinical effectiveness and convenience
in application (29). Additionally, the ideal scaffold should also be both supportive and
biodegradable.
The starting point for developing an artificial dermis should be the production of a 3-D
scaffold that facilitates the migration and organised relationship of cellular constituents.
Optimally, the composition of the scaffold should mirror that of normal skin. Collagen
represents by far the most abundant structural protein within the connective tissue of
the dermis (36). Collagen fibres are distributed either as a finely woven network in the
papillary layer of the dermis or as thick bundles within the reticular dermis. The
pilosebaceous units, eccrine glands and apocrine glands are also encircled by a thin
meshwork of collagen fibres as are the blood vessels of the dermis (36). The papillary
dermis and the surrounds of these structures are primarily composed of type III collagen
in contrast to the thicker reticular dermis which is mainly type I collagen and the
basement membrane (BM) in which type IV collagen is the predominant isoform.
Smaller elastin fibres are also present throughout the dermis and start to appear after
collagen at 22 weeks of gestation in the human (36). They are thickest in the lower
dermis where, like collagen bundles, they lie parallel to the surface of the skin. Recently,
it has been recognised that elastin may also play a significant role in production of the
optimal dermal substitute particularly in relation to reducing wound contracture (37).
Ground substance describes the amorphous substance containing glycosaminoglycans
and acid mucopolysaccharides filling the space between collagen and elastin fibres.

23
Mature dermal ground substance consists mainly of nonsulphated acid
mucopolysaccharides such as hyaluronic acid, although healing wounds contain a
greater proportion of sulphated acid mucopolysaccharides such as chondroitin sulphate
(36).
The ECM supports the dermal microvasculature which is divided into two important
strata. The superficial vascular plexus, between the papillary and reticular dermis, is in
close proximity with the overlying epidermis and anastomoses with deeper arterioles
and venules. The deep vascular plexus is found within and below the reticular dermis
and contains larger calibre vessels that extend into underlying subcutaneous fat (Figure
1.1) (36).
The options for a dermal substitute are manifold. Given the constituents of normal skin
and the histological features of a healing wound, it is not surprising that the most
commonly used materials have previously been donor derived dermis or dermal
substitutes based on such constituents as collagen, fibrin and hyaluronic acid. Many of
these are, however, of animal origin. Burns and/or wounds have been treated with
proprietary first generation decellularised human donor cadaveric dermis (DCD) such as
Alloderm® or Epiflex®, decellularised porcine derived dermis such as Permacol™,
synthetic acellular skin substitutes such as the bovine collagen type I based dermal
equivalents Matriderm® and Integra®, and hyaluronic acid-based dermal equivalents
such as Hyalomatrix PA and Hyalograft 3D. Tables 1.2a and 1.2b summarise these and
other examples of dermal substitutes that have been used in the clinical setting.
DCD preparations require removal of allogeneic cells in the epidermis and dermis, while
preserving extracellular matrix, elastin and collagen fibres and if possible the basement
membrane. Meshing of the DCD, which is normally attached to the wound bed with a
fibrin glue to limit shear forces and placed below a meshed autologous STSG or cultured
epidermal cells, has been reported to be preferential to a solid DCD graft and to improve
revascularisation of the autograft in acute burn injuries (33). Secreted factors from the
STSG or an epidermal sheet are thought to enhance DCD revascularisation, with biopsied
material approximating to normal skin histology where the burn area is relatively limited
(29,33). Although the use of DCD for the management of full thickness or extensive
acute burn injuries remains to be fully evaluated, these DCD-autologous STSGs have also

24
been used for the reconstruction of burn scar contractures and for keloid scar
management (33,38).
For synthetic, acellular dermal substitutes, Integra® has been used widely to treat full
thickness burns (39), but its architectural complexity results in delays of
neovascularisation for 10-14 days. Matriderm®, although more expensive, has the
benefit that it can be applied simultaneously with a STSG ensuring earlier wound
coverage and negating further surgery for the patient. Matriderm® results in good graft
take, improved elasticity and reduced wound contracture (40,41). Although a thinner
form of Integra® has been developed recently in order to meet the demand for single-
stage repair, there is only one published account of single-stage Integra® use (42). This
has not been compared to a suitable control such as STSG alone and has only been used
for the reconstruction of defects in the face which has a good vasculature. Therefore,
evidence is lacking to demonstrate confidence in Integra® as a dermal substitute for
single-stage wound repair.
Hyalomatrix PA is hyaluronic acid esterified with benzyl alcohol with a silicon layer that
acts as an epidermal layer prior to grafting. Although there are no prospective or
randomised studies for this dermal substitute, a retrospective series of patients treated
with deep partial thickness burns produced encouraging results (43). Hyalograft 3D has
a similar make-up but contains cultured autologous fibroblasts and has no silicon
pseudo-epithelial layer. It has been reported to reduce wound contracture and to
promote keratinocyte take and basement membrane formation in vitro (29), yet there
are no significant prospective observational or randomised control studies reported and
there is the necessity for a 2-stage reconstruction. The only publication on Hyalograft
3D is a small study in which a keratinocyte layer (Laserskin®) was compared with or
without the autologous fibroblast-containing dermal substitute in high body surface
area burns of 6 patients (3 for each subgroup). Although the results showed improved
keratinocyte take when Hyalograft 3D was used, the power of this study is limited,
particularly with regards to the small number of participants and the lack of a suitable
control (44). Substitutes that are similar to Hyalograft 3D but use allogeneic rather than
autologous fibroblasts (e.g. Dermagraft (45,46) and Apligraft (47,48)) have also been
created with limited success.

25
Table 1.2a: Acellular scaffolds that have been used for partial/full-thickness wounds. Derivation Technique/indications Pros Cons
AlloDerm® (33)
De-cellularised cadaveric dermis (DCD).
Meshed ultrathin STSG placed onto meshed AlloDerm in one-stage procedure
ECM composition closely mimics dermis Less contraction than graft alone Can use thin skin graft donor heals quicker
Delayed revasc immobilize 7-10d Questionable revascularisation (29) if 1 stage so STSG @ 4-7d advised
Epiflex® (49)
DCD Directions for use not published – likely to require 2 stage procedure
2 year sterility (5 year shelf-life approval anticipated)
Limited human use. Only 1 human series in Peyronie’s disease (50)
SureDerm® DCD Full thickness of deep partial thickness wounds and for scar reconstruction
2 year shelf life (refrigerated) Necessity for 2-stage procedure.
dCell®(51) DCD Applied onto prepared wound bed with overlying vacuum assisted cl osure (VAC)® device
Healed chronic wound with no STSG Easy to handle and cheap (NHS produces from donor skin)
Only evidence was a chronic venous ulcer. Not yet tried for acute/large wounds.
Permacol® Porcine collagen. Mainly used in abdominal wall defect repair – sutured over defect. Revascularisation over months
Cheaper than human collagen matrices. Used in hernia repair (rapid bio-integration less essential).
Slow biointegration/ vascularisation so use for dermal reconstruction limited (52).
Matriderm® Bovine collagen+elastin.
Single-stage procedure if healthy wound bed. If vascularisation suboptimal or 2 mm Matriderm®, 2 stage (STSG after 5-7d)
Can use as single stage to cover tendon, bone or joint (53) Long shelf life (5 years) Haemostatic (40)
High cost 2-stage repair for 2mm (or thicker) Matriderm®.
Integra® (29,39)
Bovine collagen and shark chondroitin-6- sulphate; silicon pseudo-epidermis.
Full thickness/deep partial thickness wounds/scar reconstruction. Coverage by thin meshed STSG 14-21d (54)
Long shelf life Low risk immune response/disease transmission Reduced contraction and scarring
10–14 days for vascularization 2-stage procedure High cost
Hyalomatrix PA®
Hyaluronic acid esterified with benzyl alcohol; silicon pseudo-epidermis.
Application to wound bed after debridement. 7-15d: silicon removed and STSG applied (55)
No animal/allogeneic/human-derived components. 4 year shelf life (room temperature) Good adult and paediatric safety profile
No prospective studies/RCTs. 2-stage procedure
EZDerm® Porcine collagen cross-linked with aldehyde.
Applied to partial-thickness skin loss, donor sites or skin ulcers or as a temporary dressing for full-thickness skin loss
Minimises protein/water loss 18 month shelf life. Similar to allograft but cheaper Analgesic on application
Doesn’t incorporate into wound Outcomes similar to petrolatum non-adherent gauze in partial-thickness burns (56).

26
Table 1.2b: Cellular scaffolds that have been used for partial/full-thickness wounds. Derivation Technique/indications Pros Cons
Hyalograft 3D®
Esterified Hyaluronic acid & autologous fibroblasts
Ulcers and deep/full thickness burns. Small skin biopsy Fibroblasts cultured on Hyalograft 3D for 16d then grafted onto wound. Keratinocytes from biopsy also cultured and applied 7d later (Laserskin®)
All autologous. Reduced wound contracture and improved keratinocyte take and BM formation (in vitro) (29).
No prospective study/RCT 2-stage procedure.
Dermagraft® Polyglactin mesh seeded with allogeneic neonatal fibroblasts
Predominant use chronic ulcers or burns (with STSG) Contra-indicated if exposed tendon /joint capsule/bone. Thawed, rinsed 3 times saline and placed into wound
Facilitates fibrovascular ingrowth and re-epithelialization. Faster wound closure in ulcers vs conventional therapy (45).
Stored at –60 to –80°C No difference vs meshed STSG alone (46) Similar outcome to allograft (38).
MySkin®
Subconfluent autologous keratinocytes on silicone
Ulcers, superficial burns and donor sites; full-thickness wounds with meshed skin grafts. 2x2cm shave biopsy keratinocytes isolated and stored or grown on silicon layer placed onto wound
Autologous cells.
3d shelf life. Often needs many applications. High cost.
ReCell (previously Cellspray)®
Autologous keratinocyte suspension & melanocytes, fibroblasts & langerhans cells
Chronic ulcers, donor sites & partial thickness wounds. Thin split thickness biopsy processed by surgical staff (20-30 minutes) spray over area 80x that of biopsy
Autologous. On-site processing. Good cell viability. Better aesthetics + function (30).
Not suitable for full thickness wounds unless with dermal element.
Apligraf®
Allogeneic neonatal fibroblasts in bovine collagen I + allogeneic neonatal keratinocytes (29)
2x2cm shave biopsy. Cells frozen or grown on silicon-based scaffold for 2-14d then applied onto wound. Re-epithelialisation approx 4d. Can apply with STSG if full-thickness defect
Improved cosmetic and functional outcomes when with STSG vs. graft alone (47).
Requires STSG if full-thickness. 5d shelf life Only case reports (57) and comparison to placebo (48).
Epicel® Autologous cultured epidermal autograft
Deep dermal or full thickness burns of total body surface area ≥ 30% (+ STSG or alone if not possible). Keratinocytes from 2 small (6cm) biopsies grown into approx. 50cm2 sheets 2-8 cell layers
Reduced mortality compared to control in large burns (58).
Residual amounts murine cells (xenotransplantation product). Must be used within 24 hours once released by laboratory.

27
1.7 Revascularisation of engineered grafts
Although recent research has focused on defining the stem cell niche in the skin
(particularly in rodents) and the circulating stem and progenitor cells involved in wound
healing, one critical consideration for tissue engineering skin in the clinical setting is the
issue of maintaining a sufficient blood supply to the graft. For dermal substitutes
covered with STSGs, the process of inosculation is of major importance. This describes
how established vessel networks within the dermal component of the STSG and
recipient wound bed connect to one another across the interface of the dermal
substitute (59,60). This has the vital role of nourishing the emerging epidermal layer.
Clinically, there are at least two suggested strategies to produce a vascularised dermal
equivalent to improve wound healing. One uses the scaffold’s physicochemical
properties to mimic the optimal microenvironment to encourage rapid host cell ingress
and maturation (61). The other involves the establishment of a pre-formed vascular
network in vitro prior to grafting onto a host wound bed (62). Both techniques accelerate
wound healing with improved neovascularisation and migration of host cells in vivo
using immunodeficient mouse models (61,62) and both options take a similar total
timeframe to achieve revascularisation with the host, approximately 2-3 weeks (62,63).
Of the two strategies and in view of the similar timeframe for development of a neo-
circulation, the more powerful approach, pragmatically would be the assured creation
of a vascular network in a portable scaffold ex vivo. This would be preferable to
expecting a scaffold with no intrinsic microcirculation to form one and link up to the
wound periphery or recipient bed, particularly in a patient with high total body surface
area burns in whom a large acute wound bed is less receptive to neovascularisation and
has a high risk of infection. An early systemic concern which might limit the success of
immediate graft placement is the massive fluid shift in patients with large burns due to
increased capillary permeability, the resulting systemic hypotension triggering intense
peripheral vasoconstriction hindering the capability of a scaffold to integrate with a
wound bed. Whilst early systemic compromise was being reversed, for example by fluid
administration, production of an autologous, pre-vascularised, dermo-epidermal graft
would ensure it did not interfere with other patient treatments. Practically, a time
window of several weeks is frequently present in severe burns where limitations in
donor site availability may necessitate temporising a wound with cadaveric skin until a
28
suitable alternative, such as re-epithelialised donor site or a newly created pre-
vascularised scaffold, becomes available.
1.8 Endothelial progenitor cells and vessel formation
A detailed understanding of the process of revascularisation is essential for the
development of vascularised grafts. Over recent years there has been significant debate
surrounding the identification of endothelial progenitor cells, which give rise to the
vasculature and the microenvironment in which the vasculature develops. The various
different endothelial progenitor cell populations have recently been reviewed (64–66)
and show endothelial colony forming cells (ECFCs) to be ‘true’ progenitors. This is in
contrast to early endothelial progenitor cells (EPCs), also called colony forming unit-
endothelial cells (CFU-ECs) or CFU-Hill (67) that are described as endothelial progenitors
but are in fact haemopoietic in origin (although they may possess pro-angiogenic
abilities). Such ‘EPCs’ are positive for the cell-surface markers CD31, CD45, CD14, CD105,
CD146, VEGFR-2, CD144 and vonWillebrand Factor (vWF), have the ability to take up
acetylated low-density lipoprotein, and do not form secondary/tertiary endothelial
colonies on re-plating. Morphologically, they appear 'spindle like' and functionally they
do not form vascular tubules (67–70). The presence of CD14 and CD45 on these cells
indicates that they are haemopoietic/monocytic rather than endothelial in origin. In
addition, markers such as CD31, CD144, VEGFR-2, vWF and endothelial nitric oxide
synthase are not necessarily endothelial specific (64) and can be detected, for example,
in monocytes cultured with endothelial growth factors (65). To investigate these
subpopulations of ECs further, Gulati et al. (70) seperated CD14+ and CD14– MNC
fractions showing that CFU-ECs developed from the CD14+ population of cells whilst cells
with a more pronounced endothelial phenotype and intrinsic angiogenic potential
developed from the CD14- fraction. The separation was repeated at d7 in culture with
the same outcome confirming that the vast majority of cells reported to be EPCs express
CD14, originate from CD14+ MNCs, and, critically, do not serve as precursors for the
endothelial lineage. Thus, CFU-Hill or early EPCs do not belong to the endothelial
lineage.
The CD14- cells have been described in the literature as late EPCs, endothelial colony
forming cells (ECFCs), blood outgrowth endothelial cells (BOECs) and endothelial

29
outgrowth cells (EOCs), and have been confirmed to belong to the endothelial lineage
(64,70). The cells have ’cobblestone’ morphology when cultured in vitro (65,69,71–77)
and are found in cord blood (CB), peripheral blood (PB), bone marrow and in vessel
walls, such as the umbilical vein (71–78). ECFCs have a hierarchy of proliferative abilities,
comprising high proliferative potential (HPP)-ECFCs, low proliferative potential (LPP)-
ECFCs and endothelial clusters. A higher percentage of ECFCs with relatively greater
telomerase activity are found in cord blood (CB) than in adult peripheral blood (PB)
(65,69,71–77).
There is no single marker to define ECFCs, and a combination of markers has been used
to confirm their identity within a heterogeneous population. Positive markers include
CD31, CD34, CD105, CD146, VEGFR-2, vWF and Tie-2, while ensuring these are CD45-
and CD14-. These cells form vascular tubule networks both in vitro and in vivo
(69,70,72,78–83). The main phenotypic difference between these cells and CFU-Hill is
that the latter also express CD45 (haemopoietic specific cell surface antigen) and CD14
(monocyte/macrophage cell surface antigen), whereas ECFCs do not.
The problem with creating a vascular network using an autologous population of ECFCs
is their relative scarcity in adult PB. Furthermore, phlebotomy to isolate sufficient
numbers of ECFCs from patients with significant burns would require such large volumes
of blood that, even accounting for expansion in culture, there is a serious ethical issue
of compromising an already unwell patient further by risking hypovolaemia. Other
practical issues relating to the use of PB ECFCs is that their growth kinetics are slower
than for umbilical cord or CB ECFCs, the time taken to grow ECFC-derived colonies from
PB is 1-2 weeks more than from CB and PB colonies also often appear smaller
(72,73,77,84). In addition, CB ECFCs can be expanded for more than 100 population
doublings (PDs) without signs of senescence, whilst PB ECFCs can only be passaged for
20 to 30 PDs(72). Thus there are potential barriers to using autologous PB ECFCs to
rapidly create a pre-vascularised dermal substitute for clinical use (85,86).
A recently identified alternative source of ECFCs is adult adipose tissue (87). The harvest
of such cells would not significantly compromise systemic physiology in patients already
under anaesthesia for wound debridement of a major burn, but again absolute numbers
may be limited in adult tissues. In addition, adipose tissue contains mesenchymal
stem/stromal cells (MSCs) which are also required to stabilise newly formed vessels (88).

30
In semi-elective cases, such as scar revision, or resurfacing after skin malignancy or a
chronic nonhealing ulcer, there may be a role for harvesting and growing ECFCs in order
to produce a suitable pre-vascularised scaffold in vitro in preparation for a planned trip
to theatre to cover the wound. Unlike the situation for acute burns, there is no time
constraint prior to undergoing definitive surgery. As an example, in giant congenital
melanocytic naevus, in view of the risk of malignant transformation (4-7% lifetime risk)
(89) and the aesthetic improvement conferred by removal, surgical excision is common
(90). Although the majority of such cases can be managed through serial excision or
expansion followed by excision, there are cases where STSGs may still be used (91,92).
In these cases, there may be a role for using easily isolated and propagated ECFCs (which
in this particular case could be directly isolated from CB or umbilical cord) to produce a
pre-vascularised dermal scaffold that would augment a STSG. Although autologous CB
or umbilical cord ECFCs would work in this case and in other congenital skin disorders
such as Aplasia Cutis Congenita, there would be issues using banked allogeneic umbilical
cord or CB ECFCs in adult populations as ECFC survival may be compromised by CB
cryopreservation (73) while allo-transplantation would induce graft rejection.
1.9 Isolation and culturing of endothelial colony forming cells
Table 1.3 summarises the various techniques for isolating and culturing ECFCs from
different sources including purification steps and plating substrates/medium. The most
commonly used plate coatings are gelatin, fibronectin (FN) or collagen I and the different
techniques add either fetal bovine serum (FBS), human plasma or pooled human platelet
lysate to medium to optimise ECFC expansion.
Standard adult blood samples of 300mls have been reported to contain as little as a
single ECFC, but this varies amongst donors (73,82). Our own studies indicate that there
are <1-2 ECFCs per 108 MNCS in adult PB and approximately 15 fold more in CB, with the
number isolated from the latter correlating inversely with placental weight at birth
(74,93). With certain donors, a single CB unit could produce at least 1012 to 1014
endothelial progeny over 1-2 months of culture. In comparison, a single PB donation can
produce at least 107, and sometimes significantly more, ECs over 1-2 months of culture.
Both CB and PB ECFCs can be used to produce tubular structures when co-cultured with
fibroblasts or MSCs though CB ECFCs seem to do so more consistently and robustly

31
(73,94). In view of the limited number of ECFCs present in PB, one would intuitively
expect to need prohibitively large quantities of peripheral blood to isolate sufficient
ECFCs to use in tissue engineering yet this is not necessarily the case with one research
group isolating more than 1x10⁸ ECFCs by day 30 from 5ml of fresh blood (95).
Isolation of ECFCs from adipose tissue is a recent development whereby minced adipose
tissue or lipoaspirate can be processed to isolate the cells, and is accompanied by cell
selection procedure(s) to purify the ECFCs. CD44- (87) and CD31+ fractions (96) can
produce characteristic colonies by day 4 or 7 respectively with the added benefit that
the ‘waste’ product from the cell selection (CD44+/CD31-) can be used to generate a
population of Adipose-derived MSCs. Other groups have sought to isolate ECFCs using
alternative cell surface markers combined with either magnetic bead or polychromatic
flow cytometry approaches. This has the advantage that the proliferative ability of the
isolated cells is not compromised by prior culture. Tura et al. (78) for example enriched
CD133-CD34+CD146+ ECFCs from CB and PB. Case and colleagues (97,98) further
demonstrated that CB ECFCs could be enriched after CD34+CD45- selection and more
closely defined the phenotype of ECFCs with a set of cell surface markers (99). Despite
these advances, a single specific marker to purify ECFCs still remains elusive.

32
Table 1.3: Techniques for the isolation of ECFCs.
Source Purification Plate coating Culture conditions Cell progeny Other findings
Lin 2000 (79) 50-100ml PB - Type 1 collagen/ Fibronectin
EGM-2
Wash at 24h
Daily media change
1019 cells by 6 weeks Most circulating ECs from vessel walls & limited growth capability.
ECFCs mainly from transplanted BM
Hur 2003 (61) 50ml PB - 2% gelatin EGM-2 + 5% FBS
Wash at d6
Media change every 3d
ECFCs after 2 weeks
1 x10¹¹ cells by 12 weeks
ECFCs incorporated with HUVECs better than CFU-ECs.
Gulati 2003 (70)
50-100ml PB CD14- Fibronectin EGM-2 + 2% FBS
Daily medium change
ECFCs seen after 2 weeks
>20 passages
ECFCs from CD14- fraction, CFU-ECs from CD14+ fraction. Capillaries better in ECFCs than CFU-ECs
Ingram 2004 (72)
50ml PB;
20-70ml CB
- Type 1 collagen EGM-2 + 10% FBS
Wash at 24h
Daily media change for 7d
ECFCs d5(CB), d14(PB)
1033 (CB) d200
1010 (PB) d100
15x ECFCs in CB vs. PB; CB & PB formed capillary-like structures in Matrigel (CB faster)
Melero- Martin 2007 (83)
50ml PB;
20-70ml CB
CD31+ 1% gelatin EGM-2 + 20% FBS
Wash at 48h (CB) or d4 (PB)
CD31+ ECFCs FN–coated plates
CB ECFCs 1 week
1014 CB ECFCs 40d (PB ECFCs 108)
CB ECFCs combined with SMCs (4:1 ratio) in Matrigel (47.5 microvessels/mm2).
Hofmann 2009 (95)
5ml PB (use within 2 hours)
- Uncoated EGM-2 + pHPL.
24h wash and media change.
30% medium change 2x/week
ECFCs by d12. 4 ECFC-colonies per ml PB. > 1 x 10⁸ cells in 30 days
Reinisch et al 2009 (132)
6-24ml PB Uncoated Fresh blood diluted EGM/10% pHPL before seeding. Wash at 24h.
1st colonies d8.6
1.5x10⁸ after 1 passage
4 colonies/1mL whole blood vs <1/ml after density gradient separation. In vivo PB/CB ECFC microvessels similar

33
Athanassop-oulos et al 2010 (73)
50ml PB; 60-120ml CB
- Type 1 collagen EGM-2 + 10% FBS.
24h wash
Medium change alternate days
ECFCs d5(CB); d14 (PB)
d60: 2.2x10¹¹ (PB); 1.8x10¹³ (CB) ECFCs.
27x CB ECFC colonies than PB. Youngest PB donor (33 y.o.) 295 fold expansion vs. average (1 month). CB ECFC > PB ECFC tubules.
Szöke et al 2012 (87)
300-600ml lipoaspirate
CD44-ECFCs; CD44+MSCs
1% gelatin Cells in MCDB 131 medium + 7.5% FBS + abx + growth factors.
d4-5 wash.
ECFCs d5. PD time 2.3d. Log growth to p14-p19. d42-56 >1x10¹¹ cells
Fresh ECs - no capillary-like structures on Matrigel unlike cultured ECs. Tubule-like structures with AT-ECs alone (better +AT-MSCs)

34
1.10 Developing the next generation vascularised scaffolds and smart biomaterials
Table 1.4 summarises examples of research where a variety of scaffolds with or without
ECs have been used in an attempt to promote and improve wound healing in in vitro and
in vivo models (62,63,74,94,100–112). In such examples, human umbilical vein
endothelial cells (HUVECs), CB ECFCs or human dermal microvascular endothelial cells
(HDMECs) together with fibroblasts or various sources of MSCs, seeded within fibrin,
collagen or matrigels, produced a well-formed capillary network in vitro. These
constructs in vivo, in a subcutaneous pocket murine model (63) or a full thickness
cutaneous wound in a rat (62), accelerated functional anastomoses with the host
vasculature, fibroblasts, pericytes or MSCs stabilising vessels, encouraging lumen
formation and promoting basement membrane assembly (60,113–116).
Seeding commercially available and compatible biosynthetic dermal scaffolds such as
Integra™® or Matriderm® with ECFCs and human dermal fibroblasts (hDFs) or MSCs has
enabled vascular networks to form to a depth of approximately 100µm in vitro 1-2 weeks
(73). In other examples, ECFCs on a fibroblast sheet placed onto a murine full thickness
wound (85), fibroblasts within and keratinocytes on top of a collagen gel in a lapine full
thickness wound (112) and ECFCs together with MSCs within Matrigel® in a
subcutaneous pocket of a mouse (105) have demonstrated significantly improved
neovascularisation in comparison to gel alone.
The alternative to pre-forming microvascular networks is to create a perfectly
ordered scaffold (cellular or acellular) that can initiate rapid host cell migration and
integration. For example, the placement of a simple 1mm-thick dextran-based hydrogel
without cellular components into an in vivo murine full thickness wound encouraged a
rapid influx of host ECs and enabled more rapid neovascularisation than an identical
thickness of Integra®, further illustrating the potential benefits of novel gels over current
dermal replacement scaffolds (61). Gel fabrication with functional amine groups
enhanced host biocompatibility while substitution of cross-linking groups promoted
tissue infiltration, neovascularisation and hydrogel degradation ensuring almost
complete digestion of the hydrogel by day 7. This all contributed to host repair of the
area with significant skin maturation to normal thickness including hair follicles and
sweat glands by 5 weeks (61).
35
Prior to neovascularisation, primary ischaemia limits the thickness and viability of any
potential engineered construct. Therefore, authors have recently attempted to create
in vitro perfusable blood vessels within cell sheets by placing them over resected tissue
with a connectable artery and vein as a vascular bed. Media passed below the sheets via
a bioreactor produce perfusable blood vessels within the sheets as long as endothelial
cells are included within constructs (117). Thicker engineered tissues can subsequently
be produced by overlaying several sheets in vitro. Alternatively, cell sheets can be placed
over collagen-based microchannels, again with medium passed through the channels to
stimulate the formation of new capillaries (118). Theoretically, such a template could be
used to produce a pre-vascularised scaffold to mimic skin in vitro by placing the scaffold
(collagen, fibrin or alternative gel) containning endothelial cells over a vascularised bed
or a gel containing perfused microchannels.
Early inosculation as a result of implant pre-vascularisation would allow for a more rapid
ingress of host cells and factors, increasing the trajectory of wound maturation and
repair (6). Recent research into biomaterials has focussed on the potential to imprint
blood vessel patterns with ordered geometry using computer controlled techniques into
3D flexible, elastic and biocompatible scaffolds. These approaches are being further
refined by functionalising the inner walls of the synthetic tubules, for example with
proteoglycans such as heparan sulphate and anchor peptides which will capture vascular
cells and their products, thereby resulting in the generation of functional vessels
extending more deeply within scaffolds while being capable of rapid inosculation with
host vessels (119–121).
Some authors advocate combining fibronectin (FN), a high molecular weight component
of the ECM, with a standard collagen I gel in order to amalgamate the structural
properties of the latter with the cell-adhesive and survival enhancing properties of the
former. FN also plays a significant role in growth, migration and wound healing (122). By
seeding HUVECs into these constructs, particularly with MSCs, it was possible to create
fully functional and longer lasting vessels in vivo (100,101). FN is widely expressed by
multiple cell types and is critically important in vertebrate development. It is an
abundant soluble constituent of plasma (300 µg/ml) and other body fluids and also part
of the insoluble extracellular matrix. It is often subdivided based on its solubility into
plasma FN (more soluble) and cellular FN (less soluble). Of note, the alternative splicing

36
of precursor mRNA from the single FN gene has the capacity to produce a large number
of variants, generating FNs with different cell-adhesive, ligand-binding, and solubility
properties thereby affecting the composition of the ECM in a tissue-specific manner. FN
has a wide variety of functional activities besides binding to cell surfaces through
integrins. It also binds to a number of biologically important molecules including
heparin, collagen/gelatin and fibrin. The collagen-binding domain binds far more
effectively to denatured collagen than to native collagen implying that FN may bind to
unfolded regions of the collagen triple helix. The physiological function of the collagen
binding domain may be more related to binding and clearance of denatured collagenous
materials from blood and tissue than to mediating cell adhesion to collagen (122).
The concentration of collagen matrices also significantly influences ECFC induced
vasculogenesis. Comparing collagen I gel (containing FN) at concentrations ranging from
0.5mg/ml to 3.5mg/ml, Critser et al. (123) demonstrated that increasing the collagen
concentration significantly decreased ECFC derived vessels per area (density), but
significantly increased vessel sizes (total cross sectional area). These examples provide
some insight into how a variety of parameters determine the extent to which the
scaffold is incorporated including its density and surface composition.
Recent research is more closely defining the molecular mechanisms which regulate
vessel formation as exemplified in (124–128). The addition of pro-angiogenic proteins
or molecules such as vascular endothelial growth factor (VEGF) and basic fibroblast
growth factor (bFGF) to scaffolds is a further strategy that has been used in attempts to
improve wound healing outcomes. As early as 2005, Stahl et al. confirmed that by adding
VEGF or bFGF to HUVECs and early EPC spheroids within a collagen matrix, it was
possible to significantly improve vascular sprouting activity in vitro (104). More recently,
human dermal fibroblast (hDF)-seeded dense-collagen depots were preconditioned
under physiological cell-generated hypoxia to up-regulate key angiogenic factors such
as hypoxia inducible factor-1α (HIF-1α) and VEGF. Angiogenic factor delivery from pre-
conditioned, non-viable depots rapidly induced an angiogenic response within HUVEC-
seeded constructs in vitro. Implanted acellular 3D collagen constructs incorporating such
angiogenic depots in their core were infiltrated with perfused vessels by 1 week in vivo,
at which stage non-angiogenic implants were minimally perfused (108). In another
example of VEGF incorporation improving angiogenesis, VEGF encapsulated into

37
nanoparticles and then seeded into Matrigel or onto poly(lactic-co-glycolic acid) (PLGA)
scaffolds showed consistently improved levels of angiogenesis when placed into murine
intraperitoneal fat pads (106).
The next generation of therapies attempt to combine various cells and biologics with
smart biomaterials with defined topography, porosity and well-ordered geometry in
order to increase the speed of cell infiltration and to improve and direct oxygen and
nutrient transport and vascular patterning (119–121,129).

38
Table 1.4: Acellular and cellularised gels and scaffolds for re-vascularisation
Cell(s) Scaffold/gel Method Outcome(s)
Schechner 2000 (100)
HUVECs Collagen I [C](1.5mg/ml) and FN (90mg/ml)
After 20h construct implanted into subcutaneous pouch in SCID mice.
In vitro @18 h HUVECs organize into cords @24h cords developed lumena. @48h HUVECs dead.
In vivo @d31 thin-walled tubes containing erythrocytes.
Koike 2004 (101)
HUVECs; 10T1/2 murine MSCs
C (1.5mg/ml) and F (90mg/ml)
1x10⁶ HUVECs (HUVEC alone) or 8x10⁵ HUVECs and 2x10⁵ 10T1/2 MSCs (co-implantation group) in 12 well plates.
D1: 4mm disc implanted in SCID mouse.
D4: lumena present in co-implantation group.
4 months: engineered vessels stable and functional.
HUVEC alone group vessels disappeared by 60d.
Wu 2004 (102)
ECFCs; SVSMCs PGA-PLLA (polyglycolic acid-poly-L-lactic acid)
CD34pos CD133pos cell selection from CB.
Loss of CD133 expression in culture (i.e. ECFCs)
ECFCs + SVSMCs onto scaffold in vitro.
76.5 microvessels/mm2 in ECFC + SVSMC group.
None if ECFCs used alone.
Tonello 2005 (103)
hDFs; HDMECs; Keratinocytes
Esterified Hyaluronan (form of Hyaluronic acid)
hDFs within scaffold – culture 1 week
Add HDMECs – further 10d culture
Add Keratinocytes – culture 1 week; air-liquid interface 3 weeks.
Well-developed dermal structure beneath stratified epidermis. Capillary like structures (CLS) by d21.
Stahl 2005 (104)
HUVECs/early EPCs + osteoblasts
C (1.5mg/ml) HUVECs/EPCs spheroids seeded into C gel with osteoblasts.
EGF and bFGF added.
36h: low baseline sprouting
+VEGF and bFGF: sprout number/length increased
+osteoblasts in matrix: HUVEC sprouting inhibited.
Melero- Martin 2008 (105)
PB/CB ECFCs and BM/CB MSCs
Matrigel 1.9x10⁶ cells (acellular control) in 200µl Matrigel® (ECFCs:MSCs 100:0, 80:20, 60:40, 40:60, 20:80, 0:100)
Implanted onto backs of athymic mice.
CB ECFC:MSC: numerous vessels with erythrocytes.
Matrigel®:CB ECFCs alone: no vessels.
MSCs alone: murine capillaries; no human vessels.

39
Chen 2009 (63)
HUVECs; fibroblasts [1:5]
Fibrin (10mg/ml) 3 groups implanted in immunodeficient mice:
UVECs + fibroblasts 7d prior to insertion /HUVECs + fibroblasts 24hrs before insertion (+ve control) / HUVECs only
4: lumenised capillaries; d7: anastomosing capillaries. No fibroblasts no capillaries
In vivo: Vessels d5 (control d14). HUVECs only No perfusion
Montano 2010 (62)
HDMECs Fibrin (7-15 mg/ml), C (2.5-3.5mg/ml) or mix
1x10⁴, 3x10⁴, 5x10⁴, 1x10⁵, 2x10⁵ HDMECs added
Gels cultured for 3 weeks Placed onto 2.6mm full thickness wounds on immuno-incompetent rats.
Optimal gel: 10 and 11mg/ml fibrin 3D lumenized vascular structures; optimal cell number 3x10⁴ cells/ml.
D15 first lumenized segments.
Helary 2010 (107)
hDFs; acellular in vivo
C (0.66 [normal collagen hydrogel], 1, 3 and 5mg/ml [concentrated collagen hydrogels 1, 3 and 5])
in vitro: hDF added to NCH and CCH 1, 3 and 5. In vivo: acellular NCH versus CCH3
hDFs contract NCH 3% after 14d; CCH5 gels granulous & heterogenous; CCH3: no contraction 7d; <50% 14d.
14d in vivo: NCH hydrolysed; CCH3 integrated & colonized by host cells with neovascularisation.
Des Rieux 2010 (106)
Acellular Matrigel™ hydrogels and PLGA scaffolds
VEGF encapsulated into nanoparticles seeded into Matrigel™ subcut. injection/ PLGA scaffolds in intraperitoneal fat pad
VEGF encapsulation improved angiogenesis in vivo with both type 3D matrices.
Hadjipanayi 2011 (108)
HUVECs; hDFs C hDFs seeded within collagen
Pre-conditioned to up-regulate HIF1α and VEGF
nap-frozen, Pplaced into collagen gel with HUVECs.
Angiogenic response in EC constructs in vitro.
Implanted acellular 3D constructs with angiogenic depots infiltrated with perfused vessels by 1 week in vivo.
Hegen 2011 (109)
HDMECs; hPASMCs
Poly-L Lactic Acid (PLLA) scaffolds filled with Matrigel®
Scaffolds: 1×10⁶ cells in 36 μl 50:50 EGM-2/Matrigel.
Scaffolds seeded with 1×10⁶ HMVEC; 1×10⁶ hPASMC; 1:1 (5x10⁵ HMVEC: 5x10⁵ hPASMC); 1:4 (2x10⁵ HMVEC: 8x10⁵ hPASMC); acellular
D7: Patent vessels in HDMECs & hPASMCs scaffolds.
No vessels in acellular or hPASMC only.
D14: Microvasc density in HMVEC-hPASMC (1:1 and 1:4) scaffolds enhanced 2.5- and 4-fold vs HMVEC alone.
Yee 2011 (110)
CB ECFCs Hyaluronic acid (HA) 2x10⁶/ml ECFCs within 3 different concentrations of HA hydrogels.
Stiff (0.22%) matrix ECFCs remained rounded and could not form CLS @96hrs.
CLS best @48hrs in lowest concentration gel (0.056%).
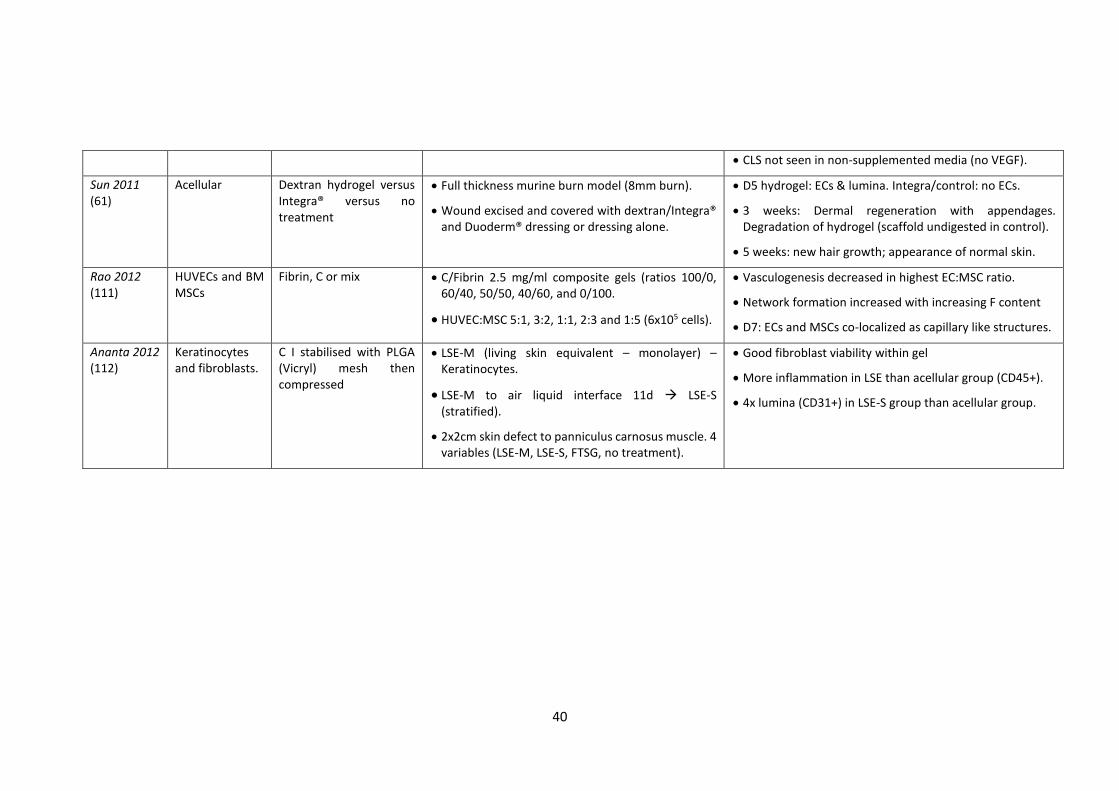
40
CLS not seen in non-supplemented media (no VEGF).
Sun 2011 (61)
Acellular Dextran hydrogel versus Integra® versus no treatment
Full thickness murine burn model (8mm burn).
Wound excised and covered with dextran/Integra® and Duoderm® dressing or dressing alone.
D5 hydrogel: ECs & lumina. Integra/control: no ECs.
3 weeks: Dermal regeneration with appendages. Degradation of hydrogel (scaffold undigested in control).
5 weeks: new hair growth; appearance of normal skin.
Rao 2012 (111)
HUVECs and BM MSCs
Fibrin, C or mix C/Fibrin 2.5 mg/ml composite gels (ratios 100/0, 60/40, 50/50, 40/60, and 0/100.
HUVEC:MSC 5:1, 3:2, 1:1, 2:3 and 1:5 (6x10⁵ cells).
Vasculogenesis decreased in highest EC:MSC ratio.
Network formation increased with increasing F content
D7: ECs and MSCs co-localized as capillary like structures.
Ananta 2012 (112)
Keratinocytes and fibroblasts.
C I stabilised with PLGA (Vicryl) mesh then compressed
LSE-M (living skin equivalent – monolayer) – Keratinocytes.
LSE-M to air liquid interface 11d LSE-S (stratified).
2x2cm skin defect to panniculus carnosus muscle. 4 variables (LSE-M, LSE-S, FTSG, no treatment).
Good fibroblast viability within gel
More inflammation in LSE than acellular group (CD45+).
4x lumina (CD31+) in LSE-S group than acellular group.

41
1.11 Perspectives
Investigators have identified the improvement of existing dermal substitutes as a
fundamental objective in reducing scarring following full thickness skin loss.
Comprehensive knowledge of the stem cell niche within skin, the normal and abnormal
wound healing responses, vessel-forming endothelial progenitor and pro-angiogenic
cells, ECM proteins, next generation scaffolds and the molecular mechanisms of vessel
formation provides a clear foundation on which to improve existing dermal
replacements. The ability to optimise scaffolds based on imprinted biomaterials, which
can be enhanced with specific molecular and cellular constituents, should enable the
creation of off-the-shelf products which, when used either in isolation or together with
STSGs, closely mimic the structure and function of human skin.
Solving the problem of how to rapidly re-vascularise grafts/substitutes will expedite the
wound healing process and thus limit scar formation. Currently, the ability to select
ECFCs post-natally from PB and adipose tissue is possible, but the process still takes
several weeks and the ECFC content is generally considered low. Although recent
interest in tissue engineering for skin regeneration has centred on these cells and the
overall strategy of enhancing vasculogenic potential of scaffolds, lack of autologous
ECFC availability after injury may require an alternative approach. The adaptation of the
healing skin microenvironment to the structure of potential matrices may be a more
suitable and achievable future perspective in the first instance. For example, the
production of a scaffold that closely replicates the microenvironment of a healing
wound may potentially enable improved host progenitor cell migration and integration
with consequent earlier wound healing and regeneration of normal tissue. Already, a
plethora of acellular scaffolds has been made from collagen, hyaluronic acid and fibrin
in an attempt to replicate the microenvironment of normal skin regeneration for larger
wounds. Through further study of skin and vascular stem/progenitor cells,
reprogramming mechanisms, signalling pathways, cell adhesion molecules and the
cellular secretomes that affect endothelial proliferation, differentiation, migration,
angiogenesis and vasculogenesis, it may be possible to create a product that further
improves the speed of graft ‘take’ and therefore the quality of regenerated skin.
Replication of skin microenvironments in novel pre-patterned functionalised scaffolds

42
with key biologics and/or cells can then be used as a springboard for further studies that
promote vasculogenesis and angiogenesis to further improve outcomes in wound
repair. Figure 1.2 summarises some of the many novel therapeutic possibilities that
should enable increased options for skin resurfacing and improved therapeutic
outcomes.
A key determinant for the development of future skin substitutes involves the
manufacture of such products under good manufacturing practice (GMP) conditions. In
addition to the cost implications of producing a scaffold containing autologous human
cells or unique biologics under GMP, account needs to be taken of automation and
increased regulatory requirements and costs. In the current climate of financial
instability, some medical institutions may be loath to sanction expensive tissue-
engineered products with only limited clinical benefits over existing therapies. The
production of a novel scaffold containing autologous cells and/or biologics will need to
show a significant clinical benefit to overcome these hurdles. Although the literature
suggests that it is relatively straightforward to culture autologous cells and implant them
within and onto scaffolds to enhance wound repair, the complexity of quality control
testing is a significant obstacle to achieving this goal. In the case of autologous cells
obtained via tissue biopsies, tissue collected in various clinical surroundings under
differing conditions may result in variances in size, condition, and site of harvest.
Because each patient presents a unique set of clinical circumstances, these and other
variables tend to be outside of the control of the tissue engineering facility but can affect
the growth and performance of the living cells. The costs of controlling the multiple in-
process variables including cleaning, sterilization, personnel training and the
maintenance/calibration of equipment cannot be underestimated. This is particularly
the case for a product where adult derived autologous ECFCs are used as the timeframe
for culture and neovascularisation within a novel scaffold is likely to be several weeks.
Existing ‘user-friendly’ substitutes that do not require specialist expertise have multiple
weaknesses and, were it possible to create an improved scaffold using autologous cells
and biologics to reproduce the physical characteristics and appearance of skin, then
providing this is financially viable it would be universally accepted.
A significant benefit of using autologous cells for a skin substitute is that infectious risks
associated with allogeneic/xenogeneic tissues are negated. The full spectrum of

43
infectious agents that might be transmitted by xenotransplantation in particular is not
known, and agents that produce only minimal symptoms in animals may have the
capacity to cause severe disease in humans. The GMP manufacture of an autologous
cell-containing skin substitute is therefore theoretically more straightforward, however,
the process is still very labour intensive from the harvest of cells under aseptic
conditions to the careful management of cell culture operations in terms of quality of
materials, manufacturing controls, equipment validation and monitoring. Further,
acceptance criteria must be established for all media and components, including serum
additives and growth factors and relevant records kept of components used including
culture media. Maintenance of cell viability and/or relevant biologic function(s) must
also be demonstrated post processing and all materials being implanted into a patient
with the cells or tissue must be tested and documented as biocompatible with other
cells or tissues at the implant site.
1.12 Aims and objectives of this thesis
In this MD thesis, the main aim was to use existing knowledge of scaffolds and
progenitor cells in order to produce a novel dermal substitute containing vascular
networks formed through the interactions of purely adult derived stem/progenitor
cells.
In order to do this it was necessary to:
Establish a bank of and characterise ECFCs sourced from cord and peripheral
blood and MSCs from adipose tissue for wound repair.
Examine ECFC chemotaxis and chemokinesis within various collagen and fibrin
gels.
Examine vascular network formation within compressed and uncompressed
collagen gels.
Assess up scaled, pre-vascularised dermal scaffolds within immunodeficient
mice.
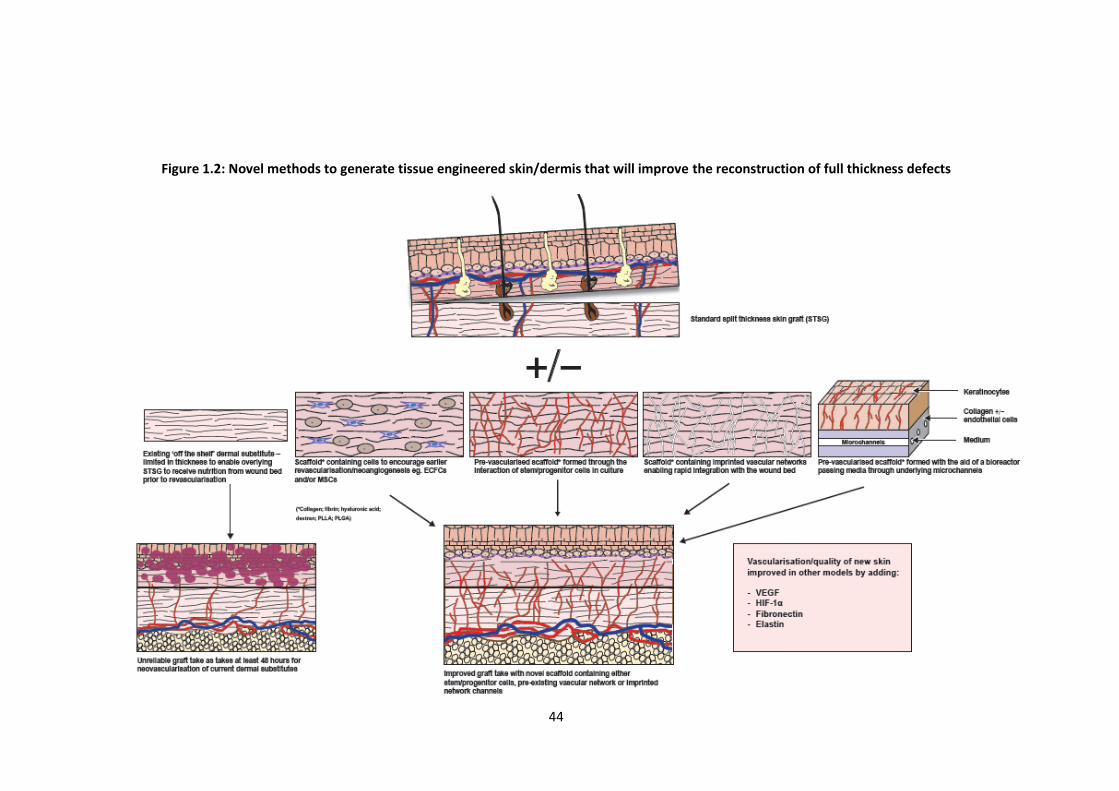
44
Figure 1.2: Novel methods to generate tissue engineered skin/dermis that will improve the reconstruction of full thickness defects
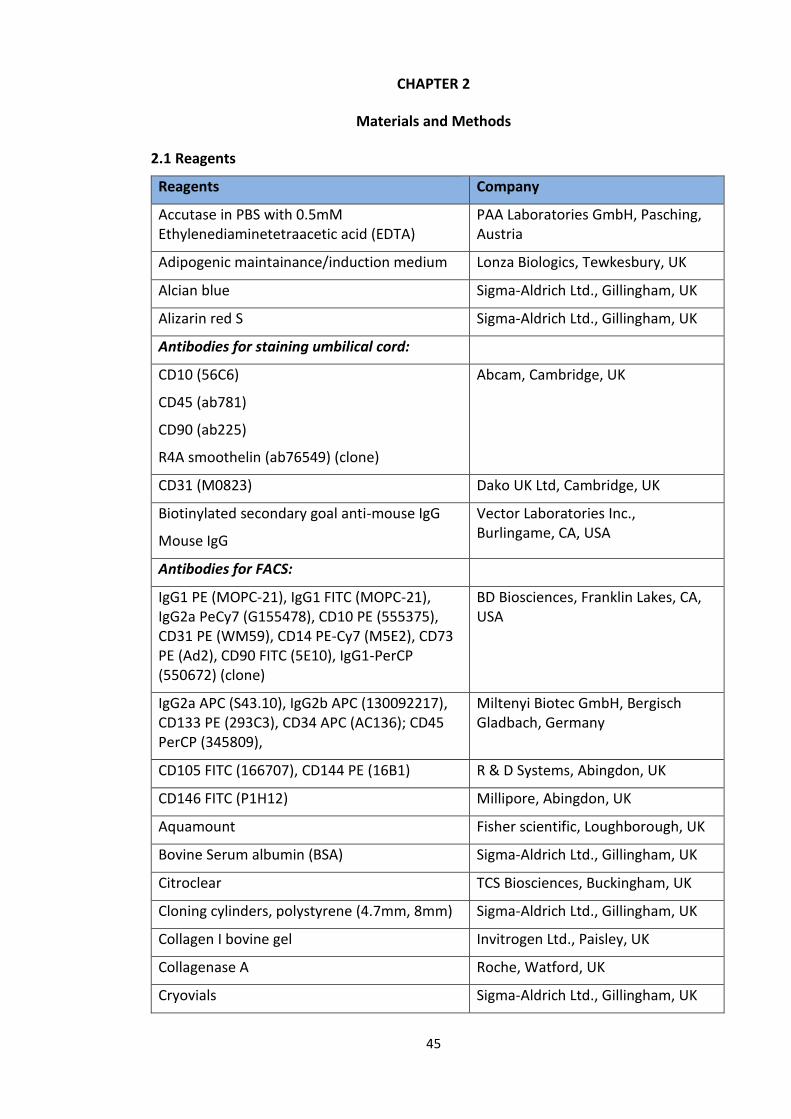
45
CHAPTER 2
Materials and Methods
2.1 Reagents
Reagents Company
Accutase in PBS with 0.5mM Ethylenediaminetetraacetic acid (EDTA)
PAA Laboratories GmbH, Pasching, Austria
Adipogenic maintainance/induction medium Lonza Biologics, Tewkesbury, UK
Alcian blue Sigma-Aldrich Ltd., Gillingham, UK
Alizarin red S Sigma-Aldrich Ltd., Gillingham, UK
Antibodies for staining umbilical cord:
CD10 (56C6)
CD45 (ab781)
CD90 (ab225)
R4A smoothelin (ab76549) (clone)
Abcam, Cambridge, UK
CD31 (M0823) Dako UK Ltd, Cambridge, UK
Biotinylated secondary goal anti-mouse IgG
Mouse IgG
Vector Laboratories Inc., Burlingame, CA, USA
Antibodies for FACS:
IgG1 PE (MOPC-21), IgG1 FITC (MOPC-21), IgG2a PeCy7 (G155478), CD10 PE (555375), CD31 PE (WM59), CD14 PE-Cy7 (M5E2), CD73 PE (Ad2), CD90 FITC (5E10), IgG1-PerCP (550672) (clone)
BD Biosciences, Franklin Lakes, CA, USA
IgG2a APC (S43.10), IgG2b APC (130092217), CD133 PE (293C3), CD34 APC (AC136); CD45 PerCP (345809),
Miltenyi Biotec GmbH, Bergisch Gladbach, Germany
CD105 FITC (166707), CD144 PE (16B1) R & D Systems, Abingdon, UK
CD146 FITC (P1H12) Millipore, Abingdon, UK
Aquamount Fisher scientific, Loughborough, UK
Bovine Serum albumin (BSA) Sigma-Aldrich Ltd., Gillingham, UK
Citroclear TCS Biosciences, Buckingham, UK
Cloning cylinders, polystyrene (4.7mm, 8mm) Sigma-Aldrich Ltd., Gillingham, UK
Collagen I bovine gel Invitrogen Ltd., Paisley, UK
Collagenase A Roche, Watford, UK
Cryovials Sigma-Aldrich Ltd., Gillingham, UK
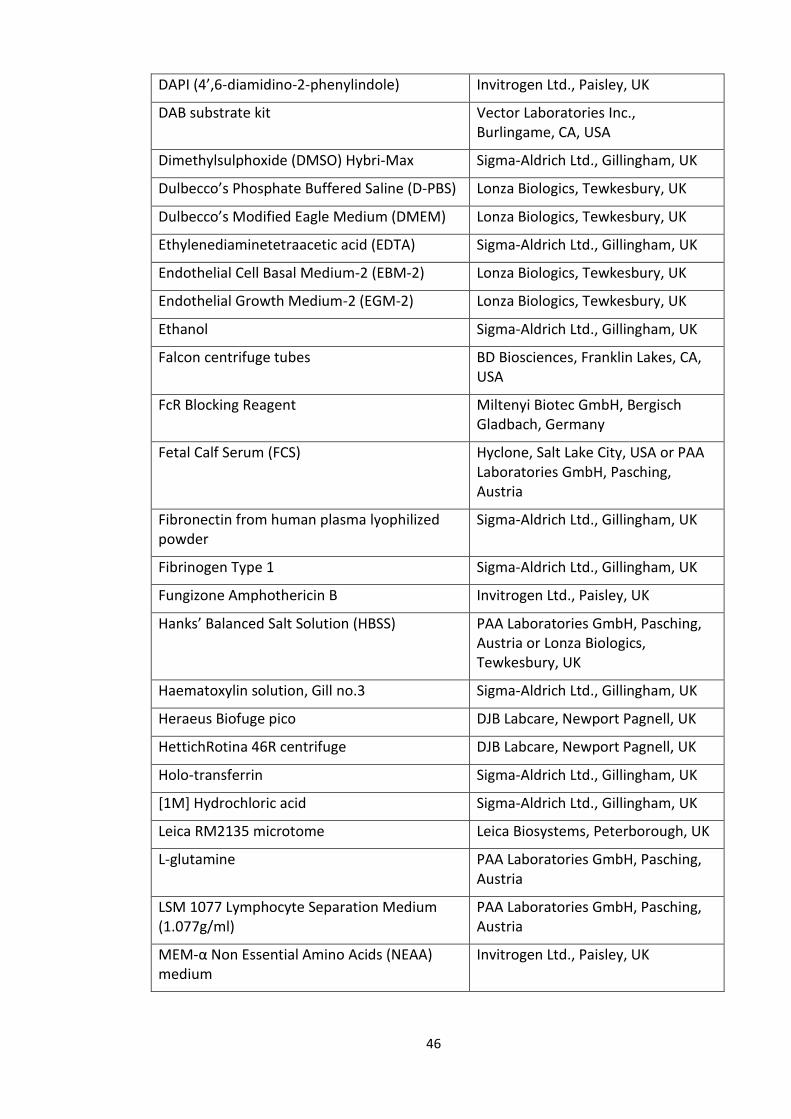
46
DAPI (4’,6-diamidino-2-phenylindole) Invitrogen Ltd., Paisley, UK
DAB substrate kit Vector Laboratories Inc., Burlingame, CA, USA
Dimethylsulphoxide (DMSO) Hybri-Max Sigma-Aldrich Ltd., Gillingham, UK
Dulbecco’s Phosphate Buffered Saline (D-PBS) Lonza Biologics, Tewkesbury, UK
Dulbecco’s Modified Eagle Medium (DMEM) Lonza Biologics, Tewkesbury, UK
Ethylenediaminetetraacetic acid (EDTA) Sigma-Aldrich Ltd., Gillingham, UK
Endothelial Cell Basal Medium-2 (EBM-2) Lonza Biologics, Tewkesbury, UK
Endothelial Growth Medium-2 (EGM-2) Lonza Biologics, Tewkesbury, UK
Ethanol Sigma-Aldrich Ltd., Gillingham, UK
Falcon centrifuge tubes BD Biosciences, Franklin Lakes, CA, USA
FcR Blocking Reagent Miltenyi Biotec GmbH, Bergisch Gladbach, Germany
Fetal Calf Serum (FCS) Hyclone, Salt Lake City, USA or PAA Laboratories GmbH, Pasching, Austria
Fibronectin from human plasma lyophilized powder
Sigma-Aldrich Ltd., Gillingham, UK
Fibrinogen Type 1 Sigma-Aldrich Ltd., Gillingham, UK
Fungizone Amphothericin B Invitrogen Ltd., Paisley, UK
Hanks’ Balanced Salt Solution (HBSS) PAA Laboratories GmbH, Pasching, Austria or Lonza Biologics, Tewkesbury, UK
Haematoxylin solution, Gill no.3 Sigma-Aldrich Ltd., Gillingham, UK
Heraeus Biofuge pico DJB Labcare, Newport Pagnell, UK
HettichRotina 46R centrifuge DJB Labcare, Newport Pagnell, UK
Holo-transferrin Sigma-Aldrich Ltd., Gillingham, UK
[1M] Hydrochloric acid Sigma-Aldrich Ltd., Gillingham, UK
Leica RM2135 microtome Leica Biosystems, Peterborough, UK
L-glutamine PAA Laboratories GmbH, Pasching, Austria
LSM 1077 Lymphocyte Separation Medium (1.077g/ml)
PAA Laboratories GmbH, Pasching, Austria
MEM-α Non Essential Amino Acids (NEAA) medium
Invitrogen Ltd., Paisley, UK

47
Mesenchymal Stem Cell Growth Medium (MSC-GM)
Lonza Biologics, Tewkesbury, UK
Medium(M)-199 and 10x M-199 Sigma-Aldrich Ltd., Gillingham, UK
µ-Slide Chemotaxis3D plates Ibidi GmbH, Thisle Sciences Ltd, Glasgow, UK
Nalgene® Mr Frosty Sigma-Aldrich Ltd., Gillingham, UK
Nuaire DH autoflow incubator Nuaire, MN, USA
Oil red O Sigma-Aldrich Ltd., Gillingham, UK
Oleic acid Sigma-Aldrich Ltd., Gillingham, UK
Optimal cutting temperature (O.C.T.) compound
Tissue-Tek, Fisher Scientific, Loughborough, UK
Paraffin sectioning mounting bath Barnstead International, Dubuque, IA, USA
Penicillin/Streptomycin PAA Laboratories GmbH, Pasching, Austria
6 (collagen coated and uncoated), 12, 24 and 96 well plates
BD Biosciences, Franklin Lakes, CA, USA
Real architecture for 3D tissues (RAFT) 96 well plates
TAP Biosystems, Royston, UK
Sodium Bicarbonate Invitrogen Ltd., Paisley, UK
Sodium Hydroxide VWR International, Lutterworth, UK
Sodium Pyruvate Invitrogen Ltd., Paisley, UK
Sodium Selenite Sigma-Aldrich Ltd., Gillingham, UK
Sutures (6/0 Prolene and 5/0 Vicryl rapide) Ethicon Europe, Norderstedt, Germany
Recombinant Human Basic-Fibroblast Growth Factor
R and D Systems, Minneapolis, MN, USA
Recombinant Human Insulin Sigma-Aldrich Ltd., Gillingham, UK
Recombinant Human Interleukin-3 R and D Systems, Minneapolis, MN, USA
Recombinant Human Stromal Cell-Derived Factor (SDF)-1α
R and D Systems, Minneapolis, MN, USA
Recombinant Human Stem Cell Factor (SCF) R and D Systems, Minneapolis, MN, USA
Saponin Sigma-Aldrich Ltd., Gillingham, UK
Sodium Selenite Sigma-Aldrich Ltd., Gillingham, UK
Syringe filter 22 (0.22µm) Techno Plastic Products (TPP) AG, Trasadingen, Switzerland

48
Sysmex Haematology Analyser Sysmex Corporation, Hyogo, Japan
Thrombin Sigma-Aldrich Ltd., Gillingham, UK
Trisodium citrate VWR International Ltd., Lutterworth, UK
Trypan Blue stain 0.4% (w/v) Invitrogen Ltd., Paisley, UK
Trypsin-EDTA (1x) 0.5mg/ml-0.22mg/ml in PBS without Ca++ and Mg++
PAA Laboratories GmbH, Pasching, Austria
Rh-insulin Sigma-Aldrich Ltd., Gillingham, UK
Vaseline® Unilever, UK
VECTASTAIN ABC kit Vector Laboratories Inc., Burlingame, CA, USA
2.2 Cells
2.2.1 Pooled human umbilical vein endothelial cells (pHUVECs)
pHUVECs were acquired from Lonza Biologics at passage 1 and were cultured in
complete endothelial growth medium-2 (EGM-2) (made from endothelial cell basal
medium-2 (EBM-2) (Lonza Biologics) supplemented with EGM-2 Single Quots (consisting
of 10ml fetal calf serum (FCS), 0.2ml hydrocortisone, 2ml fibroblast growth factor-B
(hFGF-B), 0.5ml vascular endothelial growth factor (VEGF), 0.5ml long R insulin-like
growth factor-1 (R3-IGF-1), 0.5ml ascorbic acid, 0.5ml epidermal growth factor (hEGF),
0.5ml gentamicin sulphate, amphotericin-B (GA-1000) and 0.5ml heparin per 500ml
EBM-2, all from Lonza Biologics) (72). They were passaged as per section 2.2.8 and
frozen in aliquots at passage 2 to 4, and used at a given passage as described in specific
experiments (vide infra).
The typical cobblestone endothelial morphology of these cells and their phenotype are
shown in Figures 2.1a and 2.1b respectively.

49
Figure 2.1a – Morphology of HUVECs: Morphology of HUVECs. Phase contrast image showing
x10 magnification of pHUVECs at p3 (scale bar 200µm). Note the cobblestone morphology that
is characteristic of endothelial cultures.
Figure 2.1b – FACS for pHUVECs: Representative flow cytometric phenotyping of HUVECs at P3.
These cells were CD31+, CD73+, CD105+ and CD146+ but CD14- and CD45- consistent with an
endothelial cell phenotype. MFI = Median fluorescence intensity is the mid-point of the
population and is shown along with +/- standard deviation (SD) for n=3
2.2.2 Bone marrow mesenchymal stem/stromal cells (BMMSCs)/human dermal
fibroblasts (hDFs)
BMSCs and hDFs were bought from Lonza Biologics at passage 1 and were cultured in
complete mesenchymal stem cell growth medium (MSC-GM) (made from mesenchymal
stem cell growth medium (MSC-GM) (Lonza Biologics) supplemented with MSC-GM
Single Quots (consisting of 0.5ml gentamicin sulphate, amphotericin-B (GA-1000), 50ml
mesenchymal cell growth supplement and 10ml L-Glutamine, all from Lonza Biologics).
They were passaged as per section 2.2.8 and frozen in aliquots at passage 3 to 5, and
used at a given passage as described in specific experiments (vide infra).
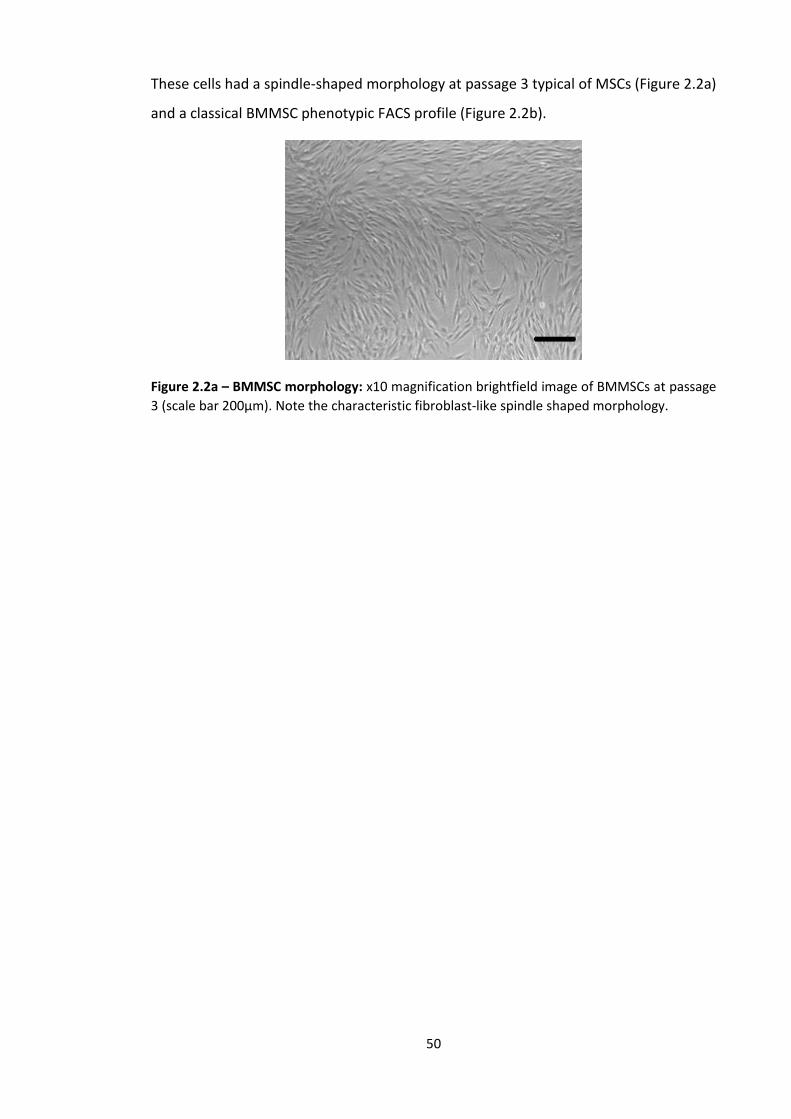
50
These cells had a spindle-shaped morphology at passage 3 typical of MSCs (Figure 2.2a)
and a classical BMMSC phenotypic FACS profile (Figure 2.2b).
Figure 2.2a – BMMSC morphology: x10 magnification brightfield image of BMMSCs at passage
3 (scale bar 200µm). Note the characteristic fibroblast-like spindle shaped morphology.

51
Fig 2.2b - FACS for BMMSCs: Representative flow cytometric phenotyping of BMMSCs at P3.
These cells were CD90+, CD73+, CD105+ but CD14-, CD45- and CD34- consistent with an MSC
phenotype. Percentage of cells within positive gate are shown in each FACS plot along with MFI
and SD (n=3).

52
2.2.3 Mononuclear cells from umbilical cord blood (MNCs)
Human umbilical cord blood (CB) was collected from the umbilical vein of the placenta
from normal term births, with written informed consent and ethical approval from the
Oxford John Radcliffe Research Ethical Committee (107853/343015/1/231). CB units
were either processed immediately or stored at 4°C overnight and then processed. Any
cells used were done so as anonymised linked donations under an HTA licence. The
process of isolating MNCs from CB was performed in a laminar flow hood under aseptic
conditions. CB units were diluted with CB dilution medium at a ratio of 1:1 if the white
blood cell (WBC) count was <7x10⁶ cells/ml and 1:2 if the count was >7x10⁶ cells/ml. The
medium was made by mixing 500mls Hanks’ Balanced Salt Solution (HBSS) without
calcium and without magnesium (PAA Laboratories, GmbH) with 1.5g trisodium citrate
(VWR International Ltd.) and 2.5g BSA (Sigma Aldrich Ltd.) which was then 0.2µM filter-
sterilised. This was stored at 4oC and used within 3 months. 25-30ml diluted CB was
carefully layered onto the frit in Accuspin tubes (Sigma Aldrich Ltd.) containing 15ml LSM
177 (PAA Laboratories) pre-spun in the centrifuge at 1000g for 5 minutes at acceleration
9 and brake 9 in a Hettich Rotina 46R centrifuge (DJB Labcare) (all centrifugation took
place in this centrifuge unless otherwise specified). MNCs were separated by
centrifugation at 1000g for 10 minutes at acceleration 9 and brake 1. Platelet rich plasma
was removed from above the MNC buffy coats and then the MNC layers were collected
and combined (2 to 4 buffy coats/ 50ml Falcon tube) and CB dilution medium added to
make a total volume per Falcon tube of 50ml. These were then centrifuged at 400g at
acceleration 9 and brake 9 for 10 minutes at 4°C. After removing supernatant the cell
pellets were re-suspended in 10ml dilution medium mixing up to 3 pellets per 50ml
Falcon tube. Tubes were then topped up to 50mls with dilution medium and centrifuged
for 10 minutes, 200g at acceleration 9 and brake 9 at 4°C. Pellets were pooled and re-
suspended in 5mls EGM-2 (Lonza Biologics) with 10% (v/v) FCS (PAA Laboratories,
GmbH) then topped up to 50mls with EGM-2 (Lonza Biologics) with 10% (v/v) FCS (PAA
Laboratories) and centrifuged for 5 mins at 200g, acceleration 9 and brake 9 at 22°C.
Cells were re-suspended in 10mls EGM-2 and a 200µl sample was used to count cells
using a Sysmex Haematology Analyser (Sysmex Corporation). Cells were then either
frozen as MNCs at a concentration of 1x10⁸ cells/ml as described in section 2.2.8 or were
plated onto 6-well plates, pre-coated with collagen I (rat tail) (BD Biosciences), at a

53
concentration of 2x10⁷ cells/well in EGM-2 (Lonza Biologics) with 10% (v/v) FCS (PAA
Laboratories, GmbH). All plates used for experimentation (6 well collagen I-coated, 12
well, 24 well and 96 well) in the course of all experiments were tissue culture grade.
2.2.4 Endothelial cells from umbilical cord blood (CBECs)
Twenty four hours after plating CB MNCs in EGM-2 with 10% FCS (2.2.3), the wells in the
6-well collagen I-coated plates (Lonza Biologics) were washed twice with 1ml of HBSS
(PAA Laboratories) and then 4ml fresh medium was added to each well (EGM-2 with
10% (v/v) FCS). After 48 hours, a further full 4ml medium change was undertaken and
this continued every 2-3 days until characteristic ECFC colonies (with a cobblestone
morphology) were noted. These can be seen in Fig 2.3. These were then cloned using
small or large cloning rings (Sigma Aldrich Ltd.). Cloning rings were carefully applied
around pre-marked (using a fine-tip permanent marker pen on the underside of the
plate) colonies, securing in place by first dipping the rings into sterile Vaseline® (Unilever
UK) using ethanol-cleansed forceps. Two 100µl Dulbecco’s phosphate buffered saline
(PBS) (Lonza Biologics) washes were carefully carried out and then 70-100µl (depending
on the size of the cloning ring) of 1x Trypsin-EDTA (PAA Laboratories) was added to cells
within the cloning rings and left for 30 seconds or until cells were seen to be lifting off
from under the microscope (Nikon Eclipse TE300 brightfield microscope (Nikon UK Ltd).
Colonies (1-2 large or 2-3 small) were then placed into new wells of a collagen I-coated
6 well plate (BD Biosciences) along with 4ml EGM-2 with 10% (v/v) FCS medium. Cells
were fed with 4ml medium on alternate days until 80% confluent and were then
passaged into collagen-coated T25 flasks. When these were 80% confluent, cells were
passaged 2-3 times until there were sufficient cells to produce sufficient cells for
subsequent experimentation. In order to coat the T25 flasks with collagen, 245µl
4.08µM rat-tail collagen I (BD Biosciences) was added to 19.755ml 0.02N Acetic acid and
3ml of this added to each T25 flask to be coated. After 2 hours incubation at 37°C, 5%
CO2 (Nuaire incubator), plates were washed twice with sterile D-PBS (Lonza Biologics).
Flasks not being used immediately could be stored containing D-PBS at 4°C for up to 1
week.
The typical endothelial morphology of CB ECFCs is shown in Figure 2.3 and their
phenotype by flow cytometry in Figures 2.4 and 2.5 and Table 2.1. These CB ECFC
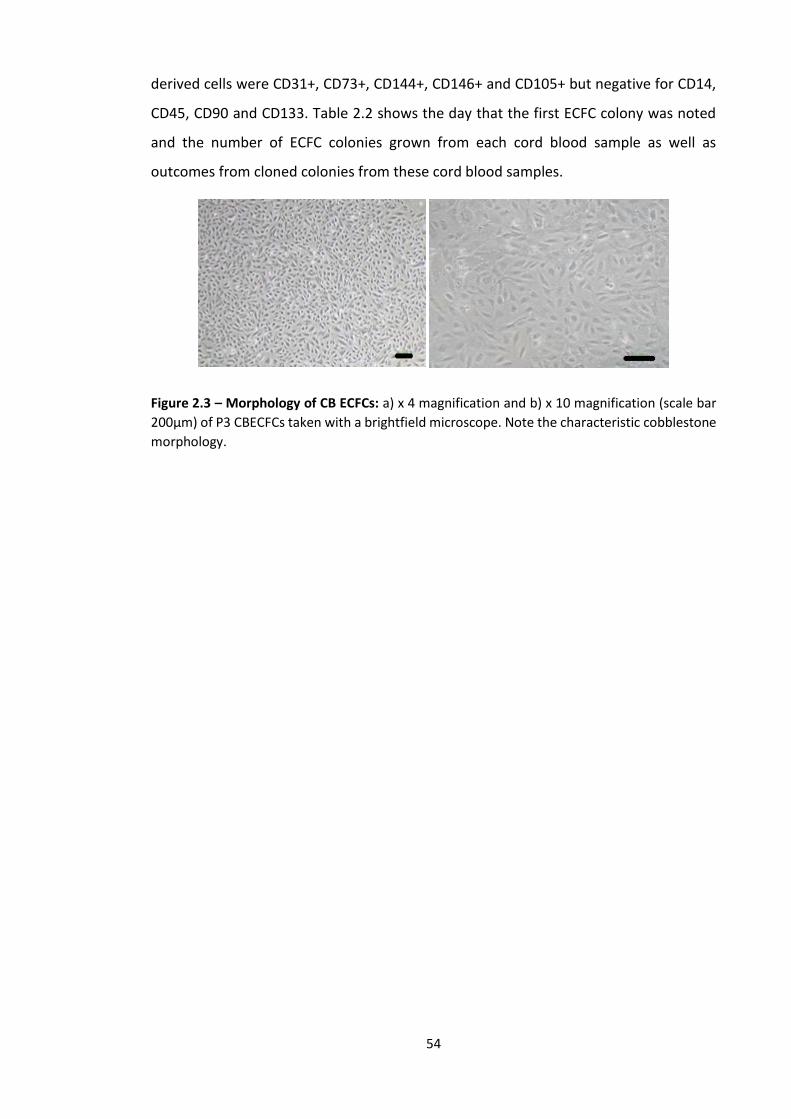
54
derived cells were CD31+, CD73+, CD144+, CD146+ and CD105+ but negative for CD14,
CD45, CD90 and CD133. Table 2.2 shows the day that the first ECFC colony was noted
and the number of ECFC colonies grown from each cord blood sample as well as
outcomes from cloned colonies from these cord blood samples.
Figure 2.3 – Morphology of CB ECFCs: a) x 4 magnification and b) x 10 magnification (scale bar
200µm) of P3 CBECFCs taken with a brightfield microscope. Note the characteristic cobblestone
morphology.

55
Figure 2.4 – CB ECFC FACS: Representative flow cytometric phenotyping of CBECFCs at P2. These cells were CD31+, CD73+, CD144+, CD146+ and CD105+, CD90-,
CD45-, CD14- and CD133- consistent with an endothelial cell phenotype. Table 2.1 shows median fluorescence intensity and number of positive cells.

56
Stain
Average
MFI SD MFI
Average
% cells
Positive
SD %
cells
positive
IgG1 PE 98.0 6.2 2.3 0.4
CD31 PE 37094.0 4894.2 99.9 0.2
CD73 PE 7951.3 866.0 99.9 0.2
CD144 PE 6760.7 4390.5 99.7 0.1
IgG1 FITC 95.0 6.1 1.3 0.7
CD90 FITC 89.3 9.3 1.1 0.4
CD146 FITC 7128.7 1358.6 99.8 0.4
CD105 FITC 14595.3 1785.9 99.8 0.2
IgG2a PE-Cy7 69.7 6.8 3.8 2.5
CD14 PE-Cy7 56.0 24.3 0.8 0.5
IgG1 PerCP 76.0 0.0 1.4 0.0
CD45 PerCP 82.3 8.5 4.5 3.2
IgG2b APC 89.0 0.0 2.0 0.0
CD34 APC 186.7 42.8 42.4 33.3
CD133 APC 78.0 24.6 1.2 0.9
Table 2.1 – CB ECFC FACS: Flow cytometry data for P3 CBECFCs (average n=3). Results are
consistent with the FACS histograms seen in Figure 3.8. MFI = median fluorescence
intensity

57
Figure 2.5 – CBECFC flow cytometry data: MFI and percentage of cells positive (n=3)
Table 2.2 – CB ECFC colonies*
Cord
Blood
number
Date of
1st ECFC
colony
No. of
colonies by
d14
Date of colony
cloning (no. cloned)
Outcome
1 d10 3 d13 (3 large) MSC subpopulation grown
2 d10 16 d10 (7 medium) Mixed population phenotype
3 and 4
(pooled)
d7 15 d12 (8 medium)
ECFCs phenotyped and frozen
5 d14 2 d14 (1 large, 1 small) ECFCs phenotyped and frozen
6 d12 4 d12 (1 large, 3 small) ECFCs phenotyped and frozen
7 d8 8 d10 (3 small, 5
contaminated)
MSCs and ECFCs frozen
*ECFC colony growth following plating of Ficoll buffy coat MNCs from different CB batches.
CBECFCs were isolated from 3 batches of CB and banked for subsequent use at p2-4.

58
2.2.5 Peripheral blood endothelial cells (PBECs)
Peripheral blood mononuclear cells (PBMCs) were obtained from anonymised
human leucocyte cones supplied by the United Kingdom Blood Transfusion Service
(donations were anonymised and within the remit of the consent taken at the time
of donation). Cones were provided within 4 hours of donation and an aperture was
created at either end to allow access to cells under sterile conditions. The cones were
back-flushed with air using a 20ml syringe into a 50ml Falcon tube (BD Biosciences)
and then with D-PBS (Lonza Biologics) to ensure all cells were transferred from the
cone to the Falcon tube which was topped up with D-PBS (Lonza Biologics). The cells
then underwent the same density centrifugation as CB (section 2.2.3) to separate the
MNC fraction. The PB MNCs were seeded at the same concentration (2x10⁷
cells/well) as the CB MNCs, in 4ml EGM-2 with 10% (v/v) FCS in collagen I-coated 6-
well plates (BD Biosciences). Excess PBMCs were frozen at concentrations of 0.5-
1x10⁷ in liquid nitrogen (section 2.2.8). Feeding and cloning of PBEC colonies was
done in the same manner as for the isolation of CBECs (2.2.4).
Peripheral blood leucocyte cones were obtained from NHS Blood & Transplant and
cells were plated and cultured in EGM-2 media with 10% (v/v) FCS until ECFC colonies
were visualised. These were then cloned and plated on collagen I-coated tissue
culture plastic dishes until a bank of ECFCs had been created (Chapter 2.2.5). The
cells were characterised by morphology (Fig 2.6) and FACS analysis (Fig 2.7 and 2.8
and table 2.3) to confirm that they were ECFCs. Table 2.4 shows the date that the
first PB ECFC colony was noted and the number of ECFC colonies grown from each
cord PB sample as well as outcomes from cloned colonies from these cord blood
samples.
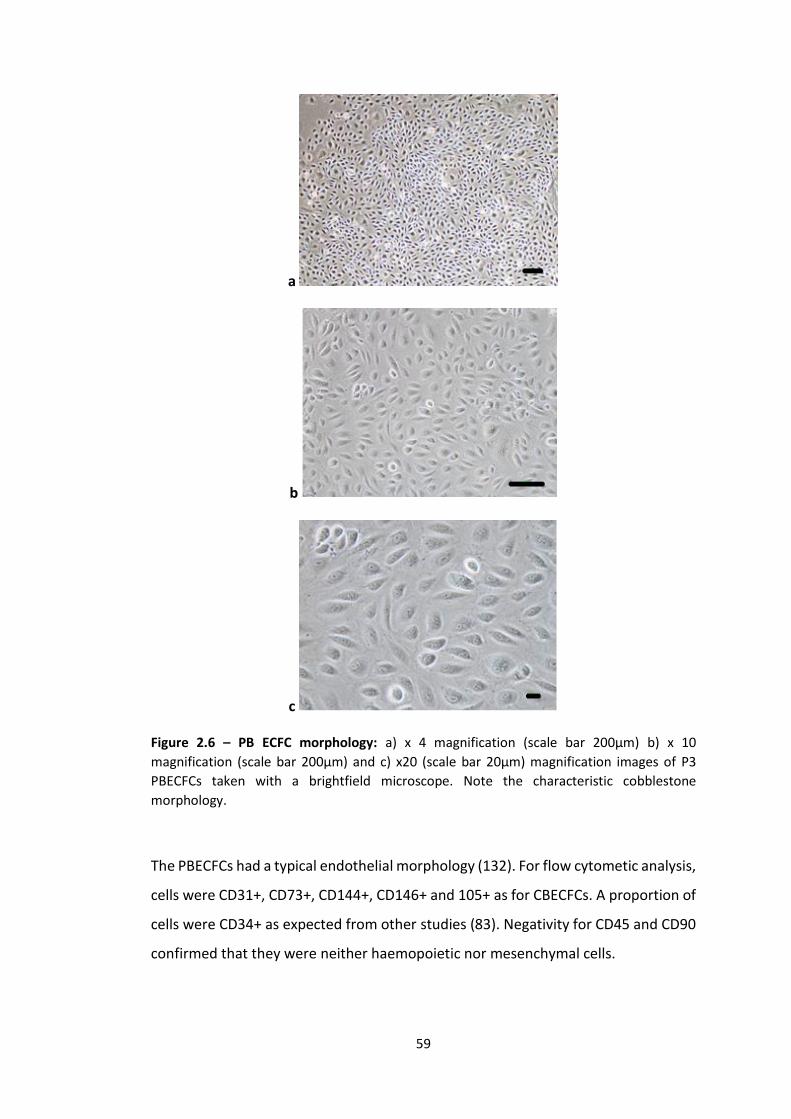
59
a
b
c
Figure 2.6 – PB ECFC morphology: a) x 4 magnification (scale bar 200µm) b) x 10
magnification (scale bar 200µm) and c) x20 (scale bar 20µm) magnification images of P3
PBECFCs taken with a brightfield microscope. Note the characteristic cobblestone
morphology.
The PBECFCs had a typical endothelial morphology (132). For flow cytometic analysis,
cells were CD31+, CD73+, CD144+, CD146+ and 105+ as for CBECFCs. A proportion of
cells were CD34+ as expected from other studies (83). Negativity for CD45 and CD90
confirmed that they were neither haemopoietic nor mesenchymal cells.

60
Figure 2.7 – PB ECFC FACS: Representative flow cytometric phenotype PBECFCs at P2. These cells were CD31+, CD73+, CD144+, CD146+ and CD105+ but CD90-,
CD45-, CD14- and CD133- consistent with an endothelial cell phenotype. Table 2.3 shows the median fluorescence intensity and number of positive cells.
61
Stain
Average
MFI
SD MFI Average
% cells
positive
SD %
cells
positive
IgG1 PE 95.0 8.2 7.3 6.9
CD31 PE 23297.7 9585.6 99.1 0.4
CD73 PE 5981.7 3700.2 99.3 0.5
CD144 PE 5730.3 1917.8 99.3 0.6
IgG1 FITC 101.0 35.1 7.6 10.6
CD90 FITC 100.0 67.7 9.3 15.3
CD146 FITC 5597.0 1960.3 98.3 1.8
CD105 FITC 7236.7 5519.4 98.5 2.1
IgG2a PE-Cy7 77.3 37.2 6.3 3.5
CD14 PE-Cy7 48.7 18.5 1.5 1.9
IgG1 PerCP 95.0 9.5 2.5 0.2
CD45 PerCP 35.0 15.7 0.1 0.1
IgG2b APC 98.7 7.0 1.6 0.6
CD34 APC 476.7 496.8 34.4 26.8
CD133 APC 73.7 16.9 1.3 1.0
Table 2.3 – PB ECFC FACS: Flow cytometry data for P2 PBECFCs (average n=3). Results are
consistent with the FACS histograms seen in Figure 3.8.

62
Figure 2.8 – PB ECFC flow cytometry data: MFI and percentage cells positive (n=3)
Table 2.4 – PB ECFC colonies
ECFC colony growth following plating of Ficoll buffy coat MNCs from different PB batches.
PB ECFCs were isolated from 3 batches of PB and these were banked at p3 for
subsequent use.
PB
number
Day of 1st
ECFC colony
No. of
colonies
Day of colony cloning
(no. cloned)
Outcome
1 20 1 n/a Too small to clone
2 13 18 (2 large) 19 Stock created
3 n/a n/a n/a No colonies
4 n/a n/a n/a No colonies
5 8 13 14 Stock created
6 12 4 15 Stock created

63
2.2.6 Adipose derived mesenchymal stem cells (Ad MSCs)
Redundant human adipose tissue was harvested from Deep Inferior Epigastric
Perforator (DIEP) flaps that were being used in breast reconstruction surgery, with
ethical approval from NRES Committee South Central - Oxford C (12/SC/0567) and
full written patient consent.
Skin was mechanically removed from adipose tissue with sharp dissection. The
adipose tissue was then placed into HBSS without Ca++/Mg++ (Lonza Biologics) as soon
as the free tissue transfer (DIEP flap) had been made avascular by disconnection from
the donor site blood supply. The adipose tissue was then immediately transported at
room temperature (RT) to the research laboratory for processing which was carried
out within 1 hour of harvest using the following protocol:
Approximately 200mg of perivascular fat was finely minced using a scalpel and was
split between two 50ml Falcon tubes containing a freshly made D-PBS (Lonza
Biologics)/Fungizone solution (30L in 20ml) (Gibco). Adipose tissue was then
transferred to Falcon tubes with D-PBS (Lonza Biologics) and 1% v/v
penicillin/streptomycin (PAA laboratories) and washed by shaking extensively (ten
times) prior to adding to fresh Falcon tubes containing collagenase A (1mg/ml)
(Roche), and into a 37°C water bath for 45 minutes shaking gently at 15 minute
intervals. The resultant digested adipose tissue was then passed through a 0.22m
filter (Techno plastic products).
The filtrate was topped up with complete EGM-2 (Lonza Biologics) and then
centrifuged at 500g and acceleration 9, brake 9, for 10mins at RT. The overlying
medium/lipid layer was carefully removed and the cell pellets re-suspended in 1ml
complete EGM-2 for counting with a haemocytometer (this cell pellet is known as the
stromal vascular fraction or SVF). Approximately 2x10⁷ cells were isolated from every
50mg of adipose tissue (calculated using a haemocytometer – see Chapter 2.2.8) and
this amount was plated per well of a collagen I-coated 6 well plate (BD Biosciences).
Four ml complete EGM-2 was added to wells and they were placed into a Nuaire
incubator at 37°C in 5% CO2 in air. At 24 hours wells were washed twice with 1ml D-
PBS (Lonza Biologics) to remove non-adherent cells (mainly red blood cells) and 4ml

64
fresh EGM-2 medium was added to each well. Cells were passaged (2.2.8) when 80-
90% confluent (approximately 3 days) and transferred directly to uncoated T25 flasks
(BD Biosciences). Subsequent passages were carried out in a similar manner, splitting
cells at a 1:3 ratio at each step and cells fed were every 2-3 days with fresh medium.
The cells were characterised by a fibroblastoid-like morphology (Fig 2.9) and FACS
analysis (Fig 2.10 and 2.11 and table 2.5) to confirm that they were indeed AdMSCs.
Three different batches of Adipose tissue were processed and all produced MSC-like
cells morphologically and cells with the correct phenotypic markers following FACS
analysis.
Fig 2.9 – AdMSC morphology: Brightfield microscope images of p1 AdMSCs taken at x4 (left)
and x10 (right) magnification (scale bar 200µm). Note the characteristic fibroblast-like
spindle shaped morphology.
Phenotypically, AdMSCs at p3 were CD73+, CD105+ and CD90+ and negative for
CD31, CD14, CD133 and CD45. Interestingly a proportion of cells were CD34+ as
previously reported (131). This differs from BMMSCs which are generally regarded as
CD34- (131).

65
Figure 2.10 – Ad MSC FACS: Representative flow cytometric phenotype AdMSCs at P3. These cells were CD73+, CD90+ and CD105+ but CD31-, CD45-, CD14- CD146-
and CD133- consistent with a mesenchymal cell phenotype. Table 2.5 shows the median fluorescence intensity and number of positive cells.

66
Stain
Average
MFI
SD MFI Average
% cells
SD %
cells
IgG1 PE 117.7 20.1 1 0.1
CD31 PE 118.3 22.5 1.5 0.4
CD73 PE 11772.3 10070.4 99.7 0.4
IgG2a PE-Cy7 69.7 41.7 2.2 0.3
CD14 PE-Cy7 37.0 27.6 0.1 0.1
IgG1 FITC 98.3 11.6 1 0.2
CD90 FITC 4590.0 5396.2 93.8 5.7
CD146 FITC 109.0 22.6 1.8 1.7
CD105 FITC 1968.3 2403.8 80.3 23.7
IgG1 PerCP 74.7 24.5 1 0.2
CD45 PerCP 60.7 20.2 0.3 0.2
IgG2b APC 62 5.7 1 0.1
CD34 APC 149.7 180.3 21.4 30.8
CD133 APC 56.7 12.7 0.8 0.7
Table 2.5 – AdMSC FACS: Flow cytometry data for P3 AdMSCs (average n=3). Results are
consistent with the FACS histograms seen in Figure 3.16.

67
CD
31
CD
73
CD
14
CD
90
CD
105
CD
146
CD
133
CD
34
CD
45
0
5 0 0 0
1 0 0 0 0
1 5 0 0 0
2 0 0 0 0
2 5 0 0 0
MF
I
CD
31
CD
73
CD
14
CD
90
CD
105
CD
146
CD
133
CD
34
CD
45
0
5 0
1 0 0
1 5 0
% c
ell
s p
os
itiv
e
Figure 2.11 – AdMSC flow cytometry data: MFI and percentage cells positive (n=3)
2.2.7 Differentiation of AdMSCs
2.2.7.1 Adipogenesis culture protocol
Three different batches of AdMSCs (P5) were seeded in 1ml of complete MSC-GM (Lonza
Biologics) into 6 separate wells (3 for differentiation and 3 for controls) of a 24 well plate
(1.5x10⁴ cells per well) (BD Biosciences). Cells were fed with fresh MSC-GM every 2-3
days until confluent (d6). At 100% confluence, AdMSCs were fed with supplemented
adipogenic induction medium (Lonza Biologics) and cultured for 3 days (37°C, 5% CO2),
followed by 2-3 days in supplemented adipogenesis maintenance medium. Non-induced
control AdMSCs were fed only with supplemented adipogenic maintenance medium on
the same schedule. Adipogenic maintenance medium contained hMSC induction

68
medium (Lonza Biologics) together with the SingleQuots™ h-insulin (recombinant), L-
glutamine, MCGS and GA-1000, whereas adipogenic induction medium contained hMSC
adipogenic induction medium (Lonza Biologics) together with these 4 SingleQuots™ and
also dexamethasone, indomethacin and IBMX (3-isobuty-l-methyl-xanthine). After 2
weeks, wells were stained with Oil red O (Sigma-Aldrich Ltd.) as follows. Wells were
washed with 300µl of D-PBS (Lonza Biologics) and fixed with 300µl of paraformaldehyde
(PFA) (2.9.1) for 15 minutes at RT. Oil red O stain (Sigma-Aldrich Ltd.) stock solution was
prepared by weighing 300mg of Oil red O powder and combining this with 100ml of 99%
(v/v) isopropanol (Sigma Aldrich Ltd. Ltd.). Three parts of this were then mixed with 2
parts of deionized water and having left this for 10 minutes at room temperature (stable
for maximum of 2 hours), the Oil red O was then filtered (Whatman No.1 (Sigma Aldrich
Ltd. Ltd.)). PFA was removed from wells and 300µl distilled water used to rinse wells.
Sixty percent isopropanol (v/v) in water was then used to cover the bottom of each well
for 5 minutes and once this had been completed and the isopropanol had been
removed, 250µl Oil red O was added to each well and this was left for 5 minutes at room
temperature. Wells were rinsed with tap water until the water ran clean. The samples
were examined using a Nikon Eclipse TE300 microscope and images taken at x4
magnification with a Hamamatsu ORCA-ER camera (2.12).
Figure 2.12 – Adipogenic differention of AdMSCs: Oil red O staining of Adipose tissue produced
by adipocytes from differentiated AdMSCs – photos taken at x4 magnification (scale bar 200µm)
for all 3 different batches (top) and control (bottom).

69
2.2.7.2 Chondrogenesis culture protocol
AdMSCs (1.5x10⁶ P5 for 3 different batches) were suspended in incomplete
chondrogenic medium (Lonza Biologics) and centrifuged at 150g for 5 minutes,
acceleration 9 and brake 9 at RT. Chondrogenic medium was made up with
differentiation basal medium (Lonza Biologics) together with the following SingleQuots™
also from Lonza Biologics – dexamethasone, ascorbate, ITS + supplement, GA-1000,
sodium pyruvate, prolene and L-glutamine. Cells were re-suspended in 2ml incomplete
chondrogenic medium and this split into two separate 15ml Falcon tubes (BD
Biosciences) prior to centrifuging again for 5mins at 150g (acceleration 9, brake 9, room
temperature) and then discarding the supernatant. One of these cell pellets was then
resuspended in 1.5mls complete chondrogenic medium (differentiation group) and the
other in incomplete chondrogenic medium (both from Lonza Biologics). Complete
chondrogenic medium was made by adding 5µl of 20µg/ml TGF-β3 (Lonza Biologics) to
10mls incomplete chondrogenic induction medium. One half ml was then aliquoted into
separate polypropylene Falcon tubes (2.5x10⁵ cells) and these centrifuged for 5mins at
150g. Supernatant was not aspirated at this stage but caps were loosened a half a turn
to enable gas exchange and medium was replaced with fresh complete (differentiation
group) or incomplete (control group) chondrogenic medium (Lonza Biologics) every 2-3
days, flicking the pellet after each medium change to ensure pellets were floating. After
14 days, pellets were placed into small bespoke kitchen foil boats and covered with
optimal cutting temperature (OCT) compound (Fisher Scientific) and these were rapidly
frozen in liquid nitrogen before being stored at -80°C until ready for sectioning. Ten µm
sections were cut using a cryotome and fixed on microscope slides before they were
stained as follows. 1% (v/v) Alcian blue (Sigma Aldrich Ltd. Ltd.) solution was made up in
0.1N HCL and this was pipetted over the sections and left in situ for 30 minutes. The
slides were then rinsed with 0.1N HCL and then distilled water before visualising
specimens under the light microscope (Nikon Eclipse TE300 microscope) and recording
images at x4 magnification (Fig 2.13). Blue staining indicated synthesis of proteoglycans
by chondrocytes.

70
Figure 2.13 – Chondrogenic differention of AdMSCs: Alcian blue staining of collagen produced
by chondrocytes from differentiated AdMSCs – photos taken at x4 magnification (scale bar
200µm) for all 3 different batches (top) and control (bottom).
2.2.7.3 Osteogenesis culture protocol
Six wells of a 24-well plate (Lonza Biologics) were each seeded with 6X10³ P5 AdMSCs
that had been suspended in 0.5ml MSCGM (Lonza Biologics) (for 3 separate batches of
AdMSCs i.e. 18 wells in total). After 24 hours incubation at 37°C in 5% CO2 in air, medium
for the 9 ‘differentiation’ wells was replaced with osteogenesis induction medium
(Lonza Biologics) and this was repeated every 3-4 days for 2 weeks. Osteogenesis
induction medium was made by adding the following SingleQuots™ to hMSC
differentiation basal medium – osteogenic (Lonza Biologics): dexamethasone, L-
glutamine, ascorbate, penicillin/streptomycin, MCGS, β-glycerophosphate. Control
wells had medium replaced with MSC-GM on the same days as differentiation well
medium changes. After 2 weeks, wells were stained with Alizarin red S (Sigma Aldrich
Ltd.). To do this, wells were washed gently with D-PBS (PAA Laboratories) and then 200µl
Alizarin red S was added. This was left in situ for 45 minutes after which wells were
washed repeatedly with distilled water until the water ran clear. Photos were taken with
a light microscope (Nikon Eclipse TE300 microscope) at x4 magnification (Fig 2.14), red
staining indicating calcium production from osteoblasts.

71
Fig 2.14 – Osteogenic differention of AdMSCs: Alazarin Red staining of calcium produced by
osteoblasts from differentiated AdMSCs – photos taken at x4 magnification (scale bar 200µm)
for all 3 different batches (top) and control (bottom).
2.2.8 Cell passage, counting and freezing procedures
Where cells were passaged, this refers to the detachment of adherent cells from tissue
culture grade flasks or plates (BD Biosciences). For this procedure, cell medium was
removed and cells washed twice with enough D-PBS (PAA Laboratories) to cover the
cells (ranging from 1ml in a 6 well plate to 10mls in a T150 flask) prior to incubation with
2-5mls 1x trypsin-EDTA or 1x accutase (PAA Laboratories) at 37°C in a Nuaire DH
autoflow incubator (Nuaire) in 5% CO2 in air, until loss of cell adherence on gentle
tapping of the flask or culture plate (normally 2-5 minutes). As soon as cells detached
the enzyme solution was neutralised with the medium specific to that cell line (section
2.2), cells collected in a Falcon tube (BD Biosciences) and centrifuged at 1200rpm,
acceleration 9, deceleration 9 for 5 minutes at 22°C. The cells were then re-suspended
in an appropriate volume for counting (approximately 1x10⁶ cells/ml) in their standard
culture medium and a 15µl cell suspension sample mixed with 15µl Trypan blue stain
(Invitrogen Ltd. Ltd.) and viable cells counted by using a haemocytometer (Neubauer)
using a Nikon Eclipse TE300 brightfield microscope (Nikon UK Ltd.). Cells within the outer
4 chambers were counted and an average calculated by dividing this number by 4. To
calculate total cell number, the following calculation was used:
Total number of cells = Average cell number per quadrant x 2 (dilution factor) x 104
(convert cells/µl to cells/ml) x number of mls of media used to re-suspend cell pellet

72
The required cell number for experimentation or re-passage was plated appropriately
and the remainder were centrifuged at 1200 rpm for 5 minutes, acceleration 9, brake 9,
RT. The resultant cell pellet was re-suspended in 90% (v/v) FCS (PAA Laboratories) with
10% (v/v) DMSO (Sigma Aldrich Ltd.) at a concentration of 5x10⁵-1x10⁶ cells/ml. One ml
of this suspension was then transferred to separate cryovials (Sigma Aldrich Ltd.), these
placed into a Nalgene® Mr Frosty (Sigma Aldrich Ltd.) and then placed into a -80°C
freezer for a minimum of 24 hours prior to storage in liquid nitrogen.
2.3 Fluorescence-activated cell sorter (FACS) analysis
To make the buffer for FACS analysis, 500mls D-PBS (Lonza Biologics) was mixed with 5g
bovine serum albumin (BSA) (Sigma-Aldrich Ltd.) and 5mls 2mM EDTA (Sigma-Aldrich
Ltd.) and filter-sterilised. This was then stored at 4°C until required and used within 3
months. This was termed magnetic-activated cell sorting (MACS) buffer. Cells for FACS
analysis were suspended in MACS buffer in a 15ml Falcon tube so that for every FACS
tube 1x10⁵ cells were suspended in 80µl MACS buffer with 20µl FcR block (Miltenyi
Biotec) (100µl total). A 15ml Falcon tube was used since several FACS tubes were
normally required, producing a total volume of approximately 2mls. This was incubated
on ice for 20 minutes to block non-specific antibody sites. One hundred µl of this cell
suspension was then added to the stated antibody or isotype control (see below) and
vortexed briefly. After 30 minutes incubation in darkness, on ice, cells were washed in
1ml MACS buffer by centrifugation at 1500rpm for 5 minutes, at 4°C in a Heraeus
Megafuge 1.0S centrifuge (DJB Labcare). The supernatant was carefully pipetted off and
the cell pellet re-suspended in 500µl ice-cold MACS buffer.

73
Table 2.6: The following quantities of (1x concentration unless stated) isotype controls and antibodies were used for FACS analysis of the various cell types:
BD Biosciences: Miltenyi Biotec: R&D Systems:
IgG1-PE (Clone MOPC-21) 20µl CD45 PerCP (345809) 20µl CD144-PE (16B1) 5µl
1gG1-FITC (MOPC-21) 20µl IgG2a-APC (S43.10) 10µl CD105-FITC (166707) 10µl
1gG2a-PE-Cy7 (G155478) 5µl CD34-APC (AC136) 10µl
CD31-PE (WM59) 20µl CD133-PE (293C3) 11µl Millipore:
CD14-PE-Cy7 (M5E2) 5µl IgG2b-APC (130092217) 10µl CD146-FITC (P1H12) 5.5µl (1:20 dilution in MACS
buffer)
CD73-PE (AD2) 10µl CD133-APC (13009054) 11µl
CD90-FITC (5E10) 2µl
IgG1-PerCP (550672) 20µl
Cell suspensions were vortexed briefly and then isotype controls were analysed on a BD
LSR II flow cytometer (BD Biosciences) using the BD FACSDiva 6 software program (BD
Biosciences) in order to set voltages for these tubes aiming for a log fluorescent intensity
peak value of 102 for each isotype control. Prior to this, the flow cytometer was set-up
using cytometer setup and tracking (CST) beads (BD Biosciences). Once voltages had
been set, all FACS tubes were analysed for 10,000 events firstly adding DAPI (0.1µg/ml)
(Invitrogen Ltd.) viability stain and briefly vortexing the tube. The cell surface cluster of
designation markers chosen for demonstrating each cell phenotype and their main
antigen expression are shown in table 2.7.
CD31 is recognised to be a haemopoietic and endothelial cell specific surface marker
(72,83). CD10 has been used as an MSC marker (133) but is also found on B cells (134)
and within epithelioid haemangioendothelioma (a vascular neoplasm) (135) and
metastatic renal cell carcinoma (136). CD90 is a more specific cell surface marker for
MSCs from BM and adipose tissue (87,105) although it is found on haemopoietic stem
cells (137) and has been described as an activation marker on some endothelial cells
(138). CD45 is a haemopoietic cell surface marker (83,139,140).
Table 2.7: Cluster of designation markers, their main antigen expression and the isolated
cells where they were present.

74
* ++ strong expression of cell surface marker; + mild expression; - no expression
CB and PB-derived ECFCs have been shown to express CD31, CD141, CD105, CD146 and
CD144 but do not express CD45 and CD14 with some expressing CD34 (72). Here, 3
separate batches of CBECFCs and PBECFCs were isolated and not only possessed a
classical cobblestone morphology but also expressed CD31, CD73, CD166, CD144, CD146
and 105 with a proportion also showing positivity for CD34 (2.2.4 and 2.2.5). All batches
Marker Main Antigen Expression HUVECs CBECFCs PBECFCs BMMSCs AdMSCs
CD14 Monocytes - - - - -
CD31 Endothelial cells, platelets,
monocytes, granulocytes, B cells,
haematopoietic stem cells
++ ++ ++ -
CD34 Haematopoietic stem and
progenitor cells, endothelial cells,
subsets of mesenchymal stem
cells
+ + - +
CD45 Leucocytes - - - - -
CD73 T and B cells, follicular dendritic
cells, epithelial cells, endothelial
cells and mesenchymal stem cells
++ ++ ++ ++ ++
CD90 Stromal cells, mesenchymal
Stem Cells, haematopoietic stem
cells
- - ++ ++
CD105 Endothelial cells, stromal cells,
mesenchymal Stem Cells
++ ++ ++ ++ ++
CD133 Haematopoietic stem and
progenitor cells, other stem cells
eg. Neural, Retinal cells
- - -
CD144 Endothelial cells ++ ++
CD146 Blood vessel endothelial cells and
some melanoma cell lines, NK
cells and neutrophils
++ ++ ++ -

75
were negative for CD45 and CD90 confirming that they were neither haematopoietic nor
mesenchymal cells.
International Society for Cellular Therapy criteria states that MSCs must be plastic-
adherent in standard culture conditions and express CD105, CD73 and CD90. They
should also lack CD45, CD14, CD19, HLA-DR and CD34 and differentiate into osteoblasts,
adipocytes and (143) chondroblasts in vitro (144). In addition to isolating, culturing and
expanding 3 batches of MSCs from human adipose tissue, their morphological,
phenotypic and differentiation profiles have been confirmed. AdMSCs at p3 were
CD73+, CD105+ and CD90+ and negative for CD31, CD14, CD133 and CD45. Given that
the aim was to isolate cells with a stromal phenotype that could support ECs in vitro it
was felt that negativity for CD45 was sufficient to rule out a leucocyte phenotype in the
isolated MSCs and that it wasn’t necessary to also check for CD19 and HLA-DR negativity
(also found on leucocytes). In fact, a proportion of cells were CD34+ (ICST criteria states
this shouldn’t be the case although CD34+ cells within an AdMSC population has recently
been reported [142]). This differs from BMMSCS which are generally regarded as CD34-
, which was the case for the BMMSCs obtained from Lonza biologics (142). All batches
of AdMSCs that were isolated showed differentiation capacity into adipogenic,
osteogenic and chondrogenic tissue.
MSCs are heterogeneous, containing multi-lineage stem and partly differentiated
progenitor cells, and are easily expandable ex vivo. Together with myeloid cells, they
have been demonstrated to enhance the de novo formation of stable vasculature by
ECFCs in surrogate models of vasculogenesis. In addition to BMMSCs having the ability
to regulate new blood vessel formation, stability and function, similar effects have been
demonstrated with MSC-like cells from human adipose tissue, the limbal niche, the
foetal circulation, amniotic fluid, the vascular wall and umbilical cord blood (143). Having
obtained and characterised ECFCs from peripheral blood (PBECFCs) and MSCs from
adipose tissue (AdMSCs) it would be of interest to determine the tubule forming
capacity of these cells together in comparison to more commonly co-cultured ECs and
MSCs from HUVECs and BM respectively (145). This is investigated in detail in Chapter
3.

76
2.4 µ-chemotaxis 3D assay
Pooled HUVECs were grown to passage 4 or 5 using the protocol described in section
2.2.1. CB (2.2.4) and PB (2.2.5) ECFCs were isolated and expanded then also used
between passage 4 and 5 for assessing chemotaxis. The day before conducting the µ-
chemotaxis assay, 5mls EBM-2 (Lonza Biologics) with 10% (v/v) FCS (PAA Laboratories)
and 5mls EBM-2 with 10% (v/v) FCS were placed into 2 separate Falcon tubes (BD
Biosciences) and put into a Nuaire DH autoflow incubator (Nuaire) in 5% CO2 at 37°C
overnight to equilibrate (cap unscrewed slightly to enable gas exchange and reduce
bubble formation). A µ-chemotaxis 3-D plate (1 plate per 3 experiments) and plugs (Ibidi
GmbH) were also placed into the incubator overnight to equilibrate (these were not
removed from their packaging as per manufacturing guidelines).
Depending on cells analysed, HUVECs, CBECFCs or PB ECFCs from an 80% confluent T150
flask (BD Biosciences) were harvested using trypsin-EDTA as in section 2.2.8 and
centrifuged in EBM-2 (Lonza Biologics). The cells were then counted after being re-
suspended in 5mls EBM-2 and 3x10⁵ cells were placed into each eppendorf that was to
be used for a specific gel concentration. Eppendorfs were centrifuged at 2000 rpm for 5
mins in a Heraeus Biofuge pico (DJB Labcare), supernatant removed and residual
amount of supernatant/cell suspension checked using a 20µl pipette set at 10µl. To
make bovine collagen I gel (Invitrogen Ltd.), collagen I/fibronectin (FN) gel or fibrin gel
the components from Tables 2.8, 2.9 and 2.10 were added, adding the collagen I or
thrombin last, prior to pipetting gels into viewing chambers of the µ-chemotaxis slides.
Table 2.8: Components for 1mg/ml and 3mg/ml collagen I gels
Component Collagen I gel
1mg/ml 3mg/ml
10x MEM-α medium (Invitrogen Ltd.) 10µl 10µl
0.5% (v/v) NaOH(1M) 0.5µl 1.5µl
5% (v/v) NaHCO3 (7.5%) 5µl 5µl
Remaining cell volume ~10µl ~10µl
distilled deionised H2O (dependent upon remaining cell vol.) (~54.5µl) (~13.5µl)
Collagen I bovine gel (5mg/ml) (Invitrogen Ltd.) (last) 20µl 60µl
TOTAL VOL
* Contains 3x10⁵ cells
100µl* 100µl*

77
Table 2.9: Components for different concentration fibrin gels.
Component Fibrin gel
Final concentration 1.25mg/ml 2.5mg/ml 5mg/ml 7.5mg/ml 10mg/ml
Fibrinogen Type I (Sigma) - 50µl1 100µl1 125µl1 15mg
D-PBS (PAA Laboratories) - 100µl 100µl 25µl 1ml
Amount of fibrinogen/D-PBS solution
25µl2
(5mg/ml)
50µl
(5mg/ml)
67µl
(7.5mg/ml)
60µl (12.5mg/ml)
67µl
10x α-MEM medium (Invitrogen Ltd.)
10µl 10µl 10µl 10µl 10µl
0.5% (v/v) NaOH IN (1M) 0.5µl 1.25µl 2.5µl 3.75µl 0µl
5% (v/v) NaHCO3 (7.5%) 5µl 5µl 5µl 5µl 5µl
Thrombin (Sigma Aldrich Ltd.) (50U/ml; 0.5ml
aliquots)
0.3µl 1.25µl 3.35µl 4.5µl 8µl
Distilled deionised H2O 47.2µl 23.5µl 0.15µl 6.75µl 0µl
Remaining cell volume 12µl 9µl 12µl 10µl 10µl
TOTAL VOL = 100µl* 100µl* 100µl* 100µl* 100µl*
* Contains 3x10⁵ cells; 1. From 15mg/ml stock solution; 2. From 5mg/ml stock solution. Note that in order to make the 10mg/ml gel
15mg fibrinogen was added to 1ml D-PBS and 67µl of this solution was used. This solution was then used to make the 2.5, 5 and
7.5mg/ml gels whereas the 1.25mg/ml gel was made using the 5mg/ml stock solution.
Table 2.10: Collagen I/FN gel
Component CB/PB ECFCs
1 4 5 6
Collagen I conc 1mg/ml 1mg/ml 1mg/ml 1mg/ml
FN conc 50µg/ml 100µg/ml 150µg/ml
10x α-MEM 10µl 10µl 10µl 10µl
NaOH IN 0.5µl 0.5µl 0.5µl 0.5µl
NaHCO3 5µl 5µl 5µl 5µl
Remaining cell volume 10µl 10µl 10µl 10µl
H2O (dependent upon remaining cell vol) (54.5µl) 49.5µl 44.5µl 39.5µl
Fibronectin# (1mg/ml) 0µl 5µl 10µl 15µl
Collagen I (add last) 20µl 20µl 20µl 20µl
TOTAL VOL= 100µl* 100µl* 100µl* 100µl*
* Contains 3x10⁵ cells; #Fibronectin from human plasma lyophilized powder (Sigma) 100µg/ml

78
The equilibrated plate was removed from the incubator and plugs were placed into the
four main reservoir ports. Collagen I (Invitrogen Ltd.), fibrinogen (Sigma Aldrich Ltd.
Ltd.), thrombin (Sigma Aldrich Ltd. Ltd.) and fibronectin (Sigma Aldrich Ltd. Ltd.) were
then placed on ice along with eppendorfs containing the remaining components of the
gel solution (Tables 2.2 and 2.3). The appropriate amount of Collagen I/Thrombin
solution was then added (20µl for 1mg/ml collagen I gel) and mixed. Using a 100µl
pipette, the complete gel solution was added to the cell suspension (10µl) and gently
mixed. Using pipettes with a specially modified tip (Grenier Bio-One), 6µl gel was
carefully injected over the top central channel port (see Figure 2.15). With the thumb
still depressing the top of the pipette, the pipette tip was inserted into the lower central
channel port to create tight seal then slowly released until gel filled the viewing
chamber. If either side was under-filled, a small amount of gel was added as required,
and if any bubbles were seen then the pipette containing some gel mixture was placed
into the bubble(s) and slowly aspirated. Of note the 3mg/ml collagen I gel and 7.5 and
10mg/ml fibrin gels were extremely viscous and therefore difficult to bring through
viewing chamber using negative pressure. All plugs were removed, the lid applied to the
plate and then this was placed inside a petri dish containing wet tissue paper to ensure
no evaporation prior to placing it into a humidified incubator at 37°C (5% CO2) for 1 hour
for the gel to set. Once the gel had set, 70µl of chemoattractant (10% (v/v) FCS in EBM-
2) or control medium (0.5% (v/v) FCS in EBM-2) was slowly injected into the reservoir
ports (Figure 2.15). Plugs were then carefully inserted into all ports and the slides were
placed into a 37°C heat chamber surrounding a time-lapse microscope. Using a Nikon
Eclipse TE300 microscope, a Prior proscan II controlled motorised stage (Nikon UK Ltd.)
and a Hamamatsu ORCA-ER camera and Simple PCI automated image capture camera
device software (Hamamatsu Photonics UK Ltd), photos at x4 magnification were taken
every 5 minutes for 24 hours generating time-lapse sequences. Analysis was carried out
using Image J with manual tracking and chemotaxis tool plugins (see Chapter 4).

79
Figure 2.15 – µ-Chemotaxis slide: Left image illustrates the filling of the central channel with 7µl gel and the next 2 images, filling of reservoirs with 70µl chemoattractant/control medium (image courtesy of Ibidi).
2.5 Lentiviral transduction of cells
2.5.1 Human embryonic kidney (HEK) 293FT cells
HEK 293FT growth medium was made by mixing 500mls Dulbecco’s Modified Eagle
Medium (D-MEM) (high glucose) (Lonza Biologics) with 50mls FCS (PAA Laboratories),
5ml L-glutamine (note D-MEM already contained L-glutamine), 5ml MEM-α Non-
Essential Amino Acids (NEAA) medium (Gibco) and 5ml sodium pyruvate (Gibco).
HEK293FT cells were purchased from Invitrogen Ltd. Ltd. and were plated at P2 at a
concentration of approximately 5x10⁵ cells in a T150 flask. Forty mls HEK293FT medium
was then added. At 48hrs the flask was 80% confluent (Fig 2.16) and was trypsinised
using with trypsin-EDTA as in section 2.2.8, to make a bank of P3 HEK293FT cells. These
were subsequently used for titering eGFP-labelled lentiviral (LV) particles (see section
2.4.2).
Figure 2.16 – Morphology of p2 HEK293FT cells: x10 (left) (scale bar 200µm) and x20 (right) (scale bar 20µm) magnification images under phase contrast microscopy.
2.5.2 Titration of lentiviral vector stocks
Two T150 flasks (BD Biosciences) of P2 HEK293T cells were passaged and then plated at
a concentration of 1x10⁵ cells/well in 1ml HEK293T medium in all wells of a 12-well plate

80
(BD biosciences). The following day eGFP labelled lentiviral particles were examined for
their transduction efficacy. To do this 1ml of viral particles was thawed from -80°C in a
normoxic incubator at 37°C and diluted as follows in several 15ml Falcon tubes (BD
Biosciences): 40µl neat vector was added to 3.96mls HEK293T medium (dilution factor
of 10-3). Then 400µl of this was added to 3.6mls medium and so on for each serial
dilution (see Fig 2.17). 1ml diluted vector was added to each well (in triplicate) with
concentrations of 10-3, 10-4, 10-5 and 10-6 (dilution factor). Throughout viral titration,
great care was taken in terms of using double gloves and disinfecting all plastic-ware
and medium for at least 20 minutes in Virkon. After 72 hours, the number of
cells/colonies in each well that had been transduced in triplicate for at least 2 dilutions
were counted using a Nikon Eclipse TE2000U microscope (Nikon UK Ltd.) and a
Hamamatsu ORCA-ER camera (Hamamatsu Photonics UK Ltd) and the viral titre was
estimated using the following equation:
Titre = number of cells/colonies transduced = Transducing Units (T/U.)/ml dilution factor
Example: 150, 133, 181 colonies at x10-5 and 20, 10 11 colonies at 10-6
Titre= 154.6 /10-5 = 1.54 x10⁷ T.U./ml Titre= 13 / 10-6 = 1.3 x10⁷ T.U./ml
Figure 2.17: Method for carrying out serial dilutions of LV particle vectors
Neat 10^-2 10^-3 10^-4 10^-5 10^-6
1. Vector stock serial dilution
40l 400l 400l 400l 400l
3.96ml 3.6ml 3.6ml 3.6ml 3.6mlMedium
3. Titer= Number of transduced cells or colonies / dilution factor= Transducing Units (T.U.)/ml
Trip
licate
s
DilutionsCount transduced colonies
10^-4 10^-5 10^-6
2. Take 1ml of your diluted stocks and place it in each well of the 12xwell plate
48-72 h
10^-3
Neat 10^-2 10^-3 10^-4 10^-5 10^-6
1. Vector stock serial dilution
40l 400l 400l 400l 400l
3.96ml 3.6ml 3.6ml 3.6ml 3.6mlMedium
Neat 10^-2 10^-3 10^-4 10^-5 10^-6
1. Vector stock serial dilution
Neat 10^-2 10^-3 10^-4 10^-5 10^-6Neat 10^-2 10^-3 10^-4 10^-5 10^-6
1. Vector stock serial dilution
40l 400l 400l 400l 400l
3.96ml 3.6ml 3.6ml 3.6ml 3.6mlMedium
3. Titer= Number of transduced cells or colonies / dilution factor= Transducing Units (T.U.)/ml
Trip
licate
s
DilutionsCount transduced colonies
10^-4 10^-5 10^-6
2. Take 1ml of your diluted stocks and place it in each well of the 12xwell plate
48-72 h
10^-3
Trip
licate
sT
riplic
ate
s
DilutionsDilutionsCount transduced colonies
10^-4 10^-5 10^-6
2. Take 1ml of your diluted stocks and place it in each well of the 12xwell plate
48-72 h
10^-3

81
Table 2.11 – eGFP lentiviral vector titre results:
Dilution factor 10-3 10-4 10-5 10-6
eGFP+ cells well 1 ++ ++ 107 12
eGFP+ cells well 2 ++ ++ 109 7
eGFP+ cells well 3 ++ ++ 93 8
Average 103 9
With a dilution factor of 10-3 and 10-4 there were too many eGFP positive cells to count accurately but using the higher dilution factors a titre of approximately 1x10⁷ particles/ml was calculated using the algorithm in Fig 2.17.
Figure 2.18 – eGFP transduction of HEK293T cells: x4 magnification fluorescence microscopy image taken 72 hours after transfection of HEK293T cells with the eGFP LV vector (10-4 dilution)
2.5.3 eGFP Lentiviral transduction
In order to calculate the number of lentiviral transducing units to be added in order to
transduce cells the following equation was used:
[MOI (multiplicity of infection) x CN (number of cells in well)] / VT (stock viral titre)
(The desired MOI is TU/cell; the VT units are TU/µl)
For example, for an MOI of 3 (which was used to transduce endothelial progenitor cells
[HUVECs/CBECFCs/PBECFCs]), a cell density of 20,000 cells per well and using a VT of
1x10⁷ the number of particles to add would be: (3x20000)/1x104 = 6 i.e. 6µl of viral stock
(titre 1x10⁷ TU/ml) is required per well for an MOI of 3.

82
Once appropriate amounts of LV particles had been added to flasks containing cells,
these were placed into the incubator. Medium containing viral particles was replaced
with fresh medium after 2-3 days and once 80% confluent, cells were either frozen in LN
or used for experimentation. An MOI of 3 for EC’s (HUVECs, CBECFCs and PBECFCs)
resulting in 100% (+/-0) cells being transduced.
2.6 Compressed collagen gels
2.6.1 Optimisation of compressed collagen gels
The various concentrations of HUVEC/BMMSC co-cultures (4:1 ratio) were grown to
passage 4 or 5, counted with a haemocytometer and transferred to 1.5ml eppendorfs.
These were then centrifuged at 2000 rpm for 5 minutes (acceleration 9, brake 9, RT), in
a Heraeus Biofuge pico (DJB Labcare). Supernatant was aspirated and the cell pellets
were re-suspended in the gel mixture, and then mixed with the correct volume of
collagen until homogenous (Table 2.12).
Table 2.12: Constituents required for Collagen I gel for a 56µl volume per well of 96-well plate.
Preparation bovine collagen gel [Stock] [Final] amount (µL)
Total Volume of gel 56.00
Final concentration of collagen desired (mg/ml) 2.00
Collagen I (bovine) (Invitrogen Ltd.) 5mg/ml 2mg/ml 22.40
[10x] M-199 (Sigma Aldrich Ltd.) 10x - 5.60
NaOH (VWR) 1M - 0.56
[1x] M-199 (Sigma Aldrich Ltd.) 1x - 25.80
Sodium bicarbonate (Invitrogen Ltd.) - - 1.64
rhSCF (R & D systems) 100µg/ml 0.2µg/ml 0.11
rhSDF1α(R & D systems) 100µg/ml 0.2µg/ml 0.11
rhIL-3(R & D systems) 100µg/ml 0.2µg/ml 0.11
For compressed collagen gels, 112µl/240µl volumes were used therefore the volumes listed need to be multiplied 2/4.3x to reach these volumes.
Plated gels were incubated at 37°C for 15 minutes. All absorption wicks apart from those
corresponding to the gels to be compressed were removed, and then the compression
83
lid was placed onto the plated gels and incubated at 37°C for a further 15 minutes. After
removing the compression lid, 100µL of top-up growth media (Tables 2.13 and 2.14) was
added to all of the gels. Top-up growth media was then aspirated and replaced every
48hrs until day 7 at which point gels were fixed with 4% (v/v) PFA (Chapter 2.8).
Table 2.13: Reagents for making 1ml top-up media for M-199 gel.
Top up growth media [Stock] [Final] mL
1x M199 (mL) 1 1 1
Reduced serum II (mL)* 250x 1x 0.004
rhFGF-2 (ng) (R & D systems) 330µg/mL 40ng/mL 0.00012
Ascorbic acid (µg) 20mg/mL 50µg/mL 0.0025
Total Volume of media 1
Table 2.14: How to make reduced serum II*.
Reagent Amount
rh-Insulin (Sigma Aldrich Ltd) 25mg
DMEM (Lonza Biologics Ltd) 500mL
[1M] HCl (Sigma Aldrich Ltd) 1L
Oleic Acid (Sigma Aldrich Ltd) 1g
Holo-transferrin (Sigma Aldrich Ltd) 100mg
Sodium Selenite (Sigma Aldrich Ltd) 10g
BSA (FA free) (Sigma Aldrich Ltd) 10g
*In order to prepare 20ml reduced-serum II supplement (RSII) per the Stratman et al. (130)
protocol the reagents from Table 2.8 were mixed in the following concentrations:
2.5g bovine serum albumin (essentially fatty acid free and globulin free, min. 99%)
(Sigma Aldrich Ltd.) and 17ml distilled water were added to a small beaker with a stir
bar and gently mixed until all bovine serum albumin was dissolved. One hundred mg of
sodium selenite (Sigma Aldrich Ltd.) was added to 4 ml distilled water in a 15ml falcon
tube (BD Bioscience) to make 25mg/ml stock. Twenty five mg of recombinant human
insulin (Na+, Zn2+ free) (Sigma Aldrich Ltd.), 1.25ml DMEM (Invitrogen Ltd.), and 60µl 1M
HCl was added to a 15ml tube for a total volume of 1.31ml (the solution should turn to
a bright clear yellow colour). The 1.31ml insulin solution, 1µl of the 25mg/ml sodium
selenite stock, and 25mg human holo-transferrin (Sigma Aldrich Ltd.) was added to the

84
beaker containing dissolved bovine serum albumin for a total volume of 18.3ml. This
was mixed well until all had dissolved. Five mg/ml oleic acid stock solution was prepared
by adding 100mg sodium oleate (Sigma Aldrich Ltd.) to 20ml 100% (v/v) EtOH. 4.28ml of
the 5mg/ml oleic acid stock solution is required in total. To a 24ml glass vial, 1ml of the
oleic acid solution was added and dried under a stream of nitrogen. This was repeated
until the entire 4.28mls of oleic acid has dried down. To the glass vial containing the
24.1mg dried oleic acid, 10ml of the bovine serum albumin mixture solution was added
and mixed well until the oleic acid had dissolved. The remaining 8.3ml of the bovine
serum albumin mixture solution was then also added and mixed well prior to adding
1.7ml distilled water for a final volume of 20ml. Using a syringe and a 0.2µm syringe
filter the RSII solution was sterile filtered into a 50ml tube. One ml aliquots were then
stored at -20°C. Thawed RSII is maintained at 4°C and can be kept at this temperature
for several months for use.
In other optimisation experiments for RAFT 3D, gels containing the above cell quantities
were compressed 48 hours after fabrication or were left empty and compressed before
re-suspending cells in top-up media and seeding them on top of the compressed gels
(see Chapter 4).
2.6.2 Compressed collagen I gels with ECs
In view of limited success attempting to co-culture ECs and MSCs in or on compressed
gels (2.6.1), gels were instead compressed with only 6x10³, 1.24 or 2.4x10⁴ HUVECs
(passage 4) basing these concentrations on previous published work using this
proprietary equipment (RAFT 3D, TAP biosystems). The RAFT 3D protocol was carried
out using only reagents from the equipment pack supplied (Table 2.15). The appropriate
volumes of 10x MEM and neutralising agent were used to re-suspend cell pellets before
adding collagen I and then plating out 240µl of the above HUVEC concentrations in
separate wells of a 96-well plate for compression at day 0 and day 3, in triplicate for
both of these time-points and further duplicated so that cell viability could be checked
at days 1 and 7 post compression. Reagents were calculated based on the protocols on
the RAFT 3D website (TAP biosystems). Whilst awaiting compression in day 3
compressed gels, 100µl DMEM (Lonza Biologics) + 10% (v/v) FCS (PAA laboratories) +

85
penicillin/streptomycin (PAA Laboratories) was added to wells (top-up medium). 50µl
was removed and replaced with 60µl fresh top-up medium every 48 hours.
Table 2.15: RAFT 3D (TAP Biosystems) protocol for fabrication of compressed gels.
Reagent Volume (ml)
10x MEM 2.8
2mg/ml collagen I 22.4
Neutralising solution 1.624
Cell stock solution 1.2
Total volume per well 0.24
Listed are the volumes required (ml) for sufficient solution for all wells of a 96-well plate. Cell stock solution is the media used to re-suspend the cells.
2.6.3 Compressed collagen I gels with hDFs, BMMSCs or AdMSCs
Separate compressed collagen I gels were fabricated containing 3 different stromal cell
lines (hDFs, BMMSCs and AdMSCs) at passage 4, using RAFT 3D reagents and protocols
all with a cell concentration of 6x10³ cells. As per the RAFT 3D protocol, cells were
counted and re-suspended in gel mix (Table 2.15) then plated in a 96-well plate and
placed into the incubator for 15 minutes. They were then compressed for 15 minutes
using the RAFT 3D compression device before adding 100µl DMEM (Lonza Biologics) +
10% (v/v) FCS (PAA Laboratories) + penicillin/streptomycin (PAA Laboratories) to all
wells. After 24 hours half the wells underwent a live/dead stain (2.6.4). The top-up
media for remaining wells was changed every 48 hours for the day 7 live/dead stain.
2.6.4 LIVE/DEAD® stain protocol
Culture medium was aspirated and replaced with 100μL D-PBS (Lonza Biologics) then
placed onto a rocker with the speed set on medium, for 10 minutes. ‘Dead controls’
were prepared by adding 25μL of 5% w/v saponin (Sigma Aldrich Ltd.) to the gels 30
minutes before aspirating culture medium, and used to check for Calcein AM
background noise. Acellular gels were used as background noise controls for both EthD-
1 and Calcein AM. The LIVE/DEAD® stain (Invitrogen Ltd.) was prepared by adding 20μL

86
of the supplied 2mM EthD-1 stock solution to 10 mL D-PBS (Lonza Biologics), then adding
1μL of the supplied 4mM Calcein AM stock solution, resulting in final concentrations of
0.4μM and 4μM for Calcein AM and EthD-1 respectively. The D-PBS (Lonza Biologics)
was then replaced with 100μL of the LIVE/DEAD® stain and incubated for an hour. The
gels were then imaged either after 24hrs or after 7 days using a Nikon Eclipse TE300
microscope and a Hamamatsu ORCA-ER camera (Hamamatsu Photonics UK Ltd) and the
average number of live and dead cells were calculated from 3 separate images over 3
wells. Percentage viability was calculated using the following equation:
%𝑣𝑖𝑎𝑏𝑖𝑙𝑖𝑡𝑦𝑑=1 𝑜𝑟 𝑑=7 = 𝑁𝑢𝑚𝑏𝑒𝑟 𝑜𝑓 𝑙𝑖𝑣𝑒 𝑐𝑒𝑙𝑙𝑠
𝑁𝑢𝑚𝑏𝑒𝑟 𝑜𝑓 𝑙𝑖𝑣𝑒 + 𝑑𝑒𝑎𝑑 𝑐𝑒𝑙𝑙𝑠 − 𝑎𝑣𝑒𝑟𝑎𝑔𝑒(𝑏𝑐𝑘𝑔𝑑𝐸𝑡ℎ𝐷11 & 2)
2.7 Uncompressed collagen I gels
HUVECs, CBECFCs and PBECFCs were labelled with eGFP (2.5) and all cells (these ECs as
well as BMMSCs and AdMSCs) were used at P4 or P5. Several different constructs
containing variable amounts of ECs and MSCs were fabricated in order to ascertain
optimal cell concentrations and gel constituents and specific details for each construct
can be found together with results for uncompressed gels, in Chapter 4. The basic
constituents for fabricating the uncompressed collagen I gel are described below.
In order to make the collagen I gel, the protocol published by Stratman et al. which
included the cytokines stem cell factor (R & D systems), interleukin-3 (R & D systems)
and stromal-derived-factor-1α (R & D systems), was used (Table 2.12) (124). Once
collagen had been added to the other components for the gels and mixed well, this was
immediately used to re-suspend cells for experiments where cells were seeded within
gels or were plated (all plated were uncoated standard tissue culture plastic) without
cells for experiments where cells were seeded onto already polymerised gels. The cells
were trypsinised (2.2.8) and counted and appropriate cell numbers were then
centrifuged at 1200 rpm for 5 minutes, acceleration 9 and brake 9, RT. The 96-well plate
was then placed into a Nuaire DH autoflow incubator (Nuaire) at 37°C in 5% CO2 in air
for 30 minutes for gels to set. All work with the gel and re-suspending of cells prior to
placement in the incubator was carried out on ice to prevent premature polymerisation
of the gel. 100µl top-up medium (Table 2.13) was then added directly to wells containing
gels with cells or was used to re-suspend cell pellets for the other wells. After 48 hours,
87
50µl top-up medium was removed from each well and 60µl top-up medium was added
(10µl extra to take account of evaporation). This half medium change was repeated after
a further 48 hours and then 72 hours after this. At day 7, gels were fixed with PFA (2.9)
and fluorescent photos were taken using a Nikon Eclipse TE300 microscope and a
Hamamatsu ORCA-ER camera (Hamamatsu Photonics UK Ltd).
In the first optimisation experiment, EGM-2 medium (Lonza Biologics) was compared to
M-199 (Sigma Aldrich Ltd.), the main constituent for the Stratman et al. protocol (124).
EGM-2 with 10% (v/v) FCS (PAA Laboratories) was used in place of 10x M-199 and EBM-
2 in place of 1x M-199 (Table 2.6). Since EGM-2 already contains numerous cytokines
including hFGF-B, VEGF, R3-IGF-1 and hEGF, no other cytokines were added to the
reagents for this gel. Once gels had set, 100µl EGM-2 with (cells on gel) or without cells
(cells within gel), was added onto the gels as a ‘top-up medium’. Medium changes and
fixing of gels were carried out as per the M-199 gels but EGM-2 with 2% (v/v) FCS was
used rather than ‘top-up medium’.
When CB/PBECFCs were co-cultured with MSCs it was noted that gels contracted away
from the edges of the wells in the 96-well plates. In order to address this, 2 separate
experiments were conducted whereby either the quantity of MSCs was reduced
(therefore hopefully reducing the amount of extracellular matrix [ECM] production) or
the collagen I concentration was reduced (from 2 to 1.5 mg/ml). In addition, a double
volume gel whereby every reagent quantity was doubled (cells and gel constituents) was
also used to see whether vessel formation was supported throughout a thicker gel
scaffold.
Constituents for the first 2 variables (low MSC concentration; double volume gel)
contained identical reagents to those for previous collagen I gels (doubled for the double
volume gel) (Table 2.12). The low collagen I concentration gel had less collagen I per well
with the total volume made up to 56µl using increased volume 1x M-199 (Table 2.16).

88
Table 2.16: low collagen I concentration gel (1.5mg/ml).
[Stock] [Final] amount (µL)
Total Volume of gel 56.00
Final concentration of collagen I desired (mg/ml) 1.50
Collagen I (bovine) 5mg/ml 2mg/ml 16.80
[10x] M-199 (Sigma Aldrich Ltd.) 10x - 5.60
NaOH 1M - 0.42
[1x] M-199 (Sigma Aldrich Ltd.) 1x - 31.54
NaHCO3 - - 1.64
SCF 100µg/ml 0.2µg/ml 0.11
SDF1α 100µg/ml 0.2µg/ml 0.11
IL-3 100µg/ml 0.2µg/ml 0.11
Having determined an optimal cell concentration for PB and CBECFCs when co-cultured
with BMMSCs and AdMSCs (2mg/ml collagen I gel; 2x10⁵ ECs with 3x10⁴ MSCs) this setup
was used in order to compare co-cultures of the various cells that had been isolated and
expanded. Table 2.12 shows the constituents for one well of a 96-well plate. Every
possible combination of 2x10⁵ ECs (3 batches of HUVECs, CBECFCs or PBECFCs) with
3x10⁴ MSCs (3 batches of BMMSCs or AdMSCs) were cultured within 56µl of this gel.
Fibronectin (FN) (Sigma Aldrich Ltd.)-containing gels were also fabricated in order to
ascertain the influence of this protein on tubule forming capacity. In order to fabricate
gels containing FN, sufficient FN was added to gel mixture prior to adding collagen I in
order for the final FN concentration to be 100µg/ml whilst still maintaining a final
collagen I concentration of 2mg/ml (an equal amount of 1x M199 was removed from
the mix to keep gel volume the same).
In order to quantify tubule formation for the different gel constructs, confocal images
were taken using a standard confocal microscope and processed using Imaris software
(version 7.6.4; Bitplane) with a filament tracer plugin. Threshold (loops) was selected
and using the ‘slice’ setting, the approximate width of tubules was measured and input
into the algorithm for the software. In the next window, segmentation settings were
corrected so that all tubules were shaded but surrounding gel was removed. A ratio of

89
branch length to trunk radius of 3.0 was used in every gel and finally all tubules with a
length of less than 8µm were removed prior to processing final calculations. Numerous
parameters were calculated including number of tubules, tubule length (average and
total), tubule diameter (average), tubule volume (average and total) and number of
branch points (average and total).
2.7.1 Upscaling to a 24 well plate
In order to assess the role of pre-vascularising gels one method would be to place such
constructs into an in vivo animal model. One way in which to do this would be to grow
a larger gel construct for example in a 1.6cm diameter well of a 24-well plate and then
place this into a murine full thickness wound.
For a 96 well plate the requirement is 2x10⁵ ECs and 3x10⁴ MSCs per well therefore in
order to upscale cell numbers, one requires 1.2x10⁶ ECs and 1.8x10⁵ MSCs per well for
a 24 well plate (Table 2.17).
Table 2.17 Volumes required for upscaling to a 24 well plate from a 96 well plate. (1.91/0.32 = 6) 336µl gel)
Vessel type Diam(mm) Growth area(cm2) Total well vol (µl) Working vol (µl)
96 well 6.35 0.32 360 56
24 well 15.62 1.91 1900 336
Table 2.18: Planned topographical layout of constituents for a 24 well plate of up-scaled gels
HUV+BM
HUV+BM
PB+ BM
PB+ BM
HUV+Ad
HUV+Ad
PB+Ad
PB+Ad
P4/5 ECs and MSCs were trypsinised, counted and centrifuged together ready for re-
suspension in gel mix prior to plating and the gel mixes were made as per table 2.12 but
with a multiplication factor of 6 for the 24-well plate format.

90
In the same way as with 96-well plate gels, gels were fabricated on ice (plate and pipette
tips in freezer prior to use and on ice during fabrication process). Cells were then re-
suspended in the gel mix without collagen I then collagen I was added and mixed. 336µl
was then pipetted into separate wells of the 24-well plate as per Table 2.18. Plates were
placed into a Nuaire DH autoflow incubator (Nuaire) in 5% CO2 in air at 37°C for 60
minutes until gels had set and then top-up media (Table 2.13) was added (600µl for each
well of the 24-well plates). Medium was changed at 48 hours and then again 48 hours
later and gels were fixed in 4% PFA and photos taken at day 7 as per previous
uncompressed gels (2.8).
Figure 2.19 – 24-well plate containing collagen I gel: At day 7, pre-vascularised collagen I gels were fixed with 4% (w/v) PFA. This caused the gels to come away from wells but they could be easily flattened again under cover slips for quantitative confocal microscopy. In addition one can see from the images that the gels were substantial, durable and easy to handle despite being uncompressed.
2.8 Fixing of gels
In order to fix the gels, medium was removed from wells and gels were gently washed
with 100µl PBS per well. This was aspirated and replaced with 100µl 4% (v/v)
Paraformaldehyde (PFA) (2.9.1) per well which was left in situ for 15 minutes. This was
aspirated and 2 further 100µl PBS washes performed. Gels were then covered with
200µl PBS and some Parafilm® before being placed into a fridge.

91
2.8.1 Making 4% paraformaldehyde (PFA)
Sixty mls of hot distilled water was placed into a glass beaker and heated to 60°C on a
hot plate in a fume cupboard. Whilst wearing a mask, 4g PFA (Sigma Aldrich Ltd. Ltd.)
and a flea were added and the solution mixed. NaOH (1M) was then added drop-wise
until the solution became clear (approximately 6 drops). 10mls 10x D-PBS (Lonza
Biologics) was then added followed by 4g Sucrose (Sigma Aldrich Ltd.) which helps to
preserve cell morphology. This solution was then made up to 100mls with MilliQ H2O
and pH checked aiming for pH 7.2-7.4 (can adjust with HCl). This was filter-sterilised
and stored at -20°C until required.
2.9 In vivo: uncompressed PBECFC/AdMSC gel in a humanised mouse model
Following confirmation of tubule formation in up-scaled uncompressed gels containing
AdMSCs co-cultured with PBECFCs (Chapter 2.8.7 and Chapter 4), 3 of these gels were
made in a 24-well plate. After culture for 1 week (with top-up media changes every 48
hours (Table 2.7)), tubule-like structures had formed within the gels and they were ready
for implantation into immunodeficient (BALB/c) mice. 24 hours prior implantation,
empty 240µl gels without cells were fabricated as controls (Table 2.12).
Gels containing tubule like structures and control gels were cut in half using a scalpel
and implanted subcutaneously but above the panniculus carnosus on the dorsum of
mice with half a control gel on one side and half a pre-vascularised gel on the other. This
was carried out under anaesthesia and was performed by Dr Fadi Issa with full Home
Office approval. Gels were secured to underlying panniculus and muscle with 6/0
Prolene (Ethicon, UK) sutures and wounds were then closed with 5/0 vicryl rapide
sutures (both Ethicon). This was done to prevent inadvertent migration of the gel that
would interfere with subsequent retrieval.
After 14 days, 6 gels from 3 mice (control and pre-vascularised) were explanted along
with overlying skin, under full anaesthesia, and were immediately placed into D-PBS with
mice being sacrificed immediately following gel harvest. Approximately 15 minutes prior
to harvest of the gels, mice were injected through their tail vein with 100µl biotinylated

92
Lectin from Lycopersicon esculentum (tomato) (Sigma Aldrich Ltd.) which had been
made up to a concentration of 1mg/ml with D-PBS (Lonza Biologics).
Once all gels had been harvested, D-PBS (Lonza Biologics) was replaced with 4% (w/v)
PFA (2.9). After 1 hour in PFA, gels were twice washed gently D-PBS and then placed into
bespoke kitchen foil ‘boats’ and covered with O.C.T. compound (Tissue-Tek). They were
rapidly frozen in liquid nitrogen and then stored at -20°C until ready for sectioning. Ten
µm sections gels with overlying dermis were then obtained using a cryostat and placed
onto microscope slides and stored at -20°C until ready for staining. They were first
stained as follows:
A PAP pen (Sigma Aldrich Ltd.) was used to draw around specimens and these were then
immediately covered with approximately 100µl D-PBS (Lonza biologics) to prevent
dessication. Meanwhile, a 0.5% BSA (v/v) in D-PBS was made into which anti-mouse FcR
block (eBioscience) was added at a concentration of 2µl per 100µl to make the final stain
buffer (SB). D-PBS overlying the specimens was removed and replaced with 100µl SB
which was left for 20 minutes at RT. SB was then removed and replaced with either
Streptavidin e450 (eBioscience) (1µl/100µl SB) to stain for lectin from Lycopersicon
esculentum (tomato), anti-mouse CD31-PE (Biolegend) (5µl/100µl SB) to stain for mouse
CD31, or PE Rat IgG2a control antibody (Biolegend) (5µl/100µl SB) for the CD31 PE
control. The slides were left in a humidified chamber for 30 minutes at RT, covered with
kitchen foil. They were then washed in SB and a drop of Vectashield mounting media for
fluorescence (Vector) added prior to covering with a cover slip. Nail varnish was then
used to seal the cover slip and slides were refrigerated at 4°C until ready for imaging.
Immunostaining using this technique did not enable visualisation of the vasculature
within the scaffolds so a CD31 biotinylated stain was carried out instead as per section
2.6 (umbilical cord immunostaining).
2.10 Statistics
For compressed gel cell viability, one-way ANOVA was performed to determine
significance between % viability calculations of cell types used, followed by post hoc
analysis using the Tukey’s honest significance difference (HSD) test to test for significant
difference between the various cell types (SPSS V22.0.0). Paired t-tests were performed

93
to test for significance between % viability calculations at day 1 and day 7 for each cell
line.
For endothelial cell migration experiments using µ-chemotaxis 3D and the comparison
between different uncompressed gel constructs, one-way ANOVA was performed with
post hoc analysis with Tukey’s HSD test and Bonferroni and paired t-tests were carried
out for subgroup analysis (SPSS V22.0.0).
To compare the number of tubules seen at 14 days in in vivo experiments, paired
Students t-test was used.

94
CHAPTER 3
FABRICATION OF A PREVASCULARISED SCAFFOLD
The main aim of this project was to improve existing proprietary dermal scaffolds which
are currently in use for the treatment of full thickness wounds (see Chapter 1). One way
in which this could be achieved would be to pre-vascularise scaffolds using autologous,
adult-derived stem and progenitor cells.
This Chapter therefore examines the migratory properties of 3 different types of
endothelial progenitor cells (HUVECs, CBECFCs and PBECFCs) within fibrin and collagen
gels. Having determined the optimal gel for ECFC migration, this is then used to co-
culture ECFCs with MSCs in compressed and then uncompressed collagen I gels in order
to attempt to create 3D pre-vascularised scaffolds.
3.1 Migration of endothelial cells: µ-Chemotaxis 3D
Directed cell migration (chemotaxis) towards a stimulus is a well-defined function of
many mammalian and non-mammalian cells. It is essential for wound healing and for
the development of bioengineered scaffolds for therapeutic use.
The gold standard for determining efficient homing and migration of stem/progenitor
cells within a wound bed and their subsequent revascularisation of the damaged tissue
is to effectively repair wounds in the human or a suitable animal model such as an
immunodeficient mouse. However, this is time consuming, costly and the Home Office
encourages as much in vitro analysis as possible prior to using in vivo surrogate models.
An initial ex vivo migration assay reduces animal studies and allows the refinement of
conditions for pre-transplant manipulation of cells so that their migratory abilities can
be assessed and optimised prior to transplant of matrix components with cells.
Ibidi GmbH (Munich, Germany) has developed a number of µ-slide chemotaxis assays.
One is 2-D, where adherent cells are seeded into a chamber with or without a supporting
matrix, and another is 3-D, where non-adherent cells or loosely adherent cells are
encapsulated within a gel. The cells are then allowed to migrate towards a
chemoattractant (Figure 3.1).
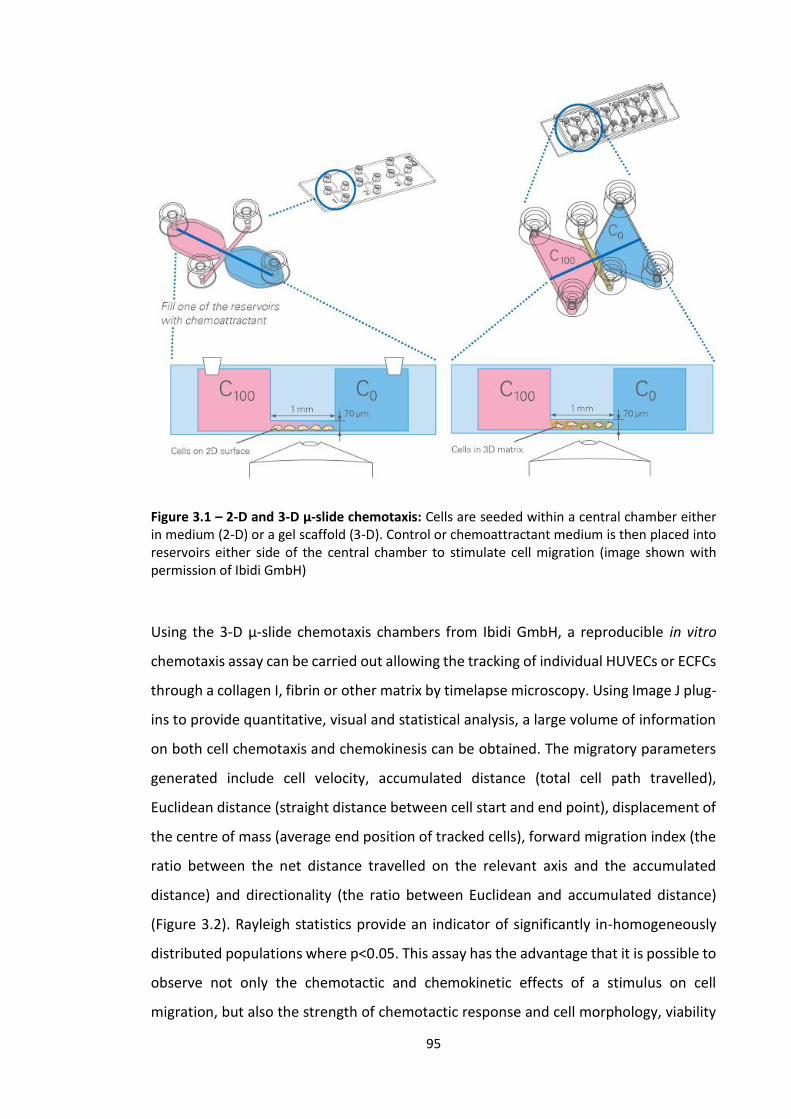
95
Figure 3.1 – 2-D and 3-D μ-slide chemotaxis: Cells are seeded within a central chamber either in medium (2-D) or a gel scaffold (3-D). Control or chemoattractant medium is then placed into reservoirs either side of the central chamber to stimulate cell migration (image shown with permission of Ibidi GmbH)
Using the 3-D μ-slide chemotaxis chambers from Ibidi GmbH, a reproducible in vitro
chemotaxis assay can be carried out allowing the tracking of individual HUVECs or ECFCs
through a collagen I, fibrin or other matrix by timelapse microscopy. Using Image J plug-
ins to provide quantitative, visual and statistical analysis, a large volume of information
on both cell chemotaxis and chemokinesis can be obtained. The migratory parameters
generated include cell velocity, accumulated distance (total cell path travelled),
Euclidean distance (straight distance between cell start and end point), displacement of
the centre of mass (average end position of tracked cells), forward migration index (the
ratio between the net distance travelled on the relevant axis and the accumulated
distance) and directionality (the ratio between Euclidean and accumulated distance)
(Figure 3.2). Rayleigh statistics provide an indicator of significantly in-homogeneously
distributed populations where p<0.05. This assay has the advantage that it is possible to
observe not only the chemotactic and chemokinetic effects of a stimulus on cell
migration, but also the strength of chemotactic response and cell morphology, viability

96
and cell-cell interactions during the migratory process through a defined 3D extracellular
matrix.
The 2D assay has already been used to demonstrate that HUVECs migrate to a 10% (v/v)
FCS positive stimulus showing strong chemotaxis (146) (p≤0.005) (Figure 3.3).
Figure 3.2 – parameters calculated using Image J ‘chemotaxis tool’ plugin: this figure shows the different parameters that can be calculated by Image J using the raw data provided by the timelapse videos of cell migration within the 3-D μ-slide chemotaxis chambers (image shown with permission of Ibidi GmbH).

97
Figure 3.3: Establishing migration using 2D μ-chemotaxis slides with HUVECs. In control conditions, minimal forward migration or shift in centre of mass was seen (Figure 3.3Ai, Bi and Bii). However, when a 0-10% (v/v) positive stimulus was established a significant displacement of centre of mass in the direction of the positive stimulus was seen (p=0.0178) (Mann-Whitney test; n≥3) (Aii and Bii). Red dots represent cells migrating towards the positive stimulus, black, away from the positive stimulus.
In view of the migration of HUVECs towards a 10% (v/v) FCS positive stimulus in this 2D
paradigm, the same methodology was used for our 3D µ-chemotaxis assays. Since the
majority of scaffolds in the literature are composed of either collagen I (100,104,108) or
fibrin (63), these were used to optimise gel concentration.
3.1.1 Aims and objectives for the µ-chemotaxis 3D assay
Previous research (146) has determined an optimal time course of 24 hours for µ-
chemotaxis 3D and an optimal chemotactic positive stimulus of 10% (v/v) FCS (146).

98
These were therefore used to determine the optimal scaffold constituents with the main
aims of experiments were therefore to:
1. Use the µ chemotaxis 3D assay to define the optimal matrix composition (fibrin
or collagen with or without fibronectin) for EC migration.
2. Compare the migration of different endothelial progenitors (HUVECs, CB ECFCs,
PB ECFCs) within the same gel matrix.
In order to ascertain the optimum gel for use when co-culturing ECs with MSCs to
attempt to grow tubule-like structures (TLS) in vitro, a number of different fibrin and
collagen I concentrations were inserted into the viewing chamber of the µ-chemotaxis
slide along with 3x10⁵ HUVECs. Once the optimum gel had been ascertained by these
experiments, 3 different batches of HUVECs, CB ECFCs and PB ECFCs were placed into
the viewing chamber of slides with 1mg/ml collagen I gel plus or minus fibronectin and
their migration over 24 hours examined (see Chapter 2.4 for methodology for
chemotaxis gel optimisation).
Throughout this thesis the term ‘TLS’ is used to describe the interconnecting networks
formed when eGFP-labelled ECs align within collagen scaffolds. The gel scaffolds in
which ECs were seeded were small (96-well plates) meaning that ‘TLSs’ don’t have
clearly identifiable lumina. Nevertheless, the terms tubule or TLS are regularly used
interchangeably within published works (73, 142) to describe similar structures and
therefore are used within this thesis.
3.1.2 Results: µ-chemotaxis assay
Figure 3.4 shows one viewing chamber of the µ-chemotaxis 3D slide when viewed under
the Nikon Eclipse TE300 microscope after the 24 hour timelapse sequence. After 30
randomly chosen cells were tracked using timelapse microscopy, their migratory
properties were then scrutinized using Image J (manual tracking plugin). Figure 3.5
shows the migration plots for HUVECs within a bovine collagen I 1mg/ml gel and human
fibrin 1.25mg/ml and 2.5mg/ml gels. They demonstrate how collagen I 1mg/ml and
fibrin 1.25mg/ml show improved migration in comparison to more concentrated gels in
terms of higher displacement of centre of mass, higher accumulated distance and faster
velocity (see Table 3.1). Although these parameters were similar whether collagen I

99
1mg/ml or fibrin 1.25mg/ml gels were used, collagen I 1mg/ml was used for quantified
chemotaxis experiments since co-culture of ECFCs and MSCs has been examined more
extensively for producing novel dermal substitutes than fibrin. If problems had arisen
using collagen I then fibrin would have been examined more closely.
Take home message: 1mg/ml Collagen I gel enables EC migration better than 3mg/ml
Collagen I gel
Fig 3.4 - µ chemotaxis assay: Collagen I 1mg/ml at 0 hours (top) and 24 hours (bottom). Note that in addition to migrating within collagen I gel, HUVECs formed TLS-like structures (black arrows) at 24 hours

100
Fig 3.5 – Migration plots for 30 HUVECs in collagen/fibrin gels: Plots showing the migration of 30 tracked pHUVECs over 24 hours with timelapse microscopy within collagen I 1mg/ml (top), fibrin 1.25mg/ml (bottom left) and fibrin 2.5mg/ml (bottom right) with 0.5% (v/v) FCS at top and 10% (v/v) FCS at bottom (plots for 5, 7.5 and 10mg/ml fibrin gels and 3mg/ml collagen I gel not shown but resembled fibrin 2.5mg/ml fibrin gel). Red dots represent cells migrating towards the positive stimulus, black, away from the positive stimulus. X and Y axes are distance travelled in µm.

101
Table 3.1 – migration results for HUVECs in different optimisation gels:
Collagen 1mg/ml
10% (v/v) FCS bottom
Fibrin 1.25mg/ml 10% (v/v)
FCS bottom
Fibrin 2.5mg/ml
10% (v/v) FCS bottom
Fibrin 5mg/ml
10% (v/v) FCS bottom
Fibrin 7.5mg/ml
10% (v/v) FCS bottom
Fibrin 10mg/ml
10% (v/v) FCS bottom
x Forward migration index
0.0 0.01 0.18 -0.01 0.06 0.09
y Forward migration index
-0.1 -0.07 -0.41 0.05 -0.03 -0.21
Center of mass
x [µm] 20.4 5.51 4.34 0 1.5 1.46
y [µm] -32.6 -32.0 -10.2 1.0 0.5 -4.7
Accumulated distance [µm]
416.7 SD:162.1
412.89 SD: 222.7
35.07 SD: 27.7
10.3 SD: 19.29
23.55 SD: 32.47
14.6 SD:31.7
Euclidean distance [µm]
60.98 SD:48.84
58.2 SD: 47.13
11.99 SD: 3.99
3.09 SD: 4.27
9.73 SD: 14.94
5.8 SD:7.3
Mean Velocity [µm/min]
0.28 SD:0.11
0.27 SD: 0.15
0.02 SD: 0.02
0.01 SD: 0.01
0.02 SD: 0.02
0.01 SD:0.02
RALEIGH TEST 0.009 1.08x10⁻⁴ 1.56x10⁻¹⁰ 0.8126207 0.3398043 0.0023784
Statistics for migration of pHUVECs through 1mg/ml Collagen I gel and 1.25mg/ml, 2.5mg/ml, 5mg/ml, 7.5mg/ml and 10mg/ml Fibrin gels over 24 hours. Negative values for y[µm] centre of mass represent displacement of the centre of mass towards the 10% (v/v) FCS positive stimulus.
3.1.2.2 Migration of endothelial cells (HUVECs/CBECFCs/PBECFCs) through collagen I
1mg/ml gel plus or minus fibronectin
Collagen I gels at a concentration of 1mg/ml were examined with or without adding
100µg/ml FN. The migration of 3 different batches of HUVECs, CBECFCs and PBECFCs
was examined. Due to variability between the different batches, very few comparisons
between the different cell types within a collagen I gel with or without FN achieved
statistical significance for mean accumulated cell distance, mean Euclidean distance or
mean velocity (Figure 3.6 A, B and C). Rayleigh statistics provide an indicator of
significantly in-homogeneously distributed populations where p<0.05 and this
information, together with the results for individual batches of ECs can be found in
tables 3.2, 3.3 and 3.4. It can be noted that Raleigh statistics were significant for samples
with a 10% (v/v) FCS positive stimulus but not in control gels where 0.5% (v/v) FCS was
in both reservoirs either side of the collagen I gel.
One-way ANOVA showed significant differences between groups for FMI Y (p=0.014)
and change in centre of mass Y (p=0.001) but not when comparing the 12 different
EC/gel combinations for mean accumulated distance (p=0.215), mean Euclidean
distance (p=0.131) or mean velocity (p=0.720). Standard t-tests were carried out to look
for statistical significance between the different EC subtypes (PBECFCs, HUVECs and
CBECFCs) within the different gels (collagen with or without FN). There was an increase

102
in FMI and change in centre of mass towards a 10% (v/v) FCS positive stimulus (FMI Y,
change in centre of mass Y) whether FN was added to the collagen gel or not (Figure 3.6
D and E). This was statistically significant for all EC cells (p<0.01** or p<0.05* - see Figure
3.6) in most gels. The only constructs where there was not statistical significance were
change in centre of mass Y for PBECFCs in collagen I gel with FN (p=0.11) and FMI Y for
HUVECs in collagen I gel with FN (p=0.171) and CBECFCs in collagen I gel without FN
(p=0.40).
Due to the clear influence that a 10% (v/v) FCS positive stimulus had on the EC cells (Fig
3.6 D and E) a number of statistically significant results were noted for FMI Y and change
in centre of mass Y but very few results for mean accumulated distance, mean Euclidean
distance or mean velocity were significant since the differences for these parameters
were small for the different EC cells. Nevertheless, certain observations from these
results could be noted (Figure 3.6 A to C). First of all there was a clear trend for
constructs containing FN to have higher values for mean accumulated distance, mean
Euclidean distance and mean velocity then otherwise identical gels (EC and collagen I).
This trend was statistically significant for PBECFCs for mean accumulated distance
[(221.6µm in FN containing gel versus 182.1µm in standard collagen I gel (p=0.039)] and
mean velocity [0.15µm/s in FN containing gel versus 0.13µm/s in standard collagen I gel
(p=0.039)] when there was no 10% (v/v) FCS positive stimulus. There was also a
statistically significant increase in Euclidean distance travelled for CBECFCs when there
was no 10% (v/v) FCS positive stimulus [33.4µm versus 22.6µm (p=0.038)] and for
HUVECs when there was a 10% FCS (v/v) positive stimulus [47.7µm versus 37.6µm
(p=0.041)]. There was a trend for increased accumulated distance, Euclidean distance
and velocity for PBECFCs compared to CBECFCs and HUVECs (Figure 3.6 A to C) but this
was never statistically significant.

103
Table 3.2a – PBECFC migration through 1mg/ml collagen gel
PBECFCs Collagen I 1mg/ml +FN
10% (v/v) FCS positive stimulus
PBECFCs Collagen I 1mg/ml +FN
0.5% (v/v) FCS top and bottom of chamber (control)
PBECFCs Collagen I 1mg/ml
10% (v/v) FCS positive stimulus
PBECFCs Collagen I 1mg/ml
0.5% (v/v) FCS top and bottom of chamber (control)
X Forward
migration index -0.02 -0.03 0.04 -0.05 0.03 0.12 -0.07 0 0.01 0.03 -0.1 0.02
Y Forward
migration index -0.14 -0.16 -0.11 0 0 0.06 -0.15 -0.13 -0.06 0.03 -0.01 0.01
Centre of mass
X [µm] -3.18 -5.62 5.63 -11.85 4.72 21.9 -13.2 -0.07 -11.75 4.35 -12.88 6.32
Y [µm] -33.67 -101.32 -32.48 -1.72 -1.96 16.5 -30.52 -24.6 -33.72 3.75 -0.85 1.35
Accumulated
distance [µm] 236.92 560.43 285.51 204.37 233.88 226.41 213.25 192.69 531.14 186.29 177.84 182.23
Euclidean
distance [µm] 49.58 170.65 50.57 40.31 32.3 50.03 46.63 38.29 124.38 29.83 24.89 26.43
Mean Velocity
[µm/min] 0.16 0.39 0.2 0.14 0.16 0.16 0.15 0.13 0.37 0.13 0.12 0.13
RALEIGH TEST 3.1x10⁻⁶ 0.001 1.7x10⁻⁷ 0.11 0.59 0.05 1.7x10⁻⁷ 1.3x10⁻⁶ 1.8x10⁻⁶ 0.66 0.06 0.43
Statistics for migration of PBECFCs through 1mg/ml Collagen I gel with or without FN over 24 hours. Negative values for y indicate migration towards 10% (v/v) FCS.

104
Table 3.2b – HUVEC migration through 1mg/ml collagen gel
HUVECs Collagen I 1mg/ml +FN
10% (v/v) FCS positive stimulus
HUVECs Collagen I 1mg/ml +FN
0.5% (v/v) FCS top and bottom of chamber (control)
HUVECs Collagen I 1mg/ml
10% (v/v) FCS positive stimulus
HUVECs Collagen I 1mg/ml
0.5% (v/v) FCS top and bottom of chamber (control)
x Forward
migration index 0.03 -0.02 0.03 -0.01 0.03 -0.02 -0.04 -0.03 0.06 0.05 0.05 -0.05
y Forward
migration index -0.07 -0.19 -0.07 0.04 0 0.03 -0.10 -0.08 -0.1 -0.02 -0.01 -0.01
Centre of mass
x [µm] 9.82 -7.05 9.82 -5 7.29 -6 -8.93 -5.66 13.58 18.68 7.28 -10.23
y [µm] -21.9 -33.75 -21.9 9.67 -1.32 7.67 -13.72 -19.90 -21.23 -5.70 -0.98 -1.81
Accumulated
distance [µm] 287.74 194.27 287.74 248.63 206.53 238.63 172.81 223.43 228.81 216.66 163.57 191.47
Euclidean
distance [µm] 46.45 50.18 46.45 31.89 28.29 30.89 42.33 33.52 36.93 51.23 24.28 28.82
Mean Velocity
[µm/min] 0.2 0.13 0.2 0.17 0.14 0.16 0.31 0.15 0.16 0.38 0.11 0.13
RALEIGH TEST 5.6x10⁻⁴ 0.006 4.2x10⁻⁶ 0.26 0.39 0.17 0.00 0.004 7.4x10⁻⁵ 0.20 0.12 0.12
Statistics for migration of HUVECs through 1mg/ml Collagen I gel with or without FN over 24 hours. Negative values for y indicate migration towards 10% (v/v) FCS.

105
Table 3.3c – CBECFC migration through 1mg/ml collagen gel
CBECFCs Collagen I 1mg/ml +FN
10% (v/v) FCS positive stimulus
CBECFCs Collagen I 1mg/ml +FN
0.5% (v/v) FCS top and bottom of chamber (control)
CBECFCs Collagen I 1mg/ml
10% (v/v) FCS positive stimulus
CBECFCs Collagen I 1mg/ml
0.5% (v/v) FCS top and bottom of chamber (control)
x Forward
migration index -0.03 0.03 -0.05 0.01 0 -0.03 0.04 -0.03 -0.06 -0.06 -0.02 -0.04
y Forward
migration index -0.1 -0.05 -0.11 0 0 0.02 -0.05 -0.08 -0.12 0.03 -0.04 -0.01
Centre of mass
x [µm] -10.95 6.59 -12.37 4.35 -0.82 -5.32 5.79 9.52 -9.08 -12.34 -4.72 5.63
y [µm] -32.55 -23.97 -29.97 -2.55 0.98 3.3 -15.39 -18.45 -22.5 4.27 -7.77 0.15
Accumulated
distance [µm] 315.99 391.84 284.68 219.87 327.64 250.7 355.20 240.73 186.68 190.76 186.41 188.65
Euclidean
distance [µm] 49.93 69.17 44.59 35.19 33.68 31.26 60.59 33.21 35.91 25.88 4.55 17.45
Mean Velocity
[µm/min] 0.22 0.27 0.2 0.15 0.23 0.17 0.25 0.17 0.13 0.13 0.13 0.15
RALEIGH TEST 4.9x10⁻⁶ 0.01 3.1x10⁻⁷ 0.49 0.62 0.30 1.2x10⁻⁵ 2.3x10⁻⁴ 5.1x10⁻⁶ 0.005 0.11 0.24
Statistics for migration of CBECFCs through 1mg/ml Collagen I gel with or without FN over 24 hours. Negative values for y indicate migration towards 10% (v/v) FCS.

106
PB
+F
N 1
0%
CB
+F
N 1
0%
HU
VE
C+F
N 1
0%
PB
10%
CB
10%
HU
VE
C 1
0%
PB
+F
N c
on
tro
l
CB
+F
N c
on
tro
l
HU
VE
C+F
N c
on
tro
l
PB
co
ntr
ol
CB
co
ntr
ol
HU
VE
C c
on
tro
l
0 .0
0 .1
0 .2
0 .3
0 .4
Me
an
ce
ll v
elo
cit
y (
µm
/min
)
Ch
an
ge
in
ce
ntr
e o
f m
as
s -
Y
ax
is
(µm
)
PB
+F
N 1
0%
PB
+F
N c
on
tro
l
CB
+F
N 1
0%
CB
+F
N c
on
tro
l
HU
VE
C+F
N 1
0%
HU
VE
C+F
N c
on
tro
l
PB
10%
PB
co
ntr
ol
CB
10%
CB
co
ntr
ol
HU
VE
C 1
0%
HU
VE
C c
on
tro
l
-1 0 0
-5 0
0
5 0
Fo
rw
ard
mig
ra
tio
n i
nd
ex
- Y
ax
is (
µm
)
PB
+F
N 1
0%
PB
+F
N c
on
tro
l
CB
+F
N 1
0%
CB
+F
N c
on
tro
l
HU
VE
C+F
N 1
0%
HU
VE
C+F
N c
on
tro
l
PB
10%
PB
co
ntr
ol
CB
10%
CB
co
ntr
ol
HU
VE
C 1
0%
HU
VE
C c
on
tro
l
-0 .2
-0 .1
0 .0
0 .1
me
an
ac
cu
mu
late
d d
ista
nc
e (
µm
)
PB
+F
N 1
0%
CB
+F
N 1
0%
HU
VE
C+F
N 1
0%
PB
10%
CB
10%
HU
VE
C 1
0%
PB
+F
N c
on
tro
l
CB
+F
N c
on
tro
l
HU
VE
C+F
N c
on
tro
l
PB
co
ntr
ol
CB
co
ntr
ol
HU
VE
C c
on
tro
l
0
2 0 0
4 0 0
6 0 0
Eu
cli
de
an
dis
tan
ce
(µ
m)
PB
+F
N 1
0%
CB
+F
N 1
0%
HU
VE
C+F
N 1
0%
PB
10%
CB
10%
HU
VE
C 1
0%
PB
+F
N c
on
tro
l
CB
+F
N c
on
tro
l
HU
VE
C+F
N c
on
tro
l
PB
co
ntr
ol
CB
co
ntr
ol
HU
VE
C c
on
tro
l
0
5 0
1 0 0
1 5 0
*****
******* ***
**
**
A B
C
D E
Figure 3.6 – Mean accumulated distance travelled [A], mean cell velocity [B], mean Euclidean distance [C], change in centre of mass (Y) [D] and forward migration index (Y) [E] for 30 ECs in collagen I 1mg/ml with or without FN: Mean accumulated distance, cell velocity and Euclidean distance were higher for FN containing gels than non-FN containing gels though this was only statistically significant for constructs labelled with * = p<0.05 or **= p<0.01 (unpaired students t-test). PBECFCs migrated further and faster than CBECFCs or HUVECs in most cases although this was never statistically significant. Change in centre of mass (Y) and FMI (Y) were significantly greater when there was a 10% (v/v) FCS positive stimulus for most cases (D and E * or ** for significance) [‘10%’ = a 10% (v/v) FCS positive stimulus; ‘control’ = no FCS positive stimulus].

107
3.1.3 µ-chemotaxis findings
In optimisation experiments using HUVECs, it was demonstrated that:
Fibrin gels and collagen I gels of a concentration of 3mg/ml and above were not conducive
to EC migration.
Therefore, a 1mg/ml collagen I gel was used to quantify chemotaxis and chemokinesis
parameters for 3 separate batches of HUVECs, CBECFCs and PBECFCs. The main observation
was that:
PBECFCs, HUVECs and CBECFCs migrated towards a 10% (v/v) FCS positive stimulus with a
statistical significance [one-way ANOVA forward migration index Y (p=0.014); change in
centre of mass Y (p=0.001)] showing that the µ-slide chemotaxis 3D (Ibidi, GmbH) is a
suitable surrogate for determining efficient directed homing and migration of
stem/progenitor cells. In attempting to compare the 3 different EC cells for accumulated cell
distance, Euclidean distance and average velocity, there were:
Trends for higher values when 100µg/ml FN was added to gels and also for PBECFCs to travel
further and faster than CBECFCs or HUVECs although these results were not statistically
significant.
This concentration of FN was chosen as it had been used to improve TLS formation in a
previous study at a similar concentration (100). It is important to recognise that although
many parameters were higher for PBECFCs than CBECFCs or HUVECs that this may have been
because these cell lines seemed to line up into TLS-like structures more readily than PBECFCs
in the chemotaxis chambers. Hence the distance travelled and average velocity would fall
compared to PBECFCs. For this reason just because PBECFCs seemed to travel further and
faster, this did not necessarily mean that they would form better TLSs and it was important
to await results of 3D co-cultures before making such conclusions. There is a great deal of
scope for the µ-slide chemotaxis 3D assay and what it can be used to ascertain. For example,
various other chemo-attractants instead of 10% (v/v) FCS could be used within the reservoirs
either side of the central gel channel to see if migration is further improved or other additives
to the gel chamber could be considered which may be more conducive to migration of ECs.
However, in order to take the project forward the above results provided sufficient

108
information as a starting point. Based on the chemotaxis outcomes it was reasonable to test
only gels of less than 2mg/ml collagen I concentration.
In terms of attempting to fabricate a collagen I scaffold containing a pre-vascularised network
of vessels, there are 2 potential paradigms that may be of use clinically – the first is a
compressed collagen I gel, onto or into which the progenitor cells required for network
formation are seeded, whilst the second is an uncompressed gel containing the required cells,
which on development of a vascular network becomes mechanically strong enough to be
handled in a clinical setting.
3.2 Compressed collagen gels
3.2.1 Rationale and aims for use of compressed collagen gels
Several authors have attempted to compress gels with the goal of producing a scaffold that
was easier to handle for clinical purposes however these have invariably been done with
fibroblasts alone (112,147–149). Clinically this would not be a suitable scaffold for skin
regeneration as a scaffold containing only fibroblasts would lead to production of ECM and
ultimately scar tissue formation unless host ECs invaded the construct to re-establish a new
microcirculation at an early stage. One reason why full thickness skin grafts produce a more
acceptable cosmetic outcome is the presence of a dermal plexus of blood vessels that helps
in the remodelling process of the healing wound. Therefore, the optimum compressed
collagen gel should have an EC element within it in addition to primary stromal cells. As MSCs
have anti-fibrotic activities and can promote new blood vessel formation (143), the studies
concentrated on ECs with AdMSCs.
RAFT 3D (TAP Biosystems) is a proprietary device that can be used to compress collagen gels
within a 24, 48 or 96-well plate format in easily replicated fashion (Figure 3.7). It compresses
gels to approximately 50 times their normal concentration resulting in a scaffold that is more
durable and easier to handle. The aims regarding compressed gels were:
1. Attempt to compress a collagen I gel containing ECs or MSCs or a combination of
these primary cell types, using RAFT 3D, and to check for viability following the
compression process.

109
2. Attempt to grow TLSs within these compressed scaffolds.
or
3. Grow vascular networks within an uncompressed gel and compress this, then
checking for persistence of these vessels.
Figure 3.7 – RAFT 3D setup: 96-well and 24-well plates are shown underneath a close-up of the compression device. Note that the wick not only compresses the gel but also absorbs fluid at the same time concentrating the gel approximately 50x (TAP Biosystems).
The RAFT 3D protocol (TAP Biosystems) states that in order to produce a compressed collagen
gel containing a fibroblast monoculture one should use 240µl for a 96-well plate. However,
previous uncompressed gels containing EC and MSC co-cultures have been fabricated with
smaller volume gels (130). Therefore prior to examining compressed gels, uncompressed gels
containing varying quantities of HUVECs and BMMSCs were plated within gel volumes of
112µl and 240µl to see whether TLSs would form in thicker gels.

110
Previous compressed gels in the literature have used concentrations of fibroblasts of between
1x10⁵/ml (147,149) and 2x10⁵/ml (112) within collagen at a concentration of between 1.65
(112,149) and 4.3mg/ml (147). Using 1x10⁵ cells/ml as an example cell concentration within
gels and a 240µl volume per well (RAFT protocol) (TAP Biosystems) would mean using 2.4x10⁴
cells in total. In uncompressed gel co-cultures within collagen and fibrin gels a ratio of
approximately 4:1 (EC:MSC) is most commonly used (this would equate to 1.92x10⁴ ECs and
4.8x10³ MSCs) (63,83,124). Based on these previous examples, the following concentrations
of HUVECs and BMMSCs were used in the first optimisation experiment: 4x10⁵ ECs and 8x10⁴
MSCs; 2x10⁵ ECs and 4x10⁴ MSCs; 1x10⁵ ECs and 2x10⁴ MSCs; 5x10⁴ ECs and 1x10⁴ MSCs;
2.5x10⁴ ECs and 5x10³ MSCs; 1.25x10⁴ ECs and 2.5x10³ MSCs. Higher concentrations, with the
same 4:1 ratio were also examined within gels that were compressed at 48 hours rather than
immediately: 8x10⁵ ECs and 1.6x10⁵ MSCs; 4x10⁵ ECs and 8x10⁴ MSCs; 2x10⁵ ECs and 4x10⁴
MSCs; 1x10⁵ ECs and 2x10⁴ MSCs.
3.2.2 Prevascularising uncompressed gels prior to compression
No TLS formation was observed by day 4 in 240μL gels (Fig 3.8); this was thought to be due to
the gel being too thick resulting in a lack of oxygenation to the cells. Early TLS formation could
be observed by day 3 in the 112μL gels, supporting this hypothesis. By day 6 there were
extensive microvascular networks throughout the 112μL gels containing 4x10⁵ HUVECs and
8x10⁴ BM-MSCs (Figure 3.10), less so at lower numbers of cells (2x10⁵ HUVECs and 4x10⁴ BM-
MSCs). The former was therefore chosen as an optimum for uncompressed gels.

111
A B
Figure 3.8 – HUVEC/BMMSC co-culture in uncompressed collagen gel: In the x10 magnification image of a 240μL uncompressed gel containing 8x10⁵ HUVECs and 1.6x10⁵ BMMSCs at d4 (A), there were only sporadic TLSs seen. In the x10 magnification image of an 112μL uncompressed gel containing 4x10⁵ HUVECs and 8x10⁴ BMMSCs at d4 there were extensive TLS networks seen (B). MSCs are labelled with cell tracker red and HUVECs with eGFP.
3.2.3 Results for compressed gels
Collagen I gels of 112μL, containing numbers of HUVECs and BMMSCs ranging from the
uncompressed optimum quantity (4x10⁵ HUVECs and 8x10⁴ BMMSCs) to 1/16 of this were
compressed at day 0, 2 and 3 using RAFT 3D (see Chapter 2). Only lower numbers of cells
along with the optimal concentration (Figure 3.8) were included as the compression would
increase the concentration of the cells within the scaffold. No microvascular networks could
be seen after compression of gels (Figure 3.9a); shortening the compression time to 5 minutes
did not have any effect (Figure 3.9b).
Acellular 240μL collagen I gels were prepared, compressed at d0 and then had cells seeded
onto the surface. Lower quantities of cells than 4x10⁵ HUVECs and 8x10⁴ BMMSCs were used
as the requirement for a 2D cell monolayer would be far less than for a 3D scaffold. Some TLS
formation was seen (Figure 3.10) however this was much less extensive than the
uncompressed 112μL gels and was mainly confined to the periphery of the gel.

112
A B
Figure 3.9 – HUVEC/BMMSC co-cultured in compressed collagen gel: a) d6, x10 magnification. 112μL gel compressed at d3 for 15mins, 4x10⁵ HUVECs, 8x10⁴ BMMSCs; b) d4, x10 magnification. 240μL gel compressed d2 for 5mins, 2x10⁵ HUVECS, 4x10⁴ BMMSCs. No microvascular networks were seen. MSCs are labelled with cell tracker red and HUVECs with eGFP.
Figure 3.10 – HUVEC/BMMSC co-cultured on top of compressed collagen gel: d6, x10 magnification, 240μL acellular gel compressed d0 for 15mins, 1x10⁵ HUVECs, 2x10⁴ BMMSCs seeded on gel surface. Sporadic TLSs were noted in this case. MSCs are labelled with cell tracker red and HUVECs with eGFP.
In view of no TLSs forming within compressed gels and previously formed TLSs disappearing
after the compression process, individual cell types rather than EC/MSC co-cultures were
examined. The first primary cell type examined, in view of their necessity for vasculogenesis,
was HUVEC. The same concentration of cells and quantities of reagents were used as for the
RAFT 3D protocol (TAP Biosystems) (Chapter 2.7). As demonstrated in Figure 3.11 and Figure
3.15, there was 100% non-viability of these cells following compression using RAFT 3D.
TAP Biosystems demonstrated the proof of principle for RAFT 3D using human dermal
fibroblast (hDFs). Therefore, in view of no HUVEC survival within the collagen I gel (Figure 3.11
and Figure 3.15) following the RAFT 3D compression process, a compressed gel containing
either AdMSCs, BMMSCs or hDFs was tested. Sixty three percent of AdMSCs and 66% hDFs

113
survived at day 7 post-compression respectively whilst only 9% of BMMSCs did so (Figures
3.12, 3.13, 3.14 and 3.15).
The statistical analysis of the LIVE/DEAD® viability assay for HUVECs, hDFs, AdMSCs and
BMMSCs is shown in Figure 3.16. Mean numbers of cells were calculated by counting the
number of live cells (green) in 3 randomly chosen areas of compressed gels at x10
magnification and dividing this by the total number of cells (red and green) within these
sections. No background noise was detected in acellular or dead controls.
Fig 3.11 – Live/dead stain for HUVECs in compressed collagen gel: x10 magnification images of 1.2x10⁴ (left) and 2.4x10⁴ (right) HUVECs within compressed 2mg/ml collagen I hydrogel 48 hours after compression. Live cells appear green and dead cells red.
Fig 3.12 – Live/dead stain for AdMSCs in compressed collagen I gel: AdMSCs within a 2mg/ml collagen I hydrogel 48 hours after compression using RAFT 3D. x4 magnification (left); x10 magnification (middle); x10 magnification of dead control (right). Live cells appear green and dead cells red.

114
Fig 3.13 – Live/dead stain for hDFs in compressed collagen I gel: hDFs within a 2mg/ml collagen I gel 48 hours after compression using RAFT 3D. x4 magnification (left); x10 magnification (middle); x10 magnification of dead control (right). Live cells appear green and dead cells red.
Fig 3.14 – Live/dead stain for hDFs in compressed collagen gel: BMMSCs within a collagen I 2mg/ml gel 48 hours after compression using RAFT 3D. x10 magnification (left); x10 magnification of dead control (right). Live cells appear green and dead cells red.
Figure 3.15 – HUVEC/hDF/ATMSC/BMMSC viability following compression: % viability of cells within compressed 2mg/ml collagen I gels. d1 and d7 refer to days after compression. x indicates % viability for single gel, – indicates mean % viability (also given numerically). One way ANOVA with Tukey's post hoc analysis on hDFs and MSCs. *p<0.05, **p<0.01

115
3.2.4 Compressed gels – summary
The aims for compressed gels were to compress a collagen I gel containing ECs and MSCs that
had already formed TLSs or would subsequently do so with the expectation that a compressed
collagen gel would resist contraction and be easier to handle in a clinical setting.
Microvascular networks formed well in uncompressed collagen I gels and penetrated
throughout the entire gel provided that the thickness of the gel did not limit passive diffusion
of oxygen to the embedded cells. However, no microvascular networks could be seen after
compression of collagen I gels containing both HUVECs and MSCs and only very few TLSs were
noted when cells were seeded onto already compressed scaffolds. Gels showing good
formation of a microvascular network before compression had a distinct lack of any TLSs when
imaged afterwards, demonstrating that compression had a significant detrimental effect on
existing TLSs as well as on prospective vessel network formation. This was shown to be
because HUVECs do not survive the compression process used here, although good viability
could be seen in gels containing hDFs and AdMSCs both 24 hours and 1 week after
compression. Importantly, % viability of AdMSCs was significantly better (p<0.01) than
BMMSCs at both day 1 and day 7 post compression. AdMSCs can be harvested with great ease
and far less morbidity than BMMSCs. Compression is still a useful technique for improving the
strength of the gel without the need for chemical cross linking agents and preventing
contraction of the gel due to the cells, however a less forceful compression may be required
in order to achieve these properties whilst ensuring survival of endothelial cells.
An alternative method would be to compress collagen I gels containing MSCs and then seed
endothelial cells onto the surface of the compressed gel with the expectation that they would
form vascular networks that may penetrate the scaffold. This approach has proved successful
for the generation of stratified epidermal cell layers on the surface of compressed gels
containing fibroblasts (148,149); however preliminary experiments with both cell types
seeded onto the surface of a compressed collagen gel formed mainly superficial microvascular
networks that were less extensive than in uncompressed gels. Further studies would
therefore compare microvascular networks in uncompressed gels with those in compressed
gels containing MSCs with HUVECs seeded on top.

116
In view of these findings, two potential options were available in order to create a scaffold
containing a viable microvascular network. The first would be to modify (most likely reduce)
the compression process but this would risk negating the main reasons for carrying out the
process in the first place – to improve handling of the scaffold and reduce secondary
contraction. The second option would be to simply seed the ECs and MSCs within an
uncompressed gel and examine whether the process of TLS formation would stabilise the gel
sufficiently to make this suitable for a potential clinical application.
Main conclusions:
- No microvascular networks were seen after compression of collagen I gels
containing HUVECs and MSCs.
- Only very few TLSs were noted when cells were seeded onto already compressed
scaffolds.
- Gels showing good formation of a microvascular network before compression had
no TLSs afterwards.
- HUVECs when seeded in isolation within collagen I gels do not survive the
compression process but AdMSCs have high post-compression viability, both 24
hours and 1 week after compression.
3.3 Uncompressed collagen gels
3.3.1 Aims for use of uncompressed collagen I gels
Aims for uncompressed collagen gels were as follows:
1. To co-culture HUVECs with BMMSCs at a variety of concentrations on top of and within
collagen I gels optimising the production of a pre-vascularised collagen gel matrix.
2. To co-culture human PBECFCs and AdMSCs within these optimised collagen I gels to
create a pre-vascularised collagen I gel that would be suitable in a clinical paradigm.
In order to form the basis for optimising gels, the angiogenesis protocol of Koh et al. was used
as it had been shown to enable TLS formation in collagen gels through the co-culture of ECs
with pericytes (5). In addition the cytokines stem cell factor (SCF), Stromal-cell derived factor

117
1α (SDF-1α) and Interleukin-3 (IL-3) were also added as per the amendments of Stratman et
al. (6) to further improve TLS formation. The main difference between this protocol and the
one used in my own uncompressed gels was that a 2mg/ml collagen I gel was used rather
than the 2.5 or 3.75mg/ml that Koh et al. used, basing this lower concentration on the
migration assays where ECs failed to migrate through a 3mg/ml collagen gel but successfully
migrated through a 1mg/ml gel.
3.3.2 Results for uncompressed gels – Pilot experiments using HUVECs and BMMSCs
As a pilot experiment to ascertain the optimal seeding density for ECs and MSCs co-cultured
within a collagen I gel and to compare this to placing these cells onto the surface of a collagen
gel, various concentrations of HUVECs (Lonza Biologics) and BMMSCs (Lonza Biologics) were
placed together within or on top of a bovine collagen I gel (2mg/ml) (Invitrogen) with either
M-199 (Sigma Aldrich) or EGM-2 (Lonza Biologics) providing the medium component to the
gel. In this experiment the following concentrations of HUVECs and BMMSCs were co-
cultured within or on top of an EGM-2 or M-199 based collagen I gel (Chapter 2, section 2.8):
4x10⁴ ECs and 1x101 MSCs; 1x10⁵ ECs and 2.5x10⁴ MSCs; 2x10⁵ ECs and 5x10⁴ MSCs. When
HUVECs and BMMSCs were seeded within a 2mg/ml collagen gel containing either M-199
(Sigma Aldrich) or EGM-2 (Lonza Biologics) TLS-like structures were noted within both as early
as 48 hours however they were not seen when identical concentrations of cells were seeded
onto the gels, cells instead growing to near confluence on these gels. TLS-like structures were
fully formed by day 7 (Figure 3.16), they were more uniform and extensive with M-199 than
EGM-2 and they remained stable until day 14.
Fig 3.16 Uncompressed collagen I gel pilot experiment (comparison of medium): x4 magnification images of HUVECs;BMMSCs (2x10⁵;5x10⁴) within 2mg/ml collagen I gel [M-199 (left); EGM-2 (right)] (see Chapter 2.2.1 for constituents of EGM-2)(scale bar = 200µm).

118
In the first pilot experiment (Fig 3.16) it was shown that TLSs formed most readily within but
not on the surface of the M-199 based 2mg/ml collagen I gel with an optimum concentration
of 2x10⁵ HUVECs with 5x10⁴ MSCs. Therefore, this concentration of cells was again used for
the next step, this time substituting CBECFCs or PBECFCs for HUVECs (Fig 3.17). Given that
there was very little TLS formation when cells were placed onto gels, this experiment was not
conducted for CB or PBECFCs. The 2 concentrations used were 2x10⁵ ECs with 5x10⁴ BMMSCs
(optimal concentration from pilot experiment 1) and 3x10⁵ ECs with 7.5x10⁴ BMMSCs. Fifty µl
medium was removed from wells and replaced with 60µl top-up medium at 24 hours (Table
2.6). This was repeated at 96 hours and photos were taken at d7 after fixing specimens with
PFA (Chapter 2.9). Photos were taken using a Nikon Eclipse TE300 microscope and a
Hamamatsu ORCA-ER camera (Hamamatsu Photonics UK Ltd).
CB ECFC:BMMSC and PBECFC:BMMSC containing gels contracted away from wells but
reducing the concentration of MSCs to 3x10⁴ stopped this from occurring whilst TLSs still
formed readily.
a b
c d
Fig 3.17 – Uncompressed collagen I gel pilot experiment 2 (ECFCs and MSCs): Day 4. a) 2x10⁵ HUVECs:3x10⁴ AdMSCs; b) 2x10⁵ HUVECs:3x10⁴ BMMSCs; c) 2x10⁵ PBECFCs:3x10⁴ AdMSCs; b) 2x10⁵ PBECFCs:3x10⁴ BMMSCs in 2mg/ml collagen I gel (x4 magnification). TLS appeared to form with all 4 combinations of cells but due to contraction and folding of the PBECFC/AdMSC containing gel the TLSs are less well circumscribed in this image (c).

119
Once cell numbers and components for the collagen I gel had been piloted by carrying out the
experiments in 3.3.2 (EC 2x10⁵ cells: MSC 3x10⁴ cells; M199 medium; SCF, SDF-1α and IL-3
added to gel), the following experiments were carried out with this setup, so that quantitative
data regarding the TLS forming capacity of different cells could be ascertained via:
1. Co-culturing a batch of AdMSCs with 3 batches of PBECFCs, CBECFCs and HUVECs.
2. Co-culturing a batch of BMMSCs with 3 batches of PBECFCs, CBECFCs and HUVECs.
3. Co-culturing a single batch of PBECFCs/CBECFCs/HUVECs with 3 batches of AdMSCs.
4. Co-culturing a single batch of PBECFCs/CBECFCs/HUVECs with 3 batches of BMMSCs.
By conducting the above experiments, it would be possible to not only confirm or refute the
TLS-forming capacity of the different batches of isolated cell types (PBECFCs, CBECFCs,
AdMSCs) but also to identify the ‘best batch’ of each cell type as every co-culture combination
would be examined.
3.3.3 Will TLSs form with 3 different batches of PB ECFCs/CB ECFCs/HUVECs?
Three separate batches of the 3 EC subtypes were co-cultured with a single batch of either
BMMSCs or AdMSCs to confirm the tubule-forming capacity of the ECs. Figure 3.18 shows x10
magnification fluorescence microscope images of the gold standard gel (2x10⁵ HUVECs and
3x10⁴ BMMSCs) from pilot experiments above. Figures 3.19 to 3.21 show the results from co-
culturing 3 different batches of PBECFCs, CBECFCs and HUVECs with a single batch of BMMSCs
or AdMSCs.
Fig 3.18 – Comparing AdMSCs to BMMSCs with HUVECs: Representative day 7 images taken at x10 magnification after co-culturing 2x10⁵ HUVECs: 3x10⁴ AdMSCs (left) or 2x10⁵ HUVECs: 3x10⁴ BM MSCs (right) in 2mg/ml collagen I gel.

120
Fig 3.19 – Comparing 3 different batches of PBECFCs with AdMSCs/BMMSCs: Representative day 7 images taken at x10 magnification after co-culturing 2x10⁵ PBECFC:3x10⁴ AdMSCs (left); 2x10⁵ PBECFCs:3x10⁴ BM MSCs (right) in 2mg/ml collagen I gel for 3 batches of PBECFCs (PB2 top; PB5 middle; PB8 bottom).

121
Fig 3.20 – Comparing 3 different batches of CBECFCs with AdMSCs/BMMSCs: Representative day 7 images taken at x10 magnification after co-culturing 2x10⁵ CBECFC:3x10⁴ AdMSCs (left); 2x10⁵ CBECFCs:3x10⁴ BM MSCs (right) in 2mg/ml collagen I gel for 3 batches of CBECFCs (CB1 top; CB2 middle; CB3 bottom).

122
Fig 3.21 – Comparing 3 different batches of HUVECs with AdMSCs/BMMSCs: Representative day 7 images taken at x10 magnification after co-culturing 2x10⁵ HUVECs:3x10⁴ AdMSCs (left); 2x10⁵ HUVECs:3x10⁴ BM MSCs (right) in 2mg/ml collagen I gel for 3 batches of HUVECs (HUVECs1 top; HUVECs2 middle; HUVECs3 bottom).
Figures 3.19 to 3.21 show the representative images of TLS-forming capacity of 3 different
batches of PBECFCs, CBECFCs and HUVECs when they have been co-cultured with either
AdMSCs or BMMSCs. However, these images only show this ability qualitatively. In order to
quantify outcomes it was necessary to take confocal images of the gels and use Imaris 3D

123
(Bitplane) (Chapter 2, section 2.8) to ascertain the number of TLSs, total TLS length, total TLS
area, total TLS volume, number of branch points, average TLS diameter and width of gel
containing TLSs. Note that for this last parameter, this measurement was the depth of gel
containing TLSs (penetration), not the total gel thickness which ranged from 200-300µm.
Figure 3.22 shows the results for each separate batch of ECs providing evidence as to the best
combination of cells for each parameter. Figure 3.23 then takes an average from the 3
different batches for each individual cell so that PBECFCs can be compared to HUVECs and
CBECFCs for their TLS forming capacity when co-cultured with the 2 different stromal cells (Ad
and BMMSCs). In addition, CBECFCs and HUVECs were also examined in gels containing
fibronectin (FN). Of particular note from Figure 3.22, PB5ECFCs formed more TLSs and sub-
TLSs than the other PBECFC batches and levels were similar whether AdMSCs or BMMSCs
were used. TLS length, volume and number of branch points were also highest for this batch
of PBECFCs although average diameter was slightly higher for PB2 ECFCs. It can clearly be seen
from Figure 3.22 that there was large a variation in parameters between the 3 batches of
PBECFCs, CBECFCs and HUVECs when co-cultured with AdMSCs or BMMSCs. However, the
graphs do confirm the fact that all batches formed quantifiable TLSs as seen in Figures 3.19
to 3.21.

124
A
B
C
Fig 3.22 – Individual gel construct results following Imaris 3D processing: Number of TLSs (A), number of sub-TLSs (B) and total TLS length (C). From PBECFC batches, PB5 had the most sub-TLSs and total TLS length whether cultured with AdMSCs or BMMSCs. Sub-TLSs were those tubules connecting to other tubules but with a of less than 3µm.
PB
2 A
d
PB
5 A
d
PB
6 A
d
PB
2 B
M
PB
5 B
M
PB
6 B
M
HU
V1
Ad
HU
V2
Ad
HU
V 3
Ad
HU
V 1
BM
HU
V 2
BM
HU
V 3
BM
CB
1 B
M
CB
2 B
M
CB
3 B
M
CB
1 A
d
CB
2 A
d
CB
3 A
d
020406080
100120140160
No of TLSs
PB
2 A
d
PB
5 A
d
PB
6 A
d
PB
2 B
M
PB
5 B
M
PB
6 B
M
HU
V1
Ad
HU
V2
Ad
HU
V 3
Ad
HU
V 1
BM
HU
V 2
BM
HU
V 3
BM
CB
1 B
M
CB
2 B
M
CB
3 B
M
CB
1 A
d
CB
2 A
d
CB
3 A
d
0
200
400
600
800
1000
1200
1400
No of sub-TLSs
PB
2 A
d
PB
5 A
d
PB
6 A
d
PB
2 B
M
PB
5 B
M
PB
6 B
M
HU
V1
Ad
HU
V2
Ad
HU
V 3
Ad
HU
V 1
BM
HU
V 2
BM
HU
V 3
BM
CB
1 B
M
CB
2 B
M
CB
3 B
M
CB
1 A
d
CB
2 A
d
CB
3 A
d
0
10000
20000
30000
40000
50000
60000
Total TLS length (µm)

125
A
B
C
Fig 3.23 – Individual gel construct results following Imaris 3D processing: Total TLS volume (A), mean diameter (B) and number of branch points (C). From PBECFC batches, PB5 had highest value for all parameters when cultured with AdMSCs and TLS volume and number of branch points with BMMSCs.
PB
2 A
d
PB
5 A
d
PB
6 A
d
PB
2 B
M
PB
5 B
M
PB
6 B
M
HU
V1
Ad
HU
V2
Ad
HU
V 3
Ad
HU
V 1
BM
HU
V 2
BM
HU
V 3
BM
CB
1 B
M
CB
2 B
M
CB
3 B
M
CB
1 A
d
CB
2 A
d
CB
3 A
d
02000000400000060000008000000
1000000012000000140000001600000018000000
Total TLS volume (µm3)
PB
2 A
d
PB
5 A
d
PB
6 A
d
PB
2 B
M
PB
5 B
M
PB
6 B
M
HU
V1
Ad
HU
V2
Ad
HU
V 3
Ad
HU
V 1
BM
HU
V 2
BM
HU
V 3
BM
CB
1 B
M
CB
2 B
M
CB
3 B
M
CB
1 A
d
CB
2 A
d
CB
3 A
d
0
5
10
15
20
25
Mean diameter (µm)
PB
2 A
d
PB
5 A
d
PB
6 A
d
PB
2 B
M
PB
5 B
M
PB
6 B
M
HU
V1
Ad
HU
V2
Ad
HU
V 3
Ad
HU
V 1
BM
HU
V 2
BM
HU
V 3
BM
CB
1 B
M
CB
2 B
M
CB
3 B
M
CB
1 A
d
CB
2 A
d
CB
3 A
d
0
100
200
300
400
500
600
700
Total branch points

126
Fig 3.24 – Individual gel construct results following Imaris 3D processing – thickness of gel: The average thickness of gels was approximately 300µm but the penetrance of tubules within gels was less than this value. This graph demonstrates the thickness of gel that was penetrated by TLSs for the different co-cultures of ECs and MSCs.
Fig 3.25 (next 2 pages) – Average Imaris 3D results from 3 separate batches of PBECFCs/CBECFCs/HUVECs when co-cultured with AdMSCs or BMMSCs: The mean for the parameters from Figures 3.2-3.4, from 3 different batches of PBECFCs, CBECFCs or HUVECs (the latter 2 with or without FN) when co-cultured with AdMSCs or BMMSCs.
* = P<0.05 (unpaired Students t-test, n=3)
PB
2 A
d
PB
5 A
d
PB
6 A
d
PB
2 B
M
PB
5 B
M
PB
6 B
M
HU
V1
Ad
HU
V2
Ad
HU
V 3
Ad
HU
V 1
BM
HU
V 2
BM
HU
V 3
BM
CB
1 B
M
CB
2 B
M
CB
3 B
M
CB
1 A
d
CB
2 A
d
CB
3 A
d
0
50
100
150
200
250
Thickness of gel (µm)

127

128

129
Fig 3.25 shows that there were very few parameters where there was a statistically significant
difference between the EC subtypes whether they were co-cultured with AdMSCs or
BMMSCs. When HUVECs were co-cultured with AdMSCs within a 2mg/ml collagen I gel
containing FN the total TLS volume was significantly higher than AdMSCs with CBECFCs (with
[p=0.019] or without FN [p=0.026]) and also higher than when PBECFCs were cultured with
AdMSCs (p=0.046). In addition, collagen I 2mg/ml gels were penetrated further with HUVEC
and BM or AdMSC-containing constructs (with or without FN), than CB or PB ECFC-containing
constructs. This was particularly the case when comparing the HUVEC (n=3) construct
containing AdMSCs and added FN to the construct containing PBECFCs (n=3) together with
either BM (p=0.003) or Ad derived MSCs (p=0.002).
3.3.4 Will TLSs form with 3 different batches of AdMSCs/BMMSCs?
Figures 3.26 to 3.28 show the results from co-culturing 3 different batches of BMMSCs or
AdMSCs with a single batch of PBECFCs (3.26), CBECFCs (3.27) or HUVECs (3.28). Imaris 3D
(Bitplane) was again used to quantify TLSs within the different constructs after confocal
images had been taken. Figures 3.29-3.31 show the results for each separate batch of ECs
providing evidence as to the best combination of cells for each parameter. Figure 3.32 then
takes an average from the 3 different batches for each individual cell type so that AdMSCs
can be compared to BMMSCs for their TLS forming capacity when co-cultured with each of
the 3 different endothelial cells.

130
Fig 3.26 – Comparing 3 different batches of AdMSCs/BMMSCs with PBECFCs: Day 7 images taken at x10 magnification of 2x10⁵ PBECFC:3x10⁴ AdMSCs (L); 2x10⁵ PBECFCs:3x10⁴ BM MSCs (R) in 2mg/ml collagen I gel for 3 batches of AdMSCs and BMMSCs (Ad1/BM1 top; Ad2/BM2 middle; Ad5/BM3 bottom).

131
Fig 3.27 – Comparing 3 different batches of AdMSCs/BMMSCs with CBECFCs: Day 7 images taken at x10 magnification of 2x10⁵ CBECFC:3x10⁴ AdMSCs (L); 2x10⁵ CBECFCs:3x10⁴ BM MSCs (R) in 2mg/ml collagen I gel for 3 batches of AdMSCs and BMMSCs (Ad1/BM1 top; Ad2/BM2 middle; Ad5/BM3 bottom).

132
Fig 3.28 – Comparing 3 different batches of AdMSCs/BMMSCs with HUVECs: Day 7 images taken at x10 magnification of 2x10⁵ HUVECs:3x10⁴ AdMSCs (L); 2x10⁵ HUVECs:3x10⁴ BM MSCs (R) in 2mg/ml collagen I gel for 3 batches of AdMSCs and BMMSCs (Ad1/BM1 top; Ad2/BM2 middle; Ad5/BM3 bottom).

133
A
B
C
Fig 3.29 – Individual gel construct results following Imaris 3D processing: Number of TLSs (A), number of sub-TLSs (B) and total TLS length (C). Ad2 (the second AdMSC batch) produced networks with the most TLSs, sub-TLSs and total TLS length when co-cultured with PBECFCs.
Ad
1 P
BEC
FC
Ad
2 P
BEC
FC
Ad
5 P
BEC
FC
BM
1 P
BEC
FC
BM
2 P
BEC
FC
BM
3 P
BEC
FC
Ad
1 C
BEC
FC
Ad
2 C
BEC
FC
Ad
5 C
BEC
FC
BM
1 C
BEC
FC
BM
2 C
BEC
FC
BM
3 C
B E
CFC
Ad
1 H
UV
ECs
Ad
2 H
UV
ECs
Ad
5 H
UV
ECs
BM
1 H
UV
ECs
BM
2 H
UV
ECs
BM
3 H
UV
ECs
020406080
100120140160
No of TLSs
Ad
1 P
BEC
FC
Ad
2 P
BEC
FC
Ad
5 P
BEC
FC
BM
1 P
BEC
FC
BM
2 P
BEC
FC
BM
3 P
BEC
FC
Ad
1 C
BEC
FC
Ad
2 C
BEC
FC
Ad
5 C
BEC
FC
BM
1 C
BEC
FC
BM
2 C
BEC
FC
BM
3 C
B E
CFC
Ad
1 H
UV
ECs
Ad
2 H
UV
ECs
Ad
5 H
UV
ECs
BM
1 H
UV
ECs
BM
2 H
UV
ECs
BM
3 H
UV
ECs
0
200
400
600
800
1000
1200
No of sub-TLSs
Ad
1 P
BEC
FC
Ad
2 P
BEC
FC
Ad
5 P
BEC
FC
BM
1 P
BEC
FC
BM
2 P
BEC
FC
BM
3 P
BEC
FC
Ad
1 C
BEC
FC
Ad
2 C
BEC
FC
Ad
5 C
BEC
FC
BM
1 C
BEC
FC
BM
2 C
BEC
FC
BM
3 C
B E
CFC
Ad
1 H
UV
ECs
Ad
2 H
UV
ECs
Ad
5 H
UV
ECs
BM
1 H
UV
ECs
BM
2 H
UV
ECs
BM
3 H
UV
ECs
05000
1000015000200002500030000350004000045000
Total TLS length (µm)

134
Fig 3.30 – Individual gel construct results following Imaris 3D processing: Total TLS volume (A), mean diameter (B) and number of branch points (C). Ad2 produced networks with the highest mean diameter, total TLS volume and number of branch points when co-cultured with PBECFCs.
Ad
1 P
BEC
FC
Ad
2 P
BEC
FC
Ad
5 P
BEC
FC
BM
1 P
BEC
FC
BM
2 P
BEC
FC
BM
3 P
BEC
FC
Ad
1 C
BEC
FC
Ad
2 C
BEC
FC
Ad
5 C
BEC
FC
BM
1 C
BEC
FC
BM
2 C
BEC
FC
BM
3 C
B E
CFC
Ad
1 H
UV
ECs
Ad
2 H
UV
ECs
Ad
5 H
UV
ECs
BM
1 H
UV
ECs
BM
2 H
UV
ECs
BM
3 H
UV
ECs
0
5
10
15
20
25
Mean diameter (µm)
Ad
1 P
BEC
FC
Ad
2 P
BEC
FC
Ad
5 P
BEC
FC
BM
1 P
BEC
FC
BM
2 P
BEC
FC
BM
3 P
BEC
FC
Ad
1 C
BEC
FC
Ad
2 C
BEC
FC
Ad
5 C
BEC
FC
BM
1 C
BEC
FC
BM
2 C
BEC
FC
BM
3 C
B E
CFC
Ad
1 H
UV
ECs
Ad
2 H
UV
ECs
Ad
5 H
UV
ECs
BM
1 H
UV
ECs
BM
2 H
UV
ECs
BM
3 H
UV
ECs
0
2000000
4000000
6000000
8000000
10000000
12000000
Total TLS volume (µm)
Ad
1 P
BEC
FC
Ad
2 P
BEC
FC
Ad
5 P
BEC
FC
BM
1 P
BEC
FC
BM
2 P
BEC
FC
BM
3 P
BEC
FC
Ad
1 C
BEC
FC
Ad
2 C
BEC
FC
Ad
5 C
BEC
FC
BM
1 C
BEC
FC
BM
2 C
BEC
FC
BM
3 C
B E
CFC
Ad
1 H
UV
ECs
Ad
2 H
UV
ECs
Ad
5 H
UV
ECs
BM
1 H
UV
ECs
BM
2 H
UV
ECs
BM
3 H
UV
ECs
0100200300400500600700
Total branch points

135
Fig 3.31 – Individual gel construct results following Imaris 3D processing – thickness of gel: The average thickness of gels was approximately 300µm. This graph demonstrates the thickness of gel that was penetrated by TLSs for the different co-cultures of ECs and MSCs.
Fig 3.32 (next 2 pages) – Average Imaris 3D results from 3 batches of AdMSCs or BMMSCs when co-cultured with ECs: The mean for the parameters from Figures 3.29-3.31, from PBECFCs, CBECFCs or HUVECs when co-cultured with 3 different batches of AdMSCs or BMMSCs.
* = P<0.05 (unpaired Students t-test, n=3)
Ad
1 P
BEC
FC
Ad
2 P
BEC
FC
Ad
5 P
BEC
FC
BM
1 P
BEC
FC
BM
2 P
BEC
FC
BM
3 P
BEC
FC
Ad
1 C
BEC
FC
Ad
2 C
BEC
FC
Ad
5 C
BEC
FC
BM
1 C
BEC
FC
BM
2 C
BEC
FC
BM
3 C
B E
CFC
Ad
1 H
UV
ECs
Ad
2 H
UV
ECs
Ad
5 H
UV
ECs
BM
1 H
UV
ECs
BM
2 H
UV
ECs
BM
3 H
UV
ECs
0
50
100
150
200
250
Thickness of gel (µm)

136

137

138
In figure 3.32, it is clear that as was the case when co-culturing 3 different batches of the
different EC subtypes (HUVECs, CBECFCs and PBECFCs) with a single AdMSC or BMMSC batch
(Figure 3.25) that when taking averages from 3 separate batches of AdMSCs and BMMSCs
that these also form similar TLSs within collagen I gels in vitro whether HUVECs, CBECFCs or
PBECFCs are used in the co-culture. When PBECFCs were combined with AdMSCs (n=3) they
formed more TLSs than any other EC(HUVECs;CBECFCs)/MSC co-culture (this was significantly
more than when HUVECs were combined with AdMSCs [p=0.04]). This point is encouraging
with respect to attaining the ultimate goal of a pre-vascularised scaffold fabricated using adult
derived stem/progenitor cells. However, this number only took into account main TLS trunks
and not TLSs coming off at branch points which often form the vast majority of total TLSs.
Indeed, sub-TLSs, total TLS area and total TLS volume are probably more relevant parameters
to measure in order to determine the optimal pre-vascularised gel. Looking at the results for
these 3 parameters, there were no statistically significant differences between the different
co-cultures of ECs and AdMSCs or BMMSCs. For all three EC types there were more sub-TLSs
when BMMSCs were used in the co-culture than when AdMSCs were used but this result did
not reach statistical significance. The total TLS area and total TLS volume were slightly higher
when BMMSCs were used in combination with PBECFCs than with AdMSCs but AdMSCs
produced higher values for total TLS area and volume than BMMSCs when co-cultured with
CBECFCs or HUVECs (none of these results were statistically significant). In terms of
penetration of networks within collagen I gels (‘gel thickness’), HUVECs co-cultured with
AdMSCs and with BMMSCs spread the deepest within gels although this was only significant
for HUVECs/BMMSCs compared to CBECFCs/AdMSCs (p=0.001). This confirmed the results
seen when 3 batches of HUVECs were all cultured with a single batch of AdMSCs or BMMSCs.
In these experiments TLSs again perfused to a greater depth than when CBECFCs or PBECFCs
were used (Figure 3.25).
3.4 Discussion
One of the important properties that needed to be considered as part of the gel fabrication
process was how readily endothelial cells would migrate within the proposed scaffold as this
would be key to neo-vascularisation. In this thesis the µ-chemotaxis 3D device created by Ibidi
was used to examine endothelial cell migration within fibrin or collagen. Previously the

139
Boyden chamber or a similar trans-well type device (150) has been used to examine
chemotaxis but these have limitations in the number of parameters that can be measured. µ-
chemotaxis 3D has the benefit that it allows for a distinction between chemotactic responses
(displacement of centre of mass and the forward migration index of the cells), and
chemokinetic responses such as total cell path travelled in any direction (accumulated
distance) and cell velocity in a 3-dimensional matrix (146). Another benefit of this simple
device is that it is possible to use reagents sparingly but still to make several conclusions
regarding the relative pros and cons for different gel constructs. Fibrin gels and collagen I gels
of a concentration of 3mg/ml and above were not conducive to EC migration. In addition using
a 1mg/ml collagen I gel it was shown that PBECFCs, HUVECs and CBECFCs migrated towards
a 10% (v/v) FCS positive stimulus with a statistical significance [one-way ANOVA forward
migration index Y (p=0.014); change in centre of mass Y (p=0.001)] showing that the µ-slide
chemotaxis 3D (Ibidi, GmbH) is a suitable surrogate for determining efficient homing and
migration of stem/progenitor cells. There is scope with the µ-slide chemotaxis 3D to use
various other chemo-attractants instead of 10% (v/v) FCS within the reservoirs either side of
the central gel channel to see if migration is further improved. For example, it would be
possible to compare the chemoattractive properties of AdMSC supernatant to BMMSC
supernatant to see whether endothelial progenitors were influenced by one more than the
other. In addition, other additives to the gel chamber could be considered which may be
improve EC migration. Fibronectin was trialled in this thesis and was added to the basic
constituents of the collagen I 1mg/ml gel. Although not statistically significant, there were
trends for higher accumulated cell distance, Euclidean distance and average velocity when
100µg/ml FN was added to gels and also for PBECFCs to travel further and faster than CBECFCs
or HUVECs. Endothelial cell migration is a motile process directionally regulated by
chemotactic (migration towards soluble chemoattractants), haptotactic (towards
immobilised ligands), and mechanotactic (driven by mechanical forces) stimuli that also
involves degradation of the extracellular matrix to enable progression of the migrating cells.
Typically, chemotaxis of endothelial cells is driven by growth factors such as VEGF and basic
fibroblast growth factor (bFGF), whereas haptotaxis occurs due to endothelial cell migration
activation in response to integrins binding to ECM component. Other chemotactic promoters
include angiopoietins, FGF-2, hepatocyte growth factor, platelet-derived growth factor,
epidermal growth factor, transforming growth factor-β, interleukins, tumor necrosis factor-α

140
, platelet-activating factor, ephrins and soluble adhesion molecules (151). Any one or a
combination of these could be added to the reservoir of the µ-slide chemotaxis 3D assay to
easily determine the relative influence on cell migration for the different EC subtypes and to
see whether they would significantly increase cell migration and thus the likely rate of TLS
formation. Although the µ-slide chemotaxis 3D carries much scope for comparing numerous
variables involved in cell chemotaxis and chemokinesis (146), there are drawbacks. Although
there was a statistically significant difference for migration towards a 10% v/v FCS positive
stimulus, for other comparisons between the EC subtypes there was a lack of statistical
significance. This occurred most likely as a result of the steep learning curve associated with
setting up the assays which meant that although experiments were carried out in triplicate,
there was a high amount of variability between each assay. Although it is clearly
advantageous in terms of preserving expensive reagents, to use only 6µl of collagen mix for
each assay, it means that tiny changes in technique when setting up the assay or microscopic
bubbles within chambers can lead to big changes in outcomes. In even the most experienced
hands several replicates would need to be carried out in order to get statistically significant
results.
Native skin has collagen as its main constituent and therefore it is unsurprising that most
proprietary scaffolds are collagen-based. Cell-seeded collagen scaffolds could therefore
potentially be utilised for skin tissue engineering. However, gels tend to contract significantly
after being mixed with cells and in addition, collagen in low concentrations (as optimised in
the µ-slide chemotaxis 3D assay) is mechanically weak. Previous studies have compared
compressed and uncompressed gels for gel contraction rate, morphology, viability of seeded
cells and mechanical properties (129,147). The results showed that the compression could
significantly reduce the contraction of the collagen gel and improve its mechanical property.
In addition, seeded dermal fibroblasts survived well in the compressed gel and epidermal cells
seeded on top developed into a stratified epidermal layer (148). In this thesis, a compressed
collagen gel scaffold was fabricated through the expulsion of liquid from reconstituted gels
by plastic compression. However, despite basing compressed collagen I scaffolds on
optimised chemotaxis gels and existing literature, vessels that formed within gels were no
longer seen once the gels had been compressed. In addition, in compressed collagen I gels
containing MSC or EC monocultures, HUVECs had a 100% mortality following compression

141
and the majority of BMMSCs also died after gels were compressed. Encouragingly however,
more than 60% of hDFs or AdMSCs survived the plastic compression process. Since in vivo and
in vitro ‘living dermal equivalents’ have been created from fibroblast-based dermal matrices
seeded with epithelial cells (85,112), there is a potential niche for producing a skin substitute
that is based on a collagen sheet containing viable AdMSCs.
Yet the main aim for this research was to produce a pre-vascularised scaffold using adult
derived stem and progenitor cells so a compressed scaffold where endothelial cells did not
survive would not serve this purpose. Therefore a variety of EC and MSC combinations were
seeded within an uncompressed 2mg/ml collagen I gel the constituents of which were based
on existing scaffolds (130) and results from the µ-slide chemotaxis 3D assay.
Various methods exist for the quantification of TLSs in 2D (152). In this Chapter 3D images of
collagen I gels were acquired using confocal microscopy and Imaris software (Bitplane) was
then used to render these 2D stacks, quantifying the rendered images using the Imaris
filament tracer plugin. Although this has mainly previously used for the quantification of
neurons (153), there is evidence in the literature of its value in quantifying blood vessel
parameters when looking at vascular remodelling in the retina (154). By quantifying the TLSs
that formed within collagen I 2mg/ml gels containing different ECs (HUVECs, CBECFCs or
PBECFCs), co-cultured with either BMMSCs or AdMSCs, it was possible to confirm that all of
the potential combinations of these stem and progenitor cells formed TLSs in vitro. Although
averages from 3 different batches of the different cells were used to confirm this conclusion,
looking at each gel separately is was possible to determine the best batch for forming TLSs,
both qualitatively and quantitatively, an important point to consider when it came to planning
up-scaled gels for in vivo experimentation (Chapter 4).

142
CHAPTER 4
UPSCALING OF PRE-VASCULARISED COLLAGEN I GELS AND THEIR IN VIVO APPLICATION
4.1 Introduction
In Chapter 3, EC migration within a variety of collagen I and fibrin gel concentrations was
explored. Having determined the optimal conditions for EC migration, the vascularisation of
a compressed bovine collagen I 2mg/ml gel with stem and progenitor cells was examined but
the compression process led to the loss of already formed tubules and was not amenable to
neo-angiogenesis. As a result, several different uncompressed 2mg/ml collagen I gels were
fabricated to try to optimise tubule formation. This ultimately led to the production of a 56µl
gel in a 96 well plate format that contained the cytokines SDF-1α, SCF and IL-3 together with
2x10⁵ ECs and 3x10⁴ MSCs. In this construct, tubules formed regardless of which combination
of ECs (HUVECs, CBECFCs or PBECFCs) and MSCs (BMMSCs or AdMSCs) was used. Although
every combination of ECs and MSCs produced tubules in 96 well plates, PB5 and Ad2
produced networks with the highest number of tubules and subtubules as well as the highest
total tubule area and total tubule volume. Therefore these batches of ECFCs and AdMSCs
were used for scaling up of gels.
Aims for upscaling collagen I gels and in vivo work
The aims for this Chapter were as follows:
1. Scale up the optimised co-culture of PBECFCs and AdMSCs from a 96-well to a 24-well
format. In this way collagen I gels with a 1.6cm diameter would be produced that
would be suitable to implant into a murine in vivo model. In addition this would
confirm that increasing the gel size did not compromise tubule formation and this
could pave the way for the production of much larger pre-vascularised sheets that
could be used clinically.
2. Place pre-vascularised scaled up collagen I gels into a murine in vivo model along with
empty collagen I gels to compare how these integrated with the host vasculature.

143
4.2 Results
4.2.1 Scaling up pre-vascularised collagen I gels
PBECFCs or HUVECs were co-cultured together with AdMSCs or BMMSCs within the optimised
2mg/ml collagen I gel (Chapter 3) with all components scaled up from a 96 to a 24 well plate
format and tubules formed within the 4 different constructs (Fig 4.1). Following confirmation
that these would still form tubules, the scaled up gels could now be implanted into a murine
in vivo model.
A B
C D
Figure 4.1 – scaled up pre-vascularised collagen I gel: x10 magnification images of tubules within a
2mg/ml collagen gel containing a co-culture of A) PBECFCs and AdMSCs; B) PBECFCs and BMMSCs; C)
HUVECs and AdMSCs; D) HUVECs and BMMSCs (1.2x10⁶ ECs and 1.8x10⁵ MSCs in each construct).
4.2.2 Implantation of gels in immunodeficient murine model
The optimum batch of PBECFCs and AdMSCs for tubule formation from Chapter 3 was co-
cultured within the scaled up 2mg/ml collagen I gel in triplicate. Simultaneously, 3 sets of an
empty gel containing no cells but otherwise identical constituents were also fabricated. These

144
gels were bisected and a pre-vascularised section was placed subcutaneously onto one side
of a mouse dorsum whilst on the contralateral side, the equivalent non-vascularised control
was placed in an identical manner. A total of three mice had the identical placement of hemi-
segments of pre-vascularised and control gel on either side of the dorsum. After 14 days, mice
were injected with 100µl biotinylated lectin from Lycopersicon esculentum (Sigma Aldrich)
then mice were sacrificed. Gels together with overlying dermis were excised and fixed using
4% PFA (Chapter 2.9) and were then sectioned and stained for mouse CD31 and for lectin, the
former to show mouse vasculature within gels and the latter to show perfusion of constructs
since lectin binds to endothelial cells. Therefore once injected into mouse tail vein, the
presence of lectin within constructs would confirm their perfusion (see Chapter 2). Figure 4.2
shows the underside of excised murine skin and gels from day 14 mice with pre-vascularised
gels appearing macroscopically to be more highly perfused than controls.
Figure 4.2 – Pre-vascularised versus control gel day 14: Images of the underside of excised mouse
dermis showing the macroscopic difference between pre-vascularised gels and control gels at day 14.
Approximate outlines of gels are indicated by dotted lines. Overall the pre-vascularied mice appear to
have increased perfusion compared to control gels both in the gels themselves and in the immediate
vicinity.
It was not possible to visualise the Streptavidin e450 (eBioscience) stain for lectin from
Lycopersicon esculentum (tomato) or the anti-mouse CD31-PE stain to check for murine
vessels (Chapter 2.10) using a fluorescence microscope. Concentrations used had been
optimised previously within the Stem Cell research group by Dr Sarah Hale for the staining of

145
mouse femur sections however the concentrations of reagents and incubation periods did
not work for these mouse skin sections (10µm). To try to optimise the protocol for mouse skin
would have necessitated examining numerous different concentrations and incubation
periods and given that there were time-constraints to complete the in vivo work for this
project the decision was made to instead use a human CD31 biotinylated stain as per Chapter
2.6. This also did not clearly demonstrate tubules which were therefore likely mouse derived.
However, counterstaining with haematoxylin and eosin (H&E) demonstrated the presence of
red blood cells (RBCs) and these were used to calculate the number of vessels within x10
magnification image of prevascularised gels and controls. The average from 3 mice was
recorded and compared for statistical significance between the control gel and pre-
vascularised one (Table 4.1). Figures 4.3 to 4.6 show the increased number of perfused vessels
seen within the architecture of pre-vascularised gels compared to controls.
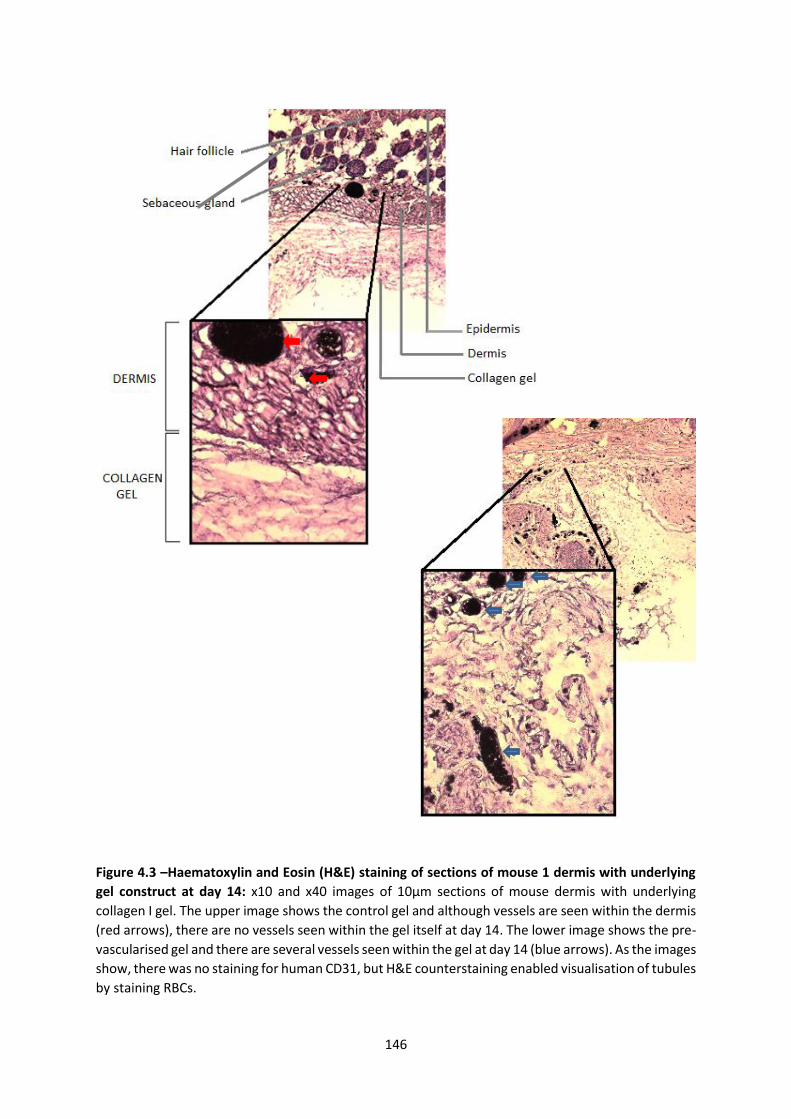
146
Figure 4.3 –Haematoxylin and Eosin (H&E) staining of sections of mouse 1 dermis with underlying
gel construct at day 14: x10 and x40 images of 10µm sections of mouse dermis with underlying
collagen I gel. The upper image shows the control gel and although vessels are seen within the dermis
(red arrows), there are no vessels seen within the gel itself at day 14. The lower image shows the pre-
vascularised gel and there are several vessels seen within the gel at day 14 (blue arrows). As the images
show, there was no staining for human CD31, but H&E counterstaining enabled visualisation of tubules
by staining RBCs.

147
Figure 4.4 – Haematoxylin and Eosin (H&E) staining of sections of mouse 2 dermis with underlying
gel construct at day 14: x10 and x40 images of 10µm sections of mouse dermis with underlying
collagen I gel. The upper image shows the control gel with several perfused vessels seen within the
dermis and only few vessels within the gel itself (red arrows). The lower image shows the pre-
vascularised gel and in addition to a large perfused vessel seen here (blue arrow), there are also
several interconnecting smaller tubules (yellow arrows) that are all perfused as evidenced by the
presence of RBCs within their lumen (best seen on x40 image).

148
Figure 4.5 – Haematoxylin and Eosin (H&E)
staining of sections of mouse 3 dermis with
underlying gel construct at day 14: x10 and x40
images of 10µm sections of mouse dermis with
underlying collagen I gel. The upper image shows
the control gel. Perfused vessels can be seen
within the lower dermal architecture (red arrows)
but not within the collagen gel itself. The lower
image shows the pre-vascularised gel and
although there seem to be fewer tubules than in
mice 1 and 2 there are still more perfused vessels
(blue arrows) than in the control.
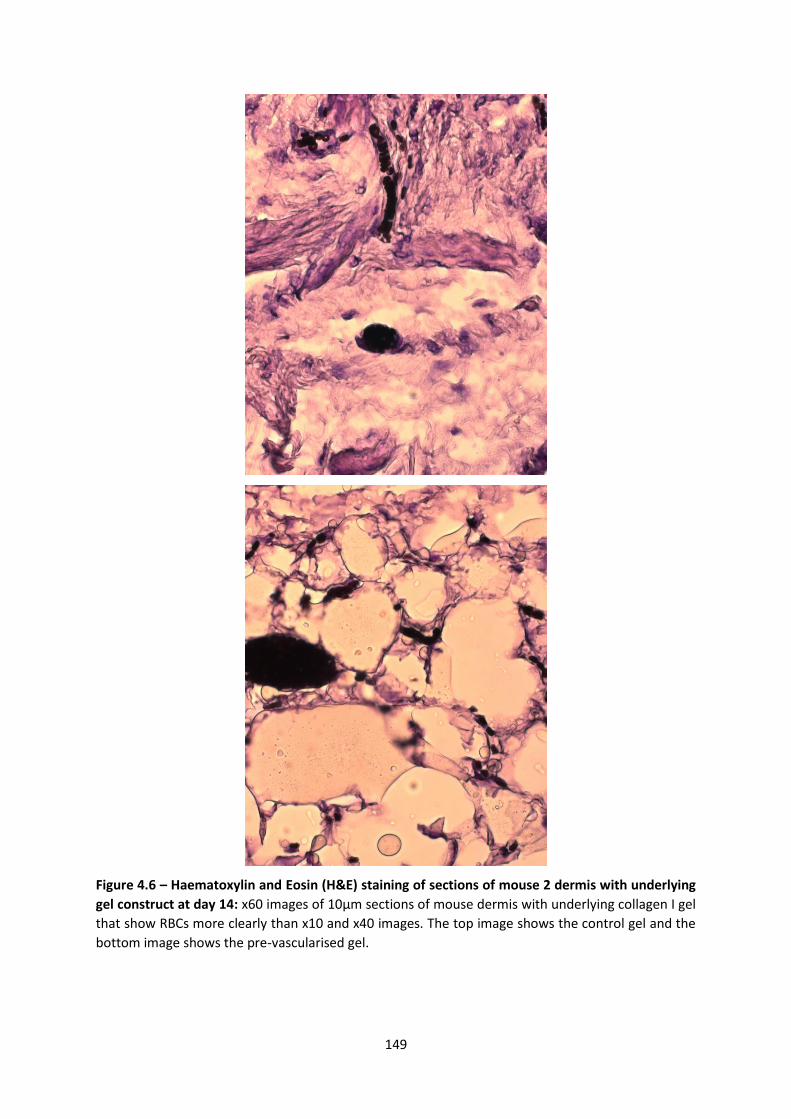
149
Figure 4.6 – Haematoxylin and Eosin (H&E) staining of sections of mouse 2 dermis with underlying
gel construct at day 14: x60 images of 10µm sections of mouse dermis with underlying collagen I gel
that show RBCs more clearly than x10 and x40 images. The top image shows the control gel and the
bottom image shows the pre-vascularised gel.

150
Table 4.1: Number of RBC containing vessels seen per x10 magnification field
Mouse
1
Mouse
2
Mouse
3 Average SD
Vessels
control 0 8 2 3.3 4.2
Vessels
prevasc. 27 26 10 21 9.5
Table 4.1 shows the number of RBC containing vessels for the 3 different mice seen in pre-vascularised
and control gels, as well as the average and standard deviation
Nu
mb
er o
f tu
bu
les
co
nta
inin
g R
BC
s
Co
ntr
ol g
el d
ay 1
4
Pre
vascu
lar i
sed
gel d
ay 1
4
0
1 0
2 0
3 0
4 0*
Figure 4.7 – Graph showing the number of tubules containing RBCs within control and
prevascularised gels: x10 images were examined and the number of tubules containing RBCs was
counted (n=3). There were significantly more tubules in prevascularised gels (*p=0.04)
Table 4.1 shows that there were almost 7 times as many RBC containing vessels seen within
pre-vascularised gels than control gels at day 14 (p=0.04 paired t-test). In order to calculate
the number of vessels for table 4.1, only vessels of a diameter greater than 1 RBC-width were
included to negate RBCs that leaked from vessels during sectioning. Figure 4.4 (x40
magnification image) shows several RBC-containing tubules with a diameter of only 1 RBC-
width in the pre-vascularised gel but these were not included within the analysis. Had they

151
been included the difference between control and pre-vascularised gels would have been
even greater.
4.3 Discussion
There were two broad aims for this Chapter. The first was to scale up the optimised co-culture
of PBECFCs and AdMSCs from a 96-well to a 24-well format whilst maintaining the formation
of tubule-like structures. The second was to implant this gel into a murine in vivo model with
the hypothesis being that a pre-vascularised gel would integrate with the host more readily
than an empty collagen I gel.
When reagents were scaled up for a 24 well plate, tubules formed within the collagen I gel
with every combination of ECs (PBECFCs/HUVECs) with MSCs (BM/Ad) (Figure 4.1). Pre-
vascularised gels made using only adult-derived stem and progenitor cells (PBECFCs and
AdMSCs), when placed into subcutaneous pockets in mice were compared to a collagen I gel
without cells but otherwise identical. The primary end-point for assessing integration of these
2 constructs with the murine tissue was to examine for the presence of perfused vessels
within the construct(s) and to determine whether these vessels were formed from murine or
human endothelial cells.
The main issues with the in vivo experiments performed in this Chapter were accurately
quantifying tubule formation and attempting to determine whether these tubules were
human ECFC or murine EC derived. Counting the number of perfused vessels within a x10
magnification field (using the presence of RBCs within lumina as a surrogate for this) was a
satisfactory method for estimating the level of wound-host integration and most authors
advocate this technique for quantification of capillary like structures (62,83,102,105).
However, in addition to this, other staining methods are also often performed to further
delineate whether tubules are host or donor-derived and the role of MSCs in their
stabilisation. For example human-CD31 fluorescence staining has been used for the former
and eGFP labelling of MSCs for the latter (105). In addition, intravital fluorescence microscopy
(155) has been used for in vivo microscopic observation of microcirculation and this would be
a useful adjunct to determine at which stage implanted gels connect with the host
vasculature.

152
In order to further investigate the potential of PBECFCs and AdMSCs within a collagen I
scaffold it would be preferable to titrate human and murine CD-31 fluorescence stains and
reagent incubation periods until scaffold tubules are identified as either murine or human EC
derived, or both. In addition, staining of MSCs would help to demonstrate the role of AdMSCs
in the development of the neo-vasculature. Finally, given the ultimate goal of producing a
clinically relevant dermal (and epidermal) scaffold, it is important to also compare the number
tubules seen when a pre-vascularised collagen I scaffold is placed onto a murine wound to
the number when a collagen I gel is implanted immediately after seeding with PBECFCs and
AdMSCs. Since both of PBECFCs and AdMSCs have a well-defined phenotype (72,143,144), it
may be possible to isolate them directly from a patient through flow activated cell sorting
(FACS) and to then create a scaffold that rapidly integrates with the host without necessitating
a period of ex vivo pre-vascularisation. Whether this would be a feasible alternative could
only be ascertained by examining scaffolds containing stem cells immediately after their
harvest, prior to them forming tubules and should this also lead to improved host-scaffold
integration as was the case with the pre-vascularised gels in this Chapter, then it would
provide a much faster, and therefore more suitable scaffold for tissue engineering. Had time
allowed, the key experiment to carry out would have been to compare one of the ‘pre-
vascularised’ gels to a gel containing PBECFCs and AdMSCs that hadn’t yet formed TLSs. If
wound integration (using RBC containing tubules as a surrogate for this) occurred to the same
extent with such a gel, this could prove extremely useful in creating a scaffold that could be
used at least 1 week earlier in a clinical scenario.

153
CHAPTER 5
Discussion and future perspectives
5.1 Introduction
Vascularisation is a vital stage in wound healing and is crucial to the integration of skin
substitutes with a wound bed (34). This MD thesis has examined how stem and progenitor
cells can be isolated from adult blood and adipose tissue, expanded and co-cultured within
an optimised collagen I scaffold to form a pre-vascularised dermal substitute. This pre-
vascularisation increased the rate of host-scaffold integration in comparison to an acellular
control in an in vivo murine model emphasising a potential improvement on existing
proprietary dermal substitutes.
5.2 Scarring
It is important to note that although a vascularised dermal replacement may increase the rate
of host-scaffold integration, this may not necessarily lead to an improved cosmetic and/or
functional wound healing outcome. Overproduction of granulation tissue – that is, the new
connective tissue and tiny blood vessels that form on the surface of a healing wound – can
lead to hypertrophic scars (156). Therefore, dermal scaffolds containing blood vessels may
also contain more primed active fibroblasts and lead to excessive microvascular regeneration,
including lateral branching, which subsequently degenerates, in part, promoting nodule
formation and remodelling (156). Nevertheless, research has demonstrated that increased
hypertrophic scarring occurs in wounds taking longer than 3 weeks to heal (6). Therefore
there is also a strong argument that a pre-vascularised scaffold which would enable
immediate split skin grafting rather than a 2 stage procedure using an existing proprietary
acellular scaffold such as Integra® or Matriderm® would produce a better functional and
cosmetic outcome. It is unlikely that the fine networks of blood vessels within a
prevascularised scaffold would contribute to the kind of increased scarring associated with an
over-granulating wound. Further, with the arrival of bioengineered autologous epithelial
sprays and sheets in recent years, a pre-vascularised dermis could be further enhanced to
create a living skin equivalent also containing an epithelial layer that could be applied in a
single stage to heal a full-thickness defect without necessitating a new donor site.

154
5.3 Stem/progenitor cells and vasculogenesis
In order to produce a pre-vascularised scaffold it is necessary to use a population of
endothelial cells and to co-culture these with stromal cells/pericytes. The former are required
to form new vessels whilst the latter stabilise them (62,133). Numerous authors have
demonstrated that endothelial cells derived from neonatal human dermis (HDMECs) or
umbilical vein (HUVECs) will form a microvasculature within scaffolds in vitro (73,83,157,158).
However, both HUVECs and HDMECs originate from non-adult tissues and therefore would
not be suitable for clinical use due to the immunogenicity they would illicit from the host.
They express proteins relevant for alloimmunity, including MHC molecules, costimulators,
adhesion molecules, cytokines, chemokines and have the ability to initiate allogeneic CD4+
and CD8+ memory T cell responses in vitro and in vivo (159). This is an issue that also needs
to be considered for CBECFCs. Although the expansion capacity for CBECFCs is almost limitless
and their harvest carries no morbidity for patients, these cells have the same immunogenic
issues as HUVECs and HDMECs. For this reason, the ideal endothelial cell for use in developing
a pre-vascularised dermal scaffold should be easily isolated from the same patient for which
its use is intended – an adult-derived endothelial progenitor cell. In this thesis, ECFCs were
isolated from the peripheral blood of NHS donors. A 500ml blood donation underwent
leukopheresis to make it suitable for transfusion, and the resultant leukocyte cone which
would have otherwise been discarded was processed to isolate the ECFCs using a similar
technique to that previously established for CBECFC isolation from a MNC fraction (73,77)
(Chapter 2.5). These cells were then expanded in vitro and co-cultured with AdMSCs within a
collagen scaffold to produce a pre-vascularised scaffold using only adult-derived
progenitor/stem cells. Although endothelial and mesenchymal cells in this thesis were
derived from different donors, this was merely done to limit the impact on patients from
whom the adipose tissue was sourced. Given that ECFCs could be sourced for
experimentation from peripheral blood leucocyte cones that would have been otherwise
discarded, it was not felt justifiable to consent the breast reconstruction patients for taking
blood from them in addition to the adipose tissue that would otherwise have been discarded.
Since in vivo experiments were conducted on immunodeficient mice there was no
contraindication to using PBECFCs from one patient and AdMSCs from another. A criticism to
using this methodology is that a 500ml blood donation was required to isolate the MNC
155
fraction (leucocyte cone). Attempting to replicate this technique in a clinical scenario would
lead to a physiological and ethical dilemma. For example, if a patient with a large body surface
area burn attended accident and emergency, although harvesting adipose tissue for retrieving
AdMSCs would not cause major morbidity, taking 500mls of blood could put more strain on
an already physiologically compromised patient. However, there are 2 ways around this
caveat for using adult-derived PBECFCs. The first involves taking the MNCs from 500mls of
peripheral blood then re-transfusing the blood back into the patient thus negating the
physiological insult. The second, more straightforward option, would be to take a much
smaller amount of peripheral blood and to isolate and expand the ECFCs from here, as
described by Hofmann et al. (95). This technique was not used in this thesis as time limitations
meant that already established techniques within the laboratory would give the best chance
of obtaining the desired PBECFCs. However, having shown a proof of principle using PBECFCs
and AdMSCs from a leucocyte cone and discarded adipose tissue respectively, the literature
shows us that it would be feasible to isolate the PBECFCs from a 5ml blood sample (1.5x10⁸
ECFCs could be isolated within 25 days) (95) and the AdMSCs from a small amount of debrided
fat/lipoaspirate and that these could then be rapidly expanded and co-cultured to make a
large pre-vascularised dermal scaffold in less than 30 days.
One of the most important conclusions that resulted from this research was that ECFCs
derived from adult patients had a similar vasculogenic potential to HUVECs and CBECFCs, a
vital determinant in the context of tissue engineering. There was no statistical difference in
the number of sub-tubules, total tubule length and total tubule volume when PBECFCs were
co-cultured with BMMSCs or AdMSCs than when CBECFCs or HUVECs were used.
Furthermore, there were more main tubule trunks when PBECFCs were co-cultured with
AdMSCs than when HUVECs were used (p=0.04) further emphasising that the adult-derived
ECFCs had a good vasculogenic potential.
In this thesis, leucocyte cones from blood donors were anonymised and demographic
information was not provided making it difficult to postulate the relationship between
different donors and whether ECFCs were likely to be obtained. ECFC colonies were obtained
from 3 out of 6 batches that were processed (on average at day 11 [n=3]). This lack of
consistency probably represented a learning curve for isolation of the ECFCs rather than a
predictable 50% overall success rate. Indeed, authors using the MNC centrifugation technique
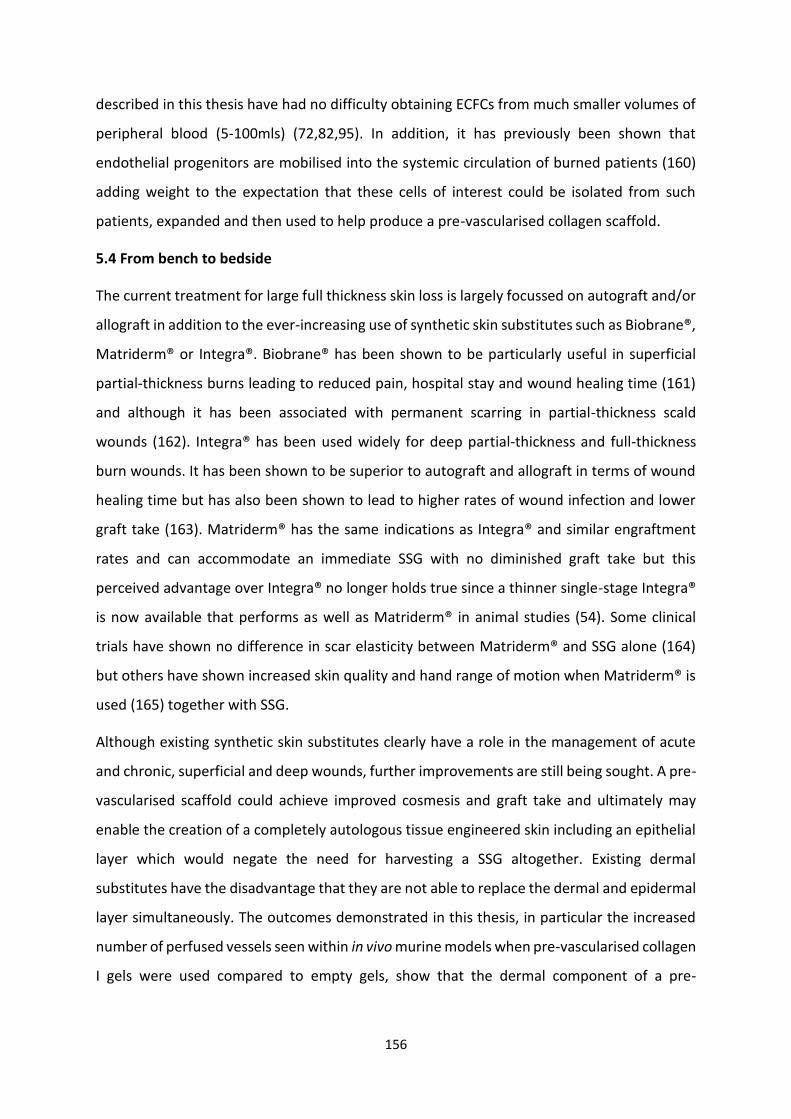
156
described in this thesis have had no difficulty obtaining ECFCs from much smaller volumes of
peripheral blood (5-100mls) (72,82,95). In addition, it has previously been shown that
endothelial progenitors are mobilised into the systemic circulation of burned patients (160)
adding weight to the expectation that these cells of interest could be isolated from such
patients, expanded and then used to help produce a pre-vascularised collagen scaffold.
5.4 From bench to bedside
The current treatment for large full thickness skin loss is largely focussed on autograft and/or
allograft in addition to the ever-increasing use of synthetic skin substitutes such as Biobrane®,
Matriderm® or Integra®. Biobrane® has been shown to be particularly useful in superficial
partial-thickness burns leading to reduced pain, hospital stay and wound healing time (161)
and although it has been associated with permanent scarring in partial-thickness scald
wounds (162). Integra® has been used widely for deep partial-thickness and full-thickness
burn wounds. It has been shown to be superior to autograft and allograft in terms of wound
healing time but has also been shown to lead to higher rates of wound infection and lower
graft take (163). Matriderm® has the same indications as Integra® and similar engraftment
rates and can accommodate an immediate SSG with no diminished graft take but this
perceived advantage over Integra® no longer holds true since a thinner single-stage Integra®
is now available that performs as well as Matriderm® in animal studies (54). Some clinical
trials have shown no difference in scar elasticity between Matriderm® and SSG alone (164)
but others have shown increased skin quality and hand range of motion when Matriderm® is
used (165) together with SSG.
Although existing synthetic skin substitutes clearly have a role in the management of acute
and chronic, superficial and deep wounds, further improvements are still being sought. A pre-
vascularised scaffold could achieve improved cosmesis and graft take and ultimately may
enable the creation of a completely autologous tissue engineered skin including an epithelial
layer which would negate the need for harvesting a SSG altogether. Existing dermal
substitutes have the disadvantage that they are not able to replace the dermal and epidermal
layer simultaneously. The outcomes demonstrated in this thesis, in particular the increased
number of perfused vessels seen within in vivo murine models when pre-vascularised collagen
I gels were used compared to empty gels, show that the dermal component of a pre-

157
vascularised scaffold can be produced in vitro, using autologous stem and progenitor cells,
and lead to better integration with a living host.
In order to move from ‘bench to bedside’ with this pre-vascularised dermal scaffold, several
questions need to be addressed:
5.4.1 Can a suitable scaffold be produced on a large enough scale to be clinically viable?
Solving the problem of how to rapidly re-vascularise grafts will expedite the wound healing
process and therefore limit scar formation. However, although the ability to select ECFCs post-
natally from PB and adipose tissue is possible, the process still takes several weeks and the
ECFC content is generally considered low. Techniques for isolating ECFCs from adult blood
include plating Ficoll buffy coats (82) or directly plating a 5ml sample of blood prior to isolation
of MNCs and then washing off non-adherent cells after 24 hours (95). Both techniques are
time consuming the former taking 10 weeks to grow 1x10¹⁰ cells, the latter 30 days for 1x10⁸
cells. This time constraint combined with the relative scarcity of ECFCs in adult blood – a
standard adult sample of 20mls of blood may contain as little as a single ECFC (82) – are their
major drawbacks as a potential autologous cell to use for tissue engineering. Even ECFCs
isolated from adipose tissue that show classical cobblestone morphology and form capillary-
like tubes in Matrigel® take several weeks to expand up to 1x10⁸ cells (87).
Even though it may take several weeks to expand sufficient numbers to produce a
microvascular network in a dermal substitute, in large burns this time window often exists.
After the essential debridement of the burn to reduce this risk of mortality from a systemic
inflammatory response, the patient is often temporised physiologically with allograft or
temporary skin substitutes until further donor sites become available for grafting.
Nevertheless, ways in which the rate of ECFC expansion could be increased are likely to be
vital to their potential clinical application in the form of tissue engineered constructs
containing pre-formed microvascular networks. Hollow fibre bioreactors made with the
biodegradable material poly(lactide-co-glycolide) (PLGA) have been used to expand
osteogenic cell lines at rates at least equivocal to standard tissue culture plastic (166). By
optimising the construction of such bioreactors and the flow rate of media from within, an
ideal environment for endothelial cell growth can be created. In addition to increasing the
rate of expansion, hollow fibre bioreactors also save on media as any waste from cells is

158
siphoned off and the media can otherwise flow for several days in a circuit without needing
to be changed.
In order to investigate the potential for fabricating a bioreactor for endothelial progenitor
expansion, HUVECs were plated on standard 96-well plates. Having optimised the cell number
required to record a noticeable increase in proliferation using the CellTiter-Fluor™ cell viability
assay (Appendix 1), HUVECs, CBECFCs and PBECFCs were then plated onto the 3 different
materials (tissue culture plastic; PLGA; polystyrene) and it was noted that PB ECFCs
proliferated at least as quickly on our own fabricated polystyrene plates as they did on
standard tissue culture plastic (Appendix 2). It would be reasonable from these pilot
experiments to hypothesise that a polystyrene based hollow fibre bioreactor would enable
rapid PBECFC expansion whilst having the added benefit of reducing costs for reagents. An
alternative approach to negate the time pressure for ECFC isolation and expansion could be
to seed scaffolds with MSCs and then allow these cells with or without added chemokines to
attract ECFCs into the wound. In this way ECFCs from the whole body would be available
rather than from a limited amount of blood.
5.4.2 What are the safety barriers to producing such a product?
MSCs have been increasingly used for tissue engineering and immunosuppressive therapy in
recent years. The ability to source these cells from adipose tissue has helped to reduce the
potential morbidity associated with their harvest from BM. However, ex vivo amplification
prior to clinical application is still required to obtain sufficient therapeutic doses. The same
premise applies to ECFCs, which to date have not been used in clinical subjects. In fact, these
cells, as explained in Chapter 1, are even more difficult to isolate and expand. Translation into
clinical-grade large-scale expansion necessitates precise definition and standardisation of all
procedural parameters and although xenogenic additives such as fetal calf serum are still
widely used for cell culture, their use clinically carries many potential risks including prion and
viral transmissible diseases. Fortunately, authors have already demonstrated GMP-grade
production MSCs (167) and ECFCs (168) to be possible. Furthermore, the latter, that were
expanded using human platelet lysates rather than animal sera, showed significantly lower
apoptosis rates and increased proliferation. Indeed, extensively expanded ECFCs could settle
on scaffold biomaterials and form tubular structures in Matrigel assays (168).
5.4.3 Can this pre-vascularised scaffold be used in humans?

159
The first clinical trial using culture-expanded MSCs was carried out in 1995 where 15 haem-
oncology patients received injections of autologous BMMSCs as part of a safety and feasibility
study. In October 2012, there were 218 registered clinical trials using MSCs for a wide range
of therapeutic applications. Most of these were in Phase I (safety studies, n = 42), Phase II
(proof of concept for efficacy in human patients, n = 57), or combined Phases I and II studies
(n = 105). Only a small number were in Phase III (comparing a newer treatment to the
standard or best known treatment, n = 8) or combined Phases II and III (n = 6) (169).
Nevertheless, the evidence base for MSCs as a therapeutic agent for treating a wide range of
conditions in humans is growing rapidly and more importantly they appear to be well
tolerated, most trials reporting a lack of any adverse effects (170). Examples of areas where
MSC therapy has been trialled include acute myocardial infarction, stroke, liver cirrhosis,
amyotrophic lateral sclerosis, graft-versus-host disease (GVHD), solid organ transplant
rejection, and autoimmune disorders (169).
Although MSCs derived from BM, umbilical cord blood and adipose tissue have now been
studied extensively, ECFC trials in human subjects have not taken off. The main reason for this
is that ECFCs are far less well understood than MSCs. The discovery of MSCs can be traced
back to the 1960s (171) whereas the concept of an endothelial progenitor cell was not
proposed until Asahara et al. in 1997 (172) and true endothelial colony forming cells (ECFCs)
are still not fully understood in terms of the cell surface markers and behavioural phenotypes
that define them when they are isolated from different sources. Furthermore, ex vivo-
cultured ECFCs can be contaminated by other cell types in peripheral blood such as circulating
MSCs, smooth muscle progenitors and inflammatory cells (173). Although endothelial
progenitors have not yet been used in human studies, the therapeutic concept of ECFC
transplantation has been established by several animal models of hindlimb ischaemia.
BMMSCs, PBMNCs, CD34 positive MNCs and CD133 positive cells have all been examined with
outcomes suggesting that cell-based therapy could be feasible in patients with critical limb
ischaemia.
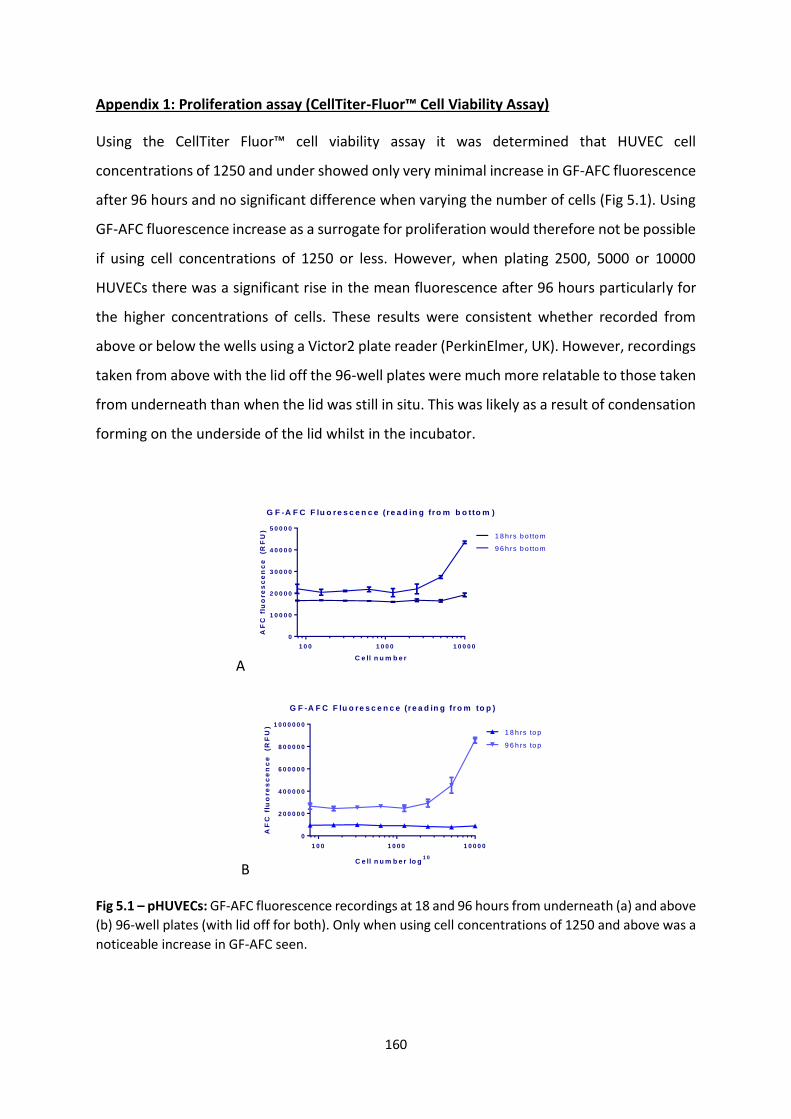
160
Appendix 1: Proliferation assay (CellTiter-Fluor™ Cell Viability Assay)
Using the CellTiter Fluor™ cell viability assay it was determined that HUVEC cell
concentrations of 1250 and under showed only very minimal increase in GF-AFC fluorescence
after 96 hours and no significant difference when varying the number of cells (Fig 5.1). Using
GF-AFC fluorescence increase as a surrogate for proliferation would therefore not be possible
if using cell concentrations of 1250 or less. However, when plating 2500, 5000 or 10000
HUVECs there was a significant rise in the mean fluorescence after 96 hours particularly for
the higher concentrations of cells. These results were consistent whether recorded from
above or below the wells using a Victor2 plate reader (PerkinElmer, UK). However, recordings
taken from above with the lid off the 96-well plates were much more relatable to those taken
from underneath than when the lid was still in situ. This was likely as a result of condensation
forming on the underside of the lid whilst in the incubator.
A
G F -A F C F lu o re s c e n c e ( re a d in g fro m b o tto m )
C e ll n u m b e r
AF
C f
luo
re
sc
en
ce
(R
FU
)
1 0 0 1 0 0 0 1 0 0 0 0
0
1 0 0 0 0
2 0 0 0 0
3 0 0 0 0
4 0 0 0 0
5 0 0 0 0
1 8 h rs b o tto m
9 6 h rs b o tto m
B
G F -A F C F lu o re s c e n c e (r e a d in g fr o m to p )
C e ll n u m b e r lo g1 0
AF
C f
luo
re
sc
en
ce
(R
FU
)
1 0 0 1 0 0 0 1 0 0 0 0
0
2 0 0 0 0 0
4 0 0 0 0 0
6 0 0 0 0 0
8 0 0 0 0 0
1 0 0 0 0 0 0
1 8 h rs to p
9 6 h rs to p
Fig 5.1 – pHUVECs: GF-AFC fluorescence recordings at 18 and 96 hours from underneath (a) and above
(b) 96-well plates (with lid off for both). Only when using cell concentrations of 1250 and above was a
noticeable increase in GF-AFC seen.

161
The mean fluorescence was also recorded from tissue culture plastic (TCP)-bottomed wells
that were empty and those containing media with no cells (Fig 5.2). There was almost no
baseline GF-AFC fluorescence from these 2 types of well (empty; containing media only) and
the values also did not change after 96 hours from those recorded at 18 hours demonstrating
that the TCP plate and media produce a negligible amount of recordable fluorescence when
there are no cells present and that this does not change over time.
G F -A F C F lu o re s c e n c e ( re a d in g fro m b o tto m )
AF
C f
luo
re
sc
en
ce
(R
FU
) lo
g2
Med
ia o
nly
TC
P o
nly
10000.
5000.
2500.
1250.
10
01
00
01
00
00
10
00
00
1 8 h rs b o tto m
9 6 h rs b o tto m
G F -A F C F lu o re s c e n c e (r e a d in g fr o m to p )
AF
C f
luo
re
sc
en
ce
(R
FU
) lo
g2
Med
ia o
nly
TC
P o
nly
10000.
5000.
2500.
1250.1
00
01
00
00
10
00
00
10
00
00
0
1 8 h rs to p
9 6 h rs to p
Fig 5.2 – pHUVECs: GF-AFC fluorescence recordings at 96 hours (log10) from wells containing pHUVECs
(10000 to 1250 shown), media only or empty TCP wells to show background fluorescence produced
by media and empty wells and how this changes over time.

162
Appendix 2: HUVEC/CB ECFC/PB ECFC proliferation assay in PLGA/polystyrene lined plates
Following the optimisation of the CellTiter Fluor™ cell viability assay, 5 different
concentrations of HUVECs, CBECFCs and PBECFCs (1250; 2500; 5000; 10000 and 20000 cells)
were plated in triplicate in 96-well plates made from either tissue culture plastic (TCP), PLGA
or polystyrene (PS). Recordings of GF-AFC fluorescence were then taken at 18 hours and 96
hours to act as a surrogate for cell proliferation (worked out by subtracting the baseline
reading at 18 hours from the 96 hour reading).
H u v e c p ro life r a t io n
N u m b e r o f c e lls
GF
-AF
C
1 2 5 0 2 5 0 0 5 0 0 0 1 0 0 0 0 2 0 0 0 0
-2 0 0 0 0 0
0
2 0 0 0 0 0
4 0 0 0 0 0
6 0 0 0 0 0
8 0 0 0 0 0
1 0 0 0 0 0 0
P ro life ra tio n o n T C P
P ro life ra tio n o n P L G A
P ro life ra tio n o n p o ly s ty re n e
Fig 5.3a – pHUVECs: GF-AFC fluorescence recordings at 18 and 96 hours taken from above TCP, PLGA
and PS wells (with lid off). Note that the surrogate for proliferation (increase in GF-AFC between 18hrs
and 96hrs) is similar on TCP and PS but is limited on PLGA and is optimal at a concentration of around
10000 cells.
C B E C F C p r o life r a t io n
N u m b e r o f c e lls
GF
-AF
C
1 2 5 0 2 5 0 0 5 0 0 0 1 0 0 0 0 2 0 0 0 0
-2 0 0 0 0 0
0
2 0 0 0 0 0
4 0 0 0 0 0
6 0 0 0 0 0
8 0 0 0 0 0
P ro life ra tio n o n T C P
P ro life ra tio n o n P L G A
P ro life ra tio n o n p o ly s ty re n e
Fig 5.3b – CB ECFCs: GF-AFC fluorescence recordings at 18 and 96 hours from above TCP, PLGA and PS
wells (with lid off). As was the case with pHUVECs increase in GF-AFC between 18hrs and 96hrs is
similar on TCP and PS and optimal at a concentration of 5000-10000 cells but is limited on PLGA,
although it does increase slightly as cell number increases.
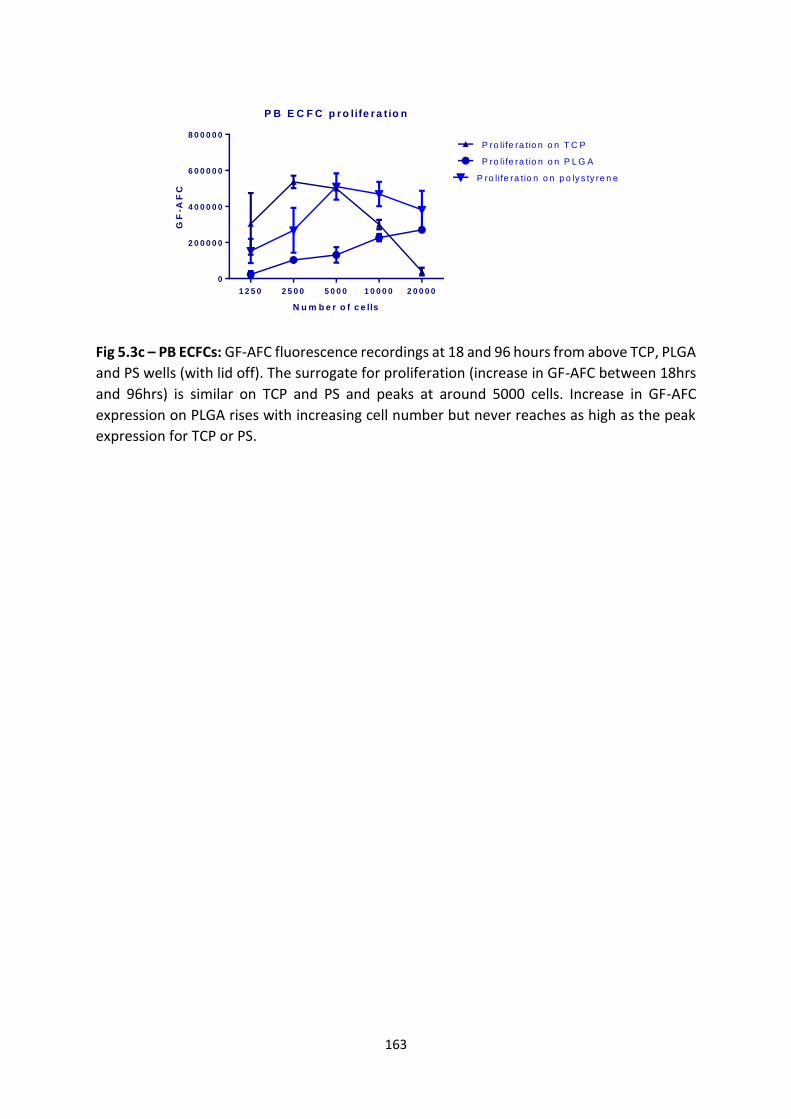
163
P B E C F C p r o life r a t io n
N u m b e r o f c e lls
GF
-AF
C
1 2 5 0 2 5 0 0 5 0 0 0 1 0 0 0 0 2 0 0 0 0
0
2 0 0 0 0 0
4 0 0 0 0 0
6 0 0 0 0 0
8 0 0 0 0 0
P ro life ra tio n o n T C P
P ro life ra tio n o n P L G A
P ro life ra tio n o n p o ly s ty re n e
Fig 5.3c – PB ECFCs: GF-AFC fluorescence recordings at 18 and 96 hours from above TCP, PLGA
and PS wells (with lid off). The surrogate for proliferation (increase in GF-AFC between 18hrs
and 96hrs) is similar on TCP and PS and peaks at around 5000 cells. Increase in GF-AFC
expression on PLGA rises with increasing cell number but never reaches as high as the peak
expression for TCP or PS.

164
References
1. Chaucer G. Troilus & Criseyde. 1385(a 1400). Available from: http://ebooks.gutenberg.us/DjVu_Collection/DJEDS/CHAUCER/TROILUS/Download.pdf
2. Brown BC, Moss TP, McGrouther DA, Bayat A. Skin scar preconceptions must be challenged: importance of self-perception in skin scarring. JPRAS 2010; 63(6): 1022-9
3. Harding KG, Morris HL, Patel GK. Science, medicine and the future: healing chronic wounds. BMJ 2002;324(7330):160–3.
4. Hettiaratchy S, Dziewulski P. Introduction. In: ABC of burns. 2005;1-3
5. Ahn CS, Maitz PKM. The true cost of burn. Burns. 2012; 38(7):967-74.
6. Cubison TCS, Pape SA, Parkhouse N. Evidence for the link between healing time and the development of hypertrophic scars (HTS) in paediatric burns due to scald injury. Burns 2006; 32(8):992–9.
7. Auger FA, Lacroix D, Germain L. Skin substitutes and wound healing. Skin Pharm and Physiol 2009;22(2):94–102.
8. Yildirimer L, Thanh NTK, Seifalian AM. Skin regeneration scaffolds: a multimodal bottom-up approach. Trends in biotech 2012;30(12):638–48.
9. Wells C. Skin and wound care manual online. 2012. Available at: http://westernhealth.nl.ca/uploads/PDFs/wound care manual for dianne clements final.pdf
10. Behrens DT, Villone D, Koch M, Brunner G, Sorokin L, Robenek H, et al. The epidermal basement membrane is a composite of separate laminin- or collagen IV-containing networks connected by aggregated perlecan, but not by nidogens. J Biol Chem 2012;287(22):18700–9.
11. Bikle DD. Vitamin D metabolism and function in the skin. Mol Cell Endocrinol 2011;347(1-2):80–9.
12. Janssens a S, Heide R, den Hollander JC, Mulder PGM, Tank B, Oranje a P. Mast cell distribution in normal adult skin. J Clin Pathol 2005;58(3):285–9.
13. Watt FM, Jensen KB. Epidermal stem cell diversity and quiescence. EMBO Mol Med 2009;1(5):260–7.
14. Ema H, Suda T. Two anatomically distinct niches regulate stem cell activity. Blood 2012; 120(11):2174-81.
15. Fuchs E, Chen T. A matter of life and death: self-renewal in stem cells. EMBO reports 2012;1–10.

165
16. Mascré G, Dekoninck S, Drogat B, Youssef KK, Broheé S, Sotiropoulou P a, et al. Distinct contribution of stem and progenitor cells to epidermal maintenance. Nature 2012;489(7415):257–62.
17. Fuchs E. Scratching the surface of skin development. Nature 2007;445(7130):834–42.
18. Tumbar T, Guasch G, Greco V, Blanpain C, Lowry WE, Rendl M, et al. Defining the epithelial stem cell niche in skin. Science 2004;20(3):359–63.
19. Blanpain C, Lowry WE, Geoghegan A, Polak L, Fuchs E. Self-renewal, multipotency, and the existence of two cell populations within an epithelial stem cell niche. Cell 2004;118(5):635–48.
20. Van Keymeulen A, Blanpain C. Tracing epithelial stem cells during development, homeostasis, and repair. J Cell Biol 2012;197(5):575–84.
21. Plikus M V, Gay DL, Treffeisen E, Wang A, Supapannachart RJ, Cotsarelis G. Epithelial stem cells and implications for wound repair. Semin Cell Dev Biol 2012;23(9):946-53.
22. Lu CP, Polak L, Rocha AS, Pasolli HA, Chen S-C, Sharma N, et al. Identification of stem cell populations in sweat glands and ducts reveals roles in homeostasis and wound repair. Cell 2012;150(1):136–50.
23. Biedermann T, Pontiggia L, Böttcher-Haberzeth S, Tharakan S, Braziulis E, Schiestl C, et al. Human eccrine sweat gland cells can reconstitute a stratified epidermis. J Invest Dermatol 2010; 130(8):1996–2009.
24. Danner S, Kremer M, Petschnik AE, Nagel S, Zhang Z, Hopfner U, et al. The use of human sweat gland-derived stem cells for enhancing vascularization during dermal regeneration. J Invest Dermatol 2012; 132(6):1707–16.
25. Rittié L, Sachs DL, Orringer JS, Voorhees JJ, Fisher GJ. Eccrine sweat glands are major contributors to reepithelialization of human wounds. Am J Pathol 2013; 182(1):163–71.
26. Culliford IV A, Hazan A. Dermatology for plastic surgeons. In: Grabb and Smith's Plastic Surgery. (Ed.6) 2007;105.
27. Paquet-Fifield S, Schlüter H, Li A, Aitken T, Gangatirkar P, Blashki D, et al. A role for pericytes as microenvironmental regulators of human skin tissue regeneration. Journal Clin Investig 2009;119(9):2795–806.
28. Brown JJ, Bayat A. Genetic susceptibility to raised dermal scarring. Brit Jour Dermatol 2009;161(1):8–18.
29. Shevchenko R V, James SL, James SE. A review of tissue-engineered skin bioconstructs available for skin reconstruction. J Royal Soc, Interface 2010;7(43):229–58.
30. Gerlach JC, Johnen C, Ottoman C, Bräutigam K, Plettig J, Belfekroun C, et al. Method for autologous single skin cell isolation for regenerative cell spray transplantation with non-cultured cells. Int J Artif Organs 2011;34(3):271–9.

166
31. Vloemans a FPM, Hermans MHE, van der Wal MB a, Liebregts J, Middelkoop E. Optimal treatment of partial thickness burns in children: A systematic review. Burns 2014; 40(2):177–90.
32. Highton L, Wallace C, Shah M. Use of Suprathel® for partial thickness burns in children. Burns 2013; 39(1):136–41.
33. Wainwright DJ, Bury SB. Acellular dermal matrix in the management of the burn patient. Aesthet surgery journal 2011;31(7 Suppl):13S–23S.
34. MacNeil S. Progress and opportunities for tissue-engineered skin. Nature 2007;445(7130):874–80.
35. Orlando G, Wood K, De Coppi P, Baptista P, Binder K, Bitar K, et al. Regenerative medicine as applied to general surgery. Ann Surg 2012;255(5):867–80.
36. Velazquez E, Murphy GF. Histopathology of the Skin (Ed.10). 2009;38–50.
37. Rnjak J, Ph D, Wise SG, Mithieux SM, Weiss AS. Severe Burn Injuries and the Role of Elastin in the Design of Dermal Substitutes. Tissue Eng Part B Rev 2011;17(2):81-91.
38. Pham C, Greenwood J, Cleland H, Woodruff P, Maddern G. Bioengineered skin substitutes for the management of burns: a systematic review. Burns 2007;33(8):946–57.
39. Heitland A, Piatkowski A, Noah EM, Pallua N. Update on the use of collagen/glycosaminoglycate skin substitute-six years of experiences with artificial skin in 15 German burn centers. Burns 2004;30(5):471–5.
40. Cervelli V, Lucarini L, Cerretani C, Spallone D, Palla L, Brinci L, et al. The use of MatriDerm® and skin grafting in post-traumatic wounds. International Wound Journal 2010;7(4):400–5.
41. Ryssel H, Gazyakan E, Germann G, Ohlbauer M. The use of MatriDerm in early excision and simultaneous autologous skin grafting in burns--a pilot study. Burns 2008;34(1):93–7.
42. Koenen W, Felcht M, Vockenroth K, Sassmann G, Goerdt S, Faulhaber J. One-stage reconstruction of deep facial defects with a single layer dermal regeneration template. J Eur Acad Dermatol Venereol 2011;25(7):788–93.
43. Gravante G, Delogu D, Giordan N, Morano G, Montone A, Esposito G. The use of Hyalomatrix PA in the treatment of deep partial-thickness burns. J burn care res 2007;28(2):269–74.
44. Travia G, Palmisano PA, Cervelli V, Esposito G, Casciani CU. The use of fibroblast and keratinocyte cultures in burns treatment. Ann Burns Fire Disast 2003;XVI(1)

167
45. Marston WA, Hanft J, Norwood P, Pollak R. The efficacy and safety of Dermagraft in improving the healing of chronic diabetic foot ulcers: results of a prospective randomized trial. Diabetes Care 2003;26(6):1701–5.
46. Hansbrough JF, Cooper ML, Cohen R, Spielvogel R, Greenleaf G, Bartel RL, et al. Evaluation of a biodegradable matrix containing cultured human fibroblasts as a dermal replacement beneath meshed skin grafts on athymic mice. Surg1992;111(4):438–46.
47. Waymack P, Duff RG, Sabolinski M. The effect of a tissue engineered bilayered living skin analog, over meshed split-thickness autografts on the healing of excised burn wounds. Burns 2000;26(7):609-19.
48. Moustafa M, Bullock AJ, Creagh FM, Heller S, Jeffcoate W, Game F, et al. Randomized, controlled, single-blind study on use of autologous keratinocytes on a transfer dressing to treat nonhealing diabetic ulcers. Regen Med 2007;2(6):887–902.
49. Rössner E, Smith MD, Petschke B, Schmidt K, Vitacolonna M, Syring C, et al. Epiflex(®) a new decellularised human skin tissue transplant: manufacture and properties. Cell Tissue Bank 2011;12(3):209–17.
50. Adamakis I, Tyritzis SI, Stravodimos KG, Migdalis V, Mitropoulos D, Constantinides C a. A novel approach for the surgical management of Peyronie’s disease using an acellular, human dermis tissue graft: preliminary results. World J Urol 2011;29(3):399–403.
51. Hogg P, Rooney P, Ingham E, Kearney JN. Development of a decellularised dermis. Cell Tissue Bank 2012;14(3):465-74.
52. Macleod TM, Williams G, Sanders R, Green CJ. Histological evaluation of Permacol as a subcutaneous implant over a 20-week period in the rat model. Br J Plast Surg 2005;58(4):518–32
53. Ryssel H, Radu CA, Germann G, Otte M, Gazyakan E. Single-stage Matriderm® and skin grafting as an alternative reconstruction in high-voltage injuries. Int Wound J 2010;7(5):385–92.
54. Böttcher-Haberzeth S, Biedermann T, Schiestl C, Hartmann-Fritsch F, Schneider J, Reichmann E, et al. Matriderm 1 mm versus Integra Single Layer 1.3 mm for one-step closure of full thickness skin defects : a comparative experimental study in rats. PediatrSurg Int 2012;28(2):171–7.
55. Gravante G, Sorge R, Merone A, Tamisani AM, Di Lonardo A, Scalise A, et al. Hyalomatrix PA in burn care practice: results from a national retrospective survey, 2005 to 2006. Ann Plast Surg 2010;64(1):69–79.
56. Boyer D, Bartelt M, Heieck J. Comparison of E-Z Derm and Jelonet dressings for partial skin thickness burns. Nebr Med J. 1989;68(1):390–4.
57. Zhu N, Warner RM, Simpson C, Glover M, Hernon CA, Kelly J, et al. Treatment of burns and chronic wounds using a new cell transfer dressing for delivery of autologous keratinocytes. Eur J Plast Surg 2005;28(5):319–30.

168
58. Munster AM. Cultured skin for massive burns. A prospective, controlled trial. Ann Surg 1996;224(3):372–7.
59. Tremblay P-L, Hudon V, Berthod F, Germain L, Auger F a. Inosculation of tissue-engineered capillaries with the host’s vasculature in a reconstructed skin transplanted on mice. Am J Transplant 2005;5(5):1002–10.
60. Cheng G, Liao S, Kit Wong H, Lacorre DA, Di Tomaso E, Au P, et al. Engineered blood vessel networks connect to host vasculature via wrapping-and-tapping anastomosis. Blood 2011;118(17):4740–9.
61. Sun G, Zhang X, Shen Y-I, Sebastian R, Dickinson LE, Fox-Talbot K, et al. Dextran hydrogel scaffolds enhance angiogenic responses and promote complete skin regeneration during burn wound healing. Proc Natl Acad Sci USA 2011;108(26):20976–81.
62. Montaño I, Schiestl C, Schneider J, Pontiggia L, Luginbühl J, Biedermann T, et al. Formation of human capillaries in vitro: the engineering of prevascularized matrices. Tissue Eng Part A 2010 Jan;16(1):269–82.
63. Chen X, Aledia AS, Ghajar CM, Griffith CK, Putnam AJ, Hughes CCW, et al. Prevascularization of a fibrin-based tissue construct accelerates the formation of functional anastomosis with host vasculature. Tissue Eng Part A 2009;15(6):1363–71.
64. Watt SM, Athanassopoulos A, Harris AL, Tsaknakis G. Human endothelial stem/progenitor cells, angiogenic factors and vascular repair. J R Soc Interface 2010;(7)S731–S751.
65. Critser PJ, Voytik-Harbin SL, Yoder MC. Isolating and defining cells to engineer human blood vessels. Cell Prolif 2011;44 Suppl 1:15–21.
66. Yoder MC. Endothelial progenitor cell: a blood cell by many other names may serve similar functions. Journ Mol Med 2013;91(3):285–95.
67. Hill JM, Zalos G, Halcox JPJ, Schenke WH, Waclawiw MA, Quyyumi AA, et al. Circulating endothelial progenitor cells, vascular function, and cardiovascular risk. NEJM 2003;348(7):593–600.
68. Mukai N, Akahori T, Komaki M, Li Q, Kanayasu-Toyoda T, Ishii-Watabe A, et al. A comparison of the tube forming potentials of early and late endothelial progenitor cells. Exp Cell Res 2008;314(3):430–40.
69. Yoder MC, Mead LE, Prater D, Krier TR, Mroueh KN, Li F, et al. Redefining endothelial progenitor cells via clonal analysis and hematopoietic stem/progenitor cell principals. Blood 2007;109(5):1801–9.
70. Gulati R, Jevremovic D, Peterson TE, Chatterjee S, Shah V, Vile RG, et al. Diverse origin and function of cells with endothelial phenotype obtained from adult human blood. Circ Res 2003;93(11):1023–5.

169
71. Ingram DA, Mead LE, Moore DB, Woodard W, Fenoglio A, Yoder MC. Vessel wall-derived endothelial cells rapidly proliferate because they contain a complete hierarchy of endothelial progenitor cells. Blood 2005;105(7):2783–6.
72. Ingram DA, Mead LE, Tanaka H, Meade V, Fenoglio A, Mortell K, et al. Identification of a novel hierarchy of endothelial progenitor cells using human peripheral and umbilical cord blood. Blood 2004;104(9):2752–60.
73. Athanassopoulos A, Tsaknakis G, Newey SE, Harris AL, Kean J, Tyler MP, et al. Microvessel networks in pre-formed in artificial clinical grade dermal substitutes in vitro using cells from haematopoietic tissues. Burns 2012; 38(5):691-701.
74. Coldwell KE, Lee SJ, Kean J, Khoo CP, Tsaknakis G, Smythe J, et al. Effects of obstetric factors and storage temperatures on the yield of endothelial colony forming cells from umbilical cord blood. Angiogenesis 2011;14(3):381–92.
75. Zhou B, Tsaknakis G, Coldwell KE, Khoo CP, Roubelakis MG, Chang C-H, et al. A novel function for the haemopoietic supportive murine bone marrow MS-5 mesenchymal stromal cell line in promoting human vasculogenesis and angiogenesis. Brit J Haem 2012;57(3)(3):299–311.
76. Walker NG, Sc B, Mistry AR, Ph D, Smith LE, Eves PC, et al. A Chemically Defined Carrier for the Delivery of Human Mesenchymal Stem / Stromal Cells to Skin Wounds. Tissue Eng Part C 2012;18(2):143-55
77. Zhang Y, Fisher N, Newey SE, Smythe J, Tatton L, Tsaknakis G, et al. The impact of proliferative potential of umbilical cord-derived endothelial progenitor cells and hypoxia on vascular tubule formation in vitro. Stem Cells Dev 2009;18(2):359–75.
78. Tura O, Skinner EM, Robin Barclay G, Samuel K, Gallagher RC, Brittan M, et al. Late outgrowth endothelial cells resemble mature endothelial cells and are not derived from bone marrow. Stem cells 2013. 31(2):338-48
79. Lin Y, Weisdorf DJ, Solovey a, Hebbel RP. Origins of circulating endothelial cells and endothelial outgrowth from blood. J Clin Invest 2000 Jan;105(1):71–7.
80. Smadja DM, Cornet a, Emmerich J, Aiach M, Gaussem P. Endothelial progenitor cells: characterization, in vitro expansion, and prospects for autologous cell therapy. Cell Biol Toxicol 2007;23(4):223–39.
81. Bompais H, Chagraoui J, Canron X, Crisan M, Liu XH, Anjo A, et al. Human endothelial cells derived from circulating progenitors display specific functional properties compared with mature vessel wall endothelial cells. Blood 2004;103(7):2577–84.
82. Mead LE, Prater D, Yoder MC, Ingram D. Isolation and characterization of endothelial progenitor cells from human blood. Current Protoc Stem Cell Biol 2008; (2):Unit 2C.

170
83. Melero-Martin JM, Khan Z a, Picard A, Wu X, Paruchuri S, Bischoff J. In vivo vasculogenic potential of human blood-derived endothelial progenitor cells. Blood 2007;109(11):4761–8.
84. Wood JA, Colletti E, Mead LE, Ingram D, Porada CD, Zanjani ED, et al. Distinct contribution of human cord blood-derived endothelial colony forming cells to liver and gut in a fetal sheep model. Hepatol 2012;1–11.
85. Hendrickx B, Verdonck K, Van den Berge S, Dickens S, Eriksson E, Vranckx JJ, et al. Integration of blood outgrowth endothelial cells in dermal fibroblast sheets promotes full thickness wound healing. Stem cells 2010;28(7):1165–77.
86. Hendrickx B, Vranckx JJ, Luttun A. Cell-based vascularization strategies for skin tissue engineering. Tissue Eng Part B 2011;17(1):13–24.
87. Beckstrøm KJ, Brinchmann JE. Human Adipose Tissue as a Source of Cells With Angiogenic Potential. Cell Transplant 2012;21(235):235–50.
88. Sanz L, Santos-Valle P, Alonso-Camino V, Salas C, Serrano A, Vicario JL, et al. Long-term in vivo imaging of human angiogenesis: critical role of bone marrow-derived mesenchymal stem cells for the generation of durable blood vessels. Microvasc Res 2008;75(3):308–14.
89. Karvonen SL, Vaajalahti P, Marenk M, Janas M, Kuokkanen K. Birthmarks in 4346 Finnish newborns. Acta Derm Venereol 1992;72(1):55–7.
90. Gosain AK, Santoro TD, Larson DL, Gingrass RP. Giant congenital nevi: a 20-year experience and an algorithm for their management. Plast Reconstr Surg 2001;108(3):622–36.
91. Kopp J, Magnus Noah E, Rübben A, Merk HF, Pallua N. Radical resection of giant congenital melanocytic nevus and reconstruction with meek-graft covered integra dermal template. Dermatol Surg 2003 Jun;29(6):653–7.
92. Arneja JS, Gosain AK. Giant congenital melanocytic nevi of the trunk and an algorithm for treatment. J Craniofac Surg 2005. p. 886–93.
93. Shelley WC, Leapley AC, Huang L, Critser PJ, Zeng P, Prater D, et al. Changes in the frequency and in vivo vessel-forming ability of rhesus monkey circulating endothelial colony-forming cells across the lifespan (birth to aged). Pediatr Res 2012;71(2):156–61.
94. Roubelakis MG, Tsaknakis G, Pappa KI, Anagnou NP, Watt SM. Spindle shaped human mesenchymal stem/stromal cells from amniotic fluid promote neovascularization. PLoS One. 2013;8(1):547.
95. Hofmann NA, Reinisch A, Strunk D. Isolation and large scale expansion of adult human endothelial colony forming progenitor cells. J Vis Exp. 2009;28(32).

171
96. Lin R-Z, Moreno-Luna R, Muñoz-Hernandez R, Li D, Jaminet S-CS, Greene AK, et al. Human white adipose tissue vasculature contains endothelial colony-forming cells with robust in vivo vasculogenic potential. Angiogenesis 2013;16(4):735-44.
97. Case J, Mead LE, Bessler WK, Prater D, White HA, Saadatzadeh MR, et al. Human CD34+AC133+VEGFR-2+ cells are not endothelial progenitor cells but distinct, primitive hematopoietic progenitors. Exp Hematol 2007;35(7):1109–18.
98. Timmermans F, Van Hauwermeiren F, De Smedt M, Raedt R, Plasschaert F, De Buyzere ML, et al. Endothelial outgrowth cells are not derived from CD133+ cells or CD45+ hematopoietic precursors. Arterioscler Thrombosis Vasc Biol 2007;27(7):1572–9.
99. Yoder MC. Human endothelial progenitor cells. Cold Spring Harb Perspec Med 2012;2(7).
100. Schechner JS, Nath a K, Zheng L, Kluger MS, Hughes CC, Sierra-Honigmann MR, et al. In vivo formation of complex microvessels lined by human endothelial cells in an immunodeficient mouse. Proc Natl Acad Sci USA 2000 Aug 1;97(16):9191–6.
101. Koike N, Fukumura D, Gralla O, Au P, Schechner JS, Jain RK. Tissue engineering: creation of long-lasting blood vessels. Nature 2004;428(6979):138–9.
102. Wu X, Rabkin-Aikawa E, Guleserian KJ, Perry TE, Masuda Y, Sutherland FWH, et al. Tissue-engineered microvessels on three-dimensional biodegradable scaffolds using human endothelial progenitor cells. Am J Physiol Heart Circ Physiol 2004;287(2):H480–7.
103. Tonello C, Vindigni V, Zavan B, Abatangelo S, Abatangelo G, Brun P, et al. In vitro reconstruction of an endothelialized skin substitute provided with a microcapillary network using biopolymer scaffolds. FASEB J 2005;19(11):1546–8.
104. Stahl A, Wu X, Wenger A, Klagsbrun M, Kurschat P. Endothelial progenitor cell sprouting in spheroid cultures is resistant to inhibition by osteoblasts: a model for bone replacement grafts. FEBS lett 2005;579(24):5338–42.
105. Melero-Martin JM, De Obaldia ME, Kang S-Y, Khan Z a, Yuan L, Oettgen P, et al. Engineering robust and functional vascular networks in vivo with human adult and cord blood-derived progenitor cells. Circ Res 2008;103(2):194–202.
106. des Rieux A, Ucakar B, Mupendwa BPK, Colau D, Feron O, Carmeliet P, et al. 3D systems delivering VEGF to promote angiogenesis for tissue engineering. J Control Release 2011;150(3):272–8.
107. Helary C, Bataille I, Abed A, Illoul C, Anglo A, Louedec L, et al. Concentrated collagen hydrogels as dermal substitutes. Biomat 2010:481–90.

172
108. Hadjipanayi E, Cheema U, Mudera V, Deng D, Liu W, Brown R a. First implantable device for hypoxia-mediated angiogenic induction. J Control Release 2011;153(3):217–24.
109. Hegen A, Blois A, Tiron CE, Hellesøy M, Micklem DR, Nör JE, et al. Efficient in vivo vascularisation of tissue-engineering scaffolds. J Tissue Eng Regen Med 2011;5(4)e52-62.
110. Yee D, Hanjaya-Putra D, Bose V, Luong E, Gerecht S. Hyaluronic Acid hydrogels support cord-like structures from endothelial colony-forming cells. Tissue Eng Part A 2011;17(9-10):1351–61.
111. Rao RR, Peterson AW, Ceccarelli J, Putnam AJ, Stegemann JP. Matrix composition regulates three-dimensional network formation by endothelial cells and mesenchymal stem cells in collagen/fibrin materials. Angiogenesis 2012;253–64.
112. Ananta M, Ph D, Brown RA, Mudera V. A Rapid Fabricated Living Dermal Equivalent for Skin Tissue Engineering : An In Vivo Evaluation in an Acute Wound Model. Tissue Eng Part A 2012;18:353–61.
113. Stratman AN, Davis GE. Endothelial cell-pericyte interactions stimulate basement membrane matrix assembly: influence on vascular tube remodeling, maturation, and stabilization. Microsc microanal 2012;18(1):68–80.
114. Sacharidou A, Stratman AN, Davis GE. Molecular mechanisms controlling vascular lumen formation in three-dimensional extracellular matrices. Cells Tissues Organs 2012;195(1-2):122–43.
115. Davis GE, Stratman AN, Sacharidou A, Koh W. Chapter Three - Molecular Basis for Endothelial Lumen Formation and Tubulogenesis During Vasculogenesis and Angiogenic Sprouting. Internat Rev Cell Mol Biol 2011. p. 101–65.
116. Stratman AN, Schwindt AE, Malotte KM, Davis GE. Endothelial-derived PDGF-BB and HB-EGF coordinately regulate pericyte recruitment during vasculogenic tube assembly and stabilization. Blood 2010;116(22):4720–30.
117. Sekine H, Shimizu T, Sakaguchi K, Dobashi I, Wada M, Yamato M, et al. In vitro fabrication of functional three-dimensional tissues with perfusable blood vessels. Nature comm 2013;4:1399.
118. Sakaguchi K, Shimizu T, Horaguchi S, Sekine H, Yamato M, Umezu M, et al. In vitro engineering of vascularized tissue surrogates. Sci reports 2013;3:1316.
119. Carletti E, Motta A, Migliaresi C. Scaffolds for tissue engineering and 3D cell culture. Haycock JW, editor. Methods Mol Biol 2011;695(2):17–39.
120. Melchels FPW, Barradas AMC, Van Blitterswijk CA, De Boer J, Feijen J, Grijpma DW. Effects of the architecture of tissue engineering scaffolds on cell seeding and culturing. Acta Biomat 2010;7(9):3432–45.

173
121. Engelhardt S, Hoch E, Borchers K, Meyer W, Krüger H, Tovar GEM, et al. Fabrication of 2D protein microstructures and 3D polymer-protein hybrid microstructures by two-photon polymerization. Biofabrication 2011;3(2):025003.
122. Pankov R. Fibronectin at a glance. J Cell Sci 2002;115(20):3861–3.
123. Critser PJ, Kreger ST, Voytik-Harbin SL, Yoder MC. Collagen matrix physical properties modulate endothelial colony forming cell-derived vessels in vivo. Microvasc Res 2010;80(1):23–30.
124. Stratman AN, Davis MJ, Davis GE. VEGF and FGF prime vascular tube morphogenesis and sprouting directed by hematopoietic stem cell cytokines. Blood 2011;117(14):3709–19.
125. Pan W, Pham VN, Stratman AN, Castranova D, Kamei M, Kidd KR, et al. CDP-diacylglycerol synthetase-controlled phosphoinositide availability limits VEGFA signaling and vascular morphogenesis. Blood 2012;120(2):489–98.
126. Krueger J, Liu D, Scholz K, Zimmer A, Shi Y, Klein C, et al. Flt1 acts as a negative regulator of tip cell formation and branching morphogenesis in the zebrafish embryo. Devel Camb Eng 2011;138(10):2111–20.
127. Chan YC, Roy S, Khanna S, Sen CK. Downregulation of endothelial microRNA-200b supports cutaneous wound angiogenesis by desilencing GATA binding protein 2 and vascular endothelial growth factor receptor 2. Arterioscl thromb vasc biol 2012;32(6):1372–82.
128. Roy S, Sen CK. miRNA in wound inflammation and angiogenesis. Microcirc 2011;19(3):224–32.
129. Alekseeva T, Hadjipanayi E, Abou Neel E, Brown R. Engineering stable topography in dense bio-mimetic 3D collagen scaffolds. Euro Cell Mater 2012;23:28–40.
130. Koh W, Stratman AN, Sacharidou A, Davis GE. Chapter 5 In Vitro Three Dimensional Collagen Matrix Models of Endothelial Lumen Formation During Vasculogenesis and Angiogenesis. Methods Enzymol 2008;443(08):83–101.
131. Lin C, Ning H, Lin G, Lue TF. Is CD34 truly a negative marker for mesenchymal stromal cells? Cytotherapy 2012;14(10):1159-63.
132. Reinisch A, Hofmann N a, Obenauf AC, Kashofer K, Rohde E, Schallmoser K, et al. Humanized large-scale expanded endothelial colony-forming cells function in vitro and in vivo. Blood 2009;113(26):6716–25.
133. Traktuev DO, Merfeld-Clauss S, Li J, Kolonin M, Arap W, Pasqualini R, et al. A population of multipotent CD34-positive adipose stromal cells share pericyte and mesenchymal surface markers, reside in a periendothelial location, and stabilize endothelial networks. Circ Res 2008;102(1):77–85.

174
134. Oberlin E, Fleury M, Clay D, Petit-cocault L, Candelier J, Mennesson B, et al. VE-cadherin expression allows identification of a new class of hematopoietic stem cells within human embryonic liver. Blood 2010;116(22):4–6.
135. Weinreb I, Cunningham KS, Perez-Ordoñez B, Hwang DM. CD10 Is expressed in most epithelioid hemangioendotheliomas: a potential diagnostic pitfall. Arch Pathol Lab Med 1965;133(12):1965-8.
136. Jung S-M, Kuo T. Immunoreactivity of CD10 and inhibin alpha in differentiating hemangioblastoma of central nervous system from metastatic clear cell renal cell carcinoma. Mod Pathol 2005;18(6):788–94.
137. McDermott SP, Eppert K, Lechman ER, Doedens M, Dick JE. Comparison of human cord blood engraftment between immunocompromised mouse strains. Blood. 2010;116(2):193–200.
138. Kollert F, Christoph S, Probst C, Budweiser S, Bannert B, Binder M, et al. Soluble CD90 as a potential marker of pulmonary involvement in systemic sclerosis. Arthritis Care Res 2013;65(2):281–7.
139. Carpenter L, Malladi R, Yang C-T, French A, Pilkington KJ, Forsey RW, et al. Human induced pluripotent stem cells are capable of B-cell lymphopoiesis. Blood 2011;117(15):4008–11.
140. Fuchs S, Hermanns MI, Kirkpatrick CJ. Retention of a differentiated endothelial phenotype by outgrowth endothelial cells isolated from human peripheral blood and expanded in long-term cultures. Cell Tissue Res 2006;326(1):79–92.
141. Farias V a, Linares-Fernández JL, Peñalver JL, Payá Colmenero J a, Ferrón GO, Duran EL, et al. Human umbilical cord stromal stem cell express CD10 and exert contractile properties. Placenta 2011;32(1):86–95.
142. Donovan D, Brown N, Bishop E, Lewis C. Comparison of three in vitro human ‘angiogenesis’ assays with capillaries formed in vivo Angiogenesis 2001;4(2):113-121
143. Watt SM, Gullo F, van der Garde M, Markeson D, Camicia R, Khoo CP, et al. The angiogenic properties of mesenchymal stem/stromal cells and their therapeutic potential. Br Med Bull 2013;108:25–53.
144. Dominici M, Le Blanc K, Mueller I, Slaper-Cortenbach I, Marini F, Krause D, et al. Minimal criteria for defining multipotent mesenchymal stromal cells. The International Society for Cellular Therapy position statement. Cytotherapy 2006;8(4):315–7.
145. Critser PJ, Yoder MC. Endothelial colony-forming cell role in neoangiogenesis and tissue repair. Curr Opin Organ Transplant 2010;15(1):68–72.
146. Pepperell EE, Watt SM. A novel application for a 3-dimensional timelapse assay that distinguishes chemotactic from chemokinetic responses of hematopoietic CD133(+) stem/progenitor cells. Stem Cell Res 2013;11(2):707–20.
147. Hu K, Shi H, Zhu J, Deng D, Zhou G, Zhang W, et al. Compressed collagen gel as the scaffold for skin engineering. Biomed Microdevices 2010;12(4):627–35.

175
148. Levis HJ, Peh GSL, Toh K-P, Poh R, Shortt AJ, Drake R a L, et al. Plastic compressed collagen as a novel carrier for expanded human corneal endothelial cells for transplantation. PLoS One 2012;7(11):e50993.
149. Levis HJ, Brown R a, Daniels JT. Plastic compressed collagen as a biomimetic substrate for human limbal epithelial cell culture. Biomaterials 2010;31(30):7726–37.
150. Chen H-C. Boyden chamber assay. Methods Mol Biol. 2005;294:15–22.
151. Lamalice L, Le Boeuf F, Huot J. Endothelial cell migration during angiogenesis. Circ Res 2007;100(6):782–94.
152. Khoo CP, Micklem K, Watt SM. A comparison of methods for quantifying angiogenesis in the matrigel assay in vitro. Tissue Eng Part C Methods. 2011;17(9):895–906.
153. Nayak D, Johnson KR, Heydari S, Roth TL, Zinselmeyer BH, McGavern DB. Type I Interferon Programs Innate Myeloid Dynamics and Gene Expression in the Virally Infected Nervous System. PLoS Path 2013;9(5).
154. McKenzie JAG, Fruttiger M, Abraham S, Lange CAK, Stone J, Gandhi P, et al. Apelin is required for non-neovascular remodeling in the retina. Am J Pathol. 2012;180(1):399–409.
155. Laschke MW, Rücker M, Jensen G, Carvalho C, Mülhaupt R, Gellrich N-C, et al. Improvement of vascularization of PLGA scaffolds by inosculation of in situ-preformed functional blood vessels with the host microvasculature. Ann Surg 2008;248(6):939–48.
156. Kischer CW, Pindur J, Krasovitch P, Kischer E. Characteristics of granulation tissue which promote hypertrophic scarring. Scanning Microsc. 1990;4(4):877–887; discussion 887–888.
157. Nör JE, Peters MC, Christensen JB, Sutorik MM, Linn S, Khan MK, et al. Engineering and characterization of functional human microvessels in immunodeficient mice. Lab Invest. 2001;81(4):453–63.
158. Peters MC, Polverini PJ, Mooney DJ. Engineering vascular networks in porous polymer matrices. J Biomed Mater Res. 2002;60(4):668–78.
159. Suárez Y, Shepherd BR, Rao DA, Pober JS. Alloimmunity to Human Endothelial Cells Derived from Cord Blood Progenitors. J Immunol 2012;179(11):7488-96.
160. Fox a, Smythe J, Fisher N, Tyler MPH, McGrouther D a, Watt SM, et al. Mobilization of endothelial progenitor cells into the circulation in burned patients. Br J Surg 2008;95(2):244–51.
161. Mandal A. Paediatric partial-thickness scald burns - Is Biobrane the best treatment available? Int Wound J. 2007;4(1).
162. Ahmadi H, Williams G. Permanent scarring in a partial thickness scald burn dressed with Biobrane. J Plast Reconstr Aesthetic Surg. 2009;62(5):697–8.
163. Heimbach D, Luterman A, Burke J, Cram A, Herndon D, Hunt J, et al. Artificial dermis for major burns. A multi-center randomized clinical trial. Annals of surgery. 1988 p. 313–20.

176
164. Kolokythas P, Aust MC, Vogt PM, Paulsen F. Dermal subsitute with the collagen-elastin matrix Matriderm in burn injuries: a comprehensive review. Handchir Mikrochir Plast Chir. 2008;40(6):367–71.
165. Ryssel H, Germann G, Kloeters O, Gazyakan E, Radu CA. Dermal substitution with Matriderm in burns on the dorsum of the hand. Burns. 2010;36(8):1248–53.
166. Ellis MJ, Chaudhuri JB. Poly(lactic-co-glycolic acid) hollow fibre membranes for use as a tissue engineering scaffold. Biotechnol Bioeng 2006;96(1):177–87.
167. Fekete N, Rojewski MT, Fürst D, Kreja L, Ignatius A, Dausend J, et al. GMP-compliant isolation and large-scale expansion of bone marrow-derived MSC. PLoS One. 2012;7(8).
168. Denecke B, Horsch LD, Radtke S, Fischer JC, Horn PA, Giebel B. Human endothelial colony-forming cells expanded with an improved protocol are a useful endothelial cell source for scaffold-based tissue engineering. J Tissue Eng Regen Med; Feb 25 2013 (epub ahead of print).
169. Sharma RR, Pollock K, Hubel A, McKenna D. Mesenchymal stem or stromal cells: a review of clinical applications and manufacturing practices. Transfusion 2014;54(5):1418–37.
170. Otto WR, Wright NA. Mesenchymal stem cells: from experiment to clinic. Fibrogenesis and Tissue Repair 2011;4(20).
171. Friedenstein AJ, Petrakova K V, Kurolesova AI, Frolova GP. Heterotopic of bone marrow. Analysis of precursor cells for osteogenic and hematopoietic tissues. Transplantation. 1968;6(2):230–47.
172. Asahara T. Isolation of Putative Progenitor Endothelial Cells for Angiogenesis. Science 1997;275(5302):964–6.
173. Wang C, Huang P, Chen J, Lin S, Lee M. Clinical Application of Endothelial Progenitor Cell : Are We Ready? 2013;479–87.