105 FOUNDATIONS OF ACL
144
Data you can trust. Results you can see. ieb76e- 4AP. 9 105 FOUNDATIONS OF ACL CONCEPTS AND PRACTICES
-
Upload
khangminh22 -
Category
Documents
-
view
6 -
download
0
Transcript of 105 FOUNDATIONS OF ACL
Data you can trust. Results you can see.
ieb76e- 4AP. 9105 FOUNDATIONS OF ACLCONCEPTS AND PRACTICES

Copyright © 2008 ACL Services Ltd. All rights reserved.
No part of these materials may be reproduced, stored in a retrieval system, or transmitted, in any form or by anymeans (photocopying, electronic, mechanical, recording, or otherwise), without permission in writing from thepublisher, except by a reviewer who may quote brief passages in a review.
ACL Services Ltd.1550 Alberni StreetVancouver, BCCanada V6G 1A5
Telephone: +1-604-669-4225Fax: +1-604-669-4087E-mail: [email protected]: www.acl.com
Printed in Canada
ACL, the ACL logo, Audit Command Language, and Access Command Language are trademarks of ACLServices Ltd. Microsoft and Windows are registered trademarks of Microsoft Corporation. z/OS is a registeredtrademark of IBM Corporation.
ITDE18025Edition 4.3.2May 1, 2008

ContentsModule 1: Fundamentals 1 Creating Tables from dBASE Data 26
Understanding Database Concepts 2 Creating Tables from Report Files 28Data 2 Creating Tables from Adobe PDF Data '32Files, Records, and Fields 2 Reusing Table Layouts 33
Understanding ACL 3 Copying and Renaming Table Layouts 33Who Uses ACL? 3 Linking Table Layouts to New Data Sources 33What Can I Do with ACL? 3 Importing Table Layouts from Other ACL Projects 33
Viewing ACL 4 Exporting Table Layouts 33
The ACL Interface 4
The ACL Project 5 Module 3: Expressions 35
Understanding Data Analysis 6 Understanding Expressions 36
Elements of Data Analysis 6 Creating Filters 37
The Data Analysis Cycle 6 Filter Elements 37Filter Examples 37
Module 2: Data Access 9 Creating Filters 38
Understanding the Data Access Process 10 Naming and Saving Filters 38
Locating Data 11 Creating Computed Fields 39Creating Partnerships with Information Staff 11 Unconditional Computed Fields 39
Educating Yourself and Your Staff 11 Conversion Computed Fields 39
Identifying Available Data 11 Conditional Computed Fields 40Determining Available Data Formats 11
Acquiring Data 13 Module 4: Data Integrity Verification 41
Determining Your Analytical Objectives 13 Understanding Data Integrity 42
Requesting Data 13 Sources of Error 42
Transferring Data 15 Testing Data Integrity 43
Accessing Data 16 Checking Validity 44
Creating Tables to Access Data 17 Using the Verify Command 44
Creating Tables from Flat Files 17 Confirming Control Totals 46
Creating Tables from MS Excel Data 20 The Count Command 46
Creating Tables from MS Access Data 22 The Total Command 46
Creating Tables from ODBC-Compliant Data 23 The Statistics Command 47
ACLI CERTIFIED11.1.1.13“ iii

Contents
What If Control Totals Do Not Match? 47 Comparing Sort and Index 67Checking for Correct Bounds 48 Quick Sort 67
The Statistics Command 48 Combining Data 68The Between( ) Function 49 The Extract Command with the Append Option 68What If Your Records Are Not within Specified Bounds? .49 The Join Command 69
Finding Missing Items 50 The Relations Command 74The Gaps Command 50 Relating Tables 75The ISBLANK( ) Function 51 Comparing Joins and Relations 78What If You Find Missing Items in Your Table? 52
Finding Duplicates 53 Module 6: Reporting Results 79
The Duplicates Command 53 Reporting with ACL 80
What If You Find Duplicate Entries? 54 Creating a Report from a View 81
Testing for Reliability 55 Creating New Views 81
Recalculating Numeric Values 55 Formatting Views 81
What If Your Computed Values Do Not Match? 55 Designing Report Layouts 83
Using Other Data Integrity Tests 56 Printing Reports 83
Testing Reasonableness 56 Advanced Reporting 85
Testing Relations 56 Creating Sorted Reports 85Creating Reports That Contain Subtotals 86
Module 5: Data Analysis 57 Creating Multiline Reports 87Profiling Data 58 Generating Reports with Crystal Reports 89
The Classify Command 58 Creating Crystal Report Templates 89The Summarize Command 58 Generating Reports Using Custom Templates 90Comparing Classify and Summarize 59 Creating Graphs 91The Cross-Tabulate Command 60 Viewing Graphs Created by a Command 91The Stratify Command 61 Creating Graphs from a View 91The Age Command 63 Using Graph Options 91
Isolating Data 64 Using the Log 93Filters 64 Adding and Viewing Log Sessions 93The Extract Command 64 Adding Comments 93The Export Command 65 Exporting from the Log 94
Organizing Data 66 Copying and Pasting Results 94The Sequence Command 66 Searching the Log 94The Sort Command 66 Documenting Your Analysis 95The Index Command 66 Create Project Notes 95
iv Foundations of ACL: Concepts and Practices

Files, Records, and Fields
Modern data structures are built from files. A file is a namedcollection of information stored or processed as an individualentity.
A file is composed of a number of smaller units, called records andfields. A record is a collection of related information grouped forprocessing. A field is an area in a record where a particular class ofdata is stored.
A useful analogy for understanding these concepts is thetelephone book, which is a collection of information about thetelephone users in a particular community.
A telephone book can be thought of as a file. Each entry for atelephone user is a record and each type of information repeated inevery record—the name, address, and telephone number—is afield.
Helmi Liimatta 2376 Front St. (235) 982-3523 I
Sean Ganton 1949 Scotia St. (927) 562-1054
Chris Rockstad 4923 Yew Ave. (943) 571-2350
Jacob Friesen 54 King Rd. (981) 235-4098
Records
Fields
Module 1: Fundamentals Understanding Database Concepts
Understanding Database Concepts
Data
Data is everywhere. Every time you use a credit card, make atelephone call, or log on to a website, you leave a digital footprint.Yet tew of us understand what data is.
For example, consider the following string of numbers:
04092003
You might interpret this string of numbers as:
An account number 04092003
A transaction amount $40,920.03
A date
April 9, 2003or, depending on your date preference,September 4, 2003
To work with raw data such as this string of numbers, you mustknow how to interpret it and what to do with it. In the same way, acomputer must first be told how to interpret raw data and how tomanage it.
For example, assume an employee enters a duplicate employeenumber so that he or she receives two checks for the same payperiod. To identify this problem, the computer must beprogrammed to interpret the raw data as employee numbers andto identify the duplicate employee numbers as irregularities.
fig. 1-1 Data structure sample
2 Foundations of ACL: Concepts and Practices

Fundamentals
To use ACL effectively, it is necessary to understand key data analysisconcepts and the data analysis cycle. You must learn how to navigate theACL interface, how to store and organize your work in ACL projects, andhow to work with the many analytical tools ACL provides. This moduleintroduces you to data analysis and the basics of working with ACLsoftware.
Understanding Database Concepts
Understanding ACL
Viewing ACL
Understanding Data Analysis

Print Project Contents 95View and Print a Table History 95Record Notes 96
Activities 97Fundamentals 98Data Access 100Data Integrity Verification 101Data Analysis 102Reporting Results 110
Solutions 111Fundamentals 112Data Access 115Data Integrity Verification 117Data Analysis 120Reporting Results 131
Index 133
ACriu ........ ..
Contents
Foundations of ACL: Concepts and Practicesvi

Module 1: Fundamentals Understanding ACL
Understanding ACLACL is a tool that lets you read and analyze data. The data may bein different types of files scattered across numerous databases ondifferent platforms. Regardless, ACL can help you access the data,ask intelligent questions about it, and distill the informationneeded to answer those questions.
Who Uses ACL?ACL is used by data analysts, auditors, accountants, and otherbusiness professionals who need timely access to data and themeans to analyze it efficiently and effectively. The informationACL provides allows confident management planning anddecision-making.
What Can I Do with ACL?Your use of ACL is limited only by your imagination. Because ACLprovides such a huge range of options, you can accomplish almostany goal in the realm of data analysis.
Gather essential information for decision -making
ACL offers a full range of analytical tools, including functions,commands, and scripts. These tools let you find answers to yourquestions quickly and easily.
Retain the integrity of your data
Because ACL is a read-only application, it cannot alter the datasource. This lets you access production data directly and safely.
Process different data types from different systems
ACL can combine data from modern databases, legacy systems,and report files. You can then analyze the data as if it was all fromthe same source.
Process files of any size rapidly
Unlimited file-size capability and high-speed processing make itpossible to analyze millions of records in seconds with ACL.
Analyze large data sets in their entirety
The large capacity and high speed of ACL allow you to work withfiles in their entirety instead of through samples. Knowing thatyou have examined an entire file gives you greater confidence thatyour results are complete and correct.
Automate analytical procedures
Automating your analysis can save time and effort. ACL scriptscan be programmed to be interactive or to run as continuousmonitoring applications.
Maintain a record of your work
When you use ACL, every step you take is recorded in the log. Thislog, or audit trail, lets you review, document, and repeat the stepsof your analysis.
AC LI 3

• N
Welcome to AC1.4,1.•/Int,
( No Open Poled )
Wekome• >
Welcome Tab
Project Navigator
Status Bar '
4
fig. 1-2 ACL interface
k Eck Eke Anahne Stowing Ptopicat■ons Took Serve, Wind. Nob
rt& A . 1'4;11 !Jitr 7.77. 77; 0) :
Module 1: Fundamentals Viewing ACL
Viewing ACLACL provides the means to access and analyze your data through:
• Multi-level organization within a project
• Easy creation and manipulation of project elements
• Analytical tools such as functions, commands, and scripts
The ACL Interface
When you open ACL, you are presented with the applicationwindow showing the Welcome Tab, the Project Navigator, and theStatus Bar.
Welcome tab
The Welcome tab is a fast and easy way to navigate between yourprojects in ACL. By clicking the links provided, you can create aproject, open a project, or access different parts of the ACLwebsite. When online, you can download product enhancements,submit support requests, and search the knowledge base.
Project Navigator
The Project Navigator has an Overview tab and a Log tab. TheOverview tab lets you organize items in your ACL project intofolders. The Log tab lets you browse a chronological record of yourpast activities, view command results, and save portions of the logto another file.
Status bar
The status bar displays information about the active table,including the table name, the number of records, and any activefilter criteria.
Foundations of ACE: Concepts and Practices
Module 1: Fundamentals
The ACL Project
Similar to a top-level folder in Windows, an ACL project is used tostore and organize your analytical work. An ACL project caninclude tables, scripts, logs, workspaces, and folders.
Tables rrnA table is the combination of a table layout and the data source towhich the table layout is linked. The data in a table is presented ina view.
Data source
A data source provides the data that populates a table. Every tablelayout is linked directly to an original data source or to a copy of thedata. The data source does not reside in the project.
Table layout A table layout contains everything needed to read a data file, includingmedia and file type, record length, and field information.
View
A view is the visual presentation of a table. A table can have more thanone view, letting you create different presentations by reformattingthe data.
Scripts
A script is a series of ACL commands that can be executedrepeatedly within your project. Almost all commands can beexecuted in a script. Scripts can be designed to run automaticallyor to prompt the user for input.
EaLogs :A
ACL automatically creates a log when you create an ACL project.The log is an audit trail, recording the commands and results fromyour analysis. This trail lets you retrace your steps and reproduceresults without always having to save your work. The log is also an
excellent resource for generating reports at the conclusion of youranalysis.
Workspaces
A workspace is a set of field definitions that has been saved forreuse with other tables. When a workspace is activated, the fielddefinitions within it are available for use with the active table.Workspaces let you maintain and reuse definitions of physicalfields, computed fields, and filters, so you do not have to definethese elements more than one time.
Folders 1:11
Folders are used to organize your work in an ACL project. ACLfolders are similar to Windows folders.
Notes:
Viewing ACL
ACLI CE!TIFIED 5

Module 1: Fundamentals Understanding Data Analysis
Understanding Data Analysis ,
Elements of Data Analysis
The main elements of data analysis in ACL are commands,expressions, functions, and variables.
Commands
Functions
A function is a predefined routine that performs a computation onspecified data. A function uses variables to accept input datavalues. ACL currently offers approximately 80 different functions.
VariablesACL commands are means of executing standard analyses, such asstatistical analysis and data profiling. Command results can besent to file, screen, print, and in some cases, graphs.
Expressions
Expressions are statements used primarily to create filters andcomputed fields. They perform calculations, specify logicalconditions, or create values that do not exist in the data file.Expressions can be named and saved as part of a project or elsecreated just for immediate use.
Filters A filter is a logical expression that lets you select the kind of datayou want to see and work with. For example, you can create a filterthat selects only records that fall within a specified range of dates.
Computed fields A computed field, also known as a calculated field, is a virtual fieldthat uses data derived from an expression or a specified constant. Itdoes not contain physical data. For example, you can create a newfield that is the product of the values in two other fields. You canalso insert into a table a specific value such as an interest rate or alogical condition.
A variable is a named memory space that stores data. The valuestored in a variable can be either a character, numeric, date, orlogical type. Variables are widely used in functions, expressions,and scripts.
The Data Analysis Cycle
Every data analysis project you undertake follows a regular cycle ofactivities. This helps to ensure that your work is thorough,accurate, and efficiently performed.
The data analysis cycle has five stages:
• Planning
• Data access
• Data integrity verification
• Data analysis
• Reporting results
Each stage is discussed in detail in this course.
6 Foundations of ACL: Concepts and Practices

Module 1: Fundamentals Understanding Data Analysis
Planning
Plan your work before you start a project. By formulating clearobjectives before you begin your analysis, you can develop concisestrategies and budget the right amount of time and resources.
Notes:
Data Access
The next step is to access the data outlined in your strategic plans.This requires locating, requesting, and transferring the data priorto reading it with ACL.
Data Integrity Verification
Having received the data, it is necessary to test its integrity. If youstart your project without having first verified the data's accuracyand completeness, your results may be unreliable or incorrect.
Data Analysis
In the analysis stage, you perform the tests necessary to achieveyour objectives. You are likely to use a combination of commands,filters, and computed fields in your analysis.
Reporting Results
Depending on the project, you may need to create reports fromyour results. ACL can create different types of reports; includingmultiline, detail, and summary reports.
u!.T.!n! .. 7

Module 1: Fundamentals Understanding Data Analysis
8
Foundations of ACL: Concepts and Practices

Data access is a critical part of any data analysis project. You need to findand acquire necessary data in an efficient and effective manner. Because ofthe variety of data sources and technologies, data access methods vary.ACL, however, can access almost any kind of data. This module helps youunderstand the process of data access using ACL.
Understanding the Data AccessProcess
Locating Data
Acquiring Data
Accessing Data
Creating Tables to Access Data
Reusing Table Layouts

Understanding the Data Access ProcessModule 2: Data Access
Understanding the Data Access ProcessIn order to prepare your analysis, you need to understand the dataaccess process. To ensure the success of the entire process, paycareful attention to each step.
To prepare your analysis:
1. Locate the data.
Locating data requires understanding the individual filesavailable, the various file types and the technologies used toaccess them. A comprehensive understanding also helps youbuild a productive relationship with the data provider.
• Formulate clear objectives.
Before attempting to acquire data, use your analyticalobjectives to determine which data files you need.
• Find out what data is available to you.
• Find out the format in which the data is stored.
2. Acquire the data.
• Create a request letter for the data provider that shows yourspecific requirements.
3. Access the data.
• Use ACL to read almost any kind of data.
ACL accesses some data directly at its source and other datathrough an imported copy. In some cases, ACL can create atable automatically. In other cases, you define aspects of thestructure for it.
Notes:
10 Foundations of ACL: Concepts and Practices

Module 2: Data Access locating Data
Locating DataIf you are to make an informed request to the data provider, youneed to learn what data is available to you and the format in whichit is stored. Effectively communicating your data needs will savetime for both you and your Information Systems (IS) department.
Creating Partnerships with Information Staff
You rely heavily upon IS to help you find data. To foster a positiveworking relationship, learn the language of technology andeducate them about your needs. Find out what information theyneed from you to process your data request and develop a requestform that conveys that information.
Educating Yourself and Your Staff
Understanding the fundamentals of data can help you to phraseyour data request succinctly. Learn the characteristics of thedifferent file formats available. Investigate data access and filetransfer methods. Encourage your staff to educate themselvesabout data technology. Understanding the fundamentals of datawill help your team build a productive relationship withInformation staff.
Identifying Available Data
Find out what data exists and where it is stored. Ask to review thedata and the data dictionary to assess what information you mayrequire. Develop a map that documents data sources, file formats,and the contents of specific files and fields. Use the map as areference for future projects. As your knowledge increases, yourreliance on IS or a system administrator will decrease.
Determining Available Data Formats
ACL can create tables from many data formats with varyingdegrees of user intervention. When you have a choice, use data inits native format. Also, work with data formats that ACL can definewith little or no help, such as ODBC-compliant sources.
ACL can access most file types, including the following:
ODBC-compliant
Open Database Connectivity (ODBC) is a Microsoft technologydata sources that provides data access with minimal user input. Most modern
database systems are ODBC-compliant.
dBASE files
dBASE is the fastest and easiest format for ACL to read. Fewmodern database systems store data in dBASE files, however, butmost systems can easily export data to this format.
Flat files Flat files contain only data. Unlike formats such as Excel anddBASE, flat files contain no field definition information. For ACLto create a table layout, you must define the file manually or usean external definition file.
Report (print- Sometimes you will not be able to acquire direct access to theimage) files
data in one of the file formats discussed in this section. In these
ACL can read report files, but you must define the table layoutcases, you may be able to get an electronic copy of a report file.
manually.
Delimited files Delimited files are typically variable-length files with one recordper line of text. Special characters such as commas or tabs areused to separate the fields in each record. CSV files (comma-separated values files) are the most common type of delimitedfile.
ACE' U!!„T. LF! ... 11

Module 2: Data Access Locating Data
XML files ACL has developed and patented technology used to processXML files so they can be analyzed like other data sources. XML isa general purpose markup language that combines data and theformatting information in the same document. XML is the basefor other special-purpose markup languages, for example XBRLand XSLT.
Notes:
These formats may not be the easiest for your data provider tosupply, so you may have to compromise.
CD For more information on file formats, see the Data AccessGuide, or select Help > Index and enter "data sources".
12 Foundations of ACL: Concepts and Practices

Module 2: Data Access Acquiring Data
Acquiring DataAfter you develop an overview of the available data, you need toacquire the data. To do that, you must do the following:
1. Determine your analytical objectives.
2. Request the data.
3. Transfer the data.
Determining Your Analytical Objectives
Before requesting data, formulate your analytical objectives. Yourobjectives determine the data that you require.
Consider the following example: You want to identify vendors thatmay be overcharging you for supplies than you have contracted.You have located the data sources and know that three relevantfiles exist:.
File
Purchases
Vendors
Supplies
Contains
Purchase transactions
List of vendors from whom you purchase goods
Master list of supplies, including the prices agreed upon by eachvendor
To identify the vendors that may be overcharging, you mustcompare records in the Purchases file to records in the Suppliesfile. Therefore, you need to request these two files. Request theVendors file only if you want to see vendor information for eachinstance of an overcharge.
Requesting Data
Requesting data is a critical step in a data analysis project.Complications with data access can seriously compromise thetimeline of your analysis. It is essential that you be very specificabout what data you need, where it comes from, and how youwould like it delivered. To accomplish this, you need to submit adata request letter and request a summary report.
Data request letter
Specify what data you require M a formal request. Your requestletter needs to have all the information that IS needs to provide thedata.
Include the following in your data request letter:
• The date of your request
• The name of the system where the data resides
• The file name, table name, or report name
• Date bounds for the data. For example, you might specify fromJanuary 1, 2002, to December 31, 2002, inclusive of start andend dates.
• Any filter criteria. For example, you might specify to includeonly positive values in the balance field.
• When you would like the data delivered
• The file format in which you would like to receive the data
• The medium on which you would like the data transferred
ACLI F.MP.E! ... !! 13

Module 2: Data Access Acquiring Data
ATTN: Jim Lasby, IS
7/31/2003
FROM: Dennis Moretti, Internal Audit
RE: Request for Supplies data
Please provide access to, or a copy of, the data specifiedbelow:
Host System Oracle, 0S/390.
File/Table
Supplies - This table contains the master listing of purchasedRequested
vendor number.supplies, the agreed-upon price, and the corresponding
Time Period From January 1, 2002, to December 31, 2002, inclusive.
Filter Include only vendors from the state of Washington.Criteria
Delivery August 15, 2003.Date
Data Format ODBC access is preferred. If that is not possible, a dBASE,Excel, Access, or XML file is preferred.
Data Access If ODBC is not available, please place the file in my publicMedium
network folder, N:\ Audit\ DM.
Please provide a summary report that includes record layoutinformation, control totals, and a printed sample from the
fig. 2-1 Sample data request letter
Summary report
You should also request a summary report from IS about the datayou receive. If you are able to get a summary report, use theinformation in the report to confirm that you have received all thedata and only the data that you requested. If possible, obtain thesame details from an independent source, such as the departmentfrom which the data originates.
Request the following items in your summary report:
• Record layout information (field names, start positions,lengths, data types, and formatting details)
• Control totals (number of records, field totals)
• A printed sample of approximately fifty records from theoriginal file. Compare the sample records against the table youcreate to confirm the accuracy of the table.
14 Foundations of ACL: Concepts and Practices

Module 2: Data Access Acquiring Data
ATTN: Dennis Moretti, Internal Audit
8/13/2003
FROM: Jim Lasby, IS
RE: Summary report for Supplies data
Record Layout:
Name Type Start Length Decimals
product_number ALPHA 1 10
vendor_number ALPHA 11 8
agreed_price NUMERIC 19 6 2
minimum_quantity NUMERIC 25 5 0
Control Totals:
Record count: 1264
a Total of agreed_price field: $23,512.57
Printed Sample:
productnumber
vendornumber
agreedprice
minimumquantity
070104397 11663 4.75 90
070104677 13808 6.87 325
070104657 12433 4.00 26
070104327 11663 2.50 700
fig. 2-2 Sample summary report
Transferring Data
The last step in acquiring data is transferring it. You must eitherobtain a copy of the data and store it on a drive where ACL canread it or you must be granted access rights to the data source.
Gaining access to data in a way that allows you to work with it canbe difficult. The method that you use depends on file size, storagemedium, and available technology. Discuss the options with IS todetermine the method that works best for both of you.
The IS department can provide you with at least one of thefollowing modes of transfer.
Access to a production database or data warehouse
You are granted access from ACL to either a production databaseor a regularly refreshed copy of a database in a data warehouse.ACL reads the data directly from the source using data accesstechnologies such as ODBC.
Access to a copy of the data
You are provided with a copy of the data source in a form that ACLcan read. Some file types contain metadata that ACL can use tostructure the data. Other file types require manual definition.
The size of the file will dictate the medium on which the file isprovided. You will typically receive files on a CD-RW, Zip disk,DVD-R, or via a network drive e-mail.
User access to the data source
You are provided with a user name, password, and instructions toaccess the host system. You must extract the data yourself. Manysystems have an extraction tool you can use to create files that ACLcan read.
ACLIF.fn!.t! .. 15

Module 2: Data Access Accessing Data
Accessing DataWhen the data has been made available in a usable format, you canbegin the process of accessing it with ACL. ACL reads different filetypes in different ways and with varying degrees of automation.Data from newer technologies requires less manual processingthan data from legacy systems.
There are two methods that ACL uses to accesses data:
Notes:
Direct access ACL reads the data directly from the source in its nativeformat without creating a copy of the data. With directaccess ACL creates tables with varying degrees ofautomation depending on how much layout informationthe source contains. ACL populates tables with data readdirectly from the source.
Import and copy ACL imports the data as a flat file and copies it to a localdrive. Details on the organization and structure of thedata are maintained together with the information. ACLreads the structure to define the layout.
16 Foundations of ACL: Concepts and Practices

Module 2: Data Access Creating Tables to Access Data
Creating Tables to Access DataBefore you can analyze data with ACL, you must create tables toaccess the data. The following procedures describe how to use theData Definition Wizard to access data from different data sources.
This section describes the following:
• Creating Tables from Flat Files
• Creating Tables from MS Excel Data
• Creating Tables from MS Access Data
• Creating Tables from ODBC-Compliant Data
• Creating Tables from dBASE Data
• Creating Tables from Report Files
• Creating Tables from Adobe PDF Data
Creating Tables from Flat Files
Creating Tables from Flat Files uses the direct access, manuallayout method to access data from a flat file named Inventory.fil.
Direct access, manual layout
ACL can read any flat file, including data from older mainframesystems, and telephone and internet logs. These files do notcontain table layout information, so you must provide theinformation to ACL.
To access data using direct access, manual layout:
1. Get a hard copy of the record layout information.
2. Locate the data source.
3. Input the record layout information in ACL.
ACL creates a table containing data read directly from the datasource.
I Manual layout I
Data source
Table layout
Views
fig. 2-3 Direct access, manual layout
Select the flat file
1. Select File > New > Table.The Data Definition Wizard starts.
2. Click Next.
By default, the Data Definition Wizard selects Disk as the datasource.
3. Click Next.4. In Select File to Define, select Inventory . f i 1 and click
Open.The Data Definition Wizard correctly identifies the characterset as ASCII.
5. Click Next.
Record layout ordata dictionary
ACLIF2gt!IF. 17

6-01 Definition Vitzald . Identify Fields •
The Wood hes hied to almay al the fields is you dale He. You tan delete. cseate. 0 moveany fiekl eepevelon to alanoPenelY set the odor..
To CREATE a field moat Mot, crock al the defiled locationTo DELETE a !Jew ',me*, click en an waning kn.o MOVE a field sepaiela, era on a len and [keg 1
0000004065 91
... 90 1
00147 -! I
01010
01010
01010
98
98
75
78 1/000.1,28
1 17010434T) ATLX 5181-GLOSS ORANGE
2 701049971' Alto SEMI-GLOSS CARAMEL3 7701041771 ATEX SEMI-GLOSS LILAC
'1'.....-4.....„)2010(....5E)111‘.0 SS APPIC
50 0059769
900(700001602
0)00101676
Select P•Orn..
.1( Bakd eta
tdOillIventtpeltlest: • .
• • Define maltpgRecords •
.• ■ Edit tleid Otopeolles .
'I -nttlah
-Bele•PhrttOtni
Oats
of:".• IdenthiPropertle•
OcIthe tieldeiRecords
II' Edit field Piropettles
.111:
Type 1N.merir(Foanolled)
Value
Decenal
r %note this Feld
Name 1eletv
RNUEERIC8 gRTERII
SOO '61105.9569. 0008612j
SOO 00031602 4 t 000451 1
01016761 001471-
00088623. 1 001281 '
00103050 00149(
0,16
Name the fields and select data types
1. Click Next.
The Edit Field Properties window shows the field properties.
Data Definition
Column Tale
PI/CC
rodno Idproddesc -Onocat stdbeEnt/DA7E2 8111/110NUME
1 107010434 (TEX 5181 - GLOSS ORANGE 6.8 01010 9.99 0101 87. 98
2 r 1
10439 72X SEMI-GLOSS CARAME 6.8 01010 9.99)0101 46 98---
3 7010417 A7EX SERI-GLOSS LILAC . 6.8 001010 9,99 0101 4 75
---11107010467TEXSEMI-GLOSSAPRICO'6.8 001010 9.99 0101 129 78
li-- Tr-1070104657 TEX SEMI-GLOSS PINK 6.0 401010 9.99 0101 1500 42
- -. -...4=47.111,0422 11 •
The Wood has ideraied the held onspediee (he Res amen fro male lba Woad,ntcomreendahont. Lick ea IN cam. hewing lo select a field.
Module 2: Data Access Creating Tables to Access Data
The Data Definition Wizard correctly identifies the file formatas Other.
6. Click Next.
On the File Properties window, the Data Definition Wizardidentifies the records as fixed length, with a length of 97 byteseach.
The Wood hes ldeenlied the He 0cpnllea Ian you. II the data ia vest:rey signed. PickNeel] lo continue.
11 you wish to akin mends at the lop ol this Re. en,0 a value in the Ryles lo Skip edit bowPali these /mods de no longer viable. 0 you data is not sighed. change the RecoilLength value in the ado box veiticaly aped. 11 you want la delve this lie mann*.elect 11.e Skip lo too h tad. button. II you Pant mote 400,00 ion on Ile ptopertlea. pick on
PitedlengthflylestoSkipr Venable Length -
r . Skip to Faith Flecad length 195---
1 07010434706LATEX SETA-GLOSS ORANGE A 6.87001010 9.99001018 870 980 50000000597690000086
2 070104397064A7EX SENS-GLOSS CARAPECLA 6.87001010 9.99001018 460 985 50000000316020000045 1
3 07010417706LATEX SEMI-GLOSS LILAC A -6.87001010 9.99001018 1480 750 00001016761000147
':::iZTIT.9Plillai.9.1...T5L2123'-j1151!!...,1.§1042222a2111010.1.111920 430
e_ 7010467706LATEX SEMI-GLOSSs 07010485706LATEX SCHI-GLOSS APRICOTA 6.87001010 9.99001018 1290 780 00000886230000128
PINK A 6.87001010 9.99001018 1500 420 00001030500000149
00001662540000241
fig. 2-4 Data Definition Wizard - File Properties
0 If you find the layout of the data is skewed diagonally, youmust adjust the record length until the fields are alignedvertically.
7. Click Next.
The File Type window shows that the Data Definition Wizardcorrectly identified the file as a single-record-type data file.
8. Click Next.
The Identify Fields window shows the Data Definition Wizard'splacement of field separators. Confirm the Data DefinitionWizard's choices and adjust if necessary.
fig. 2-5 Data Definition Wizard - Identify Fields
9. As in fig. 2-5, shift the field separator from byte 75 to byte 76.
fig. 2-6 Data Definition Wizard - Edit Field Properties
2. Click a column heading to select a field and do the following:
a. Enter a name to identify the field in the table layout.
b. Enter a column heading to identify the field in the view.
c. Select the data type from the Type drop-down list andadjust the format if necessary.
' 46' 'Select Plehrim •
SelettDete
• Identity PropertIes,
°Mina fleldainetottis
• Edlt Fleld Propetifes
P.411 Finisb
18 Foundations of ACL: Concepts and Practices

an kg .", ±, .4 I.
Fe. Ind.
1 :4 I -7J 1 i T4 -4 Z,IInvoice , Data Customer ' Invoice 'Product Product
'4:9' FOiT1 01419 ----"rl'i7P57----- - Torot 'OTIL--- —.Number
.112938 ^03/]1f1999 155851 I 12 86 02 :0239463—12960 . 0471911999 288185 90 74 02 ' 0241289 -
13083 !09105/1999 184196 862 97 '05 I U622096i13159 0112711999 286175 j 18 51 05 :0525301:13191 '1212711999 .295815 15 39 05 ■ 0525301,12866 101116/1999 293965 117 00 09 1.090669613022 106/20/1999 197564 0 15 OS 70525301:I
, 4, „. .07124/1799 20$0!..- ...,.., 0 1 5;05,--m---, 9525301 , :----.-„, :
fig. 2-7 Table in default view
Creating Tables to Access DataModule 2: Data Access
Use the following table layout as a guide:
Start Length Name Data Type Decimals
1 9 prodno ASCII
1 2 prodcls ASCII
10 2 location ASCII
12 24 proddesc ASCII
36 1 prodstat ASCII
37 6 uncst NUMERIC 2
43 6 costdate Date YYMMDD
49 12 Undefined area
61 5 qtyoh NUMERIC 0
66 10 Undefined area
76 10 value ZONED 2
86 10 Undefined area
3. For all fields you want to define, repeat Step 2.
4. Click Next.
The Final window shows a summary of table record and fieldproperties.
Name and save the table1. Click Finish.2. Name the table Inventory and click OK.
The Data Definition Wizard creates the table and displays thedefault view.
Defining overlapping fields
After you exit the Data Definition Wizard, you can defineoverlapping fields. This is, you can redefine a portion or all of analready defined field as a different field.
To define an overlapping field:
1. Select Edit > Table Layout and click the 01 (Add a New DataField) button.
2. In the Name box, enter a name for the new field. Select thedata type from the Type drop-down list, and enter the startposition, field length, and any other appropriate information.
3. Click the (Accept Entry) button.
CD, To add the new field to your view, right-click in the view, andselect Add Columns. In the Available Fields list, double-clickthe new field and click OK.
ACLIUnZ, LIR 19

Select the Face1Worksheet or Named Rank.
Names In workbook:
Months wr-
lockMonthsRemalf
thesheMSRefers to:-SmesheetqmS343
- - - --. - - - ---3701 26'132/2008 9 00 PA---16,'02/20i.113 10 13,....- .371: 1 .....---..- .." - ' .fr,14 ■ I *I \ linleSheet i Report k Benefits /Ready
,0110.0Mailaliaaairenato
Use Est mw as Feld Names
M waren Character FR' 41:1 Length
Look Yr I aCLOOS Fundamentals
r_:,Assi0nment2b(I• ACLOD9C.LOG
r ' .. Advanced.adAadvanced.1.1%1.0 Advanced LOGi'rlasslanment.th:
Asslorthent
01 assignment LAX11 ; km...nt.LoG
My DOC1.111%1115
g!.
My Cwoule∎
4;
My NetworkMetes
C3 et CI-reofkl
Emahreeistsf• as Inttenationdad
InternatIonal.UXInternartnaLlOG
1/asonfloorsalllOJOIN_RSEG_131lPF_2006.fl' Methyl. .FIL72Oetaohor.pcf
Ps chard. lelP.eporttm
dbf
My RecallDoc-were,
lJDaffier,
lACflents2.fiOiLlentsalCodes.(1 ir,ens.fi
loodlerktet
I .
Fie rem, COacktcards_mereoher
Fies of Woth [Fria Fies zi
Creating Tables from MS Excel Data
ACL streamlines the creation of tables from Excel data. ACL canread multiple worksheets, named ranges, and pivot tables.
fig. 2-8 Excel to ACL
In fig. 2-8, ACL reads worksheets and named ranges in an Excelfile. Worksheets appear with a dollar sign ($) after their name andnamed ranges appear without.
CD If the Excel file is using security features, you must open theExcel file separately and disable any password protectedworksheets before proceeding in ACL.
The following procedure uses the import and copy, automaticlayout method to access a worksheet from a Microsoft Excel filenamed Credit_cards_metaphor.xls.
In this procedure, you complete the following:• Select the Excel file
. Select the worksheet or named range
• Create and save the table
Select the Excel file
1. Select File > New > Table to start the Data Definition Wizard.
2. Click Next.
By default, the wizard selects Disk as the data source.
3. Click Next.
The Select File to Define dialog box appears.
Define• • • • • •• • • • • - • • • • iv-7U; Seka File to
fig. 2-9 Select File to Define dialog box
4. Select Credit_cards_metaphor.xls and click Open.
The wizard correctly identifies the character set as ASCII.
5. Click Next.
The wizard correctly identifies the file as an Excel file.
6. Click Next.
Foundations of ACL: Concepts and Practices-

Data Delia'Oat; WIZat II -Data Source
Index
MINPYMTIr4,.,
]000 • -. 129 00
0'1106.
.. 131: .•
10 00 '0 00 :
0 80O00'
180010 013,.. .10.00.000
65 00000'
22500 ... 10.00'
9000 925007 0410112005 000,10000 '284354 . 1170112006 • 0 ;00 .............. 0.009000:503458 0710112004 . i 000; 10.006500 750407 , 01101/2005 87 52 ,
........,.'102.00 .
a6
FiAer
I-
—
' .........- ...... ...---....
CARONUM .i 8590122497863607;
6590132281964011 ;1359012078498456685901243536217441
- . 8550125999743363;05901 20716753180:85901189477478538590122720558987 .
8590128676326319 :8590124781270125i8590121762084715 •659012959316/703'8590177307204051 !8590131782195395 1
4590121300586153!8590177180365686:659012088425038185901254312325318590171670630101;..........
CREOLIM CUSTNO EXpOT •_ , F1NCM0090130 962353 08/01120056000 812465 010112004
I 0.0
.6902 051593 1010113004 1177017 .01:1 750402 04101/7004 .9000.776088 - .0210112004 -
101 41 :0 00,
8000 776006 0001/2005 0 5010000 250402 UW01/20045700 '051593 01/01/2005 tidal-,..7300 778088 - 0910111005 . 0 00'...8000'176088 0101/2004 11166000 051593 01101/7005 000 !9000 !051593 :0910112005 1 . 000'
9000 - 878035 10101/2004 J .... 0 00'9500'776088 1010117005 0001000 778086 • 1110172004 0 00 !4400 250407 01101/2004 51.91!
7000 503456 07/01720041300 503458 '0770117004
0.0013416.
8000 284354 . 02101/2005 0.006590126323541565 '
.. 859012103925626516590122491455345:0590127043771362:
2
5
Creating Tables to Access DataModule 2: Data Access
The Data Definition Wizard - Data Source dialog box appears.
fig. 2-10 Data Definition Wizard - Data Source
Select the worksheet or named range
1. In the Data Source dialog box, select Co rp_C r edi t_Ca rds$.
If necessary, adjust the maximum character field length.
2. Click Next.
The Save Data File As dialog box appears.
3. Name the file Credi t_ca rds_meta phor and click Save.
The wizard copies the data to an ACL data file and shows you asummary of the table's record and field properties.
Create and save the table
1. Click Finish.
2. Name the table Credi t_ca rds_metaphor and click OK.
The wizard creates the table and displays the default view. TheData Definition Wizard creates the table.
fig. 2-11 Table from Excel data
0 After import, you might have to adjust data types in thetable layout.
ACU'CEnIFI ED 21

keleci File In DeNine. ....„.......
Lads *rc
L'1,, r„f)kly RecoilDoeumenls
LtI}
Desktop
HyDocursents
.1 0My c.„„..,
1 i...JAHIMeent2b FI CrecfmtAl ej vendrep.MtAttooecLos 11.OiLmployee_ht.fi work.F
Mend customeill
r'il,Advanced.act InternationatactAdvancedlIX girternalionaltlX
InternationattOG
A'slimnent.AC OlasonHours.FIL
14:•;AASsigivrent""'"'.taalk 701N_EISLG_BKPF200611
gmetaptor.FR.Assignment.t06 !..Metephai.Pulf
C.; Ourchord.trt
1:g Cren1s211 Reporctzt
Crimes ff P1 5aks.dhtCodes. f 1
' . .I11Cradi_cmds_inetephortils SY
My Mesmer& Fie pains riemplemdbPlaces
Pies oi type !Dies Fie' r.
Fier
cum) Company.Alym --.7ikh!ays Open Outck Marl
2 :ANDRE' 'Andre's Continenlal Food Markel01171112 Anthony's Beer and Ale
ExportsBERG§ — emoted's Scandinavian °roc.) ,OLUEL pine Late Deli &(KUNG .BiumS Ooods
- BOTTS 'Bolidrn.Doial MarketsBSPEV BS Beverages
10 -CONSH :ConSolidaled HoldingsIt .EASTC Eastern Connection12 `Empire !railing12 . FITZ° • F Itgetaid's Deli and VIVedI1 .F0001 F oodrnongeis, Inc.15 FP/dB°. Fraser Oishibulors15 .FRIJOP :Frugal Purse Slangs
F mime Asian Specialties18 •GARCA Garcia's NI-Dav Food MOII19 - REAL Gieal Lakes Food Markel70 ■-■,,r3ov ..nover Poultry .21 'HIGHO ,Firehhodoe Gourmet ShOPPe22 01111E0 'HungrY0v4 Al/Night Grocers23 .ISCAT:island Hiding
JJ
Address77 Overpass AreP G Boa 20933 Neptune CircleBow 2993811 S. Marlon St
.710 Main Si113 Blinn Rd23 TsawaSSen Blvd.Faunderoy Circus12 Berkeley Gardens35 King George7 Baste, Hal11E. Eastivay DI.I1B . 6111 AnyNorth Mingsgale110 GatablIt7 One72 Ddw1in P.m"401 Rodeo Or.2702 Baker Blvd400 Hanover Swam361 PiN SI.1001 West Vender151 Cioydne. Way
DeicsA_Mem
Index
IIH"E:73
OttNovoPellIngharn "-Clifton ForgeLondonScathePorlTownSendLondonIsawassenLondonLondonLondonLondonBeeevueWalla WallaLondonPocatello '-Phoenix&MonEugeneLondonJamaic aVancouveiHedge End........
Module 2: Data Access
Creating Tables to Access Data
Creating Tables from MS Access Data
The following procedure uses the import and copy, automaticlayout method to access a table named Customer from a MicrosoftAccess database named Sample.mdb.
If Access security is enabled, you are prompted to provide apassword.
To create a table from Access data:
1. Select File > New > Table.
The Data Definition Wizard appears.
2. Select Disk and click Next.
The Select File to Define dialog box appears.
3. Choose Sample.mdb and click Open.
6. Name the file a ccesscustomer and click Save.
The Wizard displays table information from the Access file.
7. Click Finish.
8. Accept the table name or enter another and click OK.
The Data Definition Wizard copies the data to an ACL data file.
9. Name the table a cc es s_c u s t ome r and click OK.
The Data Definition Wizard creates the table.
fig. 2-13 Table from Access data
fig. 2-12 Select File to Define dialog box
The Wizard selects Access database as the file type.
4. Click Next.
ACL prompts you to select the Access Table or View.
5. Select the table Customer and click Next.
22 Foundations of ACL: Concepts and Practices

Data SourceImport
Copy of data source Table layout Views
BMW
This data access method can be used to build ACL tablelayouts for Excel or Access files.
To access data using the import and copy, automatic layoutmethod:
Locate the data source.
▪ ACL copies the data to an ACL data file.
▪ ACL creates a table containing the data from the ACL file.
Module 2: Data Access
Creating Tables to Access Data
ACLIW.T.LFM"„
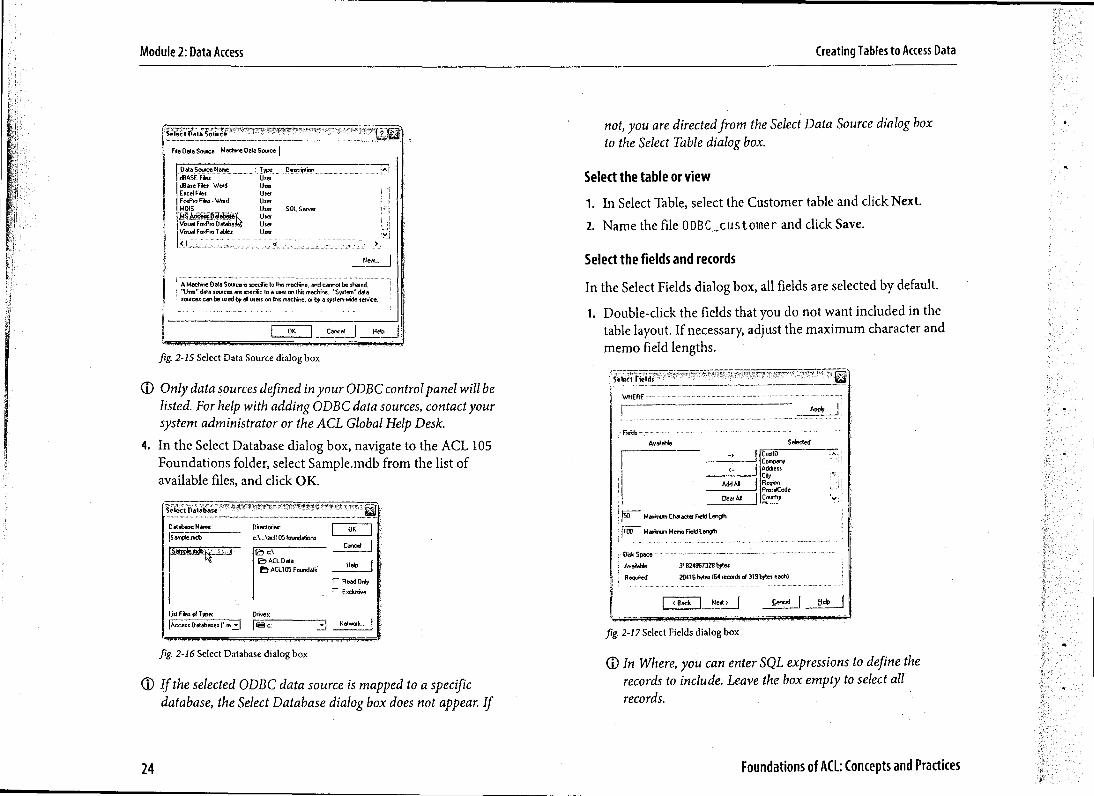
Creating Tables from ODBC-Compliant DataThe following procedure uses the import and copy, automaticlayout method to access a table named Customer from a MicrosoftAccess database named Sample.mdb.
CI You can import from any ODBC-compliant source such asOracle, DB2, and Excel. The procedure varies with each typeof data source.
Import and copy, automatic layout
The information needed to build the table layout for the ACL datafile is provided automatically with the data. Data sources in thiscategory include SAP AIS files and data sources accessed byODBC.
fig. 2-14 Import and copy, automatic layout
Using ODBC, you can refresh imported data from itssource at any time.
ACL creates a copy of the data source in a flat, fixed-length, ACLfile with a .fil extension.
In this procedure, do the following:
▪ Select the Access file
. Select the table or view
. Select the fields and records
IN Name and save the table
Select the Access file
1. Select File > New > Table to start the Data Definition Wizardand click Next.
2. Select ODBC and click Next.
3. In the Select Data Source dialog box, click the Machine DataSource tab, select MS Access Database, and click OK.
23
Disk Space
Avaiable 31824967328 bytes
Beguiled:
20416 bytes 164 records el 319 bytes each)
L < Back I Heirt2i Cancel I Help
Module 2: Data Access Creating Tables to Access Data
,
File
..... _
.. ,.....—i,
Dela Source Machine Data Source 1
•Data Source Narne .lice . Description !!■1dBASE Fie: UserdBase Res -Word User • !Excel Res User 1 i
, !Fad:ha Fies • Word User ; tMOIS User SQL Server , !:MS A61relaiiiel, UserVisual ForPio DarabaKVisual FoxPos T ables User ;y!<!
Nj
; .
A Machile Data Spume is speck to this machine, and cannot be shared.the data sources are specific to a use on lids machine. 'System" data
sources can be used by al uses on lids machine, or by a systemwide serve, . '
. '.
1 OK 1 Cancel_i Help
fig. 2-15 Select Data Source dialog box
Only data sources defined in your ODBC control panel will belisted. For help with adding ODBC data sources, contact yoursystem administrator or the ACL Global Help Desk.
4. In the Select Database dialog box, navigate to the ACL 105Foundations folder, select Sample.mdb from the list ofavailable files, and click OK.
fig. 2-16 Select Database dialog box
0 If the selected ODBC data source is mapped to a specificdatabase, the Select Database dialog box does not appear. If
not, you are directed from the Select Data Source dialog boxto the Select Table dialog box.
Select the table or view
1. In Select Table, select the Customer table and click Next.
2. Name the file OH C_customer and click Save.
Select the fields and records
In the Select Fields dialog box, all fields are selected by default.
1. Double-click the fields that you do not want included in thetable layout. If necessary, adjust the maximum character andmemo field lengths.
Wei- het& L4
WHERE
Apply I. .
Available Selected
CusilD Cone'
1 AddressCity
Add Al 1 Region PostatCode
Clem Al I CoontrY
91-0— Maximum Character Field Length
r100 Maxima Memo Field Length
fg. 2-17 Select Fields dialog box
T In Where, you can enter SQL expressions to define therecords to include. Leave the box empty to select allrecords.
24 Foundations of ACL: Concepts and Practices
ODBCcustomer
Fier
51 -.1 h,Index.
,ANTHB •'Anthony's Beer and Pie
BARU !BabuJis ExpoitsBERGS : Betgslad's Scandinavian Grocery13LUEL i Blue Lake DelLS. Grocery
• . ..
BLUMG i Bium's Goods BOTTM :Bottom-Dollar Markets
• BSBEV IB's Beverages CO1ISH I Consolidated Holdings•EASTC I Eastern Connection
: Empire TradingFibgerald's Deli and Video
,Fraser DistributorsFrugal Purse Strings
3
6
2
1516
ALWAO !Always Open Quick MarlANORG !Aildte's Continental Food Market
EMPITFITZD10001IRAS°FRUGP
Module 2: Data Access
Creating Tables to Access Data
2. Under Disk Space, compare Available to Required to ensureyou have sufficient disk space available for the data.
Name and save the table
1. Click Next.
The Data Definition Wizard copies the data to an ACL data file.
2. Name the table 0 DBC_customer and click OK.
The Data Definition Wizard creates the table and displays thedefault view.
fig. 2 - 18 Table in default view
C) To quickly auto-resize a column width in the view, double-click the vertical line to the right of the column you want toadjust.
Refresh your data
When you import a table or view from an ODBC-compliantdatabase, the Data Definition Wizard makes a static copy of thedata into an ACL data file. When you refresh from the source file,the refreshed data table reflects any subsequent changes in the dataand overwrites the data file.
To refresh your data:
I Right-click the table in the Project Navigator, select Refreshfrom Source, and click Yes.
IM • . r •
Fe. Cdt ...Age SmOrlg Kreiatrores 10* Ser ,er
At.p<I tle.geo. <
1 i L71 Ek-t- es. cm 7Sample. Promat.ACL
•• _ter. ,tremi.tt; 04*ctTst-O6Tti •C■ree
ilta.
;Jr lntiMdY_ke.
P riesht rr Sisircalei.lo■kve Pete
egret e S•y,' Fie.
p..,„a P7C0.1■10
fig. 2 - 19 Refresh from Source
CI Prior to refreshing data, back up the original file. Thisprecaution allows you to analyze the original file if needbe.
II x-`
C r .. .C9!wia41.V4A0 •
.A.oes!nothon
Jr .EEROS '6v,gs4BRE:.
'Bolu.a.BSEEV :BS etre!
011 4.3H Car,o1,.!Et Tc ask.DANT :EmoteRUE,
7; ounc custon.cr
Fes
ACC, E0
Data source Table layout Views
- I Import layout
Module 2: Data Access Creating Tables to Access Data
Creating Tables from dBASE Data
Using the Data Definition Wizard, you can access any data filecreated by xBASE software such as FoxPro or Clipper.
C) Memo and index files from xBASE software are notsupported.
Direct access, automatic layout
The information needed to build the table layout is providedautomatically with the data. On the PC platform, ACL can accessdBASE and ACCPAC files. On the OS/390 platform, the ACLServer Edition can access DB2, IMS, and VSAM.
fig. 2-20 Direct access, automatic layout
To access data using this method:
I Locate the data source.
ACL creates a table containing data read directly from the datasource.
The following procedure uses the direct access, automatic layoutmethod to access a dBASE file named Arec.dbf.
In this procedure, do the following:
• Select the dBASE file
• Name and save the table
Notes:
Fnundatinni of Afl fruirpntc and Prarticps26
Module 2: Data Access Creating Tables to Access Data
Select the dBASE file
1. Select File > New > Table to start the Data Definition Wizard.
2. Click Next.
By default, the Data Definition Wizard selects Disk as the datasource.
3. Click Next.
4. In the Select File to Define dialog box, select Arec .dbf andclick Open.
The Data Definition Wizard correctly identifies the characterset as ASCII.
5. Click Next.
The Data Definition Wizard correctly identifies the file as adBASE-compatible file.
6. Click Next.
The Data Definition Wizard shows you a summary of thetable's record and field properties.
Name and save the table
1. Click Finish.
2. Name the table Arec and click OK.
The Data Definition Wizard creates the table and displays thedefault view.
-L. rrn Arec
Fker. Inde;c
•?4
' REQQ13,1111E.LUED—It14.........AWtiff.... ___IIVE._.„_• 7.13.E1_ 1 795401 !Oa/20/199C 09/19/1995 . ! 205 ...■:795401 1 0115/1995 11/14/1995
3.795401'02104n . / ..
03106/1996 207
I
—4 516372 ': 02/1711997 03/18/19975 ' 516372 , 04/30/1997 03/180997 . -,:i.2222211011.22611 —6 ' 518008 ' 05/210 997 00016722010/1109097
,7
713
:784647 105121/1997', 518008 J 06/10/1997' 21207/10/1997
9 ' 501657 , 06/3011997 0700/1997 1212222006 ' 07/17/1997 01/01/1998 -: 436230575 : 07128/199708/27/1997 , 213
12 . ,,,, 516372 I. 08410/1997 09/09/199713 09/09/1997 . ,:.! 22 1.1 3314,.. 1,5511 86337722, ! 008/8/010/0111 999977 0910911997
' 22 17 33516372 !08/10/1997 : 09/09/199716 09/0911997 ;213
551166337722 1:108/8/11 00;119999770 0911997 ' 13
fig. 2-21 Table in default view
ID The first field in a dBASE file is record_deleted. If anyrecord has an "*" in this field it means that the record hasbeen marked for deletion in the source file. ACL does notautomatically remove or ignore records that have beenmarked for deletion.To check for the occurrence of records marked for deletion,use the filter: record_deleted = "*"
ACLI SER TI FI ED 27

Module 2: Data Access
Creating Tables to Access Data
Creating Tables from Report Files
The Data Definition Wizard can import data from report files.Often referred to as print image or print spool files, these areelectronic copies of printed reports.
Report files often contain multiple record types, sometimesspanning more than one line. The most common record types aredetail and header records, although some report files also includefooter records. Each record type may contain information youwant included in the table you create. If so, you may have toidentify these record types for the Data Definition Wizard.
Import and copy, manual layout
Information required to build the table layout is in supplementarydocumentation. Use that documentation to help ACL build thetable layout. Data sources in this category include delimited andreport files.
To access data using this method:
1. Locate the data source.
2. Provide table layout information or, when ACL can determinethe table layout, you are given the opportunity to confirm it.
• ACL copies the data to an ACL data file.
• ACL creates a table containing the data from the ACL file.
Manual layout I
Data source
Copy of data source Table layout
Views
fig. 2-22 Import and copy, manual layout
The following procedure uses the Import and copy, manual layoutmethod to access data from a report file named Report.txt. Thisfile contains only detail and header records.
In the following exercise, you will use the Data Definition Wizardto create a table from a report file. To do this, you will complete thefollowing main tasks:
• Select platform
• Identify detail information
• Identify header information
• Name the fields and select data types
• Name and save the table
28 Foundations of ACL: Concepts and Practices
flatsFlint 5 edam a field by el:eking and /gauging. A held may span mole than one line.
8.40"v■assLa " 0101
01/08/01 Inventory Valuation Report Pege 109:44:42 Aa AL Decesber 31, 2000
Quantity Unit Total CastCost
Product Class: 01 - Housewares
' :010102710.ALU0INUA TEAPOT 8 CUP 144010102840 .PRES5ORE COOKER NOT 400010119040 BLANCHER 190010134420'VEGETABLE STEAMER 50
:-..010135060'192 02 DUTCH OVEN 230
5.99 862.5639.40 15760.00 ..5.00 1520.00.3.12 156.00: e.
27.60 6340.00..."
DetailDetailDetailDecellDetail
ign.9g F it; Dail "..7v""" "
Module 2: Data Access Creating Tables to Access Data
To create a table from a report file:
Select platform
1. Select File > New > Table
The Data Definition Wizard starts. By default, the DataDefinition Wizard selects Disk as the data source.
2. Click Next.
3. In Select File to Define, select Report.txt and click Open.
The Data Definition Wizard correctly identifies the characterset as ASCII.
4. Click Next.
The Data Definition Wizard correctly identifies the file as aPrint Image (Report) file.
Identify detail information
I Click Next.
The Print Image File Definition window displays the reportfile.
The Data Definition Wizard attempts to identify detail recordsfrom patterns in the data. If it is unable to do so, you mustidentify the detail records.
fig. 2-23 Data Definition Wizard - Print Image File Definition
In fig. 2-23, the Data Definition Wizard identifies:
▪ Each detail record
▪ The start and end position of each field in the detail rows
N The record length
C) The Data Definition Wizard uses the decimal in the unitcost field to identify detail records.
Each group of detail records is preceded by a header recordcontaining a product class number and a class description.
Identify header information
1. On Print Image File Definition (fig. 2-24), define the first fieldin the header record (product class number) by highlightingthe first instance, 01.
9
•
ACLIUnV IED 29

Data'DefinitiOn Wizard • Riint Image File Definition'
Select a held by ricking and dogging. A liekl may span more than one he.
MINEINIIIMI 01/08/01 Inventory Valuation Report Page 1
09:44:42 As At December 31, 2000
Quantity Unit Total CostMINNIMMO Cost=IN
Product Class: Olt Housewares
.' 010102710 -ALUPII POT 8 CUP 144 5.99 862.56MEM- ...- 010102840 PRESSURE COOKER 135T 400 39.40 15760.00
010119040 BLANCHER 190GETABLE
8.00 1520.00nrAml
01/08/01
HousewaresProduct cla=s:lAvl7
010102710 ALUMINLYPI TEAPOT 8 CUP010102840 PRESSURE COOKER BOT
— —Hilt Select some text hat is always located in or neat the laid. It eel be used to identify at occomences
of the feki
Inventory Valuation Report Page 109:44:42 As At December 31, 2000
Quantity UnitCost
Total Cost
010119040 BLANCHER010134420 VEGETABLE STEAMER
144 5.99 862.56400 39.40 15760.00190 8.00 1520.00
50 3.12 156.00.
Data Definition Wizard - Print Image File Definition— —
Hint Select a feld by ticking and dragging. A field may span mote than one rine
01/08/01 Inventory Valuation Report Page 109: 44: 42 As At December 31, 2000
Quantity Unit Total CostCost
.":Produet C1 ass 1:01. ..;
010102710 ALOBINUM TEAPOT 13 CUP 144 5.99 862.56010102840 PRESSURE COOKER 80T 400 39.40 15760.00010119040 BLANCHER 190 8.00 1520.00
50 56
fig. 2-27 Data Definition Wizard - Print Image File Definition
Aft . -- _
Module 2: Data Access Creating Tables to Access Data
Jig. 2-24 Data Definition Wizard - Print Image File Definition
Specify Record Type (fig. 2-25) correctly shows that theproduct class number is part of a new record type.
fig. 2-25 Specify Record Type dialog box
2. Click OK.
3. In Field Definition, name the new field p r od c I s and click OK.
4. To define the header record type as the data to identify allinstances of a header record in this file, highlight P roductClass:.
30
Data Definition What d - Print image File Definition
fig. 2-26 Data Definition Wizard - Print Image File Definition
5. Click OK.
In fig. 2-26, the header is identified as Headed. The productclass number is also highlighted.
6. Identify other fields in the header record that you want toinclude in the detail records.
7. Highlight the product class description, Ho us ewa r es.
Ensure you select enough of a range to accommodate thelongest product class description in the report.
_01.10t!Selectlkda :
+iriAdentlfylliopenles -
Ili , Define FleldsPlecolds
01 Edlt Fish!. Pnipeitlee.
The Wizaid he identified the field INOPelliCS. Use I/is scteen tolecoloniendabons. Click on the column heading to seed a 6dd
r lgrwe this fieklName Type
ColumnTWoValue Value
Decimal
F
J. fin Report x
precinct proddesc•
Indea
lily
01 01 02 71 0 ALUMINUM TEAPOT 8 CUP 1 44 .........
010102840 ,PRESSURE COOKER 80T 400010119040 'BLANCHER 190 —010134420 VEGETABLE STEAMER SO010135060 192 OZ DUTCH OVEN 230010155150 :STEP-ON CAN •010155160 II SHELF BREADBOX 56010155170 4 PC CANISTER SET 96
10'010207220010226620
'NAPKIN &RELISH HOLDERCAKE DECORATING SET 204 281•
1112 010311600 :PASTA NOODLE MAKER
290114 010551340 DISH DRAINER 41215 010631140 CAKE PAN
Module 2: Data Access Creating Tables to Access Data
8. In Field Definition, name the field cl a ss_d es c and click OK.
9. Click Next.
Name the fields and select data types
1. In Save Data File As, name the file Report and click Save.
2. On Edit Field Properties, click a column heading to select afield and:
a. Enter a name to identify the field in the table layout.
b. Enter a column heading to identify the field in the view.
c. From the Type drop-down list, select the data type andadjust the format if necessary.
3. For all fields you want to define, repeat the previous step.
Bald Definition Wizard - Idit Field Plepoitios •
locodno prorlilesc ty 9°" Blue pocleoodeo
1 1010102710ALUMINUN TEAPOT 8 CUP 144 5.99 662.5631 ouseuece101026409RESSURE C000011 SOT 400 39.40 15760.0031 ousedarea1011904031.ANCHER 190 8.0 , 1523.03 1 ousederes1013442074ECETABLE STEADIER SO 3.12 156.00 1 °uses/are
5 1010135060492 02 DUTCH OVEN 230 27.60 6348.0031 ousedar• 1100.97..
fig. 2-28 Data Definition Wizard - Edit Field Properties
4. Click Next.
The Data Definition Wizard copies the data to an ACL data fileand shows you a summary of table record and field properties.
Name and save the table
1. Click Finish.
2. Name the table Report and click OK.
The Data Definition Wizard creates the table and displays thedefault view.
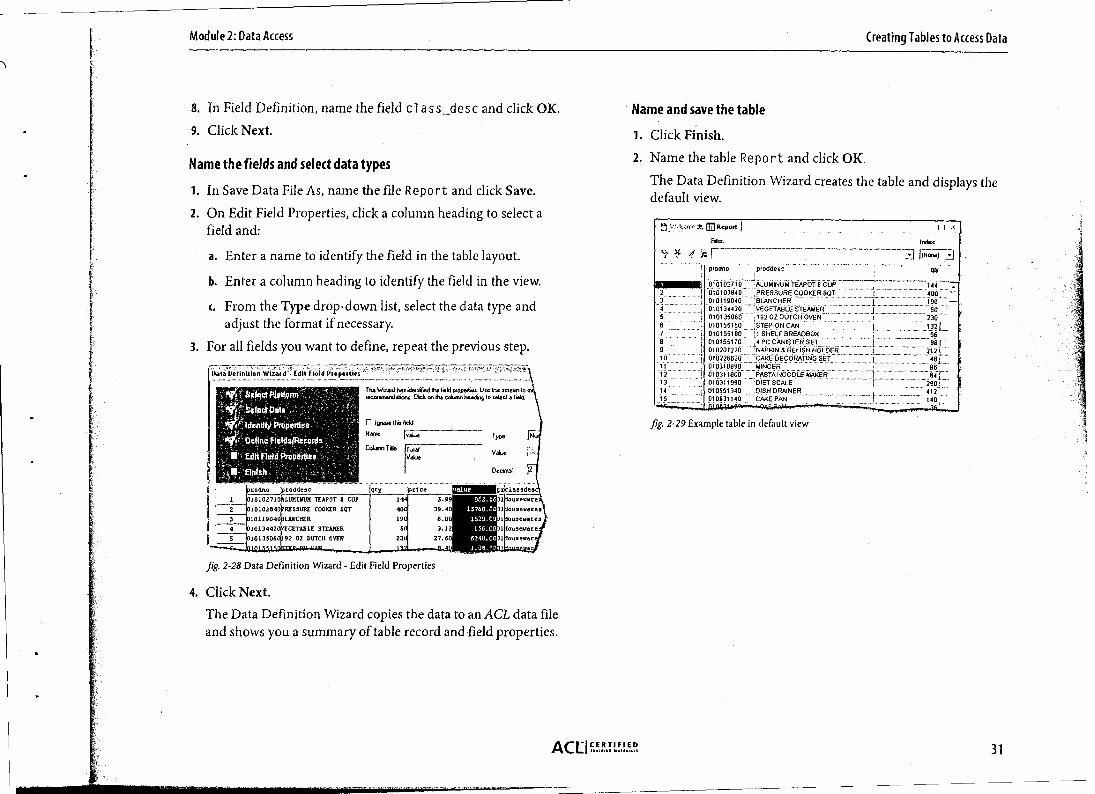
fig. 2-29 Example table in default view
ACEICERTIFIED 31
tefee 011, to Define
Lack ix 1U ACLOD5Fuldarnentds ■ a 113 ctLlAssianmet2b 7 neeleiflart&ijieticiatiiii 1::1 eenetrep.t.
A accessnmomer.II qjCrecitcak_rivertapho. ode dwakFIL
'F: t eamec LoG i:: Cteremtatj ACLQ5TVP.IM A EmPletyeeistelr , ; Advenced.acl gexcel_cosPorne. ft
Advenced.LIX r;Internabonel.ed
:hi Adv.x.e.LoG Z Intenetbnal llaAAssIgnment.AC iv Internabonal.lOG': :;Assogmerk.ACl. a lasonHous.FIL
A AssOrnert.1.1% .a JOIN_FSEG_EVF_20D6.11
1- ' asnentnent.1.06 il, Darchottitel.. ,.:.*.to C.: Rea. , hi
ACUets2.0 : Seles.dbf
gCtronts.11 0,5emple.rmlb
,Codes./1 g Transil
Fie name: finvoiceilumbet_Repon.pcl
Fies of type. IDele
Dt.
My lamentOocurieris
Desktop
My °memo*
My Comm,.
My NetworkPlaces
Cancel I
Module 2: Data Access Creating Tables to Access Data
Creating Tables from Adobe PDF Data
You can create tables for Adobe PDF (Portable Document Format)files. The procedure uses the import and copy, manual layoutmethod to access PDF files.
PDF files can contain images and text that appear in paragraphs,tables, headers, footers, and other areas. ACL extracts text dataonly.
PDF files retain spacing and font information from the originalapplication (for example, MS Word). Extra spaces or inconsistentfonts may cause data to be misaligned during the file definition. Ifpossible, ensure that spaces and fonts in the original file areconsistent before creating PDF files.
ACL is able to read files created with Acrobat 5 and later.
PDF files can be password protected requiring you to enter apassword to open or to edit and print a file. Regardless of the typeof security applied, you are required to enter a password. PDF fileswith Certificate Security (public key encryption) cannot beaccessed by ACL.
This procedure uses the following sample file:Invoice_Number_Report.PDF
To create a table for a PDF data:
1. Select File > New > Table.
The Data Definition Wizard starts. By default, the DataDefinition Wizard selects Disk as the data source.
2. Click Next.
The Select File to Define dialog box appears.
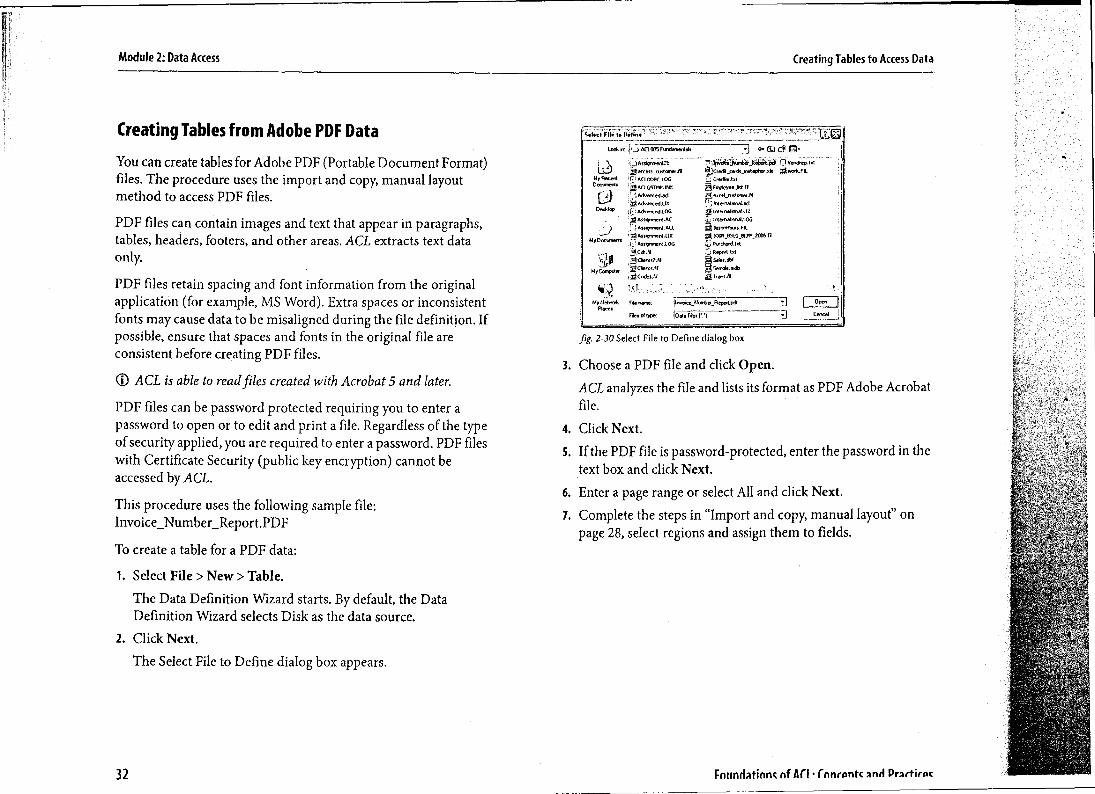
fig. 2-30 Select File to Define dialog box
3. Choose a PDF file and click Open.
ACL analyzes the file and lists its format as PDF Adobe Acrobatfile.
4. Click Next.
5. If the PDF file is password-protected, enter the password in the
text box and click Next.
6. Enter a page range or select All and click Next.
7. Complete the steps in "Import and copy, manual layout" onpage 28, select regions and assign them to fields.
32 Ffflindatinnc of All • innrantc and Prartirnc

Module 2: Data Access Reusing Table Layouts
Reusing Table LayoutsYou can reuse table layouts you created in other ACL projects oragain in the same project. You can copy table layouts, renamethem, and link them to new data sources. You can also importtable layouts from other ACL projects or export table layouts toACL Server Edition.
,0 Reusing table layouts only works when the source data areflat files.
Copying and Renaming Table LayoutsWhen you regularly receive data with the same structure, you cancopy existing table layouts to use with new data. This way, youneed to define files with the same structure only once.
To copy and rename a table layout:
1. In the Overview tab, right-click a table and select Copy.
2. Right-click the destination folder and select Paste.
ACL places the copy in the specified folder. The original tablename is appended with a 2.
3. Right-click the duplicated table layout, select Rename, enter anew name, and click OK.
Linking Table Layouts to New Data Sources1. Right-click a table and select Link to New Source Data.
2. In the Select File dialog box, select the new data source andclick Open.
Your table layout is linked to the new data source.
Importing Table Layouts from Other ACL Projects1. Right-click the project name and select Copy from another
Project > Table.
2. Locate and select the project from which you want to import atable layout and click Open.
3. Double-click the table layout(s) that you want to import andclick OK.
Exporting Table LayoutsYou can export a table layout by creating a format (.fmt) file.
To export a table layout:
1. Right-click a table and select Export a Server File.
2. Select the platform to which you want to export the tablelayout.
3. Name the table layout file and click Save.
ACLI CERTIFIED 33

...
Module 2: Data Access Reusing Table Layouts
Foundations of ACL: Concepts and Practices34

Expressions
This module describes how to use expressions in filters and computedfields. Expressions are lines of code that return values. Using expressions,you can ask questions of the data to analyze and expand on it. Expressionsare especially helpful when data needs to be normalized. This moduleshows you how to create different types of expressions.
Understanding Expressions
Creating Filters
Creating Computed Fields

ExpressionN Output?
NComputed N
Field
UnconditionalSame expression on
every record
ConditionalDifferent expression for i
each condition
Command FiltersCommand Result
Module 3: Expressions Understanding Expressions
Understanding ExpressionsExpressions are sets of operators and values used to perform calculations, specify logical conditions, or create values that do not exist directly inthe data. ACL expressions can be a combination of data fields, operators, constants, functions, and variables.
In fig. 3-1, expressions are divided into Filter and Computed Field. From there, you can choose sub-types.
fig. 3-1 Expression decision tree
0 ACL Help provides more information on expressions. In ACL, select Help > Index and enter "expressions".
36 Foundations of ACL: Concepts and Practices

Module 3: Expressions Creating Filters
Creating FiltersExpressions are used primarily to create filters or computed fields.In ACL, there are four types of expressions: logical, numeric, date,and character. Filters are logical expressions that let you select andwork with particular data types.
Filter Elements
Filters consist of fields, operators, and values.
Fields
Use fields from your table to build filters. The fields are listed in,and selected from, the Expression Builder's Available Fields list.
Operators
Operators are used to combine simple expressions into morecomplex expression.
ACL uses the following operators:
Values
Values contain the data you want to filter. Most data types must beenclosed with a delimiter. Depending on the data types that youare filtering, values must use different delimiters. The list belowshows three data types, their appropriate delimiters, and anexample of how to use them in a filter:
Delimiter Example
Single or double "LATEX"quotes
Reverse quotes '20060930'
none required 25
Filter Examples
In the examples below, each field is followed by an operator and avalue. Each value uses its appropriate field type.
Data Type
Character
Date values
Numeric values
Operator DescriptionField
prod_desc
location
quantity
price_date
Operator Value Data Type
= "LATEX" Character
= "04" Character
> 25 Numeric
<= '20060930' Date
equal to
greater than
less than
greater than or equal to
less than or equal to <_<> not equal to
ACLI CERyTLFIE U,, 37

Module 3: Expressions Creating Filters
Creating Filters
There are two types of filters:
Global Global filters restrict records that can be viewed and analyzed. When set,global filters remain active until removed.
• You can use Quick Filter to quickly create a global filter. To use thisoption: in the view, select one or more values, right-click, selectQuick Filter, and select the type of logical operator to use in your filter.
Command Command filters are applied to individual commands causing them to beexecuted only on the records that meet the filter criteria. When thecommand completes its processing, command filters are no longer active.
Global filters
Only one global filter can be in effect at a time. However, a globalfilter can consist of more than one existing filter and And/Oroperators. ACL applies the conditions defined in the selected filterand displays the name of the global filter in effect on the status bar.
To create a global filter:
1. In the active table, click the 1 (Edit View Filter) button.
2. In the Expression box, enter a logical expression and click OK.
To count the filtered records, run the Count command. ACLdoes not automatically count the records that meet the filtercriteria.
Command filters
A command filter is a condition applied to a command at the timeyou execute the command. You can make commands conditional,(dependant on a true or false condition) by specifying a filter inthe command dialog box.
To create a command filter:
1. Select the command and click the If button.
2. In the Expression box, enter a logical expression and click OK.
3. Click OK to execute the command.
Naming and Saving Filters
When named, filters are saved in the table layout as logicalcomputed fields. As with non-computed fields, you can edit anduse logical computed fields.
You can name and save filters in the table layout for future use orreference.
To name and save a filter:
1. In the Expression box, enter a name in the Save As box.
2. Click OK.
The filter is named and saved.
38 Foundations of ACL: Concepts and Practices

Creating Computed fieldsModule 3: Expressions
Creating Computed FieldsComputed fields are named expressions that calculate results tocreate additional data. Computed fields exists only in the table andare not actually a part of the data source. They are virtual fieldsthat let you perform calculations based on information in the datafile without affecting or changing the original data. You can usecomputed fields like physical fields.
Computed fields can return character, numeric, date, or logicalvalues, and can be conditional or unconditional.
You create computed fields on the Edit Fields/Expressions tab ofthe Table Layout window. When you create a computed field, it isadded to the table layout, but not to the original data file.
ACL does not automatically add new fields to the view. Toadd a field, right-click in the table, select Add Columns, selectthe field(s), and click OK.
There are four main uses for computed fields:
▪ Performing unconditional computations
▪ Converting fields from one data type to another
▪ Making word substitutions
• Creating true/false logical tests (filters)
3. Click the fN button to open the Expression Builder.
4. In the Expression box, enter a numeric expression and clickOK. For example, to calculate the extent to which people areover their credit limits, the expression might be:balance - limit
5. Click the (Accept Entry) button.
ACL uses fixed-point arithmetic to increase processingefficiency. With fixed-point arithmetic, ACL may rounddecimals unexpectedly. For more information,select Help > Index and enter "fixed-point arithmetic".
In "Using Other Data Integrity Tests" on page 56, computed fieldsare used to recalculate numeric fields.
Conversion Computed Fields
During your analysis, you may find fields that you want to use fora certain purpose, but find that those fields are a different datatype than what is required for the command. In ACL, there aremany functions that allow you to convert data from one type toanother.
Unconditional Computed FieldsTo Convert From To Use
Character Numeric VALUE()An unconditional expression is one that is applied to every recordin the file.
Character Date CTOD()
To create an unconditional computed field:Numeric Date CTOP( )
1. Select Edit > Table Layout and click the Eri (Add a NewNumeric Character STRING()
Expression) button. Date Character DATE()
2. In the Name box, enter a name for the computed field.
ACLI ED

Module 3: Expressions Creating Computed Fields
GD For more information, select Help > Index and enter"functions".
To create a conversion computed field:
1. Select Edit > Table Layout and click the Vi (Add a NewExpression) button.
2. In the Name box, enter a name for the computed field.
3. Click the 1 1,4 button to open the Expression Builder.
4. Browse the Functions list for the conversion function youwant to use, double-click, and edit the function parameters inthe Expression box.
For example, to convert an inventory value field defined asnumeric into a character field with a length of 12, yourexpression might be:STRING(value,12)
5. Click OK and click (Accept Entry).
Conditional Computed Fields
ACL populates a conditional computed field based on conditionsand values that you specify. For example, you can create acomputed field that contains:
■ "Vancouver" for location codes 01 and 02
• "New York" for location codes 03 and 04
. "Chicago" for location codes 05 and 06
• "Unknown" for all other location codes
To create a conditional computed field:
1. Select Edit > Table Layout and click . Ti (Add a NewExpression).
2. In the Name box, enter a name for the computed field.
3. In the Default Value box, if none of the conditions are met,enter a value to be used.
For example, enter "Unknown".
4. Click Zo] (Insert a Condition) and enter a condition and avalue.
For example, enter the condition location = "01" OR1 ocati on = "02" and the value "Vancouver".
You can enter as many condition and value pairs as needed.
5. Click (Accept Entry).
GD Multiple condition and value pairs are processed in theorder that they are listed from top to bottom.
Notes:
40 Foundations of ACL: Concepts and Practices

Data Integrity Verification
As a data analyst, it is important that you maintain an attitude ofprofessional skepticism toward the data you receive. To have confidencethat your conclusions are valid, you need to verify your data's integrity.
Understanding Data Integrity
Checking Validity
Confirming Control Totals
Checking for Correct Bounds
Finding Missing Items
Finding Duplicates
Testing for Reliability
Using Other Data Integrity Tests

Module 4: Data Integrity Verification Understanding Data Integrity
Understanding Data IntegrityData integrity means that your table contains:
• All the data and only the data that you requested
■ Calculated fields that deliver correct values
■ Only numeric data in numeric fields
. Only unique records
• Only valid dates
• Data in fields where it is expected
• Field relations that are consistent and logical
If your table does not meet these standards, your analysis could bebased on incorrect premises, possibly rendering your findings andrecommendations invalid. It is necessary, therefore, to build youranalysis upon data that has been verified by the processes outlinedin this module.
Sources of Error
The integrity of your data can be compromised inadvertently (orwith fraudulent intent) at any point in the data's life cycle.
Design
The data source may have undetected flaws in field definitions orexpressions, resulting in unreliable data. For example, an incorrectexpression for interest calculation generates incorrect interestexpense values. Processing problems can also result in missing,duplicate, or invalid data.
Input
A data entry clerk might enter incorrect data, omit items, includeunwanted items, or enter invalid data such as non-existent dates. If
42
the system does not have input validation controls, these errorsremain in the data.
Extraction
When receiving a data request, a programmer or business analystresponsible for extracting data may misinterpret the parameters,resulting in missing or extra records being included. For example,a request for all transactions between January 1, 2002, and January31, 2002, might be interpreted as exclusive of the beginning andend dates instead of inclusive.
Conversion
The character set for data on an IBM mainframe system isEBCDIC, which many software applications cannot read.Programmers often convert data into ASCII, which in the case ofEBCDIC, can create errors in some data types, especially packedfields.
ACL for Windows can read and process EBCDIC, soconversion is unnecessary.
Transmission
The mode of transmission, whether by network or other media,may corrupt the data.
Definition
The table layout created in ACL to accept the data source may notbe correctly defined, resulting in mismatches between fields anddata.
Foundation( of • .....

Module 4: Data Integrity Verification Understanding Data Integrity
Testing Data Integrity
ACL provides many tools for testing data integrity. Tools includefunctions and commands.
To test the integrity of your data:
1. Examine the table layout for validity by checking data types andfield definitions.
2. Check that all requested records are present, there are nounrequested records, and all numeric field totals are correct.
3. Check that data falls within expected bounds.
4. Perform other tests as required using the following:
Test
Tool Ensure
Validity Verify Data types and field definitions match.
Control Totals Count Number of records matches control totals.
Total Numeric field totals match control totals.
Statistics Record and field totals match control totals.
Bounds Values Statistics Data falls within correct bounds.
BETWEEN( ) Data falls within correct bounds.
Classify Data falls within correct bounds.
Missing Items Gaps Values are not missing from sequences.
'SWANK() Fields do not contain inappropriate blanks.
Duplicates Duplicates Tables do not contain duplicate records orinappropriate duplicate values.
Reliability Computed fields Calculations in the data source are correct.
These tests and tools are explained in the sections that follow.
Notes:
AC L .. .... 43

The results shown below are produced by running the Verify command on all thefields in the Badfile table.
Hexadecimal representationof field contents
Record number and field name
As of: 07 ,1712003 1337:03
Command: VERFY FELDS InvoiceNo Prodrro Price OnlerOly ShipOlyTotal ERRORINAT 10 TO SCREENTable: Eledlie
:20 20 20 20 20 20 20 20 42 41 44 52 45 43
Meld field delta encountered in record 2 (lield Tdel) I
:20 20 20 20 20 20 20 20 20 36 20 39 38 41
, hvefd field dale encountered in record 4 (field Price)
20 20 20 20 20 4E 4F 4E 15 i1
Inveid field dale encountered h record 10 (field 5111P31Y)
1 .30 IA 30 32 34 31 37 35 34
l impid field dale encountered in record 17 (field Prodno)
,.1.1 38 30 31 C2 C4 02 30 20
ilnveld field rhea encountered h record 18 (field Porto)
15 date velicRy errors detecledl
Module 4: Data Integrity Verification Checking Validity
Checking ValidityChecking data integrity ensures that tables are valid. Tables arevalid if the data is correct and the field definitions conform to thedata. Checking validity is especially important when working withdata that was defined without the Data Definition Wizard.
Using the Verify Command
The Verify command can identify data source, transmission, anddefinition errors by checking that:
• Character fields contain only valid printable characters (letters,numbers, symbols, and international characters)
• Numeric fields contain only valid numeric characters(numbers, decimals, and currency symbols)
• Date fields contain only valid dates
To find fields with validity errors, include all fields when runningthe Verify command.
To run the Verify command:
1. Select Data > Verify.2. Click Verify Fields, add all the fields to the Selected Fields list,
and click OK.
3. Click OK.
ACL does not verify computed fields—it assumes that thedata in these fields is valid.
fig. 4 -1 Verify command results
For each of the five errors detected, ACL displays two items: the hexadecimalrepresentation of the field contents and the record number and field name wherethe error was found.
What if you find validity errors in your table?
You need to address validity errors before proceeding with youranalysis. If the errors are concentrated in particular fields, theproblem may lie either in the definition of the fields in the ACLtable layout or in the data source. Examine the ACL layout first. Ifthe layout is correct, contact the data provider, as there may beerrors in the data source.
44 Foundations of ACL: Concepts and Practices

Notes:If the errors appear random, the problem may be input ortransmission errors. If a field is critical to your analysis, try to fixthe errors or, if that is not possible, have the data re-sent. In eithercase, notify the data provider.
To check the table layout:
Date fields Ensure that the date format specified in the fielddefinition is correct. If you have data that reads12312002 and you have specified the format asDDMMY YY Y,Aa identifies this as a validity error.Also,check that all dates are valid calendar dates.
Numeric fields Ensure that numeric fields contain only numbers,decimals, and currency symbols.
Character fields Ensure that ASCII and EBCDIC characters are stored inthe field.
You must use the hexadecimal output included in the Verifycommand results to determine the problem. Validity errors arisefrom unprintable characters that are not visible in the data.
What if ACL reports the error limit is exceeded?
In ACL, any command that reports errors has an error limitsetting. ACL processes a table until the error limit is reached. Thedefault value for the error limit is 10. You can change the errorlimit on the More tab in the Verify dialog box.
ACElur.tf, !!!), 45
Module 4: Data Integrity Verification Checking Validity
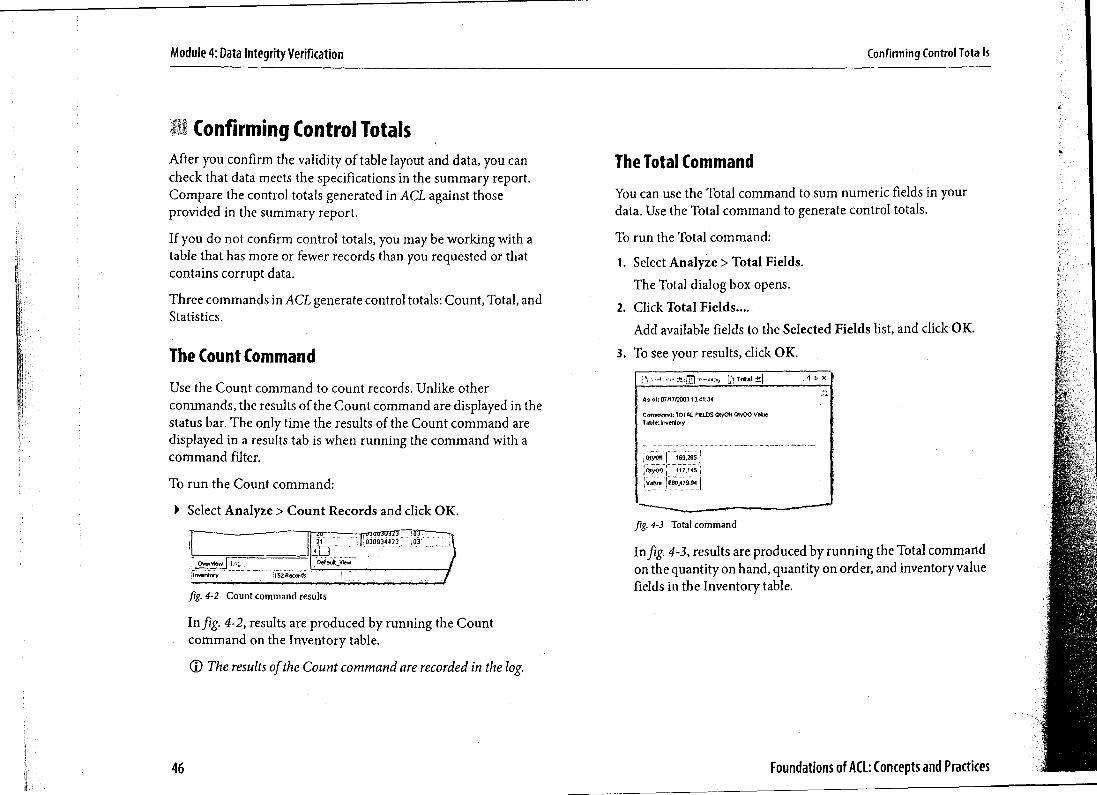
Module 4: Data Integrity Verification Confirming Control Tota Is
Confirming Control TotalsAfter you confirm the validity of table layout and data, you cancheck that data meets the specifications in the summary report.Compare the control totals generated in ACL against thoseprovided in the summary report.
If you do not confirm control totals, you may be working with atable that has more or fewer records than you requested or thatcontains corrupt data.
Three commands in ACL generate control totals: Count, Total, andStatistics.
The Count CommandUse the Count command to count records. Unlike othercommands, the results of the Count command are displayed in thestatus bar. The only time the results of the Count command aredisplayed in a results tab is when running the command with acommand filter.
To run the Count command:
I Select Analyze > Count Records and click OK.
1 ;030934123 103
Overview I . Doi oult_View
fig. 4-2 Count command results
In fig. 4-2, results are produced by running the Countcommand on the Inventory table.
C) The results of the Count command are recorded in the log.
The Total CommandYou can use the Total command to sum numeric fields in yourdata. Use the Total command to generate control totals.
To run the Total command:
1. Select Analyze > Total Fields.
The Total dialog box opens.
2. Click Total Fields....
Add available fields to the Selected Fields list, and click OK.
3. To see your results, click OK.
r) Total
1 TA X
As o1: 07/17721303 13: 41:34
Command: TOTAL FIELDS Oly0H O1y00 ValueTable: Inventory
;01y09 r 169,285 1
;91y00 117,14S ;
;Value 16130,479.94 I
fig. 4 -3 Total command
In fig. 4-3, results are produced by running the Total commandon the quantity on hand, quantity on order, and inventory valuefields in the Inventory table.
46 Foundations of ACL: Concepts and Practices

Stall ds
As on 07117/2003 13 45 07
Command: STATISTICS ON Value TO SCREEN %LUBER 5TabIe: Inventory
Inuennny Value at Cost
'111.1013er Teta: Ave. age
Range 110,967.60
eonlivt 145 !694,361.94 ' 4,768.70
Ilenative 5
2
• .13,
je, os 1 1
Totes. 152 '660,479 94 1476.04:
I Abs Rohde I - 700,24394 !. -
Record count
Numeric control total
fig. 4-4 Statistics command
Notes:•
Module 4: Data Integrity Verification Confirming Control Totals
The Statistics Command
You can use the Statistics command to generate control totals.However, unlike the Total command, the Statistics command alsoworks with date fields.
To run the Statistics command:
1. Select Analyze > Statistical > Statistics.2. Click Statistics On, add the fields to the Selected Fields list for
the fields you want control totals, and click OK.3. Click OK.
What If Control Totals Do Not Match?
When control totals do not match your request or the totals in thesummary report, it usually means the requested data was notextracted properly from the data source.
If you find that you have too many records, use a filter to extractthe required data. If you find you have too few records or that fieldtotals do not match the summary report, contact the data providerand have the source data file re-sent.
In fig. 4-4, results are produced by running the Statisticscommand on the value field in the Inventory table. The Totalsrow contains the values for the record count (in the Numbercolumn) and the numeric control total (in the Total column).
CERTIFIED1•41MING Mot AC LI 47

Module 4: Data Integrity Verification Checking for Correct Bounds
Checking for Correct BoundsHaving confirmed that your table layout is valid and control totalsmatch independent sources, you can check that the upper andlower bounds match your request.
For example:
• In a table with debit transactions only, the lower bound isgreater than or equal to 0.00 and the upper bound is a positivenumber.
• In a table for the calendar year 2002, the lower bound is notearlier than January 1, 2002 and the upper bound is no laterthan December 31, 2002.
You can use the Statistics command and the BETWEEN( )function to test if data meets your expectations.
The Statistics Command
Besides control totals, the Statistics command also generates thebounds values of a field for both numeric and date data types.These values can be checked against known values to ensure thatthe data is correct.
Using the Statistics command to check for numeric bounds
Use the highest value and lowest value in the results to determineif the records in your table are within expected upper and lowerbounds.
To run the Statistics command to check for numeric bounds:
1. Select Analyze > Statistical > Statistics.
2. Click Statistics On, add the numeric or date fields to theSelected Fields list for the fields you want boundsinformation, and click OK.
3. Click OK.
nieheet Lowest
cleatItSe
115 $4$ o 1.515.2e
24.7311,61 OS0.12
i3.176.00 —151.08 . ...................
Text
fig. 9-5 Statistics command results
In fig. 4-5, results are produced by running the Statisticscommand on the value field in the Inventory table.
Use the Statistics command to check that dates fall within bounds
Use the highest value and lowest value in the results to determineif the records in your table are within specified bounds.
To run the Statistics command to check dates fall within bounds:
1. Select Analyze > Statistical > Statistics.
2. From the Statistics On list, select a date field, and click OK.
flighest ■ Lowest
; 122, M. :01013110
,I. 12220 2e0e ,tteilEtt ;
;121•2000 ;91.111.2101,
1 J/10200f
12.1•2o„
Text
fig. 4-6 Statistics command results
In fig. 4-6, results are produced by running the Statisticscommand on the cost date field in the Inventory table.
48 A n . r__ _ n -- -

A IN..)
lit) Inventory I
Index
113E TWEEN(c41d1o, '20000101% 200012311
Product Productlocation :ProductNumber ' Class 1 Description
Defadt _View
07010434707070104397 07 .06 IATEX SEMI-GLOSS CARAMEL --070104177 07 !06 LATEX SEMI-GLOSS LIIAC —070104677 ;07 106 .LATEX SEMI-GLOSS APRICOT
')$
--..0467 ^7
Overview
Invent°. y
4LATFV eo- • • it • ..,
Global Fiber BEIWEEN(cstdte, 2000010 20001
21 ' 030934423 03 04
fig. 4 -7 Between function results
Module 4: Data Integrity Verification Checking for Correct Bounds
The Between( ) Function
An alternative to the Statistics command, the BETWEEN( )function can be used in a global or command filter to isolaterecords where numeric, date, or character data are within specifiedbounds. You can count the number of records in the resulting tableto ensure that you have the data requested.
Use the BETWEEN( ) function to check that dates fall within bounds
1. In the active table, click (Edit View Filter).
2. In the Expression box, enter an expression such as:
BETWEEN(Costdate, '20000101', '20001231')
in which:
▪ The first parameter shows the name of the date field beingexamined.
. The second and third parameters show:
▪ first and last days of the time period requested
• correct format
▪ enclosed in reverse quotes
3. Click OK.
4. Select Analyze > Count Records and click OK.
The number of records falling within the specified boundsappears in the status bar and is recorded in the log.
In fig. 4 -7, results are produced using the BETWEEN( )function and the Count command with the cost date field inthe Inventory table. If the number of records counted matchesthe number of records in your table, all of your records arewithin the specified bounds.
What If Your Records Are Not within SpecifiedBounds?
If you find that your table contains extraneous records, you canusually extract the valid records into a new table using a filter andanalyze the new table. If there are insufficient records, have thedata re-sent.
(i) If you determine that a mistake was made in the preparationof your data, take special care to ensure that no other errorsare present in your table.
ACLI CERTIFIED. ,,,,, boAtilti•O 49
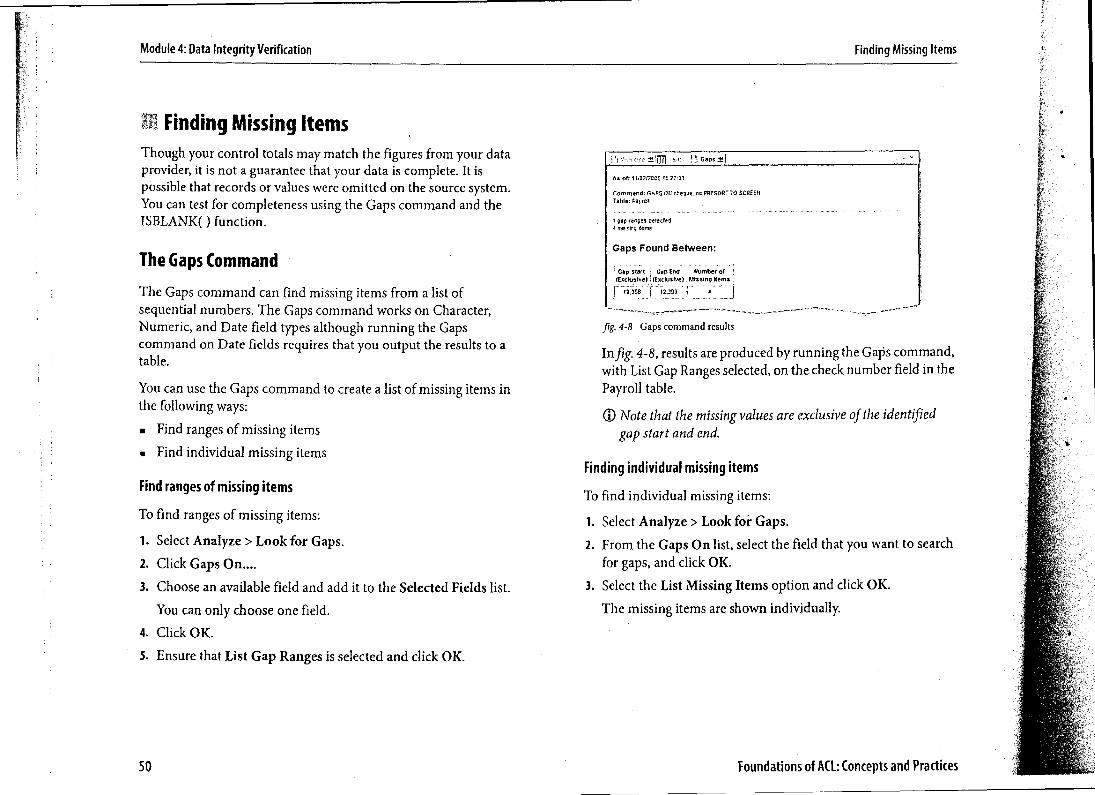
Module 4: Data Integrity Verification Finding Missing Items
Finding Missing ItemsThough your control totals may match the figures from your dataprovider, it is not a guarantee that your data is complete. It ispossible that records or values were omitted on the source system.You can test for completeness using the Gaps command and theISBLANK( ) function.
The Gaps CommandThe Gaps command can find missing items from a list ofsequential numbers. The Gaps command works on Character,Numeric, and Date field types although running the Gapscommand on Date fields requires that you output the results to atable.
You can use the Gaps command to create a list of missing items inthe following ways:
▪ Find ranges of missing items
▪ Find individual missing items
Find ranges of missing items
To find ranges of missing items:
1. Select Analyze > Look for Gaps.
2. Click Gaps On....
3. Choose an available field and add it to the Selected Fields list.
You can only choose one field.
4. Click OK.
5. Ensure that List Gap Ranges is selected and click OK.
As of: 1142.12CTS (1. 22:33
Commend: GAPS Oil chelue_ne PRESORT 70 SCREENPayrell
I gap ranges defectedrr,issi,g ferns
Gaps Found Between:
Gap Part Glop End Number of'(Exclusive) (Exclusive) :P.lissIng ffemS
r 12,258 1 12,393 4
fig. 4 -8 Gaps command results
In fig. 4 -8, results are produced by running the Gaps command,with List Gap Ranges selected, on the check number field in thePayroll table.
0 Note that the missing values are exclusive of the identifiedgap start and end.
Finding individual missing items
To find individual missing items:
1. Select Analyze > Look for Gaps.
2. From the Gaps On list, select the field that you want to searchfor gaps, and click OK.
3. Select the List Missing Items option and click OK.
The missing items are shown individually.
50 Foundations of ACL: Concepts and Practices
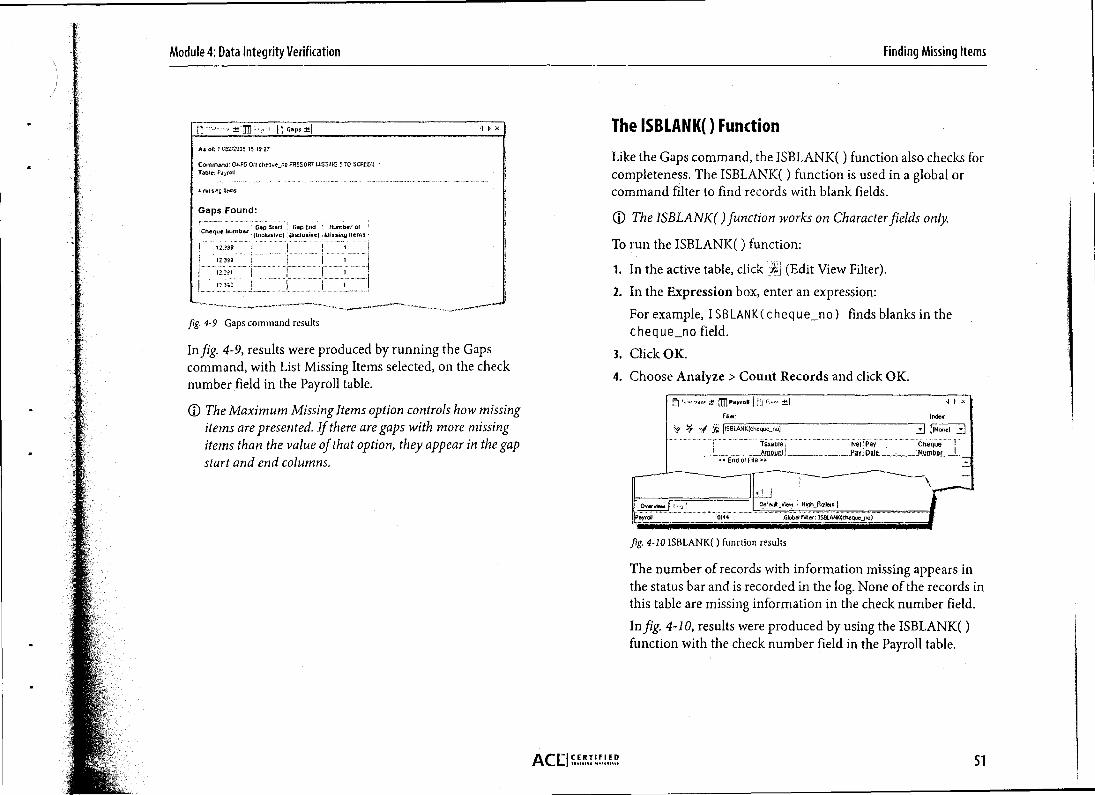
As of: 15 1427
Command: GAPS On clitide_ao PRESORT IJISSEIG S TO SCREEN -Table:
A rasing trims
Gaps Found:
Cheque bomber Gap Siari Gap End ' Humber of '(inclusive) (Inclusive) 6lissinq Items
. . . ............Taxable
aunt j,„ 4.. End of File O>
Nel Pay Cheque 1,Pay_gaig___ 'Number I
r., an Payroll X
Fill. Index:
IISOLANKIcheque_no) l(None)
Default View
0(44 Global Filter: 158LANK(chequeno)
Overview
yrak
Finding Missing ItemsModule 4: Data Integrity Verification
fig. 4-9 Gaps command results
In fig. 4-9, results were produced by running the Gapscommand, with List Missing Items selected, on the checknumber field in the Payroll table.
The Maximum Missing Items option controls how missingitems are presented. If there are gaps with more missingitems than the value of that option, they appear in the gapstart and end columns.
The ISBLANK() Function
Like the Gaps command, the ISBLANK( ) function also checks forcompleteness. The ISBLANK( ) function is used in a global orcommand filter to find records with blank fields.
CD The ISBLANK( ) function works on Character fields only.
To run the ISBLANK( ) function:
1. In the active table, click (Edit View Filter).
2. In the Expression box, enter an expression:
For example, I S B LANK ( c heq u e_no ) finds blanks in thecheque_no field.
3. Click OK.
4. Choose Analyze > Count Records and click OK.
fig. 4-10 ISBLANK( ) function results
The number of records with information missing appears inthe status bar and is recorded in the log. None of the records inthis table are missing information in the check number field.
In fig. 4-10, results were produced by using the ISBLANK( )function with the check number field in the Payroll table.
5 1ACLICENFTIF,t E D.

Module 4: Data Integrity Verification Finding Missing Items
Using filters to detect invalid or blank dates
To identify transactions with an invalid or blank date, apply a filterto the data.
For example: Cos t_D a t e= ' 19000101
Using filters to detect zero value transactions
To identify transactions with numeric data equal to zero, apply afilter to the data.
For example: Am o u n t-0
What If You Find Missing Items in Your Table?
Before proceeding with your analysis, you need to address missingitems that you find.
Results from the Gaps command shows missing items in asequence. Depending on the field, missing records may or may notbe critical to your analysis. For example, you must not have gaps ina series of transaction numbers, but you may have gaps in a seriesof check numbers because of void checks. In either case, send yourfindings to the data provider.
The ISBLANK( ) function finds records where a field is blank.Certain fields in a table are always populated and others are not.For example, in a customer table, the customer number is neverblank, but the second address is often left blank. If you findmissing items in critical fields, contact the data provider beforeproceeding.
Notes:
52 Foundations of ACL: Concepts and Practices
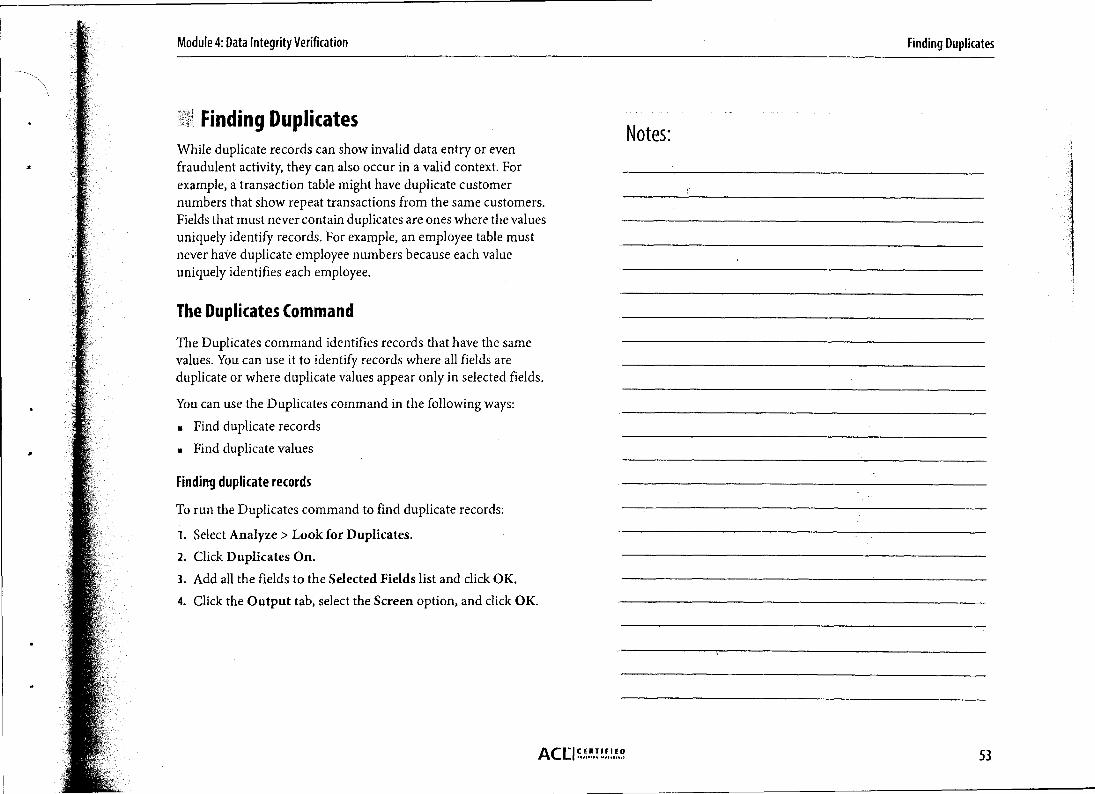
Module 4: Data Integrity Verification Finding Duplicates
Finding DuplicatesWhile duplicate records can show invalid data entry or evenfraudulent activity, they can also occur in a valid context. Forexample, a transaction table might have duplicate customernumbers that show repeat transactions from the same customers.Fields that must never contain duplicates are ones where the valuesuniquely identify records. For example, an employee table mustnever have duplicate employee numbers because each valueuniquely identifies each employee.
The Duplicates Command
The Duplicates command identifies records that have the samevalues. You can use it to identify records where all fields areduplicate or where duplicate values appear only in selected fields.
You can use the Duplicates command in the following ways:
• Find duplicate records
• Find duplicate values
Finding duplicate records
To run the Duplicates command to find duplicate records:
1. Select Analyze > Look for Duplicates.2. Click Duplicates On.3. Add all the fields to the Selected Fields list and click OK.
4. Click the Output tab, select the Screen option, and click OK.
Notes:
ACLIF,!!!.!!!,! .... 53
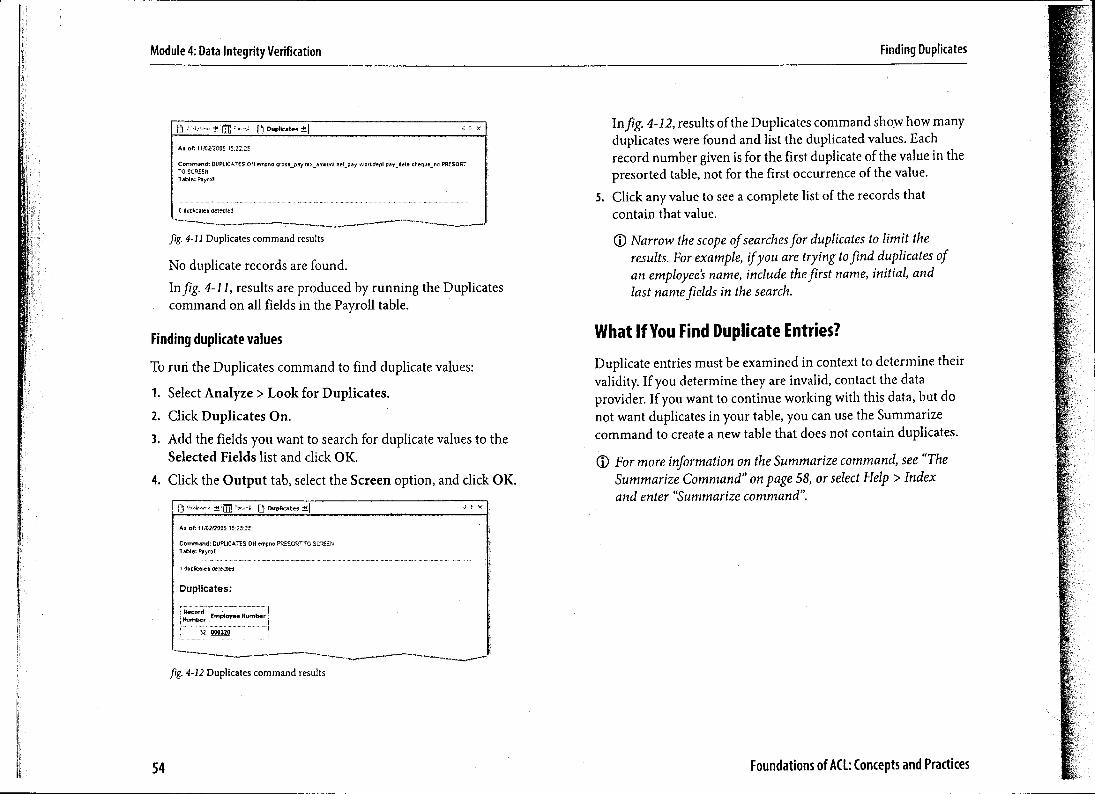
As of: 11 ,5512005 15:25:25
Command: DUPLICATES On empoo FRESCR,70 SCREDITablet Payne
deckales detected
Duplicates:
Module 4: Data Integrity Verification Finding Duplicates
e n Duplicates :I'd
As of: 11 ,0Z:200E IE:42:2E
Command: DUPLICATES ON coigne gross_pay tax_arnounl net _pay das_dale che.que_ne PRE505770 SCRUMTable: Payrot
0 duelcates detected
Jig. 4-11 Duplicates command results
No duplicate records are found.
In fig. 4- 11, results are produced by running the Duplicatescommand on all fields in the Payroll table.
Finding duplicate values
To run the Duplicates command to find duplicate values:
1. Select Analyze > Look for Duplicates.
2. Click Duplicates On.
3. Add the fields you want to search for duplicate values to theSelected Fields list and click OK.
4. Click the Output tab, select the Screen option, and click OK.
fig. 4-12 Duplicates command results
In fig. 4 - 12, results of the Duplicates command show how manyduplicates were found and list the duplicated values. Eachrecord number given is for the first duplicate of the value in thepresorted table, not for the first occurrence of the value.
5. Click any value to see a complete list of the records thatcontain that value.
0 Narrow the scope of searches for duplicates to limit theresults. For example, i f you are trying to find duplicates ofan employee's name, include the first name, initial, andlast name fields in the search.
What If You Find Duplicate Entries?
Duplicate entries must be examined in context to determine theirvalidity. If you determine they are invalid, contact the dataprovider. If you want to continue working with this data, but donot want duplicates in your table, you can use the Summarizecommand to create a new table that does not contain duplicates.
0 For more information on the Summarize command, see "TheSummarize Command" on page 58, or select Help > Indexand enter "Summarize command".
Foundations of ACL: Concepts and Practices54
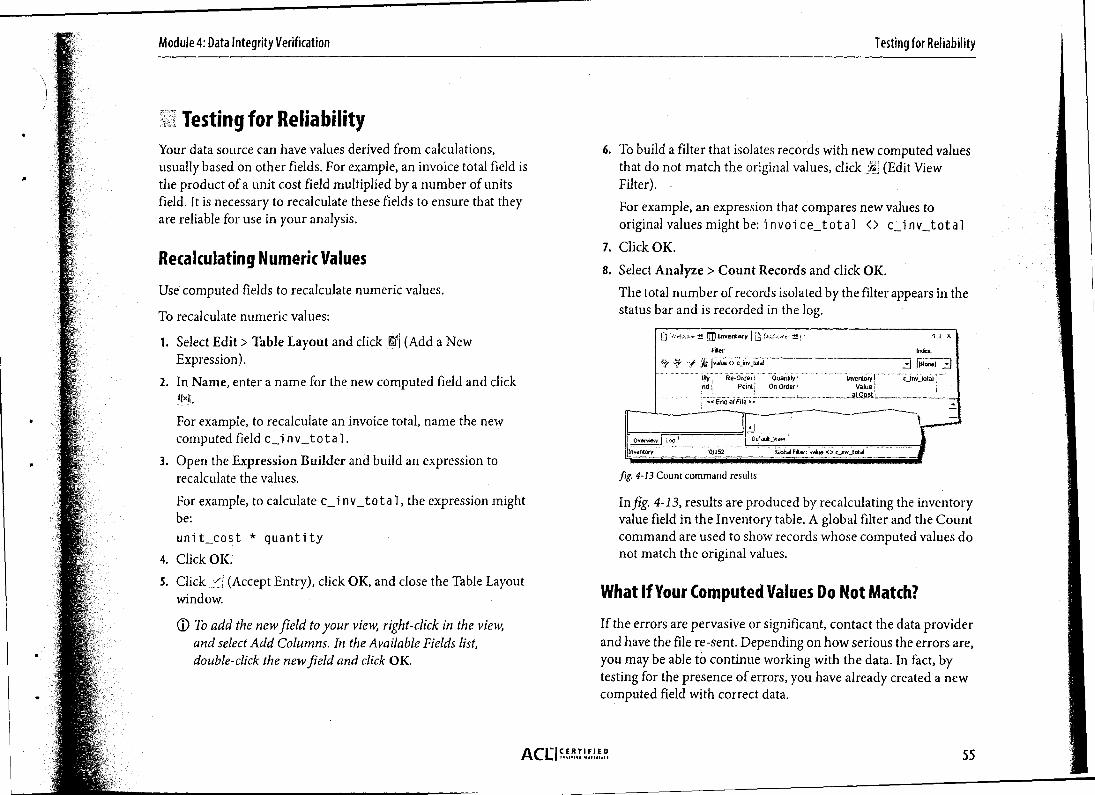
1.1!
Feta:
halos (>
lily Re-Order; Quantitynd ; Point; On Order
, End of File 4>
1 1 A.
Indak
A 11140.0 AInventory( c jny_totat
Valueat Cost
I IOefauk New
'Global Filter: slue .> c_inv_total
Overview
Inventory
0/152
Module 4: Data Integrity Verification Testing for Reliability
Testing for ReliabilityYour data source can have values derived from calculations,usually based on other fields. For example, an invoice total field isthe product of a unit cost field multiplied by a number of unitsfield. It is necessary to recalculate these fields to ensure that theyare reliable for use in your analysis.
Recalculating Numeric Values
Use computed fields to recalculate numeric values.
To recalculate numeric values:
1. Select Edit > Table Layout and click (Add a NewExpression).
2. In Name, enter a name for the new computed field and click
For example, to recalculate an invoice total, name the newcomputed field c_i n v_t ot al.
3. Open the Expression Builder and build an expression torecalculate the values.
For example, to calculate c_i n v_to t a 1, the expression mightbe:
unit_cost * quantity
4. Click OK.
5. Click /1 (Accept Entry), click OK, and close the Table Layoutwindow.
To add the new field to your view, right-click in the view,and select Add Columns. In the Available Fields list,double-click the new field and click OK.
6. To build a filter that isolates records with new computed valuesthat do not match the original values, click ij (Edit ViewFilter).
For example, an expression that compares new values tooriginal values might be: i n voi ce_t ot a I <> c_i n v_t ot al
7. Click OK.
8. Select Analyze > Count Records and click OK.
The total number of records isolated by the filter appears in thestatus bar and is recorded in the log.
fg. 4-13 Count command results
In fig. 4-13, results are produced by recalculating the inventoryvalue field in the Inventory table. A global filter and the Countcommand are used to show records whose computed values donot match the original values.
What If Your Computed Values Do Not Match?
If the errors are pervasive or significant, contact the data providerand have the file re-sent. Depending on how serious the errors are,you may be able to continue working with the data. In fact, bytesting for the presence of errors, you have already created a newcomputed field with correct data.
CERTIFIEDu.I•140ACLI 55
Module 4: Data Integrity Verification Using Other Data Integrity Tests
Using Other Data Integrity TestsThere are many other ways of testing data integrity. For example,you can test for reasonableness and relations. While checking yourdata, you can use different ACL tools to verify data integrity.
Testing Reasonableness
Sometimes common sense assumptions can be made about whatdata must be found in a table. To test these assumptions, you canuse various commands. For example:
• An online retailer makes an average of 47 transactions per day.If you receive a file containing three months of data, you expectto have approximately 4,320 records. You can use the Countcommand to confirm this estimate.
• The same retailer makes more small transactions ($0.00 to$1,000.00) than large transactions (over $1,000.00). You canuse the Stratify command to confirm the distribution oftransaction amounts.
C) For more information on the Stratify command, see "TheStratify Command" on page 61, or select Help > Index andenter "Stratify command".
Testing Relations
Relation testing allows you to confirm that the relation betweenthe data in two fields is consistent. You can use filters to comparetwo fields or you can create computed fields that calculate thedifference between fields.
For example, in a transaction table, the units shipped must neverbe greater than the units ordered. Therefore, subtracting the unitsshipped from the units ordered must never yield a negative result.
Notes:
Foundations of ACL: Concepts and Practices56

Data Analysis
Profiling Data
Isolating Data
Organizing Data
Combining Data
Data analysis is the most important phase in a project. It is the means bywhich you find answers to the questions defined in the planning phase.The bulk of the work on any project is usually spent performing dataanalysis.
The many features in ACL are designed to help you achieve fast, efficient,and thorough analyses. This module describes how to use ACL to achieveyour objectives.

As of: 0511612006 11 25 02
Command:CLASSIFY ON type TO SCREENTable: AR
Traps Type Count Pe, tent of Count
1 1 013%
76.17%
71 r 92%
1 4 1 0.52%
772 1 100%
Module 5: Data Analysis Profiling Data
Profiling DataProfiling data gives you an overview that can help identify trendsand irregularities. The commands described below show you howto retrieve results to a file of any size.
ACL has five commands to help you profile your data:
• Classify
• Summarize
• Cross-tabulate
• Stratify
• Age
The Classify Command
The Classify command creates a profile of your table by groupingunique character field values.
Use the Classify command to:
• Specify the character field upon which you want to base youranalysis
• Specify the fields for which you want subtotals
• Send output to screen, graph, print, or file
To run the Classify command:
1. Select Analyze > Classify.
2. From the Classify On drop-down list, select the characterfield.
3. Click OK.
fig. 5-1 Classify command
In fig. 5-1, results are produced by running the Classify commandon the transaction type field in the AR table.
The Summarize Command
The Summarize command performs the same type of analysis asthe Classify command, but it allows you to select one or morecharacter or date fields for your analysis.
Use the Summarize command to:
• Specify the fields you want to summarize
• Specify the fields you want to subtotal
• Send output to screen, print, or file
To run the Summarize command:
1. Select Analyze > Summarize.
2. Click Summarize On, add the fields you want to summarize tothe Selected Fields list, and click OK.
58 Foundations of ACL: Concepts and Practices

As of:07/22/2003 10.0E07
Command SUMMARLZE ON No SUBTOTAL Amount TO SCREEN PRESORTTable: Ar
,Cust Ilumbof TIM. A01011111 ,l....111 1
1iljin 1 1,115 21 1 2 1
456016 I 00011
!Oaf], i 95,891.01 1 115
-4 -ial ' 1,779.07 ! 1
:illin 634.361 2 !
I . it j 1,301.631 1 i
wzn 68E931 1)
i Lima 12,805 17 18I '
Module 5: Data Analysis
3. Click Subtotal Fields, add the fields for which you want tocreate subtotals to the Selected Fields list, and click OK.
4. Click the Output tab, select the Screen option, and click OK.
Summarize Ail x
fig. 5-2 Summarize command results
In fig. 5 -2, results are produced by running the Summarizecommand on the customer number field in the AR table.
Comparing Classify and Summarize
The Classify and Summarize commands are similar, but they havedifferent options available and differences in the way they areprocessed. The following table compares Classify and Summarize.
Functional Specification Classify Summarize
Calculates and reports the number of times a key Yes Yesfield appears in the table
Computes and displays subtotals on selected Yes Yesnumeric fields
Computes and displays percentages Yes No
Key field can be Character Yes Yes
Key field can be Date No Yes
Number of key fields allowed One One or more
Allows the display of other fields No Yes
Data needs to be sorted on key field prior to running No Yescommand (presort option
available)
Primary location utilized to handle sequence RAM Hard diskprocess, subtotaling of numeric fields, andcompression of details
Can send results to Screen Yes Yes
Can send results to Table Yes Yes
Can send results to Graph Yes No
Profiling Data
AC1 ICERTT,MI 59
0.00 -73.40 , 1,189.11 ; 0110 ,
ONO r 000 1 1,807.66 r .1 7307.66
0 00 lr -60559 1 05.020.57 .844397 ;
000 I 0.00 1 1,779.07 i 0.00
0110 I 631381 0001
0 00 I am I 1,301.93 o.00
000 BOO 1 681.93 r 000
0.00 ; -241 49 ; 14,825 67 -1,779.01 I
A. or 07/22/200310.04.13
Command: CROSSTAB ON No COLUMNS Type SUBTOTAL Amoral TO SCREENTAW Ar
!Amount I Anmont Amount Amount ; AmountCorm lkonbor
Module 5: Data Analysis
Profiling Data
The Cross-Tabulate Command
The Cross-tabulate command lets you analyze character fields bysetting them in rows and columns. By cross-tabulating characterfields, you can do the following:
. Specify a character column to be cross-tabulated with the keyfield. For example, there may be several different transactiontypes associated with each unique customer number.
▪ Specify a character row upon which the analysis of the columnsis based. The row is usually a key field such as customernumber.
Subtotal numeric fields for each intersection of a row andcolumn value. For example, total the numeric values associatedwith the intersection of each unique customer number witheach unique transaction type.
• Send output to screen, graph, print, or file.
To run the Cross-tabulate command:
1. Select Analyze > Cross-tabulate.
2. From the Rows list, select a character field.
3. From the Columns drop-down list, select a character field.
4. Click Subtotal Fields.
The Selected Fields dialog box opens.
5. Add numeric fields to the Selected Fields list by doubleclicking them, or by selecting them in the Available Fields listand clicking the right arrow button.
6. When you have selected the fields you want, click OK.
7. Click the Output tab, select the Screen option, and click OK.
fig. 5-3 Cross-tabulate command results
In fig. 5-3, results are produced by running the Cross-tabulatecommand on the customer number and the invoice type fieldsin the AR table.
Notes:
60 Foundations of ACL: Concepts and Practices

49 DI: 05716(20061231:16
Comm.* STRATFY ON *mount INTERVALS 10 TO SCREENTAW,: AR
lAninun encounlesed ma -1,5629619.5409,6 anew-PRO was 5,549.19
i.ana AnNmuu Coo.. P. 06 Cet. ,P.V.2 of field TIN.. Antow0
1 I 013% -016% .39132 90
, 0.65%'. -2 15% -10,065.71
lel 233% s60% .2167710
190 24,51% -s5% -21,09273
362 4669% , 429% , 201,164 22
For example:
-4000
-3000
-2000
-1000
0
1000
2000
3000
4000
CERTIFIEDAAAAAAAA 61
iviuuule 3: yam Analysis Profiling Data
The Stratify Command
The Stratify command creates a profile of your table by groupingrecords into ranges based on a numeric field. For example, you canuse the Stratify command to identify ranges with an unusuallyhigh number of transactions, such as multiple credit cardtransactions just below a spending authorization limit.
Use the Stratify command to:
• Specify the numeric field that you want to stratify
• Select the minimum and maximum values of the range uponwhich the command is to be executed
• Specify how many intervals you want to divide the data into
• Specify which fields are to have subtotals
• Send output to screen, graph, print, or file
fig. 5-4 Stratify command results
In fig. 5-4, results are produced by running the Stratifycommand on the transaction amount field in the AR table.
Use the Stratify command with custom ranges
To run the Stratify command: Custom ranges can be manually entered in the Stratify commandby selecting the Free option and entering each range. Each value
1, Select Analyze > Statistical > Statistics. must be entered on a separate line, beginning with the smallest2. From the Statistics On list, select the numeric field you want value.
to run the Stratify command on and click OK.
3. Select Analyze > Stratify.
4. From the Stratify On drop-down list, select the field selectedin Step 2.
The values generated by the Statistics command appear in theMinimum and Maximum boxes.
5. Click Subtotal Fields, add the numeric fields for which youwant subtotals to the Selected Fields list, and click OK.
6. Click OK.
ACU I

st•mwv -±'
As of7 05n6500611:35.113
Coninto4wk STRATIFY ON amours FREE -030,-3000.-2000,-1000,01000,2000,3030,40013,5000 70 SCREENTable: AR
Ti... 71411.4“.1 :Com* 'Petcont of Co4. • Peceent of Flokt Tr on. •Amoon4
0.13% -0.76% -3582.98
0.39% -1.36% 1 -6,371.13 ,. ,
16, 207% , -4.69%, .21,974.43 ,
I 141 j 1826%I -5.65% -26.468.32
421 54 53% ; 44.55% 208,898 46
Module 5: Data Analysis Profiling Data
fig. 5-5 Stratify command results
In fig. 5-5, results are produced by running the Stratifycommand with the Free option on the transaction amount fieldin the AR table.
Notes:
62 Foundations of ACL: Concepts and Practices

As of 0712272003 10.0946
(outman& AGE ON Dole CUTOFF 20001231 INTERVAL 0,30,60,901 20,10000 SUBTOTAL Amount TOSCREENTable:
M6 ,nun encountered was 21Maximum encountered was 331
Days •Count Peasant of Count Percent of Field 'To ins AntowO
t -21 212 1 27 46% 6.06% 20,42247 !
240 31 09% ! 36.16% ! 169,527.02 I
!ft,01 179 23 19% I, 27.54% 129133.34
ik.j-11 107
1348.64:
2593% 129153.91I1:120 - 10.000 34 462% ! 21,643 95 •
ITaals 772 100% i 100% ! 991
Module 5: Data Analysis Profiling Data
The Age CommandThe Age command creates a profile of your table by groupingrecords into specified ranges or aging periods. The most commonuse of the Age command is to age accounts receivable data,displaying the records in 0-30, 31-60, and 61 -90 day ranges.
Use the Age command to:
• Specify the date field that you want to age
• Specify a cutoff date or use the current system date
• Specify the aging periods or use the default values
• Specify which fields have subtotals
• Send output to screen, graph, print, or file
To run the Age command:
1. Select Analyze > Age.2. From the Age On drop-down list, select the date field which
you want to age and click OK.
3. In the Cutoff Date drop-down calendar, navigate to the cutoffdate you want.
4. Click Subtotal Fields, add the numeric fields for which youwant subtotals to the Selected Fields list, and click OK.
5. Click OK.
fig. 5-6 Age command results
In fig. 5-6, results are produced by running the Age commandon the invoice date field in the AR table. A cutoff date ofDecember 31, 2000 is used.
S
AC LI mnto 63
Module 5: Data Analysis Isolating Data
Isolating DataWhen you analyze a table, you are likely to encounter data that isirrelevant to your analytic objectives. ACL offers the followingways to isolate data in a table:
▪ Filters
▪ The Extract command
. The Export command
Filters
Global and command filters let you isolate records from a tablewithout physically removing them. However, a filter can beinefficient when it is returning only a few records out of a largetable. To avoid this situation, extract the target records to a newtable using a command filter.
The Extract Command
You can use the Extract command to create a new table from therecords and fields of an existing table. This can significantly reduceprocessing time by reducing the table to just those records andfields of concern. And, because the command automaticallycreates a data file and table layout, you can immediately proceedwith your analysis on the new table.
When using the Extract command, choose from the followingoptions:
Record Creates a table with an identical structure to the table from which you areextracting the data. The new table includes all defined and undefined areasof the input record and computed field definitions.
Fields Creates a table containing selected fields only. If computed fields areincluded in the Fields list, they are first calculated before being extracted tothe new table.They are given one of the following data types:• Logical• Date• ASCII• ACL (a numeric data type)• EBCDIC• PACKED
To run the Extract command:
1. Select Data > Extract Data.
2. Select Record.
Alternatively, you can select Fields and choose the fields fromthe Extract Fields list.
3. Click If and enter an expression to filter records.
4. In the To box, enter a name and click OK.
64 Foundations of ACL: Concepts and Practices
Module 5: Data Analysis Isolating Data
The Export CommandThe Export command allows you to use ACL as a data conversiontool. ACL can export files in formats readable by otherapplications. You can export to the following formats:
• Access
• Clipboard - for pasting into other applications
• dBASE III PLUS
• Delimited text
• Excel
Is Lotus
• Text
• Word merge files
• WordPerfect 4.1 or 6.0 merge files
• XML
To run the Export command:
1. Select Data > Export To Other Application.
The Export dialog box opens. The Export command lets youselect fields or views as the data elements to be processed by theother application
2. Do one of the following:
• With Fields selected, click Export Fields and choose thefields in the order they need to appear in the exported file.
• With View selected, export data based on the fields in theactive view. The exported file has the same fields, in thesame order, as your view.
3. Click If and enter an expression to filter records.
4. From the Export As drop-down list, select the file format towhich you want to export the data.
5. In the To box, enter the file name and click OK.
Notes:
ACL1 CpTIFIED65
Module 5: Data Analysis Organizing Data
Organizing DataIt is often necessary to reorder data, both to clarify the meaning ofthe data and to prepare for the requirements of subsequentcommands.
You can use the following commands to organize data:
. The Sequence command
. The Sort command
• The Index command
• Quick Sort
The Sequence CommandThe Sequence command tests that the selected fields are insequence.
a) The Sequence command does not modify the order of theoriginal table.
To run the Sequence command:
1. Select Analyze > Examine Sequence.
2. Click Sequence On and add the fields you want to sequence tothe Selected Fields list.
3. In the Selected Fields list, click the arrow beside each item toselect ascending or descending order and click OK.
4. Click OK.
The Sort CommandUse the Sort command to create a new table in which records areordered based on specified key fields.
0 To sort a table, ACL requires free disk space at least 2.5 timesthe size of the table being sorted.
To run the Sort command:
1. Select Data > Sort Records.
2. Click Sort On and add the fields you want to sort to theSelected fields list in the order of priority
3. In the Selected Fields list, click the arrow beside each item toselect ascending or descending order and click OK.
4. In the To box, enter a name and click OK.
The Index CommandAn index allows you to work with a table in a specified orderwithout creating a new sorted table. The Index command createsan index file with the extension .inx. An index provides directaccess to the records of a table in a logical rather than a physicalorder.
The status bar shows when the records in a table are indexed. Youactivate and deactivate an index using the Index drop-down list inthe view.
To run the Index command:
1. Select Data > Create Index.
2. Click Index On and add the fields you want to sequence to theSelected fields list in the order of priority.
3. In the Selected Fields list, click the arrow beside each item toselect ascending or descending order and click OK.
4. In the To box, enter a name and click OK.
66 Foundations of ACL: Concepts and Practices

Module 5: Data Analysis Organizing Data
Comparing Sort and Index
The Sort and Index commands are used for similar resultsalthough there are significant differences in how they operate. As aresult, the processing time and storage space required differ.
The following table compares the Sort and Index commandsagainst given requirements:
Requirements Sort Index
Execution speed Slower Faster
Resulting file size Larger Smaller
Required disk space More Less
Subsequent processing of an entire table Much faster Much slower
Subsequent processing searching for a few records Much Slower Much faster
Quick Sort
Another feature for organizing records is Quick Sort. Use thisfeature to temporarily sort a table based on a single field in a viewwithout creating a new sorted table.
To run Quick Sort:
Right-click the column heading and select Quick SortAscending or Quick Sort Descending.
To turn off Quick Sort:
I Right-click the column heading and select Quick Sort Off.
Notes:
AC EI CERTIFIED 67
Module S: Data Analysis Combining Data
Combining DataIn many cases, your analysis requires data from two or moretables. To access and analyze data in different tables as if it were asingle table, you need to combine the tables.
ACL provides the following methods to combine tables:
. The Extract command with the Append option
▪ The Join command
• The Relations command
The method you choose depends on the structure of the tables youwant to combine and the objectives you are trying to achieve.
The Extract Command with the Append Option
When you receive multiple tables that have the same structure andcontain the same type of information, it is often advantageous toextract the data from each original table into a new master table.For example, use this technique to combine transactions frommultiple periods. Notice that the tables you are appending musthave the same structure as the master table.
10 By appending records to a new table, you preserve theintegrity of your original source tables.
To run the Extract command with the Append option:
1. Select Data > Extract Data.
2. If you want to restrict the records you extract, in the If box,enter an expression.
3. In the To box, enter the new table name and click OK.
4. In the Overview tab, double-click the second table from whichyou want to extract records.
5. Select Data > Extract Data.
6. If you want to restrict the records you extract, in the If box,enter an expression.
7. In the To box, enter the same table name to which you sent therecords from the previous table, click OK, and select Append.
Notes:
68

Module 5: Data Analysis Combining Data
The Join CommandThe Join command combines fields from two different tables tocreate a third table consisting of matched or unmatched recordsfrom each table, or a combination of the two. The records writtento the third table are based on the comparison of common "keyfields" in both original tables. The fields contained in the thirdtable can be any combination of fields from the two source tables.
When to use the Join command
The Join command is typically used to match records in atransaction table with those in a master table.
Use the Join command to:
. Compare customer account balances to customer credit limitsto identify if customers have exceeded their credit limit.
. Compare Employee records to a vendor listing to check foremployees who are doubling as vendors.
• Compare Physician billing records to insurance claims toensure that claim amounts are accurate.
Join command rules
The following rules must be followed when running the Joincommand:
• The primary and secondary tables must exist in the same ACLproject.
• Files that are accessed using the ACL Client/Server Systemmust be on the same server and must be accessed using thesame server profile.
. Both tables must share at least one common key field. The fieldnames do not have to be the same, but they must describe thesame data element.
• The key field must be the same data type in both tables.
• The key field must be the same length in both tables. If keyfields are not the same length, use functions to harmonizethem. For example, the SUBSTRING( ) function lets you adjustthe length and content of a character field.
Join command guidelines
When running the Join command using character key fields,follow these guidelines to ensure the best results:
• The key fields must both be in the same case: UPPER, lower, orProper. To harmonize the case, use one of these functions:UPPER( ), LOWER( ), or PROPER( ).
• The key fields must both have the same justification. Toharmonize the justification, use the LTRIM( ) function toremove leading blanks.
C) If you apply a filter when running the Join command, itreferences and restricts records from the primary tableonly.
The Join command requires a primary and a secondary inputtable. A transactional table is typically used as the primary table,and a master table as the secondary table. There are six options forcombining the two tables using the Join command. The first fiveoptions, which are illustrated in the following sections, areexamples of many-to-one joins. The sixth option, a many-to-manyjoin, is taught in advanced ACL courses only.
CI To learn more about many-to-one joins, see "Duplicate keysand Join command results" on page 73.
69AcEICERTIFIED

Output Table
Cheque Pay PerEmpno Amount Period
001 $1850 $1850003 $1000 $2000003 $1000 $2000
Module 5: Data Analysis Combining Data
Payroll Ledger
Employee Records
EmpnoChequeAmount Empno
Pay PerPeriod
001 $1850 001 $1850002 $2200 003 $2000003 $1000 004 $1975003 $1000 005 $2450
Primary Table
Secondary Table
fig. 5 -7 Join command example
In fig. 5 -7, the example shows the following:
• The Payroll Ledger table has a single pay period and includesall payroll disbursements. One employee, 003, was paid twice.Note how duplicate records in the primary table are handled bydifferent join types.
• The Employee Records table is maintained by the humanresources department. Employee records consist of a completelist of valid employees and the amount that they are paid eachperiod. One employee, 002, is missing from the sequence.
In each of the five following join-type examples, the objective is totest for employees who have been paid incorrectly.
Matched primary recordsCreates one output record for every record in the primary tablethat has a match in the secondary table.
fig. 5-8 Matched primary records example
In fig. 5-8, the results of this join show all employees who havebeen paid and who are also listed in the employee records table.Analysis of this table allows you to determine if any validemployees were paid incorrectly.
Unmatched primary records
Creates one output record for every record in the primary tablethat does not have a match in the secondary table.
fig. 5-9 Unmatched primary records
In fig. 5-9, the results of this join show all employees who havebeen paid but who are not listed in the employee records table.This allows you to identify checks issued to invalid employeenumbers.
70 Foundations of AO.: Concepts and Practices

---Output Table
ChequeEmpno Amount
001 $1850002 $2200„,..........003 $1000003 $1000
Pay PerPeriod$1850
$0$2000$2000
Output Table
Cheque Pay PerEmpno Amount Period
001 $1850 $1850002 $2200 $0003 $1000 $2000003 $1000 $2000004 $0 $1975005 $0 $2450
Module 5: Data Analysis
Combining Data
Matched primary records, include all primary records
Creates one output record for every record in the primary tablethat has a match in the secondary table, and one additional recordfor every unmatched record in the primary table.
fig. 5-10 Matched primary records, include all primary records
In fig. 5- 10, the results of this join are the equivalent to thecombined results of the two preceding tests. You can account forall checks issued.
Matched primary records, include all secondary records
Creates one output record for every record in the primary tablethat has a match in the secondary table, and one additional recordfor every unmatched record in the secondary table.
Output Table
Cheque Pay PerEmpno Amount , Period
001 $1850 $1850003 $1000 $2000003 $1000 $2000004 $0 $1975005 $0 $2450
fig. 5-11 Matched primary records, include all secondary records
In fig. 5- 11, this join lets you account for all employees listed in theemployee records table. You can identify valid employees whowere paid incorrectly and those who were not paid at all.
Matched primary records, include all primary and secondary records
Creates one output record for every record in the primary tablethat has a match in the secondary table, and one additional recordfor every unmatched record in the primary and secondary tables.
Jig. 5 - 12 Matched primary records, include all primary and secondary records
In fig. 5 - 12, the results of this join account for all payroll checksissued and all employees in the employee records table. You canidentify incorrect payments (amounts and duplicates), paymentsto invalid employee numbers, and employees who were not paid atall.
Many-to -many matched records
Creates one output record for every match between records in theprimary and secondary tables.
Many-to-many is the sixth and most complex type of join. It isused in a limited number of scenarios. Use this option cautiouslybecause it is capable of producing a table that is much larger than
I.111.11 E DACL 71
Module 5: Data Analysis Combining Data
the combined size of both original tables. This type of join istaught in advanced ACL courses only.
How to join tables
Plan the join
1. Determine the objective: what results are you looking for?
2. Identify the two tables to be joined.
3. Identify the key field(s) common to both tables.
4. Examine the key field(s) in both tables to ensure that they:
• Are the same data type
• Are the same length
• Have the same case and justification
5. Identify and select the table to be the primary table. Usuallythe primary table has data that is supplemented with data fromthe secondary table.
6. When you have selected your primary and secondary tables,determine the type of join to use. Which type you choose maydepend on which table you have selected as the primary.
Test and prepare the table
1. Test the key fields in the tables for duplicates. If you encounterduplicates, you might consider removing them with theClassify or Summarize commands.
C) For more information, see "Duplicate keys and Joincommand results" on page 73.
2. Test the key fields in both tables for blanks. If blanks exist inboth tables, they are matched together, but they might notrepresent comparable data.
3. Test both tables for sequence on the key fields. If tables are notin sequential order, they must be sorted prior to the Join orsorted during the Join process using the Presort option. If thetables were previously classified or summarized on the samekey fields as used in the join, they are already in sequentialorder based on those fields.
Use the Join command
1. In the Overview tab, double-click the primary table.
2. Select Data > Join Tables.
3. From the Secondary Table drop-down list, select thesecondary table.
4. From the Primary and Secondary Keys lists, select the keyfields.
5. From the Primary and Secondary Fields lists, select the fieldsyou want to include in the final table.
® Primary and secondary key fields are only included in thefinal table if also selected as primary or secondary fields.
6. Select the Presort check box as necessary.
7. In the If box, enter any filter you want applied.
8. Click the More tab, select the type of join you want, and clickthe Main tab
9. In the To box, name the new table.
10.Click OK.
11. Check the log to see information regarding the outcome of thejoin.
ACL resolves duplicate field names by adding a "2" to thename from the secondary table.
72 Foundations of ACL: Concepts and Practices
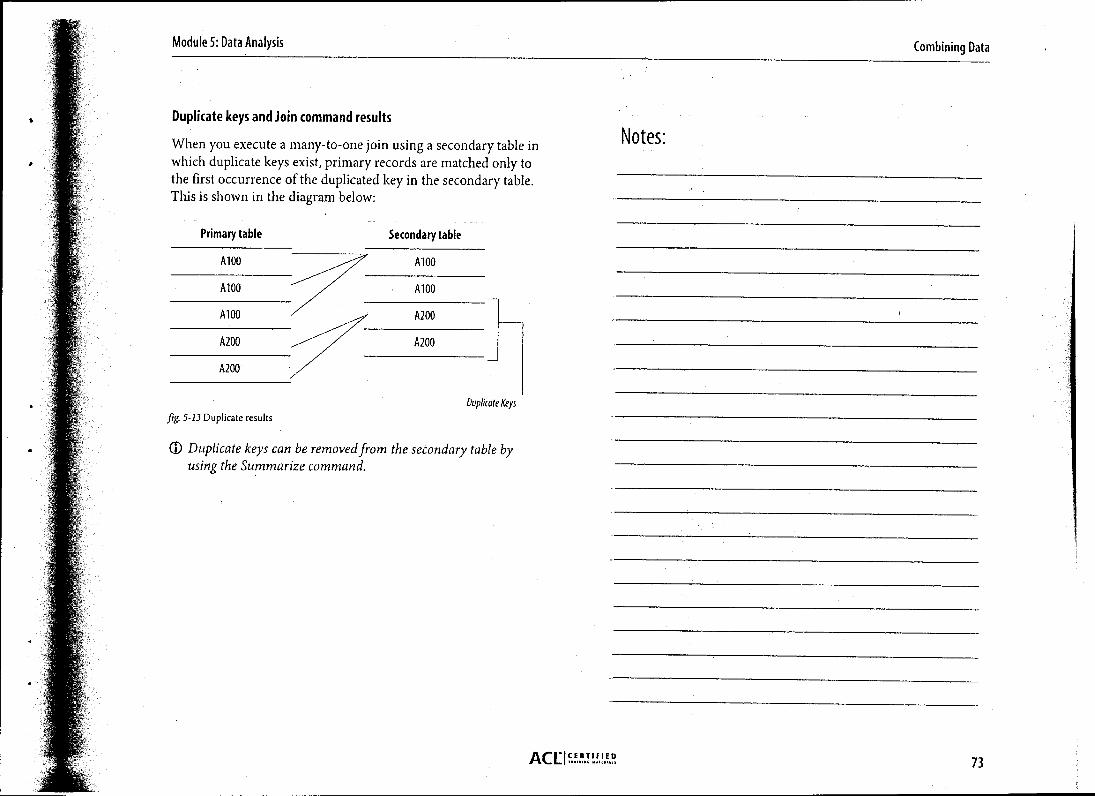
Module 5: Data Analysis Combining Data
Duplicate keys and Join command results
When you execute a many-to-one join using a secondary table inwhich duplicate keys exist, primary records are matched only tothe first occurrence of the duplicated key in the secondary table.This is shown in the diagram below:
Notes:
Primary table
A100
A100
A100
A200
A200
Secondary table
A100
A100
A200
A200
Duplicate Keysfig. 5- 13 Duplicate results
(:) Duplicate keys can be removed from the secondary table byusing the Summarize command.
AC 1: I 73

Module 5: Data Analysis Combining Data
The Relations Command
The Relations command can access data in multiple tablessimultaneously. This lets you recreate the environment of arelational database, even including tables from different systems.
Before you start to use the Relations command, however, it isimportant to have a good understanding of your tables. Theillustration below identifies the common key fields that are thebasis of the relations between the tables.
Customer
customer number
customer name
customer address
city
AR (Parent table)
state
invoice number
invoice date
customer number
contract number Contract Sales
contract number sales rep num
contract date name
contract type address
sales rep num
fig. 5-14 Relations command example
0 The relation between two tables created by the Relationscommand must be based on a single key field in each table.
The Relations command is the logical equivalent to the Joincommand using a Matched Records, All Primary join. However,the results of the Relations command are virtual and do not resultin the creation of a new table. Instead, the fields of the related orchild table(s) become available in the parent table in which therelation was created.
In the Join command, you are able to match data from just twotables: the primary and secondary tables. The Relations commandlets you relate a single parent table (equivalent to the primarytable) to many child tables (equivalent to secondary tables).
There is no limit to how many relations can exist in a parent table.However, when displaying fields in a view, specifying fields in acommand, or when creating computed fields, you can only refer tofields in a maximum of 18 tables.
The logic used to match records in the Relations command issimilar to the many-to-one logic of the Join command. If duplicatekeys exist in the child table, ACL matches the first keyencountered. If no matching key is found in the related table, therelated fields are given blank or zero values in the view of theparent table.
Relations command rules
The following rules must be followed when running the Relationscommand:
• All tables must exist within the same project. You can link andreference up to 18 tables at one time, including the parent table.
• Files that are accessed using the ACL Client/Server Systemmust be on the same server and accessed using the same serverprofile.
Foundations of ACE: Concepts and Practices74

Module 5: Data Analysis Combining Data
▪ All tables must share one common key field. The field namesdo not have to be the same, but they must describe the samedata element.
• The key field must be the same data type in the tables you arerelating.
▪ You must define and store relations within the parent table. Youcan only view relations when the parent table is open.
▪ To delete or modify an existing relation, do so from within theparent table.
. When a relation is defined, the type of the key fields from eithertable cannot be modified.
Relations command guidelines
When running the Relations command using character key fields,follow these guidelines to ensure the best results:
. The key fields must be the same length. If key fields are not thesame length, use functions to harmonize them. For example,the SUBSTRING( ) function allows you to adjust the lengthand content of a character field.
▪ The key fields must both be in the same case: UPPER, lower, orProper. To harmonize the case, use one of these functions:UPPER( ), LOWER( ), or PROPER( ).
▪ Key fields must have the same justification. Use the LTRIM( )function to remove leading blanks from the key fields.
Relating Tables
Before you can relate tables, ensure you do the following:
▪ Plan the relation
▪ Test and prepare the tables
Plan the relation
1. Determine the objective: what results are you looking for?
2. Identify the two tables to be related.
3. Identify the key field that is common to both tables.
4. Examine the key field in both tables to ensure that they:
▪ Are the same data type
▪ Are the same length
▪ Have the same case and justification
5. Determine which table is to be the parent table. Usually theparent table contains data that is complemented with datafrom the child table.
Test and prepare the tables
1. Test the key field in each child table for duplicates. If duplicatekeys are encountered in a child table, only the first key isselected. If the duplicate keys are representative of a larger item,such as transactions composing an account balance, theSummarize command can eliminate the duplicates and totalthe balances.
2. Test the key field in each table for blanks. If blanks exist inboth tables, they are matched together, but they might notrepresent comparable data.
AC L I sERILFun 75

Type) Name)N Amami• Date
Due• C No
C Not• Type
NameAddressCitylandNameNoSales_Rep_NoStateZip
Add Columns
Available Fields
•
Selected fields
NSS J Type_ Tile _i 51No ASCII Cust;Numbernate DATE Invoke;Date
71!Due DATE Due;DateRef ASCII Ref;No Add AllType ASCII Trans; Type
.Amount NUMERIC , Trans;Arnount 3:
E
< I
From TableOK I Cancel I
Module 5: Data Analysis Combining Data
To relate a table:
1. In the Overview tab, double-click the parent table.
2. Select Data > Relate Tables.3. Click Add Table and add the child table to the Relations dialog
box.
4. Click and drag the key field from the parent table to the keyfield in the child table.
5. Click Finish.
fig. 5-15 Relations dialog box
Add related fields to a view
1. Right-click in the parent table and select Add Columns.
2. From the From Table drop-down list, select the child table.
3. Add the field(s) you want in the view to the Selected Fields listand click OK.
fig. 5-16 Add Columns dialog box
0 When related fields are referred to in a parent table, theirnames are prefaced with the name of the table to which theybelong. For this reason, naming conflicts are not possiblewhen using the Relations command.
76 Foundations of ACL: Concepts and Practices
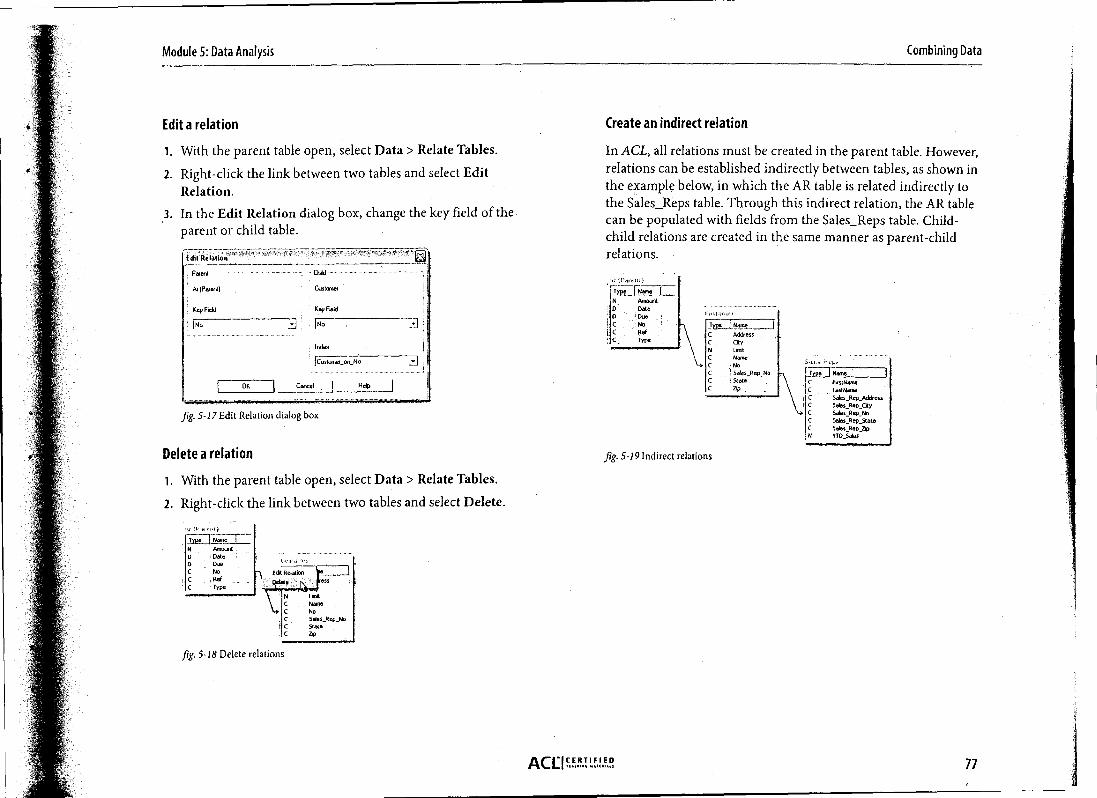
•
N AmountD Date• 'Due
C RefType
J NAddressCityLentNameNoSales_Rep_NoStateZip
Name firstNamelastNameSales Rep Metres
C Sales Rep_CeySaks Rep No
C Sales Rep_StateC Sales Rep_bpN YID Sales
Module 5: Data Analysis Combining Data
Edit a relation
1. With the parent table open, select Data > Relate Tables.
2. Right-click the link between two tables and select EditRelation.
3. In the Edit Relation dialog box, change the key field of theparent or child table.
fig. 5-17 Edit Relation dialog box
Delete a relation
1. With the parent table open, select Data > Relate Tables.
2. Right-click the link between two tables and select Delete.
fig. 5-18 Delete relations
Create an indirect relation
In ACL, all relations must be created in the parent table. However,relations can be established indirectly between tables, as shown inthe example below, in which the AR table is related indirectly tothe Sales_Reps table. Through this indirect relation, the AR tablecan be populated with fields from the Sales_Reps table. Child-child relations are created in the same manner as parent-childrelations.
fig. 5-19 Indirect relations
77

Objective Join Command Relations Command
Use filters after relatingthe tables to identify anddisplay the unmatchedrecords.
List primary records that do not Unmatched Recordshave a match in the secondary optiontable.
Equivalent to JoinMatched Records, AllPrimary. Use filters toidentify unmatcheditems.
Matched Records, AllPrimary option
List primary records that have amatch in the secondary tableplus records found only in theprimary table.
Relations CommandRequirement Join Command
Disk space requiredfor results
The Join command creates athird table containing joinresults. It is possible for thistable to be larger than bothoriginal tables combined.
Minimal disk space is requiredto create an index for the childtable(s).
Time toproduce results
No actual record matching isdone at the time the Relationscommand is executed. For thisreason, it takes considerablyless time than the Joincommand.
The duration of the executionof the Join command can varydepending on the complexityof the join, and whether or notthe primary table is sorted.
The results of the Joincommand are stored in a flattable. Flat files can beprocessed very quickly.
Time toprocess results
Matching of records is done atthe time of commandprocessing and takes longerthan with Join command.
Index is required for childtables (created automaticallyby the Relations command).
Presort or Index Sort or Presort required forsecondary tables (optional forprimary tables).
Limited to one key field pertable.
Number of keyfields
One or more key fields can beselected from each table.
Note: If more than one key isrequired to establish therelation, create a computedfield to concatenate all thefields. Apply this process toboth tables.
List primary records that have amatch in the secondary tableplus records found only ineither the primary or secondarytables.
Matched Records, All No equivalent.Primary and AllSecondary option
Module 5: Data Analysis Combining Data
Comparing Joins and Relations
The Join and Relations commands allow you to work with datafrom more than one table at one time. However, one commandmight be better suited to a task than the other. The table belowsuggests in what situations each might be used and how to usethem.
List primary records that have a Matched Records option After relating the tables,match in the secondary table. use filters to identify and
display the matchedrecords.
List primary records that have a Matched Records, All No equivalent.match in the secondary table Secondary optionplus records found only in thesecondary table.
Technical differences
There are also technical differences between the Join and Relationscommands. The table below outlines these differences.
78 Foundations of AO.: Concepts and Practices
j.

Reporting Results
The presentation of your analysis is important. You require flexiblereporting tools that let you present your results in a variety of ways, informats that are easy to review and understand. You also need tools to helpyou track and document your analysis.
ACL has numerous reporting features that offer you efficiency andversatility in the creation of your reports. This module introduces you tothese features.
Reporting with ACL
Creating a Report from a View
Advanced Reporting
Generating Reports with CrystalReports
Creating Graphs
Using the. Log
Documenting Your Analysis
Module 6: Reporting Results Reporting with ACL
Reporting with ACLWhen you complete your analysis, you must present your findings.You may also need to provide supporting documentation thatdetails the analysis you performed.
ACL has numerous features that let you easily generate what youneed for your reports and supporting documentation.
Views
You can format a view to produce a professional lookingreportthat can be sent to print or exported to other applications. If youwant to enhance and standardize reporting in your organization,you can take advantage of Crystal Reports® integration andgenerate reports using customized Crystal Reports templates.
Graphs
For a visual presentation of your findings, you can generate graphsfrom your results and customize the graphs with a variety offormatting options.
Results tab
You can easily copy and paste results from a results tab to otherapplications. Because the results are already formatted for easierviewing, you do not have to spend time formatting them yourself.If you want to access results from previously run commands, youcan do so from the log.
Logs
You can also use the log as a reporting tool. The log records anddisplays the commands issued, the tables used, and the resultsobtained during your data analysis. You can easily copy or exportlog items to other applications.
Project contents
The Print Project Contents option is a valuable tool for compilingsupporting documentation. It lets you print logs, tables, views,indexes, workspaces, and preferences, all from the same dialogbox.
Record notes
Record notes allow you to attach notes to individual records fromwithin ACL. These notes can be edited, and can be used to storewhatever information you find useful.
Notes:
80 Foundations of ACE.: Concepts and Practices
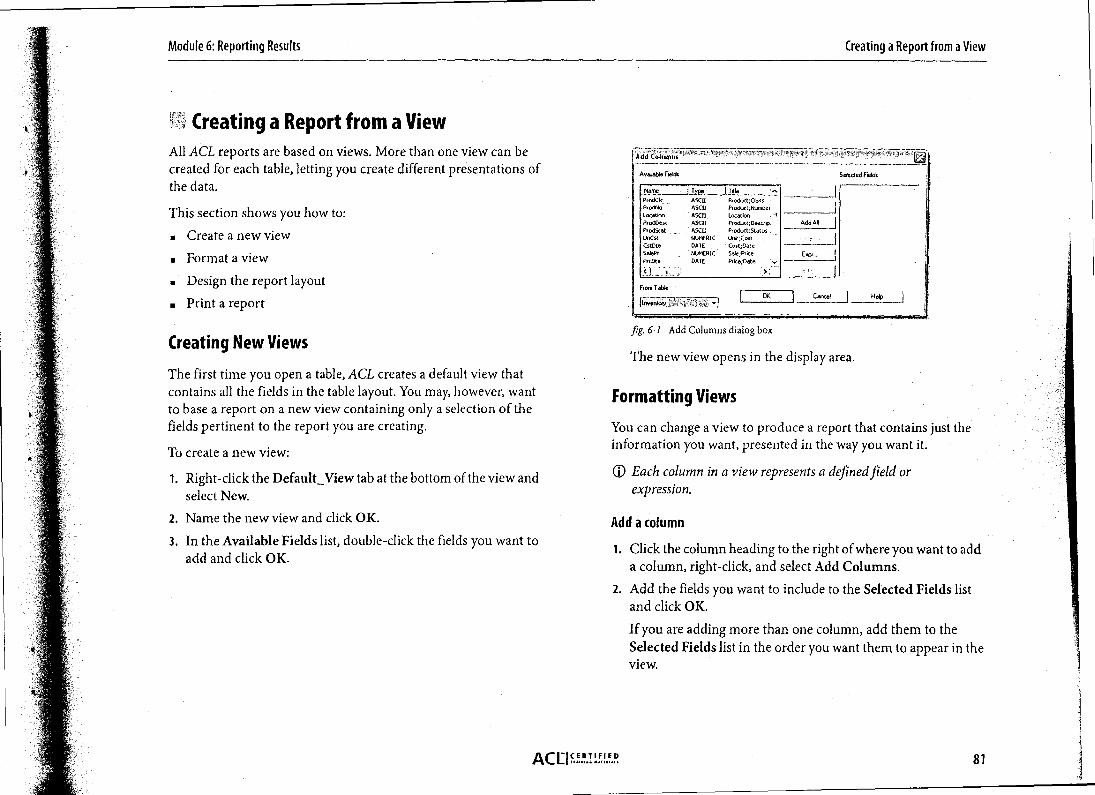
Add Colanus
Available Fields elected Fields Nato° I TT..._...._1.1.1 19— nProdCls ASCII Prodoct;ClassProdNo ASCII Product,Number,Location ASCII LocationProdDtsc ASCII Pr oduct;DescropProdStat ASCII Product;Statos ,UnCst NUMERIC Unit;Cost .CstDte DATE Cost;DateSalePr NUMERIC Sale;ProcePrcDte DATE Prve;Date
< i .
From T able
InveOteeY:...:;OK
Add AM
Eno,.
Cancel'
Module 6: Reporting Results Creating a Report from a View
Creating a Report from a ViewAll ACL reports are based on views. More than one view can becreated for each table, letting you create different presentations ofthe data.
This section shows you how to:
▪ Create a new view
▪ Format a view
▪ Design the report layout
• Print a report
Creating New Views
The first time you open a table, ACL creates a default view thatcontains all the fields in the table layout. You may, however, wantto base a report on a new view containing only a selection of thefields pertinent to the report you are creating.
To create a new view:
1. Right-click the Default_View tab at the bottom of the view andselect New.
2. Name the new view and click OK.
3. In the Available Fields list, double-click the fields you want toadd and click OK.
fig. 6 - 1 Add Columns dialog box
The new view opens in the display area.
Formatting Views
You can change a view to produce a report that contains just theinformation you want, presented in the way you want it.
W Each column in a view represents a defined field orexpression.
Add a column
1. Click the column heading to the right of where you want to adda column, right-click, and select Add Columns.
2. Add the fields you want to include to the Selected Fields listand click OK.
If you are adding more than one column, add them to theSelected Fields list in the order you want them to appear in theview.
AC LI f.anf,f ... 81

options
r 50/1 Key Cokenn
ColumnConlenta. lOnCsl
Alienate Column Tille
Unt1Corl
r Blank if zero
Formal
119.999.999191 rWerth
1 CancelOK
Select View Fonts
Al.
Header..
--_TOles..
Dela I
Torah_ I
Fooler ..
Header
AaBbCC *04Aa 0.55Bb 10.27Cc 100.01
110.83
Footer
°K I Cancel
Module 6: Reporting Results Creating a Report from a View
Delete a column
►Right-click the column heading, select Remove SelectedColumns, and click Remove.
C) Removing a column from a view does not delete the field fromthe table.
Rearrange columns
►Click the column heading and drag it to its new location.
Format columns
►Right-click the column heading and select Modify Column.
fig. 6-2 Modify Column dialog box
The Modify Column dialog box gives you several options forformatting a column. For example, you can change the columnheading, modify the column width, or suppress totals.
Change the font
1. Click the /I1). (Change Font) button.
2. Select the part of the view you want to change, make thechanges, and click OK.
3. Click OK.
fig. 6-3 Select View Fonts dialog box
You cannot change the font for only a single column, columnheading, record, or total. If you change, for example, the fontfor a column heading, you change the font for all columnheadings in the view.
82 Foundations of ACL: Concepts and Practices

Module 6: Reporting Results Creating a Report from a View
Designing Report LayoutsWhen you finish formatting a view, you can use the Report dialogbox to complete the design of your report.
To open the Report dialog box:
Select Data > Report.
fig. 6-4 Report dialog box
The Report dialog box provides the following formatting options:
Header
If you want a header at the top of your printed report, enter text
in the Header box. ACL automatically centers the header on the
report page.
Footer If you want a footer at the bottom of your printed report, enter
text in the Footer box. ACL automatically centers the footer on the
report page.
If
You can enter a filter in the If box to limit the records that appearin the report. Because it is a command filter, the filter affects justthe contents of the report, not the view.
Presort
If you want to ensure that your report is sorted correctly beforeprinting, select this option.
® For more information see "Creating Sorted Reports" onpage 85.
Summarize Select this option to create a report that contains only subtotalsgenerated on the basis of the break fields selected in the view.
Detail line spacing By default, reports are single-spaced. Use the drop-down listprovided to specify two or three spaces between each detail line.
Suppress blank
This option lets you create more compact reports by leaving outdetail lines
blank lines.
Fit to page By default, ACL prints data only to the left of the page widthindicator (vertical dotted line) in the view. Select this option ifyou want data appearing to the right of the page width indicatorto be included when you print your report.
CI Another way to make the data fit the page width is to mod-
ify the view.
Printing ReportsBefore printing your report, you must specify print and outputoptions. You need to also preview the report so that you can makeany necessary adjustments before printing.
Page setup
To specify page orientation, page size, and paper source:
Select Data > Report and click Setup.
ACLIF.u.T.! !!! 83
Module 6: Reporting Results Creating a Report from a View
Page margins
ACL uses default margin settings for all printed views and reports.
To change the default margins:
Select Tools > Options and click the Print tab.
Output
You can send a report to print, to the screen, or to a file.
If you select the File option, the report is sent by default to anASCII text file. Alternatively, you can send the report to an HTMLtext file by selecting the option from the File Type drop-down list.This lets you prepare your ACL report to be distributed orpublished via the Internet.
To select an output option:
In the Report dialog box, select the Output tab.
Print preview
Before printing, you can preview a report:
In the Report dialog box, click Preview.
CI Print preview is not available when you select the Screenoutput option.
When you are ready to print:
In the Report dialog box, click OK.
C) By default, ACL includes the report history when you print areport. To change this default setting, selectTools > Options and click the Print tab.
Notes:
84 Foundations of ACL: Concepts and Practices

Page 1Produced with ACL by: ACL Services Ltd.
FroduclNumber
ProductDesnipllun
QuantityOn Hand
UnilCost
Inventor/Value
al Cost
080107610 IT SOFT TOPING 3532.01L 6,000 16 80 100,809.00080102628 RI 61D TUBING - 5.300 7.00 37,114.00090584072 22' SELF-PROPELLED MOOS 147 173.00 25,548-60030307303 MITRE BOX 71' 600 41 23 24.730.00060126008 fir CPVC PLASTIC PIPE 9,600 2.41 23.136 90000509931 OSCILLATING SPRINKLER 3.840 5.84 22.42560052504005 5)16 SHEATHING 5,550 3.94 19.700 0007010472? LATEX SEMI-OLOSS YELLOW 2,420 6.87 16.625 40060717066 ALUMINUM DOOR 188 87 40 16.43120019102840 PRESSURE COOKER 801 400 39.40 15,760.00070104377 LATEX SEMI-GLOSS GREEN 1,870 6.87 I 2.046 00040232194 12 SP AUTO SCROLLER SAW 210 59.60 17,516 00099585322 10" REEL MOWER 88 137 80 12.126 40
- 0102006 SEVI ONCE 11,610 on
Module 6: Reporting Results
Advanced Reporting
Advanced ReportingThis section shows you how to take advantage of advancedreporting features to create sorted reports, reports that containsubtotals, and multiline reports.
Creating Sorted Reports
A sorted report lets you display records in a particular order basedon key fields that you specify.
The following procedure shows you how to create a report sortedby inventory value in descending order. The report appears asfollows:
fig. 6-5 Sorted report example - inventory value descending
To create a sorted report:
1. Click the Inventory Value at Cost column heading, right-click,and select Modify Columns.
2. Select the Sort Key Column check box, select the SortAscending option, and click OK.
fig. 6-6 Modify Column dialog box
3. Select Data > Report, select the Presort check box and clickOK.
W If you specify more than one sort key column, the order of thefields from left to right determines the order in which they aresorted.
AC L I f.f.r, 85

Page 4Produced with ACL by ACL Services Ltd.
Location Product Product Quantity InventoryNumber Description On Hand Value
al Cost
05 052484425 PLYWOOD 4X8X 314 GIS 314 2,235 6805 052484435 PLYWOOD 1X8X 1/4 REJECT 118 339.8405 052504005 5/16 SHEATHING 5,000 19,700.00
05 89,466 42,479.36
06 070101317 LATEX SEMI-GLOSS ORANGE 870 5,976.9006 070104397 LATEX SEMI-GLOSS CARAMEL 460 3,160.2006 070104177 LATEX SEMI-GLOSS ULAC 1,480 (10,167.60)06 070104677 LATEX SEMI- GLOSS APRICOT 1,290 8,862.3006 070104657 LATEX SEMI-GLOSS PINK 1,500 10,305.0006 070101327 LATEX SEMI-GLOSS YELLOW 2,420 16,625.4006 070104377 LATEX SEMI-GLOSS GREEN 1,870 12,846.90
06 9,890 47,609.10
Module 6: Reporting Results Advanced Reporting
Creating Reports That Contain Subtotals
If you format a column as a break column, ACL creates a subtotalline for all numeric columns in a report each time the value in thebreak column changes. Any sort key column containing characterdata can be formatted as a break column. The column, however,must first be moved to the left-most position in the view.
When you select the Break Column option, you are given twofurther options:
Page Break Select this option to insert a page break each time the fieldvalue in a break column changes.
Suppress Duplicates Select this option to suppress the printing of duplicate keyfields.
The following procedure shows you how to specify the Locationcolumn as a break column to produce a report with subtotals.
The report appears as follows:
fig. 6-7 Subtotal Columns example
Specify a break column
1. Place the Location column to the left-most position in the view.
2. Drag the break bar to the right side of the Location column.
3. Select Data > Report, select the Presort check box, and click
OK.
C), You can specify more than one column as a break column toproduce a report similar to the results of the Cross-tabulatecommand.
Notes:
86 Foundations of ACL: Concepts and Practices

Page 1Produced with ACL by: ACL Services Ltd
Product Location Product ProductNumber Class Status
010102710 01 01 AALUMINUM TEAPOTS CUP 14402/1012000 5.99 08/3112000
010102840 01 01 APRESSURE COOKER SOT 40011/19/2000 39.40 08/31/2000
12 07.99 062.56
110 064.98 15,760.00
010119040 01 01 A
BLANCHER 190 110 200
08/15/2000 8.00 0811112000 13.99 1,520.00
010134420 01 01 AVEGETABLE STEAMER 50 12 100
08/15/2000 3.12 0813112000 3.99 156.00
010135060 01 01 A192 OZ DUTCH OVEN 230 90 240
11/1912000 27.60 0813112000 39.98 6,348.00
010155150 01 01 ASTEP-ON CAN 132 36 0
0911512000 8.40 08/31/2000 12.99 1,108.80
010155160 01 01 A1 SHELF SREADBOX 56 48 100
06/12/2000 9.93 00/3112000 13.99 556.00-u'..: 8/ an inventory I
Fees
!Product ! Product LocationClass Number
07 —070104347 0607 070104397 ; 0607 '070104177
Indee
filione)
ProductDescription •
LATEX SEMI-GLOSS ORANGE —
LATEX SEMI-GLOSS CARAMELSS LILA
p
Module 6: Reporting Results Advanced Reporting
Creating Multiline Reports
ACL lets you set up multiline views for your report. The followingprocedures show you how to create a multiline inventory report.In this procedure, you:
• To add rows below the column heading and data cell areas,drag downwards.
• To delete rows you added previously, drag upwards. You candelete only blank rows.
. Add or delete rows below existing recordsS an Inventory
IndeK
• Add or delete rows above existing records EIN./1.1:Product Product Location Product
• Move column data to new rows Class !Number 1 Description
; 070104347 06 LATEX SEMTOL-0-6-6• Suppress column headings E111119111112 07 ;070104397 ;06 LATEX SEMI GLOSS CARAMELLATE. SEMI-GLOSS LILAC
The report appears as follows:
fig. 6-8 Break Column example
Add or delete rows below existing records
To add or delete rows below the existing ones, click and drag anyhorizontal line in the record number column as follows:
fig. 6-9 Adding and deleting rows below
0 You cannot add or delete rows separately to heading and datacell areas, but you can suppress the printing of columnheading rows as described later in this section.
Add or delete rows above existing records
To add or delete rows above the existing ones, click and drag thetop line in the record number column as follows:
• Drag downwards to add rows above the column heading anddata cell areas.
• Drag upwards to delete rows you added previously. You candelete only blank rows.
fig. 6-10 Adding and deleting rows above
AC 1:1U.r.T.1. 1.1?, 87
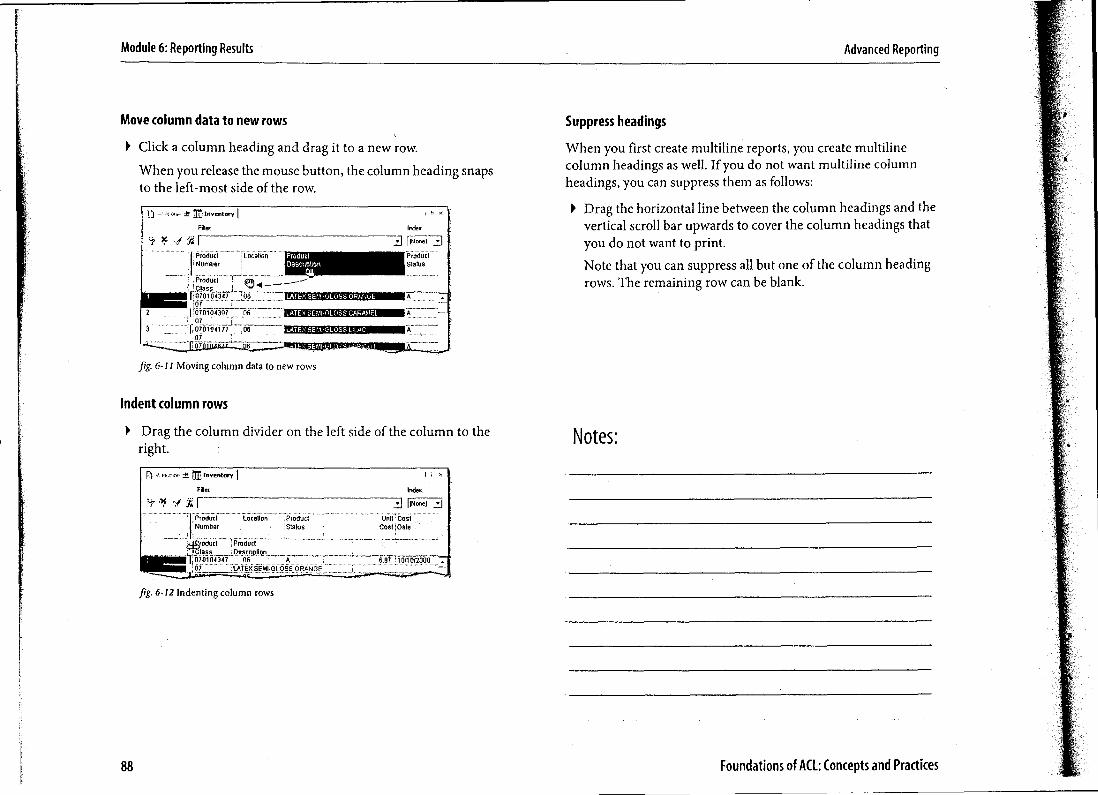
az Inventory
Filer Index
Itsionet—,3I JProduct Location Product ProductNumber ; Oescnottan Status
; Product 4
gabliiiiN LATEX SEMI-GLOSS ORANGE:07
i070101397 ,,06 LATEX SEMIGLOSS CARAMEL A1-J? I
1 PIREGMEEFIEMMI A.:07
S EM I. 1 1
Module 6: Reporting Results Advanced Reporting
Move column data to new rows
I Click a column heading and drag it to a new row.
When you release the mouse button, the column heading snapsto the left-most side of the row.
fig. 6-11 Moving column data to new rows
Indent column rows
I Drag the column divider on the left side of the column to theright.
r, nz Inventory 1
Index:
J j(None)
Product ; Location . Product Unit CostNumber I Status Cost Date
, 5'odor! ;Product
_L-ta se__ pecriplion_ ,,,, . .I",0701013/7 06 ii ' 117 !tan moo . .;07_- :LATEX SEMI-GLOSS ORANGE
fig. 6-12 Indenting column rows
Suppress headings
When you first create multiline reports, you create multilinecolumn headings as well. If you do not want multiline columnheadings, you can suppress them as follows:
I Drag the horizontal line between the column headings and thevertical scroll bar upwards to cover the column headings thatyou do not want to print.
Note that you can suppress all but one of the column headingrows. The remaining row can be blank.
Notes:
88 Foundations of AG: Concepts and Practices
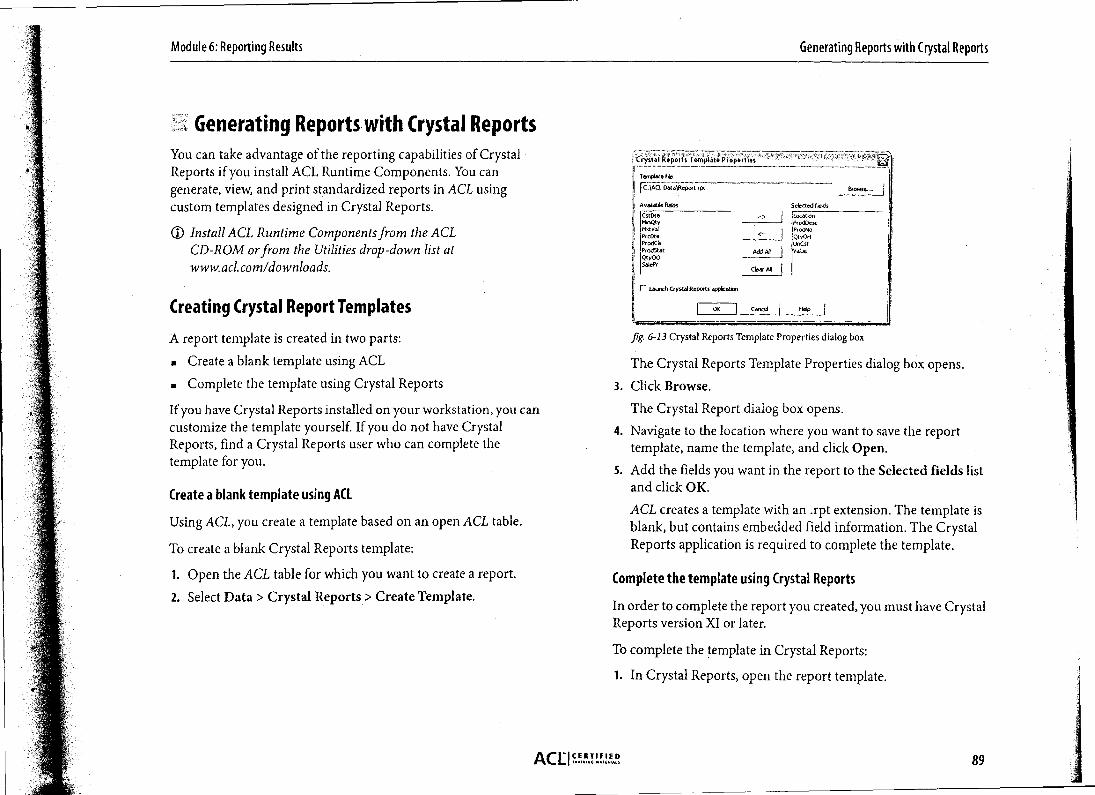
Crystal Reports Template Properties
Template file
Browse. •
Avalabie f ields Selected fields
CstOte --> LocationMinQtyMktYal
ProdDescProcINo
Pr cDte Qty0HProdCls UnCstProdaat Add AT ValueQtrooSalePr
Clear AI I
•r Launch Crystal Reports ePPlketion
°' I Cancel Help I
Module 6: Reporting Results Generating Reports with Crystal Reports
Generating Reports with Crystal ReportsYou can take advantage of the reporting capabilities of CrystalReports if you install ACL Runtime Components. You cangenerate, view, and print standardized reports in ACL usingcustom templates designed in Crystal Reports.
(i) Install ACL Runtime Components from the ACLCD-ROM or from the Utilities drop-down list atwww.ad.com/downloads.
Creating Crystal Report Templates
A report template is created in two parts:
• Create a blank template using ACL
• Complete the template using Crystal Reports
If you have Crystal Reports installed on your workstation, you cancustomize the template yourself. If you do not have CrystalReports, find a Crystal Reports user who can complete thetemplate for you.
Create a blank template using ACL
Using ACL, you create a template based on an open ACL table.
To create a blank Crystal Reports template:
1. Open the ACL table for which you want to create a report.
2. Select Data > Crystal Reports > Create Template.
fig. 6-13 Crystal Reports Template Properties dialog box
The Crystal Reports Template Properties dialog box opens.
3. Click Browse.The Crystal Report dialog box opens.
4. Navigate to the location where you want to save the reporttemplate, name the template, and click Open.
5. Add the fields you want in the report to the Selected fields listand click OK.ACL creates a template with an .rpt extension. The template isblank, but contains embedded field information. The CrystalReports application is required to complete the template.
Complete the template using Crystal Reports
In order to complete the report you created, you must have CrystalReports version XI or later.
To complete the template in Crystal Reports:
1. In Crystal Reports, open the report template.
AC LI ur, 89

Man l Ouiwt I7 .• Flan Remit Template
iC: ACLDNa \ Raw& TA
OK I Cancel I Help
Module 6: Reporting Results Generating Reports with Crystal Reports
2. Insert the fields from the Database Fields list into thetemplate.
3. Format the template.
(DI Use the template only with tables where field names and fieldtypes match those in the template. There can, however, bemore fields in the table than in the template.
Generating Reports Using Custom Templates
When the report template is complete, you can update thetemplate with ACL data.
Update the template
1. Open a table and select Data > Crystal Reports > UpdateTemplate.
fig. 6- 14 Update Crystal Report dialog box
2. Browse to the report template file you want and click OK.
3. Click the Output tab, select an output option, and click OK.
View the report
1. Select Data > Crystal Reports > View Report.
2. Browse to the report file and click Open.
The Crystal Reports viewer lets you view and print reports. Youcan also save reports to other file formats, including PDF.
T If you send your results to screen after updating a template,the report automatically opens in the Crystal Reports viewer.
Notes:
Foundations of ACE: Concepts and Practices01.
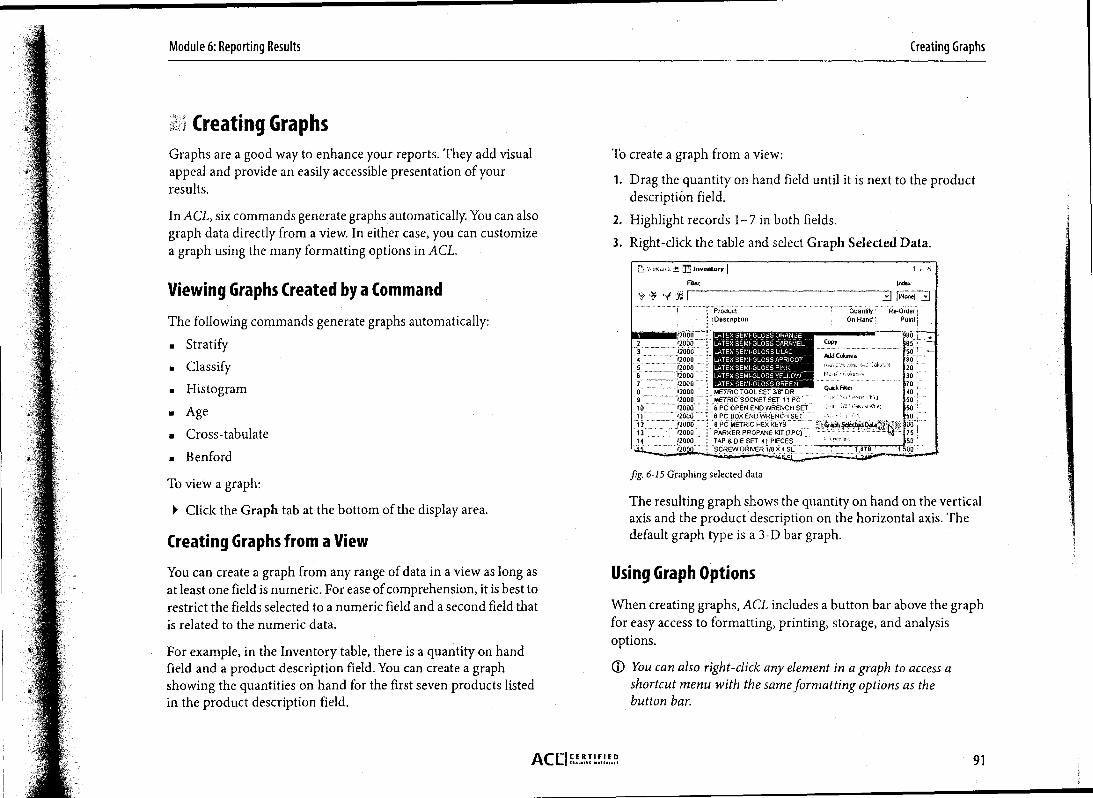
Module 6: Reporting Results Creating Graphs
Creating GraphsGraphs are a good way to enhance your reports. They add visualappeal and provide an easily accessible presentation of yourresults.
In ACL, six commands generate graphs automatically. You can alsograph data directly from a view. In either case, you can customizea graph using the many formatting options in ACL.
To create a graph from a view:
1. Drag the quantity on hand field until it is next to the productdescription field.
2. Highlight records 1-7 in both fields.
3. Right-click the table and select Graph Selected Data.
Viewing Graphs Created by a Command
The following commands generate graphs automatically:
ir an Inventory
Fier Index
r
2000
•ProductDescription
LATEX SEMI-GLOSS ORANGE
QuantityOn Hand I
•/
Re-Order
11NoneI
Point;
. Stratify 2 /2000 LATEX SEMI-GLOSS CARAMEL Copy 85 ;
• Classify345
/200020002000
LATEX SEMI-GLOSS LILACLATEX SEMI-GLOSS APRICOTLATEX SEMI-GLOSS PINK
Add Cokanns—50
206 2000 LATEX SEMI-GLOSS YELLOW 30 :-
• Histogram 70
2000 LATEX SEMI-GLOSS GREENMETRIC TOOL SET 318" DR QuKkFillor 70
9 2000 METRIC SOCKET SET 1 t PC 50 ,
• Age 1011
120002000
6 PC OPEN END WRENCH SET6 PC 80X END WRENCH SET
•• • • , •
i•• 5050
12 2000 8 PC METRIC HEX KEYS 6resi)5elected 00 .
• Cross-tabulate 13 2000 PARKER PROPANE KIT (7PC) " • • ' • " " "" • - . - 7514 12000 TAP &DIE SET 41 PIECES 50
. BenfordI 200 SCREW DRIVER 1/8 X 4 SL_ 500
To view a graph:
I Click the Graph tab at the bottom of the display area.
Creating Graphs from a View
You can create a graph from any range of data in a view as long asat least one field is numeric. For ease of comprehension, it is best torestrict the fields selected to a numeric field and a second field thatis related to the numeric data.
For example, in the Inventory table, there is a quantity on handfield and a product description field. You can create a graphshowing the quantities on hand for the first seven products listedin the product description field.
fig. 6-15 Graphing selected data
The resulting graph shows the quantity on hand on the verticalaxis and the product description on the horizontal axis. Thedefault graph type is a 3-D bar graph.
Using Graph Options
When creating graphs, ACL includes a button bar above the graphfor easy access to formatting, printing, storage, and analysisoptions.
You can also right-click any element in a graph to access ashortcut menu with the same formatting options as thebutton bar.
ACLIUV, !1.! !!! 91

Module 6: Reporting Results Creating Graphs
Formatting graphs
The following options let you change the appearance of yourgraphs.
Option Icon Description
Graph Type While the default format is a 3-D bar graph, you canchange the graph to any of the many optionsavailable. Options not suitable for the data uponwhich the graph is based are grayed out.Note: You can separate the sections of a pie graph byright-clicking on a section and selecting Explode Pie.
Incorporating a graph into a report
The following options let you print, save, and copy your graphs.
Option
Icon Description
Print Graph
To print with maximum resolution, make the graphwindow as large as possible before you print.
Save Graph as
A bitmap is a file format that can be imported intoBitmap almost any document.
Copy Graph to
Copy the bitmap image to the clipboard for easy pastingClipboard
into documents.
Legend Properties
Axis Properties
Format Data
Graph Properties
Label Properties
Format the font, background, and frame, and selectHOT- the elements you want displayed in the graph.
Format the attributes and font, and select which dataES-J series is shown in the legend.
Format the style, scale, and font of the vertical axis.
GIG]Format the horizontal axis labels and the appearanceof the data content, and select the fields you wantdisplayed in the graph.
Format the orientation, font, and other attributes oflabels on the graph. A label must be selected for thebutton to be active.Note: To add a label, click where you want the label toappear, right-click, select Add Label, enter the label,and click OK.
Exploring the data in a graph
The following options let you change and examine the data thatunderlies any portion of your graphs.
Option
Icon Description
Edit Command
If the graph was produced automatically by acommand, the Edit Command button opens the dialogbox for that command. You can change the parametersunderlying the graph.
Drill-down
Select any section of a bar, pie, or line graph anddouble-click it to view the records upon which thatsection is based. A filter selecting the relevant recordsis imposed on the data.
Show/Hide Legend Iry Make the legend visible or invisible.
Show/Hide Axis En I Make the vertical axis visible or invisible.
92 Foundations of AU: Concepts and Practices
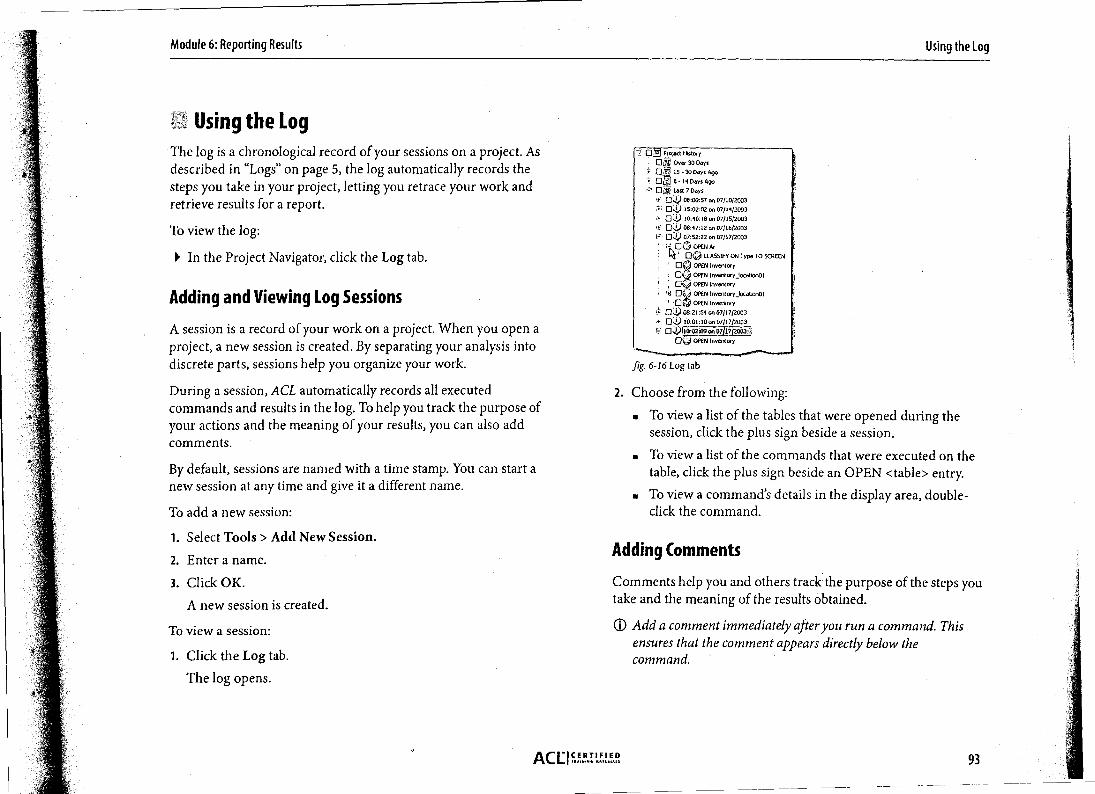
Module 6: Reporting Results
Using the log
Using the LogThe log is a chronological record of your sessions on a project. Asdescribed in "Logs" on page 5, the log automatically records thesteps you take in your project, letting you retrace your work andretrieve results for a report.
To view the log:
In the Project Navigator, click the Log tab.
Adding and Viewing Log Sessions
A session is a record of your work on a project. When you open aproject, a new session is created. By separating your analysis intodiscrete parts, sessions help you organize your work.
During a session, ACL automatically records all executedcommands and results in the log. To help you track the purpose ofyour actions and the meaning of your results, you can also addcomments.
By default, sessions are named with a time stamp. You can start anew session at any time and give it a different name.
To add a new session:
1. Select Tools > Add New Session.
2. Enter a name.
3. Click OK.
A new session is created.
To view a session:
1. Click the Log tab.
The log opens.
DM Project listoryOt Over 30 Daysag, 15 - 30 Days Apo
it 0!Py e - PI Days Ago13;:t Last 7 Days
'Y 0:4) 08:00:57 on 07110/2003• 15:02112 on 07/14/2003
• 0.!,,) 10:10:18 on 07/15/2003It" 04) 08:47:12 on 07/16/2003
07:52:22 on 07/17/2003
'[10 OPEN A,
09 CLASSIFY ON Type TO SCREEN09 OPEN Inventory
0) OPEN Inventorylocation01oq OPEN Inventory11:1 OPEN Inventory jocation01
' Du OPEN Inventory0j,) 08:21:54 on 07/17/2003
0J 10:01:10 on 07/17/2003F. 0.9 110:02 09 on mopoiiil
DU OPEN Inventory
fig. 6-16 Log tab
2. Choose from the following:
• To view a list of the tables that were opened during thesession, click the plus sign beside a session.
• To view a list of the commands that were executed on thetable, click the plus sign beside an OPEN <table> entry.
• To view a command's details in the display area, double-click the command.
Adding Comments
Comments help you and others track the purpose of the steps youtake and the meaning of the results obtained.
() Add a comment immediately after you run a command. Thisensures that the comment appears directly below thecommand.
ACLI CERTIFIED...MI. AAAAAAA 93

Module 6: Reporting Results Using the Log
To add a comment:
1. Select Tools > Add Comment.
2. Type your comment.
3. Click OK.
D.) D0:01:10 on 07117/2903
10:02:09 on 07/1712003DO OPEN Inventory
DO CLASSIFY ON Location TO SCREENOU TOTAL FIELDS Value
STATISTICS ON CstCte TO SCREEN NUMBER 5DQ COMMENT Control totals match figures provided by IS.
fig. 6-17 Adding comments
W Double-click a comment to view it in the display area.
Exporting from the Log
You can use the log as a source for your reports. You can exportselected entries'from the log to:
• HTML files
• Log files
• Scripts
• WordPad
• Text files
To export from the log:
1. Click the Log tab.
2. Select the check boxes of the sessions and commands that youwant to export.
3. Right-click in the Project Navigator, select Save SelectedItems, and select a format.
4. Name the file and click Save.
Copying and Pasting Results
You can copy and paste results into Word and Excel, and mostother text and spreadsheet programs. Word and Excel retain theformatting of the content.
Copy and paste results from the log
1. Click the Log tab.
2. Select a command by clicking the box to its left, right-click,and select Copy.
The command can now be pasted into another application.
Copy and paste results from the results tab
1. Click the Log tab.
2. Double-click the command whose results you want to copy.
3. Right-click in the display area and select Select All.
4. Right-click the display area and select Copy.
The command can now be pasted into another application.
10 To select just a portion of the results tab, highlight the portionyou want, right-click, and select Copy.
Searching the Log
In long or complex analyses, particular commands or results maybe difficult to locate. In these situations, you can search the log.
To search the log:
1. Click the Log tab, right-click in the Project Navigator, andselect Find.
2. Enter key words from the content you seek, select theappropriate options, and click Find Next.
94 Foundations of ACL: Concepts and Practices

Module 6: Reporting Results Documenting Your Analysis
Documenting Your AnalysisDocumenting your analysis is an integral part of any project. Inaddition to the log, ACL lets you keep notes within a project, printany part of a project, and view and print the history of a table.
You can create notes for the following items:
• Projects
• Tables
• Views
• Fields
• Records
• Scripts
• Workspaces
Create Project Notes
Each project has its own area for making notes.
To create a project note:
1. In the Overview tab, right-click the project name, and selectProperties.
2. Click the Notes tab, enter a note, and click OK.
To print a project's notes, use the Print Project Contents featuredescribed following.
Print Project Contents
ACL makes it easy to print any aspect of a project, including:
• Table layouts
• View definitions
• Script definitions
• Index definitions
• Workspace definitions
• Program options, notes, and the log
To print project contents:
1. Select File > Print Project Contents.
2. Select the items that you want to print and click Print.
View and Print a Table History
A table history is created when an ACL command creates a newtable.
For example, when you extract selected fields to a new table, ahistory is created for that table. This history lists the Extractcommand, the name of the table the fields were extracted from,control totals, and the date and time the table was created.
To view and print a table history:
1. In the Overview tab, double-click the table whose history youwant to view.
2. Select Tools > Table History.
3. Right-click in the display area and select Print.
ACLI E.1?, 95

As et 07/17/2003104034
Command DISPLAY HISTORY
.07/17/2003 10.43:07Invenlory SET FILTER location - 101"07/17/2003 104107 Inventory EXTRACT RECORD TO "Inventory Joc01" OPENInf.( , Records:152 Coned ToIal,0Output: Records:10 Control To1et0
Select Al
Close
011111
Preit Preview
Module 6: Reporting Results Documenting Your Analysis
fig. 6-18 Printing history
Record Notes
ACL allows you to attach a note to a single record. Use this featurefor documenting specifics about a particular record. You cancreate, edit, view, display, and delete record notes.
Notes are not supported in the Client/Server environmentwhen the table is maintained on a server.
To create a record note:
1. Click the record number of the record you want to add a noteto.
2. Select Edit > Notes > Edit Note.
3. Enter a note and click OK.
The record is marked with a pink dot to show a note isassociated with the record.
To edit or view a record note:
1. Right-click the appropriate record number.
2. Select Edit Note.
3. If required, edit the note and click OK.
To display record notes in a view:
1. Right-click a column heading in the view, and selectAdd Columns.
ACL inserts new column(s) to the left of the highlightedcolumn.
2. In the Available Fields list, double-click the RecordNote fieldand click OK.
0 The RecordNote field is only available if you have alreadycreated at least one record note.
To hide record notes in a view:
1. Right-click the RecordNote column heading and selectRemove Selected Columns.
2. Click Remove.
Record notes are no longer displayed in the view, but they canstill be viewed by selecting Edit Note.
To delete a single record note:
1. Right-click the appropriate record number.
2. Select Edit Note.
3. Select all the content in the note and press Delete.
4. Click OK.
To delete all record notes from a table:
1. Select Edit > Notes > Delete All Notes from Table.
2. Click OK.
0 Use caution when deleting all notes from a table. You areprevented from deleting all notes from a table if theRecordNote column is currently being displayed.
96 Foundations of ACL: Concepts and Practices

Activities
To master ACL it is necessary to practice with ACL. These activities aredesigned to help you learn to use ACL effectively and efficiently.
Fundamentals
Data Access
Data Integrity Verification
Data Analysis
Reporting Results

Activities Fundamentals
Fundamentals
Activity 1.1 Navigating in ACI.
Project: ACL105 Foundations.acl
Table: Customer
Purpose
This exercise provides a review of the ACL user interface includingthe menu bar, toolbar, and status bar.
Background
You are a new auditor at the ABC Department Store. You havereceived an ACL project entitled ACL105 Foundations.acl that wascreated by a team member. As a new ACL user, your firstassignment is to become familiar with this project and to learnhow to navigate in ACL.
Your tasks
1. What steps are required to open the Customer table in theACL105 Foundations.acl project?
1. Where do you access commands in ACL?3. Under which menu do you find the Count command?
4. How do you quickly access frequently used commands?
5. What two pieces of information does the status bar alwaysdisplay?
6. What information can be accessed from the Overview tab?
Activity 1.2 Fundamentals Review
Project: ACL105 Foundations.acl
Table: Customer
Purpose
This exercise provides a review of ACL fundamentals, includingACL projects, tables, and views. It is necessary to develop a solidunderstanding of these concepts because they are the foundationupon which all ACL analyses are built.
Background
After reviewing the contents of ACL105 Foundations.acl, youdetermine that there are a number of tables and views stored inthis project. Your audit team has assigned you to focus on theCustomer table. Before you begin your analysis of this table, youmust review the table layout and understand what types of fieldsare stored there.
Your tasks
1. What information does the Customer table contain?
2. Where are the field definitions for the Customer table stored?
3. Is the Customer.fil data file stored in the project?
4. How are the data file and table layout related?
5. What information is stored in a table layout?
6. The log file ACL105_Foundationslog is activated when theproject ACL105 Foundations.acl is opened. What informationis stored in a log file?
98 Foundations of ACL: Concepts and Practices

Activities Fundamentals
Activity 1.3 ACL Projects
Project: ACL105 Foundations.acl
Purpose
This exercise provides practice using ACL projects. It shows howto create a new project and import table layouts from an existingproject.
Background
You have been assigned to a surprise credit audit, separate fromyour previous work, and you need to create a new projectcontaining the Customer table from the ACL105 Foundations.aclproject.
Your task
Show how you would organize and separate your work.
ACL CE RTIf1ED99

Activities Data Access
Data AccessActivity 2.1 Accessing Flat Files
Project: Class.acl
Data file: Trans.fil
Purpose
This exercise provides practice defining flat files. Through thisprocess, you create a table for working with a data file.
Background
You received a request from the audit manager to profile the Transdata file and identify irregularities in the transaction dates. As anew assignment, you must create a new project named Class and anew table named Trans.
Your task
I Using the following table layout, create the Trans table.
Record length = 32
Start Length Field Name Data Type Decimals/Format
1 5 invoice ASCII
6 6 date DATE YYMMDD
12 2 prodcls ASCII
12 9 prodno ASCII
21 4 qty NUMERIC 0
25 8 amount NUMERIC 2
Activity 2.2 Copying and Linking Tables
Project: ACL105 Foundations.acl
Table: Inventory
Purpose
This exercise provides practice using copying and linking optionswith tables.
Background
The audit department downloads inventory data from themainframe at the end of each month. Rather than use the DataDefinition Wizard to manually create a table layout for the mostrecent inventory file, you want to reuse an existing table layout.
Your tasks
1. Copy the Inventory table and rename it Feb_invntry.
2. Link Feb_invntry to the Month2_invntry.fil data file.
100 Foundations of ACL• Concepts and Practices

Activities Data Integrity Verification
Data Integrity Verification
Activity 3.1 Count, Total, and Statistics
Project: ACL105 Foundations.acl
Table: Trans
Purpose
This exercise provides practice using the Count, Total, andStatistics commands. It shows you how to test for datacompleteness and how to profile the data to determine average,maximum, and minimum values.
Background
You have downloaded and defined the Trans file for analysis. Also,you received a report from the IT group that displays control totaldetails. According to the IT report, the total number of records is339 and the total sum of invoice amounts is $300,682.04. You needto verify the integrity of the file and answer a few additionalquestions about the details listed in the file.
Your tasks
1. Determine if the Trans table is well defined and complete.
2. What is the value of the largest credit?
3. Credits issued must not exceed $1,000. Verify if there are anytransactions over this limit.
4. Determine the total value of transactions over the credit limit.
Challenge question
I There may be transactions with invoice amounts of $0.00.Identify these types of transactions. How many are there?
Activity 3.2 Gaps and Duplicates
Project: ACL105 Foundations.acl
Table: Trans
Purpose
This exercise provides practice using the Gaps and Duplicatescommands. It shows how to scan a table for irregularities such asmissing items and duplicates. This is an essential step when usingtables for the first time.
Background
Now that the Trans table has been checked for completeness withrespect to record numbers and totals, you must determine if any .invoices are missing or duplicated. As invoices are seriallynumbered, you can perform gap and duplicate testing to test thelevel of table integrity.
Your tasks
1. Determine if the table is missing any invoice numbers.
2. Locate and identify transactions categorized as possibleduplicate invoices.
3. If there are possible duplicate invoices on the file, are thesetransactions identical?
ACE! .... 101
Activities Data Analysis
Data Analysis
Activity 4.1 Filters
Project: ACL105 Foundations.acl
Table: Demo
Purpose
This exercise provides practice creating filters. It shows you how toview transactions that meet specific search criteria or tests.
Background
As a member of the audit team, you have been asked to profile thejournal entries table, Demo, and comment on the use of a suspensebatch account. It is believed that edit checks on data entry have noteliminated the use of "catch-all" batch accounts assigned code99999. It is your task to quantify the impact of this practice onyour organization.
Your tasks
1. Are any batch accounts still being assigned code 99999? If so,how many?
2. Are any GL110 accounts affected by this practice?
Challenge question
► Comment on the number of problem transactions that exceedthe $100,000 threshold amount. Include batch 99999 andGL110 transactions in your analysis.
Activity 4.2 Computed Fields and Exception Reporting
Project: ACL105 Foundations.acl
Table: Badfile.fil
Background
You have been asked to determine the total value of billings. Beforeanalyzing the table, you must use data integrity verificationtechniques to confirm the following:
• The invoiceno and prodno fields are populated
• All invoice numbers begin with 214
• Order quantities are less than 1000 and are positive values
• All prices are positive values
Your tasks
1. Create a computed field to identify records with at least oneintegrity problem.
2. The materiality threshold for computed data errors is $0.50 pertransaction. Create a computed field to test related data fieldsfor errors greater than this threshold.
102 Foundations of ACL: Concepts and Practices

Activities Data Analysis
Activity 4.3 Summarize
Project: ACL105 Foundations.acl
Table: Demo
Purpose
This exercise provides practice using the Summarize command. Itshows how to create a summary report based on a key field. Thiscommand produces a summarization on a character fieldregardless of the number of unique key field items in the table.
Background
Your audit team has assigned you to profile the Demo journalentries table. Through other printed reports, you determine thatactivity in a number of branches has resulted in net credits duringthe fourth quarter period.
Your tasks
1. Identify branches with net credits.
2. Identify the branches with the five largest credits and saveresults in a filter.
3. Are there any branches over the $500,000 credit threshold?
Challenge question
Which branch had the highest number of daily transactions ina single day during the period? What was the net amount forthat branch?
Activity 4.4 Classify, Stratify, and Age
Project: ACL105 Foundations.acl
Table: Trans
Purpose
This exercise provides practice using the Classify, Stratify, and Agecommands. It shows how to produce summary reports onCharacter, numeric, and date fields. These reports also let youdetermine levels of materiality.
These commands are useful for grouping fields within certainranges or aging periods.
Background
The manager of the marketing department at the ABCDepartment Store would like to know which amount range is themost popular. To do that, you need to profile the Trans table ingreater detail by concentrating on the products sold.
Your tasks are to identify the best selling product based on thenumber of units sold and to identify the most popular invoiceamount range. You are also required to identify the quarter withthe highest revenue.
Your tasks
1. Examine the table and determine which product is the bestseller based on quantities sold.
2. Based on default ranges, into which range do most invoiceamounts fall? Eliminate any invoices with net credit balancesfrom your analysis.
3. Which quarter of the calendar year 2000 produced the mostrevenue? Use the aging periods 0, 91, 182, 273, and 366.
103AcEICERTIFIED

Activities Data Analysis
Activity 4.5 Extract
Project: ACL105 Foundations.acl
Table: Trans
Purpose
This exercise provides practice using the Extract command. Itshows how to create a table by extracting data from a master table.Use this command when you want to profile a subset of records.
Background
You want to examine transactions from product classes 04 and 09to determine if any invoice amounts are unusually high.
To isolate these transactions, you can choose from the followingsolutions:
▪ Create a filter to work with these transactions. This works wellfor smaller tables, with no degradation in processing speed.
▪ If the table has a large number of records, extract thosetransactions that meet your test to another table for furtherprocessing. This smaller table processes more quickly than thelarger parent table and eliminates the need to activate a filter.The downside to extracting is that it creates additional tablesthat occupy valuable hard disk space.
The ABC Department Store recently purchased a new 500 GBhard disk for the Audit LAN server, so disk space is not an issue.
Your task
Create a table that contains only transactions from productclasses 04 and 09. Name it Trans_extract_class0409.
Activity 4.6 Export
Project: ACL105 Foundations.acl
Table: Trans_extract_class0409
Purpose
This exercise provides practice using the Export command. Itshows how to produce an exported file that can be used directly byother software applications.
With an exported file, you can merge information into a word-processed document, produce high-quality presentation graphics,or provide enhanced reporting.
Background
You want to export the results from the exercise in Activity 4.5Extract to an Excel spreadsheet for analysis by a colleague whodoes not use ACL.
Your task
Generate an Excel file and verify its completeness.
104 Foundations of ACL: Concepts and Practices

Activities Data Analysis
Activity 4.7 Index and Sort
Project: ACL105 Foundations.acl
Table: Customer
Purpose
This exercise provides practice using the Index and Sortcommands. It also shows how to reorder a table on key fields.
Use indexed and sorted tables when you need a table to be inascending or descending order based on key fields.
Background
The ABC Department Store is reviewing their customer tables.Customers with credit limits over $25,000 are to be re-evaluatedfor a possible increase. Upper management has asked the auditdepartment to generate a hard copy report that profiles thesecustomers based on their credit limits.
Your tasks
1. Reorder the Customer table by credit limit in descending value.
2. Create a table that meets the test "credit limit over $25,000".Ensure that the table is in descending order by credit limit.
Activity 4.8 Extract Using the Append option
Project: ACL105 Foundations.acl
Table: Trans
Purpose
This exercise provides practice using the Extract command withthe Append option. It shows how to produce a master table fromtwo tables that have the same structure.
This exercise also shows how to use this technique to combine twotables. For example, you can create a year-to-date table that isappended to the end of each month. You can also selecttransactions from two different tables with the same structure andappend them to a new table.
Background
In the audit department, certain tests are executed on credittransactions for each branch location. The credit transactions forproduct classes 01 and 07 need to be jointly summarized andforwarded to upper management for review.
Your task
I Extract transactions for product class 01 to one table andtransactions for product class 07 to another table. Combinethese two new tables into one table namedTrans_extract_class_0107.
AC LI 1 .EO 105

Activities Data Analysis
Activity 4.9 Join (Basic)
Project: ACL105 Foundations.acl
Tables: Empmast, Payroll
Purpose
This exercise provides practice using the Join command. It showshow to compare information from two separate tables and how tocreate a new table containing information from both tables.
Background
The Human Resources Administrator has had complaints from acouple of employees who say they have been underpaid. TheHuman Resources Administrator wants you to analyze the payrollrecords to identify all underpaid employees.
All employee information is recorded in an employee master table,Empmast. This table contains all of the usual employeeinformation, including employee names, addresses, annualsalaries, and period salaries.
Payroll transactions are generated from the payroll systemmonthly and are written to a table named Payroll. This tableincludes employee numbers and gross pay for the period.
Both tables are defined in the ACL105 Foundations.acl project.
Your task
► Identify underpaid employees. There are three of them. Ofthese, one was not paid at all.
Foundations of ACL: Concepts and Practices106

Activities Data Analysis
Empmast.fil Payroll.fil
Record length = 236 Record length = 47
Start Length Field Type Decimals/Format Start Length Field Type Decimals/Format
1 6 empno EBCDIC 1 6 empno EBCDIC
7 25 first EBCDIC 7 9 gross_pay PACKED 2
32 25 last EBCDIC 16 9 tax_amount PACKED 2
57 35 address EBCDIC 25 9 net_pay PACKED 2
92 35 city EBCDIC 34 3 work_dept EBCDIC
127 25 stateprovince
EBCDIC 37 6 pay_date DATE DDMMYY
43 5 cheque_no EBCDIC152 25 country EBCDIC
177 2 code EBCDIC
179 3 workdept EBCDIC
182 4 phoneno EBCDIC
186 10 hiredate DATE MM/DD/YYYY
196 8 job EBCDIC
204 2 edlevel BINARY 0
206 1 sex EBCDIC
207 10 birthdate DATE MM/DD/YYYY
217 5 salary PACKED 2
222 5 bonus PACKED 2
227 5 comm PACKED 2
232 5 pay_per_period PACKED 2
ACLI CERTIFIED107
Activities Data Analysis
Activity 4.10 Join (Intermediate)
Project: ACL105 Foundations.acl
Tables: Empmast, Payroll
Purpose
This exercise provides practice using the Join command. It showshow to join two separate tables so that you can use the data in asingle table.
Background
The Human Resources Administrator has had complaints from acouple of employees who say they were underpaid. Also, lastmonth's payroll is several thousand dollars higher than expected.You suspect that other employees may have been overpaid bymistake. The Human Resources Administrator wants you to useyour ACL skills to analyze the payroll records and to identify allpotential payroll problems.
All employee information is recorded in an employee master table,Empmast. This table records all of the usual employeeinformation, including employee names, addresses, annualsalaries, and period salaries.
Payroll transactions are generated from the payroll systemmonthly and are written to a table named Payroll. This tableincludes employee numbers and gross pay for the period.
Both tables are defined in the ACL105 Foundations.acl project.
Your tasks
1. Confirm that the difference between these two tables for thismonth is $3,284.82.
2. Identify the following exceptions by using only one join:
• Valid employees who were paid an incorrect amount
• Valid employees who were not paid
• Payroll payments that are not accounted for by matchingmaster table records
3. Identify employees who were paid more than one time.
Ensure that all identified discrepancies account for the fullamount of the difference found in task 1.
108 Foundations of ACL: Concepts and Practices

Activities
Data Analysis
Activity 4.11 Relations (Basic)
Project: ACL105 Foundations.acl
Tables: Ap_trans, Vendor, Inventory
Purpose
This exercise provides practice using the Relations command. Itshows how to combine information from three tables into onelogical table for easier processing.
Setting up relations between tables is a common database practice.This exercise shows how to use the ACL version of this technique,the Relations command.
Background
You are preparing a report on the outstanding accounts payabletransactions contained in the Ap_trans table. To increase thereadability of the report, you want to include the vendor namewith each vendor number. You also want to include the productdescription with the product number for each item purchased.
To include the vendor name and the product description in yourreport, you need to access the vendor table and the inventory table.
The three tables that you need to use are defined within theACL105 Foundations.acl project.
Your tasks
1. Relate the Ap_trans table to the Vendor and Inventory tables.
2. In the Ap_trans default view, add the vendor name andproduct description columns next to the vendor number andproduct number columns respectively.
Activity 4.12 Relations (Intermediate)
Project: ACL105 Foundations.acl
Tables: Ap_trans, Inventory, Dept
Purpose
This exercise provides practice building direct and indirectrelations between tables.
Background
You are preparing a report on accounts payable transactions thatyou received in a table named Ap_trans. You want to include theproduct description and the department name in your report.
The product description for each item purchased is contained inthe Inventory table. The department name is contained in theDept table. To access this information, you need to build relationsbetween the Ap_trans table and the Inventory and Dept tables.
Unfortunately, there is no direct relation between the Ap_transtable and the Dept table. As a result, you need to gain access to thisinformation in an indirect manner through the Inventory table.
Your tasks
1. Open the existing ACL105 Foundations.acl project and relatethe Ap_trans table to the Inventory and Dept tables.
2. In the Ap_trans default view, add the department descriptioncolumn next to the vendor number column.
The product class field in the Inventory table matches thedepartment code field in the Dept table.
ACLIF.f, !!!!!!!!!! 109

Activities Reporting Results
Reporting Results
Activity 5.1 Graphing
Project: ACL105 Foundations.acl
Table: Trans
Purpose
This exercise provides practice creating graphs with differentcommands. It shows how to create visually appealing reports bychange graph properties and types.
Background
The ABC Department Store is projecting inventory orders for theupcoming season. To support their projections, they request aproduct sales report that shows total sales by product class. Toenhance the product class report, create a graph to show theresults.
Your tasks
1. Create a bar graph showing the invoice amounts for eachproduct class.
2. Change the graph type to a 3-D pie chart.
110 Foundations of ACL: Concepts and Practices
Solutions
These solutions present the most effective and efficient ways to solve theproblems presented in the Activities section.
Fundamentals
Data Access
Data Integrity Verification
Data Analysis
Reporting Results
Solutions Fundamentals
FundamentalsActivity 1.1 Navigating in ACL
Project: ACL105 Foundations.acl
Table: Customer
Your tasks
1. What steps are required to open the Customer table in theACL105 Foundations.acl project?
2. Where do you access commands in ACL?
3. Under which menu do you find the Count command?
4. How do you quickly access frequently used commands?
5. What two pieces of information does the status bar alwaysdisplay?
6. What information can be accessed from the Overview tab?
Solution 1
1. Select File > Open Project, select ACL105 Foundations.acl,and click Open.
2. In the Project Navigator, click the Overview tab, click the plussign to the left of the Accounts_receivable_audit folder, anddouble-click Customer.
Solution 2
I Most commands are stored on the menu bar under Data,Analyze, and Sampling.
Solution 3
I The Count command is found under Analyze.
Solution 4
►Commands are quickly accessed from the toolbar.
Solution 5
►The status bar always displays the table name and number ofrecords.
Solution 6
I The Overview tab displays a list of project contents, includingscripts, tables, and workspaces.
112 Foundations of ACL: Concepts and Practices

Solutions Fundamentals
Activity 1.2 Fundamentals Review
Project: ACL105 Foundations.acl
Table: Customer
Your tasks
1. What information does the Customer table contain?
2. Where are the field definitions for the Customer table stored?
3. Is the Customer.fil data file stored in the project?
4. How are the data file and table layout related?
5. What information is stored in a table layout?
6. The log file ACL105_Foundationslog is activated when theproject ACL105 Foundations.acl is opened. What informationis stored in a log file?
Solution 1
►The Customer table contains the organization's customerinformation, including customer identification number,customer name, address, and phone number.
Solution 2
Field definitions for a table are stored in the table layout.
Solution 3
►The Customer.fil data file is not stored in the project.
Solution 4
►The data file and the table are related through a linking process.This link is made automatically when the file is defined for thefirst time.
Solution 5
The following information is stored in a table layout:
• File types
• Record lengths
• Field names
• Data types
• Field start positions and lengths
• The number of decimal places
• Field formatting
• Column headings
Solution 6
►The information that is stored in a log file includes all thecommands that are issued during an ACL session and theresults of those commands.
C, To ensure the log does not become too large over time,regularly create a backup and start a new log.
ACLIF1 !!!!!!!!!! 113

Solutions
Activity 1.3 ACI. Projects
Project: ACL105 Foundations.acl
Your task
► You have been assigned to a surprise credit audit, separate fromyour previous work, and you need to create a new projectcontaining the Customer table from the ACL105Foundations.acl project. Show how you would organize andseparate your work.
Solution
Create a new project:
1. Select File > New > Project, name the new projectC r ed i t_a ud i t, and click Save.
2. To close the Data Definition Wizard, click Cancel.
3. Click the Overview tab.
4. Right-click the Credit_audit.acl folder, select Copy fromAnother Project, and select Table.
5. In the Locate Project File dialog box, double-click ACL105Foundations.acl.
6. In the Import dialog box, double-click Customer and click OK.
Fundamentals
Foundations of ACL: Concepts and Practices114
Solutions Data Access
Data Access
Activity 2.1 Accessing Flat Files
Project: Class.acl
Data file: Trans.fil
3. Click Next.
4. In the Select File to Define dialog box, select Trans.fil andclick Open.
The Data Definition Wizard correctly identifies the characterset as ASCII.Your task
5. Click Next.► Using the following table layout, create the Trans table.
The Data Definition Wizard correctly identifies the file formatRecord length = 32 as Other.
Start Length Field Name Data Type Decimals/Format
1 5 invoice ASCII
6 6 date DATE YYMMDD
12 2 prodcls ASCII
12 9 prodno ASCII
21 4 qty NUMERIC 0
25 8 amount NUMERIC 2
Create a new project and select a flat file:
1. Select File > New > Project, name the new project Class, andclick Save.
The Data Definition Wizard starts automatically.
2. Click Next.By default, the Data Definition Wizard selects Disk as the datasource.
6. Click Next.
In the File Properties window, the Data Definition Wizardidentifies the records as fixed length, with a length of 32 byteseach.
7. Click Next.
The File Type window shows that the Data Definition Wizardhas correctly identified the file as a single-record-type data file.
8. Click Next.
types:
1. Click Next.
The Edit Field Properties window shows the field properties.
2. Click a column heading to select a field. Using the table layout:
a. Enter a name to identify the field in the table layout.
b. Enter a column heading to identify the field in the view.
c. Select the data type from the Type drop-down list andadjust the format if necessary.
Confirm the Data Definition Wizard's placement of fieldseparators.
Solution Name the fields and select data
AC LI Eat TID„ 115
Solutions Data Access
3. Repeat Step 2 for each field you want to define.
4. Click Next.
The Final window shows a summary of table properties.
Name and save the table:
1. Click Finish.2. Name the table Trans and click OK.
The Data Definition Wizard creates the table and displays thedefault view.
Activity 2.2 Copying and Linking Tables
Project: ACL105 Foundations.acl
Table: Inventory
Your tasks
1. Copy the Inventory table and rename it Feb_invntry.
2. Link Feb_invntry to the Month2_invntry.fil data file.
Solution 1
Copy and rename the table:
1. In the Overview tab, right-click Inventory and select Copy.2. Right-click the Inventory_review folder and select Paste.
ACL places the copy in the folder and names the tableInventory2.
3. Right-click Inventory2, select Rename, enter F eb_i nvn t ry,and click OK.
Solution 2
Link the new table to the data file:
1. Right-click Feb_invntry and select Link to New Source Data.2. In the Select File dialog box, select Month2_invntry.fil and
click Open.
The Feb_invntry table is now linked to the data file.
116 Foundations of ACL: Concepts and Practices

Solutions Data Integrity Verification
Data Integrity Verification
Activity 3.1 Count, Total, and Statistics
Project: ACL105 Foundations.acl
Table: Trans
Your tasks
1. Determine if the Trans table is well defined and complete.
2. What is the value of the largest credit?
3. Credits issued must not exceed $1,000. Verify if there are anytransactions over this limit.
4. Determine the total value of transactions over the credit limit.
•
Challenge question
There may be transactions with invoice amounts of $0.00.Identify these types of transactions. How many are there?
Solution 1
Use the Count command to verify the number of records received:
I Select Analyze > Count Records and click OK.
The total number of records appears in the status bar. Thenumber of records matches the information received.
To view the results in the display area, click the Log tab anddouble-click the Count command.
Find the net total and compare it to your control total:
1. Select Analyze > Total Fields.
2. From the Total Fields list, select amount and click OK.
The control totals match the information received.
Solution 2
Run the Statistics command on amount to find the largest value:
1. In the display area, click the Trans tab.
2. Select Analyze > Statistical > Statistics.
3. From the Statistics On list, select amount and click OK.
The largest credit is $3,366.30.
Solution 3
Use the Count command with a filter to determine if any amountsexceed the credit limit of $1,000.00:
1. In the display area, click the Trans tab.
2. Select Analyze > Count Records.
3. In the If box, enter amount < -1000 and click OK.
Four records exceed the credit limit.
Solution 4
Total the amount for any records over the credit limit:
1. In the display area, click the Trans tab.
2. Select Analyze > Total Fields.
3. From the Total Fields list, select amount.
4. In the If box, enter amount < -1000 and click OK.
The total value of transactions over the credit limit is $7,308.42.
ACLIUI.I!!,!1?, 117
Solutions Data Integrity Verification
Challenge solution
Create a filter to determine which transactions have an invoiceamount of $0.00:
1. In the display area, click the Trans tab.
2. Click the (Edit View Filter).
3. Enter amount = 0 in the Expression box, enter zero in theSave As box, and click OK.
Transaction number 12903 has an invoice amount of $0.00.
4. Run the Count command to record the number of records thatmatch the filter in the log.
Activity 3.2 Gaps and Duplicates
Project: ACL105 Foundations.acl
Table: Trans
Your tasks
1. Determine if the table is missing any invoice numbers.
2. Locate and identify transactions categorized as possibleduplicate invoices.
3. If there are possible duplicate invoices on the file, are thesetransactions identical?
Solution 1
Test for missing and duplicate invoice numbers in the sequence:
1. In the Overview tab, double-click Trans.
2. Select Analyze > Look for Gaps.
3. From the Sequence On list, select invoice and click OK.
Twelve gaps are detected.
4. Click the Trans tab.
5. Select Analyze > Look for Duplicates.
6. From the Sequence On list, select , invoice.
7. On the Output tab, select the Screen option and click OK.
Twenty-two duplicates are detected.
Solution 2
Test for duplicate invoice numbers and include other fields:
1. Click the Trans tab.
2. Select Analyze > Look for Duplicates.
118 Foundations of AG.: Concepts and Practices
Solutions Data Integrity Verification
3. From the Sequence On list, select invoice.
4. Click List Fields, add amount, date, and prodno to theSelected Fields list.
5. Click OK.
6. Click the Output tab, select the File option, name the fileTrans_dups_i nvoi ce, and click OK.
The new table contains 42 records with duplicate invoice, date,and prodno values. To view the table, double-clickTrans_dups_invoice in the Overview tab.
Solution 3
Test the Trans_dups_invoice table for duplicate records:
1. In the Overview tab, double-click Trans_dups_invoice.
2. Select Analyze > Look for Duplicates.
3. Click Sequence On, add invoice and amount to the SelectedFields list, and click OK.
Results show that there are no records with the same invoicenumber and amount.
.. 119
Solutions Data Analysis
Data Analysis
Activity 4.1 Filters Solution 2
Project: ACL105 Foundations.acl Expand the filter:
Table: Demo 1. Click X.1 (Edit View Filter).
2. Change the expression to read batch_99999 AND gl"110" and click OK.
1. Are any batch accounts still being assigned code 99999? If so, 3. Select Analyze > Count and click OK.how many? The new filter identifies 314 records, or more than 62% of the
2. Are any GL110 accounts affected by this practice? transactions.
Challenge question Challenge solution
' Comment on the number of problem transactions that exceed Add the amount condition to the filter:the $100,000 threshold amount. Include batch 99999 andGL110 transactions in your analysis.
2. Change the expression to read batch_99999 AND gl
1. Click (Edit View Filter).
Solution 1
"110" AND amount > 100000 and click OK.
Create a filter: 3. Select Analyze > Count and click OK.
1. Click /-;ij (Edit View Filter). Nineteen records match the filter.
2. In the Expression box, enter batch "99999".
3. In the Save As box, enter b a tc h_99999 and click OK.
4. Select Analyze > Count and click OK.
There are 385 records that match the batch_ 99999 filter. Theserecords equal approximately 77% of the table.
Your tasks
120 Foundations of AG.: Concepts and Practices

Solutions Data Analysis
Activity 4.2 Computed Fields and Exception Reporting
Project: ACL105 Foundations.acl
Table: Badfile.fil
Your tasks
1. Create a computed field to identify records with at least oneintegrity problem.
2. The materiality threshold for computed data errors is $0.50 pertransaction. Create a computed field to test related data fieldsfor errors greater than this threshold.
Solution 1
Create a computed field:
1. Select Edit > Table Layout and click (Add a NewExpression).
2. In the Name box, enter P r obl em, and in the Default Valuebox, enter F (no quotation marks).
3. Click Z-i (Insert a Condition) and create the followingcondition and value pairs:
Condition
Value
ISBLANK(invoiceno)
ISBLANK(prodno)
invoiceno <> "214"
T
orderqty <= 0 OR orderqty > 1000
T
4. Click %1 (Accept Entry) button and close the Table Layoutwindow.
5. Click 1 (Edit View Filter).
6. In the Filters list, double-click Problem to move it to theExpression box and click OK to display the filtered view.
7. Select Analyze > Count and click OK.
Four records have integrity problems.
Solution 2
Create a second computed field:
1. Click (Remove Filter).
2. Following the procedure in Solution 1, create a computed fieldto test the reliability of the total value field.
The total value field is the product of shipping quantity andunit price, so name the computed field total_test and enterthe following expression in the default value box: s h i pq ty *price.
3. Because you are willing to tolerate a difference of up to $0.50between the data field and the expected value, enter thefollowing global filter to identify those records where the total-value data field varies by more than $0.50 from its recalculatedvalue:
total - total_test > 0.50 OR total_test - total >0.50
4. With this filter active, select Analyze > Count and click OK.
Four transaction records exceed the materiality threshold.
price <= 0
ACLIF.M!!!,! ... ?, 121
Solutions Data Analysis
Activity 4.3 Summarize
Project: ACL105 Foundations.acl
Table: Demo
Your tasks
1. Identify branches with net credits.
2. Identify the branches with the five largest credits and saveresults in a filter.
3. Are there any branches over the $500,000 credit threshold?
Challenge question
I Which branch had the highest number of daily transactions ina single day during the period? What was the net amount forthat branch?
Solution 1
Summarize the Demo data:
1. Select Analyze > Summarize.
2. From the Summarize On list, select br, and from the SubtotalFields list, select amount.
3. Click the Output tab, select the File option, name the tableDemo_s umm_b r, and click OK.
4. Click -jt,1 (Edit View Filter) and enter amount < 0 in theExpression box.
5. Name the filter C red i t and click OK.
Solution 2
Create an index:
1. Select Analyze > Statistics.
2. Click Statistics on Amount.
3. Create a filter Amount <—L owl and click OK.
Solution 3
Apply a filter:
In the Expression box, enter amount < - 500000 and click OK.
Branches 21, 22, 31, and 41 are over the $500,000 credit limit.
Challenge solution
Summarize the Demo data:
1. Select Analyze > Summarize.
2. Click Summarize On, add br and date to the Selected Fieldslist, and click OK.
3. From the Subtotal Fields list, select amount.
4. Click the Output tab, select the File option, name the tableDemo_summ_br_date, and click OK.
5. With Demo_summ_br_date open, select Analyze > Statistical> Statistics, select count, and click OK.
6. Click the Demo_summ_br_date tab.
7. Click (Edit View Filter), enter count = MAXI in theExpression box, and click OK. You can select MAXI from theVariables list.
Branch 21 had the highest number of daily transactions.
Determine the net amount for that branch:
1. Click ji I (Edit View Filter) and enter br = "21" in theExpression box, and click OK.
2. Select Analyze > Total Fields, select amount, and click OK.
The net credit for branch 21 is $694,795.08.
122 Foundations of ACL: Concepts and Practices

Solutions Data Analysis
Activity 4.4 Classify, Stratify, and Age
Project: ACL105 Foundations.acl
Table: Trans
Your tasks
1. Examine the table and determine which product is the bestseller based on quantities sold.
2. Based on default ranges, into which range do most invoiceamounts fall? Eliminate any invoices with net credit balancesfrom your analysis.
3. Which quarter of the calendar year 2000 produced the mostrevenue? Use the aging periods 0, 91, 182, 273, and 366.
Solution 1
Use the Classify command with a subtotal:
1. Select Analyze > Classify.
2. From the Classify On drop-down list, select prodno, and fromthe Subtotal Fields list, select qty.
3. Click the Output tab, select the File option, name the tableTrans_cl assi fy_prodno, and click OK.
The table shows total quantities sold for each product number.
4. Select Analyze > Statistical > Statistics.
5. From the Statistics On list, select qty and click OK.
The largest quantity sold was 4101.
6. Click the Trans_classify_prodno tab, click :41 (Edit ViewFilter), enter Qty — ma x 1 in the Expression box, and clickOK.The best seller was prodno 052530155, with 4101 units sold.
Solution 2
Determine the range of values:
1. In the Overview tab, double-click Trans.
2. Select Analyze > Classify.
3. From the Classify On list, select invoice.
4. From the Subtotal Fields list, select amount.
5. Click the Output tab, select the File option, and name thetable Trans_cl assi fy_i nvoi ce.
6. Select Analyze > Statistical > Statistics.
7. From the Statistics On list, select amount.
8. In the If box, enter amount >= 0 and click OK.
9. Select Analyze > Stratify.
10.From the Stratify On drop-down list, select amount.
11. In the If box, enter amount >= 0 and click OK.More than 34% of the total invoice amounts fall within therange of 0.00-3,789.49.
Solution 3
Age the data:
1. In the Overview tab, double-click Trans.
2. Select Analyze > Age.3. From the Age On drop-down list, select date, set the cutoff
date to December 31, 2000, enter the aging periods 0, 91, 182,273, 366, select amount from the Subtotal Fields list, and clickOK.
The results show that the third quarter generated the mostincome with more than 40% of the year's earnings.
AC1 IF1 !!!!!!! 123
Solutions Data Analysis
Activity 4.5 Extract
Activity 4.6 Export
Project: ACL105 Foundations.acl
Project: ACL105 Foundations.acl
Table: Trans Table: Trans_extract_class0409
Your task
Your task
1 Create a table that contains only transactions from product
Generate an Excel file and verify its completeness.classes 04 and 09. Name it Trans_extract_class0409.
SolutionSolution
Extract the data:
1. Select Data > Extract Data.
2. In the If box, enter the expression p rod cl s = "04" ORprodcls — "09".
3. In the To box, enter the table nameTrans_extract_cl ass0409 and click OK.
The filter shows that 87 records match.
Export the data to an Excel file:
1. Select Data > Export To Other Applica tion.
2. Click Export Fields, add all of the fields to the Selected Fieldslist, and click OK.
3. From the Export As drop-down list, sele ct Excel.
4. In the To box, enter Trans0409 and clic k OK.
The original table and the new Excel file each contain 87records.
0 The Export tab shows that ACL adds the appropriateextension to the file name.
124 Foundations of ACL: Concepts and Practices

Solutions Data Analysis
Activity 4.7 Index and Sort
Project: ACL105 Foundations.acl
Table: Customer
Your Tasks
1. Reorder the Customer table by credit limit in descending value.
2. Create a table that meets the test "credit limit over $25,000".Ensure that the table is in descending order by credit limit.
Solution 1
Create a descending index:
1. Select Data > Create Index.
2. Click Index On and add limit to the Selected Fields list.
An upward-pointing arrow, which represents ascending order,is displayed beside the field.
3. Click the arrow one time to change it to a downward-pointingarrow for descending order and click OK.
4. In the To box, enter Li mi t_des cendi ng and click OK.
The view is now in descending order by credit limit. Removethe index by selecting None from the Index drop-down list inthe top right corner of the view.
Solution 2
Create a sorted, descending table that contains records with limitsthat are greater than $25,000:
1. Select Data > Sort Records.
2. Click Sort On, add limit to the Selected Fields list, change thearrow to a downward-pointing arrow, and click OK.
3. In the If box, enter 1 i mi t > 25000 and click OK.
4. In the To box, enter I i mi t_des c and click OK.
The result is a table in descending order by limit for customerswith a credit limit over $25,000.
Forty-eight records match the filter.
See "Comparing Sort and Index" on page 67 for a discussion ofthe differences between the Sort and Index commands.
ACLIf211r,!1!), 125

Solutions Data Analysis
C) To examine the table history for the new master table, selectTools > Table History.
Activity 4.8 Extract Using the Append option
Project: ACL105 Foundations.acl
Table: Trans
Your task
I Extract transactions for product class 01 to one table andtransactions for product class 07 to another table. Combinethese two new tables into one table namedTrans_extract_class_0107.
Solution
Extract and append the data:
1. Select Data > Extract Data.
2. In the If box, enter amount < 0 AND prodcl s s "01".
3. In the To box, enter T ra ns_ext r a ct_cl a s s_01 and clickOK.
Six records match the filter.
4. In the Overview tab, double-click Trans.
5. Select Data > Extract Data.
6. In the If box, enter amount < 0 AND prodcl s "07".
7. In the To box, enter Tr a ns_ext ract_cl a ss_0107 and clickOK.
Four records match the filter.
8. Double-click Trans_extract_class_01.
9. Select Data > Extract Data.
10.In the To box, enter Trans_ext ract_cl a s s_0107, click OK,and select Append.
The new table contains 10 records.
126 Foundations of ACL: Concepts and Practices

Solutions Data Analysis
Activity 4.9 Join (Basic)
Project: ACL105 Foundations.acl
Tables: Empmast, Payroll
Your task
Identify underpaid employees. There are three of them. Ofthese, one was not paid at all.
Solution
Use the Join command:
1. In the Overview tab, double-click the Empmast table.
2. Select Data > Join Tables.
3. From the Secondary Table drop-down list, select Payroll.
4. From the Primary Keys list, select empno.
5. From the Secondary Keys list, select empno.
6. Click Primary Fields, add empno and pay_per_period to theSelected Fields list, and click OK.
7. Click Secondary Fields, add empno and gross_pay to theSelected Fields list, and click OK.
8. In the To box, enter Joi n_underpai d.
9. Click the More tab, select the Matched Primary Recordsoption and the Include All Primary Records check box, andclick OK.
10.Click 'h. I (Edit View Filter), enter gr os s_p ay < >pay_per_peri od in the Expression box, and click OK.
Three records match the filter.
Activity 4.10 Join (Intermediate)
Project: ACL105 Foundations.acl
Tables: Empmast, Payroll
Your tasks
1. Confirm that the difference between these two tables for thismonth is $3,284.82.
2. Identify the following exceptions by using only one join:
• Valid employees who were paid an incorrect amount
• Valid employees who were not paid
• Payroll payments that are not accounted for by matchingmaster table records
3. Identify employees who were paid more than one time.
Ensure that all identified discrepancies account for the fullamount of the difference found in task 1.
Solution 1
1. In the Overview tab, double-click Empmast.
2. Select Analyze > Total, select pay_per_period from the TotalFields list, and click OK.
3. Select Edit > Variables and double-click TOTALl.
4. In the Save As box, enter ppp_total and click OK.
5. In the Overview tab, double-click Payroll.
6. Select Analyze > Total, select gross_pay from the Total Fieldslist, and click OK.
7. Select Window > Show Command Line, enter Ca 1 cppp_total - TOTAL1, and click .•/] (Accept Entry).
The difference is $3,284.82.
AC L- LF,E2 127

Solutions Data Analysis
Solution 2
Perform a join and apply a filter:
1. In the Overview tab, double-click the Empmast table.
2. Select Data > Join Tables.
3. From the Secondary Table drop-down list, select Payroll.
4. From the Primary Keys list, select empno.
5. From the Secondary Keys list, select empno.
6. Click Primary Fields, add empno and pay_per_period to theSelected Fields list, and click OK.
7. Click Secondary Fields, add empno and gross_pay to theSelected Fields list, and click OK.
8. In the To box, enter Empmast_joi n_pay__al 1 ps.
9. Click the More tab, select the Matched Primary Recordsoption, select the Include All Primary Records and IncludeAll Secondary Records check boxes, and click OK.
10.With the Empmast join_pay_allps table displayed, click(Edit View Filter) button and apply each of the following
filters in turn:
To Detect Use Exceptions
Valid employees who were pay_per_period <> gross_pay empno =paid an incorrect amount AND NOT ISBLANK(empno) AND 000020,
gross_pay > 0 000120
Valid employees who were
NOT ISBLANK(empno) AND
empno =not paid gross_pay 0
000090
Payroll payments that are gross_pay > 0 AND
empno2 =not accounted for by empno <> empno2
000108,
matching master table 000109,records
000320
Solution 3
1. Remove any filters on the Empmast_join_pay_allps table.
2. Select Analyze > Look for Duplicates.
3. From the Sequence On list, select empno2.
4. Click the Output tab, select the Screen option, and click OK.
Employee 000320 was paid twice.
To ensure that the total amount of the discrepancy is accountedfor, create a computed field:
1. Select Edit > Table Layout.
2. Click K1 (Add a New Expression).
3. On the Edit Fields/Expressions tab, name the new fielddi fference and in the Default Value box, enter Gros s_pay- pay_per_period.
4. Click /t (Accept Entry).
The new field is created. To confirm the amount of thediscrepancy, run the Total command on the Difference field.
128 Foundations of AO.: Concepts and Practices

Solutions Data Analysis
AC ..
Activity 4.11 Relations (Basic)
Project: ACL105 Foundations.acl
Tables: Ap_trans, Vendor, Inventory
Your tasks
1. Relate the Ap_trans table to the Vendor and Inventory tables.
2. In the Ap_trans default view, add the vendor name andproduct description columns next to the vendor number andproduct number columns respectively.
Solution 1
Relate the tables:
1. In the Overview tab, double-click Ap_trans.
2. Select Data > Relate Tables.
3. Click Add Table and add the Vendor and Inventory tables tothe Relations dialog box.
4. Click and drag prodno from the Ap_trans table to prodno inthe Inventory table.
5. Click and drag vendor_no from the Ap_trans table tovendor_no in the Vendor table.
6. Click Finish.
Solution 2
Add new columns to the Ap_trans view:
1. Right-click in the view and select Add Columns.
To control the placement of columns in views, highlight thecolumn to the right of where you want the new columnsinserted.
2. From the From Table drop-down list, select Inventory.
3. In the Available Fields list, double-click inventory.proddesc.
4. From the From Table drop-down list, select Vendor.
5. Add vendor.vendor_name to the Selected Fields list and clickOK.
The fields are added to the table and can be rearranged asrequired.

Solutions Data Analysis
Activity 4.12 Relations (Intermediate) Solution 2
Project: ACL105 Foundations.acl Add a new column to the Ap_trans view:
Tables: Ap_trans, Inventory, Dept 1. Click the vendor_no column heading.
This activity assumes that you have completed the solution for 2. Right click in the view and select Add Columns.
Activity 4.11 Relations (Basic). 3. From the From Table drop-down list, select Dept.
Your tasks 4. Add dept.deptdesc to the Selected Fields list and click OK.
The field is added to the table beside vendor_no.1. Open the existing ACL105 Foundations.acl project and relate
the Ap_trans table to the Inventory and Dept tables.
2. In the Ap_trans default view, add the department descriptioncolumn next to the vendor number column.
The product class field in the Inventory table matches thedepartment code field in the Dept table.
Solution 1
Relate the tables:
1. In the Overview tab, double-click Ap_trans.2. Select Data > Relate Tables.
The Relations box shows relations between the Ap_trans tableand the Inventory and Vendor tables on prodno andvendor_no respectively.
3. Click Add Table and add the Dept table to the Relations dialogbox.
4. Click and drag prodcls from the Inventory table to dept in theDept table.
5. Click Finish.
130 Foundations of ACL: Concepts and Practices

Solutions Reporting Results
Reporting Results
Activity 5.1 Graphing
Project: ACL105 Foundations.acl
Table: Trans
Your tasks
1. Create a bar graph showing the invoice amounts for eachproduct class.
2. Change the graph type to a 3-D pie chart.
Solution 1
Classify the data and output to a graph:
1. Select Analyze > Classify
2. From the Classify On drop-down list, select prodcls.
3. From the Subtotal Fields list, select amount.
4. Click the Output tab, select the Graph option, and click OK.
Solution 2
Change the graph type:
1. Click 41 (Graph Type).
2. Click 6, (3-D pie chart).
3. Click OK.
ACEI Ur. .E°

Foundations of ACL: Concepts and Practices
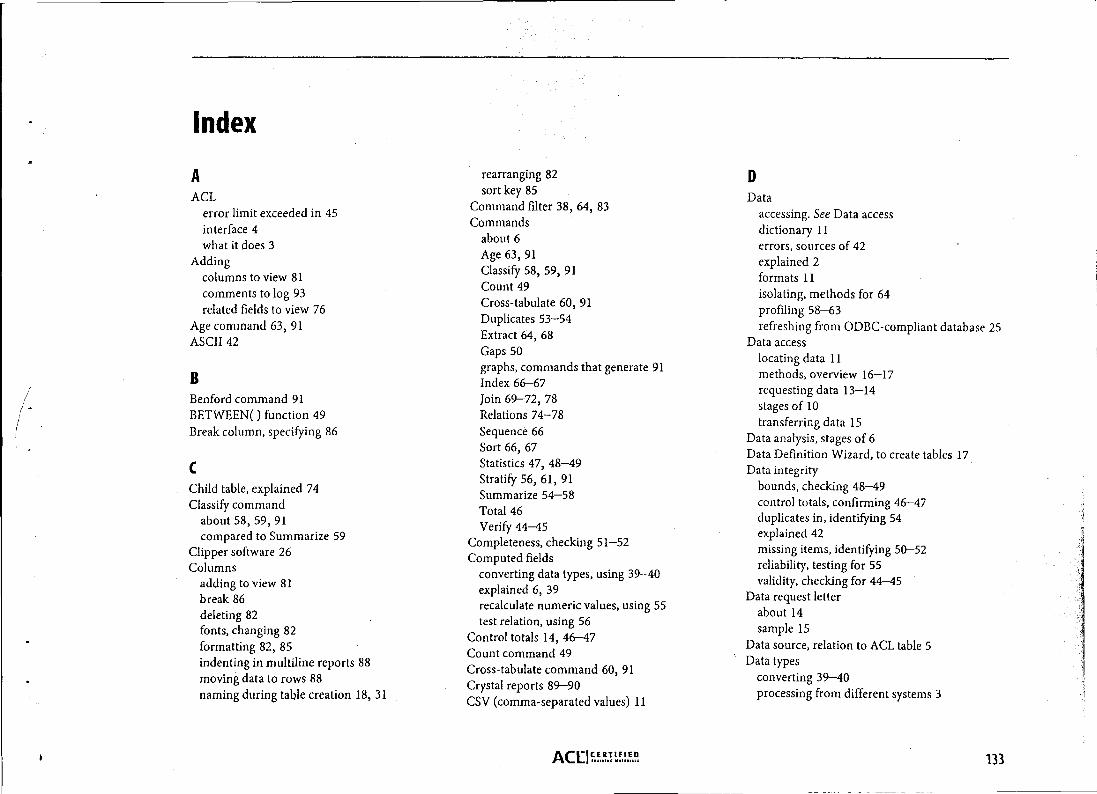
Index
AACL
error limit exceeded in 45interface 4what it does 3
Addingcolumns to view 81comments to log 93related fields to view 76
Age command 63, 91ASCII 42
BBenford command 91BETWEEN( ) function 49Break column, specifying 86
CChild table, explained 74Classify command
about 58, 59, 91compared to Summarize 59
Clipper software 26Columns
adding to view 81break 86deleting 82fonts, changing 82formatting 82, 85indenting in multiline reports 88moving data to rows 88naming during table creation 18, 31
rearranging 82sort key 85
Command filter 38, 64, 83Commands
about 6Age 63, 91Classify 58, 59, 91Count 49Cross-tabulate 60, 91Duplicates 53-54Extract 64, 68Gaps 50graphs, commands that generate 91Index 66-67Join 69-72, 78Relations 74-78Sequence 66Sort 66, 67Statistics 47, 48-49Stratify 56, 61, 91Summarize 54-58Total 46Verify 44-45
Completeness, checking 51-52Computed fields
converting data types, using 39-40explained 6, 39recalculate numeric values, using 55test relation, using 56
Control totals 14, 46-47Count command 49Cross-tabulate command 60, 91Crystal reports 89-90CSV (comma-separated values) 11
DData
accessing. See Data accessdictionary 11errors, sources of 42explained 2formats 11isolating, methods for 64profiling 58-63refreshing from ODBC-compliant database 25
Data accesslocating data 11methods, overview 16-17requesting data 13-14stages of 10transferring data 15
Data analysis, stages of 6Data Definition Wizard, to create tables 17Data integrity
bounds, checking 48-49control totals, confirming 46-47duplicates in, identifying 54explained 42missing items, identifying 50-52reliability, testing for 55validity, checking for 44-45
Data request letterabout 14sample 15
Data source, relation to ACL table 5Data types
converting 39-40processing from different systems 3
ACLIur.u.! ... 133

Index
DB2 23, 26dBASE files, accessing 11, 26-27Defining
dBASE files 26-27fields 19-31flat files 17-19Microsoft Access files 22, 23-25overlapping fields 19report files 28-31
Deletingcolumns from view 82relation 77rows in multiline reports 87
Delimited files 11Detail records, in report files 28-31Duplicates
identifying 53-54and Join command 73and Relations command 74, 75
Duplicates command 53-54
EEBCDIC 42Edit command button 92Error limit, exceeded in ACL 45Expressions
explained 6, 36types of 37-38
Extract commandabout 64, 68append option 68
FFields
computed. See Computed fieldsdefining 19-31
explained 2related, adding to view 76
File historySee Table history
FilesdBASE 26-27delimited 11explained 2flat 11formats 11Microsoft Access 22, 23-25Microsoft Excel 11, 23report 28-31
Filterscommand filter 38elements of 38explained 6global filter 38isolating data, using 64as logical computed fields 36naming and saving 38Quick Filter 38reports, using in 83
Flat filesaccessing 17-19explained 11
Folders 5Fonts
changing in views 82formatting in graphs 92
Footers 83Formatting
graphs 92options in Report dialog box 83views 81-82
FoxPro software 26Functions
BETWEEN( ) 49convert data types, using 39-40explained 6harmonize key fields, using 75ISBLANK( ) 51-52LOWER( ) 75LTRIM( ) 69, 75PROPER( ) 69, 75SUBSTRING( ) 75UPPER( ) 69, 75
GGaps command 50, 52Global filter
creating and applying 38explained 38
Graph options 91-92Graphs
commands that generate 91creating from a view 91drilling down in 92formatting 92reports, enhancing with 80, 91
HHarmonizing key fields 69, 75Header records, in report files 28-31Headers, in reports 83Histogram command 91
IMS 26Index command 66-67Input file definition. See Table layoutISBLANK( ) function 51-52
134 Foundations of ACL: Concepts and Practices
JJoin command
about 69-73compared to Relations 78and duplicate records 73join types explained 70-71rules and guidelines 69
KKey fields
harmonizing 75in Join command 69, 69-72in Relations command 74, 75
Local filter. See Command filterLog sessions 94Log tab 4Logs
about 5, 93-94adding comments to 93exporting from 94searching 94used as audit tool 5used as reporting tool 80viewing 93
LOWER( ) function 69, 75LTRIM( ) function 69, 75
MMany-to-many 69, 71Many-to-one 69, 73, 74Microsoft Access files, accessing 22, 23-25Microsoft Excel files, accessing 11, 23Missing items, identifying 51-52
Modify Column dialog box 82, 85
NNumeric values, recalculating 55
0Objectives, analytical, determining 13ODBC-compliant data
accessing 23-25explained 11refreshing 23, 25
Oracle 23Overview tab 4
PPage
break, inserting 86margins, setting 84width indicator 83
Parent tables, explained 74Print image files. See Report files 11Profiling data, about 58Project contents, printing 95Project Navigator 4Projects
documenting 95explained 5project notes 95
PROPER( ) function 69, 75
QQuick Filter 38Quick Sort 67
RReasonableness, testing data for 56Records
explained 2marked for deletion in dBASE file 27
Refreshing data, from ODBC-compliant database23, 25
Relationdeleting and editing 77indirect, creating 77
Relation testing 56Relations command
about 74-78compared to Join 78and duplicates 74, 75rules and guidelines 74-75
Reliability testing 55Removing
columns 82duplicates 72
Report dialog box 83-86Report files
accessing 28-31explained 11
Reporting ACL results, an overview 80Reports
blank detail lines, suppressing 83creating from a view 81-84Crystal Reports, creating 89-90footers 83graphs, enhancing with 80, 91headers 83layout, designing 83-84multiline, creating 87-88presorting 83previewing 84printing 84
AO:tau!!! E D 135

Index
sorted 85Results tab 80
SSelect Data Source dialog box 22, 23Select Database dialog box 24Sequence command 66Sort command
about 66compared to Index 67
Sortingpresorting 83Quick Sort 67tables 66
Source data, access to 15Statistics command
about 47, 48-49check bounds, using 48-49generate control totals, using 47
Status bar, about 4Stratify command 56, 61, 91SUBSTRING( ) function 75Summarize command
about 54-58compared to Classify 59
summary report 14, 15
Table history 95Table layouts
about 5reusing 33
Tableschild 74creating 17explained 5
parent 74primary 69secondary 69sequence testing 64, 66sorting 66
Total command 46
UUPPER( ) function 69, 75
VValidity errors, checking for 44Variables 6Verify command 44-45Views
adding columns to 81creating 81explained 5formatting 81-82related fields, adding to 76as reports 80, 81
VSAM 26
wWelcome tab, about 4Workspaces 5
xBASE software 26
136 Foundations of ACL: Concepts and Practices
ACL105 - Foundations of ACL: Concepts and Practices Participant Evaluation Form
ACL Training Course Evaluation
Participant's name:
Instructor's name:
Date:
Location:
General Excellent Poor Comments:
Overall impression of the course 5 4 3 2 1
Learning objectives clearly stated 5 4 3 2 1
Learning objectives met 5 4 3 2 1
Prerequisites appropriate 5 4 3 2 1
Instructor Excellent Poor Comments:
Quality of the instructor 5 4 3 2 1
Instructor's presentation methods 5 4 3 2 1
Content presented clearly and concisely 5 4 3 2 1
Course Content Excellent Poor Comments:
Clear and comprehensive 5 4 3 2 1
Timely and relevant 5 4 3 2 1
Topics of interest addressed 5 4 3 2 1
Practice Sessions and Exercises Excellent Poor Comments:
Overall impression 5 4 3 2 1
Number of activities 5 4 3 2 1
Time allotted 5 4 3 2 1
ACEI FLIU 1MR () 08/05/01 ACL Services Ltd.

Participant Evaluation Form ACI.105 - Foundations of ACL: Concepts and Practices
Materials Excellent Poor Comments:
Overall quality 5 4 3 2 1
Helped to achieve learning objective 5 4 3 2 1
Appropriate visual aids 5 4 3 2 1
Course Facility Excellent Poor Comments:
Overall evaluation of facility 5 4 3 2 1
Work stations and equipment 5 4 3 2 1
On-site staff 5 4 3 2 1
General condition (cleanliness, rest rooms, coatcloset, telephone services)
5 4 3 2 1
Additional comments:
Your comments are important to us. Thank you for completingthis survey. Please return this form to your instructor, or mail orfax it to:
ACL Services Ltd.1550 Alberni StreetVancouver, BCCanada V6G 1A5
Telephone: +1-604-669-4225Fax: +1-604-669-4087E-mail: [email protected]: www.acl.com/training