Network capacity reliability analysis considering traffic regulation after a major disaster
15
Network Capacity Reliability Analysis Considering Traffic Regulation after a Major Disaster Agachai Sumalee & Fumitaka Kurauchi # Springer Science + Business Media, LLC 2006 Abstract The focuses of this paper are optimal traffic regulation after a major disaster and evaluation of capacity reliability of a network. The paper firstly dis- cusses the context of traffic regulation and its importance after a major disaster. Then, this problem is formulated as an optimisation program in which the traffic regulator attempts to regulate the amount of traffic movements or access to some areas so as to maximise the traffic volumes in the network while (a) link flows must be less than link capacities and (b) re-routing effect due to changes of traffic condition in the network is allowed. The re-routing behaviour is assumed to follow Probit Stochastic User’s Equilibrium (SUE). The paper explains an optimisation algorithm based on an implicit programming approach for solving this problem with the SUE condition. With this optimisation problem, the randomness of the link capacities (to represent random effects of the disaster) is introduced and the paper describes an approach to approximate the capacity reliability of the network using Monte-Carlo simulation. The paper then adopts this approach to evaluate the performances of different traffic regulation policies with a small network and a test network of Kobe city in Japan. Keywords Network capacity reliability . Traffic regulation . MPEC and Probit Stochastic User Equilibrium 1 Introduction In an urban area, urban activities carried out under a normal circumstance rely largely on transportation systems especially road networks. However, the road network and transportation system in general are not totally disaster-proof. In the Netw Spat Econ (2006) 6: 205–219 DOI 10.1007/s11067-006-9280-0 A. Sumalee (*) Institute for Transport Studies, University of Leeds, 38 University road, Leeds LS2 9JT, UK e-mail: [email protected] F. Kurauchi Kyoto University, Kyoto, Japan
Transcript of Network capacity reliability analysis considering traffic regulation after a major disaster
Network Capacity Reliability Analysis Considering
Traffic Regulation after a Major Disaster
Agachai Sumalee & Fumitaka Kurauchi
# Springer Science + Business Media, LLC 2006
Abstract The focuses of this paper are optimal traffic regulation after a major
disaster and evaluation of capacity reliability of a network. The paper firstly dis-
cusses the context of traffic regulation and its importance after a major disaster. Then,
this problem is formulated as an optimisation program in which the traffic regulator
attempts to regulate the amount of traffic movements or access to some areas so as to
maximise the traffic volumes in the network while (a) link flows must be less than
link capacities and (b) re-routing effect due to changes of traffic condition in the
network is allowed. The re-routing behaviour is assumed to follow Probit Stochastic
User’s Equilibrium (SUE). The paper explains an optimisation algorithm based on an
implicit programming approach for solving this problem with the SUE condition.
With this optimisation problem, the randomness of the link capacities (to represent
random effects of the disaster) is introduced and the paper describes an approach to
approximate the capacity reliability of the network using Monte-Carlo simulation.
The paper then adopts this approach to evaluate the performances of different traffic
regulation policies with a small network and a test network of Kobe city in Japan.
Keywords Network capacity reliability . Traffic regulation . MPEC and Probit
Stochastic User Equilibrium
1 Introduction
In an urban area, urban activities carried out under a normal circumstance rely
largely on transportation systems especially road networks. However, the road
network and transportation system in general are not totally disaster-proof. In the
Netw Spat Econ (2006) 6: 205–219
DOI 10.1007/s11067-006-9280-0
A. Sumalee (*)
Institute for Transport Studies, University of Leeds,
38 University road, Leeds LS2 9JT, UK
e-mail: [email protected]
F. Kurauchi
Kyoto University, Kyoto, Japan
Great Hanshin-Awaji Earthquake occurred in 1995 in Japan, the road network
system was seriously deteriorated and was in fact the infrastructure which was
mostly damaged. Similarly, in the Chi-Chi Earthquake occurred in 1999 in Taiwan
most of the roads and bridges were hampered by the earthquake forcing the
emergency activities to be mainly carried out by helicopter or walking (Chi-Chi
Reconnaissance Team, 2000). In the recent Indian Ocean Tsunami disaster, the road
network in Indonesia in the vicinity of the tsunami wave was disrupted by around
31% (Athukorala and Resosudarmo, 2005).
Generally, the capacity of the deteriorated road network was recovered only
partially by some temporary measures. It is evitable to take a rather longer period
until the full capacity of the road network system can be restored given the level of
damage. However, after the initial period of the disaster various aid activities, emer-
gency or rescue activities, or other normal activities will take place. Kurauchi and
Iida (1998) analysed that changes in the automobile trip pattern within the Hanshin
region road network and discovered a substantial increase in the automobile trips
with a short-distance as compared to the figure in the normal condition. The increase
was mainly related to recovering activities such as purchasing goods and material.
The road network was found to be more robust to the disaster damage as compared
to the other modes (e.g., rail) and after the disaster all travellers will have to inevitably
shift to the road network to access the life supplies (IATSS, Research Report (2000)).
Under this circumstance, the management of the road network is critically important
particularly after the major disaster to cope with the degraded level of capacity and
increase in travel demand in order to ensure the level of service for certain activities.
In the context of network reliability, several researches have been carried out to
address several concerns over the reliability of the transportation network. In
particular, in the field of network analysis against disasters the main aim has been
to evaluate the robustness/vulnerability of the network or identify critical
components of the network. For instance, Du and Nicholson (1997) evaluated the
connectivity reliability of degradable transport networks in which the connectivity
reliability is inferred to the probability of all OD pairs to still be connected after
different possible road closure patterns. Bell (1999) proposed a game theoretic
based approach between the Bevil entity’’ aiming to degrade the network so as to
maximise the total travel time and the travellers re-routing to minimise their travel
time. The result of this game will be the most critical link in the network. D’Este
and Taylor (2003) defined the concept of node vulnerability whose accessibility
index decreases significantly with a small number of links degraded.
Despite the growing interests in the area of network reliability, there have been a
rather small number of researches which evaluate the potential performance of
different traffic management strategies or policies under the disruption. This is
indeed the main focus of this paper where we aim to develop an evaluation scheme
of the performance of different traffic management strategies under the randomly
degraded network condition.
In practice, after a major disaster the assigned network manager (e.g., police) will
be able to implement a form of traffic regulation to control the traffic movement in
the network. For instance, an area access regulation may be put in place to control the
level of traffic entering some particular areas so as to maintain the level of service in
those areas under the degraded network capacity. The legal power or specific strategy
206 A. Sumalee, F. Kurauchi
for the traffic regulation will depend largely on the prior analysis and evaluation. One
of the main indicators which may be adopted to compare the performances of
different regulation strategies (e.g., area access control as contrast to link access
control) is the index of capacity reliability.
The concept of the network capacity reliability was first proposed by Chen et al.
(2002).The network capacity is defined as a uniform multiplier of all OD demands
which generates the equilibrium link flows satisfying link capacities. The
introduction of link capacity in the analysis is to ensure a certain level of service
on all links in the network (e.g., non-congested condition). In this paper, the OD
demand multipliers are allowed to be different by OD movements representing
traffic demand regulation parameters. The capacity reliability for a certain traffic
regulation strategy can then be defined as the probability of that regulation strategy
to generate the allowed traffic volume in the network more than a specified criteria
under the random link capacities.
For a given traffic regulation strategy and a realised state of the degraded link
capacities, the actual traffic demand control parameters (i.e., the value of the OD
demand multiplier) can be optimised so as to maximise the total traffic volume in
the network considering the re-routing behaviour without violating the link capacity
constraints. In this paper, travellers’ route choices are assumed to follow the
concept of Probit stochastic user equilibrium (SUE). This problem can be
categorised as an instance of a Network Design Problem (NDP).
The paper adopts the implicit optimisation approach proposed in Connors et al.
(2006a) to solve this problem. This problem is then integrated as a part of the
overall evaluation framework in which the Monte-Carlo simulation is employed to
randomly generate different states of link capacities (under given probabilities
defined as priori) as an input to the sub-problem. The detail of this overall
evaluation algorithm will be discussed in Section 3.
This paper is structured in to further four sections. The next section presents the
mathematical formulation of the capacity reliability evaluation problem. The third
section explains the solution algorithm for the sub-problem in the evaluation process.
The algorithm will then be used to test the performances of different possible traffic
regulation strategies with a small network for demonstration purpose and with a
network of Kobe city. The last section finally concludes the paper.
2 Mathematical Formulation of Traffic Regulation Problem and Capacity
Reliability Evaluation
2.1 Probit Based Route Choice Equilibrium Model with Capacity Constraint
Let G(A, N) denotes a directed graph comprising of a set of directed arcs, A, and
nodes, N. Let x denoted a vector of link flows with the size of |A|. Define q with the
size of |R| (R is the set of OD pairs) as a vector of travel demand in which each
entry, qrs, is associated with a demand for an OD movement from nodes r to s (r ms; r, s Z N ). For each OD pair, rs, flows can move from r to s through different
paths ( p) in the network. Let f denote the vector of path flows with size equal to the
number of path (|H|, where H is the set of paths) in which each element, fp, denotes
Network Capacity Reliability Analysis Considering Traffic Regulation after a Major Disaster 207
amount of path flow on path p where p Z 9rs, and 9rs denotes the set of paths between
an OD pair rs. The matrix 4 denotes the path-OD incidence matrix (with the size of
|H| � |R|) in which 4p, r = 1 if path p is associated with OD pair r and 0 otherwise.
The relationship between a path and links (i.e., path is a combination of a
number of links in the network) is defined through a path-link incident matrix,
denoted by $ (with the size of |A| � |H|) in which its element, $a, p = 1 if link a is
related to path p and 0 otherwise.
Next, the Probit based Users’ Equilibrium (SUE) condition for travellers’ route
choices is introduced. Define ta(x) and cp( f ) as a link and path cost for link a and
path p, respectively. In this paper, we assume that ta(x) is a continuous twice
differentiable function and monotone with respect the x, and ta(x) is defined
following a standard separable BPR function: ta xð Þ ¼ aa þ b � xa=sað Þla . Define c =
$t for the relationship between path and link costs and the perceived dis-utility of
travelling on path p is:
Up ¼ cp fð Þ þ ep ð1Þ
where the stochastic term, ep, is assumed to be a joint non-degenerate multivariate
normal distribution (a way to define this term will be discussed later in the
numerical example). We assume that the variance–covariance matrix of e to be a
non-singular matrix. The travellers between OD pair rs will choose to travel on the
path with the minimum perceived dis-utility. The corresponding choice probability
of path p can then be defined as:
Pp Uð Þ ¼ Pr Up � U~pp8epp 2 Prs
� �
ð2Þ
Thus, we can define the fixed point condition for the Probit SUE as:
x ¼ D � W � qð Þ � P DT � t xð Þ� �� �
ð3Þ
where � and � denotes the element-wise multiplication and division operators for
matrices in which A � B = C (A, B, and C have the same size) and ci, j = ai, j � bi, j
(i and j denotes row and column of the matrices, respectively). Following the
Brower’s fixed point condition, it is trivial to prove that for a given vector of q
there exists a solution vector x which satisfies Eq. (3). Denote x* as vector of SUE
link flows satisfying the fixed-point condition in Eq. (3).
2.2 Traffic Regulation Problem Formulation as MPEC
In this section we will formulate this problem as a Mathematical Program with
Equilibrium Constraints (MPEC). Let q denote a vector with the size of |R| in which
each entry, 0 e qrs e 1, represents the ratio of traffic allowed to travel between the
OD pair rs. For a given normal travel demand between OD pair rs, denoted qrs, the
allowed amount of traffic to travel after a major disaster will be qrsqrs. Thus,
the total amount of traffic in the network can be defined as qT � q. In the traffic
regulation problem, the regulator attempts to set q so as to maximise the total traffic
volumes in the network whilst keeping the link flows lower than the link capacities,
208 A. Sumalee, F. Kurauchi
sj, to avoid any congestion. This can be defined mathematically as (referred to as
the REG-problem):
Maxx;qð Þ
Z � qT � qs:t:
x* qð Þ � s
0 � q � 1
ð4Þ
where following the description in the previous section x*(q) is defined as the SUE
link flow vector for a given vector of demand (controlled by q) satisfying the fixed-
point condition of:
x* ¼ D � W � q� qð Þ � P DT � t x*ð Þ� �� �
ð5Þ
For a given vector of q, the existence of x*(q), again, follows the Brower fixed-
point theorem. Note that the SUE link-flow in Eq. (4) is written as an implicit
function of q to signify that as the allowed travel demand in the network change the
SUE link flows may also change accordingly. The constraint of x*(q) e s, where s
is a vector of link capacity, ensures that the resulting SUE flows do not violate the
link capacities.
The objective function from the solution of Eq. (4) can be considered as the
capacity of the degraded network. This can be used to evaluate the capacity
reliability of the network as defined in the next section. The existence of a solution
of Eq. (4) can be shown that for a given value of q � q, one can reduce the level of
demand in the network until all SUE link flows satisfy the link capacities. The
trivial case for this is that of q = 0. Thus, the REG-problem definitely has at least
one solution satisfying the optimality condition.
2.3 Definition of Capacity Reliability
Given a directed graph G(A, N), each link a Z A may be degraded by the effect of
the disaster. We assume that the nodes in the network will not be degraded in this
analysis for simplicity. Once a link is degraded, its capacity may be reduced (which
may be due to a closure of lanes, road disruption, etc.). We assume that each link
has an independent probability of failure (0 e +a e 1) and uniform probability of the
level of degradation. With a realised state of the link capacities in the network (after
the disaster), the traffic regulation scheme as described by Eq. (4) is assumed to be
in place. The probability of each state of the network is denoted by �k.
From Eq. (4), we can obtain the maximum level of travel demands in the
network which are allowed to travel, denoted Ok. Let O* denotes the traffic volume
as defined by Eq. (4) with a non-degraded network. We can then define the ratio
between the traffic volumes after and before the degradation of the network (under
state k) as mk = Ok/O*. Indeed, Chen et al. (2002) adopted this measure to define the
capacity reliability as:
R mð Þ � Pr mk � mð Þ ¼X
8khk � akð Þ ð6Þ
Network Capacity Reliability Analysis Considering Traffic Regulation after a Major Disaster 209
where m is defined as an acceptable level of capacity of the network (defined by the
regulator) and !k = 1 if mk � m � 0 and 0 otherwise.
Evaluating Eq. (6) exactly for all possible network states may be too
computationally intensive and even impossible for the case with continuous
capacity. For instance, for a network with 50 links (and assume three discrete levels
of link capacity after degradation), there will be around 350 states. If we assume a
continuous level of degraded capacity, the number of possible states becomes
infinite. Thus, we adopt the method of Monte-Carlo simulation to estimate the
capacity reliability measure. The procedure is as follows:
Step 0: Set sample number k = 1;
Step 1: Generate a uniform random number Ya ranging from 0 to 1 for each link;
Step 2: if Ya < +a (link failure probability), generate another uniform random
number Ba, and reduce the capacity of link a as (1 j CaBa) sa, where Ca
is an input parameter.
Step 3: Solve the REG problem to obtain Ok, maximum traffic volume accepted
on the degraded network of k.
Step 4: If k < kmax, k = k + 1 and go to Step 1. Otherwise terminate.
From Ok, capacity network measures considering traffic regulation with threshold
of m can be calculated as follows.
R mrð Þ ¼ Pr m � mrð Þ ¼X
kmax
k¼1
uk;m
,
kmax
where uk;m ¼ 1 if Ok=O* � m, and 0 otherwise.
3 Implicit Optimisation Algorithm for Optimal Traffic Regulation Problem
The REG problem as defined in Eq. (4) can be solved by many available opti-
misation routines provided that the derivatives of all functions involved can be
calculated. In this case, we adopt the sequential quadratic programming (SQP)
algorithm from the Ffmincon_ solver in MATLAB\ (see Bazaraa et al., 1993 for the
detail of SQP). Noteworthy that due to the non-convexity of the SUE link-flows as
a function of q, there could be multiple optimal solutions for the REG problem.
Under this condition, we can only guarantee the local optimum from the optimi-
sation algorithm.
The objective function and the bound constraints of q in Eq. (4) are relatively
simple in which their values and related derivatives can be analytically defined. For
the non-linear inequality constraints of the SUE link-flows and the link capacities,
the evaluation of these constraints involves solving the Probit SUE assignment for a
given vector of q. In this paper, the algorithm for finding SUE link flows for a
given vector of q employs the method of successive average as defined in Sheffi
(1985) and the method of (Mendell and Elston, 1974) is adopted for evaluating the
Probit path choice probability. Note that other alternative methods can also be
adopted to carry out this task (see Rosa, 2003 for further discussions).
210 A. Sumalee, F. Kurauchi
The derivative of x*(q) with respect to q can be defined through the sensitivity
analysis of the SUE link flows with the perturbation of q (Clark and Watling,
2002). Briefly, a gap function of Eq. (5) can be defined as:
g qð Þ ¼ x*� D � W � q� qð Þ � P DT � t x*ð Þ� �� �
ð7Þ
Applying the Taylor first order approximation to g(q) around q0 and x*(q0)
yields:
g qð Þ g q0ð Þ þ rxg q0ð Þ � x* qð Þ � x* q0ð Þð Þ þ rqg q0ð Þ � q � q0ð Þ ð8Þ
where lxg(q0) and rqg q0ð Þ are the jacobians (evaluated at q0) of the gap function
vector with respect to x and q, respectively, which are:
rxg q0ð Þ ¼ I� D � W � q� qð Þ � 1 1; Hj jð Þ � I� � �rCP �DT �rxt
rqg q0ð Þ ¼ �D � P� W �rqqð Þð Þð9Þ
From Eq. (8) since the values of the gap function at q and q0 must be both zero,
one obtains:
x* qð Þ � x* q0ð Þq � q0
� rxg q0ð Þð Þ�1 � rqg q0ð Þ ð10Þ
Then, the gradient of the SUE link flows with respect to q can be derived as:
rqx* qð Þ ¼ limq!q0
x* qð Þ � x* q0ð Þq � q0
¼ � rxg q0ð Þð Þ�1 � rqg q0ð Þ ð11Þ
see Sumalee et al. (2006) and Connors et al. (2006b) for the discussion on the
numerical calculation and existence of Eq. (11).
4 Numerical and Policy Tests
4.1 Test with a Five-link Network
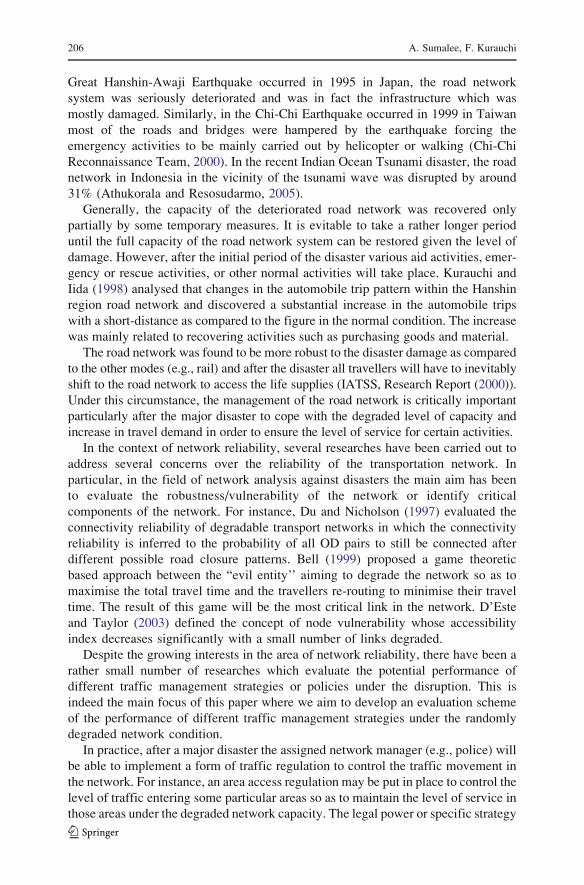
This section illustrates the application of the methodology proposed in Sections 2
and 3 to a toy network example. The five link network with two OD pairs as shown
in Fig. 1 is adopted for the test. The variance–covariance matrix of perceived path
costs is derived from the pre-defined values of the variances of perceived link travel
costs using the link-path incidence matrix. For instance, path 1 in the five-link
network is defined as the path from links 1 to 4 and path 3 in the network is defined
as the path from links 1 to 3 and 5. If the link variances of all links are defined as 1,
then the covariance between paths 1 and 3 is 1 (due to the variance on link 3 which
is the overlapping link of both paths).
In this test, the link cost variances for all links are defined as 1. Two OD pairs
are defined, from nodes 1 to 4 and from nodes 1 to 3. The total demands in the base
case for these two OD pairs are assumed to be 10. The initial test is conducted to
investigate the performance of the implicit programming in solving the problem.
With the normal probit SUE condition, the equilibrium link flows are 15.2129,
Network Capacity Reliability Analysis Considering Traffic Regulation after a Major Disaster 211
4.7871, 9.8929, 5.32, and 4.68 for links 1 to 5 in that order. In the initial test, the
capacity of all links is set to be 10. The implicit programming algorithm is then
applied to solve the REG and gave q1 = 1.00 and q2 = 0.3912 as the optimal
solution with the total demand in the network of 13.9121. The resulting SUE flows
are 10, 3.9121, 7.5747, 2.4253, and 1.4869 for links 1 to 5, respectively, which all
satisfy the link capacities of 10.
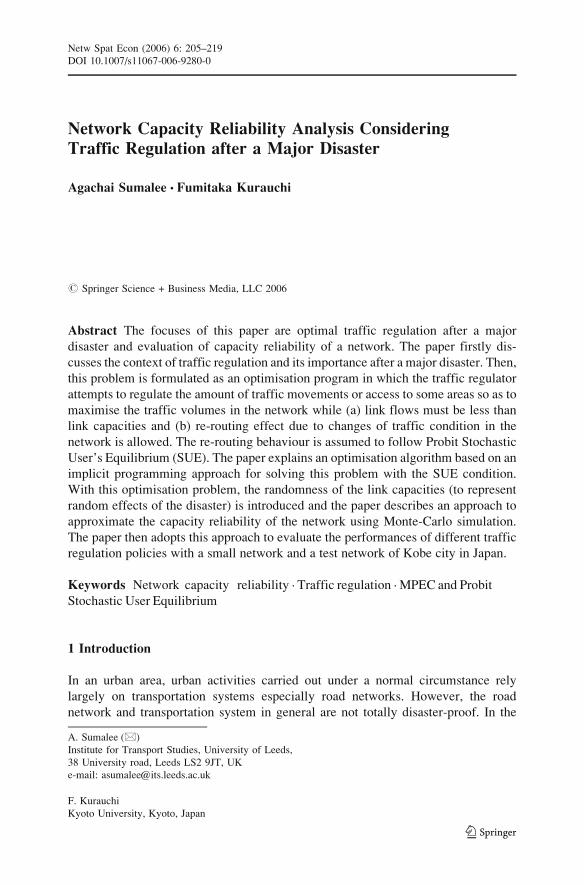
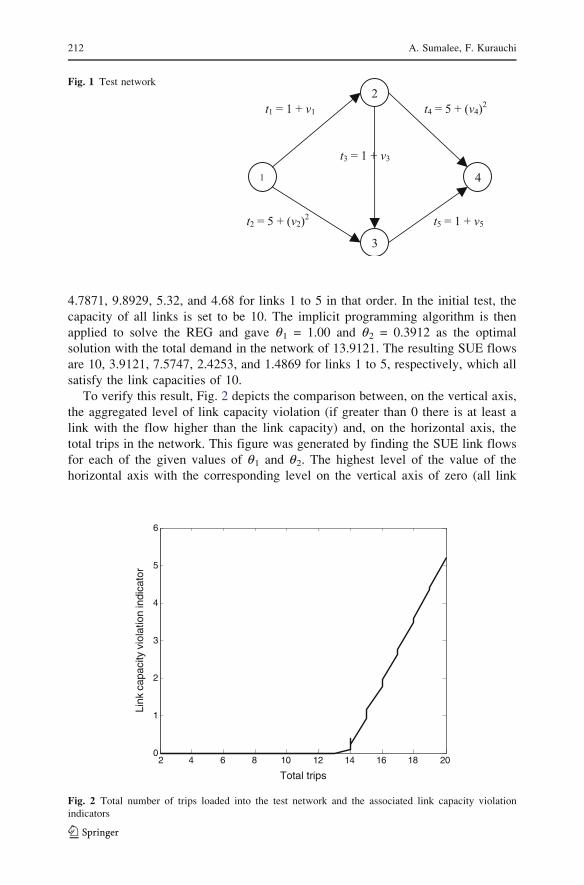
To verify this result, Fig. 2 depicts the comparison between, on the vertical axis,
the aggregated level of link capacity violation (if greater than 0 there is at least a
link with the flow higher than the link capacity) and, on the horizontal axis, the
total trips in the network. This figure was generated by finding the SUE link flows
for each of the given values of q1 and q2. The highest level of the value of the
horizontal axis with the corresponding level on the vertical axis of zero (all link
2 4 6 8 10 12 14 16 18 200
1
2
3
4
5
6
Total trips
Link
cap
acity
vio
latio
n in
dica
tor
Fig. 2 Total number of trips loaded into the test network and the associated link capacity violation
indicators
1
3
2
4
t1 = 1 + v1
t2 = 5 + (v2)2
t3 = 1 + v3
t4 = 5 + (v4)2
t5 = 1 + v5
Fig. 1 Test network
212 A. Sumalee, F. Kurauchi
flows satisfies the link capacities) is between 13 and 14 which is consistent with the
result from the implicit programming (13.9121).
After this initial test, two cases of traffic regulation are defined for testing their
performances in terms of the network capacity reliability. The first is with two
parameters of OD demand control, q1 and q2, one for each OD pair controlling the
level of OD demand allowed to travel in the network. The second case is with only
one parameter of OD demand control applied to both OD pair, q1.
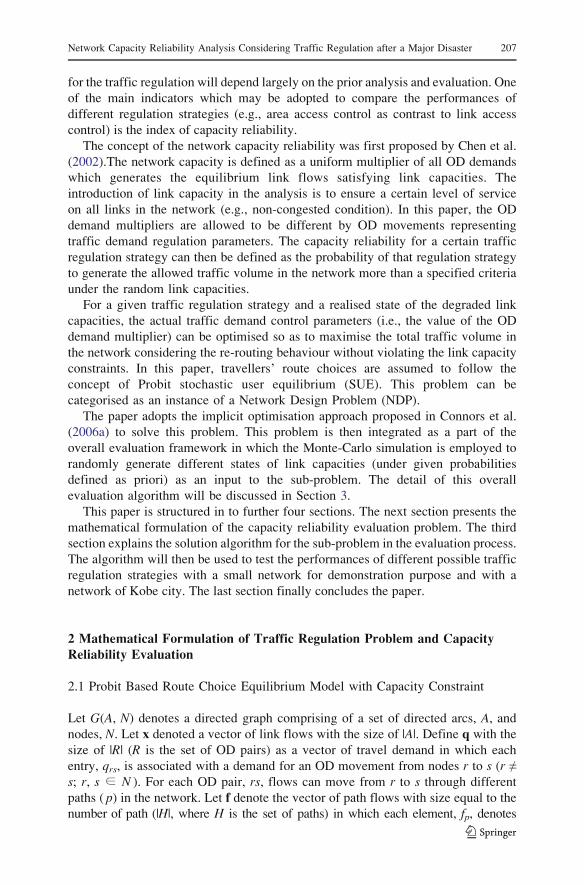
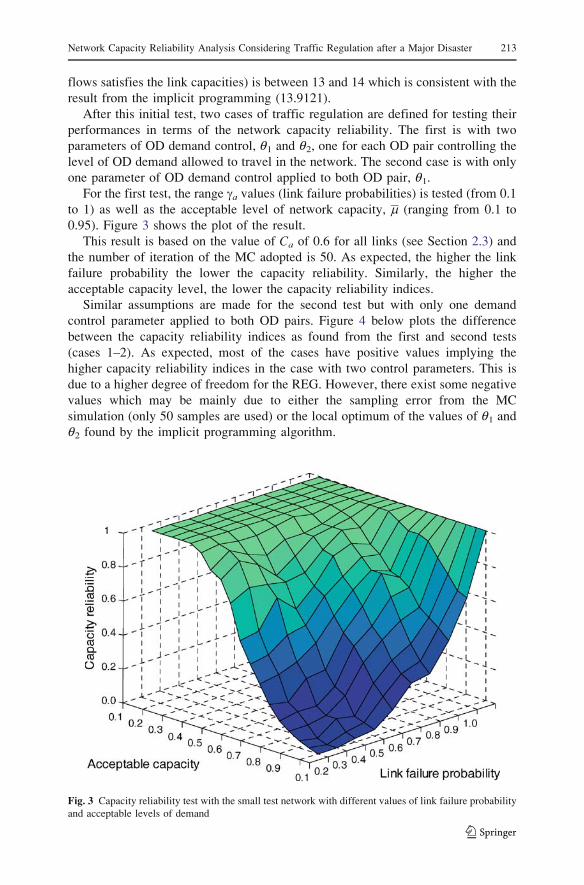
For the first test, the range +a values (link failure probabilities) is tested (from 0.1
to 1) as well as the acceptable level of network capacity, m (ranging from 0.1 to
0.95). Figure 3 shows the plot of the result.
This result is based on the value of Ca of 0.6 for all links (see Section 2.3) and
the number of iteration of the MC adopted is 50. As expected, the higher the link
failure probability the lower the capacity reliability. Similarly, the higher the
acceptable capacity level, the lower the capacity reliability indices.
Similar assumptions are made for the second test but with only one demand
control parameter applied to both OD pairs. Figure 4 below plots the difference
between the capacity reliability indices as found from the first and second tests
(cases 1–2). As expected, most of the cases have positive values implying the
higher capacity reliability indices in the case with two control parameters. This is
due to a higher degree of freedom for the REG. However, there exist some negative
values which may be mainly due to either the sampling error from the MC
simulation (only 50 samples are used) or the local optimum of the values of q1 and
q2 found by the implicit programming algorithm.
Fig. 3 Capacity reliability test with the small test network with different values of link failure probability
and acceptable levels of demand
Network Capacity Reliability Analysis Considering Traffic Regulation after a Major Disaster 213
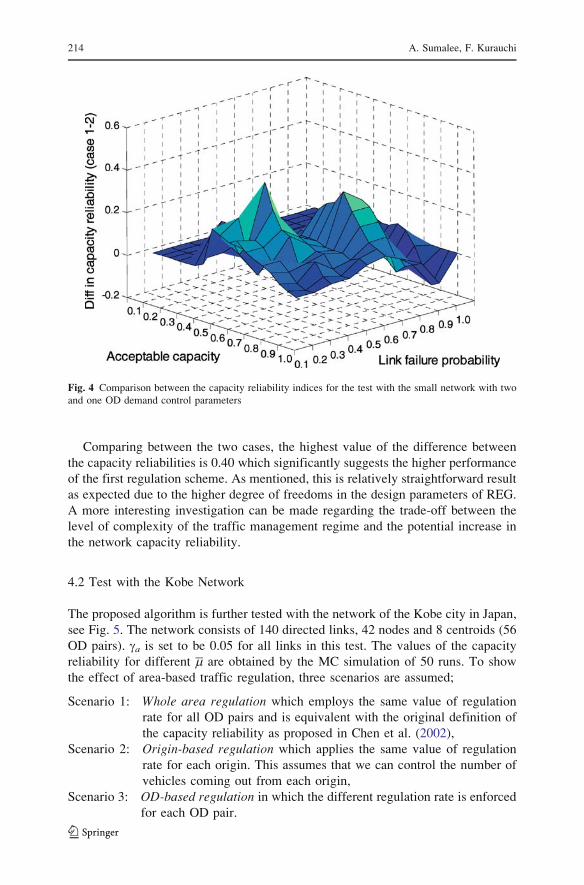
Comparing between the two cases, the highest value of the difference between
the capacity reliabilities is 0.40 which significantly suggests the higher performance
of the first regulation scheme. As mentioned, this is relatively straightforward result
as expected due to the higher degree of freedoms in the design parameters of REG.
A more interesting investigation can be made regarding the trade-off between the
level of complexity of the traffic management regime and the potential increase in
the network capacity reliability.
4.2 Test with the Kobe Network
The proposed algorithm is further tested with the network of the Kobe city in Japan,
see Fig. 5. The network consists of 140 directed links, 42 nodes and 8 centroids (56
OD pairs). +a is set to be 0.05 for all links in this test. The values of the capacity
reliability for different m are obtained by the MC simulation of 50 runs. To show
the effect of area-based traffic regulation, three scenarios are assumed;
Scenario 1: Whole area regulation which employs the same value of regulation
rate for all OD pairs and is equivalent with the original definition of
the capacity reliability as proposed in Chen et al. (2002),
Scenario 2: Origin-based regulation which applies the same value of regulation
rate for each origin. This assumes that we can control the number of
vehicles coming out from each origin,
Scenario 3: OD-based regulation in which the different regulation rate is enforced
for each OD pair.
Fig. 4 Comparison between the capacity reliability indices for the test with the small network with two
and one OD demand control parameters
214 A. Sumalee, F. Kurauchi
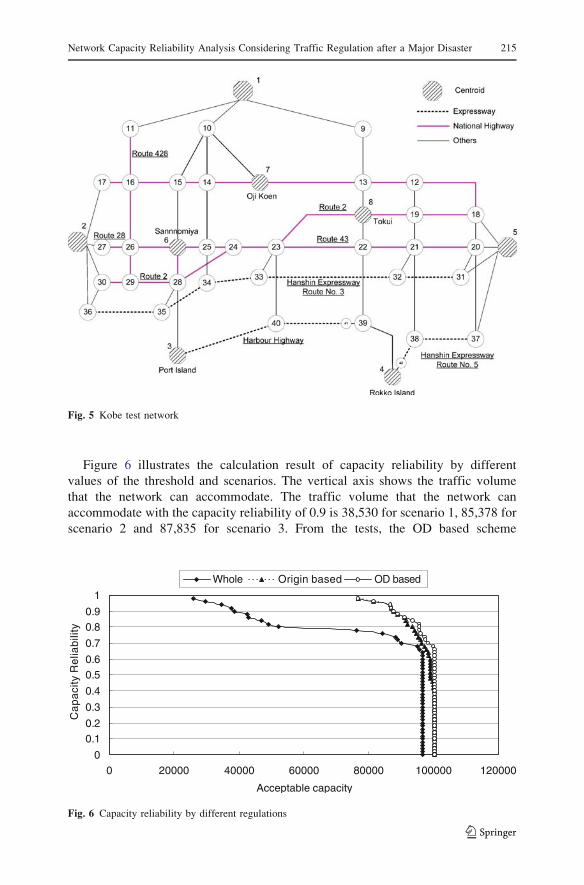
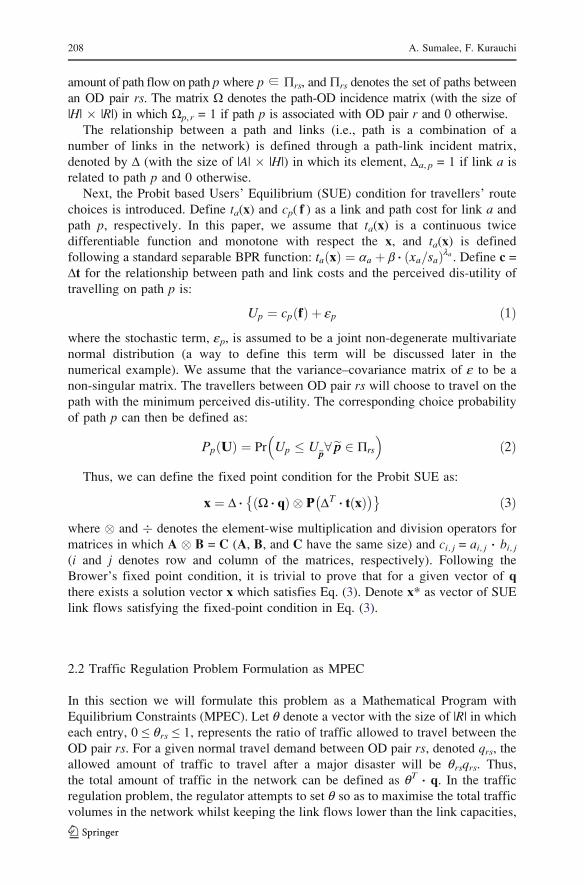
Figure 6 illustrates the calculation result of capacity reliability by different
values of the threshold and scenarios. The vertical axis shows the traffic volume
that the network can accommodate. The traffic volume that the network can
accommodate with the capacity reliability of 0.9 is 38,530 for scenario 1, 85,378 for
scenario 2 and 87,835 for scenario 3. From the tests, the OD based scheme
Fig. 5 Kobe test network
0
0.10.2
0.3
0.4
0.50.6
0.7
0.80.9
1
0 20000 40000 60000 80000 100000 120000
Acceptable capacity
Ca
pa
city
Re
liab
ility
Whole Origin based OD based
Fig. 6 Capacity reliability by different regulations
Network Capacity Reliability Analysis Considering Traffic Regulation after a Major Disaster 215
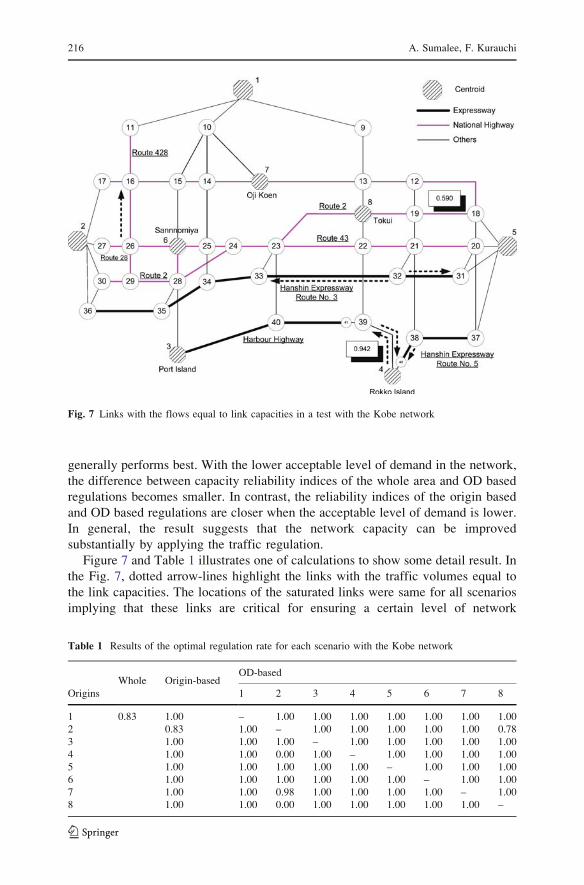
generally performs best. With the lower acceptable level of demand in the network,
the difference between capacity reliability indices of the whole area and OD based
regulations becomes smaller. In contrast, the reliability indices of the origin based
and OD based regulations are closer when the acceptable level of demand is lower.
In general, the result suggests that the network capacity can be improved
substantially by applying the traffic regulation.
Figure 7 and Table 1 illustrates one of calculations to show some detail result. In
the Fig. 7, dotted arrow-lines highlight the links with the traffic volumes equal to
the link capacities. The locations of the saturated links were same for all scenarios
implying that these links are critical for ensuring a certain level of network
Fig. 7 Links with the flows equal to link capacities in a test with the Kobe network
Table 1 Results of the optimal regulation rate for each scenario with the Kobe network
Whole Origin-basedOD-based
Origins 1 2 3 4 5 6 7 8
1 0.83 1.00 – 1.00 1.00 1.00 1.00 1.00 1.00 1.00
2 0.83 1.00 – 1.00 1.00 1.00 1.00 1.00 0.78
3 1.00 1.00 1.00 – 1.00 1.00 1.00 1.00 1.00
4 1.00 1.00 0.00 1.00 – 1.00 1.00 1.00 1.00
5 1.00 1.00 1.00 1.00 1.00 – 1.00 1.00 1.00
6 1.00 1.00 1.00 1.00 1.00 1.00 – 1.00 1.00
7 1.00 1.00 0.98 1.00 1.00 1.00 1.00 – 1.00
8 1.00 1.00 0.00 1.00 1.00 1.00 1.00 1.00 –
216 A. Sumalee, F. Kurauchi
capacity. The rectangles and the contained values mark the degraded links and their
rates of degradation. In this example, the capacity degradation of the link from
nodes 4 to 39 decreases the total network capacity substantially. This link is the
only outgoing link from zone 4 which is not the case for the other zones. Thus, the
degradation on this link should inevitably decrease the level of demand from zone 4
which can enter the network.
In scenario 1, only 83% of the original demand can be accepted. In scenario 2,
travel demands from all origins except that from origin 2 can be accommodated. In
this case, applying the origin-based traffic regulation increases the network capacity
from 84,277 (from the test with the whole area regulation) to 96,916. If OD-based
traffic regulation (Scenario 3) can be implemented, the network capacity can be
further increased to 98,635. In this case, the OD pairs with the suppressed demand
levels are (4,2), (7,2), (8,2) and (2,8) which are all related to the traffic originated and
destined at zone 2. In particular, the regulation rate of OD pair (4,2) and (8,2) are set
to be zero. This implies that an efficient traffic regulation scheme does not
necessarily involve many OD pairs in the network. However, this result can be
highly subject to the network and demand configuration. Nevertheless, this result
highlights the benefit of using this kind of analysis to detect the most important travel
movements or links for ensuring a certain level of network capacity reliability.
5 Conclusions
The road network becomes extremely important after the major disaster. This is due
to the decoupled effect of the degraded level of the link capacity and the sudden
increase in the number of short-trips made by private cars to access goods and
necessary life recovering activities as the systems of the other modes of transport
can be more disrupted than the road network. Under such a degraded condition, the
network manager may have to implement a form of traffic regulation to ensure a
certain level of service (to avoid congestion). One measure to evaluate the
performance of different traffic management schemes is the capacity reliability.
In this paper, the capacity reliability index refers to the probability of a certain
traffic regulation measure to induce an acceptable level of travel demand in the
network without violating the link capacities (possibly degraded). For a given state
of the link capacities in the network, the problem of evaluating optimal traffic
regulation parameters and the associated level of traffic demand allowed in the
network can be formulated as a Network Design Problem. The concept of Probit
SUE was introduced in the paper to represent travellers’ route choices.
The method of sensitivity analysis was then proposed for the calculation of the
derivative of the SUE link flows with respect to the traffic regulation parameters
governing the level of travel demand for a certain movement. This derivative can
then be used in any optimisation algorithm to solve the optimal traffic regulation
problem. This problem is then integrated with the method of Monte-Carlo
simulation which will randomly generate different states of the network (i.e., link
capacities) from given statistical parameters of the possibility of each link to be
disrupted. This method can be used to evaluate the capacity reliability index.
Network Capacity Reliability Analysis Considering Traffic Regulation after a Major Disaster 217
The algorithm was then tested with the five-link network and the network of the
Kobe city in Japan. Different tests with different degrees of freedom of the traffic
regulation parameters were carried out. Generally, the results from the tests with
both network suggested a possible higher level of network capacity reliability with
the regulation scheme with a higher degree of freedom (e.g., the scheme applying
OD based traffic regulation has a higher degree of freedom than the whole area
traffic regulation scheme). However, it is also found that an efficient control of the
travel demand in the network to improve its capacity is not necessarily involved
with a high proportion of the trips in the network. In the test with the Kobe network,
mainly the trips associated with zone 2 were controlled under the OD-based
regulation scheme. However, this result may depend largely on the network and
demand configuration. Future research should investigate this pattern. In addition, a
problem of optimal network improvement to improve the network capacity
reliability is also an interesting topic for further investigation.
Acknowledgments The first authors would like to thank Prof. David Watling and Dr. Richard Connors
for their contributions on the development of the sensitivity analysis method of the Probit SUE flows. He
also would like to thank the UK EPSRC for the financial support.
References
Athukorala PC, Resosudarmo BP (2005) The Indian Ocean tsunami: economics impact, disaster
management and lessons, Working Paper in Trade and Development No 2005/05, Division of
Economics, the Australian National University
Bazaraa MS, Sherali HD, Shetty CM (1993) Nonlinear programming: theory and algorithms. John Wiley
& Sons, Inc., New York
Bell MGH (1999) Measuring network reliability: a game theoretic approach. J Adv Transp 33(2):
135–146
Chen A, Yang H, Lo HK, Tang WH (2002) Capacity reliability of a road network: an assessment
methodology and numerical results. Transp Res, Part B: Methodol 36(3):225–252
Chi-Chi Reconnaissance Team (2000) BEvent report: Chi-CHi, Taiwan earthquake.’’ Risk Management
Solutions, California, USA
Clark SD, Watling DP (2002) Sensitivity analysis of the probit-based stochastic user equilibrium
assignment model. Transp Res, Part B: Methodol 36(7):617–635
Connors R, Sumalee A, Watling DP (2006a) Variable demand probit-based network design problem:
implicit programming approach. Transp Res, Part B: Methodol. Submitted
Connors RD, Sumalee A, Watling DP (2006b) Sensitivity analysis of the variable demand probit
stochastic user equilibrium with multiple user-classes. Transp Res, Part B: Methodol. Submitted
D’Este GM, Taylor MAP (2003) Network vulnerability: an approach to reliability analysis at the level of
national strategic transport networks. In: Bell MGH, Iida Y (eds.) The network reliability of
transport. Pergamon, Oxford
Du ZP, Nicholson AJ (1997) Degradable transportation systems: sensitivity and reliability analysis.
Transp Res, B: Methodol 31(3):225–237
IATSS, Research Report (2000) Study on personal passenger car traffic regulation following the great
earthquake disaster (in Japanese)
Kurauchi F, Iida Y (1998) Study on origin/destination flow fluctuations in the period following the Great
Hansin-Awaji earthquake. IATSS Rev 23(3):146–154 (in Japanese)
Mendell NR, Elston RC (1974) Multifactorial qualitative traits: genetic analysis and prediction of
recurrence risks. Biometrics 30:41–57
Rosa A (2003) Probit based methods in traffic assignment and discrete choice modelling, PhD thesis,
Napier University
218 A. Sumalee, F. Kurauchi
Sheffi Y (1985) Urban transportation networks: equilibrium analysis with mathematical programming
methods. Prentice-Hall, Englewood Cliffs, New Jersey
Sumalee A, Connors R, Watling DP (2006) Optimal toll design problem with improved behavioural
equilibrium model: the case of Probit model. In: Lawphongpanich S, Hearn DW, Smith MJ
(eds.) Mathematical and computational models for congestion charging. Springer, Berlin
Heidelberg New York
Network Capacity Reliability Analysis Considering Traffic Regulation after a Major Disaster 219