Nematode diversity and its relation to the quantity and quality of sedimentary organic matter in the...
19
Nematode diversity and its relation to the quantity and quality of sedimentary organic matter in the deep Nazare ´ Canyon, Western Iberian Margin Jeroen Ingels a, , Konstadinos Kiriakoulakis b , George A. Wolff b , Ann Vanreusel a a Marine Biology Department, Ghent University, Krijgslaan 281 S8, 9000 Ghent, Belgium b Department of Earth & Ocean Sciences, University of Liverpool, 4 Brownlow Street, Liverpool L69 3BX, United Kingdom article info Article history: Received 9 September 2008 Received in revised form 27 April 2009 Accepted 28 April 2009 Available online 7 May 2009 Keywords: Nazare ´ Submarine canyons Deep sea Meiobenthos Nematodes Sedimentary organic matter Diversity Western Iberian Margin abstract Samples collected in the deep Nazare ´ Canyon and at the adjacent slope, during the HERMES RRS Discovery D297 cruise (2005), were analysed for metazoan meiofauna, nematode structure and diversity and its relation to quality and quantity of sedimentary organic material. The amount and quality of organic matter available for direct consumption was much higher in the canyon compared to the slope and positively correlated with high nematode abundances (795–1171 ind. 10 cm 2 ) and biomass (93.2–343.5 mg dry weight 10 cm 2 ), thus leading to higher standing stocks. Canyon nematode assemblages also showed particular adaptations (e.g. higher trophic complexity, variability of nematode morphology, and presence of opportunistic genera) to canyon conditions, particularly in the deeper sediment layers. The Nazare ´ Canyon’s nematode diversity was slightly lower than that of the adjacent slope and its assemblages were characterised by a higher dominance of certain genera. Still, the canyon contributes considerably to total Western Iberian Margin diversity due to different assemblages present compared to the slope. Furthermore, the harsh conditions in terms of hydrodynamic disturbance and the high organic matter flux are likely to have a negative impact on the establishment of species rich meiobenthic communities, especially in the canyon axis. & 2009 Elsevier Ltd. All rights reserved. 1. Introduction Submarine canyons are deep, narrow fissures that cut into the continental shelf and slope (Shepard and Dill, 1966) and represent some of the most pervasive struc- tures that shape the present morphology of many continental margins (Mulder et al., 2004). However, these impressive features have remained one of the most difficult environments to study in the deep sea because of their narrow sinuous structure, instability and often vigorous internal currents with a reversal of up- and down-canyon flow (Shepard et al., 1974a,b; Shepard and Dill, 1977; Quaresma et al., 2007). Submarine canyons are important, preferential conduits for the transport of sediment and organic carbon (OC) from shelf depths to the deep sea (e.g. Gardner, 1989; Durrieu de Madron, 1994; Puig and Palanques, 1998; Schmidt et al., 2001; Palanques et al., 2005a), but can also act as traps for carbon (Oliveira et al., 2007; Arzola et al., 2008). While canyon heads with steep sloped walls are known to gather inflowing organic matter (OM), the canyon axes are active zones for channelling and transporting the OM down- canyon by means of bottom nepheloid layers, gravity flows, and turbidity currents (Buscail and Germain, 1997; Contents lists available at ScienceDirect journal homepage: www.elsevier.com/locate/dsri Deep-Sea Research I ARTICLE IN PRESS 0967-0637/$ - see front matter & 2009 Elsevier Ltd. All rights reserved. doi:10.1016/j.dsr.2009.04.010 Corresponding author. Tel.: +32 9 264 85 31; fax: +32 9 264 85 98. E-mail addresses: [email protected] (J. Ingels), [email protected] (K. Kiriakoulakis), [email protected] (G.A. Wolff), [email protected] (A. Vanreusel). Deep-Sea Research I 56 (2009) 1521–1539
Transcript of Nematode diversity and its relation to the quantity and quality of sedimentary organic matter in the...

ARTICLE IN PRESS
Contents lists available at ScienceDirect
Deep-Sea Research I
Deep-Sea Research I 56 (2009) 1521–1539
0967-06
doi:10.1
� Cor
E-m
kos@liv
Ann.Van
journal homepage: www.elsevier.com/locate/dsri
Nematode diversity and its relation to the quantity and quality ofsedimentary organic matter in the deep Nazare Canyon, WesternIberian Margin
Jeroen Ingels a,�, Konstadinos Kiriakoulakis b, George A. Wolff b, Ann Vanreusel a
a Marine Biology Department, Ghent University, Krijgslaan 281 S8, 9000 Ghent, Belgiumb Department of Earth & Ocean Sciences, University of Liverpool, 4 Brownlow Street, Liverpool L69 3BX, United Kingdom
a r t i c l e i n f o
Article history:
Received 9 September 2008
Received in revised form
27 April 2009
Accepted 28 April 2009Available online 7 May 2009
Keywords:
Nazare
Submarine canyons
Deep sea
Meiobenthos
Nematodes
Sedimentary organic matter
Diversity
Western Iberian Margin
37/$ - see front matter & 2009 Elsevier Ltd. A
016/j.dsr.2009.04.010
responding author. Tel.: +32 9 264 85 31; fax:
ail addresses: [email protected] (J. Ingel
erpool.ac.uk (K. Kiriakoulakis), [email protected]
[email protected] (A. Vanreusel).
a b s t r a c t
Samples collected in the deep Nazare Canyon and at the adjacent slope, during the
HERMES RRS Discovery D297 cruise (2005), were analysed for metazoan meiofauna,
nematode structure and diversity and its relation to quality and quantity of sedimentary
organic material. The amount and quality of organic matter available for direct
consumption was much higher in the canyon compared to the slope and positively
correlated with high nematode abundances (795–1171 ind. 10 cm�2) and biomass
(93.2–343.5mg dry weight 10 cm�2), thus leading to higher standing stocks. Canyon
nematode assemblages also showed particular adaptations (e.g. higher trophic
complexity, variability of nematode morphology, and presence of opportunistic genera)
to canyon conditions, particularly in the deeper sediment layers. The Nazare Canyon’s
nematode diversity was slightly lower than that of the adjacent slope and its
assemblages were characterised by a higher dominance of certain genera. Still, the
canyon contributes considerably to total Western Iberian Margin diversity due to
different assemblages present compared to the slope. Furthermore, the harsh conditions
in terms of hydrodynamic disturbance and the high organic matter flux are likely to
have a negative impact on the establishment of species rich meiobenthic communities,
especially in the canyon axis.
& 2009 Elsevier Ltd. All rights reserved.
1. Introduction
Submarine canyons are deep, narrow fissures that cutinto the continental shelf and slope (Shepard and Dill,1966) and represent some of the most pervasive struc-tures that shape the present morphology of manycontinental margins (Mulder et al., 2004). However, theseimpressive features have remained one of the mostdifficult environments to study in the deep sea because
ll rights reserved.
+32 9 264 85 98.
s),
(G.A. Wolff),
of their narrow sinuous structure, instability and oftenvigorous internal currents with a reversal of up- anddown-canyon flow (Shepard et al., 1974a, b; Shepard andDill, 1977; Quaresma et al., 2007). Submarine canyons areimportant, preferential conduits for the transport ofsediment and organic carbon (OC) from shelf depths tothe deep sea (e.g. Gardner, 1989; Durrieu de Madron,1994; Puig and Palanques, 1998; Schmidt et al., 2001;Palanques et al., 2005a), but can also act as traps forcarbon (Oliveira et al., 2007; Arzola et al., 2008). Whilecanyon heads with steep sloped walls are known to gatherinflowing organic matter (OM), the canyon axes are activezones for channelling and transporting the OM down-canyon by means of bottom nepheloid layers, gravityflows, and turbidity currents (Buscail and Germain, 1997;

ARTICLE IN PRESS
J. Ingels et al. / Deep-Sea Research I 56 (2009) 1521–15391522
van Weering et al., 2002; Canals et al., 2006; de Stigteret al., 2007; Garcia et al., 2008). This makes submarinecanyons favourable sites for the concentration andaccumulation of sediments (Thorbjarnarson et al., 1986;Schmidt et al., 2001), with episodic release of thesesediments to the abyssal plain, and important in budget-ing carbon sinks and sources (Thomsen et al., 2002;Accornero et al., 2003).
Despite the increasing number of studies, questions asto the nature and fate of OM transported through canyonsremain, i.e. its origin and utilisation by the resident fauna.Remains of macroalgae from near-shore growth aretransported to canyon heads by longshore transportenriching the canyon system (Kiriakoulakis and Wolff,2007). This OM enrichment can lead to enhanced(in)faunal density and biomass (Rowe et al., 1982; Soetaertet al., 1991; Vetter and Dayton, 1998, 1999; Palanqueset al., 2005b) and increased sediment community oxygenconsumption rates (Duineveld et al., 2001; Accorneroet al., 2003). Enhanced burial of OC in canyon sedimentssuggests that the settled and reworked OM is no longerbiologically labile. However, higher C/N ratios in canyonsediments relative to the open slope indicate that therecan be an elevated contribution of terrestrial/riverinematerial to these sediments (Frignani et al., 2002;Schmiedl et al., 2004; Heussner et al., 2006). Conversely,sediments in canyons that are not directly associated witha river system, can be enriched in labile phytodetrital OM,possibly as a result of transport through the canyon(Duineveld et al., 2001). Thus there is variability in theprocesses that control OM transport and fate in sea-floorcanyon sediments, and part of the shelf/slope productivitymay also be concentrated here.
In general, meiobenthos densities, biomass, and meta-bolic activity are positively correlated with the presentlevels and lability of OM reaching the deep-sea floor(e.g. Danovaro et al., 1995; Soltwedel, 1997; Pfannkucheet al., 1999; Lampadariou and Tselepides, 2006), suggest-ing that meiofauna plays an important role in the transferof OM within benthic food webs (Coull and Bell, 1979;Graf, 1989). In canyons, where a high influx of OM hasbeen observed, meiobenthos might play an even moreimportant role in the benthic community. Unfortunately,knowledge of the contribution of nematodes to totaldeep-sea sediment community activity is sparse and non-existent in the case for canyons. However, data suggestthat nematodes are important contributors in the deep-sea carbon remineralisation process (Soetaert et al., 1997).There are a number of studies on canyon-associ-ated meiobenthos (Vitiello, 1976; Vivier, 1978a, b; Soetaertet al., 1991; de Bovee and Labat, 1993; Soetaert andHeip, 1995; Soltwedel, 2000; Gremare et al., 2002;Accornero et al., 2003; Schmiedl et al., 2004; Van Gaeveret al., 2009), but few have concentrated on canyonsites deeper than 2000 m (de Bovee et al., 1990; Soltwedelet al., 2005; Garcia et al., 2007; Koho et al., 2007).Previous studies of the Nazare Canyon have failed toinclude the 3400–4300 m depth; inclusion of this area willprovide better insight into the structure of meiofaunacommunities in the deeper canyon with variablesedimentation rates and lower hydrographic activity
compared to the very active shallower canyon. This depthrange features the middle part of the Nazare Canyon(2700–4000 m; de Stigter et al., 2007), which is char-acterised by anomalously high sedimentation rates(Arzola et al., 2008) and a relatively active hydrographicregime compared to deeper sites. It also comprises thetransition to the deeper canyon (44000 m; de Stigter etal., 2007), which is relatively inactive in terms of sedimenttransport and functions as a sediment deposition centrecompared to the upper canyon, where vigorous internaltides result in sediment resuspension and transport on asemi-diurnal time scale (de Stigter et al., 2007; Arzolaet al., 2008).
The present work aims to characterise nematodecommunity structure, function and diversity within themetazoan meiobenthic community at the deeper end ofthe Nazare Canyon, in comparison with the adjacent slope.Also the potential effect of the quantity and ‘freshness’ ofsedimentary OM on meiobenthos, and particularly nema-tode diversity, is assessed and nematode communityadaptations to the canyon’s harsh and variable environ-mental conditions are investigated.
2. Material and methods
2.1. Sampling and sampling area
The Western Iberian Margin is characterised by anarrow shelf adjacent to a steep irregular slope and is cutby various canyons. The shelf hydrodynamics in this areaexhibit a seasonal pattern modulated by intensewinds: strong northerly winds induce summer upwellingat the shelf edge and south-westerly winds in winterestablish a downwelling regime over the shelf (Vitorinoet al., 2002; Quaresma et al., 2007). The largest of theWestern Iberian Margin Canyons, the Nazare Canyon,intersects the entire continental shelf (the canyonhead opens 500 m from Nazare beach, Vanney andMougenot, 1981) and its entrenched bedding on the shelfacts as a temporary catchment area and sediment trap formaterial, which is transported over the shelf, until it isflushed to the deep sea (de Stigter et al., 2007; Oliveiraet al., 2007).
During the HERMES RRS Discovery D297 cruise (Wea-ver, 2005) to the Portuguese canyons, meiofauna sampleswere taken using a multicorer (MUC; Barnett et al., 1984)and a megacorer (MGC, Ocean Scientific International Ltd),yielding virtually undisturbed sediment samples. TheMUC was equipped with 12 core tubes with an internaldiameter of 57 mm, equivalent to a 25.5 cm2 cross-sectional area. The MGC was fitted with 60-mm-diametercores, cross-sectional area 28.3 cm2. Two stations in theNazare Canyon were sampled at ca. 3400 and 4300 mdepth (station CM and CD, respectively) as well as twoopen continental slope reference sites at similar depths(station SM and SD, respectively), lying north of theNazare Canyon (Table 1, Fig. 1). Station CM in the Nazarecanyon was situated in the middle part of the canyon on asediment-draped, terraced slope next to the V-shapedaxial channel (thalweg). It is characterised by extremely

ARTIC
LEIN
PRESS
Table 1Detailed information per sediment slice for every station analysed in this study.
Station & sampling Latitude
(1N)
Longitude
(1W)
Depth (m) Sediment
depth (cm)
Clay
(vol%)
Silt
(vol%)
Sand
(vol%)
TC (%) TOC (%) TN (%) CPE
(mg/g)
Chl a
(mg/g)
C:N Chl
a:phaeopigment
Canyon deep (CD) 391 34.800 101 18.600 4335–4340 0–1 10.63 68.42 20.95 3.03 1.68 0.15 1.14 0.11 12.7 0.10
1–2 11.00 63.07 25.93 2.64 1.37 0.13 0.94 0.09 12.3 0.11
2–3 10.93 64.90 24.17 2.37 1.12 0.10 0.73 0.06 13.4 0.08
3–4 11.17 55.17 33.67 2.76 1.66 0.16 0.49 0.03 12.3 0.06
4–5 8.67 50.27 41.07 2.90 1.34 0.14 0.58 0.04 11.0 0.08
Canyon middle (CM) 391 30.000 091 56.220 3425–3453 0–1 12.17 78.62 9.22 3.70 1.64 0.23 1.70 0.13 8.4 0.08
1–2 12.63 77.43 9.94 3.58 1.69 0.20 1.76 0.13 9.7 0.08
2–3 13.53 76.16 10.31 3.58 1.70 0.22 1.79 0.12 9.0 0.07
3–4 12.70 76.95 10.35 3.54 1.57 0.22 2.08 0.16 8.5 0.08
4–5 11.93 76.89 11.18 3.58 1.59 0.21 1.80 0.12 8.9 0.07
Slope deep (SD) 401 04.380 101 21.900 4275–4277 0–1 22.35 71.24 6.41 5.62 0.67 0.11 0.25 0.02 6.9 0.10
1–2 23.20 71.55 5.25 5.54 0.61 0.11 0.04 0.00 6.6 0.00
2–3 22.93 70.86 6.20 5.42 0.64 0.12 0.03 0.00 6.5 0.00
3–4 22.00 69.80 8.20 5.49 0.65 0.11 0.02 0.00 6.8 0.00
4–5 23.33 70.91 5.76 5.55 0.66 0.12 0.03 0.00 6.6 0.00
Slope middle (SM) 401 35.700 101 22.080 3400–3403 0–1 21.85 69.98 8.17 6.86 0.76 0.11 0.46 0.02 8.1 0.05
1–2 20.83 69.70 9.46 6.68 0.61 0.10 0.05 0.00 6.9 0.02
2–3 21.37 66.78 11.85 6.69 0.62 0.12 0.04 0.00 6.3 0.02
3–4 21.97 69.60 8.43 6.86 0.63 0.11 0.07 0.00 6.6 0.01
4–5 24.47 64.75 10.79 6.70 0.58 0.10 0.04 0.00 6.6 0.00
MUC: Multicorer; MGC: Megacorer; sediment fractions (0.4–800mm) classified according to Wenthworth (1922); total carbon (TC), total organic carbon (TOC), total nitrogen (TN), chloroplastic pigment
equivalents (CPE), chlorophyll a (Chl a), molar carbon:nitrogen (C:N) ratio based on TOC and TN (C:N), chlorophyll a: phaeopigment ratio (chl a:phaeopigment).
J.In
gels
eta
l./
Deep
-SeaR
esearch
I5
6(2
00
9)
152
1–
153
91
52
3

ARTIC
LEIN
PRESS
Fig. 1. Left: Overview of the Western Iberian Margin with sampling stations (SM: 3400 m slope station, SD: 4300 m slope station, CM: 3400 m canyon station, CD: 4300 m canyon station). Right: Two detailed
maps presenting the local geomorphological setting of the Nazare Canyon sample stations CM and CD, adapted from Weaver (2005) (Bathymetry data compiled from a variety of sources, courtesy NOCS and
Instituto Hydrografico, Lisbon; 30 kHz TOBI sidescan sonar data, courtesy NOCS; both data sets published by Lastras et al. (2009); J: MUC deployments; K: MGC deployments.
J.In
gels
eta
l./
Deep
-SeaR
esearch
I5
6(2
00
9)
152
1–
153
91
52
4

ARTICLE IN PRESS
J. Ingels et al. / Deep-Sea Research I 56 (2009) 1521–1539 1525
high sediment accumulation rates (Arzola et al., 2008) andan active hydrographic regime (de Stigter et al., 2007). TheCD site was situated in the flat-floored lower canyonvalley which descends gently from 4000 to 5000 m depthand widens gradually into the Iberia Abyssal Plain. Thelower end of the canyon is presently relatively inactive interms of sediment transport, but intermittent masssedimentation events occur on a yearly or longer time-scale (de Stigter et al., 2007).
2.2. Environmental variables
Three replicate cores per sampling site were taken forgranulometry and geochemical analyses and analysedevery cm down to 5 cm sediment depth. Grain-sizedistribution of the 4- to 800-mm sediment fraction wasmeasured using a Coulter Counter LS 100TM Particle SizeAnalyzer and classified according to Wenthworth (1922).Replicate sediment samples (3 and 2 replicates for stationCD and CM, respectively, and 3 replicates for all slopestations) from the same deployments were used todetermine total organic carbon (TOC) and total nitrogen(TN). Samples for TOC analyses were acidified according tothe acid vapour method of Yamamuro and Kayanne(1995); TN in these samples was determined withoutacidification. These analyses were carried out using aCEInstruments NC 2500 CHN analyser in duplicate (meanvalue quoted here; all values were within 10% of themean). Chloroplastic Pigment Equivalents (CPE, which isthe sum of chlorophyll a (chl a) and its degradationproducts (phaeopigments); Thiel, 1978) were analysed toestimate the amount of OM in the sediment that isderived from primary production. After freeze-dryingand homogenization of the sediment samples the pig-ments were extracted in 90% acetone, separated usingreverse phase HPLC, and measured with a Gilson fluores-cence detector according to Wright and Jeffrey (1997). Theratio chl a:phaeopigments was used as a measure of‘freshness’ of the photosynthetically derived OM in thesediments.
2.3. Meiofauna and nematode analysis
At all stations, three replicate sediment samples weresliced every cm down to 5 cm sediment depth and fixed inbuffered 4% formalin. In the laboratory, samples werepassed through a 1000-mm mesh and then sieved on a 32-mm mesh to retrieve the meiofauna, which were separatedfrom any surrounding sediment by the standard centrifu-gation-flotation technique using the colloidal silica poly-mer LUDOX TM 40 (Heip et al., 1985; Vincx, 1996). Afterstaining with Rose Bengal, all metazoan meiobenthicorganisms were classified at higher taxon level (followingHiggins and Thiel, 1988) and counted under a stereo-microscope; 100–150 nematodes were picked out ran-domly from each slice of each replicate sample, thentransferred using the formalin-ethanol-glycerol techniqueof Seinhorst (1959) and Vincx (1996) and mounted onCobb slides (Cobb, 1917). Nematodes (3 replicates for the0–1 cm slice, 1 replicate for all deeper slices) were
identified to genus level using the pictorial key tonematode genera of Platt and Warwick (1983), relevanttaxonomic literature from the nematode library of GhentUniversity, and the NeMys database (Deprez et al., 2005,www.nemys.ugent.be), a generic biological informationsystem that provides online nematode identification keys.All identified individuals were grouped into four feedingtype groups (selective deposit feeders (1A), non-selectivedeposit feeders (1B), epigrowth feeders (2A), and pre-dators/scavengers (2B)) following Wieser (1953). Length(excluding filiform tail tips) and maximal width weremeasured using a Leitz dialux 20 compound microscopeand Quantimet 500 image analysis software. Nematodedimensions were used to estimate biomass using An-drassy’s formula (Andrassy, 1956), a dry-to-wet ratio of0.25 was assumed (Heip et al., 1985) to calculatenematode dry weight (dwt), and Jensen’s (1984) conver-sion factor of 12.4% was used to translate nematode wetweight (wwt) into carbon weight to compare withliterature values.
2.4. Data analysis
As measures for nematode diversity and evenness atgeneric level we calculated Hill (1973) numbers (H0, H1, H2
and HN) because they are variably dependent on samplesize (i.e. with increasing order they become less sensitiveto the rare, more sensitive to the more abundant genera)and reflect both evenness as well as genus richness (Heipet al., 1998). We used the notation H for Hill’s indices assuggested by Heip et al. (1998). In addition, Pielou (1969)evenness measure was calculated as well as the Shannon-Wiener diversity index H0 (Krebs, 1989) and the expectednumber of genera for 51 individuals (EG(51); Hurlbert,1971) to enable comparison with other studies. Toinvestigate trophic diversity of the nematode assem-blages, the trophic diversity index was calculated accord-ing to Heip et al. (1988).
All analyses, apart from correlations, were performedusing PRIMER v6 software (Clarke and Gorley, 2006). Amulti-variate Principal Component (PCA) analysis wasused to display the variability of our samples based onenvironmental parameters. Environmental data werechecked for normality and uniformity and consequentlylog(0.1+X) transformed and normalised (subtracting themean and dividing by the standard deviation, for eachvariable) before analysis. All nematode assemblage datawere standardised and log(1+X) transformed prior toanalysis except for the calculation of diversity andevenness indices. The non-metric multi-dimensionalscaling (MDS) technique served to visualise the samplesbased on Bray-Curtis similarity values for generic assem-blages. The ANOSIM function (Analysis of Similaritiesusing Bray-Curtis similarity measures) was explored totest differences between slices, stations, habitat anddepth. Firstly, three one-way ANOSIMs were performed,using only the 0-1 cm replicates, to test for station,habitat, and depth differences. Secondly, an ANOSIM testfor a non-replicated two-way layout was calculated toinfer whether there were among-station slice differences

ARTICLE IN PRESS
J. Ingels et al. / Deep-Sea Research I 56 (2009) 1521–15391526
and station differences across all slice groups. This doubleacross-group analysis is useful in testing if the differencesbetween the non-replicated slice samples for each stationare responsible for the differences observed betweenstations. A one-way SIMPER analysis (Similarity Percen-tages – species contributions) was performed on stationdata to indicate which genera are mainly responsible forsimilarity in the canyon and slope and for dissimilaritybetween both habitats. The SIMPER analysis incorporatedabundance differences between slices before summationof the slices per station and the data were consequentlystandardised and log(X+1) transformed. To investigatewhether the environmental patterns correspond withthose inferred from the nematode genera assemblagesand to define which variables correspond best, RELATEand BEST (Bio-Env) routines were used. The RELATEtechnique calculates a Spearman’s r rank correlationcoefficient between all elements of the nematode assem-blage and environmental variable resemblance matrices,followed by a permutation test. The BEST routine thensearches for an environmental variable set that maximisesr, which is obtained by computing the among-sampledistances of each subset of variables and correlated withthe nematode assemblage similarities.
Non-parametric Kendall tau statistics were used toinvestigate correlations between the geochemical vari-ables and nematode abundance and biomass usingStatistica 5.5.
Fig. 2. Meiofauna and nematode abundances for all stations, including chl a a
replicates, error bars show standard deviation). CD: canyon station deep, CM: ca
a: sedimentary chlorophyll a, TOC: sedimentary total organic carbon, ind.: indi
3. Results
3.1. Sediment characteristics
Sediment characteristics are summarised in Table 1and shown in Figs. 2 and 3. The canyon sediments werepredominantly muddy with high silt content (50–79%). Atstation CD we found increased levels of sand (21–41%) andreduced silt content especially towards the deeper layers(3–5 cm depth) compared to the (sub-)surface layers(0–3 cm, Table 1). At station CM the granulometricdistribution was consistent throughout the vertical profilewith very high silt-clay content (89–91%) and low sandcontent (9–11%). At the slope stations, grain size wasslightly finer (more clay). A slightly lower sand fractionwas also noticeable at station SD (5–8%) compared tostation SM (8–12%).
The canyon sediments were enriched in TOC, TN, andCPE compared to the open slope equivalents (Figs. 2 and3). Also the ‘freshness’ (chl a:phaeopigment) of thephytodetrital OM was highest in the canyon (Fig. 3).Highest TOC, TN, and CPE values were measured at stationCM whilst highest chl a:phaeopigment ratios weremeasured in the upper surface layers at station CD(0–3 cm). Contrary to the open slope, the deeper sedimentlayers in the canyon showed a clear CPE enrichment. Asimilar trend was found for the ‘freshness’ of thephytodetritus: below one cm sediment depth a steep
nd TOC content of the sediments (0–5 cm sediment depth, average over
nyon station middle, SD: slope station deep, SM: slope station middle, chl
viduals.
ARTICLE IN PRESS
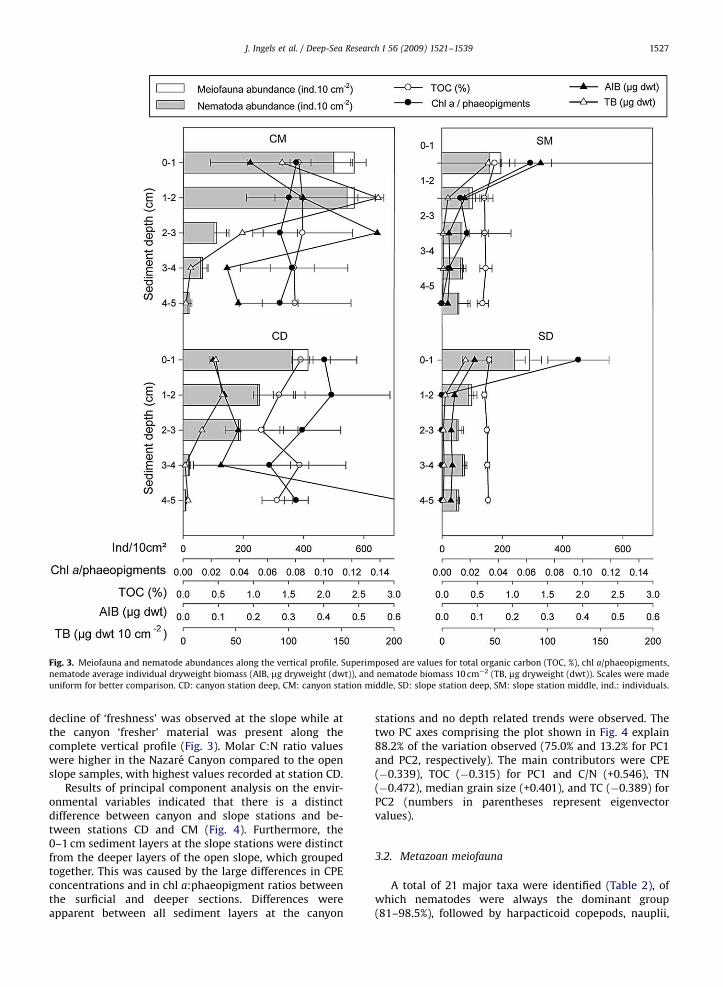
Fig. 3. Meiofauna and nematode abundances along the vertical profile. Superimposed are values for total organic carbon (TOC, %), chl a/phaeopigments,
nematode average individual dryweight biomass (AIB, mg dryweight (dwt)), and nematode biomass 10 cm�2 (TB, mg dryweight (dwt)). Scales were made
uniform for better comparison. CD: canyon station deep, CM: canyon station middle, SD: slope station deep, SM: slope station middle, ind.: individuals.
J. Ingels et al. / Deep-Sea Research I 56 (2009) 1521–1539 1527
decline of ‘freshness’ was observed at the slope while atthe canyon ‘fresher’ material was present along thecomplete vertical profile (Fig. 3). Molar C:N ratio valueswere higher in the Nazare Canyon compared to the openslope samples, with highest values recorded at station CD.
Results of principal component analysis on the envir-onmental variables indicated that there is a distinctdifference between canyon and slope stations and be-tween stations CD and CM (Fig. 4). Furthermore, the0–1 cm sediment layers at the slope stations were distinctfrom the deeper layers of the open slope, which groupedtogether. This was caused by the large differences in CPEconcentrations and in chl a:phaeopigment ratios betweenthe surficial and deeper sections. Differences wereapparent between all sediment layers at the canyon
stations and no depth related trends were observed. Thetwo PC axes comprising the plot shown in Fig. 4 explain88.2% of the variation observed (75.0% and 13.2% for PC1and PC2, respectively). The main contributors were CPE(�0.339), TOC (�0.315) for PC1 and C/N (+0.546), TN(�0.472), median grain size (+0.401), and TC (�0.389) forPC2 (numbers in parentheses represent eigenvectorvalues).
3.2. Metazoan meiofauna
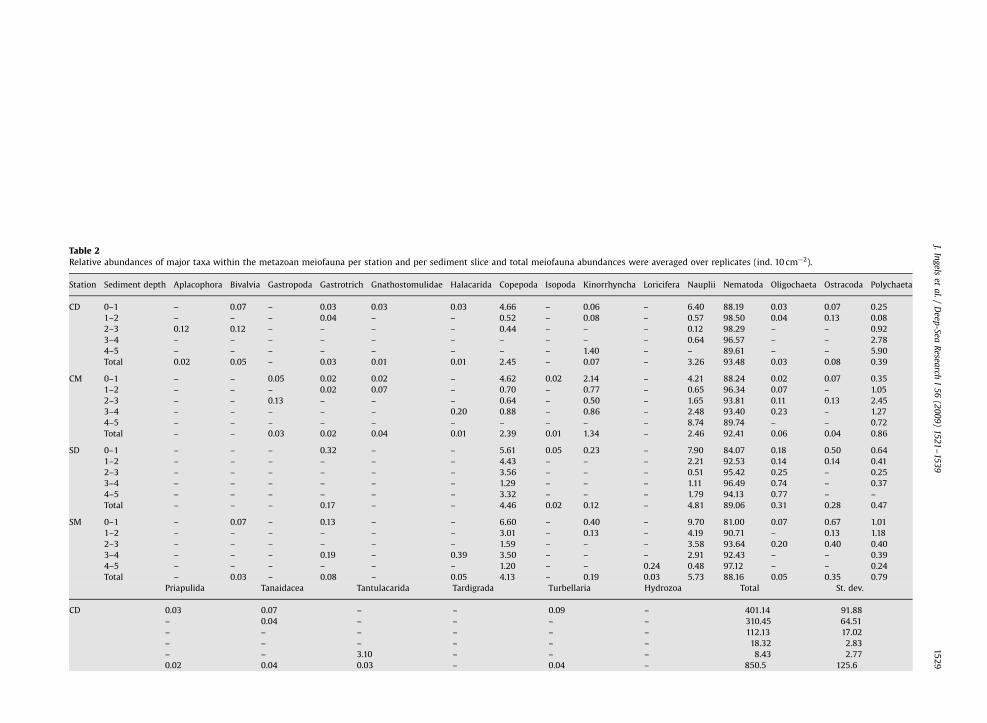
A total of 21 major taxa were identified (Table 2), ofwhich nematodes were always the dominant group(81–98.5%), followed by harpacticoid copepods, nauplii,

ARTICLE IN PRESS
Fig. 4. PCA (based on Euclidean Distance values of log(0.1+X) transformed and normalised environmental sediment data), combining all sediment slices
(including all 3 replicates, apart from station CM where only 2 replicates were available for every slice). The PC1 and PC2 axes explain a cumulative 83.5%
of the variation observed. Included data parameters are: median grain size, TC, TN, TOC (2 sets of data), C/N, chl a, phaeopigments, chl a/phaeopigments,
and CPE. Solid and broken lines indicate supported groups (left upper solid: station CM; left lower solid: station CD; right solid: open slope stations SD
and SM; right broken: 0–1 cm slices of all open slope stations. The numbers in data labels refer to the sediment layers (0-1; 1-2; 2-3; 3-4 and 4-5 cm). For
better visualisation of the plot, labels for slices deeper than 1 cm from the open slope stations were omitted. CD: canyon station deep, CM: canyon station
middle, SD: slope station deep, SM: slope station middle, WIM: Western Iberian Margin.
J. Ingels et al. / Deep-Sea Research I 56 (2009) 1521–15391528
and polychaetes. Other taxa were observed but in very lowabundances (o1%). At the canyon stations a total of 18taxa were present, whilst at the open slope stations only16 were found. No large differences were observed whencomparing the relative nematode abundances of openslope and canyon stations. However, slope sedimentsshowed higher relative abundances of harpacticoid cope-pods and nauplii compared to the canyon stations andtheir distribution along the vertical profile was moreuniform (Table 2).
Total core metazoan meiofauna abundances in theNazare Canyon at stations CD and CM were much higher(850.57125.6 and 1267.6766.7 ind. 10 cm�2, respectively)than at the deep and middle slope sites (553.8779.3 and481.17134.6 ind. 10 cm�2, respectively). These high abun-dances were associated with higher TOC and chl a
concentrations in the sediment (Fig. 2). When comparingthe vertical profiles of slope and canyon sediments (Fig. 3)it is clear that the main difference was in the deepersediment layers (1–3 cm): higher canyon subsurfaceabundances were associated with higher TOC and ‘fresh-ness’ of OM relative to the slope. Highest total core(0–5 cm) metazoan meiofauna abundances were recorded
at station CD (1267.6766.7 ind. 10 cm�2) and lowest atstation SM (481.067134.6 ind. 10 cm�2).
3.3. Nematodes
3.3.1. Nematode biomass and biometrics
Total core nematode biomass (TB, 0–5 cm) was highestin the canyon with 343.5 and 93.2mg dwt 10 cm�2 forstations CM and CD, respectively. The slope stations hadmuch lower biomass (53.7 and 29.9mg dwt 10 cm�2 forstations SM and SD, respectively). In addition, averagenematode individual dry weight was higher in the canyonwhen compared to slope stations at similar depths (0.116,0.256, 0.093, and 0.120mg ind�1 for stations CD, CM, SD,and SM, respectively). Down the vertical profile, nematodedimensions changed as nematodes were longer andslenderer deeper in the sediment, in comparison to thesurface nematodes (Fig. 5). However, average individualnematode biomass (AIB) increased with sediment depthin the canyon, but AIB decreased with depth at the slopesites (Fig. 3). Consequently, total nematode biomass washigher in sub-surface canyon sediments in contrast to the
ARTIC
LEIN
PRESS
Table 2Relative abundances of major taxa within the metazoan meiofauna per station and per sediment slice and total meiofauna abundances were averaged over replicates (ind. 10 cm�2).
Station Sediment depth Aplacophora Bivalvia Gastropoda Gastrotrich Gnathostomulidae Halacarida Copepoda Isopoda Kinorrhyncha Loricifera Nauplii Nematoda Oligochaeta Ostracoda Polychaeta
CD 0–1 – 0.07 – 0.03 0.03 0.03 4.66 – 0.06 – 6.40 88.19 0.03 0.07 0.25
1–2 – – – 0.04 – – 0.52 – 0.08 – 0.57 98.50 0.04 0.13 0.08
2–3 0.12 0.12 – – – – 0.44 – – – 0.12 98.29 – – 0.92
3–4 – – – – – – – – – – 0.64 96.57 – – 2.78
4–5 – – – – – – – – 1.40 – – 89.61 – – 5.90
Total 0.02 0.05 – 0.03 0.01 0.01 2.45 – 0.07 – 3.26 93.48 0.03 0.08 0.39
CM 0–1 – – 0.05 0.02 0.02 – 4.62 0.02 2.14 – 4.21 88.24 0.02 0.07 0.35
1–2 – – – 0.02 0.07 – 0.70 – 0.77 – 0.65 96.34 0.07 – 1.05
2–3 – – 0.13 – – – 0.64 – 0.50 – 1.65 93.81 0.11 0.13 2.45
3–4 – – – – – 0.20 0.88 – 0.86 – 2.48 93.40 0.23 – 1.27
4–5 – – – – – – – – – – 8.74 89.74 – – 0.72
Total – – 0.03 0.02 0.04 0.01 2.39 0.01 1.34 – 2.46 92.41 0.06 0.04 0.86
SD 0–1 – – – 0.32 – – 5.61 0.05 0.23 – 7.90 84.07 0.18 0.50 0.64
1–2 – – – – – – 4.43 – – – 2.21 92.53 0.14 0.14 0.41
2–3 – – – – – – 3.56 – – – 0.51 95.42 0.25 – 0.25
3–4 – – – – – – 1.29 – – – 1.11 96.49 0.74 – 0.37
4–5 – – – – – – 3.32 – – – 1.79 94.13 0.77 – –
Total – – – 0.17 – – 4.46 0.02 0.12 – 4.81 89.06 0.31 0.28 0.47
SM 0–1 – 0.07 – 0.13 – – 6.60 – 0.40 – 9.70 81.00 0.07 0.67 1.01
1–2 – – – – – – 3.01 – 0.13 – 4.19 90.71 – 0.13 1.18
2–3 – – – – – – 1.59 – – – 3.58 93.64 0.20 0.40 0.40
3–4 – – – 0.19 – 0.39 3.50 – – – 2.91 92.43 – – 0.39
4–5 – – – – – – 1.20 – – 0.24 0.48 97.12 – – 0.24
Total – 0.03 – 0.08 – 0.05 4.13 – 0.19 0.03 5.73 88.16 0.05 0.35 0.79
Priapulida Tanaidacea Tantulacarida Tardigrada Turbellaria Hydrozoa Total St. dev.
CD 0.03 0.07 – – 0.09 – 401.14 91.88
– 0.04 – – – – 310.45 64.51
– – – – – – 112.13 17.02
– – – – – – 18.32 2.83
– – 3.10 – – – 8.43 2.77
0.02 0.04 0.03 – 0.04 – 850.5 125.6
J.In
gels
eta
l./
Deep
-SeaR
esearch
I5
6(2
00
9)
152
1–
153
91
52
9

ARTIC
LEIN
PRESS
Table 2 (continued )
Priapulida Tanaidacea Tantulacarida Tardigrada Turbellaria Hydrozoa Total St. dev.
CM 0.05 0.02 – – 0.17 – 547.65 68.48
0.02 0.05 – – 0.27 – 542.78 75.71
– – – – 0.59 – 102.84 31.47
– – – – 0.68 – 57.84 16.66
– – – – 0.79 – 16.43 8.17
0.03 0.03 – – 0.27 – 1267.6 66.7
SD – – – 0.41 0.09 – 286.18 39.87
– – – 0.14 – – 94.44 16.96
– – – – – – 51.33 17.07
– – – – – – 70.66 9.19
– – – – – – 51.20 3.85
– – – 0.24 0.05 – 553.8 79.3
SM – – 0.07 – 0.27 – 193.83 46.41
– – 0.13 – 0.39 0.13 99.79 24.55
– – – – 0.20 – 65.70 23.89
– – – – 0.19 – 67.27 10.11
– – – – 0.72 – 54.47 34.88
– – 0.05 – 0.33 0.03 481.1 134.6
St. dev.: standard deviation.
J.In
gels
eta
l./
Deep
-SeaR
esearch
I5
6(2
00
9)
152
1–
153
91
53
0

ARTICLE IN PRESS
J. Ingels et al. / Deep-Sea Research I 56 (2009) 1521–1539 1531
slope where it was concentrated in the surface layer(0–1 cm).
3.3.2. Nematode assemblages
The presence and higher abundance at station CD ofSabatieria (6.47%), Sphaerolaimus (2.47%) and the highlydominant Acantholaimus (31.28%) defined an aberrant
Table 3Relative abundance of the dominant (X1%) nematode genera per station (0–5 c
CD CM
Acantholaimus 31.28 Halalaimus 13.06
Halalaimus 10.63 Paralongicyatholaimus 9.76
Desmoscolex 8.32 Daptonema 8.46
Sabatieria 6.47 Molgolaimus 8.32
Tricoma 4.16 Dichromadora 7.03
Daptonema 3.85 Pomponema 4.88
Thalassomonhystera 3.54 Retrotheristus 4.45
Dichromadora 3.39 Elzalia 4.30
Xyalidae 2.93 Sabatieria 4.02
Sphaerolaimus 2.47 Actinonema 3.59
Greeffiella 1.69 Axonolaimus 3.16
Halichoanolaimus 1.69 Sphaerolaimus 2.58
Campylaimus 1.39 Xyalidae 2.30
Metasphaerolaimus 1.39 Parasphaerolaimus 2.01
Manganonema 1.23 Amphimonhystrella 1.72
Thalassomonhystera 1.43
Nannolaimus 1.43
Campylaimus 1.29
Eleutherolaimus 1.29
Aegialoalaimus 1.15
Nematode families include all individuals that could not be assigned to a genu
canyon station middle, SD: slope station deep, SM: slope station middle.
Fig. 5. Relative frequency distributions of length/width ratios of
nematodes for the upper 2 cm of the sediment and the lower 2–5 cm;
data combined for both canyon stations (upper histogram) and both
slope stations (lower histogram); ncanyon ¼ 1499, nslope ¼ 1447.
assemblage when compared to both typical open slopeassemblages (Table 3). The generic composition of thestation CM assemblage was also different from thecorresponding open slope assemblage, with 7 of the top10 genera not present on the slope. Within the canyon,only 4 dominant genera were common to stations CD andCM, whereas there were no apparent differences betweenthe two slope assemblages. These differences were clearlyreflected in the MDS plot (Fig. 6). There was no clearseparation between the generic assemblages at stationsSD and SM. All surficial sediments (0–1 cm) were groupedtogether, suggesting that surficial genera assemblages aremore similar to each other than the deeper layers. This is aclear indication that the differences in genera assemblageswere mainly in the deeper sediment layers.
One-way ANOSIMs, based on assemblage data of onlythree 0–1 cm replicates per station, indicate significantdifferences between stations and between canyon andslope, but not between the deeper and middle sites(Table 4). The two-way ANOSIM (average of three 0–1 cmreplicates and one non-replicated value per deeper slice)test results show that there are significant differencesbetween the slices across all station groups (r ¼ 0.564,po0.001) as well as significant differences betweenstations when compared over all slice groups (r ¼ 0.823,po0.001). The significant differences between the assem-blages of the different sediment layers for every stationcomprise a large part of the total observed stationdifferences since the sample statistic for the slice testwas only slightly lower than that for the station test(0.564 vs. 0.823).
The one-way SIMPER results show that the averagesimilarity in the canyon (47.81%) is mainly attributed(with contributions 45%) to the genera Halalaimus,Sabatieria, Daptonema, Dichromadora and Sphaerolaimus.The average similarity value of 67.27 in the slope group
m, all replicates included).
SD SM
Thalassomonhystera 18.97 Thalassomonhystera 14.07
Acantholaimus 13.55 Acantholaimus 12.96
Halalaimus 9.27 Theristus 7.78
Theristus 7.56 Desmoscolex 6.85
Daptonema 5.85 Halalaimus 6.11
Diplopeltula 2.71 Daptonema 5.74
Xyalidae 2.14 Aegialoalaimus 5.00
Microlaimus 2.14 Tricoma 4.81
Tricoma 2.00 Cervonema 2.59
Aegialoalaimus 1.85 Actinonema 2.41
Desmoscolex 1.71 Leptolaimus 2.41
Syringolaimus 1.57 Xyalidae 2.04
Actinonema 1.57 Amphimonhystrella 2.04
Leptolaimus 1.43 Campylaimus 1.67
Chromadoridae 1.43 Monhysteridae 1.67
Thalassomonhystera 1.28 Syringolaimus 1.48
Southerniella 1.14 Metasphaerolaimus 1.48
Metasphaerolaimus 1.00 Microlaimus 1.30
Cervonema 1.00 Marylynnia 1.30
Disconema 1.11
s but were identified to the family level. CD: canyon station deep, CM:

ARTICLE IN PRESS
Fig. 6. MDS plot (based on Bray Curtis similarity values of standardised and log(X+1) transformed genera abundance data), combining all sediment slices
and 0–1 cm replicates for all stations. Solid and broken lines indicate supported groups (left solid: open slope stations combined; middle solid: station CD;
middle broken: all 0–1 cm sediment slices; right solid: station CM). CD: canyon station deep, CM: canyon station middle, SD: slope station deep, SM: slope
station middle, WIM: Western Iberian Margin. The numbers in data labels refer to the sediment layers (0-1; 1-2; 2-3; 3-4 and 4-5 cm).
Table 4Overview of the performed ANOSIM analyses.
ANOSIM Factors H0-hypothesis R, r p
A B
1-way0–1 Stations (CD, CM, SD, SM) – No station differences* 0.821 0.001
1-way0–1 Depth (D, M) – No depth differences 0.119 0.184
1-way0–1 Habitat (C, S) – No habitat differences* 0.594 0.002
2-way crossed (no
replicates)
Stations (CD, CM, SD, SM) Slices (0-1, 1-2, 2-
3, 3-4, 4-5 cm)
No slice differences across station
groups*
0.564 0.001
No station differences across slice
groups*
0.823 0.001
R, r: sample statistic; p: significance level; *: significant rejection of H0-hypothesis; 0–1: only 0–1 cm data were used. CD: canyon station deep, CM: canyon
station middle, SD: slope station deep, SM: slope station middle, D: deep stations (approx. 4300 m depth), M: middle stations (approx. 3400 m depth), C:
canyon stations, S: slope stations.
J. Ingels et al. / Deep-Sea Research I 56 (2009) 1521–15391532
can be predominantly ascribed to the genera Thalasso-
monhystera, Acantholaimus, Theristus, Daptonema, andHalalaimus (with contributions 45%). The average dis-similarity between canyon and slope samples is ratherhigh (52.79%), but is equivalent to the dissimilaritybetween slices observed within the canyon group(100–47.81 ¼ 52.19). The differences between canyonand slope were determined by the sum of smallcontributions (o5%) from a rather large number of genera,with Theristus, Sabatieria, Thalassomonhystera, Acantholai-
mus, Paralongicyatholaimus, and Sphaerolaimus at the topof the list (42.5%).
3.3.3. Structural and functional nematode diversity
Within station the number of genera was similar forboth canyon stations (64 and 63 genera for stations CD
and CM, respectively), yet only 38 genera on a total of 89were common to both stations. A similar observation wasmade for the slope where 46 genera were shared betweenstations out of a total of 122. A comparable patternemerged when comparing canyon and slope habitats: 31genera were found to be exclusive to the canyon whilst 68genera were unique to the adjacent slope. Hence, alpha
diversity (defined here as the diversity at one station) wasnoticeably lower than beta diversity (defined as diversityin a habitat, i.e. canyon or slope habitat) because of highgenus turnover between stations. Station SD was mostdiverse based on simple genera numbers, followed bystation SM. The canyon stations CD and CM had lowdiversity. The other Hill indices (H1, H2, HN) indicated thatthe slope is more diverse compared to the canyon and thatthe assemblages at the 3400 m stations, CM and SM, were

ARTICLE IN PRESS
Table 7Kendall tau correlation coefficients and p-values for nematode abun-
dance and biomass.
Nematode abundance Nematode biomass
tau p tau p
CPE 0.295 0.069 0.547 r0.01
Chl a:phaeophytin 0.354 r0.05 0.578 r0.01
TOC 0.200 0.218 0.474 r0.01
J. Ingels et al. / Deep-Sea Research I 56 (2009) 1521–1539 1533
more dominated by particular genera compared to thedeeper 4300 m stations. This pattern corresponded withobservations for Pielou’s evenness index, and Shannon-Wiener diversity. EG(51) values were highest for stationSD, followed by the middle depth stations (CM, SM) andfinally station CD with lowest diversity (Table 5). Whencomparing the data for the canyon and the slope itbecame clear that the adjacent slope displayed greaterdiversity and evenness compared to the canyon. However,total canyon-slope diversity is higher than the subtotalsfor canyon and slope, suggesting that the canyon diversityis not ‘included’ in the slope diversity but rathercontributes to total diversity.
The relative abundances per station of different feedingtypes, and the trophic diversity index, are shown inTable 6. The slope is characterised by high numbers ofselective and non-selective deposit feeders, while thecanyon shows a higher abundance of epistratum feedersand scavengers/predators. The trophic diversity indexsuggests a higher trophic complexity in the canyonsstations, particularly station CM. Compared tostation CM, station CD shows a shift in the trophiccommunity structure, with more epistratum feeders andfewer non-selective deposit feeders. At station CM, onemouthless nematode with rudimentary gut was found(Parastomonema).
Table 5Diversity measures calculated on genera-abundance numbers which
were recomputed for observed nematode abundances.
H0 H1 H2 HN J0 H0 E(51)
CD 64 16.184 6.702 2.848 0.669 2.784 4.015
CM 63 24.563 16.272 7.957 0.773 3.201 8.362
SD 93 27.258 12.760 5.297 0.729 3.305 12.550
SM 75 25.874 15.341 7.111 0.753 3.253 8.361
C 89 28.918 17.004 6.772 0.750 3.364 23.027
S 122 29.380 14.330 6.017 0.704 3.380 23.519
CS 153 35.730 19.179 6.911 0.711 3.576 25.074
CD: canyon station deep; CM: canyon station middle; SD: slope station
deep; SM: slope station middle; C: canyon stations combined; S: slope
stations combined; CS: all stations combined; H0, H1, H2 and HN: Hill
(1973) numbers; J0: Pielou’s (Pielou, 1969) evenness number; H0:
Shannon-Wiener diversity index (Krebs, 1989), E(51): expected number
of species.
Table 6Relative abundance of different nematode feeding types according to
Wieser (1953).
Station Feeding types Mouth
absent
Trophic
diversity
index
1A 1B 2A 2B
CD 29.8 22.4 39.5 8.3 – 0.302
CM 28.1 37.3 23.6 10.9 0.1 0.286
SD 27.1 42.9 25.9 4.1 – 0.326
SM 30.5 41.3 23.4 4.7 – 0.321
1A: selective deposit feeders, 1B: non-selective deposit feeders, 2A:
epigrowth feeders, 2B: predators/scavengers, CD: canyon station deep,
CM: canyon station middle, SD: slope station deep, SM: slope station
middle.
3.4. Relation between nematodes and
environmental variables
Kendall’s tau correlations are shown in Table 7.Nematode biomass was significantly, positively correlatedwith TOC, CPE and chl a:phaeopigments. Nematodeabundance, on the other hand, showed no significantcorrelations other than with chl a: phaeopigments. TheRELATE analysis revealed that the spatial pattern based onnematode genera assemblages is significantly related tothe patterns inherent to the environmental settings(r ¼ 0.33, pp0.01). The BEST analysis indicated thecombination of median grain size, TN, TOC, and CPE(separate values for chl a and phaeophytins excluded) asthe subset of abiotic variables that best explain the bioticpattern defined by the genera assemblages (r ¼ 0.662,pp0.01).
4. Discussion
4.1. Quantity and quality of OM
The flux of OM from surface productivity to theseafloor exerts a considerable control on meiofaunalbenthic standing stocks (Soltwedel, 2000). Indeed, meio-fauna densities at both canyon and slope stations showeda positive correlation with TOC and CPE content (data notshown), but organic input and meiofaunal densities werehighest in the canyon (Tables 1 and 2). The OM input inthe canyon also seemed more labile than on the adjacentslope (higher chl a:phaeopigment ratio). However, C:Nratios were much higher (8.4–13.4, Table 1) in the canyonsediments compared to the slope (6.3–8.1) and corre-spond with values reported by Garcia et al. (2007) for thecanyon axis. This implies either a greater terrestrialcomponent, or more degraded OM, or both. De Stigteret al. (2007) and Kiriakoulakis et al. (unpublished results)reported that the sediments in the Nazare Canyon had alarge terrestrial component and the same is true for otherlarge canyons like the Cap Breton Canyon (Gaudin et al.,2006) and the Palamos Canyon (Palanques et al., 2005a).The high sedimentary fluxes in these canyons appear to berelated with their proximity to the shore, favouring thecapture of sediments from the near-shore zone. Inaddition, Oliveira et al. (2007) suggested that thesediments in the upper Nazare canyon (o2000 m depth;de Stigter et al., 2007) originate from the shelf areas northand south of the canyon, as well as from erosion of thecoastal cliffs. Alternatively, the increased C:N ratio found

ARTICLE IN PRESS
J. Ingels et al. / Deep-Sea Research I 56 (2009) 1521–15391534
in the deeper canyon sediments could reflect removal oflabile, proteinaceous (i.e. N-rich) marine OM during thedecomposition process (Cowie and Hedges, 1992; Aller etal., 1996; Prahl et al., 1997; Aller and Blair, 2004).
Thus, there is more labile marine OM at the upper andmid (2000–3500 m; de Stigter et al., 2007) sections ofNazare Canyon with terrestrial, more refractory materialdominating in the deeper sections, although there aregenerally higher concentrations of more labile OM in thecanyon sediments than at the slope. The implications forthe meiobenthos are twofold. First, the higher amounts oflabile OM that are available for the meiofauna in thecanyon result in higher standing stocks. Second, benthicrespiration of the high level OM in the deeper canyonsections generates reducing sedimentary conditions andthis can shape the nematode assemblages present (Soe-taert et al., 2002).
4.2. Meiofauna densities and environment
Meiofauna abundance at the slope stations fell withinmagnitude reported in other Iberian Margin meiofaunastudies (Rachor, 1975; Dinet and Vivier, 1977) with valuesranging from 7 up to 437 ind. 10 cm�2. In contrast, thecanyon abundances are high and more comparable withvalues reported for shallower Iberian shelf areas(779–1802 ind. 10 cm�2) (Vanreusel et al., 1992; Flach etal., 2002). Considering methodological differences, it isclear that a Van Veen grab, Reineck corer, or even a boxcorer do not produce samples of the same quality as aMUC or MGC, which recovers cores with an undisturbedsediment-water interface. The mesh size used to separatethe meiofauna also varies between authors and can resultin a biased perception of the actual meiofauna commu-nity. These methodological differences mean that compar-isons of densities should be made with care. Yet, the largedifferences in nematode abundance between commu-nities on the slope and in the canyon suggest that otherfactors play a key role in regulating community densities.
Few meiofauna data are available for the NazareCanyon and findings differ. Garcia et al. (2007) reportedvery low abundances (9.9–236 ind. 10 cm�2) while thepresent study and Soetaert et al. (2002) found very highmeiofaunal densities (850–1267 and 617–1571 ind.10 cm�2 respectively). Intensive summer upwelling atthe Iberian Margin (McClain et al., 1986; Frouin et al.,1990) may induce high levels of primary production(Slagstad and Wassmann, 2001; Joint et al., 2002),resulting in a seasonally elevated phytodetrital input tothe deep sea, causing benthic standing stocks to increase.However, since all sampling for these Nazare Canyonstudies occurred during spring/summer, seasonal varia-bility is unlikely to account for this discrepancy. Notwith-standing sampling gear (box corer vs. MUC) and mesh-sizedifferences (32mm vs. 50mm), the difference in abundanceis likely to be explained by the different localities of thesampling stations within the very heterogeneous canyonand their variable susceptibility to episodic disturbance(de Stigter et al., 2007). Indeed, the low density samples(Garcia et al., 2007) were collected in the canyon axis
whilst the high-density samples for the present study andSoetaert et al. (2002) were collected from the terracesbeside the thalweg or nearer the canyon walls. There isevidence that meiofauna in disturbed ecosystems, parti-cularly nematodes, can recover rapidly (e.g. Sherman andCoull, 1980; Sun and Fleeger, 1994; Lee et al., 2001a, b), butcontinuous disturbance by sediment transport and de-position, as observed in the canyon axis, is detrimental forthe meiobenthic community. In addition, the sedimentaryOM is also likely to play a key role in density differences.Significant, positive correlation of nematode abundanceswith chl a: phaeopigment ratios and positive correlationswith CPE values (Table 7), underline the strong depen-dence of nematode abundance on the quantity and qualityof OM. The fact that different localities in the canyon showvariations in the freshness and amount of available OM isa factor regulating abundance differences between sta-tions (Epping et al., 2002; Garcia and Thomsen, 2008).
4.3. Nematodes
4.3.1. Nematode biomass
Nematode biomass values in the Nazare Canyon (93.2and 343.5mg dwt 10 cm�2 for stations CD and CM, respec-tively) were high compared to values for the open slopeand other stations along the Iberian Margin (Soetaert etal., 2002). Nematode biomass was significantly andpositively correlated with the amount and freshness ofthe OM. Hence, the high levels and quality of the availablefood in the canyon support higher standing stocks than onthe slope. Other data (Thiel, 1972a, b; Rachor, 1975; Flachet al., 2002; Soetaert et al., 2002; Garcia et al., 2007)generally confirm that nematode biomass is lower alongthe Iberian Margin slope relative to the Nazare Canyon.However, comparable biomass values have been reportedoff the Iberian coast although at much shallower depths(e.g. 334 and 137mg dwt 10 cm�2 at depths of 190 and325 m respectively; Vanreusel et al., 1992).
Nematode biomass values reported for the axis of theNazare Canyon by Garcia et al. (2007) (�4 up to �44mgdwt 10 cm�2) are much lower than canyon values reportedhere but are similar to those for slope sites in this study(29.9–53.7mg dwt 10 cm�2). Furthermore, Soetaert et al.(2002) found very high values at the canyon head(256mg dwt 10 cm�2 at 344 m depth) where depositionrates are high (de Stigter et al., 2007), whilst at about3000 m depth, biomass decreased to approximately halfthe amount observed at the 3400 m station in presentstudy. So, nematode standing stocks decrease with depth,but heterogeneity and patchiness in canyons can result invariable standing stocks at similar depths as illustrated.The Nazare Canyon is a very active system (de Stigter etal., 2007; Arzola et al., 2008) and its thalweg along thecanyon axis, which is the main channel of turbulent flows,may be destructive to nematode communities and lead tolow standing stocks.
Nematode biomass values (74.7–249.8mg dry weight10 cm�2) for the Gulf of Lions canyon system (de Boveeand Labat, 1993; Gremare et al., 2002) lie within the sameorder of magnitude as values for the Nazare Canyon, but

ARTICLE IN PRESS
J. Ingels et al. / Deep-Sea Research I 56 (2009) 1521–1539 1535
again, they reflect the situation at much shallower depths(240, 910, 1000 and 1200 m). Nevertheless, the dataindicate that nematode biomass is higher in canyonsystems than on the slope, providing that regular intensehydrodynamic activity does not prevent meiobenthiccommunities from settling.
At the canyon stations average individual biomassincreased with sediment depth. As a consequence, totalnematode biomass peaked in the 1–3 cm layer, belowwhich densities decreased considerably and total biomasswas reduced. This was not the case at the slope stationswhere average individual biomass diminished immedi-ately below the surface layer. The increasing nematodesize with sediment depth and the high nematode numbersin the canyon are responsible for the high biomass valuesobserved in canyon systems and mostly reflect high ratesof sedimentation and availability of OM.
4.3.2. Nematode community structure and function, and
their relation with environmental conditions
The generic assemblages were distinctly differentbetween canyon and adjacent slope stations and betweencanyon stations. Furthermore, in the canyon a discrepancydown the vertical profile was notable (Figs. 3 and 6). The2-way crossed ANOSIM test results demonstrated thatthere are indeed significant differences between sedimentlayers among all stations and that this vertical discre-pancy is responsible for a large part of the variabilitybetween stations (Table 4). The deeper layers of theNazare Canyon sediments showed higher nematodeabundances and biomass relative to the slope because ofthe higher CPE contents and the presence of relativelylabile OM throughout the vertical profile (high chla:phaeopigment ratios in deeper layers), which allowsthe nematode community to penetrate deeper into thesediment. This was supported by the significant correla-tion between nematode abundance and biomass and thefreshness of the OM (Table 7). Moreover, nematodebiomass was significantly correlated with TOC and CPEindicating that the quantity and quality of OM drivesnematode biomass at the surface and in the deeper layers.Deep vertical colonisation of the sediment by meio-benthos was also observed by Vivier (1978a) in theCanyon de Cassidaigne off the coast of Marseille. However,Vivier (1978a) related the deep colonisation to the fluidityof the mud, which enabled the meiobenthos to thrive inthat environment. Mud fluidity has not been quantified inthe Nazare Canyon, but ROV exploration of the samplingsites showed that these terraces are draped in very soft,easily resuspendable muds (pers. obs.) and possiblycomparable to those described by Vivier (1978a). Unpub-lished data of de Stigter (pers. comm.) confirm thatsurface sediments on the canyon terraces are very wateryand uncompacted, with porosity values of 70–80% in theupper 5 cm.
Sediment depth can affect nematode shape andstructural composition much more profoundly than waterdepth (Soetaert and Heip, 1989; Soetaert et al., 2002).Along the Iberian Margin and in the Nazare Canyonnematodes tend to be longer and more slender deeper inthe sediment (Fig. 5). This can be partially explained by
oxygen availability (Soetaert et al., 2002). Deeper than2000 m on the slope, oxygen concentrations declinesteadily until exhausted at �4–5 cm sediment depth(Epping et al., 2002), whereas oxygen penetration depthis reduced in the canyon to between 1 and 3 cm at 3100and 4300 m, respectively (Epping et al., 2002; Soetaert etal., 2002). In addition, Kiriakoulakis et al. (unpublishedresults) report that the oxic/anoxic boundary in NazareCanyon sediments is close to the surface (o1 cm). Limitedoxygen penetration depth in the canyon sediments iscaused by decomposition of the large amounts of OMdeposited there. Reduced, anoxic conditions are harmfulto nematodes, and although they can be rather tolerant toanoxia, nematodes cannot survive long-term exposure(Moodley et al., 1997). Soetaert et al. (2002) proposedvertical migration in the sediment as a solution to escapetemporarily reduced conditions, and stated that mobilityis enhanced by a long and slender nematode body shape.Alternatively, increasing nematode slenderness and sizewith sediment depth may be an adaptation to recurringhydrodynamic disturbance. Several authors have sug-gested that certain morphological adaptations are char-acteristic of nematodes living in high energyenvironments. Individuals may use their long, slenderbody and long, retractable tail to escape into the deepersediment layers to avoid resuspension in hydrodynami-cally active deep-sea areas (Thistle and Sherman, 1985 andreferences therein), such as the Nazare Canyon. Ourresults show an increase in the abundance of slendererand larger nematodes (higher individual biomass) withincreasing sediment depth (Figs. 3 and 5), especially in thecanyon, where only the surface layers are oxygenated andhydrodynamic disturbance is high. The dominance ofSabatieria in the canyon and its absence in the slopesediments (Table 3 and SIMPER test results) is striking inthis respect. Species of Sabatieria thrive in disturbedenvironments (Steyaert et al., 1999, 2007) and near-anoxicmuddy sediments (Vanreusel, 1990; Vincx et al., 1990). Itis also suggested that some Sabatieria species havedeveloped adaptation mechanisms to survive episodes ofanoxia (Steyaert et al., 2007). In addition, Soetaert andHeip (1995) pointed out the preference of Sabatieria
species for suboxic or anoxic environments and suggestedthat these species thrive only in those environmentswhere a substantial fraction of OM becomes incorporatedbelow the oxic zone of the sediment, as seems to be thecase in the Nazare Canyon (Epping et al., 2002; Fig. 3).Furthermore, Sabatieria species have long and slenderbody forms, well adapted to their thiobiotic lifestyle.
The canyon was characterised by more predatory/scavenging (e.g. Sphaerolaimus, Pomponema, see Table 3)nematodes and fewer non-selective deposit feederscompared to the adjacent slope. Together with a decreas-ing trophic index, this suggests that the canyon sedimentsharbour a more complex nematode community with apredominance of higher trophic groups such as predatorsand scavengers. These nematodes are naturally larger andlonger compared to other feeding types, which makesthem more agile in disturbed canyon sediments andenhances their survival rate. Inputs of abundant andrelatively fresh food at the surface and deeper in the

ARTICLE IN PRESS
J. Ingels et al. / Deep-Sea Research I 56 (2009) 1521–15391536
canyon sediment compared to the slope will help tosustain the trophic complexity of the community livingthere. In addition, there was a shift in the abundance ofdifferent feeding types between canyon stations. Inparticular station CM (highest quality and quantity ofOM) was characterised by more non-selective depositfeeders and less epistrate feeders compared to station CDleading to a more evenly distributed trophic diversity.
The environmental patterns revealed by PCA agree wellwith the MDS results. Generic assemblage patterns can beexplained largely by the quantity and quality of the OM (i.e.TN, TOC, and CPE concentrations and freshness) and themedian grain size, which seem to be the main structuringfactors for the nematode community and can be related tothe assemblages observed at the studied stations and alongvertical profiles. In addition, the dynamics of water andsediment transport and the morphology of the canyon mayhave an important role to play in controlling the biota.Levin and Gooday (2003) concluded that the ‘distinctive-ness’ of canyon fauna from the nearby slope was a functionof a variety of canyon attributes. Canyons with lowtopographic relief and mainly soft sediments had a faunaclosely resembling the nearby slope. Conversely, canyonsthat are narrow and deep with much exposed rock willhave a fauna quite distinct from the surrounding slope. TheNazare Canyon is characterised by a complex hydrography,involving tidal and turbidity currents, and intermittentsediment gravity flows transporting sediments along itsaxis. These processes shape its complex and heterogeneoushabitat morphology. Our results indicate that the genericassemblages were as dissimilar between the two canyonstations as they were between the canyon and the adjacentslope. Also, comparing axis samples (Garcia et al., 2007)with samples from other canyon locations indicated largedifferences in meiofauna and nematode assemblages. Sincethe quality and quantity of the deposited OM was similar,these differences were most likely due to the contrastinghydrodynamic disturbance and sedimentation regime.Thus, within-canyon heterogeneity plays an important rolein structuring its inhabiting fauna. Whether OM qualityprevails over habitat heterogeneity in shaping meiofaunadistributions within the canyon remains poorly resolved.Quality and quantity of OM were correlated with higherabundances and biomass within the canyon and relative tothe open slope, but within-canyon heterogeneity had alarge effect on the nematode assemblages. These twofactors are most likely closely intertwined in their role asecosystem drivers since morphological heterogeneity incombination with the canyon hydrography regulate grain-size distributions, the OM patchiness and to an extent OMquality in the canyon. When the hydrodynamic disturbancediminishes at less disturbed canyon sites (as opposed tothe harsh canyon axis), then OM quantity and quality areagain the main factors controlling the benthos, eitherdirectly or indirectly.
4.4. Nazare canyon diversity
The numbers of nematode genera indicated a highturnover rate between stations and habitats (Table 6). It is
possible that the harsh and unpredictable conditions ofthe canyon axis shape the infauna, lead to aberrantnematode assemblages, and consequently contribute tothe total diversity in the canyon. With those of Garcia etal. (2007), the numbers of genera total 112, 165, and 191for the Nazare Canyon, adjacent slope and both habitatscombined, respectively. Again, this leads to higher genericturnover rates. Few studies have documented nematodediversity along the Iberian Margin (Dinet and Vivier, 1979;Vanreusel et al., 1992; Garcia et al., 2007), but whencomparing the data between canyon and slope, the NazareCanyon seems to display a lower diversity. Hill’s diversityindices are variably dependent on the dominance ofgenera; going from H0, which is a simple reflection ofgenera numbers and is abundance independent, to HN or‘‘dominance index’’, which is the reciprocal of theproportional abundance of the most dominant genus.Hill’s higher order numbers (H2, HN) indicate that themiddle canyon has the highest diversity. Alternatively, thelower order Hill numbers (H0, H1) designate the slopestations as being most diverse. Diversity at station CM isthus higher when it takes into account generic abun-dances, which will be important in the case of highdominance assemblages. In the present study, ShannonWiener diversity was higher and Pielou’s J0 values lowerthan values put forward by Garcia et al. (2007), apart fromtwo axis stations (1121 and 2847 m) which displayedlower evenness.
In conclusion, we found that the Nazare Canyon haslower alpha diversity values, but its diversity contributesto total Iberian Margin diversity because of the highgeneric turnover or beta diversity observed betweenstations and habitats. The canyon’s heterogeneity and itsunique characteristics separate this ecosystem from theadjacent slope.
5. Conclusions
The Nazare Canyon is one of the largest near-shorecanyons on Earth and is considered a depo-centre for amixture of fresh marine and more recalcitrant terrigenousOM with episodic flushing to the deeper canyon parts andthe abyssal plain. Despite the fact that the OM in thecanyon was largely of terrestrial origin and refractory, theamount and quality of OM available for direct consump-tion was higher in the canyon. Together with the positivecorrelation of nematode abundance and biomass withquantity and freshness of the OM, this explains the highstanding stocks observed in the canyon sediments.Furthermore, canyon assemblages showed particularadaptations (e.g. higher trophic complexity, variablenematode morphology, and the presence of opportunisticgenera such as Sabatieria) to the prevailing conditions,particularly in the deeper sediment layers. Strong hydro-dynamic activity, as found in the canyon axis, is likely tobe detrimental to the meiobenthic community. Thus, boththe quantity and quality of the sedimentary OM drivemetazoan meiobenthos standing stocks and regulate thenematode assemblages directly and indirectly, and inconcordance with canyon heterogeneity and hydrography.

ARTICLE IN PRESS
J. Ingels et al. / Deep-Sea Research I 56 (2009) 1521–1539 1537
Nazare Canyon’s diversity was slightly lower than that ofthe adjacent slope and its communities were charac-terised by higher dominance of certain genera. Hydro-dynamic disturbance in the canyon is likely to have anegative impact on the establishment of meiobenthiccommunities and hence its diversity, even when thecanyon’s physical and geochemical (with respect to OM)heterogeneity suggests a high diversity. Nevertheless, theNazare Canyon contributes considerably to total WesternIberian Margin nematode diversity because of the highturnover rate and presence of assemblages that aredifferent from those found on the slope.
Acknowledgements
This research was performed under the auspices of theHERMES project, EC contract GOCE511234 funded by theEuropean Commission’s Sixth Framework Programme. Weare very much indebted to the National OceanographyCentre, Southampton and the captain and crew membersof the RRS Discovery for their expertise and profession-alism. We would also like to thank the scientific crew fortheir assistance and sampling efforts during the cruise,Prof. Dr. Magda Vinx for the use of research facilities, andall technical personnel who helped with processing andanalysing the samples. The first author would also like toacknowledge Veerle Huvenne and Veith Huhnerbach(NOCS, UK) for their help with Nazare Canyon maps.
References
Accornero, A., Picon, P., de Bovee, F., Charriere, B., Buscail, R., 2003.Organic carbon budget at the sediment–water interface on the Gulfof Lions continental margin. Continental Shelf Research 23 (1),79–92.
Aller, R.C., Blair, N.E., 2004. Early diagenetic remineralization ofsedimentary organic C in the Gulf of Papua deltaic complex (PapuaNew Guinea): net loss of terrestrial C and diagenetic fractionation ofC isotopes. Geochimica Et Cosmochimica Acta 68 (8), 1815–1825.
Aller, R.C., Blair, N.E., Xia, Q., Rude, P.D., 1996. Remineralization rates,recycling, and storage of carbon in Amazon shelf sediments.Continental Shelf Research 16 (5–6), 753–786.
Andrassy, I., 1956. The determination of volume and weight ofnematodes. Acta Zoologica (Hungarian Academy of Science) 2, 1–15.
Arzola, R.G., Wynn, R.B., Lastras, G., Masson, D.G., Weaver, P.P.E., 2008.Sedimentary features and processes in the Nazare and Setubalsubmarine canyons, west Iberian margin. Marine Geology 250,64–88.
Barnett, P.R.O., Watson, J., Connelly, D., 1984. A multiple corer for takingvirtually undisturbed samples from shelf, bathyal and abyssalsediments. Oceanologica Acta 7 (4), 10.
Buscail, R., Germain, C., 1997. Present-day organic matter sedimentationon the NW Mediterranean margin: importance of off-shelf export.Limnology and Oceanography 42 (2), 217–229.
Canals, M., Puig, P., de Madron, X.D., Heussner, S., Palanques, A., Fabres, J.,2006. Flushing submarine canyons. Nature 444 (7117), 354–357.
Clarke, K.R., Gorley, R.N., 2006. PRIMER v6: User Manual/Tutorial.PRIMER-E, Plymouth, UK.
Cobb, N.A., 1917. Notes on Nemas. Contributions to the Science ofNematology 5, 11.
Coull, B.C., Bell, S.S., 1979. Perspectives in meiofaunal ecology. In:Livingston, R.J. (Ed.), Ecological Processes in Coastal and MarineSystems. Plenum Press, New York, pp. 189–216.
Cowie, G.L., Hedges, J.I., 1992. Sources and reactivities of amino-acids in acoastal marine-environment. Limnology and Oceanography 37 (4),703–724.
Danovaro, R., Fabiano, M., Albertelli, G., Della Croce, N., 1995. Verticaldistribution of Meiobenthos in Bathyal sediments of the Eastern
Mediterranean Sea: relationship with labile organic matter andBacterial Biomasses. Marine Ecology 16 (2), 103–116.
de Bovee, F., Guidi, L.D., Soyer, J., 1990. Quantitative distribution of deep-sea meiobenthos in the Northwestern Mediterranean (Gulf of Lions).Continental Shelf Research 10 (9–11), 1123–1145.
de Bovee, F., Labat, J.P., 1993. A simulation-model of a Deep Meiobenthiccompartment—a preliminary approach. Marine Ecology—Pubblica-zioni Della Stazione Zoologica Di Napoli I 14 (2), 159–173.
de Stigter, H.C., Boer, W., Mendes, P., Jesus, C.C., Thomsen, L., van denBergh, G.D., van Weering, T.C.E., 2007. Recent sediment transport anddeposition in the Nazare Canyon, Portuguese continental margin.Marine Geology 246 (2–4), 144–164.
Deprez, T., Steyaert, M., Vanaverbeke, J., Speybroeck, J., Raes, M., Derycke,S., De Smet, G., Ingels, J., Vanreusel, A., Van Gaever, S., Vincx, M.,2005. NeMys. World Wide Web electronic publication. /www.nemys.ugent.beS. Department of Marine Biology, Ghent University.
Dinet, A., Vivier, M.-H., 1977. Le meiobenthis abyssal du Golfe deGascogne I. Considerations sur les donnees quantitatives. Cahiers DeBiologie Marine 18, 85–97.
Dinet, A., Vivier, M.-H., 1979. Le meiobenthos abyssal du Golfe deGascogne II. Les peuplements de nematodes et leur diversitespecifique. Cahiers De Biologie Marine 18, 109–123.
Duineveld, G., Lavaleye, M., Berghuis, E., de Wilde, P., 2001. Activity andcomposition of the benthic fauna in the Whittard Canyon and theadjacent continental slope (NE Atlantic). Oceanologica Acta 24 (1),69–83.
Durrieu de Madron, X., 1994. Hydrography and nepheloid structures inthe Grand-Rhone Canyon. Continental Shelf Research 14, 457–477.
Epping, E., van der Zee, C., Soetaert, K., Helder, W., 2002. On the oxidationand burial of organic carbon in sediments of the Iberian margin andNazare Canyon (NE Atlantic). Progress in Oceanography 52 (2–4),399–431.
Flach, E., Muthumbi, A., Heip, C., 2002. Meiofauna and macrofaunacommunity structure in relation to sediment composition at theIberian margin compared to the Goban Spur (NE Atlantic). Progressin Oceanography 52 (2–4), 433–457.
Frignani, M., Courp, T., Cochran, J.K., Hirschberg, D., Vitoria i Codina, L.,2002. Scavenging rates and particle characteristics in and near theLacaze-Duthiers submarine canyon, northwest Mediterranean. Con-tinental Shelf Research 22 (15), 2175–2190.
Frouin, R., Fiuza, A.F.G., Ambar, I., Boyd, T.J., 1990. Observationsof a poleward surface current off the coasts of Portugal and Spainduring winter. Journal of Geophysical Research—Oceans 95 (C1),679–691.
Garcia, R., Koho, K.A., De Stigter, H.C., Epping, E., Koning, E., Thomsen, L.,2007. Distribution of meiobenthos in the Nazare canyon andadjacent slope (western Iberian Margin) in relation to sedimentarycomposition. Marine Ecology Progress Series 340, 207–220.
Garcia, R., Thomsen, L., 2008. Bioavailable organic matter in surfacesediments of the Nazare canyon and adjacent slope (Western IberianMargin). Journal of Marine Systems 74 (1–2), 44–59.
Garcia, R., van Oevelen, D., Soetaert, K., Thomsen, L., De Stigter, H.C.,Epping, E., 2008. Deposition rates, mixing intensity and organiccontent in two contrasting submarine Canyons. Progress in Oceano-graphy 76 (2), 192–215.
Gardner, W.D., 1989. Baltimore canyon as a modern conduit of sedimentto the Deep Sea. Deep-Sea Research I—Oceanographic ResearchPapers 56, 323–338.
Gaudin, M., Mulder, T., Cirac, P., Berne, S., Imbert, P., 2006. Past andpresent sedimentary activity in the Capbreton Canyon, Southern Bayof Biscay. Geo-Marine Letters 26, 331–346.
Graf, G., 1989. Benthic pelagic coupling in a Deep-Sea Benthic commu-nity. Nature 341 (6241), 437–439.
Gremare, A., Medernach, L., deBovee, F., Amouroux, J.M., Vetion, G.,Albert, P., 2002. Relationships between sedimentary organics andbenthic meiofauna on the continental shelf and the upper slope ofthe Gulf of Lions (NW Mediterranean). Marine Ecology ProgressSeries 234, 85–94.
Heip, C., Herman, P., Soetaert, K., 1988. Data processing, evaluation,and analysis. In: Higgins, R.P., Thiel, H. (Eds.), Introduction to theStudy of Meiofauna. Smithsonsian Institution Press, Washington,pp. 197–232.
Heip, C., Herman, P., Soetaert, K., 1998. Indices of diversity and evenness.Oceanis 24 (4), 61–87.
Heip, C., Vincx, M., Vranken, G., 1985. The ecology of marine nematodes.Oceanography and Marine Biology 23, 399–489.
Heussner, S., Durrieu de Madron, X., Calafat, A., Canals, M., Carbonne, J.,Delsaut, N., Saragoni, G., 2006. Spatial and temporal variabilityof downward particle fluxes on a continental slope: lessons from an
ARTICLE IN PRESS
J. Ingels et al. / Deep-Sea Research I 56 (2009) 1521–15391538
8-yr experiment in the Gulf of Lions (NW Mediterranean). MarineGeology 234 (1–4), 63–92.
Higgins, R.P., Thiel, H., 1988. Introduction to the Study of Meiofauna.Smithsonian Institution Press, London.
Hill, M.O., 1973. Diversity and evenness: a unifying notation and itsconsequences. Ecology 54, 427–432.
Hurlbert, S.H., 1971. The nonconcept of species diversity: a critique andalternative parameters. Ecology 52, 577–586.
Jensen, P., 1984. Measuring carbon content in nematodes. HelgolanderMeeresuntersuchungen 38, 83–86.
Joint, I., Groom, S.B., Wollast, R., Chou, L., Tilstone, G.H., Figueiras, F.G.,Loijens, M., Smyth, T.J., 2002. The response of phytoplanktonproduction to periodic upwelling and relaxation events at theIberian shelf break: estimates by the C-14 method and by satelliteremote sensing. Journal of Marine Systems 32 (1–3), 219–238.
Kiriakoulakis, K., Wolff, G.A., 2007. HERMES D83—preliminary report onthe organic geochemistry of suspended particulate matter in thePortuguese canyons.
Koho, K.A., Kouwenhoven, J., de Stigter, H.C., van der Zwaan, G.J., 2007.Benthic foraminifera in the Nazare Canyon, Portuguese continentalmargin: Sedimentary environments and disturbance. Marine Micro-paleontology 66 (1), 27–51.
Krebs, C.J., 1989. Ecological Methodology. Harper & Row, New York.Lampadariou, N., Tselepides, A., 2006. Spatial variability of meiofaunal
communities at areas of contrasting depth and productivity in theAegean Sea (NE Mediterranean). Progress in Oceanography 69 (1),19–36.
Lastras, G., Arzola, R.G., Masson, D.G., Wynn, R.B., Huvenne, V.A.I.,Huhnerbach, V., Canals, M., 2009. Geomorphology and sedimentaryfeatures in the Central Portuguese submarine canyons, WesternIberian margin. Geomorphology 103 (3), 310–329.
Lee, H.J., Gerdes, D., Vanhove, S., Vincx, M., 2001a. Meiofauna response toiceberg disturbance on the Antarctic continental shelf at KappNorvegia (Weddell Sea). Polar Biology 24 (12), 926–933.
Lee, H.J., Vanhove, S., Peck, L.S., Vincx, M., 2001b. Recolonisation ofmeiofauna after catastrophic iceberg scouring in shallow Antarcticsediments. Polar Biology 24 (12), 918–925.
Levin, L.A., Gooday, A.J., 2003. The deep Atlantic Ocean. In: Tyler, P.A.(Ed.), Ecosystems of the Deep Oceans. Ecosystems of the World.Elsevier, Amsterdam, Netherlands, pp. 111–178.
McClain, C.R., Chao, S.Y., Atkinson, L.P., Blanton, J.O., Decastillejo, F., 1986.Wind-driven upwelling in the vicinity of Cape Finisterre, Spain.Journal of Geophysical Research-Oceans 91 (C7), 8470–8486.
Moodley, L., van der Zwaan, G.J., Herman, P., Kempers, L., van Breugel, P.,1997. Differential response of benthic meiofauna to anoxia withspecial reference to Foraminifera (Protista:Sarcodina). Marine Ecol-ogy Progress Series 158, 151–163.
Mulder, T., Cirac, P., Gaudin, M., Bourillet, J.-F., Tranier, J., Normand, A.,Weber, O., Griboulard, R., Jouanneau, J.M., Anschutz, P., Jorissen, F.J.,2004. Understanding continent–ocean sediment transfer. EOS Trans-actions of the American Geophysical Union 85 (27), 257–264.
Oliveira, A., Santos, A.I., Rodrigues, A., Vitorino, J., 2007. Sedimentaryparticle distribution and dynamics on the Nazare, canyon system andadjacent shelf (Portugal). Marine Geology 246 (2–4), 105–122.
Palanques, A., El Khatab, M., Puig, P., Masque, P., Sanchez-Cabeza, J.A.,Isla, E., 2005a. Downward particle fluxes in the Guadiaro submarinecanyon depositional system (north-western Alboran Sea), a riverflood dominated system. Marine Geology 220 (1–4), 23–40.
Palanques, A., Garcia-Ladona, E., Gomis, D., Martin, J., Marcos, M.,Pascual, A., Puig, P., Gili, J.M., Emelianov, M., Monserrat, S., Guillen, J.,Tintore, J., Segura, M., Jordi, A., Ruiz, S., Basterretxea, G., Font, J.,Blasco, D., Pages, F., 2005b. General patterns of circulation, sedimentfluxes and ecology of the Palamo’s (La Fonera) submarine canyon,northwestern Mediterranean. Progress in Oceanography 66 (2–4),89–119.
Pfannkuche, O., Boetius, A., Lochte, K., Lundgreen, U., Thiel, H., 1999.Responses of deep-sea benthos to sedimentation patterns in theNorth-East Atlantic in 1992. Deep-Sea Research Part I—Oceano-graphic Research Papers 46 (4), 573–596.
Pielou, E.C., 1969. An Introduction to Mathematical Ecology. Wiley-Interscience, New York.
Platt, H.M., Warwick, R.M., 1983. Free-Living Marine Nematodes. Part I.British Enoplids: Pictorial Key to World Genera and Notes forthe Identification of British Species. Cambridge University Press,Cambridge.
Prahl, F.G., De Lange, G.J., Scholten, S., Cowie, G.L., 1997. A case of post-depositional aerobic degradation of terrestrial organic matter inturbidite deposits from the Madeira Abyssal Plain. Organic Geo-chemistry 27 (3–4), 141–152.
Puig, P., Palanques, A., 1998. Nepheloid structure and hydrographiccontrol on the Barcelona continental margin, north-western Medi-terranean. Marine Geology 149, 39–54.
Quaresma, L.S., Vitorino, J., Oliveira, A., da Silva, J., 2007. Evidence ofsediment resuspension by nonlinear internal waves on the westernPortuguese mid-shelf. Marine Geology 246 (2–4), 123–143.
Rachor, E., 1975. Quantitative Untersuchungen uber das Meiobenthos dernordostatlantischen Tiefsee. Meteor Forschungsergebnisse, DeutscheForschungsgemeinshaft. Gebruder Borntrager, Berlin, Stuttgart, Ger-many, pp. 1–10.
Rowe, G.T., Polloni, P.T., Haedrich, R.L., 1982. The Deep-Sea macrobenthoson the continental-margin of the Northwest Atlantic-Ocean. Deep-Sea Research Part A—Oceanographic Research Papers 29 (2),257–278.
Schmidt, S., de Stigter, H.C., van Weering, T.C.E., 2001. Enhanced short-term sediment deposition within the Nazare Canyon, North-EastAtlantic. Marine Geology 173 (1–4), 55–67.
Schmiedl, G., Pfeilsticker, M., Hemleben, C., Mackensen, A., 2004.Environmental and biological effects on the stable isotope composi-tion of recent Deep-Sea benthic foraminifera, from the westernMediterranean Sea. Marine Micropaleontology 51 (1–2), 129–152.
Seinhorst, J.W., 1959. A rapid method for the transfer of nematodes fromfixative to unhydrous glycerine. Nematologica 4, 67–69.
Shepard, F.P., Dill, R.F., 1966. Submarine Canyons and Other Sea Valleys.Rand McNally, Chicago.
Shepard, F.P., Dill, R.F., 1977. Currents in Submarine Canyon heads offNorth St-Croix, United-States Virgin Islands. Marine Geology 24 (3),M39–M45.
Shepard, F.P., Marshall, N.F., McLoughl, Pa., 1974a. Currents in SubmarineCanyons. Deep-Sea Research 21 (9), 691.
Shepard, F.P., Marshall, N.F., McLoughl, Pa., 1974b. Internal wavesadvancing along Submarine Canyons. Science 183 (4121), 195–198.
Sherman, K.M., Coull, B.C., 1980. The response of Meiofauna to sedimentdisturbance. Journal of Experimental Marine Biology and Ecology 46(1), 59–71.
Slagstad, D., Wassmann, P., 2001. Modelling the 3-D carbon flux acrossthe Iberian margin during the upwelling season in 1998. Progress inOceanography 51 (2–4), 467–497.
Soetaert, K., Heip, C., 1989. The size structure of nematode assemblagesalong a Mediterranean deep-sea transect. Deep-Sea Research 36,93–102.
Soetaert, K., Heip, C., 1995. Nematode assemblages of Deep-Sea and ShelfBreak sites in the North-Atlantic and Mediterranean-Sea. MarineEcology Progress Series 125 (1–3), 171–183.
Soetaert, K., Heip, C., Vincx, M., 1991. The Meiobenthos along aMediterranean Deep-Sea transect off Calvi (Corsica) and in anadjacent Canyon. Marine Ecology—Pubblicazioni Della StazioneZoologica Di Napoli I 12 (3), 227–242.
Soetaert, K., Muthumbi, A., Heip, C., 2002. Size and shape of oceanmargin nematodes: morphological diversity and depth-relatedpatterns. Marine Ecology Progress Series 242, 179–1793.
Soetaert, K., Vanaverbeke, J., Heip, C., Herman, P.M.J., Middelburg, J.J.,Sandee, A., Duineveld, G., 1997. Nematode distribution in oceanmargin sediments of the Goban Spur (northeast Atlantic) in relationto sediment geochemistry. Deep-Sea Research Part I—OceanographicResearch Papers 44 (9–10), 1671–1683.
Soltwedel, T., 1997. Temporal variabilities in benthic activity and biomasson the western European continental margin. Oceanologica Acta 20(6), 871–879.
Soltwedel, T., 2000. Metazoan meiobenthos along continental margins: areview. Progress in Oceanography 46 (1), 59–84.
Soltwedel, T., Hasemann, C., Queric, N.-V., von Juterzenka, K., 2005.Gradients in activity and biomass of the small benthic biota along achannel system in the deep Western Greenland Sea. Deep-SeaResearch I—Oceanographic Research Papers 52, 815–835.
Steyaert, M., Garner, N., van Gansbeke, D., Vincx, M., 1999. Nematodecommunities from the North Sea: environmental controls on speciesdiversity and vertical distribution within the sediment. Journal of theMarine Biological Association of the United Kingdom 79 (2),253–264.
Steyaert, M., Moodley, L., Nadong, T., Moens, T., Soetaert, K., Vincx, M.,2007. Responses of intertidal nematodes to short-term anoxic events.Journal of Experimental Marine Biology and Ecology 345 (2),175–184.
Sun, B., Fleeger, J.W., 1994. Field experiments on the colonization ofMeiofauna into sediment depressions. Marine Ecology ProgressSeries 110 (2–3), 167–175.
Thiel, H., 1972a. Die bedeutung der meiofauna in kustenfernenbenthischen lebensgemeinshaft verschiedener geographischer

ARTICLE IN PRESS
J. Ingels et al. / Deep-Sea Research I 56 (2009) 1521–1539 1539
regionen. Verhandlungen der Deutschen Zoologisch Gesellschaft 65,37–42.
Thiel, H., 1972b. Meiofauna und structur der benthischen lebensge-meinschaft des iberischen tiefseebeckens. Meteor Forschung-Ergebnisse D (12), 36–51.
Thiel, H., 1978. Benthos in upwelling regions. In: Boje, R., Tomczak, M.(Eds.), Upwelling Ecosystems. Springer, Berlin, pp. 124–138.
Thistle, D., Sherman, K.M., 1985. The nematode fauna of a deep-sea siteexposed to strong near-bottom currents. Deep-Sea Research 32 (9),1077–1088.
Thomsen, L., vanWeering, T., Gust, G., 2002. Processes in the benthicboundary layer at the Iberian continental margin and their implica-tion for carbon mineralization. Progress in Oceanography 52 (2–4),315–329.
Thorbjarnarson, K.W., Nittrouer, C.A., DeMaster, D.J., 1986. Accumulationof modern sediment in Quinault submarine canyon. Marine Geology71 (1–2), 107–124.
Van Gaever, S., Galeron, J., Sibuet, M., Vanreusel, A., 2009. Deep-Seahabitat heterogeneity influence on meiofaunal communities in theGulf of Guinea. Deep-Sea Research II—Topical Studies in Oceano-graphy, in press.
van Weering, T.C.E., de Stigter, H.C., Boer, W., de Haas, H., 2002. Recentsediment transport and accumulation on the NW Iberian margin.Progress in Oceanography 52 (2–4), 349–371.
Vanney, J.R., Mougenot, D., 1981. La plate-forme continentale du Portugalet les provinces adjacentes: analyse geomorphologique. Memoriasdos Servicos Geologicos Portugal 28, 1–156.
Vanreusel, A., 1990. Ecology of the free-living Marine nematodes fromthe Voordelta (Southern bight of the North-Sea). 1. Speciescomposition and structure of the nematode communities. CahiersDe Biologie Marine 31 (4), 439–462.
Vanreusel, A., Vincx, M., Vangansbeke, D., Gijselinck, W., 1992. Structural-analysis of the Meiobenthos communities of the shelf break Area in 2stations of the Gulf-of-Biscay (Ne Atlantic). Belgian Journal ofZoology 122 (2), 185–202.
Vetter, E.W., Dayton, P.K., 1998. Macrofaunal communities within andadjacent to a detritus-rich submarine canyon system. Deep-SeaResearch II—Topical Studies in Oceanography 45 (1–3), 25–54.
Vetter, E.W., Dayton, P.K., 1999. Organic enrichment by macrophytedetritus, and abundance patterns of megafaunal populations insubmarine canyons. Marine Ecology Progress Series 186, 137–148.
Vincx, M., 1996. Meiofauna in marine and fresh water sediments. In: Hall,G.S. (Ed.), Methods for the Examination of Organismal Diversity inSoils and Sediments. CAB International, University Press, Cambridge,pp. 214–248.
Vincx, M., Meire, P., Heip, C., 1990. The distribution of nematodecommunities in the southern bight of the North Sea. Cahiers DeBiologie Marine 31, 107–129.
Vitiello, P., 1976. Peuplements de nematodes marins des fonds envasesde provence. II. Fonds detritiques envases et vases bathyales. In:Annales De l’Institut Oceanographique. Masson, Paris, pp. 283–311.
Vitorino, J., Oliveira, A., Jouanneau, J.M., Drago, T., 2002. Winter dynamicson the northern Portuguese shelf. Part 1: physical processes. Progressin Oceanography 52 (2–4), 129–153.
Vivier, M.-H., 1978a. Consequences d’un deversement de boue rouged’alumine sur le meiobenthos profond. Tethys 8 (3), 249–262.
Vivier, M.-H., 1978b. Influence d’un deversement industriel profond surla Nematofauna (canyon de Cassidaigne, Mediterranee). Tethys 8 (4),307–321.
Weaver, P.P.E., 2005. RRS Discovery Cruise D297, 27 July 16 August 2005.The geobiology of the Nazare and Setubal Canyons, PortugueseContinental Margin. HERMES reports. National Oceanography Centre,Southampton, p. 41.
Wenthworth, C.K., 1922. The wenthworth scale of grain size forsediments. Journal of Geology 30, 381.
Wieser, W., 1953. Beziehungen zwischen mundhohlengestalt, ernah-rungsweise und vorkommen bei freilebenden marinen nematoden.Arkiv For Zoologi 2 (4), 439–484.
Wright, S.W., Jeffrey, S.W., 1997. High-resolution HPLC system forchlorophylls and carotenoids of marine phytoplankton. In: Jeffrey,S.W., Mantoura, R.F.C., Wright, S.W. (Eds.), Phytoplankton Pigmentsin Oceanography: Guidelines to Modern Methods. United NationsEducational, Scientific and Cultural organization, Paris, pp. 327–341.
Yamamuro, M., Kayanne, H., 1995. Rapid direct determination of organic-carbon and nitrogen in carbonate-bearing sediments with a YanacoMt-5 Chn analyzer. Limnology and Oceanography 40 (5), 1001–1005.