Grand Canyon National Park South Rim Visitor Study
136
Social Science Program National Park Service U.S. Department of the Interior Visitor Services Project Grand Canyon National Park South Rim Visitor Study Summer 2003 Report 144 Park Studies Unit
-
Upload
khangminh22 -
Category
Documents
-
view
2 -
download
0
Transcript of Grand Canyon National Park South Rim Visitor Study

Social Science ProgramNational Park ServiceU.S. Department of the Interior
Visitor Services Project
Grand Canyon National ParkSouth Rim
Visitor Study
Summer 2003Report 144
Park Studies Unit


Social Science ProgramNational Park ServiceU.S. Department of the Interior
Visitor Services Project
Grand Canyon National ParkSouth Rim
Visitor StudySummer 2003
Margaret A. Littlejohn
Steven J. Hollenhorst
Visitor Services ProjectReport 144
May 2004
Margaret Littlejohn is the National Park Service VSP Coordinator and Dr. Steve Hollenhorst isDirector of the Park Studies Unit, Department of Resource Recreation and Tourism, University ofIdaho. We thank Mark Coburn, Bill and Loui Coleman, Lisa Collins, July Hellmich, Trina Lindig,Wendy Shields, Pixie Siebe, and the staff of Grand Canyon NP for their assistance with thisstudy. The VSP acknowledges the Public Opinion Lab of the Social and Economic SciencesResearch Center, Washington State University, for its technical assistance.


Visitor Services ProjectGrand Canyon National Park—South Rim
Report Summary• This report describes the results of a visitor study at Grand Canyon National Park (NP)—South
Rim during June 22-28, 2003. A total of 1,000 questionnaires were distributed to visitor groups.Visitor groups returned 735 questionnaires for a 73.5% response rate.
• This report profiles Grand Canyon NP—South Rim visitor groups. A separate appendix containsvisitor groups' unedited comments about their visit. This report and the appendix includesummaries of those comments.
• Thirty-six percent of visitor groups were groups of two; another 35% were in groups of three orfour people. Most visitor groups (75%) were family groups. Forty-five percent of visitors wereaged 36-60 years and 26% were aged 15 or younger.
• Nine percent of all visitors were international, from England (31%) and 27 other countries. UnitedStates visitors were from California (14%), Arizona (8%), Texas (8%), Florida (6%), and 45 otherstates, Washington, D.C., Puerto Rico, and Guam.
• Most South Rim visitors (84%) were on their first visit to Grand Canyon NP during the past fiveyears. Many visitors (67%) were also visiting for the first time in their lifetime. Most visitor groups(76%) stayed overnight away from home in the Grand Canyon area on this visit.
• Prior to this visit, visitor groups most often obtained information about Grand Canyon NP fromtravel guides/tour books (50%). Prior to a future visit, 69% of visitor groups said they would usethe National Park Service website as their source of information.
• For 73% of visitor groups, visiting Grand Canyon NP was the primary reason that brought themto the area. On this visit, most common activities were sightseeing/scenic drive (90%), taking aself-guided rim walk (68%), and shopping (50%). The most important activity for 50% of thevisitor groups was sightseeing/taking a scenic drive.
• Over one-third of visitor groups (34%) hiked or backpacked on this visit. The most used trail wasthe Rim Trail (69%), followed by the Bright Angel Trail (49%).
• The most visited place was Mather Point/Canyon View Visitor Center (72%), followed by YavapaiPoint (62%). Most visitor groups (78%) first entered Grand Canyon at the South entrance(Tusayan). Most visitor groups (61%) used a private vehicle to arrive at the park, while 38%used a rental vehicle.
• In regard to use, importance, and quality of visitor services and facilities, it is important to notethe number of visitor groups that responded to each question.
Service/facility Information service/facility
Visitor service/facility Concession service/facility
Most used Park brochure map, 95%,N=686
Park directional signs,95%, N=692
Gift shops, 86%, N=567
Most important Self-guiding trail signs/brochures, 83%, N=346
Developed campground,95%, N=49
Lodging, 90%, N=108
Best quality Assistance from visitorcenter staff, 92%, N=191
Trails, 90%, N=321 Market (general store),86%, N=242
• Most visitor groups (92%) rated the overall quality of visitor services at Grand Canyon NP as "verygood" or "good." Less than 3% of visitor groups rated the overall quality as “poor” or "very poor."
For more information about the Visitor Services Project, please contact the University of IdahoPark Studies Unit; phone (208) 885-7863 or visit the following web site: <http://www.psu.uidaho.edu>


TABLE OF CONTENTSPage
INTRODUCTION 1
METHODS 2
RESULTS 5
Visitor groups contacted 5
Demographics 5
Length of visit in area and in park 14
Sources of information—this visit/future visits 17
Awareness of land management by three government agencies 20
Grand Canyon NP visit as part of travel plans/timing of decision to visit 21
Primary reason for visiting Grand Canyon NP area 23
Forms of transport used/shuttle bus use 24
Park entrance station used/park entries 26
Wayfinding in the park 27
Activities including hiking/backpacking 29
Learning about interpretive topics 35
Places visited/order visited 37
Overnight accommodations 39
Information services and facilities: use, importance and quality 43
Visitor services and facilities: use, importance and quality 59
Commercial concession services and facilities: use,importance and quality 76
Total expenditures 88
Expenditures outside the park 91
Expenditures inside the park 98
Opinions about future shuttle system 105
Overall quality of visitor services 107
What visitor groups liked most 108
What visitor groups liked least 111
Planning for the future 113
Additional comments 116
Grand Canyon NP South Rim VSP Visitor Study June 22-28, 2003
2
TABLE OF CONTENTS (continued)
PageADDITIONAL ANALYSIS 119
QUESTIONNAIRE 121
VISITOR SERVICES PROJECT PUBLICATIONS 123

Grand Canyon NP South Rim VSP Visitor Study June 22-28, 2003
1
INTRODUCTION
This report describes the results of a visitor study at Grand CanyonNational Park—South Rim, also referred to as "Grand Canyon NP—South Rim."This visitor study was conducted June 22-28, 2003 by the National Park Service(NPS) Visitor Services Project (VSP), part of the Park Studies Unit at theUniversity of Idaho. A separate visitor study was conducted at the North Rimduring the same time period.
The report is organized into four sections. The Methods sectiondiscusses the procedures and limitations of the study. The Results sectionprovides summary information for each question in the questionnaire andincludes a summary of visitor comments. An Additional Analysis section isincluded to help managers request additional analyses. The final section includesa copy of the Questionnaire. The separate appendix includes commentsummaries and visitor groups' unedited comments.
Most of this report’s graphs resemble the example below. The largenumbers refer to explanations following the graph.
SAMPLE ONLY
1: The figure title describes the graph's information.2: Listed above the graph, the "N" shows the number of visitor groups responding and a
description of the chart's information. Interpret data with an "N" of less than 30 with CAUTION!as the results may be unreliable.
3: Vertical information describes categories.4: Horizontal information shows the number or proportions in each category.5: In most graphs, percentages provide additional information.

Grand Canyon NP South Rim VSP Visitor Study June 22-28, 2003
2
METHODS
Questionnaire design and administration
All VSP questionnaires follow the design principles outlined in Don A.Dillman's book Mail and Internet Surveys: The Tailored Design Method (1999).The Grand Canyon NP—South Rim questionnaire was developed at a workshopheld with park staff to design and prioritize the questions. Some of the questionswere comparable with VSP studies conducted at other parks; others werecustomized for Grand Canyon NP.
Interviews were conducted with, and 1,000 questionnaires weredistributed to a sample of visitor groups who arrived at Grand CanyonNP—South Rim during the period from June 22-28, 2003. Visitor groups weresampled in their vehicles near the two South Rim entrances.
Table 1: Questionnaire distribution locationspercentages do not equal 100 due to rounding.
Location Questionnaires distributedNumber %
Junction of Main Park Road and Center Road 850 85Desert View gas station 150 15
GRAND TOTAL 1,000 100
Visitor groups were greeted, briefly introduced to the purpose of thestudy, and asked to participate. If visitor groups agreed, an interview, lastingapproximately two minutes was used to determine group size, group type, andthe age of the adult who would complete the questionnaire. These individualswere then given a questionnaire and asked for their names, addresses andtelephone numbers in order to mail them a reminder-thank you postcard. Visitorgroups were asked to complete the questionnaire during or after their visit andthen return it by mail.
Two weeks following the survey, a reminder-thank you postcard wasmailed to all participants. Replacement questionnaires were mailed toparticipants who had not returned their questionnaires four weeks after thesurvey. Seven weeks after the survey, second replacement questionnaires weremailed to visitor groups who still had not returned their questionnaires.

Grand Canyon NP South Rim VSP Visitor Study June 22-28, 2003
3
Data Analysis
Returned questionnaires were coded and the information entered into acomputer using a standard statistical software package—Statistical AnalysisSystem (SAS). Frequency Distribution and cross-tabulations were calculated forthe coded data, and responses to open-ended questions were categorized andsummarized.
Sampling size, missing data and reporting items
This study collected information on both visitor groups and individualgroup members. Thus, the sample size ("N"), varies from figure to figure. Forexample, while Figure 1 shows information for 721 visitor groups, Figure 5presents data for 2,481 individuals. A note above each graph specifies theinformation illustrated.
Occasionally, a respondent may not have answered all of the questions,or may have answered some incorrectly. Unanswered questions result in missingdata and cause the number in the sample to vary from figure to figure. Forexample, although Grand Canyon NP—South Rim visitor groups returned 735questionnaires, Figure 1 shows data for only 721 respondents.
Questions answered incorrectly due to carelessness, misunderstandingdirections, and so forth turn up in the data as reporting errors. These create smalldata inconsistencies.
Limitations
Like all surveys, this study has limitations that should be consideredwhen interpreting the results.1. It is not possible to know whether visitor responses reflect actual behavior.
This disadvantage applies to all such studies and is reduced by having visitorgroups fill out the questionnaire soon after they visit the park.
2. The data reflect visitor use patterns of visitor groups to the selected sitesduring the study period of June 22-28, 2003. The results do not necessarilyapply to visitor groups during other times of the year.
3. Caution is advised when interpreting any data with a sample size of less than30, as the results may be unreliable. Whenever the sample size is less than30, the word "CAUTION!" is included in the graph, figure or table.
4. Bus passengers are may be under-represented in this study

Grand Canyon NP South Rim VSP Visitor Study June 22-28, 2003
4
Special conditions
Weather conditions during the visitor study were fairly typical of June inGrand Canyon NP for the duration of the study, with warm to hot, sunny days.
Grand Canyon NP South Rim VSP Visitor Study June 22-28, 2003
5
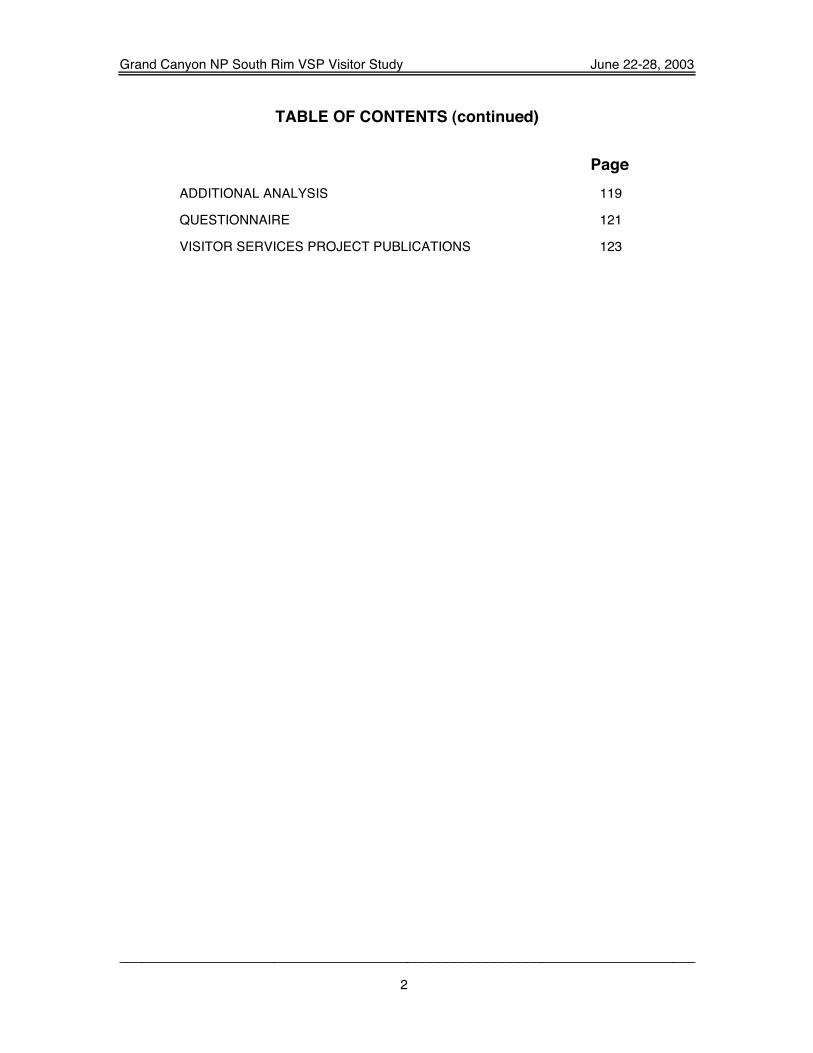
RESULTS
Visitor groups contacted
At Grand Canyon NP—South Rim, 1,114 visitor groups were contactedand 1,000 of these groups (90%) accepted questionnaires. Questionnaires werecompleted and returned by 735 visitor groups, resulting in a 73.5% response ratefor this study.
Table 2 compares age and group size information collected from thetotal sample of visitor groups who participated, with age and group size of visitorgroups who actually returned questionnaires. Based on the variables ofrespondent age and visitor group size, non-response bias was judged to beinsignificant.
Table 2: Comparison of total sample andactual respondents
Variable Total sample Actualrespondents
N Avg. N Avg.
Age of respondents 991 44.7 725 46.6Group size 999 4.3 721 4.1
Demographics
Figure 1 shows the distribution of visitor group sizes, which ranged fromone person to 54 people. Thirty-six percent of visitor groups consisted of twopeople, while another 35% consisted of three or four people. Ten percent ofgroups had seven or more people.
Most visitor groups (75%) were made up of family members and 10% werewith friends (see Figure 2). “Other” group types included scouts, businessassociate, elder hostel, fiancé and holiday tour. Four percent of visitor groups werewith guided tour groups (see Figure 3). One percent were with a school/educationalgroup (see Figure 4).
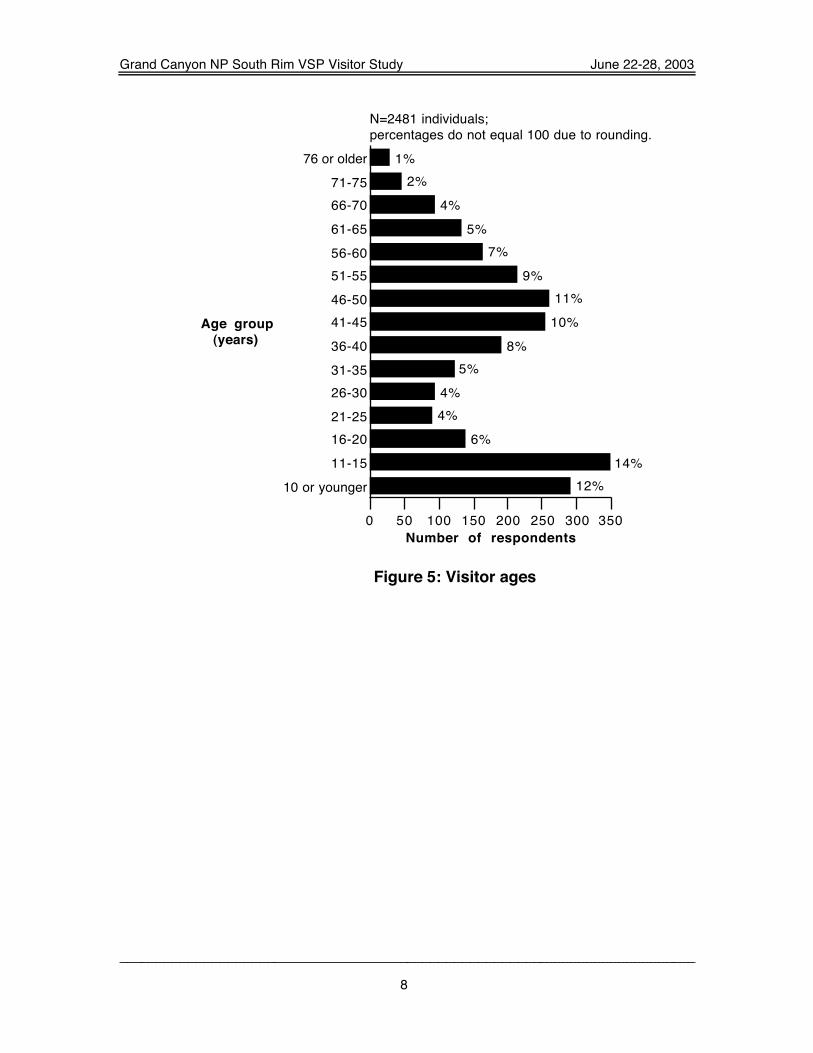
Forty-five percent of the visitors were ages 36-60 years and 26% were15 years or younger (see Figure 5).
Eleven percent of visitors were with a group member who had disabilities/impairments that limited their ability to visit Grand Canyon NP (see Figure 6). Themost common disabilities/impairments included mobility (79%) and hearing (16%),as shown in Figure 7. "Other" disabilities included age/heart condition, asthma,

Grand Canyon NP South Rim VSP Visitor Study June 22-28, 2003
6
cystic fibrosis, and back/knee problems. Thirty-one percent of disabled visitorsencountered access problems during their park visit (see Figure 8). The problemsincluded difficulty boarding buses, long walks to viewpoints and shuttle stops, notenough disabled parking, steps difficult, need more benches, and altitude.
Eight percent of the visitor groups did not speak English as their primarylanguage (see Figure 9). The primary languages these visitor groups spoke areshown in Table 3. Thirty-eight groups responded that there were services theywould like to have provided in other languages. The services includedheadphones with language options, warning signs in restrooms, internationalsigns and brochures/maps.
When asked how many times each member in the group had visitedGrand Canyon NP in the past five years, 84% of visitor groups reported that thiswas their first visit (see Figure 11). Over two-thirds of visitor groups (67%) werevisiting for the first time in their lifetime.
Nine percent of all visitors were international, with the largest proportionfrom England (31%), as shown in Table 4. Smaller proportions of internationalvisitors came from another 27 countries. The largest proportions of United Statesvisitors were from California (14%), Arizona (8%), Texas (8%) and Florida (6%).Smaller proportions of U.S. visitors came from another 45 states, plusWashington, D.C., Guam and Puerto Rico (see Map 1 and Table 5).
1
2
3
4
5
6
7 or more
3%
36%
12%
23%
10%
4%
10%
0 50 100 150 200 250 300Number of respondents
N=721 visitor groups;percentages do not equal 100 due to rounding.
Group size
Figure 1: Visitor group sizes

Grand Canyon NP South Rim VSP Visitor Study June 22-28, 2003
7
Other
Alone
Family & friends
Friends
Family
2%
5%
7%
10%
75%
0 100 200 300 400 500 600Number of respondents
N=714 visitor groups;percentages do not equal 100 due to rounding.
Group type
Figure 2: Visitor group types
Yes
No
4%
96%
0 100 200 300 400 500 600 700Number of respondents
N=693 visitor groups
With guided tour group?
Figure 3: Visitor groups with a guided tour group
Yes
No
1%
99%
0 100 200 300 400 500 600 700Number of respondents
N=674 visitor groups
With school/educational group?
Figure 4: Visitor groups with a school/educational group
Grand Canyon NP South Rim VSP Visitor Study June 22-28, 2003
8
10 or younger11-1516-2021-2526-3031-3536-4041-4546-5051-5556-6061-6566-7071-75
76 or older
12%14%
6%4%4%
5%8%
10%11%
9%7%
5%4%
2%1%
0 50 100 150 200 250 300 350Number of respondents
N=2481 individuals;percentages do not equal 100 due to rounding.
Age group (years)
Figure 5: Visitor ages

Grand Canyon NP South Rim VSP Visitor Study June 22-28, 2003
9
Yes
No
11%
89%
0 100 200 300 400 500 600 700Number of respondents
N=723 visitor groups
Group members with disabilities?
Figure 6: Visitor groups with disabilities/impairments thatlimited ability to visit Grand Canyon NP
Other
Learning
Mental/emotional
Visual
Hearing
Mobility
5%
0%
9%
9%
16%
79%
0 10 20 30 40 50 60Number of respondents
N=76 visitor groups;percentages do not equal 100 because visitors could have more than one disability.
Disability
Figure 7: Types of visitor disabilities
Yes
No
31%
69%
0 20 40 60Number of respondents
N=77 visitor groups
Access problems?
Figure 8: Encounter disability access problems at park?

Grand Canyon NP South Rim VSP Visitor Study June 22-28, 2003
10
No
Yes
8%
92%
0 100 200 300 400 500 600 700Number of respondents
N=724 visitor groups
Is English your primary language?
Figure 9: Visitor groups with English as primary language
Table 3: Primary languages other than EnglishN=18 languages
Number ofLanguage times mentioned
German 12Spanish 6French 5Swedish 4Chinese 3Dutch 3Japanese 2Korean 2Mandarin 2Polish 2Russian 2Thai 2Other languages 6

Grand Canyon NP South Rim VSP Visitor Study June 22-28, 2003
11
Figure 10: Number of visits in past 5 years(including this visit)
Figure 11: Number of visits in lifetime(including this visit)

Grand Canyon NP South Rim VSP Visitor Study June 22-28, 2003
12
Table 4: International visitors by country of residencepercentages do not equal 100 due to rounding.
Number of Percent of PercentCountry individuals international visitors of total visitors
N=211 individuals N=2,275 individuals
England 66 31 <1Australia 15 7 <1Canada 12 6 <1France 12 6 <1Sweden 12 6 <1Germany 11 5 <1Holland 9 4 <1Denmark 8 4 <1Italy 8 4 <1Japan 7 3 <1Austria 5 2 <1Latvia 5 2 <1Mexico 5 2 <1China 4 2 <1Israel 4 2 <1Africa 3 1 <1India 3 1 <1New Zealand 3 1 <1Singapore 3 1 <1Belgium 2 1 <1Dominican Republic 2 1 <1Ireland 2 1 <1Philippines 2 1 <1Poland 2 1 <1Scotland 2 1 <1Switzerland 2 1 <1Albania 1 <1 <1Czechoslovakia 1 <1 <1

Grand Canyon NP South Rim VSP Visitor Study June 22-28, 2003
13
Map 1: Proportion of United States visitors by state of residence
Table 5: United States visitors by state of residencepercentages may not equal 100 due to rounding.
Number of Percent of Percent ofState individuals U.S. visitors total visitors
N=2,064 individuals N=2,275 individuals
California 297 14 13Arizona 166 8 7Texas 162 8 7Florida 127 6 6Ohio 99 5 4Pennsylvania 98 5 4Illinois 75 4 3Georgia 68 3 3Michigan 61 3 3Minnesota 58 3 3Virginia 56 3 3Washington 52 3 2Kentucky 46 2 2New Jersey 44 2 2New Mexico 44 2 2Indiana 40 2 2Colorado 37 2 2New York 36 2 2North Carolina 35 2 2Wisconsin 35 2 2Missouri 32 2 1Louisiana 30 2 1Massachusetts 30 2 1Alabama 28 1 1Maryland 28 1 1Utah 26 1 123 other states + Washington, D.C.+ Puerto Rico + Guam 254 12 11

Grand Canyon NP South Rim VSP Visitor Study June 22-28, 2003
14
Length of visit in area and in park
Area: Visitor groups were asked how long they spent visiting GrandCanyon NP and the surrounding area (Flagstaff/Williams/Cameron) on this visit.Most visitor groups (65%) spent six or more hours in the Grand Canyon NP area,as shown in Figure 12. Another 26% spent two to four hours. Visitor groups whospent 24 hours or more in the area most often spent two days (42%), as shownin Figure 13.
Park: In Grand Canyon NP, visitor groups who spent less than 24 hoursmost often spent eight hours or more (28%), or four to six hours (47%), as shownin Figure 14. Of those who visited for 24 hours or more, 77% of respondentsspent two or three days (see Figure 15).
1
2
3
4
5
6
7 or more
5%
10%
8%
8%
5%
16%
49%
0 20 40 60 80 100Number of respondents
N=176 visitor groups;percentages do not equal 100 due to rounding.
Numberof hours
Figure 12: Hours spent in Grand Canyon NP area(Flagstaff/Williams/Cameron) by visitor groups who
stayed less than 24 hours on this visit

Grand Canyon NP South Rim VSP Visitor Study June 22-28, 2003
15
1
2
3
4
5
6
7 or more
19%
42%
20%
9%
5%
2%
5%
0 50 100 150 200Number of respondents
N=468 visitor groups;percentages do not equal 100 due to rounding.
Number of days
Figure 13: Days spent in Grand Canyon NP area(Flagstaff/Williams/Cameron) by visitor groups who
stayed 24 hours or more on this visit
<1
1
2
3
4
5
6
7
8 or more
<1%
2%
6%
11%
15%
13%
19%
6%
28%
0 20 40 60 80 100 120 140Number of respondents
N=439 visitor groups
Number of hours
Figure 14: Hours spent in Grand Canyon NP byvisitor groups who stayed less than 24 hours on this
visit

Grand Canyon NP South Rim VSP Visitor Study June 22-28, 2003
16
1
2
3
4
5
6 or more
10%
53%
24%
6%
3%
3%
0 30 60 90 120 150Number of respondents
N=273 visitor groups;percentages do not equal 100 due to rounding.
Number of days
Figure 15: Days spent in Grand Canyon NP by visitor groupswho stayed 24 hours on more on this visit

Grand Canyon NP South Rim VSP Visitor Study June 22-28, 2003
17
Sources of information—this visit/future visits
Visitor groups were asked to indicate the sources from which they hadreceived information about Grand Canyon NP prior to their visit. Eleven percentof visitor groups received no information prior to their visit. Of the groups whoreceived information, the most common sources were travel guides/tour books(50%), word of mouth/friends/relatives (47%) and maps/brochures (47%), asshown in Figure 16. The least used source of information was "living in the localarea" (5%). “Other” sources of information used by visitor groups were AmericanAutomobile Association (AAA), school, Phoenix hotel, book on national parks,elder hostel and travel agent.
Most visitor groups (82%) received the information they needed to plantheir visit, however 11% did not and 7% were "not sure" (see Figure 17). Theadditional information that visitor groups needed prior to their visit is shown inTable 6.
Prior to future visits, the sources of information that visitor groups wouldmost prefer to use included National Park Service website (69%), travelguides/tour books (55%) and maps/brochures (48%), as shown in Figure 18."Other" sources of information included AAA, school, travel agent, and RV guide.

Grand Canyon NP South Rim VSP Visitor Study June 22-28, 2003
18
Other
Live in local area
Chamber of Commerce/visitor bureau
Phone/written/e-mail inquiry to park
Park concessioner web site
Newspaper/magazine articles
Highway signs
Video/television/radio programs
Other web sites
NPS web site
Previous visits
Maps/brochures
Word of mouth/friends/relatives
Travel guides/tour books
6%
5%
5%
5%
11%
13%
13%
18%
23%
37%
41%
47%
47%
50%
0 50 100 150 200 250 300 350Number of respondents
N=649 visitor groups;percentages do not equal 100 because visitor groups could use more than one source.
Source
Figure 16: Sources of information used by visitor groups prior tothis visit
Not sure
No
Yes
7%
11%
82%
0 100 200 300 400 500 600Number of respondents
N=650 visitor groups
Receive needed information?
Figure 17: Receive needed information?

Grand Canyon NP South Rim VSP Visitor Study June 22-28, 2003
19
Table 6: Information needed but not receivedN=72 comments
Number ofComment times mentionedGeneral information 18Lodging 10Tours, including driving 6Hiking trails 5Camping 4Shuttle schedule/route 3Food/restaurants 3Hours of operation 3Maps 3Road construction 2Directions 2Admission costs 2Reservations needed 2Specific information for elderly/handicapped 2Other comments 7
Other
Live in local area
Highway signs
Inquiry to park
Newspaper/magazine article
Chamber of Commerce/visitor
Television/radio
Word of mouth/friends/relatives
Park concessioner web site
Other web site
Previous visit
Maps/brochures
Travel guide/tour book
NPS web site
2%
2%
10%
10%
11%
12%
12%
18%
23%
26%
41%
48%
55%
69%
0 50 100 150 200 250 300Number of respondents
N=418 visitor groups;percentages do not equal 100 because visitor groups could plan to use more than one source.
Source
Figure 18: Preferred sources of information prior to future visits

Grand Canyon NP South Rim VSP Visitor Study June 22-28, 2003
20
Awareness of land management by three government agencies
Visitor groups were asked, "Prior to your visit, were you aware that threedifferent government agencies—National Park Service, U.S. Forest Service andBureau of Land Management—each with different land management goals,manage land in and around Grand Canyon NP?" Eighty-one percent of the visitorgroups were not aware of this, while 16% were aware of the three landmanagement agencies (see Figure 19). Four percent were "not sure."
Not sure
Yes
No
4%
16%
81%
0 100 200 300 400 500 600Number of respondents
N=729 visitor groups;percentages do not equal 100 due to rounding.
Aware of landmanagement differences?
Figure 19: Visitor awareness that Grand Canyon NP area ismanaged by three land management agencies

Grand Canyon NP South Rim VSP Visitor Study June 22-28, 2003
21
Grand Canyon NP as part of travel plans/timing of decision to visit
Visitor groups were asked how Grand Canyon NP fit into their travelplans on this visit. Most visitor groups (74%) reported that Grand Canyon NP wasone of several destinations, as shown in Figure 20. For 22% of visitor groups, thepark was the primary destination and another 4% said the park was not aplanned destination.
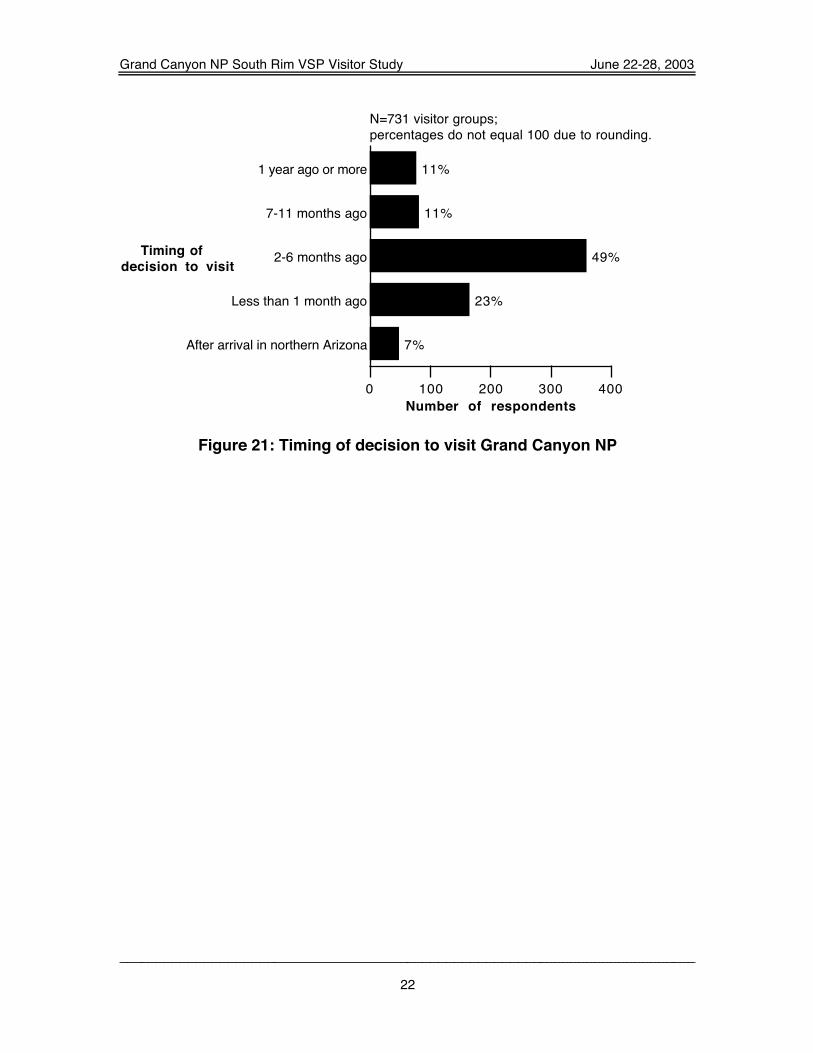
Visitor groups were asked when they made the decision to visit GrandCanyon NP on this trip. Almost one-half of the visitor groups (49%) made thedecision two to six months ago and another 23% made the decision less thanone month prior to their trip (see Figure 21). Seven percent made the decisionafter arriving in northern Arizona on their trip.
Not a planned destination
Primary destination
One of several destinations
4%
22%
74%
0 100 200 300 400 500 600Number of respondents
N=730 visitor groups
Park as destination
Figure 20: Grand Canyon NP as part of travel plans
Grand Canyon NP South Rim VSP Visitor Study June 22-28, 2003
22
After arrival in northern Arizona
Less than 1 month ago
2-6 months ago
7-11 months ago
1 year ago or more
7%
23%
49%
11%
11%
0 100 200 300 400Number of respondents
N=731 visitor groups;percentages do not equal 100 due to rounding.
Timing of decision to visit
Figure 21: Timing of decision to visit Grand Canyon NP

Grand Canyon NP South Rim VSP Visitor Study June 22-28, 2003
23
Primary reason for visiting Grand Canyon NP area
Visiting Grand Canyon NP was the primary reason for visiting the GrandCanyon NP area for 73% of the visitor groups (see Figure 22). Eleven percent ofvisitor groups came primarily to visit other attractions in the area.
Business or other reasons
Visit friends/relatives in the area
Visit other attractions in the area
Visit Grand Canyon NP
7%
9%
11%
73%
0 100 200 300 400 500 600Number of respondents
N=707 visitor groups
Reason for visit
Figure 22: Primary reason for visiting Grand Canyon NP area
Grand Canyon NP South Rim VSP Visitor Study June 22-28, 2003
24
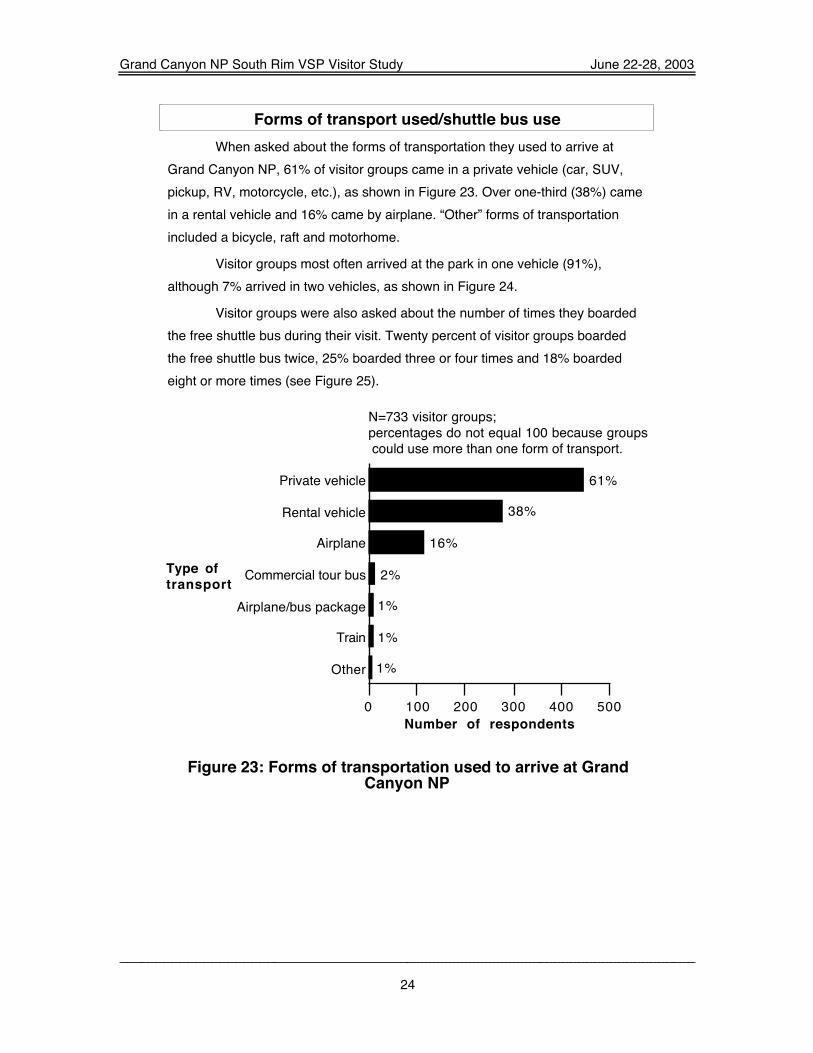
Forms of transport used/shuttle bus useWhen asked about the forms of transportation they used to arrive at
Grand Canyon NP, 61% of visitor groups came in a private vehicle (car, SUV,pickup, RV, motorcycle, etc.), as shown in Figure 23. Over one-third (38%) camein a rental vehicle and 16% came by airplane. “Other” forms of transportationincluded a bicycle, raft and motorhome.
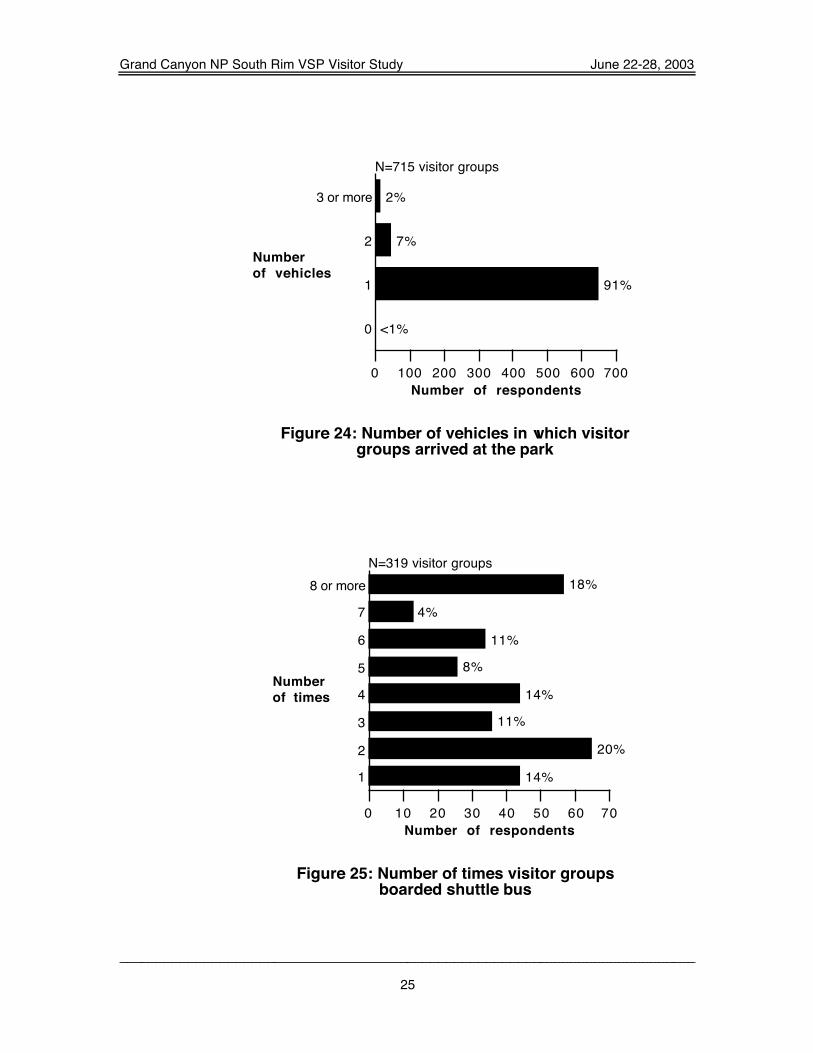
Visitor groups most often arrived at the park in one vehicle (91%),although 7% arrived in two vehicles, as shown in Figure 24.
Visitor groups were also asked about the number of times they boardedthe free shuttle bus during their visit. Twenty percent of visitor groups boardedthe free shuttle bus twice, 25% boarded three or four times and 18% boardedeight or more times (see Figure 25).
Other
Train
Airplane/bus package
Commercial tour bus
Airplane
Rental vehicle
Private vehicle
1%
1%
1%
2%
16%
38%
61%
0 100 200 300 400 500Number of respondents
N=733 visitor groups;percentages do not equal 100 because groups could use more than one form of transport.
Type of transport
Figure 23: Forms of transportation used to arrive at GrandCanyon NP
Grand Canyon NP South Rim VSP Visitor Study June 22-28, 2003
25
0
1
2
3 or more
<1%
91%
7%
2%
0 100 200 300 400 500 600 700Number of respondents
N=715 visitor groups
Number of vehicles
Figure 24: Number of vehicles in which visitorgroups arrived at the park
1
2
3
4
5
6
7
8 or more
14%
20%
11%
14%
8%
11%
4%
18%
0 10 20 30 40 50 60 70Number of respondents
N=319 visitor groups
Number of times
Figure 25: Number of times visitor groupsboarded shuttle bus
Grand Canyon NP South Rim VSP Visitor Study June 22-28, 2003
26
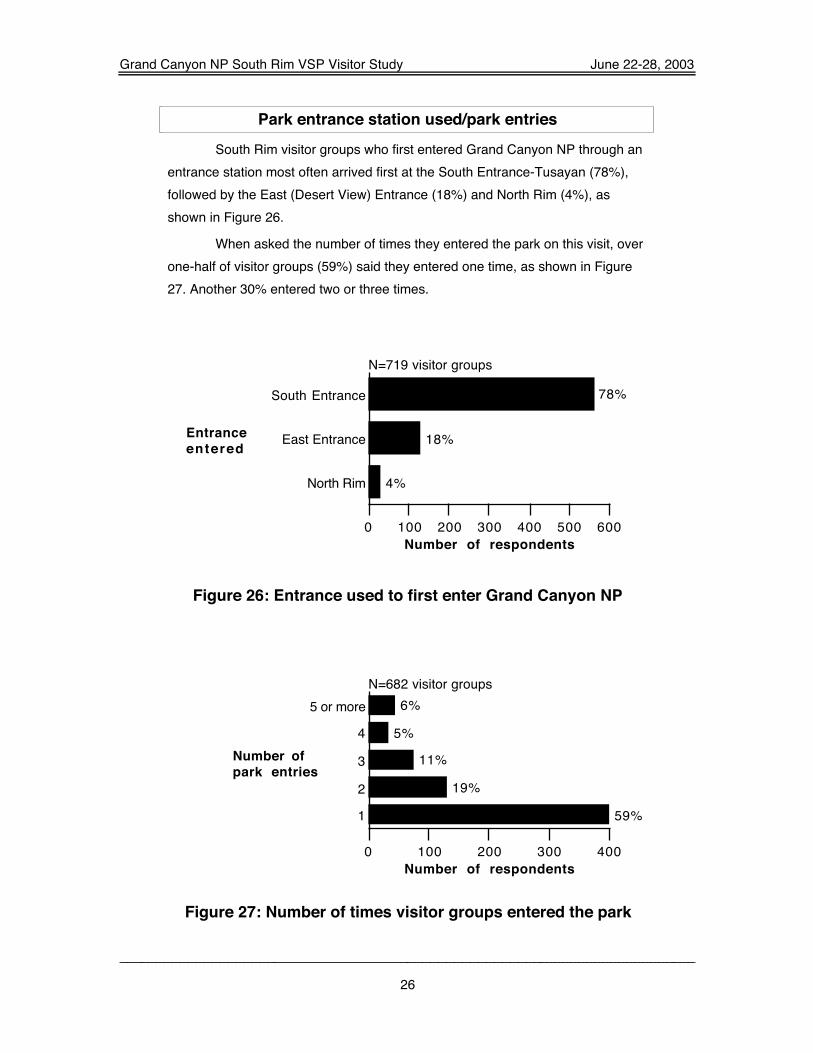
Park entrance station used/park entriesSouth Rim visitor groups who first entered Grand Canyon NP through an
entrance station most often arrived first at the South Entrance-Tusayan (78%),followed by the East (Desert View) Entrance (18%) and North Rim (4%), asshown in Figure 26.
When asked the number of times they entered the park on this visit, overone-half of visitor groups (59%) said they entered one time, as shown in Figure27. Another 30% entered two or three times.
North Rim
East Entrance
South Entrance
4%
18%
78%
0 100 200 300 400 500 600Number of respondents
N=719 visitor groups
Entrance entered
Figure 26: Entrance used to first enter Grand Canyon NP
1
2
3
4
5 or more
59%
19%
11%
5%
6%
0 100 200 300 400Number of respondents
N=682 visitor groups
Number of park entries
Figure 27: Number of times visitor groups entered the park
Grand Canyon NP South Rim VSP Visitor Study June 22-28, 2003
27
Wayfinding in the park
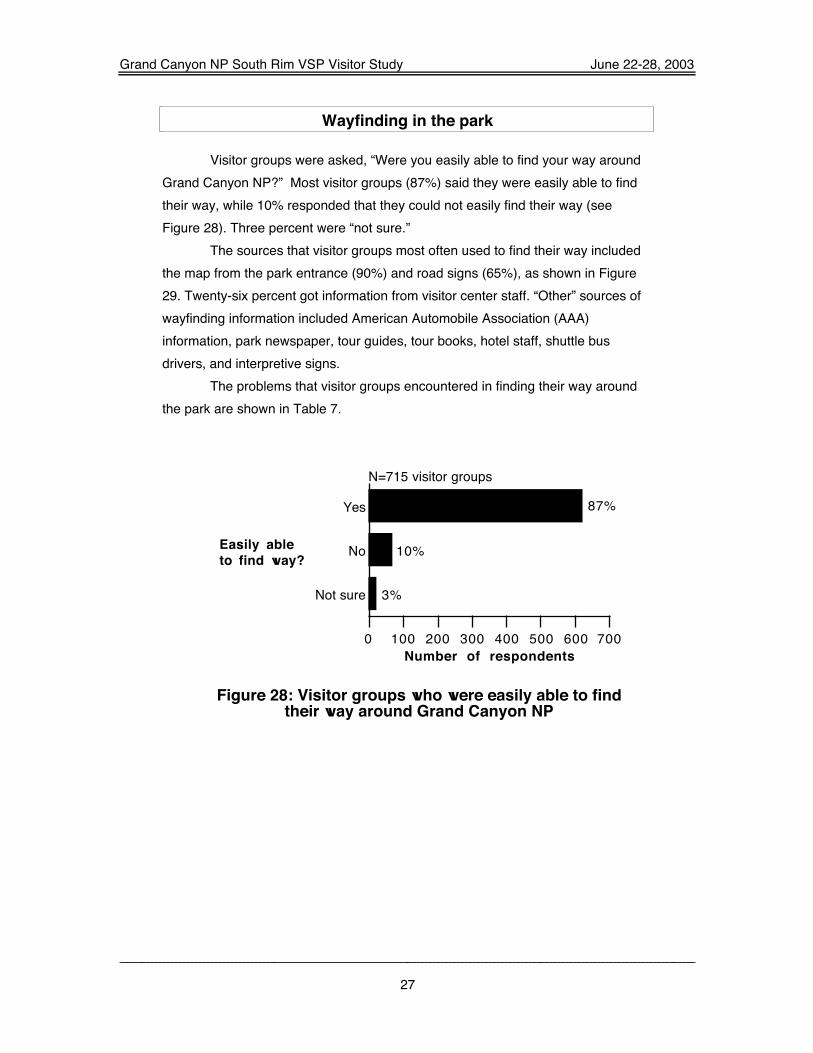
Visitor groups were asked, “Were you easily able to find your way aroundGrand Canyon NP?” Most visitor groups (87%) said they were easily able to findtheir way, while 10% responded that they could not easily find their way (seeFigure 28). Three percent were “not sure.”
The sources that visitor groups most often used to find their way includedthe map from the park entrance (90%) and road signs (65%), as shown in Figure29. Twenty-six percent got information from visitor center staff. “Other” sources ofwayfinding information included American Automobile Association (AAA)information, park newspaper, tour guides, tour books, hotel staff, shuttle busdrivers, and interpretive signs.
The problems that visitor groups encountered in finding their way aroundthe park are shown in Table 7.
Not sure
No
Yes
3%
10%
87%
0 100 200 300 400 500 600 700Number of respondents
N=715 visitor groups
Easily able to find way?
Figure 28: Visitor groups who were easily able to findtheir way around Grand Canyon NP

Grand Canyon NP South Rim VSP Visitor Study June 22-28, 2003
28
Other
Place mats at restaurants
Travelers information radio
Visitor center staff
Road signs
Map from park entrance
11%
2%
8%
26%
65%
90%
0 100 200 300 400 500 600 700Number of respondents
N=719 visitor groups;percentages do not equal 100 because visitors could use more than one source.
Source
Figure 29: Sources used to find way around Grand Canyon NP
Table 7: Problems in wayfindingN=172 comments
Number ofComment times mentionedDirectional signs confusing 40Map poor 20Bus routes confusing 28Finding parking 14Not enough directional signs 14Finding visitor center 9Construction route confusing 7Signs difficult to read, especially at night 6Hotels not well labeled 4Information radio not working 4Bus stops hard to find 3Crowds contributed to confusion 3Inconsistent information between signs/maps 3Not enough trail signs 3Signs directing to exits confusing 2Road layout confusing 2Flagstaff lacks signs/maps to direct to park 2Other comments 8

Grand Canyon NP South Rim VSP Visitor Study June 22-28, 2003
29
Activities including hiking/backpacking
Visitor groups were asked to list the activities in which they participated atGrand Canyon NP on this visit. On this visit, the most common activities weresightseeing/scenic drive (90%), taking a self-guided rim walk (68%), andshopping (50%), as shown in Figure 30. The least common activities were takinga mule ride and backpacking/camping below the rim (each 1%) "Other" activitiesincluded star gazing/astronomy, riding shuttle buses, rafting, picnicking, stayingin lodge, attending church service, taking West Rim shuttle, and ATV rides.
Respondents were asked to list the three most important activities on theirvisit to Grand Canyon NP. Visitor groups’ most important activities includedsightseeing/scenic drive (50%), taking a self-guided rim walk (21%), anddayhiking below the rim (12%), as shown in Figure 31. The second mostimportant activities included taking a self-guided rim walk (26%),sightseeing/scenic drive (20%), and photography/painting/drawing (20%), asshown in Figure 32. The third most important activity responses consisted ofphotography/painting/drawing (20%), taking a self-guided rim walk (15%),sightseeing/scenic drive (13%) and shopping (13%), as shown in Figure 33.
Just over one-third of the visitor groups (34%) said they hiked orbackpacked on this visit (see Figure 34). Those who hiked or backpackedidentified the trails they used, most often the Rim Trail (69%), Bright Angel Trail(49%) and South Kaibab Trail (19%), as shown in Figure 35. The least hiked trailwas Grandview Trail (6%). "Other" trails hiked included many along river corridorand along rim with no trail.

Grand Canyon NP South Rim VSP Visitor Study June 22-28, 2003
30
OtherTakiing mule ride
Backpacking/camping below rimParticipating in Junior Ranger Program
Camping in developed campgroundTaking plane/helicopter overflight
Taking commercial bus tourAttending ranger-led programsViewing Imax movie (Tusayan)
Day hiking below rimDining
Photography/painting/drawingShopping
Taking self-guided rim walkSightseeing/scenic drive
9%1%1%
4%7%8%8%10%
19%19%
45%45%
50%68%
90%
0 100 200 300 400 500 600 700Number of respondents
N=730 visitor groups;percentages do not equal 100 because visitors could do more than one activity.
Activity
Figure 30: Visitor activities on this visit

Grand Canyon NP South Rim VSP Visitor Study June 22-28, 2003
31
Other
Dining
Taking mule ride
Backpacking/camping below rim
Shopping
Participating in Junior Ranger Program
Camping in developed campground
Viewing Imax movie (Tusayan)
Attending ranger-led programs
Helicopter overflight
Photography/painting/drawing
Taking commercial bus tour
Day hiking below rim
Taking self-guided rim walk
Sighseeing/scenic drive
2%
<1%
1%
1%
1%
1%
1%
1%
1%
2%
3%
3%
12%
21%
50%
0 50 100 150 200 250 300Number of respondents
N=563 visitor groups;percentages do not equal 100 due to rounding.
Activity
Figure 31: The most important activity

Grand Canyon NP South Rim VSP Visitor Study June 22-28, 2003
32
Other
Backpacking/camping below rim
Participating in Junior Ranger Program
Dining
Taking plane/helicopter overflight
Attending ranger-led programs
Taking commercial bus tour
Camping in developed campground
Shopping
Viewing Imax movie (Tusayan)
Day hiking below rim
Photography/painting/drawing
Sightseeing/scenic drive
Taking self-guided rim walk
1%
1%
2%
2%
2%
3%
3%
3%
4%
6%
7%
20%
20%
26%
0 30 60 90 120 150Number of respondents
N=483 visitor groups
Activity
Figure 32: The second most important activity

Grand Canyon NP South Rim VSP Visitor Study June 22-28, 2003
33
Other
Backpacking/camping below rim
Participating in Junior Ranger Program
Camping in developed campground
Taking commercial bus tour
Taking plane/helicopter overflight
Attending ranger-led programs
Day hiking below rim
Viewing Imax movie (Tusayan)
Dining
Shopping
Sightseeing/scenic drive
Taking self-guided rim walk
Photography/painting/drawing
3%
1%
1%
1%
2%
3%
3%
4%
7%
11%
13%
13%
15%
20%
0 20 40 60 80 100Number of respondents
N=401 visitor groups;percentages do not equal 100 due to rounding.
Activity
Figure 33: The third most important activity

Grand Canyon NP South Rim VSP Visitor Study June 22-28, 2003
34
Yes
No
34%
66%
0 100 200 300 400 500Number of respondents
N=725 visitor groups
Hike or backpack?
Figure 34: Visitor groups who hiked or backpacked on thisvisit
Other
Don't know/remember
Grandview Trail
Hermit Trail
South Kaibab Trail
Bright Angel Trail
Rim Trail
2%
2%
6%
10%
19%
49%
69%
0 50 100 150 200Number of respondents
N=245 visitor groups;percentages do not equal 100 because visitors could hike more than one trail.
Trail
Figure 35: Trails hiked or backpacked on this visit

Grand Canyon NP South Rim VSP Visitor Study June 22-28, 2003
35
Learning about interpretive topics
Visitor groups were asked if they learned about any of the followinginterpretive topics—formation of the canyon and its layers, ancient humanhistory, modern human cultures, and plants and animals—during their visit.About two-thirds of the visitor groups (66%) did not learn about any of thesetopics on their visit (see Figure 36). Thirty-two percent learned about the topicsand 3% were “not sure.” Of those who learned, 85% learned about the formationof the canyon and its layers and 70% learned about plants and animals, asshown in Figure 37. Fifty-five percent of visitor groups learned about ancienthuman history and 33% learned about modern human cultures.
Visitor groups were also asked about how much their level ofunderstanding of each topic improved during their visit. Table 8 shows that 52%visitor groups felt their understanding of the formation of the canyon and itslayers improved “a lot.” The topic that received the highest “a little” improvementrating was modern human cultures (26%).
Not sure
Yes
No
3%
32%
66%
0 100 200 300 400 500Number of respondents
N=696 visitor groups;percentages do not equal 100 due to rounding.
Learn about topics?
Figure 36: Visitor groups who learned about interpretive topicson this visit

Grand Canyon NP South Rim VSP Visitor Study June 22-28, 2003
36
Modern human cultures
Ancient human history
Plants and animals
Formation of canyon
33%
55%
70%
85%
0 30 60 90 120 150 180Number of respondents
N=204 visitor groups;percentages do not equal 100 due to rounding.
Topic
Figure 37: Interpretive topics learned about on this visit
Table 8: Improvement in understanding of interpretive topicspercentages may not equal 100 due to rounding.
Level of understanding improvement
Topic N A lot Somewhat A little Not at all Don't knowFormation of canyon 165 52% 32% 14% 2% 0%Ancient humanhistory
110 38% 38% 21% 3% 0%
Modern humancultures
68 28% 41% 26% 4% 0%
Plants and animals 139 42% 34% 24% 0% 0%

Grand Canyon NP South Rim VSP Visitor Study June 22-28, 2003
37
Places visited/order visited
Visitor groups were asked to list the order in which they visited selectedplaces in and around Grand Canyon NP on this visit. Figure 38 shows that themost visited place was Mather Point/Canyon View Visitor Center (72%), followedby Yavapai Point (62%). The least visited place was Phantom Ranch (3%)."Other" places visited included Lipan Point, Grandview Point, Hopi Point, MoranPoint, Yaki Point, South rim, East Rim drive, Kaibab Trail, lodge and airport.
The place most often visited first was Mather Point/Canyon View VisitorCenter (30%), followed by Tusayan community outside park (23%), as shown inFigure 39.
Other
Phantom Ranch
Indian Garden
North Rim
Tusayan Museum
Train Depot
Hermits Rest
Tusayan (community)
El Tovar Hotel/BrightAngel Lodge, etc.
Market Plaza
Desert View Point
Yavapai Point
Mather Point/Canyon View Visitor Center
11%
3%
5%
11%
14%
19%
38%
43%
44%
52%
54%
62%
72%
0 100 200 300 400 500 600Number of respondents
N=707 visitor groups;percentages do not equal 100 due to rounding.
Place
Figure 38: Places visited in Grand Canyon NP

Grand Canyon NP South Rim VSP Visitor Study June 22-28, 2003
38
Other
Phantom Ranch
Indian Garden
Train Depot
Hermits Rest
Tusayan Museum
North Rim
Market Plaza
El Tovar Hotel/Bright Angel Lodge, etc.
Yavapai Point
Desert View Point
Tusayan
Mather Point/Canyon View Visitor Center
2%
0%
<1%
1%
1%
2%
2%
4%
7%
13%
14%
23%
30%
0 32 64 96 128 160Number of respondents
N=519 visitor groups;percentages do not equal 100 due to rounding.
Place visited
Figure 39: Places visited first on this visit

Grand Canyon NP South Rim VSP Visitor Study June 22-28, 2003
39
Overnight accommodations
Visitor groups were asked a series of questions about overnightaccommodations. Seventy-six percent of visitor groups stayed overnight awayfrom home in the Grand Canyon NP, Tusayan or surrounding area includingFlagstaff, Williams and Cameron, as shown in Figure 40.
Number of nights: Of the visitor groups staying overnight away fromhome in Grand Canyon NP, visitor groups most often stayed one or two nights(55%), as shown in Figure 41. Sixty percent stayed one or two nights in Tusayan(see Figure 42). Outside Grand Canyon NP in the surrounding area (Flagstaff,Williams, Cameron), 68% of visitor groups stayed one or two nights, as shown inFigure 43.
Type of accommodations used: In Grand Canyon NP, 77% of visitorgroups stayed in a lodge/motel, while 12% stayed in a RV/trailer campground(see Figure 44). "Other" lodging included river campsite and in van in parking lot.In Tusayan, 85% of visitor groups stayed in a lodge/motel, while 10% stayed in aRV/trailer campground (see Figure 45). "Other" Tusayan lodging included hotels.In the surrounding area of Flagstaff, Williams and/or Cameron, 81% of visitorgroups stayed in a lodge/motel, while 10% were in a RV/trailer campground (seeFigure 46). "Other" surrounding area lodging included condo, tent camping alongForest Service road, time-share, and Northern Arizona University.
No
Yes
24%
76%
0 100 200 300 400 500 600Number of respondents
N=717 visitor groups
Stay overnight?
Figure 40: Overnight stays away from home in GrandCanyon NP, Tusayan or surrounding area (Flagstaff,
Williams, Cameron)

Grand Canyon NP South Rim VSP Visitor Study June 22-28, 2003
40
0
1
2
3
4
5 or more
29%
29%
26%
9%
4%
3%
0 20 40 60Number of respondents
N=199 visitor groups
Number of nights
Figure 41: Number of nights spent in Grand Canyon NP
0
1
2
3
4
5 or more
22%
32%
28%
12%
3%
3%
0 20 40 60 80Number of respondents
N=236 visitor groups
Number of nights in Tusayan
Figure 42: Number of nights spent in Tusayan

Grand Canyon NP South Rim VSP Visitor Study June 22-28, 2003
41
0
1
2
3
4
5 or more
10%
45%
23%
9%
5%
8%
0 50 100 150 200Number of respondents
N=360 visitor groups
Number of nights in area
Figure 43: Number of nights outside Grand Canyon NP in thesurrounding area (Flagstaff, Williams, Cameron)
Other
Personal seasonal residence
Friends/relatives' residence
Backcountry campsite
Tent camp-developed campground
RV/trailer camping
Lodge/motel
4%
<1%
1%
3%
8%
12%
77%
0 50 100 150 200 250Number of respondents
N=305 visitor groups;percentages do not equal 100 because groups could use more than one type of lodging.
Type of lodging
Figure 44: Type of accommodations used in Grand Canyon NP

Grand Canyon NP South Rim VSP Visitor Study June 22-28, 2003
42
Other
Friends/relatives' residence
Backcountry campsite
Personal seasonal residence
Tent camp-developed campground
RV/trailer camping
Lodge/motel
2%
0%
1%
0%
3%
10%
85%
0 40 80 120 160 200Number of respondents
N=195 visitor groups;percentages do not equal 100 because groups could use more than one type of lodging.
Type of lodging
Figure 45: Type of accommodations used in Tusayan
Other
Personal seasonal residence
Backcountry campsite
Tent camp-developed campground
Friends/relatives' residence
RV/trailer camping
Lodge/motel
3%
<1%
1%
3%
3%
8%
81%
0 50 100 150 200 250Number of respondents
N=274 visitor groups;percentages do not equal 100 because groups could use more than one type of lodging.
Type of lodging
Figure 46: Type of accommodations used in Grand Canyon NP area(Flagstaff, Williams, Cameron)
Grand Canyon NP South Rim VSP Visitor Study June 22-28, 2003
43
Information services and facilities: use, importance and quality
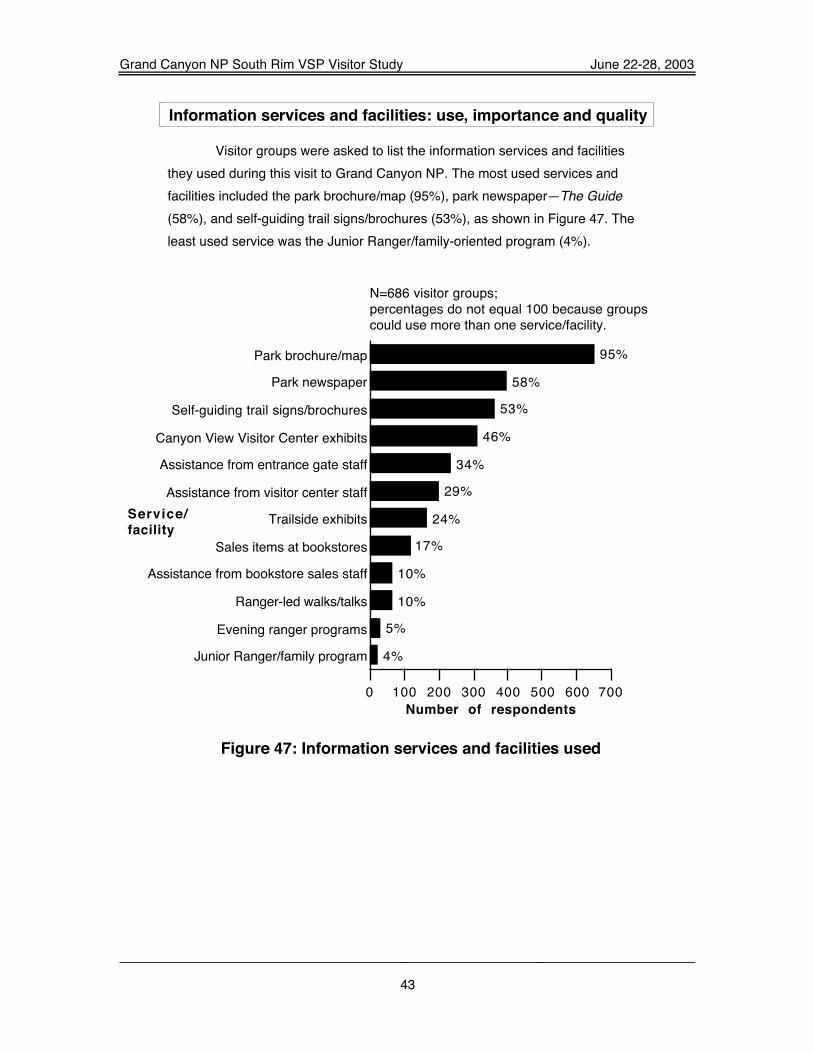
Visitor groups were asked to list the information services and facilitiesthey used during this visit to Grand Canyon NP. The most used services andfacilities included the park brochure/map (95%), park newspaper—The Guide(58%), and self-guiding trail signs/brochures (53%), as shown in Figure 47. Theleast used service was the Junior Ranger/family-oriented program (4%).
Junior Ranger/family program
Evening ranger programs
Ranger-led walks/talks
Assistance from bookstore sales staff
Sales items at bookstores
Trailside exhibits
Assistance from visitor center staff
Assistance from entrance gate staff
Canyon View Visitor Center exhibits
Self-guiding trail signs/brochures
Park newspaper
Park brochure/map
4%
5%
10%
10%
17%
24%
29%
34%
46%
53%
58%
95%
0 100 200 300 400 500 600 700Number of respondents
N=686 visitor groups;percentages do not equal 100 because groups could use more than one service/facility.
Service/facility
Figure 47: Information services and facilities used

Grand Canyon NP South Rim VSP Visitor Study June 22-28, 2003
44
Visitor groups rated the importance and quality of each of the informationservices and facilities they used. The following five-point scales were used in thequestionnaire.
IMPORTANCE QUALITY5=extremely important 5=very good4=very important 4=good3=moderately important 3=average2=somewhat important 2=poor1=not important 1=very poor
The average importance and quality ratings for each service and facilitywere determined based on ratings provided by visitor groups who used eachservice and facility. Figures 48 and 49 show the average importance and qualityratings for each of the park services and facilities. All services and facilities wererated above average in importance and quality. Note: evening ranger programsand Junior Ranger/family-oriented programs were not rated by enough visitorgroups to provide reliable data.
Figures 50-61 show the importance ratings that were provided by visitorgroups for each of the individual services and facilities. Those services andfacilities receiving the highest proportion of “extremely important” or “veryimportant” ratings included self-guiding trail signs/brochures (83%), assistancefrom visitor center staff (82%), and park brochure/map (82%). The highestproportion of “not important” ratings was assistance from bookstore sales staff(8%).
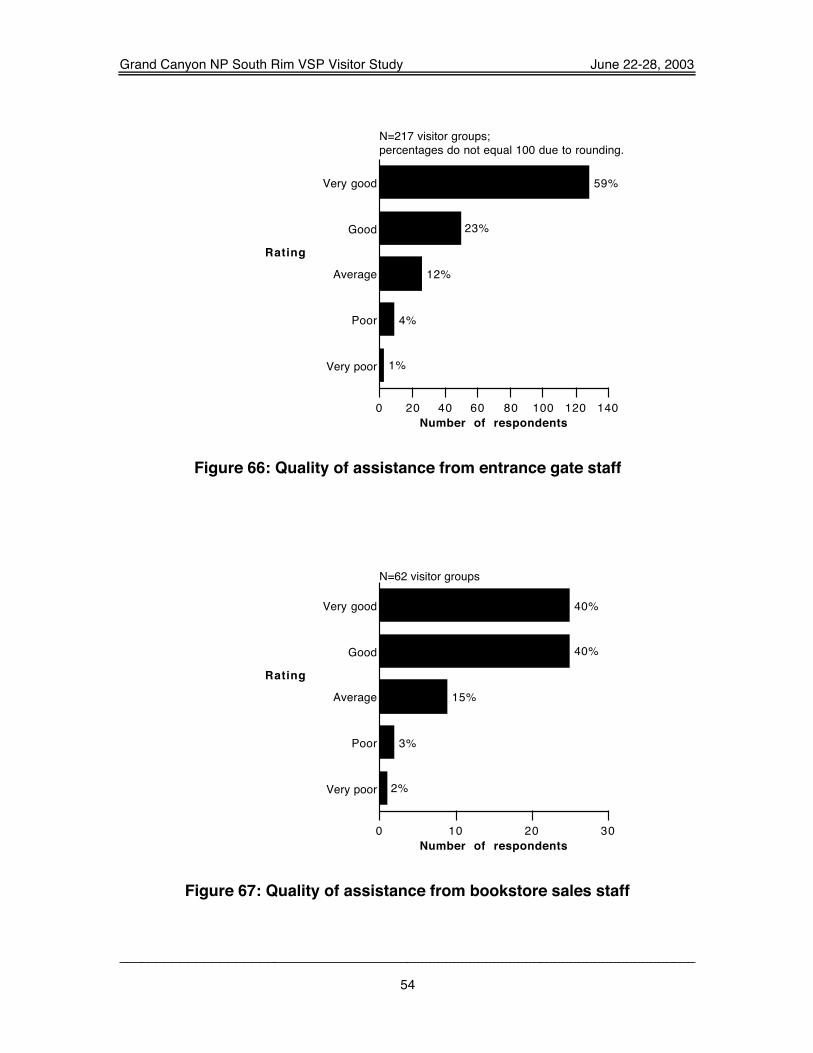
Figures 62-73 show the quality ratings that were provided by visitorgroups for each of the individual facilities. Those facilities receiving the highestproportion of “very good” or “good” ratings included assistance from visitor centerstaff (92%), ranger-led walks/talks (86%), trailside exhibits (86%). The highestproportion of “very poor” ratings was for self-guiding trail signs/brochures (3%).
Figure 74 combines the “very good” and “good” quality ratings andcompares those ratings for all of the information services and facilities.

Grand Canyon NP South Rim VSP Visitor Study June 22-28, 2003
45
Figure 48: Average ratings of information service importance and quality
Figure 49: Detail of Figure 48
fl see enlargement below

Grand Canyon NP South Rim VSP Visitor Study June 22-28, 2003
46
Not important
Somewhat important
Moderately important
Very important
Extremely important
2%
4%
12%
26%
56%
0 100 200 300 400Number of respondents
N=627 visitor groups
Rating
Figure 50: Importance of park brochure/map
Not important
Somewhat important
Moderately important
Very important
Extremely important
3%
5%
19%
27%
46%
0 50 100 150 200Number of respondents
N=388 visitor groups
Rating
Figure 51: Importance of park newspaper—The Guide

Grand Canyon NP South Rim VSP Visitor Study June 22-28, 2003
47
Not important
Somewhat important
Moderately important
Very important
Extremely important
2%
7%
30%
29%
31%
0 20 40 60 80 100Number of respondents
N=303 visitor groups;percentages do not equal 100 due to rounding.
Rating
Figure 52: Importance of Canyon View Visitor Center exhibits
Not important
Somewhat important
Moderately important
Very important
Extremely important
1%
2%
16%
26%
56%
0 20 40 60 80 100 120Number of respondents
N=195 visitor groups;percentages do not equal 100 due to rounding.
Rating
Figure 53: Importance of assistance from visitor center staff

Grand Canyon NP South Rim VSP Visitor Study June 22-28, 2003
48
Not important
Somewhat important
Moderately important
Very important
Extremely important
<1%
7%
19%
25%
48%
0 20 40 60 80 100 120Number of respondents
N=221 visitor groups;percentages do not equal 100 due to rounding.
Rating
Figure 54: Importance of assistance from entrance gate staff
Not important
Somewhat important
Moderately important
Very important
Extremely important
8%
9%
30%
30%
23%
0 5 10 15 20Number of respondents
N=64 visitor groups
Rating
Figure 55: Importance of assistance from bookstore sales staff

Grand Canyon NP South Rim VSP Visitor Study June 22-28, 2003
49
Not important
Somewhat important
Moderately important
Very important
Extremely important
6%
10%
41%
29%
14%
0 10 20 30 40 50Number of respondents
N=110 visitor groups
Rating
Figure 56: Importance of sales items at bookstores
Not important
Somewhat important
Moderately important
Very important
Extremely important
3%
2%
20%
28%
47%
0 10 20 30Number of respondents
N=64 visitor groups
Rating
Figure 57: Importance of ranger-led walks/talks

Grand Canyon NP South Rim VSP Visitor Study June 22-28, 2003
50
Not important
Somewhat important
Moderately important
Very important
Extremely important
7%
10%
7%
23%
53%
0 5 10 15 20Number of respondents
N=30 visitor groups
Rating
Figure 58: Importance of evening ranger programs
Not important
Somewhat important
Moderately important
Very important
Extremely important
2%
6%
24%
33%
36%
0 20 40 60Number of respondents
N=163 visitor groups;percentages do not equal 100 due to rounding.
Rating
Figure 59: Importance of trailside exhibits

Grand Canyon NP South Rim VSP Visitor Study June 22-28, 2003
51
Not important
Somewhat important
Moderately important
Very important
Extremely important
1%
3%
13%
30%
53%
0 50 100 150 200Number of respondents
N=346 visitor groups
Rating
Figure 60: Importance of self-guiding trail signs/brochures
Not important
Somewhat important
Moderately important
Very important
Extremely important
0%
0%
8%
42%
50%
0 5 10 15Number of respondents
N=24 visitor groups
Rating
CAUTION!
Figure 61: Importance of Junior Ranger/family-oriented program

Grand Canyon NP South Rim VSP Visitor Study June 22-28, 2003
52
Very poor
Poor
Average
Good
Very good
2%
3%
11%
31%
53%
0 50 100 150 200 250 300 350Number of respondents
N=595 visitor groups
Rating
Figure 62: Quality of park brochure/map
Very poor
Poor
Average
Good
Very good
1%
3%
14%
30%
52%
0 50 100 150 200Number of respondents
N=371 visitor groups
Rating
Figure 63: Quality of park newspaper—The Guide

Grand Canyon NP South Rim VSP Visitor Study June 22-28, 2003
53
Very poor
Poor
Average
Good
Very good
1%
2%
14%
30%
52%
0 30 60 90 120 150Number of respondents
N=288 visitor groups;percentages do not equal 100 due to rounding.
Rating
Figure 64: Quality of Canyon View Visitor Center exhibits
Very poor
Poor
Average
Good
Very good
0%
3%
5%
28%
64%
0 20 40 60 80 100 120 140Number of respondents
N=191 visitor groups
Rating
Figure 65: Quality of assistance from visitor center staff
Grand Canyon NP South Rim VSP Visitor Study June 22-28, 2003
54
Very poor
Poor
Average
Good
Very good
1%
4%
12%
23%
59%
0 20 40 60 80 100 120 140Number of respondents
N=217 visitor groups;percentages do not equal 100 due to rounding.
Rating
Figure 66: Quality of assistance from entrance gate staff
Very poor
Poor
Average
Good
Very good
2%
3%
15%
40%
40%
0 10 20 30Number of respondents
N=62 visitor groups
Rating
Figure 67: Quality of assistance from bookstore sales staff

Grand Canyon NP South Rim VSP Visitor Study June 22-28, 2003
55
Very poor
Poor
Average
Good
Very good
1%
2%
22%
33%
42%
0 10 20 30 40 50Number of respondents
N=107 visitor groups
Rating
Figure 68: Quality of sales items at bookstores
Very poor
Poor
Average
Good
Very good
2%
0%
13%
13%
73%
0 10 20 30 40 50Number of respondents
N=63 visitor groups;percentages do not equal 100 due to rounding.
Rating
Figure 69: Quality of ranger-led walks/talks

Grand Canyon NP South Rim VSP Visitor Study June 22-28, 2003
56
Very poor
Poor
Average
Good
Very good
4%
4%
0%
19%
74%
0 5 10 15 20Number of respondents
N=27 visitor groups;percentages do not equal 100 due to rounding.
Rating
CAUTION!
Figure 70: Quality of evening ranger programs
Very poor
Poor
Average
Good
Very good
1%
2%
11%
39%
47%
0 20 40 60 80Number of respondents
N=159 visitor groups
Rating
Figure 71: Quality of trailside exhibits

Grand Canyon NP South Rim VSP Visitor Study June 22-28, 2003
57
Very poor
Poor
Average
Good
Very good
3%
4%
12%
33%
48%
0 50 100 150 200Number of respondents
N=333 visitor groups
Rating
Figure 72: Quality of self-guiding trail signs/brochures
Very poor
Poor
Average
Good
Very good
0%
0%
0%
30%
70%
0 5 10 15 20Number of respondents
N=23 visitor groups
Rating
CAUTION!
Figure 73: Quality of Junior Ranger/family-oriented program

Grand Canyon NP South Rim VSP Visitor Study June 22-28, 2003
58
Figure 74: Combined proportions of "very good" and "good"quality ratings for information services and facilities

Grand Canyon NP South Rim VSP Visitor Study June 22-28, 2003
59
Visitor services and facilities: use, importance and quality
Visitor groups were asked to identify the visitor services and facilitiesthey used during this visit to Grand Canyon NP. The most used services andfacilities included park directional signs (95%), roads (91%), restrooms (87%),parking areas (81%), and trash cans (66%), as shown in Figure 75. The leastused service was backcountry campsites (1%).
Backcountry campsites
Access for disabled persons
Developed campgrounds
Picnic areas
Recycling
Pullouts
Free shuttle bus
Trails
Trash cans
Parking areas
Restrooms
Roads
Park directional signs
1%
4%
7%
9%
25%
45%
45%
48%
66%
81%
87%
91%
95%
0 100 200 300 400 500 600 700Number of respondents
N=692 visitor groups;percentages do not equal 100 because visitor groups could use more than one service.
Service/facility
Figure 75: Visitor services and facilities used
Grand Canyon NP South Rim VSP Visitor Study June 22-28, 2003
60
Visitor groups rated the importance and quality of each of the visitorservices and facilities they used. The following five point scales were used in thequestionnaire.
IMPORTANCE QUALITY5=extremely important 5=very good4=very important 4=good3=moderately important 3=average2=somewhat important 2=poor1=not important 1=very poor
The average importance and quality ratings for each service and facilitywere determined based on ratings provided by visitor groups who used eachservice and facility. Figures 76 and 77 show the average importance and qualityratings for each of the park services and facilities. All services and facilities wererated above average in importance and quality. Note: backcountry campsites andaccess for disabled persons were not rated by enough visitor groups to providereliable data.
Figures 78-90 show the importance ratings that were provided by visitorgroups for each of the individual services and facilities. Those services andfacilities receiving the highest proportion of “extremely important” or “veryimportant” ratings included developed campgrounds (95%), roads (95%), parkdirectional signs (94%), restrooms (94%) and trails (94%). The highest proportionof “not important” ratings was for recycling (2%).
Figures 91-103 show the quality ratings that were provided by visitorgroups for each of the individual facilities. Those facilities receiving the highestproportion of “very good” or “good” ratings included trails (90%), pullouts (87%),free shuttle bus (85%), recycling (85%), and trash cans (85%). The highestproportion of “very poor” ratings was for developed campgrounds (4%) andparking areas (4%).
Figure 104 combines the “very good” and “good” quality ratings andcompares those ratings for all of the visitor services and facilities.

Grand Canyon NP South Rim VSP Visitor Study June 22-28, 2003
61
Figure 76: Average ratings of visitor service importance and quality
Figure 77: Detail of Figure 76
fl see enlargement below

Grand Canyon NP South Rim VSP Visitor Study June 22-28, 2003
62
Not important
Somewhat important
Moderately important
Very important
Extremely important
1%
1%
5%
21%
73%
0 100 200 300 400 500Number of respondents
N=640 visitor groups;percentages do not equal 100 due to rounding.
Rating
Figure 78: Importance of park directional signs
Not important
Somewhat important
Moderately important
Very important
Extremely important
1%
1%
3%
18%
77%
0 100 200 300 400 500Number of respondents
N=608 visitor groups
Rating
Figure 79: Importance of roads

Grand Canyon NP South Rim VSP Visitor Study June 22-28, 2003
63
Not important
Somewhat important
Moderately important
Very important
Extremely important
1%
2%
9%
22%
65%
0 50 100 150 200Number of respondents
N=303 visitor groups;percentages do not equal 100 due to rounding.
Rating
Figure 80: Importance of pullouts
Not important
Somewhat important
Moderately important
Very important
Extremely important
1%
2%
4%
23%
71%
0 50 100 150 200 250Number of respondents
N=325 visitor groups;percentages do not equal 100 due to rounding.
Rating
Figure 81: Importance of trails

Grand Canyon NP South Rim VSP Visitor Study June 22-28, 2003
64
Not important
Somewhat important
Moderately important
Very important
Extremely important
0%
14%
14%
0%
71%
0 1 2 3 4 5Number of respondents
N=7 visitor groups;percentages do not equal 100 due to rounding.
Rating
CAUTION!
Figure 82: Importance of backcountry campsites
Not important
Somewhat important
Moderately important
Very important
Extremely important
0%
4%
0%
22%
73%
0 10 20 30 40Number of respondents
N=49 visitor groups;percentages do not equal 100 due to rounding.
Rating
Figure 83: Importance of developed campgrounds

Grand Canyon NP South Rim VSP Visitor Study June 22-28, 2003
65
Not important
Somewhat important
Moderately important
Very important
Extremely important
0%
0%
23%
39%
39%
0 10 20 30Number of respondents
N=57 visitor groups;percentages do not equal 100 due to rounding.
Rating
Figure 84: Importance of picnic areas
Not important
Somewhat important
Moderately important
Very important
Extremely important
<1%
2%
5%
21%
71%
0 100 200 300 400Number of respondents
N=537 visitor groups;percentages do not equal 100 due to rounding.
Rating
Figure 85: Importance of parking areas
Grand Canyon NP South Rim VSP Visitor Study June 22-28, 2003
66
Not important
Somewhat important
Moderately important
Very important
Extremely important
0%
0%
7%
7%
86%
0 10 20 30Number of respondents
N=28 visitor groups
Rating
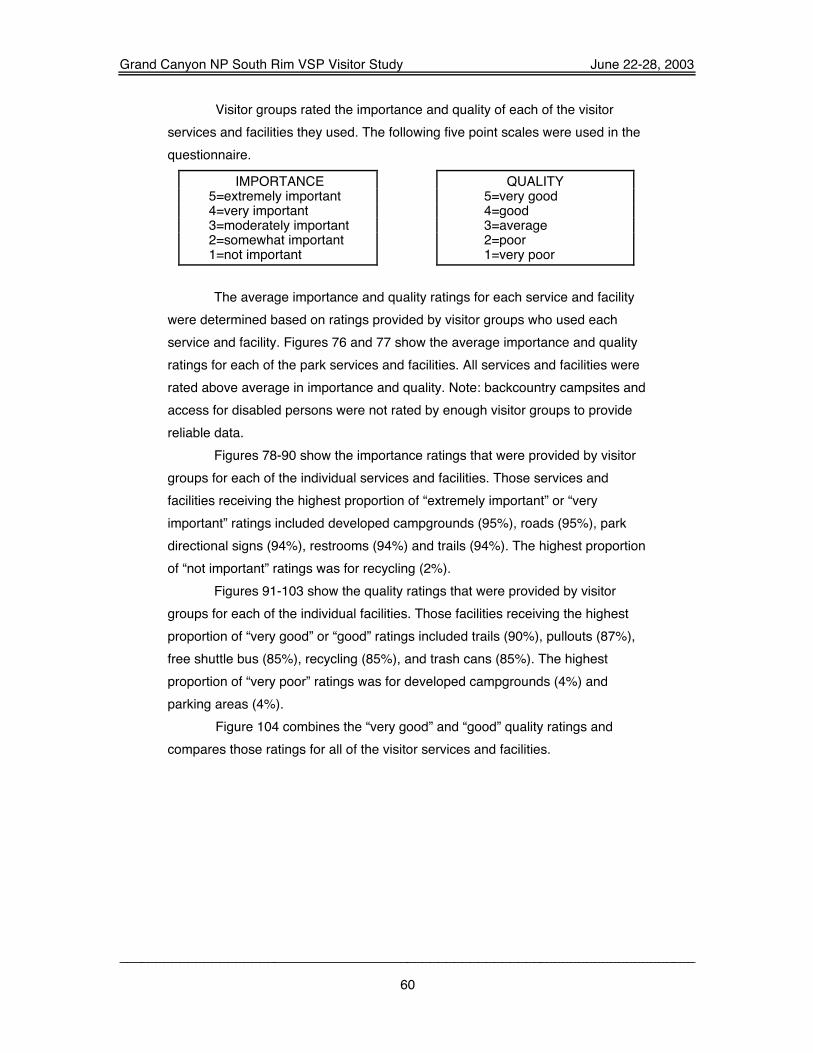
CAUTION!
Figure 86: Importance of access for disabled persons
Not important
Somewhat important
Moderately important
Very important
Extremely important
<1%
1%
6%
15%
79%
0 100 200 300 400 500Number of respondents
N=579 visitor groups;percentages do not equal 100 due to rounding.
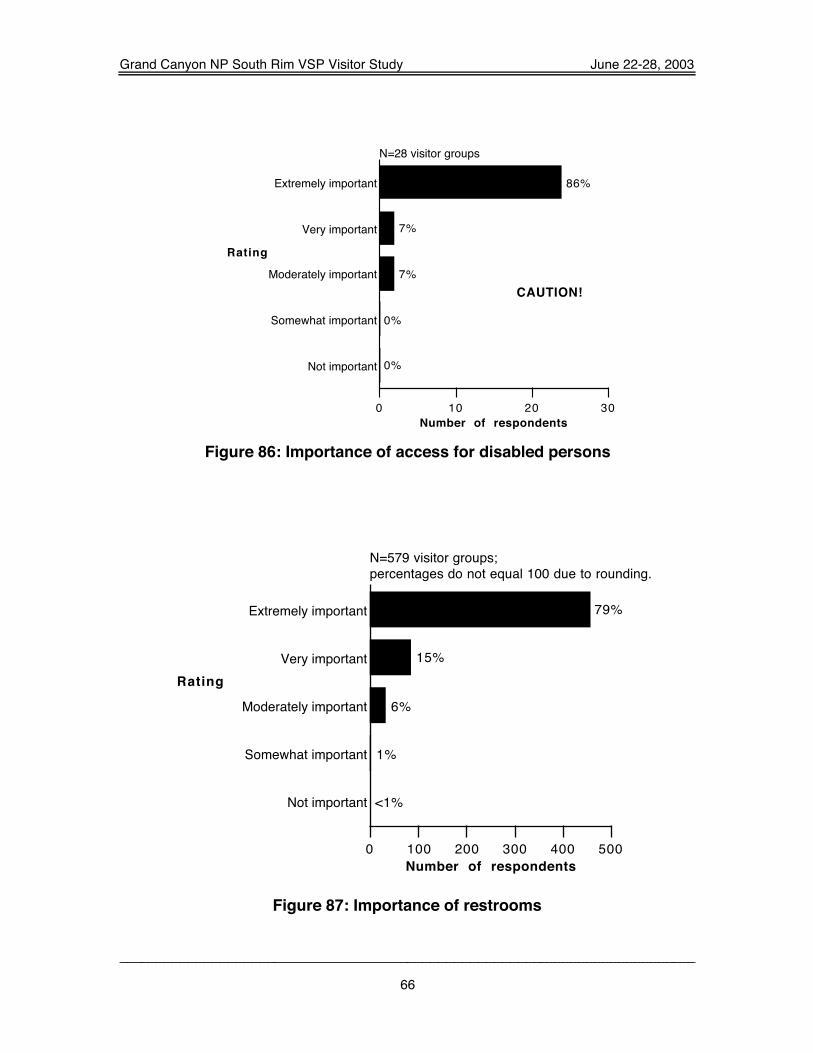
Rating
Figure 87: Importance of restrooms

Grand Canyon NP South Rim VSP Visitor Study June 22-28, 2003
67
Not important
Somewhat important
Moderately important
Very important
Extremely important
1%
1%
13%
24%
61%
0 50 100 150 200 250 300Number of respondents
N=441 visitor groups
Rating
Figure 88: Importance of trash cans
Not important
Somewhat important
Moderately important
Very important
Extremely important
2%
2%
10%
26%
60%
0 20 40 60 80 100Number of respondents
N=168 visitor groups
Rating
Figure 89: Importance of recycling

Grand Canyon NP South Rim VSP Visitor Study June 22-28, 2003
68
Not important
Somewhat important
Moderately important
Very important
Extremely important
1%
1%
6%
20%
73%
0 50 100 150 200 250Number of respondents
N=306 visitor groups;percentages do not equal 100 due to rounding.
Rating
Figure 90: Importance of access for free shuttle buses
Very poor
Poor
Average
Good
Very good
3%
4%
18%
30%
46%
0 50 100 150 200 250 300Number of respondents
N=631 visitor groups;percentages do not equal 100 due to rounding.
Rating
Figure 91: Quality of park directional signs (in park)

Grand Canyon NP South Rim VSP Visitor Study June 22-28, 2003
69
Very poor
Poor
Average
Good
Very good
1%
3%
13%
31%
53%
0 50 100 150 200 250 300 350Number of respondents
N=600 visitor groups;percentages do not equal 100 due to rounding.
Rating
Figure 92: Quality of roads
Very poor
Poor
Average
Good
Very good
<1%
2%
11%
36%
51%
0 40 80 120 160Number of respondents
N=297 visitor groups;percentages do not equal 100 due to rounding.
Rating
Figure 93: Quality of pullouts

Grand Canyon NP South Rim VSP Visitor Study June 22-28, 2003
70
Very poor
Poor
Average
Good
Very good
1%
2%
7%
37%
53%
0 50 100 150 200Number of respondents
N=321 visitor groups
Rating
Figure 94: Quality of trails
Very poor
Poor
Average
Good
Very good
0%
17%
0%
33%
50%
0 1 2 3Number of respondents
N=6 visitor groups
Rating
CAUTION!
Figure 95: Quality of backcountry campsites

Grand Canyon NP South Rim VSP Visitor Study June 22-28, 2003
71
Very poor
Poor
Average
Good
Very good
4%
9%
15%
36%
36%
0 5 10 15 20Number of respondents
N=47 visitor groups
Rating
Figure 96: Quality of developed campgrounds
Very poor
Poor
Average
Good
Very good
2%
5%
27%
30%
36%
0 5 10 15 20Number of respondents
N=56 visitor groups
Rating
Figure 97: Quality of picnic areas

Grand Canyon NP South Rim VSP Visitor Study June 22-28, 2003
72
Very poor
Poor
Average
Good
Very good
4%
8%
24%
28%
37%
0 50 100 150 200Number of respondents
N=528 visitor groups;percentages do not equal 100 due to rounding.
Rating
Figure 98: Quality of parking areas
Very poor
Poor
Average
Good
Very good
7%
7%
4%
30%
52%
0 5 10 15Number of respondents
N=27 visitor groups
Rating
CAUTION!
Figure 99: Quality of access for disabled persons

Grand Canyon NP South Rim VSP Visitor Study June 22-28, 2003
73
Very poor
Poor
Average
Good
Very good
2%
6%
20%
35%
36%
0 50 100 150 200 250Number of respondents
N=573 visitor groups;percentages do not equal 100 due to rounding.
Rating
Figure 100: Quality of restrooms
Very poor
Poor
Average
Good
Very good
1%
2%
11%
36%
49%
0 50 100 150 200 250Number of respondents
N=439 visitor groups;percentages do not equal 100 due to rounding.
Rating
Figure 101: Quality of trash cans

Grand Canyon NP South Rim VSP Visitor Study June 22-28, 2003
74
Very poor
Poor
Average
Good
Very good
1%
2%
12%
31%
54%
0 20 40 60 80 100Number of respondents
N=167 visitor groups
Rating
Figure 102: Quality of recycling
Very poor
Poor
Average
Good
Very good
2%
2%
11%
23%
62%
0 50 100 150 200Number of respondents
N=304 visitor groups
Rating
Figure 103: Quality of free shuttle buses

Grand Canyon NP South Rim VSP Visitor Study June 22-28, 2003
75
Figure 104: Combined proportions of “very good” and “good” qualityratings for visitor services and facilities

Grand Canyon NP South Rim VSP Visitor Study June 22-28, 2003
76
Commercial concession services and facilities: use,importance and quality
Visitor groups were asked to note the commercial concession servicesand facilities they used during this visit to Grand Canyon NP. The most usedservices and facilities included the gift shops (86%), restaurants (56%), andmarket-general store (46%), as shown in Figure 105. The least used service wasthe campground with full hookups (3%).
Campground with full hookups
Showers/laundromats
Desert View gas station
Assistance from concession staff
Lodging in park
Market (general store)
Restaurants
Gift shops
3%
7%
8%
15%
20%
46%
56%
86%
0 100 200 300 400 500Number of respondents
N=567 visitor groups;percentages do not equal 100 because groups could use more than one service.
Service/facility
Figure 105: Commercial concession services and facilities used

Grand Canyon NP South Rim VSP Visitor Study June 22-28, 2003
77
Visitor groups rated the importance and quality of each of the concessionservices and facilities they used. The following five-point scales were used in thequestionnaire.
IMPORTANCE QUALITY5=extremely important 5=very good4=very important 4=good3=moderately important 3=average2=somewhat important 2=poor1=not important 1=very poor
The average importance and quality ratings for each concession serviceand facility were determined based on ratings provided by visitor groups whoused each service and facility. Figures 106 and 107 show the averageimportance and quality ratings for each of the park services and facilities. Allservices and facilities were rated above average in importance and quality. Note:campground with full hookups was not rated by enough visitor groups to providereliable data.
Figures 108-115 show the importance ratings that were provided byvisitor groups for each of the individual services and facilities. Those servicesand facilities receiving the highest proportion of “extremely important” or “veryimportant” ratings included lodging (90%), gas station (89%), andshowers/laundromat (87%). The highest proportion of “not important” ratings wasfor gift shops (4%).
Figures 116-123 show the quality ratings that were provided by visitorgroups for each of the individual services and facilities. Those services andfacilities receiving the highest proportion of “very good” or “good” ratings includedmarket--general store (86%), assistance from concession staff (82%),showers/laundromat (81%). The highest proportion of “very poor” ratings were forthe gas station (9%).
Figure 124 combines the “very good” and “good” quality ratings andcompares those ratings for all of the commercial concession services andfacilities.

Grand Canyon NP South Rim VSP Visitor Study June 22-28, 2003
78
Figure 106: Average ratings of commercial concession serviceimportance and quality
Figure 107: Detail of Figure 106
fl see enlargement below

Grand Canyon NP South Rim VSP Visitor Study June 22-28, 2003
79
Not important
Somewhat important
Moderately important
Very important
Extremely important
2%
3%
6%
15%
75%
0 20 40 60 80 100Number of respondents
N=108 visitor groups;percentages do not equal 100 due to rounding.
Rating
Figure 108: Importance of lodging (inside park)
Not important
Somewhat important
Moderately important
Very important
Extremely important
4%
10%
37%
29%
21%
0 50 100 150 200Number of respondents
N=480 visitor groups;percentages do not equal 100 due to rounding.
Rating
Figure 109: Importance of gift shops

Grand Canyon NP South Rim VSP Visitor Study June 22-28, 2003
80
Not important
Somewhat important
Moderately important
Very important
Extremely important
1%
6%
22%
30%
42%
0 20 40 60 80 100 120Number of respondents
N=250 visitor groups;percentages do not equal 100 due to rounding.
Rating
Figure 110: Importance of market (general store)
Not important
Somewhat important
Moderately important
Very important
Extremely important
2%
3%
15%
27%
54%
0 50 100 150 200Number of respondents
N=308 visitor groups;percentages do not equal 100 due to rounding.
Rating
Figure 111: Importance of restaurants
Grand Canyon NP South Rim VSP Visitor Study June 22-28, 2003
81
Not important
Somewhat important
Moderately important
Very important
Extremely important
0%
3%
11%
32%
55%
0 5 10 15 20 25Number of respondents
N=38 visitor groups;percentages do not equal 100 due to rounding.
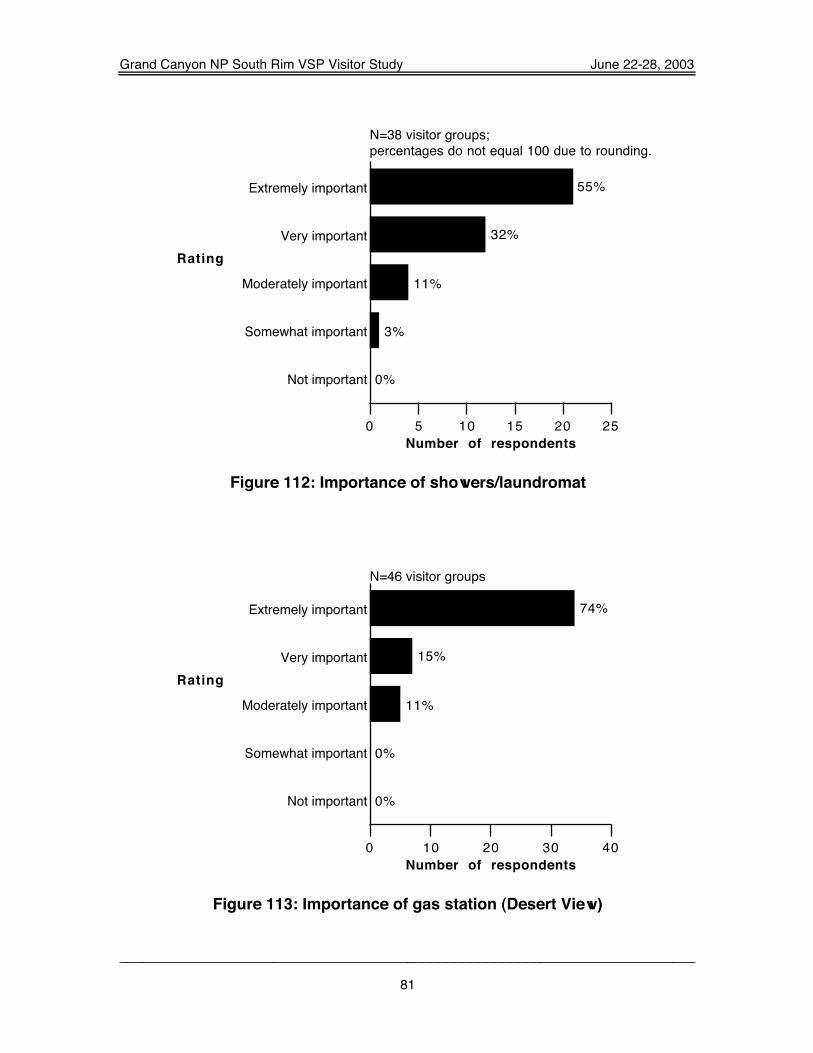
Rating
Figure 112: Importance of showers/laundromat
Not important
Somewhat important
Moderately important
Very important
Extremely important
0%
0%
11%
15%
74%
0 10 20 30 40Number of respondents
N=46 visitor groups
Rating
Figure 113: Importance of gas station (Desert View)

Grand Canyon NP South Rim VSP Visitor Study June 22-28, 2003
82
Not important
Somewhat important
Moderately important
Very important
Extremely important
1%
1%
22%
26%
49%
0 10 20 30 40 50Number of respondents
N=85 visitor groups;percentages do not equal 100 due to rounding.
Rating
Figure 114: Importance of assistance from concession staff
Not important
Somewhat important
Moderately important
Very important
Extremely important
0%
0%
0%
14%
86%
0 5 10 15Number of respondents
N=14 visitor groups
Rating
CAUTION!
Figure 115: Importance of campground with full hookups(trailer village)

Grand Canyon NP South Rim VSP Visitor Study June 22-28, 2003
83
Very poor
Poor
Average
Good
Very good
1%
8%
16%
33%
42%
0 10 20 30 40 50Number of respondents
N=106 visitor groups
Rating
Figure 116: Quality of lodging (inside park)
Very poor
Poor
Average
Good
Very good
1%
2%
18%
39%
40%
0 50 100 150 200Number of respondents
N=468 visitor groups
Rating
Figure 117: Quality of gift shops

Grand Canyon NP South Rim VSP Visitor Study June 22-28, 2003
84
Very poor
Poor
Average
Good
Very good
<1%
2%
12%
42%
44%
0 20 40 60 80 100 120Number of respondents
N=242 visitor groups;percentages do not equal 100 due to rounding.
Rating
Figure 118: Quality of market (general store)
Very poor
Poor
Average
Good
Very good
3%
7%
21%
29%
40%
0 20 40 60 80 100 120 140Number of respondents
N=304 visitor groups
Rating
Figure 119: Quality of restaurants
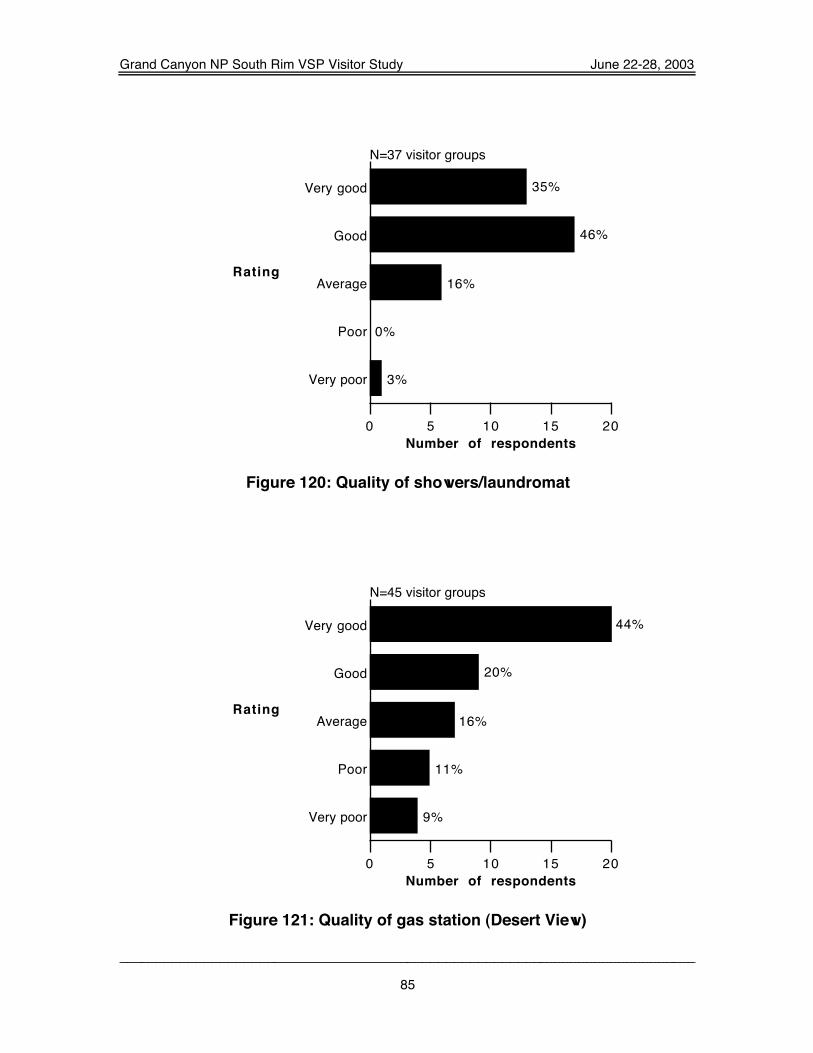
Grand Canyon NP South Rim VSP Visitor Study June 22-28, 2003
85
Very poor
Poor
Average
Good
Very good
3%
0%
16%
46%
35%
0 5 10 15 20Number of respondents
N=37 visitor groups
Rating
Figure 120: Quality of showers/laundromat
Very poor
Poor
Average
Good
Very good
9%
11%
16%
20%
44%
0 5 10 15 20Number of respondents
N=45 visitor groups
Rating
Figure 121: Quality of gas station (Desert View)

Grand Canyon NP South Rim VSP Visitor Study June 22-28, 2003
86
Very poor
Poor
Average
Good
Very good
2%
5%
11%
36%
46%
0 10 20 30 40Number of respondents
N=83 visitor groups
Rating
Figure 122: Quality of assistance from concession staff
Very poor
Poor
Average
Good
Very good
0%
14%
29%
36%
21%
0 1 2 3 4 5Number of respondents
N=14 visitor groups
Rating
CAUTION!
Figure 123: Quality of campground with full hookups(trailer village)

Grand Canyon NP South Rim VSP Visitor Study June 22-28, 2003
87
Figure 124: Combined proportions of "very good" and "good" ratings forcommercial concession services and facilities

Grand Canyon NP South Rim VSP Visitor Study June 22-28, 2003
88
Total expenditures
Visitor groups were asked to list the amount of money they had spent onthis visit, both inside Grand Canyon NP and in the surrounding area includingTusayan, Flagstaff, Cameron, and Williams. Groups were asked to indicate theamounts they spent for lodging; camping fees and charges; guide fees andcharges; restaurants and bars; groceries and take-out food; gas and oil; othertransportation expenses; admissions, recreation, and entertainment fees; allother purchases; and donations.
Total expenditures in and out of the park: Forty-six percent of visitorgroups spent up to $300 in total expenditures in Grand Canyon NP and thesurrounding area, including Tusayan, Flagstaff, Cameron, and Williams (seeFigure 125). Nineteen percent spent $801 or more. Of the total expenditures bygroups, 29% was for hotels, motels, cabins, etc., 18% for restaurants and bars,12% for guide fees and charges, and 12% for all other purchases (see Figure126).
The average visitor group expenditure during this visit was $568. Themedian visitor group expenditure (50% of groups spent more and 50% of groupsspent less) was $330. The average per capita expenditure was $162.
In addition, visitor groups were asked to indicate how many adults (18years and older) and children (under 18 years) were covered by theexpenditures. Figure 127 shows that 66% of the visitor groups had two adultsincluded in the expenditures. Figure 128 show that 56% of the visitor groups hadone or two children under 18 years of age.

Grand Canyon NP South Rim VSP Visitor Study June 22-28, 2003
89
Figure 125: Total expenditures in Grand Canyon NP andsurrounding area (Tusayan, Flagstaff, Cameron, Williams)
Figure 126: Proportions of expenditures in Grand Canyon NPand surrounding area (Tusayan, Flagstaff, Cameron, Williams)

Grand Canyon NP South Rim VSP Visitor Study June 22-28, 2003
90
1
2
3
4
5 or more
8%
66%
11%
10%
6%
0 100 200 300 400 500Number of respondents
N=627 visitor groups;percentages do not equal 100 due to rounding.
Number of adults
Figure 127: Number of adults covered by expenditures
0
1
2
3
4 or more
16%
24%
32%
17%
11%
0 20 40 60 80 100 120Number of respondents
N=376 visitor groups
Number of children
Figure 128: Number of children covered by expenditures
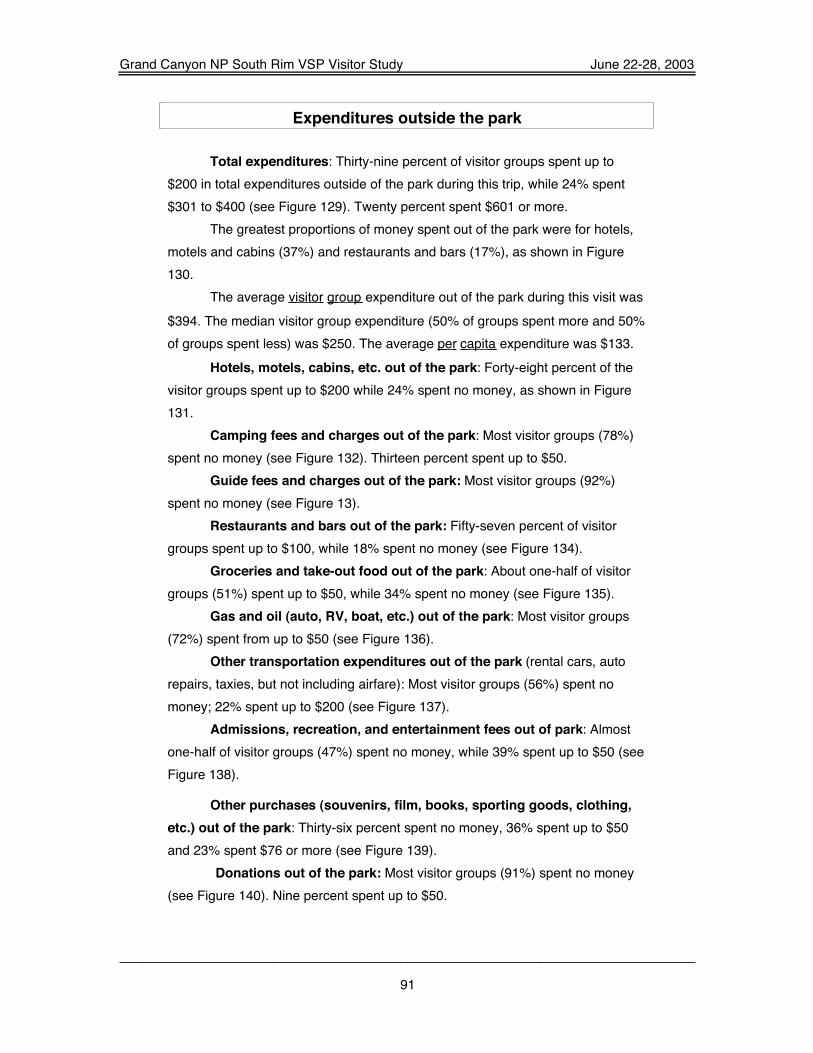
Grand Canyon NP South Rim VSP Visitor Study June 22-28, 2003
91
Expenditures outside the park
Total expenditures: Thirty-nine percent of visitor groups spent up to$200 in total expenditures outside of the park during this trip, while 24% spent$301 to $400 (see Figure 129). Twenty percent spent $601 or more.
The greatest proportions of money spent out of the park were for hotels,motels and cabins (37%) and restaurants and bars (17%), as shown in Figure130.
The average visitor group expenditure out of the park during this visit was$394. The median visitor group expenditure (50% of groups spent more and 50%of groups spent less) was $250. The average per capita expenditure was $133.
Hotels, motels, cabins, etc. out of the park: Forty-eight percent of thevisitor groups spent up to $200 while 24% spent no money, as shown in Figure131.
Camping fees and charges out of the park: Most visitor groups (78%)spent no money (see Figure 132). Thirteen percent spent up to $50.
Guide fees and charges out of the park: Most visitor groups (92%)spent no money (see Figure 13).
Restaurants and bars out of the park: Fifty-seven percent of visitorgroups spent up to $100, while 18% spent no money (see Figure 134).
Groceries and take-out food out of the park: About one-half of visitorgroups (51%) spent up to $50, while 34% spent no money (see Figure 135).
Gas and oil (auto, RV, boat, etc.) out of the park: Most visitor groups(72%) spent from up to $50 (see Figure 136).
Other transportation expenditures out of the park (rental cars, autorepairs, taxies, but not including airfare): Most visitor groups (56%) spent nomoney; 22% spent up to $200 (see Figure 137).
Admissions, recreation, and entertainment fees out of park: Almostone-half of visitor groups (47%) spent no money, while 39% spent up to $50 (seeFigure 138).
Other purchases (souvenirs, film, books, sporting goods, clothing,etc.) out of the park: Thirty-six percent spent no money, 36% spent up to $50and 23% spent $76 or more (see Figure 139).
Donations out of the park: Most visitor groups (91%) spent no money(see Figure 140). Nine percent spent up to $50.

Grand Canyon NP South Rim VSP Visitor Study June 22-28, 2003
92
Figure 129: Total expenditures outside park
Figure 130: Proportions of expenditures by category outside park

Grand Canyon NP South Rim VSP Visitor Study June 22-28, 2003
93
No money spent
$1-100
$101-200
$201-300
$301-400
$401-500
$501 or more
24%
23%
25%
14%
5%
4%
5%
0 20 40 60 80 100 120 140Number of respondents
N=497 visitor groups
Amount spent
Figure 131: Expenditures for hotels, motels, cabins, etc.outside park
No money spent
$1-50
$51-100
$101 or more
78%
13%
4%
5%
0 50 100 150 200 250Number of respondents
N=275 visitor groups
Amount spent
Figure 132: Expenditures camping fees and chargesoutside park

Grand Canyon NP South Rim VSP Visitor Study June 22-28, 2003
94
No money spent
$1-50
$51 or more
92%
3%
5%
0 50 100 150 200 250Number of respondents
N=240 visitor groups
Amountspent
Figure 133: Expenditures for guide fees and chargesoutside park
No money spent
$1-25
$26-50
$51-75
$76-100
$101-125
$126-150
$151 or more
18%
14%
20%
12%
11%
2%
7%
16%
0 20 40 60 80 100Number of respondents
N=491 visitor groups
Amount spent
Figure 134: Expenditures for restaurants and barsoutside park

Grand Canyon NP South Rim VSP Visitor Study June 22-28, 2003
95
No money spent
$1-25
$16-50
$51-75
$76-100
$101 or more
34%
28%
23%
4%
8%
3%
0 20 40 60 80 100 120 140Number of respondents
N=371 visitor groups
Amountspent
Figure 135: Expenditures for groceries and take-outfood outside park
No money spent
$1-25
$26-50
$51-75
$76-100
$101 or more
15%
32%
40%
5%
6%
3%
0 50 100 150 200Number of respondents
N=470 visitor groups;percentages do not equal 100 due to rounding.
Amount spent
Figure 136: Expenditures for gas and oil outside park

Grand Canyon NP South Rim VSP Visitor Study June 22-28, 2003
96
No money spent
$1-100
$101-200
$201-300
$301-400
$401-500
$501 or more
56%
12%
10%
10%
5%
4%
3%
0 50 100 150 200Number of respondents
N=300 visitor groups
Amountspent
Figure 137: Expenditures for other transportationexpenses outside park
No money spent
$1-25
$16-50
$51-75
$76-100
$101 or more
47%
21%
18%
3%
2%
9%
0 40 80 120 160Number of respondents
N=329 visitor groups
Amountspent
Figure 138: Expenditures for admissions, recreation,entertainment outside park
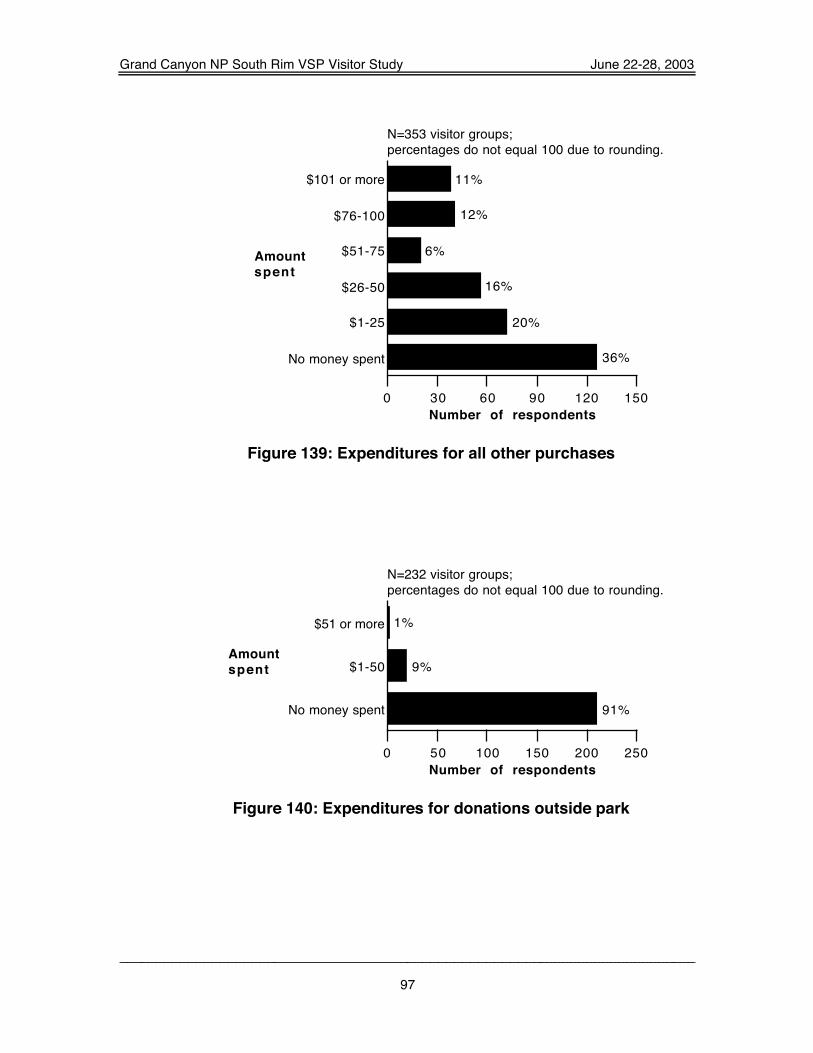
Grand Canyon NP South Rim VSP Visitor Study June 22-28, 2003
97
No money spent
$1-25
$26-50
$51-75
$76-100
$101 or more
36%
20%
16%
6%
12%
11%
0 30 60 90 120 150Number of respondents
N=353 visitor groups;percentages do not equal 100 due to rounding.
Amount spent
Figure 139: Expenditures for all other purchases
No money spent
$1-50
$51 or more
91%
9%
1%
0 50 100 150 200 250Number of respondents
N=232 visitor groups;percentages do not equal 100 due to rounding.
Amount spent
Figure 140: Expenditures for donations outside park

Grand Canyon NP South Rim VSP Visitor Study June 22-28, 2003
98
Expenditures inside the park
Total expenditures in the park: Over one-half of visitor groups (51%)spent up to $100 in total expenditures in the park on this visit (see Figure 141).Another 26% spent $101 to $300.
Guide fees and charges accounted for the largest proportion (27%) oftotal expenditures in the park, followed by restaurants and bars and "all otherpurchases" (each 19%), as shown in Figure 142.
The average visitor group expenditure in the park during this visit was$252. The median visitor group expenditure (50% of groups spent more and 50%of groups spent less) was $80. The average per capita expenditure was $62.
Hotels, motels, cabins, etc. in the park: Most visitor groups (70%)spent no money; 18% spent up to $200 (see Figure 143).
Camping fees and charges in the park: Eighty-three percent of visitorgroups spent no money, while 17% spent up to $100 (see Figure 144).
Guide fees and charges in the park: Most visitor groups (88%) spentno money (see Figure 145).
Restaurants and bars in the park: Fifty-five percent of visitor groupsspent up to $100 and 31% spent no money (see Figure 146).
Groceries and take-out food in the park: Over one-half of visitorgroups (53%) spent no money; 40% spent up to $50 (see Figure 147).
Gas & oil (auto, RV, boat, etc.) in the park: Most visitor groups (76%)spent no money; 19% spent up to $50 (see Figure 148).
Admissions, recreation, and entertainment fees in the park: Mostvisitor groups (58%) spent up to $25, while 21% spent no money (see Figure149).
All other purchases (souvenirs, film, books, sporting goods,clothing, etc) in the park: Over one-half of visitor groups (52%) spent up to $50,while 28% spent $76 or more and 12% spent no money (see Figure 150).
Donations in the park: Most visitor groups (76%) spent no money; 22%spent up to $25 (see Figure 151).

Grand Canyon NP South Rim VSP Visitor Study June 22-28, 2003
99
Figure 141: Total expenditures in the park
Figure 142: Proportions of expenditures by category in thepark

Grand Canyon NP South Rim VSP Visitor Study June 22-28, 2003
100
No money spent
$1-100
$101-200
$201-300
$301 or more
70%
5%
13%
5%
7%
0 50 100 150 200 250Number of respondents
N=328 visitor groups
Amount spent
Figure143: Expenditures for hotels, motels, cabins, etc.in the park
No money spent
$1-50
$51-100
$101 or more
83%
12%
5%
1%
0 50 100 150 200 250Number of respondents
N=284 visitor groups;percentages do not equal 100 due to rounding.
Amount spent
Figure 144: Expenditures for camping fees and chargesin the park

Grand Canyon NP South Rim VSP Visitor Study June 22-28, 2003
101
No money spent
$1-50
$51 or more
88%
7%
4%
0 50 100 150 200 250Number of respondents
N=273 visitor groups;percentages do not equal 100 due to rounding.
Amount spent
Figure 145: Expenditures for guide fees and charges inthe park
No money spent
$1-50
$51-100
$101-150
$151-200
$201 or more
31%
36%
19%
5%
4%
6%
0 40 80 120 160Number of respondents
N=425 visitor groups;percentages do not equal 100 due to rounding.
Amountspent
Figure 146: Expenditures for restaurants and bars in thepark

Grand Canyon NP South Rim VSP Visitor Study June 22-28, 2003
102
No money spent
$1-25
$26-50
$51-75
$76 or more
53%
28%
12%
2%
6%
0 50 100 150 200Number of respondents
N=337 visitor groups;percentages do not equal 100 due to rounding.
Amount spent
Figure 147: Expenditures for groceries and take-outfood in the park
No money spent
$1-25
$26-50
$51 or more
76%
13%
6%
4%
0 50 100 150 200 250Number of respondents
N=280 visitor groups;percentages do not equal 100 due to rounding.
Amount spent
Figure 148: Expenditures for gas and oil in the park

Grand Canyon NP South Rim VSP Visitor Study June 22-28, 2003
103
No money spent
$1-25
$26-50
$51-76
$76 or more
21%
58%
15%
2%
5%
0 50 100 150 200 250 300Number of respondents
N=437 visitor groups;percentages do not equal 100 due to rounding.
Amount spent
Figure 149: Expenditures for admissions, recreation,entertainment fees in the park
No money spent
$1-25
$26-50
$51-75
$76-100
$101 or more
12%
26%
26%
7%
14%
14%
0 20 40 60 80 100 120Number of respondents
N=445 visitor groups;percentages do not equal 100 due to rounding.
Amount spent
Figure 150: Expenditures for all other purchases in thepark

Grand Canyon NP South Rim VSP Visitor Study June 22-28, 2003
104
No money spent
$1-25
$26 or more
76%
22%
2%
0 50 100 150 200Number of respondents
N=260 visitor groups
Amount spent
Figure 151: Expenditures for donations in the park

Grand Canyon NP South Rim VSP Visitor Study June 22-28, 2003
105
Opinions about future shuttle system
Visitor groups were asked, “On a future trip, if the number of vehicles inGrand Canyon NP needs to be limited at some times of the year, would you andyour group be willing to park your vehicle and use a transportation system to visitmajor park attractions?" Sixty-nine percent of visitor groups said they would bewilling to ride a transportation system to visit major park attractions (see Figure152). Fifteen percent of visitor groups said they would be unlikely to ride atransportation system and 16% were "not sure."
Visitor groups were also asked if they would be willing to pay up to$15/person including the park entrance fee to use a transportation system. Thelargest proportion of visitor groups (48%) said they would be unlikely to pay thefee to ride the transportation system (see Figure 153). Thirty-one percent ofvisitor groups would be willing to pay $15/person to ride the transportationsystem and 21% were "not sure."
Not sure
No, unlikely
Yes, likely
16%
15%
69%
0 100 200 300 400 500 600Number of respondents
N=727 visitor groups
Willing to parkand use transport?
Figure 152: Willingness to park visitor vehicles and use atransportation system to visit major park attractions

Grand Canyon NP South Rim VSP Visitor Study June 22-28, 2003
106
Not sure
Yes, likely
No, unlikely
21%
31%
48%
0 50 100 150 200 250 300 350Number of respondents
N=725 visitor groups
Willing to park and pay to ride transport?
Figure 153: Willingness to park visitor vehicles and pay up to$15/person including the park entrance fee to use atransportation system to visit major park attractions

Grand Canyon NP South Rim VSP Visitor Study June 22-28, 2003
107
Overall quality of visitor services
Visitor groups were asked to rate the overall quality of the visitor servicesprovided at Grand Canyon NP during this visit. Most visitor groups (92%) felt thatthe overall quality was “very good” or “good” (see Figure 154). Less than onepercent of visitor groups rated the overall quality as “very poor."
Very poor
Poor
Average
Good
Very good
<1%
2%
6%
38%
54%
0 100 200 300 400Number of respondents
N=725 visitor groups
Rating
Figure 154: Overall quality of visitor services

Grand Canyon NP South Rim VSP Visitor Study June 22-28, 2003
108
What visitor groups liked most
Visitor groups were also asked, “What did you enjoy most about yourvisit to Grand Canyon NP?” Ninety-three percent of visitor groups (686 groups)responded to this question, which are included in the separate appendix of thisreport. Their comments about Grand Canyon NP are summarized below (seeTable 9).
Table 9: What visitor groups liked mostN=1,062 comments;
some visitor groups made more than one comment.Number of
Comment times mentioned
PERSONNELFriendly, helpful personnel, rangers 17Bus driver 5Other comments 2
INTERPRETIVE SERVICESHistory 8Ranger talk 6Availability of information 3Learning geology 3Ranger-led hikes 2Trailside exhibits 2Other comments 6
MAINTENANCE & FACILITIESShuttle buses 24Accessibility to views 23Trails 19Clean 12Well maintained 6Campground 3Well marked routes/signs 3Good facilities 2Handicapped access 2Historical architecture/buildings 2Well laid-out park 2Other comments 3

Grand Canyon NP South Rim VSP Visitor Study June 22-28, 2003
109
Table 9: What visitor groups liked most (continued)
Number ofComment times mentioned
RESOURCE MANAGEMENTCondors 11Nature 9Wildlife 7Park is preserved 5Tusayan ruins 3Not overly commercialized 2Grandview Point 2Lipan Point 2Colorado River 2Other comments 5
POLICIES/MANAGEMENTComments 2
CONCESSIONSEl Tovar Lodge 4El Tovar restaurant 3In-park lodging 3Lodge 3Excellent dining service 2Excellent food 2Mule ride 2Other comments 6
GENERALViews 252Beauty/scenery 181The canyon/seeing the canyon 93Walking/hiking 45Hiking Rim Trail 30Awesome/amazing 25Everything 17Helicopter flight 16Weather 15Time with family 11Sunset 10The experience 10Photography 9The size and depth 9Impact on children 7Hiking below rim 7Bus tour 7Landscape 6Serenity/peacefulness 6Freedom to visit at own pace 5Solitude 5Sunrise 5

Grand Canyon NP South Rim VSP Visitor Study June 22-28, 2003
110
Table 9: What visitor groups liked most (continued)
Number ofComment times mentioned
GENERAL (continued)Camping 4Different people encountered 4Seeing it for first time 4Walking to bottom of canyon 4Watchtower 4Colors 3Planning next trip 3Rafting 3Shopping 3Enjoyed visit 2Fun/recreation 2Impact on parents 2Less crowded areas 2North Rim 2Silence 2Stars 2Wonder of the world 2Other comments 13

Grand Canyon NP South Rim VSP Visitor Study June 22-28, 2003
111
What visitor groups liked least
Visitor groups were also asked, “What did you enjoy least about your visitto Grand Canyon NP?” Seventy-eight percent of visitor groups (573 groups)responded to this question, which are included in the separate appendix of thisreport. Their comments about Grand Canyon NP are summarized below (seeTable 10).
Table 10: What visitor groups liked leastN=659 comments;
some visitor groups made more than one comment.Number of
Comment times mentioned
PERSONNELRanger rude 2Comments 6
INTERPRETIVE SERVICESLack of information provided 7Maps 4Lack of information prior to visit 4Object to evolution theory 2Other comments 8
MAINTENANCE/FACILITIESParking 81Poor road directional signs 20Road construction 20Lack of railings on canyon edge 11Shuttle buses too infrequent 8Hassles of riding shuttle buses 8Lack of restrooms 8Restrooms needed maintained/serviced 7Restrooms 5Lack of picnic sites 4Lack of camping available 4Long walk from parking to visitor center 4Trash on trails 4Entrance station line 4Campground layout 3Disabled have limited access to viewpoints 3Shuttle route confusing 3Trails need more directional signs 3Lack of water fountains 2Lack of picnic sites with fire pits 2Shuttle bus too crowded 2Other comments 27

Grand Canyon NP South Rim VSP Visitor Study June 22-28, 2003
112
Table 10: What visitor groups liked least (continued)Number of
Comment times mentionedRESOURCE MANAGEMENTCrowds 71Traffic/too many vehicles 19Smokey/hazy views 6Lack of wildlife 2Other comments 2
POLICIES/MANAGEMENTCanyon commercialization 4Lack of dog-friendly trails 3Speed limits 3Entrance fee expensive 2No vehicle access to West Rim 2Other comments 5
CONCESSIONSExpensive 13Not enough restaurants 13Hotel 8Having to book a year in advance 6Cost of lodging in park 6Restaurants 5Food 5Lack of available lodging in park 5Unable to take mule ride 5Souvenirs expensive 4Lack of amenities in lodge rooms (coffee pot, etc.) 3Lack of cold water for sale 2Mule droppings on trail 2Other comments 10
GENERALLack of time/could not stay longer 36Nothing 35Difficulty finding way 28Heat 25Long drive to get to park 12Rude visitors 9Leaving 6Dust/winds 4Unable to hike 4Cold 3Noisy people 3Tusayan 3Tusayan expensive 2Too many buses 2Unattended children near canyon edge 2Walking back up out of canyon 2Too remote/far from civilization 2People who do not respect park 2Helicopter rides expensive 2Other comments 13

Grand Canyon NP South Rim VSP Visitor Study June 22-28, 2003
113
Planning for the future
Visitor groups were asked, “If you were a manager planning for the futureof Grand Canyon National Park, what would you propose?” Sixty-two percent ofvisitor groups (455 groups) responded to this question. A summary of theirresponses is listed below in Table 11 and complete copies of visitor responsesare contained in the appendix.
Table 11: Planning for the futureN=757 comments;
some visitor groups made more than one comment.Number of
Comment times mentioned
PERSONNELNeed to be warmer/friendlier 2Other comments 3
INTERPRETIVE SERVICESNeed clear, detailed information about what to see and do 10Need more ranger programs 10Need guided tours 9Need interpretive signs (canyon history) at viewpoints 8Need better maps 7Need roving rangers 5Provide more information at entrances 4Advertise services 3Educate about specific topics 3Need more information centers 3Encourage visitors to plan ahead 2Improve/update website 2Need information on hiking 2Other comments 5
FACILITIES/MAINTENANCEMore parking 45More restrooms 16Better directional signs 13Cable car to bottom of canyon 11More drinking fountains 9Add trails 9Provide a way to get people below rim instead of hiking 7Improve access to viewpoints 6Improve roads 6More trash cans 5More campgrounds 5Open more viewpoints 5Upgrade restrooms 5Clearer signs on trails 4Improve campground management 4Repair railings 3Add benches along Rim Walk 3
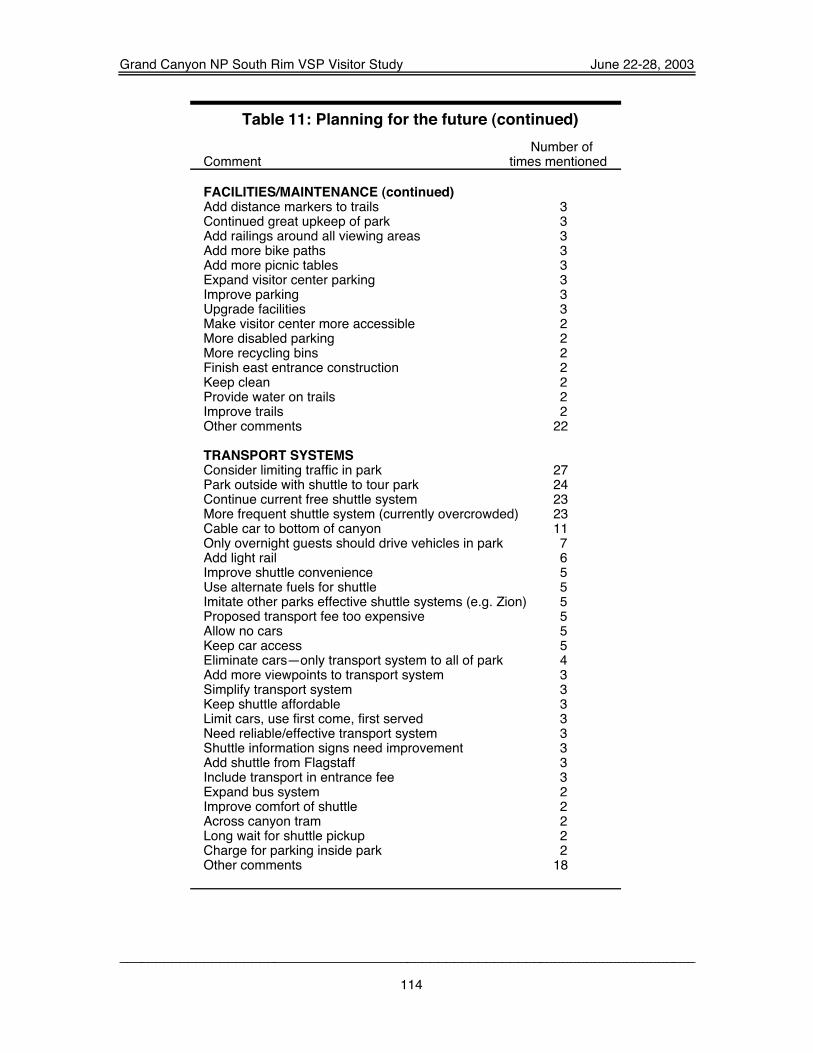
Grand Canyon NP South Rim VSP Visitor Study June 22-28, 2003
114
Table 11: Planning for the future (continued)Number of
Comment times mentioned
FACILITIES/MAINTENANCE (continued)Add distance markers to trails 3Continued great upkeep of park 3Add railings around all viewing areas 3Add more bike paths 3Add more picnic tables 3Expand visitor center parking 3Improve parking 3Upgrade facilities 3Make visitor center more accessible 2More disabled parking 2More recycling bins 2Finish east entrance construction 2Keep clean 2Provide water on trails 2Improve trails 2Other comments 22
TRANSPORT SYSTEMSConsider limiting traffic in park 27Park outside with shuttle to tour park 24Continue current free shuttle system 23More frequent shuttle system (currently overcrowded) 23Cable car to bottom of canyon 11Only overnight guests should drive vehicles in park 7Add light rail 6Improve shuttle convenience 5Use alternate fuels for shuttle 5Imitate other parks effective shuttle systems (e.g. Zion) 5Proposed transport fee too expensive 5Allow no cars 5Keep car access 5Eliminate cars—only transport system to all of park 4Add more viewpoints to transport system 3Simplify transport system 3Keep shuttle affordable 3Limit cars, use first come, first served 3Need reliable/effective transport system 3Shuttle information signs need improvement 3Add shuttle from Flagstaff 3Include transport in entrance fee 3Expand bus system 2Improve comfort of shuttle 2Across canyon tram 2Long wait for shuttle pickup 2Charge for parking inside park 2Other comments 18

Grand Canyon NP South Rim VSP Visitor Study June 22-28, 2003
115
Table 11: Planning for the future (continued)Number of
Comment times mentioned
POLICIES/MANAGEMENTKeep entrance fees low/affordable 13Spread out visitor use 6Allow reservations for entering park 5Ban smoking 4Raise admission fee 4Allow no aircraft 3Offer different entry fees for different lengths of stay 3Do not allow pets 2Open canyon to aircraft 2Park vehicles away from rim 2Require cleanup after pets 2Stop people from littering/throwing coins 2Keep low transport cost 2Obtain more funding 2Charge lower entrance fee for shuttle riders 2Charge higher entrance fee for upgrading facilities 2Other comments 28
CONCESSIONSMore restaurants/refreshment areas 19Better food 10Add lodging in park 7Add vending machines 4Keep food prices realistic 4Update lodges 3Increase number of mule rides 2Quality/prices good at market 2Park lodging too expensive 2Rent telescope/binoculars 2Other comments 25
RESOURCE MANAGEMENTKeep park as it is 25Preserve for the future 18Limit number of people 11Keep it natural 9Limit number of buildings/development 7Preserve flora/fauna 5Too commercial 3No more development 2Limit pollution of all kinds 2Other comments 4
GENERALComments 6

Grand Canyon NP South Rim VSP Visitor Study June 22-28, 2003
116
Additional comments
Forty-seven percent of visitor groups (346 groups) wrote additionalcomments, which are included in the separate appendix of this report. Theircomments about Grand Canyon NP are summarized below (see Table 12).Some comments offer specific suggestions on how to improve the park; othersdescribe what visitor groups enjoyed or did not enjoy about their visit.
Table 12: Additional commentsN=587 comments;
some visitor groups made more than one comment.Number of
Comment times mentionedPERSONNELFriendly, helpful/knowledgeable staff/rangers 26Shuttle drivers angry/not helpful/unfriendly 6Staff unfriendly/not helpful 5Shuttle drivers knowledgeable 4
INTERPRETIVE SERVICESNeeded visitor information 12Educational 6Enjoyed NPS tour/ranger talk/program 5Advertise/promote the park 3Enjoyed astronomy group 3Visitor center needs improvement 3Liked visitor centers 2Improve website 2Map needs improved 2Other comments 12
FACILITIES/MAINTENANCEClean 9Improve road signs 7Add restrooms 4Well maintained facilities 3Enjoyed free shuttle 2Need more water fountains at viewpoints 2Shuttle available/convenient 2Expand shuttle service 2Improve roads 2Parking too far from viewpoints 2Trailhead signs confusing 2Other comments 29
MANAGEMENT/POLICIESWell managed/good job 17Expensive 5Entrance fee expensive 2Limit commercialism 2Don't raise prices—double taxation 2Appreciate pass 2Other comments 15

Grand Canyon NP South Rim VSP Visitor Study June 22-28, 2003
117
Table 12: Additional comments (continued)Number of
Comment times mentioned
RESOURCE MANAGEMENTPreserve it 13Crowded/manage crowds 5Enjoyed seeing animals 3Not crowded 2Other comments 7
CONCESSIONSNeed more food/healthier options 4Restaurant very good 3Services expensive 3Food expensive 3Motel room clean 2Disappointed in concession facilities 2Other comments 13
GENERALEnjoyed visit 96Hope to visit again 35Incredible/wonderful 28Beautiful 25Visit too short 16Thank you 12Amazing/awesome 11Enjoyed views 9Repeat visit 8Will recommend to others 5First time visit 5One of best places I've ever been 4First time for children/grandchildren 3Little to do 2Life goal to visit 2Enjoyed hiking 2Dislike long wait to participate in recreation 2A treasure 2Grand Canyon not as accepting of visitors as Yellowstone 2Will never forget trip 2Hope to hike down 2Other comments 52

Grand Canyon NP South Rim VSP Visitor Study June 22-28, 2003
118

Grand Canyon NP South Rim VSP Visitor Study June 22-28, 2003
119
Grand Canyon National Park—South Rim Visitor StudyAdditional Analysis
VSP Report 144The Visitor Services Project (VSP) offers the opportunity to learn more from VSP visitor study data.
Additional analysis can be done using the park's VSP visitor study data that was collected andentered into the computer. Two-way and three-way cross tabulations can be made of any of thecharacteristics listed below. Be as specific as possible-you may select a singleprogram/service/facility instead of all that were listed in the questionnaire. Include your name,address and phone number in the request.
• Sources of information priorto this visit
• Level of understandingimprovement about topic
• Total expenditures out of park
• Sources of information priorto future visits
• Places visited • Number of adults covered byexpenses
• Receive needed information? • Order of places visited • Number of children covered byexpenses
• Awareness of 3 governmentagencies managing landaround GRCA?
• Hike or backpack on this visit? • Lodging expenditures out ofpark
• When was decision to visitmade?
• Trails used • Camping expenditures out ofpark
• Primary reason for visiting • Information services/facilitiesused
• Guide fee expenditures out ofpark
• How Grand Canyon NP fitinto travel plans?
• Importance of informationservices/facilities
• Restaurant/bar expendituresout of park
• Forms of transportation used • Quality of informationservices/ facilities
• Groceries/take out foodexpenditures out of park
• Entrance used • Visitor services/facilitiesused
• Gas/oil expenditures out ofpark
• Number of park entries • Importance of visitorservices/facilities
• Other transport expendituresout of park
• Activities on this visit • Quality of visitor services/facilities
• Admissions/recreationexpenditures out of park
• Three most importantactivities
• Concessionservices/facilities used
• All other expenditures out ofpark
• Ride free shuttle bus? • Importance of concessionservices/facilities
• Donation expenditures out ofpark
• Length of stay in park • Quality of concessionservices/ facilities
• Lodging expenditures in park
• Length of stay in area • Group type • Camping expenditures in park
• Stay overnight away fromhome?
* Guided tour group? • Guide fees expenditures inpark
* Number of nights in park • Educational group? • Restaurant/bar expenditures inpark
• Number of nights in Tusayan • Group size • Groceries/take out foodexpenditures in park
• Number of nights outsidepark--Flagstaff, etc.
• Number of vehicles • Gas/oil expenditures in park
• Type of accommodations inpark
• Age • Admissions/recreationexpenditures in park

Grand Canyon NP South Rim VSP Visitor Study June 22-28, 2003
120
• Type of accommodations inTusayan
• Zip code • All other expenditures in park
• Type of accommodationsoutside park—Flagstaff, etc.
• Country of residence • Donation expenditures in park
• Easily able to find way aroundpark
• Primary language • Willingness to ridetransportation on future visit
• Sources used to find way • Disabilities/impairments? • Willingness to pay to ridetransportation on future visit
• Learn interpretive topicsduring visit?
• Encounter access problems? • Overall quality of services
• Interpretive topics learned • Total expenditures in & outof park
Phone/send requests to:
Visitor Services Project, PSU Phone: 208-885-7863College of Natural Resources FAX: 208-885-4261P.O. Box 441139 Email: [email protected] of IdahoMoscow, Idaho 83844-1139

Grand Canyon NP South Rim VSP Visitor Study June 22-28, 2003
121
QUESTIONNAIRE

Grand Canyon NP South Rim VSP Visitor Study June 22-28, 2003
122

Grand Canyon NP South Rim VSP Visitor Study June 22-28, 2003
123
Visitor Services Project PublicationsReports 1-6 (pilot studies) are available from the University of Idaho Park Studies Unit. All otherVSP reports listed are available from the parks where the studies were conducted or from the UICPSU. All studies were conducted in summer unless otherwise noted.
19821. Mapping interpretive services: A pilot study
at Grand Teton National Park.
19832. Mapping interpretive services: Identifying
barriers to adoption and diffusion of themethod.
3. Mapping interpretive services: A follow-upstudy at Yellowstone National Park andMt Rushmore National Memorial.
4. Mapping visitor populations: A pilot study atYellowstone National Park.
19855. North Cascades National Park Service
Complex6. Crater Lake National Park
19867. Gettysburg National Military Park8. Independence National Historical Park9. Valley Forge National Historical Park
198710. Colonial National Historical Park (summer
& fall)11. Grand Teton National Park12. Harpers Ferry National Historical Park13. Mesa Verde National Park14. Shenandoah National Park15. Yellowstone National Park16. Independence National Historical Park:
Four Seasons Study
198817. Glen Canyon National Recreational Area18. Denali National Park and Preserve19. Bryce Canyon National Park20. Craters of the Moon National Monument
198921. Everglades National Park (winter)22. Statue of Liberty National Monument23. The White House Tours, President's Park
(summer)24. Lincoln Home National Historical Site25. Yellowstone National Park26. Delaware Water Gap National Recreation
Area27. Muir Woods National Monument
199028. Canyonlands National Park (spring)29. White Sands National Monument30. National Monuments, Washington, D.C.31. Kenai Fjords National Park32. Gateway National Recreation Area33. Petersburg National Battlefield34. Death Valley National Monument35. Glacier National Park36. Scott's Bluff National Monument37. John Day Fossil Beds National Monument
199138. Jean Lafitte National Historical Park (spring)39. Joshua Tree National Monument (spring)40. The White House Tours, President's Park
(spring)41. Natchez Trace Parkway (spring)42. Stehekin-North Cascades NP/Lake Chelan
National Recreation Area43. City of Rocks National Reserve44. The White House Tours, President's Park (fall)
199245. Big Bend National Park (spring)46. Frederick Douglass National Historic Site
(spring)47. Glen Echo Park (spring)48. Bent's Old Fort National Historic Site49. Jefferson National Expansion Memorial50. Zion National Park51. New River Gorge National River52. Klondike Gold Rush National Historical Park
(AK)53. Arlington House-The Robert E. Lee Memorial
199354. Belle Haven Park/Dyke Marsh Wildlife
Preserve (spring)55. Santa Monica Mountains National Recreation
Area (spring)56. Whitman Mission National Historic Site57. Sitka National Historical Park58. Indiana Dunes National Lakeshore (summer)59. Redwood National Park60. Channel Islands National Park61. Pecos National Historical Park62. Canyon de Chelly National Monument63. Bryce Canyon National Park (fall)

Grand Canyon NP VSP Visitor Study July 12-18, 2002
124
Visitor Services Project Publications (continued)
199464. Death Valley National Monument
Backcountry (winter)65. San Antonio Missions National Historical
Park (spring)66. Anchorage Alaska Public Lands Information
Center67. Wolf Trap Farm Park for the Performing Arts68. Nez Perce National Historical Park69. Edison National Historic Site70. San Juan Island National Historical Park71. Canaveral National Seashore72. Indiana Dunes National Lakeshore (fall)73. Gettysburg National Military Park (fall)
199574. Grand Teton National Park (winter)75. Yellowstone National Park (winter)76. Bandelier National Monument77. Wrangell-St. Elias National Park & Preserve78. Adams National Historic Site79. Devils Tower National Monument80. Manassas National Battlefield Park81. Booker T. Washington National Monument82. San Francisco Maritime National Historical
Park83. Dry Tortugas National Park
199684. Everglades National Park (spring)85. Chiricahua National Monument (spring)86. Fort Bowie National Historic Site (spring)87. Great Falls Park, Virginia (spring)88. Great Smoky Mountains National Park89. Chamizal National Memorial90. Death Valley National Park (fall)91. Prince William Forest Park (fall)
199792. Great Smoky Mountains National Park
(summer & fall)93. Virgin Islands National Park (winter)94. Mojave National Preserve (spring)95. Martin Luther King, Jr., National Historic
Site (spring)96. Lincoln Boyhood Home National Memorial97. Grand Teton National Park98. Bryce Canyon National Park99. Voyageurs National Park
100. Lowell National Historical Park
1998101. Jean Lafitte National Historical Park &
Preserve (spring)
102. Chattahoochee River NationalRecreation Area (spring)
1998 (continued)103. Cumberland Island National Seashore
(spring)104. Iwo Jima/Netherlands Carillon Memorials105. National Monuments & Memorials,
Washington, D.C.106. Klondike Gold Rush National Historical
Park (AK)107. Whiskeytown National Recreation Area108. Acadia National Park
1999109. Big Cypress National Preserve (winter)110. San Juan National Historic Site (Puerto
Rico)111. Saint Croix National Scenic Riverway112. Rock Creek Park113. New Bedford Whaling National Historical
Park114. Glacier Bay National Park & Preserve115. Kenai Fjords National Park & Preserve116. Lassen Volcanic National Park117. Cumberland Gap National Historic Park (fall)
2000118. Haleakala National Park (spring)119. White House Tour and White House Visitor
Center (spring)120. USS Arizona Memorial121. Olympic National Park122. Eisenhower National Historic Site123. Badlands National Park124. Mount Rainier National Park
2001125. Biscayne National Park (spring)126. Colonial National Historical Park (Jamestown)127. Shenandoah National Park128. Pictured Rocks National Lakeshore129. Crater Lake National Park130. Valley Forge National Historical Park
2002131. Everglades National Park (spring)132. Dry Tortugas National Park133. Pinnacles National Monument134. Great Sand Dunes National Monument and
Preserve135. Pipestone National Monument136. Outer Banks Group (Cape Hatteras National
Seashore, Wright Brothers NationalMonument)
137. Sequoia & Kings Canyon National Park

Grand Canyon NP South Rim VSP Visitor Study June 22-28, 2003
125
Visitor Services Project Publications (continued)
2002 (continued)138. Catoctin Mountain Park139. Hopewell Furnace National Historic Site140. Stones River National Battlefield
2003141. Gateway National Recreation Area (spring)142. Cowpens National Battlefield (spring)143. Grand Canyon National Park—North Rim144. Grand Canyon National Park—South Rim
For more information about the Visitor Services Project, please contact the University of IdahoPark Studies Unit; phone (208) 885-7863 or go to website: http://www.psu.uidaho.edu


Grand Canyon NP South Rim VSP Visitor Study June 22-28, 2003

Grand Canyon NP South Rim VSP Visitor Study June 22-28, 2003
NPS D-728 May 2004
Printed on recycled paper