Negative Associations between Corpus Callosum Midsagittal Area and IQ in a Representative Sample of...
12
Negative Associations between Corpus Callosum Midsagittal Area and IQ in a Representative Sample of Healthy Children and Adolescents Hooman Ganjavi 1 , John D. Lewis 2 , Pierre Bellec 2 , Penny A. MacDonald 3 , Deborah P. Waber 4 , Alan C. Evans 2,3 , Sherif Karama 1,2,3,5 *, The Brain Development Cooperative Group " 1 Department of Psychiatry, McGill University, Montreal, Quebec, Canada, 2 McConnell Brain Imaging Centre, Montreal Neurological Institute, McGill University, Montreal, Quebec, Canada, 3 Department of Neurology and Neurosurgery, McGill University, Montreal, Quebec, Canada, 4 Department of Psychiatry, Harvard Medical School, Children’s Hospital, Boston, Massachusetts, United States of America, 5 Department of Psychiatry, Douglas Mental Health University Institute, McGill University, Montreal, Quebec, Canada Abstract Documented associations between corpus callosum size and cognitive ability have heretofore been inconsistent potentially owing to differences in sample characteristics, differing methodologies in measuring CC size, or the use of absolute versus relative measures. We investigated the relationship between CC size and intelligence quotient (IQ) in the NIH MRI Study of Normal Brain Development sample, a large cohort of healthy children and adolescents (aged six to 18, n = 198) recruited to be representative of the US population. CC midsagittal area was measured using an automated system that partitioned the CC into 25 subregions. IQ was measured using the Wechsler Abbreviated Scale of Intelligence (WASI). After correcting for total brain volume and age, a significant negative correlation was found between total CC midsagittal area and IQ (r = 20.147; p = 0.040). Post hoc analyses revealed a significant negative correlation in children (age,12) (r = 20.279; p = 0.004) but not in adolescents (age$12) (r = 20.005; p = 0.962). Partitioning the subjects by gender revealed a negative correlation in males (r = 20.231; p = 0.034) but not in females (r = 0.083; p = 0.389). Results suggest that the association between CC and intelligence is mostly driven by male children. In children, a significant gender difference was observed for FSIQ and PIQ, and in males, a significant age-group difference was observed for FSIQ and PIQ. These findings suggest that the correlation between CC midsagittal area and IQ may be related to age and gender. Citation: Ganjavi H, Lewis JD, Bellec P, MacDonald PA, Waber DP, et al. (2011) Negative Associations between Corpus Callosum Midsagittal Area and IQ in a Representative Sample of Healthy Children and Adolescents. PLoS ONE 6(5): e19698. doi:10.1371/journal.pone.0019698 Editor: Kenji Hashimoto, Chiba University Center for Forensic Mental Health, Japan Received December 20, 2010; Accepted April 4, 2011; Published May 19, 2011 Copyright: ß 2011 Ganjavi et al. This is an open-access article distributed under the terms of the Creative Commons Attribution License, which permits unrestricted use, distribution, and reproduction in any medium, provided the original author and source are credited. Funding: These authors have no support or funding to report. However, data used in the preparation of this article were obtained from the Pediatric MRI Data Repository created by the NIH MRI Study of Normal Brain Development which is funded by the National Institute of Child Health and Human Development, the National Institute on Drug Abuse, the National Institute of Mental Health, and the National Institute of Neurological Disorders and Stroke (Contract #s N01-HD02- 3343, N01-MH9-0002, and N01-NS-9-2314, -2315, -2316, -2317, -2319 and -2320). With the exception of funding the establishment of the image database, the funders had no role in the study design, data collection and analysis, decision to publish, or preparation of the manuscript. A list of participating sites and study investigators can be found at http://www.bic.mni.mcgill.ca/nihpd/info/participating_centers.html. Competing Interests: The authors have declared that no competing interests exist. * E-mail: [email protected] " Membership of The Brain Development Cooperative Group is provided in the Acknowledgments. Introduction The corpus callosum (CC) is the largest fiber tract in the human brain and is responsible for much of the communication between the two hemispheres. It is a topographically organized structure which connects homologous areas in the two cerebral hemispheres [1]. It has been found to be important in the transfer of visual, motoric, somatosensory, and auditory information [2]. Compared to other mammals, the human brain is highly lateralized. This allows for a greater degree of specialization of the hemispheres, and potentially to the intellectual capacity of humans. According to Banich and Brown [3], it is more efficient for information to be processed by a single hemisphere, provided the task is simple enough. For more complex tasks, use of both hemispheres provides parallel processing power, and may be preferable. Thus, reliance on the CC for interhemispheric communication is a function of the task and possibly the capacity of the individual hemisphere to compute the information. Not surprisingly, it has been postulated that the size and/or morphology of the CC could be related to individual cognitive ability. Both the theories and the associated data are inconsistent, however. Consistent with the theory that a larger CC confers greater processing power, Luders et al. [4] found IQ to be positively correlated with the thickness of the posterior CC in healthy adults. In contrast, in a study of 138 individuals aged six to 88, Peterson et al. [5] found the anterior portion of the CC to be negatively associated with cognitive ability, although overall CC area was not. Allin et al. [6] found a negative correlation between the area of the posterior CC and IQ in a sample of healthy teens, a finding later replicated by Hutchinson et al. [7]. These findings were interpreted to mean that a smaller CC represents a more ‘‘high performance’’ brain that relies less on interhemispheric communication [6,7]. Still other studies finding no relationship between CC size and IQ in typically developing individuals [5,8,9,10]. In order to clarify the relationship between CC size and IQ in typically developing individuals, we investigated this relationship PLoS ONE | www.plosone.org 1 May 2011 | Volume 6 | Issue 5 | e19698
-
Upload
independent -
Category
Documents
-
view
1 -
download
0
Transcript of Negative Associations between Corpus Callosum Midsagittal Area and IQ in a Representative Sample of...
Negative Associations between Corpus CallosumMidsagittal Area and IQ in a Representative Sample ofHealthy Children and AdolescentsHooman Ganjavi1, John D. Lewis2, Pierre Bellec2, Penny A. MacDonald3, Deborah P. Waber4, Alan C.
Evans2,3, Sherif Karama1,2,3,5*, The Brain Development Cooperative Group"
1 Department of Psychiatry, McGill University, Montreal, Quebec, Canada, 2 McConnell Brain Imaging Centre, Montreal Neurological Institute, McGill University, Montreal,
Quebec, Canada, 3 Department of Neurology and Neurosurgery, McGill University, Montreal, Quebec, Canada, 4 Department of Psychiatry, Harvard Medical School,
Children’s Hospital, Boston, Massachusetts, United States of America, 5 Department of Psychiatry, Douglas Mental Health University Institute, McGill University, Montreal,
Quebec, Canada
Abstract
Documented associations between corpus callosum size and cognitive ability have heretofore been inconsistent potentially owingto differences in sample characteristics, differing methodologies in measuring CC size, or the use of absolute versus relativemeasures. We investigated the relationship between CC size and intelligence quotient (IQ) in the NIH MRI Study of Normal BrainDevelopment sample, a large cohort of healthy children and adolescents (aged six to 18, n = 198) recruited to be representative ofthe US population. CC midsagittal area was measured using an automated system that partitioned the CC into 25 subregions. IQwas measured using the Wechsler Abbreviated Scale of Intelligence (WASI). After correcting for total brain volume and age, asignificant negative correlation was found between total CC midsagittal area and IQ (r = 20.147; p = 0.040). Post hoc analysesrevealed a significant negative correlation in children (age,12) (r = 20.279; p = 0.004) but not in adolescents (age$12) (r = 20.005;p = 0.962). Partitioning the subjects by gender revealed a negative correlation in males (r = 20.231; p = 0.034) but not in females(r = 0.083; p = 0.389). Results suggest that the association between CC and intelligence is mostly driven by male children. In children,a significant gender difference was observed for FSIQ and PIQ, and in males, a significant age-group difference was observed forFSIQ and PIQ. These findings suggest that the correlation between CC midsagittal area and IQ may be related to age and gender.
Citation: Ganjavi H, Lewis JD, Bellec P, MacDonald PA, Waber DP, et al. (2011) Negative Associations between Corpus Callosum Midsagittal Area and IQ in aRepresentative Sample of Healthy Children and Adolescents. PLoS ONE 6(5): e19698. doi:10.1371/journal.pone.0019698
Editor: Kenji Hashimoto, Chiba University Center for Forensic Mental Health, Japan
Received December 20, 2010; Accepted April 4, 2011; Published May 19, 2011
Copyright: � 2011 Ganjavi et al. This is an open-access article distributed under the terms of the Creative Commons Attribution License, which permitsunrestricted use, distribution, and reproduction in any medium, provided the original author and source are credited.
Funding: These authors have no support or funding to report. However, data used in the preparation of this article were obtained from the Pediatric MRI DataRepository created by the NIH MRI Study of Normal Brain Development which is funded by the National Institute of Child Health and Human Development, theNational Institute on Drug Abuse, the National Institute of Mental Health, and the National Institute of Neurological Disorders and Stroke (Contract #s N01-HD02-3343, N01-MH9-0002, and N01-NS-9-2314, -2315, -2316, -2317, -2319 and -2320). With the exception of funding the establishment of the image database, thefunders had no role in the study design, data collection and analysis, decision to publish, or preparation of the manuscript. A list of participating sites and studyinvestigators can be found at http://www.bic.mni.mcgill.ca/nihpd/info/participating_centers.html.
Competing Interests: The authors have declared that no competing interests exist.
* E-mail: [email protected]
" Membership of The Brain Development Cooperative Group is provided in the Acknowledgments.
Introduction
The corpus callosum (CC) is the largest fiber tract in the human
brain and is responsible for much of the communication between
the two hemispheres. It is a topographically organized structure
which connects homologous areas in the two cerebral hemispheres
[1]. It has been found to be important in the transfer of visual,
motoric, somatosensory, and auditory information [2].
Compared to other mammals, the human brain is highly
lateralized. This allows for a greater degree of specialization of
the hemispheres, and potentially to the intellectual capacity of
humans. According to Banich and Brown [3], it is more efficient for
information to be processed by a single hemisphere, provided the
task is simple enough. For more complex tasks, use of both
hemispheres provides parallel processing power, and may be
preferable. Thus, reliance on the CC for interhemispheric
communication is a function of the task and possibly the capacity
of the individual hemisphere to compute the information. Not
surprisingly, it has been postulated that the size and/or morphology
of the CC could be related to individual cognitive ability. Both the
theories and the associated data are inconsistent, however.
Consistent with the theory that a larger CC confers greater
processing power, Luders et al. [4] found IQ to be positively
correlated with the thickness of the posterior CC in healthy adults.
In contrast, in a study of 138 individuals aged six to 88, Peterson et
al. [5] found the anterior portion of the CC to be negatively
associated with cognitive ability, although overall CC area was not.
Allin et al. [6] found a negative correlation between the area of the
posterior CC and IQ in a sample of healthy teens, a finding later
replicated by Hutchinson et al. [7]. These findings were interpreted
to mean that a smaller CC represents a more ‘‘high performance’’
brain that relies less on interhemispheric communication [6,7]. Still
other studies finding no relationship between CC size and IQ in
typically developing individuals [5,8,9,10].
In order to clarify the relationship between CC size and IQ in
typically developing individuals, we investigated this relationship
PLoS ONE | www.plosone.org 1 May 2011 | Volume 6 | Issue 5 | e19698
in a relatively large representative sample of healthy children and
adolescents compiled by the NIH MRI Study of Normal Brain
Development described by Evans et al. [11]. The NIH Study used
a mixed cross-sectional and longitudinal design to create a
database with MRI, clinical, and behavioral data from children
aged 4.6 to 18.3 years. In order to improve generalizability, a
population-based epidemiologic sampling strategy was used to
obtain a sample reflecting the population of the 2000 United
States Census. Data were collected at three time points (Visits 1, 2,
and 3, spaced two years apart). Only the cross-sectional data from
Visit 1 (release 4.0) were used for analysis in this study.
Methods
Ethics statementWritten informed consent was obtained from all participants or
their parents when appropriate. The institutional review board of
McGill University (Data Coordinating Center) approved this
study. Institutional review board approval was also obtained from
the six Pediatric Study Centers: Children’s Hospital, Boston;
Children’s Hospital Medical Center of Cincinnati; University of
Texas Health Science Center at Houston/University of Houston -
Texas Medical Center Annex; Washington University, St. Louis;
Children’s Hospital of Philadelphia; University of California, Los
Angeles.
Sampling and recruitmentA representative sample of 431 healthy subjects was recruited
into the study at the following study centers: Children’s Hospital
Boston, Cincinnati Children’s Hospital Medical Center, Univer-
sity of Texas Houston Medical School, UCLA Neuropsychiatric
Institute and Hospital, Children’s Hospital of Philadelphia, and
Washington University. At each site, recruitment was targeted to
be in line with the US Census data and monitored regularly to
ensure a representative sample according to age, gender, ethnicity,
and socioeconomic status. As this was a study of normal brain
development, exclusion criteria included history of an Axis I
psychiatric disorder (with some exceptions), abnormal neurological
examination, medical illness with CNS implications, history of
head trauma with loss of consciousness .30 minutes or abnormal
imaging, history of systemic malignancy requiring chemotherapy
or CNS radiotherapy, an IQ,70, known intrauterine exposure to
substances thought to alter brain structure and/or function,
complicated labor and/or delivery, and family history of inherited
neurological disorders or medical disorders with known CNS
implications. Further details about exclusion criteria can be found
in Evans, et al. [11] and Waber et al. [12]. Data from all sites were
transferred electronically to the Data Coordinating Center at the
Montreal Neurological Institute.
Mean age of puberty is estimated to range from 12.2 to 12.8
years for females in the US, with breast development and
menarche occurring somewhat earlier [13]. For males, pubertal
onset occurs with testicular enlargement which occurs at a mean
age of 12 [14]. In light of this, we defined children as being below
age 12 and adolescents age 12 and above.
IQ measurementCognitive ability was measured using the full four-subtest
version of the Wechsler Abbreviated Scale of Intelligence (WASI)
[15]. This version of the WASI provides for estimation of Verbal
IQ (VIQ), Performance IQ (PIQ), and Full-Scale IQ (FSIQ). VIQ
score is composed of the Vocabulary and Similarities subtests; PIQ
is composed of the Matrix Reasoning and Block Design subtests.
All testing was performed on the day of or within a few days of
image acquisition. Children below age six were not included in the
analysis because they did not have WASI scores (WASI norms
start at 6).
MRI acquisition and CC measurementMRI images were acquired as per the NIH MRI Study of
Normal Brain Development protocol described by Evans et al.
[11]. Briefly, a 3D T1-weighted (T1W) Spoiled Gradient Recalled
(SPGR) echo sequence was obtained with 1 mm isotropic data
acquired sagittally from the entire head. Slice thickness of
approximately 1.5 mm were obtained from GE scanners due to
their limit of 124 slices. T2-weighted (T2W) and proton density
weighted (PDW) images were acquired using a 2D multi-slice
(2 mm) dual echo fast spin echo (FSE) sequence. Subjects who
were unable to tolerate this procedure received a fallback protocol
that consisted of shorter 2D acquisitions with slice thicknesses of
3 mm. The same (or an equivalent protocol for GE scanners – see
comment above) was used at each site. While summarized below,
details are outlined in Table 3 of Evans et al. [11]. Importantly,
two forms of data were collected at each site and used to calibrate
the various scanners and make sure their outputs were
comparable:
(a) The American College of Radiology (ACR) phantom: this
phantom contains various compartments which provide
information on intensity non-uniformity over a flat intensity
field and geometric distortion over a grid pattern (collected
approximately monthly).
(b) The living phantom: one normal adult volunteer was
scanned at all sites using the full MRI acquisition protocol.
This database of real brain MRIs provided information on
inter-site variability in brain-related measures such as tissue
contrast in raw MRI signal, tissue relaxation properties and
derived morphological measurements (collected annually)
[11].
Raw MRI images were processed through the CIVET pipeline,
developed at the MNI for automated structural image analysis
[16,17,18].
Of the 431 subjects recruited for the NIH study, 392 had MRI
acquisitions that were of acceptable quality. Of these 392 subjects,
33 were under six years of age and had no IQ score (norming for
the WASI begins at age 6). Of the remaining 359 subjects, 107 had
T1W fallback protocols, and these were excluded from the study
because they did not provide adequate data for these analyses.
Scans for the remaining 252 subjects underwent a blinded visual
quality control (QC) procedure independently performed by two
investigators (HG and SK). This visual inspection identified an
additional 54 cases with inadequate image quality, leaving a final
sample size of 198 subjects for this analysis.
The boundary and 25 divisions of the CC were identified on the
midsagittal slice of the Talairach-like MNI152 template, an
average of 152 T1-weighted images [19]; the MNI152 template
was then registered to the T1-weighted image of each subject to
measure the corresponding CC areas. The boundary and divisions
of the CC on the MNI152 template were established using a semi-
automated procedure based on Clarke’s method [20]. The
procedure was as follows. The midsagittal slice of the template
was extracted and upsampled to 0.1 mm60.1 mm. An intensity-
based flood-fill was used to establish an initial boundary of the CC.
An implementation of the active contour algorithm was then used
to transform this initial estimate into a smoothed boundary at the
centre of the gradient at the edge of the CC. Lines were then
radiated from the centroid of the CC at 1-degree intervals, and for
Corpus Callosum Area and IQ in Children
PLoS ONE | www.plosone.org 2 May 2011 | Volume 6 | Issue 5 | e19698
each line that crossed the CC, the point midway between the two
points of intersection with the boundary was determined, and the
shortest length line that crossed the CC through that point was
determined. The curved line that passed through the midpoint of
each of these lines and extended to the CC boundary on either end
defined the midline. The midline was divided into 25 equal length
segments. The shortest length lines that crossed the CC at the
points defined by these midline segments defined the subregion
boundaries. The subregions are identified as 1 to 25 from rostral to
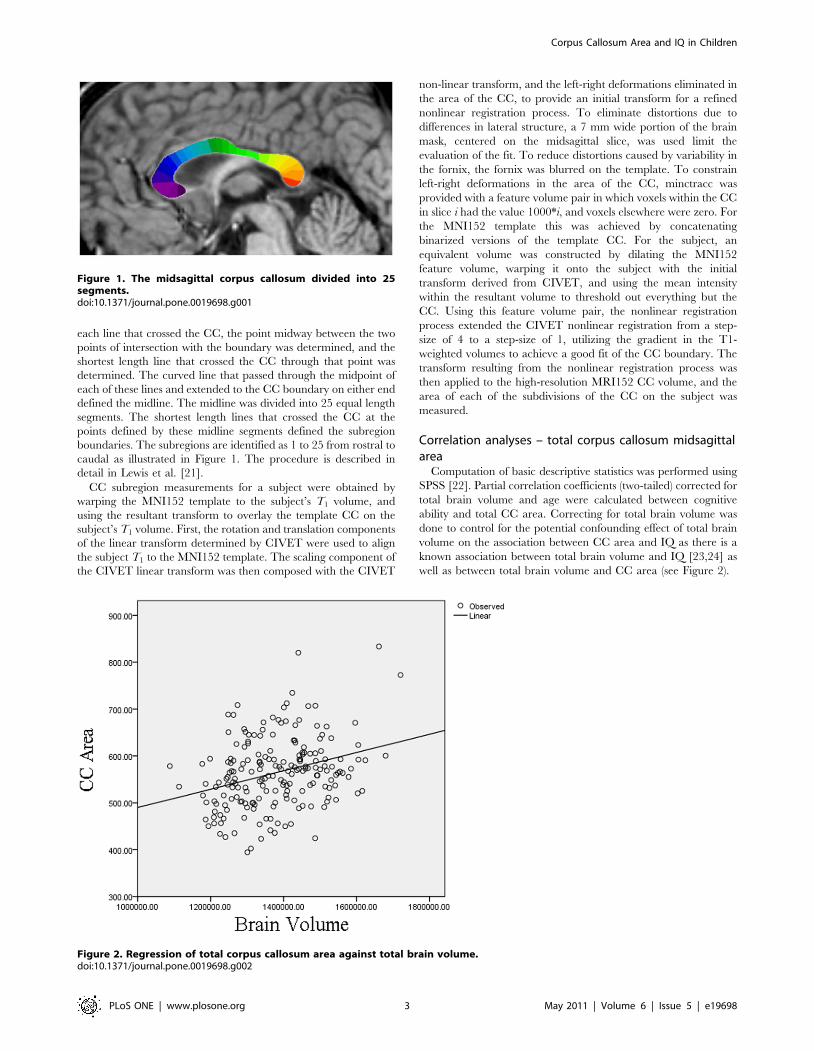
caudal as illustrated in Figure 1. The procedure is described in
detail in Lewis et al. [21].
CC subregion measurements for a subject were obtained by
warping the MNI152 template to the subject’s T1 volume, and
using the resultant transform to overlay the template CC on the
subject’s T1 volume. First, the rotation and translation components
of the linear transform determined by CIVET were used to align
the subject T1 to the MNI152 template. The scaling component of
the CIVET linear transform was then composed with the CIVET
non-linear transform, and the left-right deformations eliminated in
the area of the CC, to provide an initial transform for a refined
nonlinear registration process. To eliminate distortions due to
differences in lateral structure, a 7 mm wide portion of the brain
mask, centered on the midsagittal slice, was used limit the
evaluation of the fit. To reduce distortions caused by variability in
the fornix, the fornix was blurred on the template. To constrain
left-right deformations in the area of the CC, minctracc was
provided with a feature volume pair in which voxels within the CC
in slice i had the value 1000*i, and voxels elsewhere were zero. For
the MNI152 template this was achieved by concatenating
binarized versions of the template CC. For the subject, an
equivalent volume was constructed by dilating the MNI152
feature volume, warping it onto the subject with the initial
transform derived from CIVET, and using the mean intensity
within the resultant volume to threshold out everything but the
CC. Using this feature volume pair, the nonlinear registration
process extended the CIVET nonlinear registration from a step-
size of 4 to a step-size of 1, utilizing the gradient in the T1-
weighted volumes to achieve a good fit of the CC boundary. The
transform resulting from the nonlinear registration process was
then applied to the high-resolution MRI152 CC volume, and the
area of each of the subdivisions of the CC on the subject was
measured.
Correlation analyses – total corpus callosum midsagittalarea
Computation of basic descriptive statistics was performed using
SPSS [22]. Partial correlation coefficients (two-tailed) corrected for
total brain volume and age were calculated between cognitive
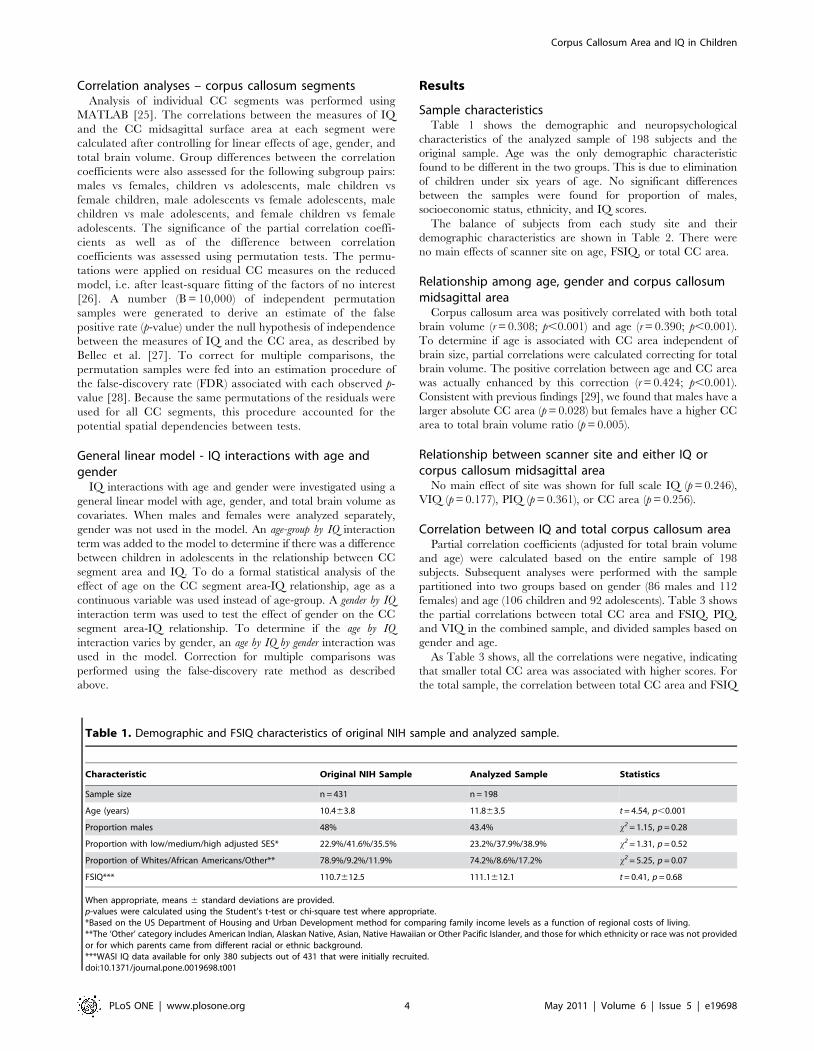
ability and total CC area. Correcting for total brain volume was
done to control for the potential confounding effect of total brain
volume on the association between CC area and IQ as there is a
known association between total brain volume and IQ [23,24] as
well as between total brain volume and CC area (see Figure 2).
Figure 1. The midsagittal corpus callosum divided into 25segments.doi:10.1371/journal.pone.0019698.g001
Figure 2. Regression of total corpus callosum area against total brain volume.doi:10.1371/journal.pone.0019698.g002
Corpus Callosum Area and IQ in Children
PLoS ONE | www.plosone.org 3 May 2011 | Volume 6 | Issue 5 | e19698
Correlation analyses – corpus callosum segmentsAnalysis of individual CC segments was performed using
MATLAB [25]. The correlations between the measures of IQ
and the CC midsagittal surface area at each segment were
calculated after controlling for linear effects of age, gender, and
total brain volume. Group differences between the correlation
coefficients were also assessed for the following subgroup pairs:
males vs females, children vs adolescents, male children vs
female children, male adolescents vs female adolescents, male
children vs male adolescents, and female children vs female
adolescents. The significance of the partial correlation coeffi-
cients as well as of the difference between correlation
coefficients was assessed using permutation tests. The permu-
tations were applied on residual CC measures on the reduced
model, i.e. after least-square fitting of the factors of no interest
[26]. A number (B = 10,000) of independent permutation
samples were generated to derive an estimate of the false
positive rate (p-value) under the null hypothesis of independence
between the measures of IQ and the CC area, as described by
Bellec et al. [27]. To correct for multiple comparisons, the
permutation samples were fed into an estimation procedure of
the false-discovery rate (FDR) associated with each observed p-
value [28]. Because the same permutations of the residuals were
used for all CC segments, this procedure accounted for the
potential spatial dependencies between tests.
General linear model - IQ interactions with age andgender
IQ interactions with age and gender were investigated using a
general linear model with age, gender, and total brain volume as
covariates. When males and females were analyzed separately,
gender was not used in the model. An age-group by IQ interaction
term was added to the model to determine if there was a difference
between children in adolescents in the relationship between CC
segment area and IQ. To do a formal statistical analysis of the
effect of age on the CC segment area-IQ relationship, age as a
continuous variable was used instead of age-group. A gender by IQ
interaction term was used to test the effect of gender on the CC
segment area-IQ relationship. To determine if the age by IQ
interaction varies by gender, an age by IQ by gender interaction was
used in the model. Correction for multiple comparisons was
performed using the false-discovery rate method as described
above.
Results
Sample characteristicsTable 1 shows the demographic and neuropsychological
characteristics of the analyzed sample of 198 subjects and the
original sample. Age was the only demographic characteristic
found to be different in the two groups. This is due to elimination
of children under six years of age. No significant differences
between the samples were found for proportion of males,
socioeconomic status, ethnicity, and IQ scores.
The balance of subjects from each study site and their
demographic characteristics are shown in Table 2. There were
no main effects of scanner site on age, FSIQ, or total CC area.
Relationship among age, gender and corpus callosummidsagittal area
Corpus callosum area was positively correlated with both total
brain volume (r = 0.308; p,0.001) and age (r = 0.390; p,0.001).
To determine if age is associated with CC area independent of
brain size, partial correlations were calculated correcting for total
brain volume. The positive correlation between age and CC area
was actually enhanced by this correction (r = 0.424; p,0.001).
Consistent with previous findings [29], we found that males have a
larger absolute CC area (p = 0.028) but females have a higher CC
area to total brain volume ratio (p = 0.005).
Relationship between scanner site and either IQ orcorpus callosum midsagittal area
No main effect of site was shown for full scale IQ (p = 0.246),
VIQ (p = 0.177), PIQ (p = 0.361), or CC area (p = 0.256).
Correlation between IQ and total corpus callosum areaPartial correlation coefficients (adjusted for total brain volume
and age) were calculated based on the entire sample of 198
subjects. Subsequent analyses were performed with the sample
partitioned into two groups based on gender (86 males and 112
females) and age (106 children and 92 adolescents). Table 3 shows
the partial correlations between total CC area and FSIQ, PIQ,
and VIQ in the combined sample, and divided samples based on
gender and age.
As Table 3 shows, all the correlations were negative, indicating
that smaller total CC area was associated with higher scores. For
the total sample, the correlation between total CC area and FSIQ
Table 1. Demographic and FSIQ characteristics of original NIH sample and analyzed sample.
Characteristic Original NIH Sample Analyzed Sample Statistics
Sample size n = 431 n = 198
Age (years) 10.463.8 11.863.5 t = 4.54, p,0.001
Proportion males 48% 43.4% x2 = 1.15, p = 0.28
Proportion with low/medium/high adjusted SES* 22.9%/41.6%/35.5% 23.2%/37.9%/38.9% x2 = 1.31, p = 0.52
Proportion of Whites/African Americans/Other** 78.9%/9.2%/11.9% 74.2%/8.6%/17.2% x2 = 5.25, p = 0.07
FSIQ*** 110.7612.5 111.1612.1 t = 0.41, p = 0.68
When appropriate, means 6 standard deviations are provided.p-values were calculated using the Student’s t-test or chi-square test where appropriate.*Based on the US Department of Housing and Urban Development method for comparing family income levels as a function of regional costs of living.**The ‘Other’ category includes American Indian, Alaskan Native, Asian, Native Hawaiian or Other Pacific Islander, and those for which ethnicity or race was not providedor for which parents came from different racial or ethnic background.***WASI IQ data available for only 380 subjects out of 431 that were initially recruited.doi:10.1371/journal.pone.0019698.t001
Corpus Callosum Area and IQ in Children
PLoS ONE | www.plosone.org 4 May 2011 | Volume 6 | Issue 5 | e19698
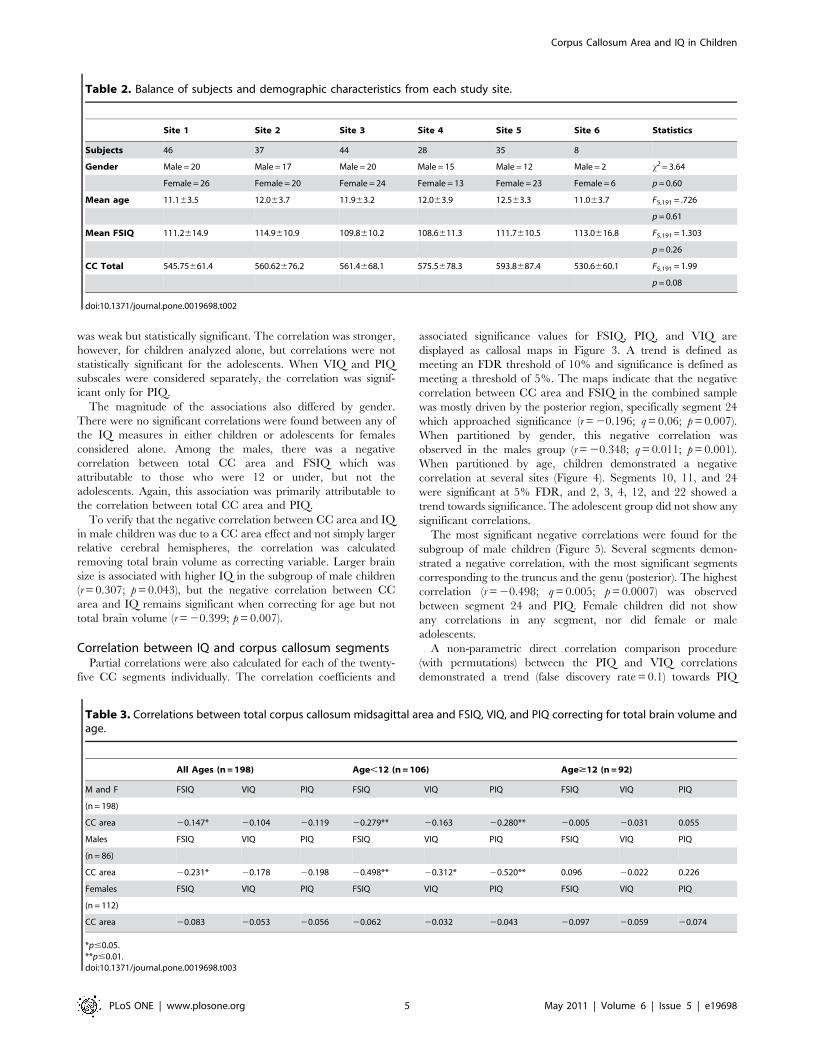
was weak but statistically significant. The correlation was stronger,
however, for children analyzed alone, but correlations were not
statistically significant for the adolescents. When VIQ and PIQ
subscales were considered separately, the correlation was signif-
icant only for PIQ.
The magnitude of the associations also differed by gender.
There were no significant correlations were found between any of
the IQ measures in either children or adolescents for females
considered alone. Among the males, there was a negative
correlation between total CC area and FSIQ which was
attributable to those who were 12 or under, but not the
adolescents. Again, this association was primarily attributable to
the correlation between total CC area and PIQ.
To verify that the negative correlation between CC area and IQ
in male children was due to a CC area effect and not simply larger
relative cerebral hemispheres, the correlation was calculated
removing total brain volume as correcting variable. Larger brain
size is associated with higher IQ in the subgroup of male children
(r = 0.307; p = 0.043), but the negative correlation between CC
area and IQ remains significant when correcting for age but not
total brain volume (r = 20.399; p = 0.007).
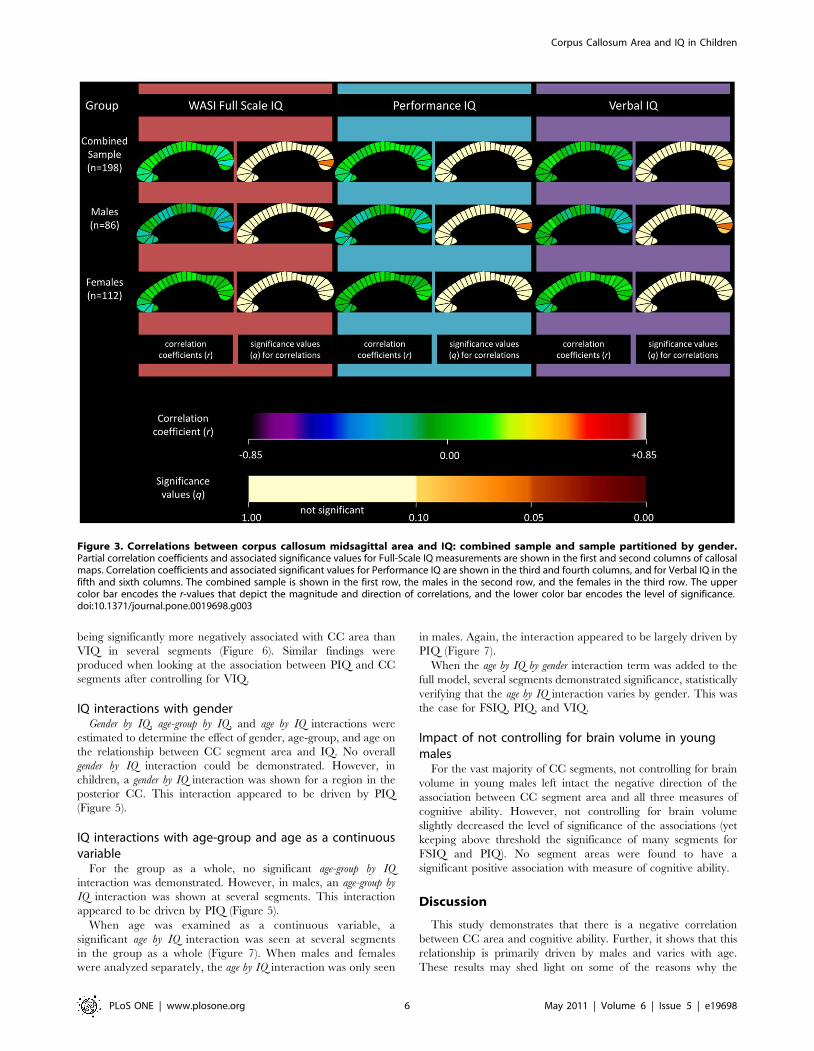
Correlation between IQ and corpus callosum segmentsPartial correlations were also calculated for each of the twenty-
five CC segments individually. The correlation coefficients and
associated significance values for FSIQ, PIQ, and VIQ are
displayed as callosal maps in Figure 3. A trend is defined as
meeting an FDR threshold of 10% and significance is defined as
meeting a threshold of 5%. The maps indicate that the negative
correlation between CC area and FSIQ in the combined sample
was mostly driven by the posterior region, specifically segment 24
which approached significance (r = 20.196; q = 0.06; p = 0.007).
When partitioned by gender, this negative correlation was
observed in the males group (r = 20.348; q = 0.011; p = 0.001).
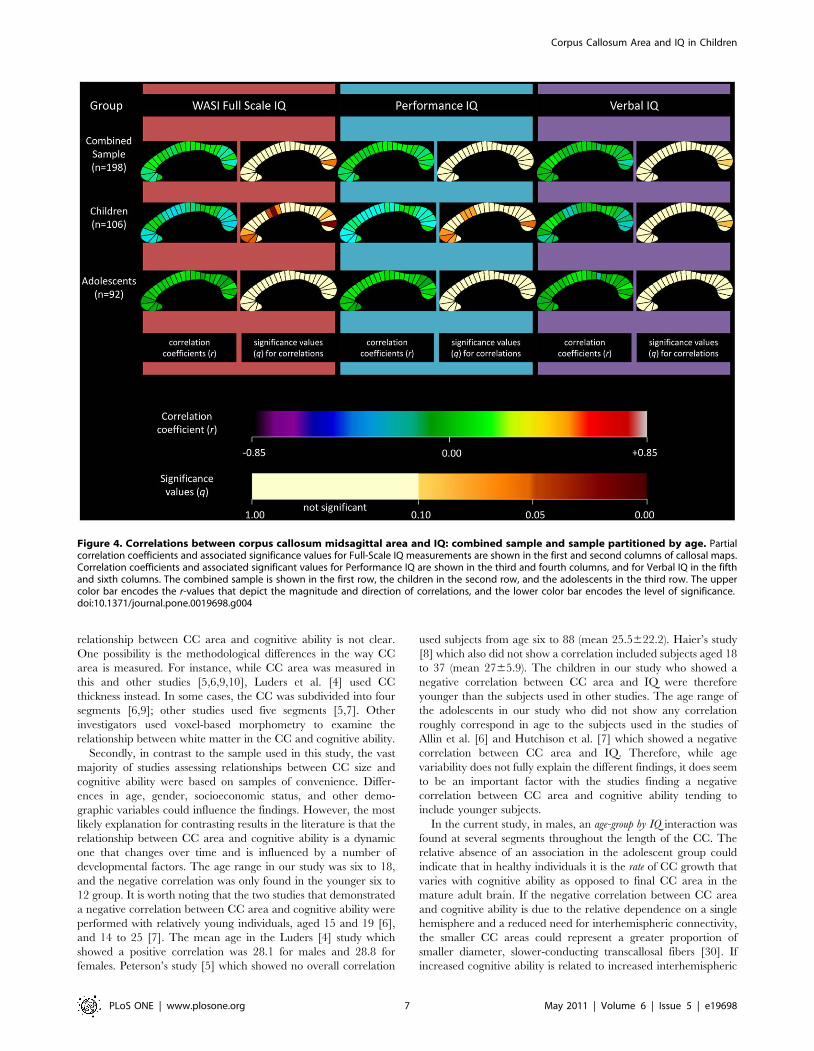
When partitioned by age, children demonstrated a negative
correlation at several sites (Figure 4). Segments 10, 11, and 24
were significant at 5% FDR, and 2, 3, 4, 12, and 22 showed a
trend towards significance. The adolescent group did not show any
significant correlations.
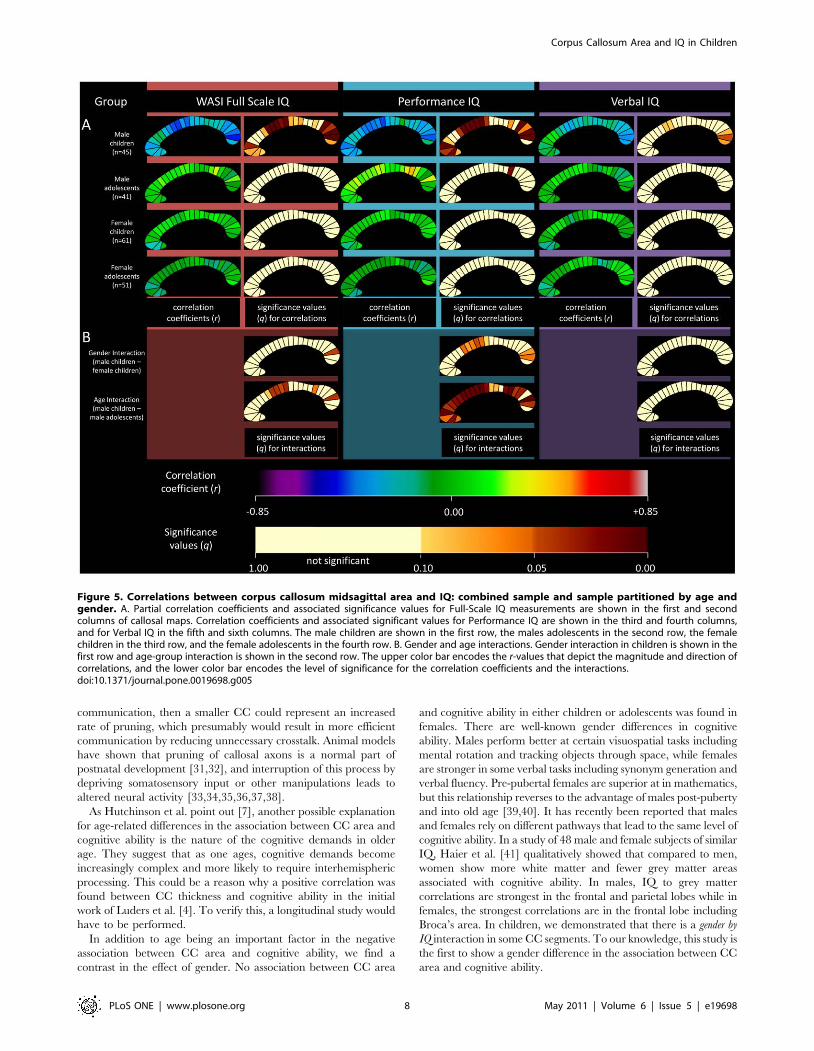
The most significant negative correlations were found for the
subgroup of male children (Figure 5). Several segments demon-
strated a negative correlation, with the most significant segments
corresponding to the truncus and the genu (posterior). The highest
correlation (r = 20.498; q = 0.005; p = 0.0007) was observed
between segment 24 and PIQ. Female children did not show
any correlations in any segment, nor did female or male
adolescents.
A non-parametric direct correlation comparison procedure
(with permutations) between the PIQ and VIQ correlations
demonstrated a trend (false discovery rate = 0.1) towards PIQ
Table 2. Balance of subjects and demographic characteristics from each study site.
Site 1 Site 2 Site 3 Site 4 Site 5 Site 6 Statistics
Subjects 46 37 44 28 35 8
Gender Male = 20 Male = 17 Male = 20 Male = 15 Male = 12 Male = 2 x2 = 3.64
Female = 26 Female = 20 Female = 24 Female = 13 Female = 23 Female = 6 p = 0.60
Mean age 11.163.5 12.063.7 11.963.2 12.063.9 12.563.3 11.063.7 F5,191 = .726
p = 0.61
Mean FSIQ 111.2614.9 114.9610.9 109.8610.2 108.6611.3 111.7610.5 113.0616.8 F5,191 = 1.303
p = 0.26
CC Total 545.75661.4 560.62676.2 561.4668.1 575.5678.3 593.8687.4 530.6660.1 F5,191 = 1.99
p = 0.08
doi:10.1371/journal.pone.0019698.t002
Table 3. Correlations between total corpus callosum midsagittal area and FSIQ, VIQ, and PIQ correcting for total brain volume andage.
All Ages (n = 198) Age,12 (n = 106) Age$12 (n = 92)
M and F FSIQ VIQ PIQ FSIQ VIQ PIQ FSIQ VIQ PIQ
(n = 198)
CC area 20.147* 20.104 20.119 20.279** 20.163 20.280** 20.005 20.031 0.055
Males FSIQ VIQ PIQ FSIQ VIQ PIQ FSIQ VIQ PIQ
(n = 86)
CC area 20.231* 20.178 20.198 20.498** 20.312* 20.520** 0.096 20.022 0.226
Females FSIQ VIQ PIQ FSIQ VIQ PIQ FSIQ VIQ PIQ
(n = 112)
CC area 20.083 20.053 20.056 20.062 20.032 20.043 20.097 20.059 20.074
*p#0.05.**p#0.01.doi:10.1371/journal.pone.0019698.t003
Corpus Callosum Area and IQ in Children
PLoS ONE | www.plosone.org 5 May 2011 | Volume 6 | Issue 5 | e19698
being significantly more negatively associated with CC area than
VIQ in several segments (Figure 6). Similar findings were
produced when looking at the association between PIQ and CC
segments after controlling for VIQ.
IQ interactions with genderGender by IQ, age-group by IQ, and age by IQ interactions were
estimated to determine the effect of gender, age-group, and age on
the relationship between CC segment area and IQ. No overall
gender by IQ interaction could be demonstrated. However, in
children, a gender by IQ interaction was shown for a region in the
posterior CC. This interaction appeared to be driven by PIQ
(Figure 5).
IQ interactions with age-group and age as a continuousvariable
For the group as a whole, no significant age-group by IQ
interaction was demonstrated. However, in males, an age-group by
IQ interaction was shown at several segments. This interaction
appeared to be driven by PIQ (Figure 5).
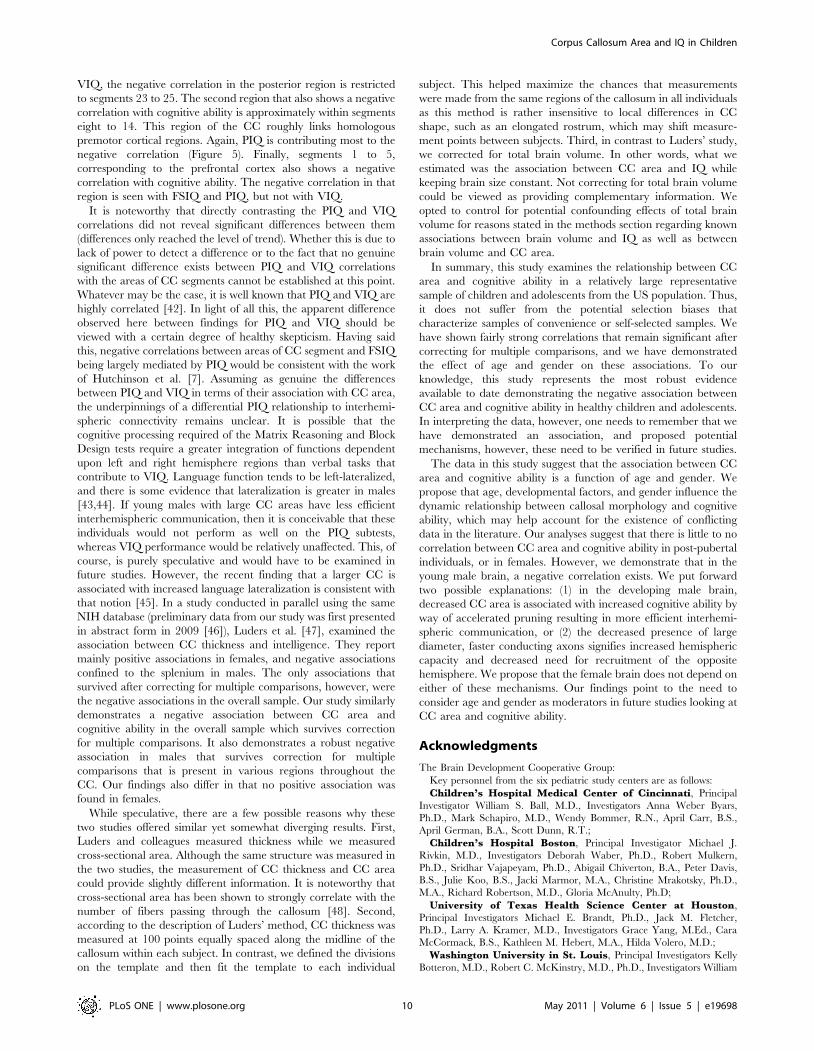
When age was examined as a continuous variable, a
significant age by IQ interaction was seen at several segments
in the group as a whole (Figure 7). When males and females
were analyzed separately, the age by IQ interaction was only seen
in males. Again, the interaction appeared to be largely driven by
PIQ (Figure 7).
When the age by IQ by gender interaction term was added to the
full model, several segments demonstrated significance, statistically
verifying that the age by IQ interaction varies by gender. This was
the case for FSIQ, PIQ, and VIQ.
Impact of not controlling for brain volume in youngmales
For the vast majority of CC segments, not controlling for brain
volume in young males left intact the negative direction of the
association between CC segment area and all three measures of
cognitive ability. However, not controlling for brain volume
slightly decreased the level of significance of the associations (yet
keeping above threshold the significance of many segments for
FSIQ and PIQ). No segment areas were found to have a
significant positive association with measure of cognitive ability.
Discussion
This study demonstrates that there is a negative correlation
between CC area and cognitive ability. Further, it shows that this
relationship is primarily driven by males and varies with age.
These results may shed light on some of the reasons why the
Figure 3. Correlations between corpus callosum midsagittal area and IQ: combined sample and sample partitioned by gender.Partial correlation coefficients and associated significance values for Full-Scale IQ measurements are shown in the first and second columns of callosalmaps. Correlation coefficients and associated significant values for Performance IQ are shown in the third and fourth columns, and for Verbal IQ in thefifth and sixth columns. The combined sample is shown in the first row, the males in the second row, and the females in the third row. The uppercolor bar encodes the r-values that depict the magnitude and direction of correlations, and the lower color bar encodes the level of significance.doi:10.1371/journal.pone.0019698.g003
Corpus Callosum Area and IQ in Children
PLoS ONE | www.plosone.org 6 May 2011 | Volume 6 | Issue 5 | e19698
relationship between CC area and cognitive ability is not clear.
One possibility is the methodological differences in the way CC
area is measured. For instance, while CC area was measured in
this and other studies [5,6,9,10], Luders et al. [4] used CC
thickness instead. In some cases, the CC was subdivided into four
segments [6,9]; other studies used five segments [5,7]. Other
investigators used voxel-based morphometry to examine the
relationship between white matter in the CC and cognitive ability.
Secondly, in contrast to the sample used in this study, the vast
majority of studies assessing relationships between CC size and
cognitive ability were based on samples of convenience. Differ-
ences in age, gender, socioeconomic status, and other demo-
graphic variables could influence the findings. However, the most
likely explanation for contrasting results in the literature is that the
relationship between CC area and cognitive ability is a dynamic
one that changes over time and is influenced by a number of
developmental factors. The age range in our study was six to 18,
and the negative correlation was only found in the younger six to
12 group. It is worth noting that the two studies that demonstrated
a negative correlation between CC area and cognitive ability were
performed with relatively young individuals, aged 15 and 19 [6],
and 14 to 25 [7]. The mean age in the Luders [4] study which
showed a positive correlation was 28.1 for males and 28.8 for
females. Peterson’s study [5] which showed no overall correlation
used subjects from age six to 88 (mean 25.5622.2). Haier’s study
[8] which also did not show a correlation included subjects aged 18
to 37 (mean 2765.9). The children in our study who showed a
negative correlation between CC area and IQ were therefore
younger than the subjects used in other studies. The age range of
the adolescents in our study who did not show any correlation
roughly correspond in age to the subjects used in the studies of
Allin et al. [6] and Hutchison et al. [7] which showed a negative
correlation between CC area and IQ. Therefore, while age
variability does not fully explain the different findings, it does seem
to be an important factor with the studies finding a negative
correlation between CC area and cognitive ability tending to
include younger subjects.
In the current study, in males, an age-group by IQ interaction was
found at several segments throughout the length of the CC. The
relative absence of an association in the adolescent group could
indicate that in healthy individuals it is the rate of CC growth that
varies with cognitive ability as opposed to final CC area in the
mature adult brain. If the negative correlation between CC area
and cognitive ability is due to the relative dependence on a single
hemisphere and a reduced need for interhemispheric connectivity,
the smaller CC areas could represent a greater proportion of
smaller diameter, slower-conducting transcallosal fibers [30]. If
increased cognitive ability is related to increased interhemispheric
Figure 4. Correlations between corpus callosum midsagittal area and IQ: combined sample and sample partitioned by age. Partialcorrelation coefficients and associated significance values for Full-Scale IQ measurements are shown in the first and second columns of callosal maps.Correlation coefficients and associated significant values for Performance IQ are shown in the third and fourth columns, and for Verbal IQ in the fifthand sixth columns. The combined sample is shown in the first row, the children in the second row, and the adolescents in the third row. The uppercolor bar encodes the r-values that depict the magnitude and direction of correlations, and the lower color bar encodes the level of significance.doi:10.1371/journal.pone.0019698.g004
Corpus Callosum Area and IQ in Children
PLoS ONE | www.plosone.org 7 May 2011 | Volume 6 | Issue 5 | e19698
communication, then a smaller CC could represent an increased
rate of pruning, which presumably would result in more efficient
communication by reducing unnecessary crosstalk. Animal models
have shown that pruning of callosal axons is a normal part of
postnatal development [31,32], and interruption of this process by
depriving somatosensory input or other manipulations leads to
altered neural activity [33,34,35,36,37,38].
As Hutchinson et al. point out [7], another possible explanation
for age-related differences in the association between CC area and
cognitive ability is the nature of the cognitive demands in older
age. They suggest that as one ages, cognitive demands become
increasingly complex and more likely to require interhemispheric
processing. This could be a reason why a positive correlation was
found between CC thickness and cognitive ability in the initial
work of Luders et al. [4]. To verify this, a longitudinal study would
have to be performed.
In addition to age being an important factor in the negative
association between CC area and cognitive ability, we find a
contrast in the effect of gender. No association between CC area
and cognitive ability in either children or adolescents was found in
females. There are well-known gender differences in cognitive
ability. Males perform better at certain visuospatial tasks including
mental rotation and tracking objects through space, while females
are stronger in some verbal tasks including synonym generation and
verbal fluency. Pre-pubertal females are superior at in mathematics,
but this relationship reverses to the advantage of males post-puberty
and into old age [39,40]. It has recently been reported that males
and females rely on different pathways that lead to the same level of
cognitive ability. In a study of 48 male and female subjects of similar
IQ, Haier et al. [41] qualitatively showed that compared to men,
women show more white matter and fewer grey matter areas
associated with cognitive ability. In males, IQ to grey matter
correlations are strongest in the frontal and parietal lobes while in
females, the strongest correlations are in the frontal lobe including
Broca’s area. In children, we demonstrated that there is a gender by
IQ interaction in some CC segments. To our knowledge, this study is
the first to show a gender difference in the association between CC
area and cognitive ability.
Figure 5. Correlations between corpus callosum midsagittal area and IQ: combined sample and sample partitioned by age andgender. A. Partial correlation coefficients and associated significance values for Full-Scale IQ measurements are shown in the first and secondcolumns of callosal maps. Correlation coefficients and associated significant values for Performance IQ are shown in the third and fourth columns,and for Verbal IQ in the fifth and sixth columns. The male children are shown in the first row, the males adolescents in the second row, the femalechildren in the third row, and the female adolescents in the fourth row. B. Gender and age interactions. Gender interaction in children is shown in thefirst row and age-group interaction is shown in the second row. The upper color bar encodes the r-values that depict the magnitude and direction ofcorrelations, and the lower color bar encodes the level of significance for the correlation coefficients and the interactions.doi:10.1371/journal.pone.0019698.g005
Corpus Callosum Area and IQ in Children
PLoS ONE | www.plosone.org 8 May 2011 | Volume 6 | Issue 5 | e19698
With respect to the specific segments of the CC that are most
highly associated with cognitive ability, our study appears
relatively consistent with the findings of Hutchison et al. [7] and
Allin et el. [6], despite methodological differences in CC area
measurement and segmentation. Our findings demonstrate that a
small region in the splenium of the CC is the region most
consistently negatively associated with cognitive ability. Hutch-
inson et al. [7] and Allin et al. [6] demonstrated a negative
association between the posterior CC and IQ. Our data also show
three separate clusters of segments along the CC that are
negatively correlated with cognitive ability. In male children, the
posterior region (approximately segments 19 to 25) shows a strong
negative correlation with FSIQ and PIQ. The region roughly links
homologous occipital, parietal, and temporal cortical areas. For
Figure 7. Age by IQ interaction: combined sample and sample partitioned by gender. A general linear model was used with an age by IQinteraction term to examine the interaction between IQ and age as a continuous variable. Significance values are displayed as callosal maps with Full-Scale IQ results shown in the first column, Performance IQ results in the second column, and Verbal IQ results in the third column. Values for thecombined sample are shown in the first row and results for males and females are shown in the second and third rows respectively. The color barencodes the level of significance for the interactions.doi:10.1371/journal.pone.0019698.g007
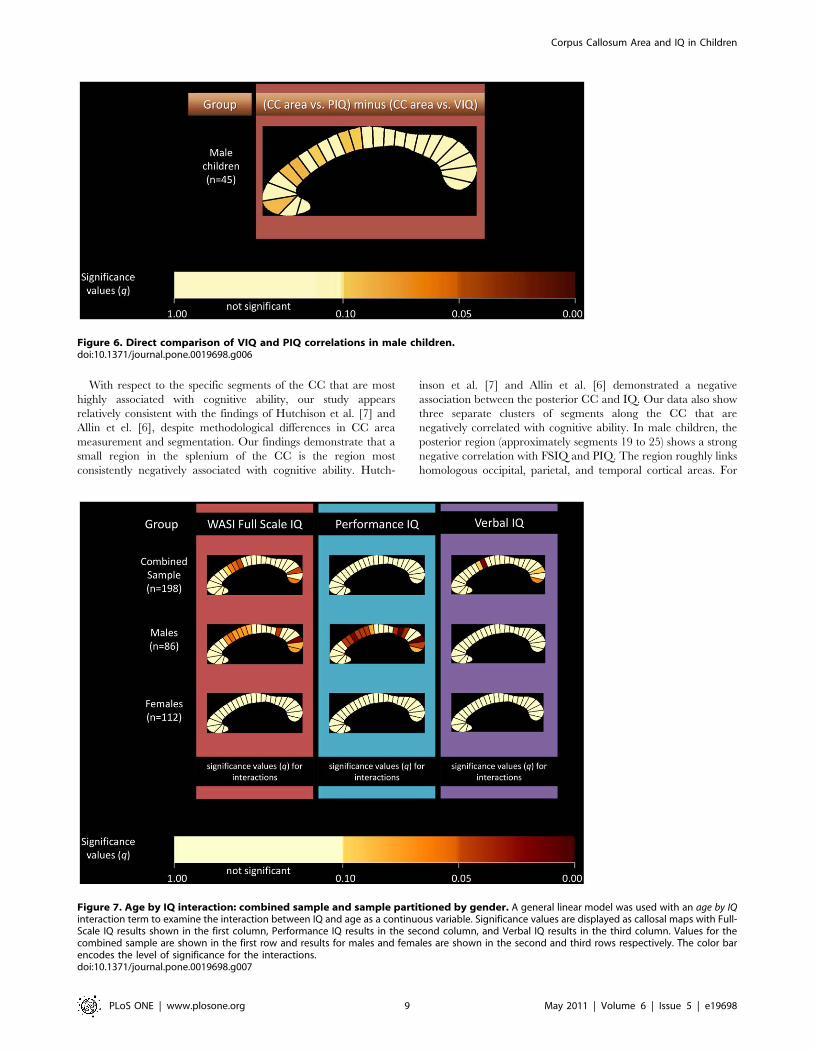
Figure 6. Direct comparison of VIQ and PIQ correlations in male children.doi:10.1371/journal.pone.0019698.g006
Corpus Callosum Area and IQ in Children
PLoS ONE | www.plosone.org 9 May 2011 | Volume 6 | Issue 5 | e19698
VIQ, the negative correlation in the posterior region is restricted
to segments 23 to 25. The second region that also shows a negative
correlation with cognitive ability is approximately within segments
eight to 14. This region of the CC roughly links homologous
premotor cortical regions. Again, PIQ is contributing most to the
negative correlation (Figure 5). Finally, segments 1 to 5,
corresponding to the prefrontal cortex also shows a negative
correlation with cognitive ability. The negative correlation in that
region is seen with FSIQ and PIQ, but not with VIQ.
It is noteworthy that directly contrasting the PIQ and VIQ
correlations did not reveal significant differences between them
(differences only reached the level of trend). Whether this is due to
lack of power to detect a difference or to the fact that no genuine
significant difference exists between PIQ and VIQ correlations
with the areas of CC segments cannot be established at this point.
Whatever may be the case, it is well known that PIQ and VIQ are
highly correlated [42]. In light of all this, the apparent difference
observed here between findings for PIQ and VIQ should be
viewed with a certain degree of healthy skepticism. Having said
this, negative correlations between areas of CC segment and FSIQ
being largely mediated by PIQ would be consistent with the work
of Hutchinson et al. [7]. Assuming as genuine the differences
between PIQ and VIQ in terms of their association with CC area,
the underpinnings of a differential PIQ relationship to interhemi-
spheric connectivity remains unclear. It is possible that the
cognitive processing required of the Matrix Reasoning and Block
Design tests require a greater integration of functions dependent
upon left and right hemisphere regions than verbal tasks that
contribute to VIQ. Language function tends to be left-lateralized,
and there is some evidence that lateralization is greater in males
[43,44]. If young males with large CC areas have less efficient
interhemispheric communication, then it is conceivable that these
individuals would not perform as well on the PIQ subtests,
whereas VIQ performance would be relatively unaffected. This, of
course, is purely speculative and would have to be examined in
future studies. However, the recent finding that a larger CC is
associated with increased language lateralization is consistent with
that notion [45]. In a study conducted in parallel using the same
NIH database (preliminary data from our study was first presented
in abstract form in 2009 [46]), Luders et al. [47], examined the
association between CC thickness and intelligence. They report
mainly positive associations in females, and negative associations
confined to the splenium in males. The only associations that
survived after correcting for multiple comparisons, however, were
the negative associations in the overall sample. Our study similarly
demonstrates a negative association between CC area and
cognitive ability in the overall sample which survives correction
for multiple comparisons. It also demonstrates a robust negative
association in males that survives correction for multiple
comparisons that is present in various regions throughout the
CC. Our findings also differ in that no positive association was
found in females.
While speculative, there are a few possible reasons why these
two studies offered similar yet somewhat diverging results. First,
Luders and colleagues measured thickness while we measured
cross-sectional area. Although the same structure was measured in
the two studies, the measurement of CC thickness and CC area
could provide slightly different information. It is noteworthy that
cross-sectional area has been shown to strongly correlate with the
number of fibers passing through the callosum [48]. Second,
according to the description of Luders’ method, CC thickness was
measured at 100 points equally spaced along the midline of the
callosum within each subject. In contrast, we defined the divisions
on the template and then fit the template to each individual
subject. This helped maximize the chances that measurements
were made from the same regions of the callosum in all individuals
as this method is rather insensitive to local differences in CC
shape, such as an elongated rostrum, which may shift measure-
ment points between subjects. Third, in contrast to Luders’ study,
we corrected for total brain volume. In other words, what we
estimated was the association between CC area and IQ while
keeping brain size constant. Not correcting for total brain volume
could be viewed as providing complementary information. We
opted to control for potential confounding effects of total brain
volume for reasons stated in the methods section regarding known
associations between brain volume and IQ as well as between
brain volume and CC area.
In summary, this study examines the relationship between CC
area and cognitive ability in a relatively large representative
sample of children and adolescents from the US population. Thus,
it does not suffer from the potential selection biases that
characterize samples of convenience or self-selected samples. We
have shown fairly strong correlations that remain significant after
correcting for multiple comparisons, and we have demonstrated
the effect of age and gender on these associations. To our
knowledge, this study represents the most robust evidence
available to date demonstrating the negative association between
CC area and cognitive ability in healthy children and adolescents.
In interpreting the data, however, one needs to remember that we
have demonstrated an association, and proposed potential
mechanisms, however, these need to be verified in future studies.
The data in this study suggest that the association between CC
area and cognitive ability is a function of age and gender. We
propose that age, developmental factors, and gender influence the
dynamic relationship between callosal morphology and cognitive
ability, which may help account for the existence of conflicting
data in the literature. Our analyses suggest that there is little to no
correlation between CC area and cognitive ability in post-pubertal
individuals, or in females. However, we demonstrate that in the
young male brain, a negative correlation exists. We put forward
two possible explanations: (1) in the developing male brain,
decreased CC area is associated with increased cognitive ability by
way of accelerated pruning resulting in more efficient interhemi-
spheric communication, or (2) the decreased presence of large
diameter, faster conducting axons signifies increased hemispheric
capacity and decreased need for recruitment of the opposite
hemisphere. We propose that the female brain does not depend on
either of these mechanisms. Our findings point to the need to
consider age and gender as moderators in future studies looking at
CC area and cognitive ability.
Acknowledgments
The Brain Development Cooperative Group:
Key personnel from the six pediatric study centers are as follows:
Children’s Hospital Medical Center of Cincinnati, Principal
Investigator William S. Ball, M.D., Investigators Anna Weber Byars,
Ph.D., Mark Schapiro, M.D., Wendy Bommer, R.N., April Carr, B.S.,
April German, B.A., Scott Dunn, R.T.;
Children’s Hospital Boston, Principal Investigator Michael J.
Rivkin, M.D., Investigators Deborah Waber, Ph.D., Robert Mulkern,
Ph.D., Sridhar Vajapeyam, Ph.D., Abigail Chiverton, B.A., Peter Davis,
B.S., Julie Koo, B.S., Jacki Marmor, M.A., Christine Mrakotsky, Ph.D.,
M.A., Richard Robertson, M.D., Gloria McAnulty, Ph.D;
University of Texas Health Science Center at Houston,
Principal Investigators Michael E. Brandt, Ph.D., Jack M. Fletcher,
Ph.D., Larry A. Kramer, M.D., Investigators Grace Yang, M.Ed., Cara
McCormack, B.S., Kathleen M. Hebert, M.A., Hilda Volero, M.D.;
Washington University in St. Louis, Principal Investigators Kelly
Botteron, M.D., Robert C. McKinstry, M.D., Ph.D., Investigators William
Corpus Callosum Area and IQ in Children
PLoS ONE | www.plosone.org 10 May 2011 | Volume 6 | Issue 5 | e19698
Warren, Tomoyuki Nishino, M.S., C. Robert Almli, Ph.D., Richard Todd,
Ph.D., M.D., John Constantino, M.D.;
University of California Los Angeles, Principal Investigator James
T. McCracken, M.D., Investigators Jennifer Levitt, M.D., Jeffrey Alger,
Ph.D., Joseph O’Neil, Ph.D., Arthur Toga, Ph.D., Robert Asarnow, Ph.D.,
David Fadale, B.A., Laura Heinichen, B.A., Cedric Ireland B.A.;
Children’s Hospital of Philadelphia, Principal Investigators Dah-
Jyuu Wang, Ph.D. and Edward Moss, Ph.D., Investigators Robert A.
Zimmerman, M.D., and Research Staff Brooke Bintliff, B.S., Ruth
Bradford, Janice Newman, M.B.A.
The Principal Investigator of the data coordinating center at McGillUniversity is Alan C. Evans, Ph.D., Investigators Rozalia Arnaoutelis,
B.S., G. Bruce Pike, Ph.D., D. Louis Collins, Ph.D., Gabriel Leonard,
Ph.D., Tomas Paus, M.D., Alex Zijdenbos, Ph.D., and Research Staff
Samir Das, B.S., Vladimir Fonov, Ph.D., Luke Fu, B.S., Jonathan Harlap,
Ilana Leppert, B.E., Denise Milovan, M.A., Dario Vins, B.C., and at
Georgetown University, Thomas Zeffiro, M.D., Ph.D. and John Van
Meter, Ph.D. Ph.D. Investigators at the Neurostatistics Laboratory,
Harvard University/McLean Hospital, Nicholas Lange, Sc.D., and
Michael P. Froimowitz, M.S., work with data coordinating center staff and
all other team members on biostatistical study design and data analyses.
The Principal Investigator of the Clinical Coordinating Center at
Washington University is Kelly Botteron, M.D., Investigators C.
Robert Almli Ph.D., Cheryl Rainey, B.S., Stan Henderson M.S.,
Tomoyuki Nishino, M.S., William Warren, Jennifer L. Edwards M.SW.,
Diane Dubois R.N., Karla Smith, Tish Singer and Aaron A. Wilber, M.S.
The Principal Investigator of the Diffusion Tensor Processing Center at the
National Institutes of Health is Carlo Pierpaoli, MD, Ph.D.,Investigators Peter J. Basser, Ph.D., Lin-Ching Chang, Sc.D., Chen
Guan Koay, Ph.D. and Lindsay Walker, M.S. The Principal
Collaborators at the National Institutes of Health are Lisa Freund,
Ph.D. (NICHD), Judith Rumsey, Ph.D. (NIMH), Lauren Baskir, Ph.D.
(NIMH), Laurence Stanford, PhD. (NIDA), Karen Sirocco, Ph.D. (NIDA)
and from NINDS, Katrina Gwinn-Hardy, M.D., and Giovanna Spinella,
M.D. The Principal Investigator of the Spectroscopy Processing Center at
the University of California Los Angeles is James T. McCracken,M.D., Investigators Jeffry R. Alger, Ph.D., Jennifer Levitt, M.D.,
Joseph O’Neill, Ph.D.
Disclaimer:
The views herein do not necessarily represent the official views of the
National Institute of Child Health and Human Development, the National
Institute on Drug Abuse, the National Institute of Mental Health, the
National Institute of Neurological Disorders and Stroke, the National
Institutes of Health, the U.S. Department of Health and Human Services,
or any other agency of the United States Government.
Author Contributions
Conceived and designed the experiments: HG SK. Performed the
experiments: HG PB SK. Analyzed the data: HG PB PAM SKP.
Contributed reagents/materials/analysis tools: ACE JDL PB SK. Con-
tributed to the writing and approval of the final manuscript: ACE DPW
HG JDL PB PAM SK.
References
1. Waxman S (2003) Lange clinical neuroanatomy. New York: McGraw-Hill.
2. Wong T, Kwan S, Chang K, Hsiu-Mei W, Yang T, et al. (2006) Corpus
callosotomy in children. Childs Nerv Syst 22: 999–1011.
3. Banich M, Brown W (2000) A life-span perspective on interaction between thecerebral hemispheres. Dev Neuropsychol 18: 1–10.
4. Luders E, Narr K, Bilder R, Thompson P, Szeszko P, et al. (2007) Positive
correlations between corpus callosum thickness and intelligence. Neuroimage 37:1457–1464.
5. Peterson B, Feineigle P, Staib L, Gore J (2001) Automated measurement of
latent morphological features in the human corpus callosum. Hum Brain Mapp
12: 232–245.
6. Allin M, Nosarti C, Narberhaus A, Walshe M, Frearson S, et al. (2007) Growthof the corpus callosum in adolescents born preterm. Arch Pediatr Adolesc Med
161: 1183–1189.
7. Hutchinson A, Mathias J, Jacobson B, Ruzic L, Bond A, et al. (2009)Relationship between intelligence and the size and composition of the corpus
callosum. Exp Brain Res 192: 455–464.
8. Haier R, Jung R, Yeo R, Head K, Alkire M (2004) Structural brain variationand general intelligence. Neuroimage 23: 425–433.
9. Nosarti C, Rushe T, Woodruff P, Stewart A, Rifkin L, et al. (2004) Corpus
callosum size and very preterm birth: relationship to neuropsychological
outcome. Brain 127: 2080–2089.
10. Tramo M, Loftus W, Stukel T, Green R, Weaver J, et al. (1998) Brain size, headsize, and intelligence quotient in monozygotic twins. Neurology 50: 1246–1252.
11. Evans A, Group BDC (2006) The NIH MRI study of normal brain
development. Neuroimage 30: 184–202.
12. Waber D, De Moor C, Forbes P, Almli C, Botteron K, et al. (2007) The NIHMRI study of normal brain development: performance of a population based
sample of healthy children aged 6 to 18 years on a neuropsychological battery.J Int Neuropsychol Soc 13: 729–746.
13. Parent A, Teilmann G, Juul A, Skakkebaek N, Toppari J, et al. (2003) The timing
of normal puberty and the age limits of sexual precocity: variations around the
world, secular trends, and changes after migration. Endocr Rev 24: 668–693.
14. Marshall W, Tanner J (1970) Variations in the pattern of pubertal changes inboys. Arch Dis Child 45: 13–23.
15. Wechsler D (1999) Wechsler abbreviated scale of intelligence. San Antonio:
Harcourt Assessment.
16. Ad-Dab’bagh Y, Lyttelton O, Muehlboeck J, Lepage C, Einarson D, et al. (2006)The CIVET Image-Processing Environment: A Fully Automated Comprehen-
sive Pipeline for Anatomic Comprehensive Pipeline for Anatomical Neuroim-
aging Research; Florence.
17. Kim J, Singh V, Lee J, Lerch J, Ad-Dab’bagh Y, et al. (2005) Automated 3-Dextraction and evaluation of the inner and outer cortical surfaces using a Laplacian
map and partial volume effect classification. Neuroimage 27: 210–221.
18. MacDonald D, Kabani N, Avis D, Evans A (2000) Automated 3-D extraction ofinner and outer surfaces of cerebral cortex from MRI. Neuroimage 12: 340–356.
19. Collins D, Neelin P, Peters T, Evans A (1994) Automatic 3D intersubject
registration of MR volumetric data in standardized Talairach space. J ComputAssist Tomogr 18: 192–205.
20. Clarke S, Kraftsik R, Van der Loos H, Innocenti G (1989) Forms and measuresof adult and developing human corpus callosum: is there sexual dimorphism?
J Comp Neurol 280: 213–230.
21. Lewis J, Theilmann R, Sereno M, Townsend J (2009) The Relation between
Connection Length and Degree of Connectivity in Young Adults: A DTIAnalysis. Cerebral Cortex 19: 554–562.
22. SPSS Student Version 16.0.
23. Deary IJ, Penke L, Johnson W (2010) The neuroscience of human intelligence
differences. Nat Rev Neurosci 11: 201–211.
24. Colom R, Karama S, Jung RE, Haier RJ (2010) Human intelligence and brain
networks. Dialogues in clinical neuroscience 12: 489–501.
25. MATLAB 7 (2007) Mathworks.
26. Anderson M (2001) Permutation tests for univariate or multivariate analysis ofvariance and regression. Canadian Journal of Fisheries and Aquatic Sciences 58:
626–639.
27. Bellec P, Marrelec G, Benali H (2008) A bootstrap test to investigate changes in
brain connectivity for functional MRI. Statistica Sinica 18: 1253–1268.
28. Logan B, Rowe D (2004) An evaluation of thresholding techniques in fMRIanalysis. Neuroimage 22: 95–108.
29. Bishop KM, Wahlstein D (1997) Sex Differences in the Human Corpus
Callosum: Myth or Reality? Neurosci Biobehav Rev 21: 581–601.
30. Doron K, Gazzaniga M (2008) Neuroimaging techniques offer new perspectives
on callosal transfer and interhemispheric communication. Cortex 44:1023–1029.
31. Innocenti G (1981) Growth and reshaping of axons in the establishment of visual
callosal connections. Science 212: 824–827.
32. O’Leary D, Stanfield B, Cowan W (1981) Evidence that the early postnatal
restriction of the cells of origin of the callosal projection is due to the elimination ofaxonal collaterals rather than to the death of neurons. Brain Res 227: 607–617.
33. Dehay C, Horsburgh G, Berland M, Killackey H, Kennedy H (1989)
Maturation and connectivity of the visual cortex in monkey is altered byprenatal removal of retinal input. Nature 337: 265–267.
34. Frost D, Moy Y, Smith D (1990) Effects of alternating monocular occlusion onthe development of visual callosal connections. Exp Brain Res 83: 200–209.
35. Innocenti G (1986) General organization of callosal connections in the cerebral
cortex. Cerebral Cortex. New York: Plenum. pp 291–353.
36. Lund R, Mitchell D (1979) The effects of dark-rearing on visual callosalconnections of cats. Brain Res 167: 172–175.
37. Shatz C (1977) Anatomy of interhemispheric connections in the visual system ofBoston Siamese and ordinary cats. J Comp Neurol 173: 497–518.
38. Zufferey P, Jin F, Nakamura H, Tettoni L, Innocenti G (1999) The role of
pattern vision in the development of cortico-cortical connections. Eur J Neurosci11: 2669–2688.
39. Hyde J, Fennema E, Lamon S (1990) Gender differences in mathematicsperformance: a meta-analysis. Psychol Bull 107: 139–155.
40. Neisser U, Boodoo G, Bouchard J, T J, Boykin A, Brody N, et al. (1996)
Intelligence: Knowns and Unknowns. American Psychologist 51: 77–101.
41. Haier R, Jung R, Yeo R, Head K, Alkire M (2005) The neuroanatomy ofgeneral intelligence: sex matters. Neuroimage 25: 320–327.
Corpus Callosum Area and IQ in Children
PLoS ONE | www.plosone.org 11 May 2011 | Volume 6 | Issue 5 | e19698

42. Kamphaus RW (2005) Clinical Assessment of Child and Adolescent Intelligence
Springer.43. Jaeger J, Lockwood A, Van Valin J, R D, Kemmerer D, Murphy B, et al. (1998)
Sex differences in brain regions activated by grammatical and reading tasks.
Neuroreport 9: 2803–2807.44. Shaywitz B, Shaywitz S, Pugh K, Constable R, Skudlarski P, et al. (1995) Sex
differences in the functional organization of the brain for language. Nature 373:607–609.
45. Josse G, Seghier M, Kherif F, Price C (2008) Explaining function with anatomy:
language lateralization and corpus callosum size. J Neurosci 28: 14132–14139.
46. Ganjavi H, Evans A, Lewis J, MacDonald P, Karama S, et al. (2009) Negative
correlations between corpus callosum area and intelligence in a representative
sample of healthy young males. International Society for Intelligence Research.
Madrid, Spain. 4 p.
47. Luders E, Thompson PM, Narr KL, Zamanyan A, Chou YY, et al. (2011) The
link between callosal thickness and intelligence in healthy children and
adolescents. Neuroimage 54: 1823–1830.
48. Aboitiz F, Scheibel AB, Fisher RS, Zaidel E (1992) Fiber composition of the
human corpus callosum. Brain Res 598: 143–153.
Corpus Callosum Area and IQ in Children
PLoS ONE | www.plosone.org 12 May 2011 | Volume 6 | Issue 5 | e19698