
Power IQ User Guide--3.1 - Raritan
238
Copyright © 2011 Raritan, Inc. PIQ-0N-v3.1.0-E November 2011 255-80-6092-00 Power IQ User Guide Release 3.1.0
-
Upload
khangminh22 -
Category
Documents
-
view
3 -
download
0
Transcript of Power IQ User Guide--3.1 - Raritan

Copyright © 2011 Raritan, Inc.
PIQ-0N-v3.1.0-E
November 2011
255-80-6092-00
Power IQ
User Guide Release 3.1.0

This document contains proprietary information that is protected by copyright. All rights reserved. No part of this document may be photocopied, reproduced, or translated into another language without express prior written consent of Raritan, Inc.
© Copyright 2011 Raritan, Inc. All third-party software and hardware mentioned in this document are registered trademarks or trademarks of and are the property of their respective holders.
FCC Information
This equipment has been tested and found to comply with the limits for a Class A digital device, pursuant to Part 15 of the FCC Rules. These limits are designed to provide reasonable protection against harmful interference in a commercial installation. This equipment generates, uses, and can radiate radio frequency energy and if not installed and used in accordance with the instructions, may cause harmful interference to radio communications. Operation of this equipment in a residential environment may cause harmful interference.
VCCI Information (Japan)
Raritan is not responsible for damage to this product resulting from accident, disaster, misuse, abuse, non-Raritan modification of the product, or other events outside of Raritan's reasonable control or not arising under normal operating conditions.

iii
Contents
What's New in the Power IQ Help x
Chapter 1 Installing the Power IQ Application 1
Virtual Machine Requirements ....................................................................................................... 1 Preparing to Install Power IQ ......................................................................................................... 1 Creating the Power IQ Virtual Machine ......................................................................................... 2 Loading Power IQ onto the Virtual Machine .................................................................................. 2
Chapter 2 Initial Configuration of Power IQ 4
Configuring Power IQ for Access over Network ............................................................................ 4 Open Port Requirements ............................................................................................................... 5
Ports Open Between Power IQ and PDUs .......................................................................... 5 Ports Open Between Clients and Power IQ ........................................................................ 5
Chapter 3 Connecting to Power IQ 6
Chapter 4 Additional Configuration Tasks 7
Configuring Logging through Syslog .............................................................................................. 7 Configuring Polling Intervals .......................................................................................................... 7
Recommended Polling Intervals .......................................................................................... 8 Buffered Data Retrieval ....................................................................................................... 9 Setting the Default SNMP Version for PDUs ..................................................................... 10 Setting Default Estimated Voltages ................................................................................... 11
Adding PDUs to Power IQ Management ..................................................................................... 11 Discovery Progress Status ................................................................................................ 13 Validating PDU Credentials ............................................................................................... 13 Editing PDUs under Power IQ Management ..................................................................... 13 Configure Estimated Voltages ........................................................................................... 15 Adding PDUs in Bulk with CSV Files ................................................................................. 15 Adding MRV PDUs ............................................................................................................ 17 Adding Raritan EMX .......................................................................................................... 17
Bulk Configuration of Dominion PX PDUs ................................................................................... 18 Requirements for Bulk Configuration ................................................................................ 18 Plan a New Rollout ............................................................................................................ 18 View Saved Rollout Plans ................................................................................................. 19 Edit a Saved Rollout Plan .................................................................................................. 19 Execute a Saved Rollout Plan ........................................................................................... 20

Contents
iv
View Status of Rollout Plans in Progress .......................................................................... 20 View Completed Rollout Plans .......................................................................................... 21 Manage Configuration Files ............................................................................................... 21
PDU Outlet Naming and Setting System Attributes ..................................................................... 22 Naming Individual Outlets .................................................................................................. 22 Naming Outlets in Bulk with CSV Files ............................................................................. 22 Setting SNMP System Attributes for PDUs ....................................................................... 23 Structure of the Outlet Name CSV File ............................................................................. 24 Exporting Outlet Names to a CSV File .............................................................................. 25
Configuring Event Management .................................................................................................. 25 User Permissions for Event Management ......................................................................... 25 Prepare PDUs for Power IQ Event Management .............................................................. 25 PDU Connectivity Lost and Restored Events .................................................................... 44 View Events ....................................................................................................................... 45 Filter the Events List .......................................................................................................... 45 Export the Events List to CSV ........................................................................................... 46 Clear Events ...................................................................................................................... 46 Automatic Delete of Cleared Events.................................................................................. 47 Enable or Disable Event Notifications ............................................................................... 47 Event Fuse Handling ......................................................................................................... 50
Configuring Proxy Connections to Power IQ ............................................................................... 50 Configuring PDU Display Settings - View PDUs by IP or Name ................................................. 51 Customizing Your View of PDUs, Devices, and Events .............................................................. 51
Chapter 5 Dashboard 53
Viewing the Dashboard ................................................................................................................ 53 Sharing a Dashboard ................................................................................................................... 54 Setting the Dashboard Layout ..................................................................................................... 55 Configuring Widgets ..................................................................................................................... 56
Active Events Widget ......................................................................................................... 56 Device Chart Widget .......................................................................................................... 57 PDU Health Chart Widget .................................................................................................. 57 Capacity Forecast Chart Widget ........................................................................................ 59 Capacity Gauge Widget ..................................................................................................... 60 Image Widget ..................................................................................................................... 61 Report Heading Widget ..................................................................................................... 62 HTML Widget ..................................................................................................................... 63 Cooling Chart Widget ........................................................................................................ 64
View Dashboards as a Slideshow ............................................................................................... 69 View Dashboard in Full Screen Mode ......................................................................................... 70
Chapter 6 User Configuration - Authorization and Authentication 71
Change the Administrator Password ........................................................................................... 71 Adding, Editing, and Deleting Users ............................................................................................ 71
Add a User ......................................................................................................................... 71 Edit a User ......................................................................................................................... 72 Delete a User ..................................................................................................................... 72 Assign Roles to a User ...................................................................................................... 73

Contents
v
Remove Roles from a User ............................................................................................... 73 Adding, Editing, and Deleting User Groups ................................................................................. 73
Default User Groups .......................................................................................................... 73 Add a User Group .............................................................................................................. 74 Edit a User Group Name ................................................................................................... 74 Delete a User Group .......................................................................................................... 74 Assign Roles to a User Group ........................................................................................... 75 Remove Roles from a User Group .................................................................................... 75
Assign Roles within a Data Center .............................................................................................. 76 Roles and User Access Levels .................................................................................................... 77
Power IQ Role Definitions ................................................................................................. 77 Roles Information for Upgraded Systems ......................................................................... 78
Configuring LDAP Authentication ................................................................................................ 78 Gathering LDAP Configuration Settings ............................................................................ 79 Configuring LDAP Authentication Settings ........................................................................ 79 Disabling LDAP Authentication .......................................................................................... 81
Chapter 7 Security and Encryption 82
Installing an HTTPS Certificate .................................................................................................... 82 Restricting Web and Shell Access Based on IP Address ............................................................ 84 Configuring Password Requirements .......................................................................................... 85 Encrypting Data Backup Files ...................................................................................................... 85 Enabling Single Sign On for Raritan PDUs ................................................................................. 86 Enabling the WS API ................................................................................................................... 87 Enabling the Web API User Account ........................................................................................... 87 Change Web User Session Timeouts .......................................................................................... 87 Configuring the Authorization Warning Message ........................................................................ 88
Chapter 8 Data Management 89
Configuring Data Rollup Retention .............................................................................................. 89 Data Backups ............................................................................................................................... 90
Downloading System Configuration Backup Files ............................................................. 90 Create a System Configuration Backup File ..................................................................... 90 Restoring System Configuration Backups ......................................................................... 91
Configuring Remote Storage of Archive Files ............................................................................. 91 Configuring Remote Access to Database .................................................................................... 92 Enterprise Relationships .............................................................................................................. 92
Overview of the Enterprise Model ..................................................................................... 92 Importing Object Mappings ................................................................................................ 95 Exporting Object Mappings as CSV Data ....................................................................... 101 Clearing Object Mappings ............................................................................................... 101 Viewing the Enterprise Model .......................................................................................... 101 Viewing Enterprise Relationship Summaries .................................................................. 102 Configuring Custom Fields .............................................................................................. 105

Contents
vi
Chapter 9 Smart Rack View and Smart PDU View 106
Opening the Smart Views .......................................................................................................... 107 Configure PDU Details - Smart PDU View ................................................................................ 107 Configure Rack Details - Smart Rack View ............................................................................... 108 Energy and Environmental Trends - Smart Views ..................................................................... 108
Energy and Environmental Trends - Details .................................................................... 109 Energy Trends - Details ................................................................................................... 110
IT Devices - Smart Rack View ................................................................................................... 111 PDU Elements - Smart Views ................................................................................................. 112 Readings - Smart PDU View ..................................................................................................... 113 Details - Smart PDU View .......................................................................................................... 114 Event Listing - Smart PDU View ................................................................................................ 115
Chapter 10 Viewing PDUs 116
Viewing a PDU ........................................................................................................................... 116 Specify Inlet, Outlet, or Outside Air Location for Environmental Sensors ....................... 117 Naming Environmental Sensors ...................................................................................... 117 Viewing Sensor Information ............................................................................................. 118 Asset Strips ...................................................................................................................... 118
PDU Status ................................................................................................................................ 119 Configure the Number of PDUs in the List ................................................................................ 120 Filter the PDUs List .................................................................................................................... 121 Export the PDUs List to CSV ..................................................................................................... 122 Launch the Web Interface for a Dominion PX PDU ................................................................... 123 Searching for PDUs ................................................................................................................... 123
Chapter 11 Sensors Connected to PX1 and PX2 PDUs 124
Hardware Configuration for Sensors on PX1 and PX2 .............................................................. 124 Connecting Environmental Sensors to a PX1 ................................................................. 124 Connecting Environmental Sensors to a PX2 ................................................................. 126 About Contact Closure Sensors ...................................................................................... 128 Configuring a Contact Closure Sensor ............................................................................ 128 Contact Closure Sensor LEDs ......................................................................................... 129
Software Configuration for Sensors on PX1 and PX2 ............................................................... 130 Configuration for PX1 Environmental Sensors ................................................................ 130 Configuration for PX2 Environmental Sensors ................................................................ 138
Sensor Measurement Accuracy ................................................................................................. 144 States of Managed Sensors ...................................................................................................... 145
"unavailable" State........................................................................................................... 145 "normal" State .................................................................................................................. 146 "alarmed" State ................................................................................................................ 146 "ok" State ......................................................................................................................... 146 "below lower critical" State .............................................................................................. 146 "below lower non-critical" State ....................................................................................... 147 "above upper non-critical" State ...................................................................................... 147 "above upper critical" State ............................................................................................. 147

Contents
vii
Chapter 12 Power Control 148
Enable or Disable Power Control ............................................................................................... 148 Configure Power Control Options .............................................................................................. 148 Control Power to Outlets in a Data Center ................................................................................ 149 Control Power to Devices in a Group ........................................................................................ 150 Scheduling Power Control ......................................................................................................... 150
View Power Control Task Results ................................................................................... 151 Add a Power Control Task ............................................................................................... 151
Configuring Graceful Shutdown ................................................................................................. 152 Add Shutdown Commands .............................................................................................. 153 Enable Graceful Shutdown for an IT Device ................................................................... 154 Disable Graceful Shutdown for an IT Device .................................................................. 155 View the IT Devices Using a Shutdown Command ......................................................... 155 Remove a Shutdown Command from Power IQ ............................................................. 155
Preparing Servers for Graceful Shutdown ................................................................................. 156 Open Ports for Graceful Shutdown ................................................................................. 156 Basic Configuration for SSH Shutdown ........................................................................... 156 Basic Configuration for Windows Remote Shutdown ...................................................... 158
Create Device Groups for Power Control .................................................................................. 158 Create a Device Group .................................................................................................... 158 Add Devices to an Existing Device Group ....................................................................... 159 Add Devices to a Group in the Data Centers Tab ........................................................... 159 Configure the Power Control Settings for a Device Group .............................................. 159 Remove a Device from a Group ...................................................................................... 160
Set a Different Power On Delay for a Device ............................................................................ 160
Chapter 13 Maintenance Tasks 161
Downloading Daily Sensor Readings ........................................................................................ 161 Upgrading Power IQ Firmware .................................................................................................. 162 Shutting Down and Restarting Power IQ ................................................................................... 162 Accessing Audit Logs ................................................................................................................ 163
Chapter 14 Appliance Administration 164
Allow HTML Widgets on Dashboard .......................................................................................... 164 Display a Logo on Every Page .................................................................................................. 164 Configuring the System Clock ................................................................................................... 165
Configuring NTP Server Settings .................................................................................... 165 Configuring the System Clock Manually .......................................................................... 166
Dynamic Plugins ........................................................................................................................ 166 Limitations of Dynamic Plugins ........................................................................................ 166 Requirements for Dynamic Plugins ................................................................................. 166 Find the MIB File.............................................................................................................. 167 Identify the OIDs for Mapping .......................................................................................... 167 Add a Dynamic Plugin ..................................................................................................... 169 Check PDUs Added with Dynamic Plugins ..................................................................... 174 View PDUs Using a Dynamic Plugin ............................................................................... 174

Contents
viii
Set Fahrenheit or Celsius Temperature..................................................................................... 175
Chapter 15 Analytics 176
What are Power IQ Analytics? ................................................................................................... 177 Adding Reports to the Analytics Page ....................................................................................... 178 Sharing Reports on the Analytics Page ..................................................................................... 179 Creating a Chart ......................................................................................................................... 180 Configuring Charts ..................................................................................................................... 180
Device Chart Settings ...................................................................................................... 180 PDU Health Chart Settings .............................................................................................. 185 Overall PDU Health ......................................................................................................... 186
Exporting Charts ........................................................................................................................ 186
Chapter 16 Upgrading Dominion PX PDUs 187
Plan a New Upgrade .................................................................................................................. 187 View Saved Upgrade Plans ....................................................................................................... 188 Edit a Saved Upgrade Plan ....................................................................................................... 189 Execute a Saved Upgrade Plan ................................................................................................. 189
Upgrade Timing ............................................................................................................... 189 View Status of Upgrade Plans in Progress ................................................................................ 190 View Completed Upgrade Plans ................................................................................................ 190 Manage Firmware Versions ....................................................................................................... 191
Chapter 17 Support and Licensing 192
Support Connections ................................................................................................................. 192 Prerequisites for Support Connections ............................................................................ 192 Create a Support Connection .......................................................................................... 192 Stop a Support Connection ............................................................................................. 193 Save Support Logs .......................................................................................................... 193
Licensing .................................................................................................................................... 193 View Licenses .................................................................................................................. 193 Add a License File ........................................................................................................... 194
Appendix A ODBC Access 196
Configuring ODBC Access to Power IQ .................................................................................... 196 ODBC Client Configuration ........................................................................................................ 197 Timezone Configuration for ODBC Data ................................................................................... 197 Advanced Reporting with Database and Reporting Programs .................................................. 197
Install and Configure a PostgreSQL Driver ..................................................................... 198 Link Database Tables in Microsoft® Access® ................................................................ 198
Power IQ ODBC Schema .......................................................................................................... 200 PDUs ............................................................................................................................... 200 PDUOutlets ...................................................................................................................... 201 PDUCircuitBreakers ........................................................................................................ 202 PDUReadings .................................................................................................................. 202

Contents
ix
PDUOutletReadings ........................................................................................................ 203 PDULineReadings ........................................................................................................... 204 PDUCircuitBreakersReadings ......................................................................................... 204 PDUSensorReadings ...................................................................................................... 205 PDUOutletReadingsRollup .............................................................................................. 206 PDUReadingsRollup ........................................................................................................ 207 PDULineReadingsRollup ................................................................................................. 208 PDUCircuitBreakerReadingsRollup ................................................................................. 209 PDUSensorReadingsRollup ............................................................................................ 210 PDUSensors .................................................................................................................... 210 DataCenters ..................................................................................................................... 211 Floors ............................................................................................................................... 212 Rooms ............................................................................................................................. 212 Aisles ............................................................................................................................... 213 Rows ................................................................................................................................ 213 Racks ............................................................................................................................... 213 EDMNodes ...................................................................................................................... 214 AssetStrips ....................................................................................................................... 215 RackUnits ........................................................................................................................ 216
Sample ODBC Queries .............................................................................................................. 216 Obtain Active Power and Apparent Power Data for a PDU With IP Address 66.214.208.92 .................................................................................................................. 217 Obtain Active Power and Apparent Power for an IT Device With Name “DBServer’’ ..... 217 Report Maximum Power Reading for Each IT Device Since Added to Power IQ ........... 218 Finding All Entities in a Rack ........................................................................................... 220
Appendix B Frequently Asked Questions 222
Security Questions ..................................................................................................................... 222 PDU Questions .......................................................................................................................... 222
Index 223

x
The following sections have changed or information has been added to the Power IQ User Guide based on enhancements and changes to the software and/or user documentation.
Adding PDUs to Power IQ Management (on page 11)
Editing PDUs under Power IQ Management (on page 13)
Adding PDUs in Bulk with CSV Files (on page 15)
Structure of the Add PDUs CSV File (on page 16)
Adding Raritan EMX (on page 17)
Rollout Timing (on page 20)
Raritan Dominion PX Supported Events (on page 35)
Filter the Events List (on page 45)
Export the Events List to CSV (on page 46)
Configure Notification Filters (on page 48)
Sharing a Dashboard (on page 54)
Cooling Chart Widget (on page 64)
Configuring Custom Fields (on page 105)
Smart Rack View and Smart PDU View (on page 106)
Specify Inlet, Outlet, or Outside Air Location for Environmental Sensors (on page 117)
Filter the PDUs List (on page 121)
Export the PDUs List to CSV (on page 122)
Set a Different Power On Delay for a Device (on page 160)
Sharing Reports on the Analytics Page (on page 179)
Device Chart Measurements (on page 184)
Device Chart Settings (on page 180)
Upgrade Timing (on page 189)
Please see the Release Notes for a more detailed explanation of the changes applied to this version of the Power IQ.
What's New in the Power IQ Help

1
If you obtained Power IQ as a VMware application, you must install it on a VMware ESX/ESXi Server.
In This Chapter
Virtual Machine Requirements .................................................................. 1 Preparing to Install Power IQ..................................................................... 1 Creating the Power IQ Virtual Machine ..................................................... 2 Loading Power IQ onto the Virtual Machine .............................................. 2
Virtual Machine Requirements
Minimum Configuration (Number of PDUs)
RAM (GB)
Datastore (GB)
CPU (GHz)
OS VMware
1-49 2 80-160 1 Linux - Other (32-Bit)
ESX/ESXi
50-199 3 80-160 2 Linux - Other (32-Bit)
ESX/ESXi
200 or more 4 80-160 4 Linux - Other (32-Bit)
ESX/ESXi
Preparing to Install Power IQ
Verify that you have the DVD containing the Power IQ .ISO file.
Verify the datastore has 80GB free for a new virtual machine.
If you plan to install the virtual machine from the datastore, verify that there is also 1.2GB free for the installation ISO file, and copy the file from the DVD to the datastore.
If you plan to install from a remote server, copy the ISO file from the DVD to the server.
Note: The instructions in this guide refer to the vSphere client, which is compatible with ESX/ESXi 4.0 and higher.
Chapter 1 Installing the Power IQ Application

Chapter 1: Installing the Power IQ Application
2
Creating the Power IQ Virtual Machine
1. Connect to the VMware server using vSphere client. Log in as a user that has permission to create, start, and stop virtual machines.
2. In the Summary tab, click New Virtual Machine in the Command box.
3. Choose Custom. Click Next.
4. Enter a name for the virtual machine. Click Next.
5. Choose a Datastore with at least 80GB of free space available. Click Next.
6. You may need to select the Virtual Machine Version, depending on your host. Select the version. Click Next.
7. Select Linux for the Guest Operating System, then select Other Linux (32-bit) from the Version drop-down. Click Next.
8. Set the number of virtual processors to 1. Click Next.
9. Adjust the amount of memory allocated for the virtual machine, using the specifications on the DVD box as a guideline for your license size. Click Next.
10. Set the number of NICs to one or two. If there are two NICs, one can be used for external access to the web interface and the other can be used as a private LAN for communication with the PDUs and other data center devices.
In either case, make sure Connect at Power On is checked, and leave all other settings at default. Click Next.
11. Select LSI Logic for the SCSI Controller. Click Next.
12. Select "Create a new virtual disk." Click Next.
13. Set the Disk Capacity between 80GB and 160GB. Select a disk provisioning option. Select "Store with the virtual machine". Click Next.
14. Leave all advanced options at default. Click Next.
15. Select the "Edit virtual machine settings before completion" checkbox, then click Continue. Select New CD/DVD, then select a Device Type option to map the CD/DVD drive on the virtual machine. Click Finish to save the drive and return to the main dialog.
16. Click Finish to create the virtual machine.
Loading Power IQ onto the Virtual Machine
1. From the tree in the left pane, select the Power IQ Virtual Machine.

Chapter 1: Installing the Power IQ Application
3
2. Select the Console tab. Click to power up the virtual machine. After a few moments, the Power IQ kickstart page opens.
3. Type 2 for a VMware installation and press Enter to begin installation. Installation takes 20 minutes. When it completes, press Enter to reboot the Power IQ virtual machine.
4. The virtual machine reboots and displays a console prompt.

4
After installing Power IQ™, you must configure the system for access over the network.
Note: Hardware versions only: Connect a keyboard, mouse, and monitor to the Power IQ device.
In This Chapter
Configuring Power IQ for Access over Network ....................................... 4 Open Port Requirements .......................................................................... 5
Configuring Power IQ for Access over Network
To configure Power IQ for access over network:
1. Power on Power IQ.
2. When prompted to log in, use the username config and the password raritan. The Power IQ configuration page opens.
3. Select Networking Setup, then select Setup LAN 1 to configure the primary Ethernet port.
4. Press the Space bar to select Enable this LAN Port.
5. To manually assign the network settings to Power IQ, leave Use DHCP deselected. Type the IP address, network masks, and gateway into the appropriate fields.
6. Select Accept to reset the network interface with the new values.
7. If you are using a second network interface, select Setup LAN 2 from the Network Configuration menu and configure the secondary Ethernet port in the same manner as the first. Optional.
Chapter 2 Initial Configuration of Power IQ

Chapter 2: Initial Configuration of Power IQ
5
8. Select Ping Network Test to ensure that Power IQ can communicate over the network. Optional.
9. To disable SSH remote access to Power IQ, select System Services. Then deselect Enable SSH. By default, the config account has access to Power IQ. SSH is re-enabled if a support connection is created. Optional.
10. Select Exit from the main menu. You can now access Power IQ from any client on the network.
Open Port Requirements
You must ensure that certain ports are open for Power IQ to work.
See Support Connections (on page 192) for details about open port requirements for support connections to Raritan Technical Support.
Ports Open Between Power IQ and PDUs
Port 161 (UDP): Required for all PDUs
Port 162 (UDP): Required for Dominion PX PDU traps to be sent to Power IQ
Port 443 (TCP): Required for Dominion PX PDU firmware upgrades performed through Power IQ
Port 623 (UDP): Required for Dominion PX PDUs. Standard IPMI communication port.
Ports Open Between Clients and Power IQ
Port 443 (TCP): allows the web interface
Port 5432 (TCP): allows ODBC access. Optional.
Port 514 (UDP) outbound from Power IQ: allows Power IQ to send syslog messages to a different server. Optional.

6
1. Connect to Power IQ using a web browser on any machine on the network.
2. In the browser's address bar, enter the IP address or hostname assigned to Power IQ. For example: https://192.168.1.10
Answer yes to any security alerts and accept all certificates. If this is your first time connecting to Power IQ, you must upload your license and accept the End User Licensing Agreement before logging in. If this is not your first time connecting to Power IQ, skip to step 4.
Licenses are .LIC files. Repeat this step to add incremental licenses if needed.
Note: Your license file can be retrieved from the Raritan web site after you have activated your registration. To activate your registration, click the link in the "Thank you for registering" email from Raritan and create your user account. Once you create your account, look for a "Your Raritan software license key is available" email containing a link to your license file download page.
3. Log in with the default username admin and password raritan.
The Power IQ dashboard opens.
Chapter 3 Connecting to Power IQ

7
In This Chapter
Configuring Logging through Syslog ......................................................... 7 Configuring Polling Intervals ...................................................................... 7 Adding PDUs to Power IQ Management ................................................. 11 Bulk Configuration of Dominion PX PDUs ............................................... 18 PDU Outlet Naming and Setting System Attributes ................................ 22 Configuring Event Management .............................................................. 25 Configuring Proxy Connections to Power IQ ........................................... 50 Configuring PDU Display Settings - View PDUs by IP or Name ............. 51 Customizing Your View of PDUs, Devices, and Events .......................... 51
Configuring Logging through Syslog
External Syslog servers can be used to record events occurring on Power IQ. Using a Syslog provides a separate external log of events.
All servers listed under Current Syslog Destinations record events on Power IQ. Recorded events include new users, configuration changes, and failed login attempts.
To configure logging through Syslog:
1. In the Settings tab, click Server Settings in the Appliance Administration section.
2. In the Syslog Destinations box, click Add, then type the IP address of a Syslog server in the "Syslog server address" field. This must be in the form of a numeric address.
3. Click OK. The server appears on the list of Current Syslog Destinations.
To stop a syslog server from recording events:
Select the checkbox next to the server you want to remove then click Remove.
Configuring Polling Intervals
At each polling interval Power IQ collects data from PDUs under its management.
To configure the polling interval:
1. In the Settings tab, click Power IQ Settings in the Appliance Administration section.
Chapter 4 Additional Configuration Tasks

Chapter 4: Additional Configuration Tasks
8
2. In the Polling Settings box, select a time period from the "Polling interval" drop-down list. The time period indicates how much time passes before Power IQ starts a new polling cycle
3. Click Save Poller Settings.
Note: When managing a large number of power distribution units you may need to configure a longer time period for the polling interval. Setting a longer time period helps ensure that all PDUs are polled within a given cycle. A warning message appears if Power IQ is unable to poll all PDUs within the configured time period.
Recommended Polling Intervals
The optimal polling interval depends on your business needs, the number of PDUs you have deployed, and their types. Outlet metered PDUs are a larger system load than unit-level metered PDUs.
Start with a longer polling interval, such as 15 minutes, to ensure system operation. Gradually shorten the polling interval as business needs require.
For larger deployments, you can generally allow 5 minutes per 500 outlet metered PDUs or 5 minutes per 1,600 unit-level metered PDUs.
See Configuring Polling Intervals (on page 7) for details on changing these settings.
Example without buffered data retrieval:
1,000 outlet metered PDUs
10 minute polling interval
Example with buffered data retrieval:
1,000 outlet metered PDUs
Buffered data retrieval, which is recommended for Raritan PDUs
10 minute sample rate
30 minute polling interval

Chapter 4: Additional Configuration Tasks
9
Buffered Data Retrieval
Dominion PX PDUs version 1.2.5 and higher have the ability to temporarily buffer power measurements. This allows Power IQ to receive more data with less frequent polling. Enabling buffered data retrieval instructs Power IQ to retrieve these buffered measurements instead of collecting a single point of data at the time of polling. This results in increased efficiency when gathering data from Dominion PX PDUs.
See Enabling Buffered Data Retrieval from Dominion PX 1.2.5 or Higher (on page 10) for instruction on enabling the feature.
Enabling this feature creates gaps in graphed data since Power IQ now collects Dominion PX data in batches instead of incrementally.
You must set a Sample Interval when using buffered data retrieval. The polling interval controls how often Power IQ requests buffered data from Dominion PX PDUs, the sample interval controls how granular the buffered data is.
For example: With a polling interval of 1 hour, and a sample interval of 1 minute, Dominion PX PDUs under Power IQ management collect measurements each minute and store the data in the Dominion PX's data buffer. Every hour, Power IQ then retrieves the data buffer with the last hour's measurements from each Dominion PX.
Shorter sample intervals cause Dominion PX PDUs to fill their buffers more quickly. As a result, Power IQ may limit the polling interval to prevent data loss due to filled buffers.
When buffered data retrieval is in use, Power IQ polls other PDUs that do not support this feature at the Sample Interval rate. This helps maintain a consistent granularity of measurements across all readings.
The Buffered Data Retrieval feature may consume the space available for data storage rapidly since it allows Power IQ to retrieve a great deal of data at once.
Note: If you enable Buffered Data Retrieval, Raritan strongly suggests enabling NTP and configuring Power IQ and your Dominion PX PDUs to use the same NTP servers. This ensures that all recorded data is in sync, whether generated by Power IQ or Dominion PX.
Note: To configure Dominion PX sampling rates, Power IQ must have SNMP write access to those PDUs. First make sure the Dominion PX SNMP agents are enabled. Then ensure that they have been added to Power IQ management using an SNMP community string that has write access.

Chapter 4: Additional Configuration Tasks
10
Enabling Buffered Data Retrieval from Dominion PX 1.2.5 or Higher
Note: All Power IQ's using buffered data retrieval that are polling the same PDU must use the same Sample Interval setting to prevent each instance of Power IQ from attempting to change the sample interval to its own setting.
See Buffered Data Retrieval (on page 9) for more details.
To retrieve buffered data from Dominion PX 1.2.5 or higher:
Make sure that Dominion PX PDUs have been added to Power IQ with a Write Community String, or buffered data retrieval will not work. See Editing PDUs under Power IQ Management (on page 13) for details on editing PDU credentials.
1. In the Settings tab, click Power IQ Settings.
2. In the Polling Settings section, select the "Enable buffered data retrieval on Raritan PDUs" checkbox.
3. Select a sample period from the Sample Interval drop-down list. This configures the sample interval that Dominion PX PDUs use to buffer power measurements.
For example: If 1 minute is selected, every minute, Dominion PX PDUs takes a power measurement and stores it in its internal buffer for retrieval.
Note: The polling interval and sample interval should not be set to the same time period. Set the polling interval to a longer time period than the sample interval. For example: 30 minute polling interval with a 10 minute sample interval. See Configuring Polling Intervals (on page 7).
4. Click Save Poller Settings.
External Sensor Data from Dominion PX
Dominion PX model PDUs do not support buffered data for external sensors. External sensor data is not recorded at the sample interval when Buffered Data Retrieval is enabled. The external sensor data is recorded at the polling interval.
See Buffered Data Retrieval (on page 9).
Setting the Default SNMP Version for PDUs
To set the default SNMP version for PDUs:
1. In the Settings tab, click Power IQ Settings in the Appliance Administration section.

Chapter 4: Additional Configuration Tasks
11
2. In the Polling Settings box, select 1/2c or 3 as the default SNMP version for new PDUs added to Power IQ.
3. Click Save Poller Settings.
You can change the default value when you add the PDU.
Setting Default Estimated Voltages
Power IQ can estimate Active Power for PDUs that do not directly provide Active Power measurements. When voltage is not available from the PDU, you can enter a default estimated voltage value for each type of PDU.
To set the default estimated voltages:
1. In the Settings tab, clickPower IQ Settings.
2. In the Polling Settings box, enter a default estimated voltage for single phase PDUs and a default estimated inlet and outlet voltage for three phase PDUs. Optional.
3. Click Save Poller Settings.
You can override the default value for any PDU in the PDU Details page. See Configure Estimated Voltages (on page 15).
Adding PDUs to Power IQ Management
Once Power IQ is configured, add Dominion PX or other PDUs to its management. Power IQ can then gather data from these PDUs.
You can also add PDUs to Power IQ by uploading a CSV file containing the information. See Adding PDUs in Bulk with CSV Files (on page 15) in the Power IQ User Guide.
Use this procedure to add a Raritan EMX to Power IQ.
To add PDUs to Power IQ management:
1. In the PDUs tab, click Add.
2. Enter the IP address of the PDU.
3. If the PDU is in a daisy-chained configuration or console server configuration, enter the PDU's position number in the chain or serial port number in the Proxy Index field.
Note: If the PDU is not in this type of configuration, leave the Proxy Index field blank.
4. Enter an asset tag number or other asset management code in the External Key field. Optional.
5. Enter data in Custom Field 1 and Custom Field 2. Optional. The labels may have been changed in Power IQ to identify these fields.

Chapter 4: Additional Configuration Tasks
12
6. If the PDU is a Dominion PX, enter a valid Username and Password for the PDU in the Dominion PX Credentials section. Re-enter the password in the Password Confirm field.
7. Select the SNMP Version.
For SNMP version 1/2c PDUs, enter an SNMP Community String that has at least READ permissions to this PDU. This enables polling the PDU for data. Enter an SNMP community string that has both READ and WRITE permissions to the PDU to enable power control, outlet renaming, and buffered data retrieval.
For SNMP version 3 PDUs, enter the Username and select an Authorization Level. The authorization levels are:
noAuthNoPriv - No Authentication Passkey, No Encoding Passkey
authNoPriv - Authentication Passkey, No Encoding Passkey
authPriv - Authentication Passkey, Encoding Passkey
a. Depending on the Authorization Level selected, you must enter additional credentials for Authorization and Privacy.
b. Authorization Protocol: Select MD5 or SHA.
c. Enter the PDU's Authorization Passkey, then re-enter the passkey in the Authorization Passkey Confirm field.
d. Privacy Protocol: Select DES or AES.
e. Enter the PDU's Privacy Passkey, then re-enter the passkey in the Privacy Passkey Confirm field.
Note: You must enable the SNMP agent on all PDUs added to Power IQ.
8. Select "Validate and wait for discovery to complete before proceeding" to check credentials and view the discovery process status as you add this PDU. Optional. See Validating PDU Credentials (on page 13) in the Power IQ User Guide.
9. Click Add.
Note: PDU discovery is complete once the PDU model type is determined. SNMP fields such as contact or location values are not determined until this device is polled for the first time.
Once added, the PDU appears in the PDU list. Power IQ begins polling the PDU for sensor data. You can configure how often Power IQ polls PDU. See Configuring Polling Intervals (on page 7) in the Power IQ User Guide.

Chapter 4: Additional Configuration Tasks
13
Discovery Progress Status
Viewing the discovery process displays a status result for each PDU. See PDU Status (on page 119).
Validating PDU Credentials
When adding PDUs to Power IQ individually, you can specify whether the admin credentials are validated.
Check the "Validate and wait for discovery to complete before proceeding" checkbox on the Add a New PDU page. See Adding PDUs to Power IQ Management (on page 11) for details on adding PDUs.
When you specify validation, the PDU will not be added if the credentials are incorrect. If you opt not to validate, all PDUs will be added, and those added with incorrect credentials will trigger an event called PDUCredentialsInvalid.
When adding PDUs to Power IQ with a CSV file, the admin credentials are not validated before the PDU is added. When credentials are found to be incorrect, an event is logged.
Power IQ can poll PDUs without the correct credentials. You cannot upgrade PDUs or use bulk configuration without the correct credentials.
Editing PDUs under Power IQ Management
Editing a PDU allows you to reconfigure the SNMP community string for a PDU, or change the username and password used to access that PDU.
You cannot edit IP address, proxy index or name. If these values have changed, delete the PDU and re-add it.
To edit PDUs under Power IQ management:
1. In the PDUs tab, click a PDU link to open the PDU Details.
2. Choose Actions > Edit.
3. Enter an asset tag number or other asset management code in the External Key field. Optional.
4. Enter data in Custom Field 1 and Custom Field 2. Optional. The labels may have been changed in Power IQ to identify these fields.
5. Select the SNMP Version. Then, use the fields that display to enter the credentials. To delete previous credentials for either SNMP version, select the "Delete SNMP privacy credentials" checkbox.

Chapter 4: Additional Configuration Tasks
14
For SNMP version 1/2c PDUs, enter an SNMP Community String that has at least READ permissions to this PDU. Use an SNMP community string that has both READ and WRITE permissions to the PDU to enable power control, outlet renaming, and buffered data retrieval. Re-enter the string in the Community String Confirm field.
For SNMP version 3 PDUs, enter the Username and select an Authorization Level. The authorization levels are:
noAuthNoPriv - No Authentication Passkey, No Encoding Passkey
authNoPriv - Authentication Passkey, No Encoding Passkey
authPriv - Authentication Passkey, Encoding Passkey
a. Depending on the Authorization Level selected, you must enter additional credentials for Authorization and Privacy.
b. Authorization Protocol: Select MD5 or SHA.
c. Enter the PDU's Authorization Passkey, then re-enter the passkey in the Authorization Passkey Confirm field.
d. Privacy Protocol: Select DES or AES.
e. Enter the PDU's Privacy Passkey, then re-enter the passkey in the Privacy Passkey Confirm field.
6. PDU Phase:
When Power IQ can detect the phase, the Automatic option is selected, and the phase displays. For example, "Automatic (determined to be single phase)."
When a PDU does not report phase, the Ignored option is selected. You can keep this setting to ignore phase, or set the phase manually.
To set the phase manually, either if it cannot be determined automatically, or is incorrect, select the "Manually set to single phase" or "Manually set to three phase" option.
7. If the PDU is a Dominion PX, enter a valid Username and Password for the PDU in the Dominion PX Credentials section. Re-enter the password in the Password Confirm field. Leave the fields blank to keep using the password already configured. If you want to use a blank password, select the "Delete PX credentials checkbox."
8. Click Save.

Chapter 4: Additional Configuration Tasks
15
Configure Estimated Voltages
Power IQ can estimate Active Power for PDUs that do not directly provide Active Power measurements. When voltage is not available from the PDU, you can enter an estimated voltage value for the PDU. This value will override the default value configured.
You can change the default inlet and outlet voltage for all new PDUs added to Power IQ. See Setting Default Estimated Voltages (on page 11).
To configure estimated voltages:
1. In the PDUs tab, select a PDU then click the Edit this PDU icon in the Actions column.
2. For three-phase PDUs, enter the voltages in the Manually Configured Inlet Voltage and Manually Configured Outlet Voltage fields.
3. For single-phase PDUs, enter the inlet voltage in the Manually Configured Voltage field.
If no value is entered, the default value is used.
4. Click Save.
Adding PDUs in Bulk with CSV Files
You can add PDUs in bulk by uploading a CSV file.
Power IQ does not check the credentials of the PDU while adding it during a CSV import. If the credentials are incorrect, an event called PDUCredentialsInvalid is logged.
Importing more than 100 PDUs at a time causes polling to suspend while the import is in progress.
You can download a step-by-step CSV template file in the Support section of Raritan's website, under Firmware and Documentation. See http://www.raritan.com/support/power-iq/.
To add PDUs in bulk with CSV files:
1. In the PDUs tab, choose Activities > Import PDUs from CSV file. The Import PDUs page opens.
2. Click Browse and select the CSV file.
3. Select "View progress of the import as each PDU is discovered" to view the discovery progress and the resulting status. Optional.
4. Click Begin Import.

Chapter 4: Additional Configuration Tasks
16
Structure of the Add PDUs CSV File
The structure of the CSV file is as follows:
One line per PDU to import.
No header row.
Each line has only the following value columns, in the following order:
1. IP address
2. Proxy index: If the PDU is in a daisy-chained configuration or console server configuration, enter the PDU's position number in the chain or serial port number. See Proxy Index Details (on page 17).
Leave blank if the PDU is not in this type of configuration.
3. Dominion PX username
4. Dominion PX password
Leave the Dominion PX username and Dominion PX password fields blank for other PDUs.
5. SNMP Community String
Leave the SNMP Community String blank if it does not apply for a PDU.
6. SNMPv3 enabled: true or false.
Leave columns 7-12 blank if SNMPv3 is set to false.
7. SNMPv3 username
8. SNMPv3 authorization level: noAuthNoPriv, authNoPriv or authPriv.
9. Authorization protocol: MD5 or SHA.
10. Authorization passkey
11. Privacy protocol: DES or AES
12. Privacy passkey
13. External key
14. Custom field 1
15. Custom field 2

Chapter 4: Additional Configuration Tasks
17
For example:
192.168.43.184,,admin,raritan,private
192.168.44.101,,,,PDUread
The first line in this example represents a Dominion PX PDU. The second line represents a PDU from another vendor. Uploading this CSV file would instruct Power IQ to add two PDUs to management. The first PDU is located at 192.168.43.184, and uses the login/password combination admin/raritan for authentication. Its SNMP Community String is set to private. The second PDU is located at 192.168.44.101 and does not use a user name and password for authentication. Its SNMP Community String is set to PDUread.
Proxy Index Details
For stand-alone PDUs, the proxy index field should be left blank.
For PDUs acting in a daisy-chain, or for PDUs that are being proxied through another PDU, the proxy index field should contain the number of the PDU's position.
For daisy chained systems, the proxy index field should be set to the PDU's position within the chain. The head-end or master system should have a proxy index value of 1. The second system in the chain would have a proxy address of 2 and so on.
For element managed systems, such as PDUs behind a serial proxy, the proxy index field should contain the serial port number to which the PDU is attached on the management console.
Adding MRV PDUs
For MRV PDUs, make sure you have configured the get and set clients with the same community string, and use that community string when adding the PDU to Power IQ.
Adding Raritan EMX
You can add a Raritan EMX to Power IQ the same way you add a PDU. All information in this help that refers to PDUs can be applied to EMX, with a few exceptions.
Power IQ collects and displays sensor and asset strip data from a EMX in the same way as other PDUs with attached sensors or asset strips. EMX does not have any outlets.
You cannot upgrade or use bulk configuration for EMX through Power IQ.
See Adding PDUs to Power IQ Management (on page 11)

Chapter 4: Additional Configuration Tasks
18
Bulk Configuration of Dominion PX PDUs
By leveraging Dominion PX's ability to create a backup of its configuration, Power IQ can configure additional PX PDUs of the same model type. This is helpful for large scale deployments.
This applies to Dominion PX version 1.2 and later, only.
Requirements for Bulk Configuration
Prerequisites for bulk configuration:
Each PX must be of the same model type.
Each PX must have the same firmware version (1.2 or later).
Each PX must be configured with an IP address and be under Power IQ management.
A configuration backup file from a configured PX.
Plan a New Rollout
To plan a new rollout:
1. In the PDUs tab, choose Activities > Bulk Configuration.
2. Click "Plan a new rollout." The bulk pdu configuration rollout planning wizard starts.
3. Enter a name for the plan and click Continue.
A summary of plan options appears at the top of the page. Continue adding details of your plan at the bottom of the page, or click the links in the summary list to add details.
4. In the Choose a PDU Configuration File section, you can add a new PX backup file or select a previously uploaded file. Configuration backup files are .XML files for PX2 configurations, and do not show a file extension for PX1 configurations.
To add a new file, click the Upload a New File tab, then click Browse to select the file. Enter comments. Click Upload. The file is automatically selected for the plan.
To select a previously uploaded file, click the Available Files tab, then select a file from the list, and click Continue.
5. All PX PDUs available for the rollout appear in a list. Select the checkboxes for the PDUs you want to configure, then click Selected PDUs to add them to the "PDUs selected for this plan" list at the bottom of the page. Or, click All PDUs to add all available PX PDUs to the list.
To remove PDUs from the plan, click Selected PDUs or All PDUs in the bottom list. Only PDUs in the bottom list will be configured.

Chapter 4: Additional Configuration Tasks
19
6. Click Continue. Click the Plan Options link in the summary at top.
7. On the Plan Options page, edit the plan name, if needed, and set other preferences.
a. Select the "Abort on failure" checkbox if you want Power IQ to cancel all remaining configurations in the plan if a configuration failure occurs. This could help prevent a configuration problem from affecting other Dominion PX PDUs in the plan.
b. Select the "Allow simultaneous rollouts" checkbox if you want Power IQ to configure multiple Dominion PX PDUs at once. This makes batch configurations faster by allowing up to 25 configurations to run at the same time.
8. Click Continue. Review the summary of the plan. Click Add Comment if you want add notes to the plan. Click Add or Remove PDUs if you want to edit the list of PDUs to configure.
9. Click Save. The completed plan summary page opens.
10. Click Start Rollout to execute the plan immediately. The rollout starts, and the status page displays. You can also execute the saved plan later. See Execute Saved Configuration Plans (see "Execute a Saved Rollout Plan" on page 20).
See View Status of Rollout Plans in Progress (on page 20) for details on checking rollouts in progress.
See View Completed Rollout Plans (on page 21) for details on checking completed rollouts.
View Saved Rollout Plans
View saved rollout plans to verify and edit their details before executing a plan.
To view saved rollout plans:
1. In the PDUs tab, choose Activities > Bulk Configuration.
2. Click "View saved plans." All plans display in a list.
3. Click the Plan name link to view the details and edit if needed.
Edit a Saved Rollout Plan
Saved rollout plans can be edited to change details, add or remove PDUs, or change the configuration file.
To edit a saved rollout plan:
1. In the PDUs tab, choose Activities > View Status of Current Rollouts.
2. All plans display in a list. Click the Plan name's link to view the details.

Chapter 4: Additional Configuration Tasks
20
3. Click the blue links in the plan summary to edit the plan. Or, scroll down to click Edit and use the wizard to edit.
See Plan a New Rollout (on page 18) for details of plan settings.
Execute a Saved Rollout Plan
To execute a saved configuration plan:
1. In the PDUs tab, choose Activities > Bulk Configuration.
2. Click "View saved plans." All plans display in a list.
3. Click the Plan name link for the plan you want to execute.
4. Click Start Roll Out to execute the plan.
See View Status of Rollout Plans in Progress (on page 20) for details on checking rollouts in progress.
See View Completed Rollout Plans (on page 21) for details on checking completed rollouts.
Rollout Timing
Each PX PDU configuration takes approximately 30 seconds.
If you select "Allow simultaneous rollouts" in the plan options, 25 configurations will begin simultaneously, and each batch of 25 will take approximately 30 seconds.
View Status of Rollout Plans in Progress
Rollout plans in progress have 3 possible statuses.
Init: Initializing to prepare the PDU for configuration
Login: Logging in to the PDU
Verify: Verifying the PDU is responsive after configuration is complete
To view status of upgrade plans in progress:
The status page for plans in progress displays when you execute the plan. You can return to the status page at any time, even after the plan has finished.
1. In the PDUs tab, choose Activities > Bulk Configuration.
2. Click "View saved plans." All saved plans display in a list.
3. Click the Status link for the plan you executed to view the status page.

Chapter 4: Additional Configuration Tasks
21
View Completed Rollout Plans
When a plan has been executed, you can view details of the plan status and results of each PDU included in the plan.
To view completed rollouts:
1. In the PDUs tab, choose Activities > Bulk Configuration.
2. Click "View previously completed rollouts." All completed plans display in a list.
3. Click the Plan name link to view the details.
If the plan completed successfully, a success message displays at the top of the plan details.
The list of PDUs included in the plan includes a Success or Failure message.
Click the "View detailed upgrade status messages" link for more information about each PDU.
Manage Configuration Files
You can upload different configuration files for use in rollout plans, and view previously uploaded configurations.
Configuration files are .DAT files. Configuration files are created by backing up a Dominion PX.
To view uploaded configuration files:
1. In the PDUs tab, choose Activities > Bulk Configuration.
2. Click Manage Configuration Files. The link is not available if you do not have any uploaded configuration files. The PDU Configuration Files page opens.
3. All configuration files previously uploaded appear in a list.
To delete a configuration file:
Select the checkbox for the configuration file you want to delete, then click Delete.
To upload a new configuration file:
1. Scroll down to the Upload New Configuration File section.
2. Enter the model name that the file is for in the Model Name field.
3. Click Browse to select the .DAT file.
4. Click Upload. The file is added to the list and will be available to select when creating a new rollout plan. See Plan a New Rollout (on page 18).

Chapter 4: Additional Configuration Tasks
22
PDU Outlet Naming and Setting System Attributes
Power IQ enables you to export all the current PDU Outlet and System Attribute names to a CSV file that you can edit, and then re-import new names. See Naming Outlets in Bulk with CSV Files (on page 22). Change individual names manually by clicking a field and editing. See Naming Individual Outlets (on page 22).
Raritan PDU outlet names can be up to 32 characters in length, with no character restrictions. See the manufacturer's specification for naming requirements for other brands of PDUs.
Note: PDUs must be configured in Power IQ with an SNMP community string that has write-level access to allow outlet naming.
The following PDUs have manufacturer limitations that affect renaming via SNMP: Outlet and system attribute naming is not available via SNMP for Avocent or Geist PDUs. Outlet naming via SNMP is not available for Tripp Lite PDUs. System attribute naming via SNMP is not available for Baytech PDUs. Names for Servertech PDUs cannot contain spaces.
Naming Individual Outlets
To name individual outlets:
1. In the PDUs tab, click the link for a PDU.
2. Scroll down to the Outlets list.
3. Double-click the outlet name, then enter the new name in the field.
4. Press Enter to save the name.
The names are written back to the PDU. If you connect to the PDU directly, the outlets appear there with their new names.
Naming Outlets in Bulk with CSV Files
To name outlets in bulk with CSV files:
1. In the PDUs tab, choose Activities > Outlet Naming.
2. Click Browse, then select the CSV file.
3. Click Import.
Power IQ names the outlets according to the values in the CSV file. The names are written back to the PDU. If you connect to the PDU directly, the outlets appear there with their new names.

Chapter 4: Additional Configuration Tasks
23
Setting SNMP System Attributes for PDUs
In addition to naming the outlets of PDUs, this CSV file can be used to set three SNMP system attributes. These attributes are SYS_CONTACT, SYS_NAME and SYS_LOCATION. These settings are optional values in the CSV file.
SYS_CONTACT: is used to identify a person to contact regarding the PDU. For example, the IT administrator.
SYS_NAME: is used to set the name of the PDU.
SYS_LOCATION: is used to describe where the PDU is located. For example, "Sales Rack - Server Closet 2."
Note: Setting SNMP system attributes is not available for Dominion PX versions lower than 1.3, Baytech, Eaton, Geist, Liebert, or Avocent PDUs. Leave these fields blank for those PDUs.

Chapter 4: Additional Configuration Tasks
24
Structure of the Outlet Name CSV File
The CSV file used for outlet naming and setting SNMP system attributes uses the following structure. There is one PDU per line/row.
CSV Import Templates are also available at: http://www.raritan.com/support/power-iq/
Note: The following PDUs have manufacturer limitations that affect renaming via SNMP: Outlet and system attribute naming is not available via SNMP for Avocent or Geist PDUs. Outlet naming via SNMP is not available for Tripp Lite PDUs. System attribute naming via SNMP is not available for Baytech PDUs. Names for Servertech PDUs cannot contain spaces. Setting SNMP system attributes is not available for Dominion PX versions lower than 1.3, Baytech, Eaton, Geist, Liebert, or Avocent PDUs. Leave these fields blank for those PDUs.
The first column is an IP address identifying a PDU.
The second column is the Proxy Index value. Leave this value blank if the PDU does not support or is not using this configuration. You cannot change the Proxy Index value via CSV import. See Proxy Index Details (on page 17).
The third column is the SNMP SYS_CONTACT value. Optional.
The fourth column is for the SNMP SYS_NAME value. Optional.
The fifth column is for the SNMP SYS_LOCATION value. Optional.
Each value/column following the SYS_LOCATION represents an outlet on that PDU. Outlets start at 1 and increase sequentially with each column.
These values indicate only what is changed by the naming operation:
If an IP address does not appear in the file, no naming operations occur on that PDU.
If an outlet value is blank, its name does not change.
For example:
192.168.77.102,,Michael,Test PX2,RACK1,KVMSwitch1,KVMSwitch2,,Sales FTP Server
A PDU at 192.168.77.102 would receive the system name "Test PX2". Its first outlet would be renamed to "KVMSwitch1" and its second outlet renamed to "KVMSwitch2." The third outlet would not be renamed. The fourth outlet would be renamed to "Sales FTP Server."

Chapter 4: Additional Configuration Tasks
25
Exporting Outlet Names to a CSV File
You can export the outlet names in Power IQ to a CSV file.
You can edit the file to change outlet names, then import it. See Naming Outlets in Bulk with CSV Files (on page 22).
Note: The following PDUs have manufacturer limitations that affect renaming via SNMP: Outlet and system attribute naming is not available via SNMP for Avocent or Geist PDUs. Outlet naming via SNMP is not available for Tripp Lite PDUs. System attribute naming via SNMP is not available for Baytech PDUs. Names for Servertech PDUs cannot contain spaces. Setting SNMP system attributes is not available for Dominion PX versions lower than 1.3, Baytech, Eaton, Geist, Liebert, or Avocent PDUs. Leave these fields blank for those PDUs.
To export outlet names to a CSV file:
1. In the PDUs tab, choose Activities > Outlet Naming.
2. Click the export link.
Configuring Event Management
Power IQ can receive SNMP traps from supported PDUs and display them as events.
You can also enable notifications, so that Power IQ sends an email message for specific events.
User Permissions for Event Management
You must have the Event Manager role to view the Events tab. See Assign Roles to a User (on page 73).
Prepare PDUs for Power IQ Event Management
Power IQ receives and displays supported events in the Events tab, and sends notifications if enabled.
You must configure PDUs to send the supported SNMP traps to Power IQ. SNMP v1 and SNMP v2 trap types are supported. See Supported Events (on page 26).
PDU trap names differ by vendor, so Power IQ maps the trap names to common event names to highlight the common traps across PDUs.

Chapter 4: Additional Configuration Tasks
26
Supported Events
Power IQ supports the following events from supported PDUs. See the vendor name for supported events.
APC (see "APC Supported Events" on page 26)
APC Netbotz (see "APC Netbotz Supported Events" on page 27)
Aphel (see "Aphel Supported Events" on page 28)
Avocent (see "Avocent Supported Events" on page 28)
Baytech (see "Baytech Supported Events" on page 28)
Cyberswitching (see "Cyberswitching Supported Events" on page 29)
Geist (see "Geist Supported Events" on page 30)
Geist EM (see "Geist EM Supported Events" on page 30)
Geist V3 (see "Geist V3 Supported Events" on page 31)
Hewlett Packard (see "Hewlett Packard Supported Events" on page 32)
Knurr (see "Knurr Supported Events" on page 33)
Liebert (see "Liebert Supported Events" on page 34)
MRV (see "MRV Supported Events" on page 34)
Raritan Dominion PX (see "Raritan Dominion PX Supported Events" on page 35)
Rittal (see "Rittal Supported Events" on page 41)
Servertech (see "Servertech Supported Events" on page 43)
APC Supported Events
APC Supported Events
Event description Trap name Common event name
Underload Threshold rPDULowLoad inletCurrentLowerWarning
Underload Condition Cleared rPDULowLoadCleared inletCurrentLowerWarningClear
Low Overload Threshold rPDUNearOverload inletCurrentUpperWarning
Low Overload Threshold cleared
rPDUNearOverloadCleared inletCurrentUpperWarningClear
Overload Threshold rPDUOverload inletCurrentUpperCritical
Overload Threshold cleared rPDUOverloadCleared inletCurrentUpperCriticalClear
Outlet Turned on rPDUOutletOn outletPowerOn
Outlet Turned off rPDUOutletOff outletPowerOff

Chapter 4: Additional Configuration Tasks
27
APC Supported Events
Event description Trap name Common event name
High temperature threshold violated on the probe
envHighTempThresholdViolation envTemperatureUpperCritical
High temperature threshold violation cleared on the probe
envHighTempThresholdViolationCleared
envTemperatureUpperCriticalClear
Low temperature threshold violated on the probe
envLowTempThresholdViolation envTemperatureLowerCritical
Low temperature threshold violation cleared on the probe
envLowTempThresholdViolationCleared
envTemperatureLowerCriticalClear
High humidity threshold violated on the probe
envHighHumidityThresholdViolation envHumidityUpperCritical
High humidity threshold violation cleared on the probe
envHigHumidityThresholdViolationCleared
envHumidityUpperCriticalClear
Low humidity threshold violated on the probe
envLowHumidityThresholdViolation envHumidityLowerCritical
Low humidity threshold violation cleared on the probe
envLowHumidityThresholdViolationCleared
envHumidityLowerCriticalClear
APC Netbotz Supported Events
APC Netbotz Supported Events
Event description Trap name Common event name
Temp Env Sensor High Threshold
netBotzTempTooHigh envTemperatureUpperCritical
Temp Env Sensor High Threshold Cleared
netBotzTempTooHighRTN envTemperatureUpperCriticalClear
Temp Env Sensor Low Threshold
netBotzTempTooLow envTemperatureLowerCritical
Temp Env Sensor Low Threshold Cleared
netBotzTempTooLowRTN envTemperatureLowerCriticalClear
Humidity Env Sensor High Threshold
netBotzHumidityTooHigh envHumidityUpperCritical
Humidity Env Sensor High Threshold Cleared
netBotzHumidityTooHighRTN envHumidityUpperCriticalClear
Humidity Env Sensor Low Threshold
netBotzHumidityTooLow envHumidityLowerCritical

Chapter 4: Additional Configuration Tasks
28
APC Netbotz Supported Events
Event description Trap name Common event name
Humidity Env Sensor Low Threshold Cleared
netBotzHumidityTooLowRTN envHumidityLowerCriticalClear
Aphel Supported Events
Aphel Supported Events
Event description Trap name Common event name
Inlet Current Upper Critical Threshold
ampsCT1TRAP
ampsCT8TRAP
inletCurrentUpperCritical
Avocent Supported Events
Avocent Supported Events
Event description Trap name Common event name
Outlet Turned on avctPmOutletStatusOnTrap
avctPmOutletCmdOnTrap
outletPowerOn
Outlet Turned off avctPmOutletStatusOffTrap
avctPmOutletCmdOffTrap
outletPowerOff
Inlet Current Upper Critical Threshold
avctPmPduMaxLoadHighTrap inletCurrentUpperCritical
Inlet Current Upper Critical Threshold Cleared
avctPmPduMaxLoadBackTrap inletCurrentUpperCriticalClear
Inlet Current Low Critical Threshold
avctPmPduMinLoadLowTrap inletCurrentLowerCritical
Inlet Current Low Critical Threshold Cleared
avctPmPduMaxLoadBackTrap inletCurrentLowerCriticalClear
Inlet Current Upper Warning Threshold
avctPmPduWarnLoadTrap inletCurrentUpperWarning
Inlet Current Upper Warning Threshold Cleared
avctPmPduMaxLoadBackTrap inletCurrentUpperWarningClear
Baytech Supported Events

Chapter 4: Additional Configuration Tasks
29
Baytech Supported Events
Event description Trap name Common event name
Outlet Turned on outletOn outletPowerOn
Outlet Turned off outletOff outletPowerOff
Inlet Current Upper Critical Threshold
currentThresholdViolation inletCurrentUpperCritical
Inlet Current Upper Critical Threshold Cleared
currentThresholdViolationCleared inletCurrentUpperCriticalClear
Inlet Current Low Critical Threshold
currentUnderThresholdViolation inletCurrentLowerCritical
Inlet Current Low Critical Threshold Cleared
currentUnderThresholdViolationCleared
inletCurrentLowerCriticalClear
Inlet Voltage Upper Critical Threshold
voltageOverThresholdViolation inletVoltageUpperCritical
Inlet Voltage Upper Critical Threshold Cleared
voltageOverThresholdViolationCleared
inletVoltageUpperCriticalClear
Inlet Voltage Lower Critical Threshold
voltageUnderThresholdViolation inletVoltageLowerCritical
Inlet Voltage Lower Critical Threshold Cleared
voltageUnderThresholdViolationCleared
inletVoltageLowerCriticalClear
Circuit Breaker Tripped circuitBreakerAlarm cbTripped
Circuit Breaker Recovered circuitBreakerAlarmClearTrap cbRecovered
Temp Env Sensor High Threshold
sensorTempThreshHiAlarmTrap envTemperatureUpperCritical
Temp Env Sensor High Threshold Cleared
sensorTempThreshHiAlarmClearedTrap
envTemperatureUpperCriticalClear
Temp Env Sensor Low Threshold
sensorTempThreshLoAlarmTrap envTemperatureLowerCritical
Temp Env Sensor Low Threshold Cleared
sensorTempThreshLoAlarmClearedTrap
envTemperatureLowerCriticalClear
Cyberswitching Supported Events
Cyberswitching Supported Events
Event description Trap name Common event name
Inlet Current Upper Critical Threshold
tricomG2UnitCurrentCritical inletCurrentUpperCritical

Chapter 4: Additional Configuration Tasks
30
Cyberswitching Supported Events
Event description Trap name Common event name
Inlet Current Upper Warning Threshold
tricomG2UnitCurrentWarning inletCurrentUpperWarning
Outlet Current Upper Warning Threshold
tricomG2OutletHighCurrentWarning outletCurrentUpperWarning
Outlet Current Lower Warning Threshold
tricomG2OutletLowCurrentWarning outletCurrentLowerWarning
Circuit Breaker Tripped tricomG2OutletTripped cbTripped
Geist Supported Events
Geist Supported Events
Event description Trap name Common event name
Inlet Current Upper Critical Threshold
totalDeciAmpsPhaseATRAP
totalDeciAmpsPhaseBTRAP
totalDeciAmpsPhaseCTRAP
inletCurrentUpperCritical
Inlet Current Upper Critical Threshold Cleared
inletCurrentUpperCriticalClear
Circuit Breaker Current Upper Critical Threshold
outlet1ADeciAmpsTRAP
outlet12CDeciAmpsTRAP
CBCurrentUpperCritical
Circuit Breaker Current Upper Critical Threshold Cleared
CBCurrentUpperCriticalClear
Outlet Current Upper Critical Threshold
outlet1ADeciAmpsTRAP
outlet12CDeciAmpsTRAP
OutletCurrentUpperCritical
Outlet Current Upper Critical Threshold Cleared
OutletCurrentUpperCriticalClear
Geist EM Supported Events
Geist EM Supported Events
Event description Trap name Common event name
Circuit Breaker Current Threshold Warning Event
mainChannelDeciAmps01WARN
mainChannelDeciAmps07WARN

Chapter 4: Additional Configuration Tasks
31
Geist EM Supported Events
Event description Trap name Common event name
Circuit Breaker Current Threshold Critical Event
mainChannelDeciAmps01ALARM
mainChannelDeciAmps07ALARM
Outlet Current Threshold Warning Event
auxChannelDeciAmps01WARN
auxChannelDeciAmps32WARN
outlet1AB-1DeciAmpsWarningTRAP
outlet24CA-8DeciAmpsWarningTRAP
OutletCurrentUpperCritical
Outlet Current Threshold Warning Event Cleared
Outlet Current Threshold Critical Event
auxChannelDeciAmps01ALARM
auxChannelDeciAmps32ALARM
outlet1AB-1DeciAmpsTRAP
outlet24CA-8DeciAmpsTRAP
OutletCurrentUpperCritical
Outlet Current Threshold Critical Event Cleared
OutletCurrentUpperCriticalClear
Phase Current Threshold Warning Event
totalDeciAmpsPhaseAWarningTRAP
totalDeciAmpsPhaseCWarningTRAP
inletCurrentUpperWarning
Phase Current Threshold Warning Event Cleared
inletCurrentUpperWarningClear
Phase Current Threshold Critical Event
totalDeciAmpsPhaseATRAP
totalDeciAmpsPhaseCTRAP
inletCurrentUpperCritical
Phase Current Threshold Critical Event Cleared
inletCurrentUpperCriticalClear
Geist V3 Supported Events
Geist V3 Supported Events
Event description Trap name Common event name
Temperature Threshold High Violation
gstTempSensorTempCNOTIFY
gstTempSensorTempFNOTIFY
gstClimateTempCNOTIFY
gstClimateTempFNOTIFY
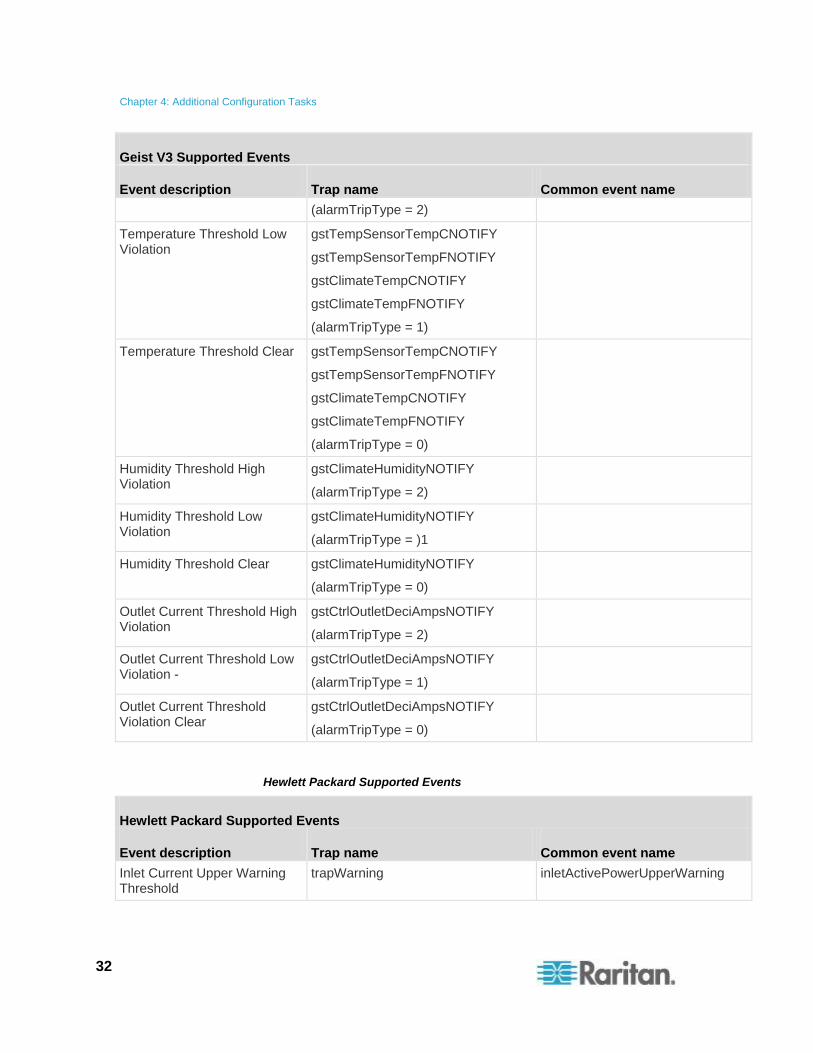
Chapter 4: Additional Configuration Tasks
32
Geist V3 Supported Events
Event description Trap name Common event name
(alarmTripType = 2)
Temperature Threshold Low Violation
gstTempSensorTempCNOTIFY
gstTempSensorTempFNOTIFY
gstClimateTempCNOTIFY
gstClimateTempFNOTIFY
(alarmTripType = 1)
Temperature Threshold Clear gstTempSensorTempCNOTIFY
gstTempSensorTempFNOTIFY
gstClimateTempCNOTIFY
gstClimateTempFNOTIFY
(alarmTripType = 0)
Humidity Threshold High Violation
gstClimateHumidityNOTIFY
(alarmTripType = 2)
Humidity Threshold Low Violation
gstClimateHumidityNOTIFY
(alarmTripType = )1
Humidity Threshold Clear gstClimateHumidityNOTIFY
(alarmTripType = 0)
Outlet Current Threshold High Violation
gstCtrlOutletDeciAmpsNOTIFY
(alarmTripType = 2)
Outlet Current Threshold Low Violation -
gstCtrlOutletDeciAmpsNOTIFY
(alarmTripType = 1)
Outlet Current Threshold Violation Clear
gstCtrlOutletDeciAmpsNOTIFY
(alarmTripType = 0)
Hewlett Packard Supported Events
Hewlett Packard Supported Events
Event description Trap name Common event name
Inlet Current Upper Warning Threshold
trapWarning inletActivePowerUpperWarning

Chapter 4: Additional Configuration Tasks
33
Hewlett Packard Supported Events
Event description Trap name Common event name
Inlet Current Upper Critical Threshold
trapCritical inletCurrentUpperCritical
Inlet Current Upper Critical Threshold Cleared
trapCleared inletCurrentUpperCriticalClear
Inlet Current Upper Warning Threshold
trapWarning inletCurrentUpperWarning
Inlet Current Upper Warning Threshold Cleared
trapCleared inletCurrentUpperWarningClear
Knurr Supported Events
Knurr Supported Events
Event description Trap name Common event name
Inlet Pole Current Upper Critical Threshold
pdu-M1TrapAlarmPh1
pdu-M1TrapAlarmPh2
pdu-M1TrapAlarmPh3
pdu-M2TrapAlarmPh1
pdu-M2TrapAlarmPh2
pdu-M2TrapAlarmPh3
pdu-M3TrapAlarmPh1
pdu-M3TrapAlarmPh2
pdu-M3TrapAlarmPh3
pdu-M4TrapAlarmPh1
pdu-M4TrapAlarmPh2
pdu-M4TrapAlarmPh3
inletCurrentUpperCritical

Chapter 4: Additional Configuration Tasks
34
Knurr Supported Events
Event description Trap name Common event name
Inlet Pole Current Threshold Clear - All
pdu-M1TrapRetToNormPh1
pdu-M1TrapRetToNormPh2
pdu-M1TrapRetToNormPh3
pdu-M2TrapRetToNormPh1
pdu-M2TrapRetToNormPh2
pdu-M2TrapRetToNormPh3
pdu-M3TrapRetToNormPh1
pdu-M3TrapRetToNormPh2
pdu-M3TrapRetToNormPh3
pdu-M4TrapRetToNormPh1
pdu-M4TrapRetToNormPh2
pdu-M4TrapRetToNormPh3
inletCurrentUpperCriticalClear
Liebert Supported Events
Liebert Supported Events
Event description Trap name Common event name
Outlet turned on lgpEventRcpPowerStateChangeOn outletPowerOn
Outlet turned off lgpEventRcpPowerStateChangeOff outletPowerOff
MRV Supported Events
MRV Supported Events
Event description Trap name Common event name
Temp Env Sensor High Threshold
irTempHighTholdAlarmRaised envTemperatureUpperCritical
Temp Env Sensor High Threshold Cleared
irTempHighTholdAlarmCleared envTemperatureUpperCriticalClear
Temp Env Sensor Low Threshold
irTempLowTholdAlarmRaised envTemperatureLowerCritical
Temp Env Sensor Low irTempLowTholdAlarmCleared envTemperatureLowerCriticalClear

Chapter 4: Additional Configuration Tasks
35
MRV Supported Events
Event description Trap name Common event name
Threshold Cleared
Humidity Env Sensor High Threshold
irHumidityHighTholdAlarmRaised envHumidityUpperCritical
Humidity Env Sensor High Threshold Cleared
irHumidityHighTholdAlarmCleared envHumidityUpperCriticalClear
Humidity Env Sensor Low Threshold
irHumidityLowTholdAlarmRaised envHumidityLowerCritical
Humidity Env Sensor Low Threshold Cleared
irHumidityLowTholdAlarmCleared envHumidityUpperCriticalClear
Raritan Dominion PX Supported Events
Some Dominion PX models support Event Rules, so that you can specify which events will be sent to Power IQ
Set up rules to reduce the number of traps sent to Power IQ. Optional.
Once rules are created, associate the rule with the SNMP Trap Action, with Power IQ as the trap destination.
See Configuring Event Rules in the Raritan Dominion PX User Guide.
Note: Model numbers that begin with "DPX2" support Event Rules.
Raritan Dominion PX Supported Events
Event description Trap name Common event name
Outlet Current Upper Critical Threshold
thresholdAlarm
or
outletSensorStateChange
outletCurrentUpperCritical
outletCurrentUpperCriticalClear
Outlet Current Upper Warning Threshold
thresholdAlarm
or
outletSensorStateChange
outletCurrentUpperWarning
outletCurrentUpperWarningClear
Outlet Current Lower Critical Threshold
thresholdAlarm
or
outletSensorStateChange
outletCurrentLowerCritical
outletCurrentLowerCriticalClear
Outlet Current Lower Warning Threshold
thresholdAlarm
or
outletCurrentLowerWarning
outletCurrentLowerWarningClear

Chapter 4: Additional Configuration Tasks
36
Raritan Dominion PX Supported Events
Event description Trap name Common event name
outletSensorStateChange
Outlet Voltage Upper Critical Threshold
outletSensorStateChange outletVoltageUpperCritical
outletVoltageUpperCriticalClear
Outlet Voltage Upper Warning Threshold
outletSensorStateChange outletVoltageUpperWarning
outletVoltageUpperWarningClear
Outlet Voltage Lower Critical Threshold
outletSensorStateChange outletVoltageLowerCritical
outletVoltageLowerCriticalClear
Outlet Voltage Lower Warning Threshold
outletSensorStateChange outletVoltageLowerWarning
outletVoltageLowerWarningClear
Outlet Pole Current Upper Critical Threshold
outletPoleSensorStateChange outletCurrentUpperCritical
outletCurrentUpperCriticalClear
Outlet Pole Current Upper Warning Threshold
outletPoleSensorStateChange outletCurrentUpperWarning
outletCurrentUpperWarningClear
Outlet Pole Current Lower Critical Threshold
outletPoleSensorStateChange outletCurrentLowerCritical
outletCurrentLowerCriticalClear
Outlet Pole Current Lower Warning Threshold
outletPoleSensorStateChange outletCurrentLowerWarning
outletCurrentLowerWarningClear
Outlet Pole Voltage Upper Critical Threshold
outletPoleSensorStateChange outletVoltageUpperCritical
outletVoltageUpperCriticalClear
Outlet Pole Voltage Upper Warning Threshold
outletPoleSensorStateChange outletVoltageUpperWarning
outletVoltageUpperWarningClear
Outlet Pole Voltage Lower Critical Threshold
outletPoleSensorStateChange outletVoltageLowerCritical
outletVoltageLowerCriticalClear
Outlet Pole Voltage Lower Warning Threshold
outletPoleSensorStateChange outletVoltageLowerWarning
outletVoltageLowerWarningClear
Outlet Power on/off powerControl outletPowerOn
utletPowerOff

Chapter 4: Additional Configuration Tasks
37
Raritan Dominion PX Supported Events
Event description Trap name Common event name
Circuit Breaker Current Upper Critical Threshold
thresholdAlarm
or
overCurrentProtectorSensorStateChange
cbCurrentUpperCritical
cbCurrentUpperCriticalClear
Circuit Breaker Current Upper Warning Threshold
thresholdAlarm
or
overCurrentProtectorSensorStateChange
cbCurrentUpperWarning
cbCurrentUpperWarningClear
Circuit Breaker Current Lower Critical Threshold
thresholdAlarm
or
overCurrentProtectorSensorStateChange
cbCurrentLowerCritical
cbCurrentLowerCriticalClear
Circuit Breaker Current Lower Warning Threshold
thresholdAlarm
or
overCurrentProtectorSensorStateChange
cbCurrentLowerWarning
cbCurrentLowerWarningClear
Circuit Breaker Tripped circuitBreakerTripped
or
overCurrentProtectorSensorStateChange
cbTripped
Circuit Breaker Recovered circuitBreakerRecovered
or
overCurrentProtectorSensorStateChange
cbRecovered
Inlet Current Upper Critical Threshold
inletSensorStateChange inletCurrentUpperCritical
inletCurrentUpperCriticalClear
Inlet Current Upper Warning Threshold
inletSensorStateChange inletCurrentUpperWarning
inletCurrentUpperWarningClear
Inlet Current Lower Critical Threshold
inletSensorStateChange inletCurrentLowerCritical
inletCurrentLowerCriticalClear
Inlet Current Lower Warning Threshold
inletSensorStateChange inletCurrentLowerWarning
inletCurrentLowerWarningClear

Chapter 4: Additional Configuration Tasks
38
Raritan Dominion PX Supported Events
Event description Trap name Common event name
Inlet Voltage Upper Critical Threshold
inletSensorStateChange inletVoltageUpperCritical
lineVoltageUpperCriticalClear
Inlet Voltage Upper Warning Threshold
inletSensorStateChange inletVoltageUpperWarning
inletVoltageUpperWarningClear
Inlet Voltage Lower Critical Threshold
inletSensorStateChange inletVoltageLowerCritical
inletVoltageLowerCriticalClear
Inlet Voltage Lower Warning Threshold
inletSensorStateChange inletVoltageLowerWarning
inletVoltageLowerWarningClear
Inlet Pole Current Upper Critical Threshold
thresholdAlarm
or
inletPoleSensorStateChange
inletCurrentUpperCritical
inletCurrentUpperCriticalClear
Inlet Pole Current Upper Warning Threshold
thresholdAlarm
or
inletPoleSensorStateChange
inletCurrentUpperWarning
inletCurrentUpperWarningClear
Inlet Pole Current Lower Critical Threshold
thresholdAlarm
or
inletPoleSensorStateChange
inletCurrentLowerCritical
inletCurrentLowerCriticalClear
Inlet Pole Current Lower Warning Threshold
thresholdAlarm
or
inletPoleSensorStateChange
inletCurrentLowerWarning
inletCurrentLowerWarningClear
Inlet Pole Voltage Upper Critical Threshold
thresholdAlarm
or
inletPoleSensorStateChange
inletVoltageUpperCritical
lineVoltageUpperCriticalClear
Inlet Pole Voltage Upper Warning Threshold
thresholdAlarm
or
inletPoleSensorStateChange
inletVoltageUpperWarning
inletVoltageUpperWarningClear
Inlet Pole Voltage Lower Critical Threshold
thresholdAlarm
or
inletPoleSensorStateChange
inletVoltageLowerCritical
inletVoltageLowerCriticalClear

Chapter 4: Additional Configuration Tasks
39
Raritan Dominion PX Supported Events
Event description Trap name Common event name
Inlet Pole Voltage Lower Warning Threshold
thresholdAlarm
or
inletPoleSensorStateChange
inletVoltageLowerWarning
inletVoltageLowerWarningClear
Env. Temperature Upper Critical Threshold
thresholdAlarm
or
externalSensorStateChange
envTemperatureUpperCritical
envTemperatureUpperCriticalClear
Env. Temperature Upper Warning Threshold
thresholdAlarm
or
externalSensorStateChange
envTemperatureUpperWarning
envTemperatureUpperWarningClear
Env. Temperature Lower Critical Threshold
thresholdAlarm
or
externalSensorStateChange
envTemperatureLowerCritical
envTemperatureLowerCriticalClear
Env. Temperature Lower Warning Threshold
thresholdAlarm
or
externalSensorStateChange
envTemperatureLowerWarning
envTemperatureLowerWarningClear
Relative Humidity Upper Critical Threshold
thresholdAlarm
or
externalSensorStateChange
envHumidityUpperCritical
envHumidityUpperCriticalClear
Relative Humidity Upper Warning Threshold
thresholdAlarm
or
externalSensorStateChange
envHumidityUpperWarning
envHumidityUpperWarningClear
Relative Humidity Lower Critical Threshold
thresholdAlarm
or
externalSensorStateChange
envHumidityLowerCritical
envHumidityLowerCriticalClear
Relative Humidity Lower Warning Threshold
thresholdAlarm
or
externalSensorStateChange
envHumidityLowerWarning
envHumidityLowerWarningClear

Chapter 4: Additional Configuration Tasks
40
Raritan Dominion PX Supported Events
Event description Trap name Common event name
Discrete Sensor State Change externalOnOffSensorStateChange
or
pduSensorStateChange
SensorContactOpen
SensorContactClosed
SensorSmokeDetected
SensorSmokeCleared
SensorWaterDetected
SensorWaterCleared
SensorVibrationDetected
SensorVibrationCleared
Asset Strip and Tag Changes assetStripDisconnected
assetStripConnected
assetTagDisconnected
assetTagConnected
assetStripDisconnected
assetStripConnected
assetTagDisconnected
assetTagConnected
Airflow Over Critical Threshold thresholdAlarm
or
externalSensorStateChange
envOverAirflowCritical
envOverAirflowCriticalClear
Airflow Over Warning Threshold
thresholdAlarm
or
externalSensorStateChange
envOverAirflowWarning
envOverAirflowWarningClear
Airflow Under Critical Threshold
thresholdAlarm
or
externalSensorStateChange
envUnderAirflowCritical
envUnderAirflowCriticalClear
Airflow Under Warning Threshold
thresholdAlarm
or
externalSensorStateChange
envUnderAirflowWarning
envUnderAirflowWarningClear
Air Pressure Over Critical Threshold
thresholdAlarm
or
externalSensorStateChange
envOverAirPressureCritical
envOverAirPressureCriticalClear
Air Pressure Over Warning Threshold
thresholdAlarm
or
externalSensorStateChange
envOverAirPressureWarning
envOverAirPressureWarningClear

Chapter 4: Additional Configuration Tasks
41
Raritan Dominion PX Supported Events
Event description Trap name Common event name
Air Pressure Under Critical Threshold
thresholdAlarm
or
externalSensorStateChange
envUnderAirPressureCritical
envUnderAirPressureCriticalClear
Air Pressure Under Warning Threshold
thresholdAlarm
or
externalSensorStateChange
envUnderAirPressureWarning
envUnderAirPressureWarningClear
Rittal Supported Events
Rittal Supported Events
Event description Trap name Common event name
Inlet Current Upper Critical Threshold
alarmUnit1
alarmUnit2
alarmUnit3
alarmUnit4
inletCurrentUpperCritical
Inlet Current Upper Critical Threshold Cleared
alarmUnit1
alarmUnit2
alarmUnit3
alarmUnit4
inletCurrentUpperCriticalClear
Inlet Current Lower Critical Threshold
alarmUnit1
alarmUnit2
alarmUnit3
alarmUnit4
inletCurrentLowerCritical
Inlet Current Lower Critical Threshold Cleared
alarmUnit1
alarmUnit2
alarmUnit3
alarmUnit4
inletCurrentLowerCriticalClear
Inlet Voltage Upper Critical Threshold
alarmUnit1
alarmUnit2
alarmUnit3
alarmUnit4
inletVoltageUpperCritical

Chapter 4: Additional Configuration Tasks
42
Rittal Supported Events
Event description Trap name Common event name
Inlet Voltage Upper Critical Threshold Cleared
alarmUnit1
alarmUnit2
alarmUnit3
alarmUnit4
inletVoltageUpperCriticalClear
Inlet Voltage Lower Critical Threshold
alarmUnit1
alarmUnit2
alarmUnit3
alarmUnit4
inletVoltageLowerCritical
Inlet Voltage Lower Critical Threshold Cleared
alarmUnit1
alarmUnit2
alarmUnit3
alarmUnit4
inletVoltageLowerCriticalClear
Temp Env Sensor Upper Critical
alarmUnit1
alarmUnit2
alarmUnit3
alarmUnit4
envTemperatureUpperCritical
Temp Env Sensor Upper Critical Cleared
alarmUnit1
alarmUnit2
alarmUnit3
alarmUnit4
envTemperatureUpperCriticalClear
Temp Env Sensor Low Critical alarmUnit1
alarmUnit2
alarmUnit3
alarmUnit4
envTemperatureLowerCritical
Temp Env Sensor Low Critical Cleared
alarmUnit1
alarmUnit2
alarmUnit3
alarmUnit4
envTemperatureLowerCriticalClear

Chapter 4: Additional Configuration Tasks
43
Rittal Supported Events
Event description Trap name Common event name
Humidity Env Sensor Upper Critical
alarmUnit1
alarmUnit2
alarmUnit3
alarmUnit4
envHumidityUpperCritical
Humidity Env Sensor Upper Critical Cleared
alarmUnit1
alarmUnit2
alarmUnit3
alarmUnit4
envHumidityUpperCriticalClear
Humidity Env Sensor Lower Critical
alarmUnit1
alarmUnit2
alarmUnit3
alarmUnit4
envHumidityLowerCritical
Humidity Env Sensor Lower Critical Cleared
alarmUnit1
alarmUnit2
alarmUnit3
alarmUnit4
envHumidityLowerCriticalClear
Servertech Supported Events
Servertech Supported Events
Event description Trap name Common event name
Infeed Current High Threshold infeedLoadEvent inletCurrentUpperCritical
inletCurrentUpperCriticalClear
Infeed Current Low Threshold infeedLoadEvent inletCurrentLowerCritical
inletCurrentLowerCriticalClear
Outlet Current High Thresholds
outletLoadEvent outletCurrentUpperCritical
outletCurrentUpperCriticalClear
Outlet Current Low Thresholds outletLoadEvent outletCurrentLowerCritical
outletCurrentLowerCriticalClear
Outlet Current Status Change outletChangeEvent outletPowerOn
outletPowerOff

Chapter 4: Additional Configuration Tasks
44
Servertech Supported Events
Event description Trap name Common event name
Temp Env Sensor High Threshold
tempHumidSensorTempEvent envTemperatureUpperCritical
envTemperatureUpperCriticalClear
Temp Env Sensor Low Threshold
tempHumidSensorTempEvent envTemperatureLowerCritical
envTemperatureLowerCriticalClear
Humidity Env Sensor High Thresholds
tempHumidSensorHumidEvent envHumidityUpperCritical
envHumidityUpperCriticalClear
Humidity Env Sensor Low Thresholds
tempHumidSensorHumidEvent envHumidityLowerCritical
envHumidityLowerCriticalClear
PDU Connectivity Lost and Restored Events
Power IQ generates PDU connectivity events when connectivity is lost or restored with a PDU. The PDU's health status will change to red when connectivity is lost. Loss of connectivity is a critical severity event.
Power IQ checks PDUs that it has lost communication with every 15 minutes. If a PDU remains inaccessible for 1 hour, the Connectivity Lost event is generated. Once communication with the PDU is restored, the Connectivity Restored event is generated, and the health status will update.
To configure email notifications for this event, see Configure Notification Filters (on page 48). Event notifications must be enabled. See Enable or Disable Event Notifications (on page 47).
The event details are in the table.
Event description Trap name
Loss of connectivity detected. A timestamp is associated with the event.
Connectivity Lost
Connectivity with the PDU is restored.
Connectivity Restored

Chapter 4: Additional Configuration Tasks
45
View Events
The Events tab displays all events that Power IQ receives from configured PDUs.
To view events:
Click the Events tab. The Events browser page opens.
To view event details:
1. Click the Events tab. The Events browser page opens.
2. Click the links in the Events column to open the Event details page.
Filter the Events List
You can customize your view of the Events list by using filters and sorting.
See Customizing Your View of PDUs, Devices, and Events (on page 51).
To filter the events list:
In the Events tab, all events in the system display in a list.
Most columns of data contain a filter criteria selection. Click the arrow in the column header to open the options. Filter is the last option.
Filter by date: In the Occurred on column filter, select the checkbox for Before, After or On, then select a date in the calendar to view events that occurred before, after or on the date you select.
Filter by event severity: In the Severity column filter, select the checkbox for the severity of events you want to view. Select multiple options as needed.
Filter by event name: In the Event column filter, enter an event name to view.
Filter by PDU associated with the event: In the Associated PDU column filter, enter a PDU name or IP address to view events associated with a PDU.
Filter by event status: In the Status column filter, select the checkbox for the status of events you want to view, either active, or cleared. Select multiple options as needed.

Chapter 4: Additional Configuration Tasks
46
Export the Events List to CSV
Export the Events list to create a CSV file that contains all the information in the grid on the Events tab.
The exported file contains the same columns as the page in Power IQ. If you have applied filters, the same filters will apply to the exported information. Export includes all records matching the filter criteria. The export is not limited by the number of events shown in the list grid.
To export the Events list to CSV:
1. In the Events tab, click the Export/Save icon in the upper right corner of the grid.
2. Save or open the file using the dialog that appears.
Clear Events
Events can be automatically cleared by other events, or you can clear them manually.
To clear events in the Events browser view:
1. In the Events tab, select the checkbox for an event in the list. Select multiple checkboxes to choose multiple events to clear.
2. Click Clear Selected Events.
To clear an event from the Events details page:
1. In the Events tab, click the link for an event to open the Event details page. The link to open Event details is in the Events column.
2. In the Event details page, click "Clear this event".

Chapter 4: Additional Configuration Tasks
47
Automatic Delete of Cleared Events
Power IQ automatically deletes cleared events from the system hourly.
Cleared events will only be deleted when there are more than 100,000 events in the database.
The oldest events in the system are eligible to be deleted first. If there are 100,000 or fewer events in the database at the hourly check, then no events will be deleted.
Only cleared events are eligible to delete. Power IQ will not delete active events.
You can access events and event configurations via ODBC views. If you need to keep a log of all generated events, run a script periodically that retrieves event data via ODBC before Power IQ deletes cleared events automatically.
Enable or Disable Event Notifications
If you would like to receive email notification for events that Power IQ receives, you must enable event notifications. When event notification is enabled, Power IQ sends an email message for every event. Set up notification filters if you do not want to receive emails for every event. See Configure Notification Filters (on page 48).
To enable or disable event notifications:
1. In the Settings tab, click Power IQ Settings in the Application Administration section.
2. In the Event Notification Settings box, select the "Enable e-mail delivery of event notifications" checkbox to enable event notifications.
or
Deselect the "Enable e-mail delivery of event notifications" checkbox to disable event notifications.
3. Click Save.
After enabling event notifications, the "Configure event notifications for your account" link appears. Click this link to use filters to manage your notifications.
After enabling, configure the SMTP settings for your system. See SMTP Server Settings (on page 49).

Chapter 4: Additional Configuration Tasks
48
Configure Notification Filters
When event notification is enabled, Power IQ sends an email message for every event. Set up notification filters if you do not want to receive emails for every event.
To add notification filters:
1. Click your username link, next to the Logoff link in the upper right corner of Power IQ.
2. Click Manage Event Notifications.
3. Click "Add a filter."
4. Select the Enable this Filter checkbox.
5. Select the Severity levels of the events for which you want Power IQ to send email notifications: Critical, Warning, and Informational.
6. Select the Sources of the events for which you want Power IQ to send email notifications: Outlet, Inlet, Circuit Breaker, Environmental Sensors, and PDU Connectivity. Power IQ generates PDU connectivity events when connectivity is lost or restored with a PDU.
7. Select "Send notifications for all PDUs" to receive email notifications for all PDUs that meet the Severity level and Source criteria selected.
or
Select "Send notifications only for the following PDUs" and then enter IP addresses for PDUs or values for Custom Fields associated with PDUs.
Enter a value in either or both custom fields to receive email notifications only for PDUs that have those custom field values assigned. Custom Field 1 and Custom Field 2 may be renamed in your system. See Configuring Custom Fields (on page 105).
Click Add to enter the IP addresses of the PDUs for which email notifications should be sent. Enter a partial IP address to specify a group of PDUs in sequence. For example, enter 192.168.45 to specify all IP addresses beginning with that sequence. Click See Matching PDUs to verify the list of PDUs for which Power IQ will send email notifications.
8. Click Save.

Chapter 4: Additional Configuration Tasks
49
Manage Event Notifications for Users
Users with the Site Administrator role can manage other user's event notification settings.
To manage event notifications for users:
1. In the Settings tab, click User Accounts in the Authorization and Authentication section.
2. Click the username link for the user whose event notification settings you want to view.
3. Click "Manage event notifications."
4. Change the settings as needed and click Save. See Configure Notification Filters (on page 48) for details.
SMTP Server Settings
Configure the SMTP server settings to determine how email notifications are sent when Power IQ receives events.
You must reboot Power IQ after changing the encryption method in the SMTP server settings. See Shutting Down and Restarting Power IQ (on page 162).
To configure SMTP server settings:
1. In the Settings tab, click Server Settings in the Appliance Administration section.
2. In the SMTP Server Settings section, enter the basic settings for the SMTP server.
a. Server name/IP address: Enter the email server's domain name or IP address.
b. Port: The default port is 25. Change this number if you use a different port.
c. "Sender email address": Enter the Power IQ's IP address.
3. In the Authentication and Encryption Settings section, select the method for your SMTP server.
a. Authentication type: Select None or Password. If you select Password, enter the Username, Password, and Confirm password.
b. Select an Encryption method.
4. Click Send a Test Email to enter your email address and try sending an email message using the settings you configured. If you see a success message, click Save SMTP Settings.

Chapter 4: Additional Configuration Tasks
50
If you see a failure message, edit your settings and try again. A password must be entered in the page to test the settings. Once saved, passwords do not display in the page for security.
Event Fuse Handling
The event fuse will not be de-activated until the trap rate drops 30% below the 15 traps/sec threshold and the trap rate is re-calculated each time a trap is received. Therefore the fuse will not be de-activated until Power IQ receives a trap and determines that the trap rate is 30% below 15 traps/sec.
If the event fuse is tripped and then no more traps are received, the event fuse will remain tripped until the next event is received.
Configuring Proxy Connections to Power IQ
If network restrictions prevent some users from connecting directly to Power IQ™, they may need access through a proxy server that is authorized to make the connection. Check your firewall and security settings to ensure that communications between the proxy server and Power IQ is allowed.
To configure proxy connections to Power IQ:
1. In the Settings tab, click Server Settings in the Application Administration section.
2. In the Proxy Configuration section, select the web protocol the proxy server communicates over, HTTP or HTTPS.
3. Enter the IP address of the proxy server in the Proxy Host field. Power IQ only accepts proxy communication from this address.
4. Enter the communications port the proxy server uses in the Proxy Port field.
5. If the proxy server is required to authenticate with Power IQ, select Yes in the Authentication Required field, and enter a Username and Password. These fields must use a valid Power IQ username and password combination.
6. Click Save Proxy Settings.

Chapter 4: Additional Configuration Tasks
51
Configuring PDU Display Settings - View PDUs by IP or Name
Select whether you want all PDUs in the system to be identified by PDU name or IP address in the Settings tab. This setting affects all pages where PDUs are listed, and is used in email notifications when identifying PDUs. This setting applies to all users in the system.
PDU names are retrieved from the PDU, via SNMP, NOT from the network. PDU name is not guaranteed to be unique. If a PDU name is not available, the PDU label is set to "Unnamed" and the IP address is included.
To configure PDU display settings:
1. In the Settings tab, click Application Settings in the Appliance Administration section.
2. In the Display Settings box, select Show PDU IP Address or Show PDU Name, then click Save Display Settings.
Customizing Your View of PDUs, Devices, and Events
Each user can save their own customized views of PDU, Device and Events lists in Power IQ. Once you save a customized view, it is retained even if you leave the tab and return, or use a different browser or client.
Note: If you open the PDU list by clicking on a health chart, your view will be filtered by the chart. For example, click the red bar of a health chart to view only the PDUs with red health status.
To customize your view of PDUs, Devices and Events:
1. In the PDU, Device, or Events tab, drag and drop columns to customize your view. Hover the mouse on a column heading then click the arrow to view a drop-down list of other options. You can hide or show each column, set the ascending or descending order of data, or enter a search term to filter the column to include only items that match the search term.
See Filter the Events List (on page 45).
See Filter the PDUs List (on page 121).
See Filter the Devices List.

Chapter 4: Additional Configuration Tasks
52
2. Click the Panel Options button in the upper right corner of the list view then select Save Current Grid Configuration to save your view.
To return to the default view:
In the PDU, Device or Events tab, click the Panel Options button in the upper right corner of the list view, then select Use Default Grid Configuration.

53
The Power IQ dashboard allows each user to customize collections of charts and widgets in a single view. You can create multiple versions of your dashboard and select which one to view, or start a slideshow for all or selected dashboards.
The default dashboard configuration includes 2 rows. The top row includes a health chart that shows overall PDU health, and a capacity gauge. The second row is a device chart that shows average active power over the past 24 hours.
You must have the Analyst role to edit the dashboard.
In This Chapter
Viewing the Dashboard ........................................................................... 53 Sharing a Dashboard ............................................................................... 54 Setting the Dashboard Layout ................................................................. 55 Configuring Widgets ................................................................................ 56 View Dashboards as a Slideshow ........................................................... 69 View Dashboard in Full Screen Mode ..................................................... 70
Viewing the Dashboard
You can configure more than one version of the dashboard.
Other users can share their dashboards with you, as a shared report. You can share your dashboards with other users. You cannot edit dashboards that you did not create.
To view the dashboard:
1. Click the Dashboard tab.
2. If more than 1 dashboard is configured, click the binoculars icon in the top right corner of the Dashboard tab. The Report Browser dialog appears.
Dashboards shared by other users are marked as "Shared by username." Dashboards you are sharing are marked as "Shared by you."
Chapter 5 Dashboard

Chapter 5: Dashboard
54
3. Hover over the dashboard you want to view then click the View link that appears. The selected dashboard loads in the Dashboard tab.
Sharing a Dashboard
A dashboard and its widgets are called a report in Power IQ. When you see the term "report" on a dashboard page, it means the whole dashboard configuration and all its widgets.
Choose to share a report on the dashboard when you want to make it public. Sharing reports gives other Power IQ users access to your dashboards, and the widgets it contains.
Users must have the View and the Create Reports and Charts role assigned to view your shared dashboards.
Reports that are shared are marked as "You are sharing." Reports that have been shared by other users are marked as "Shared by username."
The data that displays in a report is based on each individual user's permissions in Power IQ. If another user does not have permission to see information about a rack or datacenter, for example, that you have shared a report about, the user will not see the data.
Users that you share a report with cannot edit your report. You cannot edit reports that you did not create.
To share a dashboard:
1. In the Dashboards tab, select a report. If you only have 1 dashboard, it will be displayed already. If you have configured multiple
dashboards, click the icon in the upper right corner to open the Report Browser. Hover over the dashboard you want to view then click the View link that appears. The selected dashboard loads in the Dashboard tab.
2. In the Dashboard tab, click the icon in the upper right corner of the page. The Report Configuration dialog appears.
3. Select the Share this Report checkbox to make this dashboard and widgets public.
4. Click Save.

Chapter 5: Dashboard
55
To make a dashboard private:
1. In the Dashboard tab, click the icon in the upper right corner of the page. The Report Configuration dialog appears.
2. Deselect the Share this Report checkbox to remove the dashboard from public view.
3. Click Save.
Setting the Dashboard Layout
You can set the number of rows of widgets on your dashboard, drag and drop widgets into the rows, and resize each widget and row.
To set the dashboard layout:
1. In the Dashboard tab, click the icon in the upper right corner of the page. The Report Configuration dialog appears.
To see a list of all available dashboards, use the Report Browser.
Click the icon in the upper right corner of the Dashboard. You can only edit dashboards that you created.
2. Select the Share this Report checkbox to make this dashboard and widgets public.
3. Click a Layout to view the configuration in the dialog. The layouts are 1 row, 2 rows, 3 rows, or 4 rows.
4. Resize the rows by clicking and dragging the edges of a row. You can resize the width of a widget in a row, and the height of an entire row.
5. Drag and drop widgets from the bottom of the dialog into the rows. Drag and drop widgets from row to row to rearrange them. The row you're dropping into highlights green.
6. Drop a widget back into the bottom of the dialog to remove it from the layout.
7. Click Save. The dashboard layout you selected displays in the tab.

Chapter 5: Dashboard
56
Configuring Widgets
Widgets are the configurable tools and charts you can add to the dashboard layout.
Active Events Widget (on page 56)
Device Chart Widget (on page 57)
PDU Health Chart Widget (on page 57)
Capacity Forecast Chart Widget (on page 59)
Capacity Gauge Widget (on page 60)
Image Widget (on page 61)
Report Heading Widget (on page 62)
HTML Widget (on page 63)
Cooling Chart Widget (on page 64)
Active Events Widget
The active events widget displays the 10 highest severity, active events in a list.
You must have the Event Manager role assigned to view events. See Assign Roles to a User (on page 73).
The list refreshes automatically every 30 seconds.
To configure the active events widget:
1. In the Dashboard tab, click the icon in the upper right corner of the page. The Report Configuration dialog appears.
2. Drag and drop the Active Events widget icon into a row. See Setting the Dashboard Layout (on page 55) for details.
3. Click Save. The widget is added to the dashboard.
To use the active events widget:
Click an event link to open the event details page, where you can clear the event. See Clear Events (on page 46).
See Enable or Disable Event Notifications (on page 47) for details on receiving email notifications of events.

Chapter 5: Dashboard
57
Device Chart Widget
The device chart widget displays a default setting of average active power over the past 24 hours.
You can configure the device chart to display power measurements for different parts of the data center.
To configure the device chart widget:
1. In the Dashboard tab, click the icon in the upper right corner of the page. The Report Configuration dialog appears.
2. Drag and drop the Device Chart widget icon into a row. See Setting the Dashboard Layout (on page 55) for details.
3. See Device Chart Settings (on page 180) for details on configuring this chart.
4. Click Save. The widget is added to the dashboard.
To use the device chart widget:
Click the export icon to export all data in the chart to a .CSV file.
The chart will automatically refresh at each polling interval. Click the refresh icon to refresh the chart manually.
PDU Health Chart Widget
The default PDU health chart widget shows overall health of all PDUs in the system.
You can configure the chart to show overall health, which includes connectivity and active events, or active events only, or connectivity only. You can also set the chart to include all PDUs in the system, or just the PDUs in a specific level of a data center. The chart refreshes automatically every minute.
To configure the PDU health chart widget:
1. In the Dashboard tab, click the icon in the upper right corner of the page. The Report Configuration dialog appears.
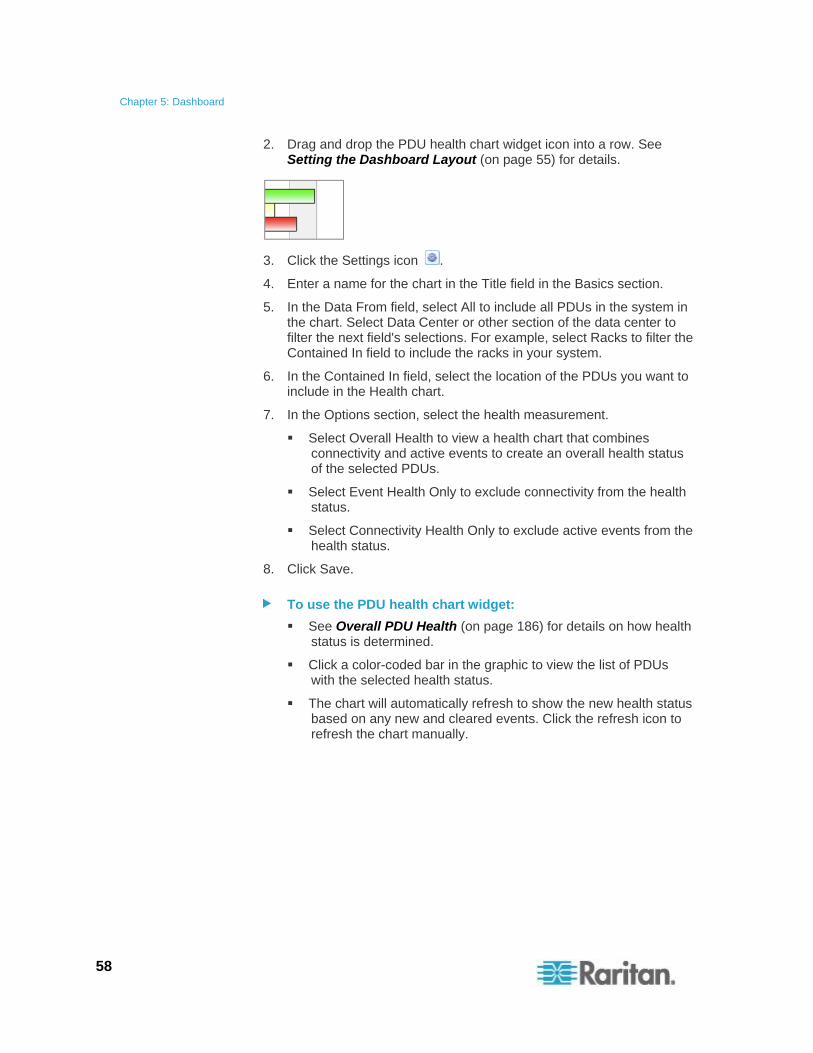
Chapter 5: Dashboard
58
2. Drag and drop the PDU health chart widget icon into a row. See Setting the Dashboard Layout (on page 55) for details.
3. Click the Settings icon .
4. Enter a name for the chart in the Title field in the Basics section.
5. In the Data From field, select All to include all PDUs in the system in the chart. Select Data Center or other section of the data center to filter the next field's selections. For example, select Racks to filter the Contained In field to include the racks in your system.
6. In the Contained In field, select the location of the PDUs you want to include in the Health chart.
7. In the Options section, select the health measurement.
Select Overall Health to view a health chart that combines connectivity and active events to create an overall health status of the selected PDUs.
Select Event Health Only to exclude connectivity from the health status.
Select Connectivity Health Only to exclude active events from the health status.
8. Click Save.
To use the PDU health chart widget:
See Overall PDU Health (on page 186) for details on how health status is determined.
Click a color-coded bar in the graphic to view the list of PDUs with the selected health status.
The chart will automatically refresh to show the new health status based on any new and cleared events. Click the refresh icon to refresh the chart manually.

Chapter 5: Dashboard
59
Capacity Forecast Chart Widget
The capacity forecast chart widget tracks actual power capacity until a trend can be forecast. Based on the capacity settings, the chart displays how many days of supply remain before a selected area of your data center reaches capacity.
You must have configured the enterprise data model and have a minimum of 2 days of daily rollup of KW data. 30 days of daily rollup data is recommended for more accurate forecasts. The capacity field must be set for the data center node selected. Power capacity is set in KW with granularity of 2 decimal places, such as 5.04 KW. You can configure the capacity for different locations in your data center as part of your enterprise data model configuration. See Enterprise Relationships (on page 92). To set individual capacities, see Set a Capacity (on page 60).
To configure the capacity forecast chart widget:
1. In the Dashboard tab, click the icon in the upper right corner of the page. The Report Configuration dialog appears.
2. Drag and drop the Capacity Forecast Chart widget icon into a row. See Setting the Dashboard Layout (on page 55) for details.
3. Click the Settings icon .
4. Enter a name in the Title field.
5. In the Show field, click the browse button, then select the data center node whose capacity you want to show in the chart. Expand or collapse the nodes by clicking the plus and minus signs. The name of the node selected displays in the field at the bottom on the dialog. Click Select Node.
6. In the Period field, select the time period to include in the forecast.
7. Click Save. The widget is added to the dashboard.

Chapter 5: Dashboard
60
To use the capacity forecast chart widget:
The solid line in the chart represents the measured time period. The dashed line represents the projected time period.
The blue line shows the observed data.
The purple line is the linear trend line.
The dashed green line shows the projected data.
The chart legend will indicate "adequate supply" when the trend does not cross the capacity line for the time period. If the trend line crosses the capacity line, the chart legend will indicate the number of days of supply remaining until capacity is reached: "Projected X days of capacity remaining."
Set a Capacity
Capacity in kilowatts can be set with up to 2 decimal places.
Capacity for Racks can only be set in the Data Centers tab. Capacity for data center, room, aisle, and row can be set either in the Data Center tab, or by importing the enterprise data model .CSV file. See Importing Object Mappings (on page 95).
To set a capacity:
1. In the Data Centers tab, select a data center level, such as a room. The details page opens.
2. Enter the capacity in the Capacity (kW) field. On the Data Center level, first expand the Ratings and Settings section to find the Capacity field.
Note: For the Rack level, click Configure Rack Details in the Smart Rack view to find the Capacity field. See Configure Rack Details - Smart Rack View (on page 108).
3. Click Save.
Capacity Gauge Widget
The capacity gauge widget shows how much power a selected node of your data center has consumed over a specified time period. The gauge shows a tick mark for minimum, maximum and average power consumed during the time period. The dial points to the real time active power reading.
To configure the capacity gauge widget:
1. In the Dashboard tab, click the icon in the upper right corner of the page. The Report Configuration dialog appears.

Chapter 5: Dashboard
61
2. Drag and drop the Capacity Gauge widget icon into a row. See Setting the Dashboard Layout (on page 55) for details.
3. Click the Settings icon .
4. Enter a name in the Title field.
5. In the Show field, click the browse button, then select the data center node whose power consumption you want to show in the dial. Expand or collapse the nodes by clicking the plus and minus signs. The name of the node selected displays in the field at the bottom on the dialog. Click Select Node.
6. In the Period field, select the time period of power consumption to include in the dial.
7. Click Save. The widget is added to the dashboard.
Image Widget
The image widget displays an image that you upload on the dashboard.
The maximum images size is 800 pixels high by 800 pixels wide. The maximum file size is 2MB for dashboard images. Images uploaded for logo usage can be up to 512KB.
Uploading a new image to an image widget removes the previously uploaded image.
For details on adding a logo to every page in Power IQ, see Display a Logo on Every Page (on page 164).
To configure the image widget:
1. In the Dashboard tab, click the icon in the upper right corner of the page. The Report Configuration dialog appears.
2. Drag and drop the Image widget icon into a row. See Setting the Dashboard Layout (on page 55) for details.
3. Click the Settings icon .
4. Click the Browse button, select the image and click Open.
5. Click Save. The widget is added to the dashboard.

Chapter 5: Dashboard
62
Report Heading Widget
The report heading widget allows you to add and format text on the dashboard. Position the report heading widget above or next to other widgets to use it as a heading. See Setting the Dashboard Layout (on page 55).
To configure the report heading widget:
1. In the Dashboard tab, click the icon in the upper right corner of the page. The Report Configuration dialog appears.
2. Drag and drop the Report Heading widget icon into a row. See Setting the Dashboard Layout (on page 55) for details.
3. In the Text field, enter the text you would like to display in the dashboard. Maximum title length is 64 characters.
4. Select the font type in the Font field.
5. Select the font size in the Size drop-down list.
6. Select the text color in the Color drop-down list.
7. In the Align field, select Left, Center or Right to specify how text will be oriented in the widget space on the dashboard.
8. Select the Bold or Italic checkboxes to format the text.
9. Click Save. The widget is added to the dashboard.
To edit text only:
Once added to the dashboard, you can edit the text only, without changing style or layout, directly from the dashboard.
In the Dashboard tab, double click heading text and edit in the text box that appears. Press Enter to save changes.

Chapter 5: Dashboard
63
HTML Widget
The HTML widget enables you to add your custom HTML portlet to the dashboard. Use this widget to add a weather tool, maps, a video camera, or anything you can code using HTML.
HTML portlets may have security implications. You must allow them before you can add an HTML widget to the Dashboard tab. See Allow HTML Widgets on Dashboard (on page 164).
In Internet Explorer, you must accept a security warning the first time you view a dashboard containing an HTML widget.
To configure the HTML widget:
1. In the Dashboard tab, click the icon in the upper right corner of the page. The Report Configuration dialog appears.
2. Drag and drop the HTML widget icon into a row. See Setting the Dashboard Layout (on page 55) for details.
If you don't see the HTML widget icon, you must allow HTML portlets. See Allow HTML Widgets on Dashboard (on page 164).
3. Click the Settings icon .
4. Enter your HTML code in the HTML field.
5. Click Save. The widget is added to the dashboard.
Note: If you see unexpected changes in your dashboard after adding an HTML widget, you can reset it by disabling HTML portlets in the Settings tab. See Allow HTML Widgets on Dashboard (on page 164).

Chapter 5: Dashboard
64
Cooling Chart Widget
Cooling charts enable you to compare your data center's sensor readings against industry recommendations.
American Society of Heating, Refrigerating and Air-Conditioning® (ASHRAE) is an industry consortium that provides guidelines for energy efficient data center operations.
ASHRAE recommends certain safe and energy-efficient operating temperatures and humidity levels. This data displays on the psychrometric chart in Power IQ. ASHRAE offers two different sets of recommendations, one from 2004, and one from 2008. The 2008 recommendations allow for slightly higher temperatures. When viewed on the chart, ASHRAE refers to these recommended regions of data as "envelopes."
In Power IQ, you configure the chart to display your data center's humidity and temperature readings on the same psychrometric chart as ASHRAE's recommendations. You can also specify smaller sections within a data center, such as a room or rack. This allows you to determine how your readings compare to an ASHRAE recommendation. You can also specify your own custom target operating zones. See Create a Custom Region.
To configure the cooling chart widget:
1. In the Dashboard tab, click the icon in the upper right corner of the page. The Report Configuration dialog appears.
2. Drag and drop the cooling chart widget icon into a row. See Setting the Dashboard Layout (on page 55) for details.
3. Click the Settings icon .
4. In the Show field, click the browse button to select a node from your enterprise data model. You can select any level, up to and including the data center. Potential energy savings is calculated only when a data center is selected.
5. In the Sensor Position field, select Inlet, Outlet, or Outside Air. Inlet specifies a "cold aisle" chart, and uses data from inlet located sensors. Outlet specifies a "hot aisle" chart, and uses data from outlet located sensors. Outside air uses data from outside located sensors. See Specify Inlet, Outlet, or Outside Air Location for Environmental Sensors (on page 117).
6. Select the region to display on the chart. See ASHRAE® Envelope Descriptions (on page 66) for details of each region.

Chapter 5: Dashboard
65
All regions display in blue on the chart. Custom regions have default settings you can change. Select Custom, then select the Min Temperature and Max Temperature and the Min Humidity and Max Humidity.
7. Select Zoom In or Zoom Out to specify a more or less detailed view of the chart to display.
8. Enter a name for the chart, or check the Autoname checkbox to accept the system name. The system name for a cooling chart contains the level of the enterprise data model, such as data center, and the sensor location information.
9. Click Save. The widget is added to the dashboard.
To use the cooling chart widget:
Hover your mouse over the sensor data points to view details. See View Sensor Data Point Details (on page 67).
Click the export icon to export sensor data in the chart to a .CSV file. See Export Sensor Data (on page 68).
The chart will automatically refresh at each polling interval. Click the refresh icon to refresh the chart manually.
To calculate savings, see Calculate Potential Cooling Energy Savings (on page 69)
Requirements for Cooling Charts
Cooling charts use data from the humidity and temperature sensors in your data center.
You must have at least 1 temperature sensor and at least 1 humidity sensor connected to use Cooling charts.

Chapter 5: Dashboard
66
ASHRAE® Envelope Descriptions
ASHRAE® operating envelopes comprise the following settings.
X-Axis: Temperature
Y-Axis: Humidity Ratio, with the relative humidity percentage calculated along curves on the chart
The area inside the region created by plotting the thresholds for these data points are recommended by ASHRAE to be safe and energy-efficient zones of operation for a data center.
There are two ASHRAE® envelopes available for display in Power IQ, based on recommendations issued by ASHRAE in 2004 and in 2008.
You can also create a custom region to display on the chart, in addition to ASHRAE regions. See Create a Custom Region.
ASHRAE 2004 Envelope:
The ASHRAE 2004 recommended operating envelope is a rectangular area with the following coordinates.
20 Celsius (68 F), 40% RH
20 Celsius (68 F), 55% RH
25 Celsius (77 F), 40% RH
25 Celsius (77 F), 55% RH
ASHRAE 2008 Envelope:
The ASHRAE 2008 recommended operating envelope is a pentagon-shaped area with the following coordinates.
18 Celsius (64.4 F), 42% RH
18 Celsius (64.4 F), 60% RH
22.7 Celsius (73 F), 60% RH
27 Celsius (80.6 F), 49% RH
27 Celsius (80.6 F), 25%RH

Chapter 5: Dashboard
67
View Sensor Data Point Details
On a cooling chart, the data points for your sensors display as green points.
You can verify whether the points are inside the recommended region you chose to display. The cooling chart allows you to view the details of each data point, and access the associated PDU details page.
Note: If more than one sensor has the same reading, the points will appear stacked, so that 2 points appear to be 1. Hover the mouse over the point to view the details of each stacked point. Export the sensor data to view the details of each point in a text file. See Export Sensor Data (on page 68)
To view sensor data point details:
1. In the Dashboard tab, locate your cooling chart. Hover the mouse over a green data point.
2. The sensor data point details display in a pop-up.
Humidity Sensor Label
Humidity Sensor Location - (EDM Hierarchy Rack location)
Temperature Sensor Label
Temperature Sensor Location - (EDM Hierarchy Rack location)
3. Click the green data point. The Sensor List for Data Point dialog appears.
4. Click a row of data to open the PDU details page for the PDU where the sensor is located. Pop-up blockers may prevent this page from opening.

Chapter 5: Dashboard
68
Cooling Chart Details - How Your Sensor Data is Charted
By default, Power IQ considers all environmental sensors to be inlet located. You can specify a sensor as outlet, inlet, or outside air located in the PDU details page. See Specify Inlet, Outlet, or Outside Air Location for Environmental Sensors (on page 117).
For each sensor data point, the cooling chart will display the details of the associated humidity and temperature sensors. See View Sensor Data Point Details (on page 67).
Each data point requires two coordinates: temperature and humidity. For each temperature measurement, Power IQ correlates the corresponding humidity value. If the same sensor does not support both humidity and temperature readings, then the nearest humidity sensor is used to correlate temperature measurement with humidity measurement. The determination of the nearest humidity sensor is based on the Power IQ Enterprise Data Model hierarchy. For example, Floor -> Room -> Aisle -> Row ->Rack.
Export Sensor Data
To view pairs of sensor readings in a CSV file, export the data. The exported file contains a column called In Region, and a list of points. Points inside the region are listed as TRUE. Points outside the region are listed as FALSE.

Chapter 5: Dashboard
69
Calculate Potential Cooling Energy Savings
Power IQ calculates the estimated cost savings you may experience by raising the temperature of your data center to a higher temperature while remaining within the guidelines of a selected ASHRAE® or custom region.
The potential cooling energy savings displays at the bottom of a cooling chart automatically when a data center is selected as the EDM node included.
Potential cooling energy savings can only be calculated at the data center level, not at lower levels, such as room, or rack.
All temperature sensor data points must be below the upper temperature limit for the region selected, or the calculation will show as 0%. The calculation works by showing you a potential estimated savings based on raising your highest temperature to the maximum allowed by the selected region.
Industry estimates show that you could save 3.9% for each 1 degree Fahrenheit that you raise the data center temperature; or 7% for each 1 degree Celsius that you raise the data center temperature. Your actual savings will vary. You can adjust the savings percentage used in the calculation.
To adjust the savings percentage used:
1. In the Data Centers tab, select the data center node.
2. In the Ratings and Settings section, enter the percentage to use in the calculation in the Savings % per degrees C field.
The Savings % is set to a default: 7% for Celsius readings. Readings for Fahrenheit are calculated based on the Celsius percentage, and estimated at 3.9%.
3. Click Save. Go back to the cooling chart in the Dashboard to view updated potential cooling energy savings.
View Dashboards as a Slideshow
When you have more than 1 dashboard configured, you can view them as a slideshow. Slideshows play in full screen mode. To enhance the full screen affect, set your browser to full screen mode, too.
To view dashboards as a slideshow:
1. In the Dashboard tab, click the Manage icon in the top right corner of the dashboard.
2. The Report Browser dialog appears. All configured dashboards display in a list. The first dashboard listed will display as your default dashboard. Drag and drop the entries in the list to set a new default, and to choose the order the entries will display in the slideshow.

Chapter 5: Dashboard
70
3. Select the checkboxes for the dashboards you want to include in the slideshow. Select the first checkbox to automatically select all configured dashboards.
4. In the Play Slideshow drop-down list, select the length of time each dashboard will display in the slideshow before moving to the next dashboard. When you select the time, the slideshow starts.
To exit the slideshow:
Click the "Exit full-screen mode" link in the top right corner, or click the Raritan logo.
View Dashboard in Full Screen Mode
You can view the dashboard in full screen mode, which removes all other borders and controls.
To view dashboard in full screen mode:
In the Dashboard tab, click the full screen mode icon in the top right corner of the dashboard.
To exit full screen mode:
Click the "Exit full-screen mode" link in the top right corner, or click the Raritan logo.

71
In This Chapter
Change the Administrator Password ....................................................... 71 Adding, Editing, and Deleting Users ........................................................ 71 Adding, Editing, and Deleting User Groups ............................................. 73 Assign Roles within a Data Center .......................................................... 76 Roles and User Access Levels ................................................................ 77 Configuring LDAP Authentication ............................................................ 78
Change the Administrator Password
It is important to change the default admin account password as soon as possible. This helps prevent unauthorized administrator access to Power IQ.
The password must follow the requirements selected in Settings > Password Requirements. See Configuring Password Requirements (on page 85).
To change the administrator password:
1. Click the Settings tab.
2. Click User Accounts. The User Configuration page opens, displaying a list of all the user accounts created for the system.
3. Click Edit for the admin user.
4. Type a new password for the admin account in the Password field, then type it again in the Confirm Password field.
5. Click Save.
Adding, Editing, and Deleting Users
Add a User
To add a user:
1. Click the Settings tab.
2. Click User Accounts. The User Configuration page opens displaying a list of all the user accounts created for the system.
3. Click Add. A blank user information page opens.
4. Enter the Common User Information.
Chapter 6 User Configuration - Authorization and Authentication

Chapter 6: User Configuration - Authorization and Authentication
72
a. Enter a username. User names must be at least 3 characters, but not more than 40 characters. Required
b. Enter the user's first name.
c. Enter the user's last name.
d. Enter an email address.
e. Password and Confirm Password: Enter a password for this user. The password must be at least 8 characters, including one numerical character, one uppercase character, one lowercase character, and one of the following special characters: ~!@#$%^&*()_+{}|:"<>?/.,';][=-`"). Required
f. In the Description field, enter comments about the user.
5. Click Add.
Edit a User
To edit a user:
1. Click Administration > Settings in the Power IQ interface. The Settings page opens in a secondary browser window.
2. Click User Accounts in the Authorization and Authentication panel.
3. Select a user and click Edit. The User Information page opens.
Click Edit to change the name information. Click Save after making changes.
Click Change Password to change the user's password. Enter the password, enter it again to confirm, then click OK.
Delete a User
In the user list page, you can delete users who should no longer have access to the system. You cannot delete the admin user.
To delete a user:
1. Click Administration > Settings in the Web Client. The Settings page opens in a secondary browser window.
2. Click User Accounts in the Authorization and Authentication panel. The User Configuration page opens.
3. Click Delete in the row of the user you want to delete.
4. Click OK to delete the user.

Chapter 6: User Configuration - Authorization and Authentication
73
Assign Roles to a User
Roles assigned to groups or users in the Settings tab give permissions that apply to all Data Centers, PDUs and Devices in Power IQ. See Power IQ Role Definitions (on page 77).
You can also assign the Administrator, Operator, Power Control, and View roles to a user or user group, but limit the role to only a specific level of a data center. To limit the permission, assign the role in the Data Centers tab, in the Permissions section of the data center level the role should cover. See Assign Roles within a Data Center (on page 76).
You must be assigned the Site Administrator role to assign roles.
To assign roles to a user:
1. In the Settings tab, click User Accounts. Select a user then click Edit.
2. In the User Roles section, select roles in the drop-down list, then click Add to assign the permission to the user. Roles assigned to the user appear in the list.
Users can perform the tasks allowed by the roles assigned.
Remove Roles from a User
To remove roles from a user:
1. Click Settings.
2. Click User Accounts.
3. Select a user and click Edit.
4. In the User Roles list, select a role, then click Remove. The user can no longer perform the tasks allowed by the role.
Adding, Editing, and Deleting User Groups
Default User Groups
There are two default user groups, All Users and Site Administrators.
The All Users group contains every user you add to Power IQ, and has the View role assigned to it.
The Site Administrators group contains the Admin user, and has the Site Administrator role assigned to it. The Site Administrator role allows users to do all tasks in Power IQ.
You can change the roles assigned to both groups.

Chapter 6: User Configuration - Authorization and Authentication
74
Add a User Group
To add a user group:
1. Click Settings.
2. Click User Groups.
3. Click Add, then enter a name. Click Next. The Group Information page opens.
4. In the Group Members section, select users in the drop-down list, then click Add. Users in the group appear in the list by login, name, and email.
5. In the Group Roles section, select roles in the drop-down list, then click Add to assign the permission to the group. Roles assigned to the group appear in the list. See Role Definitions (see "Power IQ Role Definitions" on page 77).
Edit a User Group Name
To edit a user group name:
1. Click Settings.
2. Click User Groups.
3. Select a group then click Edit.
4. Click Edit to change the group name.
5. Click Save.
Delete a User Group
To delete a user group:
1. In the Settings tab, click User Groups.
2. Select a group and click Remove.

Chapter 6: User Configuration - Authorization and Authentication
75
Assign Roles to a User Group
Roles assigned to users or user groups in the Settings tab give permissions that apply to all Data Centers, PDUs and Devices in Power IQ. See Role Definitions (see "Power IQ Role Definitions" on page 77).
You can also assign the Administrator, Operator, Power Control, and View roles to a user or user group, but limit the role to only a specific level of a data center. To limit the permission, assign the role in the Data Centers tab, in the Permissions section of the data center level the role should cover. See Assign Roles within a Data Center (on page 76).
You must be assigned the Site Administrator role to assign roles.
To assign roles to a user group:
1. In the Settings tab, click User Groups.
2. Select a user group, then click Edit.
3. In the Group Roles section, select roles in the drop-down list, then click Add to assign the permission to the group. Roles assigned to the group appear in the list.
Users can perform the tasks allowed by the roles assigned to the group.
Remove Roles from a User Group
To remove roles from a user group:
1. In the Settings tab, click User Groups.
2. Select a user group then click Edit.
3. Select a role, then click Remove. Users in the group can no longer perform the tasks allowed by the role.
To remove all roles from a user group:
1. In the Settings tab, click User Groups.
2. Select a user group then click Edit.
3. In the Group Roles section, click Empty.

Chapter 6: User Configuration - Authorization and Authentication
76
Assign Roles within a Data Center
You can control what individual users or user groups can see and do in Power IQ at each level in each data center. Permissions extend to levels nested below the selected level.
You can also assign global permissions for users and user groups for all levels of all data centers in Power IQ, and to PDUs not mapped into a data center. See Assign Roles to a User (on page 73) and Assign Roles to a User Group (on page 75).
Permissions are included in different roles that you assign. See Role Definitions (see "Power IQ Role Definitions" on page 77).
You must be assigned the Site Administrator role to assign roles.
To assign roles within a data center:
1. In the Data Centers tab, select a data center level, such as a rack. The details page opens. At the Rack and PDU levels, the Smart Rack or Smart PDU view opens. See Smart Rack View and Smart PDU View (on page 106)
2. Permissions are accessed differently for Racks and PDUs than all other enterprise data model levels.
For Data Centers, Rooms, Aisles, and Rows, use the Permissions section in the Data Centers tab to view or assign roles.
For Racks, click Configure Rack Details in the Smart Rack view to open a dialog that contains permissions settings.
For PDUs, click Configure PDU Details in the Smart PDU view to open a dialog that contains permissions settings.
Click Add Role to > Add User Role or Add Role to > Add Group Role. Adding a Group Role will give permissions selected to all users in the group.
3. Select the user or group who needs permission to this level of the data center.
4. Select the role to allow in the Roles list. Click OK.

Chapter 6: User Configuration - Authorization and Authentication
77
Roles and User Access Levels
Power IQ Role Definitions
Assign these roles to users or user groups to allow the permissions for operations within Power IQ.
You can assign any role to apply globally, meaning access to perform the tasks will be granted for every object in Power IQ. For example, a user assigned a global Power Control role can perform power control on any PDU or IT device, no matter where it is in the enterprise data model.
See Assign Roles to a User Group (on page 75) and Assign Roles to a User (on page 73).
Or, you can assign the Administrator, Operator, View, and Power Control roles to apply only to a certain object in your enterprise data model, such as a rack. See Assign Roles within a Data Center (on page 76). When these roles are assigned to the user or user group directly at the EDM-node-level via the Data Centers tab, the permission allowed will be limited to the selected enterprise data object, and all levels beneath it.
Role Tasks Applies To
Site Administrator
The Site Administrators group is assigned this role by default, and contains the Admin user.
"Super user"
Every task in Power IQ.
Power IQ
Global only.
Administrator Every task in Power IQ, except for:
Add/remove PDUs to Power IQ, when the Administrator role is applied at the EDM node level. User with Administrator role applied globally, in Settings > User Accounts page, CAN add/remove PDUs to Power IQ.
Tasks in the Settings tab
Global, when applied in Settings > User Accounts page.
Selected EDM node and down, when applied in Data Centers tab
Operator Every task in Power IQ, except for:
Add PDUs to Power IQ
Delete PDUs from Power IQ
Tasks in the Settings tab
Power control
Create reports and charts
Global, when applied in Settings > User Accounts page.
Selected EDM node and down, when applied in Data Centers tab

Chapter 6: User Configuration - Authorization and Authentication
78
Role Tasks Applies To
View View EDM in the Data Centers tab
View all other tabs in Power IQ
Global, when applied in Settings > User Accounts page.
Selected EDM node and down, when applied in Data Centers tab
Power Control Power control
Create device groups
View devices, device groups, PDUs.
Global, when applied in Settings > User Accounts page.
Selected EDM node and down, when applied in Data Centers tab
Create Reports and Charts
Create reports and charts in the Analytics tab
Create dashboards in the Dashboard tab
Global only, applied in Settings > User Accounts page.
The information a user can include or view in a report, chart, or dashboard is based on View permissions.
A user with this role also needs the View role, or another role that includes View permission.
Event Manager View the Events tab
Create event notification filters
View and clear events
View events in the Smart PDUs view
Global only, applied in Settings > User Accounts page.
Roles Information for Upgraded Systems
If you upgraded Power IQ, all users who used to have the Administrator role will now be assigned the Site Administrator role.
Configuring LDAP Authentication
To configure LDAP authentication:
1. Ensure all user accounts have been created on the LDAP server.
2. Gather the settings information. See Gathering LDAP Configuration Settings (on page 79).
3. Enable and configure LDAP in Power IQ. See Configuring LDAP Authentication Settings (on page 79).
4. Create all user accounts in Power IQ with identical credentials as on the LDAP server. This step must be completed AFTER you enable LDAP to ensure the users are created properly. See Adding, Editing, and Deleting Users (on page 71).

Chapter 6: User Configuration - Authorization and Authentication
79
Gathering LDAP Configuration Settings
The following is a list of configuration information you should know before enabling LDAP authentication in Power IQ™. If you are not familiar with these settings, ask your LDAP administrator to help you prepare this list.
LDAP configuration settings:
Type of LDAP Server used: Microsoft Active Directory or other LDAP server
IP Address of the LDAP server
Network port used by the LDAP server
If using a custom port number, what type of encryption is used: TLS, SSL or No Encryption?
Base DN of the server (used for searching for users)
Bind type of the server
Anonymous bind or standard binding
The bind DN setting, if using standard bind
The password, if using standard bind
User ID attribute or the user attribute prefix for user DN
User object class (if applicable)
Additional object filters
LDAP user access level within Power IQ
User roles
Configuring LDAP Authentication Settings
SASL is not supported.
To configure LDAP authentication:
1. In the Settings tab, click Authentication Source in the Authentication and Authorization section.
2. Click Enable LDAP Authentication.
3. Complete the fields with your LDAP information.
LDAP Server: Enter the IP address or hostname.
LDAP Port: Enter the port number.

Chapter 6: User Configuration - Authorization and Authentication
80
Port 389 is the standard, unencrypted LDAP communication port.
Port 636 is the standard, SSL-encrypted LDAP communication port.
Transport Security: Select Unencrypted, SSL Encryption, or TLS Encryption.
4. Authenticate via Search: Leave this checkbox selected to use searching. This is the recommended setting.
Deselect the Authenticate via Search checkbox to use Distinguished Name Authentication. Enter the prefix and suffix that resolves to a valid distinguished name when combined with the user name.
For example: DN == ${prefix}${username}${suffix}
Base DN: The base distinguished name (DN) is the top level of the LDAP directory tree. It indicates where in the LDAP directory to begin searching for user credentials.
For example: cn=Users,dc=raritan,dc=com.
Bind DN
Binding Credentials: Enter the credentials to access the LDAP server.
Confirm: Re-enter the credentials to access the LDAP server.
User ID Attribute
User Object Class
Search Scope: Select One Level to search only the defined Base DN. Select Subtree to search the defined Base DN and all subtrees.
Additional Object Filters
5. Click Save.
To test the LDAP settings:
LDAP must be enabled in order to test.
1. In the Settings tab, click User Accounts.
2. Enter a username and password of a user that has an authorized account in the LDAP server you configured. Click Add then click Test.

Chapter 6: User Configuration - Authorization and Authentication
81
Disabling LDAP Authentication
Disabling LDAP returns Power IQ to using the local authentication database. Users require an account on Power IQ to connect.
To disable LDAP authentication:
1. In the Settings tab, click Authentication Source in the Authentication and Authorization section.
2. Click Local User Authentication.
3. Click Enable Local Authentication.

82
In This Chapter
Installing an HTTPS Certificate ............................................................... 82 Restricting Web and Shell Access Based on IP Address ....................... 84 Configuring Password Requirements ...................................................... 85 Encrypting Data Backup Files ................................................................. 85 Enabling Single Sign On for Raritan PDUs ............................................. 86 Enabling the WS API ............................................................................... 87 Enabling the Web API User Account ....................................................... 87 Change Web User Session Timeouts ..................................................... 87 Configuring the Authorization Warning Message .................................... 88
Installing an HTTPS Certificate
A PEM file upload is required to replace the current certificate and private key. The PEM file needs to contain both an RSA private key and an X509 certificate.
Note: Power IQ™ does not provide a Certificate Signing Request (CSR). OpenSSL or any other utility can be used to generate CSR. Power IQ does not use encrypted private keys. You must remove the password from the Private key before it can be used. To remove the encryption from the key, issue a command like: "openssl rsa -in server.key -out server2.key". Use "server2.key" when using openSSL utility.
It is not required to provide root certificate of CA signing Power IQ certificate signing request (CSR).
Step 1: Generate a private key
This example procedure is for generating a private key using OpenSSL on a Linux server.
1. This command creates an RSA key with Triple DES 1024 byte encryption.
openssl genrsa -des3 -out server.key 1024
2. Remember the key password from this command.
3. Generate a Certificate Signing Request. Be prepared to complete the following information:
private key password
two character country code
full state or province name
city name
Chapter 7 Security and Encryption

Chapter 7: Security and Encryption
83
company name
organizational unit or leave it blank
servers common name or fully qualified domain name
admin email address
other attributes can be left blank
4. Create the request.
openssl req -new -key server.key -out server.csr
5. Display the CSR request.
cat server.csr
6. Copy the CSR request and send it to the certificate authority to be signed. Make sure to copy everything between the first "-----" and the last "-----".
7. Submit CSR to certificate authority and receive signed X.509 certificate.
8. Modify the server key to remove the password
cp server.key server.key.secure
openssl rsa -in server.key.secure -out server.key
Warning: The server.key file must be kept private and secure. If this key file is compromised, the certificate should be removed and then reissued.
9. Create PEM file.
The PEM file should contain both the RSA private key without password and the X.509 certificate.
Concatenate the unprotected private key to the signed X.509 certificate file from the top level certificate authority.
Use this file in the upload in Step 2.
Step 2: Upload the PEM file to Power IQ:
1. In the Settings tab, click HTTPS Certificate in the Security and Encryption section.
2. If uploaded, the currently HTTPS certificate displays. To replace it or add a new certificate, click Browse and select the PEM file.
3. Click Upload.

Chapter 7: Security and Encryption
84
Restricting Web and Shell Access Based on IP Address
To increase security, Power IQ can be configured to restrict web interface and SSH access by IP address. When trusted hosts are specified, Power IQ blocks attempts to connect from addresses not specified. When no hosts are specified, ports 22, 80, 443, 5432 are open to all hosts.
To restrict web and shell access:
1. In the Settings tab, click IP based Access Control in the Security and Encryption section.
2. The global options will override any options that allow access to the SSH and ODBC service.
Allow ICMP ping responses
Block all SSH access
Block all ODBC access: See ODBC Access (on page 196).
3. Identify the hosts to allow access to in the Trusted Hosts fields.
You can enter an IP address, or a subnet using CIDR notation such as 192.168.45.0/24.
4. For each address, select how it is permitted to access Power IQ.
Select the Enable SSH to allow SSH access checkbox.
Select the Enable HTTP/HTTPS checkbox to enable access through the web interface.
Select Enable ODBC to allow third party access.
5. Click Save.

Chapter 7: Security and Encryption
85
Configuring Password Requirements
To specify password strength for Power IQ users, select from a list of password requirements. Users that are locally authenticated will be required to use passwords that comply with the settings. For example, you may require that all passwords contain a number and are longer than 8 characters.
Password requirements apply to locally authenticated users only. If LDAP is enabled, the password requirements selected are not followed.
Changes to the password requirements apply only to future new and changed passwords. Users whose passwords were created before the password requirement change will not be forced to change passwords to comply with the requirements.
To configure password requirements:
1. In the Settings tab, click Password Requirements in the Security and Encryption section.
2. In the Minimum Password Length field, select the minimum number of characters a password must include.
3. In the Maximum Password Length field, select the maximum number of characters a password may include.
4. Select the checkboxes for each requirement you want included in locally-authenticated user passwords.
a lowercase character: Password must contain any lowercase letter.
an uppercase character: Password must contain any capital letter.
a numeric character: Password must contain a number.
a special character: Password must contain any special character, including: ~!@#$%^&*()_+{}|:"<>?/.,';][=-\`
5. Click Save.
Encrypting Data Backup Files
Power IQ encrypts data backup files according to your settings.
To encrypt the data backup files:
1. In the Settings tab, click Data Backup Encryption in the Security and Encryption section.
2. Select the Encrypt Backups checkbox.
3. Select an Encryption Algorithm from the list.

Chapter 7: Security and Encryption
86
4. Click Browse, then select and upload a certificate to Power IQ. Certificates must follow the X.509 standard.
Make sure to save both the public certificate and private key you generate. Both are needed to decrypt the data.
5. Click Save.
Example - Certificate creation using openssl:
openssl req -out [public key] -outform PEM -x509 -days 365
-set_serial 10834 -subj '/C=US/ST=New
Jersey/O=Raritan/OU=Power Management/CN=Backup Encryption'
-newkey rsa:1024 -keyout [private key]
Note: [public key] is the name of the public key file and [private key] is the name of the private key file.
Enabling Single Sign On for Raritan PDUs
You can launch the web interface of a Dominion PX PDU by clicking the Launch link on the PDU details page. When single sign on is not enabled, users must then login to the PDU manually.
Enable single sign on to allow users to automatically authenticate with their Power IQ credentials.
Users must have identical credentials on Power IQ and on the target Dominion PX, and be logged in to Power IQ with those credentials for single sign on to succeed. Single sign on must be enabled in Settings > Single Sign On.
See Launch the Web Interface for a Dominion PX PDU (on page 123).
To enable or disable single sign on for Raritan PDUs:
1. In the Settings tab, click Single Sign on in the Security and Encryption section.
2. Select the "Enable single sign on to Raritan PDUs" checkbox to enable, or deselect the checkbox to disable single sign on.
3. Click Save.

Chapter 7: Security and Encryption
87
Enabling the WS API
To get started with the WS API, the API needs to be enabled through the Settings Tab. It is disabled by default.
To enable the Web API:
1. In the Settings tab, click Other Security Settings in the Security and Encryption section.
2. In the Web API Settings, select the Enable Web API checkbox, then click Save.
Enabling the Web API User Account
The Web API user account is a locally authenticated user that can be used for Web API scripts that require user credentials. The username is "web_api." The password for the account can be configured.
The Web API account is configurable only on the Settings > Other Security Settings page. The Web API user is always authenticated locally, even when LDAP is enabled.
The Web API account is assigned the administrator role. This role assignment cannot be changed.
To enable the Web API user account:
1. In the Settings tab, click Other Security Settings in the Security and Encryption section.
2. In the Web API Settings, select the "Enable web API user web_api" checkbox.
3. In the Web API user password field and the Confirm password field, enter a password.
The password must follow the requirements selected in Settings > Password Requirements. See Configuring Password Requirements (on page 85).
4. Click Save.
Change Web User Session Timeouts
You can set Power IQ™ to log out any web users who have been inactive for a certain period of time.
To change web user session timeouts:
1. In the Settings tab, click Other Security Settings in the Security and Encryption section.

Chapter 7: Security and Encryption
88
2. In the User Session Timeout box, select a time from the "Log users out" list. The time indicates how long users can remain idle on the Power IQ web interface before being logged out. Select Never to disable this feature.
3. Click Save Timeout.
Configuring the Authorization Warning Message
The authorization warning message displays on the Power IQ login page. You can change the default message.
To configure the authorization warning message:
1. In the Settings tab, click Other Security Settings in the Security and Encryption section.
2. In the Authorization Warning message section, enter the message you want to display on the login page. You can use html tags for formatting.
Header: Text entered in this field displays on the login page in a bold font, as the heading to the message
Body: Text entered in this field displays in a normal font, as the main content of the message.
3. Click Save. Log out of Power IQ to return to the login page and view the message.

89
In This Chapter
Configuring Data Rollup Retention .......................................................... 89 Data Backups .......................................................................................... 90 Configuring Remote Storage of Archive Files ......................................... 91 Configuring Remote Access to Database ............................................... 92 Enterprise Relationships .......................................................................... 92
Configuring Data Rollup Retention
Power IQ performs periodic roll-ups. During a roll-up, the values over that period are averaged and stored along with the minimum and maximum values that were measured. As time passes, the stored roll-up data itself is rolled up into larger sets of data. Raw data measurements are rolled up every hour, and 24 hourly roll-ups are rolled up every day, and so on.
Data does not have to be purged immediately after a roll-up occurs. For example, raw data is rolled up every hour but a set of raw data can still be made available five hours later. You can configure how long Power IQ retains each level of data.
Ideally, you should adjust the data retention periods before adding PDUs to Power IQ management. You should also revisit these settings after adding a large number of PDUs.
Note: Power IQ collects a lot of data. Keeping this data for long periods of time consumes large amounts of storage space and may affect performance. If you need long term access to the raw poll data, you should download daily sensor readings regularly. See Downloading Daily Sensor Readings (on page 161).
Before making any changes to this configuration, enter your settings in the data storage calculator to ensure adequate database capacity. Improper configuration may result in data loss. Access the data storage calculator by clicking the link on the Settings > Data Rollup Retention page in Power IQ.
To configure data rollup retention:
1. In the Settings tab, click Data Rollup Retention, in the Data Management section.
2. Start with the "Retain raw data" row. Use the drop-down lists in that row to select how long Power IQ should keep this raw data.
Chapter 8 Data Management

Chapter 8: Data Management
90
3. In the Retain hourly averages of data row, configure how long hourly roll-ups are stored.
4. In the Retain daily averages of data row, configure how long daily roll-ups should be stored.
5. In the Retain monthly averages of data row, configure how long monthly roll-ups should be stored by Power IQ.
Data Backups
Power IQ creates a daily system configuration backup file.
You can download the files to another location. Downloading System Configuration Backup Files (on page 90).
To automatically download daily backup files, setup a remote storage location. See Configuring Remote Storage of Archive Files (on page 91).
You can also create a new system configuration backup file at any time. See Create a System Configuration Backup File (on page 90).
If needed, you can use a backup file to restore your Power IQ to an earlier, backed-up configuration. See Restoring System Configuration Backups (on page 91).
Downloading System Configuration Backup Files
The configuration of your Power IQ is backed up and archived once each day. Administrators should periodically copy these backup files to an external server for redundancy purposes.
Note: You can also manually create an archive of the system configuration by clicking Create at any time.
To download the system configuration backup file:
1. In the Settings tab, click Data Backups in the Data Management section. The Data Backups page opens.
2. Select a backup entry from the list and click its name to download the backup file to your computer.
Create a System Configuration Backup File
Power IQ creates a daily backup file. You can create a new backup file at any time.
To create a system configuration backup file:
1. In the Settings tab, click Data Backups in the Data Management section.

Chapter 8: Data Management
91
2. In the Backup Archives box, click Create. The file is created and added at the top of the list.
Restoring System Configuration Backups
Restoring a system configuration backup file returns Power IQ's configuration to the settings captured when the backup was made.
To restore a system configuration:
1. In the Settings tab, click Data Backups in the Data Management section. The Data Backups page opens.
2. In the Restore a Backup Archive section, click Browse, then select a backup file.
3. Click Upload. Power IQ reboots. Power IQ is restored to the backup's configuration settings.
Configuring Remote Storage of Archive Files
Configure a remote storage server to automatically store your archive files. All files that are not being actively written to will be automatically stored on the configured server. Sensor reading archives are often being actively written to, so their storage may be approximately one day delayed.
Two file types are eligible for automatic remote storage.
System configuration archives, that is, system configuration backup files, including daily automatic backups and manually created backups
Sensor reading archive files
To configure remote storage of backup files:
1. In the Settings tab, click Remote Storage in the Data Management section.
2. Select the remote storage service type.
None: to stop automatic remote storage
Amazon Web Services
SCP
SFTP
FTP
3. Select the checkboxes for the file types you want to automatically store on a remote server.
Store backup archives
Store sensor reading archives

Chapter 8: Data Management
92
4. Complete the authentication and location information for your selected remote server.
5. Click Save.
Configuring Remote Access to Database
Power IQ's ODBC interface allows ODBC compliant applications access to the power data of managed devices. For example, an ODBC compliant reporting application like Crystal Reports can access Power IQ data to create customized reports.
See ODBC Access (on page 196) for details on configuration and queries.
Enterprise Relationships
One of Power IQ's advanced features is the ability to model your IT equipment infrastructure. Power IQ can model something as simple as a single rack, or as large as a building with multiple server rooms.
Power IQ displays the enterprise data model in the Data Centers tab. You can expand and collapse each level to view the details of your data centers.
The enterprise data model is required for generating charts and other displays of your data, such as Analytics, widgets on the Dashboard, and Cooling Charts.
Download a sample Enterprise Data Model CSV file from the Support section of Raritan's web site, under Firmware and Documentation. See the "CSV Import Template" at http://www.raritan.com/support/power-iq/
Overview of the Enterprise Model
The model is a representation of your IT equipment infrastructure. This model is composed of objects and the relationships between them. Power IQ builds its understanding of your infrastructure based on the relationships between these objects.
For example: a model might describe the following: "I have a Data Center in New York. That Data Center has 1 Room. That room contains 3 Rows of racks. Each Row contains 4 Racks of Devices. The first rack is powered by PDU A1. The first rack contains these 20 devices."

Chapter 8: Data Management
93
What is an Enterprise Model Object?
An object is an item that is a part of your Data Center.
The lowest level objects are called Devices. Devices are items such as servers, KVM drawers, network switches, or other equipment commonly installed in server racks. Generally speaking, these are items you provide power to.
Larger objects contain and organize smaller objects. For example: a Rack is an object that contains Devices, a Row is an object that can contain Racks, and an Aisle is an object that can contain Rows.
Additionally, some objects such as Data Center or Device have optional attributes that further describe them.
What are Mappings and Relationships?
All objects, except for the Data Center, must have a larger object as a parent. Generally speaking, a parent object is a larger object that contains a smaller object.
The Data Center object is the largest object. It has no parent object.
This ability to identify an object's parent is a single mapping. Mapping each object to its parent describes a model of equipment and how it is organized to Power IQ.
Two objects have special relationships:
Outlet: When using a Dominion PX PDU with per-outlet metering, an outlet object is a single outlet on that PDU. Its parent object is an IT Device (a Device Object). This IT Device is the item this outlet provides power to. Using Dominion PX PDUs therefore allows Power IQ to measure the amount of power individual devices consume.
PDU: For PDUs other than Dominion PX, a PDU object is a single power distribution unit without per-outlet metering. Its parent object is a larger, organizing object such as a Rack. Row, Aisle or Room, and so on. The PDU provides power to this "parent" object, and by extension, at least some of the Devices contained within. Power IQ can only measure the power consumption at the PDU or parent-object's level.

Chapter 8: Data Management
94
Object Types and their Hierarchy
There are nine types of objects used. From largest to smallest they are:
DATA_CENTER - The data center object type. This object has no parent.
FLOOR - The floor object type. This object can only have a DATA_CENTER as a parent.
ROOM - The room object type. This object can have a DATA_CENTER or FLOOR as a parent.
AISLE - The aisle object type. This object can have a DATA_CENTER, ROOM, or FLOOR as a parent.
ROW - The row object type. This object can have a DATA_CENTER, ROOM, FLOOR, or AISLE as a parent.
RACK - The rack object type. This object can have a DATA_CENTER, ROOM, FLOOR, AISLE, or ROW as a parent.
DEVICE - The IT Device object type. This object can only have a RACK as a parent.
Two objects represent outlets and Power Distribution Units:
OUTLET - The outlet object type. This object can only have a DEVICE as a parent.
PDU - The PDU object type. This object represents PDUs that do not have outlet level metering and are unable of communicating device-specific data to the system.
A model does not necessarily have to contain all object levels. For example, a model could include: Device "Exchange Server" has a Rack "IT Rack #1" as its parent object. Rack "IT Rack #1" has a Data Center "IT Data Center" as its parent object.
Room "Server Closet" could never have Rack "IT Rack#1" as a parent. An object can only be mapped to a larger parent object.

Chapter 8: Data Management
95
Importing Object Mappings
The most efficient way to create or add to an enterprise model is to import the objects and their mappings. These mappings are imported as one or more Comma Separated Value (CSV) files. Additional CSV files append to the Enterprise Data Model, except when objects are duplicated in the CSV files. In the case of duplicates, the last uploaded object updates the previous entries.
If an Enterprise Data Model already exists, you can click Export Relationships under CSV Data Mapping Actions to export the entire model as a single CSV file. This file can then be edited to make additions, or used as a template to create a new file. See Exporting Object Mappings as CSV Data (on page 101).
Note: Uploading this CSV file only describes the relationship between objects (including PDUs and outlets). It cannot be used to add PDUs to Power IQ management. Add all PDUs to Power IQ first, before associating them into the Enterprise Model. Importing a CSV file that lists a PDU not added to Power IQ results in an error.
To import object mappings:
1. In the Settings tab, click Enterprise Relationships. The Enterprise Relationship page opens.
2. In the CSV Data Mapping Actions area, click Browse, and select the CSV file.
3. Click Import.
A status window indicates any issues that occurred when the upload completes. If any errors have occurred, none of the objects in the file are added. Edit the CSV file to correct any issues and try again.

Chapter 8: Data Management
96
Structure of the Enterprise Model CSV File
The object mapping CSV files have the following general structure:
One Object per line.
All Objects (except for a Data Center) list another valid object as a parent.
All Objects have a unique "key" for their type.
The CSV file has a maximum length of 2500 lines (objects).
Within a single CSV file, object order is not important. All objects are processed at the same time.
An object's unique identity is a combination of its object type and its object key, which is called an external key. This means you could have two objects with the same name, as long as they are different types of objects.
However, if two lines are both type "DEVICE" and both have an external key "Sales1", Power IQ sees only one device object with the key "Sales1". In this case, it uses the last DEVICE object identified as "Sales1" as the description for that device.
The columns required for each object varies, depending on the object type.
All columns are separated by a comma.
Most columns containing text information can be up to 64 characters long. These columns can contain any character except for a comma.
The custom_field_1, custom_field_2, external_key and parent_external_key fields can be up to 255 characters long. These columns can contain any character except for a comma.
Note: If you have an enterprise model with more than 2500 objects, you must upload the mapping as multiple CSV files. In this case, file order is important. All objects except for Data Center must have a valid parent when added. Thus, placing a child object in file #1, and the parent object in file #2 results in an error if file #1 is imported first. To avoid this, put all Data Centers and other large organizational objects in the first CSV file to be uploaded.

Chapter 8: Data Management
97
CSV Columns for DATA_CENTER Objects
A line that describes a Data Center object has the following attribute columns in the order listed.
All columns are separated by a comma.
Note the attribute columns toward the end. For example: by providing the cost of energy for the data center, Power IQ can calculate the cost of running the data center in an Analytics report. Report can be filtered to include only a smaller object, such as a Rack. See Configuring Charts (on page 180).
object_type - this value is always "DATA_CENTER"
external_key - The unique identifier for this object. It can be a name, number, or any other kind of text. This field must be unique.
name - The name of the data center.
contact_name - The name of the contact for this data center.
contact_phone - The phone number for the contact for this data center.
contact_email - The email address of the contact for this data center.
company_name - The name of the company that owns this data center
city - The city where the data center resides.
state - The state/province where the data center resides.
country - The country where the data center resides.
peak_kwh_rate - The cost per kilowatt hour during peak hours
off_peak_kwh_rate - The cost per kilowatt hour during off-peak hours
peak_begin - The time the peak hours begin.
peak_end - The time the peak hours end.
co2_factor - The co2 factor for this site. This indicates thse amount of carbon dioxide produced per kWh.
cooling_factor - The cooling factor per kw energy used. This is the energy used for cooling, or how many kilowatts of energy are used to cool 100 kilowatts of power consumption.
custom_field_1 - A custom field for the user to specify.
custom_field_2 - A second custom field for the user to specify.
capacity - The peak capacity in kilowatts, specified with up to two decimal places.

Chapter 8: Data Management
98
CSV Columns for FLOOR, ROOM, AISLE, and ROW Objects
Lines that describe a Floor, Room, Aisle, or Row have the following attribute columns in this order:
object_type - One of the following values: FLOOR, ROOM, AISLE, ROW
external_key - The unique identifier for this object. It can be a name, number, or any other kind of text. This field must be unique.
name - The name of the object.
parent_object_type - One of DATA_CENTER, FLOOR, ROOM, or AISLE, as described previously.
parent_external_key - The unique identifier for the parent object. It can be a name, number, or any other kind of text. This field must be unique to that parent object (however, many "child" objects may have the same parent).
capacity - The peak capacity in kilowatts, specified with up to two decimal places.
CSV Columns for RACK Objects
A line that describes a Rack has the following attribute columns in this order:
object_type - RACK
external_key - The unique identifier for this object. It can be a name, number, or any other kind of text. This field must be unique.
name - The name of the object.
parent_object_type - One of DATA_CENTER, FLOOR, ROOM, AISLE, or ROW, as described previously.
parent_external_key - The unique identifier for the parent object. It can be a name, number, or any other kind of text. This field must be unique to that parent object (however, many "child" objects may have the same parent).
location - an optional field that can be used to identify where rack sits in a row or aisle.
The Rack model object is similar to the Floor, Room, Aisle and Row objects. The exception is the location value. This value is intended to make the rack easier to identify, and can be given a location value. For example: "3rd Rack" to indicate the third rack in a particular row.
It can also use some other identifying trait. For example: "Yellow" if the rack has a yellow color.

Chapter 8: Data Management
99
CSV Columns for DEVICE Objects
A line that describes a Device object has the following attribute columns in this order:
object_type - this value is always "DEVICE"
external_key - The unique identifier for this object. It can be a name, number, or any other kind of text. This field must be unique.
name - The name of the data center.
parent_object_type - This value is always "RACK".
parent_external_key - The unique identifier for the parent rack.
customer - The customer using this device.
device_type - The type of device. For example: "exchange server" or "test unit".
power_rating - The power rating of this device in watts or VA.
decommissioned - Indicates whether this device has been decommissioned or not. This value is either "true" or "false".
custom_field_1 - A custom field for the user.
custom_field_2 - A second custom field for the user.
device_ip - The IP address of the device. Required when also importing a graceful shutdown command.
shutdown_command_name - The name of the shutdown command assigned to this device. See Add Shutdown Commands (on page 153).
shutdown_wait_time - The number of seconds Power IQ should wait for the shutdown to complete before powering off the associated outlet. See Enable Graceful Shutdown for an IT Device (on page 154).
Sample CSV columns for Devices With and Without Graceful Shutdown Commands
A device with a graceful shutdown command:
DEVICE,Device -- 54,Web Server 7,RACK,Rack -- 12,Marketing,Linux Server,,false,Dell PowerEdge R910,Tag# 336549,192.168.43.142,Marketing Linux Servers Shutdown Commands,5
A device without a graceful shutdown command:
DEVICE,Device -- 55,Router,RACK,Rack -- 12,Marketing,Cisco Router,,false,Cisco 7600 Router,Tag#044142,,,

Chapter 8: Data Management
100
CSV Columns for OUTLET Objects
A line that describes an Outlet object has the following attribute columns in this order:
object_type - this value is always "OUTLET"
pdu_ip - The IP address of the PDU that this is attached to.
pdu_proxy_address - If the PDU is in a daisy-chained configuration or console server configuration, enter the PDU's position number in the chain or serial port number.
outlet_number - The outlet number on the side of the PDU for this outlet.
parent_object_type - This value is always "DEVICE"
parent_external_key - The unique identifier for the DEVICE that this outlet serves.
Power IQ automatically creates Outlet objects when Dominion PX PDUs are placed under its management. If you create an Outlet object with a pdu_ip not under Power IQ management, the CSV file generates an error.
CSV Columns for PDU Objects
A line that describes an PDU object has the following attribute columns in this order:
object_type - This value is always PDU.
pdu_ip - The IP address of the PDU.
pdu_proxy_address - If the PDU is in a daisy-chained configuration or console server configuration, enter the PDU's position number in the chain or serial port number.
parent_object_type - One of DATA_CENTER, FLOOR, ROOM, AISLE, ROW, RACK as described previously.
parent_external_key - The unique identifier for the parent object. It can be a name, number, or any other kind of text. This field must be unique to that parent object (however, many "child" objects may have the same parent).
You must add all PDUs to Power IQ before you can map them to the Enterprise Data Model.
Recommended Number of Objects Per Level
In the EDM hierarchy, a maximum of 350 "child" objects per parent is recommended.
For example, a Data Center should not have more than 350 Racks under it.

Chapter 8: Data Management
101
Exporting Object Mappings as CSV Data
Power IQ can export the existing enterprise model as a CSV file. You can edit this file to make additions to your enterprise infrastructure, then Import the edited file to update the enterprise model. The CSV file can also be used as a template to create additional import files.
To export object mappings as CSV data:
1. In the Settings tab, click Enterprise Relationships.
2. In the CSV Data Mapping Actions area, click Export Relationships.
Power IQ exports the Enterprise Model as a single CSV file, regardless of how many objects it contains. If you want to re-import a file that contains more than 2500 objects, separate them into multiple CSV files.
Clearing Object Mappings
Clearing the mappings erases all enterprise objects and their mappings from the database.
To clear object mappings:
1. In the Settings tab, click Enterprise Relationships in the Data Management section.
2. In the CSV Data Mapping Actions box, click Clear Enterprise Relationships.
3. Click "Clear all enterprise relationships" in the warning message to confirm.
Viewing the Enterprise Model
The Data Centers view is a hierarchical view of your Enterprise Relationship objects. To view this display, click the Data Centers tab.
Power IQ displays its model of IT devices as a tree of objects. From there you can view and change individual objects, their mappings, and their individual attributes.
See Smart Rack View and Smart PDU View (on page 106) for details on the displays for Rack and PDU objects in the enterprise data model.
To view the enterprise model:
1. Expand each Data Center in the left-hand column to view the next level of objects it contains. If these objects contain smaller objects, they can also be expanded.
2. Select an object from the resulting tree to view and adjust its details in the main section of the page.

Chapter 8: Data Management
102
To add an object to the enterprise model:
Click the Add button at the top of the column. This adds a new object below (if the new object is smaller) or after the currently selected object.
To remove or rename an object in the enterprise model:
Right-click an object in the left-hand column to rename it, refresh the view, or remove it from the tree.
About Object Values
Objects shown in the main section display most of their values. A specific object's parent is not displayed here, but can be determined by the object they are nested under in the tree to the left.
The rest of the object's values can be adjusted from this main display. These object values are the same values described by the columns in the CSV file. Any changes that are saved here appear in the CSV file the next time Power IQ exports the relationship model.
You can change the names of "Custom Field 1" and "Custom Field 2" for the Data Center, Device, and PDU objects. See Configuring Custom Fields (on page 105).
Note: You cannot use this page to change the parent of an object. Changing the relationship of an object must be done through the CSV file. See Importing Object Mappings (on page 95).
For example: If a Rack called "Test Rack 1" mistakenly has a Row called "Sales Row" as its parent you cannot use the Data Center view to move it to the row "Testing Row". "Test Rack 1" 's parent object type and parent external key values must be adjusted in the CSV file to make this change.
Viewing Enterprise Relationship Summaries
This page provides an overview of the Enterprise Model configured in Power IQ. From this page you can see how many objects Power IQ is tracking. You can also see if any of those objects are not mapped for reporting.
To view enterprise relationship summaries:
1. Click the Settings tab.
2. Click Enterprise Relationships. The Enterprise Relationship page opens.

Chapter 8: Data Management
103
View Orphaned Systems Information
The Orphaned Systems information shows whether there are any PDUs in Power IQ that are not properly mapped to a parent object. PDUs that are not properly mapped cannot be included in Analytics charts.
To view orphaned systems information:
In the Settings tab, click Enterprise Relationships in the Data Management section of the page.
The Orphaned Systems information is in the top right section of the page that opens.
See the table for explanations and possible action required.
Outlets Mapped Outlets Not Mapped
PDU Mapped
The number of PDUs that are mapped to a parent object such as a rack, and have at least one outlet mapped to an IT device.
No action is required.
The number of PDUs that are mapped to a parent object such as a rack, but do not have any outlets mapped to IT devices.
No action is required.
PDU Not Mapped
The number of PDUs that are not mapped to a parent object such as a rack, but have 1 or more outlets mapped to IT devices.
Action required!
If you have unmapped PDUs, you must assign them to a parent object for analytics to perform correctly.
See Find and Map Unmapped PDUs (on page 104).
The number of PDUs that are not mapped to a parent object such as a rack, and have zero outlets mapped to a device.
Action required!
If you have unmapped PDUs, you must assign them to a parent object for analytics to perform correctly.
See Find and Map Unmapped PDUs (on page 104).

Chapter 8: Data Management
104
Find and Map Unmapped PDUs
There are several ways to find unmapped PDUs so that you can map them to parent objects in the Enterprise Data Model.
All PDUs must be mapped to a parent object, such as a rack. PDUs that are not properly mapped cannot be included in Analytics charts.
To view the number of unmapped PDUs:
See View Orphaned Systems Information (on page 103).
To find unmapped PDUs in CSV file export:
1. In the Settings tab, click Enterprise Relationships.
2. Click Export Relationships.
3. In the CSV file, find the section labeled "# The following section contains the current list of PDUs and the PDU column
headers for use during import."
4. In that section, find the "parent_object_type" column. Rows
without data in the "parent_object_type" column are unmapped
PDUs.
5. Map the unmapped PDUs to parent objects in a data center.
To find unmapped PDUs in a default Enterprise Data Model:
This method maps unmapped PDUs to an "Unassigned Data Center" parent object so that you can view the PDUs in the Data Centers tab. Then, you can drag and drop the PDUs to the correct position beneath a parent object, such as a rack.
1. In the Settings tab, click Enterprise Relationships.
2. Click Generate Default Enterprise Relationships.
3. When the generation completes successfully, click the Data Centers tab and find the Unassigned Data Center.
4. Expand the Unassigned Data Center. All the previously unmapped PDUs are assigned to this data center object.
5. Drag and drop the PDU objects to assign them to the correct parent objects, such as racks, within the correct data center.
To manually assign PDUs to a parent object:
When you attempt to manually assign PDUs to a parent object in the Data Centers tab, only unmapped PDUs will be available for assignment.
1. In the Data Centers tab, select the parent object, such as a rack, that you want to assign an unmapped PDU to.

Chapter 8: Data Management
105
2. Click Add > PDU Association.
3. In the Associate a PDU dialog, select an unmapped PDU in the PDU IP Address field, and click OK. The PDU is mapped to the data center parent object.
Configuring Custom Fields
The Data Center, Device, and PDU objects each contain two custom field values.
Custom fields display in the Data Centers tab's hierarchy on the object page, for all 3 types of custom field. PDU custom fields also display in the PDUs tab, in the PDU Details. IT Device custom fields also display in the Devices tab, in the Device Details. You can use custom field values as filters when configuring charts. See Configuring Charts (on page 180)
By default, these are named:
Data Center Custom Field 1 and Data Center Custom Field 2
IT Device Custom Field 1 and IT Device Custom Field 2
PDU Custom Field 1 and PDU Custom Field 2
Rename the field to specify the information it will contain. For example, to add data about the department that uses a group of devices, rename the IT Device Custom field "Department," and enter department names for each device in Power IQ.
To configure custom fields:
1. In the Settings tab, click Enterprise Relationships in the Data Management section.
2. In the Configure Custom Fields box, enter the new field name next to each custom field.
3. To assign data to the field, enter the data in the newly renamed custom field in either the Data Centers tab, on the objects page, or in the PDUs or Devices tab, in the details page. Data Center custom fields can only be accessed in the Data Centers tab. Or, you can use CSV import to update the information. See Importing Object Mappings (on page 95).

106
The Data Centers tab displays all objects you have configured in your enterprise data model, which is the hierarchical representation of your data centers, rooms, aisles, rows, racks, PDUs, and IT devices.
The rack and PDU levels of your enterprise data model are the sources of important information, such as power readings, sensor readings, and events. Power IQ offers an advanced display for these two levels, called the Smart Rack view and Smart PDU view.
The Smart Rack and Smart PDU views are automatically available for every rack and PDU object in your enterprise data model.
You must add PDUs to Power IQ, then configure the enterprise data model, before you can see the views in the Data Centers tab. See Adding PDUs to Power IQ Management (on page 11) and Enterprise Relationships (on page 92).
In This Chapter
Opening the Smart Views ...................................................................... 107 Configure PDU Details - Smart PDU View ............................................ 107 Configure Rack Details - Smart Rack View ........................................... 108 Energy and Environmental Trends - Smart Views ................................ 108 IT Devices - Smart Rack View ............................................................... 111 PDU Elements - Smart Views ............................................................. 112 Readings - Smart PDU View ................................................................. 113 Details - Smart PDU View ..................................................................... 114 Event Listing - Smart PDU View ............................................................ 115
Chapter 9 Smart Rack View and Smart PDU View

Chapter 9: Smart Rack View and Smart PDU View
107
Opening the Smart Views
Power IQ contains two smart views: Smart Rack view and Smart PDU view.
To open the smart rack view:
In the Data Centers tab, select a rack. You may have to expand the levels of the data center to find the racks.
The Smart Rack view contains three sections.
Energy and Environmental Trends
IT Devices
PDU Elements
To open the smart PDU view:
In the Data Centers tab, select a PDU. You may have to expand the levels of the data center to find the racks.
The Smart PDU view contains five sections.
Energy Trends
PDU Elements
Readings
Details
Event Listing
Configure PDU Details - Smart PDU View
The Configure PDU Details button on the Smart PDU view opens a dialog for accessing the "classic" PDU Details page, and editing for user permissions on this PDU.
To access PDU details configuration:
1. Click the Configure PDU Details button.
2. In the dialog that appears:
Click the View PDU details link to open the PDU Details page. See Viewing a PDU (on page 116).
View and change the roles and permissions assigned for users of this PDU. See Assign Roles within a Data Center (on page 76) for more details.

Chapter 9: Smart Rack View and Smart PDU View
108
Click Add Role to > Add User Role or Add Role to > Add Group Role. Adding a Group Role will give permissions selected to all users in the group.
Select the user or group who needs permission to this PDU.
Select the role to allow in the Roles list. Click OK.
Configure Rack Details - Smart Rack View
The Configure Rack Details button on the Smart Rack view opens a dialog changing the rack name, location, external key, and capacity, and editing for user permissions on this rack.
To access rack details configuration:
1. Click the Configure Rack Details button.
2. In the dialog that appears:
Enter a new rack name, location, external key, or capacity. See Set a Capacity (on page 60) for details on this field.
View and change the roles and permissions assigned for users of this rack. See Assign Roles within a Data Center (on page 76) for more details.
Click Add Role to > Add User Role or Add Role to > Add Group Role. Adding a Group Role will give permissions selected to all users in the group.
Select the user or group who needs permission to this rack.
Select the role to allow in the Roles list. Click OK.
Energy and Environmental Trends - Smart Views
The Smart Rack view and Smart PDU view both contain large trend charts at the top of the page.
To change the trend chart settings:
1. At the bottom of the trend charts section, select the readings and time period to include in the fields.
2. Show: minimum, maximum or average readings. Not available for past hour readings.
3. For the past: hour, day, week, month.

Chapter 9: Smart Rack View and Smart PDU View
109
Energy and Environmental Trends - Details
Smart Rack view shows Energy and Environmental Trends in charts.
Environmental sensor charts
Temperature, one chart per sensor.
Humidity, one chart per sensor.
Total Active Power for all devices and PDUs in the rack

Chapter 9: Smart Rack View and Smart PDU View
110
Energy Trends - Details
Smart PDU view shows Energy Trends only in charts.
Active Power
IT Energy
Line Current
Circuit Breaker Current

Chapter 9: Smart Rack View and Smart PDU View
111
IT Devices - Smart Rack View
The IT Devices section of the Smart Rack view contains a list of all devices that are connected to one or more outlets in the rack. If a device does not have any associated outlets, it will not appear in this list. Devices without associated outlets do still appear in the tree view.
The outlets associated with each device display beneath the IT device. There is a checkbox for each outlet, to select it for power control operations.
Each outlet shows a Trend chart showing the active power trend.
Each device shows an Active Power reading, per device, and per outlet.
Outlets that are powered on display in black.
Outlets that are powered off display in gray.
To change the active power display:
1. At the bottom of the IT Devices section, select the readings and time period to include in the fields.
2. Show: minimum, maximum or average readings. Not available for past hour readings.
3. For the past: hour, day, week, month.
To perform power control on devices:
1. Select the checkboxes for each outlet associated with a device. All outlets are grouped beneath the device.
To select all devices in a rack, select the top checkbox.
2. Choose Power Control > On, Power Control > Off, or Power Control > Cycle.
Note: Power Off and Power Cycle operations on this page do not use graceful shutdown, even if it is enabled for a selected device.

Chapter 9: Smart Rack View and Smart PDU View
112
PDU Elements - Smart Views
The PDU Elements section appears in both the Smart Rack and Smart PDU views. This section contains a list of all outlets in the rack, or all outlets on the PDU, respectively.
If a PDU has circuit breakers, the circuit breakers also display as PDU Elements in both the Smart Rack and Smart PDU views.
Each outlet or circuit breaker shows a Trend chart showing either the active power trend, or the current (amps) trend.
Each outlet or circuit breaker shows either an Active Power reading or a Current (amps) reading.
Outlets that are powered on display in black.
Outlets that are powered off display in gray.
To change the active power and current display:
1. At the bottom of the PDU Elements section, select the readings and time period to include in the fields.
2. Show: minimum, maximum or average readings. Not available for past hour readings.
3. For the past: hour, day, week, month.
4. Select either Active Power or Current in amps.
To perform power control on outlets:
1. Select the checkboxes for each outlet.
To select all outlets in a rack, select the top checkbox.
2. Choose Power Control > On, Power Control > Off, or Power Control > Cycle.

Chapter 9: Smart Rack View and Smart PDU View
113
Note: Power Off and Power Cycle operations on this page do not use graceful shutdown, even if it is enabled for a selected device.
Readings - Smart PDU View
The Readings section of the Smart PDU view contains the power readings for the PDU and for each line.
The PDU Readings shows the Active Power and Apparent Power for the entire PDU.
The Line Readings section shows the Current in amps and the Available Current for each line or circuit breaker.
The status at the bottom of the Readings section shows when the latest reading was taken.

Chapter 9: Smart Rack View and Smart PDU View
114
Details - Smart PDU View
The Details section of the Smart PDU view contains all information about the PDU. This information is also available in the PDU Details page.
Click the Belongs To link to view the PDU's rack, or appropriate parent object in the enterprise data model.
Choose Actions> Edit to open the edit page for PDU credentials. See Editing PDUs under Power IQ Management (on page 13)
Choose Actions> Remove to delete the PDU from Power IQ. The PDU and all data collected from it are deleted when you remove a PDU. Click Remove PDU(s) and Data to confirm.
Choose Actions> Rescan to poll the PDU.
Choose Actions> SNMP Diagnostics to run SNMP walk on the PDU.
Choose Actions> Launch to open the web interface for Dominion PX PDUs only. See Launch the Web Interface for a Dominion PX PDU (on page 123).

Chapter 9: Smart Rack View and Smart PDU View
115
Event Listing - Smart PDU View
The Event Listing section of the Smart PDU view shows all events for the PDU.
Click an Event link to open the Event details page.
Select the checkbox for one or more events, then click Clear Selected Events to clear them. See Clear Events (on page 46).

116
There are two methods for viewing PDUs: the Smart PDU view, in the Data Centers tab, and the PDUs tab, which includes a "classic view" PDU Details page for each PDU.
To view data collected from the PDU, and environmental charts, use the Smart PDU view, in the Data Centers tab. See Smart Rack View and Smart PDU View (on page 106).
To view details and configure the PDU or manage sensors and asset strips, use the PDUs tab. See Viewing a PDU (on page 116).
In This Chapter
Viewing a PDU ...................................................................................... 116 PDU Status ........................................................................................... 119 Configure the Number of PDUs in the List ............................................ 120 Filter the PDUs List ............................................................................... 121 Export the PDUs List to CSV ................................................................ 122 Launch the Web Interface for a Dominion PX PDU .............................. 123 Searching for PDUs .............................................................................. 123
Viewing a PDU
Click the IP address of a PDU in the list to view details about the PDU.
Details: View information about the PDU, including name, IP address, manufacturer, and firmware revision. The information is based on what Power IQ can discover and is not editable here.
Active Power Trending: A graph displays the power usage of the PDU. Click customize to adjust the graph to show power usage over the previous hour, day, or month.
Readings: View additional metric data. The metrics shown here depend on the PDU, and may include items such as apparent power usage and per-line current. If a PDU has attached sensors, you can specify whether the sensors are inlet or outlet located or if the sensor is for outside air. By default, Power IQ considers all environmental sensors to be inlet located.
Note: To fully populate the areas of this page, the PDU must be configured with an SNMP community string that has a minimum of read-level access, or, for renaming capabilities, write-level access.
Chapter 10 Viewing PDUs

Chapter 10: Viewing PDUs
117
Specify Inlet, Outlet, or Outside Air Location for Environmental Sensors
If a PDU has attached sensors, you can specify whether the sensors are inlet or outlet located or if the sensor is for outside air. By default, Power IQ considers all environmental sensors to be inlet located.
All sensor types can be included in Cooling charts on the dashboard. See Cooling Chart Widget (on page 64).
To specify inlet or outlet location for environmental sensors:
1. In the PDUs tab, click the link for a PDU with attached sensors.
2. Scroll down to the Readings section. All attached sensors display in a list.
3. In the Sensor Location column, select Inlet, Outlet, or Outside Air to specify the sensor's location.
Naming Environmental Sensors
Environmental sensors have sensor labels that you can change in Power IQ.
The following PDUs support naming environmental sensors, depending on model: APC, Eaton, Baytech, Liebert, Raritan, Servertech, Sinetica.
Sensor names cannot include only white space characters. The maximum name length is 256 characters.
Sensor labels for sensors of the same type, for example, humidity or temperature, must be unique. During polling, if Power IQ finds two sensors of the same type with the same name, the sensor readings for those sensors are not saved. Power IQ adds an error message to the audit log.
To name environmental sensors:
1. In the PDUs tab, click the link for a PDU with sensors.
2. Scroll down to the Reading section. All attached sensors display in a list.
3. Double-click the name in the Sensor Label column then enter the new name.
4. Press Enter or click in a blank area of the page to submit the name.
5. A status dialog appears. When the name change is complete, a success message displays. Click OK.

Chapter 10: Viewing PDUs
118
Viewing Sensor Information
Sensor information appears in the "classic" PDU details page for the PDU the sensor is connected to. You can also view humidity and temperature sensor information in the Smart Rack view in the Data Centers tab. See Energy and Environmental Trends - Smart Views (on page 108).
For details on configuring sensors connected to PX1 and PX2 PDUs, see Sensors Connected to PX1 and PX2 PDUs (on page 124).
To view sensor information in the PDU Details page:
1. In the PDUs tab, click the link for the PDU the sensor is connected to. The PDU details page opens.
2. Scroll down to the Readings section. The sensor readings are in the "External sensor readings" box.
See Naming Environmental Sensors (on page 117) for details on changing sensor labels.
See Specify Inlet, Outlet, or Outside Air Location for Environmental Sensors (on page 117) for details on changing sensor location.
To view sensor information in the Smart Rack views:
See Energy and Environmental Trends - Smart Views (on page 108).
Asset Strips
Power IQ can detect asset management strips connected to PDUs.
The asset strip information displays in the PDU details page.
To view asset strip information:
1. In the PDUs tab, click the link for a PDU with an asset strip.
2. Scroll down to the Asset Strip section to view the details.
To change the color of an LED:
1. In the row of the asset tag whose color you want to change, double click the hexadecimal color code.
2. Select the new color from the chart of colors.
3. The LED color on the strip changes.

Chapter 10: Viewing PDUs
119
To associate an asset tag with an IT device:
1. Copy the asset tag ID number. You can find this on the PDU details page for the PDU connected to the asset strip.
2. In the Devices tab, select the device you want to associate with the asset tag.
3. In the Device details page, paste the code into the Asset Tag Id field then click Save.
Asset Strip and Tag Events
Power IQ can receive an event whenever an asset strip or tag is moved.
See Raritan Dominion PX Supported Events (on page 35).
PDU Status
The following values may appear in the status column for each PDU.
Status Explanation
OK Most recent poll of the target PDU was successful.
New The system has not yet completed a successful scan or poll of the PDU. This is typical for systems that have been recently added.
Lost Communication This indicates a problem with network connectivity between the Power IQ and the PDU, or with the PDU itself.
Make sure the required ports are open between Power IQ and the PDU. See Ports Open Between Power IQ and PDUs (on page 5).
Poll incomplete Certain aspects of the scan or poll failed, such as retrieving the model name, persisting outlet sensor data to CSV file, or retrieving information via SNMP. This can be due to an incompatibility with this version of the PDU or because the SNMP is misconfigured or the agent is disabled on the target PDU.
Make sure the PDU's SNMP settings are correct. See Editing PDUs under Power IQ Management (on page 13).
PX version not supported
Certain aspects of the scan or poll failed due to a version conflict with this Dominion PX's firmware. An upgrade to a later version is recommended. The minimum version that is supported is <minimum version>. Note that upgrading this PX to a newer firmware version through Power IQ is supported.

Chapter 10: Viewing PDUs
120
Status Explanation
Application error This indicates an unexpected application error.
Invalid username This indicates that the username configured is not valid on the PDU.
Correct the username configured on the PDU. See Editing PDUs under Power IQ Management (on page 13).
Invalid password This indicates that the password configured is not valid on the PDU.
Correct the password configured on the PDU. See Editing PDUs under Power IQ Management (on page 13).
Missing credentials This indicates invalid or missing credentials.
Correct the PDU's credentials. See Editing PDUs under Power IQ Management (on page 13).
No contact This indicates that no successful network contact has ever been carried out with this PDU. This may indicate that the IP address is incorrect.
Correct the PDU's IP address. See Editing PDUs under Power IQ Management (on page 13).
Unmanageable This indicates that no plug-in capable of managing the PDU was detected. The target PDU is not supported by this version of Power IQ.
Make sure Power IQ supports the PDU. See the list of supported PDUs at http://www.raritan.com/resources/power-iq-rack-pdu-support/
Contact Raritan Technical Support.
Configure the Number of PDUs in the List
You can configure how many PDUs appear at a time in the PDUs list. This preference is set per user.
You can configure the default number of PDUs that appear in the list, and you can change the number of PDUs that appear at any time from the PDUs list.
To configure the default number of PDUs in the list:
1. Click your user name link in the top right corner of the page, next to the Logoff link.

Chapter 10: Viewing PDUs
121
2. In the User Information page, click the Prefs tab.
3. Enter the number of PDUs to list in the Grid Rows field.
4. Click Save.
To change the number of PDUs in the list:
1. In the PDUs tab, select the number of PDUs to display from the number drop-down list at the bottom of the page. The list refreshes.
Filter the PDUs List
You can customize your view of the PDUs list by using filters, sorting, and hiding or displaying columns of data.
See Customizing Your View of PDUs, Devices, and Events (on page 51).
To filter the PDUs list:
In the PDUs tab, all PDUs in the system display in a list.
Most columns of data contain a filter criteria selection. Click the arrow in the column header to open the options. Filter is the last option.
Most columns can be filtered by entering a search term in the column's filter.
Label, Name, Location, Manufacturer, Model, Firmware, Belongs To are filtered by search terms.
Belongs To refers to the PDUs parent object in the EDM. For example, a PDU probably belongs to a Rack object in the EDM. To check, look for the level directly above the PDU in the Data Centers tab hierarchy.

Chapter 10: Viewing PDUs
122
Filter by PDU health: In the Health column filter, select the health statuses you want to view, Good, Warning or Critical, then select the source for each status, either Connectivity or Active Events. Select multiple options for each as needed.
Filter by power readings, including Current (Amps), Active Power (Watts), or Apparent Power (VA): In the Current, Active Power or Apparent Power column filter, enter the number of amps, watts, or volt amperes in the Greater Than (>), Less Than (<) or Equal To (=) field to view only PDUs with readings in the correct range.
If a PDU has multiple line readings in the Current column, all values are shown separated by commas. When filtering by Greater Than (>), the highest number is used. When filtering by Less Than (<), the lowest number is used.
Filter by inlet temperature: In the Inlet Temperature (C) column filter, enter the number of degrees Celsius in the Greater Than (>), Less Than (<) or Equal To (=) field to view only PDUs with inlet temperature sensor readings in the correct range.
The inlet temperature shown is the maximum reading for all inlet-positioned temperature sensors associated with the PDU.
Export the PDUs List to CSV
Export the PDU list to create a CSV file containing all the data listed in the grid on the PDUs tab.
The exported file contains the same columns as the page in Power IQ. If you have applied filters, the same filters will apply to the exported information.
The export PDUs CSV file is not the same as the file used for importing PDUs into Power IQ. See Adding PDUs in Bulk with CSV Files (on page 15).
To export the PDUs list to CSV:
1. In the PDUs tab, click the Export/Save icon in the upper right corner of the grid.
2. Save or open the file using the dialog that appears.

Chapter 10: Viewing PDUs
123
Launch the Web Interface for a Dominion PX PDU
You can launch the web interface for a Dominion PX PDU in Power IQ.
Users must have identical credentials on Power IQ and on the target Dominion PX, and be logged in to Power IQ with those credentials for single sign on to succeed. Single sign on must be enabled in Settings > Single Sign On. See Enabling Single Sign On for Raritan PDUs (on page 86).
To launch the web interface for a Dominion PX:
1. In the PDUs tab, select a Dominion PX PDU.
2. Hover your mouse on the Actions column, then click the center icon to go directly to this PDU in a new window. If single sign on is not enabled, log in.
Searching for PDUs
Use the Quick Search tool at the top of the Power IQ interface to search for a PDU.
Type the name or IP address of a PDU into the Quick Search field. If a match is found, Power IQ displays that PDU's detail page.
Note: When searching by name, the whole name of the PDU must be entered. Search is case sensitive.

124
Raritan Dominion PX1 and PX2 PDUs support environmental and contact closure sensors, which you can poll through Power IQ.
The sensors must be setup and configured correctly via PX1 or PX2 before they will work correctly with Power IQ.
In This Chapter
Hardware Configuration for Sensors on PX1 and PX2 ......................... 124 Software Configuration for Sensors on PX1 and PX2 ........................... 130 Sensor Measurement Accuracy ............................................................ 144 States of Managed Sensors .................................................................. 145
Hardware Configuration for Sensors on PX1 and PX2
Connecting Environmental Sensors to a PX1
To enable the detection of environmental factors around the rack, connect one or more Raritan environmental sensors to the Dominion PX device.
The maximum distance for all sensor cabling plugged into the product's sensor port should not exceed 30 meters/100 feet. Contact Raritan Technical Support if you have questions.
To directly connect an environmental sensor:
Connect the cable of the environmental sensor to the Feature port on the Dominion PX device.
To connect environmental sensors via an optional PX sensor hub:
1. Connect a Raritan sensor hub to the Dominion PX device.
a. Plug one end of the Raritan-provided phone cable (4-wire, 6-pin, RJ-12) into the IN port (Port 1) of the hub.
b. Plug the other end into the Feature port of the Dominion PX device.
2. Connect Raritan environmental sensors to any of the four OUT ports on the hub.
Chapter 11 Sensors Connected to PX1 and PX2 PDUs

Chapter 11: Sensors Connected to PX1 and PX2 PDUs
125
Raritan sensor hubs CANNOT be cascaded so at most a sensor hub can be connected to each SENSOR port on the Dominion PX device. This diagram illustrates a configuration with a sensor hub connected.
The Dominion PX device
Raritan-provided phone cable
Raritan PX sensor hub
Raritan environmental sensors
3. If there are any Raritan air flow sensors attached, make sure that sensor faces the source of the wind (such as a fan) in the appropriate orientation as indicated by the arrow on that sensor.
Note: The temperature and humidity sensors are compatible with all Dominion PX models with these prefixes: DPXS, DPXR, DPCS, DPCR, PX-5nnn, PX-4nnn, and PX-3nnn, where n is a number.

Chapter 11: Sensors Connected to PX1 and PX2 PDUs
126
Connecting Environmental Sensors to a PX2
To enable the detection of environmental factors around the rack, connect one or more Raritan environmental sensors to the Dominion PX device.
The maximum distance for all sensor cabling plugged into the product's sensor port should not exceed 30 meters/100 feet. Contact Raritan Technical Support if you have questions.
You can connect up to 16 environmental sensors to a Dominion PX device by using a Raritan sensor hub.
Note that a Raritan environmental sensor usually contains more than one sensor. For example, a DPX-T2H2 counts as 4 sensors, and a DPX-T3H1 counts as 4 sensors.
Warning: For proper operation, wait for 15~30 seconds between each connection operation or each disconnection operation of environmental sensors.
To directly connect one or multiple environmental sensors:
Plug the connector of the environmental sensor into the SENSOR port on your Dominion PX device.
Note: Depending on the model you purchased, the total number of SENSOR ports varies.
To connect environmental sensors via an optional PX sensor hub:
1. Connect a Raritan sensor hub to the Dominion PX device.
a. Plug one end of the Raritan-provided phone cable (4-wire, 6-pin, RJ-12) into the IN port (Port 1) of the hub.
b. Plug the other end into the SENSOR port on the Dominion PX device.
2. Connect Raritan environmental sensors to any of the four OUT ports on the hub.

Chapter 11: Sensors Connected to PX1 and PX2 PDUs
127
Raritan sensor hubs CANNOT be cascaded so at most a sensor hub can be connected to each SENSOR port on the Dominion PX device. This diagram illustrates a configuration with a sensor hub connected.
The Dominion PX device
Raritan-provided phone cable
Raritan PX sensor hub
Raritan environmental sensors
3. If there are any Raritan air flow sensors attached, make sure that sensor faces the source of the wind (such as a fan) in the appropriate orientation as indicated by the arrow on that sensor.

Chapter 11: Sensors Connected to PX1 and PX2 PDUs
128
About Contact Closure Sensors
Raritan's contact closure sensor (DPX-CC2-TR) can detect the open-and-closed status of the connected detectors/switches. It requires the integration of at least a discrete (on/off) detector/switch to work properly. The types of discrete detectors/switches that can be plugged into DPX-CC2-TR include those for:
Door open/closed detection
Door lock detection
Floor water detection
Smoke detection
Vibration detection
Raritan does NOT provide these discrete detectors/switches. They are third-party probes so you must test them with Raritan's DPX-CC2-TR to ensure they work properly.
Integration and testing for third-party detectors/switches is the sole responsibility of the customer. Raritan cannot assume any liability as a result of improper termination or failure (incidental or consequential) of third-party detectors/switches that customers provide and install. Failure to follow installation and configuration instructions can result in false alarms or no alarms. Raritan makes no statement or claim that all third-party detectors/switches will work with DPX-CC2-TR.
Configuring a Contact Closure Sensor
Before using DPX-CC2-TR to detect the contact closure status, water, smoke or vibration, you must determine the normal state by adjusting its dip switch, which controls the LED state on the body of DPX-CC2-TR. A dip switch is associated with a channel.
To adjust the dip switch setting:
1. Place the detectors/switches connected to DPX-CC2-TR to the position where you want to detect a specific environmental situation.
2. Uncover the dip switch on the body of DPX-CC2-TR.
3. To set the Normal state for channel 1, locate the dip switch labeled 1.

Chapter 11: Sensors Connected to PX1 and PX2 PDUs
129
4. Use a pointed tip such as a pen to move the slide switch to the end labeled NO (Normally Open) or NC (Normally Closed).
Normally Open: The open status of the connected detector/switch is considered normal.
Normally Closed: The closed status of the connected detector/switch is considered normal. This is the default.
5. To set the Normal state for channel 2, repeat Step 4 for adjusting the other dip switch's setting.
6. Install back the dip switch cover.
Note: The dip switch setting must be properly configured, or the sensor LED may be incorrectly lit when in the Normal state.
Contact Closure Sensor LEDs
DPX-CC2-TR is equipped with the LEDs for showing the state of the connected detectors/switches.
The LED is lit when the associated detector/switch is in the "abnormal" state, which is the opposite of the Normal state. See Configuring a Contact Closure Sensor (on page 128) for how to set the Normal state.
The meaning of a lit LED varies depending on the Normal state settings.
When the Normal state is set to Closed:
LED Sensor state
Not lit Closed
Lit Open
When the Normal state is set to Open:
LED Sensor state
Not lit Open
Lit Closed

Chapter 11: Sensors Connected to PX1 and PX2 PDUs
130
Software Configuration for Sensors on PX1 and PX2
Configuration for PX1 Environmental Sensors
Complete the software configuration procedures in this task in the Dominion PX1 web interface.
The Dominion PX can monitor the environmental conditions, such as temperature and humidity, where environmental sensors are placed.
To add environmental sensors:
1. Physically connect environmental sensors to the Dominion PX device. See Connecting Environmental Sensors (Optional).
2. Log in to the Dominion PX web interface. The Dominion PX should have detected the connected sensors, and display them in the web interface.
3. Identify each sensor through the sensor's serial number. See Identifying Environmental Sensors (on page 139, on page 131).
4. The Dominion PX should automatically manage the detected sensors. Verify whether detected sensors are managed. If not, have them managed. See Managing Environmental Sensors (on page 140, on page 132).
5. Configure the sensors. See Configuring Environmental Sensors (on page 141, on page 133). The steps include:
a. Name the sensor.
b. If the connected sensor is a Raritan contact closure sensor, specify an appropriate sensor type.
c. Mark the sensor's physical location in the rack or server room.
d. If the sensor is a numeric sensor, configure its upper and lower thresholds.
Note: Numeric sensors use numeric values to indicate the environmental or internal conditions while discrete (on/off) sensors use alphabetical characters to indicate the state. Only numeric sensors have the threshold settings.

Chapter 11: Sensors Connected to PX1 and PX2 PDUs
131
Identifying Environmental Sensors
An environmental sensor includes a serial number tag on the sensor cable.
The serial number for each sensor appears listed in the web interface after each sensor is detected by the Dominion PX.
Match the serial number from the tag to those listed in the sensor table.

Chapter 11: Sensors Connected to PX1 and PX2 PDUs
132
Managing Environmental Sensors
The Dominion PX starts to retrieve an environmental sensor's reading and/or state and records the state transitions after the environmental sensor is managed.
The Dominion PX device can manage a maximum of 16 environmental sensors.
When there are less than 16 managed sensors, the Dominion PX automatically brings detected environmental sensors under management. You should only have to manually manage a sensor when it is not under management.
To manually manage an environmental sensor:
1. Choose External Sensors > External Sensors Details. The External Sensor Details page opens. All environmental sensors are listed on the page after they are detected.
2. Verify whether desired sensors are being managed by checking the Managed? column.
Presence of the Remove button indicates that the corresponding sensor is being managed.
Presence of the Manage button indicates that the corresponding sensor is NOT being managed.
3. To manage a sensor that is not under management, do either of the following:
Click the corresponding Manage button: An ID number and a name are automatically assigned to the managed sensor, and the Dominion PX starts to track and display the sensor's reading and/or state.

Chapter 11: Sensors Connected to PX1 and PX2 PDUs
133
Manually assign an ID number to the sensor: A sensor becomes "managed" after you assign an ID number to it. The default name is automatically assigned. If another sensor already occupied the ID number at the time of assignment, that sensor becomes "unmanaged" after losing the ID number. For details, see Assigning or Changing the ID Number.
A sensor's default name comprises the sensor type and serial number, such as Humidity AEI7A00021. If the sensor is a contact closure sensor, a channel number is added to the end of the default name.
Note: When the number of managed sensors reaches the maximum, you CANNOT manage additional sensors until you remove or replace any managed sensors. To remove a sensor, see Unmanaging Environmental Sensors. To replace a sensor, see Assigning or Changing the ID Number.
Configuring Environmental Sensors
You can assign new names to managed sensors for identifying them easily, and to provide them with location descriptions.
For numeric sensors, you can also configure thresholds that enable the Dominion PX to generate an alert or notification when environmental conditions detected by the sensors move outside of your ideal values.
Note: Numeric sensors use numeric values to indicate the environmental or internal conditions while discrete (on/off) sensors use alphabetical characters to indicate the state. Only numeric sensors have the threshold settings.
To configure environmental sensors:
1. You can trigger the setup page for the desired environmental sensor by doing either of the following:
Choose External Sensors > External Sensors Setup. The External Sensor Setup page opens.
Select the desired environmental sensor from the drop-down list of the "Show setup of external sensor" field.
Choose External Sensors > External Sensors Details. The External Sensor Details page opens.
Click the name of the sensor that you want to configure. The External Sensor Setup page opens.

Chapter 11: Sensors Connected to PX1 and PX2 PDUs
134
2. If the sensor selected in the previous step is a Raritan contact closure sensor connected with third-party detectors/switches, the On/Off Sensor Subtype field is displayed for you to select the detector/switch type:
Contact: The detector/switch is designed to detect the door lock or door open/closed status.
Smoke Detection: The detector/switch is designed to detect the appearance of smoke.
Water Detection: The detector/switch is designed to detect the appearance of water on the floor.
Vibration: The detector/switch is designed to detect the vibration in the floor.
3. Type a new name in the Sensor Name field.
A sensor's default name comprises the sensor type and serial number, such as Humidity AEI7A00021. If the sensor is a contact closure sensor, a channel number is added to the end of the default name.

Chapter 11: Sensors Connected to PX1 and PX2 PDUs
135
4. Describe the sensor's location by assigning alphanumeric values to the X, Y and Z coordinates. See Describing the Sensor Location (on page 143, on page 137). All location fields are optional.
5. Configure the upper and lower thresholds for numeric sensors.
The Upper Critical and Lower Critical values are points at which the Dominion PX considers the operating environment critical and outside the range of the acceptable threshold.
Once critical, the sensor reading must drop below the Upper Non-critical or raise above the Lower Non-critical value before the Dominion PX considers the environment to be acceptable again.
Note: Only numeric sensors have the threshold settings. A discrete sensor, such as a contact closure sensor, does not have threshold settings so the Thresholds panel is unavailable.
6. If necessary, change the default hysteresis value in the Thresholds panel.
To disable the hysteresis, type 0 (zero).

Chapter 11: Sensors Connected to PX1 and PX2 PDUs
136
To enable the hysteresis, type a non-zero value, which must meet the rules described in the table:
Threshold Criterion
Upper critical threshold Larger than or equal to the following formula:
upper non-critical threshold + hysteresis
Upper non-critical threshold Larger than or equal to the following formula:
lower non-critical threshold + (2 x hysteresis)
Lower non-critical threshold Larger than or equal to the following formula:
lower critical threshold + hysteresis
7. Click Apply. The sensor settings are saved.
8. If necessary, select another managed sensor from the "Show setup of external sensor" drop-down list, and repeat these steps to configure it.
Note: The number in parentheses following a sensor name is the ID number assigned to each sensor.
Note: The maximum ambient operating temperature (TMA) for the Dominion PX varies between 40 to 60 degrees Celsius, depending on the model and certification standard (CE or UL). If necessary, contact Raritan Technical Support for this information for your model.

Chapter 11: Sensors Connected to PX1 and PX2 PDUs
137
Describing the Sensor Location
Optional: Use the X, Y and Z coordinates to describe each sensor's physical location. You can use these location values to track records of environmental conditions in fixed locations around your IT equipment. The X, Y and Z values act as additional attributes and are not tied to any specific measurement scheme. If you choose to, you can use non-measurement values. For example:
X = Brown Cabinet Row
Y = Third Rack
Z = Top of Cabinet
Values for the X, Y and Z coordinates may consist of:
For X and Y: Any combination of alphanumeric characters. The value can be 0 to 24 characters long.
For Z when the 'Rack Units ("U")' checkbox is deselected: Any combination of alphanumeric characters, from 0 to 24 characters long.
For Z when the 'Rack Units ("U")' checkbox is selected: Any integer from 0 to 60.
A selected 'Rack Units ("U")' checkbox indicates that the height of the Z coordinate is measured in standard rack units. See Using Rack Units for the Z Coordinate Value (on page 137).
Note: To configure and retrieve these coordinate values over SNMP, see the Dominion PX MIB.
Using Rack Units for the Z Coordinate Value
You can use the number of rack units to describe the vertical location (Z coordinate) of an environmental sensor.
To use rack units for the Z coordinate value:
1. Choose Device Settings > PDU Setup. The PDU Setup page opens.
2. Select the 'Use Rack Units ("U") for Z coordinate' checkbox.
3. Click Apply.

Chapter 11: Sensors Connected to PX1 and PX2 PDUs
138
Now you can use the number of rack units to describe the height of the sensor's location. See Configuring Environmental Sensors (on page 141, on page 133).
Viewing Sensor Readings and States
The Home page shows the following information for environmental sensors:
Number of managed sensors
Number of unmanaged sensors
Managed sensors along with their readings and/or states
For a temperature sensor, the reading is displayed in both Celsius and Fahrenheit.
"C" represents Celsius.
"F" represents Fahrenheit.
To view the readings and states from any other page, click Home in the navigation path at the top of the page.
Configuration for PX2 Environmental Sensors
Complete the software configuration procedures in this task in the Dominion PX2 web interface.

Chapter 11: Sensors Connected to PX1 and PX2 PDUs
139
Identifying Environmental Sensors
An environmental sensor includes a serial number tag on the sensor cable.
The serial number for each sensor appears listed in the web interface after each sensor is detected by the Dominion PX.
To identify each detected environmental sensor:
1. If the PDU folder is not expanded, expand it to show all components and component groups. See Expanding the Tree.
Note: The PDU folder is named "my PX" by default. The name changes after customizing the device name. See Naming the PDU.
2. Click External Sensors in the Dominion PX Explorer pane, and the External Sensors page opens in the right pane.
3. Match the serial number from the tag to those listed in the sensor table.

Chapter 11: Sensors Connected to PX1 and PX2 PDUs
140
Managing Environmental Sensors
The Dominion PX starts to retrieve an environmental sensor's reading and/or state and records the state transitions after the environmental sensor is managed.
The Dominion PX device can manage a maximum of 16 environmental sensors.
When there are less than 16 managed sensors, the Dominion PX automatically brings detected environmental sensors under management. You should only have to manually manage a sensor when it is not under management.
To manually manage an environmental sensor:
1. If the PDU folder is not expanded, expand it to show all components and component groups. See Expanding the Tree.
Note: The PDU folder is named "my PX" by default. The name changes after customizing the device name. See Naming the PDU.
2. Click External Sensors in the Dominion PX Explorer pane, and the External Sensors page opens in the right pane.
3. Click the sensor you want to manage on the External Sensors page.
Note: To identify all detected sensors, see Identifying Environmental Sensors (on page 139, on page 131).
4. Click Manage. The "Manage sensor <serial number> (<sensor type>)" dialog appears, where <serial number> is the sensor's serial number and <sensor type> is the sensor's type.
Note: For a contact closure sensor, a channel number is added to the end of the <sensor type>.
5. There are two ways to manage the sensor:
To manage this sensor by letting the Dominion PX assign a number to it, select "Automatically assign a sensor number." This method does not release any managed sensors.
To manage this sensor by assigning the number you want to it, select "Manually select a sensor number." Then click the drop-down arrow to select a number.
If the number you selected was already assigned to a sensor, that sensor becomes released after losing this ID number.
Tip: The information in parentheses following each ID number indicates whether the number has been assigned to any sensor. If it has been assigned to a sensor, it shows that sensor's serial number. Otherwise, it shows the term "unused."

Chapter 11: Sensors Connected to PX1 and PX2 PDUs
141
6. Click OK. The Dominion PX starts to track and display the managed sensor's reading and/or state.
7. To manage additional sensors, repeat Steps 3 to 6.
Note: When the number of managed sensors reaches the maximum, you CANNOT manage additional sensors until you remove or replace any managed sensors. To remove a sensor, see Unmanaging Environmental Sensors.
Configuring Environmental Sensors
You may change the default name for easily identifying the managed sensor, and describe its location with X, Y and Z coordinates.
To configure environmental sensors:
1. If the PDU folder is not expanded, expand it to show all components and component groups. See Expanding the Tree.
Note: The PDU folder is named "my PX" by default. The name changes after customizing the device name. See Naming the PDU.
2. Click External Sensors in the Dominion PX Explorer pane, and the External Sensors page opens in the right pane.
3. Select the sensor that you want to configure.
4. Click Setup. The "Setup of external sensor <serial number> (<sensor type>)" dialog appears, where <serial number> is the serial number of this sensor and <sensor type> is the sensor's type.
Tip: You can also trigger the same setup dialog by selecting the desired environmental sensor icon in the tree and then clicking Setup on that sensor's page opened in the right pane.
5. If the selected environmental sensor is the Raritan contact closure sensor connected with a third-party detector/switch, select the appropriate sensor type in the Binary Sensor Subtype field.
Contact: The detector/switch is designed to detect the door lock or door open/closed status.
Smoke Detection: The detector/switch is designed to detect the appearance of smoke.
Water Detection: The detector/switch is designed to detect the appearance of water on the floor.
Vibration: The detector/switch is designed to detect the vibration in the floor.
6. Type a new name in the Name field.

Chapter 11: Sensors Connected to PX1 and PX2 PDUs
142
7. Describe the sensor's location by assigning alphanumeric values to the X, Y and Z coordinates. See Describing the Sensor Location (on page 143, on page 137).
Note: When the term "Rack Units" appears inside the parentheses in the Z location field, indicating that the Z coordinate format is set to Rack Units, you must type an integer number.
8. If the selected environmental sensor is a numeric sensor, its threshold settings are displayed in the dialog. Click Edit or double-click the Threshold Configuration table to adjust the threshold, deassertion hysteresis and assertion timeout settings.
To enable any threshold, select the corresponding checkbox. To disable a threshold, deselect the checkbox.
After any threshold is enabled, type an appropriate numeric value in the accompanying text box.
To enable the deassertion hysteresis for all thresholds, type a numeric value other than zero in the Deassertion Hysteresis field. See What is Deassertion Hysteresis?.
To enable the assertion timeout for all thresholds, type a numeric value other than zero in the Assertion Timeout (samples) field. See What is Assertion Timeout?.
Note: The Upper Critical and Lower Critical values are points at which the Dominion PX considers the operating environment critical and outside the range of the acceptable threshold.
9. Click OK to save the changes.
10. Repeat Steps 3 through 9 to configure additional environmental sensors.
Setting the Z Coordinate Format
You can use either the number of rack units or a descriptive text to describe the vertical locations (Z coordinates) of environmental sensors.
To determine the Z coordinate format:
1. Click the PDU folder.
Note: The PDU folder is named "my PX" by default. The name changes after customizing the device name. See Naming the PDU.
2. Click Setup in the Settings section. The Pdu Setup dialog appears.
3. In the "External sensors Z coordinate format" field, click the drop-down arrow and select an option from the list.

Chapter 11: Sensors Connected to PX1 and PX2 PDUs
143
Rack Units: The height of the Z coordinate is measured in standard rack units. When this is selected, you can type a numeric value in the rack unit to describe the Z coordinate of any environmental sensors.
Free-Form: Any alphanumeric string can be used for specifying the Z coordinate.
4. Click OK to save the changes.
Describing the Sensor Location
Use the X, Y and Z coordinates to describe each sensor's physical location. You can use these location values to track records of environmental conditions in fixed locations around your IT equipment. The X, Y and Z values act as additional attributes and are not tied to any specific measurement scheme. If you choose to, you can use non-measurement values. For example:
X = Brown Cabinet Row
Y = Third Rack
Z = Top of Cabinet
Values for the X, Y and Z coordinates may consist of:
For X and Y: Any combination of alphanumeric characters. The coordinate value can be 0 to 32 characters long.
For Z when the Z coordinate format is set to Rack Units, any numeric value ranging from 0 to 60.
For Z when the Z coordinate format is set to Free-Form, any alphanumeric characters from 0 to 32 characters.
Tip: To configure and retrieve these coordinate values over SNMP, see the Power IQ MIB. To configure and retrieve these values over the CLI, see Using the Command Line Interface.
Viewing Sensor Data
Readings of the environmental sensors will display in the web interface after these sensors are properly connected and managed.
The Dashboard page shows the information for managed environmental sensors only, while the External Sensors page shows the information for both of managed and unmanaged ones.
If a sensor reading row is colored, it means the sensor reading already crosses one of the thresholds, or the circuit breaker has tripped. See The Yellow- or Red-Highlighted Reading.
To view managed environmental sensors only:
1. Click the Dashboard icon in the Dominion PX Explorer pane, and the Dashboard page opens in the right pane.

Chapter 11: Sensors Connected to PX1 and PX2 PDUs
144
2. Locate the External Sensors section on the Dashboard page. The section shows:
Total number of managed sensors
Total number of unmanaged sensors
Information of each managed sensor, including:
- Name
- Reading
- State
To view both of managed and unmanaged environmental sensors:
1. If the PDU folder is not expanded, expand it to show all components and component groups. See Expanding the Tree.
Note: The PDU folder is named "my PX" by default. The name changes after customizing the device name. See Naming the PDU.
2. Click External Sensors in the Dominion PX Explorer pane, and the External Sensors page opens in the right pane.
Detailed information for each connected sensor is displayed, including:
Label (number)
Serial number
Sensor type
Name
Reading
State
Channel (for a contact closure sensor only)
Sensor Measurement Accuracy
Raritan environmental sensors are with the following factory specifications. Calibration is not required for environmental sensors.
Temperature: +/-2%
Humidity: +/-5%
Differential air pressure: +/-1.5%
Air flow: +/-6.5%

Chapter 11: Sensors Connected to PX1 and PX2 PDUs
145
States of Managed Sensors
An environmental sensor shows the state after being managed.
Available sensor states vary depending on the sensor type -- numeric or discrete. For example, a contact closure sensor is a discrete sensor so it switches between three states only -- unavailable, alarmed and normal.
Note: Numeric sensors use numeric values to indicate the environmental or internal conditions while discrete (on/off) sensors use alphabetical characters to indicate the state.
Sensor state Applicable to
unavailable All sensors
alarmed Discrete sensors
normal Discrete sensors
ok Numeric sensors
below lower critical Numeric sensors
below lower non-critical Numeric sensors
above upper non-critical Numeric sensors
above upper critical Numeric sensors
Note: The state change of a contact closure sensor occurs only if the sensor enters the new state for at least 1 consecutive sample.
"unavailable" State
The unavailable state means the connectivity to the sensor is lost.
The Dominion PX pings all managed sensors at regular intervals in seconds. If it does not detect a particular sensor for three consecutive scans, the unavailable state is displayed for that sensor.
When the communication with a contact closure sensor's processor is lost, all detectors (that is, all switches) connected to the same sensor module show the "unavailable" state.
Note: When the sensor is deemed unavailable, the existing sensor configuration remains unchanged. For example, the ID number assigned to the sensor remains associated with it.
The Dominion PX continues to ping unavailable sensors, and moves out of the unavailable state after detecting the sensor for two consecutive scans.

Chapter 11: Sensors Connected to PX1 and PX2 PDUs
146
"normal" State
This state indicates the sensor is in the normal state.
For a contact closure sensor, this state is the normal state you have set.
If the normal state is set to Normally Closed, the normal state means the contact closure switch is closed.
If the normal state is set to Normally Open, the normal state means the contact closure switch is open.
Note: See Configuring a Contact Closure Sensor (on page 128) for setting the normal state.
"alarmed" State
This state means a discrete (on/off) sensor is in the "abnormal" state.
For a contact closure sensor, the meaning of this state varies based on the sensor's normal state setting.
If the normal state is set to Normally Closed, the alarmed state means the contact closure switch is open.
If the normal state is set to Normally Open, the alarmed state means the contact closure switch is closed.
Note: See Configuring a Contact Closure Sensor (on page 128) for setting the normal state.
Tip: A contact closure sensor's LED is lit after entering the alarmed state. If the sensor module has two channels for connecting two switches, two LEDs are available. Check which contact closure switch is in the "abnormal" status according to the channel number of the LED.
"ok" State
Only a numeric sensor shows this state. This state means the sensor reading is within the acceptable range as indicated below:
Lower Non-Critical threshold <= Reading < Upper Non-Critical threshold
Note: The symbol <= means smaller than (<) or equal to (=).
"below lower critical" State
This state means a numeric sensor's reading is below the lower critical threshold as indicated below:
Reading < Lower Critical Threshold

Chapter 11: Sensors Connected to PX1 and PX2 PDUs
147
"below lower non-critical" State
Only a numeric sensor shows this state.
This state means the sensor reading is below the lower non-critical threshold as indicated below:
Lower Critical Threshold <= Reading < Lower Non-Critical Threshold
Note: The symbol <= means smaller than (<) or equal to (=).
"above upper non-critical" State
Only a numeric sensor shows this state.
This state means the sensor reading is above the upper non-critical threshold as indicated below:
Upper Non-Critical Threshold <= Reading < Upper Critical Threshold
Note: The symbol <= means smaller than (<) or equal to (=).
"above upper critical" State
This state means a numeric sensor's reading is above the upper critical threshold as indicated below:
Upper Critical Threshold <= Reading
Note: The symbol <= means smaller than (<) or equal to (=).
148
Power control is only available for PDUs that support this feature.
Power IQ must have valid SNMP write access to the PDU for power control to work.
In This Chapter
Enable or Disable Power Control .......................................................... 148 Configure Power Control Options .......................................................... 148 Control Power to Outlets in a Data Center ............................................ 149 Control Power to Devices in a Group .................................................... 150 Scheduling Power Control ..................................................................... 150 Configuring Graceful Shutdown ............................................................ 152 Preparing Servers for Graceful Shutdown ............................................. 156 Create Device Groups for Power Control .............................................. 158 Set a Different Power On Delay for a Device ........................................ 160
Enable or Disable Power Control
Only authorized users can control power. See Role Definitions (see "Power IQ Role Definitions" on page 77).
1. In the Settings tab, click Power IQ Settings in the Appliance Administration section.
2. In the Power Control Settings box, select the "Enable power control" checkbox to enable power control.
3. Click Save Power Control Settings.
Configure Power Control Options
To configure power control options:
1. In the Settings tab, click Power IQ Settings in the Appliance Administration section.
2. In the Power Control Settings box:
a. Select the "Enable power control" checkbox to enable power control.
b. Select the "Require reason message for power control operations" checkbox to require users to log a reason for all power control operations.
c. Select the "Allow ad hoc power control for rooms, aisles, rows, and racks" to allow authorized users to control power at the room, aisle, row and rack levels of the data center.
Chapter 12 Power Control

Chapter 12: Power Control
149
d. Select the "Allow scheduled power control" checkbox to allow authorized users to schedule power control tasks.
3. Click Save Power Control Settings.
Control Power to Outlets in a Data Center
You must enable power control. See Enable or Disable Power Control (on page 148).
Power control is available at the outlet and IT device outlet group level, unless you also enable higher levels, such as all outlets in a rack, row, aisle, or room. See Configure Power Control Options (on page 148).
You must be assigned a role that permits power control. See Power IQ Role Definitions (on page 77).
For details about controlling power in the Smart Rack and Smart PDU views, see IT Devices - Smart Rack View (on page 111) and PDU Elements - Smart Views (on page 112).
To control power in the Data Centers tab:
1. In the Data Centers tab, select the data center level, such as a rack, that contains the outlets you want to control.
2. Select the checkboxes of the outlets you want to control in the IT Devices or PDUs section.
3. Click Power Control > On or Power Control > Off.
4. If required, enter a reason message for the power control operation, and click OK to confirm.
To control power with right-click in the Data Centers tab:
1. In the Data Centers tab, right-click an IT device, or higher level, if enabled, then select On or Off.
2. If required, enter a reason message for the power control operation, and click OK to confirm.
To control power in the PDUs tab:
1. In the PDUs tab, select a PDU, then click View.
2. Select the checkboxes of the outlets you want to control in the Readings section.
3. Click Power Control > On, Power Control > Off, or Power Control > Cycle.
4. If required, enter a reason message for the power control operation, and click OK to confirm.

Chapter 12: Power Control
150
To control power in the Devices tab:
1. In the Devices tab, select a device.
2. Click Power Control > On or Power Control > Off.
3. If required, enter a reason message for the power control operation, and click OK to confirm.
Control Power to Devices in a Group
You can manually control power to devices in a group, or schedule a task to run a power control operation at a specified time.
To control power to devices in a group manually:
1. In the Devices tab, choose Activities > Device Groups.
2. Select the checkbox for the device group you want to control power to.
3. Click Power Control > On or Power Control > Off.
All devices in the group are powered on or off sequence specified in the group settings.
Devices are powered off in sequence, and powered on in the reverse sequence.
See Create Device Groups for Power Control (on page 158).
Devices in the group that are configured with graceful shutdown will be shutdown when a power off operation is selected here. The configured graceful shutdown delay is used. See Configuring Graceful Shutdown (on page 152).
To control power to devices in a group via a scheduled task:
See Add a Power Control Task (on page 151).
Scheduling Power Control
You can schedule power control for device groups only.

Chapter 12: Power Control
151
View Power Control Task Results
View the results of power control tasks that have been scheduled.
Note: Make sure that power control and scheduled power control are enabled. See Enable or Disable Power Control (on page 148).
To view power control task results:
1. In the Devices tab, choose Activities > View Task Results. The Power Scheduling Task Results page opens.
2. Click a task name link to view the results.
Add a Power Control Task
Schedule a power control task to control power to a device group at a specified time. You can schedule a task that runs only once, or that recurs on a regular schedule.
You must create device groups before you add power control tasks. See Create Device Groups for Power Control (on page 158).
To add a power control task:
1. In the Devices tab, choose Activities > Add New Task. The New Power Scheduling Task page opens.
2. Select Power On or Power Off. If Graceful Shutdown is configured for a device in the device group, a power-off task will use graceful shutdown automatically, unless you select the Skip Graceful Shutdown checkbox in the next step.
3. Select the Skip Graceful Shutdown checkbox to force a hard shutdown for all devices in the device group, even if graceful shutdown is enabled.
4. Select the Leave Outlets On checkbox to leave outlets powered on in cases where devices have been powered off using graceful shutdown.
5. Select the Device Group for the power control operation.
6. Specify when the task should run.
To schedule a task that runs only once, select the Date from the calendar in the Run Once section.
To schedule a task that recurs, select the checkboxes for the days of the week the task should run in the Recurring section.
For both types, select the time the task should run in the Hour and Minute fields.
7. Select the Active checkbox to allow this task to run. Deselect this checkbox to stop the task from running.

Chapter 12: Power Control
152
8. Click Save.
Configuring Graceful Shutdown
You can configure Power IQ to send a graceful shutdown command to a server before powering off outlets. Power IQ allows you to define a set of system-wide shutdown commands with credentials to use across multiple devices. Power IQ supports both SSH and NetRPC commands to shutdown either Unix or Windows servers.
Process for Configuring Graceful Shutdown in Power IQ:
1. Enable power control. See Enable or Disable Power Control (on page 148).
2. Prepare your servers for graceful shutdown: check open ports, define accounts for authentication, test authentication methods. See Open Ports for Graceful Shutdown (on page 156) and Preparing Servers for Graceful Shutdown (on page 156).
3. Add the shutdown commands to Power IQ. See Add Shutdown Commands (on page 153).
4. Enable graceful shutdown for the server, known as an IT Device in Power IQ, specify the command and wait time, and test the connection. See Enable Graceful Shutdown for an IT Device (on page 154).
5. To shutdown servers, use the power control functions.
a. Add a power control task to schedule the power off for a device group. See Add a Power Control Task (on page 151).
OR
b. Power off an individual outlet. See Control Power to Outlets in a Data Center (on page 149).

Chapter 12: Power Control
153
Add Shutdown Commands
Add shutdown commands if you want to enable graceful shutdown to occur on servers before Power IQ switches off outlets. Graceful shutdown will occur both when you manually power outlets off or when a scheduled power control task runs.
You can test the commands you configure when you enable graceful shutdown for a particular device. See Enable Graceful Shutdown for an IT Device (on page 154).
Add shutdown commands using Windows Remote Shutdown
Windows Remote Shutdown is the most common choice for shutting down Windows systems.
1. In the Devices tab, choose Activities > Shutdown Commands. The Add New Shutdown Command page opens.
2. Click Add.
3. Select Using Windows Remote Shutdown and click Next.
4. In the Name field, enter a name to describe this shutdown command. This name appears in the list of shutdown commands to be selected when you enable graceful shutdown for a server. See Enable Graceful Shutdown for an IT Device (on page 154).
5. In the Login field, enter the username of the account to be authenticated on each server to be shutdown.
Login can include letters, digits, underscores, dots, and hyphens.
6. In the Password and Password Confirmation fields, enter the password for the username in the Login field.
7. In the Comment field, enter the message to display to users of the server when it is shutdown.
8. Click Add.
Add shutdown commands using SSH:
SSH is the most common choice for shutting down Linux, Unix, or other systems:
1. In the Devices tab, choose Activities > Shutdown Commands. The Add New Shutdown Command page opens.
2. Click Add.
3. Select SSH and click Next.
4. In the Name field, enter a name to describe this shutdown command. This name appears in the list of shutdown commands to be selected when you enable graceful shutdown for a server. See Enable Graceful Shutdown for an IT Device (on page 154).

Chapter 12: Power Control
154
5. In the Login field, enter the username of the account to be authenticated on each server to be shutdown.
Login can include letters, digits, underscores, dots, and hyphens.
6. Enter the appropriate credentials for the account specified in the Login field. See Basic Configuration for SSH Shutdown (on page 156)for more details on authentication. The following options are valid.
a. Password and Password Confirmation
b. Private Key
c. Private Key and Passcode and Passcode Confirmation
7. In the Command field, enter the command. See Sample SSH Shutdown Commands (on page 157) for examples.
8. Click Add.
Enable Graceful Shutdown for an IT Device
Enable graceful shutdown for an IT Device if you want Power IQ to send a shutdown command that you configure to a server before powering it off.
You must add the shutdown commands before enabling graceful shutdown. See Add Shutdown Commands (on page 153).
To enable graceful shutdown for an IT device:
1. In the Data Centers tab, select a device that requires graceful shutdown to be enabled.
2. Make sure the IP address for the device is completed in the IP Address field.
3. Expand the Graceful Shutdown section of the IT Device details page and select the Graceful Shutdown checkbox.
4. Select the command to send to the server from the Shutdown Command list. You must add commands to Power IQ before selecting a command here. See Add Shutdown Commands (on page 153).
5. In the Shutdown Wait field, enter the number of seconds Power IQ should wait for the shutdown to complete before powering off the associated outlet.
6. Click Test Connection. Power IQ attempts to connect to the device using the selected command. If you see a success message, click Save. If you see an error message, click View Log in the dialog to troubleshoot the failure.
7. Click Save to save all changes.

Chapter 12: Power Control
155
Disable Graceful Shutdown for an IT Device
There are two methods for disabling graceful shutdown for an IT Device.
Remove the IT device from the shutdown command details page:
1. In the Devices tab, choose Activities > Shutdown Commands.
2. Select the shutdown command that you want to disable for the IT device.
3. Select the IT device in the Devices Using Shutdown Command list and click Remove.
4. Click Yes to confirm. The command is removed from the IT device and graceful shutdown is disabled.
Disable graceful shutdown from the Data centers tab:
1. In the Data Centers tab, select a device that requires graceful shutdown to be disabled.
2. Expand the Graceful Shutdown section of the IT Device details page and deselect the Graceful Shutdown checkbox.
3. Click Save.
View the IT Devices Using a Shutdown Command
View the shutdown command details to see a list of IT Devices using each shutdown command.
To view the IT devices using a shutdown command:
1. In the Devices tab, choose Activities > Shutdown Commands.
2. Select the shutdown command whose usage you want to view and click Edit.
3. The list of IT devices that are using the shutdown command displays below the command details.
Remove a Shutdown Command from Power IQ
When you remove a shutdown command from Power IQ, you can assign a different command to the IT devices that were using the removed command. Or, you can disable graceful shutdown for those devices.
To remove a shutdown command from Power IQ:
1. In the Devices tab, choose Activities > Shutdown Commands link.
2. Select the command you want to remove from Power IQ and click Remove.

Chapter 12: Power Control
156
3. If the command is being used by any IT devices, a dialog appears. an option and click
a. Select Remove Command from Devices and Disable Graceful Shutdown, and click OK to remove the command from Power IQ and not assign a different shutdown command to the IT devices.
OR
b. Select Assign Another Shutdown Command to Devices, and then select a different shutdown command from the list, and click OK, to assign a different shutdown command to the IT devices.
Preparing Servers for Graceful Shutdown
Servers must be configured to allow the shutdown commands to run when you enable graceful shutdown from Power IQ.
Open Ports for Graceful Shutdown
Servers that will receive graceful shutdown commands from Power IQ must have the following open ports.
Unix/Linux:
TCP 22: For SSH commands only. Custom SSH ports are not supported.
Windows:
TCP 139: NetBIOS Session Service, for Windows systems only.
TCP 445 : For NetRPC commands only.
Basic Configuration for SSH Shutdown
Open Ports
Open port 22.
Authentication for SSH:
Power IQ can send a shutdown command via SSH to systems that share an authentication method, including the following methods.
common user directories
common username and password
common username and password (users managed by a common LDAP server)
common username and encrypted key: Append the public key file
as a string to the ~/.ssh/authorized_keys file of the user
on each machine to be shut down.

Chapter 12: Power Control
157
The user must have permission to shut down the machines using the authentication method.
Each authentication method must be tested from the command line.
Shutdown Commands:
There are two types of shutdown commands that you can use in Power IQ.
1. A call to the native shutdown command, which varies by Unix type
OR
2. A common shutdown script that carries out a backup
Each method must be tested from the command line of each machine to be shut down
The command has 30 minutes to complete before Power IQ stops trying. If the time expires, Power IQ closes the SSH connection, logs an error, and does NOT power off the outlet.
If the command returns stderr, Power IQ assumes a failure. Power IQ logs stdout and stderr.
Error details are written to the Power IQ log.
Sample SSH Shutdown Commands
Resources for information on writing SSH shutdown commands:
http://www.unix.com/man-page/OpenSolaris/1m/shutdown/
Sample Linux command:
/sbin/shutdown -h now
Sample OpenSolaris command:
sudo -E /usr/sbin/shutdown -y -i5 -g5

Chapter 12: Power Control
158
Basic Configuration for Windows Remote Shutdown
NetRPC shutdown commands can be used to shutdown Windows machines remotely.
Open ports:
Open port 445.
Authentication:
The Windows Remote Shutdown command requires a user account whose security policy allows shutdowns from a remote system.
Each server that will receive graceful shutdown commands must accept the user account's username and password.
Windows Server Configuration:
RPC commands must be enabled on each Windows server that you will shutdown via Power IQ.
Create Device Groups for Power Control
Create a group of devices when you need to perform a power control task on the whole group. You can control power to the group manually, or by scheduling a power control task to run at a certain time. See Control Power to Outlets in a Data Center (on page 149) and Scheduling Power Control (on page 150).
Create a Device Group
To create device groups for power control:
1. Make sure power control and scheduled power control is enabled. See Enable or Disable Power Control (on page 148) and Configure Power Control Options (on page 148).
2. In the Devices tab, select the devices you want to add to the group.
3. Click Add to Device Group > Create a new device group.
4. In the "Create a new device group" dialog, enter a name for the group, then click "Create device group".
5. The group is created, and the selected devices are added. A success message displays. Click "View device group" to open the device group details, where you can set the default power control delays and sequence of devices for power control operations. See Configure the Power Control Settings for a Device Group (on page 159).

Chapter 12: Power Control
159
Add Devices to an Existing Device Group
Once groups have been created, you can add devices to the group in the Devices tab.
1. In the Devices tab, select the devices you want to add to the group.
2. Click Add to Device Group, and the list of groups that have been created displays beneath the "Create a new group" option. Select the group you want to add the devices to.
Add Devices to a Group in the Data Centers Tab
You can add one device or all devices within a data center, row, rack, and so on, to a group in the Data Centers tab.
To add devices to a group from the Data Centers tab:
1. In the Data Centers tab, select a device to add to the group. To add all devices from a section of the data center, select the room, or aisle, or rack. You can select any level, up to and including the data center.
2. Right-click the selected level, select "Add devices to a device group", then select the group. To add a group, select "Create a new device group", enter a device group name then click "Create device group."
Configure the Power Control Settings for a Device Group
Configure each device group to set the default power control delay and the sequence of devices for power control operations.
To configure the power control settings for a device group:
1. In the Devices tab, choose Activities > Device Groups.
2. Click a device group Name link. The Edit Device Group page opens.
3. Set the Default Power On Delay (sec), which is the number of seconds that Power IQ delays after powering on each device in the sequence of devices in a group. These settings are the default power-on delay for all new devices you add to the group.
4. Set the sequence for power control operations. Select a device, then click Up, Down, Top, Bottom, and Move To to arrange the device list in the sequence that power control operations should occur.
Devices will power off in the sequence set.
Devices will power on in the REVERSE sequence set.

Chapter 12: Power Control
160
Remove a Device from a Group
To remove a device from a group:
1. In the Devices tab, choose Activities > Device groups.
2. Click the device group Name link.
3. Select the device you want to remove, then click Remove. The device is removed from the group, but not removed from Power IQ.
Set a Different Power On Delay for a Device
Power IQ will follow the default delay setting for power-on sequences, unless you specify a different delay setting for a device. Delays are for power-on sequences only. The delay occurs after each power-on operation completes.
1. In the Devices tab, click a device group Name link in the Device Groups column. The Edit Device Group page opens.
2. Select the device in the Devices in This Group list, then double-click the Power On Delay value and enter a new value in the field.

161
In This Chapter
Downloading Daily Sensor Readings .................................................... 161 Upgrading Power IQ Firmware .............................................................. 162 Shutting Down and Restarting Power IQ ............................................... 162 Accessing Audit Logs ............................................................................ 163
Downloading Daily Sensor Readings
The sensor readings gathered by Power IQ are collected into an archive file each day. The sensor readings CSV file includes the state of the circuit breakers for applicable Dominion PX PDUs. The circuit breaker state is recorded to this file only once every polling interval, even if you enable buffered data retrieval under Polling Options.
Sensor readings include temperature, humidity, airflow, air pressure, and contact closure sensors.
Sensor readings CSV files are stored on Power IQ for eight days, one file per day. Power IQ automatically deletes the oldest file after eight days.
See Configuring Remote Storage of Archive Files (on page 91) for details on automatic remote storage of sensor reading archives.
To download daily sensor readings:
1. In the PDUs tab, choose Activities > Download PDU Sensor Readings. The Sensor Readings Archives page opens.
2. Click a filename link to download an archive of the sensor readings taken on that day. Filenames include the date of the readings. Or, click Download Latest Readings to download the current sensor readings CSV file.
Chapter 13 Maintenance Tasks

Chapter 13: Maintenance Tasks
162
Note: To delete an archived file, select the checkbox next to the filename, then click Remove.
To download daily sensor readings via script:
You can set up an external program to download the latest sensor readings file each day.
Example using wget:
wget --user [username] --password [password]
https://[hostname]/sensor_readings_csv/latest
Example using curl:
curl --user [username]:[password]
https://[hostname]/sensor_readings_csv/latest >
latest-csv-archive.zip
Upgrading Power IQ Firmware
When new firmware is released, you can upgrade Power IQ to receive the latest in features and functionality.
See the Release Notes for any special instructions on upgrading.
To upgrade Power IQ firmware:
1. In the Settings tab, click Software Upgrades in the Appliance Administration section. The Upgrade page opens.
2. Click Browse, select the firmware file (usually a *.bin file).
3. Click Upload. The new firmware uploads to Power IQ.
Shutting Down and Restarting Power IQ
You can shut down and power off or restart Power IQ.
To shut down and power off Power IQ:
In the Settings tab, click System Shutdown in the Appliance Services section.
The Power IQ shuts down and powers off.
To restart Power IQ:
In the Settings tab, click System Restart in the Appliance Services section.
The Power IQ restarts.

Chapter 13: Maintenance Tasks
163
Accessing Audit Logs
Power IQ Web Client audit logs can be viewed in a browser, or exported to a file for viewing or storage.
Warning: Audit logs are automatically deleted from the system after 3 calendar months. If you need to maintain a complete audit trail, export logs regularly and store the files outside Power IQ.
To access audit logs:
1. In the Settings tab, click Audit Log in the Application Administration section.
2. The Audit Log Entries page opens.
To export audit logs to a text file:
1. In the Settings tab, click Audit Log in the Application Administration section.
2. Click the Download Audit Logs link. All audit log entries are exported to a text file.
3. Save the file.

164
In This Chapter
Allow HTML Widgets on Dashboard ..................................................... 164 Display a Logo on Every Page .............................................................. 164 Configuring the System Clock ............................................................... 165 Dynamic Plugins .................................................................................... 166 Set Fahrenheit or Celsius Temperature ................................................ 175
Allow HTML Widgets on Dashboard
The Dashboard tab can include your custom HTML portlets as a widget. HTML portlets may have security implications. You must allow them before you can add an HTML widget to the Dashboard tab.
To allow HTML widgets on dashboard:
1. In the Settings tab, click Application Settings in the Appliance Settings section.
2. In the Display Settings section, select the "Allow user-created HTML portlets on the dashboard" checkbox.
3. Click Save.
Display a Logo on Every Page
Upload your company logo to display it on every page in Power IQ. This is useful for branding a dashboard presentation.
Logos must not exceed 150 pixels wide, 48 pixels high, or 512KB in size.
For details on adding a logo to the dashboard, see Image Widget (on page 61).
To display a logo on every page:
1. In the Settings tab, click Application Settings in the Appliance Administration sections.
2. In the Display Settings box, select the "Show a custom uploaded logo" checkbox.
3. Click Browse to select the logo file, then click Open.
If the file does not meet the logo criteria, error messages display. Edit the image as needed, then upload again.
4. Click Save Display Settings. The logo appears in the top right corner of every page in Power IQ.
Chapter 14 Appliance Administration

Chapter 14: Appliance Administration
165
Configuring the System Clock
Power IQ uses the system clock to time-stamp events and data records. Set the system clock as soon as possible to keep an accurate record of events.
Using an NTP server is recommended to keep the system clock synchronized between Power IQ and the PDUs it manages.
Important! You must use the same NTP server for Power IQ and all Dominion PX PDUs managed to get accurate readings from PX.
Configuring NTP Server Settings
The Configure Time Servers table lists the NTP servers Power IQ contacts to get date and time information. NTP must be enabled first.
Power IQ attempts to retrieve the date and time from the first server on the list. If this attempt fails, it proceeds down the list and attempts to contact the second server, then the third, and so on.
To enable NTP and configure NTP servers:
1. In the Settings tab, click Application Settings in the Appliance Administration section.
2. In the Time Settings box, click the arrow to expand the NTP Settings
3. Select the Enable NTP checkbox.
4. Click Add.
5. Type the time server's IP address in the Time Server field then click OK.
6. Click Save Time Settings.
To edit NTP server settings:
1. Select the server in the table and click Edit.
2. Type the time server's IP address in the Time Server field
3. Click Save Changes.
To remove an NTP server:
1. Select the server in the table.
2. Click Remove.
3. Click Yes in the confirmation message.

Chapter 14: Appliance Administration
166
Configuring the System Clock Manually
To configure the system clock manually:
1. In the Settings tab, click Application Settings in the Appliance Administration section.
2. In the Time Settings box, select the Time Zone Power IQ resides in from the Time Zone drop-down list.
Select the date and time using the tools in the "Set time manually" fields. Select the date from the pop-up calendar. Select the 24-hour time from the drop-down list.
3. Click Save.
Dynamic Plugins
The dynamic plugins feature enable you to add data collection support for external PDU products that Power IQ does not already support.
This can be useful to add support for a non-supported rack PDU, UPS, branch circuit monitor, or any power metered device that supports SNMP.
For simplicity, this user guide will refer to "PDUs" only, but this represents all types of devices that you can add using dynamic plugins.
Dynamic plugins work by mapping SNMP OIDs that you provide from the PDU's MIB file to Power IQ's database, so that Power IQ can find and retrieve data from the PDU.
For a full list of supported PDUs, go to http://www.raritan.com/resources/power-iq-rack-pdu-support/
Limitations of Dynamic Plugins
You can add a PDU with attached sensors using dynamic plugins, but you cannot access the sensor data in Power IQ.
Buffered data retrieval is not supported for PDUs added with dynamic plugins.
Requirements for Dynamic Plugins
MIB file for the PDU you want to manage. See Find the MIB File (on page 167).
Ability to correctly identify OIDs in a MIB file.

Chapter 14: Appliance Administration
167
Find the MIB File
To add a PDU using dynamic plugins, you must have the MIB file for the PDU.
To find the MIB file:
MIBs are usually available in one of the following locations.
The product interface. For example, Raritan's Dominion PX PDUs have a menu option to save the MIB file. Note: PX PDUs are supported. You do not need to add dynamic plugins for Raritan PDUs.
The product's website.
The product's technical support department.
Identify the OIDs for Mapping
Power IQ provides the ability to map OIDs for many components, attributes, and details of PDUs. Power IQ can collect and display data from the PDU based on the mappings you provide.
OIDs are documented in a product's MIB file.
In SNMP, the object identifier (OID) that uniquely identifies the make and model of an SNMP-managed device is the MIB-II System Object Identifier, commonly referred to as "sysObjectID." Within Power IQ, the "sysObjectID" is referred to as the "PDU System OID".
For example, the sysObjectID or "PDU System OID" for a Raritan model PX PDU is "1.3.6.1.4.1.13742.4". The "PDU System OID" is commonly used as the prefix for additional OIDs used to retrieve key PDU attribute and component information.
See the following sections for lists of components, attributes, and values that you can map from your PDU to Power IQ.
For each feature that you want to map, you must find the OID, and enter it in the mapping form to create the dynamic plugin. See Add a Dynamic Plugin (on page 169).
PDU Components
Inlets
Lines
Circuit Breakers
Outlets
Outlet Poles

Chapter 14: Appliance Administration
168
PDU Attributes
PDU Manufacturer
PDU System ObjectId
PDU Model
PDU Name
PDU Firmware
Inlet Attributes
Inlet Active Power
Inlet Apparent Power
Inlet Voltage
Inlet Power Factor
Inlet Line Attributes
Line Current
Line Voltage
Circuit Breaker Attributes
CB Name
CB Current
CB State (tripped, ok)
Outlet Attributes
Outlet Name
Outlet Pole Current
Outlet Active Power
Outlet Apparent Power
Outlet State
Outlet Switch
Outlet Control Values
Outlet State on
Outlet State off
Outlet Switch on
Outlet Switch off

Chapter 14: Appliance Administration
169
Add a Dynamic Plugin
Select the data you want to collect from your PDU and add the OID mapping for it to create the dynamic plugin.
When adding OID, you can use variables to simplify data entry and reduce errors. You must use the correct formatting, which is validated when you save the plugin. See OID Variables and Format (on page 170) for details.
For a full list of available data you can map, see Identify the OIDs for Mapping (on page 167).
To add a dynamic plugin:
1. In the Settings tab, click Dynamic Plugins in the Appliance Administration section.
2. Click Add.
3. Enter a name to identify this dynamic plugin, in the Name field. Names must be lowercase letters only.
4. Enter a description to identify this dynamic plugin in the Description field.
5. Enter the manufacturer of the PDU you want to add using this dynamic plugin in the Manufacturer field.
6. In the Use SNMPv1 field, select Yes to use SNMPv1 communication. Select No to use the default, SNMPv2 communication.
7. In the following fields, enter the value used for each status. Common values are Yes, No, On, Off, 1, 2, or some other value as specified for the PDU in the MIB.
Circuit Breaker State OK
Circuit Breaker State Tripped
Outlet State On
Outlet State Off
Outlet Power On
Outlet Power Off
8. In the Metadata section, enter the PDU System OID and PDU Model OID for the PDUs that will use this dynamic plugin. See OID Variables and Format (on page 170) for details.p
9. To add features of the PDU, select an item from the "Add another mapping" drop-down list, then click Add.
10. For each mapping you add, enter the OID. If the MIB does not have an OID for an Index item, enter an integer value. See Index Mapping Format (on page 171) for details about mapping indices.

Chapter 14: Appliance Administration
170
Mappings that may require more information have an Options arrow below the main mapping field. Click the arrow to view the options.
a. Start and Step for Index mappings:
Some MIBs number indices starting at a number other than 1, and in increments greater than 1. If your MIB shows this, enter the starting number in the Start field, and the increment in the Step field.
b. Multipliers for measurement mappings:
Power IQ uses whole units for power measurements, such as watts, amps, and volts. Some MIBs use a different measurement. The multiplier is the number to multiply the PDU's measurements by to match Power IQ's measurement units. For example, if your MIB gives power readings in kilowatts, enter a multiplier of 1000 to calculate the measurement in watts.
11. When you've finished with mappings, click Save Plugin.
12. Add the PDU that uses the dynamic plugin. See Adding PDUs to Power IQ Management (on page 11).
See Check PDUs Added with Dynamic Plugins (on page 174).
OID Variables and Format
When creating mappings in Power IQ, you can use a variable to represent some OIDs, when the number is part of another OID. For example, many OIDs contain the PDU System OID.
The following variables are supported.
OID Variable
PDU System OID {pdu_system_oid}
Circuit Breaker Index {circuit_breaker_index}
Inlet Index {inlet_index}
Line Index {line_index}
Outlet Index {outlet_index}
Outlet Pole Index {outlet_pole_index}
To use a variable in an OID:
To use a variable in an OID, substitute the variable text for the numbers. You must use the curly brackets before and after, and the period after the final bracket. Follow the examples in the table.

Chapter 14: Appliance Administration
171
Full OID without variable substitution OID with variable substitution
PDU Name for a PX1:
1.3.6.1.4.1.13743.4.1.1.13.0
{pdu_system_oid}.1.1.13.0
PDU Firmware for a PX1
1.3.6.1.4.1.13743.4.1.1.1.0
{pdu_system_oid}.1.1.1.0
Outlet Active Power for a PX1
1.3.6.1.4.1.13743.4.1.2.2.1.7.1.2.1.0
{pdu_system_oid}.1.2.2.1.7.{outlet_index}
Index Mapping Format
There are 2 options for specifying a value for the Inlet Index, Line Index, Circuit Breaker Index, Outlet Index, and Outlet Pole Index mappings.
Find an OID that provides the count.
Provide an integer to hard-code the count.
The advantage of specifying an OID that the dynamic plugin uses to retrieve the outlet count is that a single plug-in mapping can support a variety of different models with varying number of outlets.
When you provide an integer, that value is used for any model of PDU that uses the dynamic plugin, and may not be accurate.
To specify a count object OID for index mappings:
Find a count object in the MIB that specifies the number of a particular component, such as outlets, that the target PDU has. Specify the OID for the count as the value of the index.
When an OID is a scalar object, that is, not part of a table, add a ".0" to the end of the OID.
For example, the Raritan PX MIB supports an "outletCount" object with an OID of 1.3.6.1.4.1.13742.4.1.2.1.
Add a ".0" to the end of the OID to arrive at an OID of 1.3.6.1.4.1.13742.4.1.2.1.0.
Power IQ can then use this OID to perform an SNMP get request for the number of outlets on a specific PDU.
To map this value in the dynamic plugin, enter "1.3.6.1.4.1.13742.4.1.2.1.0" in the Outlet Index field.

Chapter 14: Appliance Administration
172
Troubleshooting Dynamic Plugins
For each scenario, check the Dynamic Plugin Log file to help troubleshoot errors.
Add PDU fails with error "Unmanageable", or PDU connectivity is "Unmanageable":
The wrong PDU System OID, or the wrong PDU Model OID is specified in the dynamic plugin.
Dynamic Plugin Log file excerpt sample when PDU System OID is wrong:
2011-05-12 13:44:40,394 INFO
[DiscoverTask-192.168.100.100] PduDiscovery:
supportsSystemObjectId: target
sysObjectId=1.3.6.1.4.1.13742.4
2011-05-12 13:44:40,450 INFO
[DiscoverTask-192.168.100.100] PduDiscovery:
supportsSystemObjectId: no dynamic plugin capable of
managing PDU w/ sysObjectID 1.3.6.1.4.1.13742.4
Dynamic Plugin Log file excerpt sample when PDU Model OID is wrong:
2011-05-12 12:23:36,836 INFO
[DefaultUDPTransportMapping_127.0.0.1/0] SnmpUtils:
onResponse: got an exception varbind for oid
1.3.6.1.4.1.13742.4.1.1.120.0,
error=SNMP_ERROR_NO_SUCH_OBJECT
2011-05-12 12:23:36,836 WARN
[DiscoverTask-192.168.100.100] PduDiscovery:
getModelName: failed to retrieve model name
2011-05-12 12:23:36,837 INFO
[DiscoverTask-192.168.100.100] PduDiscovery: discover:
Model Name not Found
Information on PDU details page is wrong or missing:
If adding the PDU is successful, but information on the PDU details page is missing or wrong, an incorrect OID for outlet active power may be specified in the dynamic plugin, for example.
Dynamic Plugin Log file excerpt sample when Outlet Active Power is wrong:

Chapter 14: Appliance Administration
173
2011-05-12 14:14:24,647 INFO
[DefaultUDPTransportMapping_127.0.0.1/0] SnmpUtils:
onResponse: got an exception varbind for oid
1.3.6.1.4.1.13742.4.1.2.2.1.56.1,
error=SNMP_ERROR_NO_SUCH_OBJECT
2011-05-12 14:14:24,647 INFO
[DefaultUDPTransportMapping_127.0.0.1/0] SnmpUtils:
onResponse: got an exception varbind for oid
1.3.6.1.4.1.13742.4.1.2.2.1.56.2,
error=SNMP_ERROR_NO_SUCH_OBJECT
2011-05-12 14:14:24,647 INFO
[DefaultUDPTransportMapping_127.0.0.1/0] SnmpUtils:
onResponse: got an exception varbind for oid
1.3.6.1.4.1.13742.4.1.2.2.1.56.3,
error=SNMP_ERROR_NO_SUCH_OBJECT
2011-05-12 14:14:24,647 INFO
[DefaultUDPTransportMapping_127.0.0.1/0] SnmpUtils:
onResponse: got an exception varbind for oid
1.3.6.1.4.1.13742.4.1.2.2.1.56.4,
error=SNMP_ERROR_NO_SUCH_OBJECT
2011-05-12 14:14:24,647 INFO
[DefaultUDPTransportMapping_127.0.0.1/0] SnmpUtils:
onResponse: got an exception varbind for oid
1.3.6.1.4.1.13742.4.1.2.2.1.56.5,
error=SNMP_ERROR_NO_SUCH_OBJECT
2011-05-12 14:14:24,647 INFO
[DefaultUDPTransportMapping_127.0.0.1/0] SnmpUtils:
onResponse: got an exception varbind for oid
1.3.6.1.4.1.13742.4.1.2.2.1.56.6,
error=SNMP_ERROR_NO_SUCH_OBJECT
2011-05-12 14:14:24,647 INFO
[DefaultUDPTransportMapping_127.0.0.1/0] SnmpUtils:
onResponse: got an exception varbind for oid
1.3.6.1.4.1.13742.4.1.2.2.1.56.7,
error=SNMP_ERROR_NO_SUCH_OBJECT
2011-05-12 14:14:24,648 INFO
[DefaultUDPTransportMapping_127.0.0.1/0] SnmpUtils:
onResponse: got an exception varbind for oid
1.3.6.1.4.1.13742.4.1.2.2.1.56.8,
error=SNMP_ERROR_NO_SUCH_OBJECT
2011-05-12 14:14:24,648 WARN [PollScheduler
Scheduler-10 Pool-fiber09] SnmpOutletCollector: collect:
failed to retrieve data for mapping symbol
'outlet_active_power'

Chapter 14: Appliance Administration
174
Add PDU fails with error "Application Error" or PDU connectivity is "Application Error":
The dynamic plugin encountered an unexpected error that it cannot recover from while attempting to add the PDU to Power IQ. The PDU health shows as Critical in this case, if the PDU is added.
Check PDUs Added with Dynamic Plugins
After you add a PDU using a dynamic plugin, you should check the data collected to verify accuracy.
To check PDUs added with dynamic plugins:
1. In the PDUs tab, click the PDU link. The PDU details page opens.
2. Examine the page to verify that all the data you created mappings for is available. If you do not see data you expected, check your mappings.
3. Check power measurement values to make sure that multipliers were entered correctly.
4. If you see issues, check all mappings and the log file to troubleshoot.
To access the dynamic plugins log:
1. In the Settings tab, click Dynamic Plugins in the Appliance Administration section.
2. Click View Log.
View PDUs Using a Dynamic Plugin
When a dynamic plugin is in use, you can view the PDUs that are associated with it.
To view PDUs using a dynamic plugin:
1. In the Settings tab, click Dynamic Plugins in the Appliance Administration section.
2. All dynamic plugins display in a list. In the PDU Count column, the number link shows how many PDUs use this dynamic plugin. Click the link to go to a list of the PDUs.

Chapter 14: Appliance Administration
175
Set Fahrenheit or Celsius Temperature
Specify your system temperature unit to Fahrenheit or Celsius. This setting is used wherever temperatures are shown in Power IQ.
To display temperatures in Fahrenheit or Celsius:
Temperature settings are global in Power IQ.
1. In the Settings tab, click Application Settings in the Appliance Administration section.
2. In the Language and Locale Settings, set Temperature Unit to Celsius or Fahrenheit.
3. Click Save Locale Settings.

176
In This Chapter
What are Power IQ Analytics?............................................................... 177 Adding Reports to the Analytics Page ................................................... 178 Sharing Reports on the Analytics Page ................................................. 179 Creating a Chart .................................................................................... 180 Configuring Charts ................................................................................. 180 Exporting Charts .................................................................................... 186
Chapter 15 Analytics

Chapter 15: Analytics
177
What are Power IQ Analytics?
The Analytics tab allow you to create and view custom reports based on Power IQ's knowledge of your data center and the power measurements it takes.
Reports are created as a way to organize charts. See Adding Reports to the Analytics Page (on page 178).
Each report can contain one or more charts. There are two chart types: Device and Health. See Creating a Chart (on page 180).
Device charts show power measurements of your devices. See Device Chart Settings (on page 180).
Health charts show connectivity and event statuses of your PDUs. See PDU Health Chart Settings (on page 185).
This list contains some examples of the types of information you can include in charts:
The Active Power consumed by Test Rack #2 over the past hour.
How many Kilowatt Hours were used by Rows A, B and C in the Data Center last month.
If power costs $0.062 per kWh, what did the IT server room cost to power last year?
What is the health status of all PDUs in the system, based on connectivity and events received?
You must configure an Enterprise Data Model before using Analytics. The Enterprise Data Model populates the Data Center tab with a hierarchical representation of your data center. See Enterprise Relationships (on page 92).

Chapter 15: Analytics
178
Adding Reports to the Analytics Page
The analytics page can include multiple report pages. A report page is a collection of one or more charts. Creating multiple reports is a good way to organize the Analytics information by category or specific need.
To add a report to the Analytics page:
1. Click Add in the Reports column and enter a name for the report.
2. In the Reports toolbar, select the Share This Report checkbox to make the report and charts public.
To view a report:
In the Analytics tab, select a report in the Reports column. The report opens in the main section of the page.
If the report has been shared by another user, you cannot edit it. Shared reports are marked as "Shared by username."

Chapter 15: Analytics
179
Sharing Reports on the Analytics Page
Choose to share a report when you want to make it public. Sharing reports gives other Power IQ users access to the report, and the charts it contains.
Users must have the View and the Create Reports and Charts role assigned to view your shared reports.
Reports that are shared are marked in the list as "You are sharing." Reports that have been shared by other users are marked as "Shared by username."
The data that displays in a report is based on each individual user's permissions in Power IQ. If another user does not have permission to see information about a rack or datacenter, for example, that you have shared a report about, the user will not see the data.
Users that you share a report with cannot edit your report. You cannot edit reports that you did not create.
To share reports on the Analytics page:
1. In the Analytics tab, select a report on the left side of the page.
2. In the Reports toolbar, select the Share This Report checkbox to make the report and charts public.
To make reports private on the Analytics page:
1. In the Analytics tab, select a report on the left side of the page.
2. In the Reports toolbar, deselect the Share this Report checkbox to remove the report from public view.

Chapter 15: Analytics
180
Creating a Chart
You must add a report before you can create a chart. See Adding Reports to the Analytics Page (on page 178).
To create a chart:
1. In the Analytics tab, select a report on the left side of the page.
2. Click Add Chart, then select Device Chart or Health Chart.
Device charts show power measurements of your devices. See Device Chart Settings (on page 180).
Health charts show connectivity and event statuses of your PDUs. See PDU Health Chart Settings (on page 185).
You can change the location of any chart by clicking on the title bar of the chart and dragging it to its new position.
Configuring Charts
Configure a chart to select the data you want to analyze.
Charts created in the Analytics tab can only be viewed in the Analytics tab. Charts configured in the Dashboard tab can be viewed in the Dashboard tab, or in a Dashboard slide show. See Dashboard (on page 53).
For device chart details, see Device Chart Settings (on page 180).
For PDU health chart details, see PDU Health Chart Settings (on page 185).
Device Chart Settings
A device chart displays power measurements for the devices in your data centers.
You can configure a device chart on the Analytics tab or on the Dashboard tab.
To configure device chart settings:
1. In the Analytics tab, select a Report. The charts contained in the Report open. On the chart you want to configure, click the Settings
icon . See Creating a Chart (on page 180) for details on adding a new chart.
OR
In the Dashboard tab, add a device chart widget, then click the
Settings icon in the widget. See Device Chart Widget (on page 57).

Chapter 15: Analytics
181
2. The Device Chart Settings dialog appears.
3. In the Measurement field, select the type of measurement you want to analyze from the drop-down list.
The measurement is represented on the y-axis of the chart.
See Device Chart Measurements.
4. In the Time Selection section, select Period or Range.
Select Period to show constantly updated measurement, such as power consumption over the Past hour, Past week, Past month, and so on. Select the time period from the drop-down list. See What's the difference between "Past" and "Last" time periods? (on page 183)
Select Range to show measurements from a custom Start Date and End Date. Select the start and end dates using the calendar dialogs.
The time selection is represented on the x-axis of the chart.
5. In the Granularity field, if available, select the level of granularity of data to chart. Hourly will show 1 data point per hour for the time period the chart includes, when the time period is 24 hours or longer. Poll Interval will show 1 data point per poll interval for the time period the chart includes.
The Poll Interval must be set to 5 minutes or longer to use Poll Interval granularity.
6. In the Line Configuration field, select an option to determine how many lines are on a chart, and how the lines are configured.
Select "Manually define lines" to choose the data for each line individually. You can add data from different sections of the data center to the same chart with this option. See Manually Define Individual Device Chart Lines (on page 182). Click the Individual Lines (Advanced) tab to configure the lines.
Select "Automatically define lines" then select a node from your enterprise data model in the Show field to show 1 line of data in the chart. Select the "One line per child" checkbox to show 1 line of data per child of the location selected in the Show field. For example, 1 line per child of a data center may show 1 line per room. Parent-child relationships are determined by the structure of your enterprise data model, as configured in the Data Centers tab.
Note: Humidity and Temperature measurements cannot be represented as one line per child. To chart one line per humidity or temperature sensor, use "Manually define lines."
7. In the External Key field, enter the external key of the PDU to filter the chart's data by that value.

Chapter 15: Analytics
182
8. In the Custom Fields 1 and 2, which may be renamed in your system, enter a PDU custom field value to filter the chart's data by that value.
9. Select Minimum, Maximum, or Average to specify whether you want the lowest values, highest values, or an average of the data for the measurement you selected. Min/Max/Average is not available for all measurements.
10. Click View Matching PDUs to view the list of PDUs to be included in the chart data.
11. The text in the Name field displays as the chart title. Select the Auto Name checkbox to allow the name to configure automatically, based on the criteria of the chart. Deselect the Auto Name checkbox to enter a name manually.
12. The Include Legend checkbox is enabled by default, and a chart legend for the data will be included. Deselect the Include Legend checkbox to remove the legend.
Removing the legend can make a chart more readable, depending on how many lines of data are included.
13. Click OK to save the settings and view the chart.
Manually Define Individual Device Chart Lines
You can manually define individual device chart lines to choose the data for each line individually.
You can add data from different sections of the data center to the same chart with this option.
To manually define individual device chart lines:
See Device Chart Settings (on page 180) to start the chart configuration. In the Chart Settings, select "Manually define lines" to enable the Individual Lines (Advanced) tab.
1. In the Individual Lines (Advanced) tab, select a line in the Lines column.
By default there is one line, called Power IQ, that represents the whole system.
2. In the "Select what you want to see on this line" field, click the browse button, then select the data center node you want to chart on this line. Expand or collapse the nodes by clicking the plus and minus signs. The name of the node selected displays in the field at the bottom on the dialog. Click Select Node to save the line.
3. To add more lines, click Add, then select the line and repeat step 2 to configure it.

Chapter 15: Analytics
183
4. To filter a line to a more granular level, select the line in the Lines column, then enter your criteria in the fields in the Filter by Device Properties section.
For example, to configure a chart that includes 1 line per rack or row for a certain customer, add 1 line for each rack or row, then enter the name of the customer in the Customer Name field of each line.
5. The text in the Name field displays as the line name in the legend of the chart, when legends are enabled. Select the Auto Name checkbox to allow the name to configure automatically, based on the criteria of the line. Deselect the Auto Name checkbox to enter a name manually.
6. Click the Chart Settings tab to finish the other chart configurations. See Device Chart Settings (on page 180).
7. Click Save.
What's the difference between "Past" and "Last" time periods?
A Past measurement indicates the selected period of time up to the current moment.
For example: If you view a device chart on Tuesday, and the period is set to Past Week, the chart includes data from last Tuesday through this Tuesday.
A Last measurement indicates the most recent completed period of time.
For example: If you view a device chart on Tuesday, and the period is set to Last Week, the chart includes data from last Sunday through last Saturday. The chart shows the last full week.

Chapter 15: Analytics
184
Device Chart Measurements
Device charts can be configured for many kinds of measurements.
Power Reading Charts:
Active Power (W)
Current (amp)
IT Energy (kWh)
CO2 Footprint (CO2 Kg)
IT Energy Cost ($ or other currency)
Total Energy Including Cooling (kWh)
Total Energy Cost Including Cooling ($ or other currency)
Temperature Charts:
Measurement taken as degrees Celsius or Fahrenheit, based on system setting in Settings > Application Settings > Language and Locale Settings.
Inlet Temperature
Outlet Temperature
Outside Air Temperature
Humidity Charts:
Measurement taken as percentage humidity.
Inlet Humidity (%)
Outlet Humidity (%)
Outside Air Humidity (%)
Air Flow and Pressure Charts:
Measurements taken as meters per second for air flow, and pascals for air pressure.
Air Flow (m/s)
Air Pressure (Pa)

Chapter 15: Analytics
185
PDU Health Chart Settings
A PDU health chart displays connectivity and event statuses of your PDUs.
You can configure a PDU health chart on the Analytics tab or on the Dashboard tab.
To configure device chart settings:
1. In the Analytics tab, select a Report. The charts contained in the Report open. On the chart you want to configure, click the Settings
icon . See Creating a Chart (on page 180) for details on adding a new chart.
OR
In the Dashboard tab, add a PDU health chart widget, then click the
Settings icon in the widget. See PDU Health Chart Widget (on page 57).
2. The Health Chart Settings dialog appears.
3. Click the Settings icon .
4. Enter a name for the chart in the Title field in the Basics section.
5. In the Data From field, select All to include all PDUs in the system in the chart. Select Data Center or other section of the data center to filter the next field's selections. For example, select Racks to filter the Contained In field to include the racks in your system.
6. In the Contained In field, select the location of the PDUs you want to include in the Health chart.
7. In the Options section, select the health measurement.
Select Overall Health to view a health chart that combines connectivity and active events to create an overall health status of the selected PDUs.
Select Event Health Only to exclude connectivity from the health status.
Select Connectivity Health Only to exclude active events from the health status.
8. Click Save.

Chapter 15: Analytics
186
Overall PDU Health
Overall health in a PDU Health Chart comprises both connectivity health and active events health. The overall health is determined based on these criteria:
Critical: Red - A PDU is in critical overall health if either its connectivity health is critical or its active events health is critical. The overall health is critical even when only one of these categories is critical.
Warning: Yellow - A PDU is in warning level overall health if either its connectivity health is warning, or its active events health is warning, but neither is critical. This could indicate a warning level active event and good connectivity.
Good: Green - A PDU is in good overall health if both its connectivity health is good and its active events health is good. This indicates no unsuccessful polls, and no active warning or critical severity events.
Exporting Charts
Export a chart to save the chart data to a .CSV file.
To export a chart:
1. In the Analytics tab, select a Report.
2. The charts contained in the Report open. Click the Export icon in the chart.
3. Use the dialog that appears to save the file.

187
Upgrading Dominion PX PDUs managed by Power IQ consists of three steps.
Uploading Dominion PX firmware to Power IQ
Creating an upgrade plan to distribute the firmware to Dominion PX PDUs.
Executing the plan.
You can use the plans immediately or save them for later.
Warning: Never downgrade a Dominion PX to a lower version number. Downgrading causes damage to the PDU.
In This Chapter
Plan a New Upgrade ............................................................................. 187 View Saved Upgrade Plans ................................................................... 188 Edit a Saved Upgrade Plan ................................................................... 189 Execute a Saved Upgrade Plan ............................................................ 189 View Status of Upgrade Plans in Progress ........................................... 190 View Completed Upgrade Plans ........................................................... 190 Manage Firmware Versions .................................................................. 191
Plan a New Upgrade
Bulk upgrade plans are only applicable to Dominion PX PDUs.
To plan a new upgrade:
1. In the PDUs tab, choose Activities > Upgrade Firmware.
2. Click "Plan a New upgrade." The upgrade planning wizard starts.
3. Enter a name for the plan and click Continue.
4. A summary of plan options appears at the top of the page. Continue adding details of your upgrade plan at the bottom of the page, or click the links in the summary list to add details.
5. In the Choose Firmware Version section, you can add a new firmware file or select a previously uploaded firmware file. Firmware files are .BIN files. If the file is zipped, unzip and upload the .BIN file.
To add a new file, click the Upload a New File tab, then click Browse to select the file. Enter comments. Click Upload. The file is automatically selected for the plan.
To select a previously uploaded file, click the Available Files tab, then select a file from the list, and click Continue.
Chapter 16 Upgrading Dominion PX PDUs

Chapter 16: Upgrading Dominion PX PDUs
188
6. All PX PDUs available for the upgrade appear in a list. Select the checkboxes for the PDUs you want to upgrade, then click Selected PDUs to add them to the "PDUs selected to this upgrade" list at the bottom of the page. Or, click All PDUs to add all available PX PDUs to the list.
To remove PDUs from the plan, click Selected PDUs or All PDUs in the bottom list. Only PDUs in the bottom list will be upgraded.
7. Click Continue. Click the Plan Options link in the summary at top.
8. On the Plan Options page, edit the plan name, if needed, and set other preferences.
a. Select the "Abort on failure" checkbox if you want Power IQ to cancel all remaining upgrades in the plan if an upgrade failure occurs. This could help prevent an upgrade problem from affecting other Dominion PX PDUs in the plan.
b. Select the "Allow simultaneous rollouts" checkbox if you want Power IQ to upgrade the firmware of multiple Dominion PX PDUs at once. This makes batch upgrades faster by allowing up to 25 upgrades to run at the same time.
9. Click Continue. Review the summary of the plan. Click Add Comment if you want add notes to the plan. Click Add or Remove PDUs if you want to edit the list of PDUs to upgrade.
10. Click Save. The completed plan summary page opens.
11. Click Start Upgrade to execute the plan immediately. The upgrade starts, and the status page displays. You can also execute the saved plan later. See Execute a Saved Upgrade Plan (on page 189).
See View Status of Upgrade Plans in Progress (on page 190) for details on checking upgrades in progress.
See View Completed Upgrade Plans (on page 190) for details on checking completed upgrades.
View Saved Upgrade Plans
View saved upgrade plans to verify and edit their details before executing a plan.
To view saved upgrade plans:
1. In the PDUs tab, choose Activities > Upgrade Firmware.
2. Click "View saved plans." All plans display in a list.
3. Click the Plan name link to view the details and edit if needed.

Chapter 16: Upgrading Dominion PX PDUs
189
Edit a Saved Upgrade Plan
Saved upgrade plans can be edited to change details, add or remove PDUs, or change the firmware version.
To edit a saved upgrade plan:
1. In the PDUs tab, choose Activities > Upgrade Firmware.
2. Click "View saved plans." All plans display in a list.
3. Click the Plan name's link to view the details.
4. Click the blue links in the plan summary to edit the plan. Or, scroll down to click Edit and use the wizard to edit.
See Plan a New Upgrade (on page 187) for details of plan settings.
Execute a Saved Upgrade Plan
Once a plan is saved, execute it to start the upgrade process.
To execute an upgrade plan:
1. In the PDUs tab, choose Activities >Upgrade Firmware.
2. Click "View saved plans." All plans display in a list.
3. Click the Plan name link for the plan you want to execute.
4. Click Start Upgrade to execute the plan.
See View Status of Upgrade Plans in Progress (on page 190) for details on checking upgrades in progress.
See View Completed Upgrade Plans (on page 190) for details on checking completed upgrades.
Upgrade Timing
Each PX PDU upgrade takes approximately 5-10 minutes.
If you select "Allow simultaneous rollouts" in the plan options, 25 upgrades will begin simultaneously, and each batch of 25 will take approximately 10 minutes.

Chapter 16: Upgrading Dominion PX PDUs
190
View Status of Upgrade Plans in Progress
Upgrade plans in progress have 3 possible statuses.
Init: Rebooting the PDU
Login: Logging in to the PDU
Verify: Verifying the new firmware version on the PDU
To view status of upgrade plans in progress:
The status page for plans in progress displays when you execute the plan. You can return to the status page at any time, even after the plan has finished.
1. In the PDUs tab, choose Activities > Upgrade Firmware.
2. Click "View saved plans." All saved plans display in a list.
3. Click the Status link for the plan you executed to view the status page.
View Completed Upgrade Plans
When a plan has been executed, you can view details of the plan status and results of each PDU included in the plan.
To view completed upgrades:
1. In the PDUs tab, choose Activities > Upgrade Firmware.
2. Click "View previously completed upgrades." All completed plans display in a list.
3. Click the Plan name link to view the details.
If the plan completed successfully, a success message displays at the top of the plan details.
The list of PDUs included in the plan includes a Success or Failure message.
Click the "View detailed upgrade status messages" link for more information about each PDU.

Chapter 16: Upgrading Dominion PX PDUs
191
Manage Firmware Versions
You can upload different versions of firmware for use in upgrade plans, and view previously uploaded firmware.
Firmware files are .BIN files. You can download firmware versions from the Raritan website, in the Support section. If the file is zipped, unzip and use only the .BIN file.
To view uploaded firmware versions:
1. In the PDUs tab, choose Activities > Upgrade Firmware.
2. Click Manage Firmware Versions. This link is not available if you do not have any uploaded firmware files. The Manage Firmware Versions page opens.
3. All firmware versions previously uploaded appear in a list.
To delete a firmware version:
Select the checkbox for the firmware version you want to delete, then click Delete.
To upload a new firmware version:
1. Scroll down to the Upload New Firmware File section.
2. Click Browse to select the .BIN file.
3. Enter comments in the Comment box.
4. Click Upload. The file is added to the list and will be available to select when creating a new upgrade plan. See Plan a New Upgrade (on page 187).

192
In This Chapter
Support Connections ............................................................................. 192 Licensing................................................................................................ 193
Support Connections
A support connection allows Raritan technical support to access your Power IQ to diagnose a problem.
You should open a support connection only when Raritan technical support requests one.
Prerequisites for Support Connections
1. The Power IQ device must be able to use DNS to resolve
poweriq-access.raritan.com. The DNS server must be able to
do name resolution for external host names.
2. The Power IQ device must be able to make an outbound HTTPS
request on port 443 to poweriq-access.raritan.com. You may
have to require your firewall to allow this connection.
3. The Power IQ device must be able to make an outbound SSH
request on port 22 to poweriq-access.raritan.com. You may
have to require your firewall to allow this connection.
Create a Support Connection
Make sure your Power IQ device meets the prerequisites before creating a support connection. See Prerequisites for Support Connections (on page 192).
To create a support connection:
1. In the Settings tab, click Get Support in the Appliance Services section.
2. Click Start. A log appears.
3. Make sure the final line of the log includes this text: support connection initialization complete.
4. Contact Raritan Technical Support with your Appliance ID number. The Appliance ID number is on the Settings tab, in the Appliance Information section. For example: e3b123f8-669e-4007-97bf-ca9d85c431f8. Raritan Technical Support uses his number to identify your support connection.
Chapter 17 Support and Licensing

Chapter 17: Support and Licensing
193
Stop a Support Connection
Once Raritan technical support has finished using the support connection, you can stop it. Stopping the support connection will close the SSH connection from your Power IQ device to poweriq-access.raritan.com.
Stop a support connection:
1. In the Settings tab, click Get Support in the Appliance Services section.
2. Click Stop.
Save Support Logs
If you have trouble creating a support connection, the support logs may help Technical Support find the problem.
To save support logs:
1. In the Settings tab, click Get Support in the Appliance Services section.
2. Click Save, then save the file using the dialog that appears.
Licensing
Power IQ requires a license. Licenses allow you to add a certain number of PDUs to Power IQ. You may need more than one license file to be allowed to add your full number of PDUs.
View Licenses
The licenses that you have uploaded to Power IQ are available to view.
To view licenses:
1. Click Administration > Settings. The Settings page opens in a secondary browser window.
2. Click Product Licensing in the Application Administration panel.
3. Click Add in the Licenses section.

Chapter 17: Support and Licensing
194
Use the browse function to locate and add the license file. The Licenses list contains all license files that you have uploaded to Power IQ.
Feature The feature that is allowed by this license.
Type Initial: A required license to activate Power IQ and set the initial PDU capacity allowed.
Incremental: A secondary license type that allows you to add to the initial license's PDU capacity.
Count The number of PDUs that you can add to Power IQ under this license.
Licensee Your company name.
To view licensing summary:
Licensing Summary contains information about how many PDUs your combined licenses allow you to add to Power IQ.
Customer Name
Your company name.
PDU License Capacity
The total number of PDUs allowed by all your licenses.
PDU Licenses Available
The number of PDUs remaining that you are allowed to add.
Add a License File
If this is your first time logging in and you need to add a license file, see Connecting to Power IQ (on page 6). Once you add a license file and log in for the first time, you can follow the instructions in this topic to add or remove license files as needed.
To add a license file:
1. Click Administration > Settings. The Settings page opens in a secondary browser window.
2. Click Product Licensing in the Application Administration panel.
3. Click Add in the Licenses section.
4. Use the browse function to locate and add the license file.
Licenses are .LIC files. Repeat this step to add incremental licenses if needed.

Chapter 17: Support and Licensing
195
Note: Your license file can be retrieved from the Raritan web site after you have activated your registration. To activate your registration, click the link in the "Thank you for registering" email from Raritan and create your user account. Once you create your account, look for a "Your Raritan software license key is available" email containing a link to your license file download page.
5. If you see error messages AND you're unable to use Power IQ or to add the total licensed number of PDUs, contact Raritan Technical Support. There may be a problem with your license file.

196
Power IQ's ODBC interface allows ODBC compliant applications access to the power data of managed devices. For example, an ODBC compliant reporting application like Crystal Reports can access Power IQ data to create customized reports.
The Power IQ ODBC server listens on TCP Port 5432
Roll-up tables summarize data over one hour, twenty four hours, and one month. Upon summarization, detailed readings are purged. For example, when you create a daily roll-up, the hourly poll data is purged from the database. You can configure the data retention settings. See Configuring Data Rollup Retention (on page 89).
Power IQ ODBC Interface is backed by an PostgreSQL database.
In This Chapter
Configuring ODBC Access to Power IQ ............................................... 196 ODBC Client Configuration ................................................................... 197 Timezone Configuration for ODBC Data .............................................. 197 Advanced Reporting with Database and Reporting Programs ............. 197 Power IQ ODBC Schema ..................................................................... 200 Sample ODBC Queries ......................................................................... 216
Configuring ODBC Access to Power IQ
Specify the IP addresses that you authorize to make connections to the database.
To enable ODBC access to Power IQ:
1. In the Settings tab, click ODBC Access in the Data Management section. The ODBC Access page opens.
2. Click Add, then double-click the 0.0.0.0 addresses to enter edit mode and type a Network Address and a Network Mask into the fields. Repeat to add new addresses as needed. Select an address and click Remove to remove authorization from the address.</p>
The Network Mask value can be used to specify a single address or a range of addresses.
Use netmask 0.0.0.0 to allow access from all IP addresses.
3. Click Save when all authorized addresses have been added. The Power IQ database restarts
After the restart, ODBC compliant applications are allowed to access the database from the authorized IP addresses.
Appendix A ODBC Access

Appendix A: ODBC Access
197
ODBC Client Configuration
1. ODBC Client must install and configure a suitable PostgreSQL driver. PostgreSQL drivers are available at http://www.postgresql.org/ftp/odbc/versions/msi/.
2. ODBC Client must configure Power IQ as a ODBC Data Source with the following credentials:
Database Name raritan
User ID odbcuser
Password raritan
Port Number 5432
Server Power IQ IP Address
Timezone Configuration for ODBC Data
ODBC tables use the Power IQ system time setting, which is EST/EDT. This setting is converted to your selected timezone when you are using the Power IQ web interface, but this conversion is not applied to ODBC connections. See Configuring the System Clock Manually (on page 166) for details on setting the timezone for the Power IQ web interface.
The time data available via the ODBC connection can by changed on a per session basis. By using a specific SQL statement to adjust the client session, you can run reports and view information in the desired timezone.
This link contains documentation on setting the timezone for the database using an SQL statement. Use the "SET SESSION ...." syntax, because Power IQ ODBC users do not have super user privileges.
http://www.postgresql.org/docs/8.1/static/sql-set.html http://www.postgresql.org/docs/8.1/static/sql-set.html
Advanced Reporting with Database and Reporting Programs
Create advanced reports and charts with reporting programs such as SQL report writer, Crystal Reports, and Microsoft Access. Follow these instructions to use Microsoft Access.
ODBC Access must be enabled. See Configuring ODBC Access to Power IQ (on page 196).
You must install a PostgreSQL driver first. See Install and Configure a PostgreSQL Driver (on page 198)

Appendix A: ODBC Access
198
Install and Configure a PostgreSQL Driver
You must install and configure a PostgreSQL driver before you can use Microsoft® Access® to create table reports of your Power IQ data.
To install and configure a PostgreSQL driver:
1. Configure Power IQ to allow ODBC access from your client IP address. See Configuring ODBC Access to Power IQ (on page 196).
2. Go to http://www.postgresql.org/ftp/odbc/versions/msi/ and download the latest driver .zip file. Run the .msi file contained in the .zip to install the driver on your client.
3. Go to Control Panel > Administrative Tools > Data Sources (ODBC).
4. Click Add then select the driver, PostgreSQL Unicode, and click Finish.
5. In the dialog that appears, enter the Power IQ database information:
Database: raritan
Server: Power IQ IP address
User Name: odbcuser
Description: Enter a name for this data source
SSL Mode: disable
Port: 5432
Password: raritan
6. Click Test. If the test is successful, click Save.
7. Click OK.
Link Database Tables in Microsoft® Access®
Use Microsoft Access to create links between the Power IQ database tables you want to query. See Correlated Fields in ODBC Tables (on page 199) for details on which Power IQ tables can be linked.
These instructions refer to Access 2003. Other versions may vary.
To link database tables in Microsoft Access:
Note: You only have to link database tables once in Microsoft Access, and the links are retained. You do not have to repeat this task each time you want to create queries or run reports.
1. Choose File > New then select Blank Database.
2. Name the file and click Create.

Appendix A: ODBC Access
199
3. In the dialog that appears, Tables is selected by default in the Object list. Click New.
4. Select Link Table and click OK.
5. In the dialog that appears, select ODBC Databases in the "Files of type" list.
6. In the dialog that appears, click the Machine Data Source tab, select the ODBC driver you installed, and click OK.
7. A list of all ODBC tables appears. Select the table you want to link and click OK.
8. Select the unique record identifier for the table and click OK. The unique record identifier is typically the first item in the list. See the table details in this guide to check. See Power IQ ODBC Schema (on page 200).
9. The linked table appears in the list. Repeat these steps to add other tables you want to query.
10. Identify the relationships between the linked tables.
a. Choose Tools > Relationships.
b. Select all the tables in the list and click Add. The tables appear with lists of their fields. Resize the tables to view the field names.
c. Link the fields that relate by dragging and dropping a field from one table to the field it relates to in another table. See the Microsoft Access help on "Define relationships between tables" for details.
Note: Fields that have relationships are marked as "foreign key relationships" in the ODBC schema. See Power IQ ODBC Schema (on page 200) view the lists of fields. See Correlated Fields in ODBC Tables (on page 199) for details and an example.
Correlated Fields in ODBC Tables
To find how tables in Power IQ relate to each other, look for the foreign key reference fields in each table. The tables are listed in this help. See Power IQ ODBC Schema (on page 200).
Example - the relationship between the PDUOutlets table and the PDUs table:
The PDUOutlets table has a relationship to the PDUs table, via the PDUID field in the PDUOutlets table.
PDUID Integer Foreign key reference to PDUs table

Appendix A: ODBC Access
200
See PDUOutlets (on page 201) and PDUs (on page 200).
Both tables contain a field called PDUID. Link these fields in Microsoft® Access® to enable these tables to be queried together. See Link Database Tables in Microsoft® Access® (on page 198).
Power IQ ODBC Schema
Power IQ makes a number of its data views available through the ODBC interface.
PDUs
The PDUs view contains information about the PDU device.
Field Type Notes
ID Integer Unique PDU number
Caption VarChar (64) PDU Name
Description TEXT MIB II SysDescr
IPAddress inet IP Address
ProxyIndex Integer Subtending unit ID applicable only to daisy-chained and console server connected PDU units
NameFormat VarChar (64)
ModelName TEXT PDU Model
Manufacturer TEXT PDU Manufacturer
Location TEXT MIB II SysLocation
Contact Char (256) Contact name
PDUName TEXT PDU Name
Firmware TEXT PDU Firmware version
Serial Number TEXT PDU Serial Number
CurrentStatus TEXT PDU overall health status: Good, Warning, or Critical
EventHealth TEXT PDU active events health status: Good, Warning, or Critical

Appendix A: ODBC Access
201
Field Type Notes
ConnectivityHealth TEXT PDU connectivity health status: OK, LostComm, NoContact, NoPlugin, and others.
PrimaryOwnerName Char (64) Owner name
PrimaryOwnerContact VarChar (256) MIB II SysContact
InletTemperature Float Temperature at the inlet of the PDU
External Key TEXT An external key, such as asset tag number, associated with the PDU.
Custom Field 1 TEXT A custom field for the user to specify.
Custom Field 2 TEXT A custom field for the user to specify.
Current Float Latest line current reading for the PDU, or the maximum of the line currents for three-phase PDUs
PDUOutlets
The PDUOutlets view shows the outlets associated with a PDU.
Field Type Notes
PDUOutletsID Integer Unique outlet number
PDUID Integer Foreign key reference to PDUs table
OutletID Integer PDU outlet number
OutletName VarChar(64) Outlet name
OutletState VarChar(64) Outlet state
ITDeviceID Integer Associated IT Device ID foreign key

Appendix A: ODBC Access
202
PDUCircuitBreakers
The PDUCircuitBreakers view shows the circuit breakers associated with a PDU.
Field Type Notes
PDUCircuitBreakersID Integer Unique CB Number
PDUID Integer Foreign key reference to PDUs table
CircuitBreakersOrdinal Integer Circuit breaker number on the PDU
CircuitBreakerState Integer 0 (closed) 1 (open) 3 (unknown)
CircuitBreakerLabel VarChar(64) Label assigned to a CB
CircuitBreakerRating Integer 0.01 Amps Units
PDUReadings
The PDUReadings view shows the raw power data collected from PDUs. A data record is added for each PDU polled. This data is summarized hourly in a PDUReadingsRollup view, and the readings in this view are purged.
Field Type Notes
PDUReadingsID Integer Unique ID for each reading
PDUID Integer Foreign key reference to PDU
Time Timestamp with Timezone
Local timestamp
ActivePower Real Active power drawn by PDU
ApparentPower Real Apparent power drawn by PDU
WattHour Real Cumulative watt-hours consumed by the PDU, if available for the PDU
MaxActivePower Real Maximum active power drawn by PDU
MinActivePower Real Minimum active power drawn by PDU

Appendix A: ODBC Access
203
Field Type Notes
MaxApparentPower Real Maximum apparent power drawn by PDU
MinApparentPower Real Minimum apparent power drawn by PDU
PDUOutletReadings
The PDUOutletReadings view shows the raw power data collected from PDU outlets. A data record is added for each outlet polled. This data is summarized hourly in a PDUOutletReadingsRollup view, and the outlet records in this view are purged.
Field Type Notes
PDUOutletReadingsID Integer Unique ID for each reading
PDUID Integer Foreign key reference to PDUs table
OutletID Integer Foreign key reference to PDUOutlets table
OutletNumber Integer PDU outlet number
Time Timestamp with Timezone
Local timestamp
CurrentAmps Real Amps drawn by the outlet
ActivePower Real Active power drawn by the outlet
ApparentPower Real Apparent power drawn by the outlet
WattHour Real Cumulative watt-hours consumed by the outlet, if available for the PDU
MaxCurrentAmps Real Maximum amps drawn by the outlet
MinCurrentAmps Real Minimum amps drawn by the outlet
MaxActivePower Real Maximum active power drawn by the outlet
MinActivePower Real Minimum amps drawn by the outlet

Appendix A: ODBC Access
204
Field Type Notes
MaxApparentPower Real Maximum apparent power drawn by the outlet
MinApparentPower Real Minimum apparent power drawn by the outlet
PDULineReadings
The PDULineReadings view shows the power data collected from PDU current-carrying lines. A data record is added for each line polled. Single-phase PDUs have 1 line. Three-phase PDUs have 3 lines. This data is summarized hourly in a PDULineReadingsRollup view, and the line readings in this view are purged.
Field Type Notes
PDULineReadingsID Integer Unique ID for each reading
PDUID Integer Foreign Key Reference To PDUs table
LineNumber Integer Line number on this PDU
Time Timestamp with Timezone
Local timestamp
CurrentAmps Real Amps drawn on this line
UnutilizedCapacity Real Available amps remaining on this line
MaxCurrentAmps Real Maximum amps drawn on this line
MinCurrentAmps Real Minimum amps drawn on this line
PDUCircuitBreakersReadings
The PDUCircuitBreakerReadings view shows the power data collected from circuit breakers on the PDU. This view does not contain any data for PDUs that do not have circuit breakers. A data record is added for each circuit breaker polled. This data is summarized hourly in a PDUCircuitBreakerReadingsRollup view, and the circuit breaker readings in this view are purged.
Field Type Notes
PDUCircuitBreakerReadin Integer Unique ID for each reading

Appendix A: ODBC Access
205
Field Type Notes
gsID
PDUID Integer Foreign key reference to PDUs table
CircuitBreakersNumber Integer Circuit breaker number on the PDU
CircuitBreakersID Integer Foreign key reference to PDUCircuitBreakers table
Time Timestamp with Timezone
Local timestamp
CurrentAmps Real 0.01 Amps Units
UnutilizedCapacity Real
MaxCurrentAmps Real Maximum amps drawn on the circuit breaker
MinCurrentAmps Real Minimum amps drawn on the circuit breaker
PDUSensorReadings
The PDUSensorReadings view shows the data collected from PDU sensors. A data record is added for each sensor polled. This data is summarized hourly in a PDUSensorReadingsRollup view and the sensor readings in this view are purged.
Field Type Notes
PDUSensorReadingsID Integer Unique ID for each reading
SensorID Integer Database ID of the sensor as seen in PDUSensors
Time Timestamp with Timezone
Local timestamp when the reading occurred
Value Real Sensor value

Appendix A: ODBC Access
206
PDUOutletReadingsRollup
The PDUOutletReadingsRollup view summarizes the outlet readings power data over the roll-up interval. Hourly roll-ups are rolled up once a day. Daily roll-ups are rolled up once a month. When data is rolled up, shorter interval roll-up entries in the PDUOutletReadingsRollup view are purged.
Field Type Notes
PDUOutletReadingsRollupID
Integer Unique ID for each reading
PDUID Integer Foreign key reference to PDUs table
OutletID Integer Foreign key reference to PDUOutlets table
OutletNumber Integer Outlet number on the PDU
RollupInterval Integer 1: one hour
2: one day
3: one month
Time Timestamp with Timezone
Timestamp when rollup was created
MinimumCurrent Real Lowest current (Amps) reading during rollup interval
MaximumCurrent Real Maximum current (Amps) reading during rollup interval
AverageCurrent Real Average current (Amps) reading during rollup interval
MinimumActivePower Real Lowest active power (Watts) reading during rollup interval
MaximumActivePower Real Maximum active power (Watts) reading during rollup interval
AverageActivePower Real Average active power (Watts) reading during rollup interval

Appendix A: ODBC Access
207
Field Type Notes
MinimumApparentPower Real Lowest apparent power (VA) reading during rollup interval
MaximumApparentPower Real Maximum apparent power (VA) reading during rollup interval
AverageApparentPower Real Average apparent power (VA) reading during rollup interval
PDUReadingsRollup
The PDUReadingsRollup view summarizes the PDU readings power data over the roll-up interval. Hourly roll-ups are rolled up once a day. Daily roll-ups are rolled up once a month. When data is rolled up, shorter interval roll-up entries in the PDUReadingsRollup are purged.
Field Type Notes
PDUReadingsRollup Integer Unique ID for each reading
PDUID Integer Foreign key reference to PDU
RollupInterval Integer 1: one hour
2: one day
3: one month
Time Timestamp with Timezone
Timestamp when rollup was created
MinimumActivePower Real Lowest active power (Watts) reading during rollup interval
MaximumActivePower Real Maximum active power (Watts) reading during rollup interval
AverageActivePower Real Average active power (Watts) reading during rollup interval
MinimumApparentPower Real Lowest apparent power (VA) reading during rollup interval
MaximumApparentPower Real Maximum apparent

Appendix A: ODBC Access
208
Field Type Notes
power (VA) reading during rollup interval
AverageApparentPower Real Average apparent power (VA) reading during rollup interval
PDULineReadingsRollup
The PDULineReadingsRollup view summarizes the line readings power data over the roll-up interval. Hourly roll-ups are rolled up once a day. Daily roll-ups are rolled up once a month. When data is rolled up, shorter interval roll-up entries in the PDULineReadingsRollup is purged.
Field Type Notes
PDULineReadingsRollupID
Integer Unique ID for each reading
PDUID Integer Foreign key reference to PDU
LineNumber Integer Line number on the PDU
RollupInterval Integer 1: one hour
2: one day
3: one month
Time Timestamp with Timezone
Timestamp when rollup was created
MinimumCurrent Real Lowest current (Amps) reading during rollup interval
MaximumCurrent Real Maximum current (Amps) reading during rollup interval
AverageCurrent Real Average current (Amps) reading during rollup interval
MinimumUnutilizedCapacity
Real Lowest unutilized capacity (Amps) during rollup interval
MaximumUnutilizedCapacity
Real Maximum unutilized capacity (Amps) during rollup interval

Appendix A: ODBC Access
209
Field Type Notes
AverageUnutilizedCapacity
Real Average unutilized capacity (Amps) during rollup interval
PDUCircuitBreakerReadingsRollup
The PDUCircuitBreakerReadingsRollup view summarizes the circuit breaker readings power data over the roll-up interval. Hourly roll-ups are rolled up once a day. Daily roll-ups are rolled up once a month. When data is rolled up, shorter interval roll-up entries in the PDUCircuitBreakerReadingsRollup view are purged.
Field Type Notes
PDUCircuitBreakerReadingsRollupID
Integer Unique ID for each reading
PDUID Integer Foreign key reference to PDU
CircuitBreakerNumber Integer Circuit breaker number on the PDU
CircuitBreakerID Integer Foreign key reference to PDUCircuitBreakers table
RollupInterval Integer 1: one hour
2: one day
3: one month
Time Timestamp with Timezone
Timestamp when rollup was created
MinimumCurrent Real Lowest current (Amps) reading during rollup interval
MaximumCurrent Real Maximum current (Amps) reading during rollup interval
AverageCurrent Real Average current (Amps) reading during rollup interval
MinimumUnutilizedCapacity Real Lowest unutilized capacity (Amps) during rollup interval
MaximumUnutilizedCapacity Real Maximum unutilized capacity (Amps) during rollup interval

Appendix A: ODBC Access
210
Field Type Notes
AverageUnutilizedCapacity Real Average unutilized capacity (Amps) during rollup interval
PDUSensorReadingsRollup
The PDUSensorReadingsRollup view summarizes the sensor readings power data over the roll-up interval. Hourly roll-ups are rolled up once a day. Daily roll-ups are rolled up once a month. When data is rolled up, shorter interval roll-up entries in the PDUSensorReadingsRollup view are purged.
Field Type Notes
PDUSensorReadingsRollupID
Integer Unique ID for each reading
SensorID Integer Database ID of the sensor as seen in PDUSensors
RollupInterval Integer 1: one hour
2: one day
3: one month
Time Timestamp with Timezone
Timestamp when rollup was created
MinimumValue Real Lowest sensor reading during rollup interval
MaximumValue Real Maximum sensor reading during rollup interval
AverageValue Real Average sensor reading during rollup interval
PDUSensors
The PDUSensors view contains information about sensors attached to PDUs that Power IQ manages.
Field Type Notes
SensorID Integer Auto-generated ID
PDUID Integer Foreign key reference to PDUs table
PDUSensorID Integer ID of the sensor on the PDU, as gathered from

Appendix A: ODBC Access
211
Field Type Notes
the pdu
AttributeName VarChar(64) Type of sensor
Label VarChar(255) Sensor's label as gathered from the PDU
Removed VarChar(64) When the sensor was removed from the system, or null for current sensors
Position VarChar(10) Sensor position on the PDU: inlet, outlet or outside air
DataCenters
The DataCenters view contains information about data center objects as part of the Enterprise Relationship Model. The fields in this view correspond to the item attributes in the model.
Field Type Notes
DataCenterID Integer Auto-generated ID
Name VarChar(255) Human-assigned name for this data center object
CompanyName VarChar(255) Name of the company that owns this data center
ContactName VarChar(255) Name of the person to contact regarding data center
ContactPhone VarChar(255) Phone number for contact
ContactEmail VarChar(255) Email for contact
City VarChar(255) City location of data center
State VarChar(255) State location of data center
Country VarChar(255) Country location of data center
PeakKWHRate Double Energy cost per Kilowatt Hour during peak hours
OffPeakKWHRate Double Energy cost per Kilowatt Hour during off-peak

Appendix A: ODBC Access
212
Field Type Notes
hours
PeakBegin Double Time of day peak hours begin
For example 19.5 = 19:30 hours
PeakEnd Double Time of day peak hours end
CO2Factor Double CO2 computational factor
CoolingFactor Double Cooling factor for data center
CustomField1 VarChar(255) A user-defined field
CustomField2 VarChar(255) A user-defined field
ExternalKey VarChar(255) The unique code used by the Enterprise Model to identify this data center
Floors
The Floors view contains information about Floor objects as part of the Enterprise Relationship Model. The fields in this view correspond to the item attributes in the model.
Field Type Notes
FloorID Integer Auto-generated ID
Name VarChar(255) Human-assigned name for this Floor object.
ExternalKey VarChar(255) The unique code used by the Enterprise Model to identify this Floor.
Rooms
The Rooms view contains information about Room objects as part of the Enterprise Relationship Model. The fields in this view correspond to the item attributes in the model.
Field Type Notes
RoomID Integer Auto-generated ID
Name VarChar(255) Human-assigned name for this Room object.

Appendix A: ODBC Access
213
Field Type Notes
ExternalKey VarChar(255) The unique code used by the Enterprise Model to identify this Room.
Aisles
The Aisles view contains information about Aisle objects as part of the Enterprise Relationship Model. The fields in this view correspond to the item attributes in the model.
Field Type Notes
AisleID Integer Auto-generated ID
Name VarChar(255) Human-assigned name for this Aisle object.
ExternalKey VarChar(255) The unique code used by the Enterprise Model to identify this Aisle.
Rows
The Rows view contains information about Row objects as part of the Enterprise Relationship Model. The fields in this view correspond to the item attributes in the model.
Field Type Notes
RowID Integer Auto-generated ID
Name VarChar(64) Human-assigned name for this Row object.
ExternalKey VarChar(256) The unique code used by the Enterprise Model to identify this Row.
Racks
The Racks view contains information about Rack objects as part of the Enterprise Relationship Model. The fields in this view correspond to the item attributes in the model.
Field Type Notes
RackID Integer Auto-generated ID
Name VarChar (255) Human-assigned name for this Rack object.
SpaceIdentifier VarChar(255) Optional human-assigned

Appendix A: ODBC Access
214
Field Type Notes
value to identify this rack.
ExternalKey VarChar(255) The unique code used by the Enterprise Model to identify this Rack.
The ITDevices view contains information about IT Device objects as part of the Enterprise Relationship Model. The fields in this view correspond to the item attributes in the model.
Field Type Notes
ITDeviceID Integer Auto-generated ID
Name VarChar(255) Human-assigned name for this IT Device object
Customer VarChar(255) Name of the customer that owns this object
DeviceType VarChar(255) Type of device
PowerRating Integer Power in watts that this device is rated for
Decommissioned Boolean Whether this device should be considered decommissioned
CustomField1 VarChar(255) A user-defined field
CustomField2 VarChar(255) A user-defined field
ExternalKey VarChar(255) The unique code used by the Enterprise Model to identify this IT Device
EDMNodes
The EDMNodes view captures the relationship between EDM entities arranged as nested sets. EDM entities are part of a data hierarchy. Hierarchical data can be efficiently searched when arranged as a Nested set tree structure. EDMNodes represent each EDM Entity arranged as a nested set tree structure.
Field Type Notes
ID Integer Auto-generated EDMNodes ID
Lft Integer Auto-generated

Appendix A: ODBC Access
215
Field Type Notes
EDMNode Left ID
Rgt Integer Auto-generated EDMNode Right ID
edm_entity_type VarChar(40) Entity Type. For example, DataCenter, Floor, Rack, Device, ComputerSystem. Entity Type ComputerSystem represents a PDU system.
edm_entity_id Integer Entity ID of the entity.
create_at Timestamp Create time stamp.
Updated_at Timestamp Update time stamp.
ParentID Integer Entity ID of the parent entity
AssetStrips
The AssetStrips view contains information about asset management strips attached to PDUs that Power IQ manages.
Field Type Notes
AssetStripID Integer Database id of the asset strip
PDUID Integer Database id of the attached PDU
Name VarChar (255) Name of the asset strip
State VarChar (64) ok, upgrading, unavailable, unsupported
AssetStripCreationTime Timestamp with time zone
Time asset strip was created in the database
AssetStripLastUpdateTime
Timestamp with time zone
Time the asset strip last changed in the database
AssetStripOrdinal Integer The id of the asset strip on the PDU: 1 to n

Appendix A: ODBC Access
216
RackUnits
The RackUnits view contains information about the rack units on asset strips connected to PDUs that Power IQ manages.
Field Type Notes
RackUnitID Integer Database id of rack unit
AssetStripID Integer Database id of asset strip.
See AssetStrips (on page 215).
AssetTagIDString VarChar (255) Asset tag id string of any attached asset tag that plugs into the asset strip.
Unique from the factory.
RackUnitOrdinal Smallint 1-n the number of the rack unit within the asset strip
RackUnitLEDState VarChar (64) LED state: on, off, blinking
RackUnitLEDMode VarChar (64) LED mode: automatic or manual
RackUnitLEDColor VarChar (6) LED color: hexadecimal code for the color
RackUnitCreationTime Timestamp with time zone
When the rack unit was created in the database
RackUnitLastUpdateTime
Timestamp with time zone
When the rack unit was last changed in the database
Sample ODBC Queries
This section contains sample ODBC queries that can be used to generate custom reports.
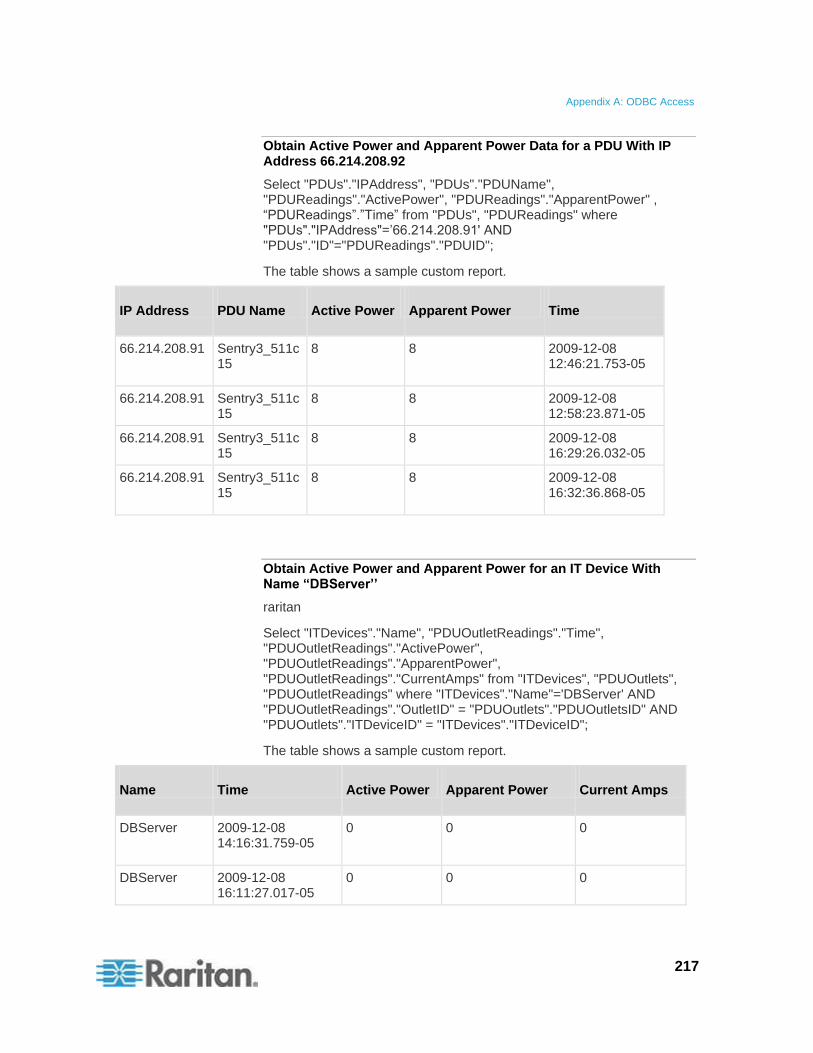
Appendix A: ODBC Access
217
Obtain Active Power and Apparent Power Data for a PDU With IP Address 66.214.208.92
Select "PDUs"."IPAddress", "PDUs"."PDUName", "PDUReadings"."ActivePower", "PDUReadings"."ApparentPower" , “PDUReadings”.”Time” from "PDUs", "PDUReadings" where "PDUs"."IPAddress"=’66.214.208.91' AND "PDUs"."ID"="PDUReadings"."PDUID";
The table shows a sample custom report.
IP Address PDU Name Active Power Apparent Power Time
66.214.208.91 Sentry3_511c15
8 8 2009-12-08 12:46:21.753-05
66.214.208.91 Sentry3_511c15
8 8 2009-12-08 12:58:23.871-05
66.214.208.91 Sentry3_511c15
8 8 2009-12-08 16:29:26.032-05
66.214.208.91 Sentry3_511c15
8 8 2009-12-08 16:32:36.868-05
Obtain Active Power and Apparent Power for an IT Device With Name “DBServer’’
raritan
Select "ITDevices"."Name", "PDUOutletReadings"."Time", "PDUOutletReadings"."ActivePower", "PDUOutletReadings"."ApparentPower", "PDUOutletReadings"."CurrentAmps" from "ITDevices", "PDUOutlets", "PDUOutletReadings" where "ITDevices"."Name"='DBServer' AND "PDUOutletReadings"."OutletID" = "PDUOutlets"."PDUOutletsID" AND "PDUOutlets"."ITDeviceID" = "ITDevices"."ITDeviceID";
The table shows a sample custom report.
Name Time Active Power Apparent Power Current Amps
DBServer 2009-12-08 14:16:31.759-05
0 0 0
DBServer 2009-12-08 16:11:27.017-05
0 0 0

Appendix A: ODBC Access
218
Report Maximum Power Reading for Each IT Device Since Added to Power IQ
To obtain the maximum power reading for an IT device since it was added to Power IQ, three queries are needed. These sample queries group data by device name. This assumes that device names are unique. If your device names are not unique, use IT Device ID for grouping.
1. Query for all devices with all readings for all outlets.
2. Group, per device, per hour, all outlets of a device and sum up the outlet usage
3. Find the maximum power per device of the total power consumption.
List all outlet readings for all devices:
SELECT odbc_ITDevices.Name,
odbc_PDUOutletReadingsRollup.Time,
odbc_PDUOutlets.PDUOutletsID,
odbc_PDUOutletReadingsRollup.MaximumActivePower
FROM odbc_ITDevices, odbc_PDUOutlets,
odbc_PDUOutletReadingsRollup
WHERE
(((odbc_PDUOutletReadingsRollup.RollupInterval)=1) AND
((odbc_PDUOutletReadingsRollup.OutletID)=[odbc_PDUOut
lets].[PDUOutletsID]) AND
((odbc_PDUOutlets.ITDeviceID)=[odbc_ITDevices].[ITDev
iceID]))
ORDER BY odbc_ITDevices.Name,
odbc_PDUOutletReadingsRollup.Time,
odbc_PDUOutlets.PDUOutletsID;

Appendix A: ODBC Access
219
Group hourly outlet readings per IT device:
SELECT [List of all Devices with all readings for all
outlets].Name, [List of all Devices with all readings for
all outlets].Time, Sum([List of all Devices with all
readings for all outlets].MaximumActivePower) AS
SumOfMaximumActivePower
FROM [List of all Devices with all readings for all outlets]
GROUP BY [List of all Devices with all readings for all
outlets].Name, [List of all Devices with all readings for
all outlets].Time
ORDER BY [List of all Devices with all readings for all
outlets].Name;

Appendix A: ODBC Access
220
Find the maximum power reading per IT device:
SELECT [Summation per Device of hourly readings].Name,
Max([Summation per Device of hourly
readings].SumOfMaximumActivePower) AS
MaxOfSumOfMaximumActivePower
FROM [Summation per Device of hourly readings]
GROUP BY [Summation per Device of hourly readings].Name;
Finding All Entities in a Rack
The following query shows all the entities, such as IT Devices and PDUs, contained in a specific rack. The example uses "Rack 4."
1. Retrieve the EDMNodes id for a rack with RackId=4.
oculan=> select id from "EDMNodes" where edm_entity_type='Rack' and edm_entity_id=4;
id
----
14
(1 row)
2. Use the EDMNodes id =14 to retrieve entities contained under this rack.
oculan=> select "EDMNodes".* FROM "EDMNodes", "EDMNodes" AS parent where (("EDMNodes".id != parent.id) AND ("EDMNodes".lft >parent.lft AND "EDMNodes".rgt <=parent.rgt AND parent.id=14)) ORDER BY "EDMNodes".lft;
The table shows a sample custom report.

Appendix A: ODBC Access
221
ID Lft Rgt EDM_Entity_Type EDM_Entity_ID Created_at Updated_at
1 4 5 Device 3 2009-06-19 11:16:48.257348-0
2009-06-19 11:16:48.257348-04
2 6 7 Device 4 2009-06-19 11:16:48.274988-0
2009-06-19 11:16:48.274988-04
3 8 9 Device 5 2009-06-19 11:16:48.276324-0
2009-06-19 11:16:48.276324-04

222
In This Chapter
Security Questions ................................................................................ 222 PDU Questions ...................................................................................... 222
Security Questions
Question Answer
Are failed login attempts recorded?
The audit log records all login attempts. You can also configure Power to send syslog notifications for entries in the audit log.
Does Power IQ support LDAP lock-out settings?
Power IQ respects the lock-out settings of an LDAP server. If a user attempts multiple invalid logins, and the LDAP server set the account to be blocked, Power IQ no longer allows access.
Do session timeouts work in an LDAP setting?
Session timeouts are applicable to LDAP users and local users.
PDU Questions
Question Answer
The status of my PDU says "Degraded."
Check to see if the SNMP agent is enabled on the PDU.
If enabled, check to see if the matching SNMP read strings are configured for the PDU and Power IQ.
Check to see if you are running the latest PX firmware. For Dominion PX PDUs.
If you have enabled Buffered Data Collection, make sure the PX has been configured with an SNMP write string. For Dominion PX PDUs.
Reduce the poll rate or increase the number of CPUs (VMware).
How do I configure my MRV PDU so that it will work with Power IQ's power control feature?
Make sure that the SNMP community string you use to configure the MRV PDU in Power IQ supports both SNMP v1 and v2c Gets and Sets. The community string must be configured for v1 and v2c access in both the Get Clients section and the Set Clients section on the MRV PDU.
Appendix B Frequently Asked Questions

223
A
About Contact Closure Sensors • 128 About Object Values • 102 Accessing Audit Logs • 163 Active Events Widget • 56 Add a Dynamic Plugin • 167, 169 Add a License File • 194 Add a Power Control Task • 150, 151, 152 Add a User • 71 Add a User Group • 74 Add Devices to a Group in the Data Centers
Tab • 159 Add Devices to an Existing Device Group •
159 Add Shutdown Commands • 99, 152, 153, 154 Adding MRV PDUs • 17 Adding PDUs in Bulk with CSV Files • x, 11,
15, 122 Adding PDUs to Power IQ Management • x,
11, 13, 17, 106, 170 Adding Raritan EMX • x, 17 Adding Reports to the Analytics Page • 177,
178, 180 Adding, Editing, and Deleting User Groups •
73 Adding, Editing, and Deleting Users • 71, 78 Additional Configuration Tasks • 7 Advanced Reporting with Database and
Reporting Programs • 197 Aisles • 213 Allow HTML Widgets on Dashboard • 63, 164 Analytics • 176 APC Netbotz Supported Events • 26, 27 APC Supported Events • 26 Aphel Supported Events • 26, 28 Appliance Administration • 164 ASHRAE® Envelope Descriptions • 64, 66 Asset Strip and Tag Events • 119 Asset Strips • 118 AssetStrips • 215, 216 Assign Roles to a User • 25, 56, 73, 76, 77 Assign Roles to a User Group • 75, 76, 77 Assign Roles within a Data Center • 73, 75,
76, 77, 107, 108 Automatic Delete of Cleared Events • 47 Avocent Supported Events • 26, 28
B
Basic Configuration for SSH Shutdown • 154, 156
Basic Configuration for Windows Remote Shutdown • 158
Baytech Supported Events • 26, 28 Buffered Data Retrieval • 9, 10 Bulk Configuration of Dominion PX PDUs • 18
C
Calculate Potential Cooling Energy Savings • 65, 69
Capacity Forecast Chart Widget • 56, 59 Capacity Gauge Widget • 56, 60 Change the Administrator Password • 71 Change Web User Session Timeouts • 87 Check PDUs Added with Dynamic Plugins •
170, 174 Circuit Breaker Attributes • 168 Clear Events • 46, 56, 115 Clearing Object Mappings • 101 Configuration for PX1 Environmental Sensors
• 130 Configuration for PX2 Environmental Sensors
• 138 Configure Estimated Voltages • 11, 15 Configure Notification Filters • x, 44, 47, 48, 49 Configure PDU Details - Smart PDU View •
107 Configure Power Control Options • 148, 149,
158 Configure Rack Details - Smart Rack View •
60, 108 Configure the Number of PDUs in the List •
120 Configure the Power Control Settings for a
Device Group • 158, 159 Configuring a Contact Closure Sensor • 128,
129, 146 Configuring Charts • 97, 105, 180 Configuring Custom Fields • x, 48, 102, 105 Configuring Data Rollup Retention • 89, 196 Configuring Environmental Sensors • 130,
133, 138, 141 Configuring Event Management • 25 Configuring Graceful Shutdown • 150, 152 Configuring LDAP Authentication • 78
Index

Index
224
Configuring LDAP Authentication Settings • 78, 79
Configuring Logging through Syslog • 7 Configuring NTP Server Settings • 165 Configuring ODBC Access to Power IQ • 196,
197, 198 Configuring Password Requirements • 71, 85,
87 Configuring PDU Display Settings - View
PDUs by IP or Name • 51 Configuring Polling Intervals • 7, 8, 10, 12 Configuring Power IQ for Access over Network
• 4 Configuring Proxy Connections to Power IQ •
50 Configuring Remote Access to Database • 92 Configuring Remote Storage of Archive Files •
90, 91, 161 Configuring the Authorization Warning
Message • 88 Configuring the System Clock • 165 Configuring the System Clock Manually • 166,
197 Configuring Widgets • 56 Connecting Environmental Sensors to a PX1 •
124 Connecting Environmental Sensors to a PX2 •
126 Connecting to Power IQ • 6, 194 Contact Closure Sensor LEDs • 129 Control Power to Devices in a Group • 150 Control Power to Outlets in a Data Center •
149, 152, 158 Cooling Chart Details - How Your Sensor Data
is Charted • 68 Cooling Chart Widget • x, 56, 64, 117 Correlated Fields in ODBC Tables • 198, 199 Create a Device Group • 158 Create a Support Connection • 192 Create a System Configuration Backup File •
90 Create Device Groups for Power Control •
150, 151, 158 Creating a Chart • 177, 180, 185 Creating the Power IQ Virtual Machine • 2 CSV Columns for DATA_CENTER Objects •
97 CSV Columns for DEVICE Objects • 99 CSV Columns for FLOOR, ROOM, AISLE,
and ROW Objects • 98 CSV Columns for OUTLET Objects • 100
CSV Columns for PDU Objects • 100 CSV Columns for RACK Objects • 98 Customizing Your View of PDUs, Devices, and
Events • 45, 51, 121 Cyberswitching Supported Events • 26, 29
D
Dashboard • 53, 180 Data Backups • 90 Data Management • 89 DataCenters • 211 Default User Groups • 73 Delete a User • 72 Delete a User Group • 74 Describing the Sensor Location • 135, 137,
142, 143 Details - Smart PDU View • 114 Device Chart Measurements • x, 184 Device Chart Settings • x, 57, 177, 180, 182,
183 Device Chart Widget • 56, 57, 180 Disable Graceful Shutdown for an IT Device •
155 Disabling LDAP Authentication • 81 Discovery Progress Status • 13 Display a Logo on Every Page • 61, 164 Downloading Daily Sensor Readings • 89, 161 Downloading System Configuration Backup
Files • 90 Dynamic Plugins • 166
E
Edit a Saved Rollout Plan • 19 Edit a Saved Upgrade Plan • 189 Edit a User • 72 Edit a User Group Name • 74 Editing PDUs under Power IQ Management •
x, 10, 13, 114, 119, 120 EDMNodes • 214 Enable Graceful Shutdown for an IT Device •
99, 152, 153, 154 Enable or Disable Event Notifications • 44, 47,
56 Enable or Disable Power Control • 148, 149,
151, 152, 158 Enabling Buffered Data Retrieval from
Dominion PX 1.2.5 or Higher • 9, 10 Enabling Single Sign On for Raritan PDUs •
86, 123 Enabling the Web API User Account • 87

Index
225
Enabling the WS API • 87 Encrypting Data Backup Files • 85 Energy and Environmental Trends - Details •
109 Energy and Environmental Trends - Smart
Views • 108, 118 Energy Trends - Details • 110 Enterprise Relationships • 59, 92, 106, 177 Event Fuse Handling • 50 Event Listing - Smart PDU View • 115 Execute a Saved Rollout Plan • 19, 20 Execute a Saved Upgrade Plan • 188, 189 Export Sensor Data • 65, 67, 68 Export the Events List to CSV • x, 46 Export the PDUs List to CSV • x, 122 Exporting Charts • 186 Exporting Object Mappings as CSV Data • 95,
101 Exporting Outlet Names to a CSV File • 25 External Sensor Data from Dominion PX • 10
F
Filter the Events List • x, 45, 51 Filter the PDUs List • x, 51, 121 Find and Map Unmapped PDUs • 103, 104 Find the MIB File • 166, 167 Finding All Entities in a Rack • 220 Floors • 212 Frequently Asked Questions • 222
G
Gathering LDAP Configuration Settings • 78, 79
Geist EM Supported Events • 26, 30 Geist Supported Events • 26, 30 Geist V3 Supported Events • 26, 31
H
Hardware Configuration for Sensors on PX1 and PX2 • 124
Hewlett Packard Supported Events • 26, 32 HTML Widget • 56, 63
I
Identify the OIDs for Mapping • 167, 169 Identifying Environmental Sensors • 130, 131,
139, 140 Image Widget • 56, 61, 164 Importing Object Mappings • 60, 95, 102, 105 Index Mapping Format • 169, 171 Initial Configuration of Power IQ • 4
Inlet Attributes • 168 Inlet Line Attributes • 168 Install and Configure a PostgreSQL Driver •
197, 198 Installing an HTTPS Certificate • 82 Installing the Power IQ Application • 1 IT Devices - Smart Rack View • 111, 149
K
Knurr Supported Events • 26, 33
L
Launch the Web Interface for a Dominion PX PDU • 86, 114, 123
Licensing • 193 Liebert Supported Events • 26, 34 Limitations of Dynamic Plugins • 166 Link Database Tables in Microsoft® Access® •
198, 200 Loading Power IQ onto the Virtual Machine • 2
M
Maintenance Tasks • 161 Manage Configuration Files • 21 Manage Event Notifications for Users • 49 Manage Firmware Versions • 191 Managing Environmental Sensors • 130, 132,
140 Manually Define Individual Device Chart Lines
• 181, 182 MRV Supported Events • 26, 34
N
Naming Environmental Sensors • 117, 118 Naming Individual Outlets • 22 Naming Outlets in Bulk with CSV Files • 22, 25
O
Object Types and their Hierarchy • 94 Obtain Active Power and Apparent Power
Data for a PDU With IP Address 66.214.208.92 • 217
Obtain Active Power and Apparent Power for an IT Device With Name • 217
ODBC Access • 84, 92, 196 ODBC Client Configuration • 197 OID Variables and Format • 169, 170 Open Port Requirements • 5 Open Ports for Graceful Shutdown • 152, 156 Opening the Smart Views • 107 Outlet Attributes • 168

Index
226
Outlet Control Values • 168 Overall PDU Health • 58, 186 Overview of the Enterprise Model • 92
P
PDU Attributes • 168 PDU Components • 167 PDU Connectivity Lost and Restored Events •
44 PDU Elements - Smart Views • 112, 149 PDU Health Chart Settings • 177, 180, 185 PDU Health Chart Widget • 56, 57, 185 PDU Outlet Naming and Setting System
Attributes • 22 PDU Questions • 222 PDU Status • 13, 119 PDUCircuitBreakerReadingsRollup • 209 PDUCircuitBreakers • 202 PDUCircuitBreakersReadings • 204 PDULineReadings • 204 PDULineReadingsRollup • 208 PDUOutletReadings • 203 PDUOutletReadingsRollup • 206 PDUOutlets • 200, 201 PDUReadings • 202 PDUReadingsRollup • 207 PDUs • 200 PDUSensorReadings • 205 PDUSensorReadingsRollup • 210 PDUSensors • 210 Plan a New Rollout • 18, 20, 21 Plan a New Upgrade • 187, 189, 191 Ports Open Between Clients and Power IQ • 5 Ports Open Between Power IQ and PDUs • 5,
119 Power Control • 148 Power IQ ODBC Schema • 199, 200 Power IQ Role Definitions • 73, 74, 75, 76, 77,
148, 149 Prepare PDUs for Power IQ Event
Management • 25 Preparing Servers for Graceful Shutdown •
152, 156 Preparing to Install Power IQ • 1 Prerequisites for Support Connections • 192 Proxy Index Details • 16, 17, 24
R
Racks • 213 RackUnits • 216
Raritan Dominion PX Supported Events • x, 26, 35, 119
Readings - Smart PDU View • 113 Recommended Number of Objects Per Level •
100 Recommended Polling Intervals • 8 Remove a Device from a Group • 160 Remove a Shutdown Command from Power
IQ • 155 Remove Roles from a User • 73 Remove Roles from a User Group • 75 Report Heading Widget • 56, 62 Report Maximum Power Reading for Each IT
Device Since Added to Power IQ • 218 Requirements for Bulk Configuration • 18 Requirements for Cooling Charts • 65 Requirements for Dynamic Plugins • 166 Restoring System Configuration Backups • 90,
91 Restricting Web and Shell Access Based on
IP Address • 84 Rittal Supported Events • 26, 41 Roles and User Access Levels • 77 Roles Information for Upgraded Systems • 78 Rollout Timing • x, 20 Rooms • 212 Rows • 213
S
Sample CSV columns for Devices With and Without Graceful Shutdown Commands • 99
Sample ODBC Queries • 216 Sample SSH Shutdown Commands • 154, 157 Save Support Logs • 193 Scheduling Power Control • 150, 158 Searching for PDUs • 123 Security and Encryption • 82 Security Questions • 222 Sensor Measurement Accuracy • 144 Sensors Connected to PX1 and PX2 PDUs •
118, 124 Servertech Supported Events • 26, 43 Set a Capacity • 59, 60, 108 Set a Different Power On Delay for a Device •
x, 160 Set Fahrenheit or Celsius Temperature • 175 Setting Default Estimated Voltages • 11, 15 Setting SNMP System Attributes for PDUs •
23 Setting the Dashboard Layout • 55, 56, 57, 58,
59, 61, 62, 63, 64

Index
227
Setting the Default SNMP Version for PDUs • 10
Setting the Z Coordinate Format • 142 Sharing a Dashboard • x, 54 Sharing Reports on the Analytics Page • x,
179 Shutting Down and Restarting Power IQ • 49,
162 Smart Rack View and Smart PDU View • x,
76, 101, 106, 116 SMTP Server Settings • 47, 49 Software Configuration for Sensors on PX1
and PX2 • 130 Specify Inlet, Outlet, or Outside Air Location
for Environmental Sensors • x, 64, 68, 117, 118
States of Managed Sensors • 145 Stop a Support Connection • 193 Structure of the Add PDUs CSV File • x, 16 Structure of the Enterprise Model CSV File •
96 Structure of the Outlet Name CSV File • 24 Support and Licensing • 192 Support Connections • 5, 192 Supported Events • 25, 26
T
Timezone Configuration for ODBC Data • 197 Troubleshooting Dynamic Plugins • 172
U
Upgrade Timing • x, 189 Upgrading Dominion PX PDUs • 187 Upgrading Power IQ Firmware • 162 User Configuration - Authorization and
Authentication • 71 User Permissions for Event Management • 25 Using Rack Units for the Z Coordinate Value •
137
V
Validating PDU Credentials • 12, 13 View Completed Rollout Plans • 19, 20, 21 View Completed Upgrade Plans • 188, 189,
190 View Dashboard in Full Screen Mode • 70 View Dashboards as a Slideshow • 69 View Events • 45 View Licenses • 193 View Orphaned Systems Information • 103,
104
View PDUs Using a Dynamic Plugin • 174 View Power Control Task Results • 151 View Saved Rollout Plans • 19 View Saved Upgrade Plans • 188 View Sensor Data Point Details • 65, 67, 68 View Status of Rollout Plans in Progress • 19,
20 View Status of Upgrade Plans in Progress •
188, 189, 190 View the IT Devices Using a Shutdown
Command • 155 Viewing a PDU • 107, 116 Viewing Enterprise Relationship Summaries •
102 Viewing PDUs • 116 Viewing Sensor Data • 143 Viewing Sensor Information • 118 Viewing Sensor Readings and States • 138 Viewing the Dashboard • 53 Viewing the Enterprise Model • 101 Virtual Machine Requirements • 1
W
What are Mappings and Relationships? • 93 What are Power IQ Analytics? • 177 What is an Enterprise Model Object? • 93 What's New in the Power IQ Help • x What's the difference between • 181, 183

U.S./Canada/Latin America Monday - Friday 8 a.m. - 6 p.m. ET Phone: 800-724-8090 or 732-764-8886 For CommandCenter NOC: Press 6, then Press 1 For CommandCenter Secure Gateway: Press 6, then Press 2 Fax: 732-764-8887 Email for CommandCenter NOC: [email protected] Email for all other products: [email protected]
China
Beijing Monday - Friday 9 a.m. - 6 p.m. local time Phone: +86-10-88091890
Shanghai Monday - Friday 9 a.m. - 6 p.m. local time Phone: +86-21-5425-2499
GuangZhou Monday - Friday 9 a.m. - 6 p.m. local time Phone: +86-20-8755-5561
India Monday - Friday 9 a.m. - 6 p.m. local time Phone: +91-124-410-7881
Japan Monday - Friday 9:30 a.m. - 5:30 p.m. local time Phone: +81-3-3523-5991 Email: [email protected]
Europe
Europe Monday - Friday 8:30 a.m. - 5 p.m. GMT+1 CET Phone: +31-10-2844040 Email: [email protected]
United Kingdom Monday - Friday 8:30 a.m. to 5 p.m. GMT Phone +44(0)20-7090-1390
France Monday - Friday 8:30 a.m. - 5 p.m. GMT+1 CET Phone: +33-1-47-56-20-39
Germany Monday - Friday 8:30 a.m. - 5:30 p.m. GMT+1 CET Phone: +49-20-17-47-98-0 Email: [email protected]
Melbourne, Australia Monday - Friday 9:00 a.m. - 6 p.m. local time Phone: +61-3-9866-6887
Taiwan Monday - Friday 9 a.m. - 6 p.m. GMT -5 Standard -4 Daylight Phone: +886-2-8919-1333 Email: [email protected]