Gifted IQ - Gwern.net
214
Gifted IQ Early Developmental Aspects The Fullerton Longitudinal Study
-
Upload
khangminh22 -
Category
Documents
-
view
6 -
download
0
Transcript of Gifted IQ - Gwern.net

Gifted IQEarly Developmental Aspects
The Fullerton Longitudinal Study

Gifted IOEarly Developmental Aspects
The Fullerton Longitudinal Study
Allen W. GottfriedCalifornia State University, Fullerton
Fullerton, California
Adele Eskeles GottfriedCalifornia State University, Northridge
Northridge, California
Kay BathurstCalifornia State University, Fullerton
Fullerton, California
and
Diana Wright GuerinCalifornia State University, Fullerton
Fullerton, California
PLENUM PRESS ¢ NEW YORK AND LONDON

Library of Congress Cataloging-in-Publication Data
Gifted IQ : early developmental aspects : the Fullerton Longitudinal
Study / Allen W. Gottfried ... [etc.].p. cm.
Includes bibliographical references and index.
ISBN 0-306-44683-931. Gifted children--United States--Longitudinal studies.
2. Children--United States--Intelligence levels--Longitudina|
studies. 3. Gifted children--Psychology. 4. Children--Intelligence
levels. I. Gottfried, Allen W. II. Title: Fullerton Longitudina]
Study.
BF723.G5G54 1994
155.45'5--dc20 94-26562CIP
1098765432
ISBN 0-306-44683-9
©1994 Plenum Press, New York
A Division of Plenum Publishing Corporation
233 Spring Street, New York, N.Y. 10013
All nghts reserved
No part of this book may be reproduced,stored in a retrieval system, or transmitted in any
form or by any means,electronic, mechanical, photocopying, microfilming, recording, or
otherwise, without written permission from the Publisher
Printed in the United States of America

Dedicated to ourgifts
Michael andJeffrey,
Dick, Kim, John, Jim, and Darien,
Keith, Jonathan, and Alexandra,
and
to the children and families participating
in the Fullerton Longitudinal Study

Preface
We embarked on the research contained in this book because of thedearth of knowledge on the early developmental aspects of gifted IQ.This book represents an integration of our interests in the fields ofintelligence, psychometrics, and developmental psychology. Theresearch presented is based on the Fullerton Longitudinal Study, whichentails the systematic investigation of a single cohort studied frominfancy onward.It will become apparentin the reading of this volumethat studies such as this one arerare in the field of psychology. Thisstudy comprises frequent repeated assessments of children’sdevelopmental status, information from a variety of sources, andobjective data collected across an array of developmental domains.Extensive behavioral and home environmental information has beengathered across the course of investigation. The essence of the researchcontained herein is on the early developmentalhistory of children whocometo perform at the gifted IQ level during middle childhood.Thisistheir early story.
Ourspecial gratitude is extended to Mariclaire Cloutier, Editor,and to Eliot Werner, Executive Editor, at Plenum for their friendship,support, and providing the opportunity for us to share the scientificresults of our scholarly endeavors.The Fullerton Longitudinal Study hasbeen supported at various times by the following foundations: ThrasherResearch Fund, Spencer Foundation, AMC Theatre Fund, and CaliforniaState Universities at Fullerton and Northridge. We also extend ourappreciation to the Child Development Department; Dr. Dan Kee, Chairof the Psychology Department; Dr. Stuart Ross and Bonni Kaaheaat theOffice of Faculty Research and Development; and Terry Jones, techni-cian in the Psychology Department,all at California State University,
Vil

Vill Preface
Fullerton. At California State University, Northridge, thanks are ex-
tended to the Department of Educational Psychology and Counseling
and the Office of Graduate Studies, Research, and International Pro-
grams.Overthe years, many graduate and undergraduate students have
devoted themselves to making the Fullerton Longitudinal Study possi-
ble. We thank them for their commitment, time, and effort. In particular,
we wouldlike to thank the following research assistants: Connie Meyer,
Jacqueline K. Coffman, Pamella H. Oliver, Craig W. Thomas, Kandi
Kipp, June Havlena, Leigh Hobson, Pam Paduano,Senia Pizzo, Rachel
Goldstein, Arnel Sison, Adrian Schein-Sokolow, Zack Loukides, Kath-
leen Ellenberger, Veronica Zuniga, Shelli Wynants, Valerie Luoma,
Catherine Lussier, Judit Au, Colleen Killian, and Charlotte Kies.
Weespecially wish to thank the children and families participating
in the Fullerton Longitudinal Study. Without their dedication, this pro-
ject would have never cometofruition.
Allen W.GottfriedAdele Eskeles GottfriedKay BathurstDiana Wright Guerin

Contents
Chapter 1
Introduction ............ 0. ccc cc cece cece cece nen n nn ey 1
Issues Investigated ........ 0.0 ccc cece eee ees 5Uniquenessof the Fullerton Longitudinal Study .............. 31
Chapter 2
Description of the Fullerton Longitudinal Study ............... 37
SubjectS .. 6...eeetenet eee eee eeeeey 37Measures and Procedures ........... 0. cc cc eeeeeee ee eeeeaaes 40Designation of Giftedness .......0. 0... ccc cece eeee nen 42Data Analytic Strategy ..... 0.0cece cece een 43
Chapter 3
Intellectual and Cognitive Functioning ........................ 51
ISSUES0.eeeee eee eee eeeeas 51Description of Measures .......... 00.eeee een 52Results ... 0... cece cece teen ent eee eennes 56SUMMALY 6...ceeeect ee ene 84
ix

x Contents
Chapter 4
Education, Achievement, and Motivation ..................... 87
ISSUCS Loeccc cece eee cence ene ne bene teeenenes 87
Description of Measures ........ 0... cee cece eee ees 89ResultS 2... 0... ccc ee ee cence ence te eeneneenens 92
SUMMALY 6...cece ete n eee e eben eee eney 105
Chapter 5
Behavioral Adjustment, Social Functioning, and Temperament 107
Issues .........eeeee eee ee eee ee eee ees 107
Description of Measures ....... 00...eee eae 108ResultS .. 0...cececnet ee teen teeny 112SUMMALY 2...ceeeee tee eee 132
Chapter 6
Home and Family Environment ............... 0.0... cence 135
ISSUCS oocnetne teen tenets 135Description of Measures ......... 0... eee cece cee cents 138ResultS 0...ceceene e tenet nee nes 146SUMMALY 1.eeeeen etn eee tenes 166
Chapter 7
On Becoming Intellectually Gifted ......................000.. 169
Potentiality-Enrichment Theory ...............0 0.0000 eae 170Implications ... 0.0...eeecence eee nee e eens 177
References 2.0.0.0... cece tee teen ene nes 185

Gifted IOEarly Developmental Aspects
The Fullerton Longitudinal Study

1
Introduction
The nature, characteristics, and consequencesof giftedness andtalenthave intrigued behavioral scientists and educators for a century ormore (C. M. Cox, 1926; Ellis, 1904; Galton, 1869; Terman, 1905; Yoder,
1894; see also Freehill, 1961; Witty, 1951). The study of giftedness andtalent has captured ongoing intense international interest (e.g.,Freeman, 1991; Gross, 1993; Parkyn, 1953; for volumes containing
papers and research programs from scholars worldwide, see Heller &Feldhusen, 1985; Heller, Monks, & Passow, 1993). We recognize that
there are many forms of giftedness (music, art, sports, business,scholarship, etc.); however, it is the intellectually gifted who havereceived the greatest amount of inquiry in the psychological andeducationalliterature.
The focus of this volumeis the scientific study of the early devel-opmentalhistory of children who cometo perform atthe gifted IQ levelduring middle childhood. The research contained herein presents asystematic, quantitative, and longitudinal approach to understandingthe early ontogeny, behavior, and family and home environmentalexperiences of children who becomeintellectually gifted. This is theirearly story from a scientific developmental perspective. To this end, wesought to discover the differences betweenintellectually gifted andnongifted children when they were infants, preschoolers, and early
elementary schoolchildren.
After a century of research on the phenomenonofgiftedness, onecan confidently concludethat there is no commonly accepted definitionor conception of giftedness (Feldhusen & Heller, 1985; Hoge, 1988;
Reis, 1989; Sternberg & Davidson, 1986). Moreover, although IQ testshave been by far the most extensively used instrument for assessing

2 Chapter 1
the intellectually gifted, there is no universally agreed upon procedurefor measuring and identifying giftedness. Using IQ as our definitionof giftedness does not negate our acknowledgmentof specific domainsof intellectual giftedness that are not measured by IQ. However, the
continuing pervasiveness of the use of IQ as one of the indexes ofintellectual giftedness by schools, and in the research literature, andthe important achievements by those high in IQ, prompted usto useIQ as thecriterion of giftedness in this research. We make no assump-tion that gifted IQ is a stable life-span trait, although there is evidenceof stability in the early elementary school years (Cahan & Gejam, 1993).Proof of relatively long-term developmental stability should befounded on empirical determination that we intend to pursue in thecourse of our longitudinal investigation. IQ tests, which measure one’sgeneral cognitive repertoire, have proven to be a valid assessmentformeasuring one’s relative intelligence (Humphreys, 1992). IQ scoresfurnish a demarcation or cutoff point, albeit statistically arbitrary, ofwhois andis not considered intellectually gifted at a given point intime (Humphreys, 1985). Again, we recognize and support the viewof multiple forms of giftedness. However, in this research program,we are working within a specific frame of reference, that being thefrequency distribution of IQ scores and its early developmental ante-cedents. In fact, we would have no objection to disregarding the term
gifted IQ andtitle this book as simply “High IQ.” However, the termgifted doestie this research to a literature, and that literature is referredto as the intellectually gifted. The fact is that IQ scores have providedthe historical, ubiquitous, and objective basis for the determination ofgifted intelligence.
Research, both past and present, on intellectually gifted childrenhas focused almost exclusively on identifying such children, develop-mental outcomes oncetheyare identified, and the educational needs andprogramsinstituted for these children. A great deal of knowledge hasbeen gathered concerninggifted children, but only after they have beenidentified or designated as gifted. The large body of developmentalresearch in this area has dealt with the consequencesof beingintellec-tually gifted. The developmental course of gifted children prior to theiridentification is, heretofore, unknown. As Horowitz and O’Brien (1985)
pointed outin their edited book commissioned by the American Psycho-logical Association:
Psychologists knowverylittle about the developmental courseof giftednessand talent, about the nature of environmental opportunities that nurture

Introduction 3
their realization, and about the nature of conditions that must change overtime to ensure continued developmentofgiftedness. (p. 450)
In their book as well as a subsequentarticle in the AmericanPsychologist (Horowitz & O’Brien, 1986), they emphasized the im-portance and necessity of longitudinal research in answering suchdevelopmental questions. However, they caution researchers thatwithout the commitment, time, and funds, such endeavors may proveunsuccessful. While longitudinal research has been conducted onthe gifted, most notably the Terman (1925-1929) life-span study,researchhas been from the school-age years onward(see, e.g., Subot-nik & Arnold, 1994). Even the multiple case follow-up studies orsurveys, which have provided fascinating, insightful accounts ofgifted children, have been conducted almost exclusively with school-age children (Feldman, 1986; Freeman, 1991; Gross, 1993; Radford,1990). In his book on The Origins of Exceptional Abilities, Howe (1990)notes:
Apart from somecasestudiesof the homelivesof particular individuals fewof the investigations have been specifically involved with the early lives ofthose children who subsequently gain exceptionalabilities. Other reasonsapart, the impossibility of knowing in advance which children are the oneswhowill becomeextraordinarily successful creates practical barriers to anyinvestigation of this kind. (pp. 110-111)
Our knowledge concerning the early developmentor antecedentsof intellectual giftedness remains void. Well-respected scholarsin thisarea have cogently argued for researchers to examine the early devel-opmentalaspects of intellectually gifted children. This is exemplifiedby both Horowitz (1987) and N. M.Robinson (1987)in their articles inthe Gifted Child Quarterly. Horowitz stated that “the overall dearth ofdevelopmentalresearch on giftednessis regrettable” (p. 165). Horowitzraised a numberofsignificant and obvious developmental questions.For example, how early can weidentify gifted children; how mightthese gifts be nurtured; what is the developmental course of giftedchildren, and is their course different from that of nongifted children;andif a child is gifted in one domain,doesit affect other developmentaldomains? She also urged researchers to study environmentalfactorsthat mightfacilitate giftedness. Questions of this nature are addressedand have been central in our research. N. M. Robinson (1987) notedthat:
The sources and early history of markedly advanced intelligence haveinterested philosophers and biographers for centuries, and more empiricalscientists for decades.... All these sources are, however, severely limited. The

4 Chapter 1
material is retrospective and no doubt highly selective, and leaves a greatmany questions unanswered. We now need systematic, contemporary inves-
tigation, not bias-prone biographizing.(p. 161)
She madea plea for researchers to search in a scientific manner forearly cues and study the origins of developmental precocity. At theoutset of her article, N. M. Robinson noted, “The time is ripe for
extending our interest in gifted children downward to infancy andpreschool” (p. 161). In our research program, we have taken on thesechallenges.
The present research is different from studies previously con-ducted. Figuratively speaking one could state that, after approximatelythree quarters of a century, our study ends where Terman’s began.Thisvolume presents an investigation focusing on development from in-fancy throughthe early school years of children who becameintellectu-ally gifted or nongifted. We assert that this is our contribution to theliterature on giftedness.
In the Fullerton Longitudinal Study, children were not selectedfor sample inclusion becauseofintellectual or cognitive status. In otherwords, we did not select infants of high versus low intellectual per-formance. If we had,statistical regression would have certainly takenits toll as the children were prospectively studied. Instead,a relativelylarge sample of healthy 1-year-olds and their families were recruited.The sample was objectively, systematically, and intensively studied atthat time and thereafter at specified intervals. As the children devel-oped over the years, some eventually performed at the high or giftedIQ level and others did not. Hence, we were in a unique position togo back in time and examine the developmental-behavioral and home-family differences that existed between these groups. The data pre-sented in this book are based on a scientific analysis of what thesegroups were like developmentally and behaviorally and what theywere exposed to environmentally. Heretofore, investigations of theearly life of gifted or talented children have relied on retrospectivereports or unscientifically collected archival data. This is not the casein the Fullerton Longitudinal Study. From the outset of the investiga-tion, data were collected contemporaneously, systematically, rigor-ously, and quantitatively by trained research staff. Most of the datawere based on objective and standardized psychological instrumentsadministered in the university laboratory and the subjects’ homes. Abattery of reliable and valid instruments has been employed. Addi-tionally, we have included ratings and checklists from informants suchas parents and teachers.

Introduction 5
ISSUES INVESTIGATED
General Issues
In this section, we provide an introductioninto the general issuesand topics to be addressed in Chapters 3 through6.It is not the intentionhere to furnish an exhaustive review orcritique of the extensivelitera-ture on the various behavioral or family aspects of intellectually giftedchildren. Numerous books andarticles have been published over theyears as wellas recently published compendiumscontaining conceptualand empirical reviews(see Heller et al., 1993; Subotnik & Arnold, 1994).
In Chapter 2, we discuss the subject sample, procedures, andmethodology of the Fullerton Longitudinal Study as well asthestatisti-cal analytic strategy employedto tackle the specific issues advanced ineach content chapter. Chapter 3 of this book presents the early intellec-tual and cognitive functioning of children who become gifted ornongifted. Chapter 4 focuses on early education, academic achievement,and motivational variables. In Chapter 5, the children’s behavioraladjustment,social functioning, and temperamentare analyzed. Chapter6 addresses the home and family environmentof these children frominfancy through the early school grades. In Chapters 3 through 6, thespecific questions, issues, and hypotheses addressed are enumeratedatthe outset, followed by the assessments employed andresearchfindings,with the main conclusions summarizedat the end. In Chapter 7, we putforth our developmental perspective or conceptualization on howyoungchildren becomegifted as well as the psychological and educa-tional implications of our findings.
Intellectual and Cognitive Functioning
There is a dearth of knowledgeon theearly intellectual or cognitivefunctioning of children who becomegifted. This deficitin the psycho-logical data base wasfirst recognized by Hollingworth(1926) in herinfluential book entitled Gifted Children. She pointed out that “ourknowledgeof the infancy of the gifted rests at present upon the insecureand fragmentarydataofparents’ retrospections, and of the ‘baby-books’which they have kept”(p.150). The notorious problemsof retrospectivereports by parents were obvious, even during thatera in the history ofpsychological research. Although Hollingworth considered baby-booksto be ofgreaterreliability than retrospective reports, she madereferenceto suchissuesastheselectivity of mothers who kept such recordsoftheir

6 Chapter1
children’s early developmentas well as the lack of universalcriteria ordefinition of behaviors recorded (e.g., talking and walking). Acknow-ledging the limitations and state of the science at that time, she put forthher solution to discovering the early developmental aspects of giftedchildren. She proposed that:
Direct study by psychologists would obviate these difficulties of interpreta-tion, but the obstacles to the scientific study of infants are numerous. In thefirst place, infants are rarely collected for a considerable period of time,except in foundling asylums, where an unfavorable selection is obtained.Inthe secondplace, evenif it were possible to collect any infants we might wish,
we would not know with certainty how to choose in order to secure thosewhowill be gifted children. In other words, we cannot nowdetectthe gifted
in early infancy.It is, nevertheless, becoming more and morepossible topredict with reliability whether a given infant will later test in the highestpercentile for intellect. If records were to be uniformly kept, for instance, ofall infants born to parents both of whomarecollege graduates, we shouldfind eventually that a large numberof records had thus accumulated of theinfancy of children testing above 130 IQ. (pp. 151-152)
Of course we have come a long wayin the scientific study ofinfancy since Hollingworth’s suggestion. Great strides have been madein our conceptualizations of infancy. Our knowledgeof infant develop-ment has expanded manifold. Several longitudinal studies beginning ininfancy have been conducted. Researchers have made arduouseffortsattempting to examine the possible link or continuity between earlybehavior andlater intelligence. Four areas relevant to the current topicare briefly reviewed.
First, psychometric and Piagetian scales of sensorimotorintelli-gence have been developed and extensively studied. There is an impres-sive body of data utilizing these measures. The findings demonstratethat they have not been successful with respect to long-term predictivevalidity (e.g., Bayley, 1970; N. Brody, 1992; A. W. Gottfried & N. Brody,
1975; McCall, Hogarty, & Hurlburt, 1972). Developmental researchershave continued to pursue other avenuesin the search for continuity inindividual differences from infancy onward. However, before present-ing these other areas, there is an interesting and relevant study byWillerman andFiedler (1974), who examined therelationship betweensensorimotorintelligence and high IQ scores during the preschoolyears.About 50 years after Hollingworth’s proposal, Willerman and Fiedler,in an article in Child Development using data from the CollaborativePerinatal Project, noted:
While there are some anecdotal data on infant mental developmentofchildren later identified as intellectually precocious, there exists no prospec-

Introduction 7
tively gathered information based on objective tests. Data of this sort couldbe of some importance, since they might permit us to deal with theintrinsi-cally fascinating issue of whether there are behavioral antecedentsto intel-lectual superiority. (p. 483)
From that longitudinal project, Willerman and Fiedler selectedchildren with a Stanford-Binet IQ of 140 or greater at age 4 years whowere administered a research version of the Bayley Scales of InfantDevelopment at 8 months. Results revealed that this superior groupcould not be distinguished from the total study population of infantsat8 months of age. Unfortunately, these were the only two assessmentperiods in the children’s early years. In their research only one testingwas conducted during infancy and no assessment was administeredduring the school-age years. Additionally, age 4 years has not beenfound to be a particularly significant age in terms of predictability, noless a reliable appraisal for determiningintellectual giftedness.
second, because of the failure of sensorimotor scales to predictsubsequentintelligence, researchers have focused on specific abilities.Onein particular has been early language abilities. Interestingly, therelation of early language developmentandlater intellectual advance-ment has been examinedbidirectionally. On the one hand, there are anumberof studiesin thegifted literature indicating that parents of giftedchildren report that their children were early talkers (e.g., Freeman,1991; Hollingworth, 1942; Terman, 1925; Witty, 1940; amongothers see
Gross, 1993). In fact, Gross (1993), who provided an impressive reviewof the giftedliterature, noted, “It is generally recognized that intellectu-ally gifted children tendto display a precocious developmentin speech”(p. 89). However,it is importantto note that this conclusion is based onparents’ retrospective reports. |
Onthe other hand,there are longitudinal studies demonstrating asignificant relationship between early language developmentandlaterintellectual performance. Fascinating data from two independentlongi-tudinal studies were published in 1967, revealing highly similar find-ings. Cameron, Livson, and Bayley (1967) derived a language factorfrom the Bayley California First Year Mental Scale (this was the prede-cessor to the well-known Bayley Scales of Infant Development). Utiliz-ing data from the Berkeley Growth Study, they then correlated thislanguagefactor during infancy with IQ between 13 and 26 yearsofage.This procedure was conducted separately for boys and girls. For theboysthe correlations never reachedstatistical significance. However, forgirls, the correlations were significant with magnitudes between .4 and-6. In London, England, Moore (1967) conducted a longitudinal study

8 Chapter 1
from 6 monthsthrough 8 years of age. He employed the Griffiths Scaleof Infant Development, which comprises among other subscales aspeech or language quotient. Most relevantare the correlations betweeninfant language development and IQ. The correlations between the18-month speech quotient and IQ at 3, 5, and 8 years were also analyzedseparately for the sexes. For boys the correlations were .40, .22, and .20(only the first wasstatistically significant). The comparable values forgirls were .67, .66, and .50 (all ps < .01). Hence, these two longitudinalstudies found a moderate to moderately high correlation betweenearlylanguage developmentandIQ severalyearslater for girls but not boys.The differential sex relationship between early language developmentand later IQ has never been explained.
Other studies have also reported a relation between early languageand later cognitive functioning. Roe and associates (Roe, 1978; Roe,
McClure, & Roe, 1982) studied 3-month-old infants’ differential vocal
responses (DVR) to a mother-interactive versus a stranger-interactivesession. The underlying assumption of this procedure is that DVRstomother versus stranger interactions imply an early manifestation inperceptualassociation and discrimination, or of cognitive skills, withgreater numbers of vocal responses to motheroverstrangerindicatingmore advanced cognitive development. DVRs were then correlated(partialling out socioeconomic status and mothers’ education) to sub-
sequent cognitive functioning up to 12 years of age across a variety oftests. The correlations with the WechslerIntelligence Scale for Children-Revised Verbal IQ were .79 (.21 for Performance IQ), and .63 and .81 for
the Wide Range Achievement Scale Reading and Arithmetic tests, re-spectively. Although the sample size was quite small in this research,the findingsare intriguing and encouraging.A final study to be reportedwas conducted by N. M. Robinson and Dale (1992). These researchers
followed a group of children betweenthe ages of 20 and 30 months, whowere precociousin their language development, until age 6.5 years. Atvariouspointsin time they were administered languageandintelligencetests. The results showed consistency in advanced languageskills acrossthe duration of the study and that early precocity in languageskills wasassociated with higherintellectual performance. There are some meth-odologicallimits to this study; however, the findings are in accord withthose abovein showing that early language developmentis related tosubsequentIQ.
Third, experimental research in infant perception has resulted insome contemporary assessments of cognitive functioning based on in-fants’ proclivity to differentially respond to novel and familiar stimuli

Introduction 9
(e.g., visual recognition memory,tactile recognition memory, and cross-modal transfer techniques). This research will be discussed in greaterdetail in Chapter 3. The habituation and paired-comparison procedureshave generated a considerable body of knowledge not only aboutbasicperceptual and cognitiveabilities of infants, but on the issue of cognitivecontinuity and predictinglater intelligence as well (Bornstein & Sigman,1986). Such measures have potential because assessments during thefirst year have been foundto correlate significantly with later perform-ance (see Fagan & Detterman, 1992). Although promising, a recentmeta-analysis indicates that the correlations between 1 and 8 years(weighted average of normalized correlations = .36 or a raw mediancorrelation = .45) have not yet reached magnitudessufficiently high fordiscerning individuals (McCall & Carriger, 1993).
A fourth and final area of infant behavioral research to be dis-cussed here pertains to early cross-time hand or manual preference andintellectual performance. A. W. Gottfried and Bathurst (1983) discov-ered that hand preference consistency measured acrossfive assessmentsfrom 12 to 42 monthsof age wasassociated with a varietyof intellectualabilities during this time frame. For boys there wasnorelation; however,for girls, those who were consistent compared to nonconsistent wereperforming significantly higher on the cognitive tasks. To determineifthe preference groups displayed performance asymmetriesindicative ofleft-hemispheric specialization for verbal processing, Kee, Gottfried,Bathurst, and Brown(1987) employed a dual-task procedure requiringfinger tapping and rhymerecitation, administered at the 5- and 6-yearassessments in our longitudinal study. Results for both male groupsshowedgreater right-hand thanleft-hand finger-tapping interference;an asymmetry implicating left-hemispheric-specific processing for theconcurrent verbalactivity. In contrast, only consistent females showedthis pattern. The nonconsistent females showed equal finger-tappingdisruption in both hands. These findings suggest a link between thefunctional organization of the cerebral hemispheres and verbal-lan-guage precocity in females. Kee, Gottfried, and Bathurst (1991) followedthese children from 5 through 9 years andintelligence and achievementtests were administered. The findings showedthat: (1) early hand pref-erence consistencyacrosstime for females predicted school-ageintellec-tual precocity; (2) the locus of the difference between consistent versusnonconsistent females is in verbal abilities; and (3) precocity of theconsistent females was also revealed on tests of school achievement(independentof intelligence), particularly tests of reading and mathe-matics. The parallel between our findings and those of Cameronetal.

10 Chapter 1
(1967) and Moore(1967) is striking. However, even moreinteresting and
relevantto the topic at handin this bookis a finding from our mostrecentstudy (Keeet al., 1991) that consistent females, compared to nonconsis-tent females, were more likely to perform at the gifted IQ level. Thepercentage of gifted performers in each group is 25% and 6%, respec-tively. Girls who exhibited cross-time consistency in hand preferencewere 4 times morelikely to becomeintellectually gifted. For males thepercentages were equivalent for the hand preference groups (17%vs.13%). These data may imply some neurobehavioral basis, specificallyverballateralization (and possibly differentially for the sexes) in thedevelopmentofintellectual giftedness or in the potential to develop thisquality. Data on cross-time hand preference will not be analyzedin thisbook because they have already been published. However, data onpsychometric and Piagetian sensorimotor scales, language develop-ment, and infant recognition and cross-modal tasks will be presentedalong with majorintelligence tests during preschool and early elemen-tary schoolyears.
Education and Achievement
Asa group,intellectually gifted children are above averagein theirschool achievement(Pendarvis, Howley, & Howley, 1990; Tannenbaum,1983). The correlation between IQ and achievement typically rangesfrom .4 to .6 (Renzulli, 1986). The relation between gifted IQ and achieve-mentis not a perfect one. For example, achievement test performance ofthe gifted can be affected by inadequatedifficulty level, and report cardgrades maybe influenced by extraneousfactors such as student compli-ance (Pendarviset al., 1990). Nevertheless,it is in the realm of education
that the gifted excel both in termsof accelerated learning (learning at alevel beyond their grade) and skill mastery.
Gifted children are often younger than their classmates. Terman(1925) reported that the gifted children as a group were younger thanchildren of their grade, which could be accounted for by their enteringschool at a youngerage. The implication of this younger ageis that thechildren are accelerated in grade level (Terman, 1925). Indeed, Termaneven calculated a Progress Quotient (standard age at a grade/child’sactual age) and foundthegifted to be accelerated in their grade accord-ing to this standard. Tannenbaum (1983) reports that high-IQ childrenoften enter school early and show accelerated advancement. Further, the
practice of accelerating children in school (i.e., advancing their gradelevel) creates the situation in which gifted children are frequently

Introduction 11
youngerthan othersin their grade. The controversy between enrichingthe curriculum versusaccelerating the gifted continues (George, Cohn,& Stanley, 1979; Pendarvis et al., 1990; Roedell, Jackson, & Robinson,1980; Tomlinson-Keasey, 1990), with proponents on both sides. While
educational acceleration is not a focus of the book, children’s age at
school entry will be examined to determineif gifted children, prior totheir identification as gifted, tend to be younger in kindergarten thannongifted children.
Whatis the breadth of areas in which the gifted excel, and is therea pattern of early accelerated achievement that is maintained fromkindergarten throughthe early school years? Terman (1925) found thatwhenteachers rated 8- to 13-year-olds, the gifted evidenced a greateradvantage in abstract and academic subjects, butlittle advantage onschool subjects involving physical, athletic, or artistic skills. Roedell etal. (1980) report in their Seattle Longitudinal Study that there has beenvariability in the pattern of achievement on the Peabody IndividualAchievement Test (PIAT) over a 4-year period beginning in preschool.For example, despite exceptionally high IQs for some of the children,not all wereearly readers, a characteristic typically attributed to young,gifted children. However, compared to an unselected sample of pre-schoolers notidentified as gifted, the gifted group performedat a higherlevel on the PIAT. In the Terman study individual patterns of achieve-ment were obtained (DeVoss, 1925). On the Stanford AchievementTest,individual children evidenced many instances of distinct patternswhereby someachievementareas were greatly accelerated, while otherswere more average. This wastrue for the gifted and nongifted groups.DeVoss (1925) interpreted this as indicating a specialization of ability.The individual differences in the pattern of abilities were unique to eachchild, not general to gifted or nongifted group status. Patterns ofachievement for individual children will be examined in the presentstudy as well.
Theissue of continuity of academic achievementwill be addressed.In the present study, we have measured children’s achievement fromages 5 through 8 using standardized, individually administeredachievement tests, and teacher and parental reports of achievement.Therefore, we have a unique opportunityto investigate the longitudinal,developmental trends regarding early childhood school performanceand the degree of continuity of early achievement patterns prior tochildren’s identification as gifted in the study. The availability of thesedifferent sources of achievement data permit us to examine the gener-alizability of achievementtrends over time.

12 Chapter 1
Motivation
An area that has received relatively less attention than giftedchildren’s academic achievement concerns their intrinsic motivation.Academic intrinsic motivation is defined as enjoymentof schoollearn-ing characterized by an orientation toward mastery, curiosity, persist-ence, task endogeny, andthe learningof challenging,difficult, and noveltasks (A. E. Gottfried, 1985, 1986a, 1990). In the present study, academicintrinsic motivation was studied. Academicintrinsic motivation rests onthe theoretical foundations of cognitive discrepancy, that is, provisionof environmental stimuli that adequately challenge the child; masteryexperiences for the development of competence; and the perception thatthe individual himself or herself is the “cause” of the outcome(A. E.
Gottfried, 1986b). The theoretical foundations of academic intrinsic
motivation are quite relevant to the issues that have been raised regard-ing the need to keep gifted children engaged in the school process(Tuttle, Becker, & Sousa, 1988).
Academic intrinsic motivation is positively related to intelligence(A. E. Gottfried, 1990). In this research, the higher the child’s IQ scores,
the higher the academic intrinsic motivation as measured by the Chil-dren’s Academic Intrinsic Motivation Inventory (CAIMI) (A. E.
Gottfried, 1986a). This relation was interpreted as indicating that chil-dren with greater intellectual performance find the process of learningmore challenging and pleasurable than children with relatively lowerintellectual performance and experience enhanced mastery of schooltasks. The significance of this hypothesis to the present researchis thatthere may be an intrinsic motivational foundation that supports thegifted child’s academic achievement.
The literature, however, has providedlittle evidence regardingacademicintrinsic motivation in the very younggifted child. WhereasA. E. Gottfried (1990) found that children with higher IQs had higheracademic intrinsic motivation, gifted children were not identified as a
separate group in that study. Henderson, Gold, and McCord (1982)reported that gifted children and adolescents had higher curiosity thantheir nongifted counterparts. Davis and Connell (1985) reported thatgifted fourth and sixth graders had higher mastery motivation thannongifted children, as did Li (1988) for fourth and seventh graders, andHom (1988) for third graders. Tomlinson-KeaseyandLittle (1990) found
that childhoodintellectual determinism of the Terman sample, a moti-vational construct bearing a resemblance to achievement and intrinsic

Introduction 13
motivation, predicted the maintenanceof intellectual skills over thelifecourse.
Motivation has often been assessed indirectly from other behav-iors. For example, Hagen (1980) reported that motivation is evident inastudent’s achievementorby hisor her active involvement in academicand extracurricular activities. These are indirect indices since factorsother than motivation mayinfluence both achievement and engagementin activities. Interest, although not synonymous with motivation(Krapp, Hidi, & Renninger, 1992), has been a widely used index ofmotivation (e.g., Terman, 1925). Terman found that more of the giftedchildren were reported to be interested in school, while more of thenongifted controls were reported to showa lack of interest in school.Gifted children also evidenced a wide rangeof extracurricular interestsindicative of curiosity (Miles, 1946; Terman, 1925). In Janos and Robin-son’s (1985) review, a numberof motivational characteristics were iden-tified as being more prevalent in the gifted, such as independence,autonomy, and characteristics associated with achievement motivation.
Renzulli’s (1986) conception of giftedness includes task commit-ment, defined as perseverance and a belief in one’s ability to pursuesignificant work. This type of motivation bears a resemblancetointrinsicmotivation, albeit it is not an identical construct, because the founda-tions of task commitmentcouldbe external sources of expectation ratherthan,or in additionto, intrinsic factors. However, observations of giftedindividuals’ task commitment, as reviewed by Renzulli (1986), provideadditional supportfor the importanceof further investigating the con-struct of academicintrinsic motivation in gifted children. Additionally,Feldman (1986) describes prodigies as evidencing an intense intrinsicmotivation in their domain of giftedness.
Theliterature suggests that gifted children oughtto be higherinacademic intrinsic motivation. Gifted children’s competence in aca-demic school tasks may provide a foundation for the motive towardseeking cognitive challenge and mastery. To the extent that gifted chil-dren’s needsfor stimulation and mastery are met, then academic intrin-sic motivation ought to be higher. Conversely, gifted children maybecomeless intrinsically motivated in schoolif they are not adequatelychallenged (Tuttle et al., 1988; Whitmore, 1986). Monks, van Boxtel,Roelofs, and Sanders (1986) found that for Dutch seventh to ninthgraders, gifted underachievers had lower school motivation than bothgifted and nongifted students.
With an increasing emphasis onearly identification of gifted chil-dren (Roedell, 1989) anda searchfor alternate methods of assessing early

14 Chapter 1
giftedness other than through standardized tests (Karnes & Johnson,1986), increased attention needsto be givento early intrinsic motivation.Dogifted children differ motivationally from nongifted children? If theydo, how early do such differences appear? The early development ofacademicintrinsic motivation in the gifted and the long-term course ofsuch development from infancy are areas with no previous empiricaldata.
In the present study, children’s academic intrinsic motivation wasmeasured at ages 7 and 8. Further, direct observations of children’stest-taking behaviors from infancy through age 6 were conducted. Thesetest-taking behaviors, as measured by the Bayley Infant Behavior Re-cord, have been identified as tapping cognitive motivation consistentwith the early manifestation of mastery motivation (Matheny, 1980).Mastery motivation is one of the major theoretical aspects of intrinsicmotivation (A. E. Gottfried, 1986b). Examples of behaviors observedinclude goal directedness, attention span, and orientation responsestothe materials.
From infancy through age 8, data are presented concerning theearly manifestation of cognitive-mastery motivation and academic in-trinsic motivation. Heretofore, no other longitudinal research on thegifted has measures of early motivation, or of academic intrinsic moti-vation.
Academic Self-Concept and Anxiety
A.E. Gottfried (1982, 1985) studied the relations between academic
intrinsic motivation, perception of competence regarding schooltasks,and academic anxiety. This research showed that higher levels of aca-demic intrinsic motivation are associated with more positive percep-tions of academic competence and lower anxiety. Since children withhigher levels of academic intrinsic motivation also tend to have higherachievement andhigherIQs (A. E. Gottfried, 1985, 1990), gifted children
may also be expected to evidence morepositive perceptions of academicself-concept and lower academic anxiety. Certainly, their greater aca-demic success and mastery of cognitive tasks alone would predict betterperception of competence and loweranxiety. Indeed,thereis also litera-ture supportive of these expectations.
Schneider (1987) reviewed literature regarding self-concept of thegifted. He found that of studies comparing gifted and nongifted chil-dren, gifted children’s advantage in self-concept was in the academicdomain. Whenself-concept was examined in nonacademic areas, there

Introduction 15
tended to be no differences betweengifted and nongifted children. Morerecent research continues to indicate that gifted school children havemore positive self-concepts in the cognitive and academic domains(Chan, 1988; Eccles, Bauman,& Rotenberg, 1989; Hoge & Renzulli, 1993;
Karnes & Whorton, 1988; Kelly & Jordan, 1990; Li, 1988). In the presentstudy, we examine perception of academic competence with regard toreading, math, and school in general at ages 7 and 8. Inasmuchasstudiesof self-concept of the gifted are concentrated in the upper elementaryand secondary schoolyears, our data will provide an important look atyounger children. Additionally, not only do we examine perception ofcompetence in the academic domain, but weare also able to examineitwith regard to children’s perceptions of specific subject areas as well asschool in general.
Regarding anxiety, there are reasons to expect either lower orhigher academic anxiety in gifted compared to nongifted children.Relations between anxiety and school achievement, and anxiety andIQ, have typically been negative (Hansen, 1977), indicating that morecapable students have lower anxiety levels. There are also studiesindicating that gifted children evidence lower anxiety than nongiftedchildren. For example, gifted children have been found to evidence
lower general and school-related anxiety than their nongifted peers(Davis & Connell, 1985; Reynolds, 1985; Reynolds & Bradley, 1983;Scholwinski & Reynolds, 1985). Another point of view was presentedby Yadusky-Holahan and Holahan (1983), who suggested that thegifted may experience higher anxiety than nongifted children attrib-utable to self-imposed pressure and pressure to succeed imposed byparents and teachers.
In the present study, academic anxiety (worry related to schooltasks andtests) is examined at ages 7 and 8. Based ontheliterature andprevious work(A. E. Gottfried, 1982, 1985), the gifted children wereexpected to show lower academic anxiety than the nongifted children.A. E. Gottfried (1985) found that academic intrinsic motivation wasinversely related to children’s academic anxiety and positively relatedto academic perception of competence. Higher academic intrinsic moti-vation is associated with lower academic anxiety and more favorableperceptions of doing well in school.
Behavioral Adjustment, Social Functioning, and Temperament
The nature of gifted children’s nonintellectual functioning hasreceived somewhatless attention than their intellectual and academic

16 Chapter 1
accomplishment. By nonintellectual functioning, we are referring toaspects of development such as children’s behavioral and emotionaladjustment, personal and social competencies and activities, and tem-peramental characteristics. Do these aspects of functioning relate tochildren’s advanced or higher developmentin the intellectual realm?Several researchers have noted the paucity of research on these nonin-tellectual aspects of development, which is particularly evident withrespect to developmentduring the infancy, preschool, and in the earlyelementary school years (Austin & Draper, 1981; Horowitz, 1987; Janos& Robinson, 1985; Lehman & Erdwins, 1981; N. M. Robinson, 1987;
Roedellet al., 1980). In addition, the methodological problems inherentin investigating these areas of development have also been detailed,including the lack of widely used standardized measurement tools(Austin & Draper, 1981; Janos & Robinson, 1985; Roedell et al., 1980),
lack of equivalent comparison or control groups (Austin & Draper, 1981;Janos & Robinson, 1985; Schneider, Clegg, Byrne, Ledingham, & Crom-
bie, 1989), bias in identification or selection of research subjects (Ludwig& Cullinan, 1984; Roedell et al., 1980), and failure to consider potentially
important moderating variables (Janos & Robinson, 1985; Schneider etal., 1989). Finally, even amongtherelatively few studies addressingthese aspects of developmentin gifted compared to nongifted children,inconsistent findings have resulted. Some studies have reported thatgifted children score more favorably than their nongifted peers onassessments of social, emotional, and/or behavioral functioning, while
others report no differences (Austin & Draper, 1981; Gockenbach, 1989;
Ludwig & Cullinan, 1984; Olszewski-Kubilius, Kulieke, & Krasney,
1988).In the currentliterature on gifted children’s developmentin these
areas, the early writings of Lombroso (1891) during the late nineteenthcentury are often contrasted to those of Termanin 1925 (cf. L. E. Brody& Benbow, 1986; Ludwig & Cullinan, 1984; Pendarviset al., 1990; Solano,
1987). Lombroso held that the intellectually gifted were at risk formaladjustment ranging to insanity, whereas Terman concluded thatgifted children surpassed average children with respect to adjustment.
Although Termanandhis colleagues did not have the psychomet-rically developed measuresof social or behavioral adjustment that arenow available to researchers, they collected a large bodyof data regard-ing the play interests, play knowledge, and play practices of giftedversus control children. Children rated their participation and prefer-ences for play activities. Activities were conceptualized to fall into oneof three categories: active-solitary (e.g., spinning tops, riding bikes),

Introduction 17
social-active (e.g., tag, hide-and-seek), or social-quiet (e.g., “playingschool,” dominoes, cards). Thelatter category was characterized as
requiring less physical strength andskill than powersof imagination orlogic. In addition, children were tested on their knowledge aboutvari-ous play activities, and parents and teachers provided informationregardingthe children’s play behaviors.
Terman’s results showed that the play interests of the gifted andcontrol groups wereonly slightly different; age and sex of child weremuch moreinfluential than intelligence in determining preferences. Inaddition, he found that gifted children were considerably more maturein their play interests than their nongifted age-mates. Furthermore,gifted children expressedgreaterinterestin less active typesofplay (ie.,cards, puzzles, checkers, chess) and less social play activities; in fact,Terman concluded that the difference between the gifted and controlgroupsonsociability was large enoughto besignificant. Additionally,Terman found that gifted children as a group possessedsignificantlymore knowledge about gamesandplay activities, indicating that theiradvantage in play knowledgeparalleled their advantage on the StanfordAchievementTest.
Parents and teachers also provided information about the playbehaviors of the gifted children. Their reports showed that the giftedplayed alone more often than controls, although the difference wassmall (about 10% fewer gifted played with other children “very much”compared to controls). Both parents and teachers also reported thatlarger percentagesof gifted children tendedto prefer to play with olderchildren compared to controls. Teachers reported that 9.1% of controlspreferred to play with older children, compared to 25.1%of the giftedby teacher report and 34.6%of the gifted according to parent report.Terman speculated that the preference for playing with older childrenon the part of gifted children might be due to the then popularpracticeof accelerating the gifted in school; in fact, over 80%of his sample hadskipped at least one gradelevel. In addition, he proposed that giftedchildren preferred older playmates due to the tendency for mental agesto seek their ownlevel.
Termanalso examinedthe interests of gifted compared to controlchildren. Gifted children were found superior to nongifted children intheir level of intellectual and social interest, but equivalent with respectto interest in play. Parent and teacherratings of varioustraits falling intoseven groups(intellectual, volitional, emotional, moral, physical, social,and mechanical ingenuity) werealso collected; the gifted group excelledon all traits except the last. To summarize, Terman’s data refuted the

18 Chapter 1
writings of Lombroso andstereotypes that were popular during that erathat gifted children developtheir intellectual interests at the expense oftheir social and activity interests.
Terman’s (1925) findings did not completely alter the popularimage of gifted individuals. Current researchers continue to mentionstereotypes of gifted individuals, including that of the gifted as the“oversensitive, unbalanced genius” (see Pendarviset al., 1990), as so-cially inept (Pendarvis et al., 1990), as prone to interpersonalisolation(Austin & Draper, 1981; Gallucci, 1988; Janos & Robinson, 1985; Solano,
1987), and as likely to have emotional problems(L. E. Brody & Benbow,
1986; Freeman, 1983). Tomlinson-Keasey (1990) note the portrayal of
gifted adolescents in popular films as “nerds” who lack appropriatesocial skills and prefer to spend their time pursuing obscure academicquestions.
To determine whetherstereotypesof the gifted as socially isolatedstill exist, Solano (1987) systematically varied gender andability level(average, able, or gifted) in descriptions of hypothetical high schoolstudents. College students completed a questionnaire assessing theirimpressions of the hypothetical person’s social and academic success.Results showed that female gifted stimulus persons were perceived assignificantly less popular than average-ability and able students. Sum-marizing across her research with high school student, high schoolpersonnel, and college student samples, Solano concluded that thegifted continue to be stereotyped as socially isolated, although thereason for this perception could not be determined.Is this perception ofsocial isolation due to an impression that the gifted are unlikable, or tothe perception that they are uninterested in socializing with others?Solano concluded that the current stereotype of the gifted as sociallyisolated is more compatible with the view of the gifted as forsakingsocial interactions in favor of the pursuit of their work as opposed tosocial deviance.
Whetherbasedin reality or in myth, several concerns have beenmentioned by parents, educators, and/or researchers regarding thesocial and emotional functioning of gifted children. L. E. Brody andBenbow (1987) and Tomlinson-Keasey (1990) noted that parents andeducators often hesitate to accelerate the grade level of gifted childrendue to concerns abouttheir social and emotional development. Pen-darvis et al. (1990)cited five worries voiced by parents and/or educatorsregarding gifted children’s adjustment: (1) they may encounterdifficul-ties in social interactions dueto intellectual differences with their age-mates,(2) they may experience elevated anxiety due to pressure to excel

Introduction 19
in school, (3) they maybeat higherrisk for dropping out of school, (4)delinquency, and (5) suicide. Freeman (1983) summarized four factorsthat may heighten gifted children’s risk for emotional or educationalproblems during development: (1) heightenedsensitivity of the giftedto environmentalor social stimuli, (2) development by gifted childrenof unreal expectations for themselves (“perfectionism”), (3) heighteningof “normal”sex-role problems of development, and (4) mismatchin theeducationalsetting in termsof curriculum, teachingstyle, and/or learn-ing environment. Freeman concludedthatgifted children have the sameemotional and educational needs for expression and exploration asother children. However, she noted that gifted children differed fromother children in that their needs were more intense, and that ifthwarted, gifted children would react more strongly.
Contrary to the concernsof parents and teachers and the negativestereotypes regarding the emotional, behavioral, and social adjustmentof gifted children, the general conclusion drawn by manyresearchersinrecently publishedstudiesis that gifted children and/or adolescentsareat least equal, if not superior, to their nongifted cohorts in these areas(L. E. Brody & Benbow, 1986; Gallucci, 1988; Hollingworth, 1942;Lehman & Erdwins, 1981; Ludwig & Cullinan, 1984; R. M. Milgram &N. A. Milgram, 1976; Schneideret al., 1989; Tomlinson-Keasey, 1990; seealso reviews by Austin & Draper, 1981; Gockenbach, 1989; Horowitz &O’Brien, 1986; Janos & Robinson, 1985; Olszewski-Kubilius et al., 1988;Pendarvis et al., 1990). Although gifted children are not immune toemotional, behavioral, or social problems, they are at a minimum nomore vulnerable than other children; they are as a group predominantlywell adjusted in the emotional, behavioral, and social realms. Most ofthese studies, however, have focused on gifted children during theschool-age and adolescent periods rather than the preschool years.Three recentstudies, for example, have examined adjustment during theadolescent years. Gallucci (1988) compared scores on the Child BehaviorChecklist of gifted 12- to 16-year-olds Participating in a residentialSummer camp to normative data and found no differences between thetwo groups. L. E. Brody and Benbow(1986) studied 13-year-old studentswith high SATscores (primarily math) and found no differences be-tween them and a comparison groupofless able students in terms ofself-reports of self-esteem, happiness, depression, or discipline prob-lems. However, the gifted viewed themselvesas less popular than theadolescents in the comparison group. Luthar, Zigler, and Goldstein(1992) compared 12- to 15-year-olds participating in a university talentidentification program to a group matched on cognitive maturity and

20 Chapter 1
groups matched on chronological age. Luthar et al. reported that thegifted adolescents showed morepositive psychological adjustmentthanthe chronological age comparison groups on depression andself-image,and equal adjustment to the group matched on cognitive maturity.However, gifted females were found to have lowerself-image scoresthan gifted males.
Studies of children of elementary school age indicate that the giftedare at least as well adjusted as their nongifted peers. Lehman andErdwins (1981) foundthat gifted third graders were quite well adjusted,scoring more favorably than their nongifted age-mates on several sub-tests of the California Test of Personality, including sense of personalworth,socialskills, sense of personal freedom,antisocial tendencies, andschool relations. Janos and Robinson (1985) studied a sample of 5- to
10-year-olds who viewed themselves as “different” and found that theirself-esteem, although lowerthan other gifted children, wasstill above
average. Ludwig and Cullinan (1984), studying adjustment of firstthroughfifth graders, foundthatgifted children showed fewerbehaviorproblemsthan their nongifted classmates using teacher reports on theChild Behavior Checklist. The children studied by Luftig and Nichols(1991) consisted of fourth through eighth graders in which the giftedwereparticipating ina pull-out education program.Utilizing peer nomi-nation data, they concluded that gifted girls were unable to establishpopularity or good social relations with nongifted peers, although giftedboys enjoyed enhanced social status. Because of the relatively lowpopularity and negatively perceived personality and schooltraits ofgifted girls, Luftig and Nichols concluded that they may beanat-riskpopulation with respect to academic achievementandpersonalorsocialadjustment. R. M. Milgram and N. A. Milgram (1976) studied fourth-through eighth-gradeIsraeli children using self-report measures assess-ing self-concept, locus of control, and anxiety. They observed that thegifted scored more favorably, that is, showed morepositiveself-concept,more internal locus of control, and lower levels of general and testanxiety. Unlike Luftig and Nichols, R. M. Milgram and N. A. Milgramreported that gifted girls were as well adjusted as gifted boys.
Ourliterature review revealed only one study of social interactionskills among preschool-aged children. Roedell et al. (1980), describingthe characteristics of gifted young children, reviewed the earlier findingsof Roedell on the social interaction skills of 3- to 5-year-old children withan averageIQ of 138. Although comparisonsto nongifted peers were notreported, Roedell et al. did report that children with higher IQs wereable to generate more ideas about wayschildren could solve hypotheti-

Introduction 21
cal social conflicts. However, no relation was observed betweentestperformanceandteachers’ ratingsof children’s adjustmentor observa-tions of children’s free-play behavior. Roedell et al. concluded thatprecocioussocial cognition byitself was insufficient to ensure appropri-ate social interaction behavior.
Thus, the exceptionality of gifted children in the intellectual realmdoes not appear to negatively impact their functioning in these otherrealms of development. Gifted children typically equal, and sometimesexcel, their nongifted age-mates in terms of adjustment. Exceptions tothese general findings, however, may include highly gifted childrenwhoseIQ exceeds 160(L. E. Brody & Benbow,1986; Hollingworth, 1942;Roedell, 1984), gifted underachievers, and possibly gifted girls (Free-man, 1983; Horowitz & O’Brien, 1986; Janos & Robinson, 1985; Luftig &Nichols, 1991; Lutharet al., 1992; Roedell, 1984).
An additional nonintellectual factor that may distinguish giftedand nongifted children is their temperament. In the Fullerton Longitu-dinal Study, the temperament model of Thomas, Chess, and Birch(1968), based on the New York Longitudinal Study (NYLS), wasutilized.In the NYLS model, temperamentis viewed as “the stylistic componentof behavior—thatis, the how of behavioras differentiated from motiva-tion, the why of behavior, and ability, the what of behavior” (Goldsmithet al., 1987, p. 508). Nine categories of temperament were delineated bythe NYLSgroup:
1. Activity level, the level, tempo, andfrequencyofthe motor componentof behavior.
2. Rhythmicity, the degree of regularity of biological functions(e.g.,sleeping and waking,feeding).
3. Approach or withdrawal, the nature of the initial response to a newstimulus.
4. Adaptability, the successive course of the child’s responses to newstimuli (i.e., slow vs. fast).
5. Intensity of reaction, the energy level of response.6. Threshold ofresponsiveness, the level of extrinsic stimulation necessary
to evoke a noticeable response.7. Quality of mood, the amount of pleasant, joyful, friendly behavior
versus unpleasant, crying, unfriendly behavior.8. Distractibility, the effectiveness of extraneous environmental stimuli
in interfering with or altering the course of an ongoing behavior.

22 Chapter 1
9. Attention span and persistence, the length of time a particularactivity
is pursued(attention span) and the continuationof an activity in spite
of obstacles to continuation (persistence).
One could hypothesize that specific dimensions of temperament
in the NYLS may promote or enhanceintellectual development.
Research on the relation between intellectual development and
temperamentis accumulating. For example, researchers have examined
the correlation betweenintelligence and temperament, whethergifted
and nongifted children differ on specific temperamental characteristics,
and the role of temperamentandpersonality variablesin predicting the
achievement of eminence in adulthood. The findings can be charac-
terized as decidedly mixed.
Temperament dimensions have been used to describe the charac-
teristics of gifted children relative to nongifted children. For example,
comparedto their nongifted peers, gifted children have been described
as having longer attention spans, being more persistent, happy, and
active (cf. Roedell et al., 1980). Matheny (1989) cites a study of limited
circulation by Burk in which the temperament characteristics of 125
gifted children in nursery school through second grade were compared
to normative data; gifted children were rated as more approaching,
adaptable, persistent, and morepositive in mood.
In a recent studyof the relation between temperamentandintelli-
gence using the Louisville Twin Study data, Matheny (1989) noted
recurrentpositive correlations between mentaltest performance and the
temperament characteristics of attention span/persistence, ap-
proach/withdrawal, adaptability, and mood.Specifically, children with
higher mental scores were rated as more attentive to and persistent on
tasks; more approaching of new unfamiliar individuals, objects, or
events; more adaptable, and more positive in mood. Whether these
temperament-intelligencecorrelations are strong enough to distinguish
gifted from nongifted children during the school years has not been
demonstrated, however.
There is also evidence suggesting no relation between childhood
temperamentandintellectual functioning. For example, Roedell et al.
(1980) reported that parents of gifted children in the Seattle Project
described their children as varying so widely on temperamentcharac-
teristics that it was impossible to describe them as a group in termsof
temperamentfeatures.
Aspects of temperament during childhood or adolescence have
also been suggested as determinants of whethergifted children maintain

Introduction 23
their intellectualskills into adulthood or achieve eminence as adults. Forexample, using structural equation modeling, Tomlinson-Keasey andLittle (1990) found that sociability of the child at age 11 years had anegative effect on intellectual skills among adults; that is, children whowere popular, enjoyed goodhealth, radiated physical energy, and main-tained a cheerful and optimistic attitude were subsequentlyless likely tomaintain their intellectual skills as adults. In addition, Albert and Runco(1986) and Howe(1990)write of nonintellectualfactors that differentiatethose who become eminent from those who do not, the former suggest-ing personality and family process variables andthe latter qualities suchas persistence and attentiveness. Decades ago, C. M. Cox (1926) notedthat childhood characteristics such as persistence and intellectual en-ergy were predictive of achievement during adulthood.
Findings from the Fullerton Longitudinal Study with respect tobehavioral adjustment, social functioning, and temperamentalcharac-teristics of gifted versus nongifted children during the infancy, pre-school, and early elementary school years are presented in Chapter5.Thesefindings will allow us to ascertain whetherintellectual giftednessis related to these aspects of functioning during the early childhoodyears, an age period not addressed by Terman and only modestlystudied since.
Home and Family Environment
The first systematic study of the families of highly intelligentpeople was conducted by Galton. With the publication of HereditaryGenius in 1869, Galton presented evidence that eminence runsin fami-lies. Moreover, Galton was convinced that genius was, to a large degree,inherited. In the United States, the well-known longitudinal study ofgifted children launchedin the early 1920s by Termanalso shedlight onthe role of family factors associated with giftedness. Terman’s studyprovided muchofthe descriptive data on the characteristics of familieswith gifted children so often cited in the literature. These two landmarkstudies and several others since provide extensive support for familydemographic correlates of giftedness (see Barbe, 1956; Cornell, 1984;Freeman, 1979, 1991; Gross, 1993; Sheldon, 1954; Terman, 1925-1929; seealso the comprehensive overview by Olszewski, Kulieke, & Buescher,1987). A summaryof previous findings are presented here along withan overview of the home and family environmentalcorrelatesof intel-lectual giftedness.

24 Chapter 1
Consistently supported by the data is the finding that the parents
of gifted children are morelikely to be of higher socioeconomic status,
to be high achievers who have earned college and graduate degrees, and
to practice in professional occupations. For example, Terman reported
that 26% of the gifted children in his sample had one or both parents
with college degrees. Otherresearchers, including Hollingworth (1942),
Sheldon (1954), Barbe (1956), and Kincaid (1969), also found more ad-
vanced educational levels in their samples ofgifted children.(It should
be noted that Freeman, 1979, did not find educational attainment differ-
ences in her study.) Some have noted the higher educationalstatus of
grandparents as well (Freeman, 1988; Galton, 1869; Gross, 1993). The
finding that educational accomplishments of children are fostered by
highly educated families is not surprising, and we would expect to see
education highly valued in the homes of the gifted children in the
current study as well.One would expect higher educational accomplishmentsto result
in higher occupational status. Indeed, Terman (1925-1929), Holling-
worth (1942), Sheldon (1954), Barbe (1956), and Freeman (1979) reported
that fathers of gifted children were far more likely to be classified as
professionals. As found in the educational domain, grandfathers of
gifted children also had occupational positions of higher status (Gross,
1993; Hollingworth, 1942; Terman, 1925-1929). Occupational status of
mothers was included in several studies as well, although the number
of mothers working outside the homewasfar less than the numberof
fathers. Sheldon (1954) noted that all mothers of the 28 highly intellec-
tually gifted (IQ = 170+) children in his study had the necessary skills
with which they could earn a living independent of their husbands,
althoughless than half were employed at the time of his study. Groth
(1975) found that mothersof gifted children as compared to mothers of
nongifted children were morelikely to be employed outside the home.
The occupations of mothers of gifted children tended to be primarily in
the social sciences (e.g., teaching). Freeman (1979) and Gross (1993)
found higher occupational status for mothers of gifted children in their
samples. Data on maternal employment need to be interpreted within
the historical context during which it was collected. Maternal employ-ment, in general, is far more frequent now thanit wasprior to the 1970s.Hence, early data on employment of mothers of gifted children is notnecessarily representative of current trends (A. E. Gottfried, Bathurst, &A. W. Gottfried, 1994; A. E. Gottfried & A. W. Gottfried, 1994).
A phenomenonoften notedin the studyof giftednessis the higherselection ratio of males to females for children identified as gifted. This

Introduction25
was true in Terman’s study andin others as well (e.g., R. L. Cox, 1977;Freeman, 1979; Hollingworth, 1942; Terman & Oden, 1959). Differentialsex ratios could possibly be due to ascertainmentbiasif subject recruit-ment for gifted children is based on teachers’ nominations (see below).As suggested by R. L. Cox (1977), this difference may be imposed bysociety as opposedto anyreal differences in intellectual functioning. Forexample, males may receive more encouragement from both parentsand teachers to excel academically, while females may hesitate to com-pete with malesfor fear of social reprisal. However, the recent changesin society and overtefforts to encourage younggirls to actively competewith young boys academically may eradicate these sex differences intoday’s gifted samples. The genderdifferentials noted in past studiescould be dated.
Several researchers have evaluated the composition of the familywith respect to marital status, parents’ age, number of people in thehome, andbirth order. When marital statusis reported, the results showthat the parents of gifted children have lower divorce rates than thegeneral population (Barbe, 1956; Groth, 1975). However, our study wasconductedin a different era and the incidence of divorce has increasedcontinually over the years since the 1950s (Cherlin, 1992; Hernandez,1988). It was of interest to evaluate whether these patterns continue tohold for gifted versus nongifted children in the 1980s and 1990s.
With respect to the age of gifted children’s parents, the findingsare consistent in the literature. Parents of gifted children are typicallyolder than parents of nongifted children (Silverman & Kearney, 1988;Storfer, 1990; Terman, 1925), with mothers typically giving birth to theirfirst child whenin their late twenties. In Terman’s study, the mean ageof fathers and mothers was 33.6 and 29 years, respectively. Silvermanand Kearney (1988) found similar demographics in their study of chil-dren with IQs in the very superior range (170+). It is noteworthy thatthese findings spanned several decades and seem to be immuneto theeffects of changing family demographics during the sameperiodoftime.A likely explanation is that postponing thebirth of children to a latertime allows parents to pursue and achieve higher educational andoccupational status and develop greater stability, maturity, and finan-cial security.
Gifted children typically come from small families and are oftenthe firstborn or only child. Barbe (1956) found that approximately 64%of the gifted children in his study had no (21.8%) or one (42.6%) sibling;92.5% were firstborns. Terman (1925-1929) reported the modeat twosiblings with approximately 60%of the subjects being only children or

26 Chapter 1
the oldest child. Sheldon (1954) reported that the highly intellectual
children in his sample tended to be firstborns or only borns. Several
yearslater, R. L. Cox (1977) reported that nearly half of a sample of 465gifted children were firstborns. Common explanations include the hy-pothesis that the first child in the family has the complete attention ofhis or her parents, while later borns must share their parents. As earlyas the mid-1800s, it was noted that men of eminenceare often the eldestchild (Galton, 1869). Over 100 years later, M. G. Goertzel, V. Goertzel,and T. G. Goertzel (1978) studied the biographies of several hundredeminent persons and corroborated this finding. Albert (1980), in inves-
tigating the birth order status of eminent persons, coined the term“special positions” to describe the unique treatment of these childrenwithin the family.
The early researchers such as Galton and Terman wereinterestedin describing the characteristics of families that producegifted children.However, demographic data provide no information aboutthe specificfeatures within the home that may accountfor the observed differencesbetweentheintellectually gifted and nongifted. More recent researchershave taken a closer look at the home and family environmentofgiftedchildren. Althoughthere are far fewer studies in this area, results have
been consistent. The homes of gifted children are child centered (Ol-
szewskietal., 1987). Indeed, Gross (1993) postulates that the family may
be the most significant factor in the developmentofintellectual talent.
Without parental encouragement and facilitation, children who havehigh potential may notreach their potential. Gross did not discounttherole of schools in the developmentofthe intellectually gifted, but Gross
argued that the developmentof exceptional ability is the result of bothparental and educator support, a position taken by Colangelo andDettmann(1983) as well. Howe (1990) also argued that children will not
realize their potential without parental support. Although an advocateof effective schooling, he stated, “On its own, a school can rarely succeed
in giving the intellectual nourishmentthat results in a child excelling atsomething, rather than being merely competent”(p. 124). A stimulatinghome environment must be accompanied by someone whois there toexplain, direct, and provide feedbackto children.
Children of high intellectual ability have parents whoare highlyinvolved in their children’s activities and education. Their parents pro-vide a wide range of reading materials; encourage hobbies; foster posi-
tive attitudes toward learning; model good learning attitudes; andencourage parent-child discussions (see Colangelo & Dettmann, 1983;Howe, 1990; Kulieke & Olszewski-Kubilius, 1989; Olszewskiet al., 1987;

Introduction 27
Roedell et al., 1980). In our earlier work (A. W. Gottfried & A. E.Gottfried, 1984), we examined the homeand family correlatesof cogni-tive ability in infants and preschool children and found that childrenwith higher intellectual functioning were provided with more materialsthat enhancechildren’s cognitive skills. Mothers were more involved intheir activities, provided them witha greater variety of experiences, readto them more as infants, and presented them with more stimulatingeducational challenges. In the Gulbenkian Project carried out in Eng-land, Freeman (1979) found two major homeinfluences associated withhigh IQ. Thefirst was the provision of more learning materials (e.g.,books and writing materials). The second, and necessary, componentwas the involvementofparents in the learning process. Parents of giftedchildren set examples for their children and provide an atmosphereconducive to learning. Mothers of high-IQ children exert more educa-tional pressure ontheir children and are moreinvolved in their activitiesand in the day-to-day functioning of their children’s school. Freemanconcluded that it was not enough for parents simply to provide theappropriate learning materials for children; parents must be activelyinvolvedin the learning process.
Readingactivities are the most often cited parental involvementpractice for educational enrichment (Colangelo & Dettmann, 1983).These include reading to children from a very young age, providingage-appropriate books that are informative andinteresting, encourag-ing and modeling reading behavior, and helping develop a positiveattitude toward learning. Freeman (1979) reported that the homes ofgifted children contained far more books than did the homesofnongifted children, that these children were more avid readers thanother children, and that they had a greatervariety ofinterests.
Terman’sdata included the numberof books read by children inhis sample, and he comparedthose data with information from severalhundred control children. By age 7, gifted children were reading anaverage of five books per month, whereascontrol-group children readvery little. By age 11 years,gifted children averaged seven and one-halfbooks per month; control-group children averaged less than four. Fur-ther, gifted children read on a broader range of topics and moreoftenchose books aboutscience, history, biography, travel, poetry, drama,and informationalfiction. These children also pursued a broad varietyof interests and hobbies. R. L. Cox (1977) noted that gifted children mostoften cited readingas a free-timeactivity. They read for entertainmentand for their own special interests, which were broad and varied.

28 Chapter 1
The study of family relationships and the quality of the social
climate in the home has revealed differences between gifted and
nongifted groups. Parents ofgifted children place a stronger value on
being closely involved with their children and on participation in more
family activities than do parents of nongifted children (Cornell, 1984;
Cornell & Grossberg, 1987; Freeman, 1979; Gross, 1993; Kulieke & Ol-
szewski-Kubilius, 1989). More specifically, families whoseactivities are
predominantly intellectual and cultural have children with higherintel-
lectual functioning (Cornell, 1984; A. W. Gottfried & A. E. Gottfried,
1984). The importance of academic achievementis stressed along with
a value of working hard, striving for success, and being active and
persevering (Kulieke & Olszewski-Kubilius, 1989). Families of intellec-
tually high-functioning children also experience less conflict in the home
(Cornell, 1984) and report higherlevels of cohesiveness (Cornell, 1984;
A. W. Gottfried & A. E. Gottfried, 1984). More free expression of
thoughts andfeelings is also characteristic of families with higherintel-
lectually functioning children (A. W. Gottfried & A. E. Gottfried, 1984).
Collectively, these prior studies provide a snapshot of the home
environment and family life of gifted children. Clearly, it is the combi-
nation of learning materials, parental involvement, and social atmos-
phere that is associated with high intellectual ability. Indeed, weexpectedto find differences between the gifted and nongifted groupsofchildren in our sample consistent with prior research in the demo-graphic, environmental, and family relationships domains. While oursummaryof the issues included the comparisonof the giftedness statusgroups in these domains, our focus wasonthe early years in develop-ment, before children were identified as gifted or nongifted.
An important question that has been inadequately addressed inthe literature is whether parents are aware of their child’s intellectualpotential and, if so, how early do they recognize that their child isadvancedintellectually? We addressed this question directly becauseitis relevant to the understanding of the process by which some childrenachieve higher intellectual status. Two earlier studies compared theability of parents versus teachersto correctly identify intellectual gifted-ness in kindergarten children. In the first (Jacobs, 1971), parents of
kindergarten children accurately identified 61% of the gifted children,while teachers correctly identified only about 4%. In the second study(Ciha, Harris, Hoffman, & Potter, 1974), parents of 465 kindergarten
children were asked to indicate whetheror not they believed their childto be gifted after they read a list of characteristics associated withgiftedness; teachers were asked to nominate those children they believed

Introduction 29
to be gifted. Again, parents did better than teachers in that they correctlyidentified 76%of the gifted children, whereas teachers correctly identi-fied only 22%. Thefindingsof these two studies question the validity ofteachers’ nominations in the process of identifying gifted children.Based on these data, parents would be moreeffective than teachers inidentifying gifted children, yet teachers have often been used forthispurpose.
Theclues that parents use to evaluatetheir children’s potentialwillhelp us to understand howparents appraise intelligence in their chil-dren. When parents of preschoolers seeking to have their child testedfor giftedness were asked tolist the characteristics in their child thatcaused them to believe their child might be gifted, the item rankednumberone was expressive or productive language, followed by mem-ory, abstract thinking, ahead of peers, curiosity, and receptive or com-prehensive language (Louis & Lewis, 1992). In the Ciha etal. (1974)study, parents of kindergartners reported advanced vocabulary, com-plex verbalizations, and highreadingskills as the discriminatingfactors.The identification of languageskills as one of thecriteria parents use toevaluate their children’s intellectual potential was common to bothstudies. Freeman (1991) noted that the gifted children in her study hadhigher reading, writing, and talkingskills than nongifted children, andthat their mothers were awareof these differences when their childrenwere very young. However, the data from Cihaet al. (1974) and Louisand Lewis (1992) were collected during the preschool and kindergartenyears, and Freeman’s data werecollected retrospectively. In the currentstudy, we measuredparents’beliefs abouttheir children’s developmen-tal status beginning in infancy and continuing through the preschoolyears and thus wereable to address the question of if or when parentswere aware oftheir child’s advancement potential during infancy andpreschool years.
Overall, these findings support the notion that parents recognizetheir child’s potential prior to the time that educatorstest for giftednessstatus, which is typically in the early elementary years. It may thereforefollow that parents respond by providing more stimulating and aca-demically oriented materials and activities to these children. Alter.nately,it is just as reasonable to suspectthat highly functioning childre1make greater demandsontheir parents for stimulating activities andexperiences. In fact, Freeman (1979) concludedthat gifted children needmore from the environmentbecause they havethe ability to take in moreand to use the information more effectively. Perhaps Olszewski et al.(1987) said it best:

30 Chapter 1
The family is an interactive system where children and parents mutuallyinfluence each other. The developmentof talent is a result of the delicateinterweaving of manyarenas such as the family history, the unique charac-teristics or attributes of the child in the family, and family events.... Gifted-ness...is both a dependent and independentvariable, a cause as well as an
effect. (p. 25)
There is substantial evidencethatintellectual giftedness blossomsin homes wherethere is high family involvement,intellectually stimu-lating materials and experiences for the children, and a social atmos-phere fostering intellectual and cultural growth. It was these findingsthat led us to the next logical phase in the study of the environmentalcorrelates of intellectual giftedness: the systematic evaluation of theearly environmental fabric of children who become gifted andnongifted. Specifically, we asked whether the environmental factorsassociated with giftedness are apparent in these children’s early devel-opmental histories, years before they are identified as gifted or
nongifted. Further, we did not rely on retrospect or past memoriesfor
data collection. On the contrary, we gathered informationas the children
developed, having begun ourinvestigation 7 years prior to identifying
the subsampleof gifted children. Thus, the present research on the early
homeand family environmentof gifted and nongifted children repre-sents a major contribution to this bodyofliterature.
A comprehensive and detailed account of the early environment
of children who becomegifted and nongifted is presented. Both direct
observation in the children’s homes and indirect assessment by use of
questionnaires and inventories were included. Theuseof indirect meas-urement allowed us to expand on the environmental information gath-ered at each assessmentby tapping aspects of children’s environmentsand provision of educationally relevant experiences not assessed in thedirect observation methods. In our past research (Bathurst, 1988; A. E.
Gottfried, Bathurst, & A. W. Gottfried, 1994; A. E. Gottfried, A. W.
Gottfried, & Bathurst, 1988; A. W. Gottfried & A. E. Gottfried, 1984), we
found indirect assessmentto be a reliable and valid meansof acquiringinformation about families. Further, we were able to gather environ-
mental data more frequently and include a morevaried set of conceptualmeasures than direct assessment would have allowed. The result was acomprehensiveset of home and family measures gathered at systematicintervals beginningin infancy and continuing throughthe early elemen-tary school years. Our measurementtools included standardized scalesand person-report instruments. This multimethod approach allowed usto contrast and compareresults across the many sources of data and to

Introduction31
determine how the early home environmentdiffers for children whobecomegifted or nongifted. In addition, our longitudinal design, use ofrepeated measures, and frequency with which we conducted assess-ments permitted us to track the environmental and family correlatesacross time, thereby allowing us to study cross-time trends (Horowitz,1987). Thus, there was an ongoing assessmentof a comprehensive arrayof variables, across methods andacrosstime.
In our approachto analyzing the data for Chapter6, we conceptu-alized our variables into three domains: distal (socioeconomicstatus,family structure, and family composition), proximal(detailed measure-ments of the home environment such as the cognitively enriching ma-terials and experiences provided to children), and family relationships(quality of the social atmosphere in the home).
In summary,the present study provides a unique opportunity toinvestigate the relation between home environment and giftedness inthe following ways: (1) onset of data collection from infancy so that theearliest aspects of the environment are measured; (2) ongoing assess-ment of multiple aspects of home and family environment; (3) datacollected prospectively, rather than retrospectively; (4) direct observa-tion as well as indirect assessment of the home; and (5) standardizedhomeinventories that permit researchers to examine comparability andgeneralizability across research programs.
UNIQUENESSOF THE FULLERTON LONGITUDINALSTUDY
The Fullerton Longitudinal Study (henceforth referred to as FLS)provides a unique opportunityfor investigatingissues pertaining to theearly developmental aspectsof gifted IQ for several reasons:
1. Because we have studied children from infancy through theschool-entry years (it is planned to study them through adolescence),we were able to conduct a reversed contingency analysis of systemati-cally collected longitudinaldata. Thisis nota retrospective or retrospec-tive longitudinal study, known to be questionable with respect todevelopmental data (see Featherman, 1980). Neither parents nor chil-dren were questioned about past developmental events. The FullertonLongitudinal Studyis also not based on unscientifically gathered archi-val data. All data were collected contemporaneously, systematically,and are based predominately on objective measures. In the reversed

32 Chapter 1
contingency analysis, the fundamental question is the following: given
gifted or nongifted IQ at school age, what were these groupsof children
like in the past as they advanced in age? However, it is important to
emphasize that reversed contingency analyses do not necessarily lend
themselves to answering questions pertaining to predictability. They are
postdictive and mayberestricted to understanding history or develop-
mental events in the past. Prediction involves a different question than
asked in this book and is based on forward contingency analysis that
does not necessarily have an overlappingset of conditional probabilities
with the reversed contingency analysis (see A. W. Gottfried, 1973).
Certainly the quality and quantity of data contained in the FLS provide
a gold mineof information for the development of predictive models.
However, this was not the task at hand in this book. Here, we present
the early developmental characteristics of children whoachievegifted
IQ scores in middle childhood. As we prospectively study our sample
through time (thus far we have followed them into adolescence), we
intend not only to address further developmental issues and questions,but to propose andtest predictive models. However, the latter task isreserved for our future volumeor publications. Long-term longitudinal
research should afford us this opportunity.2. Our sample comprises a wide range of middle-class families.
Having a range of predominantly middle-class families displaces thedistribution of IQ scores upward, thereby enhancing the probability ofobtaining a larger numberof gifted children than would be expected orfound in the population at large. Additionally, the study sample wasnonclinical and not at risk at the outset of investigation. The infantsrepresented a healthy population.
3. The FLS encompasses a comprehensive array of conceptually
derived measures tapping various developmental domains. The meth-odological framework was designed to obtain continuous and contem-poraneousinformation through the time frameof this study. Measureswere selected based on a preconceived foundation so as to answerquestions andissues addressed in the various research themes runningthrough this extensive longitudinal project. These themes include, forexample, home environment and cognitive development, academic in-trinsic motivation, cognitive and academic correlates of early manuallaterality, temperament, parental employment and children’s develop-ment, and the like (see, e.g., A. E. Gottfried, 1990; A. E. Gottfried,
Bathurst, & A. W. Gottfried, 1994; A. E. Gottfried et al., 1988; A. W.
Gottfried, 1984a; A. W. Gottfried & Bathurst, 1983; Guerin & A. W.
Gottfried, in press-a, in press-b; Guerin, A. W. Gottfried, Oliver, &

Introduction 33
Thomas, 1994; Kee et al., 1991). Moreover, data collection comprisedboth cross-context (laboratory and home) and multiple-person (child,parents, and teachers) assessments. This was included to enhance thelevel of confidence and generalizability of findings.
4. Quite often in research studies on giftedness, subjects are se-lected initially on the basis of teacher nominations and subsequently thesample is tested with psychological and/or educational tests. Based onthis recruitment technique, subjects are then designated as gifted ornongifted. This procedure wascharacteristic of the Terman study andwas subsequentlycriticized (and justifiably so) by Hughes and Con-verse (1962). However, this method of screening for gifted subjectscontinuesin the literature (see, e.g., Heller, 1991; Schofield & Ashman,1987). There are two major problemswithutilizing this procedure.First,factors other than giftedness may enter into the teachers’ nominations,resulting in ascertainment bias. For example, just as researchers havevarious conceptualizations of giftedness, so may teachers. Factors suchas creativity or behavioral functioning may intrude on teachers’ judg-ments as well as the child’s (or possibly the teacher’s) gender. In fact, inthe Munich LongitudinalStudy, Heller (1991) himself reportedthatgirlswereless frequently judged bytheir teachersto bethe bestin intellectualabilities despite the fact that the girls were somewhatsuperior to boysin academic achievement, except for math and physics. Certainly, cul-tural factors could be operating as well when it comes to teacher nomi-nations. The issue of ascertainmentbiasis discussed furtherin this book.Second, if the identification or designation of gifted children occurswithin the school context(e.g., teacher nominationsor testing by schoolpsychologists), there is the possibility that the labeling could have someunknown confoundingeffect on the research. For example,if teachersbelieve certain students are gifted and then nominate them for researchprojects (or enrichmentor special programs), there could be halo effectsor alterations in expectations operating, as well as modifications in thechild’s self-perceptionsor reactions of classmates.If parents have accessto their child’s educational records (which they do) and know orareinformed by teachers that the child has been labeled asgifted, therecould be reactionsof sorts from various family membersas well (Colan-gelo & Brower, 1987). A. Robinson (1985) contends that there are alimited amountof empirical studies on the effects of labeling with thegifted and that conclusionsare difficult to draw. However, she notedthat “labelingcarries with it more than stereotyping:It implies that somesort of differential treatment, or assistance, or adaptation of the educa-tional system is required oncethe child has beenidentified” (p. 103). Our

34 Chapter 1
point is that when designationor labeling of giftedness originates fromor is based on school assessments,there is the risk that the labeling itselfcould alter the child’s educational and family experiences in unknowndirections. In the FLS, the designation of gifted or nongifted was notbased on teacher nominations or school assessments. It was based ontesting in the laboratory. Furthermore, parents or teachers were neverinformed of the group designation and, in the data coding process,subjects were identified by number and not by name. This prevented thetesting staff from having cross-time knowledge of children’s develop-mental status.
5. Throughout the course of investigation, we maintained a highrate of families continuing to participate in the study, thus precludingsample bias resulting from selected attrition factors. Hence, retention ofthe sample was impressively high across the numerousrepeated assess-ments conducted from infancy through the primary school years.
6. The sample size is relatively high given its ratio to the compre-hensiveness of developmental assessments. In designing a longitudinalproject, the investigator must decide on havinga very large sample sizewith less frequent testings and fewer measuresor a relatively smallersample size with more frequent testing periods and a greater numberofmeasures. Because ourinterest is developmental psychology, we optedfor the latter approach. Our sample size is by no means small withrespectto the psychologicalliterature. Moreover, we have an exception-ally intense and comprehensive assessment paradigm so that stabilityand change in child and family development could be studied acrosstime.
7. The nongifted, or comparison, group represents the same cohortfrom whichthe gifted group emerged.It is not a control group that wasconstructed by matching subjects or by random selection. Problems ofcontrol or comparison groupsin ex post facto situations have long beenrecognized in the psychological, sociological, and epidemiologicallit-erature (see Campbell & Stanley, 1963; Chapin, 1955; A. W. Gottfried,
1973; MacMahon & Pugh, 1970; Meehl, 1971). Matching with after-the-
fact behavioral phenomena—for example, construction of a nongiftedor control group to compareto a gifted group after the designation—mayresult in a number of methodologicalself-defeating problems(e.g.,diminution of sample size, decrease of variability, increase in standard
error, and breaking natural covariances such as social class and IQ).
These problems were obviated in our longitudinal project. Thenongifted group was not recruited, matched, randomly selected, or
fabricated by any procedure on the part of the researcher. This investi-

Introduction 35
gation involved the ongoing study of a single cohort from infancyonward withoutany intervention instituted whatsoeverby our researchteam. In the developmental journey through the openingyearsof theirlives, some children becamegifted and others emergedas nongifted inmiddle childhood (age 8 years). Hence, the gifted and nongifted orcomparison groups emanated from the same cohort selected at onetemporalpoint and followed acrosstime.This is a unique and importantmethodological asset in studying the early developmentalaspects ofchildren wholater perform atthe gifted or nongifted level.

2
Description of the FullertonLongitudinal Study
SUBJECTS
The Fullerton Longitudinal Study (FLS) was launchedinthefall of 1979.
One hundredthirty 1-year-old children andtheir families were recruitedfrom birth notifications of hospitals surrounding California StateUniversity, Fullerton. All children were born between September andDecember 1978. The criteria used in the selection process were thatinfants were free of visual and neurological abnormalities (A. W.Gottfried & Gilman, 1983), and that all infants were full term and of
normal birth weight. All families spoke English. At the onset of thestudy, the sample comprised 52% males and 48% females. With respectto race, 117 were white, 7 Chicano, 1 Asian, 1 East Indian, 1 Hawaiian,
1 Iranian, and 2 interracial. Most (53%) of the children werefirstborn;
31%of the children were second born; 16%were third or later born. Thefamilies represented a wide range of middle-class socioeconomicstatusas measured by the Hollingshead Four Factor Index of Social Status (M= 45.6, SD = 11.7), Revised Duncan Socioeconomic Index (M = 46.5, SD
= 20.5), and Siegel Prestige Scores (M = 47.9, SD = 14.2). The age ofparents averaged approximately 30 years (mothers: M = 28.6, SD = 4.2;fathers: M = 31.5, SD = 5.1). At the onset, all mothers but three (2%) had
completed high school; 30% had high school degrees with no furtherformal education; 38% had some college; 30% had college or higherdegrees. All fathers but three (2%) had completed high school; 22% had
37

38 Chapter 2
no education past high school; 30% had somecollege; 46% had collegeor higher degrees. Whereas 64% of mothers were unemployed,all of thefathers were employed. All fathers but one were employed full-time,whereas26 of the 47 (55%) working mothers were employedfull-time.At the onset of the study,all biological parents except for nine weremarried.
Throughout the course of investigation and numerous develop-mental assessments, subject return rates remained high: 99%(128), 95%(123), 94%(122), 92%(119), 91%(118), 85% (111), 81% (105), 82% (106),and 82%(107) returned at the 1.5-, 2-, 2.5-, 3-, 3.5-, 5-, 6-, 7-, and 8-yearassessments, respectively. Analyses comparing the early data of chil-dren continuing in the study to those not continuing have yielded noevidenceof selective attrition (A. W. Gottfried, Guerin, & Bathurst, 1989;Guerin & A. W. Gottfried, in press-a, in press-b).
A description of the sample characteristics at age 8 yearsis pre-sented in Table 2.1. At age 8, the sample comprised 107 children; 58%boys and 42%girls; 92% white and 8% other ethnic groups such asChicano, Asian, East Indian, Hawaiian, and Iranian; and 51%firstborns, 33% second borns, and 16%third or later borns. The familiesrepresented a wide range of middle-class socioeconomic status asmeasured by the Hollingshead Four Factor Index of SocioeconomicStatus (SES) (A. W. Gottfried, 1985; Hollingshead, 1975). Other majorSES indicators corroborated this appraisal. These included the RevisedDuncan Socioeconomic Index (Stevens & Featherman, 1981) and theSiegel Prestige Scores (Hauser & Featherman, 1977). At the 8-yearassessment, mothers averaged 36.1 years of age and fathers averaged38.8 years of age. By the 8-year assessment, all parents, with the ex-ception of three fathers, had graduated from high school with themajority having completed some college. There was a minorincreasein parents’ educational achievements by the time the children reachedage 8 years. For both mothers and fathers, there was a wide range ofoccupations from semiskilled workers to professionals. Typically, fa-thers were continuously employed. However, mothers showed a dra-matic increase in employment status from 36.2% whenthe childrenwere age 1 year to 71.9% whenthe children were age 8 years. At age8 years, 87% of mothers were married; however, between the ages of1 and 8 years, 20%of the children had experienced the divorce of theirbiological parents. The majority of families had two children (58%)and two parents (88%) living in the home,either biological or steppar-ents, when the children wereage8.

Description of the Fullerton Longitudinal Study
Table 2.1. Demographic Characteristics of FLS Sample at Age 8 Years
Variable Mean(SD)or frequency”
SexMale 62Female 45
EthnicityWhite 98
Other 9
Birth orderFirstborn 55
Second born 35Third or later born 17
SESHollingshead Four Factor Index of 49.8 (9.1)
Social StatusMothers’ education 14.5 (2.0)
Below high school 0High school-nocollege 29
Somecollege 38College graduate-no postgraduate 24Postgraduate 16
Fathers’ educationBelow high school 3High school-nocollege 14
Somecollege 32College graduate-no postgraduate 29
Postgraduate 28
Mothers’ employment statusEmployed 77
Unemployed 30Fathers’ employmentstatus
Employed 97
Unemployed 3
Marital status of motherMarried 93
Living together, unmarried 1Separated 1Divorced 12
Numberof children in home1 14
2 623 or more 31
Numberof adults in home1 10
2 87
3 or more 10
“In cases where the numberof subjects does not total 107, data were missing.

40 Chapter 2
MEASURES AND PROCEDURES
Table 2.2 displays a summaryof the measures used and ages whenthey were administered. Well-known standardized scales and invento-ries were used wheneveravailable. In someinstances (e.g., home andfamily assessment), we developed our own instruments in order tocapture a more comprehensivepicture of the children’s environment.Details of the measures employed throughoutthis developmental studyare described in the chapters.
The schedule for the FLS developmental assessments wasas fol-lows. Beginning at age 1 year, children were tested in the laboratoryevery 6 months until they reached 3.5 years of age. Thereafter, childrenwere tested yearly in the laboratoryat ages 5, 6, 7, and 8 years. Labora-tory visits averaged 1.5 to 2.0 hoursin length and consistedof a batteryof individually administered tests given to the children. Parents com-pleted surveys and questionnaires during the laboratoryvisit. All testswere administered to the children in the same sequenceto avoid errorvariance dueto potential test order effects. Homevisits were conductedwhenthe children were 15 months (1.25 years), 39 months (3.25 years),and 8 years of age. Home assessments lasted a minimum of one hour.
Table 2.2. Summary of Measures Utilized in the Fullerton Longitudinal Studyfrom Ages 1 through 8 Years
Age(s)Measure administered”
Cognitive measures
e Bayley Scales of Infant Development 1,1.5, 2e McCarthy Scales of Children’s Abilities 2.5, 3, 3.5
e Kaufman Assessment Battery for Children 5e Wechsler Intelligence Scale for Children-Revised 6, 7,8¢ Wechsler AdultIntelligence Scale Vocabulary & Block Design subtests 3°e Test of Early Language Development 3.25e Corman & Escalona Object PermanenceScale 1,1.5e Recognition Memory(visual, tactile, and cross-modal) 1, 1.5, 2, 2.5,3
Developmental inventories and rating scales
e Parent/Child Rating Scale 1, 1.5, 2, 2.5, 3e Bayley Behavior Record 1.5, 2, 2.5,3,
3.5, 5, 6

Description of the Fullerton Longitudinal Study
Table 2.2. (continued)
41
Minnesota Child Development Inventory
Minnesota Preschool Inventory
Educational achievement and motivation measures
Kaufman AssessmentBattery for Children Achievement Scale
Wide Range Achievement Test-Revised
Woodcock-Johnson Psycho-Educational Battery
Educational History Questionnaire
Young Children’s Academic Intrinsic Motivation Inventory
Academic Anxiety and Perception of Competence Inventories
Temperament inventories
Infant Characteristics Questionnaire
Toddler TemperamentScale
Colorado Child TemperamentInventory
Behavior Style Questionnaire
Middle Childhood Temperament Questionnaire
Child behavior checklists
Eyberg Child Behavior Inventory
Preschool Behavior Questionnaire
Child Behavior Checklist-parent version
Child Behavior Checklist-teacher version
Social functioning inventories
Preschool Interpersonal Problem-Solving Scale
Vineland Adaptive Behavior Scales
Homeand family environment inventories
Hollingshead Four Factor Index of Social Status
Social History Questionnaire
HomeObservation and Measurement of the Environment
Purdue Home Stimulation Inventory
Variety of Experiences Checklist
Home Environment Survey
Child’s Requests for Activities
Family EnvironmentScale
Family Inventory
“Age reported in years; months converted to decimals.Administered to mothers at the 3-year assessment.
7,8
5,7,8
7,8
7,8
1.5
3.5
3, 3.5, 5
3.25
3.5
4,5,6,7,8
6,7,8
3.5
5, 8
1, 1.5, 2, 2.5,
3, 3.5, 4, 5,6,7,8
1, 1.5, 2, 2.5, 3,
3.5, 5, 6, 7,8
1.25, 3.25, 8
1.25
3,95
5,7,8
8
3,5,7,8
8

42 Chapter 2
Information from children’s teachers was collected when children were6, 7, and 8 years of age. Parents gave forms to teachers to complete;teachers returned completed formsdirectly to the laboratory via mail.An additional assessment was conducted at age 4 years for the ChildBehavior Checklist-parent version, because at that age this inventorybecomesage appropriate.At this time, the forms were mailed to parents.The Child Behavior Checklist was also administered at each subsequentlaboratory assessment.
DESIGNATION OF GIFTEDNESS
The IQ score obtained with the Wechsler Intelligence Scale forChildren-Revised (WISC-R)at the 8-year assessment wasusedto createthe gifted and nongifted groups. There were many reasons for ourselection of IQ. Giftedness is defined by Gagne (1985) as being aboveaveragein ability, with intellectual ability being one of the areas. His-torically, IQ has been used as a measureofintellectual ability (Pendarviset al., 1990). We needed an index that would provide a reliable, valid,and relatively stable measure by whichto delineate contrasting groupsfor research purposes. Although we recognize the emergence of newmeasures of cognition to assess intelligence, a criticism of the newmethodsis that they lack the psychometric criteria of reliability andvalidity (Reschly & Wilson, 1990). It was our view that IQ provided areliable andvalid operationaldefinition of intellectual performance. Theavailability of a longitudinal history of children’s intellectual abilityfrom infancy through childhood using standardized measures provideda unique opportunity to examine the developmental characteristics ofIQ in our sample acrossthe years.
Aside from its availability in our research program, IQ continuesto be used pervasively in schools as onecriterion for the assessmentofgiftedness (Klausmeier, Mishra, & Maker, 1987; Pendarvis etal., 1990).A score two standarddeviations above the meanhas beentypically usedto define giftedness (Pendarvis et al., 1990). In the Wechsler manuals(Wechsler, 1974, 1991), scores of 130 and aboveareclassified as “verysuperior.” IQ has had
a
history of strong relationshipsto othercriteria,such as achievement, and often serves as an indication of academicability (Pendarvis et al., 1990). Further, the Gifted and Talented Chil-dren’s Education Act of 1978 (PL95-561) defines one aspect ofgiftednessas intellectualability.

Description of the Fullerton Longitudinal Study 43
High psychometric scores, typically using a cutoff at two standarddeviations above the mean,are used extensively in the researchlitera-ture to identify intellectually gifted groups. If another form of talent isbeing studied, the strategy is typically the same, and scoresarecutoffat approximately two standard deviations above the mean on whateverparticular test is used in the research (e.g., Benbow & Arjmand,1990).Hence, ouruse of IQ provides a method consistent with otherliteratureon the gifted and allows for further generalizability to a longitudinalstudy of young children.
Weused a Full Scale IQ score of 130 from the WISC-Rasthe cutoff
value for designating a child as gifted. Of the 107 children tested at age 8years, 20 placed in the gifted range and 87 did not. It was the comparisonof these two giftedness status groups that was the focus of this researchproject. The average IQ for the 20 gifted children was 137.8 (SD =5.6) withscores ranging from 130 to 145. The average IQ scorefor the 87 nongiftedchildren was110.9 (SD = 10.2) with scores ranging from 84 to 128.
Four children in the nongifted group had IQ scores within onestandard error of measurement(3.19 IQ points [Wechsler, 1974]) of the
cutoff value of 130, that is, IOs between 127 and 129. In order to evaluate
the potential misclassification of these children, we examinedtheir 6-
and 7-year WISC-R Full Scale IQ scores. Three of the four did not obtainan IQ in the gifted range at ages 6 and 7 years. One child had a gifted IQat age 7, but not at age 6. We deemedthese fourchildrenasintellectuallynongifted. In summary, we believe our overall error rate in groupassignment was minimal, and we had a high degree of confidence in theintegrity of the gifted versus nongifted status group designation.
The WISC-R was chosen to assess IQ in our research project be-causeit is a majorintelligence test that has been used extensively in thefields of psychology and education. Moreover,it is widely used in bothresearch and applied settings. This test has well-established psychomet-ric properties such as knownprobability distributions, reliability, andvalidity. The age of 8 years wasselected as the designation year becauseof the predictive value of the test scores at that age to the subsequentschool years (Brody, 1992; McCall, 1977).
DATA ANALYTIC STRATEGY
The focus of this book is the comparison of gifted and nongiftedchildren from infancy throughthe early elementary years across a broad

44 Chapter 2
array of developmental domains and the home and family environment.Given the enormousbodyof data resulting from 10 assessment periodson the numerousvariables across these areas, it was necessary to de-velop a strategy to guide the analysesof data and presentationofresults.In the following sections, we explain our conceptualization of the dataanalyses andstatistical issues pertinent to these longitudinal data andpresentour general analytic/tactical strategy. The importance of havinga data analytic strategy has been recently discussed by Cronbach (1991).
Data Analysis
Theprinciples guiding our analyses were simplicity, interpretabil-ity, and power. We used the most powerful analysis that was appropri-ate and interpretable for each group comparison. Weopted for higherTypeIerrors(i.e., failing to find statistical differences when the popu-lations do in fact differ) and lower Type I errors(i.e., findingstatisticaldifferences when they do notexist in the population). Theresult of thisapproach wasthat if we weretoerr, it would be on theside of conser-vativeness. A variety of descriptive and inferential statistics were used.Unless otherwise noted, the level of confidence (alpha) wassetat .05 forall analyses. The analysesfell into the five categories described below.
Single Measure, Single Time
In the first category, the most simple case, analyses involvedcomparing gifted and nongifted groups on a single dependentvariablemeasured at a single point in time. Independent groupsf tests, chi-Square analyses, and proportions tests were used as appropriate to thescale of measurement. For example, an independent groupst test wasused to compare the gifted and nongifted groups on the Test of EarlyLanguage Development overall score (an interval scale), which wasadministered only once at the age of 3.25 years. The assumption ofhomogeneity of variance wasevaluatedfor each f test with alphasetat.O1. In the few cases wherethis assumption was violated, the morestringent separate variance estimate was utilized andthestatistics arereportedfor the adjusted degrees of freedom. When noviolation existed,the pooled variance estimate was used. If the data were extremelyskewed causing
a
serious violation of the assumption of normality, asin the distribution of behavior problems, a nonparametricstatistical test(Mann-Whitney U) wassubstituted for the more common parametrictest (f test). For frequency data, chi-square tests were employed. When

Description of the Fullerton Longitudinal Study 45
contingencytables were larger than 2 x 2, we used Pearson's chi-squarestatistic. For 2 x 2 tables, we used the Yates correction for continuity.Proportions tests involved calculating z scores for the difference be-tween proportions and determining the probability of obtaining such ascore using normal curve probabilities.
Same Measure Repeated over Time
The second category of analyses involved comparing the twogroups on repeated measuresof the same variable. For example,intel-lectual status was measuredat each of the 10 assessment periods. Toanalyze data conformingto this structure, we used repeated-measuresANOVA.In each analysis, we examined theinteraction of GiftednessStatus x Age. With one exception, as reported in Chapter3, none of theinteractions were significant. Therefore, these nonsignificant interactionresults are not reported in the chapters. The only instance when theinteraction wassignificant wasin the analysis of Giftedness Status x Agewith intelligence as the dependent variable (see Chapter 3). Followingthe significant interaction, we computed independentgroupsf tests ateach pointin time, correcting for the familywiseerrorrate of .05 by usingHolm’s sequential Bonferroni procedure as described by Seaman,Levin,and Serlin (1991) and Seaman (personal communication,July 13, 1992).
In this procedure, the pairs of meansare ordered hierarchically from thelargest to the smallest difference. The alpha level (.05 in all cases) isdivided by the numberof tests to be conducted.Thefirst test is carriedout with the adjusted alpha. The second and subsequenttests are con-ducted with the numberof tests minus1, 2, and so on until nonsignifi-cance is reached. At that point, no further tests are conducted. Forexample,if there are 10 comparisons to be made,the first is conductedwith alpha equal to .00500, the second with alpha equal to .00556, thethird with alpha equalto .00625, and so forth. This procedure providesa compromise betweenthe conservative and liberal approachesto posthoc testing. Finally, because the main effect of age was not inherently of
interest, these results are not reported either.
Multiple Measures, Single Time
The third category involved comparing the gifted and nongiftedgroups on multiple dependentvariables that were assessed at only onepoint in time, such as with the subscales of the Kaufman Assessment
Battery for Children.In this test, there are two cognitive indexes: Simul-

46 Chapter2
taneousProcessing and Sequential Processing. A more powerfultest canbe conducted by simultaneously comparing the groups across bothdependentvariables. Data such as these were analyzed using a one-wayMANOVA.Followinga significant multivariate F statistic, univariate Ftests were examined, correcting for familywise Type I error rate asdescribed above. Multivariate F statistics are reported in the text; uni-variate F statistics are reported in tables.
Multiple Measures Repeated over Time
The fourth category involved comparing the two groups on mul-tiple dependentvariables that were collected over multiple assessmentperiods. For example, WISC-R Verbal IQ and Performance IQ weremeasured at three different ages. Doubly multivariate data, thatis,multiple dependent variables measured two or more times, were ana-lyzed with a repeated-measures MANOVA.Asin the prior case, a morepowerful test of the hypotheses of interest can be achieved when com-bining dependentvariables. If the multivariate F was significant, theunivariate Fs for each of the dependent variables were evaluated forSignificance. The p value was adjusted using Holm’s sequential Bonfer-roni procedure described previously. Interactions between giftednessstatus and age were examined; however, none were significant and,hence, are not reported. As previously noted, the maineffectof age wasnot of interest; therefore, these statistics are not reported either. Again,multivariate Fs are presented in the text; univariate Fs are presented intables.
Planned Comparisons
Thefinal category comprised planned comparisons.In cases whereprior research governedthedirection of expected differences, one-tailedi tests were conducted. For example, specific scales of the Home Obser-vation and Measurement of the Environment inventory have beenshownto positively correlate with cognitive ability; hence, gifted chil-dren were predicted to have higher scores than nongifted children oncertain scales. The benefit of conducting planned comparisonsis theincrease in powerwhile holding familywise TypeI errorratesat accept-able levels. For a complete discussion, see Maxwell and Delaney (1990)and Toothaker(1991).

Description of the Fullerton Longitudinal Study 47
Statistical Issues
Size of Sample
The size of the FLS sample comprising the gifted and nongiftedgroups was107. Thus, the sample size was large enough to support theuse of multivariate statistics when appropriate. We were confidentthatthe sample size wassufficient to reject a false null hypothesis, therebyproviding adequate powertostatistically detect reliable differencesbetween the groups.
Relative and Absolute Group Size
Gifted IQ (i-e., IQ 2 130) is found in the top 2.28%of a theoreticallynormal random distribution. Therefore, we expected the sizes of thegifted and nongifted groups to differ considerably. Moreover, becausegiftednessis found in higher proportions in the middle- and upper-mid-dle-class segments of the population, we anticipated that a greaternumberof children in our sample would beidentified as gifted thanfound in the population at large. As indicated above, the sample at 8years comprised 20 gifted and 87 nongifted children. Because of theinequality in group sizes, we evaluated the effect that unequal groupsizes would have on inferential statistics. Several analyses were con-ducted in BMDP 2V (Dixon, 1992), which has the capability to adjust theanalyses for groupsize. In no case were the results of the unadjustedanalyses different from the results of the adjusted analyses. Therefore,we concluded this was a minor concern with respect to planned com-parisons and repeated-measures ANOVA(Tabachnick & Fidell, 1989).In somecases, however, a numberof our analyses required MANOVAs,
and the small n in the gifted group wasanissue becauseit is necessaryto have more cases than dependentvariables in every cell (Tabachnick& Fidell, 1989) or risk low powerand untestable hypotheses. This smalln impactedanalyses involving a large numberof subscales. For example,there are 10 WISC-R subscales that were measured at three points intime. This resulted in 30 dependentvariables in the MANOVA,but only20 subjects in gifted-groupcells. Our solution was to run subsets of theWISC-R subscales separately; that is, we analyzed the five verbal andfive performance subscales separately at each age. This resulted in fivedependentvariables for each analysis, which wasan acceptable number.This analytic strategy was used whenever necessary due to groupsizerestrictions.

48 Chapter 2
The absolute size of the gifted group (n = 20) precluded anymeaningfultest of hypotheses regarding sex differences. There was nota sufficient numberof subjects to further divide the group by sex andstill adhere to the analytic strategy developed for this book. Further-more, we would have been concerned aboutthereliability of the find-ings with such small cell sizes. Therefore, sex differences were notexamined.
Missing Data and Missing Subjects
Occasionally, a child was unable to complete an assessment(Bathurst & A. W. Gottfried, 1987a) or missed an assessment. Conse-quently, there are varying Ns across measures. This is not uncommon inlongitudinal research. Ourstrategy for dealing with missing data wasto utilize the listwise option onallstatistical analyses. Missing data werenot estimated or replaced. The 1 is shown oneachtable or reported inthe text for each analysis.
Outliers
Extreme values can be a serious problem in hypothesistestingwhether using univariate or multivariate tests (Tabachnick & Fidell,1989). Our data were thoroughly screened and examined for both uni-variate and multivariate outliers. We found few. Becauseoftherarity ofoutliers, we concludedthat they did not impact our analyses, and hence,no adjustments were madeto the data.
Number ofMeasures and Type I Error Rates
Given the comprehensiveness of each assessment and the numberof times the children were evaluated, the number of variables to beanalyzed was very large. We realized the risk of Type I error(ice.,erroneously detecting differences in the sample that are not reflected inthe population) would beelevated if not controlled. To reducethis risk,wecarefully considered each research question and evaluated the mostappropriate method by whichto analyze the data. Our primary guidewas provided by Hertzog and Rovine (1985) and the decision tree theypresented for repeated-measures designs. For example, when we had apriort hypotheses, we conducted planned comparisons. When wehadmultiple dependent variables, we conducted multivariate tests, fol-lowed by post hoc procedures that would maintain an acceptable fa-

Description of the Fullerton Longitudinal Study 49
milywise error rate, that is, Holm’s sequential Bonferroni procedure(Games, 1990; Seamanetal., 1991; Toothaker, 1991).
Repeated Measures
Given the longitudinal nature and goals of this unique study,we had several measures that were repeatedly administered overtime. For example, intelligence and demographic data werecollectedat each assessment. The cross-time data were therefore not neces-
sarily independent, but were likely to be correlated instead. This
condition results in a mixed model with one between factor (Gift-edness Status) and one within factor (Age). Sphericity (or circularity)is assumed amongthe repeated measures.It is highly likely, however,
that the correlations between ages close in time are greater thanthose moredistant. (For example, IQ at 8 years of age is more highlycorrelated with IQ at 7 years of age than with IQ at 6 years of age.)Because violations of homogeneity of covariance such as that de-scribed inflate the Type I error rate, a viable alternative is to adjustthe degrees of freedom for the hypotheses tests by employing Huynh-Feldt or Greenhouse-Geisser estimating procedures (Games, 1990;Hertzog & Rovine, 1985; O’Brien & Kaiser, 1985). An index of sphe-
ricity—epsilon—is computed andthe degreesof freedom of the mean
square ratios are adjusted accordingly. We tested for violations ofthe symmetry assumption and adopted the following guidelines for
values of epsilon (Hertzog & Rovine, 1985): (1) epsilon 2 .90: trivialor no violation; mixed-model F test was used (Hotelling’s T°); (2)
epsilon > .50 < .90: violations exist; adjusted degrees of freedom testwas used (Huynh-Feldt or Greenhouse-Geisser). There were no cases
where epsilon was less than .50.
A related concern with the use of repeated measuresis the timeinterval between assessments (Hertzog & Rovine, 1985). In ourlongitu-
dinal design, the amountof time between consecutive measurementsofa given construct varied. For example, intelligence was assessed athalf-year intervals from 1 through 3.5 years and at 1-year intervalsbeginningat 5 years of age. To address the issue of unequal assessmentintervals, we conducted several analyses using BMDP2V (Dixon, 1992),
whichallowsspecification of unequal spacing. We comparedthe resultsadjusting for unequal intervals with those not adjusted. In all cases,differences were negligible, and in no case were conclusionsaltered.

50 Chapter 2
Conceptually Similar Measures
The question of howto treat conceptually similar measures(e.g.,intelligence) that were assessed across the 7-year span using differentinstruments due to developmental appropriateness presented a chal-lenging dilemmathat has been heretofore unaddressedin theliterature.The constructofintelligence provides an excellent exampleof this issue.Specifically, should we treat the Mental Development Index of theBayley, the General Cognitive Index of the McCarthy, the Mental Proc-essing Composite of the KABC, and the Full Scale IQ of the WISC-R asthe same construct and therefore analyze them as repeated measures?Alternatively, should each scale be treated as a conceptually differentconstruct and therefore analyzed separately? Similar concerns wereraised for other variables such as achievement, temperament, and homeenvironment measures. We adopted the following strategy. In caseswherethere was standardizedscale available with a known populationvariance and a common metric, we opted for treating the measures as
repeated (e.g., intelligence). If we were operating without a knownpopulation variance(e.g., home environment measures), each scale was
analyzed separately or converted to a common metric(i.e., z scores).
Statistical Controlling of Variables
Wepondered the issue of whetherto control for certain variables.For example, socioeconomic status (SES) is a common measurethatis
expected to covary with other variables such asintelligence and homeenvironment. Often, researchers choose to control for SES when groupsare comparedbypartialling out variance accountedforbythis variable.However, covariate analyses are inappropriate when groups are notrandomly assigned (Overall & Woodward, 1977), as is the case in thepresent research. Moreover, we are working with naturally occurringcovariances. That is, giftedness occurs more frequently in higher-SESgroups. We would be disrupting what occurs naturally if we usedstatistical controls that, in turn, may spuriously alter our findings and
affect generalizability of our conclusions. Our approach wasto allow thevariables to naturally covary andnotto institute statistical controls.

3
Intellectual and CognitiveFunctioning
ISSUES
In this chapter, we addressthe intellectual and cognitive differences thatemerge in the course of early development of children who becomeintellectually gifted or nongifted. Several central issues and questionswere examined:
1. If differences exist during infancy or the preschool periodsbetween the designated groups, when dothese differences emerge, anddo the differences maintain continuity thereafter? If differences arepresent during infancy, are they found on psychometric and/orPiagetian-type sensorimotorscales, on measuresof recognition memory(i.e., visual, tactual, and cross-modal), or in language development(receptive and expressiveskills)?
2. Is there a characteristic developmental pattern for children whobecomegifted; that is, do the children who becomegifted have commonontogenetic age changesin intellectual performance, or are the cross-time or age-related changes individual?
3. During infancy and the preschool period, are there signs orindicators of potential intellectual giftedness that may serveto identifythose children wholater exhibit gifted IQs during the early school years?
4. Do differences in the summary IQ scores reflect differencesacross the various specific cognitive domains as well? In other words,
the issue of globality versus specificity of intellectual giftedness in thecourse of developmentis addressed.
51

52 Chapter3
5. Despite relative differences in the level of intellectual perform-ance between gifted and nongifted children, are there differential pat-terns or profiles of cognitive abilities between the groups during thepreschool and schoolentry years? Is there a pattern of cognitive abilitiescharacteristic of intellectually gifted children? This pertains to a patternnot across the ages butat a given ageor period.
6. The final issue addresses how cognizant parents are of differ-ences in the developmentof children who becomegifted or nongifted.Additionally, if differences are recognized by parents, how early arethese differences recognized and in what specific developmental do-mains? As noted in Chapter 1, the literature comprising retrospectiveanecdotal reports of parents of gifted children suggests that such chil-dren are advanced, particularly in language skills, during the earlyyears. In the courseof investigation, we gathered ongoing contempora-neous information, not retrospective reports, from each parent on how
they perceivedtheir child’s development comparedto others of the sameage across variousskills.
DESCRIPTION OF MEASURES
During infancy, preschool, and the early elementary schoolyears,intelligence tests were administered. A variety of assessments apprais-ing cognitive functioning in infants were employed. Twotypesof intel-lectual measures were administered during infancy: psychometric andPiagetian-type scales. Infants were tested on the Mental scale of theBayley Scales of Infant Development(Bayley, 1969) at 1, 1.5, and 2 years.The Bayley was selected primarily because it is the most extensivelystandardized and researched psychometric assessmentof sensorimotorintelligence. The Mental Development Index (MDI) was used in all
analyses. At 1 and 1.5 years, object permanence wasassessed using theCorman and Escalona (1969) Piagetian scale. Object permanence wasassessed because, according to Piaget (1954), it represents the basis ofepistemological construction and the most important accomplishmentduring the sensorimotor period. The scale yields a single score indicat-ing the highest level passed in the object permanenceordinal progres-sion.
In addition to the Bayley and object permanence, more contempo-raneous assessments deriving from the experimental literature wereincorporated into the cognitive test battery. Measures of recognition

Intellectual and Cognitive Functioning 53
memory of objects’ shapes, both within and across the visual andsomesthetic(i.e., tactual) sensory modalities, were based on the paired-comparison technique. The recognition memorytasks included tactual-visual cross-modal, visual intramodal, and tactual intramodalprocedures, which were administered at 1, 1.5, 2, 2.5, and 3 years. Theassessment relies on infants’ differential responsiveness to novel andfamiliar stimuli. Evidence of memory is indexed by a differential pref-erence that significantly departs from chance expectation (i.e., 50%).Beyond 2.5-3 monthsof age, infants reveal a proclivity to respond tonovel over familiar stimuli (Rose, A. W. Gottfried, Melloy-Carminar, &
Bridger, 1982). The actual procedure involves twostages: a familiariza-tion period and a subsequent recognition test phase. In the former, theinfant is familiarized (either visually or tactually) for an accumulatedtemporal period of designated length. Various time intervals were em-ployed. However, the familiarizations were reduced with age becauseof the rapidity of information processing as infants and youngchildrenadvancein chronological age. During the test phase, both the novel andfamiliar stimuli are presented simultaneously and the infants’ visual ortactual responses are recorded. The researcher recording the behaviorduring the test phase has no knowledge of which object is familiar ornovel so as to prevent any biasing. The stimuli used were designed byA. W. Gottfried and employed in several published studies by A. W.Gottfried and Rose. They are typically based on the dimensionality ofopen-closed and/orlinear-curvilinear types. In the present investiga-tion, a composite score based on the novelty percentages for each taskwas derived and usedin the analyses(results remain invariant whetherarcsine transformations on the novelty percentages are employed ornot). The paradigm usedto assess these recognition memoryskills hasbeen well documented in the developmental literature. (For furtherdiscussionof the cross-modal and intramodal recognition memorytech-nology and the developmental issues upon whichit is based, as well asphotographs of stimuli used in experiments, see Brown & A. W.Gottfried, 1986; A. W. Gottfried et al., 1989; A. W. Gottfried & Rose, 1980;A. W. Gottfried, Rose, & Bridger, 1977; Rose, Gottfried, & Bridger, 1983;Roseet al., 1982; Rose & Ruff, 1987.)
A direct appraisal of language skills was conducted during theinfancy period. A separate scale or measure was not employed. Theassessment of receptive and expressive language development wasachieved by analyzing the language items on the Bayley at ages 1, 1.5,and 2 years. Language items administered at each assessment wereextracted and categorized into the receptive or expressive domains. This

54 Chapter3
was a conceptual and not an empirical analysis (e.g., factor analysis).These two domains were selected because they (1) have long beenconsidered to represent theoretically important and distinct languageabilities (Huttenlocher, 1974; Nelson, 1973); (2) are easy to assess, iden-
tify, and distinguish; and (3) are also included in the Test of Early
Language Developmentand the Minnesota Child Development Inven-tory, both of which were usedin this longitudinal investigation duringthe preschool years (see below), thereby permitting us to explorewhether differences were present during the early years between thosechildren who becamegifted or nongifted. Lastly, it is obvious and wellestablished that receptive abilities emerge before expressive or produc-tion skills (Bates, O’Connell, & Shore, 1987). However, because evidence
shows that word comprehension begins around 9 or 10 months withconsiderablevariability thereafter in the rate at which receptive vocabu-laries expand (Bates et al., 1987), and because a major transition ininfants’ language comprehensionskills occurs between 9 and 17 monthsof age (Oviatt, 1980), we were able to determine whetherthe gifted group
wasadvanced comparedto the nongifted groupin this specific cognitiveability during this early period of language development. As noted, theinitial assessment wasat 1 year of age. For purposeof presentation, theexact items and their placementwithin the particular language categorywill be displayed in the results section.
During the preschool period, children were administered theMcCarthyScales of Children’s Abilities (McCarthy, 1972). This test wasselected becauseit is a well-known assessment of cognitive or intellec-tual functioning during the preschool years that provides informationon separate abilities relevant to success at school entry (A. S. Kaufman& N. L. Kaufman, 1977; Massoth, 1985; Massoth & Levenson, 1982).
Additionally, the separate abilities allowed us to determinethe level ofachievement within each area as well as examinedifferential patternsacrossabilities between the gifted and nongifted groups. The McCarthywas administered at 2.5, 3, and 3.5 years and comprises six indexes:Verbal, Quantitative, Perceptual-Performance, Memory, Motor, and a
General Cognitive Index (GCI) based on a summation ofthefirst three
indexes. The Test of Early Language Development (TELD) (Hresko,
Reid, & Hammill, 1981) was givento the children at the 3.25-year homeassessment. The TELD assesses various aspects of language develop-ment relating to expressive and receptive form and content. Thetotalnumberof items passed on the scale sequence was employedfor analy-ses as well as performance in the overall receptive and expressivelanguage domains.

Intellectual and Cognitive Functioning 55
At age 5 years, children were tested on the Kaufman Assessment
Battery for Children (KABC) (A. S. Kaufman & N. L. Kaufman, 1983).
The test yields several indexes: Simultaneous Processing, SequentialProcessing, and a Mental Processing Composite Score (MPS) based onthese two indexes. Additionally, there are nonverbal and achievement
indexes; results involving the latter will be addressed in the chapter onschoolfunctioning. At ages 6, 7, and 8 years, children were administeredthe Wechsler Intelligence Scale for Children-Revised (WISC-R) (Wech-sler, 1974). This well-knowntestof intellectual performance comprises
10 subtests resulting in Verbal and Performance IQs, and a Full Scale IQ
score.
Concurrent with direct psychological assessments, parents com-pleted rating scales and inventories from infancy through schoolentry.At ages1, 1.5, 2, 2.5, 3, and 3.5 years, mothersrated their children in theareas of intellectual, verbal, social, and motor development. Eachmotherrated her child’s development comparedto other children of thesame age ona Likert scale ranging from 1 (“below average”) to5 (“above
average”) in each of the developmental domains. Mothersfilled out theMinnesota Child Development Inventory (MCDI) (Ireton & Thwing,1972-1974) at age 2.5 years and the Minnesota Preschool Inventory(MPI) (Ireton & Thwing, 1979) at age 5 years. These scales have provento be valid measuresof children’s current and predictive developmentalStatus in this longitudinal study (A. W. Gottfried, Guerin, Spencer, &Meyer, 1983, 1984; Guerin & A. W. Gottfried, 1987). A numberof studieshave provided data supporting the screening efficiency of the Minne-sota inventories in both nonclinical and clinical or at-risk populations(e.g., Bryne, Backman, & Smith, 1986; Colligan, 1976, 1977; Dean &Steffen, 1984; Eisert, Spector, Shankaran, Faigenbaum, & Szego, 1980;Garrity & Servos, 1978; Ireton & Thwing, 1979; Ireton, Thwing, & Cur-rier, 1977; Saylor & Brandt, 1986; Shoemaker, Saylor, & Erickson, 1993;Sturner, Funk, Thomas, & Green, 1982; Ullman & Kausch, 1979). Hence,there is considerable evidence that the MCDI and MPIare sensitivestandardized parent report measuresof variation in children’s develop-ment. However, their effectiveness in discerning children whoare de-velopmentally advanced or gifted from those who are not has neverbeen empirically tested. The MCDI comprises 320 empirically derivedage-related items describing children’s development. The items aregroupedto form eight developmental scales: Gross Motor, Fine Motor,Expressive Language, Comprehension-Conceptual(receptive languageskills), Situation Comprehension,Self Help, Personal Social, and a Gen-eral Developmentscale that is composed of the most discriminating

56 Chapter3
items from the seven other scales. The MPI consists of 150 items assess-ing seven developmental areas: Self Help, Fine Motor, Expressive Lan-guage, Comprehension, Memory, Letter Recognition, and NumberComprehension. The mother’s task for both the MCDI and MPIis torespond “yes” or “no”to each of the statements pertaining to whetherher child attained a particular developmentalskill. The scale score wasthe numberof skills accomplished (as indexed by numberofyesre-sponsesin each developmentalarea).
RESULTS
Patterns of Group Differences
To determine if and when differences emerge in the children’sintellectual performance, a 2 x 10 (Giftedness Status x Age: 1 through 8years) repeated-measures ANOVAwas conducted onthe intelligenceindex scores(i.e., Bayley MDI, McCarthy GCI, KABC MPS, WISC-RFull
Scale IQ). We realized that a significant difference would exist at age 8because of our designation of the groups. However, the omnibustestwas the preferred choice because of its power and ability to detectinteractions. This analysis was based only on children completing all 10testings. A main effect of Giftedness Status was found (F(1, 76) = 50.77,
p < .001). The gifted children scored significantly higher than nongiftedchildren across the entire time frame. The Giftedness Status x Ageinteraction wasalso significant (F(9, 684) = 6.78, p < .001). As revealed
by post hoctests, the differences between gifted and nongifted childrenwere significant at 1.5 years and every age thereafter. These results arepresented in Table 3.1.
Wealso analyzed the intellectual indexes separately by develop-mental period (infancy: ages 1, 1.5, 2 years; preschool: ages 2.5, 3, 3.5years; early schoolyears: ages 6,7, 8 years). The KABC wasnotincludedbecause it was used at only one age. These additional analyses wereconducted because the omnibusanalysis included the 8-year data, theyear at which the children were assigned to the designated statusgroups.It is possible that the nonoverlappingdistribution of IQ for thegroupsat 8 years may be sufficiency powerful to carry the omnibustest,causing the group main effect. By conducting the analyses within thedevelopmental period, we were able to exclude the effect of the 8-yeardata. Additionally, these latter analyses allowed us to examine the groupby age interaction within each developmentalperiod. The results within

Intellectual and Cognitive Functioning 57
Table 3.1. Comparisons of Means between Gifted and Nongifted Children:Developmental andIntelligence Quotients
Giftedness status
Agein years Gifted Nongifted t test
Bayley Scales of Infant Development
1.0 116.4 (12.2) 113.1 (9.8) 1.16
1.5 126.2 (15.7) 114.1 (1.7) 3.23*
2.0 135.4 (11.6) 113.4 (18.3) 4.67*
McCarthyScales of Children’s Abilities
2.5 125.3 (11.4) 109.2 (12.5) 4.76*
3.0 118.2 (10.2) 107.5 (11.7) 3.43*
3.5 122.7 (5.2) 112.5 (9.9) 4.07*
Kaufman AssessmentBattery for Children
5.0 127.0 (9.2) 111.2 (11.0) 5.43*
WechslerIntelligence Test for Children-Revised
6.0 130.6 (7.0) 113.1 (9.6) 7.03*
7.0 133.4 (9.1) 114.0 (10.2) 7.12*
8.0 137.7 (6.0) 112.4 (9.9) 9.96*
Note. Standard deviations in parentheses. n = 17 for gifted; n = 61 for nongifted.p < .05 with Bonferroni correction.
each developmental period corroborate the overall findings presentedhere (see also 2 x 3 analyses of raw scores below).
Figure 3.1 displays the pattern of intellectual performanceof thegifted and nongifted children from age 1 through 8 years. As can be seenin this graph, the nongifted group revealsa relatively flat profile acrossthe age span studied.Thereisrelatively little cross-time variability, withvacillations in mean performance confined to the upper average IQrange. In contrast, the meansof the gifted group are always above thoseof the nongifted group(statistically different at 1.5 years and thereafter)with mean performancelevels generally in the superior range. Further-more, the gifted group exhibits markedvariability. This was particularlyevident during the infancy and elementary years, when the develop-mentaltrajectories of the gifted group revealed increasing divergencecomparedto their nongifted cohort.
Although both groups showed a downwardshift during the pre-schoolperiod, this by no meanssignifies an attenuation ofintellect. Thereasons underlying this downward shift are unknown; however, wesurmise that numerous factors may be operating. Contributingfactors,

58 Chapter3
140
135
130
125
120
115
110
Nongifted105 biBn Co
100 % ! ! \
11.5 225 3 35 5 6 7 8
Infancy Preschool Elementary
AGE IN YEARS
MEANINTELLIGENCESCORES
Figure 3.1. Mean intelligence scores for gifted and nongifted children from age 1 through8 yearsof age.
for example, could be developmental changes in temperament charac-teristics (Guerin & A. W.Gottfried, in press-a), untestability during thepreschoolyears (Bathurst & A. W. Gottfried, 1987a), preschool entry andassociated separation issues,toilet training, or the behavioral constella-tion of the “terrible twos.” Psychometric factors mayalso be responsiblefor the observed decline during the preschool period. Specifically, theMcCarthyhas been foundto underestimate overall intellectual perform-ance during the preschoolyears (Gregory, 1992; Roedell et al., 1980). Thisunderestimate may beparticularly true for highly intelligent children.A rationale behindthisis that for a child to obtain an exceptionalscoreon the GCI, he or she must achieve relatively high scores across the
Verbal, Quantitative, and Perceptual-Performance indexes. Low per-
formance on just one index could preclude the child from obtaining ascore at the superiorlevel. At the time we wereselecting our psychomet-ric intelligence measure during the preschoolperiod, there werelimita-tionsin availability of tests. The Stanford-Binet was being revised, withthe Stanford-Binet: Fourth Edition not available until 1986. The normsof the Wechsler Preschool and Primary Scale of Intelligence were out-dated, with the revision not published until 1989. We opted at the time

Intellectual and Cognitive Functioning 59
(1981-1982) for an established scale with relatively contemporary norms
that would also furnish information on various major cognitive skills.Hence, we selected the McCarthy Scales of Children’s Abilities, whichproved to be informative in addressing the developmentalissues inves-tigated.
With respect to the shifts in intellectual scores for both groups(as noted when movingacross panels in Figure 3.1), it is noteworthythat weare plotting longitudinal data from a single cohort on cross-sectional normsacrossvariousintelligence tests. The shifts from onepanel to another could be a function of differential normative char-acteristics across the population of the tests employed. By the sametoken, shifts within the same panel could be due as well to nuances
in the cross sections making up the standardization population ofthe given test. Lastly, because statistical regression can be bidirec-tional, that is, going back in time as well as forward (Humphreys,1985), it is possible that the divergent patterns of the intellectualindexes for the gifted and nongifted groups across time could tosome extent be a function of statistical retrogression(i.e., finding
regression toward the mean when examining the data in reversedage order).
BecauseIQ is not a developmental concept, but rathera statisticalabstraction(i.e., a quantity or scorerelative to others of the same chrono-logical age), a more precise picture of each group’s actual intellectualdevelopment(i.e., absolute quantity) can be obtained by examining theraw scores separately for each test. Raw scores provide a way to examinechildren’s actual intellectual development or progress without norma-tive transformations. The raw scores are displayed in Figure 3.2. (TheKABC could not be used in this analysis because it was administeredonly at age 5 years.) Examination of the data clearly reveals that bothgroups showincreases in their mental growth as would be expectedinthe course of normal development. Furthermore,this is how mental agescales are designed. However, beginning at age 1.5 years, the childrenwhobecamegifted passed a greater numberofitems (or obtained higherraw scores). These differences werestatistically confirmed by threeseparate ANOVAs,one for each test used repeatedly: Bayley at 1, 1.5,and 2 years; McCarthyat 2.5, 3, and 3.5 years; WISC-Rat ages6, 7, and8 years. Each analysis was a 2 x 3 (Giftedness Status x Age) repeated-measures ANOVAontherawscores. A maineffect of Group was foundfor the Bayley (F(1, 103) = 23.95, p < .001), the McCarthy(F(1, 85) = 29.39,p < .001), and the WISC-R (F(1, 99) = 113.97, p < .001). An interpretationof these data is that children who becomegifted exhibit a more rapid

60 | Chapter 3
Bayley Scales of Infant Development
160
150
140
130
120
GiftedPOR eee ee ee er eee eee te ee Me ee ns Bue toe eee t ents nec”d
Pe Oe ee re ee ee Bn et Mare cer nr react eee ere evaned
Peeeee fa Pears re rn enna cern vere vere rer ereenced
110
100
PeMGee ee ee ee eee eeeed
MEANRAWSCORE
1 1.5 2
McCarthy Scales of Children's Abilities
110100 bocccccccccccccccceteeeteeeeteetcteeecceeevegleeGifted|
90 bolo80bcov7Ol601.KL...Nongifted-50LotteAO biLoo30 }
MEANRAWSCORE
2.5 3 3.5
Wechsler Intelligence Scale for Children - Revised
300
280 |260 |
240 |
220 |
200 |
180
160
140
120 |
MEANRAWSCORE
Age in Years
Figure 3.2. Comparison of mean rawscoresof gifted and nongifted children for each of theintelligence measures at each developmentalperiod (infancy: Bayley; preschool: McCarthy;school entry: WISC-R).

Intellectual and Cognitive Functioning 61
pace of early mental development(i.e., on the Bayley), and their supe-riority compared to nongifted children emerges as early as infancy.Hence, continuity of superior performance characterizes the intellectualdevelopmentof gifted children as a group during the early years.It isinteresting to note that our longitudinal findings during the early yearsdovetail with those of Baldwin and Stecher(1923) of the historic Univer-sity of lowa Studies in Child Welfare. These researchers conductedconsecutivetestingsof intellectually superior and average boys andgirlsfrom ages 5 through 16 years, as shownin Figure 3.3. As can be readilyseen, the gifted children as a group maintainedtheir intellectual advan-tage comparedto the averagechildren across this considerable age span,indicating developmental stability of group differences. However,cross-timestability of individual differences is another issue (see below).
Taken together, these two longitudinal studies demonstrate that giftedand nongifted children developatdifferent levels from infancy throughadolescence.
Thefinding that gifted and nongifted children developat differentlevels should not be interpreted to mean that there are quantitativedifferences between these groups simply becausethe basisof distinctionrests on a psychometric appraisal. Data show that variation in psy-chometrically measured intelligence implies differences in cognitivedevelopment and functioning (Carter & Ormrod, 1982; Keating, 1975,1976). Researchers had school-age children tested on psychometric in-struments, which providedthe classification of gifted/bright or aver-age, and also gave them Piagetian tasks to assess concrete and formaloperations. Results showed that the gifted/bright children, comparedto the average children, were more advancedin their cognitive reason-ing as indexed bya further progression within stages and more rapidtransition from concrete to formal operations. Hence, gifted/brightchildren in contrast to average children (with age correction) are moreadvancedin their reasoning within the Piagetian theoretical framework.However, the implications of the findings go beyond this as indicatedby Keating (1976):
Since, accordingto Piaget, cognitive developmentproceedsas an interactionof the organism and the environment, the brighter individual would be atan advantage in moving through the successive stages more quickly. Thiswouldbeso because the bright child would be involved in more varied andinteresting interactions with the environment, generating a greater quantityof useful information, and would also be able to makeeffective use of theinformation generated. Thatis, the “self” enriches the cognitively relevantenvironment.(p. 98)

62 Chapter 3
220_
MENTAL GROWTH r Ja CURVES ZL
Superior (1) Average (II)
Boys Girls.— Y
. Z| |w Wa
: fi VVi
100 Th 77Ly
&
OT
WN
p=
§ 6 q 8 9 10 ll 12 13 14 15 16Chronological Age
Figure 3.3. Mental age curves based on consecutive testings of superior and average boysand girls from age 5 years through age 16 years (Baldwin & Stecher, 1923; reprinted withpermission from University of Iowa).

Intellectual and Cognitive Functioning 63
Individual Case Profiles
The pattern for gifted children as a group may not berepre-sentative of cross-time individual patterns. To determine whether thereis a uniqueor characteristic pattern for children who becomegifted, weexaminedindividual case profiles. The intellectual indexes for each ofthe 20 gifted children from ages 1 through 8 years are presentedin Figure3.4, Examination of these graphs showsconsiderable variability in per-formance across time between children as well as within each child’sdevelopmental profile. There is no ontogenetic age pattern charac-terizing the intellectual performanceof gifted individuals; that is, eachchild displays a unique courseof intellectual performance as he or sheprogresses toward giftednessat age 8. As can be seen,there are as manyindividual patterns as there are children. Development toward giftedintellectual performance appearsto be highly individualistic. The impli-cation of these data is that while one may develop a psychological theoryor conceptualization of how children become gifted, it may not bepossible to formulate a theory as to how anindividual child becomesgifted; the intellectual developmentof gifted children as a group doesnot represent how anindividual child becomes gifted. The observedintraindividualvariability patterns acrosstimeraise the issueof stabilityof gifted IQ from middle childhood through adolescence. Will thesechildren at age 8 years maintain their gifted IQ status through theremaining childhood years? We intend to address this issue as wecontinueto follow these children through adolescence.
In scrutinizing these data of individual children, however, weobserved an interesting phenomenon:a high numberof infants scoredexceptionally high (2 130) on the Bayley between 1 and 2 yearsofage.During infancy, 90% (18/20) of the gifted children displayed a BayleyMDIof 130 or greater on at least one of the three assessments (1, 1.5, 2years). In contrast, only 20.7%(18/87) of the nongifted group achieveda score of this magnitude during infancy. This was statistically signifi-cant(x? (1, N = 107) = 31.96, p <.001). Thus, children who became giftedduring childhood were morelikely to achieve an exceptionally highlevel of sensorimotorintellectual performance at one point or anotherduring infancy, thereby providinganearly indication or cue of potentialfor superior intellectual performance. This findingis intriguing in viewof the fact that infant measures of sensorimotor intelligence have beenknowntolack long-term predictive validity. However, previousconclu-sions have been based uponstatic time analysis (or scores ageregatedacross time), that is, correlations with one point in time with somelater

Subject 9 - Male
150
140|
(9 130 |
Q 1201”
G 110}
100 + 90 ¥ 1152253355 67 8AGEIN YEARS
Subject 10 - Male
150
140 |.
(130 |
Oo2120 |
110}
100 | 90 4 1152253355 67 8AGE IN YEARS
Subject 14 - Female
150
140 |.
oO 130 |......
Ooy 120}.
G 110}
100}
A 90 7 7152253355 67 8AGE IN YEARS
Subject 33 - Male
150
1401...
1 4130 |.
O6 120 |AG110} \
100 |... 90421152253355 6 7 8
AGE IN YEARS
Figure 3.4. Individual case profiles of the gifted children’s intelligence scores from 1 year
throuch8 years of age.

Subject 38 - Male
150
130co
2 120*”
Gg 110
100 |...
Pp
/fp
90 #
150
1152253355 67 8AGE IN YEARS
Subject 43 - Male
oc€> 120 |...”
90 # L
150
140
© 130
5Q 120”g 110
100
90
150
17152253355 67 8AGE IN YEARS
Subject 61 - Female
AGEIN YEARS
Subject 62 - Female
140 /\ (430
x
J \ ,
VAIN 2 120a
@ 110}.
100
Ye
90 # 1152253355 67 8
AGE IN YEARS

150
Subject 64 - Male
140 +
(9 130}
569 120).”G@ 110}.
100 |}.
904
150
1152253355 67 8AGE IN YEARS
Subject 68 - Female
140 +
9130 |aOQ120} °
GO 110+
100 + 90 4%
150
1152253355 67 8AGE IN YEARS
Subject 72 - Male
140
3130co
2 120 |~”
110}
100 +
90 4
150
140
9130aw
2120
9110
100
90
1152253355 67 8AGE IN YEARS
Subject 92 - Female
1152253355 6 7 8
AGE IN YEARS
Figure 3.4. (Continued)

Subject 100 - Female
150
140 |.
(3 130 +
O© 120 |#
@ 110}.
90+ 1152253355 67 8
AGE IN YEARS
Subject 102 - Male
150 K
140
fom
8 120
o”Co 110+
90 1152253355 67 8
AGE IN YEARS
Subject 103 - Male
~-_= oIQSCORES
0)0| 907 1152253355 67 8
AGEIN YEARS
Subject 117 - Male
150
140 +
63.130 |
5¢ 120 -
@ 110}
100 |
1152253355 67 8
AGEIN YEARS

Subject 122 - Male
1152253355 67 8AGE IN YEARS
Subject 126 - Female
150
140 +
63.130 |
G2120}. .\oOo 1101
100 +
90 #
150
1152253355 67 8AGE IN YEARS
Subject 127 - Female
140
© 130 |5
120 |.“G@ 110}
100 + 90 #
(\\_~-
x
150
1152253355 67 8AGE IN YEARS
Subject 128 - Female
140
9 130
O2120}.
oO VObof
100 | 90 #
1152253355 67 8AGE IN YEARS
Figure 3.4. (Continued)

Intellectual and Cognitive Functioning 69
criterion age. Thus, cues lurking in the course of development towardgiftedness may be found notat one fixed period(i.e., age), but, rather,within a time-frame analysis.
A comparable analysis was conducted on the McCarthy GCI dataduring the preschoolperiod(2.5, 3, and 3.5 years). It is important to keepin mind that the McCarthy may notbe a very sensitive instrument fordetecting giftedness because, as noted above,it underestimates overallintellectual or cognitive status. In fact, as shown in the middle panel ofFigure 3.1, scores were lower relative to the adjacent periods. Thepercentageof gifted children who received a GCIof 130 or greater at anyof the three McCarthy assessments was 40.0%(8/20); the comparablevalue for the nongifted was only 3.4% (3/87). This resulted in a signifi-cant chi-square value (x2 (1, N = 107) = 19.76, p < .001). Similar to the
aforementioned findings on the Bayley, children who becomegiftedcompared to nongifted are significantly more likely to also reveal excep-tionally high performance on the GCI of the McCarthy, even thoughittends to underestimate overall intellectual functioning.
Further analyses were conducted by examining the numberofchildren in each group whoachieved one or morescoresat or above twostandard deviations above the mean(this represents the top 2.28%of anormal distribution of scores on each of the four cognitive scales of theMcCarthy: Verbal, Quantitative, Perceptual, Memory). The percentageof gifted and nongifted children scoring within this upper percentilerange on these four subscalesat 2.5, 3, and 3.5 years was 50.0%(9/18)versus 15.3%(11/72), 30.0%(6/20) versus 6.2% (5/81), and 35.0%(7/20)versus 8.2% (7/85), respectively. All three chi-square tests were signifi-cant; ¥7 ranged from 7.09 to 8.14 with one degree of freedom and Nsranged from 90 to 105 (all ps < .01). Moreover, it is interesting to notethat gifted children at each of the three ages had scores abovethis cutoffacross a greater numberof the cognitive scales. For example, at age 2.5years, 77.7% (7 of the 9 gifted children who had elevated scores) of thegifted children had elevated scores on three of the scales, compared tonone of the nongifted children. The frequency of elevated scores in thegifted group wasdistributed moreor less equally across the four cogni-tive scales. There wasno pattern in the distribution of elevations. Thesefindings are in accord with the “best performance” concept advocatedby Roedell et al. (1980) that gifted children could possibly be identifiedby exceptional performance in one or morespecific realms. Rather thanidentify giftedness by the child’s average or overall performance acrossan array of tasks, these researchers have adopted the philosophythatthe most meaningful, that is, advanced or exceptional, performance area

70 Chapter3
should be employed. Hence, an individual domain of developmentalacceleration could prove to be more significant in the designation ofgifted than the use of composite scores. However, the Seattle investiga-tors acknowledgethatthe validity and utility of this concept remainstobe proven.
Our data reveal that children with gifted IQs have an overallhigher level of cognitive functioning than that of nongifted IQ chil-dren as a group. However, as individuals, gifted IQ children showdivergence in their spectrum of intellectual exceptionality (definedby scores equal to or in excess of two standard deviations abovethe mean in specific domainsor skills). They did not all show ex-ceptionality in the same cognitive realms or academic subject areas(see Chapter 4).
Another interesting finding emerging from the McCarthy datapertained to the untestability of children during the preschool period.In our longitudinal investigation, Bathurst and A. W.Gottfried (1987a)studied the significance of unresponsiveness or uncooperative behaviorof children in standardized developmental assessments(specific to theMcCarthy) during the preschool years. We found that the untestablechildren when comparedto testable children weresignificantly loweron a wide rangeofabilities at all ages from age 1 to 6 years. Althoughthe untestable children scored relatively lower on anarray of skills andtest-taking behaviors, there was a pervasive pattern of lower perform-ance, particularly in language andsocial skills. Thus, we compared theproportion or percentage ofchildren in the gifted and nongifted groupswho were untestable at 2.5, 3, and 3.5 years. (One gifted and onenongifted child werenotclassified as testable or untestable because eachmissed one assessmentduringthis time frame.) Succinctly, 5%(1 outof19) of the gifted children were untestable, whereas 22%(19 outof 86) ofthe nongifted children were untestable during this time frame. The .17difference between these proportions wassignificant (p < .05). Thesedata reveal that children who become nongifted exhibit a rate of untes-tability during the preschool years over fourfold that of children whobecomegifted. Gifted children are highly unlikely to be untestable instandardizedintelligence testing situations. These findings, in conjunc-tion with our findings in Chapter 4 involving children’s test-takingbehaviors, imply that gifted children are more adept in, oriented to, ormotivated in cognitive test-taking situations or demands. Hence, re-sponsivenessto or cooperativenessin testing situations(i.e., the dimen-sion of testability/untestability) during the preschool years may serve

Intellectual and Cognitive Functioning 71
as an additional signifier or cue in the developmental course of gifted-
ness or nongiftedness.
Globality versus Specificity
While differences were found at 18 months and thereafter onthe overall indexes of intellectual performance, we focus now ondifferences between the gifted and nongifted groups on specific cog-nitive skills (or subtests). Although specific cognitive skills correlatepositively with each other, there is still a degree of specificity op-erating. This is even the case during infancy; for example, psychomet-ric sensorimotor tests correlate with Piagetian measures ofsensorimotorintelligence (A. W. Gottfried & N. Brody, 1975). Thisphenomenonis well established during childhood as well as adult-hood (E. Brody & N.Brody, 1976; N. Brody, 1992). There is a tendencyfor a child who does well on one type of cognitive task to do wellon another. However, a child who is highly advanced in one typeof cognitive skill does not necessarily excel in another type of cog-nitive skill. To this issue we now turn in our comparison of thegifted and nongifted groups.
As noted above, significant differences between gifted andnongifted children were found on the summary score index of theBayley at 1.5 and 2 years. For object permanenceat 1 and 1.5 years,
a 2 x 2 (Giftedness Status x Age: 1 and 1.5 years) repeated-measuresANOVA showed no differences between the gifted and nongiftedgroups(F(1, 103) = 0.55, p > .05). Similarly, there were no differencesbetween the groups on the visual and tactual memory andcross-
modal tasks at 1 through 3 years as tested with a 2 x 5 (Giftedness
Status x Age: 1, 1.5, 2, 2.5, and 3 years) MANOVAon cross-modal,
visual, and tactual memory task (multivariate F(3, 45) = 0.01, p >
05). The gifted children did not exhibit significantly more noveltypreference than the nongifted group. Thus, during infancy, differ-ences betweenthe groups were found only on the general psychomet-ric sensorimotor scale.
From the Bayley, we extracted items pertaining to language devel-
opment. This provided a direct assessmentof receptive and expressiveor production language abilities during the infancy period. Thus, wewere able to determine if differences exist in this important realm ofdevelopment between those children who eventually becamegifted

72 Chapter 3
from those whodid not. Our conceptual categorization of the items fromthe Bayley scale is presented:
The Bayley 12-month languageitemsare as follows:
Receptive
84 Listens selectively to familiar words
89 Respondsto verbal request
94 Inhibits on command
117 Showsshoesor other clothing, or owntoy
126 Followsdirections, doll
128 Points to parts of doll
The 18-month Bayley language items included:
Receptive
117 Showsshoesor other clothing, or own toy
126 Followsdirections, doll
128 Points to parts of doll
131 Finds 2 objects
132 Points to 3 pictures
133 Broken doll: mends marginally
139 Points to 5 pictures
140 Broken doll: mends approximately
144 Discriminates 2: cup, plate, box
148 Points to 7 pictures
152 Discriminates3: cup, plate, box
153 Broken doll: mends exactly
158 Understands 2 prepositions
The 24-month Bayley language items comprised:
Receptive
117 Showsshoesor other clothing, or own toy
126 Followsdirections, doll
128 Points to parts of doll
131 Finds 2 objects
132 Points to 3 pictures
133 Broken doll: mends marginally
139 Points to 5 pictures
Expressive
5 Says “da-da” or equivalent
101 Jabbers expressively
106 Imitates words
113 Says 2 words
124 Names1 object
127 Uses words to make wants known
Expressive
101 Jabbers expressively
106 Imitates words
113 Says 2 words
124 Names1 object
127 Uses words to make wants known
130 Names1 picture
136 Sentence of 2 words
138 Names2 objects
141 Names3 pictures
145 Names watch, 4th picture
146 Names3 objects
149 Names5 pictures
150 Names watch, 2nd picture
Expressive
124 Names1 object
127 Uses words to make wants known
130 Names1 picture
136 Sentence of 2 words
138 Names 2 objects
141 Names3 pictures
145 Names watch, 4th picture

Intellectual and Cognitive Functioning 73
140 Broken doll: mends approximately 146 Names3 objects
144 Discriminates 2: cup, plate, box 149 Names5 pictures
148 Points to 7 pictures 150 Nameswatch, 2nd picture
152 Discriminates 3: cup, plate, box
153 Broken doll: mends exactly
158 Understands 2 prepositions
162 Concept of 1
163 Understands 3 prepositions
In order to determine whether there were differences between thegifted and nongifted children on the receptive and expressive itemsof the
Bayley, a 2 x 3 (Giftedness Status x Age: 1, 1.5, and 2 years) MANOVAwas conducted using both dependentvariables. The three-way interac-tion was significant (multivariate F(4, 100) = 20.66, p = .001). The univari-
ate tests showedthat the three-way interaction held for both dependentvariables. Therefore, we conducted three follow-up analyses, one at eachage. These post hoc comparisons were three MANOVAswith giftednessstatus as the independent variable and the two language scales as themultiple dependent variables. The means, standard deviations, and uni-
variate F results are shownin Table 3.2; a plot of the group differencesateach age can be seen in Figure 3.5. At age 1 year, the multivariate testrevealed significant differences for receptive language, but not for ex-pressive language (multivariate F(2, 102) = 3.77, p < .03). This is not
surprising, because receptive ability precedes expressive languageskillsand expressive skills are just emerging at this time. For the receptivelanguagescale, the gifted children passed 58%of the items, whereas thenongifted children passed 52%of the items. At 1.5 years, the differencesweresignificant for both receptive and expressive language (multivariateF(2, 103) = 6.76, p < .002). Again, the gifted children passed significantlymore items than the nongifted children. For receptive language, giftedchildren passed 52%, whereas nongifted children passed 38%; for expres-sive language,gifted children passed 70% compared to 49%for nongiftedchildren. The effect was again significant at 2 years of age (multivariateF(2, 102) = 10.92, p < .001). The gifted children passed significantly moreitems than nongifted children for both dependentvariables. For receptivelanguage,gifted children passed 89%and nongifted children passed 70%of the items. For expressive language, gifted children passed 98% andnongifted children passed 80%of the items.
Whethertheseparticular results in language developmentaccountfor the overall Bayley differencesis difficult to know. It may very well

74 Chapter3
Table 3.2. Comparisons of Means between Gifted and Nongifted Children:Receptive and Expressive Language Items from the Bayley across Ages1,
1.5, and 2 Years
Giftedness status
Scale Gifted Nongifted Univariate F
1 year
Receptive 3.5 (.7) 3.1 (.6) 6.62.Expressive 2.9 (1.1) 2.6 (.6) 1.80
1.5 years
Receptive 6.8 (3.0) 4.9 (2.7) 7.41-Expressive 9.1 (3.4) 6.4 (2.8) 13.66
2 years
Receptive 13.3 (1.5) 10.5 (2.5) 21.99"Expressive 9.8 (.5) 8.0 (2.3) 11.197"
Note. Standard deviations in parentheses. N = 105. Numberof items on each scale are:l-year receptive = 6; 1-year expressive = 6; 1.5-years receptive = 13; 1.5-years expressive= 13; 2-years receptive = 15; 2-years expressive = 10."p< .05."p<.01. "p< .001.
be the case. However,the findings are significant not only because theyconfirm the retrospective anecdotal reports of parents of gifted childrenas reported in the introduction, as well as our findings (to be reportedbelow), but because they reveal that children who becomegifted areadvantaged in their very early developmentin the ability to compre-hend and express themselves linguistically. Certainly this has para-mount cognitive and social implications. Oviatt (1980), who studied
comprehensionskills in infants between 9 and 17 months, noted: “Dur-ing the rapid comprehension development,... language becomes a pow-erful tool for focusing infants’ attention and one that caretakerscapitalize on to create new learning opportunities” (p. 105).
During the preschoolperiod, the issue of generality was evaluatedby examiningthe five specific subscales of the McCarthyas wellas theTELD. For the McCarthy, a 2 x 3 (Giftedness Status x Age: 2.5, 3, and 3.5years) MANOVAusing the standard scores of the five scales of theMcCarthy as the dependentvariables yieldeda significant main effectfor Group (multivariate F(5, 78) = 8.13, p < .001). Table 3.3 displays themeans, standard deviations, and univariate Fs for each McCarthy scalecombined across time. Across the preschool period from 30 to 42months, the gifted group outscored the nongifted group on the Verbal,

Intellectual and Cognitive Functioning 75
ot {Gifted oollle.
0NongiftedBl eo ce et we ew ew ww we eww Pe ee ee ee ewe eee we were eee
@ TOP cet tt ee eee ee ree ew ew wre ee ene ee ee 8 8 8 = RR - - =
oDi iec@2 SOl- [email protected] 40;©©= %0F
20i-
10}-
0 3 Scan ese a SLED a Eeeyesecon an = j £ less:
Receptive Expressive Receptive Expressive Receptive Expressive
1 year 1.5 years 2 years
Language Skill and Age
Figure 3.5. Comparison of receptive and expressive languageskills of gifted and nongiftedchildren during infancy.
Perceptual-Performance, Quantitative, and Memoryscales, but not onthe Motorscale.
The Test of Early Language Development wasalso administeredduring the preschool period (3.25 years). The results of the independentt test on the overall s_. :e are in accord with the differences found on theMcCarthy Verbalscale in that the gifted group (M = 12.7, SD = 4.9) wassignificantly more advanced onthis global measure of language devel-opmentthan the nongifted group (M = 9.2, SD = 5.0; t(101) = 2.71, p <.01). We sought to determine whether there were differences in the
specific receptive and expressive domains, as we found onthe Bayleyitems. A repeated-measures MANOVAusing the receptive and expres-sive subscale scores of the TELD as dependent variables revealed asignificant difference betweenthe gifted (M = 6.33 and 6.64 for these twosubscales, respectively) and nongifted group (M = 4.58 on bothsubscales; F(1, 101) = 8.77, p < .01). These findings are consistent with
those found on the Bayley language analyses as well as those to bereported on the MCDI expressive and receptive or comprehension

76 Chapter 3
Table 3.3. Comparison of Raw Score Means betweenGifted and NongiftedChildren: Subtests of McCarthy Scales of Children’s Abilities
Giftedness status
McCarthy scale Gifted Nongifted Univariate F
Verbal 64.6 (7.1) 56.5 (7.9) 20.72"Perceptual-Performance 59.7 (6.3) 52.8 (6.9) 22.68
Quantitative 62.9 (6.1) 55.2 (8.5) 19.84.Memory 62.5 (8.6) 55.9 (8.1) 14.10Motor 53.5 (8.0) 51.1 (7.4) 2.36
Note. Standarddeviations in parentheses. N = 84.p< .001.
languagescales (see below). However, with respect to the specific issueat hand, the overall findings show that there is generality of superiorperformanceduringthe preschoolperiod in children who becomegiftedversus nongifted. Furthermore, the results are restricted to cognitivemeasures and do not extend to motorskill tasks.
The two psychometric instruments used during the early schoolages were the KABC administered only at age 5 and WISC-Ratages 6,7,and 8. For the KABC, a one-way MANOVAwith Giftedness Status as
the between-subjects factor and KABC subtests as the multiple measuresshowed significant difference betweenthe gifted and nongifted groups(multivariate F(3, 101) = 12.45, p < .001). As shownin Table 3.4, the gifted
group scored higher on both processing subscales (Sequential and Si-multaneous) as well as the Nonverbal subscale.
As for the WISC-R Verbal IQ and PerformanceIQ scores, a signifi-cant main effect resulted, with the gifted group scoring significantlyhigher than nongifted at all ages as shownbya 2 x 3 (Giftedness Statusx Age: 6, 7, and 8 years) MANOVA(multivariate F(2, 98) = 55.46, p <
001). Twofurther analyses concerning the generality of effect across theverbal and performance subtests were also conducted. A 2 x 3 (Gifted-ness Status x Age: 6, 7, and 8 years) MANOVAusing the WISC-Rsubtests of the Verbal scale (Information, Similarities, Arithmetic, Vo-
cabulary, and Comprehension) was performed. There wasa significantoverall effect for Group (multivariate F(5, 95) = 17.16, p < .001). The same
analysis was conducted for the performance subtests (Picture Comple-tion, Picture Arrangement, Block Design, Object Assembly, Coding),resulting in a significant effect for Giftedness Status (multivariate F(5,95) = 14.00, p < .001). Acrossall 10 subtests of the verbal and performance

Intellectual and Cognitive Functioning 77
Table 3.4. Comparison of Means between Gifted and Nongifted Children:Subscales of the KABC
Giftedness status
KABCsubscale Gifted Nongifted Univariate F
Sequential Processing 117.3 (10.5) 105.0 (11.2) 19.93Simultaneous Processing 127.2 (7.5) 112.3 (11.3) 31.91"
Nonverbal 124.8 (9.5) 111.2 (10.9) 26.37
Note. Standard deviationsin parentheses. N = 105.
py <.001.
subscales, the gifted group scored significantly higher than thenongifted group. The group means, standard deviations, and univariateFs are shownin Table 3.5 for the Verbal and Performance IQ scores and
the 10 subtest scale scores.
These findings imply that gifted IQ meansgeneralized highintelli-gence (see also Humphreys, 1985). Intellectually gifted children are cogni-tively well rounded; thatis, they are cognitively adept. The gifted groupwassignificantly elevated above their nongifted peers onall cognitiveskills, certainly by preschool, and through the school-entry years. Weanticipate that these findings will be maintained thereafter as well.
While the aforementioned analyses addressed the issue of differ-ences in elevation across various cognitive skills, they do not addressthe question as to whetherthe patterns in intellectual performance acrossareas are similar or different between the groups. In other words, dogifted and nongifted groups share the sameprofile across various cog-nitive skills, and if so, is this characteristic in the course of development?Profile analysis is a repeated-measures ANOVA where the dependentvariables are treated as the within factor. Nonparallel profiles would beindicated by a significant interaction.
To determine whether the profiles between the gifted andnongifted groups were different on the four cognitive scales of theMcCarthy test during the preschoolperiod, profile analyses were con-ducted at each of the three ages. The results of these analyses revealedthat, in each case, the profiles were parallel (largest F(3, 86) = 1.27, p >
.05). The profiles of the gifted and nongifted groups, with meanscol-lapsed across age, are presented in Figure3.6.
Profile analyses were also conducted for the five subtests of theWISC-R Verbal scale and the five subtests of the WISC-R Performancescale at each of the three ages. On the verbal subtests, none of the analyses

78 Chapter3
Table 3.5. Comparison of Means between Gifted and NongiftedChildren: Subscales and Subtests of the WechslerIntelligence Scale
for Children (Revised)
Giftedness status
WISC-R Gifted Nongifted Univariate F
Verbal IQ 132.1 (10.1) 109.5 (11.3) 85.40Performance IQ 129.5 (7.5) 111.9 (10.9) 61.03"Verbal subtests
Information 15.3 (2.0) 11.2 (2.4) 64.63Similarities 15.9 (2.6) 12.3 (3.0) 45.82"Arithmetic 14.3 (2.3) 11.2 (2.6) 38.27Vocabulary 16.0 (2.2) 11.8 (2.9) 59.68Comprehension 14.1 (2.6) 11.5 (2.7) 25.16
Performance subtests
Picture Completion 13.8 (1.9) 11.7 (2.4) 19.81
Picture Arrangement 14.9 (2.1) 12.9 (2.5) 18.12
Block Design 15.4 (2.3) 11.6 (2.4) 56.35
Object Assembly 14.5 (2.5) 11.6 (2.5) 30.48Coding 12.4 (2.1) 10.9 (2.8) 9.11—
Note. Standard deviations in parentheses. N = 101.p<.0l. p<.001.
revealed reliable differentiating patterns. Profile analyses for the per-formancesubtests revealed significant interaction effects at ages 6,7, and8 years (Fs(4, 97-102) = 2.83 to 3.00, all ps < .05). The magnitude of the
differences betweenthe giftedness status groupsdiffers as a function ofthe subtests. Across the ages, the only consistent distinction was that thedifference in magnitude was largest on the Block Design subtest. It isinteresting to note that this subtest possesses the highest internal consis-tency andtest-retest stability coefficients among the WISC-R perform-ance subtests. Profiles for the verbal and performancesets, with means
collapsed acrossage, are presentedin Figures 3.7 and 3.8, respectively.
Weconclude that the difference between gifted and nongiftedgroupsis oneof elevation or superiority in intellectual performance andnotoneof differential patterns.It is our interpretationthat intellectuallygifted children are developmentally advanced or advantaged bytheirlevel of developmentand notdistinguished by their pattern of intellect.The consistently and markedly higher elevations of the gifted childrenwere more striking than any deviations in relative differences of

Intellectual and Cognitive Functioning 79
70
LJ[aw
© a aim Gifted
;a
=LU© 60 se
=EZz _= 55 , oes et
2 No NongiftedLU=
50 4 i |
Verbal | Quantitative |Performance Memory
McCarthy Scales of Children's Abilities
Figure 3.6. Meanintelligence scores for gifted and nongifted children for the subscales of
the McCarthy averaged across 2.5, 3, and 3.5 yearsof age.
20LucoOC1 prvessnsnntnttatnnsninienenueninnnannainanianniinananennunaiuninucaiinuincaaaiY)
S A”a '° i Giftedo=!1 14 \Z
2> 12 IN -
< ZO~ Nongifted
10 # | ! {| | |Information | Arithmetic | Comprehension
Similarities Vocabulary
WECHSLER INTELLIGENCE, VERBAL
Figure 3.7. Meanintelligence scoresfor gifted and nongifted childrenfor the verbal subtestsof the WISC-R averagedacross6, 7, and 8 yearsof age.

80 Chapter 3
20
18
aJ \gitted
FD benny— . ceA_Nonsited
10 £ | | | | |
Picture Completion | Blocks | Coding
Picture Arrangement Object Assembly
MEANINTELLIGENCESCORE
WECHSLERINTELLIGENCE, PERFORMANCE
Figure 3.8. Meanintelligence scores for gifted and nongifted children for the performancesubtests of the WISC-R averaged across 6, 7, and 8 years ofage.
subscales. The profiles were essentially parallel and do not represent auniqueprofile of giftedness. The fact that the profiles were not substan-tially different indicates that they may more accurately represent theprofiles of predominantly white, middle-class children of average toabove-averageintelligence during the preschool and early elementaryschool years. It is interesting to note the similarity between ourMcCarthy profiles and those found by Lesser, Fifer, and Clark (1965) fortheir white children on verbal, quantitative, and perceptual/spatialskills. Whether patterns of intellectual performance are identical be-tween gifted and nongifted children in other cultural or racial groups(as our data suggest for white children) remains to be determined (see
Saccuzzo, Johnson, & Russell, 1992). However,the delineation of differ-
ential patterns may only be accomplished by comparingprofiles of bothgifted and nongifted children within diverse racial or ethnic groups.
Parental Assessments
In contrast to the above data, which are based onobjective devel-opmentaltests, the data in this section rely on parents’ appraisalsof their

Intellectual and Cognitive Functioning 81
children’s development during infancy and the preschool period. Thecentral issue addressed here is whether parents are perceptive of differ-ences in the early development of children who become gifted ornongifted.
Every 6 monthsfrom ages1 to3.5 years, each motherrated herchild’sfunctioning compared to other children of the same age in four areas:
intelligence, verbal, social, and motor. Higher ratings (scale 1 to 5) indi-
cated more advanced functioning for the designated age. A 2 x 6 (Gifted-
ness Status x Age: 1, 1.5, 2, 2.5, 3, and 3.5) MANOVAwith these four
repeated measures as dependentvariables yielded a significant effect forGiftedness Status (multivariate F(4, 91) = 4.58, p < .001). The meanratings
givenby parents of children whobecomegifted or nongifted are displayedin Figure 3.9. In line with the significant main effect for Giftedness Status,parents of children who becomegifted rated their children as functioningat higher developmentallevels. Significant univariate effects were foundfor the dimensions of intelligence, verbal, and social functioning. Nostatistically significant difference emerged for motorskill functioning.
Parent assessments of their children’s development were alsoevaluated with the MCDI and MPI, two standardized inventories of
children’s development. Parents’ responses on the MCDI, which wascompleted at 2.5 years, were analyzed using a one-way between-subjectsMANOVA.The twogiftedness status groups were compared on sevenMCDIscales: Gross Motor, Fine Motor, Expressive Language, Compre-hension-Conceptual, Situation Comprehension,Self Help, and PersonalSocial. The General Developmentscale wasnot includedin this analysisbecauseit comprises items from the other seven scales. Results showeda significant effect for Group (multivariate F(7, 84) = 4.17, p < .001). As
shown in Table 3.6, parents of gifted children reported significantlyhigher scores on the Expressive Language, Comprehension-Conceptual,and Fine Motor scales. The overall General Development scale wasanalyzed separately because it is a composite of items from the otherscales. A t test showed that parents reported the general developmentscores of gifted children to be higher than nongifted children (t(90) =4.25, p < .001).
An analysis of the MPI responses, completed by mothers at theS-year assessment, also showedthatgifted children were reported to beperforminghigheronthescales assessing the cognitiveskills of Expres-sive Language, Comprehension, Memory, and Letter Recognition, asdisplayed in Table 3.7 (multivariate F(7,95) = 4.50, p <.001). A significant

Figure 3.9. Mothers’ ratings of gifted and nongifted children at ages 1 year through 3.5 yearsin four areas:
MEANPARENTALRATING
MEANPARENTALRATING
Intelligence
3% i a i i A L
1 1.5 2 2.5 3 3.5
AGEIN YEARS
Social
5
4.5 eeee ek de eek REE EEE ER ERE EDEN E EE REED EERE ADOC EOE OEE READER DEDEDE DEE EEE eee
Nongifted
24, 1 L 1 l 1 1
‘ 1 1.5 2 2.5 3 3.5
AGEIN YEARS
intelligence, verbal, social, and motor.
Verbal
5
oOz Gifted<*5LeeenEEE OnE MOON NCEE D EDR EE eer e rE E EEE EEE ee bed
:é 7 RaaE00
< NongiftedMB aMcARcstcnetniet
34 L 1 1 L 1 i
1 1.5 2 2.5 3 3.5
AGE IN YEARS
Motor
5
oO<=<Bennetree brn etter b bene ee ees
x |Gifted
Bb occgee cece ccc cess DN Goss cecepppetffeegicccc renin
a
< Nongifted=BBceEEREDE EE EERE EE Eee EEE Een cbt E btn bbe net n nn eed
24, i L 1 L L 1
~ 1 1.5 2 2.5 3 3.5
AGEIN YEARS
cs
¢€1ajdeyy

Intellectual and Cognitive Functioning 83
Table 3.6. Comparison of Means betweenGifted and Nongifted Children:Subscales of the Minnesota Child Development Inventory (MCDI)
Giftedness status
MCDIsubscale Gifted Nongifted Univariate F
Gross Motor 27.7 (2.1) 27.2 (2.3) 0.50
Fine Motor 32.8 (2.0) 31.4 (2.1) 6.48"Expressive Language 51.5 (2.3) 45.2 (5.5) 22,35Comprehension-Conceptual 46.8 (5.3) 36.9 (9.4) 18.57Situation Comprehension 33.3 (4.2) 31.5 (4.1) 2.58
Self Help 25.1 (4.9) 23.9 (4.4) 0.97Personal Social 28.4 (3.1) 27.3 (3.5) 1.74
Note. Standard deviations in parentheses. N = 92.p<.05. p<.001.
difference did not emerge on the numberscale; this is dueto a ceilingeffect for the gifted children.
Thesefindings suggestthat parents of children who becomegiftedor nongifted are accurate in their ratings of their children’s functioningand that parents are perceptiveof their children’s developmental posi-tion as early as infancy. This is supported by both the absolute (actualmeanlevel) and relativelevels (gifted vs. nongifted) of their ratings, andalso by the correspondenceof their ratings with the objective develop-mental test data presented above. The early advancementin verbalskills
Table 3.7. Comparison of Means between Gifted and Nongifted Children:Subscales of the Minnesota Preschool Inventory (MPI)
Giftedness status
MPI subscale Gifted Nongifted Univariate F
Self Help 15.8 (2.0) 15.8 (2.6) 0.02Fine Motor 16.7 (0.6) 15.2 (1.8) 12.31Expressive Language 17.7 (0.6) 16.5 (1.6) 9.29"Comprehension 33.1 (0.8) 29.1 (3.7) 23.12”Memory 14.0 (0.8) 12.4 (2.3) 8.52"Letter Recognition 7.0 (0.0) 5.6 (1.6) 16.80"Number Comprehension 7.7 (0.8) 7.3 (1.3) 1.40
Note. Standard deviations in parentheses. N = 103.p<.01. p<.001.

84 Chapter 3
is particularly interesting because such findings have been documentedin the retrospective anecdotal reports of the parents of gifted children inseveral studies as well as in the objective contemporaneous analysesconductedin this longitudinal investigation. Advancementin languagedevelopmentin the gifted comparedto the nongifted group was foundfrom infancy onward and onall of the objective developmentaltestsadministered in this study, that is, the Bayley items, McCarthy, TELD,and WISC-R.Thefact that parents perceive differences inintelligenceisalso in accord with the body of objective psychometric testing in thisstudy. Gifted children were perceived as advancedin social functioningwhenrated by parents, but not on the social skill items of the MCDI.However, advancementin social competence skills was also found inour study on the Preschool Interpersonal Problem-Solving test as wellas the Vineland Adaptive Behavior Scales administered duringthe earlyelementary grades. These results are presented and discussed further inChapter 5. The lack of difference found on the parent ratings of motorskills is in accord with the findings found on the McCarthy motorscale.Note that the MCDI and MPIdiscriminate between fine and gross motorskills whereas the McCarthy does not. Differences were found on thefine motor, but not gross motor, skill scales of the MCDI and MPI. Thefindings of differences in fine motorskills in these latter two scales mayreflect an element of perceptual-cognitive functioning in the fine motortasks. In view of the fact that there is a general or global advantageincognitive skills in the development of children who becomegifted, thefine motor tasks maybe tapping this quality which may not be the casein gross motor functioning which may rest more heavily or exclusivelyon coordination or neuromuscular development. The difference be-tween copying a pattern versus simply hopping on onefootillustratesthis point. In summary,the parents in our study were cognizantof theirchildren’s developmental status and their reports or perceptions werein accord with objective developmental testing. Parents’ viewsoftheirchildren’s development may be an important ingredient in the develop-mental outcomeof children, whethergifted or nongifted.
SUMMARY
1. Differences in level of intellectual performance between thegifted and nongifted children emerged on the psychometric testing at1.5 years and maintained continuity thereafter. However, the earliest

Intellectual and Cognitive Functioning 85
difference was found onreceptive languageskills at age 1 year. Differ-ences in receptive and expressive language skills were consistentlyfound from infancy onward.This wasfound on the objective assessmentas well as on contemporaneous parentratings. No differences werefound on object permanence or on the recognition memorytasks(cross-modal, visual, or tactual memory).
2. There is no characteristic pattern of intellectual performanceacross time. Each child revealed a unique ontogenetic age pattern. Asnoted, there are as many patterns as there are children, and the individu-ality of their course of development is what is characteristic of thesechildren. No individual pattern characterized the group pattern and viceversa—the group pattern was not representative of the individualscontained within.
3. There were reliable signs of potential intellectual giftednessinthe course of early development.In addition to advancedearly languagedevelopment, almostall infants who eventually becamegifted exhibiteda developmental index of 130 or greater between 1 and 2 years ofage.As preschoolers as well, these children were significantly more likelythan preschoolers who did not becomegifted to reveal a general cogni-tive index of 130 or greater between 2.5 and 3.5 years of age. Onspecificcognitive domainsofverbal, quantitative, perceptual-performance, andmemory, they werealso significantly more likely to haveat least one ormore indexat or abovethe 97th percentile. Lastly, a significantly lowerproportion of gifted children were untestable as comparedto the chil-dren whodid not becomegifted. This specific finding, which is in linewith results in Chapter4, indicates that children who becomegifted aremore strongly geared toward orienting themselvesto cognitive testingsituations.
4. Gifted IQ implies generalized high intelligence. Gifted childrenwere superior across an array of cognitive tasks beginningas early asthe preschool period. Gifted children tend to be cognitively wellroundedor adept. Globality rather than specificity in cognitive perform-ance characterizes intellectual giftedness.
5. Gifted and nongifted childrendid notdiffer substantially in theirprofiles of cognitive or intellectual abilities. In other words, there wasno particular pattern characteristic of either group. The emerging pat-terns(i.e., during the preschool years) in our study werecharacteristicof predominantly middle-class, white children performing at the aver-age or abovelevels of intelligence. Hence, we found no characteristicpattern of intellectual performance characterizing gifted children. Thedifferences we foundreside in the rate of development (during infancy)

86 Chapter3
as well as the level of performance thereafter. Gifted children progressat a higher intellectual level. They are advanced in their cognitivedevelopmentor reasoning.
6. Parents of infants and preschoolers who becomegifted werecognizantthat their children were advanced comparedto children of thesame age. This was notedparticularly in children’s intellectual or gen-eral developmental status and verbalskills, although differences werealso foundin social functioning, fine motorskills, and letter recognition
skills.

4
Education, Achievement, and
Motivation
ISSUES
This chapter presents findings concerning important aspects of theeducational histories, achievement, classroom performance, andmotivation of the gifted and nongifted children. The issues addressedin this chapter were based on our conceptualizations as well as severalraised in the literature reviewed in Chapter 1. These include:
1. Are there differences between gifted and nongifted children intheir chronological age at the time of kindergarten entry? Theliteraturereviewed suggests that gifted children tend to be younger thannongifted children in the samegradelevel. In this study we examinedchildren’s age at kindergarten entry, and also their grade levels atsubsequentages.
2. Are there any differences between gifted and nongifted childrenin the types of schools attended? This issue emerged not from theliterature per se, but because private education has become more preva-lent in recent years. We wanted to determineif gifted children tendedto be in one type of school more frequently than another.
3. From ages 5 through 8, do gifted and nongifted childrendiffer in their achievement? If differences occur, are these gener-alizable across achievementarea (subject areas), source of informa-tion (actual testing vs. teacher and parent report), and type ofachievement score (percentile, standard score, ratings)? The bodyof literature on the superior academic achievementofgifted childrenduring the school years provided the foundation for examining
87

88 Chapter 4
achievement of young children who are subsequently identified asgifted. The diversity of achievement information in the presentstudy provided a robust lookat this issue.
4, Examining intrachild achievement patterns, do gifted chil-dren evidence extremely superior achievement scores across subjectareas and over time? Our interest was to determine the extent ofindividuality or similarity of achievement patterns with regard toacademic subject areas duringthese early years. Is there a consistentpattern across gifted children, or do individual patterns of higherand lower achievement across subject areas tend to be moretypicalof the gifted?
5. Do gifted and nongifted children differ in their classroom behav-ior and other aspects of school functioning? Whereas the gifted areexpected to excel in their academic achievement,is this also likely to betrue regardingtheir classroom behaviors? Argumentsfor gifted childrenbeing either better or more poorly adjusted to school than nongiftedchildren could be advanced. To the extent that the gifted child’s needsare met or not metin the school environment, their adjustment could be
affected accordingly. Examining classroom adjustment in the presentstudy addsto the total picture of academic performancein gifted andnongifted children.
6. Are there differences between gifted and nongifted children intheir academic intrinsic motivation? Gifted children were expected to bemore intrinsically motivated than nongifted children. The literaturereviewed in Chapter 1 supports this expectation. We expectedthat gifted
children, who experience more academic mastery, would evidence more
academic intrinsic motivation.
7. Are gifted and nongifted children different in their perceptionof academic competence and academic anxiety? Theliterature reportedin Chapter 1 supports the expectation that gifted children will evidence
more positive perceptions of academic competence and lower academicanxiety compared to nongifted children.
8. Are there differences betweenthe gifted and nongifted groupson behaviors indicative of cognitive mastery motivation from infancythroughage 6? This study providesthefirst look at mastery motivationin gifted and nongifted children from infancy onward. Together withthe data on academicintrinsic motivation, the data provide a longitudi-nal, developmental account of mastery andintrinsic motivation pertain-ing to cognitive and academic tasks.

Education, Achievement, and Motivation 89
DESCRIPTION OF MEASURES
Educational History
Information regarding children’s age at kindergarten entry wascollected at the 5-year assessmentthrough a questionnaire administeredto the parent who accompaniedthe child to the lab (almost always themother). At the 7- and 8-year assessments, data concerning the child’scurrent gradelevel were obtained. The type of school the child attendedwas surveyedat age 7. Categories included public, private nonreligious,and private religious. Because the children in our study attend manydifferent schools, and becauseschools differ in their policies regardingidentification and provision of programsfor the gifted, we felt thatwhetheror not the child wasina special program would be an unreliableindicatorofhis or her giftedness. Hence, such datawill not be presented.
Achievement
Achievementtests were individually administered to each child atages 5 through 8. At age 5, the Achievementscale of the KaufmanAssessmentBattery for Children (KABC) (A. S. Kaufman & N. L. Kauf-
man, 1983) was administered. This scale consists of knowledge in nam-ing well-known faces and places, arithmetic, riddles, andreading/decoding. Standard scores are computed with a populationmean and standard deviation of 100 and 15, respectively.
At age 6, the Wide Range Achievement Test-Revised (WRAT-R)(Jastak & Wilkinson, 1984) was administered. Academic performanceinthe areas of reading, arithmetic, and spelling are appraised. Standardscores for the WRAT-R are 100 and 15 for the mean and standarddeviation, respectively.
The Woodcock-Johnson Psycho-Educational Battery (Woodcock &Johnson, 1977) was administered at ages 7 and 8. Children’s achieve-mentin reading, mathematics, and academic knowledge(science, socialstudies, humanities) was assessed. Percentile scores comparing childrenwith their appropriate grade population were analyzed.
Teachers’ andparents’ ratings of child achievement were gatheredfrom the teacher and parent versions of the Child Behavior Checklist,respectively (Achenbach, 1991a, 1991b). Teachers’ and parents’ ratingswere on a 5- and 4-pointscale, respectively, with higher scores corre-sponding to higher achievement. On the samechecklist, teachers alsorated children onthe sufficiency of their school functioning in four areas:

90 Chapter 4
how hard working they are, how well behaved they are, how much theyare learning, and how happytheyare. Ratings varied from 1 to 7, withhigher scores corresponding to more positive ratings.
Academic Intrinsic Motivation
At ages 7 and 8, children’s academic intrinsic motivation was
measured with the Young Children’s Academic Intrinsic Motivation Inven-tory (YCAIMD) (A. E. Gottfried, 1990). This instrument measures enjoy-ment of learning, an orientation toward mastery, curiosity, persistence,task endogeny, and learning challenging,difficult, and novel tasks (A.E. Gottfried, 1990). The YCAIMI, a downwardextension of the Children’sAcademic Intrinsic Motivation Inventory (CAIMI) (A. E. Gottfried, 1986a),
is a reliable and valid self-report scale in which children rate theiragreementor disagreement, on a 3-point scale, with statements such as“T like learning newthings in reading.” The content of the items on theYCAIMIwasderived from the CAIMIbut rewordedfor youngchildren.In addition, the numberof items was reduced, and the response format
wassimplified to be appropriate for youngchildren. At age 7, the areasof reading and math wereassessed with 10 items in each area, yieldinga score in reading, math, anda total score consisting of the sum of thereading and matharea. At age 8, the inventory was enlarged to a totalof 39 items in reading (12 items), math (12 items), school in general (12
items), and a scale dealing with the enjoymentof school work asrelatedto difficulty (3 items). In orderto facilitate comparability with the age-7YCAIMI, scores used for analyses at age 8 were reading, math, and atotal consisting of the sum ofall four age-8 subscales. For each scale, thetotals were divided by the numberof items comprising that scale toobtain averages, which ranged from 1 to 3. Higher scores correspond tohigher academic intrinsic motivation. These averages were used in theanalyses.
Academic Anxiety and Perception of Competence
At ages 7 and 8, children were asked to rate their anxiety andperception of competence on a 3-point scale, with higher scores indicat-ing greater anxiety and greater perception of competence, respectively.At age 7, children rated their anxiety in reading and math(e.g., “I worryabout reading (math) tests”) with three items in each area. At age 8,
anxiety items were presented for reading, math, and schoolin general(three items each). For perception of competence, children respondedto

Education, Achievement, and Motivation 91
two itemsat age 7: “I do well in reading (math)”; and to three itemsatage 8: “I do well in reading (math, school in general).” At ages 7 and8,total anxiety and perception of competence scores were computed, andthese were used in the analyses in addition to the reading and mathscores.
Cognitive Mastery Motivation
The Bayley Infant Behavior Record (Bayley, 1969) was adminis-tered from ages 18 through 72 months. Henceforth wewill refertoit asthe Bayley Behavior Record (BBR) because we extendedits use beyondthe infancy period. Ratings on the BBR reflect the child’s behaviorduring the administration of a standardized test, and are made by thetest administrator. Only items that metourcriterion of 85%interobser-ver reliability were retained for analysis (Bathurst & A. W. Gottfried,1987a). Also, some items were inappropriate at certain age levels. Theitems that were included are:
Item Ages Scoring
Examiner orientation 1.5-3.5yrs_ 1 (avoidance) to 5 (inviting)
Goal directedness 1.5-6 yrs 1 (no directed effort) to 9 (compulsive
absorption with a task until it is solved)
Object orientation: 1.5-3.5 yrs 1 (does notlook at or indicate interest inResponsiveness objects) to 9 (reluctantly relinquishestest
materials)
Object orientation: Play 1.5-3.5 yrs Plays imaginatively with materials: 1 (yes) 2 (no)
Attention span 1.5-6yrs 1 (fleeting attention) to 9 (long-continued
absorption with a toy, activity, or person)
Fearfulness 1.5-3.5 yrs 1 (accepts entire situation with no evidence of
fear) to 9 (strong indication of fear of thestrange)
Cooperativeness 15-6 yrs 1 (resists all suggestions or requests) to 9 (veryreadily and enthusiastically enters intosuggested gamesor tasks)
Emotional tone 15-6 yrs 1 (child seems unhappythroughout) to 9(radiates happiness)
Energy 1.5-3.5 yrs 1 (low level) to 9 (high level)
Activity 2.5-6 yrs 1 (stays quietin oneplace) to 9(hyperactive—cannotbe quieted forsedentary tests)

92 Chapter 4
Reactivity 2.5-3.5 yrs 1 (unreactive—seemsto paylittle heed to what
goes on) to 9 (very reactive—everylittlething seemsto stir him/her up)
Deviant behavior 1.5-3.5 yrs 1 (yes) 2 (no)
RESULTS
Educational History
The numbersof children in the gifted and nongifted groups whoentered kindergarten at age 5 are presented in Table 4.1. A chi-squareanalysis indicated that the gifted children were significantly moreJikelyto enter kindergarten at a younger age than nongifted children (y7 (1, N= 104) = 4.23, p = .04). Of the 20 gifted children includedin this analysis,90% entered kindergarten at age 5. Of the 84 nongifted children, 63%entered kindergarten at age 5. This is particularly important because thebirth months of the entire sample fall between September and earlyDecember 1978, and children entering kindergarten at age 5 would beamong the youngestin their class since the cutoff date for public schoolentry in California is generally within the initial week of December.Hence, our data are consistent with the Terman data in that the giftedchildren tendedto enter school at a youngerage than nongifted children.A child whois subsequently identified as giftedis likely to be displayingschool readinessearlier than nongifted children.
At age 7, children were either in grade 1 or 2. A chi-square analysiswas conducted on the numberof gifted and nongifted children in eachgrade level. A significant difference again emerged betweenthegifted
Table 4.1. Kindergarten Attendanceat 5 Years: Gifted versus
Nongifted Children
Kindergarten Giftedness status
attendance at age 5 Gifted Nongifted
Yes 18 (90%) 53 (63%)
No 2 (10%) 31 (37%)
Note. Column percentages in parentheses.

Education, Achievement, and Motivation 93
and nongifted (x* (1, N = 106) = 8.1, p < .01). For the gifted, 18 (90%) of20 children were in the second grade; for the nongifted, 45 (52%) of 86were in the second grade.Interestingly, the number of nongifted chil-dren in the higher grade placement was lowerthan the number who hadentered kindergarten at age 5, whereas for the gifted children, the samenumber wasin second grade as had entered kindergarten. Accordingtothe teachers’ reports gathered on the Child Behavior Checklist, eightofthe nongifted children were knownto have repeated anearlier grade,and noneofthe gifted children were knownto have repeated a grade.Results for grade placement and repeating grades werevirtually iden-tical at age 8. In sum,the gifted children were significantly more likelyto enter school at a younger age, and were not retained in a gradethrough age 8. Nongifted children weresignificantly less likely to enterschool at age 5, and weresignificantly more likely to repeat a gradebetween ages 5 and 8.
At age 7, parents reported on whethertheir children were enrolledin a public school, private religious, or private nonreligious school. Achi-square analysis was conducted to determineif gifted and nongiftedchildren differed with regard to their school type. The results werenonsignificant (y7 (1, N = 106) = 5.4, p = .07), indicating no significantdifferences in the types of schools the gifted and nongifted attended.
Achievement
Comparisons betweenthe gifted and nongifted children’s achieve-ment test scores from ages 5 through 8 are presented in Table 4.2.Analyses differed depending on whether there was one or multiplesubtests, and whether the same achievement test was repeated across
time. For the KABC, a ¢ test was used to compare the gifted versusnongifted since there wasonly one score at a single point in time;for theWRAT-R, a single-factor (Giftedness Status) MANOVA was used toanalyze the three subtests (Reading, Math, Spelling); and for the Wood-cock-Johnson,a 2 x 2 (Giftedness Status x Age: 7 and 8 years) repeated-measures MANOVAwasused with Ageas the repeated factor, and thethree subtests (Reading, Math, Knowledge) were the dependentvariables.
Results showed highly significant differences across all measure:and subtests. Acrossall measures, the meanofthe gifted group exceededthat of the nongifted groupbyatleast one standard deviation(using thestandard deviation of our sample combinedacross giftedness status).On the KABC,the significant t value is reported in Table 4.2. For the

94 Chapter 4
WRAT-R,giftednessstatus wassignificant (multivariate F(3, 98) = 15.14,
p < .001), indicating that across all three subtests, gifted children hadsignificantly higher scores. For the Woodcock-Johnson,giftednessstatuswassignificant (multivariate F(3, 100) = 12.24, p < .001), also showing
that the gifted children had higher scores on all three subtests, and atages 7 and 8. For each subarea on the WRAT-R and Woodcock-Johnson,
a univariate F test was conducted showing that each of these wassignificant, and these are presented in Table 4.2.
Comparisons betweenthe gifted and nongifted children’s achieve-mentas rated by their teachers and parents are presented in Table 4.3.Teachers’ and parents’ ratings were analyzed with separate 2 x 3 (Gift-ednessStatus x Age: 6, 7, and 8 years) repeated-measures MANOVAs
in which Age wasthe repeated factor. For teachers’ ratings, reading andmath were the multiple dependent measures, and for parents’ ratings,reading, math, writing, and spelling were the multiple dependent meas-
Table 4.2. Comparisons of Means between Gifted and Nongifted Children:AchievementTests
Giftedness status
Achievement Gifted Nongifted Univariate F
5 years
KABC? 125.2 (7.9) 108.7 (9.9) 6.956 years
WRAT-R*
Reading 119.5 (16.7) 96.9 (13.6) 38.9Spelling 114.5 (11.1) 94.9 (13.4) 34.6
Arithmetic 114.6 (8.0) 97.5 (14.8) 23.9"7 and 8 years
Woodcock-Johnson?
Reading 87.9 (16.3) 62.1 (24.5) 21.3Math 90.7 (10.2) 68.0 (23.4) 22.8Knowledge 90.5 (9.7) 62.6 (24.3) 27.8
Note. Standard deviations in parentheses. KABC = Kaufman AssessmentBattery for
Children; WRAT-R = Wide Range AchievementTest-Revised; Woodcock-Johnson =Woodcock-Johnson Psycho-Educational Battery. Ns = 105, 102, and 104 for analyses
with the KABC, WRAT-R, and Woodcock-Johnson,respectively.
“Standardscores analyzed. t test reported for KABC becausethere is no repeatedmeasurementonthis test.
Percentiles analyzed.yp <.001.

Education, Achievement, and Motivation 95
ures. For both teachers’ and parents’ ratings, a significant multivariatemain effect was obtained for Giftedness Status (F(2, 56) = 7.59, p <.01 and
F(4,75) = 4.37, p <.01, respectively). Univariate F tests wereall significantand are presented in Table 4.3.
Profile analysis was conducted for the WRAT-R and Woodcock-Johnsonto determineif the differences betweenthe gifted and nongiftedgroups wererelated to specific subject areas. Profile analysis is con-ducted using repeated-measures ANOVAin whichthe subscales of themeasureare treated as the repeated factor and Giftedness Status is thebetween-groupsfactor. A parallel profile was obtained as indicated bya nonsignificant interaction between the repeated and giftedness statusfactors. Hence, the differences between the gifted and nongifted chil-dren werethe same across the subject areas.
Overall, these data reveal consistent group differences, as early asage 5, in achievement as measured bydifferent tests, as reported byteachers and parents, and across all measured subareas. At an early age,the gifted groupis distinguishable from the nongifted groupin this way.
Individual achievement patterns were examined as well. An im-portant issue concernedthe likelihood of obtaining an extremely supe-rior achievementtest score given one’s giftedness status. An extremelysuperior achievement test score was defined as a score at or above 130
Table 4.3. Comparisons of Means between Gifted and Nongifted
Children: Teacher and Parent Ratings of Achievement across Ages6,7, and 8 Years
Giftedness status
Achievement Gifted Nongifted Univariate F
Teachers’ ratings
Reading 4.27 (.6) 3.43 (.9) 15.3Math 3.93 (.8) 3.46 (.7) 9.2
Parents’ ratings
Reading 2.85 (.4) 2.39 (.7) 13.1Math 2.74 (.4) 2.41 (.5) 10.8Writing 2.65 (.5) 2.27 (.6) 9.4"Spelling 2.75 (.4) 2.40 (.7) 7.4
Note. Standard deviations in parentheses. Teachers’ and parents’ ratings were obtainedfrom the teacher and parentversions of the Achenbach Child Behavior Checklist,respectively. Ns = 59 and 80 for teacher andparentratings, respectively.p<.0l. p<.001.

96 Chapter 4
on the KABC and WRAT-R,corresponding to the definition of gifted-ness usedin this study, whichis the second standard deviation or above.For the Woodcock-Johnsonthe 97th percentile and above wasused since
97.5 is the specific percentile at the second standard deviation and thelatter value was unavailable. Moreover, using the 97th percentile isconsistent with procedures used by the researchers at the Center forTalented Youth, Johns Hopkins University, to identify talented youth intheir national search (Center for Talented Youth, 1993).
Chi-square tests were conducted to determineif giftedness statuswas significantly associated with achieving a superior score. Separateanalyses were conducted for the KABC, WRAT-R, and Woodcock-Johnson.
In the first analysis, chi-square tests were conductedfor the follow-ing: (1) KABC: a score of 130 or greater; (2) WRAT-R:at least one of thethree subscale scores at 130 or greater; and (3) Woodcock-Johnson:at
least one of the six subscale scores (three at ages 7 and 8) at the 97thpercentile or greater. Results were highly significant, with chi-squarevalues presented in Table 4.4. Acrossall three tests, the gifted childrenweresignificantly more likely to obtain extremely superior scores. Therewas no particular subject-area pattern obtained for the Woodcock-Johnson; superior scores occurred evenly across all subtests. For theWRAT-R, however, seven of the eight superior scores werein reading.
Table 4.4. Associations between Giftedness Status and Attainment
of Extremely Superior Achievement Test Scores
Giftedness status
Extremely
superior score Gifted Nongifted x
KABCYes 8 (40%) 2 (2%)No 12 (60%) 80 (98%) 21.58
WRAT-RYes 8 (42%) 4 (5%)No 11 (58%) 77 (95%) 16.76
Woodcock-Johnson
Yes 14 (70%) 16 (19%)No 6 (30%) 68 (81%) 18.03
Note. Column percentagesin parentheses. df = 1 for all analyses.p< .001.

Education, Achievement, and Motivation 97
A second analysis was conducted to determineif giftedness statuswassignificantly associated with scoring between the 90th and 96thpercentile range. It was our judgmentthat the 90th percentile and aboveis indicative of high academic achievementbecauseit includes the upper10%. For the KABC and WRAT-R,a score of 120 wassetas the cutoff(inthe normal distribution a percentile of 90 is equivalent to a standardscore of 120), and this cutoff was similar to the percentile range reportedin the KABC and WRAT-R manuals (Jastak & Wilkinson, 1984; A.5.
Kaufman & N.L. Kaufman, 1983). For the Woodcock-Johnson, the cutoffscore wasthe 90th percentile. In these analyses, a child would have hadto achieve a single score between 120 and 129 for the KABC,at least oneof the three scores between 120 and 129 on the WRAT-R,or at least one
of the six scores betweenthe 90th and 96th percentile on the Woodcock-Johnson.
Chi-square analyses were conducted for each test separately. Forthe KABC, giftedness status was significantly associated with being inthe range extending from 120 to 129 (x2 (1, N = 102) = 10.83, p < .01). For
the WRAT-R, 2 (1, N = 100) = 13.78, p < .001). However, there was no
significant association between giftedness status and scores in the 90ththrough 96th percentile on the Woodcock-Johnson (x? (1, N = 104) = 5.43,
p > .05) (Bonferroni corrected alpha). Hence, gifted children showed avery early pattern of both extremely high and high academic achieve-mentat ages 5 and 6. At ages7 and 8,gifted and nongifted children werenot significantly different regarding scoring between the 90th and the96th percentile, but gifted children were significantly more likely toscore in the upper extreme of achievement.
A last analysis was conducted examiningthe association betweengiftedness status and obtaining multiple scores at these high and ex-tremely superior levels. This was conducted only for the WRAT-R andthe Woodcock-Johnson because these tests had multiple subscales. Forthe WRAT-R, there was no instance in whicha child had all three scores
at 130 or higher, and only one child achieved twoscoresat 130 or higher.Hence, achieving multiple extremely superior scores was rare on thistest. The association between giftedness status and achieving multiplescores at or above 120 was tested. This was also of relatively lowincidence, with only six and four children of the gifted and nongiftedgroups, respectively, scoring two out of three scores in that range. Thechi-square test was notsignificant (x? (1, N = 100) = .93, p > .05).
For the Woodcock-Johnson,there were six scores to use across ages7 and 8. Six different patterns were examined: three out of six scoresfalling at or above the 97th percentile; five or six out of six scores falling

98 Chapter 4
at or above the 97th percentile; three outofsix scoresfalling between the90th and 96th percentile; five or six of the six scores falling betweenthe 90th and 96th percentile; three out of six scores falling between the90th and 99th percentile; five or six of the six scores falling betweenthe 90th and 99th percentile. The rationale was to examine patternsfor which half were at the cutoffs, and to examine the more extremepattern in which almost all subtests were at that level. Results for allanalyses examining three outof six subtests weresignificant as reportedin Table 4.5, indicating that giftedness status was associated with obtain-ing these patterns. Again,the findingis particularly clear for the patternpertaining to scores above the 97th percentile. Almostall children whohad three of the six scores at that cutoff were gifted. However,acrossallanalyses, a gifted child was morelikely to evidence a pattern of threeoutof six scores in the specified ranges.
The analyses examining the incidence of five or six subscoresfalling at the specified ranges showed an extremely low incidence. Forthe 97th percentile and above, only three of the gifted and one of thenongifted had such a near-perfect pattern; for the analyses examiningscores between the 90th and 96th percentiles, only two gifted and onenongifted child obtained five or six scores in that range. Noneofthe chisquares for these analyses was significant. However, in examining theentire range extending from 90th to 99th percentile, giftedness statuswassignificantly associated with obtaining five orsix scores as reportedin Table 4.5, which revealed that of the 17 children who hadthis pattern,13 of them were gifted. Hence, if a child evidences a pattern of highachievementacross subtests, and across age, there is an increased like-lihoodthatthe child is intellectually gifted.
In examiningeach child’s pattern on the Woodcock-Johnson,it wasapparent that the patterns wereall different and showed noclearcutsubject-area concentration. While the WRAT-R did show a concentra-tion of extreme scoresin reading, this was notreplicated at ages 7 and8, and it is impossible to determineif this concentration was dueto ageor thetest itself. Therefore, it seems that it ismore important to examineany extremely high score, rather than an extreme score in a particularsubject area, as a sign of potential intellectual giftedness in children.
Whatdothese patternsindicate? First, and foremost, much priorto children’s identification as gifted in our study, and by schools ingeneral, the achievementofgifted children was morelikely than thatofnongifted children to fall in the extremely high range. At ages 5 and 6,almost half of the gifted children scored at 130 or above on the KABCand WRAT-R. At ages 7 and 8, 70%of the gifted had at least one score

Education, Achievement, and Motivation 99
Table 4.5. Associations between Giftedness Status and Attainment of MultipleHigh and Extremely Superior AchievementTest Scores: Woodcock-Johnson
Giftedness status
Achievementtest score Gifted Nongifted x
97th to 99th percentile: 3 out of 6 scores
Yes 10 (50%) 2 (2%)
No 10 (50%) 80 (98%) 31.3790th to 96th percentile: 3 out of 6 scores
Yes 6 (30%) 7 (8%)
No 14 (70%) 77 (92%) 27.7390th to 99th percentile: 3 out of 6 scores
Yes 16 (80%) 12 (14%)
No 4 (20%) 72 (86%) 32.4790th to 99th percentile: 5 or 6 out of 6 scores
Yes 13 (65%) 4 (5%)
No 7 (35%) 80 (95%) 38.57Note. Column percentages in parentheses. df = 1 forall analyses.
p <.001.
at or above the 97th percentile, whereas only 19%of the nongifted groupfell in that range. Moreover, 50%of the gifted had half of their scores inthe extremely superior range, whereas only 2% of nongifted childrenhad sucha pattern. The gifted were also significantly morelikely to havefive or six subtests on the Woodcock-Johnsonfall above the 90th percen-tile, with 65%of thegifted, and only 5%of the nongifted showingthispattern. Hence, it can be concludedthat overall, the gifted show a strongpattern of high and superior achievementacross measures and subtests.
However, the conclusion needs to be elaborated. There werefive
gifted children who showed noscore in the extremely superior rangealthough they did have scores betweeneither 120 and 129 or the 90th to96th percentile. Further, there was no specific age at which high andextremely high achievement patterns occurred exceptthat the incidenceof extreme scores increased across ages 7 and8.If a particular age hadbeen chosen at which to examinethe occurrence of extremely superiorscores, notall of the gifted children would haveobtained thatcriterion.Overa 3-year period, 75%of the gifted scored at that level at least once.
Hence, while it is highly likely that a child whois later identified asintellectually gifted will evidence at least one achievementtest score inthe extremely superior range, there is no specific age or subject area

100 Chapter 4
characteristic of this occurrence. For identification purposes, it would bewise to examinechildren’s early achievementtest histories over time tosearch for a single incidence of extreme scoring as an indication ofpotential intellectual giftedness. These scores may occur as young as age5 on highly reliable and valid measuresas usedin this study.
Theoretically, these data indicate the uniqueness of each giftedchild. Our findings are consistent with those of Roedell et al. (1980) inthat notall gifted children evidenced superior achievement, althoughasa group thegifted are significantly stronger in achievement. Further,these results for achievementare consistent with our findingsfor intel-ligence in infancy and early childhood. In both the achievement andintellectual domains as reported in Chapter3, gifted childrenarelikelyto evidence at least one superior score, and the group as a whole issignificantly higher. Therefore, instead of expecting superior achieve-mentor intellectual performancefor the gifted at a single measurementtime and measure, it maybe more developmentally appropriate to adopta repeated assessment approach.
Classroom Behavior and School Functioning
Teachers’ ratings of children’s functioning as gathered from theirresponses to the Child Behavior Checklist were analyzed with a 2 x 3(Giftedness Status x Age: 6, 7, and 8 years) repeated-measures MA-NOVAin which Age was the repeated factor. Multiple dependentmeasures were teachers’ ratings of children’s behaviorsin the followingareas: hard working, well behaved, learning adequacy, and happiness.A significant, multivariate, main effect for Giftedness Status was ob-tained (F(4, 51) = 3.74, p < .01). Univariate F values are presented in Table4.6. Gifted children were rated as significantly harder working,betterbehaved, and learning morethan the nongifted. However,the gifted andnongifted werenotsignificantly different on the happiness rating. Bothgroups of children tended to be slightly above average in this latterrating. Regarding the other ratings, the mean for the gifted is about 6(somewhat more than average), and the mean for the nongifted isbetween 4 (average)to 5 (slightly more than average).
Academic Intrinsic Motivation
Children’s scores on the Young Children’s Academic IntrinsicMotivation Inventory at ages 7 and 8 were analyzed with a 2 x 2
(Giftedness Status x Age: 7 and 8 years) repeated-measures MANOVA

Education, Achievement, and Motivation 101
Table 4.6. Comparisons of Means between Gifted and Nongifted
Children: Teachers’ Ratings of School Functioning across Ages6,7,
and 8 Years
Giftedness status
Teachers’ ratings Gifted Nongifted Univariate F
Hard working 5.58 (1.1) 4.47 (1.6) 8.26"
Behavior 5.80 (1.2) 4.62 (1.6) 9.48
Learning 6.08 (0.8) 4.89 (1.4) 13.07
Happy 5.41 (1.1) 4.92 (1.2) 3.04
Note. Standard deviations in parentheses. Ratings based on the teacher versionof the
AchenbachChild Behavior Checklist. N = 56.
"p < .01. "p < .001.
with Age as the repeated measure. The multiple dependent measures
were Reading and Math subscales. A separate repeated-measures
ANOVA,utilizing the same design, was conducted with the total moti-
vation score as the dependent measure. Analyses were conducted on thescale averages, rather than the sum of the raw scores within the scales,
because the total numberof items comprising the scales differed at ages
7 and 8. A significant maineffect for Giftedness Status was obtained for
the subscale and the total score analyses (multivariate F(2, 100) = 3.85, p
= 02, and univariate F(1, 101) = 5.46, p = .02, respectively). Univariate F
tests for reading and mathare reported in Table 4.7. Gifted children hadsignificantly higher intrinsic motivation scores in reading, and for theTotal score, but gifted children’s intrinsic motivation for math was not
significantly higher than nongifted children’s.
Table 4.7. Comparisons of Means between Gifted and Nongifted
Children: Academic Intrinsic Motivation across Ages 7 and 8Years
Giftedness status
Motivation Gifted Nongifted Univariate F
Reading 2.82 (.3) 2.62 (.4) 7.66Math 2.66 (.3) 2.60 (.4) 63Total 2.74 (.2) 2.59 (.3) 5.46
Note. Standard deviations in parentheses. N = 103."p <.05.p<.01.

102Chapter4
Academic Anxiety and Perception of Competence
Findings for academic anxiety and perception of competence wereconsistent with those obtained for academic intrinsic motivation. A 2 x2 (Giftedness Status x Age: 7 and 8 years) repeated-measures MANOVAwas conducted on the reading and math itemsfor anxiety and percep-tion of competence separately. Scale averages were used. For bothanxiety and perception of competence, the main effect for GiftednessStatus wassignificant (multivariate F(2, 100) = 6.58 and 4.92, p < .01,foranxiety and perception of competence, respectively). Univariate F testsrevealedsignificant differences between the gifted and nongifted acrossreading and mathfor anxiety, andin reading for perception of compe-tence. Thetotal scores for anxiety and perceptionof competence wereanalyzed with separate 2 x 2 (Giftedness Status x Age: 7 and 8 years)MANOVAs. Giftedness Status wassignificant in both analyses, as re-ported in Table 4.8. Univariate F values and group meansforall analysesare reported in Table 4.8. The gifted had significantly lower anxiety, andsignificantly more positive perception of their academic competence,than the nongifted acrossall measures except perception of competencein math. Combined with the results reported for academic intrinsicmotivation, the gifted children are significantly more motivated, lessanxious, and perceive their academic performance more positively than
Table 4.8. Comparisons of Means between Gifted and NongiftedChildren: Academic Anxiety and Perception of Competence across
Ages 7 and 8 Years
Giftedness status
Gifted Nongifted Univariate F
Academic anxiety
Reading 1.18 (.4) 1.53 (.6) 12.377"Math 1.33 (.4) 1.63 (.6) 8.87.Total 1.25 (.3) 1.56 (.5) 11.12"
Perception of competence
Reading 2.95 (.2) 2.70 (.5) 9.41"Math 2.80 (.4) 2.64 (.6) 2.31Total 2.88 (.2) 2.68 (.4) 7.64
Note. Standard deviations in parentheses. N = 103.p<.0l. p<.001.

Education, Achievement, and Motivation 103
nongifted children. However,their perceptions were stronger in reading
than in math.
Cognitive Mastery Motivation: Infancy through Age 6
Examiners’ ratings of each of the behaviors assessed onthe Bayley
Behavior Record were analyzed with separate repeated-measures
ANOVAs. Asnotall measures wererated at each age, it was necessary
to conduct analyses separately for the individual measures. The be-
tween-groupsfactor in each of the analyses was Giftedness Status. The
repeated-measures factor was Age, with a different age span included
for each measure as indicated in parentheses in Table 4.9. Univariate
Fs are reported in Table 4.9. As can be seen, the gifted and nongifted
children differed significantly on several of the variables. The gifted
evidenced significantly more goal directedness (task absorption), ob-
ject orientation (interest in test materials), attention span (absorption
in task), cooperativeness with examiner(enters into tasks enthusiasti-
cally), positive emotional tone (happiness), and reactivity to test ma-
terials. They were significantly less fearful in the testing situation.
There were nosignificant differences in examiner orientation, energy,
and activity between the gifted and nongifted. Object orientation (play)and deviant behavior were scored dichotomously. For each of these
items, a 2 x 2 (Giftedness Status x Yes/No) chi-square analysis wasconducted at each age it was measured. Noneof the analyses provedto be significant, indicating no differences between the gifted andnongifted on these measures.
These findings are noteworthy because they indicate specific be-haviors that differentiate the gifted and nongifted as early as 18 months.In particular, the differences obtained for goal directedness, attention
span, object orientation (interest in test materials), and reactivity pro-vide evidence for the existence of a core of behaviors supportive ofcognitive-motivational differences between gifted and nongifted chil-dren from infancy through6 years. Other items suggest a more positiveaffective responseto the tester and testing situation. Whereas tempera-mental differences betweenthe gifted and nongifted children were notobtained on other measures in the present research, as reported in
Chapter 5, the findings reported in this chapter are more specific to thetesting situation rather than being indicative of more general tempera-mental variables. These data strongly suggest that the gifted orient

104Chapter4
Table 4.9. Comparisons of Means between Gifted and NongiftedChildren: Bayley Behavior Record
Giftedness status
Behavior
(ages assessed) Gifted Nongifted Univariate F
Examinerorientation 3.81 (0.7) 3.43 (0.9) 5.81(1.5-3.5 yrs)
Goaldirectedness 6.08 (1.2) 5.00 (1.5) 23.16(1.5-6 yrs)
Object orientation 6.62 (0.8) 5.75 (1.5) 24.137"(1.5-3.5 yrs)
Attention span 6.37 (1.2) 5.41 (1.6) 16.93"(1.5-6 yrs)
Fearfulness 1.44 (0.8) 2.05 (1.6) 7.33"(1.5-3.5 yrs)Cooperativeness 6.63 (1.6) 5.51 (1.8) 17.87(1.5-6 yrs)
Emotional tone 7.00 (1.0) 6.32 (1.5) 12.07(1.5-6 yrs)
Energy 3.14 (0.7) 3.28 (0.6) 1.67(1.5-3.5 yrs)Activity 5.00 (1.1) 5.06 (1.4) 76(2.5-6 yrs)
Reactivity 6.26 (1.1) 5.13 (1.1) 20.61"(2.5-3.5 yrs)
Note. Standard deviations in parentheses. Ages at which the items were administeredare indicated in parentheses directly beneath each behavior. Items were included atages for which they could be reliably measured. Repeated-measures ANOVAs wereconductedacross the ages for each item. Ns varied from 86 to 99." < O1. "p< .001.
themselves to cognitive tasks more enthusiastically at an early age, andsuggest that such behaviors may be used to identify children whoreadily engage themselvesin suchtasks.It is suggested thatit is possibleto identify “gifted motivational behaviors.” In particular, goal directed-ness, attention span, object orientation, and stimulus reactivity behav-lors are prime candidatesfor identification of such children. Moreover,these behaviors are conceptually relevant to theories of intrinsic moti-vation (A. E. Gottfried, 1986b), and factor analyses conducted byMatheny(1980) have identified these behaviors as a cognitive-masterycluster.

Education, Achievement, and Motivation 105
SUMMARY
Overall, the picture of gifted children that emerges from this
research is that they are notonly higher on academic achievement, but
also more motivationally engaged in their learning than nongifted chil-
dren. Specific findings include the following:
1. Gifted children entered kindergarten at a younger age and were
not retainedat a later grade.
2. There were nodifferences betweengifted and nongifted children
in type of school attended.
3. The academic achievementof gifted children wassignificantly
higherthanthat of nongifted children. These latter findings occur across
different measures, subject areas, type of assessment, and across time
from ages 5 through8.4. Gifted children were significantly more likely than nongifted
children to obtain at least one extremely superior achievementtest score
between ages 5 and8.
5. Gifted children are viewed by their teachers as significantly
harder working, learning more, and better behaved than nongiftedchildren. Gifted and nongifted children did not differ in teachers’ ratingsof being happy. Overall, gifted children appear to be more adapted tothe demandsof school than nongifted children.
6. Gifted children evidence stronger academic intrinsic motivationat ages 7 and 8 than nongifted children. Hence, compared to nongiftedchildren, gifted children evidence stronger enjoymentof learning,ori-entation toward mastery, curiosity, persistence, task endogeny, andlearning challenging, difficult, and novel tasks.
7. Gifted children have a more positive perception of academiccompetence, and lower academic anxiety, than nongifted children.Hence, gifted children are more confident in their educational accom-
plishments than nongifted children.8. As early as infancy, and throughthe early childhood period, the
gifted show significantly greater goal directedness, object orientation,
attention span, cooperativeness, positive emotional tone, and responsiv-ity to test materials.
9. It was suggested that the processof early identification of giftedchildren maybenefit from examining motivationally relevant behaviors
during testing, such as long attention span, persistence, and positiveorientation toward materials, and that achievementtest histories should
be examined for the occurrenceof at least one extremely superior score.

106Chapter4
Our data are consistent with a body of evidence revealing thateducational endeavors and academic achievement are particularstrengths for gifted children. Moreover, gifted children appear to bemore favorably adapted than nongifted children to the demandsoftheeducational environmentcognitively, motivationally, and behaviorally.

5
Behavioral Adjustment, Social
Functioning, and Temperament
ISSUES
In this chapter, the behavioral and emotional adjustment, social
functioning, and temperamentalcharacteristics of gifted and nongiftedchildren during infancy and early childhood are investigated todetermine whether intellectual giftedness was associated with theseareas. Three major issues were examined:
1. The gifted were stereotypedat the turn of the twentieth centuryas maladjusted; current stereotypesof the gifted continue to include anelementof aberrant behavior. Therefore, the first issue addressed relatesto the issue of behavioral adjustment:Is intellectual giftedness associ-ated with increased or decreased behavioral and emotional competencyduring the early years of development,oris it unrelated to these aspectsof functioning?
2. In Chapters 3 and4, gifted children revealed superior perform-ance in intellectual and academic performance during the early years.In this chapter, we examine whether these superior cognitive skillsgeneralize to children’s social functioning. Three areas of social func-tioning were investigated: social cognition, personal and social compe-tence, and the nature of children’s social interactions. With respect to
social cognition, we examined problem solving in hypothetical interper-sonal conflictual situations. The question posed is whether the socialreasoning of gifted children is elevated compared to their nongiftedcohort.
107

108Chapter 5
The next issue addressed in the area of social functioningis per-sonal-socialsufficiency. The questionsinvestigated included the follow-ing: Do gifted compared to nongifted children differ in theirpersonal-social sufficiency? Is it the case that gifted children are ad-vancedin self-help responsibilities, interpersonal communication, andsocialization skills?
Somehave suggested that althoughgifted children maybeable toreason at higher levels aboutsocial issues or dilemmas,their sociabilityor interactions as a group are indistinguishable from their nongiftedpeers. On the contrary, stereotypesof the gifted as socially isolated arestill prevalent. Thus, a final issue addressed with respect to socialfunctioning is whether gifted and nongifted children differ in theirsocialization preferences with respect to play behavior, such as playingalone or playing with older children.
3. The third major issue addressed relates to temperament. Tem-peramenthas been demonstratedtorelate to teacher ratings of academicachievement and standardized achievementtest scores, perhaps be-cause certain behavioralstyles facilitate the acquisition of information.Do children who becomegifted exhibit similar or different temperamentcharacteristics as a group in comparisontotheir nongifted peers duringearly development?
DESCRIPTION OF MEASURES
Behavioral and Emotional Adjustment
A variety of scales and informants wasutilized to assess children’sbehavioral and emotional adjustment. Children’s adjustment was as-sessed annually at ages 3 through8 years using a combinationof parentand/or teacherreports.
Eyberg Child Behavior Inventory
The 36 items on this inventory assess a wide range of parentalconcerns (Eyberg, 1980). The parent respondsto each item using tworesponseformats.First, the parent indicates the frequency of occurrenceof each behavior on a scale from 1 (“never occurs”) to 7 (“alwaysoccurs”). These ratings are summedto yield an overall problem behaviorintensity orfrequency score. Second,the parent indicates by circling “yes”or “no” whether the behavior is a problem for him or her. The “yes”

Behavioral Adjustment, Social Functioning, and Temperament 109
responses are counted to obtain thetotal problem score. This scale was
administered at the 3.25-year homevisit.
Preschool Behavior Questionnaire
This behavior checklist, completed by the parent at the 3.5-year
assessment,consists of 30 items. It yields scores for three scales(hostile-
aggressive, anxious, and hyperactive-distractible) and a total behavior
disturbed score (Behar & Stringfield, 1974).
Child Behavior Checklist
The Child Behavior Checklist is a well-knownscale in the field of
developmental psychopathology. Twoversionsof the scale were util-
ized: Parent Report Form and Teacher Report Form. Each version con-
sists of 112 problem items; for each item, the respondentcircles 0 (“not
true”), 1 (“somewhat or sometimestrue”), or 2 (“very true oroften true”)
aboutthe target child. Ratings are summedto yield scores representingtwo broadband diagnostic categories, designated as internalizing andexternalizing, representing overcontrolled and undercontrolled behav-ioral difficulties, respectively (Achenbach, 1991a, 1991b). Also, a total
behavior problem score is obtained. The Parent Report Form wasad-ministered whenchildren were ages4, 5, 6, 7, and 8 years. The TeacherReport Form was administered at ages 6, 7, and 8 years (once childrenhad entered formal schooling) and is similar in format and scoring tothe parent version. Although manyidentical items are present on boththe parent and teacher report forms, there are also many unique itemsthat relate to behaviors specific to the home and classroom settings,
respectively.
Social Functioning
Social functioning was assessed in three ways: (1) by directlyexamining children’s social reasoning skills during the preschool pe-riod, (2) through parent reports of the child’s personal and social suffi-ciency skills at ages 6 and 8 years, and (3) by parent and teacher reportson specific items relating to children’s social functioning on the ChildBehavior Checklist at ages 4 through 8 years (parent) and 6 through 8years (teacher).

110Chapter 5
PreschoolInterpersonal Problem-Solving Test
This test assesses the ability of the child to generate alternativesolutions to two interpersonalconflict situations, one involving a con-flict with mother and the other a conflict with another child (Shure &Spivak, 1974). A higher score signifies a greater numberofalternativesgenerated by the child. This scale was administered to children at the3.5-year assessment.
Vineland Adaptive BehaviorScales
This established scale, which assesses personal sufficiency, socialfunctioning, and adaptability, yields three domain scores: Communica-tion, Daily Living Skills, and Socialization; the combination of thesethree scales yields the Adaptive Behavior Composite (Sparrow,Balla, &Cicchetti, 1984). These scales are standardized with a mean of 100 (SD =15); standard scores were analyzed. The Vineland Adaptive BehaviorScales semistructured interview was conducted with a parent (almostexclusively the mother) when children were 6 and 8 yearsold.
Temperament
The temperament measures utilized in the FLS were based on thebehavioral-style framework developed by Thomas, Chess, and col-leagues in the New York Longitudinal Study (Thomasetal., 1968).Within this framework, temperamentis defined as the how of behavior,as opposedto the why, the what, or the how well of behavior. Based ontheir interviews with parents of young children, Thomaset al. deline-ated nine temperament dimensionsandthree temperamentalconstella-tions. The “difficult” temperament constellation is perhaps the mostwidely used concept in the temperamentliterature, having at its corefrequent and intense expression of negative affect (cf. Bates, 1980; Prior,1992). Temperamental difficultness was assessed when children were1.5 years of age; beyondtheinfancy period, the nine NYLS temperamentdimensionsservedasthe level of analysis. The nine dimensionsin theThomas and Chess modelincludeactivity level, rhythmicity, approach,adaptability, negative mood, intensity, distractibility, threshold, andpersistence. These were described in more detail in Chapter1.
Temperament characteristics were assessed at six points in timeduring the infancy, toddler, preschool, and early school years usingfivedifferent temperamentscalesas required by agelevel. The temperament

Behavioral Adjustment, Social Functioning, and Temperament 111
scales utilized possess acceptablelevels of reliability (Hubert, Wachs,
Peters-Martin, & Gandour, 1982). In our research program, we have
foundparental reports to show stability across the infant, preschool, and
early elementary years and convergent validity across inventories
(Guerin & A. W. Gottfried, in press-a, in press-b).
Infant Characteristics Questionnaire (ICQ)
This inventory, designed specifically to assess difficult tempera-ment, consists of 32 items, each of whichis rated by the parent ona scalefrom 1 (optimal temperamenttrait) to 7 (difficult temperamenttrait).
Four scores, representing scales identified through factor analysis, areobtained: I. Fussy/Difficult/Demanding; II. Unadaptable; II. Persist-ent; IV. Unsociable (Bates, Freeland, & Lounsbury, 1979). Hubertetal.
(1982) noted that the ICQ possessed high test-retest reliability for thedifficult factor and an acceptable level of internal consistency. Internalreliability coefficients in our sample were .82, .67, .59, and .53, respec-tively. This inventory was administered when the children were 1.5years of age. |
Toddler TemperamentScale
The Toddler Temperament Scale was designed to assess tempera-ment in 1- to 3-year-old children (Fullard, McDevitt, & Carey, 1984).Using a scale from 1 (“almost never”) to 6 (“almost always”), the parentindicates for each of 97 items how often the child exhibits a givenbehavior. The scale yields nine temperament scores corresponding tothe nine NYLS temperament dimensions. Standardization researchdemonstrated satisfactory reliability for the scale. Coefficient alphasranged from .53 to .85 with a median of .72 for the nine temperamentdimensions;test-retest reliabilities over a 1-monthinterval ranged from.69 to .89 (median r = .81). In this sample, coefficient alphas ranged from.48 to .86 with a median r = .64. The Toddler Temperament Scale wasadministered at the 2-year assessment.
Colorado Child Temperament Inventory
This parent report inventory assesses six temperament charac-teristics derived through factor-analytic methods: sociability, emotion-
ality, activity, attention span/persistence, reaction to food, andsoothability (Buss & Plomin, 1984). Thirty items are rated from 1

112Chapter 5
(“strongly disagree”) to 5 (“strongly agree”). It was completed whenchildren were 3.5 years ofage.
BehavioralStyle Questionnaire
This 100-item questionnaire was designed to assess temperamentof 3- to 7-year-olds;it is also completed by the parent (using the sameresponse format as the Toddler TemperamentScale) and yields scoresrepresenting the nine temperament dimensions delineated by Thomaset al. (McDevitt & Carey, 1978). In the standardization of the scale,coefficient alphas ranged from .47 to .84 for the nine dimensions (totalinstrument alpha = .84). For the present sample, coefficient alphasaveraged separately for each of the nine dimensions across the threeassessmentages (3, 3.5, and 5 years) ranged from .46 to .82 witha medianof r = .69.
Middle Childhood Temperament Questionnaire
This questionnaire, designed to assess temperamentin 8- to 12-year-olds, follows the same format as the Toddler TemperamentScaleand Behavioral Style Questionnaire; the 99 items assess the nine NYLStemperament dimensions with the exceptionof biological rhythmicity,which wasreplaced with a dimension labeled predictability/quality oforganization (Hegvik, McDevitt, & Carey, 1982). There is conceptualoverlap between the predictability dimension and biological rhyth-micity in that both assess regularity of behavior; however, predictabilitydeals with task performance andsocial behavior rather than biologicalfunctioning. Coefficient alphas ranged from .71 to .87 with a median of-81 for the nine dimensions (Hegviket al., 1982). The Middle ChildhoodTemperament Questionnaire was completed by a parent during the8-year assessment.
RESULTS
Behavioral and Emotional Adjustment
There are conflicting reports in the literature as to whether giftedchildren exhibit superior, normal, or poorer adjustment compared tochildren with averageintelligence. As noted in Chapter1, early stereo-types ofthe gifted as emotionally unstable, socially ineptsocial isolates

Behavioral Adjustment, Social Functioning, and Temperament 113
have not been substantiated through empirical investigation. Nor has
the notion that genius is linked to insanity. However, there are no
studies of young children who becomeintellectually gifted. Conse-
quently, the behavioral, emotional, social, and temperamental antece-
dents of children who becomegifted are unknown.
Overall, our results showed that the behavioral and emotional
adjustmentof the gifted and nongifted groups was indistinguishable.
The gifted group demonstrated neither better nor worse behavioral and
emotional adjustment than their nongifted age-mates.
Behavior problemswerefirst assessed during the preschool yearsusing the Eyberg Child Behavior Inventory (3.25 years) and the Pre-school Behavior Questionnaire (3.5 years). Although the nongiftedgroup wasscored higher by parents on behavior problem intensity (M= 114.2) and numberof problems (M = 5.6) than the gifted group (Ms =103.6 and 4.0, respectively), a one-way MANOVAwith the two depend-ent variables indicated no overall significant difference between giftedand nongifted groups on the Eyberg Child Behavior Inventory (mullti-
variate F(2, 102) = 2.01, p > .05). Burns, Patterson, Nussbaum, and Parker
(1991) recently published meanintensity and problem scores for theEyberg Child Behavior Inventory based on a large sample of parent or
guardian responsescollected in five outpatient pediatric clinics in fourNorthwestern states. Data from ourgifted and nongifted groups and theBurnset al. sample are displayed in Figure 5.1. The Burnset al. samplecomprised over 1,300 children broughtinto clinics for checkupsor foratemporaryor chronic illness who were not being treated for a learning
disability or behavior problem. The frequency/intensity scores ofall
groupsare similar, with the gifted group averageslightly lower thanthat of the nonclinical group reported by Burnsetal.; the average for thenongifted group wasthe highestof the three. With respect to the Eybergproblem scores, all group averages were again quite similar, with thegifted-group average the lowest of the three groups.
The Preschool Behavior Questionnaire contains four scales, one of
which represents an overall total score. This total scale score was ana-lyzed with a t test; the remaining three scale scores were analyzed usinga one-way MANOVAwith the scales as the dependent variables. Resultsshowedthat the nongifted group wasrated slightly higher on all fourindexes, with means on total behavior disturbed, hostile-aggressive,
anxious, and hyperactive-distractible scales of 14.2, 5.6, 3.3, 2.6 for giftedchildren and 16.1, 6.6, 4.0, 3.2 for nongifted children, respectively. Aswith the Eyberg, no significant differences were detected between the

114 Chapter 5
120
100} --- Ei Gifted
Nongifted
so} ---
60} -
Mean
Score
40; ---
20} -
Frequency Score Problem Score
Eyberg Child Behavior Inventory
Figure 5.1. Average frequency and problem scores for gifted, nongifted, and normativegroups on the Eyberg Child Behavior Inventory.
two groups(total behavior disturbed scale, t(93) = 1.32, p > .05; remain-ing three scales, multivariate F(3, 92) = 0.88, p > .05).
Internalizing, externalizing, and total behavior problem meanscores on the Child Behavior Checklist are displayed in Table 5.1 (parentreport) and Table 5.2 (teacher report). An inspection of these dataindicated that the distributions of scores for both groups were positivelyskewed(i.e., scores clustered at the lower end of the distributions). Thiswould be typical and expected on
a
scale assessing the occurrence ofpsychopathology because mostindividuals in this study were free ofbehavioral and emotional problems. Due to the extremity of the skew,the nonparametric test statistic Mann-Whitney U wasused to analyzethe internalizing, externalizing, and total behavior problem scores ofgifted versus nongifted groups. There was no evidence of significantgroup differences in behavior problems,either from parent or teacherreports(all ps > .05). The gifted and nongifted groups were also com-pared in terms of the numberof children displaying scores above theclinical cutoff level (98th percentile) on the total behavior problem scoreat each age. Table 5.3 displays the percentage of children in the normaland clinical behavior problem ranges for the gifted and nongiftedgroups. As shownin Table 5.3, although the gifted group evidencedslightly lowerrates of problemsin theclinical range,all chi-squaretests

Behavioral Adjustment, Social Functioning, and Temperament 115
Table 5.1. Comparisons of Means between Gifted and NongiftedChildren: Child Behavior Checklist (Parent Report Form)
Giftedness status
Scale Gifted Nongifted
4 years (N = 92)
Internalizing 10.7 (8.6) 12.0 (8.0)
Externalizing 10.5 (7.2) 12.7 (8.8)
Total 25.7 (15.8) 29.6 (16.7)
5 years (N = 102)
Internalizing 9.1 (7.1) 9.9 (7.2)
Externalizing 7.9 (4.4) 9.3 (7.1)
Total 21.2 (12.1) 23.7 (14.3)
6 years (N = 99)
Internalizing 7.1 (5.0) 7.9 (6.9)
Externalizing 11.0 (5.2) 12.8 (9.6)
Total 20.1 (10.3) 23.9 (17.2)
7 years (N = 106)
Internalizing 6.9 (5.5) 9.2 (7.8)
Externalizing 10.8 (8.4) 12.4 (9.4)
Total 19.2 (13.3) 24.2 (17.9)
8 years (N = 104)
Internalizing 5.4 (5.4) 7.6 (6.9)
Externalizing 8.3 (7.7) 10.1 (8.7)
Total 16.3 (13.9) 19.9 (15.9)
Note. Standard deviations in parentheses. No between-groupsdifferences were
statistically significant; all ps > .05.
were nonsignificant. Despite these nonsignificant differences, examina-tion of the means reveals that without exception, behavior and emo-tional problem scores were consistently lower for gifted compared tonongifted children on the Parent Report Form.This wasalso true of theexternalizing and total behavior problem scores on the Teacher ReportForm. For teacher-reported internalizing problems, differences wereinconsistent in terms of favoring gifted or nongifted children.
In addition to the broadband internalizing and externalizing cate-gories, there are also eight narrow-band behavior problem scores on theChild Behavior Checklist. These scores reflect the following behaviorproblem categories: withdrawn, somatic complaints, anxious/de-pressed, social problems, thought problems,attention problems, delin-

116 Chapter 5
Table 5.2. Comparisons of Means between Gifted and NongiftedChildren: Child Behavior Checklist (Teacher Report Form)
Giftedness status
Scale Gifted Nongifted
6 years (N = 84)
Internalizing 5.3 (5.6) 4.6 (4.9)
Externalizing 8.2 (7.8) 11.6 (14.2)
Total 14.7 (13.7) 17.2 (17.3)
7 years (N = 85)
Internalizing 3.4 (3.8) 3.4 (4.1)
Externalizing 5.3 (7.3) 11.6 (15.2)
Total 9.3 10.6) 16.1 (18.8)
8 years (N = 92)
Internalizing 4.6 (5.2) 4.5 (5.0)
Externalizing 6.3 (7.1) 11.5 (13.5)
Total 11.9 (12.1) 17.2 (16.7)
Note. Standard deviations in parentheses. No between-groupsdifferences werestatistically significant; all ps > .05.
Table 5.3. Percentage of Gifted and Nongifted Children Scoring in Normaland Clinical Ranges on the Child Behavior Checklist (Parent and Teacher Forms)
Giftedness status
Gifted Nongifted
Age(yrs) Normal Clinical Normal Clinical x
Parent Report Form
4 83.3 16.7 83.8 16.2 0.00
5 100.0 0.0 91.6 8.4 0.65
6 100.0 0.0 88.9 11.1 1.06
7 95.0 5.0 89.5 10.5 0.11
8 95.0 5.0 91.7 8.3 0.00
Teacher Report Form
6 88.9 11.1 95.4 4.5 0.23
7 100.0 0.00 94.0 6.0 0.19
8 100.0 0.00 97.3 2.7 0.00
Note. Ns range from 92 to 106 for the Parent Report Form and from 84to 92 for the Teacher ReportForm. No between-groupsdifferences werestatistically significant; all ps > .05.

Behavioral Adjustment, Social Functioning, and Temperament 117
quent behavior, and aggressive behavior. Narrow-bandcategory scoresare obtained by summingthe0, 1, or 2 ratings given by respondents forthe items loading on the category. In order to compare gifted andnongifted groups on these narrow-band categories, average categoryscores were computed for each group. These means, along with thecutoff score separating the normal range from clinical behavior problemscores for each category, are displayed in Figure 5.2 for behavior prob-lems from 4 through 8 years (parent reports) and 6 through 8 years(teacher reports). Child Behavior Checklist normsdiffer slightly for boysand girls; cutoff scores displayed on these figures were averaged forboysandgirls. This approach was chosen because we wanted to com-pare the gifted and nongifted groups on the narrow-band categories, butdid not wish to base our comparison on the smaller groups that wouldresult if data were analyzed separately for males and females. As ourgifted and nongifted groups both hadsimilar proportions of males andfemales (see Chapter 6), we deemed this approach acceptable for pur-poses of examiningthe relative averages of the gifted and nongiftedgroupsto each other, as wellas to the normal-range cutoff. Onall figures,the results are striking in demonstrating two major findings: (1) thegifted and nongifted groups are not markedly different from each other,and (2) averages of both groupsare well below the normal-range cutoff.These results extend those of the broadband categories in showingthatgifted children exhibit similar levels of adjustmentto those of nongiftedchildren. On these eight narrow-bandcategories representing finer de-lineationsof internalizing behavior problems (withdrawn, somatic com-plaints, anxious/depressed) and externalizing problems (delinquentbehavior, aggressive behavior), the gifted and nongifted groups arestrikingly similar.
Hence, across three different measures of behavioral adjustment(Child Behavior Inventory, Preschool Behavior Questionnaire, ChildBehavior Checklist) and with both parents and teachers as informants,
there were nosignificant differences between gifted and nongiftedgroups from age 3.25 years to age 8 years. Our data indicate thatintellectually gifted children are neither advantaged nor disadvantagedin the behavioral and emotional adjustment realms during early child-hood comparedto their nongifted age-mates. Previous researchers haveshownthatgifted children are at least as well adjusted or evidence fewerbehavioral problemsthan children of average intelligence. Ludwig andCullinan (1984), who investigated teacher ratings of first- throughfifth-
grade gifted and nongifted children using the Behavior Problem Check-list, found that teachers reported fewer behavior problemsfor gifted

MeanScore
MeanScore
118 Chapter 5
Parent Report - 4 Years
25
m Gifted
Nongifted
2o}- -| Cut-off |-----------eeeeecee cee eee eee
ISPmeterr ee ee eee ere ee eee eer eee eee eee eee ee eee ee ee ee eee
10 p77 Tr errr es ere ene eee et ee : ss ees seers ssc eres ee ree ee is “scree rece ees oresenttet,
shinee] [fee foo : ree z=
Withdrawn Somatic Anxious! Social Thought Attention Delinquent AggressiveComplaints Oepressed Problems Problems Problems Behavior Behavior
CBCL Narrow Band Category
Parent Report - 5 Years
25
Gifted
fa Nongifted -20k- OCut-off pi...eeeeeeee cece cnc ce cece cece
Wp rr err ttt eeertere ee ee ee ee re eer meee meme reece eee eee eee een eee
tobe 2eeeeeeeeeeeeeeeeeeeees Be. oe eee cece cece eee: .
Brest cece] Bee ee ef Be ee ee el Re ee eet ee ee ee ee eee ee el Oe kee
Withdrawn Somatic Anxious/ Social Thought Attention Delinquent AggressiveComplaints Depressed Problems Problems Problems Behavior Behavior
CBCL Narrow Band Category
Figure 5.2. Averagescoresfor gifted and nongifted groups and normalcutoff scores on thenarrow-bandcategories of the Child Behavior Checklist (CBCL) Parent Report Form(4-8
years) and Teacher Report Form (6-8 years).

MeanScore
MeanScore
Behavioral Adjustment, Social Functioning, and Temperament 119
Parent Report - 6 Years
@ Gifted
EE] Nongifted
20r- -|O1Cut-off for rcrcteecee rene cece cece eee reece eee 1
Withdrawn Somatic Anx lous! Social Problems Thought Attention Delinquent AggressiveComplaints Depressed Problems Problems Behavior Behavior
CBCL Narrow Band Category
Parent Report - 7 Years
Gifted
Ei Nongifted
Somatic Anxious/ Social Problems Thought Attention Delinquent AggressiveComplaints Depressed Problems Problems Behavior Behavior
CBCL Narrow Band Category
than nongifted children. This is in line with our trend cited above, aswell as with better classroom behaviorof the gifted reported in Chapter4. Lehman and Erdwins(1981) reported that gifted third graders wereless aggressive and destructive and had feweracting-out behaviors thanthird graders of average IQ. Studying Israeli children in grades 4through 8, R. M. Milgram and N.A. Milgram (1976) reported less anxiety

MeanScore
MeanScore
120 Chapter 5
Parent Report - 8 Years&
@Gifted
El Nongifted
10} -----------------e eee eee ne anne ~ Rs
Withdrawn Somatic Anxious/ Social Problems Thought Attention
Complaints Depressed Problems Probiems Behavior Behavior
CBCL Narrow Band Category
Delinquent Aggressive
Teacher Report - 6 Years
@ Gifted
- Ei Nongifted ~Es —PF ]OCutoff frst e sess sess scscs cscs Bees recess eee e ne ad z
DOP mt ter rtette te ee ee ec ce ere eee ee ee ee ee ee eee eee el el eee ee ee eee
WSb oe eeceeeeeecceeeeeee cette guages te eeeeee ee eeeeeeee settee eee10}- . : _—
° Withdrawn | Somatic Anxious/ ” Social Problems Thought ‘Attention ° Delinquent Aggressive °Compiaints Depressed Problems Problems Behavior Behavior
CBCL Narrow Band Category
Figure 5.2. (continued)
and fewer indicators of psychological disturbance amonggifted com-pared to nongifted children. Gallucci (1988) found no differences be-tween normative data and parent, camp counselor, and teacher reportson the Child Behavior Checklist for gifted 12- to 16-year-olds. Lutharet

MeanScore
MeanScore
Behavioral Adjustment, Social Functioning, and Temperament 121
@ Gifted
| | Nongifted
“BREWithdrawn
SomaticComplaints
Teacher Report - 7 Years
Anxious! Social Probiems Thought Attention Delinquent Aggressive
Depressed Problems Problems Behavior Behavior
CBCL Narrow Band Category
Teacher Report - 8 Years
@Gifted
& Nongifted
Somatic
Compiaints
Anxious/ Social Problems Thought Attention Delinquent AggressiveDepressed Problems Problems Behavior Behavior
CBCL Narrow Band Category
al. (1992) reported that high-achieving gifted adolescents showed morepositive adjustment than age-mates notidentified as gifted.
In studies where the gifted have been found to exhibit superioradjustment, researchers have notedthat the selection of research Ppartici-pantsin the gifted group may have contributedto the findings (Ludwig

122 Chapter 5
& Cullinan, 1984; Pendarviset al., 1990). When a study involves com-paring children participating in a gifted program to those in a regulareducationalclassroom,thereis the possibility of referral (identificationor ascertainment)bias. Better-behaved children maybe selected to par-ticipate in gifted programs.It is possible that other equally gifted chil-dren with behaviordifficulties failed to be identified for participation inthe gifted program. An analogoussituation (although the inverse of theselection problem with respect to giftedness) has been observed in thelearning disabilities field with respect to dyslexia. Children who weredyslexic and also had problem behaviors were morelikely to be identi-fied for special education programming, while dyslexics with goodbehavior were more likely to be overlooked (S. E. Shaywitz, B. A.Shaywitz, Fletcher, & Escobar, 1990; see also Guerin, Griffin, A. W.Gottfried, & Christenson, 1993).
Because all children in the FLS were individually assessed todetermine giftedness status, selection or ascertainment bias was notoperating in the formation of the giftedness groups. Moreover, thefactthat our comparison group of nongifted children was not constructed,but emerged from the same cohort of children, further enhances thevalidity of our findings. In addition, our groups comprise studentsattendinga variety of schools in a variety of communities. With respectto the aforementioned studies on behavioral adjustment, two studiesshowing superior adjustment amonggifted children did involve forma-tion of groups based on schoolidentification procedures (Lehman &Erdwins, 1981; Ludwig & Cullinan, 1984); school selection or identifica-tion wasalso likely in the R. M. Milgram and N.A. Milgram (1976) studyfinding superior behavior amonggifted children. Gallucci’s (1988) sam-ple, which did not show differences with the Child Behavior Checklistnormative group,consistedof 12- to 16-year-olds attendinga residentialsummer camp for intellectually superior children who had met thecriterion for admissionof a Stanford-BinetIQ score greater than 135. Theintellectually and academically gifted 12- to 15-year-old adolescentsstudied by Lutharet al. (1992) were participating in a special summeruniversity program.Initial selection of the group was onthe basis ofhigh SAT scores; subsequentselectioncriteria, if any, were not specified.
Social Functioning
In this section, we examinesocial functioning with regardto chil-dren’s intellectual giftedness status. Three sets of data pertain to thisissue.First, the social reasoningskills of the children were assessed using

Behavioral Adjustment, Social Functioning, and Temperament 123
the Preschool Interpersonal Problem-Solving Test at age 3.5 years. Sec-ond, the children’s personalandsocial sufficiency skills were examinedusing the Vineland Adaptive Behavior Scales. Finally, parent andteacher responses to specific items of the Child Behavior Checklistrelating to the nature of social interactions with other children wereinvestigated.
On the Preschool Interpersonal Problem-Solving Test, the child isasked to generate as many solutions to two social dilemmasas possible.Our results showed that the number of solutions offered by giftedchildren (M = 3.9, SD = 2.3) wassignificantly greater than the numbergenerated by nongifted children (M = 2.3, SD = 1.7; t(100) = 3.47, p <.001). These results are in line with those of Roedell (1989), who also
reported that children with higher IQs scored higher on the PreschoolInterpersonal Problem-Solving Test. It is important to note, however,that Roedell also reported that this knowledge wasnotreflected in thechildren’s behavior; children with higher scores did not necessarily
engage in more cooperative behavior when observed in the preschoolclassroom.
The Vineland Adaptive Behavior Scales assess the ability to per-form daily activities required for personal and socialsufficiency. Giftedchildren werereported as significantly more matureonallscales of thistest. A 2 x 2 repeated-measures (Giftedness Status x Age: 6 and 8 years)ANOVArevealed that the gifted children scored significantly higher onthe overall Adaptive Behavior Composite. The means, standard devia-tions, and statistics are displayed in Table 5.4. Gifted children alsoscored significantly higher on the three domain scales of Communica-
Table 5.4. Comparison of Means between Gifted and Nongifted Children:Adaptive Behavior Composite and Domainsof the Vineland Adaptive
Behavior Scales
Giftedness status
Vineland scale Gifted Nongifted Univariate F
Adaptive Behavior Composite 111.2 (9.3) 97.1 (13.4) 24.17CommunicationSkills 119.4 (9.4) 101.2 (14.6) 33.49"Daily Living Skills 102.8 (9.0) 96.2 (11.7) 8.34"Socialization 102.8 (8.5) 96.8 (11.1) 7.01"
Note. Standard deviations in parentheses. N = 99.“p< 01. ***p < 001.

124 Chapter 5
tion, Daily Living Skills, and Socialization as revealed by a repeated-measures 2 x 2 (Giftedness Status x Age: 6 and 8 years) MANOVA(multivariate F(3, 95) = 11.06, p < .001).
These findings are supported by those of Lehman and Erdwins(1981), who compared 16 third graders in a gifted program to those inregular classes on personality; they also reported that intellectuallygifted children were quite well adjusted. More specifically, Lehman andErdwins found that the gifted as a group scored higher than theirage-mates on sense of personal worth,social skills, and schoolrelations.
Four items on the Child Behavior Checklist assess the nature ofchildren’s social interactions with peers and relate directly to issuesdiscussedat length in theliterature. These items, “Complainsof loneli-ness,” “Likes to be alone,” “Prefers playing with older children,” and“Withdrawn,” were examined individually to determine whetherpar-ents and teachers reported these behaviors as moreorless characteristicof gifted compared to nongifted children (see Tables 5.5 and 5.6). Due tothe relatively small numberin the gifted group as well as the highlyinfrequent rating of a “2” on these items,ratings of “1” (“somewhatorsometimes true”) and “2” (“very true or often true”) on the ChildBehavior Checklist were combined to produce a dichotomy (behaviorpresent or not present). Chi-square analyses were conducted for eachitem at each age. Theresults of each 2 x 2 (Giftedness Status x Behavior:Present vs. Not Present) test were consistent in that there were nosignificant differences between the gifted and nongifted children onthese four items for ages 4 through years.
On these Child Behavior Checklist items specifically relating tosocial isolation and a preference for socializing with older children, thegifted and nongifted were indistinguishable. All but one of the 32chi-square tests were nonsignificant; onestatistically significant differ-ence would be expected by chance alone. There was no evidence ofexcessive social isolation amongthe gifted observed for the first item,“Complainsof loneliness.” This was marked “present” for a minority ofboth the gifted and nongifted groups, especially by teachers. Nostatis-tical differences were revealed between gifted and nongifted children,indicating that gifted children were not more likely to be socially iso-lated than nongifted children.
On the next item, “Likes playing alone,” sizable percentages ofboth gifted and nongifted children were rated by parents as preferringto play alone. Chi-square tests indicated that none of the observeddifferences reached the .05 level of significance. Hence, gifted and

Behavioral Adjustment, Social Functioning, and Temperament
Table 5.5. Percentage of Gifted and Nongifted Children DisplayingSpecific Social Behaviors (Parent Report)
Giftedness status
Age of child (yrs) Gifted Nongifted x
Complains of loneliness
4 27.8 20.3 0.14
5 31.6 21.7 0.38
6 16.7 19.8 0.00
7 15.0 17.4 0.00
8 20.0 11.9 0.35
Likes to be alone
4 55.6 43.2 0.46
5 47.4 48.2 0.00
6 44.4 48.1 0.00
7 60.0 37.2 2.60
8 45.0 35.7 0.26
Prefers playing with older children
4 66.7 75.7 0.23
5 47.4 63.9 1.14
6 77.8 59.3 1.44
7 65.0 55.8 0.25
8 70.0 38.1 5.43.Withdrawn, doesn’t get involved with others
4 16.7 5.4 1.26
5 0.0 4.8 0.10
6 11.1 4.9 0.20
7 10.0 8.1 0.00
8 0.0 3.6 0.01
Note. Ns ranged from 92 to 106.*o < .05.
125
nongifted children were equally likely to play alone according to bothparent and teacherreports.
Our data from both teachers and parents do not support the viewthat gifted children prefer older playmates. These data are not in accordwith Terman’s conclusion. Terman found that teachers and parentsreported a greater preference among the gifted to play with olderchildren. There are several possibilities to account for this discrepancy.Terman’s data mayreflect a cohort-specific effect. Parents of today may

126 Chapter 5
Table 5.6. Percentage of Gifted and Nongifted Children DisplayingSpecific Behaviors (Teacher Report)
Giftedness status
Ageof child (yrs) Gifted Nongifted ¢
Complains of loneliness
6 5.6 3.0 0.00
7 0.0 1.5 0.00
8 5.6 5.4 0.00
Likes to be alone
6 33.3 15.2 1.97
7 27.8 9.0 2.95
8 27.8 16.2 0.63
Prefers playing with older children
6 11.1 9.1 0.00
7 16.7 10.4 0.00
8 5.6 12.2 0.15
Withdrawn,doesn’t get involved with others
6 11.1 6.1 0.05
7 11.1 3.0 0.67
8 5.6 9.5 0.00
Note. Ns ranged from 84 to 92. No between-groupsdifferences werestatisticallysignificant; all ps > .05.
be less inclined to allow their children to play with children who areolder, due to the nature of contemporary society. In the schoolsetting,such a finding may not emerge becausechildren spend so muchtimeinage-gradedclassrooms;little opportunity may exist for cross-age play.There may also be a sentiment against accelerating the grade level ofgifted children today in comparisonto practices andattitudes in placeduring the childhood years of Terman’sstudy.In fact, 84.9% of Terman’ssample skipped at least one gradelevel. Finally, Terman’s conclusionswere based on descriptive and notinferential statistics. Thus, it is notknown whetherthe percentages he reported werestatistically different.
Finally, there were also no reliable differences between gifted and
nongifted children in termsof the fourth item, “Withdrawn.”This itemwasindicated as present by low numbersof both parents andteachers.
An additional set of questions on the parent version of the ChildBehavior Checklist relate to children’s social interaction and sufficiency:

Behavioral Adjustment, Social Functioning, and Temperament 127
(1) the child’s numberof friends; (2) frequency of interactions with
friends; and (3) how well the child gets along with siblings, otherchildren, parents, and how well the child plays or works by himself orherself. Chi-square analyses comparingthe gifted and nongifted groupson these items at ages 4 through 8 yearsfailed to detect any significant
differences (all ps > .05).
Thus, gifted children enjoy the samelevel of social participation
and involvementas their nongifted counterparts during their preschooland early elementary years. Parent and teacher reports on the ChildBehavior Checklist items indicated that gifted children were not as agroup more withdrawn than nongifted children, nor were they morelikely to complain of loneliness or to prefer playing alone. Additionally,
the gifted and nongifted groups were indistinguishable in terms of the
numberof friends, frequency of contacts with friends, how well theyinteracted with siblings, parents, and friends, or how well they playedor worked alone. These findings are in accord with Terman’s (1925)
study showing that gifted children are not social isolates. Stereotypesthat gifted children are socially inept or isolated are without foundation.
Ourscientific evidence showsthat gifted children in the IQ range we
studied are socially capable and appropriately engaged in friendshipsand social interactions with others.
Caveat
Wedetected no evidenceof social disadvantage among our sampleduring their early development. In fact, we found ourintellectuallygifted children to be socially adept. However, subgroups of giftedchildren have been identified as at risk with respect to adjustment.Hollingworth (1942) noted that individuals whotested in excess of 160or 170 IQ experienced difficult problems of adjustmentto life. She notedthat the highly gifted are not, as a group, problemsforsociety, but ratherthat they suffered problems of adjustment in large part due to theirdeviation from the normallevel of intelligence. She delineated severalproblemsthatthe highly gifted were prone to experience:
1. Physical disadvantages. Due to their acceleration in school andbecausethe highly gifted naturally choose olderchildren asfriends, theyare often at a disadvantage in physical competition. Hence, they tend tochoosesedentaryactivities or solitary, noncompetitive types of physicalactivities.

128 Chapter 5
2. Impaired self-confidence. Because of age and smaller physicalsizecompared to their grade-mates, the highly gifted are less likely to beselected for positions of leadership in school. This can lead to loweredself-confidence,feelings of social inferiority, and shyness (especially formales during adolescence).
3. Poor adjustmentto occupation. If the highly gifted are not recog-nized in school and adequately challenged, they may not learn how towork hard and persevere at a difficult task. As adults, Hollingworthsuggested that these individuals would tend to spread themselves toothin and/orfail to complete difficult tasks encountered in the workenvironment.
4. Poor tolerance. Becausetheir intellectual abilities are so superiorto others, Hollingworth proposed thatthe highly gifted may be proneto contentious or aggressive behavior.
5. Isolation. Hollingworth observed that children with IQs higherthan 160 played little with others unless special circumstances wereprovided—notbecausethe highly gifted were unfriendly, but becausetheir interests, vocabulary and so on, wereso different from those oftheir age-mates as to makefinding a compatible playmate unlikely. Shealso pointed out that gifted children were more often “only” childrenand that they enjoyed reading as a pastime, both of which furtherincreased thelikelihood ofisolation.
Hollingworth decided that the higher the IQ and the youngerthechild, the more difficult it was to find a suitable play companion.Thistrouble decreased with increasing age, becauseolder highly gifted indi-viduals could seek out “like-minded” colleagues. She concluded thefollowing:
Thereis a certain restricted portion of the total range ofintelligence whichis most favorable to the developmentof successful and well-rounded per-sonality in the world as it now exists. This limited range appears to besomewhere betweenthe range of 125 and 155 IQ... above this limit—surelyabove 160 IQ—the deviationis so great thatit leads to special problemsofdevelopment whichare correlated with personalisolation. (Hollingworth,1942, reprinted in 1976, pp. 96-97)
Morerecently, Roedell (1984) discussed vulnerabilities of highlygifted children, including uneven development, perfectionism, adultexpectations, intense sensitivity, self-definition, alienation, inappropri-ate environments, and role conflict. WISC-R Full Scale IQs ranged from130 to 145 in our study, with a mean IQ of 137.8. Hence, none of ourgifted children exceededthe criterion employed by Hollingworth to beclassified as “highly” gifted andall fell into what she considered to be

Behavioral Adjustment, Social Functioning, and Temperament 129
the optimum intelligence with respect to adjustment. Our findings thus
dovetail with her observations of over 50 years ago with regard to the
range for favorable adjustment.In addition to highly gifted children, there is suggestion in the
literature that gifted girls maybe less popular andtheir social acceptancemay be compromised. Luftig and Nichols (1991) investigated the socialstatus levels ascribed to 10-year-old gifted children by their nongifted
age-mates. Comparing the popularity of gifted and nongifted girls andboys, they reported that gifted boys were the most popular of the fourability/gender groups, and gifted females were foundthe least popular.Gifted girls were generally viewed as being moody and melancholy.
Luftig and Nichols proposed that gifted boys tendedto atleast partially
masktheir giftedness by being funny, vivacious, and upbeat, whilegirls
tended to be more serious and somber,striving for academic excellenceand taking their academic achievementseriously. Solano (1987), study-ing stereotypes of the gifted, found that female gifted persons wereperceivedas significantly less popular than students of average ability.Additionally, Austin and Draper (1981) concluded that gifted adoles-
cent girls, particularly in middle-class schools, were at risk for losingsocial status. Finally, Lutharet al. (1992) also discussed conflicts betweenachievementand social acceptance faced by gifted adolescentgirls. Ofcourse, such studiesraise issues as to historical and cultural specificity,as well as the operation of gender stereotype and subject selection biases.The small numberof gifted girls in our study does not yield sufficient
powerfor analysis of the data by gender. As we follow our samplethrough the adolescent years, we will continue to assess social andacademic motivation and adjustment; case studies or other qualitativestrategies may permit us to addressthis issue.
Temperament
To determine whether differences exist in the temperament orbehavioral style of intellectually gifted children compared to theirnongifted cohort, a repeated-measures MANOVAwasconducted on
eachset of temperamentscales. For those administered only once(InfantCharacteristics Questionnaire, Toddler Temperament Scale, ColoradoChildhood TemperamentInventory, Middle Childhood TemperamentQuestionnaire), a one-way MANOVAwith the set of scales as thedependent measures was used.In the case of those administered morethan once (Behavior Style Questionnaire), a 2 x 3 (Giftedness Status x

130 Chapter5
Age: 3, 3.5, and 5 years) repeated-measures MANOVAwasused. Thenumberof dependentvariables varied according to the inventory.
The results showedthat gifted children did not differ significantlyfrom their nongifted peers in terms of temperamental difficultnessduring the infancy, preschool, or early elementary period. The InfantCharacteristics Questionnaire was completed when children were 1.5years of age. This scale, which assesses aspects of temperamental dif-ficultness, comprises fourscales:difficultness, unadaptability, nonper-Sistence, and unsociability. The MANOVArevealed no Significantdifferences between infants who subsequently became gifted and thosewhodid not on these aspects of temperament (multivariate F(4, 98) =0.67, p > .05). Differences also failed to emerge at age 3.5 years, when thesix-factor Colorado Childhood Temperament Inventory was adminis-tered (multivariate F(6, 29) = 0.26, p > .05).
The next set of analyses examined whether differences existed onthe nine temperament dimensionsderived in the New York Longitudi-nal Study (activity level, rhythmicity, approach, adaptability, negativemood, intensity, distractibility, threshold, and persistence) that wereassessedat five points in time (2, 3, 3.5, 5, and 8 years). No significantgifted versus nongifted group differences were detected on the ToddlerTemperamentScale administered at age 2 years (multivariate F(9, 87) =0.77, p > .05). Similarly, no group differences in temperament weredetected on the Behavioral Style Questionnaire during the preschoolyears (multivariate F(9, 73) = 1.06, p > .05). At age 8, there was again noevidence of differences in the nine temperament dimensions of theMiddle Childhood Temperament Questionnaire (multivariate F(9,91) =1.61, p > .05).
Thus, in the course of developmentfrom infancy throughthe earlyelementary years, the temperamental characteristics of gifted andnongifted children did not differ. Parents of gifted and nongifted chil-dren rated their children similarly on a variety of temperamentscalesadministered throughoutthe courseofstudyin this longitudinal project.Wefound nodifferences on temperamental difficultness, persistence,sociability, or adaptability at 1.5 years, the six temperament dimensionsin the Buss and Plomin (1984) temperament model assessed by theColorado Childhood Temperament Inventory, and on the nine NewYork Longitudinal Study temperament dimensions(activity, rhyth-micity/predictability, approach, adaptability, intensity, mood, persist-ence, or distractibility) assessed at 2, 3, 3.5, 5, and 8 yearsof age.
Ourfindings elaborate and extend those reported by Roedell etal.(1980), who suggested that the setting in which observations of early

Behavioral Adjustment, Social Functioning, and Temperament 131
personality characteristics are made may be a determinant of whether
significant differences between gifted and nongifted children are de-tected. For example, previous descriptions appearing in the literaturebased on observations made during administration of standardizedtests showed gifted children to exceed the nongifted in terms of charac-teristics such as cooperation, persistence in the face of challengingproblems, enthusiasm, patience, maturity, responsiveness, and resis-tance to fatigue. However, as Roedelletal. pointed out, observations
based on test administration sessions probably reveallittle about thebehaviorof either gifted or nongifted in nontest situations. Findings fromthe FLS are in line with this supposition. For example, differences intemperament between gifted and nongifted children were not evidentin parent reports of children’s temperament. Items comprising tempera-ment inventories typically require the parent to assess their children’sbehaviorin natural family interactive settings as they perform a varietyof activities (e.g., eating, sleeping, playing, socializing). However,rat-ings by the FLSstaff of the gifted and nongifted children’s test-takingbehaviordid reveal significant group differences, as discussed in Chap-ter 4. Gifted children were rated significantly higher than nongiftedchildren on aspects of cognitive mastery motivational behaviors such asgoal directedness, object orientation, attention span, and reactivity totest materials at ages ranging from infancy through the school-entryyears. Our data on gifted children’s motivational behaviors in thetestsetting dovetail with previous studies noting significant gifted versusnongifted group differences; however, as suggested by Roedell et al., nogroup differences emerged whendata werecollected in nontestsettings.Hence, results from our study demonstrate situation specificity in hu-man developmentwith respect to cognitive orientation to the environ-ment. Significant differences between gifted and nongifted childrenemergedasearly as infancy and continued throughout early childhoodfor their cognitive, motivational orientation to cognitive typesofactivi-ties. On the other hand, analyses repeatedly confirmed an absence ofdifferences betweenthe gifted and nongifted groupsin the nonacademicrealm with regard to temperamentalvariablesperse. It may be that thesemeasuresin the testing situation reflect the child’s propensity to becomeengagedin cognitive tasks and not a general behavioral or temperamen-tal style.
Nonintellectual characteristics of gifted individuals have been con-sidered determinants of whether gifted individuals attain eminence asadults. For example, Albert and Runco (1986) noted that fewer of Ter-man’s gifted children attained eminence during their adult careers than

132 Chapter 5
would have been expected given their high IQs and cautioned againstrelying on cognitive factors to the exclusion of other factors such aspersonality and family process variables in explaining achievement.Howe(1990) also argued that nonintellectual qualities such as persist-ence and attentiveness play an importantrole in determining whetherindividuals achieve eminence as adults. Tomlinson-Keasey andLittle(1990), reanalyzing parent and teacherratings of personality charac-teristics of gifted children in Terman’s study, found that childhoodsociability (age 11 years) correlated negatively with intellectual supe-riority in adulthood.
Ourdata attest to an early emergenceoffactors that differentiatedgifted children from nongifted children, but only with respect to theirtest-taking behaviorin specific situationsrelating to cognitive-orientedtasks as suggested in Chapter 4. Hence, a term such as “persistence”inthis context (relating to achievement in terms of academics or careersuccess) may indeed be a cognitive-motivational variable rather than apersonality characteristic; thatis, “persistence” and “attentiveness” maynot be temperament variables but rather cognitive-motivational vari-ables that reveal themselves in cognitively oriented and challengingtasks. Whether these cognitive-motivational characteristics (e.g., as-sessed in the test setting) or the temperamentalvariables(i.e., based onparent reports about behavior in more natural settings), both of whichwere measured prospectively in the gifted children of the FLS, willdifferentiate those gifted children who eventually attain success duringadolescence and/or adulthood from those who do not remains to bedetermined. As we follow our study population, we maybe ina positionto addressthis issue.
SUMMARY
1. Gifted children were comparable to their nongifted age-mates inbehavioral adjustment. Nosignificant differences in behavioral or emo-tional problems were detected between the gifted and nongifted chil-dren betweenages3 and 8 years ona variety of instruments thatutilizedparents and/or teachers as informants.
2. Our gifted group enjoyeda sociallife comparable to that of theirnongifted peers. Gifted and nongifted groups did not differ on itemsassessing either social advantage(e.g., numberoffriends, frequency ofcontacts,relationships with friends, siblings, parents, or ability to play
Behavioral Adjustment, Social Functioning, and Temperament 133
or work alone) or problemsin social interactions with peers(e.g., social
withdrawal, loneliness).
3. In an assessmentof social reasoning,gifted children produced a
significantly larger numberof solutions to hypothetical social dilemmas
than nongifted children. Parents of gifted children reported more ma-
ture functioning in personal and social sufficiency for their children
during the school-entry and early elementary years than did parents of
nongifted children. Thus, although similar in assessments of social
behavior, the social capability and social cognition of gifted children
were higher than those of nongifted children.
4. Gifted and nongifted groups were remarkably similar with
respect to temperamental characteristics during the infancy, preschool,
and early elementary years. On five different temperament inventories
administeredasearly as 1.5 years and through age8,the parental ratings
of the gifted and nongifted children did notdiffer.
5. In summary, during the preschool and early school years no
evidence of behavioral, social, or temperamental disadvantage was
observed when comparingthe gifted and nongifted groups. Advantage
in the cognitive realm wasnot associated with any disadvantagein the
behavioral, emotional, temperamental, or social aspects of functioning.
To the contrary, gifted IQ was associated with superior social reasoningand adaptive functioning during the early years. We concludethat thereis no detrimentfor gifted children in the 130-145 IQ range.

6
Homeand Family Environment
ISSUES
In this chapter, we examine the home environment and familycharacteristics of children whobecomeintellectually gifted or nongifted.While differences in the home environmentof gifted and nongiftedchildren have been reported in the literature, this longitudinal studyprovides an opportunity to assess whether these differences are presentin the early course of development and on whichspecific environmentalcharacteristics.
In order to present a comprehensive and detailed analysis of theenvironmental characteristics, we conceptualized the measures intothree levels: distal environmental variables, proximal environmentalvariables, and family relationship variables (A. W. Gottfried & A. E.Gottfried, 1984; A. E. Gottfried et al., 1988). Distal variables refer to the
global or descriptive aspects that characterize the environment, but donot measure the specific experiences that impinge on or interact withthe child that may influence development. Distal environmental vari-ables include demographics and family structure characteristics such associoeconomic status, marital status, and family composition or struc-ture. For organizational purposes, we included mothers’ intelligence inthis rubric. Proximal variables, which focus on the processor detailedaspects of the environment, include cognitively enriching and stimulat-ing materials and activities, variety of experiences, parental involve-ment, social and emotional supports, and the physical environment.Family relationships, which may also be considered proximal, were
135

136Chapter6
analyzed as a separate category. These included the quality of familyrelationships and the social climate in the home along a variety ofdimensionssuchastheintellectual and cultural atmosphere in the homeand the nature of family interactions such as cohesion and expressive-ness among family members.
Because theliterature clearly supports the hypothesis that giftedchildren have environmental advantages over nongifted children, ourpurpose wasnotto assess whetherdifferencesactually exist. Rather, ourgoal wasto systematically investigate the specific aspects of the homeand family environmentthat distinguish these two groupsof childrenin the openingyearsof their lives before they are designatedasgifted ornongifted. This systematic investigation of early environmentsofchil-dren who becomeintellectually gifted or nongifted makes this studyuniquein contrast to investigations that have studied the environmentsof gifted children after these children have been designated, identified,or labeled asgifted.
Our longitudinal study allowed us to address several issues thathave not been addressed by other researchersin this field. There weretwo overriding issues pertaining to home and family environmentaldifferences in the early course of developmentof gifted and nongiftedchildren. First, how early in their developmental histories do we finddifferences between children who become intellectually gifted ornongifted, and are these differences domain specific? Second, are theredevelopmental patternsin early environmentalinput; thatis, is thereevidence of cross-time patterns or continuity of environmental inputthat distinguishesgifted from nongifted children. The followingspecificquestions were addressed:
1. Do the families of the gifted and nongifted children differ insocioeconomicstatus (SES) even within this predominately middle-classsample, which represents less than the full range or extreme of SESvalues? Weusedanestablished index to appraise family SES based onparents’ educational and occupational status. We also analyzed occupa-tional status and numberof years of completed education separately foreach parentin order to determineif SES differences reside in parentaloccupation and/or educationalstatus. Lastly, are there differencesin theoccurrence of maternal employment betweenthe gifted and nongiftedgroups? Thislatter variable was investigated becauseofits contempo-rary and controversial nature.
2. Do gifted and nongifted children’s mothers differ in verbaland/or perceptual intellectual performance? We had no expectationsfor

Homeand Family Environment 137
this variable because no priorstudieson gifted children have included
an assessmentof mothers’ intellectual performance.
3. Are there differences in the numbers of boys and girls who
becomegifted? Unlike other studies where children were recruited as a
result of teachers’ nomination or from registries of gifted children, we
followed a single cohort developmentally from infancy. This precluded
potential biasing and allowed a morefair assessmentof the distribution
of males and females who becomegifted. With respect to other demo-
graphic factors, are there differences between the gifted and nongifted
groupsin their parents’ marital status, parents’ age, numberof adults
or children in the home, andbirth order? Asfor the last factor, are the
gifted children morelikely to be firstborns or only borns comparedto
nongifted children? Weanticipated that our data would beconsistent
with the large bodyofliterature.
4. With respect to proximal environmental variables, are theredifferences in the quality and quantity of home stimulation provided togifted versus nongifted children? For example, are there differences inearly cognitive enrichment, social supports, parental involvement, andeducational enhancement? Based on our previous research on homeenvironment and early cognitive development, we anticipated differ-ences would emerge. However, wewerealso interested in howearly indevelopmentthe differences become apparent.
5. Are there differences in the educational aspirations that parentshold for children who becomegifted in contrast to nongifted? Moreimportantly, if differences are found, do they exist prior to the age atwhich children were designated as gifted or nongifted?
6. Do gifted compared to nongifted children place more demandsor requests on parents for environmental stimulation or activities?While the literature supports the role of parental involvementin chil-dren’s development, there have been no systematic investigations of therole children play in this process.
7. Are there differences in the intellectual atmosphere and socialrelationships in the families of gifted and nongifted children? Specifi-cally, are the families of these groups of children different in theircohesiveness, openness,level of conflict, and means of family regula-tion? While the literature supports the notion that the social atmospherein the homeis an important aspect to the developmentof the intellectu-ally gifted, the specific components have not been systematically stud-ied longitudinally.

138 Chapter 6
DESCRIPTION OF MEASURES
Distal Environmental Variables
These variables (with the exception of mothers’ intelligence) weregathered by wayof the Social History Questionnaire, which was devel-oped by the authors and administered to parentsat every assessment.This questionnaire provided a contemporaneous and ongoing appraisalof the family. Distal variables assessed with this questionnaire includedsocioeconomic status, which wascalculated from parents’ occupationalstatus and numberofyears of education, parents’ workingstatus, mari-tal status, parents’ age, as well as several items pertaining to familycomposition. Mothers’ intelligence was included in this category ofvariables as well.
Socioeconomic Status
Socioeconomicstatus (SES) was measured at each assessment us-ing the Hollingshead FourFactor Index of Social Status (A. W. Gottfried,1985; Hollingshead, 1975). This index is a well-established measure ofSES that has been extensively used in the psychological and develop-mentalliterature. An overall family index was computed by assigningvalues based on an ordinalscale of the parents’ occupations,if gainfullyemployed, and educational attainments. These values provide the datafor calculation of SES (see Hollingshead, 1975). In cases where bothparents were employed, data from both wereentered into the computa-tion. Whenonly one parent was employed, SES wascalculated only fromthat person’s data.
Mothers’ Working Status
Mothers’ working status was measured at each assessment anddichotomously coded (working or not working). We treated motherswho were employedbothpart-time and full-time as one group becausein our research (A. E. Gottfried, Bathurst, & A. W. Gottfried, 1994: A. E.Gottfried et al., 1988), we found that there were no differences in chil-dren’s outcome measures between these two groups. Wedid not analyzeworking status for fathers because virtually all fathers were employedat each assessment.

Homeand Family Environment 139
Mothers’Intelligence
Mothers’ intelligence was measured when the children were 3years old by administering the WAIS-R Vocabulary and Block Designsubtests. These subtests were chosen because vocabulary is the bestsingle predictor of verbal intelligence, and block designis the best singlepredictor of performance intelligence (Wechsler, 1991). Furthermorewithin the group of verbal and performancesubtests, the Vocabularyand Block Design subtests, respectively, have the highest internal con-sistency andstability coefficients and smallest standard errors of meas-urement. Raw scores were converted to standard scores with a meanof10 and a standard deviation of 3 using transformation tables in themanual.
Family Characteristics
The balance of the measuresin this section were included on theSocial History Questionnaire, which was completed by mothers. Thesevariables included marital status of parents, parents’ ages, numberofadults and children in the home, and child’s birth order. Sex of the
children wasincludedin this category. Parents’ ages, sex of studychild,and birth order werecollected at the onset of the study. The other familycharacteristics were collected at each assessment. We therefore had arecord of changing family demographics overthe entire period.
Proximal Environmental Variables
A major focus of the FLS has been on environment-developmentrelationships. Over * 2 course of investigation, we have employed acomprehensiveset of age-appropriate scales that tap numerousaspects
of the children’s environment. The inventories included both stand-ardized instruments and scales developed by the authors to assessspecific characteristics of interest. Our assessments included observa-tional or direct assessments and also nonobservational or indirect as-sessments of children’s environments, the latter being furnished byparent reports.
Direct Observational Home Assessments
The quality of the home environmentwascentral to our study ofchildren’s development. We therefore visited the homesof the families

140 Chapter6
taking part in our longitudinal study on three occasions: when thechildren were ages 15 months(1.25 years), 39 months (3.25 years), and8 years. The homevisits were planned to coincide with three develop-mental periods: infancy, preschool, and elementary school age. Stand-ardized instruments were administered by ourstaff. In all cases, thechild and mother werepresent in the homeat the timeof the visit.
Home Observation and Measurementofthe Environment. The Home Ob-servation and Measurementof the Environment (HOME) (Caldwell &Bradley, 1984) inventory was selected because of its extensive use,psychometric qualities, and its relation to children’s developmentaloutcome (A. W. Gottfried, 1984a). This inventory has three versions(infant, preschool, and elementary) and requires that an administratorvisit the home of each family. Administration, which requires bothdirect observation in the home and semistructured interviews withmothers, washighlyreliable at all three ages.
The infant version was used whenthe children were 1.25 years ofage. This version contains 45 items dividedinto the followingsix scales:Emotional and Verbal Responsivity of Mother; Avoidanceof Restrictionand Punishment; Organization of the Physical and Temporal Environ-ment; Provision of Appropriate Play Materials; Maternal Involvementwith the Child; and Opportunities for Variety in Daily Stimulation.
The preschool version was used whenthe children were 3.25 yearsof age and includes 55 items divided into the following eight scales:Stimulation through Toys, Games, and Reading Materials; LanguageStimulation; Physical Environment: Safe, Clean, and Conducive to De-velopment; Pride, Affection, and Warmth; Stimulation of AcademicBehavior; Modeling and Encouragementof Social Maturity; Variety ofStimulation; and Physical Punishment.
The elementary version was used whenthe children were 8 yearsof age. Fifty-nine items form the following eight scales: Emotional andVerbal Responsivity; Encouragement of Maturity; Emotional Climate;Growth Fostering Materials and Experiences; Provision for ActiveStimulation; Family Participation in Developmentally Stimulating Ex-periences; Paternal Involvement; and Aspects of the Physical Environ-ment. In each version, the scales sum together to form an overall totalscore.
Purdue Home Stimulation Inventory. The Purdue HomeStimulationInventory (PHSI) (Wachs, 1976) was administered at the 1.25-year homevisit. Whereas the HOMEfocuses more on the socioemotional aspects

Homeand Family Environment 141
of the environment, the PHSI was devised to emphasize the physicalaspects of the home.This inventory is also based on direct observationand interview. Twenty-seven itemsof the inventory were administered.However, only thirteen were included in the present analyses becauseour earlier research showeda relation between these items and chil-dren’s cognitive developmentin the infancy and preschoolyears (see A.W. Gottfried & A. E. Gottfried, 1984). These items wereas follows: child
taken out of neighborhood,child visits neighbors, categories of training,
time per day reading to child, manipulable items, ratio of rooms topeople, floor freedom, numberof siblings, home hasrestricted view ofoutside, noise sources, noise level, number of children’s books, and
access to newspapers, magazines, and books. Each item of the PHSI wasanalyzed separately because no subscores or overall total score areavailable as presented by Wachs’ framework of environmentalspecific-ity (Wachs, 1992; Wachs & Gruen, 1982).
Nonobservational Assessments of the Home Environment
In contrast to the direct observational measures cited above, the
variables in this category were collected by parents’ written responsesto questionnaires and surveys. Because specific environmentalvariableswere found to havepervasiverelations to children’s cognitive develop-ment during the infancy and preschool periods(A. W. Gottfried & A. E.Gottfried, 1984), we sought to expand beyond measures of the immedi-ate home environmentandelaborate on the information gathered by theHOMEand PHSI. Further, we reasonedthat specific dimensions shouldbe expanded upon ina waythat wouldallow usto collect data indirectlythrough parentreport at each assessment period without the necessityfor homevisits. In prior research (Bathurst, 1988; A. E. Gottfried,
Bathurst, & A. W. Gottfried, 1994; A. E. Gottfried et al., 1988), we found
parental reports to be a reliable and valid method to gather informationabout children’s experiences and home environment. We therefore de-veloped several questionnaires and surveysto assess specific environ-mental characteristics. Thus, we were able to maintain an ongoingcomprehensive assessmentof the children’s environment, beyond ob-servational or direct assessments.
The additional surveys included the Variety of Experiences Check-list (an assessmentof children’s experiences outside the home) and the
Home EnvironmentSurvey (a measure of several home environmentalcharacteristics, such as the amountof time parents spend with their

142 Chapter6
children andprovisionsfor stimulatingactivities and experiencesin thehome).
Variety of Experiences Checklist. The Variety of Experience Check-list (VEC) (A. W. Gottfried & A. E. Gottfried, 1984) was completed bymothers at the 3- and 5-year assessments. Several out-of-the-home ex-periences werelisted and mothers were asked to check those in whichthe child had engaged during the last year. The experiences weregroupedinto three categories: types of vehicles child hastraveledin (car,plane, boat, train, bus, other), types of entertainment child has experi-enced (TV, movie theater, circus, aquarium or Marineland, museum,amusementpark, zoo or wild animal park,live theater or show,library,special lessons, other), andvisits to various geographic areas (largecity,mountains, desert, forest, beach or seashore, an island, a different statein the United States, other). The scale score was the total number ofdifferent experiencesof the child withinthe year.
Home Environment Survey. Another instrument was the Home En-vironment Survey (HES), which was completed by mothersatthe 5-, 7-,and 8-year laboratory assessments. This survey focused on cognitiveenrichment and parental involvement.At eachage,the items werefactoranalyzed for data reduction purposes. Varimax rotations were used andfactors were created based on these results. Items with factor loadingsof .30 or higher were retained. Items were slightly different at each ageto accommodate the changing environments of children with advance-ment in age. At age 5 years, 12 items formed three factors: MotherProvides Educational Stimulation, Educational Attitudes, and Provisionof Learning Materials. At age 7 years, 12 items formed three factors:Mother Provides Educational Stimulation, Educational Attitudes, andMother's Time Involvement with Child. At age 8 years, 20 items formedsix factors: Learning Opportunities, Reading Involvement with Child,TV Time, Mother’s Time Involvement with Child, Father’s Time In-volvement with Child, and Academic Assistance. We decidedto elimi-nate this last factor because it comprised only two items resulting in lowinternal consistency estimates, and also because one of the items, inhindsight, appeared ambiguousasto its meaning. Table 6.1 shows eachfactor and the items uniqueto that factor. Reliability and validity werethoroughly investigated by Bathurst (1988) at the 8-year assessment.Test-retest reliability coefficients were conducted on a subset of 53respondentsafter an interval of 2 to 4 months. These ranged from .61 to.87 on the five scales. The HES showed strong concurrent, predictive,

Homeand Family Environment 143
Table 6.1. Home EnvironmentSurvey (HES)Scales for the 5-, 7-, and 8-YearAssessment
Age 5
Mother Provides Educational Stimulation(3 items)1. Number of monthlytrips to the library
2. Number of minutes motherreads to child each day3. Number of minutes mother spends working with child on academicskills
Educational Attitudes (4 items)
1. Educational level child is expected to achieve2. Child has his/her own real musical instrument
3. Amountof time child watches TV each day (—)
4. Amountof time mother watches TV each day(—)
Provisions of Learning Materials (5 items)
1. Numberof activity books in the home not provided by school2. Numberof electronic teaching aids at home3. Encyclopedia in home4, Child receives out-of-school lessons5. Personal computer experience at home
Age 7
Mother Provides Educational Stimulation (5 items)1. Numberof monthlytrips to the library
2. Numberof minutes motherreadsto child each day3. Numberof minutes mother spends working with child on academic skills4, Child has subscription to a magazine or book club
5. Numberofdifferent magazines or journals family receives monthlyEducational Attitudes (4 items)
1. Educationallevel child is expected to achieve
2. Child receives private lessons3. Amountof time child watches TV each day (-)4. Amountof time mother watches TV each day (-)
Mothers’ Time Involvement with Child (3 items)
1. Hours spent taking care of and doing things with child—school day2. Hours spent taking care of and doing things with child—weekend day
3. Discuss child’s school work with child (numberof days per week)
Age 8
Learning Opportunities (6 items)1. Child has access to a real musical instrument2. Child has own subscription to a magazine or book club3. Child receives private lessons4. Number of magazinesor journals family receives monthly5. Child has experience with computer at home6. Educational level child is expected to receive
Reading Involvement with Child (3 items)1. Numberof monthly trips of child to library2. Amountof time child reads by him/herself daily3. Child has owndictionary
(continued)

144 Chapter 6
Table 6.1. (Continued)
TV Time(3 items)
1. Amountof time per day child watches TV2. Amountof time per day mother watches TV
3. Amountof time per day father watches TVMothers’ Time Involvement with Child (3 items)
See age 7 itemsFathers’ Time Involvement with Child
Sameas for mother
and construct validity with other environmental measures and meas-ures of achievement, intelligence, and social maturity, supporting theHESfactors as theoretically meaningful. This allowed us to makea prioripredictions about their relation to giftedness status. Specifically, weexpected to find differences favoring gifted children on factors relatedto academic involvementof parents. Further details about the items andfactor structure can be found in Bathurst (1988) and A.E. Gottfried etal.(1988).
Child's Requests for Activities. An additional set of questions wereadded to the HES at age 8 only. Because our research suggested thatyoung children’s differential cognitive development elicited corre-spondingly different levels of stimulation in the preschool years (A. W.Gottfried & A. E. Gottfried, 1984), we attempted to appraise the degreeto which children make requests or demandsuponparentsfor extracur-ricularactivities. The intentof this variable was to capture the demand-ingness by children for enrichmentactivities with the expectation thatthose children who were more cognitively advanced would be moredemandingfor environmental stimulation. Parents completed the fol-lowing questionin four categories ofactivities: “Has yourchild (a) askedfor lessonsin the areas of music, art, dance, gymnastics, skating, etc? (b)asked to allow him orherto participate in any organized team sportssuch as soccer, baseball, football, etc? (c) asked to allow him or her tojoin any clubs or organizations such as scouts, youth clubs, etc? (d)requested to engage in any hobbies such as collections of stamps orcoins, building models, etc?” Motherslisted up to three activities in eachof the four areas,yielding a total possible score of 12. Higher scores meanthat the child is making more requests of his or her parent. Our priorresearch (Bathurst, 1988) revealed that the numberofactivities childrenrequested was positively related to their intelligence and achievement,

Homeand Family Environment 145
and therefore, we expectedthis variable to be related to giftedness statusas well.
Family Relationship Variables
Family Environment Scale
The Family Environment Scale (FES) (R. H. Moos & B. S. Moos,
1986) is a well-known,reliable, and valid instrument appraising thequality of family relationships. It was completed by mothers when thechildren were 3, 5, 7, and 8 yearsof age andalsoby fathers at the 8-yearassessment. This instrument measuresthe social climate in the home andconsists of 10 scales: Cohesion, Expressiveness, Conflict, Independence,Achievement Orientation, Intellectual-Cultural Orientation, Active-Recreational Orientation, Moral-Religious Emphasis, Organization, andControl. A. W. Gottfried and A. E. Gottfried (1984) found that theIntellectual-Cultural Orientation, Cohesion, and Expressiveness scaleswere positively related to early cognitive functioning. Cornell (1984)found differences between gifted and nongifted elementary-aged chil-dren on the Intellectual-Cultural Orientation, Cohesion, and Conflictscales. Hence, we analyzed only four scales. Moos and Moosconceptu-alized Intellectual-Cultural Orientation as the interest a family shows inpolitical, social, intellectual, and cultural activities; Cohesion as the helpand support family members show for each other; Expressiveness asopenness within a family for members to express themselves; andConflict as open expression of anger and conflict among family mem-bers.
Family Inventory. Because the FES makesno provision for compu-tation of a total score, the Family Inventory wasconstructed to providea global measure of family functioning (Bathurst, 1988). This scaleincorporatesitemsthat are related to positive family functioning suchas cooperation, family participation in activities, and conflict issues.Development of the Family Inventory was based on research that as-sessed the second-orderfactor structure of the FES (Bathurst & A. W.Gottfried, 1987b; Plomin & DeFries, 1985). Both research groups foundtwo highly similar second-orderfactors, the first reflecting family in-volvementin an atmosphere promoting personal growth and the secondreflecting regulation and organization of family members. The FamilyInventory comprised 22 statements on whichparentsratedtheir familiesfrom 1 (“not true”) to 6 (“very true”). The data were subjected to factor

146 Chapter 6
analysis; two factors emerged. Thefirst was a strong general factor thatcomprised 16 items. It was labeled Positive Family Functioning. Thesecond factor comprised three items and was labeled Family Regulation.Thefirst reflects the well-functioning family that allows openness andfreedom of expression as well as provision of an intellectual-culturalatmosphere marked with a lack of conflict. Higher values on this scalealso represent families who enjoy doing things together and whosup-port each other. The secondreflects the amountof regulation and controlwithin the family. The three items measure the degree to which rulesand regulations are used in the family, the degree to which familymembers havespecifically defined roles, and the degree of interdepen-dency among family members(as opposedto independentfunctioning).The Family Inventory was completed by both mothers and fathers whenthe children were 8 years of age. Internal consistency estimates formothers andfathers for the general factor were .84 and .85, respectively;estimatesfor the regulation factor were .47 and .42, respectively. The lowestimates for the second factor were probably a result of the smallnumberof itemsonthis factor. In an earlier study (Bathurst, 1988), there
was evidence of a positive relation between the first factor, and anegative relation between the secondfactor, and cognitive performance.Therefore, we expected to find these factors similarly associated withgiftedness status.
RESULTS
The analysesin this chapter differ from preceding chapters due toour owndata derived from this project that allowed us to makepredic-tions about specific environmental variables as related to cognition.Following the decision tree of Hertzog and Rovine (1985) and thestatistical strategy in this book (see Chapter 2), planned comparisonswere used to test for significant differences between gifted andnongifted children’s environments for specific hypothesized relation-ships. Data published by A. W.Gottfried and A. E. Gottfried (1984), A.E. Gottfried et al. (1988), and Bathurst (1988) provided the primaryfoundation for these hypotheses.It is important to note, however, thatthe relation between environment and developmentcould vary acrossstudies according to sample characteristics such as SES and ethnicity(Bradley et al., 1989; A. W. Gottfried, 1984a; A. W. Gottfried & A. E.
Gottfried, 1986). For all planned comparisons, it was predicted that the
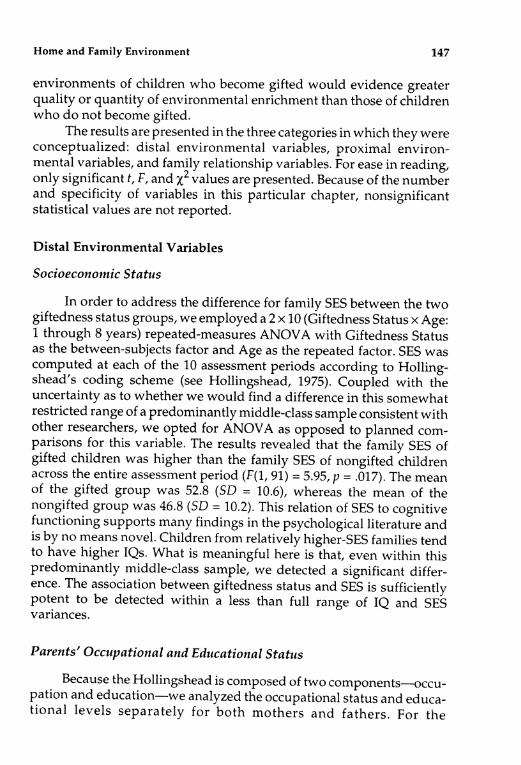
Homeand Family Environment 147
environments of children who becomegifted would evidence greaterquality or quantity of environmental enrichmentthan those of childrenwhodo notbecomegifted.
Theresults are presented in the three categories in which they wereconceptualized: distal environmental variables, proximal environ-mentalvariables, and family relationship variables. For ease in reading,only significantt, F, and x7 values are presented. Because of the numberand specificity of variables in this particular chapter, nonsignificantstatistical values are not reported.
Distal Environmental Variables
Socioeconomic Status
In order to address the difference for family SES between the twogiftedness status groups, we employed a 2 x 10 (Giftedness Status x Age:1 through 8 years) repeated-measures ANOVAwith Giftedness Statusas the between-subjects factor and Ageas the repeated factor. SES wascomputed at each of the 10 assessment periods according to Holling-shead’s coding scheme (see Hollingshead, 1975). Coupled with theuncertainty as to whether we wouldfind a difference in this somewhatrestricted range of a predominantly middle-class sample consistent withother researchers, we opted for ANOVAas opposed to planned com-parisons for this variable. The results revealed that the family SES ofgifted children was higher than the family SES of nongifted childrenacross the entire assessment period (F(1, 91) = 5.95, p = 017). The meanof the gifted group was 52.8 (SD = 10.6), whereas the mean of thenongifted group was 46.8 (SD = 10.2). This relation of SES to cognitivefunctioning supports many findingsin the psychologicalliterature andis by no means novel. Children from relatively higher-SES families tendto have higher IQs. What is meaningful here is that, even within thispredominantly middle-class sample, we detected a significant differ-ence. The association between giftedness status and SESis sufficientlypotent to be detected within a less than full range of IQ and SESvariances.
Parents’ Occupational and Educational Status
Because the Hollingshead is composedof two components—occu-pation and education—weanalyzedthe occupational status and educa-tional levels separately for both mothers and fathers. For the

148 Chapter 6
occupational status variable, we used the scale developed by Holling-shead; persons who were unemployed were excluded from the analyses.Fathers, with few exceptions, were constantly employed. Therefore, weused the same data-analytic strategy as that imposed on the SES analysis.A 2.x 10 (Giftedness Status x Age: 1 through 8 years) repeated-measuresANOVAwasconducted. There were no differences between the giftedstatus groupsdueto fathers’ occupational status. However, at each age,without exception,the fathers of gifted children achieved a higher statusthan fathers of nongifted children. It is likely, however, that the re-stricted range of occupations, in the sense of Hollingshead categoriza-tion, kept the variance at a minimum, precluding the possibility ofdetecting statistical differences. Mothers showed a large increase inemployment rate over the course of this investigation. The percentageemployed ranged from 36.2% whenthe children were 1 year of age to71.9% when the children were 8 years of age. The number of mothersproviding data across the entire period was only 19 (2 gifted and 17nongifted); this prohibited the use of ANOVA. Mothers would oftenleave and return to the workforce. Therefore, we opted to conductt testsat each age. For mothers,statistical significance with regard to occupa-tional status was reached onlyat the 7- and 8-yearperiods.In both cases,the occupational status was higher for mothers of gifted children thannongifted children: At age 7 years, the mean Hollingshead status valueswere 6.8 (SD = 1.1) and 5.8 (SD = 1.4) for gifted and nongifted groups,respectively (£(67) = 2.57, p = .01). At age 8 years, the mean Hollingsheadstatus values were 7.1 (SD = 0.9) and 5.7 (SD = 1.6) for gifted andnongifted groups, respectively (#(72) = 3.15, p = .002). At each age wherethe differences reachedstatistical significance, the mothers of giftedchildren averaged at least one category higher than the mothers ofnongifted children. The mothersof gifted children were morelikely tobe in the categories of professionals, business owners, administrators,
and managers. In fact, there were no mothers of gifted children in aHollingshead occupational category below (e.g., clerical and salesworkers, owners of small businesses), whereas mothers of nongifted
children did hold jobs in levels 4 and below (e.g., skilled and unskilledworkers). These data at ages 7 and 8 years are consistent with ourfindings regarding maternal occupational status and children’s cogni-tive development and achievement throughout childhood (A. E.Gottfried, Bathurst, & A. W. Gottfried, 1994; A. E. Gottfried et al., 1988).
Wenext analyzed mothers’ and fathers’ education. For this analy-sis, we used parents’ actual number of years of completed educationrather than the ordinal scale provided by Hollingshead. We chose this

Homeand Family Environment 149
alternative to secure a more precise measure of parent education. Inorder to equatethe valuesof this variable across the sample, the numberof years in school wasadjusted for the attained degree. For example, ahigh school degree was codedas 12 years and a bachelor’s degree as 16years. Therefore, if a parent took 5 yearsto attain a bachelor’s degree,we codedthe dataasif it took 4 years. This adjustment provided for amore precise and consistent comparison of education attained. Becausesome parents were attending college, their educational attainmentswere gathered periodically throughoutthecourse of investigation, spe-cifically at the 1-, 3-, 5-, 6-, 7-, and 8-year assessments. With the samerationale usedin analyzing SES, a 2 x 6 (Giftedness Status x Age: 1, 3, 5,6,7, and 8 years) repeated-measures ANOVAwas conducted separatelyfor each parent with giftedness status as the between-subjects variableand timeas the within-subjects variable. Within this sample of relativelyhighly educated individuals, we found significant differences betweenthe designated groups. Results showed that both parents of giftedchildren attained approximately 1.5 more years of education than theparents of nongifted children. Mothers of gifted children attained anaverage of 15.8 (SD = 1.6) years, while mothers of nongifted childrenattained an average of 14.0 (SD = 1.9) years (F(1, 95) = 14.60, p < .001).Fathers of gifted children attained an average of 16.4 (SD = 2.0) years,while fathers of nongifted children attained an average of 15.0 (SD =2.7)years (F(1, 92) = 4.97, p = .028). Hence, the SES difference between giftedand nongifted children was primarily due to educational accomplish-ments as opposedto occupationalstatus. Ourfindingsare in line withseveral other studies noting such differences(e.g., Barbe, 1956; Freeman,1979; Hollingworth, 1942; Sheldon, 1954; Terman, 1925-1929),
Mothers’ Working Status
One contemporary issue is whether the employmentstatus ofmothersis related to children’s development(A.E. Gottfried & A. W.Gottfried, 1988, 1994). Whereas Groth (1975) found mothers of giftedchildren morelikely to be employed outside the home, our own contem-porary research has shownthat maternal employmentstatus, perse,isnot significantly related to developmental outcomes (A. E. Gottfried,Bathurst, & A. W. Gottfried, 1994; A. E. Gottfried et al., 1988; A. E.Gottfried, A. W. Gottfried, & Bathurst, in press). For the current study,we examined whether maternal employmentstatus wasassociated withchildren’s giftedness status at each age (1-8 years) using chi-squareanalyses. Maternal employmentstatus (working vs. not working) was

150 Chapter 6
crossed with giftedness status (gifted vs. nongifted). The chi-squareanalyses were notsignificant, indicating that maternal working statusand children’s giftednessstatus are not associated. These results providefurther supportfor the growing bodyofliterature that finds no associa-tion betweenchildren’s development and maternal employmentstatus.
Mothers’Intelligence
To determine whether mothers’ intelligence was higher in thegroup of gifted children, we comparedthe giftedness status groups onthe Vocabulary and Block Design subscales of the WAIS-R.If differencesemerge between the groups, one might expect the differences to favorthe mothersofgifted children. However, someform of intergenerationalregression effects could be operating as well, which would attenuatedifferences. The standard scores of the two WAIS-R subscales wereanalyzed using Hotelling’s T*. Results of the multivariate test showedno significant difference. Therefore, mothers’ intelligence, whether ver-
bal or perceptual, was not a discriminating factor for giftedness statusin our sample. Hence, the findings show that it was neither parentaloccupation norintelligence, but rather the educational achievementofparents, that was predominantly associated with differences in gifted-ness status of children. More important, the parents’ educationalachievements may serve as a markeror index variable of the family’scognitive enrichment atmosphere or curriculum in the home that, inturn, may foster and nurture the developmentof children who become
gifted.
Family Characteristics
Additional characteristics were analyzed in order to determineifthe gifted and nongifted status groups differed in this category. Thesevariables included sex of study child, marital status of the parents,parents’ ages, numberof adults and children residing in the home, andbirth order.
Of the gifted children, 55% (11/20) were males and 45% (9/20)
were female. The comparable values for the nongifted children were58.6% (51/87) male and 41.4% (36/87) female. The nonsignificant chisquare indicated that there was noassociation betweengiftedness statusand children’s sex. It is interesting that in our sample we find no sexdifferences when so manystudies of gifted children note a greaternumber of boysthangirls (e.g., R. L. Cox, 1977; Freeman, 1979; Holling-

Homeand Family Environment 151
worth, 1942; Terman & Oden, 1959). In each of these studies, subjectswererecruited for their giftedness status. In our study, we began withchildren from the same cohort. The children who were identified asgifted at 8 years of age were notrecruited becauseof that characteristic,but emerged from the same cohort as the nongifted children. Thisinterpretation would suggest that ascertainment bias may well explainthe greater numberof boysthangirls in such samples.
Marital status was recorded at each assessment and coded “mar-ried” or “not married.” The code for married included cohabitation andthe code for not married included those parents who were separated,evenif notlegally divorced. At the 1-year assessment, all gifted childrenhad parents who were married, whereas 95.4% (83/87) of the parents ofnongifted children were married. At the 8-year assessment, 90.0%(18/20) of the parents of gifted children were married, whereas 88.3%(75/85) of the parents of nongifted children were married.If parentswere divorced or separated, all children resided with their biologicalmothers. A chi-square analysis conducted at each assessmentperiodindicated that giftedness status and parents’ marital status were unre-lated. An analysis was also conducted with respect to the occurrenceofdivorce; that is, had the child experienced the divorce of his or herparents duringthefirst 8 years ofhis or herlife? Ten percentof the giftedchildren and 22%of the nongifted children had experienced divorce intheir families by age 8 years. There wasnosignificant association be-tween giftedness status and the experience of divorce. These findingsimply that marital stability or disruption is unrelated to intellectualdifferences by age 8 years. Other studies have noted differences in therate of divorce(e.g., Barbe, 1956; Groth, 1975). However, this variableisnot a static one; family structure is constantly changing. It is unlikelythat a valid comparison can be madeacrossthe studies and across thedifferent eras. More information would haveto be gathered in order tobegin to makesense of the meaningofthis variable and implicationsofthe results as compared to other samples.
Researchers have found that the ages of gifted children’s parentsare typically somewhatolder thanthat of nongifted children’s parents.In order to determine whether these differences held in our sample,planned contrasts were conducted separately for mothers and fathers.At the onset or the study, the average ageof fathers of gifted childrenwas 34.2 (SD = 6.9) years; the average ageoffathers of nongifted childrenwas 31.3 (SD = 4.5) years. This difference wassignificant (£(105) = 1.76,p <.05). Although the mothersof gifted children are, on the average, ahalf-year older than the mothers of nongifted children, this difference

152 Chapter 6
wasnotstatistically significant. The average age of mothers of giftedchildren was 29.4 years (SD = 4.4) and of mothers of nongifted children
was 28.9 years (SD = 3.9). Although Hollingworth (1942) and Terman
(1925) found differences between the data from their sample and thegeneral population for both mothers’ and fathers’ ages, our samplerevealeda statistically significant difference only for fathers. Perhaps themorerestricted age range of mothers as comparedto fathers accountedfor the lack of significant differences. Further, our comparison waswithin our sample and not to the general population. Alternatively,findings from older studies may not hold up in contemporary middle-class samples.
The number of adults and children residing in the home wasrecordedat the 1-, 3-, 5-, 7-, and 8-year assessments. The predominantnumberof families had two adults; far less had one adult or three ormore adults residing in the household. Because low frequenciesin cellsof more than two adults in the homeresulted in below-acceptable valuesfor expected frequencies for chi-square analyses, the data were analyzedas having one adult versus two or more in the home. Acrossthe ages,the occurrence of one adult in the home ranged from 1%to 11%, whereasthe numberof two or more adults in the home ranged from 89%to 99%.A chi-square analysis was conducted at each assessmentperiod.Resultsindicated that giftedness status was unrelated to numberof adultslivingin the home. Although the sample size is relatively small for theseanalyses, we speculate that single parenting, per se, as indexed by oneadult in the homeis not detrimental to the developmentof children whobecomeintellectually gifted. Hence, the numberof adults in the home,and possibly adult caretakers (see A. W. Gottfried & A. E. Gottfried,1984), is not necessarily disadvantageous to the developmentof highintellectual performance.
In the gifted group, the percentages of families that had one, two,three, and four children in the homeat 8 years of age were 25%(N = 5),95%(11), 15% (3), and 5%(1), respectively. In the nongifted group,thepercentages of families that had one, two, three, four, five, and nine
children were 10.3% (9), 58.6%(51), 21.8% (19), 3.4% (3), 4.6% (4), and1.1%(1). In orderto assess the association betweengiftedness status andnumberof children in the home, the frequencies were coded as one, two,and three or more children in the home. This was done for two reasons:first, to keep the minimum valueof expected frequencies percell at anacceptable level, and second, to keep these analyses consistent with thebirth-order analyses below. Chi-square results revealed no associationbetween giftedness status and numberof children in the home. These

Homeand Family Environment 153
data, in conjunction with those pertaining to number of adults in thehome,indicate that family composition is not associated with giftednessStatus.
Birth order was codedat the onsetofthe study (age 1 year). Becauseso few families (5) had more than three children in the home, the datawere organized into the following categories: firstborn, second-born,and third- or later-born children. Among the gifted children, 80%(16/20) werefirstborns, 15% (3) were second borns, and 5% (1) werethird borns. In the nongifted group, 42.5%(37/87) of the children werefirstborns, 36.8% (32) were second borns, and 20.7% (18) were third orlater borns. Birth-order status wassignificantly associated with gifted-ness status (x2 (2, N = 107) = 9.22, p < .01). As clearly seen from thesedata, giftedness status occurred overwhelmingly more often amongfirstborns. These findingsare in accord with ourearlier analyses on birthorder and early cognitive development (A. W. Gottfried & A. E.Gottfried, 1984), the several studies noting birth-order differences assummarized by Olszewski et al. (1987) and Cornell (1984), and themeta-analysis by Falbo and Polit (1986). Hence, it appears that gifted-ness status is not associated with family composition, but rather thechild’s placementin the family. The ordinality of the child among the
children in the family has interesting implications for the environmentalstimulation being furnished by parents (A. W. Gottfried & A. E.Gottfried, 1984).
Proximal Environmental Variables
This category was divided into two subcategories: observationaland nonobservational assessments of the home environment. Inven-tories included in the observational category were the Home Ob-servation and Measurement of the Environment and the PurdueHomeStimulation Inventory. Inventories included in the nonobser-vational category were the Variety of Experiences Checklist, HomeEnvironment Survey, and Child’s Request for Activities. Based onour research demonstrating significant and positive relationshipsbetween proximal environmental variables and cognitive function-ing, it was ouroverall hypothesis thatif differences emerged betweenthe gifted and nongifted groups on environmental stimulation vari-ables, they would favor the gifted children (A. W. Gottfried & A.E. Gottfried, 1984).

154 Chapter 6
Direct Observational Home Assessments
Home Observation and Measurementofthe Environment (HOME). Theanalytic strategy for the HOMEscales included two types of analyses.The first was a 2 x 3 (Giftedness Status x Age: 1.25, 3.25, and 8 years)repeated-measures ANOVAfor the HOMEtotal scores. The omnibusanalysis was conducted for two reasons. First, whereas we expected tofind differences in specific scales favoring the gifted children, we did notnecessarily expect differences in the composite total scores, althoughone might anticipate that the overall home environmentof gifted chil-dren would be of higher quality than that of nongifted children. How-ever, one must keep in mind that the overall homescore is nothing morethan an unweighted summaryof the subscale scores, some for which wehad noprediction. Second, we were interested in whether there was an
interaction between group and age; specifically, if differences did exist,was the magnitude of these differences between groups greater at anydevelopmentalperiod? For this analysis, it was necessary to convert theraw scores to z scores (M = 0, SD = 1) because each version of the HOME
contained a different numberofitems. Figure 6.1 displays the pattern ofscores across the three home assessments. The maineffect of group wassignificant: the HOMEtotal score of gifted children was higherthan thatof the nongifted children (F(1, 101) = 10.90, p = .001). The mean total
HOMEz scoresfor the gifted group at 1.25, 3.25, and 8 years were .27,.66, and .72, respectively. The comparable valuesfor the nongifted groupwere —.07, -.14, and —.17. These results show that during the early years,children who became gifted received a more enriched home environ-mentoverall, and the differences between the groups remainedstablebetweeninfancy and early elementary years.
In Figure 6.1, we also plotted the mean z scoresfor the three sets of
intellectual assessments (3 Bayleys, 3 McCarthys, and 3 WISC-Rs). Thesetwosets of data allowed usa visual inspection of both the overall HOMEscores andintellectual measures. These findings are quite dramatic inthat they show the correspondenceofthe intellectual performanceof thetwo groups with the homestimulation being provided to the childrenacrossthe time frame from 1 to 8 years. Clearly, the intellectual perform-ance of the gifted and nongifted groups from infancy throughtheearlyelementary years corresponded with the overall HOME environmentalstimulation being providedbytheir parents across the same time frame.Levels of home environmental enrichment covary with intellectual per-formanceof these designated groups. The data intimate a confluence ofenvironmental stimulation andlevel of intellectual performance.

Homeand Family Environment 155
1.50
Gifted 10
1.25].
1.00.
0.75 Gifted Home Total~
Saaenaa
Be
ear
0.25Mean
zScore
0.00
-0.25 |
Nongifted IOj
-0.50 {oof pd dt dt tT tT yf {oy! ror TO UF ror TT Fe PT TE FTt tT ror 4
0 5 115 225 335 445 5 5.5 6 65 77.5 8
AGE IN YEARSFigure 6.1. Mean z scoresfor gifted and nongifted children for the intelligence measuresand HOMEtotalscore from age1 year through 8 years of age.
The second strategy involved a series of planned comparisonsbased on specific hypotheses generated from our prior research on homeenvironmentand early cognitive development(A. W. Gottfried & A. E.Gottfried, 1984). We used one-tailed tests when we had a priori predic-tions and two-tailed tests when no predictions were put forth. Ourhypothesesandthe rationale for each are presentedfirst, followed byasummaryof the analyses. For the infant version of the HOME,first andforemost, we expected the Variety in Daily Stimulation to be related togiftedness status because this subscale bore the most pervasiverelationto cognitive developmentin ourearlier work. Other subscales showinga significantrelation to cognitive development were Maternal Involve-ment with the Child, Emotional and Verbal Responsivity of Mother, andto a lesser degree, Provision of Appropriate Play Materials. Avoidanceof Restriction and Punishment and Organization of Environmentsubscales showednosignificant correlations with cognitive develop-ment. For the preschool version, the Stimulation of Academic Behaviorsubscale was expected to be related to giftedness status because itprovedto be the most consistentin its correlation with cognitive devel-opment compared to the other preschool subscales. Variety of Stimula-

156 Chapter6
tion; Stimulation through Toys, Games, and Reading Materials; Lan-
guage Stimulation; Pride, Affection, and Warmth; and Modeling and
Encouragementof Social Maturity also showed a consistent pattern of
correlations with cognitive measures. The Physical Environment
subscale showed a weakrelation to cognitive development, and the
Physical Punishment subscale was unrelated to cognitive functioning.
Ourexpectations for the subscales of the elementary version were de-
rived from our knowledge of the differences observed in the earlier
versions. Those specific subscales involving cognitive enrichment and
family involvement would be expectedto relate to cognitive function-
ing. We would not expect the Aspects of the Physical Environment
subscale to accountfor differences, and we had no prediction about the
Emotional Climate subscale.
Table 6.2 presents the means, standard deviations, and t-test re-
sults for all of the subscales of the three versions of the HOME.Before
proceeding with the statistical analyses, it is noteworthy that, in every
instance (with the exception of Restriction and Punishment at 1.25
years), the quality and quantity of home stimulation washigherfor the
gifted children than the nongifted children. For the infant version,statistical analyses showed that the only scale that differentiated thegroups was Opportunities for Variety in Daily Stimulation. Four of thepreschool-version subscales weresignificant: Stimulation through Toys,Games, and Reading Materials; Language Stimulation; Stimulation ofAcademic Behavior; Pride, Affection, and Warmth. Five of the elemen-
tary version subscales were significant: Emotional and Verbal Respon-sivity; Growth Fostering Materials and Experiences; Provision forActive Stimulation; Family Participation in Developmentally Stimulat-ing Experiences; Paternal Involvement. In no case werescales assessing
the physical environmentsignificant. Collectively, our results show thatthe home environments of gifted children are characterized as beingmore stimulating and socially responsive, and having greater parentalinvolvementthan those of nongifted children. In no instance did wefinda reversal in the predicted direction; that is, nowhere did we find thenongifted groupreceiving a significantly greater level of home stimula-
tion.In summary, the preponderance of our hypotheses were supported
by the planned comparison analyses. The families of gifted childrenprovided morestimulating activities than did the families of nongiftedchildren. Moreover, the parents were more involved with and appar-ently more invested in providing their children with a cognitivelyadvantageous home environment. Whereas prior researchers found

Homeand Family Environment157
Table 6.2. Comparisons of Means between Gifted and NongiftedChildren: Home Observation and Measurementof Environment
(HOME)Inventory
Giftedness status
Gifted Nongifted t
1.25 years (N = 105)
Responsivity 8.8 (1.4) 8.7 (1.6) 0.26Restriction & Punishment 6.4 (1.0) 6.5 (1.1) -—0.43
Organization 5.4 (0.8) 5.2 (0.9) 0.72Play Materials 8.7 (0.5) 8.6 (0.7) 0.37Maternal Involvement 4.4 (1.0) 4.0 (1.2) 1.29Variety of Stimulation 4.0 (0.6) 3.4 (1.0) 3.07"
3.25 years (N = 103)
Toys, Games, Materials 9.7 (0.8) 8.9 (1.7) 3.10"Language Stimulation 6.4 (1.0) 5.5 (1.2) 2.98"Physical Environment 6.7 (0.5) 6.6 (0.7) 0.67Pride, Affection, Warmth 5.5 (1.7) 4.8 (1.6) 1.73"Academic Stimulation 4.3 (1.2) 3.3 (1.4) 3.117"Social Maturity Modeling 3.7 (1.1) 3.4 (1.1) 1.14Variety of Stimulation 7.2 (1.2) 6.6 (1.4) 1.49Physical Punishment 3.5 (0.5) 3.4 (0.9) 0.62
8 years (N = 103)
Responsivity 9.7 (0.5) 9.2 (1.1) 3.19"Encourage Maturity 6.3 (1.0) 5.8 (1.3) 1.48Emotional Climate 6.1 (1.1) 6.0 (1.2) 0.09Materials & Experiences 6.8 (1.1) 5.9 (1.3) 2.78"Active Stimulation 6.8 (1.0) 5.4 (1.5) 5.16Family Participation 5.5 (0.7) 4.6 (1.0) 4.33"Paternal Involvement 3.2 (1.1) 2.6 (1.2) 1.98Physical Environment 7.6 (0.8) 7.2 (0.9) 1.39
Note. Standard deviations in parentheses.All tests were one-tailed except Restriction &Punishment and Organizationat1.25 years, Physical Environment and PhysicalPunishmentat 3.25 years, and Emotional Climate and Physical Environmentat 8 years.“p < .05. **p < .01. ***p < .001.
differences in the home environment of gifted children as well, wepresent evidence that their homes were more stimulating from infancyonward. Furthermore, there were a greater numberofsignificant differ-ences emerging with advancementin age from infancy through theprimary schoolyears(see also A. W. Gottfried, 1984b). This latter obser-

158Chapter6
vation suggests an interaction between the child and environmentthat
complements the interaction between the child and parent as suggested
by Olszewski etal. (1987). Further, the notion thatgifted children receive
more environmentalstimulation because they process information more
effectively (Freeman, 1979) and therefore assimilate more quickly is a
likely conclusion to be drawn from the findings here. We presented
evidence in Chapter3 that parents recognizetheir gifted child’s potential
early in infancy. We would expect responsive parentsto react by pro-
viding more stimulating environments.
Purdue Home Stimulation Inventory (PHSI). Among the 13 PHSI
items at 1.25 years that bore somerelationship to cognitive development
in the early years (A. W. Gottfried & A. E. Gottfried, 1984), four showed
significant differences between the gifted and nongifted children.First,
the gifted children had fewersiblings (75%had nosiblings) than the
nongifted children (40% had nosiblings) (x? (1, N = 107) = 6.56, p < .01).
This finding supports the preponderanceof those in the literature who
find there are morefirstborn children in gifted groups(e.g., Barbe, 1956,
1981; Cornell, 1984; Freeman, 1979; Hollingworth, 1942; Sheldon, 1954).
Theliterature also reveals that gifted children are morelikely to be onlyborns as well (Hollingworth, 1942; Sheldon, 1954). The differences wefound in numberof children in the home at 1 year of age, which is
analogoustothe variable of birth-order status noted earlier, were main-tained at age 8 years. Whereas 25% (5/20) of the gifted children contin-ued to be only children at age 8 years, only 10.6% (8/87) of the nongiftedchildren werestill only children at this age. This difference wassignifi-
cant (x? (1, N = 107) = 3.8, p = .05).Second,gifted children were read to by parents more each day than
nongifted children (f(adjusted df = 23.6) = 2.28, p = .03). The averageamountof time per day parents reported reading to gifted children was26.55 min (SD = 29.68); the corresponding figure for nongifted childrenwas 10.59 min (SD = 21.05). What is most interesting about this finding
is that it is occurring during infancy. Very early in the lives of giftedchildren, they receive a greater amount of exposure to parents reading
to them than do children who do not become gifted. Whereas re-searchersas early as Terman notedthat gifted children had more booksand read more often than nongifted children, we have shownthatthispractice beginsin infancy andis likely to be initiated by mothers readingto their children.
Thefinal two itemsrevealing significant differences from the PHSIwere encouragementof self-help skills and rooms per person in the

Homeand Family Environment159
home. Children in the gifted group (35%) were morelikely to receivetraining in dressing themselves than children in the nongifted group(11.5%) (x2 (1, N = 107) = 5.08, p = .024). The more rapid developmentofself-help skills was noted in Chapter 5 as well. Whatis noteworthyisthat there were differences at this very young age. Whythesechildrenare aheadof their nongifted peers maybe attributed to the finding thatproportionally moregifted children arethe firstborn in the family, andfirstborn children are more likely to be independent. Finally, there wasa larger room-to-personratio in the homes of gifted children (M = 3.17,SD = .74) than in the homesof nongifted children (M = 2.68, SD = 83;t(105) = 2.45, p = .016). This latter variable is interesting in that room-to-person ratio corresponds with cognitive functioning during the adultyears as well (Gribbin, Schaie, & Parham, 1980). Again, these datasupportthe view thatgifted children are receiving an intellectually moreadvantageous environment than nongifted children in the openingyears oflife.
It is impossible to determine the directionality of environmental-intellectual development from our data. While environmental inputmaycertainly be the result of parents’efforts,it may well be the demandsthese children make ontheir parents for intellectually enhancing mate-rials and activities (A. W. Gottfried & A. E. Gottfried, 1984). Ourearlierwork suggested that infants differing in cognitive developmentelicitedcorrespondingly different levels of stimulation in the preschoolyears.Data presented below will show thatgifted children place significantlymore demandson their parents for extracurricularactivities. Hence, therelation between intellectually gifted status and environment may beinterpreted bidirectionally.
Nonobservational Assessments of the Home Environment
Variety of Experiences Checklist. Results of the planned compari-Sons in which gifted children were expected to have experienced agreater variety of experiences outside of the home during the preschoolyears wasnot borneout. Ourearlier findings showedthese variables tobe correlatedpositively and significantly, albeit at low magnitudes, withcognitive development(A. W. Gottfried & A. E. Gottfried, 1984) duringpreschool period. However, there were no differences between thegifted and nongifted groupson this specific variable. Perhaps within amiddle-class sample,fine-line differences are not found in the children’sexperiences outside of the home, butrather in their experiences withinthe homesetting.

160Chapter 6
Home Environment Survey. The HES wasanalyzed for each of the
factors at 5, 7, and 8 years. The factors, with the items loading on each,
are listed in Table 6.1. We had specific hypotheses about the factors
explicitly assessing the academically oriented materials in the home
available to children and the involvementofparents in their children’s
academic and cultural activities; hence, these factors were analyzed with
one-tailed t tests. Because we had no
a
priori expectation for the remain-
ing factors, these were analyzed with two-tailed t tests.
At 5 years, there were three factors: Mother Provides Educational
Stimulation, Educational Attitudes, and Provisions of Learning Materi-
als. As one can readily see in Table 6.1, each of these factors contains
items related to academically orientedactivities. Therefore, we expected
gifted children to score higher than nongifted children on all three
factors. Our hypotheses were supported for two factors: Mother Pro-
vides Educational Stimulation (t(83) = 3.24, p < .002) and Provisions of
Learning Materials (t(83) = 1.95, p = .027). Gifted children made more
monthly trips to the library and had mothers who read to them more
each day and spent more time with them on academic skills than did
nongifted children. Gifted children were also provided with more learn-
ing materials such asactivity books, electronic teaching aids, and com-
puter experience. It is interesting to note the consistency of these
findings with reading moreto the child on the PHSIat 1.25 years andthe academic stimulation and materials subscales of the HOMEat 3.25years. The third factor, Educational Attitudes, did not significantly
differentiate the two groups. Examination of the items reveals that only
oneis directly related to academic attitudes: educational level childis
expected to receive. Twoofthe items assess the actual amountof timethe children and mothers watch TV each day, and the last is a measure
of whether children have their own musical instruments. Clearly, these
are a heterogeneoussetof items and hence may accountfor nonsignifi-
cance in the analysis.At 7 years, the three factors were Mother Provides Educational
Stimulation, Educational Attitudes, and Mothers’ Time Involvement
with Child. The first two factors, as shownin Table 6.1, contain itemssimilar to those bearing the same nameat age 5 years, specifically, items
relating to academic experiences. We madethe samea priori predictions
for these twofactors, that is, we hypothesized that gifted children wouldscore higher than nongifted children. We had no expectations for Moth-ers’ Time Involvementwith Child and therefore conducted a two-tailed
test. Results of the planned comparisons analyses showed supportforone of our hypotheses. Gifted children scored higher than nongifted

Homeand Family Environment 161
children on Mother Provides Educational Stimulation (t(adjusted df =37.6) = 2.33, p = .013). There was no significant difference between thegroupsfor EducationalAttitudes. These results are consistent with thosefrom the 5-year analyses. In the school-entry years, gifted childrenreceive more academically oriented materials and have mothers who aremore involved with them in academic activities. But, the factor welabeled Educational Attitudes was apparently too heterogeneous innature, and this possibly accounted forits nonsignificance. The thirdfactor, Mothers’ Time Involvementwith Child, was unrelated to gifted-ness status.It therefore appears thatthe time, as measured in actual time,mothers spend with children does not differentiate the two groups ofchildren. This becomes more apparent as weevaluate the 8-year data.
Theitems of the HES at the 8-year assessmentarelisted with theirrespective factors in Table 6.1. Consistent with prior hypotheses, weexpected factors with an academicbasisto significantly differentiate thetwo groups. These were Learning Opportunities and Reading Involve-ment with Children. We had no expectation for the remaining threefactors: TV Time and Mothers’ and Fathers’ Time Involvement withChild. One-tailed t tests found support for both hypotheses. Learningopportunities were significantly higher for the gifted children comparedto the nongifted children (#(101) = 3.67, p < .001). Gifted children hadmore accessto real musical instruments, more of their own and familymagazine/book/journal subscriptions, more private lessons, more ex-perience with a computer at home, and higher educational aspirationsby their parents. Ongoing reading to the child in the early years isconsistently associated withgifted intelligence at 8 years. Reading In-volvementwith Child wasalso significant (#(105) = 2.92, p = .002). Giftedchildren were morelikely to make more trips to the library each month,read by themselves more each day, and have their own dictionary.Again, as shown in the infancy measures and by other researchers(Colangelo & Dettmann, 1983; R. L. Cox, 1977; Terman, 1925-1929),activities involving reading continue to differentiate the gifted andnongifted groups. Results of the two-tailed t tests, for which we had noa priori hypotheses, werenot significant. Thus, we found that academi-cally oriented activities and experiences differentiated the gifted fromthe nongifted group, but not parental contact as measured by parentalreports of actual time spent with children.
Onecanseethat significant differences were consistently foundforthose factors reflecting academically oriented experiences and notforfactors reflecting the amountof time parents spendwith children perse.The amountof time family members watch TV wasincluded in each of

162 Chapter6
the HES questionnaires and consistently revealed nonsignificant differ-
ences between the groups. Ourfindings of differences in academically
oriented materials and activities are in accord with those reported by
Freeman (1979). We conclude that it is not necessarily the actual time
parents devoteto children, but the active involvementin academically
and culturally oriented activities that differentiate the gifted from
nongifted children. In a nutshell,it is the quality and not the quantity of
involvementthat is consequential.
While we were surprised that we found no differences for the
factor labeled Educational Attitudes at ages 5 and
7
years, particularly
in view that parents ofgifted children are more highly educated,a closer
look at the factor reveals a heterogeneousset of items. Only one—Edu-
cational Aspirations—directly assesses the educational/academic do-
main. Because of the developmental and psychological significance of
this one item, we chose to analyze it separately at each age. This item
wasalso the highest-loading item on the Educational Attitudes factorat
ages 5 and 7 years and on the Learning Opportunities factor at age 8years. Specifically, mothers were asked how mucheducation they ex-
pected their child to receive by checking either high school degree,college degree, master’s degree, or professional degree. The results ofthe chi-square analyses were significant at each age. The mothers ofgifted children had higher educationalaspirationsfor their child. At the
5-year assessment, 70% (14/20) of gifted children were expected toreceive at least a master’s degree as opposed to 31.7% (26/82) ofnongifted children (y? (3, N = 102) = 11.37, p < .01). The corresponding
values for the 7- and 8-year assessments were 65.0%(13/20) and 32.6%
(28/86) (v2 (3, N = 106) = 7.80, p = .05); and 70% (14/20) and 32.6%(27/83)(x7 (3, N = 103) = 12.76, p = .005). What is noteworthyin these analyses
is that mothersof gifted children had higher educational aspirations for
their children 3 years before we identified them as gifted. Further, not
one motherof a gifted child checked only a high school degree, whereas
6% to 7% of the nongifted mothers did at each of the three assessments.
Without knowing whataspirations mothers had for their children atbirth or during early infancy,it is impossible to determine whether theintellectual status of the children influenced their expectations. Never-theless, it is overwhelmingly evident that gifted children live in an
environmentthat is supportive of educational achievements and intel-
lectual advancement. Furthermore, mothersof gifted children were alsomore highly educated. Aspirations for their children mayreflect theirown educational attainment.

Homeand Family Environment 163
In summary, three major findings emerged from the aforemen-tioned analyses of both the observational and nonobservational homeassessments. First, it is evident that across the preschool and earlyelementary school years, gifted compared to nongifted children areprovided with more opportunities and materials thatfosterintellectualand academic growth. Second, parents of gifted children are moreinvolved in their children’s academic activities. Third, readingactivitiesdifferentiate gifted children from nongifted children starting in infancyand continuing into the early elementary years. This combination ofprovision of the materials and activities along with parental involve-mentis potent and a key dimension in enhancingchildren’sintellectualdevelopment (Freeman, 1979; see also A. W. Gottfried, 1984b).
Child's Requestfor Activities. We hypothesized that intellectuallyadvanced children would be morepersistentin requesting stimulationoutside of school and making demandson parents to provide additionalactivities. This was based on ourfinding suggesting that youngchil-dren’s differential cognitive developmentelicited differential levels ofstimulation in the preschool years (A. W. Gottfried & A. E. Gottfried,1984). Therefore, at the 8-year assessment, we asked parents to reporton the lessons, sports, clubs, and hobbies that their children had re-quested. The total number ofactivities across the categories was ana-lyzed. Results revealed that gifted children on the average requestedmore activities than nongifted children (¢(101) = 2.94, p = .002). The meannumberofactivities requested by gifted children was 6.6 (SD = 2.1) asopposed to 5.0 (SD = 2.3) for nongifted children. Hence, we have supportfor our view that gifted children are actively seeking or placing greaterdemandsontheir parents for more environmental enrichment.
In order to determine whichtype ofactivities requested by chil-dren differentiated the giftedness status groups, a one-way MANOVAwas conducted with the four typesofactivities as the dependent meas-ures. The multivariate test was significant (F(4, 98) = 5.88, p <.001). Theunivariate tests showed group differences for lessons, clubs, and hob-bies, but not for sports. Gifted children requested significantly more ofthese types of activities than did nongifted children. The data andunivariate F values are presented in Table 6.3. Hence, we have presentedevidence that gifted children actively seek out more environmentalstimulation than do nongifted children. Moreover, the activities thatgifted children requested are domain specific; that is, differences werenot found across all extracurricular activities. It is interesting that

164 Chapter6
Table 6.3. Comparison of Means between Gifted and
Nongifted Children: Activities Requested
Giftedness status
Activity requested Gifted Nongifted Univariate F
Lessons 2.4(0.9) 1.6(1.1) 9.71"
Sports 1.1(1.1) 1.5(1.0) 2.15
Clubs 1.5(0.8) 0.9(0.7) 13.73
Hobbies 1.6(1.1) 1.0(1.0) 5.53
Note. Standard deviations in parentheses. N = 103.
“yp <.05.""p <.01." p< .001.
nongifted children requested more sporting type ofactivities, although
this difference did not reachstatistical significance.
Family Relationship Variables
Family Environment Scale. This inventory was completed by moth-ers when the children were 3, 5,7, and 8 years of age andbyfathers atthe 8-year assessmentonly. For mothers, we had directional hypothesesaboutfour of the ten scales based on ourearlier research (A. W. Gottfried
& A.E. Gottfried, 1984) with preschool-aged children and that of Cornell(1984) with children between 6 and 11 years of age. These scales wereIntellectual-Cultural Orientation, Cohesion, Expressiveness, and Con-flict. When the FES was completed by mothers, we expected the familiesof gifted children to score higher than the families of nongifted childrenon thefirst three scales and loweron thelast scale. Although we had nopredictions about findings based on fathers’ reports, we reasoned thattheir responses may be consistent with mothers. By contrast, Cornellfound no significant differences for fathers as respondents in researchwith gifted children.
For the analyses of mothers’ responses, we opted for repeated-measures ANOVAas opposedto the 16 f tests that would be requiredfor planned comparisons. The ANOVA allowed a more powerful testwhile maintaining a constant TypeI error rate. Thus, four 2 x 4 (Gifted-ness Status x Age: 3,5,7, and 8 years) repeated-measures ANOVAswereconducted, one for each of the four FES scales for which wehadspecifichypotheses. For mothers’ reports on the Intellectual-Cultural Orienta-tion scale, there was a significant main effect for Giftedness Status (F(1,99) = 11.41, p = .001). The intellectually stimulating atmosphere was

Homeand Family Environment 165
higher in the homesofgifted children (M = 7.7, SD = 1.6) than nongiftedchildren (M = 6.4, SD = 1.9). The families of gifted children support agreater interest in political, social, intellectual, and cultural activities,and perhapsare moreactively involved as well. Certainly, we know thatgifted children have more academically oriented experiences. Theseexperiences may also generalize to the political, social, and culturaldomains.
There wasless conflict reported in the homes ofgifted children (M= 2.2, SD = 1.7) than nongifted children (M = 2.9, SD = 1.9). Therepeated-measures ANOVArevealed a maineffect of Giftedness Status(F(1, 99) = 3.91, p = .05). Similarly, there was more cohesion reported inthe homesof gifted children (M = 8.5, SD = 0.8) as comparedto nongiftedchildren (M = 7.9, SD = 1.5). The repeated-measures ANOVArevealeda main effect of Giftedness Status (F(1, 99) = 3.91, p = .05). Thus, our
findings are directly in line with those of Cornell (1984), who found
significantdifferences on the samethree scales. The gifted and nongiftedgroups differed in family Intellectual-Cultural Orientation, Conflict,and Cohesion. There wasnodifference in the Expressiveriess domain.
Because fathers completed the FES at only one assessment period(age 8 years), t tests rather than repeated-measures ANOVAswere usedto compare the groups. The analyses were conducted as jlanned com-parisons because we expected tofind results similar to those of mothers.Furthermore, we wanted to keep the analyses parallel with those ofmothers. Significant differences were found for the Intellectual-CulturalOrientation scale only (t(62) = 1.77, p < .05). As with mothers, theintellectual-cultural atmosphere was greater in the homes of giftedchildren during early elementary school years. Collectively, the consis-tent results for mothers across the 5-year span andforfathers at 8 yearson the Intellectual-Cultural Orientation scale are highly consistent withthe more enriched environments that were noted on the observationaland nonobservational measures of the home environment reportedearlier. Not only do parents provide more materials anc. experiences,they also encourage an atmosphere that promotesintellectually stimu-lating discussions and involvementin cultural and polit:cal activities.Further, the results reveal that the stimulating intellectual atmospherein the homes of gifted children is apparent from the preschool agethroughthe early elementary schoolyears.
The differences between the gifted and nongifted groupsfor theremaining three scales, Cohesion, Expressiveness, and Conflict, werenot significant for fathers’ report. Our findings—with the exception ofthe Intellectual-Cultural Orientation scale—are similar to those of Cor-

166 Chapter6
nell (1984), who found no differences in any of the FES scales when
fathers were respondents.
Family Inventory. This inventory was created in order to obtain asingle global measure of family functioning. As described earlier, thefactor analysis revealed one generalfactor and a smaller secondaryfactor.Both factors were analyzed here with specific predictions, based on ourearlier work (Bathurst, 1988). Each parent completed this inventory at the8-year assessmentand the twoscales were analyzed separately for moth-ers and fathers. We expectedto find more positive family functioning andless family regulation in the group of gifted children. Results of theplanned comparisons supported three of our four hypotheses. Frommothers’ reports, the family atmosphere wassignificantly more positivein the homesof gifted children than nongifted children (¢(101) = 1.89, p =
.03). The differences were not significant for fathers’ report. For bothparents, the families of gifted children when compared to nongiftedchildren regulated family members’ behavior less (mothers’ reports:t(101) =-1.78, p = .04; fathers’ reports: (64) = -1.90, p = .03). These findings
underscore the importance of parental involvement and suggest differ-ences in the patterns of parental involvementin the homesof gifted andnongifted children. The families of gifted children enjoy doing thingstogether, cooperate with each other, openly discuss feelings, and experi-ence less tension than do families with nongifted children. They also tendto regulate family members and the home environmentless. Thus, thefamilies of gifted children are less rule oriented and haveless well-de-fined roles as comparedto families of nongifted children.
In summary,gifted children have homes with more cohesion amongfamily members,a less conflictual atmosphere, and less control of familymembers in the form of rules and regulations. We have strong supportforan atmosphere conducive to intellectual and cultural interests. Thesefindings, coupled with results showing gifted children have more materi-als and experiences conducive to academicstimulation, allow us to paint amore colorful and completepicture ofwhat the home environmentexperi-enceis like for gifted children during their early years.
SUMMARY
1. The evidence is overwhelming that gifted children compared tonongifted children receive more enriched environments during the early

Homeand Family Environment 167
years (i.e., infancy, preschool, and early elementary). Whatis excitingaboutourresults is that these differences are found yearsbefore childrenare identified as gifted.
2. While our findings directly support others whchave studiedgifted children after they are identified, we have provided substantialsupport for the notion of enriched environmental continuity from in-fancy to middle childhoodforgifted children. The advantages providedto gifted children begin early in developmentand are noted consistentlythroughoutthe early elementary school years, perhaps even beyond.
3. Differences between the home and family environments ofgifted and nongifted children were apparentin all three categories:distal environmental variables, proximal environmental variables, andfamily relationship variables. In every case, where differences werenoted, they favored thegifted children.
4. Gifted children come from families with higher socioeconomicstatus and have parents who are more highly educated than nongiftedchildren. These differences may account for the higher-quality homeenvironments that are providedfor gifted children. Gifted children hadfathers a few years older than those of nongifted children. Familycomposition variables that did not distinguish the groups includedfathers’ occupational status (some differences emergedfor mothers’occupationalstatus), mothers’ workstatus, mothers’intelligence, sex ofthe children, marital status, experience of divorce, age of mothers, and
numberof adults and children residing in the home.9. Gifted children were predominantly firstborns, and often only
borns.
6. Within the domain of the proximal home environmental vari-ables, gifted children consistently had a more enriched cognitive envi-ronment than nongifted children. Parents were more involved, moreresponsive, and more nurturingin their children’s academic endeavorsand had higher educationalaspirationsfor their children. These findingsare consistent with ourearlier findings during infancy ancl preschool(A.W.Gottfried & A. E. Gottfried, 1984) and with Freeman’s (1979, 1991)results.
7. We also found evidence that children play an active role ineliciting environmentalstimulation; children are not passive recipientsof environmental and parental input. The gifted children placed moredemandson parents for stimulatingactivities. Althoughit is impossibleto determine from our data whetherthese children are more demandingfrom the early infancy period or whether they develop into more de-manding children because parents provide more for them, one would

168 Chapter6
hypothesize that the process is one that is continuous, interactive, andeffectual; that is, children affect their environment.
8. Within the family relationships domain, the families of giftedchildren endorse more culturally and intellectually stimulating activi-ties by the time the childrenare 3 years old, and these differences remainthroughthe early elementary years. These families have a greater degreeof cohesion andless conflict. In addition, they impose fewer regulatory
controls on family members.In sum, children who becomeintellectually gifted grow up ina
more advantageous home and family environment with regard to pro-moting cognitive growth. They experience cognitive enrichment, edu-cational enhancement, and cohesive family relationships during theirearly years of development.

7
On BecomingIntellectuallyGifted
Weinitiated the research in this book with the assumption thatintellectual giftedness is a developmentalprocess; thatis, it does notjusthappen. Although the process of identifying which children are to beconsidered or designated as intellectually gifted occurs most oftenduring the early elementary years (for both psychometric andeducationalreasons), it does not mean that this personalattribute is an
all-of-a-suddenevent. The foregoing findings strongly support the viewthat intellectual giftedness is a developmental phenomenon.
The intent of this chapter is not to summarize the results. Summa-ries of the specific findings for each domain investigated have beenfurnished at the conclusion of each content chapter (Chapters 3-6). The
purposehereis to integrate the findings into a developmental perspec-tive and put forth our owninterpretation of how children becomeintellectually gifted. Our conceptualization on how children becomeintellectually gifted shall be known as the “Potentiality-EnrichmentTheory.” We view this as an initial stage of theory development andexpect that future empirical work will help to elaborate the theory.
All theories of human behavior and development are based onprobabilities, that is, the likelihood that certain behaviors or actions (orreactions) occur under specified conditions or that certain kinds ofbehaviors are likely to follow other types of behaviors. As noted inChapter 3, one may develop a theory of how children becomeintellec-tually gifted but not of how anindividual child emergesasintellectuallygifted. The individualcase profiles of intellectual quotients across timepresented in Chapter 3 demonstrated that there were as many individ-
169

170 Chapter7
ual ontogenetic age patternsas there were gifted children. This strongly
underscores the importance of acknowledging the variability or unique-ness in the course of intellectual performance over time, particularlyduring the early years. Explaining how an individual becamegifted,accomplished, talented, or recognized in an area mayrest on detailed
biographical observations and accounts. Just as intellectually giftedchildren are statistically exceptional, individuals contained within thegifted population are also unique or exceptional in their own develop-mental way. Weassert that each child who emergesasintellectually
gifted doesso at his or her own developmental tempo. For example, theconceptof “late bloomers” would fit into our viewsonthe individualityof becoming gifted. By the same token or principle, a highly gifted or
exceptionally talented child may become an ordinary adultif continuity
of environmental enrichment, support, or opportunity is diminished.
Our theorizing focuses on behaviors and environmental experiences
that are likely to exist in the early course of developmentin children whobecomeintellectually gifted as a group.
POTENTIALITY-ENRICHMENT THEORY
Our Potentiality-Enrichment conceptualization of how childrenbecomeintellectually gifted pertains to the interface of children’s cogni-tive ability, their intrinsic motivation, and a cognitively stimulatinghome environment. Evidence for each of these aspects was obtained inthis longitudinal study. The early evidence regarding a proneness toreach superior levels of cognitive performance was found duringin-fancy on the Bayley, the preschool years on the McCarthy, and the early
school years on academic achievement with the KABC achievementscale, WRAT-R, and Woodcock-Johnson. Group differences favoringchildren who became gifted compared to nongifted were obtainedacross all these measures and age periods, beginning at 1.5 years. Moreimportant from the theoretical perspective, the gifted in contrast tonongifted children were significantly more likely to attain superiorintelligence scores at least once during the infancy and preschoolperi-ods. Individual childrenin the gifted group varied with respect to whenthese elevations occurred within each period. Moreover, they did notexhibit the same pattern of elevation on subtests of the McCarthy orWoodcock-Johnson. Therefore, there was a great deal of individuality
in the expression of superior scores. Similarly, the case profiles across

On BecomingIntellectually Gifted 171
time corroboratedthe individuality of the spiked patterns. Our interpre-tation of these spikesis that they are indicationsof the ability of thesechildren and their potential rangeof effect or signsof reach. Lastly, theseresults highlight the importance of employing a time-frame analysis inthe assessment of superior cognitive ability. If a single point in time orage had been employed asis usually done in research and practice, wewould have missed the identification of potential. Because of the highlyvariable developmental tempoin infants and youngchildren, the use ofa single time assessmentis likely to fail to identify potentially giftedchildren. By contrast, with repeated assessments across time, the oppor-tunity to express one’s potential is given more latitude. These elevatedscores may beearly signs in the developmental course ofintellectualgiftedness and mayserveas cuesin its detection. Furthermore, superiorcognitive competence maybe revealed in everyday cognitive activitieswithin the home environment, whichin turn maycatch the attention ofa knowledgeableor astute parent.
Ourfindings regarding gifted children’s advanced language dur-ing infancy and the preschool years are relevant here. Acceleratedreceptive and expressive languageabilities may be indicators of poten-tial intellectual/cognitive giftedness, not only for researchers, but forparents as well. Consequently, enhanced cognitive and language skillsmay elicit greater parental involvement and provision of cognitivestimulation and experiences.
There were, however, instances of spikes for children in thenongifted group as well. This raises the issue of why some childrenevidenced spikes in their early course of development but did notbecomegifted by age 8 years. There are several possible explanations:(1) they have not yet becomegifted; that is, such children maybelatebloomers; (2) the env:i:onmental advantages are not present; (3) parentsfailed to recognize the child’s ability and consequently did not nurturethe accelerated development; and (4) the child’s own motivation isinsufficient to encourageorelicit more advantageous environmentalstimulation.
At the heart of superiorintellect may be motivation foror pleasureinherent in acquiring knowledge,thatis, intrinsic motivation. Our dataindicate that cognitive mastery motivation and eventually academicintrinsic motivation are characteristics of the intellectually gifted frominfancy andthereafter. During infancy and early childhood, the giftedchildren’s test-taking behaviors showed that they becamereadily andenthusiastically engaged in the cognitive demandsofthesetests. Theywere rated as being significantly more goal directed; having greater

172 Chapter 7
absorption in tasks as indicated by longer attention spans; revealingmore intense interest in and reactivity to the test materials; showinggreater cooperation with the examiner; having a more positive emo-tional tone; and beingless fearful in the testing situation. These data are
also in accord with ourother findings regarding children’s testability.During the preschool years, children who becomegifted were highlyunlikely to be untestable compared to children who did not becomegifted. As reported, the rate of untestable children amongthe nongiftedwasfourfold that of children who becamegifted.
Gifted children also evidenced significantly greater academic in-trinsic motivation, lower academic anxiety, and more positive percep-tions of their academic competenceat ages 7 and 8 years. In a follow-upstudy we conducted of the children at ages 9 and 10 years, the giftedcontinued to show superior academic intrinsic motivation as measuredby the Children’s Academic Intrinsic Motivation Inventory (A. E. Gottfried,1986a). We also found continuity between early test-taking behaviors asmeasuredin infancy and early childhood with academic intrinsic moti-vation scores during the schoolyears (A. E. Gottfried & A. W. Gottfried,1993). This means that such cognitive mastery motivation test-takingbehaviors as indexed aboveare both precursors and predictors of futureacademic intrinsic motivation during the school years. Overall, thechildren who subsequently became gifted revealed superior motivationduring infancy, preschool, and the school-age years. These data are alsoconsistent with findings by A. E. Gottfried (1990) that academic intrinsicmotivation is positively correlated with IQ. Children with higher IQs,and, in particular, gifted children, find more pleasure in learning andcognitive tasks, experience more intrinsic motivation, and are indeedmore competent at such tasks and schooling. On the basis of these data,we hypothesize that children whoare intellectually gifted are likely tobe motivationally gifted, although we are not proposing a one-to-onecorrespondence betweenintelligence and motivation.
Our educational and achievement data are interpretable within amotivationalas well as the cognitive framework.Thegifted children hadconsistently higher academic achievement on both standardized testsand teacher and parent ratings, and their teachers rated the giftedchildren as significantly harder working, better behaved, and learningmore in the classroom setting. Inasmuch as academic intrinsic motiva-tion has also been shownto be positively correlated with academicachievementand a uniquepredictor of current and future achievement(A. E. Gottfried, 1985, 1990; A. E. Gottfried, Fleming, & A. W. Gottfried,
1994), gifted children’s higher academic performancecan be interpreted

On BecomingIntellectually Gifted 173
as containing a strong motivational component. Additionally, giftedchildren were highly unlikely to have their kindergarten entry delayed,and they were neverretained in school. Froma young age, children whobecome gifted are academically more ready for school entry (keep inmind our sampleof children comprised young 5-year-oldsat kindergar-ten entry), more successful in school, and evidence a greaterorientationtoward the cognitive challenges of school.
It has becomeincreasingly commonfor schools to set earlier dead-lines for kindergarten entryso that children who are acceptedforthefallterm mustbe 5 years old by June or Septemberrather than by December.In someinstances, there have been separate deadlines established forboys andgirls, with boys havingto be older thangirls. The purpose ofthis practice is ostensibly to prevent “immature”children from enteringkindergarten. Weseriously question this policy, particularly for giftedchildren. Chronological age should notbe usedas an index for develop-mental status. Gifted children may suffer if they are denied entry intokindergarten onthebasisof their chronological age. Gifted children whoare forced to delay entry due to age alone may not be provided withadequate cognitive and/or academic stimulation. Denying them opti-mal environmental opportunity to develop theirabilities may result ininadequate challenge and a reductionin their intrinsic motivation.
From ourtheorizing, we would proposethat academically under-achieving gifted children are less adequately motivated. The absence ofsufficient environmental supports for intrinsic motivation, such as in-adequately challenging cognitive tasks in the school and home environ-ments, could underminefruition of their intellectual potential (also seeMonksetal., 1986; Rimm & Lowe, 1988; Tuttle et al., 1988; Whitmore,1986). As theoretically proposed and empirically demonstrated, chil-dren’s home environments,including the provision of adequate stimu-lation, mastery experiences, and parental encouragement of taskendogeny, promote the development of mastery and academicintrinsicmotivation (A. E. Gottfried, 1986b; A. E. Gottfried, Fleming, & A. W.Gottfried, 1994; A. E. Gottfried & A. W. Gottfried, 1991).
In our view, motivation is not simply a concomitantofintellectualgiftedness. Rather, motivation is an essential componentwithout whichgifted children are unlikely to evidencetheirgift. The foundationforthisstatementrests on the integral nature or interface of intellect, motiva-tion, and environment. These three aspects are inextricably intertwinedin that each continuously promotesthe others. For example, a child witha higherintellectual ability is likely to have greater masteryor intrinsicmotivation that is further stimulated throughactive attempts to demand

174 Chapter 7
morestimulation of the environment. To the extent that the environment
is accommodatingto the child’s efforts, higher stimulation, challenge,
and mastery experiences are likely to be provided. This environmental
provision in turn further fosters greater intellect and motivation.Our research provided overwhelming evidence that gifted chil-
dren are embeddedin anintellectually and culturally advantageoushome atmosphere. Theintellectual ecology of the homes they grow upin is facilitative of cognitive advancement. This was indicated by theproximal, distal, and family relationship variables. Throughoutthe early
years, they received a more cognitively enriched home environment.
They were provided withsignificantly more environmentalstimulation,parental involvement and responsiveness, and academically enhancing
materials and experiences. These findings support our view that theparents of children who becomegifted actively provide a more enrichedcognitive and educational curriculum in their homes. Additionally, theirfamilies had higherintellectual and cultural orientations, higher family
cohesiveness, andless regulation of family members. This latter findingregarding lowerregulation of family membersis in accord with theoriesregarding family processes that are conducive to the developmentofchildren’s task endogeny andintrinsic motivation (A. E. Gottfried,Fleming, & A. W. Gottfried, 1994); that is, self-determination, a charac-
teristic of intrinsic motivation, ought to be facilitated in homes withlessexternal family regulation.
Parents ofgifted children were more highly educated and they hadhigher educational aspirations for the children who becamegifted.Mothers perceived gifted children as more highly developedintellectu-ally compared to other youngchildren of the same age. Gifted childrenwere predominantly firstborns and quite often only borns, both of whichplace them in a particularly advantageous position to benefit from agreater degree of home environmental enrichment. Our research onhome environment and early cognitive development has shown thatfirstborns comparedtolater bornsreceive a significantly greaterlevelofproximalstimulation (A. W. Gottfried & A. E. Gottfried, 1984). While
reflecting on the predominance of firstborns and only borns in thesample of gifted children, we considered how second andlater bornsbecomegifted whentheyarein statistically less favored position. Ourspeculations led us to consider the possibility that a later-born, giftedchild is even more superiorin his or herintellect than firstborn becausehe or she needsto counteract a less favorable family position. To followup on this idea, we comparedthe 8-year IQ scoresof the gifted firstbornand only-born (N = 16), second-born (N = 3), and later-born (N = 1)

On BecomingIntellectually Gifted 175
children. The mean of the gifted second- and later-born children washigher thanthatof the gifted firstborns and only borns—140.25 versus137.25, respectively. We then examinedthe IQ score of each child. Of thesecond borns,all of the IQ scores were above 140 (142, 143, and 145). Thethird-born child had an IQ score of 131. Of the firstborns and only borns,6 of the 16 (37.5%) had IQ scores above 140 ranging from 141 to 145,whereas the IQ scores of the remaining 10 children were between 130and 139. Hence, our hunch about the superiority of second andlaterborns was borne out. Admittedly, this finding is post hoc and specula-tive sinceit is based on only four second andlater borns. However, wefeel thatit is a hypothesis worthy offurther inquiry in larger samples.Ifit proves to be valid in other samples, the processes by which secondand later borns become more highly gifted would need to be explored.
Not only were the gifted children furnished with more cognitivelyenriching environments, but they were also more active in elicitingdevelopmentally enhancing experiences. Earlier findings from this lon-gitudinal project suggested that young children differing in cognitivedevelopmentelicit correspondingly different levels of homestimulation(A. W. Gottfried & A. E. Gottfried, 1984). Findings in the present researchshow that gifted children made significantly more requests of theirparents for extracurricular activities. In a similar vein, Durkin (1966)found that children who wereearly readers werepersistentin elicitingreading instruction from their parents. Hence, it is our conclusion thatchildren who becomeintellectually gifted compared to nongifted aremore environmentally engaged.
In addition to receiving and eliciting greater cognitive stimu-lation, we contendthatintellectually gifted children benefit more—that is, in a more mentally sophisticated way—from environmentalenrichment. First, with chronological age corrected, gifted childrenare (by definition) advanced in their mental age as presented inChapter 3. Their patterns ofintellectual abilities were not markedlydifferent from the nongifted, but their level of development wasadvanced. Hence, this advancement provides an advantagefor ex-tracting and interpreting knowledge from their environmental in-teractions. Second, teachers’ reports indicated that the children whobecame gifted learned more. Last, academic achievement wassig-nificantly higher in the gifted both as a group andasindividuals;gifted children were morelikely to evidence performanceat superiorlevels.
Ourfindingsare entirely consistent with the large body of dataon the environments of gifted children and eminent adults. Our

176 Chapter7
study is unique becausethis is the first empirical documentation of
enriched environments, in infancy and early childhood, of children
who ultimately become intellectually gifted. Our data also reveal
considerable continuity in the elevation of environmentalstimulation
for gifted children during the early years. The fact that weare finding
the same environmental profile during the early life of children who
becomegifted as obtained by other researchers and biographersfor
older children underscores the role of environments and the conti-nuity or stability of enhanced home environmental stimulation inthe course of developmentof the intellectually gifted. In our theo-rizing, the continuity or maintenance of environmental enrichment
is a factor of utmost importance in the developmentof intellectual
giftedness.
In summary, embeddedin the Potentiality-Enrichment Theory
of intellectual giftedness are the early behavioral and environmental
aspects that emerge in the course of development of these children.
First, children who becomegifted were highly likely to exhibit su-perior intellectual performancelevels (but not necessarily at the sameage) during the early years. During infancy and the preschoolyears,they were advanced in receptive and expressive languageabilities.
Second, as early as infancy and into school, these children revealed
greater intrinsic motivation. Early in development they were more
engaged in tests or tasks placing cognitive demands on them. Theywere more adept in testing situations and highly unlikely to beuntestable in testing conditions. Third, as early as infancy and there-after they were embedded in a more enriched family atmosphere.
By virtue of their parents’ education and their birth order they areplaced in an intellectually more advantageous position to receive
cognitive environmental stimulation. They also elicit such stimula-tion and benefit more from it. Fourth, children who ultimately be-comegifted are highly unlikely to be delayed in their kindergarten
entry or retained in a grade. Fifth, in the opening years of theireducation, these children demonstrate an overall higher level of aca-demic achievement, superior levels of academic performance, greateracademic intrinsic motivation, less anxiety about learning, and amore positive perception of academic competence.Sixth, gifted chil-dren are cognitively well rounded. Gifted IQ implies generalized
high intelligence. Seventh, gifted children are socially competentand their intellectual giftedness emerges at no expense to their be-havioral functioning, emotionality, or temperament.

On Becoming Intellectually Gifted 177
IMPLICATIONS
Webelievethat the factors that have distinguished the gifted andnongifted groups can be usedto provide applicationsforall potentiallygifted children. These implications for practice are now discussed.
Identification Strategies and Motivational Assessment
Our data indicate that psychometric measures have
a
role in theassessment of giftedness from infancy throughout childhood. Frominfancy on, gifted children’s performance on measures of cognitiveability and achievement was morelikely to show atleast one incidenceof superior elevation compared to nongifted children. Hence, there werepsychometric indicators of superior performance during infancy andearly childhoodthat occurredpriorto the child’s attainmentof an IQ ofat least 130 at age 8 years. However, we would not advocate relying ona single elevation at one point in time during infancy or the preschoolyears as an indexofgifted intellectual performance. A single elevatedscore duringthese early years may increasethe probability that the childwill becomegifted from
a
statistical point of view; however, there is amatrix of factors operating in the pathway to becoming intellectuallygifted, as presented throughout this book. Further, a child may notevidence a superiorscoreat one particular time, andyet he or she couldevidence a superior score at another pointin time. Because children areunlikely to have histories of repeated intellectual assessments duringinfancy and the preschool years, histories of achievementtest perform-ance could be particularly helpful as they are often available fromkindergarten onward. Occurrence of a superior score (at or above thesecond standard deviation) is associated with an increased likelihoodthat a child is or will becomeintellectually gifted. Children whoattaineven one elevated score on any achievementarea could beselected forfurther assessment.
Individuality of the profiles of the gifted children’s intellectualperformance, as presented in Chapter 3, and in their achievement, aspresented in Chapter 4, further supports the importanceof examiningperformance over time. There simply is no one particular intellectualability, achievementarea, or time in developmentthat could be used toidentify all gifted children during the early years. Further, examininghistories of achievement should not end when entry into the giftedprogramsbegins. Rather, attemptsto identify gifted children should be

178 Chapter 7
a continuous process to allow for inclusion of children who are notidentified as gifted at one point, but who may becomeidentified at alater point. Programs need to remain open to children who do becomeeligible, and not be restricted to those who happened to have beenincluded early. For children who may becomelate bloomers, achieve-
ment histories and motivation may provide clues as to whotheyare.
Criteria for entry into gifted programs oughtnotto be restricted toIQ. Children with superior performance in a particular academicachievement area, such as math or writing, ought to have elementaryschool programs to accommodate their gifts. For example, there weresomechildren in our nongifted group who did evidence superior aca-demic achievementat the samelevel as the gifted. Children with supe-rior academic achievement, without an accompanying gifted IQ score,are likely to be omitted from gifted programs. However, their exclusionmay diminish their future achievement, academic intrinsic motivation,
and ultimately cost society many potentially talented individuals.Wesuggest that cognitive mastery and academic intrinsic motiva-
tion be included in the identification of gifted children. The inclusion ofmotivation as a criterion for identification of gifted children has beencontroversial. For example, on the one hand, Renzulli (1978) advocated
the inclusion of task commitmentas an identification criterion in orderto detect gifted students who might otherwise be excludedby virtue ofIQ scores lower than the limit selected. On the other hand, Gagne (1985)
criticized the use of motivation for identification and proposed thatmotivation of gifted children should be a program goal rather than anidentification index. Feldhusen and Hoover(1986) propose a view simi-lar to that of Gagne.
Gagne’s criticism of the use of motivation to identify gifted chil-dren seems based on a competence versus performance distinction.Gagneis concerned that students who are unmotivated, but evidence a
gifted IQ, would be omitted from programs. Hence, Gagne’s suggestionis for competence(i.e., presumed competence based on the IQ score) tobe used preferentially in identification of gifted children. FollowingGagne’s argument, motivation is a performance variable, and as such,should not be usedto identify giftedness.
Gagnealso stated that motivation is just a catalyst for giftedness,and not essential to giftedness itself. It is our position that academicintrinsic motivation and early cognitive mastery motivationare integralto the process of giftedness, and notjust catalysts. The definition of acatalyst is “one that precipitates a process or event, especially withoutbeing involved in or changed by the consequences” (Morris, 1978).

On BecomingIntellectually Gifted 179
Hence, in Gagne’s view, motivation is conceptualized as a separateelementthat serves to promote giftedness. The present researchoffers aposition that contrasts with Gagne’s interpretation. In the present re-search, intrinsic motivation wasstudied. This type of motivationis, bydefinition, enjoymentofthe learning process, and an orientation towardmastery, persistence, and challenge (A. E. Gottfried, 1985). Theoreti-cally, intrinsic motivation serves to advance and enhanceintellectualdevelopment. For example, exposure to optimally discrepant stimuliplays a role in cognitive development andalso the motivational process(Hunt, 1971). Our perspective is that intrinsic motivationis integral tointellectual development,nota catalyst or separate element. This viewis supported by the empirical findings we presented as well as intrinsicmotivation theories.
With regard to the gifted, motivation ought not be considered onlya noncognitive personality trait (e.g., Heller & Hany, 1986; Perleth &Heller, 1994), a catalyst (Gagne, 1985), or limited to task commitment(Renzulli, 1986). Whileall of these diverse types of motivation mayplaya role in the attainmentofintellectual excellence, intrinsic motivationismore inherently involved in intellectual development. As describedabove,intrinsic motivation is a cognitively based motive emerging fromthe interaction of the child with cognitive tasks that are of optimalchallenge. It therefore promotes the process of reaching intellectualexceptionality. We agree with Renzulli that motivation oughtto be usedin the identification of gifted children. We take this position becausegiftedness can be nurtured moreeffectively if the motivational charac-teristics of children are identified. Our purpose in advocating thatmotivation be used in the identification process is to allow for theidentification of a greater numberof children. Hence, weviewthis as aninclusionary rather than an exclusionary method. Children who arehighly intrinsically motivated could be included in gifted programsevenif their actual IQ scoresfall below the required cutoff. Since in ourview gifted performanceis not simply a productof IQ,butis integrallyrelated to motivation, it is entirely appropriate to include academicintrinsic motivationin the identification process.
Behaviors suchasgoalorientation, persistence, and enthusiasm inand enjoyment of the learning process ought to be included in theassessment of giftedness of young children. Exceptionally strong orsalient observed behaviors in these areas maybe indicatorsof intellec-tual giftedness. For school-age children, strong motivation as evidencedby superior scores on the Children’s Academic Intrinsic Motivation Inven-tory and the Young Children’s Academic Intrinsic Motivation Inventory (A.

180 Chapter 7
E. Gottfried, 1986a, 1990) could be used to supplementthe process of
identifying gifted children. These instruments would beespecially use-
ful for identifying particularly strong motivation in specific academic
areas. For example, a child whois performing in the superior range on
math achievement, and wholikewise evidences strong math motivation,
but who does not evidence superior IQ, should be considered as a
candidate for gifted programs. Why shouldthis child be denied access_
to a program suitableto his or her exceptionalability in one area in favor
of a child with a gifted IQ who may not evidence the samelevelof
performance and motivation?
Using motivation in the identification process mayallowforearlierassessment, and hence provision of suitable stimulation. Intrinsic moti-
vational assessment wouldnotonly aidin the identification of well-mo-tivated children, but also those gifted children with lower motivation
who could benefit from being placed in a gifted class that is morechallenging to them.
In surveyingthe literature regarding motivation and giftedness,itbecame apparentthat motivation is often used in a global sense withoutspecifying the type of motivation being described. Some authorsreferto motivation in the gifted as achievement motivation (Heller & Hany,1986), task commitment (Renzulli, 1978), or do not specify the type ofmotivation at all but use the term nonspecifically (Gagne, 1985). Thislack of consistency and specificity with regard to motivation is clearlyinadequate.First, there are different types of motivation that vary withregard to their centrality versus externality to the cognitive process. Thedistinction betweenintrinsic and extrinsic motivation is a good example
of this. External consequencesare often used as incentives for cognitiveperformance, but the source of motivation is external to intellectual
development rather than being integral to it as in the case of intrinsicmotivation. As another example, achievement motivation emerges froman expectancy-value model (Petri, 1991) utilizing concepts involvingmultiplicative relationships between the motive to succeed and theprobability and incentive values of success. These processes involvevery different psychological variables than does intrinsic motivation.
Hence, different types of human motivation may have different ramifi-cations for the developmentof giftedness. Our main pointhereis not tocatalog the types of motivation, but to challenge researchers to considerthe implicationsof different types of motivation for gifted and nongiftedchildren, and not to groupall different types of motivation togetherunder one commonrubric.

On BecomingIntellectually Gifted 181
Examining test score histories and motivation may aid in theassessmentof children who areless likely to be identified as gifted. Forexample, in our study,firstborns were overwhelmingly morelikely tobe identified as gifted thanlater borns. Also, children of relatively lowerSES wereless likely to be gifted in our study, even thoughall childrenwere middle class. Examininghistories of test scores and motivationallyrelevant behaviors may provide a more comprehensive and extensivedata basefor the identification of potential giftedness in subpopulationsof the gifted whoare usually identified at a lowerrate.
Environmentand Parenting
Another implication of our research concerns the role of environ-mentin the developmentof giftedness. Of course, it seems obviousthata maximally enriched home environment appropriate for each child beprovided from early infancy onward. However, we advocate the earlyprovision of educational enrichment programs.Onthebasis of ourdata,wedo notbelieve thatit is adequate to wait until the middle elementaryschool years for such programs. Children could be benefiting, cogni-tively and motivationally, from the provision of adequately stimulatingand cognitively challenging environments earlier. Because giftednessdoes notjust occur all of a sudden in middle childhood, nor does thesupportive home environmentoccurall of a sudden in middle child-hood butrather is enriched from infancy onward, neither should theschool programsfor gifted children be delayed until the middle or upperelementary school grades.In our opinion, this practice misses an impor-tant opportunity to develop a child’s potential.
Ourdata have manyimplicationsfor parenting of the gifted. Therehave been manytreatmentsofthis topic in the literature, and we do notseek to review these. Books are readily available to the public (e.g.,Golant, 1991). Rather, the present data indicate some special aspects ofparenting that deserve to be highlighted.
Gifted children’s parents’ perceptions of the advancementoftheirchild’s ability, relative to other children, emerged as early as infancy.These perceptions were consistent with the child’s cognitive advance-ment(intellectual and verbal). In addition, parents of gifted childrenprovided morestimulating and enriched environments from infancythrough childhood. These two factors, parental perception and theprovision of stimulating environments, can be very important to thedevelopmentof exceptional intellectual ability. Parents who perceivethat their children are more advanced than others may provide more

182 Chapter 7
environmental opportunities and experiencesto foster cognitive devel-
opment. These parents may have, or cometo have, higher expectations
for their child’s ultimate development and academic achievement than
parents with relatively lower perceptionsof their child’s development.
Parents of such children may also have great pride in their child’s
advancement, which may enhancethe child’s cognitive and academic
self-concept.Bloom (1982) noted in his work with talented individuals that
parents played an exceptionally importantrole in procuring the proper
level of skill developmentfor their children once they acknowledged the
gift their children had. Bloom indicated that musical families selectively
focused on music cues, and promoted those in the children, whereas
athletic families focused on athletic cues. Bloom’s point is that for manychildren, these cues may go unnoticed,albeit they may exist. In families
bent toward a particular talent, the parent attends to the special behav-
iors consistent with that skill.Bloom’s work, as well as our own containedin this book, and that
publishedearlier (A. W. Gottfried & A. E. Gottfried, 1984), suggests the
importanceof a bidirectional view of environmentalstimulation.In thepresent study, gifted children not only had more cognitively stimulatinghomes, but also made more requests for extracurricular lessons andactivities compared to nongifted children. Bloom’s (1982) work impliesthat bidirectionality exists between the child’s overt evidenceofa specialtalent and the parents’ acumen in detecting and responding to thistalent.
Weview the role of stimulation in intellectual development ingeneral, and gifted intelligence in particular, as a continuous, bidirec-tional, active process between children and their parents. Additionally,
a substantial body of evidence undeniably indicates that home environ-mental processes including cognitive and academic stimulation aresignificantly related to intelligence, cognitive development, and aca-demic achievement(A. W. Gottfried & A. E. Gottfried, 1984; Kellaghan,
Sloane, Alvarez, & Bloom, 1993). Less is known, however, about the
nature of bidirectionality between children and parents. The mannerinwhich gifted children mayelicit higher levels of stimulation and theresponsiveness of parents to children’s behaviors and characteristics
need further investigation.
Wetake exception to the concept of the hurried child with respectto early cognitive skill training, which Elkind (1981) conceives of aspushing children to satisfy parental needs. While he does acknowledgethe importance of challenge, and the fact that some children do gravitate

On Becoming Intellectually Gifted 183
to learn academicskills on their own at an early age, he appears to havea static, rather than interactive, view of the role of environment. Histreatment of the topic implies that children are being imposed upon byparental pressures. Although we acknowledge that some parents mayindeed inappropriately push and pressurechildren,this does not appearto be the generalcase in the early developmentof children whoattaingifted IQs. The opposite dangerlies in the understimulation of poten-tially gifted children for fear of pushing them.
Aside from the role of environment, the present research supportsseveral other implications for parentinggifted children. Parents need tobe awareof the following. First, myths and stereotypes, such as malad-justmentofthe gifted, still abound, as presented in Chapter 1. Parentsneed accurate information that dispels these myths. Planningfor theirgifted child’s future should notbe influenced by inaccurate myths. Ourscientific analysis of the gifted child within the family presentsa positivepicture of his or her developmentand family life. This is in accordancewith other major literature, such as Terman’s study. Second, parentsneed to be apprised of the uniqueness ofeach gifted child. There is noone pattern that characterizes gifted children as a whole. Developmentaltiming and areas of developmentthat are accelerated differ from childto child. There is no one age at which giftedness occurs. Rather, ex-tremely high performance can occur on cognitive and academic achieve-menttests at different times for different children. Gifted children donot necessarily excelacrossall areas. Third, testing of young childrenatone pointin time can be misleading. As our analyses and recommenda-tions point out, multiple-pointtesting, rather than single-point testing,is needed. Hence, if a child achieves a score in the gifted range at onepointin time, that child may not necessarilytest in the gifted range atalater time. Similarly, if a child is tested and does notattain a superiorscore, that does not necessarily meanthat the child is not gifted or thathe or she would notattain a gifted score at a later time. Early single-pointtesting can result in erroneous perceptions and expectations regardingeither exceptionally high or average performance.
Ouroverall recommendationis for parents to follow their child’slead, and to be careful observers of their child’s development. Parentsshould respond appropriately to their child’s bids for stimulation basedon the child’s interest and responsivenessto different activities. Parentsought to provide experiences that enhance their child’s developmentwithout inappropriately demanding achievement. Overall, their chil-dren’s joy in the learning processis the ultimate goal without which, webelieve, intellectual giftedness will not easily be evidenced. Hence,

184 Chapter 7
parents need to be awareof the conceptsof intrinsic motivation and its
inherent importance to the developmentof intellectual giftedness.If
parents truly understandthis, then appropriate stimulation and excel-
lent developmentin all children,be they gifted or nongifted, can occur.
In conclusion, giftednessis not a chance event; it is not a coinciden-
tal phenomenon. There are early precursors, and possibly predictors,
and definitely developmental and environmental aspects to its emer-
gence. Weassertthat giftedness will blossom whenchildren’s cognitive
ability, motivation, and enriched environments coexist and meld to-
gether to foster its growth.

References
Achenbach, T. M. (1991a). Manual for the Child Behavior Checklist/4-18 and 1991 Profile.Burlington: University of Vermont Department of Psychiatry.
Achenbach,T. M. (1991b). Manualfor the Teacher’s Report Form and 1991 Profile. Burlington:University of Vermont Departmentof Psychiatry.
Albert, R. S. (1980). Family position and the attainment of eminence: A study of specialfamily positions and special family experiences. Gifted Child Quarterly, 24, 87-95.
Albert, R. S., & Runco, M. A. (1986). The achievement of eminence: A model based on alongitudinal study of exceptionally gifted boys and their families. In R.J. Sternberg& J. E. Davidson (Eds.), Conceptionsofgiftedness (pp. 332-357). New York: CambridgeUniversity Press.
Austin, A. B., & Draper, D.C. (1981). Peer relationships of the academically gifted: A review.Gifted Child Quarterly, 25, 129-133.
Baldwin,B. T., & Stecher, L. I. (1923). Mental growth curve of normal and superior childrenstudied by meansofconsecutive intelligence examinations (Vol. 2). lowaCity: Universityof Iowa.
Barbe, W.B. (1956). A study of the family backgroundof the gifted. Journal of EducationalPsychology, 47, 302-309.
Barbe, W.B. (1981). A study of the family backgroundofthe gifted. In W.B. Barbe & J. S.Renzulli (Eds.), Psychology and education of the gifted (3rd ed.). New York: IrvingtonPublishers.
Bates, E., O’Connell, B., & Shore, C. (1987). Language and communicationin infancy.In J.D. Osofsky (Ed.), Handbook of infant development (2nd ed., pp. 149-203). New York:John Wiley & Sons.
Bates, J. E. (1980). The concept of difficult temperament. Merrill-Palmer Quarterly, 26,299-319.
Bates, J. E., Freeland, C. A., & Lounsbury,M.L. (1979). Measurementof infant difficultness.Child Development, 50, 794-803.
Bathurst, K. (1988). The inventories of family functioning: A psychometric analysis.University of California at Los Angeles. Dissertation Abstracts International, 49(7),2918B (University Microfilms No. DA 88-22158).
185

186 References
Bathurst, K., & Gottfried, A. W. (1987a). Untestable subjects in child developmentresearch:
Developmental implications. Child Development, 58, 1135-1144.
Bathurst, K., & Gottfried, A. W. (1987b, April). Confirmatory factor analysis of the FamilyEnvironment Scale using structural equation modeling. Paper presented at annualconvention of Western Psychological Association, Long Beach.
Bayley, N. (1969). Bayley Scales ofInfant Development. New York: Psychological Corporation.
Bayley, N. (1970). Development of mentalabilities. In P. H. Mussen(Ed.), Manualof childpsychology (Vol. 1, pp. 1163-1209). New York: John Wiley & Sons.
Behar, L., & Stringfield, S. (1974). A behavior rating scale for the preschool child.
Developmental Psychology, 10, 601-610.
Benbow, C. P., & Arjmand, O. (1990). Predictors of high academic achievement inmathematics and science by mathematically talented students: A longitudinalstudy.
Journal of Educational Psychology, 82, 430-441.
Bloom, B.S. (1982). The role of gifts and markers in the developmentof talent. Exceptional
Children, 48, 510-522.
Bornstein, M. H., & Sigman, M.D. (1986). Continuity in mental development from infancy.
Child Development, 57, 251-274.
Bradley, R. H., Caldwell, B. M., Rock, S. L., Ramey, C.T., Barnard, K. E.,Gray, C., Hammond,
M. A., Mitchell, S., Gottfried, A. W., Siegel, L., & Johnson D. L. (1989). Home
environment and cognitive development in the first three years of life: Acollaborative study involving six sites and three ethnic groups in North America.Developmental Psychology, 25, 217-235.
Brody,E., & Brody, N.(1976). Intelligence: Nature, determinants, and consequences. New York:
AcademicPress.
Brody, L. E., & Benbow,C. P. (1986). Social and emotional adjustment of adolescents
extremely talented in verbal or mathematical reasoning. Journal of Youth andAdolescence, 15, 1-18.
Brody, L. E., & Benbow,C.P. (1987). Accelerative strategies: Howeffective are they for the
gifted? Gifted Child Quarterly, 3, 105-110.
Brody, N.(1992). Intelligence (2nd ed.). San Diego, CA: AcademicPress.
Brown,K. W., & Gottfried, A. W. (1986). Cross-modal transfer of shape in early infancy:Isthere reliable evidence? In L. P. Lipsitt & C. Rouce-Collier (Eds.), Advances in infancyresearch(Vol. 4, pp. 163-170). Norwood, NJ: Ablex.
Bryne, J. M., Backman,J. E., & Smith, I. M. (1986). Developmental assessment: Theclinical
use and validity of parental report. Journal of Pediatric Psychology, 11, 549-559.
Burns, G. L., Patterson, D. R., Nussbaum,B. R., & Parker, C. M.(1991). Disruptive behaviors
in an outpatient pediatric population: Additional standardization data on the EybergChild Behavior Inventory. Psychological Assessment, 3, 202-207.
Buss, A. H., & Plomin, R. (1984). Temperament: Early developing personality traits. Hillsdale,NJ: Lawrence Erlbaum.
Cahan,S., & Gejam A.(1993). Constancy of IQ scores amonggifted children. Roeper Review,15, 140-143.
Caldwell, B. M., & Bradley, R. H. (1984). Administration manual(revised edition) of the Home
observationfor measurement of the environment. Little Rock: University of Arkansas.

References 187
Cameron,J., Livson, N., & Bayley, N. (1967). Infant vocalizations and their relationship tomatureintelligence. Science, 15, 331-333.
Campbell, D.T., & Stanley, J.C. (1963). Experimental and quasi-experimental designsfor research.Chicago: Rand McNally College Publishing.
Carter, K. R., & Ormrod,J. E. (1982). Acquisition of formal operationsbyintellectually giftedchildren. Gifted Child Quarterly, 26, 110-115.
Center for Talented Youth. (1993). 1993 CTY Talent Search: Seventh Grade. Baltimore: JohnsHopkins University.
Chan,L. K. S. (1988). The perceived competenceof intellectually talented students. GiftedChild Quarterly, 32, 310-314.
Chapin,F. S. (1955). Experimental designs in sociological research. New York: Harper.Cherlin, A. J. (1992). Marriage, divorce, remarriage. Cambridge, MA: Howard University
Press.
Ciha, T. E., Harris, R., Hoffman, C., & Potter, M. W. (1974). Parents as identifiers ofgiftedness, ignored but accurate. Gifted Child Quarterly, 18, 191-195.
Colangelo, N., & Brower, P. (1987). Labeling gifted youngsters: Long-term impact onfamilies. Gifted Child Quarterly, 31, 75-78.
Colangelo, N., & Dettmann, D.F. (1983). A review of research on parents and families ofgifted children. Exceptional Children, 50, 20-27.
Colligan, R. C. (1976). Prediction of kindergarten reading success from preschoolreport ofparents. Psychology in the Schools, 13, 304-308.
Colligan, R. C. (1977). The Minnesota Child Development Inventory as an aid in theassessment of developmentaldisability. Journal of Clinical Psychology, 33, 162-163.
Corman,H. H., & Escalona,S. K. (1969). Stages of sensorimotor development: A replicationstudy. Merrill-Palmer Quarterly, 15, 351-361.
Cornell, D. W. (1984). Families ofgifted children. Ann Arbor, MI: UMI ResearchPress.Cornell, D. G., & Grossberg,I. W. (1987). Family environment and personality adjustment
in gifted programchildren. Gifted Child Quarterly, 31, 59-64.
Cox, C. M. (1926). Genetic studies of genius: (Vol. 2) The early mental traits of 300 geniuses.Stanford, CA: Stanford University Press.
Cox, R. L. (1977). Backgroundcharacteristics of 456 gifted students. Gifted Child Quarterly,21, 261-267.
Cronbach,L.J. (1991). Emerging views on methodology. In T. D. Wachs & R. Plomin (Eds.),Conceptualization and measurement of organism-environment interaction (pp. 87-104).Washington, DC: American Psychological Association.
Davis, H. G., & Connell, J. P. (1985). The effect of aptitude and achievementstatus on theself-system. Gifted Child Quarterly, 29, 131-136.
Dean, R.S., & Steffen, J. E. (1984). Direct and indirect pediatric screening measures. JournalofPediatric Psychology, 9, 65-75.
DeVoss,J. C. (1925). Specialization ofthe abilities of gifted children. In L. M. Terman (Ed.),Genetic studies of genius: Vol. 1. Mental and physicaltraits of a thousand gifted children(pp. 307-362). Stanford, CA: Stanford University Press.
Dixon,W.J. (Ed.) (1992). BMDPstatistical software manual (Vol. 1, pp. 921-564). Los Angeles:University of California Press.

188 References
Durkin, D. (1966). Children who read early: Two longitudinal studies. New York: Teachers
College Press.
Eccles, A. L., Bauman,E., & Rotenberg, K. (1989). Peer acceptance and self-esteem in gifted
children. Journal of Social Behavior and Personality, 4, 401-409.
Eisert, D. C., Spector, S., Shankaran, S., Faigenbaum,D., & Szego, E. (1980). Mothers reports
of their low birth weight infants’ subsequent development on the Minnesota ChildDevelopmentInventory. Journalof Pediatric Psychology, 5, 353-364.
Elkind, D. (1981). The hurried child. Reading, MA: Addison-Wesley.
Ellis, H. (1904). A study of British genius. London: Hurst & Blackett, Ltd.
Eyberg, S. M. (1980). Eyberg Child Behavior Inventory. Journal of Clinical Child Psychology,
9,29.
Fagan,J. F., II, & Detterman,D. K. (1992). The Fagan Test of Infant Intelligence: A technical
summary. Journal ofApplied Developmental Psychology, 13, 173-193.
Falbo, T., & Polit, D. F. (1986). Quantitative review of the only child literature: Research
evidence and theory development. Psychological Bulletin, 100, 176-189.
Featherman,D. (1980). Retrospective longitudinal research: Methodological considerations.Journal of Economics and Business, 32, 152-169.
Feldhusen,J. F., & Heller, K. A. (1985). Identifying and nurturing the gifted: An internationalperspective. Toronto: Hans Huber Publishers.
Feldhusen,J. F., & Hoover,S.F. (1986). A conception of giftedness: Intelligence, self concept
and motivation. Roeper Review, 8, 140-143.
Feldman,D.H. (1986). Nature’s gambit: Child prodigies and the development ofhuman potential.NewYork:Basic Books.
Freehill, M. F. (1961). Gifted children: Their psychology and education. New York: Macmillan.
Freeman, J. (1979). Gifted children: Their identification and development in a social context.Lancaster: MPT Press Limited.
Freeman,J. (1983). Emotional problemsof the gifted child. Journal of Child Psychology andPsychiatry, 24, 481-485.
Freeman,J. (1988). Environment and high IQ—A consideration of fluid and crystallizedintelligence. Personality and Individual Differences, 4, 307-313.
Freeman,J. (1991). Gifted children growing up. London: Cassell Educational Limited.
Fullard, W., McDevitt, S. C., & Carey, W. B. (1984). Assessing temperament in one- tothree-year-old children. Journal of Pediatric Psychology, 9, 205-217.
Gagne, F. (1985). Giftedness and talent: Reexamining a reexamination of the definitions.
Gifted Child Quarterly, 29, 103-112.
Gallucci, N. T. (1988). Emotional adjustmentof gifted children. Gifted Child Quarterly, 32,273-276.
Galton, F. (1869). Hereditary genius. London: Macmillan.
Games, P. A. (1990). Alternative analyses of repeated-measures designs by ANOVA andMANOVA.In A.vonEye(Ed.), Statistical methods in longitudinal research (Vol. 1, pp.81-121). New York: Academic Press.
Garrity, L. 1, & Servos, A. B. (1978). Comparison of measures of adaptive behaviors inpreschool children. Journal of Consulting and Clinical Psychology, 46, 288-293.

References 189
George, W. C., Cohn,S.J., & Stanley, J. C. (Eds.). (1979). Educating the gifted: Acceleration andenrichment. Baltimore: Johns Hopkins University Press.
Gockenbach,L. B. (1989). A review of personality factors in parents of gifted children andtheir families: Implications for research. JournalofClinical Psychology, 45, 210-213.
Goertzel, M. G., Goertzel, V., & Goertzel, T. G. (1978). 300 eminentpersonalities. San Francisco:Jossey-Bass.
Golant, S. K. (1991). The joys and challengesof raising a gifted child. New York: Prentice-Hall.
Goldsmith, H. H., Buss, A. H., Plomin, R., Rothbart, M.K., Thomas, A., Chess, S., Hinde,R.A., & McCall, R. B. (1987). Roundtable: Whatis temperament? Four approaches. ChildDevelopment, 58, 505-529.
Gottfried, A. E. (1982). Relationships between academicintrinsic motivation and anxiety inchildren and young adolescents. Journal ofSchool Psychology, 20, 205-215.
Gottfried, A. E. (1985). Academicintrinsic motivation in elementary and junior high schoolstudents.Journal of Educational Psychology, 77, 631-645.
Gottfried, A. E. (1986a). Children’s Academic Intrinsic Motivation Inventory. Odessa, FL:Psychological Assessment Resources.
Gottfried, A. E. (1986b). Intrinsic motivational aspects of play experiences and playmaterials. In A. W. Gottfried & C. C. Brown (Eds.), Play interactions: The contributionof play materials and parental involvement to children’s development (pp. 81-99).Lexington, MA: Lexington Books.
Gottfried, A. E. (1990). Academicintrinsic motivation in young elementary school children.Journal of Educational Psychology, 82, 525-538.
Gottfried, A. E., & Gottfried, A. W. (Eds.) (1988). Maternal employment and children’sdevelopment: Longitudinal research. New York: Plenum.
Gottfried, A. E., & Gottfried, A. W. (1991, November). Home environment and children’s
academic intrinsic motivation: A longitudinal study. Paper presented at the Livesthrough Time Conference on Longitudinal Research, sponsored by the AmericanPsychological Association, Palm Springs, CA.
Gottfried, A. E., & Gottfried, A. W. (1993, March). Motivation in intellectually gifted children:
A longitudinal study from infancy through middle childhood. Paper presented at thebiennial meeting of the Society for Research in Child Development, New Orleans.
Gottfried, A. E., & Gottfried, A. W. (Eds.). (1994). Redefiningfamilies: Implicationsfor children’sdevelopment. New York: Plenum.
Gottfried, A. E., Gottfried, A. W., & Bathurst, K. (1988). Maternal employment, familyenvironment, and children’s development: Infancy through the schoolyears.In A.E. Gottfried & A. W. Gottfried (Eds.), Maternal employment and children’s development:Longitudinal research (pp. 11-58). New York: Plenum.
Gottfried A. E., Bathurst, K., & Gottfried, A. W. (1994). Role of maternal and dual-earneremploymentin children’s development: A longitudinal study. In A. E. Gottfried &A. W.Gottfried (Eds.), Redefiningfamilies: Implications for children’s development (pp.55-97). New York: Plenum.
Gottfried, A. E., Fleming,J.S., Gottfried, A. W. (1994). Role of parental motivational practicesin children’s academicintrinsic motivation and achievement. Journal of EducationalPsychology, 86, 104-113.

190 References
Gottfried, A. E., Gottfried, A. W., & Bathurst, K. (in press). Maternal and dual-earner
employment status and parenting. In M. Bornstein (Ed.), Handbook of parenting.
Hillsdale, NJ: Lawrence Erlbaum.
Gottfried, A. W. (1973). Intellectual consequencesof perinatal anoxia. Psychological Bulletin,
80, 231-242.
Gottfried, A. W. (1984a). Home environment and early cognitive development: Longitudinal
research. New York: AcademicPress.
Gottfried, A. W. (1984b). Home environmentand early cognitive development:Integration,meta-analyses, and conclusions.In A. W. Gottfried (Ed.), Home environment and earlycognitive development: Longitudinal research(pp. 329-342). New York: Academic Press.
Gottfried, A. W. (1985). Measures of socioeconomicstatus in child developmentresearch:
Data and recommendations. Merrill-Palmer Quarterly, 31, 85-92.
Gottfried, A. W., & Bathurst, K. (1983). Hand preference acrosstimeis related to intelligence
in younggirls, not boys. Science, 221, 1074-1076.
Gottfried, A. W., & Brody, N. (1975). Interrelationships between and correlates ofpsychometric and Piagetian scales of sensorimotor intelligence. Developmental
Psychology, 11, 378-387.
Gottfried, A. W., & Gilman, G. (1983). Developmentof visual skills in infants and youngchildren. Journal of the American Optometric Association, 54, 541-544.
Gottfried, A. W., & Gottfried, A. E. (1984). Home environment and cognitive development
in young children of middle-socioeconomic-status families. In A. W. Gottfried (Ed.),Home environment and early cognitive development: Longitudinal research (pp. 57-115).
New York: Academic Press.
Gottfried, A. W., & Gottfried, A. E. (1986). Home environment and children’s development
from infancy through the school entry years: Results of contemporary longitudinalinvestigations in North America. Children’s Environments Quarterly, 3, 3-9.
Gottfried, A. W., & Rose, S. A. (1980). Tactile recognition memory in infants. ChildDevelopment, 51, 69-74.
Gottfried, A. W., Rose, S. A., & Bridger, W. H.(1977). Cross-modaltransfer in humaninfants.
Child Development, 48, 118-123.
Gottfried, A. W., Guerin, D. W., Spencer, J. E., & Meyer, C. (1983). Concurrentvalidity ofthe Minnesota Child Development Inventory in a nonclinical sample. Journal ofConsulting and Clinical Psychology, 51, 643-644.
Gottfried, A. W., Guerin, D. W., Spencer, J. E., & Meyer, C. (1984). Validity of MinnesotaChild Development Inventory in screening young children’s developmentalstatus.Journal of Pediatric Psychology, 9, 219-230.
Gottfried, A. W., Guerin, D. W., & Bathurst, K. (1989, April). Infant predictors of IQ and
achievement: A comparative analysis. Paper presented at the biennial meeting of theSociety for Research in Child Development, Kansas City, MO.
Gregory, R.J. (1992). Psychological testing: History, principles, and applications. Boston: Allynand Bacon.
Gribbin,K., Schaie, K. W., & Parham,I. A. (1980). Complexity of life style and maintenanceof intellectual abilities. Journal of Social Issues, 36, 47-61.
Gross, M.U. M.(1993). Exceptionally gifted children. London: Routledge.
Groth,N.J. (1975). Mothersof gifted. Gifted Child Quarterly, 19, 217-222.

References 191
Guerin, D., & Gottfried, A. W. (1987). Minnesota Child DevelopmentInventories: Predictorsof intelligence, achievement, and adaptability. Journal of Pediatric Psychology, 12,595-609.
Guerin, D. W., & Gottfried, A. W.(in press-a). Developmental stability and changein parentreports of temperament: A ten-year longitudinal study from infancy throughpreadolescence. Merrill-Palmer Quarterly.
Guerin, D. W., & Gottfried, A. W.(in press-b). Infant difficultness: Convergentvalidity andtemperamental consequences during childhood. Infant Behavior and Development.
Guerin, D. W., Gottfried, A. W., Oliver, P., & Thomas, C. W. (1994). Temperamentand schoolfunctioning during early adolescence. Journal of Early Adolescence, 14, 200-225.
Guerin, D. W., Griffin, J. R., Gottfried, A. W., & Christenson, G. N. (1993). Dyslexic subtypesand severity levels: Are there gender differences? Optometry and Vision Science, 70,348-351.
Hagen,E. (1980). Identificationof the gifted. New York: Teachers College Press.Hansen, R. A. (1977). Anxiety. In S. Ball (Ed.), Motivation in education (pp. 91-109). New
York: Academic Press.
Hauser, R. M., & Featherman,D. L. (1977). The process of stratification: Trends and analyses.New York: Academic Press.
Hegvik, R. L., McDevitt, S. C., & Carey, W.B. (1982). The Middle Childhood TemperamentQuestionnaire. Developmental and Behavioral Pediatrics, 3, 197-200.
Heller, K. A. (1991). The nature and developmentof giftedness: A longitudinal study.European Journal ofHigh Ability, 2, 174-188.
Heller, K. A., & Feldhusen,J. F. (Eds.). (1985). Identifying and nurturing the gifted: Aninternational perspective. Toronto: Hans Huber Publishers.
Heller, K. A., & Hany,E. A.(1986). Identification, developmentandanalysis of talented andgifted children in West Germany.In K.A.Heller & J. F. Feldhusen (Eds.), Identifyingand nurturing the gifted: Aninternationalperspective (pp. 67-82). Toronto: Hans HuberPublishers.
Heller, K. A., Monks,F. J., & Passow, A. H.(Eds.). (1993). International handbook of researchand developmentofgiftedness and talent. Oxford: Pergamon.
Henderson,B. B., Gold, S. R., & McCord,M.T. (1982). Daydreamingandcuriosity in giftedand average children and adolescents. Developmental Psychology, 18, 576-582.
Hernandez,D.J. (1988). Demographictrends andtheliving arrangementsof children.In E.M. Hetherington & J. D. Arasteh (Eds.), Impact of divorce, single parenting, andstepparenting onchildren(p. 6). Hillsdale, NJ: Lawrence Erlbaum.
Hertzog, C., & Rovine, M.(1985). Repeated-measuresanalysis of variancein developmentalresearch: Selected issues. Child Development, 56, 787-809.
Hoge, R. D. (1988). Issues in the definition and measurementof the giftedness construct.Educational Researcher, 17, 12-16.
Hoge, R. D., & Renzulli,J. S. (1993). Exploring the link betweengiftedness and self-concept.ReviewofEducational Research, 63, 449-465.
Hollingshead,A. B. (1975). Fourfactor index of social status. Unpublished manuscript, YaleUniversity (Available from Departmentof Sociology).
Hollingworth, L. S. (1926). Gifted children: Their nature and nurture. New York: Macmillan.Hollingworth, L. S. (1942). Children above 180 IQ. New York: World Book.

192 References
Hollingworth,L. S. (1976). The developmentof personality in highly intelligent children. InW. Dennis & M. W. Dennis (Eds.), The intellectually gifted: An overview (pp. 89-98).
New York: Grune & Stratton. (Original work published 1942)
Hom,H.L.(1988, March). Motivational orientationofthe gifted student, threat ofevaluation, andits impact on performance. Paper presented at the biennial meeting of the Society for
Research in Child Development, New Orleans.
Horowitz, F. D. (1987). A developmental view of giftedness. Gifted Child Quarterly, 31,
165-168.
Horowitz, F. D., & O’Brien, M. (Eds.). (1985). The gifted and talented: Developmental
perspectives. Washington, DC: American Psychological Association.
Horowitz,F. D., & O’Brien, M. (1986). Gifted and talented children: State of knowledge and
directions for research. American Psychologist, 41, 1147-1152.
Howe, M.J. A. (1990). The origins ofexceptional abilities. Oxford: Blackwell.
Hresko, W.P., Reid, D. K., & Hammill, D. D. (1981). The test of early language development.
Austin, TX: Pro-Ed.
Hubert, N. C., Wachs, T. D., Peters-Martin, P., & Gandour, M.J. (1982). The study of earlytemperament: Measurement and conceptualissues. Child Development, 53, 571-600.
Hughes, H. H., & Converse, H. D. (1962). Characteristics of the gifted: A case for a sequel
to Terman’s study. Exceptional Children, 29, 179-183.
Humphreys,L. G. (1985). A conceptualization of intellectual giftedness. In F. D. Horowitz& M. O’Brien (Eds.), The gifted and talented: Developmental perspectives (pp. 331-360).Washington, DC: American Psychological Association.
Humphreys,L. G. (1992). Commentary: Whatbothcritics and users of ability tests need toknow. Psychological Science, 3, 271-274.
Hunt, J. McV. (1971). Intrinsic motivation and psychological development. In H. M.Schroder & P. Suedfeld (Eds.), Personality theory and information processing (pp.131-177). New York: Ronald Press.
Huttenlocker,J. (1974). The origins of language comprehension.In R. L. Solso (Ed.), Theoriesin cognitive psychology: The Loyola Symposium (pp. 331-368). Hillsdale, NJ: LawrenceErlbaum.
Ireton, H., & Thwing,E. (1972-1974). Manualfor the Minnesota Child Development Inventory.
Minneapolis: Behavioral Science Systems.
Ireton, H., & Thwing, E. (1979). Manualfor the Minnesota Preschool Inventory. Minneapolis:
Behavioral Science Systems.
Ireton, H., Thwing, E., & Currier, S. K. (1977). Minnesota Child Development Inventory:
Identification of children with developmental disorders. Journal of PediatricPsychology, 2, 18-22.
Jacobs, J. (1971). Effectiveness of teacher and parent identification of gifted children as afunction of school level. Psychology in the Schools, 8, 140-142.
Janos, P. M., & Robinson, N. M. (1985). Psychosocial developmentinintellectually gifted
children. In F. D. Horowitz & M. O’Brien (Eds.), The gifted and talented (pp. 149-195).Washington, DC: American Psychological Association.
Jastak, S., & Wilkinson, G. S. (1984). Wide Range Achievement Test-Revised. Wilmington, DE:
Jastak Associates.

References 193
Karnes, M. B., & Johnson,L. J. (1986). Identification and assessment of gifted/talentedhandicapped and nonhandicapped children in early childhood. In R. J. Whitmore(Ed.), Intellectual giftedness in young children: Recognition and development (pp. 35-54).New York: HaworthPress.
Karnes, F. A., & Whorton,J. E. (1988). Attitudes of intellectually gifted youth toward school.Roeper Review, 10, 173-175.
Kaufman, A. S., & Kaufman, N.L. (1977). Clinical evaluation of young children with theMcCarthy scales. New York: Grune & Stratton.
Kaufman, A. S., & Kaufman, N. L. (1983). Kaufman Assessment Battery for Children:Administration and scoring manual. Circle Pines, MN: American Guidance Service.
Keating, D. P. (1975). Precocious cognitive developmentof the level of formal operations.Child Development, 46, 276-280.
Keating, D. P. (1976). A Piagetian approachtointellectual precocity. In D.L. Keating (Ed.),Intellectualtalent: Research and development. Baltimore, MD: Johns Hopkins UniversityPress.
Kee, D. W., Gottfried, A. W., Bathurst, K., & Brown, K. (1987). Left-hemispheric language
specialization: Consistency in hand preference and sex differences. ChildDevelopment, 58, 718-724.
Kee, D. W., Gottfried, A. W., & Bathurst, K. (1991). Consistency of hand preference:Predictionsto intelligence and school achievement. Brain and Cognition, 16, 1-10.
Kellaghan,T., Sloane, K., Alvarez, B., & Bloom, B.S. (1993). The home environment and schoollearning. San Francisco: Jossey-Bass.
Kelly, K. R., & Jordan,L. K. (1990). Effects of academic achievement and gender on academicand social self-concept: A replication study. Journal of Counseling and Development,69, 173-177.
Kincaid, D. (1969). A study of highly gifted elementary pupils. Gifted Child Quarterly, 13,264~267.
Klausmeier, K., Mishra, S. P., & Maker, C. J. (1987). Identification of gifted learners: A
national survey of assessmentpractices and training needs of school psychologists.Gifted Child Quarterly, 31, 135-137.
Krapp,A., Hidi, S., & Renninger, K. A. (1992). Interest, learning, and development. In K. A.
Renninger, S. Hidi, & A. Krapp (Eds.), The role of interest in learning and development(pp. 3-25). Hillsdale, NJ: Lawrence Erlbaum.
Kulieke M.J., & Olszewski-Kubilius, P. (1989). The influence of family values and climateon the developmentof talent. In J. L. VanTassel-Baska & P. Olszewski-Kubilius(Eds.), Patterns ofinfluenceongifted learners: The home, the self, and the school. New York:Teachers College Press.
Lehman, E. B., & Erdwins, C. J. (1981). The social and emotional adjustment of young,intellectually-gifted children. Gifted Child Quarterly, 25, 134-137.
Lesser, G.S., Fifer, G., & Clark, D. H. (1965). Mental abilities of children from differentsocial-class and cultural groups. Monographs of the Society for Research in ChildDevelopment (Vol. 30, No. 2, Serial No. 102).
Li, A. K. F. (1988). Self-perception and motivational orientation in gifted children. RoeperReview, 10, 175-180.
Lombroso,C.(1891). The manofgenius. London: Walter Scott.

194 References
Louis, B., & Lewis, M. (1992). Parental beliefs about giftedness in young children andtheirrelation to actualability level. Gifted Child Quarterly, 36, 27-31.
Ludwig, G., & Cullinan, D. (1984). Behavior problemsof gifted and nongifted elementary
school boys andgirls. Gifted Child Quarterly, 28, 37-39.
Luftig, R. L., & Nichols, M. L. (1991). An assessmentof the social status and perceived
personality and schooltraits of gifted students by non-gifted peers. Roeper Review,13, 148-153.
Luthar,S.S., Zigler, E., & Goldstein, D. (1992). Psychosocial adjustment amongintellectually
gifted adolescents: The role of cognitive-developmental and experiential factors.Journal of Child Psychology and Psychiatry, 33, 361-373.
MacMahon,B., & Pugh, T. F. (1970). Epidemiology: Principles and methods. Boston:Little,
Brown.
Massoth, N. A. (1985). The McCarthy Scales of Children’s Abilities as predictor of
achievement: A five-year follow-up. Psychology in the Schools, 22, 10-13.
Massoth,N. A., & Levenson,R. L., Jr. (1982). The McCarthy Scales of children’s abilities as
a predictor of reading readiness and reading achievement. Psychology in the Schools,19, 293-296.
Matheny,A. P. (1980). Bayley’s Infant Behavior Record: Components and twin analysis.Child Development, 51, 1157-1167.
Matheny,A.P. (1989). Temperament and cognition: Relations between temperament andmental test scores. In G. A. Kohnstamm, J. E. Bates, & M. K. Rothbart (Eds.),
Temperament in childhood (pp. 263-282). New York: John Wiley & Sons.
Maxwell, S. E., & Delaney, H. D. (1990). Designing experiments and analyzing data. Belmont,CA: Wadsworth.
McCall, R. B. (1977). Childhood IQs as predictors of adult educational and occupationalstatus. Science, 197, 482-483.
McCall, R. B., & Carriger, M. S. (1993). A meta-analysis of infant habituation and recognitionmemory performanceas predictorsof later IQ. Child Development, 64, 57-79.
McCall, R. B., Hogarty, P. S., & Hurlburt, N. (1972). Transitions in infant sensorimotordevelopmentandthe prediction of childhood I. Q. American Psychologist, 27, 328-348.
McCarthy, D. (1972). Manual for the McCarthy scales of children’s abilities. New York:Psychological Corporation.
McDevitt, S. C., & Carey, W. B. (1978). The measurementof temperamentin 3-7 year oldchildren. Journal of Child Psychology and Psychiatry, 19, 245-253.
Meehl, P. E. (1971). High school yearbooks: A reply to Schwarz. Journal of Abnormal
Psychology, 77, 143-148.
Miles, C. C. (1946). Gifted children. In L. Carmichael (Ed.), Manual of child psychology (pp.886-953). New York: John Wiley & Sons.
Milgram, R. M., & Milgram, N.A. (1976). Personality characteristics of gifted Israeli children.Journal of Genetic Psychology, 129, 185-194.
Monks,F.J., van Boxtel, H. W., Roelofs, J. J. W., & Sanders, P. M. (1986). The identification
of gifted children in secondary education and a description of their situation inHolland.In K. A. Heller & J. F. Feldhusen (Eds.), Identifying and nurturing the gifted:Aninternational perspective (pp. 39-63). Toronto: Hans HuberPublishers.

References 195
Moore, T. (1967). Language andintelligence: A longitudinal studyof thefirst eight years.Human Development, 10, 88-106.
Moos,R. H., & Moos,B.S. (1986). Family Environment Scale manual (2nd ed.). Palo Alto, CA:Consulting Psychologist Press.
Morris, W. (1978). The Americanheritage dictionary of the English language. Boston: HoughtonMifflin.
Nelson, K. (1973). Structure and strategy in learning to talk. Monographs of the Society forResearch in Child Development, 38 (1-2, Serial No. 149).
O’Brien, R. G., & Kaiser, M. K. (1985). MANOVAmethodfor analyzing repeated measuresdesigns: An extensive primer. Psychological Bulletin, 97, 316-333.
Olszewski, P., Kulieke, M., & Buescher, T. (1987). The influence of the family environmenton the developmentoftalent:A literature review. Journalfor the Educationofthe Gifted,11, 6-28.
Olszewski-Kubilius, P. M., Kulieke, M.J., & Krasney, N. (1988). Personality dimensions ofgifted adolescents: A review of empirical literature. Gifted Child Quarterly, 32,347-352.
Overall, J. E., & Woodward, A. (1977). Nonrandom assignment and the analysis ofcovariance. Psychological Bulletin, 84, 588-594.
Oviatt, S. L. (1980). The emerging ability to comprehend language: An experimentalapproach. Child Development, 51, 97-106.
Parkyn, G. W. (1953). Children of highintelligence: A New Zealand study. New Zealand:Whitcombe & Tombs.
Pendarvis, E. D., Howley, A. A., & Howley, C. B. (1990). The abilities of gifted children.EnglewoodCliffs, NJ: Prentice-Hall.
Perleth, C., & Heller, K. A. (1994). The Munich longitudinal study of giftedness. In R.
Subotnik & K. Arnold (Eds.), Beyond Terman: Longitudinal studies in gifted education(pp. 77-114). Norwood, NJ: Ablex.
Petri, H. L. (1991). Motivation: Theory, research, and applications. Belmont, CA: Wadsworth.
Piaget, J. (1954). The construction of reality in the child. New York: Basic Books.
Plomin, R., & DeFries, J. C. (1985). Origins of individual differences in infancy. New York:AcademicPress.
Prior, M. (1992). Childhood temperament. Journal of Child Psychology and Psychiatry, 33,249-279.
Radford,J. (1990). Child prodigies and exceptional early achievers. New York: Free Press.
Reis, S. M. (1989) Reflections on policy affecting the education of gifted and talentedstudents: Past and future perspectives. American Psychologist, 44, 399-408.
Renzulli, J. S. (1978). What makes giftedness? Reexamining a definition. Phi Delta Kappan,60, 180-184, 261.
Renzulli, J. S. (1986). The three-ring conception of giftedness: A developmental model forcreative productivity. In R. J. Sternberg & J. E. Davidson (Eds.), Conceptions ofgiftedness (pp. 53-92). New York: Cambridge University Press.
Reschly, D.J., & Wilson, M.S. (1990). Cognitive processing vs. traditional intelligence:Diagnostic utility, intervention implications, and treatment validity. SchoolPsychology Review, 19, 443-458.

196 References
Reynolds, C. R. (1985). Multitrait validation of the Revised Children’s Manifest Anxiety
Scale for children of high intelligence. Psychological Reports, 56, 402.
Reynolds, C. R., & Bradley, M.(1983). Emotionalstability of intellectually superior childrenversus nongifted peers as estimated by chronic anxiety levels. School Psychology
Review, 12, 190-194.
Rimm,S., & Lowe, B.(1988). Family environments of underachieving gifted students. Gifted
Child Quarterly, 32, 353-359.
Robinson,A. (1985). The identification and labeling of gifted children: What does researchtell us? In K. A. Heller & J. F. Feldhusen(Eds.), Identifying and nurturing the gifted: Aninternational perspective (pp. 103-109). Toronto: Hans HuberPublishers.
Robinson, N. M. (1987). The early development of precocity. Gifted Child Quarterly, 31,
161-164.
Robinson, N. M., & Dale, P. S. (1992, February). Precocity in language and its predictive
significance. Paper presented at Esther Katz Rosen Symposium on the PsychologicalDevelopmentof Gifted Children. Lawrence: University of Kansas.
Roe, K. V. (1978). Infants’ mother-stranger discrimination at 3 months as a predictor of
cognitive developmentat 3 and 5 years. Developmental Psychology, 14, 191-192.
Roe, K. V., McClure, A., & Roe, A. (1982). Vocal interaction at 3 months and cognitive skills
at 12 years. Developmental Psychology, 18, 15-16.
Roedell, W. C. (1984). Vulnerabilities of highly gifted children. Roeper Review, 6, 127-130.
Roedell, W. C. (1989). Early developmentof gifted children. In J. L. Van Tassel-Baska & P.Olszewski-Kubilius (Eds.), Patternsofinfluence on gifted learners: The home, the self, andthe school. New York: Teachers College Press.
Roedell, W. C., Jackson, N. E., & Robinson, H.B. (1980). Gifted young children. New York:Teachers College Press.
Rose, S. A., & Ruff, H. A. (1987). Cross-modalabilities in humaninfants. In J. D. Osofsky
(Ed.), Handbookofinfant development(2nd ed., pp. 318-362). New York: John Wiley &
Sons.
Rose, S. A., Gottfried, A. W., Melloy-Carminar, P., & Bridger, W. H. (1982). Familiarity and
novelty preferences in infant recognition memory: Implications for informationprocessing. Developmental Psychology, 18, 704-713.
Rose, S. A., Gottfried, A. W., & Bridger, W. H. (1983). Infants’ cross-modal transfer fromsolid objects to their graphic representations.
Saccuzzo, D. P., Johnson, N. E., & Russell, G. (1992). Verbal versus performance IQs for
gifted African-American, Caucasian, Filipino, and Hispanic children. Psychological
Assessment, 4, 239-244.
Saylor, C. F., & Brandt, B. (1986). The Minnesota Child DevelopmentInventory: A validmaternal report form for screening developmentin infancy. Journal ofDevelopmentaland Behavioral Pediatrics, 7, 308-311.
Schneider, B. H. (1987). The gifted child in peer group perspective. New York: Springer-Verlag.
Schneider, B. H., Clegg., M. R., Byrne, B. M., Ledingham,J. E., & Crobmie, G. (1989). Social
relations of gifted children as a function of age and school program. Journal ofEducational Psychology, 81, 48-56.
Schofield, N. J., & Ashman,A.F. (1987). The cognitive processing of gifted, high, average,and low averageability students. British Journal of Educational Psychology, 59, 9-20.

References 197
Scholwinski, E., & Reynolds, C. R. (1985). Dimensions of anxiety among high IQ children.Gifted Child Quarterly, 29, 125-130.
Seaman, M.A., Levin,J. R., & Serlin, R. C. (1991). New developments in pairwise multiple
comparisons: Some powerful and practicable procedures. Psychological Bulletin, 110,577-586.
Shaywitz, S. E., Shaywitz, B. A., Fletcher, J. M., & Escobar, M. D. (1990). Prevalence of
reading disability in boys andgirls: Results of the Connecticut Longitudinal Study.Journal of the American Medical Association, 264, 998-1002.
Sheldon,P. M. (1954, February). The families of highly gifted children. Marriage and Family
Living, 59-60,67.
Shoemaker, D. W., Saylor, C. F., & Erickson, M. T. (1993). Concurrent validity of the
Minnesota Child Development Inventory with high-risk infants. Journal of PediatricPsychology, 18, 377-388.
Shure, M. B., & Spivak, G. (1974). The PIPS test manual. Unpublished manuscript,
Hahnemann Medical College and Hospital, Philadelphia.
Silverman, L. K., & Kearney, K. (1988). Parents of the extraordinarily gifted. Advanced
Development, 1, 1-10.
Solano, C. H. (1987). Stereotypesof social isolation and early burnoutin the gifted: Do theystill exist? Journal of Youth and Adolescence, 16, 527-539.
Sparrow,S.S., Balla, D. A., & Cicchetti, D. V. (1984). Vineland Adaptive Behavior Scales SurveyForm Manual (Interview edition). Circle Pines, MN: American GuidanceService.
Sternberg, R. J., & Davidson, J. E. (Eds.). (1986). Conceptions of giftedness. Cambridge:Cambridge University Press.
Stevens, G., & Featherman,D. L. (1981). A revised socioeconomic index of occupationalstatus. Social Science Research, 10, 364-395.
Storfer, M. D. (1990). Intelligence and giftedness: The contributions of heredity and earlyenvironment, San Francisco: Jossey-Bass.
Sturner, R. A., Funk, S. G., Thomas, P. D., & Green, J. A. (1982). An adaptation of the
Minnesota Child DevelopmentInventory for preschool developmental screening.Journal of Pediatric Psychology, 7, 295-306.
Subotnik, R., & Arnold, K. D. (1994). Beyond Terman: Longitudinal studies in contemporarygifted education. Norwood, NJ: Ablex.
Tabachnick, B. G., & Fidell, L. S. (1989). Using multivariate statistics (2nd ed.). New York:
HarperCollins.
Tannenbaum,A.J. (1983). Gifted children: Psychological and educational perspectives. New York:Macmillan.
Terman, L. M. (1905). A study in precocity and prematuration. American Journal ofPsychology, 16, 145-183.
Terman, L. M. (1925-1929). Genetic studies of genius (Vols. 1-4). Stanford, CA: StanfordUniversity Press.
Terman,L. M., & Oden, M.H.(1947). The gifted child grows up: Genetic studies ofgenius (Vol.4). Stanford, CA: Stanford University Press.
Terman,L. M., & Oden, M.H.(1959). The gifted group at mid-life: Thirty-five years’follow-upofthe superior child (Vol. 5); Genetic studies ofgenius. Stanford, CA: Stanford UniversityPress.

198 References
Thomas, A., Chess, S., & Birch, H. G. (1968). Temperament and behavior disorders in children.
New York: New York University Press.
Tomlinson-Keasey, C. (1990). Developing ourintellectual resources for the 21st century:Educatingthe gifted. Journal of Educational Psychology, 82, 399-403.
Tomlinson-Keasey, C., & Little, T. D. (1990). Predicting educational attainment,
occupational achievement, intellectual skill, and personal adjustment amonggiftedmen and women.Journal of Educational Psychology, 82, 442-455.
Toothaker, L. E. (1991). Multiple comparisons for researchers. Newbury Park, CA:Sage.
Tuttle, F. B., Jr., Becker, L. A., & Sousa, J. A. (1988). Characteristics and identification ofgifted
andtalented students (3rd ed.). Washington, DC: National Education Association.
Ullman,D. G., & Kausch,D.F. (1979). Early identification of developmental strengths and
weaknessesin preschoolchildren. Exceptional Children, 46, 8-13.
Wachs,T. D. (1976). Purdue Home Stimulation Inventories (SectionsI, II, and III). Unpublished
manual, Purdue University.
Wachs, T.D. (1992). The nature of nurture. Newbury Park, CA:Sage.
Wachs, T. D., & Gruen, G. E. (1982). Early experience and human development. New York:Plenum.
Wechsler, D. (1974). Manualfor the Wechsler Intelligence Scalefor Children. San Antonio, TX:Psychological Corporation.
Wechsler, D. (1991). WISC-III. Wechsler Intelligence Scale for Children—Third Edition. SanAntonio, TX: Psychological Corporation.
Whitmore,J. R. (1986). Predicting severe underachievement and developing achievementmotivation. InJ. R. Whitmore (Ed.), Intellectual giftedness in young children: Recognitionand development (pp. 113-133). New York: Haworth Press.
Willerman,L., & Fiedler, M.F. (1974). Infant performance andintellectual precocity. ChildDevelopment, 45, 483-486.
Witty, P. (1940). A genetic study offifty gifted children. In G. M. Whipple (Ed.), Intelligence:Its nature and nurture. 39th Yearbook of the National Society for the Study ofEducation. Chicago: University of Chicago Press.
Witty, P. (Ed.). (1951). The gifted child. Boston: D. C. Heath.
Woodcock, R. W., & Johnson, M. B. (1977). Woodcock-Johnson Psycho-Educational Battery.Allen, TX: DLM Teaching Resources.
Yadusky-Holahan,M., & Holahan, W.(1983). The effect of academicstress upon the anxietyand depression levels of gifted high school students. Gifted Child Quarterly, 27, 42-46.
Yoder, A. H. (1894). The study of the boyhood of great men. Pedagological Seminary, 3,134-156.

Index
Academic achievement, of gifted chil-dren
comparison with nongifted childrenfrom age 5 to 8, 11, 87-88, 89-
100
Child Behavior Checklist scores,
89-90
Kaufmann Assessment Batteryfor Children scores, 89, 93, 94,
95-96, 97, 98-99
parents’ ratings of, 89-90, 94-95
superior achievementtestscores, 88, 95-100, 175, 176
teachers’ ratings of, 89-90, 94-95,
105
Wide Range AchievementTest-Revised scores, 89, 93-94, 95—
96, 97, 98-99
Woodcock-Johnson Psycho-Educational Battery scores,
89, 93, 94, 95, 96, 97-98, 99,
170
correlation with academic intrinsic
motivation, 172
literature review of research in, 10—11
Academicintrinsic motivation. See Mo-tivation, academic intrinsic
Aggressive behavior,of gifted chil-dren, 128
Anxiety, academic, of gifted childrencomparison with nongifted chil-
dren, 20, 88, 90-91, 102-103,105, 176
literature review of research in, 14—
15Ascertainmentbias, 33
Attention span,of gifted children, 103,104, 171-172
Bayley California First Year MentalScale, 7
Bayley Infant Behavior Record, 14comparison of scores of gifted and
nongifted children, 88, 91-92,
103, 104, 170language items, 71-74, 84
Mental DevelopmentIndex, 50, 52
Bayley Scales of Infant Development, 7language items, 53-54
Behavioral and emotional adjustment,of gifted children, 15-23, 107
comparison with nongifted chil-dren, 112-122, 132
Child Behavior Checklist scores,109, 114-117, 118-122
Eyberg Child Behavior Inven-
tory scores, 108-109, 113, 114Preschool Behavior Question-
naire scores, 109, 113-114,
117
199

200
Behavioral and emotional adjustment,of gifted children (cont.)
literature review of research in, 15-21
measures of, 108-109
Behavioral Style Questionnaire, 112Berkeley GrowthStudy,7Birth order, of gifted children, 25-26
comparison with nongifted chil-dren, 137, 153, 158, 159, 174-175, 176
implications for identification ofgiftedness, 181
California Test of Personality, 20Child Behavior Checklist
comparisonof scores of gifted andnongifted children
academic achievement, 89-90behavioral and emotional adjust-
ment, 20, 109, 114-117, 118-122
social functioning, 124-127gifted adolescents’ scores on, 19
Children’s Academic Intrinsic Motiva-tion Inventory, 12
comparison ofscores of gifted andnongifted children, 90, 172,
179-180Classroom behavior, comparison of
gifted and nongifted chil-dren, 100, 101
Cognitive functioning, of gifted chil-dren.See Intellectual and cog-nitive functioning, of giftedchildren
Cognitive mastery motivation,ofgifted children, 171-172
as catalyst to giftedness, 178-179comparison with nongifted chil-
dren, 88, 91-92, 103, 104correlation with home environ-
ment, 173-174
as giftedness indicator, 178Cognitive reasoning, Piagetian task as-
sessmentof, 61
Index
Colorado Childhood TemperamentIn-ventory scores, 111-112
comparison between gifted andnongifted children, 129,1 30
Competence, academic, perception of,by gifted children, 176
comparison with nongifted chil-dren, 88, 90-91, 102-103, 105
as giftedness indicator, 178Competitive activities, gifted chil-
dren’s avoidance of, 127
Conflict, familial, in families of gifted
children, 145, 165, 166, 168Culturalactivities, of gifted children,
164, 166, 168Cultural orientation, of families of
gifted children, 164-166, 174
Curiosity, of gifted children, 12, 13
Differential vocal responses, to motherversusstranger, 8
Divorce, by parents of gifted children,25, 151, 167
Dyslexic children, 122
Educational acceleration, of gifted chil-dren, 10-11
effect on social developmentandfunctioning, 18-19, 126, 127-
128Extracurricular activities, gifted chil-
dren’s requests for, 144-145,159, 167-168, 175, 176, 182
types of activities requested, 163-164
Eyberg Child Behavior Inventory, 108-109
comparison of scores of gifted withnongifted children, 113, 114
Family characteristics, of families of
gifted children, 139comparison with families of
nongifted children, 150-153Family EnvironmentScale, 145, 164—
166

Index
Family Inventory, 145-146, 166Family regulation, in families of gifted
children, 166, 174
Family relationships, of gifted chil-dren, 135-136
comparison with nongifted chil-dren, 164-166, 168
Family EnvironmentScale of, 145,
164-166Family Inventory of, 145-146, 166literature review of research in, 23—
31Family size, of families of gifted chil-
dren, 25comparison with families of
nongifted children, 152-153,
158, 167Fathers, of gifted children
age of, 151, 152, 167
educational level of, 149
occupational status of, 148, 167
Follow-up studies, of developmenalcourse of giftedness, 3
Fullerton Longitudinal Study, 23data analysis techniquesof, 43-47
multiple measures, repeatedover time, 46
multiple measures, single time,
45-46planned comparisons, 46same measure, repeated over
time, 45
single measure, single time, 44-45data collection methodsof, 4, 31-32, 33
description of, 37-50
data analytic strategies, 43-50demographicsof participating
families, 37-39
designation of giftedness, 42-43measures and procedures, 40-42middle-class orientation of, 32
nongifted control group, 34-35sample retention during, 34sample size, 34, 47
subjects, 37-39
uniquefeatures of, 31-35
201
Fullerton Longitudinal Study(cont.)issues investigated by, 5-31
academic self-concept and anxi-ety, 14-15. See also Anxiety,academic; Competence, aca-demic, perception of
behavioral and emotional adjust-ment, 15-23. See also Behav-
ioral and emotionaladjustment
education and achievement, 10—
11. See also Academic achieve-ment; Educational
acceleration; Kindergarten en-try age
homeand family environment,23-31. See also Family rela-tionships; Fathers; Home en-vironment; Mothers; Parents
intellectual and cognitive func-tioning, 5-10. See also Intellec-tual and cognitive functioning
motivation, 12-14. See also Cogni-tive mastery motivation; Mo-tivation, academic intrinsic
social functioning, 15-23. See also
Social functioningtemperament, 15-23. See also
Temperament
predictive model developmentand,32
statistical issues of, 47-50
Gifted and Talented Children’s Act of1978 (PL95-561), 42
Gifted childrenage at entering school. See Kinder-
garten entry age
highly gifted, social functioningproblemsof, 127-129
Gifted Children (Hollingworth), 5Giftedness
definition of, 42
developmental course of, 2-3
lack of research in, 34
as developmental phenomena, 169

202
Giftedness(cont.)
measurementof, 1-2
Potentiality-Enrichment Theory of,169-176
implications of, 177-184time-frame analysis of, 171
Gifted motivation, 104
Giftednessresearch, history of, 1, 2, 3-4
Gifted programs, entry requirementsfor, 178, 179, 180
Girls, as gifted children. See also Sexfactors, in giftedness
early languageability of, 7, 8teachers’ failure to identify, 33
Goal directedness, of gifted children,
91, 103, 104, 171-172, 179Grandfathers, of gifted children, 24
Griffiths Scale of Infant Development, 8
Gulbenkian Project, 27
Habituation procedure, 9Hemispheric lateralization, intellectual
performanceand, 9-10Hereditary Genius (Galton), 23
Hollingshead FourFactor Index of So-cial Status, 37, 38, 138, 147-149
Homeenvironment, of gifted children,
23-31, 135-168
direct observational homeassess-
ments of, 139-141
Home Observation and Measure-
ment of the Environment
scores, 46, 140-141, 153, 154—
158
Purdue HomeStimulation Inven-
tory scores, 140-141, 153, 158-
159
distal environmentvariables of
comparison with nongifted chil-dren, 147-153, 167
definition of, 135, 136-137
measurementof, 138-139
facilitation of academic intrinsic mo-
tivation, 173-174
facilitation of cognitive mastery mo-tivation, 173-174
Index
Homeenvironment, of gifted children(cont.)
family relationship variables ofcomparison with nongifted chil-
dren, 164-166, 167, 168definition of, 135-136measurement of, 145-146
implications for giftedness develop-ment, 170, 175-176, 181-184
nonobservational assessmentof,
141-145Home Environment Survey, 141-
145, 160Variety of Experiences Checklist,
141-142, 159-163proximal environmentvariables of
comparison with nongifted chil-dren, 153-164, 167
definition of, 135, 137
measurementof, 139-145
room-to-person ratio of, 158-159Home Environment Survey, com-
parison of scoresof giftedand nongifted children,160-163
Home Observation and Measurementof the Environment (HOME),
46, 140-141, 153comparisonof scores of gifted and
nongifted children, 154-158
Infant Characteristics Questionnaire
scores, 111
comparison betweengifted andnongifted children, 129, 130
Infant development, parents’ reportsof, 5-6
Intellectual and cognitive functioning,of gifted children, 51-86
“best performance”conceptof, 69-70
comparison with nongifted childrenBayley Scales scores, 53-54, 71-
74, 84globality versus specificity of,
71-80, 85

Index
Intellectual and cognitive functioning,of gifted children (cont.)
Kaufman AssessmentBattery forChildren scores, 76, 77
parental assessmentof, 80-84WeschlerIntelligence Scale for
Children-Revised scores, 76—
78, 79, 80, 84individualcase profiles of, 63-71
infant sensorimotorintelligencescores, 63, 69
intraindividualvariability pat-terns, 63, 85
McCarthy Scales of Children’sAbilities scores, 69-70, 74
literature review of research in, 5-10
measurement instruments for, 52-56
mental age curves of, 61, 62
parental assessmentof, 80-84, 86
patterns of group differences in, 56-62Bayley Scales scores, 57, 60decline during preschoolyears,
57-59Kaufman AssessmentBattery for
Children scores, 57, 59
McCarthyScales of Children’sAbilities scores, 57, 58-59, 60
WeschlerIntelligence Test forChildren-Revised scores, 57,
59, 60Intellectual skills, continuity into adult-
hood, 22-23
Intelligence quotient (IQ)academic achievementand, 10-11
academicintrinsic motivation and,
179, 180averagegifted, 43average nongifted, 43early language ability and, 7-8as giftedness indicator, 1-2, 42, 43
high (160+), social functioning prob-lems associated with, 127-129
sensorimotorintelligence and, 6
social interaction skills and, 20-21socioeconomic status and, 147
stability during childhood, 2
203
Johns Hopkins University Center forTalented Youth, 96
Kaufman AssessmentBattery for Chil-dren, comparisonof scores ofgifted and nongifted children
academic achievementscores, 89,93, 94, 95-96, 97, 98-99
intellectual and cognitive function-ing scores, 57, 59, 76, 77
Mental Processing Compositescores, 55
Sequential Mental Processing cogni-tive index of, 45—46, 55, 76, 77
Simultaneous Processing cognitiveindex of, 45—46, 55, 76, 77
Kindergarten entry agegender-related, 173of gifted children, 107, 172-173, 176
comparison with nongifted chil-dren, 87, 89, 92, 105
relationship to later gradelevels,
92-93for “immature”children, 173
Labeling, of gifted children, 33-34Languageability and development, of
gifted childrencomparison with nongifted chil-
dren, 53-54, 71-74, 75, 84,
171, 176age of first measurable differ-
ences, 56, 73-74, 75, 84-85
Bayley scores, 71-74, 75, 84Test of Early Language Develop-
mentscores, 74, 75-76, 84
developmentalspikes of, 171early, relationship to intellectual de-
velopment, 7-8hemispheric lateralization and, 9, 10parents’ assessmentof, 81, 82, 83-
84, 86parents’ awarenessof, 29
“Late bloomers,” 170, 171, 178
Learning materials, parental provision
of, 142, 143, 160, 161, 162, 163

204
Leisureactivities, of gifted children,
27. See also Extracurricular ac-
tivities, gifted children’sre-
quests forLongitudinal research, in developmen-
tal course of giftedness, 3. See
also Fullerton LongitudinalStudy
Louisville Twin Study, 22
Manualpreference,intellectual per-formance and, 9-10
Mastery motivation, 14Maturity, of gifted children, 123McCarthyScales of Children’s Abili-
ties, 54comparisonof scores of gifted and
nongifted children, 57, 58-59,
60, 170General Cognitive Index, 50
generality scores, 74, 75, 76, 79,
80limitations of, 58, 69
Middle Childhood Temperament Ques-tionnaire, 112, 129, 130
Minnesota Child Development Inven-tory, 54, 55-56, 81, 83, 84
Minnesota Preschool Inventory, 55-56,
81, 83, 84Mothers,of gifted children
age of, 151-152assessmentof child’s preschool de-
velopmentby, 81, 82educational attitudes of, 160, 161,
162educational level of, 149
educational stimulation providedby, 160-161
employmentstatus of, 24, 138, 148,
149-150, 167intelligence of, 139, 150, 167
occupationalstatus of, 24parentingstyle of, 27perception of child’s giftedness, 174time involvementwith child, 160,
161-162, 163
Index
Motivation, academic intrinsic, of
gifted children, 171-172, 176
as catalyst to giftedness, 178-179comparison with nongifted chil-
dren, 88, 105, 131
Young Children’s Academic In-trinsic Motivation Inventoryscores, 90, 100-101
definition of, 179
expectancy-value modelof, 180extrinsic versusintrinsic, 180
facilitation by home environment,173-174
as giftedness indicator, 178-181
literature review of research in, 12-
14
promotion of intellectual develop-ment, 179
temperamentand, 131, 132
Motorskills, of gifted children, paren-
tal assessment of, 81, 82, 83,
84, 86
Munich Longitudinal Study, 33
New York Longitudinal Study, tem-perament dimensionsof, 21-22, 110, 111, 112, 130
Novelstimuli response, by infants,
8-9
Object orientation, of gifted chidlren,
103, 104, 105Object permanence assessment, 52Occupational adjustment, by highly
gifted individuals, 128
Paired-comparison procedure, 9Parents, of gifted children. See also Fa-
thers, of gifted children;
Mothers,of gifted childrenage of, 25, 151-152assessmentof child’s preschool de-
velopmentby, 80-84, 86awarenessof child’s giftedness, 28—
29, 181-182divorced, 25, 151, 167

Index
Parents, of gifted children (cont.)educational status of, 24, 148-149,
150, 167, 174, 176educational stimulation provided
by, 142, 143homeenvironmental stimulation
provided by, 154-158intellectual-cultural stimulation pro-
vided by, 164-166
marital status of, 151, 167
occupationalstatus of, 147-148parenting guidelines for, 181-184parentingstyle of, 26-27, 28, 29-30pressure exerted on child by, 182-
183reports of child’s developmentby,
5-6as role models, 27
time involvement with child, 161—
162, 163, 166Peabody Individual AchievementTest,
11Performanceintelligence, of mothers of
gifted children, 139, 150Personal-social sufficiency, of gifted
children, comparison withnongifted children, 108, 123-127, 133
Physicalsize, of gifted children, com-parison to grade-mates, 127-128
Play, cross-age, 125-126, 127, 128Play activities, of gifted children, 16-
18, 127. See also Extracurricu-
lar activities, gifted children’srequests for
Playmates, of gifted children, 125-126,
127, 128Popularity, of gifted children, 129Potentiality-EnrichmentTheory,of gift-
edness, 9, 169-176implications of, 177-184
for home environmentand par-enting, 181-184
for identification of gifted chil-dren, 177-178
205
Potentiality-Enrichment Theory,of gift-edness(cont.)
for motivational assessment,178-181
Preschool Behavior Questionnaire, 109
comparison of scores of gifted andnongifted children, 113-114,117
PreschoolInterpersonal Problem-Solv-ing Test, 110
comparison of scoresof gifted andnongifted children, 84, 122-
123Progress Quotient, 10
Psychometric measures. See also spe-cific psychometric measures
children’s testability on, 70-71, 85,
103, 104, 171-172, 176as giftedness indicator, 43, 177multiple-point testing in, 183
Purdue HomeStimulation Inventory,140-141, 153, 158-159
Reactivity, to test materials, by giftedchildren, 103, 104, 171-172
Reading activities, of gifted childrencomparison with nongifted chil-
dren, 158, 160, 161, 163
parents’ involvementin, 27, 142,
143
as social isolation cause, 128
Recognition memory tests, 52-53Revised Duncan Socioeconomic Index,
37, 38
SAT scores, emotional development
and, 19
school achievement, of gifted children.See Academic achievement,
of gifted childrenSchool behavior, 100, 101, 172
Schoolentry age. See Kindergarten en-try age
School types attended, by gifted chil-
dren, 87, 93, 105Seattle Longitudinal Study, 11, 22

206
Self-concept, of gifted childrenin academic areas, 14, 15
literature review of research in, 14—
15in nonacademic areas, 14-15
Self-determination, 174
Self-help skills, of gifted children, 158-159
Self-image, of gifted adolescents, 20Sensorimotorintelligence, develop-
ment during infancy, 63, 69Sensorimotorintelligence scales, 71
long-term predictive validity of, 6,7Sex factors
in early languageability, 7, 8in giftedness, 24—25, 150-151, 167
in hemispheric lateralization, 9-10in social functioning, 129in verbal-languageability, 9, 10
Siblings, of gifted children, 25-26. Seealso Birth order, of gifted chil-
drenSiegel Prestige Scores, 37, 38Social functioning, of gifted children,
107, 176comparison with nongifted chil-
dren, 122-129, 132-133Child Behavior Checklist scores,
124-127parental assessmentof, 81, 82,
83, 84, 86Preschool Interpersonal Problem-
Solving Test scores, 84, 110,
122-123sex factors in, 129
Vineland Adaptive BehaviorScales scores, 84, 110, 123-
124highly gifted children’s problems
in, 127-129literature review of research in, 15-
21measuresof, 109-110
Social History Questionnaire, 138, 139
Social interaction skills, of preschool-
aged children, 20-21
Index
Social isolationof gifted children, 124, 127, 128of gifted persons, 18
Socioeconomicstatus, of families of giftedchildren, 24, 136, 137, 147
implications for identification ofgiftedness, 181
measurementof, 138
relationship to intelligence quo-tient, 147
statistical controls for, 50
Stanford AchievementTest, 11
Stanford-Binet, revision of, 58
Stereotypes, of gifted children, 18, 19,
107, 108, 112-113gender-related, 129implications for parenting, 183
Surveys, of developmentalcourseofgiftedness, 3
Talent, parents’ encouragementof, 182
Task commitment, as giftedness indica-tor, 13, 178
Teachers, of gifted children
awarenessof students’ giftedness,28-29
classroom behaviorratings by, 100,101
identification of gifted children by,33-34
Television watching time, 160, 161-162Temperament, of gifted children, 108
categories of, 21-22comparison with nongifted chil-
dren, 129-132cognitive mastery motivational
behavior and, 131, 132
Colorado Childhood Tempera-ment Inventory scores, 129,
130implications for eminence as
adults, 131-132
Infant Characteristics Question-
naire scores, 129, 130:
Middle Childhood Tempera-ment scores, 129, 130

Index
Temperament, of gifted children (cont.)comparison with nongifted children
(cont.)
Toddler TemperamentScalescores, 129, 130
definition of, 110
literature review of research in, 21-
23measures of, 110-112
Test of Early Language Development,54
comparison of scores of gifted andnongifted children, 74, 75-76,84
Test-taking behavior, 70-71, 85, 103,
104, 171-172, 176. See also
Cognitive mastery motiva-tion; Motivation, academic in-trinsic
Toddler TemperamentScale, 111
comparison of scores of gifted andnongifted children, 129, 130
University of Iowa Studies in ChildWelfare, 61
Verbal intellectual performanceof gifted children, 136-137of mothers of gifted children, 139,
150
207
Vineland Adaptive BehaviorScales, 110
comparison of scores of gifted andnongifted children, 84, 123-
124
Wechsler Adult Intelligence Scale-Re-vised, Vocabulary and BlockDesign subtests, 139, 150
WechslerIntelligence Scale for Chil-dren-Revised, 8, 42, 43, 46, 55
comparison of scores of gifted andnongifted children, 50, 57, 59,
60, 76-78, 79, 80, 84Wide Range AchievementScale Read-
ing and Arithmetic Tests, 8
comparison of scores of gifted andnongifted children, 89, 93-94,
170superior scores, 95-96, 97, 98-99
Woodcock-Johnson Psycho-Educa-tional Battery, comparison ofscores of gifted and nongiftedchildren, 89, 93, 95, 170
superior scores, 96, 97-98, 99
Young Children’s Academic IntrinsicMotivation Inventory, com-
parison of scores of giftedand nongifted children, 90,
100-101, 179-180