Pygmalion Reconsidered - Gwern.net
180
2 Pygmalion Reconsidered Janet D. Elashoff and Richard E. Snow
-
Upload
khangminh22 -
Category
Documents
-
view
0 -
download
0
Transcript of Pygmalion Reconsidered - Gwern.net

2
Pygmalion Reconsidered
Janet D. Elashoff
and Richard E. Snow


1"*ifr
PR
ygmuliorleconsidered
A Case Study in
S tatistical I nference :
Reconsideration of the
Rosenthal-J acobson Data
on Te acher Expectancy
Janet D. Elashoff
Stanford University
and
Richard, E. Sn ow
Stanford University
Charles A. Jones Publishing Company
Worthingtor, Ohio

Contemporary Educational IssuesNational Society for the Study of Education
Farewell to Schools??? Daniel U. Levine andRobert J. Havighurst, Editors
Models for Integrated Education, Daniel U.Levine, Editor
Accountability in Education, Leon M. Lessingerand Ralph W. Tyler, Editors
Pygmalion Reconsidered, Janet D. Elashoff andRichard E. Snow
React|ons to Silberman,S CRI SIS /N TH E CLASSROOM,
A. Harry Passow, Editor
O 197 I by Wadsworth Publishing Company, I nc., Belmont, California94002. All rights reserved. No part of this book may be reproduced,
stored in a retrieval system, or transcribed, in any form or by any
means, electronic, mechanical, photocopying, recording, or otherwise,
without the prior written permission of the publisher: Charles A. Jones
Publishing Company, Worthington, Ohio 43085, a division of Wads-worth Publishing Company, I nc.
t 23 4 5 67 8 910/ 7675 7473 72
Library of Congress Catalog Card Numbe r: 7 4- 1843 l3I nternational Standard Book Number: 0-8396-0017-8
Printed in the U nited States of America

Series Foreword
Pygmalion Reconsidered is one of a group of five publicationswhich constitute the first of a series published under the auspicesof the National Society for the Study of Education. Other titlesare:
Farewell to Schoots??? edited by Daniel U. Levine andRobert J. HavighurstAccountabiltty in Education, edited by Leon M. Lessinger andRalph W. TylerReactions to Silbernutn's CRIS/S IN THE CLASSROOM, editedby A. Harry PassowModels for Integrated Education, edited by Daniel U. Levine
For more than seventy years the National Sotiety has publisheda distinguished series of Yearbooks. under an expanded publica-tion program, beginning with the items referred to above, theSociety plans to provide additional services to its members and tothe profession generally. The plan is to publish each year a seriesof volumes in paperback form dealing with current iisues of con-cern to educators. The volumes will undertake to present not onlysystematic analyses of the issues in question but also varying view-points with regard to them. In this manner the National Societyexpects regularly to supplement its program of Yearbook publica-tion with timely material relating to crucial issues in education.
I n addition to their extensive reanalysis of the data from theoriginal Pygmalion study by Robert Rosenthal and Lenore Jacob-son, the authors of Pygmalion Reconsidered offer a critique of thatstudy, comments on design and measurement problems in educa-tional research, and a chapter (by J. Philip Bakei and Janet L. Crist)
_on replications and studies related to the bgmalion experiment.
In addition, the volume includes a response to the Etaitroff andSnow report prepared by Professor Rosenthal in collaborationwith Donald B. Rubin, with a final answer.
The National Society for the Study of Education wishes to ac-knowledge its ?ppreciation to all who have had a part in the prep-aration of this book.
Kenneth J. Rehagefor the Committee on the Expanded publicationProgram of the National Society for the Study of
Education

Foreword
Like any scientist, the psychologist senses the plausibilities in his
field. I t is extremely implausible that infrahumans can learn tospeak good English and less implausible that children can learn to
solve differential equations.How plausible are statements about intentional changes in hu-
man intelligence? Half a century of research has shown that such
changes are hard to make. They have been claimed by persons
using intensive treatments in preschools. They have been effected
by profound alterations in the person's whole environment-alter-ations like moving out of a barren orphan age into an enriched
middle-class home. But, even so, no one has yet been able to change
IQ substantially in any controlled and consistent way. We cannot
improve IQ as dependably as we can improve knowledge of mathe-
matics or languages.
Psychologists and educators are still working on ways to im-
prove intelligence. They are placing their bets on radical and in-
iensive improvements of the "curriculum" and "teaching methods"
in the home and school during infancy and childhood.I had this kind of feeling for the plausibilities when I first en-
countered the work of Robert Rosenthal and Lenore Jacobson.
I was serving as a discussant in the symposium at the American
Psychological Association meetings in 1966 at which they_reportef
thiir findings. It seemed implausible to me that the IQ, which
had proven so refractory, would yield to the admittedly weak treat-
ment administered to the teachers in their experiment. In my dis-
cussion, I said as much and also cited weaknesses in the design,
measurement, and analysis aspects of their experiment.
A year later, I was asked to review the manuscript of Pygmalion
in the Classroom for its publisher. Again I criti cized the work
roundly. Then the book appeared. As Professors Elashoff and Snow
indicate, it received high praise from almost all reviewers. But
most of the reviewers were untrained in psychological measure-
tv

ment and statistical analysis. Technically competent reviewers, likeR. L. Thorndike and R. E. Snow, seriously questioned the validityof the Rosenthal-Jacobson data and conclusions. I n his review,Snow promised a reanalysis of the data. This book contains thatreanalysis, which he and Elashoff did together. I t shows morethoroughly than ever the questionable nature of the Rosenthal-Jacobson data and methods.
Pygrnalion in the Classroom got more attention in the mass
media than any other product of the behavioral sciences in the1960's. It struck a responsive chord among millions who were look-ing for an explanation of the educational problems of children fromlow-income areas,-problems intimately connected with our mostpoignant national concerns. Now that the Rosenthal-Jacobson workhas been thrown in doubt, one can only hope that the whole busi-ness will not-as I feared when reviewing the manuscript-under-mine confidence in psychological research.
Do teachers' expectations affect things other than lQ-whatteachers try to teach and thus what students learn, how studentsfeel about themselves, how they get along with the teacher andtheir fellow students? Here affirmative answers seem highly plaus-ible on the basis of much previous research. The task of psycholo-gists and other behavioral scientists is to use valid methods to re-veal such effects. Then, if these effects are undesirable, we shoulddevelop techniques to guard against them. The positive residue ofthe Pygmalion affair is renewed attention to the hypothesis thatteachers' expectations make a difference in the classroom. Researchworkers are now taking a fresh look at these phenomena. Thisbook also contains a review, by Philip Baker and Janet Crist, ofthis more recent work. For our present hard-won sophisticationabout the problem, all of us should be grateful to the authors ofthis powerful book.
N. L. Gage

Preface
I ncreasingly, investigators are attempting research on difficulthuman problems. Many students in education and the behavioralsciences are preparing for research careers; others are being calledupon to read and use the results of research. They need to be con-fronted with the difficult problems in conducting research and inthe analysis and criticism of research data.
Pygmalion Reconsidered is a detailed criticism and case historyof a data analysis. At one level, it is a critical evaluation of a
research report. At another level, it is a detailed account of tech-
nical issues important in evaluating research. At still another, it isa comparison of the merits of, and the results obtained from, alter-nate analytic approaches to the same data. I t can serve as a specialkind of supplement to courses on research methodology and statis-tical analysis for the student and the practicing researcher oreducator.
This book is a case study of the research study Pygmalion in the
Classroom by Rosenthal and Jacobson ( 1968) and the report of anextensive reanalysis of the Rosenthal and Jacobson data. The studywas chosen for detailed examination for two reasons: First, itaddresses a major social problem, has received nationwide atten-tion, and has prompted a number of similar studies in the area;second, its basic design, measurement problems, and the statisticalprocedures used in its analysis and reanalysis are typical of thoseencountered frequently in educational or behavioral scienceresearch.
This book is a revised and expanded version of TechnicalReport No. 15, A Case Study in Statistical Inference: Recoruid-eration of the Rosentlwl-lacobson Data on Teacher Expectancy,by Janet Dixon Elashoff and Richard E. Snow, published
vi

December l97O by the Stanford Center for Research and Develop-ment in Teaching, School of Education, Stanford University.
Portions of the work described in that report were supportedwithin a USOE-sponsored project on the nature of aptitude (OEC4-6461269-1217), and portions were supprted by the StanfordSchool of Education and the Stanford Center for Research and
Development in Teaching under Contract No. OE-6-10-078. Theopinions expressed in this publication do not necessarily reflect theposition or policy of the Office of Education, and no official en-
dorsement by the Office of Education should be inferred.Dr. Rosenthal and Dr. Jacobson have cooperated in providing
copies of their original data and permission to reanalyze them. Wegratefully acknowledge their assistance. Portions of Pygmalion inthe Classrcom: Teacher Expectation and Pupils' Intellectual De-
velopment, by Robert Rosenthal and Lenore Jacobson, copy-right o 1968 by Holt, Rinehart and Winston, I nc. are reprinted bypermission of Holt, Rinehart and Winston, Inc. All of Rosenthal'sand Jacobson's original data can be found in Elashoff's and Snow'soriginal report upon which this book is based.
The authors wish to thank J. Philip Baker and Janet L. Crist fortheir chapter on replications and studies related to the Pygmalionexperiment. N.L. Gage, L.J. Cronbach, and I ngram Olkin have
given many helpful comments and criticisms during various stages
of the work. The assistance of Bruce Bergland, John Burke, James
Eusebio, Catherine Liu, Akimichi Omura, Donald Peters, andTrevor Whitford is gratefully acknowledged. Many others have
offered helpful suggestions on the manuscript.Special thanks go to Judy Turner, who put it all together.
Janet D. ElasholfRiclwrd E. Snow
vn

Contents
Chapter
f . I ntroduction
Summary of the RJ Study as Originally Reported,2Organization of the Book, 6
I
II Pygrr*lion in the Classroorn as a Report ofOriginal Research
Interpretations and Conclusions, l0Tables, Figures, and Charts, 12
Technical Inaccuracies, I 5
B
lII. Design and Sampling Problems
[V. Measurement Problems
Scores and Norms,27Reliability Questions, 30
Validity Questions, 39
V. Overview of Analysis and Conclusions
Reanalysis, 44The Pygmalion Effect, 44
Recommendations for Further Research, 45
26
I9
43
vtu

V[. Teacher Expectancies: A Review of the Literature,l. Philip Balter artd Janet, L. Crist 48
Direct Attempts at Replication, 49Related Studies, 52
Studies of the Teacher, S};studies of the Learner,53; studies on Teacher-pupil Interaction , s7
Summary and Theoretical Overview, 6l
WI. Reviews 65
Review of Pysmalion in the classroont, Robert L.Thorndike, 65
Empirical vs. Decreed Validation of Clocks and Tests,Robert Rosentlwl,68
But You Have to Know How to Tell rime, Robert L.Thorndike, T l
Review of Pygmalion in the classroofri, Lewis R.Aiken, Jr.,72
What Can You Expect? Robert Coles,74Goal Expectations, Herbert Kohl, 8l
Appendices
A. Details of the Reanalysis 86
Extreme Scores, 87
Relationships Between Pre and Post Scores, 88
Regression Analyses, 88; Choice of CriterionMeasure, 9l
lnvestigation of Treatment Effects Using StepwiseRegression, 99
Investigation of Treatment Effects Using Analysis ofVariance, l0lResults of Analyses of Variance, 106
Analysis by Classroom, I 12
A Closer Look at First and Second Graders, I 16
L25B. Statistical Techniques
tx

C. Pyg*alion Reaffirmed, Robert Rosenthal and,
Donald B. Rubin
l. Overview: Py7ntalion in the Classroom Reaffirmed,139
2. Additional Evidence for the Pygmalion Effect, 140
3. I nitial Equivalence of Experimental and ControlGroups, 144
4. Misleading Citation of Replication Research in ES,
l4i5. Other Criticisms, l5 I
D. Pyg*alion Rebutted , Janet D. Elashoff odRichard E. Snow
I . I ntroduction, l5 62. RR's Additional Evidence, 156
3. Initial Equivalence of Experimental and ControlGroups, I 5 6
4. Replication Attempts, 158
5. RR's "Other Criticisms," I 596. Criticisms Ignored by RR,l6l
References
Substantive References, l6 3Methodological References, I 65
Reviews, 165
References to Appendix C, 166
139
156
163
x

I
Introduction
This book is a critical evaluation of the research study reportedby Robert Rosenthal and Lenore Jacobson ( 1968b)* and thereport of an extensive reanalysis of their data.
I n his 1966 book, Rosenthal, a Harvard social psychologist,demonstrated the importance of experimenter effects in behavioralresearch, thereby developing a new field for psychological inquiry(Rosenthal, 1966). After a discussion of the experimenter asbiased observer and interpreter of data, and of the effects of rela-tively permanent experimenter attributes on subjects' responses, a
series of experiments was summarized purportedly showing the ef-fects of experimenter expectancy in studies of both human andanimal behavior. Many suggestions were offered on the controland reduction of self-fulfilling prophecies in psychologicalresearch. To suggest the generality and importance of such phe-nomena, the book closed with a preliminary analysis of data onteacher expectancy effects and pupil IQ gains in elementary school.Those closing pages (pp. 4lO-41 3) then were expanded byRosenthal and Jacobson for journal presentation (1966, 1968a)and for wider circulation in book form ( 1968b). For brevity in thepresent report, we will refer to the original study, authors, andbook source Pygmalion in the Classroom as RJ.
Our criticism and reanalysis is intended to serve several pur-poses. I ts major aim is to provide a pedagogical aid for students,researchers, and users of research. Thus it offers an extensive cri-tique of a study, its design, analysis, and reporting. This critiqueprovides a vehicle for examining common methodologicalproblems in educational and behavioral science research, and fordiscussing and comparing statistical methods which are widelyused but seldom well understood. The reanalysis of the RJ dataprovides a demonstration of the wide variation in apparent results
*Information within parentheses refers to the References section at the end ofthe book.

2 C hapter One
when similar analytic procedures are applied to data with sampling
and measurement problems. Finally, we sought to identify the
conclusions that can reasonably be drawn about teacher expect-
ancy from the RJ study, since the wide publicity attracted by the
study's expectancy hypothesis may have already sensitized teachers
to this type of experiment and thus prejudiced attempts at replica-
tion.For pedagogical purposes, we have included criticisms ranging
from major to relatively minor issues, from points of general infor-mation readily available to most educational researchers. to pointsburied in the statistics literature. It might be argued that our criti-cisms are unnecessarily stringent, that faults in the RJ study are
common faults or that RJ use procedures consistent with "standard
practice" in the field. Even if one feels that RJ should not them-
selves be unduly criticized for faults common in standard practice,
oRe must begin somewhere to examine and improve standard prac-
tice. We can see no better place to begin than with a widely quoted
popular book that is also ". . . intended for students of education
and of the behavioral sciences, generally, and for research inves-
tigators in these fields." (RJ, p. viii)t
Summary of the RJ Studyas Originally Reported
The original study involved classes designated as fast, medium,
and slow in reading at each grade level from first through sixth in a
single elementary ,school, "Oak'n School in South San Francisco.
During May 1964, while Ss (children) were in Grades K through 5,
the "Harvard Test of Inflected Acquisition" was administered as
part of a "Harvard-NSF Validity Study." As described to teachers,
the new instrument purported to identify "bloomers" who wouldprobably experience an unusual forward spurt in academic and in-tellectual performance during the following year. Actually, the
measure was Flanagan's Tests of General Ability (TOGA), chosen
as a nonlanguage group intelligence test providing verbal and
reasoning subscores as well as a total IQ. TOGA was judged aP-
propriate for the study because it would probably be unfamiliar tothe teachers and because it offered three forms, for Grades K-2,2-4, and 4-6, all of similar style and content. As school began in Fall
tFrom bgmalion in the Classroom: Teacher Expectation and Pupils' Intel-lectual Development, by Robert Rosenthal and Lenore Jacobson. Copyrighto 1968 by Ho[t, Rinehart and Winston, Inc. Reprinted by permission ofHolt, Rinehart and Winston, Inc. This credit line applies to all quotationsfrom this source identified in the text by the initials RI, a page reference, andthe symbol (t).

I ntroduction 3
1964, a randomly chosen ZOVo of the Ss were designated as"spurters." Each of the l8 teachers received a list of from one tonine names, identifying those spurters who would be in his class.TOGA was then readministered in January 1965, May 1965, andMay 1966.
RJ chose to obtain simple gain scores from the pretest (May1964) to the "basic" posttest, a third testing in May 1965, and tomake their primary comparisons with these. The main statisticalcomputations were analyses of variance. Factors used in the analy-ses were treatment group (experimental vs. control), grade (firstthrough sixth), ability track (fast, medium, slow), sex, and minori-ty group status (Mexican vs. non-Mexican). An analysis ofvariance of the full 2x6x3xZx2 classification was neither plannednor possible since the experimental group contained only 20Vo ofthe children, only 17 Vo of the total were Mexican, and the experi-ment was not designed to ensure equal representation by sex andability track. Thus, with only 382 children actually included in theexperiment, many of the 144 cells of the complete cross-classifica-tion table were empty (see our Table 2 for classroom by treatmentgroup cell sizes). RJ calculated several two-and three-way analysesof variance using the unweighted means approximation to dealwith problems of unequal cell frequencies.
The main results for Total IQ gain from pretest to basic posttestare presented in Chapter 7 of the RJ book. The main table of datais their Table 7 -l , reproduced here as Table l, which shows meangain in Total IQ for each grade and treatment group. "E*pectancyadvantage" was defined as mean gain for the experimental groupminus mean gain for the corresponding control group (also called"excess of gain" by the experimental group). An excerpt from RJ'sdiscussion follows:
The bottonl row of Table 7 -l gives the over-all results for Oak School.ln the year of the experiment, the undesignated control-group childrengained over eight IQ points while the experimental-group children, thespecial children, gained over twelve. The difference in gains could be
ascribed to chance about 2 in 100 times (F - 6.35).
The rest of Table 7-l and Figure 7-I show the gains by children of thetwo groups separately for each grade. We find increasing expectancy ad-vantage as we go from the sixth to the first grade: the correlation be-tween grade level and magnitude of expectancy advantage (r : - .86)was significant at the .03 level. (p. 74)t
The report continues with similar tables giving results for sepa-rate Reasoning and Verbal IQ scores and showing gain or "expect-ancy advantage" for breakdowns by sex and ability track. Briefprofiles of a "magic dozen" of the experimental group children are

4 Chapter One
TABLE 1
Mean Gain in Total IQ After One Year by ExperimenEal
and Control-Group Children in Each of Six Grades
(Reprinred f rom RJ , Eheir table 7 -1, p . 75)'i
Control Experimental
I GainGain
Expectancy Advantage
IQ
Points One-tailp<.05*
+15.4 .002+ 9.5 .02
0.0+ 3.4
0.00.7
+ 3.80 .02
Grade
Total
1
2
3
4
5
6
N
4847
40
49
26
4s
255
+L2
+8.42
+27.4+16.5+ 5.0+ 5.6+L7 .4 (+)
+10.0
+L2.22
7
L2
L4
L2
9
11
65
00
0
2
s (-)7
+7+5+2+L7 .
+10.
*Mean square wiEhin Ereatments within classrooms = L64.24
FIGURE 1
12.5
10.0
7_5
5.0
2.5
o
EXPECTANCY ADVANTAGE AFTER FOUR, EIGHT
AN D TWENTY MONTHS AMONG UPPE R AN D LOWE R
(TWO) GRADES (Asterisk indicates p ( .10 two-tail)'
(Reprinted from RJ, their figure 9-5. p. 141.)t
11.0*
LOWER GRADES
4.9'
0.1
MONTHS SINCE INITIATION OF TREATMENT
'r0.0'
LOWER GRADES
1.2 UPPER GRADES
4820MONTHS SINCE INITIATION OF TREATMENT
12.7'
7.9*
5.1---_UPPER GRADES
-4.3 LOWER GRADES-2.8
4820MONTHS SINCE INITIATION OF TREATMENT
10.0
7.5
5.0
2.5
0
-2.5
4.9
2.6
15
11
76.9
3
0-1
-5
UPPER GRADES
1.0

I ntroduction 5
also included, detailing their pre- and posttest IQ scores, alongwith anecdotal descriptions of each child. The over-all results areinterpreted as showing ". . . that teachers' favorable expectationscan be responsible for gains in their pupil's IQs and, for the lowergrades, that these gains can be quite dramatic." (p. 9S)t
Also provided were supplemental analyses of data from the sec-ond and fourth TOGA administrations as well as graded achieve-ment in various school subjects, teacher ratings of classroom be-havior, and a substudy of general achievement test scores. Chartssuch as those reproduced in Figure I are given to illustrate "theprocess of blooming." They show excess of IQ gain by experi-mental group over control group across testing occasions for var-ious breakdowns of the school population.
The book concludes with a discussion of selected methodol-ogical criticisms of the study and more general methodologicalaspects of Hawthorne and expectancy studies, including designsuggestions. I t also offers speculation on possible processes of in-tentional and unintentional influence between teachers andstudents, and closes as follows:
There are no experiments to show that a change in pupils' skin colorwill lead to improved intellectual performance. There is, however, theexperiment described in this book to show that change in teacher expec-tation can lead to improved intellectual performance.
Nothing was done directly for the disadvantaged child at Oak School.There was no crash program to improve his reading ability, no speciallesson plan, no extra time for tutoring, no trips to museums or ait gal-leries. There was only the belief that the children bore watching, thatthey had intellectual competencies that would in due course be revealed.What was done in our program of educational change was done directlyfor the teacher, only indirectly for her pupils. Perhaps, then, it is th;teacher to whom we should direct more of our research attention. I f wecould learn how she is able to effect dramatic improvement in herpupils' competence without formal changes in her teaching methods,then we could teach other teachers to do the same. lf further researchshows that it is possible to select teachers whose untrained interactionalstyle does for most of her pupils what our teachers did for the specialchildren, it may be possible to combine sophisticated teacher selictionand placement with teacher training to optimize the learning of allpupils.
As teacher-training institutions begin to teach the possibility that teach-ers' expectations of their pupils' performance may serve as self-fulfillingprophecies, there may be a new expectancy created. The new expect-ancy may be that children can learn more than had been believed pos-sible, an expectation held by many educational theorists, though forquite different reasons (for example, Bruner, 1960). The new expect-ancy, at the very least, will make it more difficult when they encounterthe educationally disadvantaged for teachers to think, "Well, after all,

6 C hapter One
what can you expect?" The man on the street may be permitted his
opinions and prophecies of the unkempt children loitering in a dreary
schoolyard. The teacher in the schoolroom may need to learn that those
same prophecies within her may be fulfilled; she is no casual passerby.
Perhaps Pygmalion in the classroom is more her role.(p. 182)t
Organization of the Book
At this point, we give the reader a preview of the contents of the
rest of the book. We have arranged our comments in six major sec-
tions: review of the RJ report, discussions of design and samplingproblerns, measurement problerrs, summary of analysis and
conclusions, replications of the RJ study, and analysis problems
and reanalysis results in Appendix A.The research report is a crucial part of the research process.
Chapter II contains a critical review of Pygmalion as a research
report and suggests that the report as a whole is inadequate.
Descriptions of design, basic data, and analysis are incomplete. In-consistencies between text and tables, overly dramatic conclusions,
oversimplified, inaccurate or incorrect statistical discussions and
analyses all contribute to a generally misleading impression of the
study's results.Chapter III examines RJ's experimental design and sampling
procedures. The major difficulties discussed are the lack of clarityabout the details of assignment to treatment groups, subject losses
during the experiment, and the lack of balance in the design. These
difficulties are especially important in the RJ study since the exper-
imental group showed higher pretest scores on the average.
In Chapter IV, we examine the IQ scores actually obtained by
children in Oak school, and questions of norming, reliability, and
validity for these measurements. Histograms of the score distribu-tions in each grade are shown. The number of IQ scores below 60
and above 160, especially for Verbal and Reasoning subscores,
raises doubts about the validity of the experiment as a whole and
the results of certain statistical techniques in particular.Chapter V contains a brief overview of our reanalysis and over-
all conclusions about the results of the RJ study and concludes
with some general methodological recommendations.Chapter VI by Philip Baker and Janet Crist summarizes the
results of attempted replications of the RJ study. Several of the
magazine and journal reviews of Pygmalion in the Classroom are
reprinted in Chapter VII.Appendix A contains detailed discussions of the methodological
problems involved in the analysis of a complex study, comments
on RJ's choice of analysis, and the results of our reanalyses. We

I ntroduction 7
demonstrate the wide variation in apparent results obtained fromslightly different statistical approaches when serious imbalance inthe design and major measurement problems exist.
Appendix B contains a glossary of terms and proceduresreferred to in the text.

II
Py7maliort, in theCla.ss room as a Reportof Original Research
Before discussing methodological aspects of the RJ study, weconsider it appropriate to examine the RJ book as a report of orig-inal research. A researcher's responsibility does not end when theexperiment has been conducted and analyses concluded; he mustreport to the public his methods and findings. This is not a trivialfinal step but a crucial part of the research process. If the reader ismisled about the results, it no longer matters how much care wentinto the performance of the experiment. A careful reading of thereport should provide the reader with sufficient information toallow replication of the study, to allow replication of the data anal-yses if provided with the data, and to allow him to draw his ownconclusions about the results. Stated conclusions, tables, and chartsshould be carefully presented so that the uninformed reader willnot be misled. All studies have weaknesses in design, execution,measurerRent, or analysis. These should be carefully discussed inthe report because they affect the interpretation of results.
Careful reporting is especially important when the report re-ceives considerable attention from methodologically unsophis-ticated readers, as in the case of Pygmalion The phenomenon ofteacher expectancy might be of central importance in the improve-ment of education, particularly if the scholastic development ofdisadvantaged children were strongly dependent on such effects.The problem then is of considerable social moment and the resultsof the RJ work have been widely distributed with noticeable im-pact in the news media. The following represents a sample of pop-ular reaction:
8

Pygmalion in the Classroom 9
Can the child's performance in school be considered the result as muchof what his teachers' attitudes are toward him as of his native in-telligence or his attitude as a pupil? . . Pygmalion in the Classroom isfull of charts and graphs and statistics and percentages and carefullyweighed statements, but there are conclusions that have great signifi-cance for this nation. . Among the children of the first and secondgrades, those tagged "bloomers" made astonishing gains. . TOGA'sputative prophecy was fulfilled so conclusively that even hard-line socialscientists were startled. (Coles, The New Yorker, April 9, 1969)
Here may lie the explanation of the effects of socio-economic status onschooling. Teachers of a higher socio-economic status expect pupils of alower socio-economic status to fail. (Hutchins, San FranctscoChronicle, August I l, 1968)
Jose, a Mexican American boy. . moved in a year from being classedas mentally retarded to above average. Another Mexican Americanchild, Maria, moved . from "slow learner" to "gifted child,".The implications of these results will upset many school people, yetthese are hard facts. (Kohl, The New York Review of Bool<s, September12, l 96g)
The findings raise some fundamental questions about teacher training.They also cast doubt on the wisdom of assigning children to classes ac-cording to presumed ability, which may only mire the lowest groupsinto self-confining ruts . (Time, September 20, 1968)
Other comments appeared in the Sa turday Review (October 19,1968), and a special issue of The Urban Review (September, 1968)was devoted solely to the topic of expectancy and contained a
selection from Pygmalion. (Several of the reviews are reprinted inChapter VII.) Rosenthal was even invited to discuss the results onNBC's "Today" show, thus reaching millions of viewers with theidea. The study was also cited in at least one city's decision to banthe use of IQ tests in prim ary grades:
The Board of Education's unanimous action was founded largely onrecent findings which show that in many cases the classroom perform-ance of children is based on the expectations of teachers.
I n one study conducted by Robert Rosenthal of Harvard U niversity, thetest results given to teachers were rigged, but the children performedjust as teachers had been led to expect based on the IQ scores. (Mc-Curdy, Los Angeles Times, January 31, 1969)
Because the book received wide attention and will likely stimu-late more public discussion and policy decisions as well as muchfurther research, it is imperative that its results be thoroughlyevaluated and understood. Unfortunately, a complete under-standing of the data and results are not obtainable from thepublished accounts alone.

l0 Chapter Two
Pygmalion in the Classroom can be severly criticized as a
research report. We summarize our criticisms briefly here and then
return to each in more detail. The RJ report is misleading. The text
and tables are inconsistent, conclusions are overdr amatized, and
variables are given prejudicial labels. The three concludingchapters represent only superficial, and frequently inaccurate, at-
tempts to deal with the study's flaws. Descriptions of design, basic
data, and analysis are incomplete. The sampling plan is not spelled
out in detail. Frequency distributions are lacking for either raw orIQ scores. Comparisons between text and appendix tables are
hampered by the use of different subgroupings of the data and the
absence of intermediate analysis-of-variance tables. Many tables
and graphs show only differences between difference scores, i.e.,
gain for the experimental group minus gain for the control group.
There are technical inaccuracies: charts and graphs are frequentlydrawn in a misleading way and the p-value or significance level isincorrectly defined and used. Statistical discussions are frequentlyoversimplified or completely incorrect (some of the statistical ques-
tions are considered in later sections).
I n short, our criticisms can be stated in the more general words
of D. Huff ( 1954):
The fault is in the filtering-down process from the researcher throughthe sensational or ill-informed writer to the reader who fails to miss the
figures that have disappeared in the process.
Interpretationsand Conclusions
Conclusions are frequently overstated and do not always agree
from place to place in the book. Text and tables are not always inagreement. Again, our concern is well stated by Huff (1954, p.
l3l):
When assaying a statistic, watch out for a switch somewhere between
the raw figure and the conclusion. One thing is all too often reported as
another.
RJ use labels for their dependent variables that presume in-terpretations before effects are found, a practice especially to be
condemned in publications aimed at the general public. "I ntellec-tual growth" is used in referring to the simple difference between a
child's pretest IQ score and his IQ score on a posttest. I t is ques-
tionable whether simple gain from first to a later testing (withsome adjustments for age) using the same test represents anythingso global as intellectual growth.

1
Pygmalion in the Classroom I I
The difference in gains shown by the experimental group overthe control group is described as an "expectancy advantage." Thisterm presupposes that the difference is always positive. I n fact it isnot. What particular "advantage" or "benefit" accrues to the childshowing a large gain score is not made clear. Words like "special'nand "magic" are also frequently used to refer to experimentalchildren, when less provocative terms would serve as well.
Looking at RJ's main results for Total IQ, as reported in theirTable 7 -l (see our Table I ), the first and second grade experi-mental groups show a large, significant expectancy advant?Ea, thefourth graders show a small, nonsignificant advantage, the third andfifth graders show no difference and the sixth graders show a small,nonsignificant disadvantage. So RJ's table reports an "expectancyadvantage" for the first and second graders (and possibly the fourthgraders) and reports no "expectancy advantage" for the othergrades. The significant "expectancy advant age" reported by RJ isthus based only on the 19 first and second graders in the experi-mental group. But RJ conclude:
We find increasing expectancy advantage as we go from the sixth to thefirst grade. . . (p. 74)t
Here is how RJ describe the results elsewhere in the text:
When the entire school benefitted as in Total IQ and Reasoning IQ, allthree tracks benefitted. (p. 78)t
When teachers expected that certain children would show greater intel-lectual development, these children did show greater intellectual devel-opment. (p. 82)t
The evidence presented in the last two chapters suggests rather stronglythat children who are expected by their teachers to gainintellectually infact do show greater intellectual gains after one year than do children ofwhom such gains are not expected. (p. l2l )tAfter the first year of the experiment a significant expectancy advantagewas found, and it was especially great among children of the first andsecond grades. (p. 17 6)t
There is thus a clear tendency to overgeneralize the findings. Whenthe authors are explaining away the results of contradictory experi-ments, however, the conclusions sound quite different:
The finding that only the younger children profited after one year fromtheir teachers' favorable expectations helps us to understand better the[negative] results of two other experimenters. . . . (p. 8+)t
The results of our own study suggest that after one year, fifth gradersmay not show the effects of teacher expectations though first and secondgraders do. (p. 84)t

l2 Chapter Two
Another important inconsistency is between the form of analysis
and the stated conclusions. All analyses were done in terms ofmeans, yet conclusions are stated in terms of individuals; for ex-
ample ". . . when the entire school benefitted . . . ." or ". . .
these children did show greater intellectual development." That is,
the analyses performed by RJ could only show that average gains
by experimental children were larger than average gains by control
children, but RJ's statements imply that each individual experi-
mental child gained and that these gains were all larger than those
shown by any control group child.There is a strong presumption throughout the book that teacher
expectations have an effect. Contrary evidence is explained away.
RJ cite other studies which in general did not support the
conclusions drawn in this book. The discussion of these adverse
findings de-emphasizes the possibility that teacher expectations
have little effect on IQ scores and becomes almost absurd with ref-erences to all possible alternative hypotheses,-"there is such an
effect, but . . ." (RJ, p. 57)tOne of RJ's closing chapters takes steps toward answering spe-
cific methodological criticisms. Unfortunately, much of this discus-
sion is superficial and some is incorrect. (See later chapters on
technical inaccuracies, design and sampling, and reliability.) RJ's
chapter also offers speculation on possible processes of intentionaland unintentional influence between the teachers and students, butfails to face the full implications of the fact that after the study the
teachers could not remember the names on the original lists of"bloomers" and reported having scarcely glanced at the list.
RJ's last chapter provides a capsule summary and some general
implications. It is here that the inadequacy of statistical summaries
of these data should be clearly specified. But it is not. The reader
expecting careful conclusions is given overdramatized generalities
instead.
Tables, Figures, and Charts
Even with a faulty text, a reader should be able to examine the
basic figures, tables, and analyses and draw his own conclusions.
Clearly in a massive study, we cannot demand that an author
include all the data, or a complete set of analysis-of-variancetables, etc. RJ indeed included many appendix tables of summary
data. What then is wrong?Nowhere can the reader see the distributions of pretest or post-
test scores, the relationship between pretest and posttest scores, or
the detailed results of any of the analyses. The tables in the body

Pygmalion in the Classroom 13
of the text show mean gain or "excess of gain" from pretest toposttest for treatment groups in breakdowns by grade, sex, track,or some combination of factors. Excess of gain is mean gain by theexperimental group minus mean gain by the corresponding controlgroup. This obscures the fact that some of the startling gains weremade by children whose pretest IQs were far below reasonablelevels for normal school children. Examination of alternative hy-potheses, such as "that children higher (or lower) to begin with gainnrore," or "that unreliability may have contributed to spuriousresults," is hampered. Means and standard deviations for pretest,posttest, and gain are shown in the appendix but not for the samebreakdowns as shown in the text. (I n addition, standard deviationsmust be multiplied by ,2ffi-r before use in a t-test since RJ ap-parently defined
"2 = I(*, ;l'/n instead of using
"2 = I(*, D'l(n-l) .)
Selected means or standard deviations to compare with text tables,such as Table 7 -l which shows a breakdown by grade, can be ob-tained with some computation. But for RJ tables such as Table 7 -5showing breakdown by sex, it is impossible to obtain mean pretestor posttest scores from data supplied in the book. Since noanalysis-of-variance tables are shown, the reader must rely onstatementSlike..TheinteractiontermwaSnotverysignificant(p<.15) . ." (RJ, p. 77)I However, there were several analyses ofvariance, with different combinations of factors yielding differentresults, so p-values quoted in the text were all obtained from dif-ferent analysis-of-variance calculations. The reader is left uncertainas to which results were obtained in what analysis and cannotreconstruct tables of means to interpret each effect for himself.
Since final interpretations of the results and the validity of manyof the statistical procedures RJ employed rests on the score dis-tributions and the relationships of pre to post scores, the readerwould hope to find tables, histograms, and scatterplots to enablehim to examine the data more closely, at least for the main subsets
of data. At the very least, the authors should be able to assure thereader that they have examined the data in this light and are sa-
tisfied. But no histograms or frequency distributions of individualscores are provided or mentioned. I f these were displayed, thereader would notice that Total IQ scores range from 39 to 202,Reasoning IQ scores range from 0 to 262, and Verbal IQ scoresrange from 46 to 300. (See Chapter IV for a discussion of themeaning of extreme scores like these.) There are also no scat-terplots showing relationships between pretest and posttest scores.
Of the nine figures in RJ Chapters 7-9, eight are drawn in a mis-leading way; Huff calls graphs like these "gee-whiz" graphs. RJFigure 7 -2, which also appeared in Scientific American (RJ,1968a), is mislabeled, does not state that its impressive percent-ages are based on a total of only 19 children in the experimental

l4 Chapter Two
FlGURE 2a: PERCENTAGES OF FIRST AND SECOND GRADERS
GAINING TEN, TWENTY, or THIRTY TOTAL lO
POINTS
(Reprinted from RJ, their figure 7'2, p. 76)t
o8o
=Vtooz6o
LlJ
CL
o50J
r<-r 40t.L
ogouJ(?
fzozUJ
H 10
UJo-o
D CoNTRoL GRoUP
I EXPERIMENTAL GRoUP
49
21
10 IO POINTS 20 IO POINTS 30 IO POINTS
FIGURE 2b: RJ FIGURE 7-2 REDRAWN TO ELIMINATE REPETITION
(Note that "gains" actually varied from -17 to +65)
GAIN IN IO PTS. G < 10
NO. OF CHILDREN 48 4
% OF CHILDREN 50.5 21
14
10<G<20 20< G<30296135
30.5 32 14 26
E corurRoL GRoUP
I expeRrMENTAL GRoUP
TOTAL
95 19
zLlJ(ro50
6qot!ogoLu(9
<20zUroEIUo-
G>3054521

Pygmalion in the Classroom l5
group, with the 4 children gaining 30 or more points included withthose gaining 20 or more points who in turn have been includedwith the children gaining l0 or more points. Our Figure 2b showsthe information in RJ's Figure 7 -2 redrawn to eliminate overlap-ping or repetition of information and inaccurate labeling.
RJ Figures 8-1, 8-2,9-1, and 9-2 all are drawn with false zerolines, overemphasizing apparent gains and differences in gain. Forexample, in RJ Figure 8- I the line of zero gain is in the middle ofthe chart and the entire scale displayed on the graph runs from
-0.5 to +0.8 grade points based on a scale from 0 for "F" to 4for "A." The choice of scale makes the gains and differences ingains look large when, in fact, most are considerably less than onegrade point. Our Figures 3a and 3b show RJ's Figure 8-l and thesame figure redrawn appropriately. Figures such as 8- I , 8-2, 9-1,and 9-2 should be drawn with the zero line strongly indicated andall gains originating from it.
The four "process of blooming" charts (RJ Figures 9-3 through9-6) not only display floatin g zero lines and elastic scales from oneIQ measure to another, but particular measures are drawn on dif-ferent scales in each chart so that comparisons between charts arenot possible. (Scales for the IQ differences are 0 to 5 , 3 to 12, O
to 12.5, and 0 to 6 respectively.) More important, the "expectancyadvantage" computed at each time point is based on a different setof children, since there are missing data and subject losses alongthe way. Finally, all the charts indicate no "expectancy advantage"at Time I (the pretest). Since the experiment had not begun thereare no gains to compare, but in fact the two groups did rwt havethe same average pretest scores. For example, for the Total IQchart in Figure I the experimental group had average pretestscores 4.9 IQ points higher than the control group in the lowergrades and 2.4 IQ points higher in the upper grades (thesenumbers obtained from our Table 20 in Appendix A).
Technical I naccuracies
Books intended for use by students should be free from tech-nical inaccuracies. One striking deficiency here is RJ's misuse of p-value. The concept of p-value or significance level is incorrectlydefined and interpreted through the book. In the preface, p-value isdefined incorrectly:
". . there often will be a letter p with some decimal value, usually .05or.0l or.00l. These decimals give the probability that the findingreported could have occurred by chance. For example, in comparing

iI
l6 Chapter Two
FIGURE 3a: GAINS lN READING GRADES lN SIX GRADES
(Reprinted from RJ, their figure 8'1, p. 100it
E;orurnoL GRoUP
I expER IMENTAL G ROUP
3 4
GRADES
FIGURE 3b: RJ FIGURE 8.1 REDRAWN WITH GAINS BEGINNING
AT ZERO
DcorurRoL GRoUP
IexpeRTMENTAL GRoUP
12345GRADES
'These are coded teacher's marks (A = 4, B = 3, C = 2,
D = 1, F or U = 0), not grade equivalent scores
4.5UJ
oEIza 0.0(9
(,zo[!(r -.5
52
;5uJo(r
Iza 0.0(9
(,zou,E'.5
6

Pygmalion in the Classroon l7
two groups the statistical significance of the difference in scores may be
hood was less than I in 100 that the difference found could have oc-
curred by chance." (p. ix)t
This definition should read: this means that the likelihood was less
than I in 100 that the difference found or one larger could have
occurred by chance if the dtfference between the population means
were zero and all the assumptions necessary for the test to be valtdwere satisfied. The trouble with RJ's definition is its implicationthat the observed difference ls the true difference, that because thisparticular difference is unlikely to have occurred by chance it mustbe real. The p-valus does not tell us how close an observed dif-ference is likely to be to the true difference. It simply identifies thelikelihood of a more extreme result than the one observed, giventhat the null hypothesis is true. For example, if a t-test based on a
this means that the probability of observing a difference in sample
means as large or larger than lO.2 is less than .01 if in fact there isno real difference in population means and all the assumptionsnecess ary for the test to be valid are satisfied. The "true dif-ference" need not be anywhere near 10.2. For example, the proba-bility of observing a difference in sample means by chance moreextreme than 10.2 if the "true difference" were 6.8 is about .22.
RJ seem also to use p-value as a measure of strength of effect,an indication of the size and practical importance of mean dif-ferences. They do not use a standard p-valuc such as .05, prefer-ring to quote values ranging from .25 to .00002 thus encouragingthe reader to conclude that p-values of .001 indicate truer, larger,more important effects than p-values of .01 . The p-value is not a
useful measure of the size or importance of an observed treatmenteffect for individuals because it depends on the sample sizes in-volved as well as the actual size of the difference. Small differencesof no practical importance can be shown statistically significant ata small p-value if the sample size is large enough. Conversely, large
observed differences may not be statistically significant if the
sample size is small. Procedures which can be used to assess the
size of treatment effects include: confidence interval for the dif-ferences in means, histograms showing the relative positions ofcontrol group scores and experimental group scores, percent of in-dividuals misclassified, measures of statistical association such as
,2 (Hays, 1963), and linear regression analysis showing the per-
cent of variance accounted for by treatment relative to otherfactors.
Most importantly, however, it is usually meaningless to quote
particular p-values less than .01 since the actual distribution of a

l8 Chapter Two
statistic such as t in a real problem will seldom be well approxi-mated by the tabled distribution far enough into the tails (see ourlater section on reliability) for small p-values to be meaningful.
RJ devote nine pages to a discussion of the higher gains inreading grades shown by the experimental or "special" children.Yet they state:
When the entire school was considered, there was only one of the elevenschool subjects in which there was a significant difference between thegrade-point gains shown by the special children and the control-groupchildren. (p. 99)t
Why is so much emphasis placed on results for one out of eleven
school subjects? A series of eleven independent l-tests at the lOVo
level referred to by RJ can be expected to produce at least one sig-nificant difference by chance even though there is no true dif-ference in any of the eleven. I n fact, the probability of obtaining atleast one significant difference by chance under these circum-stances is .6862*. Of course, these sets of grades are not indepen-dent and the probability of obtaining at least one significant resultby chance will be smaller than .6862 but will undoubtedly be con-siderably larger than .10.
I n a footnote, RJ argue that:
Even allowing for the fact that reading was the only school subject to
for reading seem too low to justify our ascribing them to chance. If the
eleven subjects were independent, which they were not . we might
p is about ten times larger than those obtained when classrooms servedas sampling units. (p. I l8-l l9)t
The problem of "expected p-values" needs further examination.First, no matter how small the p-value is, the difference may notbe real; there is always the chance that a rare event has occurred.Second, what is the probability of a very small p-value given thatthe p-value is less than.l0? It is easiest to examine this questionfor the sign test on seventeen classes, for which the obtained p-
value is less than or equal to .0062 is .0879. I n other words, thereis about a 9Vo chance of a p-value as small or smaller than .0062
for the difference in reading scores would provide more informa-tion about the practical importance of obtained results than anydiscussion of p-value.
*P(t significant lHr) : .10, P(no r significant lHo, I I independent I's):(.90)tr, P(one or more t significant lHo) : l-(.90)rr : .6862.

III
Desig, andSampling Problems
There are several problems inherent in the design of the RJ
study and the sample finally obtained. We list them briefly and
then discuss each in turn. The sampling plan, the procedure for as-
signment of children to treatment groups, is ill-defined. Little bal-
ance was designed into the study. A 20Vo subject loss from pretest
to posttest reduces the generalizability of the study and raises the
possibility of differential subject loss in experimental and controlgroups. Because of the uncertain sampling plan, the lack of bal-ance and the possibility of nonrandom subject loss during the ex-
periment, the fact that the experimental group showed higher pre-
test scores on the average, especially in the lower grades, suggests
serious difficulties that attempts at statistical correction may noterase.
The details of a sampling plan provide the basis for subsequent
statistical inference as well as for planning replications of a study.
I n addition, the sampling plan determines the population to whichthe results can be generalized, the unit of observation (individualor classroom), the comparability of experimental and controlgroups, and the factors which may be used in an analysis ofvariance. It is not clear from the RJ book just what the procedure
for assignment to treatment groups was. According to the authors,
a 20Vo random sample of the school's children was listed as
"bloomers" to form the experimental group. However, ". . . itwas felt to be more plausible if each teacher did not have exactly
the same number or percentage of her class listed."(p. 7O)t Thus,
the number of experimental children in a classroom varied fromone to nine. "For the same reason the proportion of either boys orgirls on each teacher's list was allowed to vary from a minimum of40Vo of the designated children to a maximum of 6OVo of the
designated children."(p. 7 t )t Was this plan simple random
I9

20 C hapter Three
TABLE 2
Number of Chlldren Taking the Basic PosEtest
by Classroom and TreaEment GrouP
Grade Group
2
3
4
6
Fast Med ium
15
4 (2L"/.)
t4
3 (182)
15
1 (67")
16
3 (L6iL)
:r.3
4 (24i()
73
15 (L77")
Slow
16
2. (LL%)
14
3 (182)
13
5 (287")
15
4 (zLi()
10
4 (zei()
L2
3 (207")
80
2L (ZLy.)
I
A11 Grades
C
E
C
E
C
E
C
E
C
E
C
E
C
E
L7
1
19
6
L2
B
18
5
16
5
20
4
LCt2
2'.9
(611)
(24%)
(4oi|)
(22%)
(247")
(L7iL)
(227")

Design and Sampling Problems 2l
sampling, or random sampling stratified by sex and classrooffi, orsome compromise solution? I t makes a difference in our choice ofanalysis. Perhaps simple randornization was followed by anonrandom reassignment procedure to fit specifications; the au-thors do not say. I n the final analysis can we actually assumerandom assignment to treatments?
The major difficulty with the RJ design is the imbalance deliber-ately created to make the experimental condition plausible for theteachers. With highly variable human subjects and a small experi-mental group, it is especially important that the experimental andcontrol groups be comparable on as many tactors as possible. Sta-tistical inference at the end of the experiment will rest on the find-ing that the experimental and control groups differ by more thancould be expected on the basis of inherent variability. I f groupsdiffer for reasons other than the experimental treatment variable,resulB may be confounded and interpretation rendered impossible.A main objective of experimental design is to control sources ofvariability so that no confounding impedes interpretation.
As a result of subject loss during the experiment as well as origi-nal inequalities, the number of children in each classroom andtreatment group available for the basic posttest varies as shown inTable 2. The oercent of children in the experimental group fromeach classroom is also shown. The lack of equality in the numberof experimental children per classroom means that some classeshave too few experimental children to make analysis withinclassrooms feasible. The addition of sex as a factor in the analysisimmediately creates empty cells. RJ's approach of cornbiningacross other factors to do analyses of variance on such cross-clas-sifications as treatment by sex, and treatment by sex by grade,necessitates combining over tracks and introduces confounding. I nthe first grade, for example, the experimental group comes mainlyfrom the middle track while in the third grade the middle track ishardly represented at all; tracks are much more evenly representedin the control group. (When tracks are combined, the analyses ofvariance may yield misleading results; see the discussion accom-panying Table l5 in Appendix A.)
I n designing experiments like the one under discussion here, anappropriate prcrcedure is first to match or block subjects on poten-tially important variables, like grade, sex, and classrooffi, and thento rely on random assignment of subjects to treatments withinblocks to provide balance for other variables. This procedure in-sures that the groups are cornparable on the blocked variables andthus equally representative of the population of interest. I t is alsoadvisable to check the adequacy of obtained balance in the sub-jects remaining in the experiment at the end; different experi-mental treatments can create differential dropout or loss rates

22 C hapter Three
TABLE 3
Number of Chlldren Taking PreEest and at LeasE One PosEEest
Control
ExperimenEal
TotaI
Pre tes r PreEesE and at ToEalonlv least one post.EesE pretested
79
L7 77 94
96 382 478
384305
among subjects, and this effect may dictate changes in the statis-
tical analysis, as well as being of interest in its own right. Vari-ables which have not been used in blocking may be included as
factors in an analysis of variance only with considerable caution(see section on analysis of variance in unbalanced designs in Ap-pendix A).
The plausibility of the lists of children expected to "bloom" is acrucial issue in an experiment of this type, but randomization and
balance are also important. RJ could have taken some steps to
achieve balance without giving every teacher a list including ex-
actly the same number of names. The most important factor forbalancing is perhaps ability track. Track assignments were made
on the basis of reading ability by the previous year's teacher, afterthe administration of the TOGA pretest but without knowledge ofthese pretest IQs. There were three classes, representing the three
tracks, at each grade level. Since classes apparently differed in size,
assigning exactly the same proportion of children in each class
would not have resulted in the same number of children on each
list. I f class size represented on the pretest is indicative of the
whole experiment, total class size varied from 16 to 27 ; ZOVo ofthese classes would vary from three to five or six. I t is questionable
whether a teacher would notice that three in a class of 17 repre-
sents the same proportion as six in a class of 28. However, another
possibility would have been to take a lower percentage of childrenfrom the fast track and a higher percentage of children from the
slow track, since fast track children might be said to have already
"bloomed." If all classes were of size 20, we might choose l|Vo,20Vo, 25Vo, or three, four, and five experimental children in the
fast, medium, and slow tracks, respectively.
With such a small experimental group it is difficult to achieve
balance on sex also, but perhaps teachers could be told that the
prediction is done separately for the two sexes so the lists contain

Design and Sampling Problems 23
equal numbers of boys and girls. There seems little reason forallowing the number of experimental children in a class to varyhaphazardly from one to nine. When many children are lost to theexperiment through attrition, the original balance may be partiallylost, but this is no reason to ignore the question of balance at thebeginning.
There is the possibility of a selection bias of unknown propor-tions. Although 478 children were given the pretest, only 382 or80Vo were present for at least one posttest and were thus "includedin the experiment" (see Table 3). RJ remark that "The ins and outsseldom belong to the high or top-achieving third of the school."(p.63)t Thus the children remaining in the experiment cannot be con-sidered a random sample of Oak School children and the resultsmay not be representative of the reactions of the whole school pop-ulation. In view of the high subject loss, it is doubtful that the ex-perimental and control children can still be regarded asrepresenting comparable groups. Although roughly the sameproportion of experimental and control children were lost to theexperiment, pretest scores on lost subjects were not available andit is impossible to tell whether both groups lost comparablechildren.
Given the uncertain sampling plan and large subject loss, it isdisconcerting to note that, for those children remaining in the ex-periment, the pretest scores are consistently superior in the experi-mental group.
I n spite of random allocation to the experimental condition, thechildren of the experimental group scored slightly higher in pretest IQthan did the children of the control group. This fact suggesred the possi-bility that those children who were brighter to begin with might haveshown the greater gains in intellectual performance.(p. 150)t
In Chapter 10, RJ explore this possibility using two differentprocedures: one involves correlations between pretest scores andgain scores; the second is based on post hoc matching of experi-mental and control children. They conclude:
These analyses suggest that the over-all significant effects of teachers'favorable expectations cannot be attributed to differences between theexperimental- and control-group children in pretest Ie. (p. l5l )t
But neither RJ procedure provides an adequate investigation of the

24 C hapter Three
possibility that children higher to begin with gained more. Thecorrelation analysis is, in fact, incorrect. RJ state:
As one check on this hypothesis, the correlations were computed be-
tween children's initial pretest IQ scores and the magnitude of theirgains in IQ after one year. If those who were brighter to begin withshowed greater gains in IQ, the correlations would be positive. In gen-
eral, the over-all correlations were negative; for total IQ r - -.23
Actually, the correlation between pretest scores and gain scorescan generally be expected to be negative. If Xi represents the pre-test scores, and Yi the posttest scores; their variances are ,?r. and
,tr , and their correlation is p . Then the correlation between gainscores, Yi Xi and pretest scores X1 is
'Y-x,x
poy ox
(oy + 2(l-p)o*o,
Thus, py-x,x can be positive only if , , o*tor. Since ox/oy should seldombe much smaller than 1.0, we see that the correlation between gainscores and pretest scores will generally be negative. (I t for ex-ample ox'oy andp a .oswhich is a situation representative of the RJdata-see Tables 4, 5, 6-th€n gy_x,x . -.4).
Clearly, correlations between pretest scores and gain scores aredetermined by the correlation between pretest scores and posttestscores and cannot be used to investigate whether those who werebrighter to begin with gained more. If pretest and posttest scoreshave a linear relationship and those with higher pretest scores gainmore, the slope of the regression equation of posttest on pretestwill be greater than unity. If those with higher pretest scoresgained a great deal more, one might expect to find a nonlinear rela-tionship between pre- and posttest. Referring to our reanalysis sec-
tion in Appendix A, note that the slope is generally less than unity;it is larger than unity for grades 5 and 6 Total and Verbal IQ andgrades 3 and 4 Verbal IQ (Tables 9 and l0). Note however, thatFigures I I through 19 show nonlinear effects produced by a fewchildren with high pretest scores and large gains.
RJ's second procedure was to match experimental and controlgroup children within classrooms on pretest scores and to computean "expectancy advantage" for each matched pair. Post hoc
matching can be useful only when close, objectively chosen matches
are possible. Since the experimental group was only one-fourth the
size of the control group, choosing a control child to match each
experimental child must involve subjective decisions. Also, the fact

Design and Sampling Problems 25
that l3 of the 65 experimental children were left unmatched in-dicates a lack of comparability of the two groups. Our reanalysissection in Appendix A presents some further evidence on thedifficulties involved in post hoc matching.

IV
MeAsurementProblems
For the main purposes of their study, RJ chose TOGA, a group
intelligence test which purportedly does not require reading abili-ty. RJ obtained individual IQ scores for each testing and defined
changes in these scores over time as "intellectual growth." TOGAforms K-2, 2-4, and 4-6 were used. On the pretest K-2 was ad-
ministered to the kindergarten and first grade classes, form 2-4 was
administered to the second and third grades, and form 4-6 was ad-
ministered to the fourth and fifth grades. On the second and thirdtests during the following year all children were retested with the
same test form (grade designation used by RJ was that at basic
posttest). On the fourth test, two years after the pretest, those who
had been in kindergarten, second grade, or fourth grade on the
pretest were again tested with the same TOGA form while the
other children were tested with the next higher-level form. These
IQ tests were multiple choice with five choices for each item; formsK-2 and 2-4 each had 63 items, 35 verbal and 28 reasoning, form4-6 had 85 items. Thus for example, children in kindergarten on
the pretest, first grade for second and third tests, and second grade
for the fourth test received form K-2 all four times, while children
in the first grade on the pretest, second grade for the basic posttest,
and third grade for the last test received form K-2 the first three
times and form 2-4 for the fourth time.Among the most important questions to be asked, here as in any
research project, are: What is being measured? How is it being
measured? How accurately is it being measured? What scale ofmeasurement is being used? In this section we examine the IQscores actually obtained by children in Oak school, and questions
of norming, reliability, and validity for these measurements.
26

Measurement Problems 27
Scores and Norms
Problems began with the decision to rely solely on TOGA. Ex-amination of the manual suggests that the test has not been fullynormed for the youngest children, especially for children fromlower socioeconomic backgrounds. I n addition, it was adminis-tered to separate classes by the teachers themselves, a fact whichraises doubts about standardization of procedure. A review of thetest manual shows that for grades K-2 the procedure is regardedmore as a class project than as a test. Although the teachei reaclseach item in the verbal subtest, in the reasoning portion childrenare left on their own with only minimal instruition or guidancefrom the teacher. There appears to have been no attempt to trainthe teachers in test administration, to check the adequicy of ad-ministration, or to determine whether the test and its instructionsand procedure were understood by the subjects. With kinder-gartners unq first graders, in particular, it is doubtful that anyclosely timed group test can be regarded as an adequate measure ofintellectual status.
All computations were based on IQ scores--a transformation ofthe raw scores based on norm groups and the age of the child. Thetotal raw score distribution on form K-2 for example has a pos-sible range of 0 to 63 points. Examining the conversion table, onenotes that a difference in raw scores of one item on TOGA willresult in an IQ difference (for children of the same age) of about 2points near the center of the distribution, up to 8 points at thebottom of the scale, and 60 points at the top.
According to the manual, TOGA IQ scores were normed so thatfor school children the mean IQ should be 100 (although it mightbe lower for some socioeconomic groups) and the standard dev'ia-tion should be 16 or 17 . Thus 95Vo of the children should be inthe range 67 to 133. A detailed table of mental ages correspondingto each raw score from one to the maximum possible is provided inthe manual. In a technical report accompanying TOGA, normsshowing mental age extrapolated up to 26.6 and down to zero areprovided. As R.L. Thorndike ( 1969) notes elsewhere, however, ex-trapolations outside the norm sample range are of questionablevalue. I ndeed, the tables showing IQ scores for each raw score andage are not extrapolated beyond IQs of 60 and 160. Thus althoughit is possible to obtain IQs of 0 to 200 or more using informationprovided in the manual, the manual implicitly discourages use ofIQs lower than 60 or higher than 160, which should occur veryrarely in any case.
_ 9: simple check on the adequacy of the IQ scores provided byTOGA would be a comparison of the score distribution obtainei

28 C hapter Four
TABLE 4
Pretest Scores
A11 Pretested Children with at Least One Posttest
Grade
1
2
1&2
3&4
5&6
I"lean
90.0
94.7
92 .3
104.3
99 .2
39
59
39
64
56
N
63
63
L26
131
L25
Total IQ
StandardDeviation
L9 .4
15.8
L7.9
L7 .4
18.4
Minimum Maximum
130
133
133
158
L52
1
2
1&2
3&4
5&6
63
63
L26
131
L25
58.0
89. I
7 3.5
99.5
96.6
Reasoning IQ
36.8
2L.6
34.1
19.5
20.3
0
39
0
56
52
111
133
133
L67
158
Verbal IQ
I
2
1&2
3&4
5&6
63
63
L26
131
L25
105. 7
99.4
L02.6
109. 7
L02 .6
2L.2
16. 1
L9.2
22 .2
24 .4
54
50
50
68
46
183
133
183
171
165
for the "Oak School" children with those of the norming groups.
RJ provide no score distributions in either text or appendix, al-
though examining RJ Tables A- I , A-2, and A-3 in the appendix
we find pretest Total IQ means within treatment group of 60.5,
76.9,79.9 for some low track classrooms. The pretest mean for
Reasoning IQ was 58.0 for the entire first grade; in the first grade
control group, Reasoning pretest means were 30.8 and 47 .2 forslow and medium track, respectively. It should be noted that, at
one time, children with IQs below 7O were officially described as
feeble-minded. Those below 40 were labeled "imbeciles." Today,

Measurement Problems 29
TABLE 5
Basic Posttest Scores
Grade
1&2
3&4
5&6
N
114
115
91
Mean
103.4
L07.7
LLz .3
Total IQ
StandardDeviation
18.4
20. 1
22 .8
I"linimum
67
57
63
Maximum
202
165
17L
1&2
3&4
5&6
39114
115
91
L02 .3
103.6
116. s
Reasoning IQ
29 .2
28 .5
29.7
0
2tr
262
25L67
1&2
3&4
5&6
114
115
108
108.6
116. 1
LL3 .2
Verbal IQ
2l.L
31.9
31.0
7L
69
59
22L
300
249
a score of 7 5 or below usually identifies individuals for specialEMR (educable mentally retarded) classes. Since IQ scores as highas 60 could easily be obtained by "guessing" on form K-2 (see
below) IQ scores as low as these must include random or systemat-ically incorrect responses and unattempted items (an IQ of 63 for asix-year-old represents 12 correct out of 63 multiple choice items).Some IQ means seemed inconsistent with the tracking classifica-tion; for the third grade control group, fast, medium, and slowtrack pretest total IQ means were 98.4, 102.2, 100.3 respectively.Pretest means for different forms of TOGA also seemed inconsis-tent; first and second graders had a mean total IQ of 92.3, thirdand fourth graders of 104.3 and fifth and sixth graders of 99.2.
As a consequence, our first step was to examine the score dis-tributions in detail. Histograms of Total IQ, Verbal IQ, andReasoning IQ scores on pretest and basic posttest for each gradeare shown in Figures 4-9. Means, standard deviations, and max-imum and minimum scores are shown in Tables 4 and 5.
Notice the pretest Reasoning IQs of zero in the first grade (Fig-ure 6), the posttest Total IQs of 202 in the second grade, the post-test Verbal IQs of 221,249,300, and the posttest Reasoning IQsof 251, 262.

30 C hapter Four
Since Total IQ scores on the pretest were so low for first and
second graders, it is interesting to compare the obtained distribu-
tion with that to be expected if children merely "guessed." TOGA
form K-2 is a multiple choice test with five choices for each of 63
items. If we define "guessing" to mean that a child selects at
random one of the five choices and each choice is made with prob-
ability ll5, then raw scores on the test should have a binomial dis-
tribution with n- 63, p : ll5. The pretest raw score distribution
for first and second graders is shown in Figure 10. The histogram
shown with dotted lines gives expected raw scores drawn as it forexample, one-sixth (or l9) of the children merely picked their an-
swers at random. The average number of items that were correct
by guessing would be 13. Notice how many of the children did
have pretest scores in the "guessing" range. Note that a raw score
of 8 in a child of age six yields an IQ of 50, a raw score of 13 an
IQ of 67 ' a raw score of 20 an IQ of 83'Actually, it is rare that all children attempt all items. I n this ex-
periment, where teacher influences on subsequent test performance
are of central importance, detailed data on test items answered in-
correctly vs. items left unanswered at each testing should have
been provided. It would be helpful in hypothesizing further about
the nature of teacher effects, if found. Thorndike ( I 969) notes that
the main influence of extra encouragement by the teacher might
well be to increase the number of items attempted, even by
guessing. RJ provide no data on this question, but Rosenthal notes
elsewhere ( 1969, p. 690) that ". . . low IQs were earned because
very few items were attempted by many of the children."
Reliability Quest ions
Examination of the score distributions reveals many extreme IQ
scores less than 60 or greater than I 60; RJ do not discuss these
strange scores and have included them in standard analyses
without comment. How stable are the IQ scores obtained across
time? Test-retest correlations seem low at times especially for
Reasoning IQ (see our Table 6, RJ's Table A-30). Looking at indi-
vidual score sequences (using the data sent us by RJ ) we noticed
many instances of instability of IQ scores across time. A few ex-
amples of the more striking cases include one child with successive
Toial IQs of 55, 1O2,95, 104; another with 84, l2O, 107, 105;
another with 88, 85, 128, l0l; and another with 97, 88, 100, 127.
For Verbal IQ we find sequences 54, l2l, l0l, 74; and 125, 87,
86, 68; and 167,293, 174, 130. For Reasoning IQ, the sequences
0,77,82, 143; and 17,148, I10, ll2; and I I l, 89, 208, 125; and
ll4,8l, 88, 106 appear. In view of the fact that children were

zu,Eo
i(J
u-oE,UJo
fz
FIGURE 4: PRETEST TOTAL tO DtSTRtBUT|ON By GRADE
50 100 l 50 zcoTOTAL IO SCORE
50 100 150 200
100 150 200
50 100 150 200
50 ro0 150 200
Measurement Problems 3l
GRADE 1
250 300
GRADE 2
250 300
GRADE 3
2so 300
GRADE 4
250 300
GRADE 5
250 300
25050 100 r50 200 300
GRADE 6

32 Chapter Four
FIGURE 5: PRETEST VERBAL IO DISTRlBUTION BY GRADE
100 150 200VERBAL IO SCORE
50 r00 150 200
50 100 150 200
50 100 150 200
z[rJ(ro
=()lJ-
o(rUJ6
lz
250
200
250
250
250
300
300
300
300
300
GRADE 1
GRADE 2
GRADE 3
GRADE 4
GRADE 5
50 100 150 200
100 150 200 250 300
GRADE 6

zIIJ(E
o
=otJ.
o(rIJJg)
=fz
FIGURE 6: PRETEST REASONING lo DtsrRtBUTtoN By GRADE
50 100 1 50 200REASONING IO SCORE
250
50 100 150 200 250
r00 150 200 250
100 150 200 250
50 100 150 200 250
Measurement Problems 33
GRADE 1
300
GRADE 2
300
GRADE 3
300
GRADE 4
300
GRADE 5
300
50
50 r00 150 200 250 300
GRADE 6

zUJ
c.oJ
rot.L
oGUJ@
=fz
34 Chapter Four
FIGURE 7: POSTTEST TOTAL lO DISTRIBUTION BY GRADE
100 150 200TOTAL IO SCOR E
50 100 r50 200
50 roo 150 200
50 100 150 200
50 100 r50 200
250
250
250
250
250
300
300
300
300
300
GRADE 1
GRADE 2
GRADE 3
GRADE 4
GRADE 5
250100 r50 200 300
GRADE 6

50zUJ(ro
=()l.L
o(rUJdl
=lz
FIGURE 8: POSTTEST VERBAL lO DtSTRtBUT|ON By GRADE
150 200VERBAL IO SCORE
Measurement Problems 3 5
GRADE 1
250 300
GRADE 2
200 250 300
GRADE 3
200 250 300
GRADE 4
200 250 300
GRADE 5
200 250 300
I
100
50 r00
50 100
50 100
50 100
150
150
150
150
50 100 150 200 250 300
GRADE 6

zt,tJ
Eo
i(J
t-L
oEujco
=lz
36 Chapter Four
FIGURE 9: POSTTEST REASONING lO DISTRIBUTION BY GRADE
r00 150 200REASONING IQ SCORE
250
50 100 150 200 250
50 100 150 250 250
50 100 r50 200 250
100 150 200 250
300
300
300
300
300
GRADE 1
GRADE 2
GRADE 3
GRADE 4
GRADE 5
150 25050 100 200 300
GRADE 6

Measurement Problems 37
tested three and four times with exactly the same test we should ex-
pect greater stability than this. A partial explanation of the
unreliability of these scores is contained in the TOGA manual:"For second grade children of average or above-average ability,TOGA 2-4 will usually provide more reliable test scores."
The sections of the RJ book devoted to discussion of the relia-bility problem are unsatisfactory. RJ state:
I n fact, on a more rigorous basis, it can be shown that the less reliable a
test, the more difficult it is to obtain systematic, significant differencesbetween groups when such differences do, in fact, exist. I n summary,there seems to be no way in which the "unreliability" of our groupmeasure of intelligence could account for our results although it could,in principle, account for the results not having been still more dramatic.(p. I 49)t
The problems of test unreliability were discussed and foundwanting as explanations of our results. (p. 179)t
These statements are exaggerated and oversimplified. First, allstatements about the effects of unreliability on a statistical testmust be based on a probability model which describes theunreliability. The standard model for the reliability of gain scoresis that pretest scores X and posttest scores Y come from a
bivariate normal distribution with correlation coefficient p . (Thatis, X and Y both have normal distributions and are linearlyrelated.) Thus "unreliability" is the same for all IQ levels, and thereliability, e s as well as the variances of X and Y, is the same forboth experimental and control groups.
Under this standard model, it is true as RJ note, that the greaterthe unreliability of the test the larger the variance of gain scoresand the larger the sample size necess ary to show significance fortrue differences of a certain size between means of the groups.Therefore, unreliability in a test increases the probability of TypeII errors, that is, it increases the probability of finding no signifi-cant difference when true differences exist. However, it does notreduce the probability of a Type I error; that is fixed by the exper-imenter. The probability of obtaining a statistically significanr dif-ference between experimental and control groups when no real dif-ference exists is still equal to the p-value and is unaffected by thesize of g . Furthermore, this is by no means the only possiblemodel for unreliability and may not accurately describe the RJdata. The standard model maintains that IQ scores or gain scoresfor both control and experimental groups are drawn from the samedistribution except that the means may be different. I f the scores

38 Chapter Four
FIGURE 1O: FIRST AND SECOND GRADE PRETEST SCORES
r-I
15
zUJE.o
i(J
u10oE.IJJ
CD
=lz
! Raw scores for all children
[] OistriUution for one-sixth of children assumed to "guess" consistently
8- r 1 16 . 19 24-27 32-35 40-43 48-51 56'594-7 12. 15 20 23 28-31 36- 39 44-47 52-55
5
0-3
in the two groups come from distributions with different variances,
different skewness, different kurtosis, then the actual probabilityof obtaining a significant difference in sample means when no dif-ference in population means exists may be quite different from the
nominal significance level of the test.
When two groups have markedly different sample sizes and
markedly different variances, the actual significance level of a t-test may be quite different from the nominal significance level (see
R. M. Elashoff, 1968). For example, if both the experimental and
control groups have normal distributions with a ratio of sample
sizes (n"/n") of 5 and a ratio of variances a'1"'"t of .5, then in large
samples and for a nominal significance level of .05, the actual sig-
nificance level of the r-test would be .12. That is, to perform a t-test at the 5Vo level of significance, we reject the null hypothesis ifthe observed l-value is greater than 1.96. When n./n" = 5
and o2.to2 = .s the actual probability of observing a t value greater
than I .96 under the null hypothesis is l2Vo. I n the RJ experimentfor the combined firsf and second grades, ../.. is about 5 and the
observed ratio of variances for Total IQ gain scores is "lr"l - .62 s
consequently p-values quoted by RJ for comparisons in the lowergrades are probably spuriously low.
I
I
L

Measurement Problems 39
Validity Questions
RJ do not provide a satisfactory discussion of the validity oftheir measure of "intellectual growth." "lntellectual growth" mustmean more than changing a few answers the second time through a
single test. Other mental ability information available from theschool or obtainable without undue additional effort could havebeen used to examine the validity of the TOGA scores. A usualprocedure in questions of construct validity is to show correlationsbetween the measure in question and other indices presumed torepresent the same or similar construct. RJ did not attempt torelate the TOGA scores to other acknowledged intelligencemeasures. The supporting evidence they introduce consists ofchanges in teacher grades, assessments of behavior made at onepoint in time, and a substudy of Iowa Tests of Basic Skills for thefifth and sixth grades. RJ report significant differences between ex-perimental and control groups on one school subject out of elevenand three of nine "classroom behavior" indices. None of these dif-ferences, however, were as large as one point on scales of I to 4 forgrades and I to 9 for behavior. No correlations between IQ andgrades or behavior or achievement are shown; no correlations be-tween gains in IQ and gains in grade points, changes in behavior,or gains in achievement are shown. I n short, it is not clear howvalid the TOGA IQ measures themselves are as a measure of in-telligence or achievement or. how valid changes in TOGA IQscores are as a measure of intellectual growth.
I n view of the conditions of test administration, pretest scores inthe lower grades very likely involve variance due to differences inlistening to instructions, perseverance, or resistance to distraction.These influences are partioularly likely in the reasoning subtest,which is not teacher paced as ltre ,eibal subtest itemJ are. In-terpretations based on these influences would at least make the lowpretest scores more credible, but a rather different interpretationof expectancy effects would also be required.
Rosenthal ( 1969) elsewhere argues that TOGA's validity isdemonstrated by its correlation (.6S; with ability track placementthe following year. A test could predict a gross, three-level judg-ment of academic status well and still be nearly useless as a
measure of individual intellectual ability or growth. Thus, such acorrelation in no way validates the scale of measurement or itsmeaning and that is the question at issue here.

40 C hapter Four
TABLE 6
TesE-retest Correlations
Pretest to Basic Posttest
lst & 2nd Grades
Total IQ
Verbal IQ
Reasoning IQ
3rd & 4th Grades
Total IQ
Verbal IQ
Reasoning IQ
5th & 6th Grades
Total IQ
Verbal IQ
Reasoning IQ
Control ExperimenEal
.72
.70
.50
.87
.74
.74
84
83
63
66
73
45
77
7L
57
87
85
48
Another check on the relationship of the TOGA scores to other
assessments of the children might be provided by considering track
transfers. RJ do not discuss transfers of children between abilitytracks, so the reader is permitted the dubious assumption that no
students changed track across the study's two-year span even
though some IQs changed more than 100 points. In fact, some
track transfers did occur. According to information received fromRJ the track location used in the analyses was track location as ofJanuary 1965, or about the time of the first posttest. There were
indeed track changes during the experiment, however, as shown in
Table 7. The relative numbers of control and experimental group
children who changed tracks is consistent with their proportions in
the experiment. Since the experimental group does not show a sig-
nificantly greater proportion of upward changes than the controlgroup, track changes do not support the contention that experi-
mental children "benefited more" than control children.

M easure ment Proble ms 4 I
TABI,E 7
Number of Children Changing Tracks
During L964-1965
No change
Up
Doum
Total
ConErol Experimental
285
t4
73
4
06
305 77
358
18
6
382
There is another difficulty created by the information that the
track location is not that corresponding to the initial assignment ofchildren within each class; we no longer know which class to com-pare these children with. Children have changed from cell to cell ofthe design during the experiment.
Another validity question concerns the experiment in general. I n
any experiment, one must be assured that the treatment conditionsactually represent the intended variables. Particularly where in-cidental processes are of interest or where deception is involved,some procedure should be included to "cross-validate" the experi-mental effect. RJ took at least a first step in this direction byincluding a teacher interview and memory test at the end of the ex-periment. However, RJ fail to face the full implications of theirresults:
While all teachers recalled glancing at their lists, most felt they paidlittle or no attention to them. Many teachers threw their lists away afterglancing at them. (p. 154)t
Also, teachers could not recall with any degree of success whichchildren had been expected to bloom and which had not.
A memory test administered to the teachers showed that they could notrecall accurately, nor even choose accurately from a larger list ofnames, the names of their own pupils designated as experimental-groupchildren. (p. 6q)t

42 Chapter Four
Evidently the Pygmalion effect, if any, is an extremely subtle and
elusive phenomenon that acts through teachers without consciousawareness on their part.

V
Overview ofAnalysis and Conclusions
The basic aim of analysis in the RJ experiment was to assess the
relationship between pretest and posttest scores in the experi-mental and control groups, to locate any statistically significantdifferences between the groups, and to assess the practical impor-tance of any significant differences observed. RJ based their anal-yses on the five-way classification of treatment x grade x track x
sex x minority group status. They performed unweighted means
analyses of variance using several different subsets of the classifi-cation factors because of unequal cell sizes and the prevalence ofsmall or empty cells. The criterion was simple gain in IQ frompretest to posttest. Pretest to basic posttest (Ts-Tr) was of primaryinterest but pretest to first posttest (Tz-Tr) and pretest to follow-up posttest (TrTr) were also included.
We considered the RJ analysis inadequate in the choice ofanalytic procedure, in the choice of criterion measure, and in the
attention paid to the basic data. Data analysis is an endeavor thatmust justify all that has preceded it in the experiment; analyticprocedures must be chosen with the details of particular substan-tive hypotheses and the intricacies of appropriate statistical ma-chinery clearly in mind. When considerable time and effort have
been invested in the design and conduct of a study, hastypreplanned analysis is false economy at best and, at worst, risksgross misrepresentation of the data.
Most importantly, the researcher is not simply choosing a "test"to confirm some hypothesis. He is, or should
-b;, investig=ating the
heuristic value of alternative statistical representations of his data.As J. W. Tukey (1969, p. 90) notes:
43

44 C hapter Five
Data analysis needs to be both exploratory and confirmatory. I n ex-ploratory data analysis there can be no substitute for flexibility, foradapting what is calculated-and, we hope, plotted-both to the needs
of the situation and the clues that the data have already provided.I n this mode,, data analysis is detective work-almost an ideal exampleof seeking what might be relevant.
With this view, we planned to reanalyze the RJ data as a case
study.
Rearlalysis
Our reanalysis had two major objectives: I ) to provide a criticalappraisal of the analytic approach taken by RJ and the conclusionswarranted by the RJ data, 2) to discuss and illustrate the optionsavailable for exploring data of this type and the problems likely tobe encountered with alternative approaches.
In a complex unbalanced design with measurement problerns,there is no one best way to analyze the data and the results maylook rather different from one method of analysis to another. I twould, in general, be preferable to analyze such data in severalways and compare the results. With imperfect data, potentialproblems associated with the application of particular methodsmay sometimes be balanced by comparing the results obtainedfrom each. I f the results are consistent across methods of analysis,we can feel more secure about our conclusions. If not, the selectionof which analysis is really most appropriate is crucial to the finalconclusions. Choices must be made carefully and reasoning mustbe made explicit. As our work proceeded, it became clear howcrucial to the choice of analysis in the RJ study were the issues,
raised earlier, of unbalanced sampling plan, ZOVo subject loss, andthe measurement problems of extreme scores and unreliability.The complete reanalysis is presented in Appendix A.
The Pygmalion Effect
Our reanalysis reveals no treatment effect or "expectancy ad-vantage" in grades 3 through 6. The first and second graders mayor may not exhibit some expectancy effect; these experimental and
control groups differ greatly on the pretest and a statistical analysis
of such data cannot provide clear conclusions. There is enough
suggestion of an expectancy effect in grades I and 2 to warrantfurther research, but the RJ experiment certainly does not demon-
strate the existence of an expectancy effect or indicate what is size
may be.

Overview of Analysis and Conclusions 45
Chapter VI by J. Philip Baker and Janet Crist reviews the find-ings of recent investigations of teacher expectancy.
Recommendationsfor Furt her Research
As an aid to planning further research on teacher expectancy ef-fects, as well as a summary of the present report, we offer here abrief review of general recommendations for the conduct ofresearch.
I ) As a first step in planning research, state as clearly as possiblethe proposition under study. This statement should suggest im-mediately what the key features of the research design are tobe. Comparison of proposition and plan will show if questionsother than the stated one are implied by the design. For ex-ample, RJ (p. 6t)t stated that their experiment s' . . . was
designed specifically to test the proposition that within a givenclassroom those children from whom the teacher expectedgreater intellectual growth would show such greater growth."However, RJ did not really plan their primary analyses to be
conducted "within classrooms" and never asked the teachers toindicate "those children from whom they expected greater in-tellectual growth."
2) Define as clearly as possible the psychological construct beingmeasured. Avoid questionable connotations in naming vari-ables. Consider in detail the scale of measurement, the reliabil-ity, and the construct validity of the measures chosen, whetherthey represent independent or dependent variables. Provide atleast two separate measures of all constructs of primary interestin the experiment and examine the extent to which the datasupport or qualify the original formulation of the construct inquestion. RJ frequently used terms like "intellectual growth"and "expectancy advantage" in referring to their dependentvariable, never discussing the possibility that their simple IQgain score might not represent the construct of interest to them.RJ offered no information about raw scores or mental ages ontheir single instrument and made no direct use of other intellec-tual measures, some of which must have been available fromschool records. "I ntellectual growth" must mean more thanchanging a few answers the second time through a single test.Neither the reliability nor the validity issues involved in thismeasure were fully explicated or studied. The term "expectancyadvantage" also presumes interpretations before effects arefound, a practice especially to be condemned in publicationslike Pygmolion which are aimed directly at the lay public.

46 C hapter Five
Words like "special" and "magico' are frequently used by RJ to
refer to experimental children, when less imaginative words
would serve as well.3) Specify as clearly as possible the population to which general-
ization is planned. Spell out in detail the steps involved in the
sampling plan. Where alternative procedures for sampling or
assigning subjects to experimental conditions exists, or where
subjects are excluded from the analysis, summarize the
reasoning that led to the decisions made. After producing a pre-
liminary design, list all possible alternative interpretations foralternative expected results. Modify or expand the design to
eliminate competing and confounding hypotheses and clarify insimple terrns the outcomes expected and the implications of
each outcome for the hypothesis of interest. Avoid unneces-
sarily complex designs and the addition of variables of mar-
ginal relevance. The final sampling plan and design should
provide clear balance with respect to the main comparisons
planned. RJ actually said little about the sampling plan. The
need for balancing and the effect of its loss were not made
clear. The reader was left uncertain regarding many points ofconcern regarding subject loss, transfer and balancing, and the
effects of these issues on the results.
4) Validate the experimental treatment by providing checks and
observations to ascertain that treatments really represent for
the subjecm what they were planned to represent for the experi-
menters. Observe and describe subject behavior in test ad-
ministration conditions as well as in experimental treatment
conditions. RJ could have included observations of teachers
and students during tests and teaching but chose not to do so.
The teacher interview, on the other hand, was a useful addition.
It showed, however, that RJ's teachers could not remember,
and perhaps had never known, who the "bloomers" were in the
first place.
5) Look carefully at the basic raw data, before applying complex
scoring formulae, transformations, or summarizations. Plot all
relationships of interest graphically. One picture is worth many
summary numbers. Use simple statistical computations to
probe the assumptions and adequacy of more complex statis-
tical abstractions. The most appropriate and productive mental
set for the experimenter is that of a detective, not a defense at-
torney. Analyze the data in several alternative ways. RJ gave
no evidence of having looked at raw data, scatterplotted rela-
tions, or of having probed into the structure of their analyses.
Alternative methods of analysis were not discussed and the ade-
quacy of the methods chosen was not questioned.
6) Emphasize the strength and character of relationships. Avoid

Overview of Analysis and Conclusions 47
reducing continuous variables to dichotomous conceptualiza-tions and decisions. Consider the amount of criterion variance
accounted for in a relation at least as important as its statisticalsignificance. Report p-values within any predetermined limits,but interpret no relation unless p is less than a fixed value suchas .05. Report p-values less than .01 as " ( .01." RJ relied al-most completely on significance tests to characteri ze the impor-tance of their findings and wrongly used p-value as a measure
of strength of effect to indicate size and practical significance ofmean differences. Nomin al p-values ranging from .25 to .00002were quoted throughout their work.
7) Use the full power of the data to reach simple rather thancomplex conclusions, whenever the former account for the data.The form of analysis chosen by RJ led them into unnecessarilycomplex results. Forming gain scores does not use the power ofthe data; using IQ instead of raw scores adds to complexity.Treating the four test occasions in separate analyses ignores thepowerful repeated measures aspect of the data. Analyzingreasoning, verbal, and total scores separately also adds tocomplexity, since the latter is a simple summation and thus is
literally dependent upon the first two subscores. RJ conductedmany separate analyses without attempting to show the full set
of possible comparisons or to use interrelationships amongvariables for data reduction. Their unweighted means analysisis a gross approximation to least squares solutions at best,
especially when proportional cell sizes were expressly built intothe experiment.
8) Report the results of research as fully and as clearly as possible,using appendices and supplementary publication where neces-
sary. Use scientific and professional journals as the initial outletfor research findings, paying conscientious attention to the sug-gestions and criticisms of referees and reviewers. Singleunreplicated studies of broad public concern should be incor-porated into popular books only with due regard for the degree
of their possible substantiation by other research and their pos-sible misinterpretation by the public.
The educational researcher will deal increasingly with hypothe-ses and conclusions of far-reaching social importance. Whileresearchers are always responsible for the proper conduct andreporting of research, nowhere should this responsibility be morekeenly felt and exercised than in work bearing directly on urgentand volatile social issues. It is essential, then, that both researchersand publishers recognize this responsibility and pursue it to the ut-most. It is hoped that this report will help to equip future workersfor that pursuit.

VI
Te acher
Expectancies:A Reviewof the Literature
J.Philip Bakerand Janet L. Crist
In earlier chapters the RJ methodology was shown to be
sufficiently faulty to throw doubt on the teacher expectancy effectsRJ claimed to have shown. I t was concluded that the studyprovided some suggestive evidence of a teacher expectancy effectbut that replication of the study was the only way to reach any firmconclusions about the existence and extent of teacher expectancyeffects.
The purpose of this chapter is to review the research pertinentto investigation of teacher expectancy, with primary emphasis onattempts at replicating the RJ study. No serious attempt has beenmade to evaluate the methodology of the research papers sum-marized in this chapter. The amount of work involved in a carefulreview of the methodology of each paper would be prohibitive.The reader should keep in mind that a number of the studiesreviewed here may be subject to the same methodological criti-cisms as the RJ study; indeed, some of the papers contain method-ological flaws obvious at first reading. U nfortunately, to ascertainwhether correction of flaws in the methodology would result inchanges in the reported findings would require examination of theraw data.
48

Teacher Expectancies 49
Direct Attemptsat Replication
The nine studies immediately following represent attempts toreplicate the RJ finding. The experiments reported vary in the
degree to which the RJ procedure was followed. We have tried tosummarize the essential features and results of each study withoutreproducing them at length. For questions about details, readers
should refer to the original reports.Vy'. L. Claiborn ( 1969) used 12 first grade classrooms, since the
RJ results seemed most significant in the lower grades. The RJ ex-pectancy induction was given in the spring and post measures
taken two months later. The criterion measures were IQ gain(using TOGA) and observations of teacher-pupil interactions inthe classroom. No significant expectancy effects were found on anyof the variables. However, the time of expectancy induction and
the length of the experiment differed from the RJ study. RI in-duced expectancies at the beginning of the school year whileClaiborn induced expectancies one month into the spring term.Thus a previous semester of teacher-pupil interaction provided a
background of experience with each child before the bogus expec-tancy was introduced, and the expectancy variable was in effectonly two months; it is probable that teachers'impressions and ex-pectancies concerning pupils were already well formed and not eas-
ily changed during the spring term. Claiborn also attempted toshow effects on observed teacher behavior, without success. He
reported that teachers in his study recalled the names of the specialpupils with considerably more accuracy than did teachers in the RJ
study. Of course, the names might have been "fresher" in the
minds of teachers in the Claiborn study.J. Jose (197 l) used first and second grade classrooms; four ex-
perimental and four control students were randomly selected fromeach of l8 classrooms. Expectancy induction apparently occurredduring the first month of the spring term; post measures of IQ gain(TOGA), changes in reading and arithmetic subtests of the Metro-politan Achievement Tests (MAT), and teacher-pupil interactionwere obtained 16 weeks later. No significant differences were
found between the experimental and control pupils on any of the
criterion measures. The author reported that expectancy inductionapparently failed for the majority of teachers in her study, and sug-
gested that the means of establishing expectancy was crucial to the
success of future studies. Jos6 suggested that simply giving IQ in-formation to teachers may not be sufficient to establish the desired
expectancy since teacher expectancies are influenced by so many

50 C hapter Six
additional factors in the natural situation. Her results indicate thatthe failure to find expectancy effects in other studies may be due to
the failure of expectancy induction.J. T. Evans and R. Rosenthal ( 1969) performed a partial
replication in a middle-class elementary school in the Midwest,using first through sixth grade pupils. There was no expectancy
main effect; an interaction effect was found for Reasoning IQ. Girl"bloomers" gained less than girl nonbloomers, and boy "bloom-ers" gained more than boy nonbloomers-just the reverse of RJ's
results.A study by L. Cono, C. Edwards, R. Rosenthal, and D. Crowne
( 1968) attempted to investigate the underlying process of expec-
tancy effects, using 258 first through sixth graders in a middle-class
suburban school. The usual RJ expectancy induction was given inFebruary, and post measures of IQ (TOGA) were taken fourmonths later. Again, IQ gain served as the dependent variable. Ameasure of student accuracy in perceiving vocally expressed emo-
tion was also obtained. There were no clear expectancy effects, butresults showed that accurate perception of female communicationof emotion was associated with significantly greater gains in IQ(TOGA) for "special" children, especially for boys. The authors
suggested that "an important factor in the interaction process is an
ability to perceive and interpret accurately subtle, nonverbal com-munications of emotion, communications quite independent of ac-
tual conten1." (p. 33)
E. S. Fleming and R. G. Anttonen (197 I a and b) investigated
the effect of different expectancy conditions on learner achieve-
ment, self-concept, and teacher grading behavior on approximately900 second grade students. In the fall, teachers were given one offour items of information about each pupil: I ) Kuhlmann-An-derson IQ inflated by 16 points,2) actual IQ,3) actual PMA per-
centiles (Primary Mental Abilities), or 4) no information. Withineach classrooffi, pupils were assigned at random to one of the four
conditions. Criterion measures (IQ, SAT, and self-concept) were
taken in February and again in the spring. Teachers were also
given a questionnaire assessing opinions toward tests in general.
There were no significant expectancy effects revealed in the IQor self-concept measures. One subtest of the SAT showed a signifi-cant effect in February, but not in the spring. There was, however,
a significant teacher opinion effect; teachers who held tests in high
regard had classes showing higher IQ's and higher scores on the
SAT reading and arithmetic subtests in the spring. These teachers
also gave higher average grades in all subject areas. In addition, an
interaction of SES with teacher opinion toward tests was noted;
low opinion teachers discriminated more between two SES groups
in assigning grades than did the high opinion teachers. Most of the

Teacher Expectancies 5l
student measures also showed an SES x opinion interaction, butthe pattern was not consistent. The variables of SES and teacheropinion toward tests were apparently more powerful influencers ofteacher behavior than the artificial induction procedures.
J. S. Goldsmith and E. Fry (1970) used ll2 experimental and
l12 control students in a high school. Expectancy lists were given
to teachers in September and post measures taken five monthslater. The criterion measures were gains in IQ (TOGA) and gains
in scores on the Sequential Tests of Educational Progress (STEP-
2B). I n addition, the teachers were reminded of the list of bloom-ers from three to five times during the following five months. Afollow-up questionnaire confirmed expectancy induction in only 29
of 6l teachers returning the questionnaire. There were no signifi-cant expectancy effects on TOGA or STEP-ZB.
D. F. Anderson and R. Rosenthal ( 1968) reported a partialreplication using a much shortened time span and multiple teacher
contacts with subjects. Subjects were 28 institutionalized retarded
boys (ages 9- I 6); their summer day camp counselors were given
the bogus expectancy after a TOGA pretest. During the followingeight weeks, the amount of attention paid by the counselors to the
boys was observed. Then, TOGA and a measure of Self-Help wereadministered as posttests. There was no significant change in IQ as
a result of the expectancy treatment. I t was found that the counsel-
ors paid less attention to the "bloomers" and that the "bloomers"gained more in Self-Help. It is not known whether the boys
becarne more independent because they had less attention, orwhether they required less attention because of some othermediating mechanism.
RJ (p.58) reviewed an earlier study by C. F. Flowers (1966)
which showed inconsistent expectancy effects on IQ and achieve-
ment, but which revealed more positive teacher attitudes towardsthe "high" groups.
S. Kester ( 197 I ) investigated teacher-pupil interaction in sev-
enth grade classrooms. There were 23 teachers and 150 average
ability students; the latter were randomly assigned to experimentaland control groups. Teachers were given the names of "bright"students in their classes during the first week of school in the falland told that these students would be observed as part of a study
on classroom behavior of bright students. Teacher interaction withexperimental and control students was observed during the follow-ing seven weeks to determine positive interactions directed to the
student, verbal praise, and nonverbal positive behavior. The Stan-ford Achievement Test (SAT), atr IQ test (Otis-Lennon), and an
attitude scale were used as pupil pretests and posttests during the
first and ninth weeks of school. There were no significant expec-
tancy effects on the pupil rneasures. Teachers did appear to display

52 C hapter Six
more "supportive" behavior toward "bright" students; they talkedto them more and spent more time particularly with "bright"students who returned positive behaviorJ to the teacher.
The nine studies summarized above each represent unsuccessfulattempts at replication of the RJ results. In none of the studies was
IQ significantly altered by expectancy. None of the studies showedsignificant expectancy effects on pupil performance measures. Amajor problem seems to be that of determining whether expect-ancy induction has in fact occurred. I t seems doubtful that a list ofpupil names representing expected "bloomers" is sufficient tocause changes in basic measures like IQ through the subtle medi-um of teacher expectations.
It must be noted that none of these studies replicated RJ exactly,but varied from the RJ paradigm in time or method of inductancy,length of experimental conditions, or age and grade of subjects. Sixof these studies examined teacher and/or pupil behavior, and "ex-pectancy effects" appeared in differential classroom or social be-
havior in pupils and/or teachers in four of the six studies. Othervariables which appear important for future investigations areteacher opinion of tests, student SES, and student accuracy in per-ceiving vocally expressed emotion.
Related Studies
While the Pygmalion effect as described by RJ has not beenreplicated, it has stimulated significant studies. Many additionalstudies related to the phenomenon of teacher expectancies havebeen conducted, some focusing on the teacher, some on thelearner, and some on teacher-pupil interaction.
Studies of the Teacher
The three studies reviewed here deal with the effects of expecta-tions on the teacher as perceiver. M. Haberman ( 1970) used 120
student teachers (STs) and their cooperating teachers (CTs), ma-nipulating expectancies for both groups by dividing them into fourconditions: STs who were told they had an outstanding CT; CTswho were told their STs had high potential; both STs and CTsgiven high expectations for their counterparts; and a control groupin which neither STs nor CTs were given particular expectations.At the end of the term of student teaching, no significant dif-ferences were found among the conditions on either STs' ratings oftheir CTs or CTs' ratings of STs. The author suggested that STs
and CTs may have had such clearly defined objectives in this situa-tion that their perceptions of each other were not susceptible to the
influence attempted.

Teacher Expectancies 53
Two studies manipulated expectancies about hypothetical or ab-sent pupils unknown to the college student subjects asked to scorepieces of the pupils' work. L. S. Cahen ( 1966) found a significantexpectancy effect on subjective scores given by 256 teaChers-in-training on a learning readiness test, when fictitious informationwas supplied about pupils' IQ and reading group placement.
le-achers gave higher scores to allegedly "bright'; pupid than theydid to allegedly "dull" pupils.
W. E. Simon (1969) also found that scorers (college students)who were told their twelve-year-old subjects were above averagegave significantly higher scores on 20 items taken from the middlehalf of the vocabulary subtest of the Wechsler I ntelligence Scalefor Children (WISC) than scorers who were told their subjectswere below average. Test protocols of real subjects (all in theaverage IQ range) were used, but the ability labels were assignedrandomly.
Two of the preceding three studies showed expectancy effects onteachers' perceptions of pupils and the operation of a halo effect(see \ry. J. Gephart and D. P. Antonopolos, 1969) resulting in adifferential grading according to an induced expectancy set.
Studies of the Learner
The following six studies investigated effects of either manipu-lated or existing teacher expectations upon measures of pupilr'achievement or sociometric ratings.
D. H. Meichenbaum, K. S. Bowers, and R. R. Ross ( 1969) used14 female adolescent juvenile offenders as subjects with 6 girlsclassified as "bloomers." The design differed from RJ in seviralways: TOGA was not given because the experimental period avail-able to the
_e_xperimenters was too short (two weeki) to expectchanges in IQ; criterion measures were objective and subjectiveexam scores given by the teachers. The four teachers were ali giventhe same induction and all taught all of the girls. Teachers *ereobserved and rated on positive, negative, and neutral interactionswith pupils during the two-week experimental period. The girlswere rated on class-appropriate behavior. A significant expectancyeffect appeared on the girls' objective exam measure anA class-appropriate behavior, but not on subjective grades. Before the ex-periment began, teachers were asked to identify the "good,, and"poor" pupils in their classes. Three "good" pupils and three"po9r'-pupils were then selected as "latJ bloomer-r," supposedlyon the basis of tests administered earlier. The teachers ait- agr.edthat the test was accurate in identifying the "good" studen-ts as"bloomers." Although initially surprised by ttre names of the"poor" students labeled as bloomers, the teachers were soon citing

54 C hapter Six
instances in the behavior of these girls that indicated they did
indeed have intellectual potential.
The principal value of this study is the information it gives
about the reactions of the different teachers to the expectancy in-structions. There was a significant decrease in negative teacher
behavior toward the "bloomers" and a significant teacher x expect-
ancy group interaction for positive behavior. Analysis of individu-
al teacher behavior suggested that 1) teachers react differently toexpectancy induction, 2) prior expectancy also influences teacher
behavior, and 3) student effects of expectancy conditions are not
always related to teacher behavior we observe.
RJ (p. 57) reviewed a study by C. C. V. Pitt ( 1956) that found
no expectancy effects on school grades, achievement tests, or
teacher ratings. An effect on pupil self-ratings was obtained how-
ever.J. M. Palardy (1969) studied existing teacher expectations about
the probable success of boys, compared with girls, in learning toread. Forty-two first grade teachers returned questionnaires in
December indicating their opinions. Five teachers who thought
boys' probability of success was about equal to girls' (Group A)were matched (on the basis of race, experience, location of schools,
and grouping and materials used in their classes) with five who
believed boys' probability of success was lower (Group B).
Reading achievement of 107 pupils (53 boys, 54 girls) of Group Ateachers and 109 pupils (58 boys, 5l girls) of Group B teachers
was measured in May (Stanford Achievement Test, Primary Bat-
tery, Form X). Pretests in September had shown no significant dif-ferences in scores between students in these groups. The results in
May, with IQ as a covariate, showed that boys with Group B
teachers scored considerably lower in reading achievement than
girls of either group and boys of Group A. This finding suggests
the possibility of differential reading achievement according to ex-
pectancies developed naturally by teachers. It is unfortunate that
the matching procedure apparently excluded so many teachers
from the sample. A more complete analysis would have been infor-
mative.
Two reports by W. R. Schrank (1968,1970) may be considered
as experimental and control conditions of a single study. I n each,
the students taking a college freshman mathematics course were
randomly divided into class sections according to five simulated
ability groupings. I n the first study, the instructors did not know
that class assignment for the 100 students in five sections had actu-
ally been made randomly rather than according to ability (ability
grouping was the usual practice for these classes); in the second ex-
periment with 42O students, instructors were told that class assign-
ment was random. The report does not specify how many sections

Teacher Expectanctes 55
were used in the later study. Criterion measures were test and
course grades. For the first year, the highest and lowest labeled
sectionJOiffered significantly on all test and course grade compari-
sons. The five sections were almost perfectly ordered on criterion
averages and labeled ability, from highest to lowest. I n the second
study, few significant differences between pairs of higher and lower
labeled groups were found. No actual data were given for either
study, anO one can question the reported use of a large series of
/-tests as the sole statistical analysis. However, an expectancy ef-
fect deserving of further attention is suggested by the results.
Jacobs ( 1970) investigated expectancy effects on sociometric
factors. After preliminary sociometric analysis of all l4 classrooms
in an elementary school, he gave teachers bogus information about
ZOVo of the children who were designated as potential sociometric
"stars." The time of the expectancy induction was not stated, but
apparently it was not at the beginning of the year. There was a
pbiitive correlation between teachers' post hoc ratings of sociome-
iric change in the classrooms and actual measured change, inldicating itrat teachers were sensitive to small changes of social
structuie in their rooms. But post treatment sociometric ratings ( l0weeks later) showed no changes in peer acceptance of the experi-
mental group members.
W. B. Seaver (1971) used archival data to investigate the effects
of natural expectancy inductions. He reported two analyses of
school recordJ for elementary school children in an upper-middle-
class suburb of Chicago. The first, which included data on 80
pupils entering grade 5, was a lagged correlational study using falliO scores (Primary Mental Abilities) in grade I to predict midyear
grade point averages in grades l, 2, 3, and 4, and then these GPAs
[o predict IQ scores in the fall of grade 4. He reasoned that if IQscoies influence teacher expectations about student performance
and thus influence performance, correlations of grade I IQ with
GPA in grades l-4 should be higher than correlations of GPA ingrades l-4 with IQ in grade 4. The results of this analysis were
uninterpretable, however, because of nonstationarity of the vari-
ables, probably due to relatively lower reliability of the IQmeasure in grade l.
Seaver also investigated a possible expectancy effect due to a
teacher's prior experience in teaching a pupil's older sibling. From
records of two elementary schools, 79 pairs of siblings were
identified and separated according to whether or not the same or adifferent teacher had taught both siblings. Then, the older siblings
were separated by independent judges into "good" or "bad" cat-
egories on the basis of their first grade IQ, Stanford Achievement
Test scores, and grade point average. Within this four-fold
classificationr lourger siblings were then compared using six Stan-

56 C hapter Six
ford Achievement Test subtests and grade point average for gradeI . Four of the subtests shcwed significant interaction; youngersiblings of good students obtained higher achievement scores if is-signed to their sibling's teacher than if assigned to a differentteacher. Younger siblings of poor students did better with newteachers than their peers did with the teachers who had had theirolder siblings. The general form of this interaction is illustrated inthe following figure.
l.L
or(9
l'J,J Z,>=uJ6
u')l-'-tguut(id=>o
OLDER SIBLING HADSAME TEACHER
OLDER SIBL]NG HADDIFFERENT TEACHER
POOR GOOD
ACADEMIC STANDING OF OLDER SIBL]NG
The Seaver study is important because it clearly illustrates ex-pectancy effects in a natural situation, without contrived experi-mental conditions or deceptions of uncertain validity. Witharchival data of this sort, the influence of both positive and nega-tive expectancies can be examined; the ethics of producing nega-tive expectancies experimentally would be questionable. I t ishoped that future studies will follow Seaver's lead and probe dataof this sort further. One issue deserving attention is whether theolder siblings' academic standing established the expectancy di-rectly, or whether teachers are attending primarily to disrup-tiveness and other classroom behavior only correlated withscholastic measures. Another concern is whether the teacher wasinstrumental at all, since self-fulfilling prophecies could have beenbrought from home by the younger siblings. Still another questionfor future work concerns the amount of teacher experience with theyounger sibling that is necess ary to reduce the effects of prior ex-pectations. Seaver studied grade I achievement; a similar examina-tion of later grade records could be enlightening.
To summarize this group of six studies (viewing the two Schrankreports as one experiment), two of the four studies using bogus ex-

Teac her Expec tanc ies 57
pectancies showed expectancy effects on student achievement,
while both of the studies utilizing existing or natural expectancies
did so. The one study with a sociometric criterion measure did not
show expectancy. effects; the expectancy condition was weakest
here, having Feen introduced after teachers had had ample oppor-
tunity to form impressions of their pupils.
Studies on Teacher-Pupil I nteraction
Seven studies focused on teacher-student interaction as the
measure of expectancy effects, though some also included measures
of learner outcome. These studies are important because they
begin to focus upon the dynamics of expectancies and the interper-
sonal processes that may serve as media.
Vy'. V. Beez (1970) followed a design in which 60 graduate
students tutored 60 preschool children, teaching a series ofsymbols in a lS-minute session. Teachers were led to believe their"pupils" were either "high" or "low" in ability, though labels were
actually assigned randomly (actual IQs were not obtained for the
study). Criterion measures were the number of symbols learned
during the tutoring session, the number tutors attempted to teach,
and tutors' post hoc ratings of their tutees. It was found that "high"pupils learned significantly more symbols and their tutors gave
them consistently more favorable ratings than children in the
"low" labeled group. On the surface, this experiment seems to sup-
port the expectancy hypothesis. But tutoring differs conceptually
from classroom teaching, where general instructional conditions
are common to both "bloomers" and nonbloomers. A tutor meet-
ing a "high" ability pupil should plan to teach more, and 15
minutes hardly allows interaction sufficient for ratings. Such
superficial ratings probably indicate only that the tutors under-
stood the experimenter's expectancy.
W. E. Brown (1970) investigated the effects on teacher behavior
of fake psychological reports, containing information on in-
telligence, SES, and personality such as is often found in students'
cumulative records. The experiment used l0 teacher trainees to
tutor 80 first graders on a paired-associate list of states and their
capital cities. As in the Beez ( 1970) study, bogus IQ informationwas related to the number of pairs the teachers attempted to teach.
However, the effect on expectancy-fulfillment ratings of teachers
was opposite to that predicted from the expectancy hypothesis.
SES and personality information had no relation to criterion
measures.*
*Review summarized from Dissertation Abstraus. The dissertation was notread.

58 C hapter Six
P. Rubovits and M. Maehr (1970) investigated the expectancy
effect on teacher behavior i'l a microteaching situation. Teachers
were 26 female undergraduates; students were 104 sixth and sev-
enth graders. The expectancy induction was accomplished by
giving the teacher a seating chart for the four students used in her
microteaching session. The chart included randomly assigned IQs
and "gifted" or "regul ar" labels for each student. Teachers were
rated on the amount of praise, encouragement, elaboration, ig-
noring, and criticism used during the session; a dogmatism scale
was also administered. Teachers were found to request signifi-cantly more statements from, and to give significantly more praise
to, the "gifted" students although there was no difference in the
total amount of attention paid to either group. The attention pat-
terns used with the regular group were not specified. There was no
effect related to teacher dogmatism.M. Rothbart et al. (197 l) investigated teacher-pupil interaction
in microteaching, using 13 female undergraduates and 52 highschool students in a 30-minute literature discussion. There were
positive and negative expectancies induced in this experiment; two
of four students in each microteaching group were labeled as
having greater academic potential, two were described as lackingin potential. Teachers were observed to spend somewhat more timeattending to "bright" students, and these students tended to talkmore.DifferenceSonlyapproachedsignificance'however(p<in both cases). There was no difference in the amount of rein-forcement given to each student. On post hoc ratings of the
students, teachers described bright students as significantly more
likely to have greater future success and as needing less approval.B. J. Willis (1970) asked each of five teachers of special classes
to rank their eight students from most efficient (ME) to least
efficient as learners (LE). The top and bottom students in each
class, along with their teachers, were then observed in simulatedclassroom sessions 30 minutes a day for eight days. Measures ofteacher-pupil interaction showed teachers ignoring LE commentsmore frequently than ME comments and providing more verbalresponses to ME comments than to LE comments. The observed"child behavior-teacher reaction" sequences were different for MEand LE students; the author concluded that 65 . . the teachers
provided consequences for the behavior of the LE which might be
described as systematic extinction of the behavior the LE most
needs to develop for sobial competence."*A study by T. L. Good ( 1970) in four first grade classrooms
sought to assess opportunities given by the teacher for pupils to*Review summarized from Dissertation Abstraus. The dissertation was not
read. Quote is from the abstract.

Teac her Expec tanc ies 59
respond in class. The teacher's own ranking of her pupils accordingto her assessment of their achievement served as a measure of ex-
isting expectations. Two days of observations in each classroomdetermined the number of opportunities given each child torespond as a function of his achievement ranking-high, middle,or low. Significant differences were found among the three groups
of pupils, favoring the high achievers. Opportunities varied some-
what from class to class, but high achievers consistently receivedmany more response opportunities. Low achievers received farfewer opportunities in all classes but one (in which they tied the
middle ranked group). Thus, differential interaction patterns be-
tween teachers and pupils were substantially related to teachers'
earlier ratings of pupils' achievement.J. Brophy and Good ( 1970) followed the design of Good's earli-
er study, again using teachers' rankings of achievement to measure
expectations for pupils' classroom performance. Six pupils (three
boys and three girls) were selected from high and low ends of the
achievement rankings for each of four first-grade teachers. Ob-servers rated teacher*hild interactions on four separate days forthe 12 pupils in each class. I t was found that high achievers ini-tiated significantly more contacts with their teachers than did lowachievers, but that the total number of teacher-afforded response
opportunities did not differ significantly between the two groups ofpupils. A difference in quality (as opposed to quantity) in the totalpattern of dyadic contacts was noted, however. Significant dif-ferences were found for all dependent variables assessing pupils'quality of academic performance favoring the high achievers. Themost important results concerned teacher differences in elicitingand reinforcing of performance in the high and low pupils. The au-
thors summa rize their findings:
The data show that the teachers consistently favored the highs over the
lows in demanding and reinforcing quality performance. Despite the
fact that the highs gave more correct answers and fewer incorrect an-
swers than did the lows, they were more frequently praised when cor-rect, and less frequently criticized when incorrect or unable to respond.
Furthermore, the teachers were more persistent in eliciting responses
from the highs then (sic) they were with the lows the teachers
failed to give any feedback whatever only 3.33Vo of the time when
reacting to highs, while the corresponding figure for lows is 14.75Vo, a
highly significant difference .(p. 372)
As supporting illustration for the findings of Good ( 1970),
Brophy and Good ( 1970), and Willis ( 1970), anthropological ob-servations by R.C. Rist ( 1970) provide striking anecdotes about
teachers' differential treatments of differently judged children. He
followed a class of black ghetto children from kindergarten

60 C hapter Six
Srudy
Replication Attempts
Claiborn (1969)
Jos6 (1971)
Evans andRosenthal (1968)
Conn, et al (1968)
Fleming andAnttonen (1971a,b)
GoldsmiEh andFry (1970)
Anderson and
Rosenthal (1968)
Flowers (1966)
Kester (f971)
Related Studies
Haberman (1970)
Cahen (1966)
Simon (1969)
Meichenbaum,et a1 (1969)
Pirr (1956)
Palardy (1969)
Schrank (1968, 1970)
Jacobs (1970)
Seaver (1971)
Beez (1970)
Bronn (1970)
Rubovi.ts andMaehr (1970)
Rothbart,et al (1971)
willis (1970)
Good (1970)
Brophy andGood (1970)
Sunrnary of Studies Reviewed
TeacherBehavior
Effect* on
i1 Behavior
PosE Gain
weak
weak
weak
weak
weak
induced
induced
induced
induced
induced
0
0
0
0
0
0
+
induced
weak induced
strong induced
weak lnduced
weak induced
weak lnduced
weak induced
strong induced
weak induced
strong natural
induced
weak induced
+
+
+
0
+
+
+
0
0
0
0
strong natural
induced
induced
moderate induced
uoderate lnduced
strong natural
strong natural
strong natural
*ResulEs: { = significant expectancy effects obtained; O = no
significant effects or differences obtained; blank = not applicable.
+
+
+
+
+
+
+
Type and Strengthof TreaEmenE In
Class ,o*T*r.,
0
+
0
+
0
0
+
0
+
+
0
+
+
+
+
0
0
0

Teacher Expectancies 6l
through the second grade. He notes information available to theteacher about home, family, and SES, obtained by parent inter-view, and about pupil appearance and performance during the firstfew days of school. Later assignments of children to tables andclassroom tasks as well as the general quality of teacher interactionshowed clear discrimination between groups of favored and non-favored children in the room. The initial groupings and differentialtreatment were shown to persist through three grade levels.
Three of these studies illustrate a planning effect in tutoring sit-uations as the result of bogus expectancy induction. One illustratesthe effect of the self-fulfilling prophecy on student behavior, andthree more demonstrate how teachers' ratings of students accordingto achievement or ability relate to teacher treatment of pupils. Allthe studies which measured pupil behavior as well showed expec-tancy effects on this criterion. Two of four show the effect on pupilachievement where it was included in the design.
Summary and
Theoretical Overview
The table on page 6:0 provides a summary of the studiesreviewed above in terms of the type of expectancy used (inducedor natural), an assessment of the strength of the expectancy inoperation, and the results for each type of criterion measure (IQ,academic, teacher behavior, or pupil behavior).
From the summary table and preceding discussion, the followinggeneralizations and recommendations seem warranted:l. Teacher expectancy probably does not affect pupil IQ. This
conclusion is supported by a background of decades of researchsuggesting the stability of human intelligence and its resistanceto alterations by environmental manipulation, by the reanalysisof RJ reported earlier in this book, and by the failure of allreplication studies to demonstrate effects on IQ. RJ'sconclusions can therefore not be justified. I t is noted that allreplication attempts used only weak or moderate induced ex-pectancies. I t is possible that strong, naturally occurring teach-er expectancies could influence intellectual growth over an
extended period of time. The issue remains a hypothesis forfurther research.
2. Teacher expectancy may affect pupil achievement. Significanteffects are likely if a strong teacher expectancy exists naturallyor if the induction is strong and a close simulation of naturalconditionso but unlikely with weak induction procedures suchas those used by RJ. Effects on achievement may be somewhatmore likely on teacher-controlled achievement measures and
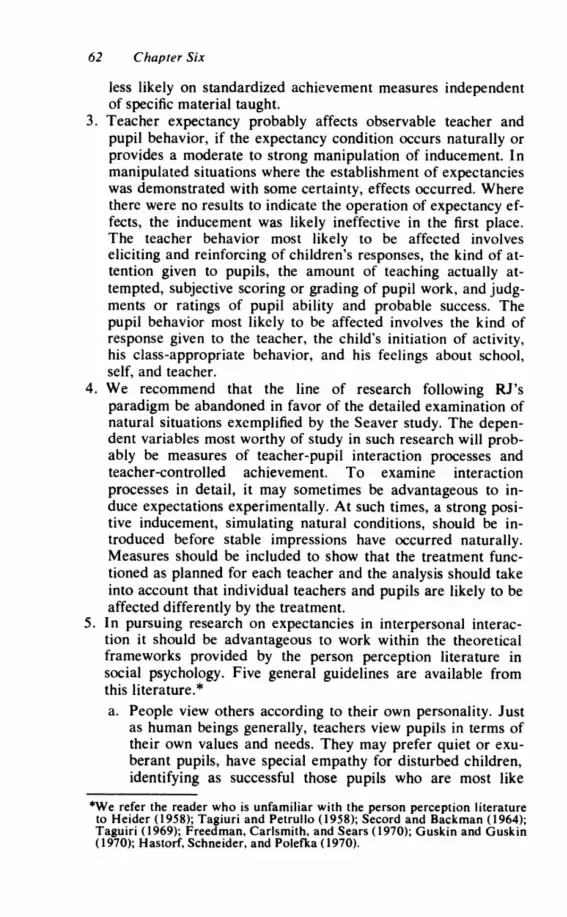
62 C hapter Six
less likely on standardized achievement measures independentof specific material taught.
3. Teacher expectancy probably affects observable teacher andpupil behavior, if the expectancy condition occurs naturally orprovides a moderate to strong manipulation of inducement. I n
manipulated situations where the establishment of expectancieswas demonstrated with some certainty, effects occurred. Wherethere were no results to indicate the operation of expectancy ef-fects, the inducement was likely ineffective in the first place.The teacher behavior most likely to be affected involveseliciting and reinforcing of children's responses, the kind of at-tention given to pupils, the amount of teaching actually at-tempted, subjective scoring or grading of pupil work, and judg-ments or ratings of pupil ability and probable success. Thepupil behavior most likely to be affected involves the kind ofresponse given to the teacher, the child's initiation of activity,his class-appropriate behavior, and his feelings about school,self, and teacher.
4. We recommend that the line of research following RJ'sparadigm be abandoned in favor of the detailed examination ofnatural situations exemplified by the Seaver study. The depen-dent variables most worthy of study in such research will prob-ably be measures of teacher-pupil interaction processes and
teacher-controlled achievement. To examine interactionprocesses in detail, it may sometimes be advantageous to in-duce expectations experimentally. At such times, a strong posi-tive inducement, simulating natural conditions, should be in-troduced before stable impressions have occurred naturally.Measures should be included to show that the treatment func-tioned as planned for each teacher and the analysis should takeinto account that individual teachers and pupils are likely to be
affected differently by the treatment.5. In pursuing research on expectancies in interpersonal interac-
tion it should be advantageous to work within the theoreticalframeworks provided by the person perception literature insocial psychology. Five general guidelines are available fromthis literature.*
a. People view others according to their own personality. Justas human beings generally, teachers view pupils in terms oftheir own values and needs. They may prefer quiet or exu-berant pupils, have special empathy for disturbed children,identifying as successful those pupils who are most like
*We refer the reader who is unfamiliar with the person perception literatureto Heider (1958); Tagiuri and Petrullo (1958); Secord and Backman (1964);Taguiri (1969); Freedman, Carlsmith, and Sears 11970); Guskin and Guskin11970); Hastorf, Schneider, and Polefka (1970).

Teacher Expectancies 63
themselves. One teacher may evaluate pupils on cleanliness,
another on discipline, while still another teacher may give
primary value to creative production; teachers will thus have
different views of the same pupils.
b. People form stable impressions on limited information. Likeother human beings, teachers meeting pupils for the first
time form impressions based on physical appearance and
conduct. They may also know something about each pupil's
past conduct, achievement, IQ scores, or the general charac-
ter of older siblings or parents. These impressions based on
a day's or a week's experience may produce expectations
about pupil behavior and future achievement. Since these
initial impressions are fairly stable, they may be expected to
influence teacher-pupil interaction for the remainder of the
year.
c. People form impressions in global terms. When teachers
charac terize pupils they are likely to label them as "goodn'
or "bad." Clean children may be "good" and dirty ones
"bad;" or there may be "fast" and "slow" learners. The ten-
dency for these global classifications to affect other judg-
ments is called a halo effect.
d. Information conflicting with current impressions may be
rearranged to resolve contradictions. This tendency
preserves the global images discussed above. It allows the
perceiver to handle discrepant events without overhauling
his over-all impressions and expectations about a person. Ifa "poor" student scores poorly on an exam, he "couldn't do
any better;" if a "good" student scores poorly, he "had an
off day." Global impressions once formed are not readily al-
tered by contradictory information.e. Interaction between perceiver and perceived may influence
how the perceived subsequently presents himself. The
human teacher's tendency to make new information consis-
tent with existing impressions has its counterpart in the
pupil's tendency to conform to expectations. The pupil may
begin to act in a manner consistent with previous interac-
tions with the teacher. I t is this aspect of person perception
theory that may represent the primary mechanism of self-
fulfilling prophecy.
The reader should realizr that the words "pupil" and "teacher"
can be interchanged: the perceiver is also the perceived, and pupils
are forming impressions and expectancies of teachers at the same
time that teachers are coming to know the pupils. Perhaps the
teacher also comes to conform to pupil expectations. The processes
described here, while simple to state, occur as a complex stream of

64 C hapter Six
interpersonal transactions, each influencing both parties in furthertransactions.
The question for future research is not whether there are expec-tancy effects, but how they operate in school situations. Such
research will need multivariate criterion measures, as well as a
multivariate conception of the teacher and pupil susceptibilitiesthat affect the operation of interpersonal expectancies in both di-rections. There is legitimate concern about the possible negativeeffects of teacher expectancy on some children. With further un-derstanding of such processes growing from improved research, ef-fective school administrative arrangements and teacher trainingprograms could be developed to avert negative effects. The solu-
tions eventually devised will hopefully capitalize on informed,humane teaching; they are not likely to include the withholding ormisrepresenting of prior information about pupils.

VII
Reviews
Review ofPyg*alioru in the Classroom
Robert L. Thorndike
The enterprise which represents the core of this document, and
presumably the excuse for its publication, has received widespread
advance publicity. I n spite of anything I can say, I am sure it willbecome a classic-widely referred to and rarely examined crit-ically. Alas, it is so defective technically that one can only regretthat it ever got beyond the eyes of the original investigators!Though the volume may be an effective addition to educationalpropagandizing, it does nothing to raise the standards of educa-
tional research.
Though it may make for a dull review, I feel I must dissect the
study to point out some basic defects in its data that make itsconclusions (though they may possibly be true) in no sense ade-
quately supported by the data. The general reasonableness of the
"self-fulfilling prophecy effect" is not at issue, nor is the reportedbackground of previous anecdote, observation, and research. Theone point at which this review is directed is the adequacy ofprocedures (of data gathering and data analysis) and the appropri-ateness of the conclusions drawn from the study that constitutes
the middle third of the book.Before we can dig beneath the surface, we must outline briefly
on a surface level what was done and what was reportedly found.In May 1964, the SRA-published Tests of General Ability(TOGA) were administered by the classroom teachers to all pupils
in kindergarten and all six grades of a school. The test had been
presented to the teachers as a test that ". . . will allow us to
Reprinted from American Educational Research Journal, S (1968), 708-71I,by permission of the American Educational Research Association. M r.Thorndike is associated with the Teachers College, Columbia U niversity.
65

66 C hapter Seven
predict which youngsters are most likely to show an academicspurt." The following September each teacher was given a list ofnames of pupils (actually selected by a table of random numbers)who were alleged to be the ones likely to show a spurt.
The children were tested again in January 1965, May 1965, andMay 1966. The authors assert that the results support the proposi-tion that the teachers' expectancies influenced the mental develop-ment of the children.
The main results of testing in May 1965 (from the authors'Table 7 -l) are as follows:
Grade
Control
N
48
47
40
49
26
45
Experimental
Gain
+27.4
+16.5
+ 5.0
+ 5.6
+17.4
+ 10.0
Difference
15.4
9.5
0
3.4
-0.1
-0.7
Gain
+12.0
+ 7.0
+ 5.0
+ 2.2
+17.5
+10.7
^v
7
l2l4
t2
9
11
I
2
3
4
5
6
Thus, to all intents and purposes, the alleged effect of the"prophecy" appears in l9 children in grades I and 2.If we are totrust the results, and the large edifice of further analysis and specu-lation built upon them, the findings for these two grades must beunimpeachable. Let us examine them.
TOGA has two subtests, one consisting of oral vocabulary andone of multi-mental ("which one doesn't belong") items. For theK-2 level of the test, the one used in the pretesting and posttestingof grades I and 2, the two parts of the test contain respectively 35and 28 items. Let us look first at the pretest data for sixclassrooms, three tested in kindergarten and three in the firstgrade. The results, from Appendix Tables A-2 and A-3 were(expressed in numbers that are always spoken of by the authors as"IQs"):
Class
1A
IB
1C
2A
28
2C
Expuimentol
Mean
Verbal
fl ,,rQ,,
3 102.00
4 Lt6.2s
2 67.50
6 114.33
3 103.67
5 90.20
Mean
Reosoning,,TQ"
84.67
54.00
5 3.50
1 12.50
102.33
77.40
Control
Mean
Vqbal,,TQ"
t19.47
104.25
95.6 8
111.53
96.s0
82.21
Meon
Reosoning,,TQ"
91.32
47.t9
30.79
100.9s
80.s6
73.93
I/19
l6l919
16
t4

Reviews 67
On the Reasoning Test, one class of 19 pupils is reported tohave a mean "IQ" of 3l ! They just barely appear to make thegrade as imbeciles! And yet these pretest data were used blithelyby the authors without even a reference to these fantastic results!
If these pretest data show anything, they show that the testingwas utterly worthless and meaningless. The means and standarddeviations for the total first and second grade classes were(calculated by combining sub-groups):
First Grade
Mean S. D.
lOs .7 2t .2
s 8.0 36 .8
Second Grade
Verbal
Reasoning
What kind of a test, or what kind of testing is it that gives amean "IQ" of 58 for the total entering first grade of a rather run-of-the-mill school?
Unfortunately, nowhere in the whole volume do the authors giveany data expressed in raw scores. Neither do they give the ages oftheir groups. So it takes a little impressionistic estimating to try toreconstruct the picture. However, it would not be far off to assumean average age of 6.0 for May of a kindergarten year. An "lQ" of58 w.ould then mean a "mental age" of 3.5. So we go to the normstables of TOGA to find the raw score that would correspond to a"mental age" of 3.5. Alas, the norms do not go down that far! It isnot possible to tell what the authors did, but finding that a rawscore of 8 corresponds to an "M.A." of 5.3, we can take a shot atextrapolating downward. We come out with a raw score of approx-imately 2! Random marking would give 5 or 6 right!
We can only conclude that the pretest on the so-calledReasoning Test at this age is worthless. And, in the words of a Eu-ropean colleague, "When the clock strikes thirteen, doubt is castnot only on the last stroke but also on all that have gone before."
Another look at one of the Appendix tables (A-6) shows that the6 pupils in class 2,A who had been picked to be "spurters" have a
reported mean and standard deviation of posttest "IQ" of I50. l7and 40.17 respectively. This looks a little high! What does it meanin raw score terms? Again, we must turn detective with somewhatinadequate clues. Not knowing pupil ages, let us assume 7 V2 asprobably on the low side for May in the second grade. An "IQ" of150 implies, then, a mean "M.A." of llv4. Back to our TOGAnorms to find the corresponding raw score. Alas, the highest entryis 10.0 for a raw score of 26 We must once more extrapolate, andthe best we can do from the existing data is to get 28 + .
(Remember, there are only 28 items in this sub-test.) The mean of
Mean
99.4
89. I
s.D.
16. r
2t.6

68 C hapter Seven
6 represents a perfect score! But the standard deviation is 40 "IQ"points. What of those who fall above the mean?
When the clock strikes 14, we throw away the clock!I n conclusion, then, the indications are that the basic data upon
which this structure has been raised are so untrustworthy that anyconclusions based upon them must be suspect. The conclusionsmay be correct, but if so it must he considered a fortunate coinci-dence.
Empirical vs. Decreed
Validatioll0f Ckrcks and Tests
Robert Rosenthal
In his recent review of Pygmalion in the Classroom (Rosenthal
and Jacobson, 1968) Thorndike ( 1968) raises such important ques-
tions about our research instrument and our results that answers
to these questions must be made available.At the beginning of the substantive portion of his review, the re-
viewer reported the results showing that the effects of favorableteacher expectations occurred only in the first two grades as
measured by gains in total IQ. To show that none of the data needbe taken seriously the reviewer then tried to demonstrate the
invalidity of the IQ measure at these lower grades. Is there, ther, ttdemonstration that the total IQ, the measure for which the effectswere significant only at the lower two grades, was poorlymeasured? No, indeed. We never see reference to total IQ again,apparently because it was too well-measured. I nstead, we are givena detailed analysis of reasoning and verbal IQ, which together,make up total IQ. What the reader is not told by the reviewer isthat it is not true that reasoning IQ, which is most criticized,showed expectancy effects at only the lower grades where it ap-peared to be less well-measured. As a matter of fact, 15 of 17
classrooms showed greater reasoning IQ gains among those ran-domly selected children who had been alleged to their teachers tobe potential bloomers (p _ .001). What if we drop those "poorly-measured" three first grade classrooms? Why, then it's 13 of 14
Reprinted from Amertcan Educational Research Journal, 6 (1969), 689-691,by permission of the American Educational Research Association.

Reviews 69
classrooms that show the hypothesized outcome (p - .001). Whilewe're tossing out "poorly-measured" classrooms, why not throwout the three second grade classrooms? That leaves us only l0 ofI I classes showing the hypothesized outcome (p - .006). It shouldbe quite clear that the general results of the effects of teacher ex-pectations on reasoning IQ do not depend upon the inclusion of the
particular classrooms singled out by the reviewer.
I n connection with his critique of the IQ scores reported, the re-
viewer made reference to a table that has as its upper and lowerlimits for total, verbal, and reasoning scores, mental age equiva-lents of 10.0 and 5.3. Such a table exists, it is true, but there is also
a table, two pages earlier, that shows limits of MA from 16.5 to0.5. In all cases IQ was defined, os might be expected, by the quitestandard formula of MA/CA, and for the subtests, as well as forthe full test, the full range of MAs was employed. Can we, now,
explain a mean posttest IQ of 150 for the six children of the fast
track classroom of the second grade who had been alleged to be
potential bloomers? I ndeed, we can! Their mean MA was simply1.5 times the magnitude of their mean CA. The MAs were 16.5,
16.5, 10.0, 10.0, 10.0, and 8.9.
Now what can be said about the very low pretest reasoning IQsof the first grade children? Let us first be very clear that these lowIQs reflect no clerical or scoring errors. These low IQs were earnedbecause very few items were attempted by many of the children.The fact that if the children had attempted all items they would
have earned a higher IQ is interesting but not invalidating. On any
IQ test, not trying an item is likely to lower the score. If Flanagan( 1960), in his development of TOGA, had intended the chance
level of performance to be the basal MA level, he would not have
tabulated the MA equivalent of a single item (out of 63) answered
correctly!The first grade children were not, of course, pretested by the firstgrade teachers. Careful reading of the Pygmalion book shows thatthe "first grade" children were pretested by their kindergartenteachers in the spring of the year. These kindergarten teachers
were primarily responsible for assigning the children to the fast,
medium, or slow track of the first grade on the basis of their kin-dergarten performance and without access to the IQ scores thatThorndike felt to be "worthless." We take the hypothesis of"worthlessness" seriously and submit it to empirical test. A worth-
less test cannot predict better than chance how a kindergarten
teacher will subsequently assign pupils to the fast, medium, or slow
tracks of a school. Yet children scoring higher on the "worthless"reasoning IQ pretest were far more likely to be assigned to faster
tracks than were lower scoring children. The F with 2 and 60 df

70 C hapter Seven
linear regression and deviation from regression component, F for
overall F were both associated with a correlation exceeding .65
(Friedman, 1968). For a "worthless" test, that's not too bad a va-
lidity coefficient. One can only wonder what tests the reviewer had
in mind as examples of tests that were really valid!There is even more dramatic evidence, however, to test the re-
viewer's hypothesis of "worthless" tests. I f the tests are worthless,
they ought not to predict what a different teacher will say about
the child's likelihood of being successful in the future, one year
after the child took the reasoning pretest, and without the teacher's
having access to the IQ scores. Unhappily for the hypothesis of"worthlessness," the tests predict fairly well. The correlation be-
tween the reasoning IQ pretests taken at the end of the kinder-garten year and a different teacher's prediction of the child's likeli-hood of being a future success, a prediction made one year later,
"worthless" test.
The reviewer likened the invalidity of the reasoning IQ subtest
to the faulty mechanism of a clock heard to chime more than 12
times. I t should be pointed out that not every listener at TeachersCollege heard those extra chimes. Thus, in their review, Peter
Gumpert (Teachers College) and Carol Gumpert (Albert Einstein
College of Medicine) said: "The study provides a perfectly satis-
factory demonstration that the teacher expectation effects
hypothesized do indeed take place." ( 1968, p. 22) Readers, never-
theless, were advised by Thorndike to throw away the clock. But,in the words of an Asian colleague, "When a demonstrably ade-
quate clock is cavalierly thrown away, we may question how sin-
cerely the discarder wants to know what time it is."
References
Flanagan, John C., Tests of General Ability: Technical Report. Chicago;Science Research Associates, 1960.
Friedman, H., "Magnitude of Experimental Effect and a Table for its RapidEstimation," Psychologtcal Bulletin 70 (1968): 245-251.
Gumpert, P., and Gumpert, C., "The Teacher as Pygmalion: Comments onthe Psychology of Expectation." Urban Review J, I (1968): 2l-25.
Rosenthal, Robert, and Jacobson, Lenore, Pygmalion in the Classroom. NewYork: Holt, Rinehart and Winston, 1968.240 pp.
Thorndike, Robert L., Review of Pygmalion in the Classroom. American Ed-ucational Research Journal 5, (November 1968): 708-7 I l.

Reviews 7l
But You Have trlKnow How tt-r Tell Tinte
Robert L. Thorndike
True enough, there is a table of age equivalents of raw scores
that goes from 0.5 years to 16.5 years! (It is for the total score on
TOGA.) But does one have to be so naive as to use it? On how
many 6-month-old examinees was it based? And if no children
were tested below about the age of 5 years, as seems likely, how
secure is an extrapolation stretching downward 4 or 5 years?
Age equivalents represent about as unsatisfactory an approach
to an equal-unit scale as we have, even during the elementary
school years. When extrapolated far beyond the ages or grades in
which testing was done, they become arbitrary, insecure, and
largely meaningless.
Noie that it is the scale of measurement that is being questioned,
not the validity of the raw scores. The fact that a child did not un-
derstand what he was supposed to do, and consequently omitted all
or most of the items, could be quite predictive of his academic
status at the time or even a year later. However, it would still be
nonsense to say that his mental age was 0.5 or 1.0 or 2.0. And it isthe scale of measurement that becomes crucial for the authors' ar-
gument.
I ncidentally, information on the number of omitted items seems
quite central to any understanding of the effects of the experi-
mental treatment. If there is one thing that extra encouragement by
a teacher might readily do, whether given before or during an ex-
amination, it would be to lead a pupil to take a shot at two or three
more items, whether he knew the answers or not. When score is
simply the number of items right, as it is on TOGA and many
other tests, normal luck could then produce a measurable if not a
substantial increment in average score. At all ages, one would wish
to see data on number attempted as well as number correct.
I n closing, let me express a very real interest in the notion of the
"self-fulfilling prophe cy." I would expect the phenomenon to ap-
pear most clearly, to the extent that it is in fact effective, in those
ireas that are most directly teacher-based and school-dependent,
such as learning to read, to write and to cipher. Perhaps others can
Reprinted from American Educational Research Journal, 6 (1969): 692,, bypermission of the American Educational Research Association.

72 Chapter Seven
learn from Pygnulion's shortcomings, and carry out research onthese problems that is psychometrically and experimentally ade-quate.
Review ofPy9malion iru the Classroom
Lewis R. Aiken, Jr.
The reader of this review will recognize Robert Rosenthal as thepsychologist who, over the past few years, has been collecting evi-dence and stimulating research by others concerned with tlie ef-fects of experimenter expectations on the results of experiments.Some of the evidence of such experiments, in which animalsranging from planaria to men have been employed as subjects, isreviewed in Chapter 4 of the present volume. In this book, howev-e r, the animals of prim ary interest are public school children andtheir teachers.
Rosenthal's general thesis is that ". . . one person's expectationfor another person's behavior can quite unwittingly become a moreaccurate prediction simply for its having been made." Afterdescribing observational and experimental support for thishypothesis in clinic, laboratory, and everyday contexts, the authorsproceed to detail a study conducted at a public elementary schoolin a lower class community; about one-sixth of the school popula-tion was Mexican. The purpose of the experiment was to deter-mine what the effects would be of indicating to their teachers thata random sample of pupils will show a significant "spurt" in intel-lectual functioning, or "blooming," within a year or so. At thebeginning of the academic year all of the children in the schoolwere pretested with Flanagan's Test of General Ability to obtaintotal, verbal, and reasoning IQs. Twenty per cent of the childrenwere identified as "potential spurtels"-sctually at random but os-tensibly by means of the test-to their teachers. The same IQ testwas readministered to all of the children in posttesting sessions onesemester, one academic year, and two academic years later. Intel-lectual growth was defined as the difference between a child's pre-test IQ and his IQ on one of the posttests. The major reseirchquestions was : Will the experimental group (expectancy group)
B:pflnt^A_ from Educational qryd ?ythqlogical Measurement, 29 (Spring1969): 226-228, by permission. Mr. Aiken is alssociated with GuilioiO i.filgi,l

Rev iews 7 3
show greater gains in. IQ than a control group of the remaining
children (all those not identified as "potential spurters")? I n gener-
zl, the expectancy children did show greater gains in IQ than the
controls, although there were significant interactions between gain
scores and grade level, nationality, sex, ability track, and othervariables. For example, children in grades one and two, Mexican
children, and those in the medium ability track showed the greatest
initial gains; boys showed greater gains in verbal IQ and girls inreasoning IQ.
The gains shown by the expectancy group were not limited to
IQ. They also gained more than controls in reading grades and
were rated by their teachers as more intellectually curious, hap-
pier, and in less,need of social approval than controls.I n spite of the rather dramatic changes shown by the expectancy
children, the investigators were unable to identify any specific
teacher behavior which might have caused such changes. The
teachers did not appear to spend more time with the expectancy
children and even failed to remember that many of them had been
identified at the beginning of the year as "potential spurters." I n
his studies of experimenter effects, Rosenthal has confessed that he
does not know precisely what experimenter behavior produces the
effects, and the same admission can be made regarding the results
of the present investigation. The authors speculate that the teacher
treated the expectancy children differently from the controls-through facial expressions, postures, and perhaps touch, but they
cite no evidence for this proposition.Rosenthal and Gregory (sic/, like Fechner before them, have an-
ticipated their critics by considering alternative explanations for
the results , viz', test unreliability, pretest IQ differences' artifacts
in the testing process, and other methodological flaws; they discuss
and dismiss each of these in turn. And it may well be, as Fechner
declared of his psychophysics, that the results of Pygmalion in the
Classroom will stand because critics will not agree on how toexplain them. Certainly Rosenthal and Gregory ( sic) have
produced a provocative experiment, and although critics should
have no problem attacking it, the array of significant findings
makes it difficult to destroy. I t should be noted that the control
group samples were much larger than the experimental groups,
that gain scores are open to question, that many of the significant
differences may have been caused by the scores of only a few
children, and that the results of the present experiment are indirect contrast to those obtained by Judy Evans (p. 96). Neverthe-
less, even as a minimum accomplishment, the results once more
call into question the meaning and stability of test scores and other
evaluations. They also point to a need for a reassessment and more

74 C hapter Seven
careful analysis of the effects of teacher behavior, both verbal andnon-verbal, and teacher attitudes on the attitudes, self-concepts,and performance of school children.
What Can You Expect ?
Robert Coles
The moment a child is born, it joins a particular kind of world.A doctor has done the delivery in a hospital, or a midwife has doneit in a rural cabin, or the baby has emerged unassisted. That babylearns how to sit up, walk, talk, play, dress, and eat. Genes have alot to do with the child's appearance and appetites and growth, but*h-ut happens to anyone, infant or grownup, is almost inevitablyordained by the laws of nature. A boy might have it in him tobecome a tall, strong, €nergetic man, and a girl might have it in herto become an unusual beauty, but without proper food they willnot survive infancy, let alone reach adulthood in anything like thecondition they might have attained, had life been more generous.
All this is common sense, but a common sense that is often miss-ilg in..arguments over the rights and powers of those two antago-nists "nature" and "nurture," each of which has its strenuouspartisans. Nor is the struggle only abstract, ideological, or philo-sophical. When a subject such as what goes to make up "in-telligence" is debated, very concrete and practical issues are in-volved. I f intelligence is to be considered something fixed andprecise, a biological "given," then teachers are right to ieparate thequick-witted child from the slow one, and to look upon themselvesas agents for each kind of child: the child comes to school with agood, fast mind, an average one, or a slow one, and the school's jobis to find out and act accordingly. This teacher works well with fastlearners, that one with the dull child; So-and-So has a knack forthose in the middle, who respond to her and go as far as they canas a result of her attentive ear, her light, gentle touch. On the otherhand, "intelligence" can be considered a complicated and variableactivity by which the mind, under certain circumstances,-andwhat is favorable for one person can be the opposite for another-meets up with facts and situations and comes to understand them,act upon them, gain some control over them. This view placesgreat stress on complexity and variability. Idiots can have as-
Reprinte.d from The New_ _Yorker, o April 19, 1969, pp. 169- l7O. 173-177,by permission of the New Yorker Magazine, Inc.

Reviews 7 5
tonishing powers of recall; geniuses can be dumb about so very
much; writers can barely know how to count; any number ofbrilliant social scientists can't write a straight sentence. More tothe point of our present national problerrls, children can be stub-
bornly, impossibly backward in school but shrewd, imaginative,
and resourceful at home-or, more likely, on the streets and in the
alleys.At this point, the anthropologist and the psychiatrist (and
perhaps the merely intelligent teacher or parent) may remind us
that sorne children grow up in a family, a neighborhood, a townwhere schools mean a lot and the children's achievement in them
means everything to their parents. Such children learn that itmakes a difference if they pay attention to the teacher and do whatshe says; others literally learn not to learn. One boy's parents are
well-to-do and ambitious, but he is afraid to learn and so has whatchild psychiatrists call a "learning block." His brain seems normalbut his mind won't, for any number of reasons, take in the facts
and put them together. A blurred, indistinct world seems mfsl-anattitude obviously the result of certain experiences. Many childrenhave no such psychological problem but still don't do well at
school-because they come there, as it is now put, "disadvan-taged" and "deprived.'n A number of physicians and nutritionistsand neurophysiologists argue that a diet low in critically importantvitamins, minerals, and proteins causes serious damage to an in-fant's brain, so he comes to school retarded not by disease or in-jury but by the repercussions of a nation's social and economic
problem, which becomes an intense personal problem for millionsof families. Yet even if poor parents can provide their childrenwith decent meals and medical care and clothes'-which is notususl-there is a larger issue. Do parents give their children con-fidence, or do they feel discouraged about life most of the time? I ttakes a lot of persuasion, subtle suggestion, charm, or even force tomake an infant the kind of child teachers like: well scrubbed,
eager, obedient, responsive. Mothers who live in broken-downtenemeotS, who never know when the next few dollars will come,
have little energy left for their children. Life is grim and hard, and
the child has to learn that. He learns it and learns it and learns it-how to survive all sorts of threats and dangers, why his parents
have given up on school, why they have fallen on their faces. Helearns about racial hatred, the state of the economy, technologicalchange; he learns whether he is an insider or an outsider, whetherstorekeepers and property owners and policemen treat his familywith kindness and respect or with suspicion and even out-and-outcontempt. By the time a child of the ghetto comes to school, his
knowledge might well be what has been awkwardly called "the in-telligence of the so-called unintelligent as it appears in sly, devious,
and haunting ways."

76 Chapter Seven
The teacher may know all that but have little time to ponder thesocial and psychological forces that make children so very differentfrom one another before they have had a single day of school. Tothe teacher, the differences are a beginning, not an end. Six-year-old children are what they are, and they are quickly found out bytheir teachers and school psychologists and by "objective criteria"
-by all those intelligence tests, each with its own twist, its own
special, prideful, reasonable (or extravagant) claims. These tests
are employed to separate children by "tracks": fast, medium, slow.The theory is valid; the able and gifted ones will not intimidate thefearful and slow ones, nor will the slow ones cost the fast ones theirright to learn at a speed they find congenial. Yet those who scorewell in the tests take an interest in schoolwork and become knownas first-rate students; those to whom teachers and the work they as-
sign are a big bore or a big fright become the "problem child," the"disruptive child," the slow-witted or stupid one-no matter howbright they may be "underneath."
Well, what can the poor overworked, underpaid teacher doabout all that? Can he be responsible for our nation's injustices,for its history of racial strife, for the regional circumstances thatdoom white Appalachian children and I ndian children and Mex-ican-American children as well as black children? Can schoolsmake up for lacks and shortages and cruelties at home? Can a fewhours in a classrooffi, even one run by the most capable and best-intentioned of teachers, really change a sullen, troubled child's des-tiny? Can it be that teachers in dozens of ways, for dozens ofreasons, determine which children will eagerly absorb their lessonsand which ones will say maybe or positively no? Can the child'sperformance in school be considered the result as much of what histeachers' attitudes are toward him as of his native intelligence orhis attinrde as a pupil?
A book with the dramatic and suggestive title of Pygmalion inthe Classroom (Holt, Rinehart and Winston) has a lot to say aboutthe whole issue. The authors are Robert Rosenthal, a Harvardsocial psychologist, and Lenore Jacobson, a San Francisco schoolprincipal, and their study has to do, in the pedantic words of theirsubtitle, with "teacher expectation and pupils' intellectual develop-ment." They began their work in 1964, when they gave the "Har-vard Test of I nflected Acquisition" to most of the children of whatthey have called the Oak School, an elementary establishment onthe West Coast. (The only ones not tested were to leave the schoolbefore the next round of tests.) The test had prophetic powers, theschool's teachers were told: "As a part of our study we are furthervalidating a test which predicts the likelihood that a child willshow an inflection point or 'spurt' within the near future. This testwhich will be administered in your school will allow us to predict

Reviews 77
which youngsters are most likely to show an academic spurt. The
top twenty per cent (approximately) of the scorers on this test willprobably be found at various levels of academic functioning. The
development of the test for predicting inflections or 'spurts' is not
yet such that every one of the top twenty per cent of the childrenwill show a more significant inflection or spurt in their learningwithin the next year or less than will the remaining eighty per cent
of the children."There is no "Harvard Test of I nflected Acquisition." Dr.
Rosenthal and Mrs. Jacobson had a mission to fulfill, and they
knew that such a name would impress schoolteachers of the second
half of the twentieth century; when someone out of Harvard comes
around to estimate "inflected acquisitior," a woman who struggles
to teach boys and girls their letters and numbers can only be grate-
ful for the assistance afforded by Progress and Science. The
children were really given the useful Flanagan's Tests of General
Ability, or TOGA. TOGA is one of a hundred tests most teachers
don't know about. They do know, however, that social scientists
are smart. So the Oak School teachers had reason to believe they
were aiding research by lending their children to an experiment
that would help establish the value of yet another manmade "in-strumenl"-1fug name given all those questionnaires and tests by
the psychqlogists and sociologists who make them up. Naturally,the teachehs also believed that they would become privy to inter-
esting and important information. The Oak School divides each
grade into fast, medium, and slow tracks, and TOGA supposedly
supplied lists of pupils for all three tracks of each grade. TOGAapparently could spot the "spurters," or "bloomers,'n and the
teachers were let in on the discoveries, though they were cautioned
not to tell what they knew to any children or pareitts. But what re-
ally happened was that Dr. Rosenthal and Mrs. Jacobson had arbi-trarily selected the names; the TOGA scores had nothing to do
with it. A third-grade class made up of fast learners might supply
only one or two children to the honor roll of the "Harvard Test ofI nflected Acquisition," and a first-grade class that seemed ex-
tremely slow might present eight or nine children headed for better
things indeed. If any of the children on the lists turned out to be
"specizl," it was because their teachers were told they were or
were going to be.
Teaphers have a lot to do besides reading and rereading the
namesr of a few children who just might be headed for a kind nod
from Mte, and the Oak School went about its regular business for a
year, finterrupted only by two more bouts with TOGA. Then our
two authors returned to Cambridge with the "data." Teachers are
always grading their pupils,-how they are getting along in each
subjept, how they behave, what their "attitude" is. All that, too,

78 Chapter Seven
went East to the computers. The teachers were asked for more in-formation: How successful might the children be; were theirachievements in class the result of native ability or, say, a capacityfor pure drudgery; was this child "appealing, well adjusted, affec-tionate" and that one "hostile and motivated by a need for approv-al"? What did the authors and their research assistants discover?Their report- Pygmolion in the Classroon+is full of charts andgraphs and statistics and precentages and carefully weighed state-
ments, but there are conclusions that have great significance forthis nation, preoccupied as it is with severe educational problemsof many kinds. Among the children of the first and second grades,
those tagged "bloomers" made astonishing gains in the later tests:
"About every fifth control-group child gained twenty IQ points ormore, but of the special children, nearly every second child gainedthat much."
The lesson in the book is clear: All sorts of young children didvery much better in school than others like them, presumablybecause their teachers expected them to become "bloomers, and
TOGA's putative prophecy was fulfilled so conclusively that even
hardline social scientists were startled. They were also taken abackby other results. The greatest gains were among the Mexican-American children, a "minority group" with "cultural disadvan-tage" and "cultural deprivation." Despite these condescendinglabels, the Mexican children became much better students in theirteachers' eyes, too. What is more, the children who looked clas-sically Mexican did better than those who looked a little "Anglo,"which prompts the authors to speculate, dryly, that "the teachers'pre-experimental expectancies of the more Mexican-looking boys'intellectual performance was probably lowest of all. These
children may have had the most to gain by the introduction of a
more favorable expectation into the minds of their teachers." Butthe teachers were not won over by the remarkable improvement;the Mexican children still were rated low in "adjustment" and in-tellectual curiosity. Harvard people might know something, theteachers appeared to agree, but these miraculous improvementshad come about because of something that had nothing to do withthe teachers and their attitudes as educators, as men and womenwho believe in some children and view others, right from the start,as hopeless. Yet maybe a teacher can silently let a child know thatgood things are, incredibly, around the corner because the expertssay so. A teacher's faith is apparently not requireLonly her loy-alty to experts, the secular gods of the twentieth century. Dr.Rosenthal and Mrs. Jacobson are quite aware of the effect a pair ofscientists armed with tons of paper can have on opinions. What ob-viously surprised them was the substantial and persisting nature ofthat effect, obtained in spite of the long-standing prejudices of

Reviews 79
teachers. "One wonders whether among these minority-groupchildren who over-represent the slow track and the disadvantaged
of Oak School their gains in intellectual competence may not be
easier for teachers to bring about than to believe."The prejudices of teachers,-and the effects the prejudices have
on learning, come across on almost every page of this book.
Bright children who were labelled "bloomers" were found morepleasant and attractive by their teachers; slow children labelled"bloomers" were grudgingly viewed as "more autonomous but less
affectionate." When children in the lowest track inexplicablyimproved, the teachers became confused and angry: "The more
such a child gained in IQ, the more unfavorably he was evaluated
by his teacher in almost every respect." The authors remark,ironically, that "if a child is to show intellectual gains, it may be
better for his intellectual vitality and for his mental health as seen
by his teacher, if his teacher has been expecting him to gain intel-lectually. I t appears that there may be psychological hazards tounexpected intellectual growth."
What actually happened in the Oak School? The authors ofPygmalion in the Classroom admit that they don't know. Before
they tell about their project, they offer a more general discussion
of what I suppose is best called the "self-fulfilling prophecy" as ittakes place in everyday life, in the practice of medicine and psychi-
atry, and in the education not only of children but even of animals.
Banks have failed simply because frightened people believed them
to be in trouble. Certain groups of people have always been con-
sidered to be by nature inferior and uneducable, and because theyhave been treated so, they have appeared so, behaved so, and con-firmed the beliefs of their oppressors. And patients feel better, get
better, because they are persuaded that a given pill will do its job.
There is evidence that even something as tangible as surgery draws
upon psychological overtones for its success. In 1961, Henry K.Beecher, professor of anesthesiology at the Harvard MedicalSchool, published in the Journal of the American Medical Assrcia-tion an article called "Surgery as Placebo." He described a new
operation to relieve angina pectoris, and reported that the benefits
of it were the result "of what happened in the minds of the patients
and the surgeons involved." Experiments revealed that surgeons
who believed enthusiastically in the new method brought relief topatients four times as often as the skeptical surgeons did. I t even
turned out that a feigned operation, done under anesthesia and
believed by the patient to be a complicated surgery, was equallyeffective. Psychiatry has not even begun to settle the issue of whichtreatment works for what reason. Entire mental hospitals have
been suddenly transformed by the arrival of a new drug or "tech-nique," and just as quickly the old despair and gloom have reap-

80 C hapter Seven
peared. Psychiatric theorists argue fiercely, attack one another indense, muddled language-often enough to conceal from them-
selves, let alone others, the ever-present hunch that the mind is
healed not only by rational explanations, however intricate and
compelling, but by experiences (in the doctor's office, outside his
office) that have to do with faith, reassurance, suggestion, per-
suasion, all of which a doctor can first inspire or offer out of his
heart, and later nervously dress up in elaborate language that is re-spectably scientific.
"To summarize now what has been learned from researchemploying animal subjects generally," the authors s&), "it seems
that those that are expected to perform competently tend to do so,
while animals expected to perform incompetently tend also to per-
form as prophesied." In describing an experiment, Dr. Rosenthal
relates animals to children in a way every teacher might thinkabout: "At the beginning of that study experimenters assigned
allegedly dull animals were of course told that they would find re-tarded learning on the part of their rats. They were, however, reas-
sured that 'it has been found that even the dullest rats can, in time,learn the required responses.' Animals alleged to be dull, then,were described as educable but slow. It was interesting in the lightof this to learn that of the experimenters who had been assigned'dull' animals, forty-seven per cent believed their subjects to be
uneducable. Only five per cent of the experimenters assigned
'bright' rats were equally pessimistic about their animal's future.From this result one wonders about the beliefs created in school-teachers when they are told a child is educable but slow, deservingbut disadvantaged."
I n the Oak School, "disadvantaged" children suddenly came tolife and made astonishing gains. Yet they were given no crash pro-grams, no special tutoring, no trips to museums; their teachers
were simply told that those particular children bore watching.Another research project is needed if we are to discover how teach-ers go about letting children know they have a special destiny. Nodoubt dozens of signals are made: gestures, postures, facial expres-sions, a manner of approach, a choice of words and the way theyare spoken, a look in the eyes, a touch of the hand. Soon the childgets the message-perhaps in the best wo), unself-consciously. Hebegins to feel the teacher's feelings, the pleasure of approval, and
begins to learn more. There comes a time when the issue is notonly emotional but intellectual, when a teacher's expectations
become a child's sense of prideful achievement, which in turn en-
ables him to expect more-of himself.Pygmalion in the Classroom is not meant to be a popular book,
though as books written by social scientists go it possesses an ex-ceptionally accessible narrative style. The writers are not afraid of

Reviews 8l
a readable and lively sentence, and they mix blunt social comment
with the most complicated statistical equations and tabulations.
Without attempting eloquence, they have achieved the matter-of-
fact eloquence that goes with an original, imaginative study of peo-
ple and their doings with one another. The authors constantly
iemind us of the ethical dimensions of scientific work. After all,
they might have persuaded the teachers of Oak School to think less
of Certain children and to feel right about expecting nothing, right
because scientists have said that it is useless to expect much but
decline in certain children.I like the way Dr. Rosenthal and Mrs. Jacobson question them-
selves, their moral purposes, and state their loyalties,-utlimately
to man as more than the sum of all labels and categories, and to
man as full of hidden as well as apparent possibilities, for the good
and for the bad. And I also like the title of this book. At the end,
Eliza Doolittle is quoted: "The difference between a lady and a
flower girl is not how she behaves, but how she's treated." I n
Shaw's -Pygmalion a professor helps ntake a slattern into a lady,
but in the Greek legend the issue is more momentous, a matter of
life and deatl-which is what the alternatives are for our
schoolchildren.
Great Expectat iotrs
Herbert Kohl
Most educational research focuses upon the success and failure
of students or on the economic "effectiveness" of school systems.
But there seems to be a tacit agreement between teachers and
researchers (usually psychologists and sociologists) not to raise
questions concerning - the teachers themselves. I t is difficult for
,-esearchers to enter a school to study teacher behavior, and they
rarely do so. Yet two researchers, Robert Rosenthal, a psycholo-
gist, and Lenore J acobson, a school administrator, have violated
tt e non-aggression pact between teachers and researchers and
studied tE- manipulation of teacher behavior in the classroom.
Pygmalion in the -Classroom
is a report on the effect of a teacher's
rifi..tutions upon the performance of his ptPils. The study is in-
genious and the results obtained highly significant.
Rosenthal and Jacobson are concerned with self-fulfilling
ith permissionEV, I nc.
Reprinted w@ 1968 NrR
from The New York Review of Books' Copyright

82 C hapter Seven
prophecies,-i.e., those predictions of future events that becomecentral factors in bringing about predicted events.* As they so),"the central proposition of this book is that one person's propheCyof another's intellectual performance can come to determine thatother's intellectual performance." They got the faculty of a schoolin South San Francisco to cooperate with them by pretending thatthey were conducting a scientific study of the performance of cer-tain students in the school who were "late bloomers." An officialdocument describing the project was presented to the teachers:
STUDY OF REFLECTED ACQUISITION
( Harvard-N ational Scie nce
Foundation)
All children show hills, plateaus, and valleys in their scholastic progress.The study being conducted at Harvard with the support of the NationalScience Foundation is interested in those children who show an unusualforward spurt of academic and intellectual functioning. When thesespurts occur in children who have not been functioning too wellacademically, the result is familiarly referred to as "late blooming."
As a part of our study we are turther validating a test which predicts thelikelihood that a child will show an inflection point or "spurt" withinthe near future. This test which will be administered in your school willallow us to predict which youngsters are most likely to show an academ-ic spurt. The top 20 percent (approximately) of the scorers on this testwill probably be found at various levels of academic functioning.
The development of the test for predicting inflections or "spurts" is notyet such that every one of the top 20 percent will show the spurt or"blooming" effect. But the top 20 percent of the children will show amore significant inflection or spurt in their learning within the next yearor less than will the remaining 80 percent of the children.
Because of the experimental nature of the tests, basic principles of testconstruction do not permit us to discuss the test or test scores eitherwith the parents or the children themselves.
Upon completion of this study, participating districts will be advised ofthe results.
There is no "inflected acquisition," of course, nor is there a "testof late blooming." Students were given an ordinary test of in-telligence and achievement, but one unfamiliar to the teachers;"late bloomers" were selected at random from the student body.The teachers were then told that some of their pupils had turnedrAn example of a self-fulfilling plophecy is a favorable medical prognosis ina case of a cancer which caused the patient to move from desiair-to hopeand became a crucial part of his cure.

Reviews 83
out to be "late bloomers,n' and that they were ready to "bloom.'o
The researchers then sat back and waited to see how the students
performed.There is one aspect of Rosenthal and Jacobson's work which
they themselves didn't explore: the effect of Rosenthal's Harvard
credentials and the false credentials of the test upon the teachers'
expectations. The teachers were fooled into believing that the test
of "inflected acquisition" was actually measuring something. Pre-
sumably they were persuaded by the weight of authority (Harvard,
The National Science Foundation, etc.) that a simple paper and
pencil test could tell them more about crucial characteristics oftheir pupils than they were able to perceive in their daily contacts
with the children. The timidity with which the teachers seemed to
accept the premises of the "test of inflected acquisition," and the
ease with which their expectations were manipulated by the
researchers show how obedient and trusting they were, and all too
willing to accept external authority. I t may also indicate why
teachers, themselves obedient, expect their pupils to be as blindly
responsive to authority as they are.
The main proposition of Pygmalion in the Classroom was sup-
ported by the results of the experimsnf-ths "late bloomers"
bloomed. The reading scores of students designated as late bloom-
ers grew at a significantly greater rate than that of the non-
blooming pupils they had been matched against. These changes
were particularly dramatic in the lower grades and for pupils in the
"middle tracks."
Girls bloomed more in the reasoning sphere of intellectual functioning,
and boys bloomed more in the verbal sphere of intellectual functioning
when some kind of unspecified blooming was expected of them. Fur-
thermore, these gains were more likely to occur to a dramatic degree in
the lower grades. That susceptibility to the unintended influence of the
prophesying teacher should be greater in the lower grades comes as no
special surprise. All lines of evidence tend to suggest that it is younger
children who are the more susceptible to various forms of influence
processes.
There are two particularly interesting cases of late blooming.
Jos6, a Mexican-American boy, had an IQ of 6l before he was
labeled a "late bloomer." A year later he had gained 45 IQ points,
testing at 106. Thus he moved in a year from being classed as men-
tally retarded to above average. Another Mexican-American child,Maria, moved from 88 to 128-i.e., from "slow learner" to "gifted
child," according to the school's classification. These two results
alone are staggering, yet many similar, though less dramatic, ad-
vances occurred when the teachers' expectations of the children
changed.

84 C hapter Seven
The implications of these results will upset many school people,yet these are hard facts. Can failure in ghetto schools be attributedto teachers' expectations and not to the students' environment orability? Can one even carry Rosenthal's results a bit further andspeculate, for example, on whether discipline problems in ghettoschools arise because teachers expect them to? Do students lack"motivation" because teachers don't expect them to be motivated?The results described in Pygmalion in the Classroom reach beyondthe ghetto. They condemn the tracking system prevalent in elemen-tary and second ary schools throughout the country. Often in thefirst, or at least second, grade, children are grouped according to"ability." The determination of ability is made by the teachers orby whatever "objective" tests of school achievement they ad-minister. Some schools have higher, middle, and lower tracks.Others draw the line finer and often seven IQ points or fourmonths' difference in reading achievement scores become the crite-rion for class placement. Teachers are keenly aware of how theirclass stands in the general school hierarchy. Almost without excep-tion the grouping according to track is self-perpetuating; and thestudents usually remain in the same track throughout their schoolcareer. *
Tracking also becomes a self-fulfilling prophecy. Both the teach-er and the student are aware that upper-track classes are supposedto perform well and lower-track ones aren't. They expect things towork out that way and usually see to it in many unspoken waysthat they do. This is as true in white middle-class suburban schoolsas in those of the urban ghettos. Not long ago I visited a C-streamclass in a suburban high school. The students were demoralizedand the teacher bored. He felt that nothing could be done with thestudents, and they agreed. One of the students asked me what I wasdoing visiting his class since the students were dumb and couldn'tpossibly interest a visitor. This boy of fifteen considered himselfdumb because he was told that in school; it seemed to me a devas-tating commentary on the destructiveness of the schools.
But the tracking system is also a disservice to the so-calledbright students who come to believe that brightness consists of theability to perform well on tests. I t frequently alienates them fromtheir true abilities. It also cuts them off from children in the lowertracks, making the notion of the public school as a community amockery; though it certainly succeeds in reflecting a society whi'chpretends to be democratic and yet limits participation in the de-mocracy to those who succeed and conform to the people in power.
*The little movement that does take place in the tracking system seems to bedownward as "behavior" and "discipline" problems arE weeded out of thetop tracks and consigned to the bottoh.

Reviews 85
The implications of the study described in Pygmalion in the
Classroom also extend beyond education. For Rosenthal and
Jacobson's research methods also involved the manipulation ofteachers, whose cooperation was enlisted in bad faith. Theresearchers assumed god-like roles; they were the only people inthe school who knew what the "experiment" was all about and whowere not themselves the subjects. They presumed their involve-ment was neutral and that their work was simply an attempt to un-
cover "objective" (though statistical) knowledge. Yet can a social
science "experiment" involving the manipulation of human beings
be neutral? Moreover, what is the moral and human cost of acquir-ing knowledge through deceit and bad faith? This study does notreveal what the teachers who have been studied feel, nor whether
they have learned something about themselves that could have
some effect.
The results of Rosenthal's work are, of course, gratifying. Theyconfirm what many critics of the schools have been saying. Yet an
approach which is itself so totalitarian makes one question the val-ue of acquiring knowledge by treating people as objects of an ex-
periment. Surely there must be a more direct way of confrontingteachers with their attitudes, and studying them in a more directway. We do not need more people in the schools who cannot be
trusted, even if they happen to be social scientists.

Appendix A:Details of the Reanalysis
In this section we discuss in detail the methodological problemsinvolved in the analysis of such a complex study, comment on RJ'schoice of analysis, and present the results of our reanalyses.
RJ applied a standard analytic procedure, analysis of variance,without discussion of its assumptions or applicability and little at-tempt at exploration of the many other possibilities for analysis. Isan analysis of variance approach the most appropriate for this ex-periment? What about investigating the relationships between pre-and posttest scores via regression analysis? What about analysis byclassroom? What about nonparametric analyses?
Given the choice of a standard analysis of variance, we can askwhether the five particular factors,-treatrnent, grade, track, sex,
minority group status'-should be included in the design. Can thenumber of cells be reduced in other ways than by dropping factorscompletely? Why choose simple gain scores as the criterion vari-able? Do the gain scores used satisfy the assumptions necessary fora standard analysis of variance to give valid results? Why not useposttest scores alone? Covariance analysis? A repeated measuresanalysis? I s unweighted means analysis the appropriate way tocalculate these analyses of variance: What about unweighted leastsquares? Weighted least squares? While the main issue is whetheranalysis of variance is appropriate at all, we include discussions ofthe other questions.
These many analyses are included to show the inconsistency ofresults from one method to another and are not necessarily validanalyses. The problems of unbalanced sampling plan, 20Vo subjectloss, many extreme scores, and low reliability cast doubt on the va-lidity of the statistical procedures reported. That is, one can neverbe sure in a given analysis how close the nominal p-value is to the
86

A ppendix A 87
actual probability of rejecting the null hypothesis when it is true.I n fact, it is not clear that any analysis or significance test on these
data can be accepted as wholly valid. It is only by examining the
data from many different aspects that we are finally able to make
any over-all "conclusions."
Extreme Scol'es
In Chapter IV we noted the existence of many extreme scores inthe RJ data. Very low scores are an indication that childrenresponded randomly, consistently incorrectly, or did not respond at
all to many questions; very high scores indicate that near the upperlimits of the test the norming process is inadequate. Neither score
gives an indication of the child's "true" mental ability. When there
are so many extreme scores, it is difficult to know how to analyze
the data. Even if we were to regard these scores as valid, theirpresence creates score distributions which are nonnormal, skewed,
and likely to have different variances in different subgroups. Ap-plying standard statistical procedures to such scores may create
a serious difference between the true and nominal significance
levels of any statistical procedure (R. M. Elashoff, 1968). (See
the section on reliability in Chapter IV for an example of this.)What procedures might be used to avoid such problems? Of
course, the best way is to choose a measuring instrument and toplan data collection so that such scores do not arise. Perhaps the
next best approach with the RJ data is to analyze the raw scores.
This removes the problem of inadequate norming but forces us toanalyze scores from the three different TOGA forms separately. Aswe shall see in later sections this is really necessary even using IQscores. We have included analyses of total raw scores for first and
second graders.
However, if analysis of the data in IQ form is still desired some
procedure must be used to handle scores outside the main normingrange of 60-160. One procedure is to truncate the data by
excluding as too poorly measured any IQ scores outside this range.
Another possibility is renorming the data by replacing all scores
less than 60 by 60 and all scores higher than 160 by 160. Neitherprocedure is wholly adequate since the effect on various statisticalapproaches is unknown, but analyzing the data in all three ways, inoriginal IQ form, in truncated IQ form, and in renormed IQ formprovides information on the sensitivity of the results to the
presence of extreme scores. Other possible procedures are trim-ming or winsorization, where a certain percentage of top andbottom scores are excluded or altered (see Dixon and Massey,

88 A ppendix A
1969), or use of a statistical model accounting for the presence
of outliers (J. D. Elashoff, 1970).
Table 8 shows the effects of these three procedures on the test-
retest correlation of total scores for first and second graders. Note
that the values are highest using raw scores. Other differences inthe effects of these options will appear in sections to follow.
TABLE 8
Test-reEest Correlations for
First and Second Grades Total IQ
Raw Scores
IQ Scores A11
Renormed
Truncated
Control
.73
.66
.68
.70
Exp e r imen ta 1
.87
.72
.75
.67
Rt'lat ionships BetweellI)re and Post Scores
The basic aim of the RJ experiment was to assess the rela-tionship between pretest and posttest scores in the experimentaland control groups, to locate bny significant differences between
the groups, and to assess the importance of these differences. The
first thing to do then is to examine the relationship between pretest
and posttest in detail.
Regression Analyses
Scatterplots in Figures I l-19 show posttest IQ plotted against
pretest IQ for Total, Verbal, and Reasoning scores for experi-
mental and control groups of first and second graders, third and
fourth graders, and fifth and sixth graders. This breakdown corre-sponds to the three different TOGA forms; further breakdown
produces sample sizes too small for reasonable regression analyses.
Experimental children are designated by X's, control children by
dots. Norm limits are shown by the box drawn at 60 and 160 forboth tests. The regression lines using all data and truncated data(all points outside the box deleted) are shown for both experi-

Appendix A 89
TABLE 9
Slope of Regression Line for Sex by Treatment by Grade Group+Pretest to Basic Posttest
Total IQ
Control Experimental
Grades
1and2
3and4
5and6
Female
.62
.gg
1.05
Ita le
.51
.92
.94
Female
.72
L.L2
1. 14
Ila1e
r.03
.92
1.07
*These twelve slopes are significantly nonParalleltr = 2.59 1p< .05 )' LL,296
TABLE 10
Slope of Regressj,on Line for Treatmenc by Grade GroupPret,es t Eo Bas ic Pos t tes t
-
Total IQ
CE
Verbal IQ Reasoning IQ
Grades I and 2
IQ Scores
Renormed IQ
TruncaEed IQ
Raw Scores
Grades 3 and 4
IQ Scores
Renormed IQ
Truncated IQ
Grades 5 and 6
IQ Scores
Renormed IQ
Truncated IQ
93
7L
58
45
.99
.95
.96
1
1
ECEC
.72
.63
.66
56
62
69
54
90
89
84
01
01
1.03
.91
.97
I .03
.90
.87
.95
.75
.62
1. J7
.75
.64
1. 14
.97
.gg
.32
.58
.61
.88
.7L
.s3
.60
.62
.45
88
88
38
1.13
1.13
.42
.''8 1
,76
90
87
771.00 1.09

90 A ppendix A
mental and control children. Note that the lines labelled T are fortruncated data. Points off the graphs are indicated by arrows. Fig-ure 20 provides the scatterplot and regression analysis for total rawscores for first and second graders.
Looking at the plots for first and second graders, one notices inFigure I l, for example, how strongly the one child with a posttestTotal IQ of 202 affects the position of the regression line for the
experimental group. The slope decreases from.93 to.58 when thatone child is removed. The regression lines for experimental andcontrol groups are generally closer together for the truncated data.Note that nearly 4OVo of the Reasoning IQ scores in Figure l3 ap-pear well outside the norming ranges, most of them less than 60; 8
pretest scores are zero.
Is the relationship between pretest and postest the same across
treatments, grades, sexes? Are lhe relationships linear? Are the
slopes near unity? How much do extreme scores affect the rela-tionships? Tables 9 and l0 show regression slopes calculated usingthe original IQ data, renormed IQ scores, truncated IQ scores foreach grade group, each treatment group, and Total, Verbal, andReasoning IQs, as well as for some raw score data.
First, let us examine regression slopes for Total IQ in twelvegroups-grade x sex x treatment, see Table 9. These twelve regres-sion lines are significantly nonparallel, but within the six treat-ments by grade groups, there are no significant slope differences
between the sexes. (Questions could be raised about the validity ofthe F tests for parallelism in view of the extreme scores; however,slopes for males and females seem generally close enough to war-rant combining the sexes to obtain larger sample sizes.)
Accordingly, males and females were combined in subsequent
analyses. With the sexes combined, we compared slopes for treat-ment and control groups. There was a significant difference inslopes only for the first and second grades (this difference is almostsolely due to the one boy with a posttest IQ of 2O2), although the
slope for the experimental group was slightly higher in all threegrade groups. The major differences in slopes appear to be be-
tween grade levels, the slopes in the first two grades being consid-erably lower than those for the higher grades which are near 1.0.
The same basic conclusions hold for Verbal and Reasoning IQscores, although for Reasoning IQ the slopes are somewhat less
than 1.0 even for the upper grades.
What effects do the extreme scores have on the regressionslopes? Renorming and truncation procedures generally reduce the
slopes and remove their apparent tendency to be higher in the ex-perimental group. Except for the third and fourth grades, these
procedures have reduced differences in slope between the experi-

Appendix A 9l
mental and control groups. Except for the first and second gradeexperimental group, different procedures produced very similarslopes for the reasonably reliable Total IQ but producedstrikingly different slopes for Verbal and Reasoning IQ, whichcontained scores far outside the norming ranges. Examination ofthe scatterplots produces some doubt about assuming a linear rela-tionship between pre and post scores for Verbal and Reasoning IQ.
Choice of Criterion Measure
To determine whether posttest scores for the experimental groupare higher than for the control group, w€ must choose a groupingof the data (by classroorrr, by grade, etc.) and a criterion variable.We have a pretest measure Tr and a posttest measure T3. (Thetime 2 and time 4 IQ scores can be treated similarly. We ignorethe repeated measures aspect of the data for the moment.) Thethree basic approaches are to examine Ts (or posttest) alone, to use
Ts - Tr (or simple gain), or to use Ts with Tr as a covariate. Eachof these choices rests on an implicit set of assumptions about thedata. If the particular assumptions necessary for an approach arenot satisfied the results obtained by applying the approach may notbe valid. We must examine the data to determine which approachis most appropriate.
RJ rely solely on simple gain scores Ts - Tr arguing that ". . .
postest only measures are less precise than the change or gainscores. . . ." (p. 108)t As we shall see, this oversimplified claimis actually false for the Reasoning IQ scores (Table l9).
Using posttest only (Ts) as a criterion requires the fewest as-sumptions. Assignment to treatment must be random and scoredistributions should be approximately normal with similarvariances in both groups. We note that where the sample sizes ofthe two groups are quite different, as in the RJ study, this assump-tion of equal variances is much more important. Potentially, analy-sis of variance of T3 only is the procedure most seriously affectedby initial differences between groups. For comparison with othermethods assume that the within-group variance using posttestscores is ,: .
If the within-group correlation between pre and posttest scores,e t is high, gain scores and covariance analysis can be expected tobe more precise than analysis of variance of posttest scores. I.Jsingeither gains or covariance requires random assignment to treat-ments and a similar relationship between pre and post scores inboth groups. To derive formulas for the precision of gain scores orcovariance analysis, we must adopt a model for the relationshipbetween pre and posttest scores. We follow the general formulationof W.G. Cochran ( 1968) and assume that in the absence of

92 Appendix A
FIGURE 11: TOTAL lO GRADES 1 & 2
POSTTEST
30 60 90PR ETEST
FIGURE 12: VERBAL lO GRADES 1 & 2
210
90PR ETEST
T. CONT
120 150 180
x
T. EXP
210
180
150
120
90
60
30
0
180
150
120
90
60
300
a
a
a
a
aa
a
a
a
xa
a
a
aaa
aa
a
a
a
30 60 120 150 180

at a'
a
x
FIGURE 13: REASONING lO GRADES I & z
A ppendix A 93
e*?
210
180
150
120
90
60
30
POSTTEST
30 60 90PR ETEST
FIGURE 14: TOTAL lO GRADES 3 & 4
120 150 180
T. CONT
EXP
E; 1 13, 211
. 'f
0
210
180
150
120
90
60
30
900 30
PR ETEST120 150 180

94 A ppendix A
FIGURE 15: VERBAL lO GRADES 3 & 4
POSTTEST
30 60 90PR ETEST
FIGURE 16: REASONING lO GRADES 3 & 4
C; 141, 300 E; 163, 267rt
120 150 180
C; 128, 262
t
ALL EXP. \
(
oti
210
180
150
120
90
60
30
210
180
150
120
90
60
30
e+e
0
POSTTEST
""-t
0 90
PR ETEST30
C;
60
0
120 150 180

x'oa
210
180
150
120
90
60
30
FIGURE 17: TOTAL lO GRADES 5 & 6
POSTTEST
30 60 90PR ETEST
FIGURE 18: VERBAL !O GRADES 5 & 6
210
A ppendix A 95
CONT
EXP.
120 150
E; 146, 217 C; 165, 249
tt
T. CONT
EXP.
90
0
180
150
120
90
60
30
0
oXx
a
a
at'
30 60PR ETEST
120 150 180
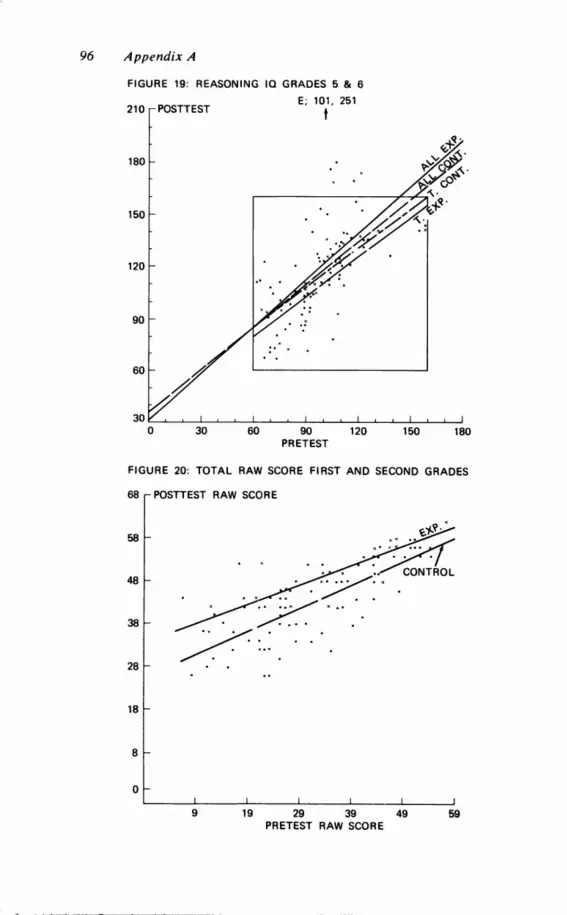
96 A ppendix A
FIGURE 19: REASONING !O GRADES 5 & 6
E; 101, 251
tPOSTTEST210
r80
150
120
90
60
30
68
58
48
38
28
18
30 90PR ETEST
120 150 180
FIGURE 20: TOTAL RAW SCORE FIRST AND SECOND GRADES
POSTTEST RAW SCORE
29 39PRETEST RAW SCORE
0
0
I 19 49

A ppendix A 97
measurement errors, y or posttest has a linear regression on x (pre-test)
y=o*Bx*e .
The observed scores, X and Y howevern do contain measurementerrorY- y + uandX: x + v,andwecanwrite:
under certain generar .oni,;t; ; ;aependence ancl normality ofvariables, we find that the residual within-group error variance incovariance analysis will be about
of,, - o! <, - o'***,l
where , is the correlation between y and x and Rxand Ryare the
reliabilities (\ - L, ,. (Note that the correlation between observedo**o,
scores X and Y is e/q\ .)
Use of covariance analysis rests on a number of important as-
sumptions about the underlying structure of the data (see Ap-pendix B and J. D. Elashoff, 1969). In the absence of measurementerror (R x - R y - I ), then, covariance analysis can be expectedto reduce the error variance by about roop2z ; thus p rnust be
larger than .3 for covariance analysis to reduce the error varianceappreciably. The less reliable the pretest and posttest the greater e
must be before covariance will be much more precise than analysisof variance on posttest scores alone; in addition, when the pretestis measured with error, covariance procedures generally underes-timate the slope and undercorrect for pretest differences.
The use of gain scores makes the implicit assumption that B, _1.0, i.e., that the regression of observed posttest on observed pre-test has a regression slope of unity. If this is the case, analysis ofvariance of gain scores will give nearly the same results as analysisof covariance. If not, the error variance can be expected to beabout orr-o?.,ff rr-r,w,.$,which is always greater than ,2r, for s' ,. 1 . Note that these
variance figures are derived for large samples; for smaller samples
imprecision due to the estimation of s will make o!, larger. Littleis known about the comparative robustness of these twoprocedures. Comparisons of two groups using gain scores will be
misleading when the regression slope of post on pre is not unity forboth groups or the pretest score distributions are different in thetwo groups; since in either case their use would not properly adjustfor pretest differences. In a general discussion of this topic, L.J.Cronbach and L. Furby ( l97O) have suggested that gain scores are
rarely useful for any purpose in educational research.
Using these formulas, we can predict whether posttest scores or

98 A ppendix A
gain scores will have smaller error variance for the RJ experimentby referring to evidence contained in RJ's Table A-30. We find apretest-posttest correlation for the total school of approximately.7 5 for Total IQ and Verbal IQ but only about .50 for ReasoningIQ. Thus assuming that B' - l, using gain scores should provide a
decrease in error variance of about 50Vo for Total IQ and VerbalIQ and none at all for Reasoning IQ. Referring to Table l9 in theanalysis of variance section, w€ find that for two types of analysisof variance actually performed the decrease in error variance ob-tained by using gain scores was about 33Vo for Total IQ and 50%for Verbal IQ but that error variance irrcreased by about 8Vo forReasoning IQ. So, for Reasoning IQ, a posttest criterion is not lessprecise than a gain criterion. (Differences between the predictedand observed decreases in error variance occur because theformulas are for large samples, and because the correlations takenfrom Table A-30 were computed with all groups combined whilethe correlation in the formula is the within-group correlation.)
Thus, careful examination of these score distributions, scat-terplots, and regression slopes suggests which scores are reasonableto analyze, whether grades (or TOGA forms) can be combined,and which analytic procedures seem appropriate.
I f IQ scores are to be used, all analyses should be based onTotal IQ; Verbal and Reasoning subscores are unreliable and in-adequately normed in all grades. The only over-all analysis com-bining all grade groups that seems reasonably justified is analysisof posttest Total IQ scores. I f random assignment to treatmentscan be assumed, analysis of posttest Total IQ scores is unbiased.I n view of the lack of assurance on this question, however, and thehigher pretest scores shown by the experimental group (see Tables20-22), the results of such an analysis must also be interpretedwith caution. Covariance analysis or gain score analysis using allgrades is unwise bpcause of the dissimilarity in pre-posttest rela-tionships across grades. Using raw scores, the three forms ofTOGA are not comparable.
Grades 3 and 4 and Grades 5 and 6 might reasonably be com-bined and analysis of Total IQ here, using covariance analysis (oranalysis of variance of gains), would not be unreasonable. Thereseems little reason to perform separate analyses for males andfemales. Grades I and 2 present a more difficult problem, howev-er. Here, gain scores are especially suspect because the pre-to post-test slope is substantially less than one and the groups differ on thepretest. Covariance analysis should not be used with all IQ scoresincluded because of the difference in slopes between groups,though it might be useful for renormed or truncated scores. Bothposttest only and covariance analysis may be inadequate becauseof the large group differences in the pretest, 8S well as its

A ppendix A 99
unreliability. Analysis using raw scores seems most desirable. Thiscould eliminate some of the problems caused by inadequatenorming of the test. For first and second graders, test-retest corre-lations are higher for raw data and the regression slopes betweenpre-and posttest are similar for experimental and control groups.
Investigationof Treatment Effects[Jsi.g Stepwise Regression
It is most_important to assess the magnitude of any "significant"treatment effects observed. One approach to this problem is step-wise regression, see Appendix B. Taking posttest Ie as the depen-dent variable, we can determine how much of the variance in post-test scores is accounted for by linear regression on pretest IQscores, treatment, sex, and other interesting variables.
First, we performed separate analyses for each of the three gradegroups using the third or "basic" Total IQ score as criterion. pre-test Total IQ, treatment group, track, sex and minority-groupstatus were included as predictor variables. In the analysis, preteJtTotal IQ was forced into the equation first and treatment was sec-ond; the other variables were left free to enter in any order.Results are shown in Table I l. These analyses must be in-terpreted with caution because of the extreme scores in Total IQ{or grades I and 2 and because the other variables are categorical.I n addition, for a dichotomous variable such as treatmeni, R2 islower when the number in each group is not the same than whenthe split is 50-50; R2 for a 20-80 split will be roughly Zt3 of R2for a 50-50 split given the same difference in Total Ie means.Moreover, the predictor variables are not independent and theircontributions overlap. Thus these analyses must be regarded asgiving at most a rough approximation of the relative importance of!h. predictor variables. Pretest Total IQ predicts 43 Vo , 63Vo, and72Vo of the variance in posttest Total IQ for grades l-z,grades 3-4,grades 5-6, respectively. Including all the variables accounts for atotal of 5 5Vo ,70Vo , andT 5Vo respectively of the variance in posttest.For grades 3-4 and 5-6, treatment accounted for less than l% of thevariance in posttest Total IQ scores; treatment accounted for 7Voof the variance in grades l-2. No attempt has been made to assessthe statistical significance of these increases in R2 because of thedifficulties mentioned earlier. Our only purpose is to gain an im-pression of the relative importance of any treatment effect.
As we remarked earlier, total raw scores seemed a moredesirable criterion measure than Total Ie for grades I and 2. The

I 00 A ppendix A
ResulEs
Grade
Criterion
Predictors:
TABLE 11
of Stepwise Regression Analyses for
Groups I and 2, 3 and 4, 5 and 6
Variable: Total IQ on Basic Posttest
Total IQ PreEest, Treatment, Track, Sex,
MinoriEy-Group Status
Cri terion
Grades 1 & 2
ToEal IQ 3
Grades 3 & 4
Total IQ 3
Grades 5 & 6
Total IQ 3
Step
1 forced
2 forced
3-5 free
1 forced
2 forced
3-5 free
I forced
2 forced
3-5 free
Variab leEntered
Total IQ 1
TreaEment
Sex, Track,Minori ty
Total IQ 1
TreatmenE
Track, Sex,Minority
Total IQ 1
Trea tment
Track,Minority,Sex
FtoENEET
85
15
190
.5
226
.0
Increase
in R2R2
43
50
55
43
o7
05
63
63
70
.72
.72
.75
72
00
03
63
00
07
TABLE L2
Results of Stepwise Regression Analyses for Grades One and Two
Criterion Variable: Total Raw Score on Ehe Basic Posttest
Predictors: Pretest Raw Score, Treatment, Track, Sex,
l"linority-Group Status, Grade, Age
Criterion
Total Raw Scoreon Basic PosE-
test
Step
1 forced
2 forced
3 forced
4-7 free
VariableEntered
Pretes traL, score
Age
TreaEment
Sex, Track,Minority,Grade
FtoEnter Rz
r* .i,
Increase
in R2
0
9.3
.549
.584
.6s4
000
035
070
I forced
2-6 forced
7 forced
PreEestraw score
Age, Grade,gtc.
136 .549
.6L7
.654
068
037Treatment LL.2

Appendix A l0I
same type of analysis was repeated for grades I and 2 using totalraw scores with age and grade included (Table 12).All variableswere forced to enter in the order shown; treatment was enteredthird in the first regression and was forced to enter last in the sec-ond regression. Note that using raw scores, the pretest predicts55Vo of the variance in the posttest and all variables togetherpredict 65Vo of the variance. The partial correlation of age withposttest after pretest has entered is negligible. Treatment predictsabout 3 to 4Vo of the variance in posttest raw scores. Analysis ofraw scores increases the predictable variance from 55Vo to 65Voand decreases the apparent predictive importance of the treatmentfactor by about half.
Table 13 ' shows stepwise regression analyses for Verbal andReasoning partscores with all grades combined. Predictor vari-ables were IQ partscores on preceding tests, treatment, sex, andgrade. (The two grade variables were dummy variables, one con-trasting grades I and 2 with 3 and 4 and the other contrastinggrades 3 and 4 with 5 and 6). Pretest IQ was forced into the equa-tion first, and treatment second; the other variables were free toenter in any order. Our previous cautions about interpreting theseanalyses must be even more strongly emphasized here due to thehigh frequency of extreme scores in these IQ subscores. For allgrades com[4ed, treatment predicts a maximum of 2Vo of thevariance in any IQ subscore. Inclusion of preceding subscores inaddition to pretest increased the predictable variance by from l3to 32Vo. For verbal IQ 54Vo,7OVo, and 69Vo of the second, third,and fourth tests were predictable using all variables; for ReasoningIQ these figures were 35Vo , 46Vo , and SlVo respectively,providing additional demonstration of the instability of theReasoning subscores.
I nvesti gationof Treatment Effects[Jsirg Analysis of Variance
RJ did not report fully on the analyses of variance performedand did not include any analysis of variance tables. Their onlyreport on actual procedure used is contained in a footnote sug-gesting they were
. following the plan of a multifactorial analysis of variance with in-terest focused on the main effect of treatments, the two-way interactionsof treatments by grades, treatments by tracks, treatments by sex, andtreatments by minority-group status. Three-way interactions were also

I 02 A ppendix A
TABLE 13
Result.s of Stepwise Regression Analyses
Using Separate Subscores
Criterion Variable: Separate Subscore IQ PosEtesEs
Predictors: Gl- (Grades L-2 vs. 3-4) , G2 (Grades 3-4 vs. 5-6) ,
Sex, TreaEmenE, Preceding IQ Scores
C ri terion Step
1 forced
2 forced
3 free
Verbal IQ 2
Verbal IQ 3 I forced
2 forced
3 free
4-6 free
Verba1 IQ 4 t forced
2 forced
3 free
4 free
5 free
6-7 free
ReasoningIQ2 lforced
2 forced
3-5 free
ReasoningIQ3 lforced
2 forced
3 free
4-6 free
ReasoningIQ4 lforced
2 forced
3 free
4 free
5-7 free
VariableEnEe red
VIQ I
Treat.ment
Sex andGrade
vrQ I
TreaEmenE
vrQ 2
Grade and
Sex
vrQ 1
Trea tment
vrQ 3
G2
vrQ 2
Sex andGrade
RIQ I
TreatmenE
Grade and
Sex
RrQ 1
Treatment
RrQ 2
Grade and
Sex
RrQ 1
Treatment
RrQ 3
RrQ 2
Grade and
Sex
FEoEnter
409. r
.19
427 .9
.6
L32 .2
197.8
4.t
7 2.4
34 .2
r-0. 3
159.5
5.7
106. 5
8.4
92 .3
44.6
.95
89.4
29 .6
Inc rease
02
t7
02
00
25
o7
01
R2 in R2
53
53
54
57
57
70
70
00
0l
00
13
00
01
13
05
01
00
,01
,03
48
49
62
67
68
69
30
31
35
26
28
44
46
18
18
43
51
51
computed for treatments by sex by tracks, treatments by sex by grade
levels, and treatments by minority-group status by sex. All other pos-
sible three-way and higher-order interactions yielded one or more
empty cells or a number of cells with ns so small as to weaken any
confidence in the results even though the analyses were possible in
principle.

Appendix A 103
All two-way and three-way analyses had unequal and nonproportional/,s per cell, and Walker and Lev's ( I 953 ) approximate solution was
employed. . The main effect of treatments was of course obtained in
each of the analyses of variance, and p-values associated with the F's
ranged from .05 to .002.(p. 94-95)t
The H.M. Walker and J. Lev approximate solution referred to by
RJ is generally known as "unweighted means analysis." (See Ap-pendix B.)
In this section, we discuss RJ's choice of computation method
and their choice of factors to include in the analyses. Later in this
section we report the results of several over-all analyses of variance
as well as some analyses of variance within grade group. These
serve primarily to demonstrate how widely the results of slightly
different analytic procedures can vary when cell sizes are unequal
and data have measurement and sampling problems.
Analysis ()f Variattct'in U nbalanced Designs
Application of analysis of variance to problems with unequal
cell sizes although common has received too little attention in the
literature beyond the cookbook details of computation. When cell
sizes are unequal we are faced with several issues: The first and
most important question concerns whether analysis of variance still
is a valid procedure. Then, if so, what factors should be included?
What computational method should be employed?
Standard analysis of variance procedures are based on the as-
sumption that individuals have been assigned at random in equal
numbers to each cell of the design (for factors like treatment) or
selected at random from a larger group to fill each cell of a cross-
classification with an equal number of individuals (for factors like
sex). When all cell sizes are equal, the analysis of variance is said
to be balanced or orthogonal and the estimates of the various main
effects and interactions are orthogonal or statistically independent.
If cell sizes in an AxBxC design are all equal, the sums of squares
for main effects and interactions of factors A and B are unaffected
by the inclusion or exclusion of factor C in the analysis. The only
difference between an analysis of variance including only factors
A and B and one including factor C also is the size of the error term;
generally speaking, the more factors included in the analysis the
smaller the error term. U nder these circumstances, the full least
squares solution with equal weights and the "unweighted means"
procedure will produce identical analyses.

I 04 A ppendix A
If cell sizes in a complete cross-classification were originally
99ual (or proportional) and subsequent subject losses were equally
likely in each cell and thus final cell sizes are not related to thedefining factors, ttr analysis of variance may be performed usingthe least squares procedure with an appropriate choice of weighti(see Appendix B). Unweighted means analysis is "a quick approxi-mate analysis to replace the tedious exact calculations" of leastsquares with equal weights (scheffe, 1959, p. 362). The adequacyof approximation depends on ths amount of variation in cell iizej.With computers so readily available, there seems no justificationfor using unweighted means analysis. Consequently, we have usedthe least squares procedure exclusively in our reanalysis.
A major issue is the validity of the analysis of variance approachwhen cell sizes are related to ths defining factors or whencollapsing over factors is necess ary because cell sizes are zero orvery small. Nonrandom cell fluctuations may occur when naturalclassifications such as intact classrooms are used or when differen-tial subject loss occurs due to treatments. I n these situationsapplication of standard analysis of variance procedures may yieldmisleading results. We illustrate with two examples-one usingnatural classifications and one involving collapsing of categories-.Both illustrate problems which occur in the RJ study.
A simple example based on the interaction in cell size betweensex and track observed by RJ illustrates the misleading results ananalysis of variance may yield when cell sizes are not independentof factors. Suppose boys and girls were distributed in the threeability tracks as shown in Table 14. Consider two differentidealized situations which might produce this situation. I n situationA, children ale_assigned to track strictly on the basis of ability; allchildren with IQs of I 20 are placed in the fast rrack, all Ies oi t OO
are placed in the medium track, all IQs of 80 are placed in theslow track. Thus, to produce the cell sizes shown, the Ie distribu-tion by sex must be that shown under situation A; the resulting cellmeans are also shown. In situation B, boys and girls have the iameIQ distribution but girls are more likely to be placed in fast or me-dium tracks than boys. Thus not only are all ihe girls with IQs of\?9 placed in hhe fast track, but also 20 of the [irts with Ies of100 are placed in the fast track, givin g a cell mean for girls in rhefast track of (30xl2} + 2Oxl00)/50 - ll2. Conversely only ZOof the 30 boys with IQs of I 20 are placed in the fast track, the restare placed in the medium track and so on.
Applying the least squares procedure with equal weights we ob-tain a sizeable main effect for track in both situations. However, insituation A we would obtain no sex effect and no sex x track in-teraction. I n situation B, we would obtain a sex effect and a track xsex interaction. Thus, in both situations an analysis of variance

Appendix A 105
TABLE L4
Example of T\uo Idealized Situations Producing an
Interaction in Sex x Track Cell Sizes
Number of Children
Track:
Sex: M
F
Fast
60
S low
70
100
100
20070
I0: L20 100 80
I
Sex: M I 20 30 50
IFl 50 30 20
SituaEion A
Number of Children
I*lean IQ
Situation B
Number of Children
IQ
Sex: I'{ 30 40 30
F 30 40 30
Iulean IQ
Track:
Sex: I'{
F
L20 100
L20 100
Track:
Sex: M
F
Slow
80
80I
1112 93.3 80
Actual Number of Children for Third and FourthGraders at Basic PostEest
SlowTrack:
Sex: M
F
Fas t
13
30
19
16
24
13
30
30
50
20
20
50
TABLE 15
Idealized Exarnple Showing the EffecE of Dropping Factors
Track:
Treatment.: C
E
Track:
Treat,ment: C
E
Number of Children
FasE l"ledium Slow
15 15 15
515
Llean Gains
Fast Medium Slow
1.0
1.0
0.0
0.0
1.0
1.0

I 06 A ppendix A
produces misleading conclusions about IQ differences between the
sexes.
Next we illustrate the misleading results that can be obtainedwhen factors are dropped from an unbalanced design. I n Table I 5
is an idealized example of cell sizes for treatment x track in onegrade-these figures are very similar to those actually obtained byRJ (see Table 2). Suppose that there is really no treatment effectbut that children in the fast and slow tracks tend to gain more thanchildren in the middle track and that we obtain the mean gains
shown. When least squares with equal weights is applied to thetreatment x track classification we obtain no treatment main effectand no treatment x track interaction. I f the track factor wereomitted because of small sample sizes, an analysis of variancewould result in a spurious treatment effect due to the unbalancedsample sizes.
Although RJ assigned children to the experimental and controlgroups to produce cell sizes in the ratio of about I to 4, they usedan unweighted analysis; every cell was assigned equal weights inthe calculation of main effects and interactions. I f there are no in-teractions, ths results are unaffected by the choice of weighs and
the standard procedure is to choose equal weights; see Appendix Bfor a more detailed discussion of this issue. If there is interaction,tests for main effects will be affected by the choice of weights. I fthe control group receives a weight of 4 and the treatment group a
weight of I and all other effects are defined using equal weights,
then the main effect for treatment and all interactions involvingtreatment will be the same as if equal weights were used; all othermain effects and interactions will be affected by the choice ofweights. Since there is no compelling reason to calculate sex andgrade effects as if the experimental and control groups were equalin size, we decided to calculate most of the analyses of varianceusing a least squares analysis with proportional weights. The F tests
for treatment and interactions with treatment will be the same withproportional weights as with equal weights but the calculated ef-fects for sex, grade, and track will be much more heavily influencedby the larger control group using proportional weights. See Ap-pendix B sections on Least Squares and Proportional versus EqualWeights.
Results ofAnalyses of Variance
We computed several over-all analyses of variance using Total IQpretest and Total IQ posttests as criterion variables. Two analyses
of Total IQ gain scores were included for comparison with RJ's
computations. Results are shown in Table 16. For completeness,

Appendix A 107
the same analyses were computed for verbal and reasoning sub-scores, although interpretation of these results is doubtful (see
Tables 17 and l8). Separate analyses of variance were computedwithin each grade group with posttest as criterion, gain scores ascriterion, and posttest with pretest as a covariate (see Tables 20-22).The many analyses of variance reported allow us to comparethe results obtained with different choices of factors, different cri-terion measures, different sets of weights, and different treatmentof extreme scores.
Our discussion of analysis of variance in unbalanced designsillustrates how important the choice of factors is to the results ob-tained. I deally treatment, track, grade, sex and minority groupshould all be included as factors in the analysis. This is impossible.Consequently some factors must be dropped or factors such asgrade must be reduced from 6 levels to 3. Decisions about how toreduce the number of factors must be guided by the sampling andbalancing needs of the design as well as by the purposes of the ex-periment.
We have dropped the minority group factor from our analyses ofvariance. The Mexican vs. non-Mexican factor was not a part ofthe design of the experiment; other variables describing ethnic ori-gin or socioeconomic background could as easily have beenanalyzed. Since only 17 Vo of the children were Mexican and thisfactor interacts with sex and track in cell size, its introductionsharply reduces cell sizes and it is unclear that a satisfactory assess-ment of its significance could be made.
Retaining grade, track, and sex there are still too few childrenper cell; there are 72 cells of which 6 are empty and many haveonly I or 2 children. As noted earlier, there are more girls in thehigh track and more boys in the low track so analyses of varianceincluding both sex and track would likely produce misleadingconclusions about the effects of these variables.
The children in grades I and 2 received TOGA Form K-2, thosein grades 3 and 4 received Form 2-4, and those in grades 5 and 6received Form 4-6. Since RJ combined these grades for some anal-yses, it seemed reasonable to use grade group rather than grade insome of our analyses to improve cell size.
Tables 16 through I 8 summa rize the results of analyses ofvariance with three choices of factors: treatment by grade goup bysex (TxG'xS), treatment by grade by ability track (TxGxA), andtreatment by grade group by sex by ability track (TxG'xSxA).Treatment by grade by ability track is the same as treatment byclassroom and is probably the most important single analysis. Forthe basic posttest, grade 5 had to be deleted because classroom 58did not take the Reasoning subtest. The other two analyses bothcontain treatment by grade group by sex and comparison of their

108 A ppendix A
TABLE 16
Analysis-of-Variance Results: Total IQ
Effects Significant at .05 Listed
CriEerion Weights
Total IQ 1 E
Data Set
A11
A11
Truncated
Factors
TxG I xS TxG>rAtt TxG
I xSxA
GrArGxA G'ATxGxA
GI
G
P
P
Total IQ 2 A11
TruncaEed
TrGr rS
TrGt
P
P
Total IQ 3 E
P
E
P
A11
A11
Truncated
Truncated
TrArGxA ArGtxS:<A,TxG
I xS
T
TrGt
TxG I xS
Gr rTxGrxS
GainrrQ3-rrQ1
E A11 TrG Gt rctxA
Total IQ 4 A11
Truncated
SP
P TrGt
P = proportional weightsE = equal weightsTT = both pretest and postEest of interesE truncated[ = denotes track or ability groupingGt = the three grade levels--one and two, three and four, flve and six'lt = Grade 5 has been deleted from this analysis because classroom 5-B
did not take the Reasoning subtest.
results shows what happens when the factor of ability track isincluded or excluded.
Analyses were performed on IQ scores from all four testings and
on gain from pretest to basic posttest. Some analyses used alldata, others truncated data; all were done using least squares, some
using equal weights and some using proportional weights. Notethat none of these analyses reproduce exactly any of those per-formed by RJ. Effects significant at the .05 level are indicated in

Appendix A 109
TABLE L7
Analysis-of-Variance Results: Verbal IQ
Effects Significant at .05 Llsted
Criterion Welghts
Verbal IQ I E
Data Set
A11
A11
Truncated
TxG'xS TxG>rAtt
ArGxA
Gt rS
*
TxG I xSxA
P
P
Verbal IQ 2 A11
Truncated
TT
S
S
E
P
P
Verbal IQ 3 E A11
A11
Truncated
TT
A
S
*
*
P
P
P
GainVerbal IQ 3-Verbal IQ 1
E A11 GxA GtxA
Verbal IQ 4 A11
TruncaEed
TT
P
P
P
Gt rS
Gt rS
Gt rS
P = proportional weightsE = equal weightsTT = both pretest and posttest of interest truncated[ = denotes track or ability groupingGt = Ehe three grade levels--one and two, three and four, five and six*There rrrere no ef f ects signif icanE at . 05tt = Grade 5 has been deleted from this analysis because classroom 5-B
did not take the Reasoning subtest
the tables; blank cells in the tables indicate analyses notperformed.
Total IQ is the only measure sufficiently reliable to admit in-terpretation. Looking at the results for pretest Total IQ we gain aconsistent picture of grade and ability track differences. Note, also,the triple interaction involving treatment. Results for Total IQ at

ll0 Appendix A
TABLE 18
Analysis-of-Variance Results: Reasoning IQ
EffecEs Significant aE.05 Listed
CriEerion Weights
Reasoning IQ 1 E
P
P
Data Set
A11
A11
Truncated
Fac tors
T:lG t xS TxGxA*'f TxG'xSxA
G,A G"A
G'rs
G
G
,SxS
Reasoning IQ 2 P
P
P
All
TruncaEed
TT
T rG'
T rG'
T,GtxS
Reasoning IQ 3 E A11 T,A GrArTxGrxSTxGtxA
G I xSxA
G'
xS
T
G
P A11
Truncated
TT
G"GtxS
G"GrxS
P
P
Gain E A11 G Gt rTxS
Reasonlng IQ 4
P = proportional weightsE = equal weightsTT = both pretest and PostEest of inEerest truncated[ = denotes Erack or ability groupingGt = the three grade levels--one and two, three and four, five and sixtt = Grade 5 has been deleted from this analysis because classroom 5-B
did not take the Reasoning subEest
second testing show how the presence of a sex effect is affected by
the treatment of extreme scores.
Analyses of Total IQ basic posttest fairly consistently indicate
some treatment effect although with the consistent superiority ofthe experimental group on the pretest these results can only be
P
P
P
A11
Truncated
TT
GtxS
GtxS
GtxS

Appendix A lll
TABLE 19
Analysis for Decrease in Error Variance Due to Use of Gain Scores
Factors
Total IQ Error Variance Using Posttest
Error Varlance Using Gain
Decrease in Vari-ance
Verbal IQ Error Variance Using Posttest
Error Variance Using Gain
Decrease in Varlance
Reasoning IQ Error Varlance Using Posttest
Error Variance Using Galn
Decrease ln Variance
TxG:<A
243
155
TxG I xS:<A
243
L66
36% 32%
649
316
629
32L
5L% 497(
627
7L4
s84
610
-47" -L4u,
regarded as suggestive that further more carefully chosen analyses
should be undertaken. The fact that inclusion of more factors or
exclusion of extreme scores reduces the treatment main effect to a
three-way interaction is an indication that treatment effects are
probably present in only a few cells of the classification.
The two analyses performed using gain scores with all the data
and equal weights should provide results closest to those obtained
by RJ. I t is interesting to note that the only consistent results ob-
tained in these two analyses are in grade effect. RJ may have ob-
tained significant treatment effects in every analysis but we do not.
The consistent appearance of grade main effects and interactions
involving grade confirms our earlier recommendation that separate
analyses be made for different forms of TOGA (or grade groups).
Although we do not recommend analysis of verbal and
reasoning partscores, we note that the analyses of the verbal sub-
test provide no indication whatever of a treatment effect. Our anal-
yses of reasoning gain do not confirm RJ's report of very significant
main effects and the treatment effects which do appear for
Reasoning IQ basic posttest disappear when extreme scores are
removed.
Table l9 provides a summary of the relative precision of gain
scores versus posttest scores obtained from analyses reported in

I l2 Appendix A
Table 16. These analyses were calculated using least squares withequal weights on all the data.
Turning now to separate analyses by grade'group, Tables 20-22provide comparisons of results obtained using pretest, gain scores,posttest only, and posttest with pretest as a covariate. Sex andtrack were not included in the analyses. Results are shown in termsof "expectancy advantage," that is, mean difference between ex-perimental group and control group scores. Calculations wererepeated on renormed and truncated IQ scores as well as rawscores for the first and second graders. (Pretest and posttest werejointly renormed or truncated.)
Examining Table 20 for Total IQ, we note that the three criteri-on measufes and three sets of scores consistently show no expec-tancy advantage for third, fourth, fifth, and sixth graders. Reiultsfor first and second grades do seem to indicate an expectancy ad-vantage but we note the 4- to 5-point advantage on the pretest andour earlier uncertainty that any of these analyses could be regardedas valid. These results warrant a closer look at first and Jecondgraders and further attempts to construct a valid analyticprocedure in the face of pretest advantage, unreliability, indimbalance. Notice that renorming and truncation tend consistentlyto reduce apparent differences between the experimental and con-trol groups.
Analyses of verbal IQ and Reasoning IQ partscores are general-ly consistent with the results obt&ined for Total IQ.Note, however,how widely the apparent results differ depending on the treatmentof extreme scores and the selection of criterion.
Analysis by Classroom
I n our analyses to this point, we have treated the individualchild as the experimental unit. What happens if the classroom isconsidered to be the unit of observation? Expectancy effects areafter all probably goup phenomena. The test information isprovided to a teacher who in turn uses it on a whole classroom. Al-though eventually to be detected in individual student perform-ance, expectancy effects may best be understood as a function ofthe particular groups in which they occur. There is, then, muchjustification for considering the experiment as a sample of 18classrooms each with a subgroup of experimental and controlsubj ects.
RJ applied the r test, the Wilcoxon, and the sign test to the eigh-teen pairs of mean gains. The number of children in the expeli-mental and control groups vary widely from classroom toclassroom and there are fairly sizeable IQ differences between

A ppendix A
TABLE 20
Pretest to Basic PosttesE "Advantage" in Total IQ
I"lean scores for experimental group minusmean scores for control grouP
u3
Pretest Posttest GainPosttest adjusted
for pretest
Grade Group
First andSecond Grades
All rQ
Renomred IQ
Truncated IQ
Raw Scores
Thlrd andFourth Grades
A11 rQ
Renormed IQ
TruncaEed IQ
Fifth and
Sixth Grades
A11 rQ
Renormed IQ
Truncated IQ
4.9
4.5
0.7
4.0
15. g*
13. 7*
10.6*
6.5*
2.3
2.L
0.1
11.0*
g.2*
g. g*
2.5
0.2
0.1
-1. 3
12. g*
10. g*&
10. 1^
4 .4*
8
6
0
1.
1.
2.
5
5
9
0
0
-1
4.5
4.4
2.3
4.3
4.3
3.6
2.O
1.6
L.7
-0. I0.1
-1.4
grades and between tracks. As a consequence, RJ's application ofthe t test is inappropriate, since its use requires that difference
scores for each pair represent a random sample from one distribu-
tion.Application of either the Wilcoxon signed ranks test or the sign
test can be justified. A more serious problem, however, is that the
gain scores are based on pre- and posttest results involving so
many extreme scores. To illustrate the effect these extreme scores
have on the results, wB have performed the sign test and the Wil-
coxon using the classroom means based on all the data and using
classroom means recalculated on truncated data. That is, all indi-
viduals who had a score below 60 or above 160 on the relevant IQmeasure were deleted from the sample. Pretest means were

r t4 A ppendix A
TABLE 2L
Pretest to Basic Posttest "Advantage" in Verbal IQ
Mean scores for experimental group mi.nusmean scores for control group
Grade Group
First andSecond Grades
A11 rQ
Renormed IQ
Truncated IQ
Third andFourth Grades
A11 rQ
Renormed IQ
Truncated IQ
Flfth andSlxth Grades
A11 rQ
Renorned IQ
Truncated IQ
Pretest PosEtest Gain for
10
9
4 -0. 6
-3 .6
-7 .3
-4 .6
-6. g*
-5.6
3
2.7
1.0
1.6
2.0
0.3
-L.4
Posttest adjusted
-4. g
-6 .4*
-5 .9
2.0
0.4
-1.0
10. 2*
g. 7*
7. g*
10.1*
g.5*
g. 3*
5*
0*
96
4
5
4
0.
0
-1
0
2
7-1.
0.7
0.7
3.0
calculated only on those individuals present at the basic posttest.Classroom 58 had no posttest reasoning scores and was deletedwhere necessary.
Using all the data, the experimental group did not showsignificantly greater gains for Total IQ or Verbal IQ. The experi-mental group showed greater average gains in Reasoning IQ thanthecontrolgroupinl5ofl7classrooms(two-tailedp<both the sign and the Wilcoxon tests). Looking at Tables 23 and25 we see that for Reasoning IQ the experimental group hadhigher pretest means in 12 of 17 classrooms and that deletion ofcases with extreme scores reduces the number of classrooms inwhich the experimental group gained more to l2 (not significant at

Appendix A I l5
TABLE 22
Pretest to Basic Posttest "Advantage" in Reasoning rQ
Mean scores for experimental group minusmean scores for control group
Postt,est adJ ustedPretest Posttest Gain for Dre test
Grade Group
Flrst andSecond Grades
A11 rQ
Renor:ured IQ
Truncated IQ
Third andFourth Grades
A11 rQ
Renormed IQ
Truncated IQ
Fifth andSixth Grades
A11 rQ
Renor:ned IQ
Truncated IQ
L3 .2
8.4
0.3
-3.0
-3.0
-3.4
4.0
4.L
3.2
25.g*
1g.6*
6.0
5.7
6.3
6.9
8.9
3.9
-1.6
L2 .6
LO.2
5.7
8.7
g. 3*
10.3*
4.8
-0.2
-4.9
21. O*
13. 7*
5.8
3
5*
o*
8
8
9
4
5
0
5
0
-4
A Clr)ser Look atFirst and Second Graders
We have examined the results of many different analyses. Forthe third through sixth grade we conclude that there is no evidenceof a treatment effect. Results for first and second graders, however,are inconclusive. Although the application of standard statisticalprocedures yields significant differences in treatments, the doubtfulmeasurements and uncertain sampling procedure and balancemake it unclear whether any of the analyses are valid. As a
consequence we must take a closer look at total raw scores forthese children. Using raw scores does not take differences in age
into account but the stepwise regression reported in Table 12 in-

I 16 Appendix A
TABLE 23
Change in "Expectancy Advantagett by Classroom
Using A11 Data
Total IQ Nuurber of Classes
Pretes t :
13 4 L7
Verbal IQ Number of Classes
Pretes t :
8 3
3 4
9
8
Pretest
11
11718
Reasoning IQ Number of Classes
11 1
2 3
L2
5
13 4L7
dicates that age is essentially unrelated to raw score gain for thisgroup anyway. Table 26 shows the ages and pretest and posttestraw scores for first and second grade children grouped by sex and
classroom. Control group children are listed according to rank onthe pretest; each experimental group child is shown beside thatcontrol group child whose pretest score provides the closest match.(There are 95 control children and l9 experimental children.)
The attempt to find a comparable control group child of the
same classroom and sex to match with each experimental groupchild reveals several things. First, there were four experimentalchildren who could not be matched because there was no control
8
5
1
3

Appendix A I 17
TABLE 24
Change in "Expectancy AdvanEage" by Classroom
with ExEreme Cases Deleted
ToEal IQ
Pretest:
Verbal IQ
Pretest.:
Reasoning IQ
Pretest:
Number of Classes
134L7
Number of Classes
5 2
4 5
PostEesE:
Pos ttest :
Posttest:
E<C
9
7
10
9 8 L7 (f tie)
Number of Classes
8
9 8 16 (1 E empty)
8
8
5
1
3
5
4
3
4
TABLE 25
Analysis of Mean Gains by Classroom
A11 data
Total IQ
Verbal IQ
Reasoning IQ
Truncated data
Total IQ
Verbal IQ
Reasoning IQ
Number ofClasses Total
Classes
L7
18
t7
L7
L7
L7
11
L2
15o"
L2*
9
L2
05
.05

I l8 Appendix A
group child with a pretest score within + 3 points. Second, in the
iwelve cells there were two with no experimental child at all, 4
with one, 3 with two, and 3 with three children. Eleven of the ex-
perimental children were young in comparison with the control
group, seven of these were the youngest in their group; four were
otO in comparison with their group, two being the oldest. Thus l6of the l9 experimental group children were extreme in age in com-
parison with classmates of the same sex, and 9 were the most ex-
tre me.
Looking at pretest scores in the same way we find four experi-
mental group children with low pretest scores, three with the
lowest; seven experimental children with high pretest scores, three
with the highest. Thus six of the experimental group children had
pretest scores which were either the highest or the lowest among
classmates of the same sex. We thus obtain somewhat clearer evi-
dence that the control and experimental children do not provide
closely comparable groups. I t is therefore unclear whether any
analysis can clarify the issue of whether or not there is a treatment
effect. We ffioy, however, gain some insight by looking further at
the scores of the two groups.
First we examine raw score gains for the matched children (see
Table 27). We note that reasonable rnatches were obtained only
for l5 of the 19 experimental children. Looking at signs only we
find 3+,3- for boys and 8+, I - for girls for a total of ll +,4-. Using the sign test then there is no significant difference in
signed rank test, we obtain sum of negative ranks - 24 which is
significant at.05. The median "excess gain" was 5. Since the mag-
nitude of gain in raw score which is possible depends on the pretest
score and thus varies considerably from grade I slow track to
grade 2 high track, the /-test on gains does not seem a valid choice.
Looking at gain in relative rank for each experimental child incomparison with his classroom and sex group (e.9. for males in
grade I track I the experimental child ranks lowest on the pretest
but ranks eighth on the posttest for a change in rank of + 7) we
obtain two zero changes, four negative changes, and l3 positive
changes. These results would be significant at the .05 level using
the sign test. This analysis does not allow for the fact that individu-als below the median on the pretest can be expected to have posi-
tive rank changes. Table 28 shows that 6 experimental children
showed changes in rank from below to above the median and I
showed a downward change; this is not significant.
Suppose we look at the problem a different way. If the treat-
ment were effective we ought to be able to distinguish between ex-
perimental and control group children on the basis of posttest or

A ppendix A
TABLE 26
Pre and PostEesE Raw scores for First and second Graders
lt9
Male
Control Experimental
First Grade--Track I
Control
Female
ExperimenEal
&6.3
6.0
6.3
6.0
5.6
5.8
5.8
6.2
5.6
6.0
Pre
11
13
L4
15_
16
20
2L
23 ,5
27
39
Pos E
40
39
28
37
s3
4L.5
26
4L.5
35
45
4E5.5
Pre
10
Post
41. 5*
&.6.2
5.6
5.9
6.3
6.0
6.4
Pre
7
Pos E
l7
First Grade--Track 2
5.7 22 31. 5 5.
6.2 22 27 s.
6. 3 23.5 41.5
5.9 29 38
5.8 3s 43
5.5 37 49
PosE A4- Pre
26
28 5.7 10
30
34
31. 5
33
7L944
72052
33 51
10
11
18
20
2L
6.0
5.8
5.8
6.3
5.6
5.7
5.7
5.7
5.6
6.1
5.5
5.9
6.0
5.7
5.7
6.4
6.3
6.2
6.5
5
9
15
20
2L
22
23 .5
23 .5
27
22
23.5
25
31.5
39
41. 5
4L.5
43
44
51
44
37
31. 5
35
41.5
36
45
46
49
44
44
43
53
53
45
55
55
48
54
.5 26 43
.0 41. 5 56
First Grade--Track 3
6.0 27 49
6.2 27 39
6.3 2g 43
5.7 29 52
6.1 34 31.5 6.4
5.5 36 50
6.2 38 38
*So*"tirnes two different rah, scores corresponded to the same mental age;in converting IQ scores back to raur scores in these cases, the averageof the two rau, scores hras used.

I 20 A ppendix A
TABLE 26 (continued)
Second Grade--Track 1
Male Female
C""try.I ExperimenEal Control
Ag. Pre Pos_t Ag_ Pre Post &. Pre Post
6.7 31.5 37
7.9 4L.5 52
7.2 22
6 .7 23,5
25 47 6.8 23.5
31.5 48 7.2 25
31. 5 48 6.9 26
6.9 30
7.L 31.5
7 .5 31.5
6.9 33
6.9 36
Second Grade--Track 2
8.0
7.L
7.L
30
31.5
49
44 49
Second Grade--Track 3
6.7 29
7.3 40
7 .0 41.5
46 57 7.0 41.5
6.7 41.5
6.9 41.5
7 .2 43
6.8 47
7.4 53
53 56
56 63
Expe rimenE a1
Age. Pre Post
6.8 33 43
59
6.6 41.5 56
7.4 45
6.8 45
7.2
7.9
6.9
6.7
7.2
7.0
6.5
7.3
7.4
6.9
6.6
7.3
6.8
L7
L7
23 .5
26
26
31. 5
33
33
33
35
36
41.5
46
41. 5
44
40
46
41. 5
53
49
51
51
49
43
44
57
50
5s
56
55
55
58
57
58
56
56
6.6
7.5
8.1
26
30
38
45
39
46
48
51
41. 5
49
35
51
57 7.0 46
6.7 36
6,7 40
7.4 43
7.5 46
6.8 48
7.2 49
6.5 s0
7.L 50
7.4 50
6.5 51
6.5
6.9
7.2
7.2
s3
40
49
51
44
50
50
47
55
56
59

Appendix A l2l
TABLE 27
Excess of Galn by Experimental Children for the
15 "l'latchedtt Pairs
Grarle 1
Grade 2
Sex
Male Female
2.5 9
-5.0 r -- 15.5 , 27
20 .5
1
2
3
Track
1
2
3
Track
-9.5, 5
7.5*, 4, L4
*Thts experlmental girl could have been matched wlthcontrol group chtldren yielding "excess gains" of L2
rde have computed the average.
TABLE 28
Changes in Rank Wlthin Sex and Classroom
any
,7of four
, 6, 5;
PretestBelow median
Above median
Posttest
Below median Above median
3 16
8
11
19
6
10
2
1
gain scores. Can we do so? How successfully can children beclassified as being from the experimental or control group on thebasis of posttest or gain scores alone? For example, there is oneexperimental boy in grade l, track I ; if we pick the boy with thehighest posttest score from the eleven boys in grade l, track l, willit be the experimental child? Results using highest posttest scoresare shown in Table 29 and using highest gain in Table 30.
Using highest posttest score, we correctly classify l0 of the 19
experimental children; using pretest we would identify 7 ; 5 are

I 22 A ppendix A
TABLE 29
Children with Highest PosE Score
Male
No. of Children
f.* to f r*_Jt
3
I3
Chlldren Selected
Ac t ual lyIdentitv from E
Grade I
Track 1
2
3
Grade 2
1
2
0
10
9
10
4
11
10
1
2
3
rackT
0
E
C
C,
c, E, E 2
0
1
C
C, C, E
Female
Grade I
Track
Grade 2
1
2
I
6
6
7
1
2
3
10
3
9
1
1
0
1
3
Track 1
2
3
0
2
3
C, E
c
c, E
E, E, E
Classified as E
Children Actually
EC
109
986
19 95
C
19
95
114
*C = Control Grouptg = Experi.mental Group
highest on both pre- and posttest. (Jsing highest gain score we cor-rectly classify 7 of the l9 experimental children. In either case, theexpected number of experimental children correctly classified byselecting at random is 4.8 with a standard deviation of 1.65 (theexpected number of boys correctly classified is 2.5 and of girls2.3). LJsing gain scores then we do not correctly classify

Appendix A 123
TABLE 30
Children with Highest Gain Scores
No. of Children
f r*_Et
Children Selected
Ac tuallyIdentitv from E
Iu1ale
Grade ITrack 1
2
3
Grade 2
Track
1
2
0
3
1
3
C*c, c
E, C, C
C
C, C, C
0
1
0
0
1
2
3
Female
Grade 1
Track
Grade 2
1
2
3
1
2
1
E
E, E
C
E, C
E, E, C
1
2
0
;2
Track 12
3
0
2
3
Children Actually
EC
Classified as E
C
7
L2
L2
83
19
95
11419 95
*C = Control Grouptg = Experinental Group
significantly more experimental children than we would expect toby selecting at random (see Appendix B).
Our closer look at first and second graders using raw scores totest for differences between experimental and control children hasproduced mixed results. The small sample size and lack of balancemake it difficult to find a really appropriate analytic procedure.

t24
There are indications that the control and experimental groupchildren are insufficiently comparable to make any soundconclusions. Examination of the data suggests that there is no ex-pectancy effect for boys but that there may be one for girls.
I n conclusion then there is some evidence to suggest thepresence of an expectancy effect in first and second graders. How-ever, with so small and poorly balanced a sample, a conclusiveanalysis of these data is not possible. Definitive conclusions requireadditional experiments.

Appendix B:
S tatistical Techniqres
Analysis of Variance
Analysis of variance is a statistical technique des igned
to test the null hypqthesis that the means of several grouPs
are the same. A brief description of a standard two-way
fixed effects analysis of variance with equal ce11 s izes will
be used as an illustration. There are rc groups arranged
in r rows and c columns; each group or ceIl contains the
y scores of n individuals. For example, the c columns
might be 2 treatments and the r rows might be 6 grades.
Then we are interested in detecting differences between the
means of the six grades, and interactions between treat,ments
and grades.
To discuss the technique of analys is of variance it is
helpful to write down a model for the individual scores '
yijt , where i denotes rows , i denotes columns, and k
denotes individuals within a group. It is assumed that the
observations in a particular cell (row i, column i , for
example) can be regarded as an independent random sample of
n observations from a normal distribution with mean Uij
r 25

126 Appendix B
and variance 02. The observations in different cells are
also independent of each other. The variance is the same in
each cell. This model can be written
Yijt = u + ci + Bj + Yij + tijL
where the .ij t are independently and normally distributedwith mean zeto and variance oz . The effects, ai ,
Bj , and yij are defined so that I
ai = 0 , I
Bj
yij = 0 . we then wish to test the three null
hypotheses: Ho : all oi = 0 or the means of the r rows
are the same, Il0 : all Bj = 0 or the means of the c
columns are the same, t{0 : all yi j = 0 or there are no
differences in means between cells except those due todifferences in row or column means.
The analysis of variance table is usually presented as
follows
S ource df SS
=0,
I Yij = o ' I
MS
Rows r-1
Columns c-1
Inter-action
.nl(yi. .-V)Z
rn[ (r..i . -nz)'
"ll tlij . -fi . .-i . j .*y-)zlJ J
IItrrrijk-lij.)lJK
IIIrvijk-n2
SSp/(r-1)
SSC/(c-t)
SSr/(r-1) (c-1)
SSwc /rc(n-t)Wi thincells
Total
(r-1) (c-1)
rc(n-1)
rcn- 1
where fi.. denotes the mean of the observations in the ithrow, 7.i. denotes the mean of the observations in the jthcolumn , ii). denotes the mean of the observations in theirjth cell, and i denotes the mean of all the observations.
To carry out the tests, we note, for example, that under
the null hypothesis of equal row means, MSp/uS*. has an
F distribution with r-1 and rc (n-1) degrees of freedom.

Appendix B 127
The null hypothesis of equal row means is rejected at the c
level of significance if F for rows is greater than the
(1-o) th percentile of the F distribution with r-1 and
rc(n-1) degrees of freedom. (See for example Dixon and
I'tassey, 1969, or Hays, 1963.)
This partition of the total sum of squares into mutually
orthogonal (or independent) sums of squares due to each
hypothesis is possible because the design is balanced (that
is, the sample size in each cell is equal) "
Le as tS uares Procedure for Analysis of Variance
The section on analysis of variance shows the general
formulas for a two-way fixed effects analysis of variance
with equal celI sizes. When cell sizes are unequal the
formulas are not so simple to write down and the sums of
squares for rows, columns, and interaction may not be orthog-
onal. To compute each particular analysis of variance we
must fal1 back on the general principle underlying the deri-
vation of the formulas, the least squares principle.
A model for a two-way class i fication where the levels
of the first factor A are denoted by i = 1, 2, ... , r
and the levels of the second factor B denoted by j = 1,
2r..o, c is
Yijt = u + oi + Bj + Yij + tijt
where there are nlj observations in each cell and a total
of N observations. The least squares principle states that
the "best" est imates of u r ci , B j , and yij are those which
minimize the sum of squared residuals about the line or those
for which
Ill'ii (Yiit - u - oi - Bi - \ii)
is minimized where the ,ij are some arbitrary systen of

I 28 A ppendix B
weights. Usually, equal weights, ,ij = 1.0 , are cnosen
unless cell variances are known to be unequal.
To derive the estinators of Ur oi, Bj, yij, and the
sums of squares for the analysis of variance table, the
"normal equations" must be solved. A normal equation is
obtained for each parameter. For example, the normal equation
for u is obtained by differentiating the expression for the
sum of squared residuals with respect to u and setting the
result equal to zero. The normal equation for U is
Ill'iik - Nu - II"ijoi
- II'iiBj
- II'ijvij = o'
There are r equations obtained by differentiation with
respect to the oi , c equations from the Bj , and rc
equat ions from the yij .
The model for the cell means leads to I + r + c + rc
equations, one for each parameter, but there are only rc
cel 1 means , so only rc paramete rs can be es t imated . To
obtain a unique solution, conditions nust be imposed on the
parameters. The standard choice of conditions can be identi-
fied as follows. Select a set of weights (u1) corresponding
to the levels of A , where ui : 0 and Iu, = 1.0 . Select
a set of weights tv5 ) corresponding to the levels of B ,
such that ,j : 0 and I"j = 1.0 . Then impose conditions
I'ioi=o
I 'j si = o
Iu.Y. =0 allj, lrjyij=0 alli.i 1 'lJ
) - t
with these conditions, the mean of the ith level of A is
Ai - I
,j ,ij , the mean of the jth)'
level of B is
tj = I
,i uij , and we define u = II ui ,j uij
Yij=Uij-Bj-Ai+U.
and

Appendix B 129
If, in fact, yij = 0 for all i,j (no interaction),
then the choice of weights {ui, ,j } will not affect SSR
or SSn or any contrast among the ai or Bj . Therefore,
if there is no interaction, it will not matter what weights
are chosen; the standard procedure would be to choose equal
weights. I f there is an interaction, the test of SSlg is
unaffected by the choice of weights but the main effects and
tests on SSI and SSn will depend on the weights chosen.
See the next section for an example showing the use of two
different sets of weights.
If cell sizes do not differ widely and no other consider-
ations suggest the use of unequal weights, the weights
{ui, rj} are usually chosen to be equal and the side conditions
b e come
Ioi=o1
I Bi = o
)'
I 'ij = o
I Yij = o '
If the rij are unequal, the normal equations will still be
messy even if al 1 the weights are chosen equal . However, if
equal weights are used and all cell sizes are equal, the nor-
mal equations become quite simple to solve. For instance'
the first equation becomes
0 = III yijt Nu and the formulas shown in thelJK
"Analys is of Variance" section hold.
For unequal cell sizes, the F test for the null hypothesis
that al I ai = 0 when the 0j and yij are included in the
model is
ssn/ [r-1 I where ssr E
III trijk-u-ei -6: -ii: ) 2
SSE/[N-rcl - ijk
where the i1, ei, 6i , and iij are obtained by sol'ving the

I 30 A ppendix B
full set of normal equations and
SSR + SSe = Ill (yijr - ;t - ei - il l, where il , 6l ,
. ^1and Vii are obtained by solving the normal equations with
all ai = 0 . When the .ij are all equal the estimators
obtained under the two different conditions will be the same
but when the .ij are unequal i f fil , etc.
For a ful1 discussion, see H. Sche ffe (1959) . It should
be noted that if there are any empty cells certain of the param-
eters will not be estimable.
Prono r t i onal versus Equal ltleiqhts
Refer to the discussion under Least Squares Procedure
f or Analysis of Vari"rr."." An example will show what happens
to the sums of squares for rows (A) and the sums of squares
for colunns (B) when the weights defining the side conditions
are varied. Consider a ZxZ design with the cell sizes shown
below.
n.1l
A1
A2
Bt
10
10
B2
2
2
Choose weights u and l -u and v and 1 -v to define the
sideconditions uol+(1-u)aZ=0 and ,81+(1-v)BZ =0 )
uylj+(1-u)y2j = 0 , vyil*(1-v)ViZ = 0 . Suppose the cell
means are those shown below.
Iij
Bt Bz
A1 1.0 2.2
AZ 1.0 1.0
Then the estimated mean for At is v(1.0)*(1-v)(2.2) ,
for AZ is 1.0 , for 81 is 1.0 and for BZ is
u(2 .2)* (1-u) (1.0) . The standard choice of equal weights

Appendix B l3l
u = v = L/Z yields estimated means for A1 and BZ of
1.6 . However, since the cells for factor 81 have five
times as many cases it does not seem reasonable to give the
cell means 1.0 and 2.2 equal weight in estinating the
mean of Al . This suggests using weights u = L/2 and
v - 5/6 , that is, weights which are proportional to the
cell sizes, to obtain an estimated mean for AI of L.? .
The use of equal weights yields sums of squares SSR = L.20
and SSn = 1.20 while use of the proportional weights yields
SSR = .24 and SSg = L.20 . Thus, in estimating the effect
of A , the cell with a mean of 2.2 receives much less
weight when its sma1l sample size is taken into account by
us ing proportional we ights . The concl.usions about B are
unaffected by the use of proportional weights.
Unweiehted Means Analys is
Unweighted means analysis is a quick approxinate method
of calculating an analysis of variance with unequal cel1 sizes
The only justification for its use is the labor involved in
solving the normal equations by hand to obtain a least squares
solution. The use of unweighted means analysis is not justi-
fied when the computer is available.
The computations for an unweighted means analysis can
be performed using the formulas shown in the section"An"lysis
of Variance"except that 7i.. and f.i. are now replaced
by fi.. = I Yii./c and flj. = I ,ij./r,
n is replacedJ-
by nh = rcl II ,r, j -' , and the within- cells and total degrees
of freedom are replaced by N- rc and N- 1 respectively
see(Winer, 1962). (A weighted means analysis could be cal-
culated by analogy with a weighted least squares analysis. )
Simple Linear Regress ion
The technique of simple linear regression is based on

I 32 A ppendix B
the model that
)ri = u + g(xi - i) + ei
where the ei are independent and normally distributed with
mean zero and variance oZ . The least squares estimators
of u and g are
u=y
^ Itrt - I)(xi - x)
o^" Ir*r -.1- '
The model can arise in the situation when the x's are con-
sidered fixed and y is assumed to have a conditional normal
distribution with mean u + g(xi - i) and variance oZ , or
in the situation where x and y are assumed to have a
bivariate normal distribution.
A test of whether two independent regression lines are
parallel or have the same slope B when the sample sizes
tl and nz are equal and ,1 r ,tr is given by:
B 62It-
whd re
sampl e i and
where sz
rr 'x
-z I(xii - xi)2ti, =
-n - 1
sp
'6:t
is the variance of the x t s in
t", +x
2s
Y z'*z
2tp
rplr r' z
)r1 '1r,e?I
The null hypothesis, 81 - Bz , is rejected at level c if
tribution with 2(n-2) degrees of freedom. See, for example,
Dixon and Massey (1969) for a more complete discussion and the
nodification of the formulas for nl f nZ o

Appendix B 133
fuialysis of Covari ance
Analysis of covariance is an analysis of variance
technique for situations in which information is available on
a covariate x , such as a pretest or ability measure, which
is strongly predictive of the y observations. Analysis of
covariance is used to test the null hypothesis that the means
of the y scores after "adjustment" using the x scores are
the same in each group. The covariance procedure reduces
possible bias in treatment comparisons due to differences in
the covariate x and increases precision in the treatment
comparisons by reducing variability in the y scores "due to"
variability in the covariate x .
The statistical model for a one-way anal,ysis of covariance
is composed of the four independent terms
Yij - u + oi + B(xij - I.) + "ij '
The uij are assuned to be an independent random sample frorn
a normal distribution with mean zeto and variance ,2 . The
basic difference between analysis of variance and analysis of
covariance is that in an analysis of covariance the within-
celt variation .i j is divided into ttdo parts, variability
predicted by a linear regression on x , and unexplained
variability uij .
The assumptions underlying the use of the analysis of
covariance for testing the null hypothesis that there is no
difference in group means for y not predictable from
differences in grouP means for x (i,e., all oj a 0 ) are:
a) random assignment of individuals to grouPs,
b) y scores have a linear regression on x scores
within each group,
c) the slope of the regression line is the same for
each group,

I 34 A ppendix B
d) for individuals in the same group with the same x
score, the y scores have a nornal distribution,
e) the variance of the y scores anong individuals
with the same x score in the same group is the
same for all x scores and all groups,
f) y scores can be represented by a linear combination
of independent components: an overall mean, a group
effect, a linear regression on x , and an error
te rm.
For the details of the computations, see Dixon and Massey (1969)
For a discussion of the importance of the assumptions, see
J. D. Elashoff (1969).
Stepwise Regress ion
Stepwise linear regression is an ad hoc multiple linear
regression technique in which predictor variables are entered
one at a time into the equation in an attempt to obtain the
"best" set of predictors. The basic "forward selection"
procedure is as follows. At step one, the correlations between
the dependent variable y and each of the possible predictor
variables *1, . . . , *p is computed. Then the x variable
with the highest corretration with y , call it * (r) , is
"entered first" and the regression of y on *(r) is com-
puted. At step two, the partial correlations are conputed
between the remaining x variables and y , adjusted for
*(f) The variable, *(Z) , having the highest partial cor-
relation with y is entered into the regress ion equation next.
At each subsequent step, the x variable which has the highest
partial correlation with y adjusted for the x's already in
the equation is entered. In other words then, Bt each step
the procedure enters the x variable which will produce the
greatest increase in the multiple correlation coefficient R .
The square of the multiple correlation coefficient, R2 ,

Appendix B 135
gives the fraction of the variance of y which is "explained
by" or predicted by the linear regression on the x variables
in the equations.
This basic procedure called "forward selection" is modi-
fied in several ways in a standard stepwise regression program
such as BMD 02R. At each step an F-statistic is calculated
corresponding to each partial correlation. I f the F- statis tic
for the x variable which has the highest partial correlation
with y is less than a prespecified critical value of F, the
procedure is terminated and no new variables are entered into
the equation. fn addition, 8t each step a check is made that
each x variable in the equation sti 11 makes a s ignificant
contribution to RZ . An F-statistic is computed based on
the partial correlation of x with y adjusted for the
other x variables in the equation; if this F value falls
below e prespeci fied F- to - remove value that x variable is
deleted from the equation.
The BMD 02R progran offers an additional option. Any
of the x variables may be forced to enter the equation
first irrespective of the value of their correlation with y .
Additional x variables nay be forced into the equation in
a predetermined or partially predetermined order. That is,
if two variables are designated to be forced in at level j ,
the variable with the highest partial correlation will be
entered first and the other variable entered next; then the
program proceeds to the next level of forced variables,
Leaving all the predictor variables "fre€ , " stepwise
regression provides an ad hoc procedure for determining the
relative importance of the x variables as predictors of y
and for obtaining the "best" set of predictors. There is,
of course, no guarantee that the variables selected will
actually constitute the best set. Using the option of forcing
variables in, e comparison may be made of the predictive

136 Appendix B
power of a variable by itself versus its additional predictive
power after other variables have been included.
Draper and Smith (1966) provide a useful introduction to
multiple regression and stepwise regression.
Test Scores and Norms
The primary outcome of a test adninistration is an
individual 's raw score , usual ly the number of items in a
test or subtest which were answered correctly. This nunber
is useful for research purposes as it stands and should always
be retained in whatever test performance records are kept.
For many practical purposes, however, the raw score must be
transformed in some way or related to other information to be
interpreted properly.
Norms are tables of score distributions obtained in
various reference groups. They relate raw score values to
proposed conversion scores, like mental ag€, IQ, or grade
equivalents. Most test manuals will provide norms at least
for a "national" sample of people for whom the test is pre-
sumed appropriate. The best manuals , however, contain care-
fully specified breakdowns of norm tables showing distribu-
tions for sex, grade , geographic or social strata, or other
subgroups of importance.
With norms and a standard error of measurement in hand,
it is possible to interpret scores more completely. A child
whose IQ score has changed 10 points in the past year may
not be considered unusual if it is seen that 10 IQ points
equals 4 raw score points at this part of the test range
and the raw score standard error of measurement is 5 . For
another child elsewhere in the range, a 10 point IQ change
might be considered substantial. One cannot te11 without
knowing raw score equivalents and standard errors.

Appendix B 137
Published norms are often incomplete or have been
extrapolated beyond the range of the distributions available
in norm samples. Use of such extrapolations, whether com-
puted by test maker or user, cannot be recommended. The cen-
tral question in using any particular score or norm conversion
is whether the obtained scale of measurement is meaningful
for the particular population and interpretation intended.
Reliability
The reliability of a variable X , such as a score on
an IQ test, is an estimate of the testts accuracy as a
measuring instrument. Reliability can be defined in different
ways depending on the model we choose to represent variation
in obtained X scores. In practical situations it nay be
difficult to estimate reliability; many different fornulas
have been advanced, some based on correlations between equiv-
alent forms of the test, some on measures of internal con-
sistency of the test, and some on correlations showing the
stability of the obtained score over repetitions of the test.
A standard model proposes that the observed score X
is a combination of a true score x and an error e , that is
X=x+e
where x and e are independent and ue - 0 . Then the
reliability of X is defined as the ratio of the true variance
to observed variance, or the proportion of variance in X not
due to error )o-* ozD-A=X..x ,r* W"
Expected Number Correctly Classified
In a particular group there are n children, c of whom
are in the control group, and t of whom are in tlre experi-
mental group. Se lect t of the n chi ldren at randon. What

I 38 A p pendix B
is the expected number of experimental children, e , among
the t chi ldren selected? The number of experimental chi ldren
among the t selected has a hypergeometric distribution with
parametersnrtrc.
P( nt = e ) =
r 3l tt:31
(t)
The mean of this distribution or the expected value of
i2E(e) = ;
e 1s
and Var(e)
See, for example, llays (1963).
Under the null hypothesis of no treatment effect,
selection of the t children on the basis of posttest or
gain scores should be equivalent to selection at random with
respect to the two treatment groups . The refore in group i ,
we expect to class ify correctly tltni chi ldren by chance;
since the groups are independent, tl're expected number cor-
rectly classified across all the groups is ItlZn, ancl the
variance is ,t2'-tn' - t')2
.
ni (n. - l)l'I
J (n-t) 2
nTt,*D

Appendix C:
Py7maliort, Reaffirmed
Robert Ros enthal and,
Dorlald B. Rubin
1. Oue ruiew:Pygmnlion iru
the Clussroom Reaf fir'med
I n this paper, an invited response to the critique of Rosenthal
and Jacobson (1968) (RJ) given in Elashoff and Snow ( 1970) (ES),
we demonstrate that the ES document in no way impugns the va-
lidity of the RJ experiment.A central thesis in ES is that there was a "wide variation in ap-
parent results" when different methods of data analysis were
employed, and that the statistically significant effects of teacher ex-pectation reported by RJ were dependent upon the choice of a par-ticular method of data analysis. This thesis is seriously in error.I ndeed, os we shall show, the net effect of the varied statisticalanalyses carried out in ES is greatly to increase the cross-methodgenerality of the results reported by RJ.
A second thesis in ES is that "imbalance" and "doubtful ran-domization" in the experimental and control groups invalidate the
results of the RJ analyses. As we shall demonstrate, there is abso-
lutely no reason to doubt the validity of the results of RJ.
Preparation of this paper was facilitated by a grant GS 29641X from theDivision of Social Sciences of the National Science Foundation. We want tothank first Paul Holland and also Judy Koivumaki for their helpful sugges-tions on earlier drafts of this paper.
139

I 40 A ppendix C
A third thesis in ES is that the RJ study is an isolated,unreplicated study. As will soon be clear, RJ is one of scores ofstudies indicating significant effects of interpersonal expectancy.
I n addition, there are many other equally erroneous theses in ES
to which we shall respond.Before responding to ES in detail, we want to emphasize the
basic simplic,ity of purpose and design of the RJ experiment. Theintent was to study the effect of favorable teacher expectancy onpupil performance. The simplest experiment RJ might have donewould have been to randomly assign some children to a conditionof favorable teacher expectation and to retain the remainingchildren as controls. Because of the randomization, the averagedifference in posttest scores between the experimental and controlgroup children would be an unbiased estimate of the effect of fa-vorable teacher expectancy for the population for which thechildren are representative. I n order to guide one's judgment as towhether the measured expectancy effect is real in the sense ofreplicable, some significance testing may often be desirable. Tomake such testing more powerful, that is, more able to detect realeffects when they do, in fact, exist, we often try to control othersources of variation besides the treatment. Thus, the randomiza-tion in the RJ experiment was done within blocks of classroomsand a concomitant variable, the pretest, correlated with posttest,was recorded. Blocking and adjusting for individual differences onthe pretest are procedures designed to increase the precision of themeasurement of the expectancy effect or, equivalently, to increasethe power of a test of the significance of the effect.
I n what follows we shall demonstrate not only that thereanalyses in ES strongly support the conclusions of the RJ reportbut also that generally the criticisms offered in ES are unsound.
2. Additional Evidencefor the Pygmalion Effect
I t is consistently claimed in ES that wide differences in resultsarise when different dependent variables (posttest scores, gainscores, adjusted posttest scores) are employed and /or when thedependent variables are "transformed" (untransformed, renormed,truncated) and/or when various nonparametric methods are used.Despite the varied procedures employed in ES, the expectancy ef-fects found in RJ remain undiminished.
Table 3l compares the RJ dependent variable (untransformedgain score) for total IQ with the eight other ES dependent vari-ables for total IQ. (Unless further specified, references to IQ are tototal IQ.) Within each grade level employed by ES, the RJ score

Appendix C l4l
and the 95Vo confidence interval for the RJ score are given alongwith the mean, median, lowest, and highest of the eight otherscores. The means and medians of the ES scores agree remarkablywell with the RI scores. I n addition, a// ES scores fall well withinthe 95Vo confidence intervals for the RJ scores and thus arethoroughly consistent with them. I n fact, the eight other ES
Table 3l ). Clearly, then, these ES procedures reaffirm thevalidity of the RJ conclusions, and we are grateful to ES forthe effort they expended in tabulating these additional dependentvariables.
We are also grateful to ES for having redrawn one of the RJ fig-ures, thereby suggesting our Figure 2l . ln their improvement overthe RJ figure, ES tabulated the data noncumulatively and showedthe proportion of children of grades one and two gaining varyingamounts of IQ. However, they failed to note the statistical signifi-cance of the results they displayed. Based on ES' display of the data,Table 32 and Figure 2l show that there is a marked linear regres-sion in the proportions (Snedecor and Cochran, 1967, pp. 246-247 ) of children who are experimentals on increasing levels of IQgain (p - .0012, one-tail.) (Unless otherwise specified, all sub-sequent p values are one-tail.) Thus, while less than 8Vo of thechildren gaining less than l0 IQ points are in the experimentalgroup, over 44Vo of the children gaining 30 or more IQ points arein the experimental group. Assuming no effects of teacher expecta-tion we would expect about 17 Vo of the children in either of thesecategories to be in the experimental group. Table 33 and Figure22 show the same analysis for posttest scores. Not surprisingly, theresults indicate a similar linear trend, which is equally significant.
Another analysis comparing the proportions of experimentaland control group children showing high posttest or gain scores iseven more elementary. We employed the concept suggested in ESthat, since there are 19 experimental children in the first twogrades, the topmost 19 gain scores or posttest scores should beearned disproportionately often by the children of the experi-men_tal group. Seven of the top 19 gain scores were earned bychildren of the experimental group, more than twice as many as we
results of this analysis and the results of the same analysis per-formed on posttest scores. As it turned out, the results were iden-tical and hence significantly supported the expectancy hypothesis.
The similar analysis performed in ES was done within sex andclassroom. Note that the top l9 children chosen by the ES methodare not necessarily the top l9 children of the entire sample of I l4children from the first two grades. Their analyses yiel d p > .05 for

I 42 A ppendix C
o\ O o
F{
..{oL)rto\oq B ll
OUtOO ^FlOr^-O@o'.r
.u1t+{ oo\/o
o
.j'ceZ U aoEJ.i(U o!
3 TsHco--
r.r I
olOrlEIod
EI
U)
O.J !r lLr olo orlo3l'sl(nrI]
l.oEtrIE .51
'ol
Hsl,i
cl(ul
sl
\O r\ F{'aaa
J
O\(v)tnaaa
lnN\t
NF{\taaa
O\OF{I
f\@ata
OF{O
c/) -f, \Oaaa
r\ r\ \o
-a-
r\@Naaa
-f, (n \o
ll\/ \./ v
O@(\laaa
F{t{O?l
(\ \t \O
1, 1, 'ocCCoo(UJcnrntt
OH
r-. Aq, rdL)OCF 'r1
C'\J.F{ (u
qo0', F{t.o.OEolda
U)
c, lr00q,GEt, tJccoroE
.A
oca
UC, F)o&O.xcfrl 'r{t+{ Eoo
hCOO-ttD O.'F{ E! f:loO.Eo
CJ
F{
ct)
c
.ooF-.
.$6l
.$\o
ll
c.r{
IJ
B
okoaETo
c$-g
Co
Eooo€
.o
c/)rd
c.?{
€oho
CL
eo
C''
o't{Hoo0or,o(J
$
-ohud(JC.l.oot) t+{
t+i -{c.aE
U!o
;{ rtrncohH

z;50(E
Oo-I3 540
fr?c(9O
-.rJ<30
5=t!<o<
UF,O<xFr!zUJ
H 10t!(L
Appendix C 143
FIGURE 21. PROPORTION OF CHILDREN WHO ARE EXPERIMENTALS GAININGVARIOUS AMOUNTS OF TOTAL IO
44.40/o
1 6 .7 o/o: EXP ECTE D o/o 17.1o/o
19 / 114
7.70/o
G<10(LOWEST s2)
10<G <20(NEXT 35)
308)
20<G <(N EXT 1
G >30(HtGHEST 9)
z_
H50{OL1L33 407Eru(9G.ciT2 30
:3OE)IH zoxilFzUJC)E 10UJo-
GAIN IN IO POINTS
FIGURE 22. PROPORTION OF CHILDREN WHO ARE EXPERIMENTALS SHOWINGVARIOUS LEVELS OF TOTAL IO POSTTEST SCORES
60
1 6. 7 o/o: EXP o/o
19/114
NEXT 35
POSTTEST IO
4/52
-6/3
5/18
/52
5/9
LOWEST 52 NEXT 18 HIGHEST 9

144 A ppendix C
significant result of their peculiar method of analysis, but failed al-together to mention the highly significant result it also yielded.Regrettably this failure to report the results of significance tests
that do not support the null hypothesis is not an isolated instance,as we shall now indicate.
I n the discussion of the analysis by classrooms across all grades(ES tables 23,24, and 25), six low power (Cohen, 1969, pp. 35,155) significance tests were performed on posttest scores and gainscores. Of these six, two were specifically mentioned in ES andbotn were nonsignificant. Of the remaining four not specifically
the predicted direction (Table 35). Similarly, when examining rawgain scores for matched children, ES give a Wilcoxon signed-ranks
because of some mysterious "dubious validity," while a less power-ful sign test found to be "nonsignificant" (p - .059) was not dis-carded. A similar kind of sweeping-under-the-rug of "undesirably"low p values was shown in the evaluation of Pygmalion by A.R.Jensen in his famous paper ( 1969, p. 107).
:J. Initial Equivalenct'of Experimentalaltd Control Groups
I n sum marizing the results of the previous section we emphasize
that they strongly support the hypothesis of the positive effects ofpositive interpersonal expectation. I ndeed ES seem to be aware ofthis fact since they repeatedly instruct their readers not be believethe results of their own analyses because of "doubtful randomiza-tion" and "imhalance" in the experimental conditions.
I mbalance in sample size has nothing to do with randomizationor the ability to obtain unbiased estimates of the effects of teacherexpectation. To claim that unequal sample sizes hopelessly con-found the analysis of an experiment (ES pp. 18, 76) is to claimthat a comparison of the means of two random samples is con-founded if the sample sizes are not equal; this claim is clearly false.
I n addition, there is no way in which the idea of "doubtful ran-domization" can be employed to impugn the validity of the
Pygmalion experiment. I n the first place, as RJ clearly pointed out,the children of the experimental condition were assigned to thatcondition at random; specifically, RJ used the table of randomnumbers provided by H. Arkin and R.R. Colton (1950). In the
second place, when the analyses that have been performed on post-

TreatmenE G . 10
Crrntrol (C) 48
ExperimenEal (E) 4
ToEa I (T) 52
p. = E/r .077!1
Tab Ic 32
Testing a Linear Regression o6 pi on IQ (iain
Ga in in lQ Prrints
10. G..20 20 G<30
29 13
65
35 18
. I 71 .278
Appendix C 145
G>30 Tota I
95
l9
114
r67
5
4
9
444
!S-D
Z.
P
First order dif ferences *.094 +.107 +.166
= .lL2
= "037
= 3.03
= .0012, One-tail
Table 33
Testing a Linear Regression o6 pi on IQ PostEest
Treatment Lowest 52a N"ag 35' Next 184 Highest 9a Total
Control (C) 48 28 15 4 95
Experimentat(E) 4 7 3 5 19
Tota I (T) 52 35 18 9 114
p. =E/T .077 .200 .L67 .556 .L67-L
First order differences *.123 033 +.389
I = -LLz
S. = .O37--b
Z = 3.03
P = .0012, one-tail
aBased on Ns glven in ES Figure 2b

t46
7, ()f 19 ExperintenEal Children
ll of 9't Control Ctrildren (P")
DiiferencL''12
Z
()ne-tail P
ha
ApproximaEe Magnitude,(Cohen,1969)
Childrert Earnitrpi 19 llighesE Scores
(t,rade.s I and 2)
Post Scores
['.rb lu 34
(p )e
37"L
l3"L
247"
5.05
+ 2.25
.oL22
o .57
Medium
Ca in Scores
37 7"
L37"
24"L
5.05
+ 2.25
.o122
0.57
N{ed ium
a tr is def ined as (2 arcsinl-e") - (2 arcsinfe")
Table 35
Percentage of Classrooms Showing Expectancy AdvanEage
Tora I IQ
Verbal IQ
Reasoning IQ
Posttest
Z One-rail p;;r.240b
.025b
One-tatl p
.l.rt'
.1198
. o01b
Ga in
Tota I N
L7
18
L7
!76%
6L%
76%
657"
67"L
887"
a Reported in ES
bN,.ra reported tn ES

Appendix C 147
test and gain scores are performed on the pretest scores, they showno more difference between the experimental and control groupchildren than would be expected by chance. Thus, for example, eSperformed 36 over-all F tests of the significance of the difierencebetween experimental and control group children on the pretest
17, l8). If we consider all interactions of treatment condition withother variables as well as main effects of treatment we find that192 (nonindependent) F tests of significance were made. Of thesel92Ftests,onlyone'atripleinteraction,waSsignificantatp<.05, a result that could easily have occurred by chance, yet wassingled out for comment in ES. Similarly, when ES analyied pre-test differences between experimental and control group childrenemploying classrooms as the sampling unit, they found no signifi-cant differences (ES Tables 23,24, and 25).
I t may also be asked whether the linear regressions shown inFigures 2l and 22 and Tables 32 and 33 to be significant for IQgain and IQ posttest might not also be significant for the pretest.Table 36 and Figure 23 show that this was not the cas e (z < I ).
Finally, employing the method of the "top 19" children in-troduced in ES, we can determine whether children of the experi-mental condition were overrepresented among the children earningthe highest l9 scores on the total IQ pretest. Under the hypothesiiof successful randomization we expect to find about three or fourchildren of the experimental group among the top 19. What wefind is just what we would expect under conditions of successfulrandomization: four of the top 19 were members of the experi-mental group (, ,' : 0.05, df : l, p - .82).
I n summary, since children were assigned to the experimentalcondition by means of a table of random numbers and lince, fur-thermore, dozens of tests on the distribution of the pretest gave noindication that there had been any failure of randomization, itbecomes most difficult to understand the continued concern shownin ES over "doubtful randomization." It must be concluded thatES' basis for not believing the effectiveness of randomizationremains obscure and that the validity of the RJ experimentaldesign has been thoroughly confirmed.
4. Misleading Citation of
Replication Research in ES
As mentioned earlier, the purpose of all the tests of significanceperformed is basically to evaluate the "reality" of the expectancyeffect obtained, i.e., to determine its replicability under virtually

I 48 A ppendix C
Trea Ernent
Control ( C)
Experimental (E)
Tota 1 ( T)
Table 36
Testing a Linear Regression of pi on Pretest IQ
Pretest Levels of IQ
Lowest 52a N"*t 35" xg*t 18" Highest 9a
31
4
35
44
8
918
278
52
13
5
D. = E/T:l L54 114 222
FirsE orderdifferences - .040 -.155
= .035
= .037
= 0.95
= .1711
Figure 2b
Table 37
Percentage of Studtes Reachtng Given p [,evels
Type of Study
Teachers Experimenters
Significance Level (N=37) (N=162)
+. 164
Tota 1
95
19
114
L67
Tota I
( N=199)
34"L
4- "/"
637"
L47"
L7"
85"/"
l0%
07,
90%
q
sz
P
eBased on Ns given in ES'
p.- .05 (one-teil)
% in Predicted DirecEion
"L in Unpredtcted Direct ion
"/" Not Sign if icant
p < .01 (one-tail)
"A in Predicted Directiorr
% in Unpredicted Direction
% Not Signiftcant
p < .001 (one-rai1)
"L in Pred icted Direct ion
"L in Unpredicted Directlon
% Not Significant
38%
0"L
62"/"
L47,
07"
86"A
117.
o%
gg"L
t*+"L
337"
637"
L47"
L7"
85"/"
9%
o"L
9L"L

o-
Lfo530
ztu
=20EUJo-xr.rJ
10
=lrJE
oI3zl!(Eo
i(J
lJ-
oUJ(,FzUJ(J(rtJ,l
L
Appendix C 149
FIGURE 23. PROPORTION OF CHILDREN WHO ARE EXPERIMENTALS SHOWING
VARTOUS LEVELS OF TOTAL IO PRETEST SCORES
27 .80/o
22.2o,h
16.7o/o:EXPECTED o/o
19 / 114 15.4o/o-
11 .40/o
LOWEST 52 NEXT 35 NEXT 18 HIGHEST 9
PRETEST IO
FIGURE 24. EFFECTS OF TEACHER EXPECTATION IN StX GRADES
1 5.4
9.5
6
2
aFzoL
I
oF
=t!(9
z
o
(Jz
(JUJLxLU
4 3.4
-0.0-000
-v. t
6
8/52
4/35
5/18
2
G RAD ES
3 4 5

I 50 A ppendix C
identical conditions. There is another sense of replicability whichhas to do with the ability of the same or other investigators to ob-tain similar results. The latter kind of replication is of particularimportance to the behavioral sciences as has been discussed else-where in detail (Rosenthal , 1966, 1969b).
I n their brief mention of replications of the Pygmalion effect,only one study was mentioned by name, a failure to replicate byClaiborn ( I 969). I n the doctoral dissertation upon which theClaiborn paper was based, it was candidly explained that two ofthe three teachers whose experimental condition was similar to thatof the RJ study were either fully aware or partially aware of thenature and purpose of the experiment (Claiborn, 1968). Regret-tably, in his subsequent article, Claiborn ( 1969) failed even tomention this difficulty in his discussion of his results. I nterestingly,within his three classrooms similar to those in RJ, the tendency toobtain reversed results was strongly related to the teachers' degreeof awareness of the purpose of the experiment.
Actually, at the time the Claiborn study appeared, numbers ofstudies showing significant positive effects of teacher expectationhad been published and/or read at conventions (e.g. , Beez 1968;Burnham and Hartsough, 1968; Meichenbaum, Bowers, and Ross,1969; Palardy, 1969). Therefore, the citation of only the Claibornstudy is misleading.
Table 37 has been provided to give the reader an up-to-date pic-ture of the results of studies of interpersonal expectation. Thoughmany of the studies summarized are very recent, most of them havebeen summarrzed elsewhere (Rosenthal, 1969b, 197 l). The firstcolumn shows for studies of teacher and counselor expectations thepercentage yielding results at the.05, .01, and.00l levels of signif-icance in either direction and the percentage yielding nonsig-nificant results. The second column gives the corresponding datafor studies conducted in laboratories rather than in everyday lifesituations. The percentages of studies reaching various levels ofsignificance agree remarkably well, from studies of teachers tostudies of experimenters. Considering those studies that are signifi-cant in the predicted direction vs. those that are not, all three
^2"are less than one. I t seems reasonable, then, to see both kinds ofstudies of interpersonal expectation as coming from a commonpopulation, and the third column of Table 37 shows the combinedresults. If there were no expectancy effect, we would expect to findabout l0 studies of interpersonal expectation to have r-eached a p
or exceeded that level, a virtually unobtainable result if therewere no effect of interpersonal expectation.
I n sum, the weight of the replicational evidence is very heavy,based as it is on the work of many investigators in many labora-

Appendix C l5l
tories throughout the country. Although no experimental results
inthebehavioralsciencescanbeexpectedtoshowp<every study or even every other study, the ability of the effects
of interpersonal expectancy to be demonstrated over a wide
variety of dependent variables, investigators, laboratories,
states, and even countries suggests a robustness not common tothe ephemeral phenomena of the behavioral sciences. The Pygma-
lion effect is real.
5. Other Criticisms
Before going on to consider other criticisms in ES, we summa-
rize very briefly what has been reported to this point:I ) The Pygmalion effect does not depend upon the particular
method of data analysis employed. This fact is clear using the
evidence provided in ES.
2) The experiment was fully randomized and there is no reason to
doubt the initial equivalence of the experimental and control
groups. This fact is clear using the evidence provided by ap-
proximately 2O0 tests performed in ES.
3) Pygmalion ts not an isolated study of interpersonal expectation.
This fact is clear based upon results of scores of studies
including many dealing specifically with teacher expectations.
In addition to the criticisms refuted above, there are other un-
sound criticisms of Pygnulion put forward in ES.
I ) ES imply that RI should have employed stepwtse regression intheir annlysis of a fully randomized experiment. At best, when
all the appropriate interactions are entered, stepwise regression
will give the same results as an analysis of variance. More
usually, interactions and nonlinear trends are not entered, in
which case stepwise regression eliminates important estimates
and displays, and usually inflates the residual variance. I n addi-
tion, stepwise regression inclines the user to assess the impor-
tance of a phenomenon using only the percentage of variance
explained and to ignore not only the expected difference be-
tween means but even the direction of the effect (e.9. see ES
Tables I l, 12, and l3).2) ES imply tlut Rl should have employed a rigid null hypothesrs
decision procedure. An ES imperative is to interpret no relation
The wisdom of this null hypothesis decision approach has been
called into serious question not only by psychologists
(Rosenthal, 1968; Rozeboom, 1960) but by a number of emi-
nent statisticians as 'well. R. A. Fisher, for example, showed
little patience with aclvice of the sort offered in ES, i.e., handy

152 Appendix C
hints as to how and when to accept or reject hypotheses(Cochran, 1967). Fisher preferred to keep track of whitever pvalue was obtained and to wait and see what happened insubsequent observations. Finally, w€ find the ES orientationtoward p values thoroughly inconsistent with the mental setthey recommend, namely that of a detective rather than that ofan attorney.
3) ES imply that R/'s claim to increastng effects of teacher expec-tatton in going from higher to lower grades is untenable. How-ever, the RJ data showed a significant interaction of treatmentwithlinearregreSSionofgrades(t:_2.69,df:3o8,p<.01, two-tail; Snedecor and Cochran, 1967, p. 278).ln order toindicate the magnitude of this linear trend in average dif-ferences, we give the Pearson r between grade level and' meanexpectancy advantage per grade: r : -.86. (RJ, p. 7 4) Onedisplay of this trend is shown in Table 3 8 and another in Figure24.These results indicate that there is a clear and significani in-creasing effect of teacher expectation as one moves from higherto lower grades.
4) ES imply that RJ should have employed the various ES datatransformations. However, these transformations are statis-tically biased. LJsing the interval of 60-160, ES renormed bysetting scores outside the range equal to the endpoints and trun-cated by discarding children outside the range. fhese would nothave been biased procedures if they had been carried out onlyon pretest scores, even though they might restrict the general-izeability of the resultant analyses. On the other hand, whenthese procedures are applied to posttest scores they are biasedand tend to diminish any real differences between the experi-mental and control groups. Specifically, if the experimental Lon-dition tends to increase or decrease scores, the aboveprocedures would tend to distort or discard experimental scoresmore often than control scores thus making the means of the ex-perimental and control groups more similar. For example, ifone discarded all subjects whose posttests did not equai 100,,!9 .*perimentals and controls would not differ on posttest.
5) ES imply that RJ obtained effects that were trivial in magni-tude even though they may lmve been signtficant statistically.lntheir discussion of the effects of teacher expectation on readinggrades, ES point out that none of the differences in gains beltween experimental and control groups is as large aJ one fullgrade pgint_equivalent (e.g., the diffeience between a grade ofB and C). Since the standard deviation of the pretest-readinggrades was less than unity, ES appear to require an effect sizEto be larger than a standard deviation in order for it to beregarded as important. Such requirements, exceeding consider-

Grade tQ Points S.D. Unitsa One-tail P <
Table 38
Expectancy Advantage tn Total IQ Gain After One Year
Appendix C /,53
Approxirnate Magn itude05 (based on Cohen, 1969)
1a rge
med ium
ze ro
sma1l
zeto
002
o2
3
4
5
+ 15.4
+ 9.5
- 0.0
+ 3.4
0.0
0.7
+
+
+
+
.93
.51
.00
.18
.00
.04
02
a u = 18.48 based on pretest total IQ of all avallable children, N = 382
6 Einy (and reversed)
Tota I + 3.8 2L small
Table 39
Expectancy Advantage in Reading Score Gain AfEer One Year
Approximate l4agnitude
Grade Readtng Scores S.D. Unitsa One-tail p < .05 (based on Cohen, 1969)
2
3
4
6
+ .55
+.49+ .42
+ .07
.02
+ .08
+ .56
+ .48
+ .42
+ .07
.02
+ .09
.03
.05
.04
rned ium
med ium
med ium
very small
Einy (and reversed)
ve ry srna I I
Total + .L7 + .L7 05 snra 1 I
e o = 0.99 based on pretest reading scores of all available children,
N = 313.

I 54 A ppendix C
ably a reasonable definition of even a large effect size (Cohen,
1969,p. 24),,are very questionable. The actual effect sizes forreading scores are shown to be at least medium size in three ofthe six grades (Table 39). Note also the similarity of effect sizes
between the expectancy advantages in reading score gains(Table 39) and total IQ gains (Table 38); the correlation be-
tween these two measures over the six grade levels is +.74.(RJ, p. 100)
6) ES imply that the RI dependent variables are unsuitablemeasures of tntellectual performance. We find in ES a concernover the "low" reliability (r _ .7 4, Column l, RJ Table A-30)of TOGA along with the implication that this threatens the va-lidity of the Pygmalion experiment. Actually, unreliability(increased noise) can never account for the significant results ofa fully randomized experiment; rather it can serve only toreduce power. We find also in ES the argument that the correla-tion of .65 between TOGA and subsequent ability track place-ment given in Rosenthal ( 1969a) does not adequately demon-strate validity. That correlation is higher than the correlationbetween scores on the nonverbal section of the Lorge-Thorndike and scores on the very same test retaken after an in-tervening summer. Finally, correlations between TOGA and
other tests of intellectual performance are even higher (e.9.,
TOGA with Lorge-Thorndike: r - .7 3). Another recommen-dation found in ES is to employ raw scores as the dependentvariable instead of IQ. We prefer to use IQ scores since it is
lQs, not raw scores, that are used in the real world to makedecisions.
7) ES imply that RJ was insufficiently reviewed prior to publica-tion. We feel, on the contrary, that RJ was unusually thoroughlyreviewed prior to publication. I n addition to having priorjournal publication, the RJ research was solicited and approvedfor inclusion in a volume prepared for Division 9 of the Ameri-can Psychological Association, Social Class, Race, and Psychol-ogical Development (Holt, Rinehart and Winston, 1968), editedby Martin Deutsch, Irwin Katz, and Arthur Jensen. Numerousother scholars in the behavioral sciences have requested permis-sion to reprint the RJ research in their own volumes ofreadings, both before and after RJ was published. I n addition,the award committee of Division l3 of the American Psycholo-gical Association presented the first prize of the Cattell FundAward to the RJ research in 1967.
Given space, we could continue to refute criticisms of RJ and in-dicate many other errors in ES, but we feel that our point has beenmade.

Appendix C I 55
Coltclusions
We now conclude this response to the criticisms of Pygmalion(RJ) given in Elashoff and Snow (1970) (ES), having demonstratedthe following:I ) The results of the varied ES analyses are absolutely consistent
with the results of the RJ analyses and indicate a significant ef-fect of teacher expectations.
2) RJ was a completely randomized experiment and the numerousES tests of the success of the randomization give absolutely no
reason to doubt the pre-experimental equivalence of the experi-mental and control groups and thus no reason to doubt the va-lidity of the conclusions above.
3) Positive effects of favorable interpersonal expectations havebeen obtained in numerous experiments conducted by dozens
of researchers and thus the result in RJ can in no sense be con-sidered a fluke.
4) Although there were among the ES criticisms a few useful no-
tions which we employed in this reply, in the main the
numerous criticisms advanced in ES were neither sound norconstructive.

Appendix D:Py7maliort, Rebutted
Janet D. Elashoffand Richard E. Sn ow
1. I ntrt-rduction
Rosenthal and Rubin (197 l) (Rn; have attempted to reaffirmthe validity of the Pygmalion experiment of Rosenthal andJacobson ( 1968) (RJ). Their responses to our critique andreanalysis are rebutted point for point below.
2. RR's Additional Evidence
RR conclude that our reanalyses only confirm the original RJfinding. They provide two tables showing results for all grades.Table 3l summarizes nine analyses showing "significant" expec-tancy effects in grades I and 2 and no "significant" expectancy ef-fects in grades 3 to 6. It is heartening that RR now admit no ef-fects beyond the first two grades, since the text of RJ's reportimplied generally significant results. However, in Table 35 at theend of the section they return to an over-all analysis by classroomin which they claim that we suppress a number of interesting one-tail p values. Our final version does mark the corresponding two-tail p values which are less than .05 for mean gain and no longerrefers to the Wilcoxon having dubious validity. It is surprising tonote, however, that RR have omitted from Table 35 the corre-sponding table and p values for the pretest (see table below). Note
t56

t57
that these results for Verbal and Reasoning IQ are almost identi-
cal with posttest results.
Percentage of Classrooms Showing Expectancy Advantage
Pre tes t
Total N z One-tail p
Total IQ
Verbal IQ
Reasoning IQ
L7
18
L7
50
24
07
53fl
6Lfl
7ofl
The other three tables and two figures in the section are con-
cerned only with grade I and 2 children. As we clearly noted, a
number of analyses of the grade I and 2 children showed
"significant" results but we were doubtful of the validity of these
results for reasons which RR continue to ignore. These doubts, oc-
casioned by the problems of extreme scores, doubtful randomiza-
tion, imbalance, are restated below.
RR Figure s 2l and 22 and Tables 32 and 3 3 simply rehash the
same data, still using arbitrary subdivisions of doubtful gain scores.
Our redrawing of RJ figures was meant to correct misleading
charts, not to sanction the data or analyses on which they were
based. RR's analyses of the top l9 children, reported in Table 34,
ignore variables of sex and classroom and are therefore subject to
possible confounding effects.
3. Initial Eqrivalence0f Experimentaland Control Croups
Using a table of random numbers per se does not ensure proper
randomization. It is still not clear in just what grouping or
blocking RJ randomized or how they ensured that the number ofexperimental boys (or girls) per classroom assigned to the experi-
mental group was between 40 and 6OVo of the experimental group
children in that classroom. I n their reply RR say only that "ran-
domization in the RJ experiment was done within blocks ofclassrooms." (RR, p. 2) The form of analysis must reflect the
way in which randomization was carried out. Their statement that
"dozens of tests on the distribution of the pretest gave no indica-

I 58 Appendix D
tion that there had been any failure of randomization" (RR, p. 6)
does not reassure us. To be certain that randomization is adequateone must know the details of the assignment procedure.Tests of significance on pretest scores would detect only gross fail-ures of randomization. I ndeed, the pretest classroom resultsreported above and the fact that Grade I and 2 experimentalchildren have total scores averaging 4.9 IQ points higher, andreasoning scores averaging 13.2 IQ points higher than the controlgroup does cast doubt on the effects of randomization. Theseaverage differences are sizeable differences; due to the excessivelyhigh variability in pretest scores for these children, they are notstatistically significant at the 5Vo level. However, using a one-tailtest,aSRRroutinelydo,theReasoningdifferencereachesp<.10. RR's Table 36 and Figure 23 also exhibit the generally higherpretest scores.
RR's argument that imbalance in sample size can not confoundan analysis confuses two important issues. First, it is well knownthat the true significance level of a test comparing the means of tworandom samples can be affected by inequality of sample sizes whenthe variances are not equal (see our discussion on page 3 8.)Secondly, the experimental and control groups in the RJ experi-ment are not two random samples; randomization was apparentlyperformed within sexes and within "blocks of classrooms." I fimbalance in sample size is sufficient to keep these factors out ofthe analysis, any effects related to these factors may become con-founded with the treatment effect.
Clearly then, the unclear randomization procedure, initial ad-vantage of the experimental group, and imbalance in cell sizes, docast serious doubt on RJ's results.
4. Replication Attempts
RR criticize as misleading our isolated citation of Claiborn's( 1969) failure to replicate the Pygmalion effect, and list four otherstudies showing significant positive effects. It is interesting to notethat none of the four studies RR cite includes IQ as criterion andseveral differ fundamentally in design from the RJ study. Yet theyare apparently offered as examples of replication. Our referencewas offered as an example of improved research design; it was notintended as a summary of literature. A clearer and morecomprehensive picture of replication attempts and related studiesis provided by Philip Baker and J anet Crist's chapter. I n theBaker and Crist summary table, it can be seen that of nine studies(other than RJ) attempting to demonstrate teacher expectancy ef-fects on IQ, none has succeeded. Of twelve expectancy studies

Appendix D 159
including pupil achievement measures as criteria, six have suc-
ceeded. Of seven studies including measures of observable pupilbehavior, three have succeeded. And of seventeen studies includingmeasures of observable teacher behavior, fourteen have succeeded.
Thus it seems that teacher expectancy effects are most likely toinfluence proximal variables (those "closest" in a psychological
sense to the source of effect, e.g., teacher behavior) and progres-
sively less likely to influence distal variables (or variables psycho-
logically remote from the source of expectations). IQ, the most
remote of pupil variables, is unlikely to be affected. These results
are consistent with a Brunswikian view of teacher-learner interac-tion (Snow, 1968). They suggest that teacher expectancies may be
important and are certainly deserving of study, but they fail utterly
to support Py gmalion's celebrated effect on IQ.Summ arizing a collection of studies is always a treacherous un-
dertaking. No study is ever truly a replicate of another. Many basic
differences between studies are glossed over in generalizing and
the temptation is strong to turn such lists of results into "box
scores" or percentages of studies for and against some conclusion,
as in RR's Table 3'7 . Such tables have little value as literature
summaries. I nstead, literature reviewers should look for subcat-
egories or patterns of findings that make some kind of psycholo-
gical sense, such as the rough continuum of dependent variables
noted above. Such patterns will likely reveal more about the psy-
chology of the phenomena at hand than will blind sweeping-
together and totalling of findings.
5. RR's o'Other Criticisms"
We reproduce, and subsequently reject, each of RR's seven
specific points below.
I ) ES imply that RI should have employed stepwise regression intheir analysis of a fully randomized experiment. We did not
imply that RJ should have used stepwise regression but stated
that they should have examined the magnitude of the treatment
effect. To quote from our section on stepwise regression: "Ouronly purpose is to gain an impression of the relative importanceof any treatment effect." (ES , p. 97)
2) ES imply that Rl should have employed a rigid null hypothesis
decision procedure. We emphasized that reporting of p values
is no substitute for plotting and probing of the basic raw data
or for examining the practical significance of results. We didnot advocate a rigid decision procedure; we urge researchers to"Report p values within any predetermined limits, but interpretno relation unless p is less than a fixed value such as .05."(ES,

I 60 A ppendix D
p. 45, emphasis added here) RR's description of R. A. Fish-er's approach is perfectly consistent with our emphasis.Keeping track of all findings while research continues is goodscience; building theory on marginal findings is not.
3) ES imply that R/'s claim to increasing effects of teacher expec-tation in going from higher to lower grades is unterutble.If theeffects were significant in grades I and 2, and were notsignificant in grades 3 , 4,5, and 6, then to describe this dichot-omy as showing ". . . increasing expectancy advantage as wego from the sixth to the first grade . . ."(RJ, p. 7 4) impliesthat there are some positive effects in the middle and highergrades as well. This gives the reader a false impression.
4) ES imply that RJ should have employed the various ES datatransformations. We did not imply that RJ should have usedpartiiular transformations, but that they should have ques-tioned the extreme scores obtained and dealt with them in somemanner. To quote from our section on renorming and trunca-tion:
"Neither procedure is wholly adequate since the effect onvarious statistical approaches is unknowr, but analyzing thedata in all three ways, in original IQ form, in truncated Ieform, and in renormed IQ form provides information on thesensitivity of the results to the presence of extreme scores."(ES,p.85)
5) ES imply that RJ obtained effects that were trivial tn magni-tude even though they moy have been significant statistically.The point was that, of eleven school subjects, only one, readinggain, showed "significant" expectancy advantage at the l0%level. Our exact statement was: "The choice of scale makes thegains and differences in gains look large when, in fact, most areconsiderably less than one grade point." (ES, p. l5) Our Fig-ure 23 and RR's Table 39 show that, of the 12 (6 grades by 2groups) mean gain scores, all but 2 were less than three-tenthsof a grade-point and of the six differences in gains, three wereless than one-tenth of a grade point.
6) ES imply that the RJ dependent variables are uruuitablemeasures of intellectual performonce. The "reliability" (stabili-ty over one year) of TOGA Reasoning IQ scores is r. - .45and r e : .50 in grades I and 2. Such values are usually con-sidered low. However, our main concern stemmed from themany instances of extreme IQ scores and the apparent instabil-ity of these scores across the four testings. Unreliability doescast doubt on the meaning of results. As to validity, a correla-tion of .65 between TOGA and subsequent track placement isa correlation calculated among three means. To quote our earli-er statement: "A test could predict a gross, three-level judg-

Appendix D l6l
ment of academic status well and still be nearly useless as a
measure of individual intellectual ability or growth."(Es, p.
39, emphasis added here) The essential evidence regarding va-
lidity in this situation would have been for RJ to include
another independent measure of IQ in their study to show thatit too displayed expectancy effects.
7) ES imply that RJ was insfficiently reviewed prior to publica-
tion. RR's list of the RJ publications, reprintings, and award,
notwithstanding, we retain our view that Pygmalion was inade-
quately and prematurely reported to the general public.
6. Criticisms Igrrored by RR
Among the important criticisms of RJ not dealt with by RR, a
few should be briefly noted here and one deserves special empha-
sis. We stated that the RJ report is misleading, that it includes
technical inaccuracies, and that it omits important information.Readers should review the relevant sections of our report to satisfy
themselves on these points.
We also stated that the RJ report ignores the psychological
meaning of the scores on which it rests. Perhaps this is the most
basic problem with Pygmalion The point was made by R. L.Thorndike ( 1968 , 1969), and by Snow ( I 969), and recurs regularly
in our reanalysis as well as in these final remarks, but it is not men-
tioned by RR. What, after all, does an IQ of zero, or 17 , or 3 l, or
202, or 210 really mean? What does an IQ gain of 100, 125, or
135 really mean? Our scatterplots of pre- and posttest scores forgrades I and 2 (Figures I l, 12, and 13) show clearly that the ap-
parent large expectancy effects are due to the influence of unusual-
ly high or low scores on the regression lines. Are these extreme
points RJ's "magic" children? What is the magic? Are we really
dealing with the effects of self-fulfilling prophecy on the intellec-
tual growth of imbeciles and geniuses, operating through teachers
who do not even remember the names of the individuals they
have supposedly influenced so profoundly? Or are we dealing withmisunderstood test instructions? Or uncontrolled test administra-tion? Or selective teacher coaching? Or teacher encouragement forguessing? Or chance? Or what?
With an IQ scale of questionable meaning, we advocated a re-
turn to raw scores as the lesser of two evils. For data analysis in
research, the scores and scales that are most likely to lead to validinterpretation should be used. RR rejected our preferentce for raw
scores because, they say, IQ is used for decision making in the real
world. But decisions in the real world must also assume a mean-
ingful scale of measurement. Fortunately for RJ, no school deci-

I 62 A ppendix D
sions were made on the basis of Pygmalion [Q's," or their studymight have lost about 35Vo of its grade I and 2 children to specialeducation programs.
RR conclude that our reanalysis ". . . in no way impugns thevalidity of the RJ experimentn' and that ". . . there is absolutelyno reason to doubt the validity of the results of RJ."(RR, p. I )
We can only reiterate the hopc that researchers will play detectiverather than attorney in their pursuit of knowledge relevant to socialproblems. In view of the readiness with which the public uncri-tically accepts results like those of the Pygmalion study, and of theimportance and complexity of phenomena like "teacher expect-ancy" and "intellectual growth," investigators must doubt; theymust be critical of their own work. Absolute certitude ill behooves
research.

References
Substantive References
Anderson, D. F. and Rosenthal, R., "Some effects of interpersonal expectancyand social interaction on institutionalized retarded children," Proceedingsof the 76th Annual Convention of the American Psychological Association3 ( 1968): 479-480.
Beez, W. V., "Influence of biased psychological reports on teacher behaviorand pupil performance," Learniis in Social Settings-, eds. M. W. Miles and
W. W. Charters, Jr., Boston: Allyn and Bacon, Inc., 1970.
Brophy, J. and Good, T. L., "Teachers'communication of differe.ntial expec.-
tati5ns for children's classroom performance: Some behavioral data,"Journal of Educational Psychology 6l ( l97O): 365-374.
Brown, W. E,., 'The influence of student information on the formulation ofteacher expectancy," Dissertation Abstracts 30 (1970): 482?-4.
Cahen, L. S.l "An Experimental Manipulation of the Halo Effect." Doctoraldissertation, Stanford U niversity, 1966.
Claiborn, W.L., "Expectancy effects in the classroom: A failure to replicate,"
Journal of Educatibnal Psychology 60 (1969): 377-383.Conn, L.; Edwards, C.; Rosenthal,R.; and Crowne, D., "Emotion percgPlion
and response to teacher expectancy in elementary school children," Psy-
chological Reports 22 (1968): 27-34.Evans, J-. T. and Rosenthal, R., "Interpersonal self-fulfilling prophecies: Fur-^
ther extrapolation from the laboratory to the classroom." Pr.oceedings.ofthe 77th Annual Convention of the American Psychological Association4(Part I ) ( 1969): 37 l-37 2.
Fleming, E.'S.and Anttonen, R. G., "Teaclgl^er(pectqnc-Y,9I my fair lady,"Amelican Educational Research Journal S (1971 a): 241-252.
_'..Teacherexpectancyasrelatedtotheintellectual,ac.ad.em1.c,a.ndp9r-ro"af growth of frrimary age children," Monographs of the Society forResearch in Child Development (197 I b), in press.
Flowers, C. 8., "Effects of an arbitrary accelerated group placement on the
tested academic achievement of educationally disadvantaged students,"
Dissertation Abstracts 27 ( 1966): 991-A.Freedman, A. L.; Carlsmith, J. M.; and Sears, D. O., Social Psychology.
Englewood Cliffs, N. J.: Prentice-Hall, Inc., 19J0.Gephlrt, W.J. and Antonopolos, D. P., "The effects of expgclancy and other
research-biasing factors,'' Phi Delta Kappan 50 ( 1969): 579'583.Goldsmith, J. S. and Fry, 8., "The test of a high expectancy prediction on
reading achievement ind IQ of students in grade l0 (_or, Pygmalion inpubert!)," submitted to American Educational Research Journal, 1979.
G6od, T: L., "Which pupils do teachers call on?" The Elementary School
J ournal 7 0 (l 970): I 90- I 98.
Guskin, A. E. and Guskin, S. L. , A Social Psychology of Education. Reading,
Mass.: Addison-Wesley Publishing Company, Inc., 1970.
Haberman, M., "The relationship of bogui expectations to success in studentteachinE," The lournal of Teaiher Education 2l (1970)169-72.
Hastorf, A. H.; Schneider, D. J.; and Polefka, J., Person Perception. Reading,Mass.: Addison-Wesley Publishing Company, Inc., 1970.
Heider, F., The Psychology of InTerperional Relations. New York: JohnWiley & Sons. Inc., 1958.
Jacobs,-J. F., "Teacher expectancies: Their effect on peer acceqtallce.".Paperpresented at Annual Me-eting, American Educational Research Association,Minneapolis, 1970.
Josd, J., "feacher-pupil interaction as it relates to attemptgd changes inje.ach-er expectancy rif icaOemic ability_ and achievement," American Huca-fiona[ Research Journal 8 (1971): 3 9-49-
Kester, S., "The communication of teacher expectations and their effects on
the achievement and attitude of secondary sihool students,," American Ed-
ucational Research Journal, l97l (in press).
t63

164
Meichenbaum, D. H.; Bowers, K. S.; and Ross, R. R., "A behavioral analysisof teacher expectancy effect," Journal of Personality and Social Psychologyl3 ( I 969): 306-3 16.
Palardy, J. M., "What teachers believe, what children achieve," ElementarySchool Journal 69 ( 1969): 370-37 4.
Pitt, C. C. V., "An experimental study of the effects of teachers' knowledge orincorrect knowledge of pupil I.Q.'s on teachers' attitudes and practices andpupils' attitudes and achievement," Dissertation Abstaus l6 (1956): 2387-23 88.
Rist, R, C., "Student social class and teacher expectations: The self-fulfillingprophecy in ghetto educatior," Harvard Educational Review 40 ( 1970):4tt-451.
Rosenthal, R., Experimenter $fects in Behavioral Research. New York:Appleton{e ntury-Crofts, I 966.
,, "Self-fulfilling prophecY," Psychology Today 2 (1968 a): 44-51.
-,
"Self-fulfilling prophecies in behavioral research and everyday life,"Claremont Reading Conference Thirty-Second Yearbook, 1968(b), ed. M.P. Douglass, I 6-3 3.
_..In!erpers.onalexpectations:Effectsoftheexperimenter'shypothesis," Artifuct in Behavioral Research, eds. R. Rosenthal and R.Rosnow. New York: Academic Press, Inc., 1969 (a).
-
"Teacher expectation and pupil learning." Paper prepared for a con-ference on The Unstudied Curriculum sponsored by the Association forSupervision and Curriculum Development. Washington, D. C., January 8-ll, 1969 (b). Also in Overly, N. V., ed., The Unstudied Curuiculum. Wash-
iqg_tgn, D. C.: Association for Supervision and Curriculum Development,1970 (a).
_'..Empiricalvs.decreedvalidationofclocksandtests,''AmericanEd-ucational Research Journal 6 (1969 c): 689-691.
_,..AnotherviewofPygmalion,''ContemporaryPsychologyl5(l97ob): 524.
Rosenthal, R. and Jacobson, L., 'nTeacher's expectancies: Determinants ofpupils'IQ gains," Psychological Reporfs l9 (1966): I l5-l18.
_,.Teacherexpectationsforthedisadvantaged,''ScientificAmerican2 l8 ( 1968 a): 19-23.
t-,, bgmalion in the Classroom: Teacher Expectation and Pupils' Intel-lectual Development. Copyright @ 1968 by Holt, Rinehart and- Winston,Inc., New York. Portions reprinted by permission of Holt, Rinehart andWinston, Inc. (b)
-,
"Self-fulfilling prophecies in the classroom: Teachers' expectations asunintended determinants of pupils' intellectual competence," Social Class,Race, and Psychological Development, eds. M. Deutsch; I. Katz; and A.Jensen. New York: Holt, Rinehart and Winston, Inc., 1968 (c).
Rothbart, M.; Dalfen, S.; and Barrett, R., "Effects of teacher's expectancy onstudent-teacher interaction," Journal of Educational Psychology 62 (1971):49-54.
Rubovits, P. and Maehr, M., Pygmalion analyzed toward an explanation ofthe Rosenthal-Jacobson findings. Paper presented at Annual Meeting,American Educational Research Association, M inneapolis, 1970.
Schrank, W. R., "The labeling effect of ability grouping," The Journal of Edu-cational Research 62 (1958): 5l-52.
"Further study of the labeling effects of ability grouping," TheJournal of Educational Research, 63 ( 1970): 358-360.
Seaver, W. B., "Effects of Naturally Induced Teacher Expectancies on the Ac-ademic Performance of Pupils in Primary Grades." Doctoral dissertation,U niversity of I llinois , 197 I .
Secord P. F. and Backmar, C. W., Social Psychology. New York: McGraw-Hill, Inc., 1964.
Simon, W. E., "Expectancy effects in the scoring of vocabulary items: A studyof scorer bias," Journal of Hucational Measurement 6 (1969): 159-164.
Snow, R. 8., "Brunswikian Approaches to Research on Teaching," AmericanEducational Research Journa, 5 (1968): 47 5-489.

165
Tagiuri, R., "Person perception," The Handbook of Social Psyglglo.gl, Vol.Itt: The Individua[ in a-Social Contexr, eds. G. Lindzey and E. Aronson.Reading, Mass.: Addison-Wesley Publishing Compan)r,_Inc., I 969.
Tagiuri, [. and Petrullo, L., eds ., Person Pelception-and Interpersonal Behav-
fur. Stanford, Calif.: Stanford University Press, 1958.
Willis, B. J., "The influence of teacher expectation on teachers' classroominteraction with selected children." Dissertation Absffacts, 30 ( 1970):
so72-A.
Methodological References
Cochran, W. G., "Errors of measurement in statistics," Technometrics l0( 1968): 637 -666.
Cronbach, L. J. and Furby, L, "How should we measure changHr shouldwe?" Psychological Bulletin 74 (1970): 68-80.
Dixon, W. J. and'Massey, F. J., Introductton to Statistical Analysis. 3rd. ed.
New York: McGraw-Hill, Inc., 1969,Draper, N. R. and Smith, H., Applied Regression Analysis. New York: John
Wiley & Sons, Inc., 1966.Elashoff, J. D., "Analysis of covariance: A delicate instrument," American
Educational Research Journal 6 (1969): 383-402-
-,
"A model for quadratic outliers in linear regressior," submitted toJournal of the American Statistical Association, 1970.
Elashoff, R: [VI., "Effects of errors in statistical assumptions," InternationalEncyclopedia of the Social Sciences 5 (1968): 132-142.
Hays, W. L. ,, Statistics for Psychologists. New York: Holt, Rinehart and Win-ston, I nc., 1963.
Hufl D., How to Lie with Statistics. New York: W. W. Norton & ComPstrY,
Inc. , 1954.Scheff6, H., The Analysis of Variance. New York: John Wiley & Sons, Inc.,
l 959.Tukey, J. W., "Analyzing data: Sanctification or detective work?" American
Psychologist 24 (1969): 83-91.Wallier, H.-M. and Lev, J., Statistical Inference. New York: Holt, Rinehart
and Winston, Inc., 1953.
Reviews
Aiken, L., "Review of figmalion in the Classroom," Educational and Psy-
chological Measure ment 29 ( I 969): 226-228.Barber,i. X. and Silver, M. J., "Fact, fiction, and the experimenter bias ef-
fect," Psychological Bulletin Monographs 70 (6, Part 2) (l96qI l-29.Coles,'R.,
t'Whatian you expect?" The New Yorker, g April (1969), pp. 169-
t77 .
Doob, L., "Review of hygmalion in the Classroom," The Key Reporter,Spring 1969.
Hutchin-s, R., "Success in schools," San Francisco Chronicle, I I August 1968.-
Kohl, H., "Review of Pygmalion in the Classroom," The New York Review ofBooks, 12 September 1968, P. 3 l.
McCurdy, J., 'testing of IQs in L.A. primary grades banned," I-os Angeles
Times,3l January 1969.Roberts, W., "Voices in the classroom," Sarurday Review, l9 October 1968,
P.72.Snow, R. 8., "[Jnfinished Pygmalion," Contemporary Psychology 14 (1969):
t97 -200.Thorndike, R. L., "Review of figmalion in the Classroom," American &luca-
tional Research Journa, 5 ( 1968): 708-7 I I .
_'..Butyouhavetoknowhowtotelltime,''AmericanHucationalResearch Journal 6 ( 1969): 692.
Time,20 September 1968, p. 62.

t66
References to Appendix C
Arkin, H., and Colton, R. R., Tables for statisticians. New York: Barnes &Noble, Inc., 1950.
Beez,-W. V-., "Influence of biased psychological reports on teacher behaviora,nd pupil p_erfo1qance." Proceedings of the 76th-Annual Convention of theAmerican Psychological Association ( 1968): 605-606.
Burlham, J. R. and Hartso.uBh, D, M., "Effect of experimenter's expectancies("The Rosenthal effect") on children's ability to learn to swiir." Paperq{esented_ at the meeting of the Midwestern Psychological Associatibn,Chicago, May, 1968.
Claiborn, W. L., "An investigation of the relationship between teacher expec-tancy, teacher behavior and pupil performance." Doctoral dissertat-ion,Syracuse U niversity, 1968
_..Expect?1cyeffectsintheclassroom:afailuretoreplicate,''Journalof Educatfonal Psychology 60 ( 1969): 377 -383.
Cochran, W. G., "Footnote to an appreciation of R. A. Fisher." Science 156( 1967): t460-1462.
Cohen, J., Statistical Power Analysis for the Behavioral Sciences. New York:Academic Press, Inc., 1969.
Elashoff, J. D. and Snow, R. 8., "A case study in statistical inference: Recon-sideration of the Rosenthal-Jacobson data on teacher expectancy." Tech-,tical. Repo_rt No. 15, Stanford Center for Research and
-Development in
_ Teaching, School of Education, Stanford University, December, 1970.Jensen, A. R.., "How much can we boost IQ and scholastic achievement?"
Harvard Educational Review 39 (1969): l-123.Meichenbaum, D. H.; Boyprs,.K. S.; and Ross, R. R., "A behavioral analysis
of teacher expegla_ncy effect," Journal of Personaltty and Social PsychologyI 3 ( 1969): 306-3 16.
Palardy, -J,-
M., "What teachers believe-What children achieve,," ElementarySchool Journal 69 (1969): 37O-374.
Rosenthal, R-., "Experimenter expectancy and the reassuring nature of thenull hypothesis decisiorr procedur€," Psychological Bullelin MonographSupplement 70 ( 1968): 30-47 .
-'..Empiricalvs.decreedvalidationofclocksandteStS,''AmericanEd-
ucational Research Journal 6 (1969a): 689-691 .
_..In.terpersonalgxpectatio.ns:Effectsoftheexperimenter'shypothesis," Artifuct in Behavioral Research, eds. R. Rosenth;l and R. L.Rosnow, New York: Academic Press, 1969b, pp. l}l-277 .
_,..Tea.ch9re]pestationandpupil!eqrniqg,'.Teachersandthelearningpro_c-ess, e4. R. D. Strom, Englewood Cliffsl New Jersey: Prentice-Hali-,197 l, pp. 33-60.
Ro_sgnthal, R. and Jacobson, L., Pygmalion in the Classroom. New York:Holt, Rinehart and Winston, Inc., 1968.
Ro_senthal, R. and R. L. Rosnow, eds., Artifuct in Behavioral Researc,h. NewYork: Academic Press, Inc., 1969.
ftozFboom, !l W., "The {a-!l_a_cy o-f the_ null-hypothesis significance tesr." Psy-
chological Bulletin 57 (1960): 416-428Sn_edecor, G. W. and Cochran. W. G., Statistical methods. 6th ed. Ames,
Iowa: Iowa State University Press, 1967.


caoa5
:
ad
oreee Village Green:Coucee