1992-brody-intelligence.pdf - Gwern.net
408
INTELLIGENCE SECOND EDITION NATHAN BRODY Department of Psychology Wesleyan University Middletown, Connecticut ACADEMIC PRESS, INC. Harcourt Brace Jovanovich, Publishers San Diego New York Boston London Sydney Tokyo Toronto
-
Upload
khangminh22 -
Category
Documents
-
view
3 -
download
0
Transcript of 1992-brody-intelligence.pdf - Gwern.net

INTELLIGENCE
SECOND EDITION
NATHAN BRODYDepartment of Psychology
Wesleyan UniversityMiddletown, Connecticut
ACADEMIC PRESS, INC.Harcourt Brace Jovanovich, Publishers
San Diego New York Boston London Sydney Tokyo Toronto

This bookis printed on acid-free paper.
Copyright © 1992, 1976 by ACADEMIC PRESS,INC.
All Rights Reserved.
No part of this publication may be reproducedor transmitted in any form or by any
means, electronic or mechanical, including photocopy, recording, or any information
storage and retrieval system, without permission in writing from the publisher.
Academic Press,Inc.San Diego, California 92101
United Kingdom Edition published by
Academic Press Limited24-28 Oval Road, London NW1 7DX
Library of Congress Cataloging-in-Publication Data
Brody, Nathan.
Intelligence / Nathan Brody.-- 2nd ed.
p. cm.Includes bibliographical references and index.ISBN 0-12-134251-41. Intellect. 2. Intelligence tests. 3. Nature and nuture.
BF431.B6844 1992153.9--dc20 91-30772
CIP
PRINTEDIN THE UNITED STATES OF AMERICA
92 93 94 95 96 HA 98765432 1

CONTENTS
Preface ix
]
HISTORICAL BACKGROUND
Spearman’s 1904 Paper
Binet and Simon’s Test of IntelligenceBinet and Spearman
Thomson and Spearman
Spearman and Thurstone OOmONNWN
—
2
THE STRUCTURE OF INTELLECT
The Theory of Fluid and Crystallized Ability 18Guttman’s Radex Theory 26Guilford’s Theory 28Gardner’s Theory of Multiple Intelligence 34Conclusion 40
3
g AND BASIC INFORMATION-PROCESSINGSKILLS: THE SEARCH
FOR THE HOLY GRAIL
Reaction TimeandIntelligence 50Inspection Time 62Infant Habituation 71Conclusion 77

v1
4
MULTIPLE AND COMPLEX
CORRELATES OF INTELLIGENCE
Multiple Cognitive Correlates of Intelligence 80
The Complex Correlates of Intelligence 97
Componential Analysis 103
Conclusion 124
5
BEHAVIOR GENETICS
OF INTELLIGENCE
Introduction 126
Twin Studies 128
Family Studies 137
Quantitative Estimates 150
Developmental Behavior Genetics 158
Special Abilities 164
Conclusion 167
6
ENVIRONMENTAL DETERMINANTS
OF INTELLIGENCE
Between-Family Environmental Effects 168
Interventionsto Increase Intelligence 174
Changesin Intelligence Attributable
to Education 186
Within-Family Environmental Influences 196
The Biological EnvironmentandIntelligence 206
Conclusion 214
7
BIOLOGICAL CORRELATESOF INTELLIGENCE
Anatomical and Physical Correlates
of Intelligence 217
Functional Properties of the Nervous
System andIntelligence 220
Conclusion 226
CONTENTS

CONTENTS
8
CONTINUITY AND CHANGEIN INTELLIGENCE
Is Intelligence Fixed? 228Life-Span Change 234
Conclusion 249
9
CORRELATES OF INTELLIGENCE
Intelligence and Education 252Intelligence and Occupations 272
OtherCorrelates of Intelligence 274Conclusion 279
10
GROUP DIFFERENCES
IN INTELLIGENCE
Black—White Differences 280The Intelligence of Japanese andChinese Groups 310
Gender Differencesin Intelligence 317
11
BEYONDIQ: SOCIAL INTELLIGENCEAND PERSONALITY
Social Intelligence 329
Personality and Intelligence 342
12
EPILOGUE: THE FUTURE
OF INTELLIGENCE
Research 349The Future of Tests 350
Literature Cited 357
Index 383
Vii


PREFACE
Science, politics, and ideology are linked in the study of intelligence.Beliefs aboutracial and genderdifferences in intelligence, the heritabilityof intelligence, declinesin intelligence amongthe aged,the relationshipsbetween intelligence and schooling, and the modifiability of intelligenceseem to be influenced by a complex mixture of ideology and science.Ifthis is true, it is not unreasonable to expect someone writing a volumeabout intelligence to explicate his or her political and ideological posi-tion. I will do so but not without a sense of reluctance. I prefer scientificanonymity and its implicit stance of objective neutrality.Myinterest in the field of intelligence began some twenty odd years
ago. My wife, Erness, was teaching Educational Psychology at RutgersUniversity, and she read Arthur Jensen’s article in which he suggestedthat racial differences in intelligence might have a genetic basis. Sheknew that I had becomeinterested in the behaviorgenetics of personalityand she asked me whatI thoughtof the article. I read the article andansweredhertruthfully that I knewlittle or nothing about the field ofintelligence. This was a curious omission in my knowledge since I waswriting a book about personality, and I thought of myself as an individualdifference psychologist. I had a course in graduate school devoted to theadministration of tests of intelligence. The information about intelli-genceI received in the course was often wrong andlargely irrelevant to anunderstandingof the natureof intelligence. I was disturbed about my lackof knowledge aboutintelligence. It seemed to me that this was an impor-tant dimension of individual differences about which I should knowsomething. Erness and I decided to learn as much as we could aboutintelligence. We were motivated by a desire to demonstrate that Jensen waswrong. Ourcollaboration led to the publication of a book by AcademicPress in 1976 Intelligence: Nature, Determinants, and Consequences.
If the world were as I would like it to be, what I think I have learnedaboutintelligence would notbetrue.I think that individual differencesinintelligence, as assessed by standardizedtests, relate to what individuals
ix

xX PREFACE
learn in schools and to their social mobility. And I think that scores onsuch tests are related, albeit weakly related, to race and social classbackground. In addition, I think we do not know howto substantiallymodify or eliminate individual differences in intelligence or the relation-ship between individual differences in intelligence and whatis learned inschools. As long as this is true, individual differences in intelligence willrelate to various importantsocial outcomes.In my utopia, children wouldbe equally capable of learning and everyone would be well educated. Dif-ferences in status associated with different occupations would be mini-mized or eliminated. Individual differences, in whatever would be analo-gous to intelligence in such a world, would beof little relevance. Thatworld is not the world in which welive. In our world, individual differ-ences in intelligence as assessed by standardized tests are important. Ihave tried to understand these differences and to write about them inwhatI hopeis an objective and honest way.
I have two beliefs that influence what I have written in this volume.First, the study of “traditional” issues surrounding individual differencesin intelligence remains important despite recent efforts to change thefield by renewed emphasis on theories and methodsderived from cogni-tive experimental psychology. I try to sketch someof the ways in whichthe traditional study of individual differences relates to the new experi-mental approach. Second, I believe that scientific analysis is capable ofleading us to an approximation of whatis “true.” I hope that mycriticswill discover the errors in what is written in this book and lead us to abetter understanding of individual differences in intelligence.There are eleven chapters in this volume. Thefirst two chapters describe
the structure of intellect. Chapter 1 is historical and deals with the worksof Binet and Spearman, amongothers. Chapter 2 deals with contemporarypsychometric analyses of the structure of intellect and includes a discus-sion of Gardner’s theory of multiple intelligence. Chapters 3 and 4 dealwith the experimental studyof intelligence. Chapter 3 is concerned withattempts to relate general intelligence to elementary cognitive processes,and Chapter 4 deals with more complex viewsof the basisof intelligenceand includesa discussion of componential analysis. Chapters 5 and 6 dealwith the behavior genetics of individual differences in intelligence. Chap-ter 5 focuses on genetic influences, and Chapter 6 is concerned withenvironmental influences. Chapter 7 contains a brief discussion of re-search on the biological basis of intelligence. Chapter 8 deals with sta-bility and changein intelligence over the life span. The three remainingchapters in the volume may be thought of as a discussion of sociallyrelevant issues related to intelligence. Chapter 9 explicitly considers therelationship between intelligence and socially relevant outcomes, includ-ing the relationship betweenintelligence and education. Chapter 10 dealswith race and gender differences in IQ. Chapter 11 considers dimensionsother than IQ that are related to social competence.

PREFACE X1
It is a pleasure for me to acknowledge someof the debts I accrued whilewriting this book. Bob Sternberg and Tony Vernonsent meprepublicationmanuscripts of books they are editing. Howard Ehrlichman and John Sim-monsread an earlier version of Chapter 10 and provided valuable com-ments. I benefited from discussions with a numberof colleagues aboutvarious issues; Ian Deary wasespecially helpful. Santina Scalia has beenwonderfully patient and hard working in dealing with my inadequacies asa typist and word processor. I am grateful for the good grace with whichshe typed and retyped manypages of this manuscript.And, finally, a special expression of love and gratitude to Erness who
first interested mein this field and taught me morethingsthanI will everknow—both about intelligence and many other far more importantthings. It is to her that I dedicate this book.


1HISTORICAL BACKGROUND
In the last two decadesof the nineteenth century, psychologists in Amer-ica, England, France, and Germanyattempted to measure individualdif-ferences in intelligence. In England, Galton (1879, 1883, 1885) developeda laboratory to measure individualdifferences in sensory functioning. Hebelieved that sensory discrimination ability was positively related to in-tellectual ability. Binet began his investigations of individual differencesin intelligence in France with observations on his daughters (Binet, 1890).In 1896 he and Henri (Binet & Henri, 1896) outlined a theoretical projectfor the developmentof a test of intelligence based on the attempt todevelop tests of several independent complex functionsor faculties whosecombined influence was assumed to determine an individual’s intellec-tual level. Binet and Henri were critical of the relatively widespread at-tempt to measureintelligence by the use of simple laboratory procedures.They believed that intelligence was best measured bytests of such com-plex functions as imagination, aesthetic sensibility, memory, and com-prehension.
Thefirst 20 yearsof research on intelligence accomplished little. Sam-ples were small, laboratory procedures were casual, and quantitative in-dices reporting relationships among measures were not used. In 1904,Binet and Simon presented a paper to a German psychological societyexpressing extreme pessimism aboutthe possibility of developing mea-sures that could be usedto assess intelligence in an objective way in alimited period of time (see, Wolf, 1973; for additional information aboutthe early history of attempts to measureintelligence, see Peterson, 1926,and Spearman 1904b). The methods of testing outlined by Binet andHenri were tentatively rejected in America by Sharp (1898-1899), whogave a series of tests to 7 Cornell University graduate students and con-cluded that the measures werenotrelated. In addition, she thought thatthey did not lend themselves to understanding fundamental psychologi-cal processesof the type studied in Cornell's influential laboratory found-ed by Titchener.

2 1. HISTORICAL BACKGROUND
The attempt to study individual differences in simple psychological
processes had also floundered. Cattell & Farand (1890) began series of
studies at Columbia University, culminating in an important paper pub-
lished in 1901 by Wissler (1901). Wissler was the first to use the coeffi-
cient of correlation to actually measure the relationship amonga set of
measures of simple psychological processes. He tested Columbia Univer-
sity students and found that the average correlation among the measures
wasclose to zero and that these measures were notrelated to measuresof
academic performance. The Sharp and Wissler studies were extremely
influential in America and did much to turn experimental psychology
away from the studyof intelligence for several decades.
Although little was accomplished in the first two decades of research
on intelligence, the two most important papersin this field were written
one year apart in 1904 and 1905. Spearmanpresented the theory of gener-
al intelligence in 1904 and Binet and Simon presented thefirst test of
intelligence that was similar to modern tests (Binet & Simon, 1905a,b,c;
Spearman, 1904b). Each of these seminal contributions involved creative
ways of thinking about traditional problems.
SPEARMAN’S 1904 PAPER
Spearman’s paperreported the results of a set of investigations designed
to test Galton’s observation that intelligent individuals had keener senso-
ry discriminations than individuals who werelowinintelligence. In addi-
tion, Galton had suggested that it would be valuable to study the rela-
tionship between measuresof sensory discrimination ability and ratings
of individual difference characteristics (see J. M. Cattell, 1890).
Spearman’s investigations were closely modeled on Galton’s sug-
gestions. He obtained measuresof the ability to discriminate visual, au-
ditory, and tactile stimuli and he related these measurestoschoolperfor-
mance in examinationsin different academic subjects as well as ratingsof
intellectual capacity for several samples of schoolchildren and one sam-
ple of adults. He found that the measures of sensory functioning tendedto be positively correlated with measuresof intelligence.
After obtaining these results, Spearmanbegana searchoftheliterature
and discovered Wissler’s paper reporting contradictory results. Spearman
(1930) stated that he would not have obtainedhis data if he had knownof
Wissler’s negative results. The discrepancy between the results he ob-
tained and those reported earlier led Spearman to undertake a review of
earlier studies using laboratory techniques to measure individual dif-
ferences in mental functioning.
Spearman hadfourcriticisms of the literature he reviewed. First, he
noted that, with the exception of Wissler (1901), earlier investigators had
not calculated quantitative indices of the relationships among their di-

SPEARMAN’S 1904 PAPER 3
verse measures. Theyrelied on subjective impressions. Spearman noted
that formulas for the calculation of the coefficient of correlation existedand that this statistical measure could be used to summarize the degreeof linear relationship between twosets of measures. Second, no one calcu-lated probable errors—a measure of the statistical reliability of the re-sults. Third, the experiments were poorly controlled and included manydifferent variables that might influencethe results. Fourth, there was nocorrection madefor the unreliability of measurement. Spearman (1904a!published a paper presenting techniquesfor calculating corrected coeffi-cients of correlation. In this article he presented formulas to correct ob-tained correlations in order to provide an estimate of the true relationshipbetween variables after the elimination of the influence of other vari-ables. These formulas includeda correction for attenuation. An obtainedcorrelation between two measures will always be lower than the hypo-thetical “true” correlation between the measures if the obtained mea-sures contain errors of measurement. Thereliability of a measure may beestimated and the obtainedcorrelation maybe corrected for unreliability.Spearman indicated that previous investigators had not corrected forat-tenuation.
Spearman’s theory was intimately connected with his data analyses.Spearmanasserted that he wasinterested in the relationship between thecommonandessential elements existing among his measures of sensorydiscrimination ability and his several estimates of intelligence. Accord-ingly, he obtained aggregated scores for his subjects by averaging theirscores on discrimination tasks and on the several estimates of intel-ligence. The correlation between these aggregates corrected for unre-liability of measurement was 1.00—the maximum possible value. Spear-manreached the conclusion that “the commonandessential elementinthe Intelligences wholly coincides with the commonandessentialele-mentin the Sensory Functions” (Spearman, 1904b).
Spearman assumed that all conceivable measuresof intelligence wererelated to a commongeneral intellectual function. It was not the case,however, that all measures of intelligence were equally good measuresofthe commonfunction. Spearman assumedthat the correlation betweenany pair of measures of intelligence was determined by the extent towhich they were both measures of the commonintellectual function. Heassumed that scores on a measure of intelligence could be partitionedinto two components—a general, or g, component and specific, ors,component. The g component is the componentthat is determined bythat which the measure has in commonwith all other measures of thecommonintellective function. The s componentis specific to each mea-sure. This implies that the correlation between any two measures ofintelligence will be determined bytheratio of g to s in each of the mea-sures. The higher the ratio, the higher the correlation. This theory isknownas the two-factor theory of intelligence.

4 1. HISTORICAL BACKGROUND
These assumptions have a number of empirical consequences. Theyimply that the matrix of all possible correlations amonga set of diversemeasures of intelligence should exhibit certain regularities. First, thematrix should exhibit a positive manifold. Thatis, all of the correlationsshould be positive. This follows directly from the assumption thatallmeasures of intelligence have a g component. Second, it should be pos-sible to rank order the measures in terms of their g-to-s ratio. SinceSpearman assumedthatthe correlation between any two measuresof thecommonintellective function is determined by the amountof g theyshare, it follows that the measure with the highest average correlationwith all other measures will have the highest ratio of g to s. A rankordering of the measures may be obtained from the averagecorrelation ofeach measure with all other measures. The rank-ordered measures maybe arrayed in matrix form as in Table 1.1. The rank-ordered matrix shouldbe one in which the correlations decrease as one goes across a row ordown a column and there should be no inversions of this order in the
matrix. Third, Spearman demonstratedlater that all possible sets of fourmeasures obtained from the set of all measures mustfulfill the law oftetrad differences (Spearman & Holzinger, 1924). The law may be ex-pressed as follows:
Tio X 134 = 113 * Tog
There are at least five respects in which Spearman’s paper may beconsidered an important contribution to our understandingof individualdifferencesin intelligence. First, the paper provides an explicit theoreticalrationale for the construction of tests of intelligence. Tests of intelligenceshould contain measures or subscales that have high g-to-s ratios. Thisprincipal has not always been followed. For example, the widely usedWechsler tests of intelligence have subscales whose average correlationwith all other scales is relatively low—in modern jargon—whose g load-ing is low. An additional principle of measurement that may be derivedfrom Spearman’s theory is that intelligence is best defined in termsof anaggregate index based on diverse measures of the commonintellectivefunction. Spearman called the use of aggregates the “hotchpotch”princi-
TABLE 1.1 A Hypothetical Matrix ofCorrelations among Five Tests?
Tests 1 2 3 4 5
1 .60 54 .48 36
2 45 .40 30
3 36 26
5 24
“The correlations satisfy the law of tetrad differences.

SPEARMAN’S 1904 PAPER 5
ple. And, as we shall see, Spearman believed that his theory provided arationale for the methods of measuringintelligence that were developedby Binet andhis collaborators. The hotchpotch principle implies thatit ispossible to obtain an estimate of an individual’s g level by using anyset ofintellectual measures that have g loadings. The aggregated score obtainedon an intelligence test with diverse subtests will be in substantial agree-ment with the aggregated score obtained on
a
test containinga differentset of g-loaded measures. Thisis referred to as the principle of the indif-ference of the indicator.
Second, Spearman developed methods for analyzing correlation ma-trices. Spearman’s methods were the foundation of factor analysis—astatistical technique that permits one to analyze the sources of varianceof a particular measure by examining thepattern of correlations betweenthe measure and other measures. Pearson (1901a,b], the statistician whodiscovered the formula for calculating the coefficient of correlation, de-veloped techniques for factor analyzing correlation matrices usingdiffer-ent procedures 3 years before Spearman published his paper. Spearmanwas thefirst to analyze a correlation matrix of psychological measuresand to indicate that the understanding of a particular measure can beobtained by an analysis of relationship between the measure and othermeasures. Spearman’s analyses may be construed as the precursor of theuse of construct validation procedures that assess the validity of a mea-sure by an investigation of the nomological network of laws andrelationssurrounding the measure.
Third, Spearman clearly understood thatintelligence is a construct andis a hypothetical entity. He would surely have thought a definition ofintelligence as that which the test measuresis bizarre. Since g was de-fined as a commonintellective function that is variably estimated by anyand all possible measures, including those that have not as yet beeninvented, it cannot be identified with any particular measure or subset ofmeasures.
Fourth, Spearman’s theory contains a strong empirical claim thatallmeasures of intelligence are measures of a single commontheoreticalentity. Whether this is correct or not is an issue of intense debate incontemporary research. There are contemporary theorists who, withsome modifications, would accept Spearman’s theory of general intel-ligence.
Fifth, Spearman assumedthat there is a relationship between intel-ligence and performance in relatively simple sensory discriminationtasks. This aspect of Spearman’s paper wasgenerally regarded as wrongifnot perverse. Binet reviewed Spearman’s papera yearafter its publicationand wrote: “He regards this conclusion as profoundly important.It maypossibly be. We ourselves are profoundly astonished at the conclusionbecauseof the very defective character both of the sensory experimentsofthe author and of the manner in which he determined or had others

6 1. HISTORICAL BACKGROUND
determine general intelligence . . . (Binet, 1905, p. 624, italics in original).American psychologists tended to accept Wissler’s researchas a definitivedemonstration that measures of simple psychological processes based onlaboratory techniques had a zero correlation with intelligence as ex-pressed in academicsettings. Spearman had twocriticisms of Wissler’sresearch. The subjects, or reagents as he called them, were Columbia
University students and weretherefore likely to be intellectually homo-
geneous. This “restriction in range of talent” must, of necessity, reduce
the magnitude of the obtained correlations. In addition, the conditionsofmeasurement were less than ideal. Subjects were tested three at a time
and were given 22 tests in 45 minutes. The experimenter also was re-quired to measure the head length and breadth of the subjects and torecord observations of several of the subject’s features.Whatis interesting about the virtually unanimousrejection of Spear-
man’s results indicating a relationship between sensory discrimination
procedures and moreglobal aspects of intellectual functioning is that
Spearman wasprobably correct. Deary (1986) has undertaken a carefulreview andreanalysisof all of the data obtained in the nineteenth centuryand for the first two decades of the twentieth century dealing with the
relationship between performance in simple laboratory tasks andesti-
mates of intelligence. Spearman obtained correlations of .66 and .56 be-
tween aggregated measures of sensory functioning and aggregated mea-
sures of intelligence as indicated by academic performance in two
different samples. Spearman had actually calculated the correlations in-
correctly. The actual correlations as recalculated by Fancher (1985) were
38 and .39. These correlations are comparable to the values obtained by
Spearman’s contemporaries. In addition, we shall review contemporary
research that indicates that measures of pitch discrimination that are
conceptually analogous to those used by Spearmanare correlated with
intelligence test scores. Thus it would appearthat the one aspect of Spear-
man’s paper that was assumedto be wrongor even absurd maybevalid.It
should be noted that Spearman withdrew his claims of an identity be-
tween discrimination ability and general intelligence in a footnote writ-
ten to a paper on a similar topic by Burt (1909-1910). He asserted that
discrimination ability and teachers’ ratings of intelligence were not iden-
tical but might better be understood as manifestation of some more fun-
damental theoretical cause. This formulation is one that is compatible
with the views of some contemporary psychologists.
BINET AND SIMON’STEST OF INTELLIGENCE
Binet and Simon’s papers represented the culmination of a decade-longeffort to develop a test of intelligence based on the theoretical analysispresented by Binet and Henri (Binet & Simon, 1905a,b,c, 1916). Unlike

BINET AND SIMON’S TEST OF INTELLIGENCE 7
Spearman, whose review of the mental testing movement of the 1890semphasized the lack of quantitative precision and experimental controlthat was characteristic of this effort, Binet thought that the work wasprecise buttrivial since it failed to measure the important humancharac-teristics that would define individual differences in intelligence. Binetbelieved that a successful test of intelligence would have to separatelymeasure several intellectual functions or faculties. And, he and Henriconcluded, after several years of work on this problem, that tests did notexist for several of the critical faculties. Therefore, it would be impossibleto measure an individual’s intellectual function in a restricted period oftime.
The immediate impetus to the developmentof the 1905 scale of intel-ligence was Binet’s interest in mental retardation. The French hadin-stituted universal education and the French ministry of education wasconcerned with the problem of educating individuals who wereclassifiedas morons,idiots, or imbeciles. It was recognized that there was no objec-tive method for diagnosing these conditions or for deciding whether achild was able to benefit from the ordinary instructional program of thepublic schools. A commission was formed, to which Binet was appointed,that was given the task of developing psychological and physical diag-nostic procedures for determining retardation.
Binet wanted to develop a testing procedure that would beeasily ad-ministered without special laboratory equipment and that would permitthe psychologist to distinguish between individuals with normal and ab-normal intellectual capacity. In order to accomplish this task he wasforced to abandon someof his theoretical commitments. Binet had beenfrustrated by his inability to measure each of the complex intellectualfaculties of intelligence. Binet simply abandoned the attempt to sepa-rately measure each faculty and decided to use complex tasks that mightbe influenced by several of the faculties. He cameto the conclusion thatany complex task must of necessity involve several complex functionsand that important intellectual functions such as judgment were mea-sured by any complex intellectual task. Thus, pure measuresofintellec-tual functions, uncontaminated bythe influence of certain omnipresentfunctions, were notattainable.
In order to develop a measureof intelligence it was necessary for Binetto think of a way of scaling items or intellectual tasks. Binet and Simonrelied on the method of age-graded norms for items used by Damaye(1903, as cited in Wolf, 1973). Intellectual tasks could be differentiated bya consideration of the age at which a typical child wasable to successfullycomplete each task. The use of age grading for intellectual tasks permitsone to define the mentalage of a person byreference to the characteristicage level of the intellectual tasks that an individual can complete. Al-though Binet had thought aboutintellectual development in age-relatedterms for manyyears, he resisted the tendency to use age-related norms
8 1. HISTORICAL BACKGROUND
as a basis for the construction of a measureof intelligence because of abelief that intelligence varied qualitatively as well as quantitatively. Binetthought the analogy between the reasoning processesof the child and theretarded person was not completely accurate. He and Simon continued tomaintain that these processes were qualitatively distinct in the very pa-pers in which they presentedtheir test of intelligence that relied on theimplicit assumption that one could measurethe intellectual capacities ofretarded individuals by comparing their functioning to children of differ-ent ages. Their theoretical assumptions were at variance with their mea-surement procedures.The actual test developed by Binet and Simon consisted of 30 items
arranged in order of increasing difficulty. On the basis of exploratoryresearch that was not completely described in their papers, the itemswere assigned an age equivalence. The test could be usedto arrive at aquasiobjective determination of the age-equivalent performanceof differ-ent groups of retarded individuals. The test is described here as quasiob-jective because the procedure for scoring performance permitted the ex-aminer to take into account qualitative features of performance on thetask. The tests could be administered in a relatively restricted period oftime and did not require any special laboratory facilities. The test pro-vided a simple and objective way of classifying different grades of retardedindividuals. Several of the items on the test are similar to those used incontemporary tests of intelligence.Binet published a new version of the test in 1908 (Binet, 1908). The new
version was based on additional empirical research and included morespecific age-graded groupingsof items. The 1908 test was also meantto beapplied to normal children in order to develop suitable instructional pro-gramsfor children at each grade level. A further revision of the scale waspresented in 1911 (Binet, 1911). The several versions of the tests weretranslated into English and used in America and subsequently becamethe basis for the Stanford—Binet test of intelligence (see Peterson, 1926;Terman & Childs, 1912). Binet never specified a method for developing asingle score from his tests. It remained for Stern (1912) to demonstratethat it was possible to calculate an intelligence quotient by dividing aperson’s mental age by their chronological age. This ratio, multiplied by100, was called the intelligence quotient or I.Q.
BINET AND SPEARMAN
Spearman provided a theory and Binet provided a test. Their contribu-tions continue to be important and certainly defined the world view ofpsychologists interested in intelligence for several decades. It would behard to imagine two individuals whose work coexisted in time andinflu-
BINET AND SPEARMAN 9
ence whoweresointellectually distinct. And, they disagreed about the
value of each other’s contributions. Spearman believed that Binet shouldhave used laboratory measures of the sort he evaluated in his originalresearch. Nevertheless, he recognized that Binet’s tests could provide anadequate measureof intelligence because his hotchpotchprinciple wouldapply to the set of items selected by Binet (See Spearman, 1923, 1927,1930). Spearmanfelt that the derivation of a single index or score on thebasis of performanceontheBinet tests was entirely appropriate since thescore must be construed as an estimate of g. He believed that his theoryprovided the intellectual foundation for the measurementofintelligenceby Binet. Binet (1905) thought Spearman’s attemptto relate intelligenceto simple laboratory measures was wrong and hedid not accept Spear-man’s theory of general intelligence. Although he was neverquite precisein his formulation, he thought of intelligence as consisting of severalrather distinct things that were involved in an unspecified way to deter-mine an average level of functioning. In onesenseit is clear that Spear-man hasthe better part of this argument. One cannot presume to mea-sure intelligence and to derive a single index unless in some way thathypothetical entity that is measuredis onething.If intelligence is manythings then a propertest or measure of intelligence mustresult in severalscores that reflect each of the distinct components of intelligence.Spearman and Binetalso differed with respect to their attitudes toward
abstraction and quantification. Binet resisted quantitative treatment. Hewas impressed with the complexity of the phenomena he studied andbelieved that numerical analyses could not dojustice to the qualitativelydistinct phenomena that the investigated. Spearman, by contrast, wasobviously at home in the realm of quantitative abstraction. He distrustedthe surface appearance of things and assumed that measurements werefraught with error. Thus he used quantitative indices and purified them inorder to understand conceptual relationships among variables that werenot immediately observable. This willingness to turn away from actualobservations is apparent in his decision to aggregate his several discrimi-nation procedures and his several measuresof intellectual functioning.This decision was justified by the assumption that there is a com-monality among the measuresthat transcends their obviousdistinctions.The presence of positive correlations among the several measures pro-vided only partial support for the decision to create aggregate indices. Thecorrelations were less than perfect and it would have been equally pos-sible to emphasize the distinctiveness of the functions measured by eachof the tests as well as their commonality. Binet would probably have beenmore interested in the former characteristic than the latter. Spearman’sdecision to aggregate his measures required a mind at homewith abstrac-tions—onethatis willing to turn away from things as they seem in orderto postulate an order amongthings that can only be imagined.

10 1. HISTORICAL BACKGROUND
THOMSON AND SPEARMAN
Spearman’s two-factor theory of intelligence wascriticized on both con-ceptual and empirical grounds. Spearman’s original presentation of thetheory left g as an undefined theoretical entity. In 1916, Thomsonpre-sented a theoretical interpretation of g that Spearman did not accept(Thomson, 1916). Thomson suggested that the law of tetrad differencesand the evidencein favor of the existence of a general factor in matricesofcorrelations of diverse tests of intellectual ability could be explained on atheory of the mind that he characterized as anarchic. Thomson assumedthat there was a large set of independent bondsor units in the mind. Anytest of ability is assumed to sample somesubsetof these bonds. Differenttests will sample different units of the total set. The expected value of thecorrelation between tests on this model will depend on the operation ofthe lawsof probability. If two tests both samplea relatively large numberof bonds, then one would expect simply on the basis of chance that theywould sample many bonds in common.If two tests each samplea rela-tively small numberof bondsor units the probability that they will sam-ple any units in commonis reduced. The expected value of the correlationbetweentests is solely a function of the number of bondsthey share incommon. Thomsonindicated that his theory explained the law of tetraddifferences without assuming that g was a single theoretical entity. Hecharacterized his theory as an anarchic model of the mind as opposed toSpearman’s monarchic theory of mind. Thus, for Thomson,the existenceof a single commonfactorof intelligence was expected by the operation ofthe laws of chance.Thomson and Spearman engaged in a heated debate for over 20 years
about the respective merits of their interpretations of the natureof g (seereferences in Dodd, 1928, 1929; Thomson, 1939). Spearman indicatedthat Thomson’s theory did not explain the law of tetrad differences sincethe theory implied that the correlation between tests would only approxi-mate the law. The actual correlations would vary depending on the lawsof chance that specified only probabilistic values of overlap among inde-pendently sampled units. By contrast, Spearman argued that his theoryspecified a deterministic model according to which the correlation be-tween tests of intellectual ability would be determined precisely by theamountof g they shared. Thomsonpointed out that this argument wascorrect but irrelevant since the law of tetrad differences was not preciselysupported by existing correlation matrices. Therefore, it was disin-genuous to argue that Spearman’s theory was superior to Thomson’s byvirtue of its ability to predict exact values satisfying the law of tetraddifferences if the exact values did not in point of fact exist in actualcorrelation matrices.Spearman also argued that Thomson’s theory implied that all indi-
viduals would have equal intellectual ability. Thomson correctly pointed

THOMSON AND SPEARMAN 1]
out that his theory could accommodate individual differences in intel-ligence by postulating that each individual possessed only a subset of theuniverse of bonds. Thomson assumedthat individuals differed in thenumberof bonds or units of intelligence that they possessed.With the benefit of hindsight, it appears that Spearman’s debate with
Thomsonwassterile. Both theories were able to accountfor the existenceof a generalfactor of intelligence. They differed metaphorically. Spearmantended to think of the commonfactor as a singular entity. He suggestedthat the factor mightbe related to the overall energy of the mind. Spear-manalso developed a theory of intelligence based on cognitive principles.He assumedthattests that had high g-to-s ratios called for the “eductionof relations and correlates” which he defined as follows:
The eduction of relations ... when a person has in mind any two or moreideas (using this word to embrace anyitems of mental content . . .) he has moreor less powerto bring to mindanyrelations that essentially hold between them.
It is instanced whenever a person becomesaware, say, that beer tastes some-thing like weak quinine . .. or that the proposition “All A is B” proves theproposition “Some A is B”...
The eduction of correlates ... when a person has in mindanyidea togetherwith a relation, he has moreor less powerto bring up into mindthecorrelativeidea.
For example, let anyone hear a musical note and try to imaginethe note afifth higher .. . . (Spearman, 1927, pp. 165-166]
The principle of eduction of correlates and relations provides a simple,if somewhat vague, characterization of g. The theory has never beenfor-mally tested but it has been used on occasion as a way of distinguishingamongtests that differ in their g-to-s ratio. This use of the principle israther informal since there is no quantitative method of assigning educ-tion of correlates and relations values to measures.Contemporary research and theory have not resolved the theoretical
debate between Thomson and Spearman. Contemporary theorists whoremain committed to a modified version of Spearman’s two-factor theorydiffer with respect to their interpretations of g. Humphreys (1976, 1985,1989}, for example, has endorsed a theoretical interpretation of the gener-al factor in intelligence that is based on Thomson’s theory. He assumedthat there are many different facets or determinants of the indefinitelylarge numberof potential measuresof intellectual ability. It is possible todefine an indefinitely large numberof relatively homogeneoustests thatdiffer in only onefacet and thus will exhibit correlations of less than 1.00.At the same timethe correlation between such independenttests willtend to be positive since they are likely to share facets in common.Eysenck (1988) stated that Spearman’s principle of the eduction of
correlates and relationsstill provides the best definition of g. There iseven contemporary research on intelligence that is reminiscent of Spear-

12 1. HISTORICAL BACKGROUND
man’s energy theory. Haier, Siegel, Neuchterlein, Hazlett, Wu, Paek,Browning, & Buchsbaum (1988) related individual differences in intel-ligence to measuresof the overall metabolism of the brain. They reporteda high negative correlation between a measureof the energy expenditureof the brain andscoreson a test of abstract reasoningability. Individualswhoscore high on a test of intelligence have brains that exhibit lessactivity during the test than individuals who score low on thetest. Thesefindings may be viewedas providing support for a contemporary versionof Spearman’s theory of mental energy.The dispute between Thomson and Spearman maybetreated as a meta-
phorical difference in ways of thinking about the general factor in intel-ligence. It is also the case that different metaphors may havedifferenttheoretical consequences and maylead investigators to suggest differentresearch problems. It is sometimes possible to resolve such issues em-pirically. Loevinger (1951) argued that it is difficult to test Thomson’stheory becauseit is without specific empirical consequences. By contrast,Willerman & Bailey (1987) argued that observations of individuals whohave sex chromosome anomalies or sensory handicaps provide evidencethat contradicts Thomson’s theory. Females with Turner’s syndrome, wholack a portionorall of the second X chromosome,havepoorspatial abilityand havedifficulty in dealing with the Block Design test on the Wechslertest of intelligence. They do not exhibit deficits on the verbal subtests ofthe Wechsler.It is also the case that individuals with Turner’s syndromeexhibit correlations between spatial and verbal measuresof intelligencethat are not substantially different from the correlations obtained fromindividuals who do not have Turner’s syndrome. The existenceof a cor-relation between different tests implies, on Thomson’s theory, that theitems must share elements or bonds in common.If an anomaly influ-ences a specific intellectual function, then the elements thatare affectedought to influence performance on related tasks. Willerman and Baileyasserted that correlations among different intellectual components thatare shownbytheir differential responsiveness to anomalies to be indepen-dent might come about because of correlated qualities of independentneural machinery subserving different intellectual functions.The Willerman and Bailey argumentis not decisive for at least two
reasons. Evidence that anomalies may influence one typeof intellectualfunction withoutaffecting a correlated but independentintellectual func-tion contradicts Spearman’s theory as well as Thomson’s theory. If thereis a single commonintellectual faculty, then anything that influencesperformance on one type of task should influence performance on otherintellectual tasks. Thomson’s theory is a theoretical account of Spear-man’s two-factor theory. Evidence that contradicts both theories cannotbe used to support one theory over the other. In addition, it is not clearthat Thomson’s theory of bonds is contradicted by the assertion thatneural machinery exists that subserves entirely different intellectual

SPEARMAN AND THURSTONE 13
functions. One could argue that the commonelementsthatlead to rela-tionships amongdiverse intellectual functions may be conceivedas oper-ating by a sampling principle. Thomson (1939) indicated that the bondsthat are sampled maybe locatedin diverse areas of the brain and need notbe physically contiguous. It is possible that Loevinger’s analysis is cor-rect. Thomson’s theory is simply too vagueto be tested. It remains on thelevel of a metaphor.
SPEARMAN AND THURSTONE
Spearman’s theory was subjected to a more fundamental criticism onempirical grounds. Matrices of correlations amongability tests did notfitthe law of tetrad differences. Spearman was awareof this problem asearlyas 1906 (Spearman & Kreuger, 1906). Tests of intelligence that appeared tobe similar with respect to the kindsof intellectual functions they mea-sured would exhibit correlations that were too high. For example, in acorrelation matrix derived from a battery of tests of spatial visualizationfunctioning and verbal tests, the correlations among tests belonging toeach class of measuresis likely to be higher than those expected on thebasis of Spearman’s theory. The discrepancy occurs because the correla-tions between tests belonging to the two separate classes of measures arelikely to be lower than the correlations amongtests belonging to the sameclass. It is apparent from this hypothetical example that correlations be-tween tests would be determined notonly by a sharedgeneralintellectualfactor but also by similarity in specific factors that are common to asubset of measures. This contradicts Spearman’s assertion that specificfactors are uniquely presentin each intellectual test. Spearman attemptedto trivialize this problem by indicating that tests may be only super-ficially different. A test of letter cancellation in which a subject is re-quired to cross out all instances of the letter “e” is only superficiallydifferent from a test of letter instancesof the letter “t’”. Spearman arguedthat such superficial similarities between tests would lead to high cor-relations simply because each test wasreally a parallel version of theother. This analysis is wrong. Tests that are not superficially equivalentto each other exhibit high correlations that cannot be solely accounted forby their sharedrelationship to a general intellectual factor. Such evidenceconstitutes a decisive refutation of Spearman’s theory. This implies thatrelationships amongtests of intelligence cannot be accounted for by asingle commonintellectual ability factor.While Spearman was aware that his theory had been empirically re-
futed, he continued to emphasize the importance of the commonintel-lectual factor. He tended totreat the possible existenceof specific abilityfactors as minor perturbationsof little general importance. It remainedfor an American psychologist, Thurstone, to construct a theory of intel-

14 1. HISTORICAL BACKGROUND
ligence based on the existence of specialized intellectual abilities.
Thurstone (1938) argued that Spearman’s theory was flawed on concep-
tual grounds and provided a misleading foundation for the measurement
of individual differencesin intelligence. He believed that there were sepa-
rate intellectual abilities that were unrelated to each other. An adequate
representation of a person’s intelligence would therefore require the spec-
ification of a person’s score on each of several ability factors. Thurstone
believed that such a representation would provide a moreaccurateassess-
ment of the strengths and weaknesses of a person and would be diag-
nostically superior to an evaluation that was based ona single score.
Thurstone developeda statistical procedure called multiple factor anal-
ysis that permitted him to analyze correlation matrices to determine the
number of independent factors or dimensions that were required to ac-
count for the relationships among the tests in the matrix (Thurstone,
1931). For this purpose, Thurstone began with several assumptions about
the structure of measures of intelligence. He assumed that there were
several independent ability factors. This assumption implies that a per-
son’s score on one ability factor is unrelated to the person’s score on
another factor. The numberof ability factors that existed in a set of
diverse tests was smaller than the numberof tests. Each test was assumed
to be a measure of one or more factors. A person’s score on a particular
test could be represented by an equation representing the sum of the
cross-products of the person’s score on eachof the factors that determine
performanceon thetest and a weighting of each factor based on its impor-
tance in determining performanceon thatparticulartest. In the case of a
test determined by twoabilities, the equation may be written as follows:
5 = a,X, + a)X>, where s equals the person’s score onthetest, x, and x,
represent the person’s score on the factors that determine performance on
the test, and a, and a, represent the weightings of the factors in termsof
their importance in determining performanceonthetest.
Multiple factor analysis is a technique for discovering the numberof
independentfactors present in the matrix of correlations that must be
postulated to accountfor the obtained correlations. While the statistical
procedures involved are complex, the basic concepts underlying thepro-
cedure are fairly easy to comprehend. Imagine a matrix of correlations
derived from tests of mathematical reasoning ability, spatial reasoning
ability, and verbal ability. Imagine that correlations amongtests belong-
ing to each of these subsetsare relatively high and correlations betweenpairs of tests belonging to different subsets are relatively low. In such acase, it is intuitively obvious that one would have to postulate three
different relatively independent factors or dimensionsto accountfor thepattern of correlations obtained in the matrix. The end result of a factoranalysis is the creation of a factor matrix that specifies several indepen-dent factors and the relation of each of the tests to the factors. Therela-tionship between a test and a factor is called the loading of a test on a

SPEARMAN AND THURSTONE 15
factor and is represented as a hypothetical correlation betweenthetestand thefactor. The set of loadings of a test on each of the factors providesan analysis of the extent to which performanceona test is determined byeach of the factors. Thefactor analysis partitions the variance of scores ona test into separate components of variance representing the contribu-tions of each of the factors to performance onthetest. Thefactor analysisalso permits oneto assign a score to an individual on each of the indepen-dent factors that are assumedto be represented in the matrix. A person’sscore on a factor is determined by his or her performanceontests thatload on the factor.
There are a numberof different criteria and procedures available fordetermining the numberof factors that must be postulated to accountforthe matrix of obtained correlations. Thurstoneused the principle of sim-ple structure to define factors. The factor analyst seeks to define factorsthat will maximize the loading of each test on one or morefactors andlead to zero loadings of the test on remainingfactors. In the limiting case,each test will load on a single factor. If a test does not load on a factoritisassumedthat factor does not determine performanceon thetest.Thurstone reported the first test of his theory in 1938. He obtained
scores on a battery of 56 tests from a sample of 240 volunteers who werestudents at universities. He factor analyzed the matrix of correlations andobtained 13 factors. Of these, 9 were assigned a psychological label. Thelabels were spatial, perceptual, numerical, verbal, memory, word fluency,inductive, arithmetical reasoning, and deduction. Thurstone believedthat his study had conclusively demonstrated that Spearman’s theory wasincorrect. He replaced the general factor with several independentfactors.Thurstone’s rejection of Spearman’s theory was premature. Thurstone
(1938) noted that the vast majority of correlations in his matrix werepositive and the median correlation among theset of correlations fellwithin the class interval .25 to .35. The correlations among independenttests of ability tended to be positive or zero. He accountedfor the pres-ence of positive correlations by indicating that most tests of intellectualability in common use were psychologically complex, containing load-ings on several factors. This would provide a basis for a relationshipamongtests since any pair of tests was likely to share a commonloadingon one or morefactors. An alternative interpretation of this findingis thatthe existence of positive correlations amongthetests is attributable to acommonintellectual ability factor—Spearman’s g. Thurstone’s study didnot provide an ideal vehicle for distinguishing between his theory andSpearman’s theory. Thurstone had made the same error that Spearmanhad accused Wissler of making 30 years earlier. The use of universitystudents had restricted the range of talent of individuals in general intel-ligence thereby decreasing the magnitudeof the correlation amongtestsof ability. If the average correlation amongtests were larger, it would bemore difficult to obtain a factor solution in which independentfactors

16 1. HISTORICAL BACKGROUND
satisfied the requirementsof simple structure. As the average correlationamong tests increases, tests tend to have higher loadings on all of theindependent factors and zero loadings of tests on factors cannot be ob-tained.Thurstone’s conclusions about the absenceof a g in his matrix of cor-
relations were challenged by Eysenck (1939}, who reanalyzedhis correla-tion matrix using a method that permitted him to define the generalfactor in the matrix. He found that g accounted for 30.8 percent of thevariance in the matrix. After removing the variance in the matrix attrib-utable to g, Eysenck defined eight specific factors that were similar tothose defined by Thurstone. The variance accounted for by these factorsranged from 6.61 to .97% of the variance in the matrix. Thus, on Ey-senck’s analysis, g accounted for substantially more variance than any ofthe individual factors. Carroll (1988) calculated the percentage of varianceof the general factor and the specific factors in each of the tests inThurstone’s battery using the results of Eysenck’s factor analysis. Carrollfound that g accounted for approximately half of the variance of scores onthese tests and that specific factors accounted for the remainingvariance.It should be noted that the relative importance of g and of specific factorsin Thurstone’s results is influenced bytherestriction in rangeof talent ofthe subjects used by Thurstone.If Thurstone had used a morerepresenta-tive sample, the importance of g relative to specific factors would beincreased. This analysis implies that individual differences in perfor-manceonthetests used by Thurstone could be accounted for by a generalfactor and one or more specific factors of the type postulated byThurstone.By 1941 Thurstonerealized that his research had not conclusively dem-
onstrated that Spearman’s theory was wrong (Thurstone & Thurstone,1941). In his subsequent factor analytic investigations Thurstone usedsamples of children who were notrestricted in range of talent for generalintelligence. He found that he was notable to define a factor solution thatpostulated the existence of independent factors and that satisfied therequirementof simple structure. Thurstone’s solution to his problem wasto change his way of defining factors. In his original factor analysesThurstone had defined factors that were unrelated to each other. Thesefactors are called orthogonal. Thurstone abandoned orthogonal solutionsfor oblique solutions that permitted factors to be correlated or related toeach other. It is possible to illustrate the import of this procedure by asimplified example. Assumethat a psychologist administered a battery oftests containing subsets of tests of verbal and spatial ability. Assumefurther that the average correlation amongverbal subtests was .70 and theaverage correlation amongspatial tests was also .70. Assumefurther thatthe average correlation between a spatial and a verbal subtest was.40.Ifone were to factor analyze this matrix of correlations it would be possibleto identify two independentfactors. It is also apparent that tests that
SPEARMAN AND THURSTONE 17
loaded highly on one of the factors would have a positive loading on thesecondfactor and the factor solution would notsatisfy the requirementsof simple structure. One way of attaining simple structure for such amatrix would be to permitthe factors to be related to each other. Such anoblique solution in this case wou!d require the factors to be correlated .4.Simple structure could be obtained at the expense of permitting the fac-tors to be nonindependent.The use of oblique factor analysis left Thurstone without a convincing
refutation of Spearman’s two-factor theory. What accounted for thepositive correlations amongthe factors? One could argue that the factorswere correlated because of the existence of a general factor. It is possibleto demonstrate this by additional statistical manipulation of the correla-tion matrix. It is possible to perform a second-orderfactor analysis of thecorrelation matrix formed by examiningthe correlations amongfactors.A general factor might emerge that was identifiable as Spearman’s g. R. B.Cattell (1941) indicated that Spearman’s theory and Thurstone’s theorymight be reconciled by postulating the existence of a hierarchical struc-ture of ability. The factor g is a general factor present in all measures ofability. Thurstone’s factors are represented at a lower level of abstractionin the hierarchy. Thusthe higher-orderfactor is defined by a widerset ofvariables (tests) than any of the individual factors that collectively defineit. The g factor is assigned a singular position at the apex of the hierarchyand may be thought of as a commonfactor that is present in all of thetests. The g factor is derivable from the relationships that exist among themore specialized factors postulated by Thurstone.This historical survey has traced the development of a theory of the
hierarchical structure of abilities whose outline was clearly establishedby 1941. In the next chapter several contemporary theories of the struc-ture of abilities will be considered and we shall compare them to thehierarchical structure of ability developed at the beginning of the fifthdecade of this century.

2THE STRUCTURE OF INTELLECT
THE THEORY OF FLUIDAND CRYSTALLIZED ABILITY
Description
R. B. Cattell (1941, 1963, 1971, 1987; see also Horn, 1985) believed thatsecond-order factor analyses provided evidence for more than one second-order factor. He suggested that Spearman’s g could be divided into twoseparate factors called fluid and crystallized ability. He subsequently ar-gued that there was evidencefor the existence of five-secondorderfactors(Horn & Cattell, 1966).The distinction between fluid and crystallized ability was closely relat-
ed to a theoretical analysis of two types of intellectual factors calledintelligence A and intelligence B developed by Hebb (1942) on thebasis ofobservations of intellectual changes in individuals following braindamage.Intelligence A was basic biological capacity to acquire knowl-edge. Intelligence B was an ability that was influenced by acculturation.Cattell was also influenced by research conducted by Spearman andhisstudents in the 1930s dealing with attempts to derive measuresofintel-ligence that had high g-to-s ratios. Tests of perceptual analogies andclas-sifications were assumedto be good measuresof g. Such tests wererela-tively independentof tests of scholastic achievement and knowledgethatwas acquired in schoolsettings.
Cattell’s theory was based on theresults of factor analytic investiga-tions that started with Thurstone’s primary mentalability factors. Sec-ond-order factor analysis of oblique factors led to a distinction betweentwo second-order factors labeled g; and g, (R. B. Cattell, 1963). Factor gy,
18

THE THEORY OF FLUID AND CRYSTALLIZED ABILITY 19
fluid ability, was defined by tests that were assumed to measure thebiological capacity of the individual to acquire knowledge. Factor Zo)crystallized ability, was defined by tests that were assumed to measurethe influence of schooling and acculturation. Thefactor with the highestloading on the second-orderg. factor was verbal ability. Tests of vocabu-lary measure g.. Inductive reasoning and spatial reasoning factors tend toload highly on the second-order g, factor. Cattell developed culture-fairtests of intelligence that were designed to present individuals with novelproblemsof reasoning using common elementsof experience. Thetestswere assumedto be good measuresof the ability to educe correlates andrelations adumbrated by Spearman. Figure 2.1 presents items from theCattell Culture-Fair tests. Such items measure g, rather than g..
Cattell’s theoretical interpretation of g, and g. has several deductiveimplications. Changesin the biological state of the organism influence &,more than g.. Intellectual ability may be influenced by brain damage,prenatal insults, and nutrition. These events influence g, more than g..Cattell believed that genetic influences were stronger on g, than on g..Cattell also argued that there were age-related changes in the functioningof the brain that lead to an inevitable age-related decline in g,. By con-trast, g, does not decline with age. Changes in the quality of schooling
Series Choose onetofill dotted square.
aeaeigdeaeeeClassification Choose odd one.
\7 EN G peOY
Topology Choose one wherein dot could be placed asin item onleft.
&] Pe] O &! @Analogies Chooseoneto complete analogy.
Artie OASMatrices Chooseonetofill empty square atleft.
Cot
(49S4 -
Ni |] LLN by
FIGURE2.1 Items from the Cattell Culture-Fair test (based on R.B. Cattell, 1971).
YY
ASSN

20 2. THE STRUCTURE OF INTELLECT
and other attempts to changeintelligence by providing improvedintellec-
tual socialization experiences influence g, more than gy.
Cattell also developed a causal analysis of the relationship between g;
and g.. The g, factor is more likely to influence g, than g,is likely to
influence g,. This assertion is related to the fundamental distinction be-
tween ability and achievement. To assert that one has an intellectual
ability is to assert that one has a capability or potential that may or may
not be actualized. An achievement, by contrast, represents the attain-
ment of something for which ability is a necessary condition. Thusit is
not possible to acquire knowledge in the absence of the ability to learn.
Onecould havethe ability to learn but, for a variety of reasons, one may
not acquire knowledge. A person with the ability to learn may have been
deprived of the opportunity to learn or, for temperamental or moti-
vational reasons, may choose not to actualize the ability. This implies
that ability measures should stand in a causal (but not a unicausal)rela-
tion to measures of achievement. At the same time achievements(intel-
lectual attainments) can influenceintellectual abilities. One can acquire
knowledge and algorithms that change one’s ability to acquire new
knowledge. This implies that the relationship between abilities and
achievements is a complex onethat changesover time. While abilities are
initially the necessary condition for achievement, achievements can
eventually influence abilities. Cattell’s causal analysis of the g,-g, dis-
tinction replicates the ability—achievementdistinction in the domain of
ability. That is, fluid ability is initially a necessary condition for the
developmentof crystallized ability.
Cattell’s second-order factor analyses of Thurstone’s primary mental
abilities factors provided evidence for additional second-order factors.
Cattell was able to identify five different second-orderfactors. In addition
to g, and g., he identified a visualization factor, a memory factorrelated to
retrieval capacity, and a cognitive speed factor (see Horn & Cattell, 1966).
The second-order factors identified by Cattell were not orthogonal.
This permitted Cattell to perform a third-order factor analysis of the
second-order factors. At the third order, Cattell defined two factors—an
educational effectiveness factor anda factor hecalled historical fluid abil-
ity. Factor g, was the factor with the highest loading on thehistoricalfluid
ability factor and g. was the factor with the highest loading on the educa-
tional effectiveness factor.
In recent years muchof the researchrelated to Cattell’s theory has been
conducted by Horn (1985). Horn modified the theory while maintaining
the essential commitmentto the importanceof the g,—g, distinction. He
believed that five second-order factors were necessary to account for the
relationships amongfirst-order ability factors. Table 2.1 presents a repre-
sentative five-factor solution obtained by Horn for a series of measures
used by cognitive psychologists. Horn does not proceed to a third-order
analysis.

THE THEORY OF FLUID AND CRYSTALLIZED ABILITY 21
TABLE 2.1 Second Order Oblique Factors2.>
Primary factors Symbol ga Asd Be 8 &y h2
AuditoryDiscrimination among sound
patterns DASP 50 15 .00 21 —.04 .68Maintaining and judging
rhythms MaJR 35 —-04 -.07 -.09 29 32Temporaltracking of sounds Tc 29 —-.07 04 .26 .20 61Auditory cognition of relations ACoR .23 .08 17 24 -.11 .47Auditory immediate memory Msa 22 -—-.01 —.04 55 -.18 -—.59Speech perception under
distraction/distortion SPUD ll 61 -.02 -.05 —-.08 53
Auditory acuity Ac -.01 39 —.15 01 04 .26Listening verbal comprehen-
sion Va ll .30 43 .08 .03 .66
Visual
Verbal comprehension V -.07 —.16 50 16 —-.16 .69
Semantic systems EMS 02 -.11 ol -.16 —-.01 00
Semantic relations CMS -.03 -—.04 47 17 —.05 73
Induction I —.07 01 .28 26 13 59Figural relations CFR 00 -.05 -.04 57 .09 61Visualization Vz ~.05 —-.05 .0O .46 .24 54Figural classes CFC 01 02 10 19 .40 .28
Speed closure Cs —.09 22 14 19 .20 41
Flexibility of closure Cf 02 -.15 -.11 .08 50 32
Spatial operation S —.05 02 -.10 .06 .47 31Visual memory Mv 04 -—-.16 .16 .00 .16 .18
Factor intercorrelations Za — 28 04 39 44Asd 28 — .OO 28 34
Bc 54 0O — 62 494 39 .28 62 — 41
Zy 44 34 39 41 —=r 191 1.15 1.63 1.70 1.67
“Based on Horn & Stankov (1982).
bAbbreviations: g,, auditory ability; Asd, auditory sensory detection; g,, crystallized ability;
g-, fluid ability; g,, visual general ability.
Horn’s second-order factors are closely related to Cattell’s. Horn usedcognitive measures to derive second-orderfactors rather than Thurstone’sprimary mental abilities factors (see Horn & Stankov, 1982; Stankov &Horn, 1980). Where Horn differs most fundamentally from Cattell is inhis theoretical interpretation of the meaning of the factors. Horn did notinterpret g, as a biological ability factor. He asserted that fluid andcrystallized ability are equally heritable although they maybe subject topartially independentgenetic influences. He assumedthat there are sepa-rate and distinct physiological and cultural influences on theseabilities.Fluid and crystallized ability develop along partially independent path-

22, 2. THE STRUCTURE OF INTELLECT
ways and g, is not causally privileged with respect to its influence on g..Horn accepted Cattell’s theory of the effects of age on these abilities.
Figure 2.2 presents a summary of Horn’s theoretical conception of theorganization of abilities. Note that Fig. 2.2 presents both g, and g. asbroad abilities that are related to the eduction of relations in Spearman’ssense. They are influenced to different degrees by other broad abilityfactors. In this representation, g, and g. are assignedprivileged status withrespect to other second-orderability factors. It is apparent that, throughsomewhat different conceptual and empirical routes, Horn and Cattell
Intensional —y Extensional Relation
Knowledge eduction
9s A
Adulthood Fluid Deep ProcessingA Ability
PerceptualIs , ‘organization
Clerical Broad
Youth speed
/
Reaction
{
AuditoryA time Thinking
Dealing withvisual novelty
Awareness CDS .;Correct Association
decision processingspeed A
SAR
. Short-term TSRChildhood acquisition Long-term
retrieval Storage
Retrieval
Vsd AsdVi :Infancy sensory Sensorimotor ‘sensory senso
detectors circular activities detectors P
Developmental Information-processinghierarchy hierarchy
FIGURE 2.2 Representation of Horn’s theory of intelligence (based on Horn, 1985}.

THE THEORY OF FLUID AND CRYSTALLIZEDABILITY 23
arrived at structural theories that are quite similar. Cattell proceedsthrough third-order factor analysis to arrive at two factors that are closelyrelated to fluid and crystallized ability factors derived from second-orderfactor analysis. The educational effectiveness factor and the historicalfluid ability factor may be construed, without excessive distortion, asfactors that preserve a privileged hierarchical status for g, and g.. Similar-ly, the theoretical schemepresentedin Fig. 2.2 assigns a privileged hier-archical status to g, and g. relative to other second-orderabilities. Hornassumedthat the abilities represented in Fig. 2.2 are hierarchically relat-ed. Complex abilities derive from developmentally primitive and simplesensory detection functions and associational abilities. The distance fromtop to bottom of the hierarchyis inversely proportional to the magnitudeof the correlations amongthe abilities. This implies that the correlationbetween complex abilities and g, and g, will be higher than thecorrela-tion between abilities based on developmentally prior and less complexinformation-processing characteristics and g, and g..
Evaluation
A full evaluation of the theory of crystallized and fluid intelligencere-quires a consideration of evidence on changesin intelligence with age,research on the behavior genetics of intelligence, and a consideration ofthe relationship between simple and complex measuresof ability. All ofthese topics are considered in subsequent chapters. In this chapter weshall consider the factor analytic evidence related to the distinction be-tween g, and g..Both Horn and Cattell propose to replace Spearman’s conceptof g with
a theory that assumesthat it is necessary to distinguish between twotypes of abilities, g, and g.. In effect, both theorists propose that Spear-man’s g is no longera scientifically useful construct. The evidence infavor of this position would befar less equivocalif g, and g. were indepen-dent. In point of fact they are not. The correlation between g, and g.factors in most studies is close to .5. It is possible to argue that it isnecessary to introduce a superordinate g factor in order to explain therelationship between g, and g.. We shall consider several different kinds ofevidence that suggest that the distinction between g, and g. does notconstitute decisive evidence against Spearman’s theory.Table 2.2 presents a summary of several third-order factor analyses
undertaken by Cattell. For three of the four analyses (those for the threeyoungest samples) the loading of the g, factor is higher on the historicalfluid ability factor than the loading of the g, factor on the educationaleffectiveness factor. The study using adult criminals is the only studythat includes the five second-orderfactors identified by Cattell. Here thepattern of results is somewhat different. The g,. factor is substantiallyloaded on the educational effectiveness factor and hasa near zero loadingon the historical fluid ability factor. The remaining second-orderfactors

TABLE 2.2 Cattell’s Summary of His Higher-Order Ability Analyses
A. Children
Educational Possibleeffectiveness maturity
gdh) factor factor
5- to 6-year-olds (114)
ZF 94 —.06 13Rc 41 38 —.12Personality
Factor X 10 89 .03
Factor Y 01 -.01 939- to 12-year-olds (306)
Re .70 —.02 25Bo 57 .48 —.06
Anxiety —.09 07 32Personality
Factor 1 —.41 .OO0 05
Factor 2 —.02 62 .04
B. Teenagers and Adults
Generalpersonality
Educational factor
effectiveness
gh) factor Alpha Beta
13- to 14-year-olds (277)
Re .69 .OO 02 —.07
Ze 63 32 —.04 07Anxiety
ULL. 24 —.01 79 -.51 —.07Exvia
ULI. 32 18 23 01 .00Corteria
U.I. 32 .O9 32 —.52 —.07
Personality
Factor A .O1 —.05 99 — .03
Factor B .0O 04 .03 —.74
Factor C 02 .06 —.69 .08Adult criminals (477)
ge 53 02 ~.08 ~.10Ze ~.04 73 20 08gy 42 —.21 —.08 —.40
Zs .60 ~.01 33 10By 57 38 —.13 18Person
ULL. .0O 11 —.32 — .66Anxiety
ULI. 24 — .03 —.41 -.31 02
Personality
Factor A .0O -.01 45 —.00
Factor D 34 .00 11 21
“Based on R.B.Cattell (1971).
24

THE THEORY OF FLUID AND CRYSTALLIZED ABILITY 295
are all more substantially correlated with the historical fluid ability fac-tor than with the educational effectiveness factor. These analyses indi-cate that, at the third order, the factor that is more closely related to fluidability accounts for more variance than the factor associated withcrystallized ability.
Humphreys (1967) reanalyzed Cattell’s study of 13- to 14-year-old chil-dren included in Table 2.2. He derived a two-factor solution for these data.In his solution, all of the Thurstone ability factors and Cattell’s culture-fair intelligence tests that are assumedto be measuresoffluid ability hadloadings ranging from .44 to .64 on thefirst factor. This factor is broaderthan the g, and g. factors. A second factor was defined by the Cattellculture-fair tests of ability. It had loadings from .20 to .35 on thefactor.This factor was not well defined by anyof thetests. It weakly resembles afluid ability factor. Humphreys found that the two factors were correlated.57. In Cattell’s solution the correlation betweeng, and g, for these data is.44. Humphrey’s analysis indicates that Cattell’s data provide substantialsupport for a single general factor that encompasses both g, and g..Humphrey’s factor solution has much in commonwiththehierarchical
models used by British psychologists such as P. E. Vernon (1961), whofirstdefined a general factor and then proceeded to define twofactors calledv:ed and k:m.Factor v:ed standsfor a verbal—educational factor and k:mstands for a mechanical—spatial ability factor. Vernon, like Humphreys,retained a superordinate g factor in his analyses.Evidence for the existence of a single general factor is also present in
the factor analyses performed by Horn.Table 2.1 presented theresults of afactor analysis of auditory and visual tasks reported by Horn & Stankov(1982). The correlations amongthefive factors obtained in their solutionare presented at the bottom of the table. Note that the correlation be-tween the fluid and crystallized ability factors is .62—a value that ishigher than the loading of any test in the matrix with any of the fivefactors derived by Stankov and Horn. Thefactor with the highest averagecorrelation with the remaining four factorsis the fluid ability factor. Thecorrelations between the fluid ability factor and the other factors rangefrom .28 to .62. The auditory comprehension factor, labeled Ac in thetable, has the lowest correlation with thefluid ability factor. It is a factorthat is not well defined by the existing tests in the matrix. A test ofspeech perception underdistraction loads .61 on the factor. No othertesthas a loading in excess of .4 on thefactor. It is also the case that the fivefactors extracted by Stankov and Horn are notwell defined by the existingtests in the matrix. Only the crystallized and fluid ability factors aredefined by two tests that have loadings in excess of .5, and nofactorisdefined by two tests with loadings in excess of .6. The five-factor solutionis not compelling—there is considerable evidence in the matrix for ageneral factor that is related to all of the other factors in the matrix.The strongest evidence for the existence of a single general factor in
matrices of correlations designed to identify first-order factors and sec-

26 2. THE STRUCTUREOF INTELLECT
TABLE 2.3 Loading of Abilities on the g Factor
Study
Factor 1 2 3 4 Mean
Ze 1.02 1.01 95 .94 .98
Ze 81 .80 .88 77 82
By .78 .70 79 73 715
Zs — 58 .66 55 .60
Zr — — .80 70 15
2Based on Gustafsson (1988).
ond-order g, and g, factors comes from studies using confirmatory factoranalysis. Gustafsson (1988; see also Gustafsson, 1984) summarized theresults of studies using these techniques. Confirmatory factor analysesmay be usedto test different models of the structure of hierarchical rela-tionships amongdifferent tests of ability. In these analyses, the expectedstructure of relationships based on previous results is specified and thentests are made of the goodnessof fit of various models to the obtainedrelationships. Gustafsson identified five second-order factors in substan-tial agreement with the theory proposed by Cattell and Horn. Table 2.3presents the correlations of each of these factors with a third-order gener-al factor. Note that each is substantially related to the general factor andthe second-order fluid ability factor is virtually indistinguishable fromthe third-order general factor. Since g, and g are essentially the samefactor, it is reasonable to remove g, from thehierarchical order of second-order factors and leave it at the apex of the ability structure. Theresidualvariance in the matrix after the general factor is removed would include ag. factor that Gustafsson interpreted as being identical to the factor la-beled k:ed by Vernon. Gustafsson identified one of the residual second-order factors as being similar to the factor Vernon labels k:m. There maybe other broad second-orderfactors identified with memory and auditoryability. Thus Gustafsson’s use of confirmatory factor analysis supports ahierarchical structure of ability that combines features of Vernon’s theorywith the Cattell—Horn theory of several second-orderfactors. The overallstructure of the resultant model is closer to Vernon’s model in that g isretained as an essential theoretical construct and fluid ability is assumedto be identical to g. Gustafsson’s analyses lead to a decisive refutation ofthe Cattell—Horn theoretical model.
GUTTMAN’S RADEX THEORY
Guttman’s theory is based on a modification of factor analysis. Guttman(1954, 1965, 1970) ordered ability tests in two ways. Tests may be orderedon a dimension of complexity. Such an ordering principle is called asimplex—it permits a rank order. Tests also differ in content. Content

GUTTMAN’S RADEX THEORY 27
differences among tests do not form a simplex. Contentrelationshipsamongtests form an orderthatis called a circumplex. Contents may beordered in a circular way, with contents thatare related assigned adjacentpositions on the circumference of the circle. The combination of a sim-plicial ordering principle with a circumplicial ordering system createswhat Guttmancalls a radex—aradial expansion of complexity. In a radex,each test may be assigned a position in a circular space. Tests that arelocated near the centerof the circle are closer, on the average, to all otherpoints in the space. This forms a simplicial ordering dimension. For anygiven simplicial ordering, tests with different contents are arrayed cir-cumplicially.Marshalek, Lohman, & Snow (1983) demonstrated that Guttman’s
radex theory is compatible with the hierarchical model of intelligencederived from factor analysis. They factor analyzed a battery of tests andwereable to specify the g loading of each of the tests. They grouped thesetests into three categories—those with high g loadings (between 54 and60% of the variance}, those with intermediate g loadings (between 28 and46% of the variance), and those with low g loadings (between 4 and 25%of the variance). They used a multidimensional scaling program to deter-mine the distance between tests in their matrix. Figure 2.3 presents the
——
a —~,
” -—
Z © USES ™ ~¢ Yy © FILM MEMOR N
/ \
/ \IDENTICAL W-PICTURE
/ PS PICTURES COMPLETION \
| NUMBER FINDING A'S _—_—~ \™~ HARSHMANCOMPARISON -
a“ PAPER ~ . GESTALT \
| 7 HIDDEN FORM BOARD \
SYMBOL 7 FIGURES A ‘\ W-OBJECT| / A \ \ ASSEMBLY \
SURFACE/ WORD DEVELOP , \ CS
/ TRANS \ \
CAMOUFLAGED a 7»— RAVEN W-BLOCKWORDS @ / y eC DESIGN | |
| NEC Lerten PAPER STREET. F
ARITH. \ SERIES OLDING | GESTALT |
WORD dec OPER. \; !& /
& END.| ACHIEVE.Q. VTERMAIN / /
VIS. NUMB. \ ACHIEVE’ Y }
aup.LetreR >AN Ug \ v. W-VOCAB. /
SPAN W-INFORMATION\W-ARITH. © W-PICTURE
W-SIMILIARITIES ARRANGEMENT
\ | W-DIGITSPAN ~~ W-COMPREHENSION / Y
BACKWARD ~ _ LY
IN= —a
\Q (-}“
_W-DIGIT SPAN _FORWARD _
eneeee
FIGURE 2.3 A radex representation of the structureof ability. Square represent tests withhigh g loadings, triangles those with intermediate g loadings, and circles represent testswith low g loadings (based on Marshalek, Lohman, & Snow, 1983).

28 2. THE STRUCTURE OF INTELLECT
results of their analysis. Note that tests that have high g loadings (repre-sented by squaresin Fig. 2.3) are located near the centerof the radex. Testswith low g loadings are located near the periphery of the radex. Tests thatwere found to have high loadings on fluid ability factors also had high gloadings andare located nearthe center of the radex. Tests with differentcontents are arrayed at different distances from the centerof the radexand are groupedin a circumplicial ordering. It is apparent that the radexrepresentation of the structure of tests of ability is congruent with thehierarchical ordering of tests of intelligence that retains a superordinategfactor.
I have argued that there is evidence that supports a hierarchical abilitymodel that retains a superordinate g factor. This conclusion would not beacceptable to two additional theorists, Guilford and Gardner. Guilford’stheory is based on factor analysis and Gardner’s is based on several addi-tional data sources. Both theorists assume that there is no reason toretain g in their theories of the structure ofintelligence.
GUILFORD’S THEORY
Description
Guilford (1964, 1967, 1985; Guilford & Hoepfner, 1971) based his theoryon a three-dimensional taxonomyof intellectual tasks. Intellectual tasksdiffer with respect to mental operations, contents, and products. Heas-sumed that there were five operations—cognition (knowing), memory,divergent production (generation of alternatives), convergent production(generation of logic-tight conclusions), and evaluation. These operationscan be applied to four types of contents—figural, symbolic, semantic, andbehavioral. Guilford (1977) subsequently modified the figural categoryinto auditory and visual categories to create five content categories. Theend result of the application of a particular operation to a particularcontent can be expressedin termsof one of six products. Theseare units,classes, relations, systems, transformations, and implications. This theo-ry implies that there are 150 different types of intellectual tasks. Thisconclusion is based on the assumptionthat all possible combinationsofthese dimensions exist. Guilford asserted that it is possible to developtests that measure each of these distinct combinationsof abilities.Each of the abilities in Guilford’s taxonomyis identified by a three-
letter code. And, each ability is assumed to be defined by one or moretests. Consider the following examples. The code CFUrefers to the cogni-tion of figural units. It is measured by a test called “Hidden Print.” Sub-jects are presented pictures of digits and letters outlined by dots. Thereare additional dots on the picture that obscurethe digit or letter that ispresented. Subjects are required to recognize the digit or letter that is

GUILFORD’S THEORY 29
presented. The task involves cognition—the subject is required to gainknowledge about a stimulus. The content of the material representedisfigural (visual in Guilford’s revised theory). And, the product that resultsis a unit—a single letter or digit. The code MSC refers to memory forsymbolic classes. A test called “Memory for Name and Word Classes”isassumed to measurethis ability. The subject is presented a set of namessuch as IRENE, IRIS, and IRVING.The subjectis required to determineina recognition task whether such words as IRA and IDA belong to theclass. The task involves the operation of memory. The stimuli are sym-bolic and the response involves a determination of class inclusion. A testcalled “Reflections” is a measure of cognition of behavioral implications(CBI). Subjects are required to pick the best psychological implication ofstatementsof the kind individuals are likely to make in psychotherapy. Asubject might be presented with the statement, “I’m just wondering howI’ll act; I mean how things will turn out.” These statements are accom-panied by multiple choice alternatives. The correct answerfor the state-ment is, “She’s worried aboutit.” This test deals with knowledge of abehavioral or psychological event. The product is defined as an implica-tion. Evaluation of semantic transformations (EMT) is measured bya testcalled ’Story Titles.” Subjects are presented with a brief story and severalpossible titles for the story. The subject is required to choose the mostappropriate title. The test involves an evaluative judgment about seman-tic (verbal) material and the product of the evaluationis a transformation.
Guilford originally argued that these abilities were unrelated to eachother. Instead of a hierarchical model, Guilford postulated a model of 150independentability factors. Tests that were similar on two of the threedimensions of his model were not assumed to be correlated with eachother more than tests that differed on all of the dimensionsof the model.In his original formulation there were no higher-order factors in themodel and,clearly, nothing at all that resembled g.
Evaluation
Guilford’s theory is based on a large set of factor analyses that he claimedresulted in the identification of many of the factors that were postulatedin his theory. These factor analyses used orthogonal rotations that re-sulted in zero correlations between the factors, thereby providing evi-dence for the independence of the abilities postulated in the model. Inaddition, Guilford (1964) explicitly rejected g on the basis of the findingthat 17% or 48,140 correlations that he computed amongtestsof abilitiesin his investigations fell within the interval of —.10 to +.10. Guilfordargued that these findings permit a decisive rejection of g.
It should be noted that Guilford’s results do not support his theory. Hefound that 83% of his correlations among ability measures exceeded .10.If his original theory were correct, correlations amongtests of ability

30 2. THE STRUCTURE OF INTELLECT
would usually be zero except for the case in whichpairs of tests belong toone of the 150 abilities defined in the theory. Even with this caveat, it isstill difficult to reconcile the assumption of a general ability measurewith the finding of a failure to obtain positive correlations among diversemeasures of ability. Guilford’s findings should be interpreted cautiouslyfor three reasons. First, some of the tests included in his matrices had lowreliability. Tests that are unreliable may not correlate highly with them-selves and are not expected to correlate highly with other tests. Second,he often used Air Force officer trainees as subjects. These individualswere selected for intelligence. Thus his samples frequently had re-strictions in range of talent. Third, someof the abilities in his model maynot be related to general intellectual ability. In particular, tests with be-havioral contents may or may not be adequate measuresofsocial skills(little evidence of validity exists for such measures}, and social intel-ligence may or maynotrelate to moretraditional cognitive abilities. So,too, tests involving divergent production in which an individualis re-quired to produce several answers to a problem including answers thatmay only be minimally relevant (e.g., “How manyusescan you think offor a brick?”) may or may not be good measuresof somegeneral cognitiveability. Indeed, Cronbach (1968) argued that such tests are better con-strued as tests of impulsivity than of intelligence or creativity.Brody & Brody (1976) examined two matrices of correlations among
ability tests obtained by Guilford and his associates. They chose matricesobtained from samples not obviously restricted in range of talent and theyexcluded correlations amongtests of ability with low reliability. Neitherof the matrices they examined included tests of divergent thinking orbehavioral contents. Tenopyr, Guilford, & Hoepfner (1966) obtained cor-relations among 50 tests of memory. Brody and Brody excluded seventests from this matrix that had reliabilities below .6. Only 2% of the 943correlations among the remaining tests were less than .12, the valuerequired to reject the null hypothesis at the .05 level that the true correla-tion was .00. This result suggests that the true valueofall of the correla-tions in the matrix was greater than zero. Although Tenopyret al. hadobtained a factor solution postulating the existence of 18 separateorthogonal(i.e., unrelated) factors, Brody and Brody foundthat oneof thetests in the battery called the SCATtest that is a good measure of generalverbal ability correlated between .16 and .70 with the 42 remainingtestsin the battery. The median correlation of the SCAT with the remainingtests was .39. These results suggest that the disattenuated correlation ofthe SCAT withall of the remaining measures accountsfor approximately25% of the variance in the matrix.Brody and Brody performed a similar analysis of data obtained by Dun-
ham, Guilford, & Hoepfner (1966), who factor analyzed a battery of testsof ability to learn concepts. After excluding tests of low reliability, Brodyand Brody found that less than 1% of the correlations in the matrix had

GUILFORD’S THEORY 31
values that were notsignificantly different from zero. A multiple choicetest of vocabulary had correlations ranging between .27 and .60 withall ofthe remaining tests in the matrix even though Dunhametal. reported anorthogonal factor solution with 15 separatefactors.These analyses indicate that Guilford’s matrices provide ample evi-
dence for a positive manifold. Guilford’s assertion that tests of abilityfrequently have zero correlations may depend on the use of unreliabletests of abilities of questionable relevance to general intellectual skillswith samples that are restricted in range of talent. These analyses alsosuggest that Guilford’s factor solutions may not be compelling. It is hardto imagine how onecould obtain results indicating that single tests in abattery have positive correlations with all other tests in the battery andstill find evidence for several orthogonal factors in the matrix. This skep-tical assertion is buttressed by a closer examination of Guilford’s factoranalyses.
Howis a factor solution justified? There is no single answer to thisquestion. Perhaps the most basic issue involved, as it is for every em-pirical claim, is replicability. Is it possible to obtain similar solutionswhensimilar batteries of tests are given to different samples? Since factorsolutions are derived from correlations amongtests, somereplicability ofcorrelational relationships is required for the demonstration offactor rep-licability. Tests should exhibit a comparable pattern of loadings in a newinvestigation that includes someorall of the same factors. A numberofobjective indices of factor replicability exist. These involve procedures tocomparetheloadings of the sametests in different investigations on thesame factors. Guilford & Hoepfner(1971) reported that numerical indicesof factor replicability failed to provide clear support for their factor solu-tions. Guilford “solved” the problem of factor replicability by using “tar-geted” or “Procrustean” rotations. These proceduresinvolve the specifi-cation of the expected outcomeof the factor analysis. Guilford and hisassociates attempted to define factors that most closely resemble thefactors that are theoretically specified. Guilford did not use confirmatoryfactor analyses to test the fit between his obtained solutions and thetheoretically predicted outcome. Horn & Knapp (1973; 1974; see alsoGuilford, 1974) examined three of Guilford’s studies. They compared theresults reported by Guilford and his associates for their factor solutionswith results obtained by the use of targeted rotations to randomly gener-ated hypotheses. For each set of data obtained by Guilford, they selected arandom factor solution. They then used targeted procedures to defineloadings of the variables on the factors. They computed indicesof correctplacement where a test with a loading of .3 or greater on the specifiedfactor was designated as a hit. If a test did not load on the randomlydesignated factor with a loadingof at least .3 it was designated a miss. Theratio of hits to hits and misses of their randomly selected factors was .83.The comparable ratio for the factor solutions obtained by Guilford was

32 2. THE STRUCTURE OF INTELLECT
84. These data indicate that the evidence obtained from targeted rota-
tions in support of Guilford’s theory is not convincing since targeted
rotations maybe used to provide comparable support for any theory aboutthe factor structure of correlations amongtests of ability.Brody & Brody (1976) examined the loadings of tests on factors in
Guilford and Hoepfner’s comprehensivereportof all of the factor analysesperformedprior to 1971. Table 2.4 presents a summaryof the frequencydistribution of loading they obtained. Table 2.4 indicates that only 7 ofthe 99 factors identified by Guilford had two or moretests with replicatedloadings of .5 or more. Forty-three of the factors had never beenreplicated.The modalreplicated value of the loadings of the test with the secondhighest loading on thefactor fell within the interval of .30 to .39. Theseanalyses indicate that Guilford’s factors are not well defined by existing
tests.Guilford (1977, 1981, 1985) modified his theory by replacing a modelof
150 unrelated ability factors with a hierarchical ability model. Heas-sumed that factors could be correlated with each other and that factorsthat shared a common dimension would be more closely related to eachother than factors that had no common dimension. The 150first-orderfactors would yield 85 second-orderfactors defined by paired dimensionsin the model. The 85 second-order factors would yield 16 third-order
factors defined by each of the 16 dimensions of the model. For example, athird-order factor might exist for memory, memory for units would con-stitute a second-order factor, and memory for semantic units would beone of the 150 first-order actors. Kelderman, Mellenbergh, & Elshout’s
TABLE2.4 FrequencyDistribution of Loadings
of the Two Tests with the Highest Loading on Each
of 99 Factors in the Guilford Model2.5.¢.4
Replicated4 Nonreplicated
Loadings f(x} f(x)
.10-.79 0 7
.60—.69 l 2
.50-.59 6 3640—.49 23 31.30—.39 26 3Not replicated 43 —
99 99
2Based on Brody & Brody (1976).
bThe loading for the factor with the second-highestrating is
tabulated.
¢Singlets are not included.dThe replicated value refers to the lowest value obtained in
all studies in which the test loaded on the factor. The tabled
value represents the lowest loading of the test with the second
highest loading on the factor.

GUILFORD’S THEORY 33
(1981) research led Guilford to modify his theory. They used confirmatoryfactor analysis to compare the relationship between obtained and ex-pected factor structures in seven of Guilford’s studies. They found thatnoneof the data sets fit Guilford’s orthogonal model. They were able tofind a satisfactory fit between obtained and expected results for three ofseven studies if they permitted the factors to be correlated. Moreover, thefactor correlations were substantial, with the majority of the factor cor-relations having values in excess of .5. These results indicate thatGuilford’s theory is frequently not compatible with his obtained data and,whereit is compatible, acceptable fits can only be obtained by assumingthat the factors are substantially correlated.
Guilford’s revised hierarchical theory has not been comprehensivelyinvestigated. Since the definition of the first-order factors in the modelare suspect, it is difficult to believe that the hierarchical structure thatisderived from the first-order factors is valid. Guilford (1981) reported anumberof illustrative analyses to provide evidence for the hierarchicalversion of his theory. He was hampered in this effort by the use oforthogonal rotations in his original studies leading to the definition offactors that were uncorrelated. Hearbitrarily defined dimensions basedon the amalgamation of scores on tests that were assumed to definefactors in his model and then obtained correlations among these aggre-gate scores. Table 2.5 presents the results of one of these analyses. Table2.5 presents the loadings of first-order aggregates on two hypotheticalfactors that share similarity on content and product categories. ST repre-sents symbolic transformations and MTrepresents semantic transforma-tion. If Guilford’s hierarchy were correct, first-order aggregates that sharesimilarity on two of three categories in the model should load more
TABLE 2.5 A Factor Pattern from Rotation of
TwoSets of Transformation Factors¢
Higher factors?
First-order reps ST MT
CST 2 35
MST 23 19
DST 52 41
NST 52 31
EST 22 02CMT 38 45
MMT .48 .48
DMT .10 18
NMT 17 .42
EMT .09 15
2Angle of rotation was 62°.
bBased on Guilford (1981).
34 2. THE STRUCTURE OF INTELLECT
substantially on a higher-order factor than those that share similarity onone of three categories. An examination of the data in Table 2.5 providessome support for Guilford’s theory, but the support is weak. For example,two of the semantic transformation aggregates have loadings below .2 onthe semantic transformation factor (DMT and EMT], and the aggregatewith the highest loading on the semantic transformation factor has anequally high loading on the symbolic transformation factor even thoughit is similar in only one of the three categories. Guilford has not providedcomparable data for many otherpredicted relationships in his model.
Guilford’s hierarchical model is incompatible with the hierarchicalmodel based on Gustafsson’s confirmatory factor analyses and the con-gruent model based on the radex theory. Guilford’s model does not in-clude a superordinateg factor. It is also the case that the review presentedhere suggests that Guilford’s theory is without empirical support. Thefactor structure that is postulated appears to be mythical. In the absenceof empirical confirmation it cannot be construedas an acceptable alter-native to a hierarchical model that retains a superordinate g factor.
GARDNER’S THEORY OF MULTIPLE INTELLIGENCE
Description
Gardner’s theory is very different from the theories of the structure ofintellect we have considered in this chapter. His theory is not based onthe analysis of patterns of correlations amongtests of ability. Gardner(1983) assumed that the existence of independent types of intelligencecould be established by the use of eight criteria. These are listed as fol-lows:
1. Potential isolation by brain damage. Gardnerrelied on neuropsycholo-gical evidence to argue that there are independentintelligences thatare related to different neural structures. Research indicating that lo-calized brain damage influences a particular ability while sparingother abilities provides evidence for the independence and separateidentity of the affected ability.
2. The existence of idiot savants, prodigies, and other exceptional indi-viduals. Prodigies are individuals who exhibit precocious intellectualskills. Evidence of precocious intellectual developmentin the absenceof parallel precocity in otherintellectual skills argues strongly for theindependent development of separate intelligences. Idiot savants areindividuals who exhibit an exceptional developmentof an intellectualability who are retarded or mediocre in other intellectual skills. Theexistence of such a pattern of ability argues for the independenceofdifferent types of intelligence.
3. An identifiable core operation or set of operations. Gardner believed
GARDNER’S THEORY OF MULTIPLE INTELLIGENCE 35
that each intelligenceis identified by a specific set of operationsthatisrelated to a neural mechanism.For example, he indicated that musicalintelligence (an independentintelligence according to Gardner) has asoneof its core operations the ability to discriminate differences in thepitch of tones. Gardner assumedlinguistic intelligence had four coreabilities: (1) rhetorical ability, the ability to convince others; (2)mnemonic abilities, the use of language as a way of rememberinginformation; (3) explanatory abilities, the use of language in eitherwritten or oral form to teach or explain; and (4) metalinguistic ability,the ability of linguistic analysis to clarify meaning that is exemplifiedin both the simple question “What did you mean by that?” and in thesophisticated theories of the abstract structure of language developedby linguists.
4. A distinctive developmental history along with a definable set of ex-pert “end-stage” performances. Gardnerbelieved that it is possible todescribe the developmentalhistory of each intelligence. In addition,itshould be possible to describe the performanceof experts. Each intel-ligence is assumed to have an independent developmentalhistory.
5. An evolutionary history and evolutionary plausibility. Gardner indi-cated that little is known about the evolutionary history of specificintelligences. He assumed that each specific intelligence has an evolu-tionary history that is related to some primordial form of expression inother species. For example, social intelligence may berelated to pri-mate social organizational abilities.
6. Support from experimental psychological tasks. The methods of theexperimental cognitive psychologist may be usedto identify the coreoperationsof an intelligence. In addition, these methods may be usedto establish the independenceof different intelligences. For example, adual-task paradigm maybe used to demonstratethat intellectual tasksthat are based on the sameintelligence may exhibit more interferencethan tasks that require separate intelligences.
7. Support from psychometric findings. Psychometric investigationsshould provide support for the independenceofdifferent intelligences.Gardner did not believe that psychometric investigations should berelied on to provide unambiguous support for the independence ofdifferent intelligences. He believed that such investigations have notsampled widely amongtheset of abilities and haverelied extensivelyon tasks that do notrelate to the intellectual abilities that individualsexhibit in important social contexts. He also believed that manyof thetasks used in psychometric investigations may be solved in differentways. Therefore, they may measure different abilities in different indi-viduals. Despite these caveats, Gardner asserted that psychometricinvestigations should provide evidence for the independenceofdiffer-ent intelligences. Tests of different intelligences should exhibit lowercorrelations than tests of the sameintelligence.

36 2. THE STRUCTURE OF INTELLECT
8. Susceptibility to encoding in a symbol system. Gardner assumedthatintelligences tend to become encodedin culturally contrived symbolsystems. Linguistic intelligence is encoded in a language with formalrules. Musical intelligence may be expressed in a notational language.
Gardnerargued that these criteria, when collectively applied, impliedthat it is possible to distinguish among six different intelligences: lin-guistic intelligence, musical intelligence, logical-mathematical intel-ligence, spatial intelligence, bodily—kinesthetic intelligence, and person-al intelligence (i.e., the ability to understand one’s own emotions and tounderstand the behavior of other individuals).
Critique
It is difficult to evaluate Gardner’s theory because his book does notpresent specific studies in support of his claims. A fully developed argu-ment in favor of his theory would require the presentation of evidenceestablishing that each of his intelligencesfulfills each of the eightcriteriathat are assumedto define an intelligence. What I find problematic in histheory is the specific list of intelligences that are defined by the applica-tion of his criteria. I shall argue that his list is arbitrary and that hisattempt to restructure the theory of intelligence to omit a general factoris no more successful than the attempts of psychometric theorists todispense with g.
Gardner’s criteria may be used to support the independentstatus of aset of intelligences that is larger than the set postulated by him. Carroll’s(1988) psychometric investigations of existing correlational matrices ofability measures provided evidence for the independentstatusof 30 differ-ent intellectual abilities. These investigations do not include three of thesix intelligences postulated by Gardner—musical, personal, and bodily—kinesthetic. Gardner indicated that the definition of an intelligence in-volves a somewhatarbitrary aggregation of abilities that may bepartiallydistinctive. He stated,
spatial intelligence entails a numberof loosely related capacities: the ability torecognize instances of the same element; the ability to transform or to recog-nize a transformation of one elementinto another; the capacity to conjure upmental imagery and then to transform that imagery; the capacity to produceagraphic likeness of spatial information; and the like. Conceivably, these opera-tions are independent of one another and could develop and break downsepa-rately; and yet, just as rhythm and pitch work togetherin the area of music, so,
too, the forementionedcapacities typically occur togetherin the spatial realm.Indeed, they operate as a family, and use of each operation may well reinforceuse of the others. [Gardner, 1983, p. 176]
This quotation indicates that the aggregation of separate componentsofability into an intelligence involves an arbitrary decision. Presumably, the

GARDNER’S THEORY OF MULTIPLE INTELLIGENCE 37
aggregation is defined by social conventionsthat entail the performanceof intellectual tasks that are mutually reinforcing, leading to the develop-ment of a composite aggregated intelligence. The issue of aggregation iscrucial in defining the number of independentintelligences. If the ag-gregation is to be defined on the basis of socially relevant activities thatare mutually reinforcing, there is at least an anecdotal argument to bemadethat social conventions may involve mutually reinforcing abilitiesthat belong to different intelligences in Gardner’s taxonomy. Gardnerindicated that physical scientists may use spatial and logical—mathe-matical intelligences. Other socially defined roles may require an indi-vidual to draw on several different intelligences. A choreographeris usu-ally a person who has been a dancer and has a developed bodily—kinesthetic intelligence. Dances are usually choreographed to music.Therefore, the choreographer usually requires a developed musicalintel-ligence. And, dances frequently express emotion and meaning. The chore-ographer must understand nonverbal expressivity. Finally, dances involvevariations on spatial configurations and choreographers musthave a high-ly developed spatial intelligence. Presumably, the practice of choreogra-phy mutually reinforces intelligences belonging to each of these fourquasiindependent domains.It is as arbitrary to aggregate across the sepa-rate abilities that collectively define the spatial domainasit is to suggestthe existence of a choreographic intelligence involving the mutually rein-forcing family of musical, personal, spatial, and bodily—kinestheticintel-ligences.
Research on brain damage and neuralstructuresalso indicatesthatit ispossible to define a set of independentintellectual abilities with manymore intelligences than are included in Gardner’s taxonomy. Prosopog-nosia provides an excellent example. Prosopognosia is a relatively raredisorder exhibited by individuals with bilateral brain damagein the in-ferior visual association cortices (Damasio, 1985). The most strikingsymptom of the disorderis an inability to recognize familiar faces. Moregenerally, the disorder may be described as one of the inability to recog-nize individual representatives of a visually presented class. Thus, pros-opognosics may notbe able to distinguish between their car and othercars.Prosopognosia appearsto provide evidencefor the definition of an inde-
pendent intelligence. The condition has a defined neurological basis.Prosopognosicsdo not, in general, exhibit other intellectual deficits. Theyhave intact linguistic, perceptual, and memory abilities. In fact, some ofthese patients can discriminate among unfamiliar faces (Benton, 1980). Itshould be possible to study the developmentof the ability to recognizeand individuate members of a visually presented class of stimuli. Theability also is present at an expert level. Gardner described Jomo Kenyat-ta’s training as a boy in Kenyathat enabled him to identify every head oflivestock in his family’s herd using the cues of color, markings, and size of

38 2. THE STRUCTURE OF INTELLECT
horns. This example suggeststhat the intellectual accomplishmentrelat-ed to this ability is socially recognized and valuable. Although I am notaware of any formal research on theissue, it is likely that there areindividuals who may be described as idiot savants and prodigies withrespect to this ability. John Le Carré created a fictional character of awomanwhorelies on a prodigious memoryfor faces to recognize Russianspies. It is also the case that this ability has an evolutionary basis. Thereis evidence for the presenceof cells in the visual cortex of monkeys thatrespond selectively to faces (Perrett, Mistlin, & Chitty, 1987; Yamane,Kaij, & Kawano, 1988). This brief review of research related to prosopog-nosia establishes that the separate visual memory for individual mem-bers of a class of related objects exists and that this ability constitutes aseparate intelligence accordingto the criteria developed by Gardner. Thusthe application of Gardner’s criteria does not lead to the set of intel-ligences that he postulates.The arguments developedagainst the specification of particular intel-
ligences defined by Gardner mayalso be used to underminehisassertionthat a model of separate intelligences should be used to replace g. Ifseparate intelligences are defined on the basis of an arbitrary aggregationof quasiindependentabilities, then it is an arbitrary act to refuse to aggre-gate across several intelligences to define a superordinate generalintel-ligence factor. Certainly the psychometric evidence that I have reviewedin this chapter provides ample evidencefor a relationship among thoseforms of intelligence mentioned by Gardnerthat are studied by psycho-metricians—spatial, logical-mathematical, and linguistic. There is alsoevidence that musical ability is correlated with other measuresof intel-ligence, although the correlation may be weak—approximately .3—andmay be present amongindividuals with IQs below the mean andbelessapparent amonghigh-IQ individuals (Shuter-Dyson & Gabriel, 1983).
It is also the case that the neurological evidence for the independenceofintelligences cited by Gardner is ambiguous. Gardnerindicated that evi-dence for the neural localization of logical-mathematicalintelligence ismore ambiguous than the evidence for the localization of other intel-ligences. He asserted, “Logical-mathematical abilities becomefragilenot principally from focal brain disease but, rather, as a result of moregeneral deteriorating diseases, such as the dementias, where large por-tions of the nervous system decompose moreor less rapidly” (Gardner,1983, p. 158). This statement provides an interesting point of contactbetween Gardner’s theory and the hierarchical concept of intelligencederived from psychometric investigations. Abilities that are less depen-dent on localized neural functioning are morelikely to be good measuresof g. Since they are involved in more central processing roles they may behighly related to many otherabilities. It should be noted that tests thatare assumedto be good measuresof g in current hierarchical models, suchas the Raven’s Test of Progressive Matrices, would probably be classified

GARDNER'S THEORY OF MULTIPLE INTELLIGENCE 39
as measuresof logical—mathematical intelligence in Gardner’s taxonomy.It is also the case that biological evidence establishing the existence ofgeneral neural conditions that influenceseveral formsof intelligence ex-ist. For example, Down’s syndrome is a condition that influences thedevelopment of neural structures. The syndrome leads to the develop-ment of low spatial, logical-mathematical, and linguistic intelligences.
Gardnerrelied on theoretical analyses of mental process that assumethat there are independent modules that are responsive to specific stim-ulus inputs. Psychologists such as Allport (1980) have developed modulartheories that postulate specific narrow modular abilities. Gardner’s tax-onomyis based on the aggregation of specific processing modules todefine a more general intelligence.It is also the case that some modulartheorists have assumedthat there are general processes that are neithermodular nor specific to a particular domain. Fodor (1983), a theorist citedby Gardnerin support of the notion of independent encapsulated modularprocessing systems, asserted, “... there must be some mechanismswhich cross the boundaries that input systemsestablish. ... I assumethat there mustbe relatively nondenominational(i.e., domain-inspecific)psychological systems which operate, inter-alia, to exploit the informa-tion that input systems provide”(Fodor, 1983, p. 103, italics in original).Modular theorists whose work is cited by Gardner in supportof his theo-ry actually hold theoretical notions that are incompatible with Gardner’staxonomy. Allport’s theory supports a taxonomy with manyintelligencesand Fodor’s theory assumesthat there are nonmodular general cognitiveprocesses.Evidence of the independence of intelligences from the study of pro-
digies and idiot savants is also of questionable relevance in arguingagainst the existenceof a generalintellectual factor. Such individuals arerare and the existence of extreme disparities among separate forms ofintelligence may in part be attributable to the occasional extreme casethat occurs in a normal distribution. Even if two intelligences are sub-stantially correlated in the population,it is still possible that individualswill exhibit dramatic disparities in these intelligences as a result of thenormal operation of the laws of chance. The existenceof a statisticallyanomalous disparity may indicate little or nothing about the usual rela-tionship between different intellectual capacities. So, too, the indepen-dent functioning of intelligences following brain damage maybeoflittlerelevance to understanding the performance of intact individuals. Sepa-rate neural structures may operate in a joint and interdependent manner
in an individual who is not brain damaged although, following braindamage, the existence of an autonomouspsychological function may beapparent. It is also the case that the examples of prodigies and idiotsavants cited by Gardner provide less than convincing evidence againstthe existence of a superordinate general intelligence. This is particularlyapparent in the domain of logical-mathematicalabilities. Idiot savants

40 2. THE STRUCTUREOF INTELLECT
exhibit amazing skills as calculators but their ability to understand com-plex mathematical reasoning is often quite limited. Mathematical pro-digies almost invariably appear to have high IQ. Gardner mentionsBertrand Russell as an example of an individual with unusual logical—mathematical ability. Russell was certainly gifted in linguistic intel-ligence. I doubt very much that he would havescored low on tests oflinguistic and spatial intelligence.
I have argued that a consideration of several sources of evidence used byGardnerto establish the existence of independentintelligences may beused to support the existence of a superordinate general intelligence fac-tor. ThusI find his taxonomyto be arbitrary and without empirical foun-dation. Neither his rejection of a superordinate general factor nor thespecific subset of intelligences that he postulates appears to have a firmtheoretical or empirical basis.
CONCLUSION
This review of contemporary theories of the structure of intellect leads toseveral tentative conclusions and leaves manyissues unresolved.First, apositive manifold among measuresof various cognitive capacities appearsto exist (I omit from this generalization social intelligence, musicalintel-ligence, and bodily—kinesthetic intelligence). Second, existing knowledgeis best accommodatedbythe hierarchical structure postulated by Gust-afsson in his confirmatory factor analytic studies providing for a superor-dinate g factor that is best defined by measuresof fluid ability, severalsecond-order factors including crystallized ability, and a numberoffirst-order factors. These generalizations leave the precise structure of abilitiesat the first and secondlevels of the hierarchy unspecified.The commitmentto a hierarchical structure of ability retainingg at its
apex leaves unresolved many fundamental questions about the generalfactor. In this concluding section we shall consider issues that bear on thevalidity and generality of the theory of general intelligence. We shallconsider whetherthe g loading of tests remains invariant in different testbatteries and samples of tests and whether the assumption of a generalintellectual ability is dependent upon a restriction in the types of mea-sures of intelligence that have been investigated.
The Invariance of g
Spearman assumed that every measure of intelligence could be charac-terized by a g-to-s ratio. This implies that the ratio remains invariantwhen the measure is administered to different groups of individuals andwhen the measureis part of a different battery of tests. The invarianceover subject samplesandtest batteries of the g loadings of tests should be

CONCLUSION 4]
relatively easy to establish. Tests could be assigned a g loadingin a partic-ular investigation and thereplicability of that number could beascer-tained in any other investigation in which the test was included in abattery of different tests given to a different sample of individuals. Rela-tively little systematic research of this sort exists, although the datarequired to perform this kind of analysis is clearly abundantly available.This has given rise to somewhat diverse attitudes to the issue of thegenerality of g loadings. Some authorities write as if g loadings were aninvariant property of tests (see Jensen, 1980a); others as if the g loading ofa test varies with the composition of the test battery and the sample towhich the battery was administered (Ceci, 1990). If it were possible toestablish the invariance of g loadings, then it would be possible to exam-ine the relationship between these loadings and the characteristics oftests with high and low loadings on g. This might provide clues to atheory of g.Thorndike (1987) examined a correlation matrix of 65 tests adminis-
tered to Air Force cadets. He arbitrarily divided the first 48 tests into 6groupsof 8 variables. He then inserted each of the remaining 17 variablesone at a time into each of the 6 artificially created test batteries andobtained theg loading of each of the 17 tests in each of the 6 test batteries.The correlations between g loadings for each of the 15 possible pairs ofmatrices were obtained. The 15 correlations ranged between .52 and .94.These data suggest that g loadings remain invariant in different test bat-teries. |Thorndike’s results do not provide information about the invariance of
g loadings over samples of individuals with different characteristics. Allof the correlations were obtained from the same sample. In addition, thetest battery he examined included several tests of motor dexterity thathad relatively low g loadings and might well be construed as not beingtests of intelligence. Table 2.6 presents the 17 tests he used and theirrespective g loadings in each of the 6 batteries of 8 tests he created. Notethat tests 12—16 appearto be tests of motor dexterity. Three of these testshave uniformly low g loadings. Thus the high median correlation amonggloadings Thorndike obtained is inflated by the inclusion of tests of du-bious relevance to intelligence construed as general cognitive abilities.Such tests have low loadings on g and act as statistical outliers thatinflate the correlations among g loadings.Although Thorndike’s investigation is less than convincing, it does
provide a model for the kind of research that is needed. Are there otherrelevant sources of data? Perhaps the most convincing evidence derivesfrom the confirmatory factor analyses reported by Gustafsson (1988). Hisanalyses indicate that the tests that are the best measuresof g are thosethat load on the fluid intelligence factor. This conclusion rests on thestudy of a particular battery of tests that led to the developmentof thefluid versus crystallized distinction in the first instance. Other batteries
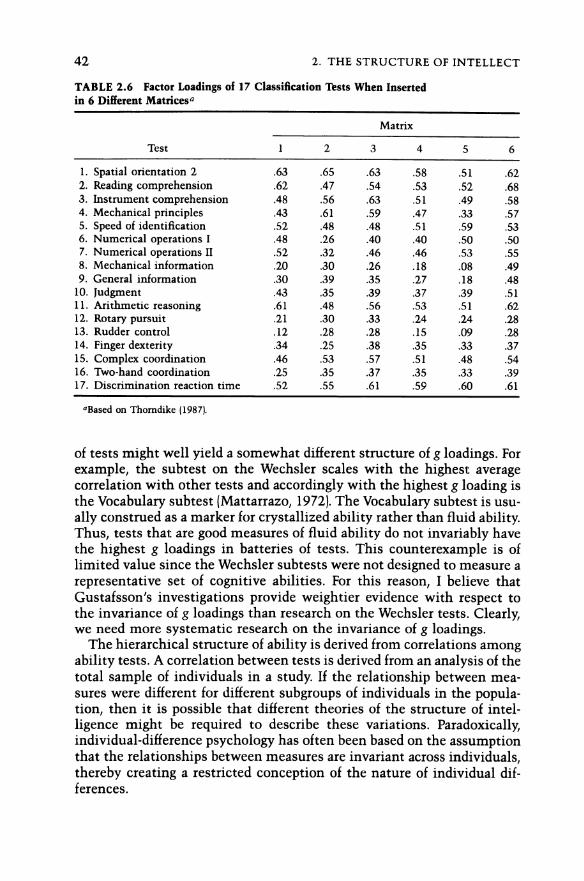
42, 2. THE STRUCTUREOF INTELLECT
TABLE2.6 Factor Loadings of 17 Classification Tests When Insertedin 6 Different Matrices
Matrix
Test ] 2. 3 4 5 6
1. Spatial orientation 2 63 65 63 58 1 62
2. Reading comprehension 62 47 54 53 52 .683. Instrument comprehension .48 56 .63 51 49 584. Mechanical principles 43 61 59 47 33 575. Speed of identification 52 .48 .48 51 59 536. Numerical operations I .48 .26 40 .40 50 507. Numerical operationsII 52 32 .46 46 53 55
8. Mechanical information .20 30 .26 18 .08 49
9. General information .30 39 35 27 18 .48
10. Judgment 43 35 39 37 39 1
11. Arithmetic reasoning 61 .48 56 53 51 6212. Rotary pursuit 21 30 33 24 24 .28
13. Rudder control 12 .28 .28 15 09 .28
14. Finger dexterity 34 25 38 35 33 37
15. Complex coordination 46 53 57 51 .48 5416. Two-hand coordination 25 35 37 35 33 3917. Discrimination reaction time 52 5 61 9 .60 61
9Based on Thorndike (1987).
of tests might well yield a somewhatdifferent structure of g loadings. Forexample, the subtest on the Wechsler scales with the highest averagecorrelation with other tests and accordingly with the highest g loadingisthe Vocabulary subtest (Mattarrazo, 1972). The Vocabulary subtestis usu-ally construed as a markerfor crystallized ability rather than fluid ability.Thus, tests that are good measuresoffluid ability do not invariably havethe highest g loadings in batteries of tests. This counterexample is oflimited value since the Wechsler subtests were not designed to measurearepresentative set of cognitive abilities. For this reason, I believe thatGustafsson’s investigations provide weightier evidence with respect tothe invariance of g loadings than research on the Wechslertests. Clearly,we need more systematic research on the invariance of g loadings.The hierarchical structure of ability is derived from correlations among
ability tests. A correlation betweentests is derived from an analysis of thetotal sample of individuals in a study. If the relationship between mea-sures were different for different subgroups of individuals in the popula-tion, then it is possible that different theories of the structure of intel-ligence might be required to describe these variations. Paradoxically,individual-difference psychology has often been based on the assumptionthat the relationships between measuresare invariant across individuals,thereby creating a restricted conception of the nature of individual dif-ferences.

CONCLUSION 43
Detterman & Daniel (1989) reported a study that indicates that the gloadings of tests are not invariant for subjects whodiffer in general intel-ligence. They used the large standardization samples for the Wechslertests of intelligence (the WAIS and the WISC). They divided their sampleinto five groups on the basis of their performance on either the Vocabu-lary or the Information subtests. They then obtained the average correla-tions among the remaining subtests for each of these five ability groups.Figure 2.4 presents their data. Note that the average correlations amongthe tests declines as ability level increases. The effects are substantial.The average correlation amongindividuals in the lowest ability grouping,with estimated IQs below 78, is approximately twice as large as the aver-age correlation amongsubtestsfor individuals in the highest ability level,with estimated IQs in excess of 122. These data indicate that the amountof variance attributable to the general factor in intelligence varies inverse-ly with general intelligence. Detterman & Daniel (1989) indicated thatcomparable analysesof other test batteries have not been reported. Thusit is not knownif the effects they obtained are specific to the Wechslertests. Given the magnitude of the effect they obtained, it is possible thatadditional empirical support for this effect would be obtained from analy-ses of other test batteries. Their research indicates that a generalfactorispresent among the subtests of the Wechsler tests for individualsatall ofthe ability levels that they examined. The amountof varianceattributableto the general factor, however, is not invariant for different ability groups.
09 LL Information 09 LL Vocabulary
0.8 08 LL = WAIS-R
© -2- WISC-R+ 0.7 0.7 L
£2g 0.6 06 LL
6 =§ 0.5 05 Lo .
8® 0.4 0.4 Le
20.3 f. a... 03 L r ‘ogee
S "i$02 L 0.2 L<
0.1 LL 0.1 LO
0 | j | i i 0 j j i | i
<78 78-92 93-107 108-122 >122 <78 78-92 93-107 108-122 >122
1Q Equivalent 1Q Equivalent
FIGURE 2.4 Correlations among subtests on the Wechsler for individuals differing inperformance on the information and vocabulary subtests (based on Detterman & Daniel,1989).

44 2. THE STRUCTURE OF INTELLECT
The Generality of g over Tasks
The assumption of a general factor does not provide us with a theory toexplain g or to account for the ubiquitous relationship amongdifferentmeasures of ability. It is also the case that the evidence in favor of gdependssubstantially on the administration of batteries of tests to indi-viduals. If existing tests, including Guilford’s comprehensive attempt todevelop measures of different abilities, are limited to a small subset ofintellectual skills, then conclusions abouta generalfactorof intelligencemay be unwarranted.
Gardner(1983) argued that the support for g is substantially based onthe examinations of tasks that have limitedreal-life validity. Ceci (1990)developed a similar argument. He asserted that positive manifolds arefound primarily because individuals whoare engagedin research onintel-ligence do not examine performancein real-life contexts. Ceci reportedthe results of a study by Ceci & Liker (1986) in support of this conclusion.They studied expertise in predicting race-track odds. They selected 30men who were long-term patrons of harness racing tracks and who werevery knowledgeable about racing. They used two measures of skill atpredicting the odds chosen by the handicappers paid by the track. Theyfoundthatthe distribution of expertise at predicting odds was bimodal—14 of the 30 men wereableto predict the favorite horses in at least 9 of 10races and the top 3 favorites in at least 5 of 10 races. The remaining 16men were not as successful at predicting the odds chosen bythe profes-sional handicappers. The two groups did not differ in IQ. Ceci and Likerused another measure of expertise. They presented subjects with a com-plex body of information about unnamedhorses and asked them to setthe odds at their winning a race against a single standard horse withdefined characteristics. Ceci and Liker used regression techniquesto de-velop a prediction equation for the odds selected for each paired com-parison for each of the subjects in their study. They included in theirequation a complex interactive variable that was based on a nonadditivecombination of variables that they assumed would berelated to the rea-soning processes used by experts to define odds at the track. They foundthat their 14 experts were morelikely to rely on this complex interactivevariable than their 16 nonexperts. A measure of the reliance on thisinteractive mode of reasoning wascorrelated with the ability to correctlyhandicap the 10 original races (Ceci & Liker, 1988). Reliance on thisinteractive mode of reasoning wasalso uncorrelated with IQ.
Ceci and Liker concluded that individuals of low IQ are able to reasonin a complex way and to solvereal-life problems. They asserted that theubiquitous findings of a positive manifold amongtests is dependent onthe selection of the limited set of tasks that are used in intelligencetests.In manyreal-world contexts IQ may be unrelated to the ability to reasonin a complex way and to perform as an expert.

CONCLUSION 45
Ceci and Liker’s conclusions were challenged by Detterman & Spry(1988; see also, Ceci & Liker, 1988). Detterman andSpry argued that Ceciand Liker’s measure of expertise was notreliable. Ceci and Liker definedexpertise by examining ability to predict odds in 10 races. Their resultswould have been more convincing if they had demonstrated that indi-viduals who excelled in this ability would have been able to repeat theirperformance on a second occasion. Ceci and Liker reported that theirmeasure of expertise correlated .56 with the use of complex interactivereasoning in the second task they developed in which individuals had toset odds for hypothetical paired comparisons between horses. This sug-gests that their measure of expertise wasreliable.
Detterman and Spry also criticized Ceci and Liker’s sample selectionprosecutors. Their sample of 30 wasselected from an original group of110 patronsof the race track. Detterman and Spry arguedthat ability topredict odds at the tracks mightbe correlated with IQ in a representativesample of race-track patrons. Ceci and Liker responded that they were notattemptingto establish the relationship between IQ and performancein arepresentative sample of individuals. Rather, they attemptedto see ifexpertise amonga group of knowledgeable individuals wasrelated to IQ.Their strategy was based on the attempt to find individuals who arecapable of sophisticated reasoning and skilled performanceatan intellec-tually demanding task who did not have high IQ. They concluded thatindividuals with low IQ are capable of exhibiting complex patters of rea-soning and that high intelligence as measured by IQ tests is not a neces-sary condition for the attainmentof intellectual skills in many real-worldcontexts. Ceci and Liker asserted that their results were compatible withGardner’s theory of intelligence and contradicted g theory.
My owncritique of the import of the Ceci and Liker study rests onissues that are different from those raised by Detterman and Spry. Ceci &Liker’s (1986) study identifies a rather limited form of expertise evenwithin the context of harness racing. Expertise in that domain would bereflected by the ability to win money betting on harness races. Ceci andLiker argued that ability to accurately forecast odds is a necessary condi-tion for winning moneyat the track. Successful betting involves findinghorses whoseprobability of winning is higher than the odds of winningassigned by the track. While this argumentis plausible, no evidenceispresented by Ceci and Liker that the ability to forecast is associated withthe ability to pick horses whose probability of winning is higher than theodds assigned by professional handicappers chosen by the track. Thisdefinition of expertise is inherently contradictory. Expertise is defined asability to predict and emulate the reasoning processesof the handicappersemployed by the track to set preliminary odds for the races. The hand-icappers’ odds are highly correlated with thefinal odds set by the bets ofrace-track patrons. Since the payoff odds guaranteea profit to the track,the patron whoslavishly bet the horses by following the handicappers’

46 2. THE STRUCTURE OF INTELLECT
odds is guaranteed to lose money. The only way to win moneyat the trackis to bet on the horses using a system to determine oddsthatis differentfrom the system usedbythe professional handicappers. Perhaps the non-experts who wereinferior at predicting the odds set by the professionalhandicappers were superior at this task because they reasonedin a differ-ent way that might be superior to the professional handicapperin predict-ing the actual outcomeofraces.
Ceci and Liker stated that their measure of cognitive complexity wasnot isomorphic with the complex process of reasoning that were involvedin handicapping harness races. They indicated that handicapping actualraces in an 8- or 10-horsefield involves the formulation of “schemas” that“cast a group of horses into a probabilistic construction of how the racewill develop” (Ceci & Liker, 1986, p. 264). Ceci and Liker did not measurethe ability to form schemas, nor did they measure the accuracy of theschemas that were developed by their subjects. As a result, there is noevidence that individuals who were expert handicappersin their study didin fact excel at the level of expertise required for successful selection ofwinning horses in a race. |
Ceci and Liker presented an interview with one of their experts with anIQ of 92 who demonstrated an understanding of the complex interactivenature of the relationships amongthe several variables that are assumedto determine the correct odds of winning a race. They indicated that themajority of their experts and someof their nonexperts were able to articu-late the complex reasoning they employedin setting odds.It is possiblethat individuals might use complex reasoning processes without under-standing the processes that they employ. Thereis a difference between themodel developed to explain the performance of an individual and themodel that the individual believes he or sheis using.It is possible to arguethat intelligent behavior is exhibited by the individual who develops amodel to explain the behavior of someone whoactsintelligently. Actingintelligently without awarenessof the basis of the action may or may notbe indicative of high intelligence. Consider an example in supportof thisassertion. In order to explain the behavior of an animal wholeaps overabarrier, it is necessary to assumethat the animal has coordinated a largenumberof dynamicvariables, including calculationsrelating to distance,the force of gravity, and the like. The ability to instantaneously coordi-nate information from diverse stimulus arrays that change as organismslocomote can only be accounted for by a complex model of the sort thathas been of concern to Gibsonian students of perception (Gibson, 1979).But this ability, however it is accomplished, is not necessarily indicativeof the kind of intelligence that is exemplified in many cognitive tasksused to assess intelligence. Perhaps cognitive tasks used to assessintel-ligence all involve someability to articulate and explain the basis forcognitive performance. Although Ceci and Liker interviewed their sub-
CONCLUSION 47
jects and found that their experts were more likely to articulate complexpatterns of reasoningin their interviews, they did not present these data,nor did they score their interviewsfor evidence of cognitive complexity ofreasoning processes exhibited, nor did they report whether such scores
were related to IQ.
This discussion of Ceci and Liker’s research deals with lacunae. Let usassumethatall of these nagging doubts and questions weresatisfactorilyanswered by a more extensive research project. Supposethatthe ability toacquire expertise in reasoning about the outcomesof harness racing wastotally unrelated to IQ and that large numbers of individuals could befound who exhibited genuine expertise and had relatively low IQ. Wouldthis support the conclusion that IQ and general intelligence were notrelated to intellectual performance in many contexts? Perhaps not. Al-though the pattern of reasoning exemplified by experts in handicappingraces is relatively complex, it is possible to argue that its complexity islimited by the relatively small numberof variables involved andtherela-tively encapsulated nature of the activity that is involved. Consider twoother “real-world” intellectual activities as comparisons—ability to playchess and ability to function as a physician. On the surface, chess exper-tise shares much in common with handicapping harnessracing. Bothactivities involve arcane knowledge in a relatively restricted context.Both involve considerations of complex interactive relationships among alimited number of units. In both, the possible outcomes are dependentupon somewhat unpredictable responses. There also appear to be somedifferencesin the activities. The possible set of outcomesin chessreadilybecomesindefinitely large and there is a large body of formalized knowl-edge codifying standard responses to standard classes of situations thatare likely to be encountered. The expert player of chess must master alarge body of formalized knowledge. Expertise at chess also appears torequire a good memory and an ability to engage in long and complexchains of reasoning. Is it possible to attain expert status at chess with alow IQ? I don’t know the answerto this question. I would find Ceci’sarguments far more convincing if he obtained evidence that expertise inchess could be obtained by individuals whoare low in IQ.
Expertise as a physician appears to be different from expertise as ahandicapper of harness races. Physicians need to be conversant with anextensive body of information. In addition, they need to master technicalliterature in several scientific disciplines. Admission to medical schoolisbased on successful academic performancethat is correlated, as we shallsee, with IQ test scores. This leads to a relationship between IQ and the
developmentof expertise in medicine. There are virtually no individualswith medical expertise and low IQ scores.This is a contingent truth thatderives from the structure of our educational system. Could individualswith low IQ develop expertise in medicine if we had different standardsof

48 2. THE STRUCTURE OF INTELLECT
admission to medical school? I am inclined to answerthis question in thenegative. That is, we have extensive evidence indicating that the abilityto master complex scientific concepts is related to intelligence.Whatdo these speculationstell us about the relationship between gen-
eral intellectual ability and expertise? Real-world tasks may be crudelyordered along such dimensions as the amount of knowledge and the de-gree of explicit formulation of knowledge that is required for successfulperformanceof the task. General intelligence may beincreasingly relatedto the development of expertise as the size of the knowledge base in-creases and as the degree of acquisition of formal knowledge required forexpertise increases. This leads me to suggest that intensive study of adomain in which(1) the codification of knowledge in formal theories islimited, and (2! the numberof variables to be considered is limited mayresult in the development of expertise for individuals who do not havehigh general intellectual ability. Such expertise is likely to be domainspecific and to apply only to domains of somewhat limited complexityand range of knowledge required. Thus I am tempted to argue that Ceciand Liker’s demonstration does not indicate that general intelligence isunrelated to the developmentof real-world expertise. Ceci and Liker haveraised a fundamental question about general intellectual ability. In orderto provide convincing evidence in favor of their position they would needto provide somewhatclearer evidence of the relationship between IQ andexpertise in harness racing. And, morecritically, it would be necessary toobtain information about the relationship between general intelligenceand expertise in a variety of situations including those that appear toinvolve more extensive bodies of information than handicapping harnessraces. Ceci and Liker’s study is too problematic and too limited in scopeto support their far-reaching conclusions. We shall return to the issuesthat they address after reviewing research relating general intelligence tooccupational and academic success.

3g AND BASIC INFORMATION-
PROCESSING SKILLS: THE SEARCHFOR THE HOLY GRAIL
Our review of studies of the structure of ability tests supports a hier-archical modelof ability with g at its apex. Such a taxonomyprovideslittle or no information about the reasoning processes that are measuredby various tests. What distinguishes the performance of individuals whoare or are not able to solve an intellectual task? Psychometric studiesprovide little or no insight into the reasons for individual differences inperformanceon varioustestsof ability. In the last 15 years many psychol-ogists have developed theories of individual differences in intellectualprocesses based on experimental research. These theories are reviewed inChapters 3 and 4 of this volume.
Two broad approachesto laboratory studies of individual differences inability have emerged. One approachis related to the ideas of Galton andSpearman andis based on the attemptto relate general intelligence torelatively simple information-processing skills (see Carlson & Widaman,1987). The other approach is based on developmentsin cognitive psychol-ogy and leads to relatively complex models of task performance. Theformer approach will be considered in this chapter, the latter in Chap-ter 4.
Psychologists seeking to relate general intelligence to performanceinrelatively simple tasks tend to share several theoretical assumptions.They assumethat individual differences in intellectual ability are influ-enced by genotypesand otherbiological events that influence the struc-ture and function of the nervous system. Differences in neural function-ing maybe indirectly measured by experimental tasks that measure speedor accuracy of processing simple stimuli. Differences in basic parametersof information processing influence the development of the complex in-tellectual skills and knowledge that are assessed bytests of intelligence.Psychologists in this tradition are usually committed to a “bottom-up”(i.e., the complex derives from the simple} and to a reductionist(i.e.,individual differences in intelligence are ultimately rooted in differencesin the functioning of the nervous system) model of intelligence. I have
49

50 3. INFORMATION-PROCESSING SKILLS
somewhat facetiously subtitled this chapter “The Search for the HolyGrail” to capture the commitmentshared by manyof these psychologiststo the development of measures of intelligence that tap fundamentalbiologically determined processes using tasks that are assumed to berelatively isolated from the cultural experiences of individuals. Thesepsychologists seek to develop laboratory-based measures of intelligencethat are relatively “culture free.” Such measures may be used to measureability as opposed to achievement. Measures of intelligence assess anindividual’s intellectual attainments and, hypothetically, the ability toacquire new information and skills. No measureof intelligence can assessa dormantability that has not been actualized. The boundary betweenability and achievementis fluid. Perhaps measures can be developed thatare relatively “uncontaminated” by an individual’s achievements. Theconstruct assessed by such measuresis akin to Cattell’s construct, histor-ical fluid ability. These constructs are archaic; theyrefer to abilities thatare present at birth and even at the momentof conception.
The search for a pure measure of ability using simple information-processing tasks is an intellectually coherent enterprise. If individualdifferences in general intelligence derive from biologically based dif-ferencesin the structure of the nervous system that influence the way inwhich individuals process information, then, in principle, it is possible todevelop measures of an archaic biological capacity. Of course, this doesnot imply that such measures have been discovered. Nor does it implythat the assumptions that are shared by many psychologists working inthis tradition are valid. Obtained relationships between measuresof gen-eral intelligence and performance in simple information-processing tasksmay or may not provide independent support for the validity of the as-sumptions that have motivated this research.
In this chapter I shall review research on reaction time, inspectiontime, and infant habituation. I shall describe the relationship betweenperformance onthesetasks andontests of intelligence. I shall then con-sider the somewhat vexed question of the theoretical explanation of theobtained relationships and I shall speculate about the relationship be-tween the results of these studies and the implicit theoretical assump-tions held by many psychologists engaged in this research.
REACTION TIME AND INTELLIGENCE
The studyof the relationship between intelligence and reaction time tostimuli was initiated by Galton and wasperiodically investigated duringthe first three decades of this century (Peak & Boring, 1926). Contempo-rary research on this topic is largely attributable to Jensen (1982a,b;1985b; 1987a), who developed an apparatus based on the work of Roth (ascited by Eysenck, 1967) that may be used to obtain measuresof several
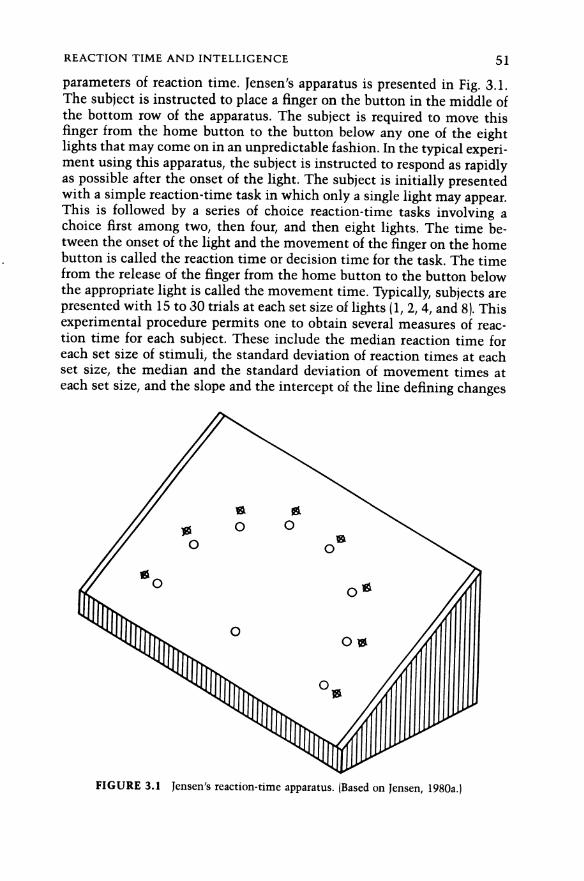
REACTION TIME AND INTELLIGENCE 51
parameters of reaction time. Jensen’s apparatus is presented in Fig. 3.1.The subject is instructed to place a finger on the button in the middle ofthe bottom row of the apparatus. The subject is required to move thisfinger from the home button to the button below anyoneof the eightlights that may comeon in an unpredictable fashion.In the typical experi-ment using this apparatus, the subject is instructed to respond asrapidlyas possible after the onset of the light. The subject is initially presentedwith a simple reaction-time task in which onlya single light may appear.This is followed by a series of choice reaction-time tasks involving achoice first among two, then four, and then eight lights. The time be-tween the onsetof the light and the movementof the finger on the homebutton is called the reaction time or decision timefor the task. The timefrom therelease of the finger from the home button to the button belowthe appropriate light is called the movementtime. Typically, subjects arepresented with 15 to 30trials at eachsetsize of lights (1, 2, 4, and 8}. Thisexperimental procedure permits one to obtain several measuresof reac-tion time for each subject. These include the median reaction time foreach set size of stimuli, the standard deviation of reaction times at eachset size, the median and the standard deviation of movement times ateach set size, and theslope and theinterceptof the line defining changes
FIGURE 3.1 Jensen’s reaction-time apparatus. (Based on Jensen, 1980a.}

52 3. INFORMATION-PROCESSING SKILLS
in reaction time as a function of set size. Each of these measures may berelated to scores on intelligencetests.
Jensen believed that reaction-time measures provide an index of thespeed and efficiency with which the nervous system processes elemen-tary information. He found that the slope relating reaction timeto setsize was positive, providing support for what he called Hick’s law (Hick,1952). Hick found that reaction time wasa linear function of the log ofsetsize. Jensen argued that each doubling of the numberofalternatives in achoice reaction-time task led to a constant increase in reaction time. Heinterpreted the linear function relating reaction time to set size as ameasure of the ability to process information of increasing complexity.He assumedthatintelligence is inversely related to reaction time and tothe slope and intercept of the function relating reaction timeto set size.Thus intelligence was related to the speed of processing information ofincreasing complexity.A substantial body of data has been collected relating intelligence to
reaction-time measures obtained using Jensen’s apparatus. Jensen (1987a)summarized the results of 31 studies. His conclusions are buttressed byfindings obtained by Detterman (1987; see also Barrett, Eysenck, & Luck-
ing, 1986; Carlson & Jensen, 1982) in a study of 860 Air Force enlistees
using a related version of the reaction-time task. These data supportseveral generalizations about the relationship between reaction-timemeasures and scores on varioustests of intelligence. Both movementtime and reaction time are negatively correlated with intelligence. Jensen(1987a} reports average correlations between median reaction timesin theno-choice, two-choice, four-choice, and eight-choice conditionsand intel-ligence of —.19, —.21, —.24, and —.26 respectively. The comparable cor-relations for movement-time measures and intelligence were —.17, —.17,—.15, and —.14. These correlations are weighted averages of 15 sampleswith 1129 subjects. Detterman (1987) reported a correlation of —.18 be-tween reaction time and IQ in his sample of 860 Air Force enlistees.These correlations may becorrected for restrictions in range of talent andattenuation. The corrected correlation between the meanofthe fourreac-tion times and IQ is —.309. Detterman reported a correlation of —.33between meanreaction time and IQ correctedfor restrictions in range oftalent. Jensen (1987a) reported that the meancorrelation in these studiesbetween theslope of the increase in reaction time overset size and IQ was—.117. This correlation when corrected for attenuation andrestriction inrange of talent becomes —.183. Detterman obtaineda positive correlationof .07 between his slope measure and IQ. Thus,it appears that the slope ofreaction-time measuresis not consistently related to IQ. Measures of the
variability of reaction time are positively correlated with measuresof thespeed of reaction time. Jensen reported a correlation of .65 between thesemeasures that becomes 1.00 whencorrected for attenuation. Since mea-sures of speed and variability of reaction time appear to be redundant,it is

REACTION TIME AND INTELLIGENCE 53
not surprising that there is a relationship between the variability of reac-tion-time measuresandgeneral intelligence. Jensen (1987a) reported aver-age correlations ranging between —.21 and —.28 for the relationship be-tween IQ and measuresof the variability of reaction timefor different setsizes. These correlations, when corrected for restrictions in rangeoftal-ent and attenuation, ranged between —.33 and —.43.Finally, it is possibleto combine several parameters obtained from a reaction-time task into amultiple correlation and obtain multiple r’s close to .50 (Jensen & Vernon,1986; Detterman, 1987).These date support the generalization that the speed and variability of
reaction time is inversely related to IQ. Reaction-time measures consid-ered singly predict approximately 10 to 15% of the variance in IQ. Theseempirical relationships appear to be well established. The interpretationof these findings remains vexed. The available data contradict severalinitial assumptions held by Jensen. He assumedthat the slope of thefunction relating set size to reaction time would provide a theoreticalindex of the rate of processing information based on the functioning ofthe nervous system and wouldberelated to intelligence. The data indi-cate that slope measuresare not as highly related to IQ as measuresof
speed and variability of reaction time. He also assumed that choicereac-tion-time tasks that involve processing of information about the locationof a stimulus would be more highly related to IQ than reaction-timemeasures in which the stimulus appears in a single constant location.The data provide very little evidence in support of this assumption. Al-though the correlation between the median reaction time in the no-choice condition and IQ is slightly lower than the comparable correlationin the choice reaction-time conditions, the difference is very small (—.19versus correlations ranging between —.21 and —.26). In addition, the cor-rected correlation between the variability of reaction-time measures andIQ in the no-choice condition is —.40. The comparable correlations forthe choice reaction-time tasks range between —.33 and —.43. These dataindicate that there is little or no difference in the magnitudeof therela-tionship between IQ and performance in simple and choice reaction-timetasks.
Frearson & Eysenck (1986) developed a variant of the choice reaction-time task using the Jensen apparatus that maylead to highercorrelationsbetween measures of choice reaction time and intelligence than thoseusually obtained with the Jensen procedure. The procedure usedis calledthe odd-man-out technique and involves the presentation of a stimulusdisplay with three lights. Figure 3.2 presents stimulus displays used byFrearson and Eysenck. Thesubject is required to choose the stimulus thatis located at the greatest distance from the remaining two stimuli that areclosest to each other. In their original study using this technique, Frear-son and Eysenck obtained a correlation of —.62 between the meanreac-tion time for odd-man-out presentations and scores on the Raven progres-

54 3. INFORMATION-PROCESSING SKILLS
0000 ©7200
4. e ° 13.e x ° °
0000 008e0
2 ° e 14. x ex e ° °
e000 0e@e0
3 ° ° 15. ° °° x ° x
o008 0080
4 ° ° 16 ° °
b( ° p.( °
0e00 00Ko
5 ° ° 17. e °
e x e °
0000 ooo
6 ° ° 18. ° e
x e ° e
©0000 oo60ee
? ° x 19 ° °
e ° ° x
0000 e@e00
8 x e 20 ° °
° e x °
e000 eooX
9 ° x 21. 0 °e ° oO °
o008 Koeoe
10. x ° 22. ° °
° e ° °
e000 oKoo
11. e x 23. e °° ° e °
o00e 00Ko
12, MM ° 24. ° °° ° ° e
FIGURE 3.2 The 24 patterns used in the odd-man-out paradigm. The target is markedwith a cross. (Based on Frearson and Eysenck, 1986.)
sive matrices. They also computedtherangeof reaction times for each oftheir odd-man-out presentations and obtained a mean range score. Thisscore correlated with scores on the Raven —.52. The correlations betweenreaction-time measures obtained in the usual way with the Jensen appa-ratus and scores on the Raven for this sample of 37 subjects were com-parable to those reported by other investigators using the Jensen apparat-

REACTION TIME AND INTELLIGENCE 55
us. Frearson and Eysenck obtainedcorrelations ranging from —.25 to —.36between their measures of mean reaction time at each of four set sizesand scores on the Raven. The comparable correlation for measures of thevariability of reaction time at each of four set sizes and scores on theRaven varied between —.23 and —.31. These data suggestthat the correla-tions between odd-man-outreaction times and intelligence are substan-tially higher than correlations between simple and choicereaction timesobtained in the usual way with the Jensen apparatus.
Frearson, Barrett, & Eysenck (1988) reported the results of a follow-upinvestigation using the odd-man-out technique with a sample of 107 sub-jects. They obtained measures of the meanreaction time for the odd-man-Out presentations as well as two measures of the variability of perfor-mance on the odd-man-out presentations—the mean of the ranges ofresponse timefor each of the stimulus presentations and the mean of theinterquartile ranges of response times. In addition, they obtained scoreson the Wechsler test of intelligence as well as the Raven test. Table 3.1presents the correlations between the odd-man-out performance mea-sures and various measuresof intelligence as well as correlations betweenthe usual reaction-time measures andtheintellectual indices. The corre-lations presentedin Table 3.1 do not provide clear support for the findingsobtained by Frearson and Eysenckin their earlier study with a smallersample. Thatis, correlations based on the odd-man-out techniqueare notalways substantially larger than correlations between traditional reac-tion-time measures and intelligence. There is some indication that cor-relations between measures of reaction time based on the odd-man-outprocedure are higher with nonverbal measuresof intelligence. And, thecorrelation between the mean odd-man-out reaction time and perfor-mance on the Ravenstest (—.48) is higher than the correlation betweenthe Raven test score and the usual reaction-time measures.The twostudies reported by Frearson and Eysenck using the odd-man-
TABLE 3.1 Correlations between Measures of Reaction Time Using Jensen’sApparatus Including Odd-Man-OutPresentations and Measures of Intelligence
Intelligence
VIQ PIQ IQ Raven
Reaction time (RT}Mean RTforset size 2 —.22 —.21 —.24 —.17MeanRTforset size 4 —.17 —.16 —.19 —.13Variance of RT for set size 2 — .35 — .38 —.39 —.36
Odd-man-out measures
Mean RT —.19 —.39 —.30 —.48
Meanrange of RT —.20 —.41 —.30 ~-.18Meaninterquintile range ~.30 ~.53 —.43 —.50
2Based on Frearson etal. (1988).

56 3. INFORMATION-PROCESSING SKILLS
out procedure suggestthat this type of choice reaction-time task may bemore predictive of performance of measuresofintelligence that include aspatial componentor that are good measures of fluid or general intel-ligence than the conventional measures obtained using the Jensen appa-ratus. The odd-man-out task appears to add to the conventional choicereaction-time task a spatial discrimination componentin which the sub-ject is required to compare distances betweenpairs of stimuli. In the nextsection of this chapter we shall consider research involving inspection-time tasks that indicates that measures of the ability to discriminatebetween stimuli that are different may correlate with intelligence morehighly than reaction-time measures. From this perspective, the odd-man-out technique maybe a hybrid task that combines elements of an inspec-tion-time task involving a discrimination task and a choice reaction-timetask. Additional research is needed to establish that odd-man-out reac-tion-time measuresare consistently more predictive of intelligence thanother choice reaction-time measures. The preliminary results obtainedwith the task are promising.Whyis there a relationship between the speed and variability of reac-
tion times and IQ? This question has been answeredin tworatherdiffer-ent ways. Although Jensen’s original theoretical assumptions were notfully supported, he would maintain that the obtained relationship is to beexplained by a bottom-up reductive model of intelligence. He believedthat the characteristics of the nervous system determine the speed ofreaction time and that individuals whose nervous systems function moreeffectively develop more complex intellectual skills. Thus the reaction-time measures are viewed by him asreflecting culture-free measures ofneural functioning. By contrast, many of Jensen’s critics argue that reac-tion-time tasks are not simple, that they provide ample room for the useof strategies, and that the relationship between IQ andreaction timeis tobe explained by a reversed causal model in which individuals who havegood intellectual skills acquire techniques and strategies that enablethem to perform in a more optimal mannerin a reaction-timetask. Let us
consider someof the specific issues that have been discussedin thelightof the available data.
Longstretch (1984; 1986; see also Jensen & Vernon, 1986) had threecriticisms of Jensen’s theoretical interpretation of his findings. First, heargued that Jensen’s slope measures were confounded with ordereffects.In Jensen’s research, subjects performed the several reaction-time tasks ina fixed order going from simple reaction time to choice reaction time withset sizes of 2, 4, and 8. Reaction-time measures for different set sizesconfoundset-size and practice effects. It is known that reaction timestend to decrease with practice (Welford, 1980). A short reaction time for aset size of 8 in Jensen’s experiments may come about because an indi-
vidual benefited from practice on the earlier reaction-time tasks. Thecorrelation betweentheslope of the reaction-time measures and IQ may

REACTION TIME AND INTELLIGENCE 57
occur because individuals with high IQ are able to benefit more from
practice than individuals with low IQ. Note that this interpretation at-tempts to provide a theoretical rationale for a relationship between IQand reaction timethat is not reductive. It assumesthat general abilitiesassociated with IQ enable individuals to benefit from experience and
adapt to novel tasks. In effect, such an explanation reverses the causalanalysis explicit in Jensen's theoretical interpretation.Jensen (1987a} argued that the small numberof trials he used in his
experiments(typically 15 at each set size) precluded the developmentofpractice effects in his studies. He reported (Jensen, 1987a) that the reac-tion timefor the first three trials is not substantially different from thereaction time for the last three trials for a particular set size. Thereis,however, evidence of the existence of practice effects in experiments inwhich the order of presentation of reaction-time tasks is experimentallyvaried. Widaman & Carlson (1989) found that the slope of the functionrelating reaction time to set size was lower when they followed Jensen’sprocedure of using an ascending order than it was when they used adescending order in which the larger set sizes preceded the smaller setsizes. In addition, they found a significant negative correlation betweenthe slope of the reaction-time increaseoverset size and intelligence whenthey used the ascending order of presentation used by Jensen (r = —.26).The comparable correlation for the reversed order of presentation waspositive (.21). These data suggest that the relationship betweentheslopeof the change in reaction time and IQ maybeattributable to the rate atwhich individuals of different IQ are able to benefit from practiceeffects.
(For contradictory results see Larson & Saccuzzo, 1986.) This criticism ofJensen’s theoretical analysis does not deal with the findings relating IQand simple reaction time in Jensen’s research. These are typically basedon the first 15 reaction-timetrials and are unlikely to be attributable topractice effects.
Second, Longstreth arguedthat visual attention effects might influencereaction-time measures. Subjects who attend to the center of the visualarray experience lights from the periphery of the display in regions of thevisual field in which optimal visual acuity is unlikely to be present.WidamanandCarlsontested this notion by varying the distance betweenthe lights in various set-size conditions and foundlittle evidence in sup-port of this notion. These attentionaleffects are not likely to be operatingin the simple reaction-time study—the light comeson in a single posi-tion in the center of the display—and we haveseen that reaction time inthe simple reaction-time experimental situation is as highly correlatedwith intelligence as reaction time in the choice reaction-time experimen-tal situation.
Third, Longstreth argued that response bias effects may be present inthe experimental arrangements usedby Jensen. The lights occurat differ-ent locations and therefore involve different movementsto the lights.

58 3. INFORMATION-PROCESSING SKILLS
Jensen argued that the use of a home button avoids this problem. Thatis,different amounts of time required to execute the different responsesshould affect the less important movement-time measures but not thereaction-time measures. Longstreth noted that responses with differentmovements might require different amounts of preparation. Thus, feed-back from the response components of the reaction-time task might in-fluence the reaction-time measure as well as the movement time. Thereis a second way in which responsebias effects might influence reaction-time measures. Individuals might release their finger from the homebutton before they have determined the direction of the movementre-sponse. The decision to move the hand toward the light could be madeafter the individual has actually responded. Individuals with high intel-ligence may be morelikely to discover the strategy of moving before theinformation-processing requirements of the task have been completedthan individuals of low intelligence. Jensen argued that response biaseffects are unlikely to occur in his studies because the responseis “bal-listic.” The term ballistic is used to suggest that the movement responseis programmedprior to its execution and cannot bealtered onceit is inprogress. Whatever the possible role of response bias effects describedabove, it should be noted that they are not present in the simple reaction-time task and thusare unlikely to accountfor the relationship betweenreaction-time measures and intelligence since that relationship occurswhere they do not exist.Detterman (1987) asserted that reaction time is not a simple task. Reac-
tion-time measures might be influenced by a variety of exogenousvari-ables including the ability to understand instructions, familiarity withthe equipment used, and motivation. While it is plausible to argue thatany of these variables may in fact be responsible for the relationshipbetween IQ andreaction time, no evidence exists that any of these vari-ables are responsible for the obtained effects. Some of these variables areunlikely to provide an explanation of the obtained relationships. Theequipment should besufficiently novel for all subjects and the instruc-tions should be unambiguous. Variations in these factors are unlikely toaccount for the relationship between IQ and reaction time, particularlyamong individuals who are above average in IQ such as those used by
Dettermanin his research.
Detterman also argued that reaction-time measures may beinfluencedby speed—accuracy trade-offs. Speed—accuracy trade-offs usually are evi-denced when individuals who respond rapidly are more likely to makeincorrect responses than individuals who respond slowly. Such trade-offsoccur when individuals adopt different criteria for the execution of aresponse. Rapid responding can occur at the cost of additional errors inresponding. This phenomenacannotexplain the relationship between IQand reaction timesinceintelligence is negatively correlated with errors inthese tasks (Detterman, 1987; Jensen, 1987a). If high-IQ subjects were

REACTION TIME AND INTELLIGENCE 59
responding morerapidly at lower levels of accuracy than low-IQ subjects,IQ should be positively rather than negatively correlated with errors.There is a second more complex way in which speed—accuracy trade-
offs may be involved in reaction-time tasks. Brewer & Smith (1984) re-ported the results of experiments comparing the performance of retardedsubjects and college students on choice reaction-time tasks for one to twothousand trials. They studied the trial-by-trial variation in respondingfollowing and preceding the occurrence of a wrong response. They notedthat subjects tended to decrease their reaction times prior to the occur-renceof an error. Onthetrial following an error, subjects increased theirreaction times. Thesetrial-by-trial variations are interpretable by assum-ing that individuals monitor the trial-by-trial variation in their perfor-manceandattemptto adoptcriteria of responding that place mostof theirresponses in a narrow “safe” band just above the threshold of responsespeed thatis likely to result in errors. Retarded subjects demonstrated thesame phenomenaof trial-by-trial variation as the college students, buttheir adjustments to the occurrence of an error were muchlessefficientand they tended to overcorrect their response speeds following an errorand then exhibit downward drifts that created errors. These phenomenacontribute to the obtained increase in the variability of reaction timeamongthe retarded subjects relative to the nonretarded subjects.To what extent do the phenomenaoftrial-by-trial variations in adjust-
ments to error explain the relationship between reaction time andintel-ligence in the studies reviewed by Jensen? There are several reasons to becautious in accepting the phenomenadescribed by Brewer and Smith asthe basis for explaining the IQ—reaction-timerelationship. First, Brewerand Smith comparedretarded subjects to college students. Larson & Al-derton (1990) obtained measuresof the increase in reaction time follow-ing an error in performingseveral relatively simple judgment tasks. Theyfound that this measure correlated —.17 with general intelligence in alarge sample of military recruits. The correlation between a measure ofvariability of reaction times and intelligence in their sample was —.36.The partial correlation between variability of reaction times and intel-ligence controlling for the degree of post-error slowing was —.35. Thesedata indicate that the relationship between variability of reaction timesand intelligence is not attributable to differences in a person’s ability tomoderate changes in reaction times following errors. Second, the phe-nomenaare present in reaction-time experiments in which subjects aregiven 200 practice trials and 2000 experimental trials. The correlationbetween the variability of reaction time and intelligence in simple choicetasks is obtained for the first 15 or 30 reaction-time responses following abrief set of practice trials. Third, errors in a simple reaction-time task asopposed to a choice reaction-time task are unlikely to occur. Yet thecorrelation between variability of reaction time andintelligence does notvary in simple and choice reaction-time tasks. For these reasons, speed—
60 3. INFORMATION-PROCESSING SKILLS
accuracy trade-offs either of the classic kind or of the type studied byBrewer and Smith are unlikely to provide an adequate explanation of therelationship between reaction-time measures and intelligence.
Attentional mechanisms may mediatetherelationship between IQ andreaction time. Speed of responding and variability of responding are high-ly correlated—indeed they maybeperfectly correlated when the obtainedcorrelation is corrected for attenuation. Individuals whoare high in intel-ligence are not consistently faster in responding to a stimulus than indi-viduals who are low in intelligence. The capacity to process stimulirapidly is not the variable that determines differences in reaction timeamong individuals who differ in intelligence. High- and low-IQ subjectsare likely to exhibit an equal numberof rapid responses. Differences inthe median reaction time may beanartifact of variations in a subject’sability to maintain a consistent response speedthatis close to his or heroptimal performancelevel.Larson & Alderton (1990) demonstrated that the relationship between
variability of reaction times and intelligence was substantially deter-mined by performance on the slowest reaction-time trials. They rankordered their subjects’ reaction times from fastest to slowest and thengrouped the rank-orderedtrials into 16 groupsof 5 trials. They then ob-tained the mean reaction time for each of the 16 groupings from thefastest to the slowest. This procedure produced 16 reaction time meansfor each of their subjects. These means were correlated with an index ofgeneral intelligence. The magnitude of the correlations increased mono-tonically from fastest to slowest reaction-time groupings. Thecorrelationbetween the meanof the fastest band and general intelligence was —.20.The correlation between the meanof the slowest band andgeneralintel-ligence was —.37. These data indicate that the relationship between reac-tion-time indices and general intelligence is substantially mediated byperformanceon trials where subjects are performingat their least optimallevel. These data suggest that individuals with high intelligence are ableto maintain levels of performancein relatively simple tasks that are closeto their optimal level whereas individuals with low intelligence are un-able to maintain constantly optimal levels of performance.
It is also possible to explain the relationship between intelligence andthe variability of responding in reaction time by the appeal to a neu-rological or, perhaps, a neuromythological model. Jensen (1980a) assumedthat individual differences in intelligence are related to the rate of oscilla-tion of an excitatory function for neurons.Individuals of high intelligenceare assumedto have neuronsthat oscillate more rapidly than individualswith low intelligence. If the onset of a stimulus occurs when the neuronis in an excitatory phase, the reaction-time response will be rapid. If astimulus is presented during the refractory phase of a neuron, the reac-tion-time response will be delayed until the neuron enters its excitatoryphase. Individuals who differ in intelligence will exhibit equally rapid

REACTION TIME AND INTELLIGENCE 61
reaction-time responses for those stimulus presentations that coincidewith neuronal excitatory phases. The reaction times of individuals whoare low in intelligence will be longer than the reaction times of indi-viduals who are high in intelligence when the stimulus occurs during arefractory phase of neuronal reactivity. This difference in reaction timeisattributable to variations in the speed of oscillation of the neuronalexcit-atory cycle. If oscillations are slow, it will take longer for a neuron toenter the exitatory phase of its cycle when a stimulusis presented duringthe refractory phase than whenoscillations are rapid. And, individuals ofhigh intelligence are assumed to have morerapid oscillatory cycles thanindividuals of low intelligence.
Jensen’s neurophysiological model explains the central feature of therelationship between IQ andreaction time. There is, however, little or noevidence in favor of the model. Evidence of a relationship between intel-ligence and theoscillatory cycle of systems of neurons does not exist.Such evidence might be obtained by experimentsthat assessthe effects ofprior stimulation on evoked potential responses to stimulation. In theabsence of any physiological evidence, the model adds nothing more thana physiological metaphorto the assertion that intelligence is positivelyrelated to the ability to maintain consistent attention to stimuli. If thephysiological model is not supported, the assumption that the rela-tionship between reaction-time measures and IQ is to be understood asproviding evidence for a bottom-up reductive explanatory system for in-telligence is not justified. Indeed, the causal direction of the relationshipremains ambiguous.It is possible that individuals who havehigh intel-ligence becomeskilled at controlling their attention. Consider a fancifulscenario. Individuals who, for whatever reason, excel in academicsettingsand whodevelop their intellectual capacities and score high on tests ofintelligence may find school a rewarding setting. They become responsiveto attentional requirements associated with formal instruction in schoolsettings. The developed attentional skills are manifested in reaction-timetasks. We have no persuasive evidence that favors either of two spec-ulative scenarios—one that assumesthatintelligence causes individualsto develop the attentional skills to excel in reaction-time tasks or theother that assumes that basic neurological processes that are related tothe performance of individuals in reaction-time tasks cause individuals todevelop the abstract intellectual skills that are assessedbytests of intel-ligence.
To assert that we do not have an appropriate causal explanation of thedirection of the relationship between IQ andreaction time does not implythat such an explanation is unattainable. There are three types of researchthat could, in principle, provide evidence that would support one of thesecausal analyses. Studies that relate reaction-time performanceandintel-ligence to physiological measures could provide evidence for physiologi-cal mediation of the relationship. Behavior genetic analyses of reaction-

62 3. INFORMATION-PROCESSING SKILLS
time measuresand otherbasic psychological processesas well as studiesof the genetic and environmental influence on therelationship betweenthe measures (i.e., behavior genetic covariation analyses) could help toclarify the role of genetic influences on the developmentof therela-tionship between experimental tasks and individual differences in intel-ligence. Finally, longitudinal studies could help to elucidate the develop-ment of a relationship between intelligence and simple information-processing skills. Although there are few studies of this type thatclarifythe relationship between reaction time and intelligence, we shall consid-er related research in this volume.Given our lack of understanding of the reasons for the relationship
between intelligence and reaction time, what, if anything, is the impor-tance of this research?It is surprising to find anyrelationship between thecomplex skills and problems found in contemporary measuresof intel-ligence and somethingas apparently simple as the variability of the timeto respond to a light in a simple reaction-time task. At the same time,itshould be recognized that the correlation between these variables is nothigh. Even with adjustmentsfor restrictions in range and attenuationit isunlikely that the true correlation between these variables exceeds .4.Thus reaction-time measures considered singly may account for as muchas 16% of the variance in intelligence. This may be too small an amountto assume that reaction-time measures provide insight into the funda-mental characteristics that account for individual differences in intel-ligence.
INSPECTION TIME
It is theoretically possible to measure the speed of apprehension of astimulus without the use of reaction-time measures. Nettlebeck (1973)and Vickers (1970; Vickers, Nettlebeck, & Willson, 1972) developed anexperimental procedure to measure the speed of apprehensionof a stim-ulus. They assumed that judgments about a stimulus occur in acumulative fashion based on discrete inspections of the stimulus untilsomecriterion level for stimulus judgmentis obtained. They attemptedto estimate the minimal duration of a single inspection that providesinformation about a stimulus.The original inspection-time task involved tachistoscopic presentation
of two adjacent vertical lines differing in length in a 1:1.4 ratio followedby a “masking stimulus” that covered both lines and was assumed toprevent additional iconic processing of the stimulus. The duration ofpresentation of the lines was varied and a psychophysical function wasobtained. The task was used to ascertain the minimal exposure timerequired to attain some predetermined level of accuracy of judgmentabout which of the two lines was longer. Inspection time was usually

INSPECTION TIME 63
defined as the estimated exposure time required to obtain 95% accuratejudgments.
Nettlebeck & Lally (1976) reported the first study relating inspectiontime to IQ and reported a correlation of —.89 between their inspection-
time measure anda test of intelligence. Comparably high correlationswere reported by Brand & Deary (1982). These extremely high correla-tions were obtained from small samples that included retarded subjectsand normals. The retarded subjects frequently had inspection-time scoresthat were extreme and these extreme values in small samples tended toinflate the value of the correlations that were reported.A considerable body of research relating inspection-time measures to
intelligence was reviewed by Nettlebeck (1987) and Kranzler & Jensen(1989; see also Brebner & Nettlebeck (1986); Lubin & Fernandez, 1986).The studies differ in many ways. Inspection times have been assessedusing visual, auditory, and tactile stimuli. Different procedures to calcu-late thresholds were used and different stimulus displays were used indifferent studies. Some psychologists used tachistoscopic displays, othersused computer displays. The visual stimuli used varied considerably. Insome studies the location of the stimuli on the computer screen variedfrom trial to trial. The IQ tests used differ and the composition of thesamples tested varies by age and IQ range. Kranzler & Jensen (1989) usedmeta-analysis to summarize all of the available studies dealing with in-spection-time measuresandintelligence. Kranzler and Jensen’s summaryof the available literature is based on a total sampleof 31 studies and 1120subjects. Kranzler and Jensen reported that the meancorrelation betweeninspection time and measuresof intelligence is .29. The correlation be-tween IQ and inspection time corrected for attenuation andrestrictionsin range of talent is —.49. The correlation appearsto be slightly higher inadult samples (r = —.54 versus —.47 for children) and to be higher forperformance than for verbal measures of IQ. Kranzler and Jensen alsoreport a meta-analysis that excludes studies that were criticized on meth-odological grounds by Nettlebeck (1987) in his comprehensive analysis ofthe inspection-time literature. The corrected correlation between inspec-tion time and IQ is —.54 for this restricted set of studies.
The correlation between inspection-time measures and intelligencemay actually be somewhat higher than the value of .54 reported byKranzler and Jensen as the optimal estimate for the adult population. Razand Willerman (1985) and their associates (Raz, Willerman, Ingmundson,& Hanlon, 1983) obtained somewhat higher correlations in a series ofstudies using auditory pitch discrimination measures. These studies werebased on an auditory version of the inspection-time paradigm. Auditorystimuli that differ in pitch may be backwardly masked by tones thatfollow the presentation of the stimuli to be judged. Variations in theinterstimulus interval between theoffset of the critical stimulus and theonset of the tone can be used to discover the amountof time required to

64 3. INFORMATION-PROCESSING SKILLS
reach somepredeterminedlevel of accuracy of judgment. Razet al. (1983)presented subjects with either a low- or a high-pitched tone for 20 ms oneachtrial. The tones were easily discriminated if they were not masked.Each tone wasfollowed by a maskingtone. Theyvaried the interstimulusinterval between theoffset of the target tone and the onset of the maskingtone and determined thebriefest interval at which their subjects couldaccurately judge whether they had been presented with a low or a hightone. Their subjects were college students who had beenselected as scor-ing either high or low on the SAT. They correlated SAT group membershipwith two threshold values—athreshold score and a logarithmically trans-formed threshold score. These scores correlated with SAT group mem-bership —.33 and —.53, respectively. A second experiment was performedas a replication of this study, again using college students selected as highor low scorers on the SAT. In the replication experiment, subjects wereadministered a Cattell Culture-Fair test of intelligence and thresholdswere obtained for stimuli presented for both 20- and 30-ms durations.Four threshold values were obtained—thresholds for interstimulusinter-vals for stimuli presented at each of two durations and logarithmic trans-formations of these threshold scores. These scores were correlated withCattell IQ test scores. The correlations ranged between —.41 and —.73.Logarithmically transformed threshold scores correlated more highlythan the original scores (the correlations were —.69 and —.73). Perfor-mance curves for subjects differing in IQ are presented in Fig. 3.3. Anexamination of these curves indicates that the largest difference is ob-tained whenthe interstimulus interval is low. The results of these twoexperiments indicate that individuals who score high on an IQ test areable to judge differences in pitch more accurately than individuals whoscore low on an IQ test whenthe time available for processing the stim-ulus is brief.Raz and Willerman (1985) reported an additional replication of these
findings using stimuli that differed both in pitch and in duration. Theirhigh- and low-pitched tones werepresentedfor durations varying between10 and 20 ms. The subjects were instructed to ignore variations in theduration of presentation of the tone and to judge only the pitch of thetone. The logarithmically transformed threshold values for the in-terstimulus interval between the offset of the tone and the onset of amasking stimulus and Cattell IQ scores correlated —.47, —.44, and —.53
for three different presentation times.In the last study in this series, Raz, Willerman, & Yama (1987) intro-
duced a different auditory task. Subjects were presented with two 20-mspresentations of two unmaskedtonesthat wereclearly different in pitch.There was an 85-msinterval between the presentationsof the first andsecond tone. The subjects were required to indicate whetherthefirst orthe second tone washigherin pitch. The difference in pitch between thetones was reduced and threshold measures were obtained for the minimal
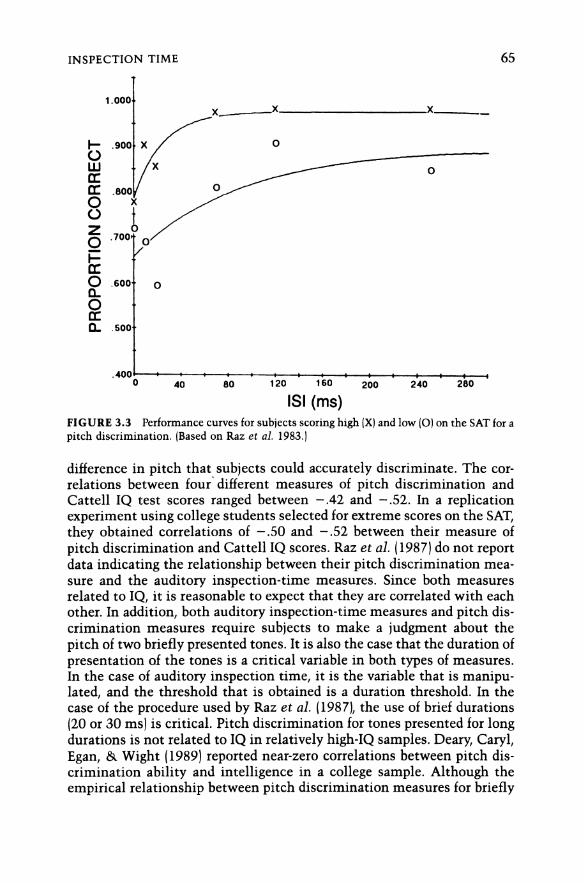
INSPECTION TIME 65
T
1.0007
>
.900
.800
.700
No
600t oO
PROPORTIONCORRECT
.900fr
400 + + ———_+— + + + > + + +0 40 80 120 160 200 240 280
ISI (ms)FIGURE3.3 Performance curvesfor subjects scoring high (X) and low (O) on the SAT for apitch discrimination. (Based on Raz et al. 1983.)
me s a me A. mt A
difference in pitch that subjects could accurately discriminate. The cor-relations between fourdifferent measures of pitch discrimination andCattell IQ test scores ranged between —.42 and —.52. In a replicationexperiment using college students selected for extreme scores on the SAT,they obtained correlations of —.50 and —.52 between their measure ofpitch discrimination and Cattell IQ scores. Raz et al. (1987) do not reportdata indicating the relationship between their pitch discrimination mea-sure and the auditory inspection-time measures. Since both measuresrelated to IQ, it is reasonable to expect that they are correlated with each
other. In addition, both auditory inspection-time measuresandpitch dis-crimination measures require subjects to make a judgment about thepitch of two briefly presented tones.It is also the case that the duration ofpresentation of the tonesis a critical variable in both types of measures.In the case of auditory inspection time, it is the variable that is manipu-lated, and the threshold that is obtained is a duration threshold. In thecase of the procedure used by Raz et al. (1987), the use of brief durations(20 or 30 ms)is critical. Pitch discrimination for tones presented for longdurationsis notrelated to IQ in relatively high-IQ samples. Deary, Caryl,Egan, & Wight (1989) reported near-zero correlations between pitch dis-crimination ability and intelligence in a college sample. Although theempirical relationship between pitch discrimination measuresforbriefly
66 3. INFORMATION-PROCESSING SKILLS
presented tones and auditory and visual inspection-time measures re-mains to be empirically investigated, it is possible to argue that bothkinds of measures may berelated to speed of information processing.Deary argued that faster inspection times would enable individuals tomake more individual inspections of the characteristics of briefly pre-sented tones thereby increasing the accuracy of the discrimination. Hestated, “. .. the argument whichpits processing speed againstfidelity ofstimulus representation may well be a nonargument: the experimentsreported here are commensurate with an explanation whichstates that afast inspection time is primarily an advantage in information processingspeed, and that this results in more faithful representation of brieflypresented stimuli” (Deary, 1989).Willerman and Raz andtheir associates do not report corrected correla-
tions for any of the correlations they obtained in their studies. They donot report test-retest correlations for their various measuresof auditoryinspection time and pitch discrimination. In addition, the use of collegestudents with extreme scores on the SAT makesit difficult to applyconventional corrections for restrictions in range of talent. Nevertheless,it is clear that somerestriction in range of talent exists in their samplesand it is undoubtedly the case that the test—retest correlation of thevarious experimental measures they useis less than 1.00. Therefore, theirobtained correlations are lower than the hypothetical true correlationbetween their experimental measures and scoresontestsof intelligence.If a representative correlation of .5 is corrected for attenuation assumingtest—retest correlations of .75 for their experimental measures (the valuefor test—retest measures of inspection time} and .9 for their measure ofintelligence, the corrected correlation is .6, indicating that the experi-mental measures may accountfor approximately 36% of the variance inintelligence test scores. Jensen and Kranzler’s meta-analysis of all of theinspection-time data suggests that inspection-time measures accountforapproximately 25% of the variance in scoreson intelligence tests. Theseanalyses indicate that inspection-time measures are more predictive ofintelligence test scores than reaction-time measures. They also indicatethat the relationship between inspection timeandintelligence test scoresis sufficiently high as to suggest that these experimental measures mustbe determined by something thatis substantially related to the determi-nants of performanceontestsof intelligence. There is no rule or law thatindicates whena particular amountof variance accounted for by a mea-sure is to be classified as substantialor trivial. I am comfortable dismiss-ing the relationship between reaction timeandintelligence as being tooinsubstantial to provide important clues to understanding the nature ofindividual differences in intelligence. I cannot respond in the same way tothe data on inspection time.If inspection-time measures accountfor 25%of the variance in scores on intelligence tests and if the measures used byWillerman and his associates accountfor 36% of the variance in perfor-

INSPECTION TIME 67
manceontests of intelligence, then this relationship is too substantial todismiss. An understanding of the nature of the relationship should pro-vide clues to an understanding of the nature of individual differences inintelligence.
Several lines of research help to elucidate the meaning of the obtainedrelationship between inspection time and measureof intelligence. If in-spection-time measuresare related to a general information-processingcapacity they ought to be independent of modality. That is, there shouldbe a relationship between measuresof inspection time derived from visu-al displays and measuresof inspection time derived from stimuli present-ed in other modalities. Deary (1980; 1986; Deary, Head, & Egan, 1989)found that auditory inspection time and visual inspection timewereper-fectly correlated, but this result was dependent on the performance ofretarded subjects. When these subjects were omitted, the correlation wasnot significantly different from zero. Irwin (1984) also found that auditoryinspection timeand visual inspection time were unrelated in a sample of50 schoolchildren. These results may beattributable to methodologicalproblems in the assessment of auditory inspection time. White noisemasks were used in these investigations and there is some evidence thatthey may not have been effective in masking the pure tones. Thus indi-viduals were able to process the tones after the onset of the mask. Inaddition, the distribution of auditory inspection items was skewed, withsome individuals having extremely long inspection times. This waspar-tially attributable to a small subset of subjects who were not able toadequately perform the discrimination task even with relatively long pre-sentation times. Deary et al. (1989) devised an improved auditory inspec-tion-time task using a more effective masking stimulus. They excludedsubjects who were unable to make the discrimination accurately whenthe tones were not masked. They found correlations ranging between .24and .53 in a sample of 120 undergraduates between their measure ofauditory inspection time and three different measures of visual inspec-tion time (see also Nettlebeck, Edwards, & Vreugdenhil, 1986).
Visual inspection time hasalso beenrelated to tactile inspection-timemeasures. Edwards(1984, as reported in Nettlebeck, 1987) failed to obtaina relationship between tactile reaction times and visual inspection-timemeasures. Nettlebeck & Kirby (1983) used a tactile discrimination task inwhichtheir subjects were required to report which of twofingers wasfirststimulated by rapidly vibrating keys. They reported that their subjectscomplained that their fingers rapidly became numb whenperforming thistask. Nettlebeck (1987) speculated that this problem may have renderedthe measures meaningless and this may accountforthe failure to obtaincorrelations between tactical and visual inspection times. Deary (1988)speculated that tactile information processing may beless centrally relat-ed to higher-order intellectual processes than either visual or auditoryinformation processing.

68 3. INFORMATION-PROCESSING SKILLS
A numberof hypotheses have been advanced to explain the relationshipbetween inspection time and intelligence. It may be the case that indi-viduals with high intelligence understand instructions in these tasks bet-ter than individuals who have low intelligence and thus perform betterfor reasonsthat have little or nothing to do with their basic information-processing skills. There are two arguments against this hypothesis. Cor-relations between inspection-time measuresandgeneralintelligence testscores have been obtained in children as young as 6. For example, Ander-son (1986) reported correlations between visual inspection-time measuresand Wechslerintelligence test scores in small samplesof children aged6,8, and 10. The correlations in these three groups of children were —.38,—.55, and —.33 respectively. If a relationship between inspection time andIQ can be obtainedin children as youngas6,it is unlikely that variationsamong a sample of university students are attributable to a failure tounderstand instructions. Raz et al. (1987) obtained data in one of theirexperiments that also provides evidencethat contradicts an instructionalexplanation for the relationship betweenintelligence and inspection-timemeasurement. They presented subjects with a loudness discriminationtask for tones presented in one of two intervals for 20 ms. Thesubjectswere required to indicate in which of two intervals the tone occurred.They obtained loudness thresholds for three different conditions involv-ing masked and unmaskedstimuli. The correlations between their loud-ness thresholds and Cattell IQ test scores were .16, .17, and —.06, respec-tively. These correlations should be compared with those obtainedbetween their measures of pitch discrimination and Cattell IQ testscores. The loudness thresholds were obtained from a sample of studentswith the same characteristics as those used in the experimentson pitchdiscrimination. In addition, the instructions and the experimental pro-cedures used in both experiments were quite comparable. The obtainedcorrelations are clearly different. Their measure of pitch discriminationthreshold for briefly presented tones had a significant negative correlationwith IQ and their measure of loudness threshold had a nonsignificantpositive correlation with IQ in two of three conditions and a weak nega-tive correlation in the third condition. Raz et al. (1987) indicated thatdecorticated cats can perform loudness discriminations but are pro-foundly impaired in their ability to perform pitch discriminations. Theyinterpreted their results as indicating that the characteristics of the infor-mation-processing demandsassociated with simple tasks accountfor therelationship between IQ and task performance and notthe ability tounderstand instructions. It is also the case that these results provideevidence against the interpretation of the inspection-time—IQ rela-tionship in terms of motivational or attentional variables. It is hard to seewhy motivational or attentional variables that might explain a rela-tionship between IQ and performancein a pitch discriminationor audito-ry inspection-time task would not lead to a comparablerelationship be-

INSPECTION TIME 69
tween loudness discrimination and IQ. Theresults of the Raz et al. (1987)experiment on loudness discrimination need to be replicated. The samplewas small (N = 24) andreliability data for the three threshold measureswere not presented. Quite apart from their substantive relevance, theyconstitute an important methodological advance. Studies attempting torelate cognitive processing measures to IQ would benefit from the useofcontrol experiments in which subjects are presented with structurallysimilar tasks using similar instructions and making comparable atten-tional and motivational demands that measure parametersof informationprocessing that are not assumedto be related to IQ. Such experimentscould, in principle, eliminate explanations of relationships that do notfocus on information-processing characteristics of the tasks that are as-sumedto relate to IQ.
Differences in performance between subjects with high and low IQ maybe attributable to the capacity of high-IQ subjects to resist boredom.Subjects whoare easily boredfail to pay attention and may makefrequenterrors. Deary (1988; Deary & Caryl, 1990) indicated that this type ofreasoningfails to explain the psychophysical regularities obtained in in-spection-time research. Subjects who may make frequent errors at oneduration of stimulus presentation may well make zero errors at longerdurations. If subjects were inattentive, unmotivated, and bored, onewould expect to find errors distributed at many different durations ofstimulus presentation in inspection-time tasks. Subjects in inspection-time experiments generate regular psychophysical data in which the du-ration of stimulus presentation appears to be a determining variable ofthe probability of correct response.The inspection-time—IQ relationship may beattributable to differential
familiarity with inspection-time tasks. Sternberg (1985) proposed thatintelligence is best measured in tasks that pose new problemsfor indi-viduals. If a task is completely novel and the relevance of previouslyacquired skills and abilities to the task are not apparent, it will not be agood measure of intelligence. If a task may be solved in a habitual waythen it may also not engage higher-order intellectual processes and maynot serve as a good measure of intelligence. We shall review researchrelated to Sternberg’s hypothesis in Chapter 4. If individuals with differ-ent IQ test scores were differentially familiar with inspection-time tasksit is possible that this might explain the relationship between IQ andinspection time. Several empirical findings are relevant to an evaluationof this hypothesis. Nettlebeck (1987) indicated that inspection-time mea-sures do exhibit improvement with practice and he reported that studieshave found between 17 and 30% improvementas a function of experiencewith the task. There is no evidence, nor is there reason to believe, thatsubjects with high IQ scores have had more experience with tasks that aresimilar to inspection time than individuals with low IQ. The test-retestcorrelations between initial and terminal performances on inspection-

70 3. INFORMATION-PROCESSING SKILLS
time tasks is high, suggesting that the determinants of performance onthe task do not change as a result of practice on the task. Andersonreported that children with experience with video games—anactivitythat superficially appears to resemble inspection-time tasks—do not haveshorter inspection times than individuals who are inexperienced. Raz &Willerman (1985) reported that improvementwith practice on their mea-sures of auditory inspection time wasnotrelated to IQ. (There was no IQx trial blocks interaction.) Although subjects do improve with practiceon the task, this improvement appears to occur at the same rate forindividuals who differ in IQ test score. These findings suggest that theinspection-time—IQ relationship is not attributable to differential famil-
iarity with inspection-time tasks.
The inspection-time—intelligence relationship may be explained by ap-peal to strategic differences in the approachto thetask. Studiesof visualinspection time have used light-emitting diodes or computerdisplays aswell as tachistoscopic presentationsof stimuli. Many undergraduatesper-forming these tasks report an apparent movementartifact for non-tachistoscopic stimulus displays in which subjects report movements ofthe lines after the onset of the mask. These cues might be used to solvethe problem, and individuals whoare able to use these cues might obtainshorter inspection times. In addition, the ability to use such cues mightbe correlated with IQ. Thus the inspection-time-—IQ relationship might
be attributable to individual differences in the use of strategies ratherthan to individual differences in ability to process information. Mac-Kenzie & Bingham (1985) obtained data on the useof strategies in inspec-tion-time tasks. They divided their subjects into two groups—those whoreported apparent motion cues and those whodid not. They found thatthe correlation between visual inspection-time measures and IQ in thegroup of subjects who reported that they did not see apparent motionsinthe displays was —.72. The comparable correlation in the group whoreported seeing apparent motion was —.20. MacKenzie & Cumming(1986) replicated these results and obtained correlations between visualinspection-time measuresand IQ of —.66 for 15 university students whoreported that they were not able to see apparent motion and a correlationof —.19 for the 22 subjects who reported apparent motion effects. Deary(1988) cited unpublished data obtained by Egan indicating that the cor-relation between IQ andinspection time is equivalent amongindividualswhodiffer with respect to their ability to observe apparent motioneffects.The available evidence suggests that the use of a strategy of relying onapparent motion effects does not influence the inspection-time—IQ rela-tionship. In addition, there are several inspection-time tasks where appar-ent motion effects are attenuated or not present at all. For example, ta-chistoscopic presentations reducevisualafter-effects and such effects arenot present in auditory tasks. The relationship between inspection timeand intelligence does not appear to conspicuously vary over these differ-

INFANT HABITUATION 71
ent classes of tasks. Where there is reason to believe that the maskingstimulus was ineffective in auditory inspection-time tasks using whitenoise masks, the correlation between inspection time and IQ appears tobe low (see Deary, 1988; 1989), and where moreeffective auditory maskswere used the correlation between auditory inspection time and IQ ap-pears to be somewhathigher. And, Raz et al. (1987) reported correlationsbetween auditory pitch discrimination and IQ using unmasked stimuli.All of these results do not demonstrate that the inspection-time—IQrela-tionship is not attributable to the useof strategies that differentiate high-and low-IQ subjects—it is impossible to disprove the mull hypothesis.Whatcan besaid is that there is no credible evidence that supports thehypothesis that the relationship between IQ and inspection timeis attrib-utable to differences in the useof strategies.
Let us assumethat the ability to discriminate between briefly present-ed simple stimuli is related to the more complex skills tapped in tests ofintelligence. Assumefurtherthat the relationshipis notartifactual andisnot attributable to strategies. Would these assumptions establish thatheritable characteristics of the nervous system influence information pro-cessing and ultimately influence the development of individual dif-ferences in intelligence? I think not. The obtained correlation does notestablish the direction of influence betweenits constituents. We have noplausible theory that explains how alleged differences in the functioningof the nervous system mightlead to differences in a complex skill such asthe ability to define words. Lacking such a theory, we might, perhaps withequal plausibility, speculate about ways in which individual differencesin complex reasoning skills might influence the ability to make simplediscriminations.
As with research on reaction time, longitudinal research, behaviorge-netic research, and physiological research might contribute to an under-standing of the causal basis of the inspection-time—IQ relationship. Whatmay be concludedis that the relationship is substantial and thebasis forthe relationship is not clearly understood.
INFANT HABITUATION
Studies of information processing in infancy maycontribute to an under-standing of the causal direction of the relationship between information-processing abilities and intelligence. Bornstein (1989; Bornstein & Sig-man, 1986; see also Fagan, 1984; Fagan & McGrath, 1981; Fagan & Singer,
1983) summarized research indicating that measures of habituation ob-tained during thefirst year of life are predictive of IQ scores obtained inearly childhood. Infant habituation is defined as a decrementin attentionfollowing the repeated presentation of a stimulus. Several different pro-cedures andstimuli have been usedin these studies and several different

72 3. INFORMATION-PROCESSING SKILLS
types of measuresof habituation have been obtained. Typically, changesin attention are measured by observingthe direction of an infant’s gaze.Stimuli may be presented for a fixed duration for several trials. Infantsusually exhibit a decrease in the time that they attend to stimuli follow-ing repeated presentations. The slope of the function defining decline inattention may be obtained. Newerstudies tend to use infant-controlledhabituation procedures. The duration of the infant’s initial attentionalresponseto the stimulusis noted, and the duration of subsequent stim-ulus presentations is controlled by the duration of the infant’s initialresponses. The duration is decreased until some predefinedcriterion ofattention is reached—typically 50% of the duration of initial attentionalresponding. In a numberof studies, measures of response recovery arealso obtained. If the stimulus is changed, there is usually an increase inattentional responding to the new stimulus. This is called dishabituationor response recovery.
Contemporary theoretical analysis of habituation and dishabituationisusually derived from the work of Sokolov (1958/1963; 1969). Sokolovbelieved that the presentation of a novel stimulus elicits an orientingresponse accompanied bya series of psychophysiological changes includ-ing visual orientation to the stimulus. Repeated examination of the stim-ulus is assumedto create a neural model or representation of the stim-ulus that encodes its properties. Subsequent presentations of thestimulus elicit a comparison process in which the new stimulus is com-pared to the developed representation of the stimulus.If the stimulus issufficiently similar to its representation, inhibitory mechanismslead tothe inhibition of the orienting reflex and a decline in attention.If there isa mismatch betweenthe representation of the stimulus and a new stim-ulus, disinhibitory mechanisms occur, initiating a new orienting reflexand a renewedattention to the stimulus. The rate of habituation is, onthis theory, a measureof the rate of development of a representation ofexternal stimuli. Measures of response recovery may be thought of asrepresenting the fidelity of the stimulus representation. Dishabituationcan only occurif there has been sufficiently detailed representation of theprevious stimulus to permit a mismatch betweentherepresentation ofthe old stimulus and the new stimulusto occur. If the representation ofthe prior stimulus hasfailed to encode relevant dimensions of the stim-ulus, including those features on which the changedstimulusdiffers fromthe original stimulus, the probability of a mismatch will decrease. Itshould be apparentthat indices of the rate of habituation and responsetonovel stimuli are thought to reflect fundamental properties of informa-tion processing. These measuresare at least metaphorically analogous tothe dimensions of information processing assumed to be measured ininspection-time tasks. |
Table 3.2 presents Bornstein’s summary ofstudies relating infant habit-uation measures to measures of intellectual functioning in early child-

INFANT HABITUATION 73
hood (Bornstein, 1989). The studies summarized in Table 3.2 derive from14 separate experimental reports and include 685 children in all. Thecorrelations reported in the last column of the table are uncorrected cor-relations. Several generalizations about these data are warranted. Theresults are remarkably consistent in indicating that infant habituationand recovery measures are consistently related to measures of intel-ligence and intellectual functioning obtainedin early childhood. Thereisrelatively little variability in the reported magnitudeof the correlationsthat have been obtained. With the exception of one study that measureshabituation in neonates,all of the correlations are above .30. The habitua-tion measures are all obtained in the first 6 monthsof life. Thus theyoccur at a time when the sophisticated skills tapped by intelligence testsin early childhood are not present. Whatever the interpretation of thecorrelations, it clearly cannot be argued that they occur because childrenwhodevelop good academic andintellectual skills of the type measuredon intelligence tests becomeskilled in basic information-processingabil-ities. Intelligence cannot be the cause of the abilities tapped by infanthabituation measures unless intelligence is construed as a latenttraitthat is present prior to its manifestation in performanceontestsof intel-ligence. The available studies summarized in Table 3.2 do not permit oneto reach a firm conclusion about the long-term predictability of measuresof infant habituation. The studies reporting the correlation between in-fant habituation and recovery measuresandintellectual performance ofolder children aged 6-8 do report slightly lower correlations than thoseobtained for the relationship between these infant measures andperfor-manceontests of intelligence administered at ages 2 through 5. Sigman,Cohen, Beckwith, & Parmalee (1986) reported correlations of .36 and .28between infant measures and IQ obtained at age 8. These are the onlystudies of children as old as 8 in the set of studies summarized by Born-stein. It is possible that the correlations between infant measures andlater IQ will decrease as IQ tests are give at a later age. Or, it is possiblethat the results reported by Sigman et al. (1986) will turn out to beanomalous, and infant measures will be as predictive of later IQ as theyare of IQ in early childhood. Additional research is required to reach afirm conclusion onthis issue.
Bornstein (1989) summarized data from six studies on the test—retestreliability of measures of habituation. The test-retest correlations de-cline as the time between test administrations increases. The correla-tions range between .3 and .7. A reasonable estimate of the long-termstability of habituation measures during the infantyearsis .4. I calculatedthe weighted average correlation for all of the data reported by Bornsteinand obtained a correlation of .44. If this correlation is corrected for at-tenuation, assuminga test-retest correlation of .40 for infant habituationmeasures and a test-retest correlation of .9 for the various intellectualmeasures, the disattenuated correlation between infant measures and

74
TABLE
3.2
Summary
ofStudiesRelating
Infa
ntHabituationandRecovery
toEa
rlyChildhoodIntelligence
Infa
ncy
Childhood
Age
Reference?
NMeasure
(mon
ths}
Measure
Age
(years)
Correlation¢ Decrement:HabituationandFi
xati
onTime
Bornstein
(198
4,19
85a)
20
Amount
Bornstein(1985b}
18Index4
RDLS-R
Lewis&
Brooks-Gunn
(198
1)22
Amount
Bayley
Miller
etal.,
(197
9)29
Amount
2—4
LanguageComprehension
Rose,
Slat
er,&
Perry(1
986)
21In
dexs
1.5-6.5
WPPSI(N=
16)
BAS(N=
16)
Sigman
(198
3)96€
‘Fix
atio
ntime‘
(Ter
m)St
anfo
rd—B
inet
Sigman,
etal.(1
986)
58¢
Amount
4St
anfo
rd—B
inet
WISC-R(N=
56)
96¢
Fixa
tion
time’
(Term)
WISC-R(N
=91
)
Reco
very
:NoveltyPr
efer
ence
,Response
toNo
velty,
andRecognitionMemory
Bornstein
(198
4)20
Recognitionmemory
4WPPSI(N=
14)
Caron,Caron&
Glass
(198
3)31
Response
5-6
Stan
ford
—Bin
et
WPPSI(N=
14)
rm oO
04
Role
)
6139
.63
1729
44
28
36
0442

75
Fagan&
McGrath
(198
1)
Lewis&
Brooks-Gunn
(198
1)
O’Connor,Cohen&
Parmalee
(198
4)
Rose&
Wall
ace(1
985)
Yarr
ow,
Klei
n,Lomonaco,&
Morgan
(197
5)
35 19 20 19 22
57
28¢
35¢
39
Novelty
pref
eren
ceNovelty
preference
Novelty
preference
Novelty
pref
eren
ceResponse
tonovelty
Response
tonovelty
Auditoryresponse
tonovelty
Novelty
preference
Novelty
pref
eren
ce
>m™ WH | mmm +t
+
Language
scal
esPPVIT
Language
scales
Language
scal
esBa
yley
Bayl
eyStanford—Binet
Stanford—Binet
(N=
14)
Stanford—Binet
(N=
17)
WISC-R(N=
19}
Stan
ford
—Bin
et
2.8
3.3
3.6
Al33
.66
462 .60
.66
4596
35
2Basedon
Born
stei
n(1989).
bListed
inal
phab
etic
alor
derby
author.
All
corr
elat
ions
areab
solu
teva
lues
and
significantat
p<
.05;
dire
ctio
nandna
ture
ofthecorrelationdependon
themeasures.
4Latentvariable
ofba
seli
ne,
slop
e,andamount.
“Sample
cons
ists
ofor
incl
udes
preterm
infa
nts;
testingca
rrie
dout
ofco
rrec
ted
age.
fOnetrial
or
firs
ttrial.
£Meanoftotal
fixa
tion
time,du
rati
onoffirst
fixa
tion
,averagefi
xati
ondu
rati
on,and
aver
agetrial
dura
tion
.

76 3. INFORMATION-PROCESSING SKILLS
early childhood intelligence becomes .733, indicating that close to 54%of the variance in childhood IQ is predictable on the basis of measures of
infant habituation obtained during thefirst 6 monthsoflife. The correc-tion reported is conservative. Correctionsfor restrictions in rangeof tal-ent were not performed. In any case, this analysis suggests that infanthabituation and response recovery measures are remarkably predictive ofearly childhood intelligence.What bearing, if any, do these results have on the interpretation of
findings relating performance on simple experimental tasks such as in-spection timeto intelligence? It is difficult to answer this question with-out knowing more about the relationship between the abilities that areassessed in infant and adult experimental tasks. Inspection-time mea-sures and infant habituation indices may both be construed as measuresof the speed and accuracy of processing stimulus information. Whetherthis represents a superficial and metaphorical analysis or a deep struc-tural relationship is unclear. Research relating performance on an infantversion of the pitch discrimination task to intelligence assessedat a laterage would be informative. If infant pitch discrimination ability predictedlater intelligence, then it would be reasonableto interpret the correlationbetween adult pitch discriminationability for briefly presented tones andintelligence as being attributable to the influence of pitch discriminationon intelligence rather than the converse. More precisely, those charac-teristics of the information-processing system that determineability insimple tasks could be assumedto be present prior to the developmentofmore complexskills and even, perhaps, to be causally related to the devel-opment of the complex skills and knowledge assessed in adult tests ofintelligence. Since such research is not available, the exact relationship
between the infant research on information-processing ability and intel-ligence and the adult research on the relationship between intelligenceand basic cognitive processing ability remains indeterminate.Although the prior longitudinal status of the infant measures renders a
causal interpretation in whichintelligence influences infant habituationnugatory, the alternative causal analysis in which infant habituation isassumedto influence the development of complex intellectual skills mayalso be unwarranted. The relationship may be mediated by the influenceof environmental events that influence the development of infant cog-nitive processing and childhoodintelligence. Two of the studies reportedin Bornstein’s summary, Sigman (1983) and Sigmanetal. (1986), assessedinfant habituation at birth. The significant correlations obtained by theseinvestigators cannot readily be interpreted in terms of the influenceofpostnatal environmental stimulation in infancy and early childhood.It ispossible that environmental events that influence developmentin uteroare correlated with postnatal environmentalevents and that these eventsinfluence both infant and early childhood intellectual ability. It is also thecase that the correlations reported by these investigators between habitu-

CONCLUSION 77
ation and intelligence were lower than havereported by other investiga-tors. Perhaps postnatal environmental events contribute to the develop-mentof both intelligence and infant habituation and these eventsare lesslikely to influence the habituation performance of neonates. Or, it may bethe case that the reliability of habituation measures obtained at birth islow. I believe that the causal interpretation of the research on infantintelligence is vexed and the bearing of this research on studiesof rela-tionship between IQ and performance on elementary information-pro-cessing tasks is indeterminate.
CONCLUSION
In this chapter I have reviewed studies relating scores on tests of intel-ligence to performanceonthree kinds of tasks—reaction time, inspectiontime, and infant habituation and response recovery. The stimuli that areused in these investigations includetones, lines, and lights. Noneof theseinvestigations used alphanumeric symbols, and thustherole of formaltuition or differential exposure to certain classes of stimuli has beenminimized or rendered irrelevant as an explanation of performance onthese tasks (see Ceci, 1990). Differential familiarity with flashinglights,line lengths, and tonesdiffering in pitch do not appear to be reasonableinterpretations of the obtained correlations between performance onthese tasks and intelligence. The stimuli used in the infant habituationtasks are probably equally novel for all infants, but they may be more orless similar to the stimuli that are encountered in the environmentsofdifferent children. We do not knowif performance on the infant tasks isdetermined by variations in patterns of stimulation encountered in theearly postnatal environment. Some of these tasks have nontrivial rela-tionships with performanceon intelligence tests and may accountfor asubstantial portion of the variance in intelligence test scores. Given thesubstantial relationships that have been obtained, it should be the casethat a theoretical analysis of the determinants of performance on thesetasks should provide insights into the nature of the abilities that aremeasuredbytests of intelligence.These tasks appearto involve the ability to process information accu-
rately and rapidly. The tasks with the most substantial correlations tointelligence, such as inspection time, pitch discrimination, and infanthabituation,all appear to involve the ability to notice differences betweenstimuli under difficult conditions. The use of backward masking in thestandard visual inspection-time tasks forces individuals to detect stim-ulus differences under conditions where there is limited opportunity toinspect a stimulus. The pitch discrimination task measures ability todistinguish differences between stimuli that are presented too briefly forfull examination andextraction of relevant information. The measuresof

78 3. INFORMATION-PROCESSING SKILLS
infant performance we have examined are assumed to involve a hypo-thetical comparison between a representation of a stimulus and a newstimulus. Responserecovery requires the ability to distinguish betweenan old and a new stimulus. Althoughthe infant tasks are not speeded, theinfant’s limited intellectual repertoire may makethetask difficult with-out the degradation of the stimulus accomplished by the rapid presenta-tions used in the adult tasks.
If the ability to detect differences is the fundamental common elementpresented in thesetasks, it is possible to suggest that Spearman’s prin-ciples of eduction of correlates and relations are not the optimaldefini-tion of the foundation of general intelligence. Before one can note thattwo different things are related, it is necessary to know that they aredifferent. In the absence of the detection of difference, things which aredifferent will be treated as identical. And, one cannot educe a correlate or
relation between twothings thatare identical. If two things are identical,then the only relation or correlate that may be educed between them isthe identity relation.This discussion leaves unresolved the nature of the discriminatory pro-
cesses that relate to individual differences in intelligence. It leaves unre-solved whetheror not the common elementthatis present in some of thetasks that are related to scores on tests of intelligence is some kind ofdiscriminatory ability. Clearly, discrimination per se is not the funda-mental attribute of tasks in which individual differences in performanceare correlated with scores on tests of intelligence. Raz et al. (1987) dem-onstrated that ability to discriminate between tones thatdiffer in loud-ness does notrelate to intelligence. Perhaps the ability to detect varia-tions in the intensity of stimuli does not relate to intelligence. Thisimplies that inspection-time measures for visual stimuli that differ inbrightness would notrelate to individual differences in intelligence. And,again pursuing the analogy of research on audition, inspection-time in-dices for stimuli differing in color might be predictive of individual dif-ferencesin intelligence. It is apparent that there are many different detec-tion experiments that could be done to obtain measuresof the ability todiscriminate between briefly presented stimuli that differ on somedi-mension. An examination of the class of discrimination measures thatpredict individual differences in intelligence, as opposed to the class ofmeasures that do not, might provide insight into the relationship be-tween information-processing skills and intelligence. It is possible to sug-gest tentative hypotheses to guide this research. Raz et al. (1987) sug-gested that differences between parallel and serial processing mightexplain whypitch discrimination correlates with intelligence test scoresand loudnessdiscrimination does not. They assumedthat pitch discrimi-nation involves parallel information processing and loudness discrimina-tion involves serial processing of information.If this hypothesis is cor-rect, it would be possible to design experiments involving discriminationof simple visual stimuli that tap differences in parallel and serial process-
CONCLUSION 79
ing of information. For example, Treisman (1982; Treisman & Gormican,
1988; Treisman & Souther, 1985} indicated that there is a preattentiveautomatic processing of stimulusfeatures of visual stimuli that appearsto involve parallel processing. She finds that the ability to detect stimulithat differ in certain dimensions may not vary as the numberofdistrac-tors in the set of stimuli increases. Other stimulus features appear to beprocessed serially since the time to detect a stimulus that differs fromothers on these features increasesasset size increases.It is interesting tonote that Treisman suggested that line lengths, the discriminative featureused in the original inspection-times tasks, are discriminable on the basisof preattentive properties that are not related to the numberof elementsin the set. By contrast such properties of line arrangements as con-vergence and parallelism are processed serially—the detection timeforsuch properties is an increasing function of the numberof distractorspresented in the set of stimuli. If the critical feature of discriminationtasks that determinestheir relationship to intelligence is the presence orabsenceof serial and parallel processing, then one would expect that theinspection time for judgments of convergenceandparallelism of lines, ordiscrimination thresholds for such lines, would notbe predictive of indi-vidual differences in intelligence.There are many otherpossible hypotheses that could be explored about
the class of psychophysical measuresthat are predictive of intelligence.Consider anotherpossible visual dimension. Livingstone & Hubel(1988)distinguished between two primate visual systems—an evolutionary oldmagno system that is designed to provide information about movingobjects and the overall structure of the visual world, and the parvo systemthat is important for analysis of the details of visual images. Livingstoneand Hubel detail the anatomical and physiological substrates of thesesystems and relate them to a variety of perceptual phenomena.If it isassumedthat variations in the functioning of the parvo system and notvariations in the magno system arerelated to individual differences inintelligence, then Livingstone and Hubel’s analysis provides a numberofsuggestions of the kind of perceptual phenomenathat one might examineto obtain possible relationships with intelligence. What should be appar-ent is that research attempting to delineate the class of psychophysicalmeasures that do or do not predict performanceontests of intelligenceshould inform us about the nature of individual differences in intel-ligence.
I have argued that we do not have a firm theoretical understandingofthe reasons why performance on somerelatively simple experimentaltasks is predictive of performance on tests of intelligence. Nor do weunderstand the way in which the abilities measured by these tasks arecausally related to performanceontests of intelligence. Nor do we knowif the reductive, bottom-up models favored by someresearchersin thisarea are justified. Such models are, at best, plausible. No more, noless.

4MULTIPLE AND COMPLEX
CORRELATES OF INTELLIGENCE
In this chapter we shall consider several different approachesto the ex-perimental investigation of individual differences in intelligence. Theexperimental approaches considered in Chapter 3 were examined fromthe perspective of a monarchical, reductive, bottom-up modelof intel-ligence. In this chapter we shall consider approachesto the experimentalstudy of individual differences in intelligence that relax one or more ofthe commoncharacteristics of the theoretical perspective used in Chap-ter 3.
First, we shall consider studies in which performanceonseveraldiffer-ent experimentaltasks is related to psychometric indices of intelligence.These studies are designed to measure several elementary componentsofinformation processingthat collectively define either general intelligenceor verbalor spatial ability. Second, we shall consider studies that attemptto define a complex correlate of general intelligence. These studies maybe understood as a contemporary version of Spearman’s attempt to char-acterize general intelligence by the ability to educecorrelates and rela-tions. Third, we shall consider the componential approach to generalintelligence whichis distinguished by theeffort to study the componentsof performance on complex tasks.
MULTIPLE COGNITIVE CORRELATESOF INTELLIGENCE
Many different experimental tasks may be used to study the cognitivecorrelates of intelligence. Several tasks have been studied that are basedon well-defined paradigms used in cognitive psychology. E. Hunt (1978!was oneof thefirst researchers to relate individual differences in intel-ligence to a theoretical parameter derived from the contemporary study ofcognitive processes. He used a task studied by Posner, Boies, Eichelman,& Taylor (1969) in which subjects were required to state whether two
80

MULTIPLE COGNITIVE CORRELATES OF INTELLIGENCE 81
letters were the sameor different. The judgmentof similarity may bebased on the physical identity of the letters—e.g., the pair “aa.” Or thejudgment may be based on nameidentity, as in the pair “Aa.” The reac-tion times for similarity judgments of physically identical letters areshorter than the reaction timesfor letter pairs with the same name. Thedifference in reaction timesis attributable to the need to access long-termmemoryfor lexical categories in order to judge nameidentity. Hunt foundthat the difference between reaction time for name-identity (NI) judg-ments of similarity and physical identity (PI) judgmentsof similarity (NI— PI) was inversely related to measures of verbal ability, implying thatindividuals with high verbal ability are able to access long-term memorycodes for lexical material more rapidly than individuals with low verbalability.
Individual differences in spatial ability have been related to the speedwith which an individual is able to rotate a visual image. Shepard &Metzlar (1971) found that the time taken to decide whether the two-dimensionalrepresentation of a three-dimensionalfigure was the same ordifferent from a previously presented target figure was a monotonicallyincreasing function of the angle of rotation of the figure. The slope of thefunction defining increases in judgmenttimeas a function of the angle ofrotation of the target stimulus is a measure of the speed of mental rota-tion and this measure mayberelated to spatial ability measures.Speed of access to memory for arithmetic stimuli may be measured by a
task studied by S. Sternberg (1970). Individuals are presented with a set ofnumerals followed by a single probe digit. The subject judges whether theprobe digit was or was not includedin the set of stimuli that was pre-viously presented. Decision time is a monotonically increasing functionof the numberof digits in the initial comparison set, suggesting thatindividuals engage in serial processing of the stimuli in order to deter-mine whetheror notthe probe digit is included in the set of stimuli. Theslope of the function relating decision times to set sizes may be taken asan index of the speed of scanning memory fordigits.The three tasks described above each provide a slope measure of the
speed of processing information. Theydiffer with respect to the kind ofinformation that is processed—lexical, arithmetic, or visual—spatial. Theslope measures that are obtained are formally analogous to the slopemeasure of increase in choice reaction timeas a function of set size. Eachof these measuresis related to a general law in cognitive psychology andvariations in a parameterof speed of processing information may bein-vestigated as a correlate of general intelligence or of a specific abilitymeasure. Studies that combine these measures, along with several vari-ants of these procedures, have been undertaken with the aim of surveyingthe relationship between measures of information processing andintel-ligence. Such studiesare, in principle, capable of clarifying several relatedissues. Are certain information-processing parameters more predictive of

82 4. COMPLEX CORRELATES OF INTELLIGENCE
intelligence than others? To what extent are these several measuresre-
dundant? Is it possible to combine several measures of information pro-
cessing into an index that is more predictive of intelligence than any
single component? Do measures of information-processing parameters
possess discriminant and convergentvalidity for different abilities? That
is, are parametersof spatial processing more predictive of spatial reason-
ing ability than they are predictive of verbal reasoning, and are parameters
of verbal processing of information morepredictive of verbal reasoningability than of spatial reasoning ability? We shall examinethese andrelat-ed questions by considering the results of several studies that have stud-ied one or moreof these or related tasks in a single investigation.
P. A. Vernon (1983) obtained reaction-time measures for several cog-nitive tasks including visual inspection time and simple andchoicereac-tion time using Jensen’s apparatus. In addition, subjects were required tojudge pairs of words that were either physically identical or not. He used asemantic version of this task in which subjects were required to judgepairs of words that were synonymsor antonyms. A digit recognition taskwas included that required subjects to indicate whetheror not a digit wasincluded in a previously presented list containing from 1 to 7 digits. Adual-task procedure was used in which subjects were given the digit rec-ognition task, interrupted after the presentation of the initial digits by thepresentation of a same—different judgment task for words, followed by thepresentation of a single digit. The subject indicated whether the digit wasor was not present in the previously presented list. Measures of responsespeed and variability of response times were obtained for each of thesetasks and these measures were correlated with performanceontests ofintelligence. The multiple correlation between various measuresofre-sponse times on these tasks and IQ was .46. The subjects in the experi-mentwere college students and therefore hada restricted range of talentfor IQ. The multiple correlation, corrected for restriction in range oftalent, was .67. Comparable results were obtained for measures of thevariability of responding in this sample. The multiple r for the variabilitymeasures and IQ was .43, which, when corrected, became .63. Theseanalyses indicate that approximately 40% of the variance of scores ontests of intelligence is predictable from scores on a battery of tests of thespeed and consistency of response speedfor tasks that have very low errorrates. The medianlatency of responding on these tasks is below 1500 ms,suggesting that they do not involve highly complex reasoning processes.Although the multiple correlations involving the combined results ofseveral measuresare higher than the correlations of any individual mea-sure, it is not clear that these values are conspicuously higher than thecorrelations obtained by Raz & Willerman (1985; Raz, Willerman, &Yama, 1987) for various measures of auditory pitch discrimination andintelligence. Also, the replicability of the multiple correlations remainsto be investigated. Vernon, Nador, & Kantor (1985) reported comparable

MULTIPLE COGNITIVE CORRELATES OF INTELLIGENCE 83
multiple correlations for similar batteries of tests and IQ in differentsamples. Although the overall magnitude of the multiple r is replicable,the exact weights assigned to the several predictor variables that enterinto the multiple prediction equation are probably not replicable. Theseresults indicate that it is possible, given several measures of elementaryinformation processing, to predict IQ.
Vernonet al. (1985) proposed that the correlation between generalintel-ligence and performance on elementary information-processing tasks isrelated to the complexity of information processing required for a task.Vernon & Jensen (1984) measured complexity by noting the medianlaten-cy required to perform each task. They found that group differences in IQwere positively related to median reaction times. Vernon and Jensenre-ported that the correlation between the mean difference in reaction timesbetween a group of university students and a group of vocational stu-dents, whose mean IQ was lower than that of the university students,correlated .97 with the median reaction time on the task. They suggestedthat median reaction time on these tasks is a measure of the complexityof the information processing required for successful completion of eachof these tasks. And, the more complex the cognitive processes involved inperforming a task, the more g loaded the task. Although the correlationreported has a dramatically high value, the conclusion may not be com-pelling. The mean differences are not presented in standard deviationunits. There is a correlation between the medianreaction timefor a taskand the standard deviation of reaction times on the tasks. It is conven-tional to compare meandifferences in terms of the standard deviations ofthe scores. If this were done, the correlation would be lower. In addition,tasks that differ in reaction timealso differ in a number of dimensionsother than complexity. For example, the largest difference in reactiontime between university and vocational college students is obtained on adual processing task that requires individuals to perform a same-—differ-ent judgmentfor pairs of words that are interspersed between presenta-tions of a digit recognition task. We shall review evidence suggesting thatdual processing tasks are highly correlated with intelligence. Finally, Ver-non et al. (1985) found a negative correlation of —.95 between meandifferences in reaction times on these tasks between two groupsof univer-sity students who had small differences in IQ (122 versus 117) and medianreaction timefor the task. In this instance, larger differences between thegroups occurred for those tasks that had the shortest reaction time—aresult exactly opposite of that reported by Vernon and Jensen for thedifferences obtained between university students and vocational collegestudents. Obviously, the relationship between differences in the magni-tude of mean differences and medianreaction timesfor different tasks forgroups differing in IQ is not constant.Larson & Saccuzzo (1989; see also Larson, Merritt, & Williams, 1988)
presenteda battery of timed tasks to 343 Navyrecruits. They chose tasks

84 4. COMPLEX CORRELATES OF INTELLIGENCE
that varied in complexity of information-processing requirements and
they correlated performance on these tasks with performanceontests ofintelligence. They used the following tasks.
1. A simple reaction-timetask.2. A visual inspection-time task.
3. A numbers task in which subjects were given a single target digit to
recall followed by a rapid presentation of a sequence of digits. The
subjects were required to indicate the digits immediately preceding
and following the target digit.4. A choice reaction-time task called the arrows task in which the posi-
tion of an arrow cued the appropriate response.
5. A mental counters task in which subjects were required to note the
location of a box above or below a line and add +1 for boxes above the
line and —1 for boxes below the line. The appropriate score for each
trial varied between +3 and —3. A description of this task is presented
in Fig. 4.1.
Larson & Saccuzzo (1989) derived three parameters of increasing com-
plexity of information processing from their subjects’ performance on
these tasks. The first parameter was an encoding parameter defined by a
WHAT THE COUNTER COUNTERSTEP SUBJECT SEES ADJUSTMENT VALUES
. — oO _ X +1 X 110
Please select your answer:
1.2002. 20-1 (Correct answeris #2)
3. 10-14. 21-1
FIGURE 4.1 Sample items from mental counters test. (Based on Larson & Saccuzzo,
1989.}

MULTIPLE COGNITIVE CORRELATES OF INTELLIGENCE 85
composite of the inspection-time measure and the standard deviation ofsimple reaction times. The secondlevel of complexity was encoding plusmemory comparison and it was defined by the standard deviation ofchoice reaction-time performance. This was based on performance on thearrowstest that required subjects to respond in a different way to stimulidepending on the position of an arrow that served as a cue. Thus thesubject was requiredto recall the position of the cue while responding toa stimulus.Thethird level of complexity was called encoding plus memo-ry comparison plus momentary workload. It was defined by performanceon the mental counters test. The correlations between thesethree derivedparameters and a composite measure of intelligence were .27, —.29, and54, respectively. The disattenuated correlations, corrected for unre-liability of measurement, were .42, —.45, and .72. The correlationsfor thefirst two parameters and a measureof generalintelligence are not signifi-cantly different. The third parameter, i.e., performance on the counterstest, has a significantly larger correlation with IQ than the other param-eters.Larson and Saccuzzo’s findings provide only partial support for the
hypothesis that complexity of information processing determines themagnitude of the relationship between IQ and information-processingtasks. There was no difference between thefirst and second parameter.Thus the introduction of a memory component to encoding does notincrease the magnitude of the correlation between a simple cognitive taskand IQ. This finding is analagous to the results obtained with the Jensenapparatus. Thevariability of reaction times in a simple reaction-time taskis as predictive of IQ as the variability of performance in a choice reac-tion-time task. The significant increment in predictability associatedwith their third parameter, performance on the counters test, may beattributable to several possible differences between this task and theother tasks used by Larson and Saccuzzo. Performance on this task isdefined by a measure of the numberof correct responses rather than byindices based on reaction times. In addition, the counters task requires anindividual to perform simple arithmetic calculations. Familiarity withalphanumeric symbols and with the task of performing mental arith-metic may influence performanceonthis task. It appearsless related to abasic ability to encode or respond to simple stimuli than the other tasksand comescloser to being a task where theassertion that performancemay be influenced by formal schooling appears to have a prima facievalidity.Matthews & Dorn (1989) obtained theoretically defined parametric
measures of information processing from performance on a variety oftimed tasks and related these measures to performance on the CattellCulture-Fair test of intelligence. Their subjects were presented with avariety of choice reaction-time tasks and several modifications of thesetasks. The choice reaction-time tasks used by Matthews and Dorn in-

86 4. COMPLEX CORRELATES OF INTELLIGENCE
cluded three “control tasks” that required subjects to respond to threedifferent colors, lights, or shapes. They introduced several variations ofthese three basic tasks in order to derive parameters for more complexinformation-processing components. Thevariations included the follow-ing tasks.
1. A degraded shape task in which the shapespresented to subjects in thechoice reaction-time task were degraded with visual noise.
2. A memory load task in which subjects were presented with sevendigits followed by a reaction-time task followed by the requestto recallthe seven digits that were previously presented.
3. An incompatible response task in which subjects had to respond withdifferent response keys to a previously encountered choice reaction-timetask.
4. An alternation task in which subjects had to respond on alternatetrials to a shape or a color discriminationtask.
5. A rare-event task in which subjects were required to respond to shapestimuli on 90% of the trials and color stimuli on 10% of thetrials.
6. A cue control task in which a plus sign signaled thestart of a trialfollowed by the presentation of one of the three choice reaction-timetasks.
7. A category cue task in which different letters cue which of the threechoice reaction-time tasks would be presented.
The preceding tasks were used to defineseveral different parameters ofinformation processing. The parameters wereas follows.
1. Feature extraction defined as the difference in reaction time for de-graded and nondegraded shapecontrol stimuli.
2. Short-term memory: memory load — shape control.3. Response selection: incompatible response — shape control.4. Flexibility I: The difference between alternation and the averageper-
formance under shape and color control stimuli.5. Flexibility II: The difference between performance on rare-eventtrials
and the average performance on shape and color control reactiontimes.
6. Consciousattention. The difference between the category cue and thecue control reaction times.
It should be apparent that each of these derived parameters is assumed tomeasure performance under conditions in which there is an additionalinformation-processing requirement added to the basic choice reaction-time tasks. A mean reaction time and the standard deviation of reactiontimes were obtained for each of the measures included. The correlationsof these measures with Cattell Culture-Fair IQ tests ranged from —.15 to—.52. The color control choice reaction-time task had the highest correla-tion with IQ. The more complex versions of the reaction-time tasks did

MULTIPLE COGNITIVE CORRELATES OF INTELLIGENCE 87
not have highercorrelations with IQ than the basic control tasks. Table
4.1 presents the correlations between the meanand standard deviation ofcontrol reaction times and IQ as well as the correlations between the
meansand standard deviation of the several derived parameters and IQ.Table 4.1 indicates that performanceon the choicereaction times with-
out the introduction of additional information-processing demands ismore predictive of IQ than the measures of derived parameters. The find-ings of the Matthews and Dorn study appear to be congruent with theresults obtained by Larson and Saccuzzo. Larson and Saccuzzo found thatthe addition of a dual-task memory componentto a reaction-time taskdid not lead to a significant incrementin the prediction of IQ.It is alsothe case that none of the complexities added to the choice reaction-timetasks presented by Matthews and Dorn involved the use of mental cal-culations or the use of alphanumeric symbols. Their data support thenotion that the increment to predictability of intelligence associatedwith performance on the counters test is not the result of the addedcomplexity of information processing per se, but rather of the introduc-tion of a mental task that is congruent with activities associated withformal education. Matthews and Dorn tentatively concluded that therelationship between performance on simple information-processingtasks and intelligence is attributable to speed of apprehensionability orencoding ability.
The studies we have considered used multiple measuresof performancein a single investigation. E. Hunt (1978; 1987; Hunt, Frost, & Lunneborg,1973; Hunt, Lunneborg, & Lewis, 1975; Lansman, Donaldson, Hunt, &Yantis, 1982) used a theory of the verbal comprehension processto obtainmeasures of several correlates of verbal ability. He assumed that these
TABLE 4.1 Correlations between IQ and
Means and Standard Deviations of Reaction-
Time Measures2
Correlations with
Mean SD
Measures
Color — 52 —.35Shape —.4] —.32Cue control —.42 — .43
Derived Parameters
Feature extraction —.26 —.26
Short-term memory —.15 —,.21
Responseselection —.10 01
Flexibility I —.15 10
Flexibility II —.12 —.19Conscious attention —.31 —.12
2Based on Matthews & Dorn (1989).

88 4. COMPLEX CORRELATES OF INTELLIGENCE
several elementary processes collectively determined individual dif-ferences in verbal ability.
Huntet al. (1975) studied individual differences in the ability to identi-fy sublexical units of speech. They presented subjects with phonemesin adichotic listening task in which different phonemes were presented toeach ear. The subjects were required to identify which of the twophonemes waspresentedfirst. Performance on this task was contrastedwith performance on a similar task in which the stimuli were nonspeechsounds (a buzz, hiss, or tone). Figure 4.2 presents the data obtained byHuntet al. (1975) indicating the numberof correct judgments madein
"HSS" "BZZ"
IDAE| IBAE|
‘ gI \
16 AUDITORY TEMPORAL ORDER STUDYNONSPEECH SOUNDS
G 15 -_
eo
5 4
D3«
S9 12ce
E we SPEECH SOUNDS ig
> 10 — _ a - *
9 a a ~ - - -
8 | | i
0 1 2 3
VERBALABILITY
FIGURE4.2 Verbal ability is related to the ability to perceive sublexical elements. Thetask was to detect the order of dichotically presented speech or nonspeech sounds. High-
verbal people were better at detecting speech sounds than were low-verbal people. There wasno difference for nonspeech sounds. (Based on Hunt, 1987.)

MULTIPLE COGNITIVE CORRELATES OF INTELLIGENCE 89
this task for the two classes of discrimination problems for individualswhodiffer in verbal ability. The data clearly indicate that there islittle orno relationship between verbal ability and the ability to discriminate theorder of presentation of nonspeech sounds. Verbal ability is positivelyrelated to the ability to discriminate the order of presentation ofphonemesthat serve as a sublexical unit of language.
Huntet al. (1975; see also Huntet al., 1973) studied the speed of accessof written symbols to a language code using the paradigm developed byPosner et al. (1969), who presented subjects with pairs of letters on acomputer display that were physically identical (AA) or nameidentical(Aa) or different (aB). The subjects were required to distinguish betweenletter pairs that were the sameor different and were further instructed toconsider the first two pairs as the same. Table 4.2 presents their datarelating performanceon this task to a classification of subjects as beinghigh or low in verbalability. Table 4.2 indicates that subjects who are highin verbal ability need less additional time to identify letters with thesame namebut different physical representations as identical than sub-jects whoare low in verbal ability. These results suggest that verbal abili-ty is related to the speed of access to overlearned verbal codes that arestored in long-term memory.
Goldberg, Schwartz, & Stewart (1977) used an analagoustask to studythe time required to identify words that were either physically identical(DEAR - DEAR), homophonically identical (DEAR - DEER}, or tax-onomically identical (DEER - ELK). Their data are presented in Table 4.3,which indicates that high-verbal subjects and low-verbal subjects differslightly in the time taken to determine the physical identity of words.High-verbal subjects are able to determine the identity of homo-phonically and taxonomically identical words more rapidly than indi-viduals whoscore low in verbal ability. These data suggest that subjectswhoare high in verbal ability are able to access lexical meanings morerapidly than individuals low in verbal ability.
Individuals whodiffer in verbal ability have also been foundto differ inthe speed with which they can verify sentences that describe a very sim-ple visual stimulus as true or false. A typical stimulus used in thesestudies is presented in Fig. 4.3. Hunt, Davidson, & Lansman(1981) ob-tained measuresof performance on a sentenceverification task as well as
TABLE 4.2 Mean of Median Reaction Time for Same—Different
Identification¢
Nameidentical (NI) Physical identical (PI) NI — PI
High verbals 588.1 524.5 63.6Low verbals 631.7 542.8 88.9
“Based on Hunt, Lunneborg & Lewis (1975).

90 4. COMPLEX CORRELATES OF INTELLIGENCE
TABLE 4.3 Mean Reaction Times (ms) on Same-
Different Identifications for Subjects Differingin Verbal Ability
Matching task High verbals Low verbals
Physical 732.8 868.7Homophone 806.3 1168.7
Taxonomic 907.4 1267.3
aBased on Goldberg, Schwartz, & Stewart (1977).
performance on a numberof tasks designed to measurespeedof accessoflexical information in long-term memory. They found that the partialcorrelation between individual differences in verbal comprehension andperformance on the sentence verification task holding constant perfor-mance on a semantic matching task was .31. This correlation indicatesthat verbal ability is related to the speed with which an individual canverify sentences that describe pictures and that this ability is partiallyindependentof the ability involved in determining that words are seman-tically identical.We have considered the relationship between performance on several
tasks and verbal ability. The tasks may be ordered in terms of the degreeto which they approximate complex abilities that are acquired as onegains facility in the comprehension of a language. Clearly, the ability todiscriminate between phonemesrequiresrelatively little linguistic so-phistication. It may be thought of as a measure of primitive processingcapacities that may be related to complex skills. By contrast, the sentenceverification task can only be performed by someone whoisliterate.It ispossible to study individual differences in verbal ability using tasks thatare dependent on highly developed linguistic skills. Sternberg & Powell(1983) developed a theory of vocabulary acquisition. They assumed thatindividual differences in vocabulary were notsolely attributable to indi-vidual differences in exposure to words with different meanings. Theyassumedthat the acquisition of vocabulary was determinedbytheabilityto infer the meaning of words from incompletely specified contexts. All ofus are able to define words for which we have never encountered a formaldefinition. We maybe able to do this because weinfer the meaning of theword from context. Sternberg and Powell believed that most of the words
PLUS ABOVE STAR
-+-
*
FIGURE 4.3 Thesentenceverification paradigm. The participant is shown a sentenceor
phrase, followed by a picture. The task is to determine whetheror not the sentence accu-
rately describes the picture.

MULTIPLE COGNITIVE CORRELATES OF INTELLIGENCE 9]
in an individual’s vocabulary are acquired in this way. In order to test thistheory, they presented high school students with passages containingunusual low-frequency nounsthat are almost never encounteredin writ-ten English. None of the words used were in the working vocabulary ofthe students. They constructed passages using these words and askedstudents to provide a definition of the word. They found that a measureofthe quality of the definitions provided by the students had correlationsof.62, .56, and .65 with IQ, vocabulary, and reading comprehension,respec-tively. These results explain why individual differences in vocabulary area good measure of general intelligence. The acquisition of vocabulary iscorrelated with the ability to determine meanings from imperfectly spec-ified contexts. Thus abstract skills related to fluid ability are probablyinvolved in vocabulary acquisition.The research we have considered permits one to develop a modelof
individual differences in verbal ability that assumesthat such differencesare related to individual differences in partially independentskills. E.Hunt(1987) summarized the theoretical import of research on individualdifferences in verbal ability as follows.
Whatis verbal ability? The theoretical position taken here is that the “dimen-sion” of verbal ability is the result of a somewhat correlated collection of skills.These skills depend upon a variety of more primitive psychological processes,including access to lexical memory, rapid consolidation of information into
long-term memory, the possession of knowledge about how to processdis-
course in general, and the possession of knowledge about the topic of thediscourse being comprehended. Some of these primitive processes can bethoughtof as properties of the brain, closely linked to physiological processes.The efficiency of consolidation of information into long-term memory is anexample. Other processes, such as the use of restaurantscripts, are learned, andare highly culture dependent.
If the various verbal skills are distinct, why do psychometric analyses soconsistently uncover a single dimension of verbal ability? It could be that allthe primitive processes of language comprehensionare derived from a singleunderlying brain process, and that the expression of different processesis corre-lated across individuals for that purpose. There may be sometruthtothis, butit is an impossible proposition to prove or disprove. The moderately high cor-
relations between measures of different aspects of language comprehensioncould also be explained by interactions between them as they are developed.Being able to consolidate information into permanent memoryrapidly wouldaid in the acquisition of lexical knowledge, and increasing one’s vocabularywould increase one’s ability to develop text and situation models, which couldbe used to increase lexical knowledge by defining new words in context. Sinceeach subprocess of verbal comprehension encourages the development of theothers, it is hardly surprising that, across individuals, the same people are
usually good at different verbal comprehension tasks (E. Hunt, 1987).
Keating, List, & Merriman (1985; see also Keating & Bobbitt, 1978)related performance on verbal and spatial information-processing tasks to

92 4. COMPLEX CORRELATES OF INTELLIGENCE
tests of verbal and spatial psychometric ability. They hoped to demon-strate whatis called discriminant and convergentvalidity for their mea-sures. That is, they assumed that evidence for the theoretical specificityof information-processing parameters would be obtained if various pa-rameters relating to spatial skills would correlate with each otherat ahigher value than they correlated with parametersrelating to the process-ing of verbal information.In addition, the same pattern of convergent anddiscriminantvalidity should be demonstratedfor correlations with abili-ty scores. That is, they assumed that parameters of verbal processingofinformation would correlate with verbal tests at a higher level than theycorrelated with spatial tests, and parametersof spatial processing shouldcorrelate with spatial ability at a higher value than they correlated withverbal ability. They also included data from two different age groups,eighth graders and adults, in order to see if the assumed relationshipsbetween elementary processingskills and ability measures were constantacross developmentallevels.Among the verbal measures they obtained were differences in name
versus physical identity judgments for letters, a delayed version of thistask in which the letters were presented sequentially, and a semanticprocessing measure in which subjects were required to judge whether thesecond word of a pair of words belonged to the same category asthefirstword in the pair. They varied the association strength of the first andsecond word and obtained a measure of the slope of reaction time forwordsof differing degrees of association. Among the spatial componentsthey investigated was a letter rotation task based on a task developed byCooper & Shepard (1973) in which letters are presented in normal orreversed orientation and with different degrees of rotation from the up-right. Subjects were required to judge whetherthe letter was presented inreversed or normal orientation. The time required to make these judg-ments is a monotonically increasing function of the degree of rotation ofthe stimulus. They obtained a measure of the slope of reaction time tomake a judgmentof reversed or normal orientation as a function of thedegree of rotation of the stimulus. They also included a measureoffacialrotation and a measureof letter rotation in which subjects were presentedwith a cue (an arrow) that indicated the direction of the rotation of thestimulus.Keating et al. (1985) foundlittle evidence for convergent and discrimi-
nantvalidity for their various parameters of information processing. Theyreported average correlations of .23 for their three verbal parameters, .37for their spatial parameters, and .08 for the average correlation betweenverbal andspatial parameters for eighth graders. The comparable correla-tions for adults were —.13, .17, and .12. Thesedata indicate that there waslittle evidence for convergent and discriminant validity in the rela-tionship amongthese different measures.The correlations between spatial and verbal ability measures and spa-

MULTIPLE COGNITIVE CORRELATES OF INTELLIGENCE 93
tial and verbal parameters derived from information-processing tasks alsoprovidedrelatively little evidence of discriminant and convergentvalid-ity. Table 4.4 presents the correlations between the various measures ofinformation processing and spatial and verbal ability for eighth gradersand adults. The data indicate that the correlations are relatively low andinconsistent. For adults, the best predictor of verbal ability is performanceon a spatial rotation task. Spatial ability is predicted by performance onrotation tasks, but also by performance on a semantic processing mea-sure. For eighth graders, verbal ability is best predicted by performance onthe semantic processing task, but it is also predicted by performance ontwo of the rotation tasks. Spatial ability is not related to any of thesemeasures.
Keating et al. (1985) (see also Keating & Bobbitt, 1978) contended thattheir results provide little or no support for the attempt to derive cog-nitive correlates of intellectual skills. They argued that the imposition ofmore stringent validity criteria and the search for convergent and di-vergent validity correlations explain the generally negative outcome oftheir study in comparison to other studies that are reported in theliter-ature. Their conclusion may be premature for tworeasons.First, their useof measures of the slope of reaction time to various stimuli, while the-oretically justified, may not provide an optimal approach to the discoveryof the cognitive correlates of ability. Recall that measures of the vari-ability of choice reaction times to stimuli tend to be more predictive ofgeneral intelligence than the slope of reaction times for choice reactiontimes for different set sizes of stimuli. In short, Keating et al. (1985) may
TABLE 4.4 Intercorrelations of Processing Parameters and Ability Measures,Eighth Graders and Adults2.5
Standard Oriented Delayed
Facial letter letter Letter letter Semantic Verbal Spatialrotation rotation rotation matching matching processing ability ability
(FR) (SLR) (OLR) (LM) (DLM) (SP) (VA) (SA)
FR — 52D *** 15 22 —.04 — .06 — 22 12
SLR 18 — 42** 11 18 12 —.24 — .06
OLR 02 .30* — .03 16 .02 —.07 -.09LM 11 —.17 —.12 — .26* 23 —.14 .03
DLM_ -.13 .08 .03 —.20 — 21 13 03
SP .26* .68 *** .20 —.08 —.12 — —.39** —,Q7
VA — .32* .O2 —.11 —.09 .O1 — .08 — .26*
SA —.16 — .43** — 23 17 — 22 — .38** 41 ** —
“Based on Keating, List & Merriman (1985).
>Adults’ data are below the diagonal; eighth graders’, above.*p < .05.
**p < O01.
***pD < 001.
94 4. COMPLEX CORRELATES OF INTELLIGENCE
not have used the best measures of elementary cognitive processes intheir study.
Second, the difficulty may in part be attributable to the search forconvergent and divergent validity correlations in the first place. Thatis,the relationship between elementary parameters of information process-ing and intelligence may not be content specific. The parameters mayrelate to more fundamental processes that correlate with generalintel-ligence rather than the difference between verbal andspatial ability. Keat-ing et al. assumed that the search for the cognitive correlates of generalintelligence as opposedto spatial and verbal ability is theoretically unin-formative. Theyasserted, “. . . a high correlation of total RT with Raven’smatrices’ scores demonstrates that they share commonvariance, but thepsychological sourceis not illuminated by the correlation”(Keatinget al.,1985, p. 151). This notion is based on the theoretical assumption that thecognitive correlates of psychometric ability measuresexist at the level ofspecific abilities. If there are cognitive correlates of general intelligenceit
is entirely possible that experimental tasks that measure reaction timesto spatial or verbal stimuli would not demonstrate the pattern of correla-tions with verbal andspatial ability measures that are required to provideevidence for discriminant and convergent validity demonstrations. Theresearch reviewed in Chapter 3 was undertaken under the assumptionthat there are cognitive correlates of general intelligence and that theseshould generalize to measures of verbal and spatial ability in so far asthose measuresrelate to g. Thus the data obtained by Keating et al. mayindicate more about inadequaciesof their theoretical assumptionsthanitdoes aboutthe general value of research for cognitive correlates of general
intelligence.McGue & Bouchard (1989) related performance on several information-
processing tasks to a battery of measures of mentalabilities that permit-ted them to derive separate verbal, spatial, perceptual speed and accuracy,and visual memory factors. They used three experimental tasks—thePosner measure of reaction time for name and physical identity judg-ments of letters, the Sternberg measure of the time taken to identify aprobe digit as belonging to a previously presented set of digits, and theShephard—Metzler measure of the time to judge visually rotated spatialimagesas being the sameordifferent from a comparison figure. For eachof their experimental measures they derived slope and intercept mea-sures. Table 4.5 presents the correlations they obtained between perfor-mance on their experimental tasks and performance on the psychometrictests. Table 4.5 indicates that there is some evidencefor discriminant andconvergent validity in these data. Parameters derived from the Posnermeasure of lexical processing of information relate more highly to scoreson the verbal tests and the verbal factor than they doto scores on otherfactors. Similarly, performance on the Shepard—Metzlerspatial rotation

MULTIPLE COGNITIVE CORRELATES OF INTELLIGENCE 95
TABLE 4.5 Correlations between Ability Clusters and Information-ProcessingMeasures2.>
Information- VR SP PSA VMprocessingmeasure Xe Fe X F X F X F
Posner identity
NI + PI —.39* —.49* —,21* 10 —.31* —.36* —-.17* -—.17*
NI — PI —.13* —.27* .07 13 .00 .06 — .06 —.07Sternberg probe
+ Intercept -—.21* -—.23* —-.16* —-.11 —.19* —.20* —.07 -.10— Intercept —.24* —.27* —-—.16* —.10 —.21 —.24 —.1] —.13
+ Slope —.16* —.22* — .04 -.01 — .03 — .04 —.03 — .04
Slope —.13* —-—.15* —.05 — 02 —.10 — .09 01 — .03
Shepard-Metzlar rotation
Intercept —.19* —-—20* -—.29* -—-.34* —-30* —-—.17* —.12* -.10
Slope .04 13 -.13 -.19 —.22 —.19 —.05 ~ .06
“Based on McGue & Bouchard (1989).
PVR, verbal reasoning; SP, spatial ability; PSA, perceptual speed and accuracy; VM, visual memory.¢X = mean score on the subtests that define each factor; F = factor score.*p < .05.
task is more highly related to performance on the spatial psychometrictests than to performanceon the other psychometric composites. In addi-tion, these data indicate that the predictability of specific parameters ofinformation processing is not completely content specific. Note thatmeasures that are good predictors of performance on one of the psycho-metric composites tend to be predictive of performance on the otherpsychometric composites. For example, the NI + PI scores from thePosner measure is significantly correlated with mean performance oneach of the other three psychometric composites. And, the intercept mea-sure of speed of rotation derived from the Shepard—Metzlertaskis signifi-cantly related to verbal ability as well as to the spatial ability and percep-tual speed and accuracy composites. These data provide evidence for thepervasive nature of the general ability factor. Specific parameters of infor-mation processing that are assumed, on theoretical grounds, to be mea-sures of a content-specific processing parameterare predictive of psycho-metric performance in other content areas. The data presented in Table4.5 also indicate that intercept measures are almost invariably morepre-dictive of performance on psychometric indices than slope measures.Note that the best predictor of performance on the psychometrictasksisthe NI + PI parameter derived from the Posner task. The parameter thathas theclearest theoretical definition, NI — PI, is invariably less predic-tive of performance on psychometric tests. Thusit is not speed of accessto lexical processes that provides an optimal measure of either verbal orgeneral intelligence, but the average speed of judgments involving both

96 4. COMPLEX CORRELATES OF INTELLIGENCE
TABLE 4.6 Genetic Model Analysis for Information-Processing Measures
Monozygotic apart Dyzygotic apart
Measure (r) (z] h2
Posner identity
NI + PI 46 —.11 43
NI — PI 05 .20 10
Sternberg probe+Intercept 95 .06 03
—Intercept 7 28 7
+ Slope .06 —.12 —
—Slope 19 —.07 17
Shepard-Metzlar rotation
Intercept .40 46 39Slope .42 19 39
“Based on McGue & Bouchard (1989).
physical and nameidentities. So, too, the intercept measures derivedfrom the Shepard—Metzler and Sternberg tasks are more predictive ofspecific and general intelligence than the slope measures that are as-sumed to measure theoretically defined parameters of speed of rotationand speed of serial processing of digits. These data help to explain thedisappointing results obtained by Keating & Bobbitt (1978). Slope mea-sures in reaction-time studies as well as those derived from otherinfor-mation-processing tasks are simply less predictive of psychometricintel-ligence than intercept measures or measures of the average speed ofprocessing information.The McGueand Boucharddata were derived from a sample of separated
monozygotic and dyzygotic twins. We shall examine twin studies of theheritability of intelligence in Chapter 5. For our purposeshere, it shouldbe noted that McGue and Bouchard wereable to derive measures of theheritability of the several measures included in Table 4.5. Table 4.6 pre-sents the results of this analysis. These data indicate that heritabilityestimates for these data are higher for intercept than for slope measureson both the Posner and the Sternberg tasks. The heritability estimates forslope and intercept measures do notdiffer on the Shepard—Metzlar task.These data provide a possible theoretical explanation of the difference inpredictability of slope and intercept measures. Parameters of informationtasks that exhibit high heritability are likely to be predictive of psycho-metric indices of intelligence. These data should be accepted cautiously.Theyare based ontheresults of a single investigation, and the sample ofdyzygotic twins reared apart is small. Nevertheless they are provocativeand they suggest that speed of information processing maybe a heritablecharacteristic of individuals that is related to performance on psycho-metric tests of ability.

THE COMPLEX CORRELATES OF INTELLIGENCE 97
THE COMPLEX CORRELATESOF INTELLIGENCE
What makes a task a good measure of intelligence? Spearman assumedthat the eduction of correlates and relations was the defining property ofgood measuresof intelligence. We shall consider two contemporary ex-perimentally based characterizations of such tasks.
Dual-Task Paradigms
Stankov (1983; 1987; 1988) argued that attentional processes are highlyrelated to intelligence and that tasks that use a dual-task paradigm inwhich individuals are required to work on twodifferent problems at thesame time tend to increase the g loading of performance on the taskrelative to performance of the task in isolation. Roberts, Beh, & Stankov(1988) studied performance in a dual-task paradigm that was designed asan analog of Jensen’s reaction-time experiment. They studied perfor-mancein a card sorting task in which subjects were required to sort decksof playing cards by color, suite, or number range and suite. These catego-ries constituted sorts into 2, 4, or 8 different categories. The task wasassumed to pose information-processing requirements that were anal-agous to those used byJensen in his choice reaction-time experiments.Card sorting without information processing was also measured in a taskin which subjects were required to sort the cards into twopiles alter-nately without regard to the content of the card. This task is analagous toa simple reaction-time task. A competing task was also introduced inwhich subjects had to indicate the semantic category of words that werepresented orally. Measures of performance on these tasks were correlatedwith scores on the Raventest.
Table 4.7 presents the correlation between measures of the time takento sort cards under competing and noncompeting task conditions andperformance on the Raven. Thedata presented in Table 4.7 indicate thatperformance onthe card sorting task is correlated with scores ontests of
TABLE 4.7 Correlations between Card Sorting Performance
and Ravens Test Scores
Card sorting task Single (S) Competing (C) C-S
Alternative piles .03 —.07 — 23
Color (2 categories) -.21 —.65 —.54
Suite (4 categories) —.49 —.7] —.62
Number(8 categories! —.30 -.59 —.75Sum of reaction times —.47 —.76
“Based on Roberts, Beh, & Stankov (1988).

98 4. COMPLEX CORRELATES OF INTELLIGENCE
intelligence. The correlations appearto be significantly higher than thoseusually obtained with the Jensen apparatus. Since the sample size wassmall (N = 48) it is difficult to tell whether or not the time taken to sortcards into various categories is more highly correlated with intelligencethan choice reaction timeto lights. What is perhaps of greater interest inthese data is the effect of the introduction of a competing task. Thecorrelations between card sorting times and performance on the Raventest exhibit large increases for card sorting performance under dual-taskconditions. The correlation of .76 for the sum of card sorting time andintelligence indicates a very substantial relationship betweena relativelysimple performancetask andintelligence. In addition, the increments incard sorting times under dual-task conditions are also substantially relat-ed to performance on the Raven.Intelligence is inversely related to theincrement in performance times associated with performing a simpletask under dual-task conditions.The results obtained by Roberts et al. should be replicated and the
boundary conditions of the phenomenathey studied need to be estab-lished. Matthews and Dorn foundthat the dual-task paradigm they useddid not add to the predictability for intelligence of a reaction-time task.What maybecritical is the use of a dual-task paradigm that involvesrelatively complex processing skills. The subjects in the Roberts et al.study were required to classify words. This task involves higher-ordercognitive processes and apparently changed the character of the card sort-ing task sufficiently to increase its correlation with intelligence. Mat-thews and Dorn required their subjects to memorize a set of digits andperform a choice reaction-time task while recalling the digits in order torespondto a question about the digits after completing the reaction-timeresponse.In contrast to the results reported by Robertset al., they foundthat the dual-task condition was less predictive of intelligence than thereaction-time measure obtained under single-task conditions. The dif-ference in the outcome of these studies may be attributable to the addi-tional cognitive processing demandsassociated with the dual task usedby Robertset al. In their task the subject had to encode semantic informa-tion and classify it. By contrast, the dual task used by Matthews and Dornrequired the subject to memorize a set of digits but not to process ortransform thosedigits in any way. This suggests that dual tasks in whichthe secondary orinterfering task involves a transformation or categoriza-tion of stimulus information will add to the predictability for intelligenceof the primary task. Simply performing a primary task while holdinguntransformed information in memory does not add to the predictabilityfor intelligence of primary tasks.The results obtained by Roberts et al. mayalso berelated to the results
obtained by Larson and Saccuzzo with the mental counters task. Thistask, which is very predictive of intelligence test scores, also measuresattention. The subject is required to memorize the results of previous

THE COMPLEX CORRELATES OF INTELLIGENCE 99
arithmetic calculations while encoding rapidly presented new informa-tion that must be transformed from a visual to a numerical code, and thenthe arithmetic results of the calculation must be added to the previousarithmetic results. Thus the results of previous calculations must beretained while encoding and transforming new inputs. This task wouldappear to have dual-task components.
A numberof issues remain unresolved in this brief review of studiesusing dual-task paradigms. Whatis needed is a moreprecise specificationof the properties of primary and secondary tasks that will increase thepredictability of primary tasks for intelligence. The data reviewed heresuggest that the secondary task must require some transformation ofinformation and must make demandsonthe attentional resources of anindividual. This hypothesis leaves undefined the characteristics of theprimary task that is used to predict intelligence in a dual-task paradigm.It is not knownif a primary task that involvesrelatively little transforma-tion of stimulus information would exhibit increased predictability for IQin a dual-task paradigm. The primary task used by Roberts et al. wasanalagousto a choice reaction-time task with someinitial processing ofstimulus information. Would a simple reaction-time task exhibit in-creased predictability of intelligence if it were paired with the oral classi-fication task for words used by Robertset al.? This and related questionsremain to be investigated.
Sternberg’s Theory of Nonentrenchment
R.J. Sternberg (1981; 1982; 1985; Sternberg & Gastel, 1989a,b; Tetewsky& Sternberg, 1986; see also, Raaheim, 1974) proposed thatintelligenceisbest assessed by tasks that cannot be solved in a habitual manner. Thehallmark of intelligence is the ability to solve novel intellectual prob-lems. Sternberg indicated that much of the experimental study of thecorrelates of intelligence used tasks that he describes as entrenched—that is, that measure the ability to solve problems using algorithms thatare well practiced. And, he suggested that more substantial correlationsbetween experimental tasks and general intelligence could be obtained bythe use of tasks that are relatively novel or nonentrenched.
Sternberg & Gastel (1989a) varied the degree of nonentrenchment ofintellectual tasks by presenting undergraduates with a statementverifica-tion task in which the subjects were presented with a counterfactual or afamiliar presupposition that wasrelevantor irrelevantto a series of state-ments that subjects were required to state were true orfalse. Table 4.8presents a representative sample of the statements that the subjects wererequired to verify. They assumedthat the verification of statements pre-ceded by counterfactual presuppositions was a more nonentrenched taskthan the verification of statements preceded by familiar presuppositionsand, consequently, they assumed that performance on the formertasks

100 4. COMPLEX CORRELATES OF INTELLIGENCE
TABLE 4.8 Representative Verification Statements
Keyed response
Familiar Counterfactual
presupposition presupposition
1. Familiar presupposition: Trees need water.Counterfactual presupposition: Trees eat
people.a. Librarians eat mapletrees. False Falseb. Cherry picking requires great bravery. False True
c. Trees are carnivorous. False True
d. Trees have branches. True True
e. Trees are harmless. True Falsef. Lumberjacks chop downtrees. True True
2. Familiar presupposition: Cats are furry.
Counterfactual presupposition: Cats arestrongly magnetized.
a. Cats “stick” to refrigerators. False Trueb. Cats attract paperclips. False True
c. Cats have sharp claws. True Trued. Cats eat iron filings. False Falsee. Cats like eating fish. True Truef. Catnip is metallic. False Falseg. Suspendedcats tend to face east—west. False False
3. Familiar presupposition: Kites fly in theair.
Counterfactual presupposition: Kites run
on gasoline.a. Kites emit exhaust.b. Kites need fuel. False Truec. Kites havetails. False True
d. Kites need wind. True True
e. Kites have four wheels. True Falsef. Kites are faster than airplanes. False Falseg. Kites can explode when they crash. False Falseh. Kites are sold in stores. False True
True True
“Based on Sternberg & Gastel (1989a).
would be morepredictive of general intelligence than performanceon thelatter task. They also obtained scores on three measuresof fluid abilityincluding the Cattell Culture-Fair test. Table 4.9 presents the correlationsbetween the decision time required to verify different classes of state-ments and performance on the psychometric tests.An examination of the correlations reported in Table 4.9 indicates that
thereis little or no difference in the magnitudeof the correlation betweenability measures and decision times for novel and non-novel items. And,on the most general measure of fluid ability—the Cattell Culture-Fairtest—the correlations are identical. Sternberg and Gastel also obtained adifference score by subtracting the time required to verify statements

THE COMPLEX CORRELATES OF INTELLIGENCE 101
TABLE 4.9 Correlations between Decision Timesfor
Different Kinds of Statements and Fluid Ability Measures
Ability measures
CTMM Cattell
Letter sets syllogisms Culture-fair
Non-novel —.46 —.66 — 32Novel —.52 —.68 — 32
2Based on Sternberg & Gastel (1989a).
with familiar presuppositions from the time required to verify statementswith nonfamiliar presuppositions. These difference scores tended to bepositive, reflecting the added difficulty of verifying statements when ex-posed to unfamiliar presuppositions. They found that the correlationsbetween these difference scores and the three psychometric measures—Letter Sets, Syllogisms, and the Cattell test—were —.34, —.38, and —.15,respectively. The negative correlations indicate that the incremental timerequired to solve novel items is inversely related to performanceontestsof fluid ability. Sternberg and Gastel attributed the difference in correla-tions between the Cattell test and the other twotests to differences in thedegree to which these three measures shared content with the statementverification task. The correlation with the Cattell test, which was leastsimilar in content to the statementverification task, is morelikely to beattributable to an overlap in process than the correlations between thestatement verification task and the other two measuresof fluid ability.
Sternberg and Gastel’s data provide relatively little support for the hy-pothesis that intelligence is best measured by nonentrenchedintellectualtasks. Their data actually provide two different tests of this hypothesis.First, if nonentrenched measures are morepredictive of general intellec-tual ability than entrenched measures, then the novel tasks should bemore predictive of fluid intelligence than the non-novel verificationtasks. The data presented in Table 4.9 indicate that the correlations be-tween fluid ability and performance on these two types of statementverification tasks are virtually identical. Second, the difference scoresbetween performance on these two typesof tasks should provide an indexof the ability to respond to nonentrenched tasks and should be predictiveof performanceontests of general intelligence. Sternberg and Gastel doreport that these correlations are negative, as would be expectedontheirhypothesis. It should be noted, however, that the correlation between thedifference scores and the Cattell test was not significantly different fromzero. This correlation provides the best test of the hypothesis since thecorrelation is least contaminated with content similarity. This correla-tion should provide the best measure of the extent to which theability todeal with novelty is predictive of a nondomain-specific general intellec-

102 4. COMPLEX CORRELATES OF INTELLIGENCE
tual ability. (For additional analyses and critique of this research seeHumphreys, 1990; Larson, 1990; R. J. Sternberg, 1990.)
Sternberg & Gastel (1989b) obtained measuresof performancein a vari-ety of inductive reasoning tasks that varied in entrenchment. They usedthree types of induction problems—analogies, classifications, and seriescompletions. The problemswere either uncuedor precuedby a relevantor irrelevant statementor cue that preceded the problem.The precue waseither familiar or novel. The novel precued items wereall counterfactual.Sternberg and Gastel obtained correlations between performance on thesetasks and performance on several measuresoffluid ability that permittedthem to obtain a fluid ability factor. The data obtained from the variousinduction tasks could be used to derive several measures of a subject’sability to cope with nonentrenchedtasks. Difference scores between pre-cued and uncued performance should provide one such measure on theassumption that subjects who were college students would be more fa-miliar with solving induction problems that were uncued.Similarly, in-duction problemsthat are cued with novel, counterfactual statementsareless entrenched than induction problems that are precued with familiarfactual statements, and the difference between these measures shouldprovide an index of the ability to cope with nonentrenched problems.Sternberg and Gastel do not report the correlations between these mea-sures and performance on their psychometric measuresof fluid ability.They do report correlations between performance on psychometrictestsand performance on cued and uncued induction problems. The relevantcorrelations are presented in Table 4.10. An examination of the correla-tions presented in Table 4.10 indicates that the correlations between per-formance on cued induction tasks andfluid ability are higher than thecorrelations between performance on uncued induction tasks and fluidability. The differences between the correlations are clearly not signifi-cant, and the difference in predictability of fluid intelligence betweenrelatively nonentrenched tasks andrelatively entrenched tasksistrivial.And, Sternberg and Gastel do not provide additional morerefinedtests oftheir hypotheses based on the novelty data and on several possible dif-
TABLE 4.10 Correlations between Response Times (RTs) and ErrorRates (ERs) with Fluid Ability Measures¢
Uncued Cued
RT ER RT ER
DATverbal reasoning -.19 —.45 —.23 —.57
Cattell abstract reasoning —.32 —.02 -.4] —.08Insight problems ~—.20 — 36 —.26 —.39Reasoning factor —.31 —.36 —.39 —.45
“Based on Sternberg & Gastel (1989b).

COMPONENTIAL ANALYSIS 103
ference scores or other measuresthat could be derived from their data oninductive reasoning.This brief review of the data presented by Sternberg and Gastel in
support of the assertion that nonentrenched measuresare better predic-tors of general intelligence than entrenched measuresindicates that theirstudies do not provide clear support for their theory. Measures of perfor-mance on nonentrenchedtasksare predictive of performanceontestsofgeneral intelligence. They are not conspicuously more predictive thanmeasures of performance on relatively nonentrenchedtasks.
COMPONENTIAL ANALYSIS
Componential analysis as a method for studying individual differences inintelligence wasfirst presented in a relatively complete form by Sternbergin 1977 (see also R.J. Sternberg, 1980). Sternberg began by studying perfor-mance on analogy tasks that were similar to those usedin tests of fluidability. Performance on these tasks was assumedtobe highly related toperformanceontests of intelligence since they were assumedto belong tothe domain of tests of intelligence. Componential analysis begins with arelatively complete theory of the task. The theory specifies the compo-nents or elements of successful task performance and providesrules forthe way in which these elementary components combine to determinetask performance. In performing a componential analysis of a task, it isnecessary to provide estimates of parametric values for each of the ele-mentary processes or componentsthat are theoretically assumedto deter-mine performance onthe task. Research in the cognitive correlates tradi-tion usually is based on some model of the cognitive processes thatdetermines performance on the task, but no attempt is madetotest thefull model in a single investigation. A simple task is selected that isassumed to measure, in isolation, one component of performance onsome measureof intellectual ability. By contrast, componential analysisfrequently involves a test of a complete theory of performance on a task ina single investigation.Componential analysis may be thought of as the basis for a process-
oriented theory of intelligence. Assume that a componentialanalysis ofsome intellectual task has been successfully tested. The theory of thetask may specify certain components that are assumedto be general. Forexample, R.J. Sternberg (1977) assumed that the encodingof the terms inan analogy problem was a general componentthat wasnecessary to solvethe problem. Encoding of stimulus meaningsis clearly an intellectualskill that is required to solve manyintellectual problems. In principle, itshould be possible to obtain a measure of encoding skill from the compo-nential analysis of performance on an analogies problem that will relateto encoding performance onotherintellectual tasks. To the extent thatit

104 4. COMPLEX CORRELATES OF INTELLIGENCE
is possible to specify a sufficiently general set of cognitive components,itoughtto be possible to explain performanceondifferent intellectual tasksby developing componential analyses of task performance. Estimatesofcomponentabilities should generalize to new tasks. Thus it should bepossible to predict a person’s performance on a new task from a compila-tion of componentscores derived from other tasks. Components may beconstrued as the elements of intelligence. It should be obvious that thisresearch program bears more than a superficial similarity to Thurstone’stheory of multiple intelligences. Thurstone assumedthatit is possible todecompose task performanceinto the several different independentfac-tors that were assumedto be involved in a particular intellectual task.And, knowledge of a person’s score on a particular factor could be used topredict his or her performance on any task. Where componential analysisdiffers most fundamentally from Thurstone’s approachis in the use of aspecific theory of task performance andin the use of experimental pro-ceduresto test that theory. Thurstone assumedthatthe factors that deter-mined performance on a task could be determinedbya factor analysis ofthe matrix of correlations amongability tests. By contrast, componentialanalysis is based on an explicit and testable theory of task performance.
In order to explain componential analysis I shall present in somedetaila study by Sternberg & Gardner (1983, Experiment 3) that represents oneof the more developed applications of this approach to the studyof intel-ligence. Sternberg and Gardner presented 18 Yale undergraduates withthree different kinds of induction problems—analogies, series comple-tions, and classification problems. Each of these problems was furthersubdivided into three different contents—verbal problems, schematicpictures, and geometric forms. Table 4.11 presents examples of the threeclasses of verbal induction problemsusedin this experiment. An exampleof a geometric classification problem that is structurally analagousto averbal classification problem is presented in Fig. 4.4. These problemsarerelatively easy for Yale undergraduates and error rates are low. Perfor-mance on these tasks is measured in terms of the time taken to solvethese problems.
Sternberg and Gardnerdeveloped an explicit theory of task performancefor each of the three classes of induction problemsthat they investigated.They assumedthat the time taken to solve an analogy problem was thesum of the time taken to execute each of several components used in thesolution. The componentsare the following: (1) encoding, a componentthat involves the time taken to classify or encode thefirst two terms ofthe analogy, (2) inference, the act of inferring the relationship between thefirst two termsof the analogy; and (3) application, which is the applica-tion of the relationship between the A andthe B term to the C term and ahypothetical ideal completion term that is assumed to be an extrapola-tion of the A—B relationship to the C term. The subject must then encodeeach of the two D termsprovided that complete the analogy, and compare

COMPONENTIAL ANALYSIS 105
TABLE 4.11 Examples of Verbal Induction Problems2.4
Analogies
Mouth:Taste::Eye: (a) Help, (b) SeeShell:Nut:: Peel: (a) Orange, (b) HouseTree: Forest: :Soldier: (a) General, (b) Army
Series completions
Second:Minute:Hour:
Decade: (a) Time, (b) CenturyRarely:Sometimes:Often:
Many: (a) Frequently, (b) MostBaby Carriage:Tricycle:Bicycle:
Measles: (a) Illness, (b) AcneClassifications
(a) Dictionary, Encyclopedia (b) Lemonade, Rum
Gasoline
(a) Furnace, Stove (b) Refrigerator, Air Conditioner
Oven
(a) Germany, France (b) Vietnam, Korea
Italy
2Based on Sternberg & Gardner(1983).
>In the analogies, subjects had to choose the answeroption that wasrelated to the third analogy
term in the samewaythat the second term wasrelated to the first. The correct answer optionsare
b, a, b. In the series completions, subjects had to formulate a rule that carried over from the first
term to the second andthesecondto the third and thenuse this rule to carry over from the fourth
term to one of the two answeroptions. The correct answer optionsareb, b,b.In theclassifica-
tions, subjects had to chose as the correct answeroption the pair of words with which the word at
the bottom fits best. The correct answer options are b, a, a. The format of the items that the
subjects actually saw (in terms of physical placement of terms on the card) was the sameas thatfor the schematic picture and geometric items.
each of the possible D answersto theideal. If one is identical to the idealsolution a response could be executed. If it is not, the subject is requiredto justify one answeras being closerto the ideal than the other. For verbaland geometric analogies the subject is assumed to perform these compo-nents in serial order. Each component is assumedto be executed in realtime. The time taken to solve a particular item is the sum of the timerequired to execute each of the componentprocesses.
Sternberg and Gardner were able to develop measures of the speed ofexecuting componentsthat entered into problem solutions. Several pro-cedures may be used to develop parametric estimates of componentsincomponential analysis. In the Sternberg and Gardner experiment themethod of precueing was used in which various elements of the problemare cued, leaving a reduced task to be solved. For example, the first twoterms of an analogy problem may bepresented and the subject may begiven a sufficient period of time to encode the termsandinfer the relationbetween them before the second two termsof the analogy are presented.In addition, independent subjects rated several elements of the task withrespect to difficulty. The degree of the relationship between the terms to
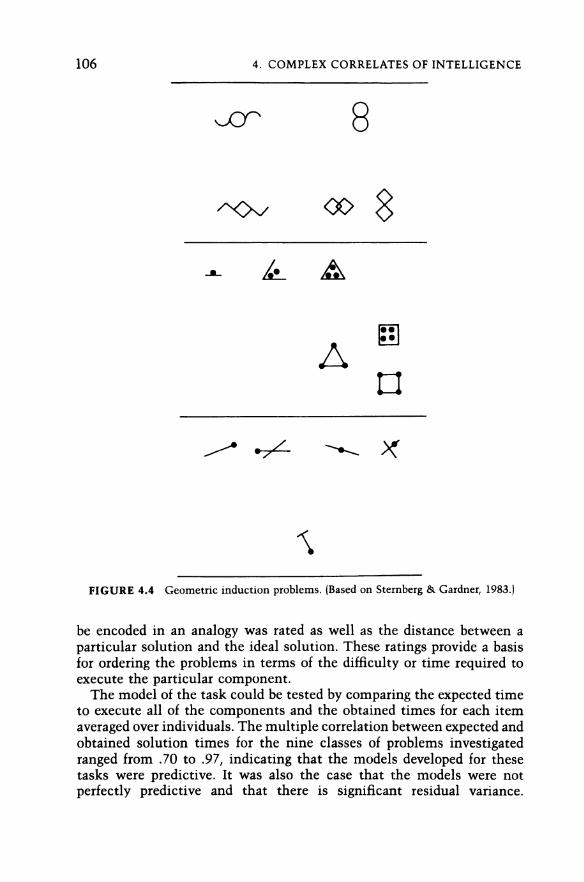
106 4. COMPLEX CORRELATES OF INTELLIGENCE
wor 3
VS © &
= f &e
FIGURE 4.4 Geometric induction problems. (Based on Sternberg & Gardner, 1983.]
be encoded in an analogy was rated as well as the distance between aparticular solution and the ideal solution. These ratings provide a basisfor ordering the problems in terms of the difficulty or time required toexecute the particular component.The modelof the task could be tested by comparing the expected time
to execute all of the components and the obtained times for each itemaveraged over individuals. The multiple correlation between expected andobtained solution times for the nine classes of problems investigatedranged from .70 to .97, indicating that the models developed for thesetasks were predictive. It was also the case that the models were notperfectly predictive and that there is significant residual variance.

COMPONENTIAL ANALYSIS 107
Sternberg and Gardner suggested that models of serial execution of com-ponentprocessesfor these tasks maybe an oversimplification. In any casethere is good evidence that the specific models developed to explain per-formanceonthesetasksare valid approximationsof the factors that deter-mine performance.
Sternberg and Gardner also demonstrated that performance on thesetasks was predictive of performance on psychometric tests. They deriveda reasoning factor from a battery of psychometric tests that may be con-strued as a measure of general intelligence or, perhaps equivalently, offluid ability. Performance on thenine classes of induction problemscorre-lated with the intelligence factor scores between —.47 and —.72. Thenegative correlations indicate that the time to solve these problemsisinversely related to intelligence.It is interesting to note that performanceon these tasks was not related to a psychometric factor that was definedas a measure of perceptual speed. Thus, rapid performance of componentprocessesin induction tasks is not a measureof speed per se but is moreoptimally construed as the time required to execute complex cognitiveprocesses. Are individual componentscorespredictive of intelligence?There are individual componentscores for each of several componentsobtained for each of the nine classes of problems investigated bySternberg and Gardner. The correlations of these componentscores withgeneral intelligence are not presented by Sternberg and Gardner. Whatispresentedare the correlations for various collapsed componentscores andintelligence. Table 4.12 presents these data. The correlations reportedvary considerably. The correlations collapsed over contents provideinfor-mation about the separate componentscores obtained by summingoverthe different contents in each of the three tasks. An examination of therelationship between componentscores for a particular induction prob-lem andintelligence indicates that the most consistent relationshipsareobtained between the componentsof reasoning and comparison andintel-ligence. The reasoning componentscore is a combined parameterrepre-
senting the time required to execute the inference of the relationshipbetween elementsin the problem and the mappingof that relationship toother terms and extrapolating the relationship to an ideal. Comparisoninvolves a comparison betweenthe ideal and theoffered solutions to theinduction problem. Thesedata do indicate that at least some componentsdo relate to performanceon tests of intelligence. These correlations arebased on componentscores that are averaged over different tasks. Theybeg the question of whether individual componentscores wouldrelate tointelligence.
Perhaps the mostcritical test for the componential analysis presentedby Sternberg and Gardner concerns the extent to which the componentprocesses that are identified in the different kinds of tasks are related toeach other. An analysis of the correlations of component scores acrosstasks is required in order to ascertain whetherthe theoretical identity of

108 4. COMPLEX CORRELATES OF INTELLIGENCE
TABLE 4.12 Correlation of Component Scores with Factor Scores
Factor score
Componentscore Reasoning Perceptual speed
Collapsed over tasks and contentsEncoding —.375 —.07
Reasoning — 79*** .08
Comparison — JH*** 07
Justifcation —.48* ~.05Collapsed over tasksSchematic pictureEncoding .46 -.03Reasoning —.70*** ll
Comparison —.64** —.19VerbalEncoding —.02 —.06
Reasoning —.61** .0O
Comparison — .66** 24
Justification —.29 ~.04
GeometricEncoding —.25 —.11Reasoning —.67** 21
Comparison —.65** —.12
Justification —.37 — .06
Collapsed over contents
AnalogiesEncoding 01 —.35Reasoning —.70** 17Comparison —.61* —.12
Justification —.58* 07
Series completions
Encoding —.51* .20Reasoning —.50* 01
Comparison — .66** 18
Justification —.19 —.10
Classifications
Encoding —.16 —.10
Reasoning —.64** .02
Comparison —.67** .04
Justification — —
“Based on Sternberg & Gardner(1983).
bNegative correlations indicated faster times are associated with high paper-and-
pencil test scores.
*p < .05, two-tailed; **p < .01, two-tailed; ***p < .001, two-tailed.
components extends beyond the fact that some have the same name.Components with the same namethat are presumed to measure the sameprocesses should correlate more highly with each other than componentswith different names. The full correlation matrix was not presented.Sternberg and Gardnerreported that the average correlation across tasks
COMPONENTIAL ANALYSIS 109
for parameters with the same namecollapsed over contents was .32. Thiscorrelation should be compared with the comparable correlation for com-ponents with different names, which was .24. The correlation of .32 isdisappointing. The correlation is obviously subject to restrictions inrange of talent attributable to the use of undergraduates from a highlyselective college. It should be noted that a correction for restriction inrange of talent should also be applied to the average correlation for com-ponents with different names and this would havetheeffect of increasingthat correlation. The evidence for the identification of separate compo-nents that determine performance on these tasks is determined not onlyby the average correlation of components with the same namebutalso bythe difference between those correlations and correlations of componentswith different names, and that difference is small.
Alderton, Goldman, & Pellegrino (1985) performed a componentialanalysis of errors rather than latency on two verbal inductive reasoningproblems—analogies andclassifications. They presented subjects withsubsets of analogies and classification problems in which part of theinformation necessary to solve the problem waspresented. For example,they presented subjects with the first two terms of the analogy. Thesubjects were askedto infer the correct solution of the problemspresent-ed on the basis of partially presented information. The subjects wererequired to infer the rule governingthe relationship between the termsofthe problem that were presented or to state the answerthat they assumedwould be correct. The subject’s verbal reports were used to obtain mea-sures of several different components assumedto be involved in correctsolution of these problems. These included the following components:accuracy of production, measured by the probability of generating thecorrect completion term; inference accuracy, the probability of correctlyinferring the rule defining the relationship amongthe elements; recogni-tion, the probability of generating a correct answerfor items on which anincorrect completion had been provided; and distraction, the probabilityof generating an incorrect answerfor an item for which a correct comple-tion had beenprovided. The probability of correct solution of an item wasassumed to be determined by the combinedrelationship among thesecomponents.
Alderton et al. (1985) found that these componentscores could be usedto predict performance on the two induction problems. Componentscores accountedfor 88 and 91.5% of the variancein the probabilities ofsolving different analogies and classification items, respectively. Compo-nent scores are not only predictive of item difficulties, but they may beused to predict variations in performancefor each subject in the experi-ment. Three models of performance were tested on an individualbasis:model 1, that assumed that performance was determinedsolely by theability to infer the appropriate relationship or completion term plus aguessing factor; model 2, which adds to the equation a recognition factor;

110 4. COMPLEX CORRELATES OF INTELLIGENCE
TABLE 4.13 Proportion of Subjects’ Best Fit by Each Model
of Forced-Choice Accuracy2
Problem Model 1 Model 2 Model 3
Analogy problemsAll subjects (N = 80} .08 .80 13Upper quartile (N = 20) .0O 95 05Lower quartile (N = 20} 25 50 25
Classification problemsAll subjects (N = 80} .16 18 67
Upper quartile (N = 20) 10 .40 50
Lowerquartile (N = 20) 15 .05 .80
2Based on Alderton, Goldman, & Pellegrino (1985).
and model 3, which adds to model 2 a distraction factor. Table 4.13 pre-sents the proportion of subjects whose performance was optimally fitwith each of the three models of solution. An examination of the datapresented in Table 4.13 indicates that the best-fitting model wasdifferentfor each of the induction problems. Model 3, which includesa distractionparameter, wasthe optimal predictor for the largest proportion of subjectsfor classification problems. The distraction parameter wasof less impor-tance in analogy problems and was not neededto predict performancefora majority of subjects. The difference in the role of distraction may beexplained by a consideration of the role of the initial two termsin ananalogy problem as opposedtotherole of initial terms in classificationproblems. Theinitial term in an analogy problem mayconstrainthesetofacceptable alternative correct answers morerigorously than the initialterms constrain classification problems. Thus subjects whocorrectly in-fer the relationship between the initial terms of an analogy problem arerarely distracted by a consideration of alternative incorrect answersto theproblem. If initial items in a classification problem are less likely toconstrain the acceptable answer to the question, it is possible that asubject who has inferred the correct answer to 'the problem maybe dis-tracted by alternative incorrect solutions to the problem. Table 4.13 alsoindicates that the best-fitting model varies as a function of ability level.The distraction componentis less likely to be importantfor subjects inthe upper quartile of verbal ability than for subjects in the lower quartileof verbal ability.The multitrait-multimethod matrix for these data indicating the aver-
age correlations between the sameand different components within prob-lem type and across problem type is presented in Table 4.14. The dataindicate that all of the componentsare positively related to each other.Components from different problems with different names have an aver-age correlation of .42. Two valuesare presentedfor the average correlationacross tasks for components with the same names, .57 and .51. The for-mer value excludes the application component on the grounds that it

COMPONENTIAL ANALYSIS lll
TABLE 4.14 Intercorrelations of Process-Outcome Measures
for Analogy and Classification Problems¢
Process—outcome measure Mean r
Within analogy, different label® 45
Withinclassification, different label 37Analogy with classification, different label 42
Analogy with classification, same label¢ 57 (.51)Analogy production with classification production .66Analogy independence with classification inference 53Analogy recognition with classification recognition 53
Analogy application with classification application 32
“Based on Alderton, Goldman & Pellegrino (1985).
>Excludes Distraction.
¢Correlation in parenthesis includes application.
plays a different role in each of the two tasks. The average correlationsincluding the distraction parameter are not presented. The correlationacross tasks for distraction was close to zero. If all of the componentsassumed to determine performance on these two tasks were included inthe average correlation for components with the same name,it is appar-ent that this correlation would be virtually identical with the averagecorrelation across tasks for components with different names.If the aver-age correlation is computedfor the three componentsthat are assumed tooperate in a comparable way for both classes of problems, then the cor-relation for components with the same nameis larger than the correla-tion between components with different names.The Sternberg and Gardner study and the Alderton et al. studies pro-
vide a basis for a general discussion of the contributions of componentialanalysis to an understanding of individual differences in intelligence.Componential analysis represents a genuine advanceovertraditional psy-chometric methods of understanding intelligence. The method providesinsights into the processes involved in the solution of an intellectual task.These insights are obtained in several different ways. Explicit models ofthe componentsinvolved in the solution of a problem are developed andtheories of the way in which these components combine to determineperformanceona taskare tested. In Sternberg’s early research it was notalways possible to empirically distinguish between models of the solu-tion of analogies. For example, one can assumethatan analogy solutionisself-terminating or exhaustive. In the formercase, all of the possiblecorrect alternatives are not evaluated with respect to an ideal solution.The evaluation process is terminated when an acceptable solution isfound. In the latter case, each of the possible solutions to an analogy isevaluated. Theories of the way in which individuals solve various prob-lems that differ in other respects have been tested. For example, compo-nent processes may be executedin a serial fixed order or there may be

112 4. COMPLEX CORRELATES OF INTELLIGENCE
backtracking and a return to an evaluation of other relationships. Suc-cessful attempts have been madeto distinguish between different theo-ries of the processof solution of a problem, and the method of componen-tial analysis can be used to distinguish among theoretical models withrespect to the extent to which they provide an optimal fit to obtaineddata. Thus the method permits testing of the adequacy of different pro-cess theories.
Theability to test different theoretical models can be extended to theindividual subject. Note that Alderton et al. indicated that there was arelationship between a person’s general verbal ability and thebest-fittingmodel of performance on a task. Perhaps the most dramatic evidence forthe ability of componential analysis to distinguish between different pro-cesses of solution for different subjects is found in a componential analy-sis of deductive reasoning reported by Sternberg & Weil (1980). Theytested different componential analyses of performancein a deductive rea-
soning task. They presented deductive reasoning problems to subjectsthat differed on several dimensions. A typical problem they used wasasfollows: “John is taller than Bill; Bill is taller than Pete. Whois tallest?John, Bill, Pete.” The problems differed on such dimensions as whetherthe first, second, or question term was marked or unmarked. A markedterm is the negative form of a dimension (e.g., shorter, slower). They alsodiffered with respect to whether the premises werestated in the affirma-tive or negative form and whetherthe correct answer to the question wasfound in the initial or second premise. Different models of the solutionprocess for these tasks were tested. Spatial models assume thatthe solu-tion to problemsof this type involves the representation of the problem tobe solved as a spatial array. Linguistic models assume that the informa-tion in the premises is coded in terms of deep structural representationsof the meaningsof the assertions. R.J. Sternberg (1980) believed that mostsubjects use a mixed modelthat relies on both verbal andspatial repre-sentations of the information that is presented. These models makesomewhatdifferent predictions about the difficulty of the different deduc-tive problems studied by Sternberg and Weil. That is, some problems areeasier to array in a spatial form than others and other problems may beeasier to represent linguistically.
Sternberg and Weil obtained solution latencies for solving a series ofdeductive problems and then attempted to predict these latencies usingdifferent models of the process of solution for each individual subject.They found that their subjects differed with respect to the model thatprovided the optimal solution for their latency data. Thus they were ableto classify their subjects with respect to whethera linguistic, spatial, ormixed model provided the bestfit for each subject’s latencies. Sternbergand Weil also administered psychometric measures of verbal and spatialability to their subjects. The correlations between theoverall score on thereasoning problemsandscores on verbal andspatial ability measures for

COMPONENTIAL ANALYSIS 113
TABLE 4.15 Correlations between Solution
Latencies and Verbal and Spatial Ability for
Subjects with Different Models of Solution
Ability
Model group Verbal Spatial
Mixed (N = 82] ~.47 ~.27Linguistic (N = 15) ~.76 ~.29Spatial (N = 15) —.08 —.60
“Based on Sternberg & Weil (1980).
subjects whodiffered with respect to the modelthat fit their latency datais presented in Table 4.15. An examination of these indicates that thereare dramatic differences in the pattern of correlation with spatial andverbal ability scores for different groupsof subjects.If subjects appeared touse a spatial strategy, then their performance on the deductive reasoningproblems waspredicted by scores on thespatial ability measure but notby scores on the verbal ability measure. The opposite pattern of correla-tions was obtained for subjects who apparently relied on a verbal strategyto solve these problems. These data indicate that different individualsmay solve the same problem in different ways and these differences inmethods of solution will lead to different patterns of correlations withabilities. These data also contain the basis for the developmentof inter-vention strategies. If a problem maybe solved in different ways it wouldbe advisable to suggest to an individual that he or she select a method ofproblem solution that will use those abilities on which heor sheexcels.Thus the optimal strategy for solution of a problem may notbe invariantover individuals. The Sternberg and Weil study extends the rangeof indi-vidual-difference research from a consideration of variations in the abili-ties that are assumed to determine performance on a task to a consider-ation of individual differences in the abilities that are engaged by thesame task.The methods used to evaluate components have been both varied and
rigorous. Statistical tests for the presence of each component have beenused to indicate that the componentis significantly related to perfor-mance on the task. The ability of the componentto add to the predictabil-ity of a multiple correlation has been considered. Thatis, does knowledgeof a score on a component permit one to predict performance over andabove that obtained from knowledge of the other components in theprediction equation? The components have been collectively evaluatedagainst the ideal of accounting for all of the variance in the task. Thatis,is there a difference between thepredictability of performance from com-ponent scores and actual performance? The deviations between actualand predicted scores provide measuresof the extent to which the compo-

114 4. COMPLEX CORRELATES OF INTELLIGENCE
nents provide an exhaustive accountof performance. Componential anal-yses havefailed this test but they have comeclose to providing exhaustiveaccounts of the predictable variance. Componential analysis has also ledto an integration of cognitive psychology and research on individualdif-ferences in intelligence. The models that are used to provide an analysisof tasks are generally drawn from cognitive experimental psychology. Inaddition, experimental variations in item format and problem type can beintroduced as a test of the model. Thus experimentally induced variationsare used to estimate components. This provides for an unusually inti-mate integration of experimental psychology and individual-differencepsychology.Componential analysis provides a general approach to the study of
individual differences. As we have seen it may be applied to differentkinds of problems and it may be used to analyze latency data as well aserror data. Despite the impressive achievements of the method thereare,Ithink, several limitations to this approach as a general modelof under-standing individual differences in intelligence. Although the method ispresented as a basis for understanding individual differences in the pro-cesses of thought as opposedto the traditional psychometric emphasis onthe products of thought, on closer examination the method leaves un-analyzed manyof the processes that are fundamentalto the solution of aproblem. Consider some of the components that we have considered thatare involved in the solution of inductive reasoning problems. Sternbergand Gardner reported that the reasoning component based on the timetaken to infer the relationship between termsin a problem and to extrapo-late that relationship is predictive of performance on psychometricabili-ty measures. Note that the reasoning parameter is a combined parameterthat is itself derivative of theoretically independent components in themodel. More critically, no theory or explication of the processes thatdetermine individual differences in the speed of execution of these prob-lems is provided. What accountsfor these differences? Similarly, Aldertonet al. (1985) found that individuals differ in the ability to infer the correctsolution of a problem from partial representations of the problem andthat this ability is predictive of performance on psychometric tests. Whatis left unexplained in this analysis is the basis for these individual dif-ferences. The componential analyses we haveconsidered do not provide afine-grained analysis of the processes involved in solution of a problem.Typically, three or four components are found to account for most of thevariance in predicting intelligence. On reflection, these componentsareself-evidently built into the structure of the problems that are being in-vestigated. It is obvious that it is necessary to encode the terms of ananalogy problem in orderto solve it and to infer the relationship betweenthe terms. While considerable experimental and theoretical ingenuity isrequired to develop measures of the independent componentsthat areinvolved in a solution and to test various models of the way in which

COMPONENTIAL ANALYSIS 115
these components combine, the end result of the analysis leads to thediscovery of components whoserelevanceto task solutionis readily ap-parent. And, the components function as unanalyzed theoretical terms,leaving mysteriousthe nature of the processes that account for individualdifferences in the ability to execute various componentsthatare requiredfor a solution to a problem.Componential analyses fail a secondcritical test. There is little evj-
dence that the components that have been identified are generalizablebeyondthe specific tasks that have been used to identify the components.Evidence for the intertask generality of components is quite limited.Recall that Sternberg and Gardner obtained average correlations of .32and .24 for the components with the same nameandwithdifferent namesobtained from threedifferent induction problems. These data suggest thatcomponents with the same namedo notrefer to the same process indifferent tasks. This result is particularly disappointing since the tasksthat are used to study the generality of components in the Sternberg andGardner investigation have a number of methodological similarities.They are based on reaction-time measures obtained during the sameex-perimentalsessions and theyare obtained by aggregating performance onthe same three problem contents. Interactions between the ability toexecute particular components such as reasoning and comparisonfordif-ferent classes of stimuli that may involve different knowledge bases ordifferential ability to work with different contents are not present inthese studies. If componentscores do not exhibit intertask generality inthese quite similar contexts it appears highly unlikely that they willexhibit intertask generality for tasks that are substantially different. Forexample, encoding, a component defined by the speed with which thesubject is able to encode termsin the induction problems, appears to beinvolved in othertasks. It is necessary to encode the stimulus in a choicereaction-timetask. Is the speed required to encode the position of a lightrelated to the speed required to encode the terms in an analogy problem?Or, to refer to a related componential analysis of induction problemsusing error rates rather than response speeds, is the accuracy of inferencefrom the initial terms in an analogy problem related to the speed ofexecution of the inference of the relationship between the terms? RecallAldertonet al. also foundrelatively little evidence that components withthe same namederived from different tasks were more highly related toeach other than components with different names. Indeed, in their study,there was probably no difference between these average correlations and,even with the exclusion of two of their components that may have haddifferential relevance to their tasks, the differences between the averagecorrelations were notlarge.The data on the intertask generalityof components provides more than
the hint of the existence of a positive manifold when components aregeneralized across tasks. If heterotask correlationsare all positive thenit

116 4. COMPLEX CORRELATESOF INTELLIGENCE
is possible to inquire about the basis for the generality of componential
reasoning. This line of inquiry leads almost inexorably to the unpalatable
introduction of the construct that componential analysis was designed to
banish—Spearman’s g. If individuals who excel in the execution of a
componentin a particular task are found to excel in the execution ofall
other components in different tasks, then it is possible to argue that
componential analysis has not discovered the components that collec-
tively define individual differences in g. Rather, componential analysis
has rediscovered g by fractionating performanceon a task into separate
components. Weare then left to explain why individuals who excel in a
componentare likely to excelin all other componentsin different tasks.
And, the explanatory burden has simply been displaced from the need to
explain why different tasks form a positive manifold to the need to ex-
plain why different componentsof task performance form a positive man-
ifold. This certainly is not the result desired by individuals whoare en-
gaged in componentialanalysis.
Two counterarguments may be advanced against this criticism. It is
possible to argue that each componentin a componential analysis may be
shown to independently predict psychometric intelligence. Thus the
components mustbepartially independent of each other. Thedifficulty
with this argumentis that it holds within a task but not across tasks. For
example, it has been demonstrated that components that are derived from
a given task each independently predict performance outcome and may
each independently predict a measure of intelligence. But the small dif-
ferences in average correlations between components with the same and
different names obtained from different tasks imply that increments to
predictability across tasks from different componentsare not likely to be
attainable. If one were to predict performance on a new task from an
aggregate measure of components on a different task that excluded one of
the componentsit is not likely to be the case that the excluded compo-
nent will add to the prediction of performancein the newtask. If compo-
nents clearly generalized across tasks and components with the same
name always accounted for unique variance in different tasks, then the
exclusion of a single componentscore from a task would always leave the
residual aggregate score as a deficient predictor of performance on a task
sn which the excluded componentis assumedtobe involved.Little or no
evidence exists that componential analysis can meet this test and the
available evidence suggests that componentialanalysis will fail this test.
What does this imply about the virtues of componential analysis as a
general model for studying individual differencesin intelligence? I think
that it implies that the method as presently constituted cannotbe used to
construct a general modelof the determinants of individual differences in
intelligence. The method appears more useful as a techniqueto study the
components that determine performancein a particular intellectual task.
Components, from this perspective, may be contrasted with g as the-

COMPONENTIAL ANALYSIS 117
oretical constructs by reference to their range of application. As aconstruct, g provides little or no information about the processes thatdetermine performance on anyparticular task. Its range of application isself-evidently extensive. It informs us about individual differences in per-formance, on the average, in virtually everything at the cost of providingus with virtually no information about the performanceof an individualon any particular task. Componential analysis, by contrast, may be con-strued as providing extensive information about the performance of anindividual on a particular task (subject to the caveat mentioned abovethat componentsare themselvestheoretically unanalyzed terms) while atthe same time providing little or no information about the details ofperformance on any other task. One approach tells us too much about toolittle and the other too little about too much.
R.J. Sternberg (1985) assumed that componentsdiffer in their intertaskgenerality. Among the components that are assumedto be general areencoding and metacomponents. We havealready indicated that there isevidence that suggests that measures of encoding do not invariably exhib-it intertask generality. Metacomponentsare assumedto function as exec-utive processes that control the execution of specific performance compo-nents. Metacomponentsare involved in the allocation of timeto differentperformance components, monitor progress on a task, respond to feed-back, and generally control the execution of performance components.Sternberg argues that metacomponentsare the most generalof all compo-nents and are highly related to performanceontests of intelligence. Hewrites,
... individual differences in general intelligence are attributable to individualdifferences in the effectiveness with which general componentsare used. Sincethese components are commontoall of the tasks in a given task universe,factor analysis will tend to lumpall of these general sources of individual-
difference variance into a single general factor. As it happens, the metacompo-nents have a muchhigherproportion of general components among them thando any of the other kinds of components, presumably because the executiveroutines needed to plan, monitor, and possibly replan performance are highlyoverlapping across widely differing tasks. Thus, individual differences in meta-componential functioning are largely responsible for the persistent appearanceof a general factor. [R. J. Sternberg, 1985].
If metacomponents are the basis of individual differences in generalintelligence, then evidence indicating that performance components havelimited intertask generality leaves open the question of the generality ofcomponents. Generality may not have been found because we havelooked for it in the wrong place. Sternberg and his associates have re-ported someresearchin which they have related measures of metacompo-nents to intelligence. We shall review these studies in orderto see if theyprovide evidence for the claims of generality of metacomponents ad-vanced by Sternberg.

118 4. COMPLEX CORRELATESOF INTELLIGENCE
R. J. Sternberg (1981) gave subjects a numberof analogies problems tosolve that had from oneto three terms of the analogy missing. Analogieswith more than one term omitted were assumedto be nonentrenched. Hepresented these problemsin either blocked or mixed form.In the blockedconditionall of the problems had a commonformat with the sametypeofanalogy problem. That is, the number of terms missing in the analogywasconstantfor that block of trials. In the mixed condition the formatofthe problems varied from trial to trial. Sternberg used this task to obtainmeasures of two different metacomponents hecalled global and localplanning. He assumed that more global planning was involved in thesolution of analogies under mixed-block conditions. If the format of aproblem varied from trial to trial, the subject must spend time planningthe methodof solution of the problem thatis appropriate for each analogyproblem.In the blocked condition global planning is minimized since thesubject needs to spend time planning the method of solution only onceduring the trial block. Local planning parameters were measured in termsof a modelof the difficulty of the problemsrelated to the changesintro-duced by omitting various terms from the analogy. Measuresof global andlocal planning contributed to the prediction of the measure of latency ofproblem solution. Global planning scores were positively related to solu-tion times and local planning was negatively related to solution time. Thepositive relationship implies that subjects who spent moretimein globalplanning wereable to solve the analogies problems morerapidly. In thisinstance, the global planning parameterrefers to the amountof additionaltime taken to solve the problems in the mixed rather than the blockedcondition. Sternberg correlated metacomponent scores with scores onpsychometric tests. He used the Raven test and twotests of ability tosolve the letter series problems. The ability to solve analogies in thisstudy wasnot significantly related to the Raventest. It should be notedthat this constitutes additional evidence against the assertion that non-entrenched tasks provide good measures of general intelligence. Since theRaven is generally recognized as a good measureof g, these data suggestthat the use of nonentrenchedor unfamiliar formats in analogy problemsdoes not necessarily increase the relationship between solution times andgeneral intelligence. Both of the metacomponent measures wererelatedto performanceon theletter series tests. The correlations between globalplanning and local planning measures and performanceon theletterse-ries tests were .43 and —.33, respectively. The correlation between thelocal planning measure and performanceon theletter series test was notquite statistically significant (the sample size was small, N = 20). Thepositive correlation between the global component measure andperfor-mance on the psychometric index wasstatistically significant. Thepositive sign of the correlation implies that more time spent in globalplanning is associated with superior performance on the psychometrictest. The conclusion that the global planning metacomponentis substan-

COMPONENTIAL ANALYSIS 119
tially related to general intelligence is somewhatvitiated by thefailure toreport data that incorporates scores on the Raven matrix in the overallindex of general intelligence. Presumably, the inclusion of this measureinto the index of psychometric ability would decrease the reported cor-relation between global planning and psychometric ability, perhaps to anonsignificantlevel.
Wagnerand Sternberg(as cited in R.J. Sternberg, 1985) obtained mea-sures of metacomponential strategies used in solving verbal comprehen-sion problems. In one of their studies subjects were told that they wouldbe asked questions that dealt with the gist of the passage, the main idea ofthe passage, the details of the passage, or the analysis and application ofideas in the passage. The subjects allocated less time to reading the pas-sages in the first two conditions. A time allocation parameterdefined asthe difference between the time allocated to reading under thefirst twoconditions and the last two conditions was predictive of overall accuracyin answering questions about the passages. The semipartial correlation,removing the influenceof overall ability, was .30.
In a second experiment, subjects read passages from the Graduate Re-cord Examination underthree conditions—a control condition, a condi-tion in which subjects were provided with information aboutthe diffi-culty level of questions about the passages, and a condition in whichcritical passages were highlighted. A numberof different strategy mea-sures were obtained based on the time allocated to various problems andprotocols obtained from the subjects about their performance. Theyfound that subjects whoreported that they changedtheir strategy of solv-ing the problemsthat were presented scored significantly higher on thereading comprehension task than subjects who did not report changingstrategies. In addition, the former subjects had slightly higher verbal rea-soning test scores. Subjects who read passages in terms of the order ofdifficulty of the passage did better on the reading comprehension thansubjects whodid not read passagesin orderof difficulty. These two groupsof subjects did not differ in verbal reasoning ability. Subjects also differedwith respect to their tendency to use the specific difficulty informationprovided to them. Those subjects who used this information tended toallocate different amounts of time to questions depending upon the spe-cific information provided to them aboutthedifficulty of the question.Subjects who used this strategy had lower verbal comprehension scoresthan subjects who did not. There were nodifferences between these twogroups of subjects in the psychometric test of verbal reasoningability.Wagnerand Sternberg identified three different strategies of reading thehighlighted passages. Some subjects read the highlighted passages ex-clusively. There was no difference in task performarice between thosesubjects who reported using this strategy and those who did not. Thesubjects whousedthis strategy scored higher on thetest of verbal reason-ing ability than the subjects who did not use this strategy. A second
120 4. COMPLEX CORRELATES OF INTELLIGENCE
related strategy involved reading the highlighted passages morecarefullythan the passages that were not highlighted. Performance on the task andon the verbal ability measure was comparable for subjects who reportedusing this strategy and subjects who did not. Another group of subjectsreported searching for the answers to the questions in the highlightedportions. Subjects whoused this strategy did not do better on this taskthan subjects who did not use thestrategy, and these two groupsof sub-jects did not differ in their scores on the verbal reasoningability.The Wagnerand Sternberg studies indicate that the metacomponential
strategies that were identified were for the most part unrelated to verbalreasoning ability. More generally, the relationships between metacompo-nents and general intelligence reported in these studies are weak. And,little evidence is presented that indicates that metacomponentsarerelat-ed to each other. For example, is there a metacomponentof efficient timeallocation for all classes of problems? The metacomponents that havebeen studied appear to be relevant to performanceofa particular task. Noevidenceis presentedin these or in related studies that metacomponentsexhibit wider intertask generality than performance components. Indeed,metacomponents that have been identified appear to be specific to a par-ticular task. Whether one spends more time reading passages that areassumedtobedifficult is, by definition, a task-specific metacomponent.Other metacomponents suchasthe timeallocated to global planning maybe general, but no evidenceis presented that indicates that this metacom-ponent is correlated with a metacomponent with the same name anddefinition derived from a totally different type of task. In addition, theevidence presented by Sternberg indicates that this metacomponentisonly weakly related to general intelligence. In summary,little or no evi-dence is presented in support of the assertion that metacomponents havegreater intertask generality than performance components, and noevi-dence is presented that metacomponentsare likely to be more substan-tially related to general intelligence than performance components. Thusthe critique presented here of componential analysis as being of limitedvalue in understanding individual differences in intelligence by virtue ofthe failure to demonstrate intertask generality of componentscoresis notvitiated by a consideration of research on metacognitive components.
Carpenter, Just, & Schell (1990) reported the results of a simulationanalysis of performance on the Raventest thatis similar in its goals to acomponential analysis of performance on an intellectual task. They askeda group of college students who were taking the Raven test to verballydescribe their thought processes and hypotheses as they attempted tosolve the problems. In addition, they recorded eye movementpatternspermitting them to obtain measuresof the elements of the stimuli thatindividuals looked at as they attempted to solve the problems. They ana-lyzed these protocols in order to develop a model of the reasoning pro-cesses of individuals who attempted to solve the Raven test. They then

COMPONENTIAL ANALYSIS 121
constructed two computer programsthat were designed to simulate theperformanceof their median college student and the best-performingcol-lege students in their sample. If the computer programsaccurately simu-late the performanceof college students taking the Raven test, they maybe construed as a modelof task performance.In addition, a comparison ofthe programs designed to simulate the performance of individuals withdifferent abilities to solve the Raven may be construed as a theory ofindividual differences in performance on the task. Since the Raven isassumedto be a good measure of general intelligence, a theory of indi-vidual differences in Raven performance may be assumedto be a generaltheory of individual differences in intelligence.The computer simulation of Raven performance maybeillustrated by a
description of the methods used to solve a representative problem thatisdescribed in Fig. 4.5. The description of the stimuli (encoding) is accom-plished by a symbolic description of the stimuli in the matrix. Thus theprocess of perceptual encodingis not addressed in the simulation model.Thisis justified by the assumption that individual differences in encodingability are not a source of variance among college students in perfor-mance on the Raventest. The program encodesstimulusattributes and
transfers them to working memory. The program also comparesadjacentfigures in an attempt to infer the rules governing variations among thestimulus elements of the problem. Amongtherules that can be generatedby the program area rule of constantin a row for a particular attribute andquantitative pairwise progression of values of an attribute. Rules that areinferred to describe variations of a figure are tested against variations inthe figures in a second row of the problem. The computer simulation isdesigned to mimic evidence that human subjects solve the Raven by theincremental development of hypotheses andbyrepeated reiterative test-ing of these hypotheses. The verbal protocols and eye movement dataprovided evidence for the emergenceof single hypotheses about the rulesgoverning variations in the figures. The rules that are generated are ap-plied to the missing entry and used to choosethe correct solution to theproblem.
The simulation of the performance of superior subjects on the Ravendiffers from the program designed to simulate performanceof the typicalsubject on the Ravenin several respects. The modelis able to infer morerules and more complex rules. For example, the more sophisticated simu-lation is able to solve problems involving a null argument with a distribu-tion-of-two-valuesrule in a row(see Fig. 4.5). Problems involvingthis rulewere not solved by the subjects whose performance wasat the medianofcollege students but were solved by the best-performing subjects. In addi-tion, the more advanced simulation program incorporated a goal monitorthat specifies the order of operation of various procedures and definesrules for modifying the order of execution of a particular operation.The simulation programs designed by Carpenter etal. (1990) reproduce

122 4. COMPLEX CORRELATES OF INTELLIGENCE
Oe ¢oo &
EEFe
_) © OLD
= > (D[IHD5 8
)ED PDO
1
3
S 6 7
a
_)
DDDDEDEDED
FIGURE4.5 Problemsillustrating rules of the Raven test. (A}) The quantitative pairwise
progression rule. The numberof black squaresin the top of each row increases by one from
the first to the second column and from the second to the third column. The numberof
black squares along the left remains constant within a row but changes between rows fromthree to two to one. The correct answeris 3. (B) The figure addition rule. The figural elementin the first columnis superimposed onthefigural element in the second column to composethe figural element in the third column. Theposition of the darkened element remains
constant in a row but changes between rowsfrom top to bottom to both. The correct answer
is 8. (C) The distribution-of-two-values rule. Each figural element, such as the horizontal
line, the vertical line, the V, and so on, occurs twice in a row, and thethird valueis null. Thecorrect answeris 5. (Based on Carpenter, Just, Schell, 1990.)
several features of the performance on the subjects whose behavior theywere designed to simulate. The regular program solves the same numberof problems as the median subject in their sample and the advancedprogram solves the same numberof problemsas the best subjects in thesample. The error patterns of the subjects and the programs were similar.For example, subjects close to the median in performancehaderrorratesranging from 17 to 70% on easy and hard problems, respectively. The

COMPONENTIAL ANALYSIS 123
simulation program had comparable error rates of 0 and 90%. Also, thespecific rules that were induced by the subjects as indicated by theirverbal protocols were similar to those that were inducedby the programs.The comparison of the performanceof the simulation programsand the
performanceof the actual subjects leaves little doubt that the simulationprograms captured some of the main features of the processes used bysubjects to solve the Raven. While there are differences in details of theperformanceof real subjects and the computer programs,the overall per-formanceis sufficiently similar to support the assumption that the com-puter programs have successfully simulated the incremental discovery ofseparate rules based on pairwise comparisons among figures in the ma-trix. Does this relatively successful simulation provide insights into thenature of general intelligence? In order to answer this questionit is neces-sary to describe the nature of individualdifferences in performance on theRaven as construed in the simulation models developed by Carpenteretal. (1990). These models provide insights into individual differences inperformance as well as insights into what is assumedto be generalin allhigher-order cognitive processes. Individual differences are present in atleast two different dimensions of problem solving. Superior performanceon the Ravenis associated with the ability to discover abstract represen-tations of the figures that are only loosely tied to the perceptual inputsofthe stimuli. Note that the distribution-of-two rule that distinguishedtypical and optimal performance of both subjects and their simulationsmay be characterized as an abstract representation of the relationshipamong perceptual elements. In addition, the simulation of the optimal-performing subjects involved the addition of goal managementinstruc-tions that specified the order of application of various routines and themodification of procedures depending on the attainmentof various sub-goals. This element of the program is analogous to the emphasis on meta-cognitive components in Sternberg’s componential analysis of intel-ligence. In addition to individual differences, these simulations contain atheory of what is general in cognitive performance. Carpenteret al. closetheir paper with this description of what is commonto the process ofRaven solution:
Thus whatoneintelligence test measures, according to the current theory, isthe common ability to decompose problems into manageable segments anditerate through them,thedifferential ability to manage the hierarchy of goalsand subgoals generated by this problem decomposition, and the differentialability to form higher level abstractions. [Carpenter, Just, & Shell, 1990, p. 429]
It is certainly possible to develop a plausible argument that many com-plex cognitive tasks involve similar elements. Indeed, Carpenteret al.demonstrated that performance on a problem thatis frequently analyzedby cognitive psychologists, the Tower of Hanoi problem, is subject to asimilar analysis and is correlated with performance on the Raven. There-fore, a prima facie argument can be madethatthe processes involved in
124 4. COMPLEX CORRELATES OF INTELLIGENCE
the simulation of performance on the Raven arerelated to performanceon other complex cognitive tasks. At the same time a strong argumentcan be developed that these simulations do not provide the basis for thedevelopmentof a complete theory of general intelligence. There are twospecific arguments that can be developed to support this conclusion.
First, the claim of a relationship between the simulation of perfor-manceon the Raven and performance on other complex cognitive tasksisan argument by analogy. The simulation programs that are provided forthe Raven cannotbe usedto solve otherintellectual problems. In order tosustain the argument that these programs provide a modelof individualdifferences in general intelligence, it would be necessary to design a pro-gram that is capable of solving a class of problems. And it would benecessary to demonstrate that differences in the parameters that defineindividual differences in the ability to solve problems would be constantacross problems. It should be realized that this argument is another ver-sion of the discussion of the intertask generality of components. To whatextent is a component with the same nameused to explain performancein different tasks a measure of the samecharacteristic?
Second, there is convincing evidence that the stimulation theory ofperformance on the Ravenstest is incomplete as a modelof generalintel-ligence. The theory omits perceptual encodingas a sourceof variations inindividual differences in intelligence. There is a considerable body ofevidence that suggests that encoding in both simple and complextasksisa source of variation in someintellectual tasks. In addition, there aretasks that are at least moderately predictive of performance on the Raventhat do not appear on the surface to involve any of the parametersthat areassumedto be critical for Raven performance in the simulations devel-oped by Carpenter et al. Consider, for example, performanceontherela-tively simple cognitive tasks reviewed in Chapter 3. How is performanceon a visual inspection-time task or pitch discrimination for briefly pre-sented tones related to the simulation parameters in these models ofRaven performance? Abstraction ability, hierarchical goal processing, andthe ability to decompose problems into manageable segments do notappear to be plausible explanations of performance on such tasks. Yetthese tasks are predictive of scores on tests like the Raven. This analysissuggests that what is commonto different measuresof intelligence mayinclude something other than that which is assumed to explain indi-vidual differences in the Raven.
CONCLUSION
The experimental investigation of individual differences has been activelypursued for the last 15 years. Earlier attempts to study intelligence inlaboratory contexts becamerelatively moribund after the developmentof

CONCLUSION 125
psychometric tests in 1905. For the brief period of its active revival, re-markable progress has been made. Methodsfor the determination of indi-vidual differences in cognitive processes on a given task and the analysisof individual models of task solution have been developed. Several corre-lates of general intelligence have been identified. Some of these tasks,such as pitch discrimination and reaction-time measures obtained underdual-task processing conditions, may even have substantial predictiverelationships to intelligence. While it is not yet possible to specify withprecision the theoretical properties of the class of information-processingtasks that are predictive of general intelligence, it is possible to tenta-tively suggest some general properties of tasks that may serve to providesuggestions about a more precise theory. Measures of the speed and ac-curacy of encoding stimulus information and the ability to maintain near-optimal attentional performance as well as the ability to attend to asimple task under conditions of distraction mayall provide at least meta-phorical clues for a moreprecise theory. It is also possible to indicate thatcomplexity of information processing per se is not a goodbasis for defin-ing experimental tasks that relate to general intelligence. Theoreticallydefined parameters involving additional information-processing require-ments are usually not more predictive of performanceontests of intel-ligence than simple measures of speed of processing stimuli.The research we have considered in Chapters 3 and 4 of this volume
was designedeither to provide the experimental foundation of Spearman’sg construct or to overthrow g either by discovering separate cognitivecomponents or by discovering theoretically defined parameters thatwould exhibit convergent and discriminant validity for separate abilitydimensions. Theeffort to dislodge g has been less than successful. Com-ponentsare positively correlated and donot, in general, exhibit sufficientgenerality to provide a basis for understanding individual differences inintelligence. Theoretically defined parametersof tasks that are presumedto correlate with specific abilities do not exhibit strong evidenceof dis-criminant and convergentvalidity. The effort to dislodge g by use of theexperimental method of investigating intelligence has not as yet beenconspicuously more successful than the attempt to dislodge g by psycho-metric methods. And, if anything, evidence that general intelligence issubstantially related to ability to process information in relatively simpletasks that appear on surface examination to require minimal formal tui-tion strengthens the need for a theoretical construct of general intel-ligence that is not restricted with respect to specific content. A generalability related to fundamental capacities to encode and attendto stimuliis sufficiently different from a modelof content-specific skills to providea theoretical foundation for a construct that predicts individual dif-ferences in performanceonvirtually all intellectual tasks.

oBEHAVIOR GENETICS OF
INTELLIGENCE
INTRODUCTION
Why do people differ in intelligence? The answer to this question isobvious.Individuals have different environments and different genotypes.Behavior genetics provides methods for studying genetic and environ-mental influences on a trait. The term behavior genetics is clearly amisnomer. This area of investigation is concerned with both environmen-tal and genetic influences. Indeed, behavior geneticists believe that onecannot understand the influence of the environment on a trait withoutstudying the ways in which genotypes mayinfluencethetrait.To what extent are individual differences in intelligence attributable to
variability among genotypes? The answerto the question is indetermi-nate because intelligence cannot, in principle, be assigned an index ofheritability. Heritability estimates are not properties of a trait. They areproperties of a trait in a given population. Heritability indices may be —different in different populations. The extent to which a trait may beheritable in a given population depends uponthevariability of genotypesin a population. In addition, the characteristics of the environment en-countered by a population of individuals will influence the way in whichgenes may influence the phenotypic measure of a trait. If we were toprovideall members of a population with an environmentthat is uniformwith respect to its influence on intelligence, then estimates of geneticinfluences would increase. The assertion that estimatesof heritability arenot properties of traits but are properties of the trait in a particular popu-lation is not merely a linguistic refinement; we shall consider researchthat indicates that the heritability of intelligence test scores may be sub-ject to secular influences(i.e., that it may be changing for individualsborn in different time periods}, that it may vary with age, and that theheritability of intelligence may be different for different populationsofindividuals. In addition, there is dramatic evidence that a genetic influ-ence on intelligence may be drastically altered by variations in the
126

INTRODUCTION 127
environment. The disease phenylketonuria is caused by an inability tometabolize phenylalanine, which interferes with the appropriate develop-mentof the nervous system. Untreated individuals with phenylketonuriausually have IQ scores below 50 (Paine, 1957). The disease is an auto-somal recessive disorder. Somewhere between .5 and 1% of the popula-tion are carriers of the recessive gene. Heritability of phenylketonuriafollows classic Mendelian laws and occurs in one of four offspring ofparents who are both carriers for the disease. Phenylketonuria can bedetected at birth and a treatment program involving the use of phe-nylalanine-restricted diets usually removesthe risk of retardation. Notethat the treatment does notalter the genetic characteristics of individualswhohavethe disease but doesalter the influence of the genotype on thephenotype. This example indicates that genotypic influencesare not nec-essarily immutable. The influence of a genotype on a phenotype is sub-ject to environmental intervention.
Behavior genetic analyses may be understood as attempts to partitionvariance. Variations in a phenotypic characteristic such as a score on atest of intelligence may beattributable to several independentsourcesofvariance. Genetic and environmental sources of variance may each bepartitioned into additional sources of variance. Environmental variancemay be partitioned into two components, within- and between-familyvariance. Between-family variance refers to variations in a phenotypeat-tributable to differences in environmental influences associated withbeing reared in different families. It is the source of variance that isgenerally considered when we think of environmental influences on in-telligence. Within-family environmental influences are environmentalinfluences attributable to different experiences of individuals reared inthe same family. These influences encompass both events that occurwithin the context of the family, such as differential treatmentof siblingsbeing reared together, and events that are not associated with experienceswithin a family, such as the effects of friendships that are not shared byindividuals reared in the same family. Genetic variance may be parti-tioned into additive genetic variance and nonadditive genetic variance.Additive genetic variance derives from the additive influence of each ofthe genes that influences a phenotype. Nonadditive genetic influencesmaybe attributable to dominancecausedbydifferential influence of oneof two genes in the heterozygouscase, and epistasis, which is an interac-tive influence of genes at different locations. Nonadditive genetic vari-ance maydecrease the resemblance between parentandoffspring.
In addition to these four sources of variance that may influence thephenotype for intelligence, there are two other sources of variance thatinvolve combinations of genetic and environmental influences. Genetic—environmental covarianceis a source of varianceattributable to the cor-relation of genes and environments.It is possible that individuals whoarelikely to have genes that are favorable for the developmentof high intel-

128 5. BEHAVIOR GENETICS OF INTELLIGENCE
ligence may also create family environments that are favorable to thedevelopmentof intelligence. The combinedinfluence of these correlatedgenetic and environmental effects may contribute to variability in thephenotypefor intelligence. Genetic X environmental interaction refers tononadditive combinations of genetic and environmentalinfluences. Sucheffects would be present if the influence of genes would vary in differentenvironments.In the most dramatic caseit is possible that the influenceof one or more genes would leadto high intelligence in one environmentand low intelligence in a different environment.Behavior genetic studies lead to the partitioning of variance in IQ
scores andare able to assign numerical valuesfor each of the independentsources of variance that are described above. In this chapter we shallconsider research on twins and family and adoption studies in an attemptto outline their bearing on genetic and environmentalinfluencesonintel-ligence.In addition, we shall consider models that combine these sourcesof data. We shall also consider studies of genetic and environmentalinflu-ences on development and changein intelligence.
TWIN STUDIES
Monozygotic twins (MZ) are genetically identical. They derive from thesplitting of a single fertilized egg. Dizygotic twins (DZ) derive from thefertilization of two different eggs and are no more similar to each otherthan siblings. If a phenotypic measureof a trait is influenced by geno-types, MZ twin pairs should be more similar to each other than DZ twinpairs. Differences between pairs of DZ twinsare attributable to variationsin their environment and their genotypes. Differences between pairs ofMZ twinsare solely attributable to environmentalvariations. Therefore,a comparison of differences between MZ and DZ twinpairs should pro-vide an index of genetic influence on trait.Each source of data that may be used to estimate genetic and environ-
mental influences on trait is liable to provide distorted estimatesfor avariety of different reasons. The twin method assumesthat the within-pair similarity of environmentalinfluences for MZ and DZ pairsis identi-cal. It is possible that MZ pairs are treated more alike than DZ pairs byvirtue of their greater physical similarity and that these environmentaldifferences cause them to be morealike in intelligence. Thus evidenceindicating that MZ twins are morealike in IQ than DZ twin pairs doesnot necessarily provide evidence for genetic influences.
Thereare several lines of evidence that suggest that an environmentalinterpretation of differences between MZ and DZ pairs is not tenable.Although MZ twins may experience a more similar environment thanDZ twins, this similarity mayitself be the result of genetic influences onthe environment. For example, if MZ twins are more likely than DZ

TWIN STUDIES 129
twins to have the samefriends this may beattributable to genetic influ-ences on interests and temperamentthat influence friendship patterns.More critically, the assertion that MZ twins experience more similarenvironments than DZ twinsdoes not provide compelling evidence for anenvironmentalinterpretation of MZ—DZdifferences on a trait unless onecan demonstrate that the environmental differences that distinguish MZand DZ pairs are related to the trait. Vandenberg & Wilson (1979) foundthat variations in within-pair similarity of treatment of MZ and DZ twinsdid not correlate with scoreson tests of intelligence. There are two othercritical sources of data that may be used to investigate the equal-environ-ment assumption. MZ twin pairs whoare reared in different familiesundoubtedly experience environments that are more varied than MZtwins whoare reared in the same family. Comparisons between these twogroups of twins should provide evidence about the importanceof varia-tions in the environment experienced by MZ twin pairs in determiningtheir similarity in intelligence. We shall consider these studies. Anothertest of the environmental interpretation of MZ—DZdifferencesforintel-ligence may be obtained by comparing same-sex and opposite-sex DZtwin pairs. Opposite-sex DZ twin pairs clearly experience larger within-pair environmentalvariability than same-sex DZ twin pairs. Although Iam not aware of any specific empirical research on thetopic, it appearsobvious that differences between same-sex MZ and DZ twin pairs inwithin-pair environmental variability are smaller than differences be-tween same-sex and opposite-sex DZ twin pairs. If this assertion is cor-rect, an environmentalinterpretation of differences between MZ and DZtwin pairs in intelligence implies that the difference between same-sexand opposite-sex DZ pairs for intelligence should be larger than thedifference between MZ and same-sex DZ twin pairs. Opposite-sex andsame-sex DZ twin pairs appear to be equally similar in intelligence. Forexample, Mehrota & Maxwell (1950) obtained a correlation of .63 for 182opposite-sex 11-year-old twins in Scotland—a value comparable to thatusually reported for same-sex DZ twins. Herrman & Hogben (1933) ob-tained slightly larger correlations on the Otis test for opposite-sex twinpairs than for same-sex DZ twin pairs. The failure to find evidence fordifferences in IQ similarity among same- and opposite-sex DZ twins sug-gests that variations in the environment experienced by pairs of twinsreared in the same homeare not the cause of differences between MZ andDZ twin pairs in similarity for IQ. Indeed, it is hard to imagine environ-mental hypotheses to accountfor differences in MZ and DZ twinpairs inintelligence that would not predict relatively large differences betweensame-sex and opposite-sex DZ twin pairs. Equivalence in similarity ofintelligence test scores for these two classes of DZ twin pairs appears torender environmental explanations of MZ—DZ differencesin intelligencenugatory.
Estimates of different sources of variance in intelligence using twin

130 5. BEHAVIOR GENETICS OF INTELLIGENCE
data are subject to empirical and conceptual difficulties. On a simpleadditive genetic model, DZ twin pairs may be assumedto have a geneticcorrelation of .5. This implies, on a purely genetic hypothesis, that thevalue of the DZ correlation for intelligence should be one-half the valueof the MZ correlation and the difference between the correlations multi-plied by two should provide an estimate of the heritability of intelligence.There are three difficulties with this simple procedure for estimatingheritability. The genetic correlation between same-sex DZ twin pairs maybe larger than .5. Assortative mating refers to the tendencyof individualswhoare genetically alike to mate. Spouses exhibit a phenotypic correla-tion in IQ of approximately .33. The genotypic correlation among spousesfor IQ is a complex theoretical parameter that can only be indirectlyestimated and not directly measured. The presenceof a genotypic correla-tion among biological parents for intelligence will inflate the geneticcorrelation between DZpairs since they are receiving genes from parents
that are similar. Assortative mating will inflate DZ correlations and leadto lower heritability estimates. Dominance and other nonadditive geneticinfluences will tend to decrease the similarity of DZ twin pairs for purelygenetic reasons. These influences do not decrease MZ correlations sinceMZtwinsare genetically identical. In order to use twin data to arrive atestimatesfor different sources of genetic and environmentalvarianceitisnecessary to develop estimates of assortative mating and nonadditivesources of genetic variance. Estimates of genetic and environmental in-fluences on intelligence using twin data may be distorted by special en-vironmental experiences peculiar to twins. Twins may influence eachother in ways that siblings whoare not twins do not and thus twins maybe more alike for environmental reasons that are not shared by otherindividuals in the population.
In addition to the conceptualdifficulties involved in deriving estimatesfrom twin data, there are also possible empiricaldifficulties in ascertainingthe actual values of twin correlations. The determination of zygosity is nolonger a serious problem with modern techniquesof blood typing. And,ifthere are errors of determination of zygosity in a study, differences betweenMZ and DZ twin pairs would be underestimated, thereby decreasingestimates of heritability. A potentially more serious source of bias isvolunteer bias. Twin studies require the cooperation of both membersof atwin pair. If twins who are dissimilar are more likely to be discordantforthe tendency to volunteerto participate, then the surviving membersofany twin studyare likely to be a biased sample of twin pairs who are moresimilar to each other than twins in the population. If MZ twins are morealike in personality characteristics that are correlated with the tendency tovolunteer and participate in psychological studies than DZ twins, then thepopulation of DZ twins whoparticipate in a studyofintelligenceare likelyto be a more biased sample of their population than MZ twinsareof their
TWIN STUDIES 131
population. Biases in obtained values of DZ correlationsare likely to leadto lower estimatesof the heritability of IQ.Bouchard & McGue (1981) summarized the available literature on
kinship correlations for intelligence. They reported a weighted averagecorrelation of .86 based on 34 correlations encompassing 4672 pairingsforMZ twins reared together. The comparable correlation for same-sex DZtwins was .60 based on 41 correlations and 5546 pairings. Thecorrelationof .86 may be comparedto the test-retestreliability of .87 for the tests ofintelligence used in these investigations. The correlation in intelligencefor MZ twins reared togetheris close to the upper boundset by the test—retest reliability of IQ tests. On the simplest genetic model, ignoringassortative mating, these data imply that 52% of the variance on IQ testsis attributable to genetic influences. Considerations of the influence ofassortative mating would increase the estimates for the heritability ofintelligence.
Loehlin, Willerman, & Horn (1988) reviewed recent twin studies ofintelligence published after Bouchard and McGue’s review. They notedthat several recent studies reported larger MZ—DZ differences. Tambs,Sundet, & Magnus(1984) reported correlations of .88 and .47 for MZ andDZ twin pairs. Wilson (1983, 1986) obtained correlationsof .88 and .54 for15-year-old MZ and DZ twin pairs. Segal (1985) found correlations of .85for MZ twins and .46 for DZ twins. Nathan & Guttman(1984) obtainedcorrelations of .80 and .34 for their twin pairs. Stevenson, Graham, Fred-man, & McLoughlin (1987) reported the only recent data that is compati-ble with the weighted estimates contained in the Bouchard and McGuereport. They obtained correlations of .84 for MZ twin pairs and .61 for DZtwin pairs on the Wechsler. The newer twin studies suggest heritabilitiesthat are somewhat higher than those based on the studies reviewed byBouchard and McGue. These data are compatible with heritability esti-mates for additive genetic variancethat are close to .7. It is not knownifthese data represent random perturbations in the obtained valuesof cor-relations, systematic changesattributable to differences in methodology,or true secular changesin theheritability of intelligence.
In addition to studies of MZ and DZ twinsreared together, there arestudies of MZ and DZ twinsreared apart. The correlation between MZtwins reared apart providesa direct estimate of the heritability of intel-ligence. For several reasons, the direct estimate of the heritability of intel-ligence based on correlations of IQ scores of MZ twinsreared apart shouldbe dealt with cautiously. There is only a small number of such studies—data are available from only six studies and the results of one of thesestudies is generally discounted as being either fraudulentor, at best, un-trustworthy. The samples are small andthere are less than 200 MZ pairsavailable, and someof these data are based on older IQ tests that may nothave been appropriately normed. In addition, only one study, whosere-

132 5. BEHAVIOR GENETICS OF INTELLIGENCE
sults are not currently available, is based on a systematic sample. Theremaining studies obtained samples that may be unrepresentative of theexceedingly small group of separated MZ twins. Finally, many of the MZtwin pairs that are includedin the available data were not separated frombirth. Many were reared in similar circumstances in families that weresimilar with respect to socioeconomic backgroundandevenin collateralbranchesof the samefamily. Thus, the correlation between separated MZtwin pairs cannot be accepted at face value as a direct estimate of theheritability of IQ.There are six studies of separated twins that provide information about
their similarity of IQ. One study, Cyril Burt’s, is currently considered toreport data that is not trustworthy (see Hearnshaw, 1979; Kamin, 1974;see also Joynson, 1989, for a somewhat contradictory point of view). Itshall not be considered here.Bouchard & McGue(1981) reported a weighted average correlation of
.72 for three classical studies of MZ twinsreared apart. Thecorrelation isbased on three studies and involves 65 twin pairs. These data have beensubject to intense scrutiny and dispute. The data are based on threeclas-sic studies, Newman, Freeman, & Holzinger (1937), Juel-Nielsen (1965),and Shields (1962). Farber (1981), Kamin (1974), and Taylor (1980) arguedthat these data cannot be accepted at face value as demonstrating theimportance of genetic influences on IQ. They presented four generalcrit-icisms of these data. First, they argued that the samples are not systemat-ically ascertained and consist of volunteers who may notbe representa-tive of the population. There is one modern study of twins reared apartthat is based on a systematic sample, Pedersen, McLearn, Plomin, &Friberg (1985), but results for MZ twins reared apart have not beenre-ported for this study. In addition, Newman, Freeman, & Holzinger (1937)may have introduced an additional sourceof bias in their study by exclud-ing any twin pairs who described themselves as dissimilar in order toreduce the probability of obtaining DZ pairs that they intended to ex-clude. Thus they may have unwittingly failed to study MZ twin pairswho were dissimilar in IQ. Their results were comparable to those ob-
tained in other studies in which this procedure was not followed. Thepossibility that the MZ twins that are included in these studies may forunknownreasonsbe a specially selected sample whose resemblance in IQmight not be representative cannot be excluded. Thereis, however, withthe possible exception of the Newmanetal. study, no reason to believethat biases have been introduced in the sample selection procedure thatwould result in an increase in the correlation for the MZ twins.
Second, Kamin argued thatthe results of the Juel-Nielsen and Newmanet al. studies are attributable to age confounds. There is a relationshipbetween the age of the twin pairs and their average IQ. Kamin attemptedto demonstrate that this age confound, probably attributable to inade-quate age standardization for the tests used, accounts for the IQ correla-

TWIN STUDIES 133
tion between them.It is known that there are cohort and ageeffects for IQand that cross-sectional data is likely to indicate a negative correlationbetween IQ and age. Thecorrelations averaged by Bouchard and McGueare age corrected and therefore should be interpreted as being free of ageconfounds. Kamin objected to the standard methodsof correcting for ageconfounds, arguing that the appropriate age correction should be doneseparately for male and female twin pairs and evenfor different subsetsofsubjects at different points of the age cycle. Kamin created pseudopairingsof twins whowere adjacent in age. He demonstratedthat the correlationsfor pseudopairs were comparable to those for actual twin pairs. Kamin’sapproach is dependenton creating separate groupingsfor male and femalepairs and on creating additional arbitrary divisions. The resultantcorrela-tions are based on exceedingly small samples and have large standarderrors. In addition, there is no reason to assumethatagecorrections thatare required for IQ should be different for male and female subjects.If
Kamin hadapplied his pseudopairing procedure consistently to the entiresample for each of the studies he examined,in all probability the effects ofthe age correction he used would have been comparable to the standardpartial correlation method of age correcting. In addition, Shield’s (1962)data are not subject to this criticism.
Third, Kamin and Farbercriticized the IQ tests used in these investiga-tions. Juel-Nielsen used a Wechsler test that may not have been ade-quately standardized for his Danish sample. The Stanford—Binet used byNewmanetal. may also have been inadequately standardized. The non-verbal Dominoes test used by Shields required extensive verbal instruc-tions and the outcomeof the test may have been biased since Shieldsadministered the test to most of his MZ twin pairs. Bouchard (1982)noted that in each of these three classic studies an additional IO test was
available. Juel-Nielsen reported data for the Raven, Newmanet al. admin-istered the Otis quick-scoring test, and Shields had data for a vocabularytest. In each case the intraclass correlations for the MZ twins were com-parable for these alternative IQ measures to those obtained from themeasures that were criticized by Kamin and Farber. Bouchard concludedthat criticism of the outcomesof the separated MZ twin studies based onthe adequacyof the tests of intelligence used were not “constructivelyreplicated” for the alternative tests used in thesestudies.
Fourth, the most fundamentalcriticism of these datais that the resultsare attributable to environmental similarity in the rearing conditions ofthese separated twin pairs. Taylor argued that the similarity between MZtwins reared apart was dependent on environmental similarity. He inves-tigated the effects of age of separation, whether the twins had beenre-united, whether they had been rearedin related or unrelated families, andthe similarity of the social environment in which they were reared.Bouchard (1982, 1983) reexamined the separated twin studies using Tay-lor’s analyses and classifications as a basis for classifying the separated

134 5. BEHAVIOR GENETICS OF INTELLIGENCE
twin pairs. He then used theseclassifications to computecorrelations fora second measureofintelligence obtained by twoof the original investiga-tors, Juel-Nielsen and Newmanetal. This analysis tests the replicabilityof Taylor’s analysis for different measuresof intelligence. Taylor’s originalanalysis and Bouchard’s constructive replication of this analysis are re-ported in Table 5.1. An examinationof the data in Table 5.1 indicates thatTaylor's analyses do not generalize to different measuresof intelligencepresented to the same twinpairs. Taylor found that age of separation wasnot related to the degree of similarity; Bouchard found that age of sepa-rated wasrelated to twin similarity. Early-separated twins were less sim-ilar than late-separated twin pairs. Taylor reported that MZ twins whohad been reunited were more similar than the twin pairs who had notbeen reunited. Bouchard found that this effect does replicate, but thedifferences in the magnitude of the intraclass correlations are smaller
than those obtained by Taylor. Taylor found that the MZ twinsreared byrelatives were more similar than those reared by nonrelatives. Bouchard
foundthat the results were reversed for the alternative measures. Perhapsthe mostcritical of Taylor’s analyses is that based on hisclassification oftwins with respect to the similarity of rearing environment. An examina-tion of the data in Table 5.1 indicates that, on Taylor’s analysis, MZ twinsreared in similar environments are more alike than those reared in rela-tively dissimilar environments. Bouchard found that the differences onthe alternative measure for Taylor’s classification do not replicate—thetwinsreared in dissimilar environmentsare slightly and nonsignificantlymore alike on the alternative measures than the twins assigned to the
TABLE 5.1 Taylor's Analysis of Variables Influencing MZA Correlationsand Bouchard’s Constructive Replication
Variable Taylor’s correlation? Bouchard’s correlation®
Reunion classification
Reunited 85 82Not reunited 57 .68
Age of separation
Late (>6 months} .70 719Early (<6 months) .67 42
Rearing classificationRelated 77 .66
Not related 61 77Environmentclassification
Related 86 67
Notrelated 52 70
2Based on Bouchard (1983).
bTaylor’s correlations are weighted averages for three studies as recalculated by Bouchard
using intraclassr.
¢Bouchard’s correlations are weighted averages for two studies using Taylor’s post hocclas-
sifications replicated for a second test score for the samesubjects.

TWIN STUDIES 135
relatively similar group. Bouchard’s reanalysis indicates that Taylor’sanalysis cannotbe usedto explain the similarity of MZ twinsreared apartby reference to environmental similarity of their rearing conditions.
Theresults of the classic twin studies are buttressed by the results of acontemporary study, the Minnesota study of twins reared apart.Bouchard, Lykken, McGue, Segal, & Tellegen (1990) reported correlationsfor three different measures of general intelligence—the WAIS, a com-bination of the Raven and the Mill—Hill vocabulary test, and the firstprincipal componentof a battery of tests for over 40 separated MZ twinpairs. The correlations for these three measures were .69, .78, and .78,respectively. The correlation for a composite index based on the mean ofthe three measures was .75. Indices of socioeconomic background andretrospective accounts of the intellectual orientation of the family en-vironment were obtained. The correlations between the family back-ground variables of the MZ twins reared apart were obtained and thecorrelations between family backgroundvariables and performance on IQtests were also obtained. Using these correlationsit is possible to calcu-late the contribution of the similarity of family background variables tothe correlation of IQ scores for the MZ twinsreared apart. Table 5.2presents these data. An examination of the data in Table 5.2 indicates thatthe twins were reared in somewhatcorrelated environments.It is also thecase that the environmentalvariables were for the most part only negligi-
TABLE 5.2 Placement Coefficients for Environmental Variables, Correlations
between IQ and the Environmental Variables, and Estimates of the
Contribution of Placement to Twin Similarity in WAIS IQ¢
Correlation Contribution
between of placementIQ and to the
MZA placement MZA
similarity variable correlationPlacementvariable (Ry) (rye) (Ry X 124)
SES indicators
Father’s education 0.134 0.100 0.001Mother’s education 0.412 —0.001 0.000Father’s SES 0.267 0.174 0.008
Physical facilities
Material possessions 0.402 0.279** 0.032
Scientific/technical 0.151 —0.090 0.001Cultural —0.085 —0.279** —0.007
Mechanical 0.303 0.077 | 0.002Relevant FES scales
Achievement 0.11 —0.103 0.001
Intellectual orientation 0.27 0.106 0.003
“Based on Bouchard, Lykken, McGue,Segal, & Tellegen (1990).
**r,,significantly different from zero at p < 0.01.
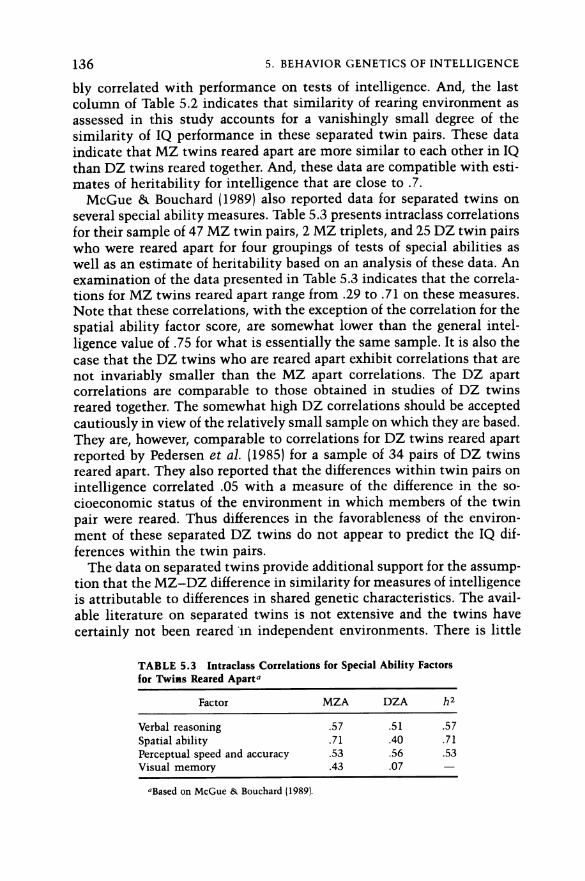
136 5. BEHAVIOR GENETICS OF INTELLIGENCE
bly correlated with performance on tests of intelligence. And, the lastcolumn of Table 5.2 indicates that similarity of rearing environmentasassessed in this study accounts for a vanishingly small degree of thesimilarity of IQ performance in these separated twin pairs. These dataindicate that MZ twinsreared apart are more similar to each other in IQthan DZ twins reared together. And, these data are compatible with esti-matesof heritability for intelligence that are close to .7.McGue & Bouchard (1989) also reported data for separated twins on
several special ability measures. Table 5.3 presents intraclass correlationsfor their sample of 47 MZ twin pairs, 2 MZ triplets, and 25 DZ twinpairswho were reared apart for four groupings of tests of special abilities aswell as an estimate of heritability based on an analysis of these data. Anexamination of the data presented in Table 5.3 indicates that the correla-tions for MZ twinsreared apart range from .29 to .71 on these measures.Note that these correlations, with the exception of the correlation for thespatial ability factor score, are somewhat lower than the general intel-ligence value of .75 for what is essentially the same sample.It is also thecase that the DZ twins whoarereared apart exhibit correlations that arenot invariably smaller than the MZ apart correlations. The DZ apartcorrelations are comparable to those obtained in studies of DZ twinsreared together. The somewhat high DZ correlations should be acceptedcautiously in view of the relatively small sample on which theyare based.They are, however, comparable to correlations for DZ twins reared apartreported by Pedersen et al. (1985) for a sample of 34 pairs of DZ twinsreared apart. They also reported that the differences within twin pairs onintelligence correlated .05 with a measure of the difference in the so-cioeconomic status of the environment in which members of the twinpair were reared. Thus differences in the favorableness of the environ-ment of these separated DZ twins do not appear to predict the IQ dif-ferences within the twin pairs.The data on separated twinsprovide additional support for the assump-
tion that the MZ—DZdifference in similarity for measuresof intelligenceis attributable to differences in shared genetic characteristics. The avail-able literature on separated twins is not extensive and the twins havecertainly not been reared 1n independent environments. Thereis little
TABLE5.3 Intraclass Correlations for Special Ability Factors
for Twins Reared Apart?
Factor MZA DZA h2
Verbal reasoning 57 51 57
Spatial ability 71 .40 71
Perceptual speed and accuracy 53 56 53Visual memory 43 .07 —
aBased on McGue & Bouchard (1989).

FAMILY STUDIES 137
persuasive evidence that the similarity of their environments can accountfor their similarity in intelligence. Separated MZ twins encounter en-vironments that are more varied than MZ and DZ twinpairs reared to-gether. Yet they appear to be somewhat morealike in IQ than DZ twinsreared in the samefamilly.It is difficult to explain these findings withoutinvoking a genetic hypothesis. The correlation for MZ twinsreared apartis a direct estimate of the heritability of IQ. Thus these data suggestheritabilities for IQ that are close to .7.
FAMILY STUDIES
Bouchard & McGue (1981) summarizedtheliterature reporting correla-tions between IQ scores of membersof the same family who wererearedtogether. They reported average weighted correlations of .42 for the cor-relation betweena parent’s IQ and the IQof his or her child. The compar-able correlation for siblings was .47. These data, consideredinisolation,providelittle or no evidence about genetic and environmentalinfluenceson intelligence. Members of the samefamily are genetically similar andshare similar environments. Their similarity in IQ maybeattributable toeither of these circumstances. Studies of adopted families provide a wayof separating genetic and environmentalinfluences.There are three contemporary studies that provide information about
the relationship between IQ scores of adopted children and their biolog-ical and adopted parents. Teasdale & Owen (1984) obtained data onDanish fathers whose biological sons were adopted. They obtained scoreson an intelligence test administered for military induction for biologicalfathers, their adopted sons, and the adopted stepfathers of these children.The correlation between biological fathers and their sons was .20. Thecorresponding correlation between the intelligence test scores of adoptedfathers and their sons was .02. These data suggest that adopted adultchildren are more likely to resemble their biological parent than theiradoptive parent in intelligence. The sample was small and informationabout possible restrictions in range of talent for either biological oradopted fathers was not presented.The two remaining studies in this category that we shall discuss are the
Texas Adoption Study (Horn, Loehlin, & Willerman, 1979) and the Colo-rado Adoption Project (Plomin & DeFries, 1985b). Both studiesare longi-tudinal and have large samples that permit several different kinds of com-parisons. The Texas Adoption Studyis an investigation of a sample of 364unwed mothers whosechildren were given up for adoptionat an early age.The mothers were given an IQ test, and IQ test data exist for their off-spring and the adoptive parents of these children. The mean IQ of theadoptive mothers was 112.4 with a standard deviation of 7.68 and themean IQ of the adoptive fathers was 115.2 with a standard deviation of

138 5. BEHAVIOR GENETICS OF INTELLIGENCE
7.52. The mean IQ of the biological mothers was 108.7 with a standard
deviation of 8.67. The biological mothers in this sample were quite com-parable in mean andvariability of IQ scores to the adoptive parents. Bothgroups exhibit somerestriction in range of talent that should decrease themagnitude of obtained correlations between parents and children. Cor-relations between characteristics of adopted children andtheir biologicalparents are frequently explained by reference to the existenceof selectiveplacement. Adoption agencies may try to match the backgroundand char-acteristics of birth parents and adoptive parents. There wasselectiveplacement in the Texas Adoption Study. The correlation between the IQof the biological mother and the IQ of the adopting mother was .14. Thecomparable correlation between the IQ of the biological mother and theIQ of the adopting father was .11.
Correlations between parents and children in the Texas Adoption Studywere reported by Loehlin, Horn, & Willerman (1989). These correlationswere obtained when the children were between 3 and 14 years old andagain 10 years later. They include correlations between adoptive parentsand their natural children as well as correlations between biologicalmothers and the natural children of the adoptive parents. Table 5.4 pre-sents these data. Several aspects of the data reported in Table 5.4 arenoteworthy. At the initial assessment, the correlations between the IQ ofthe adoptive parents and that of their adopted children were not conspic-uously different from the correlations of the adoptive parents with theirbiological children. The correlations between the IQ of the biologicalmothers of the adopted children and the children they gave up for adop-tion were slightly higher than the correlations between the adoptive par-ents’ IQ and these sameadopted children. These data provide evidence forthe influence of the family environment and geneson IQ. Thecorrelationbetween the adopting parents’ IQ and the IQ of their adopted child sug-
gests that the family environmentdid influence the developmentof theIQ of the children who were adopted, and the correlation between the IQof biological mothers and the IQ of their adopted children providesevi-dence for a genetic influence on IQ.Each of these correlations exceeds the
correlation for selective placement. This implies that the correlationsbetween adopted children’s IQ and the IQsof their biological mothers andtheir adoptive parents cannotbe attributed to selective placement.The second assessment, 10 years later, when the adopted children were
adolescents or young adults, provides a different picture of genetic andenvironmental influences on IQ. The correlation between the IQ of the
adopting parents and the IQ of the adopted child is now close to zero andis lower than the correlation between the IQ of the biological mother andher adopted child. The correlation between the IQ of the biological moth-er and her adopted child has increased slightly and is now clearly largerthan the correlations between the adopting parents IQ and the IQ of thesame children. These data suggest that between-family environmental

FAMILY STUDIES 139
TABLE 5.4 Correlations among Parents andChildren in the Texas Adoption Study2>
Time 14 Time 2¢
Variables r Nf r N
FA 19 253 .10 253M,A 13 246 05 246FN 29 92 32 92M,N 04 90 14 90B,A 23 200 .26 200
B,O 12 115 .06 115
B,N 03 95 05 95S,A 14 256 11 256S,N 17 93 17 93Among, offspring, same time:
A,A 11 75 —.09 75
A,N .20 106 05 106
N,N 27 25 24 25
“Based on Loehlin, Horn, & Willerman (1989).
IQ tests: WAIS for F, M; Revised Beta for B; WAIS/WISC/Binet for A,, N,; WAIS-R/WISC-R for A>, No.
‘Abbreviations: F, adopted father; M, adopted mother; A,
adopted child of F and M; N,natural child of F and M,;B,
birth mother of adopted child; O, other adopted child in
family that adopted B’s child; S, socioeconomic index ofadoptive family.
4Initial test.
“Follow-uptest.
‘N’s are numberof pairings or degrees of freedom within
families, as described in text.
variance has a decreasing influence on IQ as individuals age. There isclear evidence in these data for a genetic influence on IQ and, if onecomparesthe correlation between the biological mother’s IQ and the IQof her adopted child to the correlations between the IQ of the adoptingparents and that of their natural children, it is possible to argue thatvirtually all of the similarity in IQ in natural families is attributable togenetic similarity. The Texas Adoption Study thus provides two some-whatcontradictory pictures of the influence of genetic and environmen-tal characteristics on IQ. Evidencefor genetic influences appears strongerfor the second assessmentand the evidence for between-family influencesappears stronger ontheinitial assessment. Weshall see that several otherstudies provide comparable data suggesting that between-family influ-ences decline with age and genetic influences increase with age. Data onsibling correlations from the Texas AdoptionStudy which I will reviewalso support this conclusion.
The Colorado Adoption Study is another large-scale longitudinal studythat includes data on the IQ of biological parents and their children given

140 5. BEHAVIOR GENETICS OF INTELLIGENCE
up for adoption at an early age. Data are also obtained from natural fami-lies who are matched to the adopting families. There is little selectiveplacement and the samples are reasonably representative of the middleclass population of their communities. There is somerestriction in rangeof talent for IQ for all of the parent samples. Table 5.5 is based on datapresented by Phillips & Fulker (1989) for a behavior genetic analysis oflongitudinal study for children in the Colorado Adoption Project whoseIQs were assessedat ages 1, 2, 3, 4, and 7. The data exhibit evidencefor anincreasing genetic influence as a function of age. At age 7, the correlationbetween the biological mother’s IQ and the IQ of her adopted child ishigher than the correlation between the IQ of the adoptive mother andher adoptive children. The samplesare large and thecorrelations that arereported are for the same sample of adopted children. Correlations be-tween the IQ of the adoptive father and these children at age 7, thoughpositive, are still lower than those between the biological mother and heradopted children. The correlation between the biological mother’s IQ andthe IQ of her adopted child is larger than the correlation between motherand child in the matched sampleof natural families. Thus the correlationbetween the IQ of the biological motherandthe IQ of her adopted child at
age 7 may be spuriously high. Nevertheless, the trend of these data seemsclear. Adopted children exhibit an increased tendency to resemble theirbiological mother as they grow older and a declining tendency to besimilar in IQ to their adopted parents as they grow older. The data for age7 IQs suggest that all of the resemblance in IQ in natural families isattributable to shared genetic characteristics among membersof the same
family.The results of the Colorado Adoption Project and the Texas Adoption
Study are in substantial agreement. These studies provide the best avail-able data on the relationship between the IQs of parents and children inadopting and natural families. There are several other sourcesof data thatprovide additional information about the similarity in IQ of members of
TABLE 5.5 IQ Correlations for Adopted Children at Different Agesin the Colorado Adoption Project.
Child
N Age Biological mother Adopted mother Adopted father
212 ] 12 .O7 .06
189 2 .04 .O7 .03
177 3 11 12 .20
158 4 18 21 .16
139 7 37 —.05 11
2Based on Phillips & Fulker (1989).
bBased on data for families without natural children, the subset of data with the most
adequate sample size.

FAMILY STUDIES 141
the same family. There are two older studies that provide data about theIQ of biological parents and their adopted children. Skodak & Skeels(1949) reported that the correlation between the IQ of biological childrenwho were adopted at an early age and theIQ of their biological mothersincreased as the adopted children aged and was .41 at age 13. The correla-tion between the biological mother’s educational level and the IQ of heradopted child was .32. The comparable correlation between the adoptivemother and her adoptive child was .02. Kamin (1974), in his critique ofthis study, noted that the comparable correlations at age 7 exhibitedsmaller differences. The correlations between the biological mother’s ed-ucational level and the IQ of her adopted child at age 7 was .24 and thecomparable correlation between the adoptive mother’s IQ andthat of her
adopted child was .20. Kamin attributed the changesin the valuesof thesecorrelations at age 7 and 13 to changesin the composition of the sample.The changesin the composition of the sample were notlarge and do notappear to provide an adequate explanation for the change in the value ofthe correlations (see Brody & Brody, 1976, Chapter 5). A more plausibleexplanation that is compatible with the results of modern studies wouldbe that of an increased genetic influence on the IQ of older children.Snygg (1938) obtained data on the IQs of biological mothers whose
children were adoptedearly in life and the IQs of their children reared infoster homes. The children were assessed when they were between 3 and8 years of age. The correlation between the IQ of the biological mothersand their adopted children did not vary with the age of the child. Thecorrelation for the entire sample was .13. For the subset of 70 childrenwho were assessed between ages 5 and8, the correlation was .12. Snyggassumedthat the obtainedcorrelation was attributable to selective place-ment although no quantitative data about the magnitude of selectiveplacement were presented. The correlation obtained by Snygg wasslightly lower than that obtained in modernstudies. It is also the casethat his sample was relatively young and there was somerestriction inrange of talent for IQ amongthebiological mothers. The biological moth-ers in his sample were low in IQ (mean IQ = 78) and the IQs of thebiological mothers in the Colorado and Texas studies were notlow in IQ.Anyorall of these variables as well as secular changesin the heritabilityof IQ may have contributed to the divergence in outcome between theSnygg study and the modern studies we have reviewed. It should also benoted that Snygg’s results, when oneconsiders the age of his sample, arenot dramatically different from those obtainedin otherstudies.There are adoption studies that report the correlation between the IQ of
adopted children and characteristics of their biological mothers otherthan IQ. The educational and occupational levels of the biological parentsare measured as “surrogates” of IQ. As weshall see these are variablesthat correlate with IQ and therefore the relationship between these char-
acteristics of biological mothers and the IQs of their adoptive children

142 5. BEHAVIOR GENETICS OF INTELLIGENCE
provide indirect evidence about the heritability of IQ. The best modernstudy of this type for young adults aged 16 to 22 is the Minnesota Adop-tion Study (Scarr & Weinberg, 1983). The study uses educational back-groundas a surrogate for IQ for parents of adopted children. The childrenwere placed in adopted homesin thefirst year of life. The adopting par-ents tended to have upper middle class social status and the biologicalmothers tended to have working class backgrounds. Table 5.6 presents thecorrelations reported by Scarr and Weinberg. An examination of Table 5.6indicates that the correlation between the educational level of the biolog-ical parents and the IQs of their adopted children is higher than the
correlation between the educational level of the adopting parents and theIQ of these children. The correlations between the biological parents’educational level and the IQs of their adopted children is comparable tothe correlation between the educational level of parents and the IQs oftheir natural children in the control families. These data are compatiblewith the assumption that the resemblance in IQ between parents and
young adults in natural families is attributable to their genetic similarity.There are also several older studies providing information about the
relationship between parents’ social characteristics and the IQs of theiradopted children. Lawrence (1931) studied a group of 185 illegitimatechildren reared in an institution for orphans. The children were reared infoster homesuntil the start of primary school and they were tested at anaverage age of 12.5. The correlations between thesocial class backgroundof their biological fathers and the IQ of the children were .26 for boys and.25 for girls. Nothing was reported about the foster homes in which thechildren were reared. Schiff & Lewontin (1986) noted that the tests usedin this study were poorly standardized and IQ scores were inverselyrelat-ed to age. It is not clear how the possible age confound would influencethe correlation with parental occupational status unless parental occupa-tional status wascorrelated with the age at whichthe test was given. Noevidence of this confound exists and the poor standardization ought toreduce the magnitude of the correlation with parental social status.
Jones & Carr-Saunders (1927) studied the relationship between adopted
TABLE 5.6 Parent—Child Correlations from the Minnesota
Adoption Study2
Parent—child factors Correlation
Adoptive mother’s educational level—IQ natural child 17
Adoptive father educational level—IQ natural child .26
Adoptive mother’s educational level—IQ adopted child 09
Adoptive father’s educational level—IQ adopted child 11
Biological mother’s educational level—IQ adopted child .28
Biological father’s educational level—IQ adopted child 43
2Based on Scarr & Weinberg (1983).

FAMILY STUDIES 143
TABLE 5.7 Mean IQ of InstitutionalizedChildren as a Function of Occupational Statusof the Biological Father
Class N Mean IQ
1 209 106.6
2 92 105.0
3 163 96.0
4 165 95.7
5 251 93.4
“Based on Jones & Carr-Saunders(1927).
children and the social class backgroundof their biological parents. Table5.7 presents their data on mean IQsfor children adoptedat different ageswhosebiological fathers differed with respect to social class background.The data indicate that mean IQ for adoptees increases monotonically asthe social class backgroundof the biological father is higher.Burks (1928) reported that the correlation between the biological fa-
ther’s occupational status and the IQ of his adopted child was .07. Burksalso compared the relationship between parental characteristics in anadopted family and children’s IQ and the comparable relationship in bio-logical families. She matched both groups on social background charac-teristics and reported that correlations between social background charac-teristics of foster parents and their adopted children were lower thancomparable correlations obtained in natural families that were matchedon a variety of social background characteristics. For example, she re-ported correlations between foster father and mother’s IQ and the IQ oftheir foster children of .07 and .19, respectively. The comparablecorrela-tions in the matched control families were .45 and .46. Theresults of theBurks study provide contradictory data with respect to the influence ofgenetic characteristics on the relationship between the IQ of children and
parents. The correlation between the occupational status of biologicalfathers and the IQ of their adopted children suggests that thereis little orno relationship between thebiological parent and the adopted child. Thedifferences in the correlation between the IQs of adopted and foster chil-dren and natural parents suggests that the correlation between parentsand children is mediated by genetic characteristics if natural familieshave been appropriately matched to adoptive families.Leahy (1935) reported the results of a comparable investigation. She
reported a correlation of .18 between the adoptive midparent’s IQ scoreand the IQ of their adopted child and a comparable correlation of .60 inthe control natural families. The children were between 5 and 14 at thetime of testing and Leahy attempted to matchthesocial class backgroundof the adopting and natural families. Leahy did not report correlations for

144 5. BEHAVIOR GENETICS OF INTELLIGENCE
relationships between the characteristics of biological parents and theiradopted children.The matching of the natural and adoptive families in the Leahy and the
Burks studies was criticized by Kamin (1974). He argued that there were anumberof differences between the adoptive and natural families in thesestudies that might account for the differences in correlation betweenfoster parents and natural parents and the IQsof their children. He did
not demonstrate that these differences actually account for the dif-ferences that are reported, but only that they might plausibly be assumedto accountfor these differences. He argued that the correlation betweenfoster parents andtheir biological children would provide a morerelevantcontrol group for comparing correlations between foster children andtheir adoptive parents’ characteristics. Burks did not provide data of thissort. Leahy reported a correlation of .36 between the adoptive midparentIQ and the IQ of a small sample of 20 biological children of these parents.This correlation is larger than the comparablecorrelation of .18 reportedfor the sample of 177 adopted children. Whetherthe correlation of .36 orthe comparable correlation of .60 in the control families is the idealcomparison numberis debatable. In any case both values are higher thanthe correlation of .18 reported by Leahy.
In all the studies we have reviewed correlations between the IQs ofadopted children and the characteristics of the adoptive parents are low.These results may be contrasted with the findings of Freeman, Holzinger,& Mitchell (1928), who reported a correlation of .48 between a compositemeasure of the characteristics of the foster home and the IQ of fosterchildren for a large sample (N = 401) of adopted children. They alsoreported a correlation of .39 for a subsample of 169 of these childrenbetween the IQ of the child and the midparent IQ of the foster parents.
These results appear to contradict the findings of both Burks and Leahy aswell as the results of contemporary investigations. Bouchard & Segal(1985) argued that the results of the Freeman etal. study should not beaccepted at face value. In addition to the fact that the correlations theyobtained appear to be deviant, the results they obtained with a secondnonverbal measure of intelligence provide less dramatic evidencefor theinfluence of the foster family on the IQ of its adopted children. Theyobtained a correlation of .24 between their foster homerating score andscores on the International Test. Finally, many of the adoptees were lateplacements and had been given IQ tests prior to placement. For this sub-set of adoptees the correlation between the IQ of the child and theratingof the characteristics of the foster home was.34 at the time of placement.For these reasons, the results of the Freemanet al. study do not constituteclear evidence for a strong influence of the characteristics of adoptiveparents on the IQs of their adoptive children.
I have reviewed both modern andclassical literature reporting correla-tions between the characteristics of parents and children in adoptive and

FAMILY STUDIES 145
natural families. The most important modern studies—the Texas, Colo-rado, and Minnesota studies—all have large samples andindicate, at leastfor older children and young adults, that adopted children tend to haveIQs that are more highly correlated with the characteristics of their bio-logical mothers than with the characteristics of their adoptive parents.The older literature, while somewhat more problematic and possibly re-flecting true secular changes in the heritability of IQ, is generally sup-portive of these results. Burks reported a near-zero correlation betweenthe occupationalstatus of the biological fathers in her study and the IQ oftheir adopted children. The remaining older studies including Skodak andSkeels as well as the two British orphanagestudies (Lawrence, 1931; Jones& Carr-Saunders, 1927) did obtain significant relationships between thecharacteristics of the biological fathers and the IQs of their adopted chil-dren. In addition, the older studies, with the possible exception of theFreemanet al. study, report relatively low correlations between the char-acteristics of adoptive parents and the IQs of their adoptive children.Thesedata, taken together, suggest that the correlation between the IQ ofnatural parents and the IQ of their natural children is at least partially
attributable to genetic similarity between parent and child. These studiesalso suggest that between-family environmentalinfluences may not be ofgreat importance in determining individual differences in adult IQ.
Correlations between biologically unrelated siblings who are reared inthe same family provide additional information about between-familyinfluences and genetic influences in determining relationships betweenbiologically related siblings whoare reared together. There are four mod-ern studies that provide data on the IQ correlation of biologically unrelat-ed children whoare reared in the same family. Teasdale & Owen (1984)reported a correlation of .02 for a sample of Danish adoptive malesiblingsreared in the same homeonselective service IQ tests. Kent (1985, as citedin Plomin & Daniels, 1987) compared 52 pairs of adoptive siblings rearedtogether with 54 pairs of nonadoptive siblings between 9 and 15 yearsofage. An IQ index derived from a phoneinterview correlated .38 in thesample of nonadoptive siblings reared together. The comparable correla-tion for the biologically unrelated siblings reared in the same home was—.16. Scarr & Weinberg (1983) obtained a correlation of —.03 for theirsample of biologically unrelated siblings reared in the samefamily in theMinnesota study of older adopted children. Similar results were obtainedin the Texas Adoption Study. Correlations for biologically unrelated chil-dren reared in the same family decreased from the initial study to thefollow-up 10 years later. The original correlation betweenpairs of adoptedchildren reared in the same homewas .11 and the correlation between theadopted and natural children reared together was .20. The comparablecorrelations in IQ for these biologically unrelated children reared to-gether decreased to —.09 and .05, respectively. These correlations shouldbe compared to the correlation of .24 for biologically related siblings

146 5. BEHAVIOR GENETICS OF INTELLIGENCE
reared in these families. These data consistently indicate that biolog-ically unrelated older children reared in the same family exhibit little orno relationship in IQ. Thus the new data on siblings are congruent withstudies on the relationship between parents and children in IQ in adoptedfamilies. These data also support the conclusion that relationshipsamong older children and young adults in natural families are mediatedby genetic resemblance among family members.In addition, these datasupport the conclusion that between-family variance is not a major con-tributor to differences in intelligence among older children and youngadults.These data and other data we shall consider have been subjected to a
variety of sophisticated behavior genetic modeling procedures. We shallreview some of these attempts to test various quantitative models forthese data. It should be recognized that the results of the models, irre-spective of their sophistication, are in part dependent upon the quality ofthe data on which they are based. All of the adoption studies reviewedhere contain somerestrictions in range of talent. Therefore, conclusionsaboutthe relative importance of additive genetic influences and between-family environmental influenceson the IQ of childrenarestrictly relativeto the environments that are sampled. While the adopted families inthese studies vary considerably in education, occupational status, and IQ,they do not contain manyindividuals whoare at the extreme lowerendofthe distribution of these variables. Adoptive families, particularly thosewhose adoption has been vetted by social agencies, tend to be intactfamilies of good reputation in their communities. The foster families thatparticipate in these research studiesare likely to have middle class back-grounds. The homeless, the unemployed, the addicted, and the underclassare not well represented in these studies, if they are representedatall.These studies do not inform us aboutthe effects on the developmentofintelligence of being reared in extremely deprived circumstances. Consid-er the results of one of the more important contemporary adoption stud-ies, the Texas Adoption Study. The study deals with a sample of biologicalmothers who are roughly matched in mean andvariance of IQ scores tothe sample of adoptive parents of their biological children. The biologicalmothers and the adoptive parents are both above the mean in IQ andexhibit some restriction in range of talent for IQ. The samples are pre-
dominantly middle class. In these circumstances, the IQ of the adoptedchild will be determined principally by the IQ of the adopted child’sbiological mother. The adoptive parents will have a decreasing influenceon the IQ of their adopted child. This study does nottell us about theeffects of being reared in extremely deprived environments. Thus, whenwe appropriately conclude on the basis of this and related studies thatthere maybe little or no between-family environmental influence on IQfor older adopted children we should realize that this conclusion may belimited to certain defined segments of the population and maynot apply

FAMILY STUDIES 147
to more extremevariations in between-family environmentsthat are not
inlcuded in these samples.
Schiff, Duyme, Dumaret, & Tomkiewicz (1982; Schiff & Lewontin,1986} attempted to demonstrate that there were large effects on IQ attrib-utable to the effects of being reared in upper middle class families. Theyobtained a sample of 32 French children whose biological mothers hadlow occupational status who were given up for adoption at an early ageand who werereared in upper middle class homes. They compared thesechildren to their biological half sibs who had the same mother and adifferent father who werereared by their biological mothersorin a varietyof less advantaged social circumstances. The children were tested at anaverage age of 10.3 with a French version of the WISCtest. The adoptedchildren had a meanIQ of 110.6. Their biological half sibs reared by their
natural mothers had a mean IQ of 94.2. These values are roughly com-parable to what would be expected for children in natural families ofcomparable social class background. Schiff et al. argued that these dataimply that differences in average IQ of different social classes are attribut-able to between-family environmental differences.
Capron & Duyme(1989) reported the results of another French adop-tion study designedto study the influence of extreme variations in socialclass rearing on mean intelligence test scores of adopted children. Theyused a complete cross-fostering design in which they formed four groupsof adopted subjects consisting of children whosebiological parents wereeither low or high in socioeconomic status who were reared in adoptedhomesthat were either high or low in socioeconomicstatus. The childrenwere tested with the French version of the WISC at age 14. Table 5.8presents the meanIQ for children in each of the four groups. Thedata inTable 5.8 indicate that there is an influence of both biological backgroundand family rearing on mean IQ scores. Theeffects of biological back-ground are larger than the effects of family rearing in this counter-balanced design. Capron and Duymeasserted that these data do notpro-vide definitive evidence of genetic influences on IQ because thecomparison of the biological parents in their studies confounds possiblegenetic effects with prenatal influences. While this is technically correct,it should be noted that there were no differences in birth weight or gesta-
TABLE 5.8 Mean IQ of Adopted Children2
Foster parent
status
Biological parents’ socioeconomic status High Low
High 119.6 107.5
Low 103.6 92.4
“Based on Capron & Duyme(1989).
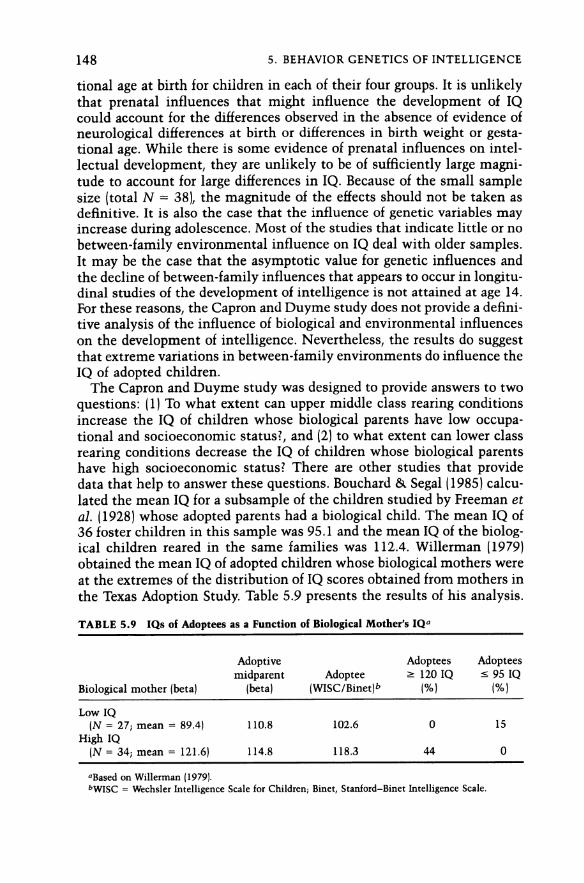
148 5. BEHAVIOR GENETICS OF INTELLIGENCE
tional age at birth for children in each of their four groups.It is unlikelythat prenatal influences that might influence the development of IQcould account for the differences observed in the absence of evidenceofneurological differences at birth or differences in birth weight or gesta-tional age. While there is some evidence of prenatal influences on intel-lectual development, they are unlikely to be of sufficiently large magni-
tude to accountfor large differences in IQ. Because of the small samplesize (total N = 38), the magnitude of the effects should not be taken asdefinitive. It is also the case that the influence of genetic variables mayincrease during adolescence. Most of the studies that indicate little or nobetween-family environmental influence on IQ deal with older samples.It may be the case that the asymptotic value for genetic influences andthe decline of between-family influences that appears to occurin longitu-dinal studies of the developmentof intelligence is not attained at age 14.For these reasons, the Capron and Duymestudy doesnot provide a defini-tive analysis of the influence of biological and environmental influenceson the developmentof intelligence. Nevertheless, the results do suggestthat extreme variations in between-family environments do influence theIQ of adopted children.
The Capron and Duymestudy was designed to provide answers to twoquestions: (1) To what extent can upper middle class rearing conditionsincrease the IQ of children whose biological parents have low occupa-tional and socioeconomicstatus?, and (2) to what extent can lowerclassrearing conditions decrease the IQ of children whose biological parentshave high socioeconomic status? There are other studies that providedata that help to answer these questions. Bouchard & Segal (1985) calcu-lated the mean IQ for a subsample of the children studied by Freemanetal. (1928) whose adoptedparents hada biological child. The mean IQ of36 foster children in this sample was 95.1 and the meanIQ ofthe biolog-ical children reared in the same families was 112.4. Willerman (1979)obtained the mean IQ of adopted children whose biological mothers wereat the extremesof the distribution of IQ scores obtained from mothers inthe Texas Adoption Study. Table 5.9 presents the results of his analysis.
TABLE 5.9 IQs of Adoptees as a Function of Biological Mother’s IQ¢
Adoptive Adoptees Adoptees
midparent Adoptee = 120 1Q = 951Q
Biological mother(beta) (beta) (WISC/Binet} (%} (%}
Low IQ
(N = 27; mean = 89.4) 110.8 102.6 0 15
High IQ(N = 34; mean = 121.6) 114.8 118.3 44 0
2Based on Willerman (1979).bWISC = WechslerIntelligence Scale for Children; Binet, Stanford—Binet Intelligence Scale.

FAMILY STUDIES 149
The children of biological mothers whose IQs were low (below 95) hadmean IQsthat were over one standard deviation lower than adoptedchil-dren whosebiological mothers’ IQs were above 120. The adopted childrenof mothers with low IQ had IQs that were higher than they would havebeen if they were reared with their biological mother. One can obtain acrude estimate of the magnitudeof this effect. The expected value of theIQ of the offspring of mothers with an IQ of 89.4 depends on spouseeffects and regression effects. Assumingan assortative mating correlation
of .33 and a correlation of .5 for the midparent to child IQ, adoptiverearing increased IQ by approximately .4 standard deviation units or 6points. This numberoughtnotto be taken too seriously given the samplesizes involved, the lack of information about the biological fathers ofthese children, and the useof different IQ tests for mothers and children.The Schiff et al. study is not unique in providing a biological sibling
control as a wayof assessing the influence of upper middle class rearingconditions. The separated twins studied by McGue and Bouchard werereared in a wide range of social class conditions. The separated-twinstudy combinesthe features of an adoption and a twin study. McGue andBouchard’s sample of separated twins werereared in families with a meannumberof years of education of 10.8 and a standard deviation of 3.5. Theadoptive families of the separated twins were equally diverse in occupa-tional status. Thus the sample of homes in which the twins were reareddoes not appearto exhibit a restriction in range of talent with respect toglobal indices of between-family environmental conditions that are as-sumed to influence the developmentof intelligence. Recall that McGueand Bouchard found near-zero correlations between social backgroundindices and several measuresof special intellectual ability. If we try to puttogetherall of the adoptive data to compare the influence of variations inbiological background and in family rearing conditions on the develop-ment of IQ of adopted children we are left with some uncertainty. It isclear that we have too few studies in which children with allegedly supe-rior genetic backgroundsare reared in circumstancesthatare thoughttobe inimical for the developmentof intelligence. Although we have moredata on children with genetic backgrounds that are thought to be lessadvantageous for the development of IQ being reared in circumstancesthat are thoughtto be favorable for the developmentof high IQ, even herewe do not have a great deal of data that permit comparisons with the mostrelevant control groups—the biological or adopted siblings of the adoptedchildren. Recall that the biological mothers in the Texas study and theColorado study rarely had extremely low socioeconomicstatus. Studiesof transracial adoption do provide someadditional relevant data butI willdefer a discussion of these studies to Chapter 10 dealing with groupdifferences in IQ. Putting all of the data together we can venture sometentative conclusions. Virtually all of the studies indicate that the biolog-ical background of adopted children influences the IQ of children. In

150 5. BEHAVIOR GENETICS OF INTELLIGENCE
adoption situations that have relatively equal restrictions in range oftalent for intelligence in both the biological and adoptive families, thebiological backgrond of the adopted child appears to be clearly moreimportant in determining the IQ of the older child than the charac-teristics of the adoptive families. Put another way, it could be assertedthat over a relatively wide rangeof variation in adopting families that arechosen to provide adequate nurturance for the development of adoptedchildren, there is a vanishingly small influence on the intellectual devel-opment of adopted children attributable to the variations in between-family environmental differences. At the extremes, differences in familyrearing conditions do influence the intellectual development of theadopted child. It should be noted that we have virtually no data on chil-dren reared in the extremes of poverty whose families are disorganizedand on public assistance. Children in such families are rarely studied inbehavior genetic research and thus wehavelittle basis to reach any con-clusion about the effects of this type of rearing on children’s IQ. It doesappear likely from the available data that children whosebiological par-ents had low IQ whoarereared in upper middle class homeswill have anIQ that is higher than they would have had if they were reared in theirown homes. The true magnitude of this effect is difficult to gauge. A 1-standard-deviation difference is probably a reasonable estimate of theouter limit of this effect although it might well be less (see Locurto, 1990,for a thoughtful discussion of the malleability of IQ based on an analysisof adoption studies). So, too, we can guessthat children whose biologicalparents had high IQs, between 1 and 2 standard deviations above themean, would have lower IQs if they were reared in extremely deprivedhomesthan if they were reared by their biological parents. Here we haveeven less basis for a quantitative estimate, but a 1-standard-deviationdifference would probably provide an upper-bound estimatefor the size ofthis effect.
QUANTITATIVE ESTIMATES
The data reviewed above maybe used to develop quantitative estimatesofthe various sources of variance that contribute to the IQ phenotype.
These estimates may give somewhatdifferent results depending on thedata that are used to estimate sourcesof variance as well as the assump-tions of the model used to derive estimates. Plomin & Loehlin (1989]contrasted what they called direct and indirect estimates of theheritability of IQ and indicated that the former estimates are usuallysubstantially larger than the latter estimates. Direct heritability esti-mates are based on a single family relationship such as the correlationbetween MZ twinsreared apart. Indirect estimates are based on the dif-ference between correlations such as the difference between MZ and DZ

QUANTITATIVE ESTIMATES 151
twins. They rely on the weighted averages of correlations for several dif-ferent kinship relationships published by Bouchard & McGue (1981) andupdated by newerresearch to reach this conclusion. Let us consider someof their comparisons. The correlation for separated MZ twins provides adirect estimate of the heritability of IQ. A reasonable estimate for thisvalue is .70. The indirect estimate is based on the difference between MZand DZ twinsand suggests heritabilities closer to .52 assuming MZcor-relations of .86 and DZ correlations of .60. There is some uncertaintyabout the magnitudeof this discrepancy. Recall that more recent researchsuggests that the DZ correlation may be lower than .60, suggesting thatthe heritability estimate based on this value for DZ correlations may betoo low.
Parent—offspring correlations provide a second wayof comparing directand indirect estimates of heritability. The correlation between biologicalparent and adopted child doubled provides a crude index of narrowheritability. An indirect estimate of heritability may be obtained fromadoption studies by obtaining the difference between the correlation ofadopted children and their adopted parents and thecorrelation of naturalchildren reared in the same family with their biological parents. Plominand Loehlin indicated that direct estimates of heritability for the follow-up data in the Texas Adoption Project are .70, and the indirect estimatefor heritability from the same study is less than half the value of thedirect estimate—.32. Plomin and Loehlin discussed a variety of possibleexplanationsfor this apparent discrepancy and concludedthatnosatisfac-tory explanation exists. The example indicates that different approachesand different sources of data used to estimate the heritability of IQ arelikely to provide discrepant results. We shall examine a small numberofcontemporary attempts to provide quantitative estimates of several pos-sible sources of influence on IQ.Before proceeding to a quantitative analysis of the relative importance
of genetic and environmental influences on IQ it should be noted thatthese estimates may vary in different populations. Loehlin et al. (1988)noted that estimatesof the heritability of the intelligence appear to haveincreased since the previous review of this area of research in 1982 byHenderson. Henderson noted that estimates of heritability that he re-viewed were conspicuously lower than those that were common in psy-chology in earlier decades. Some of these changesare attributable tochanges in methodsof analysis, some to changesin theavailable data thatare used to estimate heritability, and some possibly to secular trends inthe actual heritability of intelligence.
Heritability estimates may also be subject to cohort effects. The mostappropriate methodfor studying seculartrendsin the heritability ofintel-ligence is to study cohort effects using similar methodsof analysis. Sun-det, Tambs, Magnus, & Berg (1988) reported a twin study of this typeusing data from 11 cohorts of male Norwegian twins whoweretested at

152 5. BEHAVIOR GENETICS OF INTELLIGENCE
10.
a .
—— /FT é2 b
4 e e f/f2 .40
a e
.20
2 i , Ff a fj { 2 I 1 i i i + 1 i je,
4)
32 34 44 46 48 50 52 54 56 58 60
Year ofbirth
(19XX)
FIGURE 5.1 Cohort influences on heritability of intelligence. (Based on Sundet, Tambs,
Magnus, & Berg, 1988.)
the same chronological age when they appeared for armed services exam-
inations. Figure 5.1 presents their data. The secular trends for changesin
heritability rise and fall in a complex wave pattern that is not easy to
explain by reference to any obvious changes in Norwegian society. It is
possible that increased affluence and a moreegalitarian educationalsys-
tem resulted in an increased heritability for intelligence for their youn-
gest cohorts. This explanation does not accountfor the apparent decrease
in heritability for the cohorts born immediately after World WarII.
DeFries, Johnson, Kuse, McLearn, Polovina, Vandenberg, & Wilson
(1979) analyzed sibling and parent—offspring correlations in ability for
Caucasian and Japanese children in Hawaii. They found that parent—
offspring correlations were generally higher among Caucasians than
amongJapanese. Sibling correlations for intellectual ability exhibited a
reverse pattern. They attributed these effects to changesin the social and
economic opportunities available to Japanese-background individuals in
Hawaii that resulted in increases in intelligence (Nagoshi & Johnson,
1985). The intergenerational increase in intelligence may have resulted in
a decrease in parental—offspring resemblance for Japanese subjects in the
study. Changesin correlations among different members of a family will
change the outcomesof behavior genetic analyses.
There are other sources of data that suggest that social structural vari-
ables may be an important influence on the extent to whichintelligence
is heritable. Abdel-Rahim, Nagoshi, & Vandenberg (1990) reported the
results of a twin study in Egypt. They obtained correlations of .74 for 36
MZtwinpairs and
a
correlation of .76 for 24 same-sex DZ twin pairs on a
measure ofgeneralintelligence. The correlations suggest zero heritability
for intelligence. Abdel-Rahim et al. indicated that these results might be

QUANTITATIVE ESTIMATES 153
influenced by a high frequency of arranged marriages in this sample thatcould contribute to high levels of assortative mating, thereby inflating theDZ genetic resemblance. Whetherthis is correct or not, it should benoted that this sample was unusual in another respect. The MZ and DZcorrelations for height were .96 and .90, respectively. The unusually highDZ correlation for height implies relatively low heritability for a traitthat is usually found to be highly heritable. It is also possible that intel-ligence is not highly heritable in rural Egypt. Therole of social privilegemay belarger in such a society and between-family environmental influ-ences may play a muchlargerrole in the developmentof intelligence thanthey do in Western societies that provide greater access to equal educa-tional opportunities. It mayalso bethe case thatheritability varies amongdifferent social groups in a society. Fischbein (1980) divided a sample ofDanish twins into three groups on the basis of their socioeconomic sta-tus. The MZ and DZ correlations for twins in the lowest socioeconomicgroup on a measure of verbal ability were .66 and .51, respectively. Thecomparable correlations for twins with the highest socioeconomicstatuswere .76 and .37. Heritability estimates for these data were a monoto-nically increasing function of the social status of the twin pairs. Thesample sizes were small and the data might best be considered as sug-gestive rather than definitive.Detterman, Thompson, & Plomin (1990) studied the heritability of
intelligence for individuals differing in ability level in a twin study. Theyfound that their twin pairs with high ability had lower heritability ofintelligence than their twin pairs with low ability. For example, using amediansplit of ability level, they found MZ and DZ correlationsin intel-ligence of .57 and .32 for their high-ability twin pairs and comparablecorrelations of .59 and .09 for their low-ability twin pairs. Note that thelow DZ correlations for the low-ability twin pairs leads to an estimateof aheritability of 1.00. The pattern of correlations for the low-ability twinsiscompatible with the presence of high levels of nonadditive genetic vari-ance.The results of the Detterman et al. study are not in agreement with
those of Fischbein based on an analysis of differences in correlations fortwins differing in social class background. The differences in outcomemay be attributable to differences between an analysis based on socialclass rather than on differencesin intelligence.It is obvious that we knowtoo little aboutdifferential heritability of IQ amongdifferent groupingsofsubjects. It is probably premature to speculate about the causes of thesedifferences or even about the findings that require interpretation.This brief review of studies of differential heritability for intelligence as
a function of social background and secular trends should reinforce thecaution on the meaning of heritability placed at the beginning of thischapter. The heritability of intelligence is a numberassigned to a popula-tion, not a trait. Quantitative estimatesof heritability should be thought

154 5. BEHAVIOR GENETICS OF INTELLIGENCE
of as results for populations of individuals living in technologically ad-
vanced societies. The analyses that we shall consider are derived fromstudies conducted at different time periods and may confound seculartrends and methodologies with sample differences. They may be thoughtof as a snapshot of what may be a movingtarget.
Chipuer, Rovine, & Plomin (1990) and Loehlin (1989) used Bouchardand McGue’s summaryofcorrelations for IQ similarity to develop behav-ior genetic models. The modeling procedureis based on a specification ofthe influences of different environmental and genetic factors on variouskinship correlations. Table 5.10 presents the expectations used by
Chipueret al. An examination of Table 5.10 indicates the assumptions
that govern the behavior genetic analysis. For example, a nonadditivegenetic parameter is assumedto influence the correlation of MZ twins.The value of this parameter for DZ twinsis .25. Note also that different
parameters are specified for different environmental influences. The in-
fluence of the environmentof twins is assumed to be equivalent for DZ
and MZ twinpairs but the twin environmental parameter is independent
of the sibling parameter. The expectations expressed in Table 5.10 are
tested against an updated version of Bouchard and McGue’s summary of
correlations by LISREL procedures. A full modelis fitted to these data and
provides an adequatefit. This is a model in which each of the separate
parameters included in the expectations is assigned a specified optimal
value. The modelis tested by fixing various parameter values to zero in
order to see if this yields a significantly poorer fit to the obtained data, in
TABLE 5.10 Expected Contribution of Genetic andEnvironmental Factors to Resemblance for 12 Types of
Relatives2,>
Relationship Contribution
Monozygotic twins together h2 + d2 + 82+
Monozygotic twins apart h2 + d2Dizygotic twins together 5h2 + .25d2 + s2z
Siblings together 5h2 + 25d2 + ss
Siblings apart 5h2 + .25d2Parent—offspring together 5h2 + d2po
Parent—offspring apart 5h2Parent—adopted offspring S2po
Adoptedsiblings together S2s
Adopted/natural siblings together S2¢Half siblings together 25h2 + $25
Cousins together 125h2 + s2c
2Based on Chipuer, Rovine, & Plomin (1990).bh? are the loadings of the additive genetic factor; d? are the load-
ings of the nonadditive genetic factor; s? are the loadings of the shared
environmentfactor for twins (T}, siblings (S), parent—offspring (PO},
and cousins(C).
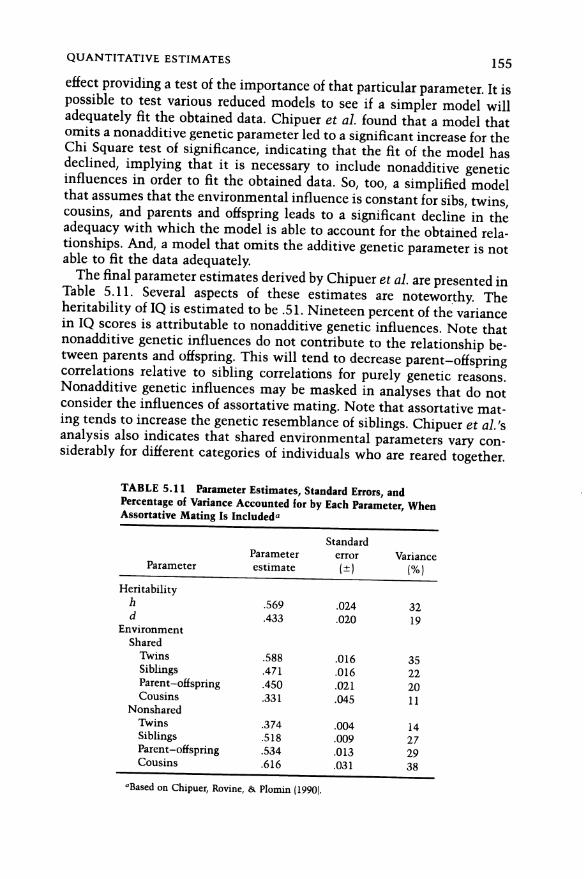
QUANTITATIVE ESTIMATES 155
effect providing a test of the importanceof that particular parameter.It ispossible to test various reduced models to see if a simpler model willadequately fit the obtained data. Chipuer et al. found that a model thatomits a nonadditive genetic parameterled to a significantincreasefor theChi Square test of significance, indicating that the fit of the model hasdeclined, implying that it is necessary to include nonadditive geneticinfluences in order to fit the obtained data. So, too, a simplified modelthat assumesthat the environmentalinfluenceis constantfor sibs, twins,cousins, and parents and offspring leads to a significant decline in theadequacy with which the modelis able to accountfor the obtained rela-tionships. And, a model that omits the additive genetic parameteris notable to fit the data adequately.
Thefinal parameter estimates derived by Chipueret al. are presented inTable 5.11. Several aspects of these estimates are noteworthy. Theheritability of IQ is estimated to be .51. Nineteen percent of the variancein IQ scoresis attributable to nonadditive genetic influences. Note thatnonadditive genetic influences do not contribute to the relationship be-tween parents and offspring. This will tend to decrease parent—offspringcorrelations relative to sibling correlations for purely genetic reasons.Nonadditive genetic influences may be masked in analyses that do notconsider the influences of assortative mating. Notethat assortative mat-ing tends to increase the genetic resemblance of siblings. Chipueret al.’sanalysis also indicates that shared environmental parameters vary con-siderably for different categories of individuals who are reared together.
TABLE 5.11 Parameter Estimates, Standard Errors, andPercentage of Variance Accounted for by Each Parameter, WhenAssortative Mating Is Included
StandardParameter error Variance
Parameter estimate (+) (%)
Heritabilityh 569 .024 32d .433 .020 19
Environment
SharedTwins 588 .016 35Siblings 471 .016 22Parent—offspring .450 021 20Cousins 33] .045 11
NonsharedTwins 374 .004 14Siblings 518 .009 27Parent—offspring 934 013 29Cousins .616 031 38
“Based on Chipuer, Rovine, & Plomin (1990).

156 5. BEHAVIOR GENETICS OF INTELLIGENCE
The largest difference is between twins and other categories. This sug-
gests that twins influence each other in ways that are different from the
influence of siblings on each other. This analysis also indicates that a
substantial portion of the variancein IQis attributable to within-family
environmental differences, i.e., differences experienced by individuals
reared in the samefamily.
Loehlin (1989) also tested various behavior genetic models for a subset
of these data. His analysis was addressed to somewhatdifferent issues. He
found that it was necessary to assumethat direct and indirect estimates
of heritability provide different estimates and that separate estimates for
these two kinds of estimates improved the fit. He also found that it was
necessary to assumethat there were genetic influences and between-
family influenceson IQ in order to obtain an adequatefit for the data and
that it was necessary to assume that twins and siblings had different
between-family environmental influences. The parametric estimates for
additive genetic influence were .41 for direct estimates and .30 for indi-
rect estimates. Nonadditive genetic influence was estimated to account
for 17% of the variance in IQ. Thustheheritability of IQ was estimated to
vary between .47 and .58. Loehlin indicated that these values are based on
correlations that are averaged over different age groups. The heritability
of IQ appears to increase with age and thus the values reported for
heritability in the two analyses considered here are probably too low for
older individuals.
Nonadditive genetic variance may contribute to the phenotypefor IQ.
This suggests another methodof testing for genetic influences on intel-
ligence—the study of inbreeding depression. The study of inbreeding de-
pression is based on a series of genetic assumptions. Offspring of genet-
ically related parents are morelikely to be homozygous for various gene
loci. It is assumed that harmful or defective traits that survived evolution-
ary selection are more likely to be recessive and to havetheir influence
masked by dominanttraits. Intelligence may be assumedto be influenced
by directional dominance effects that are beneficial. If this is correct,
offspring of genetically related individuals will be subject to inbreeding
depression, i.e., the influence of excessive unmasked recessive genes. A
coefficient of inbreeding is a measure of the degree of genetic relatedness
of the parents of a child. Incestuous matings of parents and children and
of siblings have a high genetic inbreeding correlation of .25. The offspring
of first-cousin marriages have a genetic inbreeding correlation of .0625. If
intelligence is influenced by genes that exhibit directional dominance,
inbreeding depression should occur. Theeffects of inbreeding depression
are difficult to demonstrate. Kamin (1980) and Jensen (1978) reached quite
different conclusions about the probity of evidence for the existence of
this phenomena. The expected magnitude of the effect is small and in
several small sample studies the difference between children expected to
exhibit the effect and various control samplesis notstatistically signifi-

QUANTITATIVE ESTIMATES 157
cant, although it is fair to say that in most of the studies available, the
direction of effects distinguishing between the IQ of children whosepar-ents were biologically related and control groups were consistent with aninbreeding depression effect. The difficulty with the interpretation of theresults in these studies derives from the search for an appropriate controlgroup. It is usually the case that the biological parents whoare geneticallyrelated to each otherdiffer from the biological parents who are unrelatedto each other. Consider the results of a study reported by Schull & Neel(1965). They obtained IQ scores from a large sample of Japanese childrenof consanguineous marriages and children of unrelated parents. Theyfound that the mean IQ of the former group wasslightly lower than themean IQ of the latter group. It was also the case that the parents of theformer group had lower socioeconomic status than the parents ofthe latter group. They used multiple regression analyses to adjust for thebackground differences between their two groups of subjects andstatis-tically adjusted their scores for differences in parental occupational statusand educational status. Using these adjusted scores they found a statis-tically significant inbreeding depression score equivalent to 4.5 IQ pointsfor marriagesof first cousins. Neel, Schull, Yamamoto, Uchida, Yanese, &Fujiki, (1970) reported the results of a second study in Japan. They foundthat the IQ of Japanese children of consanguineous marriages was 2.5points lower than the IQ of children whose parents were not biologicallyrelated. These were adjusted meandifferences after statistically control-ling for social class differences between the groups. This difference wasnot statistically significant even though the sample waslarge (total N =1372). These studies illustrate two of the difficulties that surround re-search on this topic. The effects are small and difficult to detect, andindividuals who choose to marry their relatives may be different fromindividuals who chooseto marry individuals whoare genetically unrelat-ed to them.It is always possible to raise questions about the adequacy ofthe statistical controls for the socioeconomic differences between the twogroups.
Thereare studies reporting inbreeding depression effects wherethereislittle or no socioeconomic difference between the parents of the inbredand outbred children. For example, Agrawal, Sinha, & Jensen (1984; seealso Bashi, 1977) obtained a significant inbreeding depression effect onthe Raven test for a sample of Muslim children in India. There were nosignificant differences in socioeconomic status between the inbred andoutbred groups. This result may not be conclusive. In addition to dif-ferences in socioeconomic status these two groups maydiffer with re-spect to attitudes about marriage. In some societies cousin marriage istraditional. The choice of marriage partner may be indicative of one’sattitude to tradition and these attitudes may be related to intelligence.Even wherethere is no difference in the socioeconomicstatus of inbredand outbred children, the parents of these children may differ in other

158 5. BEHAVIOR GENETICS OF INTELLIGENCE
salient respects. The most convincing control for possible differencesbetween groups used in this research wouldbeintelligence test scores.Iam not aware of any studies that equated the intelligence test scores ofbiologically related and biologically unrelated parents in a study of in-breeding depression. Such a study would provide more convincingevi-dence of the phenomena than theexisting research. At the same timeexisting studies, though less than perfect, when considered collectivelydo exhibit a small but relatively consistent effect that is compatible withthe phenomenonof inbreeding depression. Perhaps it would be judiciousto conclude that the available data are compatible with the existence ofinbreeding depression while at the same timefailing to conclusively dem-onstrate that it exists.
DEVELOPMENTAL BEHAVIOR GENETICS
Behavior genetic analyses may also be applied to developmental data.Such analyses address issues of stability and changein IQ. Loehlin etal.(1989) analyzed data from the Texas Adoption Study using a behaviorgenetic analysis of the relationships obtained at the initial testing and atthe secondtesting 10 years later. Their parametric analysis indicated thatthere are significant genetic and between-family environmental influ-encesfor the initial assessment period. The estimates of these pathsare51 and .25, respectively. They tested the significance of a direct path frombetween-family environmental influences and genetic characteristics tothe second assessment.In effect, this tests for the effects of additionalenvironmental and genetic influences on intelligence that have not beenexpressed at the initial assessment. The path for genetic influences to thephenotypic score for intelligence at the second assessment is .45; thecorresponding estimated path value for the effects of the between-familyenvironment is —.]11—a value that is not significantly different fromzero.
Loehlin and colleagues indicated that this implies that genetic factorscontinue to influence the developmentof intelligence. They state,
A general conclusion from this analysis is that the popular view of geneticeffects as fixed at birth and environmentaleffects as changing has got matters
almost backward, at least for the trait of intelligence in this population duringthese developmental years. Shared family environmental effects occur early inchildhood and persist to a degree in the phenotype. But changes in geneticexpression continueat least into late adolescence or early adulthood. [Loehlin
et al., 1989, p. 1000]
DeFries, Plomin, & LaBuda (1987; see also Phillips & Fulker, 1989)analyzed longitudinal data from the Colorado Adoption Project assess-ments of children at ages 1, 2, 3, and 4. They also include data obtained by

DEVELOPMENTAL BEHAVIOR GENETICS 159
Wilson (1983) for a longitudinal twin study in which correlations forintelligence were obtained for a sample of MZ and DZ twins at the sameages. Their analysis focused on the relationship between childhood IQassessments and adult IQ. The relationship between the childhood IQ of
an adopted child and the IQ of that child’s biological parent is a functionof three parameters—the additive genetic variance of the childhood IQassessment, the additive genetic variance of the adult IQ, andthe longitu-dinal genetic correlation between the two IQ measures.In the absenceofselective placement, a correlation between an adopted child’s IQ and theIQ of the biological parent can only occur if each of the IQ measures has
nonzero heritability and if there is some longitudinal genetic continuitybetween the genetic influences at both ages. If both childhood IQ andadult IQ are influenced by independentgenetic characteristics, the cor-relation between the biological parent’s IQ and the adopted child’s IQ willbe zero.The correlations used in the DeFriesetal. (1987) analysis are presented
in Table 5.12. The correlations between biological and adopted parents
TABLE 5.12 Correlations Used for Longitudinal BehaviorGenetic Analysis2.>
Phenotypic correlation
Variable¢ Year | Year 2 Year 3 Year 4
Dm, PF 13 .10 12 13
Pw, Po 07 .20 16 21PE Po 10 17 09 .08Adoptive families (pooled)
PBM, PBE 28 28 35 37
PAM, PAF 28 .28 29 31PBmM, PAF —.01 —.03 —.03 .07
Pam, PAM 02 06 .07 14
Par, DAF —.13 —.08 —.07 .03
Par PAM .04 11 .10 .19
Pam, PAO .10 .07 18 24
Par, PAo .26 34 27 .48
Par Pao .09 .08 15 11
Pam, PAO 12 05 14 17Adult twins
Pri, Pr2 (identical) 86 86 86 86
Pri, Pr (fraternal) 62 62 62 62Child twins
Pt1, Pt2 (identical) .68 81 .88 .83
Pri, Pr2 (fraternal) .63 73 79 71
“Based on DeFries, Plomin, & LaBuda(1987).
>Adult and child twin correlations are from Loehlin and Nichols (1976) and Wilson
(1983).
©M, nonadoptive mother; F, nonadoptive father; O, nonadoptive child; BM, biological
mother; BF, biological father; AM, adoptive mother; AF, adoptive father; AO, adoptedchild; Tl, twins; T2, cotwin.

160 5. BEHAVIOR GENETICS OF INTELLIGENCE
1.0
0.7 -
0.6 =
z 50.5errett fottf
oOo fF He HeelUCUtmmCUCOUDm UCU CUD CUCU CUCU CUMoOo 2 ¢¢e:e88 82 82§ 8 8S & @& 8S
E € © & —& —€ E £€ 9§° 9» © © 09 ®O Ooom © MO wn wowTto oo FX FX FFF FD
-_ = NO FO +t YH O KR O© OD w2
FIGURE 5.2 MZ and DZcorrelations at different ages in a longitudinal study. MZ TrueScore r, @-&; MZ, [+42]; DZ, $4.
andthe intelligence scores of the adopted children indicate that IQ scoresat age 4 appear to exhibit stronger genetic influences than IQ scoresobtained at earlier ages. The twin data exhibit increased divergence be-tween MZ and DZ twins at age 4, and the adoption data indicate anemerging pattern of higher correlations between the IQ of biological par-ents and the IQ of the adopted child. The quantitative analyses provide amore precise estimate of several parameters. The heritability of IQ isfound to increase from age | to age 4. The genetic correlation betweenadult IQ and childhood IQ is estimated to increase from .42 at age 1 to .75at age 4. These analyses provide insight into the stability of IQ. Thephenotypic correlations between childhood IQ at ages 3 and 4 and adultIQ are approximately .4 and .5, respectively. The genetic contributionfrom childhood IQ to adult phenotypic IQ is estimated to be .18 and .28for ages 3 and 4, respectively. This implies that approximately half thephenotypic stability from childhood to adult IQ is mediated genetically.The developmental process investigated in the DeFries et al. (1987)
analysis is probably continuousfor later stages of development. Wilson’slongitudinal twin study used in the analysis obtained data for older twins.Figure 5.2 presents theresults of this study. Figure 5.2 indicates that MZ

DEVELOPMENTAL BEHAVIOR GENETICS 161
correlations approach the test-retest reliability for measures of intel-ligence. The MZ—DZ discrepancy increases over time. The discrepancydoes not appear to have reached an asymptoteat age 15. Estimates of theheritability of intelligence based on these data indicate increasingheritability with age and decreasing between-family environmentalinflu-ence with age. Heritability estimates for these data approach .7 at age 15(see also Fischbein, 1981). These data suggest that the longitudinal genet-ic correlation between IQ scores during development and adult IQ islikely to increase as the age of the child increases.This brief review of the developmental behavior genetics of IQ suggests
four conclusions. First, the heritability of IQ increases from infancy toadulthood. Second, between-family environmental influences declinewith age—indeedthey are hardly detectable over wide ranges of the en-vironment for adult samples. Third, phenotypic continuity in IQ is sub-stantially influenced by genetic continuity. Fourth, genetic influences onIQ not expressed at an earlier age may influence IQ at
a
laterage.The combination of developmental issues and behaviorgenetics is also
relevant to understanding the influence of an additional source of vari-ance on IQ—genetic—environmentalcorrelation. Genetic—environmen-tal correlations occur when genotypesare correlated with environments.It is reasonable to assumethat such correlations exist for intelligence.Parents whoare likely to provide their children with genetic charac-teristics that are favorable for the development of high IQ arelikely toprovide superior environmentsfor the developmentof IQ. This potentialsource of influence is neither genetic nor environmental, it is both. Scarr& McCartney (1983) proposed a developmental theory of genetic—en-vironmentalcorrelation. They distinguished amongthree kindsof genet-ic—environmental correlations—passive, reactive, and active. Passive in-fluences simply result from the correlation between the geneticcharacteristics of the child and the rearing conditions provided by thechild’s biological parent. Reactive influences result from environmentalresponses to individuals that are correlated with the child’s genotype.Such influences undoubtedly exist for intelligence. For example, a teachermay respond to the intellectual ability of a child and assign that childlearning materials that are assumed to be geared to an estimate of thechild’s intelligence that might contribute to the child’s intellectual devel-opment. Active influences, sometimes called niche building, refer to atendencyof individuals to select environments that may be compatiblewith their genotypes. A child with genes that are favorable for the devel-opment of high intelligence might chose to engage in intellectual ac-tivities that foster the developmentofintelligence. Scarr and McCartneyproposed that the relative importance of these three kinds of genetic—environmental influences changes over time. Passive influences declineand reactive and active influences increase with age.Although Scarr and McCartney’s theory appearsplausible,it is difficult

162 5. BEHAVIOR GENETICS OF INTELLIGENCE
to test. Loehlin & DeFries (1987) reported several analysesof the potential
role of genetic-environmental correlation for intelligence. A relatively
direct test for the presence of this componentof variancein IQ test scores
can be obtained by comparing the phenotypic variance of IQ scores for
adopted children and natural children. Genetic—environmental correla-
tion does not contribute to the variance of adopted children, but it does
contribute to the variance of scores of children reared by their biological
parents. A comparisonof variance differences for phenotypic IQ scoresof
adopted and natural children, holding constant other relevant influences,
should provide a direct estimate of the importance of passive genetic—
environmental correlation. Unfortunately, Loehlin and DeFries demon-
strated that such estimates are unlikely to be stable for the existinglitey-
ature due to the standard error of estimates of variance. Small differences
in variance estimates for adopted and natural children that could easily
occur for the samples that are currently available lead to quite discrepant
estimates of genetic—environmental correlation. Loehlin and DeFriesrec-
ommendtheuse of path estimates of parent-to-child IQ in adoptive and
natural families. There is no genetic—environmentalcorrelation, exclud-
ing the influenceof selective placement, in adopted families. Loehlin and
DeFries estimated the magnitude of genetic—environmental correlational
influences on IQ using data from several adoption studies and obtained
estimatesfor different parametric values of heritability and between-fam-
ily environmental influences. They estimate that this source of variance
accounts for 15% of the variance in the phenotype for IQ. If the phe-
notypic IQ measureis corrected for unreliability, the percentage of vari-
ance in true score phenotype for IQ for genetic-environmental correla-
tion increases to 20%. Plomin (1987) indicated that there is some
evidence of a decline in the magnitudeof the influence of this component
for studies with older samples.Thereis little formal evidence for the influence of reactive and active
genetic—environmental correlations on intelligence. Plomin (1987; see
also Plomin & DefFries, 1985b; Plomin, DeFries, & Fulker, 1988) reported
one test for reactive genetic-environmental correlational influences on
intelligence. In the Colorado Adoption Project, observations of the home
environmentare made, including the use of a homeinventory scale (Cald-
well & Bradley, 1978) that is assumed to measure characteristics of the
environmentthat influence the developmentof intelligence. The correla-
tion between the biological mother’s IQ and scores on the homeinvento-
ry provides a test for the presence of reactive genetic—-environmental
correlation. Plomin reported correlations between the biological mother’s
IQ and the homeinventory score for the adopted family of that mother’s
child of —.06, —.02, .12, and .10 for measuresof the home inventory taken
when the child was 1, 2, 3, and 4 years old, respectively. These data
provide some support for Scarr and McCartney’s theory. There is evidence

DEVELOPMENTAL BEHAVIOR GENETICS 163
of a slight increase in reactive genetic—environmental correlation for IQas the child becomesolder. It should be recognized that this evidenceismore in the nature of a demonstration than a definitive attempt to studyreactive genetic—environmental correlational influences on the develop-mentof intelligence. There are obviously many ways in which the en-vironment may be differentially responsive to individual differencesamong individuals with different genotypes.
Intelligence may be influenced by genotype x environmentinterac-tions as well as the correlation between these components.Interactioneffects refer to the nonadditive influences of genes and environments.It istheoretically possible that there are nonadditive combinations of gen-otypic and environmental influence such that the combinedeffects ofcertain combinationsof genes and environmentsare not predictable fromknowledgeof their general effects. Perhaps individuals with genesthat areunusually favorable for the developmentof IQ experience exceptionallyrapid intellectual growth if they are placed in environmentsthat are ex-tremely favorable for the developmentof IQ. Or, more dramatically, per-haps certain genotypes might predispose individuals to develop high IQ inone environment and low IQ in a different environment. While al] ofthese effects are theoretically plausible, little or no evidence exists for aninfluence of genotype X environmentinteraction on IQ phenotypes. Oneway of testing for the presence of such interactions is to use adoptiondesigns. One can use characteristics of the biological parents as surro-gates for genotypic characteristics of the child. Measures of the charac-teristics of the adoptive home may beused as an index of the environ-ment. The IQ of the adopted child maybe studied as an outcomevariablein this design to index the presence of potential interactions betweengenes and the environment. The data presented in Table 5.8 derived fromthe Capron and Duymestudyprovidea clear test of genetic-environmen-tal influence on IQ test scores. These data indicate that the charac-teristics of the biological parent and the characteristics of the adoptiveparents each provide an independentandadditive influence on the IQ ofthe adopted child. There is no evidence of the presence of an interactioneffect. Plomin & DeFries (1985; Plominet al., 1988) reported similartestsusing data from the Colorado Adoption Projectfor ages 1, 2, 3, and 4. Theyperformed a numberof analyses searchingfor interactions between the IQof the biological mothers of the adoptees and characteristics of the adop-tive family onthe child’s IQ.Virtually all of these analyses indicated thatthere were no significant genotype X environmentinteractionsfor the IQphenotype during early childhood. It is possible that the right environ-mental measures have not been usedin this research. But the mostrea-sonable conclusion, albeit a tentative conclusion, is that genotype x en-vironment interactions are not an important sourceof influence on thedevelopmentof IQ.

164 5. BEHAVIOR GENETICS OF INTELLIGENCE
SPECIAL ABILITIES
It is possible to use behavior genetic methodsto analyze specific abilities.
Since there is a substantial amount of g variance in most measuresof
intelligence, it is apparent that a behavior genetic analysis of a specific
ability measure should resembletheresults of a behavior genetic analysis
of general intelligence. It is also the case that the g loadings of specific
ability measures vary and that the variance in any measure that is inde-
pendentof g variance may be determined by genetic and environmental
influences that are quite different from those that determine generalin-
telligence or the g componentof variance on the measure.
Plomin (1986, 1988) see also Vandenberg & Vogler, 1985) reviewed stud-
ies of the behavior genetics of specific abilities. He concluded that
heritabilities were higher for verbal and spatial tests than they were for
perceptual speed tests. Memory tests had the lowest heritabilities. Con-
tradictory data exist. Plomin cited a study by Partanen, Bruun, & Mark-
kanen (1966} of a large sample of Finnish adult twins. They found com-
parable heritabilities for tests of verbal ability, spatial ability, perceptual
speed, and memory. Similarly, the data reported in Table 5.2 obtained by
Bouchard and McGuefrom separated aduit twins in the Minnesota twin
study indicate relatively little difference in heritability for a perceptual
speed factor and verbal and spatial ability factors. Most of the research
reviewed by Plomin that supports the assumption of differential
heritability for these factors is based on younger samples. Perhaps differ-
ential heritability for different ability factors is less likely to occur among
adult samples.Plomin also indicated that studies of the heritability of general factors
may overlook important sources of variance ontests that are grouped as
common indices of a specific factor such as spatial ability. The Hawaii
Family Study of Cognition (DeFries et al., 1979) provides relevant data.
These authors obtained correlations between parent and offspring of dif-
ferent ethnic groups andsibling correlations for specific measures of abil-
ity. These data do not permit oneto partition the phenotypic variance on
any of these measures into genetic and environmental sources of vari-
ance. The parent—offspring and sibling correlations that they report pro-
vide upper-boundestimatesfor the influenceof additive genetic variance
and between-family environmental influences on these measures. The
familiality correlations for different spatial ability measures were not
equivalent. The parent—offspring and sibling correlations for one of their
spatial ability measures, the Elithorn mazes, was .14 or less in different
ethnic groups. The comparablecorrelations for other specific ability mea-
sures were higher. Thus additive genetic and or between-family environ-
mental variance must be lower on the Elithorn maze measure than on
other measures ofspatialability. It is apparentthatit is possible to study
the behavior genetics of factors and measures that differ in specificity.

SPECIAL ABILITIES 165
Just as it is possible to define a hierarchical structure of ability measuresthat contains g at its apex and specific tests or even componentsoftestperformanceat the lowerlevels of the hierarchy,it is possible to study thebehavior genetics of measures, components, or factors at any level ofgenerality in the hierarchy.
It is possible to perform behavior genetic analyses of the relationshipbetween specific measures. Such analyses indicate whetheror notrela-tionships between measuresare attributable to genetic or environmentalinfluence. Wilson (1986; see also Segal, 1985) reported greater profilesimilarity for MZ twin pairs than for DZ twin pairs on the Wechslertestsof intelligence. These data suggest that there are genetic influences onthe patterning of scores on intelligence tests. LaBuda, DeFries, & Fulker(1987) analyzed the relationship between subscale scores on the WISC ina sample of twins. Factor analyses of the Wechsler tests usually report athree-factor solution (see Cohen, 1952, 1969; Kaufman, 1975). The factorsare defined as Verbal Comprehension, Perceptual Organization, and Free-dom from Distractibility. The Vocabulary, Block Design, and Digit Spantests are the best markers for these factors. LaBuda et al. analyzed therelationship among thesetests. They found that genetic variables tendedto determine the underlying factor structure of the tests. Both the be-tween- and the within-family environmental influences were compatiblewith the assumption that there was a single commonfactorthat influ-enced scores onall of the factors. The distinctive pattern of scores wasprimarily determined by genetic influences.Ho, Baker, & Decker (1988) studied the relationship between measures
of the speed of processing information and Wechsler test performanceinasample of 30 MZ and 30 DZ twin pairs. They usedtests of rapid namingand the Colorado Speedtests. The rapid namingtests required subjects tonamefamiliar objects, colors, numbers, and letters. The Colorado Speedtest presents subjects with a four-letter nonsense syllable and requiresindividuals to identify which of several letter groups is identical to thetarget stimulus. Their analyses indicated that the information-processingmeasures were heritable. They also found that the covariance betweenthese measuresand IQ wasinfluenced by genetic characteristics. For theirtwo information-processing measures (rapid automatic naming and theColorado Speed test) they estimated that the genetic covariance betweenthe measures accountedfor 70 and 57% of the variance in the phenotypiccorrelations between these two measures and IQ. The remaining phe-notypic variance was influenced by within-family environmental vari-ance. These analyses imply that the genetic characteristics that deter-mine performance on the tests of speed of information processing areidentical to those that determine performanceontests of general intel-ligence.
Baker, Vernon, & Ho(In press) performed a genetic covariance analysisof the relationship between general intelligence and performance on the

166 5. BEHAVIOR GENETICS OF INTELLIGENCE
battery of information-processing tasks used by Vernon (1983) in his
study of the relationship between speed of information processing and
intelligence, reviewed in Chapter 4 of this book. They obtained a
heritability estimate of .44 for a general measure of speed of information
processing. They obtained correlations between a general index of speed
of reaction time and verbal and performanceIQ of —.60 and —.60, respec-
tively, for MZ twin pairs. The comparable correlations for DZ twin pairs
were —.36 and —.25. The genetic covariance analysis indicated thatvir-
tually all of the correlation between the measuresof speed of information
processing and intelligence were attributable to correlated genetic influ-
ences.
The analyses reported by Hoetal. and Bakeret al. provide a tentative
answerto one of the major issues in contemporary discussionsof intel-
ligence. Why is there a relationship between performance on informa-
tion-processing tasks and scores on tests of intelligence? There is evi-
dence that performance on information-processing tasks is heritable.
Recall that Bouchard and McGuefound that intercept parameters of in-
formation processing were heritable. Vernon (1989) reported higher MZ
than DZ twin correlations for the battery of tests he usedin his studies of
the relationship between indices of speed and variability of processing
information and IQ (see Chapter4). Although these data imply that per-
formance on information-processing tasks and performance on tests of
intelligence appear to be influenced by genotypes, they do nottell us
anything about the covariance or relationship between these measures.
The genetic covariance studies, by contrast, suggest that information-
processing tasks and IQ maybeinfluenced by the samegenes. There-
maining phenotypic variance is attributable to within-family environ-
mentalfactors that tend to individuate twins reared in the same family.It
is tempting to extrapolate these findings. Perhaps the information-pro-
cessing skills tapped by these measuresare primitive and are presentprior
to the emergence of the complex skills assessed by tests of intelligence.
These data may be viewed as adding support to the analysis of the rela-
tionship between elementary information-processing skills and perfor-
manceontests of intelligence advocated by those theorists who are com-
mitted to a monarchial, bottom-up, reductive theory of intelligence. At
the same timeit should be realized that such a conclusiononthebasis of
these data is extremely premature. These studies leave the causal direc-
tion of the influence between information processing and intelligence
ambiguous. Strictly speaking, these data are compatible with a model
that assumesthat genes influence the development of complex intellec-
tual skills and that complex intellectual skills influence the development
of information-processing skills. Speed of information processing may be
a “slave process” that is not causally related to intelligence but is the
consequence of the developmentofintellectual skills and henceis influ-
enced by the same genes. I am not suggesting that this is correct. A

CONCLUSION 167
combination of longitudinal research and analyses of the behavior genet-ics of the covariance between information-processing abilities and intel-ligence should resolve these questions.
CONCLUSION
In 1974 Kamin wrote a book suggesting that there waslittle or no evi-dence that intelligence wasa heritable trait. I believe that he was able tomaintain this position by a distorted and convoluted approach to theliterature. It is inconceivable to me that any responsible scholar couldwrite a book taking this position in 1990. In several respects our under-standing of the behavior genetics of intelligence has been significantlyenhancedin the last 15 years. We have new data on separated twins, largenew data sets on twinsreared together, better adoption studies, the emer-gence of developmental behavior genetics and longitudinal data sets per-mitting an investigation of developmental changes in genetic and en-vironmental influences onintelligence, and the development of new andsophisticated methodsof analysis of behavior genetic data. These devel-opments provide deeper insights into the ways in which genes and theenvironmentinfluence intelligence. They are, in addition, relevant to anunderstanding of general issues in thefield of intelligence. It is hard forme to imagine how one can write a general thesis on intelligence thatomits a discussion of the results of behavior genetic analyses of intel-ligence. Ourability to address manyof the central issues in contemporarydiscussionsof intelligence is enhanced by a knowledge of theresults ofbehavior genetic research.

6ENVIRONMENTALDETERMINANTS OFINTELLIGENCE
How does the environmentinfluence the developmentof intelligence? In
this chapter we shall consider a variety of research topics designed to
provide information about the nature of environmental influences on
intelligence. The material to be presented in this chapteris inextricably
linked to the concepts presented in Chapter 5. Behavior genetic analyses
provide a frameworkfor understanding the role of the environment.
BETWEEN-FAMILY ENVIRONMENTAL EFFECTS
Consider a simple scenario. Children reared in different familiesare treat-
ed differently by their parents. These differences cause children to devel-
op different intellectual skills. There are many studies in the literature
that report correlations between parental socialization practices and indi-
vidual differences in intelligence. These studies may not provide useful
information about environmental influences on intelligence. We canil-
lustrate the difficulties involved in studying between-family environmen-
tal influences on the developmentofintelligence by considering research
using the Caldwell Home Inventory (Bradley & Caldwell, 1976, 1980;
Caldwell & Bradley, 1978).The HomeInventory is an instrument that is designed to assess the
characteristics of a child’s home environment. The inventory was de-
signed to assess those characteristics of a child’s environment that were
assumedto influence the developmentof intelligence. Table 6.1 presents
the items rated by a trained observer that constitute the infant version of
the measure. Scores on the HomeInventory are positively correlated with
childhood assessmentsof intelligence. Gottfried (1984) summarized sev-
eral large-scale longitudinal studies of intellectual development that used
this instrument. He calculated an average correlation of .30 between
HomeInventory scores obtained at age 1 and childhood IQ scores ob-
tained at ages 1, 2, 3, and between 3.5 and 5. The meancorrelation for
168

BETWEEN-FAMILY ENVIRONMENTALEFFECTS 169
TABLE 6.1 Infant Version of the HomeInventory
I. Emotional and verbal responsivity of mother?
IT.
Il.
1.
2.
3.
n>
m©
OO
OO~
]]
Mother spontaneously vocalizes to child at least twice during visit (excludingscolding).
Motherrespondsto child’s vocalization with a verbal response
Mothertells child the name of some object during visit or says the nameofperson or object in a “teaching”style.
. Mother’s speech is distinct, clear, and audible.
. Motherinitiates verbal interchanges with observer—asks questions, makesspontaneous comments.
. Mother expresses ideas freely and easily and uses statements of appropriatelength for conversation (e.g., gives more than brief answers).
. Mother permits child occassionally to engage in “messy” types of play.
. Mother spontaneously praises child’s qualities or behavior twice during visit.
. Whenspeakingof or to child, mother’s voice conveys positive feeling.. Mothercaresses or kisses child at least once duringvisit.. Mother shows somepositive emotional reponsesto praise a child offered byVisitor.
Avoidanceof restriction and punishment12.
13.14.15.
16.
17.
18.
19.
Motherdoes not shout at the child duringvisit.
Mother does not express overt annoyance with or hostility toward child.Mother neither slaps nor spankschild duringvisit.
Motherreports that no more than oneinstance of physical punishment occurredduring the past week.
Motherdoes notscold or derogate child duringvisit.
Motherdoes not interfere with child’s actions or restrict child’s movements morethan three times duringvisit.
At least 10 books are present andvisible.Family has a pet.
Organization of physical and temporal environment20.21.
22.
23.
24.
25.
. Provision of appropriate play materials26.27.28.
29.30.
31.
32.
33.
34.
. Maternal involvement with child
35.
When motheris away, care is provided by one of three regular substitutes.Someonetakes child into grocery store at least once a week.Child gets out of house at least four times a week.
Child is taken regularly to doctor’s office orclinic.
Child has a special place in which to keep toys and “treasures.”Child’s play environmentappears safe and free of hazards.
Child has some muscle-activity toys or equipment.Child has pushorpull toy.
Child has stroller or walker, kiddie car, scooter, or tricycle.
Motherprovidestoys or interesting activities for child during interview.
Provides learning equipment appropriate to age-cuddly toy or role-playing toys.
Provides learning equipmentappropriate to age mobility, table and chairs, highchair, playpen.
Provides eye—handcoordination toys—itemsto go in and outof receptacle,fit-together toys, beads.
Provides eye—handcoordination toys that permit combinations—stacking ornesting toys, blocks, or building toys.
Provides toys for literature or music.
Mothertends to keep child within visual range and to look at him often.
(continued)

170 6. ENVIRONMENTAL DETERMINANTSOF INTELLIGENCE
TABLE 6.1 (Continued)
36. Mother “talks” to child while doing her work.
37. Mother consciously encourages developmental advances.
38. Motherinvests “maturing” toys with value via her attention.
39. Motherstructures child’s play periods.40. Motherprovidestoys that challenge child to develop new skills.
VI. Opportunities for variety in daily stimulation41. Father> provides some caretaking every day.
42. Mother readsstories at least three times weekly.
43. Child eats at least one meal per day with motherandfather.
44. Family visits or receives visits from relatives.45. Child has three or more booksof his or her own.
“Based on Bradley & Caldwell (1984).bThe term “mother”is used to refer to the primary caregiver, regardless of gender. The term “father”is
used to a second caregiver, living in the child’s home, generally assumedto be of the opposite gender to
the primary caregiver.
assessments at the oldest age was .38. Do these data permit us to inferthat variations in the environment assessed by means of the HomeIn-ventory are causally related to intellectual development?The inference from correlation to causation maybedifficult. Items on
the HomeInventory maybe influencedby differences in the genotypesofchildren. Items 8, 9, and 10 assess the emotional responsesof the motherto the child. Genotypes may influence temperament and children withdifferent temperaments may elicit different emotional reactions frommothers. Thus the mother’s treatment of the child may be shaped bycharacteristics of the child. The direction of influence is ambiguous.Items 36 and 42 are designed to measure the provision of intellectualstimulation in the home. Children may, for genetic reasons, be differen-tially responsive to intellectual activities. Being read to is an activity thatmay not be equally enjoyable for all children. Children who enjoy beingread to may ask questionsof caretakers whoread to them and rewardthecaretaker for engaging in this activity. Thus the frequency of occurrenceof these activities in the home may, in part, be attributable to the influ-ence of the child on the parent. The mere fact that an instrumentislabeled as a measure of the environmentandassesses variations in theenvironment does not necessarily imply that the measure is not influ-enced by genetic characteristics. It is theoretically possible to study theheritability of items on the Home Inventory. One could, for example,obtain separate HomeInventory observations for MZ and DZ twin pairsand obtain heritability indices for Home Inventory items using thesedata. I am not aware of research of this type. The assertion that HomeInventory scores may, in part, reflect the influence of genetic charac-teristics of the child on the home environmentpresented to the childremains a theoretical possibility rather than a firmly established em-pirical assertion.

BETWEEN-FAMILY ENVIRONMENTALEFFECTS 171
Environmental indices may be influenced by the genetic characteristicsof the caregiver. Home Inventory scores maybepositively correlated withthe intelligence of parents. Parents whodiffer in intelligence may providetheir children with different genotypes for the development of intel-ligence and these genetic influences may accountfor the correlation be-tween HomeInventory scores and the intellectual performance of chil-dren. Gottfried & Gottfried (1984) obtained IQ scores for mothers andtheir children as well as Home Inventory scores. They found that thecorrelation between mother’s IQ and the IQ of her child at age 42 monthswas .22. The multiple correlation between the IQ of the mother and theHomeInventory score and the IQ of the child was .49. The addition ofHomeInventory scores to a prediction equation for IQ of a child addedsignificantly to the ability to predict childhood IQ after the influenceofmother’s IQ was considered. Reversing the order of entry of variables ledto different results. The correlation of HomeInventory scores and child-hood IQ was .48. The addition of mother’s IQ to the prediction equation
did not addsignificantly to the ability to predict a child’s IQ. Otherstudies summarized by Gottfried (1984) used other characteristics of par-ents in prediction equations combined with Home Inventory scores.
These studies usually find that the prediction of childhood IQ is en-hanced whenscores on the HomeInventory are included in the predic-tion equation after controlling for parental characteristics such as so-cioeconomic status and education. Theseresults indicate that the HomeInventory measures characteristics of the home environment that areindependentof the intelligence of the parents. And, these results suggestthat childhood intellectual performanceis influenced by characteristicsof the home environmentprovidedto the child that are independentofthe genetic characteristics of the parents. Note that these results do notrule out the possibility that genetic characteristics of the child, indepen-dent of the genetic characteristics of the parent, influence the nature ofthe environmentprovided to the child.
Theresults of the Gottfried and Gottfried study may be contrasted withthe results of a study reported by Longstreth, Davis, Carter, Flint, Owen,Rickert, & Taylor (1981). They used an inventory developed by Wolf (1965)to assess the intellectual stimulation of the home environmentof a sam-ple of 12 year olds. They also obtained IQ data for mothers and children intheir sample. They found that mother’s IQ predicted child’s IQ control-ling for differences in their measure of the home environment. Thepatr-tial correlation between mother’s IQ (averaged over two measures, théRaven and the Peabody) and the child’s IQ was .33. The comparable par-tial correlation between the home environmentindex andthechild’s IQcontrolling for mother’s IQ was a nonsignificant .18. Longstreth et al.found, in contradistinction to Gottfried and Gottfried, that the rela-tionship between the home environmentandthe IQ of children is sub-stantially mediated by the mother’s IQ. This latter finding is compatible

172 6. ENVIRONMENTAL DETERMINANTSOF INTELLIGENCE
with a genetic interpretation of the relationship. The differences in theoutcomesof these studies may be attributable to differences in the en-vironmental measures that were used. In my judgment, a moreplausibleinterpretation is to be found in variations in the ages of the samples thatwere studied. Longstreth et al. studied older children. Our discussion oflongitudinal behavior genetic studies provides evidence for a declininginfluence of between-family environmentalinfluences on intelligence asa monotonic function of the age of the child. The children studied byGottfried and Gottfried had not entered school. The principal intellectualsocialization agent of the youngchild is the parent (or the nursery schoolfor children who spend several hours a day in that setting). For olderchildren, the school tends to displace the parent as the principal intellec-tual socialization agent of the child. Therefore, it is reasonable to expect adeclining influence of the home environmenton theintellectual develop-ment of the child. That is precisely what is found in developmental be-havior genetic analyses and is compatible with the combinedresults of
the Longstreth et al. and Gottfried and Gottfried studies.The correlation between measures of the home environmentand child-
hood IQ may be influenced by the genetic covariance of children andparents in natural families. Children and parents share genes and anenvironment and their shared genetic resemblance may influence theimpact of the environmenton the child. This notion may be tested bycomparing the correlations between measures of the environment andcharacteristics of offspring in natural and adopted families. Individualswhoare reared in adoptive families do not share genetic characteristicswith their adoptive parents. If the correlation between an environmentalmeasure and the characteristic of a child is lower in an adoptive than in anatural family, it is possible to infer that the correlation between theenvironmental measure and the characteristics of the child is mediatedby the genetic similarity between the child and the parent. This analysisprovides for the possibility of genetic mediation of environmentalinflu-ences. Plomin et al. (1988) obtained correlations between the HomeIn-ventory scores and childhood IQ at ages 1, 2, 3, and 4 in natural andadopted families in the Colorado Adoption Project. Table 6.2 presents
TABLE 6.2 Home-IQ Correlations for Adoptive
and Nonadoptive Siblings at Different Ages
Age Nonadoptive correlation Adoptive correlation
1 10 ll
2 38 .09
3 14 .284 10 15
4Based on Plomin, DeFries, & Fulker (1988).

BETWEEN-FAMILY ENVIRONMENTALEFFECTS 173
these data. The data in Table 6.2 provide evidence for possible geneticmediation of the relationship between home environment scores andchildhood IQ. At age 2 there is a moderately strong relationship betweenthe HomeInventory score and childhood IQ andthis relationship is clear-ly stronger in natural than in adoptive families. At ages 3 and 4, therelationship between HomeInventory scores and childhood IQ is tooweak to find evidenceof either genetic or environmental mediation of therelationship. These results suggest that the relationships between HomeInventory scores and childhood IQ maybepartially mediated by theinflu-ence of the genetic relationship between parents and children. This pat-tern of genetic mediation of environmental measuresis characteristic of anumberof other findings in the Colorado Adoption Project, includingfindings not germane to cognitive development. That is, wherecorrela-tions exist between measures of the environment and characteristics ofchildren, they are likely to be strongerin the control natural families thanin adoptive families (see Plomin, & DeFries, 1985).
It should be apparentthatit is difficult to infer causal influences fromcorrelations between measuresof the home environmentandintellectualdevelopment. One way to dissolve the causal ambiguity surroundingthese relationships is to treat them as a basis for experimental researchthat will provide a more definitive test of a causal relationship. A goodexample of this strategy is found in a study reported by Busse, Ree,Gutride, Alexander, & Powell (1972). They studied the provision of ade-quate play materials as a factor in intellectual development. They ran-domly assigned a group of black 4-year-old children to one of two class-roomsthat differed with respect to the adequacy of play materials thatwere available for the children. There were no significant improvementsassociated with a l-year exposure to the enriched classroom environ-ment. The results of this study lead to a general methodological caveatwith respect to studies of the influence of the home environment onintelligence. The observation of a correlation between a measure of thehome environmentandthe IQ of a child does not imply that manipula-tions of that environmental variable will invariably lead to changesin theintelligence of children.This discussion of between-family environmental influences on intel-
ligence has been cautiousand even skeptical. I have been led to this senseof caution by the results of the recent behavior genetic studies employingolder samples. It appears to be the case that reasonably wide ranges ofbetween-family environmental variations encountered by children inwestern societies have a vanishingly small influence on postadolescentintelligence. It may very well be the case that variations in parentingstyles and the adequacy of the home environment have importantinflu-ences on theearly intellectual developmentof children. These influencesmay fade and be of diminishing importance for mature intellectualdevelopment.

174 6. ENVIRONMENTAL DETERMINANTSOF INTELLIGENCE
INTERVENTIONS TO INCREASE INTELLIGENCE
Preschool Interventions
Is it possible to increase intelligence by changing the early intellectualenvironmentof the child? Research on this topic was influenced by thedevelopment of Project Headstart, which was an attempt to provide anenriched environment for preschool-aged children whose impoverishedbackground was assumedto place them at risk for inadequate intellectualdevelopment. It was assumedthat the provision of superior early child-hood education for these children would increase their intelligence andincrease their ability to cope with the educational program of the publicschools. Caruso, Taylor, & Detterman (1982; see also Clarke & Clarke,1976; Zigler & Valentine, 1979) found 65 studies of the impact of Head-start interventions on intellectual development. These studies employedinterventions of different durations from short term to up to 2 years induration. Most used control groups. The children were invariably pre-schoolers. Perhaps the best summary of the outcomesof these studieswas published by a consortium formedfor the amalgamation of this bodyof research (Consortium for Longitudinal Studies, 1983). The Consortiumincluded 14 investigators whose initial samples included 100 or moresubjects who were engaged in a longitudinal investigation of theeffectsofearly educational interventions. The samples included in these studieswere predominantly black preschoolers with a median IQ of 92 at thetime of entry into the program and mothers with a median numberofyears of education of 10.4. They were predominantly of lower so-
cioeconomicstatus. The results of these studies as summarized by Royce,Darlington, & Murray (1983) are reasonably consistent. Seven studiesused IQ as a dependentvariable. They obtained a clear increase in IQ as aresult of participation in Headstart. The median IQ benefit at the conclu-
sion of these projects was 7.42 points. Three or four years after the con-
clusion of these projects the median difference between the experimentaland the control group declined to 3.04 points. The last reported assess-ment includes Wechsler test scores for program participants aged 10 to17. These assessments occurred 7 to 10 years after the conclusion of the
educational intervention. Pooled over a subset of these investigations
there were no significant differences between experimental and control
groups. Although program children started first grade with an average IQthat was 5.80 points higher than the control group children, these dif-
ferences were not maintained. Other reviewsof early intervention studies
based on Headstart reached the same conclusion as the Consortium for
Longitudinal Studies. There are no enduring changesin intelligencetest
scores associated with participation in this program (see Detterman and
Sternberg, 1982, and Spitz, 1986, for a discussion of attempts to increaseintelligence). The failure of attempts to increase intelligence by early

INTERVENTIONS TO INCREASE INTELLIGENCE 175
childhood interventions maybe attributable to the relatively brief dura-tions of these programs.It is possible that interventions that continuedinto the first few years of schooling would lead to more enduring changesin performance on intelligence tests. Project Follow Through was de-signed to extend Headstart interventionsin order to obtain more enduringchanges. The interventions were based on quite different interventionmodels. A comprehensive evaluation of the Follow Through Programscompared 22 different intervention models (Bock, Stebbins, & Proper,1977). Spitz (1986) evaluated the obtained changes on the only test ofintelligence used in these studies—the Raven. For 107 comparisonsthatwere available where the children assigned to Follow Through Programswere comparable to their untreated controls, he found 5 significantdif-ferences in favor of groups assigned to the intervention, 1] significantdifferences in favor of groups not provided with the intervention, and 91comparisons in which there were nosignificant differences. Variationsbetween different treatment models were smaller than variations withintreatment models implemented at more than onesetting, suggesting thatthe theories that governed the intervention model did not determinetheeffectiveness of the model. These data indicate that interventions ex-tended into the first year or two of elementary school will not lead toenduring changesin intelligence test performance.The Abecedarian Project provided intensive university-based day-care
interventionsfor a group of children assumedto be at highrisk for inade-quate intellectual development (see Ramey, Holmberg, Sparling, & Col-lier, 1977, for a description of the project). The intervention began beforethe children were 3 monthsold. The children participated in the programuntil school entry. Over 90% of the mothers who participated in theprogram were black, and most were young, without a high school educa-tion, and single. Children were randomly assigned to either a treatmentor a control group. Ramey, Lee, & Burchinal (1990; Ramey & Haskins,1981) reported the results of a series of IQ tests administered at 6-monthintervals to the children in the experimental and control groups. Thelargest difference between the experimental and control groups was ob-tained on the 36-month Stanford—Binet test—14.7 IQ points. On the lasttest result reported, when the children were 54 monthsold, the childrenin the experimental group had IQsthat were 8.7 points higher than chil-dren in the control group on the McCarthy test. The mean IQ of thechildren in the experimental group was 101.4. Campbell & Ramey( 1990)reported in a paper dealing with performance on Piagetiantests that per-formance on the WISC IQtest given whenthesechildren were 96 monthsof age indicated that the children in the experimental group had a meanIQ that was .34 standard deviations higher than that of children in thecontrol group. This implies that the children in the experimental grouphad IQs that were 5 points higher than those of children in the controlgroup, indicating some additional erosion in the effects of the interven-

176 6. ENVIRONMENTAL DETERMINANTSOF INTELLIGENCE
tion on IQ. Theseresults establish that the Abecedarian intervention ledto a significant increasein the IQ of children.It is not at all clear that thiseffect is of enduring significance.IQ data for older children have not beenreported. The magnitudeof the effect that was obtained is comparable tothat typically reported with the less intensive interventions associatedwith Headstart programs.Since the change associated with this interven-tion is no larger than that typically obtained using the less intensiveinterventions characteristic of Headstart programs,it is possible that thelong-term effects of this intervention will be no different than the lastingeffects of Headstart.The Milwaukee Project provided an intensive preschool educational
intervention to a group of black children living in a publically assistedhousing project whose mothers had IQs below 75. A total of 40 childrenparticipated in the project, 20 in the experimental group and 20 in thecontrol group (Heber & Garber, 1972, 1975). Five children left the projectleaving a sample of 35 children. Children in the experimental group wereexposed to intensive psychological interventions designed to increasein-telligence prior to the age of 6 months. The intervention included exten-sive homevisits to train mothers in child care andthe provision of inten-sive day care with extensive intellectual stimulation for several hours a
day in an infant-stimulation center. The experimental intervention ended
at age 6. In addition to the provision of preschool intellectual stimula-
tion, special efforts were madeto place the experimental subjects in pub-lic schools whose students scored at or above the norm of academicachievement. The children in the experimental and control groups wererepeatedly given IQ tests including the Stanford-Binet and Wechslertests.Follow-up tests were given at ages 7, 8, 9, 10, and 14.
It was difficult to interpret the results of the Milwaukee Project formany years. The project was funded from 1966 to 1981, but technical
details of the project were not available in the scientific literature. Con-
troversy surroundedtheproject in part because oneof the principal inves-
tigators was convictedof fraud in connection with the administration of
funds in anotherproject (see Sommer & Sommer, 1983). Fortunately, the
long awaited complete technical report of the outcomeof the project was
published in 1988 providing the necessary data for an evaluation of the
project’s outcome (Garber, 1988). At the conclusion of the project, there
were large IQ differences between the control and experimental subjects
on the Stanford-Binet. At age 6, the experimental group had a meanIQ of
119 and the control group had a mean IQ of 87. The experimental group’s
IQ was 2.92, standard deviation units higher than the control group’s IQ.
However, the IQ differences between the experimental and control group
declined over time. The difference in favor of the experimental group was
22. points at age 7, and 10 points at age 14. The meanIQ of the experimen-
tal group was 101 at age 14, and the meanIQ of the control group was91,a difference of .87 standard deviation units.
INTERVENTIONS TO INCREASE INTELLIGENCE 177
There are two aspectsof these data that are noteworthy. First, the mean
IQs of both the experimental and control groupsare relatively high forindividuals whose mothers had a mean IQ of 67. Jensen (1989) attributedthis relatively high IQ to the effects of repeated testing and familiariza-tion with the test contents. In this connection it should be noted that theproject participants were tested 13 times with Binet tests and 9 timeswith various versions of the Wechsler tests. Second, the experimentalgroup had significantly higher IQ than the control group 8 yearsafterthe completion of the project. Note that the effect of the experimentaltreatment in this project seems to be both more enduring and larger inmagnitude than those obtained in the Abercedarian project. Jensen (1989)suggested that the experimental intervention may not have resulted inlarge scale changesin intelligence despite the evidence of changes in IQtest scores. He argued that the intervention may haveincludedintensivetraining on items that were similar to those appearing on the IQtests.This training may have decreased the construct validity of the tests as ameasure of g. Jensen’s interpretation of these data is supported by theperformance of experimental and control children on tests of scholasticachievement. On the Metropolitan Test of Achievement, the experimen-tal group declined from the 49th to the 19th percentile from thefirst tothe fourth grade. The comparable scores for the control group declinedfrom the 32nd to the 9th percentile. In math, the experimental groupdeclined from the 34nd to the 11th percentile from first to fourth grade.The comparable percentiles for the control group were the 18th and 9thfor the first and fourth grade, respectively. It is clear that differencesbetween the control group and the experimental group in academic per-formance were not as large as differences in IQ. These results supportJensen’s suggestion that the experimentalintervention did not result inlarge changes in intellectual ability. Normally, differences between twogroups in IQ arereflected in differences of comparable magnitude in in-dices of academic achievement(see chapter 9 of this volume). The discrep-ancy between the academic achievementof the children in the experi-mental group and their IQ is compatible with the view that the IQ scoresof these children have beenartificially inflated. An alternative interpreta-tion of these data is that the academic performance of the children in theexperimental group was depressed by environmental influences orthe quality of the schools they attend. There is some uncertainty aboutthe outcome of the Milwaukee Project. The experimental effects of theintervention appearto be decreasing.It is possible that further declines inthe difference in the IQs of the experimental and control groups wouldoccur if they were tested when they wereolder. Also, the true magnitudeof the changesin intelligence that were obtained as a result of the inter-vention remains uncertain. Theuseof additional tests, including tests offluid ability that were not similar in format to the specific training experi-ences of children in the experimental group, would provide information

178 6. ENVIRONMENTAL DETERMINANTS OF INTELLIGENCE
about the scope of changesin general intelligence. In any case, changes inscores on an IQ test that are not accompanied by comparable changes inacademic performance are of questionable value.There is no credible evidence that experimental interventions during
the preschool years will create enduring changes in performanceontestsof intelligence. There are two different interpretations of this generaliza-tion. Children in the various experimental groups in these studies in-creased their intelligence but these gains could not be maintained with-out totally changing the postexperimental environment to which thesechildren were exposed. Presumably the changesthat are required includethose associated with the family, the school, and the neighborhood.Alter-natively, it is possible to argue that the changes that were obtained inthese interventions were superficial and did not represent true changesinintelligence. There are two investigations that may be interpreted asproviding evidence for the latter interpretation of the findings. Jacobsen,Berger, Bergman, Milham, & Greeson(1971) provided 20 hoursof training
in solving two choice discrimination problems to a group of childrenattending a preschool day-care center for children from poor families.They obtained a 13.3-point increase in Stanford—BinetIQ as a result of
this training. The largest gains were obtained by a group of childrenwhosepreexperimentalIQ was low (mean = 72.8). Children in this low-IQ
group gained 20 points on the Stanford—Binet. These results suggest thatpreschool IQ scores may be volatile and it is possible that children mayexhibit rather large gains in performance that may not be meaningful as aresult of various experimental interventions. Zigler, Abelson, & Seitz(1973) obtained a 10-point gain on the Peabody Picture Vocabulary test fora group of 4- and 5-year-old children living in poverty when the test wasgiven a second time 1 week later. The comparable gain for middle classchildren whose initial score on this test was 35 points higher was 3points. These investigators also found that children from impoverishedbackgrounds benefited more than middle class children when a secondtest was administered by the same examinerrather than a different exam-iner. These results suggest that some of the deficit in IQ exhibited bychildren from impoverished backgrounds in preschool IQ test perfor-mance may be attributable to test familiarity and other motivationalfactors. Gains of the order of magnitude of those obtained using moreintensive interventions can be obtained in the IQ scores of preschool agechildren from impoverished backgroundswith relatively minor interven-tions of brief duration.It is unlikely that the latter interventions resultedin enduring changesin intellectual functioning. And, by implication,it isunlikely that changes resulting from more enduring interventions weremeaningful.Although evidence for true changes in intelligence as a result of pre-
school interventions is equivocal, there is evidence that children exposedto these programs did change in meaningful ways. Royceet al. (1983)

INTERVENTIONS TO INCREASE INTELLIGENCE 179
reported results for seven studies participating in the Consortium forLongitudinal Studies of special education placements andgrade reten-tions for program participants. Either of these decisions by school au-thorities may be taken as an index of inadequate educationalprogress by astudent. Of the Headstart program participants in these studies, 29.5%had either been retained in grade or assigned to a special education classby the end of the seventh grade. The comparable percentage for controlsubjects was 44.6. This was a highly significant difference for this totalsample of over 800 children. This difference in reaction of the schools tothese children was obtained in each of the eight studies for which datawere available, although the difference was notstatistically significantinmostof the studies. Although experimental and control children in Head-start programsweretreated differently by the schools there wasrelativelylittle difference between these groups of children in objective indices ofacademic performance. There was someevidence that experimental chil-dren were slightly better in math achievement in somegradesbutnotinreading skills as assessed by objective tests. By the end of sixth grade,there were no differences between control and experimental subjects inacademic achievementasassessed bytests. One wayof interpreting theseresults is to suggest that Headstart programs neverresultedin trueintel-lectual changes in children. They may have changed motivation, famil-iarity with test materials, and school-related social behaviors. Thesechanges may have been apparent to elementary school teachers whore-sponded to these children. Children exposed to Headstart may have be-haved in ways that school authorities found more acceptable than chil-dren in the control groups in these investigations. These changes,however, were not accompanied by enduring changes in cognitive func-tioning eitheras assessedbyintelligencetests or by the ability to acquirethe skills that constitute the standard curriculum of the public schools.
Interventions with Older Samples
Is it possible to increase intelligence after students enter school? Therehave been several attempts to change performanceontestsofintelligencefollowing various interventions. Perhaps the most extended interventionof this kind is contained in an experiment conducted by the Rumanianpsychologist Kvashchev. The results of this study were reported byStankov (1986). Kvashchev randomly assignedclasses of studentsin theirfirst year of high school to an experimental or a control group. The experi-mental group was provided with 3 to 4 hours per week of training increative problem solving for 3 years. The exercises usually involved pre-senting students with difficult problems followed by various suggestionsabout the barriers to problem solution. Stankov reports the results ofpretest and posttest comparisons on a battery of 28 different tests ofintelligence. He estimated that the experimental group began the experi-

180 6. ENVIRONMENTAL DETERMINANTSOF INTELLIGENCE
ment 2.62 points lower than the control group on a composite IQ indexwith a standard deviation of 15. At the end of the experimentthe experi-mental subjects were 3.04 points higher than the control group and, on afinal retesting 1 year after the conclusion of the experiment, the experi-mental subjects were estimated to have an IQ that was5.66 points higherthan that of the control group. The initial difference between the groupsmayreflect sampling error and thus the differences that were obtained atthe initial testing were not substantially larger than the differences thatwere present in students whoseclasses were assigned at random to par-ticipate in the experiment or to the control group. This is probably anoverly conservative interpretation of the results. Alternatively, it is rea-sonable to assert that 1 year after the conclusion of the study there was again of slightly less than 8 points for subjects in the experimental group.The gains were larger on tests in the battery that were considered to bemarkers for fluid intelligence than on tests that were assumed to bemeasuresof crystallized intelligence. The effects that were obtained werepresent for 17 of 28 tests used on the final assessment.It is unlikely thatthey represent specific acquaintance with the test material. These effectsare best interpretable as the developmentof an increasein fluid ability asa result of intensive instruction in creative thinking skills. There aresome unresolved questions about Kvashchev’s results. In addition to theobvious question of the duration of the effects that were obtained, hisresults leave unresolved the educational significance of the intervention.If one were to provide a subject with the answersto a test of intelligence,changes in that person’s score on the test would self-evidently be dis-missedas being dueto a procedure that compromised the constructvalid-ity of the test. Test scores as an outcome of an intervention are of nointerest in their own right. They are of interest in the first instancebecause, as weshall see, they are predictive of educational outcomes.From this perspective, changes in a test score mayreflect changesin theconstruct of which the test is alleged to be a manifestation, changes inthe score without changes in the constructas in the case of providinganswers to the test, or both. It would be interesting to know ifKvashchev’s experimental intervention was accompanied by changesinthe academic performance of students, particularly on those aspects ofthe high school curriculum that deal with problem solving and creativeability to apply insights to new tasks. Did the students in the experimen-tal group improvein their ability to solve novel mathematical problems?Did their ability to analyze literary works improve? In short, were theymore sophisticated learners? It is theoretically possible that time devotedto the development of abstract reasoning skills led to a decrease in theacquisition of standard curriculum knowledge. Until we have a fullerassessment of the academic consequencesof this type of intervention,itis premature to call for its widespread implementation in the schools.Leaving aside the practical implications of the program, Kvashchev’s ex-

INTERVENTIONS TO INCREASE INTELLIGENCE 181
periment demonstrates that an intensive program of structured learningpresented to high school students will increase fluid intelligence.The SAT (Scholastic Aptitude Test} is used by many colleges as an aid
to admission. The test measuresverbal and quantitative aptitudes. Whilethe test is not described as a measureofintelligence, scores on the test arecorrelated with scores on tests of intelligence. Messick (1980; see alsoAnastasi, 1981; Messick & Jungeblut, 1981) summarized studiesof at-tempts to increase SAT scores by coaching, including commercial coach-ing programs. The coaching programsthatare available differ with re-spect to their duration and the extent to which they provide emphasis ontest-taking skills as opposed to more general attempts to focus onchangesin the cognitive abilities that are assessed by thetest. The avail-able studies are flawed in different ways. Several studies did not use ran-dom assignment of subjects to experimental conditions. Evidenceof dif-ferences between experimental and control groups in these studiesconfoundthe effects of the experimental intervention with the effects ofself-selection. Students whoelect to participate in a coaching program toincrease their SAT scores may differ from other students in their moti-vation and in other ways. No comparison group is truly comparable andtotally satisfactory as a control group. Studies that have used randomassignment of subjects to experimental conditions often used special ad-ministrations of the SAT that were not used for admission purposes.Students in the control group may have been less motivated to performwell on these exams. In some of these studies subjects in the untreatedcontrol groups exhibited declines in SAT scores, a result that is contraryto the usual outcome. Messick’s review of these studies clearly indicatesthat they are flawed in different ways.Messick reported that the weighted average increase in SAT scores for
10 studies that used random assignmentsof individuals to treatment andcontrol groups was 9.1 on the verbal SAT and 13.0 on the quantitativeSAT. The comparable differences for studies that did not use randomizedassignments of subjects were 38 and 54 points on the verbal and quan-titative SAT, respectively. Messick does not report the standard deviationsof scores for subjects participating in these studies. SAT scores range from200 to 800 and standard deviations for unselected samples are usuallyclose to 100. Thus the average weighted obtained changesasa result ofcoaching on the SAT are usually less than .5 standard deviation. Theeffects for studies using random assignmentof subjects to conditionsareconsiderably smaller. :Messick noted that the time devoted to interventions varied consider-
ably in these studies from a low of 4.5 hours to a high of 300 hours. Therank-order correlation between the effects of coaching and the duration ofthe intervention was .60 for 22 studies of the verbal SAT and .80for 11studies of the quantitative SAT. The function defining magnitude of bene-fits associated with coaching on the SATandthe duration of the interven-

182 6. ENVIRONMENTAL DETERMINANTSOF INTELLIGENCE
tion is logarithmic rather than linear. This implies that the expectedincrements from coachingdecline. Gains are moreeasily attainable at thebeginning of an intervention program than they are after considerableexposure to the intervention.
Studies of the effects of coaching on SAT scores do indicate thatit ispossible to increase SAT performance. Thegainsthatare attainable arerelatively slight. These studies also leave unresolved the nature of thechanges that are obtained. Some of the changesthat are attained may beattributable to hints about techniques to deal with the multiple-choiceformat of these tests. These studies have not attempted to measure theeffects of the interventions on other measures of intelligence nor havethey included follow-up tests. Therefore, these studies do not indicatewhetheror not the interventions led to enduring changesin generalintel-ligence.
Feuerstein (1979) is an Israeli psychologist with extensive experiencetesting Israeli immigrants from non-Western countries. His experiencesled him to challenge the meaningof standardized intelligence test scoresobtained from individuals from culturally different backgrounds. He be-lieved that many low-scoring individuals had higher intelligence andgreater learning potential than wasrevealed by their test scores. He foundthat manyof the immigrantsto Israel he tested responded impulsively totest questions, did not reason in a planned manner, and exhibiteda vari-ety of cognitive deficits on these tests. Feuerstein was inclined to acceptthe test scores as a valid index of the intellectual functioning of theindividuals he tested. He believed, however, that IQ scores were not ade-
quate indices of the intellectual capability of individuals and he arguedthat systematic interventions could provide skills that would enable low-scoring individuals to score at a high level on tests. He developed a modi-fication of the standard methodsof test administration that changed therole of the examiner from that of an objective reporter of the examinee’sresponses to that of an active participant who demonstrated correct an-swers and attempted to change the performance of the examineein orderto assess the response of the examineeto potential attempts to remediatehis or her intellectual deficits. On this analysis, a conventional test scoreis not viewed as an index of intellectual ability but merely as an index ofcurrent functioning. By contrast, an intellectual assessment using Feuer-stein’s “Dynamic Assessment of Learning Potential” is viewed as an as-sessment of the potential of the individual to respond to interventionsdesigned to improveintellectual functioning (for a critical analysis of theassessment procedures used by Feuerstein see Glutting & McDermott,1990; In press).There are studies that purport to demonstrate that intellectual perfor-
mance maybe increased by the techniques advocated by Feuerstein. Inone of his studies he dramatically improved the performance of low-scoring individuals on the Raventest after giving them information about

INTERVENTIONS TO INCREASE INTELLIGENCE 183
the analogical principles used in the tests. The results obtained as a resultof training in Feuerstein’s work should be interpreted cautiously for tworeasons. Manyof his demonstrationsandfindings are based on samplesofindividuals who are recent immigrants who have limited exposure toWestern education. Depressed scores among such individuals may nothave the same meaningaslow scores obtained by individuals who havehad less deviant educational experiences. Also, demonstrationsthat per-formance on a particular task may be altered tell us little about thegenerality of the results that are obtained. The research reported on theeffects of the interventions used by Feuerstein in which outcomeis as-sessed by more global indices of intellectual performance are somewhatless encouraging.
Feuerstein, Rand, Hoffman, & Miller (1980) assigned a group of cultur-ally deprived and socially disadvantaged 12- to 15-year-old youth to aregular curriculum or a special intellectual enrichment curriculum thatinvolved 5 hours of training per week for a 2-year period. At the end of the2-year intervention, there were small differences in raw scores on theThurstone tests. The experimental group obtained a meanscore of 172versus a control group mean score of 164. Follow-up data were availablefor military induction examinations 2 years after the completion of theprogram. The approximate IQ of the experimental subjects was 102 com-paredto an IQ of 96 for the control group subjects. These IQ scores may becompared to a mean Thurstone IQ score of 80 obtainedat the beginningof the intervention. The increase in IQ that was obtainedfor all subjectsparticipating in the studyis probably attributable to acculturation effects.The results obtained as a result of the experimental intervention appearcomparable to those obtained by Kvashchev with a group of students whowere representative of high school students in his country.
Feuerstein reported the results of another intervention in Israel inwhich outcomeswereassessed using the Thurstonetest of intelligence.In this study, pupils attending a residential vocational high school whocame from a residential program for culturally deprived disadvantagedpupils were assigned to heterogeneously grouped classes rather than ho-mogeneousclasses. The usual practice of the school was to assign thesepupils to homogeneously grouped classes. Feuerstein argued that thescore of these pupils on the Learning AssessmentPotential test indicatedthat they had morepotential than was apparent from their initial level offunctioning. Feuerstein administered the Thurstonetest to these pupilsand a control group of regular students in the vocational school enteringthe ninth and tenth gradesat the start of the intervention and yearlater,after exposure to a heterogeneously grouped classroom. In addition,scores for military induction tests were available 2 or 3 years after theconclusion of the intervention. Table 6.3 presents these data. An exam-ination of the data presented in Table 6.3 indicates that the low-scoringgroups did exhibit increases in IQ test performance on some measures.

TABLE6.3
Scor
eson
Mili
tary
InductionExams
forSubjects
intheHodayotSt
udy2
9A(N=
30)
9B>(N=
25)
1lOA(N=
27)
10B%(N=
15)
tvalues*
Measure
XSD
XSD
XSD
xXSD
9A
versus9B-__10Aversus
10B
DAPAR
57.2
810
.73
52.4
110
.26
57.44
13.6
151
.27
18.5
81.
641.12
KABA
46.43
8.19
44.7
68.
1744
.15
10.3
740
.27
10.4
80.
751.06
Hebrew
7.76
0.94
7.35
0.98
7.84
1.07
7.60
1.64
1.58
0.50
2Basedon
Feue
rste
in(1979).
bGroups9Band10Bwerethelow-scoringgroupswh
oseoriginalTh
urst
onetestswere
.86st
anda
rdde
viat
ions
lowe
rthanth
oseof
thecontrolgroups(9Aand
10A)
.
¢Non
eof
the
tva
lues
were
sign
ific
ant.

INTERVENTIONS TO INCREASE INTELLIGENCE 185
The effects were small. The weighted mean difference between regularpupils and the special background pupils in the ninth and tenth grade inperformance on the Thurstoneat thestart of the intervention was 0.86standard deviation units using the standard deviation of the regularpupils. On the military induction general intelligence exam, the groupsdiffered by .40 standard deviation units. These data indicate that thespecial background pupils gained .46 standard deviation units in intel-ligence relative to the regular pupils from the start of the intervention totheir testing for military induction. These results cannot be attributed totheir assignment to heterogeneously grouped classrooms. There was nocontrol group and no way of knowing whether these pupils would havegained in IQ relative to their classmatesif they had not been assigned tohomogeneously grouped classes. In addition, increases in IQ would beexpected with the passage of time for low-scoring individuals as the resultof regression toward the mean.Finally, the changes that were obtainedwere less than one-half a standard deviation.The Feuerstein program wastested at three sites in the United States.
Adolescent students who wereassigned to special education classes wereprovided with interventionsfor 3 or 4 hours per week designed to increasetheir intellectual functioning (Haywood & Arbitman-Smith, 1981). Initialassessments indicated that the experimental subjects had a mean in-crease in IQ from 83 to 90 after 58 hours of intervention. The controlgroup’s mean IQ increased from 84 to 87. Thus the experimental grouphad a meanincreasein IQ that was4 points larger than the increase in thecontrol group.Blagg (1991) reported the results of a comprehensive analysis of the
Feuerstein program. The program was instituted in four secondaryschools in Somerset, England. The pupils in these schools had a mean IQof 92 and had poor math and reading achievementscores. The pupils weretrained on Feuerstein’s instrumental enrichment program. The trainingwas extensive with a mean duration of 112 hours of training. There wereno significanteffects of the program on generalintelligence or on perfor-mance on standardized tests of math or reading skills. The Blagg studyconclusively indicates that Feuerstein’s programs havelittle or no influ-ence on the developmentof intelligence.Although Feuerstein presented dramatic case histories of increases in
IQ associated with his intervention procedures, controlled studies gener-ally indicate that the changes in IQ obtained with his interventions arerelatively modest.This brief review of attemptsto increase generalintelligence in school-
age populations suggests that scores on intelligence tests increase follow-ing interventions. The long-term effects of the interventions are un-known butthere is some evidence that they persist for as long as 2 yearsafter the intervention. Well-controlled studies usually obtain relativelysmall changes in IQ asa result of interventions—generally less than .5

186 6. ENVIRONMENTAL DETERMINANTSOF INTELLIGENCE
standard deviation. There is no evidence that general intelligence can besubstantially changed as a result of experimental interventions.
CHANGES IN INTELLIGENCE ATTRIBUTABLETO EDUCATION
Intelligence and educational accomplishmentare linked and maybe sub-ject to bidirectional influences. Intelligence test scores predict pertor-mancein academicsettings. The knowledge that is acquired in academicsettings influences one’s ability to solve problemsand one’s generalintel-ligence. If the knowledge that is acquired in school influences scores ontests of intelligence, it is reasonable to assume that variations in thequantity and quality of education relate to performance ontests of intel-ligence. How might this assumption be tested? We could assign indi-viduals with the same IQ to different kinds of schooling and then assesstheir intelligence using a longitudinal design. Changes in intelligencefollowing different educational experiences could be unambiguously at-tributed to the effects of the educational experiencesof individuals. Thereare no studies that follow this simple randomized design. The assump-tion that differences in educational experience influence intelligence issupported by a variety of studies that rely on indirect demonstrationsof
the influence of schooling.The studies that we shall review are addressed to two different ques-
tions: (1) Does the amountof schooling obtained influence one’s score on
an intelligence test?, and (2) do variations in the quality of schooling one
obtains, holding constant amountof schooling, influence scores on an
intelligence test?Evidence that amount of schooling influences scores on an IQ test is
based on direct and indirect evidence. There are studies of the effects of
schooling in third-world countries where schooling is not routinely pro-
vided to individuals (Scribner & Cole, 1981). This literature will not be
reviewed here. I am concerned with the narrower issue of the extent to
which variation in amountof schooling influences performance on tests
of intelligence among children who attend schools in industrialized
countries in which school attendance is mandatory and universal. A
study by Harnqvist (1968a,b; see also Lorge, 1945, for a related study)
illustrates someof the difficulty in interpreting studies of the influence of
schooling on intelligence. He studied a sample of 10% of the male popu-
lation born in Swedenin 1948. He obtained IQ datafrom tests given at age
13 and again at 18 as part of a military induction examination. Harnqvist
studied changesin intelligence associated with the quality and amountof
secondary schooling received. Adolescents in Sweden choose educational
tracks that are designed to prepare students for higher education or that

CHANGES IN INTELLIGENCE ATTRIBUTABLE TO EDUCATION 187
are terminal. Adjusting for initial differences in IQ, Harnqvist estimatedthat students who had the mostrigorous academic education gained .62standard deviation units in intelligence relative to pupils who were as-signed or chose less academic secondary school education. Harnqvist’sconclusions are reasonable, however, they are not compelling. Individualswhochose or were assigned to an academic track might have gained in IQeven if they had been randomly assigned to a less rigorous academiceducation. Consider two individuals with the same IQ whoelect to enter
different educational tracks at the secondary school level. The studentwho chooses the academic track may like to read books more than theindividual who choosesa less academic track. Differences in intellectualinterests may be related to changes in IQ. Differences in IQ associatedwith different educational experiences obtained in the Harnqvist studymaybe attributable to the effects of educational experiencesor to charac-teristics of persons that led them to be assigned to different educationalexperiences.
The problem ofself-selection for different educational experiences can-not be overcomeeven with a study that controls for genetic differences.Newmanetal. (1937) obtained correlations of .79 and .58 between dif-ferences in the IQ scores of MZ twins reared apart and ratings of thequality of their educational experiences using two different measures ofintelligence. The twin with the higher IQ was morelikely to havea bettereducation than the twin with the lowerIQ.It is reasonable to interpretthis finding as demonstrating an influence on the quality of education onIQ scores. This interpretation is not compelling. Differences in IQ mayinfluence educational experiences. Differences in educational experi-ences between MZ twins may be causedbydifferences in IQ rather thanthe converse.Cahan & Cohen (1989) used a “between-grade-level” approach to study
the influence of schooling on intelligence. They studied the influence ofschooling by comparing pupils in the same grade whodiffered in age withpupils in different grades. The difference in test scores between the youn-gest and the oldest child in a grade in an elementary school in whichchildren are assigned to grade level by chronological age is attributable tothe influence of age rather than amountof schooling. Differences in testscores between the youngest child in a grade and the oldest child in theimmediately preceding lower grade are attributable to the influence ofamountof schooling. A 1-day difference in ages clearly will havea trivialinfluence on differences in intelligence associated with grade-level as-signment. Cahan and Cohen administeredtests of intelligenceto all chil-dren attending Jerusalem’s Hebrewschools in the fourth, fifth, and sixthgrades. They excludedall students who were in grades that were inap-propriate for their age level. Using a regression procedure they estimatedthe effects of attending school for 1 year on test performance by notingdiscontinuities in the regression of age on test scores associated with

188 6. ENVIRONMENTAL DETERMINANTSOF INTELLIGENCE
grade differences. The influence of age on test scores was estimated bycomparing individuals differing in age within the same grade. They com-pared estimated gains in test performance associated with 1 year of ageand 1 year of schooling on 12 tests of intelligence. The average gain in testscores associated with 1 year of age was .15 standard deviation units. Thecomparable change for 1 year of schooling was .275 standard deviationunits. The averageratio of the effects of schooling divided by theeffects ofage was 2:21 for these 12 tests. These results clearly establish an influ-ence of education on intellectual development. Schooling increases per-formance on tests of intelligence independent of changes in age associ-ated with schooling. These results extend findings associated with theeffects of formal schooling in third-world countries (see Scribner & Cole,1981) to the effects of schooling in a technologically advanced society. Inaddition, this result is compatible with other research on the influenceofdelayed or minimal schooling in isolated and deprived communities(seeCeci, 1990, for a review of this literature).Do variationsin the quality of schooling independent of the amountof
schooling influence IQ test scores? There are a numberof indirect studiesof this issue. Jencks (1972) summarized research on this issue and con-cluded that variations among schools had a vanishingly small effect onvariations in cognitive abilities of students. Muchof this research dealswith what is learned in school as opposed to scores ontests of intel-ligence. We shall review this literature and the controversies that it hasgenerated in Chapter 9, dealing with the relationship between intel-ligence and whatis learned in schools. One of the studies reported byJencks deals with the effects of attendance in different high schools onvocabulary test performance—a good measure of general intelligence.Jencks used Project Talent data for this analysis (see Flanagan & Cooley,1966). Data were obtained from 5000 students attending 91 different highschools in the United States. The students were tested at the ninth andtwelfth grades. An average terminal level of performance for each schoolwas obtained. Variations between schools accounted for 10.7% of the
variance on academic achievement. An expected twelfth grade achieve-ment score was obtained for each school by using a regression equationthat took into account ninth grade performance as well as informationabout socioeconomic status and aspirations for education. These ex-pected scores were related to twelfth grade obtained scores. Only 14% ofthe between-school variance in twelfth grade performance was unex-plained, implying that only 1.5% of the variance in differences in academ-ic performance amongindividuals is attributable to the school that oneattends. This number is an upper-bound estimate of the influence ofsecondary school attendance on changes in vocabulary. More effectivecontrol for additional entry characteristics at the ninth grade that mayinfluence vocabulary growth could decrease this number. It is also thecase that school effects in one subject were not necessarily predictive of

CHANGES IN INTELLIGENCE ATTRIBUTABLE TO EDUCATION 189
school success in a secondarea. A school that increased vocabulary morethan was expected onthebasis of the entry characteristics of its studentsmay not have been equally successful in increasing math skills. Jencks’sanalysis should be seen as beingrelative to variations in the schoolsstudied. More extreme variations amongschools, such as those in urbanghettos or isolated rural communities, might have been associated withlarger variations in schooleffects. Also, these results tell us about varia-tions associated with attendancein different comprehensive high schoolsin the U.S. in a particular time period. It is possible to imagine variationsamong secondary schools that are more extreme than thoseincluded inthe Project Talent sample. Private and parochial schools were not in-cluded and schools that are based on variousradical approachesto educa-tion were not studied. Jencks’s analysis indicates that variations in thesecondary comprehensivehigh schools that a student attends in the U.S.are not likely to influence scores on tests of intelligence. The IQ scorethat a student obtainsat the end of secondary education is largely predict-able from knowledge of the IQ scores that the student has at the begin-ning of secondary educationas well as other backgroundcharacteristicsofthe student.Firkowska, Ostrowska, Sokolowska, Stein, Susser, & Wald (1978) relied
on a naturalistic experiment to studytheeffects of schooling on IQ. Theystudied the population of all children born in 1963 living in the city ofWarsaw in Poland in 1974. The city had been rebuilt after World WarIIand families were assigned almost at random to housi.g and conse-quently to schools. All of the subjects in their study were given the Raventest. They obtained information about the education and occupation ofthe parents of their subjects as well as information aboutdifferences inthe schools their subjects attended and the neighborhoods in which theylived. The school characteristics included data about averageclasssize,academic qualifications of the teachers in the school, and the percentageof pupils repeating grades in the school. They also developed indices ofthe social advantageof the neighborhoodsof their subjects. They obtaineddata on theaccessibility of culturalfacilities and the demographic charac-teristics of the neighborhood. Information about background charac-teristics of pupils was used to predict scores on the Raven. Their resultsare reported in Table 6.4. The data presented in Table 6.4 indicate that theIQ scores of students were related to the occupational and educationalbackgrounds of their parents. Knowledge of school characteristics andneighborhood characteristics wastrivially related to IQ test scores. Theseresults should be considered cautiously. The appealof this study is that itis based on a massive social experiment initiated by a Communist coun-try that attemptedto allocate individuals of different social backgroundsto different neighborhoods in a random fashion. Thevalidity of the ex-periment derives from the assumption that allocation to schools andneighborhoods approximated a random assignmentof individuals to con-

190 6. ENVIRONMENTAL DETERMINANTSOF INTELLIGENCE
TABLE 6.4 Multiple Correlation and Proportion of Variance in Raven
Scores Accounted for by District, Family, and School Variables in Three
Casual Models¢
Variance
Variable Multiple accounted for r2
Step entered correlation (r) (r2} Change
Model 11 District 126 01586 015862 School .147 02161 005753 Family 326 .10618 08485
Model 2l School 115 01315 013152 Family 324 .10482 091683 District 326 .10618 | .00136
Model 31 Family 320 .10271 .10271
2 District 324 .10514 .00244
3 School 326 .10618 .00104
2Based on Firkowska, Ostrowsha, Sokolowska, Stein, Susser, & Wald (1978).
ditions. This ideological commitment would no doubt be accompanied by
an equally fervent attempt to create relatively equal educational oppor-
tunities for individuals attending different schools. If one assumesthat an
egalitarian society was able to assign individuals at random to schools,
then it is equally plausible to assumethat these schools would be sub-
stantially similar. And, under these conditions, one would not expect
variations in education to be substantially associated with intelligence
test scores. Whether schools that vary considerably in social composition
and educational programs would influence scores on intelligence tests
cannot be confidently determined from the results of the Firkowskaet al.
study.Variations amongschools do not appear to be a major influence on IQ.
There are, however, other studies of changes in intelligence that indi-
rectly implicate variations in educationas beingcritical factors in produc-
ing differences in IQ. Jensen (1977) studied a sample of pupils attending
schools in rural Georgia. He used a sibling control study in which he
compared younger and older siblings in the same families on scores on
the California Test of Mental Maturity. He obtained different results for
black and white students in his sample. Among white students, there was
relatively little difference in test scores between younger and oldersib-
lings. The black students in the sample exhibited a linear decrease in IQ
as a function of age differences between siblings. Younger siblings had
higher test scores than older siblings in this sample. The regression line
predicted a 1.42-point decline in IQ per year of difference in age. The
cumulative effects of this decline between age 6 and 16 was approx-
imately a one-standard-deviation difference in IQ. Jensen attributed the

CHANGESIN INTELLIGENCE ATTRIBUTABLE TO EDUCATION 19]
declines in his black sample to environmental rather than genetic influ-ences. He indicated that an early study (Jensen, 1974a) using the samemethodology in California failed to find evidence of differences in testscores between younger and older siblings in a black sample. Heat-tributed the differences he obtained in Georgia to the effects of acumulative deficit for individuals with extremely low socioeconomicsta-tus. The environmental influences that may contribute to the declineobserved by Jensenare notisolated. Theeffects are not solely attributableto the schools that these students attend. Presumably the white studentsattended the sameschools as the black students and they did not exhibitdeclines in IQ. Of course the educational experience of attending thesame schools may be quite different for white and black students. Thismay be peculiarly relevant for the students studied by Jensen. The studywas published in 1977 and the average age of the students was 12 years.Jensen does not state when the data werecollected, butit is quite likelythat the oldest students in his sample started school in the mid-1960s.Schools in Georgia were segregated in the 1960s and the early schoolexperiencesof the older subjects in Jensen’s sample must have occurred ina segregated schoolsettingor shortly after the endof segregated schoolingin this region of the United States. Whether these changes in the char-acter of education experienced by these black students accountfor siblingdifferences in IQ test scores is not known.
Jensen’s results are based on a small and isolated subsampleof the U.S.population. There are studies demonstrating secular changes in IQ formany industrialized countries. Flynn (1984) summarized data for theUnited States that demonstrated secular increases in IQ. Using data fromvarious standardization samples of different versions of the Wechsler andBinet tests, he estimated that IQ increased in the U.S. between 1932 and1978 13.8 points. He subsequently extended this analysis to 14 indus-trialized countries (Flynn, 1987). Table 6.5 presents his results. The gainsare widespread and substantial. They vary in magnitude for differentcountries. Flynn calculated a value of 3 points per decade for the UnitedStates. Lynn & Hampson (1986b) estimated increases of 1.71 points perdecade for Great Britain. They also estimated gains of 7.7 points perdecadefor Japan through the 1960s followed bya declining rate of gain inIQ. Although someof the studies reviewed by Flynn maybe flawed andsubject to alternative interpretations, there are studies based on very largerelatively representative populations of male subjects who appearfor uni-versal selective service examinations in The Netherlands, Belgium,France, and Norwaythat leave little doubt that secular increases in testscores have occurred.There is no obvious or simple explanation for the increase in test
scores. Evidenceof increases in IQ observedin selective service examina-tions administered to recruits in World War I and World War II wereexplained by reference to changes in the amountof formal education(see

192
TABLE
6.5
RecentIQ
Gains:
LocationsGroupedbyTe
standRankedbyRate
ofGain¢
Location
Test
Rate
Age
(yea
rs}
Period
IQ
gain
(poi
nts)
Status4 Leipzig
France
Belgium
Belgium
Netherlands
Norway
WestGermany
Aust
rali
a
Edmonton
Australia
Norway
Great
Britain
Great
Britain
Japan
Vienna
Ravens
Ravens
Ravens
Shapes
Ravens
Matrices
Horna-Ravens?
Jenkins
Ravens
Ravens
Matrices
Ravens
Ravens
Wechsler?
Wechsler
1.25
0
1.00
5
0.794
0.716
0.66
7
0.629
0.58
8
0.49
00.
402
0.33
7
0.217
0.189
0.181
0.835
0.82
4
11-16
18 18 18 18 19
12-16
10-14
910-16
19 8—14
20—30
6-15
6-15
1968-1978
1949-1974
1958-1967
1958-1967
1952-1982
1954-1968
1961-1978
1949-1981
1956-1977
1950-1976
1968-1980
1938-1979
1940-1979
1951-1975
1962-1979
10-15
25.1
2
7.15
6.45
20.0
0
8.80
10.0
0
15.6
7
8.44
8.76
2.60
7.75
7.07
20.0
312-16
3/2
QHetaetae THe TAMM 3/4
=z

193
WestGermany
Zurich
Edmonton
France
United
States
United
Stat
esSolothurn
Saskatchewan
Norway
Belgium
France
Saskatchewan
New
Zealand
Norway
Wechsler?
Wechsler
CTMM
Wechsler
Wechsler—Binet?
Wechsler?
Wechsler
Otis?
Verbal—math
Verbal—math
Verbal—math
Otis?
Otis
Verbal—math
0.741
0.65
20.525
0.38
0
0.300
0.243
0.18
60.628
0.58
20.
408
0.37
40.348
0.24
2—0.133
7-15
9and
129
6-15
2—18
16—75
8-9
10 19 18 18 1310-13
19
1954-1981
1954-1977
1956-1977
1955-1979
1932-1972
1954-1978
1977-1984
1958-1978
1954-1968
1958-1967
1949-1974
1958-1978
1936—1968
1968-1980
20.00
10—20
11.03
9.12
12.00
5.95
1.30
12.55
8.15
3.67
9.35
6.95
7.73
—1.60
3/4
tTestrnnords2/3
se
2/3
“BasedonFlynn
(198
7).
>Thecontent
ofth
ese
test
swas
substantially
alte
red.
“IQpo
ints
peryear.
41,
verified;
2,pr
obab
le;
3,te
ntat
ive;
4,sp
ecul
ativ
e.

194 6. ENVIRONMENTAL DETERMINANTSOF INTELLIGENCE
Tuddenham, 1948). Increases in IQ are present for post-World WarII co-horts that have not had substantial differences in the amountof educa-tion that they havereceived.It is also interesting to note that the changesare apparently larger on tests of fluid ability than they are on tests ofcrystallized ability. For example, they appearto be larger on the Wechslerperformancetests than on the Wechsler verbal tests. Flynn estimated thatthe median rate of gain per year for culture-reduced tests such as theRaven is .588 IQ points compared to .374 points on verbal tests. He arguedthat gains are more likely to be manifested on those tests that are as-sumed to measure decontextualized problem-solving ability than onthose tests that come closer to measuring specific knowledge. Flynnar-gued that increasesin scores on intelligence tests may occur even thoughthe quality of education is declining. He argued that declines in perfor-mance on the SAT were occurring at the same time that gains wereoccurring on tests of intelligence. The SAT required advanced academicskills and he assumed that the quality of American secondary schooleducation was declining at the sametimethat intelligence as assessed bytests of decontextualized problem-solving ability was increasing.Lynn & Hampson (1986b) and Teasdale & Owen (1989) analyzed
changes in IQ for individuals with different IQ scores. Their analysesindicate that gains were larger for low-scoring individuals than for high-scoring individuals. Lynn and Hampsonreported that gainsin IQ in Brit-ain varied with the age of the sample and the IQ of the sample. Thecorrelation between the increase in IQ on the Ravenfor different cohortsand the age of the sample was.90 for individuals at the tenth percentile inIQ scores. The comparable correlation for high-IQ individuals at the nine-tieth percentile was —.56. Gains in IQ for 14-year-old individuals were 12points for low-IQ individuals and 6 points for high-IQ individuals. Teas-dale & Owen (1989) examined test scores for Danish military examina-tions for individuals born between 1967 and 1969. They compared thesescores to scores obtained for cohorts born between 1939 and 1958. Therewasa significant increase in IQ for this cohort relative to cohorts bornearlier. The magnitudeof the increase varied inversely with IQ. The max-imum gains occurred at the eleventh percentile and at the ninetieth per-centile the curves converged. It is not knownif the results obtained byLynn and Hampsonfor England and by Teasdale and Owen for Denmarkare characteristic of IQ changes in other countries.
We can only speculate about the appropriate explanation for these phe-nomena. Clearly, changes of this magnitude cannot be attributable togenetic changes. Theyare notlikely to be explained by amountof educa-tion. Changes in socioeconomic and occupationalstatusare notlikely toprovide satisfactory explanations. Teasdale and Owen argued thatchanges in Danish schools with better provision for remedial educationexplain the increase in IQ among low-scoring individuals. This hypoth-esis is not incompatible with results showingthat increasesare larger for
CHANGESIN INTELLIGENCE ATTRIBUTABLE TO EDUCATION 195
tests of what Flynn calls decontextualized abstract reasoning than fortests of crystallized ability. Recall that Stankov found that Kvashchev’sinterventionled to larger increases ontestsoffluid ability than on tests ofcrystallized ability. Scribner & Cole (1981) reviewed the effects of formalschooling on cognitive ability and they found that formal schoolingled tolarge increases in tests of fluid ability. Combining these speculationsleads to the hypothesis that changes in performanceon tests of intel-ligence are associated with the quality of schooling. It is possible that anincreased egalitarian tendency in industrialized societies with improvedaccess to educational opportunities has increased the averageintellectualability of low-scoring IQ cohorts. It should be recognized that this hy-pothesis is highly speculative. We need better data on changes in IQ indifferent countries for different groups of individuals. And, it would beextremely valuable to relate obtained changes in sociological and demo-graphic indices as well as to analyses of educational policies and oppor-tunities.Lynn (1990a) argued that secular changesin intelligence are attribut-
able to nutrition. He indicated that secular changesin intelligence wereaccompanied by comparable secular changesin height and head circum-ference. These changes are probably attributable to changes innutrition.Both height and head circumference have beenrelated to intelligence.And, there is evidence that nutrition is related to intelligence. Lynn ar-gued that educational changes and changesin intellectual stimulationwereless plausible explanations for secular changesin intelligence sincethe changes appearto be larger on nonverbal and fluid measuresof intel-ligence than on verbal and crystallized measures ofintelligence. Hecitedevidence from adoption studies indicating that adoption in superiorhomesinfluences verbal abilities more than nonverbal abilities. There-fore, secular changes in intellectual stimulation should be manifestedmore clearly on verbal measures than on nonverbal measuresof ability.Lynn’s argument does not provide evidence against the hypothesis thatsecular changes in intelligence could be attributable to educationalchanges since there is evidence that educational interventions maychangefluid ability more than crystallized ability. Lynn’s arguments donot, in my judgment, persuasively rule out an educational interpretationof secular changes in intelligence. He has, however, persuasively arguedthat nutritional changes may contribute to secular changes in intel-ligence. In order to provide stronger evidence for his hypothesis it wouldbe necessary to obtain indices of secular changes in nutrition and heightand to relate these measuresto secular changesinintelligence in differentcountries. It is interesting to note that Japan is a country that experiencedvery large secular gains in intelligence for cohorts born before World WarII and large gains in intelligence. Whether secular changes in height andnutrition in different countries are correlated with secular changes inintelligence remains to be determined.

196 6. ENVIRONMENTAL DETERMINANTSOF INTELLIGENCE
Flynn argued that the secular changesin intelligence that he reported
indicated that intelligence tests were not good measuresof intelligence.
Changes of this magnitude in intelligence should be accompanied by
changes in academic achievementand in various indices of intellectual
accomplishmentif tests of intelligence are actually measures of intel-
ligence. Lynn (1990a) argued that Flynn’s argumentis not based on sys-
tematic evidence. It is possible that there are true secular changes in
indices of intellectual accomplishmentthat have not been studied.In this
connection he noted that the percentage of the population attending col-
lege increased in most countries. We need more systematic data about
secular changes in intellectual accomplishment that may or may not becorrelated with secular changesin intelligence.
Secular changesin intelligence remain mysterious. Nutrition and edu-
cational changes may be responsible. We have no explanation for these
changesthatis not speculative. And, we do not really knowif the changes
reflect true changesin the theoretical construct indexedbytests ofintel-
ligence. I believe, in common with Lynn, that a reasonably strong case
can be made that the index is a good measure of the construct andit is
unlikely that large changesin intelligence test scores could occurthat are
not accompanied by some change in the construct of which thetest is a
putative index.
WITHIN-FAMILY ENVIRONMENTALINFLUENCES
Behavior genetic research indicates that intelligence is influenced by the
within-family environment (Plomin & Daniels, 1987). In what follows I
will present some speculations about this source of variance in intel-
ligence.We do know that there are conditions under whichtheintelligence of
siblings reared in the same family is not influenced at all by within-
family environmental variations. MZ twins reared together correlate in
IQ .86. The test-retest reliability of the measuresof intelligence used in
these studies is estimated to be .87. These data imply that the disattenu-
ated correlation in IQ for MZ twinsis close to unity. Thus there can be
few or no within-family environmentalinfluences on IQ forthis class of
siblings. It is also the case that DZ twin pairs are more alike in intel-
ligence than nontwinsibling pairs. Whatdoesthis tell us about theinflu-
ence of within-family environmental variation on intelligence? This
question may be answered in different ways. We have seen that quan-
titative behavior genetic analyses imply that twins experience environ-
ments that are more similar to each other than do other classes of sib-
lings. An analysis of the ways in which twins differ from other sibling
WITHIN-FAMILY ENVIRONMENTAL INFLUENCES 197
pairs may provide clues to within-family variables that may influenceintelligence. Twins spend time together and have more extensive oppor-tunities to interact with each other than do nontwinsiblings. The oppor-tunity to interact extensively and to influence each other need not auto-matically lead to identity on all traits among MZ twin pairs. MZ twinsexhibit correlations on measures of personality that are considerablylower than the test-retest correlation of the tests (see Brody, 1988, Chap-ter 3). Rose & Kaprio (1987) reported that MZ correlations for neuroticismwere positively related to the degree of contact of twin pairs. Amongfemale MZ pairs the correlations for neuroticism declined from .71 foradult twins living together to .26 for MZ twins whorarely contacted eachother. Rose and Kaprio asserted that these findings imply that socialcontacts between adult twins influence their personality and their degreeof similarity. An alternative interpretation of these findingsis possible.Twins who are similar for whatever reason choose to maintain socialcontact with each other. A longitudinal study is required to distinguishbetween these alternative interpretations. Comparable data have notbeen reported for MZ resemblancein intelligence. Thereis little evidencethat MZ correlations in intelligence are lower among adult MZ twinsthan among younger twin pairs. For example, Tambset al. (1984) reportedMZcorrelationsof .88 for a sample of adult MZ twins on the WAIS. AdultMZ twin pairs experience less intimate contact than younger MZ twin
pairs. The decrease in social contact that tends to accompany adult twinexperience does not appear to result in a decrease in resemblance inintelligence. It is possible that the extended social contact experienced byMZ twins during childhood creates similarity in IQ and this similaritythen persists through the adult years. This interpretation is contradictedby other data indicating that IQ resemblance for biologically unrelatedindividuals living in the same family decreasesas children living togethergrow older. Alternatively, it could be argued that the increased socialcontact characteristic of MZ twinsis not of substantial relevance in pro-ducing IQ resemblancesince variations in social contact that occurafterthe twins leave home do not decrease IQ resemblance.
There are additional data that suggest that social contact among twinpairs is not a major factor in determining their resemblance in IQ. DZtwin pairs appear to be more alike in IQ than nontwinsiblings. Opposite-sex DZ twin pairs are as similar as same-sex DZ twinpairs. I assumethatopposite-sex DZ twin pairs have less social contact that same-sex DZtwin pairs. This implies that variations in social contact do not determinethe degree of resemblance of twin pairs in intelligence.Although there is considerable uncertainty aboutall of this, it does not
appear that a strong case can be madefortherole of social contact as afactor in producing IQ resemblance among twins. What other factorsmight differentiate twins from nontwin siblings? Perhaps the most ob-vious difference between twin and nontwinsibling pairs is that they differ

198 6. ENVIRONMENTAL DETERMINANTSOF INTELLIGENCE
in age. In most studies of resemblance among family members in IQ,twinsare usually tested at the same age. Nontwinsibling correlations areinfluenced by sourcesof variance that do not influence twin correlationsattributable to age variations. Wilson (1983) reported that changes inchildhood intelligence were heritable. He found that changes in IQ weremore highly correlated among MZ twin pairs than among DZ twins.Spurts and declines in scores on childhood indices of IQ appear to beheritable. It is not clear if these effects are present in older children. Thepresence of heritable developmental changes in IQ suggests that dif-ferences between DZ twin correlations and nontwinsibling correlationsin intelligence may be influenced by genetic characteristics. A criticaltest of this hypothesis could be obtained by varying the age of testing ofsiblings. Differences in the correlations between nontwinsiblings and DZtwins ought to decrease if nontwin siblings are tested at the sameage.
Variations in the age of testing of nontwin siblings may introduce“time-of-testing” variance. Social changes characteristic of differenttimes of testing may influence test scores. Controls for time-of-testingeffects still leave secular changes in IQ as a potential source of variancethat could causedifferences in IQ resemblance of nontwinsiblings thatisnot present in twin data. The influenceof this variable is not likely to belarge. Secular changesare usually reported to be 2 to 3 points per decade.IQ scores are usually determinedin termsof the relationship between anindividual’s score and the score of his or her age cohorts. Appropriaterenormingof IQ scores is not done on a yearly basis. Failure to adjust IQscores annually for cohort effects will produce changes in IQ that coulddecrease the resemblance of nontwinsiblings. In addition, if one uses ameasureof intelligence that is not cohort normed, such as the Raventest,secular influences may contribute to IQ differences among nontwin sib-lings. It should be realized that secular influences are not likely to havedramatic within-family effects on IQ. Secular changes in IQ of 2 to 3points per decadeare not likely to be a major source of variance betweensiblings who have small differences in their ages.
It is possible to study within-family environmental differences usingthe same variables used to study between-family environmental dif-ferences. In order to do this it is necessary to study variations amongindividuals reared in the same home. Consider some possible ways inwhich this might be done. Thereis a large literature on the relationshipbetween the socioeconomicstatus of parents andthe IQ of their children.The socioeconomicstatusof a family is not invariant. Siblings who differin age may have parents whose socioeconomic statusdiffers at differentstages of their development. We have examined whether variations inschools that one attends influence intelligence. Siblings in the same fam-ily may not attend the same schools. Siblings in the same family may besocialized in different ways. Temperamentaldifferences between children

WITHIN-FAMILY ENVIRONMENTAL INFLUENCES 199
may influence the quantity and quality of parental interaction. Theamountoftime that a parent spends with a child may vary with changesin family circumstances. A mother may be employed during the pre-school years of one of her children and remain at home during the pre-school-age years of a second child.It is obviousthat virtually any variablethat has been studied as a potential source of between-family environ-mental influence on intelligence can be studied as a within-family en-vironmental influence by studying differences between children reared inthe same family.There are few if any studies that I am aware of that attempt torelate
within-family environmental differences to differences in intelligenceamongsiblings reared together. We can only speculate about the viabilityof this research strategy. An argument can be developed that studies ofvariations within families based on an examination of the variables thatare used to characterize differences between families will not provideinformation about the characteristics of the within-family environmentthat influence intelligence. Consider socioeconomic status. White (1982)performed a meta-analysis of studies relating socioeconomic backgroundand IQ. Hereported that the correlation between parental socioeconom-ic status and the IQ of a studentis .33. Some portion, perhaps a substan-tial portion, of that variance is attributable to genetic influences. Thebetween-family influence of socioeconomic status on IQ on White’sanalysis accounts for 10% of the variance in IQ. Disputes exist, aS wehave seen, about the extent to which this correlation is mediated genet-ically, and one can argue whetherparental socioeconomicstatus has anyinfluence on IQ that is independent of a genetic relationship betweenparent and child for postadolescent individuals. Whatever one’s positionon this issue, it is clear that variations between siblings in the so-cioeconomicstatus of their parents at different stages of their develop-mentare likely to be small relative to variations between families. And,ifvariations in socioeconomic status between families have a vanishinglysmall influence on IQ, then it is unlikely that the much smaller varia-tions within families will have a large influence on IQ. And, even wherefamilies experience drastic changes in their socioeconomic status, thereis a Carry-over in someof the characteristics associated with theirpre-vious status. A well-educated parent whose occupational status changesfrom upper middle class to lower class is unlikely to adopt all of themannerismsandsocialcharacteristics of his or her newly acquired socialstatus. Literature andlife histories are filled with examplesof individualswhose social status changes over the course of their lifetime and whocontinue to maintain the vestiges of attitudes and mannerismsthat areappropriate to a previous social status. Think of D. H. Lawrence’s auto-biographical novel, “Sons and Lovers.” Manyof the characteristics of Paul(the character whorepresents D. H. Lawrence)are traced to the influence

200 6. ENVIRONMENTAL DETERMINANTSOF INTELLIGENCE
of his mother, whoseattitudes and behaviorsreflect the residual effects of
a childhood socioeconomic background that is higher than that of her
husband, whois a miner.
In order to study within-family environmental influences using those
variables that are assumedto contribute to between-family environmen-
tal influences on intelligence it would appear to be necessary to identify
variables that fulfill two criteria: (1) Variations must exist both between
families and within families on the variable; and (2) there must beevi-
dence that between-family variancerelates to variations in intelligence.
The secondcriterion is not easily fulfilled. Are there any between-family
environmental variables that relate to the intelligence of older indi-
viduals that are independent of genetic influences? The answerto this
rhetorical questionsis not self-evident. The only variable that I can think
of is the secular variable studied by Flynn.
It is possible to study within-family environmentalinfluenceson intel-
ligence using variables that are not derived from the study of between-
family environmental variables. Birth order is the classic example of a
within-family environmental variable. It is also the only within-family
environmental variable for which an explicit theoretical model exists
relating variations in birth order and birth spacing to intelligence. Zajonc
& Marcus (1975; Zajonc, 1976) developed the “confluence” modelto ex-
plain data collected by Belmont & Marolla (1973) from a population of
Dutch selective service registrants relating family size and birth order to
intelligence. The data they analyzed are presented in Fig. 6.1. These data
present scores on the Raventest as a function of the size of one’s family
and birth order within the family. There are several features of the data in
Fig. 6.1 that are noteworthy. Excluding only children, performance on the
Raven declines as the family size increases. Performance on the Raven
decreasesas birth order increases. This latter generalization is violated by
data for families within eight and nine members, where the next-to-last
sibling has higher performance than the preceding sibling. The function
relating birth order to family size is quadratic. The differences between
birth orders exhibit smaller declines with the exceptionof thelast sibling.
Last siblings exhibit large drops in performance. Only children score close
to the level of firstborn children in families of four.
Zajonc and Markus explained these data by making assumptions about
the impact of the intellectual atmosphere of family members on the
developmentof intelligence. They assumedthat the impactof the family
environment onintelligence was a positive function of the average level
of intelligence of members of a family. They assumed that a newborn
child has zero intelligence. If each of that child’s parents has an average
intelligence of 100, the average family intellectual environmentexperi-
enced by that child at birth is 66.67—the average valueof the intelligence
of each of the members of the family including the child. If the child is
born into a family with a single adult caretaker of average intelligence,

WITHIN-FAMILY ENVIRONMENTAL INFLUENCES 201
100
LLJfo
©n 99
za
LU J=5>
< 0a O
8a e
s 0 . : J=6
co A Q
Oo 98F”=
< ye?x PY eo
- e
S =8
97F 5
‘ J=9
! } ! | ' ! !1 2 3 4 5 6 7 8 9
BIRTH ORDER
FIGURE6.1 Birth order, family size, and intelligence. (Based on Zajonc & Markus, 1975.)
the average intellectual level of the family would be 50, leading to theprediction that children reared in families with a single adult caretakerwould on average have lowerintelligence than children reared in familieswith two or more adult caretakers. If a second child is born into a familywith two adult caretakers with an IQ of 100 and an older sibling who hasreached half of an adult level of intelligence of 100, the average value ofthe intellectual environmentaffecting that child will be 62.5 (the averageof 100, 100, 50, and 0). Note that the second child of a two-parent familytends to have an environmentthat is assumedto beless favorable for the

202 6. ENVIRONMENTAL DETERMINANTSOF INTELLIGENCE
development of intelligence than the first child in that family. Thesedifferences, depending on parametric assumptions, could be reversedifthe birth of a secondchild in a family is delayed. If the second child in the
example above is born whenthefirst sibling has attained three-fourths of
his or her adult intelligence, the second child’s family environmentwill
be more favorable for the development of intelligence than thefirst
child’s environment. Therefore, the spacing of children becomesa critical
variable in the model. The assumption that the average level of environ-
mentinfluencing a child’s intellectual developmentis a function of the
average level of intelligence of all of the members of a family explains
several features of the data in Fig. 6.1. Large families tend to have more
individuals who have not attained their terminal levels of intelligence
and therefore the average level of intelligence of family members tends to
be lower in large than in small families. In effect, the parent’s mature
intellectual development is diluted by the presence of many children.
Later-born children tend to experience the diluting effect of the averaging
of children with adults at a more intense level than early-born children.
There are simply more children present, decreasing the intellectual level
of the family with each successive birth in the family. The quadratic
function (excluding the last-born child) relating birth orderto intelligence
is explained by noting that the proportional decline associated with the
addition of a new child decreases for each successive child. In addition,
youngerchildren in large families are older at the birth of each succeeding
sibling and their average intelligence level is therefore higher. The as-
sumption that the impact of the family environment on the child is a
function of the average intellectual level of the family does not explain
the precipitous decline for the last-born child in each family. Nor does it
explain the anomalousposition of the only child, who might be expected
to have a more favorable environmentfor the developmentof intelligence
than siblings in any other family configuration. In order to explain these
last two characteristics of the data in Fig. 6.1, Zajonc and Marcus as-
sumed that children benefit from the opportunity to teach youngersib-
lings. Only children and last-born children are deprived of this oppor-
tunity and hence, uniquely amongall other siblings, experience a decline
in intelligence attributable to an inability to teach their youngersiblings.
Although confluence theory is able to explain, in a general way, several
features of the Dutch data, it should be noted that birth-order effects and
family-size effects are relatively small. The data presented in Fig. 6.1 are
aggregated data presenting meansfora very large population. At the indi-
vidual level, birth order and family size explain a relatively small portion
of the variance in test performance. Stein, Susser, Saenger, & Marolla
(1975) reported that the correlation between birth order and Ravenperfor-
mance was .10 and betweenfamily size and the Raven was.24. This latter
correlation maynotbe attributable to the influence of the environment.
Individuals who decide to have different sized families may differ genet-

WITHIN-FAMILY ENVIRONMENTAL INFLUENCES 203
ically. Family size may be positively or inversely related to social class.The appropriate controlfor a study of the environmental impactof familysize involves studying children whose parents have the same intelligencebut differ in family size.The confluence model was developed to explain the data presented in
Fig. 6.1. In several respects these data do notprovide an ideal test of themodel. The data do not permit one to test hypotheses aboutsingle par-ents and spacing. The data as presented are aggregated over social class.Family size is, as we havenoted, a between-family variable. Some attemptshould be madeto control for differences in parental characteristics be-fore examining the effects of family size. Birth order, by contrast, is awithin-family effect and should be tested by within-family data analysesthat contrast siblings in the same family. Marjoribanks & Walberg (1975)demonstrated that the curves in Fig. 6.1 were not the samefor differentsocial classes. They divided the Dutch selective service data into threesocial class groups and demonstrated that the functions relating familysize and birth order to intelligence differed in each of the groups. Forexample, in the lowest socioeconomic group there wasa slight increase inIQ as family size increased. The confluence model assumesthat the en-vironmental influences of these variables should be invariant and there-fore should notlead to different results for families with different socialbackgroundsunlessthere are differences in birth spacing that are relatedto social class or differences in the presence of caretakers whoare hired orwho are members of an extended family. Without additional ad hoc as-sumptions, the confluence model cannot explain the separate functionsfor different social classes obtained by Marjoribanks and Walberg for theoriginal data set used to derive the model.
Several investigators obtained data on family size and birth order thatthey claimed could not be explained by confluence theory. Brackbill &Nichols (1982) obtained Stanford—Binet and Wechsler IQ test scoresfor asample of 53,000 children participating in a study of the effects of pre-natal and perinatal events on development. They tested five hypothesesderived from confluence theory.
1. Children in father-absent homes will have lower IQs than childrenreared in homesin whichboth parentsare present. Their data for blackand white children on the Binet test administered when the childrenwere age 4 and on the Wechsler test administered whenthe childrenwere age 7 supportedthis prediction. Thebiserial correlations betweenthe dichotomousfather-absentor father-present variable and IQ scoresranged from .07 to .12 in their black and white samples for both ofthese tests. When they controlled for social class differences, the cor-relations became negative, ranging from —.02 to —.06. These data sug-gest that father absence hasa slight positive influence on IQ whensocial class differences are controlled.

204 6. ENVIRONMENTAL DETERMINANTSOF INTELLIGENCE
2. Single surviving twins will have a higher IQ than surviving twin pairs.
It is known that twins have lower IQs than singletons. Confluence
theory explains this phenomenon by appeal to the decrease of the
average family intellectual environmentassociated with the birth of
twins as opposed to singletons. Brackbill and Nichols foundthat sur-
viving members of twin pairs reared as singletons were notsignifi-
cantly higherin IQ than twins in which both membersof the twin pair
survived. For the sample of black twins, single surviving members of
twin pairs had lower IQ (but not significantly lower) than twins be-
longing to pairs in which both membersof the twin pair survived.
3. Confluence theory predicts that as birth interval increases the effects
of family size on ability should decrease. The data obtained by
Brackbill and Nichols provided support for this prediction. After con-
trolling for socioeconomic status, both birth order and the interval
between births were related to intelligence. Later-born children had
higher intelligence and children born with long intervals between
births had higher IQ.
4. Only children are expected to score lower in IQ than the firstborn
children of small families. Brackbill and Nichols used a regression
technique to predict the expected value of an only child’s IQ from
regressions of birth order and family size on IQ. There were no dif-
ferences between expected and obtained IQs. Only children did not
exhibit the expected decrement in IQ because of inability to teach
other children.
5. Children reared in homes with an extended family and additional
adults should have higher IQs than children reared in families with
two adults. There were nosignificant differences in intelligence be-
tween children reared in homes with more than two adults and chil-
dren reared in homes with two adults.
Brackbill and Nichols’s tests of the confluence of model failed to pro-
vide support for the assumptionsof the model. Theyattribute their nega-
tive results partially to their ability to control for social class differences.
The failure to find significant effects for father absence or for extended
families implies that the average level of intellectual stimulation in the
homecannotbe calculated from averages derived from the compositionof
the family. Any parametric version of confluence theory implies that the
numberof adults present in the homeinfluencesthe intellectual develop-
mentof the child. If the central assumption of confluence theory is incor-
rect, how are we to explain those findings that indicate that birth order
and birth spacing may influence intelligence? Brackbill and Nichols indi-
cated that obstetrical and epidemiological studies reported that short
birth intervals are adversely related to several indices of pregnancy out-
comeincluding mortality and birth weight. Therefore, the effects of birth
spacing may be mediated by prenatal events.

WITHIN-FAMILY ENVIRONMENTAL INFLUENCES 205
Gailbraith (1982b) studied Mormonstudentsat Brigham Young Univer-sity and obtained results that were not easily explained by a confluencemodel. Gailbraith found that average performance on the American Col-lege Test used for admissionsat Brigham Young University waspositivelyrelated to family size. He did find evidencethat birth order within familysize was inversely related to test scores. These differences were notrelat-ed to birth spacing. Berbaum, Marcus, & Zajonc (1982) argued that thedistinctive pattern of results obtained by Gailbraith was attributable tothe use of a Mormon sample. Mormonsvaluelarge families and empha-size the importanceof providing attention to each of their children. Theeffects of these socialization practices may be interpreted in termsof thecentral explanatory mechanism of the confluence model. It should benoted, however, that the appealto distinctive socialization practicesdissi-pates the quantitative elegance of the model and suggests that one cannotspecify the effects of family composition variables on intellectual devel-opment without additional information about family socialization prac-tices.
Zajonc, Markus, & Markus (1979; see also Berbaum & Moreland, 1980,Marcus & Zajonc, 1977; Zajonc, 1983; Zajonc & Bargh, 1980) developed anumberof modifications in the model and attempted to explain severallarge-scale data sets relating family size and birth orderto intelligence.Gailbraith (1982a,b; 1983) was able to show thatthe various mathematicalmodels developed by Zajonc and his collaborators led to unreasonableresults and were not necessarily internally consistent (see also Berbaumet al., 1982). One difficulty in assessing the confluence model is thatcritical tests of the model require oneto assess the impact of the familyenvironment on a child at several different times. Family compositionmay change in any of several ways: New children enter a family, olderchildren may leave home, adult caretakers may change through divorceand separation, and changesin the presence and absence of membersof achild’s extended family can occur. All of these changeswill change theaverage intellectual level of members of a family and should influence thechild’s intellectual development according to confluence theory. Large-scale data sets assessing changes in family composition and changes inintelligence in a longitudinal design do notexist. Therefore, critical testsof the confluence model based on the most appropriate data sets have notbeen done.This brief review of the confluence model leads to several tentative
conclusions. Theeffects of birth order and family size are small and aftercontrolling for socioeconomicstatus are not invariably present. The exactrelationship between these variables andintelligence mayvary in differ-ent social groups. Someof these differences are probably attributable tobetween-family differences that determine decisions about family sizeand spacing between children. The central assumption of confluencethe-ory about the impact of family environment on the child’s intelligence

206 6. ENVIRONMENTAL DETERMINANTSOF INTELLIGENCE
appearsto be contradicted by several findings in the literature. All of this
suggests that the composition of the family is not an important determi-
nant of the intelligence of a child.
There are manyotherpotential differences in the treatmentof children
within the same family. Parents may favor one child over another. Sibling
interactions may influence development. Each child may occupy a unique
position within the family. We know very little about the systematic
influence of these variables. Daniels & Plomin (1985) developed an in-
ventory to assess differences in sibling experiences. The relationship be-
tween these differences in perception of treatment and differences in
intelligence has not, to my knowledge, been studied. In addition to dif-
ferences in experiences within the context of the family, siblings may
differ with respect to extrafamilial influences. Siblings may havedifferent
friends and this could influence the developmentofintelligence.It is also
possible that many of the within-family environmental influences on
intelligence are virtually idiosyncratic. Intelligence may be influenced by
many unpredictable events that occurin a virtually random fashion. Ev-
erything from illnesses, to books read, to the influence of charismatic
adults such as teachersorreligious leaders might changethe activities of
an individual and influence scores on a test of intelligence. These influ-
ences maybeidiographic, i.e., they may be important influences in an
individual life but not necessarily in the lives of many individuals. It
should be apparent that we do not know very muchabout within-family
environmental influences on intelligence other than that they appear to
be important.
THE BIOLOGICAL ENVIRONMENT
AND INTELLIGENCE
Intelligence may be influenced by biological events. Illnesses, prenatal
experiences, the effects of birth and delivery, and nutrition are amongthe
biological events that have been assumedto influence intelligence. One
impetus to the study of the influence of the biologic environment came
from the hypothesis of “the continuum of reproductive casualty” (Pas-
samanick & Knobloch, 1966). This hypothesis implies that there is a
continuum of the effects of prenatal events and the birth process that
have enduring neurological consequences. Individuals without obvious
neurological disease may in subtle ways be influenced by the conse-
quencesof prenatal events and the birth process. Birch & Gussow (1970)
argued that the relationship between social class and intelligence might
be influenced by the biological environment. They argued that inade-
quate prenatal care and nutrition might influence the developmentof
intelligence and school failure. It is difficult to study the influence of
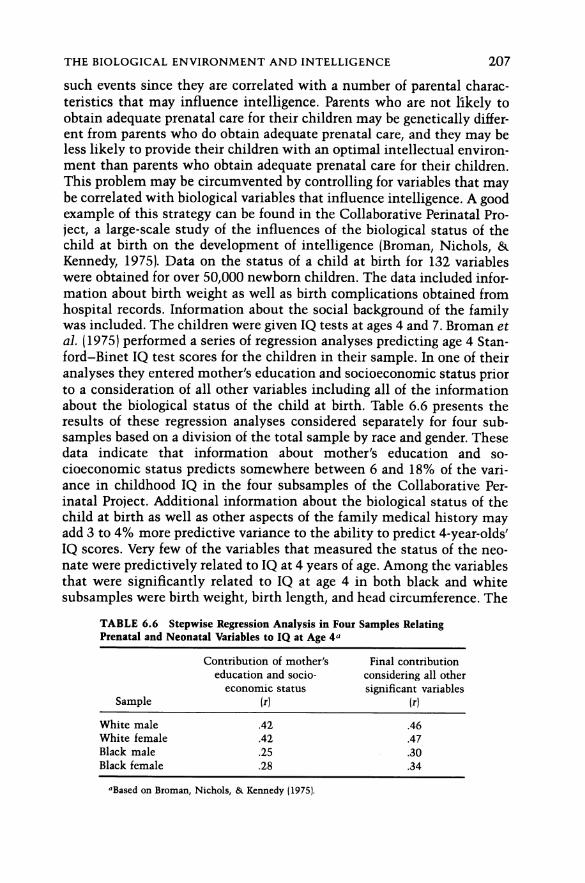
THE BIOLOGICAL ENVIRONMENT ANDINTELLIGENCE 207
such events since they are correlated with a numberof parental charac-
teristics that may influence intelligence. Parents who are notlikely toobtain adequateprenatalcare for their children may be genetically differ-ent from parents who do obtain adequateprenatal care, and they may beless likely to provide their children with an optimal intellectual environ-ment than parents who obtain adequate prenatal care for their children.This problem maybe circumvented by controlling for variables that maybe correlated with biological variables that influenceintelligence. A goodexample of this strategy can be found in the Collaborative Perinatal Pro-ject, a large-scale study of the influences of the biological status of thechild at birth on the developmentof intelligence (Broman, Nichols, &Kennedy, 1975). Data on the status of a child at birth for 132 variableswere obtained for over 50,000 newborn children. The data includedinfor-mation about birth weight as well as birth complications obtained fromhospital records. Information aboutthe social background of the familywas included. The children were given IQ tests at ages 4 and 7. Broman etal. (1975) performed a series of regression analyses predicting age 4 Stan-ford—Binet IQ test scores for the children in their sample. In one of theiranalyses they entered mother’s education and socioeconomicstatuspriorto a consideration of all other variables including all of the informationabout the biological status of the child at birth. Table 6.6 presents theresults of these regression analyses considered separately for four sub-samples based on a division of the total sample by race and gender. Thesedata indicate that information about mother’s education and so-cioeconomic status predicts somewhere between 6 and 18% of the vari-ance in childhood IQ in the four subsamples of the Collaborative Per-inatal Project. Additional information about the biological status of thechild at birth as well as other aspects of the family medical history mayadd 3 to 4% more predictive variance to the ability to predict 4-year-olds’IQ scores. Very few of the variables that measuredthe status of the neo-nate were predictively related to IQ at 4 years of age. Amongthe variablesthat were significantly related to IQ at age 4 in both black and whitesubsamples werebirth weight, birth length, and head circumference. The
TABLE 6.6 Stepwise Regression Analysis in Four Samples RelatingPrenatal and Neonatal Variables to IQ at Age 42
Contribution of mother’s Final contribution
education and socio- consideringall other
economicstatus significant variablesSample (r) (7)
White male 42 46White female 42 47
Black male 25 | .30
Black female .28 34
“Based on Broman, Nichols, & Kennedy(1975).

208 6. ENVIRONMENTAL DETERMINANTSOF INTELLIGENCE
correlations for these three variables in these two samples ranged from.06 to .11. Three othervariables characterizing the biological status of theneonate were predictively related to IQ in both black and white sam-ples—evidence of neonatal brain abnormality, neonatal serum bilirubin,and neonatalrespiratory distress. The correlation for these three variablesand IQ in black and white samples ranged from —.03 to —.09. These dataindicate that information about the biological status of the child at birthis only weakly related to his or her 4-year-old IQ. And, after controllingfor mother’s education and socioeconomicstatus, all of the informationconsidered collectively does not add appreciably to ability to predict IQ.The interpretation of the regression analyses reported by Bromanetal.
(1975)is difficult. The contribution of the biological status of the neonateto the development of childhood IQ may be overestimated or underesti-mated by the regression analyses summarized in Table 6.6. The controlfor the socioeconomic status of the mother maybeinterpretedas an over-or an undercontrol for relevant background variables. Mothers whoareimpoverished may have less adequate access to prenatal care than moreprivileged mothers. Inadequate prenatal care mayincreasethe probabilitythat the biological status of the neonate will be impaired. A control forthe socioeconomic status of the mother thus maycontrol for variablesthat influence the biological status of the neonate and thus maybe con-sidered to be an overcontrol for relevant variables. On the other hand, thecontrol for socioeconomic characteristics of mothers may fail to controlfor genetic differences that influence the ability of mothers to gain accessto prenatalcare.It is difficult to know whetherthevariables entered intothe regression equation prior to a consideration of the influenceof vari-ables that reflect the biological status of the neonate are appropriatecontrol variables. In any case, the simple uncorrected correlations be-tween biological variables and IQ are very low. Few account for more than1% of the variance in IQ. It should be noted that in individual instances
these variables may have a large impact on the developmentof a particu-lar child. Children with very low birth weight may be neurologicallyimpaired and the consequencesof this impairment mayinfluence theirintellectual development(see Drillien, 1964). In a large and representativesample these variables do not account for a substantial portion of thevariance in IQ.
Streissguth, Barr, Sampson, Darby, & Martin (1990) studied the effectsof prenatal alcohol exposure on the developmentof intelligence. Theyused an interview methodto assess alcohol use of women in the fifthmonth of pregnancy in a predominantly middle class sample. After con-trolling for educational backgroundsof the parents as well as a numberofother potential influences on JQ, they found that their measureof fetal
alcohol exposure correlated —.11 with a Wechsler test of intelligenceadministered when the children were4 years of age. They also studied theeffects of smoking and aspirin ingestion during pregnancy on childhood

THE BIOLOGICAL ENVIRONMENTANDINTELLIGENCE 209
IQ. Smoking was unrelated to IQ but aspirin ingestion was inverselyrelated to childhood IQ. Their measureof aspirin use correlated with IQ—.12 after adjusting for differences in parental educational level. Thedecrease in IQ associated with alcohol ingestion does not appear to beattributable to differences in the postnatal environment. The HomeIn-ventory was administered and wasfoundto be unrelated to alcohol inges-tion during pregnancy. A division of the sample of mothers into twogroups on thebasis of alcohol ingestion was associated with a 4.8-pointdifference in IQ. Data indicating whethertheeffects of prenatal alcoholexposure decline or persist for measures of intelligence beyond earlychildhood have not been reported. While the effects of alcohol exposuremay be small, they are only one of several possible teratogenic influenceson intelligence. The cumulative effects of all of the potential influencesof the biological environmenton the child may belarge.The Collaborative Perinatal Project focused on the biological status of
the neonate. Otherstudies of the influenceof the biological environmenton intelligence have considered measures of the biological environmentthat are notrestricted in their impact to the prenatal period and the birthprocess. There has been considerable controversy about the influenceoflead exposure on intelligence (see Lansdown & Yule, 1986; Needleman,Gunnoe, Leviton, Reed, Peresie, Maher, & Barrett, 1979; Smith, 1985).Moreextensive research with large samples appears to have documenteda Clear effect of exposure to environmental lead on intelligence. Fulton,Thomson, Hunter, Raab, Laxen, & Hepburn (1987) administered an intel-ligence test to 501 children 6 to 9 years of age in Edinburgh and obtainedblood samples permitting them to measurelead concentrations. Informa-tion about the social and academic backgroundof the children’s parentswas also obtained. Edinburgh was chosen asa site for investigation be-cause of the presence of a large numberof houses with lead plumbing.The sample was divided into deciles on the basis of lead concentrations.There was a linear dose-responseeffect. Adjusting for parental socialbackgroundandotherrelevant variables, children in the highest decile oflead concentration in their blood had IQ scores that were .43 standarddeviations lower than children in the lowest decline of lead concentrationin their blood. Lead concentrations in the blood accountedfor less thanhalf of 1% of the variance in IQ. Therefore, they clearly are not a majorsource of variance in IQ scores. At the same time these data clearlyindicate that high levels of exposure to lead do depress IQ test scores.McMichael, Baghurst, Wigg, Vimpani, Robertson, & Roberts (1988) re-
ported analogousresults in a study conductedin Port Pirie, Australia, anindustrial town with a lead-smelting plant and high levels of lead pollu-tion. They obtained measuresof lead concentration in the blood at birthand at periodic intervals for a sample of 548 children. In addition, theyadministered the McCarthytest of intelligence to these children at age 4and they obtained Wechsler maternal IQ scores as well as data on the

210 6. ENVIRONMENTAL DETERMINANTS OF INTELLIGENCE
Home measure as well as a numberof other parental background indices.They found a linear dose-responseeffect for lead concentration and IQ.Adjusting for background covariates, the optimal regression line suggeststhat children with the highest lead concentrations in their blood wouldhave an IQ that was approximately 1 standard deviation lower than chil-dren with the lowest lead concentrations. The strongest effects for mea-sures of lead concentrations were obtained for measures that integratedobservations taken at several different periods in the child’s life. This iscompatible with the notion that the effects of lead exposure arecumulative and a constant high level of exposure to lead has a moredeleterious effect on IQ scores than high-level exposure at one period in achild’s life.The results of the McMichael et al. and Fulton et al. studies provide
clear evidence that exposure to highlevels of lead in the environment hasan adverse impacton the developmentof intelligence. Whethertheeffectspersist beyond early childhood is not known, but there is no obviousreason to believe that the effects of lead exposure, if constant, woulddissipate. The range of covariates usedin both of these studiesis large andit is unlikely that the effects of lead concentrations are artifactual.
Variations in nutrition may be an additional environmental influenceon IQ. Children whoare extremely malnourished tend to have low IQ (seeStein & Kassab, 1970). Studies of malnourished children tell us relativelylittle about the influence of nutrition on intelligence since clinical mal-nutrition is invariably accompanied by neglect, poverty, poor schooling,and a host of other variables that might have a negative impact on thedevelopmentof intelligence. Even studies that have used sibling controlsand compared children whoare malnourished with their siblings whoarerelatively better nourished are not critical. Children whoreceivedifferentamounts of nutrition within the same family may betreated differentlyby their parents in many ways other than in the amountof food theyreceive. We shall examineseveral different attemptsto isolate nutritionalvariables and to study their impact on intelligence.
Stein et al. (1975) studied selective service registrants in Holland whohad experienced famineprenatally. Approximately one-half of the popula-tion of The Netherlands experienced a severe famine during World WarII.Stein et al. obtained military induction tapes for over 400,000 male 19year olds whowere born during the period of the famine. They comparedRaven test scores for individuals who experienced famine conditions atdifferent prenatal and postnatal periods. By noting place of birth they wereable to compare individuals born at the same time who did not experienceprenatal famine conditions. They found no effects of famine exposure onRavenscores at age 19. There waslittle doubt that their subjects experi-enced severe prenatal malnutrition. While pregnant women might havereceived more food than other individuals in the famine area, there wasevidence of depressed birth weights and excessfetal mortality attributed

THE BIOLOGICAL ENVIRONMENT AND INTELLIGENCE 211
to the famine conditions. It is possible that the parents who were moreresourceful were able to obtain more food and that the surviving childrenwere a biased nonrepresentative sample of the potential population ofchildren who would have survived in nonfamine conditions. This hypoth-esis cannot be tested. Whatis clear is that the presence of inadequateprenatal nutrition did not have a detectable effect on IQ under conditionsin which adequate nutrition was provided postnatally.Although the Dutch famine study suggests that prenatal nutrition is
not a critical influence on intelligence, there are other data that suggestthat prenatal nutrition may influenceintelligence. Lynn (1990a,in press)reviewed studies of MZ twins that obtained data on birth-weight dif-ferences and differences in intelligence. He found seven studies of thiskind. In each study the MZ twins whowere heavierat birth had higherIQs than their lighter twins. The differences across the studies rangedfrom 1.9 to 9.0 points in IQ. The birth-weight differences are reasonablyattributable to differences in the adequacyof prenatal nutrition. There-fore, these data are compatible with the assumption that variations inprenatal nutrition influence IQ.
Winick, Meyer, & Harris (1975) compared the IQs of three groupsofKorean children who were adopted by Americanparents before age 3. Thechildren were divided into groups on thebasis of an estimate of how wellnourished they were at the time of adoption. At age 10 the children whowere assumed to be malnourished (they were below thethird percentile ofKorean normsfor height) had IQs that were 10 points lower than thechildren judged to be well nourished. It is possible that the poorly nour-ished children differed in a numberof other respects from the well-nour-ished children.Rush, Stein, & Susser (1980) used a experimental design with random
assignmentof subjects to conditions to study theeffects of prenatal di-etary supplements on development. They randomly assigned black preg-nant women thoughtto beat high risk for delivering a low birth-weightbabies to one of three groups—a group receiving a high-protein liquidsupplement, a group receiving a high-calorie liquid supplement, or a con-trol group. Rush, Stein, Susser, & Brody (1980) tested the children result-ing from these pregnancies at age 1 on a visual habituation task. Theyfound that the children whose mothers received liquid protein supple-ments habituated morerapidly and exhibited larger response recovery to achange in the visual stimulation pattern than children whose mothersreceived a high-calorie dietary supplementor were in the control group.The differences in these habituation indices were approximately one-quarter of a standard deviation. Since the design involved a moderatelylarge sample (N = 376for the habituation measures) and a random assign-ment of women to conditions we can be reasonably sure that theeffectsare attributable to the influence of prenatal nutrition. The long-termconsequencesof the effects of protein supplementation of prenatal diet

212 6. ENVIRONMENTAL DETERMINANTSOF INTELLIGENCE
were not investigated in this study. Research reviewed in Chapter3 indi-cates that indices of habituation are correlated with IQ test scores up toage 7. If we assumethattheeffects of the changes in habituation observedby Rush and colleagues are related to later IQ in the usual manner (r =approximately .5) this would imply that prenatal protein dietary supple-mentation could have increased IQ by about an eighth of a standarddeviation. Since these children were not tested after age 1 this accountremains speculative. It is interesting to note that the changes in visualhabituation as a result of prenatal protein supplementation in this studywere obtained in a sample that was notclinically malnourished.
Schoenthaler, Amos, Eysenck, Peritz, & Yudkin (1991) reported theresults of a randomizedtrial of vitamin and mineral supplementsfor asample of 615 California eighth grade students. The students were as-signed to one of four groups who received either a placebo or dietarysupplements that contained supplementation of 50, 100, or 200% of theUSDAdietary guidelines for these nutrients for 13 weeks. All subjectswere given Wechslertests prior to the start of the experiment and at theconclusion of the study. All of the groups exhibited equal gains onretest-ing on the verbal part of the tests (approximately 2-point gains). Table 6.7presents the results for changes in nonverbal intelligence on the WISC.An examination of these data indicates that the supplemented groupsgained more than the placebo groups. The results indicate that the doseeffects were not linear—the 100% supplemented groups exhibited thelargest gains andstatistical tests indicated that only this group wassignif-icantly better than the placebo groups. If we average the results for thethree supplementedgroups, it appears that the supplemented groups were
approximately .29 standard deviations higher in nonverbal intelligencethan the placebo group. There was some evidence that the changes inintelligence were associated with changes in academic performance. The100% supplemented group gained more thanthe placebo groupin perfor-manceon the California test of basic skills in such areas as math, readingcomprehension, and science.
Theresults of the Schoenthaleret al. study are promising. The duration
TABLE 6.7 Changes in Performance IQ on theWISC for Different Nutritional Supplement
Groups?
Group Mean* SD N
Placebo 8.9 7.3 10050% Supplement 10.1 8.9 100100% Supplement 12.6 7.9 105
200% Supplement 10.4 7.6 105
4Based on Schoenthaler, Amos, Eysenck, Peritz, &
Yudkin (1991).
*F = 3.86, p < 01.

THE BIOLOGICAL ENVIRONMENT AND INTELLIGENCE 213
of these effects is unknown. And, the results, although based on rela-tively large, well-controlled study, require replication. Other attempts todemonstrate gains in intelligence using dietary supplements with smallersamples and a somewhatdifferent composition of the supplementfailedto find significant differences between supplemented and placebo groups(see, Crombie, Todman, McNeill, Florey, Menzies, & Kennedy, 1990,Yudkin, 1988). Nevertheless, these results suggest that some gains innonverbalintelligence are possible with the use of dietary supplements inrelatively well-nourished populations.Sigman, Neumann,Jansen, & Bwibo (1989) studied a sample of 7- and
8-year-old Kenyan children growing upin a rural area that was subject tofrequent droughts and food shortages. The children were given the Ravenand a verbaltest of intelligence, their nutritional intake was observed for2 days, and indicesof nutritional intake were derived for each child. Sixty-five percent of the boys and 73% of thegirls in this sample wereesti-mated to have daily caloric intakes that were below the optimal level.Parental literacy and socioeconomic status were also assessed. Table 6.8presents correlations between nutritional indices and scores on intel-ligence tests for male and female subjects controlling for parental so-cioeconomicstatus and literacy. The correlationsareall positive, indicat-ing that intelligence test performance is positively related to indices ofnutritional intake. It is difficult to know if these correlations under- oroverestimate the influence of nutrition on intelligence. Assessments ofnutritional intake for a 2-day period do not provide an adequate index ofthe adequacy of nutrition experienced by each child over his or herlife-time. More comprehensiveindices of nutritional intake would probablyresult in higher correlations with scores on intelligence tests. On theother hand, the possibility that adequacy of nutrition provided to childrenmay be correlated with parental characteristics that are independent ofsocioeconomic status and literacy that influence intelligence cannot beruled out. The most reasonable interpretation of these data is that mall-nutrition decreases performance on tests of intelligence. The effects of
TABLE6.8 Correlation between Cognitive Score and Food Intakewith SES Covaried¢
Females Males All(N = 60) (N = 73] (N = 133)
Kcal .37* 12 .18*Protein 39* 15 .21*
Animalprotein .29* 34* 31*
Fat .44* .27* 31*
Carbohydrate .30* .07 13SES (when food intake covaried) .34* 37* .38*
*p = .05.
2Based on Sigman, Neumann,Jansen, & Bwibo (1989).

214 6. ENVIRONMENTAL DETERMINANTSOF INTELLIGENCE
malnutrition on intelligence may be mediated by an influence on atten-tion that influences school performance. Sigman etal. (1989) found thatnutritional intake was inversely related to off-task behavior in classroomobservations for females but not for males. Female children who werewell nourished were more likely to exhibit appropriate classroom atten-tional behavior than children who were poorly nourished. Alternatively,it is possible that the influence of nutrition on intelligence is not medi-ated by attentional variables and is dependent upona direct influence ofnutrition on the developmentof the brain.The influence of nutrition on intelligence observed by Sigman et al.
(1989) is probably dependent on the fact that their sample was one inwhich there was chronic malnutrition. Comparable studies relating nu-tritional intake to intelligence with controls for parental characteristicshave not been reported for well-nourished samples. Although it is pos-sible that malnutrition among individuals in extremely impoverishedcircumstances in some Western countries may contribute to the negative
impact of poverty on intelligence, there is no evidence that nutritionalvariables are substantially related to intelligence in technologically ad-vanced countries.There are many other potential influences of the biological environ-
menton IQ. I am not aware of any research demonstrating that anysinglebiological environmental variable is substantially related to IQ. Thecumulative influence of all biological environmental events might besubstantial.
CONCLUSION
Chapters 5 and 6 have reviewed research on genetic and environmentalinfluences on intelligence. Current lower-bound estimatesfor heritabilityof intelligence are above .4 and some authorities believe that, for oldersamples, the heritability of general intelligence may be close to .7. Wehave examined manypossible environmental influenceson intelligence.Withthe possible exception of secular influences that are not well under-stood, there is little evidence that any single source of environmentalinfluenceis highly correlated with IQ. Variables as diverse as exposure to
lead in air and watersupplies, quality and quantity of schooling, and birthorder may each exert a small but discernible influence on intelligence.Itmay be difficult to increase scores on intelligence tests because the en-vironmental influences on tests are diverse.

7
BIOLOGICAL CORRELATESOF INTELLIGENCE
Intelligence is a heritable trait. This implies that there are biologicalcorrelates of intelligence. It is relatively easy to discover the biologicalcorrelates of intelligence but it is relatively difficult to determine thecausalrelationship between a biological measureandintelligence. Imag-ine an experiment in which a measureof brain function is obtained basedon positron emission scanning. This technique permits one to measureactivity in different regionsof the brain. Individualdifferences in activitylevel of the brain are correlated with individual differences in intel-ligence. How is the correlation to be interpreted? Consider some pos-sibilities. The relationship might be best understood in termsof a purelyenvironmentalinfluence on both intelligence and brain functioning. Indi-vidualdifferences in intelligence might depend on the degree ofintellec-tual stimulation received by an individual. Individuals whodiffer in intel-ligence might approach problemsin different ways and differences in theway in which they approach problems mightresult in differences in mea-sures of metabolicrates in different regionsof the brain. In this exampleitis assumed that environmental events influence intelligence and thatindividual differences in intelligence influence the functioning of thebrain, creating a correlation between intelligence and measures of brainfunctioning.Consider another scenario. Rats who are exposed to an enriched en-
vironmentdevelop brainsthatare structurally different from the brains ofrats exposed to “ordinary” laboratory environments. This suggests thatenvironmental events could influencestructural properties of the brain.The correlation between a structural property of the brain and intel-ligence could be interpretable by assuming that environmental eventschanged the brain and these changesin the brain influenced the develop-mentof intelligence. aThere are other possibilities. The characteristics of the biological en-
vironment mightberelated to both individual differences in brain charac-teristics and individual differencesin intelligence. For example, individual
215

216 7. BIOLOGICAL CORRELATES OF INTELLIGENCE
differences in nutrition might plausibly be assumedto be related to both
individual differences in intelligence and brain characteristics. The rela-
tionship between intelligence and brain functioning might be mediated
by the direct influence of the biological environment. More complex
interpretations are possible. The relationship might be influenced by ge-
netic—environmentalcorrelations. Individuals whodiffer in genotypesfor
intelligence maydiffer in their ability to obtain adequate nutrition. Other
interpretations are possible. Individual differences in the quality of nutri-
tion provided to a child may be correlated with adequacyof the intellec-
tual stimulation provided to the child by his or her parents. Nutrition
may influence the developmentof the brain and intelligence but the
correlation between a measureof brain function and intelligence may be
completely adventitious. That is, individual differences in intelligence
may be influenced by the quality of the environmental stimulation pro-
vided by a child’s parents, and the relationship between a measure of
brain functioning andintelligence on this analysis would not provide any
insight into the biological basis of intelligence.
It is apparent that a relationship between a biological measure and
intelligence is difficult to interpret and may occur for many different
reasons. Jensen & Sinha (In press) analyzed genetic and environmental
relationships between physical characteristics and intelligence. They in-
dicated that an environmental correlation between two phenotypic mea-
sures that are each highly heritable can occur. They presented the follow-
ing example. In a particular population brunettes may be nutritionally
favored and blondesnutritionally deprived. This maylead to a correlation
between hair color and stature. The correlation could be reversed to zero
in one generation by equalizing the nutrition of individuals whodiffer in
hair color.Jensen and Sinha distinguish between two typesof genetic correlations
between traits. A between-family genetic correlation between traits can
occur whenthere is no inherent or causal connection betweenheritable
traits but both traits have been subject to commonsocial influences. For
example, assume that both intelligence and height are heritable traits.
Assumethat in a particular society assortative mating exists for both
height and intelligence. This will tend to create a correlation between
height and intelligence.
Jensen and Sinha distinguish between genetically linked traits that
exhibit only between-family correlations and genetically linked traits
that exhibit both between- and within-family relationships. For example,
a pleiotropic correlation between traits can occur if one or more genes
influence both traits. Such an influence will be present in both within-
and between-family relationships.
Jensen and Sinha’s distinctions about environmental and genetic bases
for correlations between traits are useful in describing studies reporting
relationships between physical traits and intelligence.

ANATOMICAL AND PHYSICAL CORRELATES OF INTELLIGENCE 217
ANATOMICAL AND PHYSICAL CORRELATESOF INTELLIGENCE
Height
Height and weight are correlated, and both height and weightare corre-lated with intelligence. Since most of the studies have focused on height,I shall deal only with studies relating height to intelligence. Jensen &Sinha (In press) reviewed studies of the relationship between height andintelligence. They analyzed seven modern studies of young adult popula-tions with samplessizes varying from 203 to 7500. Thecorrelations ob-tained between height and intelligence vary from .12 to .29 with a meanvalue of .22 and an N-weighted mean value of .23. There is little doubtthat height and intelligence are significantly correlated. The correlationbetween height and intelligence may be decreasing. Teasdale, Sorenson,& Owen (1989) reported a secular decrease in the correlation for largesamples of Danish military recruits born between 1939 and 1967. Thedecline in the correlation is approximately .03 per decade, although thereis some indication that this decline is less apparent for the younger co-horts in their study.
Jensen and Sinha interpreted the correlation between height and intel-ligence as attributable to cross-assortative mating. Both intelligence andheight are related to social mobility. If individuals choose mates whoaretall and intelligent, the genes associated with both of these traits will befound to covary. They noted that the correlation between height andintelligence is not substantially decreased when indices of so-cioeconomicstatus are controlled and therefore they do not believe thatthe correlation is substantially attributable to environmental variablesthat influence both stature and intelligence. It should be noted that thereis an environmental variable that may plausibly be linked to both intel-ligence and height—nutrition. Whether the linkage between height andintelligence is mediated environmentally or by cross-assortative matingleading to an adventitious genetic covariance, the correlation betweenthese variables ought to be substantially diminished whenit is derivedfrom within-family comparisons. This is exactly what is found. Jensenand Sinha reviewed several studies that compared within- and between-family correlations for height and intelligence and indicated that theyuniformly found that between-family correlations for these variableswere invariably larger than within-family correlations, which were oftenclose to zero. For example, Jensen (1980b) obtained IQ test scores andheights for 8000 California children in grades 2 through 8. The between-family correlations averaged over grade levels had a mean of .10. Thecomparable within-family correlation was .03. If the within-family cor-relation between height and IQ is close to zero, then these traits are not
influenced by the same genesand, to the extentthat bothtraits are influ-

218 7. BIOLOGICAL CORRELATES OF INTELLIGENCE
enced by environmentalinfluences, they are influences that do not createsimilarities among children reared in the same family.
Brain Size and Head Circumference
The study of the relationship between indices of brain size and intel-ligence hasits origins in the nineteenth century and wasstudied by Binet(see Paterson, 1930, for a review of the older literature). Correlations be-tween brain size andintelligence are not usually based on direct measure-mentof brain size. Noninvasive techniques for the measurementof brainsize did not exist until recent years. Typically, head circumference is usedas an indirect index of intelligence. Head circumferenceitself is onlyimperfectly correlated with brain size. Van Valen reviewed studies cor-relating head circumference and brain size and concluded that thecor-relations typically reported ranged from .6 to .7. Van Valen (1974) citedstudies that reported correlations as low as .36. Brain size is related tobody size and it is necessary to statistically control for this variable inestimating the relationship between intelligence and brain size as indi-rectly measured by head circumference.
Jensen & Sinha(In press} reviewedthis literature relying on a compre-hensive review by Van Valen, who obtained a weighted mean correlationof .27 between measuresof head size andintelligence and partial cor-relation of .19 between these variables with height partialled out. VanValen’s review may be supplemented by tworecent large-scale studies.Broman, Nichols, Shaughnessy, & Kennedy (1987) obtained correlationsbetween head circumference and WISC IQ for a sample of 36,000 blackand white 7 year olds studied as part of the Collaborative Perinatal Pro-ject. They reported correlations of .24 and .18 betweenthesevariables fortheir white and black samples, respectively.
Sausanne(1979) reported a correlation between head circumference anda composite indexof intelligence for a representative sample of over 2000Belgian maleseligible for military service. Susanne obtained a correlationof .24 and a partial correlation with height controlled of .19. Jensen andSinha used Sausanne’s data to estimatethecorrelation betweenbrain sizeand intelligence. They indicated that there are uncertainties surroundingsomeof the appropriate corrections to use andthat the precise correlationbetween head circumference and brain size is not known. Theyesti-mated, on the basis of reasonable calculations and assumptions, that thecorrelation between brain size and intelligence is .38. This value is com-patible with the results reported by Willerman, Schultz, Rutledge, &Bigler (1989), who used magnetic resonance imagingto obtain direct mea-sures of brain size in a sample of 40 college students whodiffered in theirSAT scores. They reported a correlation between brain size and scores onthe Wechslertest of .35. (This was actually an adjusted correlation to takeaccountof the use of groups with extremescores). The Willerman etal.study needs replication with larger samples. These data, when combined

ANATOMICAL AND PHYSICAL CORRELATES OF INTELLIGENCE 219
with the findings of studies indicating a correlation between head cir-cumference and IQ,support the inference that there is a correlation be-tween brain size and IQ.It is possible that the correlation between ana-tomical features of the brain and intelligence may be underestimated instudies relating brain size to intelligence. It is probably the case thatcorrelations between morerefined measuresof the size of specific regionsof the brain and intelligence would be higher than the correlations thathave been obtained between imperfect indices of total brain weight andintelligence. With the availability of newer techniques of imaging itought to be possible to study the relationship between anatomical fea-tures of the brain andintelligence.
It is not known whetherthe correlations between brain size andintel-ligence is present in within-family correlations. Jensen & Sinha (In press)reported the results of analyses performed by Jensen of the relationshipbetween indices of head size and intelligence in a sample of 82 pairs ofMZ twins and 61 pairs of DZ twins. Thecorrelations they obtained arepresented in Table 7.1. The differences in between-family correlationsforMZ and DZ twinssuggest that the correlation between these variablesismediated genetically. The correlation of .28 for the within-family DZcorrelation suggests that differences in head size within families are pre-dictive of differences in general intelligence. Jensen and Sinha noted thatthese results must be interpreted cautiously in view of the relativelysmall sample size involved. Note that three of the four correlationsre-ported in Table 7.1 are notstatistically significant.
Myopia
Myopia, or nearsightedness, is correlated with intelligence. Myopia is acondition in which light rays entering the eye have a focal point beforethe retina. The focal point of light rays on the retina is a continuousvariable. Myopia is a heritable trait which is thought to be relatively
TABLE7.1 Correlations between Head Sizeand Intelligence for MZ and DZ Twins2
Source r
MZ (between family) 39*MZ (within family) 17
DZ (between family) 15MZ (within family) .28
“Based on Jensen & Sinha(in press).
>Between-family correlations are based on the mean
score for twin pairs in each family for each of two depen-
dent variables—IQ and a composite index of headsize.
Within-famiy correlations are based on difference scores
for each twin pair on each of the two dependentvariables.
*p < .01; for all other r’s p > .05.

220 7. BIOLOGICAL CORRELATESOF INTELLIGENCE
uninfluenced by degree of literacy or use of the eyes for close reading.
Jensen and Sinha reported the results of several large-scale studies that
indicate that myopia and intelligence correlate between .20 and .25.
Karlsson (1976) reported that California high school seniors wearingcor-
rective lenses for myopia had IQs that were 8 points higher than those
who were not wearing such lenses. Teasdale, Fuchs, & Goldschmidt
(1988) reported that the frequency of myopia was monotonically related
to scores on a group IQ test for a large sample of over 15,000 military
recruits in Denmark. Myopic individuals had IQs that were 7 points
higher than nonmyopic individuals. Rosner & Belkin (1987) reported
comparable results for a national sample of over 150,000 Israeli recruits.
There is evidence indicating that the correlation between myopia and
intelligence is present within families as well as between families. Ben-
bow (1986) selected adolescents whoseability scores on the SAT were in
the top one-half of 1% of over 100,000 students taking the test. She found
that over 50% of this group was myopic, which was over twice thefre-
quency of myopia foundin the general population. She mailed a question-
naire on myopiato the parents of these adolescents and found that 36% of
their siblings were myopic. Although the intellectual ability of the sib-
lings wasnotassessed,it is reasonable to infer that it was lower than that
of the intellectually gifted students studied by Benbow. This conclusion
follows from a consideration of the influence of regression effects. Cohn,
Cohn, & Jensen (1988) selected a group of 15 years olds with high IQ and
measured their degree of myopia. They comparedtheir scores on intel-
ligence tests and myopiato that of their siblings. The adolescents with
high IQ had IQsthat were 14 points higher on the Ravenstest than their
siblings. The high-IQ siblings had myopia scores that were .39 standard
deviation units higher than those of their siblings. Thus the correlation
between myopia and intelligence appears to be present in comparisonsof
individuals who are reared in the same family, suggesting that the influ-
ences that cause individuals reared in the samefamily to differ in intel-
ligence are correlated with the influences that cause individuals in the
same family to differ in myopia. Genetic influences are plausible candi-
dates. It is possible that the genes that influence myopia also influence
intelligence.
FUNCTIONAL PROPERTIES OF THE NERVOUSSYSTEM AND INTELLIGENCE
Nerve Conductance Velocity
Vernon & Mori (1989) measured nerve conductancevelocities of the me-
dian nerve of the arm. They obtained a correlation of .42 from theirmeasure of nerve conductance velocity and a general measureof intel-ligence on a sample of 85 university students. The nerve conductance

PROPERTIES OF THE NERVOUS SYSTEM AND INTELLIGENCE 221
velocity measure is a measure of speed of nerve conductancein the pe-ripheral nervous system and involves no obvious cognitive activity. Ver-non replicated these results in a second study of 46 university studentsand obtained a correlation of .40 between the measures of nerve conduc-tance velocity and general intelligence. Vernon (1991) is conducting atwin study to ascertain genetic and environmental influences on thecovariance between nerve conductance velocity measures and intel-ligence. It should be realized that the study of nerve conductance velocityas a possible biological correlate of intelligence is at a very preliminarystage. Reed & Jensen (1991) were unable to replicate Vernon’s findings andthe results of Vernon’s twin study are notavailable. Therefore, specula-tions aboutpossible relationships between nerve conductance velocityand intelligence, including a consideration of the reasons for the rela-tionship, are premature.
PET Scans
Another promising area of investigation of the biological correlates ofintelligence involves the use of positron emission tomography (PET) mea-sures of brain functioning. This technique, which is based on the inges-tion of a radioactive substance, permits one to obtain in vivo measures ofactivity levels of different regions of the brain. Haier etal. (1988) obtainedPET scan measuresof cortical functioning following the completion of aRavenstest for a small sample of subjects (N = 8). The levels of activityrecorded in the brain following the completion of the test may be in-terpreted as an index of activity in brain regions during the performanceof the test. The correlations were negative and Statistically significantdespite the small sample size. There are other preliminary reports ofnegative correlations between metabolic functioning as assessed by PETscans and performanceontests of intelligence (see Haier, In press; Parks,Lowenstein, & Dondrell, 1988). Research relating PET measuresto intel-ligence is at a very preliminary stage andits is premature to speculateaboutpossible relationships between individual differences in metabolicactivity in different regions of the brain and performanceon tests ofintelligence.
EEGandIntelligence
The attempt to relate EEG measuresto intelligence has a long history—studies have been conducted on this topic for five decades (see Vogel &Broverman, 1964, for a review ofolder literature). Deary & Cary](In press}presented a comprehensive analysis of the available literature. Conclu-sions aboutthe relationship between EEG measures and intelligence haveranged from the assumption that there are defined EEG biological mark-ers of general intelligence that are better measures of g than psychometrictests (Eysenck, 1988; Eysenck & Barrett, 1985) to the assertion that there

222 7. BIOLOGICAL CORRELATES OF INTELLIGENCE
are no relationships between EEG measures and general intelligence
(Howe, 1988a, b}.
It is difficult to reach clear conclusions aboutthe relationship between
EEG indices and intelligence for several reasons. Many investigators
workingin this area have used small samples. There are few clear replica-
tions of findings and therefore promising relationshipsare often based on
a single investigation. Also, many investigators have computed many
EEG measures and related them to intelligence, increasing the likelihood
of obtaining spurious nonreplicable correlations. Standardized indices of
EEG performanceare not used. Investigators used various mathematical
proceduresto derive measures from the EEG. Someused evoked potential
indices that attempt to define characteristic responses to stimuli present-
ed to a subject; other investigators have used nonaveraged EEG measures
with no attempt to relate the measures to stimulus presentations. Stim-
ulus presentations varied considerably. Stimuli have varied in modality
(e.g., visual, auditory) and in intensity. Subjects have been given quite
different instructions and tasks to perform while EEG indices were ob-
tained, ranging from passive observation of stimuli to some type ofintel-
lectual task. In addition to this plethora of indices and stimuli, technical
proceduresfor the administration of the EEG have varied. The numberof
electrodes, the location of electrodes, and various procedures for remov-
ing “artifacts” in the data differ. Given the plethora of methods and tech-
niques and the general failure to report replicationsof findings, it is not
surprising that different reviewers have reached somewhatdifferent con-
clusions about the probity of the evidence indicating possible rela-
tionships between EEGindices andintelligence.
In addition to the difficulty of summarizing studies that employed
different methods, it should be apparent that there is considerable con-
ceptual confusion surrounding the meanings of any EEG-intelligence
relationship. The EEG maybe construed as a measureof a “hard-wired”
biological index of neural functioning. Alternatively, EEG measures may
reflect information-processing characteristics of the brain that have de-
velopedasa result of experience. Thus a correlation between the EEG and
intelligence is casually ambiguous.Thisis particularly true for EEG mea-
sures derived from subjects engaged in someintellectual task. Differences
in the way in which subjects process stimuli might be related to dif-
ferences in EEG parameters. Differences in intelligence could causeindi-
viduals to respond to stimuli in different ways and the EEG could actas a
neural index of these differences.
It is beyond the scope of this book to review all of the studies relating
EEGindicesto intelligence (see Deary & Caryl, In press, for a comprehen-
sive review). I have chosen not to do so because of the inherent ambiguity
and nonreplicability of the findings in this area of research. They do not
appear to metoleadto clear conclusions.I shall review a series of studies
reported by Hendrickson and Hendrickson (Blinkhorn & Hendrickson,

PROPERTIES OF THE NERVOUSSYSTEM AND INTELLIGENCE 223
1982; Hendrickson, 1982; Hendrickson & Hendrickson, 1980) that re-ported substantial correlations between IQ and EEG indices.Hendrickson & Hendrickson (1980) presented a theoretical analysis
linking intelligence to EEG parameters. They assumed that intelligencewasrelated to the fidelity of neural transmissions. Errors in transmissionof neural impulses at the synapse were assumed to influence evokedpotential responses. They assumedthatthe complexity of the wave formof the evoked potential response was inversely relatedto errors of trans-mission andpositively related to intelligence. They used a “string” mea-sure which,in effect, superimposes a String over the wave. More complexwave forms with more componentsandgreater deviations from the base-line would result in higher values of the string length measure. Theyassumedthat string length would be positively correlated with IQ.Blinkhorn & Hendrickson (1982) tested this theory on a sample of 33
undergraduates. Average evoked potential responses were obtained in re-sponse to auditory stimuli delivered to subjects who were instructed torelax and keep their eyes closed. They obtained a correlation of .54 be-tween scores on the Raventest and their measureof string length.Hendrickson(1982) conducted a similar investigation with 219 second-
ary school students with a mean Wechsler IQ of 108. The correlationbetweenstring length of the average evoked potential responseto audito-ry stimuli and IQ was .72. A combined index based on a composite of thestring length measure and a measureof the variability of wave formscorrelated .83 with intelligencein this large relatively unselected sample.Hendrickson reported that the string length measure correlated .80 in asample of 16 court stenographers with above-average IQs. Hendricksonreported that string length measures were very high in a sample of re-tarded subjects, possibly indicating that the determinants of EEG waveforms in very-low-IQ subjects are different from the determinants ofevoked potentials in the normalIQ range.Eysenck & Barrett (1985) reported the results of a factor analysis of the
data collected by Hendrickson relating performance on the Wechsler toevoked potentials in secondary school students. They factor analyzed theWAISandobtained a general factor. They found that the compositevari-ance—string length measure loaded .77 on the general intelligence factorderived from the WAIS andhad a loading that was as high as any of theWAISsubtests, suggesting that the EEG measure could be construed as amarker for the general intelligence factor.The dramatic findings obtained in these studies should be accepted
cautiously. There are at present too few replications to assumethat theseresults constitute a firm basis for assuming that the complexity of theevoked potential response constitutes a biological marker for intel-ligence. In addition, the studies that attempted to replicate these findingshave differed both in methodological detail and in relevant findings.Shagass, Roemer, Straumanis, & Josiassen (1981) failed to find a correla-

224 7. BIOLOGICAL CORRELATES OF INTELLIGENCE
tion between the Raven test score and the string length measure in a
sample of adult psychiatric patients and their normal controls. It should
be noted that their experimental procedure differed from that used by
Hendrickson in several details. They presented stimuli in different
modalities and the interstimulus intervals were different. Whether these
or other differences in methodology accountedfor the different resultsis
not clear.
Haier, Robinson, Braden, & Williams (1983) obtained average evoked
potentials in responseto visual stimuli that differed in intensity from a
sample of 23 nursing students. They obtained correlations ranging be-
tween .23 and .50 between string length and the Ravenscores in this
sample. Higher correlations were obtained for stimuli at medium-high
and high intensities. They also reported that the string length measure
wascorrelated .80 with the difference in amplitude of the N140 and P200
components. This measure correlated between .38 and .69 with Raven
test scores, with the highest correlation occurring at the medium-high
intensity.
Haier, Robinson, Braden, & Krengel (1984) reported the results of a
replication of the study by Haieretal. (1983). They began with a sample
of 27 subjects but excluded 12 subjects who were outside the age range
previously studied or for whom they suspected measurementerrors in the
evokedpotential indices. The remaining 15 subjects exhibited a pattern of
results that were partially similar to those previously reported. They ob-
tained correlations ranging from —.15 to .50 between the N140—P200
measure and scores on the Raven. The highest correlation was obtained
for EEG measures derived from stimulus presentations at the medium-
high intensity (luminance = 75 ft L).
Stough, Nettlebeck, & Cooper (1990) reported the results of an at-
tempted replication of the relationship between string length measures
and IQ using a sample of 20 first-year psychology students. They used
auditory stimuli and procedures that were similar to those originally used
by Blinkhorn and Hendrickson. They obtained a correlation of .43 be-
tween a string length measure based on thefirst 250 ms of the average
evoked potential response to the auditory stimulus and WAIS IQ. This
correlation may be corrected for restrictions in range andtest reliability,
leading to a corrected value of .58. They also reported that the largest
value of the correlation was obtained for a measure based onthestring
length for the period from 100 to 200 msafter stimulus onset. String
length for this period correlated with IQ .60 uncorrected and .74 cor-
rected. In contradistinction to the studies reported by Haieret al. (1983)
and Robinson, Haier, Braden, & Krengel (1984), Stough et al. (1990) re-
ported a zero correlation between N140—P200 magnitude andIQ.In addi-
tion, they reported that their string length measures were unrelated to
scores on the Raven, thusfailing to replicate the results of the Blickhorn
and Hendrickson study. Someof the discrepancies in results reported may

PROPERTIES OF THE NERVOUS SYSTEM AND INTELLIGENCE 225
be attributable to sample differences or to the instability of correlationsbased on small samples.The studies based on thestring length measure, although inconsistent
with respect to details of outcome, present a promising beginning for amoredetailed analysis of the relationship between EEG parameters andintelligence. Given the uncertain status of the attempts to replicate thedramatic findings of Hendrickson and the relatively small number ofrelevant studies it is, in my judgment, premature to assumethat stringlength indices constitute a biological marker for general intelligence.
String length measures are derived from experimental situations inwhich subjects are not required to actively engage in any intellectualactivity. Schafer (1982; see also Jensen, Schafer, & Crinella, 1981) sug-gested that differences in EEG indices obtained when subjects were re-quired to process predictable sensory input and unpredictable inputwould berelated to intelligence. He assumed that subjects who were highin intelligence would commit few neuronstoprocessing predictable stim-uli and many neuronsto processing unpredictable stimuli. In orderto testthis theory he presented subjects with auditory click stimuli under threeconditions: (1) a condition in which stimuli were presented every 2 sec-onds, (2) a condition in which subjects were presented stimuli at intervalsthey selected to be random in whichthey controlled the stimulus presen-tations, and (3) a condition in which the clicks were presented automati-cally at intervals that matched those selected by the subjects in the sec-ond condition. He obtained indices of the total integrated amplitude ofthe average evoked potential for each of these conditions and constructeda “Neural Adaptability” index defined as the difference between the inte-grated amplitude measures for the third minus the second condition di-vided by the average amplitude of all three measures plus 50, a constantto ensure thatall measures were positive. He obtained a correlation of .66between this index and full-scale IQ for 74 adult subjects.Zhang, Caryl, & Deary (1989b) exploredtherelationship betweenintel-
ligence and average evoked potential responses to stimuli in an inspec-tion-time task. They presented subjects visual inspection-time stimuliunder conditions in which they were required to make a visual inspec-tion-time judgment and under conditions in which they were asked tolook at the stimuli but were not required to judge which of two stimuliwas longer in length. They wereparticularly interested in an EEG param-eter that was related to inspection-time performance—therise time forthe P200 response. They found that P200 rise time was positively corre-lated with inspection time. Since inspection time is knownto be inverse-ly relatedto intelligence, this relationship may be explained by assumingthat intelligence maybepositively associated with the speed with whichindividuals exhibit transitions between different EEG components. Thecorrelation between Zhangal.’s measure of P200 rise time and IQ in asample of 35 university students with obviousrestrictions in range of

226 7. BIOLOGICAL CORRELATES OF INTELLIGENCE
talent was —.34, indicating that rise times for the P200 component were
associated with high IQ. This correlation dropped to .05 for trials in
which subjects were not required to judge the stimuli. These data, and the
data obtained by Schafer, suggest that there may be relations between
EEG parameters obtained from situations in which individuals are re-
quired to respond to stimuli and intelligence. Further research using
these and related techniquesis required to ascertain the magnitude of the
relationship between intelligence and EEG indices obtained while indi-
viduals are engaged in various tasks.
While the search for EEG measuresthatrelate to intelligence has a long
and somewhatunproductive history, the studies reviewed above doindi-
cate that there is at least the promising foundation for additional re-
search. It appears to be reasonably clear that there is a nontrivial rela-
tionship between some EEG parametersandintelligence. It is premature
to speculate about the theoretical basis for the reasons for the rela-
tionship.It is possible that some EEG parametersthatare highly heritable
mayberelated to intelligence. And, it is possible that genetic covariance
analyses will indicate that the relationship between such hypothetical
EEG parameters andintelligence is genetically mediated. Butit should be
recognized that the studies that would permit us to reach such conclu-
sions do not exist. For the present, it is reasonable to concludethatit is
likely that there is a nontrivial relationship between the EEG and intel-
ligence and further research is needed to specify with greater precision
the nature of the relationship. We need to have a better empirical under-
standingof the relationship as well as a theoretical analysis of the reasons
for the relationship.
CONCLUSION
The study of the biological correlates of intelligence has a long history in
psychology, going back to Galton in the nineteenth century. It may also be
said to have a brief recent history in which it is being resurrected. The
status of this area of research may be comparedto the study of the rela-
tionship between psychometrically assessed intelligence and perfor-
mance in cognitive experimental situations whose recenthistory is ap-
proximately 15 years in duration. The contemporary study of the
biological basis of intelligence is still more recent—manyof the topics
dealt with in this brief chapter constitute contemporary revivals of re-
search issues that have been resurrectedin the last 5 years. It is my guess
that the next decade will lead to some progress in understanding the
biological basis of general intelligence. The development of new methods
of studying the brain (e.g., PET scans and NMR)will provide information
about individual differences in the structure and function of the brain.
Such indices may be related to psychometric measures, providing a po-

CONCLUSION 227
tential for better understanding of the biological basis of individual dif-ferencesin intelligence. Theavailable data, though far from definitive, doindicate that there are relationships between biological indices andintel-ligence. With the possible exception of the relationship between myopiaand intelligence, there is relatively little evidence that suggests that therelationships may be understood in a causal way—although a causalmodel that attempts to relate individual differences in intelligence tofeatures of the nervous system is plausible given the evidencefor a genet-ic influence on intelligence. _

8CONTINUITY AND CHANGE
IN INTELLIGENCE
IS INTELLIGENCE FIXED?
Is intelligence fixed? It is sometimes asserted that the psychometric ap-
proach to intelligence assumes that intelligence is a fixed unchanging
characteristic of individuals. In their book on intelligence, Kail & Pel-
legrino (1985) quote Hunt, who wrote about psychometriciansas follows:
“The very significance of his research andpractice lies in the capacity of
the tests to predict performanceat a later time and topredict other kinds
of performance. A faith in intelligence as a basic andfixed dimensionof a
person is probably the faith on which one can mostreadily rest such a
professional function” (J. M. Hunt, 1961, p. 14). Sternberg (1986) also
asserted that psychometricians believe in a doctrine of intelligence as a
fixed characteristic of a person. In the initial chapter of a book onintel-
ligence, Sternberg listed “five red herrings’—that is, erroneousbeliefs
held about intelligence. Sternberg wrote, “Conventionaltesters of intel-
ligence obviously have something to gain by selling the notion of intel-
ligenceas a fixed entity. After all, what good would thetests be if scores
were unstable, varying from one time or place to another? ... But is
intelligence really a fixed entity? The bulk of the evidence suggests thatit
is not. Intelligence can be increased, and there are now
a
variety of pro-
grams designedto dojust that” (Sternberg, 1986, p. 9}. It is apparent that
experts in thefield of intelligence believe that psychometrically oriented
psychologists, in contradistinction to cognitive psychologists interested
in intelligence, are committed to the view that intelligence is a fixed
entity of a person.I find these assertions puzzling. Kail and Pellegrino do
not cite any psychometricians whohold these views, but quote Hunt who
is opposed to a psychometric conception of intelligence. The assertion
that psychometriciansbelieve that intelligence is fixed is a canard andis
not representative of the views of psychometricians. Perhaps the mis-
taken notion that psychometricians believe that intelligence is fixed de-
rives from evidence that we shall review that IQ is a relatively stable
228

IS INTELLIGENCEFIXED? 229
characteristic of a person. Despite Sternberg’s assertions, there is rela-
tively little evidence that general intelligence is easily changed by inter-vention programs. Perhaps the commitment of many psychometriciansto an investigation of the behavior genetics of intelligence led psychol-ogists opposedto this view to wrongly infer that genetic influences havean immutable influence on the phenotypeof intelligence.Whatdo psychometriciansbelieve aboutthe stability and change of IQ?
If there is any legitimate claim to a notion of fixed intelligence, it mightmost plausibly derive from a genetic conception of intelligence. It ispossible to define intelligence as the ability to acquire knowledge. Suchan ability is, by definition, logically and chronologically prior to the ac-quisition of the knowledge that is enabled by possession of the ability.
Since abilities are always prior to achievements, the postulation of anability inexorably leads to a consideration of the origins of the ability. Theearliest possible origin of an ability is the moment of conception thatdetermines an unchanging genotype.If intelligence is assumedto be the-oretically equivalent to genetic ability, then it is possible to assert thatintelligence does not changeandis a fixed characteristic of a person. Butany such theory refers only to a hypothetical entity that is not iso-morphic with any index of developed intelligence. Indices of intelligenceare the product of interactions between a hypothetical genetic potentialand the acquisition of skills and knowledge that influence future abilityto acquire knowledge. Notest of intelligence may be correctly construedas a measure of primordial genetic potential to learn. It is possible toimagine some physiological index of intelligence that might be derivedfrom an examination of a person’s genotype, or from physiological mea-sures of brain functioning obtained neonatally or prenatally, that wouldindex the primordial intellectual capacity of an individual. Such a con-struct belongs to sciencefiction rather than to science.Apart from science-fiction concepts, how does intelligence change?
Consider some of the changes we have considered.
1. There are secular increases in intelligence. These changesare notat-tributable to genetic influences. Indeed, as we shall see in Chapter9,fertility patterns in the U.S. have, if anything, been dysgenic, thatis,compatible with a decrease in the genetic potential for IQ.If the genepool for intelligence has remained constantor has actually changed tocreate a lower genetic potential for the developmentof intelligence,the increases in intelligence that occurred over the last several decadesmust be attributable to changesin the influence of genotypes on phe-notypes leading to an increase in measured intelligence for youngercohorts.
2. Even the most ardent proponent of genetic influences on intelligencebelieves that there are environmental influences on the phenotype forintelligence. Hence the genetic potential that constitute a rationale for

230 8. CONTINUITY AND CHANGEIN INTELLIGENCE
a belief in intelligence as a fixed entity must havea variable influenceon the phenotype dependent upon thenature of the environment thatis encountered.
3. The way in which genetic and environmental influences combine toinfluence intelligence changes over an individual’s life. Our review ofdevelopmental behavior genetics in Chapter 5 indicated that geneticfactors may be more important determiners of adult IQ than of IQ inchildhood. This implies that the IQ index is not a measure of the sameconstruct at different points of a person’slife. If it were, the determi-nants of the construct would not change.
4. The contentof intelligence tests changes overthe life span. Items usedto assess intelligence in a 4 year old are not the sameas items used toassess intelligence in adults. In this respect, IQ is not like height,which increases but can be assessed by the sameinstrumentatdiffer-
ent times in a person’s life. The meansof assessing intelligence are notconstant over the life span and hence the increase in intelligenceisindexed by different instruments.
5. It has been argued that there are age-related changesin the biologicalbasis of fluid intelligence over the life span. Therefore, some compo-nents of intelligence may be influenced by age-related changesin the
biological basis of test performance.
6. While IQ test scores are stable, the test-retest correlation is less than
perfect. IQ is only relatively fixed or unchanging. As the time betweenadministrations increases, the test-retest stability of IQ decreases.
7. The intellectual skills that a person develops depend crucially on a
person’s cultural experiences. For example, the Puluwat, who inhabitthe Caroline islands in the South Pacific, are skilled navigators whodevelop complex mental maps of their islands and integrate thisknowledge with meteorological observations to navigate (Gladwin,1970). One might argue that intelligence would be defined as skill innavigation for the Puluwatandthatintelligence in their society wouldobviously be a different construct than intelligence assessed in our
society. It is clear that the knowledge that is acquired in differentsocieties is different. Such examples are often taken as self-evidentdemonstrationsof the cultural relativity of the conceptof intelligence.Actually, the example does not resolve a number of critical issuesabout the cross-cultural validity of the concept of general intelligence.It is possible that there are individual differences in the ability toacquire the navigational skills that are important to the Puluwat. And,further, these individual differences might be related to a cross-cultur-ally valid index of general intelligence and be related to the sameconstruct that determinesindividual differences in intelligence stud-ied in the U.S.In principle, this is even a testable hypothesis. A cross-fostering study in which children whose parentsdiffer in navigationalskills as defined by the Puluwat could be reared by Americans. Con-

IS INTELLIGENCE FIXED? 231
versely, children whose American parentsdiffer in intelligence as as-sessed by standard IQ tests could be reared in Puluwat families andtheir skills as navigators could be assessed.It is possible that there areadditive genetic differences in intelligence that are related to the ac-quisition of intellectual skills among both the Puluwat and Ameri-cans. Consider anotherdesign.It is possible to use measuresof infantattention to predict early childhood IQ. Such measuresassess abilitiesthat maybe relatively disembodied from a particular cultural context.Such measures mightbe predictive of the developmentof navigationalskills among the Puluwat. R.B. Cattell (1971), a psychometrician, usedthe metaphorically resonant term “investment” to describe the pro-cess of differentiation by means of which individuals develop specialintellectual skills andabilities from a generalized intellectual capacity.Cattell’s investmenttheory is the antithesis of a view of intelligence asa fixed characteristic of a person.
Whatis actually known aboutthestability of IQ? There have been anumberof longitudinal studies of IQ in which the same individuals arerepeatedly given IQ tests. Contemporary IQ tests are not based on themental age divided by the chronological age index of IQ. They are basedon deviation IQs that comparean individual’s performanceto thatof hisor her age cohort. IQ is defined in termsof a distribution in which themean is usually set at 100, and the standard deviation is equal to 15.Therefore, an IQ of 115 may be understoodas implying that an individualhas scored 1 standard deviation above the meanof his or her age cohort.The test-retest correlation obtained from longitudinal studies providesinformation about therelative position of an individual in the distribu-tion of scores for age cohorts. Thus an individual whoreceives the sameIQ score on two different occasions may have changed substantially inability to answer questions on an IQ test. The similarity of scores on twooccasions merely indicates that his or her change is equivalent to thechanges experienced by age cohorts used to norm thetest.Table 8.1 presents test-retest correlations for IQ test scores from ages 2
to 15 based on Wilson’s longitudinal twin study (Wilson, 1983, 1986). Anexamination of the data presented in Table 8.1 indicates that the correla-tions follow a lawlike pattern. The magnitude of the test—retest correla-tion decreases as the time between test administrations increases. By ages8 and 9, IQ test scores are highly predictive of scores at age 15.Humphreys(1989) calculated the year-to-year stability for true score val-ues for these data and arrived at a value of .95 or .96. If one assumesthatthe change in IQ is constant over years, the correlation between anynumberof years for true score values of IQ may be calculated as .95 or .96raised to the powerof the numberof years intervening between tests. Thetest—retest reliability for a 10-year period would be between .63 and .70.Predicting from one period of time to another involves the use of the
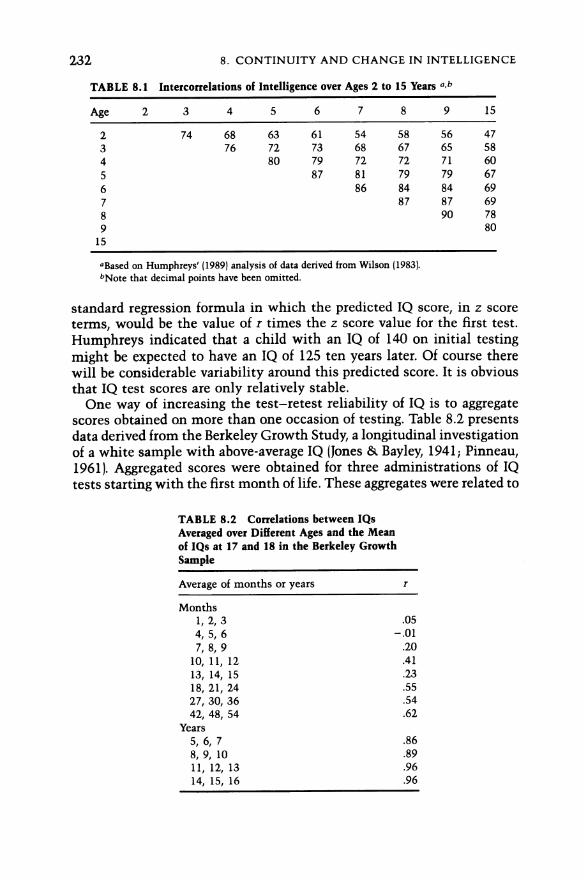
232, 8. CONTINUITY AND CHANGEIN INTELLIGENCE
TABLE 8.1 Intercorrelations of Intelligence over Ages 2 to 15 Years 2.4
Age 2 3 4 5 6 7 8 9 15
2 74 68 63 61 54 58 56 473 76 72 73 68 67 65 584 80 79 72 72 7\ 60
5 87 81 79 79 67
6 86 84 84 69
7 87 87 698 90 789 80
15
2Based on Humphreys’(1989) analysis of data derived from Wilson (1983).
bNote that decimal points have been omitted.
standard regression formula in which the predicted IQ score, in z scoreterms, would be the value of r times the z score value for thefirst test.Humphreysindicated that a child with an IQ of 140 oninitial testingmight be expected to have an IQ of 125 ten years later. Of course therewill be considerable variability around this predicted score. It is obviousthat IQ test scores are only relatively stable.
One way of increasing the test-retest reliability of IQ is to aggregatescores obtained on more than one occasion of testing. Table 8.2 presentsdata derived from the Berkeley Growth Study, a longitudinal investigationof a white sample with above-average IQ (Jones & Bayley, 1941; Pinneau,1961). Aggregated scores were obtained for three administrations of IQtests starting with the first monthof life. These aggregates were related to
TABLE 8.2 Correlations between IQs
Averaged over Different Ages and the Meanof IQs at 17 and 18 in the Berkeley Growth
Sample
Average of monthsor years r
Months1,2, 3 05
4,5, 6 -.017, 8,9 .20
10, 11, 12 41
13, 14, 15 23
18, 21, 24 55
27, 30, 36 54
42, 48, 54 62
Years
5, 6, 7 86
8,9, 10 89
11, 12, 13 .96
14, 15, 16 .96

IS INTELLIGENCE FIXED? 2.33
an aggregate score based ontests given at ages 17 and 18. Note how theuse of aggregate indices permits one to obtain high test-retest correla-tions. IQ at the end of high school can be predicted by IQ tests given atages 5, 6, and 7 with a correlation of .86. And, IQ at the preadolescent orearly adolescent ages predicts IQ at the endof the high school period witha correlation of .96. Although the test-retest correlations are relativelyhigh, it should be noted that any individual IQ test score is subject toconsiderable change. Table 8.3 presents data for the Berkeley Growthsample indicating the mean change and the standard deviation of IQchanges for tests administered at different ages and age 17 IQ. Note thatthe standard deviation of changes decreases as the time betweentestsdecreases. It is obvious that single tests given early in life may be poorindicators of young adult IQ.
Test—retest correlations for intelligence may be interpreted in terms ofa model developed by Anderson (1939, 1946; see also Bloom, 1964}. Themodel maybefit to changes in height as well as changesin intelligence.One maythink of the height of a person at time 2 as equalto height attime 1 plus gains in height from time 1 to time 2. Since the heightattained at time 1 is a componentor subsetof thetotal height attainedattime 2, a correlation between height at time 1 and height at time 2 isguaranteed. A teenager whois tall will not become short if he or sheisretested at a later date. On this model, test-retest correlations would bepositive even if growth in height andoriginal attained height were uncor-related. Anderson analyzed data on changesin intelligence and attemptedto demonstrate that gain scores in intelligence were uncorrelated withpreviously attained intelligence. Positive test-retest correlations for in-telligence test performance would occur because previousintellectual
TABLE 8.3 Changes in IQs Given at Different Ages and IQ at Age 17in the Berkeley Growth Study
Age Standard deviationat testing Range of changes Mean change of change
6 months 2—60 21.6 15.71 year 1-75 16.6 14.92 years 0-40 14.5 9.53 years 0-39 14.1 9.44 years 2-34 12.6 8.0
5 years 1-27 10.8 7.0
6 years 0-34 11.1 7.87 years 1-27 9.2 7.48 years 0-25 8.7 6.39 years Oy) 9.6 5.710 years 1-26 9.5 6.411 years 1-21 7.8 5.412 years 0-18 7.1 4.914 years 0-18 5.8 4.7

234 8. CONTINUITY AND CHANGEIN INTELLIGENCE
growth is a component of intellectual performance at a later time.Humphreys (1985, 1989; Humpreys & Parsons, 1979} fit test-retest cor-relations for intelligence to a model that assumed gain scores for truescores in intelligence are uncorrelated with previously attained true scorevalues for intelligence. He found that the model fit the data quite well.Note that models of this type imply that test-retest correlations declineas the time between administrations of the test increases during theperiod in which individuals are gaining in intellectual capacity.There are numberof problems with a model that assumesintellectual
growthis uncorrelated with previous intellectual performance. The anal-ogy between intelligence and height is strained. Height is measured bythe same techniquesat any period. Also, height is a ratio scale numberwith a well-defined metric. Intelligence is measured by different itemsatdifferent ages and growthin intelligence has both a qualitative as well as aquantitative dimension.Individuals reason differently at different devel-opmental periods. Cronbach & Snow (1977) argued that the choice of ametric is critical for determining if gain scores are or are not correlatedwith previously attained intelligence. They indicated that the correlationbetweenscores and gains could be influenced by the selection of items toassessintelligence.If the gains in items answered correctly on a test werepositively correlated with prior IQ scores, the rank orderings of IQ wouldnot be changed. Individuals with high IQ might have to exhibit morerapid gains in ability than individuals with low IQ in order to maintaintheir initial lead (Pinneau, 1961). Although Humphreys’s analyses indi-cate that a model that assumesthat gains are uncorrelated with initialperformanceis a goodfit to data on thestability of IQ, the model shouldonly be considered as an approximation.It is entirely possible that it is anartifact of the way in whichintelligence is assessed. The assumptionthatintelligence may be understood as the ability to acquire knowledge iscompatible with the assumption that gains are always positively corre-lated with prior attainments. Such a modelis logical. The available datado not provide support for this model. The model may be wrongor theavailable data and the measurementproblemsinherentin a measure thatsamples itemsin orderto assess intelligence may not permit us to obtaina strong test of the model.
LIFE-SPAN CHANGE
How doesintelligence change over the life span? Prior to 1968 it waswidely assumedthatintelligence declined after the third or fourth decadeof life and that the decline accelerated in middle andold age. This beliefwas based substantially on the results of cross-sectional analyses inwhich representative samples of the population at different ages weretested. IQ scores, which are age adjusted, mask the magnitude of decline

LIFE-SPAN CHANGE 235
in intelligence as a function of age. Younger adults would haveto scoreata higher level than older adults in order to obtain the sameIQ score.It isobvious that cross-sectional studies of changes in intelligence over thelife span are subject to a major methodological flaw. Age is completelyconfounded with timeof birth. Thus, evidence of declines in intelligencemay be attributable to the effects of aging or to cohorteffects. The discus-sion of cohort effects in Chapter 6 of this volume clearly demonstratesthat intelligence has been increasing. Therefore, cohorts born earlier inthe century will have lower intelligence than cohorts born later in thecentury and this might account for someorall of the cross-sectionaldeclinesin intelligence. Schaie & Strother (1968) provided clear evidencethat age effects and cohort effects were confounded in cross-sectionalanalyses of the effects of age on intelligence. They combined a cross-sectional and a longitudinal design. They administered Thurstonetests toa sample of individuals ranging in age from 20 to 70 and retested them 7years later. The cross-sectional analyses provided clear evidence of de-clines. The longitudinal data provided relatively little evidence of de-clines over the 7-year period for each of their cohorts born at differenttimes.
The work of Schaie and Strother suggests that some of the decline inintelligence with age that was reported in cross-sectional studies wasattributable to cohort effects. It might be concluded from these data thatthe decline of intelligence with age is best characterized as a myth. Theappropriate interpretation of studies contrasting and combining longitu-dinal and cross-sectional procedures is controversial. Horn & Donaldson(1976) argued that the use of longitudinal methodsto disentangle cohortand aging effects in the study of intelligence is not a panacea(see alsoBaltes & Schaie, 1976). They noted that longitudinal studies of aging arenot able to maintain their samples. Individuals lose contact with re-searchers. People die or in old age are no longerable to live independentlyin the community. Therefore, samples of the elderly whopersist in longi-tudinal studies are increasingly nonrepresentative subsamples of the pop-ulation. While such data may provide evidence of changesin intellectualfunctioning among a subset of aged individuals who are healthy enoughto live independently and whose mentalabilities have remained suffi-ciently intact to permit them to maintain contact with longitudinal re-searchers, their performance cannot be considered as representative of thepopulation at large.Over the last two decades, the results of longitudinal and cross-sec-
tional studies have gradually given a clearer picture of adult-relatedchangesin ability.
Schaie continued to study samples of individuals using a combinedlongitudinal and cross-sectional design. Schaie & Hertzog (1983) adminis-tered Thurstonetests to individuals born between 1889 and 1938. Theseindividuals were tested at 7-year intervals on three occasions. They

236 8. CONTINUITY AND CHANGEIN INTELLIGENCE
ranged in age from 25 to 81 at timeof testing. Table 8.4 presents changesin their longitudinal data over a 14-year period for different cohorts foreach of five separate Thurstone tests. An examination of the data in Table8.4 provides clear evidence for longitudinal changesin intelligence over a14-year period as a function of the age of the individuals whoaretested.Note that the changes are relatively uniform for each of the five tests.There is evidence of small gains in intelligence between ages 25 and 39.Intellectual declines are evident for the period between ages 53 and 67 andaverage approximately .2 standard deviations for this 14-year period. De-clines increase between ages 60 and 74. For this period, the mean declineis .29 standard deviations. The comparable decline is larger for the ageperiod between 67 and 81, where the average decline is .59 standarddeviation units. Note the pattern of accelerated declines between thesixth and ninth decadesof life. There are some limitations to these data.Schaie and Hertzog indicated that there is some evidence of cohort X ageinteractions, suggesting that the pattern of age changes in intelligencemay not be constant for different cohorts. There are wide individual dif-ferences present in these data and therefore declining intelligence withage is not an inexorableresult of aging. Aging is an idiosyncratic processand different individuals may exhibit quite different patterns of changesin intelligence over time. Nevertheless, these data do provide evidence forrelatively substantial declines in intelligence after age 50. Adding theresults for the 28-year period between ages 53 and 81 there is the sug-gestion of a one-standard-deviation decline in performance. Theseresultsmay underestimate the magnitude of declines in general intelligence inthe population. The sample studied in the Schaie and Hertzog investiga-tion is not representative of the population. The sample is middleclass,relatively well educated, and in good health. Individuals in poor health orwhosehealth has deteriorated to the point where they are not able to
TABLE 8.4 Changes in Thurstone Ability Scores for 14-Year LongitudinalData for Different Age Cohorts2>
Ability test
Age Verbal Inductive Wordcohort meaning Space reasoning Number fluency
25-39 29 .20 13 13 22
32-46 18 15 .04 — .02 .05
39-53 .04 -.01 .06 —.09 —.19
46—60 .08 —.00 -.01 -.13 —.28
53-67 —.17 —.17 —.16 -.19 —.32
60—74 —.33 —.28 —.31 —.22 —.3067-81 — .63 —.55 —.53 —.53 -.70
“Based on Schaie & Hertzog (1983).
>Changesare expressed in standard deviation units.

LIFE-SPAN CHANGE 23/7
reside in the community may be assumedto exhibit larger declines inintelligence with age.
Schaie (1980; see also 1988) attemptedto assess the influence of drop-outs and nonrepresentative samples in longitudinal research on theinflu-ence of age on intelligence. He obtained 7-year longitudinal data on asample, and for each age group hestudied he obtained an independentsample. The independent sampling of age groups controlled for cohorteffects may be assumedto reflect changesin intelligence for samples thatare representative of the original samples recruited in the study. Schaiepresentedhis data in termsof a standard of “meaningful” decline definedas the twenty-fifth percentile of performance of 25 yearolds. I used thesedata to estimate the standard deviation of performance for his indepen-dent and longitudinal samples on verbal meaning and induction compo-nents of the Thurstone battery. These tests were selected for analysissince they may be assumedto function as markers for crystallized andfluid ability factors. Recall that these abilities are assumed to show adifferent pattern of change and decline overthelife span. Fluidability isassumed to decline more than crystallized ability. Table 8.5 presentsthese data. An examination of the data in Table 8.5 clearly indicates thatthe longitudinal data give a different picture of changes in intelligencethan independent cohort-controlled samples of individuals. The lattergroups exhibit more declines than the former groups. This indicates thatthe Horn and Donaldson critique of the combined longitudinal cross-sectional design has considerable merit. Longitudinal analyses for verbalmeaning, the markerfor crystallized ability, exhibit increases from ages25 to 60. This index of crystallized ability remains above the 25-year-oldperformance level even at age 81. The independent samplesindicate thatthere is very little age-related change in verbal meaning from ages 25 to46. After age 46, evidence of decline is present, and 81 year olds areestimated to be one standard deviation lower in verbal meaning than 25year olds. The data for induction, a markerfor fluid ability, exhibit morepronounceddeclines. Longitudinal samples exhibit slightly lower induc-tion performance from ages 32 to 60. After 60, declines are manifest,reaching a value of .88 standard deviations at age 81. The independentsamples again exhibit more decline than the longitudinal samples. Thedecline appears moreor less constant over the adult life span, reaching alevel of 1.52 standard deviations lower than the norm for 25 year olds atage 81.
The data indicating age-related declines in IQ almostcertainly under-estimate the true magnitude of the decline of intellectual functioningwith age. The samples of older individuals represented in these studies,even in the data based on independent samples, are almost certainlyincreasingly nonrepresentative of the population as older samples arestudied. The aged whoagreeto participate in these studies are those whoare able to live in the community (nursing homeresidents are not in-

238 8. CONTINUITY AND CHANGEIN INTELLIGENCE
cluded in these samples) and whohavesufficient communityties and aresufficiently intellectually intact to cooperate with researchers. Since theprobability that individuals will possess these characteristics declineswith age, the sample of individuals studied is increasingly nonrepresen-tative. A better index of the normative declines with age in intellectualfunctioning may be obtained from studies that attempt to sample repre-sentative groups of individuals of a given age whether or not they areliving in the community or in institutions. Such studies would undoubt-edly provide evidence of larger declines in intelligence than the indepen-dent samples studied in Schaie’s research. Declines in fluid ability overthe life span up to age 80 might well average 2 standard deviations. Schaietypically presents his data in such a way that the average declines inperformanceassociated with aging are minimized. His data presentationsaccomplish this in two ways. Longitudinal data are sometimes presentedindicating that the percentage of individuals who declineis relativelysmall. Of course, his own data indicate that longitudinal presentationsdeal only with a selected subset of the population. And, he frequentlyuses an arbitrary reference point to define meaningful declinesorstatis-tically significant declines. For example, his presentation of the data inTable 8.5 included an index of meaningful decline based on the twenty-fifth percentile of the performance of 25 year olds. This is clearly anarbitrary number. It appears to methat it is more meaningful to describethe performance of individuals relative to their own estimated baselinesat age 25. An individual whose performanceona testof intelligence was 2standard deviations above the mean at age 25 who has declined to .5standard deviations below the level of performance of 25 year olds hasexperienced a large and meaningful decline in his or her intelligence,although such an individual would not be described as exhibiting a mean-ingful decline by Schaie. If fluid ability declines 2 standard deviationsover the adult life span, this implies that only 2% of the population doesnot exhibit declines in intelligence over the life span. Even on crystallized
TABLE 8.5 Age-Related Changes in Two Indices of Intelligence in Longitudinal
and Independent Samples¢
Age
Index 32 39 46 53 60 67 74 81
Verbal meaning Lb .30¢ 51 .68 81 85 72 .43 13[5 .08 .08 00 —-.20 -—.20 —.47 —.80 -—1.04
Induction L —.20 -.10 -.10 -.17 -.14 —-.31 —.6] —.88
I —.10 —.32 -52 -.78 -.91 -1.17 -1.36 —-1.52
2Based on Schaie (1980).
bL, longitudinal design; I, independent sample.
CAll values are expressed in terms of the mean and standard deviation of the performanceof the 25-
year-old samples.

LIFE-SPAN CHANGE 239
ability tests that are assumed to measure past learning rather than theability to acquire new knowledge, declines may be expectedto be close to1.5 standard deviation units of the adult life span, suggesting on the basisof normal curvestatistics that no more than 7% of the population may beexpected to avoid intellectual declines over the adult life span.
Additional evidence for declines in intelligence may be found in datareported by Schaie (1990) in which he reported data for a 28-year longitu-dinal sample. Schaie reported changes in Thurstoneability scores for asample of 16 individuals studied over the 28-yearinterval from ages 53 to81. Table 8.6 presents his data. Note that the sample is small and there-fore the values reported should be considered as approximations of whatwould be obtained in a large-scale longitudinal study. The data reported inTable 8.6 indicate that there is an approximately equal decline in themarkers for fluid and crystallized abilities. The composite index, whichmay be considered as an approximation of a general intellectual index,exhibits a decline over this age period of .88 standard deviations. Notethat the standard deviation of decline scores for this sample is .45, indi-cating that the mean decline was almost 2 standard deviations from thevalue of zero, suggesting that almostall of the subjects in this sampleexhibited some declinein general intelligence. Again, these results under-estimate the true magnitude of decline in unselected samples. Indi-viduals who maintain 28-year contact in a longitudinal studyare a hyper-selected subset of the population of the aged.
Although Schaie’s data provide evidence for declines in intelligenceover the adult life span, he has argued that these declines are not globaland are rarely general. He used his longitudinal samplesto ascertain thenumberof abilities that had exhibited declines in each 7-year longitudinalsample from ages 53 to 81 (Schaie, 1990). A decline was defined as areduction in a subtest score for a 7-year period that was equalto 1 stan-dard error of the baseline score at the beginning of each 7-year period.Such a declineis a statistically meaningful criterion, suggesting that thechanges werenot attributable to chance variations in performance. Table8.7 presents the proportion of individuals in each 7-year longitudinalstudy who exhibited declines in excess of 1 standard error. It is obviousthat relatively few subjects exhibit consistent declines on all abilities.
TABLE8.6 Declines in Primary Mental Abilities from Ages 53-812
Verbal meaning Inductive reasoning Composite°
Mean 875 819 875
S.D. 507 .808 452
2Based on Schaie (1990).
/N = 16.
“Composite is based on five tests: Verbal Meaning, Spatial, Inductive Reasoning,Number, Word Fluency.

240 8. CONTINUITY AND CHANGEIN INTELLIGENCE
TABLE8.7 Proportions of Individuals Exhibiting
Declines in Abilities
Age
Numberof abilities 53-60 60-67 67-74 74-81
None 41.3 26.7 24.3 15.5
One 35.3 35.1 37.7 37.2
Two 17.0 22.0 21.8 24.8
Three 49 10.3 11.8 14.0
Four 1.2 5.0 3.9 6.2
All five 5 8 1.1 2.3
4Based on Schaie.
Even in the 74- to 81-year-old subgroup, only 2.3% of the subjects exhibitstatistically significant declines on eachof thefive tests in the Thurstonebattery. It is also the case that declines are not consistent across timeperiods. For the small subset of subjects with the 28-year longitudinaldata, no subjects exhibited declinesin all four time periods on anyabilitymeasure or on the composite measureof ability.
Schaie argued on the basis of these data that declines were not globaland were not linear over the age range that he studied. Most individualsexhibit constant performance on mostabilities over most time periods.Schaie’s conclusionsare based on theidiosyncrasies of his data-analysisprocedures andhis selection of a sample to study. It is possible to arguethat these conclusions are not justified for several reasons. First, thelongitudinal sample is not representative and therefore may notbeinfor-mative of the pattern of change associated with aging in the generalpopulation. Second, the use of a single point estimate based ona criteriaof statistical significance is arbitrary. Third, the use of several abilityindices is not an optimal or exhaustive representation of the statisticalstructure of this set of measures. Schaie, Willis, Jay, & Chipuer (1989)foundthat factor structures for ability tests given to separate age cohortsacross the adult life span are relatively congruent. Thus, thestatisticalrelationships amongability tests may be assumedtoberelatively invar-iant for the samples included in these studies. The discussion of theStatistical relationships that obtain among these types of measures inChapter 2 of this book clearly established that these measures would forma positive manifold supporting the existence of a single common factorthat accounts for a substantial portion of the variance in the correlationmatrix for these tests. The attemptto treat each of these ability tests as ifthey are statistically independent of each other does not account for thecommonvariance of the tests. A more meaningful analysis of these datawould analyze changes in commonvariance before examining changesinspecific components of variance. The linear and nonlinear trends forchanges in commonandspecific componentsof varianceas a function of

LIFE-SPAN CHANGE 241
age could be analyzed. Such an analysis might be more informative thanan analysis based on the proportion of individuals who exhibit an arbi-trary statistically defined magnitude of decline on each of several nonin-dependentability measures.Declines in fluid ability with age are correlated with changesin perfor-
mance on a variety of other cognitive tasks. This has led to the develop-mentof different theoretical characterizations of the basis for intellectualdecline. I shall briefly consider four approachesto this issue.The declines in intelligence obtained in longitudinal studies of aging
may beattributable to changes in the speed of processing information.Hertzog (1989) reported the results of a cross-sectional study of age dif-ferences in intelligence as assessed with the Thurstone battery for adultsbetween ages 43 and 89. He obtained a measureof the speed of processinginformation that was a composite index of the perceptual speed measurefrom the Thurstone battery and a measure of the time required to markcorrect answers whenthey were supplied to the subjects. Hertzog calcu-lated cross-sectional changes in intelligence for Thurstone ability mea-sures that were not adjusted for speed and that were speed adjusted. Hisresults are presented in Figures 8.1 and 8.2. These data indicate that asubstantial portion of the age-related declines obtainedin intelligence areassociated with age-related changesin a speed-of-processingvariable.It isalso the case that the effects of partialling out speed measures lead toquite different cross-sectional age-related changes in different measuresof intelligence. For induction, a good markerfor fluid ability, there is anage-related decline of approximately .4 standard deviations from ages 60to 80 for speed-adjusted scores. Comparable data for verbal comprehen-sion, a good markerfor crystallized ability, indicate that speed-adjustedperformanceincreases until age 70 and exhibits little or no decline be-tween ages 70 and 80. These data imply that adjustmentsfor the speed ofresponding have a larger effect on fluid ability measures than oncrystallized ability. It should be noted that speed-adjusted scores shouldnot be thought of as pure measures of ability adjusted for a meth-odological artifact. Speed of filling out a form in which correct answersare supplied is, like many other deceptively simple tasks reviewed inChapters 3 and 4, correlated with more complex intellectual skills.Hertzog reports correlations ranging between .18 and .62 between thismeasure of speed of reasoning and Thurstoneability scores for four differ-ent age cohorts—the median correlation was .34. This implies that cor-rections for speed removetrue score variancefor intelligence as well as apossible methodological artifact in assessment.
Salthouse (1982, 1985, 1988) developed a resource theory to explaindeclines in fluid ability. He administered tasks to young and old adultsthat were assumed to vary in the numberof times the sameoperationneededto be applied in order to successfully complete the task. He used avisual synthesis and a geometric analogies problem that varied in com-

242 8. CONTINUITY AND CHANGEIN INTELLIGENCE
VOCABULARY
0.7 «
0.6 «
0.5
0.4 «
0.3 - woeoaomeae,
-- ew0.2 « os *~,
e tk &0.1 ae RN, "Sh ees
0.0 4 wee ~
-0.1. a ‘~~
-0.25 »* \,
-0.3 5 »*
-0.45 at
-0.55
-0.6 4
-0.74
-0.8-
-0.94
-1.05
“1.15
“1.25
-1.34
“1.45
“1.5 T t ' d 1 t .
40 50 60 70 80
a
AGE
FIGURE 8.1 Speed-adjusted {stars) and unadjusted (lines) cross-sectional changes in
crystallized ability. (Based on Hertzog, 1989.}
plexity. The geometric analogies task involved deciding whether the Dterm of a geometric analogy wascorrector not. Variations in the complex-
ity of the analogy were introduced by varying the number of elementsincludedin each of the terms of the analogy. Salthouse assumed that themanipulation of the number of elements in the problem did not influencethe strategies used to solve the problem. Such a manipulation is assumedto involve increases in the numberof repetitions of the same operation.The slope of the increase in decision time for the analogies is assumed tobe a function of the numberof resources available to a personto solve this

LIFE-SPAN CHANGE 2,43
INDUCTION
0.7 -
0.6 «
0.5 -
0.4 -
0.3 ey
0.2 - ane
0.1 - PERE
0.0 .« ‘. "ta*
-0.1. \, **,
0.25 ‘. *,
-0.3 5 \, *.
-0.4- \ *
-0.5+ :
-0.6- \
-0.75 ‘\
-0.8- \,
-0.9- \
-1.05 .
“1.14 \
“1.25 .
“1.3 «
-1.4-
-1.5 q q q v J 1 v Tr
40 50 60 70 80
AGE
FIGURE8.2 Speed-adjusted (stars) and unadjusted(lines) cross-sectional changesin fluidability. (Based on Hertzog, 1989.)
type of problem.Figure 8.3 indicates that decision timesanderrors exhib-it steeper slopes as a function of complexity among older adults varyingbetween 57 and 67 years of age than among young adults varying in agebetween 18 and 25. Comparable results were obtained for other tasks inwhich the slope of performance as a function of the complexity of thetask was obtained. As in the geometric analogies task, complexity wasconceptualized in terms of the number of recurrent operations of thesame type required for solution.

244 8. CONTINUITY AND CHANGEIN INTELLIGENCE
35 [- Analogies (Elements)— 30-
2 25
5= 20 =
b=
2 Le 0 Old
E 10 - gee- 5 0-7" Young
0
20 p Old7
~ 15 = /6 4
=Lu 10 = ~O---79
5 LL oOo” Young
| | j
1 2 3 4
Complexity Level
FIGURE 8.3 Performance by young and old adults on a geometric analogies task as a
function of complexity level of the task. (Based on Salthouse, 1988.)
Salthouse found that slope measuresfor different tasks were positively
correlated. For example, the slope for the geometric analogies problem
and the slope for a visual synthesis problem differing in complexity had a
correlation of .47 for older adults in one of his studies (see Salthouse,
1988, Experiment3). By comparing the magnitudeof the slope differences
for various tasks, Salthouse derived an estimate of the ratio of processing
resources of old adults to young adults. He found that older adults in his
studies were estimated to have approximately 60% of the processing
resources of young adults. The relationship between age and resource
capacity was substantially mediated by the relationship between each of
these variables and performance on the Digit Symbol substitution task of
the Wechsler test. Control for performance onthis task led to a reduction
in the common variance of age and performance on the tasks used to
measure resource capacities from 28.7% of the commonvariance to 4.8%
of the variance.Salthouse’s studies provide a theoretical foundation and languagefor an
analysis of the relationship between age andfluid intelligence. Aging is
accompaniedbya lossof the ability to repeatedly perform the sameopera-
tion rapidly. This inability is indexed in part by speed of performance of
the digit symbol tasks and also by more complex reasoning tasks involv-
ing the repeated execution of the same type of mentalprocess. The effect
is relatively general and appears to provide a basis for understanding
declines in fluid ability.
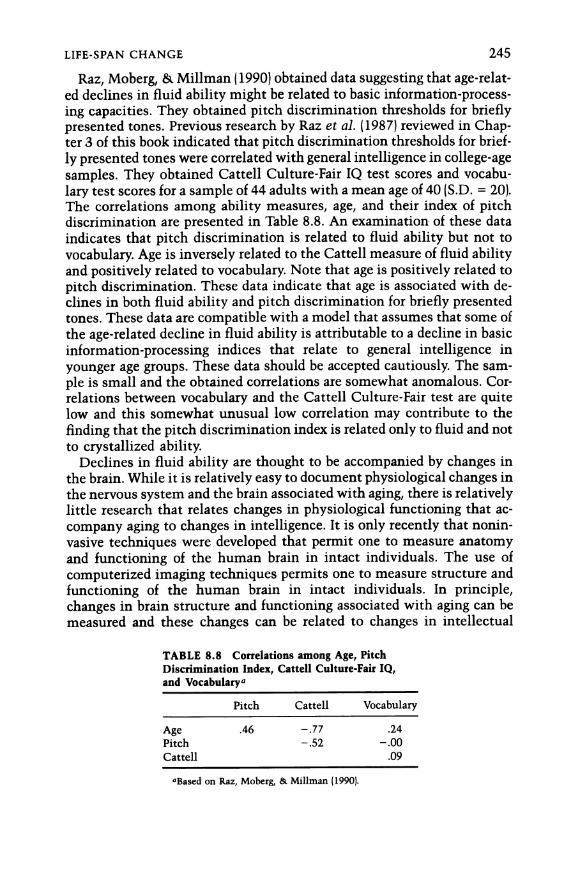
LIFE-SPAN CHANGE 245
Raz, Moberg, & Millman (1990) obtained data suggesting that age-relat-ed declines in fluid ability might be related to basic information-process-ing capacities. They obtained pitch discrimination thresholdsfor brieflypresented tones. Previousresearch by Raz et al. (1987) reviewed in Chap-ter 3 of this book indicated that pitch discrimination thresholdsforbrief-ly presented tones were correlated with generalintelligence in college-agesamples. They obtained Cattell Culture-Fair IQ test scores and vocabu-lary test scores for a sample of 44 adults with a mean age of 40 (S.D. = 20).The correlations among ability measures, age, and their index of pitchdiscrimination are presented in Table 8.8. An examination of these dataindicates that pitch discrimination is related to fluid ability but not tovocabulary. Age is inversely related to the Cattell measure of fluid abilityand positively related to vocabulary. Note that age is positively related topitch discrimination. These data indicate that age is associated with de-clines in both fluid ability and pitch discrimination for briefly presentedtones. These data are compatible with a model that assumes that someofthe age-related decline in fluid ability is attributable to a decline in basicinformation-processing indices that relate to general intelligence inyounger age groups. These data should be accepted cautiously. The sam-ple is small and the obtained correlations are somewhat anomalous. Cor-relations between vocabulary and the Cattell Culture-Fair test are quitelow and this somewhat unusual low correlation may contribute to thefinding that the pitch discrimination indexis related only to fluid and notto crystallized ability.Declines in fluid ability are thought to be accompanied by changesin
the brain. Whileit is relatively easy to documentphysiological changesinthe nervous system andthe brain associated with aging, thereis relativelylittle research that relates changes in physiological functioning that ac-company aging to changesin intelligence. It is only recently that nonin-vasive techniques were developed that permit one to measure anatomyand functioning of the human brain in intact individuals. The use ofcomputerized imaging techniques permits one to measure structure andfunctioning of the human brain in intact individuals. In principle,changesin brain structure and functioning associated with aging can bemeasured and these changes can be related to changes in intellectual
TABLE 8.8 Correlations among Age, Pitch
Discrimination Index, Cattell Culture-Fair IQ,
and Vocabulary¢
Pitch Cattell Vocabulary
Age .46 —.77 24
Pitch —.52 —.00
Cattell 09
aBased on Raz, Moberg, & Millman (1990).

246 8. CONTINUITY AND CHANGEIN INTELLIGENCE
functioning, providing insights into the biological basis of age-relatedchanges in intelligence. There is relatively little research of this typeavailable. The techniques are expensive and have not been widely used inthe study of individual differencesin intelligence. Raz, Millman, & Sarpel(1990) performed a study thatillustrates the promise of these techniques.They used magnetic resonance imaging to obtain changes in watercon-tents of gray and white cerebral tissue in the medial temporal lobes in asample of 25 adults ranging in age from 18 to 78. They also administered avocabulary test as an index of crystallized intelligence to these subjectsand the Cattell Culture-Fair test as an index of fluid intelligence. Correla-tions among age, intelligence indices, and theratio of gray to white mat-ters pin-lattice relaxation times are presented in Table 8.9. Age is nega-tively correlated with the gray/white ratio and with Cattell IO scores.Cattell IQ scores are positively correlated with gray/white ratios. Vocabu-lary scores have a negative correlation with gray/white ratios. These datashould be considered exploratory because of the relatively small sample.Nevertheless, they are interesting. A biological index of aging is nega-tively correlated with performance on a measure of fluid ability. Thesame index does not predict scores on tests of crystallized ability. Thephysiological index does not predict fluid intelligence independently ofits association with age. It would be interesting to obtain this index in asample of older individuals of the same age to see if this provides anindependentindexof fluid intelligence. There are manypotential psycho-logical indices of changes accompanyingthe aging process. Someof thesemay be predictive of changesin intelligence amongolder adults. The Raz,Millman, & Sarpel (1990) study does not indicate whetherthe physiologi-cal index they used was merely a correlate of aging or whether it was anindex of changesin fluid intelligence that is independentof age.
It is obvious that changes in fluid ability with age are related to avariety of physiological changes and changes in basic information-pro-cessing capacities. In addition to the four approaches briefly discussedabove, Horn, Donaldson, & Engstrom (1981) related changesin fluid abili-ty with aging to measures of concentration, encoding organization, inci-dental memory, eschewingattentional irrelevancies, dividing attention,and working memory. The changesin basic information-processingabili-ties that occur with age are probably related to physiological changes in
TABLE 8.9 Correlations among Age, Cattell IQ,
Vocabulary, and Gray/White Ratio
Cattell Vocabulary Gray/white
Age —.71 32 —.57Cattell 18 95Vocabulary —.28
“Based on Raz, Millman, & Sarpel (1990).

LIFE-SPAN CHANGE 247
the brain. It is clear that these changes appearto havea differential influ-ence on fluid andcrystallized abilities. And declines in the former type ofintelligence are larger and appear to be moreclearly related to physiologi-cal changes and changes in basic information-processing abilities. Dif-ferences in the relationship between basic information processes andphysiological indices and declines in crystallized and fluid intelligenceprovide a strong rationale of the theoretical distinction between thesetwo typesof intelligence.Whatis the practical significance of the decline in intelligence associ-
ated with aging? Willis & Schaie (1986) related performance on psycho-metric indices to tests of ability to perform everyday tasks in a sample ofolder adults ranging in age from 60 to 88. They administered a battery ofpsychometric tests anda test of basic skills including the ability to under-stand labels, read maps and charts, understand a paragraph, understandforms, advertisements, and technical documents, and comprehend newsstories. They factor analyzed their ability tests and obtained a four-factorsolution that includeda fluid ability factor, a crystallized ability factor, amemory spanfactor, and a perceptual speed factor. Scores on thefirst twofactors were related to performance onthebasic skills test. Fluid abilitywas more highly related to performance on basic skills than crystallizedability (r = .58 and .29, respectively). These data indicate that the compo-nentof intelligence that exhibits the largest decline with age is substan-tially related to the intellectual ability required to perform activities thatare necessary to be a competent adult. Willis and Schaie argued thatmanyof the basic skills they studied were “nonentrenched” and requiredsubjects to solve problemsin waysthat involved the application of gener-al principles applied to novel tasks. As such, they were better measuresoffluid ability than crystallized ability. The distinction between novel tasksand entrenchment maybegenerally useful in understanding theintellec-tual competenceof older adults. It is possible that aged individuals maybe relatively successful in performing intellectual tasks that draw heavilyon previously acquired crystallized abilities and knowledge. Studies ofscientific productivity have failed to documentclear-cut evidence of de-clines with age (Cole, 1979). Of course this type of evidence deals with theperformance of a small numberof hyperselected individuals and typicallydoes not include performanceof individuals past the normal retirementage of 65. Note that the Willis and Schaie study is concerned with theperformance of many adults whoare past normalretirementage.
In intellectual declines occur and theyare of somesignificancein abili-ty to perform everyday activities it would be useful to devise programstoincrease intelligence amongolder adults.
Baltes, Kliegl, & Dittmann-Kohli (1988) attempted to change fluid in-telligence in a group of healthy volunteers aged 63 to 87. The subjectswere randomly assignedto one of three groups. One group took a batteryof fluid ability test on two occasions. A second group wasgiven 10 hours

248 8. CONTINUITY AND CHANGEIN INTELLIGENCE
of training in ways of solving fluid ability problems. A third group waspermitted to take the battery of intelligence tests three times during a 10-hour period without feedback or specific instructional guidance. Thebat-tery of tests included two tests generally construed as good markersof afluid ability factor—the Cattell Culture-Fair intelligence test and theRaven's test. The control group had mean scores that were .45 and .04standard deviation units higher on the posttest than on thepretest on theCattell and Raven, respectively. The comparable gains expressed in stan-dard deviation units of the pretest scores for the group given practice testsin the battery without feedback were .82 and .29 standard deviation units.The group given specific training on the test gained .64 and .20 standarddeviation units, respectively.These data permit us to reach several conclusions aboutthe benefits of
training in improving fluid ability among older adult subjects. First, thegains associated with training are modest. On generalfluid ability testssuch as the Cattell and the Raven, specific training was associated withgains of less than one-fifth of a standard deviation unit relative to thegains obtained from a simple retesting. Second, the gains that were ob-tained as a result of practice without expert guidance were,if anything,slightly larger than those obtained asa result of specific training. Baltes etal. interpreted these findings as indicating that training effects may belargely attributable to helping individuals use skills that are already intheir repertoire.
Schaie & Willis (1986) used their longitudinal sample to attempt toremediate changes in intelligence among older adults. Their sampleranged in age from 62 to 95. They divided their sample into those who hadexhibited declines in abilities relative to a prior testing 14 years beforeand those who had not exhibited such declines. The subjects were pro-vided with 5 hours of training designed to assist them in solving eitherspatial problemsor reasoning problems. Subjects were tested on both theability they were specifically trained on and theability for which theywerenot specifically trained. The largest gains as a result of training wereexhibited by subjects who had declinesin ability and who were tested onthe specific ability that they had been trained to perform. For example,subjects who wereclassified as decliners who were trained in reasoningability exhibited gains of slightly less than .8 standard deviation units onreasoning on their retest. These gains returned over 40% of these subjectsto the level of performance they had exhibited in the test given 14 yearsearlier. The gains in intelligence exhibited by these subjects were some-whatspecific to the abilities on which they were trained. Whentested onthe generalization ability, the gains for subjects ranged. from approx-imately .2 to .3 standard deviation units.The results of the Schaie and Willis study tentatively support several
conclusions. First, while it is possible to remediate declines in specificabilities associated with aging, the effects of the remediation are smaller

CONCLUSION 2.49
on other abilities. This implies that changes in general or fluid intel-ligence, if any, obtained as a result of the intervention were smaller thanchanges on specific abilities that were remediated. Second, gains in fluidor general ability as manifested on the generalization task were modest—less than .3 standard deviations in magnitude. Third, there were no con-trols for changes attributable to the effects of retesting. Note that Balteset al. obtained changesin fluid ability in a comparable sample merely asresult of taking tests on two occasions. This suggests that the generaliza-tion gains obtained in the Baltes and Willis study may have been attribut-able solely to the effects of taking the test on two occasions. Thereisconsiderable uncertainty aboutthis matter since Baltes and Willis did notinclude a group who were not given training but were given the test ontwooccasions.In any case, gainsin fluid or general intelligence that wereobtained as a result of specific training, when adjusted for an unknowntest—retest component, are vanishingly small. Fourth, the results of thisremediation may under- or overestimate the general effects of remedia-tion. It is quite possible that longer and moreintensive interventions thatare directed to a broader range of abilities might lead to larger changesingeneral intelligence. The long-term effects of the interventions are un-knownandit is possible that such interventions may fade over time.This brief review of two intervention studies suggests that theeffects of
interventions to increase general intelligence among the aged may becomparable to the effects of interventions designed to increase intel-ligence in young children. In both instances, the changes that are ob-tained as a result of the interventions are notlarge.
CONCLUSION
Baltes & Willis (1979; see also Dixon, Kramer, & Baltes, 1985; Willis &Baltes, 1980) abstracted four conceptions from research on the develop-mentof intelligence in adulthood and old age. Theseare:
1. Multidimensionality, the notion that intelligence is composed of mul-tiple mental abilities, each with potentially distinct structural, func-tional, and developmental properties.
2. Multidirectionality, signifying that there are multiple distinct changepatterns associated with theseabilities.
3. Interindividual variability, a conception reflecting the observed dif-ferences in the life-course change patterns of individuals.
4. Intraindividual plasticity, which indicates that, in general, throughoutthe life course individual behavioral patterns are modifiable.
While there is a support for each of these, it is also the case thatitwould be possible to emphasize the converse principles of unidimen-sionality, undirectionality, interindividual stability, and intraindividual

2.50 8. CONTINUITY AND CHANGEIN INTELLIGENCE
constancy from an examination of this literature. Consider each of theseconcepts.
Unidimensionality. Although crystallized and fluid ability exhibitsomewhatdifferent changes with age, both decline andit is possible thatchangesin fluid ability may be more significant. Evidence indicating thatfluid ability is isomorphic with g and occupies a different hierarchicallevel than crystallized ability may be relevant to understanding age-relat-ed changes in intelligence. That is, it may be correct to say that fluidability, which is isomorphic with the most general conception of intel-ligence, exhibits declines and therefore changes in intelligence inadulthood may equally be characterized as unidimensional as well asmultidimensional. In a sense this issue mirrors debates about the struc-ture of intellect considered in Chapter 2 of this book.
Unidirectionality. Since analyses of independent samples adjustingfordropout effects (see Table 8.5) indicate that declines occur in bothcrystallized and fluid ability, it may be just as appropriate to discussunidirectional changeasit is to describe the changesthat occuras multi-directional.
Interindividual constancy. Long-term longitudinal data reported inTable 8.6 indicate that virtually all individuals exhibit declines in fluidability if studied for a sufficiently long period of time. While there isconsiderable interindividual variability in changes in fluid ability overthe life span, it is also correct to state that virtually everyone whosur-vives into the ninth decade of life may be expected to exhibit declines influid ability. Therefore, one could say with equaljustification that thereisinterindividual stability in the change in intelligence associated withaging.
Intraindividual constancy. Despitethe belief in the plasticity of intel-ligence, there is, in my judgment, relatively little convincing evidencethat existing programs designed to modify general intelligence are able tosubstantially increase intellectual ability. Intelligence is not particularlymalleable. While small changes may occuras a result of interventions,there is relatively little evidence that the changes that occurare of endur-ing and general significance.
It should be apparent that research on life-span changesin intelligencemay be approached from multiple perspectives. Although the conceptoffixed intelligence is a caricature of the psychometric tradition, there is asense in which it is possible to study life-span changes by appeal to amodel that emphasizes the importance of the unfolding of a biologicallyinfluenced latent ability construct that influences the responseto cultur-al opportunities presented to individuals. Evidence for genetic influenceson intelligence, preliminary suggestions from someof the behavior genet-ic analyses of genetic influences on changes in intelligence, and rela-tionships between biological mothers’ IQ and the early intellectual per-formanceof their adopted children suggest that someof the longitudinal

CONCLUSION 251
stability in IQ is attributable to genotypic influences that influence bothearly childhoodintellectual developmentand adult intellectual develop-ment(see the discussion of longitudinal behavior genetics in Chapter 5).Similarly, the emerging evidence indicating that information-processingindices obtained shortly after birth are related to childhoodIQ (see Chap-ter 3) suggests that some of the continuities in intelligence extend fromthe first year oflife. It is possible that age-related declinesin fluid abilitymay be partially determinedby genetic factors that influence physiologi-cal changes. Thus,life-span development may be viewed through thelensof inexorable changesin a biologically influenced disposition. While suchan approach may have somevalidity, it should be apparentthatit is agross oversimplification. Genetic predispositions constantly interactwith environmental events. Intelligence is clearly determined from theprenatal period on by both the social and the biological environmentencountered by individuals. It may be equally wrongto see intelligenceover the life span as the inexorable unfolding of a predetermined disposi-tion as it is to see it as a characteristic of personsthatis plastic, mallea-ble, variable, multidirectional, and multidimensional. Both perspectivesare necessary to understand the changesthat occur.

9CORRELATES OF INTELLIGENCE
From its inception, the study of intelligence has been concerned with therelationship between measuresof intelligence and real-world accomplish-ments. This issue has not been dealt with in the previous chapters in thisbook. In this chapter we shall consider relationships between intelligenceand education, occupational success, criminality, and fertility.
INTELLIGENCE AND EDUCATION
Description
Thereis a large amountof literature relating scores ontests of intelligenceto performancein various academicsettings. Lavin (1965) summarized theolder literature. Tests of intelligence correlate with measures of academicperformance. Thecorrelations that are obtained are usually close to .5.Highercorrelations are obtained for elementary school performance. Thelower correlations that are obtained for performance in the high schoolyears are probably attributable to somerestriction in range of talent.Students usually have some choiceof subjects that they study at the highschool level and these choices may berelated to IQ. The homogeneityofgrouping on intelligence may influence the magnitudeof the correlationbetween IQ and mastery of subject matter taught at the high schoollevel.The correlation between IQ and academic achievementdoes notinvari-
ably decrease as the time between the administration of IQ tests and the
administration of measures of academic achievement increases. For ex-ample, Butler, Marsh, Sheppard, & Sheppard (1985) obtained readingachievement scores for a large sample of children in the first, second,third, and sixth grades in Sydney, Australia, using a longitudinal design.IQ test scores were obtained in kindergarten. The correlations between IQand a readingscorefactor for children in thefirst, second, third, and sixthgrades were .38, .39, .46, and .46, respectively.
252

INTELLIGENCE AND EDUCATION 253
Feshbach, Adelman, & Fuller (1977) administered IQ tests to two largesamples of kindergarten children and related these scores to readingachievementscores in the first, second, and third grades. They obtainedcorrelations of .32, .40, and .45, respectively. In a secondreplication sam-ple, the comparable correlations were .42, .48, and .45. Horn & Packard(1985) reported the results of a meta-analysis of studies relating IQ mea-sures administered to children in kindergarten andfirst grade and readingachievementof children in elementary school. The meancorrelation fornine studies relating IQ to reading achievementin thefirst grade was .52.The comparablecorrelation for studies relating IQ test scores obtained inkindergarten and first grade to reading achievement in the second andthird grades was .54, again indicating little or no change in the predicta-bility of IQ test scores obtained at the beginning of elementary school andindices of academic achievement obtained at different periods of time.
Theseresults may be attributable to two processes. Early achievementsmayrelate to later achievements. Therefore, attainmentof reading skillsin first grade provides a foundation for subsequent acquisition of newskills. It is also the case that general intelligence may berelated to theacquisition of new skills not assessed in previous measures of achieve-ment.
Tests of intelligence are not only related to indices of academicperfor-mance;they are also related to measures of the numberof years of educa-tion that individuals receive. The number of years of education that aperson receives is related to a person’s occupational status. Occupationalstatus hierarchies, as determined by subjects’ rankings, are positivelycorrelated with the years of education that are required to meet entryrequirementsfor a particular occupation.If IQ is related to the numberofyears of education that a person receives, IQ measures should berelatedto the occupational status that a person attains. We indicated in Chapter6 that parentalsocial status is correlated with IQ (r = .3), and it is possiblethat parental social status may influence the amount of education a per-son receives. Therefore, the relationship between IQ and the amountofeducation that a person receives, and ultimately the social status that aperson attains, may be attributable to the influence of parental socialbackground on IQ and education.The sociologists Blau & Duncan (1967) were amongthefirst to attempt
to study relationships among IQ, parental social status, education, andoccupational status. They obtained IQ data on students in school andfollowed these individuals in order to determine the numberof yearsofeducation that they obtained. Duncan, Featherman, & Duncan (1972)developed path analytic models for these data using several historical datasets. For example, Benson (1942) obtained IQ scoresfor a group of elemen-tary school children in the sixth grade in Minneapolis. She found that thecorrelation between sixth grade IQ test scores obtained in 1923 and thenumber of years of education that a person obtained was .57. A path

254 9. CORRELATES OF INTELLIGENCE
modelrelating these variables is presented in Fig. 9.1. An examination ofthe model indicates that intelligence is a more important influence onthe number of years of education that a person obtains than a person'ssocioeconomic background. The numberof years of education thata per-son obtains is an important influence on the occupational status of aperson’s first job. Duncan et al. estimated that intelligence by itself ac-counts for 29% of the variance of educational achievement.Intelligenceand socioeconomic backgroundaccount for 44% of a person’s educationalattainment. While there are a numberof complex issues surrounding theinterpretation of these data, including questions of secular change andthe estimation of parameters using different data sources, all of the so-ciological analyses of this type of data for the U.S. are in agreement withcertain features of this analysis. Individual differences in intelligence asestimated by scores obtained early in a person’s educational career ac-count for more variance in educational attainment than a person’s social
class background. Social class background, as we haveseen, is only weak-ly related to IQ. Therefore, IQ measures a characteristic of persons thatinfluences their educational experiences that is independentof their so-cial class background. Since the number of years of education that aperson obtains influences a person’s occupational status, intelligence isrelated to intergenerational occupational mobility. Individuals with highintelligence are morelikely to attain an occupational status that is higherthan their parents than individuals who are low in intelligence. It isinteresting to note that a system of assigning individuals to educationaltracks that would determine the amount of education a person obtainssolely on the basis of a person’s IQ test score would decrease the class biasin the amountof education that a person receives.
77\ (80)
.43 (.49)INTELLIGENCE ~~~ EDUCATION
27(.25)
28 FATHER'S(28) EDUCATION
‘49 08(.08) |53(.48) (51)
FATHER'SOCCUPATION 12009) > OCCUPATION
5
f (.79)
FIGURE 9.1 Abridged version of the final model of ability and achievement with pathcoefficients for two populations. (Based on Duncan, Featherman, & Duncan, 1972.)

INTELLIGENCE AND EDUCATION 255
Jencks (1979; see also 1972) presented a comprehensive analysis usingseveral different surveys relating IQ to educational attainment and oc-cupationalstatus. He indicated that thereis very little evidence of secularchanges in the magnitudesof the correlation between IQ and the numberof years of education that a person obtainsfor data collected from 1920 to1970. The correlations between these variables are usually in the high50s, suggesting that IQ accountsfor approximately 34% of the variance ineducational attainment. Jencks’s analysesof the available survey data alsoindicated that intelligence is related to the amountof income that personobtains independentof the effect of the amountof education that a personobtains. The effects are small. Jencks indicated that the importanceofadolescent IQ in determining a person’s earnings increases with age. A 1- |standard-deviation increase in IQ is associated with a 14% increase inearnings with education andsocial class background held constant. Also,IQ has been related to earnings for men within the same occupation.Jencks reported that in one sample of individuals from Michigan, a 1-standard-deviation difference in IQ was associated with an 11% increasein earnings for individuals in the same occupation. There is considerableuncertainty surroundingthese valuessince they are based on complicatedadjustments for social class background and education. Nevertheless,Jencks’s analyses clearly indicate that IQ is the most important singlepredictor of an individual’s ultimate position in American society. Whilethere is considerable unpredictability for such indicesas social status andincome, IQ is more predictive than anythingelse.The influence of IQ on the amountof education that a person obtains
may be understood in termsof the unfolding of a set of interrelated socialinfluences. We have seen that IQ is related to academic achievement.
Individuals who do well in schools may develop positive views of theireducational abilities that may foster academic aspirations. In addition,individuals whoexcel in their academic work maybeassigned to educa-tional tracks and to classes that are designed to prepare individuals forhigher education. Educational counselors and administrators may en-courage individuals who excel in their academic work to continue theireducation. Students assigned to classes with classmates whoplan to con-tinue their education my receive encouragementfrom their classmates tocontinue their education. This hypothetical scenario about interrelatedinfluences that impact upon individuals who differ in IQ provides a basisfor understanding the way in which IQ influences the amountof educa-
tion that a person obtains. This scenario is not totally fictional. Rehberg& Rosenthal (1978) investigated the decision of high school students tocontinue their formal education. Their study was a longitudinal investi-gation of over 2000 high school students starting in the ninth grade andcontinuing until high school graduation. They related the decision toenroll in postsecondary education to measures of a pupil’s background,IQ, and academic achievement, to the influence of parents, peers, and

256 9. CORRELATES OF INTELLIGENCE
counselors, and to the curriculum that was elected. Table 9.1 presents asynthesis of their data indicating the way in which these variables influ-ence the decision to obtain postgraduate education. The data in Table 9.1include relationships for the samevariables based on data obtained in theninth grade, where the educational decision is based on intentions, anddata from the same students whohave graduated high school, where thedependent variable is the planned enrollment of students in college.These data indicate that individual differences in intelligence are a moreimportant source of variance in the decision to continue education afterhigh school graduation than they are at the beginning of high school. Theinfluence of IQ and social class background change over the course of a
person’s high school career—the formerinfluence tends to becomelarger,the latter influence tends to become smaller. The influence of IQ on thedecision to continue education is, in terms of the path model that isdeveloped, indirect. IQ influences the several variables that jointly deter-mine the decision to continue one’s education. IQ influences academicachievement. Indices of academic achievementinfluence the assignmentof individuals to educational tracks and classes that are designed to pre-pare a person for higher education. Academic achievementinfluences theadvice students receive from college counselors. And, class and curricu-lum placementinfluence friendship patterns and the kinds of influencesthat students receive from their peers. The influence of parental aspira-tions and expectations tends to decline over the course of a student’s highschool career. These changes are not dramatic, but they exert a cumula-tive influence that is documented in detail in Rehberg and Rosenthal’ssurvey data. Rehberg and Rosenthal concluded that the educational sys-tem they studied is more responsive to “merit” (this assumes that highability as assessed by IQ tests is an index of merit or at least educational
TABLE 9.1 Variables that Influence the Decision to Attend College
Ninth grade Postsecondary
intention enrollment
Male Female Male Female
Social class .46 .40 36 35Ability 39 4) 43 .40
Parental educationalstress .40 45 29 28
Further educationtaken for granted 48 47 38 31
Curriculum, grade 9 42 .48 .29 39
Peer collegeintentions, grade 9 5] 44 39 35
2Based on Rehberg & Rosenthal(1978), Tables 3.6 and 7.1).

INTELLIGENCE AND EDUCATION 257
merit) than to social class privilege. Of course, as indicated previously,the educational system is not completely based on merit since socialclass background continues to exert an independent influence on educa-tional enrollment beyond secondary school.
Jencks (1979) also cited survey data that indicated that ability testscores become a more important influence on the decision to enroll inpostgraduate education as students approachthe end of their high schoolyears. Apparently, the phenomenais characteristic of many educationalsystems in the U.S. He suggested that at the most general level the phe-nomenonis to be understood in one of two ways: (1) Schools treat indi-viduals with different ability scores differently, generally providing moreencouragementto academically talented students than to students withlow test scores; and (2) individuals with high test scores are more adeptatpreparing themselves to continue their education during the high schoolyears than students with low test scores. It is obvious that the way inwhich individual differences in IQ determine educational decisions and
influence the amountof education that a person receivesis attributableto the interactions of individuals with the educational system, and theseinfluences must be understood as the result of a complex process thatdevelops over time.We have seen that thereis relationship betweenintelligence and aca-
demic achievement. What determinesthis relationship? Behavior geneticprocedures maybeused to investigate the covariation between variablesas well as individual differences in a variable. Cardon, DiLalla, Plomin,DeFries, & Fulker (1990) used the Colorado Adoption Project sample tostudy the relationship between reading skills and intelligence in a groupof 7-year-old children who had completed 1 year of elementary school.They contrasted the relationship between IQ andreadingskills of parentsand children in adopted and control families. They found that the IQ andreading skill measures of adopted parents were not clearly related to theIQs and reading skills of their adopted children. For example, the correla-tions between the adopted mother’s IQ and the IQ andreading skill per-formance of her adopted child were .07 and —.11, respectively. By con-trast, the IQ of the biological motherin control families wasrelated to theIQ of her natural children and to the readingskills of her natural children.The correlations were .21 and .17, respectively. Cardon et al. used theseand other measuresof the relationships between IQ andreading achieve-ment for natural and adopted parents and their children to perform abehavior genetic analysis of the basis for the relationship between IQ andreading achievement. Their analysis indicated that reading achievementand IQ were equally heritable. Heritabilities were .36 and .38, respec-tively. The correlation between reading achievement and IQ was .43. Theyestimated that 90% of the covariance between reading achievement andIQ was attributable to shared genetic covariance. This implies that the
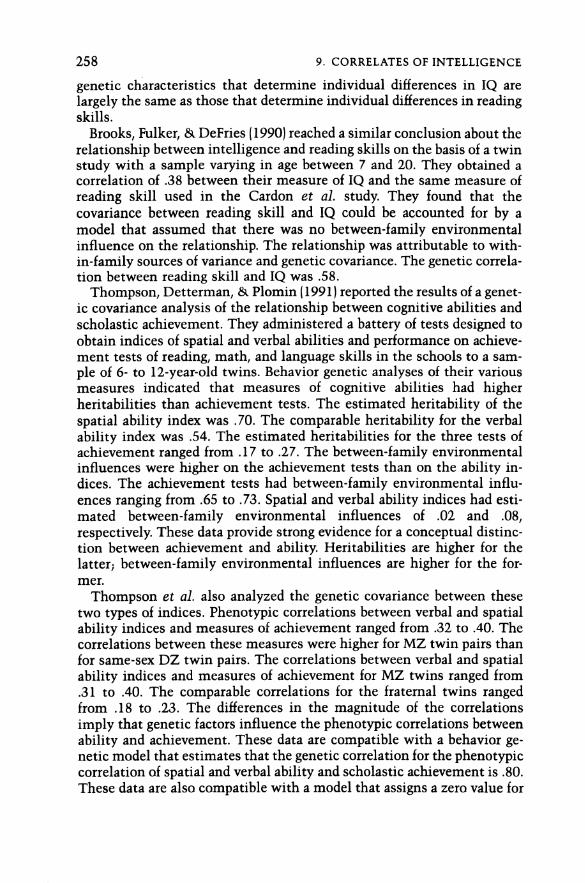
258 9. CORRELATES OF INTELLIGENCE
genetic characteristics that determine individual differences in IQ arelargely the sameas those that determineindividual differences in readingskills.Brooks, Fulker, & DeFries (1990) reached a similar conclusion about the
relationship between intelligence and readingskills on the basis of a twinstudy with a sample varying in age between 7 and 20. They obtained acorrelation of .38 between their measure of IQ and the same measure ofreading skill used in the Cardon et al. study. They found that thecovariance between reading skill and IQ could be accounted for by amodel that assumed that there was no between-family environmentalinfluence on the relationship. The relationship was attributable to with-in-family sources of variance and genetic covariance. The genetic correla-tion between reading skill and IQ was.58.
Thompson, Detterman, & Plomin (1991) reported the results of a genet-ic covariance analysis of the relationship between cognitive abilities andscholastic achievement. They administered a battery of tests designed toobtain indices of spatial and verbal abilities and performance on achieve-menttests of reading, math, and languageskills in the schools to a sam-ple of 6- to 12-year-old twins. Behavior genetic analyses of their variousmeasures indicated that measures of cognitive abilities had higherheritabilities than achievement tests. The estimated heritability of thespatial ability index was .70. The comparable heritability for the verbalability index was .54. The estimated heritabilities for the three tests ofachievement ranged from .17 to .27. The between-family environmentalinfluences were higher on the achievementtests than on theability in-dices. The achievement tests had between-family environmental influ-ences ranging from .65 to .73. Spatial and verbal ability indices had esti-mated between-family environmental influences of .02 and .08,respectively. These data provide strong evidence for a conceptualdistinc-tion between achievement and ability. Heritabilities are higher for thelatter; between-family environmental influences are higher for the for-mer.Thompson et al. also analyzed the genetic covariance between these
two types of indices. Phenotypic correlations between verbal andspatialability indices and measures of achievement ranged from .32 to .40. Thecorrelations between these measures were higher for MZ twin pairs thanfor same-sex DZ twin pairs. The correlations between verbal andspatialability indices and measures of achievement for MZ twins ranged from.31 to .40. The comparable correlations for the fraternal twins rangedfrom .18 to .23. The differences in the magnitude of the correlationsimply that genetic factors influence the phenotypic correlations betweenability and achievement. These data are compatible with a behaviorge-netic model that estimates that the genetic correlation for the phenotypiccorrelation of spatial and verbal ability and scholastic achievementis .80.These data are also compatible with a modelthat assigns a zero valuefor

INTELLIGENCE AND EDUCATION 259
parameter estimates for the influence of between-family environmentalvariations on the phenotypic correlations between ability and achieve-ment.These three studies are the first to address the reasons for therela-
tionship between academic achievement and IQ. It is premature to as-sumethat the relationship between IQ and other academic achievementsthat are acquired in the schools will be genetically mediated.It is also thecase that a model assuming that the genesthat influenceintelligence arethe same as the genes that influence the development of academicachievementsis plausible. Scores on a test of intelligence should not beconstrued as pure measuresof ability. All tests of intelligence measureintellectual achievements that are determined by the ability to acquireknowledge. They are therefore tests of achievement. Thedistinction be-tween ability and achievementis arbitrary and is a matter of degree.There are no puretests of ability uncontaminated by the opportunity toacquire knowledgeandintellectual skills. If individuals differ in a genet-ically determined aptitude to acquire knowledge andskills from commonenvironmentalexposures, it is reasonable to assumethatthat ability willbe related to the acquisition of fluid ability as well as to benefit from theformal tuition of the schools. There may even be temperamentalvariablessuch as persistence, patience, curiosity, etc., that are heritable that influ-ence the acquisition of the intellectual skills assessed by tests of intel-ligence and the acquisition of the content of the curriculum of theschools. The investigation of the genetic and environmentalbasis of thecovariance between IQ and academic achievement leads to interestingquestions about the kinds of environmentsthat foster the developmentofgenetic covariance. Are there educational settings that decrease the ge-netic covariance between IQ and academic achievements?
ModifiabilityWe have seen that IQ test scores are related to educational achievement.And, further, there is tentative evidence that the association betweenacademic achievement and IQ may be mediated genetically. Does thisimply that what children learn in schools is determined by genetic char-acteristics? And, leaving aside the issue of genetic covariance, doesthisimply that what children learn in schools is determined by the charac-teristics they bring to the schools? In this section I want to discuss themodifiability of the relationship between education andintelligence.One aspect of this issue was discussed by Christopher Jencks (1972).
Jencks analyzed differences in academic achievementassociated with thepublic school that a student attended. He obtained aggregated indicesofacademic achievementfor students in a school. Schools differ widely inthe average level of academic achievementas assessed bytests of knowl-edge of the curriculum.It is easy to examine these data and concludethat

260 9. CORRELATES OF INTELLIGENCE
some schools are better than others. That is, those schools whose pupilsexhibited superior academic performance may be assumed to be moresuccessful than those schools whose pupils exhibited inferior academicperformance. The aggregated academic performanceof pupils in a schoolis related to the socioeconomiccharacteristics of the pupils attending theschool. For the most part, students in the U.S. are assigned by the geo-graphical location of their residenceto a particular school. Schoolsat theelementary schoollevel do not influence the composition of their studentbody. But the composition of a student body can have an influence on theacademic achievement of children in a school. This suggests that dif-ferences in the average academic achievementof pupils in a school maybe attributable to differences in the social composition of the studentbody and notto intrinsic differences in the nature of the curriculum ofthe schools. Jencks found that aggregated indices of the social class back-ground of a school usually correlated in excess of .9 with aggregatedindices of the academic achievementof pupils in the school. Schools thatwere abovetheregression line relating aggregated academic achievementto aggregated social class background in a particular year might not beabove the line in the following year. Schools that performed abovetheirexpected value in reading achievement might not perform abovetheirexpected value in mathematics achievement. Jencks concludedthatvaria-tions amongschools in the U.S. might accountfor as little as 2-3% of thevariance in academic achievement after the composition of the socialclass background of the schools was taken into account. These analysessuggest that variations in what children learn in schoolsin the U.S.is notattributable to variations in the nature of the schools butis attributableto variations in the characteristics that children bring to the schools. Onemight say that the input determines the output.
Jencks’s analysis deals with social class background and academicachievement. The relationship between social class background andaca-demic achievement is mediated by individual differences in intelligence.Rehberg & Rosenthal (1978) summarized studies of the relationship ofgrades and IQ andsocial class background. Social class background haslittle or no predictive direct relationship to grades after one controls forsuch mediating influences as IQ and educational interest. IQ accounts formore variancein grades and indices of academic achievementthansocialclass background. Virtually all of the relationship between IQ and gradesand other indices of academic accomplishmentin the schools is direct.That is, it is not diminished in path analyses that control for social classbackground. This suggests that the relationship between aggregated in-dices of academic performancecharacteristic of different schools and ag-gregated indices of the IQs of students in a school, including the aggre-gated indices of pupils obtained from IQ tests given prior to school entry,would be more substantial than the relationship between aggregated in-dices of social class background and educational accomplishments of

INTELLIGENCE AND EDUCATION 261
pupils in different schools. The IQ that children bring to the schooldeter-mines variations in whatchildren learn in the schools.
Jencks’s views are controversial. Rutter, Maughan, Mortimore, Ouston,
& Smith (1979) conducted a study in London, England, to demonstratethat there were wide disparities in the academic accomplishmentof stu-dents with comparable social class backgrounds attending differentschools. Thedifficulty with Rutter’s analysis is that children in Londonare not assigned to secondary schools on the basis of their geographicresidence and have a choiceof schools. If the differences in accomplish-ment were apparent to researchers they might also have been apparent toparents in the community who might then elect to send academicallytalented children to those schools that have the best reputation. Unlessthere are good controls for the entry characteristics of children attendingdifferent schools in a system in which parents are given choice of theschool to attend, it is difficult to know if variations in the academicachievementof pupils in different schools are to be attributable to varia-tions in the quality of the schools or variations in the characteristics ofdifferent pupils in the schools.
Brookover, Beady, Flood, Schweitzer, & Wisenbaker (1979) argued thatvariations in academic achievement of pupils in different schools wererelated to the social climate of the school. They obtained a compositeindex of school climate that was based in part on measures of the at-titudes of pupils and teachers aboutthe possibility of academic successfor pupils attending different schools in Michigan. They found that theirschool climate index was more predictive of the aggregated academicperformance of pupils in the school than aggregated indices of the socialclass background of pupils in the schools. Their data are presented inTable 9.2 for two different orders of entry of variables in a hierarchicalregression analysis. Although the school climate variable is more predic-tive of academic outcomethaneither race or social class background,itshould be noted that a logical analysis of these data should be based onentering demographic variables in the equation prior to entering socialclimate variables. This assertion is based on an understanding of the
TABLE 9.2 Percentage of Variance in SchoolAchievement Related to School Characteristics¢
Variable Percentage
Socioeconomic background 46Plus percentage of whites 76Plus school climate 83
Climatefirst 73
Plus socioeconomic background 75
Plus percentages of whites 83
2Based on Brookover, Beady, Flood, Schweitzer, & Wisen-
baker (1979).

262 9. CORRELATES OF INTELLIGENCE
causal relationship that exists among these variables. Since pupils areassigned to school by geographic residence, school climate cannotinflu-ence the demographic characteristics of pupils in a school. The converseis not true. School climate and demographic characteristics are corre-lated. In this instance our understanding of the world permits usto infersomething about the causal relationship between these variables. If theappropriate orderof entry of variables is considered, it is apparent that thedemographic background of pupils accounts for 76% of the variance inaggregated indices of academic accomplishmentof different schools inthe sample. Social climate adds 7% to the predictable variance. Thesedata are interpreted by Brookoveret al. as providing strong evidencefor amodel of school effects on academic achievement. Nevertheless, demo-graphic characteristics of pupils account for more than 10 times as muchvariance asthevariable that is assumedto capture a salient characteristicof schools that determines their influence on achievement.The data obtained by Brookover and his associates may overestimate
the importance of variability among schools. The influence of demo-graphic characteristics on academic success is mediated by differences inintelligence test scores associated with race or class. Sinceintelligenceisa better predictor than eitherrace or class, it can be argued that the mostrelevant index of pupil characteristics was not includedin this study. It ispossible that aggregated indices of IQ would be morepredictive of aggre-gated indices of academic performance than the demographic variablesused in this study. In addition, school climate is not, strictly speaking, ameasureof the characteristics of the school that is independentof charac-teristics of pupils in the school. One componentin theindex is students’belief in their academic success. Brookoveret al. assumethat this belief iscausedby school characteristics. It may represent characteristics of pupilsthat are independent of demographic characteristics that predict academ-ic achievement. These hypothetical characteristics may not be influencedby variations in the academic climate of a school that the person attends.Thus the interpretation of the influence of school effects provided byBrookover and his colleagues involves the unsupported assumption thatbeliefs about academic achievementheld by pupils are influenced by char-acteristics of the school that pupils attend. Their interpretation would bemore convincing if their measure of variations among schools did notinclude any information about the pupils who attend the school.The analyses by Jencks and by Brookover et al. deal with variations
among public schools. The relatively small variations in aggregated aca-demic performance among different schools may be attributable to re-duced variability in the educational practices of different schools. Cole-man, Hoffer, & Kilgore (1982a, b) argued that students attending Catholicparochial schools at the secondary level had higher academic performancethan pupils in public schools controlling for demographic backgroundsofpupils. Thus it is possible to argue that the relatively small impact of

INTELLIGENCE AND EDUCATION 263
variations in schools maytell us more aboutthe relative homogeneityofpublic schools than aboutthe possible impactof variations in schools onthe academic achievementof pupils in a school. The comparison of per-formancedifferences of pupils in Catholic and public schools is compli-cated by the fact that pupils are not randomly assigned to these two typesof schools. Adjustmentsfor initial differences in pupil characteristics aredifficult since academically motivated and talented pupils might elect toattend Catholic schools if they believe that the public schools in theircommunity are not adequate. A good analysis of these issues may befoundin a series of articles dealing with the analysis of data from a largesurvey called the “High School and Beyond”study designedto assess theimpact of Catholic secondary schools on pupils (Alexander & Pallas,1985; Hoffer, Greeley, & Coleman, 1985; Jencks, 1985; Willms, 1985).This study provided information about the progress of students in Catho-lic and public high schools from sophomore year to senior year in avariety of academic subjects. The study assessed gains in academic workassociated with public and Catholic school attendance. Since students inCatholic schools in this sample started with better academic performancein the sophomoreyearthan studentsin the public schools, the magnitudeof the estimated gains is dependent on the procedures that are used toadjust for initial differences in academic performance.Jencks (1985) pre-sented an analysis of these data. He estimated that attendance at Catholicschools is associated with a gain in academic performance of .03 or .04standard deviations per year compared to attendance in public schools.Since these are estimated gain scores, it can be assumedthatinitial abili-ty differences are controlled. Jencks also estimated that attendance atCatholic schools from thefirst through twelfth grades may beassociatedwith a gain of between .11 and .22 standard deviationsrelative to atten-dance in the public schools. Thus the .03- to .04-standard-deviation ad-vantage per year may not be sustainable over the course of an extendedexposure to Catholic education. While there is considerable uncertaintysurrounding all of these estimates, it is clear that the impact of dif-ferences in educational accomplishments of pupils in Catholic versuspublic schools is relatively modest.The research we have briefly reviewed on differences in academic
achievement associated with different schools suggests that variationsamong schools are not major sources of variance in academic achieve-ment. Schools do not makea large difference once one has accountedforthe intellectual differences characteristic of children entering the schools.It is possible that the relatively modesteffects of schools in this researchare attributable to restrictions in variations among schools. One way toget someinsightinto this possibility is to compare the academic perfor-manceof children in different countries. Such comparisons may provideinsight into possible differences in academic accomplishmentassociatedwith variations in schooling. A good example of such a study has been

264 9. CORRELATES OF INTELLIGENCE
reported by Stevenson, Lee, Chen, Lummis, Stigler, Fan, & Ge (1990).They administered tests of mathematical knowledgeto a representativesample of first and fifth grade children attending school in the Chicagometropolitan area and in Beijing, China. The children in Beijing weresuperior to the children in Chicago on most of the measuresin thebat-tery. At the fifth grade level, the Chinese children averaged 1.32 standarddeviation units higher on the test battery than the children in Chicago.Although Chinese-American children scored higher on the battery oftests than other ethnic groups, their performance lagged behind thatofChinese students in Beijing. Although there is no control for entry char-acteristics in this study, these data do appear to clearly implicate dif-ferences in the curriculum in academic achievement.It is interesting tonote that the parents and teachers of Chinese children had less formaleducation than the parents and teachers of American children. Americanchildren also were more confident of their mathematical ability thanChinese children and were morelikely to believe that mathematics wasan easy subject. Despite these differences, the American children were farbehind the Chinese children. The differences are plausibly related to theamount of time devoted to mathematics in the elementary school and tothe rigor of the curriculum. By performing cross-national comparisonsitis possible to see that personal inputs do not constrain educational out-puts. As weshall see in Chapter 10, differences in intelligence betweenChinese-background individuals and individuals of other racial groups aresmall. Thus the large difference in academic performance obtained byStevensonet al. (1990) cannot beattributed to intellectual differences.Itis plausibly attributable to differences in the educational systems ofChina and the U.S. These data imply that individual differences in intel-ligence, though a major determinantof whatis learned in school, do notpreclude or constrain the developmentof a rigorous educational experi-ence that will substantially modify educational outcomes. As weshallsee, most educational reforms have had modest effects on academicachievementin the U.S. I suspectthat this is not attributable to anythingintrinsic about the limitations of educational reform given the entry char-acteristics of pupils. The modesteffects attained may be attributable tothe rather modest character of the reforms that have been studied.I sus-pect that American children are capable of attaining parity in mathe-matical literacy with Chinese children. In order to accomplish this goalitmight be necessary to reform our educational system in a way thatismore profound than the usual changes that are contemplated. We might,for example, need to lengthen the school day and the schoolyear, increasethe amount of homework given to children, increase the amountof timedevoted to mathematics instruction, and increase the requirementsformathematical literacy amongteachers in the upper elementary gradesinorder to have teachers with the knowledge required to teach a more ad-vanced curriculum.

INTELLIGENCE AND EDUCATION 265
We have considered naturally occurring variations among schools as asource of variance in whatis learned in the school. Another way of look-ing for variables that may modify the relationship between individualdifferences in intelligence and whatis learned in the schools is to exam-ine the influence of curriculum innovations on the relationship betweenintelligence and education. Cronbach & Snow (1977) presented a compre-hensive review of studies of the relationship between individual dif-ferences in the characteristics of learners and variations in instructionalmethods. Their review of the literature was designed to provide evidencefor the importance of whatthey called “aptitude < instructional interac-tions.” Such interactions would be manifested by the discovery of a statis-tically significant interaction between student characteristics and in-structional methods. This type of research attempts to determineif thereare different instructional methods that are optimal for learners withdifferent personal characteristics. The ultimate goal of this research froman applied point of view would be the assignmentof individuals to in-structional programs that are optimal for the learner. Cronbach andSnow’s comprehensivereview of the literature available to them led themto several generalizations about the importance of general intellectualability in determining the outcome of education. They concluded theirsurvey as follows:
We once hoped thatinstructional methods might be found whose outcomescorrelate very little with general ability. This does not appear to be a viablehope. Outcomes from extended education almost always correlate with pre-tested ability unless a ceiling is artificially imposed.The pervasive correlations of general ability with learning rate or outcomes
limit the powers of ATI findings to reduce individual differences. [Cronbach &Snow, 1977, p. 500]
Note that this statement implies that the optimal basis for individualiz-ing the curriculum based on individual differences among learners isknowledge of the learner’s general intelligence rather than knowledge ofthe learner’s specific ability scores. Learners of high general ability appearto outperform learners of low general ability under virtually all instruc-tional contexts. It is also the case that there are many examplesof ap-titude < instructional interactions involving general intelligence. Theseinteractionsare virtually never disordinal. That is, they do not lead to amodification in the expectation of superior academic achievement forlearners with high intelligence. What the interactions usually indicate isthat there are instructional programsthat can benefit low-ability learners,thereby decreasing the slope of the regression line relating general abilityto achievement. There are also instructional programs that impede theprogress of low-ability learners without decreasing the performance ofhigh-ability individuals. The instructional programs that benefit low-ability learners may be described as those that provide students with

266 9. CORRELATES OF INTELLIGENCE
structured information that relieves them of the burden of organizingmaterials for themselves. High-ability learners appear to benefit mostfrom instructional programs that provide them with an opportunity todevelop their own organizational structures (see Snow & Yalow, 1982).There are many studies reviewed by Cronbach and Snowthat provide
evidence for these general statements (see also Snow and Yalow, 1982).Snow (1980) described a study by Sharpe that provides evidence of aninteraction between measuresoffluid and crystallized ability and instruc-tional methods. Sharpe compared the performance of pupils in conven-tional classrooms with pupils assigned to IPI classrooms.IPI is a systemof individually paced instruction relying on specific pretests of knowledgewith frequent feedback to learners about their progress in accomplishingspecifically described objectives. Also mastery tests are used to assessstudent progress. Sharpe found that pupils whoscored low in crystallizedability benefited from IPI instruction; pupils who scored high incrystallized ability performed better in conventional classrooms than inIPI classrooms. Theresults for fluid ability were not significant, althoughhe did find that pupils with high fluid ability performed better in conven-tional classroomsthan in IPI classrooms.The data obtained by Sharpe are similar to other examplesof aptitude x
instructional ability interactions that are reported in the literature. Notethat the interactions obtained in this study involve interactions between
measuresof general intelligence and instructional methods.Variations ininstructional outcomesassociated with variations in general intelligenceare present under both instructional programs investigated in thisstudy—the innovative educational treatment did not eliminate the ad-vantage associated with high intelligence. Or, to put the matter differ-ently, the interactions were notdisordinal leading to a condition in whichhigh intelligence was not advantageous to the learner. The attempt toprovide a more structured learning environmentbenefited learners withlow ability. The structured learning environment produced a shallowslope relating an index of general intellectual ability to academic perfor-mance.
Bloom (1974, 1984) proposed that the relationship between generalin-telligence and whatis learned in the schools could be reducedby the useof mastery learning procedures (see Block & Anderson, 1975). He notedthat IQ tests scores are correlated with the time required to learn materialpresented to pupils. In the typical learning environmentcreated in thepublic schools, times are allocated to the mastery of academic materialthat are not sufficient to permit slow learners with low IQ to masterthematerial that is presented to them.In a typical elementary schoolclass-room different students may be allocated times to learn that have a ratioof longest to shortest time of 3:1. The ratio of time required to masteracademic material in a typical classroom may be 5:1. Therefore, underordinary instructional programs slow learners are not allocated a suffi-

INTELLIGENCE AND EDUCATION 267
cient amount of time to master the curriculum of the schools. They arepresented with new material before they have mastered the previous ma-terial, leading to the development of cumulative deficits. Bloom advo-cated the use of mastery learning procedures in order to solve this prob-lem. Mastery learning permits pupils to have a sufficient amountof timeto master material before being exposed to new material. Bloom arguedthat under mastery learning procedures pupils do not develop cumulativedeficits. In addition, he asserted that slow learners exposed to masterylearning learn to learn morerapidly. After mastery learning experiencesthe ratio of time required to exhibit mastery for slow and rapid learnersmay be decreased to 1.5:1. These changes permit a larger percentage ofstudents to master the curriculum of the public schools. And, the de-crease in the time required to attain mastery leads to a decrease in thecorrelation between intelligence and the time required to master thecurriculum. Note that Bloom does not claim that mastery learning pro-cedureswill eliminate the advantage that high-IQ pupils have over low-IQpupils in attaining mastery of the curriculum of the schools. But theimportance of IQ as a determinant of whatis learned will be reduced.
Slavin (1987) reviewed research on mastery learning. He noted thatstudies reporting dramatic improvementsas a result of the institution ofmastery learning procedures were of very short duration. For studies oflonger duration (4 or more weeks) there was no beneficial effect of mas-tery learning using standardized tests as criterion measures. For teacher-made testing, mastery learning was found to have small benefits of ap-proximately .25 standard deviations compared to regular instructionalprocedures. In addition, he found that there wasvery little evidence of theclaims madeby Bloom that the time taken to master material decreasedfor slow learners, leading to a reduction in the ratio of times required tomaster material from slowest to fastest students. As a result, it was diffi-cult to implement Bloom’s educational procedures for long periods oftime in the classroom. If students who learned rapidly were given newmaterial as they mastered previous material and students who learnedslowly were given a sufficient amount of time to master material beforebeing introduced to new material, the range of materials being taughtwithin a nonhomogeneously grouped classroom becamevery large andwas difficult for teachers to manage. While mastery learning proceduresmay be useful for slow learners by providing a sufficient amount of timefor them, thereby giving them success experiences and preventing thedevelopment of cumulative deficits, they clearly are not a panacea foreliminating individual differences. Indeed, the frequent use of masterytests to assess pupil progress may actually impede the progress of rapidlearners.
We briefly examinedresearch in ordinary educationalsettings that eval-uates attempts to reduce the influence of general intelligence on theoutcomesof education. There are also studies dealing with populations

268 9. CORRELATES OF INTELLIGENCE
that are assumedto beat special risk for school failure that are designed
as interventionsthat will lead to more satisfactory educational outcomesfor samples that are assumed to beat risk. Many of these projects are
designed as educational interventions for black students attendingschools in low-incomeurban areas (see Slavin, Karweit, & Madden, 1989,for a review of evaluation research on such programs). Few of these pro-gramshave beenrigorously evaluated and their long-term effectivenessis,for the most part, yet to be documented. Chapter6 of this book reviewedresearch reports from a consortium to evaluate longitudinal studies ofHeadstart programs for comparable populations. Recall that the review ofthat research indicated that such programsfailed to producesustainable
increases in general intelligence and also failed to lead to long-term im-provements in the educational achievementof pupils. A good example ofan evaluation of a recently instituted intervention program is containedin an article published by Slavin, Madden, Karweit, Livermon, & Dolan
(1990). They designed an intervention called “Success for All” that wasinstituted in the first three grades of an elementary school with a pre-dominantly black pupil population in Baltimore. The intervention con-sisted in part of the use of certified reading teachers to provide one-to-onetutoring for children who developed problems in reading. In addition,there was a family support team that provided assistance to the parents ofthe pupils. At the end of the school year a battery of tests was used toassess pupil progress. The performanceof pupils in this school was com-pared to the performanceof pupils in a matched elementary school. Cal-ifornia Achievement Tests of reading comprehension were .11, .23, and.63 standard deviations higher in the first, second, and third grades, re-spectively, in the experimental schoolafter a 1-year exposure to theinter-vention. The mean performanceon battery of tests designed to assess
specific reading skills as well as overall reading comprehension of theexperimental school pupils exceeded the mean performanceof the controlgroup school pupils by .48, .22, and .81 standard deviationsin thefirst,second and third grades, respectively.
TheSlavin et al. (1990) study does not indicate whether the advantagesassociated with the introduction of professional tutors in the classroomare cumulative or sustainable. The effects do not appearto be large at thefirst and secondgrade levels for measures of reading comprehension, butthey are moderately high at the third grade level. It is also interesting tonote that the effects were larger on comprehensivebatteries that includedmeasuresof specific reading skills than on a general measure of readingcomprehension. It may be that such interventions are useful to providerelatively specific skills but are less helpful in improving higher-level
understanding.Palincsar & Brown (1984) reported the results of an educationalinter-
vention study designed to improve reading comprehension. Theyselected

INTELLIGENCE AND EDUCATION 269
seventh grade pupils with adequate decoding skills who were approx-imately 2.5 years delayed in grade level performance on measures of read-ing comprehension.A subsetof six of these pupils with IQs ranging from67 to 99 (mean IQ = 83) were assignedto a reciprocal teaching interven-tion in which they were provided with instructionsin the skills of sum-marizing, questioning, clarifying, and predicting the contents of readingpassages for 30-minute sessions for a 20-day period. The students wereinstructed in groups of two and were required to lead the session inaddition to being exposed to the expert modeling of these skills by teach-ers. Considerable evidence is provided in the report of this study thatthese students developed progressin the skills they were taught andprac-ticed in the intervention. Their performance improvedrelative to controlgroups on probes of these skills when presented with new materials.Records of dialogue between teachers and learners demonstrated clearprogress in the ability to summarize andpredict the contentsof readingprograms. Theskills acquired were present on the tests taken 2 monthsafter the intervention. And, they exhibited evidenceof an ability to gener-alize the skills they had acquired to the task of detecting incongruities intextual passages.The Palincsar and Brown study maybeconsidered as a demonstration
of the possibility of intervention with children of moderately low IQ whoare not able to comprehendtext adequately. Although the Palincsar andBrownstudyprovidesclear evidence of a successful educational interven-tion, there are a numberof respects in which the study demonstrates thelimitations of the current “state of the art” in successful educationalinterventions. The results of the intervention werereplicated in a secondsample in which the pupils were reciprocally taught by teachers ratherthan by the researchers. While there may be doubts aboutthe feasibilityof large-scale interventions employing these techniques, let us assumethat the gains reported by these teachers could be obtained for poor read-ers in any classroom.Evenif this weretrue, there are a numberofsignifi-cant limitations and unresolved issues relevant to evaluating the inter-vention. First, the duration of the effects of the change is unknown. Theposttest occurred only 2 monthsafter the end of the intervention and thelong-term effects of the intervention are not known. Second, the gener-alization probes, while demonstrating some ability to use the skills ac-quired with newtexts in different contexts and to transfer these skills torelated skills, are relatively limited. For example, no demonstration ismadethatthe skills transfer to an ability to detect incongruities in math-ematical word problems or to summarize lecture material. To assert thisis not to denigrate the impressive utility of what was learned by thepupils but merely to indicate that the generalized skills that charac-terized the intellectual difference between high- and low-IQ pupils werenot eliminated by the intervention used in this study. Third, although

270 9. CORRELATES OF INTELLIGENCE
there was clear evidence of the development of new skills that were main-
tained and transferred to novel context in this study, the magnitude of the
changes in more generalized skills may have been modest. Ontests of
ability to transfer the specific skills that were acquired of summarizing
and predicting questions, subjects assigned to the control groups were
approximately 1.9 and 1 standard deviations lower in performance on
these skills, respectively, than students assumed to have normal com-
prehension skills. Subjects assigned to the reciprocal teaching groups had
gained approximately 1.5 and 1 standard deviation units relative to the
control groups on these transfer tests, respectively. Thus a substantial
portion of the deficit exhibited in these skills was substantially elimi-
nated. On the other hand, on a general test of reading comprehension,
subjects assigned to the reciprocal teaching intervention exhibited an
average gain of 15 months of progress. They began the study approx-
imately 2.5 years behind in general reading comprehension and, assum-
ing some gain in reading comprehension of normal students over the
duration of the intervention, less than half of the deficit of these pupils on
general reading comprehensionthat defined their selection for this inter-
vention had been eliminated. The standard deviation of grade equivalents
on the reading comprehension test was not provided, but a reasonable
estimate of the standard deviation suggests that the gains for the six
subjects assignedto the reciprocal teaching interventions for whom these
data are provided was approximately .5 standard deviation. And, the en-
during effects of the gains in this intervention are unknown.
The Palincsar and Brown study provides a good demonstration of the
utility of a particular type of educational technique that can provide
students with some useful skills. At the same time, when examined
critically, it also demonstrated some of the limitations of our current
effort to remediate the generalized learning deficits that are characteristic
of individuals with moderate general intelligence whoare at risk to dem-
onstrate inadequate academic achievement.
There is a ubiquitous relationship between general intelligence and
educational achievement. Our brief review of some representative inter-
vention studies indicated that there is relatively little evidence that the
relationship between intelligence and academic achievementis substan-
tially modifiable using present instructional interventions. The discus-
sion of the cross-cultural differences in mathematical achievementindi-
cated that it is possible in principle to design educational interventions
that will improve the overall performance of children in the public
schools. There is relatively little evidence that such interventions will
dramatically decrease the variability of indices of academic achievement.
Norare they likely to decrease the relationship between individual dif-
ferences in intelligence and such indices.
Although IQ test scores predict academic achievement, they maybeof

INTELLIGENCE AND EDUCATION 271
little use in creating optimal instructional programs. They may be ofsomeusein selecting students whoare likely to benefit from acceleratedand individualized experiences in the schools. IQ tests may be useful forgeneralized assignmentto broadly different curricula. They are probablyuseless in designing a specific instructional program for a student. Any-one attempting to teach a person a specific skill needs to understand thespecific knowledge andskills of the learner. Consider two opposite sce-narios involving the relationship between IQ and performanceat partic-ular academic task. Suppose a person with a high IQ performspoorly. Ateacher could inform the learner that he or she has high IQ andis there-fore capable of learning. This assertion provideslittle information to thelearner and does not provide a diagnostic understanding of the deficien-cies in the learner’s performance. Suppose a learner with low IQ hadadequately performed a task. Should the teacher inform the learner thathe or she has violated the rules of psychological theory? The learner'sability to master academic material even though heor sheis “notintel-ligent” and hence, by definition, “not able” to learn is an intellectualembarrassment. Knowledge of a person’s IQ score in such a circumstanceis useless. It is apparent that knowledgeof an IQ test scoreis of little or novalue to a teacher. IQ test scores may not even be an optimalbasis for theassignment of individuals to broadly different curricula. Even thoughthere is ample evidence that IQ does predict general academic perfor-mance, assignments of individuals to educational programs based on IQmay not be as valid as the assignment of individuals based on actualacademic performance. Consider a hypothetical choice for the selectionof a studentfor a class for “gifted” students. Assumethat such a class willprovide an enriched and accelerated academic program. Assumefurtherthat you are faced with a choiceof selecting a student with relatively lowIQ and excellent academic skills and performanceor a student with rela-tively high IQ and a poor record of academic performanceandrelativelyinadequate knowledgeof the curriculum. In most circumstances it wouldprobably be morerational to select the former than the latter student.There is little reason to use the predictive index in place of a measure ofactual academic performancethatservesas the validating criterion for theindex. Thecriterion is probably superior to the measurethat predicts thecriterion.
This discussion suggests that IQ may notbeparticularly useful as anindex to individualize instruction or to assign individuals to differentinstructional tracts. I believe that an end of the use of IQ tests in theschools would havelittle or no impact on education. The removal of thetests would not reduce the influence of the ubiquitous individual dif-ferences that influence academic achievement. Removing the tests wouldremove a tangible symbol of the pervasive importance of individual dif-ferences in academic achievement. The educational and social problems

272 9. CORRELATES OF INTELLIGENCE
associated with those differences would remain after the tests are re-moved. In short, the tests do not create the problem, they merely are oneway of informing us about the nature of the problem.
INTELLIGENCE AND OCCUPATIONS
Intelligence and the numberof years of education that a person obtainsare positively correlated. Occupational status and the numberofyearsofeducation required for job entry into occupationsof different status arepositively correlated. This implies that intelligence test scores and oc-cupational status are positively correlated. Harrell & Harrell (1945) ob-tained IQ scores for white military recruits in World War II and relatedthese scoresto their civilian occupations. They found that the mean IQfor different occupations increased monotonically with the amountofformal education required for job entry. For example, they found that thehighest mean IQsfor their recruits were for individuals with civilian jobclassifications of accountant, lawyer, and engineer (IQ means of 128.1,127.6, and 125.8, respective). The lowest mean IQs werefor individualswith civilian occupations of farmhand, miner, and teamster (mean IQsof94, 92, and 89, respectively). They also found that the range and standarddeviation of the IQsof individuals were inversely related to the mean IQof individuals in different occupations. For example, the range and stan-dard deviation of individuals with the civilian occupation of accountantwere 94-157, S.D. = 11.7. The comparable numbersfor individuals withthe civilian occupation of teamster were 46-145 and 19.6. These dataindicate that individuals with low IQsare not likely to be found in high-status occupationsthat require high levels of formal education as a condi-tion for entry into the occupation.
These analyses indicate that IQ and occupationalstatusare related.Isintelligence related to success within an occupation? Ghiselli (1966,1973) summarized studies relating general intelligence to job perfor-mance. He concluded that the correlations between general intelligenceand job performance are frequently low and that they vary considerablyand often in unpredictable ways from study to study. Hunter & Hunter(1984) used meta-analyses to reanalyze the studies examined by Ghisellias well as other relevant data bases. They indicated that some of thevariability in correlations relating intelligence to indices of job perfor-mance wasattributable to statistical variability derived from the use ofrelatively small samples in several of the studies. The use of meta-analy-ses permits one to obtain estimates of the relationship between intel-ligence and indices of job performancethat are not subject to large errorsof estimate. Hunter and Hunterdo not report specific statistical tests forthe heterogeneity of effect size statistics in these various estimates. Theyasserted that there is little indication of statistically significant hetero-

INTELLIGENCE AND OCCUPATIONS 2/73
geneity of correlations for different studies in their sample. Hunter andHunter also indicated that where the necessary information was avail-able, they corrected correlations for restrictions in range of talent in IQand for unreliability of tests and criterion measures. For example, many ofthe studies relating IQ to job performance use supervisor ratings. Theyassumedthat .80 was an upper-boundestimate of the reliability of super-visor’s ratings. Table 9.3 presents the results of their reanalysis ofGhiselli’s data relating indices of general intelligence to indices of jobperformance in different occupations. An examination of the reportedcorrelations indicates that they range from .27 to .61. Thecorrelationsbelow .40 occurfor jobs that are described by Hunter and Hunteras beinglow in complexity of intellectual demands. Hunter and Hunterestimatedthat the mean corrected correlation between IQ and measures of super-visor-rated job competencefor various positions is .53. This estimate isbased on 425 correlations obtained from over 30,000 subjects. Note thatthis is a corrected correlation with corrections for unreliability of mea-surement and restrictions in range of talent in the ability characteristicsof applicants for positions. Theyalso indicated thatintelligence is relatedto indices of performance on thejob that are used for promotion orcer-tification of adequate job performance. They estimated that the correla-tion between these measures is .53. These correlations have relativelylarge standard deviations(r = .15), indicating that in any particular study,the corrected correlation between an ability index and a measure of jobperformanceis likely to have a value that is deviant from the populationvalue of .53. These data indicate that intelligence is a reasonably goodpredictor of performance in manydifferent occupations.
It should be noted that the meta-analyses reported by Hunter andHunterare based on correlations that are corrected values. These correc-
TABLE 9.3 Validity Correlations for Predicting Success in Different Occuaptions
Mean validity Beta weight
Job families Cog? Per Mot Cog Mot r
Manager 53 43 .26 90 .08 03
Clerk 34 46 29 50 12 5
Salesperson 61 .40 29 58 .09 .62
Protective professions worker .42 37 .26 37 13 43
Service worker .48 .20 27 44 12 49Trades and crafts worker .46 43 34 39 .20 50Elementary industrial worker 37 37 .40 .26 31 47Vehicle operator .28 31 44 14 39 46Sales clerk 27 22 17 24 .09 .28
@Based on Hunter & Hunter(1984).
’Cog, general cognitive ability; Per, general perceptual ability; Mot, general psychomotorability, r,
multiple correlation. Mean validities have been corrected for criterion unreliability and for rangerestriction.

274 9. CORRELATES OF INTELLIGENCE
tions are appropriate for theoretical purposes. The corrected data indicatethat over a wide range of occupations, IQ accountsfor approximately 25%of the variance of performance in a job as typically assessed by super-visors. These correlations may also be consideredas indices of predictivevalidity. Here, the corrections may providea distorted perspective on thevalue of IQ tests as a basis for personnel decisions and the selection ofindividuals for different jobs. Hunter and Hunter do not present uncor-rected correlations in their paper. Corrections for restrictions in range
may be inappropriate since the applied decision makeris confronted withthe task of selecting individuals from a pool of applicants. The undoubt-edly correct assertion that the correlation between IQ and performanceina job wouldbe larger if the pool included individuals with IQs outside therange of the actual applicant pool is irrelevant to the decision makerunless he or she wishes to change the nature of the applicant pool tosample more widely from different IQ ranges. The corrections for at-tenuations are also problematic. The correction for unreliability of IQscoresis of little relevance to the applied decision makersince he or shenever has a perfectly reliable index of intelligence available—only anactualscore. So, too, the correction for unreliability of the criterion is alsoproblematic. While supervisor ratings or any other measureof job perfor-mance are undoubtedly imperfect indices of a hypothetically pure mea-sure of job performance, the inability to obtain an error-free measuremight be interpreted as indicating that corrections for attenuation ofcriterion measures lead to selection of individuals who will outperformunselected individuals in ways that are not readily measured. In summa-ry, these correction may overestimatethe utility of the use of IQ tests forselection purposes. These comments should not be construedas arguingagainst the useof tests of general ability in selection situations. Hunterand Hunter presented a strong argument that such tests are as predic-tively valid as any readily available alternative. Perhaps whatis importantin these data is not the particular value of a corrected or an uncorrectedvalidity coefficient relating IQ scores to job performance, but the apparentdemonstration that IQ scoresrelate to many different kinds of job perfor-mance.
OTHER CORRELATES OF INTELLIGENCE
Individual differences in intelligence have been related to manydifferentcharacteristics of individuals (see Brand, 1987, for a list of possible corre-lates of IQ scores). In many of these studies controls for social class arenot used.It is difficult to know if IQ has an influence on some charac-teristic that is independent of various indices of social privilege. There isno literature assessing the influence of IQ on social behaviors that ap-proaches the methodological sophistication and empirical adequacy of

OTHER CORRELATES OF INTELLIGENCE 275
the studies we have reviewed relating IQ, education, and social class tooccupational status and occupational mobility. There is, however, evi-dence that criminality and delinquency mayberelated to intelligence andthat this relationship is not solely attributable to social class influences.
Intelligence and Criminality
There is a relationship between IQ and criminality and juvenile delin-quency (Hirschi & Hindelang, 977). This relationship maybe explainedindifferent ways. Individuals whoare officially classified as juvenile delin-quents are morelikely to be apprehended than individuals who commitcrimes but are not apprehended.Intelligence mayberelated to the proba-bility of being apprehended.It is possible that intelligence is unrelated tothe probability of committing a crime but is inversely related to theprobability of being apprehended for a crime that is committed. Oneargumentagainst this interpretation of the relationship between intel-ligence and criminality is that it holds for self-reported incidencesofcriminal behavior as well as for officially recorded criminal behavior. Ofcourse it could be arguedthat intelligence is related to the willingness toreport that one has engagedin criminal behavior. A second explanation ofthe relationship between criminal behavior and intelligence assumesthatit is attributable to social class influences. Criminality is related to socialclass backgroundasis intelligence. This explanation implies that therelationship between intelligence and criminality would disappearif so-cial class were controlled. Hirschi and Hindelang argued that this expla-nation is unlikely to be correct since the relationship between indices ofcriminality and intelligence holds among individuals with similar socialclass backgrounds.
Moffitt, Gabrielli, Mednick, & Schulsinger (1981; see also McGarvey,Gabrielli, Bentler, & Mednick, 1981) obtained records of juvenile criminalbehavior from a cohort of Danish individuals born in Copenhagen. Theirsample included 4552 males whowereselected from their larger cohortwho were tall. They had Danish military induction intelligence testscores for this sample as well as information about parental occupation.The correlation between IQ and the number of offenses committed bythese subjects was —.19 and thepartial correlation between IQ and crimi-nality, holding constant socioeconomic status, was —.17. West & Far-rington (1973) used a prospective design in which they obtained Raventest scores for children at age 8 and studied the incidence of juveniledelinquency for their subjects. They found that individuals who wererecidivist juvenile delinquents were morelikely to have low IQs thanindividuals who were either nondelinquentor had only a single incidenceof delinquency. These relationships were present even after statisticalcontrols for family income were used.These results indicate that individual differences in intelligence are

276 9. CORRELATES OF INTELLIGENCE
weakly related to juvenile delinquency and that this relationship is notsolely or predominantly a function of social class background. They leaveunresolved the basis for this relationship. It is possible that these rela-tionships, like the relationship between intelligence and occupationalstatus, are mediated by the influence of intelligence on education. Thatis, individuals with low intelligenceare less likely than individuals withhigh intelligence to be rewardedfor their performance in schools and mayseek sources of prestige and rewards that are not related to educationalperformance. I am not aware of any studies that report the relationshipbetween intelligence and criminality that statistically control for educa-tional performance.
Intelligence and Fertility
IQ is related inversely to fertility. This relationship has been of consider-able interest to individuals who are concerned with eugenic issues relatedto differences in reproduction.If individuals with low IQ reproduce at ahigher level than individuals with high IQ, it is possible that these differ-ential fertilities will lead to an intergenerational decreasein intelligence.In fact, R. B. Cattell (1936, 1937) predicted such a decrease. We now knowthat secular changesin intelligence have been associated with an increaserather than a decrease in intelligence and therefore Cattell’s predictionswere wrong. Nevertheless, they were instrumentalin leading to investiga-tions of the relationship between IQ andfertility.
Higgins, Reed, & Reed (1962) argued that the fertility patterns associ-ated with IQ were notnecessarily dysgenic (i.e., supportive of a pattern ofreproduction in which individuals with genes that are likely to lead tolow IQ reproduce at higher levels than individuals with genes likely tolead to high IQ, thereby creating an intergenerational decline in the genepool with respect to the genetic potential for high IQ). They studied alarge sample of individuals who had completed their fertility and theyincluded individuals who had never married and had no children. Theyfound that there was no relationship between IQ andfertility. Theseresults were at odds withearlier studies reporting a negative relationship.Thediscrepancyin results wasattributable to differences in methodology.Previous research had sampled schoolchildren and had related IQ to thenumberof siblings. These studies excluded individuals who had nooff-spring. Higgins et al. found that low-IQ individuals were less likely tomarry than high-IQ individuals and were less likely to reproduce. If oneconsidered thefertility of all members of the population there waslittleor no effect of IQ on fertility. These results were buttressed by additionaldata from other samples indicating that individuals with low IQ weremore likely to have childless marriages (Bajema, 1971). These data con-vinced many individuals concerned with this problem that there waslittle or no relationship between IQ andfertility (Falek, 1971).

OTHER CORRELATES OF INTELLIGENCE 277
Vining (1982) challenged this conclusion. He noted that the samplesinvestigated were not representative. They were white, native-born indi-viduals, and they included cohorts born during a period ofrising fertility.Vining argued that the relationship betweenfertility and IQ might varyfor different groups in the U.S. and mightvary for different cohorts. VanCourt & Bean (1985) reported a comprehensive analysis of cohort effectson the relationship between IQ andfertility in the U.S. They used datacollected from national opinion surveys that were assumed to samplerepresentative samples of the U.S. population. These samples were ad-ministered a brief vocabulary test and this was used as an index of intel-ligence. The relationship betweenfertility and vocabulary scores for dif-ferent cohorts for representative samples of the white population of theU.S. is presented in Table 9.4. These data indicate that the relationshiphas been consistently negative for most cohorts born in the twentiethcentury. This generalization is not valid for cohorts born between 1925and 1935 whosepeakfertility coincided with a period of high fertility.Van Court and Bean did not have large numbers of nonwhitesin their
sample. There is data indicating that the relationship between IQ andfertility is different in black and white samples. Vining (1982) obtainedhigh school IQ data from samples of black and white women who werebetween 24 and 34 in 1978. The samples wererepresentative samples ofthe U.S. population, although the black sample was oversampledin orderto increase the numberof black respondents. Healso obtainedfertilityinformation from these samples. Note that this is not a sample withcompletedfertility. Therefore, relationships betweenfertility and IQ in
TABLE 9.4 Correlations between Numberof
Offspring and Vocabulary Scores for DifferentCohorts of the White Population of the U. S.¢
Cohort N r
= 1894 91 —.04
1895-1899 120 —.17
1900-1904 195 —.23
1904—1909 273 —.17
1910-1914 307 —.081915-1919 363 —.131920-1924 424 —.12
1925-1929 364 00
1930-1934 358 —.031935-1939 429 —.16
1940-1944 488 —.17
1945-1949 604 —.24
1950-1954 632 —.221955-1959 408 —.211960-1964 99 —.22
“Based on Van Court & Bean (1985).

TABLE
9.5
FertilityforBlackandWhiteWomen
Differingin
1Q¢
<71
71-85
86—
100
101-115
116-130
>130
All
Whitewomen
1.59
N17
Blackwomen
2..6
0
N50
1.68
122
2.12
165
1.76
522
1.79
159
1.44
907
1.63 88
1.15
438
1.20 10
92 60
.0O
1.46
2066
1.94
473
“BasedonVining
(1982).
CONCLUSION 279
these samples represent fertility experience up to age 34 and should notbe assumedto reflect completed fertility. If high-IQ women have childrenwhentheyare older than low-IQ women,the relationship betweenfertil-
ity and IQ in Vining’s data will be overly negative. And, Vining foundthatthe relationship between expected lifetime numberof children (not actualnumber) and IQ was less negative than the relationship between actualnumberof children and IQ. Table 9.5 presents Vining’s data on therela-tionship between early fertility for black and white womenasa functionof their IQ. Note that the relationship is different for black and whitewomen.Fertility is higher in the black sample. The relationship betweenIQ andfertility appears to be nonlinear for the white sample. Fertilityincreases and peaks in the 86—100 IQ group and then declines as IQincreases. In the black sample fertility is a monotonically decreasingfunction of IQ, with the highestfertility occurring for women with IQsbelow 85. Since parental IQ is related to children’s IQ, these data, ifextrapolated, suggest that the difference in fertility patterns may contrib-ute to intergenerational increases in the magnitude of the black-whitedifference in IQ test score. It should be noted that there is no evidence ofsuch an increase (see Chapter 10). And, it is entirely possible that changesin opportunities available to black people in the U.S. may prove of greatersignificance in changingtherelationship between black and whiteperfor-mance on IQ tests than differences in fertility rates for individuals withdifferent IQs. In this connection it should be noted that Van Court andBean’s data suggest that the IQ—fertility relationship for most of thetwentieth century has been dysgenic. Nevertheless, IQ has exhibited sec-ular increases.
CONCLUSION
This chapter briefly reviewed data indicating that general intelligence isrelated to a variety of socially relevant indices. There appears to belittledoubt that a person’s score on a test of general intelligence is an impor-tant index of a person’s behavior in a variety of contexts. It is difficult tothink of any othersingle index that is as widely predictive or as predictiveof socially important outcomes. And,it is clear that the predictability ofIQ test scores is not solely or even predominantly attributable to thecorrelation between IQ and social class background. IQ tests index a
characteristic of persons that is substantially independentof their socialclass background.

10GROUP DIFFERENCES IN
INTELLIGENCE
In what waysdo race and gender influence performanceontestsof intel-ligence?
BLACK-—-WHITE DIFFERENCES
Description
The study of racial differences in intelligence is as old as the study ofindividual differences in intelligence. Galton (1869) believed that therewere racial differences in intelligence and that these differences wereattributable to genetic differences between the races. There is a 1-stan-dard-deviation difference in IQ between the black and white population ofthe U.S. (Loehlin, Lindzey, & Spuhler, 1975; Shuey, 1966). The black pop-ulation of the U.S. scores 1 standard deviation lower than the whitepopulation on various tests of intelligence. Variations within race areclearly larger than variations between races. Excluding individuals whohave very low IQ attributable to neurological damage, the within-racevariability on intelligence tests is approximately 10 standard deviations.Thusthe ratio of within-group variability to between-group variability inscores on tests of intelligence is large. Jensen (1980a) calculated the per-centage of variance attributable to race and social class background on theWechsler tests for a representative sample of 622 black and 622 whiteelementary school children in California. His analysis is presented inTable 10.1. Race, with socioeconomicstatusstatistically controlled, ac-counts for 14% of the variancein IQ scores in this sample. Race andsocialclass combined account for 22% of the variance. Variations within fami-lies among children reared together with the same racial and so-cioeconomic background accounts for 44% of the variance in thesedata,indicating that variations among individuals with identical so-cioeconomic backgrounds andracial backgrounds account for more vari-
280

BLACK-—WHITE DIFFERENCES 281
TABLE 10.1 Percentage of Total Variance and Average IQ Difference inWISC-R Full-Scale IQs Attributable to Each of Several Sources
Variance Average IQSource of variance (%) difference
Between races (independent of SES) 14 12
Between SES groups (independentof race} 8 22 6
Between families (within race and SES groups) 29 9
Within families 44 73 12
Measurementerror 5 4
Total 100 17
“Based on Jensen (1980a).
ance in tests of intelligence than either race or socioeconomic status.
These data, which are roughly representative of what has been found inother studies, indicate that variationsin scores ontests of intelligence areattributable primarily to characteristics of persons that are independentof their racial and socioeconomic background. Although, in this chapter,our emphasis shifts from a consideration of individual differences to aconsideration of differences among groups of individuals, it should berecognized that an individual’s performance on test of intelligence isnever defined or predictable from his or her group identity. Research onintelligence, properly considered, should invariably serve as an antidoteto stereotypes.The 1-standard-deviation difference in IQ is magnified in importance
and visibility when IQ, or variables that are proxies for IQ, is used as abasis of selection of individuals. The IQ distributions of black and whitepopulations overlap and approximately 16% of the black population,as-suming normalcurvestatistics as a roughly accurate representation of theunderlying distributions, will have IQ scores that are above the whitemean. The ratio of white to black individuals at different points of thedistribution will vary widely. If IQ scores below 70are used asa basis forassigning individuals to special education classes, this IQ score for whitesamples will be 2 standard deviations below the white mean,andit willbe 1 standard deviation below the black mean; and the ratio of white toblack individuals at or below the score of 70 will be approximately 1 to 7.Therefore, if performance on IQ scores werethesole criterion for assign-ment to special education classes, the ratio of white to black individualsassigned would be 1 to 7. Differences in ratios of individuals of differentraces at different points of the IQ distribution becomeincreasingly differ-ent at increasingly more extreme cutting points in the distribution. For

282 10. GROUP DIFFERENCES IN INTELLIGENCE
example, the ratio of white to black individuals with IQs above 115 isapproximately 7 to 1, and the comparable ratio of individuals with IQsabove 130 is almost18 to 1. If individuals are selected for social roles suchas admission to graduate schools or selective colleges that rely on highscores on IQ tests or variables that are highly correlated with IQ,the ratioof white to black individuals who meet selective admissions require-ments will be above 1, and the size of the ratio will be determined by theextremity of the cutting score used. Gottfredson (1987) extended thisanalysis to a consideration of white to black employmentratiosin differ-ent occupations and demonstrated that the differences in the ratio ofwhite to black employment in different occupations were predictablefrom knowledge of the historical differences in the mean IQ of membersof the occupation. The higher the average IQ of members of an occupationand the higher the “threshold” IQ for entry into the occupation, thehigher the white to black ratio of employmentin the occupation. Theseanalyses clarify the social significance of a 1-standard-deviation dif-ference in IQ between the black and white populations of the U.S. Al-though race is not highly predictive of IQ, IQ, or variables that are corre-lated with IQ, is correlated with entry into various social roles. And, forthose social roles that have traditionally used IQ-related criteria restrict-
ing entry to individuals whose IQ scores are at the extremesof the dis-tribution, there will be a large difference in per capita ratios of black andwhite individuals meeting the entry requirements. Thusthe difference inIQ becomessocially visible and relevant to decisions about affirmativeaction.
Black—white differences in intelligence appear to have remained con-stant for several decades. Shuey (1966) calculated differences in individualIQ test performance for black and white schoolchildren tested before1945 and between 1945 and 1965 and obtained a meandifference of 14points for both periods. These meansrepresent findings from over 300studies. Loehlin et al. (1975) estimated black—white IQ differences formilitary recruits tested in World War I, World War II, and the VietnamWar. They estimated white—black mean differences in IQ of 1.16, 1.52,and 1.52 standard deviation units for these three wars, respectively. Thesedata indicate that the differences have not declined. The results are com-plicated by different recruitment procedures and different tests. Never-theless, these results provide little or no basis for assuming that thedifference is diminishing. The secular changesin IQ that we considered inChapter 6 have not diminished black—white differences in IQ. This im-plies that both the black and the white population of the U.S. have in-creased IQ at approximately the same rate over the last seven decades.The black—white difference in IQ appearsto be relatively constant over
large segmentsof the life span. Although thesedifferencesare not presenton the Bayley scales administered between 1 and 15 monthsof age (Bay-ley, 1969}, the Bayley and other infant tests administered during thefirst

BLACK—WHITE DIFFERENCES 283
year of life are not correlated with later IQ. Fagan & Singer (1983) foundthat black and white infants were notsignificantly different on tests ofinfant recognition memory that are predictively related to early child-hood IQ. They demonstrated that a test of novelty preference adminis-tered to infants at 7 monthsof age waspredictive of IQ at age 33 for both
white and black children in their sample. The early childhood IQ testexhibited the usual black-white difference in performance. There wereno black—white differences in performance on the novelty recognitiontask. The black infants scored slightly but not significantly better thanthe white infants on this measure. The black sample was small (N = 16)and the study requires replication. Takenat face value, these data suggestthat there are no black—white differences on the earliest indices of infor-mation processing or novelty preference thatare predictive of early child-hood IQ. Therefore, the black-white difference in IQ most probably de-
velops sometimeafter the first year oflife.Racial differences in IQ are clearly present prior to school entry.
Broman et al. (1975) obtained a 1-standard-deviation difference on theBinet test for large samples of black and white children tested for theCollaborative Perinatal Project. Montie & Fagan (1988) obtained a 1-stan-dard-deviation difference between white and black samples of 3 year oldson the Stanford—Binet. Jensen (1971) administered the Raven and thePeabody test to black and white students attending Berkeley elementaryschools. He found that the black-white difference in performance onthese tests varied on each of the tests over grades. The changes were notconsistently related to age. There was no evidence of a systematic changein the magnitude of the black-white difference over the elementaryschool years. Gordon (1984) reviewed studies of the test-retest stabilityin IQ for black samples and found that there was, with the possibleexception of Jensen’s research on cumulative deficits discussed in Chap-ter 6, little or no evidence of a cumulative decline over the school-ageyears. The lack of evidence of a systematic increase or decrease in thesedifferences suggests that the magnitude of black—white differences inperformanceontestsof intelligence does not change over the elementaryschool years. Data for high school age samples (see Shuey, 1966) and datafor military recruits suggest comparable black-white IQ differencesthrough the young adult period. Although we need moredata aboutearlychildhood differences in IQ and data about performanceoninfantindices,the available data are compatible with the assertion that the black—whitedifference is present somewhere before thethird year of life and remainsmore or less constant through the adult life span at approximately 1standard deviation.The black—white difference in performance on various tests of intel-
ligence is not constant for different types of measures of intelligence.Loehlin et al. (1975) reviewed studies on profile differences between blackand white samples and found that the results were somewhat inconsis-
284 10. GROUP DIFFERENCES IN INTELLIGENCE
tent, although several studies indicate that the black samples tend to dosomewhat better on tests of verbal ability than on tests of spatial andnumerical reasoning(see Lesser, Fifer, & Clark, 1965; Stodolsky & Lesser,1967). Jensen & Reynolds (1982) analyzed data for the national standar-dization sample of WISC-R. They studied black-white differences in per-formance on the Weschsler subtests with mean differences in full-scalescores partialled out. They found that the black sample exceeded thewhite sample on the Arithmetic and Digit Span subtests that load on thememory factor. The white samples were superior to the black samples onComprehension, Block Design, Object Assembly, and Mazes. Thelatterthree subtests are good markers for a spatial ability factor. These resultssuggest that the largest black—white differencesin tests of ability will beobtained on spatial ability measures.
Jensen (1985a) proposed that the black—white difference on varioustestsof intelligence is predictable from knowledge of the g loading of thetest.The more g loaded thetest, the larger the black—whitedifferencein favorofwhites. Jensen called this the Spearman hypothesissinceit is derived froma suggestion by Spearman. He distinguished between strong and weakforms of the hypothesis. The strong form of the hypothesis states that gconstitutes the sole basis for differences in black—white performance onvarioustests of intelligence. The weak form of the hypothesis states thatthe differences are correlated with g, but that g is not the sole basis of thedifference. The strong form of the hypothesis is contradicted by the datacited above reported by Jensen and Reynolds (1982). There are differences insubscale scores between black and white samples after removing theinfluence of full-scale IQ scores. The control for full-scale IQ may beinterpreted as a control for g. Black—white differences in the residualvariance on tests imply that someof the black-whitedifference in perfor-manceon 1Q testsis attributable to factors other than g. Jensen wasable tofind 11 data sets that permitted him to test the Spearman hypothesis. Foreach of these data sets, black and white samples were administered abattery of tests. Jensen factor analyzed the tests separately for black andwhite samples and usedthesefactor scores to derive a g loading for eachtest in each battery in the data set. He also obtained a measureof the black—white difference for each test in each data set expressed in terms ofstandard deviation units. He correlated the mean race difference scoreswith the g loadingsof each test for each of the 11 samples. The correlationaveraged overall of the data was .59. The tests with the highest g loadingshad a white—black mean difference of 1.00 standard deviationforg loadingsderived from a factor analysis of the scores of the black samplesand .95 forg loadings derived from the white samples. (It should be noted that thefactor structures of the tests and the g loadings of the tests derived fromblack and white samples were virtually identical.) The comparable dif-ferences for tests with the lowest g loadings in the studies were .59 and .55.
Jensen’s results suggest that the magnitude of black—white differences

BLACK-WHITE DIFFERENCES 285
on different tests of ability will be dependent on differences in the gloadings of the tests and differences in the tests loading on residual factorsafter g variance is removed. Of the two sourcesof individual differences,the former is more important than thelatter. Jensen indicated that varia-tions in g accounted for seven times more variance than variations inresidual group factors in accounting for black—white differencesin perfor-mance onthe national standardization data for the WISCtest analyzed byJensen and Reynolds.
Naglieri & Jensen (1987) used the Spearman hypothesis to analyzeclaims that the Kaufman AssessmentBattery for children (Kaufman &Kaufman, 1983a, b) yielded smaller black—white differences in intel-ligence than other standard intelligence tests. They tested a sample ofblack and white elementary school children who were matched for so-cioeconomic status on both the WISC and the Kaufmanbatteries. Theyfound that the white sample had a WISC IQ that was .435 standard devia-tion units higher than the black sample. The comparable difference onthe Kaufman total score was .317. They factor analyzed both tests to-gether and obtained the g loadingsof all of the subtests. The correlationbetween the g loadings of the tests and black—white differences on thetests was .78. Several of the g loadings of subtests included in the Kauf-man battery were low. The factor analyses of these twotests clearly indi-cate that the non-g variance of the Kaufmantestsis larger than the non-gvariance of the WISC. The smaller black—white difference on the Kauf-mantest is entirely attributable to the use of tests that are less likely tobe good measures of g. Blacks perform better than whites on tests ofmemory after the removal of g. It is possible to constructa test that willminimize the black—white difference in intelligence by using many sub-tests that are good markers for memory ability factors. The black—whitedifference in intelligence may beincreased bythe useof subtests that aregood markersfor spatial ability factors. These changes in the compositionof subtest batteries on omnibustests of intelligence may lead to changesin the magnitude of the black—white differences on the test withoutchanging the underlying black—white difference in general intelligence.Naglieri and Jensen’s analysis clearly demonstrates that the magnitudeofthe black-white difference in general intelligence is the same on theWISC and the Kaufmantest even though thelatter test leads to smallerdifferences than the formertest.
I criticized the analyses reported by Jensen in favor of the Spearmanhypothesis (Brody, 1987). I indicated that several of the studies used byJensen were based on the WISC and that the Digit Span, Coding, andTapping subtests of the WISC haverelatively low loadings on the generalfactor and they do not appear to be good measuresof abstract reasoning orgeneralintelligence. Their inclusionin tests of intelligence does not con-stitute evidence that they are in point of fact good measures of intel-ligence. The inclusion of these tests in the battery may be taken asevi-
286 10. GROUP DIFFERENCES IN INTELLIGENCE
denceof an error on the part of the test constructor. When tests whose gloadings are low are removed, the correlation between the g loadings ofthe remaining tests and the magnitudeof the black-white differences onthe tests is substantial on only oneof the four studies based on the WISC.The correlations ranged from .12 to .16 for loadings based on the blacksamples and from .16 to .36 for loadings based on the white sample.Similar results were obtained for another of the studies containingtestswhose g loadings were very much lowerthan othertests in the battery. Iargued that Jensen’s analyses in favor of the Spearman hypothesis wereflawed because his results could be obtained by studying any battery oftests that contained good measures of g and other tests that were notmeasuresof intelligence. Since blacks and whites do notdiffer on any andall cognitive tasks, any mixture of g-loaded tests and non-g-loadedtestswould provide evidence for the Spearman hypothesis. I argued that dif-ferences in the g loadings of tests were too evanescent and fragile toconstitute a dimension on which one could order several tests. Jensen(1987b) criticized my analysis. He indicated that his results were not anartifact of the inclusion of tests whose g loadings were sufficiently low tobe considered outliers in the battery of tests. In order to demonstrate thathis results held for different portions of the regression analysis, he dividedhis sample of tests into those that had g loadings above and below themedian and foundthat the correlations between the g loadingsof the testsand the black—white difference on tests with above-median g loadingswere .33 and .34 for g loadings derived from the black and white samples,respectively. This analysis suggests that Jensen’s results are not depen-dent on the use of tests that are not good measuresofintelligence.One difficulty with the empirical support in favor of Jensen’s hypoth-
esis is that the g loadings of the tests are empirically derived and withouttheoretical rationale. In Chapter 2 Gustafsson’s research was reviewed.His analyses using confirmatory factor analyses provide a clear structuralmodel for g. Recall that g is defined by tests of fluid ability such as theRaven. Gustafsson (1985) indicated that mostof the tests that had high gloadings in the batteries investigated by Jensen were nottests of fluidability that, on theoretical grounds, may be assumed to be isomorphicwith g. I argued that tests that are presumed to be most g loaded ontheoretical grounds do not invariably lead to the largest black—whitedifferences in performance (Brody, 1987). I indicated that the Raven,a testthat both Jensen and Gustafsson described as a test that is saturated withg variance, exhibits smaller black—white differences than tests that arenot generally considered pure measuresof g. For example, in one of thestudies cited by Jensen, the black-white difference on the Raven was .91standard deviation units and the comparable difference on the Peabodywas 1.15. The Peabody is usually thought of as a nonculture-reducedmeasure of verbal ability. It is not a good measure of fluid ability. Anoptimal test of the Spearman hypothesis would require Jensen to investi-

BLACK-—WHITE DIFFERENCES 287
gate a battery of tests that contains a representativearray oftests designedto sample the primary abilities. Gustafsson’s analysis of such a batteryindicated that the Raven is probably the best available measure of g. Thefact that black-white differences are not invariably larger on the Raventhan on other measuresconstitutes evidence against the strong version ofSpearman’s hypothesis. Given the evidence already obtained by Jensenitis unlikely that a rigorous test of the Spearman hypothesis using a repre-sentative battery of tests would provide evidence against the weak versionof the hypothesis. The actual value of the correlation between black—white differences in tests and the magnitudeof the g loading of tests ofintelligence derived from a representative battery of tests remains to bedetermined.
The Meaningof Differences in Test Scores:Bias in Mental Tests
Thereis a black—white difference in scoresontests of intelligence. Thisisnot in dispute. In order to evaluate the meaningof the differencein testscores it is necessary to examinethe predictive and constructvalidity ofintelligence tests administered to black and white samples. We wanttoknow whether test scores obtained from black and white samples havethe same meaning. Or, in somewhat more formal language, whether thenomological network of laws andrelations that define the meaning of thetest score andjustify the inference from score to construct is the same forblack and white samples. Or, to put the matter in another way, if I want toinfer something about a person on thebasis of his or hertest score, is itnecessary to consider the race of the person whosetest score is beingexamined in order to increase the accuracy of the inference? The defini-tive discussion of this and related issues is found in Jensen’s book, Bias inMental Testing (Jensen, 1980a; see also Reynolds & Brown, 1984).The most important applied issue with respect to the use of tests is
their predictive validity. The relationship between a test score and anexternalcriterion such as grades in school is defined bya regression linebetween test scores and thecriterion that may be described in termsofthree parameters—theslope of the regression line, the intercept of theline, and the standarderror of estimate of the regression line.If a test isadministered to two groups with different meantest scores,a test may besaid to be an unbiasedpredictorif the groups do notdiffer significantly onany of the three parameters that define the regression line. An unbiasedtest in the sense defined above will predict the samecriterion score forindividuals with the sametest score belonging to different groups withthe sameprobability of error (I am ignoringissuesrelated to the reliabilityof the test in this discussion. See Jensen, 1980a, Chapter 9, for a fullerdiscussion of this issue). Are IQ tests administered to black and whiteindividuals unbiased with respect to their predictive validity?

288 10. GROUP DIFFERENCESIN INTELLIGENCE
Jensen reviewed studies relating performance on IQ tests to perfor-
mancein elementary, secondary school, and colleges. Typically, but not
invariably, the criterion was grades, although in somestudiesa test of
academic achievement was used. Considering the diversity of settings,
samples, and methods, the studies are remarkably consistent. Theresults
of these investigations may be summarized using two generalizations.
(1) The regression lines predicting academic performance for black and
white students from tests of intelligence tend to be similar. (2) Where
statistically significant differences between black and white regressions
occur, they are almost invariably of the form of intercept bias. Where
intercept bias exists, it involves an overprediction of performance for
black individuals using the regression line derived from white samples.
Linn (1973) analyzed bias in predicting college grades for black students
from white regression lines on the SAT in 22 colleges. He found that the
overprediction was .11, .29, and .45 standard deviation units of grade-
point average for black students whose SAT scores were | standard devia-
tion below the black mean, at the black mean, and 1 standard deviation
above the black mean. The overprediction increased as test scores in-
creased.Studies of the relationship between intelligence tests and performance
in various occupationsalso provide evidence of approximately equal pre-
dictive validity for white and black samples (Hunter, Schmidt, & Hunter,
1979). Where differences exist between regressionstatistics for black and
white samples they are more likely to involve differences in intercepts,
with the white intercept being higher than the black intercept. This im-
plies that the use of a regression line derived from a white sample will
result in overprediction of the performance of the black sample. Jensen
analyzed regressionstatistics obtained by Ruch (1972) derived from stud-
ies comparing the predictive validity of paper-and-pencil tests for criteria
of job performance administered to black and white samples. Considering
the results of the studies collectively, Jensen’s reanalysis indicated that
there were significant intercept differences for various job-related criteria
in 8 of the 20 studies. Of these, 11 regressions obtained from these 8
studies (some studies had more than one criterion measure) reported
higher intercepts for white samples than for black samples and, for one
regression, the intercept for the black sample was higher than theinter-
cept for the white sample.The most comprehensive investigation of the relationship between in-
telligence test scores and job performance for different racial groups is
contained in the ETS—U.S. Civil Service Commission Study (Campbell,
Crooks, Mahoney, & Rock, 1973). The study examined performance in
three civil service jobs—medical technician, cartographic technician, and
inventory management. For each job, a job analysis was prepared and
supervisor ratings anchored by job descriptions were obtained. In addi-
tion, tests of job knowledge and measures based on work samples of

BLACK—WHITE DIFFERENCES 289
actual performance were obtained. Thesecriteria were predicted bytestsselected for each occupation from the French battery of tests of differentintellectual abilities. The samples were large, containing 731 white em-ployees in the three job classifications and 168 black employees. Therewasrelatively little difference in predictive validity from tests to criteriafor black and white samples. For tests of job knowledge and for measuresof work samples (but not for supervisor ratings) the differences that wereobtained tended to be in the direction of white samples having higherintercepts than black samples, indicating that the performanceof blackindividuals would be overpredicted from the white regression statistics.Differences between black and white samples on the Frenchtest batterieswere present for individuals in each of the three job classifications. Thedifferences ranged from .38 to .55 standard deviation units. The black—white differences in performance on tests for individuals holding thesame job were also present on measures of job knowledge and work sam-ples. The white samples had a meanthat was .43 standard deviation unitshigher than the black samples on tests of job knowledge. Similarly, thewhite samples averaged .46 standard deviations higher on the work sam-ple measures than the black samples. The white and black samples hadsmaller differences in supervisor’s ratings. The white samples were .13standard deviation units higher in ratings than the black samples. Theseresults indicate that black-white differences in performance on aptitudetests may be mirrored by differences in measuresof job knowledge and jobperformance.
This brief review of studies of the predictive validity of tests of intel-ligence for criteria such as job performance, academic achievement, andcollege grades indicates that the predictive validity of the tests is com-parable for white and black samples.These data have generated considerable controversy (see Elliot, 1987,
Kaplan, 1985; Mercer, 1979, 1984). What do these datatell us about racialdifferences in intelligence as assessed by tests? Mercer (1984) argued thatthe findings demonstrating correlations between test scores and perfor-mance on achievementtests assessing knowledge of the standard curricu-lum of the schools is not surprising since the criterion and the tests weremeasures of the samething andbothreflected the degree of exposure ofindividuals in different racial groups to the majority culture thatis re-flected by the tests. She referred to data cited by Jensen (1980a) thatindicated that tests of achievement may load as highly on g astests ofintelligence and that they are difficult to distinguish empirically by virtueof the high correlations between them.
Mercer’s claim that the correlation between academic achievement andintelligence is attributable to the degree to which black and white indi-viduals are exposed to a commoncultural environmentis easily refuted.Table 10.1, which is based on data collected by Mercer, indicates thatmost of the variance ontests of intelligence is attributable to differences

290 10. GROUP DIFFERENCESIN INTELLIGENCE
within families for individuals of the samerace reared in the same home.Whatever determinesscores ontests of intelligence and a fortiori tests ofachievementthatare alleged to be measuring the sameconstruct, cannotbe solely, or predominantly, degree of exposure to white middle classculture. Mercer is correct in her assertion that it is often difficult todistinguish betweentests of ability and tests of achievement. Indeed, onconceptual grounds it is certainly correct to say that all tests of intel-ligence or tests of ability are tests of achievement since they are measuresof intellectual skills that are acquired. It may be correct to infer thatindividuals have a genotypic ability level that partially determinestheirphenotype. Indeed, there is good evidence for the existence of genotypesthat influence intellectual phenotypes. There are, however, no tests ofintelligence that are measuresof a hypothetical genotypefor intelligence.All existing tests are measures of phenotypes that may be construed asthe learned intellectual achievements of an individual. To assert this,however, is not to assert that tests of achievement cannot be conceptually,or empirically, distinguished from tests of intelligence. It is possible todistinguish between these two types of measures in at least four ways.First, confirmatory factor analysesare able to clearly distinguish betweenfluid and crystallized ability measures andto define a general factor thatis isomorphic with fluid ability. This suggests that appropriate factoranalyses that include achievementtests with representative ability testswould lead to a hierarchical structure that differentiates between tests ofacademic achievementandtests of general intelligence that are best de-fined by tests of fluid ability. Second, tests of ability may be obtainedchronologically prior to tests of achievement and usedto predict achieve-ments that an individual has not attained. Such chronologically priorpredictions exist for tests of infant attention that predict later intel-ligence andfor tests of intelligence that are administered prior to schoolentry. As we haveseen, IQ test scores are predictive of what is learned in
schools. It is therefore always possible to administer an IQ test prior tothe presentation of some aspect of the curriculum andpredict pupils’achievementscores on tests of that material. Third, IQ tests can include
items that have quite different contents than tests of achievement. Theycan even include experimental tests of cognitive processes that are re-viewed in Chapters 3 and 4 of this book that on the surface do not appearto reflect the content of achievementtests that are related to the curricu-lum of the schools. It should be noted, however, that scores on tests ofabstract reasoning ability may be influenced by formal schooling as muchas if not more than tests that are presumedto directly measure the con-tent of the curriculum. Fourth, behavior—genetic analyses indicate thatthe heritability of tests of intelligence may be higher than the heritabilityof tests of achievement (see discussion of the Thompson, Detterman, &Plomin (1991) study in Chapter 9 of this volume].Achievement and intelligence tests ought to becomeinterrelated if
BLACK-WHITE DIFFERENCES 291
intelligence relates to the acquisition of knowledgeasit does. Over a longtime period individual differences in intelligence will influence whatislearned in the schools, and whatis learned in the schools will influence aperson’s intellectual ability. Measures of achievement and measures ofintelligence will become increasingly related. This relationship shouldnot obscure their conceptual and empirical distinctiveness.
Is it possible to eliminate the black-white difference in intelligencetest performance by changing the contentof thetests? It is possible thatitems that are included on standard tests may assess information thatismorelikely to be available to white individuals than to black individuals.The classic example of such an item taken from the Weschslertestsis,“Who wrote Faust?” It is easy to take such an item and argue thatitreflects nothing more than access to cultural information that is morereadily accessible to individuals with exposure to white middle classculture than black culture. If items with such obvious cultural contentare eliminated, would black-white differences in intelligence be elimi-nated? Oneof the best studies on this issue was performed by McGurkand reanalyzed by Jensen and McGurk (McGurk, 1953; Jensen &McGurk, 1987). McGurk obtained 226 items from grouptests of intel-ligence and submitted them to a panel of 78 judges who were asked torank them with respect to the degree to which they were culturallybiased. He selected 184 of these items on which there was some evidenceof agreement amongthejudges aboutthe presence or absenceof culturalbias and then administered a test of these items to a group of high schoolstudents to obtain indices of the difficulty of each item. Using these datahe constructed a test consisting of 37 “biased” and 37 “unbiased” itemsthat were matchedin difficulty and administered this test to a largesample of black and white high school students. He then selected a sam-ple of white and black students matched on school attended, enrollmentin the sameschoolsince first grade, and socioeconomic status. McGurkfound that the mean black-whitedifferences on the twoclasses of itemswere larger on the itemsrated as noncultural than on the items that wererated as cultural. There was a significant race X item interaction. Theresults are reported in Table 10.2. These data imply that intuitions aboutthe presence of bias in tests based on an examinations of item contentsare not a reliable way of distinguishing among itemsthat are likely todiscriminate between membersof different racial groups.Davis and Eels (Eels, 1951) developed a test of intelligence that was
designed to be nondiscriminatory. The test consisted of a series of car-toons representing individuals engaged in familiar activities. The testrequired individuals to answer questions about the activities of indi-viduals depicted in the cartoons. The test did not achieve its purpose.Black—white differences in test scores on the Davis—Eels games wereabout the same order of magnitude as differences obtained in othertests(Ludlow, 1956).

292 10. GROUP DIFFERENCES IN INTELLIGENCE
TABLE 10.2 Black—White Difference in Items Rated as Culture Bound versus Items
Rated as Nonculture Bound
Test White Black White — Black
Nonculture bound 15.61 (5.50) 12.61 (4.57) 3.00
Culture bound 10.46 (5.35) 8.99 (4.60) 1.47Nonculture bound — culture bound 5.15 3.62 1.53
2Based on Jensen & McGurk (1987).
Williams (1972, 1974) developed the black intelligence test of culturalhomogeneity (BITCHtest} to assess knowledge of terms that were likelyto be usedin black cultural settings. He claimed that the test would be avalid index of the ability to survive in black cultural settings and wouldpermit the computation of a survival quotient. Williams reports that itisa test on which black individuals score higher than white individuals.
Scores on the BITCHtestare not consistently related to scores on tests ofintelligence. Mattarazzo & Weins (1977) reported a correlation of .16 for awhite sample of applicants for a police job between BITCHtest scores andWechsler scores. The comparablecorrelation for the black applicants was—.33. Long & Anthony(1974) used the BITCHtest with 30 black studentswhowere assigned to special education classes. They foundthatall of thestudents who performed poorly on the WISC performed poorly on theBITCHtest and the use of the BITCHtest as a basis for assignment ofstudents to special education classes would not have resulted in decisionsthat were at variance with those reached by use of the WISC. Mattarazzoand Weins found that the black police applicants whose mean IQ was 20points above the black mean and who had an average of 2.5 years ofcollege education were below the mean of the standardization sample forthe BITCHtest, who were 16- to 18-year-old high school students.It isclear that the scores on the BITCHtestare not related to performance onany existing test of intelligence. The test does measure knowledge ofterms and expressionsthat are morelikely to be used in the black culturalcommunity than in the white cultural community.It is not clear if thetest may be usedto predict anything about black individuals other thantheir knowledge of distinctive black cultural expressions. Implicit in theeffort to develop this test is the assumption that standard testsof intel-ligence assess knowledgethatis available to the white population of theU.S. and that standard tests do not provide useful information aboutblack individuals other than the extent to which they have assimilatedthe white middle class culture of the U.S. This position discounts theevidence of the predictive validity of intelligence tests since the criterionis as biased as thetest andis culturally saturated. Apparently, this view ofcultural bias extends to knowledge of those areas of the curriculum thatare least obviously relevant to a person’s cultural outlook such as science

BLACK~—WHITE DIFFERENCES 293
and math.If one believes that it is important for black individuals to beknowledgeable about math andscienceas well as to study black culturalachievements and to be able to comprehendand analyzeliterary worksofboth black and white writers, then the abilities that are assessed by stan-dard intelligence tests are predictively relevant to those cultural attain-ments. It would be useful to develop an intelligence test that was predic-tively related to the ability to acquire knowledge that did not exhibitblack—white differences in performance. Nosuchtest exists. It should beunderstood that the attack on the validity of tests of intelligence is notonly a critique of the tests but a critique of the value of the culturalachievementsthat are predicted by scores on the test. The view that thecriteria predicted by IQ tests are not relevant for black students is ex-plicitly stated by Mercer (1979), who developed a system of assessmentthat explicitly considers an individual’s socioeconomic andracial back-ground and provides additional points to an individual’s score on tests tocompensate him or herfor the effects of impoverished or deviant culturalexperiences. Mercerargued that it is unfair to judge the system of assess-ment that she developed with respect to traditional predictive validitycriteria. Oakland (1979) reviewed studies using Mercer’s System for Mul-ticultural Pluralistic Assessment (SOMPA)and found that her proceduresreducedthepredictive validity of test scores for criteria of school achieve-ment. Mercer simply regards this as an irrelevant issue.Black—white differences in test score might be influenced by the wayin
whichtests are administered. Jensen (1980a, Chapter 12) reviewed studiesof the effects of the race of the examineron racial differences in IQ testperformance. He reviewedthe results of 16 studies of this issue that hedeemed methodologically adequate. For 10 of the 16 studies, there wereno effects of the race of the examiner on the magnitude of black-whitedifferences in IQ. The most comprehensive study was performed byJensen (1974b), who had 8 black and 8 white examiners administer grouptests including the Lorge—Thorndike test to 9000 schoolchildren inBerkeley, California. He found no race-of-examinereffect on the nonver-bal portion of the test. He did find a 1-point diminution in the magnitudeof the black—white difference in verbal IQ when children were tested byexaminers of the samerace. Healso tested a numberof children indi-vidually. He again found no effects on the nonverbal measure of theLorge—Thorndike. On the verbal measure of the test, the magnitude ofthe black—white difference in IQ was increased by 3.2 points whenscoreswere obtained by examiners of the samerace as the children theytested.The available data suggest that the race of the examineris not an impor-tant source of differences in test scores between black and whiteindi-viduals.
It could be argued that race differences in examiners is not as importantas class and professional position. Perhaps the race of the examinerisirrelevant if the black examiner occupies a position of authority and acts

294 10. GROUP DIFFERENCESIN INTELLIGENCE
as a professional. It is possible that black individuals, particularly thosefrom lower class backgrounds, may find the testing situation uncomfort-able and this may lead them to perform at less than an optimal level.There are three arguments that may be advanced againstthis position.First, the Davis—Eels tests were designed to be administered in a relaxedand gamelike manner and we haveseen that there waslittle indicationthat the magnitude of the black—white difference in performance on testswas diminished by these procedures. Second, the data supporting theSpearman hypothesis indicate that the magnitude of the black—whitedifference in test scores is in part a function of the g loading of the itemson tests. It is hard to reconcile a generalized disposition to perform at aless-than-optimal level with a tendency to exhibit differential perfor-manceeffects on different types of items. Third, a variant of the secondargument may be derived by an examination of studies of digit span.Jensen & Figueroa (1975; see also Gordon, 1984) reported that backwarddigit span performance was morehighly correlated with performance onthe WISC than forward digit span performance. The ability to repeatdigits in backward order may be interpreted as adding an elementoftransformational complexity to the simple forward digit span task. Theblack—white difference is more than twice as large on the backward digitspan task as on the forward digit span task. Forward and backward digitspan tasks are quite similar with respect to motivational and attentionaldemands. It is hard to imagine any nonintellective dimension that dis-tinguishes them. Thefact that black—white differencesare larger on back-ward than forward digit span suggests that motivation and rapport withexaminersis not a significant influence on the magnitude of black—whitedifferences in scores on tests of intelligence.Black—white differences in test scores might be influenced bythe lan-
guageof the test. Thereis a distinctive black dialect of English with somedegree of grammatical distinctiveness that is spoken by a subset of theblack population of the United States. It is possible that dialectical dis-tinctiveness might influence test scores. Quay (1971, 1972, 1974) per-formeda series of studies in which he had the Stanford—Binettranslatedinto black dialect. He found that variations in the languageof the test hadlittle or no influence on the performance of different groups of blackchildren. The meansobtained from the standard anddialectically trans-lated versions of the test were comparable and item difficulties for differ-ent items were similar. These data suggest that the performance of blackchildren ontests of intelligence is not depressed by their occasional use ofa distinctive English dialect.The difficulty of developing a test of intelligence that is both predic-
tively valid and does not lead to black—white differences in test scoresislargely attributable to the discriminating characteristics of items that areused on tests. Jensen (1980a, Chapter 11) reported the results of severalstudies of black—white differences on items used ontests of intelligence.

BLACK-—WHITE DIFFERENCES 295
He correlated item difficulties on the WISC for samples of 6-, 7-, 9-, and11-year-old black and white children. The correlation between indices ofitem difficulty in black and white samples for these four age groupsranged from .88 to .93. These data indicate that itemsthatare difficult formembers of one racial group are also difficult for members of the otherracial group. The average correlation for these four age groups was .91.Jensen foundthat the cross-racial item difficulty correlations are higherifcorrelations were adjusted for differences in average level of performancebetween the races. In order to accomplish this, he correlated item diffi-culty scores for white samples with scores obtained from older blacksamples. The average correlation for three such comparisonsof item diffi-culty between white samples and black samples that were either 1 or 2years older was .98. These data indicate that adjustments for mental agedifferences for black and white samples tend to eliminate black—whitedifferences in item difficulties.
Jensen also used analysis of variance procedures to identify possibleblack—white differences in response to different items on tests of intel-ligence. The group X item interaction in an analysis of variance can beused to detect items that may bebiased in favor of one or another group.The ratio of group differences to the group x item interaction variancemay betaken as an index of the relative importance of item biases in atest as a possible basis of group differences in performanceonthetest.Jensen indicated that for most standard tests of intelligence, the group xitem interaction variance is relatively small and cannot accountfor asubstantial portion of the difference in group scores.The use of group X item interactions as a technique for assessing the
possibility that items may not measure the same construct in differentgroups is not considered an ideal procedure by Jensen (1984). The resultsobtained maybeaffected by floor andceiling effects as well as the pos-sibility that an item may possess different degrees of diagnostic signifi-cance in different groups. The technique has been supplanted by newermethods of item response theory (Lord, 1980). These techniques requirelarge samples of approximately 1000 in each of two groups whose itemperformances are being compared. The techniques involve comparisonsof the probability of correct response to an item for individuals in differ-ent groups with the sameability. Since the samples are large, small dif-ferences in functions relating probability of passing an item to overallperformanceonthetest will lead to statistically significant evidence ofbiases in items wherebias is definedas a difference in the item responsecurve. Lord (1980) found statistically significant differences in item re-sponse characteristics for 38 out of 85 items on the Verbal SAT. Shepard,Camilli, & Williams (1984) found that 7 out of 34 items were biasedagainst black samples in a mathematics test. Shepard (1987) indicatedthat the term bias in this context meansonly that the test is multidimen-sional and is a measure of different constructs in different groups. Six of

296 10. GROUP DIFFERENCES IN INTELLIGENCE
the seven items on which white and black groups differed were wordproblems. If word problemsare considered part of the domain of mathe-matical competencethatis being assessed bythetest, the item bias resultmaybe interpreted as indicating that the differences between the groupscannotbe expressed in termsof differences on a single dimension but mayinvolve differences on more than one dimensionthatis being assessed bythe item. The effects of eliminating the seven items which were biasedagainst the black sample reduced the black—white difference on this testfrom .91 to .81 standard deviation units. Gordon(1987) indicated that thereduction of a .1-standard-deviation-unit difference in the black—whitetest score was exaggerated because Shepardet al. did not exclude threeitems that were biased against white subjects. If these items had beenexcluded the difference in test scores attributable to the removal of biaseditems would have been less than .1. Gordon also indicated that manyofthe studies of item bias use tests of achievement rather than tests ofintelligence and he suggested that the former type of test may be moresubject to the presence of bias than the latter. This brief review of theitem bias literature leads to the following conclusions. Bias in items onstandard tests exists if one searchesfor their presence using large samplesand the most sophisticated psychometric techniques. The degree of biasis slight and adjustments for the presence of bias have negligible effectson the magnitude of black—white differences in performance ontests ofachievementortests of ability.More generally, one can conclude from this review of research on bias
in mental testing that the black—white difference in performanceontestsof intelligence is not substantially attributable to differences in the con-struct validity of the tests for black and white samples. Thefactor analyt-ic studies, item analysis research, and research onthe predictive validityof tests suggests that the black—white difference in test scores is substan-tially attributable to differences in the construct that is assessed by thetest.
Reasons for Differences in Test Scores
There are two general hypotheses about thebasis for racial differences inintelligence—thegenetic and the environmental. The genetic hypothesiswasstated by Jensen as follows: “... something between one-half andthree-fourths of the average IQ difference between American Negroes andwhites is attributable to genetic factors, and the remainder to environ-mental factors and their interaction with the genetic differences” (Jensen,1973, p. 363). Although Jensen’s research since 1973 has been frequentlydirected to an understanding of racial differences in intelligence, he hasnot written extensively on the possible genetic basis of black-white dif-ferences in intelligence test scores. In 1987, he wrote,

BLACK-—WHITE DIFFERENCES 297
As to the question of a genetic component in the black-white population
difference in g, since 1969 I have always considered it a reasonable hypoth-esis, ... I also consider it highly plausible that genetic factors are involved inthe present black-white population difference. But plausibility falls far short ofthe status of a scientific fact... . There is as yet no empirical “proof” of thisplausible genetic hypothesis of the kind that would be considered as definitiveevidence in quantitative genetics. .. . the genetic hypothesis will remain un-
tested in any acceptably rigorous manner for some indeterminate length oftime, most likely beyond the lifespan of any present-day scientists. [Jensen,1987c, p. 376, italics in original]
Jensen’s statement about the current status of the genetic hypothesis ofblack-white differences in intelligence represents the views of the psy-chologist who is generally considered to be the most sophisticated de-fender of this position. His current statementof the status of the genetichypothesis represents, on my reading of his work, a more cautiousassess-ment of the status of the evidence for the hypothesis than that which headvancedin a book written in 1973. In that work he provided three kindsof argumentsin favor of the genetic hypothesis. First, he argued that noneof the known environmental variables on which the black and whitepopulations of the US. differ are of sufficiently large magnitude to ac-count for black—white differences in intelligence test scores. Second, thepattern of differences in test scores supported the hypothesis that dif-ferences on tests were predictable from a knowledge of the heritability ofthe test, suggesting that genetic differences were implicated. Third, testscores exhibited regressions toward racial means. Thusthe IQ of the childof a black person with an IQ of 100 would be predicted to be somewhere
between an IQ of 100 and the black mean IQ of 85. Thepredicted IQ of thechild of a white person with an IQ of 100 would be expectedto be 100. IQsin each case exhibit regressions toward their own means. Brody & Brody(1976) reviewed the evidence andlogic of these various claims and indi-cated that the inference that there wasa genetic basis of racial differencesin intelligence was deficient on both logical and empirical grounds. Inwhat follows I shall consider what I take to be the basis of Jensen’scurrent thinking about the genetic hypothesis. Since Jensen has writtenrelatively little about his current thinking other than to reaffirm hisbeliefthat the genetic hypothesis is plausible it is hard to reconstruct his con-temporary thinking aboutthis issue.
I do not knowif Jensenstill believes that regression arguments providevalid data in favor of the genetic hypothesis. The regression effect is basedon the observation that black and white groupsregressto their respectivemean scoresontests of intelligence. Therefore, the expected value (wherethe term expected is usedin thestatistical sense of the value that ispredicted that will minimize errors of prediction) of the IQ of a blackperson’s sibling, parent, or child whose IQ is above the white mean islower than the expected value of a white person’s sibling, parent, or child

298 10. GROUP DIFFERENCES IN INTELLIGENCE
with the same IQ. These regression phenomenaare compatible with anyhypothesis about the basis of black-white differences in performance ontests of intelligence. Regression effects must occur for mathematicalrea-sons whenever a score from which oneis predicting is extreme in itsdistribution. A black person whoseIQ score is above the white mean hasa score that is more deviant within the distribution of black scores than awhite person with the same score in the distribution of white scores.Therefore, regression will be larger in this case for the black person. Thephenomenonofdifferential regressions demonstrates nothing other thanthe observation that black persons can be considered membersof a popu-lation that can be distinguished from another population (e.g., whites].
Since Jensen has not discussed regression effects recently I take it thatthe data that he finds persuasive derive from research of the nature ofgenetic and environmental influences on intelligence. There are anumberof arguments associated with knowledge of the nature of geneticand environmental influences on intelligence that may be advanced inconnection with the genetic hypothesis of race differences. Jensen arguedthat the evidence that intelligence is heritable within black and whitegroups is compatible with the hypothesis that the between-race dif-ferenceis also attributable in part to genetic factors. Thereis little or nodoubt that IQ is a heritable trait among white individuals. There is con-siderably less data on the heritability of IQ in black samples. In theircomprehensive review of research on black—white differences in intel-ligence, Loehlin et al. (1975) were able to find only five studies thatcontained data relevant to an analysis of heritability of IQ in black sam-ples. And, these studies do not provide ideal data for an analysis ofheritability. Jensen (1973) reported data on sibling resemblance for blackand white samples. Sibling resemblance does not provide an ideal data setfor the computation of heritability indices. Scarr-Salapatek (1971) con-ducted a twin study in which she obtained comparisons between same-sex and opposite-sex twins for black and white samples. Thelack of clearzygosity information detracts from the usefulness of these data. Vanden-berg (1969, 1970) and Osborne & Gregor (1968) performed heritabilityanalyses on a very small sample of black twins (32 MZ and 12 same-sexDZ) and reached somewhatdifferent conclusions from each other aboutdifferences in heritability between black and white samples.It is obviousthat the small DZ sample precludesany realistic analysis of heritabilityin the black sample. I am aware of only two studies that provide a reason-able basis for analyzing the heritability of intelligence in black samples.Nichols (1970, as reported in Loehlin et al., 1975} obtained correlations of.77 and .52 for a sample of 60 MZ and 84 DZ 4-year-old black twin pairson the Stanford—Binet. Osborne (1978) administered a battery of tests to ablack adolescent sample of 76 pairs of MZ twins and 47 pairs of DZ twins.He also tested a comparison sample of 171 white MZ twin pairs and 133DZ twin pairs. He obtained several indices of intelligence from his test

BLACK—WHITE DIFFERENCES 299
battery including a mean score and factor scores on verbal andspatialability factors. On all of his measuresof intelligence, the heritability ofwhite and black samples was similar. For example, he obtained a meanscore on his battery of 12 tests. The correlation for this measure for blackMZ twins was .88 and the comparable correlation among black DZ twinswas .51. The corresponding results for MZ and DZ correlations for thewhite sample were .85 and .62. These data indicate that the heritability ofintelligence in the white and black samples was approximately equal.Osborne's data for the black sample are comparable to those reported inmany other twin studies using white samples. Osborne’s results suggestthat intelligence is as heritable within the black population of the U.S. asit is within the white population. It is clear that we need considerablymore data on theheritability of intelligence in black samples before wecan confidently conclude that there are no differences in heritability be-tween white and black samples. Adoption studies have not been reportedfor black samples relating the IQ of biological parents to the IQs of theiradopted children. Despite the paucity of the available data, it is not unrea-sonable to conclude that IQ is equally heritable in the white and blackpopulations of the U.S.
Let us assumethat heritability for intelligence is equal in black andwhite populations. Let us assume furtherthat heritability is high in bothpopulations—perhaps even as high as .80, as suggested by Jensen. Dothese assumptions imply that the racial difference in intelligence is dueto genetic factors? It is easy to answer this question in one word—no. Thereason on logical groundsis that the sources of between-group differencesmaybedifferent from the sources of within-group differences (see Lewon-tin, 1975; see also MacKenzie, 1980, 1984). Lewontin presented examplesfrom behavior genetic research in which within-group differences areheritable in two groups and between-group differencesare entirely attrib-utable to environmental causes. At best, evidence of within-groupheritability suggests that it is possible to entertain a genetic hypothesisabout between-group differences, but the hypothesis requires indepen-dent confirmation. Since black and white individuals are exposed to dif-ferent environmentsit is always logically possible to attribute group dif-ferences in intelligence to environmental differences. Even if theheritability of intelligence were 1.00 in both groups,it is logically pos-sible that differences between groups would be attributable to environ-mental sources of variance.
Heritability estimates within groups may provide some basis for anunderstanding of possible environmental hypotheses about the reasonsfor black-white differences in intelligence. As the heritability withingroups increases, variations within groups on various environmentalvari-
ables must have decreasing influence on the phenotype.If intelligencewere totally heritable within a group, then any source of environmentalvariability within that group would be ruled outipso facto as a possible

300 10. GROUP DIFFERENCES IN INTELLIGENCE
basis for explanation of between-group differences in intelligence. Jensenused a variant of this argument to support his view that the racial dif-ference is probably attributable to genetic differences. He argued that theamount of variance accounted for by known environmental variableswithin groupsis too small to explain the between-group differences. Thisargument hinges on estimates of the magnitude of between-family en-vironmental differences that are problematic. Jensen (1973) assumed thatheritability for intelligence was .80 and that the remaining variance wasequally divided between within-family and between-family environmen-tal variance. These assumptions permitted him to calculate the magni-tude of the between-family environmentaldifferences that are required toproduce a 1-standard-deviation difference in IQ as 4.6 standard deviation
units. Known differences in between-family environmentalvariations be-tween black and white populations are very much smaller in magnitude.For example, the mean difference in socioeconomicstatusis .53 standarddeviation units. One can quarrel with the details of the quantitative anal-yses in this argumentandstill find the argument persuasive. Jensen’sestimate for heritability is high and his estimate for between-family en-vironmental influence is low—although as we have seen recent researchis compatible with a relatively low estimate of between-family environ-mental influence on intelligence for older samples. Known environmen-tal influences that are predictive of variations in intelligence within thewhite population cannot accountfor differences between black and whitesamples in intelligence. For example, the correlation between sucio-economic status and IQ is only .3, and socioeconomic status can onlyaccount for 10% of the variance in IQ. Someof this variance, on some
accounts morethanhalf, is attributable to genetic differences. If we as-sume that only 25% of the variation between socioeconomic groupsisgenetic, we are left with an estimate that environmental variations asso-ciated with being reared in different socioeconomic groups account for7.5% of the variance in IQ. Assume that the black—white difference insocioeconomicstatus in the U.S.is .6 standard deviation units. It is ob-vious that a .6-standard-deviation-unit difference in a variable that mayaccount for 7.5% of the variance in IQ cannot accountfor a 1-standard-deviation difference in test scores between the black and white popula-tions of the U.S.Mercer (1973) attempted to account for black—white differences in in-
telligence by appeal to environmental variables. She studied a sampleof339 black children who had a mean IQ of 90.5. She found five environ-mental characteristics that related to WISC IQ scores in this sample.These were living in a family with five or fewer members, having a moth-er with high educational aspirations, living in a family in which the headof the household was married, living in a family that was buying its ownhome or owned its own home,andliving in a family that had a moder-ately high occupational status. For the subset of black children whose

BLACK—WHITE DIFFERENCES 301
families had all of the characteristics described above, the mean IQ was99.1. There were 17 black children in her sample whose families met eachof the five criteria. Mercer concludedthat for the subset of black childrenwhowerereared in an environmentthat was characteristic of the modalmiddle class white environment, the black—white IQ difference disap-peared. She interpreted these results as providing support for an environ-mental interpretation of black—white differences in intelligence.Jensen (1973) described this type of argumentas an example of what he
called the “sociologist’s fallacy.” The analysis implicitly refers to a hyper-selected subset of the black sample.In effect, it assumesthat the subset ofthe black sample that has all of the characteristics of a modal whitesample shares with that sample their characteristic modal IQ. It leavesunresolved why only 17 of the 339 children in the black sample share themodal characteristics of the white sample. Implicitly, the analysis as-sumesthatall of the variables that are correlated with IQ have a one-waycausal influence. It ignores the possibility that IQ may influence so-cioeconomicstatus, decisions about family size, and lifestyles. The diffi-culty is that many of the variables that influence IQ are also influenced
by IQ and the covariance of IQ and various environmental variables thatare related to IQ is causally ambiguous.All of the joint variance cannot bereasonably allocated to a unicausal explanation that assumes that so-cioeconomic variables influence IQ and IQ does not influence so-cioeconomicvariables (see Loehlin et al., 1975, p. 166).
It is probably correct to say that measurableaspects of the environmentconsidered in their appropriate causal role cannot accountfor the black—white difference in IQ test scores. It is possible that an accumulation ofenvironmental influences that have a small but detectable influence onIQ might collectively account for the difference. Lynn (1990c) suggestedthat nutritional variables might contribute to black—white differences inintelligence. He analyzed data collected by Bromanetal. (1987) as part ofthe Collaborative Perinatal Project. They administered the WISC to asample of over 17,000 white children and 18,900 black children and mea-sured the head circumference of each of the subjects in their sample.Table 10.3 presents Lynn’s calculations of the mean head circumferenceand height for black and white children in this study. The black samplehad a mean head circumference that was approximately .5 standard devia-tions lower than that of the white sample. There were no differences inthe height of these two groups and therefore it was not necessary tocorrect head circumference for height differences.The appropriate interpretation of data on racial differences in head
circumference is not clear. Lynn (1990c) noted that head circumferencehas increased 1 standard deviation in western countries in the last 50years. He arguedthatthis increase is attributable to changesin nutrition.Therefore, he interpreted the racial differences in head circumference asbeing attributable to nutritional influences. Rushton (1990) argued that

302 10. GROUP DIFFERENCES IN INTELLIGENCE
TABLE 10.3 Mean Head Circumference for Black and White 7 YearOlds from the Collaborative Perinatal Project
Black White
Mean S.D. Mean S.D.
Head circumference (cm} 50.91 1.57 51.72 1.53
Height (cm) 122.90 6.48 122.53 5.63
2Based on Lynn (1990c}.
racial differences in head circumference havea geneticorigin, are relatedto brain size, and are to be interpreted as evidence for a genetic hypothesisaboutdifferences in intelligence. It is not self-evident that the racial dif-ference in head circumference obtainedin these studies reflects geneticdifferences. It should be noted that Rushton does not provide data on theheritability of head circumference. Until we have a clearer understandingof the genetic and environmental influences on the development of headcircumference,it is difficult to provide an interpretation of these data. Ina senseit is as difficult to determine the reasonsfora racial difference in
head circumferenceasit is to determinethe reasonsfora racial differencein IQ.
Another variable that may contribute to racial differences in intel-ligence is lead exposure. Research reviewed in Chapter6 indicates thatexposureto lead may adversely influence the developmentof intelligence.It is reasonable to assume that the black population, with manyindi-viduals living in inner cities in deteriorated housing conditions, is morelikely to be exposedto high concentrationsof lead than the white popula-tion of the U.S. Although lead exposure may have a small influence onthe development of IQ and may notplay a role in the development ofintelligence in more than an undefined subset of the black population,lead as a variable may be paradigmatic of a series of variables that maycollectively account for the black—white difference in IQ. That is, theremay bea large set of variables that share the characteristic of having anunequal frequency of occurrence in the black and white populationsofthe U.S., each of which might have a small influence on IQ. Note that thissuggestion is merely an argument aboutthe plausibility of an environ-mental hypothesis about the causes of the racial difference in IQ. Sincewe do not have evidence indicating that the racial IQ gap may be ac-counted for by the measurement of a large numberof variables (withappropriate controls for the influence of genetic differences on thevari-ables}, the argument remainsat the level of an untested hypothesis thatmay beplausible.Flynn (1980, 1984, 1987) presented a variant of this argument. He noted
that evidence of secular changes in IQ indicates that environmentalevents exist that could accountfor a 1-standard-deviation difference in IQ,

BLACK-WHITE DIFFERENCES 303
although he admitted that weare not able to specify the environmentalevents that produced this change. Since the environmental influencesareundefined we do not know whetherthey provide an account of black—white differences in IQ.There is an additional environmental explanation of the black—white
IQ gap. There may be environmental influences on IQ that cannot bemeasured on a commonscale for black and white populationsof the U.S.That is, there may be experiences that black individuals are likely toencounter that white individuals never encounter.It is not hard to imag-ine many such influences. Black and white Americans are reared inquasisegregated environments frequently having relatively little socialcontact with each other. Thereare different cultural exposures in musicand the arts and language. Experiences of discrimination and racism areencountered at one time or another or even constantly by black Ameri-cans and not by white Americans. We havelittle or no scientific data thatquantifies the effects of living in a quasiseparate environment on thedevelopmentof IQ in black individuals. Nevertheless, the possibility ex-ists that the cumulative effects of experiences that occur frequently toblack individuals and virtually never to white individuals may accountfor someorall of the black—white IQ gap.
Jensen is probably correct in asserting that known environmentalinflu-ences that are measurable (and cannot themselves be attributed to geneticinfluences) do not accountfor the black—white IQ gap. But this observa-tion does not render a genetic hypothesis more plausible than an environ-mental hypothesis about the gap (see MacKenzie, 1984). Genetic hypoth-eses are not necessarily favored by the failure of environmentalhypothesesto be confirmed. Thatis, the genetic hypothesisis in the samelogical position as the environmental hypothesis. The assertion thatknown environmental influences do not accountfor the IQ gap leaves thepossibility that unknownenvironmentalor genetic influencesare respon-sible for the gap. The genetic hypothesis, has exactly the samestatus as anunmeasured sourceof variance as that of an unmeasuredset of environ-mental variables.The arguments for and against the genetic hypothesis for racial dif-
ferences in intelligence test scores that we have examined maybe de-scribed as indirect arguments. Direct tests of hypotheses about geneticand environmental differences could be obtained,in principle, by the useof a cross-fostering experimental design in which individuals with whiteand black genotypesare assigned to opposite race environments. Whilethere are no complete cross-fostering studies of this type available, thereare studiesthat provide information about black children who are rearedin white environments. Flynn (1980) argued that studies that directly testgenetic and environmental hypotheses, however imperfectly, provide evi-dence that is more relevantto an evaluation of these hypotheses than theindirect arguments presentedby Jensen.

304 10. GROUP DIFFERENCESIN INTELLIGENCE
There are four studies that assess the IQs of black children who havebeen reared in predominantly white environmentalsettings. Scarr & Wein-berg (1976) obtained IQ scores for a sample of black children who weretransracially adopted by upper middle class white parents in Minnesotawhose mean IQ was 119.5. The mean IQ of 154 natural children of these
parents was 116.7. The transracially adopted children of these parents weretested at a mean age of 74 months(S.D. = 30}. All of the children were4 yr.or older at the time of testing. The mean IQ of 29 adopted children whosebiological parents were both black was 96.8. The mean IQ of 68 adoptedchildren who had one black biological parent was 109.These data provide several sources of information relevant to an evalua-
tion of hypotheses aboutracial differencesin intelligence. The mean IQ ofall of the transracially adopted children in this study was 106—a valueabove the white mean. Scarr and Weinberg reported that the educationallevels of the biological parents of the adopted children were comparableto those of the black population. If we assumeon the basis of this infor-
mation that the biological parents of the children had IQsthat are repre-
sentative of the black population, then these data suggest that a represen-
tative sample of black children reared in upper middle class white homes
would have IQs that are above the white mean. Although the Scarr and
Weinberg study is plausibly interpretable as providing evidence for the
malleability of IQs for black children, these data should not be construed
as providing definitive evidence in favor of an environmental hypothesis
about racial differences in intelligence test scores. The children at the
time of testing were relatively young and the full effects of genetic influ-
ences on IQ are not apparent until the postadolescentperiod. In addition,
the influence of the family environment on IQ appearsto decline after
early childhood. Scarr and Weinberg prepared an abstract of a paper to be
delivered at a meeting of the Behavior Genetic Society reportingthe re-
sults of a 10-year follow-up study of the transracially adopted children.
The abstract indicated that the IQs of the adopted children declined dur-
ing that period. The paper wasnot delivered. Neither the abstract, nor the
paper reporting the results of the study, have been published. The abstract
did not report any of the details of the follow-up study. The magnitudeof
the decline in IQ wasnotreported in the abstract. In the absenceof these
details, it is impossible to evaluate reports of a possible decline of the IQs
of the transracially adopted children in the Scarr and Weinberg study. At
very least, their data indicate that the developmental history of IQ scores
of black children reared in white environmentsis different from the de-
velopmental history of the scores of black children reared in black en-
vironments. Recall that black children reared in black environments ex-
hibit IQ scores that are approximately 1 standard deviation below the
white meanbyage 3.If the transracially adopted children in the Scarr and
Weinberg study had IQs that regressed toward the black mean at older

BLACK-—WHITE DIFFERENCES 305
ages, their documented IQs at age 6 were more characteristic of whiteadoptees.
Scarr and Weinberg found, in commonwithotherstudies of adoptionreviewed in Chapter5, that adopted children had IQs that were lower thanthe IQsof the natural children of the adoptive parents. These data provideevidence for a genetic influence on IQ. Thedifference in IQ of the chil-dren with two black parents as opposed to one black parent might also beinterpreted as providing support for a genetic interpretation of racial dif-ferences in IQ, except that Scarr and Weinberg indicated that the socialhistory of these two groups of children were different. Children with twoblack parents were adopted at a later age, had more preadoption place-ments, and had shorter exposuresto the adopted homethan children withone black parent. When thesevariables werestatistically controlled, theinfluence of the racial backgroundof the transracially adopted child on IQwas substantially reduced.Moore (1985, 1986) obtained Wechsler test scores for a sample of 23
black children who were adopted by black middle class families and asample of 23 black children who were adopted by white middle classfamilies. The educational levels of the black and white adoptive motherswere equal. The educationallevel of the black fathers wasslightly lowerthan the educational level of the white fathers. The children were testedbetween ages 7 and 10. The children adoptedby black families had a meanIQ of 103.6 and the children adopted by white families had a mean IQ of117.1. There were no differences in the IQs of children with one or two
black parents. Moore’s results provide support for Scarr and Weinberg’senvironmental interpretation of the differences between black andbiracial children’s IQs. Her study, however, is not definitive for two rea-sons. First, the children were young. Second, no information was providedabout the biological parents of these children. Moore indicated that thecharacteristics of the biological mothers of the adopted children whosefamilies chose to participate in the study were comparable to the charac-teristics of the biological mothers of the children whose adopted familydid not choose to participate in the study. Thus, information about thebiological mothers is available but Mooredid not report these data.If thebiological parents of the children adopted by white parents were compara-ble to the biological parents of the children adopted by black parents, thenthe Moore study would provide strong evidence in favor of an environ-mental interpretation of black—white differences in IQ.Moore also studied the behavior of children in the examination and in
another session in which motherswereaskedto help their children solvea block design problem from the Wechsler test. She found that trans-racially adopted children responded differently to the demands of the IQtest than children adopted by black families. The transracially adoptedchildren appeared more confidentof their abilities as problem solvers and

306 10. GROUP DIFFERENCESIN INTELLIGENCE
were more likely to expand on the reasons for their answers than thechildren adopted by black families. The white mothers of the adoptedchildren were more likely to joke, grin, and laugh as a wayof releasingtension when their children worked on the block design than the blackmothers. The black mothers were more likely to be critical of their chil-dren’s performance than were the white mothers. These differences inbehavior and social interaction were related to differences in performanceon the IQ tests. Moore argued that differences in the intellectual so-cialization experiences characteristic of black and white rearing couldresult in differences in the intellectual performance of children. Moore’spresentation did not indicate whetherthese differences in observed be-havior accounted for all of the IQ differences obtained in the study.It isnot clear whether she has isolated the critical environmental variablesthat might accountfor racial differences in IQ test scores.
Tizard (1974) compared white and black (West Indian) children rearedin residential nurseries in England. There were 149 children tested whoranged in age from 2 years to 4 years and 11 months. Thechildren weretested with the Reynall test and the Minnesota nonverbal test, and asubset of the older children were given a WISC. The results were quiteconsistent across the measures. The meanIQ of children with either oneor two black parents was slightly higher than the mean IQ of childrenwhose biological parents were both white. Tizard indicated that therewere no conspicuous differences in the backgrounds of the biologicalparents of the children. Her results suggest that black children reared inthe same environment as white children will develop comparable IQs.Itshould be noted that the children were quite young at the time of testingand the black children were West Indian blacks. These data support anenvironmental interpretation of black—white differences in IQ. The de-velopment of IQ appears to be constant for black and white childrenreared in comparable environments.
Arguably, Eyferth (1959, 1961; Eyferth, Brandt, & Hawel, 1960) reportedthe most important direct study of the reasons for black—white dif-ferences in intelligence test performance. Eyferth studied a sample of 181children whose biological fathers were black soldiers serving in the Armyof Occupation in Germanyat the end of World WarII. The children werereared by their biological mothers, who were white German women. Thechildren were compared to a sample of white children whose biologicalfathers had been white soldiers in the same army in Germany. The moth-ers of the two samples were carefully matched on a numberof variablesincluding place of residence, socioeconomic background, and composi-tion of the family that reared the child. Approximately 75% of the fathersof the children were American soldiers; the remaining fathers wereFrench troops who were either black or white. The children were testedwith a Germanversion of the WISC at ages between 5 and 13. Two-thirdsof the children were tested when they were between 10 and 13 years of

BLACK-—WHITE DIFFERENCES 307
age. The mean IQ of the white children was 97.2 and the mean IQ of theblack children was 96.5. These data suggest that children with one blackparent who are reared in similar circumstances to children with twowhite parents will have comparable performance on IQ tests. The condi-tions of rearing in Germany,apart from the distinctive subcultural experi-ences of American blacks and under conditions that are similar for blackand white children, provide a clear test of the hypothesis that black—white differences in IQ are attributable to environmental events. TheEyferth study provides strong evidence in favor of an environmentalin-terpretation of black—white differences in IQ. There are three possibleobjections to this interpretation of the results. First, information aboutthe characteristics of the biological fathers was not available.It is possiblethat they were not a representative sample of black and whitesoldiers orof the black and white populations of the U.S. Flynn (1980) presented athorough analysis of this issue. He indicated that sexual relationshipsbetween soldiers of the occupation and German womenafter World WarIIwere widespread and were not confined to any particular segment of theArmy of Occupation.In addition, he argued that Armytest score recordsindicated that black soldiers did in fact have lower IQs than whitesol-
diers. Eyferth’s results would have provided more definitive informationif data about the biological fathers of these children had beenreported.Nevertheless, there is no reason to believe that the white and black bio-logical fathers were not representative of their groups and thereforeit isreasonable to assumethat they differed in IQ. Second, it is possible to
argue that children resulting from interracial matings will have higherIQs than children who had two black parents because of the effects ofheterosis. This is a well-known genetic phenomenon in which outbredgroups exhibit increases in a trait. Eysenck (1984) argued that Eyferth’sresults might be attributable to heterosis. This is not a highly plausiblehypothesis. Heterosis has been found for a numberof traits in animal andplant studies. Its existence in human populations is extremely prob-lematic for such traits as height (see Loehlin et al., 1975). And there islittle or no evidence for such a phenomenonforintelligence, althoughthere is some problematic evidence for the opposite effects of inbreedingdepression on IQ. Each of the other transracial adoption studies that wehave considered permits comparisons between children with two blackparents and children with one black parent. Only the Scarr and Weinbergstudy provided evidence that could be interpreted as supporting theexis-tence of heterosis, and there were persuasive reasons to assumethat thedifferences obtained in that study were attributable to differences in thepreadoption experiences of children. The Tizard and Moorestudies bothobtained data that are incompatible with the existence of heterosis.Therefore, heterosis does not provide a convincing explanation of theresults of the Eyferth study. Third, the children tested in the Eyferthstudy, though older than thosetested in other transracial adoption stud-

308 10. GROUP DIFFERENCES IN INTELLIGENCE
ies, are still not at the age at which IQ test scores are most heritable.While the Eyferth studyis not definitive, it is probably the most convinc-ing study we have available and its results support an environmentalinterpretation. If a substantial portion of the IQ difference between blackand white populations in the U.S. were attributable to genetic differences,the black children in the Eyferth study should have had IQs that wereseveral points lower than the white children. Thefact that they did notconstitutes evidence against a genetic hypothesis.
If we considerthe transracial adoption studies collectively, they provideevidence in favor of an environmental interpretation of black—whitedif-ferences in IQ test score. With the possible exception of the unpublishedfollow-up data in the Scarr and Weinberg study which cannot be evalu-ated, the data indicate that black children reared in white environmentshave IQ test scores that are characteristic of white children reared inwhite environments.There is an additional source of direct evidence on the reasons for
black-white differences in intelligence. The black population of the U.S.consists of individuals who differ with respect to their degree of black andwhite ancestry. A genetic hypothesis predicts that there should be apositive correlation between the degree of white ancestry of a black per-son andhis or her IQ. Although this hypothesis appearsto be straightfor-ward it is not easy to test. There is no simple and direct way of measuringthe degree of black ancestry of a black person. Variations in skin color, themost visible manifestation of racial admixture, may in part be attribut-able to variations in skin color among African ancestors of Americanblacks (see Harrison & Owen, 1964). Also, white ancestry might at onetime or another provide social advantages for black individuals.It is gen-erally recognized that studies of the influence of racial admixture on IQshould be pursuedusing latent biological markers such as blood groupsasa basis of estimating ancestry. This is difficult to do since blood markersthat might once have been indicative of African ancestry may no longercovary in the same waythat they did among African ancestors. Loehlin etal. (1975, pp. 124—125} indicated that blood gene markers characteristic ofEuropean ancestry in two samples of black individuals were uncorrelated.Thus genes indicative of European ancestry may no longer covary in thesame way in contemporary black populations. Although the assessmentof degree of white ancestry among black samples is not a simple matter,the data that are available suggest that IQ is not related to degree of whiteancestry in black samples. Scarr, Pakstis, Katz, & Barker (1977; see alsoJensen, 1981; Scarr, 1981) calculated the probability that an individual’sblood group was characteristic of a white or black sample and the proba-bility that an individual’s blood group markers were characteristic ofwhite ancestral samples. They obtained a correlation between these twoprobability measures and performance onfourtests of ability in a sampleof black schoolchildren. The correlations between their two measures of

BLACK—WHITE DIFFERENCES 309
white ancestry and a composite general ability measure were —.05 and—.03. These data provide no evidence that white ancestry among blackindividuals correlates with intelligence.Witty & Jenkins (1936) studied a sample of black children who had IQs
of 140 or higher. They assumedthat a genetic hypothesis would predictthat black individuals with very high IQs are more likely to have whiteancestry than black individuals with less atypical IQs. They relied on
geneological data to estimate the degree of white ancestry of their sampleof 28 children and reported that the degree of racial admixture present inthis group was comparableto that which waspresentin a larger groupof63 black children with IQs above 125 and that the degree of racial admix-
ture was comparable to that reported in a large sample of American blacksstudied by Herskovitz (1930). MacKenzie (1984) argued that the gen-eological data might not be accurate and that the Herskovitz samplemight not be a relevant control group for a study using a local rather thana national sample. While the Witty and Jenkins studyis far from ideal, atvery least it fails to provide data in support of a genetic hypothesis aboutracial differences in IQ. This study considered in conjunction with theScarr et al. study indicates that there is no relationship between degree ofwhite ancestry and intelligence in black samples.
Conclusion
After a century of research and speculation about black—white differencesin intelligenceit is, I think, fair to say that we knowrelatively little aboutthe reasonsfor the difference. We do know that the differences in intel-ligence test performanceare notattributable in any obviouswaytobias inthe tests and that the differences in test scores reflect differences not inparticular bits of cultural knowledge but in more general and abstractabilities. And, we know that the differences are related to criteria such asthe acquisition of knowledge that are valued by manyif notall indi-viduals in both the black and the white communities of the UnitedStates. The reasons for the differences are probably to be found in thedistinctive cultural experiences encountered by black individuals in theUnited States. While it maybe difficult to definitively rule out a genetichypothesis on thebasis of the available evidence, I think thatit is also fairto say that there is no convincingdirect or indirect evidence in favor of agenetic hypothesisof racial differences in IQ.
It is sometimes wrongly assumedthatthe ideological and social conse-quencesof a genetic explanation for black-white differences in scores ontests of intelligence are somehow devastating and that environmentalexplanations lead to much moresatisfactory social outcomes. It should benoted that manyof the consequencesof a genetic or environmental expla-nation maynot bethosethat are envisionedin popular discussions. Sincegenetic influences are not immutable and the influence of the genotype

310 10. GROUP DIFFERENCES IN INTELLIGENCE
on the phenotypeis variable, it is quite possible that a genetic basis forracial differences in intelligence might be more remediable than an en-vironmental difference. Someof the alleged environmental influences onintelligence that are assumed to accountfor racial differences in intel-ligence test performanceare not easily remediated. If, for example, pre-natal influences are important, we can in principle, although noteasily inpractice, provide better prenatal care for black women.If black childrenhave been damaged byinadequateprenatal care we maynotfindit easy toremediate the intellectual consequencesof this damagefor children whohave been prenatally deprived. If, as Moore suggests, black middle classparents provide intellectual socialization experiences that are less thanoptimal to develop good performanceon IQtests, will it be easy to devel-op new socialization methods for black parents?
Research on black—white differences in intelligence fails to provideanswers to three critical questions. (1) What are the reasons for the dif-ference? (2) Can we eliminateit? (3) If we cannot eliminate the difference,can we design an environment in which the effects of individual dif-ferences in intelligence are mitigated such that they are not determin-ative to the extent they are now ofracial differences in performance in theschools and in othersocially relevant contexts? If we could make progresson the third question the answersto the first two questions would appearto be less pressing. It is possible that the answer to the first questionmight enable us to eliminate the difference or to design ways to mitigatethe difference. If so, the study of the reasons for black—white differenceswould be socially useful.
THE INTELLIGENCE OF JAPANESEAND CHINESE GROUPS
There are many studies comparing black and white samples ontestsofintelligence. There are relatively few studies comparing Japaneseand Chi-nese samples to white samplesontests of intelligence. P. E. Vernon (1982)summarized studies of the performance of the descendants of Asian im-migrants living in North America on tests of intelligence. He also in-cluded data on the performance of Chinese samples in Hong Kong. Lynn(1987) also summarized the available literature.There waslittle adequate data on the intelligence test performance of
Japanese- and Chinese-background children in America or Canada untilthe 1970s. A numberof studies were published as early as the 1920s. Thesamples were small and not particularly representative. These studiesusually found that these groups exhibited deficits relative to whites inmeasuresof verbal intelligence and performed as well as white groups onmeasures of nonverbal intelligence. The deficits in measures of verbal

THE INTELLIGENCE OF JAPANESE AND CHINESE GROUPS 311
intelligence may be reasonably attributable to the possibility that manyof the subjects in these early studies were reared in homes in whichEnglish was not spoken. Data on the intelligence test performance ofrepresentative samples of Japanese and Chinese groupswerenot availableuntil after World WarII.The two most comprehensive investigations of the performanceof Chi-
nese and Japanese groups in America were reported by Flaugher & Rock(1972) and by Coleman andhis colleagues as part of the Coleman reporton the performance of American schoolchildren (Coleman, Campbell,Hobson, McPartland, Moody, Weinfield, & York, 1966). Flaugher & Rock(1972) administered grouptests of intelligence to a sample of 18,000 highschool juniors in Los Angeles. They found that Asian-American students(primarily Japanese-Americans in this sample} scored above white stu-dents on tests of reasoning and tests of spatial and numberabilities.Asian-American students scored lower on tests of verbal ability thanwhite students. The most comprehensivedata available are contained inthe Coleman report of the performance of 650,000 American school-children. Children classified as having an Asian backgroundhadthehigh-est performance of any group investigated. The Asian students exceededthe white mean at each grade investigated on tests of nonverbal ability.Their scores were approximately .25 standard deviations higher on thesemeasures thanthat of other groups. Asian groups were above the mean onverbal intelligence in the first three grades and then exhibited declines inperformancerelative to other groups. Their verbal test scores were ap-proximately .10 standard deviations below that of white groups.
Studies of Asian-background children in America going back to theearliest fragmentary reports of tests administered after World War I exhib-it a consistent pattern of results—stronger performance on nonverbalthan on verbal tests and relatively little evidence for deficits in generalintelligence even for children who havedeficits in the use of the Englishlanguage. It should be noted that these results contradict Mercer’s analy-sis of black—white differences in intelligence in that they indicate thattests of intelligence do not measure the degree of acquaintance of indi-viduals with white middle class culture.
Theresults of the intelligence test performance of Asian Americansarebuttressed by studies of the performance of Japanese individuals on testsof intelligence originally standardized on American samples. Lynn (1987)summarized the results of three large-scale studies of the performance ofJapanese on standardizedtests of intelligence (see also Lynn & Hampson,1986a). The studies include a Japanese standardization of the McCarthyscales for children ages 2—8, and two standardizations of the Wechslertests, for children aged 4—6 (for the WISC) and for samples between 6 and16 (for the Japanese version of the WAIS). Lynn compared the performanceof Japanese groups to that of American white groups on thesetests. Headjusted the scores to take account of secular trends in intelligence and

312 10. GROUP DIFFERENCESIN INTELLIGENCE
TABLE 10.4 Mean IQ of Japanese Children Relative to AmericanWhite Mean of 100 and Standard Deviation of 152
Age Spearman’s g Verbal Visuospatial Test
2.5 94.4 92.8 97.0 McCarthy3 94.1 92.5 96.5 McCarthy3.5 96.6 94.7 99.5 McCarthy
4 95.9 93.1 99.6 McCarthy
4.5 97.1 93.8 101.6 McCarthy
5 97.2 92.6 103.7 McCarthy5.5 98.7 93.8 105.7 McCarthy
6.5 101.2 97.1 107.2 McCarthy7.5 98.5 93.9 104.5 McCarthy
8 97.7 92.7 104.7 McCarthy6 100.6 96.2 103.8 WPPSI
6 101.2 97.8 106.2 WISC-R
7 100.0 95.6 106.0 WISC-R
8 102.1 97.9 106.5 WISC-R
9 102.3 99.0 105.8 WISC-R
10 104.1 101.0 106.5 WISC-R
11 104.0 100.7 106.2 WISC-R12 104.4 100.9 106.1 WISC-R
13 103.4 100.3 104.8 WISC-R
14 104.0 100.8 105.4 WISC-R
15 104.2 101.3 105.4 WISC-R
16 103.3 100.8 103.0 WISC-R
2Based on Lynn (1987).
obtained scores for general intelligence as well as scores for verbal andspatial ability. Table 10.4 presents his analyses. Table 10.4 indicates thatthe performanceof Japanese groupsis slightly lower than that of Ameri-can whites on the McCarthytests given to young children. The Japanesesamples exceed the American white samples on the Wechsler tests. Afterage 8, the differences are approximately .25 standard deviations. A secondfeature of these data is that at all ages the Japanese samples score higheron spatial measures than on verbal measures. Ignoring age trends, Japa-nese samples score approximately .33 standard deviations higher on mea-sures of spatial ability than on measuresof verbalability.Lynn also reported data for performance of Chinese groupsontests of
intelligence in Hong Kong, Singapore, and Taiwan. Chinese 13 year oldsin Hong Kongobtained an IQ of 113.3 on the Raven Progressive Matrices.This value was an estimated score adjusting for secular changes in IQ. Acomparable study in Singapore reported an IQ of 103.3 for Chinese 13year olds. And, Chinese 16 year olds in Taiwan administered CattellCulture-Fair tests obtained adjusted meansof 101 and 103 for indigenousTaiwanese and Chinese immigrant groups, respectively. These data indi-cate that Chinese-background children in Asia have nonverbal intel-ligence test performancethatis equal to or slightly superior to the perfor-

THE INTELLIGENCE OF JAPANESE AND CHINESE GROUPS 313
mance of American and British samples. Lynn (1987) indicated that thereare three aspects of these data that require interpretation. (1) Chinese-and Japanese-background children score lower on tests of intelligenceadministered prior to age 6 than American andBritish children.(2) Afterage 6, Chinese- and Japanese-background individuals have marginallyhigher general intelligence than British and American white individuals.(3) Chinese- and Japanese-background individuals have higher spatialthan verbal abilities.
Lynn’s summary of the differences between Chinese and Japaneseindi-viduals and white Americans has been challenged (see Sue and Okazaki,1990; 1991). The differences are based on scores that are adjusted forsecular trends. In addition, the comparisonsare of retrospective data setsthat were not based on samples constructed on the samebasis. There mayalso have been differences in the way in which tests were administered indifferent countries at different times. It is obviously difficult to arrive atconclusions about cross-cultural differences in performance on testswhenthese differences are not based on data sets that are explicitly col-lected for the purpose of cross-cultural comparisons.
Stevenson, Stigler, Lee, Kitamura, & Hsu (1985) obtained ability scoresfrom representative samples of first and fifth grade pupils from Min-neapolis, Minnesota, Taipei, Taiwan, and Sendai, Japan on a battery ofverbal and nonverbaltests. Although there weresignificant differences intest scores on sometests in the battery, the overall differences in scoreswere small and inconsistent. The data obtained in this study, which wasspecifically designed as a test of cross-cultural differences in performance,do not support Lynn’s analysis of racial differences in test performance.Lynn (1991) indicated that the Stevenson et al. study was not con-
clusive. He cited data indicating that individuals in Minnesota had aboveaverage IQs. It should be noted that the comparison cities chosen byStevenson et al. were designed to be comparable to Minneapolis. All ofthis points to the difficulty of making cross-cultural comparisons. Unlessthere are comprehensive comparisons of samples designed to be represen-tative of the populationsof different countries whoare tested in the samemanneron the sametests, it is difficult to reach conclusions about theperformance of individuals in different groups. Thus, it is possible toargue that Lynn’s conclusions about the natureof racial differences in IQmay notbe justified.Lynn (1987) asserted that these findings were not easily interpretable
by environmental hypotheses and he advanced a biological theory to ex-plain these results. Lynn assumedthat the relatively low performanceofpreschool Japanese groupsis attributable to a genetic influence on therate of maturation among individuals he designates as mongoloids. Itshould be noted that the empirical basis for the assumption that pre-school-age IQ is lower in Japanese samplesis weak.It is based on researchusing the McCarthy scales. Recall that Naglieri & Jensen (1987) demon-

314 10. GROUP DIFFERENCESIN INTELLIGENCE
strated that the g loading of the McCarthyscales for children was lowerthan the g loading of the WISC. The magnitude of age-related differencesin the performance of American white andJapaneseindividuals on intel-ligence tests may beattributable to the use of different tests at differentages that assess somewhatdifferent constructs. Also, the relative im-provement in Japanese samples maybeattributable to the effects of dif-ferences in schooling. Japanese elementary education may be morerigorous than American elementary education. Cross-national com-parisons of academic achievementconsistently find that the performanceof American elementary schoolchildren is lower than the performance ofchildren in Asian countries. The differences are particularly acute inmathematics achievement(see discussion of the Stevensonet al. (1990)study in Chapter 9). Elementary education in Asian countries in mathe-matics is more intensive than elementary mathematics education inAmerica. This differential emphasis on formal and abstract elements inthe curriculum might influence the developmentof fluid intelligence andaccount for someof the differences in intelligence noted by Lynn.Lynn proposed that differences between individuals with Asian back-
grounds and Caucasians in intelligence are explained by genetic dif-ferences in brain functioning. He proposed that the former group experi-enced a shift in neurological structure during the Ice Age. Thelefthemisphere of the brain of individuals with Asian backgrounds evolvedstructures capable of processing visuospatial information. Therefore, thebrains of individuals with Asian backgroundshave a higher proportion ofcortical tissue devoted to processing spatial information than the brainsof Caucasians. Consequently, the brains of individuals with Asian back-grounds are more likely to have a smaller proportion of cortical tissueavailable for processing verbal information.Lynn cited three kinds of evidence in favor of this theory. Frydman &
Lynn (1989) reported the results of a transracial adoption study in which19 Korean children were adopted by middle class Belgian parents. Thesechildren had a WISC verbal IQ of 110.6 and a performanceIQ of 123.5 atage 10. Fryden and Lynn interpret these data as support for a geneticallyprogrammedtendencyfor individuals of Asian backgroundsto have high-er spatial than verbal abilities. Although this interpretation of these datais plausible, alternative interpretations are possible. Although the dif-ferences between verbal and nonverbal IQsarestatistically significant,itshould be noted that the sample is small and that the study requiresreplication before it can be confidently asserted that transracially adoptedAsian-background children have higher performance than verbalIQs. Itshould also be noted that these children were adopted at a mean ageof 19months with differences in the age of adoption varying from 3 to 72months. Therefore, most of these children had less exposure to Frenchthan children reared from birth in French-speaking areas of Belgium.Their lower performance on tests of verbal ability may reflect nothing
THE INTELLIGENCE OF JAPANESE AND CHINESE GROUPS 315
more than a lowerlevel of exposure to the French language. In order torule out this alternative hypothesis it would be necessary to study chil-dren of Asian backgrounds whowere adoptedat birth by Caucasians. Ananalogous interpretation of many of the studies demonstrating dif-ferences in verbal and nonverbalintelligence for Asian-Americansis plau-sible. Thatis, relatively poorer performanceontests of verbalintelligencemay be attributable to decreased exposure to English for children whoarenot native speakers of the language or whoare reared by parents whoarenot native speakers of the language. It should be noted that this in-terpretation will not account for observations of a comparable pattern ofresults for Japanese children reared in Japan.Lynn (1987) presented data indicating that verbal and spatial abilities
are negatively correlated when g is held constant. P. A. Vernon (1990)argued that this relationship was a statistical artifact since g = V + Pwhere V and P represent performanceandverbal IQ, respectively. There-fore, holding g constantwill lead to an inverse relationship between V andP. Lynn (1990b) disagreed with Vernon’s analysis. He noted that g, or acomposite IQ,is a function ofall the tests that constitute thetest battery.Partial correlations amongverbal tests, with g held constant, arepositive.Similarly, partial correlations amongspatial tests are positive with g heldconstant. By contrast, partial correlations between verbal andspatial testsare negative with g held constant. It seems to me that Vernon’s analysisismore nearly correct. It is possible to factor analyze omnibustests ofintelligence such as the Wechslertests and obtain spatial and verbal abili-ty factors defined by such markers as Vocabulary and Block Design. Theexistence of such factors is not in dispute. With g held constantit ismathematically necessary that they are inversely related simply becausetheir identity as separate factors is attributable to the high positive cor-relations amongthe subtests that define each of the factors. Therefore,the inverse relationship between spatial and verbal ability factors is ana-lytically equivalent to the assertion that spatial and verbalability factorsexist (the term exist is used here solely in thestatistical sense of beingdefinable by an observed pattern of correlations). The existence of aninverse pattern of correlations cannot be used to provide evidence for aneurological model of the biological basis of spatial and verbal abilitiessince the inverse relationship is an analytical consequence of the exis-tence of separate spatial and verbal ability factors.Lynn (1987) cited data from cognitive experimental studies indicating
that there are differences in the lateralized functioning of Caucasian andAsian groups. Hatta & Dimond(1980) presentedirregular geometric visu-al stimuli to the right or left hemisphere of Japanese and English collegestudents using a tachistoscope. Subjects were required to recognize thestimuli presented to them. Thepercentage of correct recognitions for theJapanese and English students for stimuli presented to the right andleftvisual field is presented in Table 10.5. Japanese students had more accu-

316 10. GROUP DIFFERENCES IN INTELLIGENCE
TABLE 10.5 Mean Percentage of Correct Recognition
of Random Formsin the Left and Right Visual Fieldsof Japanese and English Subjects
Subjects Left visual field Right visualfield
Japanese
Mean 38.49 44.10
Standard deviation 12.46 10.42
English
Mean 45.69 31.31
Standard deviation 10.78 10.93
4Based on Hatta & Dimond (1980).
rate recognition of complex visual stimuli presented to the right visualfield (left hemisphere) than English students. Although English studentswere slightly better than Japanese students in recognizing visual stimulipresented to the left visual field (right hemisphere}, the differences werenot statistically significant. The significant interaction of visual field xsocial background of subjects is interpreted by Hatta and Dimond assupporting a model of differential lateralization of brain function amongEnglish and Japanese individuals. Japanese individuals, in contradistinc-tion to English individuals, are assumedto be capable of bilateral process-ing of stimuli and superior processing of visual stimuli in the left hemi-sphere.Tsunoda (1978) obtained data supporting a hypothesis of differential
lateralization of function among Japanese and Caucasian individuals. Hereported a right-ear (left-hemisphere) advantage for the recognition ofauditory stimuli such as a bird singing or the chirping of a cricket inJapanese subjects and left-ear (right-hemisphere) advantage for recogni-tion of the same stimuli among Western subjects. These data are in-terpreted by Lynn (1987) as supporting the assumption that the righthemisphere is freed for the processing of spatial information amongJapanese.Although both the Hatta and Dimondand the Tsunodastudies provide
evidence for differential lateralization of functioning between Japaneseand Western subjects, neither study provides strong support for a generaltheory of genetically determined differences in brain functioning betweenCaucasian and Asian individuals. Evidence indicating differential later-alization effects is not presented for other Asian groups. Both Tsunodaand Hatta and Dimond assumethat the differential lateralization thatthey obtained is attributable to the characteristics of Japanese orthogra-phy, which requires mastery of Kanji, a form of written language whichisnonphonetic and ideographic. Thus language function among Japaneserequires the involvement of skills that are normally dependent uponright-hemisphere specialization. If this analysis is correct, differential

GENDER DIFFERENCES IN INTELLIGENCE 317
lateralization of function would not be obtained for individuals of Japa-nese background whohaveneverbeen exposedto Kanji. Evidenceindicat-ing that there are left-hemisphere advantages for processing spatial infor-mation amongindividuals with Asian backgrounds would haveto be farmore extensive before it could reasonably be concluded that there is a
racially based difference in lateralization of function. In addition, it wouldbe necessary to obtain evidence for the heritability of lateralization offunctioning before it would be reasonable to entertain a hypothesis of agenetic difference in brain functioning. And, it would be necessary todemonstrate that indices of lateralization are related to patterns of psy-chometrically assessed abilities.
It is possible to summarize the evidence in favor of Lynn’s genetictheory aboutthe basis of differences between Caucasian and Asian indi-viduals by indicating that thereis little or no persuasive evidence in favorof the theory. The inverse relationship between verbal andspatial reason-ing is probablya statistical artifact of the existence of separate spatial andverbal ability factors; the single transracial adoption study cited requiresreplication and is capable of alternative interpretations; and the data ondifferential lateralization of brain function do not include studiesof sever-al Asian groupsand do not includestudies of individuals of Asian back-grounds not exposed to ideographic representations of language thatmight plausibly be assumed to influence the way in which the hemi-spheres process different kinds of information. To assert this is not toassert that there is decisive evidence against the theory. Ratherit is toassert that the evidence offered in favor of the theory is thin and notcompelling.
GENDER DIFFERENCES IN INTELLIGENCE
Meta-analyses have becomethe preferred way of summarizingliteratureon sex differences in cognitive functioning. There are three meta-analysesavailable that summarize studies of sex differences in verbal ability, spa-tial ability, and mathematicalability.Hyde & Linn (1988) analyzed 165 studies including over a million sub-
jects in their analysis of gender differences in verbal ability. They ob-tained an effect size of .14 for the mean difference between females andmales, indicating female superiority in verbal ability of approximatelyone-seventh of a standard deviation. When they calculated a weightedmean in which the meandifference for each study was weighted by sam-ple size, the effect size became —.04, indicating no difference in verbalability. The difference between the weighted mean and the unweightedmean wassubstantially attributable to the results of a single study with asample size of 977,361 subjects. Ramist & Arbeiter (1986) reported thatmales performed better than females on the SAT verbal test for college

318 10. GROUP DIFFERENCES IN INTELLIGENCE
admission. When theresults of this study were removed from theanaly-sis, the effect size became .11, indicating that females did slightly betteron tests of verbal ability than males.Hyde and Lynn examined genderdifferences in studies as a function of
several different characteristics of the studies. There wasrelatively littledifference in outcome as a function of the age of the sample. Among thestudy characteristics that related to outcome werethe year of publicationof the study. Studies that were published in 1973 or earlier, and that wereincluded in Maccoby andJacklin’s classic review of studies of genderdifferences, had an effect size of .23 (Maccoby & Jacklin, 1974). Studiespublished after 1973 had an effect size of .10, indicating that genderdif-ferences in verbal ability have declined.Hyde and Linnattribute the anomalous SATresults to the possibility
that the content of the questions in the SAT may bebiased. SAT ques-tions may be morelikely to reflect the subjects with which males aremore familiar than females. It is also possible that there are unrepresen-
tative samples of males and females taking the SAT. They indicated thatfemales taking the SAT in 1985 had lower socioeconomic status thanmales taking the test. Irrespective of the reasons for the anomalousre-sults of the SAT study, the Hyde and Linn analysis of gender-relateddifferences in mean verbalability supports the conclusion that such dif-ferences are extremely small. A tenth of a standard deviation difference,perhaps the best current estimate of the magnitude of gender differencesin verbal ability, has little or no practical or theoretical significance.These findings pose somedifficulties for theories of brain lateralizationthat have been advanced to explain genderdifferences in ability that arebased in part on the assumption that females have higher verbal abilitythan males (see Levy, 1976).Linn & Petersen (1985) reported the results of a meta-analysis of tests of
spatial ability published after Maccoby and Jacklin’s review of this liter-ature in 1974 andprior to 1982. Their analysis is based on 172 measuresof effect size differences between males and females on various measuresof spatial ability. They distinguished amongthree different spatial abili-ties—spatial perception, the ability to determine spatial relationshipswith respect to the orientation of the body as indexed by performance onthe rod and frametest in which an individual is required to determine theverticality of a rod placedin a tilted frame; mental rotation, the speed andaccuracy of ability to rotate two- and three-dimensionalfigures as indexedby tasks of the type studied by Shepard & Metzler (1971); and spatialvisualization, the ability to perform complex multistep manipulationsofspatially presented information as indexed by performance on the embed-ded figures test in which subjects are required to identify forms embeddedin a complex design that serves to obscure the location and representationof the embedded figure. Using this analysis scheme, Linn and Petersenobtained meaneffect size differences of male means minus female means

GENDER DIFFERENCES IN INTELLIGENCE 319
of .44 for spatial perception, .73 for measures of rotation, and .13 formeasures of visualization. Linn and Petersen findrelatively little evi-dence of age differences in these effect size indices. And, for studies ofrotation, the spatial ability with the largest gender difference, there is noevidence that the magnitudeof genderdifferences is related to the age ofthe subjects in the study. These results pose difficulty for theories ofgender difference that implicate biological changes associated with puber-ty as being critical for the emergence of gender differences in spatialability (see Waber, 1976, 1979).Hyde, Fennema, & Lamon(1990) reported theresults of a meta-analysis
of studies of genderdifferences in mathematics performance. Their analy-sis included 259 comparisons based on thetesting of close to 4 millionsubjects. The weighted mean effect size for the male mean minus thefemale mean was.20, indicating that males scored approximately one-fifth of a standard deviation better than females on tests of mathematics.The magnitude of the difference was related to the year of publication ofthe study. The effect size index was .31 for studies published in 1973 orearlier and .14 for studies published after 1973. In addition, the magni-tude of gender differences varied with the selectivity of the sample. Forunselected representative samples the effect size was —.05, indicatingslight female superiority in mathematics performance. For studies ofsamples with above-average mathematical performancethe effect sizesvaried between .33 and .54. These data suggest that there is little or nodifference in mathematical performance between male and female sub-jects in the population, but males are more likely to outperform femalesin samples selected for above-average mathematical performance. Thethree meta-analyses of gender differences in ability described above allfind evidenceof a secular trend of decreasing gender differences in perfor-mance. Feingold (1988) reported an analysis of gender differences in thestandardization data for the Differential Aptitude Test and the Prelimi-nary Scholastic Aptitude Test (PSAT) for tests administered at differenttimes. These analyses are particularly informative about secular trendssince they are based on representative samples of high school studentsgiven the sametests. Table 10.6 presents his analysis of gender differencesin several componentsof the Differential Aptitude Test as a function ofthe year in which the test was administered. Theresults are unusuallyconsistent. On all measures genderdifferences have declined from testsadministered in 1947 to tests administered in 1980. The magnitude ofgenderdifferences in these tests declined approximately .27 standard de-viations from 1947 to 1980, and these declines occurred for tests in whichfemales outperformed males in 1947 andfor tests in which males outper-formed females in 1947. Theseresults indicating a secular trend of declin-ing gender differences in abilities are also supported by results on thePSAT. Effect sizes for gender differences in verbal ability scores declinedfrom —.12 in 1960 to —.02 in 1983. Effect sizes for mathematical ability

320 10. GROUP DIFFERENCESIN INTELLIGENCE
TABLE 10.6 Secular Trends in Gender Differences
in Differential Aptitude Test Performance?
Male mean — female mean
Test Year (standard deviation units)
Spelling 1947 —.541962 —.53
1972 —.47
1980 —.45
Language 1947 —.49
1962 —.41
1972 —.401980 — 40
Clerical 1947 —.621962 —.53
1972 — .44
1980 —.34
Mechanical reasoning 1947 1.33
1962 1.00
1972 83
1980 76Spatial relations 1947 37
1962 .26
1972 19
1980 15
Verbal reasoning 1947 141962 .061972 .O1
1980 — .02
Abstract reasoning 1947 .231962 .09
1972 02
1980 —.04
Numerical reasoning 1947 211962 .10
1972 —.011980 —.10
“Based on Feingold (1988).
declined from .34 to .12 over this period. The demonstration of the declin-ing significance of genderdifferencesin abilities is probably not plausiblyexplainable by reference to biological explanations. These results wouldappear to implicate secular changesin our culture. These mightplausiblyinclude a decline in sex stereotyping of activities, interests, and curricularchoices among high schoolstudents.
Genderdifferences in ability measures are more likely to be present insamples that are above average in abilities. This is clearly true for mathe-matical ability and appears to also be true for ability measures wherethere is little or no difference in gender or where females perform betterthan males. Recall that Hyde and Linn reported that males had higher

GENDER DIFFERENCESIN INTELLIGENCE 32]
mean scores on the SAT verbal test than females. The SAT is taken by aselect group of high schoolstudents.It is possible to explain an advantagefor males over females at the high end of the distribution of scores on anability where there is a small mean difference in scores in favor of males.Small differences in central tendencyof a distribution are magnified atthe extremes of the distribution. This explanation will not account forhigher performance of males for above-average ability groups wherefemales have a higher mean than males. There is a second, and perhapsmore significant, reason for the relatively superior performance of malesin mathematics among high-ability groups. There are variance differencesbetween males and females. Males generally have higher variance onability scores. Therefore, more males than females are likely to be foundin the tails of the distribution. Lubinski & Humpreys (1990) analyzedProject Talent data (Flanagan, Dailey, Shaycroft, Gorham, Orr, & Gold-berg, 1962) on genderdifferences in abilities. Their sample consisted ofclose to 100,000 tenth grade students designed to be a representativesample of American students in 1960. Using these data they formed acomposite measure of mathematicsability in their sample. The meanformales was approximately .18 of a standard deviation higher than themean for females on this measure, a value that is congruent with otherreported differences for this historical period. Males also had a standarddeviation that was approximately 8% higher than females on this mea-sure. Gender differences in variance were present on indices in whichfemales had higher meanscores than males. For example, ona compositeindex of intelligence, females had a meanthat was .02 standard deviationshigher than males. Males had a standard deviation of IQ scores that wasapproximately 3% higher than females. Lubinski and Humphreysse-lected a sample of individuals who had scoresin the highest 1% of mathscores in the male and female subsamples. Amongthis group of indi-viduals who were highly selected for a measure of mathematical aptitudethat was highly correlated with their index of general intelligence, malesubjects had composite indices of intelligence that were approximatelyone-fifth of a standard deviation higher than female subjects. This meandifference reversed the small female advantage in IQ among the un-selected subjects. Differences in variability can account for the findingthat malesare likely to be disproportionately represented in high-abilitygroups above a high cutting score. These analyses explain theresults ofthe Johns Hopkinstalent search studies in whicha self-selected sample ofmathematically precocious seventh grade children take the SAT test formathematical ability designed for twelfth grade college applicants. Usinga cutting score of 500, the male-to-female ratio is 2:1, using a cuttingscore of 700, the male-to-female ratio is 13:1 (Benbow, 1988; Benbow &Stanley, 1981). These results are not substantially attributable to biases inself-selected samples. Comparable results were obtained by Lubinski andHumphreysin their analysis of Project Talent data. Benbow also indicated

322 10. GROUP DIFFERENCESIN INTELLIGENCE
that these differences in ratios have not exhibited secular changes. The
phenomena of large numbers of males at extremely high scores may
therefore coexist with a declining mean difference in ability levels. Ben-
bow obtained data on the distribution of math ability scores in male and
female samplesin her studies. Figure 10.1 presents these data. An exam-
ination of Fig. 10.1 indicates that males and females are equally well
represented at the lower end of the distribution, but there is an excess
number of males at the high end of the distribution. Comparable results
were reported by Feingold (1988) for an analysis of scores on the SAT
verbal test. Secular changes in verbal ability have diminished the excess
numberof male subjects at the low end of the distribution but have left
unchanged an excess numberof malesat the high end of the distribution.
Y1400
4
1300 -
4
1200 -
Xx1100 - 0 x
1000; X x
900 4 “~
q xX
800 4 x! 0
/ SAX700 4 /
/ 0 \
600 4/
500 +
400; |
300 -
200 ¢
q
100 - 0.00 °YTryvrryvvvvrvwypvyrvyvwvw es eee Vv vv vy vv verryY
200 300 400 500
FIGURE 10.1 Distribution on SAT Q scores for mathematically precocious male (O} and
female (X) students. (Based on Benbow, 1988.)

GENDER DIFFERENCESIN INTELLIGENCE 323
We have examinedsex differences in three different special abilities.Since standardized IQ tests are usually constructed to remove genderdifferences in means,relatively little recent research has focused on gen-der differences in general ability. It should be noted that math,verbal, andspatial abilities are highly correlated. For example, Lubinski and Hum-phreys reported correlations between their mathematical ability com-posite and scores on an IQ composite, a verbal ability composite, and aspatial ability composite ranging from .62 to .83 in their male and femalesamples designed to be representative of tenth grade high school studentsin 1960. The highest correlations are obtained in both male and femalesubjects between mathematical composite scores and general IQ, fol-lowed bycorrelations of .75 between mathematical composite scores andverbal ability scores. The lowest correlations are obtained between math-ematical ability scores and spatial ability scores. This finding posesdiffi-culty for theories of mathematicalability that link it to spatial ability andassume that differences in spatial ability explain gender differences inmathematical ability.The contemporary research on genderdifferences in intelligence leads
to several generalizations. They are as follows.
1. Gender differences in general intellectual ability are small and vir-tually nonexistent.
2. Secular changes have diminished gender differences in special abilityscores. |
3. Mean differences in verbal ability and mathematical ability in thegeneral population have virtually disappeared.
4. Males appear to be morevariable in a numberof ability measures andthis difference in variability, particularly at the high end of the dis-tribution of ability, may contribute to an excess number of malesabove relatively high cutting scores.
5. There are gender differences on tests of spatial ability. The magnitudeof the difference appears to vary with the type of test and may be ashigh as .75 standard deviation units in favor of males over females fortests of mental rotation.
Generalizations (1) and (3) do not require explanation. Thereislittle toexplain about the absence of effects. Perhaps the two most challenginggeneralizations that require explanation are generalization (4) and (5).Little is known about gender differences in variability and most of theliterature on gender differences has been devoted to the explanation ofdifferences in means rather than variability. It may be that variabilitydifferences have important social consequences. For example, if selectiveinstitutions use high cutting scores on the SAT as one meansof selectingtheir students, they will find more males meeting this criterion thanfemales. It is clear that we need to know more about the reasonsfor

324 10. GROUP DIFFERENCES IN INTELLIGENCE
differences in variability, and research on gender differences mightprof-
itably concern itself with this issue.
Generalization (5) has been the subject of a considerable body of spec-
ulation and theoretical analysis. Studies of performanceon rotation tasks
provide information about the processes that distinguish male and female
performanceonthese tasks. Linn & Petersen (1985) indicated that gender
differences are less likely to be found on measuresof the intercept of the
function relating decision time to the angle of rotation. Gender dif-
ferences are more likely to be present on measures of slope. Lohman
(1986) analyzed gender differences in speed—accuracy tradeoffs in a men-
tal rotation task. He found that differences in the slope of decision times
as a function of angle of rotation were attributable to differences in
speed—accuracy tradeoffs. Females reached asymptotic performance in
their speed—accuracy tradeoff curves morerapidly than males on the long-
est rotation tasks. Males and females did not differ significantly in speed
of rotation when the accuracy of rotation was controlled. It took females
longer to solve the more difficult problems. Slope differences in spatial
rotation measures maybe determinedby the time taken to solve the more
difficult problems. Therefore, some of the gender differences may be at-
tributable to gender differences in caution and decision criteria used to
attain a given level of accuracy. It is also the case that these data suggest
that there are gender differences in the difficulty level of rotation prob-
lems.Whataccountsfor the gender differencesin spatial ability? The analysis
of performance on rotation tasks presented in Chapter 4 based on the
Minnesota study of twins reared apart by McGueand Bouchard indicated
that the parameters of percentage correct, slope, and intercept are herita-
ble. McGue and Bouchard also found that none of their measures of
parental characteristics and childhood environmental factors correlated
with performanceonspatial ability indices in their adult sample of twins.
Thereis little ambiguous evidence thatrelates specific socialization expe-
riences to performanceoneither general or specific intellectual abilities.
Correlations between specific socialization experiences andspecific abili-
ties are not easily interpreted since the activities that children engage in
may in part be determined by genetically influenced characteristics of
children that determine their activities and the response of parents to
children. In addition, evidence that opposite-sex DZ twinsareas alike as
same-sex DZ twins in general ability suggests that gender-specific so-
cialization practices do not influence generalintelligence. I am not aware
of data on specific abilities dealing with this issue. If opposite-sex DZ
twins were as similar on measures of spatial ability as same-sex DZ
twins, this would suggest that differences in gender-specific socialization
experiences do not influence the development of specialized intellectual
abilities. This discussion supports two rather tentative conclusions.First,
thereis little convincing data that supportsa socialization explanation of

GENDER DIFFERENCESIN INTELLIGENCE 325
gender differences in spatial ability. This assertion does not imply thatsuch an interpretation is not plausible or could not be developed. It im-plies only that strong evidencein favor of such an interpretation does notexist. Whatof the possibility of a genetic explanation of the difference?The fact that spatial ability is a heritable trait indicates that geneticfactors might be implicated in gender differences. This is a very weakconclusion. It does not indicate that biological factors are implicated.
Thereare tworelated biological explanationsfor sex differences in abil-ities that have been proposed. Oneis a structural theory based on theassumption that there is a difference in cerebral lateralization amongmales and females. The second theory attemptsto relate sex differencesin abilities to hormonal differences.Levy (1969, 1976) proposed that males are more Jlateralized than
females. She assumedthat females had morebilateral representation forverbalabilities than males. She assumedthatspatial ability was mediatedby the right hemisphere andthat the representation of verbal processingin the right hemisphere of females decreased the ability for spatial pro-cessing in females in the right hemisphere, leading to a male advantage.Levy’s hypothesis is based on a series of assumptions: Males are morelateralized than females andlateralization with specialization of functionfor spatial processing in the right hemisphere is associated with superiorperformanceontestsof spatial ability. Hahn (1987; see also Bryden, 1982,McGlone, 1980) reviewed research on sex differences in cerebral later-alization derived from five different areas of investigation—dichoticlis-tening, tachistoscopic presentations, EEGs, haptic identifications, andsomatosensory discrimination. His review deals with studies from infan-cy through age 15. He concludedthatthere waslittle consistent evidenceindicating sex differences in lateralization. The studies he reviewed eitherreported no sex differences or, where sex differences were obtained using aparticular paradigm, they were not replicated by other investigators. Itshould be noted that manyof the studies reviewed had relatively smallsamples and may havehadrelatively low powerto reject null hypothesesderived from the assumption of equality in cerebral lateralization formales and females. Hahn suggested that performanceon the tasks used toassess laterality might be influenced by several methodological variablesthat might influence the degree of lateralization of performance on thetasks as well as results related to sex differences in cerebral lateralization.Voyer & Bryden (1990) reported the results of a study of sex differences
in the lateralization of rotation that provides information about sex dif-ferencesin cerebral lateralization and the relationship betweenlateraliza-tion andspatial ability. They obtained measures ofspatial ability using apaper and pencil test of rotation developed by Vandenberg & Kuse (1978).They also presented visual rotation problemsto theright and left visualhemifield using a tachistoscope. They found a gender x visual field in-teraction for performance on the tachistoscopic visual rotation task.

326 10. GROUP DIFFERENCES IN INTELLIGENCE
Males exhibited superior performance on rotation problemspresented to
the left hemifield (right hemisphere) and females exhibited superiorper-
formance for rotation problems presented to the right hemifield. They
obtained a measureof the lateralization of performance on the rotation
problem by subtracting the reaction timesfor right visual field presenta-
tions from the reaction times for left visual field presentations. A nega-
tive value for this index would indicate a right hemisphere advantagefor
processing rotation problems. They found that this lateralization index
was positively correlated for both male and female subjects with perfor-
manceontheir paper and pencil test of rotation performance(correlations
for males and females were .37 and .52, respectively). These data suggest
that superior processing of rotation problemsin the left hemisphere is
associated with superior spatial ability! Indeed, there was an ability x
lateralization interaction for the tachistoscopic presentation of stimuli,
indicating that subjects who were high in spatial ability tended to have a
right-visual-field (left-hemisphere) advantage for solving rotation prob-
lems. Other groups had
a
left-visual-field advantage. Thusthe pattern of
cerebral lateralization that was exhibited by females in this study was
characteristic of superior spatial ability. Voyer and Bryden suggested that
there is a right-hemisphere advantage for processing novel stimuli and a
left-hemisphere advantage for processing familiar stimuli. They assumed
that subjects who had superior spatial ability would be more likely than
low-spatial-ability subjects to be familiar with rotation problems and
would therefore exhibit a left-hemisphere advantage for this task.
Whetheror not this ad hoc hypothesisis correct, the results obtained by
Voyer and Brydenareillustrative of the complexities inherent in attempts
to use cerebral lateralization as an explanation for gender differences in
spatial ability. Even where cerebrallateralization differences are obtained
that are congruent with theoretical expectations derived from Levy’s
model, the relationship with spatial ability indices may not be congruent
with theoretical assumptionsrelating lateralization to differences in spa-
tial abilities.
Kimura & Hampson(In press) summarized evidence suggesting that
male and female differences in cognitive abilities are related to hormonal
differences. There is evidence relating variation in hormonal charac-
teristics to cognitive performance. Resnick, Berenbaum, Gottesman, &
Bouchard (1986) administered a battery of cognitive ability tests to
females who had congenital adrenal hyperplasia. These females are pre-
natally exposed to adrenal androgens. They compared these females to
sibling or cousin controls on a variety of cognitive abilities. The experi-
mental and control groups had relatively equal general intelligence as
indexed by performance on the Raventest. The control group had Raven
test performancethat was .08 standard deviations higher than thatof the
females with congenital adrenal hyperplasia. The experimental subjects
had spatial ability scores that averaged .665 standard deviations higher

GENDER DIFFERENCES IN INTELLIGENCE 327
than the scores of the control subjects. These results indicate thatfemales whoare exposed prenatally or perinatally to androgens will ex-hibit superior spatial ability. The results are based on small samples (N =13 in the experimental group, N = 8 in the control group) but they dosupport the assumption that sex differences in spatial ability may berelated to hormonaldifferences between males and females.
Shute, Pellegrino, Hubert, & Reynolds (1983) measured androgens inthe blood in normal male and female students. They found that femaleswith high levels of androgens had higher spatial ability scores thanfemales with low levels of androgens. For males, the results were in theopposite direction. These results, when combined, provide evidence for acurvilinear relationship between androgen levels and performance ontests of spatial ability. Very high levels of androgen characteristic of maleswith high androgenlevels are associated with relatively poor performanceon tests of spatial ability. Low levels of androgen characteristic of femaleswith low androgen levels are also associated with poor spatial ability.Intermediate levels of androgen characteristic of males with low androgenlevels or females with high androgenlevels are associated with superiorperformanceontests of spatial ability.Hampson (1990) administered a battery of tests to women when they
were assumed to be menstruatingor in the midluteal phaseof the men-strual cycle. She assumed that the high levels of progesterone and es-trogen characteristic of the midluteal phase of the menstrual cycle wouldlead to better performanceon tests in which females tended to performbetter than males and to poorer performance on tests in which femalesperformed more poorly than males. She found that women whotook thespatial ability tests when they were menstruating performedbetter thanwomen whotook the test during the midluteal phaseof their cycle. Thiseffect was not present on other ability tests that favored females. Forthese tests, women taking thetest initially during the midluteal phaseperformedbetter than womentaking the test when they were menstruat-ing. Thusthe differences in performance onspatial ability tests were notattributable to a generalized superiority on all tests of ability. Hampsonalso included within-subject comparisonsontests of abilities. Each sub-ject took the battery of tests twice during each phase of her menstrualcycle (there were counterbalanced orders of test taking). There were nostatistically significant differences in performanceontests of spatial abil-ities based on the within-subject comparisons. Hampsonattributed thelack of significant within-subject differences on tests of spatial ability tocarryover practice effects from thefirst to the second administration ofthe test. The failure to obtain within-subject differences on measures ofspatial ability makesit difficult to interpret Hampson’sresults.Kimura & Hampson (In press) reported the results of a study of
postmenopausal womenwhowerereceiving estrogen therapy. They con-trasted the performance of these womenontestsof spatial ability during
328 10. GROUP DIFFERENCESIN INTELLIGENCE
low- and high-estrogen phasesof their therapy. They found nosignificant
differences in spatial abilities as a function of the administration of en-
dogenousestrogens in this study.
It should beclear from this brief review that there maybe relationships
between hormonesand performance on various tests of cognitive abili-
ties. The relationships are complex andare not consistent. Studies in this
area rarely provide clear and unambiguousfindings in support of clearly
articulated theoretical assertions. The precise nature of the biological
differences that may contribute to gender differences in performance on
spatial ability tests is not known.
This brief survey of research on genderdifferencesin intelligence leads
to the following conclusion. There are two kindsof gender differences in
intelligence. Males are more variable than females, leading to an excess
number of males above high cutting scores. Males score higher than
females on tests of spatial ability. There are no explanations for these
differences that have received consistent empirical support.

I]BEYOND IQ: SOCIALINTELLIGENCE AND
PERSONALITY
SOCIAL INTELLIGENCE
Intelligence is often defined in termsof ability to solve personal prob-lems. Sternberg (1985) defined intelligence as “purposive adaptation to,and selection and shaping of, real-world environments relevant to one’slife” (Sternberg, 1985, p. 45). It is commonly believed that academicintel-ligence asassessedbyIQ tests is imperfectly related to ability to functionintelligently in everyday life. We all know academically intelligent indi-viduals whosepersonallives are a shambles. Indeed, we all know academ-ically intelligent individuals who do not function well in academicset-tings because of emotional problems. In this chapter we shall considerseveral attempts to go beyond IQ to a consideration of the diverse rela-tionships between intelligence and other personal characteristics thatmayinfluence a person’s ability to function “intelligently”in a variety ofsocial settings. These issues may be pursued from two somewhatcontra-dictory perspectives. Some may believe that intelligence as conven-tionally assessed by IQtests is unimportant and haslittle or nothing tocontribute to our understanding of a person’s social success. Others be-lieve that IQ may be an importantinfluence on academic performance butacademic successhaslittle or nothing to do with success in otherareas.
Sternberg (1985) presented profiles of three graduate students in Yale’sDepartment of Psychology to explicate his triarchic theory of intel-ligence. Alice is described as an admissions officer’s dream—a studentwith high grades, high test scores, and good recommendations. Sheisdescribed as having high analytical andcritical intelligence. She was IQtest smart but she was unable to develop her own ideas. Sternberg de-scribed her as being deficient in both practical and syntheticintelligencedespite her high IQ.Barbara is described as the admissionsofficer’s nightmare—a student
with good grades and “abysmal” aptitude test scores. She was excep-tionally creative and able to view things in a novel way.
329

330 11. BEYOND IQ: SOCIAL INTELLIGENCE AND PERSONALITY
Celia was somewhere between Alice and Barbara. She did not have
Alice’s analytic abilities nor was she as creative as Barbara. She had
“street smarts.” She was able to figure out the demandsof the situations
she encountered and adjust her behavior to meet those demands.
Sternberg described each of these graduate studentsas beingintelligent
in a different way and these differences are taken as the basis for the
explication of a theory of intelligence that goes beyond IQ and empha-
sizes different aspects of intellectual functioning. From myperspective,
this analysis omits much of whatis important about IQ. Whatis impor-
tant aboutintelligenceis that it is an individual-difference characteristic
that predicts whether or not a person will be successful enough academ-
ically to be admitted to Yale’s Department of Psychology as a graduate
student, or, to consider the opposite extreme, whetheror not a person will
have difficulty mastering the academic curriculum of the elementary
school. To focus on differences among students with the academicintel-
ligence to be admitted to Yale’s graduate school exemplifies an elitist
conception of intelligence. Once one hasattained
a
certain level of intel-
ligence, how muchintelligence you have, or the various forms in whichit
is expressed, may not matter. If you have moneyto buyfood, it does not
matter whether bread is available or not—you can eat cake.
There are a numberof attempts to measure characteristics of persons
that are independentof academicintelligence as assessed byIQ tests that
are assumedto predictthe ability to function intelligently in a variety of
social settings. Epstein & Meier (1989) developed an inventory designed
to measure competencein constructive thinking. They assumedthataca-
demic intelligence is a measure of the rational components of the mind
and thatit is unrelated to an experiential componentof the mindthatis
assumedto operate preconsciously and to influence an individual’s emo-
tionallife (see Epstein, 1988, for an explication of the theory). The Con-
structive Thinking Inventory measures dimensions of thought that are
designed to measure the effectiveness of an individual's ability to control
his or her emotionallife and to cope with problemsof living. Table 11.1
presents examples of items from the inventory.
Epstein and Meier administeredthe inventory to a sample of 174 under-
graduates. They also obtained self-report information abut the subject’s
“success in living.” They included items that measured success in a work
setting (these included reports about the numberof hours worked during
the past year and an index of employer satisfaction with the worker based
on such indices as invitations to return, salary increases, and estimated
favorableness of a letter of recommendation that the employer would
write for the employee—as judged by the studentfilling out the forms),
success in social situations, successin love relationships, an indexof self-
discipline referring to overeating and the use of alcohol or other mind-
altering drugs, and a medical checklist of commonstudent ailments.
Epstein and Meier found that scores on the Constructive Thinking

SOCIAL INTELLIGENCE 331
TABLE 11.1 Examples of Items from Constructive Thinking Inventory2.5
Emotional CopingI worry a great deal about what other people think of me. (—}I don’t let little things bother me.I tend to take things personally.
Behavioral CopingI am the kind of person whotakesaction rather than just thinks or complains abouta
situation.I avoid challenges because it hurts too much whenI fail. (—)Whenfaced with upcoming unpleasantevents,I usually carefully think through how I
will deal with them.Categorical Thinking
Thereare basically two kindsof people in this world, good and bad.I think there are many wrong ways, but only one right way, to do almost anything.I tend to classify people as either for me or against me.
Superstitious ThinkingI have found that talking about successes that I am looking forward to can keep themfrom happening.
I do not believe in any superstitions. (—)When something good happensto me,I believeit is likely to be balanced by something
bad.
Naive OptimismIf I do well on an importanttest, I feel like a total success andthatI will go very far in
life.
I believe that people can accomplish anything they wantto if they have enoughwillpower.
If I were accepted at an importantjob interview, I would feel very good andthinkthat Iwould alwaysbeable to get a goodjob.
Negative ThinkingWhenI am faced with a newsituation, I tend to think the worst possible outcomewillhappen.
I tend to dwell more on pleasant than unpleasantincidents from the past. (—]I get so distressed whenI notice that I am doing poorly in something that it makes medo worse.
“Based on Epstein & Meier (1989).’Itemsare scored on a 1-5scale for the degree to which theyare true orfalse. Items followed by a (—}
are scored in reverse direction.
Inventory were unrelated to intelligence. They found that IQ scores load-ed .10 on a general factor defined by the separate components of theConstructive Thinking Inventory. Table 11.2 presents correlations be-tween IQ scores and Constructive Thinking scores and the several indicesof “success in living.” These data indicate that the Constructive Think-ing Inventory is a better predictor of success in living than IQ. IQ scoresare more predictive of academic achievement than Constructive Think-ing Inventory scores. On each of the other outcomevariables, construc-tive thinking scores are more predictive than IQ.These data raise several interpretive issues. First, it should be noted
that students in a university are selected for intelligence. They are not

TABLE
11.2
Correlations
betweenConstructive
Thinking,IQ,and
Criteria
ofSuccessin
Learning?
Social
Academic
Work
Love.
relationships
achievement
CTI
scale
19
.26
36
14
IQ
scale
ll
—.04
—.13
43
aBasedonEpstein&
Meier
(198
9).
Psychological
symptoms
—.39 17
Physical
symptoms
—.22
—.04
Self-
discipline
problems
—.25
—.14
Alcoholand
drug
problems
—.22
—.02

SOCIAL INTELLIGENCE 333
selected for skill in constructive thinking. Therefore, correlations be-tween IQ and someof these outcomevariables will be subject to reduc-tions attributable to restrictions in range of talent.
Second, the correlations between constructive thinking scores and theoutcome variables are relatively low. Excluding academic achievement,they range in magnitude from .19 to .39. These data indicate that scoreson the Constructive Thinking Inventory have lowerrelationships to theseindices of success in living than IQ has to academic achievement. Theobtained relationships between constructive thinking indices andindicesof successful living may over- or underestimate the “true” relationshipsamong these variables. Constructive thinking and indices of success inliving derive principally from self-report measures. Generalized disposi-tions to describe oneself in negative terms may influence both variables.Obtained correlations between IQ and success in school are more nearly
determined by independently obtained behavioral indices. Note that IQ isa behaviorally derived index. Thatis, it is based on an individual’s abilityto answervarious questionsand to solve various problems.IQ tests do notask individuals to rate their vocabulary—a measure of a person’s vocabu-lary is derived from theability of an individual to correctly define words.By contrast, the items in the behavioral coping index measureself-de-scribed beliefs and reactions. A person whosays that he or she takesaction rather than complains about a situation is presenting a charac-terization of a behavioral tendency. This type of item is analogous toasking a person if he or she has a large vocabulary.The indices of successin living are also determined principally byself-
reports about behavior rather than byactual objective indices of behavior.By contrast, the dependent variable of academic success is determined byindependent ratings of a person’s performanceby teachers or by perfor-manceonstandardizedtests that consist of measuresof behavior, i.e., theability of an individual to correctly answer a question. Thusthevalidityof IQ measures as determinants of academic achievementrests on rela-tionships between independently assessed indices of behavior. The valid-ity of the constructive thinking score is based on correlations amongitems that are based for the most part onself-reports of behavioral ten-dencies obtained at the same time from the sameindividuals. The issueof temporal continuity underscores another importantdifference betweenvalidity correlations for IQ and the validity correlations reported by Ep-stein and Meier. Research reviewed in Chapter9 indicates that it is pos-sible to administer an IQ test to children in kindergarten and predictperformance on reading tests administered to the children several yearsafter the IQ test is administered. Note that the IQ score is obtained whenthe majority of the children taking the test do not know howtoread.Thus IQ is predictive of future behavior. It is also the case that thesecorrelations may underestimate the true relationship between construc-tive thinking and success in living. Better measures based on objective

334 11. BEYOND IQ: SOCIAL INTELLIGENCE AND PERSONALITY
indices might indicate that constructive thinking is more substantiallyrelated to successful living than is indicated by the correlations reportedby Epstein and Meier.
Third, the Constructive Thinking Inventory is related to measures ofpersonality. Epstein and Meier reported that Constructive Thinking In-ventory scores correlate .54 with a measureof neuroticism or tendency tonegative thinking derived from an adjective checklist. Epstein and Meieralso indicated that the correlations between the neuroticism index andthe measures of success in living were lower than those between scoreson constructive thinking and success in living. While the measure ofconstructive thinking appearsto be partially independent of neuroticismas assessed by an adjective checklist, the relationship between otherin-dices of neuroticism based on standard self-report measures and the kindsof dependent variables used by Epstein and Meier remains to be deter-mined. Thereis a large literature relating neuroticism as assessedbyself-report indices or ratings to other measures.It is beyond the scopeof thisvolumeto present an explication of contemporary trait theories of person-ality (see Brody, 1988, for a review oftrait theories). There is evidence thatpersonality may be described in terms of a limited numberof generaltraits including such traits as neuroticism, extraversion, and impulsivity.It is not clear if the Constructive Thinking Inventory measures charac-teristics of persons that are substantially independent of standard traitmeasures.It is possible that Epstein and Meier have simply put old winein new bottles. That is, they may have rediscovered that personality traitsrelate to social behavior.
I have raised a number of questions about the research of Epstein andMeier. Myanalysis of their research has, in some respects, indicated thatthe evidence reported for the predictive validity of the index of construc-tive thinking compares unfavorably with the evidence for the validity ofIQ tests in what may be a somewhat more limited sphere of social compe-tence. It should be noted that such a comparisonis, in a sense, unreason-able. IQ tests have been available for over 80 years and evidenceof theirpredictive validity at least for performance in academic contexts is exten-sive. The potential utility of the Constructive Thinking Inventory re-mains to be extensively investigated.
Wagner & Sternberg (1986; Wagner, 1987; Sternberg, Wagner, &Okagaki, (in press) developed a theory of tacit knowledge which theydefined as knowledge about managing oneself, managing others, andmanaging a career. They assumed that success in many different worksettings was dependent upon tacit knowledge. Such knowledgeis rarelyexplicitly taught despite its potential importance for success. They devel-oped measuresof tacit knowledge by interviewing successful profession-als in a field and then constructing work-related situations that presentalternative courses of action to individuals. Correct responsesto thesit-

SOCIAL INTELLIGENCE 335
uations were developed by obtaining the consensus judgmentsof experi-
enced and successful professionals. Table 11.3 presents examples of twoitems used in this research, one for academic psychologists and oneforbusiness managers.Wagnerand Sternberg provided two kinds of evidencefor the validity of
their indices of tacit knowledge. First, they demonstrated that groupswhodiffered with respect to exposure to professional settings differed intheir tacit knowledge. For example, undergraduates, graduate students inpsychology, and academic psychologists differed with respect to theirscores on a tacit knowledge test. Similarly, business managers receivedhigher scores on a tacit knowledge measure than business school stu-dents. They also related performance on measuresof tacit knowledge towithin-group differences in measuresof professional success. Table 11.4presents a summary of someof the validity correlations for tacit knowl-edge measuresobtainedin several different studies. Note that the correla-tions are moderately high. Tacit knowledge appears to berelated to di-verse indices of professional accomplishment. The correlations, whichare uncorrected, approach .5, suggesting that tacit knowledgescoresac-count for 25% or moreof the variance in professional accomplishment.Wagnerand Sternberg reported that tacit knowledge scores are uncorre-
lated with general intelligence—at least within the samples they studiedthat tend to be somewhatrestricted in range of talent for general intel-ligence. While the magnitude of the reported correlations obtained isimpressive, the conceptual interpretation of these findings is somewhatvexed. Tacit knowledge is related to experience. For example, Wagner andSternberg reported that the tacit knowledge scores of psychology facultywere 1.26 standard deviation units higher than the scores of undergradu-ates. Tacit knowledge scores for business managerscorrelated .30 withyears of experience as a manager. These relationships point to an impor-tant conceptual difference between validity coefficients for general intel-ligence and validity coefficients for tacit knowledge scores. Since intel-ligenceis relatively stable and does not substantially increase as a resultof professional experience in a particular occupation, intelligence mayproperly be described as a prior ability of a person. Intelligence is anindividual-difference characteristic that a person brings to the job andthus a person’s scores on an intelligence test may be usedto predict futureperformance. Some primordial aspects of intelligence are present in aperson’s genotype, and individual differences in intelligence are primor-dially manifested in the first year of a person’s life. There is no evidencethat individual differences in tacit knowledgeare heritable or are in someprimordial or latent sense manifested in thefirst year of life (although itis not utterly absurd to imagine that the ability to acquire knowledge isrelated to temperamental characteristics of a person that are partiallyinfluenced by genotypesandare primordially manifested in the first year

336 11. BEYOND IQ: SOCIAL INTELLIGENCE AND PERSONALITY
TABLE 11.3 Items Used to Assess Tacit Knowledge?
Academic Psychology Item
It is your second yearas an assistant professor in a prestigious psychology department.
This past year you published two unrelated empirical articles in established journals. Youdon’t believe, however, that there is a research area that can be identified as your own. Youbelieve yourself to be about as productive as others. The feedback aboutyourfirst year ofteaching has been generally good. You have yetto serve on a university committee. There
is one graduate student whohas chosen to work with you. You have no external source offunding, nor have you applied for funding.
Your goals are to become oneof the top people in yourfield and to get tenure in your
department. The following is a list of things you are considering doing in the next 2months. You obviously cannot do them all. Rate the importanceof each byits priority as ameansof reaching yourgoals.
. Improve the quality of your teaching
. write a grant proposal
. begin long-term research that may lead to a major theoretical article
. concentrate on recruiting morestudents
. serve On a committee studying university-communityrelations
. begin several related short-term research projects, each of which may lead
to an empirical article
moa
OF&
o. volunteer to be a chairperson of the undergraduate curriculum committee
Business Manager Item
It is your second year as a midlevel manager in a company in the communicationsindustry. You head a departmentof about 30 people. The evaluation of yourfirst year onthe job has been generally favorable. Performanceratings for your departmentareat leastas good as they were before you took over, and perhapseven a little better. You have two
assistants. Oneis quite capable. The other just seemsto go through the motionsbutto be
of little real help.You believe that although you are well liked, there is little that would distinguish you
in the eyes of your superiors from the nine other managers at a comparable level in thecompany.
Yourgoal is rapid promotion to the top of the company. Thefollowingis a list of thingsyou are considering doing in the next 2 months. You obviously cannot do them all. Rate
the importance of each byits priority as a means of reaching yourgoal.
—_____._ a. find a waytogetrid of the “dead wood,”e.g., the less helpful assistant and
three or four others__ b.participate in a series of panel discussions to be shown onthe local public
television station—__.._ c. find ways to makesure your superiors are aware of your important
accomplishments
—__.._ d._ makeaneffort to better match the work to be done with the strengths and
weaknessesof individual employees
—___‘in.._ write an article on productivity for the company newsletter
Based on Wagner & Sternberg (1986).

SOCIAL INTELLIGENCE 337
TABLE 11.4 Examplesof Validity Correlationsfor Tacit Knowledge
Group Measure rb
Academic psychologists Citations .23Academic psychologists Citations 44
Academic psychologists Publications 32
Academic psychologists Publications .28
Business manager Salary 21Bank manager Percentage salary increase .48Bank manager Performance rating 37Life insurance people Yearly quality awards 35
2Based on Wagner & Sternberg (1986), Wagner (1987); Sternberg, Wagner &
Okagaki(in press).
>All correations based on tacit knowledgeare scored in the positive direc-
tion, indicating that superior tacit knowledge is associated with higher per-
formance on the measure.
of life). Morecritically, tacit knowledge measuresare not obtained prior toentry into an occupation in this research program. Therefore, it is not atall clear if they are or are not predictively relevant to future performance.The concurrent nature of the validity correlations for tacit knowledge
indices fails to provide a basis for distinguishing between twodifferentinterpretations of the relationships between tacit knowledge and occupa-tional success. (1) The individuals who rapidly acquire tacit knowledgeuse this knowledge to perform the tasks required for professional successin an optimal manner. On this analysis, tacit knowledge is causallyrelat-ed to professional achievement. (2) Individuals who are professionallysuccessful are placed in roles that permit them to acquire tacit knowl-edge. Tacit knowledge is a by-product of professional success and is notcausally related to professional success. One wayto distinguish betweenthese two interpretationsof the relationship between tacit knowledge andoccupationalsuccessis to attempt to inculcate tacit knowledge and dem-onstrate that obtained increases in tacit knowledge are associated withbetter occupational performance. Sternberg et al. {in press) briefly re-ported that such efforts had been successful with schoolchildren.If it canbe established that increases in tacit knowledge increase occupationalsuccess, then it would be reasonable to assume that tacit knowledgeiscausally related to occupational success. It is my guess that such effortswill be only marginally successful. Here is a speculative justification forthis guess. It would be relatively easy to provide individuals with tacitknowledge. For example, the tacit knowledge information contained inthe test for academic psychologists could be assembled in relativelyshort book including examples of various situations and the responsesofexperts. If individuals assimilated this information would it improvetheir performance as academic psychologists? I think it might be useful

338 11. BEYOND IQ: SOCIAL INTELLIGENCE AND PERSONALITY
but I doubtif it would have a major impact on their eventual success.It ismy impression after serving as mentor to a numberof academic psychol-ogists that their eventual success in terms of such measuresascitationindices has little or nothing to do with their tacit knowledge of appropri-ate strategies to be followed. Individuals differ in talent for research.Many beginning academic psychologists understand that their eventualsuccess in the profession is contingent on developing programmaticre-search. Many are unable to do so in part because they do not have thetalents required to be a successful researcher. Tacit knowledge in academ-ic psychology as measured by Wagner and Sternbergis inversely related totime spent teaching. Many academic psychologists like teaching and ad-ministration and find these activities rewarding. Their efforts in theseactivities may not be seen as counterproductive. Thus their failure tospend moretimein research, irrespective of the reward structure of manyacademic institutions, may be in part a matter of choice rather than apoor decision determined by a deficiency in tacit knowledge. Similarly,skill in interpersonal relations and the ability to manage other indi-viduals may not be solely or even substantially determined by tacitknowledge. Such abilities may derive in part from personality charac-teristics that are not easily altered. What may be implicit in the Wagnerand Sternberg analysis is a belief that knowledge determines action.Knowing what to do may not be a sufficient basis for doing the rightthing. There is a rational and cognitive model of motivation and person-ality that is implicit in the research on tacit knowledge. People will be-have in an optimal mannerif they know whatthey should do. By contrast,it is possible to argue that we often know what we should do, but for avariety of reasons, not always rational, we mayfindit difficult to do whatwe know weshould do. A full discussion of this issue is clearly beyondthe scope of this book (see Brody, 1983a, for a discussion of the cognitivetheory of motivation, and Brody, 1988, for a discussion of change andstability in personality—both issues that bear on the question of the roleof belief in transforming human action).The discussion of research on tacit knowledge has detoured. To return
to the research, it is clear that a promising beginning has been made onthe development of measuresthat are related to competence in a varietyof settings. It remains to be determined whether these measures arecausally related to success or are merely a by-product of success.Do peoplediffer in social skills? Is there anything analogousto g in the
domain of social intelligence? We shall review several attempts to mea-sure individual differences in social intelligence. Rosenthal, Hall, DiMat-teo, Roberts, & Archer (1979) developed a test of the ability to understandsocial behaviors called the Profile of Nonverbal Sensitivity (PONS). Thetest consists in the film presentation of 220 scenes in which a persondepicts an affective state. The scenes vary with respect to the nature ofemotion that is depicted and also with respect to the amountof informa-

SOCIAL INTELLIGENCE 339
tion conveyed to the viewer. The film maydepict variousparts of the body(e.g., the face only) and may or may notinclude auditory information.Viewers are asked to answer multiple choice questions about each of thefilm depictions.
Rosenthalet al. reported the results of an extensive set of investigationsusing the PONStest. They demonstrated that thetest is reliable (test—retest r = .69) and that it appears to measure a general ability to accu-rately judge emotional expressions. It is possible to derive a numberofsubscores from the inventory by considering the type of emotional ex-pression depicted(e.g., positive versus negative} or the kind of representa-tion presented (e.g, including or excluding the face). Different subscoresderived from the PONSare positively correlated. Rosenthal et al. ob-tained median correlations amongseveral subscoresin six different sam-ples and then obtained the median of these medians. The mediancorrela-tion was .39. This result indicates that ability to accurately judge theemotional meaning of the scenes depicted in the PONSis a skill thatpredicts performancein several variants of this task. They also foundthatPONSscale scores are only weakly related to general intelligence. Theyobtained correlations between the PONSandvariousindices of academicintelligence (IQ, SAT, etc). The median r was .14. These results indicatethat the abilities measures by the PONStestare relatively independentofgeneral intelligence. Is the PONS test related to other social skills?Rosenthal et al. related PONSscores to self-reports about interpersonalsuccess. Table 11.5 presents a summary of these studies. An examinationof the data in Table 11.5 indicates that the correlations are quite low.Therefore, skill at interpreting emotional states is not highly correlatedwith self-reported interpersonal success. Scores on the PONStestare alsoonly weakly related to ratings by others of interpersonal or nonverbalsensitivity. Rosenthal et al. obtained a weighted meancorrelation of .16between PONSscores and ratings obtained from supervisors, teachers,andpeers in a variety of studies that included 587 subjects. These resultsindicate that the PONSis only weaklyrelated to rated interpersonalskill.Rosenthalet al. present little or no evidence that scores on the PONSarecorrelated substantially with any measureof interpersonal skill. Thus theability measured by the PONSdoesnotappear to be substantially relatedto any important external criterion.
Sternberg and Smith(as cited in Sternberg, 1985) investigated theabili-ty to judge the meaningof social situations using twodifferent judgmenttasks. They presented pictures of a man and womaninteracting and askedtheir subjects to judge whether they were individuals who werestrangersor a couple who had closerelationship. In their second task, subjectswere presented withpicturesof a pair of individuals interacting and askedto judge which wasthe other’s work supervisor. They found that each oftheir tasks wasreliable. The correlation between the two measures was.90, suggesting that ability to make accurate judgments in one social

TABLE
11.5
Correlations
betweenPONSandSelf-ReportedIn
terp
erso
nalSuccess
Subjects
N
Qual
ity
of
same-sex
rela
tionship
Quality
ofSpeed
in
oppo
site
-sex
Number
making
Understanding
rela
tion
ship
offriends
frie
nds
inre
lati
onsh
ipmedian Adults
326
College
students
378
Highsc
hool
stud
ents
369
Median
.20
.06
.08
.08
—.02
10
.08
.06
05
.04
08
—.02
02
04
.08
—.06
02
04
.08
.06
BasedonRosenthal,
Hall,Dimatteo,
Rogers,&
Archer
(1979).
.08
05
.06

SOCIAL INTELLIGENCE 341
contextis unrelated to the ability to make accurate judgments in a secondcontext. Performance on these tasks was not predicted by scores on thePONSor by scores on the Cattell Culture-Fair Test of Intelligence. Theseresults suggest that the skills measured by the PONSarerelatively specif-ic to the format of items used in that test. They do not appear to besubstantially related, or related at all, to the ability to make judgmentsabout the social relationships of individuals from pictures of their in-teractions.
Ford & Tisak (1983; see also Brown & Anthony, 1990; Keating, 1978)studied relationships between social and academicintelligence and therelationship between these intelligences and an interview measure ofsocial competence. They administered a battery of social intelligencetests and academic intelligence tests to a sample of 218 high school stu-dents. The social intelligence measures used includeda personality test(the Hogan Empathy Scale) (Hogan, 1969), measures of rated social com-petence obtained from self, peers, and teachers, and a behavioral measureof competence based on performance in an interview situation. Theyfound that the several measures of social intelligence were positivelycorrelated (average r = .36). The correlation is spuriously low. Severalsocial intelligence indices had low reliabilities. These data indicate thatdifferent indices of social intelligence form a positive manifold. Socialintelligence was weakly related to academic intelligence. The average rwas .26. The result may be spuriously high since it included teacherratings that might be assumedtoreflect academic ability. When teacherratings were removed from the subsetof social intelligence measures, theaverage correlation between indices of academic intelligence and socialintelligence decreased to .20. The correlations amongtheseveral indicesof social intelligence involve agreements between various ratings andself-reports. Only one behavioral index was used—performancein an in-terview situation. The five nonbehavioral indices of social intelligencecorrelated between .23 and .47 with performancein the interview situa-tion. The correlation between four indices of academic intelligence andperformancein the interview correlated between .20 and .31. Thesocialintelligence measures were marginally better predictors of performancein the interview situation than the indices of academicintelligence.This brief review of measures of social intelligence indicates that lim-
ited progress has been madein understanding this construct. Three fun-damental questions about the domain of social intelligence are, in myjudgment, unresolved. First, is there a positive manifold for different be-havioral measures of social intelligence? Thereis relatively little evi-dence that different behavioral measures of social intelligence are em-pirically related.It is not hard to think of an indefinitely large set of socialskills that would form a universe of potential tests analogous to thedomain of general cognitive competence. Certainly the skills measuredby the PONStest as well as those measured by Sternberg and Smith

342 11. BEYOND IQ: SOCIAL INTELLIGENCE AND PERSONALITY
would belong to the domain of social intelligence. In addition to skill atdecoding nonverbal messages, social intelligence might include a varietyof performanceskills related to mastery of appropriate behaviorsin differ-ent social settings. These might include anything from the generalabilityto make friends to knowing how to comfort a bereaved person.Becauseitis relatively difficult to obtain measures of skilled performancein real-istic social contexts, little or no adequate research has been reportedindicating whetheror not correlations amonga battery of tests of diversesocial skills would exhibit a positive manifold. Correlations amongrat-ings of social intelligence do provide evidence for a positive manifold. Bycontrast, the Sternberg and Smith study suggests that social skills thatappear to be conceptually similar may not exhibit positive relationships.It may be that social intelligence is domain specific and highly differenti-ated (see Cantor & Kihlstrom, 1987). Or, it may be that the relationshipsamongdiverse social abilities have not been adequately explored and thatsomething analogousto a generalized social intelligence does exist.
Second, to what extent do measuresof social intelligencerelate to real-world competence? Theresearch fails to provide a clear answerto thisquestion. Mostof the obtained correlations with externalcriteria are low.Whetherthis is due to inadequacies of measurementorto intrinsicallyweak relationships is notclear.
Third, in what wayis social intelligence related to personality traits?Most of the attempts to relate measuresof social intelligence to person-ality have not used measuresof the best-defined personality traits. Thereare data suggesting that personality may be defined in termsof a limitednumber of traits such as neuroticism, extraversion, and impulsivity(Brody, 1988). There is limited information available about the rela-tionships between measuresof social intelligence and basic personalitytraits. Rosenthal et al. reported inconsistent relationships between thePONSandscores on extraversion. Epstein reported that the ConstructiveThinking measure of social competence wasinversely related to neurot-icism. He did not, however, use standardized measuresof neuroticism.Itmay be that many of the measures of social skills and general socialcompetencethat are being developed by researchersin social intelligenceare related to well-defined measures of personality.
PERSONALITY AND INTELLIGENCE
Personality and intelligence are related in diverse ways. We shall considerevidence for four types of relationships.
1. Personality characteristics may modify the relationship betweenintel-ligence and academic performance.
2. Personality characteristics may influence the developmentofintellec-tual skills.

PERSONALITY AND INTELLIGENCE 343
3. Personality characteristics may influence performanceon test of in-telligence.
4. There may be conceptual analogies between personality and intel-ligence. In particular both may be construedastraits.
Evidence for each of these four types of relationships is discussed asfollows:
1. There are studies relating personality and intelligence to academicsuccess. Kipnis (1971) reported a series of studies relating scores ona self-report measure of impulsivity to academic success. He found that im-pulsivity was related to academic success and seemed to moderate theinfluence of individual differences in intelligence on school success.Table 11.6 presents data from one of Kipnis’s studies indicating a rela-tionship between intelligence as indexed by SAT scores, impulsivity, andcollege grade-point average. The data in Table 11.6 indicate that indi-viduals who score high on impulsivity and who have high SAT scorestend to have lower grade-point averages than individuals who have highSAT scores and score low on impulsivity. Kipnis also reported that indi-viduals who are impulsive are morelikely to flunk out of college thanindividuals who are not impulsive. Smith (1967) also reported that im-pulsivity related to academic successin college. He found a correlation of.47 between peer ratings of impulse control before college entry andgrade-point average.
Evidence for a relationship between personality characteristics andschool successis also present for temperamental variables. Matheny, Do-lan, & Wilson (1976) asked school authorities to nominate children intheir twin study who were experiencing academic difficulty. A controlgroup was formed from the samecohort of twins. At a median age of 10,the children who were nominated were described as having reading testscores that were 1.9 grade equivalents lower than those of the children inthe control group. It was found thatat age 6 twinsin the index group hadWechslerintelligence test scores that were 8 points lower than scoresoftwins in the control group. These results suggest that the differences inacademic performance betweentheindex andthe control children are notlikely to be attributable to differences in their intelligence. The standard
TABLE 11.6 Mean GPAfor IndividualsDiffering in SAT Scores and Impulsivity2
SAT Impulsivity
High Low
High 2.23 2.63
Low 1.70 1.81
@Based on Kipnis (1971).

344 11. BEYOND IQ: SOCIAL INTELLIGENCE AND PERSONALITY
deviation of grade-equivalent scores at an average age of 10 is not given inthe report. It is unlikely to be very much larger than 1. Differences inreading score and the general school difficulty exhibited by the indextwins relative to the control group twins cannotbe accounted for by therelatively small difference they exhibited on intelligence test scores.Mathenyetal. reported that the index twins were significantly differentfrom the control twins on measures of temperament derived from thepreschool period. The index twins were reported to be overly active (87versus 26% for the control group], distractable (89% for the index versus22% for the control group children}, and were more likely to be describedas experiencing feeding and sleeping problemsas infants. The variablesthat differentiated between the index twin cases and the control caseswere heritable; the concordances for monozygotic twin pairs for thesevariables were higher than the concordances for dyzygotic twins. Theseresults suggest that their are temperamentalvariables that are geneticallyinfluenced that moderate the relationship between intelligence and aca-demic achievement.
2. Personality characteristics may influence the developmentof intel-ligence. Huesmann, Eron, & Yarmel (1987) studied the relationship be-tween intelligence and aggression using a longitudinal design. They ob-tained measures of aggression and intellectual competenceat age 8 andagain 22 years later when their subjects were age 30. At age 8 they ob-tained IQ scores and a measure of aggression based on peer nominations.At age 30 they used the Wide Ranging AchievementTest as a measure ofintellectual competence and they obtained an aggression index from theMinnesota Multiphasic Personality Inventory. They reported that the cor-relation between age 8 IQ and their measureof intellectual competenceatage 30 was .49. Using a multiple regression technique, they found that age8 peer-nominated aggression correlated —.21 with age 30 intellectualcompetence. The multiple correlation using both of these age 8 indices topredict age 30 scores was .61. Age 8 aggression scoresadd significantly tothe ability to predict age 30 intellectual competence. The correlationbetween age 8 and age 30 aggression scores was .30. The addition of IQ atage 8 to the prediction equation did not addsignificantly to the ability topredict aggression at age 30. Huesmannetal. indicated that intelligenceis inversely related to aggression at age 8 buthaslittle or no influence onchangesin aggression after age 8. By contrast, aggressive tendencies thatexhibit some continuity between age 8 and age 30 appearto interfere withopportunities for learning and may continueto depress intellectual func-tioning. The Huesmannetal. study presents evidence suggesting thatpersonality characteristics may act over a long period of time to depressintellectual functioning.
3. Personality characteristics may influence performance ontests ofintelligence. Some of the complexities in the relationship between per-sonality characteristics and performance on grouptests of intelligence are
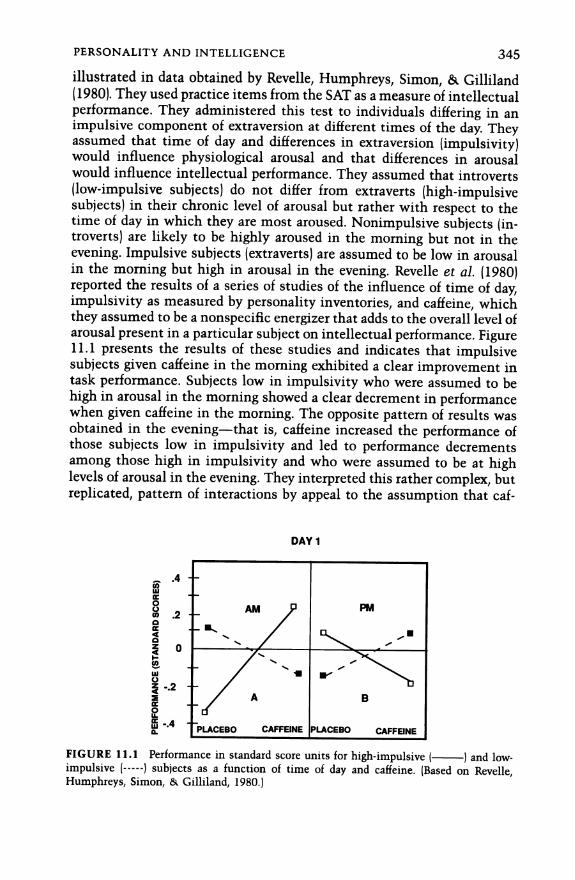
PERSONALITY AND INTELLIGENCE 345
illustrated in data obtained by Revelle, Humphreys, Simon, & Gilliland(1980). They used practice items from the SAT as a measureofintellectualperformance. They administered this test to individuals differing in animpulsive componentof extraversion at different times of the day. Theyassumed that time of day and differences in extraversion (impulsivity}would influence physiological arousal and that differences in arousalwould influence intellectual performance. They assumedthat introverts(low-impulsive subjects) do not differ from extraverts (high-impulsivesubjects) in their chronic level of arousal but rather with respect to thetime of day in which they are most aroused. Nonimpulsive subjects(in-troverts) are likely to be highly aroused in the morning butnot in theevening. Impulsive subjects (extraverts) are assumed to be low in arousalin the morning but high in arousal in the evening. Revelle et al. (1980)reported theresults of a series of studies of the influence of time of day,impulsivity as measured by personality inventories, and caffeine, whichthey assumedto be a nonspecific energizer that adds to the overall level ofarousalpresentin a particular subject on intellectual performance. Figure11.1 presents the results of these studies and indicates that impulsivesubjects given caffeine in the morning exhibited a clear improvementintask performance. Subjects low in impulsivity who were assumed to behigh in arousal in the morning showeda clear decrementin performancewhengiven caffeine in the morning. The opposite pattern of results wasobtained in the evening—thatis, caffeine increased the performance ofthose subjects low in impulsivity and led to performance decrementsamong those high in impulsivity and who were assumedto be at highlevels of arousal in the evening. They interpreted this rather complex, butreplicated, pattern of interactions by appeal to the assumption thatcaf-
DAY1
rs l '
hy
J NO !
PERFORMANCE(STANDARDSCORES)
©jl
q
/
/
/
a
VF
/
J! &
‘|PLACEBO CAFFEINE |PLACEBO CAFFEINE
FIGURE 11.1 Performance in standard score units for high-impulsive( } and low-impulsive (-----) subjects as a function of time of day and caffeine. (Based on Revelle,Humphreys, Simon, & Gilliland, 1980.)

346 11. BEYOND IQ: SOCIAL INTELLIGENCE AND PERSONALITY
feine added to the arousal level of their subjects and that low-impulsive
subjects who were highly aroused in the morning become overaroused
whengiven caffeine and thus their performance deteriorated. The high-impulsive subjects given caffeine in the morning were underaroused, andthe addition of caffeine brought them to an arousal level that was optimalfor task performance.
4. There are conceptual relationships between the domainsof person-
ality and intelligence. Cantor & Kihlstrom (1987) explored theserela-
tionships from a perspective that construes intelligence and personality
as context- and situationally determined individual-difference charac-
teristics. Personality and intelligence may also be analyzed from traittheoretical perspective (see Brody, 1988, for a fuller explication of some
conceptual analogies between personality traits and general intelligence).
This perspective may be justified by reference to the analogies in the
following paragraphs between personality traits and general intelligence.General intelligence and personality traits are longitudinally consis-
tent characteristics of persons. Evidence for the longitudinal consistencyof intelligence is reviewed in Chapter 8. Conley (1984) reviewed theevi-dencefor the longitudinal consistency of personality traits and found that
test-retest correlations for personality characteristics are only margin-
ally lower than comparable correlations for general intelligence. In addi-tion, there is evidence for the longitudinal persistence of latent person-ality traits inferred from diverse methods of measurement(see Brody,1988, Chapter 2).Personality characteristics and general intelligence exhibit cross-situa-
tional consistencies. Evidence for the existence of the cross-situational
consistency of general intelligence is found in the ubiquitousfinding of
positive manifolds among diverse intellectual measures. Also, evidence
indicating relationships between general intelligence and performance in
educational settings as well as performance in laboratory measures of
information-processing skills indicates that general intelligenceis a dis-
position that influences individual differences in diverse settings. The
existence of comparable cross-situational consistencies for personality
traits is more problematic.In part, the lack of evidenceof cross-situational
consistencies in personality derives from the difficulties of obtaining be-
havioral measures of personality characteristics in diverse situations. |
have argued that evidence of cross-situational consistencies for person-
ality traits exists. Careful measurementof individual differences in behav-
ior in diverse settings as well as longitudinal studies of consistencies in
trait-related behaviors do provide evidence for the importanceof gener-
alized personality dispositions that influence behavior in manydifferent
settings (see Brody, 1988, Chapter2).
Evidence reviewed in Chapter 6 of this book indicates thatit is rela-
tively difficult to modify general intelligence with existing technologies.
A comparable argument may be madefor personality characteristics. For

PERSONALITY AND INTELLIGENCE 347
example, there is relatively little evidence that enduring changesin neu-rotic dispositions may be obtainedas a result of therapeutic interventions(see Brody, 1983b, 1985, 1990; Prioleau, Murdock, & Brody, 1983).Evidence reviewed in Chapter 5 indicates that general intelligenceis a
heritable characteristic. Evidence for the heritability of personality char-acteristics exists (see Brody, 1988, Chapter 3; Plomin, Chipuer, & Loehlin,1990). There are differences in the details of the way in which genetic andenvironmental characteristics influence intelligence and personality. In-deed, there are differences in the behavior genetic models that also areappropriate for different personality traits. There are similarities—bothpersonality and intelligence are heritable characteristics and recent re-search indicates that within-family environmental differences are animportant source of variance for both intelligence and personality.
Evidencein favor of a heritable componentof individual differencesiscompatible with the search of the biological basis of individual dif-ferences. Tentative evidence for this approach for intelligence is reviewedin Chapter 7 of this book. A review of research on the biological basis ofpersonality may be found in Zuckerman (1991).
Intelligence and personality dispositions influence socially relevant be-haviors. Chapter 9 of this book presents evidence of this influence forintelligence. Comparable evidence indicating that personality charac-teristics are predictive of a variety of socially relevant outcomes may befound in my book on personality (Brody, 1988).
Trait conceptions are related to biological dispositions. Biological dis-positions cannot accountfor individual differences. A reductive modelofindividual differences divorced from social contexts cannot account forthe influence of the environment on the developmentand expression ofphenotypes. In order to understand the way in which biological disposi-tions are actualized, it is necessary to understand the characteristics ofthe social world that provide the arena for the actualization of disposi-tions. One can understand individual lives in terms of three distinctinfluences—biological dispositions, chance encounters, and social real-ity. George Eliot’s novel, Middlemarch, provides an apt example of theway in whichthese influences combineto influencethelife of a fictionalcharacter. Dorothea Brooke is a young woman whoisintelligent, passion-ate, idealistic, and possessed of a “hereditary strain of Puritan energy.”She impetuously enters into an inappropriate marriage with an olderclergyman whopretendsto be engagedin great worksof scholarship.If wetry to understand Dorothea Brooke’s life we must allow for personal dis-positions (character), chance encounters, and an understanding of thesocial world in which she lived. It would be impossible to predict from aknowledge of Dorothea’s personal dispositions that she would encounterDr. Causabon. Understanding her character one could understand whyshe would choose to marry him and whyher marriage would be a sourceof great unhappinesstoher. In order to understand Dorothea’s life it is
348 11. BEYOND IQ: SOCIAL INTELLIGENCE AND PERSONALITY
necessary to understand thestructure of the society in which shelivedand the limited opportunities for meaningful social action provided towomenof her social background in nineteenth-century England. We canhardly begin to contemplate Dorothea’s frustrations or, for that matter,the geniusof her creator, by appeal to scores on limited numberof person-al dispositions or traits. At the same time we cannot begin to understandeither the life of the fictional character of her creator without understand-ing the personal dispositions that each brought to the worlds, both fic-tional and real, in which theylived.

12EPILOGUE: THE FUTURE
OF INTELLIGENCE
RESEARCH
Thefirst systematic theory of intelligence presented by Spearman in 1904is alive and well. At the center of Spearman’s paperof 1904is a belief thatlinks exist between abstract reasoning ability, basic information-process-ing abilities, and academic performance. Contemporary knowledgeis con-gruent with this belief. Contemporary psychometric analyses provideclear support for a theory that assigns fluid ability, or g, to a singularposition at the apex of a hierarchy of abilities. Fluid ability is linked toinformation-processing skills that emergein thefirst yearoflife. And fluidability is linked to the acquisition of academic skills. There is at leasttentative evidence from genetic covariance analyses that the linkagesbetween fundamental information-processing capacities, fluid ability, andthe acquisition of academic knowledgeare partially mediated by geneticcharacteristics. Changesin intelligence over thelife span are also linked toa model of genetic unfolding. This interrelated complex of influences andramifications of individual differences are probably linked to biologicalprocesses and mayultimately be partially understood by reference to thestructure and function of the human nervous system. While there areenormousgapsin our understanding, the study of the behavior genetics ofintelligence supports a modelof biologically based individual-differencecharacteristics whose ramifications extend from performance on basicinformation tasks to educationally mediated social mobility. I think thatin the next decades progress will be made in elucidating the biologicalbasis of intelligence.There are a numberof respects in which a Spearmanian conception of
intelligence is incomplete. Fluid ability is “invested” in a numberofspecific abilities and specialized procedural knowledge structures thatinfluence a person's ability to act intelligently in a variety of social con-texts. Investment is a metaphorical term, not a theory. We knowlittle ornothing about the processes by meansof which generalized dispositions
349

350 12. EPILOGUE: THE FUTURE OF INTELLIGENCE
emerge into specialized knowledge. In part, this gap is attributable to anideological divide in contemporary research onintelligence. One groupofpsychologists pursuing a Spearmanian vision of the field study intel-ligence as a decontextualized biologically based general disposition. Asecond group of psychologists attempts to go beyond IQ and emphasizesmultiple skills and abilities that are expressed in different ways in differ-ent social contexts. At some point we shall haveto find waysof integrat-ing these different visions of the field. Put another way, the study ofintelligence will need to become genuinely biosocial rather than merelysocial or merely biological.A Spearmanian conception of intelligence is incomplete for a second
reason. The study of individual differences in intelligence ignores indi-vidual differences in the meaning of the construct of intelligence fordifferent individuals. Individuals with the same level of general intel-ligence may usedifferent procedures to solve the same problem, and thesame individual at different times may solve the same problem in differ-ent ways. Thus tasks may differ in the intellectual processes that theyelicit. The heritability of intelligence for different groups of individualsmaybedifferent and the generality of the constructof general intelligenceitself may vary for different groupsor overthelife span. Thus individualsmay not only vary in intelligence but also in the meaning of the constructof intelligence. Such a conception of intelligence need not end in a mo-rass of idiographic nongeneralizable meanings in which each person isintelligent in his or her own unique way. There maybe general laws thatpredict variations in the constructof intelligence for different groups. Forexample, the heritability of intelligence and the extent to which a g factoraccountsfor variations in the intellectual performance of a person may berelated to the level of intelligence of a person,or to the age of a person, orto the social background of a person. Such emerging laws qualify themeaning of the construct of intelligence and add the study of variations inthe construct to the study of variations in the level of the construct.
THE FUTUREOF TESTS
The study of intelligence is controversial because of its association withtests of intelligence. Would the world be different if the tests did notexist? I think not—orat least not substantially different. Consider someof the possible uses of IQ tests and theeffects of the elimination of thetests. Binet designed tests to identify children who required special edu-cational services. IQ tests are still used for this purpose. Judgments aboutthe need for special educational placements of children are made by con-sidering additional information about a child including his or her func-tioning in the classroom. The tests may, on occasion, wrongly indicatethat a particular child should be placed in special education and, equally,

THE FUTURE OF TESTS 351
the tests may correctly indicate that a particular child should not beplaced in a special education class. On balance, I suspect that the tests aremore nearly right than wrong andthat placementin special education canbe made with greater accuracy with the tests than without them.Specialeducation placement for children at the borderline may or may not bebeneficial for the children. In theory, the smaller classes and extra atten-tion provided to children in such classes may assist them and may evenprepare them to benefit from the regular educational program if they are“mainstreamed.” Theit is also the case that such placement mayresult ina neglect of the child’s educational needs and mayserve to “warehouse”children by placing them in a setting in whichlittle is expected of themand little is obtained. Recall the results of the evaluation of Headstartprogramsreported by Consortium for Longitudinal studies (see Chapter6). They reported that participation in Headstart programs reduced thefrequency of placement in special education classes. They also reportedthat participation in Headstart programsdid not influence the acquisitionof academicskills. This suggests that special education placement, liketracking programs in general, may have marginal influences on whatchildren learn in school. The otheralleged psychological consequencesofattendance in special education may be equally inconsistent. For exam-ple, special education placement may lower a student’s self-esteem andserve to stigmatize the student. A program that mainstreams studentswith marginal academic abilities may also serve to lower a student's self-esteem by providing a reference group of students whoare academicallymore talented than the marginal student. These speculations lead me totwotentative conclusions.First, the elimination of IQ tests for placementin special education would probably have only a marginal influence onplacements. The same students would, for the most part, be assigned tothese classes. Second, the marginal changes in placementsin special edu-cation would not have a dramatic effect on what pupils learn in school.IQ tests are not only used for selection of pupils for programs that are
assumedto benefit poor learners; they are also used to select individualswhoare assumedto be academically gifted. Consider the use of the SATtests of academic aptitude for admission to selective colleges in the U.S.The tests are not described as tests of intelligence and, I suspect forpolitical purposes, the tests are scored on a different scale (originallydesigned to have a mean of 500 and a standard deviation of 100 ratherthan a mean of 100 and standard deviation of 15). The SATtests arecorrelated with IQ tests and may be considered as grouptests of intel-ligence. It would be quite easy to replace the SAT tests of academic ap-titude with tests of achievement. Indeed, admission to English univer-sities is based substantially on performance ontests of achievement basedon the secondary school curriculum. American universities rely on gradesin secondary school, interviews, letters of recommendation, as well asperformance on tests of academic achievement and academic aptitude.

352 12. EPILOGUE: THE FUTURE OF INTELLIGENCE
Since tests of aptitude and achievementare substantially correlated andsince both are correlated with grades in secondary school thereis a sub-stantial amount of redundant information in any student’s admissionfolder. The elimination of academic aptitude tests would not depriveselective colleges of a substantial amountof information abouta poten-tial candidate for admission. There is even a conceptual argumentto bemadefor greater reliance on tests of achievement than ontestsof ability.The formerare the criterion variable used to validate the latter. It is morereasonable to usethe criterion rather than the measurethatpredicts thecriterion. Where discrepancies exist between these twoindices it is morereasonable to rely on the measure of achievement rather than on themeasure of aptitude. Students who have high ability and who have notacquired knowledge and students who have low ability but who haveacquired knowledge are both morelikely to persist in their characteristicsthan to change. Given a choice, institutions might well prefer a goodstudent to a mediocre student irrespective of the differences in theiracademic aptitudes.
It is difficult to use measures of academic achievementfor admission inthe United States because of the disparity of educational opportunitiesavailable to students in different schools. It is unreasonable to comparethe knowledge of French of a student who attended a high school thatprovides 5 years of instruction in the subject with a student who hasstudied French in a high school that provides only 3 years of instructionin the subject. Selection of students by increased reliance on tests ofacademic achievement from subsets of applicant pools that provide stu-dents with relatively equal educational opportunities appears to be bothfair and reasonable. The use of achievementtests to select students withunequal educational opportunities is not fair. The use of academic ap-titude tests may bejustified to evaluate students who attend secondaryschools that do not provide an advanced curriculum. Such schools mayoffer few advanced placement classes, have limited foreign languagecourses, and have few advanced math andscience courses. Such schoolshave few academically rigorous courses of any kind and frequently havefew students whowill attend selective colleges and universities. Academ-ically talented students who attend such schools may have good gradesand poor academic achievement as assessed by standardized tests ofachievement. In such a case, measures of academic aptitude may beusefulto a college. Note that this recommendation for the use of aptitude testsis contrary to many populardiscussionsof the use of such tests. Thatis,itis usually argued that aptitude tests should be used to assess those whoare “privileged” and should not be used to assess the disadvantaged. Insupport of this latter position it should be noted thatvariations in educa-tional opportunity may havelarger effects on fluid ability measures thanon crystallized ability. Therefore, better secondary school education mayinfluence performance on measuresof aptitude as muchas or more than

THE FUTURE OF TESTS 353
performance on measuresof achievement. Mypreferencefor a largerrolefor aptitudetests in the selection of students whose academic backgroundis weak stems in part from the belief that credentials of students forselective colleges whoattend high schools with inadequate curricula aredifficult to assess. I have taught students with excellent secondary schoolgrades from schools that had few students goingto selective colleges whohad great difficulty in my classes. In manyinstances these students hadlow SATscores.
Theuse of standardizedtests for selection is complicated by differencesin the test scores of black and white applicant pools. If admission toselective colleges and professional schools is based on test scores, theproportion of black and white applicants who will be admitted will bedifferent. Therefore, the use of tests may be viewed as a way of excludingblack individuals. Many colleges and universities are committed to in-creasing the racial diversity of their student bodies and increasing therepresentation of minorities on their campuses. The discussion of re-search on black-white differences in intelligence in Chapter 10 of thisbook can contribute in a small way to an understandingof this issue. Wedo knowthattests exhibit little or no predictive bias for black and whitestudents for measures of academic success. Therefore, test scores areequally informative about the expected academic performance of blackand white students. The use of achievementtests rather than aptitudetests would, if anything, be more detrimental to equal admissions oppor-tunities for black and white students. Achievementtests are highly corre-lated with aptitude tests. In addition, students who have inadequate sec-ondary education are unlikely to obtain good scores on tests ofachievementirrespective of their academicabilities. Thus the use of anystandardized test, indeed the use of any objective criterion, is likely todecrease the enrollment opportunities of black students. These assertionspresent the limits of scientific knowledge on this issue. Whether equaladmissionsstandards should be applied to candidates from differentracialgroups or whetheraffirmative action standards should be used to increaseminority representation is not a scientific question. One’s position onthis question is determined by a sense of history and values. I find anintellectual position that advocates race-neutral treatment of individualsattractive. It is intellectually coherent—race ought notto serve as a barri-er to individuals and equally it ought not to serve as an entitlement. Atthe same time, I believe that such a conceptually coherent position ig-nores the history of racial exclusion, prejudice, and separatism that hasmarkedrace relations in America. And,it is difficult to advocate raciallyneutral positions in the face of the history of racism in America. Accord-ingly, for what it is worth, I favor affirmative action polices. I state myposition on this issue not because I believe that my own values andexperiences carry any special importance or should be persuasive in anyway. Rather, I state this preference to indicate that there is no necessary

354 12. EPILOGUE: THE FUTURE OF INTELLIGENCE
connection betweenscientific questions related to the validity of tests ofintelligence and public policy questions. WhatI believe is scientificallycorrect is that tests inform us that race in America is weakly linked todifferences in academic aptitude. Attacking the tests will do little tomask the underlying reality revealed by the tests. Eliminating the testswill not eliminate differences in academic performance. If IQ tests hadnot been invented or if they were banned from public use the differencesin academic aptitude would not be eliminated. We would havea slightlyless precise and quantitative representation of these differences and wewould still be faced with the social problemsthat derive from the need toeducate children with different degrees of academic aptitudein schools.Ibelieve that we need to find ways to increase the academicrigor of oureducational system—American children are not well educated in com-parison to children in other countries. We need to find better ways ofeducating students with marginal intellectual abilities and we also needto find ways of fostering the education of students with unusually highintellectual ability. Intelligence tests might be useful adjuncts to thisprocess. They provide ways of indexing intellectual competencies andmonitoring educational outcomes for students with different abilities.Since the tests provide limited information aboutthe specific knowledgeand reasoningprocessesof individuals, their role in educational reform islimited. I suspect that their elimination would havelittle or no impact onour ability to reform and improve the education of American children.
I believe that we have comeas far as we can with the assessmentofintelligence by psychometric procedures.It is certainly possible to mar-ginally improve current practices of assessing intelligence. IQ tests couldbe given on more than one occasion in order to aggregate measures toobtain a morereliable individual index. Existing widely used standardmeasures could be improved. The Wechsler tests include subtests withrelatively low g loadings and are not optimal measures of intelligence.Tests could be created that reflect what we know aboutthe hierarchicalstructure of intellect. Such tests would measureg as well as second-orderspecialized ability factors as well as scores on more speciaiized factors.While such a hierarchical and differentiated view of the intellectual abili-ties of an individual would bring current assessmentpractices into agree-ment with current theoretical understanding,it is not at all clear that thisgain in assessment would be useful. To a considerable extent, rela-tionships between psychometric intelligence and performance are medi-ated by g. And, current tests do provide an adequate index of g. Whilebetter indices of g could be obtained, they are likely to be substantiallycorrelated with IQ andare thus unlikely to present independent informa-tion about a person that is more than marginally useful.
Is it possible to use new technologiesto assess individual differences? Itis not hard to imagine the development of assessment batteries usingcomputers.In principle, there are many potential advantagesin the useof

THE FUTUREOF TESTS 355
computerized assessment procedures. Tests could be individuated.Branching programs could be used that would skip problems and ques-tions and that would permit one to determinethe limits of an individual’sability rapidly and efficiently. In addition, the use of computers wouldpermit oneto obtain measures of a numberof different basic information-processing abilities. Such assessment could even be linked to psycho-physiological measures, providing additional insight into the ways inwhich individuals solve various kinds of intellectual tasks. It is not hardto imagine the development of an interactive computerized assessmentprocedure. I believe that the developmentof this type of assessment toolwould be useful for researchers. I do not know if it would have manypractical applications. It is difficult to relate individual abilities to thedesign of methods of instruction that draw on theparticular abilities ofthe learner. We have not madea great deal of progress since Cronbach andSnow comprehensively considered the problems of aptitude x instruc-tional interactions 15 years ago. Assessmentsof the particular knowledgestructures of a learner may beof great value to a teacher. Assessmentofabilities may be too removed from the actual instructional setting toprovide an ideal way of individualizing instructional programs. Whetherwe will be able to design instructional methods that are optimal forlearners whodiffer with respect to their structure of intellectual abilitiesand whether a computerized assessment procedure providing informa-tion about information-processing abilities will provide a basis for indi-vidualizing instruction remains to be determined.
Fifteen years age I co-authored a book on intelligence. Since then thefield has made major advances. New understanding has been attainedaboutthe hierarchical structure of abilities. New developments in behav-ior genetics and the emergence of developmental behavior genetics pro-vide insights into the ways in which genetic and environmental eventscombineto influence general intelligence over the life span. Our under-standing of the development of intelligence has been enhanced byre-search on infant intelligence and intelligence among the aged. Perhaps ofgreatest significance is the attempt to study intelligence with the tech-niques of the contemporary experimental psychologist. This effort marksa return to the use of techniques advocated by such pioneers as Spearmanand has invigorated the field and added greatly to the sophistication ofprocess-oriented studies of individual differences in intelligence. And,finally, a renewed interest in the social context in which intellectualskills influence performance enlarges our understanding of the scope ofresearch on intelligence. Thefield that exists today is more intellectuallydemanding, diverse, and interesting than thefield I wrote aboutin 1976.Ido not believe that our intellectual progress has had a major impact on thedevelopment of tests of intelligence. Perhaps new developments in thefield will be less closely tied to the use of tests. Of greater concern to meis that our intellectual progress has not had any great impact on our

356 12. EPILOGUE: THE FUTURE OF INTELLIGENCE
ability to modify intelligence or to modify the relationship between gen-eral intelligence and whatis learned in the schools. Thusthesocial prob-lems that have been inextricably linked with the study of intelligenceremain equally urgent and equally unremediated. In this respect we havemadelittle progress. Intelligence is not the most important thing about aperson.It maytell us little or nothing about a person’s characteror effec-tiveness in a particular social role. It is not, however, an irrelevant charac-teristic of a person. If we value education, we should be interested in acharacteristic of persons that predicts their educational performance.Scores on tests of intelligence are not important—the same may not besaid for the characteristic that is imperfectly assessed by thetests.

LITERATURE CITED
Abdel-Rahim,A. R., Nagoshi, C. T., & Van-
denberg, S. G. (1990). Twin resem-blances in cognitive abilities in anEgyptian sample. Behavior Genetics,20, 33-43.
Agrawal, N., Sinha, S. N., & Jensen, A. R.
(1984). Effects of inbreeding on RavenMatrices. Behavior Genetics, 14, 579-585.
Alderton, D. L., Goldman, S. R., & Pel-legrino, J. W. (1985). Individual differ-
ences in process outcomesfor analogy
andclassification solution. Intelligence,
9, 69-85.
Alexander, K. L., & Pallas, A. M. (1985).School sector and cognitive perfor-mance. Sociology of Education, 58,115-128.
Allport, D. A. (1980). Pattern and action. In
G. L. Claxton (Ed.), Cognitive psycholo-
gy: New directions. London: Routledgeand Kegan Paul.
Anastasi, A. (1981). Coaching, test sophis-tication and developedabilities. Ameri-can Psychologist, Special Issue, 36,1086-1093.
Anderson,J. E. (1939). The limitation of in-
fant and preschooltests in the measure-
mentof Intelligence. Journal of Psychol-ogy, 8, 351-379.
Anderson,J. E. (1946). The prediction of ter-minal intelligence from infant and pre-
school tests. Yearbook of the National
Society for the Study of Education, 39,Part I.
Anderson, M.(1986). Inspection time and IQin young children. Personality and In-dividual Differences, 7, 677-686.
Bajema, C. (1971). The genetic implication
of population control. Bio-Science, 21,71-75.
Baker, L. A., Vernon, P. A., & Ho, H.Z.(In
press}. The genetic correlation betweenintelligence and speed of informationprocessing. Behavior Genetics.
Baltes, P. B., & Schaie, K. W. (1976). On theplasticity of intelligence in adulthood
and old age: Where Horn and Don-
aldson fail. American Psychologist, 31,720-725.
Baltes, P. B., & Willis, S. L. (1979). Thecrit-ical importance of appropriate meth-odology in the study of aging: The sam-
ple case of psychometric intelligence.
In F. Hoffmeister and C. Miiller (Eds.},
Brain function in old age. Heidelberg:Springer.
Baltes, P. B., Kliegl, R., & Dittmann-Kohli,F. (1988). On the locus of training gains
in research on theplasticity of fluid in-telligence in old age. Journal of Educa-
tional Psychology, 80, 392—400.
Barrett, P., Eysenck, H. J., & Lucking, S.(1986). Reaction time and intelligence:A replicated study. Intelligence, 10,9-40.
Bashi, J. (1977). Effects of inbreeding on cog-
nitive performance. Nature, 266, 440-442.
Bayley, N. (1969). The Bayley Scales of in-fant development. New York: Psycho-logical Corporation.
Belmont, L., & Marolla, F. A. (1973). Birth
order, family size, and intelligence. Sci-ence, 182, 1096-1101.
Benbow, C. P. (1986). Physiological corre-lates of extremeintellectual precocity.Neuropsychologia, 24, 719-725.
Benbow, C. P. (1988). Sex differences inmathematical reasoningability in intel-
lectually talented preadolescents: Their
nature, effects, and possible causes. Be-
357

358
havioral and Brain Sciences, 11, 169-
232.Benbow,C.P., & Stanley, J. C. (1981). Mathe-
matical ability: Is sex a factor? Science,212, 118-119.
Benson, V. E. (1942). The intelligence andlater success of sixth grade pupils.
School and Society, 55, 163-167.
Benton, A. (1980). The neuropsychology offacial recognition. Psychologist, 35,176-186.
Berbaum, M.L., Marcus, G. B., & Zajonc,R.B. (1982). A closer look at Gailbraith’s
“closer look.” Developmental Psychol-
ogy, 18, 174-180.Berbaum, M. L., & Moreland, R. L. (1980).
Intellectual development within thefamily: A new application of the con-fluence model. Developmental Psy-
chology, 16, 506—516.
Binet, A. (1890). La perception des longeurset des nombreschez quelquespetits en-fants. Revue Philosophique, 29, 186—
200.
Binet, A. (1905). Analyse de C. E. Spearman,
the proof and measurementof associa-tion between two things and generalin-telligence objectively determined andmeasured. L’Annee Psychologique, 11,
623-624.
Binet, A. (1908). Le developpementde 1]’in-
telligence chez les enfants. L’AnneePsychologique, 14, 1-94.
Binet, A. (1911). Nouvelles recherchessurlamesure du niveau intellectual chez lesenfants d’ecole. L’Annee Psychologi-
que, 17, 145-201.
Binet, A., & Henri, V. (1896). La psychologieindividuelle. L’Annee Psychologique,2,
411-465.
Binet, A., & Simon, T. (1905a). Sur la neces-site d’etablir un diagnostic scientifiquedes etats inferieurs de |’intelligence.L’Annee Psychologique, 11, 163-190.
Binet, A., & Simon, T. (1905b). Methodesnouvelles pour le diagnostic du niveauintellectual des anormaux. L’AnneePsychologique, 11, 191-244.
Binet, A., & Simon,T. (1905c). Application
des methodes nouvelles au diagnostic
du niveau intellectuel chez des enfantsnormaux et anormaux d’hospice et
LITERATURE CITED
d’ecole primaire. L’Annee Psychologi-
que, 11, 245-336.
Binet, A., & Simon, T. (1916). The develop-ment of intelligence in children. Re-printed, 1983. Salem, NH: Clyer.
Birch, H. G., & Gussow,J. D. (1970). Disad-vantaged children: Health, nutrition,
and school failure. New York: Grune &
Stratton.
Blagg, N. (1991). Can weteach intelligence?A comprehensive evaluation of Feuer-stein’s instrumental enrichment pro-
gram. Hillsdale, NJ: Erlbaum.
Blau, P. M., & Duncan, O. D.(1967). The
American occupational structure. New
York: Wiley.Blinkhorn, S. F., & Hendrickson, D. E.
(1982). Average evoked responses andpsychometric intelligence. Nature, 195,
596-597.Block, J. H., & Anderson, L. W. (1975). Mas-
tery learning in classroom instruction.
New York: Macmillan.Bloom,B.S. (1964). Stability and change in
human characteristics. New York:
Wiley.Bloom, B. S. (1974). Time and learning.
American Psychologist, 29, 682—688.Bloom, B. S. (1984). The 2 sigma problem:
The search for methods of instruction
as effective as one-to-onetutoring. Edu-
cational Research, 13, 4-16.Bock, G., Stebbins, L. B., & Proper, E. C.
(1977). Education as experimentation:A planned variation model (Vol. IV-B.Effects of follow through models). Cam-
bridge, MA: Abt Associations.
Bornstein, M. H. (1989). Stability in earlymental development: From attentionand information processing in infancyto language and cognition in childhood.In M. H. Bornstein & N. A. Krasnegor
(Eds.), Stability and continuity in men-
tal development. Hillsdale, NJ:
Erlbaum.Bornstein, M. H. (1985a). Habituation of at-
tention as a measureof visual informa-tion processing in humaninfants: Sum-mary, systematization, and synthesis.
In G. Gottlieb and N. A. Kransnegor(Eds.), Measurementof audition andvi-
sion in the first year of postnatal life: A

LITERATURE CITED
methodological overview. Norwood,
NJ: Ablex.
Bornstein, M. H. (1985b). How infant andmotherjointly contribute to developing
cognitive competencein the child. Pro-ceedings of the National Academy of
Sciences, 82, 7470-7473.
Bornstein, M. H. (1984). Infant attention
and caregiver stimulation: Two contri-butions to early cognitive develop-ment. Paper presented at the Interna-tional Conference on Infant Studies,New York City, NY.
Bornstein, M. H., & Sigman, M. D. (1986).
Continuity in mental developmentfrom infancy. Child Development, 57,251-274.
Bouchard,T.J., Jr. (1982). Review of identicaltwins reared apart: A reanalysis. Con-
temporary Psychology, 27, 190-191.
Bouchard,T.J., Jr (1983). Do environmental
similarities explain the similarity in in-telligence of identical twins rearedapart? Intelligence, 7, 175-184.
Bouchard, T. J., Jr, Lykken, D. T., McGue,M., Segal, N. L., & Tellegen, A. (1990).
Sources of human psychological dif-
ferences: The Minnesota Study of
Twins Reared Apart. Science, 250, 223-
228.
Bouchard,T.J., Jr., & McGue, M.(1981). Fa-milial studies of intelligence: A review.
Science, 212, 1055-1059.
Bouchard,T.J., Jr., & Segal, N. L. (1985). En-
vironment and IQ. In B. B. Wolman
(Ed.), Handbook of intelligence: Theo-ries, measurements, and applications.
New York: Wiley.Brackbill, Y., & Nichols, P. L. (1982). A test
of the confluence model of intellectual
development. Developmental Psychol-
ogy, 18, 192-198.
Bradley, R., & Caldwell, B. (1976). Earlyhome environment and changes inmental test performance from 6 to 36months. Developmental Psychology,12, 93-97.
Bradley, R., & Caldwell, B. (1980). Home en-
vironment, cognitive competence and
IQ among malesand females. Child De-
velopment, 51, 1140-1148.Brand, C. R. (1987). The importance of gen-
359
eral intelligence. In S. Modgil and C.
Modgil (Eds.}, Arthur Jensen: Consen-
sus and controversy. New York: Falmer.Brand, C. R., & Deary, I. J. (1982). Intel-
ligence and “inspection time.” In H.J.
Eysenck (Ed.), A model for intelligence.
New York: Springer.
Brebner, J., & Nettlebeck, T. (1986). Inspec-
tion time. Personality and IndividualDifferences, 7, 603-749.
Brewer, N., & Smith, G. A. (1984). How nor-mal and retarded individuals monitorand regulate speed and accuracyof re-
sponding in serial choice tasks. Journal
of Experimental Psychology: General,
113, 71-93.
Brody, E. B., & Brody, N. (1976). Intelligence:Nature, determinants and_ conse-
quences. New York: Academic Press.
Brody, N. (1983a). Human motivation:
Commentary on goal-directed action.
New York: Academic Press.Brody, N. (1983b). Where are the emperor’s
clothes? Behavioral and Brain Sci-ences, 6, 303-308.
Brody, N. (1985). Is psychotherapy better
than a placebo? Behavioral and Brain
Sciences, 7, 758—762.
Brody, N. (1987). Jensen, Gottfredson, and
the black-white difference in intel-ligence test scores. Behavioral andBrain Sciences, 10, 507-508.
Brody, N.(1988). Personality: In search of in-
dividuality. San Diego: AcademicPress.Brody, N. (1990). Behavior therapy versus
placebo: Comment on Bowers andClum’s meta-analysis. PsychologicalBulletin, 107, 106-109.
Broman, S. H., Nichols, P. L., & Kennedy, W.A. (1975). Preschool IQ prenatal and
early developmentalcorrelates. Hills-
dale, NJ: Erlbaum.
Broman, S. H., Nichols, P. L., Shaughnessy,P., & Kennedy, W.(1987). Retardation inyoung children. Hillsdale, NJ: Erlbaum.
Brookover, W., Beady, C., Flood, P., Sch-weitzer, J., & Wisenbaker, J. (1979).
School social systems and student
achievement: Schools can make a dif-
ference. New York: Praeger.Brooks, A., Fulker, D. W., & DefFries, J. C.
(1990). Reading performance and general

360
cognitive ability: A multivariate geneticanalysis of twin data. Personality and
Individual Differences, 11, 141-146.
Brown,L. T., & Anthony, R.G.(1990). Con-tinuing the search for social intel-ligence. Personality and IndividualDif-ferences, 11, 463—470.
Bryden, M.P. (1982). Laterality: Functionalasymmetry in the intact brain. New
York: Academic Press.
Burks, B. S. (1928). The relative influence of
nature and nurture upon mental devel-opment: A comparative study of fosterparent—foster child resemblance andtrue parent-true child resemblance.Yearbook of the National Society forthe Study of Education, 27, 219-316.
Burt, C. (1909-1910). Experimental tests of
general intelligence. British Journal of
Psychology, 3, 94-177.
Busse, T. V., Ree, M., Gutride, M., Alex-ander, T., & Powell, L. S. (1972). En-vironmentally enriched classrooms andthe cognitive perceptual development
of Negro preschoolchildren. Journal of
Educational Psychology, 63, 15-21.
Butler, S. R., Marsh, H. W., Sheppard, M.J.,& Sheppard,J. L. (1985). Seven-year lon-gitudinal study of the early predictionof reading achievement.Journal of Edu-cational Psychology, 77, 349-361.
Cahan, S., & Cohen, N. (1989). Age versus
schooling effects on intelligence devel-opment. Child Development, 60, 1239-—1249.
Caldwell, B., & Bradley, R. (1978). Home ob-servation for measurement of the en-vironment. Little Rock: University of
Arkansas.
Campbell, F. A., & Ramey, C.T. (1990). Therelationship between cognitive devel-opment, mental test performance, andacademic achievement in high-riskstudents with and without early edu-
cational experience. Intelligence, 14,
293-308.
Campbell,J. T., Crooks, L. A., Mahoney, M.
H., & Rock, D. A. (1973). An investiga-tion of sources of bias in the predictionof job performance—A six-year study(ETS Report PR-73-37). Princeton, NJ:
Educational Testing Service.
LITERATURE CITED
Cantor, N., & Kihlstrom,J. F. (1987). Person-
ality and social intelligence. En-
glewood Cliffs, NJ: Prentice-Hall.
Capron, C., & Duyme, (1989). Assessmentof effects of socioeconomicstatus on IQin a full cross-fostering design. Nature340, 552-553.
Cardon, L. R., DiLalla, L. F., Plomin, R., De-Fries,J. C., & Fulker, D. W. (1990). Genet-
ic correlations between reading perfor-
manceandIQ in the Colorado AdoptionProject. Intelligence, 14, 245-257.
Carlson, J. S., & Jensen, C. M. (1982). Reac-tion time, movement time, andintel-
ligence: A replication and extension.In-telligence, 6, 265—274.
Carlson, J. S., & Widaman,K.F. (1987). Ele-mentary cognitive correlates of g: Prog-
ress and prospects. In P. A. Vernon (Ed.},
Speed of information-processing and
intelligence. Norwood, NJ: Ablex.Caron, A.J., Caron, R. F., & Glass, P. (1983).
Responsiveness to relational informa-tion as a measure of cognitive function-
ing in nonsuspect infants. In T. Fields
and A. Sostek (Eds.) Infants born at
risk: Physiological, perceptual, andcognitive processes. New York: Grune
and Stratton.Carpenter, P. A., Just, M. A., & Schell, P.
(1990). What oneintelligence test mea-
sures: A theoretical account of the pro-cessing in the Raven Progressive Ma-trices Test. Psychological Review, 97,404-431.
Carroll, J. B. (1988). Yes, there’s g, and whatelse. Unpublished manuscript based on
a colloquium presented at the Univer-
sity of Delaware, Nov. 17, 1988.
Caruso,O.R., Taylor, J. J., & Detterman, D.K. (1982). Intelligence research and in-telligent policy. In D. K. Detterman &R. J. Sternberg (Eds.), How and howmuch can intelligence be increased?
Norwood, NJ: Ablex.
Cattell, J. M. (1890). Mental tests and mea-
surements. Mind, 15, 373-381.
Cattell, J. M., & Farand, L. (1890). Physicaland mental measurements of the stu-dents of Columbia University. Psycho-logical Review, 3, 618-648.
Cattell, R. B. (1936). Is our national intel-

LITERATURE CITED
ligence declining? Eugenics Review, 28,
181-203.
Cattell, R. B. (1937). The fight for our na-tional intelligence. London: King &Sons.
Cattell, R. B. (1941). Some theoretical issuesin adult intelligence testing. Psycholog-
ical Bulletin, 38, 592.
Cattell, R. B. (1963). Theory of fluid and
crystallized intelligence: A critical ex-periment. Journal of Educational Psy-chology, 54, 1-22.
Cattell, R. B. (1971). Abilities: Their struc-ture, growth and action. Boston:
Houghton-Miflin.
Cattell, R. B. (1987). Intelligence: Its struc-
ture, growth and action. Amsterdam:North-Holland.
Ceci, S. J. (1990). On intelligence . . . moreor less. A bio-ecological treatise on in-tellectual development. EnglewoodCliffs, NJ: Prentice Hall.
Ceci, S. J., & Liker, J. (1986). A day at the
races: A study of IQ, expertise, and cog-
nitive complexity. Journal of Develop-
mental Psychology: General, 115, 255-266.
Ceci, S. J., & Liker, J. (1988). Stalking theIQ-—experience relationship: When the
critics go fishing. Journal of Experi-
mental Psychology: General, 117,
96-100.Chipuer, H. M., Rovine, M. J., Plomin, R.
(1990). LISREL modeling: Genetic andenvironmental influences on IQ re-
visited. Intelligence, 14, 11-29.
Clarke, A. M., & Clarke, A. D. B. (1976).
Early experience: Myth and evidence.
New York: Free Press.
Cohen,J. (1952). A factor-analytically basedrelationale for the Wechsler—Bellevue.Journal of Consulting Psychology, 16,272-277.
Cohen,J. (1959). A factor analytically basedrationale of the Wechsler Adult Intel-
ligence Scale. Journal of Consulting Psy-chology, 21, 451-457.
Cohn,S.J., Cohn, C. M. G., & Jensen, A. R.(1988). Myopia and intelligence: Apleiotropic relationship? Human Ge-netics, 80, 53-58.
Cole, S. (1979). Age and scientific perfor-
361
mance. American Journal of Sociology,
84, 958-977.
Coleman,J. S., Campbell, E. O., Hobson, C.J., McPartland, J., Moody, A. M., Wein-field, F. D., & York, R.L. (1966). Equal-ity of educational opportunity. Wash-ington, DC: U.S. Government PrintingOffice.
Coleman, J. S., Hoffer, T., & Kilgore, S.
(1982a}. Cognitive outcomes in public
and private schools. Sociology of Educa-tion, 55, 65-76.
Coleman, J. S., Hoffer, T., & Kilgore, S.(1982b). High school achievement. NewYork: Basic.
Conley, J. J. (1984). The hierarchy of con-
sistency: A review and model of longi-tudinal findings on adult differences inintelligence, personality and self opin-ion. Personality and Individual Dif-ferences, 5, 11-26.
Consortium for Longitudinal Studies (Ed.)
(1983). As the twig is bent... Lasting
effects ofpreschool programs.Hillsdale,
NJ: Erlbaum.
Cooper, L. A., & Shepard, R. N. (1973). Chro-nometric studies of the rotation of men-tal images. In W. G. Chase (Ed.}, Visualinformation processing. New York: Ac-
ademic Press.
Crombie,I. K., Todman,J., McNeill, G., Flo-
rey, C. D., Menzies, I., & Kennedy, R. A.(1990). Effect of vitamin and mineralsupplementation on verbal and non-ver-bal reasoning of school children. Lan-cet, 335, 744-747.
Cronbach, L. J. (1968). Intelligence?
Creativity? A parsimonious _rein-
terpretation of the Wallach—Kogan data.American Educational Research Jour-
nal, 5, 491-511.
Cronbach, L. J., & Snow, R. E. (1977). Ap-titudes and instructional methods.
NewYork: Irvington.
Damasio, A. R. (1985). Prosopognosia.
Trends in Neuroscience, 8, 132—135.
Daniels, D., & Plomin, R. (1985). Differen-tial experience of siblings in the samefamily. Developmental Psychology, 21,747-760.
Deary, I.J. (1980). Howgeneral is the mental
speed factor in “general” intelligence:

362
An attempt to extend inspection timeto the auditory modality. B. S. honorsthesis, University of Edinburgh, Scot-land.
Deary, I. J. (1986). Inspection time: Discov-ery or rediscovery? Personality and In-
dividual Differences, 7, 625—632.
Deary,I. J. (1988). Basic processes in humanintelligence. In H. J. Jerison and I.Jerison (Eds.), Intelligence and evolu-tionary biology. Berlin: Springer.
Deary, I. J. (1989). Auditory inspection time:
Review, recent research and reassess-
ment. In D. Vickers and P. L. Smith
(Eds.), Human information processing:Measures, mechanisms, and models.Elsevier Amsterdam: North-Holland.
Deary,I. J., & Caryl, P. G. (1990). Inspectiontime and cognitive ability. In K. J.
Gilhooly, M.T. G. Keane, R. H. Logie, &G. Erdos (Eds.}, Lines of thinking. Lon-
don: Wiley.Deary, I. J., & Caryl, P. G.(In press). Intel-
ligence, EEG andevolved potentials. InP. A. Vernon ({Ed.}, Biological ap-
proaches to the study of human intel-
ligence. Norwood, NJ: Ablex.
Deary, I. J., Caryl, P. G., Egan, V., & Wight,
D. (1989). Visual and auditory inspec-tion time: Their interrelationship andcorrelations with IQ in high ability sub-jects. Personality and Individual Dif-
ferences, 10, 525-533.
Deary, I. J., Head, B., & Egan, V. (1989). Au-
ditory inspection time, intelligence and
pitch discrimination. Intelligence, 13,135-147.
DefFries, J. C., Johnson, R. C., Kuse, A. R.,McClearn, G. E., Polovina, J., Vanden-berg, S. G., & Wilson,J. R. (1979). Famil-
ial resemblance for specific cognitive
abilities. Behavior Genetics, 9, 23—43.
DeFries, J. C., Plomin, R., & LaBuda, M.C.(1987). Genetic stability of cognitive de-velopment from childhood to adult-hood. Developmental Psychology, 23,4-12.
Detterman,D.K.(1987). What does reaction
timetell us about intelligence? In P. A.
Vernon (Ed.}, Speed of information-
processing and intelligence. Norwood,NJ: Ablex.
Detterman, D. K., & Daniel, M. H.(1989).
LITERATURE CITED
Correlations of mental tests with eachother and with cognitive variables arehighest for low IQ groups. Intelligence,13, 349-359.
Detterman, D. K., & Spry, K. M. (1988). Is itsmart to play the horses? Comment on
“A Day at the Races: A Study of IQ,Expertise, and Cognitive Complexity”(Ceci & Liker, 1986). Journal of Experi-mental Psychology: General, 117, 91-95.
Detterman, D. K., & Sternberg, R.J. (1982).
How and howmuch canintelligence be
increased. Norwood, NJ: Ablex.
Detterman, D. K., Thompson, L. A., &Plomin,R. (1990). Differences in herita-bility across groups differing in ability.Behavior Genetics, 20, 369-384.
Dixon, R. A., Kramer, D. A., & Baltes, P. B.
(1985). Intelligence: A life-span develop-mental perspective. In B. B. Wolman(Ed.), Handbook of intelligence: Theo-ries, measurements and applications.
New York: Wiley.Dodd,S. L. (1928). The theory of factors. Psy-
chological Review, 35, 211-234.
Dodd,S. L. (1929). Sampling theory of intel-ligence. British Journal of Psychology,
19, 306-327.Drillien, C. M. (1964). The growth and de-
velopment of the prematurely born in-fant. Baltimore: Williams and Wilkens.
Duncan, O. D., Featherman, D. L., & Dun-
can B. (1972). Socioeconomic back-
ground and achievement. New York:
Seminar Press.Dunham,J. L. Guilford,J. P., & Hoepfner, R.
(1966). Abilities related to classes andthe learning of concepts. Reports from
the Psychological Laboratory, 39.Eels, K. (1951). Intelligence andcultural dif-
ferences. Chicago: University of Chi-
cago Press.Elliot, R. (1987). Litigating intelligence.
Dover, MA: Auburn House.Epstein, S. (1988). Cognitive-experimental
self-theory: Implication for develop-
mental psychology. Minnesota Sym-
posium on Child Psychology. Hillsdale,
NJ: Erlbaum.
Epstein, S., & Meier, P. (1989). Constructivethinking: A broad coping variable withspecific components.Journal of Person-

LITERATURE CITED
ality and Social Psychology, 57, 332-
350.
Eyferth, K. (1959). Eine untersuchungder Neger-Mischlingskinder in West-deutschland. Vita Humana, 2, 102-—114.
Eyferth, K. (1961). Leistungen verschiedener
Gruppen von Besatzungskindern in
Hamburg—WeschlerIntelligenztest firkinder (HAWIK). Archivftir die gesamtePsychologie, 113, 222-241.
Eyferth, K., Brandt, U., & Hawel, W. (1960).Farbige kinder in Deutschland. Mu-nich: Juventa Verlag.
Eysenck, H.J. (1939). Primary mentalabili-
ties. British Journal of Educational Psy-chology, 9, 260—265.
Eysenck, H. J. (1967). Intelligence assess-ment: A theoretical and experimentalapproach. British Journal of Educa-tional Psychology, 37, 81-98.
Eysenck, H.J. (1984). The effect of race onhumanabilities and mentaltest scores.
In C. R. Reynolds, and R. T. Brown
(Eds.), Perspectives on bias in mentaltesting. New York: Plenum.
Eysenck, H.J. (1988). Editorial: The conceptof “Intelligence”: Useful or useless? In-telligence, 12, 1-16.
Eysenck, H.J., & Barrett, P. (1985). Psycho-
physiology and the measurementofin-
telligence. In C. R. Reynolds & V. L.Willson (Eds.}, Methodological andsta-tistical advances in the study of indi-vidual differences. New York: Plenum.
Fagan,J. F. (1984). The relationship of novel-
ty preferences during infancy to later
intelligence and later recognition mem-ory. Intelligence, 8, 339-346.
Fagan, J. F.. & McGrath,S. K. (1981). Infantrecognition memory and later intel-ligence. Intelligence, 5, 121—130.
Fagan,J. F., & Singer, L. T. (1983). Infant rec-
ognition memory as a measureofintel-
ligence. In L. P. Lipsett (Ed.), Advances
in infancy research. (Vol. 2). Norwood,NJ: Ablex.
Falek, A. (1971). Differential fertility and in-
telligence: Resolution of two paradoxes
and formulation of a third. Journal of
Human Evolution, 1, 11-15.
Fancher, R. E. (1985). Spearman’s original
computation of g. A model for Burt?
363
British Journal of Psychology, 76, 341—352.
Farber, S. L. (1981). Identical twins reared
apart: A reanalysis. New York: BasicBooks.
Feingold, A. (1988). Cognitive gender dif-
ferences are disappearing. AmericanPsychologist, 43, 95—103.
Feshbach, S., Adelman, H., & Fuller, W.(1977). Prediction of reading andrelatedacademic problems. journal of Educa-tional Psychology, 69, 299-308.
Feuerstein, R. (1979). The dynamic assess-
mentofretarded performers: The learn-ing potential assessment device. Theo-
ry, instruments, and techniques. Balti-more: University Park Press.
Feuerstein, R., Rand, Y., Hoffman, M. B., &Miller, R. (1980). Instrumental enrich-ment: An intervention program for cog-
nitive modifiability. Baltimore: Univer-sity Park Press.
Firkowska, A., Ostrowska, A., Sokolowska,
M., Stein, Z. A., Susser, M., & Wald, I.(1978). Cognitive development and so-cial policy: The contribution of paren-tal occupation and education to mentalperformancein 1] year olds in Warsaw.Science, 200, 1357-1362.
Fischbein, S. (1980). IQ and social class. In-telligence, 4, 51-63.
Flanagan, J. L., & Cooley, W. W.(1966). Pro-ject talent: One year follow-up studies.Pittsburgh: University of Pittsburgh.
Flanagan,J. C., Dailey, J. T., Shaycroft, M.F.,
Gorham,W.A., Orr, O. B., & Goldberg,
I. (1962). Design for the study of Ameri-
can youth. Boston: Houghton-Mifflin.Flaugher, R. I., & Rock, D. A. (1972). Pat-
terns of ability factors among four eth-nic groups. Princeton, NJ: EducationalTesting Service.
Flynn, J. R. (1980). Race, IQ and Jensen.
London: Routledge & Kegan Paul.
Flynn, J. R. (1984). The mean IQ of Ameri-
cans: Massive gains 1932—78. Psycho-logical Bulletin, 95, 29-51.
Flynn, J. R. (1987). Massive IQ gains in 14nations: What IQ tests really measure.Psychological Bulletin, 101, 171-191.
Fodor, J. A. (1983). The modularity of mind.
An essay on faculty psychology. Cam-bridge: MIT Press.

364
Ford, M. E., & Tisak, M.S. (1983). A further
search for social intelligence. Journal ofEducational Psychology, 75, 196—206.
Frearson, W.M., Barrett, P., & Eysenck, H.J.(1988). Intelligence, reaction time and
the effects of smoking. Personality and
Individual Differences, 9, 497-519.Frearson, W. M., & Eysenck, H.J. (1986). In-
telligence, reaction time (RT) and a new“odd-man-out” RT paradigm. Person-
ality and Individual Differences, 7,
807-817.Freeman,F. N., Holzinger, K. J., & Mitchell,
B. C. (1928). The influence of envi-ronment on the intelligence, schoolachievement, and conductoffosterchil-dren. 27th Yearbook of the National So-ciety for the Study of Education, 27,
Part I.
Frydman, M., & Lynn,R. (1989). The intel-
ligence of Korean children adopted inBelgium. Personality and IndividualDifferences, 10, 1323-1325.
Fulton, M., Thomson, G., Hunter, R., Raab,G., Laxen, D., & Hepbum,W.(1987). In-
fluence of blood lead on the ability andattainment of children in Edinburgh.Lancet, 1, 1221-1226.
Gailbraith, R. C. (1982a). Just one look wasall it took: Reply to Berman, Markusand Zajonc. Developmental Psycholo-gy, 18, 181-191.
Gailbraith, R. C. (1982b). Sibling spacing
and intellectual development: A closer
look at the confluence models. Devel-
opmental Psychology, 18, 151-173.Gailbraith, R. C. (1983). Individual dif-
ferences in intelligence: A reappraisalof the confluence model. Intelligence,
7, 183-194.Galton,F. (1869). Hereditary genius: An in-
quiry into its laws and consequences.
London: MacMillan.Galton, F. (1879). Psychometric experi-
ments. Brain, 2, 149-162.
Galton, F. (1883). Inquiries into human fac-ulty, and its development. London:
MacMillan.
Galton, F. (1885). On the anthropometric
laboratory at the late InternationalHealth Exhibition. Journal of the An-thropological Institute, 14, 205-219.
Garber, H. L. (1988). The Milwaukee Pro-
LITERATURE CITED
ject: Preventing mental retardation inchildren at risk, Washington, DC:
American Association on Mental Retar-
dation.Gardner, H. (1983). Frames of mind: The
theory of multiple intelligences. New
York: Basic.Ghiselli, E. E. (1966). The validity of occupa-
tional aptitude tests. New York: Wiley.Ghiselli, E. E. (1973). The validity of ap-
titude tests in personnel selection. Per-
sonnel Psychology, 26, 461—477.
Gibson,J. J. (1979). The ecological approachto visual perception. Boston: Houghton-
Mifflin.
Gladwin,T. (1970). East is a big bird. Cam-bridge, MA: Belknap Press.
Glutting, J. J., & McDermott, P. A. (1990).
Principles and problemsin learning po-
tential. In C. R. Reynolds and R. W.Kamphaus(Eds.), Handbook of psycho-
logical and educational assessmentofchildren: Intelligence and achieve-ment. New York: Guilford Press.
Glutting, J. J., & McDermott, P. A. (In press).
Childhood learning potential as an al-
ternative to traditional ability mea-
sures. Psychological Assessment: AJournal of Consulting and Clinical Psy-chology, in press.
Goldberg, R. A., Schwartz, S., & Stewart, M.(1977). Individual differences in cog-nitive processes. Journal of Educational
Psychology, 69, 9-14.
Gordon, R. A. (1984). Digits backward and
the Mercer-Kamin law: An empiricalresponse to Mercer’s treatmentof inter-
nal validity in IQ tests. In C. R. Reyn-
olds & J. R. Brown (Eds.), Perspectives
on bias in mental testing. New York:
Plenum.
Gordon, R. A. (1987). Gordon replies toShepard. In S. Modgil & C. Modgil
(Eds.), Arthur Jensen: Consensus andcontroversy. New York: Falmer.
Gottfredson, L. S. (1987). The practical sig-nificance of black-white differences inintelligence. Behavioral and Brain Sci-
ences, 10, 510-512.
Gottfried, A. W. (1984). Home environmentand early cognitive development: Inte-gration, meta-analysis, and conclusions.In A. W. Gottfried (Ed.|, Home environ-

LITERATURE CITED
ment and early cognitive development:
Longitudinal research. Orlando: Aca-
demic Press.Gottfried, A. W., & Gottfried, A. E. (1984).
Home environment and cognitive de-
velopmentin youngchildren of middle-socioeconomic-status families. In A. W.
Gottfried (Ed.|, Home environment and
early cognitive development. Orlando:
Academic Press.Guilford, J. P. (1964). Zero intercorrelations
among tests of intellectual abilities.Psychological Bulletin, 61, 401-404.
Guilford, J. P. (1967). The nature of human
intelligence. New York: McGraw-Hill.
Guilford, J. P. (1974). Rotation problems infactor analysis. Psychological Bulletin,81, 498-501.
Guilford, J. P. (1977). Way beyond the IQ:Guide to improving intelligence and
creativity. Buffalo, NY: Creative Educa-
tion Foundation.
Guilford, J. P. (1981). Higher-order structure-of-intellect abilities. Multivariate Be-havioral Research, 16, 411-435.
Guilford, J. P. (1985). The structure-of-intel-
lect model. In B. B. Wolman (Ed.}, Hand-
book of intelligence: Theories, mea-
surements and applications. New York:Wiley.
Guilford, J. P., & Hoepfner, R. (1971). Theanalysis of intelligence. New York:McGraw-Hill.
Gustafsson, J. E. (1984). A unifying modelfor the structure of intellectual abili-
ties. Intelligence, 8, 179-203.Gustafsson, J. E. (1985). Measuring and in-
terpreting g. Behavioral Brain Sciences,
8, 231-232.
Gustafsson,J. E. (1988). Hierarchical models
of individual differences. In R. J. Stern-
berg (Ed.}, Advances in the psychology
of human intelligence (Vol. 4). Hills-
dale, NJ: Erlbaum.Guttman, L. (1954). A new approachto fac-
tor analysis: The radex. In P. F. Lazars-feld (Ed.), Mathematical thinking in the
social sciences. Glencove, IL: Free
Press.
Guttman,L. (1965). The structure of the in-
terrelations among intelligence tests.Proceedings of the 1964 InvitationalConference on Testing Problems.
365
Princeton, NJ: Educational Testing Ser-
vice.
Guttman, L. (1970). Integration of test de-sign and analysis. Proceedings of the1969 Invitational Conference on Test-ing Problems. Princeton, NJ: Educa-tional Testing Service.
Hahn, W.K. (1987). Cerebral lateralization
of function: From infancy through
childhood. Psychological Bulletin, 101,376-392.
Haier, R.J. (In press). Cerebral glucose metab-olism andintelligence. In P. A. Vernon
(Ed.), Biological approaches to human
intelligence. Norwood, NJ: Ablex.
Haier, R. J., Robinson, D. L., Braden, W., &Krengel, M. (1984). Psychometric intel-ligence and visual evoked potentials: Areplication. Personality and Individual
Differences, 5, 487—489.
Haier, R. J., Robinson, D. L., Braden, W., &
Williams, D. (1983). Electrical poten-
tials of the cortex and psychometric in-telligence. Personality and IndividualDifferences, 4, 591—599.
Haier, R.J., Siegel, B., Jr., Neuchterlein, K.
H., Hazlett, M. E., Wu, T. C., Paek,J.,
Browning, H. L., & Buchsbaum, M.S.
(1988). Cortical glucose metabolic ratecorrelates of reasoning and attentionstudied with positron emission to-mography. Intelligence, 12, 199-217.
Hampson, E. (1990). Variations in sex-
related cognitive abilities across the
menstrual cycle. Brain and Cognition,
14, 26-43.Harnqvist, K. (1968a). Relative changes in
intelligence from 3—18. I. Backgroundand methodology. Scandinavian Jour-
nal of Psychology, 9, 50-64.
Harnqvist, K. (1968b). Relative changes in
intelligence from 13-18. II. Results.
Scandanavian Journal of Psychology, 9,
65-82.
Harrell, T. W., & Harrell, M. S. (1945). ArmyGeneral Classification Test scores forcivilian occupations. Educational and
Psychological Measurement, 5, 229-
239.
Harrison, G. A., & Owen,J. J. (1964). Studies
on the inheritance of humanskin color.Annals of Human Genetics, 28, 27-37.
Hatta, T., & Dimond, S. J. (1980). Com-

366
parison of lateral differences for digit
and random form recognition in Japa-
nese and Westerners. Journal of Experi-
mental Psychology: Human Perceptionand Performance, 6, 368-374.
Haywood, H. C., & Arbitman-Smith, R.(1981). Modification of cognitive func-tions in slow-learning adolescents.In P.Mittler, (Ed.), Frontiers of knowledge in
mentalretardation (Vol. 1. Social, edu-
cational, and behavioral aspects). Bal-
timore: University Park Press.Hearnshaw,L.S.(1979). Cyril Burt: Psychol-
ogist. London: Hodden and Houghton.Hebb, D.O. (1942). The effects of early and
late brain injury upon test scores andthe nature of normal adult intelligence.Proceedings of the American Philo-sophical Society, 85, 275-292.
Heber, R., & Garber, H. (1972). An experi-
ment in prevention of cultural-familial
retardation. In D. A. A. Primrose (Ed.),Proceedings of the Second Congress ofthe International Association for theScientific Study of Mental Deficiency.
Warsaw:Polish Medical Publishers.
Heber, R., & Garber, H. (1975). Progress Re-port II: An experimentin the preventionof cultural-familial retardation. In D.A.A. Primrose (Ed.), Proceedings of theThird Congressfor the Scientific Study
of Mental Deficiency (Vol. 1). Warsaw:
Polish Medical Publishers.
Henderson, N. D. (1982). Human behaviorgenetics. Annual Review of Psychology,33, 403-440.
Hendrickson, D. E. (1982). The biologicalbasis of intelligence. Part II: Measure-
ment: In H.J. Eysenck (Ed.}, A model
for intelligence. New York: Springer-
Verlag.
Hendrickson, D. E., & Hendrickson, A. E.(1980). The biological basis of indi-vidual differences in intelligence. Per-
sonality and Individual Differences,1,
3-33.
Herrman,L., & Hogben,L.(1933). The intel-lectual resemblance of twins. Proceed-ings of the Royal Society of Edinburgh,53, 105-129.
Herskovitz, M.J. (1930). The anthropometry
of the American Negro. New York: Co-
lumbia University Press.
LITERATURE CITED
Hertzog, C. (1989). Influences of cognitive
slowing on age differences in intel-
ligence. Developmental Psychology, 25,
636-651.Hick, W. E. (1952). On the rate of gain of
information. Quarterly Journal of Ex-perimental Psychology, 4, 11-26.
Higgins, J. V., Reed, E. W, & Reed, S. C.
(1962). Intelligence and family size: A
paradox resolved. Eugenies Quarterly,
9, 84-90.
Hirschi, T., & Hindelang, M.J. (1977). Intel-ligence and delinquency: A revisionistreview. American Sociological Review,42, 571-587.
Ho, H. Z., Baker, L., & Decker, S. N. (1988).Covariation between intelligence andspeed of cognitive processing: Genetic
and environmental influences. Behav-ior Genetics, 18, 247-261.
Hoffer, T., Greeley, A. M., & Coleman,J. S.(1985). Achievement growth in publicand Catholic schools. Sociology of Edu-cation, 58, 74—97.
Hogan, R.(1969). Development of an empa-
thy scale. Journal of Consulting and
Clinical Psychology, 33, 307-316.
Horn, J. L. (1985). Remodeling old modelsof intelligence. In B. B. Wolman (Ed.),Handbook of intelligence: Theories,measurements and applications. New
York: Wiley.
Horn,J. L., & Cattell, R. B. (1966). Refine-
ment andtest of the theory of fluid andcrystallized intelligence. Journal of Ed-ucational Psychology, 57, 253-270.
Horn, J. L., & Donaldson, G. (1976). On themyth of intellectual decline in adult-
hood. American Psychologist, 3, 701-
719.
Horn,J. L., Donaldson, G., & Engstrom,R.(1981). Apprehension, memory andfluid intelligence decline in adulthood.Research on Aging, 3, 33-84.
Horn, J. L., & Knapp, J. R. (1973). On the
subjective character of the empirical
base of Guilford’s structure-of-intellectmodel. Psychological Bulletin, 80, 33-—43.
Horn, J. L., & Knapp, J. R. (1974). Thirtywrongs do not makea right: Reply to
Guilford. Psychological Bulletin, 81,
502-504.
LITERATURE CITED
Horn, J. L., & Stankov, L. (1982). Auditory
and visualfactors of intelligence. Intel-ligence, 6, 165-185.
Horn, J. M., Loehlin, J. C., & Willerman, L.(1979). Intellectual resemblance amongadoptive and biological relatives: TheTexas Adoption Project. Behavior Ge-
netics, 9, 177-207.Horn, W.F., & Packard, T. (1985). Early iden-
tification of learning problems: a meta-analysis. Journal of Educational Psy-
chology, 77, 597-607.
Howe, M.J. A. (1988a}. Intelligence as an
explanation. British Journal of Psychol-ogy, 79, 349-360.
Howe, M.J. A. (1988b). The hazard of using
correlational evidence as a means ofidentifying the causes of individual
ability differences: A_ rejoinder toSternberg and a reply to Miles. BritishJournal of Psychology, 79, 539-545.
Huesmann,L. R., Eron, L. D., & Yarmel, P.W. (1987). Intellectual functioning and
aggression. Journal of Personality and
Social Psychology, 52, 218-231.
Humphreys, L. G. (1967). Critique of Cat-
tell: Theory of fluid and crystallized in-telligence: A critical experiment. Jour-nal of Educational Psychology, 58, 120—136.
Humphreys,L. G.(1976). A factor model for
research on intelligence and problem
solving. In L. Resnick (Ed.), Proceed-ings: The nature of intelligence. NewYork: Wiley.
Humphreys, L. G. (1985). General intel-ligence: An integration of actor, test,
and simplex theory. In B. B. Wolman
(Ed.), Handbook of intelligence: Theo-
ries, measurement, and applications.
New York: Wiley.Humphreys, L. G. (1989). Intelligence:
Three kinds of instability and their con-sequencesfor policy. In R. L. Linn (Ed.},
Intelligence. Urbana: University ofIIli-nois Press.
Humphreys, L. G. (1990). Erroneous in-
terpretation of difference scores: Ap-plication to a recent example. Intel-ligence, 14, 231—233.
Humphreys,L. G., & Parsons, C. K. (1979). A
simplex process model for describing
differences between cross-lagged cor-
367
relations. Psychological Bulletin, 86,
325-334.
Hunt, E. (1978). Mechanics of verbal ability.Psychological Review, 85, 109-130.
Hunt, E. (1987). The next word on verbalability. In P. A. Vernon (Ed.), Speed ofinformation-processing and _intelli-gence. Norwood, NJ: Ablex.
Hunt, E., Davidson, J., & Lansman, M.
(1981). Individual differences in long-term memory access. Memory and Cog-nition, 9, 599-608.
Hunt, E., Frost, N., & Lunneborg,C.(1973).
Individual differences in cognition: Anew approach to intelligence. In G.Bower ({Ed.), Advances in learning and
motivation (Vol. 7). New York: Academ-ic Press.
Hunt, E., Lunneborg, C., & Lewis, J. (1975).
What does it mean to be high verbal?Cognitive Psychology, 7, 194-227.
Hunt, J., M. (1961). Intelligence and experi-ence. New York: Ronald Press.
Hunter,J. E., & Hunter, R. F. (1984). Validity
andutility of alternative predictors of a
job performance. Psychological Bul-
letin, 96, 72-98.Hunter, J. E., Schmidt, F. L., & Hunter, R.
(1979). Differential validity of em-ployment tests by race: A comprehen-
sive review and analysis. Psychological
Bulletin, 86, 721-735.
Hyde, J. S., Fennema, E., & Lamon,S.J.
(1990). Gender differences in mathe-matics performance: A meta-analysis.Psychological Bulletin, 107, 139-155.
Hyde, J. S., & Linn, M. C. (1988). Gender
differences in verbal ability: A meta-
analysis. Psychological Bulletin, 104,153-169.
Irwin, R.J. (1984). Inspection time anditsrelation to intelligence. Intelligence, 8,47-65.
Jacobsen,L. L., Berger, S. M., Bergman,R.L.,
Milham,J., & Greeson,L. E. (1971). Ef-
fects of age, sex, systematic conceptual
learning sets and programmedsocialin-teraction on the intellectual and con-ceptual developmentof pre-schoolchil-dren from poverty backgrounds. Child
Development, 42, 1399-1415.Jencks, C. (1972). Inequality: A reassess-

368
mentof the effect of family and school-
ing in America. New York:Basic Books.
Jencks, C. (1979). Who gets ahead: The de-terminants of economic success in
America. New York: Basic Books.Jencks, C. (1985). How much dohigh school
students learn? Sociology of Education,
58, 128-135.
Jensen, A. R. (1971). Do schools cheat mi-nority children? Educational Research,14, 3-28.
Jensen, A. R. (1973). Educability and groupdifferences. London: Methuen.
Jensen, A. R. (1974a). Cumulative deficit: A
testable hypothesis. Developmental
Psychology, 10, 996-1019.Jensen, A. R. (1974b). The effect of race of
examiner on the mental test scores ofwhite and black pupils. journal of Edu-
cational Measurement, 11, 1-14.
Jensen, A. R. (1977). Cumulative deficit in
IQ of blacks in the deep south. Develop-mental Psychology, 13, 184-191.
Jensen, A. R. (1978). Genetic and behavioraleffects of non-random mating.In R.T.
Noble & N. Weyl](Eds.), Human varia-tion: The biopsychology of age, race,
and sex. New York: Academic Press.Jensen, A. R. (1980a). Bias in mentaltesting.
New York:Free Press.
Jensen, A. R. {1980b). Use of sibling data in
educational and psychological research.American Educational Research Jour-
nal, 17, 153-170.Jensen, A. R. (1981). Obstacles, problems,
and pitfalls in differential psychology.
In S. Scarr (Ed.}, Race, social class, andindividualdifferences in I.Q. Hillsdale,
NJ: Erlbaum.Jensen, A.R. (1982a). Reaction timeand psy-
chometric g. In H. J. Eysenck (Ed.}, Amodelfor intelligence. Berlin: Springer-
Verlag.
Jensen, A. R. (1982b). The chronometry of
intelligence. In R.J. Sternberg (Ed.), Ad-vances in research in intelligence (Vol.1). Hillsdale, NJ: Erlbaum.
Jensen, A.R. (1984). Test bias: Concepts andcriticisms. In C. R. Reynolds & R.T.
Brown (Eds.), Perspectives on bias in
mental testing. New York: Plenum.
Jensen, A. R. (1985a). The nature of theblack-white difference on various psy-
LITERATURE CITED
chometric tests: Spearman’s hypoth-
esis. Behavioral and Brain Sciences, 8,
193-263.Jensen, A. R. (1985b). Methodological and
statistical techniques for the chro-nometric study of mental abilities. In
C. R. Reynolds & V. L. Willson (Eds.},
Methodological and statistical ad-
vances in the study of individual dif-ferences. New York: Plenum.
Jensen, A. R. (1987a). Individual differencesin the Hick paradigm. In P. A. Vernon(Ed.), Speed of information-processing
and intelligence. Norwood, NJ: Ablex.Jensen, A. R. (1987b). Further evidence for
Spearman’s hypothesis concerningblack-white differences in psychomet-ric tests. Behavioral and Brain Sci-
ences, 10, 512-519.
Jensen, A. R. (1987c). Differential psycholo-gy: Towards consensus.In S. Modgil &C. Modgil (Eds.), Arthur Jensen: Con-sensus and controversy. New York:Falmer.
Jensen, A. R. (1989). Review: Raising IQwithout increasing g? A review of The
Milwaukee Project: Preventing Mental
Retardation in Children at Risk. Devel-opmental Review, 9, 1989.
Jensen, A. R., & Figueroa, R. A. (1975). For-ward and backward digit-span interac-
tion with race and IQ: Predictions fromJensen’s theory. Journal of Educational
Psychology, 67, 882-893.Jensen, A. R., & McGurk, F. C.J. (1987).
Black—white bias in “cultural” and
“noncultural” test items. Personality
and Individual Differences, 8, 295—
301.
Jensen, A. R., & Reynolds, C. R. (1982).Race, social class and ability patternson the WISC-R. Personality and Indi-
vidual Differences, 3, 423-438.
Jensen, A. R., Schafer, E. W. P., & Crinella, F.
M.(1981). Reaction time, evoked brainpotentials, and psychometric g in theseverely retarded. Intelligence, 5, 179-197.
Jensen, A. R., & Sinha, S. N.(In press). Phys-
ical correlates of humanintelligence. In
P. A. Vernon (Ed.}, Biological approach-
es to humanintelligence. Norwood, NJ:Ablex.

LITERATURE CITED
Jensen, A. R., & Vernon, P. A. (1986).
Jensen’s reaction-time studies: A reply
to Longstreth. Intelligence, 10, 153-179.
Jones, D. C., & Carr-Saunders, A. M.(1927).The relation between intelligence and
social status among orphan children.
British Journal of Psychology, 17, 343-—
364.
Jones, H. E., & Bayley, N. (1941). The Berke-ley growth study. Child Development,12, 167-173.
Joynson,R. B. (1989). The Burt affair. Lon-don: Routledge, Chapman,Hall.
Juel-Nielsen, K. (1965). Individual and en-vironment: A psychiatric-psychological
investigation of MZ twinsreared apart.
Acta Psychiatrica Scandinavica (Suppl.
183). Copenhagen: Munksgaard.
Kail, R., & Pellegrino, J. W. (1985). Humanintelligence: Perspectives and pros-pects. New York: Freeman.
Kamin,L.J. (1974). The science andpoliticsof IQ. Potomac, MD:Erlbaum.
Kamin, L. J. (1980). Inbreeding depressionand IQ. Psychological Bulletin, 87,469-478.
Kaplan, R. M.(1985). The controversyrelat-ed to the use of psychological tests. In
B. B. Wolman(Ed.), Handbook of intel-
ligence: Theories, measurements and
applications. New York: Wiley.Karlsson, J. L. (1976). Genetic factors in
myopia. Acta Geneticae Medicae etGamellologiae, 25, 292-294.
Kaufman,A.S. (1975). Factor analysis of the
WISC-Rat 11 age levels between 6-3 and
16-3 years. Journal of Consulting and
Clinical Psychology, 43, 135-147.Kaufman, A. S., & Kaufman, N.L. (1983a).
K-ABC administration and scoringmanual. Circle Pines, MN: AmericanGuidance Service.
Kaufman, A. S., & Kaufman, N.L. (1983b).
K-ABC interpretive manual. Circle
Pines, MN: American Guidance Ser-
vice.Keating, D. P. (1978). A search for social in-
telligence. Journal of Educational Psy-chology, 70, 218-223.
Keating, D. P., & Bobbitt, B. L. (1978). Indi-
vidual and developmentaldifferences in
cognitive-processing components of
369
mental ability. Child Development, 49,155-167.
Keating, D.P., List, J. A., & Merriman, W. E.(1985). Cognitive processing and cog-nitive ability: A multivariate validityinvestigation. Intelligence, 9, 149-170.
Kelderman, H., Mellenbergh, G. J., &
Elshout,J. J. (1981). Guiford’s facet theo-
ry of intelligence: An empirical com-parison of models. Multivariate Behav-ioral Research, 16, 37-61.
Kimura, D., & Hampson,E.(In press). Neu-ral and hormonal mechanisms mediat-ing sex differences in cognition. In P. A.Vernon, (Ed.), Biological approaches tohuman intelligence. Norwood, NJ:
Ablex.
Kipnis, D. (1971). Character structure and
impulsiveness. New York: AcademicPress.
Kranzler, J. H., & Jensen, A. R. (1989). In-
spection time and intelligence: A meta-analysis. Intelligence, 13, 329-347.
LaBuda, M. C., DeFries, J. C., & Fulker, D.
W. (1987). Genetic and environmentalcovariance structures among WISC-R
subtests: A twin study. Intelligence, 11,233-244.
Landsdown,R., & Yule, W.(Eds.). (1986). The
lead debate: The environment, tox-
icology, and child health. London:
Croom Helm.
Lansman, M., Donaldson, G., Hunt, E., &Yantis, S. (1982). Ability factors and cog-nitive processes. Intelligence, 6, 347-
386.
Larson, G. E. (1990). Novelty as “representa-
tional complexity”: A cognitive in-
terpretation of Sternberg and Gastel(1989). Intelligence, 14, 235-238.
Larson, G. E., & Alderton, D.L. (1990). Reac-tion time variability and intelligence:“Worst performance” analysis of indi-
vidual differences. Intelligence, 14,
309-325.
Larson, G. E., Merritt, C. R., & Williams, S.
E. (1988). Information processing andintelligence: Some replication of taskcomplexity. Intelligence, 12, 131-147.
Larson, G. E., & Saccuzzo, D. P. (1986).
Jensen’s reaction-time experiments:
Another look. Intelligence, 10, 231-
238.

370
Larson, G.E., & Saccuzzo,D.P. (1989). Cog-nitive correlates of general intelligence:Toward a process theory of g. Intel-ligence, 13, 5-31.
Lavin, D. E. (1965). The prediction of aca-demic performance:A theoretical anal-
ysis and review of research. New York:
Russell Sage Foundation.
Lawrence, E. M. (1931). An investigationinto the relation between intelligenceand inheritance. British Journal of Psy-
chology (Monograph Supplement), 16,
1-80.
Leahy, A. (1935). Nature-nurture and intel-ligence. Genetic Psychology Mono-graphs, 17, 236-308.
Lesser, G. S., Fifer, F., & Clark, H. (1965).
Mentalabilities of children from differ-
ent social-class and cultural groups.
Monographsof the Society for Researchin Child Development, 30 (4).
Levy, J. (1969). Possible basis for the evolu-tion of lateral specialization of thehuman brain. Nature, 224, 614-615.
Levy, J. (1976). Cerebral lateralization and
spatial ability. Behavior Genetics, 6,
171-188.Lewis, M., & Brooks-Gunn,J. (1981). Visual
attention at three monthsas a predictorof cognitive functioning at twoyears ofage. Intelligence, 5, 131-140.
Lewontin, R. C. (1975). Genetic aspects of
intelligence. Annual Review of Genet-
ics, 9, 387-405.Linn, M. C., & Petersen, A. C. (1985). Emer-
gence and characterization of sex dif-
ferencesin spatial ability: A meta-anal-ysis. Child Development, 56, 1479-1498.
Linn, R. L. (1973). Fair test use in selection.Review of Education Research, 43, 139-
161.
Livingstone, M., & Hubel, D. H.(1988). Seg-regation of form, movement, and depth:Anatomy, physiology, and perception.Science, 240, 740-749.
Locurto, C. (1990). The malleability of IQ as
judged from adoption studies. /ntel-
ligence, 14, 275-292.
Loehlin, J. C. (1989). Partitioning environ-
mental and genetic contributionsto be-havioral development. American Psy-chologist, 44, 1285-1292.
Loehlin,J. C., & DeFries, J. C. (1987). Geno-
LITERATURE CITED
type—environmentcorrelation and IQ.
Behavior Genetics, 17, 263-277.Loehlin, J. C., Horn, J. M., & Willerman,L.
(1989). Modeling IQ change: Evidencefrom the Texas Adoption Project. Child
Development, 60, 993-1004.
Loehlin, J. C., Lindzey, G., & Spuhler, J. M.
(1975). Race differences in intelligence.
San Francisco: Freeman.
Loehlin, J. C., Willerman, L., & Horn, J. M.(1988). Human behavior genetics. An-
nual Review of Psychology, 39, 101-133.
Loevinger, J. (1951). Intelligence. In H.
Nelson (Ed.), Theoretical foundations ofpsychology. New York: Van Nostrand.
Lohman,D.F. (1986). The effect of speed—accuracy tradeoff on sex differences inmental rotation. Perception and Psy-
chophysics, 39, 427-436.
Long, P. A., & Anthony,J. J. (1974). The mea-
surement of retardation by a culture-specific test. Psychology in the Schools,11, 310-312.
Longstreth, L. E. (1984). Jensen’s reaction-
time investigations of intelligence: A
critique. Intelligence, 8, 139-160.
Longstreth, L. E. (1986). The real and theunreal: A reply to Jensen and Vernon.Intelligence, 10, 181-191.
Longstreth, L. E., Davis, B., Carter, L., Flint,D., Owen, J., Rickert, M., & Taylor, E.(1981). Separation of homeintellectualenvironment and maternal IQ asdeter-
minants of child’s IQ. DevelopmentalPsychology, 17, 532-541.
Lord, F. M. (1980). Applications of item re-
sponse theoryto practical testing prob-lems. Hillsdale, NJ: Erlbaum.
Lorge, I. (1945). Schooling makesa difference.Teachers College Record, 46, 483—492.
Lubin, M., & Fernandez,J. M. (1986). There-lationship between psychometric intel-
ligence and inspection time. Personality
and Individual Differences, 7,653—657.Lubinski, D., & Humphreys,L. G.(1990). A
broadly based analysis of mathematicalgiftedness. Intelligence, 14, 327-355.
Ludlow, H. G. (1956). Some recent research
on the Davis—Eels game. School and
Society, 84, 146-148.Lynn,R.(1987). The intelligence of the mon-
goloids: A psychometric, evolutionaryand neurological theory. Personality and
Individual Differences, 8, 813-844.
LITERATURE CITED
Lynn, R. (1990a). The role of nutrition in
secular increases in intelligence. Per-
sonality and Individual Differences,11, 273-285.
Lynn, R. (1990b). Negative correlations be-tween verbal and visuo-spatialabilities:Statistical artifact or empirical rela-tionship? Personality and Individual
Differences, 11, 755—756.Lynn, R. (1990c). New evidence on brain
size and intelligence: A comment onRushton and Cain and Vanderwolf. Per-
sonality and Individual Differences,
11, 795-797.Lynn, R. (1991). Educational achievements
of Asian-Americans. American Psy-
chologist, 46, 875-876.
Lynn, R. (In press). Nutrition and intel-
ligence. In P. A. Vernon (Ed.), Biological
approaches to humanintelligence. Nor-
wood, NJ: Ablex.Lynn, R., & Hampson, S.(1986a). Intellec-
tual abilities of Japanese children: Anassessment of 2-3—8-3-year-olds derived
from the McCarthyscales of children’s
abilities. Intelligence, 10, 41-58.
Lynn, R., & Hampson,S. (1986b). Therise ofnational intelligence: Evidence from Brit-ain, Japan, and the U.S.A.Personality andIndividual Differences, 7, 23-32.
Maccoby, E. E., & Jacklin, C. N. (1974). The
psychologyof sex differences. Stanford,
CA: Stanford University Press.
MacKenzie, B. (1980). Hypothesized geneticracial differences in IQ: A criticism ofthree proposedlines of evidence. Behav-ior Genetics, 10, 225-234.
MacKenzie, B. (1984). Explaining race dif-
ferences in IQ: The logic, the meth-
odology, and the evidence. AmericanPsychologist, 39, 1214-1233.
MacKenzie, B., & Bingham,E.(1985). IQ,in-spection time, and response strategies
in a university population. Australian
Journal of Psychology, 37, 257-268.MacKenzie, B., & Cumming,S. (1986). How
fragile is the relationship between in-
spection time andintelligence? Theef-
fects of apparent-motion cues andpre-vious experience. Personality and Indi-vidual Differences, 7, 721—729.
Marcus, G. B., & Zajonc,R. B. (1977). Family
configuration and intellectual develop-
ment. Behavioral Science, 22, 137-142.
371
Marjoribanks, K., & Walberg, H.J. (1975).
Birth order, family size, social class, and
intelligence. Social Biology, 22, 261-268.
Marshalek, B., Lohman, D.F., & Snow,R.E.(1983). The complexity continuum inthe radex and hierarchical modelsof in-
telligence. Intelligence, 7, 107-127.Matheny, A.P., Jr., Dolan, A. B., & Wilson,
R. S. (1976). Twins with academiclearn-ing problems. American Journal of Or-thopsychiatry, 46, 464—469.
Mattarazzo, J. D. (1972). Wechsler’s mea-surement and appraisal of adult intel-ligence (5th ed.). Baltimore: Williams &Wilkins.
Mattarazzo, J. D., & Weins, A. N. (1977).Black intelligence test of cultural ho-
mogeneity and Wechler Adult Intel-
ligence Scale scores of black and white
police applicants. Journal of AppliedPsychology, 62, 57—63.
Matthews, G., & Dorn, L. (1989). IQ andchoice reaction time: An information
processing analysis. Intelligence, 13,
299-317.
McGarvey, B., Gabrielli, W.F., Jr., Bentler, P.M., & Mednick,S. A. (1981). Rearing so-cial class, education, and criminality: Amultiple indicator model. Journal of
Abnormal Psychology, 90, 354-364.
McGlone,J. (1980). Sex differences in brain
asymmetry: A critical survey. Behav-
ioral and Brain Sciences, 3, 215-264.
McGue, M., & Bouchard,T.J., Jr. (1989). Ge-netic and environmental determinantof information processing and special
mental abilities: A twin analysis. In R.
J. Sternberg (Ed.), Advances in the psy-
chology of human intelligence (Vol. 5).Hillsdale, NJ: Erlbaum.
McGurk,F.C.J. (1953). On white and Negrotest performance and socioeconomicfactors. Journal of Abnormal and SocialPsychology, 48, 448—450.
McMichael, A.J., Baghurst, P. A., Wigg, N.
R., Vimpani, G. V., Robertson, E. F., &
Roberts, R. J. (1988). Port Pirie cohort
study: Environmental exposure to leadand children’s abilities at the age of fouryears. New England Journal of Medi-cine, 319, 468-475.
Mehrota, S. N., & Maxwell, J. (1950). The
intelligence of twins: A comparative

372
study of eleven-year-old twins. Popula-tion Studies, 3, 295-302.
Mercer, J. R. (1973). Labeling the retarded.Berkeley, CA: University of CaliforniaPress.
Mercer, J. R. (1979). System of multiculturalpluralistic assessment (SOMPA): Tech-
nical manual. New York:PsychologicalCorporation.
Mercer, J. R. (1984). What is a racially andculturally nondiscriminatory test? Asociological and pluralistic perspective.In C. R. Reynolds and R.T. Brown (Eds.},
Perspectives on bias in mentaltesting.
New York: Plenum.Messick, S. (1980). The effectiveness of
coaching for the SAT: Review and re-analysis of research from thefifties toFTC. Princeton, NJ: Educational Test-ing Service.
Messick,S., Jungeblut, A. (1981). Time and
method in coaching for the SAT. Psy-
chological Bulletin, 89, 191-216.Miller, D. J., Ryan, E. B., Aberger, E.,
McGuire, M. D., Short, E. J., & Kenny,D.A. (1979). Relationships between as-
sessment of habituation and cognitiveperformance in the early years oflife.International Journal of Behavioral De-velopment, 2, 159-170.
Moffitt, T. E., Gabrielli, W. F., Mednick,S.
A., & Schulsinger, F. (1981). Socio-economic status, IQ and delinquency.Journal of Abnormal Psychology, 90,152-156.
Montie,J. E., & Fagan,J. F., Ill. (1988). Racial
differences in IQ: Item analysis of the
Stanford—Binetat 3 years. Intelligence,
12, 315-332.Moore,E.G.J. (1985). Ethnicity as a variable
in child development. In M.B. Spencer,G. K. Brookins, & W. R. Allen (Eds.},
Beginnings: The social and affective de-
velopmentof black children. Hillsdale,NJ: Erlbaum.
Moore, E.G.J. (1986). Family socializationand the IQ test performance of tradi-tionally and transracially adopted black
children. Developmental Psychology,22, 317-326.
Naglieri, J. A., & Jensen, A. R. (1987). Com-
parison of black—white differences on
the WISC-R and K-ABC:Spearman’s hy-pothesis. Intelligence, 11, 21—43.
LITERATURE CITED
Nagoshi, C.T., & Johnson,R.C. (1985). Eth-
nic group-by-generation interaction in
the Hawaii Family Study of Cognition.Intelligence, 9, 259-264.
Nathan, M., & Guttman, R. (1984). Sim-ilarities in test scores and profiles of
kibbutz twins and singletons. Acta Ge-neticae Medicae at Gemellogiae, 33,
213-218.Needleman, H. C., Gunnoe, C., Leviton, A.,
Reed, R., Peresie, H., Maher, C., & Bar-rett, P. (1979). Deficits in psychologicand classroom performanceof children
with elevated dentine lead levels. New
England Journal of Medicine, 300, 689-—695.
Neel, J. V., Schull, W. J., Yamamoto, M.,Uchida, S., Yanase, T., & Fujiki, N.(1970). The effects of parental con-
sanguinity and inbreeding in Hirado,Ja-
pan: II. Physical development, tapping
rate, blood pressure, intelligence quo-tient, and school performance. Ameri-can Journal of Human Genetics, 22,
263-286.
Nettlebeck, T. (1973). Individual differencesin noise and associated perceptual in-
dices of performance. Perception, 2, 11—21.
Nettlebeck, T. (1987). Inspection time andintelligence. In P. A. Vernon (Ed.}, Speedof information processing and intel-ligence. Norwood, NJ: Ablex.
Nettlebeck, T., Edwards, C., & Vreugdenhil,A. (1986). Inspection time and IQ: Evi-dence for a mental speed—ability asso-
ciation. Personality and IndividualDif-
ferences, 7, 633-641.
Nettlebeck, T., & Kirby, N. H. (1983). Mea-sures of timed performance andintel-ligence. Intelligence, 7, 39—52.
Nettlebeck, T., & Lally, M. (1976). Inspec-
tion time and measured intelligence.
British Journal of Psychology, 67, 17-
22.Newman, H. H., Freeman, F. N., &
Holzinger, K. H. (1937). Twins: A studyof heredity and environment. Chicago:
University of Chicago Press.
Nichols, P. I. (1970). The effects of heredity
and environment on intelligence test
performancein 4 and 7 year white andNegro sibling pairs. Doctoral disserta-tion, University of Minnesota. Ann Ar-

LITERATURE CITED
bor, MI: University Microfilms, No.
71-18, 874.Oakland, T. (1979). Research on the ABIC
and ELP: A revisit to an old topic.School Psychology Digest, 8, 209-230.
O’Connor, M.J., Cohen, S., & Parmalee, A.
H. (1984). Infant auditory discrimina-
tion in preterm and full-term infants as
a predictor of 5-year intelligence. De-velopmental Psychology, 20, 159-170.
Osborne, R. T. (1978). Race and sex dif-ferences in heritability of mental test
performance: A study of negroid and
caucosoid twins. In R. ‘1. Osborne,C.E.
Noble, & N. Wey] (Eds.), Human varia-
tion: The biopsychology of age, race,and sex. New York: Academic Press.
Osborne, R. T., & Gregor, A.J. (1968). Racialdifferences in heritability estimates for
tests of spatial ability. Perceptual and
Motor Skills, 27, 735-739.
Paine, R. S. (1957). The variability in man-ifestations of untreated patients withphenylketonuria (phenylpyruvia acid-uria). Pediatrics, 20, 290-301.
Palincsar, A. A., & Brown, A. L. (1984).Reciprocal teaching of comprehension-
fostering and comprehension-monitor-
ing activities. Cognition and Instruc-tion, 1, 117-175.
Parks, R. W., Lowenstein, D. A., & Dondrell,K. L. (1988). Cerebral metabolic effectsof a verbal fluency test. A PET scan
study. Journal of Clinical and Experi-
mental Neuropsychology, 10, 565-575.
Partanen, J., Bruun, K., & Markkanen, T.(1966). A study of intelligence, person-ality, and use of alcoholof adult twins.Stockholm: Almqvist & Wiksell.
Pasamanick, B., & Knobloch, H.(1966). Ret-
rospective studies of the epidemiologyof reproductive casualty, old and new.Merrill-Palmer Quarterly, 12, 7-26.
Paterson, D. G. (1930). Physique andintel-
lect. New York: Century.Peak, H., & Boring, E. G. (1926). The factor
of speed in intelligence. Journal of Ex-
perimental Psychology, 9, 71-94.
Pearson, K. (1901la). On the systematic fit-
ting of curves to observations and mea-
surements. Biometrika, 1, 265-303.Pearson, K. (1901b). The lines of closestfit
to a system of points. PhilosophicalMagazine, 2, 559-572.
373
Pedersen, N. L., McLearn, G.E., Plomin, P.,
& Friberg, L. (1985). Separated fraternal
twins: Resemblancefor cognitive abili-ties. Behavior Genetics, 15, 407-419.
Perrett, D. L., Mistlin, A. J., & Chitty, A.J.
(1987). Visual neurones responsive to
faces. Trends in Neuroscience, 10, 358—364.
Peterson, J. (1926). Early conceptions andtests of intelligence. Westford, CT:Greenwood Press.
Phillips, K., & Fulker, D. W. (1989). Quan-
titative genetic analysis of longitudinal
trends in adoption designs with applica-
tion to IQ in the Colorado Adoption
Project. Behavior Genetics, 19, 621-—658.
Pinneau, S. R. (1961). Changes in intel-ligence quotient: Infancy to maturity.
New York: Houghton-Mifflin.
Plomin, R. (1986). Development, genetics,
and psychology. Hillsdale, NJ: Erlbaum.Plomin, R. (1987). Genetics of intelligence.
In S. Modgil & L. Modgil (Eds.}, ArthurJensen: Consensus and controversy.New York: Falmer.
Plomin, R. (1988). The nature and nurture of
cognitive abilities. In R. J. Sternberg
(Ed.), Advances in the psychology of
human intelligence. Vol. 4. Hillsdale,NJ: Erlbaum.
Plomin, R., & Daniels, D. (1987). Why arechildren in the samefamily so different
from each other? Behavioral and Brain
Sciences, 10, 1-16.
Plomin, R., & DeFries, J. C. (1985). Origins
of individual differences in infancy:The Colorado Adoption Study. Orlan-do, FL: Academic Press.
Plomin, R., & Loehlin, J. C. (1989). Directand indirect IQ heritability estimates.Behavior Genetics, 19, 331-342.
Plomin, R., Chipuer, H. M., & Loehlin,J. C.
(1990). Behavioral genetics and person-ality. In L. A. Pervin (Ed), Handbook ofpersonality: Theory and research. NewYork: Guilford Press.
Plomin, R., DeFries, J. C., & Fulker, D. W.
(1988). Nature and nurture during in-
fancy and early childhood. New York:
Cambridge University Press.Posner, M.I., Boies, S. J., Eichelman, W.H.,
& Taylor, R. L. (1969). Retention of visu-al and nameorderofsingle letters. Jour-

374
nal of Experimental Psychology, 79, 1-
16.
Prioleau, L., Murdock, M., & Brody, N.
(1983). An analysis of psychotherapy
versus placebo studies. Behavioral andBrain Sciences, 6, 275—310.
Quay, L. C. (1971). Language, dialect, rein-forcement, and theintelligencetest per-
formance of Negro children. Child De-
velopment, 42, 5-15.
Quay, L. C. (1972). Negro dialect and Binetperformance in severely disadvantagedblack four-year-olds. Child Develop-ment, 43, 245-250.
Quay, L. C. (1974). Language dialect, age,and intelligence-test performance indisadvantaged black children. ChildDevelopment, 45, 463—468.
Raaheim,K. (1974). Problem solving andin-
telligence. Oslo, Norway: Universitets
Forlaget.
Ramey, C. T., & Haskins, R. (1981). Themodification of intelligence throughearly experience. Intelligence, 5, 5-19.
Ramey, C. T., Holmberg, M. C., Sparling, J.
H., & Collier, A. M. (1977). An intro-
duction to the Carolina AbecedarianProject. In B. M. Caldwell and D.J. Sted-man (Eds.), Infant education: A guidefor helping handicappedchildren in the
first three years. New York: Walker.
Ramey, C.T., Lee, M. W., & Burchinal, M. R.
(1990). Developmental plasticity and
predictability: Consequences of ecolog-ical change. In M. H. Bornstein and N.A. Krasnegor (Eds.}, Stability and con-tinuity in social development. Hills-
dale, NJ: Erlbaum.
Ramist, L., & Arbeiter, S. (1986). Profiles,
college boundseniors, 1985. New York:College Entrance Examination Board.
Raz, N., Millman, D., & Sarpel, G. (1990).Cerebral correlates of cognitive aging:Gray—white matter differentiation inthe medial temporal lobes, and fluid
versus crystallized abilities. Psycho-
biology, 18, 475-481.
Raz, N., Moberg,P. J., & Millman, D.(1990).Effects of age and age-related differencesin auditory information processing onfluid and crystallized intelligence. Per-
sonality and Individual Differences,
11, 1147-1152.
LITERATURE CITED
Raz, N., & Willerman, L. (1985). Aptitude-related differences in auditory informa-
tion processing: Effects of selective at-
tention and tone duration. Personality
and IndividualDifferences, 6, 299-304.Raz, N., Willerman, L., Igmundson, P., &
Hanlon, M.(1983). Aptitude-related dif-ferences in auditory recognition mask-
ing. Intelligence, 7, 71—90.
Raz, N., Willerman, L., & Yama, M.(1987).
On sense andsenses:Intelligence andauditory information processing. Per-
sonality and Individual Differences, 8,201-210.
Reed, T. E., & Jensen, A. R. (1991). Armnerve conduction velocity (NCV), brainNCV, reaction time, and intelligence.Intelligence, 15, 33—47.
Rehberg, R. A., & Rosenthal, E. R. (1978).
Class and merit in the American high
school: An assessment of the revision-ist and meritocratic arguments. New
York: Longman.
Resnick, S. M., Berenbaum, S. A., Got-tesman,I. I., & Bouchard,T.J., Jr. (1986).
Early hormonalinfluences on cognitive
functioning in congenital adrenal hy-perplasia. Developmental Psychology,22, 191-198.
Revelle, W., Humphreys, M.S., Simon, L., &
Gilliland, K. (1980). The interactive ef-
fect of personality, time of day, and caf-
feine: A test of the arousal model. Jour-
nal of Experimental Psychology:
General, 109, 1-31.Reynolds, C. R., & Brown,R.T. (Eds.) (1984).
Perspectives on bias in mental testing.
New York: Plenum.
Roberts, R. D., Beh, H. C., & Stankov, L.
(1988). Hick’s law, competing-task per-formance, and intelligence. Intelli-gence, 12, 111-130.
Robinson, D. L., Haier, R. J., Braden, W., &Krengel, M. (1984). Psychometric intel-ligence and visual evoked potentials: A
review. Personality and Individual Dif-
ferences, 5, 487-489.
Rose, D. H., Slater, A., & Perry, H. (1986).Prediction of childhood intelligencefrom habituationin early infancy. Intel-
ligence, 10, 251-263.
Rose, R. R., & Kaprio, J. (1987). Shared expe-
rience and similarity of personality:

LITERATURE CITED
Positive data from Finnish and Ameri-
can twins. Behavioral and Brain Sci-
ences, 10, 35-36.Rose, S. A., & Wallace, I. F. (1985). Visual
recognition memory: A predictor oflater cognitive functioning in preterms.
Child Development, 56, 843-852.
Rosenthal, R., Hall, J. H., DiMatteo, M. R.,Rogers, P. L., & Archer, D. (1979). Sen-
sitivity to nonverbal communication:The PONStest. Baltimore: Johns Hop-kins University Press.
Rosner, M., & Belkin, M. (1987). Intelligence,education and myopia in males. Ar-chives of Ophthalmology, 105, 1508-1511. 7
Royce, J. M., Darlington, R. B., & Murray, H.
W. (1983). Pooled analyses: Findingsacross studies. In Consortium for Longi-
tudinal Studies (Ed.}, As the twig is bent.. lasting effects of preschool programs.
Hillsdale, NJ: Erlbaum.
Ruch, W. W. (1972). A reanalysis of pub-
lished differential validity studies. Pa-
per presented at meeting of AmericanPsychological Association, Honolulu,Hawaii, September 1972.
Rush,D., Stein, Z., & Susser, M. (1980). Dietin pregnancy: A randomized controlled
trial of nutritional supplements. New
York: Liss.
Rush, D., Stein, Z., Susser, M., & Brody, N.(1980). Outcomeat one year of age: Ef-fects of somatic and psychological mea-sures. In D. Rush, Z. Stein, and M.Sus-
ser (Eds.), Diet in pregnancy: A
randomized controlled trial of nutri-
tional supplements. New York: Liss.
Rushton, J. P. (1990). Race, brain size andintelligence: A rejoinder to Cain andVanderwolf. Personality and IndividualDifferences, 11, 785—794.
Rutter, M., Maughan, B., Mortimore, P.,
Ouston, J., & Smith, A. (1979). Fifteen
thousand hours: Secondary schools
and their effects on children. London:
Open Books.Salthouse, T. A. (1982). Adult cognition: An
experimental psychology of human
aging. New York: Springer-Verlag.
Salthouse, T. A. (1985). A theory of cognitive
aging. Amsterdam: Elsevier North-
Holland.
375
Salthouse, T. A. (1988). The role of process-
ing resources in cognitive aging. In M.
L. Howe & C.J. Brainerd (Eds.), Cog-nitive developmentin adulthood:Prog-ress in cognitive developmentresearch.New York: Springer-Verlag.
Sausanne, G.(1979). On the relationship be-
tween psychometric and anthropo-
metric traits. American Journal of Phys-ical Anthropology, 51, 421-423.
Scarr, S. (1981). Race, social class and indi-vidual differences, new studies of oldproblems. Hillsdale, NJ: Erlbaum.
Scarr, S., & McCartney, K. (1983). Howpeople make their own environments.Child Development, 54, 424-435.
Scarr, S., Pakstis, A. J., Katz, S. H., & Barker,
W. B. (1977). Absence of a relationship
between degree of white ancestry andintellectual skills in a black population.Human Genetics, 39, 69-86.
Scarr, S., & Weinberg, R. A. (1976). 1.Q. test
performance of black children adopted
by white families. American Psychol-ogist, 31, 726—739.
Scarr, S., & Weinberg, R. A. (1983). The Min-nesota Adoption Studies: Genetic dif-ferences and malleability. Child Devel-opment, 54, 260-267.
Scarr-Salapatek, S. (1971). Race, social class,
and I.Q. Science, 174, 1285-1295.
Schafer, E. P. W. (1982). Neural adaptability:A biological determinant of behavioralintelligence. International Journal ofNeuroscience, 17, 183-191.
Schaie, K. W. (1980). Age changes in intel-
ligence. In R. L. Sprott (Ed.), Age, learn-
ing, ability, and intelligence. New
York: Van Nostrand Reinhold.Schaie, K. W.(1988). Internal validity threats
in studies of adult cognitive develop-ment. In M. L. Howe & C.J. Brainerd
(Eds.), Cognitive developmentin adult-hood. New York: Springer-Verlag.
Schaie, K. W. (1990). The optimization ofcognition functioning in old age: Predic-
tions based on cohort-sequential andlongitudinal data. In P. M. Baltes &M. M.Baltes (Eds.}, Successful aging:
Perspectives from the behavioral sci-
ences. Cambridge: Cambridge Univer-
sity Press.
Schaie, K. W., & Hertzog, C. (1983). Four-

376
teen-year cohort-sequential analyses ofadult intellectual development. Devel-opmental Psychology, 19, 531-543.
Schaie, K. W., & Strother, C. R. (1968). Across-sequential study of age changesin
cognitive behaviors. Psychological Bul-
letin, 70, 671-680.
Schaie, K. W., & Willis, S. L. (1986). Candecline in adult intellectual function-ing be reversed? Developmental Psy-chology, 22, 223-232.
Schaie, K. W,, Willis, S. L., Jay, G., &
Chipuer, H. (1989). Structural invar-
iance of cognitive abilities across theadult life span: A cross-sectional study.Developmental Psychology, 25, 652-662.
Schiff, M., Duyme, M., Dumaret, A., &
Tomkiewicz, S. (1982). How much
could we boost scholastic achievement
and IQ scores? A direct answer from a
French adoption study. Cognition, 12,165-196.
Schiff, M., & Lewontin,R.(1986). Educationand class: The irrelevance of IQ genetic
studies. Oxford: Clarendon Press.
Schoenthaler, S. J., Amos, S. P., Eysenck, H.
J., Peritz, E., & Yudkin, J. (1991). Con-trolled trial of vitamin-mineral supple-mentation: Effects of intelligence andperformance. Personality and_ Indi-vidual Differences, 12, 351-362.
Schull, W. J., & Neel, J. V. (1965). The effects
of inbreeding on Japanese children.
New York: Harper & Row.
Scribner, S., & Cole, M. (1981). The psychol-ogy of literacy. Cambridge, MA: Har-vard University Press.
Segal, N. L. (1985). Monozygotic and dyzy-gotic twins: A comparative analysis of
mental ability profiles. Child Develop-
ment, 56, 1051-1058.
Shagass, C., Roemer, R. A., Straumanis,J.J.,& Josiassen, R. C. (1981). Intelligence asa factor in evoked potential studies inpsychopathology. Comparison of lowand high IQ subjects. Biological Psychi-
atry, 11, 1007-1029.
Sharp,S. E. (1898-1899). Individual psychol-
ogy: A study in psychological method.American Journal of Psychology, 15,201-293.
Shepard, L. A. (1987). The case for bias in
tests of achievementand scholastic ap-
LITERATURE CITED
titude. In S. Modgil & C. Modgil (Eds.},
Arthur Jensen: Consensus and contro-versy. New York: Fulmer.
Shepard, L., Camilli, G., & Williams, D. M.
(1984). Accounting for statistical ar-
tifacts in item bias research. Journal of
Educational Statistics, 9, 93-128.
Shepard, R., & Metzler, J. (1971). Mental ro-tation of three dimensional objects. Sci-ence, 171, 701—703.
Shields, J. (1962). Monozygotic twins
brought up apart and brought up to-
gether. London: Oxford UniversityPress.
Shuey, A. M.(1966). The testing of negro in-telligence. (2nd ed.). New York: SocialScience Press.
Shute, V. J., Pellegrino, J. W., Hubert, L., &
Reynolds, R. W. (1983). The relationship
between androgen levels and humanspatial abilities. Bulletin of the Psycho-nomic Society, 21, 465-468.
Shuter-Dyson, R., & Gabriel, C. (1983). Thepsychology of musical ability (2nd ed.).
London: Methuen.
Sigman, M.D.(1983). Individual differences
in infant attention: Relations to birth
status and intelligence at five years. InT. Field & A. Sostek (Eds.}, Infants bornat risk: Physiological, perceptual, and
cognitive processes. New York: Grune& Stratton.
Sigman, M. D., Cohen,S. E., Beckwith, L., &
Parmalee, A. H. (1986). Infant attention
in relation to intellectual abilities in
childhood. Developmental Psychology,22, 788-792.
Sigman, M., Neumann,C., Jansen, A.A.J.,
& Bwibo, N. (1989). Cognitive abilitiesof Kenyan children in relation to nutri-
tion, family characteristics, and educa-
tion. Child Development, 60, 1463-
1474.
Skodak, M., & Skeels, M. H. (1949). A finalfollow-up study of one hundred adoptedchildren. Journal of Genetic Psychology,75, 85-125.
Slavin, R. E. (1987). Mastery learning recon-
sidered. Review of Educational Re-
search, 57, 175-213.
Slavin, R. E., Karweit, N. L., & Madden, N.A. (1989). Effective programs for stu-dents at risk. Boston: Allyn and Bacon.
Slavin, R. E., Madden, N.A., Karweit, N.L.,
LITERATURE CITED
Livermon,B.J., & Dolan, L. (1990). Suc-
cess for all: First-year outcomes of a
comprehensive plan for reforming ur-
ban education. American EducationalResearch Journal, 27, 250-278.
Smith, G. M. (1967). Usefulness of peerrat-ings of personality in educational re-
search. Educational and PsychologicalMeasurement, 27, 967-984.
Smith, M. (1985). Recent work on lowlevellead exposure and its impact on behav-
ior, intelligence, and learning: A review.
Journal of the American Academy of
Child Psychiatry, 24, 24-32.
Snow,R.E. (1990). Aptitude processes. In R.E. Snow, P. A. Federico, & W. E. Mon-tague (Eds.}, Aptitude, learning, and in-struction: (Vol. 1. Cognitive processesanalysis of aptitude). Hillsdale, NJ:
Erlbaum.
Snow, R. E., & Yalow, E. (1982). Education
and intelligence. In R. Sternberg (Ed.),Handbook of human intelligence.Cambridge: Cambridge UniversityPress.
Snygg, D. (1938). The relation between the
intelligence of mothers and of their
children living in foster homes. Journalof Genetic Psychology, 52, 401-406.
Sokolov, Y. N. (1958/1963). Perception andthe conditionedreflex. (Translated byS.
W. Waydenfeld.) New York: Macmillan.
Sokolov, Y. N. (1969). The modeling proper-
ties of the nervous system. In M. Cole
& F. Maltzman (Ed.), A handbook ofcontemporary Soviet psychology. NewYork: Basic Books.
Sommer, R., & Sommer, B. A.(1983). Myste-ry in Milwaukee: Early interventions,
IQ, and psychology textbooks. Ameri-can Psychologist, 38, 982-985.
Spearman, C. (1904a). The proof and mea-surement of association between twothings. American Journal of Psychology,15, 72-101.
Spearman, C. (1904b). “General Intel-
ligence” objectively determined and
measured. American Journal of Psy-chology, 15, 201-293.
Spearman C. (1923). The nature of “intel-ligence”andtheprinciples of cognition.London: MacMillan.
Spearman, C. (1927). The abilities of man.London: MacMillan.
377
Spearman, C. (1930). C. Spearman. In C.
Murchison(Ed.}, A history of psycholo-
gy in autobiography(Vol. 1). Worcester,MA:Clark University Press.
Spearman, C., & Holzinger, K.J. (1924). Thesamplingerror in the theory of twofac-
tors. British Journal of Psychology, 15,17-19.
Spearman, C., & Krueger, F. (1906). Die Kor-relation zwischen Verschiedenen geistigen Leistungsfahigkeiten. Zeitschriftfur Psychologie und Physiologie derSinnesorgane, 44, 50-114.
Spitz, H. H. (1986). The rising of intel-
ligence. Hillsdale, NJ: Erlbaum.
Stankov, L. (1983). The role of competitionin humanabilities revealed through au-ditory tests. Multivariate Behavioral
Research Monographs,(83)1.
Stankov, L. (1986). Kvashchev’s experiment:
Can weboostintelligence? Intelligence,10, 209-230.
Stankov, L. (1987). Competing task andat-tentional resources: Exploring the lim-its of primary—secondary paradigm.
Australian Journal of Psychology, 39,123-137.
Stankov, L. (1988). Single tests, competingtasks and their relationship to broadfactors of intelligence. Personality andIndividual Differences, 9, 25-33.
Stankov, L., & Horn, J. L. (1980). Human
abilities revealed through auditory
tests. Journal of Educational Psycholo-gy, 72, 21-44.
Stein, Z. A., & Kassab, H. (1970). Nutri-tion. In J. Wortis (Ed.), Mental retarda-tion (Vol. 2). New York: Grune & Strat-ton.
Stein, Z. A., Susser, M., Saenger, G., & Mar-
olla, F. (1975). Famine and human de-
velopment. The Dutch hunger winter of1944/45. New York: Oxford UniversityPress.
Stern, W.(1912). Die psychologischen Meth-oden der Intelligenzprufung. Leipzig:
Barth.
Sternberg,R.J. (1977). Intelligence, informa-
tion processing and analogical reason-ing: The componential analysis ofhuman abilities. Hillsdale, NJ: Erl-baum.
Sternberg, R. J. (1980). Sketch of a compo-
nential subtheory of human _intel-
378
ligence. Behavioral and Brain Sciences,
3, 573-614.
Sternberg,R.J. (1981). Intelligence and non-
entrenchment. journal of EducationalPsychology, 73, 1-16.
Sternberg, R. J. (1982). Natural, unnatural,and supernatural concepts. Cognitive
Psychology, 14, 451-488.
Sternberg, R. J. (1985). Beyond IQ: A tri-
archic theory of intelligence. New York:
Cambridge University Press.Sternberg, R.J. (1986). The triarchic mind: A
newtheory of humanintelligence. New
York: Viking.Sternberg, R. J. (1990). Critiques of the
smart: A reply to Humphreys and Lar-
son. Intelligence, 14, 239-244.Sternberg, R. J., & Gardner, M. K. (1983).
Unities in inductive reasoning. Journal
of Experimental Psychology: General,
112, 80-116.Sternberg, R.J., & Gastel, J. (1989a). Coping
with novelty in humanintelligence: Anempirical investigation. Intelligence,
13, 187-197.Sternberg, R.J., & Gastel, J. (1989b). If danc-
ers ate their shoes: Inductive reasoningwith factual and counterfactual prem-ises. Memory and Cognition, 17, 1-10.
Sternberg, R.J., & Powell, J. S. (1983). Com-prehending verbal comprehension.
American Psychologist, 38, 878-893.
Sternberg, R.J., Wagner, R. K., & Okagaki,L.(In press). Practical intelligence: Thenature and role of tacit knowledge in
work and at school.Sternberg, R. J., & Weil, E. M. (1980). An
aptitude—strategy interaction in linear
syllogistic reasoning. Journal of Educa-
tional Psychology, 72, 226-234.Sternberg, S. (1970). Memory-scanning:
Mental processing revealed by reactiontime experiments. In J. S. Antrobus(Ed.), Cognition and affect. Boston:Lit-
tle Brown.
Stevenson, H. W., Lee, S-Y., Chen, C., Lum-
mis, M., Stigler, J., Fan, L., & Ge, F.(1990). Mathematics achievement ofchildren in China and the UnitedStates. Child Development, 61, 1053-
1066.
Stevenson, H.W., Stigler, J. W., Lee, S., Luck-
er, G., Kitamura, S., & Hsu, C. (1985).
LITERATURE CITED
Cognitive performance and academic
achievement of Japanese, Chinese, and
American children. Child Develop-
ment, 56, 718-734.
Stevenson, J., Graham, P., Fredman, G., &McLoughlin, V. (1987). A twin study ofgenetic influences on reading andspell-
ing ability and disability. Journal of
Child Psychology and Psychiatry, 28,
229-247.Stodolsky, S. S., and Lesser, G. (1967). Learn-
ing patterns in the disadvantaged. Har-vard Educational Review, 37, 546—593.
Stough, C. K. K., Nettlebeck, T., & Cooper,C. J. (1990). Evoked brain potentials,
string length and intelligence. Person-
ality and Individual Differences, 11,
401-406.Streissguth, A. P., Barr, H. M., Sampson,P.
D., Darby, B. L., & Martin, O. C. (1990).
IQ at age 4 in relation to maternal alco-
hol use and smoking during pregnancy.Developmental Psychology, 25, 3-11.
Sue, S., Okazaki, S. (1990). Asian-Americaneducational achievements: A phenome-
nonin search of an explanation. Ameri-
can Psychologist, 45, 913-920.Sue, S., & Okazaki, S. (1991). Explanations
for Asian—American achievements: Areply. American Psychologist, 46, 878-
880.
Sundet, J. M., Tambs, K., Magnus, P., & Berg,
K. (1988). On the question of seculartrendsin the heritability of intelligencetest scores: A study of Norwegian
twins. Intelligence, 12, 47-59.Tambs, K., Sundet, J. M., Magnus,P. (1984).
Heritability analysis of the WAIS sub-
tests: A study of twins. Intelligence, 8,
283-293.Taylor, H. F. (1980). The IQ game: A meth-
odological inquiry into the heredity—environment controversy. New Bruns-
wick, NJ: Rutgers University Press.
Teasdale, T. W., Fuchs,J., & Goldschmidt, E.
(1988). Degree of myopia in relation to
intelligence and educationallevel. Lan-cet, 1, 1351-1354.
Teasdale, T. W., & Owen, O.R. (1984). He-redity and familial environmentin in-
telligence and educational level—asib-
ling study. Nature, 309, 620-622.
Teasdale, T. W., & Owen,O. R.(1989). Con-

LITERATURE CITED
tinuing secularincreasesin intelligence
and a stable prevalence of high intel-
ligence levels. Intelligence, 13, 255-262.
Teasdale, T. W., Sorenson, T. I. A., & Owen,O. R. (1989). A secular decline in the
association of height with intelligence
and educational level. British MedicalJournal, 298, 1291-1293.
Tenopyr, M. L., Guilford, J. P., & Hoepfner,R. A. (1966). A factor analysis of sym-bolic memory abilities. Reports from
the Psychological Laboratory (No. 38).
University of Southern California, LosAngeles.
Terman, L. M., & Childs, H. G. (1912). Atentative revision and extension of theBinet—Simon measuring scale of Intel-ligence. Journal of Educational Psychol-ogy, 3, 61—74.
Tetewsky, S. J., & Sternberg, R. J. (1986).
Conceptual and lexical determinantsofnonentrenched thinking. Journal ofMemory and Language, 25, 202-225.
Thompson, L. A., Detterman, D. K., &
Plomin, R. (1991). Associations be-
tween cognitive abilities and scholastic
achievement: Genetic overlap but en-
vironmental differences. PsychologicalScience, 2, 158—165.
Thomson, G.H.(1916). A hierarchy withouta general factor. British Journal of Psy-chology, 8, 271-281.
Thomson, G. H. (1939). The factorial an-
alysis of human ability. London:Houghton—Mifflin.
Thorndike, R. L. (1987). Stability of factorloadings. Personality and IndividualDifferences, 8, 585-586.
Thurstone,L. L. (1931). Multiple factor anal-
ysis. Psychological Review, 38, 406—427.
Thurstone, L. L. (1938). Primary mental
abilities. Chicago: University of Chi-cago Press.
Thurstone, L. L., & Thurstone,T. G.(1941).
Factorial studies of intelligence. Chi-
cago: University of Chicago Press.
Tizard, B. (1974). IQ and Race. Nature, 247,316.
Treisman, A. M.(1982). Perceptual groupingand attention in visual search for fea-
tures and for objects. Journal of Experi-
379
mental Psychology: Human Perceptionand Performance, 8, 194-214.
Treisman, A. M., & Gormican, S. (1988).Feature analysis in early vision: Evi-dence from search asymmetries. Psy-chological Review, 95, 15—48.
Treisman, A. M., & Souther, J. (1985). Search
asymmetry: A diagnostic for preatten-
tive processing of separable features.Journal of Experimental Psychology:General, 114, 285-310.
Tsunoda, T. (1978). Logos and pathos: Dif-
ferences in mechanism of vowel sound
and natural sound perception in Japa-
nese and Westerners and in regard to
mental structure. Journal of DentalHealth, 28, 35-43.
Tuddenham, R. D. (1948). Soldier intel-ligence in World WarI and II. American
Psychologist, 3, 54—56.
Van Court, M., & Bean, F. D. (1985). Intel-
ligence and fertility in the UnitedStates: 1912-1982. Intelligence, 9, 23-32.
Vandenberg, S. G. (1969). A twin study ofspatial ability. Multivariate BehavioralResearch, 4, 273-294.
Vandenberg, S. G. (1970). A comparison of
heritability estimates of U.S. Negro andwhite high school students. Acta Ge-neticae Medicae et Gemellologiae, 19,280-284.
Vandenberg, S. G., & Kuse, A. R. (1978).
Mentalrotations, a group test of three-
dimensional spatial visualization. Per-ceptual and MotorSkills, 47, 599-604.
Vandenberg, S. G., & Vogler, G. P. (1985).Genetic determinantsof intelligence.InB. B. Wolman(Ed.), Handbook of intel-
ligence: Theories, measurements andapplications. New York: Wiley.
Vandenberg, S. G., & Wilson, K. (1979).
Failure of the twin situation to influ-
ence twin differences in cognition. Be-havior Genetics, 9, 55—60.
Van Valen, L. (1974). Brain size and intel-ligence in man. American Journal ofPhysical Anthropology, 40, 417-424.
Vernon, P. A. (1983). Speed of information
processing andgeneralintelligence. In-telligence, 7, 53-70.
Vernon,P. A. (1989). The heritability of mea-sures of speed of information process-

380
ing. Personality and Individual Dif-
ferences, 10, 573-576.
Vernon, P. A. (1990). The effect of holding gconstant on the correlation between
verbal and nonverbal abilities: A com-ment on Lynn’s “Theintelligence of theMongoloids...” (1987). Personalityand Individual Differences, 11, 751-
754.Vernon,P. A.(In press}. The useof biological
measures to estimate behavioral intel-
ligence. In P. A. Vernon(Ed.), Biologicalapproaches to humanintelligence. Nor-
wood, NJ: Ablex.Vernon, P. A., & Jensen, A. R. (1984). Indi-
vidual and group differences in intel-ligence and speed of information pro-cessing. Personality and Individual
Differences, 5, 911-23.
Vernon, P. A., & Mori, M. (1989). Intel-ligence, reaction times and nerve con-ductance velocity. Behavior Genetics(Abstracts}, 19, 779.
Vernon,P. A., Nador, S., & Kantor, L. (1985).
Reaction timesand speed-of-processing:
Their relationship to timed and un-
timed measures of intelligence. [ntel-
ligence, 9, 357-374.Vernon,P. E. (1961). The structure of human
abilities (2nd ed.). London: Methuen.
Vernon, P. E. (1982). The abilities and
achievements of Orientals in North
America. New York: Academic Press.Vickers, D. (1970). Evidence for the ac-
cumulator model of psychophysicaldiscrimination. Ergonomics, 13, 37-
58.Vickers, D., Nettelbeck, T., & Willson,R.J.
(1972). Perceptual indices of perfor-
mance: The measurement of “inspec-tion time” and “noise” in the visualsystem. Perception, 1, 263—295.
Vining, D. R. (1982). On the possibility ofthe re-emergence of a dysgenic trend
with respect to intelligence in Ameri-
can fertility differentials. Intelligence,
6, 241-264.Vogel, W., & Broverman,D.M.(1964). Rela-
tionship between EEG andtestintel-ligence. A critical review. Psychological
Bulletin, 62, 132-144.
Voyer, D., & Bryden, M.P. (1990). Gender,
level of spatial ability, and lateralization
LITERATURE CITED
of mental rotation. Brain and Cogni-
tion, 13, 18-29.
Waber, D.P. (1976). Sex differences in cogni-tion: A function of maturationrate. Sci-ence, 192, 572-574.
Waber, D.P. (1979). Cognitive abilities andsex related variations in the maturationof cerebral cortical functions. In M.A.
Wittig & A. C. Peterson (Eds.}, Sex relat-
ed differences in cognitive functioning.
New York: AcademicPress.Wagner, R. K. (1987). Tacit knowledge in
everyday social behavior. Journal of Per-sonality and Social Psychology, 52,
1236-1247.
Wagner, R. K., & Sternberg, R.J. (1986). Tacitknowledge and intelligence in everydaylife. In R. J. Sternberg & W. K. Wagner(Eds.), Practical intelligence. Cam-
bridge: Cambridge University Press.
Welford, A. T. (Ed.) (1980). Reaction Times.New York: Academic Press.
West, D.J., & Farrington, D. P. (1973). Whobecomes delinquent: London: Heine-
mann.White, K. R. (1982). The relation between
socioeconomic status and academicachievement. Psychological Bulletin,
81, 461-481.Widaman,K.F., & Carlson,J. S. (1989). Pro-
cedural effects on performance in the
Hick paradigm: Bias in reaction timeand movement time parameters. Intel-
ligence, 13, 63-85.Willerman, L. (1979). Effects of families on
intellectual development. American
Psychologist, 34, 923-929.
Willerman, L., & Bailey, J. M. (1987). A note
on Thomson’s sampling theory for cor-
relations among mental tests. Person-ality and Individual Differences, 8,
943-944.
Willerman, L., Schultz, R., Rutledge, J. N.,& Bigler, E. (1989). Magnetic resonance
imaged brain structures and _intel-
ligence. Paper presented to the 19th an-
nual meeting of the Behavior GeneticsAssociation, Charlottesville, VA.
Williams, R. L. (1972). The BITCH Test(Black Intelligence Test of Cultural Ho-
mogeneity). St. Louis, MO: Washington
University.Williams, R. L. (1974). Scientific racism and

LITERATURE CITED
IQ: The silent mugging of the black
community. Psychology Today, 7, 32-41.
Willis, S. L., & Baltes, P. B. (1980). Intel-ligence in adulthood and aging: Con-temporary issues. In L. W. Poon (Ed.},
Aging in the 1980s: Psychological is-
sues. Washington, DC: American Psy-
chological Association.Willis, S. L., & Schaie, K. W. (1986). Practical
intelligence in later adulthood. In R.J.Sternberg & R. K. Wagner(Eds.), Prac-tical intelligence: Nature andorigins of
competence in the everyday world.
Cambridge: Cambridge University
Press.Willms, J. D. (1985). Catholic school effects
on academic achievement: New evi-dence from the High School and Beyond
follow-up study. Sociology of Educa-tion, 58, 98-114.
Wilson, R. S. (1983). The Louisville TwinStudy: Developmental synchronies inbehavior. Child Development, 54, 298—316.
Wilson,R.S. (1986). Continuity and change
in cognitive ability profile. Behavior
Genetics, 16, 45-60.
Winick, M., Meyer, K., & Harris, R. (1975).Malnutrition and environmental en-richment by adoption. Science, 190,1173-1175.
Wissler, C. (1901). The correlates of mental
and physical tests. Psychological Re-
view, (Monograph No.3).
Witty, P. A., & Jenkins, M. D. (1936). Intra-race testing and Negro intelligence.Journal of Psychology, 1, 179-192.
Wolf, R. M. (1965). The measurementof en-vironments. In C. W. Harris (Ed.}, Pro-ceedings of the 1964 Invited Con-ference on Testing Problems. Princeton,NJ: Educational Testing Service.
Wolf, T. H. (1973). Alfred Binet. Chicago:
University of Chicago Press.
Yamane, S., Kaij, S., & Kawano, K. (1988).Whatfacial features activate face neu-rons in the inferotemporal cortex? Ex-
381
perimental Brain Research, 73, 209-
214.
Yarrow, L. J., Klein, R. P., Lomonoco, S., &Morgan, G. A. (1975). Cognitive andmotivational development in early
childhood. In B. X. Friedlander, G. M.,
Sterritt, and G. E. Kirk (Eds.), Excep-
tional infant (Vol. 3). New York: Brun-ner/Mazel.
Yudkin, J. (1988). Letter to the editor. Lan-cet, 1, 407.
Zajonc, R. B. (1976). Family configuration
andintelligence. Science, 192, 227-236.
Zajonc, R. B. (1983). Validating the con-
fluence model. Psychological Bulletin,
93, 457-480.Zajonc, R. B., & Bargh, J. (1980). The con-
fluence model: Parameter estimationfor six divergent data sets on family fac-
tors and intelligence. Intelligence, 4,349-361.
Zajonc, R. B., & Markus, G.B. (1975). Birthorder and intellectual development.Psychological Review, 82, 74-88.
Zajonc, R. B., Markus, H., & Markus,G.B.(1979). The birth order puzzle. Journal
of Personality and Social Psychology,37, 1325-1341.
Zhang, Y., Caryl, P. G., & Deary,I.J. (1989a).Evoked potential correlates of inspec-tion time andintelligence. Personalityand Individual Differences, 10, 379-384.
Zhang, Y., Caryl, P. G., & Deary,I. J. (1989b).
Evokedpotentials, inspection time and
intelligence. Personality and Individ-
ual Differences, 10, 1079~—1094.
Zigler, E., Abelson, W. D., & Seitz, V. (1973).
Motivational factors in the performanceof economically disadvantaged childrenon the Peabody Picture Vocabulary Test.Child Development, 44, 295-303.
Zigler, E., & Valentine, J. (1979). Project
HeadStart: A legacy of the war on pov-
erty. New York: Free Press.
Zuckerman, M. (1991). Psychobiology ofpersonality. New York: Cambridge Uni-versity Press.


AUTHOR INDEX
Abdel-Rahim, A. R., 152
Abelson, W. D., 178Adelman, H., 253
Agrawal, N., 157
Alderton, D. ., 59-60, 109-112, 114Alexander, K. L., 263Alexander, T., 173Allport, D. A., 39Amos, S. P., 212
Anastasi, A., 181
Anderson,J. E., 233
Anderson, L. W., 266Anderson, M., 68, 70Anthony, J. L., 292Anthony, R. G., 341Arbeiter, S., 317
Arbitman-Smith, R., 185Archer, D., 338-340
Baghurst, P. A., 209-210Bailey, J. M., 12
Bajema, C., 276
Baker, L., 165-166
Baltes, P. B., 235, 247, 249
Bargh,J., 205
Barker, W. B., 308
Barr, H. M., 208
Barrett, P., 52, 56, 209, 221, 223
Bashi, J., 157Bayley, N., 232, 282Beady, C., 261-262
Bean, F. D., 277
Beckwith, L., 73
Beh, H. C., 97-99
Belkin, M., 220Belmont, L., 200Benbow,C. P., 220, 321-322
Benson, V. E., 253
Bentler, P. M., 275
Benton, A., 37
Berbaum, M.L., 205
Berenbaum,S. A., 326Berg, K., 151-152
Berger, S. M., 178Bergman, R. L., 178Bigler, E., 218
Binet, A., 1, 5-9, 218Bingham, E., 70Birch, H. G., 206Blagg, N., 185
Blau, P. M., 253
Blinkhom,S. F., 222-224Block, J. H., 266
Bloom, B.S., 233, 266-267Bobbitt, B. L., 91, 93, 96Bock, G., 175
Boies, S. J., 80, 89
Boring, E. G., 50
Bornstein, M. H., 71-76
Bouchard,T.J., Jr., 94, 96, 131, 133-137,
144, 148-149, 151, 154, 166, 324, 326Brackbill, Y., 203—204Braden, W., 224
Bradley, R., 162, 168, 170Brand, C. R., 63
Brandt, V., 306
Brebner, J., 63
Brewer, N., 59-60Brody, E. B., 30, 32, 141, 297Brody, N., 30, 32, 141, 196, 211, 285-286,
297, 334, 338, 346-348
Broman, S. H., 207—208, 218, 283, 301Brooke, D., 348
Brookover, W., 261-262
Brooks, A., 258
Brooks-Gunn,J., 74—75Broverman, D. M., 221
Brown, A. L., 268—270
Brown, |. T., 341
Brown, T. R., 287
Browning, H. L., 12Bruun, K., 164

384
Bryden, M.P., 325-326Buchsbaum, M.S., 12Burchinal, M. R., 175Burks, B. S., 143-145Burt, C., 6, 132
Busse, T. V., 173
Butler, S. R., 252Bwibo, N., 213-214
Cahan,S., 187
Caldwell, B., 162, 168, 170
Camilli, G., 295
Campbell, E. O., 311
Campbell, F. A., 175Campbell, J. T., 288Cantor, N., 342, 346
Capron, C., 147, 163
Cardon, L. R., 257
Carlson, J. S., 49, 52, 57
Caron, A.J., 74
Caron, R. F., 74Carpenter, P. A., 120-124Carroll, J. B., 16Carr-Saunders, A. M., 142-143, 145
Carter, L., 171:
Caruso, O. R., 174Caryl, P. G., 65, 67, 69, 221-22, 225
Cattell, J. McK., 2Cattell, R. B., 17-26, 50, 231, 276
Ceci, S.J., 41, 44-48, 77, 188
Chen, C., 264, 314
Childs, H. G., 8Chipuer, H. M., 154, 240, 347
Chitty, A.J., 38Clark, H., 284Clarke, A. D. B., 174
Clarke, A. M., 174Cohen,S. E., 73, 75
Cohen,J., 165
Cohen, N., 187
Cohn, C. M. G., 220
Cohn,S.J., 220
Cole, M., 186, 188Cole, S., 247Coleman, J. S., 262-263, 311
Collier, A. M., 175Conley,J. J., 346Cooley, W. W., 188
Cooper, C.J., 224
Cooper, L. A., 92Crinella, F. M., 225Crombie, I. K., 213Cronbach,L.J., 30, 234, 265-266, 355
Crooks, L. A., 288
Cumming, S., 70
AUTHOR INDEX
Dailey, J. T., 321
Damasio, A. R., 37
Damaye, H., 7
Daniel, M. H., 43Daniels, D., 145, 196, 206
Darby, B. L., 208
Darlington, R. B., 174, 178
Davidson, J., 89Davis, A., 291
Davis, B., 171
Deary,I., 5, 63, 65-67, 69-71, 221-222,
225
Decker, S. N., 165, 166
DefFries, J. C., 137, 158-160, 162-165,
172—173, 257-258Detterman, D.K., 43, 45, 52—53, 58, 153,
174, 258, 290
DiLalla, L. F., 257
DiMatteo, M. R., 338-340
Dimond,S.J., 315-316
Dittmann-Kohli, F., 247, 249Dixon, R. A., 249
Dodd,S.L., 10Dolan, A. B., 343-344Dolan, L., 268
Donaldson, G., 87, 235, 237, 246
Dondrell, K. L., 221
Dorn, L., 85, 87, 98Drillien, C. M., 208Dumaret, A., 147, 149
Duncan, B., 253-254
Duncan, O. D., 253-254
Dunham,J. L., 30Duyme, M., 147, 149, 163
Edwards, C., 67Eels, K., 291Egan, V., 65, 67Eichelman, W. H., 80, 89
Eliot, G., 348
Elliot, R., 289Elshout, J. J., 32
Engstrom, R., 246
Epstein, S., 330-334
Eron, L. D., 344
Eyferth, K., 306—308Eysenck,H.J., 16, 50, 52-55, 212, 221,
223, 307
Fagan, J. F., 71, 75, 283
Falek, A., 276Fan, L., 264, 314
Fancher, R. E., 5
Farand, L., 2
Farber, S. L., 132, 133

AUTHOR INDEX
Farrington, D. P., 275
Featherman, D.L., 253-254
Feingold, A., 320, 322
Fennema, E., 319
Fernandez, J. M., 63Feshbach, S., 253Feuerstein, R., 182-184
Fifer, F., 284
Figueroa, R. A., 294
Firkowska, A., 189Fischbein, S., 153, 161Flanagan, J. C., 321Flanagan,J. L., 188
Flaugher, R. I., 311Flint, D., 171Flood, P., 261-262Florey, C. D., 213
Flynn,J. R., 191, 193-194, 196, 200, 302-303, 307
Fodor, J. A., 39
Ford, M. E., 341Frearson, W. M., 53-55
Fredman, G., 131
Freeman, F. N., 132-133, 144-145, 148,
187
Friberg, L., 132, 136
Frost, N., 87, 89
Frydman, M., 314Fuchs, J., 220Fujiki, N., 157Fulker, D. W., 140, 158, 162-163, 165, 172,
257-258
Fuller, W., 253
Fulton, M., 209-210
Gabriel, C., 38
Gabrielli, W. F., Jr., 275
Gailbraith, R. C., 205
Galton, F., 1, 49-50, 280
Garber, H., 176Gardner, H., 34—40, 44Gardner, M. K., 104—108, 111, 115
Gastel, J., 99-103Ge, F.,, 264, 314Ghiselli, E. E., 272
Gibson, J. J., 46
Gilliland, K., 345
Gladwin, T., 230Glass, P., 74Glutting,J. J., 182Goldberg, I., 321
Goldberg, R. A., 89
Goldman,S. R., 109-112, 114
Goldschmidt, E., 220Gordon, R. A., 283, 294, 296
385
Gorham, W. A., 321
Gormican, S., 79
Gottesman,I. I., 326Gottfredson, L. S., 282Gottfried, A., 168, 171-172Gottfried, A. E., 171-172Graham,P., 131
Greeley, A. M., 263
Greeson, L. E., 178
Gregor, A. J., 298
Guilford, J. P., 28-34, 44Gunnoe, C., 209
Gussow, J. D., 206
Gustafsson,J. E., 26, 41, 286-287Gutride, M., 173Guttman, L., 25-26
Guttman,R., 131
Hahn, W. K., 325
Haier, R. J., 12, 221, 224
Hall, J. H., 338-340Hampson, E., 326—327
Hampson,S., 191, 194
Hanlon, M., 63-65
Harnqvist, K., 186—187
Harris, R., 211
Harrison, G. A., 308
Haskins, R., 175Hatta, T., 315-316
Hawel, W., 308
Haywood, H.C., 185
Hazlett, M. E., 12, 221
Head, B., 67
Hearnshaw,L.S., 132Hebb, D. O., 18
Heber, R., 176
Henderson, N. D., 151
Hendrickson, A. E., 222-223
Hendrickson, D. E., 222—225
Henri, V., 1
Hepburn, W., 209-210Herrman,L., 129
Herskovitz, M.J., 309Hertzog, C., 235-236, 241-243
Hick, W. E., 52
Higgins,J. V., 276
Hindelang, M.J., 275Hirchi, T., 275
Ho, H.Z., 165-166Hobson,C.J., 311Hoepfner, R., 28, 30, 32
Hoffer, T., 262-263
Hoffman, M.B., 183
Hogan, R., 341
Hogben, L., 129
386
Holzinger, K.J., 4
Holzinger, K. H., 132-133, 144-145, 148,
187Horn, J. L., 18, 20—23, 25, 31, 235, 237,
246Horn,J. M., 131, 137-139, 151, 158
Howe, M.J. A., 222
Hsu, C., 313Hubel, D. H., 79Hubert, L., 327Huesmann,L. R., 344
Humphreys, L. G., 11, 25, 102, 231-232,
234, 321, 323
Humphreys, M.S., 345
Hunt, E., 80-81, 87-89, 91Hunt, J. M., 228
Hunter, J. E., 272-274, 288
Hunter, R., 209-210Hunter, R. F., 272-274, 288
Hyde,J. S., 316-320
Igmundson, P., 63-65Irwin, R.J., 67
Jacklin, C. N., 318
Jacobsen, L. L., 178
Jansen, A.A.J., 213-214
Jay, G., 240
Jencks, C., 188-189, 255, 257, 259-263
Jenkins, M. D., 309Jensen, A. R., 41, 50-54, 56-61, 63, 66, 83,
85, 97—98, 156-157, 190-191, 216-220, 225, 280-281, 283-289, 291-301,
308, 313Johnson, R. C., 152, 164Jones, D. C., 142-143, 145
Jones, H. E., 232
Josiassen, R. C., 223
Joynson, R. B., 132
Juel-Nielsen, K., 132-133
Jungeblut, A., 181Just, M. A., 120-124
Kaij, S., 38
Kail, R., 228Kamin,L.J., 132—133, 141, 144, 156
Kantor, L., 82-83
Kaplan, R. M., 289
Kaprio,J., 197
Karlson,J. L., 220
Karweit, N. L., 268
Kassab, H., 210Katz, S. H., 308Kaufman, A.S., 165, 285Kaufman, N.L., 285
AUTHOR INDEX
Kawano, K., 38
Keating, D. P., 91-94, 96, 341
Kelderman, H., 32Kennedy, R. A., 213
Kennedy, W., 207-208, 218, 283, 301
Kent, J., 145
Kenyatta,J., 37
Kihlstrom,J. F., 342, 346
Kilgore, S., 262Kimura, D., 326-327
Kipnis, D., 343
Kirby, N. H., 67
Kitamura, S., 313
Klein, R. P., 75
Klieg], R., 247, 249Knapp,J. R., 31
Knobloch, H., 206Kramer, D. A., 249
Kranzler, J. H., 63, 66
Krengel, M., 224
Krueger, F., 13Kuse, A. R., 152, 164, 325Kvashchevy,R., 180, 195
LaBuda, M. C., 158-160, 165
Lally, M., 63
Lamon,S.J., 319
Lansdown, R., 209Lansman, M., 87, 89
Larson, G. E., 57, 59-60, 83-85, 87, 98,
102Lavin, D. E., 252
Lawrence, D. H., 199
Lawrence, E. M., 142. 145
Laxen, D., 209-210Leahy, A., 143-144
LeCarre’, J., 38
Lee, M. W., 175Lee, S. Y., 264, 313-314Lesser, G. S., 284
Leviton, A., 209
Levy, J., 325-326
Lewis,J., 87-89
Lewis, M., 74—75
Lewontin, R. C., 142, 147, 299
Liker, J., 44-48Lindzey, G., 280, 282-283, 297-298, 307-—
308Linn, M. C., 315-320
Linn, R. L., 288
List, J. A., 91-94
Livermon,B.J., 268Livingstone, M., 79
Locurto, C., 150
Loehlin, J. C., 131, 137-139, 150-151, 154,

AUTHOR INDEX
156, 158, 162, 280, 282-283, 297-298,
307-308, 347
Loevinger, J., 12-13Lohman,D.F., 27, 324Lomonaco,S., 75
Long, P. A., 292Longstreth, L. E., 56, 171
Lord, F. M., 295
Louge,I., 186
Lowenstein, D. A., 221
Lubin, M., 63Lubinski, D., 321, 323
Lucking, S., 52Ludlow, H.G., 291Lummis, M., 264, 314
Lunneborg, C., 87-89Lykken,D.T., 135
Lynn, R., 191, 194-196, 211, 301-302,
310-317
Maccoby, E. E., 318MacKenzie, B., 70, 299, 303, 309
Madden, A., 268
Magnus, P., 131, 151-152, 197
Maher, C., 209Mahoney, M., 288Marjoribanks, K., 203Markkanen, T., 164Markus, G.B., 205
Markus, H., 200—203, 205
Marrolla, F. A., 200, 202, 210
Marsh, H. W., 252
Marshalek,B., 27Martin, O. C., 208
Matarazzo, J. D., 42, 292
Matheny,A.P., Jr., 343-344
Matthews, G., 85, 87, 98
Maughan,B., 261
Maxwell, J., 129McCartney, K., 161McDermott, P. A., 182
McGarvey, B., 275McGlone, J., 325
McGrath,S. K., 71, 75
McGue, M., 94, 96, 131, 133, 135-137,
149, 151, 154, 166, 324
McGurk,F. C.J., 291-292
McLearn, G. E., 132, 136, 151, 164
McLoughlin, P., 131
McMichael, A.J., 209-210
McNeill, G., 213McPartland, J., 311
Mednick, S. A., 275
Mehrota, S. N., 129
Meier, P., 330—334
387
Mellenbergh,G.T., 32
Menzies, I., 213
Mercer, J. R., 289-290, 293, 300Merriman, W. E., 91—94
Merritt, C. R., 83
Messick, S., 181
Metzlar, J., 81, 94, 318
Meyer, K., 211
Milham,J., 178Miller, R., 183
Miller, O.J., 74Millman, O., 245-246Mistlin, A.J., 38Mitchell, B. C., 144-145, 148Moberg,P.J., 245Moffitt, T. E., 275
Montie,J. E., 283
Moody, A. M., 311
Moore,E. G.J., 305—307Moreland, R. L., 205Morgan, G. A., 75Mori, M., 220
Mortimore, P., 261
Murdock, M., 347
Murray, H., 174, 178
Nador, S., 82-83Naglieri, J. A., 285, 313Nagoshi, C. T., 152
Nathan, M., 131
Needleman, H.L., 29
Neel, J. V., 157
Nettlebeck, T., 62—63, 67, 69, 224Neuchterlein, K. H., 12, 221Neumann, C., 213-214
Newman, H. H., 132-133, 187
Nichols, P. L., 203-204, 207, 209, 218,
283, 298, 301
Oakland, T., 293O’Connor, M.J., 75
Okasaki, L., 334, 337Okazaki, S., 313
Orr, O. B., 321
Osborne, R. T., 298-299
Ostrowska, A., 189
Ouston,J., 261
Owen,J., 171, 194, 217
Owen,J. L., 308
Owen, O. R., 137, 145
Paek, J., 12
Paine, R. S., 127
Pakstis, A. J., 308Palincsar, A. A., 268-270

388
Pallas, A. M., 263
Parks, R. W., 221Parmalee, A. H., 73, 75Parsons, C. K., 234Partanen, J., 164
Pasamanick, B., 206
Paterson, D. G., 218
Peak, H., 50Pearson, K., 5
Pedersen, N. L., 132, 136Pellegrino, J. W., 109-112, 114, 228, 327
Peresie, H., 209
Peritz, E., 212
Perrett, D. L., 38Perry, H., 74Petersen, A. C., 318-319, 324
Peterson, J., 1, 8
Phillips, K., 140, 158Pinneau, S. R., 231, 234
Plomin, R., 132, 136-137, 145, 150-151,
153-155, 154, 158-160, 162-164,
172-173, 196, 206, 257-258, 290, 347
Polovina,J., 152, 164Posner, M.I., 80, 89, 94
Powell, J. S., 90
Powell, L. S., 173
Prioleau, L., 347
Proper, E. C., 175
Raab, G., 209
Raaheim, K., 99Ramey,C. T., 175
Ramist, L., 317
Rand, Y., 183Raz, N., 63-66, 68-71, 78, 82, 245-246
Ree, M., 173
Reed, E. W., 276
Reed, R., 209Reed, S. C., 276Reed, T. E., 221Rehberg, R. A., 255-256, 260
Resnick, S. M., 326
Revelle, W., 345
Reynolds, C. R., 284, 287Reynolds, R. W., 327Rickert, M., 171Roberts, R. D., 97-99
Roberts, R.J., 209-210
Robertson, E. F., 209
Robinson, D.L., 224
Rock, D. A., 288, 311Roemer, R. A., 223
Rogers, P. L., 338—340Rose, R. R., 197
Rose, S., 74-75
AUTHOR INDEX
Rosenthal, E. R., 255-256, 260
Rosenthal, R., 338-340Rosner, M., 220
Roth, E., 50Rovine, M. J., 154-155
Royce, J. M., 174, 178
Ruch, W. W., 288
Rush, D., 211Rutledge, J. N., 218Rutter, M., 261
Saccuzzo, D. P., 57, 83-85, 87, 98
Saenger, G., 202, 210Salthouse, T. A., 241-242, 244
Sampson, P. D., 208
Sarpel, G., 246Sausanne, G., 218
Scarr, S., 142, 145, 161, 298, 304—305,
307-308
Schafer, E. P. W., 225-226
Schaie, K. W., 235-240, 247-248Schell, P., 120-124Schiff, M., 142, 147, 149
Schmidt, F. L., 288Schoenthaler, S. J., 212
Schull, W.J., 157
Schulsinger, F., 275Schultz, R., 218
Schwartz, S., 89Schweitzer, J., 261-262
Scribner, S., 186, 188Segal, N. L., 131, 135, 144, 148, 165
Seitz, V., 178
Shagass, C., 223Sharp, S., 1, 2
Shaunessy, P., 301Shaycroft, M.F., 321
Shepard, J. L., 252Shepard, L., 295Shepard, M.J., 252Shepard, R., 81, 92, 94, 318
Shields, J., 132, 133
Shuey, A. M., 280, 282-283
Shute, V. J., 327Shuter-Dyson, R., 38Siegel, B., Jr., 12, 221Sigman, M. D., 71, 73-74, 76, 213-214
Simon, L., 345
Simon, T., 6, 8
Singer, L. T., 71, 283
Sinha, S. N., 157, 216—220Skeels, M. H., 141, 145Skodak, M., 141, 145Slater, A., 74
Slavin, R. E., 267

AUTHOR INDEX
Smith, A., 261
Smith, C., 339, 342
Smith, G. A., 59-60Smith, M., 209Snow, R. E., 27, 234, 265-266, 355Snygg, D., 141
Sokolov, Y. N., 72
Sokolowska, M., 189
Sommer, B. A., 176Sommer, R., 176
Sorenson, T. I. A., 217
Souther, J., 79
Sparling, J. H., 175
Spearman, C., 1-18, 49, 78, 97, 116, 125,
349
Spitz, H. H., 174-175Spry, K. M., 45
Spuhler, J. M., 280, 282—283, 297-298,307-308
Stankov, L., 21, 25, 97-99, 180, 195
Stanley, J. C., 321
Stebbins, L. B., 175Stein, Z. A., 189, 202, 210-211Stern, W., 8
Sternberg, R.J., 69, 90, 99-108, 111—115,
117-120, 174, 228-229, 328-329,
334-339, 342
Sternberg, S., 81, 94
Stevenson, H. W., 264, 313-314Stevenson, J., 131
Stewart, M., 89
Stigler, J., 264, 313-314
Stodolsky, S. S., 284
Stough, C. K. K., 224
Straumanis,J. J., 223Streissguth, A. P., 208Strother, C. R., 235Sue, S., 313, 318
Sundet, J. M., 131, 151-152, 197Susser, M., 189, 202, 210-211
Tambs, K., 131, 151-152, 197
Taylor, H. F., 132-133Taylor, J. J., 174Taylor, R. L., 80Teasdale, T. W., 137, 145, 194, 217,
220
Tellegen, A., 135
Tenopyr, M.L., 30Terman,L. M., 8
Tetewsky, S. J., 99Thompson, L. A., 153, 258, 290
Thomson, G., 209-210Thomson, G. H., 10-13
Thorndike, R. L., 41-42
389
Thurstone, L. L., 13-17
Thurstone, T. G., 16
Tisak, M.S., 341
Titchener, E. B., 1Tizard, B., 306-307Todman,J., 213
Tomkiewicz, S., 147, 149
Triesman, A. M., 79
Tuddenham,R. D., 194
Uchida, S., 157
Valentine,J., 174
Van Court, M., 277
Vanderberg, S. G., 129, 151-152, 164, 298,325
Van Valen, L., 218Vernon, P. A., 53, 56, 82—83, 165-166,
220-221
Vernon, P. E., 25, 310, 315
Vickers, D., 62
Vimpani, G. V., 209-210Vining, D. R., 277-279
Vogel, W., 221Vogler, G. P., 164
Voyer, D., 325-326
Vreugdenhil, A., 67
Wagner, R. K., 119120, 334-338Walberg, H.J., 203Wald, I., 189Wallace, I. F., 75
Weil, E. M., 112—113
Weinberg, R. A., 142, 145, 304-305, 307-
308Weinfield, F. D., 311Weins, A. N., 292
Welford, A. T., 56West, D.J., 275White, K. R., 199
Widaman,K.F., 49, 57
Wigg, N. R., 209-210
Wight, D., 65, 67Willerman, L., 12, 63-65, 68-69, 71, 78,
82, 131, 137-139, 148, 158, 218, 245
Williams, D., 224
Williams, D. M., 295
Williams, R. L., 292
Williams, S. E., 83
Willis, S. .. 240, 247-249
Willms,J. D., 263
Willson, R.J., 62Wilson, J. R., 151, 159, 165, 198Wilson, K., 129Wilson, R. S., 131, 231-232, 343-344

390
Winick, M., 211
Wisenbaker, J., 261-262
Wissler, C., 2Witty, P. A., 309Wolf, R. M., 171
Wolf, T. H., 1, 7
Wu, T. C., 12, 221
Yalow, E., 266Yama, N., 63, 68-69, 71, 78, 82,
245
Yamane, S., 38
AUTHOR INDEX
Yamomoto, M., 157
Yanese, T., 157
Yarmel, P. W., 344Yarrow,L.J., 75
York, R. L., 311Yudkin, J., 212-213
Yule, W., 209
Zajonc, R. B., 200-203, 205
Zhang, Y., 225
Zigler, E., 174, 178Zuckerman, M., 347

SUBJECT INDEX
Achievement-—intelligence distinction, 20,
289-291
fluid versus crystallized ability, 20black-white differences, 289-291
Additive genetic influence, 127Adoption effect, 148—150Adoptive parent—adopted child rela-
tionship, 138—142, 144-145
Age decline, 234—251
everyday tasks, 247gray matter characteristic, 246
interindividual constancy versus interin-dividual variability, 248—250
intervention, 247—249
multi versus unidimensionality, 249-250
multi versus unidirectionality, 249-250
pitch discrimination, 245-246resource theory, 241-244speed influence, 241-243see also Life span development
Age grading, 7
Aggregation, see Hotchpotchprinciple
Aptitude xX instruction interaction, 265-—266
see also Mastery learningAsian—white difference, 310-317
biological basis, 313—317laterality, 315-317
spatial versus verbal ability, 311-313
Assortative mating, 130Attenuation correction, 3
Behavior—genetic parameters, 150—158cohort effect, 151-152
direct versus indirect estimate, 150-151IQ variation, 153
LISREL estimate, 154-156
social class influence, 153
Behavior genetics, see Behavior genetic pa-
rameters, Heritability, Partition of phe-notypic variance
Between-family influence, 127, 168-173
Bias in tests, 287—296
criterion bias, 289-291
examinereffect, 293-294intercept bias, 288item characteristic, 294—295item response theory, 295-296
item selection, 291-292
linguistic distinctiveness, 294
predictive validity for occupational per-formance, 288-289
predictive validity for school perfor-mance, 287-288
see also Black Intelligence Test of Cul-
tural Homogeneity, Black—whitedif-
ference
Binet’s test, 6—8
Biological correlates, 215-227See also Brain size, Electroen-
cephalogram, Evoked potential,Head circumference, Myopia, Nerve
conductance velocity, Positron emis-
sion tomography
Biological environment, 206—214see also Perinatal influence, Prenatal in-
fluence, Lead exposure, NutritionBiological parent—adopted child rela-
tionship, 137-145, 147parental IQ, 138-141, 144-145
parental IQ surrogate, 144-145Biologically unrelated siblings reared to-
gether, 139, 145-146
Biological sibling relationship, 137, 147
reared apart, 147reared together, 137
Birth order, see Confluence theory
Black Intelligence Test of Cultural Homo-
geneity, 292
Black—white difference, 280-310African ancestry, 308-309age influence, 282-283
391

392
Black—whitedifference (cont.}
between versus within group, 280-281environmental influence, 300-301distributional overlap, 282-283
infancy test, 282-283
profile difference, 283-284regression effect, 297-298secular influence, 282sociologist’s fallacy, 301
see also Spearman hypothesis
Brain size, 218
Caldwell HomeInventory, 168—173age influence, 171-172genotype influence, 170-171IQ correlation, 168, 170parent-child genetic covariance, 172—
173
Chinese, see Asian—white difference
Cohort effect, 191-196high versus low IQ group, 194nutritional influence, 195-196schooling, 194
Colorado Adoption Project, 139-141
Componential analysis, 103-124
evaluation of components, 113-114individual differences in models, 112-—
113inter-task generality of components,
115-117
meta-cognitive components, 117-120
multitrait-multimethod matrix, 110-
111
Computersimulation of Ravens, 120-124
compared to actual subject, 121-123
evaluation, 123-124
theoretical analysis, 123
Confirmatory factor analysis, 26, 33, 40-
4]g, 26, 40-41Guilford’s theory, 33
Confluence theory, 200-206birth interval, 204
description, 200—202
effect size, 202-203
extended family influence, 204
father absence, 203mathematical model, 205
Congenital adrenal hyperplasia, 326—327Constructive thinking, see Social intel-
ligence
Criminality, 275-276
SUBJECT INDEX
Crystallized ability, see Fluid versuscrystallized ability
Cumulative decline, 190-191
Developmental behavior genetics, 158-163
longitudinal twin study, 160-161parameter estimates, 158—160
Discriminant and convergentvalidity, 91-96, 125
Discrimination, 2, 77—79
eduction of correlates and relations, 77—78
historical hypothesis, 2information-processing analysis, 77—79
Dual-task paradigm, 97-99Dynamic assessmentof learning potential,
182—185
Educational effectiveness factor, 23, 25
Educational influence, 186-196
amountof schooling, 186-188between gradelevel, 187-188quality of schooling, 188—190
Educational intervention, 268-270
Educational outcome, 252-272
Chinese schooling, 264
decision to continue education, 255-256parochial school, 262-263path model, 253-254reading score, 252-253school influence, 259-264
years of education, 253-257see also Aptitude x instructional in-
teraction
Electroencephalogram, 221-226complexity of wave form, 222-225neural adaptability index, 225stimulus: intensity, 224
see also Evoked potentialEvoked potential, 225-226
P200, 225
inspection time, 225-226
Factor analysis, 5, 14-18
discovery, 5
multiple, 14-15
oblique rotation, 16-17
orthogonal rotation, 16second order, 17-18simple structure, 15, 17
Family composition, see Confluencetheory
Fertility, 276-279

SUBJECT INDEX
black-white difference, 278-279
cohort effect, 277
Fixed intelligence, 228-231genotype, 229
psychometrician’s belief in, 229-231Fluid versus crystallized ability, 18—26
ability—achievementdistinction, 20
biological influence, 19
Horn’s theory, 22-23factor analysis, 18—21
g, 3-4, 9-13, 18, 29-31, 40, 43-48
Binet’s test, 9
energy theory, 11-12
generality over tasks, 44—48
Guilford’s critique, 29-31historical basis, 18invariance over tests, 40
ratio of g to s, 3-4, 11, 18
Thomson’s interpretation, 10-13
twofactor theory of, 3
variance difference, 43Gardner's theory, 34—40
aggregation of abilities, 36—37critique, 36—40
description, 34-36
localization of function, 38-39
modularity, 39
Genderdifference, 317-328
hormonalinfluence, 326-328laterality, 325-326mathematicalability, 319secular trend, 319-320
spatial ability, 318—319variance difference, 321—324
verbal ability, 317-318
General intelligence, see g
Genetic covariance analysis, 165-167,
257-259IQ—academic achievement, 257-259IQ—information processing, 164—166profile scores, 165
Genetic—environmental covariance, 127—
129
Genetic X environmental interaction, 128,163
Guilford’s theory, 26—34description, 28—29evaluation, 28-34
hierarchical revision, 32—34
Habituation, see Infant habituationHead circumference, 218-219, 301-302
393
black-white difference, 301-302
twin study, 219see also Brain size
Height, 217-218Heritability, 96, 125, 164-165, 298-299
as property of population, 125
in black samples, 298-299
information processing tasks, 96
special abilities, 164-165see also Behavior genetic parameters
Historical fluid ability, 23, 25, 50Hotchpotch principle, 4-5
Inbreeding depression, 156—158
Income, 255
Infant habituation, 71-77reliability, 73, 76Sokolov’s theory, 72
Inspection time, 62—71
auditory measures, 63—69
familiarity, 69—70
in children, 68meta-analysis, 63—64Strategy use, 70-71
Instructional program, 271-272
Inter-generational mobility, 253-255
Interventions to increaseintelligence, 174—-186
Abecedarian Project, 175-176
Headstart, 174-175, 178-179Kvashchev’s experiment, 179-181Milwaukee Project, 176-178SAT coaching, 181—182
see also Dynamic assessmentof learningpotential
Intelligence quotient, 8
Item response theory, see Bias in tests
Japanese, see Asian—white difference
k:m, 25
Law oftetrad difference, 4
Lead exposure, 209-210
Life-span development, 234-251cohort effect, 235-236dropouteffect, 237fluid versus crystallized ability, 237—
239
generality of decline, 239-240
representativeness of sample, 235-—237
see also Age decline

394
Magnoversus parvo system, 79Mastery learning, 266-267Modularity, see Gardner’s theory
Myopia, 219-220
within-family influence, 220
Nameversus physical identity task, 80-81Nerve conductance velocity, 220-221Nonadditive genetic influence, 127
Nonentrenched task, 99-103
Nutrition, 210-214
dietary supplement, 212-213Kenyan children, 213-214prenatal deprivation, 210-211prenatal supplement, 211-212
Occupational performance, 272-274meta-analysis, 272—274
Occupationalstatus, see Inter-generational
mobility
Odd-man-out, 53—56see also Reaction time
Parallel versus serial processing, 78—79
Parent—child relationship, 137
Partition of phenotypic variance, 127-128
Phenylketonuria, 127Perinatal influence, 207—208Personality intelligence relationship, 342—
348
academic success, 349
aggression influences on, 344influence on test performance, 345-346
trait construal, 346—349Positive manifold, 4, 15
Guilford’s data, 30-31Positron emission tomography, 221
Prediction from multiple tasks, 80-87
complexity of processes, 83—86
Prenatal alcohol exposure, 208—209Procrustean rotation, 31-34
Profile of Nonverbal Sensitivity, see Social
intelligenceProsopognosia, 37-38
related to Gardner’s theory, 37-38
Radex theory, 26-28Ravens Test of Progressive Matrices, see
Computer simulation of RavensReaction time, 49-62
bottom-up theory, 49-50Hick’s law, 52intra-individual speed, 60
SUBJECT INDEX
Jensen apparatus, 50-52neural model of, 56, 60—61
practice effect, 56-57
speed—accuracy trade-off, 58-60
visual attention effect, 57Restriction in range of talent, 6, 15, 146—
147
in adoption study, 146-147Rotation of visual image, 81
Scarr—McCartney theory, 161-163
active genetic—environmentalcorrela-tion, 162-163
passive genetic—environmentalcorrela-tion, 161
reactive genetic—environmental correla-tion, 162-163
Secular influence, see Cohort effect
Sex difference, see Genderdifference
Social intelligence, 329-342
constructive thinking, 330-334multitrait-multimethod matrix, 341Profile Of Nonverbal Sensitivity, 38-341
tacit knowledge, 334-338
triarchic theory, 329-330
Socioeconomic background, 199-200
as within-family influence, 199-200Spearman hypothesis, 284-287
see also Black—white differenceSpeed-of-access to memory, 81Stability, see Test—retest correlation
Tacit knowledge, see Social intelligence
Test bias, see Bias in testsTest—retest correlation, 231—234Anderson model, 233-234
Texas Adoption Study, 137-139
Theory of multiple intelligence, see
Gardner’s theory
Time-of-testing effect, 198Trans-racial adoption, 304-308, 314-315
heterosis, 307Triarchic theory, see Social intelligenceTwofactor theory of intelligence, see g
Turner’s syndrome, 12
Twinsreared apart, 131-137
age confound, 132-133
aggregate correlation, 132similarity of rearing environment, 133-
136
spatial abilities, 136-137standardization of tests, 133
Twins reared together, 128-131

SUBJECT INDEX 395
aggregate correlation, 131] relationship among, 91
environmental interpretation of MZ-DZ sublexical speech unit, 88-89difference, 128-129 verification of pictorial description, 89-
same sex versus opposite sex DZ, 129 90
vocabulary acquisition, 90-91ved, 25
Verbal ability correlates, 87-91 Within-family variance, 127, 196-206
nameversus physical identity, 89- between-family variables, 198-19990 social contact, 197


INTELLIGENCE