1992 - Einsele - Sedimentary Basins
632
Gerhard Einsele Evolution, Facies, and Sediment Budget Springer-Veclag
-
Upload
pustral-ugm -
Category
Documents
-
view
0 -
download
0
Transcript of 1992 - Einsele - Sedimentary Basins

Gerhard Einsele
Evolution, Facies, and Sediment Budget
Springer-Veclag


Gerhard Einsele
Sedimentary Basins Evolution, Facies, and Sediment Budget
With 269 Figures
Springer-Verlag Berlin Heidelberg New York London Paris Tokyo Hong Kong Barcelona Budapest

Prof. Dr. GERHARD EINSELE Geologisches Institut Universitat Tubingen SigwartstraBe 10 7400 Tubingen, Germany
ISBN 3-540-54743-6 Springer-Verlag Berlin Heidelberg New York ISBN 0-387-54743-6 Springer-Verlag New York Berlin Heidelberg
Library of Congress Cataloging-in-Publication Data. Einsele, Gerhard. Sedimentary basins: evolution, facies, and sediment budget; with 269 figures / Gerhard Einsele. p. cm. Includes bibliographical references and index. ISBN 3-540-54743-6 (Springer-Verlag Berlin). - ISBN 0-387-54743-6 (Springer-Verlag New York) 1. Sedimentary basins. 2. Sedimentation and deposition. 3. Facies (Geology) I. Title. QE571.E36 1992 551.3-dc24l 91-41002
This work is subject to copyright. All rights are reserved, whether the whole or part of the material is concerned, specifically the rights of translation, reprinting, reuse of illustrations, recitation, broadcasting, reproduction on microfilm or in any other way, and storage in data banks. Duplication of this publication or parts thereof is permit- ted only under the provisions of the German Copyright Law of September 9, 1965, in its current version, and permis- sion for use must always be obtained from Springer-Verlag. Violations are liable for prosecution under the German Copyright Law.
O Springer-Verlag Berlin Heidelberg 1992 Printed in Germany
The use of general descriptive names, registered names, trademarks, etc. in this publication does not imply, even in the absence of a specific statement, that such names are exempt from the relevant protective laws and regulations and therefore free for general use.
Qpesetting: Camera ready by author Printing: Beltz, Hemsbach Binding: J. Schiiffer, Griinstadt 32/3145-5 4 3 2 1 0 - Printed on acid-free papeI

Preface
The modern geological sciences are characterized by extraordinarily rapid progress, as well as by the development and application of numerous new and refined methods, most of them handling an enormous amount of data available from all the continents and oceans.
Given this state of affairs, it seams inevitable that many students and professionals tend to become experts in relatively narrow fields and there- by are in danger of losing a broad view of current knowledge. The abun- dance of new books and symposium volumes testifies to this trend toward specialization. However, many geologic processes are complex and result from the interaction of many, seemingly unrelated, individual factors. This signifies that we still need generalists who have the broad overview and are able to evaluate the great variety of factors and processes controlling a geologic system, such as a sedimentary basin. In addition, this also means that cooperation with other disciplines in the natural sciences and engi- neering is increasingly important.
Modern text books providing this broad overview of the earth sciences are rare. Some are written by several authors together to make sure that all topics are treated properly. When individual authors write a book, they run the risk of creating a text that is less balanced, because they cannot avoid indulging their own preferences for specific topics and field examples. However, this disadvantage can be compensated for by the fact that just one author can produce a more concise and uniform text and include ap- propriate cross references.
In this one-author book I have tried to put much information into a con- siderable number of figures. Once the reader has acquired some basic knowledge and has read the text, he should be able to recall it easily by looking at these composite illustrations, for example the various facies models demonstrating both the depositional environment and the resulting vertical sequences. Many of these figures may be regarded as a kind of summary of the chapter in question; therefore, I did not give written sum- maries at the end of each chapter as found in many other textbooks.
This book addresses both qualitative and quantitative aspects of basin analysis, including topics such as various flux rates, diagenesis, and fluid flow, in the context of plate tectonics and sedimentary geology. Tectonic subsidence and uplift are prerequisites for basin formation and terrigenous sediment supply, but sedimentary processes in a basin are governed by other factors, including water circulation and recycling of nutrients, sedi- ment transport, deposition, and redistribution. The sedimentary facies of a basin are largely controlled by the interrelationship between subsidence, sedimentation rate, and relative sea level change. Basinal sediment budgets are a topic which has been rarely treated in textbooks. Large-scale pro- cesses, facies associations, and especially sedimentary sequences are stressed in the book, rather than small-scale sedimentary structures, tex- ture, petrographic characteristics, or detailed descriptions of biogenic sediment components and trace fossils. The latter phenomena are suffi- ciently described in a number of modern books. Finally, brief sections

VI Preface
address the application of basic knowledge to exploration for hydrocar- bons, coal, minerals, and deep groundwater.
This book is written for advanced students and professionals who re- quire a comparatively straightforward, elementary treatment of sedimen- tary basin processes and evolution. The reader should already be familiar with general geology and geologic principles and have some basic know- ledge of sedimentology. Quantitative aspects are described by simple equations and idealized examples. The book emphasizes broad, large-scale features of sedimentary basins and their facies associations. It provides only a limited number of case studies, which are chosen mostly from Europe and North America, but from other continents as well. Many ex- perts will probably find that their specific topics are not treated thorough- ly enough and that important datails have been omitted. Others may cri- ticize that not all publications relevant to their fields are cited in the reference list. I would be grateful if these colleagues were to inform me when important points are missing or not treated properly.
All books bear the personal stamp of the author. In keeping with this unavoidable tradition, this book is influenced by my experience in studies of both modern marine sediments and ancient sedimentary rocks on land. Furthermore, I have done some work on mass physical properties and the mechanical behavior of soft and overconsolidated sediments, as well as in the area of groundwater behavior. This volume is based partially on cour- ses which I have taught for many years, as well as on an intensive litera- ture study, particularly of papers and topical volumes published during the past three to four years. Nevertheless, I am afraid and even certain that I have missed a great number of important publications, especially those written in languages I cannot read, such as Russian, Chinese, Japanese, and others. I apologize for these omissions, but then, one person is no longer able to evaluate the enormous literature which is published today, even in a limited field of geology.
Finally, I wish tc express my thanks to a number of colleagues who re- viewed specific chapters of this book and provided me with invaluable comments: Thomas Aigner (Tubingen), Erwin Appel (Tubingen), Robin Bathurst (Liverpool), R. Langbein (Greifswald), Stefan Kempe (Hamburg), Hanspeter Luterbacher (Tubingen), Ulrich von Rad (Hannover), Werner Ricken (Tubingen), Rudiger Stein (Bremerhaven), Jobst Wendt (Tubin- gen), Jan Veizer (Bochum), and Andreas Wetzel (Basel). Nevertheless, only I can be taken to task for any shortcomings or errors in this text.
Linda Hobert and Susanne Borchert reviewed the English text and helped clarify many points. Hermann Vollmer produced most of the text's figures. Wolfgang Engel and Susanne Fink of Springer-Verlag, among others, assisted me in many ways in the production of this volume. All this help is gratefully acknowledged.
Last but not least I wish to thank my wife Ruth and my family, who with great fortitude tolerated my incessant work on weekends and in the evenings and did their best to spare me from the usual house chores and many other obligations which I should have taken care of.
Gerhard Einsele
Tubingen, November 199 1

Contents
. . . . . . . . . . . . . . . . . . . . Part I Types of Sedimentary Basins 1
. . . . . . . . . 1 Basin Classification and Depositional Environments 3 . . . . . . . . . . . . . . . . . . . . . . . . . . . . . . . . . . . . 1.1 Introduction 3
. . . . . . . . . . . . . . . . . . . . . . . . 1.2 Tectonic Basin Classification 4 1.3 Pre-. Syn.. and Post-Depositional Basins . . . . . . . . . . . . . . . 10 1.4 Basin Morphology and Depositional Environments . . . . . . . . 10
Part 11 Depositional Systems and Facies Models . . . . . . . . . . 17
. . . . . . . . . . . . . . . . . . . . . . . . . . . . . . . 2 Continental Sediments 19 2.1 Glacial Deposits of Lowlands and Shallow Seas . . . . . . . . . . 19
2.1.1 Continental Glacial Deposits . . . . . . . . . . . . . . . . . . . . 19 . . . . . . . . . . . . . . . . . . . . . . . 2.1.2 Glaciomarine Sediments 25
2.2 Fluvial Sediments, Alluvial Fans. and Fan Deltas . . . . . . . . . 29 2.2.1 Bed Forms. Sedimentary Structures. and
. . . . . . . . . . . . . . . . . . . . . . . . . . . . . Facies Elements 29 2.2.2 Alluvial Fans and Fan Deltas . . . . . . . . . . . . . . . . . . . . 37 2.2.3 Various River Systems and Their Sediments . . . . . . . . . 43 2.2.4 Large-Scale Lateral and Vertical Evolution of
. . . . . . . . . . . . . . . . . . . . . . . . . . . . . . Fluvial Systems 51 2.3 Eolian Sediments . . . . . . . . . . . . . . . . . . . . . . . . . . . . . . . . . 54
2.3.1 Introduction . . . . . . . . . . . . . . . . . . . . . . . . . . . . . . . . 54 2.3.2 Eolian Sands . . . . . . . . . . . . . . . . . . . . . . . . . . . . . . . . 55
. . . . . . . . . . . . . . . . . . . . . . . . . . . . . . . . . 2.3.4 Clay Dunes 63 . . . . . . . . . . . . . . . . . . . . . . . . . . . . 2.3.5 Eolian Dust. Loess 64
. . . . . . . . . . . . . 2.4 Volcaniclastic Sediments (Tephra Deposits) 66 2.4.1 General Aspects and Terms . . . . . . . . . . . . . . . . . . . . . 66 2.4.2 Tephra Deposits on Land and Below the Sea . . . . . . . . 67 2.4.3 Volcaniclastic Sediments in Basins of
Various Tectonic Settings . . . . . . . . . . . . . . . . . . . . . . 74 2.4.4 Alteration. Diagenesis. and Metamorphism
of Volcaniclastic Rocks . . . . . . . . . . . . . . . . . . . . . . . . 76 . . . . . . . . . . . . . . . . . . . . . . . . . . . . . . . . . . 2.5 Lake Sediments 77
2.5.1 Different Lake Systems and Their Sediments . . . . . . . . 77 2.5.2 Recent and Ancient Examples of Lake Sediments . . . . 90 2.5.3 Specific Features of Lakes and Lake Sediments . . . . . . 92
3 Coastal and Shallow Sea Sediments (Including Carbonates) . . . 94 3.1 Beach and Shoreface Sediments . . . . . . . . . . . . . . . . . . . . . . 94
3.1.1 Coastal Processes. Beach and Shoreface Sands . . . . . . . 94 3.1.2 Storms and Storm Deposits (Tempestites) . . . . . . . . . . . 100
3.2 Sediments of Tidal Flats and Barrier-Island Complexes . . . . 109 3.2.1 Tidal-Influenced Environments and Sediments . . . . . . 109 3.2.2 Sediments of Barrier- Island Complexes . . . . . . . . . . . . 121

VIII Contents
. . . . . . . . 3.3 Sediments of Shallow Seas (Including Carbonates) 125 . . . . . . . . . . . . . . 3.3.1 Predominantly Siliciclastic Sediments 125
3.3.2 Carbonate Buildups and Reef-Lagoon Complexes . . . . 133 . . . . . . . . . . . . . . . . . 3.4 Sediments of Marine Delta Complexes 147
. . . . . . . . . . . . . . . . . . . . . . . . 3.4.1 Types of Marine Deltas 147 3.4.2 Sedimentary Processes and Facies of
. . . . . . . . . . . . . . . . . . . . . . . . . . Various Delta Types 149 3.4.3 Facies Architecture, Constructional and
. . . . . . . . . . . . . . . . . . . . . . . . . . Destructional Phases 155
. . . . . . . . . . . . . . . . 4 Sediments of Adjacent Seas and Estuaries 161 . . . . . . . . . . . . . . . . . . . . . . . . . . . . . . . . . . . . 4.1 Introduction 161
. . . . . . . . . . . . . . . . . . . . . 4.2 Water Circulation and Sediments 161 4.3 Sedimentary History of Some Modern Adjacent Seas . . . . . . 170
. . . . . . . . . . . . . . . . . . . . . . . . . . . . . . . . . . 5 Oceanic Sediments 177
. . . . . . . . . . . . . . . . . . . . . . . . . . . . . . . . . . 5.1 General Aspects 177 . . . . . . . . . . . . . . . . . . . . . . 5.2 Water Circulation in the Oceans 179
. . . . . . . . . . . 5.3 Hemipelagic and Pelagic Deep-sea Sediments 185 . . . . . . . . . . . . . . . . . . . . . . . . . . . . . . . . . . 5.3.1 Overview 185
5.3.2 Deep-sea Carbonates and Carbonate Dissolution . . . . . 187 . . . . . . . . . . . . . . . . 5.3.3 Red Clay and Manganese Nodules 191 . . . . . . . . . . . . . . . . 5.3.4 Sediments in Zones of Upwelling 192
. . . . . . . . . . . . . . . . . . . . . . . . . . . 5.3.5 Siliceous Sediments 193 . . . . . . . . . . . . . . . . . . . . 5.3.6 Marine Phosphorite Deposits 198
5.3.7 Sediments on Marginal and Oceanic Plateaus, . . . . . . . . . . . . . . . . . . . . . . . . Ridges, and Seamounts 203
. . . . . . . . . . . . . 5.4 Gravity Mass Flow Deposits and Turbidites 206 . . . . . . . . . . . . . . . . . . . . . . . . . . . 5.4.1 Gravity Mass Flows 206
. . . . . . . . . . 5.4.2 Turbidites and Deep-sea Fan Associations 214
. . . . . . . . . . 5.5 Erosion and Reworking of Deep-sea Sediments 231
. . . . . . . . . . 6 Special Depositional Environments and Sediments 233 . . . . . . . . . . . . . . . . . . . . . . . . . . . . . . . 6.1 Green Marine Clays 233
. . . . . . . . . . . . . . . . . . . . . . . . . . . . . . . . 6.2 Oolitic Ironstones 235 . . . . . . . . . . . . . . . . . . . . . . . . . . . . . . . . . . . . . . . 6.3 Red Beds 238
. . . . . . . . . . . . . . . . . . . . . . . . . . . . . . . . 6.4 Marine Evaporites 242 . . . . . . . . . . . . . . . . . 6.4.1 Models for Evaporite Deposition 242
6.4.2 Sequences, Sedimentary Structures. and . . . . . . . . . . . . . . . . . . . . . . . . . . Sedimentation Rates 253
6.4.3 Diagenesis and Geochemical Characteristics . . . . . . . . . . . . . . . . . . . . . . . . . . . . . . . . of Evaporites 257 . . . . . . . . . . . . . . . . . . . . . . . . . . . . . . . 6.4.4 Salt Structures 259
. . . 6.5 Nonactualistic (Precambrian) Depositional Environments 264 6.5.1 The Evolution of the Atmosphere. Hydrosphere.
. . . . . . . . . . . . . . . . . . . . . . . . . . . . . . . . . and Climate 264 . . . . . . . . . . . . . . . . . . . . . . . . 6.5.2 Precambrian Sediments 267
. . . . . . . . . . . . . . . 7 Depositional Rhythms and Cyclic Sequences 271 . . . . . . . . . . . . . . . . . . . . . . . . . . . . . . . . . . 7.1 General Aspects 271
. . . . . . 7.2 Special Features and Examples of Rhythmic Bedding 278 7.3 Depositional Cycles in Lakes. Fluvial and Deltaic Systems . . 286
. . . . . . . . . . . . . . . . . . . . . . 7.3.1 Cyclic Sequences in Lakes 286 7.3.2 Sediment Successions in Fluvial and Deltaic Systems . . 287
. . . . . . . . . . 7.4 Sea Level Changes and Sequence Stratigraphy I 288 . . . . . . . . . . . . . . . . . . . 7.4.1 General Principles and Terms 288
7.4.2 Changes in Sea Level and Storm Wave Base in . . . . . . . . . . . . . . . . . . . . . . . . . . . . . . . Shallow Basins 291

Contents IX
7.4.3 Sequence Stratigraphy in Continental . . . . . . . . . . . . . . . . . . . . . . . . . . . . . . Margin Settings 297
. . . . . . . . 7.5 Long-Term Cyclic Phenomena in Earth's History 304 7.6 Superposition of Cycles of Various Orders and
. . . . . . . . . . . . . . . . . . . . . . . . . . . . . . . . . Differing Origin 307
Part EI Subsidence. Denudation. Flux Rates. . . . . . . . . . . . . . . . . . . . . . . . . . . . . . . . . and Sediment Budget 3 1 1
. . . . . . . . . . . . . . . . . . . . . . . . . . . . . . . . . . . . . . . . 8 Subsidence 313 . . . . . . . . . . . . 8.1 General Mechanisms Controlling Subsidence 313
. . . 8.2 Methods to Determine Subsidence of Sedimentary Basins 320 8.3 Modeling of Rift Basins and Observed Subsidence Curves . . 327
. . . . . . . . . . . . . . . . . . . . . . . . 8.4 Passive Continental Margins 332 8.5 Subsidence of Basins Related to Tectonic Loading.
. . . . . . . . . . . . . . . . . . Subduction. and Strike-Slip Motion 341
9 Denudation: Solute Transport and Flux Rates of . . . . . . . . . . . . . . . . . . . . . . . . . . . . . . Terrigenous Material 345 . . . . . . . . . . . . . . . . . . . . . . . . . . . . . . 9.1 Weathering and Soils 345
9.2 Chemical and Mechanical Denudation Rates from . . . . . . . . . . . . . . . . . . . . . . . . . . . . . . . . . . . . . RiverLoads 348
. . . . . . . . . . . . . . . . . . . . . 9.2.1 Chemical Denudation Rates 348 . . . . . . 9.2.2 Mechanical Denudation from Solid River Load 356 . . . . . . 9.2.3 Chemical Versus Mechanical Denudation Rates 362 . . . . . 9.3 Mineralogical Composition of Suspended River Loads 363
9.4 Long-Term Denudation Rates from the Sediment Budget . . . . . . . . . . . . . . . . . . . . . . . . . . . . . . . . . of Various Basins 366
. . . . . . . . 9.5 Tectonic Uplift, Denudation. and Geomorphology 376 9.5.1 Long-Term Denudation Rates from Changes
inTopography . . . . . . . . . . . . . . . . . . . . . . . . . . . . . . . 376 . . . . . 9.5.2 Geomorphological Consequences of Denudation 378
9.5.3 Interrelationship Between Tectonic Uplift andDenudation . . . . . . . . . . . . . . . . . . . . . . . . . . . . . . 381
10 Sedimentation Rates and Organic Matter . . . . . . . . . . . . . . . . in Various Depositional Environments
. . . . . . . . . . . . . . . . . . . . . . . . . . . . . . . . . 10.1 General Aspects 385 . . . . . . . . . . . . . . . . . . . . . . . 10.2 Average Sedimentation Rates 388
. . . . . . . . . 10.3 Production and Preservation of Organic Matter 393 . . . . . . . . . . . . . . . . . . . . . . . . . . . . . 10.3.1 General Aspects 393
. . . . . . . . . . . . . . . . . . 10.3.2 Organic Matter in the Oceans 394 10.3.3 Organic Matter Preservation and Black Shales . . . . . . 398
11 The Interplay Between Sediment Supply. Subsidence. . . . . . . . . . . . . . . . . . . . . . . . . . . . . . . . . . . and Basin Fill 409
. . . . . . . . . . . . . . . . . . . . . . . . . . . . . . . . . . . . 11.1 Introduction 409 11.2 Simple Relationships Between Source Area on
. . . . . . . . . . . . . . . . . . . . . . . . . . . . . . Land and Basin Fill 410 . . . . . . . . . . . . . . . . . . . 1 1.3 Different Modes of Basin Filling 414
. . . . . . 11.4 Vertical and Lateral Facies Associations (Overview) 422

X Contents
. . . . . . . . . . . . . . . . . . . . . . . . . . . . . . Part IV Basin Evolution 427
. . . . . . . . . . . . . . . . . . . . . . . . 12 Basin Evolution and Sediments 429 . . . . . . . . . . . . . . . . . . . . . . . . . . . . . . . . . . . . . 12.1 Rift Basins 429
. . . . . . . . . . . . . . . . . . . . . . . . . . . . . . 12.1.1 Rift Structures 429 . . . . . . . . . . . . . . . . . 12.1.2 Examples of Young Rift Zones 434
. . . . . . . . . . . . . . . . . . . . . . 12.1.3 Sediments of Rift Basins 435 12.1.4 Transition from Rift Basins to
. . . . . . . . . . . . . . . . . . . . . Continental Margin Basins 438 . . . . . . . . . . . . . . . . . 12.2 Continental Margin and Slope Basins 442
. . . . . . . . . . . . . . . . . . . . . . . . . . . . . 12.2.1 General Aspects 442 12.2.2 Sediment Successions of Continental Margin Basins . . 445 12.2.3 Sediment Successions on Continental Slopes . . . . . . . . 453
. . . . . . 12.3 Intracratonic Basins Associated with Mega-Rifting 455 12.3.1 Permian to Mesozoic Basin Development
. . . . . . . . . . . . . . . . . . . . . . . . in Europe (Overview) 455 12.3.2 Mesozoic Sediments Between the North Sea and the
. . . . . . . . . . . . . . . . . . . . . . . . . . . . . Western Tethys 456 . . . . . . . . . . . . . . . 12.4 Continental or Intracratonic Sag Basins 459
. . . . . . . . . 12.5 Ceep-see Trenches, Forearc and Backarc Basins 461 . . . . . . . . . . . . . . . . . . . . . . . . . . . . 12.5.1 General Features 461
. . . . . . . . . . . . . . . . . . . . . . . . . . 12.5.2 Deep-sea Trenches 663 . . . . . . . . . . . . . . . . . . . . . . . . . . . . . . 12.5.3 Forearc Basins 474 . . . . . . . . . . . . . . . . . . . . . . . . . . . . . . 12.5.4 Backarc Basins 479
12.5.5 Preservation and Recognition of Ancient . . . . . . . . . . . . . . . . . . . . Subduction-Related Basins 484
. . . . . . . . . . . . . . . . . . . . . . 12.6 Remnant and Foreland Basins 485 . . . . . . . . . . . . . . . . . . . 12.6.1 Remnant Basins with Flysch 485 . . . . . . . . . . . . . . . . . . 12.6.2 Foreland Basins with Molasse 488
. . . . . . . . . . . . . . . . . . . . . . . . . . . 12.7 Pannonian-Type Basins 492 . . . . . . . . . . . . . . . . . . . . . . . . . . . . . . . 12.8 Pull-Apart Basins 495
. . . . . . . . . . . . 12.9 Basin-Type Transitions (Polyhistory Basins) 501
. . . . . . . . . . . . . . . . . . . . . . Part V Diagenesis and Fluid Flow 507
. . . . . . . . . . . . . . . . . . . 13 Mechanical and Chemical Diagenesis 509 13.1 General Aspects of Mechanical and
. . . . . . . . . . . . . . . . . . . . . . . . . . . . . Chemical Diagenesjs 509 13.2 Compaction. Compaction Flow. and Other
. . . . . . . . . . . . . . . . . . . . . . . . . . . . . . . Flow Mechanisms 515 . . . . . . . . . . . . . . . . . . . 13.3 Principles of Chemical Diagenesis 532
13.4 Thermal History of Sedimentary Basins and . . . . . . . . . . . . . . . . . . . . . . . . the Onset of Metamorphism 548
. . . . . . . . . . . 13.5 Special Methods and Processes in Diagenesis 551
. . . . . . . . . . . . . . . . . . . . . . . . . . . . . . 14 Hydrocarbons and Coal 557 14.1 Source Rocks. Kerogen Types. and
. . . . . . . . . . . . . . . . . . . . . . . . . . . . Hydrocarbon Potential 557 . . . . . . . . . . . . . . . . . . . . . . . 14.2 Generation of Hydrocarbons 560
. . . . . . . . . . . . . . . . . . 14.3 Examples of Hydrocarbon Habitats 565 . . . . . . . . . . . . . . . . . . . . . . . . . . . . . . . 14.4 Evolution of Coal 572
. . . . . . . . . . . . . . . . . . . . . . . . . . . . . . . . . . . . . . . . . References 577
SubjectIndex . . . . . . . . . . . . . . . . . . . . . . . . . . . . . . . . . . . . . . . 615

Part I Types of Sedimentary Basins

1 Basin Classification and Depositional Environments (Overview)
1.1 Introduction 1.2 Tectonic Basin Classification 1.3 Pre-, Syn-, and Post-Depositional Basins 1.4 Basin Morphology and Depositional Environ-
ments General Aspects Depositional Environments (Overview) Some General Trends for Sediment Accumulation and Facies Facies Architecture
1 .I Introduction
Sedimentary basins are, in a very broad sense, all those areas in which sediments can accunlulate to considerable thickness and be preserved for long geological time periods. In addition, there also exist areas of long-persisting denudation, as well as regions where erosional and depositio- nal processes more or less neutralize each other (creating what is known as non-deposition or omission).
In plan view sedimentary basins can have num- erous different shapes; they may be approxima- tely circular or, more frequently, elongate depre- ssions, troughs, or embayments, but often they may have quite irregular boundaries. As will be shown later, even areas without any topographic depression, such as alluvial plains, may act as sediment traps. The size of sedimentary basins is highly variable, though they are usually at least 100 km long and tens of km wide.
We can distinguish between (1) active sedi- mentary basins still accumulating sediments, (2) inactive, but little deformed sedimentary basins showing more or less their original shape and sedimentary fill, and (3) strongly deformed and incomplete former sedimentary basins, where the original fill has been partly lost to erosion, for example in a mountain belt.
As many workers have pointed out, the re- gional deposition of sediments, non-deposi-
tion, or denudation of older rocks are control- led mainly by tectonic movements. Hence, most of the recent attempts to classify sedi- mentary basins have been based on global and regional tectonic concepts which will be brief- ly discussed below. In spite of obvious advan- tages, however, this approach has some serious shortcomings if it is not supplemented by additional criteria. One ought always bear in mind that the characteristics of sediments filling a basin of a certain tectonic type are predominantly controlled by other factors and can be extremely variable. With few excep- tions (also discussed later), there is hardly such a phenomenon as a "tectonic sedimentary facies". For example, the broad concept of "geosynclinal sediments", often postulated in the past, was more misleading than helpful.
In addition to tectonic movements in the basinal area itself, sedimentary processes and facies are controlled by the paleogeography of the regions around the basin (peri-basin mor- phology and climate, rock types and tectonic activity in the source area), the depositional environment, the evolution of sediment-pro- ducing organisms, etc. Many sedimentologists therefore prefer a classification scheme based mainly on criteria which can be recognized in the field, i.e., the facies concept and the defi- nition of the depositional environment (fluvial sediments, shelf deposits etc.). A further ap- proach is the subdivision of sediments into important lithologic groups, such as siliciclas- tic sediments of various granulometries and composition, carbonate rocks, evaporites, etc. Having established the facies, succession, and geometries of such lithologic groups, one can proceed to define the tectonic nature of the basin investigated.
In this book an attempt is made to combine some principal points of these different clas- sification systems and to show the interaction between tectonic and environmental charac- teristics of depositional areas.

4 Chapter 1 Basin Classification
1.2 Tectonic Basin Classification
Basin-generating tectonics is the most impor- tant prerequisite for the accumulation of sedi- ments. Therefore, a tectonic basin classifica- tion system should be briefly introduced at the beginning of this chapter. Such a basin classi- fication must be in accordance with the mo- dern concept of global plate tectonics and hence will differ from older classifications and terminology.
In recent years, several authors have sum- marized our current knowledge on the inter- action of plate tectonics and sedimentation
(e.g., Dickinson in Dickinson and Yarborough 1976; Kingston et al. 1983; Miall 1984; Mit- chell and Reading 1986; Foster and Beaumont 1987; Klein 1987; Perrodon 1988) and propos- ed basin classification systems. Although basically identical, these systems differ somewhat and do not use exactly the same terms. In this text we essentially use the sys- tem described by Mitchell and Reading, but add some minor modifications.
The different types of sedimentary basins can be grouped into seven categories, which in turn may be subdivided into two to four spe- cial basin types (Table 1.1 and Figs. 1.1 through 1.3):
Table 1 . l . Tectonic basin classification. (After Kingston et al. 1983; Mitchell and Reading 1986)
Basin category Special basin Underlying Style of Basin type or synomym(s) crust tectonics characteristics
Continental Epicontinental Continental Divergence Large areas, or interior basins, infra- slow subsidence sag basins cratonic basins
Continental Graben structures, Continental Divergence Relatively narrow or interior rift valleys and basins, fault-bounded, fracture rift zones, rapid subsidence dur- basins aulacogens ing early rifting
Basins on pas- sive wntinen- tal margins, margin sag basins
Tensional-rifted basins, tension-sheared basins, sunk margin basins
Oceanic sag Nascent ocean basins basin (growing
oceanic basin)
Basins related to subduction
Basins related to collision
Strikeslipl wrench basins
Deepsea trenches
Forearc basins, backarc basins. interarc basins
Remnant basins
Foreland basins (peripheral), retroarc basins (intramontane), broken foreland basins,
Terrane-related basins
Transitional Divergence Asymmetric basins + shear partly outbuilding of sediment, moderate to low subsidence dur- ing later stages
Oceanic Divergence Large, asymmetric, slow subsidence
Oceanic Convergence Partly asymmetric, greatly varying
Transitional, Dominantly depth and oceanic divergence subsidence
Oceanic Convergence Activated subsidence due to ra id sedi- mentary /' oading
Continental Crustal Asymmetric flexuring , basins, trend to local con- increasing vergence or subsidence, transform uplift and sub- motions sidence
Oceanic Similar to backarc basins
Pull-apart basins Continental Transform Relatively small, (transtensional) andlor motion, + di- elongate, rapid and transpres- oceanic vergence or subsidence sional basins convergence

Tectonic Basin Classification
- Continental or interior sag basins (Fig. 1.1 a). Basins on continental crust are common- ly generated by divergent plate motions and resulting extensional structures and thermal effects (cf. Chap. 8.1). In the case of large interior sag basins, however, major fault sys- tems forming the boundaries of the deposi- tional area or a central rift zone may be ab- sent. Subsidence occurs predominantly in re- sponse to moderate crustal thinning or to a slightly higher density of the underlying crust in comparison to neighboring areas. In addi- tion, slow thermal decay after a heating event and sedimentary loading can promote and maintain further subsidence for a long time (Chap. 8.1). Alternatively, it was recently suggested that long-term subsidence of intra- cratonic basins may be related to a decrease of the mantle heat flow above a "cold spot", i.e., to abnormal cooling (Ziegler 1989). In general, rates of subsidence are low in this geodynamic setting (cf. Chap. 12.3).
- Continental graben structures and rift zones form narrow elongate basins bounded by large faults (Fig. 1.1 b and c). Their cross sections may be symmetric or asymmetric (e.g., half- grabens, see Chap. 11.4 and 12.1). If the un- derlying mantle is relatively hot, the litho- sphere may expand and show updoming prior to or during the incipient phase of rifting. Substantial thinning of the crust by attenua- tion, which is often accompanied by the up- streaming of basaltic magma, thus forming transitional crust, causes rapid subsidence in the rift zone. Subsequent thermal contraction due to cooling and high sedimentary loading enable continuing subsidence and therefore the deposition of thick sedimentary infillings.
- Failed rifts and aulacogens (Fig. I .lc). If divergent plate motion comes to an end before the moving blocks are separated by accretion of new oceanic crust, the rift zone is referred to as "failed". A certain type of such failed rifts is an aulacogen. Aulacogens represent the failed arm of a triple junction of a rift zone, where two arms continue their development to form an oceanic basin. Aulacogen floors con- sist of oceanic or transitional crust and allow the deposition of thick sedimentary sequences over relatively long time periods. Basins simi- lar to aulacogens may also be initiated during the closure of an ocean and during orogenies.
- Passive margin basins (Fig. 1 .Id). The initial stage of a true oceanic basin setting (or a pro- to-oceanic rift system) is established when
two divergent continents separate and new oceanic crust forms in the intervening space. This does not necessarily mean that such a basin type fills with oceanic sediments, but it does imply that the central basin floor lies at least 2 to 3.km below sea level. When such a basin widens due to continued divergent plate motions and accretion of oceanic crust (drif- ting stage), its infilling with sediments lags more and more behind ocean spreading. Con- sequently, the sediments are deposited predo- minantly at the two continental margins of the growing ocean basin. The marginal "basins" developing on top of thinned continental crust are commonly not bordered by morphological highs and represent asymmetric depositional areas. Their underlying crust increasingly thins seaward; hence subsidence tends to be- come greater and faster in this direction (Chapt. 8.4). Here, sediments commonly build up in the form of a prism (Fig. 1.ld and Chap. 12.2). Some of these marginal basins may be affected and bordered by transform motions (tension-sheared basins). In a sediment- starved environment, subsided transitional crust can create deep plateaus (sunk basins). In general, subsidence of these marginal basins tends to decrease with passing time, unless it is reactivated by heavy sediment loads.
- Oceanic sag basins or nascent ocean basins occupy the area between a mid-oceanic ridge, including its rise, and the outer edge of the transitional crust along a passive continental margin (Fig. I . 1 f). They commonly accumu- late deep-sea fan or basin plain sediments. Due to the advanced cooling of the aging oce- anic crust, subsidence is usually low, unless it is activated by thick sedimentary loading near the continental margin. Fault-bounded basins of limited extent are common in conjunction with the growth of mid-oceanic ridges (Fig. 1.le).
- Basins related to subduction. Another group of basins is dominated by convergent plate motions and orogenic deformation. Basins related to the development of subduction complexes along island arcs or active conti- nental margins include deep-sea trenches, forearc basins, backarc basins (Fig. 1.2a and b), and smaller slope basins and intra-arc ba- sins. Deep-sea trench floors are composed of descending oceanic crust. Therefore, some of them represent the deepest elongate basins present on the globe. In areas of very high sediment influx from the neighboring conti- nent, however, they are for the most part fil-

Chapter 1 Basin Classification
CONTINENTAL AND SHALLOW MARINE SEDIMENTS
ONGOING C RlFT ZONE, 4 k SPREADING
GRABEN AULACOGEN --- . .,
d MARGIN SAG BASIN CONTINENTAL SEDIMENT OF EMBANKMENT CONTINENTAL
OCEANIC CRUST
SEDIMENTS OF INCIPIENT SPREADING TROUGH
e OCEANIC BASIN PLAIN AND FAULT-BOUNDED BASIN
RIFT VALLEY DEPOSITS
f OCEANIC SAG BASIN DEEP SEA FAN SEA LEVEL
1000 km I
Fig. l.la-f. Tectonic basin classification for continental, marginal, and oceanic basins. See text for explanation. (After Dickinson and Yarborough 1976; Kingston et al. 1983; Mitchell and Reading 1986)

Tectonic Basin Classification
led up and morphologically resemble a conti- nental rise. Deep-sea trenches commonly do not subside as do many other basin types. In fact, they tend to maintain their depth which is controlled mainly by the subduction mecha- nism, as well as by the volume and geometry of the accretionary sediment wedge on their landward side (Chap. 12.5.2). Forearc basins occur between the trench slope break of the accretionary wedge and the magmatic front of the arc. The substratum beneath the center of such basins usually consists of transitional or trapped oceanic crust older than the magmatic arc and the accretionary subduction complex (Chap. 12.5.3). Rates of subsidence and sedi- mentation tend to vary, but may frequently be high. Subsequent deformation of the sedimen- tary fill is not as intensive as in the accretio- nary wedge.
Backarc or interarc basins form by rifting and ocean spreading either landward of an island arc, or between two island arcs which originate from the splitting apart of an older arc system (Fig. 1.2a). The evolution of these basins resembles that of normal ocean basins between divergent plate motions. Their sedi- mentary fill frequently reflects magmatic ac- tivity in the arc region.
- Terrane-related basins are situated between micro-continents consisting at least in part of continental crust ( Nur and Ben-Avraham 1983) and larger continental blocks. The sub- stratum of these basins is usually oceanic crust. They may be bordered by a subduction zone and thus be associated with either basins related to subduction or collision.
- Basins related to collision. Partial collision of continents with irregular shapes and boun- daries which do not fit each other leads to zones of crustal overthrusting and, along strike, to areas where one or more oceanic basins of reduced size still persist (Fig. 1 .2~) . These remnant basins tend to col!ect large volumes of sediment from nearby rising areas and to undergo substantial synsedimentary deformation (convergence, also often accom- panied by strike-slip motions). Foreland ba- sins, and peripheral basins in front of a fold- thrust belt, are formed by depressing and flexuring the continental crust ("A-subduc- tion", after Ampferer, Alpine-type) under the load of the ovcrthrust mountain belt (Fig. 1 . 2 ~ and Fig. 1.3a). The extension of these asym- metric basins tends to increase with time, but a resulting large influx of clastic sediments from the rising mountain range often keeps
pace with subsidence (Chap. 12.6). As a result of the collision of two continental crusts, the overriding plate may be affected by "conti- nental escape", leading to extensional graben structures or rifts perpendicular to the strike of the fold-thrust belt (Fig. 1 .2~) .
Retroarc or intramontune basins (Fig. 1.2b) occur in the hinterland of an arc orogen ("B- subduction" zone). They may affect relatively large areas on continental crust. Limited sub- sidence appears to be caused mainly by tecto- nic loading in a backarc fold-thrust belt.
Pannonian-type basins originate from post- orogenic divergence between two fold-thrust zones (Fig. 1.3a). They are usually associated with an A-subduction zone and are floored by thinning continental or transitional crust.
During crustal collision, some foreland (and retroarc) basins can get broken up into sepa- rate smaller blocks, whereby strike-slip mo- tions may also play a role (Fig. 1 .2~) . Some of the blocks are affected by uplift, others by subsidence, forming basinal depressions. The mechanics of such tilted block basins were studied, for example, in the Wyoming Provin- ce of the Rocky Mountain foreland (McQueen and Beaumont 1989). So-called Chinese-type basins (Bally and Snelson 1980) result from block faulting in the hinterland of a contin- ent-continent collision. They are not directly associated with an A-subduction margin, but it appears unnecessary to classify them as a special new basin type (Hsii 1989).
- Strike-slip and wrench basins (Fig. 1.3b and c): Transform motions may be associated either with a tensional component (transten- sional) or with a compressional component (transpressional). Transtensional fault systems locally cause crustal thinning and therefore create narrow, elongate pull-apart basins (Chap. 12.8). If they evolve on continental crust, continuing transform motion may lead to crustal separation perpendicular to the transform faults and initiate accretion of new oceanic crust in limited spreading centers. Until this development occurs, the rate of subsidence is usually high. Transpressional systems generate wrench basins of limited size and endurance. Their compressional compo- nent can be inferred from wrench faults and fold belts of limited extent (Fig. 1 .3~) .
In order to identify these various basin cate- gories, one must know the nature of the un- derlying crust as well as the type of former plate movement involved during basin forma- tion, i.e., divergence or convergence. Even in the case of transform movement, either some

Chapter 1 Basin Classification
a SUBDUCTION-RELATED BASINS, INTRAOCEANlC INTERARC (BACKARC) BASIN VOLCANIC ISLAND ARC
FOREARC BASlN
INTERMEDIATE CRUST (ARC STRUCTURE)
ACCRETION CRUST B-SUBDUCTION COMPLEX (MELANGE) TRANSITIONAL CRUST
(ARC STRUCTURE) ETlON
ELANGE) /
TRANSITIONAL CRUST
RETROARC INTRA-ARC BASINS , I
VOLCANIC AHL
b CONTINENTAL MARGIN \
; BASIN (PARTIALLY
OCEANIC CRUST
LKUS I
-THRUST BELT
COLLISION-RELATED BASINS
REMNANT BASIN INTRAMONTANE BASIN
OUGHS, CAUSED BY PE OR STRIKE-SLIP
ACCRETION
FORELAND BASlN
FOLD-THRUST BELT OVEFiRlDlNG P
Fig. 1.2a-c. Tectonic basin classification (Fig. 1 .1 continued). Subduction and collision-related basins (remnant basin). See text for explanation

Tectonic Basin Classification
FORELAND PANNONIAN-TY PE BASIN BASIN (INTRAMONTANE B.)
FOLD-THRUST ZONE /
AND SHALLOW-MARINE
b STRIKE SLIP/ WRENCH BASINS DEXTRAL (RIGHT-LI ., ,, .. .,,
Fig. 1.3a-c. Tectonic basin classification (Fig. 1.2 continued). Collision-related basins and strike-sliplwrench basins. See text for explanation

10 Chapter 1 Basin Classification
divergence or convergence must take place. Small angles of convergence show up as wrenching or fold belts, and small angles of divergence appear as normal faulting or sag- ging.
One should bear in mind that all these basin types represent proto-types of tectonically controlled basins. They offer a starting point for the study and evaluation of basins, but there are no type basins which can be used as a complete model for any other basin (Burch- fie1 and Royden 1988). Even within a single broad tectonic setting, the development of smaller individual basins may display great variation. As soon as basins are analyzed in greater detail, the broad tectonic basin classi- fication listed above becomes less useful. In addition, over long time periods, a sedimen- tary basin may evolve from one basin type into another (polyhistory basins) and thus exhibit a complex tectonic and depositional history (Chap. 12.9).
1.3 Pre-, Syn-, and Post-Depositional Basins
Principally, tectonic movements and sedimen- tary processes can interact in three different ways. These are used to distinguish between different types of sedimentary basins (Fig. 1.4; Selley 1985a):
- Post-depositional basins. The deposition of sediments largely predate tectonic movements forming a basin structure. Hence, there is no or little relationship between the transport, distribution, and facies of these sediments and the later evolved basin structure (Fig. 1.4a). However, some relationship between the syn- depositional subsidence phase and the subse- quent basin-forming process cannot be ex- cluded.
- Syn-depositional basins. Sediment accumu- lation is affected by syn-depositional tectonic movements, e.g., differential subsidence (Fig. 1.4b). If the sedimentation rate is always high enough to compensate for subsidence, the direction of transport and the sedimentary facies remain unchanged, but the thickness of the sediment in certain time slices varies. In Fig. 1.4b the sediment thickness increases toward the center of the basin. In this case, the basin structure is syn-depositional, but there was hardly a syn-depositional morpholo- gical basin controlling the sedimentary facies
of the basin. If sedimentation is too slow to fill up the subsiding area, a morphological basin will develop. Then, the distribution and facies of the succeeding sediments will be affected by the morphology of the deepening basin (transition to the situation shown in Fig. 1 .4~) .
- Pre-depositional basins. Rapid tectonic movements predate significant sediment accu- mulation and create a morphological basin, which is filled later by post-tectonic sedi- ments (Fig. 1 .4~) . The water depth in the basin decreases with time, although some syn-depo- sitional subsidence due to sediment loading is likely (Chap. 8.1). Sediment transport as well as vertical and lateral facies development are substantially influenced by the basin morpho- logy.
Of course, there are transitions between these simplified basin types and, as we shall see later (Chap. 12), certain basins may show a complex history and therefore contain pre- tectonic as well as syn-tectonic or post-tec- tonic sediments.
1.4 Basin Morphology and Depositional Environments
General Aspects
The geometry of an ultimate basin fill is con- trolled mainly by basin-forming tectonic pro- cesses, but the morphology of a basin defined by the sediment surface is the product of the interplay between tectonic movements and sedimentation. Therefore, as already mentio- ned, a purely tectonic classification of sedi- mentary basins is not sufficient for charac- terizing depositional areas. It is true that a sedimentary basin in a particular tectonic setting also often undergoes a specific deve- lopmental or subsidence history (Chaps. 8 and 12), but its morphology, including water depth, may be controlled largely by other factors, such as varying influx and distribu- tion of sediment from terrigenous sources (Chap. 1 1).
For example, a fluvial depositional system can develop and persist for considerable time on top of subsiding crust in various tectonic settings (Miall 1981). Fluvial deposits are known from continental graben structures, passive continental margins, foreland basins,

Basin Morphology
a POST-DEPOSITIONAL BASIN ERODED - - -. ..
VERTICAL TREND
< LITTLE LATERAL CHANGE > PALEO-CURRENT IN FACIES AND THICKNESS DIRECTION
SY N-DEPOSITIONAL BASIN PALEO-CURRENT DIRECTION
DIFFERENTIAL SUBSIDENCE
< SIGNIFICANT LATERAL CHANGE \LITTLE VERTICAL
IN THICKNESS, SOME CHANGE IN FACIES FACIES CHANGE
PRE-DEPOSITIONAL BASIN REEF
SHALLOWING w? UPWARD a* ,.\ < -
.
< > PRONOUNCED LATERAL FACIES CHANGE
Fig. 1.4. a Postdepositional basin created by tectonic though a morphological basin barely existed. c Rapid, pre- movements after the deposition of sheet-lie fluvial and depositional tectonics creates a deep morphological basin lake sediments; younger syn-tectonic basin fill is removed which is later filled up by post-tectonic sediments. The by subsequent erosion. b Syn-depositional tectonic move- geometry of the former basin can be derived from transport ments control varying thicknesses of fluvial and shallow- directions and facies distribution marine sediments and generate a basin-fill structure, al-

12 Chapter 1 Basin Classification
forearc and backarc basins, pull-apart basins, etc. Fluvial sediments accumulate as long as rivers reach the depositional area and supply enough material to keep the subsiding basin filled. Although the basin-forming processes and subsidence histories of these examples differ fundamentally from each other, the sedimentary facies of their basin fills display no or only minor differences. In order to dis- tinguish between these varying tectonic set- tings, one has to take into account the geome- try of the entire basin fill, as well as vertical and lateral facies changes over long distances, including paleocurrent directions and other criteria. Syndepositional tectonic movements manifested by variations in thickness, small disconformities, or faults dying out upward (cf. Fig. 1.4b) may indicate the nature of the tectonic processes involved.
The erosional base level and sediment dis- tribution within a basin are additional impor- tant factors modifying basin morphology and thus the development of special sedimentary facies. This situation is demonstrated in the elementary model of Fig. 1.5. In a fluvial en- vironment, sediments cannot accumulate higher than the base level and gradient of the stream. If there is more influx of material into the depositional system than necessary for compensation of subsidence, the sediment surplus will be carried farther downslope into lakes or the sea. This signifies that the level up to which a basin can be filled with sediments may depend on the geographic position of the basin in relation to the erosional base. In Ti- bet, for example, the floors of present-day fluvial basins (intramontane basins and graben structures) are elevated higher than 3000 m in
comparison l o the coastal fluvial plains elsewhere.
The morphology of water-filled basins may significantly change as a result of depositional processes. Lakes and low-energy basins fre- quently show a prograding deltaic facies, cau- sing pronounced basinward outbuilding of sediment (Chaps. 2.1.1, 2.2.2, 2.5.1, 3.4.1). Consequently, the areal distribution of the finer-grained sediment in the deeper basin portions decreases with time, although the initial, tectonically controlled basin configura- tion persists. By contrast, high-energy basins are little influenced by sediment outbuilding (Fig. 1.5). For example, terrigenous sediments transported into high-energy shelf seas tend to be reworked and swept into deeper water by wave action and bottom currents, except for some local seaward migration of the shoreline. Even on deep submarine slopes and in the deep sea, there is no general outbuilding or upbuilding of sediments, because gravity mass movements and deep bottom currents redistri- bute large quantities of material.
These few examples demonstrate that the most appropriate classification scheme for sedimentary basins depends primarily on the objectives of the study. If tectonic structure and evolution of a region are the main topics, then basin fill geometry and subsidence his- tory derived from the thickness of stratigra- phic units (Chap. 8.4) are of primary impor- tance. If, on the other hand, the depositional environment, sedimentary facies, and paleo- geographic reconstructions are of primary interest, then the basin classification used should not be strictly tectonic. Such a classifi- cation should also take into account changes in
SEDIMENT LIMIT FOR THE BUILDUP OF SEDIMENT INFLUX / \
BASE LEVEL OF SEA LEVEL
SUBSIDENCE
0, 1 ,2 = ISOCHRONES
Fig. 1.5. Base level of erosion, hydrodynamic regime in the sea, and gravity mass movements as limiting factors wn- trolling upbuilding and outbuilding of sediments. Note that the model may be modified by sea level changes

Depositional Environments
basin morphology caused by depositional pro- cesses, the chemical and hydrodynamic regi- mes of the basin, and peri-basin characteris- tics such as the size and nature of the drainage areas on nearby land.
Many workers distinguish between recent and ancient examples of depositional environ- ments (e.g., Davis 1983; Reading 1986a), be- cause the interpretation of paleoenvironments from the fossil record is subject to greater uncertainties. Furthermore, the methods of investigation and the possibilities of observing certain physical and biological sedimentary structures differ between soft sediments and lithified rocks. Soft material, for example, is suitable for the determination of primary grain size distribution, which in the case of lithified rocks is frequently problematic. On the other hand, any kind of structure is com- monly much better visible in ancient rocks than in soft sands and muds. The surface of recent sediments on land and under water can be well observed, but in many cases, for ex- ample in fluvial environments, such temporary surfaces are rarely preserved in the sedimen- tary record. By contrast, indurated beds alter- nating with weaker material frequently show excellently preserved lower and upper bedding planes with trace fossils, various marks, and imbrication phenomena which are difficult to observe in soft sediments. Diagenesis may, however, also obscure primary bedding fea- tures. In addition, there are special sediments in the past, particularly far back in the Earth's history, for which no present-day analogies are known. Such environments are mentioned in Chapter 6.5.
In spite of such various problems between recent and ancient sediments, the depositional environments of both groups are treated joint- ly in this book, except for some special depo- sits. After a brief overview in this chapter, the most important groups of depositional envi- ronments are described in simplified facies models in Chapters 2 through 6.
Depositional Enqironments (Overview)
On the surface of our present-day globe, on land and below the sea, hundreds of deposi- tional areas are known which meet the defi- nition of sedimentary basins as described in Chapter 1 . l . If we add to this list medium to large ancient sedimentary basins whose fill is still largely preserved, we have some thousand sedimentary basins. Taking into account this large number and the many factors controlling
a sedimentary environment, it appears at first glance that an enormous number of differing depositional environments should exist. This is in fact the case, but nevertheless it is possible to subdivide this great quantity into a limited number of distinct groups which have many characteristics in common.
Such depositional environment models have been extensively described in several text- books (e.g., Reineck and Singh 1980; Blatt et al. 1980; Scholle and Spearing 1982; Davis 1983; Walker 1984a; Selley 1985a and b; Rea- ding 1986a), and single groups of environ- ments have been dealt with repeatedly in spe- cial publications, memoirs, short course notes, etc.
In Figure 1.6 the various types of sedimen- tary basins are predominantly classified ac- cording to their depositional environment and basin morphology. However, peri-basin geo- morphology and climate also play a role. One can distinguish between several principal groups, for example:
- Continental (fluvial, glacial, eolian), lacustrine, and deltaic environments.
- Adjacent sea basins and epicontinental seas of varying salinity.
- Marine depositional areas of normal salinity.
As an alternative, a group of "transitional" en- vironments may be defined between continen- tal and marine environments (e.g., Davis 1983). This group includes marine deltas, in- tertidal environments, coastal lagoons, estua- ries, and barrier island systems (cf. Chap. 3). In Part I1 of this book, a more diversified classification is used with the following main groups:
- Continental sediments. - Coastal and shallow sea sediments
(including carbonates). - Sediments of adjacent seas and estua-
ries. - Oceanic sediments. - Special sediments and environments.
In addition, a chapter deals with depositional rhythms and cyclic sequences which may oc- cur in all groups of depositional environments. In the following, a few general principles for the sedimentary fill of various basins are briefly discussed.
The fluvial environment is controlled by its erosional base level as well as by the sediment supply from more elevated regions sufficient

Chapter 1 Basin Classification
a CONTINENTAL, LACUSTRINE b ADJACENT SEA BASINS OF DIFFERENT TECTONIC SETTINGS OF DIFFERENT TECTONIC SETTING AND
SUBSIDENCE
SHALLOW- SHALLOW DEEP DEEP SYMMETRIC SYMMETRIC ASYMMETRIC & *- -
E N - NARROW. WIDE, VARYING , SHALLOW DEEP
SEDIMENT SOURCE (S) A (PLAN VIEW) ONE, TWO-OR MULTI- ONE.
NEARBY SOURCE SYSTEM DISTANT
SIN
OPEN DEEP UNDER VARIOUS CLIMATES AND SEA WITH DIFFERING INPUT OF
TERRIGENOUS SEDIMENTS
C MARINE DELTAS SEA LEVEL
/ . . :
FLOODPLAIN WITH LAKES, SWAMP TIDAL AREAS, LAGOONS
d MARINE DEPOSITIONAL AREAS
SHALLOW MARINE SEA LEVEL MARINE TROUGHS AND RIDGES ---------I--
C RAMP . x---(~
-.SPECIAL BASIN (S)
DEEP MARINE, (SHELF NARROW OR MISSING)
OCEANIC RIDGES, ETC.
T )RISE DEEP-SEA
(BASIN PLAIN)
DEEP MARINE DEEP SEA TRENCH WITH WIDE SHELF
---------------- -- SLOPE BASIN
Fig. 1.6a-d. Overview of depositional environments, based to continents (b and c), are strongly affected by variations primarily on basin morphology and peri-basin characteri- in terrigenous input under differing conditions of climate stics. All basins, particularly those on land (a) or adjacent and relief. d Various marine basins

Depositional Environments
to compensate for subsidence in different tec- tonic settings (Fig. 1.6a). Under these circum- stances, the river gradient and thus a more or less constant average net transport direction can be maintained for rather long time pe- riods. A topographic depression, i.e., a syn- depositional morphological basin (Fig. 1.4b) can only develop when fluvial transport lags behind basin subsidence. This clear relation- ship between gradient and transport direction is somewhat modified in the glacial and eolian environments. Subglacial abrasion often leads to erosional depressions, over-deepened val- leys, and ice-filled troughs, which are later filled with water creating short-lived lakes. Similarly, eolian deflation can generate local depressions in the land surface which, if the groundwater table rises, may be transformed into salt pans. However, such erosional fea- tures are normally filled up again with sedi- ments within a short time span. On the other hand, eolian sand can accumulate large "sand seas" reaching elevations well above the sur- rounding landscape. In addition, wind-blown sand can migrate into different directions, partially up-slope.
The influence of peri-basin morphology on fluvial-lacustrine sedimentation is described in Figure 1.6a. Terrigenous material entering the basin may come either from one or several nearby sources, or, solely or in addition, from a distant source. Consequently, deposition will be either texturally immature or markedly mature and display either a fairly uniform or complex composition. In addition, the climate in the source area(s) exerts a strong influence (Chap. 2.2.4). Where sediment accumulation cannot compensate for subsidence, long per- sisting, deepening lakes or shallow seas evolve (see below).
Marine deltas represent a transitional, highly variable depositional environment between continental and marine conditions (Fig. 1 .6~) . The subaerial part of such a delta is controlled by fluvial and possibly lacustrine processes, whereas its coastal and subaqueous regions are dominated by the hydrodynamic and chemical properties of the sea. Large terrigenous sedi- ment supply causes prograding of the deltaic complex toward the sea; high sedimentation rates and subsidence enhanced by the sedi- ment load enable the formation of thick, wid- ely extended deltaic sequences. Marine delta complexes provide a particularly good exam- ple of depositional environments which are controlled predominantly by exogenic factors (Chap. 3.4).
Adjacent sea basins and epicontinental seas are connected with the open sea and therefore exchange basin water with normal ocean water (Fig. 1.6b). The extent of this water exchange and thus the salinity of the basin water strongly depend on the width and depth of the opening to the ocean. In humid regions, ad- jacent basins with a limited opening tend to develop brackish conditions, while arid basins frequently become more saline than normal sea water. Adjacent basins and epicontinental basins on continental crust are commonly shallow, but basins on oceanic or mixed crust may also be deep. All these basins may show either symmetric or asymmetric cross sections, and they may represent either simple morpho- logical features or basins subdivided by shal- low swells into several subbasins (segmented basins). In the latter case, markedly differing depositional subenvironments have to be taken into account. Most of these adjacent basins are still strongly influenced by the climate and relief of peri-basin land regions, which con- trol the influx of terrigenous material from local sources. In addition, more distant pro- venances may contribute to the sediment fill. In summary, adjacent basins may exhibit a particularly great variety of facies (Chap. 4).
The shallow sea and continental shelf sedi- ments are still considerably affected by pro- cesses operating in neighboring land regions, which generally provide sufficient material to keep these basins shallow. Strong waves, and surface and bottom currents usually tend to distribute the local influx of terrigenous sedi- ment over large areas. Especially in shallow water, the high-energy, sediment-transporting systems prevent the deposition of fine-grained materials, partially including sands. Therefore, such areas often persist over long time periods without being filled up to sea level. This is also true for widely extended shallow-marine basins, as long as excess sediment volume (in relation to space provided by subsidence) can be stored in special depressions (Fig. 1.6d) or be swept into a neighboring deeper ocean basin. The margin of such basins is commonly characterized by a kind of ramp morphology.
Deeper marine basins are usually bordered by a shelf zone of varying width followed by a wide and normally gentle slope (continental slope, Fig. 1.6d). The foot of the slope in deep water (continental rise) is still gently inclined basinward; it is built up to a large extent by redeposited material derived directly from the slope (slope apron) or by sediments funnelled by submarine valleys and canyons into the deep sea (deep-sea fans). The terms continen-

Chapter 1 Basin Classification
tal slope and continental rise are commonly used to describe corresponding features of the present-day passive, Atlantic-type continental margins. These terms, however, imply a plate- tectonic interpretation.
Deep-sea basins or basin plains are the deepest parts of marine environments except for the special features of deep-sea trenches (see below).
Large volumes of terrigenous material can also be collected by the troughs in a submarine horst and graben topography bordering the continent. Similarly, deep sea trenches at the foot of relatively steep slopes and slope basins are sites of preferential sediment accumulation (Fig. Id). Thick, ancient flysch sequences are mostly interpreted as depositions in such ba- sins. Less important sediment accumulation features are small basins, called "ponds", which occur along oceanic ridges, and infil- lings of narrow troughs due to fracturing of the oceanic crust.
The thin, frequently incomplete sedimentary records on the tops of submarine ridges, plat- forms, and seamounts strongly contrast with all other marine sediments. These deposits are mostly biogenic or chemically precipitated and usually contain only very small proportions of terrigenous or volcaniclastic materials. Although such limited sediment accumulations can hardly be referred to as basin fills, they do constitute an important and diagnostically significant part of larger marine depositional environments.
The direct influence of tectonic basin evolu- tion on sedimentary facies is only evident in areas, where tectonic movements are rapid and nonuniform, such as at the basin margins, or where sediment accumulation lags far behind subsidence. This situation is common in con- tinental rift and pull-apart basins during their early stages of evolution, in subduction-rela- ted settings, in remnant and foreland basins, and in deep marine environments along ocea- nic ridges or transform faults far away from large land masses. These problems are further discussed in Chapter 12.
Some General Trends for Sediment Accumulation and Facies
From the previous discussion one can draw some general, straightforward rules for the sediment accumulation and facies in various depositional environments:
- The influence of a terrigenous sediment source on the basin fill decreases from high- relief continental environments, to lowlands and shallow seas, to the deep sea. - Similarly, the sedimentation rate tends to decrease from highland continental basins to the central parts of large oceanic basins. - Chemical sediments of some extent com- monly form in lowlands and special portions of adjacent shallow seas, but rarely in the other depositional environments. - Basins with low sedimentation rates tend to accumulate sediments relatively rich in bioge- nic components. Such basins may persist for long time periods and are therefore often markedly affected by synsedimentary tectonic movements. - The sedimentary facies of many basin fills do not reflect tectonic basin evolution and specific structural elements. Only in some basin types and/or during the most rapid phase of basin evolution do tectonic move- ments directly control sedimentary facies. However, the geometry of basin fills, sedimentation rates, and syn- and post-de- positional deformations characterize the tec- tonic style and evolution of the basin consi- dered.
Facies Architecture
The principal characteristics of the various depositional environments include features on different scales. These range from large-scale phenomena, relevant to the facies distribution in the total basin, to micro-scale properties which are studied in a single rock specimen. As Allen (1983) and Mia11 (1985) have point- ed out, the sedimentary basin fill often dis- plays a certain type of stratigraphic architec- ture, i.e., larger units are built up by a number of smaller, basic units. In single outcrops, ge- nerally.only the smaller scale units can be ob- served, which are often not sufficiently diag- nostic for the recognition of the true nature of the total basin fill or a large part of it.
The brief summaries for the common depo- sitional environments presented in Chapters 2 through 6 are largely based on these prin- ciples. They preferentially show field and out- crop phenomena and how these fit into a lar- ger scale facies model. Micro-scale features and processes are only described in special cases.

Part I1 Depositional Systems and Facies Models

2 Continental Sediments
2.1 Glacial Deposits of Lowlands and Shallow Seas
2.1.1 Continental Glacial Deposits Introduction Continental Ice Sheet Deposits Glaciofluvial Sediments Proglacial Lacustrine Deposits
2.1.2 Glaciomarine Sediments Final Remarks
2.1.1 Continental Glacial Deposits
Introduction
Glaciers produce and effect numerous types of both continental and marine sediments. From present-day glaciated and periglacial regions we know a great variety of features charac- teristic of glacial environments, including many minor structures and patterns which can be observed at or near the land surface. Therefore it is barely possible to summarize all these phenomena in a few simple facies models.
However, if we focus only on glacial sedi- ments of a high geological preservation poten- tial, we can neglect glacial landforms and sediments in highly elevated mountain ranges or periglacial phenomena such as patterned ground, gelifluction, and other gravity mass movements on subaerial slopes. Then the re- maining environments to be considered are glaciated lowlands and predominantly shallow seas. In order to understand the sedimentary processes of these selected environments, a general knowledge of glacial phenomena is, of course, necessary, a topic which is treated in many special articles and textbooks (e.g., Eyles 1984; Eyles and Miall 1984; Edwards 1986; Anderson and Molnia 1989; Brodzikowski and van Loon 1991). The following simplified
facies models therefore present some infor- mation only on those glacial sedimentary fa- cies which have a relatively good chance of being preserved over long geological time.
Continental Ice Sheet Deposits
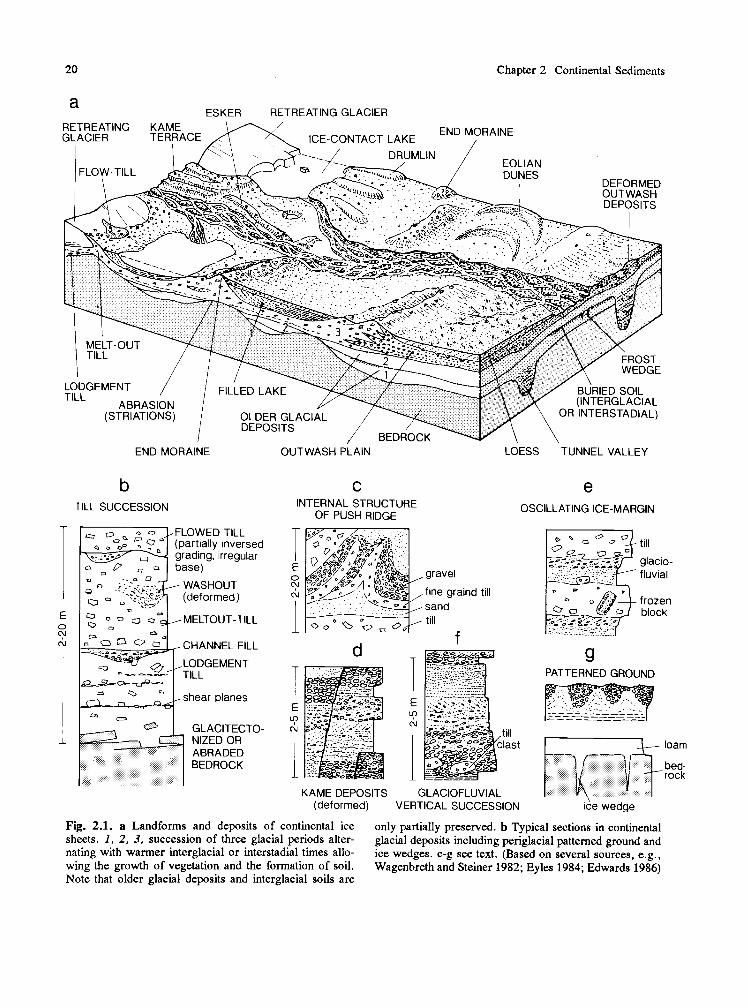
A continental ice sheet, advancing over areas of low relief, carries debris from its usually more elevated source area and takes up further material by basal erosion. If the base of the glacier is cold and frozen to the ground, more basal debris is generally accumulated than by "temperate" glaciers, which have a wet base sliding relatively easily over the substrate.
The debris left behind after the ice melts (Fig. 2.la and b) is usually poorly sorted and unstratified and, if its origin is uncertain, described as diamict (when unlithified also as diamicton or mixtum). Such sediments typical- ly contain boulders and large clasts floating in a finer grained matrix of silt and sand. Clays derived from weathered soils are absent (due to the cold climate) or play only a minor role. If the debris clearly originates from glacial action, the terms till (for unlithified material) and tillite (for lithified material) are common; recently the term orthotill (in contrast to para- till which has undergone mass movement or is sedimented through a column of water) was recommended (e.g., Shaw 1985). Debris ac- cumulated at the base of glaciers is termed basal till or lodgement till, because part of the material is trapped by obstacles in the sub- strate. "Cold-based" glaciers can cause defor- mation of the underlying bedrock (glaciotec- tonic structures) and rip up large slabs or plates from the substrate by shearing. One can also observe thrust faults and small-scale folds within the lodgement till. Nearly horizontal or low-angle shear zones within the till cause some crude stratification and imbrication of coarser components. At wet-based ice mar- gins, these phenomena are even better deve-
Chapter 2 Continental Sediments
a ESKER RETREATING GLACIER
RETREATING KAME GLACIER TERRACE ICE-CONTACT LAKE END MORAINE /
END MORAINE OUTWASH PLAIN LOESS TUNNEL VALLEY
b c e TILL SUCCESSION INTERNAL STRUCTURE
OF PUSH RIDGE OSCILLATING ICE-MARGIN
FLOWED TlLL (partially Inversed . - *---o - grading, Irregular base) -
WASHOUT
p + c H A N N E L -.-P-b-c' FILL
LODGEMENT " -= P---
&S-0-4-- TlLL
:4$- shear planes
gravel
fine graind till sand till
f d
I
till last
KAME DEPOSITS GLACIOFLUVIAL
block
g PATTERNED GROUND
I L- loam
bed- rock
(deformed) VERTICAL SUCCESSION ike wedge
Fig. 2.1. a Landforms and deposits of continental ice only partially preserved. b Typical sections in continental sheets. 1, 2, 3, succession of three glacial periods alter- glacial deposits including periglacial patterned ground and nating with warmer interglacial or interstadial times allo- ice wedges. c-g see text. (Based on several sources, e.g., wing the growth of vegetation and the formation of soil. Wagenbreth and Steiner 1982; Eyles 1984; Edwards 1986) Note that older glacial deposits and interglacial soils are

Glacial Deposits
loped. The particles of the relatively thin basal debris layer often undergo intense abrasion (ice- faceted clasts) their long axes tending to become aligned parallel to the direction of ice flow. Continued lodgement of clasts on top of the substrate may lead to the formation of lenticular beds of coarse grained diamict.
Melting of glacier ice both at its surface and/or its base leads to the release and ac- cumulation of debris in the form of melt-out till (Fig. 2.la and b). This process usually oc- curs where the entire ice sheet, or at least its basal part, is stagnant. Hence melt-out till, if not overridden by a later ice advance, is not internally deformed. Its clasts may also be striated, but for the most part melt-out till is less affected by basal or internal abrasion and therefore tends to be coarser grained than lodgement till. Melt-out till may also contain frozen blocks of unlithified substrate which are incorporated into the basal zone of a gla- cier. Clast orientation is preferentially parallel to the direction of ice flow, and a considerable number of clasts dip up glacier. Due to run- ning melt-water, this type of till also contains locally minor areas of stratified sorted beds. If these are deposited on top of till still holding some ice, they later become contorted or in- tensely faulted.
Melt-out till accumulating on top of the ice or at the slopes of moraines is frequently redeposited by mass flows (Fig. 2.1). Such flowtills, flowed tills or flow (flowed) dia- micts are difficult to discriminate from debris flow deposits of other environments (Chap. 5.4.1) unless they contain striated clasts or ice- cemented blocks, or unless they show defor- mation characteristics of ice contact. As inter- calations of a glacial sedimentary sequence, such flow tills as well as grain flows originat- ing from glaciofluvial outwash are easier to identify. At standing ice margins, melt-out till and supraglacial outwash may form end mo- raines of considerable height and length. These moraines are frequently overridden and deformed by advancing ice (Fig. 2 .1~) .
Special morphological features developd in the subglacial environment are drumlins, es- kers, and tunnel valleys. Whereas eskers and drumlins form narrow ridges or elongate hills on the land surface after the ice has melted, tunnel valleys may cut deeply into the under- lying bedrock. Tunnel valleys probably result from subglacial meltwater erosion, where the channels are completely filled with water and therefore do not need a continuous gradient. In northern Germany such tunnel valleys lo- cally reach depths of 400 to 500 m below the
present sea level. They are cut into weakly indurated Neogene sandstones, have steep side walls, and are infilled by glacial outwash dia- mict and finer grained water-deposited sedi- ments. They are known only from subsurface investigations. Such deep tunnel valleys have a very high preservation potential in the geolo- gic record, although it may be difficult to identify them as such when only small por- tions of the former tunnel system are exposed by erosion.
Glaciofluvial Sediments
Transitional facies between till and glacioflu- vial sediments are glacial outwash, primarily deposited either supraglacially on top of the ice (e.g., kame terraces), or englacially in large ice cracks or tunnels at the base of the ice (esker). These sediments may show sharp lateral facies changes into other glacial depo- sits, because the meltwater streams were origi- nally bounded by ice.
Glaciofluvial sediments in the proglacial re- gion usually show the same characteristics as deposits of alluvial fans and less sinuous brai- ded rivers (Chap. 2.2). Large valley glaciers and some continental ice sheets release enor- mous quantities of coarse- and fine-grained debris which is transported by meltwater into the proglacial lowlands. Along the ice margin, some of the material is deposited in outwash fans, and further away in outwash plains (san- dur, Fig. 2 . 1 ~ ) . Outwash deposits of alpine glaciers are mostly rich in gravel, whereas outwash plains of continental ice sheets (for example, those of the Scandinavian Pleistocene ice sheet) consist predominantly of sand. This results not only from the general downstream decrease in grain size, but also from the lower proportion of coarse-grained material deli- vered by the continental ice mass. In any case, meltwater streams, with their high bedload, tend to accumulate the coarser grained portion of their load and may therefore generate com- paratively thick glaciofluvial sequences. Dis- tinctive features of the glacial environment, in contrast to normal fluvial conditions, are de- formation structures formed by post-deposi- tional melting of buried ice (Fig. 2.1 b and d), and the occurrence of "frozen blocks" of till or sand, which were carried and finally deposited in this state (Fig. 2.le and f).
A special feature of proglacial meltwater sediments are the deposits of catastrophic floods, the so-called jokulhlaups, which were

Chapter 2 Continental Sediments
described from Iceland and other presently or formerly glaciated regions (e.g., Maizels 1989). These floods result form sudden drainage of ice-dammed lakes, from landslides on to gla- ciers, or from subglacial volcanic eruptions. Jokulhlaup flows may contain very high sus- pended sediment loads (hyperconcentrated flows with up to 35 Oh sediment concentration) consisting predominantly of silt, sand, and gravel. These flows predominantly form thick, more or less homogeneous, poorly structured massive beds.
As long as the outwash plains are devoid of vegetation, sand and silt sized particles are easily blown away by strong winds. The sand can be deposited nearby in the form of dunes; the silt is carried farther away and ac- cumulates as loess, often in areas where tun- dra vegetation is then able to grow (Chap. 2.3.5). On surfaces where neither ac- cumulation nor erosion takes place for some time, we often observe the development of patterned ground, ice wedges, and other phe- nomena typical of the periglacial zone (Fig. 2. lg). The accumulations of large rivers drain- ing a glacial/periglacial region may provide good evidence of alternating colder and war- mer climates (Fig. 2.2). Cold periods are in-
dicated by patterned ground (cryoturbation), ice wedges, and the deposition of loess; war- mer periods enable the growth of more and more varied vegetation and thus the formation of soil. Paleosols are important indicators of former environmental conditions. Loess pro- files with intercalated soils deposited far away from the ice margin in a region of little ero- sion (Fig. 2.2) may provide better evidence of the climatic history of a glaciated area than the more directly deposited glacial sediments themselves. If such loess is transformed by diagenesis into a redbed sequence (Chap. 6.3), its true origin may be difficult to recognize.
Proglacial Lacustrine Deposits
In glacial or proglacial environments, lakes (and their rapid filling by clastic sediments) are very common. They are generated by the erosion of bedrock in valleys or flat foreland areas by ice, by the buildup of moraines or glacial outwash as dams, by the melting of buried ice or, in the case of large ice caps and inland ice, by the depression of the continen- tal crust due to isostasy.
LOESS SOIL CRYOTURBATION ICE WEDGE GLEY
BEDROCK (MIOCENE ' LOWER INTERGLACIAL UPPER SANDS AND SOME BROWN COAL) GRAVEL BED PEAT AND CLAY GRAVEL BED
Fig. 2.2. Example of fluvial sediments and loess with Coal pit in PleistoceneIMiocene deposits of the Lower intercalated peat layers and soils indicating periods of war- Rhine Valley, northern ViUe, near Cologne, Germany. mer climate. Apart from loess, periglacial conditions are (After Woldstedt and Duphorn 1974) also shown by a cryoturbated horizon and ice wedging.
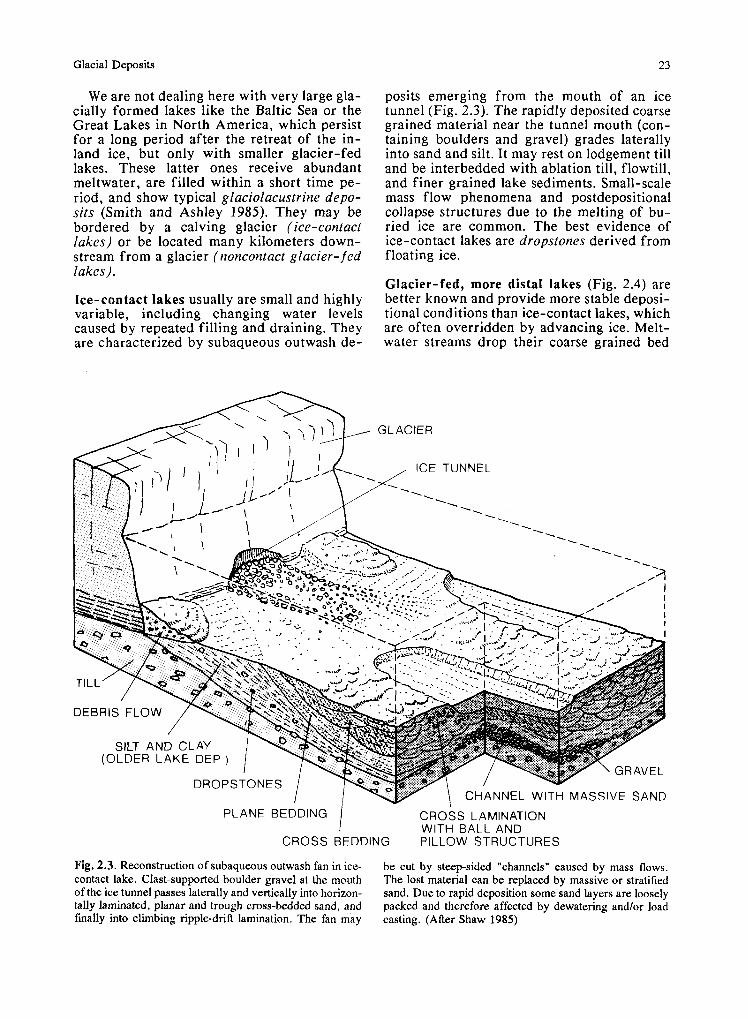
Glacial Deposits 23
We are not dealing here with very large gla- cially formed lakes like the Baltic Sea or the Great Lakes in North America, which persist for a long period after the retreat of the in- land ice, but only with smaller glacier-fed lakes. These latter ones receive abundant meltwater, are filled within a short time pe- riod, and show typical glaciolacustrine depo- sits (Smith and Ashley 1985). They may be bordered by a calving glacier (ice-contact lakes) or be located many kilometers down- stream from a glacier (noncontact glacier- fed
posits emerging from the mouth of an ice tunnel (Fig. 2.3). The rapidly deposited coarse grained material near the tunnel mouth (con- taining boulders and gravel) grades laterally into sand and silt. It may rest on lodgement till and be interbedded with ablation till, flowtill, and finer grained lake sediments. Small-scale mass flow phenomena and postdepositional collapse structures due to the melting of bu- ried ice are common. The best evidence of ice-contact lakes are dropstones derived from floating ice.
lakes). Glacier-fed, more distal lakes (Fig. 2.4) are
Ice-contact lakes usually are small and highly better known and provide more stable deposi- variable, including changing water levels tional conditions than ice-contact lakes, which caused by repeated filling and draining. They are often overridden by advancing ice. Melt- are characterized by subaqueous outwash de- water streams drop their coarse grained bed
PLANE BEDDING CROSS LAMINATION WITH BALL AND
CROSS BEDDING PILLOW STRUCTURES
Fig. 2.3. Reconstruction of subaqueous outwash fan in ice- be cut by steepsided "channels" caused by mass flows. contact lake. Clast-supported boulder gravel at the mouth The lost material can be replaced by massive or stratified of the ice tunnel passes laterally and vertically into horizon- sand. Due to rapid deposition some sand layers are loosely tally laminated, planar and trough cross-bedded sand, and packed and therefore affected by dewatering andlor load finally into climbing ripple-drift lamination. The fan may casting. (After Shaw 1985)

Chapter 2 Continental Sediments
UPPER DELTA FORESETS
MID-DELTA FORESETS
LOWER DELTA
VARVES AND SURGE DEPOSITS
€ a. 0
draped lam.
7' fining-up turbidite (surge current)
g year E
DISTAL VARVES
wlnter- 4-
. . . . . . . . . laver .climb. ripples I - grain
flow PROX. VARVES S F
/ winter layer (suspension settling)
E f --y-
o load casts
ripple c r o s s 1 bedding
sand and gravel (matrix-supported)
gravelly sand
summer layers multiple- (settling from over graded beds flow, interflow of fine sand underflow, and and silt surge currents)
Fig. 2.4. a Sedimentation i n a proglacial (non-ice contact), partially obscured by event deposits, i.e., distinct surge de- meltwater-fed lake. Note the marked facies change from posits (lake turbidites) and successions o f very thin, graded the upper to the lower delta foresets (b, C, d), as wel l as beds o f silt and fine sand. (After Smith and Ashley 1985) the different types o f annual varves (e, f, g) which are
load in the form of a classical lake delta, 2.4a). Upper-delta foresets, if they have not which can be built out rather rapidly into the been affected by wave action, show steeply lake. The sediment is distributed over the inclined coarse-grained beds (Fig. 2.4b). Their delta front by avalanching, fallout from susp- grain size may alternate from gravel-domi- ension, river water underflowing the standing nated to sandy layers, due to the fluctuating lake water, and gravity mass movements (Fig. competence of the meltwater stream. In-

Glacial Deposits
dividual foresets reflect special storm events during the summer time rather than annual meltwater conditions. Mid-delta foresets are less inclined and finer grained than the upper- delta foresets. Caused by high fallout of fine sand from suspension, they frequently show climbing ripple or ripple drift sequences and draped lamination (Fig. 2 .4~) .
The lower-delta foresets consist of rhyth- mic ripple cross-laminated fine sands and graded beds of fine sand and coarse silt (Fig. 2.4d). These layers are mainly formed by un- dercurrents or surging currents during the summer time. They are often overlain by somewhat darker, millimeter-thick layers of fine silt and clay deposited during the long winter period. These proximal and irregular varves grade into thinner (<1 cm) and better developed rhythmites in the distal lake basin (Fig. 2.4). The coarser laminae deposited from summer underflows frequently consist of several sublaminae, indicating a series of events during one summer season (Fig. 2.4f). The rest of the year is represented by a thin, fining upward silt-clay lamina. Whereas these rhythmites may contain a high proportion of randomly occurring, slump-generated, very thin, silty or sandy turbidites (Fig. 2.4e), there are also rhythmites which are hardly affected by such depositional events.
These varves are thinner, more regularly bedded, and devoid of any current structures (Fig. 2.4g). Their material is delivered by sur- face currents (overflows) or by currents cros- sing the lake at middepth (interflows). The varves are produced mainly by vertical settling of fine grained particles and therefore dis- tinctly reflect summer (light laminae) and winter (dark laminae) conditions. The regular bedding of these types of lake bottom sedi- ments may be disturbed by different proces- ses: mass flows, load casting (represented, for example, by small-scale ball-and-pillow structures), and even by burrowing organisms (bioturbation). Overriding ice can promote compaction of the clayey bottomsets and de- form some of the lake deposits.
2.1.2 Glaciomarine Sediments
Glaciomarine sediments or sedimentary se- quences contain facies types which indicate the direct influence of glaciers (Molnia 1983; Eyles et al. 1985; Grobe 1987; Anderson and Molnia 1989). However, this clear relationship cannot be described by a simple facies model. The net growth of ice on the continents and
the advance of ice toward the sea during a cold period is accompanied by sea level fall and vice versa. Furthermore, loading of the crust by thick continental ice sheets causes isostatic subsidence and, after melting of the ice, uplift. However, both sea level fluctuation and isostatic adjustment of the crust do not act synchronously, the latter lagging behind the sea level changes.
If, for example, in a nonglaciated area the global sea level has reached its eustatic minimum level, a glaciated shelf sea may still subside due to the isostatic effect of the ice- load and therefore experience a transgressive sea. When the global eustatic sea level has again reached its maximum, the coaststline of a formerly glaciated area may still continue to rise, causing a regression of the sea.
In short, glaciomarine sedimentary sequences are strongly and complexly affected by migra- ting coastlines over long distances.
Simultaneously, the continental and lacus- trine glacial associations can migrate back and forth a shallow sea and alternate with glacio- marine and normal marine facies types. Dur- ing low sea level stands, the glaciers may ad- vance over the emerging bottom of a shelf sea and deposit a till-outwash-periglacial-lacus- trine facies association on top of marine beds (Fig. 2.6a). The subsequent transgressing sea, in conjunction with a warmer climate, will in general cause a drastic retreat of the ice mar- gin, drown the tills and their associated con- tinental and lacustrine sediments, and enable the deposition of subaqueous glaciomarine sediments. As long as the sea is in contact with the ice margin, subglacial meltwaters can de- posit submarine ice-contact fans (Fig. 2.3a and 2.5a) and release their suspended loads as plumes into the sea. Floating ice can drop its solid material over large areas. Its fine and coarse grained rain of particles forms massive or stratified diamicts (Fig. 2.5b, c, and d), which locally may be affected by bottom cur- rents, reworked by storm waves, or redeposit- ed as grain flows, mud flows and, in deeper water, as turbidity currents (Fig. 2.5e, f , and g). This facies association is highly variable, depending on the load of the ice, the configu- ration and hydraulic regime of the marginal sea, and many other factors. The most dis- tinctive features of glaciomarine sediments are dropstones in stratified marine muds which also contain some fossils and frequently dis- play bioturbation.
In some modern and ancient glaciomarine environments, a special carbonate mineral, i.e., calcium carbonate hexahydrate (ikaite) or pseudomorphs after ikaite were found, which

26 Chapter 2 Continental Sediments
SUPRAGLACIAL DEBRIS, DEFORMED BY ICE ADVANCE
a
COARSE-GRAINED
PELAGIC MUDS DEBRIS F INE SEDIMENTS, AND DlAMlCTS SLIDES GLACITECTONIZED
ICE MARGIN PROXIMAL -> DISTAL
b c BOULDER d
- DIAMICT, MASSIVE,
, MATRIX- SUPPORTED
CLUSTERS OF DROP- STONES - GLENDONITE
DIAMICT, STRATIFIED.
FINE GRAINED MUD WITH DROPSTONES. MATRIX-
SUPPORTED LAMINATED
GRAVITY MASS MOVEMENTS EFFECTS OF CURRENTS AND WAVES
LAG SEDIMENT
STORM
GRAVEL- SAND BEDS (TEMPESTITES)
LARGE WAVE RIPPLES MUD FLOW
CHANNEL FILL DEBRIS
FLOW
Fig. 2.5. Glaciomarine ice-contact environment (a) and the Proximal massive submarine diamicts (b) grade seaward resulting sediment types (b through g). The advancing ice- into stratified diamicts (e) and rhythmic laminated muds margin can disturb the underlying, relatively soft marine with dropstones (d). Reworking and redeposition of these sediments and release most of its debris load via tunnels as facies types leads to lag deposits and large ripples in coar- submarine outwash fans. Suspended material is widely se-grained sands (e), proximal tempestites (f), or different distributed and deposited as mud. Supraglacial debris drops types of gravity mass movements (g). (Based on different along the icemargin or is camed by icebergs into the sea. sources, including Eyles and Miall 1984)

Glacial Deposits
\ RAISED BEACH NORMAL MARINE
-'-.,. HIGH SEA SAND
PROGLACIAL MUD WlTH DROPSTONES .- OR DlAMlCT
NORMAL MARINE SEDIMENTS
LODGEMENT TILL y +SUPRA-GLACIAL MORAINE .f I ..
., .: - ..
\ UU I V V H 3 I - i
LOW
PATTERNED GROUND
BEACH SAND
MARINE P a DlAMlCT
NORMAL MARINE 4 I
I MARINE
- 0-,300 DlAMlCT R
I
I I
GLACIAL RETREAT AND UPLIFT
I I I I I I I I
.p;.p:.:,>\ BEACH GRAVEL ,,*-FL.<a. OUTWASH , 0 ,.:-.-P\
-- --- --- LAKE DEP.
- -
FLOW . OUTWASH
MARINE - a a00 DlAMlCT
MUD WITH
NORMAL <A+- MARINE
MUD
LODGEMEN TlLL ..,> 1.5 0. - 0.. - - - - ii
.-$* + - .?? - 'a. - -..+ 2.i El MUD WlTH DROPS
- BEDROCK
NORMAL MARINE MUD A, GLACIAL ADVANCE
R, GLACIAL RETREAT I
Fig. 2.6. a Glacial deposits on continental shelf, origina- a short intervall. c Mid-shelf cycle showing several marine ting from one advance and subsequent retreat of ice, ac- and non-marine subsections. d Fully marine symmetric companied by lowering and raising sea level, as well as cycle where the maximum advance of ice is represented by some isostatic subsidence and following uplift due to the relatively coarse-grained diamict. (Based on several sour- growing and waning ice load. b, c, d Simplified sequences ces, e.g., Boulton and Deynoux 1981; Eyles 1984; Ed- of one glacial cycle: b Asymmetric cycle along the coast wards 1986) with raised beach, glaciomarine diamict representing only

Chapter 2 Continental Sediments
are referred to as glendonites (Suess et al. 1982; Shearman and Smith 1985; Kemper 1987). This mineral occurs in morgenstern- like or stellate aggregates, several centimeters in size, and indicates sub-zero temperature conditions in the sediments at or somewhat below the sea floor, where these minerals are formed from organic-rich interstitial so- lutions.
During periods in which no ice reaches the coast of the sea, outwash streams of nearby glaciers deposit their bed load as proglacial fans and deltas along the coast. Their sus- pended load can be distributed over large areas of the sea, especially if flocculation of clay particles and their settling as aggregates is delayed, which in general is caused by mixing of the inflowing fresh water with sea water. In this case, however, the marine sediments carry no direct evidence of glacial influence.
Thus, repeated advance and retreat of the ice sheets across shelf seas can in principle lead to a cyclic sequence of alternating (con- tinental) glacial, glaciomarine and normal marine sediments (Fig. 2.6b, c, and d). Due to glacial erosion and marine current activity, however, often only part of such a complete succession will be preserved.
In regions of very cold climate and suf- ficient ice accumulation (as today in the Ant- arctic), large areas of the sea can be covered with comparatively "clean" thick shel f ice. Since most of the debris in these floating ice sheets is located near their base and dropped below the ice due to subglacial ablation, the ice margins and floating icebergs are poor in debris and therefore leave behind little evi- dence of ice action. Neogene and Quaternary
proglacial marine sediments in this environ- ment are often rich in diatoms, bioturbated, and contain few dropstones. On the other hand, large and "dirty" valley glaciers reaching the sea can provide great amounts of silici- clastic debris and accumulate glaciomarine se- quences several kilometers in thickness in subsiding areas, as for example in the Neogene in the Gulf of Alaska (Powell and Molnia 1989) or on the Barents shelf (Vorren et al. 1989). Icebergs originating from such dirty glaciers frequently carry their debris load over long distances, and hence are the source of dropstones found in pelagic and hemipelagic sediments in large ocean basins far away from glaciated regions. In addition, productivity of biogenic carbonate and opal may significantly vary from glacial to interglacial periods (Hen- rich 1990).
Final Remarks
Glacial sediments are extremely variable both in texture and composition, because they are deposited in greatly differing subenviron- ments. Their material may be derived from many sources, some of them extrabasinal (thereby delivering erratic blocks), others intrabasinal. Distinctive features of glacial sediments are characteristic deformation structures and dropstones in lacustrine and marine deposits, as well as relics of periglacial structures.
Tills and tillites may be confused with mud flows or debris flows of non-glacial origin, if certain details of their structure or their facies associations with other sediment types are not sufficiently evaluated.

2 Continental Sediments
2.2 Fluvial Sediments, Alluvial Fans, and Fan Deltas
2.2.1 Bed Forms, Sedimentary Structures, and Facies Elements Introduction Minor and Medium-Sized Bed Forms and Internal Sedimentary Structures Large-Scale Phenomena and Types of Fluvial Systems Basic Facies Elements and Architecture of Fluvial Systems
2.2.2 Alluvial Fans and Fan Deltas Alluvial Fans Fan Deltas
2.2.3 Various River Systems and Their Sediments Braided Rivers and Braidplains Meandering Rivers Anastomosed Rivers Mud-Dominated Low-Gradient Rivers
2.2.4 Largescale Lateral and Vertical Evolution of Fluvial Systems
2.2.1 Bed Forms, Sedimentary Structures, and Facies Elements
Introduction
For many past decades, fluvial sediments did not receive much attention from sedimen- tologists, because their origin and interpre- tation appeared essentially clear in comparison to the deposits of many other environments. Also, fluvial sediments do not form a very large part of the depositional record. In the last 10 to 20 years, however, a considerable number of geologists and sedimentologists have viewed both recent and ancient fluvial sediments as interesting objects of study. This new impetus was initiated not only by acade- mic scientists, but also by many workers in- terested in fluvial deposits as reservoirs for hydrocarbons and groundwater.
The body of new, detailed knowledge gained in this field has been summarized in several specialized volumes (e.g., Miall 1978, 1980, and 1981; Scholle and Spearing 1982; Collinson and Lewin 1983; Galloway and Hobday 1983; Rust and Koster 1984; Flores et al. 1985; Collinson 1986a; Ethridge et al. 1987). In the context of this book, only a brief and therefore incomplete overview can be included. Mineralogical and petrographic as- pects of fluvial deposits, including their provenance from various rock types, can also not be treated in any detail (see, e.g., Davis 1983; Pettijohn et al. 1987; Fiichtbauer 1988; Bosellini et al. 1989).
Minor and Medium-Sized Bed Forms and Internal Sedimentary Structures
Based on direct observations in present-day streams and on experimental studies in flumes, the relationship between hydrodynamic re- gime, erosion, sediment transport, and accu- mulation is fairly well established. This al- lows the prediction of the behavior of part- icles of different size, density, and shape, as well as the formation of minor bed forms, such as small current ripples and larger mega- ripples or dunes, including their internal sedimentary structures. Some of this know- ledge is summarized in Fig. 2.7; a further tr- eatment of this topic is found in several text books (e.g., Blatt et al. 1980; Leeder 1982; Allen 1982; Collinson and Lewin 1983: Davis 1983; Collinson 1986a).
With the aid of the criteria documented in Fig. 2.7, one can, for example, distinguish minor bed forms and internal structures ge- enerated in a lower flow regime. Gravel is transported only if the current reaches a cer- tain critical velocity (around 100 cm/s). In slower currents, gravel forms a lag deposit, which protects the underlying sand from erosion. Stronger currents with velocities higher than the critical value for gravel can

30 Chapter 2 Continental Sediments
INCREASING BED FORMS TRANSPORT LARGER COMPOSITE RIVER CURRENT AND INTERNAL BEHAVIOR OF BED FORMS AND SYSTEM VELOCITY STRATIFICATION SAND AND GRAVEL INTERNAL STRUCTURES
DIRECTION OF FLOW - LAG DEPOSIT y & 6 ~ ~ .o~;&a~.b , i I WATER I
GRAVELBARS I
I 1-10 rn 4 ___----- IN DEEP
IMBRICATION -- 1.2 I I I
SAND BARS I
- 0.4 -0.7
- 0.2-0.3
INCREASING GRAIN SIZE AND/OR GRAIN DENSITY
0.6 mm COARSE SAND GRAVEL BOULDERS DEPOSITION OF LAMINATED SILT,MUD (FI) RIVER SYSTEMS
tt SAND TRANSPORT CONTINUOUS OR INTERMITTENT A, LOW-GRADIENT, MEANDERING OR ANASTOMOSING, PERENNIAL
SAND TRANSPORT ONLY INTERMITTENT - GRAVEL TRANSPORT CONTINUOUS OR INTERMITTENT B' BRAIDED, -
Q GRAVEL ROLLS INTO SCOUR C, HIGH-GRADENT, EPHEMERAL
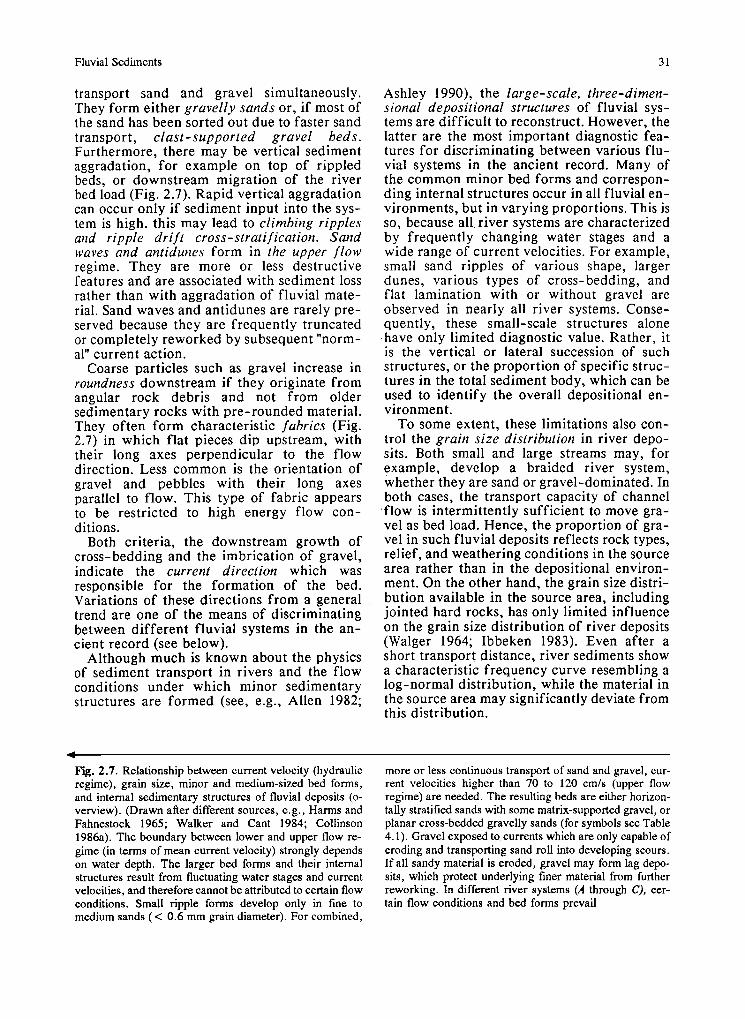
Fluvial Sediments 3 1
transport sand and gravel simultaneously. They form either gravelly sands or, if most of the sand has been sorted out due to faster sand transport, clast-supported gravel beds. Furthermore, there may be vertical sediment aggradation, for example on top of rippled beds, or downstream migration of the river bed load (Fig. 2.7). Rapid vertical aggradation can occur only if sediment input into the sys- tem is high. this may lead to climbing ripples and ripple drift cross-stratification. Sand waves and antidunes form in the upper flow regime. They are more or less destructive features and are associated with sediment loss rather than with aggradation of fluvial mate- rial. Sand waves and antidunes are rarely pre- served because they are frequently truncated or completely reworked by subsequent "norm- al" current action.
Coarse particles such as gravel increase in roundness downstream if they originate from angular rock debris and not from older sedimentary rocks with pre-rounded material. They often form characteristic fabrics (Fig. 2.7) in which flat pieces dip upstream, with their long axes perpendicular to the flow direction. Less common is the orientation of gravel and pebbles with their long axes parallel to flow. This type of fabric appears to be restricted to high energy flow con- ditions.
Both criteria, the downstream growth of cross-bedding and the imbrication of gravel, indicate the current direction which was responsible for the formation of the bed. Variations of these directions from a general trend are one of the means of discriminating between different fluvial systems in the an- cient record (see below).
Although much is known about the physics of sediment transport in rivers and the flow conditions under which minor sedimentary structures are formed (see, e.g., Allen 1982;
Fig. 2.7. Relationship between current velocity (hydraulic regime), grain size, minor and medium-sized bed forms, and internal sedimentary structures of fluvial deposits (o- verview). (Drawn after different sources, e .g . , Harms and Fahnestock 1965; Walker and Cant 1984; Collinson 1986a). The boundary between lower and upper flow re- gime (in terms of mean current velocity) strongly depends on water depth. The larger bed forms and their internal structures result from fluctuating water stages and current velocities, and therefore cannot be attributed to certain flow conditions. Small ripple forms develop only in fine to medium sands (< 0 . 6 mm grain diameter). For combined,
Ashley 1990), the large-scale, three-dimen- sional depositional structures of fluvial sys- tems are difficult to reconstruct. However, the latter are the most important diagnostic fea- tures for discriminating between various flu- vial systems in the ancient record. Many of the common minor bed forms and correspon- ding internal structures occur in all fluvial en- vironments, but in varying proportions. This is so, because all river systems are characterized by frequently changing water stages and a wide range of current velocities. For example, small sand ripples of various shape, larger dunes, various types of cross-bedding, and flat lamination with or without gravel are observed in nearly all river systems. Conse- quently, these small-scale structures alone have only limited diagnostic value. Rather, it is the vertical or lateral succession of such structures, or the proportion of specific struc- tures in the total sediment body, which can be used to identify the overall depositional en- vironment.
To some extent, these limitations also con- trol the grain size distribution in river depo- sits. Both small and large streams may, for example, develop a braided river system, whether they are sand or gravel-dominated. In both cases, the transport capacity of channel
.flow is intermittently sufficient to move gra- vel as bed load. Hence, the proportion of gra- vel in such fluvial deposits reflects rock types, relief, and weathering conditions in the source area rather than in the depositional environ- ment. On the other hand, the grain size distri- bution available in the source area, including jointed hard rocks, has only limited influence on the grain size distribution of river deposits (Walger 1964; Ibbeken 1983). Even after a short transport distance, river sediments show a characteristic frequency curve resembling a log-normal distribution, while the material in the source area may significantly deviate from this distribution.
more or less continuous transport of sand and gravel, cur- rent velocities higher than 70 to 120 cmls (upper flow regime) are needed. The resulting beds are either horizon- tally stratified sands with some matrix-supported gravel, or planar cross-bedded gravelly sands (for symbols see Table 4.1). Gravel exposed to currents which are only capable of eroding and transporting sand roll into developing scours. If all sandy material is eroded, gravel may form lag depo- sits, which protect underlying finer material from further reworking. In different river systems (A through C), cer- tain flow conditions and bed forms prevail

32 Chapter 2 Continental Sediments
In contrast to the transport of individual particles and the formation of small-scale sedimentary structures, which can be simu- lated in laboratory flumes, medium-sized sand bars or gravel bars can be studied only in pre- sent-day rivers. They move during floods, have different shapes (transverse, longitudina- l, linguoid bars), and are modified and reorga- nized by repeated changes between lower and higher water stages in the channel system. As a result, the bars frequently show composite internal structures (Fig. 2.7), which may be associated with both upper and lower flow conditions. They may contain lag deposits, gravel beds and sand beds.
The terminology used in Figs. 2.9 and 2.10 was proposed by Mia11 (1978) as well as Rust and Koster (1984). The most important litho- facies types are listed in Table 2.1.
Clast or framework-supported gravel (Gm, Gt, and partially Gp) originates from high energy flow transporting and accumulating coarse bedload and keeping sand and finer material in suspension. The remaining pore space between the gravel is usually infiltrated later by sand, when the flow velocity has de- creased. The matrix-supported gravel results either from debris flows (Gms), or from the simultaneous transport of sand and gravel in a river with a high flow regime (Gp).
Table 2.1. Small-scale facies or bed types in fluvial sediments
Facies Description code
Interpretation
Gms Massive matrix (sand and mud) supported gravel
Gm Massive or crudely bedded gravel
Gt Trough cross-bedded, clast-supported gravel
GP Planar cross-bedded gravel and/or matrix-supported gravel
Debris flow deposit
Longitudinal bars, lag deposits, sieve deposits
Minor channel fills
Linguid bars or deltaic growth
Sh Horizontally stratified sand Upper flow regime
St Trough cross-stratified sand Lower flow regime
SP Planar cross-stratified sand
Sr Ripple marks and samall-scale cross stratification
Transverse bars, lower flow regime
Lower flow regime
Fm Massive, fine sandy mud or mud
F1 Laminated or cross-laminated fine sand, silt or mud
Overbank or drape de- posits
Overbank or waning flood deposits
P Pedogenic concretions (carbonate) Soil formation
a Description somewhat changed by the author

Fluvial Sediments
Large-Scale Phenomena and Types of Fluvial Systems
The most distinctive features of fluvial sys- tems are large-scale phenomena, such as the size and geometry of channels, their sinuosity and ability to migrate, associated compound bars, and the occurrence of more or less ex- tended overbank deposits, natural levees, etc. The factors controlling these large-scale struc- tures are more complex than those mentioned for the small-scale and medium-scale phe- nomena. In the case of meandering channels, it is a general rule that the wave length and width of the meanders grow with increasing river discharge and slope of the river valley or fluvial plain. Braided stream systems with channels of low sinuosity tend to form in environments of large sediment supply and relatively steep gradients.
In present-day fluvial environments, the channel system and its sinuosity are the most striking, diagnostic features. With the aid of these criteria, one can distinguish between several types of fluvial systems, although there are no sharp boundaries between these deposi- tional environments (Fig. 2.8):
- Alluvial fans and fan deltas (bed-load chan- nels).
- Braided rivers and braidplains (bed-load- channels).
- Meandering river systems (mixed-load and suspended-load channels).
- Anastomosed river systems (predominantly suspended-load channels).
Another classification (already included above) is based on the mode of sediment transport in the channel systems (e.g., Schumm 1981; Galloway 1981):
1. Bed-load channels typically have steep gradients, high width/depth ratios (>40), and channel patterns of low sinuosity. These chan- nels tend to migrate laterally, and channel fills are coarse-grained and contain little suspen- ded-load material. The total alluvium of bed- load systems consists predominantly of chan- nel and channel-flank deposits (Fig. 2.9). Silty and muddy floodplain deposits play a subor- dinate role. 2. Mixed-load fluvial systems preserve a higher percentage of floodplain deposits which consist of silts, muds, and (locally) backswamp carbonaceous muds and clays. Their channels are more stable and have a
lower width/depth ratio than those of the bed-load system; they are mainly filled with sand and minor proportions of silt and clay. These channel fills are flanked by levee sands and silts and crevasse-splay sands (Fig. 2.9), thus raising the overall sand content to about 20 to 40 96. 3. Suspended-load fluvial systems are charac- terized by high-sinuosity single channels of great stability and low width/depth ratio (<lo). Their gradient and stream power are usually low. Their channel fills contain a high proportion of silts and muds. Silty or muddy levee deposits are well developed, and flood basin deposits consist predominantly of over- bank fines or, in humid climates, of back- swamp and lacustrine muds.
Some authors also separate gravel-dominated systems from sandy fluvial systems (e.g., Wal- ker and Cant 1984), because grain size is an important indicator of relief (that is, tectonic activity) as well as climate in the source area. High relief and arid or periglacial/paraglacial conditions favor the production of coarse- grained materials and the primary input into the different fluvial transport systems. In ad- dition, the resistivity of source rocks exposed to weathering and erosion processes also plays an important role (Chap. 9).
In ancient fluvial sediments, it is usually very difficult or impossible to reconstruct the former paleo-channel systems and their sinuo- sity, unless there are many very large out- crops. If such exposures are missing, it is of some use to analyse the proportions of bed- load and suspended-load in the channel fills and in the total flood basin to determine the mode of sediment transport. However, this has its limitations, and consequently many wor- kers have attempted to improve the facies analysis of ancient fluvial environments through other means. The simplest approach is to subdivide the sedimentary fill of a fluvial basin into channel sediments and finer- grained overbank or floodplain deposits. This can easily be done in systems where the dif- ference in grain sizes between these two sub- environments is sufficiently large. A general trend in the relationship between these two principal facies types is shown in Fig. 2.8. Thus, for example different types of sand- stone reservoir geometries can be distin- guished (Fig. 2.9a). One should use caution. however, when deducing subsurface channel distribution and geometry from the present- day, active channel type (Fig. 2.9b).
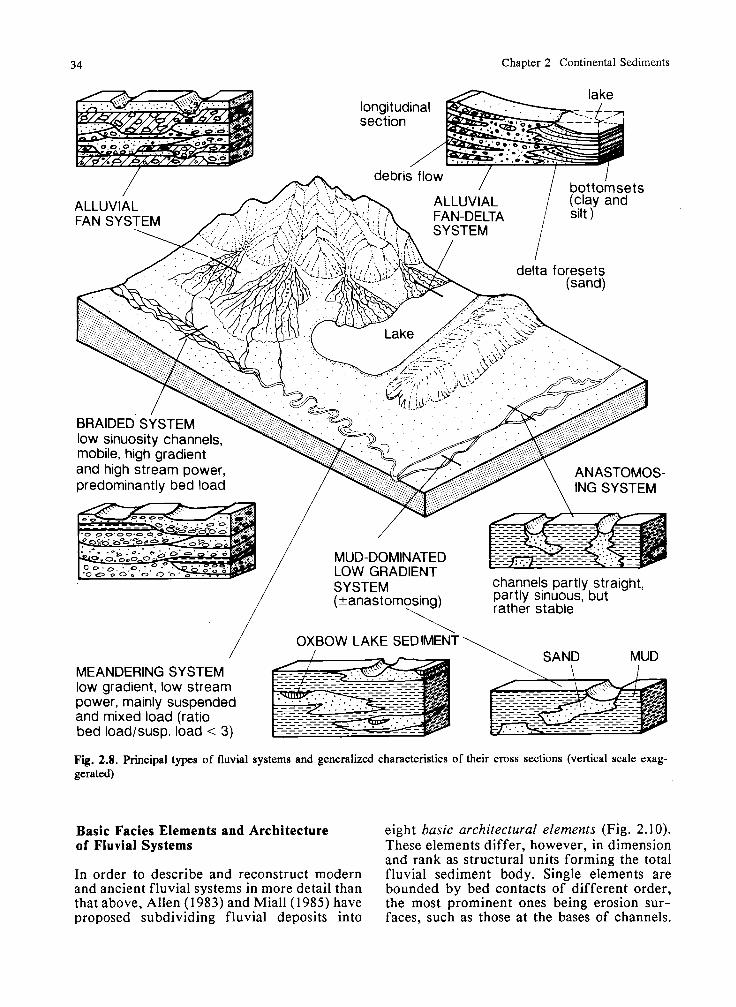
34 Chapter 2 Continental Sediments
'\ / OXBOW LAKE SEDIMENT \ /
MEANDERING SYSTEM low gradient, low stream power, mainly suspended and mixed load (ratio bed loadlsusp. load < 3)
Fig. 2.8. Principal types of fluvial systems and generalized characteristics of their cross sections (vertical scale exag- gerated)
Basic Facies Elements and Architecture eight basic architectural elements (Fig. 2.10). of Fluvial Systems These elements differ, however, in dimension
and rank as structural units forming the total In order to describe and reconstruct modern fluvial sediment body. Single elements are and ancient fluvial systems in more detail than bounded by bed contacts of different order, that above, Allen (1983) and Miall (1985) have the most prominent ones being erosion sur- proposed subdividing fluvial deposits into faces, such as those at the bases of channels.

Fluvial Sediments
1. NARROW IS.0- 2. BROAD ISOLATED LATED CHANNEL RIBBON
3. OVERLAPPING RIBBONS
4. SAND SHEET
4. LATERAL CHANNEL MIGRATION (STACKING), LITTLE CONTEMPORANEOUS SUBSIDENCE
1. VERTICAL STACKING
2. LATERAL STACKING
3. ISOLATED STACKING
c 1. BEDLOAD CHANNELS 2. MIXED LOAD CH. 3. SUSPENDED LOAD CH.
\ \ I \ ;and and gravel sand lateral accretion mud sand
Fig. 2.9a-c. Principal types of sand and sandstone reser- any difference) do not necessarily indicate the nature of the voir geometries generated by channel fills in fluvial sy- buried channel complex; bl is associated with rapid sub- stems. a Single sandstone bodies. b Different types of sidence, b4 with little subsidence. (Ethridge 1985; Miall stacked channel sands. Note that the active channels visible 1985, modified). c Channel fills of bed-load, mixed-load, at the surface (e.g., cases bl , b3, and b4, showing hardly and suspended-load rivers. (Based on Galloway 1985)
Large elements may be composed of several smaller elements. For example, channel fills can consist of up to five subordinate units. It is, however, the smaller elements which we can recognize in outcrops of limited size. Therefore, an approach from smaller to larger architectural elements is recommended for the study of such compound structures seen in many fluvial sediments. The physical pro- cesses generating such compound deposits are not discussed in this approach.
Fluvial deposits may also alternate with eolian sediments when sand is blown out from dry, neighboring alluvial plains, channels, or land surfaces (Chap. 2.3). Commonly, such eolian intercalations only form thin beds, fre- quently on top of coarser lag deposits, because they are partially eroded by subsequent floods. Modern examples of intercalated flu- vial/eolian deposits have been described from several regions, for example from the Great Sand Dunes in Colorado (Fryberger et al.

36 Chapter 2 Continental Sediments
FM : FORESET MACROFORMS
LATERAL ACCRETION DEPOSITS
\
LS : LAMINATED MAIN ACTIVE CHUTE SAND SHEETS CHANNEL CHANNEL
SG : SEDIMENT GRAVITY FLOW DEPOSITS
Gms
sg
CH : CHANNELS 1
\ CH : CHANNELS
SB : SANDY BEDFORMS
GB : GRAVELLY BARS / AND BEDFORMS

Fluvial Sediments 37
1979); ancient examples include parts of the predominantly fluvial Triassic Buntsandstein in Europe (e.g., Mader 1985; Marzo 1986).
2.2.2 Alluvial Fans and Fan Deltas
Alluvial Fans
Alluvial fans are cone-shaped piles of sedi- ment formed at the foot of highlands where streams confined by narrow valleys emerge into an adjacent lowland (Figs. 2.8 and 2.1 1; Bull 1977; Heward 1977; Gloppen and Steel 1981; Nilsen 1982). A series of overlapping alluvial fans generates a clastic wedge. Fan deltas are alluvial fans that have built into a lake or the sea. The proximal facies of alluvial fans and the subaerial part of fan deltas are essentially the same, but the subaqueous sedi- ments of fan deltas differ strongly from those of their subaerial counterparts. There are also some differences between alluvial fans in arid and humid climates. Alluvial fans in arid to semi-arid regions have been frequently des- cribed, whereas fans in humid regions have been rarely studied.
Sedimentation on alluvial fans begins where the streams leave their confined valleys and lose some of their transport efficiency. Basic- ally, alluvial fans are composed of two types of sediment: stream deposits and sediment gravity flows (Fig. 2.1 la). Current-transported sediments usually predominate. They are de- posited either from ephemeral or perennial water flow in the channel system or, after extreme rain storms, from sheet- floods inun- dating large parts of the alluvial fan. Some- times, gravel is concentrated locally to form
Fig. 2.10. Basic architectural elements of fluvial deposits according to MiaII (1985), somewhat changed, varying scale. Note that there are simple and more complex ele- ements consisting of several simple units. OF Overbank fines, sheet-like geometry, predominantly vertical aggrada- tion of lithofacies FI, mud or silt with thin lenses or lami- nae of silt to fine sand, commonly showing ripple cross- lamination; LS Laminated sand sheets, up to several meters thick, produced by flash floods, Sh lithofacies, and other sandy bedforms. SB Sand bedforms, including Sh, St, Sp, and Sr lithofacies (see Table 4.1 for explanation of sym- bols). Typical examples: fields of dunes and transverse bars, crevasse channel and crevasse splay deposits (Fig. 2.16). GB Gravelly bars and bedforms comprising litho- facies Gm and Gp, frequently alternating with SB and MF (in proximal regions); FM foreset macroforms of the active main channels, i.e., large compound bar forms, consisting
sieve deposits (coarse gravel and boulders devoid of finer-grained matrix). From time to time, large debris flows with a muddy-sandy matrix reach the proximal and mid-fan area and bury part of the pre-existing, radiating channel system. At their lower end, such de- bris flows terminate in characteristic lobes, and they often concentrate large boulders and gravel at their outer margin, forming levees. Later, new channels cut into the mass flow deposits and rework and redistribute great proportions of their material.
Many alluvial fans are only a few kilometers long, but some can reach a length of more than 50 km. The stream gradients of fans in arid to semi-arid climates often decrease from 1 to 3 degrees at the head of the fan to 0.1 to 0.5 degrees at its base. Similarly, grain size decreases down fan, and roundness of gravel increases.
In humid regions, alluvial fans have lower gradients and are dominated by stream proc- esses with marked seasonal variations in run- off. The mid and lower fan areas are vege- tated and therefore less susceptible to rework- ing. They are cut by a limited number of ac- tive, narrow channels. The sedimentary proc- esses in such fans, particularly those of humid tropical regions, are only poorly known.
One of the largest present-day examples of this type is the Kosi alluvial fan in India, draining the area around Mount Everest (Wells and Dorr 1987). This fan has a length of more than 150 km, but a very gentle slope ( m a n value 0.04O). River flow varies greatly due to the monsoonal climate. The channels are partly braided, and partly mean- dering and anastomosed, but there are also many aban- doned channels forming oxbow lakes. The dominant grain size is sand and finer-grained material; sheetfloods and mud flows are absent. Minor primary sedimentary struc-
of several co-sets of presumably upper flow regime bed forms; predominantly smaller-scale element in SB. LA Lateral accretion deposits (including point bar deposits), with variable internal geometry and lithofacies, consisting of different smaller-scale elements, for example GB (at the base) and SB, gently dipping surfaces toward the main channel. CH Channel fills of different size and geometry (Fig. 2.9). The total fill may show several episodes of erosion and refding (mulri-storey Jills), and each part of such a fill can consist of smaller-scale elements such as GB, FM, SB, OF or LS, SB, OF, which often display fining-upward successions, but also large-scale elements such as FM and LA play a role. MF Mass flow deposits, mainly Gms lithofacies, frequently associated with GB. Author's note: the elements FM and LA are difficult to define clearly

38 Chapter 2 Continental Sediments
Fig. 2.11. Simplified facies models of a alluvial fan (proximal to mid fan region) and b fan delta. See Table 2.1 for explanation of symbols
tures are frequently obscured and obliterated by vegetation and bioturbation. The maximum thickness of these fan deposits is about 900 m. The Kosi fan is thought to be analogous to the depositional environment of fluvial molasse accumulating in the fore- deep of a high mountain range.
In all alluvial fan deposits, current directions deduced from sedimentary structures show
radial flow patterns from the fan head down fan (Collinson and Thompson 1982; Walker and Cant 1984; Pettijohn et al. 1987). Due to their braided stream system, current directions measured in a limited area display little varia- tion (in comparison to meandering systems). Vertical sequence profiles may be quite ir- regular without showing a particular trend because they are controlled by several factors.

Fluvial Sediments
Flood events and debris flows are stochastic processes with greatly varying recurrence intervals. Nevertheless, they generate small- scale repeated successions, which are fre- quently a few meters thick. On the other hand, processes outside of the depositional area (extrabasinal factors) control long-term trends. Such factors include the amplification or reactivation of relief in the hinterland (tec- tonic control, see e.g. North et al. 1989), climatic changes affecting weathering condi- tions and erosion in the drainage area, and the base level of fans entering a lake.
For example, coarsening-upward sequences (Fig. 2.12a) may reflect fan growth during continuous faulting, i.e., uplift of the source area or subsidence of the fan region. The fan then progrades toward the lowland. Fining- upward sequences are generated if a short phase of faulting is followed by retreat of the scarp front and lowering of relief in the high- lands (Fig. 2.12b). In paraglacial environ- ments, the same phenomena can be generated in a different way: Periods of glacial advance lead to coarsening-upward successions, whereas fining-upward sequences result from glacial retreat.
Modern alluvial fans are associated with the source area containing the deposits of a con- fined stream, as well as with talus or col- luvium from .the adjacent slopes. In general, these facies types are not preserved in ancient examples. Down-slope, alluvial fans grade into other alluvial deposits, mostly those of a braided river system flowing perpendicular or at high angle to the outbuilding fans (Fig. 2.8). The lower fan sediments, consisting predo- minantly of sand and mud, may feed wind- blown sand transport systems or be associated with eolian sand (Fig. 2.21). On abandoned fan surfaces, vegetation starts to grow and soil forming processes take place. Distal fans may reach lacustrine environments, for example, playa lakes in arid regions (Chap. 2.5).
Paleosols and the interfingering of fan deposits with characteristic other facies types, such as playa sediments, tillites, and glaciola- custrine sediments, permit the recognition of their paleoenvironment. Ancient fan deposits occasionally contain plant relics, traces of burrowing organisms, and other fossils which may be useful in identification.
Fan Deltas
Coastal alluvial fans prograding into a lake or into the sea form fan deltas (Figs. 2.1 1b and
2.13). As soon as the streams, carrying a high bed-load, reach the standing water body, they drop their coarse material at the shore face and in prodelta foresets (Chap. 2.5). The in- tensity of reworking, sorting, and redeposi- tion, as well as the transport of material along the shoreline, depend on the wave energy and, in marine environments, on the tidal range. In the case of lakes and protected embayments, fan progradation is little influenced by these processes. Gravel and sand accumulate at the mouths of streams until they become unstable from time to time and move as subaqueous debris flows into deeper water (cf. Chap. 5.4.1). There, they alternate with muddy lake or marine deposits. On high-energy coasts, some of the coarse material dropped at the river mouth is transported alongshore adjacent beaches where it forms distinctive beach gra- vel (cf. Chap. 3.1); some sand and gravel is swept by storms into deeper water. It is not possible to describe these greatly varying con- ditions by one simple facies model (also see Nemec and Steel 1988).
However, two to three common processes affecting fan deltas should be briefly men- tioned. Figure 2.13 depicts an alluvial fan or braided river entering an active tectonic gra- ben filled by a lake. The normal facies as- sociation in such a basin fill is a succession of topsets, foresets, and bottom sets. Lateral switching of the river mouth, however, com- plicates this simple facies pattern and leads to repeated displacements of the site where the coarsest material is deposited. Thus, in con- junction with ongoing subsidence, several coarsening-upward sequences may be gener- ated on top of each other (Fig. 2.13). Mass flow deposits, and silty and muddy turbidites (Chaps. 2.5.1 and 5.4.2) reflect the prograding delta front in more distal regions. This model also applies to proglacial lakes fed by melt- water streams (Chap. 2.1).
Fluctuations in the water level in lakes or the sea affect both the subaerial and sub- aqueous facies of fan deltas (Fig. 2.14). They are reflected by fluvial terraces and coarse- grained river mouth deposits at varying eleva- tions. A lowering of the lake or sea level cau- ses the emergence of delta foresets and the subsequent cutting of fluvial channels into the foresets. These channels are commonly filled later with fluvial deposits.
The thick Oligocene-Miocene conglomerates of the famous Meteora monasteries in Greece represent coarse-grained foresets of a fan delta with intercalated channel fills (Ori and Roveri 1987) which may be interpreted as incised

Chapter 2 Continental Sediments
SAND ( GRAVEL
--__ RETREAT OF SCARP FRONT -'/ AND LOWERING
DECREASING OR CEASING FAULTING
I
SAND I GRAVEL
100's t 0
1000's of
meters

Fluvial Sediments
,' \DISTAL PROXIMAL . ----
I MUD ETS TOPSETS PHASE FLOW
COARSENING 4
I &RESETS, SIT
$E~~oM: 3 ----- MT ------- J - - - - - - - - - - - 7 2
SIT \
TOPSETS '.---- - I SI
1 MT
FORESETS M
CS, COARSE TO MEDIUM SANWGRAVEL
FS, FINE SAND SI. SILT
SIT: SILT TURBIDITE M, BASINAL MUD MT, MUD TURBlDlTE
Fig. 2.13. Facies pattern of topsets, foresets, and bottom- ing, coarsening-upward sequences, and gravity mass move sets of a lake affected by switching river mouth and sub- ments reflecting the approaching delta front siding lake bottom. Note several phases of delta prograd-
Fig. 2.12. Idealized vertical sequences in alluvial fan depo- shifting and abandonment of fan (not shown). c and d sits and their possible cause. a Large-scale coarsening- Small-scale coarsening-upward cycles due to the prograding upward sequence due to continuous faulting and fan pro- of individual fan lobes. e Small-scale fining-upward cycle gradation (Stages 1 through 3). b Large-scale fining-up with channelized base generated by bar processes or filling ward sequence caused by retreat of scarp front and lowe- of braided channel. (After Ethridge 1985) ring of relief in source area (Stages 4 and 5), or lateral
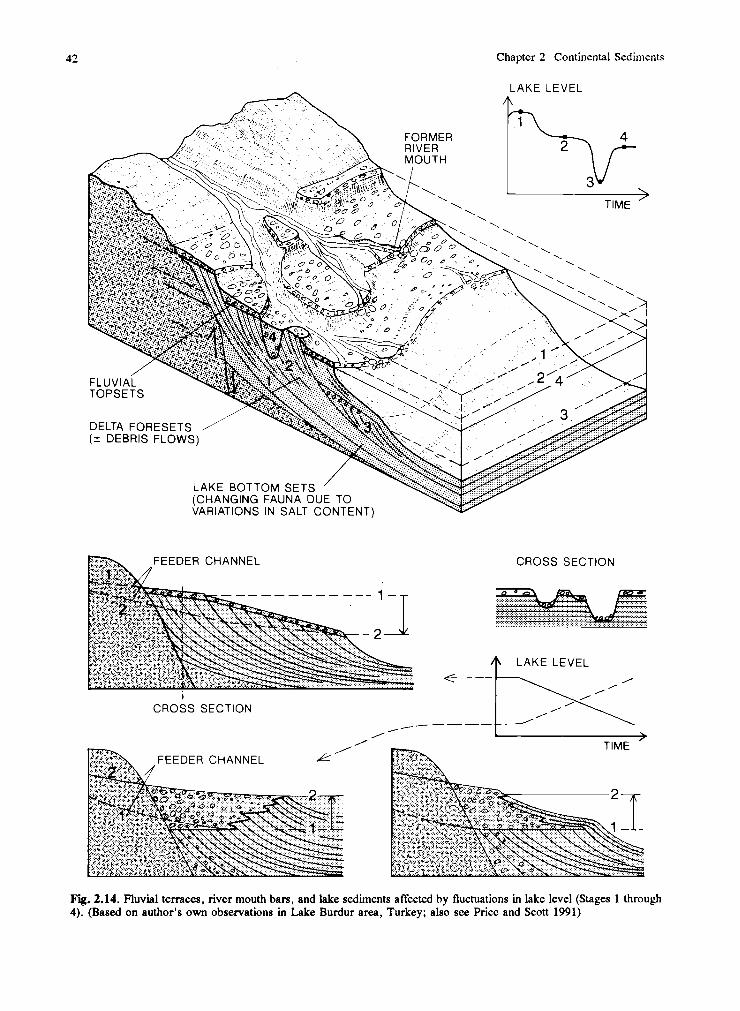
Chapter 2 Continental Sediments
FEEDER CHANNEL CROSS SECTION
-....... ,
LAKE LEVEL e - - - k ,
I / /
I
CROSS SECTION
/ /------ I-/---'\>
TIME - FEEDER CHANNEL
Fig. 2.14. Fluvial terraces, river mouth ban, and lake sediments affected by fluctuations in lake level (Stages 1 through 4). (Based on author's own observations in Lake Burdur area, Turkey; also see Price and Scott 1991)

Fluvial Sediments
valley fills during low sea level stands (compare Chapter 7.4).
A fluctuation water level also causes charac- teristic vertical and lateral facies changes in lake deposits (Fig. 2.14) and shallow-marine sediments.
2.2.3 Various River Systems and Their Sediments
Braided Rivers and Braidplains
If we define sinuosity as the ratio between channel length and valley length, braided systems have a low sinuosity of the order of 1.1 to 1.2, while meandering channels reach values >I .5 (Fig. 2.8). Braided streams usually consist of several individual channels se- parated by bars and islands and therefore form a wide, shallow stream bed. Braided rivers develop near areas of high relief, which deliver relatively large amounts of debris, gravel and sand into the fluvial system. A prominent modern example is the Brah- maputra River in Bangladesh, draining large areas in the High Himalayas (Bristow 1987). The recent sedimentation of this river produ- ces a sheet-like sand body approximately 20 km wide and 40 m thick. The channels can be subdivided into larger and smaller ones and have a very high width/depth ratio of about 50:l to as much as 500:l. Medium-sized chan- nels may move laterally at rates up to 1 km/a (a = year). Continual reworking withih the channel belt and occasional channel switching generates complex internal structures within the sand body. The most important depositio- nal process is lateral accretion, followed by downstream and upstream accretion.
Glaciofluvial outwash rivers also belong to this low-sinuosity, multiple-channel category. Both the valley gradient and the stream power are relatively high, the latter often intermit- tently so. From all these characteristics, it can be inferred that braided systems are bed load- dominated, i.e., they carry and deposit chiefly gravel and sands. Therefore, they consist pre- dominantly of channel and channel-flank deposits, while silty and muddy floodplain facies are subordinate. Downstream, they often display a progressive decrease in grain size, as well as in bed forms and internal sedi- mentary structures.
In the proximal reaches of such multiple- channel bed-load rivers (Miall 1985), lon-
gitudinal gravel bars are characteristic channel bed forms (Fig. 2.15a). They develop as a result of intermittent clast accretion under flow passing obliquely over the bar. There- fore, the bars migrate not only downstream parallel to the current, but also laterally. The resulting planar sheets of gravel show indis- tinct, crude horizontal stratification. The interstices in the gravel are usually later filled with sand during low water periods, but in this system sandy beds are relatively rare in the proximal zone, unless there is little gravel available in the source area. Sandy beds de- velop best at somewhat higher topographic elevations within the braided system next to the active channel system. Here, minor chan- nels active during floods may drop their bed load during waning flow.
A typical vertical sequence in such a pro- ximal braided system is shown in Figure 2.15b. The dominant sediments are multistory gravel units, originating from channel bars. Many bars are somewhat graded. Interbedded with the gravels are thin lenses of sand repre- senting deposition in abandoned channels or sand wedges at the edge of bars. In places, one can observe repeated successions of fining- upward gravel-sand sequences 1 to 2 m thick, but in general i t is difficult to identify the bottoms of former channels and the geometry of their fill. The reason is that the underlying and neighboring sediments also consist largely of gravel.
Downstream, the predominantly gravelly beds grade into beds consisting partly of smaller pebbles and sand. In the lower, more active channels, bar gravels dominate, whereas sands and pebbly sands are common at higher topographic elevations. In rarely flooded areas, some silt and mud may be deposited and preserved. In the total assemblage, the gravel content varies between 10 and 70 %. As a result of downstream and laterally migrating sand and gravel bars, planar and trough cross- bedding are the most important internal sedi- mentary structures. Both the lateral migration and sudden abandonment of channels due to avulsion cause fining-upward channel fill sequences a few meters thick (Fig. 2.1 5c). Such autocyclic sequences (Chaps. 7.1 and 7.4) are considered the most distinctive characteristic feature of this type of braided river deposit.
In distal reaches of braided fluvial plains, runoff is distributed by numerous shallow channels. The gradient and stream power of the system are lower than in proximal areas, and sand is the dominant grain size deposited. Typical present-day examples of this situation

Chapter 2 Continental Sediments
PROXIMAL BRAIDED RIVER
ALLUVIAL FAN) BRAIDED RIVER DISTAL BRAIDPLAIN
(SCOTT TYPE) (DONJEK TYPE) (PLATTE TYPE) (BIJOU CREEK TYPE)
MINOR f CANNEL
If BAR-EDGE 1SAND WEDGE
t DEBRIS FLOW
DEPOSIT
SUPER- IMPOSED BARS
SUPRERIMPOSED LlNGUOlD BARS
LONG1 BAR
SUPER- IMPOSED FLOOD CYCLES
FINE SAND, SILT AND CLAY OF FLOODPLAIN
Fig. 2.15a-f. Braided river systems. a e Proximal to nated system with wide channels and flat, linguoid sand middle reaches, graveldominated (b), or sanddominated bars (d and e), or wide floodplain rarely inundated by flash (c) with minor proportion of gravel. d-f Distal, sanddomi- floods (0. (After Miall 1985)

Fluvial Sediments 45
Table 2.2. Main characteristics of selected braided river systems. (Some authors identify more types, but there are no sharp boundaries between the different subenvironments.) (After Miall 1985)
Subenvironment, Percentage Prevailing lithofacies Minor Name of type general description of gravel and internal structure lithofaciesl (Miall 1985)
(96)
Proximal braided river de~osi ts > 50 Massive gravel GP, Gt Scott ( i ~ l u d & ~ lower alluvial fans), graveldominated
s p , St Sr, %1 Fm
Braided river Planar and trough cross- Sh, Sr Donjek deposits (middle bedded gravel and sand, F1, Fm reaches), rich in massive gravel gravel 10-70
Mainly sandy Trough and planar cross- Sh, Sr South Saskatchewan bedded sand S1, Gm
F1, Fm
Distal braided < 10 Trough and glanar cross- Sh, Sr Platte river deposits, Mainly bedded sand Gm, F1 sanddominated sand Fm
Silt and mud- Silt and mud Massive and fme la- St Slims dominated minated silt, mud and
sand
Sandy river plains Mainly Horizontal and low angle Sp Bijou creek subject to flash floods sand cross-bedded sands Sr
l For explanation of symbols, see Table 2.1 Fining-upward channel fills cause distinct minor sedimentary cycles
are the distal outwash plains of glaciated areas (sandar), but the same type also occurs in non-glacial river systems. The channel sands form large Iinguoid bars (Fig. 2.15d), sand waves, and smaller bed forms such as dunes and ripples (see Fig. 2.7). In vertical sections, planar cross-bedding prevails, whereas trough cross-bedding is less common (Fig. 2.15e). Gravel may occur in small lenses, and over- bank fines are occasionally intercalated. Flu- vial cyclicity due to the filling and abandon- ment of channels is much less pronounced than in the medium reaches of this deposi- tional system. In the most distal parts of out- wash rivers, or in regions which receive main- ly fin2e-grained silts and muds from the hin- terlands, the river system is characterized by a low gradient, as well as by low-relief channels and bars. The main sediment types are mas-
sive, laminated and cross-laminated sandy silts.
Sand-dominated distal braidplain en- vironments are somewhat different from the braided systems described so far. Such braid- plains appear to be rather common in arid regions. Here, runoff and sediment accu- mulation are controlled by rare flash floods over a broad river plain with very shallow channels. Flow may be either channelized or occur as sheet floods. During waning flow, most of the sand is deposited essentialla in sheets, displaying horizontal lamination resul- ting from upper flow regime conditions. Such sands often grade vertically into finer and small-scale trough cross-bedded layers (Fig. 2.15f).
he most characteristic features of the dif- ferent subenvironments of braided river sys- tems are summarized in Table 2.2.
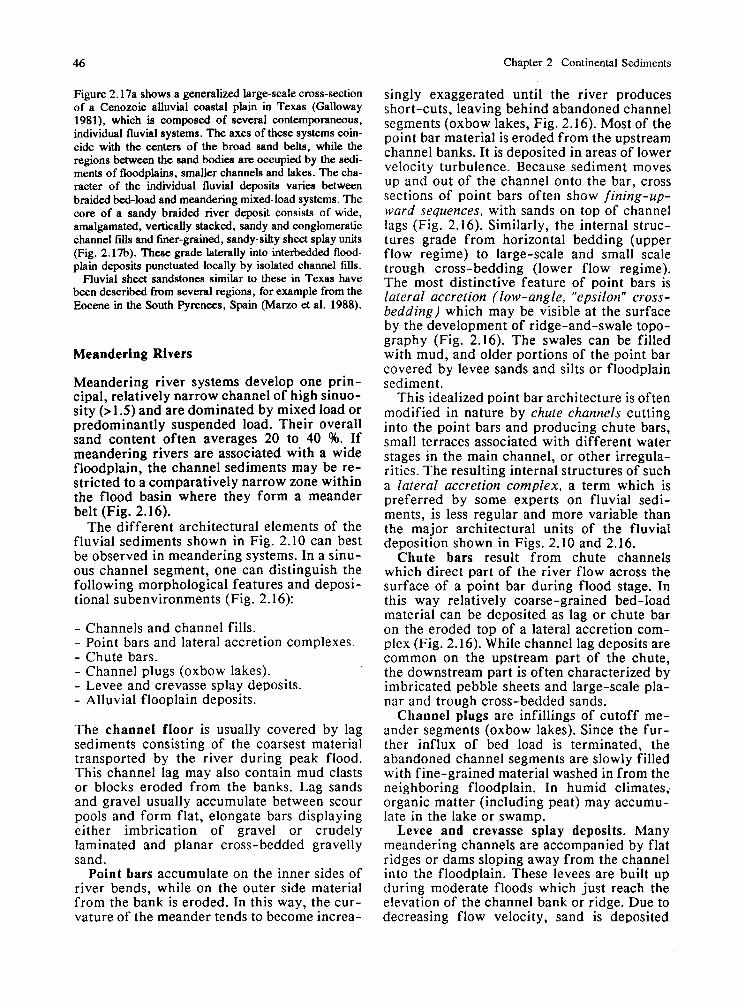
Chapter 2 Continental Sediments
Figure 2.17a shows a generalized large-scale cross-section of a Cenozoic alluvial coastal plain in Texas (Galloway 1981), which is composed of several contemporaneous, individual fluvial systems. The axes of these systems win- cide with the centers of the broad sand belts, while the regions between the sand bodies are occupied by the sedi- ments of floodplains, smaller channels and lakes. The cha- racter of the individual fluvial deposits varies between braided bed-load and meandering mixed-load systems. The core of a sandy braided river deposit consists of wide, amalgamated, vertically stacked, sandy and conglomeratic channel fills and finer-grained, sandy-silty sheet splay units (Fig. 2.1%). These grade laterally into interbedded flood- plain deposits punctuated locally by isolated channel fills.
Fluvial sheet sandstones similar to these in Texas have been described from several regions, for example from the Eocene in the South Pyrenees, Spain (Marzo el al. 1988).
Meandering Rivers
Meandering river systems develop one prin- cipal, relatively narrow channel of high sinuo- sity (> 1.5) and are dominated by mixed load or predominantly suspended load. Their overall sand content often averages 20 to 40 %. If meandering rivers are associated with a wide floodplain, the channel sediments may be re- stricted to a comparatively narrow zone within the flood basin where they form a meander belt (Fig. 2.16).
The different architectural elements of the fluvial sediments shown in Fig. 2.10 can best be observed in meandering systems. In a sinu- ous channel segment, one can distinguish the following morphological features and deposi- tional subenvironments (Fig. 2.16):
- Channels and channel fills. - Point bars and lateral accretion complexes. - Chute bars. - Channel plugs (oxbow lakes). - Levee and crevasse splay deposits. - Alluvial flooplain deposits.
The channel floor is usually covered by lag sediments consisting of the coarsest material transported by the river during peak flood. This channel lag may also contain mud clasts or blocks eroded from the banks. Lag sands and gravel usually accumulate between scour pools and form flat, elongate bars displaying either imbrication of gravel or crudely laminated and planar cross-bedded gravelly sand.
Point bars accumulate on the inner sides of river bends, while on the outer side material from the bank is eroded. In this way, the cur- vature of the meander tends to become increa-
singly exaggerated until the river produces short-cuts, leaving behind abandoned channel segments (oxbow lakes, Fig. 2.16). Most of the point bar material is eroded from the upstream channel banks. It is deposited in areas of lower velocity turbulence. Because sediment moves up and out of the channel onto the bar, cross sections of point bars often show fining-up- ward sequences, with sands on top of channel lags (Fig. 2.16). Similarly, the internal struc- tures grade from horizontal bedding (upper flow regime) to large-scale and small scale trough cross-bedding (lower flow regime). The most distinctive feature of point bars is lateral accretion (low-angle, "epsilon" cross- bedding) which may be visible at the surface by the development of ridge-and-swale topo- graphy (Fig. 2.16). The swales can be filled with mud, and older portions of the point bar covered by levee sands and silts or floodplain sediment.
This idealized point bar architecture is often modified in nature by chute channels cutting into the point bars and producing chute bars, small terraces associated with different water stages in the main channel, or other irregula- rities. The resulting internal structures of such a lateral accretion complex, a term which is preferred by some experts on fluvial sedi- ments, is less regular and more variable than the major architectural units of the fluvial deposition shown in Figs. 2.10 and 2.16.
Chute bars result from chute channels which direct part of the river flow across the surface of a point bar during flood stage. In this way relatively coarse-grained bed-load material can be deposited as lag or chute bar on the eroded top of a lateral accretion com- plex (Fig. 2.16). While channel lag deposits are common on the upstream part of the chute, the downstream part is often characterized by imbricated pebble sheets and large-scale pla- nar and trough cross-bedded sands.
Channel plugs are infillings of cutoff me- ander segments (oxbow lakes). Since the fur- ther influx of bed load is terminated, the abandoned channel segments are slowly filled with fine-grained material washed in from the neighboring floodplain. In humid climates, organic matter (including peat) may accumu- late in the lake or swamp.
Levee and crevasse splay deposits. Many meandering channels are accompanied by flat ridges or dams sloping away from the channel into the floodplain. These levees are built up during moderate floods which just reach the elevation of the channel bank or ridge. Due to decreasing flow velocity, sand is deposited

Fluvial Sediments 47
IDEAL POINT BAR SEQUENCE
POINT BAR OVERBANK ABANDONED WITH CHUTE FINES ON CHANNEL BAR FLOODPLAIN (OXBOW LAKE)
Fig. 2.16a-h. Meandering river system. a Formation of basin. h One fluvial cycle (autocyclic). See Table 2.1 for sandy meander belt within a flood basin. b Different sub- explanation of symbols; sm small-scale. (Based on different environments of meandering channel. c-g Characteristic sources, e.g., Walker and Cant 1984; Galloway 1985; vertical sections of the youngest sediments of the flood Miall 1985)

Chapter 2 Continental Sediments
along the channel banks, grading into silt somewhat farther away. Locally, channel water may spill over the levees into the flood- plain, forming crevasse splays. The fallout of sand and silt usually extends farther into the floodplains than the levees, but such crevasse splays can also contribute to the buildup of the levees. The prevailing internal structures of these sand sheets may resemble those of thin sandy turbidites, showing some grading, horizontal lamination and small-scale ripple cross-bedding, including climbing ripples and occasional convolute or contorted cross-bed- ding. These structures are, however, often mashed or destroyed by the roots of vegeta- tion. Whereas distal crevasse splays become interbedded with floodplain deposits, levee sands often tend to be reworked by subsequent channel migration.
Floodplain deposits accumulate during rare inundations. They consist predominantly of suspended load, i.e., silt and mud, though fine sand may also be present in areas where the peak flood currents are sufficiently strong to transport this grain size. The deposits from individual large floods reach thicknesses of only a few millimeters or, locally, a few cen- timeters. Such thin beds may be either some- what graded, or internally finely laminated or cross-bedded. A series of flood layers can show distinct lamination. Floodplains may be wetlands and backswamps or areas of des- sication and calcrete development. Therefore, primary sedimentary structures are often des- troyed by vegetation, mud cracking, salt precipitation, concretion formation (such as carbonate nodules or caliche), and other soil forming processes.
Fluvial red beds. Originally gray or brown flood deposits may become red through time, if they contain little or no organic matter, as for example in arid and semi-arid regions. In this case, brownish iron hydroxides deposited with the original sediment can be later trans- formed into hematite and thus produce very fine-grained, evenly dispersed red pigment (cf. Chap. 6.3). Another mechanism generating red beds is the weathering of iron-bearing silicate minerals within the sediment during shallow-burial diagenesis (Walker 1967; van Houten 1973; Fiichtbauer 1988). Com- paratively unstable minerals, such as biotite, hornblende, and smectite can release iron which, under oxic conditions, slowly forms hematite.
Swamps. In humid climate and on very gently sloping alluvial plains, the groundwater level can reach the surface. As a result, back-
swamps and lakes occupy parts of the inter- channel area (Fig. 2 .18~) . These depressions are filled either with sediments delivered by crevasse splays and peak floods forming flat, deltaic sequences and well-laminated fine muds, or they accumulate organic detritus and peat. Numerous coal deposits, with individual coal seams usually limited in extent and thick- ness, formed in alluvial plains (e.g., Flores 1981; Galloway and Hobday 1983; Flores et al. 1985; Lyons and Alpern 1989). Many of these ancient floodplains were situated not only near the paleo-coastline of a former sea, but also in more elevated fluvial environments, including intermontane basins. In addition to the non- marine fauna in the accompanying sediments, abundant siderite concretions often indicate a fresh or brackish water depositional environ- ment (see Chap. 2.5).
Large-Scale Facies Associations
The large-scale vertical and lateral facies in- terrelationship between channel fills and levee and crevasse splay sands, on the one hand, and floodplain and lake deposits, on the other, is indicated in Fig. 2 .17~. In large-scale cross- sections of a meandering system, the intercha- nnel deposits predominate. Under the load of younger sediments, these fluvial sediments are affected by differential compaction (Chap. 13.2), leading, for example, to considerable deformation of fine-grained floodplain depo- sits and coal seams near the channel fills, which themselves are little compacted. Be- cause compaction begins early in interchannel areas, peat and subsequent coal seams may become thicker there than near the channels, where they frequently split up into several thin bands before pinching out (Fig. 2.17~).
We can conclude that floodplain deposits are the most important facies type in meandering fluvial systems, if the river system is not con- strained by nearby valley slopes. Apart from this exception, floodplain deposits make up more than half of the total floodbasin sedi- ments. The rate of their vertical aggradation is a major factor controlling the total fluvial system. High rates are associated with abun- dant supplies of suspended load and substan- tial subsidence. They tend to generate vertical stacking of the channel deposits (point bars, etc., including relatively good preservation of levee deposits, see Figs. 2.9 and 2.17). The contrary situation, however, leads to pro- nounced channel migration, lateral stacking of channel deposits, and hence more reworking

Fluvial Sediments
INDIVIDUAL FLUVIAL SYSTEMS / \
a FLOODPLAIN, SMALL CHANNELS AND LAKE DEPOSITS
/ /
/ /
/ / /
/ /
FLOODPLAIN CHANNEL FILL AND CREVASSE SPLAY FACIES '\ \
MUD TO' PEBBLY SAND TO SAND CLAY SANDY GRAVEL
SIMULTANEOUS AGGRADATION CHANNEL FILL, LEVEE AND PEAT OF CHANNEL AND INTERCHANNEL CREVASSE SPLAY SANDS AND SILTS (LATER COAL) DEPOSITS
LACUSTRINE MARL OR LIMESTONE, 2 FOSSILS
Fig. 2.17ac. Macro-scale cross sections of fluvial systems. a Generalized ~ r o s s section of Cenozoic coastal plain, Texas, demonstrating the principal large-scale depositional elements. b Section of a, bed-load river deposits forming a sand belt several krn wide and about 20 m thick (a and b after Galloway 1981). c Idealized channel and interchannel- backswamplake deposits of a mixed-load meandering sys- tem. Channel sands are accompanied by levee and crevasse
INCISED ' FLOODPLAIN CHANNEL SILTS AND CLAY
splay sands; floodplain deposits make up the majority of the basin fdl. Coal, carbonaceous shales and some fresh- water limestones accumulate in poorly drained backswamps or lakes. Aggradation of channel fdls and floodplain depo- sits occurs either simultaneously (rapidly subsiding flood basin), o r the channels cut into pre-exixting fluvial sedi- ments. (Based on Flores 1981; Galloway and Hobday 1983)

Chapter 2 Continental Sediments
and removal of the levee and floodplain sedi- ments.
The sedimentation rate of floodplain deposits in terms of vertical upbuilding varies greatly. Some values mentioned in the literature are of the order of one to several meters per thous- and years (also see Chap. 10.2).
Anastomosed Rivers
In contrast to the braided and meandering river systems, anastomosed rivers and their deposits are known only from a few recent and ancient examples (Smith 1983; Walker and Cant 1984). Such systems appear to result from an elevating base level at the down- stream end of the river course. This in turn creates a low gradient and causes the overbank deposition of fine-grained material.
Anastomosed rivers develop an inter-con- nected network of straight to sinuous chan- nels, which are relatively narrow and deep (Fig. 2.1 8). Because their banks are built up of fine-grained sediment and are usually covered with vegetation, channels and islands are re- markably stable. The channels are filled with sand and gravel. Since vertical aggradation proceeds comparatively rapidly, rather thick and narrow ribbons of channel sand can form, bounded by the sandy silts of the levees. On the river plain or in the wetlands between the channels, laminated silty clays and clayey silts accumulate, or some other facies types such as backswamp deposits and peats containing large amounts of organic matter and iron sulfides may develop. Modern examples of anastomos- ed rivers have been described from western Canada and central Australia (Rust and Legun 1983).
In the ancient record, one can expect that anastomosed river systems are often associated with coal seams generated in low-gradient alluvial plains. Dense vegetation favors soil formation and hampers erosion and thus reduces the supply of sand and coarser grained material to the river system; low river gradients and relatively stable levees enable widely extended backswamps. However, it appears that a generally accepted facies model for this type of river system has not yet been developed.
Mud-Dominated Low-Gradient Rivers
In areas of very low relief, seasonally or perennially hot, dry climates, and deeply weathered clayey soils, fluvial sediments tend to become mud-dominated. Such conditions are found in the present-day arid to semi-arid Lake Eyre Basin in Australia, where the depo- sits of the Cooper and Diamantina Rivers, with their braided or meandering channel system infillings, can consist predominantly of muddy material (Rust 1981; Rust and Legun 1983; Rust and Nanson 1989).
In these cases, the mud occurs in sand-sized pedogenic aggregates, which originate from repeated drying and wetting at or near the land surface, and partially from the bottoms of shallow dry lakes or their accompanying wind-blown clay dunes (see Chap. 2.3.3). The clay content of these aggregates may surpass 50 %, the rest being silt and sand-sized particles. As long as the clay aggregates are moist and exposed to the air, they stick together. After drying, they form micro- cracks and can be eroded by running water. In rivers the clay aggregates are kept separate and are transported like sand or small pebbles as bed (or traction) load over long distances. The mud aggregates are remarkably durable, even under upper flow conditions. Finally, they form porous structures similar to sand bars. Thus, not only are overbank flood deposits (resulting largely from the suspended load) fine-grained, but also the deposits of point bars or lateral accretionary complexes. Even the channel fills may consist predomi- nantly of mud. After burial and compaction, the aggregate texture of these muds can be obscured or entirely destroyed. Hence, such mud-dominated river systems are difficult to recognize in the ancient record.
This may be the reason why onIy a limited number of ancient examples of mud- dominated fluvial deposits are known (Rust and Nanson 1989). It is likely that a number of red and green claystones were deposited in this manner. To identify them, careful study of their texture and sedimentary structures is necessary.
Muddy river bed loads can also originate from the weathering and erosion of overcon- consolidated claystones and mudstones in va- rious climates (cf. Chap. 9.2). In these cases, sand and gravel-size lithoclasts can constitute a major part of the bed load, but are com- monly commonly accompanied by normal co- arse-grained material.

Fluvial Sediments
- LEVEE
FLOOD- - PLAIN
- ROOTS
- CHANNEL - FlLL
LAKE
PEAT
LACUSTRINE SILT AND CLAY ---
FLOOD- PLAIN
CREVASSE SPLAY
CREVASSE SPLAY OR LEVEE
CHANNEL
FlLL
MUD LUMPS
LEVEE
t STACKED CHANNEL FlLL
I I I I I 1
Fig. 2.18. Anastomosing fluvial system with low to high common. Interchannel areas accumulate overbank fines sinuosity and branching channels. Channel sediments form (floodplain deposits) or shallow lacustrine muds and peat. isolated ribbon sand bodies, often accompanied by fine Note the great differences between the vertical profiles! sandy to silty levee deposits. Lateral accretion deposits play (Based on Smith 1983; Miall 1985) a minor role. Crevasse channels and crevasse splays are
2.2.4 Large-Scale Lateral and Vertical Evolution of Fluvial Systems erosional base, such as sea level). The gradient
of the main channel of a fluvial system tends Fluvial sediments of some thickness ac- to decrease systematically downstream. Thus, cumulate and are preserved only in subsiding a complete idealized system would include an regions (relative to a more or less fixed alluvial fan (steepest gradient) evolving to a

52 Chapter 2 Continental Sediments
braided stream, then to a meandering and pos- sibly anastomosing system (lowest gradient, Fig. 2.19). As part of this evolution, the bulk of the sediments becomes finer, and flood- plainplain deposits predominate over channel fills.
However, rock types in the hinterland and changes in climate also strongly control both the type and grain size distribution of fluvial systems. Humid climates and abundant vege- tation generally reduce mechanical erosion and promote the formation of fine clay minerals (Chap. 9.1). In addition, the mineralogical composition of fluvial sands is affected by
changing climate. In this respect, the so-called first-cycle fluvial sandstones derived from nearby crystalline rocks are of particular interest. If such sandstones have not been subjected to subsequent significant meta- morphism, the degree of their compositional maturity as expressed in quartz/feldspar/rock fragment percentages (e.g., Pettijohn et al. 1987; Girty et al. 1988) may be used as an indicator of paleoclimate (e.g., Basu 1985; Suttner and Dutta 1986). Provided that the pe- trographic composition of the source rocks was more or less constant over a long period of time, high feldspar and rock fragment
COASTAL PLAIN
A C T I V E FAULT
B R A I D E D RIVER ( B E D - L O A D ) DEP.
Fig. 2.19a,b. Evolution (Stages I through 4) of deposi- coastal plain and fewer fan deposits. b Waning tectonic tional fluvial systems. a Active faulting maintains high activity, lowered relief, and widespread vegetation (Stage relief during either semi-arid (Stages I and 3) or humid 4) reduce the significance of braided streams and lead to climates (Stage 2). Stages I and 3 are characterized by extensive fine-grained floodplain deposits of meandering extensive alluvial fans in the montane basin, as well as and anastomosing systems, including interchannel lake braided bed-load rivers and meandering mixed-load rivers deposits and peat. Note the various vertical trends at diffe- on the coastal plain. Stage 2 displays a predominance of rent locations mixed-load and suspended-load meandering riven on the

Fluvial Sediments
contents reflect an arid paleoclimate, while a relative enrichment in chemically stable quartz indicates warm and wet paleoenvironmental conditions. High relief in the source area diminishes the influence of climate on the composition of sands, unless they have been exposed to extended weathering during al- luvial storage (Johnsson 1990). Other criteria, such as the varieties of quartz present, may serve to identify different source areas.
An idealized example in Figure 2.19 demonstrates large-scale lateral and vertical facies changes in a subsiding montane basin and on a sediment-aggrading coastal plain, re- flecting the tectonic and climatic history of the area. The montane basin generally receives sediments from several small and medium lo- cal sources, indicated by strongly differing transport directions, and material of possibly greatly varying composition. In contrast, coas- tal plains are fed by a limited number of large point sources, distributing their granulo- metrically and compositionally mixed sedi-
ment load in a fan-like fashion. This is ac- complished by frequent changes in river course (avulsion) over the plain with the aim of evenly aggrade the depositional surface. The variation in mean transport directions of such a radiating distribution system, however, is much less than that of a montane basin. Humid phases tend to provide more fine- grained, quartz-rich material to the fluvial system (Fig. 2.19, Stage 2). Particularly in combination with lowered relief and decreas- ing stream gradient, such conditions favor mixed-load and predominantly suspended- load meandering and anastomosing systems (Fig. 2.19b). High groundwater levels may generate interchannel swamps and lakes.
There are several other tectonic and deposi- tional scenarios which may also explain the various vertical and lateral, large-scale facies successions of recent and ancient fluvial sys- tems. The above-mentioned general rules may be used to identify the nature of fluvial sys- tems not discussed in this text.

54
2 Continental Sediments
Chapter 2 Continental Sediments
2.3 Eolian Sediments
2.3.1 Introduction 2.3.2 Eolian Sands and Sandstones
Source, Composition, Color, Texture, and Migration of Sand Bed Forms and Sedimentary Structures of Inland Dunes Coastal Dunes Large-Scale Facies Associations of Eolian Sands Distinctive Features of Eolian Sandstones (Summary)
2.3.3 Clay Dunes 2.3.4 Eolian Dust, Loess
Transport, Texture, Source, and Composition Dust Deposition Pleistocene Loess
2.3.1 Introduction
Wind-blown dust and sand contribute to the composition of various types of sediments which ultimately accumulate in fluvial or sub- aquatic environments. Thus, for example, flood plains of desert rivers, coastal sedi- ments, and deep-sea muds may contain signi- ficant proportions of air-borne dust or sand, but sedimentary structures and faunal charac- teristics of these environments only indicate the final mode of dust or sand deposition. Eolian sediments, however, are deposited under the direct influence of wind without the influence of running or standing water. They still exhibit primary features typical of eolian environments. Eolian sediments have been understood by geologists for a long time, because their accumulation can be observed in the present-day deserts. Numerous articles and most textbooks present more or less detailed descriptions of these sediments (e.g., Glennie 1970; Bigarella 1972; Cooke and Warren 1973; Hunter 1977 and 1981; McKee 1979; Warren 1979; Blatt et al. 1980; Galloway and Hobday
1983; Chorley et al. 1984; Collinson 1986b; Frostick 1987; Pettijohn et al. 1987).
The medium of transport of eolian sediments is the atmosphere. Planets or moons without an atmosphere are devoid of eolian processes and sediment, but even a very thin atmosphere such as that on Mars is sufficient to produce sand dunes. Deserts constitute about 20 % of the present-day land surface of the Earth, but only 20 to 45 96 of the area classified as arid is covered by "sand seas" (ergs) (Lancaster 1990). The major part of deserts comprises high- lands, stony plains, alluvial fans, and playas. Deserts range from low-latitude, hot and arid regions within the zones of trade winds and monsoons to cold and dry polar regions. The western margins of continents affected by cold ocean currents and land-locked conti- nental interiors, particularly on the leeward side of the principle wind directions, may acquire the characteristics of deserts. Beaches with high sand supply can cause dune fields of limited extent under various climatic con- ditions.
In the geologic past, the general principles governing the formation of deserts were the same as today, but the proportion and regional distribution of deserts on the land surface were frequently quite different from the present situation. During the cold phases of the Pleistocene, the climatic belts and thus also the large subtropical deserts shifted poleward and gained in extent (e.g., Sarnthein 1978; Leinen and Sarnthein 1989). Continental drift and the changing configuration of the oceans and land masses significantly affected global climate and thus also the areal extent of deserts and proportion of eolian sediments in the geological record. In the Permo-Triassic, for example, when the older continents had created one supercontinent (Pangea), arid cli- mates and eolian sediments played a much greater role than today. Since eolian sediment transport is favored by the lack or absence of vegetation, the evolution of land plants during the Earth's history has to be taken into con-

Eolian Sediments
sideration. Prior to the Devonian, plant life was limited, and also in the pre-Upper Cre- taceous, soil protection by dense roots of an- giosperms did not yet exist. Colder climate and the advance of glaciers during glacial periods led to a reduction in land surface cov- ered by vegetation. For all these reasons, the contribution of eolian processes to sediment accumulation and basin filling can have been been much greater in the past than today.
Winds are an effective agent for taking up and transporting fine to medium-grained, un- consolidated materials, if the sediment par- ticles do not adhere to each other, for example by moisture. Hence, the land surface must be dry and not be protected by vegetation. Fine silt is whirled up and kept in suspension as long as the turbulence of the air is sufficiently high to counteract its settling by gravity (Fig. 2.20). Thus, silt may travel from desert areas over distances of tens to several hundreds to a thousand kilometers and reach vegetated land. The larger and heavier sand grains move near the land surface by saltation and therefore migrate much more slowly than dust. Both dust and sand can, in contrast to fluvial trans- port, also migrate upslope, and their move- ment is not channelized by valleys. Particu- larly dust can easily overcome hilly and mountainous regions and settle far away from its source area. Thus, eolian sediments are less topography-controlled than most other types of depositions. They record the dominant wind pattern of the region and time period studied.
2.3.2 Eolian Sands
Source, Composition, Color, Texture, and Migration of Sand
Sand Sources
Various sources supply wind-blown sand:
- Fluvial sands of alluvial fans, ephemeral streams and flood plains which fall dry part of the year or longer periods.
- Coastal sands of mixed origin including bio- genic components.
- Weathering of older sandstones including former dune sands.
- Weathering of plutonic and metamorphic rocks.
- Sand-size silt-clay aggregates including salt particles from playa lakes.
Composition of Sand
Because eolian sands may be derived from different sources, their composition varies considerably, a fact which was pointed out by several authors (e.g., Solle 1966; Glennie 1970; McKee 1979). Many present-day sand dunes are, however, mineralogically fairly mature, i.e., they represent quartz arenites with minor amounts of feldspar and other weatherable silicate phases. The thin, platy minerals of mica are usually rare in eolian sands, because they behave differently during air transport than the other, more compact mineral grains. At first glance, the predominance of quartz is somewhat surprising because chemical wea- thering in arid regions is limited (Chap. 9.1) and, therefore, cannot account for the ad- vanced maturity of most of the desert sands. The reason for the minor importance of im- mature sands is that many dune sands are not derived from nearby sources of the desert region itself, but are transported by rivers from areas of intensive weathering into the desert. In other cases, the sands are recycled from older, more or less mature sandstones. Coastal sand dunes composed of carbonate grains or special dune fields consisting of gypsum grains are fed by nearby primary sources. Their potential to be preserved in the geologic record or to become recycled is limited.
Color of Eolian Sands
Many recent sand dunes are yellow, light- brown or reddish in color which is caused by iron hydroxide impurities, for example limonite on the surface of the sand grains. Ancient eolian sandstones are commonly red- colored. The hematite pigmentation of these rocks usually results from the decomposition of unstable, iron-bearing minerals during diagenesis (Walker 1979; also see Chap. 6.3). The reddening commonly increases with the age of the sands. In the Australian dune fields, the dunes farthest away from the source area exhibit the most intensive reddening (Wopfner and Twidale 1988).
Transport and Texture o f Eolian Sands
The capacity of winds to transport solid par- ticles of a density similar to that of quartz (2.65 g/cm3) is mostly limited to fine and medium sand (grain diameter 0.125 to 0.5

Chapter 2 Continental Sediments
a LAYERED ROCK
DUST IN
WIND ABRASION Jc3<RTlcLE - ".,-+,52y .< - , . SusPEN:
FACETED ROCK \ A;):-.' \ -0 ! ,--..,'.i DEFLATION
4 I I
UP TO SEVERAL 100's TO 1000's m
,-,a,- ' PLANE BED 4 LAMINATION
7 SALTATION OF SAND GRAINS
LONG-TERM SUSPENSION (<20 P I UP TO SEVERAL
SHORT-TERM SUSPENSION (20-70 pm) +
UP TO SEVERAL 10's km
t MODIFIED SALTATION
*,, , (70- 100 pm)
1 -5m
>500pm 70-500 p m LAND SURFACE
Fig. 2.20. a Various modes of eolian transport of silt, areas, as shown in Fig. 2.21). b Modes and distance of sand, and gravel, specific features of desert surfaces in- eolian particle transport by moderate storms (wind veloci- cluding deflation and wind abrasion, and bed forms on flat ties of 10 to 20 cmls) in relation to grain sizes. (After Pye surface with limited sand accumulation (e.g., in interdune 1987)
mm). These size fractions predominate in gravel by creep. These particles are too coarse coastal sand dunes (mainly fine sand) and to be lifted and therefore roll along the sur- inland sand seas (fine to medium sands). Only face where they suffer impacts by saltating very strong storms (wind velocity on the order sand grains. Silt size particles, on the other of 20 to 30 m/s) can slowly move pebbles and hand, are transported very fast (Fig. 2.20;

Eolian Sediments
Chap. 2.3.4). Hence, wind is very effective in producing and accumulating well sorted sands.
Sorting of sand in eolian dunes and par- ticularly in interdune areas may, however, also be poor. Each individual storm event can move a certain population of grain sizes (Folk 1971). Thus, sand beds originating from a number of storms of varying intensity tend to be less sorted than individual sand laminae. Relatively fine-grained and very well sorted sand is typically found in coastal dunes, con- sisting of pre-sorted beach sand, and on the crests of large inland dunes. Coarser and less sorted sand is characteristic of dune flanks and interdune areas.
Due to saltation transport and continued grain impacts, eolian sands become better rounded than sands accumulating in any other environment, but in many sand dunes not all of the grains are well rounded. Generally, smaller grains remain angular longer than larger ones. The grain surface of young eolian sands commonly displays frosting and small pits caused by grain impacts. Older eolian sands often lose this distinctive criterion due to diagenetic overgrowth and cementation of the pore space (Chap. 13.3).
Wind-blown sands travel with varying velo- cities. Sand blown over a flat and smooth sur- face migrates fast. As soon as the sand has to overcome obstacles of some size and elevation, it tends to settle on the leeside. The migration of total dune bodies is much slower than that of single grains. It is a function of the dune size and sand volume. Small dunes such as isolated barchans (see below) move relatively fast (several tens of meters per year), while large sand dunes and sand seas are fairly stab- le.
In the trade wind belt of the western Sahara, for example, the position of barchan dunes was repeatedly photographed from the air, because a railway transporting iron ore from inland to the coast was endangered by sand dunes. Isolated dunes migrate with a mean velocity of approximately c = 300lH (mla), if the height H of the dunes is measured in meters (mean value of H = 9 m, Samthein and Walger 1974). In a cross-section perpendicular to the dominating wind direction, a sand volume of approximately 200 m3/a per 1 km width is transported in the form of barchan dunes seaward to the West African coast. Sand drift on flat bottom is, however, significantly more effective for trans- porting sand (on the order of 50 000 m3/a per km width) in this region.
These values indicate that in this area large volumes of sand reach the coast line and the sea (see below). The giant draas of large sand
seas, on the other hand, migrate at rates as slow as 1 to 2 cm/a.
Bed Forms and Sedimentary Structures of Inland Dunes
Bed Forms
Accumulating eolian sand generates specific bed forms which are found more or less in all deserts. As long as the climate is sufficiently arid (precipitation less than 100 to 150 mm/a) vegetation on sand is virtually absent and the eolian bed forms are mobile. Dry, sandy bed forms move, but more or less maintain their shape. The barchan dunes with their two horns pointing downwind (Fig. 2.21a) represent a typical example of this behavior. They lose sand on the windward side and add about the same amount of sand on the leeside. The dune migrates by this process, but only slowly changes its shape and volume.
Eolian bed forms occur in various shapes and sizes. Here, only the most important types can be mentioned. The smallest features are wind ripples on flat ground (Fig. 2.20a). They display a high lengthlheight ratio (ripple in- dex > 15) and commonly consist of medium to coarse sand, because the finer sand is sorted out and accumulated in larger dunes. The lar- gest grains of wind ripples, possibly including pebble-size grains and heavy minerals, are concentrated along ripple crests. Cross lami- nation is frequently indistinct. These ripples may alternate with plane or low-angle bedded sand forming thin, sheet-like sand bodies around the margins of dune fields or inter- dune areas (sea below). Climbing ripples which occur on the inclined surfaces of all types of large dunes are widespread (Fig. 2.21a). They consist of fine sand, and their direction of migration (perpendicular to the ripple crests) frequently deviates from the dominant wind direction controlling the movement of larger dunes.
The large dunes tend to be oriented either parallel (longitudinal) or transverse to the prevailing wind direction (Fig. 2.21 a). Many forms, such as the barchan dunes, however, exhibit transverse (the center of the barchans) and longitudinal components (the horns). The less elevated horns migrate faster than the higher center of the dune. Isolated barchans develop in areas of limited sand supply at the edge of larger sand seas. They may be ar- ranged in longitudinal or oblique chains. As a result of growing size and and diminishing

Chapter 2 Continental Sediments
OLDER, STABILIZED EPHEMERAL
DRAA STREAM (SAND PREVAILING WIND
INTERDUNE SOURCE) DIRECTION
PLAYA LAKE
SAND, CLAY, GYPSUM ETC )
SElF DUNES DUNES DUNES REL ATlVE VELOCITIES OF SAND MOVEMENT
ON FLAT SURFACE AND MIGRATION OF BARCHANS
GRAIN FALL AND GRAIN FALL
DOMINANT WIND DIRECTION
LAMINATION
OF EARLIER
DERCUTTING OF E-SIDE SLOPE
(CONTORTED BEDDING)
LAMINATION
OF EARLIER
EROSION OF PROGRADING MAJOR PART NEW DUNE OF OLDER DUNE \
WATER OLDER TABLE TRUNCATION
SURFACE

Eolian Sediments
space between the barchan dunes, these may pass into more straight-crested transverse dunes. Parabolic dunes are mainly known from coastal regions and periglacial environ- ments. In contrast to the barchans, the lower arms of the parabolic dunes tend to stick to the moist and/or vegetated ground, while the higher, central part of the dune migrates or is partially blown away.
Longitudinal sand ridges or seif dunes are the most widespread form in the present-day deserts, for example in Australia, but presum- ably their preservation potential in the ancient record is limited. Seif dunes develop parallel or subparallel to the dominant wind or the resultant of two wind directions (Fig. 22.21a). They grow downwind and tend to be spaced at equal intervals (often 100 to 300 m). Part of their sand may be derived from their inter- dune area from where it is transported by side winds or so-called helicoidal flow processes to the dune. Seif dunes typically reach several tens of kilometers in length and are 10 to 30 m high.
The largest eolian sand bodies are draas, i.e., elongate sandy hills of considerable height (up to several hundreds of meters) and wide spacing (some kilometers). They are typical representatives of giant sand seas. Because draas constitute huge volumes of sand, they require long time periods to form (on the or- der of at least 0.1 Ma) and move very slowly. Draas may be regarded as complex dunes re- sulting from the coalescence and growing together of other dune types. A special feature of draas are the so-called star dunes or rhourds (Fig. 2.21a) with high central peaks and radiating arms reflecting multidirectional wind patterns.
Sedimentary Structures
Eolian sands display various large and small- scale sedimentary structures (e.g., McKee 1979; Collinson and Thompson 1982). The most conspicuous features are large-scale pla-
Fig. 2.21. a Most important dune forms in relation to prevailing wind directions. From right to leR increase in sand supply and volume of sand accumulation, but decrease in the velocity of dune migration. Playa lake ponides, besides sand, sand-size clay aggregates, carbonate, and evaporites such as gypsum which make up part of the neighboring dunes. (Based on various sources, e.g., Cooke and Warren 1973; McKee 1979). b Large transverse or barchan dune mainly displaying unidirectional grain fall
nar cross beds which characterize transverse dunes and the central parts of barchans (Fig. 2.21b), but also occur in the other dune types. The cross beds develop on the lee-side of the dune crests and dip at angles around 30 degrees. In the case of transverse and barchan dunes, their strike is approximately perpendi- cular to the dominant wind direction. The foresets of the planar cross beds result from two different processes (Fig. 2.21b):
- Grain fall of sand particles blown over the dune crest blankets the lee slope. The angle of dip of these mostly thin, grain-fall laminae is 28 degrees or less. - Avalanching sand flows on steeper slopes create thicker, irregular foresets. This process is favored by occasional rain falls providing an additional load to the normally dry sand. Due to its moisture content, the avalanching sand gains some cohesion and may break up into small blocks or display contortions. These features are distinctive for eolian sands, be- cause loose sand under water cannot develop such structures. The slip planes of the sand flows are inclined up to about 35 degrees. - Several minor features may be superimposed on the dominant, large-scale cross beds (Fig. 2.21b). Climbing ripples caused by various wind directions migrate with the dominant wind to the dune crest and provide sand for grain fall lamination and sand flow foresets. Additional climbing ripples result from aero- dynamic eddies behind the dune crest or from wind reversals. They move upward on the lower lee-side slope of the dune and create a characteristic cross lamination which is fre- quently preserved in ancient eolian sandstones. Further climbing ripples of differing orien- tation can develop on both the windward and lee-side slope of the dune. Overall, climbing ripple stratification can distinctly contribute to the structures of large-scale bed forms. Strong wind reversals may blow away sand on the lee-slope and allow it to accumulate on the gentler windward side of the dune.
lamination and sand flow cross bedding. These large-scale bedding phenomena are superimposed by small-scale clim- bing ripple lamination caused by various subordinate, tem- poral wind directions. (Based on Hunter 1981, strongly modified). c Hypothetical cross section of longitudinal dune (after McKee 1979). d Truncation of older dune at capilla- ry fringe of groundwater table and prograding new dune over erosion surface

Chapter 2 Continental Sediments
An interdune area which is overridden by transverse or barchan dunes thus typically exhibits the foHowing vertical succession of structures (from top to bottom):
- Climbing ripple lamination and plane bed lamination near the dune crest.
- Large-sclae foresets of grain-fall lamination and sand flow.
- Wind ripple lamination and parallel to sub- parallel laminae sticking to the flat ground due to adhesion caused by soil moisture and sparse vegetation (adhesion ripples, ad- hesion laminae).
- In places: lag sediment (desert pavement) where sand and dust is blown away.
This dune sequence is commonly incomplete in the ancient record for two reasons: (1) A mig- rating dune can truncate its own deposits such that only the lowermost part of the dune is preserved. (2) Large dune fields may be erod- ed by wind action down to the capillary fringe of the (climatically fluctuating) groundwater table, where the sand is stabilized by adhesion (Fig. 2.21d). In this case, widely extended, approximately horizontal truncation surfaces are generated. Particularly the dip of the pre- served large-scale cross beds is used to deter- mine paleo-wind directions and to identify the former dune type. Transverse dunes show the least scatter of wind directions, whereas lon- gitudinal dunes tend to display a bimodal dis- tribution of paleo-wind pattern (see below).
The sedimentary structures o f longitudinal dunes and draas are complex as a result of more than one dominant wind direction and the coalescence of different basic dune types to these sand bodies. Our knowledge about the structures of compound dunes is limited, be- cause it is difficult to study these phenomena in recent examples consisting of dry loose sand. Longitudinal dunes commonly exhibit two or three large-scale cross beds dipping laterally from the dune crest (Fig. 2.21b). Fre- quently, the upper part of these foresets is truncated by subsequent lateral wind action. In this manner, typical wedge-shaped planar cross beds are generated. In addition, these dunes may develop all the minor features pre- viously mentioned for barchan and transverse dunes. However, only the lowermost portions of the dune, if any, are normally preserved. The huge draas and star dunes are assumed to produce particularly thick sets of cross beds (up to several tens of meters in height) which are also known from ancient eolian sandstones.
Finally it should be mentioned that eolian sands may display the imprints of rain drops and various biogenic structures. Burrows and traces of small animals, particularly arthro- pods, and molds of plant roots are common in present-day examples and were frequently found in ancient eolian sandstones. Even foot- prints of large animals were found in such rocks (McKee 1979).
Coastal Dunes
Coastal sand dunes normally do not reach the same large extent as many inland sand seas. They develop along both arid and humid coast lines. Their sand is derived from the beach zone and blown inland by prevailing onshore winds (Fig. 2.22a). In humid regions, the interdune and backdune areas are covered by vegetation and the inland migrating sand is soon trapped and stabilized by moist soils and plants. In arid regions, the coastal sand can travel far inland, produce a broad dune belt, and contribute to the formation of large, in- terior sand seas.
The dune types of coastal sands are princi- pally the same as those of the interior deserts. Many coasts are characterized by a narrow longitudinal sand ridge of considerable thick- ness (mostly up to several tens of meters). Where the coastal sand ridge is blown away, transverse, barchanoid, and parabolic dunes may follow farther inland, but it is hardly possible to establish a general rule for the suc- cession of special dune types. In the more arid zones, barchan dune fields originating from the coastal sands may pass landward into large transverse and longitudinal dunes. The inter- nal structures of coastal dunes resemble those of inland desert dunes, but tend to be still more complex. They may be affected by storm wave erosion and flooding of their interdune areas, and locally they interfinger with fluvial, lake and lagoonal deposits. Root horizons from vegetation and generation of soils may alter the primary structures and facies of the sands. Dunes along arid coasts often alternate with coastal sabkhas and may prograde over sup- ratidal algal mats and salt crusts.
Coastal dune sands frequently contain con- siderable amounts of bioclastic carbonate or may consist entirely of carbonate sand derived from various marine organisms. Such sands are readily stabilized due to the dissolution and reprecipitation of carbonate near their surface (McKee and Ward 1983). This early lithifica- tion of carbonate-bearing eolian dunes is

Eolian Sediments 6 1
DOMINANT WIND ?HYPERSALINE BAY WITH IN WETTER PERIODS: DIRECTION TIDAL AND SUPRA-TIDAL LAKES AND INTERDUNE \ , SED. AND COASTAL SABKHAS FLUVIAL ACTIVITY
FORMER CLIFF IN SAND DUNE
EOLIAN SAND EDGE HIGHEST SEA LEVEL MARINE SANDS
Fig. 2.22. a Interaction between seaward migrating eolian on coasts with prevailing onshore winds. In arid regions, sands and marine processes including relative sea level the coastal sand may migrate far inland to feed interior ohanges. The development of lakes or fluvial systems in sand seas, while the sand is stabilized by vegetation in the interdune areas is also indicated. (Mainly based on Sarnt- more humid zones. During low sea level, shelf sand can hein and Diester-Haass 1977; Schwarz et al. 1975; Einsele contribute to the buildup of coastal dunes. See text for et al. 1977). b Various types of coastal dunes developing further explanation

Chapter -2 Continental Sediments
known, for example, from the southern coast of the Mediterranean, from Florida and the Bahamas, or from southern Australia, where several chains of Quaternary dunes are aligned parallel to a prograding coast. The older the dunes, the more they are cemented by carbon- ate and thus gain a high preservation potential and are protected from truncation, as shown in Fig. 2.21d.
Large-Scale Facies Associations with Eolian Sands
I~tteraction with Fluvial and Playa Sediments
Continental eolian sands may alternate lateral- ly and vertically with deposits of marginal desert and fluvial environments. Sand dunes often overlie alluvial fans, fluvial deposits, or playa sediments and frequently pass laterally into such sediments deposited in the interdune or marginal dune areas (e.g., Langford 1989; Langford and Chan 1989). Fluvial flow in interdune areas erodes dunes, but may also contribute to the preservation of basal por- tions of the sand dunes when both fluvial and eolian aggradation occur successively. Then, fluvial channel and overbank-interdune depo- sits may form elongate, lenticular bodies in between eolian dunes. Flooding of interdune areas can create ephemeral lakes. The lateral interfingering of eolian sands and interdune calcareous or siliceous lake sediments in Pleis- tocene and older sediments is mostly ascribed to a change to a wetter climate (Fig. 2.22a). Then the mobile sand dunes are also stabilized to some extent by vegetation and soil forma- tion. During the subsequent geologic develop- ment, however, the higher portions of the dunes tend to become eroded by fluvial action. Thus, in a normally subsiding continental basin, the thickness of the eolian sands pre- served is limited.
Thickness of Eolian Sands
The thickness of eolian sands in the modern large sand seas commonly attains only several tens to a few hundreds of meters. The average sand thickness of widely extended longitudinal dune fields is usually on the order of only 10 to 20 m, for example in Australia. One has to consider, however, that the Australian dunes accumulated in the relatively short time period of approximately 30 ka (Wasson 1986; Wopf- ner and Twidale 1988). These and many other
modern occurrences of eolian sand are af- fected significantly by the shift of climatic belts during the Pleistocene. These shifts di- minished rather than enhanced the accumula- tion of large volumes of eolian sand, because great proportions of the older sands were re- peatedly redistributed by fluvial processes and deposited in other environments, including coastal areas.
Some ancient examples of eolian sediments exhibit very thick sequences of wind-blown sand. In Europe, Permian sandstones (Rot- liegendes) mostly have a thickness up to a few hundreds of meters, but locally they reach more than 1000 m, probably due to accen- tuated synsedimentary subsidence. The Meso- zoic Navajo sandstone of North America and eolian sandstones in China also attain several hundred meters in thickness. Longer persisting dry climate, sufficient subsidence, and the inability of plants to grow in desert environ- ments in the early Paleozoic favored the ac- cumulation of eolian sands.
Interaction with Shallow-Marine Sediments
Eolian sands may also interact with coastal and shallow-marine sediments. In the case of do- minant offshore winds as, for example, along the western margin of the Sahara desert in Africa, sand dunes, drifting sand, and dust are blown into the Atlantic by trade winds (Fig. 2.22a). The sands are redistributed by waves, longshore and tidal currents, and generate a seaward prograding sandy coastal belt. The interdune area of seaward migrating, lon- gitudinal dunes may be occupied for some time by hypersaline marine bays or lagoons. Tidal and supratidal flats bordering coastal sabkhas are characterized by sediments con- taining high proportions of eolian sand, in- cluding quartz-sandy algal mats and stromato- lites (Schwarz et al. 1975). Short-period, high sea levels, flooding the interdune areas, may lead to the deposition of thin, shallow-marine, calcareous sands in between large dunes (Fig. 2.22a). A particularly high, long-persisting sea level, however, will cause dune erosion and liquefied sand flows, and shift the entire coastline landward. Then the basal marine bed may consist of a massive, fine grained sand- stone derived from the pre-existing, planated eolian dunes, as for example observed in the upper Jurassic of Utah, North America (Esch- ner and Kocurek 1986). The preservation of the dune topography may be better with a very rapid, low-energy transgression, when

Eolian Sediments
the dunes were already cemented by evapo- rites or carbonate.
During sea level fall, the coastline moves toward the shelf edge, enabling the eolian sand to migrate over the emerged shelf. If the sand reaches the head of submarine canyons, it is trapped, easily liquefied, and transported by turbidity currents into deeper water (Sarnt- hein and Diester-Haass 1977; Eschner and Kocurek 1986). The present-day shelf sedi- ments off west Africa, which accumulated since the Holocene transgression, contain high proportions of eolian sand and dust (Einsele et al. 1977). A situation similar to the Pleistocene marine sediments on the west African shelf is also assumed for Permian marine sandstones and siltstones in Texas and New Mexico (Fischer and Sarnthein 1988).
Distinctive Features of Eolian Sandstones (Summary)
The characteristic features of modern and ancient eolian sands and sandstones are sum- marized as follows (see also, e.g., Blatt et al. 1980; Galloway and Hobday 1983; Collinson 1986b):
Observations in single outcrops: - Large-scale, 1 to more than 10 m high sets
of steep, truncated tabular cross beds and planar-wedge cross beds are the most strik- ing features in field exposures. The cross bed sets are either vertically stacked with- out muddy intercalations (large dunes), or they alternate with thin, flat-bedded or rippled interdune deposits. The dips of cross beds frequently indicate varying pa- leo-wind directions and wind reversals.
- Minor distinctive features include avalanch ing and brecciation of individual cross la- minae, and an abundance of climbing ripp- les with a high length/height ratio, imprints of rain drops, desert pavement, faceted gravel, and other ventifacts.
- Ocurrence of plant roots, burrows and tracks of animals living in the desert or in coastal dune environments.
- In some regions: Intercalations of volcanic ash falls without any indication of fluvial transport as, for example, observed in Per- mian eolian sandstones of Argentina (Lima- rino and Spaletti 1986).
Lateral and vertical facies transitions: - Occurrence of broad, widely extended de-
flation surfaces.
- Alternation with and lateral transition into playa and sabkha deposits, fluvial and allu- vial fan systems.
- Great areal extent of interior sand seas, but more elongate geometry of coastal dunes.
- Lateral transition of coastal dunes or sea- ward migrating inland dunes to the shore zone and shallow-marine environments.
Texture and composition: - Mostly fine to medium-grained sand, fre-
quently well sorted, fairly to well rounded, frosted grain surfaces of modern eolian sands.
- Mineralogically immature to fairly mature, depending on the source and recycling of sand.
- Scarcety of mica; silt and clay are found only in the interdune area.
- Yellowish, brown, or red staining.
In spite of this considerable number of crite- ria, thin eolian sand layers of limited extent, intercalated in fluvial or other deposits, are frequently overlooked and sometimes difficult to identify.
2.3.3 Clay Dunes
Clay dunes or lunettes occur along the margin of seasonally drying shallow lakes in semi-arid climates, for example in North Africa (Tune- sia) and South Australia. Mud from the lake bed is either entrained by waves and redepo- sited in emergent shoals (Lees and Cook 1991), or the drying mud and salt in the lake crinkles and forms silt and sand-sized pellets by ag- gregation (Bowler 1973; Pye 1987). These con- sist of clay, silt, some sand, and carbonate and/or gypsum and other salts. The pellets are blown away from the lake surface to the downwind lake margin. The larger clay pellets usually accumulate close to the lake in the form of flat, parabolic dunes; finer pellets are dispersed more widely. After rainfall, the clay dunes become stabilized as a result of cohesion between the wet clay and silt particles. Hence, no further migration of these dunes can take place, but they may grow larger and higher in subsequent dry seasons. Specific internal structures are normally absent in these dunes. They may become vegetated and repeatedly develop soils as they grow. Some examples show carbonate nodules originating from near-surface carbonate dissolution and repre- cipitation similar to the formation of caliche. Some ancient, massive, red mudstones, for

Chapter 2 Continental Sediments
example in the Keuper (Upper Triassic) of central Europe, are believed to represent an- cient clay dunes formed in a slowly subsiding, semi-arid basin with frequently switching shallow ephemeral lakes. In addition, the de- position of eolian dust (see below) may have contributed to the formation of such poorly defined deposits.
2.3.4 Eolian Dust, Loess
Transport, Texture, Source, and Composition
Similarly to sand-size particles, dust particles are entrained into the air by drag and aerody- namic uplift exerted by the turbulent wind current. The threshold wind velocities to move both fine sand and silt-size dust are on the order of 0.1 to 0.3 m/s (Morales 1979; Pye 1987). Storms capable of entraining and trans- porting dust commonly occur several times each year. The deflation surface, however, must be dry and the dust particles should not adhere to each other by cohesion. Even low moisture contents or low concentrations of cementing salts can significantly raise this threshold velocity and thus prevent dust trans- port. Furthermore, the roughness of the sur- face plays an important role. A dense desert pavement resulting from the removal of sand and dust finally terminates further deflation.
While there is little difference in the thres- hold velocities for the entrainment of fine sand and dust, the modes of particle transport and distance o f migration of these grain size fractions differ significantly (Fig. 2.20b). The finer the dust particles are, the higher and longer can they be transported in the atmo- sphere. Global wind systems may carry fine- grained dust over distances of several thou- sand kilometers and distribute it widely.
Dust mainly consists of silt-size particles smaller than about 20 pm (Pye 1987); larger grains settle quickly back to the ground when the turbulence of strong wind decreases. Far- traveled dust particles are smaller than 10 pm and many are even smaller than 2 pm. Such dust may remain in the atmosphere for weeks and then largely accumulate in the oceans. Loess which is commonly transported shorter distances is composed mainly of particles in the range from 10 to 50 pm.
The dust particles may be derived from several dif ferent sources. Mechanical and che- mical weathering provide silt and clay-size material. Grinding of solid rocks by glacial
action and fluvial transport can produce sub- stantial amounts of silt-size particles. In desert regions, silt is generated by eolian abrasion of rocks during saltation of sand grains (Fig. 2.20a). Finally, volcanoes can eject large amounts of silt-size material (Chap. 2.4). The relative importance of these various mecha- nisms to produce dust particles differs from area to area, reflecting the effects of climate, relief, lithology, and geomorphic history (Pye 1987). In regions of cold climate, glacial and fluvial abrasion as well as frost action are most important. Mountain regions with their high rate of mechanical erosion (Chap. 9.2) gene- rally provide more silt-size material than low- relief areas.
The mineralogical composition of dust also varies in relation to the source area. Many, relatively coarse grained, local dusts are rich in quartz, feldspar, and carbonate minerals. They reflect the composition of nearby sQurce rocks, such as quartz sandstones and carbonate sequences. With increasing distance from the source, however, textural and mineralogical sorting of the dust particles takes place. Con- sequently, far-traveled dusts tend to be en- riched in fine-grained micas and clay minerals and also may contain organic matter such as pollen grains, fungal spores, seeds, etc. With the aid of such components, the source of the dust may be determined (e.g., Sirocko and Sarnthein 1989).
Dust Deposition
Eolian dust is deposited when the velocity and turbulence of the dust storm wane or the dust particles are washed out by precipitation. An- other possibility is the coalescence of smaller particles to larger aggregates which can no longer remain in suspension. The deposition of dust is accelerated by the presence of vegeta- tion which creates surface roughness and thus impedes air flow and subsequent resuspension (Yaalon and Dan 1974). Settling dust can also accumulate on the downwind side of hills and other topographic highs, or in depressions; moist surfaces trap the dust grains.
Measured present-day rates o f dust deposi- tion on land range between 10 to about 200 g/m2 per year, corresponding to sedimentation rates of approximately 0.5 to 10 cm/ka. Local- ly and discontinuously, the sedimentation rate of dust must have been higher in the past, for example for Pleistocene loess with rates up to several tens of cm/ka (see below). The contri- bution of dust to oceanic sediments is less

Eolian Sediments
known, although this topic has been studied recently by several workers (see, e.g., Chamley 1989; Leinen and Sarnthein 1989; Weaver 1989). Dust deposition rates in the ocean re- ported in the literature vary between 0.1 and more than 10 g/m2 per year. Taking into ac- count the very low sedimentation rates of deep-sea sediments (in large areas 1 cm/ka, Chaps. 5.3 and 10.2), one can draw the con- clusion that eolian dust should make up a sig- nificant proportion of marine sediments in regions, where offshore winds from deserts reach the open ocean. The carbonate-free fraction of early Cretaceous to late Miocene pelagic to hemipelagic sediments in the North Atlantic consists predominantly of eolian silt and clay (Lever and McCave 1983). In the ea- stern Atlantic, northwestern Pacific, and nor- thern Indian ocean, eolian dust may comprise more than 50 Oh of the total modern sediment. Such sediments mainly consist of fine-grained quartz and clay minerals characteristic of their source areas. During the last 8000 years, the dust flux into the Arabian Sea reached nearly the same volume as the suspended load of the Indus river (Sirocko and Sarnthein 1989). It appears that dust deposition in the oceans increased in the Neogene in conjunction with a long-term climatic change.
Pleistocene Loess
Unconsolidated silty dust sediments of Plei- stocene or regionally also somewhat older age, which are deposited on land are termed loess. Unweathered and nonredeposited loess is ho- mogeneous, non- or weakly stratified and highly porous (Pye 1987). It consists predomi- nantly of quartz, feldspar, mica, clay minerals, and carbonate grains in varying proportions and is mostly buff or yellowish in color. The principle grain size of loess ranges from 20 to 40 pm, but loess can also contain minor pro- portions of fine sand (> 63 pm) and clay (i 4 pm). Loess exhibits a wide areal distribution on the present land surface, is agriculturally important, and frequently used for dating Pleistocene processes and sediments.
At least two principally different source areas of loess are distinguished. In Europe and North America, most loess is derived from glaciated areas and accumulated under cold
and relatively dry conditions (cold loess) with steppe vegetation not very far from the Plei- stocene glaciers. Most of the silt-size material was blown out of widely distributed, partially abandoned meltwater streams.
By contrast, the so-called desert loess is derived from arid regions. This is, for examp- le, true of most of the Chinese loess which covers a large area and attains locally more than 300 m in thickness (Liu Tungsheng 1988). According to paleomagnetic dating (Heller and Liu Tungsheng 1984) loess ac- cumulation in China began 2.4 Ma B.P. and took place discontinuously in relatively cool, dry periods. During warmer and wetter pha- ses, dust transport from the desert areas to the west slowed down and soils formed on top of the loess deposits. The average accumulation rates of loess in Asia and Europe varied bet- ween 2 and about 25 cm/ka, but in fact they were much higher during the cold stages when loess was actually deposited. Around the time of the last glacial maximum, loess accumulated at a rate of 0.5 to 3 m/ka (Pye 1987).
Loess is easily eroded by running water and fluvial action. The Yellow River (Huang Ho) in China and some other rivers of eastern Asia carry extremely high loads of suspended ma- terial, mostly derived from loess, into the sea. Here, they cause unusually high sedimentation rates of siliciclastic material and the rapid shallowing of coastal seas with prograding shorelines.
Pre-Quaternary loess deposits have rarely been reported. Considering the widespread occurrence of Quaternary loess, covering as much as 5 to 10 % of the present land surface of the earth, lithified loess (loessite) should be preserved more frequently in the ancient re- cord than known so far. Possibly the thickest loessite (about 500 m) was described from Upper Carboniferous to Lower Permian mixed fluvial and eolian red beds in northwestern Colorado (Johnson 1989). Part of this sequence is characterized by homogeneous, structureless sandy siltstones interpreted as loessite. This view as supported by intercalations of indis- tinct paleosols, the lateral gradation of these beds into fluvial deposits, and the inferred paleogeographic setting of the sedimentary basin. Other occurrences of loessite were de- scribed from some Precambrian to Neogene deposits in North America and Norway.

2 Continental Sediments
2.4 Volcaniclastic Sediments (Tephra Deposits)
2.4.1 General Aspects and Terms 2.4.2 Tephra Deposits on Land and Below the Sea
Various Tephra Deposits on Land Tephra Deposits Derived from Submarine Volcanic Activity Transport Distances of Various Tephra Depositional Environments and Facies of Tephra
2.4.3 Volcaniclastic Sediments in Basins of Various Tecto- nic Setting
2.4.4 Alteration, Diagenesis, and Metamorphism of Volca- niclastic Rocks
2.4.1 General Aspects and Terms
Hardly a depositional system exists in which volcaniclastic beds or some reworked pyro- clastic components in other sediments are ab- sent. In fact, in several of the basin types described in Chapter 1.2, volcaniclastic depo- sits play a significant part in the total basin fill. The contribution of volcaniclastic material to the total volume of sediments in various basin types may be as high as about 25 96. For this reason, a brief review of volcaniclastic- producing phenomena is necessary in the con- text of this book. Chapin and Elston (1979), Fisher and Schmincke (1984, 1990), Cas and Wright (1987), Schmincke (1988), Schmincke and Bogaard (1 99 1 ) describe volcaniclastic sediments and their genesis in more detail.
The term volcaniclastic sediments or tephra deposits refers to all types of volcanic frag- ments regardless of grain size, grain shape, composition, origin, and depositional process. Volcaniclastic fragments are subdivided into the following groups:
- Juvenile fragments, comprising two sub- groups:
1. Pyroclasts generated during explosive volcanic eruptions caused or dominated by degassing of magma. 2. Hydroclasts formed during eruptions due to the contact of hot magma with external water (phreatomagmatic eruptions).
- Accessory or cognate fragments are derived from older, co-magmatic rocks.
- Accidental fragments originate from under- lying rocks of any composition.
The latter two types of fragments are collec- tively called lithic fragments or lithoclasts. Based on the grain size of volcanic fragments, the following terms are used:
- Blocks and bombs (diameter L 64 mm). - Lapilli (2-64 mm). - Volcanic ash ( i 2 mm). - Volcanic dust ( i 0.063 mm).
The most important group of fragments dealt with here are juvenile fragments. They repre- sent chilled samples of the erupted magma and indicate the nature of the volcanic eruption. Depending on the state of magma prior to eruption, these fragments may consist of volcanic glass, or they are partially crystal- lized. Magmatic explosive eruptions of basalt and basaltic andesite are dominated by lapilli- sized pyroclasts which show many vesiculae caused by the degassing magma. Dark colored pyroclast accumulations of a basic to inter- mediate composition are called scoria. Because of the fluid nature of the erupting basaltic magma, the shape of larger fragments may be affected by their flight through the air and their impact on the ground surface (angular or drop-like form, ropy or stringy surface). More viscous, silicic to intermediate magmas (e.g., phonolites and trachytes) commonly produce highly vesicular pyroclasts (pumice). These consist of volcanic glass, but may also contain crystals formed in the magma chamber prior to eruption. Pumice clasts are usually light in
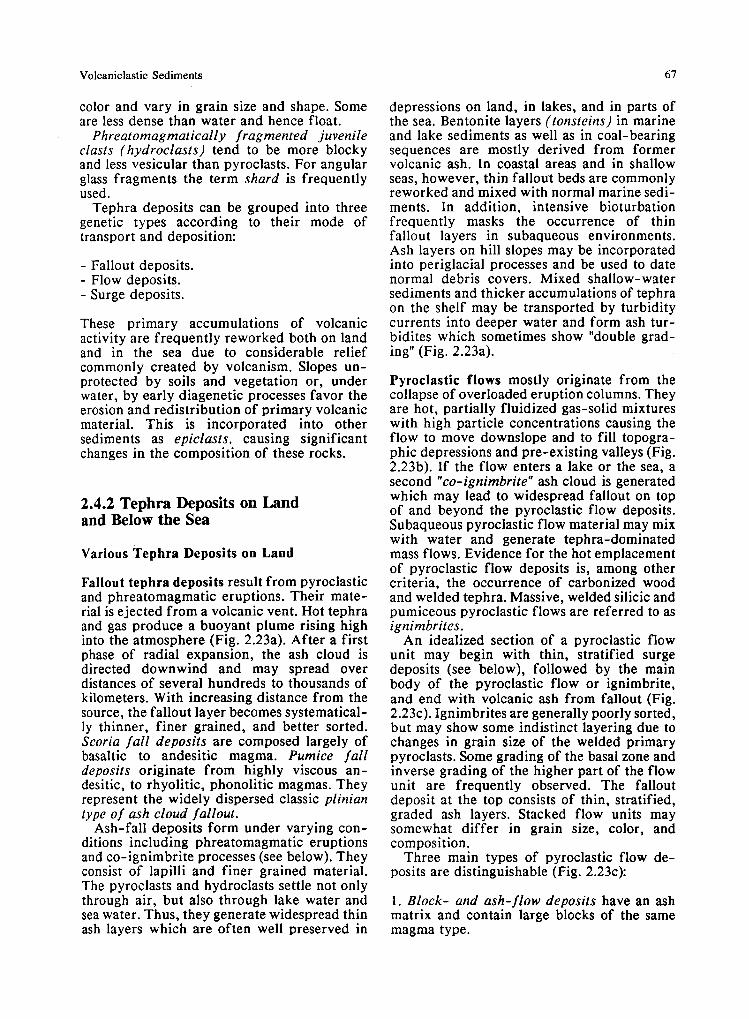
Volcaniclastic Sediments
color and vary in grain size and shape. Some are less dense than water and hence float.
Phreatomagmatically fragmented juvenile clasts (hydroclasts) tend to be more blocky and less vesicular than pyroclasts. For angular glass fragments the term shard is frequently used.
Tephra deposits can be grouped into three genetic types according to their mode of transport and deposition:
- Fallout deposits. - Flow deposits. - Surge deposits.
These primary accumulations of volcanic activity are frequently reworked both on land and in the sea due to considerable relief commonly created by volcanism. Slopes un- protected by soils and vegetation or, under water, by early diagenetic processes favor the erosion and redistribution of primary volcanic material. This is incorporated into other sediments as epiclasts, causing significant changes in the composition of these rocks.
2.4.2 Tephra Deposits on Land and Below the Sea
Various Tephra Deposits on Land
Fallout tephra deposits result from pyroclastic and phreatomagmatic eruptions. Their mate- rial is ejected from a volcanic vent. Hot tephra and gas produce a buoyant plume rising high into the atmosphere (Fig. 2.23a). After a first phase of radial expansion, the ash cloud is directed downwind and may spread over distances of several hundreds to thousands of kilometers. With increasing distance from the source, the fallout layer becomes systematical- ly thinner, finer grained, and better sorted. Scoria fal l deposits are composed largely of basaltic to andesitic magma. Pumice fall deposits originate from highly viscous an- desitic, to rhyolitic, phonolitic magmas. They represent the widely dispersed classic plinian type of ash cloud fallout.
Ash-fall deposits form under varying con- ditions including phreatomagmatic eruptions and co-ignimbrite processes (see below). They consist of lapilli and finer grained material. The pyroclasts and hydroclasts settle not only through air, but also through lake water and sea water. Thus, they generate widespread thin ash layers which are often well preserved in
depressions on land, in lakes, and in parts of the sea. Bentonite layers (tonsteins) in marine and lake sediments as well as in coal-bearing sequences are mostly derived from former volcanic ash. In coastal areas and in shallow seas, however, thin fallout beds are commonly reworked and mixed with normal marine sedi- ments. In addition, intensive bioturbation frequently masks the occurrence of thin fallout layers in subaqueous environments. Ash layers on hill slopes may be incorporated into periglacial processes and be used to date normal debris covers. Mixed shallow-water sediments and thicker accumulations of tephra on the shelf may be transported by turbidity currents into deeper water and form ash tur- bidites which sometimes show "double grad- ing" (Fig. 2.23a).
Pyroclastic flows mostly originate from the collapse of overloaded eruption columns. They are hot, partially fluidized gas-solid mixtures with high particle concentrations causing the flow to move downslope and to fill topogra- phic depressions and pre-existing valleys (Fig. 2.23b). If the flow enters a lake or the sea, a second "co-ignimbrite" ash cloud is generated which may lead to widespread fallout on top of and beyond the pyroclastic flow deposits. Subaqueous pyroclastic flow material may mix with water and generate tephra-dominated mass flows. Evidence for the hot emplacement of pyroclastic flow deposits is, among other criteria, the occurrence of carbonized wood and welded tephra. Massive, welded silicic and pumiceous pyroclastic flows are referred to as ignimbrites.
An idealized section of a pyroclastic flow unit may begin with thin, stratified surge deposits (see below), followed by the main body of the pyroclastic flow or ignimbrite, and end with volcanic ash from fallout (Fig. 2.23~). Ignimbrites are generally poorly sorted, but may show some indistinct layering due to changes in grain size of the welded primary pyroclasts. Some grading of the basal zone and inverse grading of the higher part of the flow unit are frequently observed. The fallout deposit at the top consists of thin, stratified, graded ash layers. Stacked flow units may somewhat differ in grain size, color, and composition.
Three main types of pyroclastic flow de- posits are distinguishable (Fig. 2.23~):
1. Block- and ash- flow deposits have an ash matrix and contain large blocks of the same magma type.

Chapter 2 Continental Sediments
a ASH CLOUD AND FALLOUT CONVECT~VE PLUME
. .
PYROCLASTIC DUE TO CONTACT WITH SEA WATE
ASH FLOW, SCORIA PUMICE FLOW OR
DUE TO CONTACT WITH SEA WATE
ASH FLOW, SCORIA FLOW, PUMICE FLOW OR IGNIMBRITE)
IDEALIZED COMPLETE SUCCESSION MAIN TYPES OF PYROCLASTIC FLOW DEPOSITS (PROXIMAL) OF ONE ERUPTION EPISODE
AIR-FALL ASH ASH-CLOUD SURGE DEP.
PYROCLASTIC 1 1-5 m
LITHOCLASTS 1
GROUND SURGE DEi? (1)
PLlNlAN FALL DEP
BLOCK-AND ASH-FLOW DEPOSITS
DENSE ANDESlTlC CLASTS
SCORIA DEPOSITS
VESICULATED BASALTIC- ANDESlTlC
GROUND SURGE DEP
PUMICE-FLOW DEPOSITS OR IGNIMBRITES
-GAS SEGGREGATION PIPE
PUMICE CLASTS
FINE GRAINED -BASAL LAYER

Volcaniclastic Sediments 69
2. Scoria flow deposits consist of basaltic to andesitic ash, lapilli, and larger clasts. 3. Pumice-flow deposits or ignimbrites are poorly sorted, normally welded, massive tephra layers as described above.
Volcanic mud flows and debris flows (lahars) are generated in the same way as other gravity mass flows (Chap. 5.4), i.e., under normal . temperature with the aid of water. They are, however, similar to pyroclastic flow deposits in composition and structure. In fact, they may form the distal facies of pyroclastic flows. Lahars tend to show a more polymict composition, better rounded clasts, and higher proportions of clay-sized matrix than pyro- clastic flows. They form either during erup- tions or independently of specific volcanic activities. They comprise not only a large proportion of the proximal facies on the lower slope of explosive volcanoes, but frequently travel distances of 10 to 200 km. Lahars also transport volcanic fragments to the coast and thus provide the source for volcaniclastic submarine debris flows and turbidites.
Pyroclastic surges are high-velocity, low- density turbulent flows which are caused by various mechanisms. Most important are base surges initiated by phreatomagmatic eruptions (interaction of magma with external water). These can create a collar-like cloud near the Earth's surface expanding radially in all direc- tions (Fig. 2.24a) as also observed in nuclear explosions. Such a debris-laden base surge may reach velocities up to 100 m/s and shatter all trees and other objects many kilometers away from the locus of eruption. Phreatomag- matic base surges are commonly "wet" and have a low temperature. Other types of surges are associated with pyroclastic flows (ground surges) and the collapse of an eruption column (ash-cloud surges).
Base surge deposits are commonly thin and irregular. They mantle to some extent the ground surface, but tend to reach greater thicknesses in topographic depressions (Fig. 2.24a). They predominantly consist of poorly
sorted sand to gravel-size particles of various composition; juvenile clasts often make up only a small proportion of the total sediment, while older tephra and lithoclasts constitute the major part. The sedimentary structures of base surge deposits at any given locality are unidirectional. They include wavy planar lamination, low-angle cross bedding, climbing dunes and antidunes, and chute-and-pool structures. Characteristic features are also low-angle truncations and steeply inclined laminae draping obstacles on the stoss side (Fig. 2.24b and c). The occurrence of base surge deposits is mostly limited to a few kilometers from the source, after which they grade into laminated fallout layers.
Tephra Deposits Derived from Submarine Volcanic Activity
Submarine volcaniclastic sediments are wide- spread and have a high preservation potential in the rock record. For those derived from volcanic eruptions on land, generation and mode of deposition was already mentioned in the previous section. The nature and products of volcanic activity under the sea are, how- ever, much less known and must be inter- preted from their results rather than from direct observation. A further problem is the differentiation of primary from redistributed (epiclastic) volcanigenic products.
The model in Fig. 2.24d is an attempt to describe two characteristic stages of a sub- marine eruption. During the most active phase of the volcano, large volumes of tephra are ejected high into the overlying water body. Part of the pyroclastic material settles back to the sea floor to form a subaqueous pyroclastic flow. Other proportions, such as highly vesi- cular pumice, may rise to the water surface and float until they come to rest along a coast. Fine-grained ash can remain in suspension for considerable time and thus be widely dis- persed by ocean currents. When the volcanic activity slows down, the ejected material cannot maintain a steady pyroclastic flow. As
Fig. 2.23. a Plinian volcanic eruption with gas thrust and b Collapsing eruption column leads to pyroclastic flow and winddriven convective plume. Tephra deposits include the formation of ignirnbrites and co-ignimbrite ash clouds ballistic bombs and blocks, lapilli, and volcanic ash. Note with widespread fallout. c Idealized sections of pyroclastic that ashcloud derived fall deposits uniformly drape the flow deposits. (AAer Sheridan 1979; Cas and Wright 1987; landscape (mantle bedding), form distinct layers in lakes, Schmincke and Bogaard 1991). See text for fufier expla- but are commonly reworked and redistributed in coastal nation areas and shallow seas.

Chapter 2 Continental Sediments
+--
a
LANAR B. MASSIVE BEDS SAND WAVES
SURGE
CLIMBING DUNES (PROGRESSIVE) BOMB SAG
CLIMBING ANTIDUNES (REGRESSIVE)
- LOW-ANGLE CROSS STRATIFICATION
WAVY, PARTIALLY DISCONTINUOUS LAMINATION STEEPLY INCLINED
. (ADHESINE) INDISTINCTLY LAYERED LAPlLLl BEDS IN F ~ O N T
OF OBSTACLE OR EROSION SURFACES
PELAGIC SEDIMENT CONTAINING FINE-
(1) CLIMAX OF (2) FINAL STAGE ERUPTION OF ERUPTION
RRENT-INDUCED ON OF FINE-GRAINED
ASH TUREIDITES (WITH LAPILLI)
SUBMARI'NE PYROCLASTIC FLOW
Fig. 2.24. a Base surge and partially topography-controlled material causes intermittent turbidity currents. e Idealized surge deposits. b and c Characteristic sedimentary structu- compound section (left) reflects maximum and waning sta- res of base surge deposits. d Model for submarine erup ges of submarine eruptions. (A&r Wohletz and Sheridan tions; stage I Large volumes of ejecta generate subaqueous 1979; Allen 1982; Cas and Wright 1987) pyroclastic flows; stage 2 Decreasing amount of erupting

Volcaniclastic Sediments
a result, it accumulates near the volcanic vent until the slope of the stored tephra fails. The sliding mass frequently evolves into a tur- bidity current, by which the volcanic material is intermittently transported into deeper water and deposited as ash turbidites. Towards the end of the eruptive phase, the turbidity cur- rents become less frequent and carry finer ash. In addition, the pelagic settling intervals may contain some fine-grained ash which was distributed by normal oceanic currents.
Divers have directly observed submarine lava flows forming pillow lava. However, it is not clear whether submarine eruptions can generate hot pyroclastic flows and welded tephra (ignimbrites). Welding in pyroclastic flow can occur on island volcanoes and may continue when the flow enters the sea.
Deep-sea ash layers commonly exhibit a sharp base and a more gradational top. They are moderately affected by bioturbation. They originate from both subaerial and submarine volcanic eruptions and occur several hundreds of kilometers away from the source areas. Wind-driven ash fallen on the sea surface may additionally be transported by ocean currents. Bottom currents rework and redistribute ash accumulated on the sea floor. Ash settled on top of submarine highs can be carried by gravity mass movements into deeper water. Due to this variety of transport machanisms, the areal distribution and thicknesses of marine ash layers is very irregular. In spite of this, deep-sea ash layers provide excellent indicators of former explosive volcanism, and they permit high resolution dating of marine sediments.
Transport Distances of Various Tephra
As already pointed out in the previous sec- tions, volcaniclastic material can be widely distributed and deposited far from its source. The approximate range of primary transport distances for various tephra is indicated in Fig. 2.25 a. Although these values greatly vary in relation to the size of the volcano, the magnitude of eruption, the type of magma, the relief of the land surface or sea bottom around the eruption center, and other factors, they clearly demonstrate the potential, sig- nificant contribution of volcanic processes to the filling of sedimentary basins. In addition to primary transport, loose volcaniclastic material is frequently reworked and redepo- sited by fluvial, eolian, and marine processes and can thus principally be transported over
unlimited distances. However, much of this redistributed, fine-grained and mostly altered volcanic material is mixed with "normal" siliciclastic sediments and remains uniden- tified.
Volcaniclastic sediments are easily recog- nized only up to a certain limit in the field. This limit is set, for example, by a minimum thickness of an ash layer, the occurrence of characteristic primary sedimentary structures (Fig. 2.24), or a high, easily visible proportion of reworked pyroclastic material in various types of sandstones and conglomerates, debris flows and turbidites. The examples in Figs. 2.25b and 2.26a demonstrate how characteris- tics of continental tephra deposits change with increasing distance from the source. Most of the typical volcaniclastic beds pinch out after some distance and are replaced by normal f luvial sandstones and mudstones with de- creasing proportions of reworked pyroclastic material (see also below).
Depositional Environment and Facies of Tephra
The volcaniclastic facies can be defined in relation to distance from the source, the depo- sitional environment, or to the primary petro- logic-chemical composition (Fisher and Schmincke 1984, 1990). In this section, the depositional environment of the rocks is of particular interest, but other approaches such as the petrofacies of sandstones (based on the occurrence of special mineral phases and their ratios) are also important tools in recognizing and evaluating volcaniclastic rocks. In settings where the chemical characteristics of magma change with time, the chemical composition of concurrently produced volcanic rocks may permit a stratigraphic correlation of rock types which vary in other characteristics.
Continental Tephra Deposits
In the continental realm, proximal tephra deposits near the source tend to fill valleys on the slopes and form coarse-grained alluvial fans at the base of the volcanic structures (Fig. 2.25b). At greater distances from the source (intermediate source, medial), predominantly gravel- and sand-size volcaniclastics alternate with the deposits of braided streams and/or are mixed with these fluvial beds. In distal depositional sites far from the source, sand- and silt-size volcaniclastics are increasingly

72 Chapter 2 Continental Sediments
PRIMARY TRANSPORT DISTANCES FROM SOURCE
VOLCANIC ASH FROM ASH CLOUDS
I severa l 100 t o 1 0 0 0 krn
DEBRIS FLOWS AND MUD FLOWS ( L A H A R S ) 3 --------- -- + SECONDARY - s e v e r a l 10 t o 100 krn TRANSPORT
PYROCLASTIC FLOWS --------- ---- (FLUVIAL
s e v e r a l 10 t o 100 krn EOLIAN. SURGE DEPOSITS OCEAN
1 t o 10 krn -------------------- -------- 3 CURRENTS)
LAVA FLOWS. BRECCIA. E T C - - - - - - - - - -
1 t o 100 krn 3
b CONTINENTAL AND LACUSTRINE ENVIRONMENTS
, ; - . P R 0 X l M A L MEDIAL DISTAL .. . .,. '.., if' 2 ALLUVIAL FANS
J PLATEAU VULL. HbH
BRAIDED STREAMS
C DOMINANT MARINE ENVIRONMENTS WINDS
.: .,du::;.:..!;12-.:;:::,.:.::: ::,.::; ? R 0 X I M A L c=g:> 7 : ::-::s\1. $ - . . . ... DISPERSION OF VOLC
ASH BY CURRENTS
PYROCLASTIC FLOWS. SURGE DEPOSITS
/ HYALOCLASTITES / BOTTOM CURRENTS VOLCANICLASTIC APRON ASH TURBIDITES
Fg. 2.25. a Frequent ranges of primary transport distances of various tephra. b, Volcaniclastics in continental environ- ments in relation to distance from source. c Same as b, but in marine environments.
incorporated into the deposits of fluvial plains or swept into lakes. Finally, volcaniclastic material can also reach a marine delta and the coast. The areal distribution of primary vol- caniclastic beds is more dispersed over the landscape than the linearly accumulating, purely fluvial sediments. Debris flows, sheet floods, and so-called hyperconcentrated flows with a relatively high proportion of suspended material tend to generate broad sheets of
sand- and gravel-size pyroclasts extending laterally beyond the range of normal fluvial channels. Airfall ash commonly covers even larger areas, but it is easily redeposited by fluvial activity. If ash accumulates on isolated plateaus which receive no other sediments and undergo little erosion, airfall deposits may build up sequences of some thickness.
Figure 2.26 illustrates proximal to distal facies changes in a Miocene fluvial to lacus-

Volcaniclastic Sediments
VOLC. ASH (TUFF)
I-
--- - MUDSTONE
OVERBANK SANDSTONES t . . . . . . . . . . . . . . . . . . . . . . . . . . . . . . . . . . . . . . . . . . . . . . . . . . . . . . . ..:.: ......................................................................... ........................ - . . . . . . . . . . . . . . . . . . . . . . . . . . . . . . . . . . . . . . . . . . . . . . . . . . . . . . - --- . . . . . . . . . . . . . . . . . . . . . . . . . . . . . . . . . . . . . . . . . . ...:.:.: ....... ::. : : ....................................................................................... ................................................................................................................ .................................................................................................................... . . . . . . . . . . . . . . . . . . . . . . . . . . . . . . . . . . . . . . . . . . . . . . . . . . . . . . . . . . . . . . . . . . . . . . . . . . . . . . . . . . . . . . . . . . . . . . . . . . . . . . . . . . . . . . . . . . . . . . . . . . . . . . . . . . . . . . . . . . . . . . . . . . . . . . . . . . . . . . . . . . . . . . . . . . . . . . . . . . . . . . . . . . . . . . . . . . . . . . . . . . . . . . . . . . . . . .:::: SANDSTONES, . . . . . . . . . . . . . . . . . . . . . . . . . . . . . . . . . . . . . . . . . . . . . . . . . . . . . . . . . . . . . .
. . ,.- ..-..., ..-.- ..-.......:.;.. - -1" "'i.': ' .--. '. ' . ..“. ...... .. ..... . .......... ...... lJ.I SCOUR-AND-FILL ...'-' :.: .,:.: * . - - - - - -..- -.:: .:::: :---.. - - - .,:.-?-. . .'..+TROUGH
. . ........ ... ...... 0 - BEDDED SANDST- - - ....,-..:'..I .....- - ..<. ---.-. .. -,____. .__.. . __.--. .__.. _ _ _. .-...:..,.. AND PLANAR ... . . . . ... . . . .... _..%__. __.--. - .*.'<.. < \:--. : . s::... .- .-.-:.-.. ..-- -.- .-.. --... ... CROSS- .... ? ,-.:,::,>:: ..-:;- ---:;::::: .. .--: . .-. . .. _ .__ __._. .-.--. - - - - .._. x . . . . . BEDDED ...... - - - - - - - . . .
MASSIVE ..:. .-.: ewCONGLOMERATE a . :--4s. , Fus .-..+,. ._>~.b.- CLAST-
SUPPORTED .. .. ....-.... ------ - 0 ~ ;<. i.i;':$',... j -::.o.>:.'j :;.+:,..:.: ..<*'... -: -. .,-:.: c-: ..-. :.-'.' . . - .,-.. ' .... " .....
HY PERCONCENTRATED - * ~ ? '9'L0, ' 4 . a V'.RW, \v.@9 ! . ,-* ;,-; 5 ;$?,;,Let;* , , , h-. ;. r - 1 .e. .?.I
FLOOD FLOW (PEBBLY SANDSTONE) e.&,o; ,,9 . $1 ,ZP.;&'.. PO . I;" ' :*.,i-
\ DEBRIS FLQWS 1 d- BEDDED CONGLOMERATE (SHEET FLOODS) DISTANCE FROM SOURCE
PROXIMAL DISTAL CROSS SECTION OF CHANNEL FILL (VOLCANICL.) (vOLC.+SILICICLASTICS) AND SHEET-LIKE VOLCANICLASTICS
I
SILT SAND PEBBLES
HY PERCONCENTRATED FLOOD FLOW DEP. SHEET FLOOD
DEBRIS FLOW \ DEPOS(TS FOR 5-10 krn
PALEO-VALLEY FILL (POLYMICTIC AIR-FALL TUFF CONGLOM.) 2 OVERBANK DEP. ON PALEOSOL
Fig. 2.26. a Relative abundance (thicknesses of bars) of c Cross section perpendicular to flow direction showing continental volcaniclastic facies in relation to distance from syneruption, sheet-like volcaniclastics and siliciclastic to the source, Miocene, Washington. b Characteristic sections mixed valley fills generated in inter-eruption periods. (Af- of a in the proximal and distal range. ter Smith 1988)
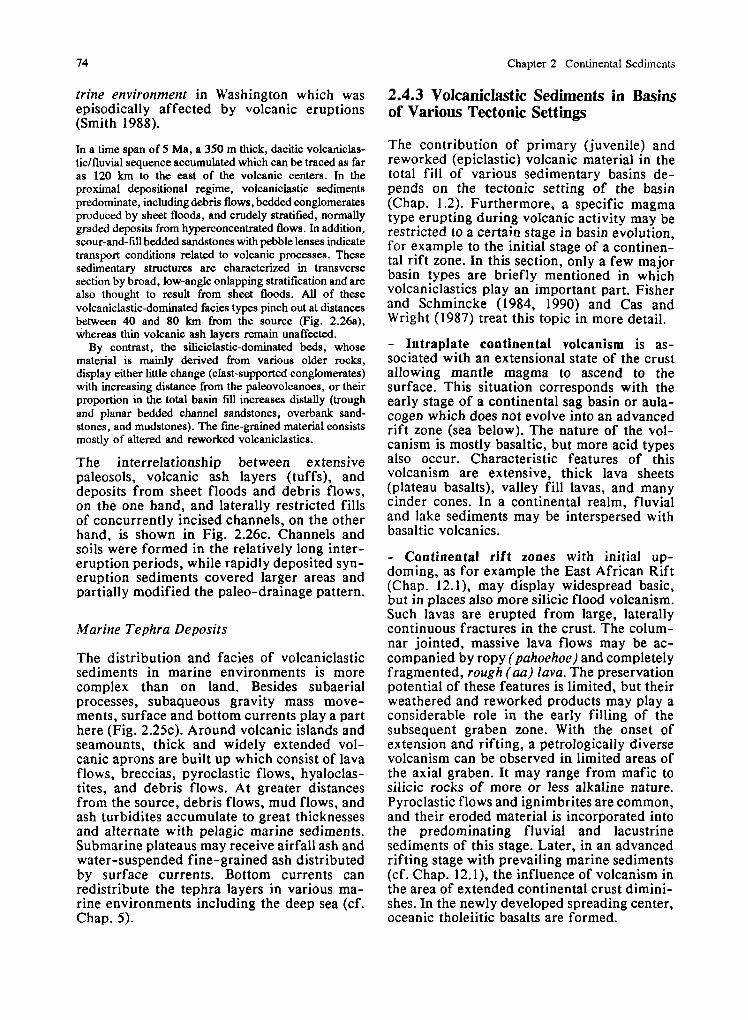
Chapter 2 Continental Sediments
trine environment in Washington which was episodically affected by volcanic eruptions (Smith 1988).
In a time span of 5 Ma, a 350 m thick, dacitic volcaniclas- ticlfluvial sequence accumulated which can be traced as far as 120 km to the east of the volcanic centers. In the proximal depositional regime, volcaniclastic sediments predominate, including debris flows, bedded conglomerates produced by sheet floods, and crudely stratified, normally graded deposits from hyperconcentrated flows. In addition, scour-and-fill bedded sandstones with pebble lenses indicate transport conditions related to volcanic processes. These sedimentary structures are characterized in transverse section by broad, low-angle onlapping stratification and are also thought to result from sheet floods. All of these volcaniclasticdominated facies types pinch out at distances between 40 and 80 km from the source (Fig. 2.26a), whereas thin volcanic ash layers remain unaffected.
By contrast, the siliciclasticdominated beds, whose material is mainly derived from various older rocks, display either little change (clast-supported conglomerates) with increasing distance from the palwvolcanoes, or their proportion in the total basin fill increases distally (trough and planar bedded channel sandstones, overbank sand- stones, and mudstones). The fine-grained material consists mostly of altered and reworked volcaniclastics.
The interrelationship between extensive paleosols, volcanic ash layers (tuffs), and deposits from sheet floods and debris flows, on the one hand, and laterally restricted fills of concurrently incised channels, on the other hand, is shown in Fig. 2 .26~. Channels and soils were formed in the relatively long inter- eruption periods, while rapidly deposited syn- eruption sediments covered larger areas and partially modified the paleo-drainage pattern.
Marine Tephra Deposits
The distribution and facies of volcaniclastic sediments in marine environments is more complex than on land. Besides subaerial processes, subaqueous gravity mass move- ments, surface and bottom currents play a part here (Fig. 2.25~). Around volcanic islands and seamounts, thick and widely extended vol- canic aprons are built up which consist of lava flows, breccias, pyroclastic flows, hyaloclas- tites, and debris flows. At greater distances from the source, debris flows, mud flows, and ash turbidites accumulate to great thicknesses and alternate with pelagic marine sediments. Submarine plateaus may receive airfall ash and water-suspended fine-grained ash distributed by surface currents. Bottom currents can redistribute the tephra layers in various ma- rine environments including the deep sea (cf. Chap. 5).
2.4.3 Volcaniclastic Sediments in Basins of Various Tectonic Settings
The contribution of primary (juvenile) and reworked (epiclastic) volcanic material in the total fill of various sedimentary basins de- pends on the tectonic setting of the basin (Chap. 1.2). Furthermore, a specific magma type erupting during volcanic activity may be restricted to a certain stage in basin evolution, for example to the initial stage of a continen- tal rift zone. In this section, only a few major basin types are briefly mentioned in which volcaniclastics play an important part. Fisher and Schmincke (1984, 1990) and Cas and Wright (1987) treat this topic in more detail.
- Intraplate continental volcanism is as- sociated with an extensional state of the crust allowing mantle magma to ascend to the surface. This situation corresponds with the early stage of a continental sag basin or aula- cogen which does not evolve into an advanced rift zone (sea below). The nature of the vol- canism is mostly basaltic, but more acid types also occur. Characteristic features of this volcanism are extensive, thick lava sheets (plateau basalts), valley fill lavas, and many cinder cones. In a continental realm, fluvial and lake sediments may be interspersed with basaltic volcanics.
- Continental rift zones with initial up- doming, as for example the East African Rift (Chap. 12. l) , may display widespread basic, but in places also more silicic flood volcanism. Such lavas are erupted from large, laterally continuous fractures in the crust. The colum- nar jointed, massive lava flows may be ac- companied by ropy (pahoehoe) and completely fragmented, rough (aa) lava. The preservation potential of these features is limited, but their weathered and reworked products may play a considerable role in the early filling of the subsequent graben zone. With the onset of extension and rifting, a petrologically diverse volcanism can be observed in limited areas of the axial graben. It may range from mafic to silicic rocks of more or less alkaline nature. Pyroclastic flows and ignimbrites are common, and their eroded material is incorporated into the predominating fluvial and lacustrine sediments of this stage. Later, in an advanced rifting stage with prevailing marine sediments (cf. Chap. 12.1), the influence of volcanism in the area of extended continental crust dimini- shes. In the newly developed spreading center, oceanic tholeiitic basalts are formed.

Volcaniclastic Sediments
- Intraplate oceanic volcanism occurs on older oceanic crust. Typical representatives are the volcanic island-sea mount chains in the Pa- cific (Chap. 12.5.4). The basaltic volcanoes are built up of pillow lavas, hyaloclastites (fine- grained sideromelane glass shards), pyroclastic material, and massive lava. They eject large volumes of volcanic debris into the at- mosphere and into the sea. The volcaniclastic material may mix with reef detritus, shallow- water carbonate, and pelagic sediments.
- Mid-oceanic ridge volcanism leads to the accretion of new oceanic crust. This mecha- nism yields the highest production rate of volcanic rocks, but only a minor proportion of the ascending magma is widely dispersed as volcaniclastic material. The basaltic magma extrudes from fissures in the median valley and produces abundant pillow basalts, other lava flows, volcanic breccia, and pyroclastic deposits. These volcanic rocks are characteris- tically associated with pelagic sediments such as radiolarian chert, siliceous green and red clay, or limestones. Metalliferous sediments of limited extent can accumulate near hydro- thermal vents.
- Island arc and continental margin arc volcanism associated with an active subduction zone (Chap. 1.2, Fig. 1.2 and Chap. 12.5) is most effective in producing large volumes of volcaniclastic materials. The volcanoes are lined up in a narrow, at least several hundred kilometers long zone parallel to a deep-sea trench. The magma production rate is a func- tion of the subduction rate and possibly en- hanced by concurrent spreading of a backarc basin. In the case of an island arc, the vol- canoes may be partially submerged or emerged above sea level. Their volcanic products are mainly basaltic or andesitic, but locally more silicic differentiates including ignimbrites have been observed. Arc volcanism along Anden-type continental margins exhibits high proportions of intermediate and silicic, largely calc-alkaline material. They may also eject large volumes of ignimbrites.
The 1980 eruption of Mount St. Helens in Washington is a medium-scale example of this type of arc volcanism. Due to westerly winds, the pyroclastic fallout was dispersed about 1000 km to the east of the volcano. At a distance of 300 km east of the source, the ash fall deposit was 2 cm in thickness (Lipman and Mullineaux 1981). Contempo- raneous debris flows and mud flows, originating on the summit and the flanks of the volcano, travelled as far as 130 km and filled valleys and preexisting lakes.
Estimates on prehistoric volcanic eruptions partially yield much higher volumes and transport distances of the pyroclastic material. Sin le explosive eruptions can eject 10 to 10' ! km of magma and disperse volcanic ash more than 1000 km from the source (Kukal 1990: Schmincke and Bogaard 1991).
Forearc basins sediments (Chap. 12.5.3) range from continental to shallow-marine and deep-marine. In the case of an island arc, they tend to be rich in volcaniclastic material of basaltic to andesitic character. Forearc basins associated with continental margin arcs, on the other hand, accumulate more acidic to inter- mediate, calc-alkaline tephra. Deep forearc basins typically display abundant debris flows and thick turbidite sequences rich in vol- caniclastics.
Backarc basins (Chap. 12.5.4) commonly provide less deep depositional environments ranging from fluvial, lacustrine to shallow- marine. If the dominant winds are directed toward the continent, backarc basins can accumulate high volumes of fallout deposits from ash clouds over the entire basin. Lava flows, pyroclastic flows, and debris flows, however, enter the basin from the side of the island arc and thus create an asymmetric basin fill. The backarc basins east of the Andes in South America provide a prominent example of thick continental volcaniclastic sequences derived from a volcanic arc to the west.
Tephra Volume and Time Span of Volcanic Activity
Island arc volcanism can persist for con- siderable time periods in relation to the time span needed for subduction of an ocean basin.
Given an ocean of 1000 km width and a subduction rate of 5 cmla, the closure of the ocean and hence the volcanic activity will last for 20 Ma. The volume of ejected volcanic material depends on the proportion of the subducted crust which is molten and extruded at the surface. If a plate 1 km long (parallel to the subduction zone), 1000 km wide, and 6 km thick, is subducted and only 1 % of the volume of this rock body is transformed into volcaniclastic material, a sediment volume of approximately 60 km3 results. Evenly distributed over a basin of 120 km width and 1 km length, the volcaniclastic material can form a layer 500 m thick in a time span of 20 Ma.
This simple and purely theoretical calculation demonstrates that subduction-related vol- canism can produce indeed very large amounts of volcaniclastic material. Nakamura (1974, cited in Fisher and Schmincke 1984, 1990)
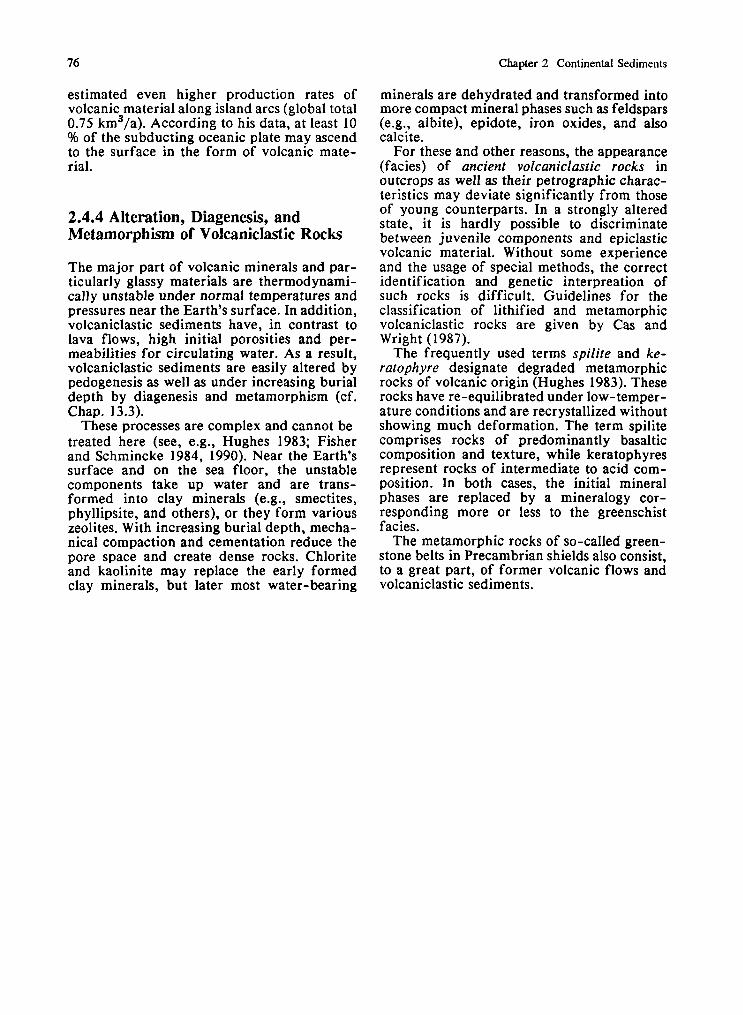
Chapter 2 Continental Sediments
estimated even higher production rates of volcanic material along island arcs (global total 0.75 kms/a). According to his data, at least 10 % of the subducting oceanic plate may ascend to the surface in the form of volcanic mate- rial.
2.4.4 Alteration, Diagenesis, and Metamorphism of VolcanicIastic Rocks
The major part of volcanic minerals and par- ticularly glassy materials are thermodynami- cally unstable under normal temperatures and pressures near the Earth's surface. In addition, volcaniclastic sediments have, in contrast to lava flows, high initial porosities and per- meabilities for circulating water. As a result, volcaniclastic sediments are easily altered by pedogenesis as well as under increasing burial depth by diagenesis and metamorphism (cf. Chap. 13.3).
These processes are complex and cannot be treated here (see, e.g., Hughes 1983; Fisher and Schmincke 1984, 1990). Near the Earth's surface and on the sea floor, the unstable components take up water and are trans- formed into clay minerals (e.g., smectites, phyllipsite, and others), or they form various zeolites. With increasing burial depth, mecha- nical compaction and cementation reduce the pore space and create dense rocks. Chlorite and kaolinite may replace the early formed clay minerals, but later most water-bearing
minerals are dehydrated and transformed into more compact mineral phases such as feldspars (e.g., albite), epidote, iron oxides, and also calcite.
For these and other reasons, the appearance (facies) of ancient volcaniclastic rocks in outcrops as well as their petrographic charac- teristics may deviate significantly from those of young counterparts. In a strongly altered state, it is hardly possible to discriminate between juvenile components and epiclastic volcanic material. Without some experience and the usage of special methods, the correct identification and genetic interpreation of such rocks is difficult. Guidelines for the classification of lithified and metamorphic volcaniclastic rocks are given by Cas and Wright (1987).
The frequently used terms spilite and ke- ratophyre designate degraded metamorphic rocks of volcanic origin (Hughes 1983). These rocks have re-equilibrated under low-temper- ature conditions and are recrystallized without showing much deformation. The term spilite comprises rocks of predominantly basaltic composition and texture, while keratophyres represent rocks of intermediate to acid com- position. In both cases, the initial mineral phases are replaced by a mineralogy cor- responding more or less to the greenschist facies.
The metamorphic rocks of so-called green- stone belts in Precambrian shields also consist, to a great part, of former volcanic flows and volcaniclastic sediments.

2 Continental Sediments
2.5 Lake Sediments
2.5.1 Different Lake Systems and Their Sediments General Aspects Lake Systems (Overview) Open Lake Systems in Regions of Humid Climate Closed Lake Systems in Semi-Arid to Arid Clinate Black Shale Deposits in Lakes
2.5.2 Recent and Ancient Examples of Lake Sediments 2.5.3 Specific Features of Lakes and Lake Sediments
Sedimentation Rates and Lifetime of Lakes Remarks to Specific Sediment Successions and Lake Deposits
2.5.1 Different Lake Systems and Their Sediments
General Aspects
Where ancient lake deposits are well exposed, their origin as lacustrine sediments can usually be recognized at first glance. Many lake depo- sits are particularly well horizontally bedded or laminated and, in addition, show frequent vertical changes in lithology and color. Fresh- water carbonates, thin dolomitic beds, iron oxides or siderite concretions, oil shales, and evaporites (commonly differing from those of the marine realm) characterize certain stages and types of lacustrine environments. One or several of these rock types are found in many lake deposits. Features characteristic of strong wave and current action are rare, although storm-wave erosion is known from large lakes. True tidal currents are absent, but wind stress may repeatedly drive water against a shore and create "wind-tidal flats".
Faunal remains usually comprise only a li- mited number of species and are often res- tricted to certain beds. They may indicate a varying chemical environment from fresh to brackish and hypersaline water. Fresh-water lakes usually contain less than 1 g/l dissolved
constituents, brackish water lakes 1-5 g/l, and salt lakes more than 5 g/l. Highly con- centrated brines reach ion concentrations of 200 to 300 g/l and more. The pH of lake wa- ters may vary from about 4 to 10. Lake depo- sits are frequently associated with fluvial sedi- ments and fossil soils (paleosols).
From these criteria one can conclude that lake deposits display some distinctive features, but also include a great variety of facies types and vertical sequences which cannot be de- scribed and explained here in detail. A more thorough treatment of this topic is given, for example, by Kukal (1971), Dean and Fouch (1983), Eugster and Kelts (1983), Allen and Collinson (1986) and several special publica- tions mentioned below.
Lakes originate from different exogenetic and endogenetic geological processes. They occur in areas of crustal subsidence such as rift zones, continental sag basins, and foreland basins (cf. Chap. 1.2) which cannot be inun- dated by sea water. They are also very com- mon in glaciated regions (Chap. 2.1) and in some arid to semi-arid lowlands where wind- induced deflation leads to morphological de- pressions. Most of the present-day lakes are shaped by glaciers and therefore provide poor analogs for the interpretion of ancient lacus- trine systems, which were predominantly con- trolled by tectonic movements. Furthermore, only few modern lakes have an areal extent and accumulate sediment thicknesses similar to those of prominent fossil counterparts.
Lakes are often referred to as "clearing ba- sins" of rivers. The total bedload and most of the suspended load of entering rivers settle out in the lake. Lakes with high influx of detrital clastics are short-lived, as for example ice- contact lakes, proglacial lakes (Chap. 2.1.1), and many lakes found in graben structures and rift zones bordered by mountain ranges. Small and shallow lakes of this type may become filled within a few thousand years or less and therefore rarely experience long-term drastic climatic changes. In contrast, large and deep

Chapter 2 Continental Sediments
lakes, and particularly lakes in areas of long- lasting crustal subsidence and low terrigenous influx, can persist during considerable geolo- gical time periods. It is usually this latter type of lake which displays the sensitivity of lacus- trine sediments to changing climatic con- ditions indicated by pronounced, repeated vertical facies changes. Such variations affect either the lake area itself or its drainage area, or both of them.
Lake Systems (Overview)
The great diversity of lake basins and their sedimentary fill makes it difficult to sum- marize our knowledge in a simple clas- sification scheme (Horie 1978; Allen and Col- linsen 1986). Apart from the factors men- tioned above, we have to consider physical, hydrological, biological, and chemical proces- ses which play a great part, particularly in long-persisting lakes. In contrast to the open sea, waves and wind-driven currents are gen- erally much less important in lakes for the distribution and reworking of sediments. These processes operate to some extent along the lake shores but normally do not affect the lake bottom, unless the lake is very shallow and large.
For these reasons, lake waters tend to be- come stratified either permanently or season- ally (Fig. 2.27bl). Permanent stratification is characteristic of tropical lakes (temperature stratification, oligomictic lakes) and lakes in which the bottom water is more saline than surface water (meromictic lakes). In both cases, the bottom water (hypolimnion) can become completely stagnant and be depleted in oxygen and nutrients, which leads to re- stricted benthic life and the preservation of organic matter produced in the near-surface water (epilimnion). If such stratified condi- tions are maintained for a long time period, i.e., for at least several thousands of years, laminated muds rich in organic matter (sapro-
pel) can accumulate. Hence, lacustrine black shales in the ancient record indicate either a warm climate with small seasonal variations in temperature and a lake basin with limited inflow and outflow of river water, or a com- pletely closed lake system (see below).
In regions of temperate climate, the surficial lake water is warmer during the summer and less dense than the deeper water; hence, lakes with limited inflow and outflow are stratified. However, during the winter the surface water cools and reaches the same or a higher density as the bottom water. Consequently, the total lake water body can be turned over once or two times a year and mixed (monomictic or dimictic lakes, Fig. 2.27a). In this case, a per- manently stagnant hypolimnion with fully anoxic conditions cannot develop. Similarly, a major river crossing a lake will cause under- flow (Fig. 2.27a) if its water is cool and com- paratively dense. Then the total lake water body including the hypolimnion is well sup- plied with oxygen and enables a fairly high seasonal biogenic production (e.g., diatoms, different types of algae, etc).
Lakes with marked seasonal changes in their physical, chemical, and biological conditions tend to produce fine annual varves which are a few tenths to a few millimeters thick (Fig. 2.27al). Such varves are well developed and preserved in lakes with little benthic bottom life where influx of terrigenous material is not too high and irregular. Such conditions are fairly common in regions of humid climate where permanent, sufficient inflow of river water keeps the lake filled and enables out- flow and thus a hydrologically open system. In this case, water chemistry, the areal extension of the lake, its relatively narrow beach zone, etc. (i.e., the entire depositional system) are kept more or less stable. Most of these open lakes are short-lived fresh-water systems which are dominated proximally by river- derived clastic sediments and distally by mix- tures of fine-grained elastics, carbonate, and biogenic silica.
Fig. 2.27a-c. Overview of different lake systems. a Open lake system with inflow and outflow; the lake water chemi- stry is riverdominated. a1 Well oxygenated, oligotrophic lake @oar in nutrients). a2 Chain of connected lakes, at the downstream end open or closed; arid to semi-arid re- gions show a tendency to increased salinity and fractioning of evaporite5 from the higher to the lower lakes. b Closed lake systems without outflow, concentration of dissolved species increasing with lifetime of lake. bl stable strati- fication of lake water and eutrophic conditions with oxy-
gendeficient bottom water (also feasible for a). b2 Perennial lake, sufficiently deep with enough inflow to maintain a permanent water fill. b3 Ephemeral lake, usual- ly dry or reduced to small shallow pond, seasonally or irregularly flooded. b4 Ephemeral or permanently dry lake with groundwater table below lake floor, and downward leaching of salts. c Open sea-lagoon-lake system, controlled mainly by subsurface sea water and groundwater flow; regional and seasonal variations in water chemistry (Coo- rong model, Australia). For further explanation see text

bike Sediments
a OPEN^ LAKE SYSTEMS b "CLOSED" LAKE SYSTEMS
OUTFLOW OVERFLOW INFLOW
- - . . - . . .
OVERTURN UNDERFLOW (THIN TURBIDITES)
WATER FRESH OR SLIGHTLY BRACKISH, RIVER-DOMINATED CLASTIC SEDIMENTS,
TENDENCY TO:
LITTLE NUTRIENTS
INFLOW - .
FLUCTUATING
MUD FLATS LAKE LEVEL - - -
(SHIFTING FACIES BELT, REPEATED REWORKING AND DISSOLUTION OF SALTS)
bl EUTROPH EPlLlMNlON
MESOLIMNION
HYPOLIMNION, BOTTOM LIFE OXYGEN MINIMUM SPARSE OR ABSENT \ ZONE
ANNUAL VARVES OR POOR LAMINATION, DISTINCT LAMINATION, RICH IN ORG. LITTLE ORG. MATTER, PARTLY IRON MATTER, i- SIDERITE CONCRETIONS HYDROXIDES, TURBIDITES
/ b EPHEMERAL LAKES b PERENNIAL LAKES 3 (PLAYA, INLAND SABKHA)
MUD CRACKS, CRUSTS OF MG-CALCITE, FRESHWATER FLUCTUATING LAKE LEVEL DOLOMITE, GYPSUM, OR HALITE CARBONATE
(SPRING)
A/ . . . ., .
: -.75.".:.7:::..:..>- -'- - PERMANENT EVAPORATIVE PUMPING CENTRAL THIN SALT
BUT CHANGING FROM HIGH WATER TABLE DEPOSITION, ALTERNATING
SALINITY WITH CLASTICS
BEDDED CARBONATES AND/OR THICK EVAPORITES ALTERNATING WITH FINE-GRAINED CLASTICS b 4 WATER TABLE BELOW LAKE FLOOR OR BLACK SHALES
CLAY DUNES (WIND-BLOWN DEFLATION AND LEACHING OF SALTS
CLAY PELLETS)
a2 LAKE CHAIN ... ,,
(IN SEMIARID TO ARID REGION) . . . 8 --------,
_ . _ . , - , , INCREASING SALINITY GROUNDWATER BRINE
f --------
CHLORIDE SULFATE CARBONATE PRECIPITATION
C SEA-LAGOON-LAKE SYSTEM
CHANGING WATER CHEMISTRY
DIFFERENT CARBONATES (INCL. DOLOMITE)

Chapter 2 Continental Sediments
Hydrologically closed lake systems have no outflow (Fig. 2.27b). They are common in regions of warm, semi-arid climate. If evapor- ation of lake water is about equal to inflow, a permanent water body can be maintained (perennial lakes, Fig. 2.27bl and b2). How- ever, as a result of minor climatic variations in the range of 10 to one 100 years, the water level of such lakes may fluctuate considerably and affect a wide beach and near-shore zone (sand flats or mud flats, Fig. 2.27b and b l ) by repeated emergence and inundation.
The water level of the well-known Great Salt Lake in North America, for example, varied by about 10 m in the Holocene, but in the late Pleistocene (Lake Bonneville stage) it stood about 300 m higher than the present level (Currey 1990).
During periods of high water level, the chem- istry of lake water may change markedly by dilution of highly mineralized water or re- dissolution of salts precipitated during emer- gence in the near-shore zone. Deeper lakes tend to evolve stable stratified conditions with oxygen-depleted bottom water.
During longer time periods (thousands of years) the concentration of highly soluble species in the lake water tends to increase and finally to lead to the precipitation of salts. Ephemeral or playa lakes (inland sabkhas) are shallow and fall dry most of the time, apart from a central pond containing highly concen- trated brines (Fig. 2.27 b3). By "evaporative pumping", i.e., ascending capillary water from a shallow groundwater table, they can preci- pitate salts at the surface. If the groundwater table drops too deep for capillary water to reach the surface, salts of the playa or salt pan are leached and transported into the under- ground (Fig. 2.27b4, also see below).
Finally, several open lake systems may be combined to form a lake chain (Fig. 2.27a2), where the last (lowermost) lake has either an outflow or is closed. In arid to semi-arid regions, such lake chains may display a sys- tematic change in water chemistry and thus also in their precipitated salts. Similarly, the chemistry of lakes near the ocean may be in- fluenced by both seaward flowing ground- water and landward intruding sea water (Fig. 2.27~). This situation can create special chem- ical environments for the formation of coastal carbonates including dolomite (Chap. 3.3.2).
Open Lake Systems in Regions of Humid Climate
Lakes in regions of temperate, humid climate can accumulate four main types of sediments (Dean 198 1 ):
- Detrital clastic material (primarily siliciclas- tics and reworked carbonates).
- Autochthonous biogenic and bio-induced carbonate.
- Autochthonous biogenic silica. - Sediments rich in organic matter.
Lakes Dominated by Detrital Clastics
The detrital clastic components of lake sedi- ments reflect the relief, climate, and the rock types present in the drainage area of the lake (Chap. 9). Proglacial lakes (Chap. 2.1.1) and many lakes in mountainous areas are domi- nated by terrigenous clastic sediments includ- ing detrital carbonate. Due to a high sedimen- tation rate, the autochthonous sediment com- ponents are strongly diluted, or they are pro- duced in quantities too low to gain a sig- nificant influence. Sedimentation in such lakes is largely controlled by physical processes distributing both the bedload and supended load of the entering river(s) over the lake (see, e.g., Sturm and Matter 1978). The river bed- load builds a delta out into the lake which usually has a lobate or birds-foot form and typically consists of fluvial topsets, lake fore- sets, and bottomsets (forming a classical "Gil bert-type" delta). However, where rivers dis- charge into very shallow lakes, less regular deltaic sediments may accumulate.
In deeper lakes, a great part of the sandy river bedload is transported from oversteepen- ed delta slopes into deeper water either direct- ly by underflows during river floods, or by gravity mass movements (evolving into tur- bidity currents, see Chap. 5.4.2). Thus, the principal sediment types on the bottom of such lakes are silty-sandy, comparatively thin turbidites alternating with fine-grained mud which settles slowly from suspension. The sediment-laden flows of large rivers can also form subaqueous channels with levees on the delta slope extending into the deeper lake (Fig. 2.28 a) as, for example, observed in Lake Geneva.
If the river .water with its suspended load during floods is less dense than the bottom water of the lake, the supended matter is dis- tributed by overflow (surface currents) or

Lake Sediments
interflow over the lake (Fig. 2.27a). Rhythmic sequences resulting from these processes range from sandy, mostly thin-bedded proximal tur- bidites to varve-type distal successions. The recurrence time of turbidite events is seldom controlled by the seasons, but rather by ir- regular storms occurring several times per year and/or rare larger events. Lake slopes at some distance away from river deltas receive only fine-grained material from overflows and intermediate flows (apart from autochthonous sediments, see below). Part of these fine- grained slope sediments is transported by slumps and mud flows into the deeper lake.
The sedimentation rates of lakes receiving water from large to medium-sized rivers draining nearby mountainous regions are very high. The following orders of magnitude for the different zones of a detrital, terrigenous- dominated lake are characteristic (also see Wright et al. 1980; Hsu and Kelts 1984; Sun Shuncai 1988):
- Prodelta area: several tens to hundreds of meters per thousand years (ka).
- Lake center: 3 to 10 m/ka. - Lake slopes: 1 to 3 m/ka.
These values demonstrate that such lakes have a short life time and that prodelta and proxi- mal bottom sediments make up the bulk of their sediment fill. This typically shows a dis- tinct coarsening-upward sequence from silty, varve-type bottom sets to sandy prodelta fore- sets and fluvial sands and gravel (Fig. 2.28b).
Lakes with Significant Proportions of Btogenic Sediments
Many lakes or parts of them exhibit a tran- sitional stage between over-supplied and sedi- ment-starved conditions (Fig. 2 . 2 8 ~ through e). The contribution of biogenic skeletal com- ponents to lake sediments is strongly influ- enced by the chemistry of lake water and nutrient supply. Waters rich in earth alkali ions, particularly calcium, favor the growth of lime-secreting organisms, whereas lakes poor in calcium ions but relatively rich in dissolved silica and nutrients (such as phosphorus and nitrate) are characterized by a relative enrich- ment of biogenic opaline silica. Usually both biogenic carbonate and opaline silica are found in lake sediments, but in widely varying fractions of the total sediment.
In so-called hard-water lakes which, at least seasonally, are oversaturated with respect to
calcium carbonate, calcareous shells of srgan- isms play a significant part in the littoral zone, even in lakes which are well supplied with detrital clastics (Fig. 2.28 c). Charophytes and bluegreen algae extract C 0 2 from lake water for photosynthesis and thus cause precipitation of calcium carbonate at their surface. Succes- sive layers of calcite coatings form different types of crusts and nodules (oncoids), as- sociated with reworked, sand-sized carbonate.
During the warm season calcium carbonate is also precipitated chemically in the form of tiny micritic crystals of low-Mg calcite. Then the epilimnion becomes markedly over- saturated as a result of increased temperature and C 0 2 consumption by phytoplankton (Fig. 2.28d). The tiny calcite particles are partially redissolved in the hypolimnion which is un- dersaturated with respect to calcium carbo- nate, due to the release of C 0 2 from decaying organic matter and a lower pH. The rest of the micritic calcite (lutite) generates a thin, light- colored layer in the profundal lake zone which is later (in fall and winter time) overlain by clayey material and settling organic debris (Kelts and Hsu 1978). In spring a high pro- duction of diatoms may contribute to the for- mation of such nonglacial annual varves. However, these varves on the lake bottom can only be preserved when benthic life is absent or very limited.
As demonstrated in Fig. 2.28e, the oxygen content of the hypolimnion (as well as ter- rigenous input) may vary from lake to lake or in the same lake with time. The bottom sedi- ments of such lakes therefore may show tran- sitional facies between bioturbated marly silts and clays, marls, and light-colored, highly calcareous muds (seekreide), or between sedi- ments poor and rich in organic matter. Muds containing considerable amounts of organic detritus but still showing some bioturbation are called gytt ja. Well laminated, organic-rich muds are referred to as sapropel, which fre- quently contains more than 10 % organic car- bon (also see below).
Soft-water lakes poor in calcium but suf- ficiently rich in nutrients, particularly phos- phorus and nitrate, may accumulate sediments rich in opaline silica derived largely from diatom frustules. Such lakes are common in regions of cool climate. A prominent example is the deep, relatively old Lake Baikal in Sibe- ria, which exists since the Miocene and has accumulated about 2000 m of sediments. The sedimentation rate of such lakes is compara- tively low (on the order of 10 cm/ka). Arctic lakes, which are not associated with glaciers,

82 Chapter 2 Continental Sediments
T (OC) 02(mg/l) CaCO, SATURATION LITTORAL C CARBONATE FACIES
HY POLIMNION
HIGH TERRIGENOUS
LOW
FORESETS
?BENTHIC ORGANISMS CHANNEL AND
?LAMINATED (ANNUAL VARVES) *RICH IN ORGANIC MATTER BOTTOM SETS
(PROXIMAL TURBIDITES)
SLOPE SED.
VARIATIONS e DUE TO: ---- m1
c i MARL BIOTURBATED ?SOME 0RG.C
TERRIG. OXlC INPUT BOTTOM WATER
LOW IN ORG. C
MUD, S A L C . ,
SUB-OXIC SOME BIOTURB. MEDIUM-RICH IN
- - - - - - - - ORG. C (GYTTJA)
ANOXIC LAMINATED MUD (ANNUAL VARVES).
LIGHT: RICH IN 0RG.C
PRECIP. (SAPROPEL)
CALCITE - DARK: CLAY, ORGANIC 1
0 , l - l m m DETRITUS (FALL, WINTER)
GRAINED ,-
-(VARVE-TYPE)
Fig. 2.28. a Scheme of open lake system with high ter- teristics of the epi- und hypolimnion of hard-water lakes rigenous input into main basin and low input in adjacent allowing calcite precipitation in summer time (based on hard-water lake. b Coarsening-upward sequence of detrital Dean 1981). e Variations in profundal (bottom) sediments elastics-dominated basin fill with (bl) proximal and (b2) of hard-water lake due to changing temgenous input and distal (varve-like) turbidites. c Littoral carbonate facies oxygenation of bottom water. Note the occurrence of annu- influenced little by temgenous material. d Some charac- al varves

Lake Sediments
INPUT OF DETRITAL CLASTlCS FLUVIAL SANDS
FOREST PEAT RESIDUAL LAKE DECREASING HIGH AND GRAVEL
DYSTROPHIC
EUTROPHIC
OLIGOTROPHIC
OLDER BEDROCK
PROGLACIAL "VARVES" (COMMONLY NON-ANNUAL TURBIDITES)
Fig. 2.29. Generalized scheme of the post-glacial sediment fill of a glacier-shaped lake. (After Dean 1981). It is assumed that the input of detrital clastics decreases with time and finally ends
commonly are poor in nutrients and organic production and often receive little detrital material (Kipphut 1988). Lakes in arid polar regions may even precipitate salts such as hydrated sodium sulfate and calcium chloride (Miiller 1988). Shallow, poorly drained lakes with the growth of peat tend to become acidic and develop reducing conditions.
Post-Glacial Lake Evolution
The post-glacial development of a glacier- shaped lake in humid temperate climate is shown in Fig. 2.29. The overall tendency is the evolution from a relatively deep, large, water- filled basin to a small pond and finally dry land. At the beginning of this development, the lake floor may be coverd by thick glacial till (as, e.g., observed in several lakes along the northern rim of the Alps). The first lake sediments after the retreat of ice are sandy prodelta foresets and silty glacial varves depo- sited by turbidity currents in the profundal zone. These sediments and their relatively high sedimentation rates reflect intensive me- chanical erosion and reworking of bedrock by ice action and meltwater in the drainage area. Vegetation is absent or sparse in the surround- ing land and, due to the still unfavorable cli- matic conditions and low nutrient supply, the organic productivity of the lake is also very low at this stage. Consequently, the rapidly accumulating clastic sediments are poor in organic matter. In a second stage, vegetation starts to spread out over the land and reduces
the input of detrital clastics into the lake. Simultaneously, dissolution of carbonates and chemical weathering of silicates in the drai- nage area increase and thus provide the lake with calcium, silica, and nutrients.
Once calcite has reached saturation, the lake precipitates calcium carbonate in summer time as described above and accumulates, depen- ding on the terrigenous input, a sediment more or less rich in carbonate (marly clay, marl, seekreide). This sediment is still fairly poor in organic matter. As soon as a dense vegetation cover is established, more plant remains are swept into the lake, and the fer- tility of the lake increases as a result of higher nutrient supply and recirculation of nutrients from decaying organic matter within the lake. Thus, the lake tends to become eutrophic with a high production of phytoplankton and algae in the epliminion and an oxygen deficiency in the hypoliminion. The resulting sediment is a gyttja or sapropel, which still may contain a considerable proportion of calcium carbonate.
The relatively high lacustrine sedimentation rate, as compared to marine sediments, favors the preservation of organic matter (Chap. 10.3.3). As the lake shallows, the littoral zone of rooted aquatic vegetation begins to grow outward into the lake, the algal gyttjy around the lake margins is replaced by sedge peat (Fig. 2.29). Peat provides a stable substrate for the growth of higher plants, the remains of which generate forest peat. If the main river is diverted from the lake, the lake water be- comes poor in nutrients and acidic (i.e., dystrophic) as a result of decaying plants with

84 Chapter 2 Continental Sediments
Mg SALTS, HALITE, HALITE HALITE AND OTHER SALTS AND OTHER SALTS AND OTHER SALTS
1 t GLAUBERITE'
(CaS0iNa2S04)
THENARDITE (Na2S04) GYPSUM
MlRABlLlTE (Na2S04.1 0 H20)
T "SODA LAKES"
/
f WITH GAYLUSSITE t , (Na2C03-CaC03-5H20)
\
GYPSUM ' AND TRONA
MAGNESITE', A (NaHCO3- Na,CO,* 2H2C)
DOLOMITE ', A ARAGONITE,
HIGH-Mg CALCITE
A
I LOW-Mg CALCITE
i= B V)
Ca 2 Mg C a v Mg Ca>> Mg i T 0 U Z HCOBz Ca + Mg HC03 aCa + Mg HC03 s-Ca + Mg
NORMAL HYDROGEN SULFATE AND HYDROGEN CARBONATE a 2 CARBONATE WATERS CHLORIDE WATERS WATERS RICH IN Na 5 5 I - (HUMID CLIMATE) (AND K), PARTLY CAUSED 0 LL BY ION EXCHANGE
O ' ) DIAGENETIC SECONDARY MINERALS
Fig. 2.30. Simplified scheme of salt precipitation in lakes omitted. Vertical seguences of lake sediments reflect suc- due to increasing evaporative concentration. The principal cession of salt precipitation. (After Eugster and Hardie lines of evolution are controlled by the composition of 1978) inflowing water; minor deviations from these trends are
the generation of humic substances. Conse- quently, the life of the lake ends with a peat layer or fluvial deposits on top of prodelta foresets.
Closed Lake Systems in Semi-Arid to Arid Climate
Overview
Salt lakes can show a variety of phenomena depending on the characteristics of their drai- nage areas (e.g., volcanic versus sedimentary rocks) or their stage of evolution. The most important types of salt deposits in lakes and
their possible vertical successions are sum- marized in Fig. 2.30. Regardless of the com- position of inflowing waters, the first mineral which is precipitated chemically or biochemi- cally due to an increasing salt concentration, is normal, low-Mg calcite. Then, in relation to the chemistry of inflowing water, three dif- ferent lines of development can be distingu- ished:
- The inflowing water is of the common, earth alkali-hydrogen carbonate type which is cha- racteristic for many rivers draining carbonate- bearing sedimentary rocks and plutonic rocks in highlands. Prograding evaporation leads to the precipitation of earth alkali carbonates
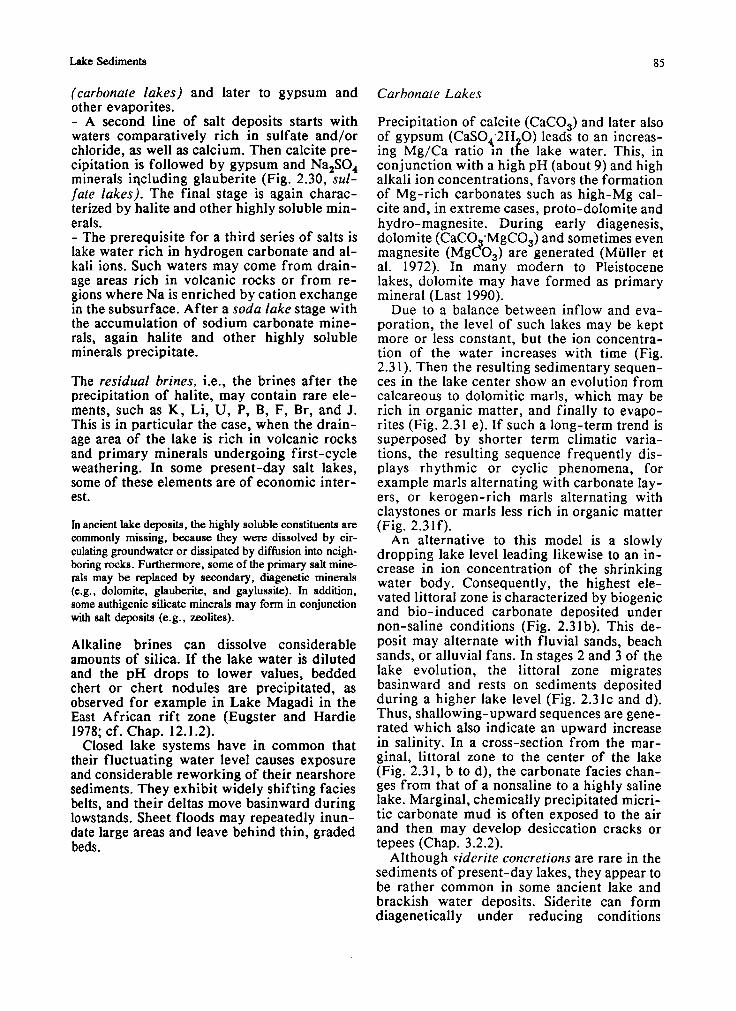
Lake Sediments
(carbonate lakes) and later to gypsum and other evaporites. - A second line of salt deposits starts with waters comparatively rich in sulfate and/or chloride, as well as calcium. Then calcite pre- cipitation is followed by gypsum and Na,SO, minerals iqcluding glauberite (Fig. 2.30, sul- fate lakes). The final stage is again charac- terized by halite and other highly soluble min- erals. - The prerequisite for a third series of salts is lake water rich in hydrogen carbonate and al- kali ions. Such waters may come from drain- age areas rich in volcanic rocks or from re- gions where Na is enriched by cation exchange in the subsurface. After a soda lake stage with the accumulation of sodium carbonate mine- rals, again halite and other highly soluble minerals precipitate.
The residual brines, i.e., the brines after the precipitation of halite, may contain rare ele- ments, such as K, Li, U, P, B, F, Br, and J. This is in particular the case, when the drain- age area of the lake is rich in volcanic rocks and primary minerals undergoing first-cycle weathering. In some present-day salt lakes, some of these elements are of economic inter- est.
In ancient lake deposits, the highly soluble constituents are commonly missing, because they were dissolved by cir- culating groundwater or dissipated by diffusion into neigh- boring rocks. Furthermore, some of the primary salt mine- rals may be replaced by secondary, diagenetic minerals (e.g., dolomite, glauIx.de, and gaylussite). In addition, some authigenic silicate minerals may form in conjunction with salt deposits (e.g., zeolites).
Alkaline brines can dissolve considerable amounts of silica. If the lake water is diluted and the pH drops to lower values, bedded chert or chert nodules are precipitated, as observed for example in Lake Magadi in the East African rift zone (Eugster and Hardie 1978; cf. Chap. 12.1.2).
Closed lake systems have in common that their fluctuating water level causes exposure and considerable reworking of their nearshore sediments. They exhibit widely shifting facies belts, and their deltas move basinward during lowstands. Sheet floods may repeatedly inun- date large areas and leave behind thin, graded beds.
Carbonate Lakes
Precipitation of calcite (CaC03) and later also of gypsum (CaSOq'2H 0 ) leads to an increas- ing Mg/Ca ratio in t i e lake water. This, in conjunction with a high pH (about 9) and high alkali ion concentrations, favors the formation of Mg-rich carbonates such as high-Mg cal- cite and, in extreme cases, proto-dolomite and hydro-magnesite. During early diagenesis, dolomite (CaCO .MgC03) and sometimes even magnesite (MI&,) are generated (Miiller et al. 1972). In many modern to Pleistocene lakes, dolomite may have formed as primary mineral (Last 1990).
Due to a balance between inflow and eva- poration, the level of such lakes may be kept more or less constant, but the ion concentra- tion of the water increases with time (Fig. 2.31). Then the resulting sedimentary sequen- ces in the lake center show an evolution from calcareous to dolomitic marls, which may be rich in organic matter, and finally to evapo- rites (Fig. 2.31 e). If such a long-term trend is superposed by shorter term climatic varia- tions, the resulting sequence frequently dis- plays rhythmic or cyclic phenomena, for example marls alternating with carbonate lay- ers, or kerogen-rich marls alternating with claystones or marls less rich in organic matter (Fig. 2.3 1 f).
An alternative to this model is a slowly dropping lake level leading likewise to an in- crease in ion concentration of the shrinking water body. Consequently, the highest ele- vated littoral zone is characterized by biogenic and bio-induced carbonate deposited under non-saline conditions (Fig. 2.31b). This de- posit may alternate with fluvial sands, beach sands, or alluvial fans. In stages 2 and 3 of the lake evolution, the littoral zone migrates basinward and rests on sediments deposited during a higher lake level (Fig. 2 . 3 1 ~ and d). Thus, shallowing-upward sequences are gene- rated which also indicate an upward increase in salinity. In a cross-section from the mar- ginal, littoral zone to the center of the lake (Fig. 2.31, b to d), the carbonate facies chan- ges from that of a nonsaline to a highly saline lake. Marginal, chemically precipitated micri- tic carbonate mud is often exposed to the air and then may develop desiccation cracks or tepees (Chap. 3.2.2).
Although riderite concretions are rare in the sediments of present-day lakes, they appear to be rather common in some ancient lake and brackish water deposits. Siderite can form diagenetically under reducing conditions

Chapter 2 Continental Sediments
STAGES OF a BloGENlc CARBONATE WATER W c t i IN LAKE LEVEL AND / OR (BIOHERMS, STROMATOLITES, Ca ++ ,Mg ++ , tic03 ION CONCENTRATION ONCOIDS)
\ MaICa PRECIPITATION OF \ 4 5 . z s - - - - - - - - - - - - - - - - - - -
CARBONATE
REGULAR
ROCK SALT AND OTHER EVAPORITES
GYPSUM AND
LAKE EXTENSION WITH FALLING WATER LEVEL (STAGES 1 TO 4) g
- STAGE 4 - - --
EVAPORITES
(ARAGONITE) DOLOMITIC MARLS
--- 3-1 Mg- CALCITE, CALCAR. mm. MARLS s
Fig. 2.31. a Scheme of carbonatedorninated, more or less and aragonite are frequently converted into dolomite. closed lacustrine depositional system where either (1) the b, c, d Incomplete marginal lake sections resulting from lake level maintains its elevation but ion concentration falling lake level and prograding fluvial sediments. e and f increases with time, or (2) ion concentration grows with Complete sections in lake center, e without, and f with falling lake level. In both cases, the MglCa ratio increases, influence of short-term climatic variations. (Based on diffe- and primary carbonate precipitation proceeds from low-Mg rent sources, e.g., Miiller et al. 1972; Kelts and Hsii 1978; calcite to aragonite. It may be followed by gypsum and Eugster and Kelts 1983) other evaporites. During early diagenesis high-Mg calcite

Lake Sediments
where the calcium and sulfide contents of pore waters are low and, in addition, the Fe/Ca mol ratio relatively high (20.4; Fiicht- bauer and Richter 1988). Since the water of many lakes contains much less sulfate than sea water, the source for generating iron sulfide with the aid of sulfate reducing bacteria is limited. Therefore, iron carbonate has a better chance of being formed in lake sediments than in marine sediments, provided iron-bearing minerals can release sufficient iron.
Sulfate Lakes, Soda Lakes, Chloride Lakes
After precipitation of gypsum and possibly other sulfate minerals, the remaining lake water contains only salts of very high solubi- lity. In order to precipitate these components, i.e., predominantly Na, Mg, C1, and SO4, a further drastic increase in the total ion con- centration of the lake water is required. The nature and succession of salts deposited after this process is controlled by the chemistry of the lake water (cf. Fig. 2.30). The most promi- nent salt occurring in most of the lakes at this stage is halite (NaC1) (Fig. 2.32a). It may be accompanied by Mg salts and some other com- pounds which are rarely preserved in the an- cient record. Saline waters rich in sodium and sulfate precipitate thenardite (Na2S04), mira- bilite Na SO4-lOH,O), and glauberite (CaS0,- .Na,Sq,) before halite is formed. Soda lakes precipitate natron (Na CO -lOH,O) and trona ( N ~ H C O ~ . N ~ , C O ~ . ~ H , ~ ) (big. 2.32a2 and a3).
As a result of increasing aridity these lakes may develop the following sequence (from top to bottom):
- Trona and gaylussite (Na2C03'CaC03~5H20, formed diagenetically).
- Dolomite and gaylussite (in summer). - Calcite and dolomite.
Prior to the precipitation of trona, the ion concentration of the brine must be very high. Therefore, the comparatively low evaporation loss of one year can cause precipitation of a fairly thick trona layer on the order of 5 mm. Similarly, annual layers of halite (rock salt) reach a thickness on the order of 1 cm (cf. Chap. 6.4.2).
Playa Lakes (Inland Sabkhas)
Whereas perennial, long-persisting salt lakes can accumulate rather thick and pure salt
deposits (Fig. 2.27b2), ephemeral playa lakes usually leave behind only thin salt layers al- ternating with clastic material. These playa lakes are dry most of the time, with a salt pan in their center (Figs. 2.27b3 and 2.32b). Their marginal zone is commonly characterized by wide sand and mud flats, which may develop thin salt crusts (consisting, e.g., of proto-dolo- mite on the outer flats and gypsum and halite on the inner flats). In addition, this zone shows desiccation cracks and locally also some sparse vegetation and burrowing organisms (Fig. 2.32bl). Well laminated algal mats are fairly common on the mud flats, but some centimeters or decimeters below the surface they are mostly destroyed.
As long as the capillary fringe of the groundwater table reaches the lake floor, salts such as halite, gypsum, and sodium sulfate crystallize interstitially from the ascending groundwater. This process is referred to as "evaporative pumping". It leads to the for- mation of nodules or irregular layers of these salts below the surface of sand and mud flats. The flats and the central salt pan are occasion- ally inundated by sheet floods. Then part of the salt is redissolved and later reprecipitated in the salt pan on top of silty and clayey layers resulting from the flood event. Reworked carbonate crusts and algal mats may locally form intraclast breccias or flat pebble conglo- merates.
The salts dissolved during floods and con- centrated in depressions having no outflow may also be leached by infiltrating rain water and enhance the mineralization o f ground- water. This is the case when the groundwater level as well as its capillary fringe drop below the lake floor, as for example reported from a number of Quaternary lakes in southeastern Australia (Bowler and Teller 1986; Teller and Last 1990). Then vegetation can begin to grow and form some soil on the lake floor. Figure 2.33 shows the interaction between a fluc- tuating groundwater level and the sedimentary processes in such a lake. It can be seen that the lake sediments respond very sensitively to slight changes in the hydrologic regime of the lake and thus also to minor variations in cli- mate. They frequently exhibit minor sedimen- tary cycles of widely differing thickness and duration. If leaching of salts and deflation are involved, such cycles tend to become asym- metric (Fig. 2.33). It is interesting to note that in this case not the salt deposits, but the soil horizon corresponds with the lowermost groundwater table and therefore most likely with the dryest period. For that reason, salt

Chapter 2 Continental Sediments
.- ALLUVlAl FAN /, 1
NON-SALINE SALINE
T STAGNANT
HYPOLIMNION . . .
... . . 0' ...
-vO
DOLOMITE A A h --------------- Is?
OIL SHALE (KEROGEN-RICH MARL)
DETRITAL CL4ST'CS
CALCARFOUS CRUSTS AND PORE CEMENT
SAND FLATS
HALITE CARBONATE I GROUNDWATER
- 3 BEDDED SALTS ? d'
A N H y D R T E (HALITE. TRONA. 0 4- /OR HALITE ANHYDRITE, ETC.)
DOLOMITIC MARL
ILT AND CLAY, AND DOLOMITE ANHYDRITE
RICH IN ORG. C ALGAL MATS
INTRACLAST BRECCIA b-4dY SOMEROOTS.
-- SILT AND CLAY BIOTURBATION
Fig. 2.32a,b. Generalized facies models for a perennial, flats, 2 mud flats, and 3 of residual playa lake. Note that predominantly saline lakes and b ephemeral playa lakes part of the salts precipitated on the surfaces of 1 and 2 is (continental sabkhas). a1-a3 Idealized sequences of central leached during subsequent flood or later, after burial, wit- lake: I carbonate-sulfatechloride lake; 2 sulfate-chloride hin sediment. For further explanation see text lake; 3 soda-chloride lake. bl-b3 Sequences of I sand
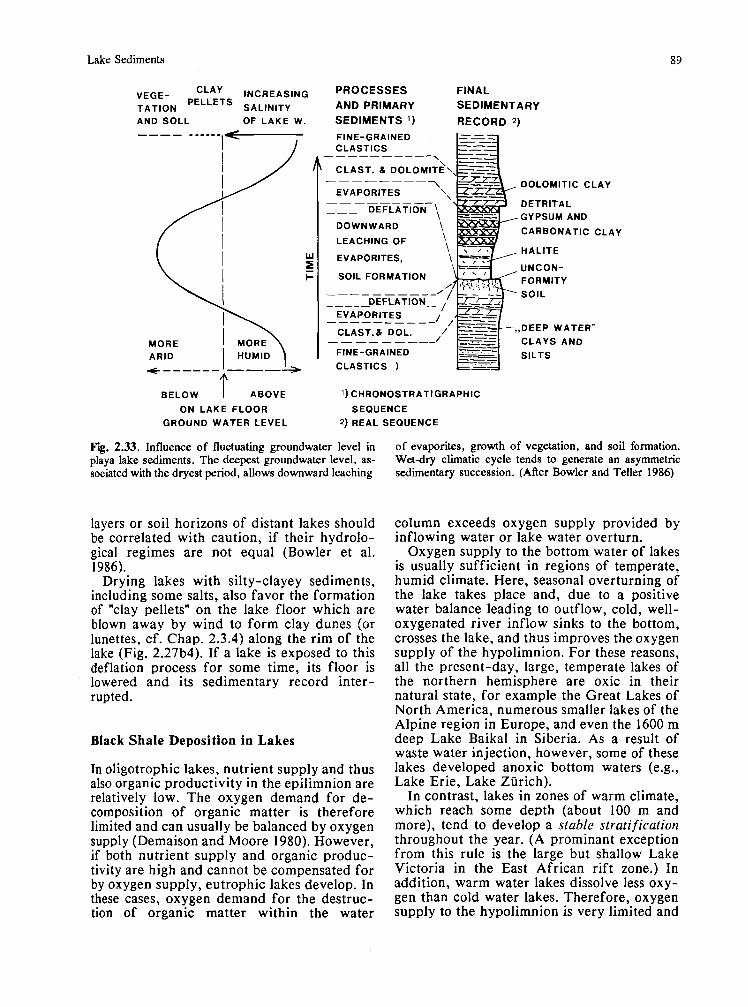
Lake Sediments
V E G E - CLAY I N C R E A S I N G TATION S A L I N I T Y A N D SOLL OF L A K E W.
PROCESSES FINAL AND PRIMARY SEDIMENTARY SEDIMENTS I ) RECORD 2 )
FINE-GRAINED CLASTICS - - - - - - - - -
\ CLAST. 8 DOLOMITE\ \ , - - - - - - - - DOLOMITIC C L A Y
EVAPORITES - - - - - - - - - DETRITAL
GYPSUM AND DOWNWARD
CARBONATIC C L A Y LEACHING OF
H A L I T E EVAPORITES,
UNCON- SOlL FORMATION FORMITY
---- - - ---- / SOlL
EVAPORITES - - - - - - - - - -1 CLAST.8 DOL. / ,DEEP WATER" -- - - - - ---/ C L A Y S A N D FINE-GRAINED SILTS
CLASTICS )
B E L O W I A B O V E I) CHRONOSTRATIGRAPHIC
ON L A K E FLOOR S E Q U E N C E G R O U N D W A T E R L E V E L 2) R E A L S E Q U E N C E
Fig. 2.33. Influence of fluctuating groundwater level in of evaporites, growth of vegetation, and soil formation. playa lake sediments. The deepest groundwater level, as- Wetdry climatic cycle tends to generate an asymmetric sociated with the dryest period, allows downward lcaching sedimentary succession. (AAer Bowler and Teller 1986)
layers or soil horizons of distant lakes should be correlated with caution, if their hydrolo- gical regimes are not equal (Bowler et al. 1986).
Drying lakes with silty-clayey sediments, including some salts, also favor the formation of "clay pellets" on the lake floor which are blown away by wind to form clay dunes (or lunettes, cf. Chap. 2.3.4) along the rim of the lake (Fig. 2.27b4). If a lake is exposed to this deflation process for some time, its floor is lowered and its sedimentary record inter- rupted.
Black Shale Deposition in Lakes
In oligotrophic lakes, nutrient supply and thus also organic productivity in the epilimnion are relatively low. The oxygen demand for de- composition of organic matter is therefore limited and can usually be balanced by oxygen supply (Demaison and Moore 1980). However, if both nutrient supply and organic produc- tivity are high and cannot be compensated for by oxygen supply, eutrophic lakes develop. In these cases, oxygen demand for the destruc- tion of organic matter within the water
column exceeds oxygen supply provided by inflowing water or lake water overturn.
Oxygen supply to the bottom water of lakes is usually sufficient in regions of temperate, humid climate. Here, seasonal overturning of the lake takes place and, due to a positive water balance leading to outflow, cold, well- oxygenated river inflow sinks to the bottom, crosses the lake, and thus improves the oxygen supply of the hypolimnion. For these reasons, all the present-day, large, temperate lakes of the northern hemisphere are oxic in their natural state, for example the Great Lakes of North America, numerous smaller lakes of the Alpine region in Europe, and even the 1600 m deep Lake Baikal in Siberia. As a result of waste water injection, however, some of these lakes developed anoxic bottom waters (e.g., Lake Erie, Lake Ziirich).
In contrast, lakes in zones of warm climate, which reach some depth (about 100 m and more), tend to develop a stable stratification throughout the year. (A prominant exception from this rule is the large but shallow Lake Victoria in the East African rift zone.) In addition, warm water lakes dissolve less oxy- gen than cold water lakes. Therefore, oxygen supply to the hypolimnion is very limited and

Chapter 2 continental Sediments
thus favors the development of anoxic bottom waters. Under these conditions, as already mentioned earlier, both the open freshwater lakes and the closed saline lake systems can produce oil shales with high contents of or- ganic matter. Of course, in both cases a low input of detrital clastics (or a limited precipi- tation of salts) is required for the formation of sediments rich in organic matter.
In fresh-water lakes of tropical and sub- tropical regions, black shale deposition coin- cides with periods of high nutrient supply and fertility. A well-known example of this lake type is the 1500 m deep Lake Tanganyika in the East African rift zone (Degens et al. 1971; Cohen 1989). Its drainage area is semi-humid, and the lake has an outflow. Most of the river load settles in the upstream Lake Kivu. Lit- toral sediments of Lake Tanganyika are rich in carbonate including ooid shoals and beach rock. Anoxic conditions with some hydrogen sulfide in the water prevail below a water depth of about 200 m. Sediments deposited in the shallower part of the lake contain 1-2 O/o organic carbon, whereas the laminated anoxic sediments in deeper water reach 7-1 1 % or- ganic C mainly derived from diatoms. The sedimentation rate of the basinal muds is about 0.5 m/ka; interbedded silty-sandy tur- bidites are common.
Even highly saline waters are not devoid of organisms (Larsen 1980). Although only a few species exist, these can grow in large quan- tities due to the abundance of nutrients and a high temperature. Bluegreen algae and bac- teria in particular, but also some planktonic organisms, copepods, nematods, crustacea, and higher plants manage to live under these con- ditions and produce and decompose organic matter (Eugster and Hardie 1978). Recent measurements of primary productivity, for example in the Great Salt Lake, Utah, have shown that salt lakes represent some of the most productice ecosystems (Eugster 1985). Phytoplankton productivity as well as the growth rate of algal mats can be very high. Because most of this production is destroyed by grazing higher organisms and microbial decomposition, only a small fraction of this production is eventually deposited together with the inorganic sediment fraction (cf. Chap. 10.3.3). However, this fraction is suf- ficient for the formation of organic-rich oil shales prior to the precipitation of salts. Even within evaporite sequences, black layers rich in organic carbon and some pyrite are en- countered.
Organic matter is generally preserved bettei in lake sediments than in marine deposits for the following reasons:
1. The sedimentation rate in lakes is usually much higher (often by one to two orders of magnitude) than in open marine environments and thus protects part of the organic matter from decomposition on the lake floor. 2. In contrast to marine sediments, a low sul- fate content in the pore water of many lake sediments prevents strong activity of sulfate reducing bacteria that simultaneously consume organic matter. Degradation of organic matter must therefore be accomplished mainly by the less efficient methane fermentation (Demaison and Moore 1980, also see Chap. 14.1).
For the same reason, sulfide supply is com- monly limited and cannot precipitate all the released iron as pyrite; consequently siderite nodules can form (as, e.g., found in the former lake stage of the Black Sea; Degens and Stoffers 1980). Anoxic lake sediments are usually also rich in carbonate.
Under changing climate, such lake sedi- ments may display vertical successions alter- nating between (Fig. 2.32):
- Kerogen-rich beds, coinciding with the more humid phase and high lake level. - Evaporitic beds, less rich in organic matter, associated with the more arid phase.
Successions of this type are common in many ancient lake deposits, for example in the Triassic and in the Eocene Green River For- mation of North America (see below).
2.5.2 Recent and Ancient Examples of Lake Sediments
Many modern and ancient lake sediments have been described in detail. Apart from the examples mentioned above, including the Great Salt Lake in Utah, the Caspain Sea, the Dead Sea, Lake Chad in North Africa, and Lake Eyre in Australia provide particularly interesting present-day examples and are therefore briefly mentioned here:
Caspian Sea. This modern, closed, brackish lake (1 3 g/l dissolved species) is dominated by detrital clastics, because two large rivers (the Volga river from the north and the Kura river

Lake Sediments
from the Caucasus ranges in the west) flow into the basin. However, the Caspian Sea also exhibits a considerable production of autoch- thonous (biogenic and bio-induced) carbonate. Its littoral zone and shallow northern part are therefore characterized by the deposition of sediments rich in carbonate, including shell- beds and oolites.
In the 800 to 1000 m deep central and southern part of the lake, fine-grained marls accumulate with a very high sedimentation rate on the order of 1 to 10 m/ka (1 to 10 km/Ma). Because these sediments are both rich in organic matter and are buried rapidly, they enable hydrocarbon generation and oii production from Pliocene to Quaternary strata in the Baku area. Irregularly occurring gas eruptions and numerous mud volcanoes testify to the fact that oil and gas generating proces- ses, as well as differential compaction of these young sediments, are still in operation (also see Chap. 14.2).
Another, interesting feature of the Caspian Sea described in many textbooks (e.g., Son- nenfeld 1984; Miiller 1988) is a large, shallow lagoon on its eastern margin, the Kara Bogas Gol. As a result of very high evaporation in the warm, arid climate, the water level of the lagoon drops below that of the Caspian Sea and thus causes continuous inflow of brackish water. The ion concentration of this water increases from the inlet to the inner part of the lagoon and hence leads to the precipitation of carbonate, gypsum, glauberite and halit in a lateral succession (cf. Chap. 6.4.1).
The Great Salt Lake in Utah is known for its fluctuating water level and very wide sand and mud flats during lowstand. The lake has a salt concentration about four to seven times as high as normal sea water, but the composition of the dissolved salts is similar to that of sea water. The lake water is oversaturated with respect to carbonate; gypsum and more soluble salts are precipitated only during lowstands in special marginal parts of the lake. In shallow water, ooids, primarily composed of aragonite, some Mg-calcite, and dolomite are common. In the central part of the perennial lake, muds are deposited which are more or less rich in organic matter (Spencer et al. 1984).
The Dead Sea is a salt lake occupying the deepest depression (about 400 m below sea level) in the young Jordan rift graben. The lake is about 400 m deep, but below or ad- jacent to the Dead Sea, more than 3000 m thick salt deposits have been discovered (Neev
and Emery 1966). The lake is fed by the river Jordan which partially drains regions with young volcanic rocks. In addition small springs nearby the lake discharge high-concentrated salt water originating from the leaching of older marine salt deposits. The salt content of the lake (about 300 g/l) is eight to nine times higher than that of normal sea water, but its composition differs considerably from sea water. NaCl makes up only on third of the total salt content, whereas MgClz reaches about one half. The brine is remarkably rich in Ca, K, and Br (4.6 g/l), but poor in sulfate. The stable pycnocline, observed years ago bet- ween the somewhat lighter surface water and the heavier, rather old water of the hypolim- nion, appears to be gone (Beyth 1980).
The Dead Sea is not completely barren of life; it contains bluegreen algae, some planktic microorganisms, and several types of bacteria. At present aragonite, gypsum, and some halite precipitate, but most of the gypsum is dis- solved in the anoxic hypoliminion by bacterial sulfate reduction. The generation of hydrogen sulfide leads to the formation of iron sulfide. Thus, dark, mainly calcareous mud with some gypsum, halite, and organic matter is deposit- ed. Precipitation of halite in the form of "salt reefs" is taking place in the shallow southern part of the lake, where "end brines" from eva- poration pans mix with Dead Sea brines (Beyth 1980).
Lake Chad in North Africa (cf. Fig. 9.10) and Lake Eyre in Central Australia are playa lakes draining very large, tectonically stable areas. During relatively long dry periods, the widely extended sand and mud flats are exposed to wind action and develop large fields of eolian dunes (Eugster and Hardie 1978). Lake Chad is mainly fed by the river Chari draining the highlands of Cameroun. If the lake level rises, the interdunal depressions are filled with wa- ter. The present lake water is rather fresh, favoring the deposition of clayey muds, but some of the small interdunal lakes were con- verted into salt pans exhibiting crusts of trona, natron, halite, and gypsum. Other pans pre- cipitate thenardite, halite, and other salt minerals indicating that most of the time a uniform brine does not exist.
Lake Eyre in Australia is inundated by floods in quite irregular time intervals on the order of 10 years and more. The mean annual runoff of the Lake Eyre basin is only 3.5 mm; thus the lake falls dry more than 90 % of the time (Kotwicki and Isdale 1991). Its drainage re-
92 Chapter 2 Continental Sediments
gion comprises an area 140 times greater than that of the lake floor. Potential evaporation exceeds precipitation (average of 220 mm/a in the entire drainage area) by a factor of about 12, and in the lake itself, i.e., in the arid con- tinental core, by a factor of 30 (Bowler 1986). The shape of the lake is partially controlled by wind action. On the downwind margin the ephemeral basin is bordered by transverse dunes which are built up by material blown out from the dry lake floor. On the upwind side the lake exhibits a cliffed margin which tends to migrate landward. Irregular deflation on the lake floor may leave behind islands within the lake. During the long dry intervals, the mudflats dry sufficiently to permit the efflorescence of salts at or somewhat below the surface.
The nature of the salts which can be pre- served is controlled mainly by the ground- water chemistry. If it is saturated with respect to calcium sulfate, gypsum precipitates (gyp- sum-dune building phase). Later, as a result of a prolonged warm and arid period, the groundwater becomes saturated with respect to halite (halite-saturation phase). Lake Eyre, as well as a number of other Australian epheme- ral lakes, thus show a development from gyp- sum to halite deposition and vice versa.
Ancient lake deposits can be recognized using the criteria discussed above. Some of the most distinctive features are ( I ) the absence of ma- rine fauna, (2) the occurrence of salt minerals which cannot be derived from normal sea water, and (3) successions with marked litho- logical variations and pronounced cyclicity.
Well studied, frequently cited examples of ancient lake sediments are those of the classic Newark supergroup (Triassic-Jurassic) in eastern North America (van Houten 1964; Gore 1989) and the marl-carbonate-gypsum-halite successions of the shallow Triassic (Keuper) basin in Central and Western Europe (e.g., Schriider 1982), parts of which were repeatedly filled by prograding birdsfoot deltas or wider alluvial plains (Wurster 1964).
Of great economic interest is the occurrence of wide- spread oil shales and trona beds in the Eocene Green River Formation in North America (Eugster and Hardie 1978; Eugster 1985). The oil shales of the small Lake Messel in Southern Germany were deposited at about the same time. They are famous for their excellently preserved fauna, particularly vertebrates (Koenigswald and Michaelis 1984; Schaal and Ziegler 1988). The well-known Miocene Ries impact crater in Southern Germany was once oc- cupied by a playa lake where algal bioherms, dolomite, gypsum, and also some oil shales were deposited (Wolff and Fiichtbauer 1976). Later, it evolved into a fresh-water lake and finally fell dry.
More examples of lacustrine sediments de- posited in Phanerozoic time are described by Picard and High (1981), Allen and Collinson (1986), and Talbot and Kelts (1989).
2.5.3 Specific Features of Lakes and Lake Sediments
Sedimentation Rates and Lifetime of Lakes
As already mentioned above, most of the post- glacial open lake systems fed by rivers drain- ing mountainous regions show very high sedi- mentation rates on the order of 1 to 10 m/ka and more. Such lakes, particularly shallow ones, have only a comparatively short lifetime. In the Caspian Sea about 1 m/ka is deposited, which signifies that Quaternary lake sediments reach a thickness of more than 1 km. Such high sedimentation rates are capable of com- pensating even for rapid subsidence (Chap. 8) and thus lead to a fast filling of subsiding lake basins, including closed lake systems in arid and semi-arid zones.
Provided the ion concentration of perennial lakes or that of groundwater below an ephe- meral lake has already reached saturation with respect to principal salts, further small evapo- ration losses can cause a rapid precipitation of salts (several meters to tens of meters per 1000 years). Using the data for chemical (and me- chanical) denudation discussed in Chapter 9, one can estimate the time necessary for the accumulation of salts (and detrital elastics) in a lake basin representing a certain fraction of the total drainage area (cf. Chap. 11.2).
However, some modern and ancient lakes are also characterized by rather low sedimen- tation rates (less than 0.1 m/ka). Large lakes of lowland regions belong to this category when their ratio of drainage area to lake area is low. They receive only limited quantities of predominantly fine-grained, clastic material which is distributed over a large lake area. Consequently, the lake is filled up slowly. Such lakes can persist for long time periods, provided their floor subsides sufficiently. Then, different carbonates may constitute a significant sediment component. The wide- spread European Keuper marls, for example, alternating with dolomitic limestone beds (cf. Chap. 2.5.2), belong to this group. The sedi- ments of long-persisting lakes commonly re- flect climatic and hydrologic changes in their drainage area and may experience transitions from an open to a closed drainage system,

Lake Sediments
including marked variations in lake extent and salinity.
Remarks to Specific Sediment Successions and Lake Deposits
Sediment Successions
Lake sediments and particularly their evapo- rites are extremely variable. In response to changes from dryer to wetter climate and vice versa, lake deposits show characteristic suc- cessions. They may display rhythmic or cyclic sequences (cf. Chaps. 7.1 through 7.3). It is not possible to demonstrate all these phenomena in a few facies models. For a number of large, long-persisting individual lakes, composite facies models are required which combine aspects of both the open and the closed lake systems (e.g., Sullivan 1985; Gore 1989). Arid lake basins close to the sea may receive influx from both fresh-water rivers and the ocean, resulting in a complicated system which preci- pitates various carbonates and evaporites (e.g., Decima et al. 1988).
Isotopes Indicating Paleoclimate
Ancient shorelines and sediments of closed lakes are very sensitive indicators of paleo- climates. The paleoenvironmental interpre- tation of such lakes can be refined con- siderably by stable isotope studies (Oberhansli and Allen 1987; Talbot and Kelts 1989). The isotopic signature of lake carbonate, for ex- ample, reflects the river input and climate of the drainage area rather than the situation in the lake itself. A relative enrichment of the heavy carbon isotope 13c indicates that plant material was strongly affected by bacterial activity and that the lake floor possibly emerged. Isotope studies also reveal that prim- ary lake sediments, such as sulfates and car- bonates, may undergo significant diagenetic changes (e.g., Decima et al. 1988).
Subsurface Brines and Diagenesis
In addition, it should be borne in mind that salts, which precipitated on or directly below the surface of present-day sand and mud flats, are mostly not preserved in deeper cores. Nodules of gypsum and thin salt layers may dissolve completely in the subsurface and thus enhance the ion concentration of groundwater. Later, the cavities produced by salt dissolution are frequently filled by secondary calcite or quartz. Salts are preserved in the subsurface if the surrounding groundwater has reached saturation for these salts. Furthermore, most of the preserved salts undergo significant dia- genetic changes within the sediment. Some are transformed to new salt minerals (Eugster and Hardie 1978; Chambre syndicale 1980), and porewaters rich in silica may lead to the for- mation of authigenic silicate minerals such as zeolites.
Residual Brines and Mineral Deposits
After precipitation of halite and/or other, highly soluble principal salts, the residual brine may become relatively rich in rare ele- ments (Chap. 2.5.1) and hence be of economic interest in some places. As a result of mineral precipitation, oxidation of pyrite, and decom- position of organic matter, brines can also become acidic. Then they can take up con- siderable amounts of heavy metals by dissol- ving oxide coatings and/or by oxidation of metal-rich black shale (Eugster 1985). Even alkaline brines may carry heavy metals. These metals can precipitate as sulfides along a re- ducing front within or in coherence with the lake sediments and thus form ore bodies con- taining significant amounts of Cu, Zn, Pb, and Co. Acidic groundwater brines rich in ferrous iron precipitate iron hydroxides when they ascend to the floor of well oxidized, shallow, or dry lakes.

3 Coastal and Shallow Sea Sediments (Including Carbonates)
3.1 Beach and Shoreface Sediments
3.1.1 Coastal Processes, Beach and Shoreface Sands Waves, Wave-Generated Currents, and Coastal Processes Beach and Shoreface Sands and Their Budget
3.1.2 Storms and Storm Deposits (Tempestites) Characteristics of Tempestites Tempestite Sequences in Basin Analysis
3.1.1 Coastal Processes, Beach and Shoreface Sands
Waves, Wave-Generated Currents, and Coastal Processes
Beach processes and, in a broader sense also coastal and shelf processes, are controlled predominantly by wind waves, tidal waves, and wave-generated currents. In this first chapter on coastal and shelf sediments we shall briefly discuss wind waves and wind-gener- ated currents of the coastal zone (wave-domi- nated shorelines). Detailed descriptions of these processes have been given in several books, recently for example by Carter (1988). Tidal effects and other oceanic currents will be referred to in Chapters 3.2 and 3.3.
Waves are the result of mechanical energy transfer from the wind onto the water surface. The large surface of an ocean can absorb much more energy from the atmosphere than that of a small lake, i.e., areas with a long "wind-fetch" can create much larger waves than water bodies of limited length parellel to the wind direction.
Primarily, waves do not transport water and therefore do not induce currents. This is a secondary effect taking place in shallow water where "deep-water waves" are transformed into "shallow-water waves" and finally dis- sipate.
Deep-water waves only affect a specific layer of the water mass. The thickness of this uppermost layer is approximately L/2, where L is the wave length (Fig. 3.la). The depth of L/2 below the water surface is also referred to as the wave base or the depth up to which wave-induced currents exert a significant in- fluence on the sea floor. Between the water surface and the wave base, the water particles perform circular (orbital) movements. At the surface, the diameter of these circles is equal to the wave height H, and the time T, neces- sary for a water particle to finish one rotation, is the wave period. This is the same period of time measured at a fixed point from one pas- sing wave crest to the next one. Below the sea surface the diameter of the rotating water particles is reduced and their orbital velocity slows down until this movement almost com- pletely ceases at the wave base. Although the water affected by deep-water waves remains more or less in place, the migrating waves transport energy, for example from localized storm centers to remote coastlines.
As soon as the water depth is less than the wave base (L/2), the deep-water waves start to be transformed into shallow-water waves. A significant change of the wave characteristics takes place, if the water depth is as shallow as one-sixth to one-eighth of the wave length. Thereafter, wave length and speed of wave propagation decrease, but their energy is packed into a smaller area and their height increases (Fig. 3.1). Simultaneously, the form- erly circular motion of single water particles is transformed into an elliptic and, near the sea- bed, into a bidirectional oscillating movement. Approaching the shoreface and the beach the waves become shorter, asymmetrical, and their height increases until they collapse in the breaker and surf zone at a water depth of approximately 4/3 H (H = wave height in deep water; Fig. 3.1).
If a wave front migrates obliquely toward the coast, its landward section "touches the bottom" and is affected by wave-length re-

Beach and Foreshore Sediments
- - - SHOREFACE - - - -- 7
DEEP-WATER WAVES
-ENERGY BEACH:
WARD IRREGULAR
LANDWARD v
LUNATE RIPPLES ROUGH ZONE
Fig. 3.1. a Transition from deep-water waves to shallow- further explanation see text. b More complex structures water waves and swash (backwash) in the shoreface zone, due to shifting of the facies zones under changing wave as well as associated bedforms and internal sedimentary characteristics. (After Clifton et al. 1971, and others) structures. No offshore sand bars present; not to scale. For

96 Chapter 3 Coastal and Shallow Sea Sediments
duction earlier than the other part. As a result, the waves undergo refraction and change their course toward the land (Fig. 3.2a). In this way the wave energy is concentrated at headlands, where it promotes strong erosion, exhibited by cliffs and a wave-cut platform slightly below mean sea level (Fig. 3 . 2 ~ ) . In an advanced, and at times inactive state of cliff erosion, the beach zone may consist mainly of fallen blocks and gravel, displaying a characteristic imbrication.
In bays protected by headlands, the wave energy is reduced by refraction, and instead of erosion, deposition of sand along the beach prevails. Both processes, strong wave attack at the headlands and prograding beaches in the bays, favor a development from (usually young) tectonically controlled irregular coast- lines to straightened (old) coastlines of tec- tonically stable areas (Fig. 3.2a and b).
Shoaling waves periodically transport water toward the beach. The water runs up over the
DEVELOPMENT SANDY CLIFF A
OF COASTAL MORPHOLOGY
a
DOMINANT
e ACRETION OF BEACH RIDGES
A 1 I I I V I A I ,..LL". .-L
LAGOON PLAIN
FORESHORE
'. RUNNEL
NDS v .
OFFSHORE SILT, bLnm, n l w v a-m.~
Fig. 3.2. a,b Two stages of coastal headland erosion due d Sand movement in the foreshore zone. e Beach ridges to wave refraction and longshore sand transport. c Wave- and barrier islands resulting from longshore sand transport cut platform and cliff erosion.

Beach and Foreshore Sediments
foreshore as swash and returns due to gravity as backwash and bottom current to the sea. If waves approach the coastline obliquely, part of the water masses spilled onto the beach does not flow back immediately, but is direct- ed parallel to the shoreline. This occurs every- where along the shore and thus the longshore current is reinforced until it reaches rather high velocities in the order of 1 m/s. The pre- ferred line of movement is along a specific depression between the foreshore zone and, if present, the inner sand bar (Fig. 3.2b and d).
Further along the coast, the longshore cur- rents return as rip currents back into deeper water (Fig. 3.3a). They can produce erosive channels in the breaker zone and carry sand and particularly finer grained material into the lower shoreface and offshore zone where the rip currents disperse. In the breaker and surf zone much sand and sometimes even gravel is mobilized. This material can be transported by longshore currents in considerable quantities within a narrow belt landward of the breaker zone. Most of this sediment is, not carried in suspension, but as bedload in numerous small steps, and partly by a "sawtooth movement" (beach-drifting) caused by alternating swash and backwash, directed obliquely toward the shore (Fig. 3.2d).
Longshore sand transport distributes the sand provided by entering rivers or cliff ero- sion, and also in some cases by eolian dunes. The migrating sand creates prominent coastal features such as hooks and spits behind head- lands or tombolos connecting former islands with the main coast (Fig. 3.2b) and is also a main factor in the formation of broad beach- ridge strand plains (chenier plains, see below).
Beach and Shoreface Sands and Their Budget
The Beach-Shore face Zone
The complicated and permanently changing hydraulic regime of the nearshore zones is reflected by the beach-shoreface profile and its sediments. There is a specific dynamic equilibrium between this profile, the grain- size of sediments, and the wave type. Apart from special features like sand bars, the slope of the beach-shoreface profile usually dimini- shes from foreshore to deeper water. The mean angle of this slope is low along shore- lines subjected to steep high-energy waves (high H/L ratio), because a high energy input is dissipated most efficiently by a wide, flat beach profile. In contrast, low energy input
under flat waves enables a rather steep beach gradient. Furthermore, the presence of coarse- grained sand or gravel increases the slope angle of the beach-shoreface profile. These slope angles therefore often vary between 0.2" (high-energy waves, very fine sand) ,and ap- proximately 10" (low-energy waves, coarse sand).
A gentle slope profile appears to be espe- cially interesting, because under these con- ditions a broad coastal sand belt can develop. A further consequence of these rules is the fact that many coastlines exhibit a seasonal change in the beach profile. Due to a higher proportion of steep waves in winter time, the winter beach tends to be lower and its slope gentler than the summer beach. The lost sand is usually stored in submerged sand bars parallel to the coast at some meters depth below mean sea level (Fig. 3.2a) and later, under a subdued wave regime, slowly swept back onto the beaches. Loss of beach sand to deeper water is also caused by single storm events (see below).
Bed Forms and Sedimentary Structures
The bedforms and internal sedimentary struc- tures along the beach-shoreface profile are shown in Fig. 3.la for fairweather wave con- ditions. They reflect the transformation of deep-water waves (oscillatory flow) to shoal- ing waves, generating land-directed flow and return flow into the foreshore zone under upper flow regime conditions.
At depths near, or below the fairweather wave base (often 10 to 20 m), long-crested symmetrical wave ripples, produced earlier by rare storm waves, are bioturbated during nor- mal fairweather conditions. Landward, these inactive ripples pass into active ripples which become increasingly asymmetric, irregular, and short-crested. Larger, lunate-shaped me- garipples are frequently observed in the brea- ker zone. All these bedforms are associated with small-scale or larger scale cross-bedding which is predominantly oriented toward the land. In the foreshore zone the most charac- teristic feature is parallel to low-angle cross- bedding dipping seaward.
The upper face of beach and foreshore sand may display distinctive swash marks including fine shell debris, as well as small bones and teeth, backwash rills and kolk marks around gravel or shells, and sometimes rhomboid rip- ple marks formed under a very thin cover of running water.

Chapter 3 Coastal and Shallow Sea Sediments
LONGSHORE RIP CURRENT
WEATHER (RIPPLE
BASE
- LANDWARD
WAVE HIGH
C ENERGY: LOW
ICHNO- FACIES
Fig. 3.3. a Summer and winter (storm) beach profile, the shoreface-beach zone of high- and low-energy shoreli- offshore sand bars, longshore and rip currents. For further nes, partly with rip channels and offshore bars. Note the explanation see text. b Sedimentary structures of offshore changing orientation of foresets in different types of cross- sand bars, generalized. (From various sources, e.g., Wer- bedding. (Based on Fig. 3.1, Elliott 1986a, and others; ner 1963; Davis et al. 1972). Note the prevailing landward ichnofacies after Ekdale et al. 1984) dip of foresets. c Complete synthetic vertical sections of

Beach and Foreshore Sediments
Foreshore and backshore sands frequently contain dark laminae or layers consisting of heavy mineral concentrations. In some places these placer deposits are of economic interest, if they contain significant quantities of certain minerals (e.g., rutile, zircon, ilmenite, and monazite).
High-Energy Shorelines
The general tendency in the lateral sequence of bedforms and sedimentary textures can be modified on high-energy coasts or on shore- faces which exhibit one or several shore- parallel sand ridges or offshore bars (barred shorelines). On a nonbarred high-energy shoreface, two zones with predominantly pla- nar bedding occur, an inner (upper) foreshore planar zone and an outer (lower) planar zone within the breaking waves (Fig. 3.1). In bet- ween the two planar zones the sea bed be- comes rough due to dotted and irregular erosi- onal and depositional features.
Offshore sand bars are complex structures, because they often migrate in different direc- tions, either landward, seaward, or parallel to the shoreline. Prominent internal structures are landward-dipping large-scale foresets and more or less horizontal lamination, but small- scale cross-bedding is also common (Fig. 3.3b).
Gravelly shoreface deposits are charac- terized by large, asymmetric gravel wave rip- ples (wave length frequently between 100 and 150 cm, height 10 to 20 cm), which may form at water depths down to more than 6 m (Hart and Plint 1989). Gravel forms decimeter- thick, massive or cross-bedded layers alter- nating with thinner sand beds. Pebble fabric and cross-bed orientation indicate predomi- nantly alongshore sediment transport.
Shoreline Migration and Vertical Sediment Successions
The facies zones of the shoreface migrate back and forth permanently in response to the mo- mentarily active wave regime. As a result, vertical sequences record frequent variations between neighboring facies zones, described above. They may include the internal struc- tures of sand bars and rip channel fillings (Figs. 3.lb and 3 .3~) .
Seaward prograding shorelines generally show a tendency for the sands to coarsen up- ward. Simultaneously, bioturbation structures
are less readily preserved due to the per- manent erosion and redeposition of sand in the upper shoreface zone. Transgressive shoreface sediments display the opposite vertical deve- lopment with a fining-upward sequence.
Gently sloping beaches create a wide belt of shoreface sands, whereas steeply sloping shorelines generally only produce a narrow belt of coastal sands. Then the transitional facies between deeper water and the swash- backwash zone may be largely absent.
The Sand Budget o f the Beach-Shore face Zone
An aspect of some interest is the sand budget of the total beach-shoreface zone of a par- ticular area. It is fed by river input, cliff eros- ion, and longshore sand transport, and it is reduced by longshore transport to other areas, as well as by losses to coastal eolian sand dunes. Sand is also transported into deeper water via submarine canyons beginning in the shoreface zone and by storm events producing tempestites seaward of the shoreface (see below and Chap. 5.4).
Apart from these long-term gains and los- ses, the sand budget of a given shoreline sec- tion appears to remain fairly stable under a defined wave regime. Although the beach- shoreface sands are permanently in motion and often migrate landward and seaward with the seasons, their volume remains approxima- tely constant, at least for a limited, geological- ly relevant time period. This may also be the case during rising and falling sea levels. In this instance, a major part of the coastal sand belt can migrate either landward or seaward with- out leaving behind many relics in deeper water or in emerged coastal areas.
On the other hand, observations and mea- surements of several present-day coastlines have revealed that longshore currents are cap- able of transporting enormous volumes of sand (up to several hundred thousands of cubic meters per year). For this reason, sand ac- cretion in sections of coastline protected a- gainst strong wave attack is common and may proceed comparatively quickly. In some cases, it is possible to show that a shoreline consis- ting of sandy beach ridges has migrated roughly 1 m/a seaward during the last few thousands of years. Accretion of coastal sand may take place directly on the mainland coast or in front of barrier islands (Fig. 3.2e). High lateral sand supply may generate a wide beach and shoreface sand belt within a geologically short time period.

Chapter 3 Coastal and Shallow Sea Sediments
3.1.2 Storms and Storm Deposits (Tempestites)
In storm-dominated shallow-marine environ- ments, the shoreface processes described so far, as well as processes in deeper regions of the inner and possibly outer shelves, are strongly affected and modified by rare storm events. Storms can deposit sandy material in the supratidal zone (supratidal storm layers, Chap. 3.2.2), as well as generate special non- channelized flow conditions in deeper water. These frequently produce characteristic sheet- like sand and mud beds (tempestites) of con- siderable lateral extent (reviewed, e.g., by Allen 1982; Johnson and Baldwin 1986; Mor- ton 1988; Nummedal 1991; Seilacher and Aig- ner 1991). These are briefly described here.
Storm Generation
Strong and laterally extensive storms develop under special climatic and geographic con- ditions. Tropical storms (hurricanes) are initi- ated in low-latitude regions within the trade wind belt (cf. Fig. 5.le), where the surface temperature of the sea is in excess of 26.5 OC. They travel westward and are deflected to- ward the poles by Coriolis forces (Chap. 5.2), in a manner similar to surface ocean currents. Extratropical storms are common in zones of mid-latitudinal, eastward-directed atmosphe- ric circulation along polar fronts. They mi- grate eastward, are more consistent in their direction, and can reach at least the same or even greater magnitudes than tropical storms.
In viewing the geologic record, one can as- sume that tropical storms prevailed during warm periods exhibiting gentle temperature gradients between the poles and the equator, whereas extratropical storms were more fre- quent and important during cooler periods with steep temperature gradients.
A third mechanism producing landward-di- rected storms are the monsoons. They are cre- ated when large landmasses establish intense summer lows and winter highs. The summer season is characterized by strong onshore winds carrying large quantities of moisture inland. The best present-day example is the monsoon belt of Asia along the margin of the Indian and Pacific Oceans. Monsoonal cir- culation can also influence the tracks and landfall locations of tropical and extratropical storms.
Storm Action
Storms not only generate large waves with high amplitudes, great lengths, and deep wave bases, but can also drive a net mass flux of water toward or away from the coast. The set- up of water along a wide section of the coast during a storm flood is enhanced by onshore winds, low barometric pressure, abundant rainfall, converging shorelines, and broad, shallow shelves. Such storm surge elevations are particularly effective in producing bottom currents and transporting sand into deeper water (Fig. 3.4a). In the northern hemisphere, shore-parallel, or obliquely onshore-directed, wind-driven surface currents are deflected to the right by Coriolis forces and may cause and maintain such water set-up for several hours or days. Since this additional water can neither flow back as surface currents nor flow away as longshore currents, a seaward pressure gra- dient is established in the water column, lead- ing to downwelling and return bottom flows. These are also deflected by Coriolis forces and therefore flow obliquely away from the coast- line.
Currents modified in this way by Coriolis forces, pressure gradients, and bottom topog- raphy are referred to as geostrophic currents. Seaward-directed bottom flows may be for- tified by increased density of the currents, caused by suspended material stirred up from the shoreface. In regions with high tides, geo- strophic flows can be augmented by tidal ebb currents.
Storm waves and storm-induced geostrophic currents operate simultaneously and therefore cause a hydrodynamic system which is re- ferred to as combined flow (Harms et al. 1982; Snedden et al. 1988). Back-and-forth oscil- lation of the ground wave is superimposed on the quasi-steady bottom current (Fig. 3.5). In such a flow regime the net shear stress im- parted on the sea floor may erode and move sediment during one half of the wave stroke, but be insufficient to do so during the other half.
The relative magnitude of wave- and cur- rent-induced shear stresses differs from the shoreface to the inner and outer shelves. The wave-induced component rapidly increases landward and may cause erosional features more or less normal to the shore, whereas the current-induced bed shear stress grows at a much lower rate in this direction. Hence, the shoreface and parts of the inner shelf are do- minated by wave-induced oscillatory shear during storms, while the deeper environments

Beach and Foreshore Sediments
SURFACE CURRENT (DEFLECTION TO T H E / A /WELLING
"\ COASTAL DOWN-
RIGHT BY CORlOLlS FORCES)
ENTRAINMENT OF GEOSTROPHIC MUD AND SAND BOTTOM CURRENT (STORM SURGE EBB CURRENT, DEFLECTED BY CORlOLlS FORCES)
SHORELINE ORIENTATION WAVE RIPPLES b COMBINED FLOW I /
SOLE MARKS k'' (OCCASIONALLY BI POLAR)
\ MASSIVE, GRADED DIVISION
Fig. 3.4. a Wind-induced surface current, deflected by rent- and wave-induced sedimentary structures of idealized Coriolis forces, set-up of storm flood, and generation of sandy tempestite and their relationship to the shoreline. geostrophic bottom current. (After Walker 1984b). b Cur- (After Leckie and Krystinik 1989)

Chapter 3 Coastal and Shallow Sea Sediments
BAROMETRIC EFFECT WIND DIRECTION SET-UP OF WATER
CURRENT
l DEAL PROXIMAL HUMMOCKY AND SWALEY DISTAL TEMPESTITE, SlLlClCLASTlC CROSS-STRATIFICATION TEMPESTITE , d ,
wr WAVE RIPPLES cb CURRENT RIPPLES b
PRE-EXISTING MUD LAYER
MUD TEMPESTITE IDEAL PROXIMAL AMALGAMATION BY CARBONATE TEMPESTITES SUCCESSIVE STORMS EVENTS
s PLACED am
- 2
m
CLAST
Fig. 3.5. a Hydraulic regime during storm in a section gamation of proximal tempestites. d Siliciclastic proximal across the shoreface and inner shelf, simplified. Coastal and distal sandy tempestites. e Proximal carbonate or mix- set-up ofwater and basinward bottom current superimposed ed carbonatelsiliciclastic tempestites. f Distal mud tempes- by oscillating wave motion (combined flow conditions). b tites. (Based on Dott and Bourgeois 1982; Walker et al. Shoreface sands displaying hummocky and swaley cross- 1983; Aigner 1985, and others) stratification, when muddy interbeds are missing. c Amal-

Beach and Foreshore Sediments
are controlled mainly by steady, obliquely offshore or almost shore-parallel currents (Duke 1990).
Storm-Induced Bed Forms and Sedimentary Structures
Storm-generated bed forms show a distinct trend from the beach into deeper water (cf. Chap. 3.1.1 and Fig. 3.1):
- Beach. Storms frequently erode seaweed and shells of fauna living in the sediment and ac- cumulate them on the beach, where they form linear beds parallel to the shoreline. - The upper shoreface (surf zone) displays megaripples oriented parallel to the shoreline, as well as flat swash lamination on the off- shore bar crests. The resulting internal struc- tures are dominated by trough cross-stratifi- cation and planar or low-angle swash laminae. Somewhat channelized longshore currents and rip currents form additional sedimentary structures of differing orientation (Chap. 3.1.1). - The middle shoreface is still within the range of fairweather waves and thus essential- ly controlled by wave action. High-stress os- cillatory flow, such as that created during storms, generates both flat and swaley bed forms with nearly horizontal or low-angle swaley cross-stratification (Fig. 3.5). Due to the fact that the sediments of this zone are under continuous agitation, the deposition of mud is prevented, and bottom life is limited to filter-feeding infauna. The sedimentary re- cord of rare, heavy storms is usually destroyed on the upper and middle shoreface. - On the lower shoreface (5 to 20 m water depth), the stress imparted by geostrophic currents reaches about the same magnitude as storm-wave induced oscillating stress. Hence, for a short time period, both flow components may stir up sand and mud, which are redepo- sited as graded beds at the same location or nearby. The typical bed form of this combined flow regime is thought to be hummocky cross- stratification (HCS or Shc, see below and Fig. 3.5). Laboratory experiments, however, have shown that this bed form can also be produced by purely oscillatory flow (Southard et al. 1990). Hummocky cross-stratification appears to form only in fine-grained sand and may be associated with wave-formed, coarse-grained ripples (Leckie 1988). Deceleration of storm flows over slight topographic highs and down their lee sides may cause the coarser sand
fraction to settle first, while the mud and some fine sand are carried farther offshore. Individual, graded beds resulting from a storm event are called tempestites. In the long inter- vals between large storms, the lower shoreface can be intensely bioturbated, but sufficiently thick tempestites are burrowed only on their tops. - On the inner shelf and parts of the outer shelf, particularly in high-energy environ- ments, storm-induced combined flow may still generate hummocky stratified sand layers or thin, graded sandy beds resulting from lateral- ly flowing suspension currents. If the suspen- sion originates from storms and the sandy layers alternate with shelf muds, the storm- induced beds represent distal tempestites. As the storm currents subside, wave-driven re- working may form oscillation ripples on top of the HCS-stratified or graded beds. Muddy interbeds are produced either by storms which have moved inland and eroded fine-grained material, or by the slow and repeated deposi- tion of suspended river load. - At greater water depths on the outer shelf, the current component of the combined storm flow becomes dominant, leading to current- rippled fine sand and silt beds. Since only the largest storms can affect the sea floor in this depth zone, storm events are followed by long periods of quiescence. These allow intensive bioturbation and thus frequently obliterate the storm record. However, if an extremely heavy storm hits the deeper sea bottom, the resulting tempestite may be relatively thick and wide- spread and thus have a good chance of being preserved and buried under younger, "normal" sediment. The time interval between such storm events may be several hundreds or thousands of years.
In this way, numerous successive storm events may build up a more or less rhythmic tempes- tite-shale sequence over a certain geologic time period (see below).
Recently, it was lively debated whether or not the shore- normal current directions deduced from tool marks and gutter casts at the base of many ancient tempestites were generated by gwstrophic currents (Leckie and Krystinik 1989; Higgs 1990; Hart et al. 1990; Duke 1990). Gwstro- phic currents should run obliquely or almost parallel to the coast due to Coriolis forces. It appears that shore-normal current directions measured at the base of storm sand beds reflect the dominant influence of wave-induced near-bottom flow during the storm peak, whereas internal structures such as cross bedding frequently deviate from this direc- tion. They result in large part from the gwstrophic current component of combined flow. Shoreparallel rippled tops

Chapter 3 Coastal and Shallow Sea Sediments
may be caused by subsequent waves approaching the shore- line at nearly right angles. In addition, some graded sand beds on the shelf may also be generated by river-fed den- sity underflows.
Characteristics of Tempestites
The typical tempestite is a sand bed produced on the lower shoreface and in somewhat deeper water, where during fair weather late- ral sand transport is not an important factor. Here, we can distinguish between an erosional and a depositional phase in the formation of a storm bed, as with the standard sand turbidite (Chap. 5.4.2). In some cases, erosional depth can be determined from casts of animal bur- rows with known geometry, and which were shaped just prior to the storm event (Fig. 3.6).
Erosional features due to the combined flow conditions are unidirectional, or bipolar if the oscillatory flow component of the wave action dominates. Therefore, bipolar or even multi- directional sole marks, such as bounce and prod marks and gutter casts (Fig. 3 3 , are of particular diagnostic value. Frequently, small channels with coarse grained infillings are also observed. They are usually oriented more or less perpendicular to the shoreline, but may also display other directions and thus indicate a specific predominant wind-storm system (Aigner 1985).
Still, during peak storm flow, the deposition of lag sediments takes place, forming the base of the storm layer. It often contains mud clasts, disarticulated or broken shells of mol- luscs and other organisms, and occasionally gravel and small rock fragments or reworked algal structures, as known from Precambrian and Cambrian flat pebble conglomerates (Fig. 3.6).
When the storm wanes, the finer grained sandy material stirred up during the storm peak phase starts to settle according to the hydraulic properties of the individual particles or aggregates. The resulting bed is therefore distinctly graded and may consist predomi- nantly of either siliciclastic terrigenous mate- rial, or mainly or entirely of coarser grained shell debris, mostly carbonate. This sublayer is followed or may be replaced by a parallel- laminated and/or low-angle cross-stratified section displaying the typical hummocky cross-stratification (Fig. 3.5). This structure is usually well developed in the zone of signifi- cant combined flow, i.e., above the storm wave base, where high-energy flow conditions with a strong oscillatory component (orbital velocities r 0.5 m/s) develop. The medium to
large-scale hummocks exhibit erosional faces and an undulose or sharp-crested top surface. Their laminae vary in thickness and dip direc- tion, but basinward downlap of the basal sets is common, because hummocks tend to mig- rate with the offshore-directed bottom flow. At greater water depths, hummocky cross- stratification becomes less distinct and is more or less replaced by parallel lamination.
The uppermost sandy part of an ideal sandy tempestite is deposited during the final stage of a waning storm and consists of ripple cross- bedding. The top of the storm bed frequently displays oscillatory ripple marks oriented ap- proximately parallel to the shoreline (Fig. 3.5). It may be succeeded by storm-reworked mud, if this material is not carried away by bottom currents.
Sedimentary Structures and Amalgamation
A complete tempestite shows the following sedimentary structures (from top to bottom, Fig. 3.5):
- Redeposited shelf mud (muddy tail of combined flow)
- Wave ripples and wave ripple Sm)
cross-stratification - Low-angle hummocky cross-
(Swr)
stratification - Parallel lamination and current
(She)
ripple cross-stratification (spl) - Graded layer with basal lag deposit (S,,) - Erosional base with sole marks (in
places bipolar or multi-directional) and casts of animal burrows.
- Normal shelf mud, intensely bioturbated (MI
The symbols proposed here are similar to those used for turbidites (Chap. 5.4.2); S signifies "storm beds".
Such idealized, complete tempestites are pro- duced only in certain water depths. In shal- lower water, the graded subdivision, S,,, is often reduced or missing, and large-scale hummocky cross-stratification, She,. and swa- ley stratification are most characteristic. Fur- thermore, there is evidence of scours and small channels, often filled with coarse- grained material and/or large shells. The up- permost subdivisions, s,, and S , are rarely realized in this area, because the Rner grained material is sorted out and carried away.
A common phenomenon in the proximal zone is amalgamation (am) or cannibalism

Beach and Foreshore Sediments
MUDDY BACKGROUND TEMPESTITES
CAMBRIAN POST-C PALEOZOIC
SEDIMENTATION
11111111 SOFTGROUND
t
BlOLGGlCAL SUBSTRATE CHANGE RESPONSE PROCESS
REWORKING
lA l A
Fig. 3.6. a Infaunal tiering in trace fossil associations, that older, thin tempestites and flat pebble conglomerates indicating minimal depth of subsequent storm erosion (from are less bioturbated and therefore better preserved than Aigner 1985). b Increasing diversity of infauna and epifau- younger ones. (Sepkoski 1982). c Biological response to na, affecting storm beds and their subsequent degree of substrate change caused by different levels of storm ero- obliteration, from Cambrian to post-Cambrian times. Note sion. (Aigner 1985)
G >:-- ~ ~ . * L ~ c - z ~ ' 7 E R 0 S I 0 N L[ 4 ,-Le l.2 LLL 2- - -g:y *LLL
< .
i-- L--ctb/() G-=F.7 -- -

Chapter 3 Coastal and Shallow Sea Sediments
(Figs. 3.5 and 3.7). These terms signify that either thin tempestites resulting from previous average storm events, or the upper parts of pre-existing thick tempestites are reworked by storms of particularly high erosional capacity. Thus, the material of older tempestites is in- corporated into new ones. This process may occur repeatedly, until finally a very big storm event produces a thicQ bed, the base of which can no longer be reworked by successive storms. Proceeding from deeper to shallower water, amalgamation and repeated reworking become increasingly important. Multiple re- working, in turn, will abrade and break up mechanically unstable particles; even some chemical effects cannot be excluded, for ex- ample the accelerated dissolution of carbonate in an environment unfavorable for carbonate preservation. Consequently, amalgamation leads to increasingly "mature" lag deposits. Thin, delicate skeletal remains are broken and ground into sand and silt, and are partially redeposited elsewhere or, in some cases, dis- solved.
Skeletal remains of vertebrates, particularly teeth (but also coprolites which have been phosphatized prior to reworking), may be concentrated in the basal layer of storm beds affected by amalgamation. Thus, certain types of bonebeds, shell coquinas, grainstones, packstones, and placer deposits may all result from amalgamation in proximal storm-domi- nated environments. No sharp boundary can be drawn between the characteristics of beds caused by repeated amalgamation and "con- densed" layers, which also frequently reflect several episodes of reworking. However, con- densed layers commonly represent a much longer time period than amalgamated tempes- tites and include long intervals of non- deposition or omission (also see Chap. 7.4).
Due to wind and current directions that vary from storm to storm and even during in- dividual storm events, some of the storm-ero- ded material at a certain locality may be lost, while other material is gained. Therefore, the new tempestite may be thicker or thinner than the eroded bed and consist of material from different sources, some being autochthonous, some allochthonous.
Composition and In fauna
As far as the grain size distribution and com- position of tempestites are concerned, a wide range is possible, from quartzose sandy types with hardly any fossil remains to calcareous or
partially siliceous types. The latter may fre- quently form wackestones or packstones that contain rather large components. For example, many of the building stones of the famous pyramids in Egypt come from Eocene num- mulitic limestones, which were formed as storm deposits (Aigner 1982).
As mentioned above, storm erosion com- monly disturbs and removes pre-event epiben- thic and shallow infaunal populations. This is especially obvious when muddy sediments at water depths below the shoreface are so af- fected. The remains of such fauna are incor- porated into the overlying event deposit or transported into deeper or shallower water. The exhumed and partly washed out burrows are filled with sand, forming characteristic casts at the base of the storm bed (Fig. 3.6a). Burrow-fill sedimentation has also been ob- served after a hurricane struck the carbonate platform of Caicos in the West Indies (Wanless et al. 1988). Here, the pre-existing, mounded, approximately 2 m deep bottom was flattened, the seagrass cover partially removed, and Cal- lianassa burrows filled with coarse molluscan and peloidal-skeletal packstone, but a con- tinuous storm deposit did not accumulate.
The post-event community recolonizes either the top of the tempestite, or erosional surfaces which were not covered by the storm bed (Fig. 3.6c), for example in somewhat elevated pro- ximal regions. Because of the change in sub- strate, the new epibenthic fauna and ichno- fauna may differ in character and species content from the background commumity of the shelf muds. The firmer, coarser substrates attract oysters, brachiopods, crinoids, stroma- tolites, and firm-ground burrowers of Glos- sifungites association. In distal zones, where only thin tempestites are deposited and re- working by successive storms is rare or insig- nificant, burrowing by post-event benthic organisms can markedly overprint or com- pletely obscure storm event stratification (Fig. 3.7a).
Because the diversity of such cummunities and their ability to live below the sediment surface generally increased during the Earth's history, tempestites of Precambrian to Cam- brian age had a better chance of not being destroyed by bioturbation than post-Cambrian storm beds (Fig. 3.6b).
Proximal-Distal Trends
The proximal-distal tempestite trends discuss- ed above are summarized in Figures 3.5 and

Beach and Foreshore Sediments 107
INNER SHELF a
LOWER TO MIDDLE SHOREFACE
DISTAL / PROXIMAL
/ I I / \ HUMMOCKY, SWALEY NON-EROSION TOOL IRREGULAR SURGE
MARKS SCOURS CHANNELS AMALGAMATION
PARAUTOCHTHONOUS FAUNA MIXED FAUNA
. ..,...--, . -, INDIVIDUAL BEDS
. -. . . . - ~ . a . ~ , ~ t ~ d d * * ~ * * - PER UNIT HEIGHT
INCREASING OBLITERATION AMALGAMATION,
OF TEMPESTITES BED THICKNESS, GRAIN SIZE
_ - - - _ - - PRESERVATION OF BIOTURBATION
MUD TEMPESTITES
b c SlLlClCLASTlC SEQUENCE CARBONATESEQUENCE
FINING- UP
(DEEPENING)
TEMPESTITES
PROXIMAL TEMPESTITES
r HUMMOCKY AND SWALEY CROSS-STRATIF
SHOREFACE
COARSEN- ING-UP
(SHALLOWING)
TEMPESTITES
TEMPESTITES
F'ii. 3.7. a Hypothetical cross section of storm deposits shallowing upward calcareous ternpestite sequence (number from shoreface to inner shelf with proximaldistal trends. of beds reduced). (Mainly based on Dott and Bourgeois b Idealized deepening (thinning) or fining upward silici- 1982; Aigner 1985; Johnson and Baldwin 1986) clastic ternpestite sequence. c Coarsening (thickening) or
Chapter 3 Coastal and Shallow Sea Sediments
3.7. The nearshore zone of swaley and large- scale hummocky cross-stratification is usually not included in the term tempestite. Relatively thick and often amalgamated tempestites begin when muddy intercalations are present. How- ever, tempestites tend to change laterally in thickness and frequently pinch out. Further seaward, i.e., more distally, the number of individual tempestites over a certain time span first tends to increase, because amalgamation becomes rarer, but it then decreases due to the limited distance which the suspended load of weaker storms can travel. Distal tempestites are thin and fine-grained, show the same in- organic sedimentary structures as distal tur- bidites (but differ in their faunal characteris- tics), and may end up as mud tempestites. Distinctive features useful in the discrimina- tion of tempestites and turbidites are sum- marized by Einsele and Seilacher (1991).
In high-energy shelf seas, distal tempestites may occur at water depths up to and in excess of 50 m. They show greater discontinuity than do proximal ones and are traceable, for ex- ample in the North Sea, over tens of kilome- ters in water depths up to 30 m (Aigner and Reineck 1982). Widely extensive, fairly thick, sandy tempestite sequences require a substan- tial continuous source of sand, which is usual- ly provided by river deltas or rapidly eroding sandy coastal cliffs. In mud-dominated shal- low environments, mud tempestites may be common. They are, however, difficult to re- cognize and therefore have been frequently overlooked.
Frequency of Tempestite Events
Storms are represented in the geologic record by tempestites less frequently than they hit present-day coastal zones. In modern seas, a 100-year storm appears to be an exceptionally large storm event (Nummedal 1991). Modern storm layers in seaward prograding sediments on the inner shelf (20 to 30 m of water depth) of northeast Japan formed over time intervals of 20 to 100 years (Saito 1989a). However, for many ancient tempestite sequences we have to assume average sedimentation (or subsidence) rates of approximately 20 to 100 m/Ma. If 1 m of vertical section contains two to five well developed tempestites, the time interval bet- ween two tempestites ranges from about 1000
years to possibly k10 000 years. This surpri- singly long recurrence time suggests that even prominent storm beds are wiped out or obs- cured by subsequent very rare, extremely large storm events. The previous action of weaker storms may be inferred from the oc- currence of mechanically abraded, coarse par- ticles and/or mixing of materials from dif- ferent sources in a preserved tempestite bed.
Tempestite Sequences in Basin Analysis
As for turbidite sequences (Chap. 5.4.2), the occurrence of tempestites and their proximal and distal facies provides a useful tool in basin analysis (e.g., Aigner 1985). Tempestite se- quences may reflect three different basin evo- lution scenarios:
1. Steady-state conditions in a foreshore-shelf environment, i.e., the average sedimentation rate more or less compensates for subsidence. In this case, comparatively thick sequences of alternating tempestites and shelf muds can develop, and the paleo-water depth at a cer- tain location within the basin will remain about constant. 2. Deepening basin, with an average sedimen- tation rate lower than subsidence. In this case the vertical sequence will display a trend from thick, coarse-grained, proximal tempestites to thin, fine-grained ones, and finally end up with mud tempestites or purely autochthonous shelf muds (Fig. 3.7b). Usually, such a transi- tion zone will not be very thick, because the sandy tempestites vanish at relatively shallow water depths (mostly between 20 to 50 m). 3. Shallowing basin, with a sedimentation rate higher than subsidence. The resulting tempes- tite sequence coarsens (thickens) upward (Fig. 3.7c), and the transition zone from shelf muds to a siliciclastic or bioclastic foreshore and beach environment will also be of limited thickness, as in case (2). Such regressive con- ditions favor the amalgamation of storm beds (Morton 1988).
Hence, tempestites can be distinguished from turbidites not only on the basis of certain sed- imentary structures (particularly hummocky cross-stratification and wave ripples) and faunal characteristics of individual beds, but often by rapid changes in their vertical se- quences.

3 Coastal and Shallow Sea Sediments
3.2 Sediments of Tidal Flats and Barrier-Island Complexes
3.2.1 Tidal-Influenced Environments and Sediments Tides, Tidal Ranges, and Tidal Currents Tidal Ranges, Coastal Morphology, and Hydro- graphic Regime General Characteristics of Tidal Sediments Various Types of Tidal Sediments and Climate Control Response of Tidal Flats to Sea Level Changes Remarks to Ancient Tidal Sediments
3.2.2 Sediments of Bamer-Island Complexes General Characteristics Subenvironments of Bamer-Island Complexes Controls by Climate and Hydraulic Regime Response of Bamer-Island Complexes to Sea Level Changes Remarks to Ancient Barrier-Island Sands and Lagoonal Sediments
3.2.1 Tidal-Influenced Environments and Sediments
Tides, Tidal Ranges, and Tidal Currents
Generation o f Tides
Tidal processes operate along the coasts of all large oceans and are described in many books and special articles (e.g., King 1972; Dietrich 1975; Davis 1978; Pethick 1984; Carter 1988; de Boer et al. 1989). Tides and tidal waves are caused by the attraction of the Moon and, to a lesser degree, by the Sun. On the side of the Earth facing the Moon, as well as on the side opposite to it, the water level of the ocean is raised, while perpendicular to this line the water level is depressed (Fig. 3.8a). Due to the counter-clockwise rotation of the earth, the piled-up water mass dragged along by the Moon travels clockwise until it hits a con-
tinental margin and its shore, where it is forced to flow back toward the center of the ocean basin. This process is repeated once or twice daily (diurnal and semi-diurnal tides) and its intensity fluctuates in 2-week periods from high spring tides (with the Moon and Sun working in the same direction) to low neap tides and vice versa.
Apart from the gravitational effect of the Moon and the Sun, the magnitude of the tides also depends on the period with which the water mass of an ocean, an enclosed sea, Or a bay tends to oscillate in its basin. If this pe- riod corresponds approximately with the peri- odically changing gravity forces of the Moon and Sun, the tidal range is substantially en- hanced.
Tidal Waves, Tidal Ranges, and Tidal Currents
Tidal waves (as used here, not the erroneous synonym of storm surges or tsunamis) have a very long wave length and therefore in some respects behave, even in deep ocean basins, like wind-generated waves in shallow water (Chap. 3.1). In deep water the tides are hardly noticeable, but when a tidal wave approaches the continental slope and shallow water, the migrating water masses are piled up and often bundled to considerable height (Fig. 3.8b and c).
Tides of great amplitude only develop on the coasts of very large water bodies, i.e., at the margins of the oceans. Lakes and smaller sea basins separated from the open ocean only show very small tidal effects (Fig. 3.8d). Even the Mediterranean does not have tides greater than 10 to 20 cm, because its connection with the open sea is too narrow to allow tidal waves to enter from the Atlantic into the adjacent Mediterranean basin. For other reasons, the tides along the coasts of most oceanic islands, as well as along elongated continental coast lines behind narrow or missing shelves, are also limited (<1 m).

Chapter 3 Coastal and Shallow Sea Sediments
Fig. 3.8. a Simplified view of a rotating slice of the Earth shelf width on tidal range. c Influence of coastal morpholo- beside a stationary Moon to explain oceanic tides. b Land- gy on tidal range and tidal effect in an estuary. d Influence ward migration of tidal wave leading to an increase in tidal of the orientation of elongated ocean basins on tidal range range from deep to shallow water, as well as influence of and tides in adjacent basins

Tidal Flats
Fig. 3.9. a Simplified scheme of the development of se- microtidal, mesotidal, and macrotidal coastlines. (After veral tidal systems in an epicontinental sea similar to that Hayes 1980; Reineck 1984) of the present-day North Sea. b, c, d Typical examples of
High tides and consequently strong tidal currents are generated under one or both of the following conditions:
- Wide shelf or continental sea (Fig. 3.8b), - Large bay with funnel-shaped opening
(Fig. 3 .8~) .
On the continental shelves of the present-day oceans, tides higher than 2 to 3 m usually occur in regions where the shelf is at least 100 to 200 km wide. The tidal range is further enhanced, if tidal waves behind a shallow sea are funneled into a bay with a wide opening
(producing tidal ranges up to 10 to 15 m). East-west extended bays, fjords, or adjacent seas give rise to higher tides than north-south extended seaways (Fig. 3.8d). Adjacent basins display high to very high tides only when their openings are wide and'deep, such as, for ex- ample, the Gulf of California.
These general rules about tidal ranges can locally be modified in many ways, particularly along irregularly shaped coastlines and in epi- continental seas. An example of tides rein- forced by resonance and modified by the to- pography of the basin as well as Coriolis for- ces (see Chap. 5.2) is the North Sea (Fig. 3.9a).

Chapter 3 Coastal and Shallow Sea Sediments
BARRIER a MUD FLATS
COASTAL PLAIN
MARSH CLIFF
Fig. 3.10. a Cross section of a creek-mudflat-saltmarsh system at the North Sea coast. b Changing current veloci- ties (solid line) of single water particles during a tidal cycle (broken line). Peak velocities occur only in the creek at water levels below mean water stand (0) during the first half of the flood and the second half of the ebb period. At water levels above about 0, water flows with low velocities over the mudflats (between points A and B). (After Pethick 1984)
- I- m m W
In this simplified figure, the entering tidal wave from the North Atlantic forms three more or less separately working tidal systems. Tidal ranges are high only at the western and southern margins of the epicontinental basin, and very low on the eastern side. From this and other examples we may conclude that while the recognition of ancient tidal deposits is very useful for paleogeographic reconstruc- tions, tidal ranges can vary considerably, even within the same basin.
Tides also penetrate into the river mouths, particularly if these are wide and form es-
, \ /-
LOW TIDE TIME (HOURS) I I I I I
tuaries (Figs. 3 . 8 ~ and 3.9d). When freshwater discharge is limited, salt water can intrude as bottom water far upstream into the estuary. With abundant fresh water flow, the salt water is hampered from moving upriver and there- fore forms a "salt wedge" near the mouth of the estuary (Fig. 3 . 8 ~ and Chap. 4.2, Fig. 4.1).
The incoming tidal water is called flood, the outgoing ebb. The highest water level reached at a certain point is the high water line, the lowest point the low water. The difference between mean high and mean low water is the "normal" or mean tidal range. According to their elevation with respect to the mean high and mean low water line, the tidal environ- ment is subdivided into three zones:
0 5 1 0 15 2 0 2 5
- Supratidal zone above the mean high water line.
- Intertidal zone between the mean high and mean low water lines.
- Subtidal zone below the mean low water line.
The higher the tidal range, the more water has to be transported from deep water into the coastal zone and back again during one tidal cycle. Consequently, high tides are associated with strong tidal currents flowing onshore and offshore. They often reach velocities of 1 to 2 m/s, with local values of up to 4 to 8 m/s. In tidal flats their maximum velocities commonly develop in the middle of the flood or ebb period, when the rise or fall of sea level is most pronounced (Fig. 3.10b). At other loca- tions, for example in special tidal channels or at the heads of estuaries, the tidal current maxima and minima may occur earlier or later in relation to the tidal cycle.
Tidal Ranges, Coastal Morphology, and Hydrographic Regime
There is a distinct relationship between tidal amplitude and coastal morphology (Table 3.1 and Fig. 3.9b-d; Hayes 1980; Reineck 1984; Elliott 1986a).
In addition, coastal morphology and sedi- mentation in tidal flats are strongly influenced by wind-generated waves. Therefore it has become common for sedimentologists to sub- divide coastal areas into three subenviron- ments (e.g., Elliott 1986a):
- Wave-dominated shorelines: beaches, micro tidal barrier islands and cheniers,
- Mixed wave-tide influenced shorelines:

Tidal Flats
Table 3.1. Tidal-influenced environments
Tidal range Coastal morphology
- Microtidal < 2 m Long bamer islands, few inlets
- Mesotidal 2-4 m Short bamer islands with numerous inlets, ebb and flood tidal deltas
- Macrotidal > 4 m Small or missing is- lands, estuaries with subtidal ridges
mesotidal barrier islands with tidal inlets and ebb and flood tidal deltas, and
- Tide-dominated shorelines: tidal flats, estuaries and associated sand ridges.
This subdivision is based on the assumption that wind waves are the dominant coastal pro- cess when the tidal range is less than 2 m. Features such as beaches, sand spits, and long barrier islands are controlled mainly by wind- generated waves. In contrast, tidal ranges in excess of 4 m are the dominant influence on coastal areas and their sediments, although wind waves also play some part. In this chap- ter, both tide-dominated and mixed wave-tide influenced environments will be discussed.
General Characteristics of Tidal Sediments
Modern tidal sediments commonly consist of (from higher to lower elevated zones):
- Mudflats. - Mixed sand-mudflats. - Sandflats.
Furthermore, they display various characteris- tics which can be easily recognized in ancient sedimentary rocks. Tidal sediments are there- fore of outstanding interest for paleoenviron- mental and paleogeographic reconstructions. Besides numerous special articles, several text- books present summeries and some special books deal entirely with this topic (e.g., Gins- burg 1975; Friedman and Sanders 1978; Rein- eck and Singh 1980; Klein 1985c; Elliott 1986a; Boer et al. 1988).
Provenance and Distribution o f Tidal Sediments
Tidal flat sediments may have different sour- ces: input by rivers, cliff erosion, and re- worked material from the offshore sea bottom. The proportion of mudflats, mixed sand-mud- flats, and sandflats also depends on the avail- ability of mud and sand in the source areas. Along coastal plains and near mud-dominated rivers, muddy tidal flats tend to prevail. In front of coastal mountain ranges delivering large quantities of sand into a tidal regime, sandier flats and subtidal sand ridges are pro- minent. An example of the latter situation is the Miocene (Burdigalian) marine molasse in the northern foreland basin of the Alps (Homewood and Allen 1981). It can be as- sumed that sandy material usually forms nar- rower tidal flats than finer grained muds, which better withstand erosion and reworking (see below).
The material forming tidal sediments is commonly transported by the flood from deeper water into the tidal flats as suspended load or as bed load. Due to the special creek system which develops in such areas, the in- coming water flow is restricted first to the channels or creeks, where it can reach high velocities on the order of 1 m/s (Fig. 3.10b). Later, after the water level has risen, the water spills onto the higher widely extended flats. Consequently, the velocity of the flood current drops significantly, and the suspended particles, flocs or pellets, start to settle. After the tide has attained its maximum height, the thin water layer on top of the mudflats nearly comes to rest for a short time (approximately 1 h).
All particles which have settled to the ground during that time have a chance of staying behind in the mudflats. The rest, including most of the nonflocculated clay-size grains, will flow back seaward with the fol- lowing ebb current. This current in turn will reach high velocities, as soon as the mudflats are drained and the seaward-flowing water becomes confined to the creek system. There- fore the channels are kept clean of fine- grained sediments, and erosion along their banks is very common.
In this way small slides are produced which are reworked by the channelized ebb or flood currents, forming clasts and pebbles of mud. As a result of the periodic emergence of the mudflats during low tides, the fine-grained sediment at the surface loses water by evapo- ration and becomes more solid than freshly

Chapter 3 Coastal and Shallow Sea Sediments
deposited mud covered permanently by water. For this reason, mud pebbles are fairly resis- tant and often preserved in the sedimentary record.
Mud Deposition
The above mentioned mud deposition gener- ates a striking contrast between mudflats along protected coasts and beach and foreshore sands along open coasts (Chap. 3.1). On sandy beaches the finer-grained particles are sorted out and carried into deeper water, whereas in tidal flats the fine-grained material is depo- sited near the coast slightly below or above the mean water line (Fig. 3.10a). This may even occur in medium to high energy tidal environ- ments (waves and currents). This type of mud deposition is favored by the following circum- stances and processes:
- Mud flats, marshes, or coastal sabkhas are usually found in areas sheltered from the ef- fects of powerful wind-driven waves, i.e., they lie behind barrier islands and within coastal embayments or estuaries (Fig. 3.9b-d). - The formation of mud flats is favored by gentle offshore slopes and, of course, high concentrations of suspended fine-grained material provided by nearby mud-dominated rivers. - Mud deposition in tidal flats is enabled by the special distributary system for the in- coming and outflowing water masses of the tidal waves, as well as by the flocculation of clay-sized particles or the incorporation of clay and silt particles into faecal pellets. - After settling, the flocs or pellets stick toge- ther to form a cohesive sediment which re- quires higher current velocities for erosion than sand. In addition, thin mats of micro- organisms (Gerdes et al. 1985) and, particular- ly in supratidal marshes, plants able to with- stand the severe environmental conditions often further protect the muddy sediments from erosion.
Because water is lowest on the landward part of the flats, settling flocs and pellets do not need much time to sink to the ground. The slowly starting subsequent ebb current usually carries only part of this material back into deeper water. In this way the highest portions of the mudflats tend to increase in height more quickly than the deeper portions.
The Holocene mudhts of the North &a accumuhted at an average sedimentation rate of 1 to 2 mmla. Over per- iods of months, however, the mudtlats may grow much faster (about 5 to 10 mmlmonth), but vertical aggradation is frequently interrupted by erosional events (Reineck 1980; Anderson et al. 1981). Long-term rapid upbuilding is limited by tidal range and basin subsidence. In supratidal areas, which are flooded only during spring tides or storms, the rate of deposition decreases considerably.
Tidal marsh sediment along the Delaware river near Philadelphia accumulated at the rate of 0.4 mmla during the last 2 ka, prior ,to the modem colonization of this area (Orson et al. 1990).
When muds are deposited under comparatively low-energy conditions, they are little affected by subsequent channeling and thus contain only small portions of cross-bedded sands and sand bars characteristic of the intertidal and subtidal zones.
Specific Sedimentary Structures o f Tidal Flats
A special feature of laterally migrating tidal channels is lateral accretion bedding, or lon- gitudinal cross-bedding (cf. Fig. 3.12), in contrast to normal, transverse cross-bedding, generated by current ripples and dunes within the channels. Due to the changing direction of flood and ebb currents, these types of small and large-scale cross-bedding often display bidirectional orientation of subsequent sets of laminae, a feature which is referred to as her- ringbone stratification (cf. Fig. 3.1 2).
Another interesting and diagnostic feature of tidal channel deposits is the large sand waves (often 1 to 2 m high), which may in- dicate not only the diurnal or semi-diurnal tidal cycle, but sometimes also the effects of the fortnightly variation from neap tide to spring tide (neap-spring cycles, Visser 1980; Fig. 3.11), which were found in modern and ancient sediments of different ages. Such sandwaves grow with the dominant current (this often being the ebb current), but are also affected by the weaker opposite current (re- worked foresets and migrating smaller rip- ples).
During slack water at high water stand, clay and silt-sized sediment (flocs and pellets) can settle on top of sandy foresets and particularly in ripple troughs and thus form characteristic mud drapings, which partly resist later ero- sion. In shallow water channels, the accumula- tion of coarse shells and shell debris, derived mostly from eroded parts of the tidal flats, is common.

Tidal Flats 115
A DOMINANT CURRENT STAGE - h BUNDLE ( 1 TIDAL CYCLE) -
RRENT R W E S
A FIRST SLACK WATER STAGE -\\A\@ . . . . . .
. . . . . . . . .: . . ' . . : ...A\..... ::., . . . . . . . . . . . .
M
C SUBORDINATE CURRENT STAGE B - /-qQs@?&""\~~;E
-- . . \ . . . i, \a . . . . . . . . . . .
E L
D SECOND SLACK WATER STAGE 2ND MUD DRAPE
..........
LATEST EBB CA
SPRING TIDE I
Fig. 3.11~4. Subtidal to intertidal sand waves as found in 200 m long) in subtidal environment. Subordinate current estuaries. a Formation of a bundle of cross-bed foresets, a increases in importance from A to C (C begining of her- reactivation surface, and mud drapes during an ebb-flood ringbone patterns). E erosional surfaces; M mud drapes and tidal cycle. b Succession of bundles affected by spring tide mud clasts; CL cross lamination. (a and c after Allen 1980 and neap tide. (AAer Homewood and Allen 1981). c Diffe- and 1982). d Intertidal to subtidal sand waves observed on rent (theoretical) types of sand waves (about 4 m high and the Dutch North Sea coast. (Boersma and Tenvindt 1981)

116 Chapter 3 Coastal and Shallow Sea Sediments
Various Types of Tidal Sediments and Climate Control
The sediments of tidal flats proper and par- ticularly those of the supratidal zone are strongly influenced by climatic factors con- trolling biogenic production, terrigenous sedi- ment input, salinity of coastal waters, etc. Therefore several types of tidal flat sediments cam be distinguished (e.g., Ginsburg 1975):
- Siliciclastic tidal sediments (Fig. 3.1 2 ) . - Calcareous tidal sediments (Fig. 3.13). - Stromatolitic tidal sediments (Fig. 3.14).
The most important characteristics of these depositional systems are summarized in the
facies models (Figs. 3.12 through 3.14). A detailed discussion of these various types of tidal sediments with their great variability and numerous special features is not possible here, but the general rules discussed above can be applied to most of them.
Depending on climatic conditions, the mud- flats may become vegetated (salt marsh, Figs. 3.9 and 3.10a) or, in tropical to subtropical regions, enable the growth of mangrove with a dense net of rootlets (Fig. 3.13). Such en- vironments are commonly populated by a rich fauna, which is sometimes also found in the fossil record (e.g., Westgate and Gee 1990). In more arid climates, the supratidal zone may be characterized by coastal sabkhas where due to high evaporation some salts are precipitated (Chap. 6.4.1).
Fig. 3.12. Main features and special sedimentary structures 1954; Klein 1970; Ginsburg 1975; Reineck 1984, and of mesotidal siliciclastic tidal flats. (Based on Van Straaten others). Vertical scale exaggerated approximately 500x

Tidal Flats
Fig. 3.13. Main features and special sedimentary structures Hardie 1975; Shinn 1983; Sellwood 1986, and others). of tidal flats associated with carbonate shelves and plat- Vertical scale of block diagram exaggerated approximately forms in warm, humid climate. A highenergy environment 500x. Note the different scales of sections displaying sedi- leads to many large channels. (Based on Ginsburg and mentary structures

118 Chapter 3 Coastal and Shallow Sea Sediments
Hypersaline waters favor the growth and preservation of microbial (algal) mats in the intertidal and subtidal zone (Figs. 3.13 and 3.14), because other organisms feeding on them become rare. Such stromatolitic struc- tures are frequently found in ancient rocks, particularly in the Proterozoic (Chap. 6.5). They often give rise to the formation of cha- racteristic voids (vugs, fenestrae, tepees, bird's eyes, Fig. 3.14) which are generated by crinkling when the sediments are exposed to air, or by gas due to decomposing organic matter.
Tidal sediments consisting largely of cal- careous sands and muds can become cemented early and therefore have a particularly high preservation potential. Carbonate platforms (Chap. 12.2) such as the Bahamas are built up in great part as tidal flats, They may develop a sand ridge at their outer margin and ponds within the tidal flats proper, which are filled up by fine-grained lime mud (Fig. 3.13). Idealized sections of various types of tidal flat
sediments are shown in Fig. 3.15. They de- monstrate the influence of both the hydraulic regime and climate, but they do not account for sea level changes and large erosional events.
Response of Tidal Flats to Sea Level Changes
As are all nearshore sediments, tidal deposits are strongly affected not only by variations in the influx of allochthonous material, but also by relative sea level changes. Relative sea level fall leads to a seaward migration of the tidal complex and usually causes partial erosion of pre-existing tidal sediments (Fig. 3.16a). If such a situation persists for some time, the chances for preservation of tidal deposits, particularly of supratidal and intertidal mud- flats, are very limited. In contrast, inter and supratidal deposits can easily follow a rising sea level and build up thick sequences, be- cause their sedimentation rate is sufficiently
Fig. 3.14. Algal and evaporitic tidal flats in warm arid lagoons. Note the different types of algal structures accor- regions and low-energy environment (few channels!). (Bas- ding to their positions below or above mean sea level. For ed on Purser 1973; Schwarz et al. 1975; Butler et al. 1982; evaporite5 in sabkha environments also see Chapter 6.4.1 Schreiber 1986, and others). The intertidal algal flats and and Fig. 6.5. Vertical scale exaggerated about 500x coastal sabkhas border protected hypersaline bays and

Tidal Flats
HUMID HUMID, WARM TEMPERATE SLICICL. AND/OR
ENVIRONMENT SlLlClCLASTlCS CARBONATE
CONTI- NENTAL
STORM L.(SAND, I BROKEN CRUSTS - -&- OR ALGAL MATS) sUPRA- LEVEE-DEP.
A- -- ----
A LAMINATED SAND
CHANNELS MUDDY SAND, BIOT. SUB-
! TIDAL 1
I
SUB- MUD PEBBLES
TIDAL I
SHALLOW OPEN SEA (INNER SHELF)
I "HYDRAULIC
REGIME HIGH-ENERGY
HUMID ARID TEMPERATE WARM
MUD-DOMINATED CARBONATIC OR SlLlClCLASTlCS SlLlClCLASTlC
I ANHYDRITE
GYPSUM OR
CHANNEL 1;: , >lf- LAGOONAL (OR FILL, .>:=.-- BAY) MUD, BIO-
T BIOTUR- TURBATED, BATED SAND LAYERS
OR: MASSIVE REEF (BIOHERM OR BIOSTROME)
1) CHICKEN-WIRE TEXTURE 2) IN PLACES: GRAINSTONE CRUST.
+BORED (HARDGROUND)
LOW-ENERGY
Fig. 3.15. Hypothetical sections to compare tidal deposits of gray subtidal sediments are chiefly controlled by hydrau- formed in areas of different climates and hydraulic condi- lic conditions (highenergy open shelf versus lowenergy tions. The variability of these sediments increases from the bays and lagoons). The thickness of the different tidal subtidal to the supratidal zone due to climatic influences. zones is based on the assumption that neither subsidence Fully oxidized browncolored primary sediments of the nor sea level changes occur (see Fig. 3.17). (Compiled supratidal and partly of the intertidal zones tend to become alter different sources, e.g., Ginsburg 1975; Shinn 1983; red during diagenesis. In contrast, the thickness and nature Sellwood 1986)
high. In addition, they are fairly capable of resisting wave and current attack when their erodibility is diminished by algal mats and early cementation. If the sea level rise is slow or terminated, mud flats and supratidal sedi- ments may prograde seaward and thus enlarge their areal extent. This is one of the reasons for the surprising thickness and wide areal distribution of tidal sediments in the geologic record. Furthermore, specific tectonic settings, such as long-lasting, slowly subsiding shallow platforms are needed to maintain a tidal flat environment over long time periods.
Remarks to Ancient Tidal Sediments
In spite of their great variety, siliciclastic and calcareous tidal sediments are normally easy to recognize in the ancient record. Their most distinctive features are:
- Sections with alternating subtidal, intertidal, and supratidal sediments.
- Small- and larger scale migrating channel systems filled with reworked sediments (mud pebbles) and shell deposits.
- Current and wave-induced sedimentary structures, partially bipolar, mud drapings, and sand waves indicating diurnal, semi-

Chapter 3 Coastal and Shallow
a NORMAL SUPRATIDAL ,-- -- -- - --
EROSION
V ///////
INTERTIDAL
SEDIMENTS LESS STABLE,
Sea Sediments
f STABLE SHOREF\ACE EROSION
BUILDUP OF SUPRA- TIDAL SEDIMENT
1 I - , . : : : : : : : : j i m -*-- ' - - LOWER SHORE /:!:I ::!:%-:%:
d SHOREFACE EROSION
SURFACE
LOWER SHORE- FACE
LAGOONAL MUD, FLOOD-TIDAL DELTA SANDS, CHANNEL FILLS
Fig. 3.16a-d. Response of tidal sediments and bamer island complexes to sea-level changes; resulting vertical sequences and lateral facies changes. a Falling sea level (Stage 1 to 2) leading to coastal erosion and preferential loss of older supratidal and intertidal sediments. New re- gressive tidal sediments prograde or build out. Slow sea level fall may enable the preservation of widely extended subtidal sediments. b Rising sea level, transgressive se- quence or continuous upbuilding of muddy intertidal and
supratidal sediments. c Rapidly rising sea level, drowning of former barrier-island complex and buildup of second bamer-lagoonal complex farther inland. d Slowly rising sea level causing the barrier-island complex to migrate landward. Shoreface erosion, prograding from stage dl to d3, removes older sediments and generates vertical sections with differing stratigraphic gaps. (Based on Howard and Reineck 1981; Elliott 1986a, and others). Vertical scales strongly exaggerated

Barrier-Island Complexes
diurnal, and neap-spring tidal cycles. - Indications of emergence (mud cracks, crin-
kled microbial mats, etc.). - Specific epifauna and infauna. - Characteristic facies associations: coastal
barrier sands, lagoonal and estuarine sedi- ment.
- Transitions either into shallow-marine envi- ronments or emergence with pedogenesis, plant rootlets, karstif ication, etc.
For a safe identification of tidal deposits, sev- eral of these features should be present.
When the overall fining-upward sequence of low tidal flat, midflat, and high tidal flat de- posits is complete, its thickness allows an es- timation of the paleotidal range (Klein 1971). The preservation of complete tidal sequences is, however, rare, and the lower limit of the tidal range is often difficult to determine (Terwindt 1988).
The sedimentary record provides evidence that tidal action occurred from the Precam- brian to the Present (e.g., Klein and Ryer 1978; de Boer et al. 1988). Consequently, the Earth-Moon system must have always op- erated in a similar way as it does today. In addition, it has been tried to determine the duration of a Proterozoic year by investigating tidal cycles and rhythmites in glacial-in- fluenced ebb-tidal deposits and banded iron formations (Chap. 6.5) in South Australia (Williams 1989a, b). According to this study, the Proterozoic year was about 400 days long; each day lasted approximately 22 h.
3.2.2 Sediments of Barrier-Island Complexes
General Characteristics
On microtidal and mesotidal shorelines (Fig. 3.9b and c), tidal sediments often represent part of a larger facies association which inclu- des the deposits of barrier-islands and lagoons (Davis 1978; Reinson 1984; Elliott 1986a; Boggs 1987; Ward and Ashley 1989). Such environments can be summarized under the term barrier- island complex.
Barrier islands are the result of nearshore transport and accumulation of sand-size silici- clastic or carbonate particles along coastlines which are exposed to considerable wave ac- tion, but moderate tidal range. Their forma- tion is favored by a low-gradient shoreface- shelf profile and abundant supply of sand-size
sediment. The islands develop from beach ridges, nearshore sand bars, or sand spits pro- grading parallel to the coastline. They often grow upward with rising sea level, separating an estuary or lagoon from the open sea. The barrier ridge is cut by channels (inlets), al- lowing tidal waves to enter and exit the lagoon (Fig. 3.17). In this way, a rather complex de- positional environment is created, consisting of several subenvironments:
- The subtidal to subaerial barrier-beach complex.
- The subtidal-intertidal ebb-delta associated with shoreface sediments.
- The subtidal-intertidal flood-delta associat- ed with lagoonal and tidal flat sediments (back-barrier zone).
- The (laterally migrating) subtidal-intertidal inlet-channel complex.
Barrier-island systems frequently form long, extended chains along straight coasts (cf. Fig. 2.3). Therefore, their deposits usually repre- sent elongate bodies which parallel the strand- line. Three of the above-mentioned suben- vironments are characterized by sandy depo- sits, whereas in the back-barrier zone both sand and muds accumulate. The sediment source may be chiefly terrigenous and/or bio- genic (carbonate) and thus magnify the vari- ability of the barrier-island complex as a de- positional system. As 'pointed out above, tidal sediments and fauna in the lagoon strongly reflect the climatic conditions of the neigh- boring landmass.
Subenvironments of Barrier-Island Complexes
The barrier-beach complex consists of, from bottom to top:
- Shoreface sands down to a depth of 10 to 20 m below mean sea level, where the normal wave action ceases. These sands generally exhibit decreasing grain size and increasing bioturbation with growing water depth (Fig. 3.17). While the upper shoreface deposits may contain gravelly sands and display multi- directional sedimentary structures (trough cross-beds and low-angle planar cross-beds), the lower ones consist of fine to very fine- grained sand or muddy sand. Here, the prim- ary sedimentary structures, consisting mainly of planar laminated and small-scale cross- bedded material, are frequently obliterated by bioturbation.

122 Chapter 3 Coastal and Shallow Sea Sediments
FE~FEORESS IVEETPE---- I GRADING) BARRIER
PLANAR I BEDDING
BACKSHORE FORESHORE
- BIOTURB.
-- SEA- - LAND
SHORE- CONTI-
FACE LAGOONAL
TRANSGRESSIVE BARRIER - SHOREFACE
BACKSHORE DUNE
- WASHOVER -MARSH (COAL LENSES) WASHOVER
-TIDAL FLAT
FLOOD TIDAL DELTA
SUBAQUEOUS LAGOON
- SHELLS, DEBRIS
Fig. 3.17. a Sediments of a barrier-island complex and chain and resulting prograding (regressive) or transgressive lagoon in microtidal to mesotidal environments. Here chief- sedimentary sequences. Note that parts of these sequences ly upbuilding of sediments is assumed with laterally shift- may be lost by erosion (cf. Fig. 3.16d). (Based on Reinson ing inlets. b Seaward or landward migrating barrier-island 1984; Elliott 1986a, and others)

Barrier-Island Complexes
- Beach- foreshore sands displaying parallel to low-angle, seaward-dipping laminations and usually little bioturbation. They are overlain by - Backshore eolian dunes starting with rather small-scale, multi-directional trough and pla- nar cross-beds. If storm surges overrun parts of the islands, they create - Washover sands which extend into the lagoon. These show either subhorizontal planar lamination or, if they reach the lagoon, delta foresets. The washover deposits may make up a significant portion of the total barrier island complex. They reflect the tendency of the islands to migrate landward. They also feed the - Back-barrier sand flats (Fig. 3.17). The sedimentary structures of both eolian dunes and washover sands can be obliterated or modified by plant growth and soil formation.
Ebb-tidal sands accumulate seaward of the barrier and are associated with shoreface sands. In contrast to flood-tidal sands, they are also affected by wind-generated waves and longshore currents. Therefore their sedi- mentary structures can reflect several proces- ses and current directions. Their faunal con- tent is mainly of open-marine origin, although ebb currents may also transport lagoonal bio- genic particles seaward into the ebb-tidal delta.
Flood-tidal sands alternate with lagoonal muds and tidal flat sediments of the back- barrier zone. These delta sands show planar and trough cross-beds which are mainly gene- rated by flood-oriented mega-ripples and sand waves, but a seaward orientation of cross-beds also occurs.
Tidal-channel deposits between the ebb and flood-tidal delta can cover relatively large areas, because the channels and tidal inlets between the barrier-islands frequently migrate parallel to the shoreline. Shifting of inlets involves erosion on one side of the barrier and accretion of sand on the other (spit accretion). Channel fills usually begin at the erosional base with relatively coarse lag deposits. These are overlain by large-scale bidirectional planar and trough cross-beds. On top of this se- quence bidirectional small to medium-scale trough or planar cross-beds, and parallel and ripple lamination are observed.
Controls by Climate and Hydraulic Regime
Depending on the climate, lagoonal and tidal flat sediments can vary considerably. If the barrier-island chain is interrupted by many wide inlets (mesotidal hydraulic regime), the lagoonal waters are sufficiently exchanged with the open sea water and therefore are normal saline. Under these conditions, lagoon- a1 fauna can develop a highly diverse assem- blage, and the fine-grained, often laminated lagoonal muds tend to become thoroughly bio- turbated and structureless. However, if there are just a few narrow inlets (microtidal re- gime), the lagoonal waters become either brackish or hypersaline, and their fauna is abnormal and of low diversity. Oyster beds, for example, indicate freshwater influence, specific gastropods and seagrass typify hyper- saline conditions. Due to storms which pro- duce washovers, the lagoonal environment may change episodically. Simultaneously, shells of normal marine organisms can be swept in.
In humid regions, the lagoons often ac- cumulate organic matter, which later may form coal seams, and their bottom waters can easily become anoxic. Arid to semi-arid lagoons tend to collect more carbonate, and their tidal deltas may become oolitic. Marginal portions of the lagoons can periodically dry out and accumulate gypsum (cf. Chap. 6.4.1). Migration of eolian sand over dry lagoons is common. Tidal flat sediments bordering the lagoon may include plant roots, peat, or microbial mats and stromatolites, as well as evaporites formed in coastal sabkhas.
Response of Barrier Island Complexes to Sea Level Changes
Barrier-island complexes are dynamic systems responding to changing sediment input and sea-level changes. Rapid sea-level fall (or emergence of the barrier system by uplift) tends to destroy the sedimentary complex by erosion and is therefore not further discussed here. With constant or rising sea level, the island chain can migrate either landward or seaward and thus bury and preserve some of its older deposits (Fig. 3.17b). If sediment input from the hinterland or alongshore is high, the island chain moves seaward (pro- grading or regressive barrier). In this case, vertical sections show a transition from shal- low marine and shoreface facies into the fore- shore, backshore, and dune sands of the bar-

Chapter 3 Coastal and Shallow Sea Sediments
rier island. Lagoonal deposits may follow on top of the foreshore and backshore sands.
In contrast, low sediment input favors the landward transgression of barrier systems. Then a complete vertical section starts with continental or tidal flat sediments and grades into lagoonal muds, flood-delta sands and channel fills of the inlet system. Finally, washover sands and eolian dunes may follow. Consequently, vertical sections clearly docu- ment the regressive or transgressive history of the barrier.
However, in many cases the development of a transgressive barrier system is considerably modified during rising sea level (or submerg- ing coast). If the sea level rises relatively quickly, the pre-existing barrier islands are drowned in-place and form a kind of inner shelf shoal (Fig. 3.16~) as described, for ex- ample, from the abandoned western part of the Mississippi delta (Penland et al. 1988). Then, a new barrier may be built up farther landward (Fig. 3.16~). Consequently, the former lagoonal muds and flood-delta deposits are covered directly by shoreface sediments. The drowned sand barriers can later provide interesting reservoirs for hydrocarbons or groundwater.
The second alternative, as mentioned before (Fig. 3.17b), is a slow landward migration of the total barrier system with moderately rising sea level. Then, the transgression can be ac- companied by significant shoreface erosion or shoreface retreat (Fig. 3.16d). In this case, the sediment eroded from the upper shoreface is redeposited either in deeper water (transgres- sive lower shoreface) or swept through inlets or storm-generated washovers into the back- barrier region.
Shoreface erosion can affect not only barrier sands, but may also proceed into lagoonal and tidal deposits. As a result, the transgressive beds of the lower shoreface can overlie both back-barrier sands and lagoonal muds (includ- ing flood-delta deposits), only lagoonal muds, or directly older bedrock (Fig. 3.16d1, d2, d3).
The bedrock may have been exposed to air prior to the transgression. Deep erosion into pre-existing beds is favored by slow sea level rise and low sediment supply. It often creates planar erosion faces and appears to be rather common in the ancient sedimentary record, whereas the former barrier islands may be completely gone. Only the infillings of deep channels of the former inlet systems have a good chance of being preserved under suth conditions. These and other complications have been repeatedly described from modern and ancient examples (e.g., Nummedal et al. 1987; Nummedal and Swift 1987).
Remarks to Ancient Barrier Island Sands and Lagoonal Sediments
Ancient barrier island sands are more difficult to identify than tidal sediments, particularly when their upper portions (foreshore, wash- over, and eolian sands) are missing. The lower portions of these complexes may be easily confused with the normal shoreface sands of shallow seas or with mouth bar sands of ma- rine deltas (Chaps. 3.4.2 and 3.4.3). In such cases it is necessary to investigate the larger scale facies association of the sand complex under consideration.
Even lagoons are not always readily recog- nized in the geologic record, because of the variety of associated deposits (Ward and Ash- ley 1989). Lagoons are shallow features, and modern examples frequently display sedimen- tation rates on the order of 1 to 2 mm/a. Therefore, they are filled up with sediments in a relatively short time period (Nicols 1989). Thus, lagoonal sediments are volumetrically less significant than many other coastal and shallow-water deposits, particularly deltaic sequences (Boggs 1987). Nevertheless, ancient lagoonal sediments provide valuable infor- mation on the position of the paleo-coastline, climate, and biota of the corresponding time period.

3 Coastal and Shallow Sea Sediments
3.3 Sediments of Shallow Seas (Including Carbonates)
3.3.1 Predominantly Siliciclastic Sediments Introduction Facies Models for Shallow Seas Modifications of the Facies Models Large-Scale Shallow-Marine Sand bodies
3.3.2 Carbonate Buildups and Reef-Lagoon Complexes Introduction Carbonate Ramps Reefs and Other Carbonate Buildups Response of Carbonate Buildups to Sea Level Chan- ges "Pelagic" Carbonate Platforms Diagenesis of Reefs and Carbonate Buildups
3.3.1 Predominantly Siliciclastic Sediments
Introduction
The physical processes briefly described in the previous sections (beach and shoreface sediments, tidal deposits, and barrier island complexes) also control, to a large extent, the sediment dispersal and sedimentary structures of shallow-marine environments. Wind-gener- ated waves and currents as well as tidal cur- rents may affect the depositional processes in relatively deep water. The processes are addi- tionally influenced by storm-generated den- sity currents and oceanic currents of different origin (Chap. 5.2).
Epicontinental Seas and She1 f Seas
For several reasons it is useful to distinguish between two types of shallow seas (Fig. 3.18; also see Chap. 1.2):
- Epeiric or epicontinental seas which develop on continental crust and are bordered on seve- ral sides by land areas. - Marginal or pericontinental seas (she1 f seas) located on top of transitional crust along the boundary between continents and deep oceans. This type corresponds with the present-day shelves, particularly those on passive conti- nental margins.
The depth range of both types of shallow seas is from 10 to 20 m near the coast (apart from the nearshore areas) to roughly 200 m in the case of many modern shelf seas. Some sub- basins in epicontinental seas and on the shel- ves can attain greater depths. Both types of seas are fully marine, and deviations from the mean salt content of the open sea are limited (Chap. 5.2). Of course transitions exist be- tween semi-enclosed epicontinental seas and adjacent seas (Chap. 4), which tend to become brackish or hypersaline depending on the cli- mate of the region.
The physical processes in the two types of shallow seas may show significant differences:
- Continental shelves are normally fully ex- posed to the hydraulic regime of large neigh- boring oceans. They may be affected by dis- tant storm centers and long-distant oceanic currents, whereas epicontinental seas are often better protected from these influences (Fig. 3.18). If epicontinental seas are partly enclos- ed, their areal extent is not sufficiently large for the initiation of long, high-energy waves or significant tidal waves. Although, for ex- ample, the North Sea and the Bering Sea are situated on continental crust, they are not typical epicontinental seas in this sense. - Shelf seas often lose a great part of their sediments (sand and finer grained material) into deeper water by traction currents and gravity mass movements. This occurs less in typical, widely extended epicontinental seas, although even these basins collect thicker sed-

Chapter 3 Coastal and Shallow Sea Sediments
NENTALSEAS
LIMITED SUB- SIDENCE AND SEDIM.THICK- MODERATE
STORM WAVES
MUDDY LOWLAND
DOMINATED SHELF SEA SHELF SEA SHELF SEA DOMIN. SHELF SEA
Fi. 3.18. Different types of shallow-marine basins, epi- processes operating in these basins. Normal fairweather continental seas and shelf seas, and dominant physical waves are present in all these environments and not men-
tioned here
iments in topographic deeps than in shallower regions. - Because they evolve on thinning transitional crust, shelf seas exhibit stronger subsidence, particularly during their early stages of basin development, and therefore have the potential to accumulate thicker and possibly other sedi- mentary sequences than epicontinental seas (see Chap. 12.2).
Factors Influencing Shallow Sea Sediments
The sediments of shallow seas may vary con- siderably for the following reasons:
- Marked differences in the input of terrigen- ous material from neighboring land areas due to changing climates, presence or ab- sence of large river deltas relevant to the location studied.
- Variations in biogenic production. - Influence of relative or eustatic sea level
fluctuations. - Reworking of earlier intra-basinal sedi-
ments, etc.
Due to all of these influences, it is not possible to describe the various sedimentary facies of shallow seas by only a few simple facies models. In addition, it has been quoted repeat- edly'(e.g., Johnson and Baldwin 1986) that the modern continental shelves are not yet in e- quilibrium with their present-day hydraulic regime and sediments sources. These shelves and their sediments still reflect the unusually rapid, high-amplitude Pleistocene regressions and transgressions (cf. Chaps. 7.1 and 7.4). The last transgression (Holocene) terminated only a few thousand years ago! This is a time period in which only about half a meter of shelf sediment can accumulate. The present- day shelf sediments, particularly those on the outer shelf but also those in other areas of low deposition, therefore still reflect conditions of the last and possibly former low sea level stands at depths of more than 100 m. This si- tuation has to be taken into account when mo- dern shelf sediments are studied in order to achieve a better interpretation both of ancient counterparts and, even more so, of the depo- sits of ancient epicontinental seas.
Prior to the modern concept of sequence stratigraphy (Chap. 7.4), the architecture of shallow-sea sediments was poorly understood.

Shallow Seas, Siliciclastics
Older facies models presented elsewhere and partially summarized in this chapter are, how- ever, useful for the interpretation of short- period processes which are not or only little affected by sea level changes. The following simple models, which are deduced theoretical- ly as well as from modern and ancient examp- les, should be regarded in this sense. They mainly characterize siliciclastic sediments, but also take into account mixed siliciclastic-car- bonate deposits.
Facies Models for Shallow Seas
The facies models of this chapter are all based on the assumption that the coastline progrades seaward. They can be used only for short time periods in which the sea level is more or less constant.
In a first step we assume that there is no subsidence. Consequently, the shallow basins are filled up in a comparatively short geologic time span (a few millions of years) if they accumulate sediments at a rate of about 50 to 100 m/Ma. In reality, basins generally subside during sediment accumulation and therefore frequently persist for much longer time peri- ods. This point will be discussed below.
High Terrigenous Input
Low-energy waves, mud input. Figure 3.19al demonstrates shallow seas with high terrige- nous input, mainly as mud (silt and clay-size particles). Under prevailing low-energy wave conditions, the shoreface sediments are domi- nated by silty muds overlain by a thin cap layer of beach and foreshore sands. In deeper water, muds of different nature are encount- ered. One portion of the mud is carried di- rectly from the mouths of rivers as flocs or aggregates to its location of final deposition, whereas the other portion is reworked by moderate storms along the lower shoreface and redeposited as thin mud tempestites in deeper water (Chap. 3.1.2). Such an alternation of autochthonous and allochthonous mud layers is frequently masked or completely obliterated by intensive burrowing on the sea floor. It is mostly overlooked in field exposures. Muddy shorelines and shoreface zones commonly oc- cur downdrift from deltas prograding into low-gradient shallow seas (e.g., Fraser 1989). Well known modern examples are the Louisi- ana-Texas coast west of the Mississippi delta and the Surinam coast west of the Amazon delta (Wells and Coleman 1981).
Low-energy waves and high input of sand and mud may lead to a situation as shown in Fig- ure 3.19a2. The thickness of shoreface sands increases considerably; it may include offshore sand bars and proximal sandy tempestites (Chap. 3.1.2) in the transition zone to deeper water. Farther offshore, bioturbated mud tempestites alternating with silty and clayey autochthonous host sediments are again a cha- racteristic facies. As in the example in Figure 3.19b, some shell beds may also be present, but biogenic production is generally very di- luted by the high input of terrestrial material.
Storm-dominated sea, high input of sand and mud (Fig. 3.19bl). The beach-shelf profile becomes more gentle. The sandy, in places gravelly facies belt, comprising shoreface sands, sands with swaley and hummocky cross stratification (Chap. 3.1.2), and sandy tempes- tites, expands seaward into deeper water. In such cases, sands represent a great portion of vertical sections through the entire basin fill (e.g., Howard and Reineck 1981). Part of the sands transported by storms into deeper water can be reworked by subsequent storm-induced currents, direct storm wave action, or oceanic currents (see below). Far offshore, mud tem- pestites should be the dominant bed type.
Tide-dominated seas. As known from pre- sent-day tidal- and current-influenced shal- low seas, such as the North Sea, the Irish Sea, and the Atlantic shelf of North America, tidal currents may also affect the sedimentary proc- esses at water depths up to 50 m and more (Model b2 in Fig. 3.19). They generate charac- teristic sand waves, which may show mud draping. In addition, tidal waves form and slowly move flat, large sand ridges tens of kilometers in length, several hundred meters to some kilometers wide, and up to several tens of meters high (Reineck and Singh 1980; Stubblefield and McGrail 1984; Swift 1985; Johnson and Baldwin 1986; Saito 1989b).
A 200 krn long and 90 km wide, radiating field of tidal current ridges was observed in the southwestern Yellow Sea at water depths up to 20-30 rn (see Fig. 11.2; Liu Zhenxia et al. 1989). The sand ridges consist of fme sand originating from the abandoned deltas of the Yellow River and the ancient Yangtze River and were shaped as a result of the interaction of two tidal wave systems operating in the Yellow Sea.
Bottom currents in between the sand accumu- lations commonly erode longitudinal furrows which may collect and store coarse lag depo- sits, if coarse-grained material is present in

Chapter 3 Coastal and Shallow Sea Sediments
DOMINANT WIND DIRECTION RAPID COASTAL
LOSS OF SEDIMENT TO DEEPER WATER
HIGH INPUT BASINS
a L o w ENERGY (WAVES) I ) MUD ?I, FAIF-WEATHER a2 WAVE BASE,
TIDAL
BLC
CHANNELS
Sh, Gr
SW+MU
TIDAL SAND RIDGE
ST. REWORKED
I
ROSION
Fig. 3.19. Top Shallow sea with locally low or rapid pro- basins receive high input of tenigenous material, predomi- gradation of shoreline8 controlled by coastal morphology, nantly mud (al) or both sand and mud (a2, b l , and bf), position of river delta, and prevailing wind and current but differ in their hydraulic regimes. Stable sea level, no directions. a and b Facies models of rapidly prograding subsidence. Legend see Fig. 3.20 ("regressive") sedimentary sequences of shallow seas. All

Shallow Seas, Siliciclastics
LOW INPUT BASINS
.... MARL, LIMEST
WAVE BASE
S AND+MUD LOW TO HIGH ENERGY
\
ORKED EROSION \ L
OCEANIC CURRENT
S, mainly sand LEGEND Si, mainly silt
CI, silty clay Sh, shell accumulations Gr, gravel ST, sandy tempestites ShT, shell beds in tempestites MT, muddy ternpestites
- -- id I ...... r.:;:.:,.
~ O N T I N E N T A L . .. ._. - . ....... .. .... - ---- - - - TIDAL
----I \ MARL CHERT
S. REWORKED BIOTURB.
S,tGLAUCONITE. CHAMOSITE
EROS SURFACE
PHOSPHORITE
S,Si,CI
HCS, hummocky cross stratification FS, foreshore sands SF, shoreface sands BLC, barrier island-lagoon complex
(including some tidal deposits) SB, offshore sand bars SW, sand waves MD, mud draping
Fig. 3.20 (Fig. 3.19, continued). c through e Facies mo- and mud ( ~ 2 , d, and e), but differ in their hydraulic regi- dels of slowly prograding ("regressive") sedimentary se- mes and biogenic production. Stable sea level, no subsi- quences of shallow seas. All basins receive low input of dence. Coastal upwelling may lead to the deposition of temgenous material, predominantly mud (cl) or both sand marls and limestones rich in organic carbon and chert (c2)

Chapter 3 Coastal and Shallow Sea Sediments
the underlying beds. Different types of ripples and current lineations provide evidence of frequently active bottom currents. Flat ribbons or patches of sand are common features in rather deep water. Thus, vertical sections of such a basin fill show again a very high pro- portion of sand with a variety of sedimentary structures, some of which are not very well known. They may indicate bidirectional cur- rent orientation, although one current direc- tion (either the ebb or the flood current) is usually dominant. The fine-grained river load or muds produced in the basin itself are main- ly deposited in basin areas which are protected from tidal and other bottom currents or, in the case of shelf seas, they are transported into deep water.
Storm- and current-dominated seas. The high- energy models (Fig. 3.19bl and 2) are charac- terized by widely extended sand bodies. Pro- minent modern examples are the shelves of the western North Atlantic or the southern North Sea, where large, flat sand-ridges cover large areas. However, these sand-ridges still reflect the last Quaternary rapid sea level fluctua- tions. It is therefore doubtful whether these sand bodies are analogs of ancient shelf sands.
Low Terrigenous Input
The second series of models shown in Fig. 3.20 represents examples with low input of terrigenous mud and sand. These models are probably realized in nature more frequently than those discussed above. For obvious rea- sons, such basins also persist for longer time periods than basins receiving large terrigenous influx.
Wave-dominated, mud input. The sedimentary fill of a low-energy, wave-dominated basin with prevailing mud input (Fig. 3.20~1) re- sembles that in Figure 3.19a1, but the slower siliciclastic sedimentation rate enables higher concentrations of biogenic constituents and more intense bioturbation. For that reason, shell accumulations in the shoreface zone and, subordinately, in offshore tempestites are more pronounceed than in model Fig. 3.19al. The sediments of the outer shelf may become marly, because they contain relatively high proportions of biogenic carbonate of both benthic and planktonic origin. Mud tempes- tites tend to become completely mixed with host sediments and thus obliterated.
A further reduction of terrigenous input to an insignificant portion of the total sediment may lead, when low-energy conditions are maintained, to sediments rich in biogenic com- ponents (Fig. 3.20~2). In this case, a favorable climate and sea water sufficiently rich in nutrients is needed. The latter may be provid- ed by river water or by oceanic currents entering the shelf sea. As a result, the sedi- ments of the inner shelf can again display abundant shell layers and bioclastic sands and silts. Larger shells are commonly crushed to small pieces by predatory organisms. On the outer shelf, the carbonate content may become so high that marls and lime muds are depo- sited which later form marl-limestone sequen- ces (Chap. 7.2). If the contribution of tiny skeletons of planktonic organisms is high, the limestones resemble deep-water pelagic lime- stones. They can also contain some chert, but it is usually possible to infer their shallow- water origin from alternations with other sedi- ment types. Bioturbation is again very intense in this environment, thus diminishing the pre- servation potential of tempestites.
An alternative of this model is an en- vironment with an oxygen minimum zone in bottom waters of the outer shelf or in special depressions of epicontinental seas. Such a situation may be caused by upwelling waters rich in nutrients (Chap. 5.3.4) or by restricted water circulation. The resulting sediments are laminated bituminous clays and marls which may contain some limestone beds and chert layers. Bioturbation is limited to certain hori- zons or completely missing.
Storm- and tide-dominated seas. The model in Fig. 3.20d characterizes high -energy con- ditions (storms and tides) with low input of sand and mud. Coastal progradation is limited and the slope of the beach-shelf profile be- comes rather gentle. In contrast to model b l (Fig. 3.19), shell beds and finer grained bio- genic components may become significant contributors to the total sediment. Repeated reworking due to storm action leads to pro- nounced amalgamation in the shoreface-off- shore transitional zone and to other erosional surfaces with lag deposits and condensed beds in deeper water. Beds already buried and somewhat indurated may become re-exposed to sea water by current action and colonized by faunal assemblages needing firm or hard grounds.
Shelf seas affected by oceanic bottom currents. The last model (Fig. 3.20e) deals with shelf

Shallow Seas, Siliciclastics 131
seas which are strongly influenced by oceanic currents entering the shelf and preventing the deposition of fine-grained material in these regions (e.g., Flemming 1980). In the shore- face zone, the depositional processes may re- semble those described for models c l or c2, but at a greater depth strong and repeated re- working including mixing of older and younger sands is common. Gravel may be con- centrated in lag deposits, and vertical sections are characterized by many erosional surfaces. If the mean sedimentation rate becomes very low including periods of non-deposition, glauconitic minerals may be formed at the sediment/water interface (Chap. 6.1). Under special conditions, phosphorites can grow and may be concentrated in such an environment. Bottom life may differ from the previous ex- amples, and the intensity of bioturbation tends to change considerably from bed to bed.
Summary
All the facies models described so far (Figs. 3.19 and 3.20) represent so-called "regressive" sequences, although the sea level was kept constant. They are generated solely by a pro- grading shoreline. Most of these models imply coarsening-upward sections and, in view of the thickness of sand bodies, also thickening- upward sequences. Exceptions from these rules are the high-energy models d and e in Figure 3.20. The low-energy models c l and c2 with an upward-decreasing proportion of biogenic constituents may referred to as se- quences with "upward-decreasing biogenics". The low-energy models a l , a2, c l and c2 mainly represent epicontinental seas. The storm-dominated, tide-dominated, and cur- rent-dominated models b l , b2, d and e are realized predominantly in shelf seas. Model e is restricted to shelf seas.
Modifications of the Facies Models
The generalized vertical sequences described above can be modified significantly by a variety of factors not mentioned so far:
1. Under the assumption that there is no sub- sidence, the thicknesses of the facies se- quences shown in Figs. 3.19 and 3.20 cor- respond to the original water depths of the sedimentary basins. Taking subsidence into account, the thicknesses of the total basin fills, as well as those of single facies types increase.
If subsidence is equal to the sedimentation rate for a certain time period, the facies at each location within the basin remain un- changed. As a result, each particular facies zone, for example the shoreface or the outer shelf sediments, can theoretically reach very great thicknesses. 2. If the basin floor subsides faster than sedi- ment accumulates, the water depth at a certain locality increases. Consequently, the different facies zones migrate landward, and vertical sequences show the opposite tendency as des- cribed above, i.e., fining-upward or thinning- upward trends. Similar results are brought about by a rapid sea level rise leading to an increase in water depth. Conversely, tectonic uplift of the basin floor or sea level fall cause a seaward migration of the facies zones and thus a shortening of the vertical sequences. These problems are further discussed in Chap- ter 7.4 (also see, e.g., Aigner and Dott 1990). 3. Furthermore, the two-dimensional models of Figs. 3.19 and 3.20 do not take into account local control of sedimentary processes result- ing from irregular basin morphology, shifting and abandonment of river deltas, input of sediment from different sources, regional and temporal changes of climate, direction of do- minant winds and currents, etc. Coevel depo- sitional processes may strongly differ from one location to the other in the same basin (Fig. 3.19, top). At one site, the coastline may retreat landward and at the other prograde seaward at the same time. Such complications should be borne in mind, if the theoretical models are applied to observations in nature.
Large-Scale Shallow-Marine Sand Bodies
The processes of the beach and shoreface zone including the inner and outer shelf region des- cribed above may generate widely extended, partially amalgamated or stacked marine sand sheets. Prerequisites for such a development are effective sediment sources and a relatively fast subsiding basin. In this case, even mode- rate sea level falls cannot cause emergence and thus lead to subaerial erosion and reworking of the marine sand sheets (cf. Chap. 7.4).
A well exposed and repeatedly studied ancient example of sandy and muddy shelf-slope sediments is the foreland basin of the Western Interior seaway in North America (Shurr 1984; Swift and Rice 1984; Swift et al. 1987; also see Chap. 12.6). The western margin of this seaway was bordered by the emerging Rocky Mountains which shed large quantities of mud and sand into the seaway (Fig. 3.21a and b). Currents generated by the dominant north-

Chapter 3 Coastal and Shallow Sea Sediments
NW LAGOONAL SANDST. AND SHALE SHOREFACE SANDSTONE SE
a HUMMOCKY RIVER FLOOD STAGE
NORTH STRAND PLAIN AMERICA CROSS-BEDD
AREA CRETACEOUS SEAWAY
HICK GRADED BED
d STRAND PLAIN
GRADED
GRADED MUD
DOWNWELLING STORM CURRENT
SAND BEDS
BEDS
AMALGAMATED INTERBEDDED SAND FACIES SAND-MUD FACIES MARINE EROSION
SURFACE RAVINEMENT SURFACE (LAG SED.)/

Shallow Seas, Carbonates
westerly to northeasterly winds and deflected by Coriolis forces (see Chap. 3.1.2) caused stom tides along the western coastline (Fig. 3 . 2 1 ~ and d). The measured o p posite paleoflow directions are explained by the special coastal morphology of the study area situated in a large bight where setup of water along the coasts has created geostrophic currents of varying directions (Swift et al. 1987). The shelf sands are either linked to the shoreface sands, or they fom large, partially isolated, lenticular sand bodiesin between shelf muds. In some areas these elongate sand bodies resemble the sand-ridges and sand-ridge fields described from modem shelf seas (e.g., Tillman and Sie- mers 1984). Sands entering the basin are distributed either directly from the river delta by longshore transport and stom flow, or from the foreshore zone by downwelling stom currents into deeper water (Fig. 3 . 2 1 ~ and d).
The seaward prograding sands consist of seve- ral facies units (from top to bottom):
- Cross-bedded sands of the strand plain. - Relatively coarse grained, cross-stratified
sands of the upper shoreface (surf zone) with sand waves.
- Fine grained, amalgamated sands of the middle shoreface with hummocky cross stratification.
- Very fine grained, graded shelf sands (tem- pestites) alternating with muds.
These storm deposits may rest on a submarine erosion surface characterized by lag deposits and channel fills (Fig. 3.21e and b). Such an erosion surface is not necessarily associated with a relative sea level fall (cf. Chap. 7.4), but may also be caused by waning sediment supply in an unsteadily subsiding basin.
Many other examples of ancient shelf sands may be interpreted in a similar way (e.g., Reineck and Singh 1980; Matthews 1984; Till- man et al. 1985; Knight and McLern 1986; Morton and Nummedal 1989; Aigner and Dott 1990). In any case, the interplay between sub- sidence, sediment accumulation, and sea level changes is of eminent importance for the thickness and vertical and lateral facies as- sociation of such sands.
3.3.2 Carbonate Buildups and Reef-Lagoon Complexes
Introduction
A major part of the present-day and ancient carbonate rocks was, and is formed in very shallow marine water up to a water depth of about 10 to 20 m. Most of this carbonate is produced by organisms (skeletal carbonate) in regions of warm climate in low latitudes, whereas carbonate production is very limited in high-latitude oceans. Here, part of the car- bonate may even be dissolved on or near the sea floor.
The physical environment of nearshore and shallow-marine carbonate sediments is in many ways similar to that of sediments domi- nated by siliciclastic components. The physical processes mentioned in the chapters on beach and shoreface sediments, barrier-island com- plexes, and shallow seas (Chaps. 3.1, 3.2, and 3.3.1) also operate in carbonate-dominated environments. In spite of these common featu- res, many textbooks and numerous articles treat carbonate rocks more or less separately from siliciclastic rocks for the following rea- sons:
- Carbonate rocks are strongly influenced by the evolution of carbonate-producing or- ganisms and their different faunal assemblages through the Earth's history. The various as- pects of this topic, particularly those of reef structures, are described in many special ar- ticles and books (e.g., Wilson 1975, Toomey 198 1; Sellwood 1986; Scoffin 1987; Fliigel 1989). - Organisms produce not only a variety of skeletal particles of different size and shape, but also carbonate minerals of differing com- position and thermodynamic stability. In ad- dition, biochemically induced growth of car- bonate particles as well as purely inorganic precipitation of carbonate minerals from sea and lake waters are common under special environmental conditions. These problems are treated by Bathurst (1975), Purser (1980),
Fig. 3.21a-e. Large-scale distribution and facies association of widely extended shallow-sea sandstones in the Cretace- ous North American seaway. a General paleogeographic situation; b Cross section of Upper Cretaceous shale and sandstone formations, Book Cliffs, Utah, displaying shore face and shelf sandstones prograding step-wise seaward over shelf muds. c and d Models of sand distribution at
wave-dominated, prograding deltas. River mouth sand is distributed by littoral currents and storm flow (c), and redistributed by a stomdriven inner-shelf transport system (d). e Coastal retreat, sediment trapping in lagoons, shore face and shelf erosion as a result of transgression (insuffi- cent sediment supply for prograding). (After Swift et al. 1987)

Chapter 3 Coastal and Shallow Sea Sediments
Fiichtbauer (l988), Tucker and Wright (1990), and others. - Moreover, because of their relatively high solubility in water, carbonate minerals tend to dissolve and reprecipitate much easier and faster than silicate minerals. As a result, loose sediments can become indurated even at or near the sediment-water interface (early dia- genesis) and, with passing time, their pore space may be filled with different types and generations of carbonate cements. All these phenomena are described in detail in several texts (e.g., Bathurst 1975; Fliigel 1982; Sell- wood 1986; Schroeder and Purser 1986; Moore 1989) and can be dealt with here only in a brief summary.
The first prerequisite for the accumulation of carbonate-rich sediments is a low input of siliciclastic material to the site of deposition. Otherwise the predominantly biogenic- produced carbonate is too diluted to form car- bonate rocks, even when carbonate production is very high. For this reason, carbonate sedi- ments cannot form at the mouth of large river deltas or along the coasts of mountain ranges, shedding large volumes of weathering pro- ducts into the sea. If the siliciclastic influx is low, carbonate-rich sediments can accumulate not only in warm but also in temperate waters (see below). However, carbonate production is favored in tropical seas where different groups of organisms secrete thick, large car- bonate skeletons and where, in addition, car- bonate can also precipitate directly from sea water supersaturated with respect to calcium carbonate. Therefore, thick and widespread carbonate deposits are concentrated nowadays in the tropical and subtropical zones, and we have reason to assume that this was also the case in the geological past.
However, pure or high carbonate deposition alone is not sufficient to explain the special geometry of many carbonate rocks and their relationship to other deposits. Shallow-water carbonates and biogenic carbonate structures have the outstanding ability to build up sedi- mentary bodies which may rise with relatively steep slopes high above the sea floor. Such structures are referred to as carbonate build- ups no matter whether they are mainly pro- duced by organic reefs, or by skeletal sand und mud. Even originally unconsolidated car- bonate sediment can form wave-and current- resistant structures if it is lithified by early cementation (see below).
To summarize, the following factors favor the generation of carbonate buildups: Produc-
tion of biogenic carbonate in excess of the accumulation rate of siliciclastic material, frame-building organisms forming reefs, early cementation of skeletal sands and muds, and sufficient subsidence.
Three types of large-scale depositional en- vironments are important for the buildup of significant carbonate bodies (Read 1982, 1985; Scholle et al. 1983; Scholle et al. 1989; Stanton and Fliigel 1989; Tucker et al. 1990):
1. Carbonate ramps. 2. Rimmed carbonate shelves. 3. Isolated carbonate platforms.
Whereas carbonate ramps and shelves are at- tached to land masses, the typical carbonate platforms are isolated from mainland coasts and therefore ideally meet the requirement of low or absent terrestrial influx.
The best known and frequently described example of this type of carbonate buildup is the Bahama Platform (e.g., Purdy 1963; summaries in Bathurst 1975; Sellwood 1986, and Chap. 12.2.2), where a carbonate massif more than 4 km thick has accumulated since the Cretaceous. Ancient carbonate platforms are of similar extent (e.g., in the Alps, in the southern Apeninnes, and in the Devonian of Canada) but normally do not reach such great thicknesses.
Carbonate ramps may develop without signi- ficant contribution from reefs, whereas rim- med carbonate shelves and platforms need reef structures to build up and maintain compara- tively steep slopes.
Carbonate Ramps
A carbonate ramp is a gently sloping sea floor (generally less than 1 to 2 degrees) without a marked break in slope and thus deviates from most present-day shelves, which are charac- terized by a distinct shelf edge (Ahr 1973; Read 1982 and 1985; Wilson and Jordan 1983; Wright 1986).
Well known modem examples of ramp settings are the shallow region of the southern ArabianlPersian Gulf (Pur- ser 1973; Chap. 4.4.3), the deeper shelf and upper slope of West Florida (Mullins et al. 1988), the Libyan coastal zone of the Mediterranean, and the Yucatan shelf.
On a carbonate ramp, the high-energy facies of the wave-dominated nearshore zone gra- dually pass downslope (1 to 2') into deeper water and finally into basinal sediments depo- sited under low-energy conditions (Fig. 3.22). Landward, ramps are characterized by a high-

Shallow Seas, Carbonates
INNER RAMP a
SHALLOW RAMP LAGOONAL AND TIDAL FLAT BUILDUPS, CARBONATES (LOCAL COAL
OUTER RAMP OOLITIC AND SEAMS OR EVAPORITES) PELOID SANDS
, . . . . .
BANKS, LOCAL BIOHERMS (PACKSTONES, GRAINST.)
SHELLY BlOCLASTlC AND OR MARL. OOLITIC SANDS TENSE^ BIOTURBATED
CALCARENITE SHEETS. TEMPESTITES
RAMP (1) TO SHELF (3) EVOLUTION
/ SEA LEVEL
DISTINCTIVE TRENDS IN BlOF (E.G..FORAMINIFERA), ICHNO- FACIES, AND INCREASING BIOTURBATION
SHELF ( 1) TO RAMP (3) EVOLUTION
'ACIES
GRAVITY MASS TALUS FROM REEF FLOW DEPOSITS STRUCTURES
RAPID FILLING OF BASIN (E.G., BACK-ARC BASIN)
Fig. 3.22. a Idealized carbonate ramp with an inner ramp barrier complex separating a lagoonai-tidal zone from the open marine ramp facies. b Evolution of a carbonate ramp
to a rimmed carbonate shelf. c Evolution of a rimmed shelf to a carbonate ramp (rare). (Based on Read 1982; Aigner 1985; Buxton and Pedley 1989)

Chapter 3 Coastal and Shallow Sea Sediments
energy grainstone belt, whereas rimmed car- bonate shelves exhibit such a zone on their basinward edge. Continuous, large reef struc- tures and sediment gravity flow deposits con- taining clasts of cemented, shallow-water fa- c i e ~ at the foot of the gentle ramp slope are generally absent.
The nearshore zone of shallow, high-energy oolitic and peloidal sands or skeletal shoal complexes separates a protected landward area with lagoons, coastal and peritidal clastics, and possibly tidal flats from an open marine, high-energy foreshore and shallow-water belt (Fig. 3.22a). The back-barrier area is domi- nated by low-diversity euryhaline faunal as- semblages which tolerate a wide range of sali- nities. The inner ramp, seaward of the beach and barrier facies, is an efficient "carbonate factory", providing additional carbonate for both the back-barrier region and the outer, deeper ramp.
Different types of organisms have flourished on the inner ramp, reflecting the faunal evolution over Earth's history. In the Cenozoic, coralgal patch reefs, nestling and boring bivalves, sedentary gastropods, tube-secreting worms, en- crusting bryozoa, and large foraminifera have typified this zone (Buxton and Pedley 1989); in the Triassic crinoidal ramps were common (Aigner 1985).
In addition to biogenic carbonate production, the forma- tion of oolitic sands may contribute significantly to overall carbonate production. Hardgrounds appear to be a common feature on inner ramvs. Normal wave action and frequent storms transport biogknic sands and larger skeletal pa&cles (calcarenites and calcrudites) along shore and as traction carpets into somewhat deeper water. Rare large storms pro- duce sandy and muddy tempestites (Chap. 3.1.2) which extend into the deeper ramp and basin, where they alternate with lime muds or marls. Here, pelagic sediments, such as planktonic foraminifera1 and nannofossil oozes (cf. Chap. 5.3.1), dominate, but some isolated carbonate buildups may also occur on the outer ramp. A distinct trend in ichnofacies is also observable from the inner to the outer ramp.
It appears that carbonate ramps are common in geologic periods or environments in which reef builders secreting large, rigid skeletons are rare. The organic assemblages of ramps function mainly as grain and mud producers, as well as trappers and binders to form carbonate banks. Ramps are possibly more common in temperate climatic zones than in warmer regions. A modem example of this type is the shelf of southern Australia (see below).
Carbonate ramps are common on passive (ex- tensional) continental margins and in epicon- tinental seas. On continental margins, carbon- ates frequently overlie volcanics, evaporites, and clastic sediments, representing an early phase of deposition in a rift basin or a young ocean basin (cf. Chap. 12.1). Ramps tend to evolve into rimmed carbonate shelves (Fig.
3.22b) when carbonate production on the de- veloping shelf edge is high, and the produc- tion and deposition of carbonate in deeper water remains limited. The buildup of a rim with a steepening slope can be promoted by mud mounds which contain only minor pro- portions of biogenic framework (see below). Such structures may be confused with normal reefs where frame-building organisms play a great part (Fliigel 1989). The transformation of a rimmed shelf into a ramp is less common (Fig. 3.22~); it may occur, for example, where the shelf is drowned and buried by prograding clastics, or when the basin is filled rapidly from another side.
Reefs and Other Carbonate Buildups
General Aspects
In terms of large-scale sedimentary bodies, organic reefs are relatively simple structures which rise above the sea floor as a result of high skeletal calcium carbonate production and low siliciclastic input. In contrast to other sedimentary bodies, the growth and geometry of reefs are controlled mainly by organisms, the reef community, and to a limited extent by the physical processes of their environ- ment.
The internal structure of reefs is complicated, because they are composed not only of the solid skeletons of sessil frame-builders (for example, massive stocks of corals in the modem seas), but of the skeletons and shells of other, less resistant benthic organisms attached to the reef. Fur- thermore, skeletal debris provided by physical breakup or by boring and rasping organisms (bioerosion) as well as other sediments can be caught in cavities within the reef structure and contribute considerably to the buildup of the reef core (Fig. 3.24b). Encrusting organisms often grow over the dead parts of the reef surface and aid in stabilizing the structure. In addition, most reefs are associated with a mantle of talus on their flanks which, in effect, also forms part of the reef complex.
It is only the upper part of a reef which is organically active, because reef-builders take their food and nutrients from the surface water. Calcareous algae or hermatypic corals, which live in symbiosis with microscopic algae (zooxanthellae) need sunlight for photosynthesis. Hence, the reefs can only grow in shallow water up to a depth of about 50 to 80 m, but they grow optimally just a few meters below sea level. Their upward growth terminates within the tidal zone, where they form a flat surface cover- ed by water during high tide. The growth rate of coral reefs can be extremely fast in comparison to the sedimen- tation rate of other biogenic and clastic marine sediments (Chap. 10.2). Under favorable conditions in the late Qua- ternary, coral reefs were able to grow upward with the rk- ing sea level as fast as 1 cm per year (or 10 mh).

Shallow Seas. Carbonates
Reef -Building Communities
The modern coral reefs are restricted to warm tropical to subtropical waters of normal salini- ty and are unable to withstand substantial changes in water chemistry. Furthermore, the main reef-builders cannot tolerate muddy water because they are filter-feeders or mic- ropredators, whose feeding apparatus can be clogged by fine sediment particles. As a result, reefs are unable to survive near the mouth of rivers delivering large quantities of fresh water and mud. It is generally assumed that most ancient reef communities required en- vironmental conditions similar to thqse of the modern ones. I
Nevertheless, several types of reef com- munities exist, which do not need warm water and much sunlight. Based on studies of mo- dern and Cenozoic examples, many authors distinguish two groups of reef-building com- munities (e.g., James 1983):
- Chlorazoan association, consisting of green algae and hermatypic corals and, in addition, benthic foraminifera, molluscs, bryozoans, calcareous red algae, and barnacles. This as- sociation forms the prominent modern reefs in tropical-subtropical waters most of which also contain inorganically grown ooids and pelletal carbonate muds. Apart from normal calcite, aragonite and Mg-calcite are important prim- ary carbonate minerals. - Foramol association, consisting predomi- nantly of benthic foraminifera, molluscs, bryozoans, and partially calcareous red algae and barnacles. These communities can exist in temperate waters and at greater depths than the chlorazoan association, but they grow more slowly and cannot normally develop iso- lated, high bioherm structures (see below). Another difference is that in primary car- bonate mineralogy calcite predominates over aragonite and Mg-calcite, and ooids are ab- sent. At depths below 100 to 200 m, glauconite may be present.
Modem examples of this type of community were found in the western North Sea and in the northeastern Atlantic on the Rockall and Voering Plateau, where very little silici- clastic material is deposited. Widely extended cool water cahonates also occur on the shelf of southern Australia, where an inner shelf association rich in coralline algae, bivalves, and brachiopods passes, without a reef barrier, into an outer shelf association characterized by bryozoans, calcified worm tubes, foraminifera, and sponges (James 1990). Cold-water carbonates were reported from the ancient Permian shelf sea of Tasmania (Rao 1981), where they alternate with tillites and siliciclastic shallow-sea sediments rich in dropstones.
In some periods during Earth's history, other groups of frame-builders played a major role in the construction of reefs, for example stromatolites in the Precambrian, bryo- zoans, stromatoporids and tabulate corals in the lower Paleozoic, coralline sponges in the Permian, Triassic, and Jurassic, or rudist bivalves in the Cretaceous.
Reef Types
Despite the great variability of the reef-buil- ding communities and their internal structu- res, most of the reef bodies can be classified simply according to their geometry (from flat and small to usually thick and large struc- tures):
- Flat muddy banks, one to several km long, rising some decimeters or meters above the surrounding sea floor, partially built by sedentary organisms such as algae, sea grass, branching corals, molluscs and many other groups. Such skeletal-rich banks occur not only in warm coastal seas as, for example, on the Florida shelf, but also in temperate waters.
In the latter case, however, the thick and rapidly growing shells of tropical waters are absent and replaced by repre sentatives of the foramol association. Generally, these banks become more sandy and gravelly (including coarse shell debris and fragments of algal structures, e.g., Litho- thamnium), and lime mud is scarce or absent. Banks simi- lar to these nearshore structures of the temperate zone are also found in deeper water in environments with little siliciclastic input, especially on top of plateaus at depths between 100 and several hundred meters. Here, of course, algal activity is absent or very limited (red algae), but aher- matypic corals may be present and form patches rising somewhat over the neighboring sea floor. Glauconite is rather common in such temperate environments of low accumulation (e.g., on the Rockall Bank in the northeastern Atlantic). Carbonate banks in shallow and deeper water, under either warm or temperate conditions, can be stabiliz- ed by early cementation forming erosion-resistant tops or hardgrounds.
The bank-type reefs of the present-day oceans are con- sidered counterparts of the frequently described bwstromes in ancient sediments (Fig. 3.23a). By defmition, these are also bedded structures, such as shell beds or coral-rich beds exhibiting part of their fauna in situ, but they did not grow fast enough in their central part to form lens-like or mound-lie bodies as was the case for b i o h e m . Super- position of biostromes or small bioherms can result in thick reef structures ("stratigraphic" o r stratified reefs), but these never developed a substantial primary relief.
In contrast, "emlogic" reefs form prominent topo- graphic, wave-resistant features such as bamer reefs, patch reefs, pinnacle reefs (Fig. 3.23a and d).
- Reef mounds are flat, long lenses or steeper conical piles of incomplete reef structures (James 1983), which consist of poorly sorted

138 Chapter 3 Coastal and Shallow Sea Sediments
MUD MOUND a
MUD BANKS AND MOUNDS
SUPERIMPOSED BIOHERMS OF LlTTE RELIEF:
BIOSTROME BlOHERM "STRATIGRAPHIC REEF"
ALLY FLATTENED ANlC ISLAND
MOUTH
LARGE BARRIER REEF d
PINNACLE e
CARBONATE PLATFORM E F SANDY OOLITE
AND. OOLIDS, RAINSTONES
(TALUS AND REEF BUILDUP REEF TALUS LIME MUD PELAGICS) (BARRIER ANG BARRIER PLATFORM) AND PELAGICS AND PELLET MUD
Fg. 3.23. a Nomenclature and environmental position of d Large bamer reef with bamer platform and deep lagoon, different reefs and reef-like structures in modem seas and collecting mainly pelagic coccolith and foraminifera1 ooze ancient rock sequences, demonstrated on an idealized car- (chalk) o r marly muds. e Carbonate platform isolated from bonate shelf. b Fringing reefs and c, barrier reefs attached mainland and surrounded by deep water. Note the different to mainland coasts o r islands. c Atoll, developed from facies zones of platform rim and shelf lagoon. (Based on previous fringing and barrier reefs (b, c) on top of sub- James 1983; Sellwood 1986, and others) merging volcanic island.

Shallow Seas, Carbonates
SHOAL-RIMMED PLATFORM a ARID; SALT FLATS AND PONDS.
(SHOALS AND ISLANDS OF DOLOMITE.EVAPORITES SKELETAL SAND. 00113s)
FORESLOPE MUD MOUNDS
BASIN. PELAGIC OOZE OR MARL
NERlTlC (DISTAL TALUS)
REEF-RIMMED PLATFORM (REEF BELT)
b REEF MOSAIC c STAGE
DOMAL & MASSIVE METAZOA
ATTACHEDSEGMENTED CALCAREOUS BENTHOS / BRANCHING METAZOA
ENCRUSTING RASPING FISH
CAVITIES ' SEDIMENT WITH INTERNAL
SEDIMENT
d REEF LIMESTONES
TOCHTHONOUS -
DOMINATION
DIVERSIFICATION
OLONlZATlON
STABILIZATION
TYPE OF LIMESTONE
bindstone to framestone
lramestone (bindstone)
mudstone to
wackestone matrix
balflestone to floatstone (bindstone) with a mud
stone to wackestone matrix
grainstone to rudstone (packstone to wackestone)
4 ALLOCHTHONOUS
5
FRAMESTONE BINDSTONE BAFFLESTONE RUDSTONE FLOATSTONE
Fig. 3.24. a Topography and facies zones of shoal-rimmed shelf is influenced significantly by climate. b Reef mosaic, (upper part of block diagram) and reef-rimmed carbonate showing details of composite reef buildup. c Stages of reef shelves or platforms (lower ha&). Low-energy (LE) wave growth; high species diversity with domal, massive, lamel- produce a gentler foreslope with mud mounds, sandy lar, branching and encrusting reef builders is realized only shoals, and islands at the shelf break. High-energy (HE) in the diversification stage. d Simple nomenclature of au- conditions can only be tolerated by solid reef structures that tochthonous and allochthonous reef limestones. (Based on have steep foreslopes. The mud belt facies of the inner different sources, e.g., Zankl 1971; Wilson 1975; James
1983; Sellwood 1986, modified)

Chapter 3 Coastal and Shallow Sea Sediments
bioclastic lime mud with minor amounts of delicate to dendroid skeletons of sessil orga- nisms growing on top of the muddy matrix (e.g., sponges, algae, bryozoans, branching corals, bivalves).
The cap of such mounds may be formed by a thin layer of encrusting organisms or an early lithified limestone crust (Fig. 3.23a). Larger skeletons of typical frame-builders are generally not found. For that reason, reef mounds cannot grow up to the zone of strong and constant wave tur- bulence (Fig. 3.24 a). They have lengths on the order of 100 m and occur on the gently dipping slopes of carbonate platforms, in tranquil reef lagoons, shelf seas, and occasio- nally in deeper basins.
- Knoll reefs and patch reefs are frame-built, isolated, roughly circular bioherms (Fig. 3.23a). Knoll reefs occur on the upper fore- slope of medium-energy shelf or platform margins, where they often form a reef barrier or gently seaward dipping ramp in combina- tion with forereef or interreef debris. Patch reefs usually grow in the shallow outer part of a protected reef lagoon belonging to the back reef zone behind a larger reef barrier. Patch reefs are frequently associated with skeletal and oolithic sand bars. In deep lagoons the patch reefs may develop into isolated conical high pinnacle reefs (Fig. 3.23d), surrounded largely by pelagic carbonate.
- Reef rims, fringing reefs, and barrier reefs. In high-energy environments the frame-buil- ding organisms can produce narrow elongated structures referred to as reef rims. They grow up to or close to mean sea level into the zone of greatest wave action. This implies that their primary structure must be sufficiently solid to withstand permanent and occasionally very strong wave attack. As a result, their seaward slope tends to be very steep and their proximal foreslope talus often consists of coarse reef debris and fallen blocks from the active reef zone. Nevertheless, these structures are fre- quently able to progress not only upward, but also seaward toward their food supply and on top of their foreslope talus (Fig. 3.25a).
If seaward outbuilding prevails and the car- bonate body is attached to land masses or is- lands, the resulting coastal carbonate plat- forms are called fringing reefs (Fig. 3.23b).
Wide structures of this type develop when carbonate pro- duction exceeds subsidence and, in addition, the relative sea level remains constant or repeatedly reaches about the same level. Modem fringing reefs are commonly 0.5 to 1 km wide and may include some very shallow lagoons of li- mited extent. Well-known examples occur, for example,
along the coasts of the Red Sea and many tropical islands where only little temgenous material is swept into the sea.
Conversely, rapidly rising sea level or strong subsidence often leads to a pronounced vertical buildup of the reef front and thus to barrier reefs and atolls separating shallow or sometimes also rather deep and wide lagoons from the open sea (Figs. 3 . 2 3 ~ and d). The most prominent recent example of this type is the 2000 km long Great Bamer Reef along the eastern continental margin of Australia. An outstanding fossil example are the Devonian bamer reefs in the Canning basin, western Australia.
The Back Reef Zone and Reef Lagoons.
The salinity and other environmental charac- teristics of the back reef zone are strongly influenced by water exchange between the open sea and reef lagoons via inlets or deeper channels crossing the barrier reef. If water exchange is sufficient to maintain approxima- tely normal marine conditions, carbonate pro- duction in the lagoons remains predominantly biogenic. However, it often lags behind the carbonate buildup along the reef front, with the exception of isolated patch or pinnacle reefs mentioned above, or along inshore banks, for example, of branching corals and algae. Consequently, lagoons associated with barrier reefs tend to become deeper during times of rapid relative sea level rise.
In humid regions with inflow of fresh wa- ter, lagoons with limited sea water exchange may develop stratified waters (see Chap. 4.2) and an oxy- gen-deficient bottom water zone. Then lagoonal muds may become bituminous and lack bioturbation. Generally, lagoonal sediments are sensitive to seasonal and longer term climatic changes and frequently record such variations in their sediments.
The inner parts of lagoons, including tidal flats in par- ticular, are strongly affected by climatic change. In humid tropical to subtropical zones, brackish and fresh water ponds with corresponding faunas and rapid plant growth may develop (Fig. 3.244. In arid regions, hypersaline wn- ditions often promote chemical and biochemical carbonab precipitation, early transformation of calcium carbonate to dolomite, and the generation of evaporitic layers in the supratidal zone (Chaps. 3.2.2 and 6.4.1).
The many a toh of the present-day oceans (more than 320 examples in the Indian and Pacific oceans) are ring- like bamer reefs surrounding a shallow lagoon in which a central land mass is lacking (Fig. 3.23~). As already d e scribed by Darwin, most of these atolls are associated with submerged, isolated, volcanic seamounts, which previously formed islands. These reef structures can be explained by alternating outbuilding of fringing reefs and upbuilding of bamer reefs related to the rapid Quaternary and slower earlier sea level fluctuations. In addition, a general ten- dency of the seamounts to subside plays a role. The car-

Shallow Seas, Carbonates 141
bonate buildups of some atolls reach thicknesses in excess of 1000 m and represent time spans of some tens of million years. The central lagoons collect reef debris and sediment produced in the lagoon itself, mainly sand- and silt-size skeletal carbonate.
Composite Structures: Carbonate Buildups
Carbonate shelves and carbonate platforms are composite structures, consisting of the reef front or reef belt, the foreslope proximal and distal reef talus (fore reef), and the back reef, including the reef flats and the lagoon (Figs. 3.24a and 3.25a). In the case of carbonate shelves, the coastal mud belt and tidal flats form an additional part of the total structure (cf. Chap. 3.2.2).
The lateral sediment distribution on carbonate platforms, as for example observed on the Great Bahama Bank, may in- clude (from land to sea): - Calcareous mud (biofacies adjusted to normal to
hypersaline conditions). - Pellet mud. - Oolite shoals and oolitic grapestone. - Reefs and rocky bottom along the platform edge.
These different facies zones can migrate land- ward or seaward with time in response to rela- tive sea level fluctuations, changes in car- bonate production or in the hydraulic regime. Thus, some of the facies zones can become more, others less important as contributors to the total carbonate buildup. Nevertheless, both the isolated and land-attached platforms may grow more or less continually, regardless of the specific carbonate production of frame- building organisms, the various reef types dis- cussed above, and the different facies zones of the reef. Mechanical reef destruction and bio- erosion by endolithic organisms causing a downward erosion on the order of 0.3 m/ka (Stearly and Ekdale 1989) lead to a redistribu- tion of carbonate on platforms and their slopes.
In some shallow-water environments, carbonate may also precipitate inorganically from supersaturated sea water, as observed in the Persian Gulf and on the Great Bahama Bank (e.g., Shinn et al. 1989). These so-called "whitings" are characterized by milky water containing about 10 mg/l fme grained calcium carbonate, mostly aragonite.
Types o j Ree j Limestones
Apart from lagoonal and tidal sediments, the different facies zones of a reef complex are represented by various types of reef lime-
stones (Fig. 3.24a through e). These can be subdivided into two groups (James 1983):
1. Autochthonous reef limestones displaying in-place fossils, which support the framework of the reef. We can distinguish: - Framestones, consisting largely of frame-
building skeletons. - Bindstones, showing in-place tabular or la-
mellar fossils, which encrust or bind the sediment together during deposition.
- Bafflestones, exhibiting in-place stalked fossils, which trap sediment by baffling.
2. Allochthonous reef limestones, the material of which was not produced at the site of final deposition but delivered from nearby or more distal sources: - Rudstones, clast-supported limestones, con-
taining a high proportion of coarse-grained particles.
- Floatstones, containing more than 10 % par- ticles with diameters greater than 2 mm, which, in contrast to the rudstones, are ma- trix-supported.
The occurrence of these limestone types with- in a reef complex is indicated by numbers in Figure 3.24a.
Response of Carbonate Buildups to Sea Level Changes
Vertical Buildup and "Drowning"
Because carbonate shelves and platforms are sensible gauges of sea level changes, their growth is in turn strongly affected by relative sea level changes (Kendall and Schlager 1981; cf. Chap. 7.4).
A relatively simple structure is the pure ver- tical buildup of an isolated carbonate platform with sea level rise (or subsidence of the basin floor; Fig. 3.23e). If lateral shifting of the facies zones is limited, vertical sequences of such platform carbonates can theoretically show very thick successions of the same fa- cies, for example superimposed knoll reefs or bioherms, fore-slope reef talus, lagoonal muds, etc. (Fig. 3.23e). At the same time, interreef basinal muds or even deep-sea pela- gic sediments can accumulate close to the car- bonate platform. If the platform is subdivided by large and deep channels or troughs, as for example the Bahama Platform by the Tongue of the Ocean, shallow water carbonates can be bordered by carbonate turbidites and other deposits transported by gravitiy mass move- ments.

Chapter 3 Coastal and Shallow Sea Sediments
FORE REEF FRONT PATCH BACK REEF REEF AND REEF FLAT ,REEF WITH LAGOON
CONTINENTAL (CT)
TIDAL FLATS (T I AND
NEARSHORE MUD BELT (NMB)
LAGOONAL LIME MUD, PELLET MUD, BITUM. MARL (L)
SKELETAL SANDS, PATCH (S) REEFS
REEF FRONT (RF)
FORE REEF TALUS AND "PELAGICS" (FRT)
- HEMIPELAGIC TO PELAGIC lV OOZE (CHALK. LIMESTONE)
AND MARL (HP)
b "DROWNING" OR DECLINING CARBONATE BUILDUP
SHELF MUD SHOREFACE SAND
SHALLOWING AND DEEPENING-UP DEEPENING-UP (FINING- AND COARSENING -UP)
c EMERGING CARBONATE BUILDUP
C 1 FALLING SEA-LEVEL CT
C2 FALLING AND RISING SEA-LEVEL
---
FRESH WATER
INTENSIVE MEDIUM LITTLE KARSTIF., ' LOCAL REGENERATION KARSTlFlCATlON LITTLE RESIDUE OF REEF GROWTH
Fig. 3.25. a Complete, idealized sequence of a prograding carbonate buildup (reef front). Note the limited thickness of each facies (in contrast to Fig. 3.23e), the changing pro- portions of different facies zones during the carbonate buildup, as well as repeated coarsening (shallowing) u p ward and fining upward. b "Drowning" or declining reef, due to rapid sea level rise or, more likely, to deteriorated conditions for reef growth. Landward migration and sub- sequent termination or replacement of different facies zones of the carbonate buildup. For abbrevations see (a).
Note differences in the vertical sections 1 to 3. c Pema- nently (cl) or temporarily (c2) emerging and karstified carbonate buildups. c l Different intensities of karstification in relation to climate, duration of subaerial exposure, etc., or to nature and thickness of overlying beds. c2 Reef growth or general carbonate buildup starts with preferred initiation on topographic highs of previously karstified land surface. (Consequences for carbonate diagenesis are shown in Fig. 3.26)

Shallow Seas, Carbonates
In many cases, however, the relatioship bet- ween relative sea level rise and the growth potential of carbonate buildups leads to more complicate structures. The reasons for these complications are that (1) sea level changes occurred frequently and at differing rates over the Earth's history (Chap. 7) and (2) the growth rates of carbonate buildups varied with the type of reef builders involved and changing environments. One can distinguish several situations (Kendall and Schlager 198 1 ):
- Start-up phase. Carbonate accumulation lags behind the rapidly rising sea. - Catch-up phase (after initial drowning). Carbonate accumulation exceeds the rate of coeval sea level rise. Then two cases are pos- sible: (a) The fast-growing rim and patches of the interior platform are able to catch up with sea level rise and survive, whereas the plat- form interior is transformed into a deep lagoon (Figs. 3 . 2 3 ~ and d and 3.25~2). (b) The total shelf or platform builds to sea level, but may include shallow lagoons (Fig. 3.24a). - Keep-up phase. Carbonate accumulation closely matches (or exceeds) the rate of sea level rise. The top of the buildup remains flat and closely to sea level; deep lagoons cannot develop. An excess in carbonate production may cause a seaward prograding of the flat- topped platform (Fig. 3.25a); the platform is frequently capped by evaporites. - Drowning phase ("give-up"). Sea level rise exceeds carbonate growth potential; Shallow- water carbonates are overlain by hardgrounds and/or sediments of deeper environments (Fig. 3.25b).
Apart from rapid sea level rise, reef growth and the production of biogenic carbonate can also be hampered, or completely subdued, by other changes in the environmental conditions such as salinity, supply of food and nutrients, muddy waters, oxygen deficiency of sea water, etc. As a result of the extremely fast sea level rises during short intervals of the Quaternary, part of the pre-existing reefs really drowned. However, in pre-Quaternary times, when sea level fluctuations had smaller amplitudes and probably showed a slower rate of change, drowning of active carbonate buildups appears to be less likely. It is as- sumed that such sedimentary bodies as a whole can grow upward as fast as 200 to 1000 m/Ma (0.02 to 0.1 cm/a, Hallock and Schlager 1986), which is much less than the optimum growth rate of single reef structures (up to about 1 cm/a; also see Section 10.2). Nevertheless,
even the much smaller growth rates of car- bonate buildups are probably sufficient to compensate for most of the relative sea level rises of Phanerozoic times.
On the other hand, reef growth and carbon- ate buildups ended more or less abruptly and were replaced by other deposits several times during nonglacial periods, for example during the Mid-Cretaceous (Hallock and Schlager 1986). The cause of such global crises in the growth of carbonate platforms is not yet clear, but there is a striking coincidence of world- wide "drowning" and oceanic anoxia (Schlager and Philip 1990).
Pro- and Retrograding Carbonate Buildups
Figure 3.25b shows a model of landward migrating carbonate facies zones and their termination under a transgressive sea. The vertical sections of such a sedimentary body vary according to their location far off or close to the paleo-coastline. Under these transgressive conditions, fining and deepen- ing-upward sequences prevail (Locations 1 to 3 in Fig. 3.25b).
Due to the fact that reef fronts are able to grow seaward on top of their talus and sub- siding basin floor, prograding carbonate buildups are common in the geological record (Fig. 3.25a). In this case, the different facies zones reach only limited thicknesses in vertical sequences. Typical successions below the reef front show coarsening- and shallowing-up- ward trends. Farther landward, where lagoonal and tidal sediments cover the reef core, the vertical sections on top of the reef core ex- hibit a fining- and deepening-upward trend toward the central lagoonal deposits, there- after some coarsening.
A classic example of a large, prograding carbonate buildup is the Permian reef complex of the Guadalupe Mountains region in Texas and New Mexico (Newell et al. 1953; Ward et al. 1986), which is also known for its rich oil and gas fields. Hydrocarbons have accumulated mainly at the contact of the lagoonal sediments (here dolomites) with the coastal evaporites, and in the basinal channel-fill clastic carbonates. The cavernous pore space of the marginal reef facies is commonly fded with water.
Emergence and Continued Growth of Carbonate Buildups
Because both isolated and land-attached car- bonate buildups usually grow close to mean sea level, even minor relative sea level falls

144 Chapter 3 Coastal and Shallow Sea Sediments
lead to mechanical abrasion or to an emer- gence of the carbonate platform. If the plat- form surface remains uncovered by continen- tal deposits, dissolution of carbonate, starting at the surface and penetrating into deeper parts of the carbonate body, can bring about karstification and soil formation (Fig. 3.25~1). These phenomena are absent or less pronounc- ed, if the carbonate surface is only briefly exposed to weathering before it is covered by poorly permeable material or additional car- bonate-bearing layers.
Sea level rise subsequent to emergence can reactivate local reef growth or extensive car- bonate buildup on top of a karstified, ir- regular surface (Fig. 3.25~2). Thereafter, reef growth starts again on topographic highs, and inter-reef lagoons or basins tend to become deeper than the pre-existing ones, providing the reefs can keep pace with the rising sea level. For this reason and also due to a succes- sion of sea level changes with the long-term tendency to a slow net rise, a previously flat- topped large platform may become subdivided into a series of ecological superimposed reefs and small inter-reef basins. Exposure of car- bonate buildups to the air and karstification are also important factors controlling car- bonate diagenesis (see below).
"Pelagic" Carbonate Platforms
Drowned or subsided carbonate platforms below the depth favorable for reef growth may be referred to as "pelagic" carbonate plat- forms (Franke and Walliser 1983; see Chaps. 5.3.7 and 12.2.2). In an intermediate stage between shallow-water and pelagic carbonate deposition, where the platforms are still ex- posed to storm and current action, the sequence overlying a carbonate buildup may become discontinuous and interrupted by intervals of omission and erosion.
Such condensed carbonate sections are common in the geologic record and were described from many regions, for example from the Jurassic and Cretaceous ( e x . . Bernoulli and jenkyns 1974; Fbrsich 1979; ~ e r ~ n e r L ' a l . 1982; Jenkyns 1986) and from late Devonian and early Carboni- ferous strata in various European countries and North Africa (Tucker 1974; Wendt and Aigner 1985; Wendt 1988).
These platform carbonates are frequently cha- racterized by irregular bedding and a nodular appearance, red color, ferromanganese nodu- les, corrosion surfaces and hardgrounds with a sessil fauna, and accumulations of special fossils, for example cephalopods and crinoids.
Average sedimentation rates on such platforms are very low (0.1 to 1 m/Ma), while adjacent' basins are filled at rates between 20 and 100 m/Ma. Laterally, such condensed horizons may show transitions to clastic shelf sediments or to brecciated, gravity-deformed, and rese- dimented slope sediments. A clear distinction between this type of "pelagic" platform and the deep marginal and oceanic plateaus dis- cussed in Chapter 5.3.7 appears to be difficult.
Diagenesis of Reefs and Carbonate Buildups
General Processes of Carbonate Diagenesis
As previously mentioned, reefs and other car- bonate sediments often undergo marked chan- ges immediately after their deposition (early pre-burial diagenesis) and also later on when they are buried under younger sediments (late or burial diagenesis). The most important processes involved are:
- Dissolution of pre-existing carbonate mine- rals creating void space, for example, in the unsaturated vadose zone of emerged platforms (Fig. 3.26b). - Cementation, i.e.? growth of new carbonate crystals in the void space, thus leading to lithification. - Replacement of single crystals or mosaics of fine crystals by other, often larger carbonate minerals (neomorphism).
Numerous articles have been written on this topic, and several textbooks discuss the vari- ous aspects of this problem in detail (e.g., Bathurst 1975; Purser and Schroeder 1986; Sellwood 1986; Fiichtbauer 1988; Moore 1988; Scholle et al. 1989). The following brief sum- mary is based partly on these texts, but phy- sico-chemical considerations are omitted here (also see Chapter 13).
Rapid and intensive diagenetic transforma- tion of most of the primary material of a car- bonate buildup is favored by:
- Relatively good solubility of skeletal car- bonate and thermodynamic instability of some carbonate minerals (aragonite and Mg-calcite) under changing physico-chemical conditions. - High porosity and permeability of many reef structures, reef talus, and skeletal sands. - "Internal draining systems" within the car- bonate buildup, i.e., zones of better per- meability acting as conduits for pore fluids flowing laterally and upward, or for meteoric water with an initially downward flow.

Shallow Seas, Carbonates
- Frequent emergence of carbonate platforms resulting from both major and minor sea level falls, which lead to significant alterations in the pore water chemistry. - Carbonate diagenesis is also affected by the hydraulic regime of the water body overlying the sediment. High energy conditions may promote rapid cementation through sea water pumping (see, e.g., summary in Tucker and Wright 1990).
These criteria explain the great-importance of allochemical diagenesis, which is characteristic for these rock types and is especially demon- strated by dolomitization. The latter process requires the introduction of substantial amounts of magnesium from outside. It must be transported by large volumes of pore-water circulating through the rocks (cf. Chap. 13.2).
Cement Sequences
Carbonate rocks exhibit different types of cementation:
1. Early marine cements (fibrous or micritic Mg-calcite and aragonite), form very close to the contact with sea-water at the reef front, foreslope, and on top of a carbonate buildup (Fig. 3.26a). These cements contribute con- siderably to the mechanical resistivity of reef structures and some sandy shoals against wave attack. 2. Early meteoric cements (sparitic or micritic low-Mg-calcite) grow during periods of emergence in zones of fresh-water influence, mainly in the phreatic zone (Fig. 3.26b). 3. Late calcite cements are represented by coarse sparry crystals, which frequently show an increasing ferrous iron content (deep-bu- rial diagenesis, Fig. 3.26b). In a closed system (isochemical diagenesis), cements filling void space have to be procured by a simultaneous dissolution of metastable carbonate minerals (Land 1967; Bathurst 1975). Under increasing overburden load, this process is promoted by pressure dissolution at the grain contacts (Chap. 13.3). As a result, the carbonate sediment becomes more solid and the total structure undergoes compaction. Reef cores are subject to less compaction than their surrounding finer grained sediments. Therefore, their relief is enhanced and, in addition, they tend to drain the expelled pore- water from their neighboring sediments (Fig. 3.26b). Neomorphism usually occurs simul- taneously with the filling of pore space. Skele- tal aragonite and fine crystalline mosaics of
other carbonate minerals are replaced by coar- ser calcite. Magnesium, released by dissolution of high-Mg-calcite can form some dolomite.
Dolomitization
Significant dolomitization of carbonate buil- dups is, however, only possible in open sys- tems,-if large quantities of Mg are transported by circulating pore waters, particularly sea water, to the site of diagenesis (see Chap. 13.3). For reasons mentioned above, reefs are especially susceptible to early and late dolo- mitization. Under arid conditions, lagoonal water may become hypersaline and attain a salt concentration sufficiently large for the precipitation of gypsum (Chap. 6.4.1). If cal- cium sulfate is precipitated, the Mg/Ca ratio of the brine far exceeds that of normal sea water (Mg/Ca = 5.2) and consequently initi- ates dolomitization of skeletal carbonate. The relatively dense lagoonal brine tends to sink into the underlying rocks and to flow back toward the sea (sabkha model with evaporative reflux, Fig. 3.26~). In addition, skeletal opa- line silica can be dissolved and later repreci- pitated as chert in the mixing zone between brine and normal pore-water.
In a humid climate, lagoonal water may be- come brackish or fresh and, due to its lower density, form a lens-shaped water body reach- ing into the subsurface (Fig. 3.26b). Where fresh (or brackish) waters and marine pore waters mix, the solution becomes supersatu- rated with respect to dolomite. Hence, even these conditions may cause replacement of calcium carbonate by dolomite (early dolomi- tization, "Dorag model"). Similarly, fresh groundwater from emerged platforms, or from the continent can flow seaward and partially flush out the primary marine pore water. The resulting mixing zone between meteoric and sea water may persist for a long time span and thus bring about substantial dolomitization. However, this mixing-zone model has been questioned recently as a viable explanation for massive dolomitization (Hardie 1987).
The "Coorong modelw derived from present- day lagoons and coastal plain lakes of Southern Australia can explain lagoonal and lacustrine dolomites (Fig. 3.26 d).
According to this model, Mg-rich groundwaters flow seaward through an extensive aquifer and mix with sea water seepage through a seaward prograding belt of coastal sand dunes, composed mainly of skeletal carbonate (von der Borch and Lock 1979; Warren 1990). Whereas the outer lagoon maintains its connection to the open sea, older lagoons farther inland are separated from direct sea water

1 46 Chapter 3 Coastal and Shallow Sea Sediments
a SEA-WATER b DORAG MODEL J, 4 HUMID ClRCULATlON LOW PER FRESH OR
MEABILITY BRACKISH WATER VADOSE ZONE PREVAILING DISSOLUTION ------ PHREATIC ZONE DISSOLUTION AND CEMENTATION (LOW -Mg CALCITE)
Mg CALCITE) WATER WITH MARINE PORE-WATER DEEP-BURIAL 0 CEMENTATION DOLOMlTlZATlON
DEEP STAGNANT COMPACTION F + , #-'- LOW-Mg CALCITE
5 MARINE PORE SOME DOLOMITE WATER, LITTLE CEMENTAION
C
C EVAPORATIVE REFLUX d COORONG MODEL (SEMI-ARID) (ARID CLIMATE)
OPEN LAGOON, EPHEMERAL BASALTIC YOUNG HY PERSALINE SEA NORMAL LAKE: VOLCANICS
EVAPORATION
-----
ARAGONITE, PROTO- DOLOMITIZATION, ?CHERT MG-CALCITE DOLOMITE DOLOMITE
Fig. 3.26a-d. Diagenesis of reefs and carbonate buildups. gypsum). d L.acust&e primary dolomitic muds on top of a Early marine cementation. b Dissolution and cementation marine and lagoonal skeletal carbonates, caused by Mg-rich in the zones influenced by meteoric water as well as dolo- groundwaterlsea-water mixing (Coorong model). (Based on mitization in the mixing zone between freshlbrackish water Blatt et al. 1980; Sellwood 1986; Schroeder and Purser and marine pore water. Compaction flow and deepburial 1987; Von der Borch and Lock 1979; Warren 1990, and diagenesis (calcite and some dolomite). c Dolomitization by others) evaporative reflux of lagoonal brine (after precipitation of
influence and presently form very shallow ephemeral lakes. Intensive evaporation during the summer leads to highly concentrated, Mg-rich brines, which enable the true prim- ary precipition of dolomite and the deposition of dolomitic mud. Dolomite is associated predominantly with Mgcalcite and, in the more arid settings, with magnesite (or rarely: hydromagnesite). Dolomite makes up about 10 % of the carbonate minerals in the surface sediments across the coastal plain. Highly soluble salts of chlorides and sulfates are flushed back into the sea during the winter when the lakes are flooded. The lacustrine dolomitic muds consist to a great part of pellets and are mostly laminated. They rest on top of skeletal marine carbonates and organic-rich early Holocene lacustrine muds and show extensive mud cracks at their surface.
The Coorong model should not be used to explain widespread dolomitization in ancient supratidal and shelf carbonates (Warren 1990).
Dolomitization largely destroys the primary organic reef structures and physical sedimen- tary structures. It usually leads to a "second- ary" porosity, which can be of great economic
importance (Chap. 13.3), but other diagenetic processes may modify this trend. Long-lasting burial diagenesis generally tends to close the pore space completely.
The nature and duration of carbonate dia- genesis in relation to deposition largely control the great economic significance of carbonate buildups as reservoirs for hydrocarbons, groundwater, and host rocks for mineral de- posits, particularly Pb/Zn ores (Chap. 13.5). Reservoir potential and quality of reef car- bonates as material for building and industrial purposes vary significantly with regard to reef types (Fliigel 1989). Organic reefs and reef mounds tend to become exposed to subaerial weathering and karstification during their early history and therefore commonly provide abundant pore space, while mud mounds grown at a greater depth below sea level seem to be of minor importance as reservoirs and host rocks.

3 Coastal and Shallow Sea Sediments
3.4 Sediments of Marine Delta Complexes
3.4.1 Types of Marine Deltas Introduction Prograding Fan Deltas Larger Marine Deltas (Overview)
3.4.2 Sedimentary Processes and Facies of Various Delta Types Fluvial-Dominated and Lobate Deltas Wave-Dominated Deltas Tide-Dominated Deltas
3.4.3 Facies Architecture, Constructionaland Destructional Phases Facies Architecture of Lobate Deltas Facies Architecture of Birdfoot Deltas Delta Lobe Switching and Response to Sea Level Changes
3.4.1 Types of Marine Deltas
Introduction
Modern, large marine deltas commonly repre- sent complex depositional systems, composed of sediments of greatly differing characteris- tics and environments (Fig. 3.27~). Their facies range from fluvial plains over shallow lakes, lagoons, tidal flats, estuaries, beach and shore- faces, to subaqueous delta fronts, delta plat- forms, and prodelta slopes. In addition, the offshore shelf may be affected significantly by deltaic sedimentation. Many deep-sea fans are associated with large marine deltas shedding huge volumes of terrestrial material into the sea. For these reasons, the depositional en- vironments of marine deltas are discussed here with reference to the less complex subenviron- ments described earlier (particularly in Chaps. 3.1 and 3.2).
In spite of the variety in depositional en- vironments, the different facies types of lateral or vertical deltaic sequences represent a characteristic, diagnostically significant facies
association. The following brief summary is based on special publications and books on marine deltas (e.g., Scruton 1960; Allen 1965; Morgan and Shaver 1970; Wright and Coleman 1973; Weimer 1976; Galloway and Hobday 1983; Elliott 1986b; Fraser 1989; and others), but cannot cover all variations and details observed in recent and ancient case studies.
Prograding Fan Deltas
Marine deltas develop where rivers enter the sea and cause a seaward prograding of the coastline due to their high sediment load. In the case of a narrow coastal plain in front of a high mountain range, such a progradation can take place rather uniformly along a wide coast-parallel zone and generate a series of coalescing fan deltas (Fig. 3.27a). Coarse ma- terial transported during river floods reaches the coast and may form comparatively wave- resistant blocky and gravelly beach ridges. Lagoonal muds can accumulate behind such ridges. The foreshore is characterized by sort- ed gravel and sand; the shoreface profile tends to be relatively steep and may show indica- tions of delta foresets similar to those of lake deltas (Chap. 2.5). Most of the sand trans- ported into shallow water depth, however, is reworked repeatedly by storm waves and cur- rents and therefore loses its primary deltaic sedimentary structures.
Larger Marine Deltas (Overview)
The greater and more typical marine deltas are built by rivers which drain large areas and reach the sea after a long passage through alluvial plains. Hence their sediment load is finer grained and consists predominantly of silt and clay with minor proportions of sand. Gravel is often absent or transported only in very small quantities. The shape of these del- tas is mainly controlled by the rate of sedi-

148 Chapter 3 Coastal and Shallow Sea Sediments
Fi. 3.27. a Marine fan delta caused by seaward prograd- b Different types of large marine deltas controlled by wa- ing alluvial fans or braidplain. Note coarse-grained beach ves and tidal currents (LE low energy; ME medium energy; ridges (blocks and gravel) protecting small lagoons or HE high energy conditions) as well as sediment input (HI, ponds from wave and current action. Older beach ridges high input; MI, medium input). c Different subenviron- and lagoonal silts and muds may be ovemdden by fluvial ments of a large, lobate, wave- and tide-influenced delta deposits. system (similar to the Niger delta)

Marine Delta Complexes
ment input and the hydraulic regime of the sediment-receiving basin. Strong waves and tides hamper or prevent the outbuilding of fluvial sediments into the sea, whereas low- energy conditions favor this process. Using these criteria, one can distinguish several types of marine deltas (Fig. 3.27b):
- Fluvial-dominated birdfoot delta, elongate: Due to high sediment input and low counter- action by the sea forces (low-energy con- ditions), the single main distributaries of the delta prograde seaward separately and create a coastline similar to the shape of a birdfoot. A prominent example of this type is the modern Mississippi delta. - Mixed fluvial- to wave-dominated, "classi- cal" delta, lobate. Higher wave energy, which may be accompanied by moderate tides, pre- vents the separate outbildung of fluvial sys- tems. Instead, all distributaries advance more or less uniformly and thus generate the cha- racteristic protruding lobate or triangular coastline which the Greek compared with their capital letter "deltan. Many modern rivers build this type of delta, for example the Da- nube into the Black Sea, the Nile and Ebro into the Mediterranean (e.g., Sestini 1989). In all these cases, the influence of tides can be neglected. However, the deltas of the Niger and Orinoco entering the Atlantic Ocean also belong to this type, although they are modera- tely affected by tides. - Wave-dominated deltas, cuspate: Strong wave action prevents the local outbuilding of a delta front. Temporarily deposited river load is reworked and transported from the river mouth along the high-energy coast or into deeper water. Splitting of the main river into several distributaries and avulsion (shifting) of channels are less frequent than in birdfoot deltas. Overall, wave-dominated deltas ad- vance more slowly over a broader front. Mo- dern examples include the deltas of the Rhone (Mediterranean), the Brazos entering the Gulf of Mexico and the Sao Francisco and other South American rivers discharging into the South Atlantic. - Tide-dominated delta, estuarine. Strong tides and tidal currents migrate, as discussed in Chapter 3.2, some distance up the river and therefore widen the river mouth to form an estuary. In combination with wave action, the river load is swept out into the shallow sea or transported longshore into areas of lower energy conditions, where it can settle in tidal flats or deeper water. The main river may split into several distributaries with islands in bet-
ween, and part of the sand load forms separate subaqueous sand ridges in front of the river mouth. The coastline does not protrude sea- ward and the total delta complex progrades comparatively slowly. Present-day examples of this delta type are the Ganges-Brahmaput- ra, the Colorado, and the Rhine.
3.4.2 Sedimentary Processes and Facies of Various Delta Types
Fluvial-Dominated and Lobate Deltas
Distributary Channels and Levees
The processes taking place at the mouth of an individual distributary channel of the elongate to lobate delta type are schematically shown in Fig. 3.28. On both sides of the channel, flat natural levees are built up during times of peak flood. In places where the levees are not high enough, the flood spills over into the adjacent marshland and generates sandy crev- asse splays. The levees consist of fine sand and silt (cf. Chap. 2.2.3) and can also be traced as subaqueous sand bars from the river mouth some distance into the sea. Because large delta areas usually subside but are flooded discon- tinuously, their subaerial levees display ir- regular vertical aggradation. Plant cover and soils may develop in times of non-deposition. The walls of channels cutting such levees, marsh deposits, or bay muds can be very steep, but often the channels migrate laterally, eroding one of their banks and aggrading on the other. Channels may also be filled with sand bars or mud.
Interdistributary Delta Plain
The interdistributary space between the ra- pidly prograding subaerial levees of a birdfoot delta or behind the uniformly advancing beach ridge barrier of a lobate delta is oc- cupied by marshland, swamps, and fresh water lakes. In a tidal regime with outlets to the sea, tidal flats develop behind the beach ridge barrier. The sediments of these areas are pre- dominantly siliciclastic and strongly influ- enced by the climate of the region as des- cribed in Chapter 3.2. Under humid condi- tions, the interdistributary, slowly subsiding swamps offer ideal prerequisites for the ac- cumulation and preservation of peat and al- lochthonous plant debris. Many coal deposits

Chapter 3 Coastal and Shallow Sea Sediments
INTERDISTRIBUTARY MARSH (SILT AND CLAY)
BAY MUDS MOUTH BAR S
LARGE-AND SMALL-SCALE TROUGH CROSS- BEDDING WlTH PLANT FRAG- MENTS, MUD PEBBLES, SOME CONTORTIONS
ERlAL LEVEE
CULATlON AND SETTLING OF CLAY MINERALS MINERALS (KAOLINITE AND SILT)
DURING FLOODS
/ VERY SMALL CLAY MIN. (MONTMORILLONITE)
CLAYEY SlLT WITH THIN SAND PLANAR LAMINATION,
RELICS OF SOME AND SILT LAYERS, RIPPLE AND SAND AND SILT L, PLANT FRAG- CLIMBING RIPPLE
MENTS, LITTLE LAMINATION, BIOTURBATION PLANT FRAGMENTS
Fig. 3.28ae. Model of a distributary channel (bird-foot or a Cross section through channel with adjacent sediments. lobate delta type) and depositional processes at its mouth. b through e characteristic sedimentary structures of some
subenvironments
were formed in such an environment, and grained material of the main river as observed hydrocarbons found in deltaic sediments also on the Mississippi delta plain (Tye and partially derive from source rocks of this type. Coleman 1989). These deltaic sediments repre- Shallow, large lakes developing in the upper sent short basin-filling episodes and differ part of the delta plain may be filled by rapidly from the common, Gilbert-type lacustrine prograding lacustrine deltas fed by fine- deltaic sequence (Chap. 2.5.1) in displaying

Marine Delta Complexes
extensive distributary mouth-bar sands and parallel-laminated prodelta muds instead of coarser grained, steeply inclined prodelta for- esets.
River Mouth and Delta Front
The bedload of the distributary channels is deposited directly in front of the subaerial delta, commonly at water depths in the range of 5 to 30 m. The sediment load of large river systems draining extensive alluvial plains (ap- art from highlands far from the coast) is com- monly fine grained. Consequnetly, the river mouth bars are composed mainly of fine sand displaying large- and small-scale trough cross-bedding of rather consistent current direction (Fig. 3.28 b). At a lobate delta, river mouth bars, subaqueous levees, and foreshore sands of the beach ridge barrier may combine to form a more or less continuous sand sheet (delta front sands) of locally varying thick- ness on the order of 5 to 30 m.
The beach ridge barrier is fed by sands transported alongshore from the river mouths. Separately advancing channels of the birdfoot delta type, however, generate isolated elongate sand bodies, the so-called bar finger sands (Fig. 3.28b).
Typical features of a rapidly prograding delta front are growth faults, slope gullies, and mud diapirs originating from differential compaction and failure of underconsolidated sediments. They were intensively studied in the Mississippi delta and Niger delta regions (see below), but are also known from ancient examples (e.g., Galloway and Hobday 1983; Prior and Coleman 1984; Martinsen 1989; Pulham 1989; Doust and Omatsola 1990; also see Chaps. 5.4.1 and 13.2).
Delta Platform and Prodelta Slope
The river mouth and its accompanying shore- face sands prograde as the delta front. During times of peak flood, however, the river water with its suspended load may become denser than sea water. Then it flows basinward as undercurrent and drops its sandy and silty bedload in deeper water. Seaward of the delta front a kind of delta platform is observed at shallow water depths (10 to 30 m). This fea- ture results from the combined action of rapid deposition and wave action during the con- structive phase, but may also be shaped during a subsequent destructive phase of the delta
development (see below). The prodelta slope farther offshore is generally very gently in- clined (less than one up to a few degrees) toward the floor of a shelf sea or a deeper oceanic basin.
A particularly great part of the silt- and clay-size material of the river load is depo- sited on the prodelta slope. The transport and settling behavior of sand and silt particles is little affected at the transition from fresh water to sea water. The suspended clay mine- rals, however, tend to flocculate and form ag- gregates as soon as they pass, under conditions of normal river discharge, from the less dense, overlying fresh-water wedge into the zone of mixed brackish water or normal sea water (Fig. 3.28). The clay aggregates sink much faster than isolated clay particles and thus sig- nificantly contribute to the prodelta slope sediments.
Since comparatively large clay minerals such as kaolinite produce denser aggregates and settle earlier than do very small ones (e.g., montmorillonite), there may be a kind of late- ral fractionation of these minerals. Kaolinite tends to accumulate near the river mouth, while illite and montmorillonite are normally transported further into deeper water.
Sedimentary Structures
Characteristic sedimentary structures of all these environments are shown in Fig. 3.28b through e, as well as in the sections especially dealing with these subenvironments (Chaps. 2.5,3.1 through 3.3). Of particular interest are the prodelta sediments, because they usually reach considerable thicknesses and have a good chance of preservation, even if the up- per part of the deltaic sequence is eroded. Prodelta sediments typically consist of clayey silt or silty clay (hemipelagic terrigenous ma- terial) with thin (mm to cm) intercalations of fine sand or coarse silt reflecting episodes of minor and major river floods. Plant fragments may be abundant, but the percentage of au- tochthonous marine biogenic components is generally low. Due to a high sedimentation rate (on the order of a few mm to tens of cm per year), burrowing by bottom dwelling or- ganisms is sparse. Therefore, primary lamina- tions within the clayey silts, although indis- tinct and irregular, are frequently preserved.

Chapter 3 Coastal and Shallow Sea Sediments
Growth Faults and "Depobelts"
The prograding prodelta sediments of major rivers form huge clastic wedges which may reach thicknesses in excess of 10 km and overlie oceanic crust (e.g., in the Niger delta region, Doust and Omatsola 1990). Such sedi- ment wedges are strongly affected by syn- sedimentary and postsedimentary normal faults. In these cases the prograding delta complex can be divided into a number of ma- jor, growth fault-bounded sedimentary units or "depobeltsn. Within each depobelt, the sedi- ment buildup may occur stepwise or cyclic in response to continued deformation and sea level changes. Even the gentle foot of the prodelta slope may undergo deformation cha- racterized by imbricated "toe thrusts".
The shelf sediments in front of a large delta also tend to be dominated by fine-grained siliciclastic material delivered by the river. With decreasing sedimentation rates bioturba- tion becomes a significant process masking or obliterating all kinds of bedding.
Wave-Dominated Deltas
These deltas are characterized by beach ridge/foreshore sands advancing with the active delta lobe in a wide coastal-parallel front basinward (Fig. 3.29a). In relation to the wave energy and wave base, these coastal barrier sands form sheets of considerable thickness (up to tens of meters). Due to inten- sive reworking, the coastal barrier sands tend to be better sorted than the distributary chan- nel and mouth bar sands of the fluvial-domi- nated deltas. They coarsen upward as a result of the prograding shoreface and often contain abundant shell debris which is produced by shallow water organisms and added during the processes of coastal sand transport (Fig. 3.29a and c). Sideward shifting and return of the active delta lobe to the subsiding initial site may generate a second or several coastal bar- rier sand sheets on top of the first one (see below). Behind the active coastal beach ridge, the space between older barrier sands and other parts of the interdistributary area may be occupied by mangrove swamps, marshes, or lakes. The suspended river load of wave-do- minated deltas is usually removed from the river mouths and widely distributed in the adjacent basins. As a result, the prodelta fa- c i e ~ of fluvial-dominated deltas is poorly developed or more or less missing.
Tide-Dominated Deltas
In contrast to the other delta types, tide-do- minated deltas lack an advancing subaerial delta front, but accumulate most of the river sediment in front of their wide, estuarine mouth in shallow water or in the adjacent deeper sea (Fig. 3.29b). Thus, an extensive subaqueous delta platform is produced, on which at least part of the bedload and sus- pended river load comes to rest. Unlike the fluvial-dominated deltas, the sands are not dropped as localized mouth bar sands, but repeatedly reworked and redistributed by tidal currents mainly directed perpendicular to the general coastline. Hence, they form elongate subparallel sand ridges between the estuarine distributaries of the river mouth, as well as on the deeper delta platform. The sideward mi- grating distributaries are filled with tidal cur- rent-influenced sands, exhibiting bidirectional cross-bedding and ripple lamination, in ad- dition to estuarine muds with mixed fauna (fresh water to normal saline).
Although the estuaries of a tide-dominated delta give little evidence of progradation, the total complex of such a delta also slowly ad- vances seaward. The resulting facies as- sociation, however, resembles that of a normal tide-dominated coastline (some distance away from an entering river, see Chap. 3.2) rather than the associations found in the other delta types. A typical vertical facies succession for such a constructional phase includes (from top to bottom):
- Alluvial plain sediments. - Supratidal marsh or, depending on the cli-
mate, evaporitic beds of a coastal sabkha or other supratidal deposits.
- Extensive intertidal sediments. - Point bar and tidal-influenced sands of
distributary channels, estuarine muds with variable fauna.
- Tidal-influenced sediments of the delta platform with subtidal sand ridges and sand waves.
- Shelf sediments, still more or less influenced by tidal currents.
Figures 3.29d and e display characteristic vertical successions of an estuarine channel fill and a sand ridge on a delta platform. Coastal barrier sands play a subordinate role in this type of delta. These deltaic sediments and their facies architecture are not discussed further here, because they are more related to subtidal, tidal, and estuarine deposits des- cribed in Chapters 3.2.1 and 4.2.

Marine Delta Complexes
stratified sand
LATERAL ACCRETION (POINT BAR DEP.)
INTENSIVE DlSP OF SUSPENDED
CHANNEL MIGRATION
STUARINE MUD
PLATFORM SED. asal scour and lag
SHELF AND SHELF mud. bioturbated ATFORM SEDIMENTS
Fig. 3.29a,b. Conceptual models of a wavedominated and tions of estuarine channel fill and tidal sand ridge on pro- b tidedominated delta. c Vertical section of an advancing delta platform of tidedominated delta. (c through e based foreshodcoastal banier sand ridge. d and e Vertical sec on Galloway and Hobday 1983).

Chapter 3 Coastal and Shallow Sea Sediments
3.4.3 Facies Architecture, Constructional and Destructional Phases
Facies Architecture of Lobate Deltas
Constructional Phase
The final facies architecture of a delta com- plex is controlled not only by its constructio- nal phase during outbuilding, but also by des- tructional periods of reworking and redistri- bution of sediments delivered by rivers. The lobate and wave-dominated delta types are less susceptible to extensive destruction than the birdfoot delta. In the latter case, the far seaward protruding distributaries can be re- worked easily by waves and currents, espe- cially when they are cut off from their sedi- ment source by crevasse splays which evolve into new distributaries. Figure 3.30a shows the pure constructional facies association of a lobate delta consisting of five main facies groups (from bottom to top):
- Prodelta muds (with some intercalated silt and sand layers) prograding seaward. - River mouth and coastal barrier sands (delta front sands) prograding seaward similar to the prodelta muds. - Point bars and infillings of distributary channels (predominantly sand) and levee sands and silts (possibly including soils). - Sediments of the interdistributary delta plain (bay or lagoonal muds, possibly sediments of tidal flats, marshes, lakes), locally overlain or interrupted by crevasse splay silts. Delta plain deposits are characterized by relatively slow upbuilding (aggradation) on top of the sub- siding delta complex. - Fluvial sediments of the prograding alluvial plain consisting of point bars, channel fills, and finer grained deposits of the flood plain (cf. Chap. 2.2.3).
The elevation of the actual delta front deposits is always adjusted to the sea level, but older equivalents of the deposits are affected by sediment compaction and subsidence of the crust under the increasing sediment load. Therefore, the delta front sediments buried below the prograding subaerial delta plain dip slightly landward. The different types of sedi- ment accretion discussed here, i.e., prograda- tion of prodelta and delta front deposits gene- rate an unusual pattern of the isochrones within the total delta complex (Fig. 3.30a) and contrast to the prevailing vertical aggradation of delta plain sediments.
Destructional Phase
Destruction of delta lobes commonly takes place where main distributaties have pro- graded too far into the sea and lose their sedi- ment supply by channel diversion. Such a development is mostly initiated by breaches in the levees, crevasse splays, and crevasse chan- nels that find a shorter and steeper course into the sea. Another cause of coastal retreat is subsidence and/or rising sea level (also see below). Destruction is brought about by wave action and wave-induced currents (Chap. 5.2) which predominantly rework and redistribute the river mouth and delta front sands, the coastal sand barrier close to the distributaries, and part of the interdistributary sediments behind the sand barrier. This process may produce a chain of retreating beach ridges and barrier islands (Fig. 3.30b) which protect flooded portions of the delta plain from fur- ther erosion. As a result, widely extended shallow bay muds and salt marsh deposits of limited thickness can accumulate.
In front of the retreating coastal sands, a veneer of reworked, relatively coarse foreshore and shoreface sands may rest on truncated mouth bar sands or directly on prodelta muds. These sands frequently contain shell concen- trations of mixed origin, part of which are derived from eroded bay and lagoon deposits. Fine grained material reworked from the in- terdistributary areas is swept into deeper water by currents. Such a destructional phase continues until a new equilibrium is es- tablished between the forces of the sea and the capability of the accumulated sediments to resist erosion. A new delta lobe may prograde and incorporate the retreated coastal sands into the subaerial delta plain of a subsequent constructional phase.
Vertical Facies Successions
Vertical sections in delta sediments are very variable, particularly in cases, when the delta was subjected to destructional periods (Fig. 3 .30~ through g). A characteristic feature is coarsening-upward of prodelta silts and clays, mouth bar sands, and shore face/beach ridge sands. The opposite tendency is observed in vertical sections through the infillings of dis- tributary channels and minor channels as- sociated with crevasse splays. On or near the channel floor, mud clasts, logs, and sometimes reworked nodules of ironstone, formed during early diagenesis, are common. An irregular

Marine Delta Complexes
MARSH PEAT CONSTRUCTIVE PHASE OR MUD. LAKE
LEVEE
COASTAL FINE SANDS BARRIER SANDS
AND SILTS
a
'SILTS AND MUDS
-POINT BAR AND
ALTERNATING CONSTRUCTIONAL ' ' ( d l - AND DESTRUCTIONAL PHASES I _',, , _ \- '& k ..---
POST-EROSIONAL/ X - 1 . Z SHELF SEDIMENTS l2
PRODELTA MUD
Fig. 3.30a-g. Facies association of a classical lobate delta, b Discontinuous progradation, interrupted by periods of generalized, with landward dipping coastal and fluvial partial delta destruction (erosional faces 1 and 2), which deposits due to continuous subsidence (similar to the Niger may remove river mouth bar and subaqueous levee sands delta, see, e.g., Allen 1970; Doust and Omatsola 1990). and silts, as well as part of the primarily overlying sedi- a Constructive phase with permanent outbuilding (progra- ments of shallow bays, lagoons, marshland, and lakes. c dation) of prodelta muds and aggradation of sediments of through g Vertical sections (locations shown in a and b), the delta plain. Note the unusual position of isochrones. see text for explanation

Chapter 3 Coastal and Shallow Sea Sediments
coarsening-upward trend is also common in interdistributary sequences, i.e., from lagoonal muds to tidal flats, from salt marsh and crevasse splay silts to sands, or from lake bot- tomsets to lake delta foresets and topsets of the alluvial delta plain. Such coarsening-up- ward sections may occur repeatedly and are often described as autocyclic deltaic sequences (Chap. 7.1).
The most important sedimentary structures of these subunits are described in the previous chapters. Normally graded sand and silt layers may occur in the prodelta environment as a result of density currents (Fig. 3.28), as well as in crevasse splay sheet sands and silts due to waning flow conditions after peak flood. Delta abandonment and coastal retreat lead to trun- cated vertical sequences (Fig. 3.30g). Usually the upper part of a prograding constructional sequence is more or less eroded and, after deposition of a thin veneer of reworked mate- rial, overlain by sediments of a younger con- structional phase.
Lateral Facies Transitions
The facies in the prodelta region gradually change laterally from prodelta silts and clays to shelf sediments (Fig. 3.28d and e; cf. Chap. 3.3). In shallower water and particularly within the delta plain, the facies strongly vary laterally and may display the following tran- sitions:
- From lower part of point bar sands and infillings of main channels to mouth bar sands, subaqueous levee sands and silts, and shoreface sands. - From infillings of channels, levee and crevasse splay sands and silts to sediments of bays, lagoons, tidal flats, salt marshes, or salt pans, depending on the climate. - Successions of lakes and swamps including their minor deltas may pass laterally into overbank deposits of the advancing alluvial river plain.
One has to bear in mind that such lateral fa- cies transitions occur not only within sedi- ments of the same age, but also between older and younger units of the complicated facies architecture of a marine delta (see isochrones in Fig. 3.30a).
The facies also change from the upper to the lower delta plain. In the upper plain, channel sands play a main role and the interdistri- butary area is largely occupied by levee and
crevasse splay deposits. Truncation due to delta lobe abandonment is insignificant. How- ever, relatively thick bay-fill and lagoonal sequences prevail in the lower delta plain, particalurly in the case of birdfoot deltas (see below). The seaward portions of these deposits are exposed to delta destruction.
Facies Architecture of Birdfoot Deltas
The facies association of a birdfoot delta is in many ways similar to that described in Figure 3.30, but some important differences exist. During constructional phases the distributaries build, on top of prodelta silty clays or clayey silts, elongate isolated bodies of delta front and mouth bar sands out into the sea (Fig. 3.31). The area in between is occupied by bays accumulating muds with marine fossils. If such elongate delta lobes are abandoned, part of their delta front sands retreat and form sand barriers which convert the former inter- distributary marine bays into lagoons of vary- ing salinity. Later, marsh and/or lake deposits may follow, before the prograding fluvial plain, its crevasse splays, and overbank fine- grained muds take over. Therefore it is com- mon for marine prodelta sediments or bay muds to be directly overlain by lagoonal, in- tertidal, marsh, or lake sediments in the inter- distributary area of a birdfoot delta.
The interdistributary environment is a par- ticularly favorable site for the accumulation and preservation of organic matter and thus for the generation of coal seams. Outcrops in this area may show similar sequences over fairly large distances and therefore give little evidence of distributary channels and their specific facies association (also see below). In total, the vertical and lateral facies successions display the same variations as the classical lobate delta. However, they include a larger percentage of marine bay sediments.
Delta-Lobe Switching and Response to Sea Level Changes
"Shallow-" and "Deep-Water" Delta Prograding
In both types, the classical lobate and the birdfoot deltas, a delta lobe advancing over an abandoned part of the former delta can pro- grade faster than a lobe which is built out into deeper water. Such a shallow-water delta pro- duces a thin delta front sequence and tends to
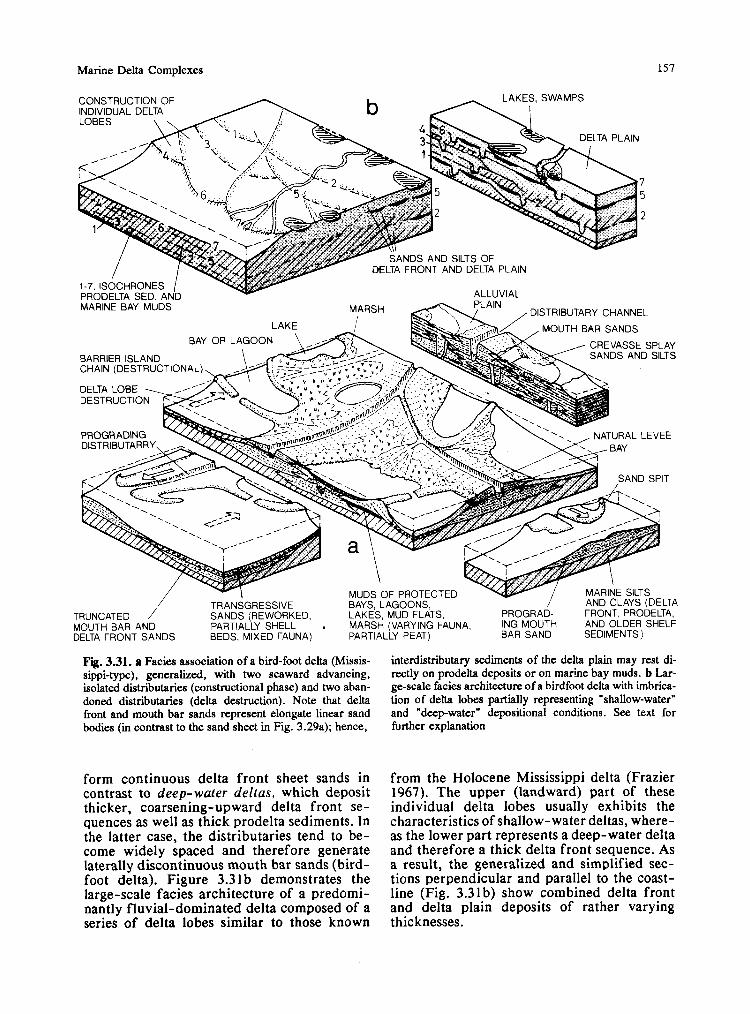
Marine Delta Complexes
Fig. 3.31. a Facies association of a bird-foot delta (Missis- interdistributary sediments of the delta plain may rest di- sippi-type), generalized, with two seaward advancing, rectly on prodelta deposits or on mariie bay muds. b Lar- isolated distributaries (constructional phase) and two aban- ge-scale facies architecture of a birdfoot delta with imbrica- doned distributaries (delta destruction). Note that delta tion of delta lobes partially representing "shallow-water" front and mouth bar sands represent elongate linear sand and "deep-water" depositional conditions. See text for bodies (in contrast to the sand sheet in Fig. 3.29a); hence, further explanation
form continuous delta front sheet sands in contrast to deep-water deltas, which deposit thicker, coarsening-upward delta front se- quences as well as thick prodelta sediments. In the latter case, the distributaries tend to be- come widely spaced and therefore generate laterally discontinuous mouth bar sands (bird- foot delta). Figure 3.31b demonstrates the large-scale facies architecture of a predomi- nantly fluvial-dominated delta composed of a series of delta lobes similar to those known
from the Holocene Mississippi delta (Frazier 1967). The upper (landward) part of these individual delta lobes usually exhibits the characteristics of shallow-water deltas, where- as the lower part represents a deep-water delta and therefore a thick delta front sequence. As a result, the generalized and simplified sec- tions perpendicular and parallel to the coast- line (Fig. 3.31b) show combined delta front and delta plain deposits of rather varying thicknesses.

Chapter 3 Coastal and Shallow Sea Sediments
In spite of the obvious imbrication o f delta lobes, the overall, large-scale delta complex commonly renders the impression of a cyclic sequence in which layers rich in organic mat- ter (coal seams) are particularly arresting. More thorough investigations, however, fre- quently reveal that the coal seams switch late- rally to d e e ~ e r or higher positions in the total sequence, and the same is true of all the other facies types.
The Scale o f Marine Deltas and Depositional Cycles
The problems associated with bed correlation and cyclic sequences, mentioned above and described in Chapters 7.2 and 7.3 in more detail, underline the necessity to discuss the scale of delta facies models.
The delta plains of present-day large marine deltas cover areas of thousands of square kilo- meters. The delta front of the Holocene Mis- sissippi delta is approximately 400 km wide and protrudes 100 to 150 km into the Gulf of Mexico. Similarly, the delta lobe of the Niger is about 400 km wide and has prograded sea- ward 100 to 200 km. Several other recent delta plains reach about the same size, and we can assume that ancient delta plains were of the same magnitude. - On the other hand, the thoroughly inves- tigated facies associations of deltaic coal fields usually cover smaller areas and therefore can barely reveal the complete architecture of geological bodies as large as those of entire delta complexes shown in Fig. 3.31b. Instead, the local studies usually give rise to the im- pression that individual beds can be traced over relatively long distances and that cycli- city is rather regular and possibly of regional or even global importance. This is not true in those cases in which the vertical sequences are caused solely by delta lobe switching. How- ever, some deltaic coal cyclothems appear to be controlled by eustatic sea level changes ori- ginating from processes outside of the deltaic depositional area (cf. Chaps. 7.4 and 14.5).
Response of Marine Deltas to Sea Level Changes
Such a situation is demonstrated in Fig. 3.32 for the classical lobate delta type. A rapid rise in sea level leads to extensive coastal retreat on top of the submerging former delta plain. If the sea level rise does not exceed a few tens
of meters and then persists for some time, the delta front can prograde again as a shallow- water delta (Fig. 3.32a). As soon as the posi- tion of the former delta front is reached, fur- ther outbuilding takes place in deeper water and therefore will proceed more slowly (Fig. 3.32b, deep-water delta). Falling sea level promotes coastal advance in conjunction with the prograding delta front to a deeper level. The former delta plain emerges above sea level by tens of meters and will therefore be dissected and partially eroded by the main river and its tributaries. The eroded material contributes significantly to the further out- building of the lowstand delta. Part of the emerged deltaic terrace may also be removed by large slumps and mass flows (Chap. 5.4.1). A subsequent sea level rise to its initial level tends to restore the former coastline and to generate a transgressive sequence again (Fig. 3.32c, similar to that shown in a).
The vertical facies successions resulting from such sea level changes vary from locality to locality within the delta complex (Fig. 3.32d through f). Interdistributory sites landward or seaward of the initial coastline show alter- nations between the following facies groups (listed from land to sea):
- Lower delta plain association (lagoonal, tidal, marsh, crevasse splay deposits) alter- nating with the alluvial plain association (flood plain, point bar, channel fill, lake deposits, etc.; Fig. 3.32f).
- Lower delta plain association alternating with shoreface and delta front deposits (delta front association; Fig. 3.32e).
- Shoreface/delta front alternating with the inner shelf/prodelta association (Fig. 3.32d).
Most of these different facies successions show variations between two principal groups and are restricted to certain parts of the delta complex. Some of them may, however, occur and follow each other in the same area and thus display greater facies variations. Other complications may arise from additional swit- ching of delta lobes. Point bar deposits, chan- nel fills, and their associated levee sediments may become stacked due to alternating periods of downcutting and refilling of the distributa- ries (Fig. 3.32a).
When the sea level fluctuations reach ampli- tudes on the order of 50 to 100 m, prodelta sediments and inner shelf associations play a greater part in the facies successjons than de- scribed in the model of Fig. 3.32. Then, the sea may transgress beyond the former delta
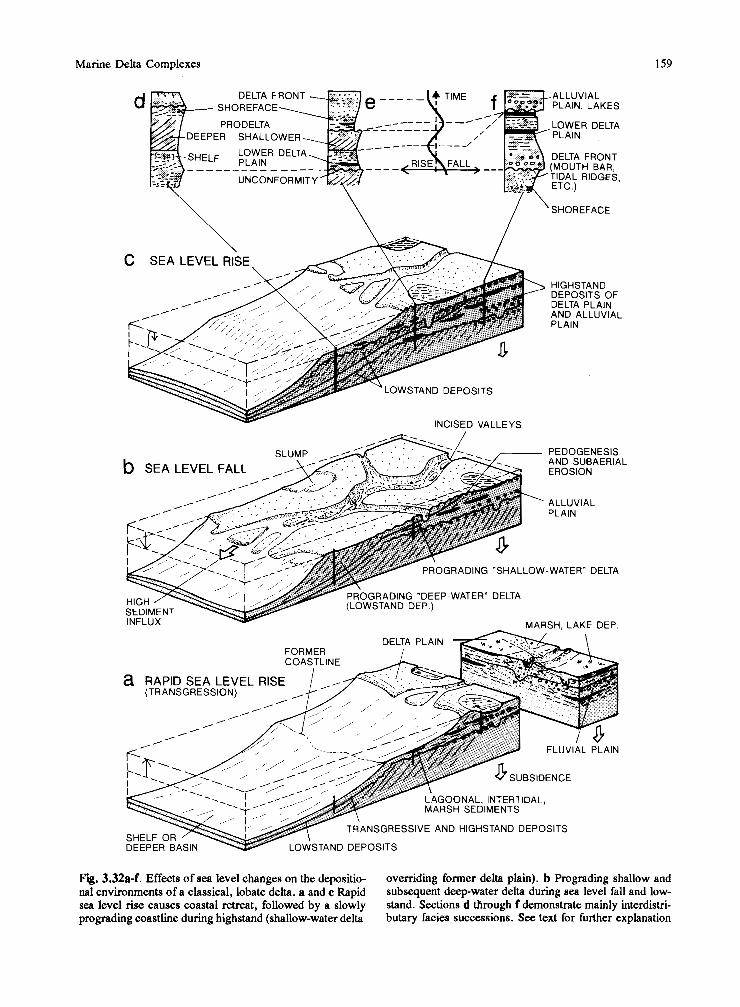
Marine Delta Complexes
Fig. 3.32a-f. Effects of sea level changes on the depositio- ovemding former delta plain). b Prograding shallow and nal environments of a classical, lobate delta. a and c Rapid subsequent deepwater delta during sea level fall and low- sea level rise causes coastal retreat, followed by a slowly stand. Sections d through f demonstrate mainly interdistri- prograding coastline during highstand (shallow-water delta butary facies successions. See text for further explanation

160 Chapter 3 Coastal and Shallow Sea Sediments
plain and prograde a long way upriver and In any case, the flat lowlands of a delta plain thus completely change the configuration of are the prototype of an environment, where the depositional area. Such scenarios are, how- even small sea level oscillations can affect the ever, rarely discussed in studies on the effects depositional processes of large areas. of sea level fluctuations on deltaic sediments.

4 Sediments of Adjacent Seas and Estuaries
4.1 Introduction 4.2 Water Circulation and Sediments.
Estuaries "Humid Adjacent Seas" with Estuarine Water Circulation "Arid Adjacent Seas" with Anti-Estuarine Water Circulation The Composite Basin of the Mediterranean Sea Basins with Horizontally Separated Inflow and Outflow Estuarine and Anti-Estuarine Large Ocean Basins
4.3 Sedimentary History of Some Modem Adjacent Seas The Black Sea The Gulf of Aden and Gulf of California The Red Sea The Persian Gulf
4.1 Introduction
Adjacent seas are shallow or deep water-filled basins of limited extent which are connected with the world oceans by a gateway or strait. Such basins may develop on both continental and oceanic crust, as well as in diverse tecto- nic settings. Prominent present-day examples are the Red Sea, representing an ocean in its initial stage, the Persian Gulf, a foreland ba- sin, the Black Sea, a kind of remnant basin, and the Gulf of California, which originated from strike-slip movements along a plate boundary. Wide river estuaries, although usually covering only limited areas, also show some features characteristic of adjacent basin.
The nature of adjacent seas is largely deter- mined by the mechanism controlling the con- nection with the neighboring ocean. Depend- ing on the dimension of this opening and the climate, such basins may have a more or less normal salinity, or they may tend to become brackish (hyposaline) or more saline (hyper- saline) than average sea water (Seibold 1970; Grasshoff 1975). Because such systems react very sensitively to small changes in the en- trance area, the sediments of adjacent basins may vary significantly with time, definitely more so than normal marine deposits.
Some adjacent seas represent immature ocean basins (e-g., the Red Sea) which evolve into wider ocean basins. Then the sediments of the adjacent sea stage may become buried deeply under younger, fully marine slope sediments or continental margins sediments (Thiede 1978; cf. Chap. 12.2). Land exposures, when the area was later uplifted, or drillholes in such sequences can reveal the early clima- tic-oceanic history of such a basin develop- ment. To understand the highly variable facies of adjacent basin sediments, we should briefly consider some general rules concerning the water circulation of such basins (also see, e.g., Seibold 1970; Seibold and Berger 1982; Pick- ard and Emery 1982). Some rules for oceanic water circulation are discussed in Chapter 5.2.
4.2 Water Circulation and Sediments
The general rules for thermohaline circulation in the oceans (Chap. 5.2) also apply for cir- culation in estuaries and adjacent basins. In addition, the circulation is largely controlled by the geometry of the connection between the open sea and the basin, i.e., by the width and depth of the opening, frequently charac- terized by a sill. Furthermore, river inflow and the climate of the neighboring land are important factors.
Estuaries
The wide mouth of a river, i.e., an estuary, may be regarded as a comparatively small, specific, frequently occurring type of an adjacent sea. Such a semi-closed elongate basin has a relatively wide connection to the open sea and on the landward end a substan- tial inflow of fresh water (Figs. 3 . 8 ~ and 4.1). The river water entering the estuary mixes to some extent with the denser sea water, but

Chapter 4 Adjacent Seas
a
VERTICALLY I * = =--- - - - - - - - - - - - - - - - -
S INCREASING
STRATIFIED
C
STRATIFIED
I
d +FRESH WATER LARGE INFLOW \ -
SALT WEDGE ESTUARY
* ------ - - - - - - S
Fig. 4.la-d. Estuary in plan view (at top) and models of estuarine water circulation in cross section (a through d). Arrows marked with S and narrowing hatching indicate increasing salinity
eventually flows out in the form of a surface current into the open sea. The inflowing sea water enters the estuary as a bottom current and later mixes with outflowing fresh water. This type of water exchange is referred to as estuarine circulation. It is interesting to note that an increase in river flow also causes a somewhat higher inflow of sea water. How- ever, the salinity of the estuarine water is reduced under such conditions. Estuaries display either vertically mixed or stratified waters. The latter type is controlled by the markedly differing salt contents of the out- flowing and inflowing waters, in contrast to the open sea where (smaller) density gradients are generated primarily by differences in water temperature.
The models in Fig. 4.1 show the four prin- cipal cases identified in nature. In a shallow estuary, the entering river water and sea water may become completely mixed and therefore unstratified (Fig. 4.lb), but salinity increases from the river inlet toward the open sea. If mixing of sea water and fresh water is less effective, which occurs particularly in deep estuaries with a sill, the water body displays a more or less pronounced and stable density stratification (Fig. 4.lc and d). Very stable conditions are typical for deep fjords, as for example along the Norwegian coast. A large river inflow can create a fresh water layer over the total length of the estuary, which is underlain by a wedge-like salt-water body. As a result of some mixing of surface and bottom

Water Circulation and Sediments 163
water, the outflowing surface current trans- ports more water into the sea than the entering river into the estuary. Thus, the outflow at the mouth of the estuary can be ten or more times the volume of the river flow.
The sedimentation rate of terrigenous material tends to be generally high in es- tuaries, reflecting the high suspended load of many rivers. It is, however, difficult to de- velop a simple facies model for estuaries. An individual estuary may pass from one cir- culation system into another as a result of strongly variable river discharge. It may be affected by tides and tidal currents (Chap. 3.2.1), causing coastal erosion, reworking and redeposition of sediments in both landward and seaward directions. Supported by a high, fluvial nutrient supply, organic productivity in estuaries is commonly high, but the number of species is restricted in brackish water subjected to frequent changes in salinity. Plant debris delivered by the river and marine fauna entering the estuary often become mixed in the estuarine sediment. Sediment reworking
and redeposition are common in shallow estuaries, whereas organic matter and fossil remains have a good chance of being pre- served in deeper estuaries due to rapid sedi- ment accumulation. Where estuarine water masses are stratified (Fig. 4.lc), the oxygen content of bottom water may drop and hamper benthic life.
"Humid Adjacent Seas" with Estuarine Water Circulation
In larger adjacent seas, evaporation from the water surface of the basin becomes an impor- tant factor (Fig. 4.2). In humid climates, precipitation, P, and river discharge, R, into the basin are greater than water loss by evapo- ration, E. This situation is similar to that observed in estuaries. Therefore the term es- tuarine circulation is also used for such "humid basins".
' Present-day examples of this basin type are the Baltic Sea and the Black Sea (Figs. 4.2a
a "HUMID": ESTUARINE CIRCULATION, HIGH FERTILITY
SHALLOW (BALTIC SEA) DEEP (BLACK SEA)
VERTICAL MIXING
h LAMINAED, RICH IN ORG C
PYCNOCLINE. E CHEMOCLINE
\
AND HEAVY METAL SULFIDES
b "ARID": ANTI-ESTUA.RINE CIRCULATION, LOW FERTILITY
SHALLOW OR DEEP (RED SEA) DEEP. SEGMENTED (MEDITERRANEAN SEA)
SINKING OF HIGH-DENSITY WATER (EVAPORATION, COOLING IN WINTER)
---. - -. . . . . y . . . . -.
INTERMEDIATE WATER HIGH SALINITY PARTIALLY LAMINATED
Fig. 4.2a,b. Circulation models for adjacent seas with shallow, narrow entrances. See text for further explanation

1 64 Chapter 4 Adjacent Seas
and 4.4). They are characterized by a narrow, shallow entrance, allowing the denser sea water to enter the basin as subsurface inflow, while the less saline water from the basin flows as surface current out into the sea. The Gulf of California also displays estuarine circulation. However, in contrast to the pre- vious examples, its opening to the Pacific is wide and deep and therefore readily allows subsurface inflow of cold and comparatively dense intermediate ocean water (Fig. 4.5, see Chap. 4.3 for further details).
Baltic Sea. This fairly shallow basin (average depth about 100 m) corresponds more or less to the vertically mixed estuary model (Fig. 4.lb). Its water mass is largely unstratified and was well oxygenated in pre-industrial times, apart from some deeps with water depths up to 460 m. The salinity of the Baltic Sea (usually less than 10 to 15 !Xi) increases from the landward side toward the opening(s) to the normal saline North Sea. Consequently, stagnant stratified waters only developed in some marginal bays and deep depressions in the central part of the basin. However, the redoxcline rose during the last 20 years due to man made "eutrophication" (cf. Chap. 2.5.1) with the result that about one third of the Baltic Sea bottom ( r 75 m of water depth) is now covered by laminated sediments (Jonsson et al. 1990). Nutrients for aquatic life are delivered by rivers from the neighboring land areas as well as by erosion of sediments in the coastal zones. Therefore, production of organic matter can be high, and some of it may be preserved in the sediments, particularly in the deeps mentioned above where benthic life is reduced or missing due to oxygen deficiency (for more details see, e.g., Hinz et al. 1971 ; Seibold et al. 1971 ; Kijgler and Larsen 1979). Similar depositional conditions are also realized in many deep fjords along formerly glaciated coasts where fresh- water enters the sea.
Black Sea. The modem, approximately 2000 m deep Black Sea is an example of estuarine circulation with distinctly stratified water masses (Figs. 4.ld, 4 2 , and 4.4). Its connection with the Mediterranean Sea via the Bosporus strait is narrow and only about 40 m deep. Because the Black Sea also belongs to the "humid" basin type, its out- flow at the Bosporus is stronger than subsurface inflow. Nevertheless, the limited inflow of sea water has filled the major part of the modem deep basin with saline water. Thus, the bottom and intermediate water mass of the Black Sea has a salinity of about 22% and is therefore much denser than the surface water. Mixing between these two water masses is hampered by the pronounced pycnocline, which also acts as a stable chemocline separating well oxygenated, nutrient-rich surface water f r ~ m stagnant, oxygendeficient deeper water. The surface water exhibits phytoplankton productivity, including calcareous nannofos- sils which accumulate on the sea floor. The anoxic deeper water contains H2S and does not allow any benthic life apart from anaerobic micro-organisms. For this reason, the bottom sediments are well laminated and fairly rich in organic matter and heavy metal sulfides (see Chap. 4.3 for further details and the sedimentary history of this basin).
"Arid Adjacent Seas" with Anti-Estuarine Water Circulation
Adjacent "arid basins" are characterized by an excess in evaporation, E, over the sum of precipitation, P, and river runoff, R. As a result, the water surface of these basins is slightly inclined towards the land (Fig. 4.2b), particularly if the connection to the open sea is limited. In contrast to the "humid basin", sea water flows as a .warm surface current into the arid basin (anti-estuarine circulation) and tends to become increasingly saline due to continued high evaporation. Examples of this basin type are the Red Sea, the Persian Gulf, and the Mediterranean Sea.
Red Sea. At the northern end of the Red Sea, far away from the opening to the Gulf of Aden, the salinity becomes 42.5 Yw, and the water temperature reaches 30 OC in summer. In winter the surface water begins to sink as a result of the combined effect of increased salinity and falling temperature (about 20 "C). Thus, the deeper water is forced to leave the basin as subsurface outflow, which may form an intermediate water layer in the Gulf of Aden. In the Red Sea, the deep water is surprisingly warm (2 20 OC) up to a depth of more than 2000 m and has a salinity of > 40 Yi. Apart from some special deep brine pools (Degens and Ross 1969), water stratification is absent, and the oxygen content is high throughout the basin. However, planktonic and benthic biogenic productivity in this basin are only moderate, because river discharge and nutrient influx are very low. On the other hand, these conditions are favorable for the growth of coral reefs, mainly fringing reefs which border the coasts on both sides of the Red Sea. The Holocene deep-sea sediments of this basin consist mainly of biogenic carbonate; laminated beds with high organic carbon contents are absent. At the northern end of the Red Sea, carbonate ooids are formed in shallow water. The sedimentary history of this basin is briefly described in Chapter 4.3.
Persian Gulf. In contrast to the Red Sea, the Persian Gulf represents an example of a shallow adjacent sea with a somewhat wider opening to the ocean (cf. Fig. 4.6). The mean depth of the gulf is only 25 m; water temperatures vary between 15 "C in the southeastern part near the entrance and about 35 OC in the shallow western and southwestern regions. In the latter areas, the salinity in- creases (40 to 50 %) and may reach values up to 100 % in the tidal zone. The tidal range is mostly between 0.5 and 1 m. In spite of the inflow of a large river, the Persian Gulf shows the characteristics of an "arid basin". It is well oxygenated and provides a limited supply of nutrients for surface productivity. Biogenic carbonate is the most important constituent of the sediments; it also contains plankton influenced or camed by surface currents from the Indian Ocean. On the particularly arid southwestern side of the basin, calcareous oolites are common, and aragonite is precipitated in the hypersaline intertidal zone as cement, thin crusts, or grain coatings (ooids). Some reefs grow along the coast and on topographic highs within the

Water Circulation and Sediments
shallow southwestern part of the gulf. In the supratidal zone behind the reefs and barrier islands, coastal sabkhas occur (Chap. 6.4). Some information on the history of this basin is given in Chapters 4.3 and 14.3.
"Arid basins", or lagoons with a small opening to the ocean, also tend to develop highly concentrated brines and to precipitate marine salts (Chap. 6.4). The present entrances of the Red Sea (about 25 km wide and 140 m deep) and Mediterranean Sea are too wide and deep to permit significant brine concentra- tions, but during the late Miocene thick salt deposits were generated in these basins (Chap. 6.4.1). As in the Black Sea, the Red Sea and the Persian Gulf experienced drastic changes during their history, leading to pronounced variations in their sedimentary records (Chap. 4.3).
The Composite Basin of the Mediterranean Sea
The Mediterranean Sea is divided into a western and an eastern deep basin by a sill between Sicily and the North African coast (Fig. 4.2b). The eastern basin in particular is characterized by a large excess in evaporation over precipitation, leading to relatively high water temperatures and salinities. Three dif- ferent water masses can be distinguished in this type of basin: Surface water, intermediate water, and deep bottom water, which interact in several ways. Intermediate and bottom waters are formed in winter, when cooling leads to an increase in density. The inter- mediate water flows back over the mid-basin sill and out as an undercurrent through the Strait of Gibraltar into the Atlantic Ocean. The deep water is somewhat cooler, and it circulates more slowly than the other water masses. It mixes to some extent with inter- mediate water and flows out into the Atlantic.
Today, the oxygen content of the deep water is fairly high in both basins, but during the early Holocene and during several inter- vals within the Quaternary, the bottom water in the eastern basin, including the Adriatic Sea, was more stagnant and repeatedly deplet- ed of oxygen. During the last 0.5 Ma, up to 12 discrete, basin-wide, organic-rich sapropel layers formed in the eastern Mediterranean, which may be associated with periods of high, monsoonal precipitation in eastern Africa and the general climatic changes on the nearby land masses (Rossignol-Strick 1985; Ten Haven et al. 1987; Murat and Got 1987). As a
result, fresh water flooding by the Nile River may have caused the influx of land-derived organic matter and have provided nutrients for high marine organic productivity. In addition, the increased freshwater discharge favored the formation of stratified waters and thus prevented convective overturn and ventilation of bottom water. Whether or not a current reversal in the Strait of Gibraltar occurred during the transition from the last glacial phase to the Holocene, as well as whether additional reversals resulted from earlier Pleistocene climatic changes, is con- troversial (Diester-Haass 1973; Huang and Stanley 1974).
All the larger and smaller basins of the Mediterranean Sea contain similar fills (Bouma 1990), showing the following sequence:
- Pliocene to Quaternary predominantly clastic sediments.
- Miocene evaporites. - Older deep-water sediments.
The present-day basinal sediments of the Mediterranean are largely hemipelagic muds with low to medium carbonate contents pro- duced mainly by foraminifera and coccoliths. In addition, several mid-sized fans in front of major rivers (e.g., Rhone, Ebro, and Nile Rivers) and many smaller ones are observed. In some regions, various volcaniclastic sedi- ments play a role. Sedimentation rates are on the order of 10 to 30 cm/ka, but locally may be considerably higher, particularly where mud flows and mud turbidites play a role (for further details see Stanley 1972, 1977; Emel- yanov 1972; Wezel 1980; Stanley and Wezel 1985; Van Hinte et al. 1987).
Basins with Horizontally Separated Inflow and Outflow
Some marginal ocean basins have a horizontal- ly separated inflow and outflow (Fig. 4.3 b; Pickard and Emery 1982). Due to the gain or loss of heat, salinity, and fertility in the adjacent sea, the characteristics of the out- flowing water may deviate considerably from those of the inflow. Consequently, organic production and sediments may differ on the inflowing and outflowing sides of the mar- ginal sea. Present-day examples of this basin type are the Caribbean Sea (the American counterpart of the Mediterranean) and larger, marginal parts of the world oceans, such as the Norwegian-Greenland Sea.

Chapter 4 Adjacent Seas
HIGH TIDES
INFLOW OF INTERMEDIATE SEPARATED INFLOW WATER. RICH IN NUTRIENTS AND OUTFLOW
Fig. 4.3. a and b Contrast between widely opened adjacent huge sediment drift bodies to the south of the ridge. Asym- basin with surface outflow and intermediate water inflow metric sediment distribution is briefly discussed in text. (e.g., Gulf of California, cf. Fig. 4.9, and basin with NACNorth Atlantic Current; NCNorwegian Current; NCC horizontally separated inflow and outflow of surface water Norwegian Coastal Current; EGCEast Greenland Current; (e.g., Caribbean Sea). c Norwegian-Greenland Sea with JMC Jan Mayen Current; WSC West Spitsbergen Current. simplified surface current pattern and bottom currents in (Based on Stow and Holbrook 1984; Thiede et al. 1989; the neighborhood of the Greenland-Iceland-Scotland Ridge. Bohrmann et al. 1990) Note special sites of bottom water overflow and associated

Water Circulation and Sediments
The Caribbean Sea
The surface water circulation of the warm Caribbean Sea is characterized in the southeast by the inflow of a portion of the trade wind- driven South Equatorial Current through the Lesser Antilles Islands, and in the northwest by outflow df Caribbean water through the Straits of Florida (Gordon 1966). Surface water temperatures are high throughout the year (25 to 28 OC), and salinities are slightly above average (34 to 36.5 %). Such conditions, in conjunction with limited nutrient supply, enable optimal coral reef growth. The shape and extent of carbonate shelves, associated with the Caribbean islands and coral reefs, are among other factors influenced by the wind pattern and surface current system (Adey and Burke 1977; Geister 1983). The shelf off west Florida and the platforms of Florida and Campeche represent outstanding examples of a carbonate province.
In contrast to the Red Sea, the water masses of the Caribbean are distinctly stratified due to the wide connection to the Atlantic. Conse- quently, the Caribbean deep water has a much lower temperature and is less saline than the surface water (Gordon 1966). The bottom waters of the deep Colombian and Venezuelan basins are well oxygenated, apart from a small area in the southeast (Cariacq Trench). The deep-sea sediments of this region, however, exhibit no clear relationship with the sepa- rated inflow and outflow of surface currents. This may result from the topographic and tectonic complexity of the Caribbean Sea and its transition into the Gulf of Mexico (Nairn and Stehli 1975). Some of the basins, such as the western part of the Gulf of Mexico and the Colombian basin in the western Caribbean, receive large amounts of terrigenous material delivered by major rivers, as well as vol- caniclastics from different sources within the area. These sediments build delta cones and deep-sea fans, including turbidites, and dilute the biogenic sediment production in various ways. The Neogene pelagic sediments are predominantly nannoplankton-foraminifera1 oozes, reflecting the high temperature and limited nutrient content of the surface waters.
The Norwegian-Greenland Sea
This Sea represents the northern North Atlan- tic and forms a subpolar deep-sea basin to the north of the Greenland-Iceland-Faeroe- Scotland Ridge (Fig. 4 .3~) . The depositional
environment of this basin is markedly asym- metric as a result of basin morphology and water circulation (Thiede et al. 1986). On the eastern side, the relatively warm surface water of the Norwegian Current (4 to 13 OC, salinity about 35 %), originating from the northern branch of the Gulf Stream, flows northward and transports nutrient-poor water masses and heat into the basin. The sediments below this current tend to be relatively rich in biogenic carbonate, although the sediments of the Norwegian-Greenland Sea are predominantly derived from terrestrial sources. By contrast, the outflowing East Greenland Current is cold (- 1.5 to + 2' C) and less saline (31 to 34 %), due to waters entering from the Arctic Ocean. It is richer in nutrients than the Norwegian Current and enables a relatively high pro- duction of siliceous phytoplankton (diatoms) during the warmer season and thus the depo- sition of sediments rich in biogenic silica (Bohrmann 1988). In addition, the East Greenland Current carries ice-rafted materials southward. At present, the deep waters of the entire basin have high oxygen contents.
The sediments of the Norwegian-Greenland Sea reflect the Neogene to Quaternary changes in climate and current patterns (Bohrmann 1988; Bohrmann et al. 1990). In the lower to middle Miocene, biosiliceous sediments rela- tively rich in warm-water species and marine organic matter prevailed. High fertility may have been caused by river-supplied nutrients (not by upwelling). With an increasingly cooling climate in the upper Miocene and Pliocene, the Norwegian Current and import of pelagic carbonate became stronger. Simul- taneously, bottom water from the Norwegian Greenland Sea began to flow over the Green- land-Scotland Ridge into the North Atlantic Ocean and caused the formation of very large, elongate sediment ridges (or "sediment drifts", Fig. 4 . 3 ~ ; Stow and Holbrook 1984; Swift 1984).
In the western part, the Greenland Sea, mainly biosiliceous sediments were deposited, while the eastern basin, the Norwegian Sea, was characterized by both calcareous and siliceous sediment components. Ocean cir- culation varied from stronger to more reduced inflow of Atlantic surface water. As a result, the sediment composition fluctuated from carbonate-rich to opal-rich sections. Inten- sified bottom water circulation is also evident from several hiatuses found in drill cores. A significant contribution of ice-rafted material and pronounced, glacial-induced cyclicity in the sediments began not earlier than 1 to 1.2

Chapter 4 Adjacent Seas
Ma B.P. (Henrich 1990). During cold periods, the southward prograding polar front, sea ice, and lowered sea level led to a marked decrease in water exchange with the Atlantic, reduced oxygenation of the deep water masses, and sediments characterized by higher proportions of organic matter and biogenic silica.
Estuarine and Anti-Estuarine Large Ocean Basins
Finally, the terms "estuarine and anti-estua- rine circulation" can also be applied to large ocean basins (Berger 1970, 1976), which may also exchange their water masses. For exam- ple, the present-day Atlantic Ocean exhibits deep-water outflow into the Pacific and thus anti-estuarine circulation. Consequenctly, the Atlantic tends to accumulate more carbonate and less silica than the Pacific, which in turn exhibits higher fertility, especially for bioge- nic silica, and increased carbonate dissolution. Generally, oceanic basins with estuarine cir- culation tend to develop stagnant bottom wa- ters and to accumulate anaerobic sediments. Another consequence of slow inter-oceanic water exchange is the fact that, for example, Pleistocene carbonate-rich layers in deep-sea sediments are not necessarily coeval in the Atlantic and Pacific Oceans (Grotsch et al. 1991).
4.3 Sedimentary History of Some Modern Adjacent Seas
The Black Sea
The young sedimentary history of the Black Sea is particularly interesting (Fig. 4.4), but still controversial (Degens and Ross 1974; Hsii 1978; Steininger and Rogl 1984). Apart from climatic variations, there are two reasons for the special development of this basin: (1) The Black Sea is not connected with the world oceans, but with another marginal sea, the Mediterranean, and is therefore strongly affected by the history of the latter basin; and (2) the shallow, narrow opening of the Bospo- rus has probably existed only for short time intervals, i.e., at present, in the Late Pleis- tocene, and in the Miocene. During these periods, the depositional environment and sediments of the Black Sea were influenced by inflowing marine waters (Fig. 4.4e, Sections A and C).
Miocene-Pliocene Development
In the late Miocene, the Black Sea and Caspian Sea were euxinic basins with marine fauna. During the subsequent "salinity crisis" in the latest Miocene (Chapter 6.4), the eastern Mediterranean Sea was reduced to some small relic basins (Steininger and Rogl 1984) and, simultaneously, the Black Sea (as well as the Caspian Sea) were closed off from the ocean and formed lakes, which is indicated by the presence of endemic fauna and shallow-water carbonates (Fig. 4.4e).
In the long interval between the late Mio- cene and late Pleistocene (Fig. 4.4, Section B), the Black Sea was a fresh to slightly brackish water lake with predominantly carbonate deposition. This period is characterized by pronounced siderite formation and climatically controlled alternation of marly and calcareous beds accumulated under changing redox conditions (Fig. 4.4). During the Late Pleis- tocene, the depositional environment fluc- tuated several times from lake to adjacent sea conditions with marine influence, because the glacial sea level in the Mediterranean repeat- edly rose above or dropped below the sill depth of the Bosporus. The organic matter of the last lake phase is prdominantly of terrest- rial origin (Calvert and Fontugne 1987).
The Holocene Black Sea
The modern situation of the Black Sea began about 7000 years ago, when the Holocene transgression had reached the sill depth of the Bosporus and enabled the spillover of sea water into the former fresh to brackish water lake (Degens and Ross 1974; Degens and Stoffers 1980; Stanley and Blanpied 1980; Glenn and Arthur 1985). It took another 4000 to 6000 years until the present-day environ- ment was established. During this interval, saline, anoxic bottom waters expanded and finally filled the major part of the basin. This development can be deduced from hydrogra- phic reasoning, as well as from dated sediment cores taken from the abyssal plain and basin slope. Surface water productivity was high during this transitional interval and led to the accumulation of laminated sapropel rich in organic matter (up to about 15 % organic carbon) and a carbonate content on the order of 10 % (Calvert and Fontugne 1987). A typical deep-water sequence is shown in Fig. 4.4d, but intercalations of mud flow deposits are omitted, which may occur between the uppermost two units.

Water Circulation and Sediments
C : CONNECTED WITH MEDITERRANEAN
> 800 I m
CARBONATE BRECCIA VIA BOSPORUS SHALLOW I
%DRY" PHASE I --+ LAMINATED CARBONATES B : LAKE (SHALLOW WATER)
I
A : A S C I
MIOCENE (?) A I BLACK SHALE
Fig. 4.4a-e. Model of a "humid", Black Sea-type basin d PleistocenelHolocene sediments of the basin center. e with surface outflow of low salinity and more saline sub- Neogene sediments drilled at DSDP Site 380 in the Black surface inflow. a Basin configuration and chemocline. b Sea (simplified sequence; age determinations are uncer- and c Relationship between salinity (S), temperature fT), tain). (Based on Degens and Ross 1974; Hsii 1978; Degens and chemical parameters with depth below water surface. and Stoffers 1980; Calvert and Fontugne 1987)

Chapter 4 Adjacent Seas
The last one to two thousand years in Black Sea evolution are characterized by a shallow, rather stable chemocline, separating oxyge- nated, fairly fertile surface water from a thick deep-water mass which is anoxic and contains considerable quantities of H S, NH , and P (Fig. 4.4b and c; also see drasshofi 1975). Most of the hydrogen sulfide is produced by bacterial sulfate reduction within the water column. After a peak in organic carbon depo- sition about 5000 years ago, the rate of or- ganic carbon accumulation has tended to slow, because the rising chemocline/pycnocline has reduced the recycling of nutrients and thus surface water fertility. The uppermost, varved coccolith ooze on the abyssal plain commonly contains between 1 and 4 % of organic carbon and between 15 and 55 % of carbonate. The accumulation rate of organic carbon is low in comparison to that of modern, highly pro- ductive coastal upwelling zones (Chap. 5.3.4).
Consequently, the formerly widely held opinion that the Black Sea provides a par- ticularly effective depositional environment for hydrocarbon generation, should be sig- nificantly modified. Such a favorable situation only existed during relatively short periods, as for example during the last 7000 years (also see Chap. 10.3.3).
Gulf of Aden and Gulf of California
Both the Gulf of Aden and the Gulf of Cali- fornia are rather narrow, deep oceanic basins affected by strike-slip movement (Cochran 1981; Moore and Buffington 1968; Curray, Moore et al. 1982a). Their spreading axes exhibit several offsets and thus generate a number of deep subbasins. Both gulfs have wide, deep openings to the world oceans, which allow the exchange of intermediate and bottom waters without the restraints of a barrier. For this reason, the salinity in these basins is normal marine.
The Gulf o f Aden
The hemipelagic Neogene sediments of the Gulf of Aden consist predominantly of nanno oozes, with varying proportions of land- derived material and calcareous, shallow- water biogenic components. The planktonic component does not deviate markedly from that of the Indian Ocean (pelagic nanno oozes and minor proportions of oozes rich in foram- inifera and radiolaria, Cronan et al. 1974).
In contrast to the Red Sea (see below), surface salinities and temperatures during the last glacial period did not differ very much from present values, but plankton productivity may have been lower. Thus, the "glacial" sediments in this region show lower carbonate contents, lower organic carbon values, and a reduced abundance of aragonitic pteropods than the present-day sediments. While the strait of Bab a1 Mandab is kept practically free of sediment by the outflowing bottom cur- rents, the sedimentation rates in the Gulf of Aden beyond the influence of these bottom currents are unusually high (100 to 170 cm/ka for wet sediment, containing about 50 % car- bonate; Einsele and Werner 1972).
The Gulf o f California
The narrow, deep Gulf of California shows some special features, which are summarized in a simplified model (Fig. 4.5). After a proto- gulf stage on continental crust, characterized by a shallow-marine basin, the modern Gulf of California began to grow 4 Ma B.P. as a result of rifting and strike-slip movements along transform faults. Presently, the gulf is in an early drifting stage in which new oceanic crust is generated in several specific spreading troughs separated by comparatively deep sills (Fig. 4.5, cf. Chap. 12.8; Curray, Moore et al. 1982a). The long, rather deep gulf is sur- rounded by mountainous regions and exhibits rugged, complicated sea floor topography (van Andel 1964; Einsele and Niemitz 1982), which favors the entrapment of sedimetits within the gulf. Because of its wide, deep opening, the tidal range in the gulf is high at its shallowing, narrowing northern end. The climate ranges from arid in the northern region to moderately humid in the south. In spite of the high relief and several rivers entering the basin, the hemipelagic deep-water sediments and rede- posited gravity mass flows (mud turbidites) are predominantly fine-grained.
The most striking hydraulic feature of this basin is the subsurface inflow of very large volumes of cold, nutrient-rich, intermediate ocean water and the outflow of warm surface water (Roden 1964; Calvert 1966). Seasonally changing offshore winds cause upwelling of nutrient-rich deeper water masses along the eastern or western margin of the gulf. These generate plankton blooms, with diatoms being the most abundant group with minor propor- tions of radiolaria, calcareous nannofossils and foraminifera. Most of the silica necessary for

Modem Examples, Sedimentary History
PROGRADING HIGH WIDE SHELF WITH SEASONAL UPWELLING,HIGH FERTILITY, DELTA-TIDAL TIDES BIOCLASTS AND PRODUCTION OF DIATOMS FLAT COMPLEX, I /
-APART BASIN
(MAINLY MUD
RIVER-DERIVED SEDIMENTS SLOPE BASIN
SUBMARINE
BASIN OUTFLOW OF SPREADING WATER PLAIN SURFACE WATER RIDGE
SLOPE SEDIMENTS SEDIMENTS OF ABYSSAL SEDIMENTS (BELOW UPWELLING) PULL-APART BASIN AT WIDE ENTRANCE OF GULF
HOMOGENEOUS DIATOM. MUD
THlN MUD TURBlDlTES
SANDY TURBlDlTE
(VARVED)
THlN DOLOMITIC
DIATOM. MUD AND MUD TURBlDlTES
MUD FLOW, SLUMPS
DOLOMITE -CHERT
LAMINATED DlAl DOLERITE SILL
INTRUSION
--- -OM. MUD ---
DIATOM. MUD AND MUD TURBlDlTES
-DIATOM. MUD
MASS FLOW SAND AND GRAVEL
DIATOM. MUD OR MUDSTONE AND MUD TURBlDlTES
OCEANIC CRUST
Fig. 4.5. a Gulf of California-type marine strikeslip basin, ductivity along both wasts of the gulf. b through d Sim- with several deep spreading centers and wide, deep open- plified sediment sections at different sites within the gulf ing to the ocean. Inflow of intemdiate, wld, nutrient-rich (locations marked in a). (Based on van Andel 1964; Cal- water, causing seasonal upwelling and high plankton pro vert 1966; Curray, Moore et al. 198%)
Chapter 4 Adjacent Seas
diatom skeletons is derived from inflowing ocean water. Partial mineralization of the plankton leads to an oxygen minimum zone at intermediate depths along the slopes, as well as to annual varves, consisting mainly of dia- toms (seasonal high plankton production) and fine-grained detrital material swept into the gulf by seasonal rains.
The exceptionally high primary producivity of these upwelling systems is also indicated by the enrichment of trace elements, such as P, S, Mo, Se, and Cd, in com- parison to average shales (Brumsack 1986a).. Calcareous skeletons are partially dissolved and normally constitute only a few percent of the sediment. During diagenesis, thin, interbedded dolomites can form.
The sedimentation rate on the slopes below the zones of coastal upwelling is very high (about 400 to 600 m1Ma of porous sediment, corresponding to approximately 100 to 150 mlMa of dry, solid rock).
A large proportion of the slope sediments is redeposited and accumulates as mud turbidites in the deepest troughs of the subbasins. The mean sedimentation rate of the 4 Ma old modern gulf is about 50 m/Ma (dry, solid material). This value does not represent the present sedimentation rate, but is calculated from the total sediment volume, taking into account the growth of the gulf (cf. Chap. 1 1.3: extensional basin filling). Biogenic silica has contributed about 15 % of the total sediment volume. Locally, the sedimentation rates have varied from practically zero on bathymetric highs to 1000 m/Ma in some of the spreading troughs (Einsele and Niemitz 1982).
The organic matter in the basin and slope sediments is predominantly of marine origin, derived mainly from diatomaceous proto- plasm. Its concentration is highest (2 to 4 % organic carbon) in the sediments accumulated below the oxygen minimum zones along the basin slopes. Sediments in the deep basins contain less organic carbon (mostly 1 to 2 %), because the bottom water characteristics fluctuate between anaerobic and slightly aerobic. Part of the organic matter transported by mud turbidites into the deep subbasins, however, is land-derived. Varved sections are richer in organic carbon than homogeneous layers. On the average, the sediments of the
Gulf of California contain about 2 % of organic carbon and are therefore potentially good sources of oil and gas (Chap. 14.1). Despite high heat flow, the organic matter is thermally immature (see Chap. 14.21, except for sediments affected by the intrusioq of basaltic sills and hydrothermal processes in the actively spreading oceanic subbasin centers. Here, thermogenic hydrocarbons occur, and diatomaceous oozes and terrigenous turbidites may be thermally altered to an epido,te-zoisite facies.
Quaternary climatic changes and sea level fluctuations obviously exerted only a limited influence on the sediments of the Gulf of California. Drilling cores display thick alter- nations between laminated and homogeneous, bioturbated sediments. It is possible that the latter sections correspond with low sea level stands.
The Red Sea
The Red Sea is a young, narrow ocean basin in transitional from rifting to drifting mode (Fig. 4.6a, cf. Chaps. 12.1 and 12.2). The northern part of this basin is still in the stage of rifting, which generated a wide "main trough" on top of thinned, intensively faulted continental crust (Cochran 1983a; Le Pichon and Cochran 1988). This period of extension and dike injection lasted for about 20 Ma (since the early Miocene, Fig. 4.6b) and affected an area which is 100 to 160 km wide. The structural basin evolution is characterized by an early stage of tilted blocks caused by substantial extension, which was followed by the forma- tion of horsts and grabens, indicating rapid subsidence (Montenat et al. 1988). After evaporite deposition (see below), extension continued, accompanied by halokinetic struc- tures. In the middle and more southern part of the Red Sea, the main trough is bisected by a deep axial trough, formed by sea floor spread- ing during the last 4 Ma. To the north and south of this region, the axial trough is dis- continuous and represented by a series of deeps, alternating with shallower intertrough zones.
Fi. 4.6. a Sedimentary history of Red Sea-type, "arid" basin in a transitional stage from rifting (main trough) to driftiig (axial trough). Early rifting is accompanied by coastal and normal to hypersaline, shallow-marine sedi- ments, which are followed by thick sabkha salts and deeper water evaporites. Post-evaporite sequences in shallow and deep water environments reflect normal to slightly hyper-
- saliie conditions. b Simplified cross section of northern Red Sea. (AAer Montenat et al. 1988). c Idealized section of drill hole in axial trough (based on Stoffers and Ross 1974). d Glaciallinterglacial variations in water circulation of the Red Sea and resulting pelagic sediments. (Based on Locke and Thunell 1988)

Modem Examples, Sedimentary History
MAIN TROUGH ..A (CRUSTAL THINNING-// FRINGING I REEFS
PRE-EVAPORITE SEDIMENTS (COASTAL TO SHALLOW-MARINE SANDST., SHALES, CARBONATES, SOME ANHYDRITE LAYERS)
THINNED CONT. CRUST (FAULTS NOT SHOWN) AND PRE-RIFT PLATFORM SEDIMENTS
POST-EVAPORITE
SALT FLOW
EVAPORITES, MOSTLY HALlT INTERBEDDED AND SHALES AND DEEPER
LEVEL CHANGE WATER
b CARBONATES, MARINE PLIO- PRESENT.COAST EVAPORITES MARLS,ANHYDRlTE PLEISTOCENE
PRE-NEOGENE
FORAM. NANNO OOZE
LlTHlFlED LAYERS
RlCH INTERVALS
DARK SHALES
BLACK DOLOMITIC SILTST. AND SHALE
THICK EVAPORITES MAXIMUM (UP TO 3-4 km)
HOLOCENE (INTER GLACIAL)
FORAM. NANNO OOZE
RlCH IN ORGANIC MATTER
GLACIAL :
"APLANKTIC" ZONE, RlCH IN ARAGONITE AND MG-CALCITE, HIGH 6180

Chapter 4 Adjacent Seas
Rift-Stage Sediments with Evaporites
During early rifting, continental, coastal, and shallow-marine sediments of mostly normal salinity were deposited (Miller and Barakat 1988; Montenat et al. 1988). In addition, some evaporites and dolomites formed during short intervals.
The subsequent period (middle to late Mio- cene) is characterized by thick evaporites (also see Chap. 6.4. l) , which accumulated partially in shallow-water and coastal sabkha environ- ments (Stoffers and Kiihn 1974; Miller and Barakat 1988), but probably also in the deeper water of the rapidly subsiding basin. The evaporites reach thicknesses of more than 1000 m in the northern part and up to 3000 or 4000 m in the central and more southern parts of the basin. All these evaporites probably formed prior to the generation of the axial trough, i.e., on thinned continental crust, although evaporites are also found in the axial trough. This indicates subsequent salt flow from the flanks of the main trough into the axial trough (Girdler and Whitmarsh 1974). In the central Red Sea (DSDP Site 227), the drilled upper section of the evaporites con- tains, besides halite, several intervals of anhydrite, dark shales, and dolomites, which clearly indicate that evaporite deposition occurred discontinuously. During its "salinity crisis", the Red Sea was probably connected with the Mediterranean Sea and closed at its southeastern end. Later, the strait of Bab a1 Mandab opened and connected the Red Sea with the Gulf of Aden and the Indian Ocean.
Post-Evaporite Sediments
The post-evaporite Pliocene and Quaternary sediments recovered during the Deep Sea Drilling Project from the central graben of the Red Sea also record variable depositional conditions (Fig. 4 .6~ ; Stoffers and Ross 1974). The first strata on top of the evaporites are dark grey, dolomitic silty claystones and early diagenetic dolomites. Intervals with high organic carbon and pyrite contents point to periods of restricted water circulation in the basin (cf. Fig. 4.6d). Further development is characterized by hemipelagic nanno oozes, marls and marly claystones, which again exhibit dark, organic-rich interbeds. Locally, volcanic ashes may be intercalated. The youngest sediments consist of foraminifera1 nanno ooze and chalk, which are more or less diluted by clay and silt from terrestrial sour-
ces. This occurred particularly during periods in which the climate was wetter than today.
In the main trough and axial trough, the sedimentation rate of post-evaporite deposits was generally 30 to 60 m/Ma, but much higher and lower values occurred locally. In the axial trough of the southern Red Sea, young wet sediment accumulated at a rate of about 25 cm/ka (250 m/Ma, Einsele and Werner 1972).
A characteristic feature of the young, unconsolidated (or only slightly consolidated) Red Sea sediments is the occurrence of many lithified layers, containing high proportions of chemically precipitated aragonite and Mg- calcite. These layers obviously formed during times of glacial sea level lowstand and increas- ed salinity (Reiss and Hottinger 1984). Further evidence for this assumption is the faunal and isotopic composition of Holocene and late Pleistocene sediments in the central and southern Red Sea (Reiss et al. 1980; Locke and Thunell 1988; Thunell et al. 1988). Glacial surface and bottom water salinities were significantly higher than at present, possibly by more than 10 %. Water exchange between the Gulf of Aden and the Red Sea was markedly reduced and the bottom waters were low in oxygen. At the same time the climate was extremely arid.
During such periods, fertility in the photic zone rose in the northern Red Sea (Gulf of Aqaba), whereas planktonic carbonate pro- duction was limited in the southern regions. The resulting "aplanktic" layers also exhibit high 6180 values (Fig. 4.6d). During deglacia- tion, i.e., about 11 000 to 8000 years B.P., the sea level began to rise, but the bottom water in the Red Sea was still hypersaline and rather stagnant beneath a surface water zone of lower salinity and increasing exchange with the open sea. As a result, the sediments representing the transition from the last glacial -maximum (about 18 000 years B.P.) to the Holocene are relatively rich in organic matter.
The Persian Gulf
Since the Upper Cretaceous, the Persian Gulf has been a shrunken foreland basin in front of the Zagros fold belt (Fig. 4.7), and its deepest portion (80 to 100 m) is a structural feature running parallel to this mountain range in the northeast (Purser 1973, Murris 1985). The sediments in front of the fold belt are mainly siliciclastic sandstones, silts, and shales, but farther to the southwest an open-marine basin

Modem Examples, Sedimentary History
FOLDITHRUST BELT
x.;y - -= CALCAREOUS OOlDS I' C\ - ' *J:.
SUPRATIDAL COASTAL SABKHAS = 40-5/0 ' (EVAPORITES)
1 INTERTIDAL CARBONATES (INCLUDING ARAGONITE)
SAND DUNES
PRESENT HIGH SEA LEVEL - -/_ - - - - - - - - - - - -
10-30 rn T HOLOCENE
LAST LOWSTAND
MIOCENE
CARBONATE SAND, MUD, OR MARL
REWORKED CARBONATE AND SAND -DUNES, CARBONATE-CEMENTED
SHELLY CALCARENITE AND OOLITES
EOLIAN AND FLUVIAL SANDS, GYPSUM
I A A A - -& SHELF CARBONATES AND EVAPORITES :~-1?3 1 Fig. 4.7. Shallow, "arid" adjacent sea (Persian Gulf-type), others). Miocene to Holocene sediment sequence mainly tectonic setting, salinity (S in 460). and distribution of most characterizes shallow regions of gulf opposite to the moun- important sedimentary facies. (Based on Seibold 1970; tain range. (After Kassler 1973) Sarnthein 1972; Purser 1973; Stoffen and Ross 1979; and
has been maintained which in turn has been bordered by a shelf region characterized by carbonate and evaporite deposition. In the central basin, marls and calcareous shales have accumulated, because carbonate production has been diluted by suspended river load carried into the basin from the east and north- west. In the northwest, the Tigris-Euphrates River system has built a fluvio-deltaic com- plex out into the gulf.
Oligocene and Miocene sandstones and limestones, which are sealed by evaporites, are
the principal reservoirs of several giant oil fields. They store hydrocarbons derived from older source rocks (Chap. 14.3). The present configuration and hydrographic situation of the gulf is unfavorable for the accumulation of significant amounts of organic matter.
The late Pliocene and Quaternary history of the gulf was strongly affected by the glacial regressions and transgressions (Stoffers and Ross 1979). During low sea level stands, the basin became nearly completely dry. Emerged shallow-marine skeletal carbonates, tidal car-

Chapter 4 Adjacent Seas
bonates, and oolites were cemented and form- ed lithified layers, or they were reworked. Fluvial sediments and eolian sand dunes migrated into and across the basin (Fig. 4.7b). Consequently, the Holocene marine sediments rest on terrestrial deposits in large areas of the gulf (Kassler 1973).
The Holocene marine deposition began at about 12 000 years B.P. with carbonate sands and light muds rich in aragonite needles and pellets (carbonate content r 70 %). Under the present conditions, silty marls (carbonate
content about 55 %) accumulate in wide areas of the gulf. They are rich in biogenic consti- tuents and contain abundant high magnesian calcite. Thicknesses and sedimentation rates of the Holocene carbonate sands and calcareous muds vary according to the irregular pre- Holocene topography. Average sedimentation rates are on the order of 10 to 20 cm/ka; in depressions, sediments accumulated at a rate up to about 300 cm/ka, whereas topographic highs may be almost free of Holocene sedi- ments.

5 Oceanic Sediments
5.1 General Aspects Introduction Sediment Sources Transport Mechanisms and Sediment Types Specific Behavior of Muddy Sediments
5.2 Water Circulation in the Oceans Salinity and Density of Ocean Water Density Stratification and the Pycnocline Oceanic Water Circulation Current Speeds, Transport of Water Masses and Nutrients Paleoceanography
5.3 Hemipelagic and Pelagic Deep-Sea Sediments 5.3.1 Overview 5.3.2 Deep-Sea Carbonates and Carbonate Dissolution
Biogenic Carbonate Production Carbonate Dissolution The Dynamic Equilibrium Between Production and Dissolution of Carbonate The Chalk Problem
5.3.3 Red Clay and Manganese Nodules 5.3.4 Sediments in Zones of Upwelling 5.3.5 Siliceous Sediments 5.3.6 Marine Phosphorite Deposits 5.3.7 Sediments on Marginal and Oceanic Plateaus,
Ridges and Seamounts 5.4 Gravity Mass Flow Deposits and Turbidites
5.4.1 Gravity Mass Flows Introduction Types of Gravity Mass Movements Occurrence, Volume, and Transport Distances Deposits of Debris Flows and Mud Flows
5.4.2 Turbidites and DeepSea Fan Associations General Characteristic of Turbidites Coarse-Grained Turbidites Medium-Grained Sandy Turbidites (Siliciclastics and Carbonate) Mud Turbidites DeepSea Fan Associations Current Directions and Paleocurrent Patterns Sedimentation Rates and Frequency of Turbidite Events Concluding Remarks
5.5 Erosion and Reworking of Deep-Sea Sediments Erosional Features and Depositional Ridges Contour Currents and Contourites Stratigraphic Gaps in the Deep-Sea Record
5.1 General Aspects
Introduction
The ocean basins are the ultimate sink for all the material transported by rivers or blown by winds into the sea. In addition, they produce large quantitities of autochthonous biogenic material. In their areal extent, the sediments of the present-day deep ocean basins surpass all the other sedimentary environments by far. Even measured by volume and for a certain time slice, deep-sea sediments have presum- ably predominated over other sediment types, for example shelf deposits, for the last mil- lions of years. However, in the ancient record, a relatively large proportion of former deep- sea sediments is missing. These materials were subducted and partially transformed into metamorphic rocks at convergent plate mar- gins, incorporated into orogenic belts, and eroded as a result of uplift. Nevertheless, even in ancient rock sequences on the continents, nonmetamorphic deep-sea sediments play a great part, and their identification and inter- pretation are an important objective in basin studies and paleogeographic reconstructions.
As a result of intensive research during the last few decades, including the Deep Sea Dril- ling Project, our knowledge about deep-sea sediments in the present and ancient oceans has increased enormously. Much has been written on the distribution of marine sedi- ments in space and time in relation to the changing configuration of the ocean basins, varying climate, and paleoceanographic condi- tions (e.g., Kuenen 1950; Emery 1960; Shepard and Dill 1966; Shepard 1973; Schopf 1980; Berger 1981; Emiliani 198 1; Kennett 1982; Seibold and Berger 1982; Pickering et al. 1986; etc.). This brief summary emphasizes some general principles for the generation and dis- tribution of deep-sea sediments and includes an overview of the most important processes controlling oceanic circulation (Chap. 5.2).

Chapter 5 Oceanic Sediments
Without an elementary knowledge of these processes, many sedimentary features and their regional variations cannot be properly understood. Special case studies from both present-day and ancient ocean basins are mentioned in the references.
Sediment Sources
Marine sediments are derived from several sources. These sources contribute, on a global scale, approximately the following proportions to the present-day total sediment accumulation in the oceans, including shelf environments (Gorsline 1984):
1. Allochthonous sediments from the continents (also see Chaps. 2 and 9): - Suspended load of rivers (290 %). - Eolian dust ( s 1%). - Volcaniclastic material ( i l %).
2. Autochthonous biogenic sediments (around 10 Yo).
These values may considerably underestimate the importance of both eolian dust and fine grained volcanic ash, which are easily over- looked in marine muds (cf. Chaps. 2.3 and 2.4). If we exclude the enormous sediment accumulation in shelf seas, which catch the mayor part of the incoming river load, and only consider deep-sea environments, the minor contributors can reach much higher percentages than those listed above. In areas far away from the continents, the allochtho- nous portion of pelagic sediments probably consists mainly of wind-borne material and oceanic volcanic input. Chemical precipitation of salts in deep oceanic basins does not occur today, though it was significant during some periods in the past in deep marginal basins (Chap. 6.4).
Transport Mechanisms and Sediment Types
In addition to their source, deep-sea sediments also can be classified in terms of transport mechanisms and deposition:
- Slow pelagic settling (Chap. 5.3.1). - Redeposition of shallow-water and slope
sediments by gravity mass movements (Chap. 5.4).
- Redeposition of deep-sea sediments subse- quent to winnowing and current-reworking (Chap. 5.5).
Sediments primarily formed by slow pelagic settling are subdivided into two groups:
1. Hemipelagic sediments, deposited in the neighborhood of continents, which contain a large proportion of terrigenous silt and clay. At least 25 96 of their grain size fraction L 5 pm is terrigenous and volcanogenic in origin, or it is derived from shallow-marine sedi- ments (Berger 1974, Jenkyns 1986). The me- dian grain size of hemipelagic sediments is ~5 pm. This group may be further subdivided into:
- Terrigenous muds and mudstones (CaC03 content r 30 %).
- Volcanogenic muds (predominantly volcanic ash, CaCO, content r 30 %).
- Calcareous muds and marlstones (CaCO, content L 30 %).
2. Pelagic sediments, which are usually depo- sited at greater distances from the continents, and contain less than 25 % terrigenous mate- rial of the fraction 25 pm. Their median grain size is r 5 pm, apart from authigenic minerals and skeletons of microfossils. This group is subdivided into:
- Pelagic (silty) clays and claystones contain ing s30 % CaCOs and biogenic SiOz (calca reous clays or siliceous clays and claystones).
- Calcareous oozes, marls and marlstones, chalk and pelagic limestones, CaC0, 230 '%.
- Siliceous oozes, silicified claystones, porcel- lanite, diatomites, radiolarites, chert, SiOz 230 96.
Within these subgroups, more special types of sediments can be defined. Black shales con- taining relatively high amounts of organic matter may be either rich or poor in carbonate or silt-size terrigenous material (cf. Chap. 10.3.3). Therefore they cannot be clearly at- tached to one of the groups or subgroups listed above. Hemipelagic and pelagic sediments are frequently redeposited and partially mixed with shallow-water material by gravity mass movements, and they may be winnowed and reworked by deep bottom currents (Chaps. 5.4 and 5.5).
Specific Behavior of Muddy Sediments
Erosion, transport, and deposition of fine- grained sediments do not follow the compara-

Water Circulation
tively simple rules found for cohesionless materials such as sand and gravel. Clay and fine silt-size particles stick together due to van der Waals forces or electrostatic attrac- tions which are large relative to the small weight of the single particles. In addition, they may be bonded by organic secretions of bac- teria, algae, diatoms, and other micro-or- ganisms living on top of or within the sedi- ment (McCave 1984). Fecal pellets, consisting mainly of inorganic, fine-grained particles bound together by organic compounds, are abundant on widely extended areas of the sea floor. Furthermore, the same assemblage of particles may vary in water content or degree of compaction. The combined result of all these processes is described and measured as cohesion. Consequently, the same general type of mud may display quite different values of cohesion and thus require lower or higher critical current stresses for its erosion, which are difficult to predict. It is, however, evident that many marine muds need higher current velocities to be eroded than clean coarse silts or sands, even if their grain fabric is disturbed by burrowing organisms or other discontinui- ties. Erosion usually does not occur particle by particle, but in the form of variously sized aggregates.
Similarly, transport and deposition of fine- grained sediment depends to a large extent on the size and settling velocity of aggregates (Gibbs 1985; Kineke and Sternberg 1989). Small particles and aggregates colliding in the water column can adhere to one another and form larger aggregates. Fully flocculated sus- pensions settle much faster than their in- dividual particles do in a disaggregated state. In most marine environments, such aggregates have diameters greater than 1 mm, but under higher fluid shear close to the sea bed they break up into sizes i 100 pm unless they have strong biological binding as, for example, fecal pellets. In this broken up state the ag- gregates are deposited on smooth or rough beds, where some sorting between larger, more stable aggregates and smaller aggregates may take place.
5.2 Water Circulation in the Oceans
Salinity and Density of Ocean Water
Circulation of water masses in the oceans is the result of an interplay between the at- mosphere and the oceans. Both atmospheric
and oceanic circulation are driven by the energy provided by the sun's radiation. The nature of these two circulation systems is, however, quite different. Atmospheric cir- culation, which affects a medium of very low density, is extremely fast and complex, and is not restricted to certain basins with strict boundaries like the oceans. Circulation in the oceans is much slower, which is chiefly caused by the higher density of water in comparison to air. Thus, much more energy is needed to move thick water masses than to drive the atmosphere.
Besides absolute density, variations in den- sity also play an important part in controlling circulation systems (e.g., Pickard and Emery 1982). The density variations of sea water are controlled by salinity (S), water temperature (T), and to a minor extent by pressure. The average salinity of present-day ocean water is about 35 g of salts per kg of sea water (for exact determinations all carbonate has to be converted to oxide, while bromine and iodine are replaced by chlorine). Salinity is usually written as, for example, S = 35 %o or 35 ppt (parts per thousand). Whereas the total con- centration of dissolved salts, i.e., the salinity, varies from place to place and at different depths, the ratios of the main components of sea water are found to be almost constant in all parts of the oceans (see below). This fact is explained by the permanent mixing of water masses not only within certain oceanic basins, but also by water exchange from one basin to another. On the other hand, this homogeniza- tion of sea water is counteracted by processes continually diluting or concentrating the salt content of sea water in specific areas, for example by entering fresh water from the continents, by forming or melting sea ice, or by high evaporation in warm, shallow seas.
In the large oceans, salinity only varies bet- ween about 33 and 37 %o (Fig. 5.1 a and b). Therefore its influence on the density of sea water is generally lower than that of tempera- ture variations (Fig. 5.2a). The surface tem- peratures of present-day ocean waters vary between about -2 and +30 "C (Fig. 5.la and c). In low latitude regions the difference in temperature of surface water and deep water (>lo00 m depth) is greater than 20 "C. Pro- vided salinity and pressure are kept constant, a substantial increase in temperature, AT, leads to a significant decrease in the density of sea water (e.g., for AT = 30 "C and S = 35 %, the density changes from about I .028 to 1.022 g/cm3, Fig. 5.2a).

Chapter 5 Oceanic Sediments
OCEAN SURFACE
1 1 HEAT \I V
SALINITY s o )
0
LATITUDES
2
km DEPTH
LATITUDE
EASTERLIES WESTERLY W. TRADE WINDS WEST. W.
d DENSITY (g/cm3) C TEMPERATURE 23 24 25 26 27 1.028 0 10 20 30°C
0
LAYER "UPPER 1 - / WATER"
Fig. 5.1. a Variation in surface temperature, salinity, and average density relative to latitude. b Salinitydepth profiles in the Pacific. c Temperaturedepth profiles, thermocline, and zones of "upper water" and "deep water". d Typical densitydepth profiles for low and high latitudes. All data in a d from presentday oceans. (After Pickard and Emery 1982). e Rectangular ocean with idealized, simplified circu- lation system as a result of wind forces and thermohaline
effects (based on different sources). Note the distinct asym- metry of the gyres (STG subtropical gyre; SPG subpolar gyre), the intensified surface (SC) and bottom (BC) cur- rents along the western margin of the basin -(longer ar- rows), and the zones of coastal upwelling (CUW) along the eastern margin. ED equatorial divergence associated with equatorial upwelling (EUW); STC and PC subtropical and polar convergence giving rise to downwelling (DW)
PYCNOCLINE
2 - 1
4 ' km DEPTH I I
- 1 I I '
-
I I I
-I
3
km
' LOW, I--- HIGH t
"DEEP WATER"
LATITUDES
HIGH LATITUDE -
DEPTH 2

Water Circulation
a SALINITY ( Yoo)
10 20 30 40
I 'FREEZING POINT OF TEMPERATURE OCEAN OF MAXIMUM DENSITY
N C N
CURRENT DIRECTIONS - - - - - - - - . WITHOUT CORlOLlS EFFECT 7... WITH CORlOLlS EFFECT
NORTHERN HEMISPHERE d
COASTAL DOWNWELLING COASTAL UPWELLING
Fig. 5.2. a Density of water (Dw) as a function of salinity them hemisphere (Eckman spiral). (Stowe 1979). c Ocea- and temperature (at atmospheric pressure). Note changing nic convergence and divergence causing downwelling and temperatures of maximum density and freezing point. M upwelling as a result of the Coriolis forces in the northern mean value for present world ocean; hatchedjield 90 % of hemisphere. (After Pickard and Emery 1982). d Coastal ocean. (After Pickard & Emery 1982). b Deflection of downwelling and upwelling caused by winds along the winddriven currents due to the Coriolis effect in the nor coast, northern hemisphere. (After Stowe 1979)

Chapter 5 Oceanic Sediments
Although the effect of pressure changes on the density of sea water may be relatively high, for example between surface waters and deep ocean waters, its influence on water cir- culation is usually neglected. The reason for this is that water masses at the same depths are subject to the same pressure. Thus no horizon- tal density gradient due to pressure is generat- ed which may initiate or enhance lateral flow. Therefore, the pressure component of sea- water density will not be further discussed here. The effects of salinity and temperature on the density of sea water are generally de- picted in Fig. 5.2a. At high temperatures, the density change with A T becomes more pro- nounced than at lower temperatures. The change in density with AS is about the same at all temperatures. It should, however, be noted again that about 90 % of the ocean water covers only a very narrow range of salinities; the temperature range also remains rather limited if surface waters at low latitudes are excluded.
Furthermore, it is of interest that both the temperature of maximum density as well as the freezing point of sea water drop with in- creasing salinity. Low saline water sinks be- fore freezing, because its maximum density is already reached at temperatures above the freezing point. Consequently, the total water column is overturned until it all reaches the temperature of maximum density. On further cooling, the surface water becomes lighter and finally freezes from the surface downward. At salinities above 25 %o, the maximum density is reached at approximately -2 "C at the freez- ing point. Thus the overturning of the water column continues up to this temperature. As a result freezing is delayed.
Density Stratification and the Pycnocline
Everywhere in the ocean, the most dense water tends to sink to the bottom and the least dense water comes up to the surface. Par- ticularly in small, closed basins and basins with restricted water circulation, but also in equatorial and tropical regions of the present- day oceans, this process often leads to a rather stable density-stratified water mass. Charac- teristically, water density does not increase uniformly with depth. Usually there is a rela- tively shallow, wave-affected water layer of lower density underlain by a thick denser water mass. The transitional layer between these zones is called the pycnocline; it may frequently also act as a thermocline and/or
halocline (boundary between water masses of different salinity). Here, density increases rapidly with depth (Fig. 5.ld). As long as the surface water.remains less dense than the deep water body, for example in warm climates, and the bottom water cannot be replaced, the density stratification and the pycnocline per- sist for long time periods.
This can be observed in many lakes in warm, low-latitude regions (Chap. 2.5), in the Black Sea, or in the Eastern Mediterranean. In all these cases, the surface water may be characterized by turbulence and circulation, but the bottom waters are little affected by atmospheric forces.
The pycnocline acts as an effective barrier to water movement, either downward or upward. It is often associated with a thermocline, sepa- rating an upper warmer water mass from a deeper cooler one (Fig. 5.lc), and a chemocline indicating a major change in water chemistry. The stability of such an internal boundary layer is, however, essentially based on the rapid change in water density with depth.
In mid and high-latitude regions, where surface waters undergo cooling during winter time or are permanently cool, density stratifi- cation tends to be less stable or absent (Fig. 5.ld). It can be only maintained if the surface water has a considerably lower salinity than the bottom water and thus always remains less dense. Such special conditions are found, for example, in some Norwegian fjords or in parts of the Baltic Sea.
Oceanic Water Circulation
Circulation in the oceans is essentially driven by two mechanisms: Variations in water den- sity and winds. Since density is controlled by water temperature and salinity, the first mechanism is called thermohaline circulation. It enables deep water circulation. The second component is wind-driven near-surface cir- culation.
Thermohaline circu'lation
Thermohaline circulation is essentially con- trolled by the temperature gradient between the poles and the equator. The horizontal and vertical density distribution in the modern oceans (Fig. 5.la and d) deviates from the ideal, horizontally stratified water masses consisting of two layers of constant tempera- ture and salinity indicated above. The density of surface water changes in a north-south

Water Circulation
section through the present-day oceans as a function of water temperature and salinity (Fig. 5.1). Although salinity decreases from low latitudes toward the poles, density is grea- test at high latitudes due to a lower tempera- ture and, in places, by the ejecting of salt when ice freezes. Furthermore, density-depth profiles (as well as salinity and temperature) near the equator and tropical seas considerably differ from those at high latitudes (Fig. 5.lb, c, and d). Although both locations show the expected increase in density with depth, low latitudes are characterized by a big jump in density creating a two-layer ocean, whereas at high latitudes, the vertical density gradient is small.
Ocean water displaying such a density dis- tribution cannot be in a stable condition; it circulates. The relatively dense surface water at high latitudes sinks and is replaced by sur- face water from lower latitudes. The sinking dense water approaches the sea floor, and then flows as bottom currents towards the equator and then somewhere upwards. Such thermo- haline circulation is kept in operation as long as the nonequilibrium conditions can be main- tained. This is accomplished by continuous heat transfer from the warmer atmosphere to the low-latitude surface waters, or by heat loss from the oceans to the cooler atmosphere at high latitudes, Therefore, small ocean basins and long, narrow, east-west extended ocean regions which belong entirely to the same climatic zone, are but little affected by ther- mohaline circulation. If there was a period of more or less uniform climate on earth, even large oceans extended widely from north to south could hardly develop pronounced ther- mohaline circulation.
Wind- Driven Circulation
Wind blowing over the surface of a standing water body causes both waves and motion of the surface water. In the open ocean, waves transport energy but not water masses (see Chap. 3.1). Hence in this case, we must deal only with the second consequence of at- mospheric circulation: wind-generated cur- rents. On a gross scale, wind-driven currents reflect the global wind pattern and only move surface waters. However, surface currents are modified by the ocean basin boundaries and by Coriolis forces. The combined effect of these factors is shown in Fig. 5.le for a hypo- thetical rectangular ocean resembling the pre- sent-day Atlantic Ocean. Trade wind belts to
the north and south of the equator give rise to a north equatorial and south equatorial current flowing westward. Near the coast they turn either to the north or to the south until they reach the west wind belts in the mid-latitude regions. Then the surface waters flow east- ward, until they are divided into two branch- es, a northeast current and a southeast current.
In the northern hemisphere, the southeast current turns south along the eastern conti- nental margin and finally feeds into the north equatorial current, thus forming a large gyre with clockwise water circulation. In the southern hemisphere, similarly a counter- clockwise gyre is completed. Those parts of the eastward-directed mid-latitude currents which turn poleward can again form gyres, a counter-clockwise gyre in the northern hemi- sphere and a clockwise gyre in the southern hemisphere. Another conspicuous phenome- non, related to the rotation of the Earth, is that the currents become narrower and faster on the west side of an ocean, where the water is piled up somewhat before it flows back in other directions, both in the northern and southern hemisphere. Between the westward- flowing equatorial currents, an eastward-di- rected counter-current may develop.
This idealized current pattern in a rectan- gular ocean is, of course, substantially modi- fied by deviating atmospheric circulation and, in particular, by the irregular topography of a single or several connected ocean basins. The present South Atlantic, for example, is openly connected with the other large oceans. There- fore, water masses flowing southward feed into an Antarctic circumpolar current system, where large volumes of water sink due to cooling and initiate thermohaline bottom cir- culation flowing northward (Antarctic bottom water). Wind-driven surface currents as well as currents in deeper water are also affected by Coriolis forces. Consequently, surface cur- rent directions deviate from those of the wind (Fig. 5.2b). In the northern hemisphere, the Coriolis force deflects wind-driven currents to the right, in the southern hemisphere to the left. The clockwise gyre north of the equator and the counter-clockwise gyre south of the equator reflect this mechanism (Fig. 5.le). At the surface of a deep water body, the angle between the directions of wind and current may be up to 45" (Fig. 5.2b), in shallow water less. Below the surface, each layer of water is dragged along by the layer above it. Hence, due to the Coriolis force, each sublayer flows to the right of the overlying layer. Since the Coriolis deflection increases with slower cur-

Chapter 5 Oceanic Sediments
rent speeds, the slower moving deeper waters turn even more to the right than the surface currents. The resulting distribution of current directions at different depths is called the Eckman spiral. The direction of net water transport over all depths is 90" to the right of the wind direction. In shallow waters the de- flection of net water transport is less than 90".
Combined Effects o f Therrnohaline and Wind- Driven Circulation
The phenomenon of the Eckman spiral clearly demonstrates that wind-driven surface cur- rents and thermohaline circulation prevailing in deeper waters cannot act independently. Ocean currents are the result of the combined effects of both factors. Wind primarily causes horizontal motion, whereas the thermohaline effects primarily generate motion with a ver- tical component. Combined horizontal surface currents in places can accelerate vertical mo- tion (downwelling and upwelling) and thus intensify deep bottom currents. On the other hand, there are large areas in the ocean with little exchange between the upper water layer (300 to 1000 m deep including the thermo- cline) and deep water, whereas regions with substantial exchange between these two water masses are limited.
In the open ocean, currents generated by easterly winds near the equator tend, due to the Coriolis effect, to diverge to the north or to the south of the equator (Fig. 5 .2~) . The resulting equatorial divergence of surface waters leads to upwelling of deeper water along this zone (Fig. 5.le). The same pheno- menon is created at the boundary of op- positely directed currents if, for example, in the northern hemisphere the more northerly current flows westward (Fig. 5.2~).
In contrast, converging surface currents tend to pile up water and thus generate a downward motion (downwelling). The most prominent example in the present-day oceans is the subtropical convergence and the Ant- arctic polar front in the southern hemisphere, where eastward-directed currents are forced to converge. Here, as well as in northern polar regions, downwelling is intensified by the cooling of surface waters. Downward moving water reaches, according to its density, inter- mediate depths or the sea bottom and feeds into relatively slow subsurface or bottom cur- rents. These currents are also subjected to the Coriolis effect and thus tend to turn to the right in the northern hemisphere and to the left in the southern hemisphere.
Of particular interest to sedimentologists are bottom currents, because they may be able, at least locally, to transport sedimentary particles and even to rework silty to fine-sandy sedi- ments. Equator-directed bottom currents de- rived from downwelling, high latitude waters travel preferentially on the western boundary of an ocean, for example at the base of the continental margin (Fig. 5.le). They more or less follow the contours of the ocean basin and are therefore referred to as contour currents. Such currents may also occur on the eastern margin, but they usually flow poleward.
Upwelling and downwelling also occur in coastal waters. Onshore surface currents tend to stack up water along the coast, which will consequently begin to sink and replace deeper water (coastal downwelling). Offshore cur- rents generate coastal upwelling of inter- mediate or deep water. Due to the effect of the Eckman spiral, these processes are initi- ated or intensified by winds blowing parallel to the coast line, for example in front of a coastal mountain range (Fig. 5.2d). These rules allow one to predict from the wind direction and the position in the northern or southern hemisphere whether or not coastal upwelling or downwelling exists.
If an ocean extends into polar regions and is partly covered by sea ice during a glacial period, its circulation pattern will be modi- fied. The high-latitude area of downwelling, high-density water will move toward the equator, but the comparatively stable water stratification at low latitudes will persist. The formation of large quantities of sea ice may lead to an increase in ocean salinity by 1 to 2 %o and thus stabilize the deep water mass. In addition, temporarily melting ice can locally dilute surface water and further promote den- sity stratification. As a result of both proces- ses, thermohaline circulation may slow some- what and transport of oxygen into deep water may be reduced.
Current Speeds, Transport of Water Masses and Nutrients
Surface current speeds can locally reach values as high as 150 to 250 cm/s (Gulf-Stream, Ku- roshio off Japan), but are often considerably lower. The present-day Antarctic circumpolar current has a speed of 4 to 15 cm/s. Deep bottom currents can locally develop about the same velocity (contour currents up to 15 to 20 cm/s), but are generally much slower (1 to 3 cm/s).

Water Circulation
Because oceanic currents affect water mas- ses with very large cross sections (in terms of both width and depth) they transport enor- mous volumes of water (e.g., the Gulf Stream and Kuroshio from 30 to 150.10~ m3 s, the 6 Antarctic circumpolar current 1 10.1 0 ms/s, and the northward flowing Antarctic bottom water in the South Atlantic 18.10~ m3/s). Hence, oceanic circulation also transfers huge quantities of heat from equatorial zones into high latitudes and, vice versa, provides for cooling in low latitudes regions. In this way, the oceans also exert a very large influence on the climate and life of neighboring continents. Surface currents carry fine-grained, suspend- ed particles and living organisms, including their larvae, over long distances and thus dis- tribute life and sediments. Currents, par- ticularly those upwelling from intermediate and deep water, transfer oxygen and nutrients released by the mineralizsation of organic matter or dissolution of biogenic skeletal par- ticles (see following sections) into coastal or equatorial regions. There, in the euphotic zone to depths of several meters to several tens of meters penetrated by sun light, the nutrients enable high phytoplankton productivity and strong activity by its consumers (Chap. 10.3.2).
Paleoceanograph y
All observations discussed so far have per- tained to modern oceans under the present climatic conditions, with a strong temperature gradient from the poles to the equator and thermohaline circulation which is driven by the formation of cold bottom water in the polar regions. This and the present-day con- figuration of the ocean basins has led to a circulation pattern which prevents the exis- tence of large bodies of stagnant bottom water, apart from adjacent basins and very limited coastal sea areas (Chap. 4).
However, we still live in a "glacial world" and have to take into account that the modern oceans are poor analogs of the ancient oceans. Over the Earth's history, the configuration of the ocean basins has undergone profound changes and has significantly affected the climatic zones of the globe. The above men- tioned physical rules controlling oceanic cir- culation may have led to a circulation pattern quite different from the present one. Many workers believe, for example, that the Creta- ceous oceans developed rather stagnant, warm, and more saline bottom water. This is ascribed to a warmer, more equable climate, which
generated denser water in arid shallow water regions and, during high sea level stands, in widely extended marginal seas. This water flowed into the deep basins and formed more or less stagnant bottom water (e.g., Thierstein 1979; Berger 198 1; Hay 1987; several papers in Brooks and Fleet 1987). Thus, most of the oceanic circulation at this time may have been restricted to surface and intermediate waters. Some of the consequences of such a pattern are discussed below and in Chapters 10.3.3 and 7.5.
We are just beginning to understand such global changes in paleoceanography. In under- standing the most important features of pre- sent-day oceanic currents, one can proceed then to develop conceptions about the cir- culation patterns of ancient ocean basins. Phy- sical oceanographers are trying to quantify and simulate all these processes, in addition to many other phenomena not mentioned here.
First attempts'have already demonstrated that it may also become possible, through a joint effort of oceanographers and marine sedimentologists, to simulate the current pat- terns of ancient oceans and thus significantly improve our understanding of ancient marine sediments (also see, e.g., Witzke 1987; Berger et al. 1989; Barron and Peterson 1991).
5.3 Hemipelagic and Pelagic Deep Sea Sediments
5.3.1 Overview
The Terrigenous Component
The terrigenous component of hemipelagic and pelagic sediments is delivered as the sus- pended load of rivers and wind-borne dust derived either from arid to semiarid regions or from volcanic eruptions (cf. Chaps. 2.3.4, 2.4, and 9.4). During floods, highly concentrated suspensions near the river bed can directly reach the deep sea as underflows, but less concentrated suspensions may float for a short time as a fresh water wedge on top of sea water. As already mentioned in Chapter 3.4, clay suspended in fresh water is generally much less aggregated than in sea water. Thus it can be widely distributed (Fig. 5.3) before it comes in contact with more saline water pro- moting aggregation. Once flocculated, the settling velocity of the aggregates increases to values of several meters up to several tens of meters per day (McCave 1984). Thus their

Chapter 5 Oceanic Sediments
DEEP SEA AGGREGATES OF CANYON SLOPE GULLIES IN CERTAIN TRENCH FINE-GRAINED CATCHING REGIONS: WITH SANDY TERRIGENOUS LONGSHORE SHELF MUD EOLIAN DUST OR FAN, ETC. MATERIAL SAND TRANSPORT I VOLCANIC ASH
\ \ \ I I
CARBONATE DISSOLUTION
CARBONATE PRESERVATION
\
CALCITE COMPENSATION DEPTH, CCD '1
Fig. 5.3. a Principles of sediment distribution by surface function of water depth and the positions of the lysocline and bottom currents in deepsea environments and the and calcite compensation depth, CCD. Note that lysocline accumulation of hemipelagic and pelagic sediments. b and CCD may rise o r fall with time and from basin to Supply, dissolution, and preservation of carbonate as a basin. See text for further explanation

Hemipelagic and Pelagic Sediments
additional lateral transport is a function of water depth and the velocity and depth range of the ocean currents.
This can be demonstrated by a very simple example, which does not take into account effects of large-scale turbulen- ces: If a surface current has a mean velocity of 0.2 mls (= ca. 17 kmld) to a depth of up to 200 m, an aggregate settling from sea level with a velocity of 10 mlday can reach a point 340 km away from its original position.
However, there are also other means for trans- porting fine-grained particles or aggregates into deeper waters. Silts and clays are sorted out of river input by wave action and move offshore via nepheloid plumes associated with bottom currents (Gorsline 1984). Depending on the stratification of the water masses and the densitiy of the suspensions, such turbid plumes may migrate near the surface, at mid- depth, or they may reach the deep sea where they drop most of their suspended material. The finest-grained part of the suspension can, however, be suspensed for a long time by deep bottom currents and form the so-called ne- pheloid layer in many parts of the modern oceans (Fig. 5.3). The thickness of this layer is on the order of 100 to 1000 m, but the con- centration of suspended matter is very low.
Although fine-grained terrigenous particles are distributed in a number of different ways (including gravity mass flows as described below) over relatively long distances, it is also obvious from the current patterns discussed earlier that large areas in the oceans probably receive very little terrigenous mud. Most of this material probably stems from dustfall from the stratosphere, where fine-grained particles are rapidly distributed around the globe (cf. Chap. 4.3.5).
The Biogenic Component
The biogenic component of the hemipelagic and pelagic sediments is produced either in surface waters (plankton) or on the sea floor (benthos). In the deep sea, the latter contribu- tion to the sediment mass is of minor impor- tance, although it may be a significant in- dicator of ancient water depth. Primary planktonic production varies significantly in different parts of the oceans (Chap. 10.3.2); in addition, a great part or, in certain regions, virtually all of the organic and skeletal re- mains is mineralized or dissolved on its way to the sea floor. Thus, the ultimate contribution of biogenic components to the deep-sea sedi- ments of an individual basin may differ great-
ly in space and time. For example, the follow- ing situations can be distinguished:
1. The biogenic autochthonous component is strongly diluted by allochthonous terrigenous material resulting in hemipelagic silty clays or clayey silts, a relatively high sedimentation rate (greater than ca. 5 cm/ka), and low bio- genic carbonate and/or opaline silica contents. Many fine-grained sediments on gentle con- tinental slopes belong to this category, but they may also contain redeposited material (see below). 2. The biogenic component is moderately diluted by terrigenous material, creating hemipelagic calcareous and/or siliceous silty clays or clayey silts, and a medium sedimen- tation rate (often 2 to 4 cm/ka). 3. The biogenic component is only slightly diluted by terrigenous material, resulting in pelagic calcareous or siliceous oozes, chalks, limestones, diatomites, radiolarites etc., usual- ly with a sedimentation rate of s2 cm/ka. These sediments are particularly sensitive to relatively small environmental changes and therefore frequently produce rhythmic and cyclic sequences (Chaps. 7.1 and 7.2). 4. Partial or entire dissolution of the biogenic component and a very low influx of ter- rigenous matter may produce pelagic clay (usually reddish brown, known as red deep- sea clay) and a very low sedimentation rate ( ~ 1 cm/ka).
Under euxinic conditions and in poorly oxy- genated areas (Chap. 10.3), the sediments of groups (1) to (3) can be transformed into "black shales" of rather differing composition. Group (4) is frequently associated with the occurrence of manganese nodules (see below).
5.3.2 DeepSea Carbonates and Carbonate Dissolution
Biogenic Carbonate Production
Planktonic carbonate is produced mainly by coccolithophores (nannoplankton), foramini- fera, and free-swimming molluscs over wide areas of the tropical, subtropical and tempe- rate zones of the modern oceans. It is less abundant at high latitudes where cool tem- peratures cause the living conditions for these organisms to deteriorate and, in addition, pro- mote their dissolution in carbonate-undersatu- rated waters. Total oceanic carbonate produc-

Chapter 5 Oceanic Sediments
tion is a function of the evolution of life, i.e., the efficiency of organisms to extract calcium carbonate from sea water, the availability of calcium delivered by rivers from the conti- nents, or other (minor) sources, and the re- cycling of calcium and nutrients (particularly nitrogen and phosphorus) by the oceanic cir- culation system. In addition, plankton growth depends on the presence of special organic compounds, such as vitamins. These "micro- nutrients" are mainly produced by bacteria and required by many phytoplankton species. A summary on these and other growth factors is given by Grant Gross (1980); rates of car- bonate production are discussed in Chapter 10.2.
Over the Earth's history there have been times with low and high global marine pro- duction and preservation of carbonate. A peak in shallow-marine carbonate production oc- curred in the middle to late Paleozoic; an ad- ditional era of high carbonate production began around 100 Ma ago which has persisted into present times. Since that time the fixation of calcium carbonate as calcite by marine plankton has become an important factor.
Carbonate Dissolution
The modern oceans and their living communi- ties, including those in shallow-water en- vironments (Chap. 3.3.2), extract considerably more calcium carbonate per unit time than can be replaced by river influx of calcium hydro- gen carbonate and by smaller contributors, for example hydrothermal sources along mid-oce- anic ridges. However, the deficiency in bio- genic calcium carbonate consumption is bal- anced by the oceanic circulating system which recycles part of the extracted material. Cal- cium carbonate is dissolved in the deep sea by cold bottom currents coming from high- latitude regions (in the present oceans by Ant- arctic and Arctic bottom waters). Prior to their downwelling, these water masses flow pole- ward as surface currents. On their way to high latitudes, they become depleted in calcium carbonate but rich in free C 0 2 due to near- surface productivity, cooling, and uptake of CO, from the atmosphere.
Later, after they have sunk into interme- diate depths or to the sea floor, they can take up C 0 2 from the decomposition of organic matter on their way toward the equator (cf. Fig. 5. le). Thus, they become undersaturated with respect to calcium carbonate and therefore dissolve carbonate shells settling through deep
waters or already resting on the sea floor. Aragonite shells and thin skeletons of calcite are more readily dissolved than robust calcitic shells. Carbonate wrapped into fecal pellets has a better chance of being preserved than do free floating shells.
From mapping the sea floor and testing its surface sediments, one can find two bounda- ries (Figs. 5.3b and 5.4a):
1. A contour zone on the sea floor, where dissolution of less stable shells (consisting of aragonite) starts to reduce significantly the normal carbonate content of the sediment found at higher elevations. This boundary is referred to as the lysocline. 2. The second, deeper boundary, is known as the calcite compensation depth, or CCD. Here, the planktonic calcium carbonate supply rate is balanced by the dissolution rate.
Below this depth, the sediment should be free of calcium carbonate. In the present-day oce- ans the CCD is observed generally at depths between 3.5 and 5.5 km (Seibold and Berger 1982). It is usually depressed in low-latitude regions and below zones of equatorial diver- gence (upwelling) due to the high production of calcium carbonate, and i t is raised in high- latitude areas with low carbonate production. A higher CCD is also found along western continental margins, where coastal upwelling is widespread. In this case, dissolution of car- bonate near or at the sea floor may be en- hanced by decomposition of organic matter, which releases CO provided by the highly fertile photic zone (see below).
The Dynamic Equilibrium Between Production and Dissolution of Carbonate
For a limited geologic time period which is not affected by major climatic or other global changes, the position of the lysocline and CCD can be expected to remain constant. These boundaries then signify that a kind of steady- state condition is being maintained between (biogenic) precipitation of calcium carbonate, retrieval of calcium carbonate from the ocean by dissolution, and supply of calcium carbon- ate from outside sources. Figure 5.4e shows such a situation for the sediments of a mid- oceanic spreading center. With continuing accretion of new oceanic crust, the ridge crest moves away from its former position (from location 1 to 2) and the cooling crust subsides. As a result, the depositional area sinks below

Deep-sea Carbonates 189
SUBSIDENCE -_
CCD DROPPING , , ' I -1, I .
DECREASING SUPPLY OF TERRIGENOUS "CLAY"
ZONE OF LOW LATITUDE. COASTAL BLACK SHALE RICH UPWELLING
LAMINATED BLACK SHALE, IN HIGH LATITUDE PREDOMINANTLY
BIOTURBATED
CLAY, FREE OF CARB
Fig. 5.4. a Zones of high and low fertility, calcite compen- sions of calcareous, siliceous and clayey sediments on top sation depth (CCD) and lysocline, and corresponding dis- of oceanic crust adjacent to mid-oceanic ridge, as contml- tribution of pelagic sediments (b, c, d) in a hypothetical led by a more or less constant (e) or lowering CCD (f). g, ocean segment from the equator to polar regions (diatorna- h, i Onshore-offshore (g) and latitudinal variations (h and ceous oozes of polar and subpolar zones omitted). Note i) in the composition and bed-sequences of black shales ac- that a fluctuating CCD can cause carbonate-bearing beds to cumulated under coastal upwelling. For further explanation alternate with carbonate-free interbeds (c). e and f Succes see text

Chapter 5 Oceanic Sediments
the CCD, and the calcareous sediments sitting directly on pillow lava or basaltic flows are overlain by light gray or red siliceous sedi- ments and later by red clay.
In the history of many ocean basins, how- ever, the CCD (including the lysocline) did not maintain a constant position, particularly when long time periods are considered. Bio- genic carbonate production in shallow waters and carbonate dissolution in deep waters may be considered as a system being in a dynamic equilibrium. The steady-state model men- tioned above implies a raising or lowering of the CCD, if one or several of the parameters controlling the system are changed. Decreasing oceanic circulation, for example due to a more balanced climate between the poles and the equator, can lead to a drop in the overall fer- tility of the oceans and thus to lower car- bonate production. This in turn will reduce the need for carbonate dissolution in deep waters to keep the carbonate budget balanced and consequently cause a drop of the CCD. A similar result can be achieved by an increase in the input of hydrogen carbonate from the continents or by dissolution of emerged car- bonate buildups during low sea level stands.
In contrast, intensified oceanic circulation and mineralization of organic matter can en- hance fertility and thereby raise the CCD. The same effect may be generated by increased carbonate production on shelves and in reefal structures.
From information gathered in the Deep Sea Drilling Project, the CCD has moved up and down several times (by as much as 2 to 3 km) in the last 100 Ma (e.g., Hay 1987). Sometimes these variations were synchronous in the three major ocean basins, sometimes the CCD behaved quite differently in each. The CCD was very low around the CretaceouslTertiary boundary in the Pacific Ocean, while it stayed relatively high in the Atlantic and Indian Oceans. A CCD markedly higher than at present was found for the early Tertiary, with the result that far fewer pelagic deep-sea carbonates were preserved than during other periods.
In the transitional zones between full car- bonate preservation above the lysocline, car- bonate-bearing sediments between the lyso- cline and the CCD, and siliceous red clay (see below), a fluctuating CCD can generate an alternating succession of these two bed types (Fig. 5.4b and c, cf. Chap. 7.2). In addition, the carbonate system of the oceans is closely linked with the carbon dioxide content of the atmosphere. Warm periods in the Earth's his- tory appear to have been associated with high CO, partial pressures in the atmosphere,
which in turn promoted carbonate dissolution in the oceans (e.g., Berger 1985). This topic is currently being investigated by many workers from various disciplines.
Adjacent seas with narrow openings to the world oceans and therefore limited exchange of water masses (Chap. 4, Fig. 4.2) are charac- terized by their own carbonate budget and a CCD which may deviate significantly from those of the major ocean basins. Such smaller basins are controlled mainly by the climate and river input of neighboring continents. A high influx of calcium hydrogen carbonate and limited carbonate production, as fre- quently observed in humid, mid-latitude zones, cause the CCD to drop to or below the sea bed. Dissolution of calcium carbonate can then only take place within the sediment as a result of organic matter decomposition (e.g., in the Baltic Sea, cf. Chap. 4.2). Similarly, ad- jacent basins surrounded by hot, arid regions will not necessarily develop a high CCD, be- cause their carbonate production is usually kept low due to a shortage of nutrients, if their water exchange with the open ocean is limited. Thus, a CCD appears to be absent in most of these basins, i.e., it lies below their basin floors (e.g., in the Red Sea).
The Chalk Problem
Young, soft, calcareous muds are commonly described as calcareous oozes. Hemipelagic to pelagic oozes are transformed into chalk as a result of incomplete, moderate diagenesis (e.g., Neugebauer 1974; also see Chap. 13.1). The term chalk refers to a variety of ancient, white to light grey calcareous marine sedi- ments, which are still porous, friable, and composed predominantly of tiny, calcitic ske- letal remains, such as coccolithophorides. Apart from pure chalk, there are also chalks containing sands, larger shells, glauconite, pyrite, phosphorite (see sections below), and considerable proportions of clay (marly chalk) and organic matter (bituminous chalk).
Although chalk consists predominantly of planktonic skeletal remains, it was formed not only in the deep sea above the calcite compen- sation depth, but also in shallow seas, par- ticularly in the upper Cretaceous. The presen- ce of abundant sighted ostracods in chalk sug- gests that the late Cretaceous sea floor in Ala- bama and Mississippi was within the photic zone, i.e., not deeper than 65 to 90 m (Puckett 1991). Most of the typical, widespread chalk deposits in Europe, North America, in the

Red Clay and Manganese Nodules
Middle East, and Australia were generated during this period (Hattin 1986b, 1989; Han- cock 1989). The formation of chalk on shelves and in epicontinental seas was favored by a high sea level stand and low influx of ter- rigenous material, high production of calcitic nannoplankton, and scarcity of aragonitic skeletal remains which commonly promote lithification and cementation. Wide and stable shelves, as well as flooded continental regions were exposed to wind patterns and current systems providing nutrients for planktonic productivity.
In the examples mentioned above, the pure chalk facies may grade landward into marly chalk and mudstone or, in high-energy en- vironments, into shelly chalk and skeletal limestone. Basinward, the chalk tends to be- come laminated and richer in organic matter. On slopes and in special morphological de- pressions, part of the material forming chalk may be derived from shallower water and be redeposited by mass flows and turbidity cur- rents (Chap. 5.4). On submarine highs where continuous chalk deposition is prevented by wave and current actions, or hampered by low sea level stands, the chalk sequences are fre- quently condensed and contain hardgrounds and omission surfaces. Many chalk sequences contain chert and show rhythmic bedding in the Milankovitch frequency band (Chap. 7.2).
5.3.3 Red Clay and Manganese Nodules
Red Deep-Sea Clay
The water masses of large oceanic gyres (Fig. 5.le) have little exchange with nutrient-rich coastal waters or intermediate waters welling up in equatorial regions. Therefore the plank- tonic productivity of the central ocean basins is low and the CCD tends to rise. These basins receive little terrigenous input, and their bot- tom waters are well oxygenated. Under these conditions, the so-called red clay is deposited (Fig. 5.4a and d). In a fresh state, this extremely slowly accumulated material has a reddish brown color, because it contains finely dispersed iron oxyhydroxides as pigment. It has lost nearly all its organic matter by oxida- tion as a result of long-term exposure to oxy- genated bottom water. The clay mineral as- semblage of red clays is controlled mainly by their source areas and therefore varies in space and time. Illite, smectite, kaolinite, and chlorite are major constituents in wide re- gions. Eolian dust is assumed to contribute a
large portion of such red clays, and even some cosmic dust (spherules of nickel-iron, mine- rals of chondrites) has been discovered (Bry- ant and Bennett 1988).
In the transition zone between highly and poorly fertile surface waters, biogenic car- bonate may already dissolve in the water column, whereas part of the siliceous remains may reach the sea bottom. In this case, red clays contain considerable proportions of ra- diolaria (predominantly living in warm equa- torial waters) or diatoms (mainly from colder waters).
Manganese Nodules
In large areas of the present oceans, par- ticularly in the central Pacific, the red clay is covered by manganese nodules which may also contain various amounts of iron and relatively high quantities of nickel, cobalt, copper, mo- lybdenum, and other trace metals (e.g., Sei- bold 1978; Calvert and Piper 1984; Halbach et al. 1988). The nodules are concentrated on the sea bed and mostly become sparse some tens of cm below the sediment-water interface. For this reason it has been postulated that the nodules dissolve under reducing conditions at some depth below the sea floor and that Mn migrates by diffusion to the interface and precipitates at the contact with sea water. If the chemical environment in interstitial waters remains oxidizing, the nodules are preserved. It has been also noted that bacteria play a role in the fixation of manganese.
Most nodules are flat at their base and show concentric growth structures. Their growth rates vary from relatively high values (several mm/ka) to very low rates (several mm/Ma). The low values are even lower than the sedi- mentation rate of pelagic red clay (0.5 to about 5 mm/ka, Andreyev and Kulikov 1987; Halbach et al. 1988). No relationship was found between the growth rate of nodules and their host sediments. The finding that most manganese nodules have a higher age than the surrounding surface sediment leads to the conclusion that they "migraten upward with the sea bed. This may be accomplished either by continuous dissolution and reprecipitation, by burrowing organisms lifting the nodules, or by bottom currents, which are occasionally strong enough to move and turn over porous nodules. Bottom currents also prevent con- tinuous sediment accumulation and thus are responsible for the very low average sedimen- tation rates characteristic of deep-sea sedi- ments rich in manganese nodules.

Chapter 5 Oceanic Sediments
The source of manganese, iron, and the other metals is a matter of debate. They may derive from the metal content of organic com- pounds, which were produced in surface waters, but were decomposed at, or near the sea bottom. Other sources may be submarine exhalations and normal bottom currents con- taining the metals in very low concentrations, either in solution or adsorbed to suspended particles. In addition, the composition of the nodules is influenced by diagenesis, par- ticularly their variable Mn/Fe ratios.
In recent years, these widely distributed nodules and particularly their contents in Co, Ni, and Cu have aroused considerable interest, and tests were run by several groups for un- derwater mining of these enormous ore depo- sits. These activities, including our present knowledge on the formation and geochemistry of manganese nodules, were recently sum- marized in a special volume (Halbach et al. 1988). In ancient sediments, manganese nodules formed in the deep sea are relatively rare (Cronan et al. 1991). If they occur on top of paleo-seamounts or in former basinal set- tings, they resemble lithologically, mineralogi- cally, and geochemically the modern fer- romanganese deposits. In many cases, how- ever, they have either been subducted with their accompanying sediments and trans- formed by metamorphism, or they have been dissolved as mentioned above.
5.3.4 Sediments in Zones of Upwelling
General Aspects
In zones of coastal and equatorial upwelling, where nutrient-rich waters come to the sur- face, the productivity of phytoplankton (e.g., coccoliths and diatoms) and zooplankton (e.g., foraminifers) is significantly enhanced (Fig. 5.4a). The availability of abundant food at- tracts larger organisms (e.g., fish) which feed on the micro-organims. Although most of the primary production is used up and mineralized in the water column, the overall sedimentation rate of biogenic material increases con- siderably in zones of upwelling as compared to areas of normal fertility. Therefore, deep-sea sediments associated with equatorial upwelling usually still contain biogenic carbonate and silica and more organic matter than their neighboring sediments. This means that the CCD and possibly also the lysocline drop below the sea floor (Fig. 5.4a).
Coastal Upwelling
Preservation of organic matter, biogenic silica, and carbonate is particularly significant in zones of coastal upwelling where the nutrient supply from intermediate waters is concen- trated in rather narrow zones on the upper slope and outer shelf along continental mar- gins (Fig. 5.le). The modern oceans display four major areas of year-round coastal upwel- ling as part of the eastern boundary currents in the Atlantic and Pacific Oceans (Thiede and Suess 1983): off northwest and southwest Africa, western North America, and north- western South America. There are also areas of seasonal upwelling associated with prevail- ing wind regimes, for example in the northern Indian Ocean, off northwest Australia, and in the Gulf of California.
The lower part of the water column below coastal upwelling is often characterized by a pronounced oxygen minimum zone. Oxygen demand for total mineralization of the large quantities of organic matter produced in sur- face waters is higher than oxygen supply in the relatively short (shallow) water column. In addition, the particulate organic matter needs less time to sink through the water column and reach the sea floor than in the deep ocean. Thus, oxygen transfer from outside the zone of coastal upwelling cannot compensate for rapid oxygen consumption below the area of high biogenic productivity. Consequently, benthic life at the sea bottom is reduced or entirely absent, the sediment can become lam- inated, and a large part of the organic matter reaching the sea floor is preserved. The cen- ters of upwelling are, however, not fixed to a certain location, but may move along the coast and seaward. Similarly, the intensity of up- welling varies with time, because it is con- trolled by fluctuations in the wind and oceanic current patterns. For example, rapid oxygen depletion by a sudden plankton bloom can cause a mass mortality of fish and other or- ganisms (Brongersma-Sanders 1957).
Sediments Below Coastal Upwelling
For reasons mentioned above, black shales originating from coastal upwelling usually display frequent changes from anoxic to low- oxygen conditions, as can be seen by the ap- pearance or disappearance of a particular ich- nofauna (Savrda and Bottjer 1987,1989). Sim- ilarly, the occurrence of molluscan shell beds in black shales indicates an interval, in which

Sediments in Zones of Upwelling
the upper boundary of the oxygen minimum zone dropped to the sea floor (Schneider and Wefer 1990). Due to a high productivity of diatoms and/or radiolaria, sediments from upwelling zones are often rich in siliceous layers or chert nodules. Diatoms prevail in cool, high-latitude waters where the produc- tion and preservation of carbonate are low. In warm, lower latitude regions, the carbonate content in upwelling sediments can become rather high and attain those values typical of marls, and sometimes even those of marly limestones. During diagenesis, dolomite may form, a process which is favored by the de- composition of organic matter (Lippmann 1973; Suess et al. 1987).
The fauna preserved in upwelling sediments is characterized by a limited number of spe- cies and indicates a cooler environment than in adjacent regions. The organic matter in such sediments usually reaches a few percent, but sometimes also up to 10 % by dry weight. It is entirely or predominantly of marine planktonic and bacterial origin (Summerhayes 1983; ten Haven et al. 1990), which is an im- portant indicator for the type of black shale. The sediments in zones of upwelling may also contain abundant fish debris (bone beds) and a relatively high amount of phosphorus due to the accumulation of abundant fecal pellets and coprolites. Several trace metals, particularly U , Mo, Cd, Zn, and Ni occur in considerably higher concentrations than in normal deep-sea sediments (e.g., Baturin 1983; Brumsack 1986a and b). The sedimentation rates in coastal upwelling zones are to a large extent controll- ed by terrigenous influx.
In the Peru upwelling region, the mean sedimentation rates of late Pleistocene sediments (drilled at water depths of about 250 and 450 m) are about 7 and 17 cmlka, respec- tively (Wefer et al. 1990); older sediments accumulated more rapidly.
Coastal upwelling was certainly also an impor- tant process in ancient marine environments. The formation of many black shales is now ascribed to this mechanism not only in the Cenozoic and Mesozoic, but also in older times (Parrish et al. 1983; Parrish 1987; Pedersen and Calvert 1990). Most of these black shales occur along west-facing coasts, in settings similar to the present-day major centers of upwelling. In the completely different paleo- geographic situation in the Paleozoic, how- ever, it can be assumed that coastal upwelling also operated along east-west trending coast- lines.
5.3.5 Siliceous Sediments
Biogenic Production of Opaline Silica
Skeletons of opaline silica are produced in the modern oceans by several groups of organisms (diatoms, radiolaria, silicoflagellates, and sponges) in large quantities. By number, dia- toms are the most abundant siliceous organ- isms; in tropical regions they make up bet- ween about 30 and 75 % of the total amount of opal-concentrating organisms, in Antarctic waters 99 % (Lisitzin 1972; Blueford 1989). The most abundant group by weight, however, are the radiolarians. On the average, 1 mg of silica corresponds to 2000 radiolarian skele- tons, but 100 000 diatom cells and 250 000 dinoflagellates equal that weight (thus yielding a weight ratio of 25051). For that reason, the radiolarians today reach a weight percentage of about 60 to more than 95 % of the silica production in tropical waters, but s1 % in the Antarctic. In addition, the radiolaria have a much higher potential for the preservation in marine sediments than the other two groups (see below). Nevertheless, it is assumed that the importance of the radiolarians in the for- mation of siliceous sediments was even greater in pre-Cenozoic times.
As with carbonates, the organisms extract much more silica from ocean waters than is added by rivers and volcanic activity. Conse- quently, the sea water near the surface is ex- tremely undersaturated (it normally contains about 1 mg/l SO2), particularly with respect to opaline silica. Therefore most of the tiny tests of microorganisms (solubility around 110 mgjl; in contrast to quartz, about 5 mg/l) are already dissolved within the upper water column before they reach deeper waters, which have higher silicon concentrations, and finally the sea floor. But even here a great part of the remaining tests is still dissolved within the uppermost sediment layer (Hein and Obradovic 1989). For average conditions in the present oceans, it is assumed that per- haps 1 % of the originally produced biogenic silica is stored in the sediment. For that rea- son, there are large areas on the sea floor where biogenic silica is completely absent or can be neglected as an important constituent of deep-sea sediments.

Chapter 5 Oceanic Sediments
Biosiliceous Sediments
Preservation of Opaline Silica
The chances for preservation of siliceous ske- letal remains is enhanced if they settle com- paratively fast through the water column. This is true for relatively robust skeletons, such as those of radiolaria, and of course in shallower waters, for example in zones of coastal up- welling. Particularly favorable for their pre- servation is the incorporation of microor- ganisms into fecal pellets, which protect the skeletons from being dissolved. In addition, submarine volcanic activity, releasing substan- tial amounts of silica into the ocean, may locally reduce the dissolution of opaline silica. The most effective way to increase the preser- vation of this material is, however, high pro- ductivity in zones of upwelling. One has to bear in mind that the input of silica alone (e.g., by volcanism) into surface waters cannot enhance fertility unless other nutrients such as nitrogen and phosphorus are also available.
In order to have high concentrations of opa- line silica in sediments, the preserved part of the primary production must not be diluted by terrigenous material or carbonate. Consequ- ently we can expect highly siliceous or bio- siliceous sediments only in areas with (1) high primary productivity where (2), in addition, the influx of river-borne material is very low, and (3) the carbonate production also is so low or the lysocline and CCD are so high that most of the carbonate is dissolved in the water column or within the sediment.
Areal Distribution of Biosiliceous Sediments
In the present oceans such conditions mainly occur at high latitudes far away from the coasts. Here, diatomaceous oozes are deposited in two wide, circumpolar belts, particularly around the Antarctic and in the northern Pacific. Sediments very rich in diatoms and poor in carbonate are also found in several regions of present-day coastal upwelling, for example off southwest Africa, Peru, Baja California, and in the Gulf of California. During the Miocene, great parts of the coastal waters around the Pacific (e.g., along North America) were characterized by rapid deposi- tion of diatomaceous oozes (Monterey For- mation).
Another, less well developed belt displaying biosiliceous sediments is observed in zones of equatorial upwelling. Here the sediments are
dominated by radiolarians (see above) and contain variable amounts of biogenic carbon- ate. At the transition to red clay below the CCD, carbonate is dissolved, which may lead to a relative enrichment of biogenic silica. The widespread radiolarites in the Triassic-Liassic and Middle und Upper Jurassic Tethyan Ocean probably were also associated with an equatorial zone of high fertility (Jenkyns and Winterer 1982; Hein and Parrish 1987; Hein and Obradovic 1989). In addition, the CCD must have been very high, because radiolarites were found not only in deep basins, but also on subsiding carbonate platforms and outer shelves. A simplified model of such a scenario is shown in Fig. 5.4f. Since prolific planktonic carbonate production tending to raise the CCD is not known prior to the Late Jurassic, the high CCD was probably caused by large, widely extended carbonate platforms bor- dering the northern and southern rim of this east-west-oriented seaway. They extracted and fixed most of the carbonate available in the Tethyan Ocean.
In zones of coastal upwelling with bottom waters low in oxygen, Neogene and Recent siliceous oozes are frequently laminated and rich in organic matter. They form thick, dark layers and may contain intercalations of cal- careous beds, carbonate nodules and phospho- rite (see below). Siliceous oozes deposited in deeper water, for example on mid-oceanic ridges and in ponded basins on oceanic crust, tend to become fully oxidized and therefore red-colored (Fig. 5.5). Bioturbation in such layers is sparse or absent, because there is not enough organic matter left to live on.
Bedded Cherts
The silica of lithified biosiliceous sediments is frequently concentrated in chert bands and layers of chert nodules. Some of these features are of primary origin, other due to diagenesis. In contrast to layers deposited from pelagic settling, many rhythmically bedded radiolari- tes also represent bioclastic, fine-grained tur- bidites deposited by low-density turbidity currents. Their individual beds display a sharp lower boundary and some grading (either in grain size or in composition, see Chap. 5.4.2). They are derived from the slopes of submarine highs (ridges, hills, deep plateaus; Fig. 5.5) which receive little terrigenous material (e.g., Barrett 1982). If they accumulate below the CCD, the siliceous turbidites are devoid of carbonate. These types of red or greenish

Siliceous Sediments 195
ARAGONITE COMPENSATION HIGH FERTILITY LOW TERRIGENOUS DEPTH (LYSOCLINE) (SILICEOUS AND
CALCAREOUS
CALCITE COMPENSATION DEPTH (CCD)
SIL. SED., RED SIL. SED. (PE, TM, CT), AND GREEN (TM;CA) IN MOSTLY RED, -CA LYSOCLINE SHELF, SIL. SED. I PONDED BASINS \ I MOSTLY DARK
CCD LOWER ING WITH TIME
OLDER ROCKS
OCEANIC CRUST
RISING CCD TENDS TO CAUSE REVERSE SEQUENCES !
TM (+ CA)
Rp&! -
I-& SIL.
PE, DEPOSITION FROM PELAGIC SETTLING
TM, TURBlDlTE MUD (BIOCLASTICS)
- ' (BIoci. CARBONATE)
I SlLlCEOUS OOZE, SIL. AND CALC. PELAGIC OOZE CT, NORMAL CURRENT BANDED CHERT OR OOZE, CHALK OR LIMESTONE TRANSPORTED RADIOLARITE OR CALC. CHERT SIL. CALC. OOZE +CA, CARBONATE- ? RHYTHMICALLY AND RADIOLARITE OR CHERTY BEARING BEDDED ? BEDDED PEL. LIMESTONE -CA, CARBONATE-FREE
Fig. 5.5a-e. Siliceous sediments, e.g., radiolarites, in a elevation of the CCD and lysocline. a through e Vertical relatively narrow oceanic basin with regionally high fertili- changes in lithology due to lowering CCD (raising CCD ty, bordered by a wide, block-faulted continental margin from an initial low position causes reverse sequences). (e.g., a former uniform carbonate platform). Note the (Based on several sources, e.g., Bernoulli and Lemoine different types of radiolarites (deposited by pelagic settling, 1980; Hein and Obradovitch 1989; Vecsei et al. 1989; bioclastic mud turbidites, or current sorted, with or without Ruiz-Ortiz et al. 1989) carbonate) in relation to the submarine topography and the

Chapter 5 Oceanic Sediments
colored, banded chert layers may alternate with more or less siliceous red or greenish mudstones and are usually interpreted as deep-water deposits.
Carbonate-bearing biosiliceous sediments and cherty pelagic limestones indicate a de- positional depth above the CCD or between the aragonite and calcite compensation depth (Fig. 5.5 and Chap. 5.3.2). Successions of purely pelagic, biosiliceous sediments overlain by siliceous carbonates and pure carbonates do not, however, necessarily signify shallowing sequences, but can originate from a drop in the CCD as well (Fig. 5.5a through e). Simi- larly, pelagic limestones followed by chert layers are not always the result of subsidence and consequent deepening of the basin in question.
In particular, radiolarites in ancient rocks are frequently ungraded and show well devel- oped laminations and low-angle cross-bed- ding. Because it is unlikely that beds with these sedimentary structures have been depo- sited from suspension currents, they are as- sumed to originate from normal traction cur- rents at the sea bottom, which sorted and con- centrated hydrodynamically equivalent par- ticles (e.g., Barrett 1982; Gursky 1988; Ruiz- Ortiz et al. 1989; Vecsei et al. 1989). Due to subsequent strong compaction of the highly porous primary beds, the initially steeper ang- les of the cross-laminae have been modified. Such beds may have formed at different water depths and may thus contain carbonate and siliciclastic material (Fig. 5.5).
Silica Diagenesis
Because of the relatively good solubility of opaline silica, which is enhanced with increas- ing temperature at growing burial depths, deep-sea siliceous sediments are susceptible to marked diagenetic modifications. Near the sea floor and up to several hundred meters sub- bottom, siliceous oozes normally remain more or less unchanged and maintain a very high porosity (75 to 90 %). Below this depth range, which depends significantly on the tempera- ture gradient and other factors, the original skeletal material (opal-A) is dissolved and reprecipitated as cristobalite and tridymite (opal-CT). Sediments rich in this phase are still porous and are referred to as porcellanite. The first skeletons to be destroyed are the delicate tests of diatoms, which are followed by the more robust radiolarians and sponge needles. Later, with increasing temperature
and burial depth, these SiO, modifications are in turn transformed into quartz (chalcedony).
These processes have been described by many authors in detail (e.g., Lancelot 1973; Calvert 1974; Kastner 1981; Pisciotto 1981; Isaacs et a1 1983; Thein and von Rad 1987; Fiichtbauer 1988; Hein and Obradovic 1989; Ruiz-Ortiz et al. 1989).
Coeval with these mineral transformations, the porosity of the siliceous sediments is drastical- ly reduced in two steps (Fig. 5.6a, cf. Chap. 13), because (1) the intratest porosity of the microfossils is diminished, and (2) the normal pore space between the grains is filled with quartz cement. Layers particularly rich in primary SiO, and/or layers more porous than others may be the loci of preferential repreci- pitation of quartz (Tada 1991). Thus, they are transformed into chert beds of secondarily en- hanced SiO, concentration (Fig. 5.6a). Migra- tion of SiO, and growth of chert bands and nodules cease when the sediments become impermeable as a result of cementation.
In Mesozoic-Cenozoic clayey siliceous oozes below the present sea floor, the transformation of opal-A into opal- CT and quartz took place about 50 Ma after their depo- sition, provided the sedimentation rates and thermal gra- dients were about average (Thein and von Rad 1987). However, the silica in calcareous oozes, diatomaceous oozes, and oozes associated with reactive volcanic material can be transformed into porcellanite and quartz after shorter time periods, particularly if the thermal gradient is high.
Part of the silica released from microfossils may also be utilized to form clay minerals (zeolites) if sufficient A1203, alkali and alka- line earth ions are available in the pore water. Thus the formation of chert bands or nodules is hindered or completely prevented if the opal content in the primary sediment was lim- ited. In the case of silica-poor calcareous oozes which cannot provide enough additional ions for the generation of zeolites, the silica is diagenetically concentrated in chert nodules (Fig. 5.6b).
Their precipitation appears to start rather early in diagene- sis, because their cores are frequently richer in SiOz than their outer rims. More features of silica and carbonate diagenesis are shown in Fig. 5 . 6 ~ and d. Precipitation of both phases can be more or less coeval, that is, chert may form the center of a carbonate nodule, o r preexisting carbonate concretions may influence the formation and shape of chert. In this respect it may be important whether o r not carbonate was originally present as unstable arago- nite or high-Mg calcite in some quantity. In clayey and marly sediments, gravitational compaction continues after the formation of concretions, in special cases deforming

Siliceous Sediments
a POROSITY Si02 CONTENT
DEPTH
LITHOLOGY (PREDOMINANTLY
SILICEOUS)
PORCELLANITE
MINERALS (ZEOLITES)
A
CHERT
BY DIFFUSION TION)
SILICEOUS MARLS AND LIMESTONES b
VEINLETS C
LIMESTONE WITH MARL WITH LAYERS AND CHERT NODULES NODULES OF
CHERT AND DIRECTION LIMESTONE
d
IMPURE CHERT
Fig. 5.6. a Processes and results of silica diagenesis in b through d Diagenetically formed bands and concretions pelagic, siliceous oozes (based on several sources, see of chert or carbonate in limestones and marls. e Veinlets of text). Note that banded cherts may be partially generated chert or laminated marl deformed subsequent to quartz by a kind of rhythmic unmixing, which accentuates prima- precipitation. (After Lancelot 1973) ry minor differences in texture or composition of beds.
Chapter 5 Oceanic Sediments
chert "veinlets" (Fig. 5 . 6 ~ and d). Siliceous turbidites and calcareous turbidites rich in opaline silica are affected by diagenesis in a way similar to that described for pelagic sediments (Fig. 5.6e, see, e.g., Elorza and Bustillo 1989).
5.3.6 Marine Phosphorite Deposits
General Aspects
Phosphorite deposits have attracted the inter- est of geologists for a long time not only be- cause of their economic potential, but also be- cause they are significant indicators of a cer- tain depositional environment. Numerous pa- pers on this topic were collected and sum- marized by Bentor (1980), Slansky (1 980), Kolodny (1981 ), Baturin (1982), Burnett and Riggs (1 990), and Notholt and Jarvis (1 990).
Phosphorite studies deal with a variety of problems, for example physicochemical consi- derations for their precipitation, trace elem- ents including uranium and rare earths, radio- metric dating, budget and recycling of phos- phorus, paleoceanographic reconstructions for their depositional environment, the role of diagenesis and replacement of carbonate, ef- fects of repeated reworking and weathering, economic evaluations, etc. Some of these pro- blems are still not very well understood. We can touch here only a few general points.
Since Neogene times and probably in older periods, phosphorite preferentially formed atop submarine highs, along the edges of con- tinental shelves where mainly pelagic sedi- ments accumulated (also see below), and in shallow seas. Water depth appears to be less important for the accumulation of phosphorite or its parent sediment than a specific topo- graphic situation or low sedimentation rate and reworking of sediment. Phosphorites are frequently observed in the following sequen- ces (also see F6llmi et al. 1991):
- In condensed beds on top of drowning shal- low-water carbonate platforms, often followed by pelagic sediments. - At the top of shallowing, coarsening upward sequences, overlain by sediments of deeper water. - In condensed intervals, rich in organic mat- ter, topped by siliceous sediments indicating an increase in coastal upwelling. - In transgressive-regressive sequences in rather shallow marine environments with low terrigenous input, where organic-rich sedi- ments (with phosphorus) deposited during the transgression are partially or entirely reworked
(relative enrichment of phosphorite) during the subsequent regression (e.g., Glenn and Arthur 1990).
All these situations have in common a chang- ing depositional environment with phases o f condensation and reworking. Although many sediments deposited in coastal upwelling zones are also characterized by high phosphorus contents, enhanced upwelling is probably not required for phosphogenesis (McArthur et al. 1988). Some modern phosphorites, for ex- ample on the shelves off eastern Australia and on the western margin of South Africa, occur in environments where upwelling is weak and the bottom sediments are not rich in organic matter. In regions of strong present-day up- welling, for example off Peru and Namibia, significant phosphorite concentrations in fact tend to occur in the transitional zone between fully developed laminated black shales, rich in organic matter and chert, and adjacent, better oxygenated sediments seaward or landward (Figs. 5.4g and 5.7a). With rising or falling sea level, however, such a zone of phosphorite formation may migrate upslope or downslope and thus create a broader deposit along a shelf-slope or bank-ridge setting.
The phosphate phase of the common phos- phorites consists of the mineral francolite, i.e., carbonate fluorapatite. This mineral contains variable amounts of trace elements, particul- arly uranium and rare earth elements, which are not further discussed here.
Phophate Precipitation
For some time it was believed that, under certain conditions, such as high phosphorus content in upwelling sea water, decreasing partial pressure of CO and increasing tem- perature, francolite couyd be chemically preci- pitated directly from sea water. This view is now rejected by most of the experts on phos- phorites (see, e.g., Kolodny 1981). Instead, it is assumed that phosphate is precipitated within the uppermost layer of organic-rich sediments during early diagenesis.
Buried organic matter contains considerable amounts of phosphorus (often around 1 %), which is released by microbial decomposition at the sea floor or several cm to tens of cm below (e.g., Baturin 1982; Froelich et al. 1988; Glenn 1990). In addition, the phosphorus in bones (e.g., fish), fecal pellets, coprolites, and adsorbed to iron-hydroxides (inorganic P sources, see below) may be dissolved and thus

Phosphorites
OXYGEN MINIMUM p -
POSITION OF ORG. M. PHOSPHOGENESIS AND PRECIPITATION OF P
RELATIVE CONCENTRATIONS
(+OXIC, IN CERTAIN b
AUTHlGENlC SEA WATER TIMES AND PLACES MINERALS
ALSO ANOXIC)
SEDIMENT-WATER / INTERFACE
1; -"7 ; ! WEAKLY REDUCING (PARTLY ~ e + + + - Fe ++)
ALKALINITY
STRONGER INTERSTITIAL REDUCING WATER OF ORGANIC-RICH REDUCTION, SEDIMENT METHANE-
PRODUCTION )
DEPTH
BENTHOS, BIOTURBATION, INTENSIVE DECOMPOSITION OF ORGANIC MATTER AND RELEASE OF P AND OTHER NUTRIENTS INTO SEA WATER
GLAUCONITE (?UPTAKE OF
. MAGNESIUM BY CLAY MINERALS)
PHOSPHORITE (CARBONATE FLUOR APATITE IN PELLETS, NoDuLds. COATINGS, ETC. OR F~EPLACING CARBONATE
PYRITE
IN PLACES CARBONATE NODULES, DOLOMITE, CHERT
SEDIMENT BUILDUP
C VERTICALLY MIGRATING ZONE OF PHOSPHOGENESIS (? GLAUCONITE)
Fig. 5.7. a Schematic cross section of continental margin or submarine plateau, showing main zones of phosphogeie- sis in relation to oxygen minimum and intensity of decom- position of organic-matter. (After Slansky 1980). b Che mica1 environment within uppermost sediment (not to sca- le), which enables microbial release of P from organic matter (andlor bone remains) and precipitation of carbonate fluorapatite andlor replacement of carbonate by phosphate. The weakly reducing milieu which can release ferroan iron
also is favorable for the formation of glauconite. @rite and dolomite as well as chert may be formed at greater depths below the sediment-water interface. (Based on several sources, e.g., Ouwehand 1986; McArthur et al. 1988; Froelich et al. 1988; Glenn and Arthur 1988). c Tie-sedi- ment buildup demonstrating vertical migration of the zones of phosphogenesis, pyrite precipitation, and possibly dolo- mite and chert formation. For further explanations see text

Chapter 5 Oceanic Sediments
increase the phosphorus concentration in interstitial waters to values much higher than in sea water.
Phosphorus is also provided by the suspended load of riven, particularly those draining regions with lateritic soils (Glenn and Arthur 1990). In this case, phosphorus is predominantly adsorbed to iron hydroxides and released later, when the river load has been deposited in a shallow sea where the sediments are subject to weakly reducing conditions below the sedimentlwater interface.
Recently, some workers have pointed out the signifi- cance of microbial mats for the uptake of phosphorus and the precipitation of phosphate (O'Brien d al. 1981; Lucas and Wvot 1984), which can also take place in lagoonal environments (Soudry and Lewy 1988).
The uppermost sediment zone with phos- phorus release appears to be characterized by a weakly reducing, mildly anaerobic environ- ment (Fig. 5.7b). Hence, nitrate and some ferric iron can be reduced, thus providing ferroan iron for the generation of glauconite.
Sulfate reduction and the precipitation of iron sulfide commonly do not yet take place at this shallow burial depth. These processes require strongly reducing conditions up to the sediment-water interface, which only occur in a very weak current regime. In this case, pyrite may be precipitated simultaneously with phosphate.
Reprecipitation o f phosphorus takes place within the sediment or directly below the sediment-water interface (Fig. 5.7b). Due to the concentration gradient between the pore water and sea water, phosphorus tends to migrate upward by diffusion, and fluoride from sea water (with its higher concentration) downward into the sediment. Poorly soluble carbonate fluorapatite will precipitate prefe- rentially where
1. Phosphate nuclei are already available (e.g., in fecal pellets or coprolites).
2. Calcium concentration in the porewater is also high, and/or
3. Calcium carbonate is present.
The phosphate forms ooid-like pellets, no- dules, and crusts, or coatings on other materials, particularly on the surface of car- bonates and calcareous shells, which can be more or less replaced by phosphate in the course of time.
Secondary Enrichment of Phosphorite
Because the phosphorus content in the organic matter of marine sediments, including those in zones of high fertiliy, is limited, a sediment layer with a certain thickness can produce only a small quantitity of phosphate. Such a situation can be observed in some present-day arid ancient sediments which were deposited more or less continuously in zones of upwel- ling. They contain thin layers of phosphate particles or pllosphatized lenses and laminae consisting of fecal pellets, microbial filaments, or foraminifera (Garrison et al. 1987; Fijllmi et al. 1991).
Significant concentrations of phosphorite can only be generated by repeated alternation of sediment accumulation, in situ phospho- genesis, winnowing and reworking (Fig. 5.8b and c, also see, e.g., Baturin 1982; von Rad and Kudrass 1984). Sea level changes can favor such a process as mentioned above. In consequence, the net sedimentation rate over a considerable time period approaches zero or becomes even negative, i.e., erosion prevails over deposition. Simplified examples repre- senting such a situation on a large scale are shown in Figure 5.9. Phosphorite is con- centrated on submarine highs, on shelf breaks, or in shallow, channel-like depressions, where high wave or current energy leads to maxi- mum erosion and long-term nondeposition. The original parent sediment for primary phosphate precipitation may be completely dissolved and reworked at the site of maxi- mum phosphorite concentration (Fig. 5 . 8 ~ and 5.9b).
For these reasons, the phosphorite in one individual deposit may show a considerable age range, as identified with the aid of included fossils or radiometric age determina- tions (e.g., von Rad and Kudrass 1984; Thom- son et al. 1984; McArthur et al. 1988).
Furthermore, there have been certain time periods of enhanced phosphorite formation in the Earth's history, for example in the late Proterozoic and Cambrian, Permian, late Cre- taceous/early Tertiary, and Miocene (Slansky 1980; Valeton 1988), but phosphogenesis also takes place at some locations in the modern oceans, for example in the coastal upwelling zones off Baja California, Namibia, and Peru. However, as previously mentioned, upwelling is not the only prerequisite for phosphoge- nesis.
Weathering processes on land in emerged formations can further enhance the concentra- tion of phosphorus which originated from

Phosphorites
INCREASING INTENSITY OF WINNOWING AND REWORKING SEDIMENT RICH MULTI-EVENT
PHOSPHORITE DEPOSIT, 2PHOS-
TlME
INCREASING PHOSPHORITE EROSION AND THICKNESS (TREND WINNOWING TO COARSENING
b
SEDIMENT \ \
?CONTINUOUS SEDIMENTATION
IN SITU-GENERATED
Fig. 5.8a-c. Tiesediment buildup diagrams demonstrat- ing different types of phosphorite deposits in relation to winnowing and reworking. a More or less continuous accumulation of sediment rich in organic matter with thin layers of early diagenetic phosphate particles or phosphatic layers. b Discontinuous accumulution and winnowing of phosphate-bearing sediment generating increasingly thick, more or less authochthonous layers of phosphorite. Net sedimentation rate approaches zero. c Different episodes of phosphorite concentration by winnowing, reworking, and
TlME
possible redeposition (allochthonous phosphate) of p re exixting ~ h o s ~ h a t e formed within the sediment. Note that "' . only layer B was rich in organic matter or bone fragments delivering P; however, layer B may be completely gone except for phosphatized pebbles preserved with pebbles from layer A in the final, partly phosphate or carbonate- cemented phosphorite deposit. Net erosion exceeds net sedimentation. (Based on different sources, e.g., von Rad and Kudrass 1984; FBllmi et al. 1991, greatly modified)

Chapter 5 Oceanic Sediments
a YOUNG PHOSPHORITE GLAUCONITE
SHELL SAND NODULES
FORAMINI- 0 0
AND SILTS - OLD PHOSPHORITES (EARLY QUATERNARY
OOZE OR MUD OR PRE-QUATERNARY)
EROSIONAL UNCONFORMITY "20 km -4 -
WATER DEPTH ------ N 400 m POST-MIOCENE EROSION
AND REDEPOSITION
GLAUCONlTlC SAND
MIOCENE
I
UNCONFORMITY
CALCARENITE PHOSPHORITE, \ CURRENT Fe-Mn- IMPREG-
PHOSPHATIC TERTIARY CHALK 1 /
SILTY LMESTONE CHALK (SENONIAN) HARDG~OUND -2km- -1 km-
Fig. 5.9. a Schematic cross-section of continental margin (Late Miocene) can only be observed at the ridge flanks. demonstrating zones with different sedimentation rates, (After van Rad and Kudrass 1984). c Model of phosphorite condensation, and phosphorite ages, similar to the present- lag deposits of the inner Blake Plateau, derived from Mio- day situation off Namibia and Peru. (After Baturin 1982). cene strata and exhumed by the Gulf Stream. (After Man- b Phosphorites on the Chatham Rise to the east of New heirn et al. 1980). d Senonian phosphorites of the Anglo- Zealand, in two stages of development (bl and b2), con- Paris Basin, concentrated on top of hardgrounds in current- centrated at the ridge crest by pronounced erosion and eroded channels and troughs. (After Jarvis 1980) reworking. Note that the primary phosphate-bearing strata

Plateaus, Ridges, and Seamounts
marine deposits, for example, by preferential dissolution of the accompanying calcium car- bonate (also see Valeton 1988).
Co- Existing Authigenic Mineral Phases
The weakly reducing environment enabling phosphogenesis to occur, particularly in com- bination with repeated winnowing and reworking, is also favorable for the formation and relative enrichment of glauconitic mine- rals (Chap. 6.1). Therefore, this mineral is frequently associated with phosphorite depo- sits and may occasionally occur in large quan- tities, as, for example, in the upper Cretaceous of Egypt (Glenn and Arthur 1990). Pyrite may also be present in phosphorites, but is fre- quently precipitated subsequent to phosphoge- nesis at somewhat greater burial depths, when sulfate reduction has already started (Fig. 5.7b and c). The occurrence of chert, carbonate nodules and dolomite, as well as calcite cement in conjunction with phosphorite, is assumed to be a result of later diagenesis.
5.3.7 Sediments on Marginal and Oceanic Plateaus, Ridges, and Seamounts
By applying the general rules described in the previous chapters, most of the sedimentary processes observed on deep submarine plateaus, on isolated seamounts, and on ridges and bank tops of block-faulted, topographi- cally structured shelf areas can be easily un- derstood. Their deep position below sea level is frequently the result of long persisting sub- sidence which, in contrast to shelf seas, could not be compensated for by sediment accumu- lation. Some simplified examples for such a situation are shown in Fig. 5.10a. In all these cases, sedimentation on older rocks started with shallow-marine deposits, but was later followed by hemipelagic and pelagic material. In this chapter we are dealing only with this second depositional phase.
Deep Plateaus and Seamounts (Weak Currents)
Deep, isolated oceanic or marginal plateaus (Fig. 5.10a) which are little affected by sur- face and intermediate currents can preserve a fairly complete record of pelagic to hemipela- gic sedimentation. Elevated above the CCD,
they tend to be carbonate-dominated, for example, the Rockall Plateau in the North Atlantic (Zimmerman et al. 1984). During certain times and particularly at high latitudes, platform sediments may also become rich in biogenic silica. Sea floor spreading and asso- ciated plate tectonic motions may shift their position in the course of time, for example from higher to lower latitudes or from regions of weak to strong oceanic currents, which can lead to unconformities. In such a way their sedimentary facies can gradually change and, in some cases, include periods of equatorial or coastal upwelling with the formation of phos- phorite, chert, and glauconite. The sediments on deep plateaus also frequently record minor climatic oscillations, which generate rhythmic or cyclic calcareous ooze (limestone)-marl successions (Diester-Haass 1991) or, in sub- polar regions, alternations between layers rich in biogenic carbonate or silica as reported from the Meteor Rise in the South Atlantic (Shipboard Scientific Party 1988a).
In the present-day oceans, such phenomena can be likewise observed at the tops of old, sunken seamounts which lie at considerable depths below sea level (more than 100 to 200 m). They are often covered by pelagic mate- rial consisting of nannofossils, foraminifers and/or siliceous remains and the correspond- ing lithified sediments. If they are situated below zones of equatorial upwelling or have passed through such a zone due to plate tec- tonic motion, they can also be rich in phos- phorites.
The likelihood that submarine plateaus and seamounts show a kind of steady-state, undisturbed depositional environ- ment for a very long geological time span is low. Ongoing subsidence of these structures, in conjunction with changes in climate and morphology of the ocean basin involved, may modify or completely alter the regional oceanic cur- rent pattern and thus strongly influence terrigenous and biogenic sedimentation at these sites.
Current-Influenced Plateaus
If a fairly deep marginal plateau is subjected to the influence of powerful, deep-reaching surface currents, deposition of pelagic and some benthic carbonate as described above is drastically curtailed or completely prevented (Fig. 5.10a, example for tropical-subtropical waters). The resulting sequence is markedly condensed and displays hardgrounds with ses- sile benthos (sponges, serpulids, sometimes deep-water corals, signs of boring organisms etc.). In zones of particularly strong current

204 Chapter 5 Oceanic Sediments
DEEP MARGINAL PLATEAU DEEP OCEANIC PLATEAU WARM, STRONG CURRENTS TS, TEMPERATE TO COLD,
PELAGIC SEQUENCE S AND/OR SILICEOUS, OSPHORITE), R'ARE
UNCONFORMITIES
SHALLOW -WATER
GIC SILICEOUS z CARBONATE
SHALLOW-'WATER LAG DEPOSITS,
SOME GLAUCONITE. WITH PELAGIC LIGHT-DARK ALTER-
CARBONATE NATIONS, z CARBONATE
( NANNOS, FORAM') IN PLACES PERI-PLATFORM PHOSPHORITE REDISTRIBUTED CALC. MUD
AND BRECCIAS
U ISLAND SHELF SEDIMENTS, HEMIPELAGIC DEEP-SEA FAN, TERRIG. AND BlOGENlC MAINLY TERRIGENOUS MAT., CALCAREOUS SANDS AND MU
5 COASTAL UPWELLING
AND GLAUCONITE, CALCAREOUS SAND AND
RELIC AND MUDS (MOLLUSCS, FORA- RESIDUAL SED. MINIFERS , ETC. FROM UNDER- LYNG ROCKS EMlPELAGlC AND REDEPOSITED
ROCKY BOTTOM PELAGIC SEDIMENTS SLOPE SED. (MEDIUM SEDIM. (OLDER ROCKS) (SILICEOUS AND/OR CARB.) RATE, 5- 10 cm/Kaj

Plateaus, Ridges, and Seamounts
action, for example near the shelf slope, erosi- onal uncon formities and lag sediments are common. At least some of these carbonate sediments will become completely oxidized and later rqd-colored.
Fossil examples are the widespread occurrences of con- densed nodular red limestones of the Ammonitico Rosso type in the Jurassic Tethys (Bernoulli and Jenkyns 1974; also see Chap. 3.3.2).
During times of virtual nondeposition, nodules and crusts of ferromanganese may develop. Other periods allowing some deposition of clay and the preservation of some organic matter may enable the formation of glauco- nite.
The 800 to 1000 m deep Blake Plateau off the eastern Florida shelf belongs to this type of deep plateau (Sheridan and Enos 1979). Its older sediments represent shallow- water carbonates, but at the beginning of the Paleocene deep water environments were established. In addition, the sediments deposited since that time also contain conside- rable quantities of phosphorite and some chert. The phos- phorite occurs in the form of phosphatized carbonate debris, pellets, pebbles and conglomeratic layers, as well as continuous pavements (Manheim et al. 1980, also see Section 5.3.6). It is a lag deposit derived from Miocene strata which accumulated in an oceanographic regime quite different from the present situation under the Gulf Stream.
Another example for a subsiding, sediment-starved, Jurassic-Cretaceous continental margin at low latitudes is the Mazagan Plateau off Morocco (Bernoulli and Kalin 1984; Jansa et al. 1984; Witere r and Hinz 1984). Here, the constructional phase of carbonate buildup ended in the early Cretaceous. Hence, greatly condensed, reworked, middle to upper Jurassic reddish limestones are overlain by hemipelagic Tertiary beds.
In cooler, temperate and subpolar waters with less current influence but greater influx of terrigenous material, the pelagic to hemipela- gic sediments of a marginal plateau display mixtures of terrigenous mud, and siliceous and calcareous ooze. Depending on changing cli- mate and oceanic circulation, one of these three main components may dominate over the others.
Fig. 5.10. a Sediments on deep submarine plateaus under different environmental conditions, for example temperatu- re, currents, nutrient supply. (Based on several sources, e.g., Sheridan and Enos 1979; Stow 1986; Eldholm et al. 1987). b Sediments of complex, segmented shelf (Califor- nian borderland-type) with basins and ridges of various depths below sea level; structural elements of wrench tecto- nics omitted (see, e.g., Howell et al. 1980; Teng and Gorsline 1989). Note that only the youngest sediments are
The example in Fig. 5.10a is based on drilling results from the approximately 1000 m deep Voering Plateau off the Norwegian coast (Eldholm et al. 1987). Here, pelagic sedimentation began in the Miocene, after the plateau had subsided from a position near the sea level down to a considerable water depth. Since that time, the composition of the 200- to 300 m-thick sediment cover varied between dominantly siliceous, mixed siliceous and calcareous, to dominantly siliciclastic deposits. Carbonatedominated layers rarely occurred. With the onset of glaciation in the northern hemisphere in the Late Pliocene, the plateau sediments changed. They were replaced by alternating dark and light mud layers. The dark ones are poor in carbonate and contain ice-rafted debris. They represent glacial periods, while the light layers are richer in carbonate and sand deposited during interglacials. Only two groups of benthic organisms, sponges and foraminifers, are abundant throughout the entire sequence, which is more or less bioturbated. The mean sedimentation rate in the Neogene, including the Pleistocene, was around 2 cmka and thus considerably higher than for the Blake Plateau. Never- theless, reworking and hiatuses indicate the frequent ac- tivity of bottom currents. In certain time intervals, the biogenic carbonate settling on the sea floor was entirely dissolved within the sediment.
Slopes and Basins Close to Submarine Plateaus
The slopes and basins adjacent to submarine plateaus may be considerably affected by sed- iments shed from the plateaus (also see Chaps. 12.2.2 and 12.2.3). This occurs, as long as the plateaus are within the reach of oceanic cur- rents strong enough to move sediment. The sediments of slope aprons and peri-platform oozes reflect to some extent the environmental conditions of the submarine plateaus. They have been described from the present oceans and ancient examples (e.g., Mullins and Cook 1986; Schlager and Camber 1986; Schlanger and Premoli Silva 1986; Eberli 1989). On shal- low carbonate platforms, aprons and peri- platform sediments are markedly controlled by sea level variations, because carbonate production and thus the sediment supply into deeper water can be high only during sea level highstands. In contrast, deeper plateaus may increase carbonate production during sea level lowstands.
shown, which may still be influenced by lower sea level stands and temporal variations in the intensity of coastal upwelling. (Based mainly on Emery 1960; Gamson et al. 1987). Older sediments may be strongly affected by alter- nating up and down movement of crustal blocks, causing unconformities, pinch outs of certain layers, and slump aprons of varying size and position along the foot of the slopes. For further explanations see text

Chapter 5 Oceanic Sediments
Submarine Ridge and Basin Topography
Some continental margins display a series of topographic basins and ridges with markedly diversified sediments.
Such settings may originate from listric faulting along divergent plate boundaries (provided that sediment ac- cumulation is too low to smooth out the submarine relief), from strike-slip motions, or from the accretion of terranes.
A very simplified, generalized view of one of the most prominent modern examples, the Californian continental borderland (Ingersoll and Ernst 1987), is presented in Figure 5. lob. The narrow elongate basins and ridges of such a borderland have various depths below sea level.
Basin Sediments
Most sediments are delivered to the basins via gravity mass movements (Chap. 5.4). The in- ner, landward basins are fed primarily by submarine canyons collecting sand and mud from the continent and inner shelf; they are filled mainly by deep-sea fans and reach sedi- mentation rates on the order of 20 to 50 cm/ka (Gorsline and Douglas 1987; Teng and Gors- line 1989). The outer basins are cut off from direct terrestrial sediment supply. They ac- cumulate pelagic to hemipelagic sediments derived from their slopes and produced in the water column; minor amounts of material may also come from island shelves. As a conse- quence the sedimentation rate drops to mode- rate values (5 to 10 cm/ka).
Sediments on Submarine Ridges and Bank Tops
Deposition ontop of these highs is controlled by several factors, the most important ones being distance from river mouths and other siliciclastic sediment sources, climate and oce- anic current patterns, water characteristics, and local topographic features. In the example of Figure 5.10b, the climate is semi-arid, sed- iment supply by rivers is fairly high, and the region is subjected to moderate coastal upwel- ling. Under these conditions one can distin- guish between several zones (Fig. 5.10b, main- ly based on Emery 1960; Garrison et al. 1987):
- Rocky bottoms with some sessil organisms, practically devoid of sediment. This situation is observed on hills rising above the level of
island shelves and large, flat bank tops, at the outer edges of island shelves and large bank tops, on the upper parts of steep basin slopes, and on the walls of submarine canyons. - Mainland continental shelves and island shelves. Terrigenous, and mixed terrigenous and biogenic sand and mud, decreasing grain size and increasing carbonate content with depth (for further details see Chap. 3.3). - Large bank tops at medium depths (about 100 to 300 m). Biogenic sands and muds, relic sediment and residual sediment from under- lying rocks, abundant phosphorite and glauco- nitic sand. Depressions on the flat ridges are filled with sediment. - Large bank tops at greater depths (2 about 300 m), far away from the coastline. Thick cover of biogenic pelagic sediment, in this case mainly siliceous. Layers of small nodules of phosphorites and other authigenic sedi- ments are, if present in certain horizons, diluted and buried.
The phosphorite may occur in small grains, nodules, and slabs, or it may form thin coatings on rocky grounds and gravel. It is usually covered by a film of manganese oxide. Frequently, older nodules are cemented together by younger phosphorite to form a nodular conglomerate. The phosphorite is often associated with glauconitic foramini- feral sand (banktop glaucophosphorites), which is found either within or surrounding the nodules. In the Californian borderland, the age of the phosphorite dredged from the surface of large banks is Late Miocene to Quaternary. Hence the net sedimentation rate at these locations was extremely low during the last 10 to 15 Ma. It is, however, not clear whether part of this phosphorite was precipitated directly from upwelling sea water or whether all of it is a product of diagenesis, which would mean that the host sediment was more or less eroded.
5.4 Gravity Mass Flow Deposits and Turbidites
5.4.1 Gravity Mass Flows
Introduction
In the present-day oceans, as well as in many ancient sedimentary basins, the deposits of gravity mass movements form a great portion of the total sediment body (e.g., Kelts and Arthur 198 1; Stow and Piper 1984; Thornton 1984; Stanley 1985). Such deposits are par- ticularly important in deep basins nearby con- tinents, and they often result from laminar

Gravity Mass Flows
mass flows and turbulent suspension currents. Widespread, thick flysch sequences in the Alps and other orogenic belts consist predominantly of redeposited sediments. Since around 1950, numerous articles and some special books have been published on turbidites and other gravity mass flow deposits (e.g., Walker 1978, 1984a,c; Stanley and Kelling 1978; Saxov and Nieu- wenhuis 1982; Schwarz 1982; Prior and Cole- man 1984; Mutti and Ricci Lucchi 1978; Mutti et al. 1984; Mutti and Normark 1987). The flow behavior of the different types of gravity mass movememts is treated for example in Middleton and Hampton (1976), Blatt et al. (1980), Stow (1980), Allen (1982), Lowe (1982), Komar (1970, 1985), Postma (1986), and summarized by Stow (1986).
In this chapter, the most characteristic features and depositional environments s f these mass flow deposits in the marine realm are desribed, using a few, simplified concep- tual models. The general characteristics dis- cussed for deep-sea environments can also be applied to lake sediments (Chapter 2.5), but large-scale phenomena are commonly missing.
Nomenclature
Up to now, there is no uniform, consistent nomenclature for all the bed-scale phenomena and internal sedimentary structures resulting from gravity mass flows and turbidity currents of various magnitude and grain size distribu- tion. Bouma (1962) proposed a simple nomen- clature to describe the succession of internal sedimentary structures in sandy turbidites (T through T,), which has generally been used for many years. This nomenclature is well suited for medium-grained sandy beds, but it suits neither distinctly proximal types of rela- tively coarse-grained turbidites nor pure mud turbidites (see below) or mass flow deposits. Therefore, additional terms and symbols were introduced (Lowe 1982; Walker 1984a, c; sum- mary in Stow 1986). However, these different nomenclatures are difficult to combine into one broad, consistent system. For that reason, new, purely descriptive symbols are proposed (Fig. 5.14), which are used in all the other figures of this chapter.
For example, sandy turbidites are discriminated from mud turbidites by using the symbols TS and ZiU, respectively; ig signifies inversed grading, Im laminated mud, etc. All types of redeposited beds can be described with these sym- bols. Carbonate turbidites may be referred to as CTS and CZM. This system can be expanded or modified as needed. For the more large-scale phenomena of deep-sea fans, additional terms are briefly mentioned in Chapter 5.4.2.
Types of Gravity Mass Movements
The most important gravity mass movements found in both ocean and lake basins are sum- marized in Fig. 5.1 1. They can be subdivided into several groups:
- Mass movements of lithified, jointed rocks: Rockfall along coastal cliffs or steep sub- marine slopes and fault scarps (Fig. 5.11a). The transport distance of such fallen rocks is very limited, unless there is a possibility of a composite mass movement, as indicated in Fig. 5.1 1i.
- Creep, sliding and slumping of semi-solid to soft sediments (Fig. 5.1 1c through e) on slopes of various angles (as little as a few degrees). Movement takes place if the shear stress ex- ceeds the shear strength of the sediment at some depth below the sedimentary surface, which is usually tested by stability analysis (Fig. 5.1 lb). The shear stress increases with the slope angle and depth below the sea floor. Deep below the surface of a gentle slope, the shear stress can be as high as on a steep slope at shallow depth. For this reason, there is a tendency for thick mass movements to develop on gentle slopes, whereas thin ones are cha- racteristic for steep slopes. The shear stress can, in addition, be significantly enhanced by earthquakes and, in shallow water, by the effect of storm waves on the sea bed. Further- more, the sudden loading by an approaching slide or slump often generates secondary failure planes and propagation of the mass movement. Similarly, a drop in sea level or tectonic uplift can lead to an additional load- ing of emerging sediments which when losing buoyancy may trigger slope failure.
The shear strength of sediments usually in- creases with depth below the sea floor, but is reduced by high pore pressure in undercon- solidated sediments. Such a situation fre- quently occurs in areas where fine-grained sediments are deposited rapidly, for example in front of deltas. A further reduction in shear strength is caused by the rather common de- velopment of biogenic gas in the uppermost tens of meters in slope sediments rich in or- ganic matter. Finally, the release of methane from crystallized gas hydrates due to increas- ing water temperature (resulting from climatic changes or shifting of current systems) may locally diminish the shear strength of sedi- ments and thus cause mass movements.
In creep and slides, the sediment masses do not change their mechanical state, i.e., they move as a kind of rigid plug without sig-

Chapter 5 Oceanic Sediment< ~
a ROCKFALL b STABILITY ANALYSIS c SEDIMENT CREEP
. . . t i SHEAR
SLIP STRENGTH
PLANE
- SEJ LEVEL -----_ - - -_
NON-COHESIVE (COARSE) f GRAIN FLOW
v FINE,

Gravity Mass Flows
nificant internal disturbance. The distance of transport is very short. Slumps show conside- rable internal disturbance, slump folding, and frequently several slip faces (Fig. 5.1 1 e). They often evolve into debris or mud flows.
- Sediment gravity flows. Flow may occur in several different ways:
1. Viscoplastic flows with internal shear planes and virtually no movement at the base of the flow. Such gravity movements usually need a rather high slope angle (5 to 10') and reach limited thicknesses. 2. Slide-debris flows, or slideflows move as a more or less rigid plug over a basal shear zone, where the water pressure is in excess of hydrostatic pressure and thus reduces the shear strength of this material, which may even be liquefied. Such flows can reach great thicknesses and occur on very gentle slopes (0.1 to lo). In addition, they can develop ero- sional features in the form of broad channels. 3. Liquefied mass flows. As a result of their high in-situ water content and meta-stable grain packing, sediment masses on subaqueous slopes can be frequently transformed by earthquake shocks into fluids of high density and viscosity. Partial or entire remolding of the sediment creates a small surplus of pore water which cannot immediately escape. As a result, the shear strength of the material drops drastically and approaches zero without the uptake of additional water (Einsele 1989). The liquefied masses start to flow downslope, even on very gentle slopes (s0S0), and become fur- ther remolded and disorganized. Similarly, already moving slump masses may be con- verted into slow, plastic debris flows or mud flows. Typical examples of this type of liquefaction are non-cohesive or low-cohesive sands and silts, but it appears that many sedi- ments rich in diatoms, nannofossils and other micro-organisms are also susceptible to this process. 4. Grain flows consisting of pure sand are characterized by their frictional strength. To overcome friction between the grains, a kind of dispersive pressure must develop. This can
Pig. 5.11a-i. Summary of submarine mass movements and gravity mass flows (based on many sources, e.g., Middle- ton and Hampton 1976, Walker 1978, Moore DG et al. 1982, Prior and Coleman 1984; Stow 1986, Einsele 1989). Rockfalls (a), slides (d), and slumps (e) occur if the shear stress exceeds the shear strength of the rock or sediment at some depth (b stability analysis). g and h Debris and mud
only be achieved on fairly steep slopes (18 to 37O), as at the head of submarine canyons and on some prodelta slopes. Grain flows require an environment with ready supply of sand, and they usually travel only short distances. The deposits of individual grain flow proces- ses are thin (several centimeters) and may show reverse grading (see, e.g., Shepard and Dill 1966; Lowe 1976; Dingler and Anima 1989).
Because many sediment gravity flows evolve from laminar to fully turbulent systems (flow transformation, see also Lowe 1979; Postma 1986), an exact correlation of natural flows to idealized flows (fluidized flow, liquefied flow, grain flow, mud flow or cohesive debris flow) is often difficult. In the oceans, the most im- portant flow types are mud flows and cohesive debris flows (see below). They contain varying proportions of mud, which provide them with cohesive matrix strength supporting larger particles. When their excess pore water dis- sipates, the flow masses come to rest.
By uptaking additional water from the over- lying water body, individual gravity flows or parts of them can evolve into masses of lower density and viscosity and, if there is a long, sufficiently steep gradient, finally generate turbulent suspension currents of high velocity (turbidity currents).
- Compound mass movements result from the sudden loading of slope sediments by other masses, e.g., slides, slumps, or grain flow de- posits originating from higher slope areas (Fig. 5.1 li). In this way, the underlying sediment is transformed into a loaded, undrained con- dition with reduced shear strength.
Moore DG et al. (1982) reported an interesting case from the southern Gulf of California, where coastal sand and gravel were first transported as a grain flow and debris flow via a steep submarine canyon, down to a mid-fan and lower slope region (around 2500 m deep). There, the superposition of a great load of coarse clastics onto sili- ceous silty clays (porosity 70 to 80 96) triggered a second, considerably larger mass movement on a much gentler slope (about 1 So), which camed the coarse material down to a 3000 m deep marginal basin plain (slope angle 0.1').
flows usually originate from slides and slumps by liquefac- tion of the primary, metastable grain packing (in situ water content, w, greater than liquid limit, wL). Turbidity cur- rents evolve by uptaking of additional water. i A composi- te, two-step grain-mud flow mechanism can explain long- distance transport of pebbles and gravel into the deep sea

Chapter 5 Oceanic Sediments
The mass spread over an area of approximately 300 km2, forming a sheet several tens to about 100 m thick. Due to the remolding and differential settling of the flow mass particles, the coarse material now forms the base of the mass flow deposit, 70 km away from its source area.
From this example one can see that such com- pound mass movements provide a mechanism for transporting coarse gravel over long dis- tances and on very gentle slopes into the deep sea.
Occurrence, Volume, and Transport Distance of Gravity Mass Movements
Preferential Sites of Mass Movements
Figure 5.12 summarizes the most important tectonic and environmental settings for the occurrence of large gravity mass movements. Most of theses settings provide both high in- flux of sediment and strong relief.
Marine deltas exhibit a variety of mass movements, including mud diapirs and large- scale creep generating growth faults (Fig. 5.12a). Very common are slides and mud flows on extremely gentle slopes in shallow water as described for example for the Mississippi delta (Prior and Coleman 1984); even more wide- spread are the huge deep-sea fans in front of the deltas of major rivers. They are fed directly by suspension currents from the river, or by slumps, mud flows, and turbidity cur- rents originating at the prodelta slope. Well documented examples include the 1929 Grand Banks slump and turbidity current off the Laurentian Channel of North America (Piper and Shor 1988; Hughes Clarke et al. 1990) and the 1979 mass-wasting at the prodelta slope of the Var river in the northwestern Mediter- ranean (Auffret et al. 1988). The deep-sea fans of major modern rivers (e.g., Bengal, Indus, Mississippi, Amazon, Congo fan) are 250 to 2500 km long and are cut by channels 5 to 25 km wide (Stow 1981; Mutti and Normark 1987).
Similarly, submarine canyons collecting shallow-water sediments from the foreshore zone, or directly from river input, can gene- rate large deep-sea fans of many tens to seve- ral hundreds of kilometers in length. These fans tend to have high sand contents and even may incorporate some gravel, in contrast to many slope aprons which are predominantly fed by fine-grained, muddy slope sediments. Rapid subsidence and active faulting during rifting and early drifting (right-hand side of
Fig. 5.12a) can create an environment par- ticularly favorable for extensive gravity mass movements along the shelf break of young basins (Bourrouilh 1987; Eberli 1987). Due to "shelf break erosion", the debris flows may carry soft and lithified material of various age.
Subduction-related depositional environ- ments provide several possibilities for dif- ferent types of gravity mass movements. Deep-sea trenches adjacent to a main con- tinent (not shown in Fig. 5.12b), such as the modern Peru-Chile trench, frequently receive high quantities of river material, and therefore can be rapidly filled up with both sandy and muddy gravity flow deposits (Thornburg and Kulm 1987). Trenches far away from sig- nificant terrestrial sediment sources (Fig. 5.12b) are fed by slumps and debris flows originating from an accretionary wedge as well as young, autochthonous slope sediments. For that reason, they often contain material of varying age and nature (polymict clast com- position), sometimes including ophiolites and metamorphic rocks. The sedimentary fill of forearc basins, and to some extent that of backarc basins (not shown in Fig. 5.12b), is usually characterized by a high proportion of volcaniclastic material, provided by a volcanic arc and transported by gravity mass move- ments into the basin.
Redeposited gravel-sized rock fragments and skeletal material (rudites), sand-sized shell fragments (arenites), and finer-grained lutites (including pellets) play a great part in deep- sea carbonate depositional environments (Fig. 5.12~). The main sources of these materials are carbonate shelves and isolated carbonate plat- forms. Due to early differential lithification and the extremely steep slope of many reef buildups, rock falls including large boulders are fairly common. Oversteepened slopes may also lead to collapse events, generating large- scale slumps and debris flows. Turbidity cur- rents transport coarse and fine-grained shal- low-water carbonate farther basinward (see e.g. Remane 1960; Wilson 1975; Cook and Enos 1977; Scholle et al. 1983a; McIlreath and James 1984; Eberli 1987).
Large mass movements in particular tend, as mentioned above, to evolve from slides or slumps into debris and mud flows which in turn may lose part of their mass to turbidity currents (see below).

Gravity Mass Flows
MUD DlAPlRS AND SHELF, DELTA PLATFORM SEDIMENT SHELF
MUD FLOWS WlTH OVER- LAPPING TOE LOBES
MAINLY SLUMPS
LARGE ACTIVE AND BURIED SAND-FILLED CHANNEL
MAINLY MUD TURBIDITES, SOME MUD FLOWS AND MUD,
CHANNEL FILLS. LOWER FAN: MAINLY MUD AND MUD TURBIDITES CURRENTS
SAND TURBIDITES, SOME CHANNEL FILLS
RAPID ACCUMULATION VOLCANIC ARC CARBONATE PLATFORM CARBONATE SHELF OF VOLCANICLASTICS (SAND (ANDESITIC) WITH REEFS, LAGOON,ETC. EARLY INDURATION AND SILT), BEACH GRAVEL
TURBIDITES
REEF DETRITUS
NATE BRECCIAS)
DEBRIS FLOW ACCRETIONARY DEEP-SEA FAN- (CALCAREOUS TURBlDlTES (POLYMICT) WEDGE (TOPHIOLITES) CHANNEL SYSTEM (SAND AND MUD)
Fig. 5.12ac. Summary of the most important depositional faults. b Convergent margin with forearc basin. c Redepo- environments, where large gravity mass movements and sition associated with carbonate shelf and platform. (Based turbidite sedimentation take place. a Passive continental on different sources, e.g., Stow 1986) margins, including an early riftingdrifting stage with active

Chapter 5 Oceanic Sediments
Volume of Dislocated Sediments
In the present-day oceans, a number of ex- tremely large slides have been reported, the volume of which reaches 1000 to 20 000 km3 (summary in Schwarz 1982); many mass move- ments range between 0.001 and several 100 km3. The same orders of magnitude are cha- racteristic of the volume of large mud flows and turbidity currents which evolved from slides and slumps. Of course, there are also numerous smaller displacements of sediments with volumes between lo3 and lo6 m3, which are usually not further described in reports on the modern sea floor. However, this is the category in which we may notice local, large mass movements or thin, more widespread turbidite beds in normal field exposures.
Travel Distances
Debris flows and mud flows can travel distan- ces of several 100 up to 1000 km, as observed in the present-day oceans (Akou 1984; Simm and Kidd 1984); turbidite flows may redeposit material as far as several 1000 km away from its primary location. In ancient rocks (Eastern Alps, Apeninnes, Pyrenees) it is possible to trace specific marker beds across 100 to 170 km (e.g., Hesse 1974; Ricci Lucchi and Val- mori 1980; Mutti et al. 1984). These obser- vations clearly indicate that gravity flow de- posits have a high potential for being widely distributed in relatively large and deep basins.
Deposits of Debris Flows and Mud Flows
The principal features of debris flows and mud flows are summarized in Fig. 5.13. They reflect the flow process prior to deposition (Lowe 1982), which can be characterized as a more or less laminar, cohesive flow of a com- paratively dense, sediment-fluid mixture of plastic behavior. The sediments of these mass flows are supported by the cohesive matrix and their clasts, at least partially, by matrix buoyancy. Blocks float on the debris as a result of small density differences between the blocks and the debris, plus the cohesive strength of the clay-water slurry (Rodine and Johnson 1976). Debris flows come to rest as the applied shear stress drops below the shear strength of the moving material. The flows "freeze", which is accomplished either by co- hesive freezing or, in the case of a cohesion- less sandy matrix, by frictional freezing, or by both processes.
Debris flow deposits (debrites, DF) and olis- tostromes (very thick, extensive debrites) con- sist of a medium to fine-grained matrix and a varying proportion of matrix-supported clasts (Fig. 5.13a). The typical debrite is rich in clasts of different sizes; the clasts may be derived from older sediments and rocks within the basin (intraclasts), or from sources outside the basin (extraclasts). In olistostromes, single clasts or blocks can reach the size of a house and more. They are called olistoliths and re- semble blocks or intact rock bodies that are frequently observed in tectonic melange zones. Internally, most debrites lack any bedding phenomena or imbrication of clasts. Except at the top of the debrite, in situ traces of bur- rowing organisms are completely missing. In some examples, elongate clasts are aligned horizontally, indicating the direction of flow.
The base of debrites may be scoured or, when particularly coarse-grained material on steep slopes is involved, show plug-flow chan- nels (Cas and Landis 1987); the basal sedi- ments often display a thin sheared zone. The lowermost part of a debrite is frequently in- versely graded, due to prograding frictional freezing. The higher portion may exhibit in- distinct normal grading; the top of the bed is either sharp or grades into an overlying tur- bidite, thus forming a compound debrite-tur- bidite couplet (DF-TS/TM, see below). In places, the top of a debrite may be current- winnowed and therefore transformed to a clast-supported layer. In some cases, a debrite or mud flow deposit is directly overlain by a subsequent debrite or an overlapping lobe of the same mudflow (also see Fig. 5.12a). The two layers are then combined by amalgama- tion.
Calcareous debrites resulting from large- scale slope collapse often form sheet-like megabreccia beds, which are primarily clast- supported and contain little fine-grained ma- trix material (Mullins and Cook 1986). Brec- ciation of semi-lithified platform carbonates may also result from tectonic deformation, for example during rifting, and thus generate "internal breccias" which can be incorporated into debris flows (Fiichtbauer and Richter 1983).
Mud flow deposits have much in common with debrites Fig. 5.13b), and there is no sharp boundary between these two end-members of the same group. They have a muddy matrix with a high silt (or micro-fossil) content and contain only a small amount of clasts, mostly intraclasts which are frequently deformed by

Gravity Mass Flows 213
a DISTAL (BASIN PLAIN, LOWER FAN) f - - - - - - - - - - - (BASE OF SLOPE, SLOPE)
LOW-DENSITY HIGH-DENSITY, TURBIDITY
SLOW COHESIVE
CURRENT HIGH-VELOCITY FLOW OF PLASTIC MASS TURBIDITY CURR.
(UPTAKE OF ADDITIONAL WATER) DEBRIS FLOW DEPOSITS MIXED
DEFORMED, FROM SUBSTRATUM
WINNOWED MATRIX
ic, INTRACLASTS (rnrn, MONOMICT)
SHEARED ZONE FINE-GRAINED
LUTITE ARENITE RUDITE
SLUMP SL
MUD FLOW DEPOSITS PREDOMI- NANTLY MUDDY SEDIMENT SOURCE, MOSTLY SOFT
see fig. for mud turbidites
i LAMINAR FLOW ! (MUD LOBES)
0 I
/ /
SL SLUMP FOLDS D~TINCT DOWNSL~PE GRADATION -
PEBBLY MUD OR MUDDY MATRIX
MF OF SILT AND/OR ec, EXTRACLASTS
Irn, (PLANAR) LAMC DIATOMS, NANNOS, NATED MUD
BACKGROUND SED. BIOTURBATED (bi) rn ' - l01
Fig. 5.13a,b. Conceptual models for proximal and distal sources, e.g., Middleton and Hampton 1976; Lowe 1982; debris flows (a) and mud flows (b), finally evolving into Stow 1986; Bourrouilh 1987; Souquet et al. 1987). See text high and lowdensity turbidity currents. (Based on different for further explanation

Chapter 5 Oceanic Sediments
the preceding slumping and flow process. Locally, the admixture of gravel or other co- arse material from submarine canyons leads to pebbly mud or mudstone.
Due to their structureless, homogenized matrix and relation to earthquakes, volcanic eruptions, and tsunamis, the terms "unifites" (Feldhausen et al. 1981), "homogenites" (Cita and Ricci Lucchi 1984) and, for thick beds of frequently compound origin, "megaturbidites" or "seismoturbidites" (Mutti et al. 1984) are used by some workers to charac- terize gravity flow deposits of exceptionally large volume and areal extent.
Elmore et al. (1979) described a modem megaturbidite, 500 km long, more than 100 km wide, and up to 4 m thick, of upper Pleistocene age from the Hatteras abyssal plain in the western Atlantic. This bed consists predomi- nantly of fluvially derived sand and shelf mud with a large proportion of mollusc shell fragments. In proximal regions, the poorly sorted lower part of the bed (>20 % mud) may have been deposited as a sandy debris flow, whereas its upper part and more distal portions reflect deposition from a turbidity current. Another compound, but carbonate- bea&g, debrite-turbidite was observed in the Exuma Sound, Bahamas (Crevello and Schlager 1980). This bed is 2 to 3 m thick and covers an area of more than 6000 km2. Hicke (1984) reported a Holocene example from the Ionian abyssal plain in the Mediterranean. Here, a 12 m thick homogenized mud layer containing around 50 % carbonate, partially from intermediate and possibly even from shallow waters, coven an area of 1100 km2 in about 4000 m of water. Locally, the layer has a sandy base composed of shell Cr~gments.
Couplets of debrites (mud flow deposits) with sandy and muddy turbidites, indicated in Fig. 5.13 by the symbols DF-TS-TM or MF-TM (see Fi.g. 5-14), were also described from seve- ral ancient sedimentary sequences (e.g., Stan- ley 1982; Mutti et al. 1984; Bourrouilh 1987; Souquet et al. 1987).
5.4.2 Turbidites and Deep-Sea Fan Associations
General Characteristics of Turbidites
Sediments deposited from suspension currents show a variety of distinctive features which vary depending on the magnitude and velocity of turbidity currents, the material in and the distance from the source area, the morphology of the basin, as well as other factors. In fact, turbidity currents were postulated as a mecha- nism for producing graded, sheet-like sand beds (sandy turbidites) from having studied rhythmic bedding and their internal structures in ancient rock sequences (Kuenen and Mig- liorini 1950). This fascinating concept can
explain all the different observations in the field with one group of simple processes:
- The episodic transport of large volumes of shallow-water sands, including their fauna, into the deep sea and their distribution over wide areas. - Marked linear erosion or nondeposition in submarine canyons (turbidity current feeder channels) and widely extended erosion of the uppermost centimeters of the pre-existing, soft, deep-sea sediments on deep-sea fans and basin plains. - The generation of certain bed types, as well as vertical and lateral successions of sedimen- tary structures, including traces of bottom dwelling organisms.
Reports of breakage of submarine telegraph cables on continental slopes testify to the great power of turbidity currents. This occurred, for example, as a result of the famous Grand Banks earthquake 1929 off Newfoundland (Piper and Normark 1982; Piper and Shor 1988), as well as in front of submarine- canyons at the mouth of some large rivers. The Grand Banks turbidity current eroded deeply and entrained sediment from the sea floor over a distance of at least 200 km (Hughes Clarke et al. 1990). However, due to their infrequent occurrence in relation to human life spans, such large-scale turbidity currents could never be directly observed in operation. Direct measurements were per- formed on low density undercurrents in lakes or water reservoirs, as well as in some small- scale flume experiments.
Suspension or turbidity currents result either directly from suspended sediments delivered by rivers in flood state, or from unstable sub- marine sediment accumulations which have failed. In the marine realm, the density of suspensions caused by river floods is, how- ever, usually not high enough to produce den- sity currents in the sea (density of sea water 1.027 g/cmS). Therefore, the failure of large sediment accumulations in shallow waters is probably the most important prerequisite for turbidity currents. Such accumulations are common on prodelta slopes, or they are ac- complished by longshore currents (Chap. 3.1) carrying material into the head of submarine canyons. Rip currents and storm action gener- ally transport sediment into deeper water and to the shelf edge.
Turbidity currents evolve from high-density gravity mass flows such as slumps, grain flows or mud flows (Fig. 5.15a) by uptaking addi-

Turbidites 215
a MUD TURBlDlTES SAND TURBlDlTES SLUMPS, DEBRIS AND MUD FLOWS
TM TS SL, DF, MF
gm, GRADED, (MASSIVE) MUD (E2)
MUD (E l ) gs, GRADED SAND (FOR FURTHER
PE, PELAGIC TO / HEMI PELAGIC (Tf )
Im, LAMINATED MUD (Tcje) CONVOLUTE BEDDING
Cb, CROSS-BEDDED ( Tc ) Is, (PLANAR) LAMINATED
SAND (Tb) am, AMALGAMATION
MASSIVE AND 2 gr s U
HIGH DENSIT
' 4 . . . 11 : , . . '?
, . *.,.
* ---:"-e .. ....-.. , . . - . . . ...:.. ......... .,/ . . St.
GRADED (SUS- PENSION SEDI- MENTATION, T,) INVERSE GRADING (TRACTION CARPET)
STRATIFIED (NORMAL CURRENT-TRACTION 1
SYMBOLS MAY BE COMBINED TO
TM FOR NON-DIFFERENTIATED TSgr, IS TSig-mv
TS-TM T M I ~ , ~ ~ etc. TSgr-lm etc.
MINOR FEATURES OF GRADING LIGHT, HEAVY MINERALS /
am, AMALGAMATION ec, EXTRACLAST
IC, INTRACLAST
WI, WINNOWING gr, NORMAL GRADING
01, OLlSTOLlTH ~g , INVERSE
GRADING
Sh, SHEARED ZONE
SLsh DBig-gr MFic
DB-TSls .,b MF-TM etc.
INCREASE IN CARBONATE,
SILICA,ETC.
- ~
GRADED GRADED MINERALOGICAL CHEMICAL LAMINATION CROSS-BEDDING GRADING GRADING
(go (gcb) (gmi) (gch)
C FURTHER SUBDIVISIONS
MUD TURBIDlTES SAND TURBIDITES SLUMPS, DEBRIS AND hlUD FLOWS (TM) (TS) (SL, DF, MF? /\ / \
PELAGIC HEMIPELAGIC CALCAREOUS SILlCICLASTlCS (mostly coarse breccia)
BIOCLASTICS SILICICLASTICS \
siliceous f r o m terrigenous monomict \ \ monomict ,
TM r ich i n (allochthonous) organic matter
CALCAREOUS SILICICLASTICS '\ /
(allodapic 1 '\\
\ ' \ /
limestones) \ /
non- / \ from terrigenous further differentiation sources \, according to sources areas
siliceous ', siliceous volcaniclastics
Fig. 5.14. a Descriptive terms and symbols for the internal sole marks and trace fossils (lebensspuren) are omitted. b structures of redeposited sediments (association of slumps, Minor features and different types of grading. c Further debris and mud flows, sand and mud turbidites); Bouma subdivisions of the main groups; additional terns and sym- divisions inparentheses. Many other characteristics such as bols may be introduced as needed

216 Chapter 5 Oceanic Sediments
a SEA LEVEL PROGRADING DELTA, SHELF ------------------------- ------
BASIN PLAIN DEEP-SEA FAN
TURBIDITY CURRENT BY UPTAKE OF WATER
DlSTALf -------- OF SAND AND MUD
SLIDING-SLUMPING
Im(d) cv(c1) cb(c) 1s (b)
TRUNCATION BY
d f -- SUBSEQUENT EROSION
L f -----------------------
G - - BASAL DIVISIONS - - MISSING
e 1
PRE-DEPOSITIC OF COHESIVE TRACE FOSSIL$
h \ EROSION
DIMENSION OF SOLE MARKS RELATED TO BED THICK- POST- NESS , DEPOSITIONALTRACE FOSSILS
I FLUTE CASTS G R A N ~ A R I A PHYCOS~PHON SCOLICIA

Turbidites 217
tional sea water (or lake water). As a result, the sliding or flowing masses become less dense and therefore turu from a slow cohesive flow into a more rapid, turbulent density flow. The sediment particles lose their mutual con- tact and go into suspension. They are kept in this state by the upward component of fluid turbulence. The driving force of the turbidity current is primarily a function of the diffe- rence in density of the suspension and the overlying water body (in contrast to river flow under air!), the submarine relief, i.e., the angle and length of slope, and the thickness of the suspension current. Thus, high-velocity suspension currents can be achieved only when at least two of these factors become comparatively great.
This is usually true for submarine slopes along continental margins and deep, narrow ocean basins. Although these slopes usually have angles of only a few degrees, they are much steeper than the gradients of large, sub- aerial rivers (0.1 to O.OlO). In addition, sub- marine mass movements also can produce tur- bidity currents of considerable density (up to 1.10 to 1.1 7 g/cmS) and thickness (several hundred meters, see e.g. Piper and Shor 1988). In combination, these factors can cause high- velocity currents (up to 10 to 20 m/sec).
High- and Low-Density Turbidity Currents
We distinguish between high- and low-density turbidity currents. High-density turbidity cur- rents reach high velocities and can carry rela- tively coarse-grained sand, pebbles, and intra- clasts. Within the confines of submarine chan- nels, large-scale turbidity currents have the competence to transport gravel (up to at least 10 cm in diameter) as bed load, and thus may generate lenses of conglomerate at the foot of prodelta slopes (Komar 1969; Piper and Shor 1988). In addition, they have the capacity to erode cohesive muds on extensive areas of the sea floor. The eroded material feeds the sus- pension with new sediment (a kind of feed- back system), which replaces coarser material
settling out of suspension in the slackening body and tail of the current (Fig. 5.15b). In this way, and by the maintenance of tur- bulence by gravitational forces (auto-suspen- sion), the current is kept in motion and can travel over long distances.
Low-density turbidity currents flow slowly and can therefore keep only silt and clay-sized material in suspension, or larger aggregates consisting of particles of these sizes. Their erosional capacity is very low or nonexistent, but weak turbulence maintains such suspen- sion currents for relatively long periods of time. They can attain considerable thicknesses and distribute their suspended load as a thin bed over wide areas. It can be assumed that low-density, muddy turbidity currents often are the final stage of sand-bearing suspension currents, which have lost their coarser grain size fraction (Chough 1984; Stanley 1985).
Proximal and Distal Turbidites
With the aid of internal sedimentary structures in the turbidite beds and different sole marks (Fig. 5.15e and f), one can distinguish between proximal (near-source) and distal turbidites (Fig. 5.1 5d). However, this concept should be used with caution, particularly in deep-sea fan associations (see below; further discussion in Macdonald 1986; Stow 1986). Proximal tur- bidites are often relatively coarse-grained and thick-bedded, and their tops may be truncated by a subsequent turbidity current (amal- gamation). Downslope, the turbidites succes- sively tend to lose their basal divisions; they become thinner and finer-grained. In many turbidite sequences, a striking correlation between the dimensions of sole marks and the thicknesses of the corresponding sandy beds can be noticed. For example, large flute casts or groove casts are often associated with par- ticularly thick sandstone layers (Fig. 5.15 e and f). This and the following observations strongly support the turbidity current hypo- thesis explaining all features of a turbidite by one single sedimentological event.
Fig. 5.15a-f. Conceptual model for the generation of pro- ximal and distal sandy turbidites and their internal structu- res. a Transition from slope failures (slumps, debris and mud flows, grain flows) on continental slopes and canyon heads to turbidity currents. b "Classic", complete turbidite (more or less proximal) showing the total succession of Bouma divisions (in parentheses) with modified descriptive symbols (Fig. 5.14a), as well as autosuspension due to
turbulence. c More distal turbidite, no erosion, basal Bou- ma divisions missing. d Idealized proximaldistal develop- ment of turbidite bed; proximal channel fills may show sedimentary structures due to traction by normal currents (st), as well as traction carpets (ig inversely graded). e Different sizes of flute and groove casts in relation to bed thicknesses. f Predepositional and postdepositional trace fossils. (After Seilacher 1962; Kern 1980)

Chapter 5 Oceanic Sediments
Pre- and Post-Event Trace Fossils
As Seilacher (1962) has pointed out, we can distinguish between pre-event trace fossil associations living in the pelagic to hemi- pelagic mud interval, and post-event assemb- lages which recolonize a freshly deposited turbidite sand layer. The burrows of the first group are exhumed by the erosive force of the turbidity current and filled up with sand (le- bensspuren on the sole of the sand bed, Fig. 5.15g). The recolonizing assemblage has to dig down into the sandy layer from a new, higher level Fig. 5.15h). If the turbidite is thin, some of the burrowing organisms may reach its base and feed on the background sediments. If the sandy layer is thick, only its top sections can be burrowed, and only those assemblages able to live on sand can persist.
Coarse-Grained Turbidites
High-density turbidity currents carrying pebbles and clasts as bed load and finer- grained material in suspension may show an initial stage of traction sedimentation (coarse- grained conglomeratjc sand with plane lami- nation, cross-bedding, and internal scour). This is then overlain by thin, horizontal layers displaying inverse grading. This division re- presents traction carpet deposits resulting from mixed frictional freezing and suspension sedi- mentation (Lowe 1982). The uppermost divi- sion of such a proximal turbidite is generated by rapid settling from suspension (suspension sedimentation), and may be either structure- less or normally graded. Typical features are water-escape structures (pillar and dish struc- tures). This division more or less corresponds with the lowermost division of the "classic" sand turbidite (Bouma division T,; here re- ferred to as TS,, see Fig. 5.14).
Medium-Grained Sandy Turbidites (Siliciclastics and Carbonate)
Sedimentary Structures of Individual Beds
The divisions of a "classic", medium-sized sand turbidite deposited from suspension cur- rents of moderate density can be interpreted in a similar way as above. The divisions con- sisting of plane laminated and cross-bedded sand (Figs. 5.14 and 5.15, 1s and cb; Bouma division T and T,) reflect traction structures, while the &vision showing laminated mud, lm
(Bouma Td), may be explained as mixed trac- tion/suspension sedimentation. Finally, the following structureless and indistinctly graded mud interval, gm (Bouma T,), originates solely from suspension sedimentation. There is also an important group of fine-grained mud tur- bidites consisting only of the muddy divisions, lm and gm (Bouma divisions Td and T,), which are described further below.
Upward-decreasing grain size (normal grad- ing) can be observed not only within division gr (Bouma T,) and generally from bottom to top in a turb~dite bed, but often within the parallel laminated and small-scale cross- bedded divisions, 1s to lm (Bouma T,, to T,, Fig. 5.14b). In these cases, the thicknesses of individual laminae or cross-bedding sets de- crease from bottom to top; this is known as graded lamination, or graded cross bedding.
It is, however, important to note that the presence and degree of grading in a turbidite bed are also controlled by the availability of a range of grain sizes. Well sorted material in the source area does not allow the formation of distinctly graded beds.
An extreme example of this type, indicated in Fig. 5.12a, is nongraded, well-sorted, yellowish sand turbidites in the eastern Atlantic, which are derived from Saharian desert sands. These were blown by offshore winds during glacial low sea level stands onto the shelfbreak, and carried by slumps and turbidity currents into the deep sea (Sarnthein and Diester-Haass 1977).
Bed Sets and Sequences
Vertical sequences in predominantly sandy turbidites do not show only one bed type, for example thick and partially amalgamated, relatively coarse-grained, so-called proximal turbidites, but usually also display thinner and finer-grained beds of a more distal ap- pearance. Nonetheless, a certain trend from sequence to sequence is often apparent (Fig. 5.16a). Such vertical variations in bed types are common in channelized deep-sea fans (see below), where thick-bedded channel fills dif- fer greatly from levee deposits and overbank sediments.
If turbidity currents reach abyssal areas below the carbonate compensation depth (CCD), they can drop calcareous beds alter- nating with pelagic clays free of carbonate. This fact has often been used for paleoceano- graphic reconstructions (e.g., Berger and von Rad 1972; Hesse 1975; Hesse and Butt 1976). Furthermore, sandy and muddy turbidity cur- rents can carry organic matter from terrestrial

Turbidites
DISTAL (BASIN PLAIN, LOWER
< PROXIMAL FAN LOBE) (UPPER FAN LOBE,
BASE OF SLOPE)
-c ANOXIC DEEP WATER
OXlC DEEP WATER, BELOW CCD
OXlC DEEP WATER ABOVE CCD, REDE- POSITED ORGANIC
MATTER
TM ---
,',I_' + carb.
10-50 bi
gr WATER ESCAPE STRUCT. ig cb IS T i?;.?;..:;.':;fj
20-200 1. a
crn 9;P 1 q-:-; ,*
. . . . . . . . . . . . . . . - . . . . . .
- Irn
- gr PE, bi grn Irn
t carb crn
1 TM
TS
/ /A LUTITE ARENITE
R \
RUDITE OVERBANK DEPOSITS A
b GRADED CALCARENITES ALLODAPIC LIMESTONES) (AND ASSOCIATED CARBONA ! E SEDIMENTS OF SLOPES)
DISTAL +----- ------- - -------- PROXIMAL
(BASIN PLAIN. DEEP-SEA FAN, LOWER SLOPE) (UPPER SLOPE, PLATFORM MARGIN)
IDEAL, COMPLETE \ CARBONATE TURBIDITE\\
\ \ PE '&. lrn+gm
----.
, CHERT .- cb+cv - -....-. .. - - . - - -. - . . - - - . . . . .
.,, . . Is
4 R
FINE-GRAINED CARBONATE TURBIDITE (MUD TURBlDlTE TM)
OR MARL
/ I \
See legend on page 220

Chapter 5 Oceanic Sediments
sources and low-oxygenated slope areas into well-oxygenated deep basins, where it may be preserved as allochthonous organic material (Fig. 5.16 a). Contrarily, autochthonous black shales can alternate with turbidites containing little organic material and displaced fauna characteristic of an oligotrophic environment.
Carbonate Turbidites (Allodapic Limestones)
So far we have not considered the composition of the principal material forming sandy tur- bidites. Essentially there are two groups of sand-sized materials: siliciclastic sands and carbonate sands, which may, of course, occur in all kinds of mixtures. In the case of quartz and feldspar being the main constituents, one observes that grains of equal diameter behave hydraulically in a similar way. If settled from suspension, a poorly sorted sand with a "wide" unimodal grain size distribution will build up a regularly graded bed, without distinct "jumps" in grain sizes, or enrichments of cer- tain minerals in particular divisions of the bed.
In contrast, carbonate sands consisting chiefly or partly of skeletal material produced on carbonate platforms may behave quite dif- ferently. Therefore, turbidite sands and muds rich in carbonate have often been treated separately from siliciclastic turbidites, and called allodapic limestones (Meischner 1964). In this case, grains with diameters much greater than 2 mm may behave hydraulically like quartz sand, or sand-sized microfossil shells may be transported and settle in a man- ner similar to compact silt grains. As a result, the graded carbonate layer deposited from a turbidity current can show distinct jumps in its vertical internal succession of grain sizes and/or sediment composition.
For example, the graded division, gr (Bouma division T,), can be replaced by a comparatively coarse shell bed, and instead of a carbonate silt division, Im (T,,)? a chert layer may be present, which was formed diagenetlcally from hy- draulically equivalent siliceous sponge needles and radiola- rians (Fig. 5.16b).
Fig. 5.16. a Vertical successions of pelagic or hemipelagic beds and event deposits (gravity mass flows, sandy and muddy turbidites) in more proximal or distal regions and in different chemical environments (CCD carbonate compen- sation depth). Note the different vertical scales. Thin-bed- ded overbank deposits may occur in mid-fan regions, as well as in more distal areas (cf. Fig. 5.18). Organic matter
Due to the uptake of eroded deep-sea mud, the amount of autochthonous fauna (nekton, plankton) often increases toward the top of a turbidite bed.
Redeposited carbonate sediments are often coarser than their siliciclastic counterparts. The primary source of sand-sized and larger carbonate grains are the margins of carbonate shelves and platforms (Figs. 5 . 1 2 ~ and 5.16b). Abundant shell material, reef detritrus, and early lithification of different types of car- bonates provide various coarse-grained mater- ials. Hence, allodapic limestones may alternate with carbonate breccias and sands derived directly from platform margins. The maxi- mum thickness of an individual bed is not commonly attained in the neighborhood of the source area, but at some distance downcurrent (Eder et al. 1983); it then decreases distally.
Mud Turbidites
General Aspects
Overlooked for a long time was the fact that a great part of the fine-grained muddy sedi- ments in a deep basin or submarine fan may also be transported by low-density turbidity currents (Stow and Piper 1984; Piper and Stow 1991), instead of being distributed and ac- cumulated by normal, more or less steady pelagic settling.
Mud turbidites may be regarded either as an end-member of gravity mass flows of mixed granulometry, or they may be derived from muddy sediment sources such as prodelta slopes and other fine-grained slope sediments. In addition to gravity movements, large river floods or muddy sediments stirred up by storms in shallow seas can contribute to the formation of mud turbidites. The sediments of several modern submarine fans (e.g., Nile cone, Indus fan, see below) on the continental rises of present-day large oceans, and in smaller oceanic basins (e.g., Black Sea, Gulf of California), consist to a large degree of mud turbidites. Because these beds are deposited from low-density suspension currents, they
(OM) is either autochthonous or allochthonous, i.e., lateral- ly transported into the basin by mud turbidites. b Proximal and distal carbonate turbidites more or less associated with platform margins and slope sediments; various vertical scales. (After Meischner 1964; Scholle et al. 1983a; McII- reath and James 1984)

Turbidites 22 1
a MUD TURBlDlTES DISTAL + - - - - - - - -- - - - - PROXIMAL MUD FLOW
\ \
\
COMPLETELY "BIOGENIC GRADING" \
d PELAGIC MUD TURBlDlTES
\
TURBlDlTES \
C HEMI PELAGIC TO PELAGIC MUD TURBlDlTES
RICH IN RICH IN CALCAREOUS REDEPOSITED RICH IN ORGANIC BlOGENlC Si02 MICRO FOSSILS VOLCANIC ASH MATTER (OM)
CLAY, bi
CHERT LAYERS
CHERT NODULES
t INCREASE BlOGENlC OPAL
INCREASE IN NANNOS, DECREASE IN FORAMS
BlOGENlC CARBONATE
CARBONATE DISSOLVED
OM, ALLOCH- THONOUS
bi OM, AUTOCH- THONOUS (BLACK SHALE)
Fig. 5.17a-d. Different groups of mud turbidites. a Proxi- d Pelagic mud turbidites, rich in either carbonate or opali- rnaldistal trend. b and c Hernipelagic, predominantly silici- ne silica clastic (b), volcaniclastic, or rich in organic matter (c).
usually are thin; but rather thick, proximal mud turbidites also occur, for example in the Gulf of California (Einsele and Kelts 1982), probably representing a transitional stage from mud flows to muddy suspension currents (hy- perconcentrated flow). The hydraulics of muddy suspensions and their behavior during sedimentation is described by Piper and Stow (1991).
Types o f Mud Turbidites and Their Internal Structures
Similar to sandy turbidites, mud turbidites can be subdivided into proximal and distal types (Fig. 5.17). Taking into account the source and composition of their material, Kelts and Ar- thur (1981) distinguish between hemipelagic, pelagic (fine-grained bioclastics), and volcani- clastic (ash) mud turbidites. The most charac- teristic features of mud turbidites are a sharp basal contact to the underlying bed, internal
222
positive grading, and bioturbation at their tops, if the environment at the sea bottom was oxygenic. Grading may become very indis- tinct, but in modern examples, the bulk den- sities of such turbidites were still found to de- crease towards the tops of such beds. There- fore, it appears often sufficient to distinguish between a laminated division, lm (according to Piper E l , in conjunction with Bouma's divi- sions a to e, or A to E), and a structureless, indistinctly graded division, gm (E2).
Proximal mud turbidites may contain a thin sand layer at their base, which displays some of the Bouma divisions for sand turbidites. Distal mud turbidites of the hemipelagic group, and many mud turbidites of the pelagic group often become so thin that they are com- pletely reworked by burrowing organisms. When this happens, their nature as mud tur- bidites is obscured, and they can only be re- cognized if their material and/or fauna differ substantially from the pelagic or hemipelagic background sediment (host sediment, PE).
Because biogenic components are often a significant source material for marine muds, many pelagic and hemipelagic mud turbidites contain hydraulically sorted, slightly altered microfossil assemblages (Brunner and Ledbet- ter 1987). Because foraminifera, calcareous nannofossils, diatoms or radiolarians behave hydraulically differently, mud turbidites may also show chemical grading. Consequently, the carbonate content of an individual sandy or muddy turbidite can increase or decrease from bottom to top; likewise, biogenic silica, later forming chert layers, may be concentrated in an upper division of the turbidite.
Frequently, both biogenic carbonate and silica are transported by turbidity currents into deep basins below the carbonate compen- sation depth (CCD), where the background sediments are poor in or free of carbonate or opaline silica. In this way, a succession of lay- ers alternatingly with and without carbonate or biogenic silica ("banded" sequences) can be produced. Similarly, mud turbidites containing high amounts of organic matter from their source area (e-g., slope sediments under re- gions of upwelling) can alternate with deep sea sediment poor in organic carbon (Fig. 5 .17~) . In this case, the organic matter is rapidly buried, and therefore at least partly preserved from decomposition in oxygenated environments. Examples of this mechanism are known from the present-day oceans, e.g., from the Cape Verde Rise or the Biscaya abyssal plain in the eastern Atlantic (Kelts and Arthur 1981, Degens et al. 1986). In contrast,
Chapter 5 Oceanic Sediments
"normal" black shale sediments slowly depo- sited by vertical settling from the overlying water body in anoxic deep water can be re- peatedly interrupted and modified by inter- bedded, muddy turbidites poorer in organic matter, as in the eastern Mediterranean (Stan- ley 1986).
Deep-Sea Fan Associations
Large-Scale Phenomena
The "classical" hypothesis, which explains lateral facies changes within individual tur- bidite beds in terms of proximal-distal trends, was developed for turbidites which originate from a highly efficient sediment source and are deposited on the plain of elongate basins (type I turbidite deposits, according to Mutti and Normark 1987). This type may include the fringe of the lower, unchannelized part of deep-sea fans or detached fan lobes (Fig. 5.18, D), where turbidity currents are not affected by submarine channels and their levees. This situation is also common at the foot of con- tinental slopes, where relatively low sediment input by slope failures creates a nonchan- nelized slope apron (Fig. 5.12a). The predomi- nance of such a "line source" is also charac- teristic of calcareous deep-sea sands and muds which were produced on carbonate shelves and platforms and later transported into deeper water.
However, as mentioned earlier and as indi- cated in Fig. 5.16 a, the sedimentary facies of many deep-sea fans fed by sediment input from large rivers, i.e., from an efficient point source, are strongly affected by a channelized sediment distribution system (Fig. 5.18 A through E; type I I turbidite deposits of Mutti and Normark 1987). Several thoroughly studied modern examples have shown that submarine canyons do not end at the foot of the slope, but mostly continue into deposition- al fans and basin plains (e.g., Barnes and Nor- mark 1985; Mutti and Normark 1987). In ad- dition, the long-term input of large volumes of river sands generates migrating, sinuous channel-levee complexes with crevasse splays similar to those of subaerial meandering rivers (Nelson and Maldonado 1988; Damuth et al. 1988). The channels of large submarine fans are many kilometers wide and have gradients of the order of 1 %. In the upper and middle fan region, their levees may rise above the surrounding sea floor by tens and, in extreme cases, more than 100 m. Large slumps and

Deep-sea Fan Associations 223
ATTACHED FAN. CHANNEL MOUTH BAR
/ BY BASSING DETACHED LOBES.
OVERBANK FINE / SANDS, SILTS, AND --- MUDS, THIN-
/-
BEDDED, GRADED ' TScb-lm (Tc-d) AND
-TM (LOW-DENSITY T. C.)
SAND AND GRAVEL, st and ig (NORMAL TRACTION AND TRACTION CARPET)
/ \ SED. DEBRIS FLOW GRAIN FLOW
LEVEE. TERRACE ACTIVE FAN VALLEY
SAND, PEBBLES, MUD LUMPS FROM HIGH-DENSITY T. C. (PARTIALLY INVERSED GRADING)
CREVASSE SPLAY
SANDY TURBlDlTES TSgr-lm !Ta-d,e) TURBlDlTES
,TRANSPORT DIRECTIONS
/ HEMIPELAGIC MUD AND MUD TURBlDlTES TM lm,qm (E l -3)
EROSION SURFACE (AM ALGAMYTION)
(TRACTION CARPET FROM HIGH- DENSITY TURBIDITY CURRENTS)
Fig. 5.18. Model of the facies association of a deepsea Note the difference W e e n channelized, attached fan and fan. (Based on several sources, e.g., Mutti and Ricci Luc- detached, nonchannelized fans which show a more regular chi 1978, Nelson et al. 1978, Walker 1978, Shanmugam turbidite sequence. For explanation of symbols see Fig. and Moiola 1985, and author's own observations). 5.14

Chapter 5 Oceanic Sediments
debris flows may bury parts of the pre-exis- ting channel-levee system from time to time and thus cause the formation of a new distri- butory system. In addition, smaller mass flows down the backside of the levees have been observed (Amazon fan, Damuth et al. 1988).
Sediment Distribution System
From the study of both modern and ancient sediments, several models for sediment dis- tribution in such deep-sea fans have been developed (e.g., Mutti 1977; Mutti and Ricci Lucchi 1978; Nelson et al. 1978; Walker 1984a, c; Shanmugan and Moiola 1985; Mutti and Normark 1937). All of them show a great va- riety of bed types in the channel system, its levees and overbank regions, and the lobes of the upper to lower fan region.
Moving down the feeder channel, one may encounter more or less channelized deposits of cohesive mass flows, coarse grained sands and conglomeratic sandstones. The latter two are generated either by normal current traction transport or by mixed frictional freezing and suspension sedimentation (traction carpet dis- playing inverse grading, ig, Fig. 5.18, A). In addition, normally graded beds preferentially showing divisions gr and 1s (Bouma Ta,J, as well as indications of vertical water escape (dish and pipe structures), are common. These channel fills cut into or pass laterally into thick or thin-bedded turbidites of the more classical types on the levees and fan lobes (Fig. 5.18, B and C).
In the transition zone between relatively high-gradient channelized flow and uncon- fined flow on a gentler gradient at the begin- ning of a depositional lobe (channel-lobe tran- sition), turbidity currents may suddenly change their flow regime from rapid to more tranquil flow (Mutti and Normark 1987). Such a hydraulic jump is accompanied by increased turbulence and enlargement and dilution of the suspension flow. The sea bed is frequently marked by large-scale scour features, mud clasts, and rapid deposition of sand and coar- ser material. Mud-dominated currents tend to deposit the bulk of their suspended load downstream of the hydraulic jump. In the zone of channel-lobe transition, they usually cause less scouring and leave only some cross- stratified sands.
Whereas thin, relatively dense, fast turbidity currents tend to flow basinward within the confines of the channels and their levees, low- velocity, less dense thicker suspension currents
build up levees and drop their fine-grained load in interchannel areas (type I I I turbidite deposits). Within these deposits, sands are almost entirely restricted to the infills of minor channels. The direction of flow may be deflected from the main channel by Coriolis forces. Thus, originating in the upper fan area, the turbidity currents form thin-bedded overbank deposits (Fig. 5.18, B and C), show- ing predominantly the upper divisions of tur- bidite sands, cb, lm, and gm (Bouma T,-,). Correlation of such beds becomes difficult even over short distances, since levee erosion can take place locally. Fine-grained inter- calations between these sand layers for the most part represent redeposited material: mud turbidites. Downslope, on the fringe of the lower fan and on the basin plain, large-scale turbidity currents usually deposit extensive sand and mud layers of the more distal type (Fig. 5.18, D). Only very large, rare debris and mudflows and their subsequent turbulent flows spread their load over large areas of the total fan and basin plain.
According to a comparative study of sand layers in present-day ocean basins (Pilkey et al. 1980), the percentage o f sand layers in the total sediment volume decreases distally, as also observed in ancient flysch sequences. The thickest layers were found in basins which have large drainage areas. Single sand beds could be traced over distances as great as 500 km (Hatteras abyssal plain in the western At- lantic). A more detailed description of the characteristics of deep-sea fans, the adjacent basin plains, and slope aprons is given by Stow (1986) and Mutti and Normark (1987).
Active and Inactive Phases o f Fan Deposition
An ideally prograding slope-fan association with a more or less fixed channel system pro- duces an upward increase in proximality, i.e., a coarsening, thickening sequence. However, as a result of shifting channels and changing sites of mass movement on slopes, vertical sections of deep-sea fan sediments can show a succession of beds of apparently widely dif- fering proximality (Fig. 5.18, B and C, and Fig. 5.16a). Normal, current-transported material may alternate with debrites and mud flow deposits, sandy and muddy turbidites, and hemi-pelagic or pelagic sediments, Switching o f fan lobes in conjunction with migrating channel systems (Fig. 5.19a) can generate both fining (and/or thinning) upward as well as coarsening (and/or thickening) up-

Deep-sea Fan Associations
A FINING-UP B (THINNING)
SANDY @, . TURBlDlTES .;:;;,;;;.,:,.:z..
. >. .- .- *-. ;., .- ..-= -.- ,...., (TS) ..-7 : .... -:.. - ., ......- _ . . . . , . - . . ..... . AMALGA- MATION
C COARSENING-UP D (THICKENING)
. . . . . . . -. ,&' .'.' :.. , . . . . . . . ..
MUDDY TURBlDlTES
. , . , , , . (TM)
,- HEMI- PELAGIC OR
PELAGIC INTERVAL
(PE)
Fig. 5.19ac. Facies association and development of deep- sea fan. a Constant sea level and steady position of conti- nental slope, permanently high sediment input via submari- ne canyon; switching fan lobes (1, 2, 3) and migrating fan valleys. Note that both fming (andlor thinning) upward (A and B) and coarsening (andlor thickening) upward sequen- ces (C and D) occur; the overall tendency ia fining upward (E). b Relative sea level fall favors rapid prograding and upbuilding of fan due to high sediment input. Most of the
sections tend to coarsen (andlor thicken) upward (F, G, H). c Relative sea level rise and resulting large reduction in sediment supply may terminate fan growth. Channel fills and turbidites are replaced by fine-grained transgressive deposits QD), a thin, condensed section (CS black shales, pelagic ooze, etc.), and highstand deposits (HSD) of in- creasing thickness (again, coarsening upward). (Partially based on Walker 1978; Bally 1987, greatly modified)

Chapter 5 Oceanic Sediments
ward sequences. Under constant sea level and a persisting slope, or a landward retreat of the slope, vertical aggradation of fan sediments causes a slight tendency for fining-upward sequences to develop (Fig. 5.19, E). Similarly, substantial basin subsidence may lead to an aggradational fan system with insignificant vertical but marked lateral facies change (Macdonald 1986).
In response to the amount of sediment input by their feeder system, deep-sea fans undergo phases o f rapid progradation and/or upbuild- ing, or periods o f inactivity, including some reworking. The former case is usually cor- related with a lowering of sea level, when the gradients of rivers entering the sea are stee- pened, and former coastal and shallow water sediments are eroded and swept into deeper waters. As a result of slope and fan progra- dation, one may get coarsening (and/or thick- ening) upward stratigraphic sequences (Fig. 5.19b, sections F through G). In contrast, sea level rise usually leads to reduced sediment supply from terrestrial sources and may bring about the filling of submarine valleys and canyons. Consequently, gravity mass move- ments usually come to an end during such periods, and fan deposits may be draped by normal hemipelagic to pelagic sediments (Fig. 5.19c, section I). The transition from the transgressive to the highstand phase may be characterized by particularly reduced sediment accumulation. The resulting condensed section is often represented by pelagic oozes, lime- stones, or thin black shales. For further conse- quences caused by sea level variations see Chap. 7.4.
Example: the Mississippi Deep-Sea Fan
The Late Pliocene-Pleistocene Mississippi fan in the Gulf of Mexico is one of the most thoroughly studied modern deep-sea fans. It represents an example of a mud-dominated fan fed by a major river whose delta migrated from southwest to northeast with time (Figs. 5.20a and 5.21a). Similarly, the channel system of the Indus deep-sea fan, the second largest submarine fan-in the world covering an area of 1.2.10~ km2, migrated from west to east (Mchargue and Webb 1986; Kolla and Coumes 1987). Both canyon cutting and fan deposition were strongly affected by eustatic sea level changes of large amplitude and high frequen- cy.
In the case of the Mississippi fan, at pre- sent, only the youngest feeder canyon is pre- served, which was cut more than 500 m deep into older shelf and slope sediments during the late Pleistocene (prior to 30 ka; Goodwin and Prior 1989). Older canyons are completely filled with sediments and incorporated into the prograding slope, which also includes lo- calized slope fans. Since 19 ka B.P., even the youngest canyon was partially filled with the material of a prograding delta and deposits of gravity mass movements, which occurred along the originally steep canyon flanks (Fig. 5.20c, d, and e). Thus, the canyon widened by retrogressive slope failure and mass movement processes resulting in arcuate re-entrants which contain slumped debris and residual knolls (Fig. 5.20~). Erosional unconformities within the channel fill indicate two to three episodes of deposition and subsequent erosion (Fig. 5.20e). The canyon was rapidly filled with prodelta sediments of a lowstand delta, which alternate with mud and debris flow deposits (Fig. 5.20d). About 7.5 ka B.P. the delta moved northward away from the canyon head. Since that time, hemipelagic muds drape the channel fill.
The Mississippi fan sediments are up to 4 km thick and can be subdivided into 13 to 17 depositional sequences (Figs. 5.20b and 5.21c), reflecting the same number of sea level oscil- lations (Feeley et al. 1990; Weimer 1990). Most of the fan sediments accumulated during the last 2.4 Ma at rates up to more than 1000 m/Ma (for more details see Wetzel and Kohl 1986). The location of the older, buried chan- nel systems in the upper and middle fan re- gion was investigated using multifold seismic data (Weimer 1990).
The result is a complicated pattern of super- posed, mostly branching channels (Fig. 5.21b) which generally young from west to east. The individual sequences consist of channel-levee systems, which may be branched, and associ- ated overbank deposits (Fig. 5.21~). Several sequences are bounded by erosional unconfor- mities truncating the upper portion of the pre-existing fan surface. Deposits of slides and gravity mass flows frequently form the base of a new depositional sequence. They are interpreted to have formed during a lowering sea level, whereas the channel-levee systems were deposited when the sea level was near its lowest position. With rising sea level, sediment transport into the deep sea decreased, and during high sea level stand a thin layer of hemipelagic sediment accumulated (condensed section, see above and Chap. 7.4).

DeepSea Fan Associations
RE-ENTRANT DEVELOPMENT
RE-ENTRANT
C
KNOLL
RETROGRESSIVE MUD AND DEBRIS FLOWS SLIDING TRANSPORTED DOWN-
CANYON
PROGRADING DELTA PELAGIC A DRAPE
d UNSTABLE I DELTA FRONT 1 - -L / INTERBEDDED DEBRIS
MASSIVE -e- PRODELTAIC (?)
DEBRIS FLOWS SEDIMENTS
WSW SEA LEVEL ENE
____----_---I----_---_------_-----_-- - ---- ----
Fig. 5.20. a Extension of the late Pliocene-Pleistocene upper slope, indicating widening of canyon by gravity mass Mississippi deep-sea fan in the northern Gulf of Mexico. movements and erosion subsequent to incision. d and e Numbers refer to DSDP drilling sites; shaded area is Longitudinal and transverse section of canyon, respective- shown in Fig. 5.21b and c in more detail. (After Wetzel ly, showing stepwise filling interrupted by phases of ero- and Kohl 1986). b Isopach map of upper and middle fan sion which caused unconformities. See text for further sediments shown in (a). (Weimer 1990). c Schematic trans- explanation. (After Goodwin and Prior 1989) verse section of late Pleistocene Mississippi canyon on

228 Chapter 5 Oceanic Sediments
SHELF EROSION DURING
a LOW SEA LEVEL
YOUNGER CHANNEL
SLOPE ' FAN
SALT DlAPlR YOUNG FAN
OLDER CHANNEL SYSTEM (?FILLED) AND DEEP-SEA FAN LOWSTAND FAN
DEPOSITION (OLD)
MASS FLOW DEPOSITS CHANNEL SEDIMENTS
BRlS APRON
EROSIONAL SURFACE DEFORMED SEDIMENTS A WSW ENE U
V.E. 1 : l
Fig. 5.21. a Very simplified model of shifting, Mississippi- portions of the Mississippi fan (cf. Fig. 5.20a). Channels type deltaic canyondeep-sea fan system. Canyon cutting are numbered from 1 to 17 (oldest to youngest) and partial- and fan building occur mainly during lowering sea level. ly dated (Ma before present). c Cross section through Note smaller slope fans and other complications caused by proximal fan (location shown in b). Note eastward migra- salt diapirism. (Feeley et al. 1990). b, c, and d Superimpo- tion of depositional sequences with time; strong vertical sed channel-levee systems of 17 depositional sequences of exaggeration as compared to true vertical scale (d). (After late Pliocene-Pleistocene age, revealed by seismic inves- Weimer 1990) tigations and several drill holes in the upper and middle

DeepSea Fan Associations
Deep-Sea Channels
A continental margin/deep-sea fan system characterized by a submarine canyon and channelized fan lobes may continue into a deep-sea channel which finally ends in an abyssal plain. Such deep-sea channels were observed in the present oceans, where they reach lengths of 2000 to more than 3000 km and widths of a half to several kilometers (Carter 1988; Hesse 1989a). The most promi- nent example is the Northwest Atlantic mid- ocean channel of the Labrador Sea, which represents a submarine, river-like drainage system with several tributaries. The main deep-sea channels have levees and a low long- itudinal gradient similar to large subaerial rivers. The infillings of these channels consists of sandy to gravelly fining-upward sequences far away from any land source. On the levees, parallel laminated, thin mud turbidites were observed (Hesse and Chough 1980; Hesse 1989a). The channel system may end an a kind of submarine braidplain.
Current Directions and Paleocurrent Patterns
Current directions in turbidity currents can easily be derived from sole marks (Fig. 5.15e), internal structures such as cross-bedding, clast and grain orientation etc., and current ripples (see, e.g., Collinson and Thompson 1982).
In several early studies on ancient turbidite sequences, one of the most striking pheno- mena, besides regular rhythmic bedding, was that the directions of turbidity currents were surprisingly constant over large areas. Later it became evident that these examples predomi- nantly represent basin plain and lower fan environments in elongate basins (type I depo- sits), which are fed by one main sediment source. In more proximal fan associations as well as in basins supplied with sediment from varying major sources, the paleocurrent pat- terns become less regular and sometimes rather complex. In cases where the fan lobes have room to switch (Fig. 5.18), the sediments are dispersed radially over the course of time.
Small-scale turbidity currents flowing within the levees of a meandering, distribut- ing channel system are forced to change their flow directions significantly. Larger, thicker currents spill over the levees, are deflected from the main current, and may even cause some levee erosion (Piper and Normark 1983). Slackening currents tend to be further reflect- ed by Coriolis forces. Finally, one should take
into account that in certain areas the current patterns of turbidites can be overprinted by contour currents (Stow 1986). Slow, low-den- sity turbidity currents may even turn into contour currents (Hill 1984).
Paleoslope orientations can be inferred from slide scars, slump folds, and sometimes from the imbrication of clasts in debrites and mud flows. For reliable measurements, good, large exposures are needed.
Sedimentation Rates and Frequency of Turbidite Events
Deep-sea fans and adjacent basin plains are areas of high sedimentation rates (cf. Chap. 10.2), particularly during relatively low sea level stands or in times of tectonic activity creating increasing relief. In modern fan en- vironments, including Miocene to Pleistocene deposits, average sedimentation rates between 100 and 1000 m/Ma are common, but near the sediment source and in over-supplied basins (Mutti et al. 1984), higher values also occur. The giant Bengal fan, Indus fan, Amazon fan, Mississippi fan, and some other elongate, pre- sent-day deep-sea fans represent wedge- shaped sediment bodies which reach maximum thicknesses on the order of 5 to 10 km which have been built up in a time span of a few Ma to 20 Ma (Curray and Moore 1974; Bouma et al. 1985; Bouma et al. 1986; Kolla and Coumes 1987; Damuth et al. 1988). The same applies to many thick, ancient flysch sequences.
The frequency of cohesive mass flows and turbidite events is related to the rate of sedi- ment accumulation in their source area, though it also varies greatly among the dif- ferent fan and basin plain environments (Fig. 5.22). In addition, frequent earthquakes, vol- canic eruptions, or rapid uplift in the source area (Klein 1985a) may cause a relatively short recurrence time for redepositional events. As a result, only thin beds of limited areal exten- sion may be generated. There appears to be an inverse (logarithmic) relation between bed thicknesses and frequency in ancient tur- bidites (Piper and Normark 1983).
In the Sea of Japan, representing a modem backarc basin, one thin-bedded mud turbidite (with an average thickness of 6 mm) has been deposited at time intervals of 50 years (Chough 1984); larger turbidite events on the Toyama submarine fan occurred in the Pleistocene with periodicities between about 3000 and 8000 years, in the late Miocene to Pliocene at time intervals of about 60 000 years (Klein 1985a). Somewhat longer recurrence times have been reported from the Coral Sea basin (Klein 1985a). On the

230 Chapter 5 Oceanic Sediments
VERY ' THlN TM w THlN TS w
THlN .
) 3 C 1 3 M b H b I l V l l T
LOW (TECTONICS, VOLCANISM)
MtDIUM-IHICK IS / \/ FREQUENCY
THICK KEY BED "-----y / VERY HIGH ( 20 - 100 THlN TM w'
MEDIUM-THICK TS MEDIUM-THICK TM /\/\ LOW ( 20 - 100
KEY BED - A VERY LOW ( 0,1 - 1
years) years)
Fig. 5.22. Frequency of turbidite events and bed thicknesses in relation to sediment supply, seismic activity, and location within a deep-sea fanhasin plain facies association
California continental borderland, the recurrence time of gravity mass movements is one event every 200 to 500 years (Malouta et al. 1981). Where river floods generate thin, fin-grained turbidites, as for example in the Santa Barbara basin, recurrence intervals of 50 to 120 years are common (Thornton 1984). From the Mediterranean, Rupke and Stanley (1974) report one mud turbidite, on the average, every 300 to 400 years for the last 20 000 years. In the central and southern part of the Gulf of California, relatively thick (often several dm) Quaternary mud tur- bidites have been generated with a frequency between 2000 and 10 000 years (Einsele and Kelts 1982); a similar order of magnitude is typical of many sand turbidites with small to medium thicknesses in lower fan and basin plain en- vironments.
In submarine channels and overbank deposits in middle fan environments, Piper and Nor- mark (1983) assume frequencies of one event per 10 to 100 years and 100 to 1000 years, respectively. This signifies that, according to a rough estimation, one out of ten turbidity currents is thick enough to spill over channel levees and deposit its suspended load. Similar- ly, the frequence of preserved turbidites ap- pears to be less in distal fan regions than in channels and overbank settings (Klein 1985a). However, most of the smaller turbidite events
do not leave much sediment in the higher parts of the channel system, where erosion and amalgamation are common.
The longest recurrence times are to be ex- pected for thick mud flows and turbidites (megaturbidites) which form extensive sheets on submarine fans and basin plains (Fig. 5.22). In ancient rocks, such key beds, often rich in redeposited carbonate due to high carbonate production in shallow waters, occur once ap- proximately every 50 000 years to 1 Ma, de- pending on the amount of sediment supply (Mutti et al. 1984). They may have been trig- gered by extremely strong earthquakes with very long recurrence times. In a deep-sea drillhole at the foot of the slope of Baja Cali- fornia, only one of these event deposits was found in a mud turbidite sequence represen- ting 3 to 4 Ma (Moore et al. 1982). This, and some other even larger mass movements ob- served in the present-day oceans, occurred during the last glacial sea level lowstand (16 to 17 ka ago). A famous example is the com- pound slide/mudflow/turbidity current in the Canary basin (Embley, in Saxov and Nieu- wenhuis 1982), where a 10 to 20 m thick mud flow deposit covers an area of 30 000 km2.
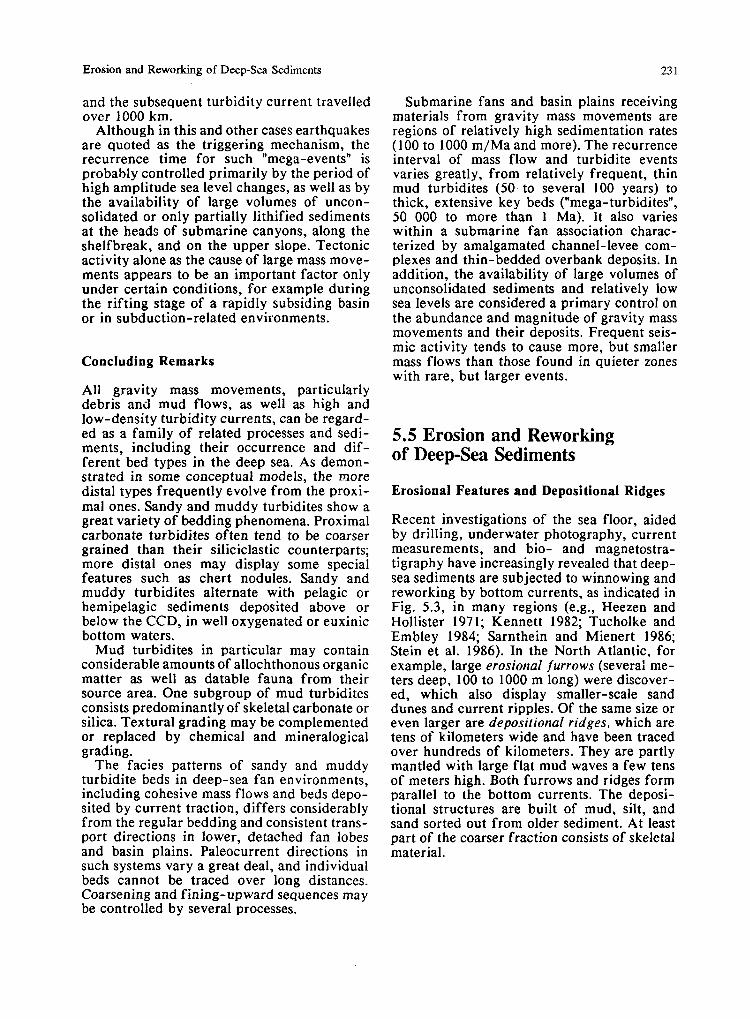
Erosion and Reworking of Deep-Sea Sediments
and the subsequent turbidity current travelled over 1000 km.
Although in this and other cases earthquakes are quoted as the triggering mechanism, the recurrence time for such "mega-events" is probably controlled primarily by the period of high amplitude sea level changes, as well as by the availability of large volumes of uncon- solidated or only partially lithified sediments at the heads of submarine canyons, along the shelfbreak, and on the upper slope. Tectonic activity alone as the cause of large mass move- ments appears to be an important factor only under certain conditions, for example during the rifting stage of a rapidly subsiding basin or in subduction-related environments.
Concluding Remarks
All gravity mass movements, particularly debris and mud flows, as well as high and low-density turbidity currents, can be regard- ed as a family of related processes and sedi- ments, including their occurrence and dif- ferent bed types in the deep sea. As demon- strated in some conceptual models, the more distal types frequently evolve from the ptoxi- ma1 ones. Sandy and muddy turbidites show a great variety of bedding phenomena. Proximal carbonate turbidites often tend to be coarser grained than their siliciclastic counterparts; more distal ones may display some special features such as chert nodules. Sandy and muddy turbidites alternate with pelagic or hemipelagic sediments deposited above or below the CCD, in well oxygenated or euxinic bottom waters.
Mud turbidites in particular may contain considerable amounts of allochthonous organic matter as well as datable fauna from their source area. One subgroup of mud turbidites consists predominantly of skeletal carbonate or silica. Textural grading may be complemented or replaced by chemical and mineralogical grading.
The facies patterns of sandy and muddy turbidite beds in deep-sea fan environments, including cohesive mass flows and beds depo- sited by current traction, differs considerably from the regular bedding and consistent trans- port directions in lower, detached fan lobes and basin plains. Paleocurrent directions in such systems vary a great deal, and individual beds cannot be traced over long distances. Coarsening and fining-upward sequences may be controlled by several processes.
Submarine fans and basin plains receiving materials from gravity mass movements are regions of relatively high sedimentation rates (100 to 1000 m/Ma and more). The recurrence interval of mass flow and turbidite events varies greatly, from relatively frequent, thin mud turbidites (50 to several 100 years) to thick, extensive key beds ("mega-turbidites", 50 000 to more than 1 Ma). It also varies within a submarine fan association charac- terized by amalgamated channel-levee com- plexes and thin-bedded overbank deposits. In addition, the availability of large volumes of unconsolidated sediments and relatively low sea levels are considered a primary control on the abundance and magnitude of gravity mass movements and their deposits. Frequent seis- mic activity tends to cause more, but smaller mass flows than those found in quieter zones with rare, but larger events.
5.5 Erosion and Reworking of Deep-Sea Sediments
Erosional Features and Depositional Ridges
Recent investigations of the sea floor, aided by drilling, underwater photography, current measurements, and bio- and magnetostra- tigraphy have increasingly revealed that deep- sea sediments are subjected to winnowing and reworking by bottom currents, as indicated in Fig. 5.3, in many regions (e.g., Heezen and Hollister 197 1; Kennett 1982; Tucholke and Embley 1984; Sarnthein and Mienert 1986; Stein et al. 1986). In the North Atlantic, for example, large erosional furrows (several me- ters deep, 100 to 1000 m long) were discover- ed, which also display smaller-scale sand dunes and current ripples. Of the same size or even larger are depositional ridges, which are tens of kilometers wide and have been traced over hundreds of kilometers. They are partly mantled with large flat mud waves a few tens of meters high. Both furrows and ridges form parallel to the bottom currents. The deposi- tional structures are built of mud, silt, and sand sorted out from older sediment. At least part of the coarser fraction consists of skeletal material.

Chapter 5 Oceanic Sediments
Contour Currents and Contourites Stratigraphic Gaps in the Deep-Sea Record
Due to Coriolis forces, equator-directed bot- tom currents are deflected to the western mar- gin of oceanic basins in both the northern and southern hemispheres. They follow the con- tours of the continental slope and rise (Chap. 5.2) or the foot of slopes of oceanic plateaus and ridges. Conversely, poleward flowing bottom currents converge along the eastern boundaries of such basins. These so-called contour currents evidently sometimes reach velocities (probably 230 cm/s) sufficiently strong enough to erode and transport fine- grained sediments. Therefore, the erosional and depositional features mentioned above are particularly well developed along the paths of such contour currents.
In times of strong climatic contrast between the poles and the equator, contour currents are able to undercut continental slopes and trigger very large submarine slides and slumps in certain regions (Sheridan 1981; von Rad and Wissmann 1982). Not only pelagic and hemi- pelagic sediments are affected by such contour currents or other tractive bottom current processes, but sands and finer-grained materi- als of deep-sea fans and slope aprons can also be partially reworked and redeposited as con- tourites, or just as layers displaying tractive transport (Stow 1986; Stanley 1988a). For ex- ample, the basal, graded subdivision of an individual turbidite (cf. Chap. 5.4.2) may be preserved, while the higher portions are re- placed by structures characteristic of normal tractive transport. Such phenomena can be only found if the structures of such current- reworked sediments are not destroyed by con- temporaneous or subsequent bioturbation. For that reason, contourites are often masked or difficult to recognize.
On mature passive continental margins, the sediments at the foot of the slope, i.e., on the continental rise, form thick wedges which thin seaward (Figs. 5.3 and 12.15). These sediments may include gravity mass flows and channel sediments deposited as slope aprons or deep- sea fans, materials from different provenances reworked and redeposited by contour currents, and normal hemipelagic sediments. The discri- mination of fine-grained turbidites, con- tourites, and pure hemipelagic material in such settings is often difficult, particularly in bioturbated sediments.
Seismic records, numerous gravity cores, and hundreds of drill holes from the Deep Sea Drilling Project have shown that erosional features are not restricted to the present sea floor (e.g., Van Andel et al. 1977; Moore et al. 1978; Thiede 198 1; Ehrmann and Thiede 1985; Burckle and A brams 1987). Unconformities and stratigraphic gaps of both short and long duration are ubiquitous in the deep ocean and occur throughout the history of these large basins. In the South Atlantic about one third of the aggregated time represented by all drill sites is occupied by stratigraphic gaps. Gener- ally, more than half of the record is missing in the Paleogene, while in the Neogene between one tenth and one half are missing (Berger 1981). Hiatuses have formed even in periods in which thermohaline circulation is believed to have been sluggish. There is hardly a single location in the present-day oceans where a really complete stratigraphic section can be found. However, because of the limits of bio- stratigraphic resolution, only long hiatuses can usually be clearly identified.
MacLeod and Keller (1991) have stressed the importance of hiatuses as a significant factor for the far-reaching global events at the Cretaceous/Tertiary (K/T) boundary. They postulate that mass extinction, abrupt shifts in carbon isotope abundances, and specific trace element concentrations in deep-sea sediments are related to long intervals of nondeposition. The stratigraphic hiatuses resulted from a marked sea level rise during the latest Maas- trichtian and earliest Danien. This caused the locus of sediment deposition to migrate land- ward across the continental shelf, where stra- tigraphic sections are more or less complete over the same time interval (cf. Chap. 7.4). In any case, the effects of incomplete or ex- tremely condensed stratigraphic deep-sea re- cords should be taken into account when rare events such as bolide impacts and their conse- quences for the evolution of marine organisms are discussed.

6 Special Depositional Environments and Sediments
6.1 Green Marine Clays Introduction Remarks to the Nature of Green Particles Greenish Sediments in the Modem Oceans
6.2 Oolitic Ironstones Depositional Environment Provenance of Iron Effects of Reworking and Sea Level Changes
6.3 Red Beds General Aspects Primary, AUochthonous Red Beds In Situ (Secondary) Formation of Red Beds Depositional Environments of Brown and Red Beds
(Continued under heading of Chap. 6.4)
6.1 Green Marine Clays
Introduction
Sediments greenish in color are fairly common in the present-day oceans at various water depths. They are also frequently observed in ancient sediments, but in these cases the minerals causing the green color may differ from those found in young sediments due to diagenesis. The correct identification, crystal- lographic and geochemical characterization of fine-grained green minerals is difficult and can be done only in the laboratory using spe- cial methods in clay mineralogy. For simple rock descriptions in the field, barely more than the greenish color can be noted, which in turn may be modified by other sediment com- ponents such as organic matter and fine- grained particles of different composition.
For these reasons and the unavailability in the past of special investigative techniques, much uncertainty existed about the nature of greenish marine sediments. Most geologists and sedimentologists used the mineral names glauconite, chamosite, and chlorite for green particles, which were often poorly defined. In the last decade, however, much new infor- mation has become available in this field
(Odin and Matter 1981; Van Houten and Purucker 1984; Odin 1988; Odin and Morton 1988). Some important aspects of our present knowledge are briefly summarized.
Remarks to the Nature of Green Particles
Green particles in the oceans are authigenic aluminum silicates (clay minerals, mica) rich in iron and magnesium. In addition, they may contain various amounts of potassium and other cations. While magnesium and potassium are present in sea water in relatively high quantities, the concentration of iron in oxy- genated waters is extremely low. Therefore, normal sea water cannot be the source o f iron.
Iron is delivered to the oceans by two prin- cipal sources (Fig. 6.1): (1) by rivers from the continents in the form of detrital particles and colloids of iron oxyhydrates, and (2) by vol- canic activity within the oceans, such as is common at mid-oceanic ridges, island arcs, and other volcanic islands. In the second case, iron can be leached from basaltic rocks either on the sea floor or from deeper sections of the oceanic crust by sea water circulating through basaltic rocks and generating hydrothermal systems.
The green minerals contain either ferrous iron or iron in both the ferrous and ferric states. Thus, their formation is associated either with overall slightly reducing con- ditions, or with reducing microenvironments within the sediment near the sea floor. The authigenic growth of green pigment is re- ferred to as verdissement (Odin 1988) and in- cludes glauconitization, verdinization, and chloritization.
Greenish Sediments in the Modern Oceans
In the present-day oceans, several zones of greenish or brown, iron-rich sediment facies can be distinguished from shallow to deep water (Fig. 6.1).

234 Chapter 6 Special Depositional Environments
Fig. 6.1. Generalized model demonstrating source and by volcanic activity, including submarine leaching of basal- distribution of iron-rich marine sediments, mostly green tic rocks. See text for explanation of the various facies clays. Note that iron is provided either by fluvial input or types. (After Odin 1988)
- Early diagenetic pyrite and siderite occurs in sediments in front of rivers entering the sea. The iron is derived from detrital iron minerals which are deposited and frequently redistri- buted in such areas. In conjunction with si- multaneously delivered organic matter, reduc- ing conditions are established within the sedi- ment. Iron is released from terrigenous mate- rial and made available as easily soluble fer- rous iron to form pyrite and siderite. - Verdine facies. In tropical to subtropical warm regions, this facies zone follows the del- ta-front zone on the inner shelf (at water depths of 20 to 60 m). The verdine facies oc- curs in areas of fairly rapid sediment ac- cumulation and is characterized by various marine green clays of the phyllite group. Thus, this facies differs from the glaucony facies (see below) in both the depositional en- vironment and mineral composition. Similar to the glauconitic minerals, these green clays are found as pigment in microtest chambers, fecal pellets, or in pores between other sediment particles. The green clays are predominantly ferric and rich in magnesium. In the present oceans this facies is known from shelf sedi- ments off the mouths of the rivers Amazon, Orinoco, Niger, Senegal, Congo, and other tropical rivers (Odin et al. 1988a). Green ma- rine shales of considerable thickness are also
common in the ancient record, for example in the Lower Cretaceous. - Iron ooides. If delta-front and inner shelf sediments rich in iron are frequently reworked and redeposited in areas some distance away from the zone of rapid sedimentation, the fer- rous iron compounds may become partially oxidized, transformed to ooids and concen- trated as oolitic iron deposits (see Chap. 6.2). - Brown iron oxyhydrates. Detrital iron mine- rals transported along the coast in shallow water are chemically and/or biochemically altered, particularly so in tropical waters. The iron released is precipitated as brown iron oxyhydrate (limonite, goethite). - Glauconitic minerals commonly form in deeper water along the shelf edge and upper slope or on the tops of submarine highs, i.e., outside the influence of deltaic or various other types of continuous sedimentation. Glauconitic minerals constitute a wide spec- trum of minerals from K-poor glauconitic smectites to K-rich micas and are known only from marine environments. Marine sediments characterized by the green pigment of these minerals may be referred to as glaucony facies (Odin 1988).
Glauconitization takes place ir. rather cold waters and is a long-lasting process in en- vironments of slow, discontinuous deposition.

Green Marine Clays
The sediment should contain clay minerals and mica and develop microenvironments with slightly reducing conditions. As a result of the interaction between sea water and such a favorable substrate, the initial minerals are slowly altered to green grains or thin films on the surfaces of larger particles or hardgrounds. Glauconitic minerals may fill small cavities, for example the tests of microfossils, or parti- ally replace fecal pellets and bioclasts. After deep burial, glauconitic minerals are subject to modifications, particularly in their chemical composition.
- Iron-rich smectite. In the deep sea, iron is frequently concentrated in either iron-rich smectites or ferromanganese nodules (Chap. 5.3.3). At least some of the iron and mangan- ese required for these sediments is delivered by volcanic activity (known as juvenile iron). - Celadonite or celadonitic minerals are ty- pical clay minerals rich in ferric iron and pot- assium, which have a higher silica content than glauconitic minerals. The iron is derived from oceanic basalts. It is incorporated into clay minerals at the contact with sea water around volcanic islands and along mid-oceanic ridges (Fig. 6.1). Celadonitic minerals fill ves- icles, veins, and other small voids in porous lava flows. Celadonite-bearing rocks may be regarded as an additional, independent green facies characteristic of marine environments. - Pyrite and iron-rich smectite also occur at active mid-oceanic ridges, where sea water intrudes into basaltic rocks and returna as hot submarine springs to the ocean. The water in such hydrothermal systems is frequently de- pleted in oxygen and can leach considerable quantities of ferrous iron and other metals (Mn, Cu, Zn, Co, Cd, Pb, etc.) on its way through hot basaltic rocks. The vents of these hydrothermal fluids are known as "black smokers", because they discharge water con- taining tiny, suspended particles of metal sul- fides. These are distributed over the sea floor in the neighborhood of the vents. In this way, sediments rich in pyrite are formed which may pass laterally into sediments characterized by iron-rich smectites.
Other portions of the metal sulfides derived from mid-oce- anic hydrothermal systems may be precipitated as massive ore deposits on and below the sea floor (called "stockwork mineralization", see e .g . Oberhinsli and Stoffers 1988).
In contrast to earlier views, it is now thought that these various green minerals are not the result of a slow transformation of pre-existing
clay minerals and mica, but represent newly formed mineral phases. Each of these mineral groups (verdine, glauconitic minerals, cela- donitic minerals) characterizes a specific ma- rine depositional environment. The verdine facies found in shallow seas off the coasts of subtropical regions may also be widespread in ancient rocks and typify rather thick sequen- ces. The glaucony facies, on the other hand, develops on various initial substrates and oc- curs both at considerable depths (about 50 to 500 m) and across many latitudes. Due to its relation to very low or interrupted sedimenta- tion, the typical glaucony facies is usually re- stricted to thin strata or special layers in both siliciclastic and carbonate rocks.
6.2 Oolitic Ironstones
Oolitic ironstones are known throughout the Phanerozoic, but seldom from Neogene sedi- ments. Due to the lack of modern analogs, and stirred by substantial economic interest, much has been written and speculated about these perticular deposits. In the last decades, how- ever, mining of these ore deposits has declin- ed, because their iron content is considerably lower than that of the large Precambrian banded iron deposits (Chap. 6.5.2) which are now exploited in several continents.
Depositional Environment
The genesis of oolitic ironstones is still con- troversial and obviously not fully understood (e.g., Gygi 1981; Maynard 1983; Odin et al. 1988; Schneider and Walter 1988; Young and Taylor 1989). Most of these deposits contain marine fossils and exhibit sedimentary struc- tures and bedding sequences characteristic of shallow-marine environments. However, iron ooids (ooliths) were also found in lakes, for example in Lake Chad, North Africa (Lemoal- le and Dupont 1976). The formation of ooids, i.e., sand size grains consisting of a smaller nucleus surrounded by concentric layers of goethite and/or chamosite, requires repeated reworking under turbulent hydrodynamic conditions (Fig. 6.2). This is indicated by the shrinkage, fractioning, and overgrowth of in- dividual ooids. Such an environment should be permanently oxidizing, but the presence of ferrous iron in chamosite, which is a diage- netic chlorite mineral, indicates that the ooids

Chapter 6 Special Depositional Environments
a POSSIBLY SOME MUDFLATS, DEEPLY WEATHERED SOILS OF GROUNDWATER MICRO-CON- TROPICAL TO SUBTROPICAL CLIMATE DISCHARGE CRETIONS OF /
REWORKING
ELTAIC MUD WlTH OME PYRITE AND
SEA LEVEL C RISE FALL
IRON OOLITES (GOETHITE AND CHAMOSITE)
POSSIBLY PHOSPHORITE AND GLAUCONlTlC MIN.
IRON OOLITE
SHELL BED SAND
SIDERITE
DARK SHALE WlTH PYRITE
FAECAL b ,
IT' GOETHITE ( ~ e + + + )
MUD
REPLACEMENT OF Fe+++ BY Fe++ + FERROUS CLAY (CHAMOSITE!
EXTRA- SEDIMENTARY ACCRETION, NUCLEUS (E.G.. BlOGENlC CARB.)
Fig. 6.2. a Model depicting most common hypothesis on cover (reducing conditions, replacement by ferroan clay iron supply by suspended river load from deeply weathered minerals). Note that fecal pellets can also become enriched soils or groundwater rich in ferrous iron. Repeated win- in ferrous iron. c Idealized transgressive-regressive sedi- nowing, reworking, and final deposition of iron oolites mentary cycle with iron oolites as "roof beds". (Based on below the sea level of the lowermost stage of transgressive- several sources, e.g., Maynard 1983; Bayer et al. 1985; regressive cycles. b Two-stage formation of ooids at the Van Houten and Purucker 1984; Odin et al. 1988; Bayer sea bottom (oxidizing conditions, limonite-goethite coatings 1989a) including some organic matter and silica) and under mud
also developed partially within the sediment under reducing conditions.
An alternative hypothesis is given by Dahanayake and Krumbein (1985), who as- sume that iron ooids form under coatings of microbial films. Fecal pellets and algal-pro- duced oncoid particles may also be transform- ed into iron-rich ooid size particles due to their organic matter content favoring a reduc- ing microenvironment. In any case, after buri- al, the primary iron-rich sediment and its constituents are more or less modified by dia- genetic overprint, including the precipitation of some pyrite and/or siderite. Carbonate ooids may be replaced by iron compounds
(diagenetic ferruginization, see, e.g., Kimber- ley 1979; Maynard 1983).
Provenance of Iron
A further problem is the sources of iron in thick ironstones. As with oolitic carbonates, an environment is needed where input or deposi- tion of terrigenous silicates is low or virtually absent. However, unlike the formation of car- bonate ooids, which are precipitated from sea (or lake) water supersaturated with respect to calcium carbonate, the iron required for the ironstones has to be delivered by rivers drain-

Oolitic Ironstones
ing deeply weathered, vegetated soils. Another mechanism supplying iron may be oxygen- free groundwater rich in ferrous iron, which discharges directly into the sea (Fig. 6.2). The latter process is probably not sufficient to produce iron concentrations on the order re- quired for larger ore bodies.
In the case of river input, regardless of whether iron is supplied in the form of detri- tal iron-bearing minerals or as mixed iron oxyhydrate-organic matter colloids, this pro- cess is accompanied by the transport of con- siderable quantitities of other clastic materials into the sea. These cause high sedimentation rates near the river mouths and thus dilution of any kind of chemical or biogenic sediment. Consequently, comparatively pure iron oolites of substantial thickness can only form at some distance away from deltaic areas. This also applies to those iron oolites which may consist predominantly of eroded ooids formed in lateritic soils, as assumed by Siehl and Thein (1978) for the large, shallow-marine Jurassic iron deposits of the minette ores in Lorraine, eastern France. The nuclei of the ooids in many oolitic ironstones, however, originate from marine environments and therefore in- dicate that the ooids were produced in shallow seas (Maynard 1983).
Effects of Reworking and Sea Level Changes
Some of the above mentioned problems can be solved by assuming that iron oolites are the product of repeated reworking, winnowing, and sorting of sediments containing disseminated ooids. During the first stage, detrital, iron- bearing minerals may accumulate in marine deltaic regions, and iron may be precipitated as pyrite, siderite, green particles, and limonite as desribed in the preceding chapter (Fig. 6.1). After abandonment or lateral mi- gration of the delta away from the site of sub- sequent iron concentration, the bulk of the fine-grained sediment is reworked, and the various pre-existing iron compounds are par- tially oxidized, dissolved, and replaced by iron ooids, possibly with the aid of microorga- nisms. Alternating exposure to aerated waters and reducing conditions after shallow burial below mud may lead to oolith growth under changing redox conditions (Fig. 6.2b). During repeated transgressions and regressions, the sand size ooids are sorted out and concentrated in sand bars in the foreshore zone or on sub- marine swells. This zone alternatively migrates landward and seaward with rising and falling
sea level (Hallam and Bradshaw 1979; Bayer et al. 1985; Bayer 1989a). If the sea level be- comes particularly low, the ooids move far basinward and tend to become stable and buried under the subsequent finer grained transgressive sediments.
In fact, many iron oolites represent the roof beds of transgressive-regressive sedimen- tary cycles, beginning with dark pyritic shales (peak of transgression), followed by normal to greenish shales with some siderite concretions (Fig. 6.2c), then predominantly fine grained quartz sand, and culminating in ironstone de- position (Hallam and Bradshaw 1979; Bayer et al. 1985). The latter frequently show distinct cross bedding which may be bipolar, thus indicating subtidal environments. The iron oolites often alternate with shell beds and other lag deposits and are sometimes overlain by thin layers containing phosphorite nodules and glauconitic minerals. Oolitic ironstones are frequently excellent marker beds (Dreesen 1989).
Summary
In summary, oolitic ironstones occur predomi- nantly in clastic sequences and represent a kind of condensed lag sediment. Most of the iron appears to have been supplied as clastic particles by rivers draining deeply weathered lateritic soils, where the iron was already pre- concentrated and the quartz content low. The ooids and other iron-rich particles probably formed in coastal waters under repeatedly changing environmental conditions, partially at the sea bottom and partially within the sed- iment. Transgressive-regressive cycles led to winnowing, repeated migration, and final de- position of oolitic sand bodies in the form of offshore bars or more widely extended sand sheets during the deepest sea level stands. In tidal-dominated regimes, the iron oolites mostly represent sediments of the subtidal to lower intertidal zones.
Most Phanerozoic ironstones formed dur- ing long periods of high, but short-term fluc- tuating sea level (Ordovician to Devonian and Jurassic to Paleogene) in epicontinental seas (Van Houten and Arthur 1989). During these times, the climate was warm and humid, ter- rigenous sediment influx into the sea was low, and deeper water masses tended to become poorly oxygenated. Thus, black shale deposi- tion, coeval with, or shortly before or after iron oolite formation was common.

Chapter 6 Special Depositional Environments
6.3 Red Beds
General Aspects
Red beds include claystones, sandstones, ar- koses, radiolarites, some limestones, and oc- casionally other rock types such as tephra lay- ers. The striking reddish color of red beds, in contrast to the drab gray color of most other ancient sedimentary rocks, has always roused the interest of both lay persons and professio- nal geologists alike. It was frequently assumed that red beds indicated ancient arid environ- ments, because they are often associated with evaporites. Indeed, this type of red bed is par- ticularly common and occurs in regions of low paleolatitude. In the Permian and Triassic, thick, widespread red beds accumulated on all continents. However, red sands or soils are rare and not typical in present-day deserts. In addition, red beds were identified in a variety of other depositional environments, including marine sediments. In principle, they can occur even in glacial sequences. These findings led to much controversy over the origin of red beds. Summaries on the current state of knowledge were published by Glennie (1970), Van Houten (1973), Turner (1980) and in sev- eral textbooks on sedimentology and stratigra- phy (e.g., Dunbar and Rodgers 1957; Leeder 1982; Fiichtbauer 1988).
Most authors assume that the staining pig- ment of red beds is very fine-grained, uni- formly dispersed hematite (Fe203), whereas hematite concentrated in larger crystals or at certain spots does not cause red color. Torrent and Schwertmann (1987) have pointed out that the red color is produced by the special optical behavior of tiny hematite clusters; the color of synthetic hematite-clay mixtures varies with the grain size of the hematite crystals. The hydrous ferric iron oxides, such as goethite and the less well defined limonite, are brown to ocher in color. Less than 1 % of hematite is sufficient to generate the red staining of clays and silts. The total iron content of claystones, however, is commonly two to three times higher than that needed by the staining pig- ment, because clay minerals and other mineral phases also contain ferric and ferrous iron. In alternating red and green claystones, the iron content of red beds is, if at all, generally only
insignificantly higher than that of green beds. The red color of sandstones is caused by grain coatings containing hematite; their hematite content may be even less than in claystones. Reddish colored top layers of sandstones may also be caused by mechanical infiltration of detrital clay (Turner 1980).
The presence of limonite or hematite in- dicates that the sediment is in an oxidizing state. This is generally better achieved and maintained in continental environments above the groundwater table than in aquatic systems. Therefore, red beds are common in continen- tal deposits, although they also occur in speci- al lacustrine and marine sediments. During the early history of the Earth, when the at- mosphere was poor in or free of oxygen (Chap. 6.5.1), the formation of red beds was limited or impossible.
Oxidizing conditions within a sediment can be maintained for a long time when little or no organic matter or reducing pore wat!rs are . available to reduce the ferric to ferroan iron. Then, iron cannot be incorporated into iron- bearing carbonates, clay minerals, or form iron sulfide (pyrite). Furthermore, ferric iron cannot be carried away by circulating pore water like dissolved ferrous iron. In contrast, in buried sediments containing sufficient or- ganic matter to reduce all the pre-existing limonite and hematite, the brown or red pig- ment cannot survive. Hence, they become drab gray in color. Secondary reddening can occur only if the excess organic matter is de- stroyed by oxidizing pore water or some other mechanism.
Having these basic rules in mind, the oc- currence of red beds in various depositional environments is easy to understand.
Primary, Allochthonous Red Beds
Red, lateritic soils develop preferentially in tropical regions with seasonally wet and dry climates (wet-dry tropics, see e.g., Valeton 1983). These soils contain hematite in addition to hydrated iron oxide and other stable mine- rals such as quartz and clay (cf. Chap. 9.1). Such soils can be eroded and carried by rivers or wind into regions with differing climates (Fig. 6.3a). In rare cases, red dust and red- stained sand may reach deserts and form

Red Beds
primarily red sand dunes and clay dunes (cf. Chap. 2.3; Millot 1964; Solle 1966). The red- dening of sand dunes in Australia, however, is only observed in old eolian sands where origi- nally brown-coated sand grains have become red by agidg (Wopfner and Twidale 1988, see below and Chap. 2.3.2).
More frequently, river-transported red soils accumulate in semi-arid and arid lowlands and may alternate with carbonates and evaporites deposited in playa lakes. If the redeposited soils contain sufficient organic matter, hematite and ferric iron hydroxides are slowly reduced. As a result, the bed be- comes drab gray or greenish in color. Alterna- tions of red and green beds may be caused by minor differences in primary organic matter content. Primarily red silts and sands, or marly limestones, which have low hematite and ferric iron hydroxides contents, require less organic matter for decoloring than do silty clays and clayey silts with relatively high ferric iron contents. For that reason, sand- stones, limestones, and evaporites, intercalated into red claystones frequently show drab gray colors.
Redeposited lateritic soils can also occur on river floodplains in semi-arid regions, where sparse vegetation cannot provide suf- ficient organic matter for ferric iron reduc- tion. Ancient examples of this type of red bed frequently contain in situ pedogenic limestone nodules (caliche, cf. Chap. 2.2.3), indicating a relatively dry paleoclimate. Similarly, rapid deposition of carbon-poor prodelta sediments in lakes and in the sea may allow the maintai- nance of the primary red color in parts of the prodelta sequences. Red prodelta deposits are known, for example, from the marine deltas of the Orinoco, Amazon, and Yangtze Rivers, i.e., rivers draining tropical and subtropical regions. In shallow seas with limited inputs of lateritic soils, the red pigment mostly vanishes at depths of a few centimeters to decimeters below the sediment-water interface, as ob- served in the Adriatic Sea (Hinze and Meisch- ner 1968) or in the western part of the Gulf of Aden (pers. observ.).
Furthermore, red soils are carried into lakes and swamps in humid regions where they are usually reduced and form gray deposits alter- nating with organic-rich layers such as peat. Occasionally, however, a thick red bed may be
preserved within a sequence with coal seams, as Tor example in some Tertiary coals in Europe. Another instructive example is the barren red Carboniferous coal measures of Britain, which occur adjacent to the produc- tive coal measures of the same age (Glennie 1970; Turner 1980). Conclusive evidence for the primary nature of these red beds is, how- ever, not available. They may also result from originally brown material or reflect post-de- positional oxidation processes (see below).
In Situ (Secondary) Formation of Red Beds
Many red beds do not result from redeposited lateritic soils, but reflect in situ processes and may therefore be referred to as secondary red beds. In this case, the source area and its cli- mate are of minor importance. The principal factor controlling the subsequent sediment color is a well oxygenated depositional en- vironment in which the organic matter, either autochthonous or allochthonous, is mineralized completely or to a very high degree. Then the potential of the relic organic matter to reduce all the ferric iron compounds present in the sediments is too low (Fig. 6.3).
The precursors of such red beds are either brown soils or brown sediments, because ferric iron hydroxides left behind after the consum- ption of organic matter are commonly brown or ocher in color at or near the sediment sur- face. With increasing burial depth, tempera- ture, and age, these iron compounds lose their water and are transformed into hematite. Hence, one can expect that present-day brown sediments, found below the zone of active aeration and bottom life, alter after burial and become red. The formation and preservation of brown colored sediments are favored by:
- High iron content in sediment (e.g., silici- clastic material rich in biotite, pyroxene, am- phibole, olivine, and iron-bearing clay mine- rals). - Low production and rapid mineralization of organic matter in the depositional area (e.g., fluvial plain with sparse vegetation in semi- arid climate). - Slow or intermittent sedimentation, allowing organic matter consumption in the zone of active bottom life (soil zone or subaquatic benthic epifauna and infauna).

Chapter 6 Special Depositional Environments
WET-DRY TROPICS DESERT
HUMID RED-STAINED WINDBLOWN
SWAMP
PLAYA LAKE
GREEN MUD (PRIMARILY RED, HEMATITE REDUCED BY ORGANIC MATTER)
WET-DRY TROPICS DESERT
HUMID RED-STAINED WINDBLOWN
PLAYA LAKE
\ GREEN
b RED BEDS FORMED IN SlTU
VARIOUS SEDIMENT SOURCES (GENERALLY BROWN, OXIDIZED MATERIAL)
n VARIOUS, WELL OXYGENATED
FLUVIAL -, DEPOSITIONAL ENVIRONMENTS
(E.G.. ARID. SEMI- / / / I ARID' WITH LITTLE VEGETATION)
DELTAIC, SUPRA-
PLAYA LAKES
SHALLOW SEAS (DESTRUCTION OF ORGANIC MATTER BY REWORKING)
DEEP SEA, OCEANIC RISE, DEEP PLATEAUS
INCREASING BURIAL DEPTH, AGE, AND TEMPERATURE
(VERY SLOW SEDIMEN- TATION OXIDATION RED (HEMATITE) . OF ORG MATTER e
, FAULT
e PRIMARY BEDDING
RED
DRAB
SEDIMENT SURFACE
ZONE OF RAPID OXIDATION (FAST EXCHANGE OF GAS AND WATER)
C-ORG CONTENT TO REDUCE SUFFICIENT 1 FERRIC
COMPOUNDS INSUFFICIENT 1
ALTERATION OF IRON- BEARING> MINERAL
OXIDIZING INTERSTITIAL WATERS
IN SlTU WEA- THERING, NEO- FORMATION OF CLAY MINERALS AND HEMATITE
Fig. 6.3ae. Various origins of red beds. a Allochthonous temperature, and age. d In situ alteration of iron-bearing primary red beds formed by eroded, redeposited lateritic minerals (e.g. pyroxene, biotite) by interstitial water with soils. b Secondary red beds resulting from brown, well high redox potential; release of femc iron and nw-forma- oxygenated sediments which do not contain enough organic tion of hematite within sediment. (After Walker 1967, matter for the complete reduction of femc iron in limonite 1976). e Secondary discoloring of red beds by circulation and goethite below the zone of near-surface rapid oxida- of waters with low redox potential along faults. (After tion. c Slow transformation of brown limonite and goethite Franke and Paul 1980) into hematite (red pigment) with increasing burial depth,

Red Beds
- Redox and pH conditions in interstitial water favoring the formation of iron oxide after burial, if subsequent reduction is absent (Walker 1967, 1976, 1979).
Depositional Environments of Brown and Red Beds
Examples of depositional environments with a high potential of forming brown beds can be easily deduced from these general rules. They include both continental and marine systems (Fig. 6.3b). The fluvial red mudstones of many formations can be interpreted as originally brown floodplain sediments derived from muddy suspension load or aggregated river bed load (Rust and Nanson 1989; Chap. 2.2.3).
Environments with relatively rapid sedi- mentation such as river floodplains, prodelta deposits in lakes and in the sea, or supratidal sediments can maintain an oxidized state only when their primary organic carbon content is low. In contrast, slowly deposited pelagic sedi- ments on submarine plateaus and in the deep sea may originally contain relatively high amounts of organic carbon, but benthic life in oxygenated waters has sufficient time to des- troy the organic matter before it is finally buried under younger sediments. Red deep- sea clay accumulating below the calcite com- pensation depth (Chap. 5.3.2) is representative of this group of red beds, which does not de- pend on a specific clay mineral source.
Red deep-sea sediments are restricted to basinal sites and mid-oceanic ridges without major clastic influx (Franke and Paul 1980), although they may contain biogenic silica and carbonate. Red clays may alternate with gray
turbidites which are deposited rapidly and obtain their organic material from source areas with higher sedimentation rates (Faupl and Sauer 1978).
Carbonates poor in iron only require a little preserved organic carbon to be held in a reduced state. Therefore, most ancient car- bonates are light gray in color. Red limestones indicate a particularly well oxidized environ- ment, low sedimentation rate, and in some cases possibly emergence above sea level. In addition, some red limestones, sandstones, and to a lesser degree claystones with irregular color boundaries across primary bedding pla- nes may result from postdepositional proces- ses, such as circulating groundwaters with a high redox potential. Similarly, reducing pore waters can destroy red staining, particularly along zones of high fracture permeability (Fig. 6.3e). Transgressions of the sea over brown or red continental sediments normally leave be- hind gray deposits, but can also affect the un- derlying sediments by providing circulating, reducing pore waters. Thus, the uppermost portions and locally deeper zones of these sed- iments may be discolored.
Finally, it is important to note that iron is also released from unstable, iron-bearing minerals during diagenesis (Walker 1967, 1976, 1979; Fiichtbauer 1988). Oxidizing in- terstitial waters lead to in situ weathering of these particles and to the formation of new clay minerals, as well as ferric iron hydroxide. The latter slowly alters to hematite and thus causes red staining as mentioned earlier. This process commonly takes place in sediments which were originally brown and did not con- tain sufficient organic matter to maintain re- duced conditions in the subsurface.

6 Special Depositional Environments and Sediments
6.4 Marine Evaporites
6.4.1 Models for Evaporite Deposition Introduction Common Models for Evaporite Deposition Complex Models for Evaporite Deposition (Giant Salt Deposits)
6.4.2 Sequences, Sedimentary Structures, and Sedimen- tation Rates of Evaporites Characteristic Sequences with Salt Deposits Sedimentary Structures Sedimentation Rates
6.4.3 Diagenesis and Geochemical Characteristic of Evaporites Diagenesis Trace Elements, Stable Isotopes, and Accessories
6.4.4 Salt Structures Halokinesis Mechanics of Salt Flow Evolution of Salt Structures
(Continued under the heading of 6.5)
6.4.1 Models for Evaporite Deposition
Introduction
Marine sea water-derived salt deposits are more uniform and, in several respects, easier to interpret than continental evaporites (Chap. 2.5). Their large representatives, however, impose some difficult problems (see below). Salt deposits are known from the Precambrium and throughout Phanerozoic time, but there were some major epochs of halogenesis, for example in the early Cambrian, the Devonian, the Permian, and the late Triassic to early Jurassic (e.g., Zharkov 1981). Due to their importance in geology and for the economy, salt deposits have received much attention from earth scientists of different specific dis- ciplines; thus there are numerous publications summarizing our knowledge in this field (e.g., Lotze 1957; Richter-Bernburg 1968; Braitsch
1971; Kirkland and Evans 1973; Nissenbaum 1980; Kendall 1983; Sonnenfeld 1984; Dronkert 1985; Peryt 1987b; Miiller 1988; Peryt 1987b; Schreiber 1988a and b; Sonnen- feld and Perthuisot 1989; Warren 1989). Be- cause marine evaporites originate from sea water of more or less constant composition (at least since the Cambrian), their mode of pre- cipitation can be predicted rather well. There is, however, only a limited number of cases in which the sequence and amount of marine salts can be explained just by evaporation of a certain volume of sea water.
Normal sea water has a density of 1.025 g/cmS and contains about 35 g per liter dis- solved constituents. These mainly consist of the following (water-free) salts (in percent by weight of the total salt content):
78 % NaCl (halite), 18 % potash salts, i.e., chlorides and sulfates
of K and Mg (e.g., sylvite KCl, carnallite M~CI;KC'.~H,O, kainite MgSO .KC]. 3H 0 , kieserite MgS0;H 0 , etc3,
3.5 % E~so, (gypsum and ankydrite), 0.3 % carbonates, and some minor constitu-
ents such as bromides, fluorides, borates.
Common Models for Evaporite Deposition
The following models for the depositional en- vironment of evaporites were developed from recent examples and the study of ancient salt deposits. All of them have in common that the depositional basin lies in an arid to semi-arid zone and loses more water by evaporation than it receives by precipitation and inflow of river water. Consequently, ancient salt deposits are important paleoclimatic markers, indicating arid, normally low-latitude zones as opposed to tropical or temperate and cold high-latitude regions.
As a result of an excess in evaporation, the water level in a basin tends to decrease and salt concentration and density of the water

Marine Evaporites
SALTS PRECIPITATED
POTASH SALTS 1.40
PLAN VIEW
CLOSED BASIN, STATIC CONCENTRATION OF SEA WATER
CARBONATE
HALITE GYPSUM & ANHYDRITE
INFLUX OF EVAPORATiON INCREASING CONCENTRATION OF BRINE
SALT LAGOON WITH FREE C REFLUX OF BRlNE
(BAR MODEL)
PLAN VEW: TEAR-DROP PATTERN
SEEPAGE MODEL (PERMEABLE BAR)
f L IDEAL EVAPORITE SEQUENCE IL EVAPORITE SEQUENCE OF LAGOON,
OF CLOSED MARINE BASIN VARYING INFLUX AND REFLUX
WW-BLOWN SANDS AND SILTS
POTASH SALTS (+HALITE)
HALITE 2ANHYDRITE (PERIODS OF BRlNE DILUTION)
+ BlOGENIC LIMEST. INLET WIDENING
DECREASING BRlNE DOLOMITE CONCENTRATION
A INLET NARROWING G INCREASING BRINE DOLOMITE CONCENTRATION LIMESTONE, NORMAL MARINE I
Fig. 6.4a-c. Models of evaporite deposition. a Closed meable bar (sand dunes, reef etc.) allowing slow influx of basin with "static" concentration of sea water and "bull's sea water and reflux of brine. Situation similar to c with eye" facies pattern. b Proportions of different evaporites tendency to high brine concentration and therefore predo- precipitated under conditions of a. c Silled salt lagoon, minance of halite. e Idealized evaporite sequence of closed open system with brine reflux ("dynamic" system of evapo- basin (a). f Idealized example of evaporite sequence of rite deposition), frequently causing a "tear drop" facies silled lagoon (c) with reversed development (prograding pattern. d Lagoon separated from the open sea by per- dilution) in upper half. For further explanations see text

Chapter 6 Special Depositional Environments
increase. We distinguish several basic models of evaporite deposition:
1. Closed Basiq
This model is based on the following con- ditions: the initial salt content is equal to that of normal sea water; the full basin is assumed to hold 100 volume units of water; there is no inflow of sea water or outflow of brine (Fig. 6.4a).
During the first stage of development, the water volume is reduced to about 30 volume units and its density is raised to 1.126 $j/cm3. Throughout this period a small quantity (about 0.3 % of the total salt content) of biogenic carbonate and later possibly chemically preci- pitated aragonite are deposited. Upon the ex- traction of Ca, the Mg/Ca ratio of the deve- loping hypersaline water increases and thus favors the early diagenetic transformation of aragonite and calcite to dolomite.
In the second stage, the brine volume is re- duced from about 30 units to 10 units (density 1.214 g/cm3) by evaporative drawdown, and gypsum is precipitated (3.5 % of the total salt content). The formation of anhydrite at nor- mal field temperatures (g25 OC) is possible only in the last part of this period, when the concentration of the brine has nearly reached saturation for halite.
During the third stage of development, when the brine volume drops below 10 units, the major part of rock salt (halite) is deposit- ed. Mostly, the crystals start to grow at the air-water interface before they settle through the water column. Precipitation of some an- hydrite may continue, particularly in winter time or during periods of temporary brine dilution caused by ephemeral fresh water in- flow.
The final stage of this "static brine con- centration" begins with a volume of about 6 units (density 1.257 g/cmS) and is characteriz- ed, in addition to continuing halite precipita- tion, by the deposition of chlorides and sul- fates of K and Mg (18 % of the total salt con- tent of the original sea water). Halite makes up about 78 % of all salts precipitated (cf. Fig. 6.4b).
The areal distribution of the different salts reflects the evaporative drawdown (Fig. 6.4a). The comparatively poorly soluble carbonates and calcium sulfates occupy the margin of the basin, whereas the most soluble salts are found in the center of the basin. Such a facies distri- bution is referred to as a "bull's eye" pattern.
The dry salt pan may be overlain by wind- blown sand and silt. An ideal vertical section of such a development is shown in Figure 6.4e.
This model is seldom verified in nature in its pure form. Additional influx of sea water may augment the volume of salts precipitated, but cannot change the contribution of the dif- ferent evaporites to the total salt body. How- ever, the salt content of a closed basin with initial normal sea water composition is often also supplemented and modified by inflowing surface and ground water of differing com- position. Thus, the basin is slowly transformed into a continental salt lake or playa, where additional salts may gain importance (Chap. 2.5).
2 (2a). Salt Lagoon or Shallow Barred Basin
This basin type is connected with the open sea by a small opening (Fig. 6 .4~) . Lowering of the water level by intensive evaporation leads to influx o f surface water from the open sea. Salt concentration and density of this water increase toward the landward side of the lagoon and causes the surface water to sink and flow back seaward as underflow and over the sill into the sea (brine reflux, cf. Chap. 4 , arid adjacent seas). Consequently, salts are transported continuously into and out of the lagoon, but since the influx of salts is greater than their reflux, part of the salts can be pre- cipitated in the lagoon. Such a situation can be described as a "dynamic system of evaporite deposition".
The type o f salts precipitated depends on the salt concentration which is reached in dif- ferent parts of the lagoon. If the entrance to the lagoon is relatively large, the water ex- change between open sea and lagoon is little hampered, and the concentration of the la- goonal water remains low. With decreasing area of inflow, the salt concentration in the lagoon increases. Thus, a certain opening in conjunction with the surface area of the basin may, for example, cause a brine concentration which leads to the precipitation of gypsum in large parts of the lagoon, but not yet to the crystallization of halite. In this case, the ratio of the areas of the evaporite basin and its inlet is often between lo7 and lo8 (Lucia 1972). Under these conditions, NaCl is returned by brine reflux to the open sea before it reaches saturation. Such a situation can be maintained for a considerable time period and thus en- ables the deposition of a thick gypsum or an- hydrite layer.

Marine Evaporites
Consequently, the lagoon may experience different stages of development. It may start with the preferential deposition of carbonate followed by gypsum and anhydrite. Then the halite stage is reached and finally also potash salts (chlorides and sulfates of K and Mg) can be precipitated. However, in contrast to the closed basin model, the thickness or volume of these different evaporites is no longer a func- tion of normal sea water composition; it rather depends on how long a certain stage of evapo- rite deposition is maintained.
Figure 6.4f shows a vertical section of such a lagoonal evaporite sequence, in which the carbonate and calcium sulfate stages lasted much longer than the halite stage and there- fore generated comparatively thick layers. In this example, the stage of potash salt precipi- tation was realized for a short period, but in many cases in nature neither this nor the ha- lite stage were ever reached.
Deepening or widening o f the inlet or shal- lowing of the lagoon as a result of salt ac- cumulation may again cause increased water circulation in the lagoon and thus dilution of the brine. Consequently, the development of the depositional system can be reversed and stages of high salt concentration are followed by the precipitation of lower soluble evapo- rites (upper part of section in Fig. 6.4f).
Particularly in shallow lagoons, the concen- tration of the brine may also change laterally and become higher in a landward direction. As a result, different evaporites can form simul- taneously as shown in Fig. 6.4c, i.e., car- bonates precipitate near the entrance of the lagoon, while rock salt and possibly K and Mg salts are deposited at its landward end. In plan view, such a facies distribution is called a "tear drop pattern".
A famous recent example described in many textbooks (see above) is the Kara Bogas Go1 (lagoon) on the eastern side of the Caspian Sea.
It covers an area of approximately 20 000 km2 but has a maximum depth of only 8 m. Although the Caspian Sea has a salinity of only 1,3 % and its salt composition differs from that of normal sea water, the lagoon inspired Och- senius in 1877 (see, e .g . , Sonnenfeld 1984; Miiller 1988) to propose the depositional model of a silled lagoon ("Bar- ren-Theorie") and also to apply this model to marine eva- porite~. Carbonate and gypsum are precipitated near the entrance of the Kara Bogas lagoon; glauberite (Na2S04.- CaS04) and halite follow landward.
The sill between the open sea and the lagoon or shallow adjacent sea may be caused by tec- tonic movements, but is also generated by
sedimentary processes such as reef structures, nearshore sand bars, or barrier islands (Chap. 3.2). In the ancient record, shelf carbonates and reefs of different nature (e.g., algal struc- tures) in front of a reef lagoon are frequently associated with evaporites, because warm cli- mate favors both carbonate production includ- ing reef growth and high evaporation.
Seepage basin. The lagoon may also be sepa- rated from the open sea by a permeable sub- aerial bar or ridge (Fig. 6.4d). Similar to the process in the silled basin, evaporative draw- down of the water level in the lagoon then causes sea water to flow underground into the lagoon and denser brine to flow back into the ocean. Due to the restricted inflow and reflux, this system creates a transitional situation be- tween a closed and a silled basin. In contrast to the silled basin model, the ratios of the dif- ferent salts precipitated tend to deviate less from those given by the composition of nor- mal sea water. Consequently, the predominant salt in a seepage lagoon will often be halite. A well studied example of this type of basin is the MacLeod evaporite basin in western Aus- tralia (Logan 1987), where carbonates, gypsum, and halite were precipitated in the Holocene.
The brine reflux in both the subaerially separated and the barred basin may cease when the permeability of the underground ridge becomes too poor or the water level in the lagoon drops too deep to enable reflux, respectively. The latter case is already verified for the Kara Bogas Go1 (see above). In this manner, a kind of closed system is established which, in contrast to model (1), is fed for a certain period of time by inflowing sea water (also see below).
2b. The Synsedimentary Subsidence Model
This model is a modification of the barred basin model (2) (Fig. 6.6a). It was proposed to explain the formation of salt deposits thicker than the limited depth of the model 2 basins (e-g. Sonnenfeld 1984). Normal slow tectonic subsidence is enhanced by the isostatic effect of the rapidly accumulating salt deposits on top of (usually) continental crust (see Chap. 8.1). In addition, differential subsidence with- in the basin may cause lateral variations in the evaporite thickness. If the basin is filled up, the residual brine precipitating K and Mg salts may be collected in ponds above the areas of maximum subsidence.

Chapter 6 Special Depositional Environments
Except for rapidly subsiding rift zones and strike-slip basins (Chap. 1.2), the great thick- nesses of salt deposits frequently observed cannot be interpreted adaquately by this me- chanism. If the basin is filled up rapidly by one evaporative phase, the time for the crust to react to the applied load is too short to cause substantial additional subsidence. Thick salt deposits can be deposited only if a basin experiences several evaporative cycles inter- rupted by long intervals of starved sedimen- tation or non-deposition. During these inter- vals, continued tectonic subsidence and the isostatic effect of the former salt load can create sufficient space for further significant salt accumulation (see below).
3. Coastal Sabkhas
Coastal sabkhas represent supratidal flats which are rarely flooded during spring tides (Chap. 3.2). They usually develop behind bar- rier island chains and more or less hypersaline lagoons (Fig. 6.5a). They are built up by the accumulation of marine sediment transported onshore, or by eolian and fluvial material. The surface of such sabkhas is controlled by the groundwater table, which normally gently rises from the sea level in a landward direc- tion. Continental groundwater from the land may flow seaward and mix with sea-derived groundwater. Where unconsolidated sandy and silty sediment above the capillary fringe of the groundwater becomes dry, it may be removed by wind as long as the sabkha is not overrid- den by large volumes of dune sand or fluvial deposits.
Salt precipitation is accomplished by eva- poritive pumping o f groundwater up to the sabkha surface, where the concentration of the brine exceeds saturation for calcium sulfate and finally also for halite. The minerals pre- cipitated in the different zones of the inter- tidal and supratidal area are shown in Fig. 6.5b). The precipitation of gypsum begins in the lower sabkha within the algal mats. Prima- ry anhydrite can be formed in the higher outer part of the sabkha, where the brine con- centration approaches saturation for halite. Halite usually is found as crusts at the surface, but it is often re-dissolved during floods which also deliver new brine into the system. Locally, more halite and even potash salts may accumulate in small ponds excavated by ear- lier floods.
It is assumed that a kind of brine reflux may take place underground, possibly along
older buried valley or channel fills. Provided the concentration of the brine becomes suffi- ciently high in the pore system, gypsum or anhydrite are also generated below the groundwater table, particularly in the upper supratidal zone (Fig. 6.5b, c, and d). Primary gypsum may be overgrown later by anhydrite or transformed into anhydrite, which often shows characteristic contorted beds, small dia- piric structures, or a nchicken-wire" pattern (Fig. 6.5 d). Under the influence of increasing Mg/Ca ratios, primary aragonite and calcite are partially or entirely converted to dolomite.
The host sediment of the mostly nodular and lenticular sabkha evaporites is either car- bonate sand and mud, siliciclastic, or a mix- ture of both components. Because of the lack or oxidation of organic matter in the middle and upper supratidal zone, the sediment tends to be brown and later, after more pronounced diagenesis, red in color.
The upper limit of one cycle o f sabkha evaporites is controlled by the capillary fringe of the groundwater table. When this fringe can no longer reach the surface and is overlain by dry sandy material, the evaporation of groundwater practically ceases. Consequently, the sabkha evaporites are usually overlain either by windblown sand or fluvial deposits (Fig. 6.5 d). The lower boundary depends on the concentration of brine reached below the water table. Thus, assuming constant sea level and neglecting subsidence, the thickness of such a cycle is approximately one to a few meters, and its areal extent is also limited. However, under conditions of changing sea level and subsidence, sabkha evaporites can reach greater thicknesses and form cyclic se- quences (Fig. 6.5e). Channels, storm erosion, and redeposition of sabkha sediments in the intertidal or subtidal zone can complicate such a simple cyclicity model.
As a result of relative sea level changes, sabkha evaporites often affect larger areas than observed in the many present-day ex- amples (see, e.g., Purser 1985). Due to fre- quent sea level changes in the past, this type of evaporites is very common in the ancient record. In relation to the local situation, there are many modifications of the conceptual model shown in Fig. 6.5. In the context of this chapter, the most important alternative, not shown in Fig. 6.5, is the transition from a salt lagoon to a sabkha. In this case, lagoonal eva- por i te~ formed adjacent to coastal sabkhas may eventually be overlain by sabkha evapo- rites. This development is frequently observed in ancient sediments.

Marine Evaporites 247
a COASTAL SABKHA
EVAPORATIVE CONTINENTAL PUMPING GROUND WATER
GROUND WATER WlTH HALITE
- - - - - - - -
HALITE CRUST
CONCENTRATION
SPRING FLOOD ARAGONITE +CALCITE
NORMAL TIDAL RANGE (INTERTIDAL ZONE)
PRIMARY ANHYDRITE - (OR GYPSUM)
ALGAL MAT WlTH DESICCATION FEATURES
' CRYSTAL MUSH OF GYPSUM AND CARBONATE (PARTIALLY DOLOMITE)
LARGE GYPSUM CRYSTALS
LAGOONAL MUD, -tBIOTURBATED
EOLIAN SAND (+STORM SAND)
LOCALLY SOME HALITE
DOLOMITIC MUD. USUALLY RED
ENTEROLITHIC ANHYDRITE (CONTORTED EARLIER-FORMED GYPSUM)
" CHICKEN-WIRE " ANHYDRITE (AFTER GYPSUM)
ALGAL MAT. DOLOMITIC, WlTH GYPSUM CRYSTALS
LAGOONAL MUD (CARBONATE AND SILICICLASTICS)
INTERTIDAL FACIES WITH CONTINENTAL FACIES CHANNELS
SUBTIDAL F. SUPRATIDAL (LAGOONAL. FACES WITH OOLITIC BAR EVAPORITES
Fig. 6.5a-d. Model of coastal sabkha (based on studies of groundwater, lateral change in evaporite precipitation abo- the Trucial Coast, Abu Dhabi) of the Arabo-Persian Gulf ve and partially also below the groundwater table. c and d and other areas, see, e.g., Purser 1985). a General setting; Vertical sections of lower and higher supratidal zones, note that the lagoonal water is already hypersaline. In the location shown in b. e Scheme of landward and seaward case of a narrower opening to the sea, salts may precipita- migrating facies belt including sabkha evaporites. Note the ted in the lagoon and underly the sabkha evaporites. b different vertical successions indicated by arrows. (After Coastal sabkha with evaporative pumping of inflowing sea Shearman 1978; Shinn 1983, and others). water (underground or epidodic by floods) and continental

Chapter 6 Special Depositional Environments
4. The Deep Basin-Deep Water Model
This model (Fig. 6.6b) is another attempt to explain a rapidly deposited very thick evapo- rite sequence without synsedimentary subsi- dence (Schmalz 1969). The principal points of this model are briefly summarized as follows.
Stage I. Due to a narrowing gateway to the open sea, the former deep-reaching water cir- culation with normal marine deposition of siliciclastic and biogenic sediments in the deep adjacent basin (on thinned continental or on oceanic crust) is replaced by a circulation sys- tem restricted to the upper water layer (Fig. 6.6b). In this stage, the lower water body has already reached a higher density (1.07 to 1.08 g/cm3) than the surface water, where the pro- duction of phytoplankton continues. The stag- nant deep water favors the development of euxinic conditions and the deposition of bitu- minous marls or limestones (Stinkkalke).
Stage 2. In the succeeding stage, caused by further narrowing or shallowing of the sill, the surface brine increases in density and starts to sink on the landward side of the basin. At the beginning of this process, gypsum and halite precipitate at the water surface and are re- dissolved when they sink into less con- centrated deeper water.
Stage 3. The subsequent development of the basin is controversial. According to Schmalz (1 969), halite, gypsum, and some car- bonates are deposited rapidly and more or less simultaneously, generating a lateral facies suc- cession as shown in Fig. 6 .6~ . Once the basin is partially or nearly filled up, residual brines occupy smaller ponds on top of halite. In con- trast, Kendall (1988) points out that the brine concentration of a deep, silled basin must be more or less laterally homogeneous, because differences in water density can hardly be maintained in such a basin. Therefore, the deep-water basin appears to be incapable of precipitating different mineral facies simulta- neously.
The Miocene evaporites below the Red Sea rest on thinned continental and, probably due to postdepositional salt flow, locally also on young oceanic crust (see Chap. 4.3 and Fig. 4.7). They were explored by seismic inves- tigations and scientific and commercial deep sea drilling. Not taking salt diapirs into account, the evaporites reach a thickness of up to 3 to 4 km and a width of 100 km (Kinsman 1975b). Some authors believe that these evapo- rites represent a prominent example of deep basin-deep water evaporites, but others argue that at least in the upper section and in marginal regions of the evaporite basin, shallow-water and sabkha conditions were prevailing (Stof- fen and Kiihn 1974, also see below and Chap. 4.3). In any
case, the connection to the open ocean, most likely to the north, must have been much narrower than the present-day Straits of Bab el Mandeb in the southeast. The present inlet permits the exchange of very large water volumes and therefore controls a water circulation which allows slightly hypersaline conditions only in the northernmost part of this basin.
5 . The Deep Basin-Shallow Water Model
Several salt deposits, which most likely were formed in deep basins, clearly show evidence for shallow water and even sabkha environ- ments. These occurrences are explained by two related processes: (1) evaporative draw- down of the water table after the basinal brine had already reached a relatively high con- centration, and (2) closing of the barrier to the ocean. Seepage below the barrier or episodic spill-overs may deliver sea water, besides some fresh water, into the shrinking basin. Saturation for the different evaporites is es- tablished in a similar way as described for model 1. In order to initiate halite precipita- tion, the water level must fall deep below the original niveau, and the final stages of evapo- rite precipitation occur under playa and sabkha conditions. The areal distribution of the resulting salt deposits therefore resembles a bull's eye pattern (Fig. 6.4a). Most workers believe that the Late Miocene evaporites be- low the Mediterranean Sea were formed in such a way (see below).
Complex Models for Evaporite Deposition (Giant Salt Deposits)
General Aspects
Many ancient evaporite deposits of relatively small to medium dimension can be both inter- preted with the models described above and compared to present-day small evaporite basins. However, as already mentioned earlier, these basic models in their pure form cannot explain all the phenomena observed in ancient regions of salt deposition. Especially the origin of the so-called "saline giants" (Hsii 1972) has been and still is the object of lively debates (Jauzein 1984; Sonnenfeld and Perthuisot 1989; Bussot 1990).
One of the reasons for this uncertainty is the lack of present-day examples for such en- ormously thick (up to several thousand meters) and widely extended evaporites (several thou- sand km long and hundreds of km wide) as known from Precambrian to Miocene times.

Marine Evaporites 249
a EVAPORATIVE
OF RESIDUAL
L SY NSEDIMENTARY
EVAPORITES
1 : WATER CIRCULATION AND
b PYCNO-/CHEMOCLINE DURING I EUXlNlC STAGE
&ff-----C- K-AND MG- SALTS
GYPSUM AND ANHYDRITE
Fig. 6.6. a Synsedirnentary subsidence model with brine water body. 2 Increasing brine concentration leads to deep reflux explaking fairly thick salt deposits precipitated in circulation and later to the precipitation of gypsum, anhyd- shallow barred basin (see Fig. 6.4b). b and c Deep basin, rite, and halite in the center and landward part of the basin. deep water model with brine reflux. (After Schmalz 1969). The basin is rapidly filled up with salts; K and Mg salts Normal marine conditions are followed by 1 an euxinic may be formed in special ponds; the dry salt pan is over- stage with high plankton productivity, but stagnant deep ridden by eolian sand

Chapter 6 Special Depositional Environments
There is no real large or deep salt basin on the present Earth, probably because we are living in an interglacial period, in which the temper- ature gradients between the equator and the poles are unusually high, and the continents are widely distributed over the surface of the globe. Therefore, climatic zones and tectonic settings favorable for the generation of large evaporite basins are limited.
The complex evaporite basin model is a combination of several simple models dis- cussed above and takes into account substan- tial relative sea level changes, which occurred throughout the Phanerozoic and probably even in the earlier history of the Earth (Chap. 7.5).
The model is largely based on studies on the classical Zechstein basin in Central and Northwestern Europe (Fiichtbauer and Peryt 1980; Richter-Bernburg 1985; Paul 1987; Peryt 1987a), and particularly on the review by Smith (1980). Earlier discussions concerning this example are discribed by Hsii (1972).
Basin Development
The development of such a basin is briefly summarized in the following simplified way (Fig. 6.7):
- Desert drainage basin. A continuously sub- siding large inland basin on continental (or transitional) crust is separated from the open sea by a land barrier and receives, due to arid climate and low relief in its drainage area, little sediment. If such a situation persists for a long time period, the floor of the desert drainage basin drops substantially below mean sea level (several hundred meters), even under conditions of slow subsidence. - Flooding by the sea. During a phase of part- icularly high sea level, the entire basin is flooded and an inflow-reflux system estab- lished (Fig. 6.7a; model 2). As long as the water exchange between the open ocean and the inland sea is sufficiently great, normal marine sediments and fauna (including pelagic carbonate and in places redeposited material) are distributed over the entire basin. In mar- ginal, shallow parts of the basin, shelf car- bonates and even lagoonal and sabkha evapo- rites may be deposited. Shelf edges and sub- marine ridges and highs are preferential sites of algal reef growth in warm waters. - Onset of sea level fall. In the course of time and forced by slowly falling sea level in the neighboring ocean, the salt concentration of the inland sea begins to increase and may first lead to stagnant, but only slightly hypersaline
bottom waters in parts of the basin (cf. Model 4, Fig. 6.6b). During such a period, black, bi- tuminous shales may be deposited.
A famous example of this type of sediment is the "Kup ferschiefer", a laminated marl rich in trace metals, particul- arly lead, zinc, and copper. It accumulated at the beginning of the fust Zechstein evaporite cycle (Paul 1982).
The lateral extent and upper limit of the oxy- gen-depleted bottom water can be inferred from bioturbated sediments on the basin mar- gin and on submarine highs, respectively. La- ter, besides continued carbonate accumulation in shallow waters, gypsum is precipitated in parts of the shelves, on slopes (often in the form of thick, massive beds), and in the deep- er parts of the basin (frequently as thin var- ves). Warmer and more highly concentrated marginal waters tend to accelerate salt precip- itation and cementation and thus produce thicker evaporites in the shallow parts of the basin than in the deeper central basin. - Continued falling sea level further reduces water exchange between the ocean and the adjacent basin, until the connection is com- pletely interrupted (Fig. 6.7b). The im- migration of normal marine fauna is ter- minated. The water level in the closed basin is drawn down by evaporation. Entering rivers start to incise valleys into the emerged shelf and slope areas. Marginal carbonates are sub- jected to karstification. Earlier formed la- goonal and sabkha evaporites are partially leached and their salts transported by surface runoff and groundwater into the shrinking inland sea. During this phase, the major part of halite is rapidly deposited still in rather deep water; it may alternate with thin layers of anhydrite indicating minor climatic varia- tions including annual varves (see below). The evaporites may reach considerable thicknesses in the basin centers, because (1) they now cover only parts of the total basin, and (2) the brine was already highly concentrated prior to evaporative drawdown. Marginal areas of the inland sea again exhibit lagoonal and sabkha evaporites. The main basin may be subdivided into several subbasins (Fig. 6.7b) with differ- ing salt concentrations and salt deposition. In relation to the hydrologic regime of the drain- age area, the basin may finally fall dry except for some playa lakes containing highly con- centrated brine including potash salts. - The dry, huge salt flats are more or less covered by thin continental beds and some playas. During this period, subsidence driven by the additional salt load continues and may

Marine Evaporites 25 1
LAGOONAL
DRAINAGE BASIN
HIGH SEA
FLOOR OF SAGGED
N-WIDE NORMAL MARINE SEDIMENTS FAUNA, PARTIALLY EUXlNlC FACIES
/ (PARTIALLY SHELF CARBONATES Ca-SULFATES
FRESH WATER
b DESICCATING INLAND BASIN
LOW SEA
L
SALINE GROUNDWATER
INLAND SALT SEA SEA (POTASH SALTS)
Fig. 6.7a,b. Model of complex large evaporite basin on continental or transitional crust (Zechstein-type basin), demonstrating one large depositional cycle in two main stages of development: a Particularly high-rising sea level (2) causes flooding of long-persistent former inland drai- nage basin (during stage I of sea level), which has sub- sided up to several hundred meters below mean sea level. AAer flooding sediments with normal marine fauna accu- mulate which are basin-wide correlatable; then salinity
b Lowering sea level (stage 3) restores land bamer and creates large hypersaline inland sea; evaporative drawdown of water level (4) leads to rapid "deep-water" salt precipi- tation (mainly halite). Finally large areas fall dry and pot- ash salts may accumulate in residual playa lake8 (5), before continental deposits take over. Note that during all stages of development shallow-water lagoonal and sabkha evapori- tes may be precipitated along the margin of the basin. For further explanations see text
increases and evaporite deposition can begin.
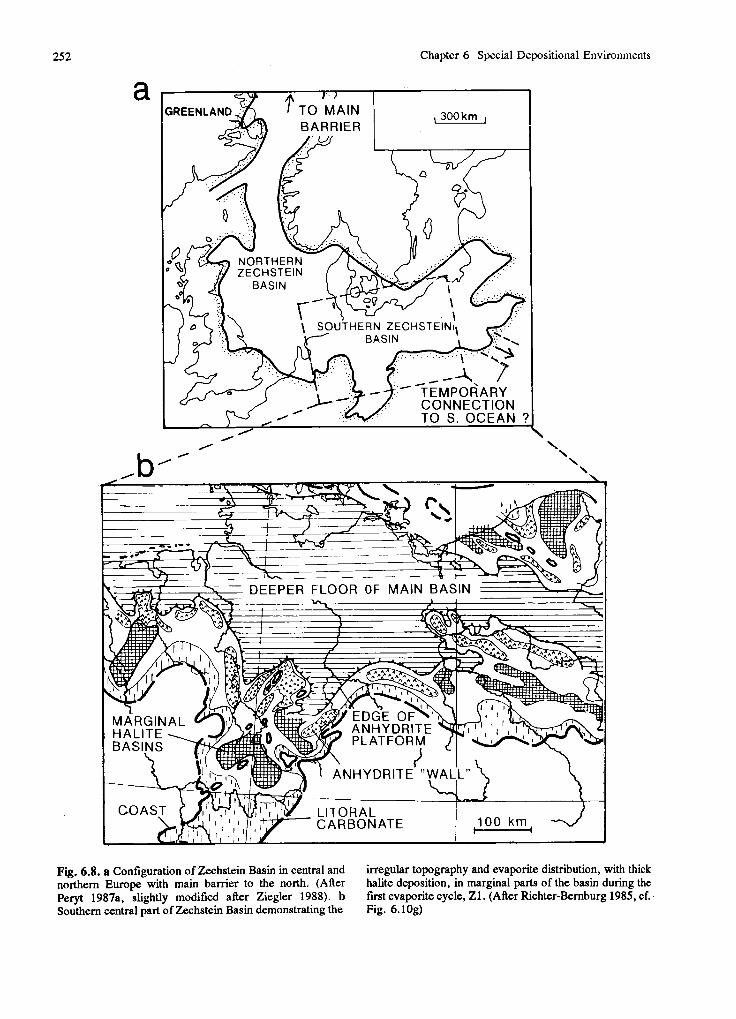
Chapter 6 Special Depositional Environments
Fig. 6.8. a Configuration of Zechstein Basin in central and irregular topography and evaporite distribution, with thick northern Eumpe with main bamer to the north. (After halite deposition, in marginal parts of the basin during the Peryt 1987a. slightly modified after Ziegler 1988). b fmtevaporitecycle, Z1. (After Richter-Bernburg 1985,cf. Southern central part of Zechstein Basin demonstrating the Fig. 6.10g)

Marine Evaporites
restore the situation to the one at the begin- ning of this development, until a pronounced high sea level rise causes a further flooding of the inland depression and initiates a new cycle of evaporite deposition.
Examples
The European Zechstein basin experienced four to five large depositional cycles. Their total thickness varies con- siderably from some tens of meters in the marginal zones to more than 2000 m (maximum thickness 3500 m includ- ing Rotliegend evaporites) in s p i a l troughs. The thicknes- ses of the salt deposits of a single large cycle often reach several hundred meters, but also vary considerably from marginal to central parts of the basin (Fig. 6.8), thus in- dicating both pronounced differences in synsedimentary subsidence as well as variations in sedimentation rate (see below). Local differential subsidence may originate from strikeslip movements (Ziegler 1989). The large deposi- tional cycles are superimposed by minor cycles (Richter- Bernburg 1985, Langbein 1987).
The Late Miocene (Messinin) evaporites below the Mediterranean were detected and explored by deepsea drilling and compared with uplifted Messininn sections on land. They represent two evaporite cycles and generally reach thicknesses of several hundred meters, in places 1000 to 2000 m, which were deposited in a very short time interval. They cover an area of about 2.5 x lo6 km2 and lie, at least partially, on top of oceanic crust which was created prior to the "salinity crisis" (Hsk et al. 1977; Dron- kert 1985; Busson 1990). The salts are underlain and covered by hemipelagic deepwater sediments; rivers enter- ing the Mediterranean have incised deep valleys and can- yons to adjust to the drop of water level. For these and other reasons, most workers believe that these evaporites originate from a closure of the basin in the region of the present-day Straits of Gibraltar, leading to the drying of a formerly water-fded basin of about 1500 m depth. Hence, the salts must have precipitated in shallow water in a desic- cated deep basin (previous section, model 4). A drastic change of climate was not necessary for this development. Actually, even lagoonal and sabkha evaporites in marginal zones have been found (cf. Fig. 6.7), whereas potash salts were discovered in the basin centers. There are many inter- esting details such as high bromium contents in the lower salt unit indicating evaporation of sea water (see below), or isotopic studies giving evidence for the occurrence of brackish environments in the upper unit due to the influx of river water. A critical point is the salt budget which r e quires either a high brine concentration prior to the closure of the opening to the west, or repeated surface inflow, or exceptionally intensive seepage of ocean water into the Mediterranean.
Other Ancient Salt Deposits
Large marine salt deposits are known from the late Precambrian throughout the Phanerozoic,
but a peak of evaporite deposition was ob- viously reached in the Permian to Early Juras- sic, when the supercontinent of Pangaea was assembled and started to break up (cf. Chap. 7.5). The rifting and early drifting stage of proto-oceans provided a number of restricted, rapidly subsiding basins favorable for the de- position of thick evaporite sequences. For this reason and due to widely extended arid clim- ate, the large salt occurrences below the pre- sent passive continental margins and slopes (e.g., around the Atlantic ocean) were formed. Other important evaporites were deposited in marginal and epicontental basins on continen- tal or transitional crust. Examples are listed and described in the literature mentioned ear- lier.
6.4.2 Sequences, Sedimentary Structures, and Sedimentation Rates of Evaporites
Characteristic Sequences with Salt Deposits
As already demonstrated above (Fig. 6.4), pro- gressing or decreasing brine concentrations cause characteristic successions of salt deposits including their accompanying sediments such as marine bituminous shales, carbonates, and terrestrial beds.
In addition to the large depositional cycles mentioned above, many evaporite sequences show a greater number of minor cycles, which may originate from sea level changes with periods within the Milankovitch band (e.g., 40 ka; Chap. 7.1).
A prominent example of such evaporite cycles is the Penn- sylvanian of the Paradox Basin in the United States, where thick salt deposits, consisting of 29 to 40 cycles, are flank- ed laterally by thinner carbonates (Kendall 1988). During low sea level still allowing influx of sea water but p r e venting brine reflux into the open sea, carbonates on a shelf barrier probably formed coevally with the precipita- tion of evaporitea in a restricted deeper basin (Fig. 6.9a). Conversely, high sea level led to brine reflux and decrease in the salinity of the basin. When the bottom water became stagnant during high sea level, black shales were deposited (Fig. 6.9b, cf. Fig. 6.6b).
Generally or at least in some cases, the longest residence time and hence the highest brine concentration in a basin occurs during sea level rise (Fig. 6.9c), as long as the brine does not flow back into the open sea. Thus, in contrast to the general opinion, well soluble salts may be precipitated preferentially during slowly rising sea level, whereas less soluble evapo- rites, followed by terrestrial deposits, tend to

254 Chapter 6 Special Depositional Environments
a LOW SEA LEVEL CLASTICS
OPEN SEA SHELF
/ BLACK SHALE
b HIGH SEA LEVEL
Fig. 6.9a,b. Model for the origin of minor cyclic evaporite with the deposition of halite and other salts in the basin. sequences caused by sea level changes in a shelfirestricted b Brine reflux during high sea level leads to decreasing basin setting. (AAer Hite 1970, in Kendall 1988, modi- salinity in the basin and to a circulation favorable for the fied). a No brine reflux during low and intermediate sea accumulation of black shales level; algal reef growth on the shelf barrier occurs coevally
accumulate in times of sea level fall (Kendall 1988).
Relative sea level changes, regardless of whether they are caused by eustacy or by tec- tonic movements, also generate characteristic transitions from siliciclastic deposits to evapo- rites and carbonates. The carbonates normally represent the high sea level stand. Transitions between two or three of these sediment types occur frequently in the geologic record; they have been recently desribed, for example, from the Persian Gulf (see Chap. 14.3), the northern part of the Red Sea, and Tunisia (Purser et al. 1987; Ben Ismail and M'Rabet 1990).
Sedimentary Structures
Sedimentary structures of evaporites are either of primary origin or predominantly generated by diagenetic processes (see below). One of the most striking phenomenon in subaquatic deposited evaporites is primary parallel lamination (Fig. 6.10a) which frequently oc- curs in all types of salt rocks (gypsum and an- hydrite, halite, potash salts) as well as in car- bonates associated with them (Richter-Bern- burg 1960). The laminated evaporitic facies is most regular and best preserved in relatively deep parts of the basin, but it is also observed
7
Fig. 6.10. a Thickness of annual vanes in halite, anhyd- evaporite basin due to partial early cementation and sub- rite, and carbonate. b, Anhydrite section in cycle 1 (Z1, sequent differential compaction. f Collapse breccia caused Goslar) of Zechstein showing repeated facies change pro- by early cementation of top'layers and subsequent differen- bably due to (climatically controlled?) brine concentration, tial compaction. g Lateral facies change in Zechstein Basin see c. c Decreasing brine wncentration and diminishing during three cycles. (a, b, and g based on Richter-Bern- early cementation of evaporites with depth causes a vertical burg 1985; c through f after Langbein 1987) facies change in sulfates. d and e Generation of shelves in

Marine Evaporites
ANNUAL VARVES
ANHYDRITE OF BITUMINOUS MARL OR CARBONATE
2 VARVES OF HALITE
ANHY DRlTE INTERLAYER
ANHYDRITE VARVES
FLASER ' ANHYDRITE
C SATURATION FOR :
CEMENTED GYPS
PARTIALLY CEMENTED
"PERL" ANHYDRITE
/ GYPSUM NODULES
/ IN DOLOMITE
CARBONATE /
STRONGLY COMPACTED GYPSUM ' €
-- - -
UNCEMENTED GYPSUM W D
--------- ------------ PRIOR TO
AFTER COM-
3 PROGRADING SHELF FACIES POTASH SALTS K 2 \
CYCLE ANHYDRITE MARGINAL ANHYDR. I \ \ Ca 1 A 1 HALITE Na 1 "WALL" DOLOMITE Ca 2 A 1 A 2 Ca 1

Chapter 6 Special Depositional Environments
in marginal shallow-water areas. Here the la- minae of the same evaporite facies tend to become thicker than in the basin center. This observation is explained by higher brine con- centration, faster salt precipitation, and inten- sive early cementation in warmer, shallower parts of the basin. The thickness of the la- minae (varves) generally depends on the rock type. In the Zechstein evaporites, but also in other marine evaporites, the following charac- teristic (rounded) values and variations in thickness are frequently observed:
- Carbonates (Stinkkalke) 0.05 mm (0.04 - 0.1 mm). - Gypsum and anhydrite 0.5 mm (0.2 - 30 mm). - Halite 50 mm (20 - 150 mm).
The mean ratio of these varve thicknesses is approximately 1 : 10: 1000 and reflects the solu- bility of these components as well as their rate of precipitation when a certain height of water evaporates. If, for example, the brine has just reached saturation for CaSO,, the evaporation of 1 m of water (annual water loss of NaC1-saturated brines in warm arid regi- ons, Sonnenfeld and Perthuisot 1989) can pre- cipitate about 1 mm anhydrite. In the case of a NaC1-saturated brine, the same rate of eva- poration generates a halite layer with a thick- ness in the order of 15 cm. If the brine is somewhat undersaturated with respect to these salts, the same annual evaporation renders thinner salt laminae. The laminae are always separated by much thinner layers of a less so- luble salt, for example halite by anhydrite or anhydrite by an extremely thin carbonate film. All these observations indicate that the lami- nae are annual varves and originate from the seasonal climatic change.
Furthermore, it was pointed out that evaporite varves may show the 11 year solar cycle (Richter-Bernburg 1960). In the Zechstein basin, anhydrite varves have been correlated over distances of up to 300 km, but in vertical sections, the varved units are frequently interrupted by diagenetically overprinted units (Fig. 6.10b) or by erosional surfaces. Therefore it remains problematic to determine the time span for the deposition of a thick evaporite sequence with the aid of varve counts.
Evaporites of comparatively deep basins also contain redeposited carbonates and salts from shallow water in the form of mass flows and turbidites (Chapter 5.4). These features are, however, frequently difficult to identify and to distinguish from diagenetic structures (see below).
Sedimentation Rates
The sedimentation rates for the different evaporites can be determined in undisturbed, varved evaporite sections. Using the above data, one obtains the following orders of mag- nitude:
- Carbonates 5 cm/ka - Gypsum and anhydrite 50 cm/ka - Halite 5000 cm/ka
Of course, these values vary considerably within a certain evaporite sequence or from one salt deposit to another. Whereas the sedi- mentation rate for carbonates compares well with normal marine shelf carbonates (Chap. 3.3.2), it is obvious that the deposition of ma- rine salts, especially that of halite and the potash salts, can be extremely fast in compar- ison to other marine sediments. These high rates are, however, only valid for basins where the whole water column has reached saturation for the corresponding salt to be precipitated. Prior to this situation or as a result of episodic brine dilution, the sedimentation rates can be considerably lower.
Nevertheless, the assumption that a rather deep basin is rapidly filled up with halite ap- pears to be well justified by the observations on varves. If, for example, a 1000 m deep, NaC1-saturated basin is cut off from sea water influx, drying of this basin can produce a ha- lite layer of about 150 m thickness throughout the entire basin. If halite precipitation occurs only in parts of the shrinking basin, the halite deposit can become much thicker. Such a ra- pid deposition of halite is possible only in a pre-existing deep basin, because subsidence cannot proceed with the same high rate. Thus, the frequently observed rapidity of evaporite deposition supports the deep basin model dis- cussed above for "saline giants". However, the deposition of thick units of gypsum and an- hydrite requires an open brine reflux system, because the solubility of CaSO, is too low to allow an adequate storage of this component in the brine of a closed basin. In the case of cyclic evaporite sequences, most of the geolo- gic time comprises the intervals of non-eva- porite deposition. Sabkha evaporites, mainly consisting of anhydrite and carbonate, show vertical growth rates of the order of 1 m/ka and horizontal progradation of 1 km/ka (Schreiber and Hsii 1980).
Marine Evaporites
6.4.3 Diagenesis and Geochemical Characteristics of Evaporites
Diagenesis
After burial, the primary salt deposits, parti- cularly those precipitated under a standing water body, are strongly affected by mechani- cal and physicochemical-mineralogical diage- nesis. In order to interpret the origin of an- cient evaporites, this substantial diagenetic overprint has to be taken into account.
In an early, more or less euxinic stage of a salt basin development (Chap. 6.4. l), relatively small quantities of gypsum settling together with organic matter can be removed by micro- bial sulfate reduction. Thus, the beginning of the sulfate precipitation may be obliterated or, as observed in some cases, halite directly overlies bituminous marls or carbonates.
In subaqueous environments, the salt mine- rals and their primary deposits are basically formed in three different ways:
- Crystal growth at the water surface or at the pycnocline (halocline) between lower mineral- ized surface water and the deeper brine; settl- ing of the crystals without any further change. - Crystal growth predominantly at the sedi- ment-water interface. - Crystal growth within the sediment (displa- cive crystals).
Under the latter two conditions, the size of the crystals tends to be large and the porosity of the fresh salt deposits is limited. Finer grained crystals settling through the water column may, however, create a rather porous sediment. Mechanical compaction of such eva- por i te~ is substantial and can therefore bring about great differences in thickness between the above mentioned types of salt deposits. Compaction moves both pore water and water of crystallization out of the evaporites. The updip or upward migrating, highly con- centrated fluids can affect the surrounding sediments and, for example, cause dolomitiza- tion of calcarous rocks or, in some cases, also calcitization of already dolomitized strata. Frequently, the precipitation of salts from migrating brines leads to cementation and thus to plugging of porous rocks.
Early Cementation and Differential Compaction
A further characteristic feature observed in evaporites is the occurrence of early cemen- tation by gypsum, anhydrite, halite, and other salt minerals (Fig. 6 . 1 0 ~ through f). Primary sedimentary features are best preserved under conditions of early complete cementation (e.g. banded and massive anhydrite beds). If, how- ever, early cementation is incomplete, nodular and flaser anhydrite result. Differential com- paction between early cemented marginal and non-cemented central evaporites (undergoing relatively late and strong compaction) may accentuate differences in bathymetry of the depositional basin and therefore mislead re- constructions of the original basin topography and the subsidence history of the basin (Fig. 6.10d and e).
The buildup of thick marginal evaporites as a kind of shelf brings about a lateral prograd- ing of salinar facies as indicated in Fig. 6.10g (cf. Fig. 6.8). In addition, the compaction of early, but only partially cemented calcium sulfate deposits frequently causes the forma- tion of collapse breccias (Fig. 6.10f, Langbein 1987). These should not be confused with sed- imentary breccias originating from the re- working of salt crusts on tidal flats, or with mass flows (olistostromes, Chap. 5.4) in deep water-filled basins. Similarly, intensively de- formed anhydrite or gypsum layers exhibiting micro- folds are usually not caused by sliding, but reflect a kind of liquefaction. This results from the release of water in conjunction with the transformation of gypsum to anhydrite in poorly permeable strata at some depth below the basin floor (see below).
Subsurface Dissolution
Stratigraphic correlations and hence also paleogeographic interpretations of ancient salt deposits are often complicated by subsurface dissolution resulting from circulating ground- water or more or less stagnant formation water (Kendall 1988). It may eliminate easily soluble evaporite intervals, preferentially in marginal zones of the basin (Fig. 6.1 1). Thus, an origi- nally onlapping sequence can be transformed into an apparently offlapping stratigraphic pattern with an erosional unconformity. Such a sequence may be incorrectly interpreted as an evaporite system according to the bull's eye model (Chap. 6.4.1). Salts leached from mar- ginal zones of the basin (salted-out halite and

Chapter 6 Special Depositional Environments
INCREASE IN THICKNESS DUE TO "SUBSOLUTION" AND DIAGENESIS .
- A A A A
-2- /
- ---_
APPARENT OF DUE TO DlSS
I
SYLVITE ETC.
CARBONATE FUTURE DISSOLUTION FRONT, CARNALLIT
GYPSUM AND ANHYDRITE SHALE
Fig. 6.11a,b. Effects of subsurface solution of halite and tionship and thickness of subsequent evaporite deposits. conversion of water-bearing salt minerals (e.g., carnallite) (After Kendall 1988) into water-free salts (e.g., sylvite) on stratigraphic rela
potash salts) are frequently reprecipitated in more central parts of the basin. Highly con- centrated NaCl brines can cause substantial changes of the primary mineral composition of the potash salts.
Phase Changes o f Salt Minerals
Already a modcrate increase in temperature (and pressure) induces phase changes of sever- al salt minerals. Primary gypsum is converted to anhydrite at temperatures between 18 and 56 OC; carnallite loses its crystalline water at 85 OC, polyhalite and kieserite at higher tem- peratures. In all cases, water is released and may, if it cannot readily escape, build up ex- cess pore pressure and promote rock deforma- tion, for example small diapiric structures in sulfate deposits. If volume loss in the subsur- face by subsolution and/or phase changes oc- curs concurrently with precipitation of over-
lying salts, the basin floor becomes depressed. As a result, thickened salt deposits are formed locally or in limited parts of the basin (Fig. 6.1 lb).
These brief remarks can only indicate the par- ticularly great importance of diagenetic proc- esses on sedimentary structures and mineral composition of evaporites. Detailed descrip- tions of these phenomena including illustra- tions and a special nomenclature for the mani- fold structures, particularly those in calcium sulfate rocks, are given in the references men- tioned above, e.g., by Richter-Bernburg (1985), Langbein (1987), Schreiber (1988a). It has to be borne in mind that many of the dia- genetically generated or overprinted structures can be further modified by salt diapirism (see below) and subrosion. Anhydrite is again transformed into gypsum near the land surface and may cause rock swelling, if not enough sulfate is removed by circulating water in sol- ution.

Marine Evaporites
Trace Elements, Stable Isotopes, and Accessories in Marine Evaporites
Much work has been done on the geochemis- try of evaporites (see, e.g., Sonnenfeld 1984; Pierre 1988), but only a few points can be mentioned in this text. Of particular interest are the elements strontium, barium, bromine, fluorine, and boron. Strontium is a minor con- stituent of aragonite, gypsum and anhydrite. It is released in conjunction with recrystalliza- tion of these minerals and can form an own mineral, celestite SrSO , which is less soluble than gypsum and thereftore can be precipitated in small quantities before saturation for the calcium sulfate minerals is reached. Celestite is found along the margin or on subaqueous highs of some evaporite basins (Miiller 1988). It also occurs when gypsum is leached by sub- rosion. Similarly, barium may be precipitated as barite, BaS04, prior to gypsum and an- hydrite. Both celestite and barite hence tend to occur in clays, marls and carbonates in the lower part of an evaporite sequence. Fluorine can be precipatated as fluorite, CaF,, and is sometimes found in dolomites.
Bromine and boron are enriched in highly concentrated brines. Since bromine substitutes to some extent for chlorine, the bromine con- tent of halite, sylvite and other salt minerals increases with the brine concentration. There- fore, the bromine content is used to determine the stage of evaporation as well as to correlate salts deposited in the same basin. Boron is predominantly found in residual brines.
Many evaporites also contain or are inter- bedded with siliciclastic material, mostly silt and clay, which are swept by either currents or wind into the basin. Alkaline brines often dissolve substantial amounts of silica which is later reprecipitated in form of euhedral quartz crystals or, in the neighborhood of the evapo- rites, as chert.
Stable isotopes provide specific infor- mation on the changing conditions of deposi- tion and diagenesis of evaporites (Pierre 1988). They indicate the origin of brines precipitat- ing salt minerals, and the concentration, resi- dence time, and recycling of brines in the de- positional system. For example, the isotopes Br and Sr may serve to separate marine from nonmarine evaporites. Similarly, heavier oxy- gen isotopes in fluid inclusions within the salt point to a marine environment. The propor- tion of the sulfur isotope "S in sulfate mine- rals has changed through earth history. With the aid of this isotope it is therefore possible to approximately determine the age of evapo-
rites. This method is particularly useful if salts of different ages are involved in diapirism (see below).
6.4.4 Salt Structures
Halokinesis
Many thick, widely extended, originally more or less uniform salt deposits of the subsurface are transformed by halokinesis into very ir- regular and often isolated salt structures (Fig. 6.12). These structures may result from non- tectonic and tectonic processes (Jenyon 1986). Here, mainly the nontectonic origin of such structures is briefly discussed.
Salt domes and other salt structures are commonly explained as the result of buoyancy (Trusheim 1960; Ramberg 198 1). Where low- er-density salt is buried under higher density strata, the salt tends to flow upward through the overlying sediment (buoyancy halokinesis). In this case, the burial depth of the salt should be at least 900 to 1200 m; otherwise the over- lying rocks do not reach the high density re- quired for this process (see below). However, apart from buoyancy, overburden anomalies (differential loading halokinesis) may cause salt sinks and salt dome growth (Jackson and Talbot 1986; Kehle 1988). This mechanism does not depend on the density of the overly- ing sedimentary rocks and therefore accounts for the initiation of salt structures at shallow burial depth (as little as 100 m) as observed in several salt provinces. The combined effect of both mechanisms can be summarized as fol- lows.
Mechanics of Salt Flow
It is assumed that rock salt behaves like a Newtonian or viscoelastic fluid. In both cases, the fluid starts to flow if there is a hydraulic gradient within the fluid. If rock salt repre- sents a viscoelastic fluid, flow of salt takes place only if the differential stress exceeds the yield point of the salt body. A hydraulic grad- ient is defined by a difference in hydraulic head between two points within the salt layer (Fig. 6.13a). The hydraulic head of a certain point within the fluid is the sum of its gravity potential, G, at its elevation, z, above an ar- bitrary datum line, and the fluid pressure head, p, at this point, i.e., the height of fluid column in a manometer adjusted at this point.

260 Chapter 6 Special Depositional Environments
SALT PILLOW
PRE-SALT FLOOR
Fig. 6.12. Main types of salt structures and their structural evolution, from left to right. (After Jackson and Talbot 1986)
Salt flow always occurs in the direction of the maximum hydraulic gradient, i.e., from areas of higher to lower hydraulic heads. A tilted salt layer can flow upward, if the de- crease in pressure, Ap (e.g., pB - p4 in Fig. 6.13a), is greater than the increase in gravita- tional potential, AG, defined by the difference in elevation between two points and the den- sity of the fluid (e.g., AG = zBDS - zA.DS). This occurs when the average rock density, Dp, is greater than that of the salt, D ; other- wise the salt flows donwhill (from C! to B in Fig. 6.1 3a). Hence, total overburden load plays no direct role in this model; solely the gradi- ents of pressure and gravitational potential are important and, in addition, the yield point of the viscoelastic salt body must be overcome.
If a horizontal salt layer is buried under horizontal and laterally uniform younger sedi- ments, the hydraulic gradient within the salt equals the gradient of the gravity potential, because the overburden weight is the same everywhere. In this case no salt flow occurs. However, if the salt surface is locally elevated (elevation z in Fig. 6.13b), a gradient in the hydraulic head of the salt layer is built up. Salt flows toward the irregularity, if the den- sity of the overlying rocks in the range of z exceeds that of salt, and it flows away from the irregularity for rocks of lower densities. Similarly, a local increase in overburden pres- sure (differential loading), for example by a prograding delta lobe, can cause a significant hydraulic gradient in the salt layer and thus force the salt to flow away from the delta
lobe. Many other sedimentary load anomalies are common, for example reefs, sandy shoals, desert dunes etc., and can trigger salt flow in the subsurface.
Evolution of Salt Structures
The evolution and shape of some idealized salt structures is shown in Figure 6.14. In nature, these structures are highly variable dependent on their position within a basin, the original thickness of salt deposits, and the history of subsidence and sediment accumulation (Trus- heim 1960; Jackson and Talbot 1986; Kehle 1988). Salt domes are typically one to several km in diameter and have steeply dipping or even overhanging sides that may extend sever- al km downward. They commonly exhibit the following stages in their development:
1. Initiation and salt pillow formation. 2. Erosional truncation of overlying rocks. 3. Extrusion of salt domes or pillars through erosional holes in the sedimentary cover (piercement salt domes, diapirs). 4. Collapse and burial.
Much salt is lost during the stage of extrusion through erosion and dissolution (Chap. 9.2). Once the salt layer next to the dome is com- pletely evacuated, the upward movement of salt ceases, and the salt structure reaches a stable configuration, regardless of whether or not the dome is buried under an increasing

Marine Evaporites 261
a HYDRAULIC GRADIENT WITHIN SALT LAYER
TENDENCY TO FORM SALT STRUCTURE
: ASING DENSIT'I
DELTA LOBE
WATER
T-
Fig. 6.13ae. Flow of salt in the subsurface in relation to larity on surface of salt layer initiates salt flow into the the hydraulic gradient within the salt layer. (After Kehle irregularity, if rock density DR within depth zone z exceeds 1988). a Downhill and uphill flow of salt due to the lower Ds of salt; with DR i DS salt flows away from the irregu- or higher density DR of sedimentary rocks overlying the larity. c Differential loading of horizontal salt layer, e.g., tilted salt layer with density Ds. At point B the converging by prograding delta lobe, causes salt to flow away from the salt flow tends to create a salt structure. b Positive irregu area of maximum loading

Chapter 6 Special Depositional Environments
C MIDDLE SLOPE SALT d SHELF PROGRADING MOVEMENT SHALLOW-WATER SANDS
BASE OF SALT SEDIMENT MOVEMENT DEPOCENTER
b FINAL STAGE SECONDARY GRABEN LOW-RELIEF EXTENSIONAL
PRIMARY EARLY MOVEMENT GRABEN /OF SALT SEA LEVEL
ING OF OVERLYING SED.
Fig. 6.14a-f. Different types of salt structures. a and b mulation due to prograding shelf edge. Sands may form Evolution of salt pillows and salt anticlines from originally reservoirs for hydrocarbons. (After Jackson and Galloway basinward thickening wedge of evaporites. (After Kehle 1984, in Kehle 1988). e and f Two stages of the growth 1988). c and d Development of depotroughs over thick salt history of salt domes: e Salt pillow formation and begin- deposits on a continental slopelshelf setting. Differential ning of erosional truncation, f piercement of overlying movement of salt and younger sediment is initiated on rocks, and extrusion. Final collapse and burial is not lower slope and accentuated by increasing sediment accu- shown. (After Kehle 1988)

Marine Evaporites 263
sediment cover. The internal structure of Part of these phenomena, as well as the many salt domes is characterized by tight folds structures of subsiding depotroughs (Fig. 6 . 1 4 ~ and highly deformed salt bodies of different and d), are favorable for the migration and nature (Fig. 6.14f). Their associated rocks accumulationof hydrocarbons(Chap. 14). Due show systems of normal faults and graben to their plastic behavior at shallow burial structures over the tops of the domes (Fig. depths, evaporites act as seal rocks for upward 6.14b) and frequently upturned strata along migrating oil and gas. the flanks.

6 Special Depositional Environments and Sediments
6.5 Nonactualistic (Precambrian) Depositional Environments
6.5.1 The evolution of the Atmosphere,Hydrosphere, and Climate Introduction Atmosphere and Climate Evolution of the Hydrosphere
6.5.2 Precambrian Sediments Bedded Quartzites Dolomites Banded Ironstone Formations Placer Deposits and Paleosols Stromatolites, Phosphorites Evaporites Clastic Deposits
6.5.1 The Evolution of the Atmosphere, Hydrosphere, and Climate
tion, all continents were more or less barren of higher life and represented huge deserts. In contrast to the present-day situation, a large part of these deserts must have received con- siderable amounts of rain and should therefore have undergone rapid mechanical and chemi- cal erosion. Nevertheless, we can understand these processes from observations in modern, mountainous regions with sufficient precipita- tion, but sparse vegetation.
Serious problems arise for the interpretion of the Precambrian, that is the Archean and Proterozoic spanning the times from about 4600 to 2500 Ma and 2500 to 590 Ma before present, respectively (Windley 1984). Since weathering of rocks and sedimentary processes were always closely related to the properties and circulation of the atmosphere and the oceans, as well as to the evolution of life, we have to consider the question whether and in which way these factors deviated in pre- Phanerozoic times from the younger Earth's history.
Introduction Early Li fe
This brief chapter is added to remind the reader that most of our knowledge on deposi- tional systems summarized in this book is de- duced from observations in modern en- vironments. It is based on the frequently quot- ed principle: " The Present is the key to the Past". Furthermore, it is widely accepted that the depositional environments did not change fundamentally during the Phanerozoic. This view is derived from the fossil record and from the results of various geochemical inves- tigations. Even long-term, profound climatic variations from an icehouse to a greenhouse state of the Earth (Chap. 7.5) can be explained by minor changes in the composition of the atmosphere and the volume and salinity of the oceans. A major step in the evolution of sedi- mentary environments occurred in the late Paleozoic when the continents were colonized by plants. Prior to this stage of plant evolu-
The earliest life forms are microfossils repre- senting possibly cell walls and having shapes and sizes like bacteria. They occur in dark cherts and shales as old as about 3500 Ma (e.g., Schopf 1983; Schopf and Packer 1987). They were capable of either utilizing inorga- nic compounds for synthesis of organic mol- ecules (autotroph bacteria, e.g., methane bac- teria), or of living on organic molecules gene- rated by abiotic chemical synthesis (fermenta- tion bacteria). Stromatolites, i.e., microbially precipitated layered structures, have been pre- served in several metamorphic series (green- stone belts) as old as 2600 to 3500 Ma (Fig. 6.15). Their structure was most probably ge- nerated by mats of blue-green algae (cyano- bacteria). These cyanobacteria may therefore have started to produce oxygen as early as about 3500 Ma ago. Results from stable carbon

Nonactualistic Precambrian Sediments
EVOLUTION OF
BEFORE LIFE AND OTHER
PRESENT IMPORTANT
Ma PROCESSES
0
I M E I I METAZOA
/ (MULTICELLED)
FIRST EUKARYOTIC CELLS,
DEVELOPMENT OF AEROBIC RESPIRATION
WIDESPREAD STROMATOLITES
FIRST STROMATOLITES
ONSET OF PHOTO- SYNTHESIS
PROKARYOTIC
BACTERIA
OUTGASSING OF EARLY ATMOSPH AND OCEANS
COMPOSITION OF ATMOSPHERE
TRACE MAJOR ELEMENTS COMP.
PROPERTIES
OF OCEAN
pH
? ? l ?
RESPONSE OF
SEDIMENTS
ACCRETION OF EAR
LOSS OF H AND He TVSPACE
QUALKATIVE
SCALE
(1) MINOR O2 FROM PHOTOLYSIS OF H20
(2) +MINOR CH4AND NH3
BlOCLASTlC
CARBONATES AND
SILICEOUS SEDIMENTS
FIRST MASSIVE
SULFATE DEPOSITS (?)
I ONSET OF ABUNDANT
I RED BEDS
BANDED IRON FORMATIONS
(+FeCS, Fe-SILICATES, AND CHERT)
URANIUM AND PYRITE AS PLACER MINERALS
?PRIMARY DOLOMITES AND LIMESTONES
PRECIPITATION OF
SODIUM CARBONATES (?) (LATER DISSOLVED AND
REMOVED BY SUBDUCTION)
(CHEMICALLY PRECIPITATED CHERTS AND
CARBONATES
Fig. 6.15. Some characteristics of the (hypothetical) Pre 1984; Kempe and Degens 1985; Veizer 1988). See text for cambrian atmosphere, ocean, and sediments. (Overview, further explanation based on several sources, e.g., Holland 1984; Windley

Chapter 6 Special Depositional Environments
isotopes studies on limestones and dolomites (Schidlowski et al. 1975; Schidlowski 1987) indicate that substantial amounts of carbon, accumulated by autotrophic organisms, under- went biologically mediated fractionation. This led to a depletion of light carbon in carbonates as common in younger carbonates. Stromato- lite growth was restricted, however, to shallow subaqueous environments.
With the beginning of the Proterozoic, micro-organisms including bacteria, algae, fungi, and possibly lichen-like plants became more abundant and diversified, but the more complex, multicellular metazoa obviously did not yet exist. In the period between 2300 and 600 Ma, the stromatolites were the most com- mon, widespread fossil structures, which built thick sequences of limestones, dolomites, and cherts in the tidal and subtidal zone. The am- plitude of single structures reached many me- ters (cf. Chap. 3.2.1). It appears that since that time the importance of cyanobacteria mats gradually declined.
The evolution of multicellular metazoa did not start until after about 1,800 Ma. It is as- sumed that they required an atmosphere con- taining oxygen (see below) and an ozone screen in the upper atmosphere to protect them from ultra-violet radiation. Early types of metazoa were not capable of building shells or skeletons. They include jelly fish, worms, sponges, and soft corals and are summarized under the term "Ediacaran fauna", which was first found in the Flinders Ranges in southern Australia (e.g., Conway Morris 1990). The main evolution of the metazoa occurred in the Phanerozoic; the formation of hard skeletal parts by "biomineralization" started at the Pre- cambrian/Cambrian boundary.
Atmosphere and Climate
The Early Atmosphere
Although the atmosphere represents a very small mass in relation to the total mass of the Earth, it exerts a dominant influence on the shaping of the landscape, the existence and evolution of life, weathering of rocks, trans- port and deposition of sediments. For this rea- son, an atmosphere differing from the pre- sent-day situtation must have had a profound impact an all these aspects.
The evolution of the atmosphere was closely related to the formation of the Earth's crust and hydrosphere. Most experts hold the opin- ion that the primordial atmosphere of the
Earth resembled that of Jupiter, which has sufficient mass to retain light molecules and noble gases. In the case of the Earth, however, the light, volatile components, such as hydro- gen and helium, were early lost to space and replaced by an atmosphere mainly caused by outgassing of the Earth's mantle (Salop 1983; Holland 1984; Budyko et al. 1987). The accre- tion of planetesimal material, meteoric im- pacts, and enhanced radioactive decay raised the temperature on Earth to such a degree that the primarily more or less homogeneous mass melted (e.g., Wetherill 1990). This led to a dif- ferentiation of the accreted mass into core, mantle, early crust, and a secondary atmos- phere derived from the volatiles of the magma and/or late phases of accretion.
This atmosphere attained a very high den- sity comparable to that of Venus. Its main components were water vapor, carbon dioxide, and nitrogen. Minor constituents included hy- drogen, methane, and ammonia. Light vola- tiles were continuously lost to space; acids (HCl, HF) and H,S exhaled from volcanoes were washed out by precipitation. Subsequent rapid heat loss to space led to cooling of the crust and condensation of water. Evidence for a first hydrosphere on Earth comes from water-laid sediments ranging back as far as about 4000 Ma.
Oxygen in the Early Atmosphere
Whether or not oxygen was present in small quantities in the early atmosphere is contro- versial (e.g., Schidlowski et al. 1975; Clemmey and Badham 1982; Holland 1984; Budyko et al. 1987; Walker and Drever 1988). A limited amount of oxygen produced by photolysis, i.e., by dissociation of water vapor as a result of ultra-violet radiation in the upper atmo- sphere, was rapidly used up by oxidation of volcanic gases, ferrous iron dissolved in sea water (see below), and weathering of rock- forming minerals. It was not before the plants had started photosynthesis by using water, car- bon dioxide and solar energy to generate or- ganic compounds and release molecular oxy- gen that larger volumes of oxygen could be produced than were permanently consumed. However, an excess in free oxygen was only achieved by the storage of organic matter in sediments. From then on, the oxygen content of the atmosphere slowly increased (Fig. 6.15). Rock weathering and the formation of car- bonates were very efficient in binding carbon dioxide during this early stage of atmospheric

Nonactualistic Precambrian Sediments 267
evolution and thus did not allow the main- tainance of high carbon dioxide pressure for long (Kempe and Degens 1985). The transition from an oxygen-free or oxygen-poor to an oxygen-bearing atmosphere occurred between 2500 and 1500 Ma B.P., but temporal varia- tions in the contents of oxygen and carbon dioxide cannot be excluded during this stage (Budyko et al. 1987).
Climate
With the establishment of a hydrosphere, the climate on Earth probably became rather stab- le (Henderson-Sellers and Henderson-Sellers 1989; Kasting 1989). On the one hand, the young Sun had a lower luminosity than today, but on the other hand, the early oceans prob- ably covered a much higher proportion of the Earth's surface, generating a thalassocratic epoch. Thus, the Earth sent back a smaller fraction of the received solar energy to space than at present. The effect of the following slow increase in solar luminosity on the sur- face temperature of the Earth was probably counteracted by a decrease in atmospheric carbon dioxide (and possibly other gases) di- minishing the "supergreenhouse" effect (cf. Chap. 7.5). Thus, a reasonable temperate cli- mate and the persistence of the oceans were maintained for at least the last 3500 Ma.
Evolution of the Hydrosphere
The water of the hydrosphere is derived from the differentiation and outgassing of magma and late phases of meteorite accretion (e.g., chondrites and comets containing ice). It was estimated that the Earth's mantle contains ap- proximately three times the water mass pre- sent in the modern oceans (Salop 1983). The initial high partial pressure of C02 in the at- mosphere must also have raised significantly the C02 content of sea water. The salt content and the nature of the early ocean are less clear. It was probably hot and rich in both carbonic acid and stronger acids and therefore capable to rapidly extract alkali and earth al- kali ions, iron, and silica from volcanic rocks. For this reason, the various acids became neu- tralized, and the pH of ocean water was pre- sumably higher than assumed by some authors (at least pH 6 according to Walker and Drever 1988). The total salt concentration of the early ocean may have been higher than that of the modern ocean. Sodium delivered by rocks and
chlorine provided as hydrogen chloride by volcanic exhalations were important constitu- ents. Most of the other major ions, such as calcium and magnesium, tended to form less soluble mineral phases which precipitated. Potassium released from primary rock mine- rals was largely used to form clay minerals.
It was recently pointed out that the early ocean might have been a "soda ocean" in ana- logy to modern soda lakes, which occur in volcanic regions (Kempe and Degens 1985; Degens 1989; Kempe et al. 1989). Since vol- canoes commonly deliver more CO, than HCl, not only contained the early atmosphere more CO , but also the initial ocean may have had higber concentrations in HCO,' and C O ~ - than in chloride. This, in turn, may have caus- ed a situation similar to that in modern soda lakes, which are highly alkaline and contain little calcium and magnesium due to the pre- cipitation of these ions as carbonates. If this is correct, the early ocean water must have been rich in sodium carbonate and have had a high pH, ranging between 9 and 11 (Fig. 6.15; for kinetic and mass balance considerations re- lated to this problem see Kempe and Degens 1985). Such a sea water, particularly if it was hotter than the present ocean, could dissolve large amounts of silica.
As long as only little free oxygen was avail- able, the conditions in sea water were reduc- ing and allowed, in addition, the solution of considerable amounts of ferrous iron (ap- proximately 1000 times the mass of ferric iron dissolved in the modern ocean). Thus, the ear- ly ocean may have been a "soda ocean" rich in silica and ferrous iron, but relatively poor in calcium and magnesium, and devoid of sul- fate, because there was not sufficient oxygen for the oxidation of hydrogen sulfide and sul- fur. Later, as a result of the growing con- tinents, the time span necessary for the re- cycling of marine sediments including car- bonates and organic carbon increased. At the same time, sodium-rich pore waters were in- corporated into subduction complexes where sodium was used to form sodium feldspars (albite and plagioclas) in the growing grano- dioritic continental crust. Thus, the soda-do- minated ocean was gradually transformed into a halite-dominated ocean (Fig. 6.1 5).
6.5.2 Precambrian Sediments
Archean and Proterozoic rocks are known from all continents and represent a major part of the so-called shields or cratons. The most

Chapter 6 Special Depositional Environments
common rock associations are old, high-grade gneiss and low-grade greenstone belt com- plexes. They include banded ironstone forma- tions and various siliciclastic rocks, for ex- ample turbidite sequences. Here, some special sedimentary rocks are briefly discussed.
The above mentioned views on the early evolution of the atmosphere and hydrosphere are derived from the sparse Precambrian fossil record and rocks, which are commonly strong- ly affected by repeated periods of metamor- phism and tectonism. In spite of these dif- ficulties, Precambrian rocks including sedi- mentary sequences have been studied inten- sively in various aspects and have provided significant results. Chemical sediments in par- ticular have shed some light on the nature of the early atmosphere and hydrosphere.
Banded Quartzites
Some of the oldest sedimentary sequences in the Archean (23500 Ma) are characterized by metamorphic quartzite-amphibolite associa- tions. The bedded quartzites can reach 1000 m in thickness, are recrystallized, and do not show any internal structures or clastic tex- tures, such as the contours of primary grains (Salop 1983). These rocks can be interpreted as mineralogically and texturally mature sand- stones, as known from younger, repeatedly recycled quartz deposits, although they appear to contain some clastic interbeds with zircon and sillimanite grains. Therefore, these quartzitic rocks are thought to be chemically precipitated as chert layers in a similar way as observed in present-day highly alkaline soda lakes of the Magadi type (Chap. 2.5). Such an explanation supports the above mentioned "soda ocean" theory, allowing the dissolution of high amounts of silica, which precipitate when water evaporates, for example in mar- ginal shallow seas, or as soon as the pH is lowered and/or the water temperature drops. Without advocating the soda ocean theory, Drever et al. (1988) assume that the silica con- centration of the early ocean was about 20 times greater than that of the modern oceans (6 ppm) which are depleted in silica by the abundant growth of diatoms and radiolaria.
Dolomites
The dominance of dolomites over limestones in Proterozoic and some older sequences may have been caused by a high Mg/Ca ratio
(Tucker 1982; Budyko et al. 1987) and by a possibly high pH of the early ocean. These rocks precipitated either directly from ocean water, which may have been a soda-rich ocean, or formed during early diagenesis (see Chap. 13.3). In addition, all carbonates are comparatively rich in iron, manganese, and silica, and they may alternate with chert layers. Furthermore, some authors also assume that strontium-rich aragonite precipitated from Proterozoic ocean water in both peritidal and open marine subtidal environments (Grotzinger 1986; Peryt et al. 1990). In any case, both dolomites and limestones were generated by chemical or biochemical preci- pitation. Biogenic skeletal carbonate was not available prior to the Phanerozoic (Fig. 6.15). Periods with a decrease in the partial pressure of CO and an increase in pH may have favored the precipitation of carbonates from ocean water.
Banded Ironstone Formations
A third, frequently discussed phenomenon of the Precambrian is the occurrence of thick and widespread, economically important banded ironstone formations (e.g., Cloud 1973; Tren- dall and Morris 1983; Holland 1984; Zhu et al. 1988). Most of these deposits have an age be- tween 2000 and 3000 Ma with a maximum around 2000 Ma, but some are also older or younger. In their typical facies, they consist of alternating thin layers of chert and red, iron- rich beds composed of hematite, magnetite, siderite and iron silicates. In addition to the signature of the depositional environment, the mineralogical composition of these rocks is also affected by metamorphism and subse- quent weathering processes (e.g., Trendall and Morris 1983; Weggen and Valeton 1990).
The coexistence of chert, iron carbonate, iron silicates, and iron oxyhydrates (as precur- sors of hematite and magnetite) reflect preci- pitation from an alkaline, alternatively reduc- ing and oxidizing solution rich in dissolved silica and ferrous iron. The thin-bedded strata of Proterozoic ironstones probably formed in widely extended shallow seas, partially in the tidal zone. The surface waters of the oceans were possibly somewhat more oxygenated than deeper water masses (Drever et al. 1988; Vei- zer 1988). In addition, algal blooms may have produced oxygen periodically for the rapid oxidation and precipitation of iron present in sea water. Accompanying clastic beds may contain pyrite. Some occurrences of iron-rich

Nonactualistic Precambrian Sediments
beds are associated with deposits of deeper water, mafic tuffs and subaqueous volcanic exhalations which may have delivered dis- solved iron and silica (Simonson 1985; Breit- kopf 1988). Archean representatives of banded iron-formations are more difficult to explain because of the scarcity of all types of micro- fossils; some of them are thought to be of vol- canic origin.
Placer Deposits and Paleosols
Another indicator of an oxygen-poor atmos- phere are the placer deposits of uraninite (U,O,) in fluvial sandstones and conglome- rates. Such deposits are older than about 2200 Ma and occur, for example, in the Witwaters- rand in South Africa and in the Elliot Lake region in Canada (e.g., Pretorius 1981; Holland 1984). In oxidizing conditions, this mineral is unstable and cannot survive exposition to weathering and fluvial transport for long. Py- rite in such placer deposits has also been quot- ed as evidence for a reducing atmosphere, but since this mineral can easily form during dia- genesis, it appears less useful.
The evidence of both uraninite and pyrite including some other arguments for a reducing early atmosphere discussed here are not gene- rally accepted (e.g. Clemmey and Badham 1982). Many experts currently hold the view that the early atmosphere was not completely devoid of oxygen. This opinion is supported by the occurrence of Precambrian paleosols of various ages, which show all criteria of soil formation (Grandstaff et al. 1986; Farrow and Mossman 1988; Zbinden et al. 1988). Some red beds, weathering crusts at the surface of pil- low-basalts, and the occurrence of thin sulfate beds indicate the presence of oxygen in the Archean and early Proterozoic atmosphere.
Stromatolites, Phosphorites
The occurrences of thick and widespread cal- careous and dolomitic stromatolites reflect an environment, where minor local effects, such as the uptake of CO, by blue-green algae from sea water supersaturated with repect to calcium carbonate and dolomite, caused bio- chemical precipitation of carbonates. Ex- amples of this mechanism have been described from modern alkaline lakes, which have low contents of calcium (Kempe and Kazmierczak 1990). A 4500 m thick upper Precambrian se- quence in the Peking area consists predomi-
nantly of carbonates with stromatolites and some siliciclastic beds. These deposits ac- cumulated in a long-persisting subtidal, inter- tidal, and supratidal environment and thus reflect very stable tectonic and environmental conditions (Song and Gao 1985).
Due to its low calcium content, a soda-rich ocean may also have contained relatively high concentrations of phosphate, as observed in present soda lakes. Phosphorites in economic concentrations appear, however, not before the late Proterozoic (Veizer 1988). In contrast to younger occurrences, these and most Cam- brian phosphorites are commonly nonpelletal, i.e., a direct relationship to biogenic activity cannot be established. Thus, chemical precipi- tation of phosphorite at the sediment-water interface, which is also discussed for some Phanerozoic phosphorite deposits (e.g., Shel- don 1981), cannot be excluded. A rise in cal- cium content of the ocean and minor changes in the physico-chemical properties of sea water may have led to supersaturation with respect to calcium phosphate. Diagenetically formed phosphorites caused by the release of phosphorous from decomposition of stroma- tolitic algal tissue (cf. Chap. 5.3.6) may have acted as nuclei for precipitation of phospho- rite from sea water or interstitial water. On emerging phosphate-bearing stromatolites phosphorite may also have formed crusts ("phoscrete") similar to calcrete as observed in Cambrian carbonates in Australia (Southgate 1986).
Phosphorites were described from Precambrian sequences in several regions (e.g., Salop 1983). In China, wide- spread, partially thick phosphorite beds in association with cherts, dolomites, limestones, carbonaceous shales, and stromatolites are known from the early and late Proterozoic (e.g., Sang and You 1988). They were deposited on stable platforms which received little temgenous input.
Red Beds
Red beds (cf. Chap. 6.3) only became abun- dant after the period of banded iron forma- tion. This may be related to the fact that the early Earth was dominated by oceans and the area of emerged continents was limited. In addition, a great part of the red beds formed on the continents may have been eroded later. Nevertheless, many workers have assumed that the appearance of extensive red beds coin- cided with a substantial increase in the oxygen content of the atmosphere (Fig. 6.15).

Chapter 6 Special Depositional Environments
Evoparites
The question whether or not significant eva- porite deposits accumulated in the Archean is difficult to answer, because subsurface dis- solution, diagenesis, and metamorphism may have obscured and obliterated most of them. Nevertheless, relics of gypsum crystals and sulfate nodules have been found in a chert- barite unit as old as 3500 Ma in Western Aus- tralia (Buick and Dunlop 1990). However, thick sulfate layers could only precipitate after sufficient oxygen was available for the oxida- tion of hydrogen sulfide and sulfur. Such sul- fate deposits appear in the second half of the early Proterozoic, and the majority of gypsum and anhydrite is younger than 800 Ma (Budy- ko et al. 1987; Veizer 1988). If the soda ocean concept is applied, the late appearance of thick, massive gypsum in the upper Protero- zoic may also result from the depletion of the earlier ocean in calcium (Kempe and Degens
1985). In the following period of the late Pro- terozoic and early Cambrian, thick evaporites with high proportions of halite, potassium and magnesium salts, and dolomites accumulated. In addition, the Ca/Mg ratio in carbonates tended to increase and their contents in man- ganese and silica to decrease. Organic matter and pyrite are present in Precambrian sedi- mentary rocks, but their contribution to the composition of sediments preserved in the geologic record becomes significantly greater in the Phanerozoic.
Clastic Deposits
Apart from these special sediment types and environments, many Precambrian siliciclastic and volcaniclastic deposits closely resemble their Phanerozoic counterparts. Hence, facies models derived from modern environments are more and more used for the interpretation of Precambrian depositional systems.

7 Depositional Rhythms and Cyclic Sequences
7.1 General Aspects Individual Beds, Rhythmic Bedding, and Sedimentary Cycles Autogenetic and Allogenetic Processes Scales of Rhythmic and Cyclic Phenomena Symmetry and Asymmetry of Sedimentary Cycles Cycle Hierarchy Biologic Response to Sedimentological Events and Cycles Diagenetic Overprint
7.2 Special Features and Examples of Rhythmic Bedding Cyclic Versus Discyclic (Event) Bedding Examples of Marine Cyclic Bedding Peritidal-Lagoonal Carbonate Cycles Examples of Discyclic Event Bedding Recurrence T i e and Dating of Cyclic Bedding Couplets
7.3 Depositional Cycles in Lakes, Fluvial and Deltaic Systems 7.3.1 Cyclic Sequences in Lakes 7.3.2 Sediment Successions in Fluvial and Deltaic
Systems Autogenetic Sediment Successions Allogenetic Sequences
7.4 Sea Level Changes and Sequence Stratigraphy 7.4.1 General Principles and Terms
Introduction Relative Sea Level Change and Sediment Accumulation
7.4.2 Changes in Sea Level and Storm Wave Base in Shallow Basins
7.4.3 Sequence Stratigraphy in Continental Margin Settings General Aspects Models for Siliciclastic, Calcareous, and Deltaic Environments
7.5 Long-Term Cyclic Phenomena in Earth's History Introduction Continental Flooding Cycles and Associated Phenomena
7.6 Superposition of Cycles of Various Orders and Differing Origin General Aspects The Signature of Long- and Short-Term Sea Level Oscillations Milankovitch Cycles Within Third Order Sea Level Variations Concluding Remarks to Depositional Rhythms and Cyclic Sequences
7.1 General Aspects
Individual Beds, Rhythmic Bedding, and Sedimentary Cycles
Many sedimentary sections exhibit a kind of rhythmicity due to regularly alternating beds traceable over long distances, or a repetition of larger units which are referred to as de- positional cycles. Rhythmic and cyclic sequen- ces occur world-wide on various scales in presumably every environmental and strati- graphic system. They have attracted the inter- est of earth scientists for a long time, but their origin is still a matter of debate in many cases. In fact, they may be caused by a variety of processes and special feedback systems which are difficult to resolve in detail. Cyclic pheno- mena in particular are becoming increassingly important in stratigraphic correlations and possibly in the dating of sedimentary succes- sions. Special volumes have summarized our current knowledge and concepts in this field (e.g., Weller 1964; Duff et al. 1967; Schwar- zacher 1975; Einsele and Seilacher 1982; Ein- sele et al. 1991), and many publications on facies analysis deal with this subject. In the following discussion we proceed from small units observed in field exposures, to large sequences which are studied in basin cross- sections and compiled from the sections of several basin fills.
The basic sedimentological unit described in sequence analysis is the laterally traceable, relatively uniform bed. Bed thicknesses vary from a few centimeters to several meters, but commonly are some 5 to 40 cm thick. Their lateral extent ranges from a few meters to thousands of kilometers. Beds are separated from each other by thinner or thicker, usually weaker intercalations, i.e., interbeds, of dif- fering composition or structure (for more de- tailed definitions see, e.g., Campbell 1967; Reineck and Singh 1980; Collinson and Thom- pson 1982). The bed and overlying interbed

Chapter 7 Rhythmic and Cyclic Sequences
form a bedding couplet. When the interbed becomes very thin, as found in bed-dominated alternations, it may essentially represent a bedding plane. Bedsets or bundles represent several bedding couplets, separated by thicker interbeds (Fig. 7.lg). Bedsets without inter- beds are formed by the amalgamation of event layers (see below). Depositional rhythms and cycles are defined as follows (Fig. 7.1):
- Rhythmic bedding or rhythmic sequences consist of two alternating bed types (succes- sion AB, AB, etc), i.e., beds and interbeds, or a succession of bedding couplets. This group is subdivided into two different categories:
1. Bedding variations result from abrupt changes in sedimentation due to depositional events or episodes at random to quasi-periodic time intervals (forming stochastic, episodic, and discyclic bedding; Fig. 7.1 a and b). The most prominent examples of this group are tempestites and turbidites, flooding episodes in alluvial plains, and repeated volcanic ashfalls into basins receiving normal back- ground sedimentation.
2. Bedding variations are caused by slow, gradual repeated changes in deposition. This type may also be called cyclic bedding, or when strictly periodic, periodic bedding (Fig. 7.lc and d). Typical examples are unlithified chalk-marl sequences and pelagic limestone- marl alternations.
- Sedimentary cycles and cyclic sequences are composed of at least three different beds and interbeds which form a repeated succession (e.g., ABC, ABC, etc.; Fig. 7.le and f).
The term cyclothem (e.g., Weller 1964) is widely used in North America in a purely descriptive way, especially for coal-bearing sequences, particularly those of Pennsylvanian age (Heckel 1986; Klein 1989; Riegel 1991). This term describes a basic cycle, i.e., a package of lithologies representing the smal- lest cyclic unit of a sequence. The succession of beds and interbeds in a cyclothem may be symmetric, semisymmetric, or completely asymmetric (Fig. 7.1 e and f). In seismic stratigraphy (Chap. 7.4) this term is replaced by depositional sequence, which is defined by its lower and upper boundaries as well as by lowstand, transgressive and highstand depo- sits, or, if it is a smaller unit, by the term parasequence (van Wagoner et al. 1987; Vail 1987; Vail et al. 1991). In this book, primarily the terms depositional sequence or deposition-
al cycle and, for a succession of such cycles, cyclic sequence are used.
Autogenetic and Allogenetic Processes
Genetically, one can distinguish between two groups of mechanisms leading to rhythmic and cyclic sequences. These mechanisms were originally defined by Beerbower (1964) to describe cyclic styles in fluvial systems:
Autocyclic sequences (or "autogenetic sequen- ces", Dott 1988) are controlled primarily by processes taking place in the sedimentary basin itself. Their beds usually show only limited stratigraphic continuity. Prominent examples in this category are storm-generated tempestites, turbidite sequences caused by mass flows, the migration and superposition of channel and lobe systems in fluvial environ- ments as well as in the deep sea, and succes- sions of coal seams produced by switching lobes of a subsiding delta plain.
Allocyclic sequences (or "allogenetic sequen- ces") are caused mainly by variations external to the considered sedimentary system (e.g., the basin), such as climatic changes, tectonic movements in the source area, and global sea level variations. Such processes tend to gene- rate cyclic phenomena of a greater lateral continuity and time period than autocyclic processes. Most characteristically, allocyclic processes may operate simultaneously in dif- ferent basins in a similar manner. Thus it should be possible to correlate part of the allocyclic sequences over long distances from one basin to another, and perhaps even from continent to continent.
However, it is often not possible to distinguish sharply between autocyclic and allocyclic processes. For example, regional tectonics may affect both the drainage area outside the depositonal basin as well as tectonic structures within the basin and thus initiate the influx or redeposition of coarse-grained sediments. The occurrence and frequency of essentially auto- cyclic mass flows and turbidites is commonly also controlled by allocyclic eustatic sea level changes. Climate-induced rises in lake level will affect outbuilding and upbuilding of delta lobes. In fact, there are many depositional se- quences displaying the results of both allocy- clic and autocyclic phenomena. Nevertheless, the terms autogenetic and allogenetic still appear useful when applied in the sense that the processes are dominated by one of these two processes.

General Aspects
RHYTHMIC BEDDING ,
STOCHASTIC EVENT STRATI- INCREASING THICKNESS INCREASING "BEDDING" FlCATlON, OF BEDDING COUPLETS SED. RATE,
TlME
3
"DEPO- SITIONAL NOISE"
TlME (LINEAR) - DUE TO EXPANDED (LINEAR) TlME PERIOD
- PERMANENTLY \ B
HIGHER SEDIMEN- TATION RATE (1),(2) ...
TlME (LINEAR) 3
. . --
TIME (NON-
.......
.......
DISCYCLIC, 2 ENHANCED BY , - - - - - - - - - - --J EPISODIC DlAGENETlC OVER- (NON-PERIODIC) PRINT AND/OR STRICTLY CYCLIC (PERIODIC) AB1 # AB2 + AB3 WEATHERING TIME PERIOD FOR AB= const.
e SYMMETRIC
GRAIN SIZE
NORMAL FIELD-SCALE CYCLES
CLAY, COARSEN- FINING-UP INCOMPLETE CARBONATE ING-UP CYCLES DUE TO CONTENT, ETC. LIMITED TRUNCATION DEE? TRUNCAl ION
g BUNDLES
Fig. 7.la-g. Different types of rhythmic (a through d) and lic (nonperiodic; a and b). The thicknesses of correspond- cyclic (e through g) sedimentary successions and definitions ing bed types can change from cycle to cycle: due to va- of some terms. Alternations between beds and interbeds riations either in the time period (c) of succeeding cycles or and the time periods of cyclic sequences may be either in the sedimentation rates of (d). See text for explanation. strictly cyclic (periodic), quasi-cyclic (c and d), or discyc- (Einsele et al. 1991)

274 Chapter 7 Rhythmic and Cyclic Sequences
Scales of Rhythmic and Cyclic Phenomena
A simple, primarily descriptive classification of rhythmic and cyclic phenomena is shown in Fig. 7.2, which is based mainly on the thick- nesses of beds and larger sedimentary cycles. Here, rhythmic and cyclic sediments are sub- divided into four groups:
- Varve-scale laminations. - Bed-scale rhythms and cycles. - Field-scale sedimentary cycles (including
the third and fourth order cycles and para- sequences of the nomenclature proposed by Haq et al. 1987; Vail et al. 1991; Table 7.1).
- Various orders of macro-scale cyclic se- quences (supercycles and megacycles).
Except for the macro-scale sequences, this descriptive classification can be easily applied in the field and in well logs without any information on genesis, sedimentation rates, and associated time spans.
Varve-scale laminations or bed-scale alter- nations are well-known features, but none are the product of only one specific process in a certain environment, and each may represent quite different time periods. Field-scale se- quences represent the typical outcrop cycle,
several meters to tens of meters thick. Many of these field-scale marine cycles are inter- preted today as representing global and rela- tive sea level changes on the order of 100 ka to several Ma. However, in lacustrine environ- ments, where overall sedimentation rates are usually much higher than in the deeper sea, cycles of the same thickness are commonly controlled by short-term climatic fluctuations on the order of 20 to 100 ka. Climatic varia- tions with time periods on this order are also believed to be the cause of many rhythmic, marine marl-limestone sequences. Vail et al. (1977, 1991) and Haq et al. (1987) proposed subdividing depositional sequences into six orders of cycles, defined primarily in terms of time periods (Table 7.1). These groupings define the time period over which the process is active or will not change markedly in character, or they signify the duration of a cycle or type of event (if the term "event" is used in a broader sense than in the following).
Macro-Scale Cycles
Cycles of the first and second order normally cannot be seen in single field exposures. They comprise successions of considerable thickness
Table 7.1. Orders of time periods, origins, and consequences of various cyclic phenomena. (After Vail et al. 1991, modified)
Order Duration Tectonic origin, consequences, Eustacy (global) (Ma) distribution in space
1 r 50 Formation of sedimentary basins Major continental (regional) flooding epochs
2 3 - 50 Specific phases in the evolution Sequence cycle of sedimentary basins: Major transgressive-regressive facies cycles (regional)
3 0.5 - 3 Folding, magmatism, diapirism: Sequence with Disturbances of general trans- systems tracts gressive-regressive trends (local)
4 0.1 - 0.5 Parasequences
5 0.02- 0.1 Milankovitch cycles

General Aspects 275
VARVE-SCALE BED-SCALE NORMAL FIELD-SCALE MACRO-SCALE LAMINATIONS RHYTHMS AND SEDIMENTARY CYCLES CYCLIC SEQUENCES
CYCLES (4th and 3rd order sequ.) (2nd and 1 st order)
IN HAND SPECIMENS BEDDING PHENOMENA IN SETS OF LARGE AND UNDER THE <- AND CYCLIC SEQUENCES IN j FIELD EXPOSURES, MICROSCOPE NORMAL FIELD EXPOSURES LOGS OF DEEP WELLS
Fig. 7.2. Descriptive terms for rhythmic and cyclic sedi- theses after Vail et al. (1977) and Haq et al. (1987). The mentary sequences of various scales, t_ime periods, and term "megacycle" is used here for "supercycle set" in Haq different origins in the field. Orders of cycles in paren- et al. (1987)
(100 m up to several km) and represent long time periods (usually between 10 Ma and more than 100 Ma). They are commonly caused by long-term tectonic processes generating sedi- mentary basins and controlling their specific phases of evolution. Hence, these cycles are primarily associated with crustal extension, lithospheric flexure, thermal contraction, oce- an spreading, and subduction, but also with uplift in the basin drainage area and other tectonic processes (Chaps. 1 and 12). They are characterized, for example, by long persisting
onlap of coastal sediments on continental mar- gins (Watts et al. 1982; Sheridan 1987). Al- though tectonic processes operate on a regio- nal scale, they may cause global major, first order continental flooding epochs or second order transgressive-regressive facies cycles, when regional processes change the total volu- me of the oceans (Vail et al. 1991). By con- trast, depositional sequence cycles of higher orders are thought to be caused by changes in ocean water volume (glacio-eustatic cycles).

Chapter 7 Rhythmic and Cyclic Sequences
Field-Scale Cycles (Third to Fifth Order)
Conspicuous cycles in the field are third order sequences with a time range of 0.5 to 3 or 4 Ma. Fourth order cycles represent eustatic variations around the larger eccentricity cycles of the Milankovitch band (E 3 and E 4, Chap. 7.2). The so-called parasequences of the Vail nomenclature fall into this category. Further- more, some of the coal cycles seem to have this periodicity. Fifth order sea level varia- tions represent the generally shorter periodici- ties of the Milankovitch frequency band, such as glacio-eustatic cycles (0.02 to 0.1 Ma). Va- riations on these orders of magnitude include field-scale and bed-scale phenomena, as ex- pressed for instance in peritidal carbonate cycles (Strasser 1990). Sea level changes with higher frequencies than the Milankovitch variations (with periods ~ 2 0 ka) are denoted as sixth order cycles (Table 7.1).
The expression of all these cyclic phenome- na in sedimentary sequences is significantly modified locally by various depositional envi- ronments. It is the aim of sequence stratigra- phy to divide the stratigraphic record into genetically related units, to date these units and their sequence boundaries, and to investi- gate the processes which have caused them.
Periodic, Quasi-Periodic, and Discyclic Sequences
Categorizing cyclic phenomena into various orders and using the term sedimentary cycle may foster the opinion that cycles within a sequence represent equivalent time periods. This is not necessarily true, and in fact most workers use the term cycle not in this sense, but only as a convenient way to describe re- peated successions of certain lithologies and facies types. In rhythmic sequences caused predominantly by autogenetic processes (e.g., turbidite and tempestite sequences), it is clear that they are the result of frequently but irre- gularly recurring (discyclic) sedimentological events. Smaller irregularities in the mode and rate of deposition are sometimes referred to as depositional noise, resulting in purely stocha- stic sequences (Fig. 7.la). By contrast, some types of cyclic bedding and certain cyclic sequences may reflect allogenetically domi- nated processes with a regular time period (strictly cyclic or periodic sequences; Fig. 7.lc and d).
It is, however, very difficult to prove whe- ther or not a given cyclic sequence is really
caused by a mechanism with a constant time period. It may even be difficult to determine the average cycle duration from a series of subsequent cycles if the beginning and end of the cyclic sequence is not precisely known, as recently pointed out for Pennsylvanian coal cycles in North America (Klein 1990). Nume- rical techniques, such as time series analyses, are important testing tools for the problem of cycle duration (e.g., Schwarzacher 1975; Wee- don 1991). The most prominent examples of periodicity affecting depositional patterns are the Earth's orbital cycles of precession, obli- quity, and eccentricity with periods of 21, 41, and about 100 and 400 ka (i.e., Milankovitch cycles, see, e.g., Berger et a1 1984; Fischer 1991; Einsele and Ricken 1991). If, as demon- strated for the Pleistocene oxygen isotope curve, a depositional system is repeatedly affected by phenomena with constant or qua- si-constant recurrence times, the resulting sediments may be termed periodites (Einsele 1982~). However, even in this case, the thick- nesses of single layers A and B may vary due to changing sediment composition or fluctua- ting sedimentation rates (Fig. 7.lc and d).
Symmetry and Asymmetry of Sedimentary Cycles
Sedimentary cycles may be either symmetric or asymmetric (e.g., coarsening-upward or fining-upward sequences), as well as complete or incomplete (Fig. 7.le and f); the latter com- monly results from low subsidence values. The so-called "punctuated aggradational cycles" (Goodwin and Anderson 1985) represent trun- cated, shallowing-upward sequences deposited in shallow water environments under a fluc- tuating sea level. The superposition of two or several periodically recurring processes can generate a succession of bundles (Fig. 7.lg; Schwarzacher and Fischer 1982). A more de- tailed description of various types of sea le- vel-related asymmetric sedimentary cycles is given by Einsele and Bayer (1991).
Cycle Hierarchy
Sedimentary cycles are caused by various pro- cesses, including regional and global tectonics, sea level fluctuations, changes in climate, and variations in the water volume of lakes. They are affected by variations in biogenic sedim- ent production and modified by local factors. In addition, biological processes such as the

General Aspects
appearance and mass production of new or- ganisms in specific environments, or the mass extinction of pre-existing groups, may lead to significant, repeated biological events which leave behind a signature in the sedimentary record.
When cyclic phenomena of different fre- quencies and natures are superposed, the re- sulting sedimentary record may show a com- plex multi-cyclic pattern. This reflects not only the added effects of two or more cyclic processes, but the different processes also exert some influence on each other. The term cycle hierarchy includes such an interplay between various factors controlling the actual stratigraphic record (for more details and ex- amples see Chaps. 7.3 and 7.6).
Biologic Response to Sedimentological Events and Cycles
One of the best means for discriminating bet- ween subaquatic cyclic beds and event beds is the study of benthic organisms and their bur- rows preserved in beds and interbeds. The reactions of benthic marine and lacustrine fauna, or of plants in a fluvial environment, to gradual, cyclic fluctuations versus short episo- dic events are fundamentally different. Long- term environmental changes on the order of Milankovitch cycles will be accommodated by shifts in the faunal and floral spectrum and species dominance. Physical events, in con- trast, will be experienced as catastrophes, wiping out the existing bottom life (Brett and Seilacher 1991; Seilacher 199 1). Re-establish- ment of the original bottom community can begin only after the depositional event. In the case of tempestites and turbidites, the post- event community may differ from the back- ground fauna, if the new substrate on the sea floor provides different conditions for epifau- na and infauna (e.g., Kidwell 1991; Sepkoski et al. 1991).
Such taphonomic feedback systems also ope- rate in regressive and transgressive situations in shallow seas. During regressions, the muddy fraction is winnowed and transported into deeper water, leaving behind a shell layer which can be settled by a new epifauna. Re- duced siliciclastic influx during transgressions may allow the establishment of sessile epifau- nal organisms (such as some species of corals and oysters), who live in quiet waters near or below the storm wave base and achieve stabi- lity through their large, massive skeletons. Rare storm events may rework such outsized
bioclasts and mix them with diagenetically formed concretions (see below). Thus, over significant periods of time, the production of outsized bioclasts and concretional diaclasts in combination with episodic burial and winno- wing may eventually generate thick shell beds or mounds even in regions where overall fine- grained substrate conditions persisted (Brett and Seilacher 199 1 ).
Epibenthic shell beds occur throughout the Phanerozoic record. They have been frequent- ly used as marker beds, because they occur over considerable distances and commonly coincide with biozonal boundaries. They may have been formed during either regressions or transgressions. The latter situation applies if the coarse particles are produced in place by biological processes and are enhanced by dia- genesis, and if the sedimentary structures reflect short turbulence events rather than the background regime.
Diagenetic Overprint
Primary bedding features, including sedimen- tary structures, bedding planes, bedding rhythms and larger sedimentary cycles, can be significantly modified by diagenetic over- prints, particularly in carbonates and siliceous sediments (Chaps. 13.3, 3.3.2, and 5.3.5; also see Ricken 1986; Ricken and Eder 1991; Tada 199 1 ). Even minor variations in primary com- position and pore space are sufficient to cause significant diagenetic modifications. As a result, primary structures and bedding pheno- mena may be enhanced, modified, or in some cases obliterated.
Selective Cementation and Pressure Dissolution
In rhythmic sequences, selective cementation and pressure dissolution are the most impor- tant processes enhancing compositional varia- tions. At burial depths of several hundred meters, carbonate or silica starts to dissolve from the potential interbed and to reprecipi- tate as pore cement in either the overlying or underlying bed. Unstable carbonate minerals or, in the case of silica, increased tempera- tures, promote these processes. As a result, the beds become lithified and resist further me- chanical compaction, while the interbeds con- tinue to compact and lose dissolved matter by diffusion. Thus, the original thicknesses of the interbeds are substantially reduced, while the

Chapter 7 Rhythmic and Cyclic Sequences
thicknesses of the cemented beds are essenti- ally retained. In addition, the original diffe- rences in composition between beds and inter- beds are amplified. Solution seams and stylo- lites are sites where intensive dissolution has taken place. In sequences with high carbonate contents, bedding eventually becomes brick- like, consisting of limestone layers of similar thickness alternating with thin, highly com- pacted, carbonate-depleted marl beds (com- pare Fig. 13.18). In skeletal carbonates, early diagenetic differential dissolution and cemen- tation may lead to selective lithification of specific layers.
Hardgrounds, Concretions, and Nodular Limestones
Other common features generated by diagene- tic overprint are hardgrounds, concretion lay- ers, and the cementation of beds adjacent to the event bed (e.g., underbeds). Hardgrounds are formed by early cementation at the sedi- ment surface in various calcareous environ- ments when the sea floor is subject to winno- wing and erosion, as on carbonate platforms, shelves, and continental slopes. Cemented hardgrounds with erosional surfaces may oc- cur repeatedly in a sequence and thus indicate a kind of rhythmicity or cyclicity.
Concretions of carbonate, silica, and phos- phate generally form early in diagenesis near the sea floor, but they also grow at greater depth below the sediment-water interface (Raiswell 1987). Concretions are frequently concentrated in layers which deviated in their original composition and/or texture from the underlying and overlying sediments. They may have had higher carbonate, biogenic silica, or organic carbon contents, or relatively high porosities and somewhat differing grain size distributions. For this reason, most concretion horizons reflect subtle primary depositional variations and are found to be more or less parallel to the primary bedding.
Bedded, nodular limestones are generated by early concretionary cementation of bioturbat- ed carbonate muds and by pressure dissolution during the later stages of diagenesis. Flint layers in chalk may develop independently from the primary bedding rhythm (Ricken and Eder 1991). Cementation of graded beds can also affect a thin layer below the event bed, thus forming an underbed, which appa- rently enhances the thickness of the event bed.
Effects o f Weathering
Further alterations of rhythmic and cyclic sequences are caused when sections are expo- sed to weathering. In the case of limestone- marl alternations, strata with carbonate con- tents s 65 to 85 % are commonly subject to rapid physical disintegration, while layers with higher carbonate contents resist. Hence, rhythmic bedding may become more conspi- cuous in field exposures than in drill cores, but weathering may also obscure the existence of bedding couplets if the carbonate contents in both the bed and interbed are below or above the "weathering boundaryn.
7.2 Special Features and Examples of Rhythmic Bedding
Cyclic Versus Discyclic (Event) Bedding
Cyclic Bedding
Some characteristics of the entirely different processes generating rhythmic sequences are shown in Fig. 7.3. Cyclic bedding is caused by slow, gradual variations in primary sediment composition and associated variations in sedi- mentation rates (Fig. 7.3a). These lead to a vertical sediment buildup that changes smoothly with time and is characteristic for various sediment types, particularly for cal- careous and siliceous deposits. However, a small variation in the primary composition, texture, or fabric may be sufficient to pro- mote a secondary differentiation into beds and interbeds accentuated by diagenetic overprint, as mentioned above. When not interrupted by depositional events, the intensity of burrow mottling is continuous in succeeding beds, although slow variations may occur in number and type of bottom dwelling species as well as planktonic organisms (see below). Anoxic intervals may further modify the alternating beds and their biological record.
The recurrence intervals of the various cyclic deposits can theoretically be strictly periodic, quasi-periodic, or nonperiodic. The 11 year sun spot cycles found in varved marine salt deposits and lake sediments (Richter-Bern- burg 1960; Glenn and Kelts 1991) represent a strict periodicity. Milankovitch cycles (Chap. 7.1 ), however, hold some complications. Whereas, for example. the individual orbital

Rhythmic Bedding
COMPONENT A ALLOCHTHONOUS MEAN COMPOSITION
CHANGE IN FL -A-L, , PRIMARY
COMPOS' COMPONENT B BACKGROUND MEAN COMPOSITION
(-CLAY") SEDIMENT
SEDIMENT BUILDUP
A ACCUMULATION
ANOXIC
.c-- -+ EXPOSURE
SEDIM. RATE OF F
ANOXIC
I I I, 1 u I,
TIME TIME
EROSION I J
Fig. 7.3a,b. Vertical sediment buildup time curves (BT episodes of different magnitudes at random time intervals. curves) to characterize different types of rhythmic bedding. Both a and b may also show anoxic intervals. Bypw zone of a Cyclic or periodic bedding due to slow gradual changes bioturbation migrating slowly upward; Bdw new community in accumulation and composition of sediments. b Event of bottom dwelling organisms burrowing downward. (After bedding caused by repeated erosional and depositional Einsele 1982c)
parameters seem to have constant amplitudes and time periods, their complicated combined effects on climate and sediments tend to create a periodicity with considerably varying ampli- tude and changing importance of the various time intervals (Einsele and Ricken 1991; Fi- scher 1991). The response of a depositional system may lag behind the orbital signal. Cyc- lic sequences caused by relatively long-term, third order sea level changes (Chap. 7.4) also show varying time periods within a certain order of magnitude. It is the superposition of several mechanisms creating differing time periods and intensities which often renders it difficult to discover from the response of sediments whether there is a true periodic process in operation above the depositional background noise. For these reasons, many allocyclic phenomena in sediments appear to
be quasi-periodic, and some even nonperiodic, rather than strictly periodic.
Discyclic Bedding
By contrast, alternations due to episodic phe- nomena (e.g., tempestites, turbidites, river floods, and sequences recording volcanic epi- sodes) show a very irregular sediment build- up-time curve (Fig. 7.3b). Slow, but more or less continuous vertical accumulation of fine- grained background sediment is interrupted irregularly by erosional and immediately suc- ceeding depositional episodes. In the case of turbidite sequences (cf. Chap. 5.4.2), back- ground deposition is discontinuously interrup- ted by laterally transported, allochthonous turbidite sediment. Therefore, the rates of
Chapter 7 Rhythmic and Cyclic Sequences
sedimentation also change abruptly. The bio- turbated surface layer of the background sedi- ment, occupied by bottom dwelling organisms which normally slowly migrate upward with the sediment surface, is episodically truncated and replaced by an event deposit. Recoloniza- tion of the event layer is achieved by specially adapted fauna burrowing from the new sur- face downward.
As in cyclic sequences, intervals of anoxic conditions may occur. Whereas turbidites al- ways contain material from distant sources, often mixed with sediments taken up under- way, the tempestite material is either entirely autochthonous or derived from nearby sources (Chap. 3.1.2). In many other respects, as well, tempestites resemble turbidites.
Most event beds show a kind of amalgama- tion and cannibalism, i.e., large events wipe out the record of earlier, smaller ones includ- ing part of their host sediment. As a result, one event bed may directly follow another or several other ones, the tops of which were truncated (Fig. 7.lf and 7.3b). Generally, the thicker the event bed and the deeper it has eroded, the longer is the recurrence interval of the event. The sedimentological episode is normally a matter of hours or days. The areal extent of individual event beds is commonly limited to parts of a particular sedimentary basin. However, there are also periods in the ancient record in which allogenetic processes, such as global sea level falls, have triggered the generation of discyclic rhythmic bedding (see below).
Combinations o f Both Cyclic and Discyclic Bedding
Some limestone-marl sequences (see below) and sediments from oxygen-deficient en- vironments, such as black shales, phosphorite- bearing strata, and varved siliceous oozes, may show both gradual cyclic variations and episo- dic bedding types. Cyclic phenomena are commonly ascribed to variations in climate causing changes in the oceanic current systems and thus in the distribution of nutrients and oxygen in sea water. Event beds are frequently represented by various turbidites including muddy and bioclastic types; storm-related winnowing of mud may produce bioclast-rich lags. Long-term rhythms or cycles are often superposed by short-term fluctuations, gene- rating thin, varve-scale (bio)laminations, or they may contain benthic and bioturbated intervals due to water mass mixing and turn-
over (Gerdes et al. 1991; Savrda et al. 1991; Oschmann 1991).
Examples of Marine Cyclic Bedding
The most prominent examples of cyclic bed- ding in the marine environment are:
- Hemipelagic to pelagic limestone (or chalk)- marl alternations.
- Black shale-carbonate rhythms (redox cyc- les).
- Pelagic banded cherts.
These types of rhythmic bedding are mention- ed in Chapter 5.3.7 and described in detail in Einsele et al. (1991). Here, some important points are briefly summarized.
Pelagic Limestone-Marl Alternations
Pelagic limestone-marl alternations have been formed since the upper Jurassic, after sub- stantial planktonic carbonate production began in deep and shallower marine environments which were little affected by waves and bot- tom currents. In earlier periods, particularly in the Paleozoic, fine-grained carbonate deposi- tion was restricted to the upper slopes, shel- ves, and epicontinental seas, where either well-bedded or nodular limestones were form- ed.
In order to produce pelagic carbonates, the rate of planktonic carbonate deposition must have been three to four times higher than ter- rigenous silt and clay input (Seibold 1952; Einsele and Ricken 1991). On the shelf and in epicontinental basins, rhythmic limestone- marl sequences of some thickness needed spe- cial requirements, such as the coincidence of subsidence and sea level rise, which may have restricted their occurrence to relatively short time spans of 1 Ma to a few Ma.
Generally viewed, three basic processes can produce limestone-marl alternations (Einsele and Ricken 1991; Arthur and Dean 1991):
1. Variations in carbonate production. 2. Periodic carbonate dissolution. 3. Periodic terrigenous dilution.
Each of these types represents an end member of alternations with simultaneous oscillations of several inputs. Cycles formed by varying carbonate production and dissolution show rhythms with thick limestone beds and thin

Rhythmic Bedding 28 1
marly interbeds, whereas terrigenous dilution is indicated by the oppbsite trend. Limestone- marl successions can be formed in the fol- lowing environments (Fig. 7.4):
- Outer shelves, lower slopes o f carbonate ramps, central portions o f epicontinental seas, marginal plateaus. Rhythmic bedding is caus- ed predominantly by periodically increased terrigenous influx (dilution cycles) in relation to variations in climate, vegetation, and/or sea level. These types of limestone-marl rhythms may contain intercalations of distal carbonate and siliclastic tempestites. With increasing terrigenous influx, limestone-marl successions are replaced by claystone-marl sequences,
displaying thicker bedding couplets, but thin marl beds. Shallowing of the sea favors re- working, omission, channeling, and finally interfingering and replacement of the bedded pelagic limestones by bioclastic carbonate arenites and a reef association. - Marginal deep seas, deep-sea plateaus, and environments around isolated carbonate plat- forms appear to provide the most suitable environments for the development of lime- stone-marl rhythms. Carbonate accumulates at water depths above the lysocline and is af- fected by dissolution only under the presence of substantial amounts of organic matter (e.g. Diester-Haass 1991). Thus, variations in car- bonate content reflect changes in productivity
DEEP SEA DEEP SEA RISE MARGINAL OUTER SHELF
OLlAN DUST
RM-INDUCED TOM CURRENTS
SUCCESSION (TERRIG. DILUTION,
(EXTENSIVE DISSOLUTION, THICK COUPLETS, THIN COUPLETS) THIN MARL LAYERS
INCREASING CARBONATE CONTENT
Fig. 7.4. Overview of depositional environments and processes generating different types of pelagic to hemipelagic limestone-marl, claystone-marl, or calcareous redox rhythms. See text for discussion
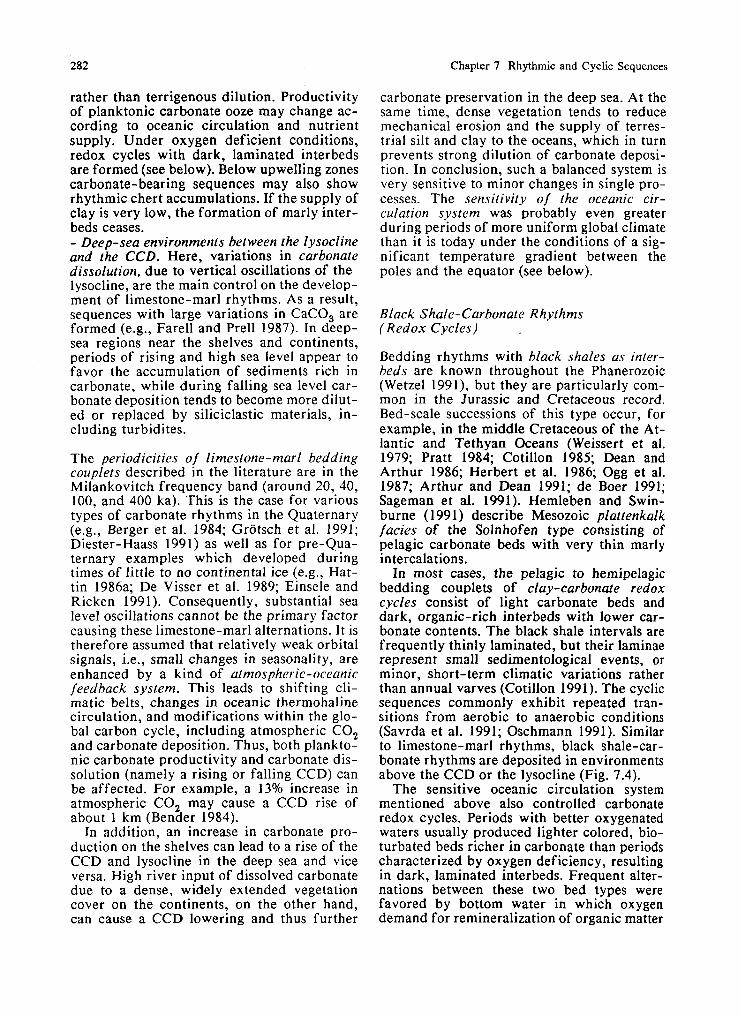
Chapter 7 Rhythmic and Cyclic Sequences
rather than terrigenous dilution. Productivity of planktonic carbonate ooze may change ac- cording to oceanic circulation and nutrient supply. Under oxygen deficient conditions, redox cycles with dark, laminated interbeds are formed (see below). Below upwelling zones carbonate-bearing sequences may also show rhythmic chert accumulations. If the supply of clay is very low, the formation of marly inter- beds ceases. - Deep-sea environments between the lysocline and the CCD. Here, variations in carbonate dissolution, due to vertical oscillations of the lysocline, are the main control on the develop- ment of limestone-marl rhythms. As a result, sequences with large variations in CaC03 are formed (e.g., Farell and Prell 1987). In deep- sea regions near the shelves and continents, periods of rising and high sea level appear to favor the accumulation of sediments rich in carbonate, while during falling sea level car- bonate deposition tends to become more dilut- ed or replaced by siliciclastic materials, in- cluding turbidites.
The periodicities of limestone-marl bedding couplets described in the literature are in the Milankovitch frequency band (around 20, 40, 100, and 400 ka). This is the case for various types of carbonate rhythms in the Quaternary (e.g., Berger et al. 1984; Grotsch et al. 1991; Diester-Haass 1991) as well as for pre-Qua- ternary examples which developed during times of little to no continental ice (e.g., Hat- tin 1986a; De Visser et al. 1989; Einsele and Ricken 199 1). Consequently, substantial sea level oscillations cannot be the primary factor causing these limestone-marl alternations. It is therefore assumed that relatively weak orbital signals, i.e., small changes in seasonality, are enhanced by a kind of atmospheric-oceanic feedback system. This leads to shifting cli- matic belts, changes in oceanic thermohaline circulation, and modifications within the glo- bal carbon cycle, including atmospheric CO, and carbonate deposition. Thus, both plankto- nic carbonate productivity and carbonate dis- solution (namely a rising or falling CCD) can be affected. For example, a 13% increase in atmospheric C 0 2 may cause a CCD rise of about 1 km (Bender 1984).
In addition, an increase in carbonate pro- duction on the shelves can lead to a rise of the CCD and lysocline in the deep sea and vice versa. High river input of dissolved carbonate due to a dense, widely extended vegetation cover on the continents, on the other hand, can cause a CCD lowering and thus further
carbonate preservation in the deep sea. At the same time, dense vegetation tends to reduce mechanical erosion and the supply of terres- trial silt and clay to the oceans, which in turn prevents strong dilution of carbonate deposi- tion. In conclusion, such a balanced system is very sensitive to minor changes in single pro- cesses. The sensitivity of the oceanic cir- culation system was probably even greater during periods of more uniform global climate than it is today under the conditions of a sig- nificant temperature gradient between the poles and the equator (see below).
Black Shale-Carbonate Rhythms (Redox Cycles)
Bedding rhythms with black shales as inter- beds are known throughout the Phanerozoic (Wetzel 1991), but they are particularly com- mon in the Jurassic and Cretaceous record. Bed-scale successions of this type occur, for example, in the middle Cretaceous of the At- lantic and Tethyan Oceans (Weissert et al. 1979; Pratt 1984; Cotillon 1985; Dean and Arthur 1986; Herbert et al. 1986; Ogg et al. 1987; Arthur and Dean 1991; de Boer 1991; Sageman et al. 1991). Hemleben and Swin- burne (1991) describe Mesozoic plattenkalk facies of the Solnhofen type consisting of pelagic carbonate beds with very thin marly intercalations.
In most cases, the pelagic to hemipelagic bedding couplets of clay-carbonate redox cycles consist of light carbonate beds and dark, organic-rich interbeds with lower car- bonate contents. The black shale intervals are frequently thinly laminated, but their laminae represent small sedimen tological events, or minor, short-term climatic variations rather than annual varves (Cotillon 199 1). The cyclic sequences commonly exhibit repeated tran- sitions from aerobic to anaerobic conditions (Savrda et al. 1991; Oschmann 1991). Similar to limestone-marl rhythms, black shale-car- bonate rhythms are deposited in environments above the CCD or the lysocline (Fig. 7.4).
The sensitive oceanic circulation system mentioned above also controlled carbonate redox cycles. Periods with better oxygenated waters usually produced lighter colored, bio- turbated beds richer in carbonate than periods characterized by oxygen deficiency, resulting in dark, laminated interbeds. Frequent alter- nations between these two bed types were favored by bottom water in which oxygen demand for remineralization of organic matter

Rhythmic Bedding
was either slightly lower or higher than oxy- gen supply by oceanic circulation. The organic matter in the dark layers may have been de- rived from both marine productivity and ter- restrial sources.
During times of reduced temperature dif- ferences between the poles and the equator and the generally warmer climate than at pre- sent, such as in the Cretaceous (e.g., Barron and Washington 1985; Sloan and Barron 1990), thermohaline oceanic circulation tended to slow. Instead of cold polar deep-water masses, warm dense saline water, originating from flooded low-latitude shelves and adjacent seas, may have become the major bottom wa- ter source (Arthur et al. 1987). Since the solu- bility of oxygen decreases with increasing temperature and salinity, the sinking, more saline, warm surface waters soon became oxy- gen depleted. This, in turn, hampered the mineralization of organic matter in inter- mediate and deep waters, as well as the release and recycling of nutrients controlling surface productivity. These processes may have caused short-term, expanded, intensified oxygen- minimum zones at intermediate water depths and thus the widespread deposition of black shale layers, even in epicontinental sea sett- ings. Subtle changes in climate and oceanic circulation were sufficient to periodically restore more oxygenated conditions with higher planktonic carbonate production.
Rhythmic Bedding in Siliceous Sediments
Alternations between marine, biogenic sili- ceous and non-siliceous beds and their origin were already mentioned in Chap. 5.3.5 (Fig. 5.6). Their rhythmic bedding is generated by both cyclic and discyclic (event-related) depo- sitional processes. In addition, calcareous beds may contain layers of chert nodules which indicate primary alternations between beds poor and rich in opaline silica. Rhythmic bed- ding in siliceous sediments was described from many regions, particularly in Mesozoic sedi- ments of the Tethys Ocean (Hein and Obrado- vic 1988) and in Tertiary sequences around the Pacific (Iijima et al. 1985), i.e., regions of high fertility in siliceous plankton. Rhyth- micity may be expressed in annual varves or in banded ribbon radiolarites (e.g., Jenkyns and Winterer 1982; Jenkyns 1986), which are mo- dified and enhanced by silica diagenesis (Chap. 5.3.5). The most important facts about such alternations were summarized recently by Decker (1991). In this section, cyclic pheno-
mena in the range of the Milankovitch fre- quency band are discussed.
Similar to limestone-marl alternations, cyc- lic sequences in siliceous sediments result from (1) variations in siliceous plankton pro- ductivity, ( 2 ) periodic dilution of siliceous sediments by terrigenous material, and (3) variations in dissolution o f opaline silica in the water column and at the sea floor. How- ever, productivity cycles appear to be more effective than dilution cycles in generating rhythmically interbedded chert layers. Thus, climate-induced global changes in oceanic circulation and the recycling of nutrients through upwelling may predominantly control the generation of beds rich in opaline silica. At the same time, carbonate production should be low, or the position of the lysocline or CCD should be well above the sea floor in order to prevent strong dilution of opaline silica by carbonate. The occurrence of banded chert is not restricted to deep water; it rather indicates an environment of high siliceous plankton production and very limited terrigenous in- flux.
Peritidal-Lagoonal Carbonate Cycles
Cyclic carbonate sequences formed in peritidal environments, i.e., in the shallow subtidal, intertidal, and subtidal-lagoonal zones, com- monly display thicker individual depositional cycles and are more complex than deep-water limestone-marl or black shale-carbonate alter- nations. They may be caused either by auto- cyclic (intra-basin sedimentary processes) or allocyclic processes (sea level changes; Strasser 1988 and 1991).
Peritidal carbonate cycles have been described from many regions since the pioneering study by Fischer (1964) in the Triassic Dachstein limestone in the northern calcareous Alps. Similar carbonate cycles are known from other parts of ihe widely extended Triassic carbonate platforms of the western Tethys (e.g., northern and southern Alps, inner Carpathians, and Hellenids; e.g., Bechstidt 1975; Gold- hammer et al. 1987), but also from the Paleozoic in Europe and North America (e.g., Koerschner and Read 1989).
Peritidal-lagoonal carbonate sequences com- monly reach thicknesses of several hundreds of meters. Individual cycles are typically one to several meters thick and may be symmetric or asymmetric; they can be correlated laterally over distances of more than 10 km (Haas 1990). Their periodicities mostly range bet- ween 20 and 50 ka and thus fall within the

Chapter 7 Rhythmic and Cyclic Sequences
Milankovitch frequency band. Hence, the average rate of carbonate deposition (around 5 to 20 cm/ka) is much greater than in the deep sea (see above and cf. Chap. 10.2). One can distinguish two end member types:
1. Transgressive Lofer cycles or Loferites re- present deepening -upward sequences with subsequent erosional unconformities (Fig. 7.5b) consisting of (from top to bottom):
- Erosional unconformity (emergence, karstification, paleosol)
- Subtidal calcarenite bed with diverse marine fauna
- Intertidal and subtidal algal mats - Supratidal argillaceous bed - Erosional unconformity
(emergence, karstification, paleosol)
2. Regressive, shallowing-upward sequences (Fig. 7.5b; Strasser 1991):
- Erosional unconformity
- In places: soils, calcrete, beach ridges, eolian deposits, etc.
- Supratidal algal marsh, freshwater to hypersaline ponds, sabkha
- Intertidal carbonate mud and sand in chan- nels
- Subtidal carbonate muds and sands, stromatolites, reefs
Shallowing-upward sequences displaying little erosion and no emergence can be formed in slowly subsiding areas without sea level chan- ges (Fig. 7.5d). Carbonate sediment produced in shallow-marine environments is transported toward the tidal flats and builds sediment up to sea level (Phase 1). With decreasing sedi- ment supply, the sediment surface maintains its position near sea level for some time (Phase 2), but then drops due to continued subsidence (Phase 3). As soon as sufficient sediment be- comes available after a certain lag time, sedi- ment buildup starts again and forms the base of the next cycle.
By contrast, cyclic sequences showing emer- gence, karsti f ication, pedogenesis, and erosion can be interpreted only with the aid of rela- tive sea level changes (Fig. 7.5be). The ampli- tude of such oscillations may be very small in comparison to Pleistocene sea level changes, but they must allow subaerial erosion, karsti-
fication, soil formation under vegetation, or the existence of a coastal sabkha. Relatively deep erosion may remove the regressive part of a cycle and thus lead to an asymmetric, deepening-upward type, as in the Lofer cycle.
A simple facies model for symmetric and a- symmetric peritidal-lagoonal cycles is shown in Figure 7.5f. On the landward side of the lagoon, cyclic sediments tend to be intensively dolomitized as a result of evaporative pumping (Chap. 6.4.1) and truncated by erosion. Many shallow-water carbonate cycles seem to be delicately balanced between high-frequency eustatic variations and autocyclic processes related to laterally migrating tidal flats.
There is increasing evidence that such high- frequency sea level variations occurred throughout the Phanerozoic (e.g., Einsele et al. 199 1 ). Small sea level variations with ampli- tudes of 1 to 10 m may result from storage and release of continental water, affecting lake and ground water reservoirs, as well as possibly some mountain and polar ice.
Examples of Discyclic Event Bedding
The most prominent examples of discyclic, event-related rhythmic bedding are:
- All types of turbidites, sandy and muddy (siliciclastic, calcareous, and siliceous) and associated minor gravity mass flow deposits (Chap. 5.4.2).
- Siliciclastic and calcareous tempestites (Chap. 3.1.2).
- Flood event deposits on alluvial plains (inun- dites; Chaps. 2.2.1 and 2.2.3).
- Tephra layers, particularly widely dispersed ashfalls (Chap. 2.4).
These types of event beds do not always form conspicuous rhythmic bedding. Frequently, one event bed may follow an earlier one with- out an intercalated interbed representing the more or less autochthonous background sedi- mentation. A sequence of fine-grained, thin mud turbidites, for example, is commonly not referred to as rhythmic bedding, but rather as massive siltstone or claystone (Kelts and Ar- thur 1981). Other event beds such as thick mud flows, debris flows, and olistostromes, or thin silt layers originating from dust storms, tsunami- and bolide-related deposits, and sediments reflecting earthquake shocks with- out being displaced (seismites) are either too rare, too thick, or too thin, and not suffici- ently extensive to generate rhythmic bedding (also see Clifton 1988).

Rhythmic Bedding 285
a LACUSTRINE CYCLE (NEWARK GROUP)
CP.LCAREOUS CLAYSTONE , AND SILTSTONE. - ABUNDANT DESI'CCATION
CRACKS AND ROOT HORIZONS (MUDFLATIPLAYA FACIES)
BLACK SHALE,
CYCLE CALCAREOUS, MICROLAMINATED,
.v 6m +FISH FOSSILS, ETC.
I (LACUSTRINE FACIES) I CALCAREOUS CLAYSTONE
OR SILTSTONE WITH I L--T-- LENTICULAR LAMINATION, I - - -
BURROWS, MUDCRACKS I .!=.-I I I 5 : ?OOLITES, STROMATO- I --='. \ - , - 2 -. - -- --=.
LITES
(TRANSGRESSIVE LAKE SHORE FACIES)
b BACKREEF DACHSTEIN-TYPE ('LOFER CYCLE")
I DEEPENING I UPWARD I I S U T D L /' I BIOCLASTIC LIME-
STONE, DIVERSE CYCLE MARINE FAUNA
MEGALODONTS
SEDIMENT BUILDUP
LAG SEA LEVEL
I DEPOSIT
I
SUPRATIDAL-INTERTIDAL ALGAL MATS (LOFERITES). ?DOLOMITIC, MUD CRACKS
EMERGENCE:
ROOTS, SOIL, SHALLOWING UPWARD
CYCLE ,, SABKHA -0,5rn TIDAL CARBONATE,
v FACIES FACIES -
SUBSIDENCE TIDAL
LAGOONAL MUD TRANSGRESSIVE LAG
I e
DEEP KARSTI- WATER DEPTH FlCATlON
AND LIMITED
(KARSTIFICATION)
Fig. 7.5a-f. Idealized sedimentary cycle in the lacustrine emergence, karstification, and pedogenesis, while Purbeck- Triassic Newark Group, North America (a Fischer 1991) ian cycles (c) are shallowing-upward. d and e Models to and peritidal-lagoonal carbonate cycles from the Triassic in explain peritidal cycles by subsidence alone (autocyclic, d) the Alps and southern Europe (b) and Purbeckian in the or by sea level oscillations (allocyclic, e; based on Strasser Swiss-French Jura Mountains (c after Haas 1991; Strasser 1991; Koerschner and Read 1989). f Facies model for the 1991). Lofer cycles in the Dachstein limestone (b) display generation of symmetric and asymmetric peritidal carbonate transgressive, deepening-upward sequences truncated by cycles, with or without dolomite. (After Haas 1991)

Chapter 7 Rhythmic and Cyclic Sequences
The following considerations on the recur- rence intervals of rhythmic phenomena take into account only the common types of macro- scale rhythmic bedding.
Recurrence Time and Dating of Cyclic Bedding Couplets
Although the recurrence time of cyclic and episodic phenomena in sedimentary sequences spans a very wide scale, many common fea- tures in marine environments such as tempes- tites, turbidites, limestone-marl rhythms and banded chert layers occur in about the same, narrower range of frequencies, i.e., between 1000 and several 100 000 years. This implies that the thicknesses of individual bedding couplets are also often in the same range, rz- gardless of whether they are generated by sedimentological events or gradual cyclic changes. Since both types of bedding rhythms can occur in the same sequence, distinguishing between cyclic and discyclic bedding and determining the number of cycles in a par- ticular section may be problematic in such cases. However, this is only true for environ- ments where the sedimentation rates are of the same order of magnitude, as for example in wide areas of the oceans. Most lake sediments accumulate much faster, with the result that cycle periods similar to those in the sea gene- rate thick packages of sediment, but event deposits maintain their dimensions or tend to decrease in size.
A special problem is the identification of the various periodicities o f the Milankovitch frequency band. The Earth's axial precession (P) has a mean period of 21 ka, the change in axial obliquitiy ( 0 ) spans 41 ka, and the or- bital eccentricity (E) varies in several cycles: E l at 95 ka and E2 at 125 ka form the ca. 100 ka E cycle (e.g., Herbert and D'Hondt 1990; Fischer 1991); E3 has a period of 413 ka, while E4 is ca. 1300 ka. If only one or two of these frequencies, for example P and 0 , or 0 and E, are recorded in the sediments, it is normally difficult to decide which of the dif- ferent periods they represent. A better deter- mination is possible when P, E, and possibly E3 occur in the same sequence and form a bundle, or when 0 , E, and E3 are present. Then, in combination with other methods for stratigraphic dating, (e.g., radiometric dating and magnetostratigraphy) very precise strati- graphic resolution can be achieved (e.g., Schwarzacher 1987; Kauffman et al. 1991).
7.3 Depositional Cycles in Lakes, Fluvial and Deltaic Systems
7.3.1 Cyclic Sequences in Lakes
Lakes represent particularly sensitive deposi- tional environments which respond imme- diately and markedly to various kinds of change in their drainage area (Chapter 2.5). When lake sediments accumulate rapidly under stratified water conditions, they may allow very accurate time resolution, including seaso- nal variations. Hence, lake sediments can re- cord a wide range of cyclic and episodic phe- nomena in various climatic zones. Their po- tential for registering short-term cycles and events has been recently summarized by Glenn and Kelts (1991). Here, cyclic sequences re- lated to climatic changes within the Milanko- vitch frequency band are considered.
Effects of Changes in Climate
Salt Lakes
Pleistocene and Holocene variations in climate have commonly left a very distinct record in many lake sediments. Present-day hypersaline lakes and playas in regions of arid to semiarid climates experienced cooler, wetter conditions during glacial periods or during the transitions from glacials to interglacials. Closed lake sys- tems were transformed into open systems and vice versa (Chap. 2.5), with the result that deposition of carbonates and evaporites was largely replaced by siliciclastic material. The thicknesses of such Pleistocene clastic-evapo- rite cycles depend on the sedimentation rate in the lake. One cycle may reach tens to hund- reds of meters in thickness.
An outstanding example o f a continuous, annual climatic record has been reported from varved Permian evaporites of the Delaware Basin in New Mexico (Anderson 1982). The measured sequence consists of calcite-laminated an- hydrite and anhydrite-laminated halite caused by seasonal changes in temperature and evaporation (compare Section 6.4.2). It represents a time span o f 260 ka, but can be subdivided into cycles o f various lengths (about 100 ka, 20 ka, 2.7 ka, and 200 years). The 2.7 ka period may indicate episodes of basin freshening similar to the climatic changes known from the Holocene.

Depositional Cycles in Lakes, Fluvial and Deltaic Systems
Post-Glacial "Humid" Lakes
In more humid climates, the post-glacial sedi- ment successions known from many glacier- shaped lakes along the margins of mountain ranges frequently display a half-cycle consis- ting of clastic sediments followed by car- bonates (seekreide) and organic-rich muds.
Sediment -Starved Lakes
In the past, relatively sediment-starved, long- persisting lake systems accumulated less sedi- ment over time periods of the same order as the Pleistocene climatic variations (Milanko- vitch cycles). Hence, their Milankovitch cycles are thinner and occur more frequently than in depositional systems with high sediment in- flux.
Some of the Triassic rift basins associated with the breakup of Pangea (Chap. 12.3), for example the Newark rift in the eastern United States, existed over a period of 30 to 40 Ma (Smoot 1991). Their sediment fills include various lake deposits of both perennial and ephemeral lake systems (cf. Chap, 2.5). Dry phases may be characterized, for example, by playa mud flats, whereas wet phases led to laminated calcareous black shales (Fig. 7.5a; van Houten 1964).
In the so-called Newark Supergroup, the mean thickness of the basic cycle is 5 to 6 m; in the basin center, the cycles may contain some evaporites. In such depositional settings, all signals of the Milankovitch frequency band (P, 0, E, E3 and E4, cf. Chap. 7.2) could be identified (Olsen 1986; Fischer 1991).
Cyclic deposits from a very large playa lake also occur in the upper Triassic (Keuper) of Europe (cf. Chap. 12.3). Here, mostly red shales alternate with thin, dolomitic limestones and form bedding couplets 1 m thick and less. Locally, fluvial and deltaic sands or gypsum and anhydrite are intercalated.
Some generalized types of lake sequences which may occur cyclically are discussed in Chapter 2.5. Normally, one cannot expect that many of these cycles are actually realized in an individual lake system, because the life times of lakes are limited. Either a lake is filled up and overlain by fluvial deposits, or the lake floor and its surroundings subside below sea level and are transformed into a marine basin (cf. models in Chap. 12.1).
7.3.2 Sediment Successions in Fluvial and Deltaic Systems
Autogenetic Sediment Successions
Alluvial fans and rivers represent systems transporting material from more elevated re- gions into lowlands and the sea, but many of them do not leave behind any fossil record. Fluvial deposits of some thickness, and thus sequences displaying some sort of cyclicity, can be only expected in areas of substantial subsidence which are continuously filled. Under such conditions, even alluvial fans can show sequences of fluvial material alternating with deposits of sheet floods and debris flows (Chap. 2.2.2), and thus form a kind of dis- cyclic succession, with irregularly spaced thin and thick event beds. Similarly, fan deltas into lakes and shallow seas can exhibit special flood events triggering subaquatic gravity mass flows.
Repeated sequences of larger areal extent can be generated in braided and meandering river systems (Chap. 2.2.3). As a result of late- ral channel migration, relatively coarse-grain- ed channel fills can form wide, elongated sand sheets. Particularly in braided systems, older channel fills may be partially reworked and their material incorporated into subsequent channel fills, which ultimately produces an architecture of vertically and laterally stacked channels (Fig. 2.9). Idealized channel sections then consist of an asymmetric sequence with a fining-upward trend, which is commonly ter- minated by the erosional face of the subse- quent channel. Meandering systems show channel fills with a better developed fining- upward character and less erosional trun- cation, because flood deposits predominate over channel sediments. Abandoned channels (ox bow lakes) may be filled with mud or organic detritus (Fig. 2.16). Pedogenesis under various climates (soil horizons with roots, formation of calcrete or silcrete) characterizes long intervals between large flood events and sediment accumulation affecting the total flood plain.
In this way, autocyclic or autogenetic se- quences are generated, consisting of channel fills, overlying flood plain deposits, and swamps which are partially truncated by the subsequent channel cutting process. Many coal seam successions were generated in the purely fluvial environment (Fig. 2.18) of a subsiding basin. Coal seams, and soil horizons in par- ticular, can be traced laterally over distances

Chapter 7 Rhythmic and Cyclic Sequences
of many kilometers, but they may be inter- rupted locally by channel sands.
Records of major river floods show repeti- tions of 10 to 150 years. Measured in terms of a human life span or the written historical record, these floods are large and rare, but not gigantic enough to be transmitted to the rock record -(Dott 1988; Clifton 1988). The recur- rence interval of large flood episodes which can be preserved in the geological record pro- bably ranges from hundreds to thousands of years.
Allogenetic Sequences
Autocyclic or autogenetic processes related solely to the dynamics of the depositional system itself may be superposed by other pro- cesses of a more regional or global nature. As shown in Fig. 2.19a, tectonic uplift in the hinterland of the fluvial basin commonly cau- ses a longer-term coarsening-upward trend in the irregular autocyclicity of an alluvial fan and its accompanying river deposits. Sub- sidence or the wearing down of highlands in the drainage area produces the opposite trend (Fig. 2.19b). Climatic variations on the order of Milankovitch frequencies can bring about a cyclic change from the relatively coarse- grained, channel fill-dominated deposits of a braided river system to the finer grained, flood plain-dominated sediments of a mean- dering or anastamosing river system.
Flood plains in lowlands near the sea may also be affected by eustatic sea level variations and thus be overprinted by a global, possibly periodic to quasi-periodic signal. During sea level highstands, marine ingressions cover large areas and leave behind shallow-marine strata with marine fossils. After the following regression, beach, lagoonal, tidal and tidal marsh, swamp and fluvial sediments again take over. Many of the Paleozoic coal cyclo- thems and younger transgressive-regressive sequences with coal are explained in this way (e.g., Ryer 1983; Riegel 1991).
Similarly, cyclic phenomena in deltas enter- ing the sea may originate from both autoge- netic and allogenetic processes. The irregular switching of delta lobes, related to the degree of sediment accumulation and the geometry of the delta complex, may lead to alternations between sediments of the delta plain and ma- rine incursions (Chap. 3.4). Interdistributary areas cut off from sediment supply subside below sea level and are flooded either by fresh water or the sea (Fig. 3.32). When deltaic pro-
gradation returns to this area, marsh, lagoonal, and shallow-marine layers are again covered by sediments of the fluvial delta plain. In this way, a purely autocyclic sequence may be es- tablished with alternating fluvial, lagoonal, lacustrine, and marine sediments. Holocene cycles in the Mississippi delta plain span a time period of approximately 1000 to 1500 years (Tye and Kosters 1986). However, as in the case of low-lying river plains, these auto- cyclic processes can be overprinted and modi- fied by global sea level oscillations.
One of the means for discriminating bet- ween allogenetic and autogenetic processes is correlation. While global and regional pheno- mena can be traced over long distances and from basin to basin, beds and sedimentary cycles related to autocyclic processes pinch out in a relatively short distance.
7.4 Sea Level Changes and Sequence Stratigraphy
7.4.1 General Principles and Terms
Sea level changes were already mentioned in previous chapters as a mechanism controlling vertical and lateral facies transitions (e.g., Chaps. 3.2 and 3.3), as well as a factor influ- encing subsidence (Chapter 8). Minor varia- tions in sea level were discussed in Chapters 7.2 and 7.4 on peritidal carbonate cycles and fluvial-deltaic cyclic sequences. In this chap- ter we shall deal mainly with third order sea level changes (duration 0.5 to 3 or 4 Ma, Table 7.1), which have recently been described from many regions throughout the Phanerozoic (e.g., Hallam 1984 and 1988; Haq et al. 1987, Bond et al. 1988) and even in the Proterozoic (e.g., christie- lick et al. 1988; Southgate 1989).
Modern sequence stratigraphy has been de- veloped for cyclic successions produced by this type of mechanism, but it may also be used for cycles of lower and higher orders and combinations of sea level oscillations of dif- ferent orders. The well-known Quaternary sea level variations caused by the buildup and melting of enormous ice sheets had amplitudes on the order of 100 m, but their time period was much shorter (largely fifth order, see Ta- ble 7.1) than that of the third order cycles. The amplitudes of the pre-Quaternary, third order sea level oscillations, on the other hand,

Sea Level Change and Sequence Stratigraphy
are poorly known. Estimations range mostly Relative Sea Level Change from ten to a few tens of meters. and Sediment Accumulation
It should be emphasized that there is still great uncertainty For the description and understanding of stra- not only as to the time period and amplitude (e.g.9 Budon tigraphic sequences, one should be familiar et al. 1987), but particularly as to the cause of pre-Quater- with some general principles and special, re- nary sea level fluctuations (e.g., Donovan and Jones 1979; Matthews 1984b; Watts and Thorne 1984; Cloetingh 1986; cently introduced terminology (Posamentier
Hubbard 1988; Ziegler 1988). and Vail 1988; Van Wagoner et al. 1988; also see C h a ~ . 7.4.3).
At present,. it does not yet appear to be suf- ficiently proven whether or not the third or- der sea level oscillations are really synchro- nous on a global scale. The exact and reliable dating of relatively short-term processes and their correlation from continent to continent is still difficult. Another reason for this uncer- tainty is that eustatic oscillations are frequent- ly superposed by regional and local tectonic processes (cf. Chaps. 7.1 and 7.6). In addition, local variations in sediment supply and the location of the sections investigated within a particular basin play a significant role in the recognition and dating of sedimentary cycles (e.g., McGhee and Bayer 1985).
The purpose of this chapter is to show the response of sediment accumulation to relative sea level changes, and to introduce the concept of sequence stratigraphy which can explain the large-scale structure of depositional sys- tems much better than earlier approaches. Our knowledge of sea level fluctuations through geologic time is increasing rapidly, and dis- cussions on the global nature and synchroneity of these oscillations are still continuing, but these topics are beyond the aims of this text.
The old terms transgression and regression of the sea are not used unanimously and may sometimes even be misleading. Figure 7.6 de- monstrates that during rising sea level the coast line does not always retreat landward (transgressive sea), but can also prograde sea- ward, provided that the influx of sediment is high at this locality. Therefore, the terms transgression and regression refer here only to relatively rising or falling sea level and do not necessarily include landward or basinward shifting of the coast line.
Sedimentary basins are areas of long-term subsidence and sediment accumulation. If we define relative sea level change as the change in water depth at a certain location in the ba- sin, then we mean that it is controlled by the interplay of the rates of subsidence, sediment accumulation, and rise or fall of sea level (e.g., Pitman and Golovchenko 1983, 1988; Vail et al. 1984). The interrelationship between sea level change and subsidence is demonstrated in Fig. 7.7 for three different rates of subsi- dence. It is assumed that sea level oscillates regularly like a sine curve and subsidence is constant over a long period. If there is no se-
LOW TO MEDIUM SEDIMENT INFLUX
RELATIVE RISE (TRANSGRESSION)
RETREATING COAST LINE
HIGH SEDIMENT INFLUX (E.G., DELTA)
Fig. 7.6. Relative sea level rise (transgression) and retreat or progradation of coast line due to differing sediment influx

Chapter 7 Rhythmic and Cyclic Sequences
TIME > I EUSTATlC SEA LEVEL
INFLECTION POINT
HIGHEST RATE RELATIVE OF SEA LEVEL CHANGE IN ,,**** RISE SEA LEVEL '
' P ,L I I 1 l i l + + SUBSIDING BASIN FLOOR (WITHOUT SEDIMENTS
Fig. 7.7. Relationship between absolute sea level change (above), different rates of subsidence, and relative sea level with time. For further explanation see text
diment accumulation on top of the basin floor, then the relative change in sea level through time is described by a curve as shown in the lower part of Fig. 7.7.
A relative sea level fall takes place only when the rate of sea level fall is higher than that of subsidence (Curve 1). If subsidence is fast (Curve 3), the sea level rises continuously, but with changing rates. The varying space available between sea level and the subsiding basin floor can be called the "sediment accom- modation potential". this is reduced by sedi- ment accumulation, which ultimately controls the water depth in the basin. Furthermore, it should be noted that the highest rate of sea level rise coincides with the so-called inflect- ion point of the sea level curve (Figs. 7.7 and 7.12). This point indicates the time of most rapid coastal onlap associated with a minimum sediment supply to the somewhat deeper parts of the basin (Fig. 7 . 9 ~ and f).
In addition to the interplay between abso- lute sea level change and subsidence, the water depth in the basin is further modified by se- diment accumulation on top of the basin floor (Fig. 7.8). Constant sediment supply to a cer-
tain location within the basin may, over a longer period, just compensate for relative sea level change (Fig. 7.8a, Curve 2) and thus lead periodically to a filling up or deepening. The same sediment influx causes a stepwise deep- ening of the basin, if the subsidence rate is greater than the sedimentation rate (Curve 3). When the sediment supply is constant as befo- re, the effect of sea level variations on the depositional system is most pronounced during times of slow subsidence (Curve 1). Here, when relative sea level falls, some of the ar- riving sediment cannot be deposited and there- fore will bypass shallow-water regions. Even more important is the fact that sediment accu- mulated earlier will be eroded and swept into deeper water. In the end, the basin tends to be filled up in this region, but sediment accumu- lation is repeatedly interrupted by erosional periods.
Finally, Fig. 7.8b demonstrates a case in which, over a long length of time, relative sea level change is compensated for by sediment accumulation, but sediment supply also varies. Influx is high during falling sea level, but low during the transgressive phase. Such an as- sumption agrees with our observations in na- ture. The model shows that even under condi- tions of long-term sediment/subsidence com- pensation there are periods with excess sedi- ment supply or erosion. Consequently, the se- dimentation rates at a given location and at other locations farther basinward vary mar- kedly. Times of rapid accumulation are inter- rupted by periods of omission and erosion, which in turn are followed during the trans- gressive phase by relatively long-lasting sedi- ment-starved conditions before the next sedi- mentary cycle begins. Intervals of very low sediment supply lead to condensed sections, e.g., black shales, which are discussed further below.
Figure 7.8 also shows vertical sediment se- quences which originate from the described conditions. A significant difference exists bet- ween the normally measured sediment thick- ness and a chronostratigraphic sequence which has a linear time scale. Only the latter method can clearly demonstrate stratigraphic gaps and show whether a certain layer is deposited ra- pidly or slowly, as for example the condensed layer in Figure 7.8b. Similarly, the water depth curve plotted along the linear time scale deviates from the sediment thickness curve (Fig. 7.8b).

Sea Level Change and Sequence Stratigraphy
a TIME - RELATIVE
INITIAL BASIN FLOOR SEDIMENT SUPPLY PREVIOUSLY DEPOSITED (FOR CURVE 1) SEDIMENT
WATER DEPTH
b TIME - SED. ACCUMULATION CHRONOSTRATI- WATER I GRAPHIC SEQUENCE DEPTH
THICKNESS
CON- DENSED
'LAYER
SHALLOW- ING
HIATUS
ING DEEPEN-
Tr\ /T ;;EI~ENTATION RELATED : $ELE THICKNESS SEDIMENT
Fig. 7.8a,b. Relationship between relative sea level change a Constant sediment supply, with ve~tical sequences corre- (controlled by absolute sea level fluctuation and subsidence, sponding to Curve 1. b Changing sediment supply, with cf. Fig. 7.7) and sediment accumulation versus time. Re- vertical sequences originating from sea level Curve 2. For sulting sedimentary sequences and changing water depth further explanation see text are plotted either versus thickness o r versus time.
7.4.2 Changes in Sea Level and Storm depth which is kept sediment-free in the shal- Wave Base in Shallow Basins low parts of marine basins. For reasons of
simplicity, this depth is referred to in the Models for Basins with Differing Subsidence as the wave base.
The simplistic models in the previous section allowed sediment aggradation up to sea level. In marine basins, however, this is rarely and only locally realized, because waves and cur- rents prevent sediment from settling in a wide foreshore zone. Especially storm waves and their resulting bottom currents (Chap. 3.1.2) remove and transport sediment either to the coast or into deeper water. Hence, the depth range of storm waves and their associated geostrophic currents largely control the water
Model Parameters
The wave base is taken into account in the models in Fig. 7.9, which may represent two common settings:
- Shelf basin. Storm wave base 50 m deep, intermediate subsidence rate of 50 m/Ma.
- Epicontinental sea. Storm wave base only 20 m deep, subsidence rate 10 m/Ma).

Chapter 7 Rhythmic and Cyclic Sequences
\ WATER SEDIMENT DEPTH THICKNESS
(m) (LINEAR SCALE) . .
WINNOWING
Fi. 7.9a-g. Idealized models showing the relationships sidence. Note that vertical scales in e and g differ from b between sea level change, as well as its corresponding and d; sections in d and g display sediment thicknesses storm wave base, and sediment accumulation for single versus non-linear time scales. For abbrevations in d and g locations (a points P and Q) in shallow marine basins with see Fig. 7.12a). See text for further explanation. (Einsele constant subsidence. b, c, d Rate of sea level fall less than 1985; after Baum and Vail 1987; Vail 1987). subsidence. e, f, g Rate of sea level fall greater than sub-

Sea Level Change and Sequence Stratigraphy
The amplitude of sea level change and the duration of one regression-transgression cycle is assumed to be equal in both cases (50 m and 4 Ma, respectively).
Under these conditions, the rate of sea level fall is either lower (Fig. 7.9b) or higher (Fig. 7.9e) than the rate of subsidence at cer- tain time intervals. The sediment supply (Fig. 7 . 9 ~ and f ) varies, as in the models of Fig. 7.8. Then, sedimentation at points P and Q pro- ceeds in the way shown in Figs. 7.9b and e. Point P is situated slightly below the storm wave base during mean sea level, point Q is below the storm wave base of low sea level (Fig. 7.9a).
The Shelf Basin Model
In the shelf model (Fig. 7.9b), the sediment accommodation potential at point P is reduced during the regressive phase by a falling storm wave base. As a result, some of the sediment is carried into deeper water, and the sediment left behind may show signs of winnowing. Erosion of previously deposited material is not required, but it may take place locally in this depth zone by cutting shallow submarine channels. The transgressive phase is charac- terized by rapid deepening, because it is com- bined with low sediment influx from ter- rigenous sources. The sedimentation rate tends to be lowest near the inflection point of the transgressive phase and may therefore gen- erate condensed layers consisting largely of pelagic material or, in certain environments, of black shales or thin beds rich in authigenic minerals, such as phosphorite or glauconite (Loutit et al. 1988). Sediment lost at location P during the regressive phase can be accumul- ated at location Q in deeper water. Con- sequently, vertical sections at P and Q differ markedly from each other (Fig. 7.9d). At both locations, the water depth versus sediment thickness curves show "rapid" transgression and "slow" regression (only plotted for P), although both phases have the same duration in the models.
The Epicontinental Sea Model
In Figure 7.9e the rapidly falling storm wave base (faster than subsidence) leads at location P to an erosional unconformity during the regressive phase. If the previously deposited sediments are cohesive (clays, silty clays, marls) and contain layers which are already
diagenetically indurated (e.g. hardgrounds, limestone or siderite concretions, limestone layers), submarine erosion often ends at such horizons (Fig. 7.10e and f). As a result, lags of the eroded material may be left behind (e.g., reworked fossils and concretions, iron ooids, clasts of semi-solid mudstone, etc.; Fig. 7.10d). Sessile fauna which need hard sub- strates may establish a new community, in- cluding rock-boring species. Storm wave ero- sion may proceed stepwise from shallower to deeper indurated layers and locally cut chan- nels (Fig. 7.10e and g). In all other aspects, the situation in Fig. 7.9e is similar to that in Fig. 7.9b, including an asymmetric water depth curve (Fig. 7.9g).
Vertical Sequences and Their Interpretation
In order to deduce sea level changes from the resulting depositional sequences, transgressive and regressive sections as well as sequence boundaries must be identified. Whether this can be done easily or not depends on the me- thod used and on the location or area con- sidered within a basin fill. Seismic stratigra- phy along a cross section from the margin to a more central part of the basin is a powerful tool in solving this task (see Chap. 7.4.3 and, e.g., Payton 1977; Vail et al. 1984; Van Wag- oner et al. 1987), if the sequence boundaries and sections between these boundaries can be dated. Field exposures or drill cores, on the other hand, allow a thorough sedimentological description and sampling of the sections for biostratigraphic and geochemical invest- igations, but are commonly less useful for the establishment of a continuous, two-dimen- sional cross-section through the basin. This is necessary for the identification of low-angle, large-scale types of coastal offlap or onlap and other important features (see below). Thus, a combination of both methods should be ap- plied whenever possible (e.g., Baum and Vail 1987).
In the case of Figure 7.9e representing field exposures or drill holes, it is obvious that ero- sional unconformities should be used as se- quence boundaries (Type I after Vail 1987, see below). Then the sediment package between two of these unconformities can, as a first approximation, be referred to as a transgres- sive/regressive sedimentary cycle consisting of several subunits, an erosional phase (repre- sented by a lag deposit), a deepening-upward section, and a shallowing-upward section.

Chapter 7 Rhythmic and Cyclic Sequences
EMERGENCE
a INCISED VALLEY \
PALEOSOL a
SUBMARINE EROSION
REWORKED MUD LUMPS d AND SHELLS
EROSIONAL UNCONFORMITY
TD
LSD
REDEPOSITED COASTAL SANDS AND OOlDS
e EXHUMEDHARDGROUNDS AND CONCRETION LAYERS
W-TL HARDGROUND
C DROP (2) AND RISE (3) OF BARRIER-LAGOONAL COMPLEX
LAGOON SWALEY CROSS STRAT.
I S~DERITE I v
f LAYER WITH PHOSPHORITE, MULTIPLE REWORKED
BIOCLASTS GLAUCONITE, PYRITE
LOWER SHOREFAC H H BORINGS OF PHASES OF PHOSPHO- ORGANISMS RITE AND CALCAREOUS
NODULES
g SUBMARINE CHANNELS
FORESHORE SAND AND MUDS
Fig. 7.10. a-f Various types of subaerial and submarine (After a Weimer 1986; c Plint 1988; d Bayer et al. 1985 erosional unconformities related to sea level changes. See and Hallam 1988; e Einsele 1985; f Brandt 1985) text for explanation.

Sea Level Change and Sequence Stratigraphy
In the other examples in Fig. 7.9, erosional unconformities are missing and the sequence boundaries are therefore less distinct (Type 2 boundaries, if the sea level fall is slower than subsidence), or the section was always depo- sited below the storm wave base (locations Q). Here, the transition from the shallowing unit (regressive deposits RD) to the lowstand depo- sits (LSD) is usually taken as the sequence boundary.
Other terms and symbols of the concepts of sequence stratigraphy listed in Fig. 7 .9 are explained below (also see Fig. 7.12). Furthermore, it is important to note that the sequence boundaries in general do not coincide with the lowstands (or highstands) of the eustatic sea level curve, but may migrate up and down in time according to their position near to or far away from the edge of the basin (also see Fig. 7.11).
Cross-Sections Through Epicontinental Basins
In the models described above only certain locations in a shallow sedimentary basin were evaluated. In the following model (Fig. 7.1 I), the response of sediments to sea level changes is demonstrated in a cross-section through the broad marginal zone of a basin which receives little influx of terrigenous material. This is a common situation for epicontinental seas. Basin subsidence is assumed to increase from the hinge line near the coast toward the center of the basin, and long-term sediment ac- cumulation (below the storm wave base of low sea level) approximately equals subsidence. The duration and amplitude of sea level oscil- lations may vary, as shown in the chronostra- tigraphic sequence of Fig. 7.1 1.
During times of transgression and coastal onlap, a new sedimentary cycle can begin with a transgressive lag deposit on top of older rocks or sitting on an earlier submarine ero- sional surface. Pre-existing channels are filled with transgressive sediments (Fig. 7.10a). The coastal onlap of the transgressive phase varies with the changing amplitude of sea level oscil- lations. If the time period of the transgressive- regressive cycles is long enough (e.g., on the order of 1 Ma), a considerable part of the coastal onlap sediments is removed on the landward side by mechanical and chemical denudation (Fig. 7.10a and b; also see Chap. 9.2) during the subsequent regressive phase, unless it is protected by overlying continental sediments. However, this is rarely the case under the conditions outlined above.
In addition to subaerial weathering and soil formation, part of the transgressive sequence is eroded by the storm wave base during the subsequent regressive phase (Figs. 7 . 1 0 ~ and 7.11a). Eroded sands are redeposited in the form of tempestites and prograding barrier islands (Chaps. 3.1.2 and 3.2.2). Vertical sec- tions from this region may show sharp-based shoreface sequences with erosional gaps (Fig. 7.10~; Plint 1988). Calcareous or iron ooids formed in shallow water during high sea level stand may be transported seaward and come to rest on submarine erosional surfaces (Fig. 7.1 Od). The basinward extension of these (Type 1) unconformities also varies, according to the differing amplitudes of sea level chan- ge, but in deeper water the erosional surfaces are well preserved under the cover of subse- quent transgressive sediments. However, the depth range of erosion and the intensity of reworking decrease basinward (Fig. 7.11b) until the erosional surfaces merge into sedi- ments which are no longer affected by storm wave erosion. Consequently, the erosional surfaces are in a strict sense diachronous, and the same unconformity can sit on a transgres- sive sequence (landward) or on the subsequent regressive unit (basinward).
Beyond the depth range of the storm wave base, the chronostratigraphic sequence should be devoid of significant stratigraphic gaps if deeper, erosive bottom currents can be exclud- ed. Here, the sequence often includes thin horizons of maximum sediment starvation, i.e., the condensed horizons mentioned earlier. They are associated with the inflection point of sea level rise, when the rate of sea level rise has reached its maximum and little terrigenous sediment is swept into deeper water.
Figure 7.1 1c shows the same cross-section as in (b), with the addition of sediment thick- nesses. Here, the erosional unconformities of the successive T-R cycles merge landward and may form composite beds. Unconformities associated with the regressive phase are fre- quently overlain directly by transgressive lags, or they are mixed with such lags.
Finally, it is important to note that the number of cycles which can be identified in vertical profiles differs along the cross-sec- tion. In the deepest part of the basin shown in Figure 7.1 lc, it may be difficult to recognize cyclicity when sandy regressive deposits are missing and the condensed section is poorly developed. Similarly, the true number of cy- cles cannot be found at the very edge of the basin. Even somewhat farther seaward, the number of readily visible cycles varies due to

296 Chapter 7 Rhythmic and Cyclic Sequences
LOWIN- * HIGH SEA LEVEL TRANSGRESSION- REGRESSION /,LOW SEA LEVEL
CHEMICAL DENUDATION , PRESERVED
OF TRANSGRESSIVE SEDIMENT STORM WAVE SEDIMENT
I -! i EROSION J I (1 CYCLE)
SEA LEVEL EROSION AND REWORKING HIGH LOW LONG AND DEEP SHORT AND SHALLOW
CONDENSED
- SUBSIDENCE - 8

Sea Level Change and Sequence Stratigraphy 297
the differing basinward extension of the un- conformities. Such local differences are one of the major reasons why the number and cor- relation of T-R cycles for a certain region and time period often remain controversial.
Many regional studies in various shallow- marine environments have recently contribut- ed to our knowledge in this field (see, e.g., Aigner and Dott 1990).
7.4.3 Sequence Stratigraphy in Continental Margin Settings
General Aspects
The Concept of Sequence Stratigraphy
Relative sea level changes affect not only coastal areas and shallow seas, but also have far-reaching consequences for the sediments of deeper basins. This was first recognized by a working group of Exxon Production Re- search Company under P. Vail, which evaluat- ed seismic records and well logs from present- day and ancient continental margins in many parts of the world (Payton 1977; Schlee 1984; Vail et al. 1984). This method became known under the term seismic stratigraphy. Based on this work, the general concept of sequence stratigraphy was developed (Baum and Vail 1987; Vail 1987; Van Wagoner et al. 1987; Posamentier and Vail 1988). This concept is particularly suitable for continental margin settings with their shelf break, slope and deeper basin, but it can also be applied to basins with a ramp margin, as shown in the previous section. Sequence stratigraphy is the study of rock relationships within a chrono- stratigraphic framework of repetitive, geneti- cally related strata.
The Sequence and its Boundaries
In order to define and apply this concept, several special terms have been introduced. Although some of these terms may still be subject to change, most of them are listed and
explained to some extent in Fig. 7.12. The fundamental unit of sequence stratigraphy is the sequence, which is bounded by uncon- formities and their correlative conformities, which replace the unconformities basinward (Fig. 7.12b). A sequence results, as demon- strated previously, from one transgression- regression cycle. An unconformity is a surface along which there is evidence of subaerial and/or submarine erosion, indicating a sig- nificant hiatus. Such a regional surface is cal- led a Type I sequence boundary (SB l). It is associated with a basinward shift of the facies and coastal onlap of overlying strata. It is formed in areas where the rate of eustatic sea level fall exceeds the rate of basin subsidence. Sequences can also be bounded by regionally extended Type 2 sequence boundaries (SB 2), which lack both significant erosion and a basinward shift in facies. They occur in areas where the rate of eustatic sea level fall is less than the rate of basin subsidence. If subsidence increases basinward, a Type 1 boundary may therefore pass into a Type 2. Type 2 boundaries are commonly less distinct than Type 1 bound- aries, but they mark the transition from sea level highstand to lowstand (see below) and thus can usually be identified.
Systems Tracts
A sequence can be subdivided into so-called systems tracts, as is shown in Fig. 7.9d and g and Fig. 7.1 1 b dealing with shallow basins, although thus far these terms have been only rarely applied to these types of depositional setting. The term systems tracts, however, is used here only as a heading for the subunits. For the designation of individual subunits the simpler and more common term deposits is used (see, e.g., Baum and Vail 1987). For ex- ample, "highstand systems tracts" is referred to here as "highstand deposits". The boundaries of the system tracts for the most part do not coincide with the peaks or lows of the eustatic sea level curve (e.g., the highstand deposits, or HSD, Fig. 7.12). Each sequence consists of three different systems tracts (from bottom to top):
Fig. 7.11a-c. Cross-section through shallow basin and b Chronostratigraphic section: for abbrevations for systems response of its sediments to relative sea level changes of tracts see Fig. 7.12. c Cross section showing sediment differing time periods and amplitudes (ramp setting without thicknesses; note difficulties in recognizing and correlating shelf break, differential subsidence, little influx of temge- cycles between different vertical profiles marked by arrow- nous sediment). a Margin of basin with oscillating sea level he&. For further explanation see text. (AAer Einsele and associated storm wave base. 1985)

298 Chapter 7 Rhythmic and Cyclic Sequences
I I I I I I I 1 W
HIGH I LOW C--> t t
EUSTATIC SEA LEVEL POSITION
b REGRESSIVE
COASTAL ONLAP
PARASEQUENCE
PROGRADATIONAL PARASEQUENCE SET
SEQUENCE
(MAXIMUM FLOODING SURFACE. MFS)
TRANGRESS~VE (PARTLY FLUVIAL SURFACE (TS) OR ESTUARINE) (PARTLY MASS FLOWS) BASIN-FLOOR FAN SB
Fig. 7.12. a Relationship between eustatic sea level curve, basin. Positions of transgressive-regressive sequences in subsidence, rate of sea level change, and sediment accom- shallow and deep water, their boundaries (SB) and sub- modation potential versus time, as well as associated sedi- division into system tracts (LSD, TD, HSD) and additional ment sequences with coastal onlap and terms of sequence subunits. For explanation see text. (Mainly after Baum and stratigraphy. b Cross-section through sediments of conti- Vail 1987; Haq et al. 1987; van Wagoner et al. 1987; nental margin with shelf, shelf break, slope, and deep Christy-Blick et al. 1988)

Sea Level Change and Sequence Stratigraphy
- Lowstand deposits (LSD) typically lie on top of a Type 1 sequence boundary (SB1). They develop during the phase of rapid eustatic sea level fall up to the early part of the rise. In a basin with a distinct shelf break, the lowstand deposits can be subdivided into three separate units, a basin-floor fan, a slope fan, and a lowstand wedge. The basin- floor fan is usual- ly associated with the erosion of canyons into the slope and the incision of fluvial valleys into the shelf, particularly in its inner portion where subsidence is usually slow. The base of the submarine fan is the lower sequence boun- dary. The slope fan is characterized by tur- bidite and debris flow deposition. It may be coeval with the basin-floor fan or the early lowstand wedge. The lowstand wedge (LSW) progrades basinward, with downlapping sur- faces onto the basin-floor fan or the slope fan. In front of a river mouth, a lowstand delta may be built out into the deeper sea. In the late stages of the development of a low- stand wedge, the sediments onlap onto the underlying sequence boundary, while the shoreline may still migrate seaward or become more or less stable. The reason for this behav- ior is the fact that now most of the incoming sediment is deposited in shallow water (cf. Fig. 7.6) and no longer in the deeper, pro- grading lowstand wedge. Simultaneously, in- cised valleys on the shelf are filled with fluv- ial, estuarine, or shallow-marine sediments. The top of the lowstand wedge is a marine flooding surface called a transgressive surface (TS), which marks rapid landward retreat of the shoreline.
If lowstand deposits lie on a Type 2 se- quence boundary, they are called shelf margin deposits (Fig. 7.12b). In shallow basins without a shelf break (i.e., with ramp margins) the lowstand deposits only form a thin wedge. During relative sea level fall, the shoreline steps rapidly basinward, enabling stream in- cision and sediment bypassing. When the sea level starts to rise slowly, the incised valleys are filled and a thin lowstand wedge is built out seaward (cf. Fig. 7.1 1).
- Transgressive deposits (TD) begin with the traizsgressive surface (TS) and form during rapid sea level rise. Landward, they onlap onto the lower sequence boundary, but seaward they downlap onto the transgressive surface. The top of the transgressive deposits is the so- called surface o f maximum flooding (MFS). This surface marks the change from a land- ward-onlapping and upbuilding sedimentary unit to a basinward-prograding wedge with
downlap onto it. It is therefore also referred to as a downlap surface.
At some distance basinward from the shoreline, the time of maximum flooding also signifies a time of maximum sediment star- vation. The resulting facies consists of thin hemipelagic or pelagic beds deposited at very low sedimentation rates. Such a condensed section (SC) occurs largely within the trans- gressive and distal highstand deposits (Loutit et al. 1988).
- Highstand deposits (HSD) represent the late part of a eustatic sea level rise, its stillstand, and the early part of its fall. Highstand depo- sits are widespread on the shelf or in the mar- ginal areas of shallow basins. A lower aggra- dational unit is succeeded by a seaward pro- gradational unit with downlap onto the top of transgressive deposits, the maximum flooding surface (downlap surface). The subsequent rapid sea level fall generates a Type 1 or Type 2 sequence boundary on top of the highstand deposits.
Sequences and Parasequences in Various Depositional Environments
Sequences and their systems tracts may be subdivided into parasequences and parase- quence sets (Fig. 7.12). A parasequence is de- fined as a "relatively conformable succession of genetically related beds or bedsets bounded by marine flooding surfaces and their correl- ative surfacesn (e.g., Bally 1987; Van Wagoner et al. 1988). They are progradational and their beds shoal upward. Parasequence sets are suc- cessions of genetically related parasequences which form distinctive stacking patterns. A parasequence may consist of smaller units representing time periods on the order of the Milankovitch frequency band (see above and Chap. 7.6).
The subdivision of sedimentary deposits into sequences, systems tracts, and their sub- units provides a powerful methodology for basin analysis. The identification, detailed mapping, and correlation of sequence boun- daries and other characteristic surfaces enables a better understanding and interpretation of large-scale vertical and lateral facies relation- ships in a depositional system.
Although all sequences, originating from relative sea level changes, show principally the same succession of systems tracts, their litho- logic and stratigraphic expressions vary enor- mously from the nearshore zone to deep water

Chapter 7 Rhythmic and Cyclic Sequences
(Fig. 7.12). In the coastal zone, sequence boundaries are represented by erosional un- conformities, and the sequence is frequently composed of fluvial and shallow-marine sands. In deep water, the same transgressive- regressive cycle may be bounded by the base of a submarine fan and, at its top, by an in- conspicuous, conformable surface within a hemipelalgic unit with an increasing sedimen- tation rate. Here, the most distinctive horizon is a condensed section.
In the deep-water sequence, pelagic organ- isms and occasional volcanic ash layers are used to date the cycle. In shallow water, relics of benthonic life are commonly predominant, and transgressive or regressive erosional lag deposits mostly contain mixed faunas from re- worked sediments of various ages. Therefore, an exact dating of sequence boundaries is fre- quently problematic (see, e.g., Baum and Vail 1987).
Models for Siliciclastic, Calcareous, and Deltaic Environments
Continental Margins Dominated by Siliciclastic Sediments
In order to demonstrate the deposition of se- quences in a passive continental margin set- ting, the model in Fig. 7.13 shows several stages of development. Similar to the model in Fig. 7.11, it is assumed that the subsidence rate increases from the hinge line toward the basin. The influx of terrigenous material is moderate and the sediments are predominantly siliciclastic. This model demonstrates that the depositional history of a transgressive-regres- sive cycle can also be subdivided into two steps. During the transgressive and highstand phase, most of the incoming sediment is trap- ped in shallow water and on the shelf, while little material is transported into deeper water. In contrast, during falling sea level and low- stand (lowstand deposits) the locus of major sediment accumulation is the slope and con- tinental rise, where relatively high sedimen- tation rates are reached. With an increasing rate of subsidence, however, the lowstand deposits may also be concentrated on the outer shelf and upper slope as shelf margin deposits (SMD) on top of a Type 2 sequence boundary (SB 2). In this case, only a short hiatus bet- ween HSD and SMD is present on the land- ward side.
Carbonate-Dominated Continental Margins
Figure 7.14 displays a situation similar to that of Fig. 7.13, but terrigeneous input is low and thus carbonate sedimentation prevails. The sedimentary dynamics of carbonate systems differs considerably from siliciclastic systems, however, particularly with changing sea level (e.g., Sarg 1988; also see Chap. 12.2). Carbo- nate production on shelves and carbonate plat- forms commonly provides much more sedi- ment volume per unit area and time than planktonic organisms for pelagic sediments.
On a flooded shelf, abundant benthic car- bonate production generates fairly pure car- bonates behind rapidly growing reefs near the prograding shelf break. During the late high- stand or at the beginning of the lowstand phase, when the inner platform is infilled and the prograding highstand deposits have reach- ed the former shelf break, reef debris and reworked shelf carbonate tend to be transport- ed to the foot of the slope or basin floor by mass flows or turbidity currents. If, in addi- tion, a terrigenous sediment source is present, mixed carbonate-siliciclastic sediments ac- cumulate in the basin (e.g., Yose and Heller 1989).
The steep slopes of carbonate platforms favor instability and slope collapse during fall- ing sea level and thus the formation of large debris flows. If part of the carbonate was al- ready indurated or semi-lithified prior to fail- ure, the resulting mass flow deposits have the appearance of sedimentary megabreccias con- taining gravel-size and even larger clasts with little matrix.
During a lowstand, however, at least part of the shelf is emerged and benthic carbonate production on the shelf as a whole decreases markedly. Then, two different situations must be distinguished:
- In the absence of terrigenous sediment sour- ces, relatively thick, possibly cyclic pelagic limestones and marls may accumulate in deep water, as the calcite compensation depth (or CCD; see Chap. 5.3.2) is depressed during low sea level. - In systems with terrigenous influx, streams entering the sea may cut valleys into the shelf, develop steeper gradients, and gain in ability to transport terrigenous material. Hence, the composition of slope and basin-floor sedi- ments may change significantly from predo- minantly carbonates to deposits rich in silici- clastic material, i.e., silty clays and turbidite sands, or mixtures of both carbonates and si- liciclastic sediments.

Sea Level Change and Sequence Stratigraphy 301
Fig. 7.13a-d. Model of predominantly siliciclastic sequence gressive, highstand, and shelf margin deposits (SMD). d and systems tracts in continental margin-deep sea setting, Chronostratigraphic succession from a through c and ap- controlled by sea level change and differential subsidence. proximate correlation of systems tracts with eustatic se. a Transgressive m) and highstand deposits (HSD). b level curve. For abbrevations see Fig. 7.12. (After Haq et Subsequent lowstand deposits (LSD). c Subsequent trans- al. 1987; Baum and Vail1987; Posamantier and Vail1988)

302 Chapter 7 Rhythmic and Cyclic Sequences
FLUVIAL, i TEMPESTITES SUPRATIDAL AND TIDAL r TURBIDITES,
POSSIBLY SlLlClCLASTlC
PELAGIC LIME-
LOCALLY CANYON CUTTING AND/OR REEFS (AND FILLING DURING TR) SEQUENCE (PARTLY SILICICLASTIC)
ENVIRONMENTS PROMISING r FACIES INDICATING LOWSTAND, PROGRADING FOR CYCLOSTRATIGRAPHY HIGHSTAND, AND SHELF MARGIN SYSTEMS TRACTS
Fig. 7.14. Model of caxbonate shelf with transition to deep surface (TS) and the maximum flooding surface (MSF). For sea, affected by sea level changes and differential subsi- further explanation see text and Fig. 7.12. (After Vail and dence. The different systems tracts are separated from each Sangree 1988; Sarg 1988) other along the sequence boundaries (SB), the transgressive
During subsequent transgressive and early highstand phases, the input of terrigenous material into deeper water is greatly reduced. As a result, the condensed section in deeper water is frequently represented by marls and pelagic oozes (limestones), which may contain high proportions of organic carbon. At water depths below the CCD, thin clay beds with some authigenic minerals or black shales may develop. A rapid rise in sea level may thereby lead, along with other factors, to a "drowning" of the carbonate buildup along the platform margin, while closer to land the carbonate ac- cumulation continues (Vail et al. 1991).
A further alternative is discussed by Ro- baszynski et al. (1990) in their study on a 800 m thick Turonian limestone-marl section in central Tunisia. These beds accumulated in a basin close to a carbonate shelf and consist of three main components: terrigenous muds, detrital platform-derived carbonate, and pel- agic carbonate. Changes in sea level led to the following modifications (Table 7.2). In this case, the terrigenous mud component dominated during high sea level stands, when sediment supply and progradation overtook the slowing eustatic rise. Then vertical pelagic
carbonate flux was diluted by lateral mud in- put. Lowstands are characterized by reworked skeletal material (wackestones, packstones, and grainstones) derived from the carbonate shelf, whereas the transgressive deposits ex- hibit an increasing proportion of pelagic cal- careous nannofossils and foraminifers. Strati- graphic boundaries rich in ammonites appear to be flooding surfaces in transgressive system tracts.
Marine Deltas
In a deltaic depositional system, not only are the delta plain and delta front facies affected by sea level changes (Chap. 3.4), but also the deeper water sediments in front of the delta. Figure 7.1 5 presents the scenario of a fluvially dominated delta with a generally high sedi- ment input. Sediment influx varies, however, between highstand and lowstand conditions. During highstand the stream gradient is low, resulting in a meandering system depositing large amounts of sediment onto a coastal al- luvial plain. Therefore, during the transgres- sive and highstand phase, the delta front pro-

Sea Level Change and Sequence Stratigraphy 303
Table 7.2. Proportions of various components in basin sediments
Terrigeneous Detrital Pelagic mud carbonate carbonate
Lowstand High/low High Low (shelf margin wedge, (dilution) shelf partially exposed)
Highstand
Transgressive
High
Low
Low Low (dilution)
Low High
Lowstand High/low High Low (shelf partially exposed) (dilution)
DELTA PLAIN (INTERDISTRIBUTARY MUD.ETC )
1 PRODELTA SILTS AND MUDS
CANYON FILL
SUBMARINE FANS WITH MASSIVE CHANNEL FILLS A THIN-BEDDED OVERBANK D
ENCE BOUNDARY
Fig. 7.15. Response of a fluvially dominated deltaic depositonal system to sea level change from highstand to low stand. For abbrevations see Fig. 7.12. (After Vail and Sangree 1988; Vail et a]. 1991)
grades relatively slowly. In contrast, lowering sea level increases the stream gradient and favors the development of a braided system, cutting a wide channel into the previously accumulated coastal plain and transporting large quantities of terrigenous material basin- ward. This process leads to rapid progradation of a lowstand deltaic wedge, including various types of gravity mass movements (Chap. 5.4).
Such deposits have a high potential of being presevered and are therefore described from a number of regions, for example from the Natashquan river entering the Gulf of Lawrence (Long et al. 1989) or from ancient deltas on the North American Atlantic continental margin (Poag et al. 1990).
At the foot of the prodelta slope, debris flows and slumps, sometimes containing blocks of indurated sediments, may be abundant. Far-
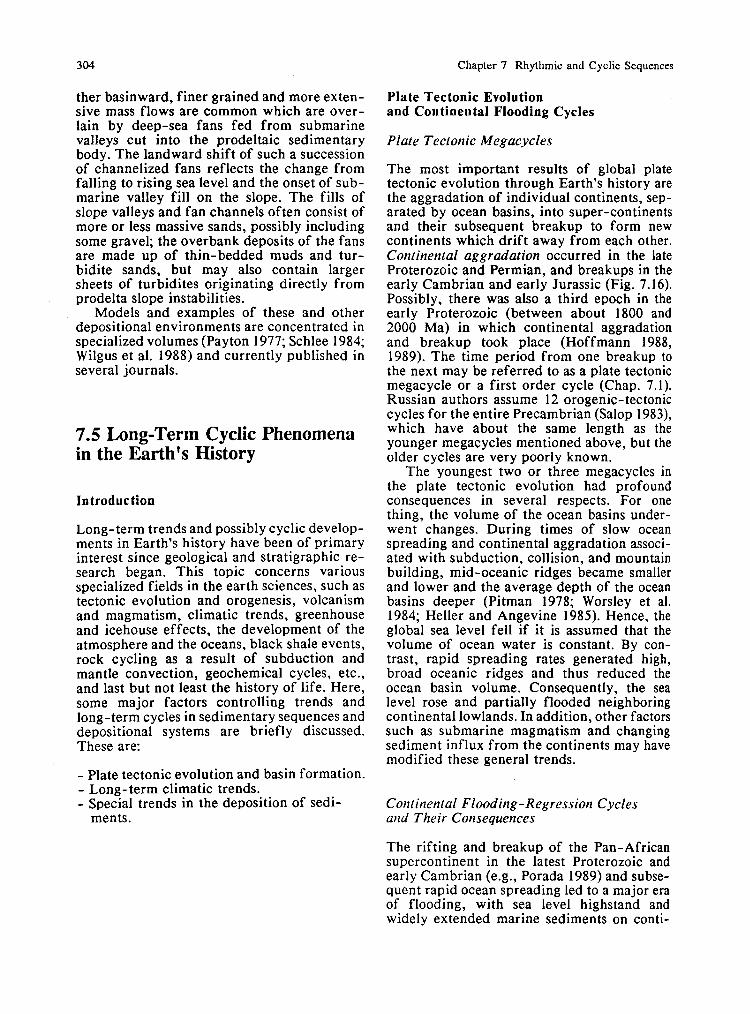
Chapter 7 Rhythmic and Cyclic Sequences
ther basinward, finer grained and more exten- sive mass flows are common which are over- lain by deep-sea fans fed from submarine valleys cut into the prodeltaic sedimentary body. The landward shift of such a succession of channelized fans reflects the change from falling to rising sea level and the onset of sub- marine valley fill on the slope. The fills of slope valleys and fan channels often consist of more or less massive sands, possibly including some gravel; the overbank deposits of the fans are made up of thin-bedded muds and tur- bidite sands, but may also contain larger sheets of turbidites originating directly from prodelta slope instabilities.
Models and examples of these and other depositional environments are concentrated in specialized volumes (Payton 1977; Schlee 1984; Wilgus et al. 1988) and currently published in several journals.
7.5 Long-Term Cyclic Phenomena in the Earth's History
Introduction
Long-term trends and possibly cyclic develop- ments in Earth's history have been of primary interest since geological and stratigraphic re- search began. This topic concerns various specialized fields in the earth sciences, such as tectonic evolution and orogenesis, volcanism and magmatism, climatic trends, greenhouse and icehouse effects, the development of the atmosphere and the oceans, black shale events, rock cycling as a result of subduction and mantle convection, geochemical cycles, etc., and last but not least the history of life. Here, some major factors controlling trends and long-term cycles in sedimentary sequences and depositional systems are briefly discussed. These are:
- Plate tectonic evolution and basin formation. - Long-term climatic trends. - Special trends in the deposition of sedi-
ments.
Plate Tectonic Evolution and Continental Flooding Cycles
Plate Tectonic Megacycles
The most important results of global plate tectonic evolution through Earth's history are the aggradation of individual continents, sep- arated by ocean basins, into super-continents and their subsequent breakup to form new continents which drift away from each other. Continental aggradation occurred in the late Proterozoic and Permian, and breakups in the early Cambrian and early Jurassic (Fig. 7.16). Possibly, there was also a third epoch in the early Proterozoic (between about 1800 and 2000 Ma) in which continental aggradation and breakup took place (Hoffmann 1988, 1989). The time period from one breakup to the next may be referred to as a plate tectonic megacycle or a first order cycle (Chap. 7.1). Russian authors assume 12 orogenic-tectonic cycles for the entire Precambrian (Salop 1983), which have about the same length as the younger megacycles mentioned above, but the older cycles are very poorly known.
The youngest two or three megacycles in the plate tectonic evolution had profound consequences in several respects. For one thing, the volume of the ocean basins under- went changes. During times of slow ocean spreading and continental aggradation associ- ated with subduction, collision, and mountain building, mid-oceanic ridges became smaller and lower and the average depth of the ocean basins deeper (Pitman 1978; Worsley et al. 1984; Heller and Angevine 1985). Hence, the global sea level fell if it is assumed that the volume of ocean water is constant. By con- trast, rapid spreading rates generated high, broad oceanic ridges and thus reduced the ocean basin volume. Consequently, the sea level rose and partially flooded neighboring continental lowlands. In addition, other factors such as submarine magmatism and changing sediment influx from the continents may have modified these general trends.
Continental Flooding-Regression Cycles and Their Consequences
The rifting and breakup of the Pan-African supercontinent in the latest Proterozoic and early Cambrian (e.g., Porada 1989) and subse- quent rapid ocean spreading led to a major era of flooding, with sea level highstand and widely extended marine sediments on conti-

Long-Term Cyclic Phenomena
SEA LEVEL WELL OXYGENATED OCEAN
LOW HIGH SLOWER 0 SPREAD1
SEA FLOOR SPREADING
BREAKUP OF PANGEA -
PANGEA
500
BREAKUP OF
Fig. 7.16. Long-term, first order cycles in Earth's history sea level with warmer, more equable climate (greenhouse associated with aggradation and dispersion of continents. state) and tendency for black shale deposition. (After Fi- Note coincidence of low sea level with major glaciations scher 1982; Vail et al. 1991) (icehouse state) and well oxygenated ocean waters, or high
nental crust in the early Ordovician. The peak in sea level may have been 100 to 150 m above the present level (Bond et al. 1988). It was followed by a long-term, slow sea level fall which reached its deepest level with the com- pletion of Pangea at the end of the Permian.
The late Permian and Triassic represent an epoch of radical change from falling to rising sea level. The overall climate changed from 'an icehouse state with polar ice caps and large latitudinal temperature gradients to a green- house state (Veevers 1988, 1990). In the Trias- sic, large volumes of sediment did not reach the oceans, but were deposited as nonmarine strata in incipient rift zones (Chapters 12.1 through 12.3) and in lowlands adjacent to the sea. The base level was low and the sediment supply exceeded the space being created by slow relative rise in sea level, resulting in
major regression (Vail et al. 1991). The ten- dency for arid climates favored the deposition of evaporites, red beds, and eolian sediments.
In the oceans, relatively narrow, low-lati- tude zones were characterized by a high supersaturation with respect to calcium car- bonate and a high Mg/Ca ratio (Mackenzie 1990). As a result, carbonate platforms were dolomitized to a great extent (e.g., in the Alps), and aragonite was the dominant mineral forming pore-lining cements and ooids in the so-called "aragonite oceann (Sandberg 1985; Opdyke and Wilkinson 1990). Several major groups of organisms became extinct, but oth- ers persisted with modifications; reef - builders developed new types of framework.
During the Jurassic and early Cretaceous, the sediment supply could not keep up with the new space created by an accelerated sea

Chapter 7 Rhythmic and Cyclic Sequences
level rise. Thus, predominantly marine sedi- ments encroached onto the continental mar- gins of the drifting continents, originating from the breakup of the Pangea superconti- nent. Ocean spreading was fast in the early Cretaceous and accompanied in the Pacific by the extrusion of large volumes of basaltic magma (Schlanger et al. 1981; Arthur et al. 1985). As a result, global sea level reached an absolute high represented by several peaks in the period from the Turonian up to the Cam- panian (Kauffman 1983; Sahagian 1987; Han- cock 1989). It is assumed that the sea stood 200 to 250 m above its present level. Large areas of the continents were flooded and covered by shallow-marine sediments. After this highstand, a long-term, slow sea level fall was initiated by decreasing ocean spreading which has lasted into the present time. This trend, as in earlier times, has been superposed by many shorter-period oscillations. As a con- sequence of the overall conditions, the upper Cretaceous and Cenozoic marine sediments were restricted to the continental margins and deep ocean basins.
The overall influx of terrigenous material into the world ocean was reduced during high sea level (Mackenzie 1990). Nannofossil car- bonates accumulated in widely extended areas on shelves and in epicontinental seas. The Mg/Ca and Sr/Ca ratios in sea water were relatively low. The dominant abiotic carbonate mineral in enlarged, low-latitude ocean reg- ions (so-called "calcite oceansn) became calcite; reef growth was acchieved by a few species of reef builders; evaporites were rare, and gla- ciers were, if at all present, restricted to high mountain ranges on the continents.
The Greenhouse State o f the Earth
The association of fast ocean spreading with increased volcanic activity and CO, in the atmosphere is probably a major factor in the establishment of a greenhouse state during times of high sea level. In addition, the en- larged ocean surface with its low albedo was able to absorb more solar energy than the re- duced water surface during times of sea level lowstand. This mechanism contributed to the development of a warmer, more equable, humid climate with reduced temperature gra- dients between the poles and the equator. Deep ocean water reached temperatures simi- lar to those of surface waters. Thermohaline circulation was fundamentally different from the present situation, which does not differ
profoundly from the icehouse state represent- ed by three major glaciation periods (Fig. 7.16).
Warmer oceans with slower circulation resulted in poorly oxygenated waters and thus promoted the deposition of black shales (Schlanger and Cita 1982; cf. Chaps. 5.2 and 10.3.3), either in stagnant basins or in enlarged zones of coastal upwelling and oceanic diver- gence (Parrish and Curtis 1982; Parrish 1987). At the same time, the vegetation cover on the continents expanded into high latitude regions and may have contributed to the enrichment of organic matter in marine sediments (e.g., Simoneit and Stuermer 1982; Stein et al. 1989).
This development was accompanied by a decrease in the 6% values of carbonate rocks (Arthur et al. 1988), reflecting the transfer of sedimentary organic carbon to the oxidized inorganic carbon in limestones. At the same time, sulfur was transferred from evaporitic sulfate rocks to the reduced sulfur reservoir of p s i t e in sediments, resulting in an increase of d S values of evaporitic sulfate minerals (Mackenzie 1990). In addition, oolitic iron- stones and phosphorites appear to have been formed in relatively large quantities (Van Houten and Arthur 1989).
"Bio-Events" in the Evolution o f Life?
Whether or not and in which way these long- term continental flooding and regression cy- cles have influenced the evolution and distri- bution of life in the sea and on the continents is an open question. Many authors postulate special "bio-events", including the punctuated evolution of species, dispersal events, and mass extinctions, which have controlled the distribution, survival, and recovery of life (e.g., Nitecki 1981; Fischer 1982; Sepkoski 1989; Kauffman and Walliser 1990). Other authors are more cautious and hold the opin- ion that our data base is too limited and in- complete for the establishment of a periodicity in the evolution of life (e.g., Hoffmann 1989). In any case, major bio-events cannot be cor- related directly with the first order flooding- regression cycles. The occurrence of abundant calcareous plankton since the upper Jurassic, for example, appears to be independent of sea level change and other related factors.
Some of the bio-events may have been associated with rapid changes in the depositional environment, such aa the famous "Kellwasser crisis" in the upper Devonian (Fra- snian-Famennian, see, e .g . , Schindler 1990; Buggish

Long-Term Cyclic Phenomena
199 1) . This event is characterized by mass extinction of pelagic marine organisms in tropical regions and a wide- spread black shale horizon. The sudden deterioration in living conditions occurred during a long-term trend towards a cooler climate, i .e. , during the transition from a green- house to an icehouse state of the Earth (see above). In addition, the bio-event was associated with the narrowing of the Paleotethys Ocean.
The Pleistocene period with its rapid climatic change is the most understood example for the influence of environmental stress on life. Gla- ciation at high latitudes caused not only the migration of plants and animals into lower latitude regions, but also led to the extinction of various families and species. It appears, however, that most of the bio-events in the Phanerozoic cannot be explained by one single mechanism (Raup and Jablonski 1986). On the other hand, one cannot entirely reject the possibility that there is some relationship be- tween the physical processes outlined above and the evolution and extinction of species.
7.6 Superposition of Cycles of Various Orders and Differing Origins
General Aspects
The previously mentioned, long-term plate tectonic megacycles (first order cycles in Table 7.1) in the Phanerozoic had durations of about 250 and 350 Ma. These periods cor- respond approximately to the life times of major sedimentary basins, such as passive continental margin basins or passive margins evolving into foreland basins (cf. Chaps. 8.5 and 12.6.3). The evolution of such basins may be comprised of several tectonically controlled phases, for example two or three phases of extension (passive margin settings, e.g., Hynes 1990) or the transition from an extensional to a compressional regime (foreland basin). As a result, the subsidence rates change with time, and the subsidence-time curves show transi- tions from concave to convex-upward forms (Fig. 7.17b; Vail et al. 1991). These subsidence rate changes lead to regional relative rises and falls in sea level (Fig. 7 .17~) and thus to major transgressive-regressive facies cycles. Such second order, tectonically controlled cycles typically last several tens of Ma (Table 7.1) and are superposed on the long-term (1st or-
der) continental flooding cycles (Fig. 7.17a; Fischer 1982; Vail et al. 1991). They may then be superimposed in turn by third order cycles and possibly another one or two shorter term eustatic cycles (Fig. 7.17).
The Signature of Long and Short-Term Sea Level Oscillations
Transgressive-regressive sequences on all scales are controlled by the nature of eustatic variations, the degree of sea floor subsidence, and the rate of deposition. Erosion of pre- viously deposited sediments can only occur when the rate of sea level fall is greater or equal to the rate of sea floor subsidence (Pi- tman and Golovchenko 1983 and 1988; Vail et al. 1984). In this case, shallow-marine sedi- ments may undergo subaerial erosion, or storm-induced currents can remove older marine deposits and produce Type 1 sequence boundaries. However, when the rate of maxi- mum sea level fall is lower than the rate of subsidence, sediment accumulation at a spe- cific site is continuous, and no distinct se- quence boundary is generated.
It is important to note that the maximum rate of sea level fall is much greater for higher frequency oscillations than for lower ones (Fig. 7.17d). Consequently, high-frequency eustatic variations have a greater potential for causing erosion and, thus, sequence boun- daries. This holds true even when a long-term sea level rise, which normally cannot produce submarine unconformities, is superposed with shorter oscillations (Fig. 7.17d). The erosion potential of these oscillations is restricted, however, to shallow-water environments. Par- ticularly peritidal carbonates, which undergo early cementation and lithification, have been found to record and preserve such high-fre- quency eustatic variations (Chap. 7.2).
Thus, short-term cycles producing a great number of unconformities are particularly evident in field exposures of limited extent, while longer-term sea level changes are better expressed in large-dimensional cross sections and seismic records.
Milankovitch Cycles Within Third Order Sea Level Variations
The Milankovitch climatic cycles discussed in Chapter 7.1 have time periods which are 10 to 100 times shorter than the third order eustatic cycles (Table 7.1). They represent the parase-

308
GLOBAL SEA LEVEL
Chapter 7 Rhythmic and Cyclic Sequences
FIRST ORDER CONTINENTAL FLOODING-REGRESSION CYCLE
I
k- BASIN EVOLUTION -4 _ / - J
_/--
I \
/--- \
b
v SUBSIDENCE
SUBSIDENCE CURVE
RELATIVE SUPERPOSED I SECOND ORDER CYCLE SEA LEVEL CURVE SEA LEVEL THIRD ORDER I k-- ---- L- 4 (SUPERPOSITION OF FIRST
AND SECOND ORDER CYCLE)
C
, , / / J L. .
..... /-- .. /--
-. /
. . /-- -1
/ /-- -1
I- .. .
1 r - THIRD ORDER CYCLE
LLI It -------------- SEQUENCE ----------------- d
> I
RASEQUENCE (CYCLOSTRATIGRAPHY MILANKOVITCH CYCLES)
. I I -'.LONG-TERM MAX. SEA LEVEL FALL
> SUBSID. (+ UNCONFORMITES) I
I I I I+ LOWSTAND S.T.+TRANSGRESSIVE s . T . ~ HIGHSTAND S.T.+LOWST.
(SHELF MARGIN S.T.) LOW TERRIGENOUS INPUT
TENDENCY FOR HIGH TERRIGENOUS INPUT CONDENSED SECTION
Fig. 7.17a-d. Superposition of eustatic sea level variations Van Wagoner et al. 1987), superposed by short-term Mi- with different time periods and amplitudes and tectonically lankovitch-type oscillations (fourth to fifth order cycles, controlled regional subsidence. a Global first order cycle. Table 7.1). Note that short-term oscillations display higher b Regional subsidence time curve of multiphase extensional rates of maximum sea level fall and thus are more capable basin. c Corresponding second order transgressive-regres- of producing erosional unconformities in coastal environ- sive cycles caused by a and b. d Third order eustatic sea ments than longer term sea level changes. See text for level variation and associated systems tracts S. T. (After explanation

Superpostion of Cycles
quences, simple sequences, or even shorter units in the Vail nomenclature. If the orbital signals of the Milankovitch cycles are trans- formed into climatic variations which cause minor oscillations in sea level, then third order sea level variations are superposed by a great number of high- frequency but, in nonglacial times, low-amplitude eustatic oscillations (Fig. 7.17d).
The sedimentological expression of these high-frequency (fourth and fifth order) eus- tatic variations depends on several factors, such as their temporal position within the third order cycle and the depositional en- vironment. In shelf and tidal flat carbonates, superposed high-frequency oscillations permit the deposition of thicker carbonate cycles with higher proportions of subtidal sediments dur- ing slowly rising sea levels than during slowly falling sea levels (Koerschner and Read 1989). If the rate of long-term sea level fall is equal to subsidence, only intertidal and supratidal sediments can accumulate, interrupted by un- conformities.
In siliciclastic shallow-water environments, the potential to generate and preserve high- frequency cycles is less favorable as compared to peritidal carbonate cycles which undergo early lithification. Coal cycles (cyclothems) containing marine beds may represent the siliciclastic counterparts of the shallow-water carbonate cycles.
Marl-limestone rhythms, black shales, and rhythmic sequences containing various types of event beds are associated with different phases of the third order transgressive-regres- sive cycle. Periodic limestone-marl successions and black shale-limestone alternations, depos- ited on the outer shelf or in the deeper sea, form preferentially during the transition from the transgressive to the highstand phase (con- densed section; Fig. 7.17d). Episodic event beds such as mass flows, tempestites, and tur- bidites, however, seem to be associated with the prograding phases of the lowstand and highstand systems tracts.
Concluding Remarks to Depositional Rhythms and Cyclic Sequences
The superposition of cyclic and episodic phenomena of various natures and scales pro- duces a kind of sequential ordering of beds, which is found in almost all stratigraphic suc- cessions. The identification of such an order- ing and the unraveling of the various mecha- nisms and time periods creating a particular
sequence are tasks of modern sedimentology and stratigraphy. One of the main problems in pursuing this is the fact that global and re- gional causal factors are frequently modified and obscured by local processes in the specific depositional environment. This is the reason why we observe such a great variety of sedi- mentary sequences in the geologic record.
On the other hand, some of the concepts of sequence stratigraphy need further refinement and should be tested in more types of en- vironments. Some of the terms and their defi- nitions, for example the use of erosional sur- faces and their lateral correlatives as sequence boundaries, are not generally accepted (e.g., Galloway 1989). Isostatic compensation, sedi- ment compaction, and sedimentary dynamics have to be taken into account to evaluate more accurately the geometry of stratigraphic se- quences (Steckler et al. 1990). Reliable strati- graphic correlation of sediments and inferred sea level curves from different basins far away from each other is still a major problem (e.g., Ziegler 1988; Hancock 1989).
Much uncertainty still exists concerning the frequency and amplitude of pre-Quaternary sea level changes. The greatest frequency of transgression/regression cycles for a given time span appears to occur in sedimentary sections which allow high stratigraphic resolu- tion. In the Turonian of central Tunisia, for example, the time period of third order cycles was found to be less than 1 Ma (Robaszynski et al. 1990). Furthermore, the signature of high-frequency sea level changes appears to be best preserved in low-energy, slowly sub- siding basins with sufficient sediment input to generate a fast, seaward prograding depositio- nal system (Fulthorpe 1990).
Further studies on ice volume-induced and thus sea level-related excursions of oxygen isotopes may provide some of the means to get more information for resolving these problems (Matthews 1984b; Burton et al. 1987; Boer 1991).
The occurrence of both cyclic and episodic phenomena in a certain region can be used to refine stratigraphic correlations. Biostratigra- phic boundaries or datable volcanic ash layers provide the chronostratigraphic framework. Between these boundaries, short-term rhythms or cycles and the succession of various event beds, including biologic 1 and geochemical marker horizons, permit "1 he subdivision of large stratigraphic zones into relatively short subunits. These can provide a detailed succes- sion of relative time lines within a basin fill. Under favorable conditions, many of these

310 Chapter 7 Rhythmic and Cyclic Sequences
phenomena can be traced over large distances In the pelagic realm, where Milankovitch- within an epeiric basin or shelf basin and type variations are commonly much better sometimes even between several of these ba- preserved than in shallow seas, it may be pos- sins. This method is referred to as "high resol- sible in the future to develop detailed cyclo- ution cyclic and event stratigraphy" (Kauffman stratigraphy. 1988; Kauffman et al. 1991).

Part I11 Subsidence, Denudation, Flux Rates and Sediment Budget

8 Subsidence
8.1 General Mechanisms Controlling Subsidence Isostasy Initial Subsidence of Sediment-Filled Basins (Without Thermal Effects) Thermal Uplift and Subsidence Flexural Response of the Crust to Loading Summary of Factors Controlling Subsidence
8.2 Methods to Determine Subsidence of Sedimentary Basins Introduction Techniques to Determine Subsidence
8.3 Modelling of Rift Basins and Observed Subsidenge Curves Rift Models Modifications of the Rift Model and Other Factors Controlling Subsidence Subsidence of Rift Basins Inferred from Stratigraphic Sections
8.4 Passive Continental Margins Concepts for Modeling Passive Margin Subsidence Examples of Simulated and Observed Subsidence
8.5 Subsidence of Basins Related to Tectonic Loading, Subduction, and Strike-Slip Motion Foreland Basins Arc-Trench Systems Pull-Apart Basins Conclusions
8.1 General Mechanisms Controlling Subsidence
Isostasy
Substantial sediment accumulation and the formation of sedimentary basins result from crustal subsidence. At least in the beginning of basin formation, tectonic subsidence must predate sedimentation, whereas later, subsi- dence may also be actively driven by an in- creasing sediment load (total subsidence). In this chapter, the different mechanisms leading
to crustal subsidence as well as some models quantifying the development of subsidence versus time, i.e., subsidence history curves, are briefly introduced. A more comprehensive treatment of this topic is given by Allen and Allen (1990).
In most cases, tectonic subsidence of the land surface or sea floor is controlled by the principle of isostasy, thermal contraction of the lithosphere, and/or flexural loading (Fig. 8.1). According to the present view of isosta- sy, the elevation of the top of the crust is a function of the thicknesses and densities of several layers (sea water, sediments, solid crust consisting of igneous and metamorphic rocks, and solid upper mantle or mantle lithosphere, Fig. 8.1) resting on the viscous asthenosphere (mantle asthenosphere). Within the astheno- sphere, horizontal surfaces of constant pres- sure can be assumed, which implies that the mass per unit area of the overlying rock co- lumn is everywhere the same. Hence one can write:
p,h + p,h, + pchc + pmhm + pJ, = constant (8.1)
where the layers (with thickness h) are sea water, w, sediment, s, crust, c, mantle litho- sphere, m, and mantle asthenosphere, a. Den- sity values, p, of these layers are listed in Fig. 8.1. The mass of the atmosphere per unit area is neglected in Eq. (8.1).
The base of the lithosphere is assumed to be a temperature boundary (approximately 1350 "C). Therefore, the hotter mantle asthe- nosphere has a somewhat lower density than the overlying mantle lithosphere. Thickening of the crust at the expense of the mantle litho- sphere causes uplift of the land surface or sea bottom, whereas thickening of the mantle- lithosphere at the expense of the crust is fol- lowed by subsidence. For that reason, thick continental crust usually rises above sea level, whereas the top of much thinner oceanic crust lies several km below. Newly formed oceanic

Chapter 8 Subsidence
SEA WATER DENSITY (g/cd) SEDIMENT \ / I
BULGE
LOCAL ISOSTASY
FLEXURAL RESPONSE OF CRUST (REDUCED LOCAL SUBSIDENCE)
Fig. 8.la-d. Principle of isostasy demonstrated by two used in the models (see text). c Local isostatic response of crustal columns (a high plateau; b continental she10 con- lithosphere to additional load. d Reduced but more widely sisting of layers of different thickness and density on top of extended subsidence due to flexural response of rigid crust a surface of constant pressure. Values in parenthesis are
lithosphere is encountered at an average depth of about 2.5 km below sea level. This is also approximately the tectonic subsidence of a basin resulting from the partial replacement of thinning continental crust by upwelling denser upper-mantle material (Fig. 8.1 b). Old oceanic crust on top of cooling mantle lithosphere may subside more than 6 km below sea level.
In order to quantify the mechanism of isostasy, two relationships have to be consi- dered:
1. The thicknesses of the different layers on top of a given datum in the asthenosphere may change, but the mass of the total rock column per unit area will remain constant. Hence the sum of all changes in mass above the datum line is zero:
2. The changes in thickness of all layers above the datum line, including the thickness chan- ge, dhg, of the atmosphere, is zero.
hence, the subsidence, Si, of the land surface or sea floor (below the base relation to a fixed sea line is
The law of isostasy was first proposed by Ai- ry; it is only valid for cases in which each crustal column behaves completely indepen- dently from its neighboring columns and does not support any adjacent loads. In addition, it as assumed that equilibrium conditions are established, which is not the case shortly after a rapid change in the load resting on the da- tum line within the asthenosphere. The type of

General Mechanisms
isostacy under equilibrium conditions may be described as local isostatic compensation, in contrast to the flexural response of an elastic crust to a surface load (Fig. 8.lc and d).
Initial Subsidence of Water-Filled Basins (Without Thermal Effects)
In simplified cases, subsidence, Si, due to local isostatic compensation, neglecting any thermal effects, can be calculated under the following assumptions: The densities of the different layers remain constant and the thicknesses of the layers (except that of sea water) are known or will be given as variables. Mantle litho- sphere and mantle asthenosphere are combined into the thickness hma with the density p (= 3.33 g/cm3). Prior to subsidence, the su?ace of the crust is at sea level and covered neither by water nor sediment. For these conditions, one can simplify Eq. (8.2) to
and Eq. (8.3) to
where Si = ah, (Fixed sea level) (8.5)
After equating (8.4) and (8.5), one obtains
Inserting the density values listed above and in Fig. 8.1 (e.g., p, = 1.03 g/cm3 for sea water), we obtain
ah, = - 0.23 ah, , or ah, = - 4.34 ah, . If under these simplified conditions the crustal thickness h, is reduced, for example, by 15 km (around half of its normal thickness), the top of the crust subsides from sea level to a depth of 3.5 km and creates space for a water body of the same depth. Similarly, the water depth of a basin can increase by 1 km, if the thickness of the mantle is increased by 4.34 km at the expense of the crust.
A more general expression for the initial sub- sidence of a basin filled with water up to the (fixed) sea level, derived from Eqs. (8.2) and (8.3), is (e.g., Suppe 1985):
where R = stretching factor, which describes the amount of stretching of a certain segment of the lithosphere. For z = original thickness and b = original width (Fig. 8.2), the new width after extension is increased to bR and the thickness reduced to z/B. This formula, however, still does not take into account any sediment load or thermal effects which are usually associated with crustal thinning and the formation of a topographic low.
Inserting the values from the previous example (0 = 2, p, = p, = 3.33 g/cm3, h, = 30 km, and h, = 100 km) into Eq. 8.7, the result is Si 3.5 km. With p, = 3.4 glcm3, p, = 3.3 glcm3 (Fig. 8.1), and the other parameters from t 6 s example remaining unchanged, the initial isostatic subsidence for the water-filled basin is Si = 5.5 km.
These examples demonstrate that the results of such calculations strongly depend on the den- sity values assumed for the mantle lithosphere and mantle asthenosphere, as well as on the thickness of the crust and lithosphere prior to stretching. Some authors have pointed out that stretching of a crust thinner than 18 km will generate uplift, whereas stretching of thicker crust causes subsidence. However, this boun- dary condition also varies considerably with the densities and thicknesses of the crust and mantle lithosphere (Jarvis 1984).
Initial Subsidence of Sediment-Filled Basins (Without Thermal Effects)
The sediment load of a partially or entirely filled basin causes additional subsidence due to isostatic compensation. This effect can be easily calculated if the former water-filled basin (water depth, h,) is completely filled with sediments up to sea level (sediment thickness, ha, and average density of sedi- ments, for example, pa.= 2.4 g/cm3). Then the elevation above the isostatic compensation depth remains the same as before, and from Eq. (8.3) we can assume:
Similarly, the mass above the compensation level does not change (Eq. 8.2), hence we ob- tain
Equating (8.8) and (8.9) gives

Chapter 8 Subsidence
TEMPERATURE -0 1 350°C
GRADIENT
1 350°C/Z
DEPTH
CONDUCTIVE LATERAL LOSS OF HEAT
NO 1 3 5 0 ' ~
DEPTH
SEA WATER (AND SEDIMENT) SEA LEVEL
Fig. 8.2ae. Finitelength extensional rift basin model. a cooling lithosphere, geothermal gradient approximately Prior to rifting. b Initial subsidence due to isostatic adjust- reduced to original state. See text for explanation. (After ment at the end of short rifting event, buildup of high McKenzie 1978) geothermal gradient. c Thermal subsidence due to slowly

General Mechanisms
where h, is the maximum sediment thick- ness up to sea level.
With an average sediment density of p, = 2.15 g/cm5, a sediment thickness twice the initial water depth can develop (amplification factor 2); with p, = 2.55 g/cm3 the amplification factor is about 3.
In our example of a water-filled basin (based on Eq. 8.7) we obtained h,,, = 3.5 km. Using the density values men- tioned above and listed in Fig. 8.1, from Eq. (8.10) one gets h, 5 8.7 km. This signifies that a sediment-filled seg- ment of this model basin will subside 2.5 times more than a purely water-filled segment, due to isostatic response of the crust. In comparison to an air-filled depression below sea level, the amplification factor for a corresponding sedi- ment-filled basin becomes even greater (in our example a p proximately 1.46 x 2.5 5 3.6, also see Jarvis 1984).
Thermal Uplift and Subsidence
If a column of the lithosphere is heated above the temperature of the surrounding rocks, its mass remains unchanged, but its volume in- creases and may cause uplift at the land sur- face or sea bottom. Upwelling hot mantle ma- terial, for example at oceanic spreading cen- ters, generates oceanic ridges which later, due to cooling of the oceanic crust and thickening of the underlying mantle lithosphere, subside considerably with age by several km. Similar ly, upwelling hot mantle material below a thinning continental crust will first tend to raise the surface of the thinned crust, if this thermal expansion is not exceeded by the ef- fects of isostasy, and then cause subsidence due to cooling. This type of subsidence is re- ferred to as thermal subsidence, St. Thermal subsidence and uplift, apart from changes in temperature and geometrical factors, are con- trolled by the coefficient of thermal expansion (or contraction). a = 3.4 x 10-'/O~. and the thermal diffusi"ity of the lithospherk, k = 8 x lo-' m2/s.
If for example the temperature of a 50 km high rock co- lumn is raised or lowered uniformly by 300 O C , its height will increase or decrease due to thermal expansion or con- traction by ca. 0.5 km. This is, of course, an unrealistic example, which only demonstrates the order of magnitude of such thermal effects. In nature we observe a thermal gradient from the base of the mantle lithosphere (1350 O C ,
Fig. 8.2) to the land surface or sea water (slightly above 0 O C ) . With changing lithosphere thickness, this gradient and thus the temperatures at different depths vary, but the com- bined effect of this process causes approximately the same amount of expansion or contraction as that calculated for a rock column which is subjected to the same change in mean temperature as the lithosphere.
As a result of mantle upwelling, a steep tem- perature gradient is established. Later, this gradient is slowly reduced by heat loss to the atmosphere, until the original gradient will be restored (Fig. 8.2b and c). This process is de- scribed by the thermal diffusivity of the litho- sphere. Cooling of an abnormally heated litho- sphere takes tens of million years, and there- fore thermal subsidence is a long-term, slowly decaying process. The mathematical treatment of thermal expansion and contraction of the lithosphere is beyond the purpose of this text (see, e.g., Royden et al. 1980; Watts and Thor- ne 1984; Sawyer 1988), but the following basin modeling does include thermal effects.
Flexural Response of the Crust to Loading
It is a well-known fact from geological obser- vation that the lithosphere adjacent to local or regional loads (water, ice, sediment accumu- lation, isolated seamounts on top of oceanic crust) or unloading (lake dessication, ice mel- ting, rock denudation) reacts by downwarping or uplift, respectively (Fig. 8.1 c and d). The best studied examples are continental ice caps, which cause not only isostatic compensation below the ice, but also some subsidence in areas adjacent to the ice load. Later, after ice melting, these regions begin to rise again in conjunction with the formerly ice-loaded crust. This phenomenon may affect a zone 50 to 300 km wide adjacent to the loaded and unloaded crust.
Several authors have made an attempt to simulate the flexural response of the crust to a given load (e.g., Watts et al. 1982; Watts and Thorne 1984). They treat the lithosphere ei- ther as an elastic or visco-elastic plate under- lain by the viscous mantle. In the case of pure elastic behavior, the mechanics of lithospheric flexure can be compared with the bending of sheets or beams having a certain flexural rigi- dity. This flexural rigidity, D, in turn is a function of the elastic constants of the rock material, i.e., Young's modulus, E, and Pois- son's ratio, a, as well as thickness, he, of the elastic lithosphere. Then we obtain
Equation (8.1 1) clearly shows that the elastic thickness, h , is the most important factor controlling t i e rigidity or flexural strength of the lithosphere.
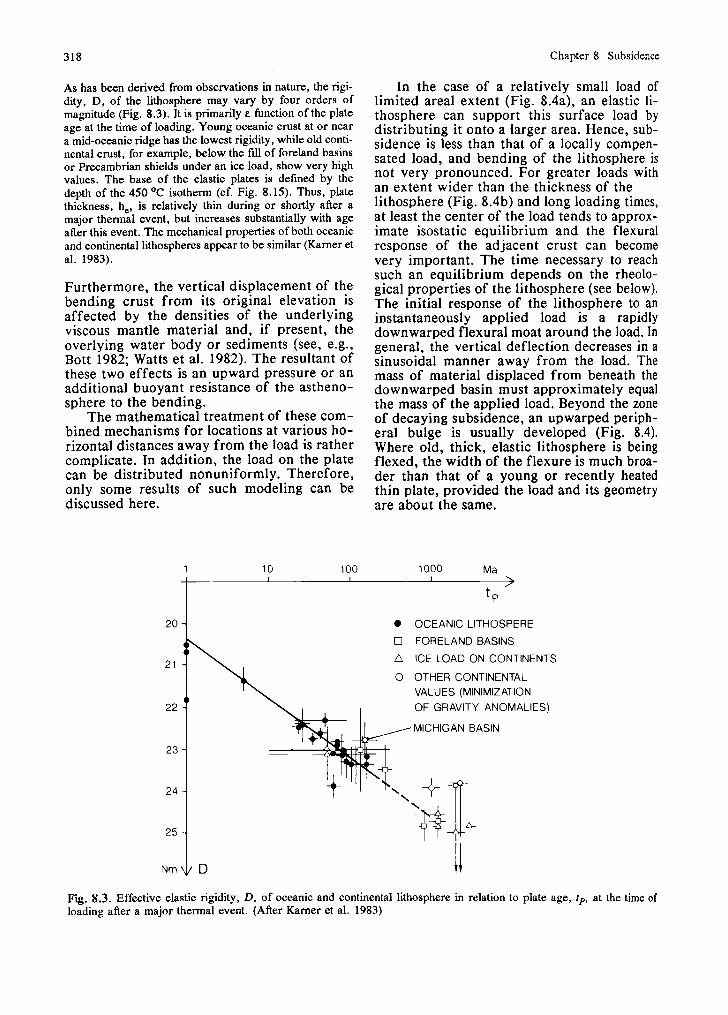
318 Chapter 8 Subsidence
As has been derived from observations in nature, the rigi- dity, D, of the lithosphere may vary by four orders of magnitude (Fig. 8.3). It is primarily e function of the plate age at the time of loading. Young oceanic crust at or near a mid-oceanic ridge has the lowest rigidity, while old conti- nental crust, for example, below the fill of foreland basins or Precambrian shields under an ice load, show very high values. The base of the elastic plates is defined by the depth of the 450 O C isotherm (cf. Fig. 8.15). Thus, plate thickness, he, is relatively thin during or shortly after a major thermal event, but increases substantially with age after this event. The mechanical properties of both oceanic and continental lithospheres appear to be similar (Karner et al. 1983).
Furthermore, the vertical displacement of the bending crust from its original elevation is affected by the densities of the underlying viscous mantle material and, if present, the overlying water body or sediments (see, e.g., Bott 1982; Watts et al. 1982). The resultant of these two effects is an upward pressure or an additional buoyant resistance of the astheno- sphere to the bending.
The mathematical treatment of these com- bined mechanisms for locations at various ho- rizontal distances away from the load is rather complicate. In addition, the load on the plate can be distributed nonuniformly. Therefore, only some results of such modeling can be discussed here.
In the case of a relatively small load of limited areal extent (Fig. 8.4a), an elastic li- thosphere can support this surface load by distributing it onto a larger area. Hence, sub- sidence is less than that of a locally compen- sated load, and bending of the lithosphere is not very pronounced. For greater loads with an extent wider than the thickness of the lithosphere (Fig. 8.4b) and long loading times, at least the center of the load tends to approx- imate isostatic equilibrium and the flexural response of the adjacent crust can become very important. The time necessary to reach such an equilibrium depends on the rheolo- gical properties of the lithosphere (see below). The initial response of the lithosphere to an instantaneously applied load is a rapidly downwarped flexural moat around the load. In general, the vertical deflection decreases in a sinusoidal manner away from the load. The mass of material displaced from beneath the downwarped basin must approximately equal the mass of the applied load. Beyond the zone of decaying subsidence, an upwarped periph- eral bulge is usually developed (Fig. 8.4). Where old, thick, elastic lithosphere is being flexed, the width of the flexure is much broa- der than that of a young or recently heated thin plate, provided the load and its geometry are about the same.
OCEANIC LITHOSPERE
FORELAND BASINS
A ICE LOAD ON CONTINENTS
0 OTHER CONTINENTAL VALUES (MINIMIZATION OF GRAVITY ANOMALIES)
MICHIGAN BASIN
Fig. 8.3. Effective elastic rigidity, D, of oceanic and continental lithosphere in relation to plate age, tp, at the time of loading after a major thermal event. (After Karner et al. 1983)

General Mechanisms
b LINEAR LOAD
FLEXURAL DOWNWARPING
AIRY-TYPE
DEPENDENT
a CENTRAL CENTRAL CIRCULAR LOAD
+ MORE DOWNWARPING, NARROWER FLEXURAL MOAT
Fig. 8.4a,b. Flexural response of lithosphere adjacent to initial subsidence ( I ) may be followed by further slow sub- (a) local small or (b) large, wide linear load, not to scale. sidence (2) until the load is ultimately compensated by a A load on top of relatively young, thin lithosphere crea- local isostasy (3). Simultaneously, the peripheral bulge tes a deeper, narrower flexural moat than a load on thick, migrates toward the load. (Partially based on Quinlan and old lithosphere. b Under a long-persisting load, rapid Beaumont 1984).
Aside from such general rules, the results of modelling the If the load remains in place for a long time lithospheric flexure often remain uncertain and even pro- period, deformation of the lithosphere changes blematic. The flexural rigidity of the lithosphere appears to in a manner as shown in Fig. 8.4b. After a be dependent not only on plate age at the time of loading, first stage of rapid downwarping, lithospheric as mentioned above, but also on the duration of loading material at depth under the load relaxes stress, (e.g., Bott 1982). An initially high rigidity may decrease with time following loading. Short-period loading (on the thereby creating a deeper central depression in order of 10 000 generates less bending of the lithe- conjunction with a narrower basin. The peri- sphere than loading times of the order of 100 Ma. This pheral bulge is progressively uplifted and mi- phenomenon may be related to thinning of the elastic plate grates toward the load. Ultimately, relaxation with age due to a rising 450 OC isotherm under the long- will evolve toward a State of local isostatic persisting load, o r it may be ascribed to a viscoelastic equilibrium. lithosphere and a softening of the crust with time.

Chapter 8 Subsidence
Such a timedependent development is primarily controlled by the mechanical state of the lithosphere. Although some workers strongly believe that models based on elastic con- dition plates can fairly well predict the processes observed in nature, others favor a uniform viscoelastic (Maxwell) model of the lithosphere. A third possibility is the assump tion of a Maxwell layer with temperaturedependent vis- cosity overlying a low-viscosity fluid (e.g., Quinlan and Beaumont 1984). Few of the models have taken into ac- count additional local heat sources associated with special magmatic or volcanic events during the history of a con- tinental margin or other flexure-influenced basins.
Summary of Factors Controlling Subsidence
In summary, subsidence of the floor of a sedi- mentary basin (or uplift of the land surface) is controlled by the following principal factors:
- Thinning (or thickening) of the lithosphere due to horizontal extension (or com- pression, underplating).
- Upwelling of mantle material in response to crustal thinning.
- Increase (or decrease) in lithospheric den- sity, for example due to 1. cooling (or heating), 2. pervasive dike intrusion or other injec-
tions of magma, 3. phase changes in the crust such as melt-
ing and magma crystallization as well as transitions of minerals of relatively low density into minerals of higher density (or vice versa).
- Isostatic subsidence (or uplift) in response to sediment loading (or erosion).
- Flexural loading. - Subcrustal magma convection.
The subsidence models of Chapter 8.3 have been worked out for relatively simple cases and deal primarily with the effects of isostasy, including sediment loading and thermal subsi- dence as well as flexural downwarping. The results obtained for simplified model basins can be compared with subsidence curves ob- served in nature for characteristic basin types of similar tectonic setting.
8.2 Methods to Determine Subsidence of Sedimentary Basins
Introduction
The subsidence history of sedimentary basins may be described in different ways. Structural geologists and geophysicists are primarily interested in that part of subsidence which is controlled by crustal processes (tectonic or thermo-tectonic subsidence), whereas sedi- mentologists and stratigraphers deal with the progressive burial history of sediments (total or cumulative subsidence) and often want to interpret subsidence curves in terms of sedi- mentation rates, paleo-water depth, and sea level changes. Proceeding from endogenetic, geodynamic to exogenetic processes, the subsidence history at a certain location within a basin is controlled by the following mechanisms (Fig. 8.5):
- Thermo-tectonic subsidence due to processes within the crust and the mantle lithosphere (extension, thermally induced changes in thickness and density, see below). The result- ing, essentially exponential subsidence curve (A) for an air-filled basin represents the mini- mum amount of subsidence which is not af- fected by any other mechanism (such as filling by water or sediment, see below). - Subsidence caused by water load. When the tectonically driven, subsiding basin is filled up to sea level with water, the amount of subsi- dence versus time increases considerably (cur- ve B in Fig. 8.5). - Subsidence caused by sediment load. If a tectonically subsiding basin is permanently filled with sediments up to a fixed sea level, subsidence in relation to a water-filled basin is magnified by a factor about 2.5 (see above), but the resulting subsidence curve (C) is still exponential and smooth.
The regular subsidence curve for a sediment- filled basin can be modified by several minor factors:
I . At certain times, the basin is not completely filled with sediments. Hence, the total load on top of the basin floor is reduced according to the paleo-water depth, and subsidence de- creases (Fig. 8.5, Curve D). Occasional erosion of sediment leads to additional unloading with similar effects (Curve E).

Methods to Determine Subsidence 321
180 140 100 6 0 2 0 0 I I I I I I I I I SHALLOW
Ma B.P. MARINE LONG-TERM DEEPEN- CONTI- EUSTATIC SEA LEVEL DRILLHOLE (NG NENTAL
C-+
0
RMO-TECTONIC SUBSIDENCE OF
. AIR-FILLED BASIN
1 -----_____ ER-FILLED B,
DIMENT-FILLED B.
UNCORRECTED 2 SUBSIDENCE CURVE
. . . . . . . .
FOR COMPACTION
3
...... ...,.... . . . . . . . , . . . . . . . ,
CORRECTION FOR EROSION
4
CORRECTED FOR BOTH
3-
CORRECTIONS FOR LONG-TERM
Fig. 8.5. Synthetic, semiquantitative example showing filled basin (C) up to the present sea level. Curve C is drilled vertical sediment succession and derived, uncorrec- modified by sediment compaction, a reduced sediment load ted subsidence curve at a given location within a basin. (increasing paleo-water depth or bathymetry), and eustatic Purely thermo-tectonic subsidence in an a i r - f W basin sea level changes. In addition, erosion can diminish sub- (Curve A) is magnified by a water load (B, related to pre- sidence, or a sediment load above sea level can enhance sent sea level) and the load of a permanently sediment- subsidence

Chapter 8 Subsidence
2. In contrast, eustatic sea level rise brings about a greater water load and sometimes mo- re sediment load, thus causing increased sub- sidence (Curve F). In periods of sea level fall, subsidence is again reduced. These effects apply to long-term eustatic sea level fluctua- tions; short-term variations are not considered here. 3. Compaction reduces the initial thickness of the sediments, particularly in the lower part of the section where the overburden load beco- mes high. Consequently, subsidence curves derived from the present thicknesses of special stratigraphic units (Curve G) do not show a true subsidence history. The older units yield subsidence rates too low and the younger units rates too high in comparison with true sub- sidence.
The combined effect of the last three factors (change in water depth, sea level change, and compaction) may cause marked excursions from the regular curve (C), but these factors can also more or less counterbalance each other. The second case occurs when increasing paleo-water depth coincides with a high sea level stand. In summary, the uncorrected sub- sidence curve (G in Fig. 8.5), which is found from present sediment thicknesses of known stratigraphic age, represents the cumulative result of the effects of several factors. It is usually a rather irregular curve comprising a systematic error due to sediment compaction.
An evaluation of the role of all factors controlling subsidence is possible when the sedimentary fill of a basin is largely preserved and nature and thickness of the underlying crust can be determined. Sediment thicknesses deposited at known water depths during cer- tain time intervals allow to derive the subsi- dence history of the basin at chosen locations.
Techniques to Determine Subsidence
In order to determine the subsidence of a cho- sen location in a sedimentary basin as well as to discriminate between the various mecha- nisms mentioned above, special techniques must be used. If the tectonically driven part of subsidence is the objective, this technique is referred to as "backstripping" (Watts and Steckler 1979; Gradstein et al. 1985; Hegarty et al. 1988; Steckler et al. 1988). The purpose of backstripping is to calculate and remove the effects of compaction, sediment loading, changing paleo-bathymetry, and sea level variations. If backstripping is combined with
the search for information on the development of the depositional system, such as data on sedimentation rates, paleo-water depth or eustatic sea level changes, often the term "geo- history analysis" (van Hinte 1978) or burial history is used (Guidish et al. 1985).
Sediment Decompaction
The first step in backstripping is to recon- struct the original sediment thicknesses, ha, of the growing sedimentary fill from the basin floor up to dated stratigraphic boundaries in particular exposures or well logs. Provided a sedimentary column with present thickness, h,,, and mean porosity, np, had an original mean porosity, nl, then its original thickness, hSl, was
The initial mean porosities for particular li- thologic units and depths below the sedimen- tary surface can be taken from well logs or published porosity-depth curves (e.g., Hegarty et al. 1988; cf. Chap. 13.2). A graphical me- thod approximating decompaction in combi- nation with Eq. (8.12) for sections consisting of different lithologic units is shown in Fig. 8.6. This procedure has to be repeated for all time steps and units considered. The resulting curve corrected for decompaction demonstra- tes that without this correction subsidence is underestimated for the first phase and overes- timated for the last phase of basin develop- ment.
Effects o f Paleo- Bathymetry and Sea Level Changes
The second step in backstripping is the remo- val of the effects of paleo-bathymetry and sea level changes. The simplest way to account for changes in sediment and water loading is the assumption of local, Airy-type isostatic ad- justment. Figure 8.7 demonstrates some cases which can be easily calculated under the fol- lowing premises: The thermo-tectonic subsi- dence of a particular location within a com- pletely sediment-filled basin proceeds in the way shown from (a) to (b). This "normal" de- velopment (Curve AB in Fig. 8.7b') may be modified by several processes:

Methodes to Determine Subsidence
b POROSITY, n, OF LAYER "A"
a SEDIMENT ACCUMULATION (km)
TIME
POROSITY, n, OF LAYER "B" -
(km) BURIAL DEPTH
Fig. 8.6ac. Graphical method for decompacting present sediments demonstrating decompaction of units A and B sediment thicknesses of units 4, B3, C2 to their original (4 to A1 or A2, respectively, and Bg to B1) using Eq. thicknesses (Al, B,, C1). a Growth of sedimentary column (8.12) in text. c Resulting corrected subsidence curve in with time, t, and progressive compaction of buried units. comparison to uncorrected curve; no changes in paleo- b Two examples of porosity-depth curves for different water depth and eustatic sea level
to t~ t~ 'C +D >
, UNCORRECTED FOR DECOMPACTION
- 0
- 1
- 2
- 3
- 4
q 5 SUBSIDENCE (km)

324 Chapter 8 Subsidence
TlME
a b
's
AB. COMPL SEDIMENT-FILLED AC -'T '
EROSION
TlME FALLING -> h
HIGH SEA LEVEL
N
I 0
I + n W n
INTERPOLATED
&NORMALn CURVE

Methods to Determine Subsidence 325
1. Reduced or ending sediment deposition and thus deepening of the basin (increase in paleo- water depth, WD). Using Eqs. (8.1), and (8.3) or (8.5) from Chapter 8.1, we can write (cf. Fig. 8.7b and c)
h,' = h, - WD - U1,
where U = uplift in relation to normally subsiding basin floor, and
Inserting of Eq. (8.13) into Eq. (8.14) yields
P, - Pw Ul = WD. (8.15)
Pm - Ps
With p, = 2.4 iglcm3, p, = 3.33 glcm3 (as in the ex- ample of Chap. 8. I), and no further sediment accumulation with time (h' as in a) relative uplift is U1 5 1.5 WD. Hence, the rate of total subsidence is reduced (Curve AC in Fig. 8 . 7 ~ ' ) in comparison to a basin which is permanent- ly kept sediment-filled (Curve AB). For more accurate calculations, it must be taken into account that the average sediment density, p,, grows with increasing thickness of the sedimentary column.
2. Eustatic sea level fall (-EU) prevents sedi- ment accumulation and may even lead to ero- sion (Fig. 8.7d) in a shallow-marine environ- ment. As in the previous example, we compare columns (b) and (d) and get
h," = h, - U2 - E U (8.16)
and U2 pm + h," p, = h, p, .
Equation (8.16) inserted into (8.17) yields
With the same values as those used above one obtains for uplift in relation to the normally subsiding basin floor U2 = 2.58 EU. This signifies that a falling sea level in asso- ciation with submarine erosion can produce a very sig- nificant negative deviation (Fig. 8.7d1, relative uplift U2 and curve AD) from the "normal" subsidence curve (Curve AB).
3. Eustatic sea level rise and stagnant sedi- mentation (Fig. 8.7e, i.e., the sediment thick- ness remains the same as in a) may still cause uplift, Us, of the basin floor in relation to the normally subsiding basin. If the amplification factor for the growing sediment thickness from (a) to (b) is r , then h, = r h,' or h,' = l / r h . By comparing columns (b) and (e) on top of the isostatic compensation depth and again using Eqs. (8.1) and (8.3), we find
In our example, with r = 1.7 and other values as above, we obtain U3 = 0.24 h, - 0.45 EU. Due to stagnant sedi- mentation, we get less subsidence in this case (Fig. 8.7e1, Curve AE) than in the normally sediment-f111ed basin without sea level rise (Curve AB).
4. Eustatic sea level rise is accompanied by continuous sedimentation (Fig. 8.7f) as from (a) to (b). Comparing columns (b) and (f) and applying Eqs. (8.1), and (8.3) or (8.5), we ob- tain the additional subsidence, S1, superposed on the general subsidence trend:
For p, = 3.33 &m3 we obtain S1 = 0.45 EU. In this example, however, the water depth is not only increased by the eustatic rise, EU, but by EU + S1 = 1.45 EU.
- Fig. 8.7a-h. Deviations (U and S) from the "normal", thermo-tectonicallydriven subsidence curve (AB in b') of basin permanently fded with sediment up to (constant) sea level (transition from stage a to b, also see h). Sediment thickness increases from h,' to h, Deviations are caused by changes in palm-water depth (WD) and eustatic sea level (EU). b through g Crustal parameters (thickness and densi- ty) as well as average sediment density are assumed to remain constant, whereas sediment thicknesses, h,, WD and EU vary. For local, Airy-type isostatic compensation, the excursions from the "normal" curve (AB in b') are shown in c' through g' and further explained in text. c and c' Subsequent to a , sedimentation ceases and basin deepens to WD: reduced subsidence (Curve AC). d and d' Eustatic
sea level fall prevents sediment deposition and even leads to some erosion: greatly reduced subsidence (Curve AD). e and e' Eustatic sea level rise and from a on stagnant sedimentation: reduced subsidence (Curve AE). f and f Eustatic sea level rise and sediment accumulation as from a to b: increased subsidence (Curve AF), but also increase in WD (Eu + S1). g and g' Sediment-fill up to "normal" sea level: strongly increased subsidence (Curve AG), WD r EU. h Long-term subsidence curve composed of inter- vals with sediment-filled basin (a, b) at normal sea level and intervals as shown in c through g. "Normal" curve can be approximated by interpolation. Deviations from "nor- mal" curve may be used to calculate palm-water depth and eustatic sea level changes. All illustrations not to scale

Chapter 8 Subsidence
The additional subsidence S1, caused by sea level rise, is the so-called hydro-isostatic ef- fect or hydro-isostasy. The resulting subsi- dence (Curve AF) is steeper than the "normal" curve AB (Fig. 8.7f').
5. Eustatic sea level rise is associated with in- creased sediment accumulation (h,"' = h, + SZ) up to the pre-existing sea level (Flg. 8.7g). By comparing columns (b) and (g) we obtain
By inserting the values used above, one obtains S2 = 1.11 EU, i .e. , subsidence increases significantly (curve AG in Fig. 8.7g').
In summary, these simple examples have yielded the following deviations from the "normal" subsidence curve of a completely sediment-filled basin at constant sea level (where U = relative uplift, decreasing the rate of sub- sidence; and S = relative subsidence, increasing the rate of subsidence):
(c) Ending sedimentation, increasing water depth, WD: U, = 1.50 WD (d) Ending sedimentation, sea level faU, and erosion: U, = 2.58 EU (e) Ending sedimentation and sea level rise: U, = 0.24 h, - 0.45 EU (f) Sea level rise. continuous sedimentation: S, = 0.45 EU (g) Sea level rise, increasing sedimentation: S2 = 1.11 EU
From these data one can see the order of mag- nitude by which the subsidence curve of a particular basin may deviate from a smooth, exponentially decaying curve, which is usually expected for purely endogenetic processes such as thermo-tectonic subsidence. Conver- sely, one can deduce the effects of paleo-wa- ter depth, varying sedimentation rates includ- ing erosion, and eustatic sea level changes from these deviations, if the "normal" subsi- dence curve can be inferred from the uncor- rected curve (Fig. 8.7h).
This method can be used when the subsi- dence history comprises intervals for which the sea level can be assumed to have been at average level or constantly high or low. In addition, the basin investigated must have been filled up to sea level with sediments dur-
ing these intervals. Then the curve for a per- manently sediment-filled basin is found by interpolation, and the amount of deviation for a particular time span can be quantified. With the aid of sedimentation rates derived from stratigraphic dating and sedimentological-pa- leontological criteria for determining paleo- water depth, an attempt can be made to dis- criminate between the different factors caus- ing such deviations. Equations (8.15), (8.18), and (8.19) through (8.21) may enable a rough quantitative evaluation of these factors.
Thermo-Tectonic Subsidence
The purely thermo-tectonic part, T, of total subsidence can be calculated from the uncor- rected subsidence with the equation (Steckler et al. 1988):
where hgl = decompacted sediment thickness; other symbols as above.
In many cases, for example on continental margins (see below), the response of the litho- sphere to surface loads is not that of Airy- type isostatic compensation. Due to the strength of the upper lithosphere, the region around a load will also deform by flexural downwarping (Chap. 8.1). Hence, subsidence directly beneath the load will decrease. Conse- quently, all the results based on the equations in this chapter will yield maximum values for the amount of deviation from a given regular curve as well as minimum values for purely thermo-tectonic subsidence (Eq. 8.22).
In contrast to backstripping, "forward mo- deling" is a technique which first takes into account crustal parameters (extension, thermal heating and cooling, flexural behavior) in or- der to predict thermo-tectonic subsidence. Then additional loads (water depth, sediment thickness, eustatic sea level changes) are in- troduced which amplify and modify purely tectonic subsidence. Some results of this meth- od are presented in the following chapter.

Rift Basin Models and Observed Subsidence 327
8.3 Modeling of Rift Basins and Observed Subsidence Curves
Rift Models
The McKenzie Extension Model
Many sedimentary basins or part of them ori- ginate from continental rifting. These elon- gate, more or less symmetrical basins have a simple geometry, and the processes controlling their subsidence are relatively well known. Thus, several authors have made an attempt to simulate the subsidence history of such basins by means of a one- or two-dimensional model (e.g., McKenzie 1978; Cochran 1983b; Steckler et al. 1988). A one-dimensional model con- siders the uplift or subsidence of crustal col- umns or blocks which do not influence each other, neither mechanically nor by heat trans- fer, whereas two-dimensional models take into account such phenomena. The models are based on data shown in Fig. 8.1 and the fol- lowing additional assumptions:
- A relatively short phase o f horizontal stretching (extensional model for a finite- length rifting event) and crustal thinning are accompanied by passive upwelling of upper mantle material (Fig. 8.2b). This advection of heat above the original upper boundary of the asthenosphere (having a temperature of ap- proximately 1350 O C ) produces thermal expan- sion and thus uplift. The amount of isostatic adjustment of the thinned crust is greater than thermal uplift. Therefore, the combined effect of both factors is rapid initial subsidence dur- ing rifting. If the primary crustal thickness was 40 km, in a one-dimensional model this initial subsidence accounts for about 40 % of the total subsidence, including subsequent thermal subsidence (e.g., solid curves and curve B in Fig. 8.8). - The temperature within the uppermost mantle is assumed to be kept more or less constant by convection, but the solid litho- sphere acts as a heat conductor to the atmo- sphere. Rapid extension of the lithosphere and upwelling of upper-mantle material cause an increase in the geothermal gradient between
INITIAL THERMAL SUBSIDENCE
I
0 50 100 150 200
TIME AFTER ONSET OF RIFTING (Ma)
Fig. 8.8. Theoretical subsidence curves (solid lines) for for R = 4 and describe: A subsidence curve equivalent to different values of stretching factor, A, and finite rifting mid-oceanic ridge; Bthermalsubsidenceafterinstantanmus time, tR, of 25 Ma followed by thermal subsidence (one- rifting, and C thermal subsidence after tR 25 Ma. Steck- dimensional model proposed by McKenzie 1978, after ler et al. 1988). Note difference in subsidence of water- Sawer et al. 1982, modified). Dotted curves are calculated and sediment-filled basin (amplification factor 2.5, see text)

Chapter 8 Subsidence
the mantle top and the crustal surface (sea bottom) and thus, as already mentioned, an increase in the average lithospheric tempera- ture. This initial phase is followed by a long period of thermal subsidence as the lithosphere cools and thickens to its original, pre-exten- sion equilibrium thickness (Fig. 8 .2~) . The graphic expression of this subsidence is that of a decaying exponential curve (Figs. 8.8 and 2.10). Under the premises mentioned above, thermal subsidence may account for about 60 % of thg total subsidence (Fig. 8.8, except curves A and C). In the absence of other fac- tors (e.g., flexural effects), the asymptotic level to which the basin floor subsides is con- trolled by crustal thinning, expressed by the stretching factor D (Fig. 8.8), as well as by the amplitude of the exponential curve as a func- tion of lithospheric heating. The more thin- ing and heating the crust undergoes, the greater is the total subsidence of the basin floor.
Finite Rifting Time and Lateral Heat Transfer
The rather simplistic "McKenzie extension model" can frequently describe the first-order features of rifts and other sedimentary basins, but the detailed subsidence history of particu- lar basins derived from field data (Chaps. 8.3 and 12.1), possibly including periods of still- stand or even uplift, often deviates from si- mulations based on this model. It clearly neg- lects a number of additional factors (Chap. 8.1) which may considerably influence or mo- dify the subsidence curves.
One of the assumptions in the McKenzie model is that extension has occurred instanta- neously. Later calculations have shown that the error due to this assumption is small as long as rifting time does not exceed 20 Ma. However, the rifting stage of a basin may last longer (20 to 50 Ma and more; see, e.g., Zieg- ler 1988). Furthermore, the fact that there is also lateral heat conduction across the horizon- tal temperature gradient set up by lithospheric thinning should also be evaluated (Fig. 8.2b). The model proposed by Cochran (1983b) takes into account these two additional factors.
Example: Model parameters as in Chap. 8.1 and Fig. 8.1 ; also, h, = 31.2 km, thickness of lithosphere h, + h, = 125 km, p, = pa = 3.33 glcm3, temperature at base of lithosphere To = 1333 OC, thermal conductivity 0.0075 cal/(deg. cm- s). The lithospheric thermal time constant is 62.7 Ma.
Using these parameters, old, 125 km thick, continental lithosphere at sea level is in isostatic balance with oceanic
lithosphere containing a 5 km thick young crust 2.5 km below sea level, i.e., a ridge crest, later subsiding toward a final depth of 6 .4 km.
The following results are of interest:
- The history and mode of subsidence of the model basin (Fig. 8.9) are strongly influenced by the rifting time and by lateral heat transfer into the flanks of the basin. Instantaneous rifting without lateral heat loss (one-dimen- sional model, Fig. 8.9a) in the water-filled basin leads to equal amounts of initial (syn- rift) and thermal (post-rift) subsidence (in total 3.4 km). The basin floor (points B and C) subsides uniformly, and there is no change in elevation of the shoulder of the basin (point A). - In contrast, finite rifting times (5, 20, 50 Ma) and lateral heat transfer bring about an increase in syn-rift subsidence (Fig. 8.9b through d). The longer the rifting time, the greater will be the proportion of syn-rift sub- sidence in the total subsidence. - During early stages of the subsidence histo- ry, lateral heat transfer causes the margin of the graben (point B) to subside faster than its center (point C). It further raises the graben shoulder (point A). Toward the end of thermal subsidence, however, points B and C in the graben have reached about the same final depth, and the graben shoulder, due to ther- mal contraction following early expansion, approaches again its original elevation.
The subsidence curves (versus time) of these examples are shown in Fig. 8.10. They are calculated for the same stretching factor (I3 = 2). but take into account neither any sediment fill nor the possible effect of flexural response of neighboring crustal segments. An increase in the width of the hinge zone (e.g., from 20 km to 40 km, compare Fig. 8.9) has a large effect on the subsidence pattern near this zone, but little influence on the basin center.
Sediment Fill and Crustal Flexure
In the cross-sections in Fig. 8.11, the ad- ditional effects of sediment fill and flexural response of the adjacent crust are evaluated for the same model basin as discussed above. It is assumed that the basin will be filled up to sea level with sediment all the time. During the syn-rift phase, the sediment fill is com- pensated by local isostasy due to active fault- ing during that stage. Later, the sediment load may be compensated in a regional manner through lithospheric flexure as further discus- sed below. (Flexural rigidity was defined by the depth of the 450 O C isotherm, Fig. 8.ld,

Rift Basin Models and Observed Subsidence
I INSTANTA- 1 NEOUS
RIFTING, NO LATERAL HEAT FLOW
2 (IDIM. MODEL)
(2 DIMENSIONAL
4 I I I
0 20 b0 $0 80 km c B HINGE ZONE 4--'-+
R = l , I I 11.2,1.5'1 I I 2 I , , I 1.5,1.21 1 I .O I , Fig. 8.9a-d. Subsidence in cross section of model basin b). Dashed lines indicate development of basin due to showing effects of a particular finite rifting time; develop instantaneous rifting without lateral heat loss. Basin water- ment of subsidence (0, 9 , 36, and 100 Ma after end of filled, width 80 km; stretching parameter of basin floor R rifting), and lateral heat flow (solid lines, compare Fig. 8.2 = 2, at the hinge zone less. ( A h Cochran 1983b)
and thus varies in time and space across the basin).
This model variation demonstrates that lithospheric flexure is most pronounced if the phase of rifting and local isostatic adjustment is short. In this case, post-rift subsidence and thus total subsidence in the center of the sedi- ment-filled basin are reduced. This means that the amplification factor to convert the depth of a water-filled basin into that of a sedi- ment-filled basin becomes smaller than found from Eq. (8.10). This effect can also be seen from Fig. 8.10c, where the subsidence curves of the water- and sediment-filled model basin are shown for different rifting times.
On the other hand, a short rifting phase in conjunction with a strong flexural response of adjacent crustal segments causes wide areas outside the rift basin to subside and collect sediments. Hence, the rift shoulders also tend
to subside considerably in post-rift times after a short syn-rift period of uplift (Fig. 8.10a and b). However, the size of the basin increa- ses only slightly with time. With increasing rifting time, expansion of the basin out of the rifting region is delayed, and thus the width of the basin decreases (Fig. 8.1 1). However, the progressive onlap onto the unrifted area becomes more pronounced.
The transition from local to regional iso- static compensation at the end of the rifting phase is accompanied by reduced tectonic subsidence within the rift basin and may even lead to a short period of slight uplift. During that time, the rift shoulders are also still being uplifted by lateral heat flow from the rift into the hinge zone. Hence a slight unconformity between syn-rift and post-rift sediments may develop (not shown in Fig. 8.1 l) , a phenome- non which is also known from examples in na-

Chapter 8 Subsidence
b, GRABEN SHOULDER
I POINT A. BASIN WATER-FILLED,
1 - I POINT A, BASIN SEDIMENT-FILLED WlTH FLEXURAL RESPONSE OF ADJACENT CRUST
0 - ---- y 0 5 0 Ma - - 10-
0.5 -
0 krn
2 krn
NO FLEXURAL EFFECT
/O M a _ ~ , o * - ~ p
C, GRABEN CENTER (POINT C)
I
NO LATERAL BASIN WATER-FILLED, NO FLEXURAL EFFECT
BASIN SEDIMENT-FILLED, WlTH FLEXURAL EFFECT
DEPTH 8-- krn ----- L ------------- ----------- -
J/ , I
60 40 20 0 50 100 150 Ma RIFTING TlME f+> POST-RIFTING TlME
Fig. 8.10ac. Subsidence curves for three locations A, B, 1983b). Stretching factor in rift graben for all curves 0 = and C of water-filled basin without flexural effects (Fig. 2. Note that amount of syn-rift subsidence increases with 8.9) and sediment-fded basin including flexural effects growing rifting time at the expense of post-rift subsidence (Fig. 8.11) for different rifting times tR. (After Cochran
ture. Pronounced "breakup unconformities" in ancient sedimentary basins are, however, asso- ciated with the transition from rifting to an early stage of drifting and accretion of new oceanic crust (Chap. 12.2), which is not con- sidered in this model basin.
The simulated subsidence curves in Fig. 8.10 are modified somewhat further when the stretching factor, 0, does not increase linearly throughout rifting, as previously assumed, or when the lithosphere is thinned by an amount greater than that required by crustal extension. The latter situation may lead to some uplift during the initial phase of crustal thinning, but otherwise these variations in the model para- meten affect the subsidence curves very slightly. Similarly, greater compaction of deeply buried sediments in compari- son to younger deposits, a factor which is not taken into account in the simulations, does not significantly change the results.
Modifications of the Rift Model and Other Factors Controlling Subsidence
Several workers have refined or modified the subsidence models described above by intro- ducing additional factors, for example, the injection o f melt segregated from the mantle into the thinning continental crust (Keen et al. 1983). However, this mechanism does not significantly affect the results gained by the simpler models.
Another alternative supported by geophy- sical data from passive continental margins (see below) is the nonuniform or depth-depen- dent extension model (Royden and Keen 1980; Chenet et al. 1983). Whereas the uniform ex- tension model is based on the assumption that the entire lithosphere is subjected to the same stretching factor, 0, the nonuniform model takes into account differences in the amount of stretching between the upper and lower portions of the lithosphere.

Rift Basin Models and Observed Subsidence
POST-RIFT SEDIMENTS (REGIONAL FLEXURAL
0
SYN-RIFT SEDIMENTS (LOCAL ISOSTATIC COMPENSATION)
5
Fig. 8.11. Cross sections of sediment-filled and flexurally times, tR. Syn-rift sediments are assumed to be compen- influenced model basin with lateral heat loss (same model sated by local isostasy, but post-rift sediments cause regio- parameters as for Fig. 8.9b through d) after post-rifting nal (flexural) response of the crust. (After Cochran 1983b) thermal subsidence time of 100 Ma, but varying rifting
Observations in nature reveal that the upper crust in rift zones may show a series of tilted blocks separated by listric faults (Fig. 8.15a and b). The stretching factor derived from this geometry is usually much smaller than that needed to explain the substantial thinning of the under- lying, ductile lower crust. The additional attenuation of the lower crust is assumed to result from mass loss from the lithosphere to the mantle asthenosphere. Consequently, in this model tectonic subsidence is caused by two main mechanisms acting simultaneously: (1) extension by stret- ching the entire lithosphere, and (2) additional thinning of the lower crust by thermal processes.
Some authors favor the phase transition from gabbro (average density 3.0 g/cm3) to the den- ser eclogite (average density 3.5 g/cm3) in the lower lithosphere as a principal mechanism of subsidence (summarized, e.g., in Wyllie 1971; Artyushkov and Sobolev 1983). Dependent upon depth within the lithosphere (pressure),
this phase transition is accomplished at tempe- ratures of 700 to 800 O C and accelerated by the presence of small quantities of water. Anomalous heat transfer from the deeper mantle can raise this phase boundary and thus reduce lithospheric thickness without chan- ging the mass of a given lithospheric column on top of the isostatic compensation depth.
If, for example, the phase boundary migrates 10 km u p ward and consequently a 10 km thick column of gabbro is transformed into eclogite, then the thickness of the litho- sphere is reduced by approximately 1.5 km (without taking into account a possible additional sediment load or the simultaneous thermal expansion of the lithosphere). Becau- se this mechanism does not require horizontal extension of the lithosphere, it is quoted as the main factor for the formation of certain inland seas, such as the Black Sea, the Caspian Sea, or the Michigan Basin in North America.

Chapter 8 Subsidence
Phase transitions due to deep crustal metamor- phism may explain unloaded subsidence (or uplift) up to the order of 2 km. Such transi- tions may take place over a very long time period (order of 100 Ma) when small quanti- ties of water are pot available in the litho- sphere to speed the process. But it is doubtful whether phase transitions alone can cause the strong and rapid subsidence observed in many rift settings. Therefore it appears that deep crustal metamorphism is not the dominant me- chanism generating subsidence during rifting.
Finally, it should be mentioned that all the rift models discussed do not take into account the differential subsidence known from half- graben structures associated with "simple shear" (Chap. 12.2.1). These features appear to be very common in nature and frequently show an asymmetric basin fill as a result of stronger subsidence on the side of the basin with the master fault.
Subsidence of Rift Basins Inferred from Stratigraphic Sections
Young Rift Systems
One of the classic examples of a young tecto- nic graben is the Upper Rhine valley in cen- tral Europe (cf. Chap. 12.1). Continental rift- ing started in the Middle Eocene and has con- tinued into Present time. However, pure ex- tension of the lithosphere is superimposed by a left-lateral strike-slip movement. Partly for this reason, subsidence within the graben va- ries considerably by a factor of approximately 3. Figure 8.12b shows curves of maximum total subsidence in three parts of the graben. Typically, the highest rates of subsidence (ap- proximately 100 to 300 m/Ma) occurred dur- ing the first 10 to 20 Ma after the onset of rifting and therefore primarily represent local isostatic compensation. Subsidence has ended in the southern and middle part of the graben, while farther north, subsidence still proceeds at a slow rate. In fact, in the southern graben there is now a small amount of uplift, accom- panied by a relatively strong uplift of the graben shoulders.
The Dead Sea, which is also affected by strike-slip motion, has experienced subsidence rates of the same magnitude (up to 200 to 500 m/Ma, cf. Chap. 12.1). Other young conti- nental rift zones, such as the western branch of the East African rift system which started to evolve 7 to 12 Ma ago, exhibit maximum
average subsidence rates of 500'to 1000 m/Ma (based on data summarized by Ebinger 1989). These high values are valid for the master .fault in asymmetric half-graben structures, and they differ markedly from basin to basin in the segmented rift zone.
Older Continental Rift Zones
Older continental rift zones frequently display a large degree of total subsidence over the long term, although the rate of subsidence may be relatively low. Three wells from the Paris basin demonstrate that central parts of the basin, i.e., the former rift basin, began to subside earlier than locations outside of the rift in the flexurally controlled portion of the basin (Fig. 8.13b). The North Sea basin has a long and complicated history of subsidence (Ziegler 1988), causing deposition of Permian to Mesozoic sediments up to several kilometers in thickness.
A generalized curve of total subsidence in the sediment- filled Viking graben, in the northern North Sea, shows three distinct phases of increased, fault-related subsidence during the Triassic, late Jurassic, and early Tertiary (Fig. 8.13b, from Beach et al. 1987). Most wells drilled in the central North Sea, representing a failed rift zone, also indicate accelerated post-Middle Cretaceous subsidence (around 20 m/Ma), the general trend of which is shown in Fig. 8.13b. Whether this subsidence was entirely due to continental stretching (e.g., Sclater and Christie 1980; Sclater and Shorey 1989; Beach et al. 1987) or caused mainly by mineral phase transition in the lower crust ( M y - ushkov and Baer 1989) still appears to be an open question (also see Chap. 12.1).
Continental sag basins show long-persisting subsidence at very low rates (average 10 to 20 m/Ma, compare Chap. 12.4).
8.4 Passive Continental Margins
Concepts for Modeling Passive Margin Subsidence
Passive continental margins evolve from a rift basin into a wider oceanic basin due to the accretion of new oceanic crust. They com- monly develop on both margins of the grow- ing ocean and therefore include one half of the former rift basin. Continuing tectonic subsidence and sediment accumulation usually cause a landward and seaward extension of the depositional area (cf. Fig. 8.16). Under these

Passive Continental Margins
Fig. 8.12a,b. Subsidence of young passive continental (Rh 28,30, 47), subsidence ceases earlier in middle (Rh % margin at southern end of Baja California (Curray et al. and 108) and southern part (Rh 142 and 143) of the Rhine 1982b, cf. Figs. 4.5 and 12.37) and decompacted curves of graben, and is followed by slight uplift. Insert subsidence maximum subsidence for Rhine graben, southwest Germa- rates in mlMa ny (Roll 1979, cf. Fig. 12.2). In contrast to northern part
a b
conditions, flexural response of the adjacent continental and oceanic lithosphere becomes a primary factor in passive margin subsidence in addition to local, Airy-type isostatic compen- sation.
As already discussed in the previous sec- tion, some recent simulations of rift basin de- velopment use a two-layer model of the litho- sphere. In addition, many seismic investiga- tions have revealed that there is a disconti- nuity between the upper and lower continental crust, commonly at a depth of about 10 to 15 km (Fig. 8.15a and b). This discontinuity is explained as the transition from the brittle to the ductile state of the crust. Extension of the brittle material leads to the formation of listric
0
1 -
2 -
3 -
4
km
faults and tilted blocks, whereas the ductile lower crust is deformed by creep (Fig. 8.15b). Although the manner of stretching is differ- ent, it is nevertheless a uniform extension of the crust, i.e., the thicknesses of both layers are reduced by the same stretching factor (one-layer model).
This amount of stretching is not sufficient, however, to predict the actual amount and history of subsidence observed on many pas- sive continental margins. Therefore it has been proposed that an additional thinning of the lower part of the lithosphere takes place (Fig. 8.15a and b), which is caused by heat transfer from the mantle to the lithosphere but does not involve extension (Chenet et al. 1983).
10 0 Ma B.P. 40 30 20 10 0 Ma I I I I
RHlNE GRABEN RIFTING
I j
AFTER ONSET OF SEA-FLOOR SPREADING
GULF OF / CALIFORNIA.
i DSDP SITES
"\ 475 AND 476 PRESENT DEPTHS
-.
rn/Ma
500 100 50

Chapter 8 Subsidence
a 150 100 , 50 0 Ma I , l l l l l l l l l I , ,
CRETACEOUS I TERTIARY B.P.
JURASSIC 0.2
- .- .- -- '
SEDIMENT PALEO-WATER DEPTH 1-1 \ \ -l -- SURFACE
Fig. 8.13. a Total and thermo-tectonic Jurassic to Neogene Greenlee et al. 1985). b Total subsidence determined from subsidence at well C.O.S.T. B-2 on U.S. Atlantic conti- wells in central and marginal parts of Paris basin (Cochran nental margin, as affected by long-term sea level changes, 1983b) and general trend of subsidence in North Sea basin variations in bathymetry (including periods of emergence), (curve NN from Beach et al. 1987; trend CN from Sclater and volcanism (initiation of second cooling cycle). (After and Christie 1980). See text for explanation

Passive Continental Margins
Hence, the apparent stretching factor, B, of the lower layer of the crust becomes greater than that of the upper layer (two-layer model). This thermal effect may also lead to an up- ward shift of the 450 O C isotherm and thus to a thinning of the effective elastic thickness of the lithosphere adjacent to the rift basin (Fig. 8.15 c). This in turn will reduce the flexural rigidity of the lithosphere and therefore pro- mote downward bending and the formation of a sediment wedge adjacent to the rift basin.
The following examples of passive conti- nental margins take into account these proces- ses in the development of the rift basin, as well as thermal thinning of the effective ela- stic thickness of the adjacent lithosphere. First, some subsidence curves for single sites are described, before we proceed to differen- tial subsidence along transects across conti- nental margins.
Examples of Simulated and Observed Subsidence
Young Passive Margin, Gulf of California
The rifting phase of the very young passive continental margin at the southern tip of Baja California (cf. Chaps. 12.1,4.3, and 12.8, Figs. 9.13, 4.5 and 12.37) is characterized by a sub- sidence rate (around 200 m/Ma) of the same magnitude as the early rifting phase in the Rhine graben (Fig. 8.12) and in other young continental rifts. This value was found in two drillholes (DSDP Sites 475 and 476, Curray et al. 1982b) on the relatively steep continental slope 6 to 10 km away from the outer edge of the subsided continental crust. With the onset of ocean spreading in the southern Gulf of California 3 to 4 Ma ago, subsidence at these sites accelerated up to at least 1000 m/Ma for a very short interval, before slowing down again.
Subsidence and Burial History at Single Sites in the Northwestern Atlantic
Real subsidence curves for single locations within a sedimentary basin have been worked out for many regions. They are usually based on deep drillholes with well studied stratigra- phic sections which include paleoenvironmen- tal interpretations (cf. Chap. 8.2).
The results of such a study from the Grand Banks off Newfoundland, i.e., on the north-
western Atlantic continental margin, are shown in Fig. 8.14 (Agterberg and Gradstein 1988, for location see Fig. 12.7).
Well Hibernia 0-35 was drilled on the edge of a graben which has been subsiding since the early Jurassic; Puffin B-90 is near the southern transform margin of the Grand Banks; and Gabriel C-60 lies farther east close to the edge of subsided continental crust. The latter two wells were affected by rifting later than Hibernia (Fig. 8 .14~). All three sites are characterized by a lower Cretaceous clastic wedge (sedimentation rate 10-25 cmlka) with a major sand influx around 120 Ma (Fig. 8.14a). By contrast, sediment accumulation was markedly reduced between about 80 to 40 Ma B.P., as a result of high sea level and a hinterland of low relief.
Figure 8.14b depicts the total subsidence and burial history of individual stratigraphic units at the Hibernia site, taking into account changing paleo-water depths and increasing compaction with burial. Short intervals in the curves characterized by steep gradients reflect time periods with high sedimentation rates. Thermo-tectonic subsidence differs consider- ably between the three sites mentioned above; the Gabriel well on the outer margin exhibits greater subsidence than the other two sites.
All three wells, however, show less sub- sidence than would be expexted for purely oceanic crust or continental crust with 60 Yo dike injection. The principal reason for this difference is the fact that subsidence in the theoretical curves starts at a depth of about 2 or 2.5 km below sea level, while the observed curves begin near sea level.
A second example from the shelf off New Jersey (well C.O.S.T. B-2, Greenlee et al. 1988) displays the effects of changing bathy- metry, long-term sea level fluctuation, and an early Cretaceous volcanic episode on total and thermo-tectonic subsidence (Fig. 8.13a). In fact, the long-term sea level curve was par- tially inferred from the observed total subsi- dence and from the other parameters control- ling subsidence. In this example, the combined effect of volcanism and rising sea level has caused a significant positive excursion of the actual subsidence curves from "normal beha- vior. Neglecting these processes, the reduced sediment accumulation during the late Creta- ceous and Paleogene would have led to de- creasing subsidence rates.
Passive Continental Margin Transect, Northern Biscay
A particularly interesting example for study- ing the tectonic subsidence of a passive conti-

Chapter 8 Subsidence
AGE (Ma)
PALEO-WATER DEPTH - m
DECOMPACTED
"BASEMENT"
STRATIGRAPHIC BOUNDARIES
COMPACTED
----_____,'.
THEORETICAL
THEORETICAL
Fig. 8.14ae. Example of subsidence and burial history c Inferred thermo-tectonic subsidence ofthree Grand Banks from Grand Banks continental margin, northwestern Atlan- wells as compared to theoretical curves for thinned con- tic. a Sedimentation rates at well Hibernia 0-35. b Varia- tinental crust with 60 % dike injections and pure oceanic tions in water depths, compaction and burial histories of crust. (Agterberg and Gradstein 1988) stratigraphic units (total subsidence) at well Hibernia 0-35.

Passive Continental Margins
nental margin transect is the northern Biscay (Goban Spur), because here the sediment co- ver is relatively thin (cf. Chap. 12.1). In this sediment-starved area, active rifting took place during the lower Cretaceous in a pre- existing shallow-marine basin without any indications of doming. The thicknesses of the upper and lower crust were reduced in a way similar to that shown in Fig. 8.15a and b.
At the end of rifting in Aptian time (120 Ma B.P.), a sub- marine trough 2.5 km deep had developed, although the upper crust was extended by only 10 to 15 % (stretching factor 0 = 1.1 to 1.15). The topography of the sea floor during that time can be reconstructed using information from drill holes, dredging and seismic data. In a transect through this passive margin, post-rift subsidence, i.e., from late Aptian to Present time, increased seaward until it reached a similar amount as the oceanic crust at the conti- nental-oceanic crust boundary (Fig. 8.1%).
If the thinning of the total crust (due to both extension and thermal attenuation) is taken into account (using the thinning ratio, B, in the same way as the stretching factor in the uniform extension model), the relationship shown in Fig. 8.15d can fairly well predict the observed data. A second possibility is the evaluation of different stretching factors for the upper and lower layers of the lithosphere. Most of the post-rift subsidence (up to 4000 m) can be attributed to cooling of the litho- sphere, which was previously thinned during the rifting phase.
Atlantic Passive Margin Transect, North America
One of the best studied examples of flexural response of the crust to sediment loading is the Atlantic passive margin of North America. In order to apply the method of "forward modeling" (Chap. 8.2) for determining subsi- dence and sediment accumulation, the assumptions shown in Fig. 8.16a and b were made (Steckler et al. 1988). Seaward of the hinge zone, the crust and lithosphere are thin- ned by similar amounts, but landward solely the lower part of the lithosphere is affected by thermal contraction.
Continental breakup and rifting started during the Triassic and ended during the middle Jurassic. The resulting subsidence and thickness of syn-rift sediments (Fig. 8.17 a) are primarily controlled by local isostasy as described above. Directly seaward of a 30 to 50 km wide hinge zone, which marks the tran- sition from relatively undeformed thick conti-
nental crust to highly thinned and heated crust of the rift basin, the syn-rift sediments ap- parently reach their greatest thickness (cf. Fig. 8.6). With the onset of drifting, local subsi- dence in the former rift basin slowed and was followed by a broad downsagging of the evolving continental shelf and slope including the neighboring continent.
As a result of flexural downwarping, a landward thinning wedge of coastal plain se- diments was developed, which began in the late Jurassic and extended during the lower Cretaceous more than 300 km inland. The fact that Jurassic sediments are nearly absent at the base of this sediment wedge (observed data shown in Fig. 8.17b) strongly indicates addi- tional heating of the lithosphere adjacent to the rift basin. During the late Cretaceous, most of the flexure-induced part of the shelf basin was filled up. Near the hinge zone the thickness of this sediment wedge is about 4 km.
Passive Margin Transect, Southern Australia
A third example (Fig. 8 .17~) displays results of a similar "forward model" for the passive margin of southern Australia. The syn-rift phase is characterized by rapid tectonic sub- sidence of about 50 m/Ma (even higher values for total subsidence!). The maximum thickness of syn-rift sediments (more than 5 km), com- prising 25 to 30 Ma (during the early Creta- ceous), is again found directly seaward of the hinge zone, although here the thinning of the lithosphere (13 = 3.5 to 4.2) is less than farther seaward (B = 6.2).
The high stretching factor of 0 = 6.2 at the continent- ocean boundary signifies that the initial thickness of the continental crust (31.2 km) is thinned to average oceanic crust thickness (5.0 km).
The syn-rift sediments also reach great thick- nesses on the 100 km wide hinge zone (B = 1.2 to 1.6). In the subsequent post-rift or drifting phase of 100 Ma, subsidence is controlled by cooling and contraction of extended lithos- phere, as well as by the flexural response of the lithosphere landward of the hinge zone. The thickness and extent (200 km) of the landward sediment wedge is less than in the previous example, probably due to the wide hinge zone.
Some simulated and observed tectonic subsidence curves are compared in Fig. 8.18. They have been derived from drill holes on the south Australian continental margin and

Chapter 8 Subsidence
RIFTING
4 4
IN~TIAL BASE OF CONT. CRUST
THINNING OF CONTINENTAL CRUST (WITHOUT EXTENSION)
b EXTENSION OF BRITTLE UPPER CRUST (TILTED BLOCKS BOUNDED BY LlSTRlC FAULTS)
6 krn
OCEANIC CRUSl
DUCTILE CREEP
SHELF THINNED CONTINENTAL CRUST CONTINENT-OCEAN BOUNDARY I I I 1
50 100 150 *
0 200 krn
0
-RIFT SUBSIDENCE
2
4
6
DEPTH (km)
d THINNING RATIO O
1 1 . 5 2 3 4 5 6 1
PREDICTED FROM
OBSERVED
krn TECTONIC SUBSIDENCE, Z

Passive Continental Margins
LITHOSPHERIC NO VERTICAL EXAGGERATION
Fig. 8.16a,b. Conceptual models (cross-sections) of U.S. hinge zone (besides uniform thinning seaward and within Atlantic passive continental margin showing extension and the hinge zone, R stretching factor). b Thickness of effec- thinning of continental crust and lithosphere as a result of tive elastic plate defined by 450 OC isotherm. See text for rifting and drifting with accretion of new oceanic crust. a explanation. ( A h r Steckler et al. 1988) Additional thinning of the lithosphere landward of the
Fig. 8.15a-d. Conceptual model of passive continental margin showing combined effect of a thermal thinning and b stretching of the crust, generating tilted fault blocks in the brittle upper crust and ductile creep in the lower crust. S discontinuity of seismic velocity at the transition from brittle to ductile material; M Mohorovicic discontinuity. (After Chenet et al. 1983). c Theoretical curves of post-rift subsidence versus time for different locations on a transect through sediment-starved northern Biscay margin similar to
b. (After Montadert et al. 1979). d Relationship between thinning ratio (corresponding to stretching factor, U, calcu- lated for total crust regardless of whether it is extended or thermally thinned, hence analogous to uniform stretching model) and subsidence of sediment-starved passive margin, northern Biscay. Hatched observed subsidence of crust backstripped from sediment load since rifting. A maximum subsidence computed from extension of upper crust. (After Chenet et al. 1983, based on Le Pichot and Sibuet 1981)

340 Chapter 8 Subsidence
b DRILL HOLES SHORELINE
VERTICAL EXAGGERATION x 50
VERTICAL EXAGGERATION x 25
BASEMENT 2 -
I VERTICAL
Fig. 8.17ae. Synthetic stratigraphic cross sections of pas- sive continental margins using flexural loading model. a Coastal plain and shelf region of New Jersey, two-layer model with thinning of elastic lithosphere landward of hinge zone (cf. Fig. 12.7; after Steckler et al. 1988). Note pinching out of Jurassic sediments beneath coastal plain and onlap of early Cretaceous onto basement.
- 0
- 2
- 4
- 6
- 8
-10
krn
b Observed New Jersey section based on drill holes. c Southern Australian margin, onelayer model, stretching factor (I3 = 6.2) seaward of the hinge zone larger than in a, where B = 4. Onlap of post-rift sediments onto base ment where no stretching occurred (B = 1); both subsiden- ce and sedimentation rates decrease versus time. (After Hegarty et al. 1988)

Passive Continental Margins 341
TIME (Ma)
TECTONIC SUBSIDENCE (km)
A, TOTAL SUBSIDENCE 2.6 km
Fig. 8.18. Comparison of model results (solid lines), using varying stretching factors, a, and rifting times between 25 and 30 Ma, with observed tectonic (not total) subsidence (dofted lines) for wells drilled on the passive continental margin of southern Australia. Total subsidence due to sedi- ment loading is about 2.5 times tectonic subsidence. (After Hegarty et al. 1988)
corrected for sediment loading. The good fit of many syn- thetic curves with the real curves is taken as evidence that the model assumptions are adequate.
The subsidence history can be subdivided into two phases, a rifting stage with rapid tectonic subsidence lasting around 25 to 30 Ma, and a post-rift margin development (drift phase) with distinctly slower rates of subsidence as a consequence of cooling and contraction of the lithosphere.
The isochrones for post-rift development (Fig. 8.17a and c) display decreasing sediment
accumulation versus time, which is a result of the assumption that the average water depths in the cross section have remained the same all the time (this is also assumed for the model in Fig. 8.17a). In reality, the sedimentation rates may vary considerably and therefore bring about changes in water depths as well as in the location of the shelf edge which often does not coincide with major structural boundaries of the continental margin. Minor modifica- tions of these models are caused by sea level changes which may generate erosional uncon- formities (Chap. 7.2).
Concluding Remarks on Passive Continental Margins
All these examples of passive continental mar- gins show a relatively good agreement between simulated and observed subsidence curves. In many cases, however, subsidence histories are more complex. Rifting and crustal extension may occur in several distinct phases and thus cause subsidence curves with repeatedly stee- pening gradients. Such a situation was found, for example, for the Mesozoic shelves of the alpine Tethys (Swiss Plateau and Jura Moun- tains), which experienced major subsidence phases in the Triassic, early Jurassic, middle Jurassic, and early Cretaceous (Wildi et al. 1989), but only part of these phases were ac- tive at one location.
The sedimentary sequences of subsiding passive continental margins are discussed in Chapter 12.2.
8.5 Subsidence of Basins Related to Tectonic Loading, Subduction, and Strike-Slip Motion
Foreland Basins
General Aspects and Problems
The primary factor producing foreland basins in front of overthrusting mountain belts is flexure o f the lithosphere. Foreland basins develop on continental crust loaded by the vertical weight of an approaching overthrust belt as well as by the lateral force exerted by plate compression (cf. Chap. 12.6). Although the quantification of overthrust loads appears

342
to be very difficult, some authors (e.g., Watts et al. 1982; Quinlan and Beaumont 1984) have made an attempt to model such a situation for different time steps. There are, however, ex- amples (e.g., the Apennines and Carpathians) where the mountain belt overthrust load ap- pears to be insufficient to create the existing foreland basins. In these cases, a deep basin already existed on top of the foreland plate prior to overthrusting. Thus the approaching load did not produce a marked topographic high and its effect on the underlying plate was limited.
Another serious problem, as already dis- cussed in Chapter 8.4 and summarized by Allen et al. (1986), is the rheological state o f the crust being flexed. Neither the model as- sumption of a purely elastic nor of a visco- elastic plate appears to be adequate to suffi- ciently explain the observed phenomena. The elastic plate model fails to account for the observed rapid relaxation of the lithosphere to a loading event, and the visco-elastic model implies the unrealistic prediction that flexural stresses vanish to zero over geological time. Therefore, additional assumptions are being proposed for the modeling of foreland basins. A thermo-rheological model including time- dependent effects may be better suited to explain both short-term relaxation and long- term finite rigidity of the lithosphere. Rapid subsidence and sedimentation in active fore- land basins produce thermal anomalies within the sediments and the lithosphere which later decay. Consequently, the mechanical state of the lithosphere changes considerably through time.
In this context, it is also important to note that foreland basins, at least their internal parts, are often superimposed on a passive continental margin, i.e., on lithosphere which was already mechanically extended and had thermally subsided. As overthrusting contin- ues, the orogenic belt progressively loads more rigid lithosphere on the landward side of the former margin. Variations in flexural rigidity along the strike of mountain belts may lead to unpredictable lateral changes in the subsidence history of foreland basins. This is, for exam- ple, postulated for the northern margin of the Indian plate which was exposed to the load of the overthrusting High Himalayas (Lyon-Caen and Molnar 1985).
Finally, in some cases the behavior of the foreland plate may be strongly affected by low-angle subduction from the side opposite to the approaching overthrust belt. As a con- sequence of the doubled thickness of the
Chapter 8 Subsidence
lithosphere, the foreland plate undergoes sig- nificant uplift and may therefore greatly in- fluence the geometry and subsidence history of the foreland basin. Such a mechanism (sub- lithospheric loading) is postulated for the up- lift of the Colorado Plateau in North America and the rapid subsidence of the adjacent ba- sins during the Upper Cretaceous (Cross 1986).
For all these reasons, modeling the deve- lopment of foreland basins probably remains a difficult task and is therefore not further treated here. A qualitative understanding of the processes involved is very useful, how- ever, in studies of the development and sub- sidence history of such basins.
Examples o f Subsidence Curves
The examples in Fig. 8.19 demonstrate some general trends found in several foreland basins of various ages. During the pre-molasse stage, total subsidence frequently resembles that of passive continental margins characterized by exponential decay. The rates of subsidence depend on the stage of evolution of this pas- sive margin as well as on the location of the site investigated. Sites close to the former ocean or remnant basin experience higher subsidence than landward sites (Fig. 8.19b, example of Venetian basin). With the ap- proaching overthust belt (cf. Fig. 1.2), subsi- dence accelerates and may operate at very high rates in the subalpine region (total sub- sidence 100 to 300 m/Ma) for a short time interval.
For the Swiss Alps foreland, Homewood et al. (1986) inferred a thrust dip progagation of 7 mmla and a conver- gence rate decreasing from around 8 to 2 mmla during basin evolution (also see Chap. 12.6.3).
As soon as plate collision is complete and con- vergence comes to an end, the downgoing plate is not further subject to increasing loads. Consequently, subsidence slows down quickly. In the northern foreland basin of the Alps, rapid subsidence is followed, after a very short time interval, by uplift (Fig. 8.19b). This may be explained by crustal rebound due to isostatic adjustment of the thickened crust, by removal of the negative thermal anomaly built up in the lithosphere under overthrusting (Kominz and Bond 1986), as well as by ero- sional unloading of the emerged, high-relief frontal overthrust and fold belt.

Basins Related to Tectonic Loading, Subduction, etc.
a 300 200 1 00 0 Ma
1 -
( G E W UNION OYSTER WELL)
2 -
FORELAND BASIN SUBSIDENCE
3 - km
3 '. \
..\ li 2 GERMANY
MOLASSE 1
V, VENETIAN BASIN, S. ALPS, 100 km u ITALY. (V, NEAR THRUST
BELT, V,, AT OUTER MARGIN)
Fig. 8.19a,b. Subsidence histories of various foreland tectonic subsidence, while the other curves represent total basins. All long-term curves show a pre-molasse phase, subsidence (Alberta curve corrected for compaction; Utah commonly characterized by slow to medium subsidence curve from Cross 1986). b Examples of total, uncorrected rates, and a molasse phase of rapid subsidence with the subsidence curves from northern Alpine molasse basin onset of foreland basin evolution. a Examples of the Rocky (After Lemcke 1974) and Venetian basin, southern Alps Mountains foreland in North America and the northern (Massari et al. 1986). Note strong rebound, particularly in Helvetic zone of the Alps (Funk 1985). Note that Denver western portion of molasse basin in front of Swiss Alps and Green River curves (Kominz and Bond 1986) indicate
Chapter 8 Subiidence
Subduction-Related Arc-Trench Sys terns
As in foreland basins, flexure of the litho- sphere in conjunction with subduction is an important mechanism for generating deep-sea trenches. In this case, however, the crust is oceanic and much thinner than continental crust. The subducting oceanic plate is under- thrust beneath an accretionary prism and an island arc or continental margin (cf. Chap. 12.5). The vertical load of these overriding bodies varies with the dip angle of subduction and the landward increasing thickness of the accretionary prism and magmatic arc. In ad- dition, lateral forces exerted by convergence and the subduction rate play some role, at least in parts of the arc-trench system.
As described in Chapter 12.5 (Fig. 12.26), the seaward and central portions of an accre- tionary prism, as well as the magmatic arc, tend to gain in elevation with time, while the forearc and backarc regions subside. The depth of the trench floored by the subducting oceanic plate may be comparatively stable through time due to the establishment of steady-state conditions, i.e., a kind of balance between incoming and accreting sediment (Chap. 12.5.2).
Subsidence of the forearc region is con- trolled by the nature of the underlying crust, which may be oceanic or intermediate. Sea- ward parts of the basin fill may rest on de- formed sediments of the accretionary wedge (composite forearc basins, Chap. 12.5.3). The subsidence of backarc regions varies in rela- tion to the lack or occurrence of backarc spreading and overthrusting of the magmatic arc. Consequently, both the total amount and rate of subsidence are very variable in forearc and backarc basins, but they may reach high values during their evolution. It is evident from these points that the subsidence histories are problematic to simulate for such tectonic settings .
Pull-Apart Basins
Strike-slip movements commonly operate at high rates, but commonly persist only for limited time periods (Chap. 12.8). Particularly
in transtensional systems, they cause signifi- cant crustal extension or the opening of a crustal "gap" which is filled by upwelling magma. Consequently, the early stage of basin formation is accompanied by rapid subsidence which, due to lateral heat loss, may be even higher than that of rift basins. In this case, subsidence can be modeled in a way similar to that described for rift basins (see above and Fig. 12.35).
However, many pull-apart basins show a complex subsidence history with more than one pulse of rapid subsidence. In addition, subsidence may be followed by a period of uplift. Such complications have been described from the onshore Tertiary basins in Califor- nia, such as the Los Angeles, Sacramento, Salton Trough, Ventura, and other basins (Dickinson et al. 1987; Mayer 1987). Changes in subsidence trends are probably caused by the transition from transtensional to transpres- sional deformation (see Chap. 12.8), but other processes such as volcanism associated with wrench faulting may also play a part.
Conclusions
As summarized by Dickinson and Yarborough (1976) and evident from the discussion in this chapter, the various basin types display a spe- cific trend in their subsidence history. Rift basins, pull-apart basins, passive continental margin and oceanic basins show a concave-up shape of their subsidence curves indicating exponential decay. By contrast, orogenic ba- sins subject to tectonic loading (remnant and foreland basins, many backarc basins) are characterized by convex-up sections in their subsidence curves. In the later stages of evolu- tion, however, subsidence of these basins slows and is frequently followed by uplift. Failed rifts and aulacogens exhibit composite, S-shaped subsidence curves with an early convave-up and later convex-up section. In addition, the (total) subsidence curves of many sedimentary basins are modified significantly by local tectonic processes, variations in pa- leobathymetry, volcanic events, and other factors mentioned in this chapter.

9 Denudation: Solute Transport and Flux Rates of Terrigenous Material
9.1 Weathering and Soils Introduction Weathering, Soils, and Composition of Terrigenous Sediments (Overview)
9.2 Chemical and Mechanical Denudation Rates from River Loads 9.2.1 Chemical Denudation
General Aspects Rock-Specific Phenomena, Groundwater Chemistry Denudation Rates in Various Rock Units and Morpho-Climatic Zones
9.2.2 Mechanical Denudation from Solid River Load General Aspects Mechanical Denudation Rates in Relation to Relief and Climate
9.2.3 Chemical Versus Mechanical Denudation Rates 9.3 Mineralogical Composition of Suspended River
Loads General Aspects and Problems Results and Interpretation Detrital Clay Minerals in Marine Sediments
9.4 Long-Term Denudation Rates from the Sediment Budget of Various Basins Introduction Example of a Closed Basin (Chad Basin) Examples of Semi-closed Basins (Black Sea, Gulf of California) The Himalayas-Bengal Deep-Sea Fan Denudation- Accumulation System Summary
9.5 Tectonic Uplift, Denudation, and Gwmorphology 9.5.1 Long-Term Denudation Rates from Changes in
Topography 9.5.2 Gwmorphological Consequences of Denudation
Cuestas (Model) Differential Denudation in the Amazon Drainage Area (Model)
9.5.3 Interrelationship Between Tectonic Uplift and Denudation Uplift Rates Long-Term Epeirogenic Uplift and Denudation (Model) Uplift and Denudation of Orogenic Belts (Model)
9.1 Weathering and Soils
Introduction
Most of the sediment deposited in sedimentary basins is derived from land areas exposed to subaerial weathering. To some extent, this is also true for biogenic and chemical sediments, insofar as their production depends on the dissolved river load delivered into the sedi- mentary basins. The land-derived, solid ma- terial is usually referred to as the terrigenous, allochthonous, clastic component of a sedi- mentary deposit.
Due to weathering and erosion, the land surface is slowly lowered. The average amount of this lowering in a certain region over a given time span is defined as the denudation rate. Denudation involves the transport of bedrock, soil, and vegetation mass into con- tinental basins or into the oceans. This mass transfer is brought about by a variety of physical, chemical, and biological processes. Rainfall, surface runoff, and river transport are the most important transport agents, but groundwater circulation, ice and wind trans- port also play a significant part in many regions. Mass transfer to a marine basin may take place discontinuously due to intermediate storage as soils, continental sediments, and lake deposits.
Disintegration of rocks due to stress release, as well as thermal expansion and contraction is apparent even at a depth of several tens of meters below the land surface (Fig. 9.lb). Newly formed joints near the surface and in- creasing pore space favor the circulation of water and thus accelerate mechanical and chemical weathering. The zone of most pro- nounced weathering is near the surface in the pedosphere, where biological activity also promotes the alteration of rocks and minerals. In general, large, thermodynamically unstable minerals are transformed into smaller, stable components such as clay minerals ("mineralo-

Chapter 9 Denudation and Mass Transport
CLIMATE: HUMID TROPICAL
MOST ROCK I
PRESERVED \"'' \"'I (CARBONATE DISSOLVED)
DESTRUCTION OF OLIVINE, AMPHIBOLES, ' HORNBLENDE. PLAGIOCLASE, ORTHOCLASE
'IN PLACES BAUXITE AND FERRICRUSTS
HUMID TEMPERATE
SLOW DE- >% STRUCTION OF ROCK MINERALS
D~SSOLUT~ON OF CARBONATES
ARID TO SEMI-ARID
MINERALS PRESERVED
-IN PLACES CALCRETE AND/OR SILCRETE
b ZONE OF STRONG CHEMICAL-MINERALOGICAL AND MECHANICAL WEATHERING (SOIL ZONE)
TO SEDIMENTARY BASIN
PREDOMINANTLY - - - - RIVER MECHANICAL DIS INTEGRATION
INTEGRATION OR CHEMICAL LEACHING
(DECREASING DUE TO (INCREASING AT THE MECHANICAL ABRASION) EXPENSE OF BED LOAD)
C CONTRIBUTION TENDENCIES FOR
/ ', TO SOLID RIVER LOAD CLASTIC \
SOIL ZONE DISSOLVED SEDIMENTS RIVER LOAD
HUMID TROPICAL PREDOMINANCE CLIMATE OF NEo-cLAy 3 rlE,"X̂'.:19:i, ca,
MINERALS Mg , HCO3, SiOt ,
QUARTZ SAND, MICA, CLAY, IN TOTAL MEDIUM,
MINERALS DERIVED 3 OFTEN RICH IN FROM BOTH SOILS Ca, Mg, HC03 AND PARENT ROCKS
I / / \ r IN TOTAL LOW, LOW - - - - - - - - - - - - POOR IN MOST - - -3 QUARTZ SAND, MAIN CONSTITUENTS,
ABUNDANT BUT LOCALLY HIGH FELDSPAR, ETC., DUE TO EVAPORATION REDEPOSITION OF OR DISSOLUTION OLDER CLAY
/ MINERALS OF SALTS
PARENT ROCK AND ITS MINERALS
Fig. 9.la-c. Qualitative relationship between climate, wea- particulate and dissolved load. c General trends in clima- thering, and delivery of clastic sediments as well as dis- tically-controlled production of clastic sediments and the solved materials into sedimentary basins. a Intensity and input of dissolved constituents into sedimentary basins. depth of destruction (or preservation) of parent rock miner- Note that the temperate and especially the arid to semi-arid als and formation of clay-type nw-minerals (including regions can deliver substantial amounts of unchanged pa- oxides and hydroxides of A1 and Fe). b Different zones of rent rock material and nonaltered minerals (including clay weathering, resulting denudation, and river transport of minerals)

Weathering and Soils
gical" weathering). At the same time, the parent minerals lose part of their solid matter by chemical reactions and dissolution ("che- mical" weathering). Thus, the entire alteration process should really be referred to as "chemi- cal-mineralogical" weathering, but it is fre- quently called chemical weathering. Several minerals are completely dissolved, such as car- bonate minerals.
Whereas in arid climates rocks are broken down mainly by mechanical processes, chemi- cal-mineralogical and biological weathering is dominant in wet climates. The products of chemical weathering are best developed in lowland areas or on flat plateaus, where the altered material, the regolith or saprolite, cannot readily be removed from its parent rock. Hence, deeply weathered profiles of completely altered parent rock are common in tropical lowlands (Fig. 9.1 a).
Regions of high topographic relief in con- junction with substantial rainfall are most important in delivering particulate matter into rivers. As Carson and Kirkby (1972) and others have pointed out, erosion on hillslopes is controlled by the weathering rate and transport processes which remove the disin- tegrated, loose material at the surface. Erosion may be "weathering-limited, if the capacity of the transport process exceeds the rate at which erodible material is generated by wea- thering. As a result, the bedrock is exposed and the slopes tend to steepen, thus further promoting mechanical denudation. In contrast, erosion is "transport-limited, if more material can be supplied by weathering than can be removed by transport processes. In this case, thick soil profiles develop, and transport of materials in solution predominates.
Weathering, Soils, and Composition of Terrigenous Sediments (Overview)
Climate Control
In humid tropical and subtropical regions, carbonate is completely removed in solution from the regolith. The newly formed clay minerals (neo-minerals), for example kaoli- nite, reflect the climate of their drainage area rather than the mineralogical composition of the source rocks. As a result of the pedogenic formation and enrichment of iron as Fe203 (hematite), many of these soils become red (laterites; cf. Chap. 6.3). If the common clay minerals, as aluminum silicates (e.g., kaoli- nite), also become unstable and their silica
content is dissolved and carried away by running water, hydroxides and oxides of alu- minum and iron are left behind as residue. In some places, these ferrallitic end products (soils called pedal fers) accumulated as bauxite deposits, or they form thick, hard lateritic crusts (ferricrusts, Fig. 9. la). Detailed descrip- tions of these processes are given in several text books (e.g., Ollier 1969; Birkeland 1984; Chorley et al. 1984; Weaver 1989; Retallack 1990).
In more temperate humid zones, illite is a characteristic weathering product (cf. Chap. 9.3), whereas in high-latitude regions, as well as in arid zones, soil generating processes and hence the formation of neo-minerals are slow. Such regions can provide even relatively un- stable minerals as sediment components for basin fill, such as minerals of the pyroxene and hornblende groups, different types of feldspar, chlorite, etc. Consequently, the terrigenous material derived from such source areas is controlled primarily by source rocks in the drainage area.
In semi-arid zones, where little water is available to remove calcium in solution, even calcium carbonate can be reprecipitated in the soil zone. It often forms nodules close to the surface (calcrete or caliche, Fig. 9.la). Such soils are called pedocals. Similarly, dissolved silica can reprecipitate to form siliceous crusts and near-surface silcrete (see, e.g., Twidale and Milnes 1983; Thiry and Milnes 1991).
Rock-Type Control
The nature of the parent rocks exposed to weathering is also of considerable interest when weathering processes and sedimentary rocks from various geological epochs are compared. In the early history of the Earth, the land masses were entirely or predomi- nantly composed of igneous rocks and subject to first cycle weathering and deposition. Later, as a result of successive cycles of weathering, sedimentation, and mountain building, sedi- mentary and metamorphic rocks became in- creasingly important on the land surface. Thus, the composition of the weathering products, and hence that of the sediments also changed through geologic time (cf. Chap. 6.5).
First cycle sedimentary rocks may already contain a high proportion of stable minerals. If they are exposed to weathering again, either the proportion of stable minerals in the new sediment will be enhanced (increased minera- logical maturity in warm and wet climates), or

Chapter 9 Denudation and Mass Transport
the second cycle deposit will strongly reflect the composition of the parent sedimentary rocks. Claystones and mudstones, for example, can be easily and rapidly broken down to their fine-grained fundamental components by me- chanical processes (chiefly by repeated drying and wetting), if they are not protected by a vegetated soil cover. Thus, particularly in arid and semi-arid zones, the nature of the clay particles delivered into a sedimentary basin may be controlled by the pre-existing exposed rock types rather than by the climate of the drainage area (cf. Chap. 9.3).
Rock type is, of course, also important for all the coarser grained materials provided by mechanical disintegration in the drainage area. In areas of high relief, marked soil formation is prevented by rapid erosion (weathering- limited conditions). In this case, slightly altered parent rocks are carried away by rivers as gravel and even boulders into lower regions. But during this transport, particularly the gravel and to some extent the sand grains become mechanically rounded and tend to de- crease in size along the river's course. In this way, the parent rocks add additional material to the fine-grained clastics, mainly to the silt fraction.
Clastic Sediments and Dissolved River Load
The relationship between the climate of the source area and the weathering products of the bed rock (in this case granite), providing both clastic sediments and dissolved river load for a sedimentary basin, is summarized in Fig. 9 . 1 ~ . Tropical regions tend to deliver predo- minantly neo-minerals and a small portion of the most stable minerals from pre-existing bed rocks as terrigenous sediment components. Temperate, humid regions supply both neo- minerals and stable pre-existing minerals, whereas arid regions may deliver compara- tively unstable minerals. This simplified model may be modified by grain sorting during sedi- ment transport. Fine-grained suspended river load moves much faster and usually over long- er distances than the coarser, sandy, gravelly bed load (Fig. 9.lb) and can therefore be separated from the bed load.
The dissolved river loads in the three cli- matic zones shown in Fig. 9.lc also differ markedly both in the concentrations of various chemical species and in their freight rates. Due to intensive precipitation and chemical weathering, more solid matter per unit area and time is dissolved in the tropics than in
other zones. As a result, denudation by dis- solution is often much greater than that caused by mechanical processes. Even in temperate humid zones, chemical denudation frequently exceeds mechanical denudation, whereas in arid regions, mechanical processes are more important than dissolution. These aspects will be discussed quantitatively in the following chapter.
9.2 Chemical and Mechanical Denudation Rates from River Loads
9.2.1 Chemical Denudation Rates
General Aspects
Chemical denudation is the lowering of the land surface by total or partial dissolution of soils and rocks in water at or below the sur- face. The dissolved constituents are carried away by running surface water or ground- water. The chemical denudation rate can be measured quantitatively by analyzing the dis- solved species in the runoff of small and large river systems. Such measurements should be carried out at short intervals for several years in order to evaluate seasonal or short-term changes in water chemistry. In addition, the volume of discharged water, as well as the areal extent of the river catchments must be known. Moreover, it should be ascertained that no substantial quantity of groundwater is lost by subsurface flow from the area studied.
An alternative method of determining the chemical denudation rate is to quantify che- mical residues in soil profiles, i.e., the degree of dissolution which the parent rock has un- dergone since it was exposed to weathering. This method can only be applied under favor- able conditions, for example, when during the last glaciation a fresh rock surface was formed by ice action and subsequent mechanical de- nudation can be ruled out. Thus far, only sparse data have been obtained by this method (e.g., Colman and Dethier 1986; April et al. 1986; also see Chap. 9.5.1). The following dis- cussion is therefore based mainly on the "river discharge method".
The chemistry of natural surface waters and groundwaters is the result of interaction between infiltrating rainwater and soils and rocks. Short-term overland flow during storm events, as well as shallow-circulating near-

Dissolved and Solid River Loads
surface runoff or interflow, are not in contact with the soil particles and the rocks suf- ficiently long to reach a state of equilibrium between the concentrations of dissolved species in the water and the solid phases. As a result, the concentrations of most of the dissolved constituents are lower than they could be under equilibrium conditions. On the other hand, more deeply circulating ground- water usually has a long enough residence time to reach equilibrium conditions with most rock components, before it emerges again at the surface and contributes to the runoff of rivers.
Because the groundwater component and long-term interflow make up 60 to 80 Oh of the total discharge of many river systems, we can assume that the chemistry of river water during low and intermediate runoff (between peak floods) is often close to equilibrium with the most abundant rock minerals present in the drainage area. In other words, the com- position of river water reflects the major soil and rock types present in the catchment area rather than other environmental conditions (e.g., climate and relief), but the presence or absence of vegetation cover may also play a significant role, particularly in carbonate karst terrains (see below). However, streams solely draining areas of high relief, polar or subpolar regions, and ephemeral streams resulting from storm events in arid zones, show rather low concentrations of dissolved species (apart from highly soluble salts in limited areas).
Apart from rock type, the chemical denu- dation rate is of course also largely controlled by the effective rainfall (creating runoff), i.e., precipitation minus evapotranspiration. Thus, chemical denudation can be substantial even in regions of cold climate and/or areas of marked nonequilibrium between water-soil- rock interactions, if the effective precipitation is high. For these reasons, differences in chemical denudation rates in large regions (up to and including continents) are not as great as those for mechanical denudation rates (see below).
Chemical denudation in a particular region may also vary considerably with the nature and thickness o f the soil profile. According to several authors (e.g., Carson and Kirkby 1972; Stallard 1985), there is presumably an op- timum soil thickness which maximizes the rate of chemical rock weathering. For less than optimum soil thickness, the soil cannot retain the water supplied by precipitation long enough to interact sufficiently with the altered or fresh subsurface bedrock. Hence, chemical
denudation decreases. If soil thicknesses exceed the optimum, more water is stored in the soil and evapotranspiration can reach its maximum. As a result, less water is available for the weathering of bedrock and output of dissolved material. In addition, the formation of thick, impermeable soil layers can induce a further reduction in the weathering rate. Thus, the denudation rate for a certain area may decrease through time, for example after 10 to 100 ka of soil formation, even if the climatic conditions remain constant.
Rock-Specific Phenomena, Groundwater Chemistry
Dissolution o f Salt Rocks, Sulfate Rocks, and Carbonates
Chemical dissolution, as well as the alteration of rock and soil minerals, are selective proces- ses. Rock salt, gypsum and anhydrite, and other salt minerals are easily dissolved either direcly on the land surface or at some depth in the underground. Locally, they can contribute enormously to the dissolved river load and thus increase the denudation rate substantially (Fig. 9.2), even when the concentration of these salts in spring and river waters is mostly far below saturation.
During an active phase of subsolution of rock salt in a region with temperate climate, the land surface may be lowered by 1 to 5 mm/a (assuming an effective precipitation of 200 to 500 mm/a and a concentration of only 10 to 20 g/l NaCl in the runoff, i.e., far below saturation). However, such a local pheno- menon will last only for a short time period, because either the salt deposit is used up, or it is sealed by more or less impermeable residual clays released from the evaporitic sequence. Thereafter, the pore fluid of the neighboring rocks tends to become stagnant and saturated with rock salt, and thus subsolution more or less ceases.
Near-surface and subsurface dissolution of sulfate rocks may proceed in temperate humid regions at a rate of about 0.2 to 0.5 mm/a (200 to 500 mm/ka). These values do not necessa- rily mean that the land surface is lowered at this rate, because substantial dissolution occurs along fraction zones and in caves; nonetheless, in the long run, an entire sulfate layer can be removed in this manner.
Of particular interest in this context are carbonate rocks, because they often form thick and extensive deposits which may be exposed

Chapter 9 Denudation and Mass Transport
ROCK SALT (CONCENTRATION RUNNING WATER 1
GYPSUM AND ANHYDRITE
(CONCENTRATION IN RUNNING WATER 1-2 g / l )
2 0 0
u- -
CARBONATE ROCKS
UMlD TROPICS AND EMPERATE WITH HIGH RAINFALL
MID TEMPERATE
. "NUDE" KARST E 40 DIFFERENT ROCKS E
20 AND SEDIMENTS
SUBTROPICAL. WITH CARBONATE
BASALTIC AND ULTRA-BASIC ROCKS
SLATES. GREY WACKE,
7 4 SILTSTONE . E
METAMORPHIC QUARTZ- ROCKS SANDSTONES
Fig. 9.2. Chemical denudation rates primarily controlled rnorphic, and siliciclastic sedimentary rocks. (AAer Pries- by rock type, mainly in temperate climates. Note the dif- nitz 1974; Hohberger and Einsele 1979; Ford and Williams ferent orders of magnitude for evaporites (rock salt, sulfate 1989; and others). (1000 a = 1000 years = 1 ka) rocks), carbonates, carbonate-bearing rocks, igneous, meta-
on the land surface for comparatively long time periods. Since carbonate is chiefly dis- solved as bicarbonate, the vegetation cover and production of C02 by decomposing orga- nic matter in the soil zone are also important factors controlling the carbonate denudation rate (Fig. 9.2; Priesnitz 1974; Bogli 1978; Ford and Williams 1989). Therefore, regions with dense vegetation ("green" karst) and high effective precipitation, such as large parts of the tropical zone or mountainous areas with high rainfall in the more temperate regions,
enable denudation rates of between 50 and 150 mm/ka. In zones of temperate climate and medium rainfall (700 to 1000 mm/a), the carbonate dissolution reaches 20 to 50 mm/ka, and in subtropical and subarctic regions 15-30 mm/ka. Where soils and vegetation are absent (barren or "nude" karst), springs and stream waters have concentrations of bicarbonate only 25 to 50 Yo of those observed in green karst regions.
Although dissolution processes below the land surface (caves, etc., summarized as endo-

Dissolved and Solid River Loads
karst) can be very spectacular, most of the carbonate dissolution takes place near the surface (exokarst), because the infiltrating waters become saturated with bicarbonate relatively fast. Therefore, subsolution is responsible for only a small percentage (up to a maximum of ca. 10 Oh) of the total carbonate dissolution (Bogli 1978). Despite the fact that lowering of the land surface in karst regions often proceeds very irregularly, one can assume and calculate from river output a certain mean denudation rate for such regions.
Silicate Rocks
Crystalline rocks free of carbonates and other easily soluble constituents yield lower quan- tities of dissolved matter than the rock types discussed so far, but they also show consi- derable variations in their weathering solu- tions. The characteristics of solutions from such silicate rocks or soils can be best eva- luated by studying their groundwater che- mistry (Fig. 9.3), because the establishment of equilibrium conditions in these rocks requires a fairly long residence time for the circulating water.
The mostly dark minerals of ultrabasic, basic (such as basalt and gabbro), and inter- mediate volcanic rocks (such as andesite), which are rich in iron, magnesium and cal- cium, break down more readily than most feldspars, muscovite, and quartz, which are abundant in granitic rocks. Among the plagio- clase group, anorthite rich in calcium is less stable than albite (rich in sodium) or K - feldspar; biotite is altered more quickly than muscovite. From these and other observations we can draw the following conclusions:
- In the case of basic and ultrabasic rocks, all principal minerals are readily altered and therefore contribute substantially to the composition of groundwater and river water. The concentration of dissolved species tends to be relatively high (2150 mg/l, Fig. 9.3), and the waters are fairly rich in Ca and Mg. - Waters from granitic rocks, on the other hand, draw their ions essentially from the weathering of plagioclase (rich in Na), biotite, and K-feldspar. Since most of the potassium is fixed in clay minerals, such waters tend to be relatively rich in sodium, but poor in calcium and magnesium; their total dissolved species concentrations are low (50 to 100 mg/l, Fig. 9.3).
- Si02 released by the breakdown of minerals is partly retained in secondary minerals. Therefore, the silica content of natural waters from igneous rocks is limited and far below the values known for amorphous silica dis- solved in water. In the first case, the aqueous silica content more or less reflects equilibrium conditions with newly formed aluminosili- cates. - Except for environmental conditions with very low pH-values, all the AI,O, released by the weathering of primary minerals is retained to form secondary minerals. - Quartz is dissolved in substantial quantities only under tropical to subtropical climatic conditions and is therefore of minor impor- tance for the composition of natural waters outside such specific regions. As a result, it is enriched in the alteration products and thus in the sediments derived from these sources. - Iron, although present in many rocks in considerable quantities, is rarely a substantial component in near-surface groundwater. It is generally fixed in the soil zone as oxide or hydroxide and may be transported as solid river load.
Meteoric waters passing metamorphic rocks, which do not contain substantial amounts of carbonate, have chemical characteristics similar to those of many claystones and shales, impure sandstones, and acidic and basic magmatic rocks. Figure 9.3 shows an example of mica schists, whose water does not deviate much from that of intermediate or basic igneous rocks.
Very low mineralization of near-surface groundwaters is usually observed in quartzitic sandstones and in shales and slates devoid of carbonate (Fig. 9.3). These rocks consist of the most stable minerals which are little dissolved under normal weathering conditions. Shales containing pyrite may deliver more concen- trated waters rich in sulfate.
When sedimentary or metamorphic rocks contain carbonate (e.g., marly or dolomitic claystones, carbonate-cemented sandstones, and greenschists with lenses of marble), their groundwater chemistry approaches that of limestones or dolomites with high con- centrations of earth alkali ions and bicar- bonate.

Chapter 9 Denudation and Mass Transport
. . KEY ( . ) = Sum of cations or anions in meq/l (without SiOq)
solids (without minor constituents)
MICA SCHIST
GRANITE, ANDESITE, BASALT GNEISS QUARTZ-DIORITE
SHALES AND SLATES (devoid of carbonate)
QUARTZlTlC SANDSTONE
LIMESTONE
Fig. 9.3. Major constituents of near-surface natural Si02). Water chemistry of similar rock types may, how- groundwaters for some principal (nonevaporitic) rock ever, vary considerably from location to location. (Data types. All analyses come from humid temperate regions from various sources, e.g., Matthess 1973; Georgotas and and represent mean values in mgll, meqll, or mmoYl (for UdluIl 1978; Drever 1982; Hem 1983)
Denudation Rates in Various Rock Units For example in the river Main, a major tributary of the and Morpho-Climatic Zones river Rhine in central Europe (in a temperate, humid
climate), 86 96 of the total dissolved constituents are pro- vided by groundwater from different rock types (Fig. Solute Transport in Rivers 9.4a). Of these lithologic units, carbonate and sulfate- bearing sedimentary rocks deliver approximately 90 % of
In many drainage basins, the total dissolved the chemical load, whereas regions with crystalline rocks river load is controlled mainly by the ground- and quartzitic sandstones (comprising 22 % of the total water chemistry contributing Significantly to drainage area) yield only 5 % of the dissolved load. The river runoff. average transport rate of the entire drainage basin amounts

Dissolved and Solid River Loads
(rng/l) TOTAL DISSOLVED CONSTITUENTS A (mg/l)
140 - \ DRY SEASON
6 0 -
o o WET SEASON
SAMPLING STATIONS
0 . - 0 i? * * * r
0
9 100 200 300 400 500 1 :m l o o 0 looo iooo 4 RHlNE LENGTH OF RIVER COURSE (km) SPRING ANDES DISTANCE FROM OCEAN OCEAN
Fig. 9.4. a Drainage basin of river Main, Gemany, with populated, only a small percenta e of the dissolved river different rock types in humid tern rate climate. Numbers load (mainly N O i and some ~ 1 - 9 and SO:-) Fornu P refer to dissolved load (in t / m a)) drained by ground- from anthropogenic sources. (Udlufi 1978). c Changing water. (Einsele and Hohberger 1978). b Changing concen- water chemistry along the river Amazon caused by low- trations of chemical species along the river Main passing concentration tributaries from tropical regions. (Drever areas of different rock types. Although the area is densely 1982)

Chapter 9 Denudation and Mass Transport
to about 100 t/@n2.a), which corresponds to a mean che- mical denudation rate of 4 cmlka or 40 mlMa (see below). In reality, the denudation rate varies between ap- proximately 5 m1Ma (Bunter sandstone) and 80 mlMa (claystones with gypsum). The morphogenetic consequen- ces of differing denudation rates are discussed in Chap. 9.5. Furthermore, the chemistry of the river water also varies significantly along its course (Fig. 9.4b) as a result of tributaries draining different rock types and industrial sites in the westernmost region.
Changing water chemistry is observed in many rivers. A more spectacular example is the Amazon River, where water from the Andes, relatively rich in dissolved constituents, is diluted by tributaries draining areas with deeply leached tropical soils (Fig. 9 . 4 ~ ) .
Solute tranport in rivers all over the world has been studied for many years (Walling and Webb 1986). Figure 9.5 shows the water chemistry of major rivers as summarized by Meybeck (1979, 1983, 1987) and others; how- ever, modern pollution problems (see, e.g., Meybeck 1989) are not discussed here. Most of the published data correspond to discharge- weighted mean values for one or several years. In these examples, which represent the most important drainage basins of the world, the concentrations of total dissolved solids (TDS) vary between 33 and 880 mg/l. If smaller catchments are included, TDS ranges from 5 to 8 mg/1 (some tributaries of the Amazon river) to more than 20 000 mg/l (rivers drain- ing sequences containing evaporites). Most rivers fall into the range of 30 to 300 mg/l (Walling and Webb 1986). In spite of this wide range, one can distinguish several groups with similar characteristics:
- Rivers draining either largely fropical regions with thick soil cover consisting of nw-minerals of low solubility (Amazon, Orinoco, Congo, Indonesian Rivers) or crystal- line rocks (e.g., Scandinavia) exhibit low concentrations of TDS between 33 and 58 mgll. The rivers Niger and Pa- ran6 show concentrations slightly above this range. In all these cases, the river water contains little bicarbonate and less TDS than the groundwater circulating in unweathered or only partly altered rocks, except quartzitic sandstones (Fig. 9.3). The concentration of SiOz in these river waters, however, approaches the norm (I I mg/l, average of world
- -
rivers). - The Siberian rivers Lena, Ob, and Yenisei coming from subarctic areas with sparse vegetation also have low TDS values, although carbonate-bearing rocks are present in their drainage areas. - Rivers originating in the Alps and Himalayas (including the Yangtze River), as well as the Mississippi River, range from about 170 to 300 mgll of TDS. They all display medium values for Ca and bicarbonate due to the presence of carbonate rocks in their drainage areas.
- Two of the major drainage basins shown in Fig. 9.5 (Murray River in Australia and Rio Grande River in North America) are markedly affected by the dissolution of salt andlor gypsum and therefore reach unusually high TDS values.
According to Livingstone (1963) and Meybeck (1979, 1983, 1987) the average river water o f the world contains about 115 mg/l TDS (load- weighted mean, i.e. total load transported by rivers) and has a composition as shown in Fig. 9.5. The most important constituent (by weight) is HC0,- (about 58 mg/l) which, however, is derived partially from decaying plant material in the soil zone and recycled into the atmosphere. It is followed by ca2+ (about 14 mg/l), SiO, (about 11 mg/l), and
(10 mg/l). These four components gene- rally make up more than 80 % of the total dissolved river load.
Specific Transport Rates
If the TDS concentrations are multiplied by the specific runoff (per unit area of the drainage basin, taking into account seasonal and short-term variations), one obtains the specific transport rate of dissolved constitu- ents. Values frequently range between 5 and 80 t/(km2.a), but can also be considerably lower or higher. Such data are plotted in Fig. 9.6 for major river basins of the world and grouped according to different climatic zones. In some cases, relief and rock type are also considered.
It is obvious that a high specific runoff, i.e., humid climate where precipitation substantially exceeds evapotranspira- tion, leads to high specific transport rates of TDS, even when the TDS concentrations are fairly low (e.g., Iceland or most of the tropical river basins). Under conditions of low specific runoff (arid to semi-arid climates), salt concentrations in river water must be extremely high in order to give rise to a high transport rate (e.g., catchments of the Aral Sea, the Caspian Sea, or the Shatt el Arab). Due to medium concentrations and high specific runoffs, many mountain ranges have high to very high TDS yields (e.g., the Alps, partially drained by the Danube River, or the Himalayas giving rise to the rivers Indus, Ganges, and Brahmaputra).
Mean Chemical Denudation Rates
The specific transport rates of TDS, expressed as the mass or weight of dissolved solids per unit area and time, can be converted into mean denudation rates (mm/ka or m/Ma) by dividing the weight by the basin area and

Dissolved and Solid River Loads 355
INDUS (VARIOUS
SEDIM. ROCKS)
GANGES ') YANGTZE (CRYST., VOLC., AND (VARIOUS SEDIM.
SEDIM. ROCKS) AND CRYST. ROCKS)
MURRAY ') (PARTLY FROM INDONESIA '1
(VOLC. AND SEDIM. ROCKS)
OB. YENISEI SED. & CRYST. ROCKS)
SEMI-ARID AREAS)
SCANDINAVIAN R. ~ l s s l s s l p p l I ) (CRYSTALLINE ROCKS) (DIFF. SEDIM. ROCK ORINOCO 3,
(CRYST. AND ARGILL. ROCKS)
PARANA (SED. & VOLC. R.)
AMAZON R. (ARGILL. AND
CRYST. ROCKS)
DANUBE R. '1 (PARTLY RIO GRANDE 4,
LIMESTONES) (PARTLY EVAPORITES)
CONGO (ZAIRE) (CRYST. AND SED. ROCKS)
NIGER ') NILE R. 2,
(CRYST. AND (CRYST., VOLC., SED. ROCKS) AND SED. ROCKS)
Fig. 9.5. Water chemistry of major rivers of the world, all Congo, Orinoco, etc.). Many large riven drain areas of values in mgll, chemical species marked in Rio Grande mixed rock types and zones of different climate and relief, plot and in Fig. 9.3. Total dissolved solids (TDS) increase and therefore show medium TDC values (e.g., Nile, Indian with the proportion of carbonate and evaporitic rocks in the rivers, Yangtze, etc.). (Mainly after Livingstone 1963; drainage basin (e.g., Danube and Rio Grande Riven). Meybeck 1979,1983,1987; supplemented by Degens et al. Rivers draining tropical zones with deep soils are low in 1982, 1983, 1985; and others) TDS and little affected by parent rock types (e.g., rivers

Chapter 9 Denudation and Mass Transport
convering from weight to volume. For the weight to volume conversion, an average rock density of 2.5 t/ms is assumed. The mean chemical denudation rate indicates the thick- ness of soil or rock which is removed from the land surface by solute transport after a certain time period. As shown in Fig. 9.6, chemical denudation rates are high in many drainage basins of the tropics, as well as in some river catchments of high mountain ranges with very high precipitation.
Globally, the mean (discharge-weighted) transport rate of dissolved solids is about 40 t/(km2.a), which corresponds to a denudation rate of 16 mm/ka (Fig. 9.6).
Chemical Denudation in Specific Morpho-Climatic Zones
These interrelations are most obvious if TDS transport rates and chemical denudation rates are correlated with specific morpho-climatic zones (Fig. 9.7), rather than with the drainage areas of rivers, which are often composed of zones of different climate and relief. It then becomes evident that two maxima of solute transport and chemical denudation exist: the very humid temperate zone and the humid mountainous zone in the tropics. Minima of chemical denudation are found in arid zones and in tundra and taiga regions with low specific runoffs. Maximum and minimum va- lues for chemical denudation thus differ by a factor of 20 to 30.
9.2.2 Mechanical Denudation from Solid River Load
General Aspects
Denudation rates on land can be evaluated in different ways. A common method is the mea- surement of sediment discharge from rivers.
Data gained by this method must be viewed with caution, however. Usually these measurements do not include rare events, for example catastrophic floods, which may occur once in 10 or 100 years and carry more suspended and bed load than a long period of normal river discharge. There- fore, average values based on measurements of a few years are often not representative of longer periods. In addition,
many of these measurements are strongly affected by the activities of humans (e.g., deforestation) and therefore often yield denudation rates much higher (by a factor of 2 to 10, but locally up to 100 to 1000!, see, e.g., Toy 1982) than those of prehistoric times. The sediment input from the Yellow River in China into the Yellow Sea has in- creased by a factor of about 10 since the land is agricul- turally used (Milliman et al. 1987, cf. Chap. 11.3).
On the other hand. the solid load of rivers as measured today can also be too low in comparison with the prehis- toric era. This is the case for most of those rivers in which man-made dams and reservoirs trap a large part of the sediment. Moreover, a considerable number of rivers draining previously glaciated areas pass natural, ice-formed lakes, where they deposit part of their load. Such sediment traps are short-lived and did not exist during long periods of the Earth's history. Hence, many measurements re- present in fact delivery rates of sediment into the oceans and not denudation rates in the source areas (Leeder 1991). Furthermore, we should consider that normally only the suspended river load can be easily determined. It is true that the bed load of large rivers makes up only a few percent of the total solid load, but mountainous rivers may carry a much higher proportion of bed load (up to 50% or more), which can sometimes be measured in lakes or arti- ficial reservoirs.
Finally, it should be mentioned that data collected at gauging stations upstream of the river mouth do not necessarily record the actual input of sediments into the depositional basins. Some of the load may be deposited on its way to the river mouth or, conversely, more sediment may be taken up down-stream from the gauging station. A striking example of the first case is the Yellow River in China which deposits as much as 76 5% of its suspended load before it reaches the open sea.
In spite of these various sources of error, the large number of data collected all over the world allow us to infer some general rules and to estimate the orders of magnitude for me- chanical denudation in different regions:
- Small drainage basins in mountainous areas yield more sediment than larger river systems, which also usually drain regions of lower relief. Steep stream-channel gradients and steep valley slopes, only partly protected by vegetation, favor erosion and sediment trans- port by running water. In mountain ranges, annual mean precipitation and rainstorm events are often greater than in lowlands. Most of the solid river load, especially the bed load (sand and gravel) is transported only during peak flows. Single, major floods with a recurrence interval of tens of years may accomplish more sediment transport than a span of many normal years.
Fig. 9.6. Chemical and mechanical denudation rates of major river basins of the world. ZZlS total dissolved solids; KYS total suspended solids. (Mainly after Meybeck 1979,
1987; Milliman and Meade 1983; supplemented by Emeis 1985; Subramanian 1985; Iriondo 1988; and others)

Dissolved and Solid River Loads
ARCTIC TO HIGH LATITUDES
IOB,YE-( LENA /COLUM{ MAC- ISCAN- ICE- I NISEI
ROCKS
3 0 0 -1 CONCENTRATION OF TDS n
SPECIFIC
( I /s . kin2 )
MAINLY ARID TO SEMI-ARID 'I WORLD PARTLY TROPICAL T O SUBTROPICAL
PATRTLY HUMID RIVERS
NILE NIGER ZAM- OR- MUR- CASP. ARAL SHATT CHAD BESI 1 ANJE R A Y SEA SEA AREZB BASIN
n
SPECIFIC TRANSPORT RATE OF TSS (t/kmz.a) 1 I
ALPS - HIMALAYAS
::NCENTRATION
j CHEMICAL AND MECHANICAL .. . . . . . DENUDATION RATE . . . . . . . (mrn/1000 a or rn/Ma)
1 1 0 ,SPECIFIC TRANSPORT RATES OF TSS ( t / k d . a)
2 1 5 8 3 -150 1 0 0 - 6 0 0 -900 - 5 0 0 -1400 307 1 5 0 42

chapter 9 Denudation and Mass Transport
400 CONCENTRATION OF TDS
SPECIFIC RUNOFF
TUNDRA AND
TAIGA
TRANSPORTRATE
mm/ka or m/Ma
TROPICAL
Fig. 9.7. Chemical denudation rates in different morpho- assumed to be 2.5 t/m3. (Primarily after Meybeck 1979). climatic zones derived from concentrations of total dis- 2) Values for temperate, very humid zones are affected by solved solids (TDS), specific runoff, and specific transport the abundance of carbonate rocks and therefore appear too rates of mS. 1) All measured rates are corrected for cyclic high as compared to the values of very humid tropic re- salts (e.g., NaCI) and atmospheric COz; rock density is gions with predominantly crystalline rocks
- Dense, permanent vegetation cover prevents or strongly reduces soil erosion. Many studies in forested areas in the temperate humid zone have shown that even on rather steep slopes hardly any soil erosion can be observed, apart from sites where gravity mass movements oc- cur. In these areas erosion is restricted mainly to the banks of stream channels. By contrast, if vegetation is sparse or completely absent, the soils and rocks are directly exposed to the agents of erosion. Consequently, not only linear erosion along the streams occurs, but also erosion-on the surface of the slopes. Thus, even in regions of little rainfall, comparatively large amounts of soil and rock debris can be delivered to river systems or blown away by winds. Therefore, soil erosion and sediment
VERY HUMID PLAINS
MOUNT.
PART- LY
TAIGA '
yield from limited areas in arid to semi-arid zones are often greater than expected, espe- cially if infrequent rain storms are taken into account.
HU- MID
TEMPERATE TEMPERATE
HU- MID
Several authors have pointed out that sediment yield from some steppe and shrub desert regions with a mean annual rainfall of about 300 to 600 mm (precipitated seasonally or very irregularly) can reach greater values than those from temperate humid zones (mean annual precipitation up to 1000 mm and more). Generally, large river basins in arid to semi-arid regions appear to transport low amounts of suspended solids (see below and Fig. 9.6). As mentioned above, cultivation of land also exerts a strong influence on the denudation rate, which may be raised locally by a factor of 10 to 100, but regionally, for land of mixed use, normally by a factor of only 2 to 5. Because this text focuses on the sediment sources of ancient sedimentary basins, this problem is not discussed further here.
VERY
:yi VERY
iyi HU- MID
-

Dissolved and Solid River Loads 359
- If seasonal or annual rainfall surpasses a certain level characteristic of the temperate humid zone, the mechanical denudation rate can reach a second, yet higher peak than that mentioned above for semi-arid climates. The highest sediment yield of rivers is reported from mountainous areas in the tropics, where annual precipitation is on the order of 2000 to 3000 mm (e.g., Taiwan, New Guinea, Hawaii), but also regions with high seasonal monsoon precipitation fall into this category. In these cases, it is primarily the rapid weathering process (see Chap. 9.1) and the abundance of running water which enhance the denudation rates. - Finally, denudation rates also are affected by the rock types exposed to weathering and erosion in the drainage area. Non-indurated and weakly indurated sediments are easily eroded, in contrast to granitic or metamorphic rocks. Quartzitic sandstones and cherts resist weathering far longer than carbonate-ce- mented or clayey silts and sands. Claystones and marlstones are rapidly disintegrated by mechanical processes if they are not protected by soil and vegetation cover. They may then form characteristic badlands incised by many rivulets and small streams which deliver relatively large amounts of fine-grained clastic sediments to larger river systems.
Outstanding examples of the influence of rock type on sediment yield are apparent in some large, present-day rivers of China. The Yellow River (Huanghe) delivers more sediment to its delta and the sea than the Yangtze River (Ying Wang et al. 1986), although its drainage area, and particularly its annual water discharge, are much smaller than those of the Yangtze River (Changjiang). This is due to the fact that the Yellow River enters a loess region in its lower reaches, where its course migrated southward and northward several times during its history. The high mean sediment yield of the Yellow River (1400 t/(km2.a) versus 250 tl(km2,a) of the Yangtze River) is, of course, also influenced by the more intensive cultivation of the land in the Yellow River drainage basin.
Mechanical Denudation Rates in Relation to Relief and Climate
Specific Transport Rates o f Rivers
The following data (Figs. 9.6, 9.8, and 9.9) are based mainly on measurements of the sus- pended load in large rivers which usually drain regions of different relief, climate, and rock type and hence often cannot be asso- ciated with one particular morpho-climatic zone. N e v e m s s , these measurements yield average values for the mechanical denudation of large regions which are of special interest here:
Fig. 9.8. Specific transport rates (in t/(km2.a)) of suspended solids from various drainage basins and larger regions of the world. (After Milliman and M a d e 1983)

Chapter 9 Denudation and Mass Transport
Fig. 9.9. Common range of mechanical and chemical denu- converted into denudation rates (mmlka or mlMa) using an dation rates in relation to relief and climate (including average rock density of 2.5 t/m3. (Based on many sources, vegetation) for moderate to large drainage areas. In small e.g., Selby 1974; Meybeck 1979, 1987; Milliman and river basins, denudation may be largely controlled by rock Meade 1983; Chorley et al. 1984; Collins 1986; Hadley types and therefore deviate considerably from the values 1986; Tamrazyan 1989). See text for further explanation shown in the graph. Specific transport rates (tl(km2.a)) are
- Rivers draining arctic or high-latitude regions of mostly low relief, such as the Siberian Ob, Yenisei, and Lena Rivers, have low specific transport rates for total suspended solids (TSS): approximately 5 t/(km2.a). With TSS ~ 1 0 t/(km .a), most of the rivers of the Canadian northern territories, as well as those of northwestern Europe, belong in this cate- gory (Fig. 9.8). If areas of high relief make up a large proportion of the drainage area, the sediment yield may increase to about 50 t/(km2.a) (e.g., Mackenzie and Columbia Rivers). - Similarly, in most arid to semi-arid regions, TSS is somewhat low. Apart from the Shatt el Arab, which drains nearby mountainous re-
gions and reaches a sediment yield of 50 to 100 t/(km2.a), all the other examples plotted in Fig. 9.6 range from only 2 to 33 t/(km2.a). Of these, the highest values are from the Niger River and Murray River (Australia), which originate from humid tropical or temperate drainage basins, respectively. However, for limited, usually mountainous areas in semi- arid regions, very high TSS values (over 1000 t/(km2.a)) are also found (e.g., Zachar 1982). In some of these cases, the high sediment yield may be due to human-induced soil erosion. - In regions with Mediterranean or subtropical climates, the specific transport rate of sus- pended solids is usually moderate. Whereas the Paran& River and Tapti River (India) deliver

Dissolved and Solid River Loads
about 30 to 40 t/(km2.a), the Mississippi River, which also drains areas of cooler climates, attains approximately 150 t/(km2.a) (Fig. 9.6). Large areas in southern Europe, Middle America, India, and central China provide suspended solids within the range of 100 to 500 t/(km2.a) (Fig. 9.8). - High mountain ranges usually yield large amounts of suspended matter. The upper river Rhine draining central parts of the Swiss Alps provides about 1000 t/(km2.a), which are deposited in glacial lakes along the northern rim of the Alps. The transport rates of the rivers Rhone and Danube measured farther downstream are much lower (1 10 and 150 t/(km2.a), respectively) than that of the upper Rhine. The Alps in total are thought to attain 150 t/(km2.a), a value which, by comparison with the Andes (500 to 1,000 t/(km2.a), Fig. 9.8), appears low. The large rivers draining the Himalayas have average sediment yields which differ considerably from one another. Whereas the Indus exhibits a comparatively low specific transport rate (100 t/(km2.a)), the Ganges and Brahmaputra Rivers deliver 600 and 900 t/(km2.a), respectively. The Yangtze River originating from the Tibetan Plateau also has a high sediment yield (500 t/(km2 a)). - Lowland rivers o f the tropical zone have moderate TSS values of 100 to 500 t/(km2.a) (Figs. 9.6,9.8, and 9.9), although some may be less (e.g., the Congo River). However, moun- tainous regions in this climatic zone can provide a maximum TSS on the order of 1000 to 3000 t/(km2.a) (e.g., New Guinea and Indo- nesia). - On a global scale, the present-day, average river trans ort of suspended solids is 100 to F. 120 t/(km a) (Milliman and Meade 1983; Tamrazyan 1989).
Mean Mechanical Denudation Rates
As previously mentioned (Chap. 9.2.2), TSS transport rates can be easily converted into average denudation rates (Figs. 9.6 and 9.9). These rates provide an indication of the mean thickness of soil or rock material removed from the total drainage area. The mean denu- dation rate, therefore, does not distinguish between (1) summit lowering, (2) slope denu- dation, and (3) rate of stream erosion in the river valleys or lowlands (Ahnert 1970; cf. Fig. 9.20b).
From the data discussed so far it is obvious that no simple law can be expressed for me- chanical denudation, because the interrela-
tionship between the various factors control- ling this process is complex. Each region reacts in a somewhat different way, even if most of the variable factors are comparable. Therefore, an evaluation or prediction of mechanical denudation rates is more difficult than for chemical denudation rates, such as those shown in Figure 9.7 for different mor- pho-climatic zones.
Pinet and Souridu (1988) assume that the mechanical denudation rate (DJ is largely correlated with the mean drainage basin elevation (H in m), but not with environ- mental factors. They give the following empirical formula:
D, = 419 x ~ o - ~ H -0.245 (mlka),
where 1 ka = 1WO years.
Using this formula, however, one obtains results which frequently differ from those depicted in Figures 9.6 and 9.9 (also see Leeder 1991). Some workers have also pointed out that the denudation rate is controlled by the slope gradient rather than by the absolute elevation of a region. An elevated plateau which is little dissected by deep valleys may display much less denudation than a coastal region with steep slopes, as in South Africa (Summerfield 1991).
In spite of the various problems mentioned above, some of the most important facts can be summarized in a simple, generalized dia- gram (Fig. 9.9). This diagram depicts the effects of relief and climate, and therefore, to some extent, the influence of soils and vegeta- tion on denudation rate, although rock type is neglected. If we consider large drainage areas, which usually include many different rocks and soils, this omission may be permissible. If, however, only small drainage basins are evaluated, their rock types may strongly influence sediment yield, particularly in mountainous areas with limited soil cover and vegetation, as in semi-arid regions. In such areas, the denudation rate can deviate sub- stantially from the rates shown in Fig. 9.9. Therefore, this simplified model should be used only to estimate average denudation rates for relatively large regions with mixed litho- logic units.
Regions of Extremely Low Denudation
From Fig. 9.9, one might draw the conclusion that considerable denudation is taking place everywhere on the land surface, even in arid lowlands. This, however, is not quite true. As Fairbridge and Fink1 (1980) have pointed out, some of the great Precambrian shields which

Chapter 9 Denudation and Mass Transport
were not affected by the Pleistocene glacia- tions have shown little evidence of denudation for very long time periods. These tectonically stable areas were leveled many hundred mil- lion years ago and since then have kept an elevation slightly above or below the base level of erosion. As a result, part of their almost planar erosion surface (peneplain) was repeatedly buried by a thin veneer of sedi- ment and exhumed by subsequent erosion.
This is documented by the presence of relic sediments of different ages at the edges of these cratonic regions. In Africa andparticularly in western Australia, such multiple "stacked" veneers are superimposed and subparallel not only to each other, but also to the original cratonic surface. They are often separated from the basement and from one another by palwsols and duncrusts (e.g., silcrete or lateritic crusts). In more central parts of the peneplain, which remained uncovered or were rarely buried by sedi- ments, very deep, old weathering profiles may be pre- served (also see, e.g., Firman 1988).
In such "cratonic regimes", the long-term net surface lowering can be extremely slow (in southwestern Australia 0.1 to 0.2 m/Ma, in the Chad Basin 0.5 to 2 m/Ma, see Chap. 9.4 and Fig. 9.1 1). However, in such cases there is no permanent denudation process, but alternat- ing, shorter-term phases of accumulation and erosion.
Another important point is that substantial unloading of the crust by denudation com- monly causes isostatic rebound. The amount of this uplift, however, is less than surface lowering by denudation. Nevertheless, this process enables denudation to continue for long time periods, even when thermotectoni- cally generated uplift is excluded (cf. Chap. 9.5).
9.2.3 Chemical Versus Mechanical Denudation Rates
Global Denudation Rates
On a global scale, according to Milliman and Meade (1983) about 13.5 x lo9 t/a (100 to 120 t/(km2.a)) of suspended solids (TSS) are trans- ported from the continents into the oceans. Likewise, according to Meybeck (1979) ap- proximately 3.9.10' t/a (about 30 t/(km2.a)) of dissolved materials (TDS) are transported. Thus the TSS/TDS ratio is approximately 3.5 (also see Fig. 9.6), and it is evident that, glo- bally, the transport of particulate matter clearly exceeds solute transport.
Regional Variation and Trends
On a regional scale or for individual drainage basins, the situation may be quite different. In the river basins discussed earlier, the TSS/TDS ratios vary between 0.14 (Lena, Siberia) and 11 (Ganges, Brahmaputra), and, if smaller catchments are included, the deviation from the global mean is even greater. As Walling and Webb (1983) have pointed out, there is no clear relationship between the particulate and dissolved loads of rivers, which may be partly due to the significantly differing transport mechanisms for the two load components.
Most of the particulate load is tranported by peak flows during just a few days of the year, while the dissolved load moves downriver more or less continuously. TDS varies season- ally and the concentrations of the dissolved species normally decrease during storm events. Furthermore, the specific transport rate of suspended solids often declines with increas- ing basin area, while the transport rate of dissolved solids generally is not thus affected.
If the data plotted in Figs. 9.6 and 9.9 are considered together with information summa- rized by Walling and Webb (1986), the fol- lowing trends can be identified:
- In mountainous regions, due to incomplete soil cover and high precipitation, usually both load components increase as relief increases, but the TSS transport rate increases much faster than the TDS rate. In the Alps the TSS/TDS ratio is about 1 to 2, in the Himala- yas 4 to 8. In tropical mountain ranges, the TSS/TDS ratio reaches very large values of 10 to 30 (it should be noted that several of the areas studied are relatively small). - In tropical areas with low or mixed relief, the TSS/TDS ratios vary considerably, bet- ween about 1 (Congo) and 3 to 5 (e.g., Ama- zon, Orinoco). - In large river basins in arid to semi-arid regions, the TSS/TDS ratio appears to range between 2 and 4 (apart from the Nile River with 0.5). But as pointed out earlier, much higher (and lower) ratios may occur locally, which can exceed even those of high mountain ranges in other climatic zones. - In areas with temperate to subtropical cli- mates and mixed relief the TSS/TDS ratio varies between about 0.5 and 4 (Fig. 9.6). Most of the rivers in northwestern and central Eu- rope (apart from those originating in the Alps) have ratios below 1, i.e., chemical denudation is more effective than mechanical denudation. With increasing annual runoff (and no change

Detrital Clay Minerals
in relief) the TDS transport rate is also usually enhanced, while the TSS load remains appro- ximately constant, or even declines due to increasing soil protection by dense vegetation cover. - The lowest reported TSS/TDS ratios are from the arctic to high-latitude rivers of Si- beria which drain mainly lowlands. With growing relief, this ratio also increases and exceeds 1 (e.g., Mackenzie River, Fig. 9.6). Reliable data on the transport rates of solids from glaciated areas are sparse and greatly variable.
Very high mechanical denudation rates occur in areas with wet-based, rapidly moving gla- ciers, as in Alaska.
For the Glacier Bay area, an average denudation rate of 12 m k a has been suggested (Powell and Molnia 1989). Pleis- tocene glacial denudation in central parts of Spitsbergen may have removed 3 km of Tertiary sediments (Svendsen et al. 1989). In the sea southwest of Alaska and on the Barents shelf (Vorren el al. 1988), Pleistocene diamicton accumulated at rates between 0.1 and 1 m h over large areas, and locally even faster. These data testify to the fact that denudation rates in the source areas of these accumula- tions, i.e., at the base of the eroding glaciers, must have reached about the same order of magnitude. In the An- tarctic, however, glacial denudation operates at a much slower rate (Alley et al. 1988; Henrich 1990).
9.3 Mineralogical Composition of Suspended River Loads
General Aspects and Problems
Fine-grained sediments, comprising the clay and silt grain size fractions, are the most ab- undant group of all sedimentary rocks. To describe these rocks, various names are used, such as claystones, argillites, clayey siltstones, mudstones, marlstones, and shales, but slates and many schists also originate from this group. Their material is delivered mainly by the suspended load of rivers flooding alluvial plains, entering lakes, or reaching the sea. In addition, other fine-grained sediments, such as many biogenic deposits (hemipelagic and pelagic marls and marly limestones, siliceous oozes, etc.) also often contain considerable proportions of allochthonous, terrigenous ma- terial. Accordingly, the mineralogical (and chemical) composition of suspended river loads is of great interest to sedimentologists.
In Figure 9.10, the results are summarized of some recent studies of the solid loads of major world rivers.
It should be mentioned that these data display considerable scatter, when results gained by different authors on the same river system are compared. These discrepancies probably arise due to the investigation of samples of dif- fering grain size distribution. Samples taken during peak floods contain a higher proportion of silt than those col- lected during normal or low runoff. If, for example, only the fraction containing particles <2 pm is analyzed, it is unlikely that much quartz or other non-altered rock mine- rals would be obtained, but, rather clay minerals would predominate (e.g., in Indian rivers draining the flood basalts of the Deccan Traps, Fig. 9.10). Furthermore, the different methods employed to analyze these fine-grained materials (which may be partially X-ray amorphous) add to the uncertainties regarding quantification of their minera- logical composition.
Results and Interpretation
As for the results, the following points are of interest:
- Small river basins have a more uniform mi- neralogical suspended solid composition, re- flecting the influence of parent rocks and soils more than large drainage areas with mixed conditions.
A prominent example of limited and rather uniform river basins are the Deccan Plateau riven in India, which are dominated by montmorillonitic clay due to the basaltic parent rocks and their alteration products in the subtropical climate. A second example of this type is the Caroni River in South America, which drains crystalline rocks in tropical conditions. Here illite, rnontmorillonite, and kaolinite are the most abundant clay minerals. All the other river basins listed in Fig. 9.10 represent large areas of mixed rock types, relief and climate, which is reflected in the minera- logical composition of their suspended load.
- The suspended solid flux consists essentially of a limited number of minerals which can be subdivided into two groups:
1. Primary detrital minerals inherited from the parent rocks. 2. Secondary minerals (neo-minerals) generat- ed by chemical-mineralogical weathering in the soil zone in the drainage area (cf. Chap. 9.1). 3. An additional group of fine-grained mine- rals includes authigenic and diagenetic clay minerals, which form in the depositional en- vironment or within the sediment (e.g., Es- linger and Pevear 1988). Generally, this last

Chapter 9 Denudation and Mass Transport
HIGH LAT., MIXED
AFRICA S. ASIA, HIMALAYAS, CHINA TROPICS
Fig. 9.10. Mineralogical composition of suspended matter QU quartz; PL plagioclase; KF K-feldspar; CD calcite and of major world rivers. (Based on 1 Emeis 1985; 2 Konta dolomite; AM amphibole; MO montmorillonite, smectite; 1985 and 1988; 3 Naidu et al. 1985). Differing results for ZL illitelmuscovite; CH chlorite; KA kaolinite; GI gibbsite. the same river system may be caused by differences in Generally, the proportions of these minerals are not well grain size distribution of the investigated samples as well as established. See text for further explanation by varying methods of analysis.
group is of minor importance for the minera- logical composition of clayey sediments, and it is not discussed further here.
Limited Chemical Weathering
When physical weathering processes predomi- nate and chemical weathering is limited, the minerals of group 1, i.e., both silt-size par- ticles, such as quartz, plagioclase, K-feldspar, calcite and dolomite, and smaller particles, such as chlorite and other parent rock-derived clay minerals, contribute substantially to the river load (e.g., Konta 1985, 1988). The pre- sence of carbonate minerals in the river load is a particularly sensitive indicator of the ab- sence of deeply weathered soils in parts of the
drainage area. This situation is common in regions of high relief or under arid conditions (e.g., the rivers Nile, Mackenzie, the Hima- layan Rivers, and the river Rhine entering Lake Constance).
The preservation and river transport of feldspars, especially the less stable plagioclase, are also strong indicators of limited chemical weathering conditions. Small proportions of plagioclase occur in nearly all the river loads shown in Fig. 9.10, but the Nile River (drain- ing arid regions) and St. Lawrence River (from the Canadian shield) contain relatively large quantities. As already mentioned in Chapter 9.2, some of the clay minerals may also be derived directly from parent rocks, if claystones, shales, etc., are exposed to erosion, as for example in badlands.

Detrital Clay Minerals
Illite is a common weathering product from acidic crystalline rocks in humid temperate climates, but it is also abundant in many argil- laceous bedrocks. Thus, sheet-silicates, in- cluding muscovite and sometimes mixed-layer minerals, may also originate directly from parent rocks. Illite predominates in the sus- pended load of the Indus and Ganges Rivers, Yangtze and Yellow Rivers, Parana River, and in several major rivers of Europe (Fig. 9.10; Konta 1988).
Chlorite is a major constituent of slates and greenschists; therefore the presence of this mineral in considerable quantities, as observed in the suspended load of many large rivers (Fig. 9.10), results from the mechanical ero- sion of pre-existing minerals. However, chlo- rite is destroyed in warm, humid climates, be- cause it is very sensitive to chemical weather- ing. Hence, the presence of detrital chlorite indicates a cold or possibly arid climate. On the other hand, some secondary chlorite may be formed under special conditions (acidic soils, humid temperate climates, basic parent rocks). In addition, it can form diagenetically at relatively low temperatures.
Limited Mechanical Denudation
If transport-limited conditions prevail in large parts of the drainage area, then soil-formed neo-minerals tend to predominate in the sus- pended river load. Under these conditions, thick soil profiles can develop, and fluvial erosion processes therefore remove mainly soils and little parent rock material. The neo- mineral group includes minerals of the mont- morillonite/smectite type (mostly basic parent rocks, temperate to subtropical climates), the sheet-silicates of the illite/muscovite type (humid temperate climate), kaolinite, gibbsite (and the iron oxide goethite; semi-arid to tro- pical climates).
Montmorillonite is an important constituent in the Caroni and some other tributaries of the Amazon River, in the Orange River (SW Africa), and in the Deccan Plateau rivers draining basaltic rocks and their weathering pro- ducts. It is also common in the Mississippi River near its mouth, where the 110 pm size fraction contains 40 % smectite o r montmorillonite, 25 % illite, and 20 % kaoli- nite (Potter et al. 1975). Kaolinite and gibbsite are abun- dant in the soils of wet tropical climates, where the less stable chlorite disappears. Kaolinite is a principal com- ponent in the river loads of the Orinoco and Caroni, Niger, Congo, the Deccan rivers, and in some rivers of New Guinea; gibbsite was reported only from the Niger River.
There are more soil-formed clay minerals than those mentioned here, but a more detailed treatment of this topic is beyond the scope of this text (see e.g. Birkeland 1984; Eslinger and Pevear 1988; Chamley 1989; Weaver 1989). In any case, one should be cautious in deducing the paleoclimate of a specific region solely from the clay mineral composition of sedi- ments derived from the area.
Chemical-mineralogical weathering is cha- racterized by different partitioning of ele- ments between the dissolved and the suspend- ed phases. Generally, the solids tend to be- come enriched in aluminum, iron, and (in regions of humid, temperate climate) in sili- con, while sodium, calcium, and (to a lesser extent) potassium and magnesium are carried away in solution (e.g., Stallard 1985). If the cation-poor minerals (kaolinite, gibbsite, goe- thite) are regarded as the end products of intensive weathering, and the chemical com- position of the suspended load is identified, then a kind of chemical-mineralogical matu- rity of the soil-derived solids can be defined (Emeis 1985, Konta 1985 and 1988). Relative- ly high concentrations of ~ l ' + (and ferric iron), or relatively low SiO, contents and low concentrations of Na' and Ca++ (and Mg", K') indicate an advanced maturity (tropical rivers). Low maturity, expressed by a low Al/Si ratio, is typical of arid drainage basins. With growing maturity, the Al/Si ratio also increases.
Detrital Clay Minerals in Marine Sediments
Fine-grained marine sediments on prodelta slopes and in nearby regions usually exhibit clay mineral suites similar to those of the en- tering rivers.
The clay mineral composition of the sediments in the Gulf of Mexico is about the same as that of the Mississippi River at its mouth (Potter et al. 1975; cf. Chap. 11.3). The sediments off the Niger delta (cf. Chaps. 3.4.2 and 14.4) are rich in kaolinite delivered by the Niger River (Fig. 9.10). However, the kaolinite content in the sediment decreases seaward due to the specific transport and settling behavior of the various clay minerals (Chap. 3.4.2). The eastern Mediterranean accumulates sediments relatively rich in montmorillonite, which for the most part is supplied by the Nile River. A large portion of the suspended load in the Amazon River (predominantly montmorillonite and kaolinite) is transported to the northwest and deposited in the coastal region as mudflats (Weaver 1989).
The clay mineral distribution in modern ocean sediments reflects to some extent the global

Chapter 9 Denudation and Mass Transport
climatic zones. The largest amounts of kaoli- nite are found in low latitudes, where rivers from humid tropical regions enter the sea. The kaolinite content tends to decrease towards the poles and from coastal waters to the deep sea. Detrital chlorite is most abundant in the polar and subpolar regions, where chemical wea- thering is limited. Illite and smectite (mont- morillonite) are the most important clay mine- rals in modern ocean sediments. Illite-rich sediments are found in temperate to cold cli- matic zones, whereas smectite is abundant in regions of extensive volcanic activity both below the sea and on land.
Authigenic clay minerals usually comprise only a minor proportion of the total com- position of marine sediments. These and dia- genetically formed clay minerals are not dis- cussed in this text (see e.g. Weaver 1989).
9.4 Long-Term Denududation Rates from the Sediment Budget of Various Basins
Introduction
Because evaluating mechanical and chemical denudation rates from present-day river loads is problematic, geologists have repeatedly tried to derive long-term average denudation rates from the volume of sediment accumuluated in sedimentary basins during a certain time peri- od. In these cases, the extent of the former drainage and depositional areas must be known, and the time period of the sediment slice or wedge (e.g., in a shelf sea, a subma- rine fan, or in front of a lake delta) should be sufficiently accurate. The general problems encountered in such a study are demonstrated in Fig. 9.1 1. This method is therefore more appropriate for the investigation of closed or semi-closed basins of young geologic age (Quaternary and Tertiary), where uncertainties about the drainage area can be minimized.
If we are dealing with closed basins, the dissolved river load should also be found, as chemical precipitate, in the skeletons and or- ganic matter produced by organisms, or in the pore fluid of the deposited sediments. In semi-closed basins, part of the dissolved river load may be trapped by organisms and incor- porated into the ultimate sink of the eroded material, but most is probably lost to regions beyond the depositional wedge under inves- tigation.
Consequently, the "sediment budget me- thod" should be used with caution for cases in which chemical denudation exceeded mecha- nical erosion. In addition, there are cases in which the exchange of water masses with lar- ger basins exerted a strong influence on the character and volume of the investigated sedi- ments (e.g., in the Gulf of California, see below).
Example of a Closed Basin (Chad Basin)
The Chad Basin in the central part of North Africa, described in detail by Gac (1980), is a completely closed basin with an internal drai- nage system (Fig. 9.12). River water, supplied mainly by a subtropical region to the south- east, flows into a large, shallow playa lake, Lake Chad, from which it evaporates. The total drainage area of the lake comprises an area of approximately 2 x lo6 km2, while the area of the lake itself varies in response to dry and wet years. Under average, present-da 2' conditions it covers an area of 2.1 x lo4 km . Six thousand years ago, when the climate in North Africa was more humid, the lake was much larger and had an outlet to the Niger River to the southwest. Today the climatic conditions range from hot and arid in the north (Sahara Desert) to subtropical in the southeast (Fig. 9.12 b). Evaporation from the lake is 2150 mm/a.
Mechanical denudation by rivers originating largely in mountainous regions to the southeast delivers an average of 10.5 t/(km2.a) for the total drainge area; chemical denudation a- mounts to 3.6 t/(km2.a). Thus, the present-day total average denudation rate is 5.6 mm/ka. This low value is a result of the low relief of large parts of the drainage area as well as of the thick, extensive soil cover on top of crys- talline parent rocks (Fig. 9.12 c).
As climate changes, the intensity of mechanical erosion and chemical alteration of the parent rocks may vary signifi- cantly. When arid conditions in the region are more in- tense, and part o f the soil cover is lost, denudation pro- gresses more quickly than today, whereas more humid conditions only exert a minor influence on weathering.
If both mechanical and chemical river loads would be evenly spread over the present-day lake area, a solid sediment layer of about 550 mm/ka would result. Assuming a porosity of 60 Yo, the sedimentation rate of the uncom- pacted material in the lake should amount to about 1400 mm/ka. The actual thickness of wet Holocene sediments (10 ka) consisting of

Sediment Budget of Various Basins
TOTAL AREA OF ACTUAL
DISSOLVED MATTER
SPILL- OVER ISOCHRONE (STRATIGR.
SEDIMENT VOLUME OF SEDIMENT TO BE DETERMINED BOUNDARY)
(TERRIG.AND BIOGENIC)
Fig. 9.11. Scheme demonstrating the general problems involved in the assessment of the denudation-basin fill budget. See text for further explanation
terrigenous silty clay, carbonate and biogenic silica ranges from 4 to 6 m and thus cor- responds to an average uncompacted sedimen- tation rate of about 500 mm/ka or a sedimen- tation rate of compacted, solid material of 200 mm/ka. The latter value indicates an average denudation rate of only 2 mm/ka.
The discrepancy between the calculated and observed sediment thicknesses may be due to the fact that 6000 years ago the lake was larger, and therefore the sedimentation rate was lower than today. Furthermore, it should be mentioned that most of the dissolved and detrital material is derived from only about 30 % of the drainage area (in the southeast). Hence, the denudation rate there may be three times higher than that calculated for the area taken as a whole.
There are more recent examples of this type of closed basin with a salt water lake or playa lake in its center; well known are the Great Salt Lake in North America and Lake Eyre in Australia. A systematic study of the sediment volume accumulating in such lakes during a certain time span is not yet available, how- ever.
Examples of Semi-closed Basins (Black Sea, Gulf of California)
Adjacent seas can also be described as semi- closed basins, because they have an opening to the world oceans (Chap. 4). Some of these basins have been studied to determine the denudation rates in their drainage areas. Two examples include the Black Sea, with shallow, narrow opening to the Mediterranean Sea (also a semi-closed basin) and the Gulf of Califor- nia, with a deep, wide connection to the Paci- fic. Whereas the Black Sea appears to be a relatively simple, straightforward case study, the Gulf of California incorporates a number of complications characteristic of the initial stage of a young, narrow ocean basin.
The Black Sea
The modern Black Sea is a gigantic catch basin for the river discharge of half of Europe and part of Asia (Fig. 9.13), where all incoming sediments are trapped. Degens et al. (1978) have calculated denudation rates in the drai- nage area from river loads and have compared these values with the sedimentation rates in the Black Sea (0.45 x lo6 km2). The total drai-

Chapter 9 Denudation and Mass Transport
initial semi-arid
arid ( today) humid
...... ...... ...... ...... ...... ...... ...... CHEMICAL ...... ...... ALTERATION ...... ...... ...... ...... 1.76 ......
PARENT
Fig. 9.12. a Closed internal drainage basin of Lake Chad, in the southeastern part of the Lake Chad drainage area. central North Africa. Note that the lake is fed primarily by Arrows signify increasing aridity. c Progress of mechanical rivers from the subtropical mountainous region in the and chemical denudation (in mmlka) under different cli- southeast (b), while the Sahara desert in the north wntri- matic conditions. (After Gac 1980) butes hardly any water. b Annual precipitation (in mmla)
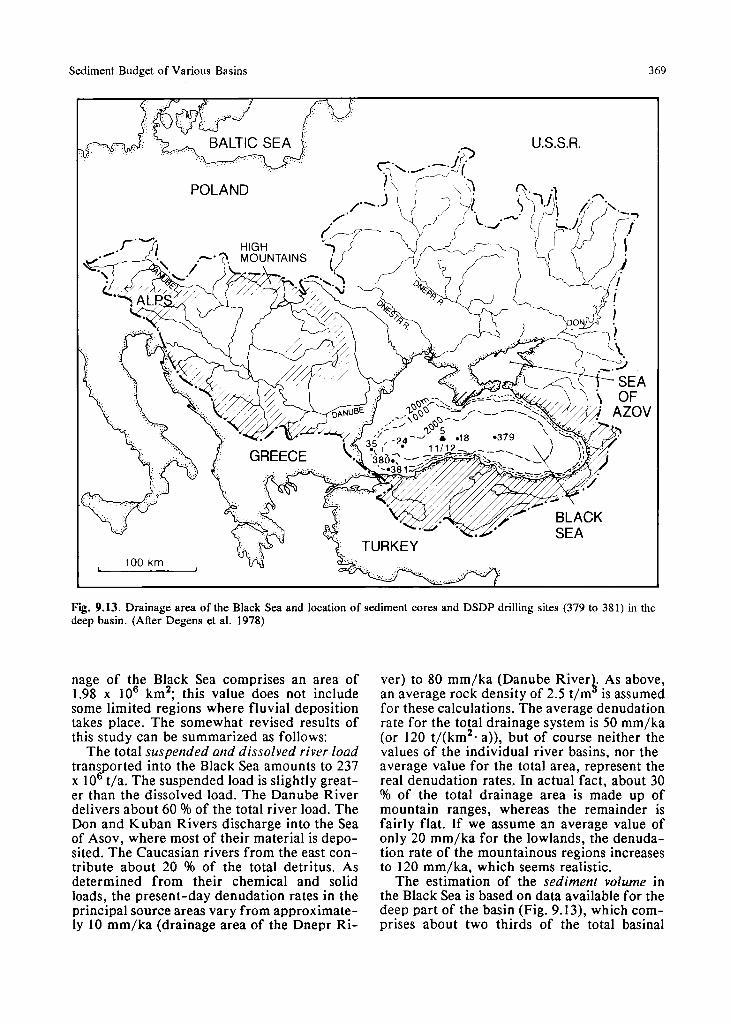
Sediment Budget of Various Basins 369
Fig. 9.13. Drainage area of the Black Sea and location of sediment cores and DSDP drilling sites (379 to 381) in the deep basin. (After Degens et al. 1978)
nage of the Black Sea comprises an area of 1.98 x lo6 km2; this value does not include some limited regions where fluvial deposition takes place. The somewhat revised results of this study can be summarized as follows:
The total suspended and dissolved river load transported into the Black Sea amounts to 237 x lo6 t/a. The suspended load is slightly great- er than the dissolved load. The Danube River delivers about 60 % of the total river load. The Don and Kuban Rivers discharge into the Sea of Asov, where most of their material is depo- sited. The Caucasian rivers from the east con- tribute about 20 % of the total detritus. As determined from their chemical and solid loads, the present-day denudation rates in the principal source areas vary from approximate- ly 10 mm/ka (drainage area of the Dnepr Ri-
ver) to 80 mm/ka (Danube River As above, 5. an average rock density of 2.5 t/m is assumed for these calculations. The average denudation rate for the total drainage system is 50 mm/ka (or 120 t/(km2. a)), but of course neither the values of the individual river basins, nor the average value for the total area, represent the real denudation rates. In actual fact, about 30 % of the total drainage area is made up of mountain ranges, whereas the remainder is fairly flat. If we assume an average value of only 20 mm/ka for the lowlands, the denuda- tion rate of the mountainous regions increases to 120 mm/ka, which seems realistic.
The estimation of the sediment volume in the Black Sea is based on data available for the deep part of the basin (Fig. 9.1 3), which com- prises about two thirds of the total basinal

Chapter 9 Denudation and Mass Transport
area. In the past 5000 years, the sedimentation rate of uncompacted sediment (including coc- colith ooze, sapropel, and intercalated turbi- dites), was approximately 1000 mm/ka. If we take into account an average porosity of 70 %, the sedimentation rate of compacted, solid material drops to 300 mm/ka. Normalized based on the drainage area, which is 4.4 times larger than the basin, this value yields an ave- rage denudation rate of about 70 mm/ka.
This result agrees fairly well with the rate found from the suspended and dissolved river loads. It is assumed that most of the dissolved constituents delivered by rivers is used up by organisms and deposited in the basin as bioge- nic carbonate and opaline silica. There is, however, also some exchange of dissolved material via the narrow passage of the Bospo- rus connecting the Black Sea with the Medi- terranean, but outflow from the Black Sea is greater than inflow (Chap. 4.3). Due to this water exchange, the sedimentary environment of the present-day Black Sea is not far from normal marine conditions. Its sediment volume is probably not substantially affected by the inflow of sea water.
The denudation rates obtained in this study are characteristic of the steppe vegetation present in large parts of the drainage area. During times of more extensive forest growth, denudation was probably reduced by more than half. During such times, sapropels were preferentially deposited in the Black Sea basin. Similarly, in the course of Pleistocene glacial melting and loess mobilization in the hinter- land, denudation and sedimentation rates in- creased considerably and may have reached values up to ten times greater than those found for the Holocene.
The Gulf o f California
The Gulf of California is a young oceanic basin formed by strike-slip movements and therefore shows a rather complicated mor- phology with a number of small deep basins separated by higher areas (Fig. 9.14a, also see Fig. 4.5). Prior to the building of dams, the northern gulf was fed by the Colorado River draining a large hinterland. In the south the gulf has a wide, deep opening to the Pacific Ocean. To assess a hemipelagic sediment budget, the influence of the Colorado as a source of terrigeneous material was excluded by choosing some gulf islands as the northern boundary of the depositional study area (Fig. 9.14a), as these islands act as a sort of dam
which traps the Colorado sediments. In the south and southwest the boundary line of the study area separates a gulf region still influ- enced by hemipelagic sediments from the deeper ocean floor, where pelagic deposits (with a sedimentation rate of less than 20 mm/ka) prevail. The sediment volume of this part of the gulf has been determined for the last 4 Ma (Einsele and Niemitz 1982), i.e., for the so-called post-rift sediments which were deposited after the initiation of ocean spread- ing (Curray and Moore et al. 1982a).
Prior to this development a "protogulf" existed, in which pre-rift sediments of con- siderable thickness accumulated, particularly below the eastern shelf of the present gulf (Fig. 9.15a). The older protogul f sediments rest on subsiding continental crust, while the younger, post-rift sediments were deposited either on new oceanic crust in the deep main part of the gulf, or on top of protogulf sedi- ments.
Because the pre-rift protogulf sediments are often some- what faulted and tilted, the boundary between these and the post-rift sediments can be detected in seismic profiles. Thus, it is possible to determine the thickness and volume of sediments which accumulated during the last 4 Ma in the entire study area. Information on the nature of these sediments has also been gained from a number of desp holes drilled during Leg 64 of the Deep Sea Drilling Project. Based on these results, an isopach map for the post-rift sediments could be drawn, which shows extremely varying sediment thicknesses (Einsele and Niemitz 1982). In order to calculate the sediment volume of the depositio- nal area, the different sediment thicknesses were sub- divided into slabs of equal thickness and porosity. Wet, uncompacted sediment volume was then converted into volume o f compacted, solid (dry) material using the porosityJdepth relationship found in the boreholes (Fig. 9.1% and d).
In this way, the average sedimentation rate for dry solid material could be determined for the young gulf (25 m/Ma) as well as for its eastern shelf (58 m/Ma), where the young sediments lie on protogulf deposits. When the areal extents of both depositional areas are taken into account, the average sedimentation rate becomes 36 m/Ma (Fig. 9.1 5). Because 11 of the 36 m/Ma are made up of biogenic silica, carbonate, and organic matter, only 25 m/Ma originate from the influx of terrigenous material from the neighboring land masses. If the dissolved river load is excluded, and the sedimentation rate, drainage area (2.71 x 10' km ), and the studied gulf area (1.92 x 10' 2 km ) are applied, an average denudation rate (TSS) of about 20 m/Ma for the last 4 Ma can be determined. This is, however, a minimum

Sediment Budget of Various Basins 371
Fig. 9.14. a Relief of 20 x 20 km squares in the drainage special sections (I - V) across the gulf. b Mean annual area of the central and southern parts of the Gulf of Cali- precipitation in the drainage area of the gulf. (Einsele and fornia, as well as limits of the studied depositional area and Niemitz 1982)

Chapter 9 Denudation and Mass Transport
TRANSFORMATION
THICKNESS INTO
o loo 200 300 400 500 600 rn
THICKNESS OF SOLID MATTER
SLABS OF EQUAL THICKNESS
0 10 20km
SW IV pp - - -- -
A__&--
WET SEDIMENT
Fig. 9.15. a Simplified model for the development of an initial, Gulf of Califomia-type ocean from (1) a shallow protogulf on continental crust to (2) a narrow, deep oceanic basin by rifting and accretion of new oceanic crust. Note the boundary (partly represented by an unconformity) bet- ween pre-rift and post-rift sediments. b Sections across the gulf (I1 and IV in Fig. 9.14a) with thicknesses ~f wet (un- compacted, porous) and dry (compacted, solid) sediment (shown only for part of the section);
vertical exaggeration x 5. c Porosityldepth relationship representative of major parts of the Gulf of California and conversion from wet to solid sediment thickness: results are shown in d, vertical exaggeration x 50. e Average sedi- mentation rates in the studied gulf area and derived mean denudation rate in the corresponding drainage area. For- merly high sediment input from the Colorado river at nor- them end of gulf is excluded from this study. (Einsele and Niemitz 1982)

Sediment Budget of Various Basins
value, because some of the eroded material was deposited in alluvial plains before it reached the gulf.
Compared to drainage areas similar to that of the Gulf of California, the denudation rate, even if it were twice as high as the calculated value, appears to be rather low. The drainage area of the gulf lies in the transition zone between the hot dry climate to the northwest and the semiarid and increasingly wet climate of the lowlands and mountain ranges of mainland Mexico in the southeast (Fig. 9.14b). Here, some riven drain regions of high relief, consisting largely of Cenozoic volcanics. It can be assumed that the size of the drainage area has not changed significantly during the last 4 Ma, since the principal physiographic features of this region, including the mountain range of the Sierra Madre Occidental, were formed earlier.
Average sedimentation rates calculated for short time intervals in the post-rift gulf have not been constant during the last 4 Ma, be- cause its areal extent increased as a result of ocean spreading (extensional basin model, Chap. 1 1.3).
The Himalayas-Bengal Deep-Sea Fan Denudation-Accumulation System
Introduction and Previous Studies
In the present-day oceans, detritus of large rivers forms deep-sea sediment fans of various sizes and thicknesses (e.g., Barnes and Nor- mark 1985; cf. Chap. 5.4.2). Some of these fans have been thoroughly studied using seve- ral methods, including seismic investigations and deep ocean drilling. If the volume and age of such a huge sediment wedge are known, as for the Mississippi Fan in the Gulf of Mexico (Chaps. 5.4.2 and 1 1.3), and the Indus Bengal Fans in the Indian Ocean, the mean denuda- tion rate in the source area can be calculated. In addition, alluvial deposits on land and the outbuilding of river deltas have to be taken into account. This procedure is briefly de- monstrated for the most prominent present- day example: the rivers Ganges and Brahma- putra, which drain a major part of the Hima- layas and deposit most of their solid load in the Bengal Fan, a submarine sediment wedge approximately 3000 km long and, at its maxi- mum, 1000 km wide (Fig. 9.16).
Curray and Moore (1971) made a first at- tempt to compare the volume of this sediment wedge with the sediment load of the two com- bined rivers (Table 9.la and c). Because age control for both the base of the fan and an unconformity within the fan was poor, they
calculated the age of the fan from the present- day load of the two rivers (Table 9. lc). Hence, their denudation rate for the Himalayas (620 or 720 mm/ka) is in fact based on the "river load method" and not on the sediment volume of the fan. Furthermore, it should be men- tioned that their average denudation rate is determined for an area including lowlands, which is much greater than that occupied by the high mountain ranges.
New Mass Balance
In a new estimate, some of the results of Leg 116 of the Ocean Drilling Program were em- ployed (The Leg 116 Shipboard Scientific Party 1987; Kassens and Wetzel 1989; Stow and Cochran 1989; Cochran 1990). It was found that the uplift of the Himalayas and the deposition of the deep-sea fan had already begun about 20 Ma ago, and the age of the unconformity within the fan sediments (caus- ed by deformation of the underlying oceanic crust) is 7.5 to 8.0 Ma (in Table 9.1 an age of 7.7 Ma is used).
In addition to the huge sediment volume of the fan, large quantities of river detritus were deposited in the sub-Himalayan foredeep, an east-west trending molasse basin along the southern foot of the Himalayas, as well as in the Bengal Basin of Bangladesh (Alam 1989). The foredeep is essentially filled with coarse to fine fluvial sediments of mainly Middle Miocene to Holocene age. These sediments are derived directly from the Himalayan uplift and reach thicknesses of up to 10 km.
The Miocene to Quaternary sediments of the Bengal Basin underneath the modern del- taic flood plain of the Ganges River consist of proto-Bengal Fan deposits overlain by a sea- ward prograding delta complex. These two units form a wedge-like sedimentary body with thicknesses of a few kilometers or less in the northwest and up to more than 10 km (maximum of 15 km) near the present river mouth. The exact sediment volume deposited during the last 20 Ma in the sub-Himalayan foredeep, including the Bengal Basin is not known. An estimation based on available data on the sediment thicknesses and extents of these basins yields a volume of around 3 x lo6 km3.

374 Chapter 9 Denudation and Mass Transport
Fig. 9.16. a Drainage area of rivers Ganges and Brah- b Model for the different areas and volumes of denudation maputra in the Himalayas, their alluvial plain and delta, and deposition of the GangeslBrahmaputra-Bengal Fan and the submarine Bengal Fan. (After Curray and Moore system (see Table 9.1 for results of calculations) 1971; Alam 1989; Stow and Cochran 1989).
Average Denudation Rate in the Himalayas
Using the above mentioned value and the data listed in Table 9.lb, an average denudation rate of 950 mm/ka (950 m/Ma) can be deter- mined for the high mountain ranges of the Himalayas. In this case, uniform erosion dur- ing the last 20 Ma is assumed.
The minor sediment contributions of mountainous regions in the southern part of the drainage area of the Ganges
River are neglected. Likewise, the sediment supply of riven entering the Gulf of Bengal from the west are not taken into account. If the sediment volume of the Bengal Fan (as well as that of the plains) is subdivided into post- 7.7 Ma (sediment volume V,) and pre-7.7 Ma (V,) por- tions, one obtains denudation rates for the Himalayas of 730 and 1070 mlMa, respectively. This calculation takes into account the lower bulk density of the fan sediment (2.0 to 2.2 t/m3), as compared to the eroded solid rocks (2.6 tlm3) in the denudation area. C o n s i d e ~ g the many sources of error, all these values may deviate from the true rate by + 20 to 30 %.

Sediment Budget of Various Basins 375
Table 9.1. Mechanical denudation rates of the Himalayas drained by the Ganges and Brah- maputra Rivers. Calculation based (a) on sediment volume of Bengal deep-sea fan, (b) on sediment volumes of Bengal Fan, molasse foredeep, alluvial plains, and subaerial delta, and (c) on present-day river loads. (For symbols see Fig. 9.16~). All values rounded
a) Curray and Moore (1971)
Time interval a tb - 'i ti - t, 'b - 'e (Ma B.P.) 8.8 - 1.8 = 7.0 1.8 - 0 = 1.8 8.8 - 0 = 8.8
Volume of uncompacted 7.0 3.1 10.1 fan sediment (x lo6 km3) (Foredeep and subaerial delta neglected)
Wet bulk density of fan sediment (t/m3) 2.2 2.0
Conversion factor for rock density in denu- 0.846 0.762 dation area 2.6 t/m3
Eroded rock volume 5.92 2.38 (x lo6 km3)
Drainage area (x lo6 km2) Mountainous part 1.54 1.54 1.54 Total area 2.05
Denudation rates (mlMa) Mountainous part 550 860 Total area
b) New estimate
Time Interval (Ma B.P.)
Sediment volumes (x lo6 km3) Molasse foredeep, V,, and delta plain, Vd ca. 2 ca. 1 ca. 3
"Dry" fan sediments, Vfl, Vfz, and Vf 5.92 2.38 8.35 (conversion wetidry see a)
Denudation area (x lo6 krn2) High mountains area 0.6 0.6 0.6 Total area 1.48 * 1.48 1.48
- -
Average denudation rates High mountain area 1070 730 950 Total area (m/Ma) 435 300 380
Chapter 9 Denudation and Mass Transport
Table 9.1 Continued
c) River load method (for rivers Ganges and Brahmaputra)
After Holeman (1968) in Milliman and Meade in Curray and Moore (1971) (1983) -
Total suspended solids, TSS (x lo9 t/a) 2 .2 1.67 + 25 % bedload 2 .9 2.1
Total denudation area High mountain area (x lo6 km2)
Average denudation rate from TSS and bedload (mlMa) 720
a Calculated from present-day river load (no stratigraphic control) After Holeman (1968). Values should be equal, because both are based on present TSS (total suspended solids). After Milliian and Meade (1983). Density of eroded mcks 2.6 t/m3.
The average denudation rate in the Himalayas is considerably lower if the Bengal Fan vo- lume is only 4 x lo6 kms, as assumed by Bar- nes and Normark (1985), or if fan sedimen- tation initiated by crustal uplift in the Hima- laya region began earlier. The denudation rate is somewhat higher if sediment loss to the Nicobar Fan (to the east of Ninety East Ridge) is considered (about 1 x lo6 km , A. Wetzel, pers. commun.). An average denudation rate on the order of 500 to 1000 m/Ma over a time period of 20 Ma signifies that a rock package 10 to 20 km thick has been removed. The present-day outcropping of 12 to 20 Ma old granitic intru- sions in south Tibet, which were emplaced during to the main and late phases of tecto- nism in the Himalayas (Lefort et al. 1987), is compatible with such a large amount of ero- sion (also see Chap. 9.5.3).
Summary
tioned in Chapter 9.2.3 (discontinuous denu- dation), but the ancient lower denudation rates may also be the result of differing climatic conditions or errors in the evaluation of both the sedimentary budget and/or the river bed load.
In addition, some authors have tried to establish sediment budgets for large individual ocean basins or budgets on a global scale for long time periods (cf. Chap. 11). Hay et al. (1989) have made an attempt to redistribute the sediments deposited in ocean basins to their former source areas.
9.5 Tectonic Uplift, Denudation, and Geomorphology
9.5.1 Long-Term Denudation Rates from Changes in Topography
Denudation rates found by the sediment bud- A method similar to sediment budget assess- get method discussed here are summarized in ment is the determination of the rock volume Table 9.2, together with values taken from the which was eroded from a known topographic literature. Most of these denudation rates are feature, for example a volcanic cone, within a in relatively good agreement with those cal- certain time period. culated from the suspended load of present- day rivers. Some of the long-term denudation rates, however, appear rather low. One of the reasons for this discrepancy was already men-

Uplift, Denudation, and Landscape Evolution 377
Table 9.2 Mean denudation rates derived from the budget of sedimentary basins, river deltas, and submarine fans
Study area Time Average denudation Reference Remarks period rate (mmlka)
Denudation Deposition Total Mountain. (Ma) area Dart
Chad drain- LakeChad 0.01 2 6 Gac (1980) Arid to age basin N. Africa Holocene (Min. values) semi-arid
Black Sea Black Sea 0.01 70 Degens et Modified drainage Holocene (Steppe veget.) a1.(1978)
Mississippi Miss. delta Pleistocene 46 drainage area and fan
North. A p Volume of palachians Cenozoic ca. 150 27 South. App. sediments 5
S. Califor- S. Californ. 1 120 nian coas- borderland Pleistocene tal range
Menard et a1 (1965)
Values Mathews probably too (1975) low
Moore (1969)
W. Mexico, Gulf of 4 20 50 Einsele and coastal California, (Min. values) Niemitz ranges central and (1982)
southern part
W. Alps Rhone sub- Pleistocene 400 Menard et marine fan al. (1965)
Swiss Alps Rhine delta 50 years Upper Rhine in Lake
Constance
250 Miiller (1966) New cal- culation
Swiss Alps Lake Ziirich Holocene 1000 Schindler sediments (1974)
Himalayas, Bengal deep 8.8 460 720 Curray and Ganges and sea fan, fore- Moore (1971) Brahmaputra deep, coastal Rivers plain 20 380 950 This book New cal-
culation
In this way, Mills (1976) calculated a mean denudation rate of 1100 mmka (= 1100 m/Ma) for the slopes of the 4000 m high andesitic Mt. Rainier in the northwestern United States (for the last 0.32 Ma).
In the uplands of the Little Colorado Valley, Arizona, volcanic extrusions invaded the valley floor several times since the early Pliocene. A denudational lowering of the landscape in Permo-Triassic mudstones, siltstones, and sandstones on the order of 80 to 100 m/Ma has been deduced (Rice 1980) from the downcutting of the trunk river through these radiometrically dated lava flows.
In southern Germany, relics of Upper Jurassic limes- tones which formed the older landscape and have sunken
into a Miocene volcanic pipe indicate that the land surface was lowered by about 600 m during the last 18 Ma (Geyer and Gwinner 1986). These data yield an average denu- dation rate of 33 mIMa.
Extended post-Variscan peneplains at the base of the continental Triassic in Europe truncate granitic and meta- morphic rocks and thus show that a thick rock cover has been removed by denudation subsequent to the Variscan orogeny.
Another method for estimating denudation is the enrichment of "insoluble" residues in the soils of karstic terrains or the formation of

378 Chapter 9 Denudation and Mass Transport
lateritic crusts (duricrusts) in tropical "wet- dry" regions (e.g., Chorley et al. 1984).
Weathering of 30 m of granite is estimated to yield 1 m of laterite. The assessment of denudation rates from these observations is problematic, however, because lateral transport of soil and iron cannot be excluded. More re- liable estimates can be gained from carbonate leaching in young loess, fluvial beds, o r tills, the original carbonate contents of which are known.
In hilly areas, which were affected by Late Pleistocene solifluction processes forming a typical soil cover, the subsequent changes in topography by linear stream erosion can be evaluated.
Applying this method, Schmidt-Witte and Einsele (1986) found an average denudation rate of approximately 10 mmka for forested Keuper hills, consisting predominantly of claystones and sandstones, in the Holocene temperate humid climate of southern Germany.
9.5.2 Geomorphological Consequences of Differential Denudation
At the end of this chapter, a discussion of some of the consequences of chemical and mechanical denudation on landscape develop- ment appears appropriate. This is addressed in a semi-quantitative way, using simplified mo- dels of several characteristic morphogenetic regions containing subunits with various structures and lithologies. In order to simulate the evolution of landforms in such regions, it is assumed that (1) climatic conditions remain
constant, (2) denudation proceeds continuous- ly at the same rate in each subunit, and (3) the investigated region is tectonically stable. These assumptions are, of course, unrealistic (cf. Chap. 9.5.3), but the purpose of this exercise is to get a feeling for the evolution of land- forms in certain geological time periods.
Cuestas (Model)
Figure 9.17 presents a cross-section through a cuesta landscape similar to thzt of southern Germany. This type of landscape is found in many other regions of Europe and other con- tinents. Tilted Mesozoic sedimentary rocks of different lithologies rest on a crystalline base- ment. It is assumed that in this case only che- mical denudation takes place, which is by far the most important denudation process in humid temperate conditions with low to mo- derate relief. The denudation rates vary con- siderably, however, according to the rock type (Fig. 9.17). As a result, denudation proceeds very irregularly.
In this simplistic model, the outcropping carbonate rocks are more or less removed after 10 Ma, although they originally covered wide areas, unless they are protected by less soluble overlying beds or thick soils. The rocks least affected by chemical denudation are quartzitic sandstones. They maintain almost all their initial elevation and, in addition, their ex- posed surface area increases at the expense of less resistant rocks. This phenomenon can be observed in large areas of central Europe.
z W GRANITE, QUARTZlTlC CLAYSTONES Ill < GNEISS SANDSTONE a a I 1
- - - . . . . - . CARBONATES, MOLASSE: SHALES SANDSTONES
Fig. 9.17. Theoretical model for the development of a particular may proceed differently if dissolution is ham- cuesta landscape with different rock types in persistently pered by primary clayey intercalations andlor soil for- humid temperate climate. Only chemical denudation is mation protecting the underlying rocks. See text for further considered. The geological setting resembles that in explanation. (After Hohberger and Einsele 1979) southern Germany. In reality, carbonate denudation in

Uplift, Denudation, and Landscape Evolution
After 20 Ma of continued erosion, the sand- stones form the highest mountains or hills in a region largely eroded down to the base level of rivers. During this development, tectonic grabens may temporarily display inverted relief.
In reality, however, denudation in such regions is more complex and irregular. Me- chanical denudation along the valley slopes of shifting river courses generates slope retreat, although the significance of this process in carbonate rocks is probably overestimated. The effect of progressive denudation on the landscape is also frequently modified by in- tercalated beds in the rock sequence which are particularly resistant to weathering. In ad- dition, climatic changes, including periglacial processes which strongly promote mechanical denudation, play a role. A thorough discussion of this topic for particular regions is beyond the scope of this book.
Differential Denudation in the Amazon Drainage Area (Model)
Present-Day Situation
The second example deals with the drainage basins of the Amazon and Orinoco Rivers and is based on both Drever (1982) and especially on Stallard (1985). In terms of runoff, the Amazon is the largest river in the world, draining tropical forests as well as high, snow- covered mountain regions (Fig. 9.1 8a). Annual precipitation ranges mostly between 1000 and 2000 mm and in some parts is even higher. The relatively high load of solutes acquired in the Andes is diluted by lowland rivers with very low dissolved constituent concentrations (due to thick soils; Fig. 9 .4~) . Thus, 86 Yo of the dissolved load entering the Atlantic Ocean is supplied by 12 % of the total drainage area of the river, i.e., by the mountainous region of the Andes. Similarly, the chemical denudation rates of the different morphotectonic units of the Amazon and Orinoco drainage basins vary by a factor of nearly 100 and, if the evaporitic sediments are included, even up to a factor of 1000 (Figs. 9.18b and c). These chemical de- nudation rates are in fairly good agreement with the rates for the morphoclimatic zones shown in Fig. 9.7.
As for the mechanical denudation rates, the ratio of suspended/dissolved load is 3.1 for the Amazon and 4.2 for the Orinoco (Walling and Webb ,1986, also see Fig. 9.6). The average ratio of mechanical/chemical denudation rates for the total drainage area of the Amazon is approximatly 3, i.e., 60120 m/Ma. The me- chanical denudation rates of the different morphotectonic units can only be estimated, however. According to Milliman and Meade (1983) and the data discussed in Chapter 9.2.2, the rates plotted in Fig. 9 . 1 8 ~ (as mean denu- dation, MD, in m/Ma) are assumed.
Long-Term Land form Evolution
Starting with (unrealistically) idealized topo- graphy resembling the present-day in this region, and applying these chemical and me- chanical denudation rates, one can predict the region's landform evolution after 1 and 5 Ma, respectively (Fig. 9.18~).
In addition to the assumptions mentioned above, it is assumed that the lithology of the units do not change with depth and thus bring about variations in denudation rate. Furthermore, isostatic rebound due to denudational un- loading is neglected (see below).
Because both the chemical and mechanical de- nudation rates are high in parts of the drai- nage area, they produce marked changes in the landscape even within the relatively short time period of 1 Ma (Fig. 9.18~). Chemical denudation alone may considerably lower the elevation of the carbonate and evaporite sec- tions in the Andes as well as in the foothills. After 5 Ma, the same units are strongly af- fected, whereas little change can be registered in the low-lying shield. The combined proces- ses of chemical and mechanical denudation will erode in 5 Ma about three fourths of the Andean mountains and entirely remove the foothills. Both the low-lying and particularly the elevated shield are also significantly low- ered, but the lowland sediments in the rivers remain adjusted to their erosional base, i.e., the Atlantic Ocean, and therefore more or less maintain their elevation by alternating erosion and deposition. In approximately 10 to 20 Ma (not shown in Fig. 9 .18~) the crystalline rocks of the Andes and the elevated shield may have reached about the same (rather low) elevation above a very large lowland area, unless they undergo uplift coeval with denudation.

380 Chapter 9 Denudation and Mass Transport
BOUNDARYOF DRAINAGE BASIN
HIGH MOUNTAIN CHAIN
krn + (THYRETICAL) INITIAL STAGE
CONCENTRATION OF TDS IN mg/l 1 1 0 0 0 10000
LOWLAND SHIELD
LOWLAND SEDIMENTS
ELEVATED SHIELD
DRIER BASIN
1 1 0 I do 10'00 10000
DENUDATION RATE m/Ma
CHEM. DENUDATION AFTER 1 Ma AFTER 5 Ma
EVAPORITES , CH ~ 5 0 0 0 ELEVATED
SHALES AND CARE. SHIELD CH-10-30 CH-200, MD - 5 0 0 CHEM. DENUD.
AFTER 5 Ma FOOTHILLS
CHEM.+MECH. AFTER 5 Ma
SEDIMENTS
C
DENUD.
Fig. 9.18ac. Model for predicting landscape development b Cross-section through drainage basin with different sta- in region similar to that in the drainage basins of the rivers ges of prograding denudation, after 1 and 5 Ma, respec- Amazon and Orinoco. a Morphotectonic map. b Total die- tively. Note the extreme differences in denudation, leading solved solids (TDS in mgll) in river water and derived to rapid destruction of great parts of the Andean cordillera. chemical denudation rates for the morphotectonic zones Isostatic rebound, however, is not taken into account. shown in a. (After data of Stallard 1985, generalized)

Uplift, Denudation, and Landscape Evolution
9.5.3 Interrelationship Between Tectonic Uplift and Denudation
Uplift Rates
The examples in the previous section describe the progress of denudation in tectonically stable, hilly or mountainous areas which are assumed not to be affected by tectonic uplift or isostatic rebound as a result of denudation. This assumption is geologically unrealistic, because any kind of unloading, for example by substantial erosion of rock material or by melting ice, leads to isostatic rebound which partially compensates for denudation. This process will be taken into account in the fol- lowing discussion. In addition, many regions are characterized by active tectonic uplift due to crustal processes or plate motions (cf. Chap. 12).
With epeirogenic movements, large areas are affected by moderate vertical uplift or sub- sidence on the order of 0.02 to 0.2 mm/a (20 to 200 m/Ma), which may persist for tens of millions of years. These movements originate from processes within the lithosphere and the mantle (cf. Chaps. 1 and 8). Higher rates of vertical movements result from isostatic res- ponse of the crust to rapid loading or unload- ing, for example by the growth or melting of icecaps. Post-glacial uplift in Scandinavia and other, formerly thickly glaciated areas is still in progress and reaches values as high as seve- ral mm/a and more, but is exponentially de- creasing with time.
Orogenic uplift of mountain belts is, con- trary to earlier hypotheses, a rather lengthy process lasting between 20 and 100 Ma (in- cluding isostatic rebound after initial isostatic equilibrium has been established). It evolves at plate boundaries as a result of plate conver- gence, subduction, and underthrusting of oceanic or continental crust. As long as these processes continue, uplift rates may be very high (up to several mm/a). Later, isostatic rebound of the thickened mountain root is the principal factor of slowly declining uplift.
From the cooling history and radiometric dating of meta- morphic rocks, several authors (e.g., Grundmann and Mor- teani 1985; Selverstone 1985) derive an uplift rate of 0.2 to 1.0 mmla (= 200 to 1000 m1Ma) for the last 30 to 50 Ma in the eastern Alps (Tauern Widow). In tlie western Alps, uplift probably proceeded somewhat faster (e.g., Hurford 1991). According to Zhao and Morgan (1985), the Tibetan Plateau has experienced uplift for about 25 Ma (onset of collision) at an average rate of 0.2 to 0.3 mmla, but for the High Himalayas an average rate of about 1.5 mmla is as- sumed for the last 20 Ma (Burg et al. 1987).
During shorter periods and in limited areas, however, the uplift rates may be considerably higher in such tectonic settings.
For the Himalayas, dated, first-cycle detrital K-feldspar and muscovite samples from the distal Bengal Fan indicate that episodic rapid uplift and erosion must have taken place at rates greater than or equal to 5 mmla (Copeland and Harrison 1990). Various radiometric measurements indicate that the uplift rates in the Nanga-Parbat-Haramosh massif have increased from ~ 0 . 5 to more than several mmla during the last 7 Ma (Hurford 1991).
Recent vertical movements in Japan, which are asso- ciated with an active subduction zone, amount to 1 to 2 mmla. Parts of the North Island of New Zealand show young, subduction-related uplift of more than 1 mmla, and locally more than 3 mmla (Walcott 1987). Plio-Pleistocene, collision-related uplift of an accretionary wedge in Taiwan occurred at an average rate of 4 to 5 mmla, as inferred from the u n m f i g history of this area. This is documented in adjacent sediments and derived from fission track ages, radiocarbon dates of coral reefs raised above sea level during the Holocene, and estimates on present-day denuda- tion rates (Dorsey 1989). For the Caucasus, uplift rates of about 10 mmla are reported (International Union of Geo- desy and Geophysics 1975). Values of similar magnitude (4 to 12 mmla) were measured in the Coastal Ranges of California. However, some of these high uplift rates may be caused by short-lived strike-slip movements and are therefore only of local importance.
In addition, melting of large, thick glaciers in the Holo- cene and subsequent crustal rebound may be responsible for the very high young uplift rates ( 2 3 mmla) observed for several high mountain ranges with repeated geodetic surveys or with the aid of young, elevated fluvial terraces (Gansser 1984). These high values are probably not charac- teristic of longer periods.
Additional data of uplift rates in various tectonic settings are summarized in special articles (e.g., Leeder 1991).
Long-Term Epeirogenic Uplift and Denudation (Model)
The models in Fig. 9.19a and b demonstrate the interaction between comparatively strong, long-term epeirogenic uplift and regional denudation.
The rate of uplift (0.2 mmla) is kept constant for a period of 40 Ma. Denudation is assumed to proceed uniformly over the entire area as is similarly observed in the forma- tion of peneplains in tropical to subtropical climates. The inhence of changing rock types, linear downcutting of deep valleys, as well as other minor geomorphological features such as benches, terraces, and pediments, are neg- lected.
Beginning at zero elevation (in relation to the base level of erosion), continuous uplift leads first to a rising land surface, because denuda- tion lags behind uplift. With increasing eleva-

382 Chapter 9 Denudation and Mass Transport
DENUDATION RATES mmla crnl1000a
TROPICS HUMID TEMPERATE 0,5750 , CONTINUOUS
- / /ARID TO SEMI-ARID UPLIFT
7
0 10 20 3'0 4'0 Ma'
mmla T RATES OF
1 ,O DENUDATION
0,s
0
ARID TO SEMI-ARID
-/ RELIEF ABOVE BASE LEVEL
- 71 TROPICS 3 SUMMIT ELEVATION)
CLIMATE-CONTROLLED
2
1
n
LANDFORMS $.b ..... & A \ ..
I HUMID-
Fig. 9.1%-d. Interaction between tectonic uplift, denuda- denudation maximum lags behind a the strongest pulse of tion, and isostatic rebound, plotted semi-quantitatively for uplift, or c the onset of uplift. b and d Development of (a and b) a period of continuous, moderate uplift, or (c and relief above base level with time. The resulting landforms d) one orogenic cycle. a and c Rates of uplift (including also strongly reflect the influence of climate, which may isostatic rebound) and long-term denudation; note that the change during the time span considered here

Uplift, Denudation, and Landscape Evolution 3 83
tion, which proceeds linearly versus time mi- nus denudation loss, the denudation rate grows rapidly, more or less exponentially (cf. Figs. 9.9 and 9.20b) until it matches the uplift rate. Then, a kind of equilibrium between uplift and denudation is reached which tends to maintain a certain maximum land surface ele- vation under the given circumstances. This is also the case, when tectonic uplift is enhanced by isostatic rebound due to denudational un- loading.
Depending on the climate, this equilibrium elevation is established after different time spans and at different heights above the base level. Tropical climates, which may cause high denudation rates even in lowlands, bring about equilibrium earlier and at lower altitude than temperate humid or arid to semi-arid condi- tions (Fig. 9.19b). With decreasing denudation rates (for the same elevation and relief), the
RATE OF UPLIFT
TROPICAL CLIMATE
HUMID TEMPERATE Z X I Z Z
ARID TO SEMI-ARID
ABOVE BASE LEVEL
I I
0 1000 2000 3000 4000 m'
"EQUILIBRIUM ELEVATION"
landscape is raised to increasingly high equi- librium levels (Fig. 9.20a), provided the rate of uplift remains constant. If the climate changes during continuous uplift, the plateau or summit elevation of the landscape will vary as shown in Fig. 9.19b.
Without denudation, an assumed uplift rate of 0.2 mm/a would cause an elevation of 8 km over a time period of 40 Ma. An increase in the uplift rate leads, of course, to higher al- titudes (Fig. 9.20a). Because denudation grows rapidly with relief and therefore in very high mountain ranges always exceeds long-term uplift rates, there must be an upper limit for the elevation of the land surface above sea level (at present about 9 km) which cannot be surpassed on the Earth's surface. Again, the total uplift rate may include a proportion caused by isostatic rebound. In fact, uplift as a result of denudation may continue after the tectonic process has ceased. The maximum altitude of mountain belts or plateaus is also limited by isostacy, however, depending on rock densities and crustal thicknesses (cf. Chap. 8.1).
Uplift and Denudation of Orogenic Belts (Model)
Model Parameters
The model shown in Figure 9 . 1 9 ~ and d repre- sents a situation similar to that of large moun- tain belts. Because the long-term uplift and denudation history of orogenic belts, even of the best studied examples such as the Alps, the North American mountain ranges, or the Hi- malayas are not very well known and to some extent still controversially discussed (see above), the following simplifying assumptions are made:
SUMMIT b - A phase of rapidly increasing, relatively
VALLEY strong uplift (1 mm/a), which persists for some time (10 Ma), is followed by a period (10 Ma) of decreasing uplift. - Then a second phase of comparatively long-
.-"' term (20 Ma), constant, moderate uplift (0.3 STREAM mm/a) is caused by isostatic adjustment of the CHANNEL thickened crust to previous or decelerating
MEAN SLOPE , underplating, as well as by rebound resulting DENUDATION D= 7 (D, + D,) from erosional unloading.
Fig. 9.20. a Ultimate elevation above base level as a func- - At the end this phase* up1ift tion of the rate of uplift and climate. b Development of within another 10 Ma- valley-side slopes according to different rates of summit (DJ and stream-channel denudation (D,). (After Ahnert As in the example in Fig. 9.19a and b, the interaction 1970; Chorley et a1 1984; Gerrard 1988, greatly modified) between vertical tectonic movements and denudation,

384 Chapter 9 Denudation and Mass Transport
wearing down the increasing relief, is based primarily on W. Penck's fundamental hypothesis (cited and discussed, e.g., in Thomes and Brunsden 1977; Chorley et al. 1984). It suggests that there is a continuous interplay between endogenetic and exogenetic forces which shape the land- scape. This idea is contrary to the once widely accepted hypothesis of W.M. Davis, who assumed short, pulse-like uplift and subsequent slow downwearing as the main factors in the evolution of mountain ranges.
Landform Evolution
At the start of uplift above base level, denu- d a t i o ~ once again lags behind uplift by 3 to 4 Ma (Fig. 9.19d). Similarly, when constant strong and moderate uplift ends, denudation still proceeds at a rate almost as high as be- fore. This is a result of the high elevation the mountain belt has reached, even though the uplift rate has already decreased. During peri- ods of constant uplift, an equilibrium eleva- tion is established (at altitudes of 23000 m and about 2000 m, respectively) as discussed above (Fig. 9.19b).
These two levels are, of course, intersected by many deep valleys, which may generate a main valley floor considerably deeper than the summit elevation (Fig. 9.19 d). During certain times, for example when uplift surpasses de- nudation, channel lowering (D, in Fig. 9.20 b) may predominate over summit lowering (D,), or vice versa. In these cases, the mean denu- dation rate is approximately D = 1/2 (D, + "8)
with the passage of time, the valleys usually become wider and their slopes gentler; in this way the areal extent and heights of the sum- mits are reduced. Especially during the later
stages of this development, when the summit elevation is already considerably lowered, the evolving landforms are significantly controlled by climatic factors. In the model shown here, uplift ceases completely after 80 Ma. (This is not quite realistic, because isostatic rebound due to erosional unloading is still possible). Denudation, however, continues at a low rate for a long time, showing only slow decline. Even 20 Ma later, a relief of about 500 m is still present.
In total, uplift during the preceding 80 Ma amounted to 23 km for this example. This appears to be realistic, since alpinotype moun- tain belts of this age now exhibit outcropping metamorphic rocks which were formed at bu- rial depths of approximately 10 to 30 km.
Finally, it should again be stressed that the models described here are greatly simplified. Modern geomorphologists have become cau- tious regarding the usage of the term "equi- librium landforms" (see, e.g., Chorley et al. 1984). It seems that steady-state equilibrium, with only small fluctuations of certain land- forms around a specific average condition, does not exist in nature. Rather, landforms resulting from uplift and denudation should be characterized as dynamic metastable sys- tems. Such systems respond not only to exter- nal influences as discussed above, but may also be affected by internal processes such as the discontinuous storage or loss of large vo- lumes of detrital sediments in or from its drai- nage area. During metastable equilibrium, channel patterns may change from straight and braided to sinuous, and slopes may re- treat, become gentler, and evolve from convex to a more concave form.

10 Sedimentation Rates and Organic Matter in Various Depositional Environments
10.1 General Aspects Sedimentation and Accumulation Rates Short- and Long-Term Sedimentation Rates Potential and Actual Sedimentation Rates
10.2 Average Sedimentation Rates In Various Environments (Overview) In Carbonate Depositional Systems Sedimentation Rates in Relation to Denudation, Subsidence, and Sea Level Change
10.3 Production and Preservation of Organic Matter 10.3.1 General Aspects 10.3.2 Organic Matter in the Oceans
Primary Production and Heterotrophic Organisms New Production and Export Production Terrestrial Organic Matter in the Sea
10.3.3 Organic Matter Preservation and Black Shales General Aspects Vertical Organic Carbon Flux and Inorganic Accumulation Rates Organic Carbon Preservation and Black Shales Organic Carbon Preservation Factor
10.1 General Aspects
Sedimentation and Accumulation Rates
It has become common in the sedimentological literature to distinguish between sedimentation rates (sediment thickness per unit time) and accumulation rates (solid sediment mass per unit area and time), particularly in papers dealing with modern sediments and the results of ocean drilling (e.g., Van Andel 1983; Ehr- mann and Thiede 1985). This discrimination is important when sediments of different porosi- ties are compared, and it is indispensable for any kind of sediment budget.
Both sedimentation and accumulation rates are usually determined for sections taken bet- ween dated lower and upper boundaries. They then represent average values for these sec-
tions, based on the assumption that during the corresponding time interval the sediments were deposited continuously at a constant rate.
Sedimentation Rates
The sedimentation rate, SR, is the thickness, z, of a certain vertical sediment section divid- ed by the time span, t, necessary for its depo- sition:
It is calculated in mm/a (a = year), mm/ka (1 ka = 1000 years), cm/ka, or m/Ma (1 Ma = 10' years; 1 cm/ka = 10 m/Ma). In the fol- lowing text, the latter two notations are used.
It is obvious that sedimentation rate is not an accurate scale to describe the deposition of solid particles quantitatively. Fresh sediments have a high porosity which is later reduced under the load of younger sediments by com- paction (Chap. 13.2). Thus, sedimentation rates calculated without taking porosity into account become lower with decreasing poro- sity. However, if sediments have undergone deep burial and lithification, their differences in porosities become less pronounced. None- theless, the errors associated with dating of section boundaries and/or the assumption of steady state deposition within the measured section may be often substantial. For these reasons, the average sedimentation rate ap- pears to be acceptable only as an approxima- tion for many applications in sedimentology and geology.
Accumulation Rates
The accumulation rate, AR, is defined as the quantity (weight), W, of solid particles depo- sited during a certain time span, t, on unit area, A:
AR = W/(A. t). (10.2)

Chapter 10 Sedimentation Rates and Organic Matter
It may be expressed in g/(m2. a), kg/(m2. ka), g/(cm2. Ma), or t/(m2. Ma); 1 g/(m2. a) = 1 kg/(m2. ka) = 100 g/(cm2- Ma) = 1 t/(m2. Ma).
One can distinguish between bulk accumu- lation rates, AR,, comprising all constituents of a sediment, and specific accumulation rates for certain sediment components such as cal- cium carbonate, opaline silica, organic matter, etc. In order to calculate bulk accumulation rates, besides the requirements mentioned above, the porosity, n (as a portion of I), as well as the wet and dry bulk densities, D, and Dd (in g/cm3 or t/m3), of the sediment must be known. Note that Dd is related to the same volume as D,; it must not be confused with average grain density, y,:
If the total pore space is filled with sea water (density y,, = 1.025 g/cm3), wet and dry bulk densities are linked by the term
For pore fluids differing from sea water, other correction factors have to be used. Poro- sity, n, derived from (5.3) is
n = (D, - Dd)/l .025 . (10.5)
D, and Dd are usually determined as follows:
D, = Ww/Vt and Dd = Wd/Vt , (10.6)
where W, and Wd are wet weight and dry weight, respectively, and V, is total volume of the (water-saturated) sample being measured.
The porosity, n, is also found by
where V = the volume of water in the water- saturatersample.
Fresh fine-grained samples from drillholes o r from the sea bottom usually are fully water-saturated. If part of the pore space is filled by gas, other formulae must be applied (see, e.g., special literature on soil mechanics or from the oil industry).
Having determined Dd, the bulk accumulation rate, AR,, is
AR, = SR. D,, or AR, = SR. (1-n). y, (10.8)
In order to calculate the accumulation rate of specific sediment components, AR,, the con-
centration, C,, of component x in the total sediment must be determined. If C is given in percent by weight, the accumufation rate, AR,, of component x is
AR, = AR, . C,/ 100 . (10.9)
In order to convert sedimentation rates, SR, of sediments of different grain densities, y,, and porosities, n, into bulk accumulation rates, ARb, and vice versa, the diagram in Fig. 10.1 may be used.
Short- and Long-Term Sedimentation Rates
As was pointed out by many authors (e.g., Wetzel and Aigner 1986; Anders et al. 1987; Tipper 1987; Dott 1988; Sadler and Strauss
GRAIN DENSITY, y, (glcrn3)
Fig. 10.1. Diagram for converting sedimentation rates, SR, into bulk accumulation rates, AR, and vice versa. r, mean grain density; n porosity; CF conversion factor. For y, = 1 &m3 and n = 0 it is 1 m/Ma = 1 g/(m2a) or 1 t / ( m 2 - ~ a )

Sedimentation Rates in Various Environments 387
1990; Ricken 199 1 ), most sedimentary sequen- ces have not accumulated continuously at a steady rate, but contain minor and major stra- tigraphic gaps (Fig. 10.2a). However, only the long intervals of non-deposition or erosion on the order of at least 0.1 to 1 Ma can be iden- tified in terms of geologic time as missing in the stratigraphic record. Well known examples of discontinuously accumulating sediments are fluvial and tidal flat deposits displaying dis- tinct erosional features, but their stratigraphic record is difficult to evaluate. Minor erosional events can be deduced, for example, from the truncation of primary bedding features below traction current beds, or from the truncation of burrows at the base of turbidites and tem- pestites (Wetzel and Aigner 1986). Discon-
tinuous sediment accumulation, such as that caused by a series of mud turbidites deposited at relatively long, irregular time intervals is, however, difficult to recognize. Similarly, foreshore sediments resulting from repeated wave and current reworking and redeposition contain many short episodes of erosion and sediment accumulation, which can also be barely defined.
Hence, short-term sedimentation rates de- termined for single beds or small proportions of the total sediment section are generally considerably higher than long-term rates (Fig. 10.2 a). However, this problem is not dis- cussed further in the following chapters, be- cause here long-term, large-dimensional basin fills are of primary interest.
OMISSION C
h AC SR=- DEPOSITION t~~ TIME t
A
PRESERVED INCREMENTS w OF SEDIMENT CHRONOSTRATIGRAPHIC SEQUENCE
SEDIMENTATION I PRODELTA 1 1 RATE
LIMITED BY CARBONATE
,NO SPECIFIC LIMIT
I . . .. .
PRODUCTION I 100% MIXED 100%
CARBONATES SEDIMENTS SlLlClCLASTlCS
Fig. 10.2. a Sediment buildupltime diagram displaying in the horizontally plotted chronostratigraphic sequence. discontinuous sedimentation with intervals of omission b Mixed carbonate-siliciclastic sediments tend to produce (nondeposition) and erosion. Note that long-term average higher sedimentation rates with increasing proportions of sedimentation rates, SRAc, may be lower than short-term terrigenous material, as shown for some marine examples. rates, SRe, and rates of single beds, for example, those (W. Ricken, pers. commun.) of tempestites. The stratigraphic gaps (hiatuses) are shown

Chapter 10 Sedimentation Rates and Organic Matter
Potential and Actual Sedimentation Rates
Another general problem is the distinction between potential and actual sedimentation rates. The term potential sedimentation rate as used here refers to the capacity of a sediment- delivering system to accumulate a maximum of sediment per unit time in a particular area. For example, the sediment supply of a river system can fill an open lake basin at a rate which is equal to the potential rate, as long as the lake can hold the total river sediment in- put. However, as soon as the lake is filled with sediment, the subsequent sedimentation rate in the lake basin is controlled by its subsidence, as well as by the base level and gradient of the river system. From then on, the actual sedi- mentation rate drops below the potential rate, because most of the river sediment is trans- ported farther downstream out of the lake area. Similarly, a tectonic graben filled up to the gradient of a through-flowing stream can store sediment only in the space provided by subsidence. In a slowly subsiding, high-energy shelf basin, only part of the sediment supply can commonly settle permanently, while the remainder is swept into deeper water (cf. Chaps. 1.4 and 11). Additional examples of environments where the actual sedimentation rates are normally slower than the potential rates are delta plains, lagoons, tidal flats, and shallow carbonate platforms.
The sedimentation rate data discussed in the following sections are for scenarios in which either porous sediments or massive sediments with little pore space are considered. Most signify actual sedimentation rates observed in modern and ancient environments.
10.2 Average Sedimentation Rates
In Various Environments (Overview)
In a discussion of sedimentation rates in vari- ous depositional systems it appears useful to distinguish between two end members of sedi- ments (Fig. 10.3):
- Allochthonous siliciclastic sediments, con- sistting mostly of terrigeneous material, but also including bioclastic components.
- Autochthonous biogenic sediments.
Siliciclastic Sediments and Evaporites
The sedimentation rates of siliciclastic sedi- ments are controlled mainly by the size and characteristics of the source area (Chaps. 9 and 1 1 ), as well as by the distance of the de- positional area from the site of sediment in- put. Lakes, marine prodelta slopes, and deep- sea fans fed with sediments from a major point source may accumulate large amounts of terrigenous material in short time periods and thus exhibit very high sedimentation rates. Similarly, proglacial lowlands, lakes, and ma- rine basins reached by advancing glaciers and ice shields frequently display very high sedi- mentation rates.
On the Barents shelf glacigenic sediments accumulated at rates between 10 and 100 c m h ; fiord troughs were fded at rates up to 6000 c m h (Vorren et al. 1989). During the Holocene, the rapidly moving, cool-temperate glaciers of southern and southeastern Alaska produced an average sedimentation rate of 500 c m h on the shelf, and in the last 6 Ma about 50 cmlka on the shelf edge and in deeper water (Powell and Molnia 1989). In the Ross Sea of the Antarctic region, however, Pleistocene diamicton accumu- lated at a much lower rate (around 1 cmka, Alley et al. 1988).
In intracontinental tectonic grabens, delta plains, tidal flats, high-energy shallow seas, and in foreland basins the actual sedimenta- tion rates are commonly high, but frequently lower than the potential rates (Fig. 10.3). In contrast, deep sea regions far away from the coast and any significant sediment source are characterized by extremely low sedimentation rates, as for example red, deep-sea clay. A major portion of these clays may consist of desert-derived eolian dust. The actual sedi- mentation rate is equal to the potential rate in these cases.
Extremely high sedimentation rates may be reached when concentrated brines precipitate salts, for example halite, with a rate up to about 5 000 cm/ka. For several reasons, how- ever, such rates cannot be maintained for a long time (Chap. 6.4).
Biogenic Sediments
Biogenic sediments are formed from the ske- letal remains of plants and animals. In ad- dition, some carbonate may be precipitated from supersaturated surface waters, for exam- ple as a result of C03 uptake by subaqueous plants. Most of the biogenic sediment is pro- duced by a few groups of organisms. In shal-

Sedimentation Rates in Various Environments 389
I BlOGENlC SEDIMENTS SlLlClCLASTlC SEDIMENTS
* SEDIMENTATION RATE LIMITED BY SUBSIDElr!CE
Fig. 10.3. Overview of sedimentation rates in various de- (Data from many sources, including Seibold and Berger positional environments which are either dominated by al- 1982; Scholle et al. 1983; Nelsen and Stanley 1984; Stow lochthonous, siliciclastic sediments, or autochthonous, bio- et al. 1985; Jenkyns 1986; Liitzner 1989) genic materials.
low marine waters, benthic organisms, such as pteropods, or siliceous tests of diatoms and various reef-builders, algae, sea grass, mol- radiolaria. In their freshly deposited state luscs, brachiopods, and bryozoa, are most these deep-water sediments form water-rich important. Since the Mesozoic, biogenic sedi- oozes with porosities of around 80 %. Later, ments in deeper basins consist mainly of the they compact and undergo chemical-minera- tiny remains of planktonic organisms includ- logical diagenesis, leading to chalk and pelagic ing calcareous nannofossils, foraminifera, and limestone, or to porcellanite and chert.

Chapter 10 Sedimentation Rates and Organic Matter
The sedimentation rates of autochthonous biogenic sediments are limited by the produc- tion and dissolution of skeletal carbonate and opaline silica. (Phosphatic remains play a minor role in rock-forming processes and are therefore not discussed here.) These processes are controlled by a variety of factors (also see Chap. 5.3), the most important of which are favorable living conditions of the carbonate and silica secreting organisms, sufficient nut- rient supply, and prevention of dissolution in the water column and on the sediment surface.
As regards dissolution in the oceans, cal- careous and siliceous skeletal remains behave quite differently. While carbonate skeletons are preserved in shallow and medium deep waters and only dissolve in deep water regions below the lysocline and CCD, siliceous or- ganism tend to dissolve in shallow waters which are undersaturated with respect to silica (cf. Chap. 5.3). This difference in carbonate and silica dissolution contributes to the gene- ral rule that shallow-water carbonates are commonly poor in opaline silica, and that pure siliceous sediments mostly occur below the carbonate compensation depth in relatively deep water.
The highest biogenic sedimentation rates, apart from reefs (see below), are observed below zones of coastal and equatorial upwel- ling, in estuaries, marginal basins with suf- ficient nutrient supply by rivers, and shelf seas. Such sediments may accumulate at rates up to 10 cm/ka and in special cases up to 50 to 100 cm/ka, for example Miocene diatomites in Sicily and uncompacted Recent diatomites in the Gulf of California (based on data from Martinson et al. 1987). Compacted Mesozoic radiolarites from the western Tethys (Jenkyns 1986) and the Miocene diatomites of the Mon- terey Formation, California Isaacs 1984), range between 0.2 and 2 cm/ka, in the eastern Pacific around 0.2 cm/ka (Gursky 1988).
Warm, low-latitude regions commonly pro- mote organic productivity and thus the ac- cumulation of skeletal remains, but high fer- tility of siliceous organisms also occurs in subpolar regions. Modern siliceous oozes of the North Pacific and Bering Sea reach values of about 1 cm/ka (when measured as massive beds without pore space). Cretaceous chalk formed in shelf seas reached sedimentation rates of about 5 to 15 cm/ka, while modern deep-sea carbonates commonly display lower rates of about 1 to 3 cm/ka.
Very low biogenic sedimentation rates are found below central parts of large ocean ba- sins where fresh supply and recycling of nut-
rients are limited. The modern Sargasso Sea in the Atlantic is an example of this situation. When the CCD is elevated and silica concen- tration in near-surface sea water is low, the preservation of skeletal carbonate and silica may be markedly reduced, and sediments de- void of carbonate and/or siliceous remains may be deposited. The actual sedimentation rates of biogenic materials are mostly equal to the potential rates, except for carbonate depo- sition in very shallow water and tidal flats (see below).
Biogenic and biochemically precipitated ccrrbonate in fresh-water lakes may form at rates of 10 to 100 cm/ka and more. The high- est rates are observed in the littoral zones, due to the assimilating activity of macrophytes and the abundance of gastropods and molluscs (Kelts and Hsii 1978). Sedimentation rates similar to those of carbonates can be expected for lakes rich in diatoms (cf. Chap. 2.5).
Peat
The accumulation and preservation of peat depends on the terrestrial to lacustrine deposi- tional environment and on the maintainance of a high groundwater level. Holocene peats in temperate and tropical regions have accumu- lated at rates of about 20 to 200 cm/ka (Ca- meron et al. 1989). Sedimentation rates report- ed in the literature for compacted Paleozoic to Cenozoic coals (Stephanian basins in France, upper Paleozoic to Mesozoic basins in China, Tertiary Rhine basin in Germany, African rift valleys) vary between 0.3 up to 200 cm/ka (Courel 1989). In all of these coal-bearing sequences, peat formation was sufficiently fast to keep pace with subsidence, which ranged, for example, in the Permian foreland basins of Australia from 5 to 40 cm/ka (Hunt 1989).
Mixed Sediments
Mixed sediments consisting of both siliciclas- tic and biogenic components commonly show higher sedimentation rates than do purely biogenic deposits. In calcareous sediments, the carbonate content tends to decrease with in- creasing sedimentation rate (Fig. 10.2b), re- flecting dilution of the limited carbonate pro- duction by terrigenous material. Similarly, the percentage of opaline silica decreases with increasing sedimentation rate. Black shales frequently contain considerable amounts of carbonate and accumulate at a relatively slow

Sedimentation Rates in Various Environments
rate (0.5 to 10 cm/ka). Up to a certain point, preservation of organic matter and thus the organic carbon accumulation rate in shales and marls is furthered by an increasing sedimen- tation rate (Chap. 10.3.3), but beyond this limit the effect of dilution prevails. The or- ganic matter content also tends to decrease with growing carbonate content (Ricken 1991).
Sedimentation Rates in Carbonate Depositional Systems
Reefs and Shallow-Water Carbonates
Although the sedimentation and accumulation rates of biogenic carbonate are limited by organic productivity, they also display a wide range of values from about 0.1 to 1000 cm/ka (1 to 10 000 m/Ma). The highest values have been observed in young coral reefs which grew vertically upward with the rapid Holo- cene sea level rise. However, these extremely high rates should not be taken as average growth rates for longer time periods. Reef mounds, calcareous tidal flats, ooid shoals, and coastal sabkhas have the potential to grow upward at rates on the order of 50 to 100 cm/ka (Enos 1989; Hubbard et al. 1990; Stras- ser 1991). Thus, the average sedimentation rate of a very shallow carbonate platform may reach approximately 100 cm/ka (Fig. 10.4) provided there is an equal rate of subsidence maintaining steady state conditions. If sub- sidence is slower than this high potential sedi- mentation rate, the actual sedimentation rate drops below the potential rate.
Carbonate Shelves and Platforms
As pointed out by Sarnthein (1973) and con- firmed by many other studies in tropical and subtropical regions, benthic carbonate produc- tion decreases with water depth. Coral reefs, algal structures, sea grass beds, and other or- ganisms depending on photosynthesis can live only near the water surface where they receive sufficient sunlight. They may be accompanied by large foraminifera, molluscs, and gastro- pods growing on shallow banks. In such a fau- nal and floral community, biological and bio- chemical carbonate production reaches its maximum.
Below water depths of 30 to 40 m, benthic carbonate production drops by a factor of approximately 10 and is frequently on the
order of 1 to 10 cm/ka. This signifies that outer, deeper portions of carbonate ramps exhibit benthic carbonate production which has approximately the same magnitude as planktonic production in this and deeper re- gions (for example chalk, Fig. 10.4). On the other hand, carbonate accumulation in shal- lower water may be inhibited by insufficient subsidence (see above) and lead to the export of carbonate into deeper water. In this way, carbonate accumulation in shallower and deeper water can be more or less equalized and make up in total an average of several cm/ka. Such rates are characteristic of the long-term buildup of carbonate platforms (cf. Chap. 12.2.2). An excess in carbonate produc- tion over the average subsidence rate is com- monly used for the lateral progradation of the platform.
Deep- Water Carbonates
In deep water, benthic carbonate production becomes insignificant, but mass flows and turbidity currents may transport considerable volumes of shallow-water carbonates into the deep sea. There, they contribute to the build- up of deep-sea fans, slope aprons, and con- tinental rises and may lead to sedimentation rates similar to those listed for their siliciclas- tic counterparts (Fig. 10.3). Sedimentation rates of plankton-produced carbonates are discussed above and plotted in Fig. 10.3.
Sedimentation Rates in Relation to Denuda- tion, Subsidence, and Sea Level Change
The sedimentation rates in the specific en- vironments discussed above represent rela- tively wide ranges and may be used as a gene- ral guideline. However, they do not include special cases which deviate from these com- mon values. In addition, the fact that sedi- mentation rates may vary through time is not taken into account. During sea level high- stands, terrigenous input into the sea usually slows, and carbonate production may also sig- nificantly vary as a result of sea level changes and other processes. Neglecting these compli- cations, it is useful to compare common sedi- mentation rates with other rates relevant in geological processes.
It is interesting to note that denudation rates on land cover almost the same range (0.2 to more than 100 cm/ka, see Chap. 9.5) as the sedimentation rates discussed above (0.1 to

392 Chapter 10 Sedimentation Rates and Organic Matter
cmlka m/Ma A r\ 5000
500 -
I
I I - 1000
2000 200-
I I I
I I 100
I I I I
I I 50- i I 500
I I
I
1 BIOHERM MUD MOUND 1 I I I - I SHORT-TERM, -100 cmlka. - -3 q- -- LONG-TERM SEDIMENTATION - 3 I RATE COMMONLY LOWER (2-20 cmlka) I I (INSUFFICIENT SUBSIDENCE)
I I SLOPE APRON, I CARBONATE DEEP-SEA FAN --- LONG-TERM, SEVERAL cmlka ------------
I Y I Fig. 10.4. Sedimentation rates in carbonate depositional sidence and sediment transport from shallow regions onto environments. In shallow water, benthic carbonate produc- the outer shelf and into the deeper sea. (Compiled from tion is dominant, while in deeper areas carbonate-secreting several sources, e.g., Sarnthein 1973; Schlager 1981; Bo- plankton prevails. Note that long-term rates are commonly sence 1989; Hubbard et al. 1990; Strasser 1991) much lower than short-term rates due to insufficient sub
1000 cm/ka; also see Kukal 1990). However, a direct comparison of sedimentation and denu- dation rates makes sense only for such cases in which siliciclastic material predominates. In addition, the drainage area of the basin should be approximately equal to the area of the ba- sin itself, or the ratio between drainage area and basin area should be known (cf. Chap. 1 1.2).
Furthermore, the subsidence rates in the various types of sedimentary basins have a
range (about 0.2 to more than 100 cm/ka, Chap. 8) similar to that of the sedimentation rates. This signifies that, theoretically, any type of basin subsidence can be compensated for by sediment accumulation, i.e., even the most rapidly subsiding basin may be kept fill- ed with sediments if an effective sediment source is available. Actually, all small basins, such as graben structures, foreland basins, and pull-apart basins, can be filled, for example with fluvial material, although they may dis-

Organic Matter Production and Carbon Flux
play very high subsidence rates in their early evolutionary stage. However, when the basins become larger and continue to subside sub- stantially, such as in growing ocean basins, sediment supply and sedimentation rates are normally no longer sufficient to keep the ba- sins filled. These problems are discussed fur- ther in Chapter l l .4.
Finally, it is useful to know whether or not the sedimentation rates in specific environ- ments could keep pace with pre-Quaternary and Quaternary sea level rises. In the early Holocene, the short-term sea level rise was so fast (6 to 10 m/ka) that carbonate platforms were drowned, and many individual reefs were not able to follow the rising water level (Schlager 198 1). Pre-Quaternary, long-term sea level changes occurred at rates of about 1 cm/ka; short-term oscillations within the Mi- lankovitch frequency band (Chaps. 7.1 and 7.2), which only had low amplitudes, may have caused maximum rates of sea level change of about 10 to 50 cm/ka. Even in the latter cases, the sedimentation rates of some environments, for example tidal and subtidal carbonates, were sufficiently high to keep pace with the sea level rise and to maintain approximately the same depositional system through long time periods (Strasser 1991).
10.3 Production and Preservation of Organic Matter
10.3.1 General Aspects
Production and Types of Organic Matter
Sediments with biogenic skeletal parts com- monly also contain some organic matter. This chapter summarizes the most important facts about the production and preservation of or- ganic matter. It is based to a large extent on publications by Durand (1980), Grant Gross (1980), Romankevich (l984), Tissot and Welte (1984), Brooks and Fleet (1987), Berger et al. (1989), and Stein (1991). The transformation of organic matter under increasing sediment load and temperature is described in Chapter 14.2.
All life on earth is based on photosynthesis, which began two to three billion years ago (Chap. 6.5). In this process carbon dioxide combines with water to form carbohydrates, at the same time releasing oxygen. The energy
necessary for this synthesis is provided by the sun via light-absorbing pigments such as chlo- rophyll. This basic process can be accomplish- ed by all autotrophic organisms, including primitive bacteria and blue-green algae, as well as by highly evolved plants. All of these organisms are the primary producers of the organic matter, whereas heterotrophic orga- nims (animals) feed on this organic matter.
Carbohydrates contain stored energy which can be released when oxygen is taken up by animals and plants which thereby gain energy for their life processes (called "respiration"). Through respiration, the gross productivity of plants, which is defined as the mass of carbon fixed by photosynthesis per unit area and time, is reduced by 10 to 50 %. The remaining mass is the primary net production, which is discussed further below. Part of the energy gained by respiration is used to build up other organic compounds, such as proteins, lipids, lignin and tannin. Of these, the carbohydrates (including cellulose), which consist of carbon, oxygen, and hydrogen, are the most important organic matter constituent of plants, whereas animals (e.g., oceanic zooplankton or zooben- thos) and bacteria contain particularly high proportions of proteins. Some of the organic compounds incorporate small amounts of nit- rogen, sulfur, and other elements. In the fol- lowing discussion all of these organic com- pounds, including the products of biological activity such as excretions and secretions, are included in the term organic matter.
Primary Production in Various Environments
The primary production of organic matter (here described in a broader sense than defin- ed in Chap. 10.3.2) is controlled by several factors. Light (for photosynthesis), tempera- ture, and the availability of certain nutrients all play a large role. On the continents, climate and precipitation are of eminent importance. The most significant production per unit area is accomplished by tropical rain forests, while desert regions permit only very limited plant growth. In aquatic systems, of course, water is not the limiting factor. Here, primary produc- tion is a function of the amount of light re- ceived by the autotrophic community. Sun light also affects the surface temperature of the water body and thus promotes life proces- ses. The growth rate of primary producers may be limited when nutrient supply (e.g., nitrate, phosphate, and so-called micro-nutri- ents such as vitamins, soluble organometallic

394 Chapter 10 Sedimentation Rates and Organic Matter
Table 10.1. Primary production in various Recent environments, dry organic mattera in g/m2 per year. (Mainly after Huc 1980; for additional data see Romankevich 1984)
Continents Short grasslands, deserts 50- 200 Temperate forests 1300-3200
Tropical rain forests 4000-9000
Fresh-water lakes
Salt marshes, mangroves
Marine Open oceans Continental shelves
Zones of upwelling
Estuaries Algal beds
Reefs
a Conversion factor for organic carbon/fresh organic matter: 0.31
compounds) is insufficient. Therefore, some lakes and low latitude oceanic regions only enable low growth rates. However, many swamps, lakes, estuaries, and nearshore zones with inflowing water rich in nutrients have high primary production rates (Table 10.1).
Standing Crop and Annual Productivity
So far we have discussed the primary net pro- duction of plants, which can be estimated by multiplying the average standing crop (the biomass present in a given area at a certain time) of a population by its rate of generation (doubling time). If the average standing crop doubles once every 2 months, the net produc- tion per year will be six times greater than the standing crop. Thus, the productivity of a population can be high even though its stan- ding crop or biomass is small (e.g., in the oce- ans); similarly, the biomass or standing crop of an ecosystem can be considerably greater than the annual net productivity (e.g., in forests).
Preservation of Organic Matter (Overview)
Plants on the continents and in the oceans contribute approximately equal amounts to annual global primary production. However,
the situation on land is completely different from that in aquatic environments, if the con- sumption of primary production by other or- ganisms and the preservation of organic mat- ter in sediments are considered. Under aerobic conditions in soils, only the most resistant organic compounds, such as chitine or the cuticles of pollen and spores (sporopollenine), can be preserved over long time periods.
Therefore, with the exception of coal-for- ming environments (Chaps. 2.2.3 and 3.4.3), little organic matter is preserved in continental deposits.
In aquatic environments such as lakes, swamps, and anoxic marine basins, however, decomposition of organic matter is slower. Aerobic organisms may cease to destruct or- ganic matter if the oxygen supply of the water body is used up and cannot be replaced rapid- ly enough. Thus, most of the organic matter preserved from earlier geologic times occurs in marine sediments; therefore the preserva- tion of organic matter in the marine realm is dealt with here in some detail.
10.3.2 Organic Matter in the Oceans
Primary Production and Heterotrophic Organisms
Primary Production
In the modern oceans the main producers of primary organic matter are diatoms, cocco- lithophorids, and dinoflagellates. These phyto- plankton can grow only in the photic (or "eu- photic") zone where sunlight enables photo- synthesis. As soon as the autotrophic organ- isms sink or are carried by currents into deeper water, their growth ceases or they die. The depth of the photic zone usually extends to between 50 and 100 m. At mid-latitudes, surface waters cool in winter, and the pene- tration of sunlight is limited. Consequently, primary production is low. As insolation in- creases with the onset of spring, the phyto- plankton begin to grow and reproduce more rapidly, also developing in deeper water, and thus forming "plankton blooms". Such blooms, however, are restricted to areas with abundant nutrient supplies either from rivers or from deeper upwelling waters (Chap. 5.3.3). For this reason, most estuaries, continental shelves, and areas with upwelling water masses are regions of high productivity (cf. Fig. 10.13). About one half to two thirds of the present-day glo-

Organic Matter Production and Carbon Flux
bal oceanic primary production (30 gigatons, Gt, per year, where 1 Gt = 1016 g; Berger et al. 1989) is derived from these fertile areas of the ocean (approximately one third of the ocean surface). Such an unbalanced regional distribution of organic production is even more pronounced when new production and export production are considered (see below).
The Food Chain
The primary production by phytoplankton is used by heterotrophic organisms as food. In the present oceans we can observe the fol- lowing food chain, or food web:
- Phytoplankton (primary producers). - Zooplankton (herbivores, i.e., plant eaters). - Zooplankton (carnivores, i.e., eaters of other
zooplankton). - Fish (plankton-eaters or fish-eaters).
Phytoplankton are eaten mainly by herbi- vorous zooplankton; they in turn are eaten by carnivorous zooplankton or fish. At each "tro- phic level" in the food chain, dissolved and suspended, dead organic matter is released from living organisms into the water. Part of this organic detritus is used up by other hete- rotrophic organisms living in the surface wa- ter, but some dead plant and animal matter also sinks into deeper water, thereby support- ing life at all depths, including on the sea floor (Fig. 10.5).
Most of the energy the animals gain from their food is used for locomotion and other activities, and only a small part for growth and reproduction. In other words, the popula- tion at a higher trophic level must be much larger (often five to six times by weight) than the population at the lower trophic level which feeds on the higher one. Thus, the a- mount of organic matter produced by phyto- plankton is reduced drastically from one tro- phic level to the next, and the biomass of the standing crop in the entire ecological system represents only a small fraction of the primary plant production. The organic matter, which is needed as energy by organisms in the food chain, is transformed into compounds with lower energy contents (through metabolism) and finally by bacterial activity into carbon dioxide and water.
At the same time, inorganic nutrients are released into the water. If these salts remain in the trophic zone or are recycled by currents into surface waters, they allow high primary production to be maintained.
SUN PRODUCTIVITY LIGHT VERTICAL CARBON FLUX
"NEW-,/ FOOD WEB I PRIMARY I 1 PROD. / (PLANKTON, / PRODUCTION, FISH, ETC.) / UPTAKE OF
COZ AND I DEAD
PELLETS, ' MINERALIZATION OF AGGRE- ORGANIC MATTER,
RELEASE OF Cop AND ,NUTRIENTS
BENTHIC BOUNDARY
I PRESERVED
---
1 several
cm to dm
Fig. 10.5. Processes controlling vertical organic carbon flux from zone of primary productivity to burial in sedi- ment. For further explanations see text.
New Production and Export Production
. . . . . . . : . f . ' .. . . . - . . IN'FAUNA, FUNGI,
General Aspects
. . 1,;
Primary productivity and life processes in the photic zone are not commonly a focus of geo- logical and sedimentological studies. Geolo- gists are more interested in the burial and preservation of organic matter below the sea floor. For this reason, marine biologists and sedimentologists have introduced the terms new production and export production (e.g., Berger et al. 1989). New production is the vertical organic carbon flux below the photic zone (at about 100 m below sea level, Figs. 10.5 and 10.6b).
. . . . . . . . . . . . AEROBIC --,BACTERIA j S,EDIMENT:, -, ., . ANAEROBIC , ORGANIC MATTER
Whereas primary production is difficult to quantify, new production, i .e. , the downward flux of particulate organic matter, can be measured by free-floating particle traps. This quantity may also reflect the seasonal variation in primary production.
However, the vertical particle flux between 100 m and the sea floor is reduced by orga- nisms in the deeper water. The remaining pro- portion of organic matter at a given depth, as on the sea floor, is called export production.

396 Chapter 10 Sedimentation Rates and Organic Matter
PRIMARY PRODUCTION, PP DOWNWARD CARBON FLUX, Fc
&- COASTAL, NON-UPWELLING ZONE I iiii (CALIFORNIA)
P P ~ PP3 N P = --- 400 340 000
NORTHEAST PACIFIC
NP = PP2/400
(for PP<150)
0 100 g c/(m2-a) t WATER DEPTH, z
t
NEW PRODUCTION, NP
Sarnthein et al. (1988):
Fig. 10.6. a Relationship between primary net production, b Downward C flux, Fc (export production), as a function PP, and new production, NP, in the present-day oceans. of new production, NP, and water depth, z , in the present- Curve A after Berger et al. (1989); B after data from E p day oceans. Formula by Betzer et al. (1984) relates Fc, pley and Peterson (1979); C after Martin et al. (1987). PP, and z
-
-
Thus, the vertical carbon flux finally reaching the sediment surface is often only a small fraction of the new production.
Adsorbed and Dissolved Organic Matter
I I I I
Organic matter accumulates on the sea floor not only as pure organic particulate material, but also in combination with inorganic mine- rals, especially clay minerals. These adsorb dissolved organic compounds onto their sur- faces during settling through the water co- lumn. Under specific conditions, particularly in front of deltas or in estuaries where fresh water mixes with sea water, organic com-
pounds and clay minerals can flocculate and form organomineral aggregates which slowly settle to the sea floor. In this and similar cases, the highest organic carbon contents correlate with the finest grain sizes. In addition, rela- tively large amounts of organic matter are dissolved in sea water as well as in fresh- water lakes and river runoff. The concentra- tions of dissolved organic compounds in sea water are on the order of 0.5 g c /mS and therefore are usually much higher than those of particulate organic matter. But only a small fraction of this pool can be adsorbed by clay and settle as coatings on the mineral particles.
Some of the dissolved organic compounds is also consumed by plankton organisms. Thus,
- - -
\
FC = 20.65 NP' 67.z-0.55
Betzer et al. (1984):
Fc = 0.409 P P ' . ~ ' . z - O 63
NORTHEAST PACIFIC
-Fc

Organic Matter Production and Carbon Flux
the contribution of dissolved organic matter to the total vertical carbon flux is included in the data measured by the free-floating sediment traps.
Vertical Carbon Flux
In recent years considerable efforts have been made (see, e.g., Suess 1980; Betzer et al. 1984; Martin et al. 1987; Sarnthein et al. 1988; Ber- ger et al. 1989) to quantify the vertical carbon flux in different parts of the modern oceans. Primary (total) production and new production at the 100 m water depth appear closely relat- ed (Fig. 10.6a). If primary production is low, most is consumed by heterotrophic organisms already in the photic zone, and little is left to sink as export production into deeper waters. However, as soon as primary production in- creases to 100 g/(m2. a) and more, a large part of it is left over as new (and export) pro- duction. On the average, new production at 100 m is about 20 % of the primary produc- tion (Berger et al. 1989). It amounts to about 6 gigatons per year in the modern oceans.
Export production decreases regularly with depth, a pattern which can be found in all present-day ocean basins where the deep water oxygen content is at least 50 to 100 pmol/kg (1.6 to 3.2 g/m3). Studies on settling dead foraminifers have shown that the number of tests devoid of organic matter increases rapidly with depth; below 1000 m most of the tests contain none.
From many trap studies it is now possible to make estimates for the downward vertical carbon flux below the photic zone (export production) as a function of either primary production, PP, or new production, NP, and water depth, z (Fig. 10.6b). Data from dif- ferent regions reveal the same tendency. How- ever, such calculations do not take into ac- count terrestrial organic matter which may be transmitted into the sea in greatly varying quantities (see below).
Regional Variation
Primary (total) production and new production vary considerably in the different regions of the present-day oceans. In open ocean condi- tions, primary roduction of organic carbon is P about 50 g/(m a), whereas in coastal, non- upwelling regions about 150 g/(m2. a) are typicaI (TabIe 10.2). Ocean regions with oligo- trophic waters (e.g., areas of subtropical gyres
such as the Sargasso Sea) contribute less than 5 Yo of the global new production, although they constitute as much as 40 % of the ocean surface. Most new production occurs in nar- row, high-fertility belts along the equator, the subpolar divergence zones, and in regions of coastal upwelling (Figs. 5.1 and 5.2, Chaps. 5.2.3 and 5.3.3).
The export production of organic carbon arriving on the sea floor is only about 0.5 g/(m2- a) in the deep ocean (water depths of 5000 m), but some 15 g/(m2.a) in nonupwel- ling coastal waters (water depths of 250 m). Thus, a ratio of 1:3 in primary production is magnified to 1:30 on the sea floor. Conse- quently, the carbon flux to the deep-sea floor is less than that to the continental shelf floors, although the shelves comprise only about 10 % of the total surface area of the oceans. Below zones of coastal upwelling, the organic carbon fallout on the sea floor at depths of 250 m is about 250 g/(m2. a).
Table 10.2. Primary production, new produc- tion, export production (organic carbon flux to the sea floor), and organic carbon accumu- lation in sediments from various, present-day ocean regions (all values in g/(m2. a); from Stein 1991, based on Romankevich 1984; Bet- zer et al. 1984; Berger et al. 1989; for additio- nal data also see Deuser 1986; Martin et al. 1987; Knauer et al. 1990)
open Coastal ocean non- U P
upwelling welling
Primary production 50 150 250
New production 5 50 110
Export production (organic carbon flux, F,, to the sea floor) at water depth of
250 m 15 30
Organic carbon accu- mulation in sediment, when sedimentation rate 1 c m h 0.01
10 cmka 3
20 cmka 13

Chapter 10 Sedimentation Rates and Organic Matter
These observations in the modern oceans agree with the geologic record, in which most of the organic matter preserved in ancient sediments accumulated in shallow seas. However, in cer- tain. regions and during specific periods or- ganic carbon flux to the sea floor increased as a result of widespread anoxic deep-water en- vironments (cf. Chaps. 5.2 and 7.5). In addi- tion, considerable amounts of organic matter, including those in slope sediments, were transported by turbidity currents into deeper water (e.g., Degens et al. 1986; Stein et al. 1989; Stein 1991). Also important is the con- tribution of terrestrial organic matter to the organic carbon content of marine sediments.
Terrestrial Organic Matter in the Sea
In addition to the autochthonous production of organic matter in the oceans, input by rivers of both dissolved and particulate, plant-deriv- ed material from the continents is an impor- tant source. Furthermore, in the organic car- bon-poor sediments of the central open-ocean regions, organic carbon supplied by winds may be a major proportion of the organic matter accumulated in these environments (Zafiriou et al. 1985; Prahl and Muehlhausen 1989; Stein 1991).
Uetailed work on the composition of or- ganic matter in many cores taken during the Deep Sea Drilling Project from Mesozoic and Cenozoic sediments has shown (Fig. 10.7) that a great portion of the kerogen (insoluble or- ganic compounds, Chap. 14.1) must have come from neighboring continents (e.g., Stein et al. 1986, 1989). The source of organic mztter can be identified by different techniques (Section 14.1). As long as the sediments are immature, i.e., not deeply buried and substantially heated, marine organic matter (kerogen type 11) derived from algae, phytoplankton, zocplankton and bacteria is charac- terized by a high hydrocarbon index (Fig. 10.8). These organisms contain a high proportion of hydrogen-rich lipid material, whereas terrestrial organic matter (kerogen type 111). dominated by cellulose and lignin, renders low hydro- carbon index values. In the following paragraphs, only the quailtitative importance of landderived organic matter in marine sediments is considered.
According to Degens and Ittekkot (1985), the present-day continents deliver dissolved and particulate organic matter in large, but con- siderably varying quantities into the oceans (Fig. 10.9). Although these data only partially include the effects of peak floods (which transport large quantities of organic matter) and may often underestimate particle flux, they allow some important conclusions to be drawn:
- The carbon yield of the continents, in terms of dissolved and particulate matter delivered by rivers to the ocean, is almost of the same order of magnitute (per unit area of land sur- face) as the mean new productivity of the ocean (20 g/(m2. a), see Table 3.2). The con- tinents range between approximately 2.5 g/(m2a) (Africa and Europe) and 12 g/(m2a) (Asia and Oceania). The mean value of this type of "new productivity" for all the continents together is 8 g/(m2. a), but it may actually be higher because peak floods with high organic carbon concentrations are not sufficiently taken into account, as mentioned above. - The total carbon yield from the present-day continents to the oceans reaches at least 1.2 Gt/a; at least 20 % of this amount enters the oceans as dissolved organic compounds. - Regions with high relief and forests, par- ticularly tropical rain forests (for example Oceania) contribute larger amounts of organic matter per unit area to the oceans than do areas of low relief and dry climate (Africa).
10.3.3 Organic Matter Preservation and Black Shales
General Aspects
Present-day deep-sea sediments are generally poor in organic matter, because the vertical carbon flux originating from primary produc- tion is continuously reduced by remineraliza- tion in the water column as well as by the activity of benthic organisms. However, gra- vity mass movements can transport organic- rich sediments from the outer shelf or slope into deep water. Fine-grained mud turbidites, in particular, often contain relatively high amounts of organic carbon (Morris 1987; Stein 1991; also see Chap. 5.4.5). For that reason, the accumulation rate of organic matter can be fairly high in some deep water sediments, even when the vertical carbon flux from the overlying photic zone is negligible. In ad- dition, some small, deep ocean basins with restricted water circulation (Chaps. 4 and 5) can store relatively large amounts of organic matter.
Most of the land-derived organic matter en- tering the ocean is mineralized, used up by heterotrophic organisms, or deposited in coas- tal and shallow-water zones. Here, the already fairly high autochthonous vertical carbon flux can be augmented, particularly in estuarine and prodelta environments.

Organic Matter Preservation 399
h, humid climate
water inflow
Fig. 10.7a,b. Accumulation rates in g l ( c m 2 . ~ a ) or the Atlantic Ocean. (After Stein et al. 1986 and 1989). gl(m2.a) of marine @olid bars) and terrestrial organic mat- Note that the land-derived allochthonous proportion of total ter (open bars) in a Albian and b Cenomanian sediments of organic matter often surpasses that of marine origin
Organic Carbon Loss on the Sea Floor 10.5), i.e., bottom water with a slightly higher concentration of suspended material and che-
Processes mical characteristics which often deviate somewhat from those of the overlying water
The export production which reaches the sea body. Increased activity by planktonic micro- floor as particulate matter is commonly a small and macro-organisms in this benthic boundary fraction of the primary and new production. It layer may reduce the vertical carbon flux first enters the benthic boundary layer (Fig. more rapidly than it is in the higher water

400 Chapter 10 Sedimentation Rates and Organic Matter
Fig. 10.8. Hydrocarbon index values (from Rock-Eva1 py- rolysis and maceral analysis) as a means of discriminating between marine and terrestrial organic matter. DSDP sam- ples, vitrinite reflection R,, ~ 0 . 5 . (After Stein et al. 1986)
1 0 0 0 -
p SO0 - ? 0 0
3 1 2 0 0 -
E - ; 100- n Z z w 5 0 - Q 0 a n > = 2 0 -
1 0 -
column. Although this process is linked with increased oxygen consumption, the bottom water usually still contains enough oxygen to support bottom life on top of and within the upper few centimeters to decimeters of the
. - -
-
- - - - - MARINE ORGANIC MATTER ( % I - - -
8 0 6 0 40 2 0 I /
sediment (epibenthos, infauna, fungi and bac- teria, Fig. 10.5). The sediment community with its micro-organisms growing rapidly in the uppermost millimeters or centimeters of the sediment, can accomplish further drastic reduction of the vertical carbon flux and thus release considerable quantities of C 0 2 and nutrients.
Most of this activity is accomplished under aerobic conditions. Oxygen flux from the bot- tom water into the sediment is facilitated by burrowing organisms, but at some depth below the sediment/water interface (usually several centimeters) oxygen transfer becomes insuf- ficient. Only anaerobic organisms can then persist, such as bacteria which reduce nitrate and sulfate, or bacteria which produce meth- ane (cf. Chap. 13.6.3). They gain their energy from the mineralization of organic matter and thus further reduce the vertical carbon flux. In environments with oxygen-depleted bottom water and a high sedimentation rate, anaerobic bacteria decompose more organic matter than do aerobic organisms in the same situation. Ultimately, at the end of this long chain of consumers, only the most resistant organic particles and compounds are preserved in the sediment and have a chance of being fossi- lized. As a result of all these activities, most of the organic matter arriving at the sea floor is commonly decomposed above and below the sediment/water interface.
0 2 0 40 6 0 8 0 100
TERRESTRIAL ORGANIC MATTER (%) -
ORGANIC CARBON
AMERICA REGIONS
Fig. 10.9. Annual carbon yield of the presentday continents, transported by rivers into the ocean as particulate or dis- solved organic matter. Oceania includes Australia. (After Degens and Ittekkot 1985)

Organic Matter Preservation
Quantification
It is difficult to quantify these processes on the sea floor; nevertheless it is possible to measure the accumulation rate of organic mat- ter ( I ) on the sedinent surface and (2) at some depth below the zone of biological activity, i.e., to measure the difference between the input into and the output from the benthic life zone. In this case, however, the activity within the benthic boundary layer is neglected.
Therefore, attempts have been made to measure the bio- mass of the different communities living in this environ- ment in order to estimate their reproduction and food requirements. One may also determine the oxygen con- sumption and C 0 2 release o f the living communities, e .g . , the C 0 2 flux from the sediment surface into the sea water. Oxygen consumption by benthic respiration, for example, is substantial in ocean regions with high organic carbon fallout to the sea floor. It contributes significantly to the strong oxygen minimum in many shallow-marine regions (Berger et al. 1989).
Applying these and other methods to the 1300 m-deep sea floor of the Santa Catalina basin off the coast of California, Smith et al. (1987) found that up to one half of the total minera- lization of particulate and dissolved organic matter occurs in the benthic boundary layer, mainly by micro-plankton. At least the same quantity is decomposed within the top layers of the sediment.
In total, roughly 10 to 20 g/(m2. a) of car- bon are mineralized. This is certainly more than the vertical carbon flux available in most of the ocean regions at this depth (Table 10.2), but it does correspond approximately with the flux of particulate matter typical in areas of upwelling, which is in fact the case for this basin. Furthermore, it should be noted that part of the organic matter mineralized on or near the sea floor is taken from the large pool of dissolved organic compounds in sea water. In the Catalina basin, the buried sediments below the benthic life zone still contain 6.5 % (by weight) of organic carbon.
A situation similar to that of the Santa Cata- lina basin has been studied in the zone of coastal upwelling off Peru (Suess et al. 1987). In the southern part of this region, average primary organic carbon production is on the order of 300 g/(m2. a), and the carbon flux arriving on the sea floor (water depth ~ 5 0 0 m) is 88 g/(m2- a). Ultimately, 24 g/(m2. a) are buried, i.e., about 8 % of the primary produc- tion. This results in an organic carbon content of 25 % in the sediment which signifies that about 70 % of the organic carbon fallout are
used up by benthic organisms on the sea floor and by processes of early diagenesis. At the same time, most of the biogenic carbonate reaching the sea floor (on the order of 150 &(m2. a)) is dissolved with the aid of CO, generated by the decomposition of organic matter. In order to dissolve a CaCOs flux of 142 /(m2. a), an organic carbon flux of 34 8 g/(m . a) is required.
In other regions, benthic degradation loss is frequently around 80 % of the carbon flux ar- riving on the sea floor (e.g., Stein 1991).
Organic Carbon Flux and Inorganic Accumulation Rates
The results of direct measurements, as report- ed from the Santa Catalina basin and off Peru, cannot be applied to other regions, but a num- ber of studies compare organic carbon con- centrations or accumulation rates (for defini- tions see Chap. 10.1) in young marine sedi- ments with present-day production rates in the overlying water body (e.g., Miiller and Suess 1979; Johnson Ibach 1982; Bralower and Thierstein 1984; Emerson 1985; Stein 1986, 1991). Although this information is still some- what controversial, one can nonetheless draw some general conclusions on the interrelation- ship between the input of organic matter, the sedimentation or accumulation rate of carbon- free material, benthic life activity, and the preservation of organic matter (Fig. 10.10).
Flux Rates
In order to discuss this fairly complicated problem, we can distinguish between
- Flux rates of organic carbon, Fc, and inor- ganic material, FI, from the water body into the benthic zone. - Flux rates or accumulation rates of organic carbon, ARC, and inorganic material, ARI, in the deeper sediment below the zone of benthic life activity.
If erosional processes and dissolution on the sea floor are excluded, ARI is equal to FI, but ARC becomes less than Fc due to benthic de- gradation.
When describing these relationships, one should not con- fuse accumulation rates, e .g . , in gl(m2. a), linear sedi- mentation rates, e.g. , in m/Ma, and concentrations in per- cent by dry weight.

Chapter 10 Sedimentation Rates and Organic Matter
SEDlMENTATlON RATES: SR (m/Ma), FOR DIFFERENT POROSITIES (25, 50, 75 % : SR,,, SRSo , SR7, )
INORGANIC ACCUMULATION RATE, ARI = F, (g/m?a)
Fig. 10.10. Preservation of organic carbon, Cc (in 5% by upper limit of organic carbon concentration, Cc, for BDL weight), as a function of organic carbon flux, Fc, into the = 0. Stippled and harched fields show possible C wn- benthic degradation zone, flux of inorganic material, F,, to centrations in sediments of oxic and anoxic environments the sea floor, and benthic degradation loss, BDL. Solid related to different carbon flux rates, Fc. Note that carbon straight lines indicate changing Fc/FI ratios, with FC held contents increase with intermediate inorganic accumulation constant. Dashed line indicates FclFI ratio, with FC in- rates, FI, but decrease with higher rates due to dilution creasing with FI. Both types of line mark the theoretical
The relationship between the inorganic ac- cumulation rate, ARI, and the total sedimen- tation rate, SR (including biogenic skeletal material), is shown in Fig. 10.10 for three different porosities (25, 50, and 75 %). The concentration of organic carbon buried in deeper sediments is Cc = ARc/(ARI + ARC).
Flux Rates and Organic Carbon Concentration
A simple relationship exists between Fc and FI (= ARI) and thus between these parameters
and Cc. If Fc remains constant, Cc decreases systematically with increasing FI. This effect is usually referred to as clastic dilution. It is shown in Fig. 10.10 by solid lines for the (hy- pothetical) case that the sediment accumula- tion rate, ARC, is equal to the fallout to the sea floor, Fc. In reality, ARC is always smaller than Fc, even in anoxic environments. The concentration of organic carbon, Cc, in sedi- ments is therefore generally lower than the theoretical upper limit shown for the various Fc/FI- ratios in Fig. 10.10. In areas of very high Inorganic sedimentation rates, for ex-
Organic Matter Preservation
ample on prodelta slopes, CC approaches a linear relationship in which it is negatively correlated with SR or ARI, although the flux and accumulation rates of organic carbon, Fc and ARC, into the depositional system are usually hlgh.
Factors Controlling Benthic Degradation Loss
We define the difference between the input of organic carbon, Fc, into the benthic life zone and the accumulaation rate, ARC, in the bu- ried sediment as benthic degradation loss, BDL; (BDL = Fc - ARC): This loss appears to be relatively low in environments where the residence time of organic matter in the zone of benthic life activity is short due to a high inorganic accumulation rate, ARI (= FI). Con- versely, BDL is very high in areas of low ARI ( s l cm/ka = 10 m/Ma) and under oxic condi- tions, because the benthic community has a long time (hundreds to thousands of years) to decompose the organic material near the sedi- ment surface. As a result, only the most resis- tant compounds settle into the deeper layers. Under these conditions, the organic carbon concentrations, Cc, in the buried sediments generally remain low (usually 0.1 to 0.3 Yo by weight), even if the carbon flux, Fc, into the benthic zone varies between low and medium values.
If, however, the inorganic accumulation rate, ARI (= FI), surpasses a certain lower limit (about 10 to 20 g/(m2.a) or roughly 10 to 20 m/Ma, assuming a porosity of 50 to 75 941, cf. Fig. lO.IO), the residence time of organic matter in the benthic life zone is significantly reduced. Bioturbation begins to affect deeper layers, because some food is still available. This in turn introduces carbon into deeper portions of the sediment, where it more effec- tively depletes the still oxygenated pore water and thus may reduce degradation. With in- creasing inorganic accumulation rates, benthic degradation loss, BDL, is even more diminish- ed. Better preservation of organic matter, ARC, is thereby accomplished, and conse- quently the concentration of organic carbon, Cc, in the buried sediment may increase. Se- veral authors (summarized by Stein 1986 and 1991) have found such a positive correlation between Cc and increasing sedimentation rates for oxic environments (Figs. 10.10 and 10.1 1 ).
It is not quite clear to what extent this somewhat surprising finding is caused by the processes mentioned above or by other phenomena. Higher sedimentation rates arealso often associated with increasing carbon flux, Fc, into the benthic
zone, especially if part of the inorganic flux, FI, consists of biogenic skeletal material. Such a case is indicated in Fig. 10.10 by the note "Fc increasing with FI" . Here it is ob- vious that Cc will grow with increasing FI (= ARI). Cer- tainly the proportion of relatively resistant organic matter (e.g., landderived plant material) in the total carbon flux also plays a significant role.
Clastic Dilution
Approaching the "dilution line" marked by so- lid lines in Fig. 10.10, Cc again decreases, as pointed out earlier. This bend in the band of organic carbon concentrations occurs when inorganic accumulation rates range from about 20 to 100 g/(m2. a), depending on the input rate, Fc.
Dilutlon of organic carbon also occurs in sediments deposited in anoxic environments (black shales). In contrast to oxic conditions, black shales can already have high organic carbon concentrations, Cc, in conjunction with low accumulation rates (Fig. 10.10), be- cause the benthic degradation loss, BDL, is much lower under anaerobic conditions than under aerobic ones. Therefore, a decrease due to dilution rather than an increase in C with growing inorganic input, FI, is expectec?. This is in agreement with actual data shown in Fig. 10.11.
Organic Carbon Preservation and Black Shales
Organic Carbon in Various Depositional Environments (Model Basins)
The simple models shown in Fig. 10.12 semi- quantitatively display the influence of the total carbon flux (Fc or ARC) in both oxic and anoxic water conditions, as well as the resulting concentrations of organic carbon, Cc, in the buried sediment. Whereas they take into account the inorganic particle flux (FI = ARI), they neglect the different types of or- g a n ~ matter discussed in Chapter 14.1 as well as the changing proportions of bioclastic and terrigenous material in the inorganic flux. The models address the following environmental conditions:
- Deep-sea oxic environments (Fig. 10.12a) with either low or high primary and new pro- duction, very low or low to medium inorganic accumulation rate, ARI, and low to medium benthic degradation loss, BDL. As a result, the organic carbon flux, ARC, into the deeper

1 COrg (% BY WEIGHT)
Chapter 10 Sedimentation Rates and Organic Matter
HIGH
. , . . . . . .
PRODUCTIVITY
5 10 20 50 100 200 500 1000
SEDIMENTATION RATE (m/Ma)
Fig. 10.11. Correlation between organic carbon con- sent-day oceans (DSDP samples, including Jurassic and centrations and sedimentation rates of oxic and anoxic Cretaceous sediments) and adjacent seas, for example, environments as well as areas of high organic productivity Baltic Sea, Black Sea, Mediterranean. (After Stein et al. (e.g., regions of upwelling). Based on data from the pre- 1986)
sediment is very low to low; Cc is consequent- ly very low or medium, respectively. - Deep-sea basins (of various size) with strati- f ied water and an oxygen minimum (Fig. 10.12 b), and either low or high primary and new productivity. Low ARI enables high to very high values of C . Although BDL is very low, high AR, only yeads to low to medium Cc values. - Shallow seas (e.g., shelves) with oxic con- ditions, low or high primary new production, and medium to very high inorganic accumu- lation rate, AR Although organic carbon input, F , into tke benthic zone may become very h i g (and thus the organic carbon accu- mulation rate, ARC), the carbon concentration values, C , turn out to be low to medium due to high A%,. - Shallow seas (shelves or shallow basins) with anoxic conditions caused by restricted water circulation or coastal upwelling; low or high
primary and new production. The low to high values of Cc are mainly controlled by Fc and AR,.
These models may be modified by additional factors, for example by the lateral input of organic carbon, including plant material, by bottom currents and gravity mass movements. The uppermost sediment layers may be re- worked, and organic matter already buried may again be redeposited in the zone of in- tense benthic degradation.
The identification of the different types of black shale environments mentioned above and shown in Fig. 10.1 3 is often difficult in ancient rocks. Specific planktonic microfaunas of low diversity and with high amounts of biogenic opal may indicate upwelling con- ditions (e.g., Thiede and Suess 1983; Kuhnt et al. 1986, cf. Chap. 5.3.5). High concentrations of trace metals trapped from sea water by

Organic Matter Preservation 405
a PRODUCTIVITY AND VERTICAL Corg FLUX ( %or
PRIMARY PROD.
,,NEW" PROD.
NO OXYGEN MINIMUM
I , I BENTHIC
BOUNDARY LAYER
,SEDIMENT
b PRODUCTIVITY AND VERTICAL COrg FLUX
8
! I '
I ! / CHEMOCLINE
BDL & I I - BDL
C PRODUCTIVITY AND PRODUCTIVITY AND VERTICAL Corg FLUX ( F, or ARC) VERTICAL Corg FLUX
I '
) I
.............
Id SEDIMENT
BDL d[+b+
very high low
+ I 1 - BDL
Fig. 10.12a-d. Semiquantitative models showing the d e (cf. Fig. 10.10). a, Deep basin with deepreaching water crease in organic carbon flux, Fc, from surface waters circulation. b Deep basin and stratified waters with oxygen through the deeper water column and due to benthic degra- minimum. c Shallow sea (e.g., shelf) with oxic conditions dation loss, BDL, in the sediment (accumulation rateAR3, on the sea floor. d Shallow sea with oxygen minimum in in oxic and anoxic environments. BDL and concentration shallow basin or under coastal upwelling. For further ex- of organic carbon, Cc, in the buried sediment are control- planation see text led by the inorganic accumulation rate, ARI

406 Chapter 10 Sedimentation Rates and Organic Matter
MARINE DELTA ALLUVIAL PLAIN SHALLOW LC - WITH SWAMPS WITH SWAMPS
(PEAT) (PEAT)
4KE FRESH-WATER LAKE P I C SURFACE WATER
I Q, IRnY lc
\ \ u"-v,,.-
LAYER I
\ LAGOON VlTRlNlTE ESTUAR'
IPTINITE - EXlNlTE
CORE OF LIPTINITE-EXINITE-VITRINITE - - - - WITH C-RICH ~NERTINITE COASTAL UPWELLING MUD TURBlDlTES
SILLED DEEP BASIN EXINITE-LIPTINITE
OCEANIC BLACK SHALE EVENTS
Fig. 10.13. Schematic diagram showing major depositional comparatively stable suboxic or completely anoxic zones, environments for the accumulation of organic-rich sedi- whereas zones of coastal and equatorial upwelling are cha- ments, with their dominant types of kerogen. (After Brooks racterized by spatial and temporal variations in their de- et al. 1987). Basins with stagnant bottom waters develop grees of oxygen deficiency

Organic Matter Preservation
hydrogen sulfide and/or organic matter are probably best explained by a stagnant anoxic basin and a low sedimentation rate (e.g., Brumsack 1986b).
Neglecting these complications, one can summarize the results of the models as follows:
1. Low concentrations of organic carbon, Cc, occur in sediments in many environments, including regions with high primary and new productivities. 2. Sediments with high to very high Cc values are formed only under anoxic or oxygen mini- mum conditions, in either deep or shallow water. Primary productivity can be fairly low, but inorganic accumulation rates must also be low or, at the most, intermediate (in shallow water). Under such conditions, organic carbon content does not increase with the sedimen- tation rate (Stein 1991). 3. High to very high accumulation rates of organic carbon, ARC, are found in deep water if productivity is hlgh and the water anoxic. In shallow water, ARC can become high even under oxic conditions, if productivity is suf- ficiently developed.
Hydrocarbon Source Rocks and Black Shales
In the evaluation of petroleum source rocks (Chap. 14), the total organic carbon concen- tration, Cc, is a crucial factor. Carbonate source rocks should contain at least 0.3 '% or- ganic carbon and clastic source rocks at least 0.5 % (Tissot and Welte 1984). However, the nature of the buried organic matter also plays an important role. Oil-prone organic constitu- ents are better preserved if the residence time of the organic particles in the zone of intense benthic activity is limited by high bulk accu- mulation rates. Therefore, if two marine source rocks have the same lithology and or- ganic carbon content, the more rapidly depo- sited one usually has a greater potential of generating oil (Johnson Ibach 1982).
The most favorable terrestrial and aquatic environments for the formation of hydrocar- bon source rocks are summarized in Fig. 10.1 3. They include:
- Swamps and the tidal flat zones of marine deltas (Chap. 3.4.2).
- Estuaries and lagoons with high nutrient supplies (Chap. 3.2.3).
- Basins with restricted circulation on the continental shelf and in adjacent seas (Chap. 4).
- Shelves and upper continental slopes under zones of coastal upwelling (Chap. 5.3.3).
- Widely extended deep-sea regions during periods of sluggish oceanic circulation.
In most of these environments, intermediate to relatively high sedimentation rates (up to se- veral 100's of m/Ma) prevail.
In recent years, the term black shale has become rather popular. Black shales are fine- grained, dark-colored, compacted sediments which usually display distinct lamination and commonly contain >0.5 O/o of organic matter (Wetzel 1989). Their dark gray color is caused by finely dispersed iron sulfides and organic compounds. However, not all dark shales are true black shales with high organic matter contents, and not every black shale is a hydro- carbon source rock (cf. Chap. 14.1).
Organic Carbon Preservation Factor
Finally, we may ask the question: which pro- portion of the primary production, PP, in overlying surface waters is preserved in the sediments below the zone of benthic activity? The organic carbon accumulation rate, ARC, in the sediment, expressed as a percentage of PP, is defined as the organic carbon preser- vation factor.
This factor can be determined for young sediments for which both values, PP and ARC, can be measured with confidence. As can be seen in Fig. 10.14, most of the present-day pelagic and hemipelagic deep-sea sediments have a low to very low preservation factor (less than 1 9'0, often only about 0.01 to 0.1 %; also see Table 10.2). In contrast, near-shore sediments deposited more rapidly display much higher organic carbon preservation fac- tors: up to 3 %, especially in cases of coastal upwelling. Under anoxic conditions, where burrowing organisms can no longer live on the sea floor and the sediments are laminated, the preservation factor can surpass 3 % and reach values as high as 10 % or more, for example on the Peru shelf (coastal upwelling), in some basins of the Gulf of California and in the Californian borderland, and in some bays and inlets along various coasts. Black Sea sedi- ments under H2S-bearing waters display an average preservation factor of 4.3 %, if land- derived organic carbon is neglected.
Taking into account such preservation fac- tors and evaluating the paleoenvironment (oxic or anoxic conditions, bulk accumulation rate, etc.), some authors have recently tried to re-

408
4 PRESERVATION FACTOR
VARIOUS TROUGHS, BAYS, INLETS qKlr4 / l o %
1 %
BLACK SEA / / /
-/ 1
MARGINAL /= / DEEP-SEA BASINS OCEANIC \= RISES =EZ-=
/ /
E F T ? /' PACIFIC) / / /
/
PRIMARY PRODUCTION R ~ T E gc/(rn2.a) [ l g c / ( m 2 a) = 0.1 gC/(cm . k a ) ]
Fig. 10.14. Organic carbon preservation factors (accu- mulation rate, ARC, expressed as a percentage of primary production rate, PP) of Holocene sediments. (After Bra- lower and Thierstein 1984)
Chapter 10 Sedimentation Rates and Organic Matter
calculate the primary productivity or, paleo- fertility, of ancient ocean basins from the organic carbon accumulation rate of their pre- served sediments (summary in Berger et al. 1989).
Samthein et al. (1987), for example, demonstrate that the fertility (or in this case the new production) of low- and mid-latitude ocean regions during the last glacial period must have been about twice as high as in the Holocene. In their investigation of mid-Cretaceous, laminated black shales, Bralower and Thierstein (1984, 1987) come to the conclusion that the primary production rate may have been as much as one order of magnitude lower than that measur- ed in the modem oceans.
Warm ocean basins with sluggish circulation and limited oxygen supply hamper the remi- neralization of organic matter and thus the recycling of nutrients. In addition, an increas- ed loss of nitrate through denitrification in oxygen deficient waters may limit fertility and cause "starved ocean basins" (Berger et al. 1989).
In all estimates in which the organic carbon accumulation rate, ARC, is determined for compacted and more or less lithified sedi- ments, corrections for additional organic car- bon losses from shallow to deep burial have to be introduced. In immature hydrocarbon sour- ce rocks (see Chap. 14) or nonsource rocks, however, these diagenetic carbon losses appear to be relatively small (Berner 1982; Bralower and Thierstein 1987).

11 The Interplay Between Sediment Supply, Subsidence, and Basin Fill
11.1 Introduction Principal Factors Controlling Basin Fills Remarks to Basin-Filling Models
11.2 Simple Relationships Between Source Area on Land and Basin Fill Predominantly Terrigenous Material Chemical Sediments
11.3 Different Modes of Basin Fill Out- and Upbuilding of Sediment from a Point Source Extensional and Closing Basin Filling Variations in Subsidence and Sediment Supply
11.4 Vertical and Lateral Facies Associations (Overview) Three Principal Types of Vertical Facies Evolution Facies Associations
11.1 Introduction
Principal Factors Controlling Basin Fills
The general principles of mass balances bet- ween the drainage area of sedimentary basins and the corresponding basin fill were already discussed in Chapter 9.4. The examples de- scribed there were selected for the determi- nation of long-term denudation rates. In this section, some basic laws of "basin-filling mo- dels" (e.g., Cross 1990; Angevine et al. 1990) are discussed. The filling of sedimentary ba- sins is controlled by the interaction between specified, more or less independent factors, for example:
- Size and denudation characteristics of land areas delivering terrigenous sediments.
- Areal extent and geometry of corresponding basin.
- Tectonic subsidence of basin floor and com- paction of sediments.
- Hydraulic regime of a river system or a wa- ter-filled basin.
- Eustatic sea level changes. - General rules for autochthonous sediment
production, including carbonate buildups.
Using these parameters and taking into ac- count their interrelationships, other, depen- dent variables may be derived, such as:
- Grain size distribution and lateral and ver- tical sedimentary facies successions within the basin.
- Sedimentation rates at different locations in the basin.
- Occurrence and extent of carbonate build- ups, etc.
Remarks to Basin-Filling Models
Basin-filling models or "quantitative dynamic stratigraphy" (Cross 1990) are still in an early state of development. In this state they can barely provide a means for exactly modeling many types of sedimentary basins, but they are a means of generalizing complex systems and of exploring the effects of varying para- meters (Angevine et al. 1990). Basin-filling models can be subdivided into two groups:
1. Geometric models characterize basins which have a constant surface geometry, for example a fluvial basin which subsides but is filled with sediments all the time. In this case, sedimentation rate and subsidence are in ba- lance and maintain an equilibrium. Similarly, a coastal plain and the adjacent foreshore zone may maintain a fixed slope which is restored all the time, regardless of sea level fluctua- tions and/or differential subsidence. Such mo- dels are relatively simple to construct.
2. Dynamic models take into account sedi- ment transport and the rate of deposition. Both tend to change laterally, i.e., downstream a river, or from the coastline toward the cen- ter of a basin. As a result, the geometry of the sedimentary surface may undergo significant modification.
A precise treatment of this complex topic is beyond the intention of this book, but it may

Chapter 1 1 Sediment Supply, Subsidence, and Basin Fill
be useful to briefly discuss some general points related to basin modeling. Various working groups are trying to simulate the evolution of sedimentary basins with the aid of computers (e.g., Bitzer and Harbough 1987; Strobe1 et al. 1989; Cross 1990; Lawrence et al. 1990). This forward modeling is commonly carried out in two dimensions along transects and requires both a large data set and special training. The basic concept of this approach is founded on the fact that the factors mentioned above and additional relevant processes can be subdivided into two groups (Lawrence et al. 1990; cf. also Chap. 7.4):
- Processes controlling the creation and de- struction of space in a basin.
- Processes controlling the introduction and removal of sediment.
Space is generated in a basin by tectonic sub- sidence of the basement, isostatic response of the crust to sediment and water loads, com- paction of sediments, and rise in sea level. If these processes predominate over sediment ac- cumulation, land-derived sediment can be de- posited on the coastal plain and shelf. By con- trast, an excess o f sediment supply over space- generating processes causes the sediments to bypass the shelf and to settle in deeper water. This occurs in periods of slow subsidence or uplift and sea level fall. For a given rate of space creation, the volume of sediment intro- duced into the basin controls how far the sedi- ments prograde seaward. If clastic sediment sources can be neglected, in situ biogenic sed- iment production is the principal factor inter- acting with space-creating processes.
For example, the buildup and drowning of reefs and car- bonate platforms is frequently controlled by the rate of car- bonate production, which in turn depends on a variety of other factors, such as carbonate-producing organisms at differing water depths, temperature, nutrient supply, and water turbidity (e.g., Schlager and Philip 1990).
Forward numerical simulation of these proces- ses is only possible under the assumption that empirical growth rates at different locations within a basin can be used (e.g., Aigner et al. 1989). In addition, lateral prograding of car- bonate buildups and their reactions to minor fluctuations of sea level have to be taken into account (Bosence and Waltham 1990; cf. Chap. 12.2.2).
Most of the factors mentioned above are subject to changes during the evolution of a basin. The characteristics of the source area on land, the size and geometry of the basin, and
processes within the basin may vary substan- tially with time. Such an evolution is referred to as basin dynamics.
The following sections deal (1) with simple models demonstrating some general principles and (2) a limited number of generalized case studies of the evolution of common basin types.
11.2 Simple Relationships Between Source Area on Land and Basin Fill
Predominantly Terrigenous Material
Model Parameters
First, some simple models demonstrating the influence o f the drainage area on land and its clastic river load on the filling of sedimentary basins of various sizes are presented. The mo- dels of Fig. 1 1.1 are based on the following assumptions:
- Denudation area on land and depositional basin constitute a closed erosion-deposi- tional system (Hay et al. 1989).
- The subsidence rate has a medium value (cf. Chap. 8) and is constant over the entire ba- sin floor.
- The sediments are distributed evenly over the entire basin.
- The time period considered for denudation and sediment accumulation is 10 Ma.
- The initial elevation of the basin floor cor- responds with the sea level which is held constant.
Over- Supplied Basins
If the drainage area, AD, on land is large in comparison to the area of the basin, AB, for example AB/AD = 0.1, the basin is frequently over-supplied with sediment and remains fill- ed at all times (geometric basin-filling model, see above). This is also true for a low denuda- tion rate, as long as the subsidence rate in our example does not exceed 100 m/Ma. In this case, the basin fill consists entirely of con- tinental deposits, mostly fluvial sediments. Surplus river load not used for the basin fill is transported into other depositional areas. This is a common situation in many graben-like structures on the continents. Exceptions from

Basin-Filling Models 41 1
HIGH RATE OF MECHANICAL DENUDATION
ACCUMULATION IN 10 Ma: 10 km
SEDIMENTS SUBSIDENCE 50 m/Ma
b LOW RATE OF MECHANICAL DENUDATION
Fig. l l . la,b. Simple scheme demonstrating relationship between mean mechanical denudation rates, ratio ABIAD of basin area, AB, and denudation area, AD, and subsi- dence rate. The initial basin floor corresponds to sea level. The rates of denudation and subsidence are kept constant. The time period for basin fill is assumed to be 10 Ma. a High denudation rate and low ABlAD (= 0.1) cause rapid infflig of basin with fluvial deposits up to an eleva- tion at which most sediment is carried away into other regions. ABlAD = 1 still provides more sediment than
necessary for (fluvial) basin fill. With ABlAD = 10, tem- genous clastics cannot fully compensate for subsidence: shallow sea, slowly deepening. b Low denudation rate still generates fluvial basin fill above sea level, as long as ABlAD is small (ABIAD = 0.1). With ABlAD = 1 and 10, the sub- siding basin is only partially filled with ter- rigenous clastics. For ABIAD = 10, autochthonous bio- genic sediments (assumed sedimentation rate 10 m/Ma) predominate over very low clastic input

412 Chapter 11 Sediment Supply, Subsidence, and Basin Fill
Fig. 11.2. a Qualitative model showing the influence of ~ u a n ~ h e and Changjiang; grain size classification after size and relief of denudation area on sediment fdl of neigh- Folk 1954. (After Lee and Chough 1989, sand ridge field boring basins. b Holocene sediment distribution in the after Liu Zhenxia et al. 1989) Yellow Sea controlled by suspended load of the riven
this rule are grabens or rift zones in a stage of partially filled by lake or sea water (for ex- initial rapid subsidence (on the order of 200 ample in the East African rift zone), or the m/Ma, see Chap. 8.3) which, in addition, have sediment surface may subside below sea level a comparatively small drainage area with low (Jordan graben with Dead Sea, Death Valley denudation. In such cases, the graben may be in California).
Basin-Filling Models
The modem Yellow Sea between mainland China and the Korean peninsula is an example of an epicontinental shelf sea oversupplied with temgenous material from major rivers, especially the Huanghe and the Changjiang (Yang- tze, cf. Chap. 9.2). Since post-glacial sea level rise had established approximately the present basin configuration about 7000 years ago, the Yellow Sea was largely con- trolled by siliciclastic mud deposition (mainly silty clays and clayey silts with minor proportions of sand, Fig. 11.2b; Lee and Chough 1989). In the northem portion (Gulf of Bohai) where the influence of the modem Huang- he river is greatest, the Holocene sedimentation rate attains 30 m k a (solid dry material); in the central portion of the Yellow Sea, the sedimentation rate is around 3 m k a , and in the south it is 0.5 to 1 m k a . The highest accumulation rates have been found in the subaqueous delta areas with very gently inclined foresets and proximal bottomsets (Alexander et al. 1991). All these rates appear to be in good agreement with the suspended load which the rivers discharge into the sea. Under steady-state conditions, the ello ow-Sea will be fded with sediments in a very short geological period. As a result of extensive agricultural use of the loess plateau, the Huanghe river load (about 1 km3/a) was in the last 2300 years an order of magnitude higher than in the early and middle Holocene (Milliman et al. 1987).
Basins with Moderate to Low Sediment Supply
Given a ratio of AB/AD 1, the denudation rate on land predominantly controls basin fill and the nature of the sediment. High and me- dium denudation rates still deliver more sedi- ment volume than required for basin filling due to moderate subsidence (50 m/Ma). Only a low sedimentation rate leads to insufficient sediment supply and, thus, to a deepening basin with marine sediment. Provided the bio- genic sediment production reaches a medium value of 10 m/Ma, half of the marine sedi- ment is autochthonous, the other half alloch- thonous (terrigenous).
With an increasing AB/AD (in Fig. 11.1: AB/AD = lo), even a very high rate of denu- dation is not able to fill the basin and com- pensate for subsidence. Under the assumptions of Fig. 1 l . la , only one half of the resulting marine sediment is terrigenous which is typi- cal of hemipelagic sediments in the modern oceans. AB/AD = 10 in combination with low denudation eventually leads to predominantly biogenic marine sediments which contain only a small fraction of land-derived material. This model approximates the conditions of pelagic sedimentation in large ocean basins some dis- tance away from a continent (see below).
Influence o f Relief and Several Sediment Sources
If the area of the basin is appoximately equal to the drainage area on land (AB/AD = l ) , uplift and increasing relief of the drainage area lead to rising input of terrigenous mate- rial. The mechanical denudation rate is closely correlated with the mean relief (Chap, 9.2; Pinet and Souridu 1988). As a result, the de- positional environment becomes shallower and finally passes into a fluvial system. Simul- taneously, the proportion of terrigenous mate- rial increases at the expense of biogenic com- ponents (see example of Texas-Louisiana shelf, below, Fig. 11.6). On the contrary, a lowering of relief in the denudation area di- minishes the terrigenous clastics/biogenics ratio and causes a deepening of the basin, pro- vided the subsidence rate remains constant.
The influence of various terrigenous sedi- ment sources on basin fills is shown qualita- tively in Fig. 11.2. Rivers flowing through lakes before they reach the sea deposit their bed load and suspended load in the lake and therefore carry little material into the sea. A high-relief mountain range bordering the sea may exert a strong influence in terms of sedi- mentation rate and composition on the filling of a neighboring basin, even if a medium to major river from a large hinterland enters the same basin. Low-relief peninsulas and islands of limited extension commonly shed small a- mounts of clastic material into the sea in com- parison to major rivers draining large areas of differing relief and climate. For this reason, the existence of islands in large, ancient ocean basins is often difficult to assess from the basin fill, unless the island differs signifi- cantly in its petrographic characteristics from the other, volumetrically predominating sedi- ment sources.
Two modern examples (Gulf of Mexico and Atlantic Ocean) of the relationship between denudation area and basin filling are briefly discussed below (Chap. 1 1.3). In closed ero- sion-depositional systems, mass balances of sediments can also be used to reconstruct the size and topography of the drainage area of the basin (Hay et al. 1989). The sediment bud- gets of some closed and half-closed basins are described in Chapter 9.4; those of accretionary wedges are discussed in Chapter 12.5.
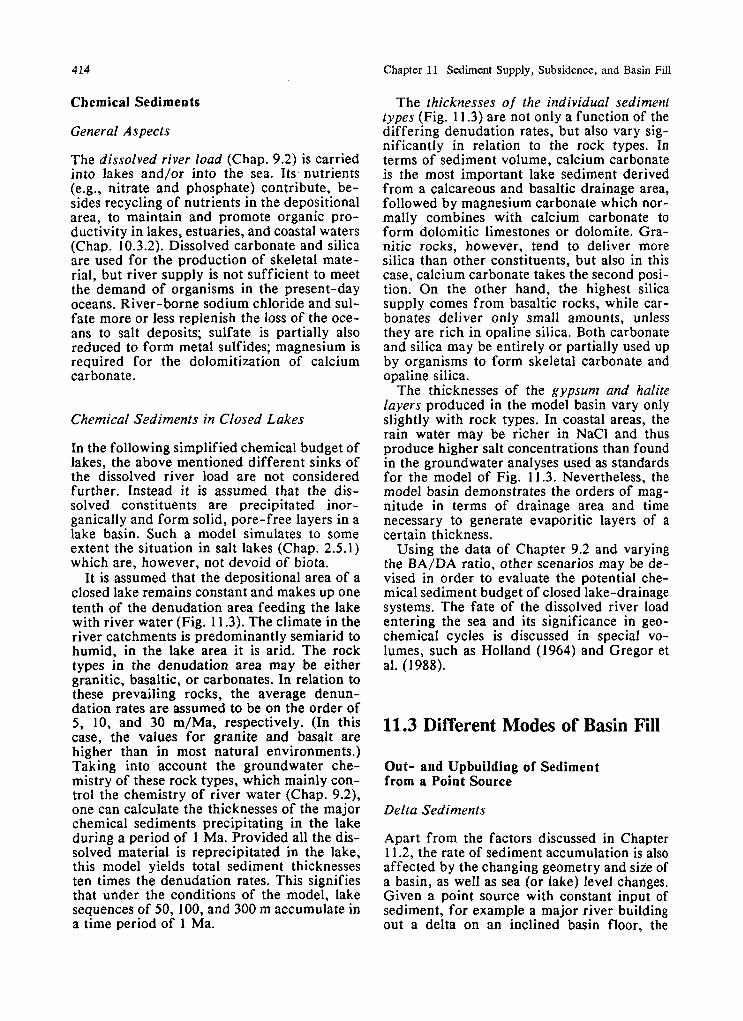
Chapter 11 Sediment Supply, Subsidence, and Basin Fill
Chemical Sediments
General Aspects
The dissolved river load (Chap. 9.2) is carried into lakes and/or into the sea. Its nutrients (e.g., nitrate and phosphate) contribute, be- sides recycling of nutrients in the depositional area, to maintain and promote organic pro- ductivity in lakes, estuaries, and coastal waters (Chap. 10.3.2). Dissolved carbonate and silica are used for the production of skeletal mate- rial, but river supply is not sufficient to meet the demand of organisms in the present-day oceans. River-borne sodium chloride and sul- fate more or less replenish the loss of the oce- ans to salt deposits; sulfate is partially also reduced to form metal sulfides; magnesium is required for the dolomitization of calcium carbonate.
Chemical Sediments in Closed Lakes
In the following simplified chemical budget of lakes, the above mentioned different sinks of the dissolved river load are not considered further. Instead i t is assumed that the dis- solved constituents are precipitated inor- ganically and form solid, pore-free layers in a lake basin. Such a model simulates to some extent the situation in salt lakes (Chap. 2.5.1) which are, however, not devoid of biota.
It is assumed that the depositional area of a closed lake remains constant and makes up one tenth of the denudation area feeding the lake with river water (Fig. 11.3). The climate in the river catchments is predominantly semiarid to humid, in the lake area it is arid. The rock types in the denudation area may be either granitic, basaltic, or carbonates. In relation to these prevailing rocks, the average denun- dation rates are assumed to be on the order of 5, 10, and 30 m/Ma, respectively. (In this case, the values for granite and basalt are higher than in most natural environments.) Taking into account the groundwater che- mistry of these rock types, which mainly con- trol the chemistry of river water (Chap. 9.2), one can calculate the thicknesses of the major chemical sediments precipitating in the lake during a period of I Ma. Provided all the dis- solved material is reprecipitated in the lake, this model yields total sediment thicknesses ten times the denudation rates. This signifies that under the conditions of the model, lake sequences of 50, 100, and 300 m accumulate in a time period of 1 Ma.
The thicknesses of the individual sediment types (Fig. 11.3) are not only a function of the differing denudation rates, but also vary sig- nificantly in relation to the rock types. In terms of sediment volume, calcium carbonate is the most important lake sediment derived from a calcareous and basaltic drainage area, followed by magnesium carbonate which nor- mally combines with calcium carbonate to form dolomitic limestones or dolomite. Gra- nitic rocks, however, tend to deliver more silica than other constituents, but also in this case, calcium carbonate takes the second posi- tion. On the other hand, the highest silica supply comes from basaltic rocks, while car- bonates deliver only small amounts, unless they are rich in opaline silica. Both carbonate and silica may be entirely or partially used up by organisms to form skeletal carbonate and opaline silica.
The thicknesses of the gypsum and halite layers produced in the model basin vary only slightly with rock types. In coastal areas, the rain water may be richer in NaCl and thus produce higher salt concentrations than found in the groundwater analyses used as standards for the model of Fig. 11.3. Nevertheless, the model basin demonstrates the orders of mag- nitude in terms of drainage area and time necessary to generate evaporitic layers of a certain thickness.
Using the data of Chapter 9.2 and varying the BA/DA ratio, other scenarios may be de- vised in order to evaluate the potential che- mical sediment budget of closed lake-drainage systems. The fate of the dissolved river load entering the sea and its significance in geo- chemical cycles is discussed in special vo- lumes, such as Holland (1964) and Gregor et al. (1988).
11.3 Different Modes of Basin Fill
Out- and Upbuilding of Sediment from a Point Source
Delta Sediments
Apart from the factors discussed in Chapter 1 1.2, the rate of sediment accumulation is also affected by the changing geometry and size of a basin, as well as sea (or lake) level changes. Given a point source with constant input of sediment, for example a major river building out a delta on an inclined basin floor, the

Basin-Filling Models
Fig. 11.3. Model of chemically precipitated lake sediments area consist alternatively of carbonates, basalts, or granites derived from chemical weathering in a closed lakedrainage and thus cause differing chemical denudation rates, DR. system and deposited in 1 Ma. The ratio ABlAD of lake Note that part of the sediments may be biogenic and that area, AB, and denudation area, AD, is 10 and kept con- MgC03 commonly is used to form dolomitic limestones stant; the climate in the drainage area is semiarid to tempe- and dolomites. See text for further explanation rate, around the lake it is arid. The rocks in the drainage
progradation of the deltaic sediment wedge mmla) and lateral progradation (ranging from 1 to 6.5 slows down through time (Fig. 11.4a and b; mla). During the most rapid Holocene sea level rise, dynamic model, see Chap. 1 1.1). Falling sea progradatign declined to less than 1 m/a. In other areas.
level causes progradation and rapid the Holocene eustatic rise in sea level was not substantially outbuilding of the delta, while rising sea level reduced rebound of the crust deglaciation;
thus, many former lowstand deltas were flooded and the may result either in coastal retreat or seaward had to build new deltas adjusd to the pment progradation, depending on the rates of both level (Fig. 11.4c). sea level rise and deposition (Fig. 11 .4~ and d).
The Fraser River d e h of British Columbia, for example, fiaStal ~ ~ ~ ~ ~ ~ d ~ ~ i ~ ~ continued to prograde during the Holocene relative rise in sea level. Progradtion amounted to 13 km in the last 9000 yeam (Fig. 11.4e and f, Williams and Roberts 1989). The The described drainage system of sediment discharge of this river was sufficient to allow the Mississippi river delivering its sediment aggradation to keep pace with the rate of sea level rise and load into the Gulf of Mexico (Fig. 1 1 .h) is a to maintain outbuilding of the delta. The delta growth was classic example of the interplay between pro- accomplished by both vertical accretion (about 2 to 5 cesses in the source area and deposition along

Chapter 11 Sediment Supply, Subsidence, and Basin Fill
OUTBUILDING
ISOCHRONES
POINT
WASH lOOkm U
VANCOUVER
,5km,
-T---- - - - - - ?
RAPID RISE 6 5 IN, SEA LEVEL / _/__ -L-;
TOPSET BEDS
FORESET BEDS
BOTTOMSET BEDS
f FRASER RIVER DELTA
TIDAL MARSH /FLOODPLAIN , PEAT BOG
g HIGH-ENERGY SHALLOW SEAS e
rt_ UN~FORM SEDIMENT DISTRIBUTION OVER ENTIRE BASIN
Fig. 11.4. a d Simple theoretical models demonstrating outbuilding and upbuilding of delta during constant (a and b) or rising sea level (c and d). Note that outbuilding from a point source slows down due to both increasing water depth and lateral sediment dispersal (b). Outbuilding during rising sea level, SLR, can only be maintained by high sedi- ment supply, SP (d). e and f Out- and upbuilding of Fraser
h HIGH-ENERGY SHELF/DEEP SEA
_ _ - _ _ _ _ _ _ _ _ _ _ _ _ - - - -
DEEP-SEA FAN 3 LIMITED UPBUILDING
. . SEDIMENT BY PASSING VIA CANYONS
River delta, British Columbia, during the last 9000 yeare (After Williams and Roberts 1989). g Tendency to uniform sediment distribution in highenergy shallow seas due to strong wave and current action. h Limited sediment buil- dup on highenergy shelf resulting in prograding slope and sediment bypassing via submarine valleys into the deep sea

Basin-Filling Models
a passive continental margin (summarized, e.g., by Matthews 1974, 1984a; mass balance see Hay et al. 1989). In contrast to the prev- ious example, here the river-derived material is distributed over a wide shelf and slope re- gion. With the onset of uplift of the Rocky Mountains and the Appalachians in the upper Cretaceous, terrigenous sediment input into the gulf increased significantly. As a result, Jurassic and lower Cretaceous carbonate depo- sition in a broad shelf region was replaced by the accumulation of a huge clastic wedge.
This wedge migrated about 200 km seaward since the upper Cretaceous. Uniform out- building was, however, modified by sea level fluctuations and regional differential subsi- dence in response to the increasing sediment load and diapirism of Jurassic salt. Cenozoic clastic sediments reach a thickness of up to 15 km. Mass balances indicate that extensive areas of the Rocky Mountains and High Plains have been uplifted as much as 1 to 3 km since the late Pliocene (Hay et al. 1989). On the western Florida shelf, which is an area outside of the influence of the Mississippi river, car- bonate sedimentation continues to prevail up to the Present. The clay mineral composition of modern sediments in the gulf reflects the mineral suite of the Mississippi river (Chap. 9.3).
Using the present-day chemical and mecha- nical denudation rates of the Mississippi river also for the other drainage areas of the Gulf of Mexico, one can estimate the average sedi- mentation rate of the gulf if the incoming river load is distributed evenly over the entire basin. The gulf covers an area of about 1 .5.106 km2, the drainage area of the rivers approxi- mately 4.5.10~ km2 (the drainage of the Mis- sissippi river alone is 3.27.10~ km2); hence the AB/AD ratio is about 1/3. With a mechanical denudation rate of 60 m/Ma (Fig. 9.6), the average total sedimentation rate (solid, pore- free sediment) in the gulf can reach 180 m/Ma. The chemical denudation rate in the drainage area is 15 m/Ma, but only part of the dissolved river load is deposited in the basin. About 15 % of this load is ca2+ (cf. Fig. 9.5, Mississippi and Rio Grande rivers), cor- responding to a Ca denudation rate of around 2 m/Ma. After conversion into CaCO (factor 2.5) and using AB/AD = 1/3, one ostains a (biogenic) calcium carbonate sedimentation rate of approximately 15 m/Ma.
These estimates do not yield the real sedimentation rates in the basin, which is filled irregularly by a large and several smaller point sources, but they provide the right order of
magnitude. Most o f the temgenous material is deposited on submarine fans such as the Mississippi fan, where very high sedimentation rates occur (up to 1000 mlMa, cf. Chap. 5.4.2). The calcium carbonate sedimentation rate calculated from the river load is about equal to rates found for pelagic carbonates in other ocean basins above the CCD (Chap. 10.2).
Apart from some shelf regions (western Flori- da, Yucatan), calcium carbonate deposition in the gulf, however, is too much diluted by sili- ciclastic material to generate carbonate-rich sediments. Finally, it should be mentioned that part of the dissolved river load is exchanged with sea water flowing into and out of the gulf.
Extensional and Closing Basin Filling
Extensional Basin Models
Similar to the declining rate of delta outbuil- ding into deepening water. the vertical sedi- ment buildup of a basin growing in size will decrease with time, if the volume of sediment input is kept constant. Such a situation was investigated quantitatively by Schlische and Olsen (1990) for rift basins. Their extensional basin filling model is based on the following assumptions:
- The basin represents a continental full-gra- ben or half-graben and is bounded by pla- nar faults dipping at equal angles (Fig. 1 1.5a).
- Uniform extension causes uniform subsi- sidence along the boundary faults and hence the depth of the basin increases linearly.
- The outlet of the basin is held at a constant level with respect to an external datum line.
- The volume of fluvial sediment added to the basin per unit time is constant; the sediment is distributed uniformly over the entire ba- sin.
The principal results of such a model are briefly summarized here with a few modifi- cations:
1. Early stage of basin evolution. Sediment supply is large enough to fill the small basin, and excess sediment and water leave the basin (Fig. 1 1.5a, Stage 1). The basin is hydrologi- cally and sedimentologically open. During this phase, the sedimentation rate is constant and equal to the subsidence rate. 2. As the basin continues to grow, a point is reached at which the sediment input can no

Chapter 11 Sediment Supply, Subsidence, and Basin Fill
a CONSTANT SEDIMENT SUPPLY
HYDROLOGICALLY AND SEDIMENTO-
. . . . LOGICALLY OPEN
FLUVIAL, . . . . . . . . . 7 - - - - - - - - - - -
SED RATE = SUBSID. \ Y/E = 67% HYDROLOG
LAKE WATER OPEN 2 , 4
LAKE SED. . . . . , . . . . .
. . . CLOSED I (SHALLOW) I
DEEPEN- \ ,,,
ING OF HYDROLOG LAKESED - - FACIES CLOSED
SUBSIDENCE , WATER DEPTH OF - 5 10- v, - DEPTH OF
f 0 : SEDIMENT THICKNESS r 5 -
5 t w - n -
0 -
SEDIMENTATION RATE i;. Fig. 11.5a-e. Simple model of extensional rift basin filling under the assumptions of constant volume input of sedi- ment and uniform subsidence. a Full-graben filled with fluvial and lake deposits under hydrologically open (1 to 3) and closed conditions (4); E extension (46). b Twodimen- sional model of progressive, complete fill of half-graben growing in size; cumulative sediment thickness in total basin (average) and basin center, and declining sedimen
b BASIN CENTER
BASIN CENTER ..- - / - -
\ / M y /
1 \\, , W I N CENTER
\
ONLAP ONTO
BASIN FLOOR
ONLAP ONTO
STRATA OF BASIN
TILTING m 4 ----------
BY ADDITIONAL FAULTS
4 NEWARK BASIN FRIASSIC-JURASSIC) PRESENT-DAY SITUATION AFTER I FLUVIAL-
FURTHERTILTING AND EROSION \ / PLAYA
LACUSTRINE DELTAIC
tation rates through time. c Transformation of half-graben into full-graben to apply full-graben f i g model (d) based on data from Triassic-Jurassic Newark basin (see Fig. 12.7). e Adjustment of deposition to asymmetric, uniform basin subsidence (1). accelerated tilting (2), additional faulting (3), and (4) situation after further tilting and ero- sion. (After Schlische and Olsen 1990; e4 from Manspeizer 1988b)

Basin-Filling Models
longer completely fill the space made available through subsidence. Consequently, the basin is sedimentologically closed and becomes a lake (Stage 2 in Fig. 1 1.5a). The sedimentation rate of the lake deposits slows due to the increasing size of the basin. Younger strata progressively onlap the basement rocks of the hanging wall block. 3. Further development is controlled by clima- tic factors and the size of the hydrologic drai- nage area of the basin. If water supply into the basin remains high enough to keep the basin water-filled up to the fixed outlet, the basin deepens and the sedimentation rate continu- ously decreases (Fig. 11.5a, Stage 3). 4. However, if evaporation from the growing surface area of the lake exceeds water supply, the basin becomes hydrologically closed. In this case, lake depth decreases as a function of both the increasing size of the basin and in- creasing evaporation loss (Fig. 11.5a, Stage 4). As a result, the depositional environment is controlled by a playa lake which may record minor climatic variations.
Deposition in the rift basin can also begin with lake sediments, if sediment input is small. As long as rifting and subsidence con- tinue at the initial rate, the sedimentation rate should decrease indefinitely (Fig. 1 1.5b and c). However, subsidence slows down and is final- ly only driven by sediment loading (cf. Chap. 8.3). Consequently, the basin is slowly filled up until the depositional surface reaches the level of the outlet. The subsequent sediments are again fluvial and accumulate at a rate e- qual to subsidence.
The results of two-dimensional modeling of a permanently filled half-graben, continuously growing in size (Fig. 11.5b), are similar to those found of a full-graben. The cross section of this model reflects the geometry of the early Mesozoic Atlantis basin in North America (cf. Fig. 12.7) and its time slices represent 0.55 Ma. If sediment input balances the space provided by subsidence, the de- positional surface area of the basin ceases to grow. Ac- celerated tilting of the half-graben causes the basin fdl to shift toward the border fault and young layers to onlap previously deposited strata as shown in Fig. 11 .Se (Stage 2).
Modifications o f the Models
These simple models cannot account for vari- ous complications realized in nature, such as nonuniform subsidence and sediment supply, lateral facies changes within the basin, long- term changes in climate and drainage areas, and compaction. In addition, several important
factors may significantly vary along-strike of the basin, i.e., one has to consider three-di- mensional problems. Nevertheless, these mo- dels allow to predict some general trends in the sedimentary filling of such basins.
Modeling the situation of the early Mesozoic Newark basin (shown on map in Fig. 12.7), Schlische and Olsen (1990) found a fairly good agreement between their model (Fig. 1 1 . 5 ~ and d) and the gross stratigraphic and depositional development of this basin (Fig. 11.5e, Stage 4). In order to apply the more simple full-graben model to the basin, the half-graben cross section of the basin was transformed into a full-graben. The subsidence rate was inferred from the sedimentation rate of time intervals during which both rates were equal. Over long periods, the cumulative sediment thickness and the sedimentation rate of the model approxi- mates the true values. Major discrepancies between model and nature were caused by volcanic activity and climatic change. An idealized evolution of this basin is shown in Fig. 11.5e.
Consequences for Stratigraphic Sequences
In conclusion, this and similar extensional basin filling models can explain, to some ex- tent, the tripartite stratigraphic sequences ob- served in numerous continental basins:
1. A basal, alluvial fan and fluvial unit in- dicates through-going drainage and open- basin conditions. 2. After an initial deepening trend, the subse- quent lacustrine or shallow-marine unit may reflect gradually shoaling upward related to closed-basin conditions. 3. Overlying fluvial sediments once again tes- tify to through-going drainage.
This general trend, however, may be modified by climatic and various other, mainly regional factors (see, e.g., Smoot 1991). Conditions similar to those of short-lived continental rift basins, i.e., graben and half-graben structures, are also found in many pull-apart basins (Chap. 12.8).
Rift - Drift Stage Transition
If the rift stage of a basin is followed by sea- floor spreading, the extension of the basin commonly continues at an accelerated rate. For example, if a full-graben of 50 km width is formed during a time period of 20 Ma, the average rate of basin extension (but not crustal extension) is 0.25 cm/a. By contrast, ocean spreading frequently operates at a rate of one to several cm/a. Hence, the average sedimen-

Chapter 11 Sediment Supply, Subsidence, and Basin Fill
tation rate of an extensional basin passing from the rift to drift stage should drastically decrease. This is the case to some extent, but does not apply to the sediment accumulation on shelves. In large ocean basins most of the incoming sediment is trapped on the shelves and therefore cannot be distributed uniformly over the entire basin as assumed for the simple models discussed so far.
Example: Sediments in the Growing Atlantic Ocean
Nevertheless, the sedimentary history of the Atlantic Ocean shows the expected trend of a decreasing clastic sedimentation rate with time. During its early stage of rifting the nar- row South Atlantic displayed sedimentation rates for carbonate-free material of about 30 m/Ma (and more) and thus was dominated by terrigenous deposits (Van Andel et al. 1977). With continued sea-floor spreading, the sedi- mentation rate of clastics dropped in the Late Mesozoic and Early Cenozoic to values mostly under 10 m/Ma along the margins and to 2 to 5 m/Ma on the Mid-Atlantic ridge (Fig. 1 1 .6~) .
By contrast, the in situ biogenic carbonate production and preservation did not show such a distinct trend, but rather was controlled by changes in the oceanic circulation system (Fig. 11.6b). Similarly, the North Atlantic shows sedimentation rates of terrigenous material which were generally high during its early history and then declined with the widening of the basin up to the early Miocene (Ehr- mann and Thiede 1985). However, this rate increased again from the middle Miocene up to the Quaternary as a result of climatic change.
An approximate mass balance of the pre- sent-day denudation on land and overall sedi- mentation in the Atlantic Ocean between 50°N and S yields the following results: The total drainage area in North and South Ame- rica, Europe, and Africa is 30.10~ km2 and the basin area 75.10" kmz. Hence the AB/AD ratio is 75/30 = 2.5. Assuming the modern global mechanical denudation rate of 48 m/Ma (Chap. 9.2, Fig. 9.6) for the drainage area, the average sedimentation rate of clastic material in the Atlantic is about 48/2.5 = 19 m/Ma (solid, water-free material). As compared to Figure 11.6, this value appears to be realistic. However, this calculation does not take into account that much sediment is deposited on the relatively narrow shelves of this wide ocean basin.
As regards chemical denudation, the global rate is 16 m/Ma (Fig. 9.6) and approximately 12 % of the dissolved river load is ca2+, 10 % SiO . A calcium denudation of 1.9 m/Ma may leac! to a calcium carbonate (factor 2.5) sedi- mentation rate in the Atlantic of 1.9 x 2.5/2.5 = 1.9 m/Ma or 1.9 mm/ka (AB/AD = 2.5).
This low value demonstrates that the cal- cium river supply is insufficient to maintain the present-day oceanic biogenic carbonate production and thus favors carbonate dis- solution below the CCD (cf. Chap. 5.3.2). Si- milarly, the river-borne SiO yields an average sedimentation rate of 1.5 m&a or 1.6 mm/ka, which is too low to provide diatoms, radio- laria, and sponges with enough silica to build their skeletons. Hence, most of their skeletons are dissolved in the water column (Chap. 5.3.5).
Closing Basins
In contrast to extensional basin filling, closing basins such as remnant basins, part of foreland basins, some forearc and backarc basins, as well as intramontane basins (see Chaps. 1.2, 12.5, and 12.6)) show the reverse development in their sedimentary fill. With decreasing area of sediment dispersal, the sedimentation rates grow and commonly cause shallowing-upward sequences until the basin is completely filled and subaqueous deposition is replaced by ter- restrial environments. Some examples describ- ed in Chapters 12.5 and 12.6 reflect this situa- tion.
Long-term, global sediment mass balances, as indicated in Chapter 9.2, are subject to further complications. Estimates of the mass- age distribution of Phanerozoic sedimentary rocks, preserved on the continents and be- neath the sea, clearly show that only part of the older sediments is still present and can be identified (Mackenzie 1990). The older the rocks, the less of their original volume is pre- served. The total mass of sediments deposited over geologic time has been recycled several times, because sediments are continuously subducted and incorporated into mountain building from where they are eroded again. However, this problem is not further discussed here.
The out- und upbuilding of an accretionary wedge along a subduction zone is also largely controlled by the sediment budget of the as- sociated deep-sea trench. The specific prob- lems of this topic are discussed in Chapter 12.5.2.

Basin-Filling Models
b DISTANCE FROM RIFT AXIS
2000 1000 0 1000 2000 km a I 4
I S.AMERICA
SEDIMENTATION
CALCAREOUS OOZE OR LIMES1 ONE
JUR.-LOWER CRET U.CRET -PLEISTOCENE CARBONATE SHELF CLASTIC WEDGE ( 1 - 4 )
N I I S w GULF OF MEXICO
km CRUS? AND PALEOZOIC SED
Fig. 11.6. a Present-day Mississippi drainage area and Calcareous oozes are almost restricted to mid-Atlantic ridge upper Cretaceous to Recent deposition of a huge, seaward (rift axis), while sediments at greater distance from rift axis migrating clastic wedge in the Gulf of Mexico. (After were mostly deposited below CCD (see Chap. 5.3.2). Matthews 1974). b Extension of South Atlantic through Asymmetry of sediment distribution is caused by cir- time and generalized chronostratigraphic cross section of its culation system. c Trend of carbonate-free sedimentation sediments between Brazil (Brazil basin) and Angola margin rate to diminish with increasing extension of ocean. (AAer according to results from Deep Sea Drilling Project. Note Van Andel et al. 1977) that vertical drill holes appear as oblique lines in diagram.

Chapter 11 Sediment Supply, Subsidence, and Basin Fill
Variations in Subsidence and Sediment Supply
Variations in subsidence with time are another factor controlling the facies evolution of a sedimentary basin. In Fig. 11.7a through c, the sedimentation rate is approximately constant and of medium magnitude (20 m/Ma). In case (a), the basin remains shallow over a long time period, because sedimentation compensates for subsidence. In (b) and (c), time periods of rapid subsidence occur and therefore also of marked deepening of the basin with accom- panying facies change. If the subsidence rate decreeases, the basin is filled up slowly, and the resulting vertical sequence will show a shallowing/coarsening trend.
If the rate of sedimentation substantially changes with time in a basin of constant sub- sidence, the depositional environment may vary drastically (Fig. 1 1.7d and e). In case (d), sedimentation starts with a very low rate and subsequently grows steadily. As a result, the basin is governed by marine conditions most of the time. If, in contrast, the development starts with a high sedimentation rate which gradually slows down (Fig. 1 1.7e), the basin remains filled up above sea level most of its lifetime and therefore collects continental deposits. The last example (Fig. 1 1.7f) shows a basin development in which both rates, sub- sidence and sedimentation, decrease with time and thus permit only a relatively short marine episode during the early basin history. A per- manently high sedimentation rate would never enable the development of a water-filled, morphological basin, but maintain a continen- tal depositional environment.
11.4 Vertical and Lateral Facies Associations (Overview)
Three Principal Types of Vertical Facies Evolution
General Trends
Summarizing the results of the interplay bet- ween denudation and depositional areas, sedi- mentation, and subsidence, three principal alternatives for the vertical facies evolution in sedimentary basins are established:
1. Sediment supply 2 subsidence (over-sup- plied basins): shallowing basin, transition from marine or lake deposits into fluvial or
another continental environment. Decrease in the proportion of biogenic sediment com- ponents. (Increase in benthic and reef-derived carbonate in the case of marine carbonates.)
2. Sediment supply s subsidence (sediment- starved basins): deepening basin, transition from continental or shallow-marine into deep- marine environment. Increase in the propor- tion of biogenic sediment components, except for water depths below the lysocline (dis- solution of carbonate and opaline silica).
3. Sediment supply approximately compen- sates for subsidence ("balanced" basins): long- persisting identical morphological basin con- figuration, maintainance of deep-marine, shallow-marine, or continental facies. No long-term drastic change in the proportions of terrigenous and biogenic sediment compo- nents.
Basins Over-Supplied with Sediment
Over-supplied basins are short-lived, but well represented in the geologic record. Their fa- cies types are dominated by clastic sediments and comprise deep-sea to continental environ- ments including
- Graben structures and rift basins with fluv- ial deposits (see examples of Chap. 12.1).
- Lakes fed by rivers from high-relief regions (Chaps. 2.2.2 and 2.5.1) and proglacial lake deposits (Chap. 2.1 .I).
- Marine deltas and deep-sea fans (Chaps. 3.4 and 5.4.2).
- Remnant basins with flysch sedimentation (Chap. 12.6.1).
- Foreland basins with molasse deposition (Chap. 12.6.2).
- Forearc and backarc basins with high supply of volcaniclastics and other clastic material (Chaps. 12 5.3 and 12.5.4).
- Pull-apart basins in areas of high relief (Chap. 12.8.2).
- Some adjacent seas with high terrigenous sediment input, for example the northern Gulf of California (Chap. 4.3).
Sediment -Starved Basins
Sediment-starved basins tend to be deep and far away from high-relief terrigenous sedi- ment sources. Their thin sediments make up only a small portion of the sedimentary record of a certain time period. Typical represen- tatives include

Vertical and Lateral Facies Associations 423
SEDIMENTATION RATE: CONSTANT (20 m1Ma)
SUBSIDENCE RATE: VARYING / 10 \ 20 30 40' ~a
WATER DEPTH MARINE SEDIMENT
a-f, VALID FOR LIMITED AREA IN SEDIMENTARY BASIN
UBSIDENCE RATE
SEDIMENTATION RATE: VARYING SUBSIDENCE RATE: CONSTANT
(50mlMa)
SEDIMENTATION AND SUB- SIDENCE RATE: VARYING
50 20YT INENTAL 100 ,,:?:+?::.:?: ,.,-L-
..................................... .< . . . . . . . . . . . . . . . . . -...:I 0 40 Ma ................................................. :;*, ,
CONTINENTAL
1 -
2; km
Fig. 11.7a-f. Relationship between rates of subsidence, Su, Su varying. d and e Su = constant, Sd varying. f Both Sd and sedimentation, Sd, versus time for a certain location and Su vary with time. Note that specific environmental within a sedimentary basin (all rates in mlMa). a Both conditions, for example a shallowing basin, may be created rates are constant, but Sd i Su. b and c Sd = constant, by different combinations of the factors Sd and Su
. . . . . . . . . . . . . . . . . . . . . . . . . K...........................'...'...'.‘............... K . . . . . . . . . ~ . . . . . . . . . . . . . . . . ~ . . . . ~ - M A R I N E . .................................................... . . . . . . . . ...................... . . . . . . . . . . . . . . . . . . . . . . . . . . . . . . . . . . . . . . . . . . . . . . . . . . . . . . . . . . .
,.,.,.,.,. .............................. .................................... . . . . . . . . . . . . . . . . . . . . . . . . . . . p','
... ........................... . . . . . . . . . . . . . . . . . . . . . . . . .
e \\;.:.:. 1.1. :.: \ .:. .:.
CONTINENTAL \"'.'. \;. BASIN FILL

Chapter 11 Sediment Supply, Subsidence, and Basin Fill
- Central parts of large oceanic basins and special smaller basins in the vicinity of mid- oceanic ridges (Chaps. 5.3.2 and 5.3.3).
- Isolated submarine platforms and highs (Chaps 5.3.7).
- Epicontinental seas surrounded by lowlands. - Arid adjacent seas, for example the present-
day Red Sea (Chap. 4.3).
Basins with Balanced Sediment Supply
These basins tend to maintain their depositio- nal environment for considerable time periods. Characteristic examples are
- Shelf seas, particularly carbonate shelves and carbonate platforms, with and without vari- ous types of reefs (Chap. 3.3.2).
- Some areas subject to upwelling and high organic productivity, for example the mo- dern shelves off Peru and South Africa (Chap. 5.3.4).
- Epicontinental seas with moderate influx of terrigenous sediment.
- Some forearc and backarc basins with limit- ed sediment supply.
Modifying Factors
The three principal trends mentioned above, however, are modified in many ways by chan- ges in oceanographic and climatic conditions, variations in organic productivity due to the faunal and floral evolution through time, as well as by sea level fluctuations and lateral tectonic movements, such as ocean spreading and subduction. The great variety of sedimen- tary facies through time is mainly a result of these modifying factors which obscure the simple basic principles.
The Abundance of Shallow-Marine Deposits
It is surprising that shallow-marine deposits constitute a great proportion of the total sedi- ment volume in present-day environments as well as in the fossil record. One should expect that the principle condition (3), i.e., a balance between sediment supply and subsidence, is rarely realized for a time period of some geo- logical significance. Hence, long-persisting shallow-water conditions should be an excep- tion. However, the present-day, high-energy shelf environments demonstrate that the hyd- rodynamic conditions of the sea prevent ag-
gradation of sediment up to sea level. Instead, the incoming terrigenous sediment is widely distributed over the inner and outer shelf areas and partially transported into deeper water (Fig. 11.4g and h; Chap. 3.3). Outbuild- ing of the coastline is normally restricted to zones of very high sediment influx.
Thus, long persistence of shallow-marine conditions in the sedimentary record testifies to the fact that the former basin was probably oversupplied with sediment most of the time, but has lost part of the sediment influx to deeper, poorer supplied regions. Similarly, fluvial basins are commonly filled up to the level of their stream gradient. Any excess in river supply is carried farther downstream; thus a balance between sediment aggradation and basin subsidence is established for a sig- nificant time period. Such a process renders thick fluvial records. On the other hand, i t should be mentioned that deep-sea sediments are under-represented in the fossil record, because they were largely subducted at con- vergent plate boundaries and transformed into metamorphic rocks.
The examples in Chapter 12 further il- lustrate the relationship between subsidence and sediment supply, but also take into ac- count other modifying factors, including tec- tonic basin evolution. It is, however, not pos- sible to deal with all basin types in detail. Once the general principles of the interplay between the various factors discussed above are demonstrated in a few representative ca- ses, this approach can be applied to the great variety of other basin types in space and time.
Vertical and Lateral Facies Associations
Facies and Facies Change
As described in Part 11, sediments deposited in special environments have distinct characteris- tics, i.e:, texture, sedimentary structures, mi- neralogical and chemical composition, pre- served fauna and flora, trace fossils, etc. All these characteristics are summarized under the term (sediment) facies, which is discussed in more detail in many textbooks (e.g. Dunbar and Rodgers 1957; Krumbein and Sloss 1963; Blatt et al. 1980). The facies of a sediment may indicate its particular depositional en- vironment that distinguishes it from other facies in the same or another basin. Changing sedimentary environments cause facies chan- ges both in vertical and lateral directions. One of the basic rules in sedimentary geology is

Vertical and Lateral Facies Associations
that a special facies type can "migrate" obli- quely through space and time, whereas the facies types change both in horizontal and vertical directions (Walter's Law, see, e.g., Teichert 1958). This means that a specific environment, producing a certain sediment facies, is established at different locations and times during the basin evolution.
Individual facies types can be combined to characteristic vertical facies successions or, more generally, to vertical and lateral facies associations. The morphological evolution of ancient sedimentary basins can be reconstruct- ed mainly with the aid of such facies associa- tions. The identification and interpretation of facies associations or, in other words, deter- mining architectural elements (cf. Chap. 1.4.3) of a basin fill are one of the most important aims in sedimentary geology. For this reason, the major groups of large-scale facies asso- ciations are briefly mentioned here; smaller- scale trends in the facies evolution of specific depositional systems were described in Part 11.
Vertical Facies Successions
Common vertical facies successions include:
1. Deepening environments with
High clastic input Lower clastic input
Abyssal plain
Deep-sea fan
Shallow marine clastics
Delta and lake sediments
Braid plain
Alluvial fan
Deep-sea pelagic sediments
Deeper marine hemipel. sediments
Shallow marine (below wave base)
Coastal-marine (above wave base)
Delta, lagoon, tidal flats
Alluvial plain
2. Shallowing environments with
Siliciclastic Carbonate sediments sediments
Fluvial plain Alluvial plain (red beds)
Delta plain, lake, Coastal sabkha marsh
Coastal, tidal- Carbonate lagoon, lagoonal evaportites
River mouth bar Reef and reef sands detritus
Prodelta, clastic Deeper carbonate shelf platform
Deep-sea fan Carbonate slope Basin plain Slope apron carbonates
Deep-sea carbonate
Frequently, only part of these successions is realized in a particular basin (cf. Part 11, e.g. Figs. 2.13 and 2.14, 2.28b, 3.15, 3.25a and b, 3.30 and 3.31, 4.6, 6.5e and 6.9).
In addition, there are frequently occurring minor vertical facies associations such as:
- Pelagic to hemipelagic shales, marls, lime- stones, and black shales (cf. Chap. 7.2). - Pelagic carbonates, carbonaceous siliceous shales and chert, red shales, mostly associated with oceanic crust (cf. Chap. 5.3, Figs. 5.4 and 5.5). - Skeletal lag deposits, consisting of cephalo- pods, crinoids, gastropods, etc., phosphorites, glauconitic minerals, crusts and nodules of iron and manganese oxyhydrates (condensed sections). - Red and green shales and various evaporites (cf. Chap. 6.4, e.g., Fig. 2.32).
These and many other minor facies associa- tions described in Part I1 are particularly use- ful for the identification of depositional en- vironments.
Lateral Facies Associations
Similar successions also occur as lateral facies associations:
- Alluvial fan - braidplain - (playa) lake ,+ eolian sands (Figs. 2.8 and 2.32). - Alluvial plain - tidal flats (lagoon) - shallow marine - deeper marine. - Alluvial plain (red beds, eolian sands) - coastal sabkha - lagoonal carbonates/evapo- rites - reef - forereef - carbonate slope - slope apron. (Partially in Fig. 6.5e). - Clastic shelf - slope and slope channels - deep-sea fan - basin plain (Fig. 5.18). - Mid-oceanic ridge - deep-sea pelagic and hemipelagic environments (below and above CCD) - deep-sea trench - accretionary wedge with slope basins. (Chap. 12.5, Fig. 12.19).

Proximal-distal trends in relation to the sedi- ment source also lead to distinct lateral facies associations, for example:
- Slope channel deposits - upper and lower deep-sea fan - overbank deposits - basin plain, displaying channel, proximal and distal turbidites (Chap. 5.4.2, Fig. 5.18). - Lava flows - pyroclastic flows and ig- nimbrites - ash falls with decreasing grain size
Chapter 11 Sediment Supply, Subsidence, and Basin Fill
- fluvial-transported tephra - ash turbidites in lakes and in the deep sea (Chap. 2.4.2, Fig. 2.23). - Relatively coarse fluvial sand - fine eolian sand - eolian dust (loess, Fig. 2.1).
Further examples of such facies associations in various tectonically defined basin types are described in Chapter 12.1 through 12.8.

Part IV Basin Evolution

12 Basin Evolution and Sediments
12.1 Rift Basins 12.1.1 Rift Structures
Pure Shear and Simple Shear Other Structural Features Rift Volcanism Subsidence of Rift Zones
12.1.2 Examples of Young Rift Zones The East African Rift Zone Other Young Rift Zones
12.1.3 Sediments of Rift Basins Introduction Facies Models for Half-Graben Basins Examples
12.1.4 Tran_sition from Rift Basins to Continental Margin Basins Introduction Rift Basins on Continental Margins
12.2 Continental Margin and Slope Basins 12.2.1 General Aspects
Types of Continental Margins Basin Morphology and Sediments (Overview)
12.2.2 Sediment Successions of Continental Margin Basins Sediment Buildup on Atlantic-Type Continen- tal Margins Depositional History of Conjugate Marginal Basins Sediment-Starved Marginal Basins Submarine Marginal Plateaus
12.2.3 Sediment Successions on Continental Slopes Introduction Construction and Destruction of Slopes Ancient Slope Deposits Concluding Remarks
12.3 Intracratonic Basins Associated with Mega-Rifting 12.3.1 Permian to Mesozoic Basin Development in
Europe (Overview) Introduction Basin Evolution
12.3.2 Mesozoic Sediments Between the N6rth Sea and the Western Tethys Triassic Sediments Jurassic Sediments Cretaceous Sediments Summary
12.4 Continental or Intracratonic Sag Basins General Aspects Sediments
(Continued under the headings of Chaps. 12.5 and 12.6)
12.1 Rift Basins
12.1.1 Rift Structures
Modern and ancient rift basins are amongst the most important geological structures in terms of their abundance and sediment ac- cumulation. Geologically young, topographic- ally expressed rift structures occur on all con- tinents, as well as on thinned continental crust beneath the sea. Rift basins on both present- day and older, deformed passive continental margins signalize the initial stage (or rift stage) in the formation of a new ocean basin (drift stage). Other rift zones (i.e., failed rifts), including aulacogens, are those which have not evolved into an oceanic stage.
In Chapters 1.2 and 8.3 some simple models of rift basin evolution and subsidence were introduced. These models provide an initial approach for understanding the generation and tectonic evolution of such basins. In re- cent years, however, these models have been refined and modified considerably, and a wealth of new information on modern and ancient rift basins has become available (e.g., Frostick et al. 1986; Manspeizer 1988a; Price 1989; Allen and Allen 1990). These new re- sults show that many rift basins are more complex and that their evolution is less pre- dictable than was earlier assumed (Reading 1986b).
Pure Shear and Simple Shear
The extension of the crust by pure shear (Fig. 12.la), as derived from "classic" graben struc- tures (e.g., the Rhine graben in central Europe according to early interpretations, Fig. 12.2), is not as common as previously assumed. Pure shear implies instantaneous and uniform ex- tension (cf. Chap. 8.3); if it reaches the drift- ing stage, the center of the rift graben coin- cides with the later spreading axis.

Chapter 12 Basin Evolution and Sediments
a b PURE SHEAR BRITTLE SIMPLE SHEAR
CONVECTING ASTHENOSPHERE
AND INTRUSION
ALBIAN-APTIAN
Y - TUCANO BASIN ATLANTIC r GABON B A S I N 1
LANTIC EASTERN
SEDIMENTS
HALF-GRABEN HANGING WALL BASIN SAG BASIN
s TYPE e A TYPE HALF-GRABEN
A L EXTENSION = C A L I L (%)
Fig. 12.la-c. Pure shear (a) and simple shear (b) as alter- the lateral separation of the rift boundary fault from the native models for crustal extension and formation of rift basins produced by thermo-tectonic subsidence after wn- basins (from Tankard and Welsink 1988). c Schematic tinental breakup. (Kusznir et al. 1987). d Different styles section across lower Cretaceous basins of the south Atlantic of sedimentary basins developed from extension at various continental margins and adjacent Tucano basin (Brazil) and crustal levels. (Blundell et al. 1989). e S-type. (limited eastern Gabon basin (Africa). All basins are assumed to extension) and A-type shear causing large extension (modi- result from one major extensional detachment zone. Note fied from Artyushkov and Baer 1989)

Rift Basins
LANDAU W ,
RHlNE R. BRUCHSAL
BRACKISH-LIMNIC-HYPER-
EVAPORITES
JURASSIC BITUM. SHALE
LlMNlC LIMEST. LOWER OLIGOCENE, (PREDOMINANTLY EOCENE LAKE SEDIMENTS)
MESOZOIC ROCKS
Fig. 12.2. a "Classic", approximately symmetric cross- graben fill, and the geological structures of the graben section of Upper Rhine graben, north of Karlsruhe, central shoulders (not shown here) indicate a left-lateral strike-slip Europe, as an example for the pure shear model (Fig. component. c Simplified and idealized vertical facies s e 12.la); no vertical exaggeration. b In reality, cross sections quence. d Schematic longitudinal section of Rhine graben of this structure are more complicated and commonly fill. (After Pflug 1982; Geyer and Gwinner 1986; also see asymmetric with changing polarity; various features, in- Illies and Greiner 1978; Fuchs et al. 1981) cluding graben morphology, variations in thickness of

Chapter 12 Basin Evolution and Sediments
However, many recent investigations of rift zones have revealed that crustal stretching is accomplished by slip along an intra-crustal detachment surface (simple shear, Fig. 12.1 b). Such detachments were first observed in the Basin-and-Range Province of the western United States (Wernicke and Burchfiel 1982; Wernicke 1985) and confirmed by deep seis- mic reflection profiling in many other regions, for example on the Atlantic continental mar- gins (e.g., Enachescu 1987; Boillot and Winter- er 1988; Benson and Doyle 1988; Manspeizer 1988b; Tankard and Welsink 1988). In the detachment model, extension is nonuniform and decreases in the direction of shear. Simple shear allows the lateral separation of the zone of initial rifting and the zone of magma up- welling which may initiate ocean spreading (Fig. 12.1 b and c). Low-angle detachments may explain the coeval initiation of different basin types (Fig. 12.ld).
To reconcile these two hypotheses, Barbier et al. (1986) proposed combined shear, i.e., a mechanism comprising thinning of the crust by both pure shear and simple shear (see also Ziegler 1988). Neugebauer (1 987) emphasizes that lithospheric thinning is controlled not only by one principal parameter, but by seve- ral independent processes. Dome, rift, and basin structures represent stages of the thin- ning process and thus form a genetic sequence. Long-term, slow thinning may be superimpos- ed by short-term episodes of increased tectonic and magmatic activity.
Other Structural Features
- Rift zones frequently evolve along pre- existing lineaments in the crust and may display a substantial strike-slip component (Fig. 1 2 . 3 ~ and d, cf. Chap. 12.8). As long as extension exceeds strike-slip, the term rift is commonly used. - Many rifts are not symmetrical, with the deepest basin floor located in the center, but may display the pronounced asymmetry of a half-graben (Figs. 12. l e and 8.10a). - Rifts are not necessarily continuous, simple features as illustrated in small-scale maps; they may be broken into special segments by transverse structures (transfer or accommo- dation zones, Fig. 12.3a and e). Transfer zones in extensional regions display a wide range of geometries from discrete fault zones to zones of broad warping (Morley et al. 1990). The direction of asymmetry may alternate between neighboring segments, as observed, for ex-
ample, in the region of Lake Tanganyika, East Africa (Burgess et al. 1988). The smaller the scale of observation, the more complex rifts become. Individual segments vary in their structural style and thus also in their basin fill. However, such rift structures may evolve into a full symmetric graben (Woldegabriel et al. 1990). - Rifting along a rift zone does not necessarily occur simultaneously, but may proceed from one end to the other, as found in the East African rift zone (see below). - One may find both thermally induced rift zones with initial updoming (Fig. 12.4b), as well as other rifts caused, for example, by continental collision and escape, which lack an early phase of uplift.
Rift Volcanism
Some of the rift zones and their sediments are strongly influenced by syn-rift volcanism (Fig. 12.4); others are little affected by these processes. When continental lithosphere is thinned by stretching, the underlying astheno- sphere wells up to fill the space. As a result, the asthenosphere decompresses and generates partial melt (White 1989). The hotter the as- thenosphere, the more melt is generated (and the more the crust is elevated). Relatively small variations in temperature cause major differences in the volume of magma generat- ed. Large volumes of magma are produced if the lithosphere is underlain by abnormally hot mantle material (forming plumes or "hot spots"). The partial melt is buoyant and rises to be added to the overlying crust or to ex- trude at the surface. The phase prior to rifting may be characterized by widely extended flood basalts. Later, the rift valley may be filled by lava flows and tephra of variable composition, or volcanic structures are built up in the graben zone separating it into sub- basins.
Subsidence o f Rift Zones
Finally, it should be mentioned that the prin- cipal mechanism of subsidence in rift zones is not always clear. The widely used stretching models (also see Chap. 8.3) are not generally accepted. According to Artyushkov and Baer (1 989), there are two main modes of stretching (Fig. 12.le): (1) S-type (synthetic) stretching, in which the fault blocks are not or only slightly tilted toward the down-thrown side of

Rift Basins
a LINKED HALF-GRABEN b BRANCHED RIFT STRUCTURE (LAKE TANGANY IKA) (BASS STRAIT, BETWEEN AUSTRALIA
AND TASMANIA)
C HIGH ATLAS RIFT
DIRECTION OF
OMMODATION ZONE
ALICIA BANK
Fi. 12.3. a Rift zone composed of half-grabens with alternating polarities. Adjacent half-grabens are separated by interbasinal ridges oblique to the rift axis. Model of Lake Tanganyika, Western Rift of the East African rift zone (see Fig. 12.4a; Rosendahl et al. 1986). b Cretaceous branched rift structure of the Bass Strait region between Australia and Tasmania. (Etheridge et al. 1987). c Com- bined syndepositional extension and strike-slip displace- ment. Pre-existing N 70°E faults are reactivated by strike- slip motion and produce secondary N 30°E normal faults within the graben structure. Model for Triassic rifting in
the High Atlas, Morocco. (Beauchamp 1988; cf. Fig. 12.6). d Superposition of detachment above and perpen- dicular to previous extensional regime generates substantial dipslip movement along listric faults and thus strike-slip parallel to boundary fault of extensional basin. Model for the development of secondary detachment in the Jeanne d'Arc basin, Grand Banks of Newfoundland (see e). e Sim- plified model of rifted continental margin between New- foundland and Iberian Meseta, Spain (see Fig. 12.7a and c) prior to ocean spreading. (d and e Tankard and Welsink 1988)

434 Chapter 12 Basin Evolution and Sediments
ERUPTION TYPE
LATE PLIOCENE
TRACHYTE-BASALT
EARLY PLIOCENE LATE MIOCENE
Fig. 12.4. a Simplified map of East African rift zone. b Different stages of riff evolution and volcanic activity in Eastern (Gregory) Riff. (After Williamson and Savage 1986; Uemura and Mizutani 1984, based on Baker et al. 1978)
a boundary fault; and A-type (antithetic) stretching, in which the blocks are markedly tilted and separated by listric faults. Substan- tial subsidence due to significant crustal thin- ning can be attained only by A-type processes. If S-type rift basins exhibit great subsidence but limited extension, the lowermost crust may have been altered or replaced by astheno- spheric upwelling and injection of mantle- derived material. This process is also referred to as "basification" of the lower crust (e.g., Ziegler 1988). Then, the altered, moderately thinned crust may break into wide blocks under tensile stresses and subside isostatically along normal faults.
Consequences
From this brief discussion, it is obvious that one or even just a few rift basin prototypes
are not sufficient to define this basin type. Tectonic and volcanic processes in differing stress fields in the crust provide a great varie- ty of rift basins. In addition, variations in the topography and drainage pattern of rift zones, climate, and source rocks contribute substan- tially to the great differences from one basin to another.
12.1.2 Examples of Young Rift Zones
The East African Rift Zone
The most prominent and frequently described present-day rift zone, the 4000 km long East African rift, is an example of the enormous variability of rift basins and their sediment fills (e.g., Uemura and Mizutani 1984; Fro- stick et al. 1986). It lies within a large, elon- gated dome structure (the Kenyan and Ethio-

Rift Basins
pian dome) which has risen about 1800 m since the middle Tertiary (Fig. 12.4a). The narrow Western Rift is occupied by lakes ar- ranged en echelon (cf. Fig. 12.3a) and displays a relief of approximately 3000 m between the rift shoulder and the floors of the deepest lakes (Lake Tanganyika and Lake Malawi). Here, volcanic activity is virtually absent. The 50 km wide Eastern Rift (or Gregory Rift) exhibits lower relief, and is subdivided by transverse ridges into several small, shallow basins, partially occupied by lakes. The East- ern Rift in particular was strongly affected by pre-rift and syn-rift volcanism of basaltic to more felsic nature (Fig. 12.4b). Where the volume of volcanic products exceeded the space created by rifting, the rift zone was totally filled by volcanics and volcaniclastic sediments.
In the main Ethiopian Rift, six major volcanic episodes were recognized from the late Oligocene to the Quaternary (Woldegabriel et al. 1990). Extruding carbonatitic magmas are at least partially responsible for the extremely high alkalinity (pH up to 10.3) and chemistry of Magadi-type sodium carbonate lakes in the Gregory Rift (Eugster 1986).
Furthermore, the climatic conditions of the East African rift zone range from a tropical, high-rainfall belt to desert areas. Open lake systems with fresh water alternate with closed lake basins where evaporites accumulate.
To the north, the East African rift system continues and forms the Red Sea basin. The evolution of this basin started 70 Ma ago and is more advanced than the East African rift zone. One can distinguish four phases of de- velopment (e.g., Guennoc et al. 1988): (1) A Cretaceous to Eocene pre-rift stage, (2) 01- igocene rift formation, (3) Miocene subsidence (Red Sea depression), and (4) Pliocene to Re- cent sea-floor spreading. The sedimentary history of this basin is briefly discussed in Chapter 4.3.
Other Young Rift Zones
Other modern or Cenozoic rift zones include the Upper Rhine graben (Fig. 12.2), the Bres- se-Rhone graben, and the Eger graben in the Alpine foreland of Europe; the Dead Sea rift, with its strong strike-slip component (see Chap. 12.8); the Baikal rift, with the very deep Lake Baikal in central Asia; several rift basins in China (Hsii 1989), and many other examples. A large number of greatly varying rift basins was formed during the Triassic and
early Jurassic as a result of the breakup of the Pangea supercontinent prior to the formation of the Atlantic Ocean and Indian Oceans (Manspeizer 1988b; Ziegler 1988).
A comparison of all these modern and ancient rift basins, with their great variations in tectonic style, volcanism, and sedimentary fill may lead to the conclusion that each rift basin should be regarded as an individual case. Nevertheless, some general trends in the evol- ution of these basins can be identified. These are briefly discussed in the following, with the principal aim of showing the interrelationship between tectonic basin evolution and sedi- mentation.
12.1.3 Sediments of Rift Basins
Introduction
The great variety of structural style and de- positional environments mentioned above makes it difficult to define a specific facies evolution for rift basins. Although a succes- sion from (1) fluvial deposits, (2) lake deposits with a tendency towards playa conditions, and finally a return to (3) fluvial deposits frequ- ently occurs (as demonstrated in Chap. 11.3), many rift basins show other facies sequences (see, e.g., Smoot 1991). Pre-rift topography controls the positions of major rivers, which may or may not enter the basin and thus gov- ern its hydrological and sedimentological bud- get. Rifting below sea level and at great dis- tances from the continents may create, at least for some time, sediment-starved basins with marine sequences of limited thickness (cf. Fig. 12.14).
Facies Models for Half-Graben Basins
Some idealized facies models for half-graben basins exposed to various depositional envi- ronments are shown in Fig. 12.5 (Leeder and Gawthorpe 1987). All indicate a markedly asymmetric basin fill caused by differing sed- iment supply and depositional processes on the two sides of the basin, particularly if most of the material is supplied from the flanks of the half-graben. Sediments on the steep wall (or footwall) of the boundary fault tend to be coarse grained and form alluvial fans, fan deltas, and debris flows in deeper water. Sedi- ments entering the basin from the gentler hanging wall usually come from more distant sources and are finer grained. If the basin is

436 Chapter 12 Basin Evolution and Sediments
Fig. 12.5a-e. Simplified facies models of half-graben fdl the boundary fault. e Half-graben morphology in shallow- under continental (a and d) and coastaYmarine conditions marine carbonate environment may be modified by reef (b, c, and e). Note that the tectonic structure of the basins buildups and abundant reef detritus on both sides. Full may be more complicated and that more synsedimentary discussion in text. (AAer Leeder and Gawtholpe 1987) faults occur. Lakes and the axial river tend to shift toward

Rift Basins
filled predominantly by a through-flowing axial river or by an axial delta lobe in con- junction with a prograding submarine fan, both the main trunk of the river and the sub- marine fan tend to shift towards the boundary fault. In a marine carbonate regime, the hang- ing wall represents a ramp setting where reefs and their associated facies may develop and finally create a morphology similar to that along the boundary fault.
In many cases, these "pure" facies as- sociations will not persist throughout the en- tire evolution of the basin. For example, widening and deepening of the half-graben may lead to a deepening-upward facies suc- cession a-b-c in Fig. 12.5 or, if tectonic movements have come to an end, to a shal- lowing-upward succession. Similarly, as men- tioned in Chapter 1 1.3, axial through-drainage may be followed by internal drainage and thus result in succession a-d. Regional subsidence may allow the sea to enter and to turn a semi-arid to arid continental environment into a marine carbonate basin (succession d-e).
Volcanic activity is neglected in these facies models, but may modify them significantly. Well exposed middle Jurassic to early Cretaceous rift basins of eastern Green- land represent excellent examples of such halfgraben fil- lings consisting of alluvial fans, fandeltas, shallow-marine sediments, and deeper marine fan to basin associations (Surlyk et al. 1981).
Examples
East African Rift Basins
The East African rift basins display a large variety of alluvial fan, fluvial, and lake de- posits (Frostick et al. 1986). The latter reflect changing climatic conditions through time and from basin to basin. Diatomites and black shales occur in the more humid regions, while arid zones are characterized by playa lakes with evaporites, including sodium carbonate and lacustrine chert (Eugster 1986). The rift basins of the Eastern Rift in particular contain abundant volcaniclastics of varying com- position. Repeated ashfalls favored the preser- vation of footprints, soft-bodied organisms, and all kinds of organic relics (Pickford 1986). Sedimentation rates in this rift zone range from about 10 cm/ka up to several 100 cm/ka (Tiercelin and Faure 1978).
Upper Rhine Graben
The rift basin of the Upper Rhine graben in central Europe is well explored by numerous drill holes (summaries by Roll 1979; Pflug 1982; Geyer and Gwinner 1986). Rifting began in the early Eocene and continued to the present. It was accompanied by left-lateral strike-slip motion, while the zone of maxi- mum subsidence migrated from south to north (Fig. 12.2d, for subsidence curves see Fig. 8.12). The sedimentary fill in this basin is an example of the complexity of rift basin sedi- ments. The simplified sections in Figures 1 2 . 2 ~ and d omit most of the many stratigra- phic details and boundaries known from this area. Nevertheless, they demonstrate the con- spicuous vertical and lateral variations in fa- cies and thicknesses of certain stratigraphic units.
The vertical section (Fig. 1 2 . 2 ~ ) reflects numerous changes in the depositional environment due to repeated marine ingressions and alternating limnic (lacustrine), brackish, and hypersaline conditions. Greenish to reddish marls, lacustrine limestones and dolomites, and various evaporites including potash salts characterize the more arid playa lake and lagoonal intervals. Bituminous shales are probably as- sociated with more humid lake periods, but may also have accumulated during times of marine ingressions, which are normally recorded by gray marls and fossil-bearing sandy limestones and sands near the basin margin. The upper part of the section contains some layers of brown coal, indi- cating a general tendency towards a more humid climate. Volcanic activity during the Oligocene and Miocene was moderate and characterized by ashes of alkaline and bimo- dal mafic-felsic composition. With the onset of longitudinal drainage by the Rhine River, fluvial deposits accumulated in the entire graben. As a result of continuing differential subsidence, the youngest deposits show significant varia- tions in thickness along strike and attained their maximum thickness in the northern part of the graben.
Remarks to Older Rift Zones
Many ancient rift zones which evolved into passive margins were later incorporated into orogenic belts by convergent plate movements. Good examples have been described from the Alps (Winterer and Bosellini 1981; Lein 1985; Eberli 1987; Lemoine and Triimpy 1987). Rifting in the Alps occurred in the early and middle Jurassic and pre-dated the opening of the Ligurian Tethys ocean by spreading and transform movements. The rift basins are bordered by normal faults with throws up to a few kilometers. However, these are often dif- ficult to identify because of subsequent inten- sive deformation. The best evidence for

Chapter 12 Basin Evolution and Sediments
former rift basins is therefore their basin fill, which is frequently characterized by mega- breccia, olistostromes, and turbidite fans of limited extent. In addition, such basin fills display marked lateral changes both in facies and in thicknesses.
The Inverted Ri f t Zone o f the High Atlas
A quite different example of a rift zone evol- ution is the High Atlas in northwestern Afri- ca, which represents an intracratonic mountain belt bordered by elevated plateaus, the Saha- ran craton to the south, and Oran Meseta microplate to the north (Fig. 12.6a; Beau- champ 1988; Jacobshagen 1988). The deve- lopment of this structure may have resulted from northward directed crustal detachment (Fig. 12.6 b). It began with the breakup of Pangea during the Triassic (see below) after a period of erosion and peneplanation. Rifting was accompanied by strike-slip motion, and the rift zone extended from the Triassic proto-Atlantic to the Tethys ocean over a distance of more than 1000 km.
During the first phase of rifting (from the late Triassic to early Jurassic), the rift graben of the High Atlas accumulated continental red beds and evaporites, and was affected by syn- rift basaltic volcanism. Due to continuing rifting, subsidence, and eustatic high sea level stands, the sea entered the rift zone several times from the west (proto-Atlantic) and the east (Tethys) during the Jurassic, Cretaceous and Tertiary. In the central High Atlas, the widening and deepening rift zone was border- ed by narrow carbonate shelves and subdivid- ed by a central deep carbonate platform (Fig. 12.6~; Warme 1988). The northern and south- ern troughs were partially filled by turbidites and other mass flow deposits.
Beginning with the Toarcian high sea level rise, a middle Jurassic thick marly sequence was deposited in the central to eastern regions of the High Atlas, showing several shal- lowing-upward cycles. These cycles and several uncon- formities indicate continued differential subsidence and tilting of blocks within the rift zone. Periods in which sedimentation lagged behind subsidence and the basin deepened, alternated with phases in which the basin was filled up and the depositional environment changed from marine to continental. During the Paleogene, biogenic carbonates and reworked phosphorites accumulated in a marine, bay-like ramp setting in the western regions (Trap pe 1991). Variations in subsidence and subsequent uplift along the strike of the rift brought about substantial chang- es in the depositional and erosional history of the rift zone. Transpression caused steepangle overthrusting and gravita- tional gliding of rift sediments, locally including their
basement, onto molasse-like Tertiary sediments of the northern and southern Subatlas zones (Fig. 12.6d; Froitz- heim et al. 1988).
In summary, the High Atlas rift zone repre- sents an example of an inverted, uplifted, multi-phase, but relatively short-lived, failed rift complex (cf. Chap. 1.2). It shows a highly variable depositional history controlled by tec- tonics, eustatic sea level fluctuations, and climatic changes documented in continental and shallow-marine sediments.
12.1.4 Transition from Rift Basins to Continental Margin Basins
Introduction
In recent years a great number of buried rift basins have been detected by geophysical sur- veys and drilling below the present continental shelves, for example in the northern Atlantic (Fig. 12.7). These basins result from the breakup of Pangea and the stretching and thinning of a 500 to 1000 km wide zone of continental crust during the Mesozoic prior to continental breakup and sea-floor spreading. Some of these basins are exposed on land and commonly display simple structures and rela- tively short time periods of basin filling, as described in Chapter 11.3 (Fig. 11.4) and in the facies models for half-grabens (see above). The late Triassic-early Jurassic rift basins in the northwest Atlantic (in the regions of the former Appalachian orogeny) belong to this group (Fig. 12.7b). They are characterized by high relief and fluvial-lacustrine sediments (Manspeizer 1988b; Schlische and Olsen 1990).
Rift Basins of Continental Margins
Example: The North Atlantic
The rift basins on the continental shelves of the north Atlantic, for example, are buried under late Mesozoic and Cenozoic post-rift sediments and experienced longer and more complicated depositional histories than the rift basins mentioned above (Manspeizer 1988b; Tankard and Welsink 1988; Ziegler 1988; Wel- sink et al. 1989; Hiscott et al. 1990).
- First phase o f rifting. The development of these basins also started in the late Triassic with continental siliciclastics, mostly red beds, but most of them lay in regions of low relief,

Rift Basins - Continental Margin Basins
TRANSPORT OF CLASTICS
INGRESSION OF SEA
JURASSIC, t '9 ALTITUDE UP TO
4000 m A.S.L.
GRAVITATIONAL 1 CENTRAL UPLIFT LATE TRIASSIC-EARLY JURASSIC GLIDING TERTIARY RED BEDS, BASALTS, AND
EVAPORITES (BLACK)
- IN WESTERN HIGH ATLAS:
BAJOC.IBATHONIAN BEDS OF MID-CRETACEOUS s
LATE TRIASSIC-EARLY LIASSIC REDBEDS, EVAPORITES.
OLISTOSTROVES
ORAN N. b
SAHARAN MESETA SHELF N. CENTRAL HIGH S. SHELF CRATON
Fig. 12.6a-c. Evolution of High Atlas rift zone from exten- Note that younger sediments (Middle Jurassic, in the wes- sional to compressional (transpressional) phase. a Paleo- tern High Atlas, to Turonian) indicate continued subsidence geographic rconstruction for the late Triassic, overview. (b and c after Warme 1988). d Simplified block diagram of (Beauchamp 1988). b Simplified cross section of High present structure of High Atlas caused by compression Atlas rift zone showing possible interpretation of structural (transpression ?) and uplift of the central rift zone (inverted features according to simple shear model with low-angle failed rift). (After Stets and Wurster 1982; Wurster and detachment. c Idealized stratigraphic cross section drawn Stets 1982; Froitzheim et al. 1988) on a Domerian-Toarcian datum (peak of transgression).

Chapter 12 Basin Evolution and Sediments
Fig. 12.7. a Main Jurassic and early Cretaceous basins on (Modified from Hutchinson and Klitgord 1988). c Rift rifted continental crust of the North Atlantic ocean. (After basins of the Grand Banks shelf off Newfoundland, based Hiscott et al. 1990). b United States Atlantic continental on seismic and gravity data. Note subdivision of Grand margin behveen Nova Scotia and north Florida showing Banks by transfer (strike-slip) faults and changing orienta- location of late Triassic to early Jurassic rift basins (black) tion of normal faults on southern Grand Banks. (AAer exposed on land, rift basins below younger shelf sedi- Tankard and Welsink 1988; Welsink et al. 1989) ments, and Mesozoic-Cenozoic basins along the shelf edge.
were inundated by the sea, and accumulated evaporites of varying thickness. This first rifting phase was terminated before any ocea- nic crust was generated. It was followed in the middle Jurassic by a period of slow, thermal subsidence (Fig. 12.8a) which led to the for- mation of a wide epeiric sea and predominant deposition of shallow-marine shales and lime- stones.
- The second phase of rifting in the north Atlantic began in the late Jurassic (also see Winterer and Hinz 1984; Gradstein et al. 1990) and lasted approximately 50 Ma until the Ap- tian. After an initial episode of uplift accom- panied by erosion and valley cutting, exten- sion of a wide zone of crust was accomplished along a low-angle detachment (cf. Figs. 12.3e

Rift Basins - Continental Margin Basins
PROCESS BASIN EVOLUTION
-HER DEVELOPMENT OF SHELF SEDIMENTS ILY AFFECTED BY:
VARIATIONS IN CLIMATE AND OCEANIC 1:l I CIRCULATION, FAUNAL EVOLUTION MAJOR EVENTS IN MESOZOIC RIFT BASINS
POST- CENOZOIC MESOZOIC
OF NORTH ATLANTIC (FROM HISCOTT ET AL. 1990)
DEFORMATION AND MULTIPLE HIATUSES
EROSION, VALLEYS ,HIATUS CA-
TENS.
THERM. SUB- SID.
I LAKES, LAGOONS, SHALLOW-MARINE
VALLEY CUTTING AND FILLING LOCAL,ABRUPT DEEPENING
, WIDESPREAD HATUS
SHALE
LIMEST.
DOLOMITE (ABORTED RIFT)
o RIFT - - SEA LEVEL ING
5 EXTENSION E
1 ' 1 I EVAPORITES CONTINENTAL RED BEDS, FAN DELTA
UPPER CRET. BONAVISTA JEANNE D'ARC FLEMISH b
C GALlClA LIMEST. AND PLATFORM BASIN CAP BANK IBERIA
SYNDEPOSITIONAL UPLIFT, REWORKING
TRANSFORM FAULT
Fig. 12.8. a Main principles of Mesozoic rift basin evolu- of continental crust along low-angle detachment. Size of tion in the North Atlantic. (Based on Tankard and Welsink listric faulted blocks and associated basins increases in 1988; Hiscott et al. 1990). b Idealized cross-section bet- direction of shear (distal). c Structure and sedimentary fill ween Newfoundland and Iberia showing boundary fault of of Jeanne d'Arc basin based on seismic interpretation, also aborted Triassic rift basin and Callovian-Aptian extension see Fig. 12.3d and e. (b and c after Tankard and Welsink)

Chapter 12 Basin Evolution and Sediments
and 12.8a and b). This mechanism reactivated pre-existing basins, for example the Jeanne d'Arc basin on the Grand Banks of New- foundland (Fig. 12.8c), and generated a num- ber of new basins. Fault-controlled synsedi- mentary subsidence created special depocent- ers separated by sills. The sedimentary fill in these basins consists predominantly of shal- low-water limestones and shales with inter- bedded sandstones and organic-rich layers. - At the climax of rifting in the late Jurassic, basins near the continent or adjacent to up- lifted blocks were partially filled with fluvial and deltaic deposits. - Late-rift evolution is characterized by de- creasing local subsidence and a transition into regional thermal subsidence (for subsidence curves of some sites see Fig. 8.14). However, further adjustments of the broken, brittle upper crust to continuing extension and a changing stress field (see Fig. 12.3d and e) led to local variations in the sedimentary fill of the basins. A basal Cretaceous transgression created a widespread unconformity. The sub- sequent sediments include shallow-water limestones and are affected by additional un- conformities. - Breakup unconformity. The last and well developed unconformity during the Aptian is associated with the breakup of the stretched continental crust and the separation of Eurasia with Galicia Bank and the Iberian peninsula from the North American plate (Fig. 12.8b). This breakup unconformity indicates that up to this time the individual blocks of the con- tinental crust had rotated, subsided differen- tially, or were uplifted and eroded.
Such a complex tectonic and stratigraphic history, with repeated regional rifting episodes and possibly more than one phase of breakup, is also known from other passive continental margins, for example from the Campos Basin of Brazil and the Gabon Basin of West Africa (Edwards and Santogrossi 1990). In north- western Australia several depositional wedges were built out into the evolving marginal basin (Boote and Kirk 1989).
In spite of the great differences in their subsidence histories and sedimentary fills, the Mesozoic north Atlantic rift basins share a number of "sedimentological events" (Fig. 12.8 a; Hiscott et al. 1990). These features include more or less coeval hiatuses and periods of condensation. Uncon- formities are associated with the deposition of coarse- grained clastics. The rift phases in the Triassic and upper Jurassic are characterized by high rates of subsidence (50- 100 mlMa, up to 250 m/Ma in some basins). "Pulses" of extension and similarities in the evolution of these basins
result from their common origin by intracontinental rifting and subsequent separation of Europe and North America (see also Ziegler 1988).
General Trends in the North Atlantic
As crustal extension progressed, rifting tended to migrate toward the axial zone at the ex- pense of peripheral graben and fault systems, which became inactive. The rifting stages of both aborted rifts (without crustal separation) and fully developed rifts (followed by sea floor spreading) lasted from about 50 Ma to more than 200 Ma. Continued subsidence and decreasing siliciclastic sediment supply com- monly led to fining-upward sequences in the post-rift phase.
The effects of eustatic sea level variations and other long-term trends, such as climatic change and variations in the carbonate pro- duction, are superimposed on tectonic deve- lopment. Shelf sediments from the post- breakup, mature ocean phase in the late Cre- taceous and Tertiary are dominated by pelagic carbonates or silty clays. Their facies are con- trolled mainly by variations in climate, oceanographic circulation, sea level fluctua- tions, and faunal evolution (for a detailed description see, e.g., Gradstein et al. 1990).
12.2 Continental Margin and Slope Basins
12.2.1 General Aspects
Types of Continental Margins
A rift system evolves into a continental mar- gin basin when two divergent plates are separ- ated by a spreading center, creating new ocea- nic crust. Crustal extension and rifting (syn- rift stage) are then followed by drifting (post-rift stage), but subsidence of the thin- ned, wedge-like continental crust continues due to cooling of the lithosphere and increas- ing sediment load. Syn-rift and post-rift sedi- ments are frequently separated by a more or less distinct breakup unconformity caused by differential movements of the crustal blocks at the onset of drifting. Higher elevated blocks may undergo subaerial or submarine erosion. Three different classes of passive margins have been identified (Fig. 12.9, e.g., Roberts et al. 1984; Hinz et al. 1987):

Continental Margin Basins
NON-VOLCANIC MARGIN a SYNRIFT SEDIMENTS
100-300km
BREAK-UP UNCONFORMI
+ + + + +
I THINNED, SUBSIDED - -,I<- -UNSTRETCHED
CRUST CONTIN. CRUST I CONTINENTAL SEDIMENTS CRUST
VOLCANIC MARGIN
+ + + + + + + + +
+ + + + + + + + + + +
+ + + + + + + + + + + + +
STRUCTURAL HIGH IN VOLCANIC SUCCESSION CONTINENTAL CRUST AT CONTINENT-OCEAN BOUNDARY
TRANSFORM MARGIN
-50-100 km- 100- 150 km- 50-150 km-
PU LL-APART THIN, SUBSIDED BASIN ON CONTINENTAL
MARGINAL THINNED CRUST CRUST
FRACTURE ZONE
Fig. 12.9ac. Three principal classes of passive continental (Report of Second Conference on Scientific Ocean Drilling, margins. a Non-volcanic. b Volcanic. c Rift-transform 1987, European Science Foundation, Strasbourg, France) margin.

Chapter 12 Basin Evolution and Sediments
- Nonvolcanic passive continental margins (Fig. 12.9a), where lithospheric deformation is dominated by block faulting over a broad zone (100-300 km) and volcanic activity in the upper crust is of minor importance (examples: Red Sea, eastern United States, northwestern Africa, Galicia Bank off Iberia, Goban Spur to the southwest of Ireland, northwestern Australie, also see below). These margins may be either sediment-starved ( i l - 2 km post-rift sediments) or heavily sedimented (up to 210 km post-rift sediments). - Volcanic passive margins (Fig. 12.9b), where the boundary between continental and normal oceanic crust is characterized by a thick zone of seaward dipping volcanic units overlying continental crust. Margins of this type are narrower than nonvolcanic margins, and some of them appear to be associated with marginal plateaus (e.g., Rockall Bank, Vplring Plateau, see Fig. 12.10). - Ri ft-trans form margins (Fig. 12.9c), which originate from extensional deformation, in- cluding a significant strike-slip component. It is assumed, for example, that the early devel- opment of the South American and southwest African margins was affected by transtension. A young example is the Gulf of California (see below).
The following examples of basin evolution deal predominantly with the first and most common category of continental margins. The fact that most margins are segmented along their length on a scale of several hundred to more than a thousand kilometers (cf. Fig. 12.7c, Canadian shelf) is not further dealt with here. While the structure and subsidence history within individual segments appear to be relatively uniform, they may differ signifi- cantly from one segment to another.
Basin Morphology and Sediments (Overview)
Young continental margins with a limited sediment supply tend to have narrow shelves and to exhibit relatively thin sedimentary sequences. In contrast, the sediments on ma- ture passive continental margins, such as those of the present-day Atlantic Ocean, can fre- quently store sediments more than 10 km thick. The accumulating sediments may show both upbuilding and outbuilding (cf. Figs. 12.11 and 12.15c), but they are frequently trapped by structural highs, reefs, or other dam-like structures at the outer margin (Fig. 12.1 1).
The width of continental margin basins is mainly a function of the continental crust, which was subjected to rifting prior to drift- ing. The circum-Atlantic basins are typically 200 to 300 km wide, but some are much nar- rower or considerably wider. In many cases, the present shelf edge or base of slope corresponds approximately with the boundary between subsided continental crust and ocea- nic crust. Narrower shelves may result from strong ocean currents preventing sediment accumulation (e.g., the Gulf Stream off Flori- da) or insufficient sediment supply and heavy storms (e.g., along the margins of islands ex- posed to the open sea). Then the subsided crust forms marginal plateaus, the surface of which lies several hundred to more than a thousand meters below sea level. The relativ- ely young Norwegian-Greenland Sea, for ex- ample, exhibits continental margins of various widths and sunken plateaus, such as the Vplr- ing Plateau (Fig. 12.10; Birkenmajer 198 1; Ziegler 1988; Eldholm et al. 1989).
The syn-rift sediments of continental mar- gin basins represent the deposits of buried rift graben systems, as already described in the previous sections. Along the margins of the Atlantic and other ocean basins resulting from the breakup of Pangea, these syn-rift sedi- ments are of Triassic to early Jurassic age and consist predominantly of continental red beds, lake deposits, volcanics, evaporites, and some shallow-marine sediments of variable thick- ness and limited extent. Paleozoic and Tertiary passive continental margins may show other syn-rift sediment successions, but are com- monly also characterized by fluvial, lacustrine, and shallow-marine sequences. The Miocene evaporites in the Red Sea were also deposited prior to the onset of sea floor spreading, and their changing thickness reflects a basin with nonuniform, locally rapid subsidence (see Chaps. 12.1.2 and 4.3).
Detailed descriptions of the structural fea- tures, stratigraphic sequences, and the hydro- carbon propects of the Atlantic continental margins have recently been published in seve- ral volumes (Emery and Uchupi 1984; Poag 1985; Sheridan and Grow 1988; Walsh 1988; Ziegler 1988; Tankard and Balkwill 1989; Edwards and Santogrossi 1990; Gradstein et al. 1990).

Continental Margin Basins 445
Fig. 12.10. Physiographic elements of the Norwegian- Barents shelf, submarine plateaus, and rift structures along Greenland Sea, generalized. Note the variable width of the the eastern margin. (After Birkenmajer 1981; for more continental margin (shelf), continental platform of the details see Eldholm et al. 1989)
12.2.2 Sediment Successions of Continental Margin Basins than those of syn-rift subsidence of special
rift basins (Chaps. 8.3 and 8.4). Sediment Buildup on Atlantic-Type Margins On Atlantic-type, "mature" continental mar-
gins, where basins are filled with sediments up The post-rift sediments of continental margins to near sea level (present water depth 100 to overlie the rift basin fill and commonly cover 200 m), the structure and nature of most of wider areas. Rates of post-rift subsidence these sediments can be subdivided into four decay exponentially and are commonly lower groups (Fig. 12.1 1; Kingston et al. 1983):

Chapter 12 Basin Evolution and Sediments
a NORMAL UP AND OUTBUILDING OF CLASTICS MIGRATION OF DEPOCENTER DEPTH
CONT. RISE CONT. SLOPE C 0
5
10
VOLCAN~CS SYNRIFT CONTINENTAL SED. CRUST
b CARBONATE BANK DEPTH I, m
- - -
BREAKUP UNCONFORMITY PRERIFT EROSION
C PROGRADING MAJOR DELTA DEPTH
PRODELTA SED. COAST DELTA FRONT FLUVIAL PLAIN km - - - - - - - - - - - 0
5
10
d SALT TECTONICS DEPTH SALT COAST K m
Fig. 12.11a-d. Generalized architecture and sediment suc- Syn-rift sediments are predominantly continental, postrift cessions of Atlantic-type passive continental margins (end- sediments marine. (After Kingston et al. 1983). See text members). for explanation
1. Upbuilding and Outbuilding o f terized by a breakup unconformity) increases Siliciclastic Sediments seaward and thus produces a wedge-like sedi-
ment body. The deepest portion of the base- The subsiding continental margin accumulates ment (basin floor) is commonly found below predominantly siliciclastic sediments at mode- the continental slope or rise. The zone of max- rate rates. The isochrones show upbuilding imum thickness (or depocenter) of a certain and outbuilding of sediment. The rate of total stratigraphic unit tends to migrate basinward subsidence of the basement (in places charac- with time (cf. Fig. 12.1 la). The margins of

Continental Margin Basins 447
EROSION PLATFORM a (BOX CANYONS) \ I
TURBlDlTES
ACCRETION OF MUD (SAND IN GULLIES) /--
TURBlDlTES ! v E 2
SLUMPS. /----
THIN ,TURBIDITES I- '
SLOPE SEDIMENTS d PROGRADING STRAITS
ENE A MARGIN I BlMlNl BANK j OF ANDROS j ANDROS BANK \B
(4 ) LOWERING SEA LEVEL (3) RISING SEA LEVEL (DECREASING CARBONATE (INCREASING CARBONATE PRODUCTION) , PRODUCTION)
Fi. 12.12. a Model of lateral progradation and "self-em- sion" of limestone escarpments in the Bahamas and Mar- shall Islands. Note oversteepening and various types of erosion with increasing vertical buildup (1. 2, 3; angles of upper one-third of slope up to about 30"). (Schlager and Camber 1986). b through d Location and internal structure of the northwest Bahama Bank displaying two buried banks (Bimini Bank and Andros Bank) with completely fded former trough (Straits of Andros) in between. Lateral pro- gradation of Bimiii western margin by 20 km as a result of sediment accretion on slope. Vertical upbuilding since the
mid-Cretaceous is about 2 km (lower correlation horizon); earlier platform consists of carbonates and evaporites. Vertical exaggeration about 12x. (Derived from seismic profiles, ocean drilling, and dredge hauls on the exposed flanks; Eberli and Ginsburg 1987; Schlager et al. 1988). e Simulated vertical and lateral growth of carbonate plat- form in response to sea level changes. During rising sea level, lateral progradation is rapid as a result of high car- bonate production on shelf. Falling sea level leads to slow progradation due to reduced carbonate production on e merging platform. (Bosence and Waltham 1990)

Chapter 12 Basin Evolution and Sediments
southwest Africa, southern Morocco, and the northern Gulf of Mexico provide examples of this basin type. High-latitude continental margins may accumulate glacio-marine depos- its of considerable thickness as known from the Barents shelf off northern Scandinavia.
2. Carbonate Buildups
Large portions of the modern and ancient continental margins are predominantly built up of carbonates (cf. Chap. 3.3.2; Stanton and Fliigel 1989; Tucker et al. 1990). If the shelf edge is dammed by reefs (thereby forming a rimmed carbonate shelf), the slope can be- come very steep. Basinward of the reefs the slope may prograde due to the accumulation of reef talus (Fig. 12.1 1 b) and debris flows, or shelf and terrigenous material may spill over the shelf edge. Modern examples of this type of shelf structure include the continental mar- gin off the Senegal and Florida coasts. The upward growth of the Blake Plateau was largely terminated by the Gulf Stream, how- ever (Chap. 5.3.7, Fig. 5.10). The marginal Mazagan plateau off Morocco shows an early, syn-rift phase of Jurassic carbonate buildup which was terminated due to insufficient sub- sidence in the early Cretaceous and then fol- lowed by post-rift hemipelagic and pelagic deposition (Chap. 5.3.7).
Isolated carbonate platforms on continental or intermediate crust as, for example, the pre- sent-day Bahamas Archipelago, also result entirely from carbonate accumulation.
The previously held view that carbonate buildup always occurred under shallow-water conditions and was accomp lished predominantly by stationary upward growth has, however, to be modified (Schlager and Camper 1986; Eberli and Ginsburg 1987 and 1989; Leg 101 Scientific Party 1988). Seismic records and drilling have shown that this bank-and-basin archipelago was characterized by periods of lateral expansion and retreat as well as by phases of deeper water carbonate deposition (Fig. 12.12b through d). Upbuilding in the late Jurassic and early Creta- ceous was followed by drowning and retreat during the mid-Cretaceous and by renewed lateral expansion in the Cenozoic. Lateral, discontinuous prograding of 500 to 1000 m thick carbonate platforms has also been described from the Triassic of the Dolomites in northern Italy (Bosel- h i 1984).
Generally, fine-grained, muddy carbonates produce gentle prograding slopes (2-4O), fre- quently characterized by erosional gullies, while coarser grained debris forms steep slo- pes (10- 12O, up to more than 30° in the upper part), which commonly exhibit increased
slumping, debris flows, and bypassing of sedi- ment via canyons (Fig. 12.12a, also see Chap. 12.2.3 and Kenter 1990). In the latter case, sediment buildup is concentrated on debris aprons.
The result of a computer simulation for vertical and lateral carbonate platform growth in response to sea level changes is shown in Fig. 12.12e (Bosence and Waltham 1990). Such a depositional system is controlled largely by benthic carbonate production, which is high during rising sea level, but very limited during falling sea level. Hence, lateral progradation o f carbonate platforms takes place predomi- nantly during sea level rise and highstand (Eberli and Ginsburg 1989). Similarly, the high sediment input of platform sediments into deeper basins is restricted to sea level highstands (this is known as "highstand shedd- ing", also see Chap. 7.4). Lowstands cause hia- tuses and possibly karst horizons on emerged parts of the platform. Slope and periplatform carbonates have a high potential of being stabilized by early diagenesis.
3. Prograding Deltaic Sediments
High sediment influx from a major river delta causes continuous filling of the subsiding marginal basin and rapid progradation of the slope beyond the continental/oceanic crust boundary (Fig. 12.1 lc). As a result, the zone of maximum sediment thickness of a modern delta may lie landward of the present coast line. The low strength of muddy, undercon- solidated sediments leads to the formation of growth faults, rollover structures, and mud diapirs (Figs. 3.30a and 12.16b). Prominent examples are the shelf off the Niger delta in West Africa (Doust and Omatsola 1990), and the northern margin of the Gulf of Mexico with the Mississippi delta (cf. Chap. 13.2), which is also modified by salt diapirism.
4. Continental Margins Affected by Salt Structures
The growing sedimentary wedge in the mar- ginal basin is strongly affected by halokinesis of the underlying salt (Fig. 12.1 1d; cf. Chap. 6.4.4). Salt diapirs act as dams for shelf sedi- ments which in addition are deformed by sub- sidence in special troughs and uplift over the rising salt structures. This type of continental margin basin is very common around the At- lantic. It is known, for example, from the

Continental Margin Basins
shelf of Nova Scotia (Scotian basin) and the conjugate margin of West Africa (Essaouira- Agadir basin and Aaiun-Tarfaya basin; e.g., Jansa and Wiedmann 1982) or the Gabon basin (Kingston et al. 1983; Teisserene and Villemin 1990).
Many basins on passive continental margins also exhibit a combination of two or three of these end-member basin types. In the margi- nal basins of northwest Africa, for example, Triassic and Liassic salt may be overlain by Jurassic shelf carbonates and reefs, followed by early Cretaceous prodelta clastics. General- ly, the sequence of post-rift sediments reflects the climatic and oceanographic history of the region, as well as the impact of the evolution of rock-forming calcareous microorganisms and eustatic or relative sea level changes.
Depositional History of Conjungate Marginal Basins
Particularly conjugate marginal basins which formed one common basin or lay close to- gether prior to ocean spreading, but which are now separated by a large ocean (Fig. 12.13), may exhibit more or less identical depositional histories. For example, the Scotian basin along the North American margin and the Essaou- ira-Agadir basin off northwest Africa show the following common characteristics (from base to top of the basin fill):
- Late Triassic syn-rift graben infillings consisting of continental red beds and alkaline volcanics. - Early Jurassic evaporite5 and dolomites, and some alka- line volcanics (late rifting stage, with an at least local marked decrease in subsidence). - Mid-Jurassic latest rift sediments or early post-rift sedi- ments consisting of clastics, deltaic sediments, red beds, and a first reef phase on the African side. - Late Jurassic post-rift carbonate platforms with reefs (second reef phase followed locally by renewed rapid subsidence). - Early Cretaceous platform drowning, "Wealden"-type fluvial clastics and marine prodelta deposits. - Mid-Cretaceous siliciclastics and limestones and, on the African side, black shales and cherts resulting from coastal upwelling. - Late Cretaceous to Paleogene sediments characterized by slow sedimentation rates and high proportions of biogenic material.
During mid-Cretaceous time, the central At- lantic had already reached the size of a large ocean basin and the depositional environments on the opposite margins of this ocean became increasingly dissimilar. This asymmetric evolu- tion is documented by the mid-Cretaceous
Fig. 12.13. Position of conjugate margins in the north Atlantic during the late Jurassic (magnetic line M-25) and major Mesozoic-Cenozoic marginal basins. (Jansa and Wiedmann 1982)
black shales in the Essaouira-Agadir basin, as well as by late Cretaceous shelf construction in the Scotian basin while the marginal basin on the African side was characterized by shal- lowing and the onset of emergence. In ad- dition, the northwest Atlantic basins drifted into a region of increasingly cold climate and subarctic ocean currents, while the northwest African basins more or less remained in a zone of warm, relatively dry climate. Another ex- ample of a similar Mesozoic-Cenozoic tectonic history and depositional environment repre- sent the eastern margin of the Grand Banks in the North Atlantic and the Galicia Bank mar- gin of Spain (Grant et al. 1988; cf. Chap. 12.1.4 and Fig. 12.7). Another, well described example of conjugate marginal basins is the Campos Basin of Brazil and the Gabon Basin of West Africa (Edwards and Santogrossi 1990); one basin is the mirror image of the other.
As a result of differential subsidence and/or uplift of the landward side of the basin, many

Chapter 12 Basin Evolution and Sediments
Atlantic-type continental margin basins be- came partially emerged. These parts of the basins are referred to as "coastal basins".
Sediment-Starved Marginal Basins
All the basin types discussed so far have in common the tendency for being more or less continuously filled with sediments up to the depth of the continental shelves and therefore generally display either shallow-water or slope deposits along their outer margin. However, subsidence can exceed vertical sediment ag- gradation and thus cause deepening, "sedi- ment-starved" basins, or sediment supply is greater than necessary to keep pace with sub- sidence. The latter case is common during late basin evolution, when subsidence slows and the basin becomes "over-supplied" with sedi- ment. As a result, the excess sediment supply will bypass the shelf and settle on the slope or in deeper water (see below).
Examples of Young Continental Margins
After the onset of drifting, passive continental margins tend to subside so rapidly that even relatively high sedimentation rates are insuf- ficient to keep pace with subsidence. Hence, young continental margins frequently deepen.
For example, sea-floor spreading at the southern end of the Gulf of California began 4 Ma B.P. and caused the pas- sive, rifted continental margin adjacent to the tip of Baja California to subside by about 2 km as shown in Fig. 12.14~ and d (subsidence curve see Fig. 8.12). The pre- sent, post-rift sediment wver on top of this stretched and sunken continental crust is only 100 to 200 m thick, al- though the sedimentation rate for diatomaceous ooze on this slope was relatively high (30 to 80 m/Ma; Curray et al. 1982b).
Deeply subsided, sediment-starved continental margins also occur in other young ocean bas- ins, for example in the Mediterranean (Burol- let et al. 1978).
The young, recently drilled passive continental margin east of Sardinia subsided rapidly with the onset of sea floor spreading in the late Miocene or early Pliocene (Fig. 12.1Sa and b; Kasten, Mascle et al. 1988; Savelli 1988). It borders the Tyrrhenian Sea, which is interpreted as a backarc basin with young oceanic crust. The syn-rift sedi- ments of the sunken continental margin (Site 654, Fig. 12.15a) partially show a typical transgressive sequence beginning with subaerial conglomerates, overlain by oyster- bearing sands and marine marls. During the Messinian (latest Miocene) desiccation of the Mediterranean, the
landward Sardinian margin accumulated nannoplankton- bearing clays interbedded with laminated gypsum, while the seaward, more rapidly subsiding margin apparently stood higher, as indicated by subaerial and lacustrine facies. The post-rift sediments are about 200 m thick and consist of nannofossil ooze with minor proportions of calcareous mud, volcanic ash, and sapropel.
The evolution of the Tyrrhenian Sea as an extensional basin from an early rifting stage prior to 8 Ma ago to the present situation is shown in Fig. 12.15b. New oceanic crust was generated during two spreading episodes (7 Ma and 1.9 to 1.3 Ma). The center of magmatism migrated from west to east and formed the Eolian Islands, Strom- boli, and the volcanoes of central Italy (Savelli 1988).
Older, Sediment-Starved Outer Margins
If the outer part of a marginal basin does not receive sufficient sediment to be filled up to the normal shelf depth, a deep-water environ- ment will be established. Then the post-rift sediments tend to show a deepening-upward trend, with hemipelagic and pelagic sediments replacing shallow-water deposits. Figure 12.14 demonstrates such a situation in two differing tectonic settings, i.e., on an old and on a young continental margin.
In the first case, the Goban Spur southwest o f Ireland, the old continental margin of the eastern Atlantic is too far away from con- tinental sediment sources and therefore sub- sided to bathyal depths without sufficient sedimentary cover (Fig. 12.14a and b; de Gra- ciansky and Poag 1985).
Drilling of this sediment-starved margin has revealed a half-graben within the rifted continental crust, which con- tains syn-rift, shallow-water marls and limestones of early Cretaceous and possibly older ages. Post-rift development began after the Albian after the formation of an unconfor- mity. Bathyal to abyssal chalks indicate rapid subsidence subsequent to the onset of sea floor spreading.
Further development is characterized by minor modifi- cations due to a fluctuating CCD and periodic influx of temgenous detritus, especially in the Cenozoic. Additional unconformities are associated with sea lwel lowstands.
In total, the thickness of the post-rift sedi- ments is between 0.5 and 1.5 km and is thus in striking contrast to the huge depositional prism of the opposing North American mar- gin, which displays post-rift sediment thick- nesses in excess of 10 km (e-g., the Baltimore Canyon Trough). The Galicia Bank off the Iberian peninsula shows a similar situation, with a very thin, incomplete post-rift sedi- ment cover.

Continental Margin Basins 45 1
SW GOBAN SPUR TRANSECT NE
b - - 4 - - 4 - - - - ------ 48 --------------- 4 --- - - I I I I 1 ALB~AN FAULTS l NEOGENE I I I 1 APTIAN - &
NEOGENE BASALT ,:= LATE CRET CHAL CONT. CRUS
IUEDPVllll qN \ I lLnu I lrlr OCEANIC TRANSITIONAL BARR.-HAIJT R A C ~ L R F N T
CRUST CRUST SHALLOW
WNW BAJA CALIFORNIA / d .RIFT GRABEN
ESE r 2
I 50 km I VE = 3.1 r \ CONT. /-- OCEANIC CRUST CRUST
Fig. 12.14. a and b Sediment-starved passive continental the southern Gulf of California. (After Curray et al. margin of the eastern Atlantic. (After de Graciansky et al. 1982a). Note the different vertical and horizontal scales. 1985). c and d Young, rapidly subsided passive margin of See text for explanation
Submarine Marginal Plateaus characteristics similar to those of sediment- starved outer margins mentioned above.
Submarine plateaus some 1000 to 3000 m be- In the southwest Pacific, submarine pla- low sea level occur in all large ocean basins. teaus occupy broad areas of the sea floor, They are more or less separated from terrigen- including the Ontong-Java Plateau at the ous sediment sources and their sediments show equator, several rises between Melanesia and

Chapter 12 Basin Evolution and Sediments
0
FOSSIL OOZE
200 LC. ASH -
AND MARL, DOLOM
400 MARINE SANDST. m
ONGLOMERATE
. A A . ... -. - - PEBBLES
SANDY SILT AND SAND,
SARDINIA ORNAGLIA TERRACE - - - - - - - - - VAVILO BASIN
0
2
4
< - - THIN, SUBSIDED CONT. CRUST - - &-OC. CRUST-A k m
SARDINIA ( c . BELLAVISTA)
CALABRIA 1.3 Ma - RECENT (c. VATICANO)
QUAT. SED. METAMORPHIC-C RYSTALLINE SARDINIA CALABRIA BASEMENT
b(liw==--LT-/~ > 8 M a B . P . - 1 km
STRUCTURAL HIGH, REEF, SALT, OR
C SUBMARINE CANYON
SLOPE GULLY AND CHANNEL
RSE CLASTICS
I I
CONTOUR CURRENTS I
i SEA LEVEL CHANGES I SLUMPS, DEBRIS FLOWS, If--- NEGLECTED --2
SLOPE AND BASIN FLOOR FANS OLISTOSTROMES, CONTOURITES

Continental Margin Basins
Australia, and some plateaus east of New Zea- land (Kennett and von der Borch 1986). The tops of most of these plateaus lie well above the CCD. They are usually covered by relativ- ely thick Neogene to Paleogene calcareous foraminifera1 nannofossil oozes, which are little to not affected by carbonate dissolution. Deeper portions of such plateaus may have been affected by CCD fluctuations and there- fore show distinct layering. Microfossils and carbonate contents of these sediments are use- ful not only for biostratigraphy, but also as indicators of the changing climatic and pale- oceanographic conditions in the late Mesozoic and Cenozoic (e.g., Berger et al. 1991).
Parts of the Exmouth Plateau off northwest Australia, being an old passive continental margin of the Indian Ocean, lost their syn-rift Jurassic sediment cover due to uplift in conjunction with block faulting. After breakup of the Gondwana continent and the onset of sea floor spread- ing in the early Cretaceous, the entire Exrnouth Plateau subsided below sea level. Outer parts of this marginal basin (e.g., the Wombat Plateau) became sediment-starved and therefore display only a thin post-rift sequence, including condensed horizons, pelagic limestones and black shales at the Cenomanian-Turonian boundary (Leg 122 Shipboard Scientific Party 1989; von Rad et al. 1989).
12.2.3 Sediment Successions on Continental Slopes
Introduction
A description of continental margin basins should also include their slopes leading from the shelf edge to the deep sea. Present-day continental slopes commonly have gentle gra- dients of a few degrees and therefore widths of 50 to 150 km. Hence, prograding slopes and slope aprons (Figs. 5.3 and 5.12) constitute a significant part of continental margin sedi- mentation. They accumulate sediments which have migrated over the shelf or are derived from the upper slope and are redeposited on the lower slope.
However, slopes may also undergo long- term nondeposition or erosion. For example, the postglacial rapid sea level rise may have caused oversteepening of some modern slopes and thus favored erosion. High temperature gradients between the poles and the equator during glacial periods, in conjunction with low sea level, have probably initiated particul- arly strong thermohaline oceanic circulation. As a result, contour currents were able to erode the foot of the slope and trigger large mass movements.
Construction and Destruction of Slopes
Some principles for the upbuilding and out- building (or so-called constructional phase) and destruction of mainly siliciclastic slope sediments are summarized in Fig. 12.15~ (for carbonate slopes see above). Slopes dammed by structural highs, volcanic structures, reefs, salt or mud diapirs tend to remain sediment-starv- ed until the shelf basin behind the dam is filled. Progradation of the slope may proceed either rapidly or slowly in relation to the in- flux of terrigenous or biogenic sediment. The upper slopes on modern continental margins are frequently characterized by sediment by- passing and local sediment ponding, prograda- tion, and the filling of channels and gullies. Thus the outbuilding slope sediments frequ- ently reflect the composition of the shelf de- posits and their variation through time. The lower slope or slope apron collects slides, de- bris flows, and turbidites.
For example, seismic lines along the slopes of the western Atlantic off the United States have revealed that temgenous material was transported across the early Cretaceous con- tinental shelf to form several large shelf edge deltas (Poag et al. 1990). Each delta supplied sediment gravity flows to slope aprons and deep-sea fans on the lower slope and continental rise. In the northern Hatteras basin, one of these sediment distributary systems extended 500 km basinward.
Fig. 12.15. a Cross section of young, sediment-starved passive continental margin off Sardinia in the Thyrrhenian Sea with some drilling results. (After Kasten, Mascle, et al. 1988). b Sections similar to (a) displaying two stages of basin evolution and several magmatic episodes. (After Savelli 1988). c Theoretical model demonstrating principal types of outbuilding and upbuilding of slope sediments: 1 Mainly vertical aggradation with stratal onlap behind "dam". 2 Rapid slope progradation due to high sediment
influx including infillings of slope channels and coarser grained redeposited material on lower slope. 3 Slow slope progradation. 4 Current-eroded and oversteepened slope with gravity mass flows and contourites. 5 Prograding slope affected by sea level changes (cf. Chap. 7.4). Note that several phenomena may be superimposed. (Based on von Rad and Wissmann 1982; Sheridan 1981; Pickering et al. 1989; Vail et al. 1990)

454 Chapter 12 Basin Evolution and Sediments
Erosion at the foot of the slope not only pre- Undercutting of the slope at various levels created long
vents further progradation, but also causes hiatuses and angular unconformities in the stratigraphic
destruction and redeposition of older slope record. These processes initiated the cutting of major
sediments. ~i~~~~ 12-16 shows two examples canyons into the slope sediments. In this case it is also assumed that intensified bottom currents occurred during
Of mid-Cretaceous Cenozoic times of cooler climate and sea level lowstand. Mass wast- slope destruction from the northwest African panicularly active during the mid-Miosene and margin which are based On seismic profiles late Pleistocene. Debris flows and huge olistostromes and information from boreholes (van Rad and interfinger with contourite drifts. In addition, these cross Wissmann 1982). sections display antithetic growth faults with giant rollover
a OFF MOROCCO (CAPE BoJADoR)
RISE - ---- 39, I s::," I SHELF SE
b OFF MOROCCO (UAD CRAA)
W F ---- -------
CH. CHANNELS PLIOCENE
APTIAN-ALBIAN ~ / ~ $ ~ ~ ~ .
Fig. 12.16a,b. Schematic cross sections of continental Note multi-phase erosion and mass wasting on huge scale. slope off (a) Cape Bojador and (b) Uad Craa, Morocco. (After von Rad and Wissmann 1982)
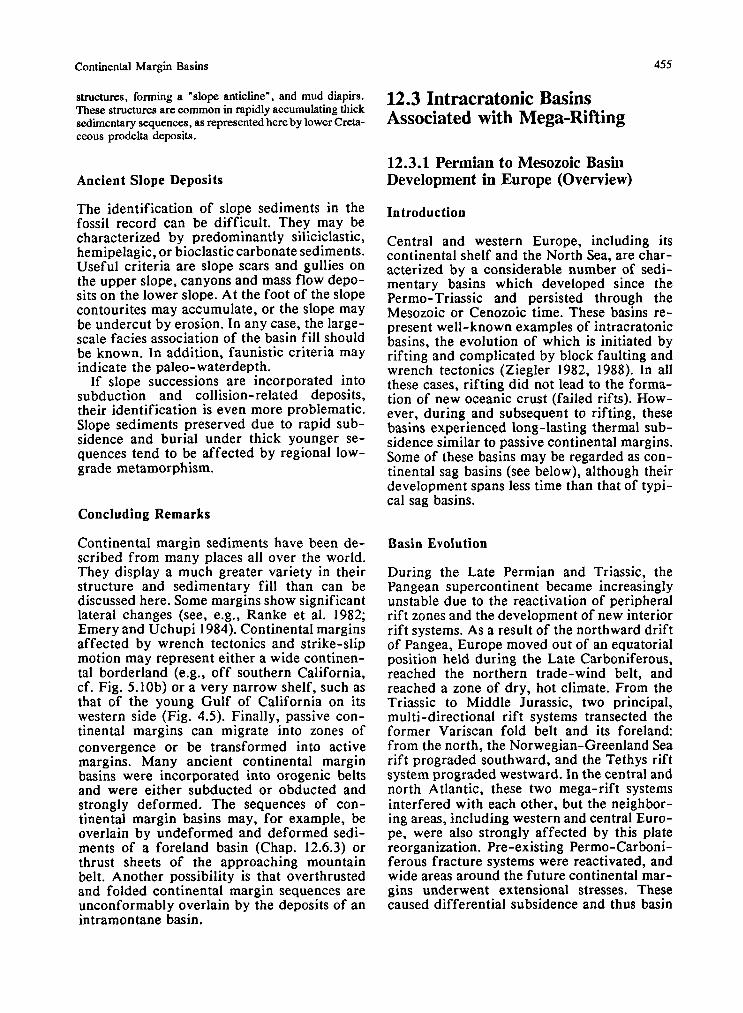
Continental Margin Basins
structures, forming a "slope anticline", and mud diapirs. These structures are common in rapidly accumulating thick sedimentary sequences, as represented here by lower Creta- ceous prodelta deposits.
Ancient Slope Deposits
The identification of slope sediments in the fossil record can be difficult. They may be characterized by predominantly siliciclastic, hemipelagic, or bioclastic carbonate sediments. Useful criteria are slope scars and gullies on the upper slope, canyons and mass flow depo- sits on the lower slope. At the foot of the slope contourites may accumulate, or the slope may be undercut by erosion. In any case, the large- scale facies association of the basin fill should be known. In addition, faunistic criteria may indicate the paleo-waterdepth.
If slope successions are incorporated into subduction and collision-related deposits, their identification is even more problematic. Slope sediments preserved due to rapid sub- sidence and burial under thick younger se- quences tend to be affected by regional low- grade metamorphism.
Concluding Remarks
Continental margin sediments have been de- scribed from many places all over the world. They display a much greater variety in their structure and sedimentary fill than can be discussed here. Some margins show significant lateral changes (see, e.g., Ranke et al. 1982; Emery and Uchupi 1984). Continental margins affected by wrench tectonics and strike-slip motion may represent either a wide continen- tal borderland (e.g., off southern California, cf. Fig. 5.10b) or a very narrow shelf, such as that of the young Gulf of California on its western side (Fig. 4.5). Finally, passive con- tinental margins can migrate into zones of convergence or be transformed into active margins. Many ancient continental margin basins were incorporated into orogenic belts and were either subducted or obducted and strongly deformed. The sequences of con- tinental margin basins may, for example, be overlain by undeformed and deformed sedi- ments of a foreland basin (Chap. 12.6.3) or thrust sheets of the approaching mountain belt. Another possibility is that overthrusted and folded continental margin sequences are unconformably overlain by the deposits of an intramontane basin.
12.3 Intracratonic Basins Aisociated with Mega-Rifting
12.3.1 Permian to Mesozoic Basin Development in Europe (Overview)
Introduction
Central and western Europe, including its continental shelf and the North Sea, are char- acterized by a considerable number of sedi- mentary basins which developed since the Permo-Triassic and persisted through the Mesozoic or Cenozoic time. These basins re- present well-known examples of intracratonic basins, the evolution of which is initiated by rifting and complicated by block faulting and wrench tectonics (Ziegler 1982, 1988). In all these cases, rifting did not lead to the forma- tion of new oceanic crust (failed rifts). How- ever, during and subsequent to rifting, these basins experienced long-lasting thermal sub- sidence similar to passive continental margins. Some of these basins may be regarded as con- tinental sag basins (see below), although their development spans less time than that of typi- cal sag basins.
Basin Evolution
During the Late Permian and Triassic, the Pangean supercontinent became increasingly unstable due to the reactivation of peripheral rift zones and the development of new interior rift systems. As a result of the northward drift of Pangea, Europe moved out of an equatorial position held during the Late Carboniferous, reached the northern trade-wind belt, and reached a zone of dry, hot climate. From the Triassic to Middle Jurassic, two principal, multi-directional rift systems transected the former Variscan fold belt and its foreland: from the north, the Norwegian-Greenland Sea rift prograded southward, and the Tethys rift system prograded westward. In the central and north Atlantic, these two mega-rift systems interfered with each other, but the neighbor- ing areas, including western and central Euro- pe, were also strongly affected by this plate reorganization. Pre-existing Permo-Carboni- ferous fracture systems were reactivated, and wide areas around the future continental mar- gins underwent extensional stresses. These caused differential subsidence and thus basin

Chapter 12 Basin Evolution and Sediments
fills of varying thicknesses between zones of higher elevation and moderate uplift.
The depositional environments and histories of these basins were affected by many local factors and therefore vary from basin to basin. Nevertheless, some general trends can be re- cognized which may also characterize other basins of similar origin. These trends predo- minantly reflect the interplay between sub- sidence and sediment accumulation, as well as the influence of climate and eustatic sea level changes. This is exemplified by the evolution of the European Mesozoic basin between the growing Tethys Ocean in the south and the North Sea in the north.
12.3.2 Mesozoic Sediments Between the North Sea and the Western Tethys
Triassic Sediments
Western Tethys, Alps
During the Triassic, the large shelf areas in the western Tethys Ocean were characterized by extensive carbonate platforms, some eva- porite basins, and intervening troughs ac- cumulating deep water carbonates and shales (Fig. 12.17a; e.g., Bechstadt et al. 1978; Ziegler 1988; Elmi 1990). The extensive, thick car- bonate bbildups of the eastern and southern Alps and other Alpine regions in southern Europe document subtropical climate and the efficiency of shallow-water carbonate produc- tion in keeping pace with the subsidence of the continental margins.
Germanic Facies Province
The fully marine facies in the Alpine-Medi- terranean Triassic was replaced by predomi- nantly clastic sediments in the Germanic fa- cies province, i.e., on the western and north- western Tethyan shelves and in the intracrato- nic basins of central and western Europe (Fig. 12.17a; e.g., Schroder 1982). During the Perm-
ian, red beds, evaporites, and volcanics were deposited in narrow troughs of the former Variscan fold belt. With the onset of the Tri- assic the relief was largely peneplained, but differential subsidence (20 to 50 m/Ma) of wide basins and uplift of large blocks con- tinued. The term Triassic is derived from these regions, because its sequence can be subdivided into three distinctly different sub- units: (1) The lower continental Buntsandstein clastics, (2) the marine Muschelkalk carbon- ates and evaporites, and (3) the upper coastal/playa lake/continental deposits of the Keuper. In Spain, for example, the Triassic sequence is quite similar to that in central Europe (Garcia-Mondejar et al. 1986).
1. Buntsandstein. The basins were filed by alluvial fans and extended red sandstones and claystones, which ac- cumulated in braided and meandering fluvial systems (Tietze 1982; Mader 1985; Pirez-Arlucea and Sopena 1986). Locally, playa sediments with evaporites were deposited. Fluvial cycles and paleosols with silcrete and pedogenic carbonate reflect short-term climatic variations and changes in the drainage systems. 2. Muschelkalk. The shallow-marine Muschelkalk basin in central Europe is associated with a long-term eustatic sea level rise which caused a transgression of the Tethys Ocean through two graben systems, one to the east of the Bohe- mian massif and the other between the Bohemian massif and Massif Central in France (Fig. 12.17a). To the north the basin was connected with the Arctic Ocean by a seaway between Greenland and Fennosannatia. This palmgm- graphic setting created a shallow-marine environment very sensitive to eustatic sea level variations. Warm and com- paratively arid climate favored the production of biogenic and chemically precipitated carbonate, which in turn was slightly diluted by temgenous siliciclastics. The carbonates show distinct lateral facies changes ranging from open marine ramp settings to marginal banks and protected, hypersaline back-bank regions (Aigner 1985). Mud flats and channels indicate moderate tidal activity (Schwan 1975). Evaporites of limited thickness in the middle Mu- schelkalk reflect a sea level fall and arid climate. Cyclic, shallowing-upward tempestite/marginal bank sequences and the repeated occurrence of specific marker beds in the upper Muschelkalk are interpreted by small, short-term sea level oscillations superimposed on longer-term trends (Aigner 1985; R6hl 1990). The highstands in these oscil- lations are represented by thin, clay-rich beds which can be traced over long distances.
- - -
Fig. 12.17ae. Triassic to Jurassic riWsag basin evolution in central Europe, overview. a and b Paleotectonic and palmgeographic situation during the middle Triassic (a Muschelkalk) and late Jurassic (b). Abbrevations for land masses (massifs): AM Annorican; BM Bohemian; EH Ebro High; IBM Iberian; LiU Irish; LBM London-Brabant; RM Rhenish. (Simplified from Ziegler 1988). c Greatly gene ralized Permian to lower Cretaceous sedimentary sequence.
- (Based on Wurster 1968; Kriimmelbeim 1986; Anderton et al. 1979; Schriider 1982; Geyer and Gwinner 1986; and others) in relation to long-term sea level changes (after Haq et al. 1987, including time scale) and climatic trends (Schwarzbach 1974; Frakes 1979). Note that long-term trends are superimposed with shorter variations in climate and sea level, generating various cyclic phenomena. See text for further explanation

Intracratonic Basins 457

Chapter 12 Basin Evolution and Sediments
3. Keuper. The facies of the upper Triassic (Keuper) repre sent transitional or predominantly continental environmental conditions, although according to Haq el al. (1987) the eustatic sea level was still rising during the first half of this period (Fig. 12.17~). This indicates that, at least part of the time, the basin received a surplus of clastic sediments. Some short-term marine ingressions entered the central European basin and led to the deposition of tidal sediments, thin carbonate beds and evaporites. However, most of the time a huge playa lake occupied the region in which red and greenish clayey marls alternating with thin carbonate beds and some sabkha-type evaporites accumulated. Mas- sive, red silty clays in the uppermost part of the sequence containing irregular layers of pedogenic carbonate nodules are interpreted as fossil clay dunes (Chap. 2.3.3). Throughout this development, the neighboring highlands shed sand and gravel into the basin from various sources, but mostly from Fennosarmatia southward.
The total thickness of the Triassic sequence in the Germanic facies frequently ranges from 800 to 2000 m, but is less adjacent to the up- lifted massifs. By contrast, the thickness of the carbonates accumulated on the Tethyan shel- ves is much greater. These strata are also af- fected by sea level changes (e.g., Brandner 1985; also see Chaps. 7.2 and 7.4). Basin fills similar to those in the central European area resulted from Tethyan transgressions into other rift zones, for example into the Aqui- taine basin and the Bay of Biscay rift up to the Paris basin and the Celtic Sea basin. To- ward the west, the Gibraltar and Atlas rifts were affected by transgressions (Ziegler 1988). In most of these basins, the Triassic sequences are characterized by red beds and evaporites, Muschelkalk- type shallow-marine carbonates, and Keuper-type playa lake/continental depo- sits.
Jurassic Sediments
During the Rhaetian and early Jurassic, the pre-existing rift systems remained active, and differential subsidence in central and western Europe continued. This development led, in combination with long-term rising sea level, to a long-lasting seaway between the Tethys and Arctic Oceans (Fig. 12.17 b, Ziegler 1988). Ocean spreading in the Tethys prograd- ed westward and connected the Tethys with the evolving central Atlantic.
In Rhaetian time, the sea again invaded the central Euro- pean basin and established normal marine, epicontinental conditions until the end of the Jurassic and, in smaller areas, throughout the Cretaceous and part of the Tertiary. Due to the influence of both the mixing of colder Arctic water with warmer Tethys water and the increasingly
humid and cooler climate, the sediments of the lower and middle Jurassic are predominantly shales with minor con- tributions of fine sand and carbonate (Fig. 12.17~). Sea level oscillations led to widespread submarine erosional un- conformities characterized by reworked limestone and siderite concretions, redeposited iron ooids, and some layers containing glauconiie and phosphorite.
The marked Hettanaian and Toarcian rrawressions favored the formation oufrelatively thin, but extensive black shale horizons. With the onset of increasing biogenic carbonate production in the upper Jurassic, possibly as- sociated with a trend towards a warmer climate, marls, limestones, and reefal carbonates were deposited. Rhythmic and cyclic phenomena, including phases of reef emergence, again indicate variations in sea level.
At the same time, the Viking and Central graben systems in the North Sea became active and established com- paratively deep water environments. The Kimmeridgian and Tithonian organic-rich shales are regarded as the principal hydrocarbon source rocks for the North Sea oil (cf. Chap. 14.3, Fig. 14.11). By contrast, the late Jurassic of the Lower Saxonian basin in Northern Germany is characterized by clastic sediments and evaporites indicating aridity.
Cretaceous Sediments
A land bridge running from the London-Bra- bant massif to the Bohemian massif, and wrench faulting in the North Sea and north of the land bridge, led to marked differences in the upper Jurassic and early Cretaceous basin evolution in central Europe.
While, for example, the southern (Franconian) basin went dry at the end of the Jurassic, subsidence continued in the Lower Saxonian basin, in the North Sea, and in the Paris basin. Evaporite accumulation came to an end due to a change to more humid climate.
The lower Cretaceous Wealden facies represents sandy to clayey nonmarine, brackish, deltaic, or coastal deposits. The overlying shallow-marine sediments consist mainly of shale, sand, and minor proportions of carbonate and o p aline silica, but may vary significantly due to the influence of local sediment sources. In conjunction with the mid- Cretaceous sea kvel rise, and the evolution of carbonate secreting microorganisms, the sediments become increas- ingly rich in carbonate and show Milankovitch-type lime stonemarl rhythms (Chap. 7.2).
The Jurassic sequence varies in thickness from about 400 to 600 m in southern Germany to approximately 1000 to 1800 m in northwestern Germany. The Cretaceous sediments in the Lower Saxonian trough may reach more than 1500 m in thickness. If regions with high sedi- ment thicknesses are taken into account, the average rate of Mesozoic subsidence was on the order of 25 m/Ma.

Intracratonic Basins
Summary
This brief discussion of basin evolution in central Europe with a plate tectonic view de- monstrates the following points.
- On the one hand, sedimentary sequences in neighboring basins evolving in a continent- wide common tectonic setting may develop striking similarities. In addition, the formation of easily correlatable sediment successions is favored by coeval variations in climate, eu- static sea level fluctuations, and changes in biogenic sediment production. - On the other hand, the intracratonic Meso- zoic basins in Europe and the north Atlantic show a great variation in both their tectonic and sedimentological histories.
Therefore it appears problematic to define certain "type basins". There are transitions between small, short-lived, simple rift basins and long-lasting, prograding, large rift sys- tems which may in addition be affected by wrench faulting. Such processes may cause differences in regional subsidence over long time periods. Whether or not these basin types can be accurately discriminated from intra- cratonic sag basins as discussed below is not clear.
12.4 Continental or Intracratonic Sag Basins
General Aspects
As already mentioned in Chapter 1.2, con- tinental or intracratonic sag basins are com- monly slowly subsiding, long-lived basins. They lack major extensional faulting, because in these cases lateral tensile deviatoric stress is insufficient to overcome rock strength and cause brittle fracture (e.g., Allen and Allen 1990). Subsidence is brought about by thermal contraction without significant extension and fracturing. Intracratonic sag basins are known from all continents and may accumulate thick (up to 10 to 15 km), undeformed or little de- formed sedimentary sequences over long peri- ods of time (on the order of 200 to 1000 Ma).
Basins of this type with late Proterozoic to middle Paleozoic sediments have been de- scribed, for example, from northeastern Asia, around the Siberian platform, and the south-
ern Urals (Artyushkov and Baer 1986). Other, mostly Precambrian to Paleozoic intracratonic sag basins are known from Africa, Australia, and North America (e.g., the Paleozoic 11- linois, Michigan, and Williston basins, with 3,700 to 6,000 m of sediments; Klein and Hsui 1987; Fisher et al. 1988). The central parts of the Michigan basin subsided steadily at a an average rate of 24 m/Ma over a time span of 200 Ma (Fischer 1975). Several basins of North Africa, including the Tindouf basin in Morocco and Algeria, as well as the Murzuk and Kufra basins in Libya, existed since the Paleozoic and continued to subside until Neo- gene times.
"Modern" examples of intracratonic sag ba- sins include the slowly subsiding, continental Chad basin in northern central Africa and the Eyre basin in Australia (Mitchell and Reading 1986); the North Sea and Hudson Bay in Ca- nada are sag basins inundated by the sea.
The crustal processes forming these basins are not well understood. Some basins may be underlain by rift structures, but their post-rift subsidence appears to be much longer than that which can be attributed to a rift-pro- duced thermal anomaly (Quinlan 1987). In the absence of significant stretching and thinning (or shortening) of the crust, a slow gabbro- eclogite transformation in the lowermost crust could be the principal mechanism causing subsidence (Artyushkov and Baer 1986; cf. Chap. 12.1 .I). Other authors (e.g., Finlayson et al. 1989) emphasize that the earlier history of the crust (prior to the evolution of the sag basin) plays an important role in determining the subsidence and structure of this type of basin. Klein and Hsui (1987) assume that the North American cratonic basins resulted from the breakup of a late Precambrian supercon- tinent similar to the Triassic-Jurassic breakup of Pangea mentioned in Chapter 12.3.
Sediments
Due to slow subsidence, the sediments of in- tracratonic sag basins tend to be continental to shallow-marine. In addition, their stratigra- phic record may display pronounced gaps. Special trends in their vertical facies succes- sions are governed by climatic changes and sea level fluctuations, rather than by tectonic processes (see above). Some of the basins may reflect the evolution of land plants and rock- forming marine organisms from the Protero- zoic era to Phanerozoic times. Basins isolated from sufficient terrigenous sediment sources

may become sediment-starved and accumulate shallow-marine carbonates and evaporites.
The Michigan basin in North America, for example, collected sediments from the Cambrian to the Jurassic, and then again in the Quaternary, but it also experienced peri- ods of erosion and sediment starvation (Fisher et al. 1988). After an initial stage of continental and shallow-marine deposition, the basin displays two upper Silurian, 600 m
Chapter 12 Basin Evolution and Sediments
thick evaporite-carbonate cycles, which are replaced along the margins by reefs and skeletal shoals, while on the slopes and in deeper water pinnacle reefs occur (Schreiber 1988b).
The basin fds of the Murzuk and Kufra basins in north Africa are only 2 to 3 km thick and consist predomi- nantly of fluvial deposits (Nubian sandstone), which were transported in northerly directions (Selley 1985a). In the late Cretaceous and early Tertiary, the basins were flooded by the sea.

12 Basin Evolution and Sediments
12.5 Deep-See Trenches, Forearc and Backarc Basins
12.5.1 Plate Tectonic Overview 12.5.2 Deep-sea Trenches
General Characteristics and Sediment Sources Relationship Between Trench Sedimentation and Accretion Consequences for Sediments in Accretionary Wedges Example: The Sunda Arc-Trench System Sediment Budget of Subduction Complexes and Depths of DQollement
12.5.3 Forearc Basins General Characteristics Sediment Successions of Forearc Basins Example: The Great Valley Forearc Basin of Cali- fornia
12.5.4 Backarc Basins General Characteristics Sediment Successions of Backarc Basins Examples of Modem Backarc Basins
12.5.5 Preservation and Recognition of Ancient Subduc- tion-Related Basins
(Continued under the heading of Chap. 12.6)
12.5.1 General Features
The basic principles governing the structure and evolution of arc-trench systems have been outlined by several authors (e.g., Dickinson and Seely 1979), as well as in many modern text books on geodynamics, and therefore are not repeated here. Similarly, the highly vari- able geotectonic settings of these systems can- not be described in this book. The following discussion of sedimentary sequences in deep- sea trenches and forearc and backarc basins will concentrate on a few characteristic, well studied examples. The evolution of most arc-
trench systems can be sufficiently defined by two-dimensional cross sections (Fig. 12.18) due to the well developed longitudinal con- tinuity of these structures.
Arc-trench systems result either from the breakage of a previously intact oceanic plate or from the activation of a passive continental margin (cf. Fig. 1.2, A and B subduction). Ilttraocearlic volcaltogellic arc systems have oceanic lithosphere in both the forearc and backarc regions. The island arc can be entirely volcanic (e.g., present-day Tonga-Kermadoc Islands and Mariana Islands) or comprise a continental sliver (e.g., Japan). "Normal" sub- duction of oceanic plate beneath an island arc is directed toward the continent following behind the island arc and backarc basin; re- versed subduction (polarity reversal) affects backarc basins, whose oceanic crust is sub- ducted oceanward, i.e., away from the con- tinent. The minimum distance between arc and trench is about 100 km in modern oceanic arc systems; trenches are commonly smoothly arcuate, as for example the Sunda trench (see below).
By contrast, the edges of rifted continental margins tend to be jagged and to exhibit off- sets and projections (Fig. 12.18a). Here, the subducting oceanic plate cannot trace all these irregularities but tends to adjust to the points of the crustal projections on the continental block. Hence, oceanic and transitional crust is caught between the projections. The presence of such thin, trapped crustal slivers is prob- ably a prerequisite for the deep-water en- vironment and/or large subsidence and sedi- ment thickness within the forearc region. Sim- ilarly, backarc basins on oceanic or transi- tional crust have a higher potential for sub- sidence and sediment accumulation than ba- sins in the region of continental crust. Addi- tional subsidence may be caused by compres- sional downfaulting.

Chapter 12 Basin Evolution and Sediments
b INTRA-OCEANIC ARC-TRECH SYSTEM
VOLCANOGENIC ISLAND ARC (OR CONTIN. SLIVER) FOREARC
? BACKARC SPREADING CENTER CRUST
C CONT. MARGIN ARC-TRENCH SYSTEM
CONT. CRUST VOLCANIC ARC BACKARC FOREARC \ BASIN ridP BASIN, TRENCH
? BACKARC FOLD- THRUST BELT (CONTRACTED MARGIN. INCREASE MANTLE PART OF IN SUBSIDENCE) LITHOSPHERE
d INTRA-MASSIF RESIDUAL TRAPPED OCEANIC OR TRANSITIONAL CRUST
RETIONARY (SLOPE) BASIN
WITH LOCAL STACK
SIDING OR SEMI-STABLE
TRANSITION \ f V e CONSTRUCTED BASIN COMPOSITE BASIN
I /
TRAPPED OCEANIC UST PRESENT BENEATH
Fig. 12.18. a Plan view of intra-oceanic arc-trench system giving rise to reversed subduction. c Continental arc-trench (upper half) with transition into continental margin arc- system with a fold-thrust belt in the backarc region, pos- trench system (lower ham. Note that preexisting rifted sibly leading to a "contracted" margin and causing ad- continental margin may be jagged and trap parts of the ditional subsidence. d through f Various types of forearc subducting oceanic crust (compare d). b Structure of intra- basins in relation to their basement, with or without t r a p oceanic arc-trench systems with (1) the volcanic island arc ped oceanic or transitional crust; see text for explanation. consisting of a sliver of continental crust andlor (2) a (After Dickinson and Seely 1979) spreading center developing in the backarc region, possibly

DeepSea Trenches, Subduction Complexes
12.5.2 DeepSea Trenches
General Characteristics and Sediment Sources
Deep-sea trenches represent the deepest mor- phological features on Earth and reach water depths of 6 to 11 km. They evolve at the front of a subduction complex, where the sedimen- tation rate cannot balance the loss of sediment to the accretionary wedge as a result of sub- duction (see below). In regions with very high sedimentation rates, the site of a potential deep-sea trench remains permanently filled and morphologically resembles the lower slope or continental rise of a passive margin. Then, sediments delivered to the trench can spill over the outer trench margin and rest on the flat deep-sea floor (left-hand side of Fig. 12.19a).
Deep-marine trenches collect sediments from a number of different sources (Fig. 1 2.1 9a):
- Lateral in flux of predominantly siliciclastic material from the side of the magmatic arc (inner slope and forearc region) via submarine canyons or gravity mass movements. These sediments mainly accumulate as trench fans along the inner side of the trench (Fig. 12.19b). Larger submarine fans remain in the confines of the trench, as long as the trench is not completely filled, and finally distribute their material in an axial direction. - Axial transport of mainly siliciclastic mate- rial along the trench from distant areas with high sediment input. This mechanism can be active as long as the trench has a morpho- logical expression. Sediment transport is ac- complished by a channel system with levees (Fig. 12.19b, cf. Chap. 5.4.2), which may dis- play depositional and erosional phases. At in- termediate to long distances from the sediment source, the basin fill may become "sheeted" (Fig. 12.19d), as in distal fluvial plains, where fine-grained materials predominate. Contour currents can rework and redeposit part of these materials. - Lateral migration of the pre-existing sedi- ment cover of the subducting oceanic plate to the site of the trench. These sediments may consist of pelagic calcareous and/or siliceous oozes, red clay, and hemipelagic silts and clays. In regions adjacent to the deltas of major rivers, turbidite successions may rest on the incoming oceanic plate. - Pelagic and hemipelagic sediments directly settling from the overlying water body to the trench floor. However, this sediment source is
comparatively insignificant, because of the low sedimentation rate of pelagic and hemi- pelagic sediments in a basin whose sediments are permanently consumed by subduction (see below).
Trench Fills and Their Residence Times
Trench sections with high sediment input (over-supplied systems) become filled and have a wide cross section (Fig. 12.19a and b). If the deposits of a submarine fan spill over the outer trench margin, trench sediments are overlain by the sediments of a deep-sea fan association (Chap. 5.4.2). In contrast, sedi- ment-starved trenches form narrow, ponded basins (Fig. 12.19a and f). Seamounts, oceanic ridges and faulted crust approaching the trench may create major irregularities in the trench fill and the ensuing subduction process.
The sediments in a deep-sea trench have little chance of being preserved in their origi- nal position, because they are continuously scraped off by the overriding accretionary wedge and incorporated into the subduction complex. The residence time of sediments in a deep-sea trench is a function of the conver- gence rate, CR, and the width, W, of the trench (Schweller and Kulm 1978). Given, for a example, an axial sediment source, the sedi- ment wedge would be widest and thickest near the source and diminish distally (Fig. 12.20a). The maximum residence time of a sediment layer in the trench is W/CR.
Sediment deposited in a 20 km wide trench subject to a convergence rate of 5 cmla, for example, would therefore have a maximum residence time of only 400 000 years.
Nevertheless, deep-sea trenches may collect relatively large volumes of material, in ad- dition to the incoming sediment on the sub- ducting oceanic plate, and therefore contri- bute greatly to the sediment stack of the ac- cretionary wedge.
Relationship Between Trench Sedimentation and Accretion
Sedimentation and Convergence Rate
The relationship between new sediment ac- cumulation in the trench and sediment loss by accretion is demonstrated by the models in Fig. 12.20a and b (based on Thornburg and Kulm 1987). If the sedimentation rate in the trench and the convergence rate of the sub-

Chapter 12 Basin Evolution and Sediments
AXIAL a
FROM VOLC. ARC AND ONARY WEDGE
SEDIMENT-STARVED TRENCH SYSTEM
PELAGIC TO HEMIPELAGIC SEDIMENT
b PROXIMAL TRENCH FAN
' OF ACCR. WEDGE
OC'EANIC PLATE COARSENING
Uz7%c----- / \ PELAGIC '
f DISTAL (SEDIMENT-STARVED)
PONDED BASIN
Fig. 12.19. a Scheme of the various processes which con- trol the f l i n g of deep-sea trenches. Over-supplied, fded trenches may be fed by axial channel systems (b), laterally from the side of the volcanic arc by submarine canyons or mass wasting on the slope, and by a thick clastic sediment cover from the subducting oceanic plate. A relatively dis- tal, "sheeted" basin fill (d) may develop in the trench bet- ween submarine canyons. Sedirnent-starved, ponded tren- ches (f) accumulating mainly pelagic and hemipelagic mate
rial from the overlying water body and from the subducting ocean plate, tend to be deeper and narrower than their over-supplied counterparts. Approaching seamounts (in a) may cause large irregularities in trench filling and the accretionary wedge. b and c, d and e, f and g Possible relationship between mode of trench fill and position of the d6collement zone, controlling the lithofacies successions within the accretionary wedge. (Mainly after Thornburg and Kulm 1987; P i c k e ~ g et al. 1989)

Deepsea Trenches, Subduction Complexes 465
NEWLY DEPOSITED DEFORMATION FRONT OF TRENCH SEDIMENT SR I/ ACCRETIONARY WEDGE
BELOW TRENCH FILL .- +
SEDIMENT ADDED TO ACCR. WEDGE
CR, CONVERGENCE RATE
SR, SEDIMENTATION RATE 3 .... . ........ ......... . ......... .' \ .......... w .............. / ................................. . . . . . .. ............. ... . . . . . . . . ..&
DECOLLEMENT WlTH TRENCH FlLL
SUBDUCTING OCEANIC PLATE WlTH PELAGIC AND HEMIPELAGIC SEDIMENTS
DEFORMATION FRONT
c ACCRETED SEDIMENT USED FOR ADVANCE OF DEFORMATION FRONT
HEMIPELAGIC \ AVAILABLE FOR
AND PELAGIC INCREASE IN HEIGHT SEDIMENT OF OF ACCR. WEDGE OCEANIC PLATE
FROM OCEANIC PLATE ADDED TO ACCR. WEDGE
BASALT UNDERPLATING OF
Fi. 12.20ac. Sediment budget of accretionary wedges as tanR. The volume of accreted sediment per unit length of a function of sedimentation rate, SR, in the trench, conver- trench is V, = W S R = WCR.tad3. c Trench sediments gence rate, CR, and angle of dip, 0, of the subducting and part of incoming sediment cover of oceanic plate (with oceanic plate. Wwidth of the trench. To, thickness of sedi- thickness To& are incorporated into accretionary wedge. ment scraped off from the subducting oceanic plate (in c). Accreted sediment volume may be used for advancing a and b Trench sediments only are considered. For steady- deformation front andlor increasing height of the pre-exis- state conditions and 0 and CR = constant, it is SRICR = ting accretionary wedge. See text for further explanation

Chapter 12 Basin Evolution and Sediments
duction process are kept constant, steady-state conditions at the front of the accretionary wedge can be achieved. This signifies that the sedimentation rate exactly balances the rate of sediment attrition caused by the seaward mi- gration of the deformation front, i.e., the vol- ume of newly deposited trench material is e- qual to the volume of sediment lost to the ac- cretionary wedge (neglecting changes in poro- sity).
Under these conditions, the sedimentation rate, SR, is a function of the convergence rate, CR, and the angle of dip, 0, of the subducting oceanic plate:
as can be seen from simple geometric consi- derations. In this case, SR is independent of the width, W, of the trench and the thickness, T, of the trench sediments.
Examples given by Thornburg and Kulm (1987) for the Chile Trench yield the following results for
Angle of dip of the subducting plate 3O, Convergence rate 10 cm/a:
a) Sediment-starved trench off central Chile: Width W = 10 km, thickness T = 0.5 km.
b) Sediment-filled trench off south Chile: Width W = 30 km, thickness T = 1.5 krn.
For both examples, SR is found to be about 0.5 cmla (5000 mlMa), which appears to be extremely high, parti- cularly for the relatively sediment-starved central Chile trench. Hence, it is assumed that, in addition to trench material, incoming sediment from the subducting oceanic plate is being incorporated into the accretionary wedge (Fig. 12 .20~) . This assumption has been confirmed for several active subduction zones by seismic records and ocean drilling (see below).
Sediment Volume and Accretion
The volume of sediment derived from newly deposited trench deposits and incorporated into an accretionary wedge per unit time de- pends on the width of the trench fill. This means that trenches oversupplied with sedi- ment provide more sediment for accretion than narrow trench fills, even when their sed- imentation rate is equal. The volume of ac- creted trench sediment, V,, per unit time and length of the trench is
and for accretion of both trench and oceanic sediment (Fig. 12.20~)
where To, = thickness of the sediment scraped off from the oceanic plate.
Part of the accreted sediment is used for the seaward advance of the accretionary wedge, the other part for the thickening of the ac- cretionary wedge. Sediments below the decol- lement zone are atop basaltic oceanic crust.
In conclusion, the convergence rate and sed- iment supply from different sources are the dominant factors which control the configu- ration of a deep-sea trench and the buildup of an accretionary prism.
Consequences for Sediments in Accretionary Wedges
The considerations in the previous section and the assumption that a kind of equilibrium bet- ween sediment supply and sediment loss to accretion is established in arc-trench systems, lead to the qualitative models of sediment ac- cretion shown in Fig. 12.19b through g:
1. Oversupplied trenches. Sediment fills tend to be sheared off along a decollement within the young trench fill. Failure by thrusting may be facilitated by increased pore pressures of the rapidly accumulated, underconsolidated sediments (von Huene 1986). As a result, the sequence within a slice of the accretionary wedge is built up entirely of trench sediments. These mainly represent the axial channel sys- tem and fan deposits from the foot of the landward trench slope (Fig. 12.19b and c). In this case, the sediments within a slice of the subduction complex are about the same age, but may contain some isolated, displaced older material transported by mass wasting from the landward slope into the trench. 2. Trenches associated with low to medium sediment supply and a moderate convergence rate (3 to 5 cm/a) usually develop medium- size trench wedges with discontinuous tur- bidite basins. The subduction decollement commonly develops below the young trench fill in pelagic or hemipelagic strata of the in- coming oceanic plate (Fig. 12.19d and e). In cases where the pelagic sediment cover on the oceanic crust is scraped off, the idealized stra- tigraphic sequence within a little-disturbed slice of the accretionary wedge coarsens up- ward from older pelagic to hemipelagic to younger trench fill sediments (Fig. 12.19e; Lash 1985). This sequence may represent a comparatively long time period.

Deep-Sea Trenches, Subduction Complexes
HEMIPELAGIC FOREARC BASIN ~~~~~~H
SEDIMENTS, STRUCTURAL ,HIGH / VOLCANIC ARC
DEFORMED i
Fig. 12.21. a Northern Japan trench and its juncture with b Model of subduction-related tectonic erosion off Peru, the Kuril trench at Erimo Seamount located on transform causing continental crust to extend almost to the deep-sea fault. Note collapse of lower slope due to tectonic erosion trench. (Moberly et al. 1982) of ovemding plate. (Cadet, Kobayashi, et al. 1987).
3. Sediment-starved trenches which also re- ceive little material from the incoming sub- ducting plate are narrow, discontinuous, and display a partially empty axis. Modern ex- amples of this type include trenches associated with volcanic island arcs in the western and southwestern Pacific. Starved trenches need a very long time span to build up an accretion- ary wedge of some size. Consequently, the deformation front progrades slowly, and the landward slope tends to steepen. In this case, thrust faults may propagate along weak zones in the upper oceanic crust and scrape off sli- ces of basaltic crust, pelagic sediments and
isolated bodies of ponded trench fill (Fig. 12.19f and g). Such settings allow the study of basal deep-water sediments on top of accreted oceanic crust in the subduction complex. 4. Tectonic erosion. When the subducting oce- anic plate has a marked relief and the total sediment supply into the trench is low, sedi- ment from the upper plate (accretionary wedge) can be scraped off and subducted as, for example, off southern Peru and northern Chile or in the northern portion of the Japan trench (Fig. 12.21). This process is referred to as "tectonic erosion" (Moberly et al. 1982; von Huene 1986; Cadet, Kobayashi, et al. 1987;

Chapter 12 Basin Evolution and Sediments
von Huene and Lallemand 1990). It creates stratigraphic gaps, reduces the volume of the accretionary wedge, and may finally lead to the collapse and retreat of this complex.
Off northwestern Peru, the edge o f the continental crust may be as close as 2 0 to 40 km to the trench axis (Fig. 12.21b). Here, the subducting oceanic plate has scraped off the underside and edge of the adjacent continental crust.
Most ancient subduction complexes, whose internal structure has been exposed on land by deep erosion following uplift, are much more complex than may be inferred from the simple rules described above. Besides packets of bed- ded sequences, in which stratification is pre- served in spite of faulting and folding, other, once deeply buried portions of the accretion- ary wedge display pervasive metamorphic fa- brics which indicate low temperature and high pressure conditions. Zones of intensive shear- ing creating a scaly fabric are common.
Melange, Wild f lysch
Other portions of the subduction complex consist of a mixture of various rock types in- cluding large solid blocks in a more uniform, but sheared matrix. Such completely chaotic zones are referred to as melange (see, e.g., Hsii 1974; Raymond 1984; Cowan 1985; Aalto 1989; Pickering et al. 1989). It is frequently difficult to decide whether a melange results entirely from tectonic processes within the subduction complex, or whether it represents a former large mass flow (olistostrome) from the slope into the trench, which was later in- corporated into the subduction complex and modified by tectonic deformation. Material from the accretionary wedge may be trans- ported into the trench again and thus recycled within the arc-trench system. Where a genetic interpretation of a chaotic deposit is difficult, the descriptive term wildflysch may be used.
Specific Tectonic and Sedimentary Structures
The internal structure of modern accretionary wedges is poorly known. One of the best stud- ied examples during deep-sea drilling is the accretionary wedge of the Barbados Ridge in the Caribbean Sea (Shipboard Scientific Party 1988b, Leg 1 10; Fig. 12.23d). The drilled cross section, about 30 km long, displays two gene- rations of landward-dipping thrust faults which tend to steepen with increasing distance
from the deformation front. The second gene- ration disrupts the older thrust faults and thus promotes further deformation of the accreted sediments. As pointed out by Moore and Byrne (1987), initial fault surfaces are aban- doned and deformation propagates into ad- jacent undeformed sediment. This is caused by sediment strengthening along the faults due to dewatering and release of excess fluid pres- sure. As a result, the fault and shear zones thicken and contribute to the intensive defor- mation of a tectonic melange.
In addition to these major structures, deep- sea trenches, the lower slopes of accretionary prims, and some forearc basins may show a variety of medium to large-scale sedimentary structures, which partially result from lique- faction of water-rich, overpressured sedi- ments. Such structures were observed in seis- mic records and by side-scan sonar mapping in modern environments. They include seepa- ges on the sea floor (cf. Chap. 13.5), mud vol- canoes and mud diapirs, wet sediment intru- sions such as vertically and laterally injected sand dikes, and thick and widely extended "chaotic layers" generated in semi-lithified rocks. The latter can easily be misinterpreted as debris flows or tectonic melange zones. A summary of these features is given by Picker- ing et al. (1989).
Example: The Sunda Arc-Trench System
A particularly instructive and large continen- tal margin arc-trench system is the Sunda arc between Burma and the Sumba Island to the east of Java (Fig. 12.22; Moore GF et al. 1982). It represents a 5000 km long subduction zone of the Indian oceanic plate beneath the Eurasian plate, which has been intermittently active since the Permian. The youngest active phase began in the late Oligocene. During the Neogene, the northern part of this system was dominated by detritus from the Himalayas which was dispersed by mass flows and tur- bidity currents on the huge submarine Bengal fan, the Nicobar fan, and along the axis of the Sunda trench.
Whereas sediment supply to the Nicobar fan was cut off in the mid-Pleistocene as a result of the eastwardly migrating Ninetyeast Ridge, a major submarine channel still trans- ports sediment today over the long distance from the nor- them end of the trench to the southeast into the region of the Sunda Strait (also see Velbel 1985). In the northwest, i .e. , the Andaman section, transport o f large volumes of material down the trench axis is indicated by a wide and relatively shallow trench floor (water depth about 3000 m,

Deep-sea Trenches, Subduction Complexes
TERTARY
SUMBA / ISIAND
Fig. 12.22. Sunda arc-trench system. Map view with Ben- axis as far as Sunda Strait. At present, forearc basins and gal and Nicobar deep-sea fans accumulating sediments from the outer arc ridge trap sediments from the island arc (Su- the Himalayas; such material also migrates along the trench matra and Java)
Figs. 12.22 and 12.23a). West of Sumatra, the trench floor is still broad, but narrows and deepens to about 5000 m off Nias Island (Fig. 12.23b). South and southeast of Java, the trench is formed by narrow, isolated basins at water depths of 6000 to 6500 m.
Sediments on the subducting plate are thus primarily thick turbidite sequences in the northwestern and central portions of the sys- tem, but only thin (200 to 400 m) pelagic and hemipelagic sediments off Java. Consequently, accretion of thick Neogene fan and trench sediments created a wide, high outer arc ridge in the northwestern and central trench por- tions, while the ridge is narrower and less ele- vated in the southeastern part (Fig. 12.23).
Since this outer ridge formed, sediments from the volcanic arc, i.e., from Sumatra and Java, are trapped in forearc basins and therefore can no longer reach the trench. Prior to the mid-Tertiary, volcaniclastic material from the arc contributed significantly to the trench sediments and thus was incorporated into the accretionary wedge.
Between the arc and the outer ridge a series of forearc basins developed (Fig. 12.22). These basins are 150 to 500 km long and 50 to 100 km wide. In Burma, about 8 km of marine, deltaic, and fluvial sediments accumulated from the late Cretaceous to the Pliocene. Off Sumatra, water depths in the basins are 500 to

Chapter 12 Basin Evolution and Sediments ,. QUAT
a I U MIOC lPLIOC HIM ::::::I SILT -.
IliI?:-l EOC IM MlOC ANDAMAN SEA / 1 M MlOC ANDAMAN ISLANDS - '1
SAND
PALEOG: -. . . . . . . . . . . . . . . - \..... PELAGIC AND HEMIPELAGIC MUD
SAND PROVENANCE
HIM HIMALAYAS
S SUMATRA
- J JAVA
km l f l QUA1
L+S - - - U MlOC IPLlOC _ _ _
.... MlOC
CRET-PLIOC U CRET
7 OUG. SUMH I HI3 C-
krn
1 VERT. EXAGG. 5x
MIUL; JAVA U MIOC IPLIOC L- M MIOC ..--.-----.. ----.........-....
--<: -
DEFORMATION FRONT
BARBADOS RIDGE COMPLEX A OCEANIC PLATE 54,2
I FORWARD AND UPWARD E ACTIVE LATE THRUSTS STEEPENING OF EARLY PACKAGE PROPAGATING
BELOW SEA INACTIVE THICKENED UNDERTHRUST OCEANIC I
LEVEL THRUSTS SHEAR ZONE SEQUENCE CRUST VERT EXAGG 2~
Fig. 12.23. a, b, and c Cross sections of arc-trench sys- tem from northwest (Andaman Islands) to southeast (Java). Note decreasing thickness of sediment on subducting oce- anic plate, decreasing width and elevation of outer arc ridge, increasing water depth of forearc basin, and change in sand provenance from distal Himalayas to more local sources from the arc. See text for further explanation. (After Moore GF et al. 1982). d Schematic cross section at
deformation front of northern Barbados Ridge, Caribbean Sea, as reconstructed from seismic records and ocean dril- ling. Note relatively shallow dkollement zone on top of thicker, underthrust late Cretaceous to Oligocene strata, steepening of early thrusts in accretionary wedge, upslope formation of secondary thrusts disrupting early thrusts, and thickening basal shear zone. (Shipboard Scientific Party 1988, Leg 110; after Moore and Byrne 1987)

Deep-Sea Trenches, Subduction Complexes
2000 m, while off Java the basins are 3500 to 4000 m deep; the sediment fill attains thick- nesses of up to 6000 m. The basins are separ- ated from each other by transverse structural highs, and therefore the fill in each basin dif- fers in composition from adjacent basins. The sediments in the forearc basins are derived primarily from the arc terranes and are dis- persed by submarine slope canyons and small deep-sea fans. Off north Sumatra, quartzose sediments accumulate, whereas off Java, vol- caniclastic sediments predominate in the fore- arc basins. Shallow-water carbonates and their detritus also play a role.
Sediment Budget of Subduction Complexes and Depths of Decollement
The growth rate of accretionary wedges is commonly very high, because they take up huge masses of sediments from both the deep- sea trench and the subducting oceanic plate. As an initial approach, the rate of sediment uptake can be estimated from the average thickness of the accretionary prism, its aver- age porosity, and the subduction rate.
In this manner, a sediment mass accumulation of around 350 k r n 3 / ~ a for a 1 krn wide strip along strike was found for the Makran continental margin off southwestern Pakis- tan (White and Louden 1982). Here, the Arabian oceanic plate is subducting at a rate of 50 km/Ma beneath the Eura- sian plate and creates an accretionary wedge about 7 km thick.
The Cascadia Subduction Zone
A more precise calculation was tried for the modern Cascadia subduction zone in the northeastern Pacific Ocean off British Col- umbia (Davis and Hyndman 1989). In this case, the mass of the accretionary wedge was balanced. This was done for two time periods: the Pleistocene accretionary prism (1.8 Ma) and the pre-Pleistocene prism which began forming in the Eocene. The geometry of the accretionary wedge is relatively well known from seismic records and the position of earthquake hypocenters (Fig. 12.24a through d). The decollement zone is situated at or near the top of the underlying oceanic crust, thus indicating that almost all of the incoming sed- iment is scraped off.
At the deformation front, the pre-Pleistocene section con- sists of fine-grained hemipelagic sediments about 1.5 km thick overlain by a 1.7 to 2 km thick Pleistocene turbidite
sequence, which was drilled and sampled during the Deep Sea Drilling Project. The high Pleistocene sedimentation rate of approximately 1000 mlMa results from the high- relief, glaciated hinterland in the Rocky Mountains. The pre-Pleistocene/Pleistocene boundary can be traced in seis- mic records within the accretionary prism.
In this way, the Pleistocene portion of the wedge could be delineated. It contains about 170 km3 of sediment per kilometer of its length. Taking into account an average sedi- ment porosity of 15 to 20 %, the volume of the solid fraction is about 140 km3. The total sup- ply of incoming sediment from the trench and the oceanic plate is estimated from a subduc- tion rate of 4.5 cm/a. This rate gives 80 km of convergence during the Pleistocene, but at the same time the deformation front advanced about 25 km seaward, thus yielding a relative, total convergence of 105 km. Assuming an average porosity of 35 % for the incoming sediment, a section about 2 km thick (1.3 km of solid material) is needed to build up the volume of solid material estimated in the ac- creted Pleistocene wedge. This calculated average thickness is within the range between the present sediment thickness at the defor- mation front (3.5 km) and the thickness at the beginning of the Pleistocene (about 1.5 km).
Hence, this balance supports the observation from seismic lines that, due to the deep posi- tion of the decollement zone, most of the in- coming sediment was incorporated into the accretionary prism during the Pleistocene. The present-day trench structure has no topogra- phic expression but is kept filled as a result of both high sedimentation rate in the trench itself and high sediment input to the accre- tionary prism by the obliquely subducting oceanic plate.
The sediment balance for the pre-Pleisto- cene proportion of the accretionary wedge yielded a 0.9 km thick sediment section (with 45 % porosity), which must have been per- manently scraped off during the subduction process since the Eocene (Davis and Hyndman 1989).
Other Modern Examples
The thickness of undeformed sediment being underthrust with the subducting oceanic plate varies considerably.
Along the central Aleutian trench it is 1 km (McCarthy and Scholl 1985). Sediment accu- mulation in this trench is also rapid, and the convergence rate reaches 8 cm/a. At the nor- thern Japan trench, the sediment thickness
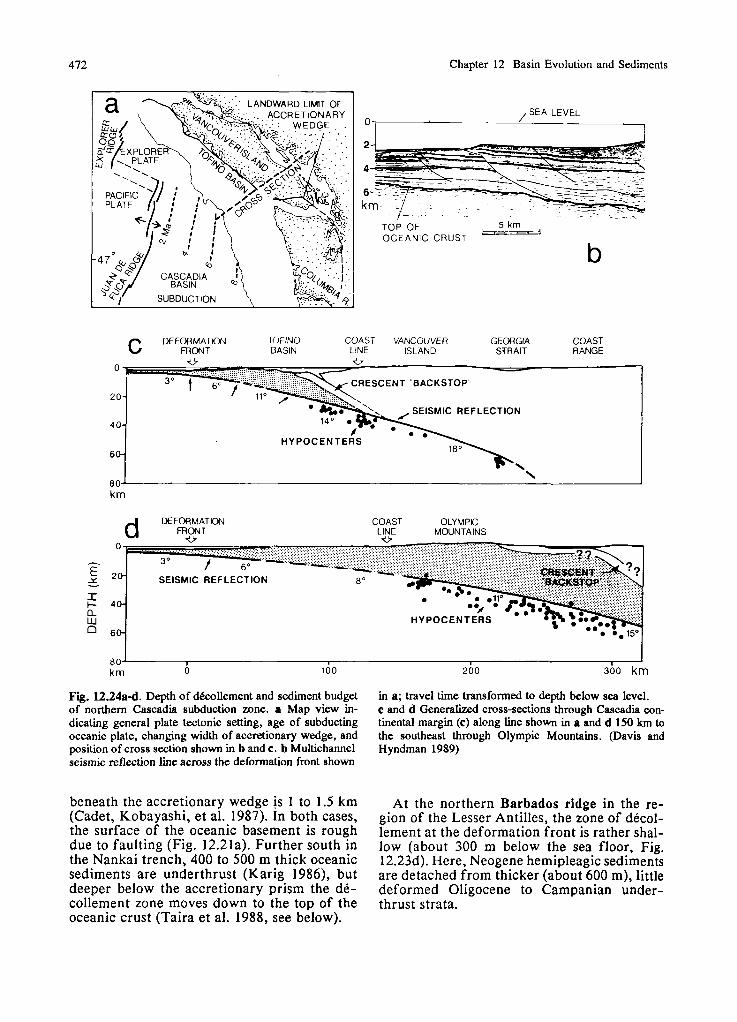
Chapter 12 Basin Evolution and Sediments
, SEA LEVEL O
1
TOP OF 5 km OCEANIC CRUST
w
b
TOF IN0 COAST VANCOUVER GEORGIA COAST BASIN LINE ISLAND STRAIT RANGE
7
40 -
60-
\ 80- krn
HYPOCENTERS
Fig. 12.24a-d. Depth of d h l l e m e n t and sediment budget of northern Cascadia subduction zone. a Map view in- dicating general plate tectonic setting, age of subducting oceanic plate, changing width of accretionary wedge, and position of cross section shown in b and c. b Multichannel seismic reflection line across the deformation front shown
beneath the accretionary wedge is 1 to 1.5 km (Cadet, Kobayashi, et al. 1987). In both cases, the surface of the oceanic basement is rough due to faulting (Fig. 12.21a). Further south in the Nankai trench, 400 to 500 m thick oceanic sediments are underthrust (Karig 1986), but deeper below the accretionary prism the de- collement zone moves down to the top of the oceanic crust (Taira et al. 1988, see below).
in a; travel time transformed to depth below sea level. c and d Generalized cross-sections through Cascadia con- tinental margin (c) along line shown in a and d 150 km to the southeast through Olympic Mountains. (Davis and Hyndman 1989)
At the northern Barbados ridge in the re- gion of the Lesser Antilles, the zone of decol- lement at the deformation front is rather shal- low (about 300 m below the sea floor, Fig. 12.23d). Here, Neogene hemipleagic sediments are detached from thicker (about 600 m), little deformed Oligocene to Campanian under- thrust strata.

Deep-sea Trenches, Subduction Complexes 473
SHIKOKU NANKAI METAMORPHIC BELT TROUGH (JURASSIC S.C.) 14 Ma GRANITE PLIO-PLEISTOCENE S.C.
.
SHIMANTO BELT - - -
e STRATIGRAPHY OF MELANGE UNlT
MELANGE UNIT CLASTIC DIKE PELAGIC AND (IDEALIZED) HEMIPELAGIC
SLATY CLEAVAGE IMBRICATE SEDIMENTS TURBlDlTES AND SHALES (TRENCH FILL)
TRENCH FILL VARICOLORED HEMIPEL. SHALE AND ACIDIC TUFF RED PELAGIC SHALE
BEDDED RADIOLARIAN CHERT
DUCTILE FOLD DECOLLEMENT
RED PELAGIC SHALE AND/OR NANNO-LIME-
ALE FOLIATION STONE ASALT SLIVER OCEANIC BASALT
Fig. 12.25a-e. Cretaceous to Miocene accretionary prism d Idealized cross section through accretionary wedge, of the Shirnanto belt, southeastern Japan. a and b Location displaying principal features observed in Shimanto belt. e maps. c Cross section from modem Nankai trough to Shi- Idealized stratigraphic section of mklange zone. On top of koku island, showing increasing age of subduction com- oceanic crust, sulfide andlor manganiferous hematite depo- plexes (S. C.). sits may occur. (After Taira et al. 1988)

Chapter 12 Basin Evolution and Sediments
Growth and Elevation o f Accretionary Wedges
The seaward advance, thickness, and elevation of an accretionary wedge are controlled main- ly by the rate of incoming sediment (in terms of volume) and the dip of the underthrusting oceanic crust (Davis et al. 1983). In the case of the Cascadia subduction zone, it is assumed that the deformation front advanced 60 km in pre-Pleistocene time and 25 km during the Pleistocene. The dip angle of the subducting oceanic plate normally increases landward or arcward (Fig. 12 .24~ and d). The Cascadia example demonstrates that the relatively steep dip ( r l lo) of the subducting plate beneath the Vancouver island margin prevents the buildup of a highly elevated ridge. In contrast, the Olympic Mountains farther to the south (Fig. 12.24d) owe their existence to a more gentle dipping subduction zone (11 lo), as well as to particularly high sediment supply at the accre- tionary wedge front (Davis and Hyndman 1989).
Example of an Ancient Accretionary Wedge
The architecture of modern accretionary wed- ges is an important objective of current re- search. Ancient examples have been described from many regions (e.g., Leggett 1982), but many of them are not sufficiently exposed and therefore not well understood.
One of the best known examples of a Creta- ceous to Miocene accretionary prism is the Shimanto belt in Shikoku, Japan (Taira et al. 1988). It lies landward of the Nankai trench (Figs. 12.25 and 12.21a) and resembles in its structure and sedimentary facies this modern subduction complex. The decollement of the young accretionary prism takes place above the pelagic and hemipelagic sediments of the downgoing oceanic plate within muddy sedi- ments of the outer trench fill (Fig. 12 .25~ and d). Hence, the sediments of the young accre- tionary prism are dominated by muddy and sandy flysch from the trench fill. However, at a depth of about 5 km below the slope, the decollement zone moves down to the top of the oceanic crust and forms duplex structures into which sediments of the oceanic plate are incorporated.
Thus, the older thrust slices may contain two basic units:
- Melange consisting of basalt slivers, pelagic and hemipelagic sediments, and fine-grained matrix from the trench fill.
- Flysch units from the trench fill (Fig. 12.25d).
Intact sections of pelagic and hemipelagic sed- iments show characteristic vertical facies suc- cessions deposited on pillowed basalt of the subducted oceanic plate (Fig. 12.25e). With increasing distance from the modern trench, increasing age and overburden pressure, the rocks of the thrust sheets develop scaly folia- tion, slaty cleavage, and are finally subject to metamorphism.
12.5.3 Forearc Basins
General Characteristics
Types o f Forearc Basins
According to Dickinson and Seely (1979) four types of forearc basins can be distinguished (Fig. 12.18d through f):
- Intranzassif or intra-arc basins, where the sediments lie unconformably on rocks of the island arc or continental margin arc. In the latter case, the basins collect arc or backarc- derived, commonly nonmarine sediments of limited extent and thickness. Intramassif sedi- ments of island arcs tend to be predominantly marine. Several forearc basins along the Paci- fic coast of South America evolved on con- tinental or transitional crust; for example, off Peru, crust with continental affinity extends to the shelf edge or lower slope of the margin (Fig. 12.21b, Moberly et al. 1982; Shipboard Scientific Party 1988c, Leg 112). After an ear- lier period of uplift, a series of elongated, narrow, coast-parallel forearc basins evolved on top of this crust, i.e., on the shelf and up- per slope. These basins collected sediments which are in part strongly affected by coastal upwelling since the Miocene. Hence, some of these forearc sediments are characterized by black shale intervals, phosphorite horizons, widespread diagenetic dolomitization, and other special sedimentary features (cf. Chap. 5.3.4). The infillings of these basins are limit- ed in thickness. - Accretionary basins, i.e., basins within the accretionary wedge of the subduction zone (mostly slope basins), whose sediments lie un- conformably on older, deformed strata. Their sediments are derived mainly from the uplift- ed subduction complex or the arc massif and reflect a comparatively deep marine environ- ment. They may be deformed mainly by com-

Forearc Basins
pressional forces exerted during the con- tinuing growth of the underlying accretionary wedge. - Residual basins accumulate sediments on oceanic or transitional crust trapped between the arc massif and the subduction zone (Chap. 12.5.1, Fig. 12.18d). - Constructed basins collect sediments lying unconformably on both the arc massif (inner side of the basin) and deformed strata of the subduction complex (outer side of the basin).
The latter two basin types are most important and discussed further here.
Basin Evolution and Sediment Source
During its evolution, a forearc basin may go from a narrow, residual basin to a broader, composite basin that onlaps the arc massif on one flank and lies on the accretionary wedge on the other side. The initially deep residual forearc basins particularly have a high poten- tial for great subsidence under increasing sed- iment load and can accumulate thick sedimen- tary sequences in comparatively short time periods.
The nearby volcanic arc acts as a sediment source of extreme efficiency. Continuing rapid subduction keeps the volcanic system active and thus provides both high relief and large amounts of easily erodable volcaniclastic material (cf. Chap. 2.4), which is transported into the forearc or backarc regions. The accre- tionary wedge frequently serves as a dam for ponding sediments in the forearc basin. In addition, this submarine or emerged high (shelf edge, outer ridge) may shed some sedi- ment derived from the subduction complex, possibly including ophiolites, into the forearc basin.
The subsidence histories of forarc basins are more complicated and less predictable than those of rifted continental margins (Moxon and Graham 1987; Angevine et al. 1990). Sev- eral mechanisms play a significant role (cf. Chap. 8). (1) The sediment load of the depres- sion between the topographic highs of the vol- canic arc and the accretionary wedge. (2) Iso- static response to the emplacement of dense oceanic crust beneath the forearc region by subduction. (3) Rapid cooling of a relatively warm upper plate resulting from the subduct- ed cooler plate. This third mechanism may apply to situations where hot, young oceanic crust is incorporated as upper plate into a forearc region. In addition, the subsidence
histories of forearc basins may be influenced signifiantly by variations in the subduction rates and, as in all basins, by the history of sediment loading.
Variations in Basin Evolution
The forearc basins in the modern oceans show considerable variation in their configuration (Fig. 12.26), which is partly due to their dif- ferent stages of evolution. Sloped forearc re- gions (e.g., along New Britain, the Solomon Islands, and the south New Hebrides) may develop some small slope basins on top of the accretionary wedge, but do not provide larger basins for sediment accumulation. Similarly, terraced forearc regions, as known from the northeastern Pacific off Oregon and Washing- ton, cannot accumulate sediments of substan- tial thickness on top of the subduction com- plex. Back-tilted forearcs (south Tonga, Mari- ana Islands, northern New Hebrides) are char- acterized by a partially submerged volcanic arc (Fig. 12.26a) and a kind of intra-arc basin directly adjacent to the arc.
Ridged and Shelved Forearc Basins
In terms of sediment accumulation, the ridged forarcs creating a ponded basin are most im- portant. Their evolution depends on the vol- ume of sediment which is collected by the deep-sea trench and accreted in the subduc- tion complex per unit time (Chap. 12.5.2). Trench systems well supplied with sediments enable rapid progradation and upbuilding of the accretionary wedge and thus widening of the forearc basin or the outer ridge (structural high). Modern examples of ridged forearc re- gions include the western Aleutian trough, the Kermadoc trough, the Manila trough, and forearc basins bordered by an emerged outer ridge such as the Sumatra-Mentawai trough (Figs. 12.22 and 12.23 b) and the Lesser Antil- les-Barbados ridge.
As a result of continuing subduction and accretion, such ponded basins tend to evolve from open, deep, narrow basins into broader basins with increasingly restricted environ- ments and shallowing-upward sequences (Fig. 12.26b). Sediment-filled basins of this type are referred to as shelved forearc basins. Their basin fill may begin with abyssal sediments and finally end with terrestrial deposition, particularly on the side of the arc massif.

476 Chapter 12 Basin Evolution and Sediments
b "OLC. ARC PONDED OR SHELVED FOREARC BASIN
TENDENCY TO UPLIFT AND COMPRESSION
UPLIFT
Fig. 12.26a,b. Variations in the configuration of forearc than shown in figure. In addition, the basin fa may be basins, partially related to their evolution. Note that in a affected by extension or compression, with or without a back-tilted system (a) the volcanic arc may also be sub- strike-slip component. (Based on Karig and Shaman 1975; merged below sea level; sedimentary fill (b) will subside Dickinson and Seely 1979, simplified and modified) more and become more deformed during basin evolution
Tectonic Overprint Sediment Successions of Forearc Basins
A tendency for uplift of both the arc massif and the outer ridge and subsidence of the basin center favor the continuation of sedi- mentation for some time. Additional deforma- tion of the strata can be caused by extension, compression, and wrench faulting of the basin fill. In the early stage of such deformation, normal or reverse faults are common on the side of the arc massif, while folding and over- thrusting predominate on the seaward side of the basin fill (Fig. 12.26b). If the forearc basin fill is exposed to collision, as in ancient oroge- nic belts, it is further tectonically overprinted.
An idealized residual forearc basin may dis- play the following succession (modified from Dickinson and Seely 1979, from top to bot- tom):
- Fluvial and deltaic sands, partially derived from the uplifted roots of the arc. On the in- ner edge of the basin, these sediments may interfinger with deposits from pyroclastic flows, relatively coarse grained ash fall, lava flows, and alluvial fans consisting of both vol- canic and nonvolcanic materials (cf. Chap. 2.4).

Forearc Basins
- Sands and shales deposited in shallow-ma- rine environments (shelf sea); high proportion of volcaniclastic material but a relatively low amount of biogenic components, resulting from a high influx of terrigenous material and rapid sediment buildup. - Flysch-like shale-sandstone sequence with upwardly increasing proportion of coarser grained turbidites, largely composed of vol- caniclastic material; shales may contain some carbonate (when deposited above the CCD) and partially have a relatively high organic carbon content. - Abyssal-plain sediments containing mont- morillonitic shales devoid of carbonate, fine- grained ash fall deposits, and fine-grained turbidites.
A large supply of terrigenous material com- monly results in rapid infilling of the forearc basins, particularly of basins associated with continental margins.
The modem forearc basin of Guatemala, for example, has accumulated non-marine, predominantly volcaniclastic material during the past 20 000 to 30 000 years (Vessel1 and Davies 1981). These sediments reflect major volcanic eruptions, which have demonstrated a certain degree of cyclicity expressed by (a) a long quiescent phase with in- cision of meandering rivers and delta reworking, @) an eruptive phase with airfall ash and pyroclastic flows, (c) a fan building phase dominated by debris flows and coarse grained fluvial deposits, and (d) a braided stream phase with the introduction of large sediment volumes into the fluvial system and delta progradation on the coast.
The South American forearc basins along the coast and offshore of Ecuador, Peru, and Chi- le contain Cretaceous and Tertiary sediments with thicknesses of several to ten kilometers (Moberly et al. 1982). Their facies range from deep marine sediments containing large pro- portions of turbidites, gravity mass flows and slides to paralic and continental deposits. They evolved on continental crust (intra-massif bas- ins) and frequently show landward dipping strata in their lower sections, indicating syn- depositional uplift of a seaward basement high. Syndepositional uplift of landward or seaward parts of the basins also caused the cutting of deep submarine channels. As a re- sult of coastal upwelling, some of these basins accumulated substantial amounts of hydrocar- bons.
The present-day forearc basins of the Sun- da arc provide an example of basins unequally filled in relation to the sediment sources (Chap. 12.5.2, Figs. 12.22 and 12.23).
Similar to remnant basins and foreland ba- sins (Chap. 12.6 ), forearc basins accumulate
sediment successions of several to more than 10 km in thickness within a relatively short time span of 10 to 50 Ma. The contribution of volcanic material to the basin fill is normally high, but may also be low and insignificant, where a major river from the continent enters the basin, or where nonvolcanic uplands are nearby (e.g., in Peru). In sediment-starved, warm, equatorial regions, reefs and carbonate banks can grow along the shallow basin mar- gins and build up thick carbonate sections (e.g., in the Mentawai trough).
The percentage and time equivalents of deep-water, shallow-water, and subaerial de- posits in a forearc basin succession depend on the mode of basin filling (cf. Chap. 11.3). If a basin is filled up very rapidly during its early stage, as for example in continental margin settings, a large proportion of its sediments consists of shallow-water and nonmarine de- posits which accumulate during the (sediment load-induced) later subsidence phase. In con- trast, relatively slowly filling basins and co- eval subsidence maintain deep-water condi- tions for longer time periods and thus lead to the buildup of a thick deep-water sequence.
The normal evolution of forearc basins may be modified significantly by jumps or shifts in the position of the subduction zone. Other modifications result from a change in the vec- tor of plate convergence through time. Such processes complicate the interpretation of the structural evolution and facies successions of ancient forearc basins. The evolution of fore- arc basins as depositional systems ends when subduction of oceanic crust is followed by obduction and collision of plates, and the area is uplifted and exposed to erosion.
Example: The Great Valley Forearc Basin of California
The Great Valley forearc basin in California is one of the most thoroughly studied and best- understood ancient forearc basins in the world (Ingersoll 1982). All three major components of the arc-trench system, i.e., the (Franciscan) subduction complex, the (Great Valley) fore- arc basin, and the (Sierra Nevada) magmatic arc are exposed on land in their original rela- tionship (Fig. 12.27a). This relationship is pre- served, because further compression of the arc-trench system was terminated by strike- slip movement along the San Andreas Fault, converting the convergent margin into a trans- form margin.

Chapter 12 Basin Evolution and Sediments
METAMORPHIC
CRETACEOUS
SAN ANDREAS
MAIN TRENDS IN SANDSTONE PETROFACIES
VOLCANICS
[ //////////A QUARTZ
TRANSFORM FAULT (SAN ANDREAS F.)
SUBDUCTION COMPLEX I
TRENCH-SLOPE RESIDUAL
EARLY CRET. COLLISION ZONE OF EARLIER (JURASSIC)
OCEANIC CRUST OCEANIC ARC
ARC MASSIF (ACCRETED
OCEANIC FANS (SANDS AND CONGLOMERATES) JURnsslC ARC) CRUST
MIGRATION OF EASTERN N LIMIT OF GREAT VALLEY BASIN
I
100 Ma WESTERN LIMIT OF
FRANCISCO
SAN ANDREAS FAULT km - Fig. 12.27a-d. The Cretaceous-Tertiary Great Valley fore- basin, the western part of which was uplifted and partially arc basin of California. a Simplified map of major gwtec- eroded. c Simplified cross-section of Great Valley (location tonic units. b Evolution of convergent margin and forearc shown in a and b). d Map view of basin evolution, show- basin of central California in three stages; note transition ing widening of basin as well as migration of volcanic arc from Cretaceous terraced, residual basin on oceanic crust with time. (After Dickinson and Seely 1979; Ingersoll to Palwgene shelved composite basin on both oceanic crust 1982; Moxon and Graham 1987) and subduction complex, and finally to "remnant" forearc

Forearc Basins
After the collision of an older intraoceanic arc with the North American plate in the Jurassic, a new trench and forearc basin formed west of the suture belt. The shape of the new continental margin was irregular and thus enabled the trapping of oceanic crust (Fig. 12.27) and the initiation of a residual basin in the Great Valley area, whereas to the north and south such basins are missing. Later, the basin evolved into a composite forearc basin resting on both oceanic and continental crust as well as partially on the newly formed accretionary wedge (Fig. 12.27b). In ad- dition, the forearc region developed from a terraced or ponded, narrow basin with a deeply submerged ridge into a wider, shelved forearc basin behind a high, broad outer ridge.
Sedimentation in the newly created residual forearc basin began in the upper Jurassic and lower Cretaceous, with muddy slope deposits and conglomeratic channel fills. Sand and coarser grained components are derived from the underlying ophiolites, metamorphic and plutonic rocks of the former collision (suture) zone, and volcanic material from the mag- matic arc. A great part of the suture-derived material came from the Klamath Mountains in the north (Fig. 12.27a). The petrofacies of the sandstones particularly reflect the develop- ment and erosion of the magmatic arc and the suture zone. For example, the proportion of volcanics decreases upsection, while the quartz content increases (Fig. 12.27~). Later, arkosic sands and sandstones point to the fact that the batholithic roots of the magmatic arc were exposed to erosion.
Concurrent with the westward growth and upbuilding of the Franciscan subduction com- plex, the forearc basin was enlarged and fill- ed. Sands were dispersed by submarine slope channels and deposited in large fan systems. However, the Sierran magmatic arc migrated eastward (Fig. 12.27d) and lost its dominant role as a sediment source.
The total sediment thickness in the western part of the basin amounts to about 13 km; in the eastern part it is much less. The sedimen- tation rate during the upper Cretaceous was about 280 m/Ma in the basin center. By the end of the Cretaceous, the forearc basin had attained the morphology of a wide shelf, al- lowing arc-derived clastic material to migrate westward and to accumulate in the trench. Paleogene sediments were deposited predomi- nantly under shallow-marine and nonmarine conditions; the Neogene is represented by pri- marily nonmarine strata, apart from some small, deep basins caused by Neogene wrench tectonics associated with the development of the San Andreas fault system. These move- ments finally terminated the evolution of the Great Valley basin and converted the subduct-
ing margin into a transform margin (Fig. 12.27b).
In the Great Valley basin, the western, oceanward parts of the basin first underwent strong subsidence and then uplift as a result of the growing subduction complex (Moxon and Graham 1987). In contrast, the eastern, land- ward parts of the basin display subsidence closely related to the thermal contraction and eastward migration of the Sierran magmatic arc.
12.5.4 Backarc Basins
General Characteristics
Backarc basins develop behind volcanic arcs either on continental, transitional, or oceanic crust. In continental margin settings, the early evolution of a backarc region is commonly characterized by subduction-related extension and rifting, which may be followed by accre- tion of new oceanic crust (Fig. 12.18~). In ad- dition, the arcward side of the basin may be strongly affected by folding and overthrust- ing, similar to the tectonic evolution of fore- land basins (see below). In intra-oceanic arc- trench systems, the backarc region is an ocea- nic basin of limited size which is subject to sedimentary processes similar to those in larg- er ocean basins with a volcanic sediment sour- ce.
Most of the modern backarc basins lie in the northwestern, western, and southwestern Paci- fic (e.g., Bering Sea, Okhotsk basin, Sea of Japan, South China basin, Celebes basin, Bis- marck Sea, Solomon Sea, New Hebrides basin, and South Fiji basin, Fig. 12.28a) and deve- loped behind volcanic island arcs on oceanic crust. However, several basins in this area cannot be classified absolutely as backarc ba- sins and therefore are referred to as small ocean basins (e.g., Leitch 1984). Examples in the Mediterranean Sea are the Tyrrhenian (with new oceanic crust and active volcanism, Fig. 12.15; see, e.g., Savelli 1988) and Aegean Seas (continental crust, cf. Chaps. 12.2.2 and 12.7). The Black Sea and Caspian Sea are relics of a once larger ocean basin (see below).
The largest modern backarc basin associated with the Sunda trench in the northeastern In- dian Ocean is the Andaman Sea (Fig. 12.22, Chap. 12.5.2). The center of this elongate basin is floored by young oceanic crust, but its northern and southern extensions into Burma and Sumatra, respectively, lie on continental crust. Thus, moving from north to south, the

Chapter 12 Basin Evolution and Sediments
present-day depositional environment of the basin changes from continental (Burma) to deltaic and oceanic (Andaman Sea), and again resumes continental conditions in Sumatra (Stoneley 198 1).
In some regions, intramontane troughs de- velop between the magmatic arc and backarc thrust belt. They may collect great thicknesses of volcaniclastic material as for example the Altiplano of Bolivia (Mitchell and Reading 1986).
Sediment Successions of Backarc Basins
From their variable tectonic setting, changes in sediment supply and oceanographic or other environmental conditions in the depositional area, it is evident that the sedimentary infil- lings of backarc basins also vary markedly. There are no generally applicable, simple fa- cies models, even if backarc basins on con- tinental and oceanic crust are considered sepa- rately. Therefore, ancient backarc basins are normally identified with the aid of their over- all setting in a plate tectonic context. Some general rules, however, can be useful in re- cognizing such basins from their sedimentary infillings:
- Many backarc basins are typically asym- metric, with a steep, often thrust-faulted, outer margin against the volcanic arc and a gentler dipping, possibly block-faulted inner margin. The sediments include clastics derived from both margins, i.e., from the volcanic arc and drainage areas of the craton, but lateral sediment influx from distal sources may also play a role, as in the previously mentioned example of Burma and the Andaman Sea. - On continental crust, the basin fill tends to evolve from an initial phase of coarse, clastic deposition into shallow-marine environments, and then to thick, molasse-type sediments de- rived largely from the volcanic arc and its basement. The backarc region on the eastern flanks of the Andes in South America (Suban- dean zone) is probably the most prominent example of this type of basin (e.g., Jordan et al. 1983; Megard 1984; Reutter et al. 1988). These basins are 100 to 200 km wide, and their late Mesozoic to Neogene infillings fre- quently attain 5 to 10 km in thickness, locally up to 15 km. An example of such basin evolu- tion is the Oriente basin east of the Andes in Ecuador and Peru (Fig. 12.28b, Stoneley 1981), where middle Cretaceous and older shelf sediments are overlain by thick upper
Cretaceous and Cenozoic molasse deposits. Cretaceous backarc basins in Chile contain thicknesses as great as 7 to 9 km of coarse clastics, including gravity mass flow deposits and turbidites (Mitchell and Reading 1986). Many of these basins experienced synsedi- mentary compressional deformation, mostly during the Tertiary, which created a thin- skinned fold-thrust belt. - Backarc basins on oceanic crust or rift ba- sins developing sea-floor spreading in the backarc region tend to become filled after shorter time periods than larger ocean basins due to their limited size and nearby clastic sediment sources. The different stages of a backarc basin resulting from the splitting of an oceanic arc are shown by the simplified model in Fig. 12.29. This model largely re- flects observations in the backarc region of the Mariana arc characterized by several older remnant arcs and basins in the backarc region, and other examples from the western and southwestern Pacific (Carey and Sigurdsson 1984):
- Stage I. Rifting of an island arc along a zone of crustal weakness and subsequent backarc spreading create a narrow trough bet- ween the active arc and inactive remnant arc. The basal fill in the trough is dominated by gravity mass flows, i.e., slides, slumps, debris flows, and turbidity currents, which transport basal tic p yroclas tic and epiclas tic material (eroded older pyroclastic deposits) into the basin (cf. Chaps. 2.4 and 5.4). Around the backarc spreading center, special hydrother- mal deposits may accumulate. On the side of the remnant arc, epiclastic and some pelagic sediments are common. The basin attains only moderate depth, and sedimentation rates are generally high during this stage (at least 100 to 200 m/Ma). - Stage 2. Continued backarc spreading causes basin widening and subsidence of previously formed oceanic crust as a result of cooling. Episodic volcanic activity in the arc region further provides large quantities of basaltic volcaniclastic material, which is deposited in aprons at the base of the arc or dispersed as ash falls over wider areas. Deposition of epi- clastic material on the side of the remnant arc is more or less replaced by deposition of pela- gic sediments, which also play some role on the active arc side. The basin floor is com- monly still above the CCD (Chap. 5.3.2) and thus allows preservation of calcareous micro- fossils. Dissolution of siliceous fossils may be hampered by relatively high SiO, contents in

Q, QUATERNARY P, PLIOCENE M, MIOCENE 0 , OLIGOCENE E, EOCENE
Pa, PALEOCENE
SW A N D E S , U M ~ S O Z O I C
ORlENTE BASIN
PLATFORM SEQUENCE NE / CORIENTES OIL FIELD
I -0- - 0 _ .
', -0- ' TERTIARY MOLASSE 1
Fig. 12.28. a Modem backarc and small ocean basins of (numbers). (After Leitch 1984). b Simplified cross-section the southwestern Pacific and results of the Deep Sea Dril- of Oriente backarc basin, Peru, fined with shallow-marine ling Project shown in simplified sections for specific sites to molasse-type sediments. (Stoneley 1981)

482 Chapter 12 Basin Evolution and Sediments
STAGE 3 NEW INTRA-ARCIBACKARC INACTIVE BACKARC BASIN BASIN
CCD A
PEL~GIC VOLCANICLASTIC SPLITTING OF ARC, SEDIMENTS APRON NEW SPREADING CENTER
STAGE 2 PELAGIC HYDROTHERMAL VOLCANICLASTIC _,, DEPOSITS DEPOSITS APRON ,:A,,, , 2
d d ' “ " - " f --- ---L -- ---- ,&-"---I'---i- d--- -*-- -------
EPICLASTIC SEDIMENT SUBSIDENCE
STAGE 1
-----
ASH TURBlDlTES SUBDUCTION
Fig. 12.29. Sedimentation model for backarc areas of deposition of thick volcaniclasitc apron at base of active arc oceanic island arcs in three stages of evolution. 1 Splitting flank and pelagic sediment farther away. 3 Backarc spread- of island arc by rifting, and initiation of backarc spreading ing ceases and renewed splitting of island arc may initiate into active arc and remnant arc; high influx of volcaniclas- a new basin. (AAer Carey and Sigurdsson 1984) tics. 2 Basin widening by continued backarc spreading;
sea water due to the presence of volcanic ash and glass (cf. Chap. 5.3.5). In the more distal parts of the basin, the sedimentation rate drops to around 50 m/Ma, but may maintain high values arcward in the volcaniclastic apron. Increased arc volcanism leads to propa- gation of the areas previously dominated by pelagic sedimentation. If volcanism wanes, pelagic, ash-poor sedimentation will prevail. - Stage 3. Ocean spreading in the existing
basin ceases, and splitting of the volcanic arc initiates the formation of a new backarc basin. The old basin still receives some epiclastic material and subaerially dispersed ash from the active arc, but is dominated by pelagic sedimentation. Continued subsidence may lower the basin floor below the CCD and thus cause carbonate dissolution, resulting in the deposition of brown clays. The sedimentation rate drops to values characteristic of normal

Backarc Basins 483
pelagic deposits in the oceans (5- 15 m/Ma for nannofossil ooze and around 5 m/Ma for brown abyssal clays). The subsequent sediment succession will be controlled mainly by factors unrelated to arc volcanism and backarc sprea- ding.
The sediment successions of small ocean ba- sins resulting from the rifting of continental crust or predating the formation of a volcanic island arc frequently begin with normal clastic sediments containing quartz, feldspar and mica. They are followed by pelagic and hemi- pelagic sediments and display a shallowing- upward trend, with increasing influence from volcaniclastic material, if a volcanic source is nearby. In addition, they show marked differ- ences between their outer and inner margins.
Examples of Modern Backarc Basins
Modern backarc basins of the southwestern Pacific. Some examples of Tertiary sediment successions drilled in backarc basins during the Deep Sea Drilling Project more or less fol- low the rules outlined above (Fig. 12.28a, Leitch 1984; Klein 1985b). Young, narrow ba- sins behind an active arc (e.g., west of the Tonga arc, Site 203) or older basins adjacent to an island arc (e.g., New Hebrides basin, Site 286, west of the Vanuatu islands, and the South Fiji basin, Site 205) display successions rich in various volcaniclastics and calcareous nannofossil ooze. The sedimentation rates of volcaniclastic sequences mostly range between 50 and 100 m/Ma. However, the drillholes (Sites 210 and 287) in the older Coral Sea ba- sin, generated by rifting of continental crust, and in the New Caledonia basin (Site 206) are dominated by slowly deposited nannofossil oozes and silty clays, with minor proportions of volcaniclastic material.
The upper portion of Site 210 contains about 2000 muddy turbidite beds alternating with calcareous ooze, deposited during a time span of 10 Ma (sedimentation rate around 50 m/Ma). This increase in sediment supply can be explained by a rejuvenated sediment source in the remnant arc re- gion. Early to mid-Oligocene unconformities observed in several basins are associated with accelerated bottom cur- rents. According to seismic records, the narrow New C a l e donia basin is filled with a 3000 m thick succession of sub- marine slumps derived largely off the Lord Howe Rise. The Tasman Sea basin adjacent to the Australian continent is characterized by a sequence rich in siliceous ooze and chert (not shown in Fig. 12.28a).
The same applies to the Sea of Japan which represents an approximately 20 Ma old, inac- tive backarc basin behind a volcanic arc as- sociated with an active subduction zone. This basin is more than 3500 m deep and separated from the open sea by a shallow sill.
Its sediments and basement rocks were investigated during Legs 127 and 128 of the Ocean Drilling Project (Brumsack and Shipboard Scientific Party, Leg 127; Holler et al., Preliminary Reports 1990).
The basal sediments on top of young oceanic crust in- dicate hemipelagic conditions. At Site 799, the lower half of a 1000 m thick Miocene to Quaternary sequence (ave rage sedimentation rate about 50 mlMa) consists of siii- cwus claystones and porcellanites with minor proportions of calcareous ooze and rhyolite tuff. The organic carbon content of these sediments is mostly around 1 96. The upper half is dominated by diatom ooze with an upwardly increasing proportion of clay and silty clay, including vol- canic ash.
In summary, the modern backarc basins of the western Pacific display a variety of sediment types including coarse-grained mass flow de- posits, submarine fan turbidites and basinal turbidites, hemipelagic and pelagic silts and clays, biogenic carbonates and biosiliceous sediments, and various types of tephra depo- sits (Klein 1985b). Whereas volume and nature of the siliciclastic material are controlled by arc volcanism and the presence and relief of nearby land sources, the biogenic sediments depend on ocean circulation and surface pro- ductivity. Most of the sediments represent deep-water conditions, either above o; below the CCD.
The deep basins of the Black Sea and Cas- pian Sea are assumed to be remnants of a much larger, 3000 km long, 900 km wide, Mesozoic to early Tertiary backarc basin (Steininger and Rag1 1984; Zonenshain and LePichon 1986).
This interpretation is based on seismic evidence indicating that these basins are floored by oceanic crust. In addition, the basins experienced increased rates of subsidence in conjunction with the approaching thrust belt from the south (the western and eastern Pontides, the Lesser Caucasus, and the Elburz Mountains). The area between the two basins was closed by collision in front of the northward moving Arabian promontory.
In the Black Sea, upper Cretaceous to Neogene sediments attain a maximum thickness of nearly 15 km. The oil-bearing middle Pliocene to Quaternary strata of the southern Caspian Sea are 3 to 6 km thick and thus were depo- sited at a rate on the order of 1000 m/Ma. They are underlain in the basin center by 8 to

Chapter 12 Basin Evolution and Sediments
10 km older sediments. The youngest develop- ment and present depositional environments of these basins are discussed briefly in Chapter 4.3.
12.5.5 Preservation and Recognition of Ancient Subduction-Related Basins
Ancient subduction-related basins are normal- ly identified by evaluating their temporal and spatial relationship with magmatic arcs. Deep- sea trenches, forearc basins, and oceanic backarc basins are commonly closed by con- tinued plate convergence. Their infills are in- corporated into collision zones, where they are strongly deformed, disrupted and partially metamorphosed. Backarc basins behind con- tinental margins, however, have a better chan- ce of being preserved in a state which is only moderately modified by subsequent tectonic movements.
In many ancient examples, however, the differentiation of trench fills and sequences from forearc and backarc basins exposed in orogenic belts is difficult. Trenches are always filled in deep water, but their sediments in- clude slumps and mass flows, which contain material from shallower or terrestrial environ- ments. Both forearc and backarc basins display a shallowing-upward trend if the sediment supply is sufficient to fill the basins. The pre- sence of oceanic basalts associated with deep- marine sediments in a subduction complex or melange is taken as evidence for accreted sea
floor, but may also indicate the former exis- tence of a residual forearc basin or an oceanic backarc basin.
The determination of paleo-current direc- tions and textural trends of subaerially and subaquatically deposited beds (e.g., fluvial transport, sediment gravity flows, turbidity currents) can be used to distinguish between forearc and backarc depositional systems. In addition, large proportions of volcaniclastic material and the occurrence of specific detri- tal minerals in sandstones (e.g., clinopyroxene and amphibole, Morris 1987) indicate nearby active arc volcanism.
The composition of volcaniclastic material derived either from continental margin arcs (dominated by intermediate and silicic, largely calc-alkaline magma types) or oceanic arcs (mainly basaltic and andesitic material) is fre- quently quoted as a means of discriminating these tectonic settings (e.g., %rook 1974; Dick- inson 1982; Dickinson et a1 1983; Maynard et al. 1982; Valloni and Mezzardi 1984; also cf. Chap. 2.4.3). Large proportions of feldspar and other minerals characteristic of granitic and granodioritic rocks may testify to the fact that the arc massif was already deeply eroded. Interpretations of ancient sedimentary succes- sions based solely on composition should, however, be regarded with caution (e.g., Moore GF et al. 1982; Lash 1985; Velbel 1985; Zuffa 1987), since several modern examples of trench fills, forearc basins and backarc basins have shown that distant sediment sources and sediment recycling can play a decisive role.

12 Basin Evolution and Sediments
12.6 Remnant and Foreland Basins
12.6 Remnant and Foreland Basins 12.6.1 Remnant Basins with Flysch
General Aspects Basin Evolution and Sediments
12.6.2 Foreland Basins with Molasse General Aspects Basin Evolution and Sediments
12.7 Pannonian-Type Basins General Characteristics Sediment Successions
12.8 Pull-Apart Basins General Characteristics Sediments of Pull-Apart Basins The Guaymas Basin Model (Gulf of California) Concluding Remarks
12.9 Basin-Type Transitions (Polyhistory Basins) General Aspects Basin-Transition Models Sediment Preservation Potential of Various Basin Types
12.6.1 Remnant Basins with Flysch
General Aspects
The late phase of the development of an oro- genic belt is commonly characterized by the transition from remnant basins of a closing ocean to a foreland basin. While remnant ba- sins are largely filled with flysch-type sedi- ments, foreland basins accumulate mainly mo- lasse deposits. Flysch is typically a thick ma- rine sequence of turbidite beds and gravity mass flows, contains an autochthonous deep- water fauna (apart from displaced shallow- water organisms), and is incorporated into the thrust and fold belt of an orogen. Molasse consists predominantly of shallow-marine to continental deposits including large alluvial fans and fan deltas. The evolution of both types of basin fills is closely related to the geodynamic development of an orogen. This is
shown in the simplified model of Fig. 12.30, which imitates to some extent the situation in the Swiss Alps (e.g., Matter et al. 1980; Stock- ma1 and Beaumont 1987; Caron et al. 1989).
Remnant basins resulting from subduction are underlain by oceanic crust and therefore represent deep, narrowing basins (cf. Chap. 1.2). In Figure 12.30a, the remnant basin is confined on one side by a pre-existing passive continental margin with a wedge of older clas- tics and carbonate sediments, and on the other side by an approaching overthrust belt (accre- tionary wedge) shedding relatively large vo- lumes of various clastics in the form of tur- bidites and mass flow deposits into the basin.
Some flysch basins may also develop in top-. ographic depressions generated by tectonic deformation of continental crust and micro- cratons.
Basin Evolution and Sediments
Flysch sediments markedly vary in grain size distribution and composition in relation to the changing influence of intra-basinal and extra- basinal sediment sources (Fig. 12.31a). The wide spectrum of flysch deposits may include proximal conglomeratic beds, coarse-grained debris flows ("wildflysch", but also see Chap. 12.5.2) and olistostromes (Chap. 5.4.1), and shale-dominated sequences with distal fine- grained turbidites. In places also marly and calcareous flysch facies occur (Fig. 12.31a and b). Most of these deposits accumulate in deep water, but not all of them indicate water depths below calcite compensation, depending on the degree of basin fill and temporal and spatial fluctuations of the CCD (cf. Chap. 5.3.2).
Flysch sediments deposited along the front of the overthrust belt are successively incor- porated into the overriding accretionary wedge (cf. Chap. 12.5.2). Older flysch is fre- quently overthrust onto younger flysch depo- sits. In a cross-section from the internal fold-

Chapter 12 Basin Evolution and Sediments
MIPELAGIC SED.
Fi. 12.30a-d. Model showing transition from remnant sediment source. Mohse deposits of foreland basin tend to oceanic basin (a and b) to foreland basin (c and d) due to evolve from marine (possibly rather deep, flyschoid) to emplacement of overthrust belt as tectonic load onto p r e continental sediments and to prograde over the shelf se- existing passive continental margin (collision). With pro- quence of former passive margin. Late phase, rapid ero- grading overthrust belt, zone of subsidence, basin axes, sion of high elevated thrust-fold belt fmally initiates uplift and flexural foreland bulge migrate outward toward the including the inner parts of the foreland basin. (Mainly foreland. Successive flysch deposits (deepsea fans and after Matter et al. 1980; Stockmal and Beaumont 1987) trench fills) may differ in composition due to changes in

Remnant Basins, Flysch 487
a SUBMARINE FAN, VARIABLE "'"
PASSIVE TRANSPO
\
\ ccD (ABOVE CCD)
FLYSCH DEPOSITION J L W ~ L D ~ ~ I I Y D L L W V V bbu (ABOVE CCD)
FORELAND b
INTERNAL ZONE . OLISTOSTROMES
FLYSCH LITHOLOGY
I" / ' OUTER FAN HEMIPELAGIC SLUMPS AND MIDFAN OLISTOSTROMES ASSOCIATION
Fig. 12.31ae. Some general problems of flysch sediments of the northern Apennines, Italy. (After Ricci-Lucchi in orogenic belts. a Different types of flysch basins with 1975). Note coarsening-upward and progradational trend in various sediment sources and transport directions, deposi- Miocene Marnoso-arenacea flysch (d) over-supplied with tion above or below calcite compensation depth (CCD). sediment, while Upper MioceneLower Pliocene Laga b Simplified scheme of decreasing age toward the foreland formation (e) is characterized by fining-upward trend as a and various lithologies of flysch basins in the Swiss Alps. result of sediment supply insufficient to compensate for (After Matter et al. 1980). c and d Location and mega- subsidence facies distribution of longitudinal sections in flysch basins

488 Chapter 12 Basin Evolution and Sediments
thrust belt to the foreland, the flysch deposits (in their original position) generally become younger toward the foreland (Fig. 12.3 1 b). Younger flysch may differ in composition from older flysch due to variations in the sed- iment source provided by the growing accre- tionary wedge and its hinterland. Specific sed- iment sources such as ophiolites or overthrust metamorphics can be of particular diagnostic value (e.g., Winkler 1988). Over-supply of a narrowing basin (i.e., sedimentation 2 sub- sidence) may lead, at least locally, to shal- lowing sequences (Fig. 12.3 l d). However, as long as oceanic crust continues to be subduct- ed beneath the prograding overthrust belt at a relatively high rate (Chap. 12.5.2), the basin normally remains deep and may even exhibit a fining-upward trend.
The megafacies distribution in flysch and deep foreland basins (see below), as well as the directions of sediment transport may vary with time and from basin to basin (e.g., Ricci- Lucchi 1975 and 1986; Hesse and Butt 1976; Ackermann 1986). The most important facies associations include deep-sea midfan and outer fan sediments, outer fan sediments in- terfingering with those of the basin plain, basin plain deposits, slumps and olistostromes, and hemipelagic sediments (Fig. 12.3 1c through e, also see Chap. 5.4.2). The vertically and laterally changing megafacies result main- ly from the varying efficiency and repeated shift of submarine canyon and fan systems funneling sediment into the elongate basins. In addition, the facies evolution is frequently controlled by synsedimentary tectonic basin deformation along the front of the overthrust belt (Homewood and Caron 1983; Ricci-Lucci 1 990).
Some uplift of the foreland (foreland bulge or forebulge) may cause an erosional uncon- formity in the older sediment wedge of the passive margin sequence (Fig. 12.30~).
12.6.2 Foreland Basins with Molasse
General Aspects
The evolution of a peripheral foreland basin begins, when the former ocean is closed and the front of the overthrust belt has reached the stretched crust of the pre-existing con- tinental margin (Chap. 1.2, Fig. 1.3a; Fig. 12.30~). Then the active subduction zone evol- ves into a collisional over-thrust belt as one continent overrides another.
The subsidence history of these basins reflects the rate of thrusting in the adjacent orogenic belt and sedimentation rate in the basin (Angevine et al. 1990). In addition, the nature and thickness of the lower plate plays a role. If the overriding tectonic load increases slowly with time and the continental crust beneath the thrust belt is thick, subsidence of the evolving foreland basin proceeds at a low rate and cannot exceed a specific limit. In contrast, rapidly overriding thick tectonic loads on thinned continental or transitional crust generate fast and deep subsidence in relatively narrow basins. The migration of thrust sheets into the basin results in an in- creasing rate of subsidence of the flexing crust in the basin in front of the thrust belt (con- vex-up subsidence curves, cf. Chap. 8.5 and Fig. 8.19). A discontinuous movement of the thrust sheets may lead to irregular subsidence curves. Sediments derived from the thrust belt are deposited in the basin and thus further cause subsidence to migrate outward toward the foreland. Finally, after thrusting has teas- ed, erosion of the thrust load and heating of the subducted crust generates crustal rebound. i.e., uplift.
A somewhat modified evolution of foreland basins was found in the southern Alps, the Po basin on the Apennine margin, and in the northern Apennines, Italy, as well as on the Pyrenean margin of the Ebro basin in Spain (Ori and Friend 1984; Massari et al. 1986; Ricci Lucchi 1986; Boccaletti et al. 1990). In these cases, satellite foreland basins also de- velop on top of deeper lying thrust sheets in addition to the main foreland trough. The basins may be split by prograding thrust sheets or carried "piggyback" toward the foreland (Fig. 12.33b). Furthermore, older portions of the molasse incorporated into the thrust belt are uplifted and eroded, i.e., their sediments are recycled.
Modern Examples
Some deep basins in modern oceans result from rapid emplacement of overthrust loads, such as the 1.5 km deep western Taiwan fore- land basin (Covey 1986) and the 2 to 3 km deep Timor-Tanimbar Trough between Aus- tralia and the Banda Arc (Audley-Charles 1986).
The Timor-Tanimbar Trough is located to the east of the Sunda and Java Trench (Fig. 12.224 where the Australian continental crust underplates the non-volcanic island chain

Foreland Basins, Molasse
OLDER '
w RELIEF z I-
DELTAIC
SHALLOW MARINE
b . . . . , . . . - . . ... ... - ... ..:;
BRACKISH LACUSTRINE LOW RFI IFF
\ M H M l N t bHNL / 1 FLUVl / : . : : . : : ~ ~ : ~ ~
LAUSANNE / nlcral I ...
SANDS AND WlTH COAL GYPSIFEROUS / SHALLOW- MARLS ..- -,.,-
-"'" FLUVIAL IAL PROXIMAL
SUBMARINE FANS L. MIOCENE -7 - U. OLIGOCENE DEEP MARINE
- I -M nl ICOCENE
l l c a . l O k m , / u
FLUVIAL WlTH MARINE AND RED BEDS BRACKISH SANDS
AND SHAL FS LONGITUDINAL SECTION (BAVI
! C BRACKISH WITH COAL STRATIGR. MARINE SAND
\ BOUNDARIES AND CONGLOM.
UPPER FRESHWATER MOLASSE ALLUV. FANS, CONGLOMER.
0.7 (MANY FLYSCH CLASTS)
PPER MARINE MOLAS LAUC. SANDS, SHELL
__----- MARLY SHALES
Fig. 12.32. a Evolution of foreland basin fill, stages I to and freshwater molasse. (After Matter et al. 1980). d Lon- 3 (4). (After Covey 1986). b Generalized, reconstructed gitudinal section of foreland molasse in Bavaria, Germany, cross-section of foreland (molasse) basin in western Swit- exhibiting transition from permanently marine conditions in zerland. (Homewood et al. 1986). c Simplified stratigra- the east to partial brackish and continental environments in phic section of Swiss molasse showing two major shal- the west. (After B6gli and Miller 1976) lowing-upward cycles, each of them represented by marine

Chapter 12 Basin Evolution and Sediments
of the Banda Arc. Subsequent to collision during the mid- dle Pliocene, crustal shortening set in and continues to the Present. It operates at rates of 6 to 12 cmla and causes both uplift of the island arc (1 to 3 mmla) and subsidence of the foreland basin (1 mmla along the present axis of the basin). In an upper Quaternary sediment section drilled in the Timor Trough, 400 m consist of fme-grained siliciclas- tics and biogenic carbonates. The total sediment thicknesses of the water-fded foreland basin ranges between 4 and 7 km.
Basin Evolution and Sediments
Early Stage of Evolution
Due to the emplacement of a tectonic load on thinned continental crust, the early stage of many ancient foreland basins tends to be fair- ly deep and thus may be still characterized by flysch-like marine sediments and submarine fans near the rising mountain range (Fig. 12.32a). The deformation front of the over- thrust belt may advance at rates up to several cm/a onto the foreland and cause rapid sedi- ment accumulation in the foredeep.
Excellent examples of this stage have been described from the southern Pyreneans (Mutti 1984; Mutti et al. 1985; Labaume et al. 1985), the northern Apennines and the southern Alps (Ricci Lucchi 1986; Boccaletti et al. 1990). In the northern Apennines, the Neogene deformation front advanced at a rate of 0.25 to 1 cmla; further south the depocenters of Miocene foredeeps migrated outward at a rate of up to 7.5 cmla, and sediments accumulated as fast as almost 1000 mlMa. In the South Pyrenean foreland basin, a deformation rate of 3.5 cmla is assumed. Rapid subsidence led to the accumulation of turbidite sequences up to 3.5 km in thickness. These were shed in an axial, western direction and also include carbonate turbidites derived from shelves to the north and south of the deep basin. In addition, the basin was segmented by synsedimen- tary structural highs transverse to the basin axis. The east- ern portion of the foreland basin was largely filled with fluvial and deltaic sediments.
Foreland basins are markedly asymmetric. Thus, already in the early stage of evolution shallow-marine (marine molasse) or fluvio- deltaic sediments (freshwater molasse) predo- minate near the bordering platform.
Later Stages
During further development, the advance of nappes of the overthrust belt is increasingly hampered by the thickening, flexured and cratonward rising top of the underlying con- tinental crust (Fig. 12.30d). Some cases have been described in which upper portions of the
underplating crust and its shelf sediments were scratched off and incorporated into the overthrust belt (not shown in Fig. 12.30). Ear- ly molasse may be sheared off and folded in front of the overthrust belt, or overridden by the nappes. In this stage, the overthrust sheets are forced to move obliquely upward and reach elevations high above sea level, before they finally come to rest. This in turn pro- motes subsidence and additional flexure of the continental plate and thus expansion of the basin toward the foreland. The extension of the basin is, however, limited by the outward migrating foreland bulge.
Sediments filling the foreland basin are predominantly clastics derived from both sides of the basin, but particularly from the highly elevated parts of the folded overthrust belt. The general tendency is a shallowing-upward sequence which ends with continental sedi- ments (Figs. 12.30a and 12.32a). During the early deep-water stage, the orogenic belt may still form a submarine ridge or a ridge of low elevation above sea level. Later, shallow-ma- rine, deltaic, and fluvial sediments predomi- nate. When uplift of the orogenic belt is ba- lanced by erosion, the elevation of the moun- tain belt and its denudation rate have reached their maximum. This may lead to a kind of steady-state evolution of the foreland basin during its further migration toward the pas- sive mainland (Covey 1986). Under these con- ditions, the basin's cross-sectional area re- mains more or less constant, and its sedimen- tary fill displays only minor changes.
Such a situation, however, was commonly superposed by additional processes. The depo- sitional environment of many foreland basins frequently varied between shallow-marine, brackish, and continental as a result of signi- ficant spatial and temporal changes in sedi- ment supply, sea level changes, and climate (Figs. 12.30b, c and 12.32; also see, e.g., Bach- mann et al. 1987; Lemcke 1988; Barrio 1990). As mentioned above, a solely marine sequence may laterally pass into brackish, lacustrine or fluvial sediments (Fig. 12.32d). Coal seams of limited thickness and extension are common in such transitional regimes.
Example: The huge, about 5000 km long foreland basin east of the Rocky Mountains in North America, the so- called Western Interior seaway, was flooded from the Aptian to the late Cretaceous and formed a broad seaway, connecting the proto-Gulf of Mexico and the Circum- Boreal seaway for nearly 35 Ma (Weimer 1960; Jordan 1981; Kauffman 1984: Molenaar and Rice 1988). It experienced five major and numerous minor transgressive regressive cycles (cf. Chap. 7.4), and accumulated marine

Foreland Basins, Molasse
a CHRONOSTRATIGRAPH~C CHART
PROXIMAL COARSE- GRAINED FAClES
\
OUTWARD MIGRATION OF FOREBULGE
W @ QUIESCENCE
/ FINE-GRAINED FACIES OF BASIN AXIS AND FORELAND MARGIN
CRATON BASIN SPLITTING PIGGYBACK BA
WITH PRE-MOLASSE SEDIMENTS THRUST SHEETS
C QUATERNARY PLIOCENE-QUAT. ALLUVIAL FANS PLIO-QUATERN. OF AND FLUVIAL CONGLOM. AND SANDS KATHMANDU BASIN
s \ S T - / / - 4 N (INTRA-HIMALAYAN)
, MIO-PLIOCENE FLUVIAL HIMALAYAN NAPPES
SANDS AND PELITES (PRECAMBRIAN AND PALEOZ. ROCKS
MOTION OF -MIOCENE C INDIAN PLATE VOLCANICS OF FINE SANDST. AND RED BEDS:
I 50 km
I INDIAN SHIELD PALEO-EOCENE SHALLOW-
MARINE SHALES AND LIMEST.
Fig. 12.33. a Model of foreland basin subject to episodic thrust belt and minor basin camed piggyback on thrust- thrusting (stages I and 3) causing migration of the fore- sheets. (After Ori and Friend 1984; Ricci Lucchi 1986). bulge toward the thrust belt. Periods of tectonic quiescence c Evolution of Himalayan foreland basin in two stages (I (2) lead to thrust erosion and outward migration of fore and 2) with sediment wedge of the Siwaliks. MET Main bulge. Note stairstepped facies package and erosional un- boundary thrust; ST Siwaliks thrust. (AAer Mascle et al. conformity. (AAer Flemings and Jordan 1990). b Scheme 1986). See text for explanation of foreland basin with deposition partially on top of fold-

Chapter 12 Basin Evolution and Sediments
sediments up to about 6000 m in thickness. A special fea- ture of this basin was its wide eastward extension onto the stable craton beyond the forebulge zone. This development was favored by the heavy sediment load deposited east of the thrust belt, as well as by the unusually high eustatic sea level during the middle Cretaceous. This basin displays a variety of sedimentary facies including deltaic sediments, coal seams, coastal barrier sandstones, offshore siltstones and shales, shelf sandstones and limestones, black shales, and even some turbidites.
Sediment Supply and Lateral Facies Change
Foreland basins receiving large volumes of clastic material during their evolution, as for example the widely extended Eocene to Quaternary molasse basin south of the High Himalayas, are filled predominantly with alluvial fans and fluvial deposits (Fig. 12.33~; Mascle et al. 1986; Delcaillau 1986). Such over-supplied basins develop a marine deposi- tional environment only during their early stage.
Thick conglomerates deposited as alluvial fans frequently border the front of the mountain belt which undergoes rapid erosion. Fan deltas may prograde over shallow-marine sands. Some distance away from the mountain front, the distributory systems follow the longitudinal trend of the basin. A surplus of sediment can be transported longitudinally out of the basin into an adjacent ocean. The mo- lasse sediments prograde onto the platform with time (Fig. 12.32 a); younger beds succes- sively overlap older, pinching-out strata (e.g. Homewood et al. 1986). Finally, isostatic ad- justment to the continuous erosion of the rising mountain range leads to exhumation of formerly deeply buried rocks and structures, as well as to some uplift of the neighboring parts of the foreland basin (cf. Chap. 8.5).
These general trends are modified in settings where thrusting occurs discontinually. Episodic thrusting with periods of tectonic quiescence in between may cause a stair- stepped facies package as modeled for a nonmarine foreland basin (Fig. 12.33a; Flemings and Jordan 1990). Thrusting and high elevation of the thrust belt (stage 1) induces thrustward migration of the forebulge and the deposition of proximal alluvial fans. The subsequent stage of quiescence (2) is characterized by continued erosion along the thrust belt, outward migration of the fore- bulge, and deposition of mainly fine-grained sediments in the center and distal portions of the basin. Renewed thrusting and thrustward migration of the forebulge (stage 3) causes
partial erosion of former distal sediments and the formation of a new proximal clastic wedge. The simplified chronostratigraphic chart of such an evolution shows periods of slowly prograding proximal and more distal facies, interrupted by intervals of erosion and retrogradation toward the thrust zone. Facies retrogradation marks the onset of a new thrusting event. Other variations in foreland basin evolution result from an irregular shape of a continental margin subject to collision (e.g. Lash 1988). In this case, the tectonic load of the thrust belt is emplaced at different times along strike of the basin and thus causes diachronous pulses of subsidence and sediment supply.
Sediment Composition and Sedimentation Rates
The mineralogical composition of molasse sandstones varies from quartz-rich, feldspar- poor types derived from intensely weathered continental blocks to varieties which are less quartz-rich but rich in rock fragments (Schwab 1986). The latter types constitute the bulk of sand in many foreland basins. Material derived from tectonically uplifted subduction complexes or magmatic arcs is found only in small quantities. Systematic variations in com- position through time, related to unroofing of deeply buried rocks, are rarely observed.
The average sedimentation rates in foreland basins strongly differ between proximal (near the thrust belt) and distal areas. Average rates range between 50 and 1000 m/Ma; in the foreland basin south of the High Himalayas 200 to 500 m/Ma are common (Mascle et al. 1986).
12.7 Pannonian-Type Basins
General Characteristics
Relatively large, intramontane basins related to adjacent collision belts and subduction zones are referred to as Pannonian-type basins (cf. Chap. 1.2). Such basins are underlain by thinned continental crust, and they may origi- nate from former backarc or retroarc basins which predominantly undergo extension be- hind fold-thrust belts migrating towards the foreland (Mitchell and Reading 1986). The prototype of these basins is the Pannonian basin of Hungary and its neighboring coun-

Pannonian-Type Basins
tries. Although recent studies (Royden and Horvath 1988) shed some doubt on the useful- ness of the Pannonian basin as a model basin for the interpretation of other intramontane basins, some of the new results are briefly discussed here. The Pannonian basin is a young and relatively simple system which is not overprinted by subsequent tectonic pro- cesses. It is therefore well suitable for an ex- ample of basin analysis (Burchfiel and Royden 1988).
The Pannonian basin lies within the Alpine mountain belts of eastcentral Europe (Fig. 12.34a). From east to west it is about 800 km long and from north to south 400 km wide. It is currently interpreted by most authors as a back- arc extensional basin of middle Miocene age. However, it should more accurately be called the "Pannonian basin system" because it consists of several smaller individual basins separated by relatively shallow basement blocks. This structural pattern results from a combined backarc and escape tectonic setting during the Miocene (Fig. 12.34d). It is caused by the collision between the European plate and several smaller plates to the south including Africa. Deformation of the Pannonian region occurred during the final stage of thrusting and folding in the outer part of the Carpathians. Thrusting was directed outward from the Pan- nonian basin toward the European platform and the Adria- tic region. Extension of the Pannonian plate fragment oc- curred along a conjugate system of faults and was accom- panied by strikeslip (Fig. 12.34a). Size and shape of the resulting special troughs including pull-apart basins (see below) vary considerably, but their long axes more or less follow the directions of the dominant fault system.
In some of these special basins the Neogene- Quaternary sediments exceed 7 km in thick- ness. Part of the Neogene Pannonian basin sediments overlie the internal Mesozoic thrust sheets of the surrounding mountain belts, for example below the Vienna basin (Fig. 12.34b). Paleogene sediments occur only in limited areas.
The northernmost basins near the mountain belt (Vienna and Transcarpathian basins) subsided and were mainly filled in early to middle Miocene time, i.e., prior to the basins farther south (Danube, Zala, Drava, Mak6 and Bik6s basins) where rapid subsidence began in the middle Miocene.
This diachronous basin development was caus- ed by two processes (Mattick et al. 1988; Roy- den 1988; Nikolaev et al. 1989):
1. Thermal subsidence of the basins located near the thrust belt occurred earlier and at a more rapid rate than in the central part of the Pannonian system. Hence, the basins adjacent to the mountain belt contain thick, fault- bounded sediments which were deposited dur-
ing the extensional phase (syn-extensional sediments). They are covered by thin post- extensional strata (see scheme of Fig. 12.34e and f). By contrast, basins located far from the thrust belt exhibit only thin fault-bounded syn-extensional sequences which in turn are overlain by thick, flat lying, unfaulted post- extensional sediments. 2. Due to the location of the principal sedi- ment source to the north and east of the Pan- nonian system, the basins were successively filled from north or east to south and south- west.
Sediment Successions
The sedimentary fill strongly varies within individual basins and from one basin to another basin. Therefore only some general trends can be mentioned (Fig. 12.34g). Com- monly, Neogen sedimentation started with continental or marine transgressive beds fol- lowed by shallow-marine shales and marls with sandy intercalations. During the early, marine deep-water stage of the basins, result- ing from rapid subsidence and insufficient sedimentation to keep pace, predominantly marly, hemipelagic sediments with turbidites and submarine fans including gravity mass flows were deposited (Mattick et al. 1988). The depths of the troughs may have been on the order of 1000 m; stagnant water conditions occurred in several basins. As subsidence slowed down, the basins were slowly filled by prodelta and delta front sediments. The final stages were characterized by delta plains, brackish and freshwater lakes, and fluvial de- posits of the evolving Danube river and its tributories.
Generally, the basins display a shallowing- upward tendency. However, the sedimentary facies may locaily vary in type and thickness and display unconformities due to synsedi- mentary faulting, uplift and tilting of indivi- dual blocks, and small-scale horst and graben structures within the basins. In addition, the marginal facies of the basins differ from those of the more central parts.
Such complications are known, for example, from the Vienna basin (Fig. 12.34b and c), which is a significant oil and gas field and has therefore been intensively explored by numerous drill holes during the last 60 years (Wessely 1988, also see Chap. 12.8).
The subduction-related Neogene deformation of the Pannonian fragment was accompanied by Miocene calcalkaline volcanism and young-

494 Chapter 12 Basin Evolution and Sediments
0
k m
4 a MIOCENE
(INCLUDING INACTIVE ALPINE NAPPES)
d N 15 Ma B.P.
EUROPEAN FORELAND
GHP EAST CARP. /
- 10 Ma B.P. '3 (AFTER EXTENSION) GHP A TS I I
g _ _ -_ _.' DELTA PLAIN FACIES 'r SUBCRUSTAL'-,
I FLUVIAL TO LACUSTRINE , 200km, LITHOSPHERE I SILTY CLAYS, MARLS. MARSH.
AND SANDS. LOCALLY LIGNITE AND PALEOSOLS
,DELTA FRONT FACIES e MIGRATION OF EXTENSION
SAND, SILTS, AND MARLS, AND SUBSIDENCE
INCLINED AND DEFORMED BEDS S O R W <=I N O R E
- PRODELTA FACIES, MARINE SANDS AND MARLS 2 SLUMPS AND TURBlDlTES
- DEEP BASIN FACIES, MARINE SHALES AND MARLS + TURBlDlTES f YOUNG AND OLDER BASIN FILL PARTIALLY ELJX~NIC \
, BASAL FACIES, S~ALLOW-MARINE OR COhTINEhTA,
Fig. 12.34. a Pannonian basin system within the Alpine belts of centraleastern Europe. Hatched areas indicate smaller basins with Neogene to Quaternary sediment thick- nesses > 3000 m. DA Danube basin; Z Zala b.; DR Drava b.; S Sava b.; TC Transcarpathian b.; TS Transsylvanian b.; M Mak6, and B B6k6s depressions; GHP Great Hun- garian Plain; HCM Hungarian Central Mountains; P.A.L. Pen-Adriatic Line. b and c Simplified plan view and cross- section of Vienna pull-apart basin. (In realitiy the structure and sedimentary fill of the basin are much more complex;
Wessely 1988.) d Migration towards to the foreland and steepening of East Carpathian subduction zone causes ex- tension of Pannonian plate fragment and formation of a number of small basins. e Simplified scheme demonstrating migration of specific zones of subsidence and basin fdl away from thrust belt. f Idealized succession of sedimen- tary facies in special basins of the Pannonian system. (After Royden et al. 1982; Mattick et al. 1988; Royden 1988)

Pannonian-Type Basins
er alkali basalts. Their material contributed to the filling of the basins.
Other Examples
Pannonian-type intramontane back-arc basins which are deformed by continuing mountain building processes are also found in other re- gions. The Aegean Sea behind the Hellenic arc in the eastern Mediterranean may be regarded as a modern example of such a basin (Le Pi- chon 1982; Jacobshagen and Giese 1986). This area is underlain by continental crust, is sub- ject to rapid extension (2-6 cm/a during the last 70 years, Jackson and McKenzie 1988), and started to subside in the Miocene.
12.8 Pull-Apart Basins
General Characteristics
Both continental and oceanic crust may be affected by strike-slip creating pull-apart ba- sins (Chap. 1.2). These basins occur in dif- ferent tectonic settings (Mann et al. 1983; Christie-Blick and Biddle 1985):
- Along strike-slip boundary zones between rigid, continental plates. - In zones of oblique subduction along vol- canic arcs. - In zones of "continental escape" in response to collision.
In addition, many extensional continental gra- ben and rift zones exhibit a significant strike- slip component.
Pull-apart basins are generated at the re- leasing bend of trans form faults and display a certain evolution from a small initial stage (e.g., spindle shape) to a "lazy-S" and rhom- boidal basin to a more mature, elongate trough stage (Fig. 12.35a). Furthermore, there are more complicated strike-slip systems with various basin morphologies (Ballance and Reading 1980; Biddle and Christie-Blick 1985), such as basins associated with the bi- furcation of faults. Small basins are commonly underlain by thinned continental crust, while greater strike-slip motions lead to the forma- tion of new oceanic crust in one or several special troughs within the larger basin, as for example in the Gulf of California (see below). Pull-apart basins are typically narrow (less
than 50 km wide). Extremely long pull-apart basins may develop a short spreading ridge comparable to mid-oceanic ridges.
The Cayman trough in the Caribbean is 1400 km long and probably the world's longest pull-apart basin. It is charac- terized by such a spreading ridge, the 100 km long Cay- man rise (Mann et al. 1983). This basin results from sinis- tral strike-slip motion between the North American and Caribbean plates.
Along a widely extended strike-slip zone, sev- eral pull-apart basins may be created simul- taneously as, for example, known from the Gulf of Aqaba and Dead Sea Rift in the Middle East (Manspeizer 1985), the San Andreas Fault system in California, or the Anatolian Fault system in Turkey (Hempton and Dunne 1984; Sengor et al. 1985), and New Zealand.
The displacement along strike-slip faults may be accompanied either by extension (transtension) at a releasing bend or compres- sion (transpression) at a restraining bend along the fault line in map view (Fig. 12.35b, cf. Chap. 1.2). Transpression leads to reverse fault separation, vertical uplift, thrusting, and fold- ing (Fig. 12.35b and c) and is therefore inef- fective in creating sedimentary basins of some size (Reading 1980). Transtension, however, and simple, "sharp" pull-apart motion (Fig. 12.37d, scheme for Gulf of California-type spreading troughs) form important basins with substantial sediment fills. The size of these basins is mainly controlled by fault separation and overlap of the master faults. Further pro- minent features of strike-slip faults are "en echelon" faults and folds which may occur within or adjacent to the principal displace- ment zone. In profile, strike-slip zones show characteristics as shown in Fig. 12.35~. The sediments may be segmented in wedge-shaped bodies with laterally variable facies and thick- ness. Both normal and reverse separation faults may be present in the same depth range and along the same fault at different levels.
Strike-slip movements commonly operate at very high rates (1 to 10 cmla). With the aid of displaced alluvial fans, average slip rates of 2.2 to 3.4 cmla were determined along the San Andreas fault in California for the last 30 000 years (Harden and Matti 1989). Maximum rates were as high as 6 to 8 cmla.
Due to such high slip rates, subsidence of pull-apart basins is also relatively fast. The subsidence of narrow pull-apart basins is more rapid than that of rift basins of infinite length. In the former case, the heat provided

Chapter 12 Basin Evolution and Sediments
ULT SEPARATION
'LAZY-S'- SHAPED BASIN
RHOMBOIDAL BASIN
OVERLAP OF MASTER FAULTS
NARROW LONG TR
OCEANIC CRUST %SPREADING RIDGE
d DEPOSITION RATE lmlka STRETCHING RATE 3 cm/a
0 1 2 3 TIME (Ma)
HORSETAIL RELEASING RESTRAINING SPLAY BEND FOLDS BEND
1 \ I I
AREAS OF REVERSE (Rj
SUBSIDENCE SEPARATION
AND-SEDIMENT NORMAL (N) ACCUMULATION SEPARATION ////////
EN ECHELON
DEAD SEA
HORNELLEN B + CHUCKANUT BtSIN
IN THE IENNA* PANNONIAN
R BASIN BASIN B
PER CARBONIFERWS SIN OF SPAIN
1 HANMER PLAIN & CARRINGTON B LC PETROCKSTOW B.
0 20 40 60 80 100 LENGTH OF PULL-APART BASIN (km)
Fig. 12.35. a Generalized model of the evolution of simple (After Christie-Blick and Biddle 1985). d Calculated sub- pull-apart basins in relation to fault separation and overlap sidencettime curve for crustal block of 10 km width and of master faults. Basins with large fault separation may constant sedimentation rate. (Pitman and Andrews 1985, develop two or several smaller, pull-apart troughs. Mature see text). e Relationship between maximum sediment thick- basins form narrow, elongate troughs partially underlain by ness and length (overlap of master faults) of modem and newly accreted oceanic crust. (After Mann and Dunne ancient pull-apart basins. (After Hempton and Dunne 1984; 1984). b Plan view and c transverse profile of idealized data of Pannonian basin from Royden and Horvith 1988) strike-slip fault with associated structures.

Pull-Apart Basins
by the upwelling magma under the stretched crust is laterally lost and thus subsidence ac- celerated (Pitman and Andrews 1985; Sawyer et al. 1987; cf Chap. 8.3).
The Los Angeles basin was formed since the middle Mio- cene (11 Ma B.P.) and accumulated in its center a se- quence of 9 to 10 km in thickness. About 4 km of this total subsidence result from purely tectonic subsidence. A pull- apart basin assumed below the northeastern Nile delta subsided at a rate of about 0.5 cmla during the last 7000 years (Stanley 1988b).
A model calculation using the local Airy model for a crustal block of 10 km width sub- jected to a stretching rate of 3 cm/a and a continuous sediment loading of 1 m/ka (Fig. 12.35d) shows that subsidence during a period of 0.2 Ma can create a 2 km deep basin. In this initial phase the basin is sediment-starved in spite of the high sedimentation rate assumed. Later, sedimentation exceeds subsidence which is now only driven by sediment loading. When the basin is filled up, the sediments have reached a thickness of 4 to 5 km.
The empirical relationship between crustal stretching and maximum sediment thicknesses of pull-apart basins can also be seen from Fig. 12.35e. Here, the length of the basin, i.e., the amount of strike-slip displacement represent- ed by the overlap of the master faults, is plotted versus maximum sediment thickness of the basin (Hempton and Dunne 1984). Short basins have a comparatively shallow basin floor, while long pull-aparts tend to be very deep and may display one or two depocenters on newly formed oceanic crust. Known basin depths range from a few hundred meters up to 7 to 10 km (Dead Sea, Los Angeles basin, and some troughs in the Pannonian basin, Royden and Horvath 1988). Subsidence is caused by both the local thinning of continental crust and the accumulating sediment load on top of continental or new oceanic crust.
Sediments of Pull-Apart Basins
In relation to the interaction of subsidence and sedimentation rate, the sedimentary facies of strike-slip basins may strongly vary. In their early stage of evolution, the deep basins tend to be filled by lake or sea water, because riv- ers or other sediment transporting systems are not yet adjusted to the newly formed morpho- logic depression. Later, modified or newly developed drainage systems of rivers or sub- marine canyons funnel larger volumes of sedi- ment into the pull-aparts and keep pace with
or overcome subsidence. Mean sedimentation rates of known basin fills are very high rang- ing from 0.5 to 4 m/ka.
Another characteristic feature of many pull-aparts is their asymmetric basin fill dis- played in both longitudinal and lateral sec- tions. The basin margin bounded by a strike- slip fault is usually characterized by a steep fault scarp of high relief, while the opposite side is more irregular and morphologically less pronounced. Hence, lateral cross-sections mostly show deep downfaulting on the side of the dominant fault and less subsidence on the opposite side along the subordinate fault sys- tem (Fig. 12.36a and b).
Several of the modem examples on land (e.g., the Dead Sea, the Death Valley in California, the Enincan Basin in Turkey) show a relief between 2000 and more than 4000 rn on the strike-slip bounded side. Pull-apart basins below the sea display similar morphological features (e.g., the troughs of the Californian borderland, see below).
Intercratonic Pull-Apart Basins
These basins are frequently filled with fluvial and lake deposits, but these facies have a limited lateral extent (Fig. 12.36b). If an asymmetric basin is fed predominantly from its sides, the deeply downfaulted, high-relief side of the basin commonly displays marginal sediments consisting of locally derived coarse- grained alluvial fans and debris flows. By con- trast, the opposite, subordinate margin is characterized by a wider zone of finer mate- rials of alluvial plains built up by gentler streams. The remaining, more central part of the basin tends to be filled with deltaic sedi- ments and various lake deposits depending on the climate of the region. Pull-aparts in humid climates may accumulate some black shales and peat. External drainage in conjunction with an open lake system (Chap. 2.5) or a through-flowing river may be replaced by an internal drainage system dropping its total dissolved and suspended load in the basin (cf. Chap. 12.1.3, Fig. 12.5).
Strike-slip motion is frequently accompan- ied by volcanism of variable nature including silicic and intermediate magmas. Hence, vol- caniclastic sediments can contribute to the infill of such basins.
The central part of the 400 km long, but narrow Dead Sea- Jordan rift system provides an example of rapidly accum- ulated, up to 4000 rn thick Pliocene salts, mostly halite. They indicate that the rift was connected with the open sea during that time. The evaporites interfinger with fan deltas,

Chapter 12 Basin Evolution and Sediments
a MASTER FAULTS
SEDIMENT
' MIGRATION OF ACTIVE BASIN. STRATIGRAPHIC YOUNGING
RHYOLlTlC VOLCANISM /
ALLUVIAL FANS AND DEBRIS FLOW
LACUSTRINE AIDED STREAM
Fig. 12.36. a Generalized longitudinal section of pull-apart young in direction opposite to sediment influx. b Cross basin formed by sinistral strike-slip; major part of basin fJl section of pull-apart basin demonstrating asymmetry of is removed to show basin floor. Depocenter migrates away basin floor and basin fill. (After Crowell 1974; Steel and from the direction of strike-slip motion and sediments Gloppen 1980)
fluvial sediments, lacustrine limestones and marls in a sediments young upstream as shown by the dip series of strike-slipinduced depressions (Manspeizer 1985; the strata (Crowell 1974; Steel and ~l~~~~~ Kashai 1988). In the northern part of the transform zone, 1980; ~ i l ~ ~ ~ and ~ ~ ~ ~ ~ ~ h l i ~ ,985). Hence, a 4000 m deep Pliocene section of alternating salts and gabbroid to basaltic flows was drilled. The deepest basin the thickness of the dipping strata may turn fills may reach a thickness of 8 to 10 krn. The surface of Out be greater than the true basin depth. the Dead Sea lies approximately 400 m below sea level However, if a major river enters the basin because neither salts nor fluvial sediments and volcanic from the opposite end, the depocenter tends to rocks could fill up the basin to a higher level. migrate downstream.
If a pull-apart basin is fed from one end by a river sufficiently competent to keep it filled Marine Pull-Apart Basins all the time, a depositional architecture similar to that shown in Fig. 12.36a may result. In this Most of these basins evolve along continental case, the depocenter migrates away from the margins or on subsided continental blocks. direction of the strike-slip motion, and the Here, deposition may begin with cornpara-

Pull-Apart Basins
tively deep-marine facies, including mass flows and turbidites. As they enlarge their drainage area and fill, they pass into shallow- marine and finally continental facies.
Neogene basins of this type are known from southern California (for example the Ridge basin, Crowell 1974; Link and Osborne 1982) and the Californian borderland (see Fig. 5.10 in Chap. 5.3.7 and Gorsline and Douglas 1987; Teng and Gorsline 1989). Further examples were described from the Pannonian basin system in Hungary and its neighboring countries (Chap. 12.7, Royden and Horvith 1988) and many other regions (Biddle and Chris- tie-Blick 1985).
The intensively drilled Vienna basin is an example of the complex structure of a pull-apart basin caused by extension and left-handed shear with a strike-slip displace- ment of a few tens of kilometers (Fig. 12.34b and c; Roy- den et al. 1982). This basin is superimposed on early Mio- cene and older Alpine thrust sheets and has a maximum depth of 6 km (cf. Chap. 12.7).
Larouziere et al. (1987) and Montenat et al. (1987) de- scribe Nwgene basins of southeastern Spain which ex- perienced, besides strike-slip motion and mafic to calcalka- line volcanism, a main phase of extension followed by compression.
Marine pull-apart basins far away from effi- cient sediment sources form special troughs which are considerably deeper than the neigh- boring sea floor. These basins tend to remain unfilled or only partially filled for con- siderable time spans. Their sedimentary facies may include slowly deposited pelagic sedi- ments, submarine fans, and gravity mass movements. Such basins exist in the Gulf of Aden, the Red Sea, and the Gulf of California (see below and Chap. 4). The previously men- tioned large Cayman trough in the Caribbean Sea has a mean depth of 5 km below sea level and contains a sediment cover of significant thickness only in its eastern part.
The Guaymas Basin Model (Gulf of California)
One of the submarine pull-apart basins of the Gulf of California, the Guaymas Basin, was investigated during the Deep Sea Drilling Pro- ject (Curray, Moore, et al. 1982a) and the re- sults used to develop a model for this type of basin (Fig. 12.37; Einsele 1986).
After an initial shallow-marine "proto-gulf' stage, the pre- sent Gulf of California was formed along the strikeslip boundary between the North American and the Pacific plates. The dextral, somewhat transtensional plate motions started about 4 Ma B.P. and operated at an average rate of several cmla. As a result, a series of pull-apart basins was
generated (Fig. 12.37a and d) which are 2000 to 3000 m deep and separated by higher elevated sills (cf. Fig. 4.5).
During the first stage of basin evolution ( r i f t stage), the continental crust reacted by thin- ning, block faulting and listric faulting, which was accompanied by the injection of magma- tic dikes. The subsiding crust was covered by shallow-marine to hemipelagic rift-stage sedi- ments. This stage was followed by the accre- tion of new oceanic crust in the center of the pull-apart basins (stage of early drifting). In contrast to the mid-oceanic spreading ridges of mature oceans, the spreading centers of these pull-apart basins are mostly situated in the morphological basin deep, thus forming spreading troughs. In spite of the fact that these troughs collect large amounts of hemi- pelagic sediments, turbidites, and mass flows from nearby slopes and marine deltas, they remain open due to the continuing growth of the basins.
Only in the northern part of the gulf and in the Salton Trough in southern California is the sedimentation rate so high that the underlying pull-apart basins and their spread- ing troughs are fded up (Fig. 12.37e; Fuis and Kohler 1984) and no longer have a topographic expression.
The interrelationship between spreading rate (strike-slip) and sedimentation rate in such basins is demonstrated by the idealized models of Fig. 12.37b and c.
Assuming a 4 km wide spreading trough and a (realistic) sedimentation rate as high as 3000 mlMa in this trough, then a 4 km wide and 3 km high sediment body can ac- cumulate during 1 Ma. However, due to simultaneous accretion of oceanic crust at a rate of 6 cmla = 60 km/Ma, this sediment volume is spread out to a width of 60 km. Thus, its thickness is reduced to 200 m. In other words: A sediment volume element E of 200 m thickness (Fig. 12.37~) migrates laterally with the half-spreading rate and reaches a position 30 km away from the spreading center after 1 Ma. On its path to the new position, it will be co- vered by coeval flank sediments which are assumed to accumulate at a rate of 1000 m/Ma (Fig. 12.3%).
Further evaluations of this problem utilizing various other assumptions indicate that Gulf of California-type spreading troughs can be maintained under sedimentation rates of up to several km/Ma, if the rate of strike-slip and crustal accretion is also high. In this case, the basaltic magma rarely extrudes on the sea floor, but rather generates a sill-sediment complex of several hundreds of meters in thickness between sheeted dikes (oceanic layer 2) and the sediment cover (layer 1, also see Chap. 13.5).

Chapter 12 Basin Evolution and Sediments
b SEDIMENTS SEA LEVEL ON FLANKS
km L L SUBSIDENCE < I I >
30 krn 30 krn/Ma
FLUVIAL, VERY HIGH e LAKE-DELTA SEDIMENTATION RATE
SHALLOW I I SEA-LEVEL
HEMIPELAGIC HlGH SEDIMENTATION RATE
RIVER SHELF OR SUBMARINE HIGH,
SLOPE
/?.? ' I '
, . . VOLC ~ -
TRANSF. - FAULT CONT.
I PULL-APART BASIN
'A ErD.rCHING WITH SPREADING CENTER
OF CONT. (OCEANIC CRUST) ., , ,.L,
CRUST

Pull-Apart Basins
If the sedimentation rate is extremely high and surpasses the spreading rate, the pull-apart basins are filled up and become continental (Fig. 12.37e).
The Pliocene to Quaternary infilling of the Imperial Valley depression to the north of the Gulf of California is 5 to 6 km thick and begins with an approximately 1000 m thick shallow-marine to brackish sequence overlain by very thick, mainly lacustrine and fluvial deposits (Quinn and Cronin 1984). Their basement, consisting of rift-stage crust and newly formed oceanic crust, is depressed under the high sediment load. Magma of basaltic to acidic composi- tion rarely extrudes at the surface of the alluvial plain.
By contrast, low sedimentation rates in con- junction with normal spreading rates (1 to 10 cm/a) lead to very thin sediment covers on top of newly accreted crust.
The tectonic setting, depositional environment of the Biind- nerschiefer in the Alps, and the intrusion of basaltic magma in the Mesozoic Northern Penninian (Valais) trough may have been similar to the conditions and processes in the modem Gulf of California (Kelts 1981).
Concluding Remarks
The number of known modern and ancient strike-slip zones and pull-apart basins is steadily increasing with the progress of geolo- gical investigations on land and below the sea. Similar to the Pannonian basin system men- tioned above, other intramontane basins may have been affected by extension and trans- form faulting. A new evaluation of the sedi- mentary basins of China (Hsii 1989; Zhu 1989), for example, reveals that several of these basins or parts of them can be inter- preted as pull-apart basins. Strike-slip motions also occur in conjunction with oblique rifting and on divergent continental margins. They are probably common on convergent margins with oblique subduction as for example observed in New Zealand (Lewis 1980), but the resulting basins and their sedimentary fills
Fig. 12.37a-e. Interaction of sedimentation and strike-slip induced spreading in Gulf of California-type pull-apart basins. a Location of Guaymas Basin (I water depth 22000 m; 2 tra-form faults and spreading centers). b Idealized cross-section of s u b m a ~ e pull-apart basin with spreading trough and flanks showing its evolution during 1 Ma (thick arrows indicate sedimentation rates; spreading rate is 6 cmla; vertical scale exaggerated 4x). Note that after 1 Ma the basin will have grown in length by 60 km; sediment volume element E of the spreading trough will have moved to E' and have subsided under the load of
are complex. Ancient examples of this catego- ry are usually strongly overprinted by subse- quent compressional tectonic events and meta- morphism, or the former basin sediments were eroded upon uplift.
The sedimentary fills of many pull-apart basins, particularly those accumulated in con- tinental environments, may be distinguished from rift basin sediments by higher sediment- ation rates, greater thicknesses in limited areas, and greater structural complexity (Hempton and Dunne 1984). Displaced fan/ source relationships, the migration of the depocenter parallel to the master faults, and special tectonic features provide evidence for strike-slip motion.
Most of the pull-apart basins have a short life span on the order of a few million years, because their growth is terminated by super- imposed tectonic movements unrelated to the basin-forming processes. Their length is therefore mostly limited to several tens to hundreds of kilometers.
If their depositional environment was favorable for the accumulation of organic matter and subsequent tectonic overprint was moderate, pull-apart basins are interesting targets for hydrocarbon exploration in spite of their limited size. Rapid subsidence, sediment accumulation, and burial of source rocks favor the preservation and maturation of organic matter in these basins more effectively than in many other basin types (cf. Chap. 10.3.3).
12.9 Basin-Type Transitions (Polyhistory Basins)
General Aspects
.The tectonic style of a sedimentary basin may change over time, as already indicated in the previous chapters. Rift basins, for example,
1 km thick flank sediments. c As 6, during 1 Ma a body of trough sediments, 3 km thick and 4 km wide, is distributed by basin spreading to form a 60 km wide blanket of 200 m thickness (sediment compaction neglected). d Simplified plan view and block diagram of gulf-type pull-apart basins in stage of early drifting. Formation of sill-sediment com- plexes in spreading troughs. e and f Pull-apart basins in stage of early drifting subject to high (e) and very high (f) sedimentation rates. See text for further explanation. (After Einsele 1986)

Chapter 12 Basin Evolution and Sediments
frequently evolve into continental margin ba- sins (Chaps. 8.1 and 8.2), or remnant basins (with flysch deposits) exhibit transitions into peripheral foreland basins (with molasse depo- sits; Chap. 12.6). Basins displaying such tran- sitions are referred to as "polyhistory basins" (e.g., Kingston et al. 1983; Klein 1987). The early and even young sediments of these ba- sins are commonly deformed by syndepositio- nal or subsequent basin transformation (cf. Chap. 1.3). -
The evolution of polyhistory basins follows the general principles of plate tectonics. Ocean basins open along a rift zone, grow by accre- tion of new oceanic crust to form a deep ocean basin, and close again, when the sub- duction rate of oceanic crust exceeds the spreading rate. Subduction may finally result in a continent-continent collision (cf. Figs. 1.1 and 1.2). This life cycle of an ocean basin is called Wilson cycle (Wilson 1965, 1968; Dewey and Bird 1970) and may last for a few hund- red million years. A specific region may un- dergo several Wilson cycles during its evolu- tion. The most important stages of this con- cept are summarized in Table 12.1
This simplistic scheme of the Wilson cycle does not take into account several modifica- tions, for example: (1) the "mature ocean" can also be relatively narrow before it starts to close again, as assumed for the Alpine orogeny
~cro-con- (Frisch and Loeschke 1986). (2) M' tinents and terranes (cf. Chap. 1.2) may pro- duce various regional complications, partially associated with plate rotations, as known from the Mediterranean. (3) There is an increasing amount of evidence that strike-slip move- ments and wrench faulting play a significant part in basin evolution related to the stages of the Wilson cycle.
Basin-Transition Models
Passive Continental Margins
Figure 12.38 shows some straightforward models of basin-transitions on a passive con- tinental margin, i.e., from the embryonic to the mature stages of the Wilson cycle.
The early rift stage with predominantly continental deposits (Chap. 12.1.3) may be followed by a shallow-marine protogulf stage, in which tectonic basin subsidence is still con- trolled by thinned continental or transitional crust (Fig. 12.38a). With the onset of ocean spreading (b), the basin develops an elongate central trough (as in the Red Sea) or several
individual small troughs (Gulf of Aden, Gulf of California), where hemipelagic sediments and sediments of various gravity mass move- ments accumulate. Ascending basaltic magma may form dikes and sills in these rapidly ac- cumulating first deep-water sediments (Chaps. 4.3 and 12.8.3).
In the subsequent stages (Fig. 12.38~ through e), the sedimentary history of the passive margin basin is characterized by the aggradation and outbuilding of sediments on the shelf, the continental slope and rise (Chap. 12.2). In the early stage of this evolution the shelf tends to be narrow and its sediments largely consist of clastic material including sands. Later, frequently shales and carbonate- buildups take over depending on the climatic situation and presence of large rivers. The depositional area may include coastal regions which in earlier stages acted as sediment sour- ce or were sediment-free. In a final stage, a wide, very thick embankment may prograde seaward beyond the oceanic/continental crust boundary and deeply bury older sediments under its load.
Basin Transitions on Convergent Margins
Basins evolving from the declining to the relic scar (suture zone) stage of the Wilson cycle, are more diversified and complicated. Figure 12.39 displays, for example, the closing of an ocean basin between two continental plates with a subduction-related szenario at the right-hand side. The terminal stage of the ocean (Fig. 12.39a) exhibits basin-type tran- sitions from
1. Passive margin basin with a shelf-continen- tal slope-rise association to remnant basin with flysch-type sediments.
2. Shelf basin along active margin to forarc basin, and possibly
3. Deformed sediments of accretionary wedge to undeformed slope basin sediments.
Terminal and Relic Basin Development
After the closure of the remnant basin and the formation of fold-thrust belts both on top of the downgoing passive margin plate and pos- sibly in the backarc region, several types of narrow, shallow-marine or continental basins are left. One can identify the following basin- type transitions (Fig. 12.39b):

Basin-Type Transitions 503
Table 12.1. Stages of the Wilson cycle and basin evolution. (After Wilson 1968, modified)
Stage Basin type (modem examples)
Motions, volcanism, formation of temg. sediment sources
Characteristic depositional environments and sediments (depending on climate)
Embryonic Continental Frequently updoming Continental and lacustrine, rift (East and block uplift, partially also marine, African Rift) extension and strikeslip; elastics, volcaniclastics,
alkaline, mostly basic, but (red beds and evaporites) also more silicic volcanism
Young Narrow ocean Incipient ocean spreading, Marine, narrow shelves, (Red Sea, rapid subsidence of basin, one central trough or several Gulf of Aden, continued uplift of nearby small spreading troughs, Gulf of continental regions, variable sediments depending California) tholeiitic basalts on connection to world ocean,
entering rivers, etc.
Mature Wide ocean Spreading, mid-oceanic Wide shelves with thick (Atlantic ridges, continued subsidence clastic and carbonate Ocean) of basin flanks, tholeiitic sediments, deep-sea fans
ocean floor, alkali basalt and basin plains, large islands, distant temgenous areas with pelagic clay sediment sources and biogenic oozes
Declining Narrowing of Convergence and marginal Deep-sea trenches, forarc ocean basin uplift, island arcs or and backarc basins, (Pacific Ocean) or Anden-type active margin, flysch-type and pelagic
basaltic and andesitic sediments, volcaniclastics volcanics
Terminal Ocean basin Convergence and uplift, strongly re- young orogenic belts, duced in size andesitic volcanics (Mediterra- and rising granodiorite- nean Sea) gneis complexes
Remnant basins (flysch) and foreland basins (marine and continental) accumulate clastic wedges, volcaniclastics, (red beds and evaporites)
Relic scar Suture zone Collision and continued Final stage of foreland (Indus-Tsangpo uplift of orogenic belt, basins with continental suture, exposed granitic and clastic wedge, intramontane Himalayas) metamorphic rocks molasse (red beds)

Chapter 12 Basin Evolution and Sediments
PROTO-GULF SEDIMENTS EARLY RIFT SEDIMENTS POTENTIAL UPLIFT (SHALLOW-MARINE OR (CLASTICS, VOLCANICL.) AND EROSION '
CONTINENTAL)
a THINNED CONTINENTAL AND TRANS- ITIONAL CRUST
SEDIMENTS OF EARKY SPREADING TROUGH (S) , DRIFTING (INITIAL ,POSSIBLY DIKE AND SILL INTRUSIONS OCEANIC PH
b
OCEANIC CRUST
NARROW SHELF PROTO-GULF AND INITIAL OCEANIC PHASE,
(BASAL CLASTIC PHASE), SEDIMENTS OF EARLY RIFTING,
1
CONTINENTAL RISE WIDE SHELF (SHALES, CARBONATE BUILDUP) COASTAL BASIN
(TURBIDITES, CONTOURITES) I /
CONTINENTAL EMBANKMENT (CARBONATE BUILDUP, SHALES, ETC.) COASTAL / BASIN
e - - - . - - -
PRE-OCEANIC
OLDER TERRACE-SLOPE-RISE SED
Fig. 12.38a-e. Basin evolution from a early rift stage and well as onset of slope and continental rise deposition. Not proto-gulf to b initial oceanic phase and C, d, e several to scale (crustal thicknesses reduced), tectonic modifica- stages on passive continental margin. Note increase in shelf tions omitted. (Largely after Dickinson and Yarborough width (including coastal basin) and sediment thickness, as 1976)

Basin-Type Transitions
PASSIVE MARGIN REMNANT FORMER BASIN (SHELF, BASIN OUTER FOREARC SHELF BACKARC SLOPE, RISE SED.) (2FLYSCH)
\ \ ARC \ BASIN BASIN
\ \
/ SLOPE BASIN SUBDUCTION OCEANIC CRUST COMPLEX
FORELAND RELIC OF b
PARTIALLY BASIN REMNANT BASIN INTRA- FOLD- CONTI-
(SHALLOW-MARINE) MONTANE THRUST NENTAL PIGGY- I MOLASSE BELT SEDIMENTS BACK BASlN / \ GRANITE I /
THRUST SHEETS SUBDUCTION CO PLEX (SEDIMENTS OF PASSIVE MARGIN
?OPHIOLITES) r (SUTURE ZONE, M LANGE,
AND REMNANT BASIN)
Fig. 12.39a,b. Basin evolution during two stages of a transitional) plates. Note various basin-type transitions; closing ocean. a Remnant basin between passive margin folding, strikeslip, and other structural modifications are with wide shelf and subduction-related basins. b Closed omitted; not to -scale. See text for further explanation. oceanic basin and onset of collision of two continental (or (Based on various sources)
4. Transition from deep remnant basin into shallow-marine relic basin.
5. Passive margin basin (inner shelf) to peri- pheral foreland basin, or deformed shelf basin (overthrust) to piggy-back basin (Chap. 12.6.2).
6. Forearc basin to intramontane or intra-arc basin (continental molasse).
7. Marine backarc basin to predominantly continental retroarc basin with molasse.
These few examples of basin-type transitions do not take into account syn-depositional and post-depositional deformations, as well as wrench tectonics, which may strongly modify basin types and their sedimentary fill (e.g., Kingston et al. 1983).
Polyhistory basins may be subdivided fur- ther into the following groups (Klein 1987):
- Superposed basins which develop on a suture zone.
- Successor basins consisting of changing ba- sin types along a zone of long-persisting tectonic "weakness".
- Resurgent basins in situations, where the original basin style is repeated and main- tained along older tectonic boundaries and trends.
The unraveling of the "polyhistories" of such basins is one of the tasks of regional and structural geology, but this can only be done by using and testing basic concepts.

Chapter 12 Basin Evolution and Sediments
Sediment Preservation Potential of Various Basin Types
It is important to note that mountain belts re- sulting from continental collision preserve only part of their sedimentary history. The sediments of early rifting and drifting as well as post-rift sediments on continental crust have a relatively good chance of being pre- served. In addition, part of the record of the terminal and final stages, i.e:, sediments of remnant basins, foreland baslns, and intra- montane basins, may escape erosion and trans-
formation. However, the sediments of the in- tervening oceanic period are largely vanished or obscured by subduction, accretion, and me- tamorphism.
Below the present-day oceans, the oldest oceanic crust with oceanic sediments is Juras- sic in age. It is found only in marginal regions, whereas most deep-sea sediments and their underlying crust are younger. This signifies that older deep-sea sediments only occur in large accretionary complexes and mountain belts, where they are commonly highly de- formed and altered by metamorphism.

Part V Diagenesis and Fluid Flow

Mechanical and Chemical Diagenesis
13.1 General Aspects of Mechanical and Chemical Diagenesis Introduction Principles of Mechanical Diagenesis Mechanical and Chemically Modified Compaction (Overview)
13.2 Compaction, Compaction Flow, and Other Flow Mechanisms Analytical Equations to Describe Compaction Compaction Ratio and Differential Compaction Compaction Flow Other Hydrogeologic Flow Regimes in Sedimentary Basins
13.3 Principles of Chemical Diagensis Introduction Pressure Solution Various Diagenetic Realms and Solute Transport Mechanisms Early Diagenesis Late Diagenesis Cementation and Secondary Porosity of Sandstones (and Calcarenites)
13.4 Thermal History of Sedimentary Basins and the Onset of Metamorphism
13.5 Special Methods and Processes in Diagenesis Age, Temperature, and Degree of Diagenetic Reactions Diagenetically Controlled Ore Deposits Pore Water as a Source of Special Hydrothermal Systems
13.1 General Aspects of Mechanical and Chemical Diagenesis
Introduction
Freshly deposited sediments are commonly unconsolidated, have a relatively low bulk den- sity and high permeability and, if accumulated under water, a high water content. However, with increasing burial depth under younger sediments, and occasionally shortly after de- position, the sediments become denser and more solid or lithified. All the processes in- volved in such a change of sediment state are
summarized under the term diagenesis. It comprises both mechanical and chemical-min- eralogical processes.
However, if sediments, for example clays, become very deeply buried and/or are affected by relatively high t e m p ratures, they start to recrystallize and form new minerals. In addition, their porosities drop to values around 3 % and less. This occurs to a large extent in the so-called low grade greenschist facies (k200 OC). This phenomenon is referred to as metamorphism (see below). A well-defined boundary between diagenesis and metamorphism, however, cannot be set.
The phenomena at the transition from diagenesis to m e tamorphism also depend on the tectonic setting of a basin, i.e., whether baric o r thermal effects predominantly control this evolution (Robinson 1987).
Some authors, particularly those dealing with the transformation of organic matter into hy- drocarbons and coal (Chaps. 14.2 and 14.4), distinguish a zone of catagenesis or an anchi- metamorph zone (anchizone) between diage- nesis and metamorphism. At this depth range, most sediments have become lithified, shales and claystones are transformed into slates, smectite and mixed-layer clay minerals are replaced by well-crystallized illite and chlo- rite, and vitrinite reflectance is high, but temperatures are only 100 to 150 OC (e.g., Krumm et al. 1988).
Mechanical diagenesis results from vertical and accompanying lateral stresses caused by the overburden load of younger sediments, and possibly by additional stresses due to compressional tectonic movements. It expels pore water and leads to a rearrangement of the sediment particles (fabric).
Chemical-mineralogicalor, simply, chemical diagenesis includes dissolution and recrystal- lization of primary sediment particles, as well as repre-cipitation of dissolved matter as ce- ment in the pore spaces. Dissolution and ce- mentation may take place at different levels within the sediment and thus involve mass transfer from one layer to another. Chemical diagenesis is driven by the tendency of solid

Chapter 13 Diagenesis
matter to reach thermodynamic stability under the changing conditions in the subsurface (increasing temperature and pressure, possibly changing pore water chemistry). As a result, a limited number of stable minerals are formed at the expense of various unstable phases. In old and deeply buried shales, for example, the illite-chlorite-quartz mineral assemblage is common, regardless of the initial clay mineral association. Calcite and dolomite replace less stable skeletal carbonates, such as aragonite and high Mg clacite. Furthermore, all sorts of minerals having a large surface area tend to dissolve and reprecipitate into more compact particles and thus to achieve a state of lower energy.
All these processes promote the reduction of porosity and permeability, enhance the bulk density, and affect the strength of the rock. The loss in porosity and thus in sediment thickness is referred to as compaction. Com- paction of a water-saturated sediment is al- ways associated with the expulsion of pore water, which is frequently called compaction flow.
The effects of both mechanical and chemi- cal diagenesis in various sediment types are very complex and can be studied and des- cribed in several ways, as for example by En- gelhardt (1973), Bathurst (1975), Magara (1978), Larsen and Chilingar (1979), Parker and Sellwood (1983), McDonald and Surdam (1984), Gautier (1986), Mumpton (1986), and Fiichtbauer (1988). In this text, only a brief summary is given, in which the aspects of compaction and pore water flow are em- phasized, while the various chemical and min- eralogical processes are little addressed; the latter aspects have been frequently and exten- sively described in many special articles and textbooks. An introduction to carbonate and silica diagenesis is given in Chapters 3.3.2 and 5.3.5.
Principles of Mechanical Diagenesis
Subaqueous mechanical diagenesis starts im- mediately below the sediment-water interface and progressively alters all the mass physical properties of the sediments versus depth. It controls or influences the porosity, water con- tent, bulk density, permeability and pore water flow, shear strength and rheologic behavior, sensitivity to liquefaction and, finally, mass transfer via molecular diffusion and advection.
In normally consolidated sediments, the fabric strength or compaction state is in equilibrium with the overburden pressure at all depths below the sediment-water interface (Fig. 13.la). The overburden pressure can be expressed as total lithostatic pressure (see below) or as effective vertical stress (reduced by buoyancy) per unit area of a horizontal plane within the sediment. In reality, such an effective verticai stress acts as a grain-to- grain stress at the contact of individual par- ticles (see below). The state of compaction can be defined in terms of porosity, water content, or bulk density. The pore water pressure is equal to the hydrostatic pressure at the corre- sponding depth; hence, if sediment accumula- tion has ended, there is no upward or laterally directed pore water flow. However, if a new increment of sediment is added on top of such a sedimentary column (A h in Fig. 13.la), this equilibrium is disturbed. In order to establish a new equilibrium between the increased ver- tical stress and the compaction state, some pore water must be expelled (see below). In a fairly permeable sediment, this pore water expulsion takes place more or less simulta- neously with the growth of the sedimentary column, i.e., the sediment maintains its state of normal consolidation. Normal consolidation can also be maintained in fine-grained, low- permeable sediments if the sedimentation rate is low and the pore water has sufficient time to escape.
If, by contrast, the sedimentation rate is high and the growing sedimentary column has a low permeability and becomes less and less permeable with depth, the pore water to be released by prograding compaction cannot escape readily to the sediment-water interface. Hence, compaction is delayed (Fig. 13.1 b), and the sediment is in a state of undercon- solidation, in which fabric strength is less than that which would result from the total over- burden pressure. In this state, excess pore water pressure builds up, which may approach and counteract the effective vertical pressure induced by the (buoyancy-reduced) weight of solid matter in the sediment. Such a state sig- nifies that the weight of the oyerlying sedi- mentary column is no longer carried alone by the solid grain structure (grain-to-grain stress), but to a great part or nearly entirely by the practically incompressible pore water. This condition causes a drastic reduction in shear strength (friction) and is therefore one of the most important factors generating gravity mass movements (Chap. 5.4.1).

General Aspects
a HYDROSTATIC
b NORMALLY CONSOLIDATED UNDERCONSOLIDATED
PRESSURE, p,
I WATER
OVERCONSOLIDATED
,-r - 5/11 ,-r - ;.l - - I - 1 I ' I l l I I I I I I I I EROSION I I/REDEPOSITION
n, POROSITY
xb, SUBMERGED BULK DENSITY
pe, EFFECTIVE OVERBURDN PRESSURE
Fig. 13.la-c. Normal consolidation (a), underconsolidation (b), and overconsoliQation (c) of subaqueous fine-grained sedimentary columns. Encircled numbers indicate subse- quent stages of evolution. a Newly added sediment incre- ment, Ah, disturbs equilibrium between vertical effective stress, p,, and compaction state of sediment at all depths, z. However, rapid escape of pore water adjusts new equi- librium, exemplified by shifting curves of porosity (or water content), and bulk density, yb. b Downward de- creasing permeability prevents the escape of pore water released by additional sediment load, Ah, and thus ham- pers further compaction. Consequently, porosity and bulk
density barely decrease versus depth, and most of the sedi- ment load is carried by the pore water. The resulting ex- cess pore water pressure, u, counteracts the vertical pres- sure exerted by the sediment load. c After erosion (Stage 2) the remaining sedimentary column is overconsolidated. Further consolidation can only take place if redeposition (Stage 3) surpasses the former top of the sequence. Note that during Stages 1 to 3, porosity (or water content) and bulk density remain approximately constant in the zone of overconsolidation, but the vertical stress varies. See text for further explanation

512 Chapter 13 Diagenesis
Cohesive, commonly clay-bearing sedi- the erosion surface (Stage 3 in Fig. 13 .1~) does ments, may exhibit a state of mechanical over- not affect the compaction state of the under- consolidation, i.e., a state in which their fabric lying material as long as the newly added sed- strength is higher than under equilibrium with iment does not surpass the former top of the overburden pressure. This frequently occurs sequence. when the upper part of the sedimentary col- umn is removed by erosion (Fig. 13.1~). Due Recent marine .Sediments frequently show apparent over-
consolidation, discernible, for example, by shear strength a kind of "memory effect"' the values higher than normal for this depth, at or slightly
sediment maintains its compaction state below the sea floor. This phenomenon is not related to sub- achieved under the higher marine erosion, but to the onset of chemical diagenesis (the pressure, i.e., too high a bulk density and too beginning of cementation). low a porosity with respect to the lowered sediment-water interface. The erosion-in- As sediment builds up over time, a fine- duced reduction in vertical stress has practi- grained sequence may undergo changes in its cally no influence on the compaction state. consolidation state, as demonstrated in the Furthermore, renewed deposition on top of model in Fig. 13.2. Emergence of sediments
I STATE OF CONSOLIDATION I I I UNDER- VARYING INCREASING OVER-
TRANS- I I CONSOL. (ADDITIONAL CONSOLIDATION ITIONAL LOADING) I
UNDER- NORMAL CONS.
DEPTH. Z
OVERCONSOL.
SEDIMENT Z SURFACE
Fig. 13.2. Sediment buildup versus time, displaying dif- land. Note position of marker bed indicating the progress ferent consolidation states for fme-grained material in rela- of compaction associated with compaction flow. All the tion to sedimentation rate, erosion, emergence caused by porosity-depth curves represent sediment of equal, homo- falling sea level, and tectonic uplift with denudation on geneous composition

General Aspects
above sea level and the groundwater table leads to an increase in effective overburden pressure and therefore initiates renewed com- paction or underconsolidation. Water loss by evaporation near the land surface, associated with high capillary pressures, can produce "evaporative hardening" of fine-grained mate- rials. Present-day erosion on land generally leads to overconsolidated shales and mudrocks, while earlier erosional events followed by sub- sequent deposition mostly become masked. Underconsolidation and excess pore water pressures in the subsurface are well known phenomena in the exploration of hydrocarbons and deep groundwater (see below).
Mechanical and Chemically Modified Compaction (Overview)
The aim of this brief overview is to show that there is hardly a case in nature where the po- rosity-depth relationship of a thick, usually nonuniform sedimentary column is controlled only by gravitational, mechanical compaction. The pronounced compaction of fine-grained sediments, for example, is caused by both me- chanical and chemical-mineralogical proces- ses, while coarser-grained materials (sand and gravel) are but little affected by purely me- chanical diagenesis.
Purely mechanical (or gravitational) com- paction of a fine-grained, mainly siliciclastic sediment may lead to a porosity-depth rela- tionship as indicated in Fig. 13.3a. As stated by many authors (e.g., Chilingarian 1983, Briickmann 1989), the absolute values of po- rosity at certain burial depths are reversely related to grain size (Fig. 13.6, siliciclastic sediments). Clays rich in smectite, montmoril- lonite, and mixed-layer clay minerals general- ly exhibit higher porosities than illitic or kao- linitic clays. Clays rich in exchangeable Na', for example montmorillonitic material, usually bind more pore water and hence have higher porosities than Ca++-rich clays. The porosity- depth curve of a normally consolidated, fine- grained sequence can, as mentioned above, be modified by underconsolidation or overconso- lidation (Fig. 1 3 . 3 ~ and d).
In Figure 13.3a, the regularly decreasing porosity versus depth is only interrupted by intercalated sands (thick beds or relatively thin sandy tufbidites) which cause a drastic drop in the porosity curve in the upper part of the sequence. However, at greater burial depth, as long as the sands are not affected by pressure solution and cementation (see below),
they may maintain a higher porosity than their neighboring shales and mudrocks.
If the same sequence is also affected by chemical diagenesis, the porosity-depth rela- tionship may be modified in such a way as that shown in Fig. 13.3b. At a burial depth of several hundreds of meters, the less stable portions of the fine-grained material, for ex- ample various bioclasts, start to dissolve and reprecipitate as pore cement. At greater depths, unstable clay minerals "mature" into stable ones and lose their crystal water (dehy- dration). As a result, the porosity curve shifts to lower values. Sandy interbeds in particular undergo shallow-burial cementation and, in addition, deep-burial pressure solution at the contacts of individual grains. Both processes strongly reduce the pore space and permea- bility of such beds.
Pelagic carbonates, consisting mainly of calcareous nannofossils, tend to display a step- like decrease in porosity and strength (and other properties) versus depth (Fig. 13.3e). Partial dissolution and recrystallization of cal- cium carbonate as cement already starts in the soft nanno ooze (Fig. 13.3f; Schlanger and Douglas 1974; Matter et al. 1975), but becomes more important in the deeper regions where firm chalk and hard limestone are en- countered. While the nanno chalk is still high- ly porous, the pelagic limestone has lost most of the porosity of the initial nanno ooze at a depth, where a siliciclastic mud would main- tain a considerably higher porosity (Fig. 13.3a). The depths of the transition zones bet- ween ooze, chalk, and limestone also depend on the temperature gradient within the sedi- mentary column (Wetzel 1989). A high gradi- ent furthers chemical diagenesis and thus a shift of the boundaries into shallower burial depths. Normally, calcareous ooze is converted into chalk at burial depths of at least 150 to 300 m (Garrison 1981). The chalk-limestone transition commonly occurs at burial depths between 500 and 1000 m (e.g., Neugebauer 1974) and thus takes a very long time.
Siliceous sediments rich in opaline silica exhibit a behavior similar to that of nanno oozes, but commonly have a higher initial po- rosity. Opal A is generally transformed into opal CT, in conjunction with a marked de- crease in porosity, at depths below 100 to 300 m (Kastner 1981), but high geothermal gradi- ents lead to lithification of these sediments at considerably shallower burial depths (see also Chap. 5.3.5 and Fig. 5.6). Beginning shallow- burial lithification of layers rich in diatoms, which originate from short upwelling periods

Chapter 13 Diagenesis
POROSITY, n
2ooo , / ;i SANDSTONE
m I I
DEPTH, Z
POROSITY, n
0.2 0.4 0.6 0.8
CONSOLIDATION'
// UNDER- / CONSOLIDATION
I
- - 7-----;7
ERO+IO~,I-
0 I I / , I I/
/ I v
,' CONSOLIDATION
1000-
m v OVERCONSOLIDATION
b MECHANICAL AND CHEMICAL COMPACTION
POROSITY, n
SAND- SHALLOW-BURIAL CEMENTATION
' DEEP-BURIAL PRESSURE SOLUTION AND CEMENTATION
CLAY MINERAL "MATURATION" AND DEHYDRATION
DEPTH, Z
POROSITY, n 0 0.2 0.4 0.6 0.8
NANNO OOZE
200
400
600
m LIMESTONE
CEMENT VOLUME
50 %
DEPTH
g h ----- --- --
100 m
LIMESTONE OR CHERT
DEPTH
Fig. 13.3a-h. General porositydepth relationships of vari- ous marine and lacustrine sediments; depth (z) below sedi- ment-water interface. a Mechanical (gravitational) compac- tion of silty clay and sands. b Mechanical compaction (equal to a) is enhanced by chemical-mineralogical reduc- tion of porosity. c Underwnsolidation of low-permeable sediments resulting from delayed escape of pore water, as compared to normally consolidated material. d Overcon- solidation due to erosion of thicker overlying sediments prior to the accumulation of the present (thinner) sediment
column. e and f Transition from pelagic nanno ooze to chalk and limestone accompanied by mechanical and che- mical compaction (dissolution and reprecipitation of car- bonate as cement; after Matter et al. 1975; Wetzel 1989; Hobert and Wetzel 1989); cement volume in f and g is related to total sediment volume. g and h Shallow-burial onset of carbonate (or silica) diageneses in shelf and plat- form sediments (containing unstable mineral phases), gene- rating extreme fluctuations in porosity versus depth

General Aspects
during the late Pleistocene, have also been found in the Norwegian Sea (Kassens 1990).
In shallow-marine sediments, chemical dia- genesis frequently starts at shallow burial depths and proceeds very irregularly (Fig. 13.3g and h). Layers containing higher pro- portions of unstable, relatively reactive com- ponents, such as aragonitic bioclasts, high Mg calcite, and opaline silica, become cemented and lithified earlier than their clay-rich inter- beds which maintain a rather high porosity. Instead of continuous hard beds, layers of isolated carbonate concretions or chert nodules can be formed. The role of microbial decom- position of organic matter on the formation of carbonate nodules is briefly described in Chapter 13.3.
There are numerous other factors influenc- ing sediment diagenesis: Sediments rich in finely dispersed organic matter, for example lake gyttjas or Black Sea muds, have particu- larly high initial porosities. Clayey sediments deposited in freshwater lakes tend to develop higher initial porosities than marine clays, but they can be surpassed by marine diatomaceous and radiolarian oozes (see below). When ex- posed to freshwater circulation, carbonates especially tend to become rapidly lithified. In slowly reactive and low permeable sediments, such as shales devoid of carbonate, age is an important factor in diagenesis, because the escape of both the excess pore water and water released by dehydration of clay minerals as a result of their transformation into stable phases takes a long time.
In most cases, the effects of mechanical compaction are more or less overprinted by chemical diagenesis, particularly in sediments with large proportions of relatively highly soluble, unstable components. Variations in temperature gradients and differences in age further modify the porosity-depth relationship in sediments of similar composition. For all these reasons, the porosity-depth curves sum- marized in many articles and special volumes mentioned above display a wide scatter, even within sediments of approximately identical composition. It is therefore frequently not possible to successfully describe the porosity- depth relationship and compaction of natural sediments in a general way by simple rules or equations (see below). This can only be done for compaction or consolidation experiments in the laboratory, and to some extent for young, shallow-buried sediments below the present sea or lake floors.
Some examples of such porosity-depth curves which reflect primarily mechanical com-
pactioil are shown in Fig. 13.4. The highest initial porosities are in sediments rich in dia- toms and radiolarians, as long as the delicate opal skeletons resist mechanical and chemical destruction. They can maintain porosities higher than 0.7 (70 %) up to several hundreds of meters below the sea floor. In addition, other biogenic oozes may display abnormally high initial porosities as a result of their intra- test porosity. This may increase the total sedi- ment porosity by approximately 35 to 45 % (Bachman 1984), as compared to a sediment consisting simply of solid grains of the same size. Pelagic carbonates consisting mainly of nannofossils and foraminifers, however, ex- hibit about the same initial porosities as silici- clastic marine muds with minor proportions of microfossils and organic matter.
13.2 Compaction, Compaction Flow, and Other Flow Mechanisms
Analytical Equations to Describe Compaction
In spite of the complexity of sediment com- paction and the constraints mentioned above, several authors have made an attempt to des- cribe the porosity-depth relationship or con- solidation of sediments by simple analytical equations. They were encouraged by the ob- servation that the reduction of porosity versus depth takes place in a more or less exponential fashion, i.e., the porosities of succeeding depth intervals decrease systematically. Figure 13.5a through d illustrates four different ways to approach this problem: (1) Soil engineers (Terzaghi 1925, Fig. 13.5a) have learned from laboratory consolidation tests that the com- paction of clayey materials renders straight line relationships, if the void ratio, e, is plot- ted versus the logarithm of the effective over- burden pressure, p, (see above and Fig. 13.1). The void ratio, e, is the ratio between the volumes taken by the voids and the solid ma- terial of a sediment sample (cf. Fig. 13.6a, Eq. 3). Because p, is not a linear function of depth, z, and therefore not very convenient to use in the study of sedimentary columns with downward-increasing bulk density, Athy (1930) proposed plotting porosity versus log z according to the equation
where no = initial porosity n, = porosity at the depth z .

Chapter 13 Diagenesis
POROSITY, n
OOZE
SlLlClCLASTlC SEDIMENTS RADIOLARIAN OOZE (>50°/,j
DEPTH BELOW SEA FLOOR (m)
Fig. 13.4. Generalized porosityldepth type-curves for (Einsele 1989). Each curve is based on 20 to approximately young marine sediments little affected by chemical diagene- 70 DSDP-sites. The oozes contain more than 50 56 diatoms sis. Curves represent most important groups of hemipelagic or radiolarians to pelagic marine sediments according to DSDP data.
Athy's exponential equaticn (cf. Fig. 13.5b) is characterized by the initial porosity, no, and an exponent, 8 , the value of which depends on the sediment type and the dimension of z (m or km). Young marine sediments frequently have R values between 5 and 15 x lo-', if z is measured in meters (Briickmann 1989). How- ever, while both the Terzaghi and the Athy equations describe the true situation fairly well in medium depth ranges (Fig. 13.5b, Wetzel 1986), they render differing results for shallow burial depths, and the "Terzaghi curve" cannot be used for deeply buried sediments. The rea- son for this is that the straight lines approach zero porosity with depth, which is on the whole unrealistic.
To overcome this difficulty, Beaudoin et al. (1985) and Maillart (1989) set certain limits for the initial porosity, no, and the residual porosity, n,, at great depth. (several kilo- meters). Between these two boundaries, the porosity changes exponentially (Fig. 13.5~).
The specific parameters, a and R, are empiri- cal and may include effects of chemical dia- genesis.
Instead of using an exponential equation, Baldwin and Butler (1985) emphasize that a power-law equation (Fig. 13.5d) may suit the porosity-depth relationship better than an exponential equation. Their equation is based on the average porosity-depth relationship of a number of fine-grained sediments. In this case, however, the sediments start with an (unrealistic) porosity of 1 (100 96) at the sedi- ment surface. The power-law equation plots as a straight line on log-log paper (Fig. 13.5d). In addition, these authors replace porosity by "solidity" (S = 1 - n), which is the complement of porosity.
Calculation of burial depths. If the compac- tion of a sedimentary column folIows one of these equations, one can calculate from poro- sity or solidity the burial depth, G, for a spe-

Compaction, Flow Mechanisms
a VOlD RATIO, e
b VOlD RATIO, e
I 0.9
LL w POROSITY, n
Lu" " ' ' I 0.1 0.5 0.7 0.8 0.85 0.9
POROSITY, n dP TERZAGHl (1925) : el= eo- C, log (po+ - Po
C,= COEFFICIENT OF COMPRESSIBILITY (DEPENDS ON MATERIAL AND USE OF log OR In) p o = INITIAL, EFFECTIVE VERTICAL STRESS
POROSITY, n
' , U , p = EMPIRICAL CONSTANTS i ! I
Fig. 13.5a-d. Approximations to describe the porosity- depth relationship of fme-grained sediments. a Void ratio versus logarithm-of effective vertical stress after Terzaghi; Clp' low plasticity, normally consolidated clay; Cw high plasticity clay; Cw highly colloidal clay (after Skempton 1970) and young diatomaceous oozes (Einsele 1982a, simp lified). b Comparison of Athy-type and Tenaghi-type cur- ves using logarithmic scales for depth add porosity, but linear scale for void ratio.
d POROSITY, n
Note the field of good agreement between both curves. (Wetzel 1986). c Porositydepth curves between fixed upper and lower limits, no and n , respectively. Shape of curve is controlled by empirical constants, a and B (ab- solute values depend on dimension of z; after Maillart 1989). d Porositydepth curve in log-log diagram according to a power-law equation. (Baldwin and Butler 1985, soli- dity replaced by porosity). See text for further explanation

Chapter 13 Diagenesis
cific site (e.g., Magara 1976). Using the Athy equation, one obtains
where z, is found in m, when R values are, for example, between 5 and 15 x lo-' as men- tioned above. The depth values calculated may differ considerably from the true values, when no and R are not known exactly.
According to Baldwin and Butler (1985), the burial depth, z, (in km), for normally consoli- dated shales is:
and for underconsolidated shales:
Whether this method can also be applied to sandstones as quoted by Baldwin and Butler (1985) is, however, not sufficiently ascertain- ed. Lithic arenites and wackes containing a significant volume of ductile grains display a reduction in porosity from approximately 40 % at the surface to 15 % at a depth of 500 to 800 m (Smosna 1989). This is caused by simple grain rearrangment, whereas plastic grain deformation operates at greater depths and proceeds more slowly. Evaluating a large data base, Scherer (1987) concludes that, in ad- dition to the factors mentioned above, sand- stone porosity also significantly decreases with the age of the rocks considered. This finding indicates that long-term processes, such as pressure solution and various types of slow, chemical processes are involved (see below).
There are other and more sophisticated approaches to the mathematical modeling of compaction (summarized, e.g., by Briickmann 1989; Bayer 1989b; Smosna 1989). All of them try to understand and interpret this process in order to predict situations which cannot be directly measured.
Compaction Ratio and Differential Compaction
Compaction Ratio
In the following we consider horizontal layers or slices of a compacting sedimentary column at various depths. All the layers contain the
same solid mass per unit area or the same height, h,, of pore-free, solid material. The reduction of porosity versus increasing burial depth causes individual layers or beds of an initial thickness, hl, and mean porosity, nl, to compact to a secondary thickness, h,, with a mean porosity, n,, at the average depth, z,, below the top of the sequence (Fig. 13.6a and b).
The ratio between hl and h2 is the compac- tion ratio, CR (or r), which directly indicates the reduction in thickness between a higher and lower interval in a sedimeritary column. Since hl is usually not known, the compaction ratio is determined from the porosities, n1 and nz (Fig. 13.6a, Eq. 1).
In this case, n2 is measured from rock samples, and nl is assumed from published porositydepth curves for the corresponding sediment type. One has, however, to take into account that the value of nl and thus the compaction ratio significantly depend on the height, hl, chosen for the topmost (initial) layer as compared to that of the deeper buried layer (Fig. 13.6b). A thick top layer renders a lower nl value than a thin one, and therefore yields a lower compaction ratio for the same sequence and depth range considered.
Under favorable conditions, compaction ratios can also be determined or estimated directly (Fig. 1 3 . 6 ~ through e). For example, horizon- tal, originally cylindrical, sediment-filled burrows, generated several to tens of cen- timeters below the sediment-water interface, are deformed under higher burial load to bo- dies with elliptical cross sections. Shallow- burial concretions preserve more or less the original thickness of parallel sediment lami- nae, while the same laminae become compact- ed outside. Sediment-filled body fossils, the shells of which are dissolved on or slightly below the sea floor, also register subsequent sediment compaction.
Differential Compaction
Except for the above mentioned special obser- vations and changes in mass physical proper- ties, the effects of compaction are difficult to detect in homogeneous, widely extended sedi- ments. Compaction becomes evident, however, in lithologic sequences with varying compac- tion ratios, as well as in basins with inclined or irregular basin floors (Fig. 13.7). For example, mechanically resistant reef structures undergo little or no compaction, particularly if their pore space is cemented early. By con- trast, the adjacent interreef sediments usually

Compaction, Flow Mechanisms
n, POROSITY SEDIMENT COLUMN
0 0.2 0.4 0.6
CR, COMPACTION RATIO
7f; I
h , ~
I SOLIDS I
h 1-n2 COMPACTION RATIO CR= A=-
h2 1-n l
SINCE h,=(l-nl) h l = ( l - n 2 ) h2 ,
HEIGHT OF PORE WATER LOSS
n VOID RATIO e= -
hs
SOLID PARTICLE SHALLOW-BURIAL COMPACTION a
&- "2 ------
T- ------ -- ----- - -----
DIFFERENTIAL COMPACTION
/ SEDIMENT-FILLED
\ PRIMARY 2 INTACT LAMINATION 2
PRIOR TO DISSOLUTION OF SHELL SHELL
Fig. 13.6. a Demonstration of compaction ratio, CR, void ratio, e, and thickness or height of expelled pore water by comparing two sedimentary columns. These have the same height, h,, of compact, solid matter, but differing porosi- ties, n, and n2. b Relationship between porositydepth curve and compaction ratio, CR, at different depths, z, below top of sedimentary sequence. Note that CR depends on the height, hl, of the uppermost sediment column and on its average porosity, nl, which decreases with increas-
ing thickness of hl. c, d, and e Direct measurement of compaction ratio using: c horizontal, initially cylindrical sediment-filled burrows, d compacted part of sediment- filled fossil, the shell of which was dissolved or broken early within the sediment, and e initial, parallel lamination deformed by differential compaction adjacent to solid gravel, compact fossil (e.g., belemnite, bone of vertebrae), and early diagenetic concretion

520 Chapter 13 Diagenesis
CARBONATE MIGRATION SEA LEVEL - - - - - - - - - - n--
@ SAND AND GRAVEL
FINE-GRAINED MUD (SHALE) \
Fig. 13.7a-d. Frequent examples of medium to largescale b Deformation of sand-filled channels and accompanying sedimentary structures caused by differential compaction at shales. c Differential compaction in three stages of deve- a burial depth of z = 1000 m. a Primary relief of bioherm lopment on top of a steplike structure on the basin floor with talus (Stage I) is strongly enhanced (Z), assuming generating a nontectonic fault. d Deformation of primary compaction ratios, r, of 1.0 (reef core) up to 2.2 (basin horizontal bed on top of inclined basin floor. (b, c and d sediments). Mechanical compaction may be modified by after Maillart 1989). r = CR = compaction ratio (see carbonate redistribution. (After Shaver 1977). Fig. 13.6a

Compaction, Flow Mechanisms
display a high compaction ratio. Such differ- ences in compaction, i.e., differential compac-
,tion of sediments not far apart, may enhance the primary relief of a bioherm (Fig. 13.7a), or accentuate and modify the shape of sand- filled channels within a shale sequence (Fig. 13.7b). Differential compaction may generate faults on top of a step-like relief in the un- derlying bedrock (Fig. 13 .7~) and lead to a synthetic fault system on top of an inclined basin floor (Fig. 13.7d).
Differential compaction is also a common feature in marine deltaic environments. Where fluvial sands of distributary channels, river mouth bars and the delta front (see Chap. 3.4) accumulate on top of thick prodelta muds, they cause greater compaction than in ad- jacent areas less loaded. The resulting slight depressions in the topography are immediately filled up with more sand, which adds to the already existing higher overburden pressure at this site. In this way, so-called growth faults are generated (Fig. 13.8a and b), which may cause a rotation of the more loaded sediment bodies. High sand input into the basin and a seaward prograding delta front or shelf edge during sea level lowstand may lead to a series of basinward prograding minor to medium- sized faults (Fig. 13.8a), while a balance bet- ween subsidence and de~osi t ion tends to form a single or only a few la&e growth faults (Fig. 13.8b).
Some of these initially steeply inclined faults may be af- fected by the lateral sliding of sediment masses, such that they then continue basinward as gently dipping reflectors (Bruce 1973). As a result, a rather complicated extensional fault pattern can develop, as observed seismic records of the Texas coast (Fig. 13.8~). Cross-sections of the con- tinental margin in the northwestern Gulf of Mexico, which is little affected by salt diapirs, show Tertiary sands and sandy shales subdivided by growth faults into a series of coastal-parallel troughs. These rest on the irregular top of older, thick shales which form "ridge-like" structures between the sand-fded troughs. The growth faults die out near the deepest parts of the troughs. The underlying shales appear to be more compacted than the shales forming the ridges, which are underconsolidated and exhibit excess pore fluid pressures from subsurface depths of approx- imately 1500 m downwards.
The true origin of all these structures is re- vealed by decompacting the sediments with the aid of the (downward increasing) compaction ratio. In this way, the state and thickness of a sediment body prior to compaction can be reconstructed. As demonstrated in Figs. 13.6b and 13.7, decompaction can be carried out in several steps to show the evolution of a spe- cific structure. Using this method, the com- paction-induced structures can also be dated.
Compaction Flow
Another important aim of the study of com- paction is the evaluation of compaction-in- duced pore water flow, frequently referred to as compaction flow or advection (e.g., Engel- hardt 1973). The reduction of the water-filled pore space of sediments versus depth is ac- companied by the expulsion of considerable volumes of water. This water moves either vertically upward through the entire sedimen- tary column, or uses inclined, highly perme- able layers to escape laterally. In this way, pore waters can transport dissolved inorganic matter and hydrocarbons.
Model Calculations
In the following consideration, the amount of pore water is expressed in terms of height of a pure water column. The height or volume of expelled pore water can be calculated from the reduction in porosity and the thickness of the sedimentary column considered (Fig. 13.6a, Eq. 2). An example of such a calculation for vertically ascending water, using the Baldwin- Butler (1985) porosity-depth curve for nor- mally consolidated argillaceous sediments, is shown in Fig. 13.9.
First, the volume of expelled pore water is determined for specific depth intervals (1000 m in thickness, in the upper- most 250 to 500 m of the section), which was released by the deposition of the last 1000 m increment of sediment. For this purpose, the difference in mean porosity between succeeding intervals is evaluated. In a second step, the volume increments of the intervals are summed from bot- tom to top of the sequence (right-hand side of diagram). As expected, the water volumes expelled from the single intervals increase upward, and thus, the volume of the total pore water flow through given horizontal cross-sections or marker beds in the sedimentary column grows substantially toward the top. A new increment of 1000 m of sediment would release the same amounts of pore water from the underlying intervals and generate an equal cumulative compaction flow. Values derived by Bjerlykke (1983) from a somewhat different porositydepth curve are similar to those reported here.
However, these values represent neither the total pore water loss from individual sediment intervals nor the total water loss from the entire sequence during its burial his- tory. If, for example, the mean porosity of the lowermost sediment interval in Fig. 13.9 is compared with the poro- sity of the uppermost 1000 m thick section (mean porosity n = 0.35), one gets (using Eq. 2 in Fig. 13.6a as before) a volume of released pore water of 515 m3jm2. If the initial porosity at the sediment-water interface (no = 0.72) is taken into account, one obtains 2520 m3/m2. The latter value corresponds to a water column higher (or thicker) than the present thickness of the deeply buried sediment interval, which is reasonable, because 72 96 of the surface sediment consisted of water.

Chapter 13 Diagenesis
--3 SAND SEA LEVEL
DEPOSITION SEA LEVEL - .- - - - - - - - - - - - - - - - - - - - - -SUBSIDENCE
. . . . ... . . . . . . . . . . . . . . . . ..........
TERTIARY SANDSTONE d QUATERNARY SAND AND SHALE AND SHALES
--- -- \ COASTAL PLAIN ----I--- CONT. SHELF -
"RIDGES" OF SHALE WITH HIGH FLUID PRESSURE UNCOMPACTED SHALE
Fig. 13.8a-d. Large-scale sediment deformation by dif- ed slide over gently inclined slip face (Stage 4 constructed ferential compaction and development of syndepositional after seismic record). d Generalized cross section of pas- fault systems. (After Bruce 1973). a and b Growth faults sive continental margin on the Gulf mast of Texas. Note in marine deltas o r along edge of continental shelf as wn- seaward migrating depocenters of sand-shale sedimentation trolled by subsidence and rate of deposition in three stages on top of a thick shale sequence, forming wide "ridges" of of development (1, 2, 3). c Reconstruction of the evolution underconsolidated sediment in between the sand-fded (Stages 1 through 4) of individual fault system due to a "troughs" combination of differential compaction and laterally direct-

Compaction, Flow Mechanisms 523
POROSITY, n n = 0.72 EXPELLED PORE WATER (1
COMPLETELY COMPACTED 0 100 m?mL
Fig. 13.9. Upward-directed compaction flow calculated for intervals. Right-hand curves: 1 Cumulative compaction a standard porosity-depth curve for normally consolidated, flow, released by an additional 1 km increment of sedi- argillaceous sediments (after Baldwin and Butler 1985); ment, from all six succeeding 1 km-thick sediment sec- curve for underconsolidated material for comparison. tions. (2) Total volume of pore water released from all six, Heights, or rather volumes, of expelled pore water are 1 km-thick sediment sections during their burial history, based on equation in Fig. 13.6a (Hamilton 1976). Columns summed from top to bottom. 1 m3/m2 = 0.1 l/cm2. (See Water released from individual lower to higher sediment also Bjerlykke 1983 and Galloway 1984)

Chapter 13 Diagenesis
The overlying sediment intervals have increas- ingly higher porosities and therefore have lost smaller total amounts of water. In addition, they had to take up the ascending pore water from the compacting underlying sections, i.e., part of their original pore water was replaced by older pore water.
This is demonstrated in the three-layer mo- del in Fig. 13.10b, using the same porosity- depth curve as in Fig. 13.9. As a result of compaction caused by the new sediment in- crement (Layer 1, hl), the original pore water in the middle layer (Layer 2) moves upward beyond its base and top and penetrates far into the uppermost layer (Layer 1).
This process is particularly interesting when this pore water differs in chemistry from that of the other layers. Even more con- spicuous is the case in which the lowermost layer (Layer 3) deviates in its pore water chem- istry from the higher layers. If the oldest layer was a fresh water sediment or was deposited under hypersaline conditions, and was then overlain by two normal marine sections, its pore water can later influence a large part of the younger sediments (Fig. 13.1 Oc).
In order to determine the total water loss of the entire sequence during its burial history, the cumulative water loss of all intervals can be summed from top to bottom (Fig. 13.9, Curve 2). It is found for this example that a water volume of approximately 3150 m3/m2 was released. This means, in other words, that a water column of about one half the present thickness of the sequence was expelled.
One can deduce from this example, as well as by simple reasoning, that the height of the total compaction flow is always less than the thickness of the sequence. As long as sedimen- tation continues and compaction flow occurs uniformly and solely vertically, the ascending pore water from deeper sections can never reach the sediment-water interface (Einsele 1976). In this case, the total amount of water confined in the pores over all depths also in- creases and therefore must be complemented by newly added sea water.
Ascending pore water can only cross the sediment-water interface if sediment accu- mulation has ended and an underconsolidated sequence is still in the process of compaction. In addition, irregular dewatering of compact- ing sediments may cause local pore water dis- charge at the sediment-water interface.
Compaction Flow as Function of the Sedimentation Rate
During deposition, the range and velocity of ascending pore water flow and its potential solute transport are mainly a function of the sedimentation rate. This relationship is ex- emplified in Fig. 13.10 (based on the same porosity-depth curve as Fig. 13.9).
Here, a two-layer sequence with the layers hl and h2 is overlain, in the course of time, by a new increment of sediment with thickness hi . Under conditions of normal consolidation, the former sediment layen, hi and h2, are compacted to h2 and h,, respectively, and their former porosities, nl and n2, are reduced to n2 and n3, until a new state of equilibrium is established. In contrast to the model in Fig. 13.9, the thickness, h,, of compact solid matter is kept constant in all three succeeding sections, i .e. , they become thinner with increasing burial depth. The loss of pore water in terms of the height, , from the freshly compacted sections h2 and h3 can eas "3 y be found graphi- cally. Because of the preservation of mass, the sum of h3 and hp2, for example, is equal to the thickness, ha, of the former, less compacted section.
The height, h,, of expelled pore water can also be calculated with the aid of the compaction ratio, CR (Fig. 13.6a, Eq. 1). If hl/h2 = CR,,, and h2/h3 = CR,,, etc., we find
and h,
I i )
(1 3.6) Sequences subdivided into more sections can be treated in the same way.
The h, values of expelled pore water signify the heights of columns or the thicknesses of layers of pure water. In reality, the ascending pore water passes through pores which occupy only a fraction of the sediment volume. Hence, the range of ascending pore water flow, hf, crossing the boundaries of the sedi- ment sections in question is greater than h,. It is generally
For our example we find

Compaction, Flow Mechanisms
d PERMEABLE SAND
e DIFFERENTIAL COMPACTION
f
\
LOW-PERMEABLE MUD, UNDERCONSOLIDATED (OVER PRESSURED)
TIME, t c
h,= HEIGHT OF COMPACT SOLID MATTER Ti = MEAN POROSITIES WITHIN INDIVIDUAL LAYERS 1, 2. 3 h,= HEIGHT OF EXPELLED PORE WATER h f= RISE OF EXPELLED PORE WATER IN POROUS SEDIMENT
Fig. 13.10. a Two-layer sequence (hl' and h2') based on the same porositydepth curve as in Fig. 13.9, but later loaded by new increment of sediment (hl). This causes compaction and pore water flow (hp or h+ from underlying Layers 2 and 3. The thickness, h,, of compact solid matter is the same in all layers, but mean porosities, n, vary with depth. b Upward migration of pore water from Layer 2 and Layer 3, respectively, caused by additional compaction under the load of Layer 1 (hl), with dispersion and mixing
neglected. c Total upward migration of pore water from lowermost layer (h3) resulting from sediment load of both overlying layers (h2 and hl). Note the especially wide, secondary depth range of pore water from the lowermost layer. d through f Refraction of vertically ascending pore water flow through highly permeable, inclined individual sand layers, sand wedges, and reef detritus. See text for further explanation

Chapter 13 Diagenesis
hPl hfl = - hP2 and hn = - .
Velocity o f Ascending Pore Water
The velocity, v, of the pore water ascending in the porous sediment is then approximately (t = time interval)
because the sedimentation rate is SR = h/t.
Equation (13.8) shows that the velocity of the upstreaming pore water is controlled by the sedimentation rate and is inversely related to the thickness, h, of the uppermost sediment layer considered. For the example in Fig. 13.10 we find (using n1 = 0.3)
v1 = hfl SRW
= 0.84 SR, , "1
where SR, = sedimentation rate of wet sedi- ment in the uppermost section with hl = 1000 m.
For SR, = 10, 100, 1000 m/Ma, the velocity of ascending pore water in our example is v = 8.4, 84, and 840 m Ma, or 2.7~10-l3: 2.7~10-12, and 2 .7~10-l f m/s, respectively. These extremely low values will be discussed further in Chapter 13.3. In the underlying sediment intervals, the velocity of compaction flow becomes successively less with depth.
It should be mentioned here that one can distinguish bet- ween different sedimentation rates (measured, for example, in m/Ma; also cf. Chap. 10.1): The sedimentation rate of wet sediment calculated from hl, the sedimentation rate for dry, compact sediment derived from h,, and the elevation, A h, of the sediment-water interface above the basin floor (Fig. 13.10).
Pore Water Pressure
As discussed earlier, compaction flow is de- layed or prevented if the permeability of the overlying beds drops to such low values that the released pore water cannot escape. It then becomes overpressured with respect to the normal hydrostatic pressure, ph, because it has
to carry part of or almost the entire load of solid matter exerting lithostatic pressure (Fig. 13.1 la). Hence, the state of underconsolidation of subsurface layers can be determined from the pressure of their pore fluids. The ratio between the pressure of the pore fluid, pf (= ph + U; u = excess pore pressure), and the lithostatic pressure, pl, is called geostatic ratio. Values for this ratio vary between 0.47 (no excess pore pressure) and in excess of 0.9, indicating very high overpressure.
In the latter case, the fluid pressure can exceed the minimum horizontal stress and thus cause fracturing (Fig. 13.1 1 b; Rouchet 1978). This preferentially occurs in the depth range of 1000 to 3000 m, where horizontal stresses are considerably lower than vertical stress. The existence of overpressure signifies that the section is more or less sealed by overlying low permeability layers. Consequently, there is a high likelihood that hydrocarbons, possibly released from the sequence, are not lost by migration to the land surface or sea bottom. Similarly, one can assume that the primary pore water (connate water or chemically al- tered formation water) was not recently mixed with meteoric water (see below).
Some sedimentary basins also exhibit sub- normal pressures in drillholes of some depth. These pressures are less than the hydrostatic pressure. Such low pressures can only occur in porous rocks that are separated from circulat- ing groundwater by a low permeable barrier. Under this condition, subnormal pressure can be generated by extracting fluids or gas from the reservoir. Other causes for the reduction in pressure may be an increase in pore volume by fracturing and decompression, a decrease in the subsurface temperature, or osmotic effects.
Refraction o f Pore Water Flow
So far, only vertically ascending pore water in homogeneous sediments has been considered. The direction of compaction flow can, how- ever, be significantly modified by the inter- calation of highly permeable layers, sediment wedges, and irregular sediment bodies, which in addition may give rise to differential com- paction and inclined bedding (see above). If vertically upstreaming pore fluid in low-per- meable muds reaches, for example, an inclined porous sand bed or sand wedge, its direction of flow is refracted and thus forced to follow more or less the dip of the sandy bed (Fig. 13.10d and e).

Compaction, Flow Mechanisms
PRESSURE a 0 200 400 600 800 1000bar
100 MPa
' BULK DENSITY OF SEDIMENT / (INCREASING WITH BURIAL DEPTH)
LITHOSTATIC (GEOSTATIC) PRESSURE GRADIENT (= 0.225 barlm)
u , EXCESS PORE PRESSURE
pIIp , , GEOSTATIC RATIO
EFFECTIVE OVERBURDEN PRESSURE (pI-u)
C LlTHOSTAlC PRESSURE s3F:F:7~u~~ UNIT /ae AREA /
52
I P h + Ll I I Pe = P I - (P~+u)
S3, MINIMUM PRINCIPAL STRESS
MEAN EFFECTIVE STRESS AT GRAIN CONTACTS
A Peg = Pe ',
AREA OF GRAIN CONTACTS, a, PER UNIT AREA, A
d DECREASING THICKNESS CEME
, ,:. f , r 3.. . > I
INCREASING a, BUT DECREASING peg SOLUTION SEAMS
Fig. 13.11. a Relations between hydrostatic pressure, direction of minimum principal stress in zone of overpres- lithostatic (or geostatic) pressure, excess pore water pres- sure. (Rouchet 1978). c Comparison of effective stress on sure, and burial depth (from Gretener 1979; Gretener and unit area of horizontal plane and mean effective stress at Feng 1985). Note the buildup of excess pore water pres- grain contacts. d Increasing compaction due to pressure sure in the zone of "overpressure" and the associated re- solution. See text for explanation duction in effective stress. b Possible fracturing normal to

Chapter 13 Diagenesis
In the South Caspian basin subsurface pressure data in- dicate that sands are acting as drains not only for the underlying, but also for the overlying compacting shales (Bredehoeft et al. 1988). The highly permeable sands therefore display flow velocities considerably higher than those calculated for vertically ascending pore waters. The lateral movement of compaction water may allow subdivi- sion of a sequence irto several horizontal units which are hydraulically more or less isolated from one another. Similar to sand layers and sand wedges, reef detritus acts as conduit for compaction flow (Fig. 13.100.
In conclusion, the compactional flow regime is characterized by upward and outward expul- sion of pore waters from growing basin fill. Lithostatic loading or compressive tectonic stress provides the driving mechanism for flow. The zone of compaction flow may also include burial depths where the fluid pressure exceeds hydrostatic pressure (Fig. 13.1 1). Compaction flow is substantial in thick se- quences and may contribute significantly to diagenetic processes. Nevertheless its volume is finite and limited by the water content of the sediments involved. Growth faults fre- quently act as barriers for the updip migration of compaction water (including hydrocarbons).
Other Hydrogeologic Flow Regimes in Sedimentary Basins
In growing sedimentary sequences, compac- tion flow is the most obvious result of pore space reduction with increasing burial depth. Sedimentary basins are, however, also affected by other flow mechanisms. We have to con- sider at least four different types of hydro- geologic flow regimes (Bjorlykke 1984; Gal- loway 1984; Hanor 1987) (Fig. 13.12):
- Meteoric flow (gravity-driven flow). - Compaction flow (pressure-driven flow,
discussed above). - Thermobaric flow (temperature/pressure
driven flow). - Convection (density driven flow).
All these flow regimes may occur simul- taneously in an active, repeatedly prograding shelf-slope depositional system as is common on passive continental margins; this is shown in the model of Fig. 13.12.
Meteoric water circulation primarily occurs in shallow portions of the basin fill near the coast. Groundwater infiltrated on land from precipitation or surface water tends to move down the topographic gradient in the direction
of decreasing hydraulic potential and dischar- ges at or below sea level. A drop in sea level or the emergence of parts of the sequence permit deeper and more widely extended fresh water flushing of sediments which originally contained marine pore water.
In addition to local circulation cells, larger regional circulation systems may develop (Fig. 13.12d). Along the Atlantic continental margin of North America, fresh, artesian groundwater was found far offshore by ocean drilling (Kohout et al. 1988). If special water conduits such as fault systems are present, meteoric water circulation can also affect deeply buried strata. However, the volume of water passing through deeper parts of the basin fill during a certain time interval is usually much less than that of shallow meteoric circulation systems. Compared to other flow mechanisms, shallow meteoric flow involves large volumes of water which not only replace the primary pore wa- ter, but also leach soluble and unstable mine- rals from the sediments.
Thermobaric flow occurs in the deepest parts of basin fill and is related to compaction flow. Under increasing temperature and pressure, significant volumes of water may be released by dehydration of clay minerals and other hydrous mineral phases, besides the expulsion of residual pore water. Similar to pure com- paction flow, the fluids tend to move slowly upward until they reach permeable layers allowing lateral flow. However, the extremely low permeability of the intensely compacted sediments in this depth zone commonly re- stricts water movement over long time periods. As a result, this zone is characterized by ab- normally high pore water pressures. Thermo- baric waters frequently contain methane, car- bon dioxide, and hydrogen sulfide derived from the thermal alteration of organic matter within the sediment.
Convective or density-driven flow can operate in different ways:
- Near the surface when water of higher den- sity (salinity) forms a kind of reflux system through sediments. This is known from some modern salt lagoons separated from the open sea (cf. Chap. 6.4). Circulation of sea water with slightly elevated salinity may also occur in carbonate platforms. Beneath the North Island of the Great Bahama Bank, for exam- ple, sea water with salinities between 38 and 42 %o flows eastward, mixes with colder groundwater of normal salinity, and enters

Compaction, Flow Mechanisms
METEORIC COMPACTION FLOW FLOW (FRESHWATER
FLUSHING)
THERMOBARIC FLOW (* C 0 2 , HEAT CONVECTION '3-44, H2 S)
OVERPRESSURED GROUNDWATER LOCAL
REGIONAL RECHARGE METEORIC FLOW
Fig. 13.12. a,b,c Principal types of flow regimes possible hydrogeologic flow regimes. A sea level fall may extend in sedimentary basins. d Simplified model of repeatedly the influence of meteoric water circulation, MF. (Based on prograding, partially deltaic shelf-slope facies on passive Bjarlykke 1983; Galloway 1984; Bethke 1989, greatly continental margin, illustrating various contemporaneous modified)
again the sea at water depths of 200 to 300 m (Whitaker and Smart 1990). Such flow systems are thought to be important for pervasive dolomitization of carbonate buildups (see be- low). - Pore water flow in a circle or loop within a permeable sediment body may also occur without uptake of water from outside or loss of water to an adjacent flow system. Density differences may arise as a result of differences in temperature and/or salinity (Chap. 5.2). However, convection of fluid can only occur in relatively large, highly permeable rock
bodies if the difference in density is suffi- ciently high and, in addition, the viscosity of the fluid is low enough to overcome friction within the porous medium.
Theoretical calculations and some field observations con- cerning temperature gradients and pore water chemistry have presented evidence that such flow systems are pos- sible in several sedimentary basins (Wood and Hewett 1984; Hanor 1987). For example, density inversions in pore fluids on the Gulf coast of Texas are sufficient to drive large-scale convective flow at rates of meters per year.

Chapter 13 Diagenesis
Convective mass transport can redistribute relatively large quantities of mass in compara- tively short times (Schwartz and Longstaffe 1988). A quantitative evaluation of these vari- ous large-scale flow systems is difficult, be- cause the three-dimensional structure of basin fill and its heterogeneities are seldom suf- ficiently known. The permeabilities of the different sedimentary facies in particular vary markedly in space and time (Bethke 1989, Bj~r lykke et al. 1989).
There are several other, so-called nonhyd- raulic mechanisms, such as osmosis and ultra- filtration, which may cause or influence fluid flow and pore water chemistry in argillaceous sediments (Neuzil1986; Hanor 1987).Although several experimental studies have been carried out in this field, the significance of these phe- nomena in large-scale natural systems is still poorly known.
Significance o f Various Flow Regimes
The importance of various hydrogeologic re- gimes depends on the type of sedimentary basin and its age and evolution through time (Bjerrlykke 1983; Galloway 1984). Compactio- nal and thermobaric regimes are associated with the active depositional phase of many marine basins, particularly basins on conti- nental margins, marine rift zones, or delta-fed basins which subside significantly and are filled rapidly. If this active phase comes to an end and is followed by emergence of the basin fill due to sea level fall or the onset of uplift, compactional and thermobaric flow slow down and finally cease.
Depositionally inactive basins or hydrogeo- logically maturing basins are then increasingly subjected to gravity-driven, meteoric water circulation and therefore flushed by fresh water. Recharge commonly occurs along the uplifted margins of the basin, and meteoric flow is directed toward the less elevated basin center. Pressure gradients versus depth com- monly record hydrostatic conditions. Many basins all over the world have evolved to the stage when gravity flow predominates, for example the Aquitaine basin and Paris basin in France, the Pannonian basin in Hungary, and several basins in North America.
Pore Water Flow in Various Depositional Systems
The young, slowly deposited sediments in deep-sea basins far away from the continents, as well as most sediments of slowly subsiding epicontinental seas, exhibit only minor com- paction flow and are barely thick enough to develop overpressured thermobaric zones.
The emerged, more or less horizontally lay- ered sediments of an epicontinental sea, for example, provide little possibility for deeply circulating meteoric waters (Fig. 13.1 3a), as long as significant hydraulic gradients are ex- cluded due to low relief. Hence, the evolving circulation systems are limited in extent both laterally and vertically, except for emerged carbonates which may provide more effective conduits for ground water circulation. Sand- stones in such sequences are usually thin and contain small proportions of unstable minerals which could be later leached and allow the formation of secondary porosity (see below).
Thick, fluvial, and deltaic sediments along the margins of a continental rift basin are usually well and deeply flushed by meteoric waters during and after the time of their de- position (Fig. 13.1 3b). Their frequently im- mature sediments derived from nearby uplift- ed rift shoulders can thus be strongly affected by leaching and alteration, as in the example of kaolinitization of feldspar. Some compac- tion flow may originate in the basin center and migrate some distance outward.
Deep-water turbidites, which have been buried by pelagic and hemipelagic marine sediments (Fig. 13.13c), are normally not af- fected by early freshwater flow. If the tur- bidites are relatively fine-grained and poorly sorted, they lose most of their primary poro- sity due to compaction, or their pores are fil- led by carbonate cement provided by compac- tion flow from carbonate-bearing host sedi- ments (Fig. 13.1 3d). Only thicker turbidites with thin intercalations of host sediment de- void of carbonate or easily soluble opaline silica, have a chance of preserving some of their primary porosity, or they may gain some secondary porosity by the leaching effect of compaction water (Fig. 13.13e).
The flow regimes of other basin types and their evolution over time can be inferred from these general rules. Many basins also exper- ience changes in the development of certain flow regimes during their depositional history.
For example, Lower and Middle Jurassic deltaic sands, representing the riftiig stage in the central North Sea, were

Compaction, Flow Mechanisms
SHALE, MARL SEA LEVEL CARBONATE
\ LIMITED s A ~ ~ y SHALE^ MINERALOGICALLY COMPACTION FLOW MARL MATURE SANDSTONE
b CONTINENTAL RIFT BASIN STRONG AND DEEP METEORIC CIRCULATION
FAN DELTA DEPOSITS FINE-GRAINED SEDIMENTS
C BURIED DEEP-SEA FAN - - - - - - - - - - - - - - - - -
. .
COMPACTION FLOW ONLY COMPACTION FLOW
Fig. 13.13a-e. Dominant flow regimes in various types of environment. c Buried deep-sea fan and d, e sections of sedimentary basins. a Epicontinental sea in stage of emer- special turbidite sequences. See text for further explana- gence. b Continental rill basin with central lake or marine tion. (After Bjerlykke 1983)
subjected to meteoric water circulation during and im- mediately after their deposition (Fig. 13.14a). As a result, feldspar and mica in the sands were converted to kaolinite. Then the sandy deposits (Brent Sandstone of the Viking graben) were covered by transgressive shales and carbo- nates, which cut them off from the meteoric water supply
- -
and initiated some compaction flow (Fig. 13.14b). Grain- to-grain pressure was, however, not sufficiently high to produce pressure solution (see below). In a third stage during the Upper Jurassic, part of the sequence emerged due to tectonic uplift. Thus, the clay cover on top of the sandstones was removed, allowing the renewal of meteoric water circulation within certain portions of the sandstone (Fig. 13.14~).
Later development (Fig. 13.14d) is characterized by significant subsidence and deposition of more than 2000 m of younger beds, which again sealed the Jurassic sand- stones and caused overpressure, limited compaction flow, and possibly thermobaric flow and hydrocarbon ac- cumulation within the deeply buried part of the basin fill. Further compaction and cementation of the sandstone by pressure solution (see below) was inhibited by the buildup of very high excess pore pressure equivalent to approx- imately 3000 m of water column. Today, about 70 to 80 % of the overburden load is carried by pore water and only 20 to 30 % by the sandstone framework (Bjarlykke 1983).

TERTIARY SANDSTONE AND SHALES\
Chapter 13 Diagenesis
UPPER CRETAC. CARBONATES - LOWER CRET. / SHALES
OVERPRESSURED SEQUENCE; LIMITED, SLOW COMPACTION FLOW
EROSION OF CLAY COVER AND RENEWED INFILTRATION
KlMMERlAN UNCONFORMITY
I I METEORIC FLOW TECTONIC UPLIFT
CLAY OR CARBONATE
LOWER & MIDDLE JURASSIC
PROGRADING - D E LTA
SOME COMPACTION FLOW
INFILTRATION
SEA LEVEL
KAOLI'NIT~ZATION OF FELDSPAR AND MICA
Fig. 13.14. Burial history and varying flow mechanisms controlling diagenesis of Jurassic Brent sandstone in the North Sea, burial depth 2.5 to 3 krn. (After Bjmlykke 1983)
13.3 Principles of Chemical Diagenesis
Introduction
Chemical diagenesis is an extremely complex, but very interesting and important topic in sedimentology and economic geology. There is an immense, never ending literature on the different aspects of chemical diagenesis in various rock types from many regions all over the world. Chemical diagenesis affects silici- clastic and biogenic materials (skeletal remains and organic matter) of greatly varying solu-
bility and thermodynamic stability, and it includes mineral reactions with pore fluids ranging from meteoric waters to highly con- centrated brines. Primary minerals may be replaced to a great extent by secondary min- erals; pore cements often display a character- istic evolution of the diagenetic system with several cement generations and secondary leaching. Primary minerals may be depleted in trace elements, which are enriched in second- ary mineral phases or may migrate in solution to other sites. Some inorganic processes are closely related to the decomposition and dia- genesis of or anic matter. Stable isotopes, such 5 as 13c and 80, may undergo fractionation

Chemical Diagnesis
relative to "C and 160, respectively, during diagenesis and thus reveal the origin and na- ture of the secondary minerals in which they are found. Fluid inclusions in cement minerals reflect the composition, temperature, and pressure of the former diagenetic environ- 'ment.
Chemical diagenesis is commonly accom- panied by compaction. The term "chemical compaction" may refer to pressure solution, but is also used in a broader sense to describe the total compaction effect of chemical dia- genesis. We may, however, distinguish bet- ween processes retarding the onset and effi- ciency of chemical compaction (e.g., early cementation, pore filling with oil) and situa- tions accelerating chemical compaction (pre- sence of metastable mineral phases, aggressive pore fluids, effective flow systems; Moore 1989). Carbonates normally undergo earlier and more intensive diagenesis than siliciclastic sediments.
Sediments rich in volcaniclastic material (Chap. 2.4) tend to be altered rapidly during diagenesis, because they contain high porpor- tions of very unstable minerals which are easily converted into clay minerals. These form rims and coatings around the grains and more or less fill the pore space, thus reducing the primary porosity and permeability of sands.
Due to all these and further complications, it is not possible to present a simple system including and summarizing all important pro- blems of chemical diagenesis. In the following, only a few of these various aspects can be discussed.
Pressure Solution
Mechanical compaction includes ductile de- formation and fracturing of minerals which contribute to denser grain packing. However, more important in diagenesis is pressure solu- tion at the contacts of individual grains. This can be regarded as a process transitional bet- ween mechanical and chemical diagenesis. The principle mechanism has long been known, but its efficiency as a provider of pore cement for various types of sandstones, orthoquartz- ites, and carbonates is somewhat controversial (Bj~r lykke 1983 and 1984; Bathurst 1987 and 1991; Pettijohn et al. 1987; Fiichtbauer 1988; Mitra 1988; Bayer 1989b; McBride 1989; Tada and Siever 1989).
According to Riecke's principle, the solu- bility of minerals is enhanced under compres-
sional stress, i.e., at the contact between two grains or bedding planes. If the composition of adjacent particles is different, one usually maintains its shape at the expense of the other, which is partially dissolved. Pressure solution has frequently been described from carbonate rocks and quartzitic sandstones, but it also occurs in other rock types.
The effective vertical stress at the grain contacts is a function of the effective over- burden pressure and the area, a, which the grain contacts occupy per unit area, A. of a horizontal plane within the rock (Fig. 13.1 lc). The smaller the grain contacts, the higher is the effective stress at these contacts.
For example, at a burial depth of 2000 m, the effective vertical stress exerted on a plane with area A is
pe = p, - p,, = 25 Mpa (= 250 bar)
(using the hydrostatic pressure and lithostatic pressure gradients listed in Fig. 13.1 la, and assuming that there is no excess pore pres- sure). Then, the mean effective stress at the grain contacts, peg, is
If a = 0.1 A, the effective stress at the grain contacts amounts to 250 MPa (= 2500 bar).
Such a high stress is, however, strongly reduced if excess pore water pressure builds up. In this way, significant pressure solution is prevented. This is the reason why many reser- voir rocks can maintain a great part of their primary porosity at an advanced stage of their burial history and thus allow the migration and accumulation of hydrocarbons.
Fine-grained quartzose sandstones appear to develop more intergranular pressure solu- tion than coarser counterparts (Houseknecht 1988). Pressure solution of quartz may be en- hanced by the presence of clay as grain coat- ings. Chemical reactions involving clays pro- bably yield high pH in the pore water and thus favor the dissolution of quartz. There- fore, clean quartz sands have a higher poten- tial to preserve their porosity with depth than "dirty" sands. At burial depths of 2.5 to 3.5 km microstylolites between quartz grains are com- mon (see below).
Ongoing pressure solution will lead to an increase in the area of grain contacts (Fig. 13.11d) and thus to a reduction in stress at these contacts. As a result, the solution process

Chapter 13 Diagenesis
slows down. Finally, the grain contacts often merge and display dissolution seams, sutures, or stylolites. The dissolved matter is usually precipitated immediately next to the grain contacts on free grain surfaces and in the open pore space, where minimum stress conditions prevail. The pressure-solved material forms mineral overgrowths and pore cement (Trurnit and Amstutz 1979; Mitra 1988). If all pores are filled, pressure solution tends to end (Park and Schot 1968). It may continue during early stages of rock deformation, when fractures can be filled by pressure-solved material (Mitra 1988).
The question whether or not the cement of orthoquartzites or carbonate-cemented strata has been derived entirely from the same layer by pressure solution is controversial. Several authors assume that both carbonate and silica can also be delivered from neighboring mud- stones and shales (e.g., Fuchtbauer 1974a and b; Ricken 1986; McBride 1989). However, it was also inferred from petrographic evidence that, in the case of quartz sandstones, pressure solution during deep burial diagenesis may provide more silica than needed for complete cementation. In other words, deeply buried sandstones can export silica to less deeply buried strata.
While pressure solution and cementation of quartz appear to take place predominantly at deep burial depths of at least 1.5 to 2 km (Fuchtbauer 1988) or in the "silica mobility windown at 80 to 120 OC (McBride 1989), pressure solution of carbonates largely occurs at depths of a few hundred meters (Bathurst 1975, Ricken 1986).
Various Diagenetic Realms and Solute Transport Mechanisms
Pore fluids are the main mediator of all reac- tions in chemical diagenesis. Solid-solid reac- tions are negligible under the low temperature conditions characterizing diagenetic processes. Therefore, the chemistry of pore fluids is one of the most important criteria for distin- guishing between various diagenetic realms (Fig. 13.15). Furthermore, the mechanisms of solute transport within the sediments play a great role in the type and intensity of chem- ical diagenesis. Both factors, the chemistry of pore fluids and the types of solute transport, are closely related and operate in different ways at shallow and deep burial depths.
There are open systems, which exchange dissolved matter with sea water or other parts
of the sedimentary basin (allochemical dia- genesis), and more or less closed systems, which preserve their bulk chemical compo- sition (isochemical diagenesis), although they exhibit internal solution and recrystallization processes.
Solute Transport by Meteoric Water Circulation
Dissolution, transport, and reprecipitation of solid matter by meteoric water circulation is a very important process in carbonate sediments (Chap. 3.3.2), but also affects siliciclastic ma- terial as will be demonstrated in the following.
On the continents, for example in fluvial systems or along lake shores, chemical diagen- esis is controlled by meteoric water circulation with recharge in elevated areas and discharge in lowlands. The unsaturated, vadose zone above the groundwater table is commonly well aerated, but oxidation also affects the upper part of the saturated, phreatic zone. As a re- sult, primary sediment particles containing ferrous iron and manganese are oxidized and partially replaced by oxyhydrates of iron and manganese (e.g.? limonite) or hematite. Un- stable minerals in sands, for example biotite and feldspar, are slowly dissolved or trans- formed into clay minerals. In humid climates, kaolinite predominates as a secondary mineral, while arid conditions may lead to the neofor- mation of potassium feldspar (Fuchtbauer 1974 a). The carbonate fraction in sands tends be be dissolved, but part of the dissolved car- bonate may be reprecipitated either as over- growths on the surfaces of various grains (meniscus cement) in the vadose zone, or as pore-filling cement (equant low Mg calcite) in the deep phreatic zone where water circulation is very slow. Both these effects and those of brackish and hypersaline waters on carbonate diagenesis in the coastal zone are briefly des- cribed in Chapter 3.3.2 (Fig. 3.25).
Similar to sands on land, emerging coastal sands are subjected to relatively strong meteoric leaching. Thus, their unstable com- ponents also tend to be altered and dissolved. Cementation only occurs locally, for example along beaches, when unstable carbonate is present, then partially dissolved and reprecip- itated as aragonite or high Mg calcite cement (beach rock). Under semiarid conditions dis- solved carbonate or silica can be precipitated near the land surface as nodules or crusts (cal- Crete, silcrete). Wood and pre-existing car- bonate, including calcareous fossils, are fre-

Chemical Diagenesis 535
FRESH WATER, VADOSE ZONE LOW HIGH SED. BEACH ROCK FRESH BRACKISH OR GOETHITE
RATE
DEEP PHREATIC ZONE (MARINE PORE FLUID, BRINES)
PRODUCTS CONCENTRATION
H2 S, C 0 2
NITRATE REDUCTION LCITE, DOLOMITE
SULFATE REDUCTION (Cop ISOTOPICALLY
MICROBIAL METHANO- GENESIS [FERMEN I I
(ISOTOP. HEAVY C 0 2 , Fe-RICH CHLORITE MIN.
CH4
/ / / / / I / / / / THERMOCATALY TIC 1' DECARBOXYLATION LATE DlAGENESlS
IRON-POOR SED. (CARBONATES) : LITTLE OR NO AUTHlGENlC CARBONATES IN ZONES OF SULFATE RED. AND METHANOGENESIS
C FRESH WATER ENVIRONMENTS (POOR IN s o q )
ANOXIC OXYGENATED BOTTOM WATER BOTTOM WATER
OXIDATION WATER --- --------_ -- - - _ _ _ _
SULFATE REDUCTION ZONE + ABSENT
LITTLE PYRITE SEDIMENT
MICROBIAL METHANOGE ABUNDANT SIDERITE
Fig. 13.15. a Overview of various realms of diagenesis. rapid burial (right column). c Same as b but for fresh b and c Processes and products of early diagenesis in a water environments. (Based on several sources, e.g., Bjsr- marine sediments with oxygenated bottom water and slow lykke 1983; Curtis 1987). See text for further explanation burial (leff coluntn), and with anoxic bottom water and

Chapter 13 Diagenesis
quently silicified (see, e.g., Hesse 1989b). The effects of meteoric water circulation may also control large proportions of shallowly buried shelf sands, if there is sufficient recharge on land and a hydraulic connection between the emerged coastal and submerged shelf sands (cf. Chap. 3.3.1 and 13.2). All these meteori- cally controlled systems are "open" and may transfer considerable quantities of solutes from the recharge to the discharge zone.
Solute Transport by Compaction Flow
In contrast, a sedimentary sequence below a lake or the sea may be affected only by com- paction flow (upward directed advection) and diffusion (see below). Because these mechan- isms of solute transport operate relatively slowly, such systems are commonly thought of as more or less "closed (Fig. 13.17a and b). As pointed out in Chapter 13.2, the velocity of vertical compaction flow, v, and the filter velocity, vf = v. n, are commonly less than the sedimentation rate, SR,.
Using the example in Chapter 13.2 (velocity of compaction flow vl = 0.84 SR,, S R , = 40 mlMa, porosity nl = 0.3), the filter velocity of upstreaming pore water is vfl = 10 mlMa. If, for example, the pore fluid contains 20 mgll or 20 glm3 dissolved silica, then the transport rate of silica through a horizontal plane within the sediment is 200 g / m 2 . ~ a . This amount corresponds to a 0.074 mm thick layer of solid quartz or chert. If a water column 1000 m high, with the same Si02 concentration as before, passes through a unit area of the horizontal plane, it may leave behind a quartz layer of 7 .4 mm at most.
This solute transport is not enough to provide cement for a sand layer of a few to tens of meters in thickness (Bjarlykke 1984). Similar- ly, limited compaction flow can barely dis- solve enough preexisting cement in order to create secondary porosity (see below). Even the relatively well soluble calcium carbonate (100 to 1000 g/m3) cannot be transported by compaction flow in sufficient quantities to account for the large volumes of carbonate cement observed in many sequences. However, where thin sandy beds act as lateral drains of upstreaming compaction flow, the volume of pore fluid and the concentration of solutes may match the requirements for significant cementation.
Solute transport by diffusion
Molecular or ionic diffusion in aqueous solu- tions is one of the most important processes of mass transport in diagenesis. It tends to over- come differences in concentration or chemical potential of a specific ion or pair of ions, for example Na+ and C1- at the surface of buried rock salt, between two locations (distance, d) within the solution. These locations are usually the source and sink (or reaction zone) of the specific ions in question. A thorough treat- ment of diffusion in sediments is a rather difficult topic (see, e.g., Berner 1980; Ran- ganathan and Hanor 1987).
Under simplified steady state conditions, the flux, Ji, of a dissolved chemical species, i, through a unit area, A, is directly proportional to the concentration gradient, (C2-C )/d, bet- ween the two locations (distance, df and the time, t, the diffusion process operates (Fig. 13.16a; based on Garrels and Mackenzie 197 1; Pingitore 1982; Hesse 1986):
Ji = - = Do (C2-C,). - [g/(m2. a)]. t d (13.10)
The quantity, q, of the transported material is expressed here in g, the ion concentration in the aqueous solution, C, in g/m3, A in m2, and d in m. The factor of proportionality, D, is the diffusion coefficient for the s ecific ion in P water. It is here expressed in m /a, but values given in the literature are usually in cm2/s or cm2/day cm2/s = 0.0864 cm2/day = 0.00315 m /a). The diffusion coefficient sig- nifies the mass of material transported through a unit area per unit time, if the dis- tance corresponds to one unit length and the concentration gradient is also 1 (in terms of the mass units used, Fig. 13.16a).
If, for example, the diffusion coefficient of ca2+ in water is D = 7 . 9 . 1 0 - ~ cm2/s = 0.025 m2/a (at 2S0 C, Lerman 1980), the diffusion flux under steady state conditions (as shown in Fig. 13.16a) is J = 0.025 g/(m2. a) or 25 kgl(m2. Ma).
Solute transport by diffusion increases with growing concentration gradient, decreasing distance between the ion source and the reac- tion zone, and increasing temperature. An increase in temperature on the order of 30 OC doubles the effectiveness of diffusion. How- ever, this does not necessarily mean that dif- fusion increases with burial depth. The sig- nificance of diffusion is reduced by low con-

Chemical Diagenesis
k d = 1 m +>A = l m 2 I SOLUTE FLUX BY DIFFUSION
AQUEOUS DIFFUSION a
J = - = D ( C . C A (IN WATER t 2 1) 7 ONLY)
t = 1 a (year)
DIFFUSION COEFFICIENT D- J (g/m2a) (e.g.. wi th D = 7 . 9 . 1 0 - ~ ~ m ~ 1 ~ ~ 0 . 0 2 5 m2/a J = 0.025 g/m2.a)
CONVECTION-CONTROLLED DIFFUSION-DOMINATED
SEA WATER RECHARGE SED.SURFACE
T
I I- DISCHARGE I I I
CONVECTION I 'XI-. ,! CELL
I
SEVERAL
CONCEN Z TRATION
GRADIENT= 0 FOR VARIOUS CHEM. SPECIES
YOUNG HIGH HEAT
OCEANIC FLOW
CRUST
DOLOMI- CONCENTRATION TlZATlON IN SEA WATER
GRADIENT DUE TO DIFFUSION ONLY
1 ~ D I F F . COEFFICIENT ."E DECREASING WITH Z
DIFF. MODIFIED BY z ADVECTION
L'
V V V V V V *SINK FOR ~ g f - V V V V V V V
d e DIFFUSION-DOMINATED DIFFUSION FROM EVAPORITES
.-.' ALTERNATIVE :
OVERLYING EVAPORITES
E V A P O R I T E ~ (NaCI. CaS04. DOLOMITE)
Fig. 13.16. a Meaning of the diffusion coefficient in terms gradient, somewhat modified by depthdependent diffusion of diffusion transport under simplified conditions. coefficient or advection, in sediments on top of older ocea- b through d Various types of vertical concentration gradi- nic crust. d Same as c but for ca2+. e Diffusion-control- ents in marine sediments. b In young sediments of limited led, strong vertical gradients of chemical species associated thickness on top of the oceanic crust of mid-oceanic ridges. with underlying (or overlying) evaporites. (Largely based Differences in heat flow cause convective flow, which on Hesse 1986) prevents chemical gradients. c Diffusiondominated M ~ ~ +

Chapter 13 Diagenesis
AQUEOUS DIFFUSION COMPACTION FLOW (ADVECTION)
I ON WATER ION A+B WATER \ "OPEN"
SYSTEM
CLOSED SYSTEM (ISO- CHEMICA DIAG.)
/
ENI-IANCED FLOW, LEACHING OR
?CLOSED SYSTEM
/ DECREASE IN FLOW VELOCITY
ASYMMETRIC CEMENTATION
DECREASING / MULTI-
FLOW SEDIMENT DIFFUSION DIRECTIONAL COEFFICIENT TRANSPORT
tUNlDlRECTlONAL TRANSPORT
EXCHANGE OF DISSOLVED SPECIES
FLOW IN MACROPORES /(DIFFUSION)
MIXED SOLUTE TRANSPORT
METEORIC FLOW +DIFFUSION EMERGED
?OPEN SYSTEM (ALLO- CHEM. DIAG.)
?CLOSED SYSTEMS
f#i& PRIMARY
NEW, STABLE MINERAL
PREDOMINANTLY DIFFUSION DIFFUSION, SOME COMPACTION FLOW
INTRAGRANULAR MICROPORE, AQUEOUS SOLUTION, DIFFUSION ONLY
f DISSOLUTION OF CARBONATE.
SUBSURFACE CONVECTIVE FLUID FLOW SHALE
ACCUMULATION OF QUARTZ AND HYDROCARBONS
DISSOLUTION - OF QUARTZ, ACCUMULATION OF CARBONATES
Fig. 13.17. a c Various mechanisms of solute transport in f Convective pore fluid flow in folded sand sheet inter- sediments reflecting more or less "closed" or "open" c h e calated with shales. (AAer Wood and Hewett 1984). Quartz mica1 systems. d Solution-recrystallization via thin film of is dissolved in the hotter synclinal trough and precipitated pore fluid in micropore of closed (isochemical) system. in the cooler anticline, while carbonate behaves vice versa e Same as d but in open (allochernical) system.

Chemical Diagnesis
centration gradients and long transport distan- ces. In addition, diffusion is generally ham- pered in sediments as compared to water, be- cause sediments consist for the most part of solid matter and have rather irregular, chan- ging pore space and pore geometry. Therefore, both the porosity, n, and the tortuosity (length/length) of the pores, i.e., the actual path a dissolved species has to travel between two points within a sediment, have to be taken into account. Thus, the diffusion coefficients for sediments, D,, are commonly smaller than those for water, D, only. The diffusion trans- port in sediments becomes
For n = 0.2 and a tortuosity of 1.33, o r D, = 0.75 D, the diffusion transport for the example in Fig. 13.16a is re- duced to 15 % of the amount calculated for diffusion in water only.
With increasing burial depth and continued loss in porosity, the diffusion factor, n.D , may drop to values of lo-' to cm2/s an- heim 1970), and thus the efficiency of dif- fusion declines further (Fig. 13.16~). Never- theless, solute transport by molecular diffu- sion is frequently more effective than com- paction flow.
Using the example in Fig. 13.16~1 and taking into account a reduction in the diffusion factor, n. D, = 0.1 D, as dis- cussed above, the diffusion flux in sediments is J, = 0.1 x 25 = 2.5 kg/(m2. Ma) (for distance d = 1 m). For d = 100 m, J, drops to 0.025 kg/(m2- Ma), for d = 0.1 m it increases to 25 kg/(m2- Ma). The transport rate of com- paction flow, calculated in the previous section for a con- centration (or difference in concentrations between the inflowing and outflowing pore water) of 10 g/m3 was only 0.2 kg/(m2. Ma).
This means that molecular diffusion is the main transport mechanism over short distances in both closed and open sedimentary systems.
The significance of time in diffusion pro- cesses may also be defined in terms of a mean diffusion path length, z, (Gieskes 1975):
This is the distance over which diffusion will dissipate concentration anomalies for a given period of time.
The mean diffusion path length, h, is 100 to 200 m for a time period of 1 Ma and values of D, between a p proximately 4 and 10 x 1 0 ' ~ cm2/s (= 0.0126 to 0.0315
m2/a), which include the bulk sediment diffusion coef- ficients of ~ a ' , ca2+, C1-, and so4'' in young soft muds with n = 0.71 at a temperature of 20 to 25 OC (Berner 1980).
This signifies, for example, that solute trans- port by diffusion from sea water can penetrate about 100 m downward into the sediment, as long as the sedimentation rate does not exceed 100 m/Ma. Long diffusion pathways on the order of several hundred to more than 1000 m were found in drill holes of the Deep Sea Drilling Project (Fig. 13.16~ and d). Here, diffusion is reflected by vertical concentration gradients between sea water and oceanic base- ment (e.g., for Ca++ and Mg") in the pore fluids of the sediments over great depth ran- ges. Only where convective flow causes rela- tively fast, upward and downward directed solute transport is the effect of diffusion lar- gely eliminated (Fig. 13.16b).
Evaporites greatly influence their overlying or underlying sediments, because they create very steep concentration gradients for several chemical species (e.g., C1-, ca2', M ~ ~ ' , Na'; Fig. 13.16e).
For example, in the Mediterranean, the pelagic to hemipe- lagic sediment cover on top of Late Miocene (Messinian) evaporites (Chap. 6.4) forms a section of about 200 m with abnormally high, but upwardly decreasing pore water sali- nity. The pore fluids are characterized by the easily soluble constituents of the underlying halite, anhydrite, and dolo- mite deposits. In this case, diffusion transport has covered a vertical distance of 200 to 300 m in a time interval of a p proximately 5 Ma. Similar observations were reported from the North and South American Atlantic margin, offshore West Africa, and the Gulf coast of the United States (Hol- mes 1986; Bjerrlykke 1988). As known from several other examples, sandy sediments in the neighborhood of evapo- rites may contain salt minerals as cement (e.g., anhydrite).
The diffusion coefficients of different chem- ical species vary slightly. Chloride and car- bonate ions have relatively high diffusion coefficients and can therefore migrate some- what faster than most of the common cations.
In a sediment undergoing chemical diagen- esis, the concentration gradients of the various chemical species often vary considerably. At a single site, a strong gradient may exist for one or a pair of species, but weak or no gradients at all for other species. Hence, only the species affected by a significant concentration gradi- ent will exhibit diffusion transport. Such con- ditions are encountered, for example, along the boundary between an oxidation and reduc- tion zone, where sod2- is used up by anaerobic bacteria and ferrous iron precipitated as iron

Chapter 13 Diagenesis
monosulfide or pyrite (Fig. 13.15, reaction- controlled diffusion).
In contrast to advective mass transport through pore water flow, mass transfer of specific ions by diffusion can occur toward or away from the reaction zone simultaneously ("two-way traffic"). In relation to the con- centration gradients, one species may enter a certain reaction zone, while another species leaves (Pingitore 1982).
For example, during the transformation of skeletal arago- nite (e.g. corals) to calcite, the aragonite may release strontium to its environment, while the new calcite takes up magnesium from outside (compare Fig. 13.17d).
Redistribution of Solutes by Convective Fluid Flow
As already mentioned in Chapter 13.2, con- vection of pore fluids in a relatively large, closed circulation system appears to be a rath- er common phenomenon in the subsurface (Wood and Hewett 1984), even under con- ditions of normal geothermal gradients. Such long-term operating circulation systems have been postulated by several other authors in order to explain the volume of dissolved and redistributed cement in thick sandstone bo- dies, which otherwise are difficult to explain (e.g., B j~r lykke 1984).
For example, the slowly moving pore fluid (rate of convection about 1 m/year) may cir- culate in a thick sand layer in a folded se- quence in a so-called toroidal cell (Fig. 13.17f). It is heated during its downward flow to the synclinal trough and cools as it ap- proaches the anticlinal crest. During its cir- culation, the pore fluid has the tendency to maintain chemical equilibrium with the ad- jacent rock matrix. Because the solubility of minerals is, among other factors, a function of temperature, the cooling pore fluid precipi- tates minerals which have "prograde solubili- ties" (for example quartz) and dissolves miner- als whose solubility decreases with increasing temperature ("retrograde solubility", for exam- ple carbonates). As a result, quartz will move from hot source zones to cooler sinks, but carbonates from cool sites to hot ones. Dis- solution and reprecipitation are particularly intense in anticlinal crests and synclinal troughs where the pore fluids are most rapidly cooled or heated. In this way, a continuous tranfer of solutes is accomplished in the per- meable rock layer.
It is interesting to note that from 60 to 150 OC the solubilities of common hydrocarbons in water are similar to that of quartz. Hence, both components can be transferred and ac- cumulated in comparable quantities under these conditions.
Combination of Various Processes of Solute Transport
Finally, there are many sedimentary basins where several of the above mentioned solute transport systems operate simultaneously (Fig. 13.17~). While the meteoric, open system is realized in emerged, coastal and shallow- buried parts of the basin fill, water-covered and deeply buried portions of the basin fill are characterized by compaction flow, diffusion, and convective flow in a more or less closed system.
As a result of differing solute transport, the mineral reactions occurring in individual pores and micropores in the sediments also vary fundamentally. In a closed system, an unstable mineral may dissolve and be replaced by one or several stable minerals, which in total have the same chemical composition as the parent mineral. For example, high Mg calcite may be transformed into low Mg calcite and some dolomite. The new mineral phase(s) are form- ed directly adjacent to the dissolving mineral; solute transport takes place by diffusion via a very thin film of pore water (Fig. 13.17d).
In an open system, the micropores between a dissolving and newly crystallizing mineral are more or less in contact with the macro- pores (Fig. 13.17d). These serve as conduits for pore fluid flow and thus for the exchange of chemical species between the reaction zone of the micropore and zones far away from this location. In this case, the new mineral phase(s) and their trace element contents frequently differ in their bulk composition from the pri- mary mineral(s) (allochemical diagenesis).
Early Diagenesis
Most geologists and sedimentologists dealing with diagenesis distinguish between processes of "early" (shallow-burial) and "late" (deep- burial) diagenesis, but some experts have des- cribed more stages of diagenesis for particular rock sequences or regions. A sharp boundary between early and late diagenesis is difficult to define, because it depends on the nature of the process which is considered most impor- tant.

Chemical Diagenesis
If, for example, the transition from biogenic decomposition of organic matter to thermocatalytic reactions (see Chap. 14.2) and the onset o f hydrocarbon migration are taken as particularly significant in diagenesis, the lower boundary of early diagenesis coincides with a temperature o f 60 to 75 OC (e.g., Edman and Surdam 1984; Hesse 1986). As- suming a normal temperature gradient o f 25 OC per 1000 m and a surface temperature o f 10 OC, the transition to cata- lysis corresponds with a burial depth o f at least 2000 m. However, if the peak of carbonate diagenesis is thought to characterize early diagenesis, a much shallower burial depth appears to be appropriate.
Therefore, many authors (e.g., Berner 1980) leave this question rather open. Thus, early diagenesis may refer to changes occurring during burial to a few hundred meters, where elevated temperatures are not encountered.
The processes and products of early diage- nesis vary strongly according to the deposi- tional environment and the type of sediment.
Marine Muds under Oxic and Anoxic Conditions
Fine-grained marine sediments deposited slow- ly under oxic bottom waters display the fol- lowing diagenetic subzones (Fig. 13.15b). The upper sediment layer below the interface is kept in an oxygenated state by downward diffusion of dissolved ogygen from the over- lying water column. Hence this layer can be colonized by benthic organisms and aerobic bacteria, which consume and oxidize organic matter reaching the sea floor. Burrowing or- ganisms in turn promote mass transfer from the sea water into the sediment and vice versa. If all the organic matter is used up and iron and manganese are oxidized to form oxyhy- drates, brown or reddish brown sediment may result which is no longer affected by organic processes (see Chap. 5.3.3). If some reactive organic matter is left over below the oxidation zone, a very thin zone of bacterial nitrate reduction and a somewhat thicker zone of anaerobic sulfate reduction develop. In this way, C 0 2 and H S (and small amounts of NH,) are produced, which may migrate to the sea floor by upward diffusion or react with other ions to form new minerals, for example pyrite.
Sediments deposited more rapidly under anoxic conditions are commonly rich in or- ganic matter and have a stronger tendency to form early diagenetic authigenic minerals (Irwin et al. 1977; Goldhaber and Kaplan 1980; Gautier and Claypool 1984; Curtis 1987). Nitrate reduction occurs in the water
column and sulfate reduction operates both above and below the sediment-water interface (Fig. 13.15b). Since normal benthic organisms are absent, comparatively large amounts of organic matter are available for bacterial sul- fate reduction. A shortage in the sulfate con- tent in the pore water can to some extent be replenished by downward diffusion of sulfate from the sea water reservoir. Hence, conside- rable quantities of CO and H2S can be pro- duced. Iron released &om minerals and re- duced to ~ e ~ + is precipitated as (metastable) monosulfide and stable pyrite, particularly in the upper part of the sulfate reduction zone. Commonly, early diagenetic pyrite occurs as fine-grained framboidal grains and ag- gregates, but it may also form internal moulds of fossils (e.g., Hudson 1982). Calcareous fos- sil shells, particularly those consisting of ara- gonite, are frequently dissolved or replaced by pyrite.
Somewhat deeper, but still within the sul- fate reduction zone, the decomposition of organic matter causes the formation o f authi- genic calcite or dolomite (Lippmann 1973; Kelts and McKenzie 1982), often in the form of concretions. Diffusive transport of methane from below may stimulate anaerobic sulfate reduction and provide the alkalinity for the precipitation of carbonate (CH + SO:- = HC03- + HS- + H,S; Raiswell 1687). A slow sedimentation rate or a break in sedimentation favors the formation of concretions. In par- ticular cases, salinity variations in the over- lying water body may be recorded in the min- eral phases of concretions and their isotopic composition (e.g., Carpenter et al. 1988).
Normally, the early formed carbonate con- cretions are nonferroan, since the pore fluids are depleted in iron by the preceding iron sulfide precipitation. Diagenetically early iron carbonate (siderite) only forms under specific conditions when the rate of iron reduction exceeds the rate of sulfate reduction. Then, the dissolved sulfide is insufficient to precipi- tate all the available dissolved ferrous iron, as observed in late Holocene marsh and sandflat sediments on the Norfolk coast, England (Pye et al. 1990).
The lowered "C content of carbonate con- cretions reflects some bacterial fractionation of carbon isotopes. The lower boundary of this zone may lie several meters up to 10 m below the sea floor. Early diagenetic phosphogenesis as briefly discussed in Chapter 5.3.6, is related to the processes taking place in the sulfate reduction zone.

Chapter 13 Diagenesis
If sulfate is exhausted and can no longer be sufficiently supplied by downward diffusion, the precipitation of pyrite and isotopically light carbonate ceases. Further decomposition of organic matter is now accomplished by microbial fermentation reactions, which pro- duce isotopically light methane and heavy carbon dioxide. Carbon dioxide may be re- duced to provide oxygen for anaerobic respi- ration. These processes are frequently sum- marized under the term methanogenesis (Fig. 13.15b). Characteristic authigenic minerals in this zone are carbonates rich in ferrous iron and 13c (ferroan calcite, dolomite, ankerite, and siderite).
Siderites formed in such marine environments are common- ly impure (in contrast to freshwater siderites) and are rich in Mg and Ca (Mozley 1989). Even the occurrence of rhodochrosite (MnC03) has been reported (e.g., von Rad and Botz 1987). Carbonate precipitation often occurs in the form of concretions, which tend to develop a flatter shape than in the sulfate reduction zone. Some of the carbonate in the concretions may be derived from dissolution and repre- cipitation of detrital, biogenic carbonate.
In addition, iron-rich chlorite minerals can form in the zone of methanogenesis. However, iron-poor marine muds, for example pelagic carbonates, can only form small quantities of pyrite in the sulfate reduction zone and little or no authigenic carbonates in both the sulfate reduction and the methanogenesis zones.
Infresh water environments where pore fluids are poor in sulfate, the sulfate reduction zone and the precipitation of pyrite are subordinate o r absent (Fig. 13.15~). As a result, the zone of methanogenesis expands upward. Under anoxic conditions, it may extend into the water body. The prin- cipal authigenic mineral is siderite, which may occur in large quantities, while pyrite is rare.
The zone of microbial methanogenesis extends deep below the sea floor, but a specific depth range is difficult to define. In organic matter- rich sediments on the continental margins of the present oceans, methane has been observed in the form of gas hydrates (clathrates; Hesse et al. 1985; Hesse 1986) in several drill holes.
Gas hydrates are ice-like substances, which form with high methane concentrations, elevated hydrostatic pressures (at water depths of at least 500 m), and relatively low temper- atures (less than + 10 to +30 OC). The vertical range of gas hydrates may be up to 1000 m within a sedimentary column. When the gas hydrates thaw, for example due to increasing temperature with depth, they release large quan- tities of methane and fresh water, thus influencing sediment stability and pore water chemistry.
Biogenic Sediments
Fine-grained sediments rich in carbonate (e.g., hemipelagic oozes and marls), but also grain- stones, show additional early diagenetic fea- tures, which result from the relatively good solubility of the primary carbonate minerals. Aragonitic and high Mg calcitic skeletal par- ticles in particular are easily dissolved and reprecipitated as carbonate cement in neigh- boring layers (Figs. 13.17b and 13.18). With increasing burial depth, pressure solution may become an important mechanism providing carbonate cement.
It occurs, however, only in those layers, which have not been lithified by previous cementation (e.g., Hird and Tucker 1988; James and Bone 1989). The dissolved car- bonate is transported by diffusion over short distances (over few to tens of centimeters).
In this way, indistinct primary bedding is enhanced by diagenetic overprint (Ricken 1986; Ricken and Eder 1991; Bathurst 1987, 1991). Even minor variations in primary com- position and pore space are sufficient to cause significant diagenetic modifications. Typical examples demonstrating this internal carbo- nate redistribution process are limestone-marl successions, layered carbonate concretions,and nodular limestones (Fig. 13.18). Hardgrounds may result from both the reaction of surface sediment with the overlying sea water and internal carbonate redistribution. Marked dif- ferences in compaction between limestone concretions, limestones, and adjacent marls testify to the fact that carbonate is commonly redistribed at relatively shallow burial depths (several to tens of meters). In contrast, pelagic oozes consisting predominantly of calcite ske- letons usually dissolve and recrystallize at deeper burial depths (Chap. 13.1, Fig. 13.3e and f). The diagenesis of shallow-water car- bonate buildups and reefs is briefly described in Chapter 3.3.2.
A frequently discussed problem is the do- lomitization of thick, deeply buried calcium carbonate deposits. The Mg content of normal marine pore waters and compaction flow is not sufficient for transforming large volumes of calcium carbonate into secondary dolomite (pervasive dolomitization). Mg-rich bittern salts are rare in the subsurface. Thus, per- vasive dolomitization normally appears to require a system which allows downward Mg transport from the sea water reservoir or other Mg sources by diffusion, convective flow, or meteoric water circulation (Land 1985; Moore

Chemical Diagenesis
PRIMARY PRIMARY SIGNAL n
SEDIMENT I 1
STRONG LESS DISTINCT J, I
/ /-
_/-- - --- --- EVENT BED
-- -- ----__ CEMENTATlOl -- - - INCREASED MECHANICAL
C3 AND CHEMICAL COMPACTION
- _--- NODULAR LIMESTONE
EVENT BED CEMENTATION
- UNDERBED DIFFERENTIAL
--- ---_ DISSOLUTION -- -, AND CEMENTATION 1 -\ - -
CARBONATE M l G R A T ! o N r
PRESSURE DISSOLUTION / SEAMS
_--- -- _--- _---- CaC03
GRAIN SIZE AND/OR CaC03
Fig. 13.18. Various types of diagenetic overprint and ac- mechanical and chemical compaction, as well as cementa- centuation of indistinct primary bedding features in fme- tion of particular beds. Several of these processes may grained calcareous sediments. LeJ-handside Uncompacted operate simultaneously in the same sediment. (After Ricken primary sediment. Right-hand side Selected sections after and Eder 1991)
1989). Smaller quantities of Mg can be re- leased in conjunction with the transformation of unstable to stable clay minerals (see below), but at least part of the available Mg may be consumed in the formation of chlorite. More details on this difficult and somewhat controversial topic, including dedolomitization (the process of calcite replacing dolomite), are given, for example, by Chilingar et al. (1979), Lee and Friedman (1987), Fiichtbauer (1988), Moore (1989), and Tucker and Wright (1990).
The diagenesis of siliceous, predominantly deep-sea sediments is described in Chapter 5.3.5 (see also summary by Iijima 1988). The phenomena of silica diagenesis in shelf car- bonates are in many ways similar to those observed in pelagic carbonates. Due to more pronounced undersaturation of shallow waters with respect to silica, however, opal skeletons, such as sponge spicules, are frequently dis- solved and replaced by carbonate as long as they are in diffusive contact with sea water

Chapter 13 Diagenesis
(e.g., Brachert et al. 1987). Opaline silica pre- served within the sediment usually forms early diagenetic chert nodules which are little af- fected by compaction. Under special con- ditions, calcareous fossil remains become sili- cified. This may result, for example, from silica-rich alkaline pore fluids below hyper- saline lagoonal waters. Silicification of car- bonate may also occur at the contact with fresh pore water, when part of the dissolved silica in saline pore fluids is precipitated due to lowered pH.
In highly saline, alkaline, sodium carbonate-bicarbonate lakes, a special type of early diagenetic chert may be precipitated (Sheppard and Gude 1986). This was fust observed in Upper Pleistocene deposits of Lake Magadi in Kenya, but since then has been found in many lake depo- sits of Jurassic to Pleistocene age. This Magadi-type chert occurs as thin, discontinuous beds or as plates and nodules of irregular shape. Typically, the chert is dense and trans- lucent and has a white rind. It probably formed from a primary precipitate of hydrous sodium silicate. The conver- sion of the precursor mineral to chert is accompanied by a loss of sodium and water and a reduction in volume. Magadi-type chert is an excellent indicator of past environ- mental conditions.
Both fine-grained, deep-sea carbonate and siliceous sediments commonly lithify as a result of recrystallization and cementation at burial depths of a hundred to several hundred meters. Shallow-water carbonates containing high proportions of unstable mineral phases, however, tend to lithify earlier. Hypersaline conditions frequently promote the formation of hardgrounds at or slightly below the sea floor. In contrast, siliciclastic shales and marls maintain their plastic, ductile state and under- go compaction up to great burial depths (seve- ral kilometers).
Late Diagensis
At deep burial depths the sediments are sub- ject to increased temperature and effective stress, but solute transport by the various me- chanisms described in the previous section generally slows down as a result of decreasing permeability and sediment diffusion coef- ficients. Thus, on the one hand, the solubili- ties of many mineral species (e.g., quartz) increase considerably due to elevated temper- ature and pressure solution. Other mineral species that are stable at surface temperature become unstable and tend to transform into new minerals (Fig. 13.19). On the other hand, the macro-scale exchange of dissolved matter
is hampered, which frequently leads to more highly concentrated pore fluids. These may significantly deviate in their composition from pore waters near the sediment-water interface. However, when freshwater or brackish water deposits are overlain by marine sediments, the deeply buried pore fluids may have lower salinities than marine pore waters.
With increasing temperature and burial depth, the zone of microbial methanogenesis is followed by the zone of thermocatalytic decarboxylation (cf. Chap. 14.2). This process is generally ascribed to late diagenesis. Its products are methane, carbon dioxide, and various hydrocarbons. In addition, siderite may form in minor quantities. If the decom- position of kerogen releases some sulfur, small quantities of late diagenetic pyrite may also result.
The solubility of quartz markedly increases with temperature, while carbonates show little effect or even decreasing solubilities (compare Fig. 13.17f). At deep burial depth, hydrous mineral phases tend to transform into denser, less hydrous phases (Fig. 13.19). Thus, for example smectite (i.e., montmorillonite) forms illite at temperatures between 60 and 100 O C and releases water. Similarly, kaolinite is con- verted to illite and quartz (120 to 150 OC).
In conjunction with continued porosity re- duction, possibly enhanced by lateral tectonic stress, shales transform into slates. Oxyhyd- rates of iron and manganese may form less hydrous compounds or, after reduction, may be incorporated into carbonates.
Volcanic glass (tuffs) take up water when shallowly buried and form zeolites (Iijima 1988). These and other unstable minerals may later transform into chlorite, low-temperature feldspar (preferentially potash feldspar or albite), and quartz. Most of these various reactions release water and dissolved species and thus modify the ionic strength and com- position of the pore fluids.
Cementation and Secondary Porosity of Sandstones (and Calcarenites)
Sandstone diagenesis (as well as diagenesis of relatively coarse-grained carbonate buildups, Chap. 3.3.2) is of particular interest in hydrocarbon exploration and hydrogeology, because these rocks provide reservoirs and conduits for water, oil, and gas. One of the principal problems is the question whether the sandstones maintained or regained significant porosity, when hydrocarbons started to mi-

Chemical Diagnesis 545
TRANSFORMATION OF CLAY MINERALS
Na-FELDSPAR.
REPLACED BY ILLITE, CHLORITE,
AND QUARTZ
Fig. 13.19. Diagenesis of pelitic sediments with most important mineral transformations. (After Frey et al. 1980; Heling 1988)
grate. It is also important to know whether meteoric water could have circulated in the deeply buried sandstone. Sands and sandstones are permeable and therefore act as favored conduits for all kinds of flow (Chap. 13.2), as long as they are not completely cemented. During a long burial history they may be ex- posed to the influence of pore fluids of varying composition. For these reasons and many other factors, sandstone diagenesis is a very complex topic.
The initial porosity of sands (frequently between 25 and 45 %) is just moderately reduced by mechanical compaction, i.e., rear- rangement and deformation of grains (Fig. 13.20a; Chap. 13.2). More important are the
following processes (e.g., Bj~rrlykke 1983, 1988; Fiichtbauer 1988):
- Precipitation of cement in the primary pore space and overgrowth of grains.
- Transformation of primary minerals (e.g., feldspar) into expanded hydrous mineral phases (kaolinite and other clay minerals).
- Pressure solution.
Early ~ i a ~ e n ' e s i s of Sands
Significant early diagenesis of sands occurs where they are circulated by meteoric waters with low ionic strength. Then their unstable

Chapter 13 Diagenesis
INTERGRANULAR POROSITY POROSITY 7
PRIMARY DEPO- ' SlTlONAL POROSITY
MINERAL OVERGROWTH
\ i
POROSITY INTRA- MATRIX ,-> PARTICLE
POROSITY \ / I
DEPTH I I 1 /
/ I
I EARLY CEMENTATION (LITTLE MECH. COMP.)
LATER CEMENTS 2 REPLACING EARLIER
[CEMENTS
DENUDATION dNi SELECTIVE
LEACHING OF CEMENT
I
(NO FURTHER REDUCTION SECONDARY POROSITY \ IN PORE SPACE) / ? FRACTURING INTERORYSTALLINE POROSITY MOLDIC AND
\ SECONDARY / PARTIALLY FILLED FRACTURE
1
PRESSURE SOLUTION DURING DEFORMATION
Fig. 13.20a-e. Evolution of sandstone porosity with in- c Early cementation largely prevents mechanical compac- creasing burial depth and time. a Reduction of porosity by tion and pressure solution; secondary porosity by leaching mecllanical and (iso)chemical compaction predates late of cement and unstable grains. d Selective leaching of (allochemical) cementation. b Same as a but prograding cement and unstable grains after uplift and denudation. pore space reduction is hampered or terminated by over- e Some features of secondary porosity in carbonates. (Par- pressure and oil fill. tially based or. Selley 1976; Mitra 1988)

Chemical Diagenesis
and easily soluble mineral phases are removed or altered, reflecting to some extent the climatic conditions of the region. Some of the solutes may be precipitated in zones of very slow water movement or stagnant pore water (Chap. 13.3). In warm climate, shallow-marine waters are frequently supersaturated with respect to calcium carbonate. Hence, coastal and foreshore sands which are in contact with these waters tend to precipitate carbonate cement (Fig. 13.20~).
Sands in deeper marine environments, on the other hand, are affected neither by meteoric waters nor by carbonate super- saturated sea water. Since most of their com- mon mineral phases (quartz, feldspar, clay minerals) are more or less in equilibrium with sea water, there is little cause for reactions between the sand particles and the marine pore fluid during the early stages of diagenesis (Fig. 13.20a). Above or near the redox bound- ary (Fig. 13.15a and b), some glauconitic min- erals and iron-rich chlorites and chamosites may form (cf. Chap. 6.1). In the sulfate reduc- tion and methanogenesis zones, pyrite and various carbonates may locally fill the pore space.
Where relatively thin sand layers and sand bodies act as drains for upstreaming compac- tion flow (Chap. 13.2) which is supersaturated with respect to carbonate and silica, small amounts of quartz cement and possibly larger volumes of carbonate may precipitate. How- ever, the solubility of carbonate may increase with the cooling of the pore fluids and thus prevent precipitation. Sands in direct or in- direct contact with evaporative brines fre- quently exhibit sulfates, halite, and zeolites as pore cement.
The Cement Source o f Deeper Buried Sandstones
In spite of these various reactions releasing water and dissolved constituents in the deep subsurface, many authors have pointed out that the mass of dissolved matter and the volume of pore fluids are insufficient to ac- count for the large volumes of cement ob- served in many sandstones.
Even in the case of relatively easily soluble carbonates, about 100 000 volumes of pore water are needed to fill one volume of pore space (Bathurst 1975). Therefore, the release of carbon dioxide from the decomposition of organic matter and kerogen is often quoted as a mechanism for dissolving carbonate, which can be precipitated elsewhere.
Particularly the source of silica for quartz cement, which is the most important cement type besides carbonate, is frequently discussed in the literature. Several sources of silica have been proposed (e.g., B j~r lykke 1988; Fucht- bauer 1988): (1) Pressure solution, (2) trans- formation of feldspar and mica into kaolinite, (3) smectite-illite transformation, (4) meteoric water rich in silica due to intensive chemical weathering, etc. The last process may account for the cementation of shallowly buried sand- stones, but is normally excluded for deeply buried strata. Therefore, in the deep subsur- face, pressure solution within the sands and mass transfer by diffusion from directly un- derlying and overlying shales probably pro- vide the major part of silica necessary for large volumes of quartz cement. Finally, in some regions, convective flow in large cir- culation cells (Fig. 13.17f) may transfer silica in considerable quantities from deeper and warmer to more elevated and cooler portions of a sand body.
Cement Mineral Sequences
The previous discussion on the various realms of diagenesis and systems of mass transport in different rocks and rock sequences demon- strates that a common rule for the succession of cement minerals (diagenetic mineral para- genesis) cannot exist. In addition, the numer- ous mineral reactions involved, including the replacement of primary grains and early ce- ment by secondary mineral phases (Fig. 13.20c), render it difficult in many cases to establish the true, complete cement sequence. Great, small and larger scale spatial variations in porosity and permeability, as found for example in siliciclastic delta plain sediments or in carbonate buildups (Dreyer et al. 1990; Schroeder 1988) enhance this problem. They may lead to differing coeval cements and ce- ment successions which are caused by primary differences in grain size and fabric, skeletal structures, bitoturbation and bioerosion, ocea- nographic parameters, etc.
For certain depositional environments or individual sedimentary basins, however, fairly regular cement sequences have been found (e.g., Schmidt and McDonald 1979; Edman and Surdam 1984; Fuchtbauer 1988). Accord- ing to observations of thin sections (Fig. 13.20), which may be supplemented by evidence from geochemical, unstable and sta- ble isotope studies (Chap. 13.5), the following cement sequences occur frequently in sand- stones:
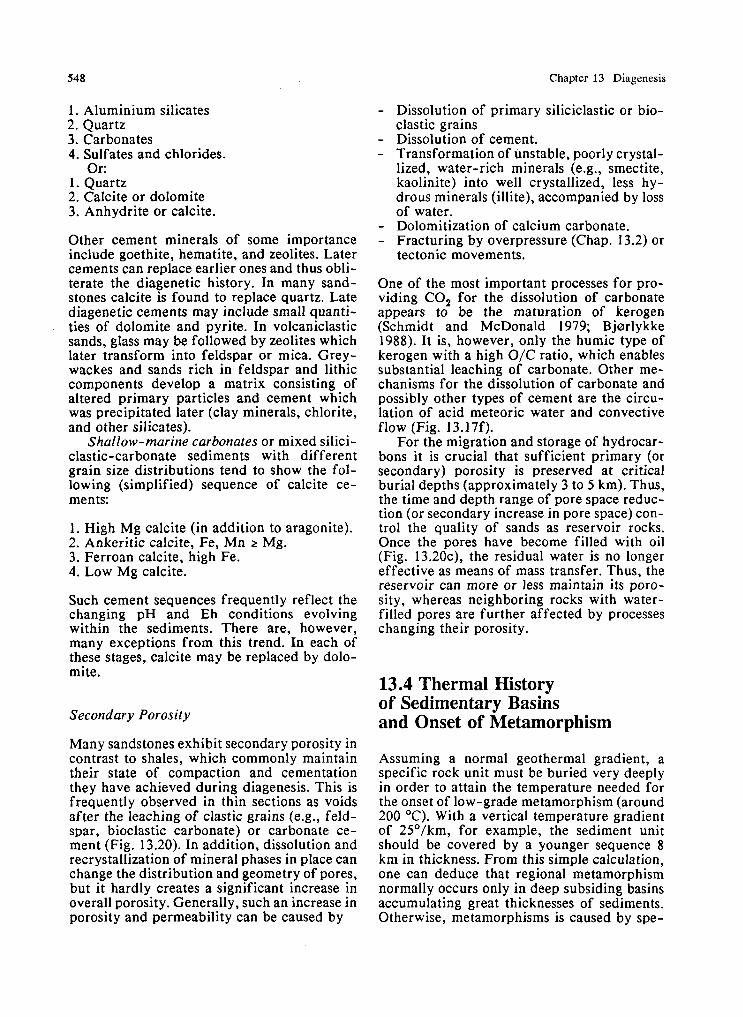
Chapter 13 Diagenesis
1. Aluminium silicates 2. Quartz 3. Carbonates 4. Sulfates and chlorides.
Or: 1. Quartz 2. Calcite or dolomite 3. Anhydrite or calcite.
Other cement minerals of some importance include goethite, hematite, and zeolites. Later cements can replace earlier ones and thus obli- terate the diagenetic history. In many sand- stones calcite is found to replace quartz. Late diagenetic cements may include small quanti- ties of dolomite and pyrite. In volcaniclastic sands, glass may be followed by zeolites which later transform into feldspar or mica. Grey- wackes and sands rich in feldspar and lithic components develop a matrix consisting of altered primary particles and cement which was precipitated later (clay minerals, chlorite, and other silicates).
Shallow-marine carbonates or mixed silici- clastic-carbonate sediments with different grain size distributions tend to show the fol- lowing (simplified) sequence of calcite ce- ments:
1. High Mg calcite (in addition to aragonite). 2. Ankeritic calcite, Fe, Mn 2 Mg. 3. Ferroan calcite, high Fe. 4. Low Mg calcite.
Such cement sequences frequently reflect the changing pH and Eh conditions evolving within the sediments. There are, however, many exceptions from this trend. In each of these stages, calcite may be replaced by dolo- mite.
Secondary Porosity
Many sandstones exhibit secondary porosity in contrast to shales, which commonly maintain their state of compaction and cementation they have achieved during diagenesis. This is frequently observed in thin sections as voids after the leaching of clastic grains (e.g., feld- spar, bioclastic carbonate) or carbonate ce- ment (Fig. 13.20). In addition, dissolution and recrystallization of mineral phases in place can change the distribution and geometry of pores, but it hardly creates a significant increase in overall porosity. Generally, such an increase in porosity and permeability can be caused by
- Dissolution of primary siliciclastic or bio- clastic grains
- Dissolution of cement. - Transformation of unstable, poorly crystal-
lized, water-rich minerals (e.g., smectite, kaolinite) into well crystallized, less hy- drous minerals (illite), accompanied by loss of water.
- Dolomitization of calcium carbonate. - Fracturing by overpressure (Chap. 13.2) or
tectonic movements.
One of the most important processes for pro- viding C 0 2 for the dissolution of carbonate appears to be the maturation of kerogen (Schmidt and McDonald 1979; Bjarlykke 1988). It is, however, only the humic type of kerogen with a high O/C ratio, which enables substantial leaching of carbonate. Other me- chanisms for the dissolution of carbonate and possibly other types of cement are the circu- lation of acid meteoric water and convective flow (Fig. 13.17f).
For the migration and storage of hydrocar- bons it is crucial that sufficient primary (or secondary) porosity is preserved at critical burial depths (approximately 3 to 5 km). Thus, the time and depth range of pore space reduc- tion (or secondary increase in pore space) con- trol the quality of sands as reservoir rocks. Once the pores have become filled with oil (Fig. 13.20c), the residual water is no longer effective as means of mass transfer. Thus, the reservoir can more or less maintain its poro- sity, whereas neighboring rocks with water- filled pores are further affected by processes changing their porosity.
13.4 Thermal History of Sedimentary Basins and Onset of Metamorphism
Assuming a normal geothermal gradient, a specific rock unit must be buried very deeply in order to attain the temperature needed for the onset of low-grade metamorphism (around 200 OC). With a vertical temperature gradient of 25O/km, for example, the sediment unit should be covered by a younger sequence 8 km in thickness. From this simple calculation, one can deduce that regional metamorphism normally occurs only in deep subsiding basins accumulating great thicknesses of sediments. Otherwise, metamorphisms is caused by spe-

Thermal History 549
cific factors, such as abnormally high temper- ature gradients, lateral compressional stress, and overthrusting in an accretionary wedge.
Thermal History of Basin Fills
The temperature distribution in a sedimentary basin is controlled by conductive heat flow from the deeper crust and, in particular cases, by advective heat transfer due to meteoric water circulation. Figure 13.21 demonstrates examples of the reconstruction of the thermal history and temperature distribution of basins assuming that meteoric flow was absent or insignificant. Rift basins evolving into passive continental margin basins experience an early
phase of enhanced conductive heat flow (Chap. 8.3), i.e., high temperature gradients, which is followed by cooling and decreasing temperature gradients. Such a situation has been modeled for several cross-sections of the North American Atlantic margin (Sawyer 1988).
In the model of the Georges Bank Win off New- foundland (Fig. 13.21a), it is assumed that the stretching factor (lithospheric attenuation) was B = 2.5 (see Chap. 8.3). During the initial riftiig stage, 200 Ma before p r e sent, the temperature gradient may have been about 50 OCIkm, but later it dropped to approximately 30' C. Be cause of the rapid subsidence and sediment accumulation during the lurassic, the base of these sediments reached a temperature of 12S0 C within a time period of about 40 Ma (subsidence curve crossing temperature lines in Fig.
a AGE B.P. (Ma) C AGE B.P. (Ma)
0 - 200 100 0
I I I 1 1
I
DENUDATION v --__
CURVE FOR BASE TEMPERATURE ("C)
OF JURASSIC
b LATE JURASSIC
JURASSIC AND
------ I PRESENT
-- -- MATURE FOR GAS
L V \ OVERMATURE
Fig. 13.21a-c. Temperaturedepth history of sediments not with results of thermal model for Late Jurassic and present affected by meteoric water circulation. a On passive Atlan- time. (a and b Sawyer 1988). c Thermal history of Permian tic continental margin of North America, Georges Bank sediments of the Colorado Plateau, reflecting increasing basin, COST well G-2. b Cross section of Baltimore Can- burial and subsequent uplift and denudation. (Meyer et al. yon trough, Atlantic continental margin of North America, 1989)

Chapter 13 Diagenesis
13.21a). About 110 Ma B.P., the maximum temperature was established at a burial depth of approximately 6 krn. Then the temperature at the base of the Jurassic (as well as in younger strata) remained more or less constant.
During rapid subsidence, a temperature of approximately 125 OC is thought to be neces- sary for the generation of oil. Later, the mini- mum temperature for oil generation can drop (Fig. 13.21a), because oil generation is con- trolled by both the temperature and the time elapsed since deep burial (Waples 1980; Tissot and Welte 1984).
For the deeply filled Baltimore Canyon trough farther south, thermal modeling pre- dicts a subsurface temperature distribution as shown in Fig. 13.21 b.
During the Late Jurassic, thermal gradients in the center of the trough (containing Triassic sediments at burial depths of up to 15 km) and farther offshore reflect the rifting and early drifting stage and therefore were greater than at present. For a specific sediment layer, however, the tem- perature still increased somewhat during the last 140 Ma, because subsidence and sediment accumulation in the passive margin basin continued. The sediments below the 200 OC isoline are considered overmature with respect to oil generation. They should display the characteristics of low-grade metamorphism.
Thermal Effects o f Subsidence Followed by Uplift
If a phase of subsidence is followed by uplift and significant denudation, the thermal histo- ry of a specific sediment body exhibits both a phase of conductive heating and a phase of cooling. This is a common feature in fold belts (Chap. 9.10), but here the reconstruction of the thermal and stress history of certain rock units is complex due to tectonic implications. A prominent example of a simple case is the Colorado Plateau in North America (Fig. 13.21c, based on Meyer et al. 1989).
After their deposition, Permian sediments were buried under 2700 to 4000 m of younger sediments and heated to 100-140 OC, assuming a geothermal gradient of 30' Clkm. After a short period of nondeposition, the Colorado Plateau sediments were u p l i f t , and about 2500 m of the over- lying sediments were removed. To verify the estimation of maximum temperature and its date, three independent additional methods were applied (see below): (1) inves- tigation of fission tracks in apatite, (2) study of fluid inclu- sions, and (3) determination of the so-called vitrinite reflec- tance of the organic matter.
All three methods showed that the maximum temperature reached during the burial history
of the Permian sediments was between 120 and 140 OC. Thus, significant changes in the evolution of the thermal gradients or strong effects of meteoric water circulation can be ruled out. During the last 65 Ma, the Permian sediments underwent cooling down to about 30 OC (Fig. 13.21~).
Thermal Effects of Meteoric Water Circulation
As discussed in Chapters 13.2 and 13.3, many sediments which have partially or entirely emerged, are affected by meteoric water cir- culation. In these cases, the subsurface tem- perature distribution caused by conductive heat flow may be greatly disturbed or com- pletely modified. The direction of meteoric flow is controlled mainly by the topography of the land surface. In an elevated former fore- land basin sloping away from a thrust belt, groundwater circulation tends to develop a pattern as generalized by Jones and Majorowicz (1987) for the western Canadian Prairies Basin (Fig. 13.22a).
Below the area of regional recharge (A), the geothermal gradient and thus the vertical heat flow densitiy in the upper part of the basin fill (Mesozoic-Cenozoic sediments) are less than in the underlying Paleozoic strata. In the area of regional discharge (B), temperature increases rapidly with depth in the basin fa.
Local areas not affected by this basin-wide redistribution of heat by groundwater flow may be of interest for the exploration of oil and gas. Such areas display the original tem- perature field and thus indicate the presence of impermeable rocks favorable for the reten- tion of hydrocarbons. A subsurface tempera- ture distribution similar to that in Fig. 13.22a was calculated for the Paleozoic Illinois Basin (Fig. 13.22b, Bethke 1989). It is also caused by regional, long-distance groundwater cir- culation.
The marked influence of the permeability of the rock or sediment mass on the distortion of conductive heat flow was demonstrated by Smith et al. (1989) for a situation with high relief (Fig. 13.22d and e). If hydraulic con- ductivity is relatively high, the thermal gradi- ents in the basin fill are significantly affected by groundwater circulation.
In the model, the difference in elevation between ground- water recharge and discharge zones was assumed to be 500 m over a distance of a few km. If the sediment mass is hornoge-neous and has a very low permeability (k = 10-l8

Thermal History
REGIONAL RECHARGE REGIONAL DISCHARGE
TEMPERATURE
C STRATIGRAPHIC BOUNDARIES
VERY LOW PERMEABILITY 18 2 (k = 10- rn )
HIGHER PERMEABILITY ( k = 1 0 - l 5 m2)
O F - . . . . . . . . . .
Fig. 13.22a-e. Subsurface temperature distribution dis- system in the Illinois basin. (Bethke 1989). d and e Distur- turbed by meteoric water circulation. a and b Foreland bance of conductive thermal regime in areas of high relief basin of the Canadian Rocky Mountains, displaying marked (e.g., entirely or partially elevated sediments on narrow differences in thermal gradients of the recharge and dis- shelf) in relation to sediment permeability. (Smith et al. charge areas. (Jones and Majorowicz 1987). c Temperature 1987; distribution calculated for Mesozoic groundwater flow
m2, corresponding with a hydraulic conductivity of about 1 0 . ~ mld or 0.4 mmla), conductive heat flow lines and the geothermal gradient are only slightly disturbed (Fig. 13.22d). However, if the permeability increases by three orders of magnitude (hydraulic conductivity around 0.4 mla), conductive heat flow lines and thermal gradients are strongly affected (Fig. 13.22e). Other examples are report- ed, for example, by Chapman and Rybach (1985).
All these thermal effects have to be taken into account in the interpretation of inorganic and organic processes in diagenesis.
13.5 Special Methods and Processes in Diagenesis
Age, Temperature, and Degree of Diagenetic Reactions
As already indicated, there are several meth- ods to determine the maximum temperature a sediment body has experienced. If particulate organic matter is present, its state of diagen-

Chapter 13 Diagenesis
esis, defined by the vitrinite reflectance, is a function of temperature and time (e.g., Teich- muller and Teichmuller 1979). Fluid inclusions frequently occur in secondary crystals precipi- tated in rock fractures or in large pores. At normal temperatures they consist of a fluid phase and a gas phase. By heating them under the microscope, one can observe that the fluid and gas are transformed into a homogeneous fluid. From the homogenization temperature, corrected for the effects of pressure and con- sidering other sources of error, one can recon- struct the temperature and pressure at the time the inclusion was formed (Roedder 1984).
Stable isotopes, for example the b180 val- ues of carbonate cements, can be used to de- termine the temperature at the time the ce- ment mineral was formed. However, one has to be cautious, because these values may be affected by the mixing of pore fluids derived from sea water and meteoric water. In ad- dition, one must take into account that the isotopic composition of ocean water changed from the Paleozoic to the present time (Garrels 1986; Veizer et al. 1986; Carpenter and Loh- mann 1989). For example, the b180 values increased, but carbon and sulfur isotopes fluc- tuated during Phanerozoic time (Schidlowski et al. 1984). To investigate such a question, one must search in ancient sediments for pri- mary minerals or early cements which formed in equilibrium with the former ocean water and were preserved unaltered.
The timing of thermal events can be deter- mined by dating cement or recrystallized min- erals containing unstable isotopes. Another method is the study of fission tracks in apat- ite, other minerals, and volcanic glass (e.g., Naeser 1979; Odin 1982; Faure 1986). Fission tracks are caused by nuclear particles emitted from uranium-238 impurities. They are oblit- erated if the temperature exceeds a certain limit (for example 100 to 120 OC for apatite) and start to form again and grow with time if the temperature drops below this boundary. Hence, fission tracks indicate that the rock sample has been exposed to elevated tempera- tures a certain time ago.
The transition from shales to slates, i.e., from deep-burial diagenesis to low-grade or "sub-greenschist facies" metamorphism is cha- racterized by increasing crystallinity of il- lite/muscovite (e.g., Dunoyer de Segonzac et al. 1968; Frey 1987; cf. Chap. 13.4).
Diagenetically Controlled Ore Deposits
From the processes discussed above in this chapter, it is obvious that the generation, mi- gration, and accumulation of oil and gas (Chap. 14), as well as the precipitation of ore deposits from pore fluids, are controlled by the various mechanisms operating during dia- genesis. Of particular interest with respect to hydrocarbons and metal deposits is deep burial diagenesis. In this regime the elevated temper- atures needed for the generation of oil and gas are established, acd many of the deep pore fluids are highly saline and contain metals in concentrations sufficient to be precipitated when the pore fluids move to areas of lower temperature.
Many sediment-hosted ore deposits result from diagenetic processes and can be explain- ed without the aid of magmatic exhalations or metal-bearing hydrothermal fluids derived from the zone of metamorphism (see e.g. Amstutz et al. 1982; Maynard 1982; Guilbert and Park 1986; Friedrich and Herzig 1988). Hot brines, particularly those rich in chlorine, have the capacity to leach metals (Zn, Pb, Ba, Cu, U, Ag, and other elements such as Ba and F) from deeply buried strata. Such strata may consist of continental, fluvial or shallow-ma- rine clastics derived from igneous and vol- canic rocks. The metal content of such silici- clastic sediments may become relatively en- riched by weathering processes, either prior to deposition or in situ.
A prominent example for such a possibility is the Permian red beds (Rotliegendes) below the Zechstein evaporites in Europe (Chap. 6.4.1), which provided the metals in the overlying, copper-bearing black shales of the "Kupfer- schiefer". Other metal-rich black shales gained their metal content from sulfides precipitated in normal sea water as well as from organic matter.
In Mesozoic extensional basins, "immature" syn-rift sediments frequently alternate with evaporites and are overlain by post-rift, thick marine shales. Such basins appear to provide a favorable tectonic setting for the formation of strata-bound, diagenetically-formed ore depo- sits of the Mississippi Valley type (Maynard 1982; Large 1988). Due to the low-permeable shales acting as caprocks in more central parts of the basin, sediment compaction forces the hot, C1-rich, metal-bearing brines to migrate laterally upward. As they pass black shales, the brines may take up additional metals, be- fore they escape along more permeable layers toward the basin margins. Alternatively, the

Special Methods and Processes
brines may migrate upward along syngenetic (i.e., post-rift) faults.
Cooling, changing Eh and pH conditions, and mixing with shallow pore fluids from other sources cause the precipitation of metals, mostly as low soluble sulfides (for example Pb, Zn, and Fe); however, several elements, such as Ba, Mn, and U, behave differently. Varia- tions in the chemical conditions over time lead to special successions of ore minerals (ore mineral paragenesis), as in the case of the common cement minerals.
Diagenetically generated ore deposits are found in siliciclastic and carbonate host rocks. The ores may fill macropores and voids, as well as faults and fracture systems. Carbonates with initially high porosities, such as oolitic wackestones, packstones, and bioherms, and rocks with karst cavities, are particularly pro- mising host rocks. One can distinguish bet- ween several phases and types of ore genesis, for example between early diagenetic cemen- tation of pores (disseminated ores), replace- ment of carbonate, sulfidization of carbonates, secondary concentration of primary ores (for- mation of discontinuous flat beds and nests), and filling of fractures.
The precipitation of metal sulfides in areas outside of the sulfate reduction zone is dif- ficult to understand, possibly because two different types of pore fluids are needed. One pore fluid has to provide the metals in solution (in part as chloride complexes at high temper- atures or as organic complexes), while the other (probably from shallow sources) has to deliver sulfur in the form of HS- from the sulfate reduction zone. However, an alter- native model has also been proposed (see, e.g., Roberts and Sheahan 1988), in which sulfur migrates with the metals to the site of deposit- ion. If ore deposition takes place within the shallowly buried sulfate reduction zone, the upstreaming metal-rich brine may mix with more or less stagnant water in a reduced state, with sulfur being supplied by diffusion from the sea bottom.
Redox conditions can easily change under such conditions. Thus, precipitation of metal sulfides may be followed by the formation of barite and other compounds characteristic of oxidizing conditions. The deposition of metal ores in carbonates is frequently associated with dolomitization and/or brecciation, and occasionally with silicification. This indicates that various diagenetic processes may operate in the same rock body, either more or less simultaneously, or successively.
The special conditions of ore precipitation at the contact with evaporites are related to the phenomena discussed above. For example, in the Gulf Coast basin of the United States, the intrusion of salt into the overlying argillaceous sediments had several significant effects (Hol- mes 1986). As in the Mediterranean, a 125 m thick Tertiary/Quaternary sediment section on top of drilled salt diapirs displays upwardly decreasing pore water salinity. In addition, the increased heat flow through salt dehydrated the clay minerals at the salt-sediment inter- face at relatively shallow burial depth. The chemical reactions between the pore water containing sulfate and the sediments rich in organic matter created a diagenetic sulfide- rich front. Within this zone, metals such as zinc and lead were concentrated. Anhydrite residue from evaporite dissolution, transfor- mation of anhydrite to gypsum, and newly precipitated carbonate form the cap rock of the salt domes.
Pore Water as a Source of Special Hydrothermal Systems
Most of the hydrothermal systems discussed in the literature, including those at active spreading centers on mid-oceanic ridges (e.g., Fyfe and Lonsdale 1981), are fed either by sea water cr meteoric water circulating in fracture zones or highly permeable layers through vari- ous rocks. If there is no difference in hydraulic head, such systems are driven by a magmatic heat source or by local differences in the geothermal gradients. Hot water is forced to move upwards to the sea floor or land surface to vents or springs, but it has to be simultaneously replaced by downward moving sea water or meteoric water.
However, there also are hydrothermal sys- tems which are partially or entirely fed by the expulsion of pore water from young, soft se- diments. In the last ten years two types of such systems were detected in the present oceans. Because their origin is closely related to the topics of this chapter, they are briefly described here. Whether or not they signifi- cantly contribute to the formation of mineral deposits is not yet sufficiently known.

Chapter 13 Diagenesis
Expulsion o f Pore Water from Young Spreading Troughs
In young, narrow ocean basins and pull-apart basins (see Chaps. 1, 12.1, and 12.8), the ac- cretion of new oceanic crust does not take place at sediment-starved oceanic ridges, but in spreading troughs collecting large quantities of sediment. This can be observed, for exam- ple, in the central graben of the Red Sea and in special basins in the Gulf of California (Guaymas basin). Since these spreading troughs represent the deepest depressions in the total depositional area and are situated close to terrigeneous sediment sources, they are commonly characterized by high sedimen- tation rates. In such cases, the upwelling ba- saltic magma intrudes into soft sediments and tends to generate horizontal sills as soon as the magma- pressure exceeds the lithostatic pres- sure and tensile strength of the sediments (Fig. 13.23a).
During Leg 64 of the Deep Sea Drilling Project in the Gulf of California, such basaltic sills were encountered in sev- eral drillholes in the Guaymas basin at burial depths bet- ween approximately 50 and 350 m (Curray, Moore, et al. 1982; Einsele 1982b and 1986). Two of the shallowly buried sills were still hot. Downhole measurements showed that the porosity of the sediments was reduced by 20 to 40 % within several tens of meters above and especially below the sill-sediment contacts (Fig. 13.23b).
Sediment porosity is reduced by "thermal tamping" (Walker and Francis 1987), which is caused by heat transfer from the hot magma into the neighboring sediment, as well as by the emplacement of heavy magmatic loads on top of highly porous sediments.
In addition, siliceous and calcareous micro- fossils may dissolve, and sediments below thick sills and not far above the sheeted dike zone of young oceanic crust (Fig. 13.23d) may be further altered by high-temperature, low- pressure metamorphism ranging from an- hydrite-dolomite to chlorite-pyrite-albite- epidote-sphene associations. Such an inter- action between the injection of basaltic dikes and sills and soft sediments leads to the expul- sion of great volumes of water (in terms of height on the order of 30 m). This water moves upward to layers of relatively high permeability which act as lateral conduits to fractures (Fig. 13.23~). Along such growth faults in the spreading center, the hot water escapes to the sea floor where it reacts with sea water and precipitates part of its dissolved constituents.
This type of hydrothermal system is con- trolled by special magmatic pulses and is thus subject to considerable variation in space and time. Dike and sill intrusions may also cause hydrothermal convection systems, due to the marked thermal anomalies they create, and thus produce metal deposits (Tarkian and Garbe 1988). The interaction between rapidly accumulating sediments, ongoing ocean spread- ing, and discontinuous large basalt injections in young oceanic basins may create special sill-sediment complexes (Fig. 13.23d; Einsele 1986: Gibb and Kanaris-Sotiriou 1988).
Expulsion of Pore Water Along Subduction Zones
A second possibility for expelling pore water from soft sediments was found along conver- gent continental margins. When the sediments on a subducting oceanic plate reach the sea- ward edge of an accretionary wedge (Fig. 13.24), they are deformed by two processes: (1) increasing overload due to underthrusting, and (2) additional lateral stress originating from compressional forces. As a result, the sediment porosity will be reduced and pore water expelled (e.g., Bray and Karig 1985; Pickering et al. 1989; Suess and Whiticar 1989).
At the Barbados Ridge accretionary complex, the porosity in the uppermost 300 m of pelagic to hemipelagic sedi- ments with initial values between 50 and 75 % was re- duced by 2 to 9 % at the deformation front (Mascle, Moore, et al. 1988; Briickmann 1989). Assuming an aver- age porosity reduction from 63 to 57 % for this 300 m sediment section, the expelled pore water is equivalent to a water layer of about 50 m &I thickness (compare Fig. 13.6). Using this value and assuming a subduction rate of 4 cm/a, one has a volume of 2000 m3 of pore water ex- pelled from a 1 km length of the subduction zone per year. Submarine springs venting pore fluids at the toe of the Cascadia accretionary complex off the Oregon coast have been observed to discharge approximately 70 m3/a.
In total, the porosity reduction of deeply un- derthrusted sediments within an accretionary wedge, and thus their water loss are much higher than estimated here for the onset of deformation at the toe of the wedge.
In the case of the Cascadia subduction zone (Fig. 13.24) and along convergent plate boundaries in the northwestern Pacific (Boulegue et al. 1987), the pore fluid vents were observed and sampled with deep-sea submersibles and additional devices.

Special Methods and Processes 555
SEA FLOOR a
PRESSURE, STRENGTH b
LlTHOSTATlC \ PRESSURE OF \ SEDIMENT
INJECTON
MAGMA DEPTH OF SEDIMENT
b POROSITY (%)
1 ME2:::iFq 1 300 POROSITY
POROSITY CURVE NOT AFFECTED BY SILLS
SAND-MUD HOLE3477 A 477 481 A 478 HYDROTHERMAL TURBlDlTES 20 4 2.9 H i u
DECREASING HEAT FLOW INCREASING AGE OF UPPERMOST SlLL
d --- --
CRACKS SPREADING TROUGH
SILL PRECOMPACTED DIKES GREAT MAGMATIC BY OLDER SILL SPREADING CENTER PULSE
Fig. 13.23~-d. Sill-induced expulsion of pore water and (HFU), because sill-induced thermal anomaly dissipates hydrothermal deposits in young, Gulf of California-type with time. c Model of successive sill intrusions and expul- spreading center. a Emplacement of basaltic sill in soft sion of pore water from neighboring sediments. Hot water sediment. The magma pressure has to overcome the lithos- migrates along sand layers and growth faults and may de- tatic pressure and tensile strength of the sediment. b Poro- posit minerals on the sea floor. d Buildup of sill-sediment sity-depth curves of sill-affected sediments in the Guaymas complex on top of sheeted dike zone by special magmatic Basin (DSDP, Leg 64). Hatched areas Sill-induced reduc- pulses (1 through 4) in time intervals of about 10 ka; futed tion of porosity as compared to drillhole in similar sedi- spreading center, half-spreading rate 3 cmla. (Einsele ments not affected by basaltic sills. Older, more deeply 1982b, 1986). buried sills are associated with lower values of heat flow

Chapter 13 Diagenesis
POROSITY
I + a W 0
SUBDUCTION
I I
HIGH SEDIMENTATION RATE u
5 krn km r I SUBDUCTION
Fig. 13.24a-c. Simplified model of Cascadia accretionary a Location map. b Cross-section with vents. c Dewatering complex off the Pacific coast of North America, showing of sediment caused by reduction in porosity due to increas- vents with discharge of hot pore water containing hydrogen ed vertical and lateral stress. (After Suess and Whiticar sulfide and/or methane, and other dissolved constituents. 1989; Han and Suess 1989)
The submarine vents may discharge not only water with elevated temperatures, but also pore fluids reflecting the chemical properties of the sulfate reduction zone and the zone of methanogenesis mentioned in Chapter 13.3. If the subducting sediments are deposited relati- vely rapidly and are rich in organic matter, the expelled pore water may contain hydrogen sulfide and/or methane in considerable quan- tities (Fig. 13.24; Suess and Whiticar 1989; Han and Suess 1989). Part of the methane is oxidized near the surface and gives rise to the precipitation of calcium carbonate as cement or in the form of chimneys at the vents. Near these vents, faunal communities, including giant clams and large tube worms adapted to methane, hydrogen sulfide, and warm water, were observed.
Such phenomena may also be found in ancient subduction zones. Overpressuring o f sediments may also cause liquefaction and fluidization. As a result, sediment is forced upward to form mud diapirs, or it is injected vertically and laterally as dikes and sills into neighboring deposits (Pickering et al. 1989). In this way, chaotic structures of large dimension can form which resemble phenomena known from thick debris flows or tectonic melange zones. Fluidized sediments reaching the sea floor may also create mud volcanoes. The dewatering of accretionary prisms is an im- portant process in the deformation, stress re- lease, diagenesis and subsequent metamor- phism of sediments at convergent plate boun- daries.

14 Hydrocarbons and Coal
14.1 Source Rocks, Kerogen Types, and Hydrocarbon Potential Source Rocks Kerogen Types and Hydrocarbon Potential
14.2 Generation of Hydrocarbons The Evolution of Organic Matter Transformation Ratio Expulsion and Migration of Oil
14.3 Examples of Hydrocarbon Habitats Lacustrine Source Beds Marine Deltas Shallow Epicontinental Seas and Rift Basins Carbonate Shelf With Evaporites Summary
14.4 Evolution of Coal Introcuction Preservation of Peat Coalification and Composition of Coal Example of a Coal Basin
14.1 Source Rocks, Kerogen Types, and Hydrocarbon Potential
Source Rocks
Hydrocarbon source rocks may be defined as fine-grained sediments which in their natural setting have generated, are generating, or will generate and release enough hydrocarbons to form a considerable accumulation of oil or gas (Brooks et al. 1987). Whether such an accu- mulation is commercial largely depends on economic considerations. A potential source rock has the capacity to generate hydrocarbons in substantial quantities, but has not yet reached sufficient organic maturation.
Oil shales contain thermally degradable or- ganic material, usually about 20 Yo of the total organic matter, TOC, the remainder consisting of insoluble compounds (kerogen, see below). Oil shales and coal must have a very high or- ganic matter content to be of economic inter- est. In contrast, hydrocarbon source rocks may release only very small proportions of oil or
gas per unit rock volume to form an important accumulation in reservoir rocks. This is pos- sible if the source rocks represent a large and sufficiently subsided rock mass. The following brief discussion focuses on hydrocarbon sour- ce rocks, but also includes to some extent other types of organic-rich sediments. The depositional environment of these sediments is discussed in Chapters 5.3 and 10.3.
As already mentioned in Chapter 10.3.3, the preservation of organic matter is, among other factors, a function of the oxygen content of bottom waters, the sedimentation rate, and the intensity of benthic life. The influence of these factors is summarized in Fig. 14.1. With water oxygenation and benthic activity de- creasing, the zone of methane fermenting bac- teria expands upward at the expense of the sulfate reduction zone. As a result, more and also less stable organic matter can be preserv- ed in the sediment.
Kerogen Types and Hydrocarbon Potential
During burial and under increasing tempera- ture, the organic matter undergoes a series of geochemical reactions leading from "biopoly- mers" to "geopolymers" (Fig. 14.4), often col- lectively called kerogen (Tissot and Welte 1984; Brooks et al. 1987). Besides kerogen, the organic matter of buried sediments still con- tains a small fraction of organic compounds which are similar to the compounds originally produced by organisms. Such "geochemical fossils or markers" provide evidence for the source of organic matter and, to some extent, also for the depositional environment (cf. Fig. 10.13; Tissot and Welte 1984). They are also found in crude oil and thus testify to the ori- gin of petroleum from the remnants of ani- mals and plants.
Carbonate sediments containing at least 0.3 to 0.6 % organic carbon and shales with 0.5 to 1 % organic carbon may already be regarded as hydrocarbon source rocks. These lower li-

558 Chapter 14 Hydrocarbons and Coal
DESTRUCTIVE OXlC SUB-OXIC ANOXIC PROCESSES AEROBIC DYSAEROBIC ANAEROBIC
COARSE BK)-
BENTHIC SCAVENGERS
SULFATE AND NITRATE REDUCING BACTERIA METHANE FERMENT-- ING BACTERIA
SEDIMENTATlON / L o w t-- HIGH I L o w HIGH I INFLUENCE UNCLEAR j RATES
I
EXPECTED KEROGEN TYPES,
( INERTINITE/ vlTRlNlTE
Fig. 14.1. Dominant kerogen types and hydrocarbon potential of aquatic petroleum source rocks in relation to benthic environment and sedimentation rate. (After Demaison and Moore 1980; Brooks et al. 1987)
HYDROCARBON GAS-PRONE TO POTENTIAL NON SOURCE
mits of potential source rocks depend, how- ever, on the kerogen type present in these rocks. The composition of kerogen in the dif- ferent source rocks is significantly controlled by the processes shown in Fig. 14.1. Low sedi- mentation rates under well oxygenated condi- tions only allow the preservation of the so- called inertinite (usually in very small amounts), whereas anoxic depositional en- vironments enable the preservation of com- paratively large quantities of the H-rich lip- tinite (see below) and thus strongly enhance the hydrocarbon potential.
Principally, the organic matter of hydro- carbon source rocks is subdivided into two groups (Fig. 14.2):
1
EXlN - vim I VlrR ExlN
- Bitumen: organic matter soluble in organic solvents which represents only a small propor- tion of total organic carbon, TOC. - Kerogen: organic matter which is insoluble in organic solvents, nonoxidizing mineral acids, and aqueous alkaline solvents. Keregon always represents the bulk of TOC.
I ExlNlTE I LlPTlNlTE
MODERATELY OIL-PRONE TO
GAS-PRONE
Whereas the extractable bitumen is already in a migratable state, the kerogen is fixed in the sediment, but has the potential to generate
STRONGLY OIL-PRONE
migratable crude oil and gas. A thorough stu- dy of the amount and composition of kerogen in source rocks is therefore an important mo- dern tool in evaluating the hydrocarbon po- tential of lacustrine and marine sediments. For this purpose optical methods (organic petro- graphy), physicochemical methods, and orga- nic geochemical analyses including certain geochemical (biological) markers are used (see, e.g., Durand 1980; Tissot and Welte 1984; Brooks et al. 1987; Tissot et al. 1987). With the aid of such methods, kerogen can be classified into four main groups (Fig. 14.2):
1. Liptinite-type kerogen. Derived mainly from the lipid components of algal material after partial bacterial degradation, altered by decomposition, condensation, and polymeriza- tion. Liptinite-rich deposits are typically dark, finely laminated or structureless, and rich in TOC. They commonly form in lakes and la- goons, but liptinite is also an important con- stituent in the organic matter of marine en- vironments (Fig. 10.13). Liptinite is relatively rich in hydrogen and therefore exhibits a high H/C ratio; it has a low oxygen content and low O/C ratio (Fig. 14.3). Liptinite-dominated kerogen is classified as type I kerogen (Tissot

Source Rocks, Kerogen Types
KEROGEN
/ /
' / \ -\ ' / \\ '\
e g., 3 % OF SOURCE ROCK)
, ' I \ \ '. \
SOLUBLE ORGANIC MATTER PHATlCS MATICS pkE/&
(MIGRATABLE HYDROCARBONS
ORIGIN
TYPE \
POTENTIAL GAS
+ AFTER TISSOT AND 'NELTE
Fig. 14.2. Soluble and insoluble (kerogen) organic matter of hydrocarbon source rocks, kerogen type after Tissot and Welte (1984), and hydrocarbon potential. (After Brooks et al. 1987).
and Welte 1984). Liptinite-rich source rocks have a very good potential for the generation of oil. 2. Exinite-type kerogen. Derived mainly from relatively resistant membraneous plant debris such as spores, pollen, leaf cuticle; etc. Resins and waxes also belong to this group. Such plant particles are not only produced on land and swept into lakes and swamps later forming certain varieties of coals, but they also grow in lakes and in the ocean (e.g., dinoflagellates and other phytoplankton). Exinite has a high H content and H/C ratio (but lower than lip- tinite) and a medium 0 content and O/C ratio (Fig. 14.3). Many marine sediments and hyd- rocarbon source rocks contain a mixture of liptinite, exinite, and vitrinite (see below) which is classified as type II kerogen. Exinite-
rich source rocks have a good potential for the generation of oil, condensate, and wet gas (see below). 3. Vitrinite-type kerogen. Derived mainly from woody material of higher plants, more or less degradated. Vitrinite has a relatively low H content and H/C, but a high initial O/C ratio (Fig. 14.3). It is the main constituent of most coals. However, it also occurs in marine and lake sediments in varying quantities. Vitri- nite-dominated organic matter corresponds to type III kerogen, which has a high potential for the generation of gas, but only a limited potential for oil and condensate. 4. Inertinite-type kerogen ("dead carbon", type IIIb or type IV kerogen). Black opaque debris of highly altered, frequently resedimented older organic matter, mostly derived from

Chapter 14 Hydrocarbons and Coal
INCREASING LIPIDS
WAXES, FATS rEMPERATURE MATURATION x 1 PATHWAY
LlPTlNlTE ("TYPE I")
H3 O C02, BIOGENIC CH4
L-- -
ACIDS LIGNO-CELLULOSES - ( ..TYPE lllbu )
(ALTERED WOODY MATERIAL) or "TYPE IV"
I , I ,
0 ' I " " I " " I " " ' 0 . 0 5 0.10 0 . 1 5 0 . 2 0 0.25
O/C ATOMIC RATIO
Fig. 14.3. Kerogen-types in van Krevelen-type diagram lower HIC and OIC values (carbon enrichment, loss of showing HIC versus OIC and pathways of organic matura- H20 and CH4). All kerogen types tend to approach more tion. (After Brooks et al. 1987). With increasing burial or less constant C, H , and 0 values depth and temperature, kerogen composition moves to
plants. Due to previous oxidation and/or high levels of carbonization, the H content and the H/C ratio of inertinite are very low. Rocks containing only inertinite practically have no potential for oil or gas.
The van Krevelen-type diagram (Fig. 14.3), based on the ratios of the three most impor- tant elements of kerogen, C, H, and 0, clearly displays the different kerogen types and is therfore widely used. However, this is ap- plicable only for immature organic matter. With increasing maturity, i.e., under growing temperature due to subsidence and burial be- neath younger sediments, the elemental com- position of the initial kerogen types gradually changes, and the curves of the different kero- gen types tend to merge. All types of kerogen become relatively richer in C, but lose H and 0 , because they release H20, CHI, and other hydrocarbons.
14.2 Generation of Hydrocarbons
The Evolution of Organic Matter
The evolution of organic matter from biopoly- mers to geopolymers with increasing burial depth (and temperature) is shown in the over- view of Fig. 14.4. As a result of different biochemical, chemical, and physicochemical processes, the primary organic compounds are transformed into insoluble kerogen or, in the case of coal evolution, into sub-bituminous brown coal. This first stage of evolution is re- ferred to as diagenesis; it ends as soon as ex- tractable humic acids are more or less used up.
In the zone of catagenesis, part of the ke- rogen is converted into hydrocarbons. It is the main zone of oil and wet gas generation ("oil kitchen"). The coal evolution proceeds to the

Generation of Hydrocarbons
(%) CARBON RESIDUE M~RPHISM loo YO c
Fig. 14.4. Overview of the evolution of organic matter taneously releasing gas and some oil). Note the logarithmic from young, organic-rich sediment or peat to the deep depth scale; R, signifies v i t ~ i t e reflectancy (optical mea- burial metamorphic zone. The source rocks generate hydro- sure for maturity). (After Tissot and Welte 1984; coal carbons (oil and gas) or are transformed to coal (simul- ranks after Stach et al. 1982)
development of bituminous hard coal, which also releases gas and some oil. In the next zone, namely that of metagenesis, both hydro- carbon source rocks and hard coal mainly re- lease gas. In oil source rocks the carbon-rich residue remains disseminated in the shale as a minor constituent. In coal deposits (Chap. 14.4), the carbon-enriched residue forms an- thracite and, after the onset of metamorphism, graphite.
The relationship between increasing kero- gen maturity with temperature (and depth) and the release of migratable organic com- pounds, i.e., the generation of hydrocarbons, is demonstrated in more detail in Fig. 14.5.
- At shallow burial depths the immature or- ganic matter can only release (biogenic) meth- ane gas produced by methane fermenting bac- teria (cf. Fig. 14.1 and Chap. 13.6.2) and small quantities of heavier hydrocarbons.
- Early to mid-mature stage. Large quantities of oil are generated within the temperature range between 60 to 80 OC and 120 to 150 OC. The relatively heavy oil is predominantly com- posed of molecules with 15 and more C atoms (C,,+ hydrocarbons) and contains condensates of lighter molecules (C8-15. hydrocarbons), such as paraffins and aromatic compounds. - Late mature zone for oil generation. At tem- peratures higher than about 130 OC, part of the large organic molecules are cracked to form light hydrocarbons of the C,-, fraction (wet gas) and methane (dry gas).
Transformation Factor
The percentage of oil and gas that the kerogen can generate if subjected to adequate tempe- rature during a sufficient time period, is re- ferred to as genetic potential or transformation

Chapter 14 Hydrocarbons and Coal
CONDENSATE
WINDOW "
IMMATURE
EARLY MATURE
FOR OIL
MID- MATURE
FOR OIL
LATE MATURE
FOR OIL ,/
/ /
/ /
/ /
GENERATION OF GAS
I I I I I I
0 100 200 300 400 500 mg/g TOC
Fig. 14.5. Hydrocarbon generation in relation to tempe- source rock with type I1 kerogen. Temperature scale ad- rature (burial depth) leading to different stages of source justed to North Sea conditions; the trends for temperatures rock "maturity". Horizontal axis shows amount of gene- greater than about 160 OC are not well established. (After rated hydrocarbons in mglg TOC (total organic matter) in Brooks et al. 1987)
ratio. The optimal conditions, in terms of thermal and burial history, to reach a maxi- mum transfsrmation ratio vary between dif- ferent source rocks (Tissot et al. 1987).
Type I kerogen has a genetic potential up to 80 to 90 % (e.g., the lacustrine bituminous shales of the Eocene Green River Formation of North America). The common type I I kero- gens of many marine shales have a genetic po- tential of about 60 %, but carbonaceous shales rich in type I I I kerogen (vitrinite, coal) only reach about 25 % (Tissot and Welte 1984).
In the example of Fig. 14.5, the horizontal axis indicates the amount of oil and gas which can be generated by 1 gram of total organic matter, TOC. The fraction of the primary production which, after losses in the water column and in the benthic degradation zone of the sediment, can finally be converted into hydrocarbons, is shown schematically in Fig. 14.6. These values vary greatly from site to site, but one can again see the enormous dif- ference between the preservation of organic matter and the hydrocarbon potential of oxic and anoxic sediments.

Generation of Hydrocarbons
PRIMARY PRODUCTI\JITY (HIGHLY VARIABLE, 2 TERRESTRIAL
" NEW PRODUCTIVITY " 3-30 %
(LEFT OVER AT WATER DEPTH OF 100 m)
ANOXIC BASIN -210%
'V 0.5% ARRIVING ON SEA FLOOR UNDER FAVORABLE CONDITIONS (E G RELAT HIGH SED RATE)
PRESERVED IN SEDIMENT ~ 5 % BELOW ZONE OF BENTHIC JJ,&,,/ DEGRADATION
\ \ /
3 ORGANIC CARBON L-'
0.5-1 % / IN SEDMENT \ 2-1 0 %
\1/ POTENTIAL HYDROCARBON ~4 %
GENERATION " O1 % (AFTER MATURITY, WITHOUT
rs? SIGNIFICANT LOSSES) GAS + OIL
m OIL + GAS
Fig. 14.6. Percentage of primary production of organic the water column and on the sea floor. Note that these matter (= 100 96) in oxic and anoxic environments which values represent orders of magnitude and vary greatly from can be converted ultimately into oil and gas after losses in location to location
Expulsion and Migration of Oil
Fig. 14.7 demonstrates two stages of the burial history of a hydrocarbon source rock in a sub- siding basin. At stage (a) only the lowermost part of the source beds have reached early maturity and can begin to generate and expel heavy oil. After deeper burial (stage b), most of the source bed has become early, mid-, or late mature and can yield heavy and light oil including condensate. The released hydrocar- bons migrate first through narrow pores and capillaries of the fine-grained source bed (primary migration). Later they reach the
water-saturated wider pores and more perme- able carrier beds and final reservoir rocks (secondary migration). Because the densities of oil and gas are lower than that of (usually highly mineralized) formation water, the hyd- rocarbons tend to move upward into reservoirs located in structural highs.
The oil generated in source rocks migrates either in molecular solution in pore waters or as a hydrocarbon phase (Magara 1978; Roberts and Cordell 1980; Tissot and Welte 1984; Durand 1987). Because of the low solubility of hydrocarbons in water, the first process can only be effective if a relatively large volume

Chapter 14 Hydrocarbons and Coal
a 80 Ma B.P.
SEAL ROCK YOUNGER SEDIMENTS
' EARLY MATURE SOURCE ROCK
b PRESENT
CLAYEY SOURCE ROCK WITH THICK HOMOGENOUS CLAYEY THIN SANDY INTERBEDS: SOURCE ROCK: HIGHLY EFFECTIVE DRAINAGE RESTRICTED DRAINAGE
Fig. 14.7a-d. Progressive maturation of hydrocarbon rock have reached different stages of maturity (including source rock and expulsion of oil with increasing subsidence generation and expulsion of light oil and condensate). c and and burial beneath younger sediments. a Only deepest part d Differences in hydrocarbon drainage and migration due of structural basin reaches stage of early mature source to the presence or lack of interbedded permeable layers. rock with generation of heavy oil. b Large parts of source (After Brooks et al. 1987)
of water moves from the source bed to the reservoir. The volume of pore water expelled from sediments by compaction is, however, limited, particularly at the depths where the source rocks become thermally mature (cf. Chap. 13.4). Therefore many experts assume that the movement of hydrocarbons in liquid phase is the major factor in primary oil mi- gration. To enable this process, a substantial part of the pores must be filled with oil (oil
saturation on the order of 20 %, i.e., in excess of the residual saturation).
Oil movement occurs mainly as two-phase flow and is driven by buoyancy ("buoyancy drive", e.g., Davis 1987), which is caused by the fact that dil has a lower density than wa- ter. According to this concept, water drive is not important except in those cases when the tops of the petroleum transporting strata have very low dips (generally less than 5').

Generation of Hydrocarbons
The expulsion of oil is promoted by high fluid pressures which evolve mainly from continuing compaction. Assuming that the source rock and part of the overlying deposits are more or less impermeable, the excess pore water cannot escape and thus develops high geostatic pressures. Such a pressure-driven, discrete hydrocarbon phase movement can oc- cur in different rock types and has to be maintained for long time periods in order to accomplish significant hydrocarbon accu- mulations.
Hydrocarbon expulsion from a source rock already becomes effective in an early stage if thin carrier beds are interbedded (Fig. 14.7~). They allow the migration of heavy, early ma- ture oil, as well as a high oil expulsion ef- ficiency (50 % and more), even if the total or- ganic carbon content is relatively low. As a consequence, after further burial, the yield of lighter hydrocarbons, condensate, and gas, however, is reduced (Brooks et al. 1987).
In contrast, thick homogeneous shale source rocks (Fig. 14.7d) require a higher organic carbon content and an advanced level of ma- turity to expel oil in a certain period of time. Hence they tend to retain a large proportion of heavy oil products until they reach higher maturity in the course of further subsidence. Then they expel light oils, condensate, and gas, but their expulsion efficiency is lower (5 to 25 %) than that of the interbedded source rocks.
Secondary oil migration occurs as multi- phase flow. Oil globules or gas bubbles in porewater tend to move upward solely due to buoyancy or driven by hydrodynamic condi- tions (Tissot and Welte 1984). Oil and also gas are trapped if they can no longer be pressed through fine rock pores. The pore space of traps is, however, never fully occupied by petroleum, but always contains some residual water which cannot be replaced by hydrocar- bons. For secondary migration in permeable rocks, some authors stress the importance of large-dimension, regional subsurface flow systems (e.g., Toth 1980), where water is the principal medium for carrying oil and gas (mostly in solution).
14.3 Examples of Hydrocarbon Habitats
The general concept of hydrocarbon genera- tion in a subsiding basin (Fig. 14.7) is demon- strated here in a few examples of well known oil and gas fields:
Lacustrine Source Beds
The large, intracratonic, rift-style Songliao Basin in northeastern China (Fig. 14.8) is fill- ed with fluviatile and lacustrine sediments of Cretaceous and Tertiary age (Demaison 1985; Ma Li 1985).
During the early Cretaceous highly oil-prone black shales (lcerogen type I), 500 to 700 m thick, were deposited in a lake. The main river entering the lake formed a delta with elongated distributary channel sands and lenticular suba- queous mouth bar sands (see Chap. 3.4.2) extending into and building up with the shale in the subsiding basin. In the basin center, these deposits were buried under 1500 to 2000 m younger sediments, tectonically deformed, and split up into fault blocks.
Fig. 14.8. Oil fields associated with bituminous lake sedi- ments and delta sands in the Songliao Basin, northeastern P.R. of China. (AAer Demaison 1985)

Chapter 14 Hydrocarbons and Coal
The oil released by the thermally mature sour- ce rock migrated into the anticlines and other structural traps and accumulated in the deltaic sandstones. The giant Daqing oil field is locat- ed immediately updip from the center of the oil-generating basin. It represents the largest known oil accumulation in a non-marine basin fill. The maximum distance of oil migration is less than 40 km.
The hydrocarbons accumulate in sands of the overlying paralic sequence sealed by shales. The giant oil fields (largely light waxy paraf- finic oils, partially transformed bacterially to heavier crude oil) and gas fields are concen- trated in the area of maximum thickness of the deltaic sediment wedge where sufficient sand traps are available in the subsurface. Within a given structure the gas-bearing rocks become more important downdip.
Marine Deltas Shallow Epicontinental Seas and Rift Basins
Large, young deltas are favorable settings for the formation of hydrocarbon source rocks, coal seams, and the accumulation of oil and gas. Whereas peat-derived coal frequently originates from swamps located on the deltaic plain (Fig. 10.13 and Chap. 3.4.3), hydrocar- bon source rocks commonly accumulate on the delta slope in marine environments. Although such sites receive large amounts of terrigenous material, delta slope sediments may become sufficiently rich (0,5 to 1 96) in land-derived and marine organic matter to act as hydrocar- bon source rocks. The disadvantage of their relatively low C content is compensated for by their large rock volume accumulated in a short time period. The delta front and river mouth sands provide reservoirs which are sealed by the overlying, fine-grained deposits of the delta plain. As a result of delta front prograd- ing and rapid sediment accumulation, the delta complex subsides considerably. Hence, the source rocks reach thermal maturity after a relatively short time span and can generate hydrocarbons.
The well explored Tertiary Niger delta is one of the best known examples for this type of petroleum habitats (Evamy et al. 1985; cf. Chap. 3.4.2).
The prograding delta complex has reached a thickness o f 9000 to 13- 000 m on top of down-faulted oceanic crust (Fig. 14.9). The huge sediment wedge can be subdivided from bottom to top into three main units: marine shales (principal source rocks with an organic C content of about 1 A, mainly type 111 kerogen), a paralic sequence (shales and sands of the delta plain with distributary channels), and fluvial sands and gravels o f the alluvial plain. Deepreach- ing basement faults and shallower gravity-induced growth faults created separate s t~c tura l units for the generation and accumulation of hydrocarbons. The marine shales of these units are generally over-pressured. They release oil and gas at depths in excess of 3000 m, but the temperature gradient varies considerably (from about 2.7 to 5.5 OCllOO m) due to the cooling effect of locally deeply circulating groundwater.
The well explored Paris Basin (Fig. 14.10) represents a classic example of a slowly sub- siding, wide basin on continental crust, which was filled by alternating continental and shal- low-marine sediments of Triassic to Tertiary age (Schonenberg and Neugebauer 1987). The center of the basin appears to have been af- fected by rifting during Permian/Triassic time. The younger basin fill reaches a maxi- mum thickness of 3000 m. The moderate oil production of the basin is provided by Middle Jurassic limestones; the source rocks are Lias- sic (Toarcian) shales cropping out as bitumin- ous marlstones along the rim of the basin (Fig. 14.10). They are also known from other parts of Western Europe and represent a kind of anoxic event with kerogen type 11. Although source beds and reservoirs are separated by a thick shale sequence, the producing fields lie within or very close to the central part of the basin where the Toarcian source rocks are most deeply buried (2000 to 2500 m) and ma- ture for the generation of oil (Huc 1980; Tis- sot and Welte 1984; Demaison 1985).
Outside this central depression no oil or gas could be found. According to geochemical modeling, the fraction of kerogen which has been converted to petroleum decreases from the center of the basin outward (from about 150 to less than 50 g petroleum per kg organic carbon). The evolution of the Toarcian kero- gen with increasing burial depth is shown in Fig. 14.10b in comparison to values from deeper burial sites in northwestern Germany.
The failed rift zone of the North Sea, which has not evolved into a wide, deep ocean basin, has become one of the major oil and gas provinces of the world (Fig. 14.1 1). The prin- cipal source rocks for oil are marine shales (largely with kerogen type 11) of Late Jurassic age.

Hydrocarbon Habitats 567
BENIN CITY
b MARINE MAIN OIL ZONE SHALE SHALES :EST
SILTS DlAPlRS (SOURCE r
Ssw AND SANDS \ CONTINENTAL I
NNE \ ROCKS) / . PARALIC
I OCEANIC CRUST 200 km
I CRUST
1 CONTINENTALI
Fig. 14.9. a Major oil fields of the Tertiary Niger Delta on oceanic crust, and the subsided and buried growth faults top of downwarped oceanic basement, seaward of the con- generated along the former delta front. (After Evamy et al. tinental edge. b Cross section demonstrating the prograding 1978; Tissot and Welte 1984) of the delta complex, the down-faulting of continental and
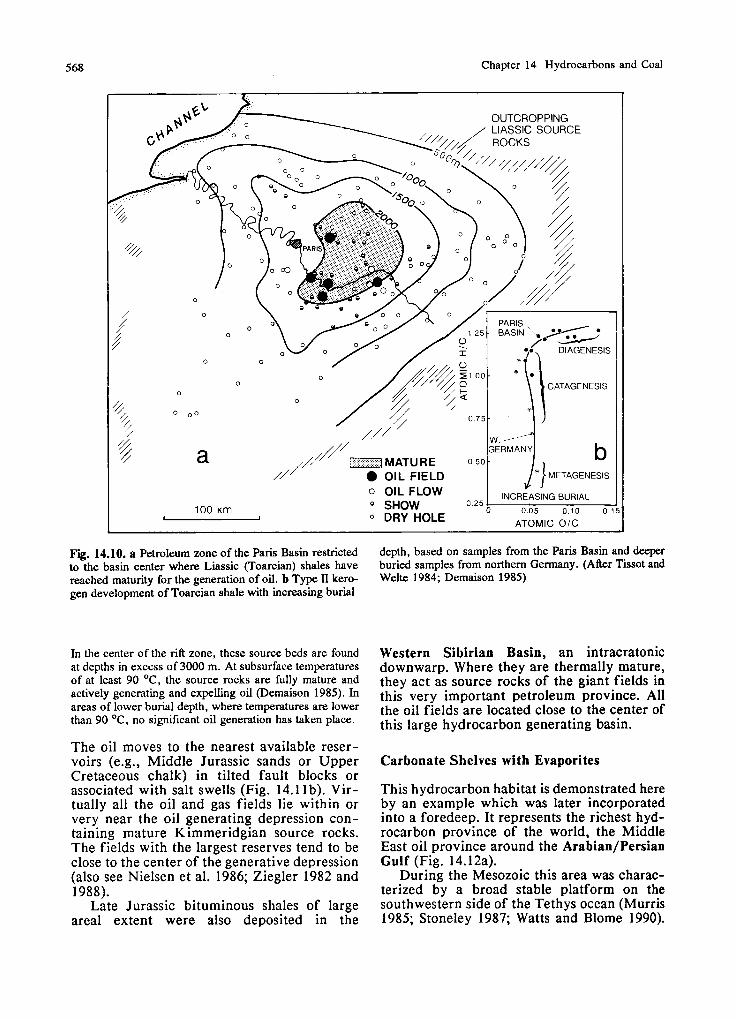
568 Chapter 14 Hydrocarbons and Coal
OUTCROPPING
CATAGENESIS
OIL FIELD
0 0 5 0.10 0.15
Fig. 14.10. a Petroleum zone of the Paris Basin restricted depth, based on samples from the Paris Basin and deeper to the basin center where Liassic (Toarcian) shales have buried samples from northern Germany. (After Tissot and reached maturity for the generation of oil. b Type I1 kero- Welte 1984; Demaison 1985) gen development of Toarcian shale with increasing burial
In the center of the rill zone, these source beds are found Western Sibirian Basin, an intracratonic at depths in exccss of 3000 m. At subsurface temperatures downwarp. Where they are thermally mature, of at least 90 OC, the source rocks are fully mature and they act as source rocks of the giant fields in actively generating and expelling oil (Demaison 1985). In this very important petroleum province. All areas of lower burial depth, where temperatures are lower the oil fields are located close to the center of than 90 OC, no significant oil generation has taken place. this large hydrocarbon generating basin.
The oil moves to the nearest available reser- voirs (e.g., Middle Jurassic sands or Upper Cretaceous chalk) in tilted fault blocks or associated with salt swells (Fig. 14.1 lb). Vir- tually all the oil and gas fields lie within or very near the oil generating depression con- taining mature Kimmeridgian source rocks. The fields with the largest reserves tend to be close to the center of the generative depression (also see Nielsen et al. 1986; Ziegler 1982 and 1988).
Late Jurassic bituminous shales of large areal extent were also deposited in the
Carbonate Shelves with Evaporites
This hydrocarbon habitat is demonstrated here by an example which was later incorporated into a foredeep. It represents the richest hyd- rocarbon province of the world, the Middle East oil province around the ArabianIPersian Gulf (Fig. 14.12a).
During the Mesozoic this area was charac- terized by a broad stable platform on the southwestern side of the Tethys ocean (Murris 1985; Stoneley 1987; Watts and Blome 1990).

Hydrocarbon Habitats 569
b JURASSIC (INCLUDING PALEOCENE KlMMERlDGlAN SOURCE ROCKS) LATE
CRETACEQUS
EOCENE A U K @ F U L M A R @ E K O F I S K TO PLEISTOCENE
\ 50- L
r 0 I 1 1 I I I 1
BASEMENT DEVONIAN AND ROTLIEGEND ZECHSTEIN SALT TRIASSIC
Fig. 14.11. a Oil and gas fields in the rift zone of the b Cross section of the central North Sea showing fault North Sea with mature Kirnmeridgian source rocks. (After blocks and oil fields in structural highs or on flanks of salt Demaison 1985, modified). dome. (After Ziegler 1982)

570 Chapter 14 Hydrocarbons and Coal
Fig. 14.12. a Principal oil fields of the Middle East, as- Upper Jurassic (Late Oxfordian to Early Kimmeridgian). sociated with source beds deposited in intra-shelf basins of c Simplified, undefomed cross section of central Gulf dis- a very large Jurassic-Creatacwus carbonate platform (after playing the relationship between major hydrocarbon source Stoneley 1987). b Depositional environment during the beds, reservoirs, and seal rocks. (After Mums 1985)

Hydrocarbon Habitats
On the landward side of the platform, ramp- type, mixed carbonate-clastic units were de- posited during regressive phases. The central and northeastern, seaward parts of the shelf were differentiated into broad regional highs, horsts, tilted faultblocks, and salt swells. These areas were dominated either by carbonate sed- iments accumulated under euxinic conditions in intra-shelf basins, or shallow-water car- bonates and evaporites on the higher parts of the platform (Fig. 14.12b).
During the Upper Cretaceous the outer shelf region was affected by the onset of orogenic movements creating a foredeep along the Tethys margin. The deposition of plat- form sediments continued up to the late Alpine orogeny in the Miocene, when the northeastern part of this area was overthrust by the Zagros chains and anticlinal traps formed in the foredeep now occupied by the Gulf (Fig. 14.12a).
The hydrocarbon source rocks accumulated from middle Jurassic to late Cretaceous times in the starved shelf basins, especially during transgressive periods. The richest basinal sour- ce rocks (thinly laminated lime-mudstones, kerogen type 11) are of Oxfordian to Kimme- ridgian age. They usually contain between 3 and 5 Yo organic carbon, and their oil yield can be as high as 2 9'0 of the total rock volume. The neighboring marginal reef mounds, ooidal grainstones and other shallow-water sands were used as reservoirs.
The porosity of these rocks was improved in places by sub- aerial leaching during times of low sea level stand. The reservoirs are sealed by shales and supratidal evaporites (Fig. 1 4 . 1 2 ~ ) . The temperature gradient from Jurassic to present time varied only slightly around 3.5 OCllOO m. At 2000 m depth about 90 OC and at 2700 m approximately 110 OC are reached in drillholes. Upper Cretaceous and Tertiary source rocks remain immature.
Several giant oil fields on the south side of the Gulf are associated with relatively shallow burial depths of the older source rocks. The oil has a relatively high sulfur content indicat- ing the marine euxinic depositional environ- ment and possibly the influence of the inter- calated sulfate rocks. Cross-strata migration of oil from deeper source beds to higher reser- voirs appears to have been facilitated by (oil- filled) microfractures. Gas fields coincide with those areas where the source rocks are buried below 5000 m and have reached the zone of metagenesis.
The exceptionally prolific habitat for oil and gas of the Gulf region is not a result of extraordinary rich and/or thick source rocks, but rather originates from the vast horizontal dimensions of the depositional platform area
(2000 to 3000 km wide and 5000 km long). In addition, abundant highly porous and perme- able reservoirs as well as efficient seals lie in close proximity to the source rocks. Tectonic structures are simple and of very large scale, allowing comparatively long-distance migra- tion and a high degree of reservoir fill. Final- ly, the area was not affected by a major phase of post-depositional erosion and intensive, deep meteoric water circulation.
Summary
All these examples have in common that the hydrocarbon source rocks reached a burial depth on the order of 1500 to 3000 m with a temperature of at least 60 to 90 OC. In this depth range part of the kerogen is or was transformed to petroleum and/or gas under the influence of both subsurface temperature and time. Areas underlain by source rocks undergoing such processes are called petroleum generative depressions or "hydrocarbon kit- chens" (Demaison 1985). A generative basin may contain one or more petroleum generative depressions.
The largest petroleum accumulations tend to occur in reservoir rocks located close to the center of the generative basins or on structural highs neighboring deeper generative depres- sions. Large volumes of hydrocarbon generat- ing sediments and long time spans for the drainage are a prerequisite for giant oil and gas accumulations. Evaporites and fine-grain- ed, water-wet clayey shales and mudrocks, which must not have open fractures, act as efficient seals on top of the porous oil and gas traps. Such seal rocks prevent oil (lower den- sity than water!) and gas from migrating up- ward to the surface over long time periods, if the generative basin is not affected by subse- quent tectonic activity. Large oil and gas fields still exist in Paleozoic basins, for exam- ple in North America, North Africa, and in the Soviet Union.
Oil usually migrates over distances not more than a few tens of km in the updip drai- nage area of individual tectonic structures. Most of the producible hydrocarbons and the largest oil fields occur within the ranges of generative depressions. These conclusions apply to different types of basins (e.g., intra- cratonic basins, rift basins, passive margin basins). Long-distance oil migration is docu- mented from some foreland basins. Migration of gas, however, is frequently more difficult to predict.

Chapter 14 Hydrocarbons and Coal
Subsurface mapping of hydrocarbon gene- rative basins, including kerogen analyses and an evaluation of the thermal history of the basin, is one of the most important tasks in petroleum exploration. In addition, the three- dimensional facies distribution and architec- ture of the depositional system, reservoir and seal rocks in the neighborhood of the source rocks, and the tectonic structure of the basin fill have to be investigated.
14.4 Evolution of Coal
Introduction
In contrast to oil and gas, coal remains in its primary position within a sedimentary body, but with continued burial it undergoes proces- ses similar to the diagenesis and catagenesis of hydrocarbon source rocks (Teichmuller and Teichmiiller 1979; Tissot and Welte 1984).
Important prerequisites for the formation of substantial volumes of coal are the evolu- tion of plant life on the continents, a relative- ly high plant productivity under favorable climatic conditions with sufficient nutrient supply, and a depositional environment where plant remains can be preserved. Most coals originate from the detritus of terrestrial plants forming peat either in shallow freshwater lakes and swamps (Fig. 10.13, limnic coals and coals of fluvial plains, Chap. 2.2.3), or in brackish transitional environments such as those observed in coastal and marine deltaic areas (paralic coals, Chap. 3.4.3). Summaries on coal-forming environments are given, for example, by Teichmuller (1973) Galloway and Hobday (1983), and Lyons and Alpern (1989).
Regional studies are published in special journals. An overview on the Permo-Carboni- ferous coals in China, for example, is given by Liu Guanghua (1990). These coals accumulat- ed either in lakes (coals with low sulfur con- tent), in backswamp areas of marine deltas with switching lobes (coal seams of limited extent with intermediate sulfur content), or in supratidal marshes of coastal regions. The latter type is characterized by wide lateral extent, high sulfur content, and coal cycles resulting from sea level changes.
Preservation of Peat
In both limnic and paralic environments, the plant debris has to be protected from rapid microbial decomposition under oxic conditi- ons. This is accomplished by a water level standing just at or above the surface of the deposited plant material. To maintain such conditions for longer time periods, the deposi- tional area has to subside; only that part of the plant accumulation can be preserved which is compensated for by subsidence and is there- fore kept under the protection of a water cover or water-saturated sediment.
Therefore, long-term sedimentation rates o f peat and coal commonly correspond with overall sedimentation and subsidence rates of the basin considered (cf. Chap. 10.2). Thus, peats of different thicknesses, composition, and purity are formed. Some of the peat may still be subject to aerobic decomposition by bacteria and fungi, while deeper-seated parts undergo changes by anaerobic bacteria. In this biochemical phase of early diagenesis, some biogenic methane is produced.
Coalification and Composition of Coal
After burial, geochemical processes take over to convert the peat into brown coal and, later, into bituminous hard coal and anthracite (Fig. 14.4). These processes are summarized under the term coalification. Special investigations, such as the determinations of the moisture and volatile matter contents, carbon and hydrogen contents, the reflectance of vitrinite (see be- low), and the calorific value, allow to distin- guish between several stages of coalification (e.g., Alpern 1987). These stages are referred to as rank levels which indicate the maturity of coal.
Peat and coal contain various organic com- ponents (macerals) which, similar to the com- ponents of the hydrocarbon source rocks, are affected by the coalification process in dif- ferent ways. The three main groups of mace- rals are (Tissot and Welte 1984; Robert 1985):
1. Huminite and vitrinite. Remains of woody and humic substances which are the major components of brown coals and bituminous hard coals. 2. Liptinite or exinite. Remains of lipid-rich plant relics (resins, waxes, spores, cuticles, algae) which are summarized under the terms liptinite or exinite.

Evolution of Coal
3. Inertinite. Oxidized or reworked older car- bon-rich particles.
Over all, the organic components of coal re- semble kerogen type I11 described earlier for hydrocarbon source rocks. Their potential to generate hydrocarbons is similar to that of this kerogen type.
Prograding coalification leads to the fol- lowing physical and chemical changes:
- Decrease in water content and porosity, in- crease in density.
- Condensation of organic molecules, polyme- rization, aromatization, and loss of functio- nal groups.
The net result of these processes is a relative enrichment of carbon with increasing burial depth and temperature (or coal rank). These changes are accompanied by the expulsion of H,O and the generation and release of carbon dioxide and hydrocarbons (Fig. 14.4):
- At shallow burial depth: carbon dioxide and biogenic methane.
- At medium burial depth (range of medium volatile bituminous coal): large amounts of methane and minor volumes of heavier hyd- rocarbons including oil.
- At deep burial depth: methane.
Part of the generated hydrocarbons can be stored in coal under high in-situ pressure and temperature. However, especially the genera- tion of methane greatly exceeds the storage capacity of coal. Therefore, the bulk of me- thane migrates into structural traps with reser- voir rocks or escapes into the atmosphere.
Example of a Coal Basin
The Carboniferous in northwestern Germany extending from the Rhenish Massif with the Ruhr district to the North Sea (Fig. 14.13). is one of the best explored coal basins. In con- junction with the exploration of gas fields, the top of the coal-bearing strata was drilled at numerous sites, and vitrinite reflectance (O/o Rm) was determined (Teichmiiller et al. 1984). The cross section in Fig. 14.13 shows several characteristic features:
- The predominantly pre-orogenic, relatively high-rank coalification of the folded Upper
Carboniferous is found at the present land surface in the south. This area was uplifted, and part of the Carboniferous was eroded. - The less intense coalification in the deeply buried northern part of the section is explain- ed by young subsidence of this area. The tem- perature gradient is relatively low, and burial time was not long enough for the coal to reach a higher rank. Most gas fields occur where the vitrinite reflectance varies between 1 and 2 O/o
Rm. Reservoir rocks are sands of the upper Carboniferous, the Permian (Rotliegend), and Lower Triassic (Bunter sandstone). They are sealed by evaporites of Permian and Triassic age.
- The striking maximum in the coal rank of the Ibbenburen mine district (4-5 % Rm) re- sults from an Upper Cretaceous magmatic intrusion, causing a very high temperature gradient. Local strong uplift and subsequent erosion brought the coal-bearing strata to or close to the present land surface.
The results of a model calculation for the de- gassing of Ruhr coal is shown in Fig. 14.14 (after Tissot and Welte 1984, based on Juntgen and Klein 1975).
It is assumed that the initial shallow-burial, highly volatile bituminous coal subsided to a burial depth of 3000 m dur- ing a time period of 20 Ma (Fig. 14.141). Simultaneously, the temperature rose from 20 to 140 OC, which corresponds to a heating rate of 6 OCIMa or about 1.6 x lo-' 'Clday. Using the results of experimental heating of coal and extrapolating these data to the natural heating rate, the history of degassing of the initial coal as well as the amounts of released gas were found (Fig. 14.14b).
During the first 16 Ma of heating, only H 0 , CO,, and CO were released according to &is calculation. Then methane, hydrocarbons, and also some nitrogen were produced. This pro- cess continued until about 40 Ma after the onsct of heating. Over all, the coal has lost more than 30 % of its weight and evolved from a highly volatile into a less volatile bitu- minous coal and later into C-rich anthracite. Finally, the area was uplifted and exposed to erosion as mentioned above. As a result, burial depth and temperature of the coal seams de- creased. Because high maturation of the coal was already established prior to this process, however, this development had no further sig- nificant effect on the coal and its degassing.
These general principles can also be applied to other coal deposits of various burial and uplift histories.

S
RU
HR
DIS
TR
ICT
M
ON
ST
ER
BA
SIN
IB
BE
NB
UR
EN
'-'
b
LOW
ER
SA
XO
NIA
N
N
j /(-\:,,
NO
RT
H S
EA
R
HE
NIS
H
QU
AT
ER
NA
RY
GA
S F
IELD
S
IN N
W G
ER
MA
N
WE
T
DR
Y G
AS
4 T
OP
OF
C
AR
BO
NIF
ER
OU
S
YO
UN
G S
UB
SID
EN
CE
50
km
1
4
a 1.
8 V
lTR
lNlT
E R
EF
LEC
TA
NC
E
(DE
GR
EE
OF
CO
ALI
FIC
AT
ION
)
ST
EP
HA
NIA
N
D
WE
ST
PH
ALI
AN
--
- C
I,
--
- B
N
---
A
,I
N
NA
MU
RIA
N
GA
S F
IELD
S

Evolution of Coal
HIGH-VOLATILE A~~D$$,, SEMI-ANTHRACITE
TIME (Ma)
Fig. 14.14a,b. Evolution of carboniferous coal of the Ruhr Note that the coal-bearing strata were uplifted about 40 Ma area, western Gemany, and release of different types of after their subsidence. Geothermal gradient is 4 "C1100 m. gas (b) as a result of increasing burial depth and tempe- (After Tissot and Welte 1984). For further explanation see rature (a). text

References
Aalto KR (1989) Franciscan complex olistostrome at Crescent City, northern California. Sedimentology 36: 47 1-495
Ackermann A (1986) Le flysch de la nappe du Niesen. Eclogae Gwl Helv 79: 641684
Adey WH, Burke RB (1977) Holocene bioherms of Lesser Antilles: gwlogic control of development. In: Frost SH, Weiss MP, Saunders JB (eds) Reefs and related carbonates: ecology and sedimentology. Am Assoc Petrol Gwl, Studies in Gwlogy, 4: 67-81
Agterberg FP, Gradstein FM (1988) Recent developments in quantitative stratigraphy. Earth Sci Rev 25: 1-73
Ahnert F (1970) Functional relationship between denuda- tion, relief, and u lift in large mid-latitude drainage basins. Am J Sci %8: 243-263
Ahr WM (1973) The carbonate ramp: an alternative to the shelf model. Trans Gulf Coast Assoc Gwl Soc, 23rd Annu Conv, p 221-225
Aigner T (1982) Event-stratification in nummulite accu- mulations and in shell beds from the Eocene of Egypt. In: Einsele G, Seilacher A (4s ) Cyclic and event stratification, Springer, Berlin Heidelberg New York, p 248-262
Aigner T (1985) Storm depositional systems. Lecture Notes Earth Sciences, 3, Springer, Berlin Heidelberg New York, 174 p
Aigner T, Dott RH (eds) (1990) Patterns and processes in epeiric basins. Sediment Gwl 69 (Spec Issue): 165- 134
~ i ~ n ; T, Reineck HE (1982) Proxirnality trends in mo- dem storm sands from the Helgoland Bight (North Sea) and their implications for basin analyiis. Senck- enb Marit 14: 183-215
Aigner T, Doyle M, Lawrence D, E in M, Van Vliet A (1989) Quantitative modeling oP(a2onate platforms: some examples. Soc Econ Palwntol Mineral Spec Publ 44: 27-37
Akou AE (1984) Subaqueous debris flow deposits in Baffm Bay. Gwmar Lett 412: 83-90
Alam M (1989) Gwlogy and depositional history of Ceno- zoic sediments of the Bengal Basin of Bangladesh. Palwgwgr Paleoclimatol Palwecol 69: 125-139
Alexander CR, De Master DJ, Nittrouer CA (1991) Sedi- ment accumulation in a modem epicontinental-shelf setting: the Yellow Sea. Marine Gwl98: 51-72
Allen JRL (1965) Late Quaternary Niger delta, and ad jacent areas: sedimentary environments and lithofacies. Am Assoc Petrol Gwl Bull 49: 547600
Allen JRL (1982) Sedimentary structures, their character and physical basis, v. 11. Developm Sediment01 30 B, Elsevier, Amsterdam, 663 p
Allen JRL (1983) Studies in fluviatile sedimentation: bars, barcomplexes and sandstone sheets (low sinuosity braided streams) in the Brownstones (L. Devonian), Welsh Borders. Sediment Gwl33: 237-293
Allen PA, Allen JR (1990) Basin analysis - principles and application. Blackwell, Oxford, 45 1 p
Allen PA, Callinson JD (1986) Lakes. In: Reading HG (ed) Sedimentary environments and facies. Blackwell, Oxford, p 63-94
Allen PA, Homewood P, Williams G (eds)(1986) Foreland basins: an introduction. Spec Publ Int Assoc Sedimen- to1 8: 3-12
Alley BB, Blankenship DD, Rooney ST, Bentley CR (1988) Sedimentation beneath ice shelves - the view from ice stream B. Marine Gwl85: 101-120
Alpem B (1987) A lication de la p&rographie des or- ganoclastes l i ~ i s t o i r e geOlogique et thermique des bassins skdimentaires carbon&. Mtm Soc G h l Fr NS 151: 55-75
Amstutz GC, El Goresy A, Frenzel G, Kluth C, Moh G, Waschkuhn A, Zmmennann RA (1982) Ore genesis, the state of the art. Soc Gwlogy Applied to Mineral Deposits, Spec Publ 2, Springer, Berlin Heidelberg New York, 804 p
Anders MH. Krueeer SW. Sadler PM (198n A new look - - - - - ~
at sed&entat%n rat& and the cdmpl&ness of the stratigraphic record. J Gw195: 1-14
Anderson FE, Black L, Watling SE, Mook W, Mayer LM (1981) A temporal and spatial study of mudflat erosion and deposition. J Sediment Petrol 51: 729-736
Anderson JB, Molnia BF (1989) Glacial marine sedimen- tation. Short course in gwlogy 9, Am Geophys Union, Washington D.C., 127 p
Anderson RY (1982) A long geoclimatic record from the Permian. J Gwphys Res 87, C9: 7285-7294
Anderton R, Bridges PH, Leeder MR, Sellwood BW (1979) A dynamic stratigraphy of the British Isles. Allen & Unwin, London, 301 p
Andreyev SN, Kulikov AN (1987) Sedimentation rates in areas of manganese-nodule formation in the Pacific. Trans (~okla&) USSR Acad Sciences, Earth Science Sections. 297. 6: 75-77
Angevine CL, ~ e l l e r PL, Paola C (1990) Quantitative basin modeling. Continuing Education Course Note Series, 32, Am Assoc Petrol Gwl, Tulsa, 133 p, 108 figs
April R, Newton R, Truettner Coles L (1986) Chemical weathering in two Adirondeck watersheds: past and present-day rates. Geol Soc Am Bull 97: 1232-1238
Arthur MA, Dean WE (1991) An holistic geochemical approach to cyclomania: examples from Cretaceous pelagic limestone sequences. In: Einsele G, Ricken W, Seilacher A (4s ) Cycles and events in stratigraphy. Springer, Berlin Heidelberg New York, p 126-166
Arthur MA, Dean WE, Pratt LM (1988) Geochemical and climatic effects of increased marine organic carbon burial at the Cenomanian/Turonian boundary. Nature 335: 714-717
Arthur MA, Dean WE, Schlanger SO (1985) Variations in the global carbon cycle during the Cretaceous related to climate, volcanism, and changes of atmospheric C02. In: Sundquist ET, Broecker WS (4s ) The car- bon cycle and atmospheric C02: natural variations

Archean to Present. Am Geophys Union, Geophys Monogr 32, p 504-530, Washington DC
Arthur MA, Schlanger SO, Jenkyns HC (1987) The Ceno- manian-Turonian oceanic anoxic event, 11. Palaeocea- nographic controls on organic matter production. In: Brooks J, Fleet AJ (eds) Marine petroleum source rocks. Gwl Soc Spec Publ 26: 401-420
Artyushkov EV, Baer MA (1986) Mechanism of formation of deep basins on continental crust in the Verkhoyanak fold belt: miogeosynclines and cratonic basins. Tec- tonophysics 122: 217-245
Artyushkov EV, Baer MA (1989) The mechanism of for- mation of the North Sea basin. In: Price RA (ed) Origin and evolution of sedimentary basins and their energy and mineral resources. Geophys Monograph, 48 (IUGG v 3): 109-123. Am Geophys Union. Wa- - - shirkon DC .
Artvushkov EV. Sobolev SV (1983) Mechanism of passive -margins a"d inland sea 'formation. In: ~ a & s JS,
Drake CL (eds) Studies in wntinental margin geology. Am Assoc Petrol Geol Mem 34: 689-701
Ashley GM, Symposium chairperson (1990) Classification of largescale subaqueous bedforms: a new look at an old problem. J Sedunent Petrol 60: 160-172
Athy LF (1930) Density, porosity, and compaction of sedimentary rocks. Am Assoc Petrol Geol Bull 14: 1- 24
Audley-Charles MG (1986) Tunor-Tanimbar Trough: the foreland basin of the evolving Banda orogen. In: Allen PA, Homewood P (eds) Foreland basins. Int Assoc Sedimentol Spec Publ 8: 91-102, Blackwell, Oxford
Auffret G, Malinverno A, Pautot G, Ryan WBF (1988) Sonar images of the path of recent failure events on the continental margin off Nice, France. In: Clifton HE (ed) Sedimentologic consequences of convulsive geologic events. G a l Soc Am Spec Pap 229: 59-75
Bachman R (1984) Intratest porosity in foraminifera. 1 Sediment Petrol 54: 257-262
Bachmann GH, Miiller M, Weggen K (1987) Evolution of the Molasse Basin (Germany, Switzerland). Tectono- physics 137: 77-92
Baker BH, Crossley R, Goles GG (1978) Tectonic and magmatic evolution of the southern s art of the Kenva riftWvalley. In: Neumann ER, ~ a m d e r ~ IB (4s ) PA- roloev and ~eochemistm of wntinental rifts. Reidel. ~ o r & c h t , 29-50
Baldwin B, Butler CO (1985) Compaction curves. Am Assoc Petrol Geol Bull 69: 622-626
Ballance PL, Reading HG (1980) Sedimentation in oblique- slip mobile zones. Int Assoc Sedimentol Spec Publ 4, Blackwell, Oxford, 265 p
Bally AW (1987) Atlas of seismic stratigraphy. AAPG Studies in Geology, 27, vol 1, 125 p
Bally AW, Snelson S (1980) Realms of subsidence. Canad Petrol Geol Bull, Jan 1980: 9-75
Barbier F, Duvergt J , Le Pichon X (1986) Structure profonde de la marge Nord-Gascogne. Implications sur le mbhanisme de rifting et dee la formation de la maree continentale. Bull Cent Rech Ex~lor-Prod Elf- ~ ~ G t a i n e 10: 105-121
Barnes NE, Normark WR (1985) Diagnostic parameters for comparing modem submarine fans and ancient turbidite systems. In: Bouma AH, Normark WR, Barnes NE (eds) Submarine fans and related turbidite systems. Springer, New York Heidelberg, p 13-14 with maps and table
Barrett TJ (1982) Stratigraphy and sdimentology of Juras- sic bedded chert overlying ophiolites in the North Apennines, Italy. Sedimentology 29: 353-373
Bamo CA (1990) Late Cretaceous-Early Tertiary sedimen-
tation in a semi-arid foreland basin (Neuqutn Basin, western Argentina). Sediment Geol 66: 255-275
Barron EJ, Peterson WH (1991) The Cenozoic ocean cir- culation based on General Ocean Circulation Model results. Palaeogeogr Palaeoclimat Palaeoecol83: 1-28
Barron EJ, Washington WM (1985) Warm Cretaceous climates: high atmospheric CO as a plausible mecha- nism. In: Sundquist ET, ~roe&er WS (4s ) The car- bon cycle and atmospheric COz. Gwphys Monogr 32: 546553, Am Geophys Union
Basu A (1985) Influence of climate and relief on composi tions of sands released at source areas. In: Zuffa GG (ed) Provenance of arenites. NATO AS1 Series, Rei- del, Dordrecht, p 1-18
Bathurst RGC (1975) Carbonate sediments and their diagenesis, 2nd edn. Developm Sedimentol 12, El- sevier, Amsterdam, 658 p
Bathurst RGC (1987) Dia enetically enhanced bedding in argillaceous platform &nestones: stratified cementation and selective compaction. Sedimentology 34: 749-778
Bathurst RGC (1991) Pressure dissolution and limestone bedding: the influence of stratified cementation. In: Einsele G, Ricken W, Seilacher A (4s ) Cycles and events in stratification. Springer, Berlin Heidelberg New York, p 1-19
Baturin GN (1982) Phosphorites on the sea floor. Deve lopm Sedimentol 33, Elsevier, Amsterdam, 330 p
Baturin GN (1983) Some unique sedimentological and geochemical features of deposits in coastal upwelling regions. In: Thiede J, Suess E (4s ) Coastal upwelling - its sediment record. Part B, Sedimentary record of ancient coastal upwelling. NATO Conference Ser 4: Marine Sci, 10, Plenum Press, New York London, p 1 1-27
Baum GR, Vail PR (1987) Sequence stratigraphy, allostratigraphy, isotope stratigraphy and biostratigraphy: putting it all together in the Atlantic and Gulf Paleogene. Eighth Annual Res Conf, Gulf Coast Section, Soc Econ Paleont Mineral Foundation, Earth Enterprises, Austin, p 15-23
Bayer U (1989a) Stratigraphic and environmental patterns of ironstone deposits. In: Young TP, Taylor WE (eds) Phanerozoic ironstones. Geol Soc Spec Pub1 46: 105- 117
Bayer U (1989b) Sediment compaction in large scale sys- tems. Geol Rundsch 78: 155-169
Bayer U, Wetzel A (1989) Compactional behavior of f m e grained sediments - examples from Deep Sea Drilling Project cores. Geol Rundsch 78: 807-819
Bayer U, Altheimer E, Deutschle W (1985) Sedimentary cycles and bed formation. In: Bayer U, Seilacher A (4s ) Sedimentary and evolutionary cycles. Lecture Notes Earth Sci 1: 347-381
Beach A, Bird T, Gibbs A (1987) Extensional tectonics and crustal structure: d seismic reflection data from the northern North ~ea?ilcin~ graben. In: Coward MP, Dewey JF, Hancock PL (4s ) Continental extensional tectonics. Geol Soc Spec Publ 28: 467-476
Beauchamp J (1988) Triassic sedimentation and rifting in the High Atlas (Morocco). In: Manspeizer W (ed) Triassic-Jurassic rifting, parts A and B. Developm Gwtectonics 22, Elsevier, Amsterdam, p 477-497
Beaudoin B, Cojan I, Fries G, Pinoteau B (1985) Lois de dbompaction et approche de tvolution du taux de suimentation dans les forages roliers du Sud-Est de la France. Programme G h P* ogie Profonde de la France. Doc BRGM 95/11, theme 11: 133-148
Bechstiidt (1975) Zyklische Sedimentation im erzfihren- den Wettersteinkalk von Bleiberg-Kreuth (Kiirnten, Osterreich). N Jahrb Geol Paliiontol Abh 149: 73-95
Bechstiidt T, Brandner R, Mostler H, Schmidt K (1978)

Aborted riftiig in the Triassic of the Eastern and Southern Alps. N Jahrb Geol Paliiontol Abh 156: 157- 17s
~ e e r b o w e r JR (1964) Cyclothems and cyclic depositional mechanisms in alluvial plain sedimentation. In: Mer- riam D F (ed) Symposium on cyclic sedimentation, Kansas Geol Surv Bull 169,l: 3 1-42
Bender ML (1984) On the relationship between ocean chemistry and atmospheric C 0 2 d u m g the Cenozoic. In: Hansen JE, Takahashi T (eds) Climate processes and climate sensitivity. Geophys Monogr 29: 352-359, Am Geophys Union
Ben Ismail MH, M'Rabet A (1990) Evaporite, carbonate, and siliciclastic transitions in the Jurassic sequences of southeastern Tunisia. Sediment Geol 66: 65-82
Benson RN, Doyle RG (1988) Early Mesozoic rift basins and the development of the United States middle At- lantic wntinental margin. In: Manspeizer W (ed) Triassic-Jurassic rifting. Developm Geotectonics 22, Elsevier, Amsterdam, p 99-127
Bentor YK (1980) Phosphorites - the unsolved problems. In: Bentor YK (ed) Marine phosphorites. Soc Econ Paleontol Mineral Spec Publ 29: 3-18.
Berger A, Imbrie J , Hays J, Kukla G, Saltzman B (eds) (1984) Milankovltch and climate. NATO series C 126, I, 11, Reidel, Dordrecht, 895 p
Berger WH (1970) Biogenous deep-sea sediments: frac- tionation by deep-sea circulation. Geol Soc Am Bull 81: 1385-1402
Berger WH (1974) Deep-sea sedimentation. In: Burk CA, Drake CL ( 4 s ) The geology of continental margins. Springer, New York Heidelberg, p 213-241
Berger WH (1976) Biogenous deepsea sediments: pro- duction, preservation and interpretation. In: Riley JP, Chester R ( 4 s ) Chemical oceanography, vol 5, 2nd edn, Academic Press, London, p 265-388.
Berger WH (1981) Paleoceanography: the deep-sea record. In: Emiliani C (ed) The sea, v 7, The oceanic lithosphere. Wiley-Interscience, New York, p 1437- 1519
Berger WH (1985) C 0 2 increase and climate prediction: clues from deep-sea carbonates. Epsodes, 8 , 3: 163- 168
Berger WH, Kroenke LW, Mayer LA, and Shipboard Scientific Party (1991) Ontong Java Plateau, Leg 130: synopsis of major drilling results. In: Kroenke LW, Berger WH, Janecek TR, et al. Proc ODP Init R y t s 130: 497-537, College Station, TX (Ocean D d m g Program)
Berger WH, von Rad U (1972) Cretaceous and Cenozoic sediments form the Atlantic ocean. In: Hayes DE, P i i m AC, et al, Init Repts DSDP, 14: 787-954, US Govt Print Office, Washin
Berger WH, Smetacek VS, We p er G (1989) Ocean produc- tivity and paleoproductivity - an overview. In: Berger WH, Smetacek VS, Wefer G (eds) Productivity of the ocean: resent and ~ a s t . Dahlem Konferenzen. Wiev.
- 7
chicheiter, pp 1-34 Berner HD. Gebhard G. Wiedmann J (1982) Konden - - . - - - - - - -
~ationsdrscheinun~en'in der marokka;lisch& und al- pinen Mittelkreide (Apt, Alb). N Jahrb Geol Paliontol Abh 165: 102-124. Stuttgart
Berner RA (1980) Early diag&esis. Princeton Univ Press, 237 p
Berner RA (1982) Burial of organic carbon and pyrite sulfur in the modem ocean: its geochemical and en- vironmental significance. Am J Sci 282: 451-473
Bernoulli D, Jenkyns HC (1974) Alpine, Mediterranean, and central Atlantic Mesozoic facies in relation to the early evolution of the Tethys. In: Dott RH, Shaver RH ( 4 s ) Modem and ancient geosynclinal sedimen-
tation. Soc Econ Paleontol Mineral Spec Publ 19: 129- 160
Bernoulli D , Lemoine M (1980) Birth and early evolution of the Tethys: the overall situation. In: Auboin J, Debelmas J , Latreille M ( 4 s ) Geology of the Alpine chains born of the Tethys. Mem BRGM 115: 168-198
Bethke CM (1989) Modeling subsurface flow in sedimen tary basins. Geol Rundsch 78: 129-154
Betzer PR, Showers WJ, Laws EA, W i n CD, DiTullio GR, Kroopnik PM (1984) Primary productivity and particle fluxes on a transect of the equator at 153' W in the Pacific Ocean. Deep-Sea Res 31: 1-1 1
Beyth M (1980) Recent evolution and present stage of Dead Sea brines. In: Nissenbaum A (ed) Hvmrsaline brines and evaporitic environments. 'Developm Sedi- mentol 28. Elsevier. Amsterdam. D 155-165
Biddle KT, ~h&stie- lick N (eds)(198J) Strike-slip defor- mation, basin formation, and sedimentation. Soc Econ Paleontol Mineral Spec Publ 37, 386 p
Bigarella JJ (1972) Eolian environments: their characte- ristics, recognition and importance. In: Rigby JK, Hamblin WK (eds) Recognition of ancient sedimentary environments. Soc Econ Paleontol Mineral S m Publ 16: 12-62
Birkeland PW (1984) Soils and geomorphology. Oxford Univ Press, New York
Birkenmajer K (1981) The geology of Svalbard, the wes- tern part of the Barents Sea, and the wntinental mar- gins of Scaninavia. In: Nairn AEM, Churkii MJr, Stehli FG ( 4 s ) The ocean basins and margins, vol5, the Arctic ocean. Plenum Press, New York London, pp 265-329
Bitzer K, Harbough JW (1987) DEPOSIM: a Macintosh computer model for two-dimensional simulation of transport, deposition, erosion, and compaction of clastic sediments. Computers & Geosci 13: 61 1-637
Bjorlykke K (1983) Diagenetic reactions in sandstones. In: Parker A, Sellwood BW ( 4 s ) Sediment diagenesis. NATO AS1 Series C 115: 169-213, Reidel, Dordrecht
Bjrarlykke K (1984) Formation of secondary porosity: how important is it? In: McDonald DA, Surdam RC (eds) Clastic diagenesis. Am Assoc Petrol Geol Mem 37: 277-286
Bjrarlykke K (1988) Sandstone diagenesis in relation to preservation, destruction and creation of porosity. In: Chilingarian GV, Wolf KH (eds) Diagenesis, I. D e velopm Sediment01 41, Elsevier, Amsterdam, p 555- 588
Bjrarlykke K, Ramm M, Saigal SC (1989) Sandstone diage- nesis and wrositv modification during basin evolution. Geol ~ u n h s c h 78: 243-268
- Blatt H. Middleton GV. Murray RC (1980) Origin of
sedhentary rocks, 2nd edn. ~ r e n t i c e ~ ~ a l 1 , ' ~ n ~ l ~ w o o d Cliffs, 782 p
Blueford JR (1989) Radiolarian evidence: Late Cretaceous through Eocene ocean circulation patterns. In: Hein JR, Obradovic J (eds) Siliceous deposits of the Tethys and Pacific regions. Springer, New York Heidelberg, p 19-29
Blundell DJ, Reston RJ, Stein AM (1989) Deep crustal structural controls on sedimentary basins geometry. In: Price RA (ed) Origin and evolution of sedimentary basins and their energy and mineral resources. Geophys Monograph, 48 (IUGG vol3), Am Gwphys Union, Washington DC, p 57-64
Boccalmi M, Calamita F, Deiana G, Gelati R, Massari F, Moratti G, Ricci-Luchi F (1990) Migrating foredeep thrust belt system in the northern Apennines and southern Alps. Palaeogeogr Palaeocliimatol Palaeoecol 77: 3-14
Bogel H, Schmidt K (1976) Kleine Geologie der Ostalpen. Ott Verlag, Thun, 231 p

Bogli A (1978) Karsthydrographie und physische Spelio- logie. Springer, Berlin Heidelberg New York, 292 p
Boer PL de, (1991) Pelagic black shale-carbonate rhythms: orbital forcing and oceanographic response. In: Ein- sele G, Ricken W, Seilacher A (eds) Cycles and events in stratigraphy. Springer, Berlin Heidelberg New York, p 63-78
Boer PL de, Oost AP, Visser MJ (1989) The diurnal in- equality of the tide as a parameter for recognizing tidal influence. J Sediment Petrol 59: 912-921
Boer PL de, van Gelder A, Nio SD (eds) (1988) Tide-in- fluenced sedimentan environments and facies. Reidel, ~ o r d r e c h t , 530 p -
Boersma JR, Terwindt JHJ (1981) Neapspring tide se auences of intertidal shoal deposits in a mesotidal estuary. Sedimentology 28: 15f-170
Boggs SJr (1987) Principles of sedimentology and stratigra- phy. Merril, Columbus, Ohio, 784 p
Bohrmann G (1988) Zur Sedimentations eschichte von biogenem Opal im n 6 r d l h e n ~ordatfantik und dem Europiischen Nordmeer. Berichte Sonderforschungs- bereich 313 Sedimentation im Europiischen Nord- meer. Univ Kiel 9 , 221 p
Bohrmann G, Henrich R, Thiede J (1990) Miocene to Quaternary paleooceanography in the northern North Atlantic: variability in carbonate and biogenic opal accumulation. In: Thiede J, Bleil U (eds) Geological history of the polar oceans: Arctic versus Antarctic. NATO AS1 Series C, Kluwer, Dordrecht, p 647-675
Boillot G, Winterer EL (1988) Drilling on the Galicia margin: retrospect and prospect. In: Boillot G, Wi te re r EL, et al., Proc ODP Sci Results 103: 809- 829; College Station, TX (Ocean Drilling Program)
Bond GC, Kominz MA, Grotzinger JP (1988) Cambro- Ordovician eustacy: evidence from geophysical modeling of subsidence in Cordilleran and Appa- lachian passive margin. In: Klienspahn K, Paola C (eds) New perspectives in basin analysis. Springer, New York Heidelberg, p 129-161
Boote DRD, Kirk RE3 (1989) Depositional wedge cycles on evolving plate margin, western and northwestern Australia. Am Assoc Petrol G w l 73: 216-243
Bosellini A (1984) Prograding geometries of carbonate platforms: examples from the Triassic of the Dolo- mites, northern Italy. Sedimentology 31: 1-24
Bosellini A, Mutti E, Ricci Lucchi F (1989) Rocce e suc- cessioni sedimentarie. Unione Tipografico-Editrice Torinese (UTET), Torino, 395 p
Bosence D (1989) Biogenic carbonate production in Florida Bay. Bull Marine Sci 44: 419-433
Bosence D, Waltham D (1990) Computer modeling the internal architecture of carbonate platforms. Geology 18: 26-30
Bott MHP (1982) The interior of the earth: its structure, constitution and evolution, 2nd edn. Arnold, London, 403 p
Boulegue J, Iiyama JT, Charlou JL, Jedwab J (1987) Nan- kai trough, Japan trench and Kuril trench: Geochemis- try of fluids sampled by submersible "Nautile". Earth Planet Sci Lett 83: 363-375
Boulton GS, Deynoux M (1981) Sedimentation in glacial environments and the identification of tills and tillits in ancient sedimentary sequences. Precambrian Res 15: 397-422
Bouma AH (1962) Sedimentology of some flysch deposits. Elsevier, Amsterdam, 168 p
Bouma AH (1990) Clastic depositional styles and reservoir potential of Mediterranean basins. Am Assoc Petrol Geol Bull 74: 532-546
Bouma AH, Coleman JM, Meyer AW, et a1 (1986) Init Repts DSDP, 96, Washington, US Govt Print Office
Bouma AH, Normark WR, Barnes NE (eds) (1985) Sub- marine fans and related turbidite systems. Springer, New York Heidelberg, 351 p
Bourrouilh R (1987) Evolutionary mass flow-megatur- bidites in an interplate basin: example of the North Pyrenean basin. Geo-Marine Lett 7: 69-81
Bowler JM (1973) Clay dunes: their occurrence, formation and environmental significance. Earth Sci Rev 9: 315- 338
Bowler JM (1986) Spatial variability and hydrologic evolution of Australian lake basins: analogue for Pleistocene hydrologic change and eGaporite formation. Palaeogeogr Palaeoclimatol Palaeoecol54: - - 21-41
Bowler JM, Teller JT (1986) Quaternary evaporites and hydrological changes, Lake Tyrell, north-west Vic- toria. Aust J Earth Sci 33: 43-63
Bowler JM, Huang Qi, Chen Kezao, Head MJ, Yuan Baoyin (1986) Radiocarbon dating of playa-lake hydrologic changes: examples form northwestern China and central Australia. Palaeogeogr Palaeo- climatol Palaeoecol 54: 241-260
Brachert TC (1987) Diagenesis of siliceous sponge limes tones from the Pleistocene of the Tyrrhenian Sea (Mediterranean Sea). Facies 17: 41-50, Erlangen
Braitsch 0 (1971) Salt deposits, their origin and corn position. Springer, New York Heidelberg, 297 p
Bralower TJ, Thierstein HR (1984) Low productivity and slow deep-water circulation in Mid-Cretaceous oceans. Geology 12: 614-618
Bralower TJ, Thierstein HR (1987) Organic carbon and metal accumulation rates in Holocene and mid- Cretaceous sediments: palaeoceanographic signi- ficance. In: Brooks J, Fleet AJ (eds) Marine petro- leum source rocks. Geol Soc S Publ 26: 345-369
Brandner R (1985) Memsspiegelsc~ankungen und Tek- tonik in der Trias der NW-Tethys. Jahrb G w l Bun- desanst 126: 435-475. Wien
Brandt K (1985) Sea-level changes in the upper Sinemurian and Pliensbachian of Southern Germanv. In: Baver U. Seilacher A (eds) Sedimentary and evolu6onaG cycles. Lecture Notes in Earth Sciences, 1, Springer Berlin Heidelberg New York, p 113-126
Bray CJ, Karig DE (1985) Porosity of sediments in accretionary prisms and some implications for dewatering processes. J Geophys Res 90: 768-778
Bredehoefi JD, Djevanshir RD, Belitz KR (1988) Lateral fluid flow in a compacting sand-shale sequence: South Caspian basin. Am Assoc Petrol Geol Bull 72: 416- 424
Breitkopf JH (1988) Iron formations related to mafic vol canism and ensialic rifting in the southern margin zone of the Damara Orogen, Namibia. Precambrian Res 38: 111-130
Brett Cb , Seilacher A (1991) Fossil lagerstaetten: a taphonomic consequence of event sedimentation. In: Einsele G, Ricken W, Seilacher A (eds) Cycles and events in stratigraphy. Springer, Berlin Heidelberg New York, p 283-297
Bristow CS (1987) Brahmaputra River: Channel migration and deposition. In: Ethridge FG, Flores RM, Harvey MD ( 4 s ) Recent developments in fluvial sedimento- logy, Soc Econ Paleontol Mineral Spec Publ 39: 63-74
Brodzikowski K, van Loon AJ (1991) Glacigenic sedi- ments. Developm Sediment01 49, Elsevier, Amster- dam, 674 p
Brongersma-Sanders MB (1957) Mass mortality in the sea. In: Hedgpeth JW (ed) Treatise on Marine Ecology and Paleoecology. Geol Soc Am Mem 67 (1): 941-1010
Brooks J , Fleet AJ (eds)(1987) Marine petroleum source rocks. Geol Soc Spec Publ 26, Blackwell, Oxford,

444 p Brooks J, Cornford C, Archer R (1987) The role of hydrocarbon source rocks in petroleum exploration. In: Brooks J , Fleet AJ (eds) Marine petroleum source rocks. Geol Soc Spec Pub1 26: 17-46
Bruce CH (1973) Pressured shale and related sediment deformation: cohteinporaneous faults. Am Assoc Petrol Geol Bull 57: 878-896
Briickmann W (1989) Typische Kompaktionsabliiufe mari- ner Sedimente und ihre Modifikation in einem rezen- ten Akkretionskeil (Barbados Ridge). Tiibinger Geo- wiss Arbeiten, A 5, Geol Inst Univ Tiibingen, 135 p
Brumsack HJ (1986a) The inorganic geochemistry of Cretaceous black shales (DSDP Leg 41) in comparison to modem upwelling sediments from the Gulf of Cali- fornia. In: Summerhayes CP, Shackleton NJ (eds) North Atlantic ~aheoceanoera~hv . G w l Soc S ~ e c u . .
bubl21: 447-461 Brumsack HJ (1986b) The geochemical facies of black
shales from the Cenomanian/Turonian Boundary Event (CTBE). Mitt Geol-Paliontol Inst Univ ahb bur^, SCOPE UNEP Sonderb, H 60: 247-265
Brumsack HJ and Shipboard Scientific Party ODP Leg 127 (1990) Erste Ergebnisse von ODP-Leg 127 (Japan-See I). In: Beiendorf H (ed) Deutsche Forschungs- gemeinschaft, Protokoll Kolloquium im SPP "Ocean Drilling PromamIDeev Sea Drilling Proiect" in - ~ r e m e i , ~ o n s , p 31-33
Brunner CA. Ledbetter MT (1987) Sedimentological and micropaleontological detkction of turbidite -muds in hemipelagic sequences: an example from the late Pleistocene levee of Monterey Fan, central California continental margin. Marine Micropaleontol 12: 223- 239
Brunsden D (1979) Weathering. In: Embleton C, Thornes J (eds) Process in geomorphology. Arnold, London, p 71-1 29 .- ---
Bryant WR, Bennett RH (1988) Ori in, physical and mine- ralogical nature of red clays: t fe Pac~fic Ocean basin as a model. Geo-Marine Lett 8: 189-249
Budyko MI, Ronov AB, Yanshin AL (1987) History of the Earth's atmosphere. Springer, Berlin Heidelberg New York, 139 p
Buggisch W (1991) The global Frasnian-Famennian "Kell- wasser Event". Geol Rundsch 80: 49-72
Buick R, Dunlop JSR (1990) Evaporitic sediments of Early Archaean age from the Warrawoona Group, North Pole, Western Australia. Sedimentology 37: 247-277
Bull WB (1977) The alluvial fan environment. Progress in physical geography, vol 1, Arnold, London, p 222- 270
Burchfiel BC, Royden LH (1988) A general approach to basin analysis (afterword). In: Royden LH, Horvith F (eds) The Pannonian basin: a study in basin evolu- tion. Am Assoc Petrol Geol Mem 45: 373-375
Burckle LH, Abrams N (1987) Regional late Pliocene-early Pleistocene hiatuses of the southern ocean - diatom evidence. Marine Gwl77: 207-218
Burg JP, Leyreloup A, Girardeau J , Chen GM (1987) Structure and metamorphism of a tectonically thick- ened continental crust: the Yalu Tsangpo suture zone (Tibet). In: Oxburgh ER, Yardley BWD, England PC (eds) Tectonic settings of regional metamorphisms. Philos Trans R Soc London A 321: 67-86
Burgess CF, Rosendahl BR, Sander S, Burgess CA, Lambiase J , Derksen S, Meader N (1988) The struc- tural and strati raphic evolution of Lake Tanganyika: a case study okwntinental rifting. In: Manspeizer w (ed) Triassic-Jurassic rifting, parts A and B. Develop m Geotectonics 22, Elsevier, Amsterdam, p 859-881
Burnett WC, Riggs SR (eds) (1990) Phosphate deposits of the world, vol3, Genesis of Neogene to Recent phos- phorites. Cambridge Univ Press
Burollet PF, Mugniot JM, Sweeney P (1978) The geology of the Pelagian Block; The margins and basins off southern Tunisia and Tripolitania. In: Nairn AEM, Kanes WH, Stehli FG (eds) The ocean basins and margins, v 4 B: the Western Mediterranean. Plenum Press, New York, p 331-359
Burton R, Kendall CGSC, Lerche J (1987) Out of our depth: on the impossibility of fathoming eustacy from the stratigraphic record. Earth Sci Rev 24: 237-277
Busson G (1990) Le Messinien de la MMiterrank - vingt ans aprks. Ghlogie de la France 1990, 3-4: 3-58
Butler GP, Hams PM, Kendall CGSC (1982) Recent eva- pontes from the Abu Dhabi wastal flats. In: Handford CR, Loucks RG, Davies GR (eds) Deposition and dia- genetic spectra of evaporites. Soc Econ Paleontol Mineral Core Workshop 3, Calgary, p 33-64
Buxton MWN, Pedley HM (1989) A standardized model for Tethyan Tertiary carbonate ramps. J G w l Soc London 146: 746-748
Cadet J-P, Kobayashi K, et al. (1987) The Japan Trench and its juncture with the Kuril Trench: cruise results of the Kaiko project, Leg 3. Earth Planet Sci Lett 83: 267-284
Calvert SE (1966) Origin of diatom-rich varved sediments from the gulf of California. J Geol 76: 5 6 5 6 5
Calvert SE (1974) Depostion and diagenesis of silica in marine sediments. In: Hsii KJ, Jenkyns HC (eds) Pelagic sediments on land and under the sea. Int Assoc Sediment01 Spec Publ 1: 273-299
Calvert SE, Fontugne MR (1987) Stable carbon isotopic evidence for the marine oripjn of the organic matter in the Holocene Black Sea sapropel. ~ h e m ~ w l (Isotope Geosci Sect) 66: 315-322
Calvert SE, Pi r DZ (1984) Geochemistry of ferroman ganese n o G e s from DOMES Site A, Northern Qua- torial Pacific: multiple diagenetic metal sources in the deep sea. Gwchim Cosmochim Acta 48: 1913-1928
Cameron CC, Esterle JS, Palmer CA (1989) The geology, lbotany and chemistry of selected peat-forming en- vironments from temperate and tro ical latitudes. In: Lyons PC, Alpern B (eds) peat a n l w a l : origin, fac- i e ~ , and depositional models. Elsevier, Amsterdam, p 105- 156
Campell CV (1967) Laminae, lamina set, bed and bedset. Sedimentology 8: 7-26
Carey SN, Sigurdsson H (1984) A model of volcanogenic sedimentation in marginal basins. In: Kokelaar BP, Howells RE (eds) Marginal basin geology: volcanic and associated sedimentary and tectonic processes in modem and ancient marginal basins. Geol Soc Spec Publ 16: 37-58
Caron C, Homewood P, Wddi W (1989) The original Swiss flysch: a reappraisal of the type deposits in the Swiss Prealps. Earth-Sci Rev 26: 2 4 5
Carpenter SJ, Lohmann KC (1989) 8 ' 0 and 8 l 3 c varia- tions in Late Devonian marine cements from the Gol- den Spike and Nevis reefs, A l b e ~ , Canada. J Sedi- ment Petrol 59: 792-814
Carpenter SJ, Erickson JM, Lohmann KC, Owen MR (1988) Diagenesis of fossiliferous concretions from the upper Cretaceous Fox Hills Formation, North Dakota. J Sediment Petrol 58: 706-723
Carson MA, Kirkby MJ (1972) Hillslope, form and pro- cess. Cambridge Univ Ress, 475 pp
Carter RM (1988) The nature and evolution of deepsea channel systems. Basin Res 1 : 41-54
Carter RWG (1988) Coastal environments. Academic Press, London, 617 p
Cas RAF, Landis CA (1987) A debris-flow deposit with multiple plug-flow channels and associated side ac- cretion deposits. Sedimentology 34: 901 -9 10

Cas RAF, Wright JV (1987) Volcanic successions: modem and ancient. Unwin Hyman, London, 528 p
Chambre de syndicale de recherche et de la production du @role et du gaz nature1 (1980) Evaporite deposits, dustration and interpretation of some environmental sequences. Editions Technip, Paris, 266 p
Chamley H (1989) Clay sedimentology. Springer, Berlin Heidelberg New York, 623 p
Chapin CE, Elston WE (eds) (1979) Ash-fall tuffs. G w l Soc Am Spec Pap 180, Boulder, 21 1 p
Chapman DS, Rybach L (1985) Heat flow anomalies and their interpretation. J Gwdynamics 4: 3-37
Chenet P, Montadert L, Gairaud H, Roberts D (1983) Extension ratio measurements on the Galicia, Portugal, and northern Biscay continental margins: implications for evolutionary models of passive continental mar- eins. In: Watkins JS. Drake CL ( 4 s ) Studies in con- rinental margin gwldgy. Am ~ s s o c petrol G w l Mem 34: 703-715
Chilingar GV, Zen e r DJ, Bissel HJ, Wolf KH (1979) Dolomites and folomithtion. In: Larsen G, Chilingar GV (eds) Diagenesis in sediments and sedimentary rocks. Developm Sedimentol 25A, Elsevier, Amster- dam, p 423-536
Chilingarian GV (1983) Compactional diagenesis. In: Parker A, Sellwood BW (eds) Sediment diagenesis. NATO AS1 Series C 115, Reidel, Dordrecht, p 57-168
Chorley RJ, Schumm SA, Sugden DE (1984) Geomorpho- logy. Methuen, London New York, 605 p
Chough SK (1984) Fine-grained turbidites and associated mass flow deposits in the Ulleung (Tsushima) back-arc basin, East Sea (Sea of Japan). In: Stow DAV, Piper DJW (eds) Fine-grained sediments: deep-water proces- ses and facies. G w l Soc Spec Publ 15: 185-196
Christie-Blick N, Biddle KT (1985) Deformation and basin formation along strikeslip faults. In: Biddle KT, Christie-Blick N (eds) Strike-slip deformation, basin formation, and sedimentation. Soc Econ Palwntol Mineral Spec Publ 37: 1-34
Christie-Blick N, Grotzinger JP, von der Borch CC (1988) Seauence stratiera~hv in Proterozoic successions. G&logy 16: 106-164-
Cita MB. Ricci Lucchi F (cdsM1984) Seismicitv and sedi- mentation. Marine G&l 55, N O 112, 161 6
Clemmensen LB, Abrahamsen K (1983) A w h n stratifi- cation and facies association in desert sediments, Ar- ran basin (Permian) Scotland. Sedimentology 30: 31 1- 339
Clemmey H, Badham N (1982) Oxygen in the Precambrian atmosphere: an evaluation of the gwlogic evidence. Gwlogy 10: 141-146
Cliff RA, Droop GTR, Rex DC (1985) Alpine metamor- phism in in south-east Tauern Window, Austria:2. Rates of heating, cooling and uplift. J Metamorphic G w l 3 : 403-415
Clifton HE (ed)(1988) Sedimentologic consequences of convulsive gwlogic events. G w l Soc Am Spec Pap 229. 157 D
Clifton HE, ~ L n t e r RE, Phillips RL (1971) Depositional structures and processes in the non-barred, high-ener- gy nearshore. J Sediment Petrol 41: 651-670
cloeGgh S (1986) Intraplate stresses: a new tectonic mechanism for fluctuations of relative sea level. Gw- logy 14: 617-620
Cloud P (1973) Palwecological significance of the banded iron formation. Econ G w l 68: 1135-1 143
Cochran JR (1981) The Gulf of Aden: structure and evolu- tion of a young ocean basin and continental margin. J Gwphys Res 86: 263-287
Cochran JR (1983a) A model for the development of the Red Sea. Am Assoc Petrol G w l Bull 67: 41-69
Cochran JR (1983b) Effects of finite riftme times on the development of sedimentary basins. G r t h Planet Sci Lett 66: 289-302
Cochran JR (1990) Himalayan uplift, sea level, and the record of Beneal fan sedimentation at the ODP Lee 1 16 sites. In: b c h r a n JR, Stow DAV, et al., pro; ODP, Sci Results, 116: 397-414. College Station, TX (Ocean Drilling Program)
Cohen AS (1989) Facies relationships and sedimentation in large rift lakes and implications for hydrocarbon exploration: examples from Lakes Turkana and Tan- ganyika. In: Talbot MR, Kelts K (eds) The Phanero- zoic record of lacustrine basins and their environmen- tal signals. Palawgwgr Palawclimatol Palaeoecol70, 65-80
Collins MB (1986) Process and controls involved in the transfer of fluviatile sediments in the deep ocean. J G w l Soc London 143: 915-920
Collinson JD (1986a) Alluvial sediments. In: Readine HG (ed) ~ e d h e n t a j environment and facies. l lac bell, Oxford. D 20-62
Collinson JD-(1986b) Deserts. In: Reading HG (ed) Sedi- mentarv environments and facies. Blackwell. Oxford. p 95-1 i 2
Collinson JD, Lewin J (eds) (1983) Modem and ancient fluvial systems, Int Assoc Sedimentol Spec Publ 6
Collison JD, Thompson DB (1982) Sedimentary struc- tures. Allen & Unwin, London, 194 p
Colman SM, Dethier DP (eds)(1986) Rates of chemical weathering of rocks and minerals. Academic Press, Orlando, 603 p
Conway Moms S (1990) Late Precambrian and Cambrian soft-bodied faunas. Ann Ev Earth Planet Sci 18: 101- 122
Cook HE, Enos P (eds) (1977) Deepwater carbonate en- vironments. Soc Econ Palwntol Mineral Spec Publ 25, 336 p
Cooke RV, Warren A (1973) Gwmorphology in deserts. Batsford, London, 374 p
Copeland P, Harrison TM (19948) Epj~odic rapid uplift in the Himalaya revealed by Arl Ar analysis of det- rital K-feldspar and muscovite, Bengal fan. Gwlogy 18: 354-357
Costa JE (1984) Physical gwmorphology of debris flows. In: Costa JE, Fleisher PJ (eds) Developments and applications of gwmorphology. Springer, Berlin Hei- delberg New York, p 268-317
Cotillon P (1985) Les variations ti diffkrentes echelles du taux d'accumulation saimentaire dans le sbries p6lagiques alternantes du CdhcC infbrieur, cons& quences de phknomknes globaux. Bull Soc G h l Fr 8: 59-68
Cotillon P (1991) Varves, beds, and bundles in pelagic sequences and their correlation (Mesozoic of SE France and Atlantic). In: Einsele G, Ricken W, Seilacher A (eds) Cycles and events in stratigraphy. Springer, Heidelberg New York, p 820-839
Courel L (1989) Organics versus clastic conditions neces- sary for peat (coal) development. In: Lyons PC, Al- pern B (eds) Peat and coal: origin, facies, and depo- sitional models. Elsevier, Amsterdam, p 19-207
Covey M (1986) The evolution of foreland basins to steady state: evidence from the western Taiwan foreland basin. In: Allen PA, Homewood P (eds) Foreland basins. Int Assoc Sedimentol Spec Publ 8: 77-90, Blackwell, Oxford
Cowan DS (1985) Structural styles in Mesozoic and Cenozoic melanges in the western Cordillera of North America. G w l Soc Am Bull 96: 4 5 1 4 2
Crevello PD, Schlager W (1980) Carbonate debris sheets and turbidites, Exuma Sound, Bahamas. J Sediment Petrol 50: 1121-1 147

Cronan DS, Damiani W, Kinsman DJJ, Thiede J (1974) Sediments from the Gulf of Aden and western Indian Ocean. In: Fisher RL, Bunce ET, et al, Init Repts DSDP, 24, US Govt Print Office, Washington, p 1947-1 109
Cronan DS. Galhcz A. Mindszenty A, Moorby SA. Pol- gari M '(1991) ~ethyan fernmanganese oxide deposits from Jurassic rocks in Hungan. J Geol Soc London - - - - - - . 148: 655-668
Crook KAW (1974) Lithogenesis and geotectonics: the significande of com$sitionaI vahtion in flysch arenites (graywackes). Soc Econ Palwntol Mineral Spec Pub1 19: 304-310
Cross TA (1986) Tectonic controls of foreland basin sub- sidence and Laramide style deformation, western United States. In: Allen PA, Homewood P, Williams G (4s ) Foreland basins: an introduction. Spec Publ Int Assoc Sedimentolog 8: 15-39
Cross TA (ed) (1990) Quantitative dynamic stratigraphy. Prentice Hall, Englewood Cliffs
Crowell JC (1974) Origin of late Cenozoid basins in southern California. In: Dott RH, Shaver RH (4s ) Modem and ancient geosynclinal sedimentation. Soc Econ Paleontol Mineral Spec Publ 19: 292-303
Curray JR, Moore DG (1971) Growth of the Bengal deep- sea fan and denudation in the Himalayas. Geol Soc Am Bull 82: 563-572
Curray JR, Moore DG (1974) Sedimentary and tectonic processes in the Bengal deep-sea fan and geosyncline. In: Burk CA, Drake CI (eds) The gel0 y of continen- tal margins. Springer. New York ~eicfelber~, p 617- 637
CUG; JR, Moore DG, et al. (1982a) Init Repts DSDP 64, Parts 1 and 2, US Govt Print Office, Washington, 1313 p
Curray JR, Moore DG, Kelts K, Einsele G (1982b) Tec- tonics and geological history of the passive continental margin at the tip of Baja California. In: Curray JR, Moore DG, et al., Init Repts DSDP 64, part 2: 1089- 11 16, US Govt Print Office, Washington
Currey DR (1990) Quaternary palaeolakes in the evolution of semidesert basins, with special emphasis on Lake Bonneville and the Great Basin, U.S.A. Palaeogeogr Palaeoclimatol Palaeoecol 76: 189-2 14
Curtis C (1987) Mineralogical consequences of organic matter degradation in sediments: Inorganiclorganic diagenesis. In: Leggett JK, Zuffa GG (eds) Marine clastic sedimentology, Graham and Trotman, p 108- 123
Dahanayake K, Krumbein WE (1985) Microbial structures in oolitic iron formations. Miner Deposits 21: 85-94
Damuth JE, Flood RD, Kowsmann RO, Belderson RH, Gorini MA (1988) Anatomy and growth pattern of Amazon deepsea fan as revealed by long-range side- scan sonar (GLORIA) and high-resolution seismic studies. Am Assoc Petrol Geol Bull 72: 885-911
Davis DM, Suppe J, Dahlen FA (1983) Mechanics of fold- and-thrust belts and accretionarv wedges. J Geovhvs - . . Res 88 B2: 1 153-1 172
Davis EE. Hvndman RD (1989) Accretion and recent d e formatioh of sedimen'ts aldng the northern Cascadia subduction zone. Geol Soc Am Bull 101: 1465-1480
Davis RA Jr (1978) Coastal sedimentary environments. Springer, New York Heidelberg, 420 p
Davis RA Jr (1983) Depositional systems: a genetic a p proach to sedimentary geology. Prentice-Hall, Engle- wood Cliffs, 669 p
Davis RA, Fox WT, Hayes MP, Boothroyd JC (1972) Comparison of ridge and runnel systems in tidal and nontidal environments. J Sediment Petrol 42: 413-421
Davis RW (1987) Analysis of hydrodynamic factors in petroleum migration and entrapment. Am Assoc Petrol Geol Bull 71: 643-649
Dean WE (1981) Carbonate minerals and organic matter in sediments of modem north temperate hard-water lakes. Soc Econ Paleontol Mineral Spec Pub1 31: 213-231
Dean WE, Arthur MA (1986) Ongin and diagenesis of Cretaceous deepsea, organic carbon-rich lithofacies in the Atlantic Ocean. In: Mumpton FA (ed) Studies in diagenesis. US Geol Survey Bull 1578: 97-128
Dean WE, Fouch TD (1983) Lacustrine environment. In: Scholle PA, Bebout DG, Moore CH (eds) Carbonate deuostional environments. Am Assoc Petrol Geol ~ k m 33: 98-130
Decker K (1991) Rhvthmic beddine in siliceous sediments - an o;erviiw. in: Einsele G,kicken W, Seilacher A
(e+) Cycles and events in stratigraphy. Springer, Heidelberg New York, p 464-479
Decima A, McKenzie JA, Schreiber BC (1988) The origin of "evaporative limestones: an example from the Mes- sinian of Sicily (Italy). J Sediment Petrol 58: 256-272
Degens ET (1989) Perspectives on biogeochemistry. Sprin- ger, Berlin Heidelberg New York, 423 p
Degens ET, Ittekot V (1985) Particulate organic carbon: an overview. In: De ens ET, Kempe S, Herrera R (4s ) Transport of ca ion and minerals in major world rivers. Part 3. SCOPENNEP Sonderband, Mitt Geol- Paleont Inst Univ Hamburg, H 58: 7-27
Degens ET, Ross DA (4s ) (1969) Hot brines and recent heavy metal deposits in the Red Sea. Springer. Berlin Heidelberg New York, 600
Degens ET, Ross DA (1974) d e Black Sea - geology, chemistry, and biology. Am Assoc Petrol Geol Mem 20, 633 p
Degens ET, Stoffers P (1980) Environmental events recor- ded in Quaternary sediments of the Black Sea. J Geol Soc London 137: 131-138
Degens ET, Kempe S, et al. (4 s ) (1982, 1983, 1985) Transport of carbon and minerals in major world rivers, parts 1, 2, and 3. SCOPENNEP Sonderband, Mitt Geol-Paleontol Inst Univ Hamburg, H 52,764 p, H 55, 535 p, H 58, 645 p
Degens ET, von Herzen R, Wong HK (1971) Lake Tan- ganyika: water chemistry, sedments, geological struc- ture. NatumissenschaRen 58: 229-241
Degens ET, Emeis KC, Mycke B, Wiesner MG (1986) Turbidites, the rinciple mechanism yielding black shales in the earb deep Atlantic occan. In: Summer- hayes CP, Shackleton NJ (eds) North Atlantic palaeo- geography. Geol Soc Spec Publ 21: 361-376, Black- well, Oxford
Degens ET, Stoffers P, Golubic S, Dickman MD (1978) Varve Chronology: estimated rates of sedimentation in the Black Sea deep basin. In: Ross DA, Neprochnov YP et al, Init Repts DSDP 42, 2: 499-508
de Graciansky PC, Poag CW, et al. (1985) The Goban Spur transect: geologic evolution of a sediment-starved passive continental margin. Geol Soc Am Bull 96: 58- 76
~elcaillau B (1986) Dynamique et kvolution morphostruc- turale du pikmont frontal de 1'Himalaya: les Siwaliis du Nkpal oriental. Revue G h l Dynam Ghgr Phys 27: 319-337
~emaison G (1985) The generative basin concept. In: Demaison G, Mums RJ (eds) Petroleum geochemist and basin evaluation. Am Assoc Petrol Geol BX Mem 35: 1-14
Demaison GJ, Moore GT (1980) Anoxic environments and oil source bed genesis. Am Ass Petrol Geo164: 1179- 1209

Deuser WG (1986) Seasonal and interannual variations in deepwater particle fluxes in the Sargasso Sea and their relation to surface hvdroera~hv. DeeDSea Res . - . . 33: 225-246
De Visser JP, Ebbing JHJ, Gudjonsson L, Hilgen FJ, Jorissen FJ. Verhallen PJJM, Zevenboom D (1989) The origin of rhythmic bedding in the ~1iocene'~rubi formation of Sicily, southern Italy. Palawgwgr Palawclimatol Palawecol 69: 45-66
Dewey JF, Bird JM (1970) Mountain belts and the new global tectonics. J Geophys Res 75: 2625-2647
Diclunson WR (1982) Composition of sandstones in cir- cum-Pacific subduction complexes and forearc basins. Am Assoc Petrol Geol Bull 66: 121-137
Dickinson WR, Seely DR (1979) Structure and stratigraphy of forearc regions. Am Assoc Petrol Gwl Bull 63: 2- 3 1
Dickmson WR, Yarborough H (1976) Plate tectonics and hydrocarbon accumulation. Am Assoc Petrol Gwl Educ Course Note Series 1, Tulsa Oklahoma
Dickinson WR, Beard IS, Brakenridge GR, Erjavec JL, Ferguson RC, Inman KF, Knepp RA, Lindberg FA, R berg PT (1983) provenance of Nodh American ~lanerozoic sandstones in relation to tectonic setting. Gwl Soc Amer BuU 93: 95-107
Dickinson WR, Armin RA, Beckvar N, Goodlin TR, Janecke SU, Mark RA, Noms RD, Radel G, Wort- man AA (1987) Geohistory analysis of rates of sedi- ment accumulation and subsidence for selected Califor- nia basins. In: Ingersoll RV, Ernst WG ( 4 s ) Cenozoic basin development of coastal California. Rubey vol6: 1-23, PrenticeHall, Englewood Cliffs
Diester-Haass L (1973) No current reversal at 10,000 B.P. in the Strait of Gibraltar. Marine Gwl 15: MI-M9
Diester-Haass L (1991) Rhythmic carbonate content varia- tions in Nwgene sediments above the oceanic lyso- cline. In: Einsele G, Ricken W, Seilacher A (4s ) Cycles and events in stratigraphy. Springer, Heidel- berg New York, p 94-109
Dietrich G (1975) Allgemeine Meereskunde. Erne Ein- lijhrung in die Ozeanogra~hie. 3. Aufl. Borntriger. - . , - . Berlin Stuttgart, 593 p
Dingler JR, Anima FU (1989) Subaqueous grain flows at the head of Camel submarine canyon. California. J Sediment Petrol 59: 280-286
Donovan DT, Jones EJW (1979) Causes of world-wide changes in sea-level. J Geol Soc London 136: 187-192
Dorsey RJ (1989) Provenance evolution and unroofing hlstory of a modern arc-continent collision: evidence from petrography of Plio-Pleistocene sandstones, eas- tern Taiwan. J Sediment Petrol 58: 208-218
Dott RH Jr (1988) An episodic view of shaUow marine clastic sedimentation. In: de Boer PL, van Gelder A, Nio SD (4s ) Tidal-influenced sedimentary environ- ments and facies. Reidel, Dordrecht, p 3-12.
Dott RH Jr, Bourgwis J (1982) Hummocky stratification: significance of its variable bedding seuuences. J Sedi- ------~ . 7 .
ment petrol 53: 5-23 Doust H, Omatsola E (1990) Niger Delta. In: Edwards JD,
Santogrossi PA (eds) Divergent/passive margin basins. Am Assoc Petrol Gwl Mem 48: 201-238 - -. . . - - - - - - -
Dreesen R (1989) Oolitic ironstones as event-statigraphical marker beds within the Upper Devonian of the Arden- no-Rhenish Massif. In: Young TP, Taylor EG ( 4 s ) Phanerozoic ironstones. Geol Soc Spec Publ 46: 65-78
Drever JI (1982) The geochemistry of natural waters. Pren- tice-Hall, Englewood Cliffs, 388 p
Drever JI, Li Y-H, Ma nard JB (1988) Geochemical cyc- les: the continenta r crust and the oceans. In: Gregor CB, Carrels RM, Mackenzie FT, Maynard JB (4s ) Chemical cycles in the evolution of the Earth. Wiley, New York, p 17-53
Dreyer T, Schleie A, Walderhaug 0 (1990) Minipermea- meter-based study of permeability trends in channel sand bodies. Am Assoc Petrol Geol Bull 74: 359-374
Dronkert H (1985) Evaporite models and sedimentology of Messinian and Recent evaporites. GUA Papers of Gwlogy, Series 1, No 24, Univ Amsterdam, 283 p
Duff PM, Hallam A, Walton EK (eds)(1967) Cyclic sedi- mentation. Developm Sediment01 10, Elsevier, Amsterdam, 280 p
Duke WL (1990) Gwstrophic circulation or shallow marine turbidity currents? The dilemma of palwflow patterns in storm-influenced prograding shoreline systems. J Sediment Petrol 60: 870-883
Dunbar CD, Rodgers J (1957) Principles of stratigraphy. Wilev. New York. 356 D
~ u n o ~ e r he Se onzac G (1970) The transformation of clay minerals during diagenesis and low-grade matamor- phism: a review. Sedimentology 15: 281-346
Durand BM (ed) (1980) Kerogen, msoluble matter from sedimentary rocks. Editions Technip, Paris, 519 p
Durand BM (1987) Du kkrogkne au $role et au char- bon: les voies et les mkhanismes des transformations des matikres organiques suimentaires au coun de l'enfouissement. MCm Soc G b l Fr NS 151: 77-95
Eberli GP (1987) Carbonate turbidite sequences deposited in rift-basins of the Jurassic Tethys Ocean (eastern Alps, Switzerland). Sedimentology 34: 363-388
Eberli GP (1991) Calcareous turbidites and their relation ship to sea-level fluctuations and tectonism. In: Emsele G, Ricken W, Seilacher D (1989) Cycles and events in stratigraphy. Springer, Heidelberg New York, p 340- 359
Eberli GP, Ginsburg RN (1987) Segmentation and wa- lescence of Cenozoic carbonate platforms, north- western Great Bahama Bank. Gwlogy 15: 75-79
Eberli GP, Ginsburg RN (1989) Cenozoic pro rading of northwestern Great Bahama Bank, a recod of l r u n l platform growth and sea level fluctuations. Soc Econ Palwntol Mineral Spec Publ 44: 339-351
Ebinger CJ (1989) Tectonic development of the western branch of the East African rift svstem. Gwl Soc Am Bull 101: 885-903
Eder FW. Engel W. Franke W. Sadler PM (1983) Devo- nian 'and-~arbbniferous lhnestoneturdidites' of the Rheinisches Schiefergebirge and their tectonic signifi- cance. In: Martin H, Eder FW (4s ) Intracontinental fold belts. Springer, Berlin Heidelberg New York, p 93-124
Edman JD, Surdam RC (1984) Diagenetic history of the Phosphoria, Tensleep and Madison Formations, Ti Top Field, Wyoming. In: McDonald DA, Surdam R; (eds) Clastic diagenesis. Am Assoc Petrol Geol Mem 37: 317-345
Edwards JD, Santogrossi PA (4s ) (1990) Diver- gent/~assive margin basins. Am Assoc Petrol Gwl " u
em-48, 252 p Edwards M (1986) Glacial environments. In: Reading HG
(ed) Sedimentary environments and facies, Blackwell, Oxford, p 445-470
Ehrmann WU, Thiede J (1985) History of Mesozoic and Cenozoic sediment fluxes to the North Atlantic. Con- tributions to Sedimentology 15. Schweizerbart. Stutt- -- .
109 P Einsele G (1976) Range, velocity, and material flux of
compaction flow in growing sedimentary sequences. Sedimentology 24: 639-655
Einsele G (1982a) Mass physical properties of Pliocene and Quaternary sediments in the Gulf of California, Deep Sea Drilling Project Leg 64. In: Curray JR, Moore DG et al., Init Repts DSDP, 64: 529-542, US Govt Print Office, Washington

Einsele G (1982b) Mechanism of sill intrusion into soft sediment and expulsion of pore water. In: Curray JR, Moore DG et al., Init Repts DSDP, 64, 2: 1169-1 176, US Govt Print Office, Washington
Einsele G (1982~) Remarks about the nature, occurrence, and recognition of cyclic sequences. In: Einsele G, Seilacher A (eds) Cyclic and event stratification. Springer, Berlin Heidelberg New York, p 3-7
Einsele G (1985) Response of sediments to sea-level changes in differing subsiding stormdominated mar- ginal and epeiric basins. In: Bayer U, Seilacher A (eds) Sedimentary and evolutionary cycles. Lect Notes Earth Sci 1: 68-97
Einsele G (1986) Interaction between sediments and basalt injections in young Gulf of California-type spreading centers. Geol Rundsch 75: 197-208
Einsele G (1989) In-situ water contents, liquid limits, and submarine mass flows due to a high liquefaction potential of slope sediment (results from DSDP and subaerial wuntemarts). Geol Rundsch 78: 821-840
Einsele G, ~ o h b e r ~ e r - ~ (1978) Zusammensetzung und Bi- lanzierune der fisunesfracht im Maineebiet. In: Das ~ a i n ~ r o j & t , Schrift&reihe Bayer La%desamt Was- senvirtschaft H 7: 278-289, Miinchen
Einsele G, Kelts K (1982) Pliocene and Quaternary mud turbidites in the Gulf of California: sedimentology, mass physical properties and significance. In: Curray JR, Moore DG et al., Init Repts DSDP 64, 2, US Govt Print Office, Washington, p 511-528
Einsele G, Niemitz JW (1982) Budget of postrifig sedi- ments in the Gulf of California and calculation of the denudation rate in neighboring land areas. In: Curray JR, Moore DG, et al., Init Repts DSDP 64, Part 2, US Govt Print Office, Washington, p 571-592
Einsele G, Ricken W (1991) Limestone-marl alternations - an overview. In: Einsele G, Ricken W, Seilacher A (eds) Cycles and events in stratigraphy. Springer, Berlin Heidelberg New York, p 23-47
Einsele G, Seilacher A (1982) (eds) Cyclic and event strati- fication. Springer, Berlin Heidelberg New York, 536 P
Einsele G, Seilacher A (1991) Distinction of tempestites and turbidites. In: Einsele G, Ricken W, Seilacher A (eds) Cycles and events in stratification. Springer, Heidelberg New York, p 377-382
Einsele G, Werner F (1972) Sedimentary processes at the entrance Gulf of AdenIRed Sea. Meteor-Forschungs- Ergebnisse C, 10: 39-62, Berlin Stuttgart
Einsele G, Ricken W, Seilacher D (1991) Cycles and events in stratigraphy: introduction. In: Einsele G, Ricken W, Seiiacher A (eds) Cycles and events in stratigraphy. Springer, Heidelberg New York, p 1-19
Einsele G, Ricken W, Seiicher A (eds) (1991) Cycles and events in stratigraphy. Springer, Berlii Heidelberg New York, 955 p
Einsele G, Elouard P, H e m D, Kijgler FC, Schwan HU (1977) Source and biofacies of Late Quaternary sedi- ments in relation to sea level on the shelf of Mauri- tania, West Africa. Meteor-Forschungs-Ergebnisse C 26: 1-43, Berlin Stuttgart
Ekdale AA, Bromley RG, Pemberton SG (1984) Ichno- logy: trace fossils in sedimentology and stratigraphy. Short Course 16, 316 p, Soc Econ Paleontol Mineral, Tulsa
Eldholm 0 , Thiede J, Taylor E (1987) Summary and preli- minary conclusions, ODP Leg 104. In: Eldholm 0 , Thiede J, Taylor E, and Shipboard Scientific Party. Proc Init Repts ODP 104 A: 751-771, College Station, TX (Ocean Drilling Program)
Eldholm 0. Thiede J. Taylor E (1989) The Norwegian wntinental margin: &tonic, volcanic, and pal&en- vironrnnetal framework. In: Eldholm 0 , Thiede J,
Taylor E, et al., PKK: ODP, Sci Results, 104: 5-24, College Station, TX (Ocean Drilling Program)
Elliott T (1986a) Siliciclastic shorelines. In: Reading HG (ed) Sedimentary environments and facies. Blackwell, Oxford, p 155-188
Elliott T (1986b) Deltas. In: Reading HG (ed) Sedimentary environment and facies, 2nd ed. Blackwell, Oxford, pp 113-154
Elmi S (1990) Stages in the evolution of late Triassic and Jurassic carbonate platforms: the western margin of the Subalpine Basin (Ardkche, France). In: Tucker ME, Wison JL, Crevello PD, Sarg JR, Read F (4s ) Carbonate platforms: facies, sequences and evolution. Int Assoc Sediment01 Spec Pub1 9, Blackwell, Oxford, p 109-144
Elmore RD, Pikey OH, Cleary WJ, Curran HA (1979) Black shell turbidite, Hatteras ab ssal plain, western Atlantic ocean. Geol Soc Am B U ~ 90: 1165-1176
Elorza JJ, Bustillo MA (1989) Early and late diagenetic chert in carbonate turbidites of the Senonian flysch, northeast Bilbao, Spain. In: Hein JR, Obradovic J (4s ) Siliceous deposits of the Tethys and Pacific regions. Springer, New York Heidelberg, p 93-105
Emeis K (1985) Particulate suspended matter in major world rivers - 11: results on the riven Indus, Waikato, Nile, St. Lawrence, Yangtse, Parana, Orinoco, Caroni, and Mackenzie. Mitt Geol-Paliiontol Inst Univ Hamburg, H 58: 593-617
Ernelyanov EM (1972) Principal types of recent bottom sediments in the Mediterranean Sea: their mineralogy and geochemistry. In: Stanlea DJ (ed) The Mediter- ranean Sea: a natural sedimentation laboratory. Dow- den, Hutchinson & Ross, Stroudsburg, P 355-386
Emerson S (1985) Organic carbon preservation in marine sediments. In: Sundquist ET, Broecker WS (eds) The carbon cycle and atmospheric C02: Natural variations Archean to Present. AGU Geophys Monogr 32: 78-87
Emery KO (1960) The sea off southern California. Wiey, New York London, 366 p
Emery KO, Uchupi E (1984) The geology of the Atlantic Ocean. Springer, New York Heidelberg, 1050 p and
- -
map set Emiliani C (ed) (1981) The oceanic lithosphere. The sea, v
7, Wiley-Interscience, New York, 1738 p Enachescu ME (1987) Tectonic and structural framework
of the northeast Newfoundland wntinental margin. In: Beaumont C. Tankard AJ ( 4 s ) Sedimentary basins and basin-forming mechanisms..~an Soc ~ & l Geol Mem 12: 117-146
Engelhardt W von (1973) Sedimentpetrolo ie, Teil 111: Die Bildung von Sedimenten und dunentgesteinen. Schweizerbart, Stuttgart, 378 p
Enos P (1989) Islands in the bay - a key habitat of Florida Bay. Bull Marine Sci 44: 365-386
Eppley KW, Peterson BJ (1979) Particulate organic matter flux and planktonic new production in. the ocean. Nature 282: 677-680
Eschner TB, Kocurek G (1986) Marine destruction of eolian sand seas: origin of mass flows. J Sediment Petrol 56: 401411
Eslinger E, Pevear D (1988) Clay minerals. Soc Econ Paleontol Mineral Short Course Notes 22: 4-1 to 4-22
Etheridge MA, Branson JC, Stuart-Smith PG (1987) The Bass, Gippsland and Otway basins, Southeast Austra- lia: a branched rift system formed by continental ex- tension. In: Beaumont C, Tankard AJ (eds) Sedimen- tary basins and basin-forming mechanisms. Can Soc Petrol Geol Mem 12: 147-162
Ethridge FG (1985) Modem alluvial fans and fan deltas. In: Flores RM, Ethridge FG, Miall AD, Galloway WE, Fouch TD (4s ) Recognition of fluvial systems and their resource potential. Soc Econ Paleontol

Mineralog Short Course 19: 101-126 Ethridge FG, Flores RM, Harvey MD (1987) Recent deve-
lopments in fluvial sedimentology. Soc Econ Paleontol Mineralog Spec Publ 39: 389 p
Eugster HP (1985) Oil shales, evaporites and ore deposits. Geochim Cosmochim Acta 49: 619-635
Eugster HP (1986) Lake Magadi, Kenya: a model for rift valley hydrochemistr). and sedimentation? In: Frostick LE, Renaut RW, Red I, Tiercelin JJ (4s ) Sedimen- tation in African rifts. Gwl Soc Spec Pub1 25: 177- 189
Eugster HP, Hardie LA (1978) Saline lakes. In: Lerman A (ed) Lakes: chemistry, geology, physics. Springer, Berlin Heidelberg, p 237-293
Eugster HP, Kelts K (1983) Lacustrine chemical sediments. In: Goudie AS, Pye K (4s ) Chemical sediments and geomorphology. Academic Press, London, p 321 -368
Evamy BD, Haremboure J, Kamerling P, Knaap WA, Molloy FA, Rowlands PH (1985) Hydrocarbon habitat of Tertiary Niger Delta. Am Assoc Petrol Geol Bull 62: 1-39
Eyles CH, Eyles N, Miall AD (1985) Models of glacio- marine sedimentation and their application on ancient glacial sequences. Palaeogeogr Palaeoclimatol Palaw- ecol 51: 15-84
Eyles N (ed) (1984) Glacial Geology - an introduction for engineers and earth scientists. Pergamon Press, Ox- ford, 409 p
Eyles N, Miall AD (1984) Glacial facies. In: Walker RG led) Facies models. 2nd edn. Geosci Canada Reurint ~ e i 1, Gwl Assoc 'canada, p 15-37
Fairbrid e RW, Fink1 CW (1980) Cratonic erosional un conformities and peneplains. J Geol 88: 69-86
Farell JW, Pre11 WL (1987) Climate forcing of calcium carbonate sedimentation: a 4.0 my record from the central equatorial Pacific Ocean. EOS Trans 68: 333, Am Geophys Union
Farrow CEG, Mossman DJ (1988) Geology of Pre cambrian palwsols at the base of the Huronlan Super- group, Elliot Lake, Ontario, Canada. Precambrian Res 42: 107-134
Faupl P, Sauer R (1978) Zur Genese roter Pelite in Tur- biditen der Flyschgosau in den Ostalpen (Oberkreide Alttertiir). N Jahrb Geol Paliiontol 1978, 2: 65-86
Faure G (1986) Principles of isotope geology, 2nd edn. Wdey, New York, 589 p
Feeley MH, Moore TC Jr, Loutit TS, Bryant WR (1990) Sequence stratigraphy of Mississippi fan related to oxygen isotope sea level index. Am Assoc Petrol Gwl Bull 74: 407-424
Feldhausen PH, Stanley DJ, Knight FU, Maldonado A (1981) Homogenization of gravityemplaced muds and unifites: models from the Hellenic Trench. In: Wezel FC (ed) Sedimentary basins of Mediterranean margins. CNR, Italian Project of Oceanography, Tecnoprint, Bologna, p 203-226
Field ME, Gandner JW, Jennings AE, Edwards BE (19822 Earthquake-induced sediment failures on a 0.25 slope, Klamath river delta, California. Geology 10: 542-546
Finlayson DM, Wright C, Leven HJ, Collins CDN, Wake- Dyster KD, Johnstone DW (1989) Basement features under four intra-continental basins in central and eas- tern Australia. In: Price RA (ed) Origin and evolution of sedimentary basins and their energy and mineral resources. Geophys Monogr 48 (IUGG vol3): 43-55, Am Geo hys Union, Washington DC
Fiman J (4 (1988) Landscapes of the southern hemi- sphere. Earth Sci Rev 25, 5,6: 343-519
Fischer AG (1964) The Lofer cyclothems in the Alpine Triassic. Kansas Gwl Surv Bull 169: 107-149
Fischer AG (1975) Origin and growth of basins. In: Fi- scher AG, Judson S (4s ) Petroleum and global tec- tonics. Princeton Univ Press, Princeton, New Jersey, p 47-79
Fischer AG (1982) Long-term climatic oscillations recorded in stratigraphy. In: Climate in earth history. Studies in Geophysics, Nat Academy Press, Washington DC, p 97-104
Fischer AG (1991) Orbital cyclicity in Mesozoic strata. In: Einsele G, Ricken W, Seilacher A (eds) Cycles and events in stratigraphy. Springer, Heidelberg New York, p 48-62
Fischer AG, Sarnthein M (1988) Airborne silt and dune- derived sands in the Permian of the Delaware basin. J Sediment Petrol 58: 637-643
Fischer AG, de Boer PL, Premoli-Silva I (1989) Cyclo- stratigraphy. In: Ginsburg RN, Beaudoin B (4s) Cretaceous resources, rhythms, and events. NATO AS1 Ser C 304: 139-172, Kluwer, Dordrecht
Fisher JH, Barmtt MW, Droste JB, Shaver RH (1988) Michigan basin. In: Sloss LL (ed) The geology of North America, v D-2: Sedimentary cover - North American craton: U.S. Geol Soc America, Boulder, p 361-382
Fisher RV, Schmincke HU (1984,1990) Pyroclastic rocks, 1st and 2nd edn. Springer, Berlin Heidelberg New York, 472 p
Flemings PB, Jordan TE (1990) Stratigraphic modeling of foreland basins: Interpreting thrust deformation and lithosphere rheology. Geology 18: 430-434
Flemming RW (1980) Sand transport and bedform patterns on the continental shelf between Durban and Port Elizabeth. Sediment Geol 26: 179-206
Flores RM (1981) Coal deposition in fluvial palwenviron ments of the Paleocene Tongue River Member of the Fort Union Formation, Powder River area, Powder River basin, Wyoming and Montana. Soc Econ Paleontol Mineralog Spec Publ 3 1: 169-190
Flores RM, Ethridge FG, Miall AD, Galloway WE, Fouch TD (1985) Recognition of fluvial systems and their resource potential. Soc Econ Paleontol Mineralog Short Course 19, 290 p
Fliigel E (1982) Microfacies analysis of limestones. S ringer, Berlin Heidelberg New York, 633 p
niigefE (1988) Problems with reef models: the late Trias- sic Steinplatte "reef" (northern Alps, SalzburglTyrol, Austria). Facies 20: 1-138, Erlangen
Fliigel E (1989) Typen und wirtschaftliche Bedeutung von Rifkalken. Archiv f LagersGttenfonch, Geol Bun- desanst Wien 10: 25-32
Fdllmi KB, Garrison RN, Grimm K (1991) Stratification in phosphatic sediments. In: Einsele G, Ricken W, Seila- cher D (4s ) Cycles and events in stratigraphy, Sprin- ger, Heidelberg New York, p 492-507
Folk RL (1971) Longitudinal dunes of the northwestern edge of the Simpson Desert, Northern Temtory, Australia. 1. Geomorphology and grain-size relation- ships. Sedimentology 16: 5-54
Ford D, W i m s P (1989) Karst geomorphology and hydrology. Unwin Hyman, London. 601 p
Foster NH, Beaumont EA (4s) (1987) Gwlogic basins I: Classification, modelling, and predictive stratigraphy. Treatise of Petroleum Geology, Reprint Series 1, Am Assoc Petrol Gwl, Tulsa, 458 p
Frakes LA (1979) Climate throughout geologic times. Elsevier, Amsterdam, 310 p
Franke W. Paul J (1980) Pelagic redbeds in the Devonian of Germany - dep6sition and diagenesis. Sediment Gwl25: 231-256
Franke W, Walliser OH (1983) "Pelagic" carbonates in the Variscan Belt - their sedimentarv and tectonic environ- ments. In: Martin H, Eder ~ ~ ( e d s ) Intracontinen&l

fold belts. Springer, Berlin Heidelberg New York, p 77-92 . . - -
Fraser GS (1989) Clastic depositional sequences. Prentice Hall, Englewood Cliffs, 459 p
Frazier DE (1967) Recent deltaic deposits of the Mississip pi river: their development and chronology. Gulf Coast Assoc Geol Soc Trans 17: 287-315
Frey M (1987) Low-temperature metamorphism. Blackie, Glasgow
Frey M, Teichmuller M, Teichmiiller R, Mullis J , Kunzi B, Breitschmid A, Gruner U, Schwizer B (1980) Very low-grade metamorphism in the external parts of the Central A1 s: Illite crystallinity, w a l rank, and fluid inclusion &a. Eclogae Geol Helv 73: 173-203
Friedman GM, Sanders JE (1978) Principles of sedimen- tology. Wiley, New York, 792 p
Friedrich GH, Herzig PM (1988) Base metal sulfide deposits in sedimentary and volcanic environments. Soc Geology Applied to Mineral Deposits, Spec Pub1 5, Springer, Berlin Heidelberg New York, 290 p
Frisch W, Loeschke J (1986) Plattentektonik. ErtrSge der Fonchung, Band 236, Wissensch Verlagsbuchgesell- schaft, Darmstadt, 190 p
Froelich PN, Arthur MA, Burnett WC, Deakin M, Hensley V, Jahnke R, Kaul L, Kim KH, Roe K, Sou- tar A, Vathakanon C (1988) Early diagenesis of or- ganic matter in Peru continental mar in sediments: phosphorite precipitation. Marine Geof 80: 309-343
Froitzheim N, Stets J , Wurster P (1988) Aspects of wes tern High Atlas tectonics. In: Jacobshagen VH (ed) The Atlas system of Morocco. Lecture Notes Earth Sci 15, Springer, Berlin Heidelberg New York, 219- 244
Frostick LE (ed) (1987) Desert environments: ancient and modern. 'Gd ~ o c ' s p e c Publ 35, 401 p
Frostick LE. Renaut RW. Reid I. Tiercelin JJ (edsM1986) sedimentation in ~ f n c a n ri&. G w l Soc S& &bl25', Blackwell, Oxford, 382 p
Fryberger SG, Ahlbrandt TS, Andrews S (1979) Origin, sedimentary features, and significance of low-angle eolian "sand sheet" deposits, Great Sand Dunes Natio- nal Monument and vicinity, Colorado. J Sediment Petrol 49: 733-746
Fuchs K, Bonjer KP, Prodehl C (1981) The continental rift system of the Rhiiegraben - Structure, physical pro- perties and dynamical processes. Tectonophysics 73: 79-90 * < - -
Fuchtbauer H (1974a) Zur Diagenese fluviatiler Sandsteine. Geol Rundsch 63: 904-925
Fiichtbauer H (1974b) Some problems of diagenesis in sandstones. Bull Cent Rech Pau SNPA 8: 391-403
Fuchtbauer H (1988) (ed) Sedimente und Sedimentgesteine, 4th edn. Schweizerbart, Stuttgart, 1141 p
Fiichtbauer H, Peryt T ( 4 s ) (1980) The Zechstein basin with emphasis on carbonate sequences. Contributions to Sedimentology 9, Schweizerbart, Stuttgart, 328 p
Fuchtbauer H, Richter DK (1983) Relations between sub- marine fissures, internal breccias and mass flows during Triassic and earlier rifting periods. Geol Rund- sch 72: 53-66
Fiichtbauer H , Richter DK (1 988) Karbonatgesteine. In: Fiichtbauer H (ed) Sedimente und Sedimentgesteine. Schweizerbart, Stuttgart, p 233-434
Fuis GS, Kohler WM (1984) Crustal structure and tec- tonics of the Imperial Valley. In: Rigsby CA (ed) The Imperial Basin - tectonics, sedimentation, and thermal aspects. Soc Econ Paleontol Mineral Pacific Section, p 1-13
Fulthorpe CS (1990) Fourth order sequences and the re sponse of a basin to eustatic sea-level variation. 13th Int Sediment01 Congress, Aug 1990, Nottingham, Int Assoc Sedimentol, Abstracts of Papers, p 177
Funk HP (1985) Mesozoische Subsidenzgeschichte im Helvetischen Schelf der Ostschweiz. Eclogae Geol Helv 78: 249-272
Fursich FT (1979) Genesis, environments, and ecology of Jurassic hardgrounds. Neues Jb Geol Palionto1 Abh 158: 1-63
Fyfe WS, Lonsdale P (1981) Ocean floor hydrothermal activiy. In: Emiliani C (ed) The oceanic lithosphere. Thc sea, vol7, Wiley-Interscience, New York, p 589- 638
Gac JY (1980) G h h e m i e du bassin du Lac Tchad, bilan de alteration. de I'krosion et de la sidimentation. Travaux et documents de I'ORSTOM 123, 251 p
Gallowav WE (1981) De~ositional architecture of Cenozoic Gu$coastd p l a ~ flbvial systems. Soc Econ Paleontol Mineral Spec Publ 31: 127-155
Galloway WE (1984) Hydrogeologic regimes of sandstone diagenesis. In: McDonald DA, Surdam RC (eds) Clas- tic diagenesis. Am Assoc Petrol Geol Mem 37: 3-13
Galloway WE (1985) Meandering streams - modem and ancient. In: Flores RM, Ethridge FG, Miall AD, Galloway WE, Fouch TD (eds) Recognition of fluvial systems and their resource potential. SEPM Short Course 19: 145-166
Galloway WE (1989) Genetic stratigraphic sequences in basin analysis I: architecture and genesis of flooding- surface bounded depositional units. Am Assoc Petrol G w l Bull 73: 125-142
Galloway WE, Hobday DK (1983) Temgenous clastic de positional systems - applications to petroleum, coal, and uranium ex~lorahon. S~ringer . New York Hei- . - . delberg, 423 p
Gansser A (1984) The morphogenetic phase of mountain building. In: Hsii KJ (ed) Mountain building proces- ses, 2nd ed. Academic Press, London, p 221-228
Garcia-Mondtiar J. Puialte V, Robles S (1986) Carac teristicas - sedimeni~lo~icas, secuenciales ; tecto- estratigraficas del Triasico de Cantabria v norte de ~ a l e n s a . Cuardernos Geologia Ibtrica 1 0 151-172, Madrid
Garrels RM (1986) Sediment cycling and diagenesis. In: Mumpton FA (ed) Studies in diagenesis. US Geol Surv Bull 1578: 1-1 1, US Govt Print Office, Washing- ton
Garrels RM, Mackenzie FT (1971) Evolution of sedimen tary rocks. Norton, New York, 397 p
Gamson RE (1981) Diagenesis of oceanic carbonate sedi ments: a review of the DSDP perspective. In Warme JE, Douglas RG, Winterer EL (eds) The Deep Sea Drilling Project: a decade of progress. Soc E w n Pale- onto1 Mineral Spec Pub1 32: 181-207
Gamson RE, Kastner M, Kolodny Y (1987) Phosphorites and phosphatic rocks in the Monterey Formation and related Miocene units, coastal California. In: Ingersoll RV, Ernst WG ( 4 s ) Cenozoic basin development in coastal California. Rubey vol 6: 348-381, Prentice- Hall, New Jersey
Gautier DL (ed) (1986) Roles of organic matter in sedi- ment diagenesis. Soc Econ Paleontol Mineral Svec Publ 38,203 p
Gautier DL, Claypool GE (1984) Interpretation of methanic diagenesis in ancient sediments by analogy with pro- cesses in modem diagenetic environments. In: McDo- nald DA, Surdam RC (eds) Clastic diagenesis. Am Assoc Petrol Geol Mem 37: 111-123
Geister J (1983) Holgdne westindische Korallenriffe: Geomorphologie, Okologie und Fazies. Facies 9: 173- 284, Erlangen
Georgotas N, Udluft P (1978) Inhaltsstoffe des oberfi- chennahen Grundwassersund desOberflBchenwassers. Anorganische Inhaltsstoffe. In: Das Mainprojekt,

Schrifienreihe Bayer Landesamt f Wasserwirtschafi H 7: 258-265, Miinchen
Gerdes G, Krumbein WE, Reineck H-E (1985) Verbrei- tung und aktuogwlogische Bedeutung mariner mik- robieller Matten im Gezeitenbereich der Nordsee. Facies 12: 75-96, Inst Paliontol Univ Erlangen-Niirn- berg
Gerdes G, Krumbein WE, Reineck H-E (1991) Biolami- nation: ecological versus depositional dynamics. In: Einsele G. k c k e n W. Seilacher A (eds) Cycles and events in ' stratigraphy. Springer, ~ e i d e l b k r ~ New York. D 592-607
Gerrard d ( 1 9 8 8 ) Rocks and landforms. Unwin Hyman, London, 319 p
Geyer OF, Gwinner MP (1986) Geologie von Baden- Wiirttemberg. Schweizerbart, Stuttgart, 472 p
Gibb FGF, Kanaris-Sotiriou R (1988) The geochemistry and origin of the Faeroe-Shetland sill complex. In: Morton AC, Parson LM (eds) Early Tertiary vol- canism and the o ~ e n i n e of the NE Atlantic. Geol Soc Spec Pub1 39: 241-25r
Gibbs RJ (1985) Settling velocity, diameter and density of flocs of illite. kaolinite, and montmorillonite. J Sedi- ment Petrol 55: 65-68 '
Gieskes JM (1975) Chemistry of interstitial waters of marine sediments. Annu Rev Earth Planet Sci 3: 433- 453
Ginsburg RN (ed)(1975) Tidal deposits: a casebook of Recent examples. Springer, Berlin Heidelberg New York, 428 p
Ginsburg RN, Hardie LA (1975) Tidal and storm deposits, northern Andros Island. Bahamas. In: Ginsburg RN (ed) Tidal deposits, 201-208. Springer, Eerlin Heidelberg New York
Girdler RW, Whitmarsh RB (1974) Miocene evaporites in Red Sea cores, Their relevance to the problem of the width and age of oceanic crust beneath the Red Sea. In: Whitmarsh RB, Weser OE, Ross DA, et al., Init Repts DSDP 23, US Govt Print Office, Washington, p 913-921
Girty GH, Mossman BJ, Pincus SC (1988) Petrology of Holocene sand, Peninsular Ranges, California and Baja Norte, Mexico: implications for provenance-dis- crimination models. J Sediment Petrol 58: 881-887
Glenn CR (1990) Pore water, petrology and stablef carbon isotopic data bearing on the ongin of modem Peru margin phosphorites and associated authigenic phases. In: Burnett WC, Riggs SR ( 4 s ) Phosphate deposits of the world, v 3, Genesis of Neogene to Recent phos- phorites. Cambridge Univ Press, p 46-61
Glenn CR, Arthur MA (1985) Sedimentary and geoche- mical indicators of productivity and oxygen contents in modem and ancient basins: the Holocene Black Sea as the "type" anoxic basin. Chemical G w l 48: 325-354
Glenn CR, Arthur MA (1988) Petrology and major element geochemistry of Peru margin phosphorites and asso- ciated diagenetic minerals: authigenesis in modem organic-rich sediments. In: Burnett WC, Froelich PN (eds) The origin of marine phosphorite. The results of the R.V. Robert D. Conrad Cruise 23-06 to the Peru shelf. Marine G w l 80: 231-267
Glenn CR, Arthur MA (1990) Anatomy and origin of a Cretaceous phosphorite-greensand giant, Egypt. Sedi- mentology 37: 123-154
Glenn CR, Kelts K (1991) Sedimentary rhythms in lake deposits. In: Einsele G, Ricken W, Seilacher A (eds) Cycles and events in stratigraphy. Springer, Heidel- berg New York, p 188-221
Glennie KW (1970) Desert sedimentary environments. Developm Sediment01 14, Elsevier, Amsterdam, 222 P
Gloppen TG, Steel RJ (1981) The deposits, internal struc- ture and gwmetry in six alluvial fan-fan delta bodies (Devonian Norway) - a study in the significance of braiding sequence in conglomerates. In: Ethridge FG, Flores RM (eds) Recent and ancient nonmarine depositional systems: models for exploration. Soc Econ Palwntol Mineral Spec Pub1 31: 49-69
Goldhaber MB, Kaplan R (1980) Mechanisms of sulfur in- corporation and isotope fractionation during early diagenesis in sediments of the Gulf of California. Marine Chemistry 9: 95-143
Goldhammer RK, Dunn DA, Hardie LA (1987) High- frequency glacioeustatic sea-level oscillations with Milankovitch characteristics recirded in Middle Trias- sic ~latform carbonates in northern Italv. Am J Sci 287: 853-992
Goodwin PW. Anderson El (1985) Punctuated aeerada- tional cydles: a general h)pothksis of episodigItrati- graphic accumulation. J Geol 93: 515-533
Goodwin RH, Prior DB (1989) Geometry and depositional sequences of the Mississippi canyon, Gulf of Mexico. J Sediment Petrol 59: 318-329
Gordon A (1966) Caribbean Sea - oceanography. In: Fair bridge RW (ed) Encyclopedia of earth sciences series, vol 1, The encyclopedia of oceanography. Reinhold, New York, p 175-181
Gore PJW (1989) Toward a model for open- and closed- basin deposition in ancient lacustrine sequences: The Newark supergroup (Triassic-Jurassic), eastern North America. In: Talbot MR. Kelts K (eds) The Phanero- zoic record of lacustrine basins and their environmen- tal signals. Palawgwgr Palawclimatol Palawecol70: 29-5 1
Giirler K, Reutter KJ (1968) Entstehung und Merkrnale der Olisthostrome. Geol Rundsch 57: 484-514
Gorsline DS. Douglas RG (1987) Analvsis of sedimentarv systcms'in actTvemargh b a s k : ~alifornia continen61 borderland. In: lneersoll RV. Ernst WG ( 4 s ) Ceno- zoic basin development of coastal califorha.' Rubey vol 6 , PrenticeHall, Englewood Cliffs, p 64-80
Gorsline DS (1984) Review of f iegrained sediment ori- gins, characteristics, transport and deposition. In: Stow DAV, Piper DJW ( 4 s ) Fine-grained sediments: deepwater processes and facies. G w l Soc Spec Pub1 15: 17-22, Blackwell, Oxford
Gradstein FM, Agterberg FP, Brower JC, Schwarzacher WS (1985) Quantitative stratigraphy. Reidel, Dord- recht, 598 p
Gradstein FM, Jansa LF, Srivastava SP, Williamson MA, Bonham Carter G, Stam B (1990) Aspects of North Atlantic paleo+ceanography. Chapter 8. In: Keen MJ, W i m s GL (eds) Geology of the continental margin of eastern Canada. Gwlog Survey Canada, Geology of Canada, no 2, p 351-389
Grandstaff DE, Endelman MJ, Foster RW, Zbinden E, Kimberley MM (1986) Chemistry and mineralogy of Precambrian paleosols at the base of the Dominion and Pongola Groups (Transvaal, South Africa). Precamb- rian Res 32: 97-131
Grant AC, Jansa LF, McAlpine KD, Edwards A (1988) Mesozoic-Cenozoic wlogy of the eastern margin of the Grand Banks anf i t s relation to Galicia Bank. In: Boillot G, Witerer EL et a]., Proc ODP, Sci Results, 103: 787-808, College Station, TX (Ocean Drilling Program)
Grant Gross M (1980) Oceanography, a view of the earth, 2nd edn. Prentice-Hall, Englewood Cliffs, 475 p
Grasshoff K (1975) The hydrochemistry of land-locked basins and fjords. In: Riley JP, Skirrow G (eds) Chemical Oceanography, vol 2, 2nd edn. Academic Press, London, p 456-597

Greenlee SM, Schroeder FW, Vail PR (1988) Seismic stratigraphy and geohistory analysis of Tertiary strata from the continental shelf off New Jersey; calculation of eustatic fluctuations from stratigraphic data. In: Sheridan RE, Grow JA (eds) The Geology of North America, ~01112, The Atlantic continental margin. US Geol Soc Am, p 437-444
Gregor CB, Carrels RM, Mackenzie FT, Maynard JB (eds) (1988) Chemical cycles in the evolution of the Earth. Wiey, New York
Gretener PE (1979) Pore pressure: fundamentals, general ramifications and implications for structural geology. Am Assoc Petrol Geol. Cont Ed Course Note Ser 4. 2nd edn, 131 p
Gretener PE, Feng ZM (1985) Three decades of geopres- sures - insights and enigmas. Bull Verein Schweiz petrol-Geol Ing 511120: 7-34
Grobe H (1987) Facies classification of glacio-marine sedi- ments in the Antarctic. Facies 17: 99-109
Gr6tsch J , Wu G, Berger WH (1991) Carbonate cycles in the Pacific: reconstruction of saturation fluctuations. In: Einsele G, Ricken W, Seilacher A (eds) Cycles and events in stratification. S ~ n n g e r . Heidelberg New . u r 0
York, p 110-125 Grotzinger JP (1986) Cyclicity and palwenvironmental
dynamics, Rocknest platform, horthwest Canada. G w l Soc Am Bull 97: 1208-123 1
Grundmann G, Morteani G (1985) The young uplift and thermal history of the central Eastern Alps (Austriantaly), evidence from apatite f ~ s i o n track ages. Jahrb Geol Bundesanst (Wien) 128: 197-216
Guennoc P, Pouit G, Nawar Z (1988) The Red Sea: his tory and associated mineralization. In: Manspeizer W (ed) Triassic-Jurassic r i t i ig , parts A and B. Deve- lopm Geotectonics 22: 957-982, Elsevier, Amsterdam
Guidish TM, Kendall CG, Lerche SC, Toth DJ, Yarzar RF (1985) Basin evaluation using burial history calcula- tions: an overview. Am Assoc Petrol Geol Bull 69: 92-105
Guilbert JM, Park C F Jr (1986) The geology of ore deposits. Freeman, New York, 985 p
Gursky H-J (1988) GeEge, Zusammensetzung und Genese der Radiolarite im ophiolitischen Nicoya-Komplex (Coasta Rica). Miinstersche Forschungen Geol Paliion- to1 68, 189 p, Geol-Paliiontol Inst MGnster
Gygi RA (1981) Oolitic iron formations: marine or not marine. Eclogae Geol Helv 74: 233-254
Haas 1 (1991) A basic model for Lofer cycles. In: E i s e l e G, Ricken W, Seilacher A (eds) Cycles and events in stratification. Springer, Heidelberg New York, p 722- 732
~ a d l e ~ k ~ (ed) (1986) Drainage basin sediment delivery. Proc Symp Albuquerque, IAHS Int Comm on Con- tinental Erosion, IAHS Pub1 159
Hallam A (1984) Pre-Quaternary sea-level changes. Ann Rev Earth Planet Sci 12: 205-243
Hallam A (1988) A reevaluation of Jurassic eustacy in the light of new data and the revised Exxon curve. In: Wigus CK, Hastings BS, Posamentier H, Van Wago- ner J , Ross CA, Kendall CGSC (eds) Sea-level chan- ges: an integrated avvroach. Soc Econ Paleontol Mine- :I spec pui i 42: 261-273
Hallam A. Bradshaw MJ (1979) Bituminous shales and oolithic ironstones as kdicat'ors of transgressions and regressions. J Geo1 Soc London 136: 157-164
Halbach P, Friedrich G, Stackelberg U von (1988) The manganese nodule belt of the Pacific ocean: geological environment, nodule formation, and mining aspects. Enke, Stuttgart, 254 p
Hallock P, Schlager W (1986) Nutrient excess and the
demise of coral reefs and carbonate platforms. Palaios 1: 389-398
Hamilton EL (1976) Variations of density and porosity with d e ~ t h in d e e ~ s e a sediments. J Sediment Petrol 46: 286300
Hampton MA (1972) The role of subaqueous debris flow m generating turbidity currents. Jour Sediment Petrol 42: 775-793-
Harn~ton MA (1979) Buovancv in debris flows. J Sediment * .
petrol 49:' 753-758 Han MW. Suess E (19891 Subduction-induced Dore fluid - - ~
vent& and thd fokation of authigenic iarbonates along the Cascadia continental margin: implications of the global Ca-cycle. Palaeogeogr Palaeoclimatol Palaeoecol 7 1 : 97- 1 18
Hancock JM (1989) Sea-level changes in the British region during the Late Cretaceous. Proc Geol Assoc 100: 565-594
Hanor JS (1987) Origin and migration of subsurface sedi- mentary brines. Lecture Notes for Short Course 21, Soc Econ Paleontol Mineral, 247 p
Haq BU, Hardenbol J , Vail PR (1987) Chronology of fluctuating sea levels since the Triassic. Science 235: 1156-1 167
Harden JW, Matti JC (1989) Holocene and late Pleistocene slip rates on the Sand Andreas fault in Yucaipa, Cali- fornia, using displaced alluvial fan deposits and soil chronology. Geol Soc Am Bull 101: 1107-1 117
Hardie LA (1987) Dolomitization: a critical view of some current views. J Sediment Petrol 57: 166-183
Harms JC, Fahnestock RK (1965) Stratification, bed forms, and flow phenomena (with an example from the Rio Grande). Soc Econ Paleontol Mineral Spec Pub1 12: 84-115
Harms JC, Southard JB, Walker RG (1982) Shallow ma- rine environments - a comparison of some ancient and modem examples. In: Structures and sequences in clastic rocks. Soc Econ Palwntol Mineral Short Course 9: 8.1-8.51
Hart BS, Plint AG (1989) Gravelly shoreface deposits: a comparison of modem and ancient facies sequences. Sedimentology 36: 551-557
Hart BS, Vantfoort RM, Plint AG (1990) Is there evidence for geostrophic currents preserved in the sedimentary record of inner to middle shelf deposits? - Discussion. J Sediment Petrol 60: 633-635
Hattin DE (1986a) Interregional model for deposition of Upper Cretaceous pelagic rhythmites, U.S. Western Interior. Paleoceanography 1 : 483-494
Hattin DE (1986b) Carbonate substrates of the Late Cre- taceous Sea, Central Great Plains and Southern Rocky Mountains. Palaios 1: 347-367
Hattin DE (1989) Global perspective on Cretaceous shelf- sea chalk deposits. 28 th Int Geol Congr, Abstr 2: 38- 39, Washington DC
Hay WB (1987) The past and future of scientific ocean drilling. In: Kozlowsky EA (ed) 27th Int Gwl Congr, Moscow 1984, General Proc 27-40
Hay WW, Shaw CA, Wold CN (1989) Mass-balanced pa- leogeographic reconstructions. Geol Rundsch 78: 207- 242
Hayes MO (1980) General morphology and sediment pat- terns in tidal inlets. Sediment Geol 26: 139-156
Heckel PH (1986) Sea-level curve for Pennsylvanian eus- tatic marine transgressive-regressive depositional cy- cles aalong mid-continent outcrop belt, North Ame- rica. Geology 14: 330-334
Heezen BC, Hollister CD (1971) The face of the deep. Oxford Univ Press, New York, 659 p
Hegarty KA, Weissel JK, Mutter JC (1988) Subsidence history of Australia's southern margin. Am Assoc Petrol Geol Bull 72: 615-635

Hein JR, Obradovic J (1989) Siliceous deposits of the Tethys and Pacific regions. In: Hein JR, Obradovic J (eds) Siliceous deposits of the Tethys and Pacific regions. Springer, New York Heidelberg, p 1-17
Hein JR, Parrish JT (1987) Distribution of siliceous de- posits in space and time. In: Hein JR (ed) Siliceous sedimentary rock-hosted ores and petroleum. Van Nostrand Reinhold, New York, p 10-57
Heling D (1988) Ton- und Siltsteine. In: Fiichtbauer H (ed) Sedimente und Sedimentgesteine. Schweizerbart, Stutt- gart, p 185-231
Heller F, Liu Tungsheng (1984) Magnetism of Chinese loess deposits. Geophys J Royal Astron Soc 77: 125- 141
Heller PL, Angevine C (1985) Sea-level cycles during the growth of Atlantic-type oceans. Earth Planet Sci Lett 75: 417-426
Hem JD (1983) Study and interpretation of the chemical characteristics of natural water, 3rd ed. US Geol Surv Water-Supply Pap 2254: 263 pp
Hemleben C, Swinburne NHM (1991) Cyclical deposition of plattenkalk facies. In: Einsele G, Ricken W, Sei- lacher A (eds) Cycles and events in stratigraphy. Springer, Heidelberg New York, p 572-591
Hempton MR, Dunne LA (1984) Sedimentation in pull- a ~ a r t basins: active examules and eastern Turkev. J deology 92: 513-530 -
Henderson-Sellers B. Henderson-Sellers A (1989) Model- ling the ocean cbmate for the early h i h e a n : Palaeo- geogr Palaeoclimatol Palaeoecol (Global and Planetary Change Section 113) 75: 195-221
Henrich R (1990) Cycles, rhythms, and events in Quater- nary Arctic and Antarctic laciomarine deposits. In: Bleil U, Thiede J ( 4 s ) Geokgical history of the polar oceans: Arctiv versus Antarctic. Kluwer, Dordrecht, p 213-244
Herbert TD, D'Hondt SL (1990) Precessional climatic cyclicity in Late Cretaceous-Early Tertiary marine sediments: a high resolution chronometer of Creta- ceous-Tertiaw b o ~ n d a ~ events. Earth Planet Sci Lett 99: 263-275
Herbert TD, Stallard RF, Fischer AG (1986) Anoxic events, productivity rhythms, and the orbital signature in a mid-Cretaceous deep-sea sequence from central Italy. Paleoceanography 1 : 495-506
Hesse R (1974) Longdistance continuity of tur- bidites:Possible evidence for an Early-Cretaceous trench-abyssal plain in the East Alps. Bull Geol Soc Am 85: 859-870
Hesse R (1975) Turbiditic and non-turbiditic mudstone of Cretaceous flysch sections of the East Alps and other basins. Sediientolopv 22: 387-416
Hesse R (1 986) Early diagknetic pore waterlsediment inter- action: modem offshore basins. Geosci Canada 13.3: 165-196
Hesse R (1989a) "Drainage systems" associated with mid- ocean channels and submarine yazoos: alternative to submarine fan depositional sistems. Geology 17: 1148-1151
Hesse R (1989b) Silica diagenesis: origin of inorganic and replacements cherts. Earth Sci Rev 26: 253-284
Hesse R, Butt A (1976) Paleobathymetry of Cretaceous turbidite basins of the East Alps relative to the calcite compensation level. J Geol 34: 505-533
Hesse R, Chough SK (1980) The Northwest Atlantic mid- ocean channel of the Labrador Sea: 11. Deposition of parallel laminated levee-muds from the viscous sub- layer of low density turbidity currents. Sedimentology 27: 697-711
Hesse R, Lebel J, Gieskes JM (1985) Interstitial water chemistry of gas hydrate bearing sections on the Mid-
dle-America Trench Slope Deep Sea Drilling Project, Leg 84. In: Von Huene R, Aubouin J, et al., Init Repts DSDP 84: 727-737, US Govt Print Office, Washington
Heward AP (1978) Alluvial fan sequence and mega- sequence models: with examples from Westphalian D- Stephanian B coalfields, northern Spain. In: Miall AD (ed) Fluvial Sedimentology, Can Soc Petrol Geol Mem 5: 669-702
Hieke W (1984) A thick Holocene homogenite from the Ionian abyssal plain (eastern Mediterranean). M a ~ e Geol 55: 63-78
Higgs R (1990) Is there evidence for gwstrophic currents preserved in the sedimentary record of inner to middle shelf deposits? - discussion. J Sediment Petrol 60: 630-632
Hill PR (1984) Facies and sequence analysis of Nova Scotian slope muds: turbidite vs "hemipelagic" deposi- tion. In: Stow DAV, Piper DJW (eds) Fine-grained sediments: deepwater urocesses and facies. G a l Soc Spec Pub1 15: 311-318
Hinz K. Kiieler FC. Richter I. Seibold E (1971) Refle- xiohsseHmische'~ntersuchun~en mit e&er pieumati- schen Schallquelle und einem Sedimentecholot in der westlichen Ostsee. Meyniana (Kiel) 21 : 17-24
Hinz K, Mutter JC, Zehnder CM, and the NGT Study Group (1987) Symmetric conjugation of wntinent- ocean boundary structures along the Norwegian and East Greenland margins. Marine and Petrol Geol 4: 166-187
Hinze C, Meischner D (1%8) Gibt es rezents Rotsedimente in der Adria? Marine Geol6: 53-71
Hird K, Tucker ME (1988) Contrasting diagenesis of two Carboniferous oolites from South Wales: a tale of climatic influence. Sedimentology 35: 587-602
Hiswtt RN, Wilson RCL, Gradstein FM, h j a l k e V, Garcia-Mondkjar J, Boudreau RR, Wishart HA (1990) Comparative stratigraphy and subsidence his- tory of Mesozoic rift basins of Nolth Atlantic. Am Assoc Petrol Geol Bull 74: 60-76
Hobert LA, Wetzel A (1989) On the relationship between silica and carbonate diagenesis in deep-sea sediments. Geol Rundsch 78, 3: 765-778
Hoffmann A (1989) Mass extinctions: the view of a scep tic. J Geol Soc London 146: 21-35
Hoffmann PF (1988) United plates of America, the birth of a craton: early Proterozoic assembly and growth of Laurentia. Annu Rev Earth Planet Sci 16: 573-603
Hoffmann PF (1989) Speculations on Laurentia's first gigayear (2.0 to 1.0 Ga). Geology 17: 135-138
Hohberger KH, Einsele G (1979) Die Bedeutung des G- sungsabtrags verschiedener Gesteine f i r die Land- schalbentwicklung in Mitteleuropa. Z Geomorph NF 23: 361-382
Holland HD (1984) Tne chemical evolution of the atmos- phere and oceans. Princeton Univ Press, Princeton, 582 p
Holler P, Krumsiek K, Stein R (1990) Erste Ergebnisse von ODP-Leg 128 (Japan See). In: Beiersdorf H (ed) Deutsche Forschungsgemeinschafl, Protokoll Kollo- quium im SPP "Ocean Drilling ProgramIDeep Sea Drilling Project" in Bremen, Bonn, p 47-49
Holmes CW (1986) Salt-induced diagenesis of argillaceous sediments. In: Mumpton FA (ed) Studies in diagene sis. US Geol Surv Bull 1578: 347-362
Holser WT (1984) Gradual and abrupt shifts in ocean chemistry during Phanerozoic time. In: Holland HD, Trendall AF ( 4 s . ) Patterns of change in Earth evolu- tion, Springer, Berlin Heidelberg New York, p 123- 143.

Homewood P, AUen PA (1981) Wave-, tide-, and current- controlled sandbodies of Miocene molasse, western Switzerland. Am Assoc Petrol Geol Bull 65: 2534- 2545
Homewood P, Caron C (1983) Flysch of the western Alps. In: Hsii KJ (ed) Mountain building processes. Acade- mic Press, London, p 155-186
Homewood P, Allen PA, W i m s GD (1986) Dynamics of the molasse basin of western Switzerland. In: Allen PA, Homewood P, Williams G (eds) Foreland basins: an introduction. Spec Publ Int Assoc Sedimentol 8: 199-217, Blackwell, Oxford
Horie S (1978) Lacustrine sedimentation. In. Fairbridge RW, Bourgwis J ( 4 s ) The Encyclopedia of sedimen- tology. Dowden, Hutchinson & Ross, Stroudsburg, p 421427
Houseknecht DW (1988) Intergranular pressure solution in four quartzose sandstones. J Sediment Petrol 58: 228- 246
Houten FB van (1973) Origin of red beds: a review - 1961-1971. Annu Rev Earth Planet Sci 1: 39-61
Howard JD, Reineck H-E (1981) Depositional facies of high energy beach to offshore sequence: comparison with low energy sequence. Am Assoc Petrol Geol Bull 65: 807-830
Howell DG, Crouch JK, Greene HG, McCulloch DS, Ved- der JG (1980) Basin development along the late Meso- zoic and Cainozoic California margins: a plate tectonic margin of subduction, oblique subduction and trans- form tectonics. In: Ballance PF, Reading HG (eds) Sedimentation in obliqueslip mobile zones. Spec Publ Int Assoc Sedimentol 4, Blackwell, Oxford, p 43-62
Hsii KJ (1972) Origin of saline giants: a critical review after the discovery of the Mediterranean evaporite. Earth Sci Rev 8: 371-396
Hsii KJ (1974) Mtlanges and their distinction from olis- tostromes. Soc Econ Palwntol Mineral Spec Publ 19: 321-333
Hsii KJ (1978) When the Black Sea was drained. Scient American 23813: 52-63
Hsii KJ (1989) Origin of sedimentary basins of China. In: Zhu X (ed)(1989) Chinese sedimentary basins. El- sevier, Amsterdam, p 207-227
Hsii KJ, Jenkyns HC ( 4 s ) (1974) Pelagic sediments on land and under the sea. Int Assoc Sedimentol Spec Publ 1, Blackwell, Oxford
Hsfi KJ, Kelts K (eds) (1984) Quaternary geology of Lake Ziirich: An interdisciplinary investigation by deep lake drilling. Contributions to Sedimentology 13, Schwei- zerbart, Stuttgart
Hsii KJ et al. (1977) History of the Mediterranean salinity crisis. Nature 267: 399-403
Huang TC, Stanley DJ (1974) Current reversal at 10,000 years B.P. at the Strait of Gibraltar - a discussion. Marine G w l 17: MI-M7
Hubbard DK, Miller AI, Scaturo D (1990) Production and cycling of calcium carbonate in a shelf-edge reef sys- tem (St. Croix, U.S. Virgin Islands): applications to the nature of reef systems in the fossil record. J Sedi- ment Petrol 60: 335-360
Hubbard RJ (1988) Age and significance of sequence boun- daries in Jurassic and Early Cretaceous rifted conti- nental margins. Am Assoc Petrol Geol Bull 72: 49-72
Huc AY (1980) Origin and formation of organic matter in recent sediments and its relation to kerogen. In: Du- rand B (ed) Kerogen. Editions Technip, Paris, p 445- 474
Hudson JD (1982) Pyrite in ammonite-bearing shales from the Jurassic of England and Germany. Sedimentology 29: 639-667
Hughes CJ (1983) Ignwus petrology. Elsevier, Amsterdam
Hughes Clarke JE, Shor AN, Piper DJW, Mayer LA (1990) Largescalecurrent-induced erosion and deposi-
th of the 1929 Grand Banks turbidity E&~t .y&enlohgy 37: 613629
Hunt JW (1989) Sedimentation rates and coal formation in the Permian basins of eastern Australia. In: Lyons PC, Alpern B ( 4 s ) Peat and coal: origin, facies, and depo- sitional models. Elsevier, Amsterdam, p 259-274
Hunter RE (1977) Basic types of stratification in small wlian dunes. Sedimentology 24: 361-388
Hunter RE (1981) Stratification styles in wlian sandstones: some Pennsylvanian to Jurassic examples from the western Interior, U.S.A. In: Ethridge FG, Flores RM (eds) Modem and ancient nonmarine depositional environments. Soc Econ Paleontol Mineral Spec Publ 31: 315-329
Hurford AJ (1991) Uplift and cooling pathways derived from fission track analysis and mica dating: a review. G w l Rundsch 80: 349-368
Hutchinson DR, Klitgord KD (1988) Evolution of rift basins on the continental margin off southern New England. In: Manspeizer W (ed) Triassic-Jurassic rifting, parts A and B. Developm Geotectonics 22, Elsevier, Amsterdam, p 81-98
Hynes A (1990) Two-stage riftiig of Pangea by two dif- ferent mechanisms. Geology 18: 323-326
Ibbeken H (1983) Jointed source rock and fluvial gravel controlled by Rosin's law: a grain size study in Cala- bria, South Italy. J Sediment Petrol 53: 1213-1231
Iijima A (1988) Diagenetic transformations of minerals as exemplified by zeolites and silica minerals - a Japanese view. In: Chilingarian GV, Wolf KH ( 4 s ) Diagene- sis, 11. Developm Sedimentol 43, Elsevier, Amster- dam, p 147-211
Iijima A, Matsumoto R, Tada R (1985) Mechanism of sedimentation of rhythmically bedded chert. Sediment G w l 41: 221-233
Illies H, Greiner G (1978) Rhinegraben and the Alpine system. Bull G w l Soc Am 89: 77@782
Ingersoll RV (1982) Initiation and evolution of the Great Valley forean: basin of northern and central Califor- nia, U.S.A. In: Leggett JK (ed) Trench-forearc geol- ogy: modem and ancient active plate margins. Geol Soc Spec Publ 10: 458-467
Ingersoll RV, Ernst WG ( 4 s ) (1987) Cenozoic basin deve- lopment in coastal California. Rubey, vol6, Prentice Hall, New Jersey, 496 p
Iriondo MH (1988) A comparison between the Ama~on and Paran& river systems. In: Degens ET, Kempe S, Naidu S (eds) Transport of carbon and minerals in major world rivers, lakes and estuaries, Part 5, Mitt Gwl-Paliiontol Inst Univ Hamburg, SCOPE1UNEP Sonderb 66: 77-92
Irwin H, Curtis C, Coleman M (1977) Isotopic evidence for source of diagenetic carbonates formed during burial of organic-rich sediments. Nature 269: 209-213
Isaacs CM (1984) Hemipelagic deposits in a Miocene ba- sin, California: toward a model of lithologic variation. In: Stow DAV, Piper DJW ( 4 s ) Fie-grained sedi- ments: deepwater processes and facies. G w l Soc Spec Publ 15: 481-496
Isaacs CM, Pisciotto KA, Gamson RE (1983) Facies and diagenesis of the Miocene Monterey Formation, Cali- fornia: a summary. In: Iijima A, Hein JR, Siever R (eds) Siliceaous deposits in the Pacific region. El- sevier, Amsterdam, p 247-282
Jackson J, McKenzie D (1988) Rates of active deformation in the Aegean Sea and surrounding regions. Basin Res 1: 121-128

Jackson MPA, Talbot CJ (1986) External shape, strain rates, and dynamics of salt structures. Gwl Soc Am Bull 97: 305-323
Jacobshagen VH (ed) (1988) The Atlas system of Morocco. Lecture Notes Earth Sci 15, Springer, Berlin Heidel- berg New York, 499 p
Jacobshagen V, Giese P (1986) Bau und gwdynamische Entwicklung der Helleniden - ein Gesamtbild. In: Jacobshagen V (ed) Gwlo ie von Griechenland. Bei- triige zur Regionalen Geo f ogie der Erde 9. Borntrii- - geE Berlin, 37-279
James NP (1983) Reef environment. In: Scholle PA. Be- bout DG, ~ ' o o r e CH (eds) Carbonate depositional en- vironments. Am Assoc Petrol Gwl Mem 33:345-440
James NP (1990) Cool water carbonate sediments: viable analogues for Palwzoic limestones? Abstracts of Papers. 13th Int Sedimentol Congress, Notlingham, England, Int Assoc Sedimentol, p 245-246
James NP, Bone Y (1989) Petrogenesis of Cenozoic, temperate water calcarenites, South Australia: a model for meteoriclshallow burial diagenesis of shallow water calcite cements. J Sediment Petrol 59: 191-203
Jansa LF, Steiger TH, Bradshaw M (1984) Mesozoic car- bonate deposition on the outer continental margin off Morocco. In: Hinz K, Wmterer EL et al., Init Repts DSDP 79: 857-891, US Govt Print Office, Washing- ton
Jansa LF, W~edmann J (1982) Mesozoic-Cenozoic develop ment of the eastern North American and northwest African continental margin: a comparison. In: Rad U von, Hinz K, Sarnthein M, Seibold E ( 4 s ) Gwlogy of the Northwest African continental margin. Springer, Berlin Heidelberg New York, p 215-269
Jarvis GT (1984) An extensional model of graben sub- sidence - the first staee of basin evolution. Sediment - - - - - - ~ ~ w
Gwl 40: 13-31 Jarvis I (1980) The initiation of phosphatic chalk sedi-
mentation - the Senonian (Cretacwus) of th Anglo- Paris Basin. In: Bentor YK'(ed) ~ a r i n e phosphoriies. Soc Econ Palwntol Mineral Spec Pub1 29: 167-192
Jauzein A (1984) Sur la valeur de quelques hypothkses relatives h la genbe de gramdes s h e s salines. Rev G h l Dynam G h g r Phys 25: 149-156
Jenkyns HC (1986) Pelagic environments. In: Reading HG (ed) Sedimentary environments and facies. Blackwell, Oxford, p 343-398
Jenkyns HC, Wmterer EL (1982) Palawceanography of Mesozoic ribbon radiolarites. Earth Planet Sci Lett 60: 351-375
Jenvon MK (1986) Salt tectonics. Elsevier Avvlied Science . . - Publ, Lbndon New York, 191 p Johnson AM (1984) Debris flows. In: Brunsden D. Prior
DB (4s ) 'slope instability. Wiey, Chichester, p 257- 36 1
~ohnson HD, Baldwin CT (1986) Shallow siliciclastic seas. In: Reading HG (ed) Sedimentary facies and environ- ment, 2nd edn. Blackwell, Oxford, p 229-252
Johnson SY (1989) Significance of loessite in the Maroon Formation (Middle Pennsylvanian to Lower Permian), Eagle Basin, northwest Colorado. J Sediment Petrol 59: 782-791
Johnson Ibach LE (1982) Relationship between sedimen- tation rate and total organic carbon content in ancient marine sediments. Am Assoc Petrol Gwl Bull 66: 170-188
Johnsson MJ (1990) Tectonic versus chemical-weathering controls on the composition of fluvial sands in tropical environments. Sedimentology 37: 713-726
Jones FW, Majorowicz JA (1987) Some aspects of the hydrodynamicx of the western Canadian sedimentary basin. In: Goff JC, W i m s BPI (eds) Fluid flow in
sedimentary basins and aquifers. Gwl Soc Spec Publ 34: 79-85
Jonsson P, Carman R, Wulff F (1990) Laminated sedi- ments in the Baltic - a tool for evaluating nutrient mass balances. AMBIO 1913: 152-158
Jordan T (1981) Thrust loads and foreland basin evolution, Cretacwus. Western United States. Am Assoc Petrol Gwl Bull 65: 2506-2520
Jordan T. Isacks B. Allmendineer RW. Brewer JA. Ramos and an do CJ '(1983) ~ n d & n tectonics related to gw- metry of subducted Nazca plate. Gwl Soc Am Bull 94: 341-361
Kalin 0 , Bernoulli D (1984) Schizosphaerella Deflandre and Dangeard in Jurassic deeper-water carbonate sedi- ments, Mazagan continental margin (Hole 547B) and Mesozoic Tethys. In: Hinz K, Wmterer EL, et al., Init Repts DSDP 79: 411-448, US Govt Print Office, Washington
Karig DE (1986) The framework of deformation in the Nankai Trough. In: Kagami H, Karig DE, Coulbourn WT, et al., Init Repts DSDP 87: 927-940, US Govt Print Office, Washington
Karig DE, Shaman I11 GF (1975) Subduction and accre- tion in trenches. Gwl Soc Am Bull 86: 377-389
Karner GD, Steckler MS, Thorne JA (1983) Long-term thermo-mechanical pro rties of the continental lithos- phere. Nature 304: 259253
Kashai EL (1988) A review of the relations between the tectonics, sedimentation and petroleum occurrences of the Dead Sea-Jordan rift system. In: Manspeizer W (ed) Triassic-Jurassic rifting, parts A and B. Deve- lopm Gwtectonics 22: 883-909, Elsevier, Amsterdam
Kassens H (1990) Verfestigte Sedimentlagen und seis- mische Reflektoren: Frijhdiagenese und Palio-Ozeano- graphie in der Nonvegischen See. Doct thesis, Math- natunviss Fak, Univ Kiel, 100 p
Kassens H, Wetzel A (1989) Das Alter des Himalaya. Die Gwwissenschahn 7, 1: 15-20, VCH Verlag, Wein- heim
Kassler P (1973) The structural and gwmorphic evolution of the Persian Gulf. In: Purser BH (ed) The Persian Gulf. Springer, Berlin Heidelberg New York, p 11-32
Kasten K, Mascle J, et al. (1988) ODP Leg 107 in the Tyrrhenian Sea: insights into passive margin and back- arc basin evolution. Gwl Soc Am Bull 100: 1140- 1156
Kasting JF (1989) Long-term stability of the Earth's cli- mate. Palaeogwgr Palaeoclimatol Palawecol (Global and Planetary Change Section 1) 75: 123-136
Kastner M (1981) Authi enic silicates in deepsea sedi- ments: formation a n t diagenesis. In: Emiluni C (4) The sea, v 7, The oceanic lithosphere. Wiey-lntersci- ence, New York, p 915-980
Keefer, D.K., & Johnson, A.M. (1983): Earth flows: morphologbilization, and movement. US Gwl Surv Prof Pap 1264: 1-56
Kauffman EG (1983) A geological and palwceanographic overview of Cretaceous history in the Western Interior seaway of North America. In: Kauffman EG (ed) depositional environments and palwclimates of the Greenhorn tectono-eustatic cycle, Rock Canyon an- ticline, Pueblo, Colorado. Gwl Soc Am, Penrose Conf Guidebook, p 3-32
Kauffman EG (1984) Paleobiogwgraphy and evolutionary response dynamic in the Cretaceous Western Interior seaway of North America. In: Westermann GEG (ed) Jurassic-C~ceous biochnology and palmgeography of North America. Gwl Assoc Canada Spec Pap 27: 273-306

Kauffman EG (1988) Concepts and methods of high-resolu- tion event'strat&raphy.-Annu Rev Earth planat Sci 16: 605-654
Kauffman EG, Walliser OH (eds)(1990) Extinction events in earth histo Lecture Notes in Earth Sciences, 30, Springer, ex Heidelberg New York, 432 p
Kauffman EG, Elder WP, Sageman BB (1991) High-reso- lution correlation: a new tool in chronostratigraphy. In: Einsele G, Ricken W. Seilacher A (eds) Cycles and events in stratigraphy. Springer, Heidelberg-~ew York. D 795-819
Keen ~ ~ , . ~ e a u m o n t C, Boutilier R (1983) A summary of thermo-mechanical model results for the evolution of continental margins based on three rifting processes. In: Watkins JS, Drake CL eds) Studies in continental margin geology. Am Assoc Petrol Geol Mem 34: 725- 728
~ e h l e - ~ ~ (1988) The origin of salt structures. In: Schrei- ber BC (ed) Evaporites and hydrocarbons. Columbia Univ Press, New York, p 345-404
Kelts K (1981) A comparison of some aspects of sedi- mentation and translational tectonics from the Gulf of California and the Mesozoic Tethys, Northern Pen- ninic margin. Eclogae Geol Helv 74: 317-338
Kelts K, Arthur MA (1981) Turbidites after ten years of deep-sea drilling - wringing out the mop? In: Warme JE, Douglas RG, Wmterer EL (eds) The Deep Sea Drilling Project: a decade of progress. Soc Econ Pale- onto1 Mineral Spec Pub1 32: 91-127
Kelts K, Hsii KJ (1978) Freshwater carbonate sedimen- tation. In: Lerman A (ed) Lakes - chemistry, geology, physics. Springer, New York Heidelberg, p 295-323
Kelts KR, McKenzie JA (1982) Diagenetic dolomite for- mation in Quaternary anoxic diatomaceous muds of Deep Sea Drilling Project Leg 64, Gulf of California. In: Curray JR, Moore DG et a]., Init Repts DSDP 64: 553-569, US Govt Print Office. Washington
Kempe S, ~ e g e n s ET (1985) An eariy soda o k n ? Chemi- cal Geol 53: 95-108
Kempe S, Kazmierczak J (1991) Chemistry and stromato- lites of the sea-linked Satonda Crater lake, Indonesia: a recent model for the Precambrian sea? Chemical Geol (in press)
Kempe S, Kazmierczak J, Degens ET (1989) The soda ocean concept and its bearing on biotic evolution. In: Crick RE (ed) Origin, evolution and modem aspects of biomineralisation in plants and animals. Proc Inter- nat Symp Biomineralisation, Arlington, Texas, May 1986. Plenum Press, New York, p 29-43
Kem~er E (1987) Das Kiima der Kreide-Zeit. Geol Jahrb {~annover) A %: 5-185
Kendall AC (1983) Subaaueous eva~orites. In: Walker RG (ed) ~adies iodels, L~eosc i ~ & a d a Reprint ~ e r - 1 , p 159- 174
Kendall AL (1988) Aspects of evaporite basin stratigraphy. In: Schreiber BC (ed) Evaporites and hydrocarbons. Columbia Univ Press, New York, p 11-65
Kendall CGSC, Schlager W (1981) Carbonates and relative changes in sea level. Marine Geo144: 181-212
Kennett JP (1982) Marine eeoloev. Prentice-Hall. Enzle- - -. , .= wood dliffs,'813 p
Kennett JP. von der Borch CC et al. (1986) Init Re~ t s DSDP'~O, parts 1 and 2, US Govt h in t office] ~ a - shington
Kenter JAM (1990) Carbonate platform flanks: slope angle and sediment fabric. Sedimentology 37: 777-794
Kern JP (1980) Origin of trace fossils in Polish Carpathian flysch. Lethaia 13: 347-362
Kidwell SM (1991) Taphonomic feedback (liveldead inter- actions) in the genesis of bioclastic beds: keys to re- constructing sedimentary dynamics. In: Einsele G,
Ricken W, Seilacher A (eds) Cycles and events in stratigraphy. Springer, Berlin Heidelberg New York, D 682-695
~ i r n t k r l e ~ MM (1979) Origin of oolitic iron formations. J Sediment Petrol 49: 1 1 1-132
Kieke GC, Sternberg RW (1989) The effect of particle settling velocity on computed suspended sediment con- centration profiles. Marine Geol 90: 159-174
King CAM (1972) Beaches and coasts, 2nd edn. Edward Arnold, London, 570 p
Kingston DR, Dishroon CP, W i m s PA (1983) Global basin classification system. Am Assoc Petrol Geol Bull 67: 2175-2193
Kinsman DJJ (1975a) Rift valley basins and sedimentary history of trailing continental margins. In: Fischer AG, Judson SS (eds) Petroleum and global tectonics. Princeton, Univ Press, 322 p
Kinsman DJJ (1975b) Salt floors to geosynclines. Nature 5: 375-371
Kipphut GW (1988) Sediments and organic carbon cycling in an Arctic lake. Mitt Geol-Palionto1 Inst, Univ Hamburg, SCOPElUNEP Sonderb H 66: 129-135
Kirkland DW, Evans R (eds)(1973) Marine evaporites: origin, diagenesis, and geochemistry. Benchmark Papers in Geology. Dowden, Hutchinson & Ross, Stroudsburg, 426 p
Klein G deV (1970) Depositional and dispersal dynamics of intertidal sand bars. J Sediment Petrol 40: 1095-1127
Klein G deV (1971) A sedimentary model of determining paleotidal range. Geol Soc Am Bull 82: 1095-1127
Klein G deV (1985a) The frequency and periodicity of preserved turbidites in submarine fans as a quantitative record of tectonic uplift in collision zones. Tectono- physics 119: 181-193
Klein G deV (1985b) The control of depositional depth, tectonic uplift, and volcanism on sedimentation proces- ses in the back-arc basins of the western Pacific ocean. J Geo1 93: 1-25
Klein G deV (1985~) Sandstone depositional models for exploration of fossil fuels, 3rd edn. IHRDC Publ, Boston, 209 p
Klein G deV (1987) Current aspects of basin analysis. Sediment Geol 50: 95-1 18
Klein G deV (1989) Origin of coal-bearing cyclothems of North America. Geology 17: 152-155
Klein G deV (1990) Pennsylvanian time scales and cycle periods. Geology 19: 455-457
Klein G deV, Hsui AT (1987) Origin of cratonic basins. Geology 15: 1094-1098
Klein G deV, Ryer TA (1978) Tidal circulation patterns in h a m b r i a n , Paleozoic and Cretaceous epeiric and mioclinal shelf seas. Geol Soc Am Bull 89: 1050-1058
Knauer GA, Redalje DG, Hamson WG, Karl DM (1990) New production at the VERTEX time-series site. Deep-sea Res 37: 1121-1 134
Knight RJ, McLern JR (eds)(1986) Shelf sands and sand- stones. Canad Soc Petrol Geol Mem 11, 347 p
Koenigswald W von, Michaelis W (1984) Fossillagerstitte Messel - Literaturiibersicht der Forschungsergebnisse aus den Jahren 1980-1983. Geol Jahrb Hessen 112: 5- 26
K6gler FC, Larsen B (1979) The West Bornholm basin in the Baltic Sea: geological structure and Quaternary sediments. Boreas 8: 1-22, Oslo
Koerschner I11 WF, Read JF (1989) Field and modelling studies of Cambrian carbonate cycles, Virginia A p palachians. J Sediment Petrol 59: 654-687
Kohout FA, Meisler H, Meyer FW, Johnston RH, Leve GW, Wait RL (1988) Hydrogeology of the Atlantic continental margin. In: Sheridan RE, Grow JA (eds) The geology of North America, vol 1-2, The Atlantic wntinental margin, US. Geol Soc Am, p 463-483

Kolla V, Coumes F (1987) Morphology, internal structure, seismic stratigraph and sedimentation of Indus fan. Am Assoc Petrol L&l Bull 71: 650677
Kolodny Y (1981) Phosphorites. In: Emiliani C (ed) The oceanic lithosphere. The sea vol7, Wiley-Interscience, New York, p 981-1023
Komar PD (1969) The channelized flow of turbidity cur- rents with application to Monterey deep sea fan chan- nel. J Gwphys Res 74: 4544-4558
Komar PD (1970) The competence of turbidity current flow. Geol Soc Am Bull 81: 1555-1562
Komar PD (1985) The hydraulic interpretation of turbidites from their grain sizes and sedimentary structures. Sedimentology 32: 395-408
Kominz MA, Bond GC (1986) Geophysical modelling of the thermal histom of foreland basins. Nature 320: - -
252-256 Konta J (1985) Mineralogy and chemical maturity of sus
pended matter in major rivers sampled under the SCOPEIUNEP Roject. Mitt Geol-Paliontol Inst Univ Hamburg H 58: 569-592
Konta J (1988) Minerals in rivers. In: Degens ET, Kempe S, Naidu S (eds) Transpoe of carbon and minerals in major world rivers, lakes and estuaries, Part 5, Mitt Geol-Paliiontol Inst Univ Hamburg, SCOPEIUNEP Sonderb 66: 341-365
Kotwicki V, Isdale P (1991) Hydrology of Lake Eyre, Australia. Palawgeogr Palaeoclimatol Palaeoecol 84: 87-98
Emmelbein K (1986) Brinkrnanns AbriR der Geologic, Band 2, Historische Gwlogie, 12113th edn. Enke, Stuttgart, 400 p
Krumbein WC, Sloss LL (1963) Stratigraphy and sedimen- tation, 2nd edn. Freeman, San Francisco, 660 p
Krumm H, Petschick R. Wolf M (1988) From diagenesis to anchimetamorphism, u per Austroalpine sdimen- taw cover in Bavaria and Tirol. Geodvnam Acta 2. 1: 33147
Kuenen PH (1950) Marine gwlogy. Wdey, New York London, 551 p
Kuenen PH, M i g l i o ~ i CI (1950) Turbidity currents as a cause of graded bedding. J Geol 58: 91-127
Kuhnt W, Thurow J, Wiedmann J, Herbin JP (1986) Oce- anic anoxic conditions around the CenomanianITuro- nian boundary and the response of the biota. Mitt Gwl-Pakontol Inst Univ Hamburg, SCOPE UNEP Sonderb H 60: 205-246
Kukal Z (1971) Gwlogy of recent sediments. Academia Pub1 House, Prague, Academic Press, London, 490 p
Kukal Z (1990) The rate of geological processes. Earth Sci Rev 28: 1-284
Kusznir NJ, Karner GD, Egan S (1987) Geometric, ther- mal and isostatic consequences of detachments in wntinental lithosphere extension and basin formation. In: Beaumont C, Tankard AJ (eds) Sedimentary basins and basin-forming mechanisms. Can Soc Petrol Geol Mem 12: 185-203
Labaume P, Mutti E, Se uret M (1985) Megaturbidites: a depositional model k m the Eocene in the SW-Pyre- nean foreland basin. Gw-Marine Lett 7: 91-101
Lancaster N (1990) Palaeoclimatic evidence from sand seas. Palawgeogr Palaeoclimatol Palaeoecol76: 279- 290
Lancelot Y (1973) Chert and silica diagenesis in sediements from the Central Pacific. In: Wmterer EL, Ewing JI et al, Init Repts DSDP 17: 377405, US Govt Print Of- fice, Washington
Land LS (1967) Diagenesis of skeletal carbonates. J Sedi- ment Petrol 37: 914-930
Land LS (1985) The origin of massive dolomite. J Geol Educ 33: 112-125
Langbein R (1987) The Zechstein sulphates: The state of the art. In: Peryt TM (ed) The Zechstein facies in Europe. Lecture Notes Earth Sci 10, Springer, Berlin Heidelberg New York, p 143-188
Langford RP (1989) Fluvialeaolian interactions: part I, modem systems. Sedimentology 36: 1023-1035
Langford RP, Chan MA (1989) Fluvial-aeolian interaction: part 11, ancient systems. Sedimentology 36: 1037-105 1
Large D (1988) The evaluation of sedimentary basins for massive sulfide mineralization. In: Friedrich GH, Herzig PM (1988) Base metal sulfide deposits in sedi- mentary and volcanic environments. Soc Geol Applied to Mineral Deposits, Spec Pub1 5, Springer, Berlin Heidelberg New York, p 3-11
Larsen G, Chilingar GV (1979) Diagenesis in sediments and sedimentary rocks. Developm Sedimentol 25A, Elsevier, Amsterdam, 519 p
Larouzibre FD de, Montenat C, Ott D'Estevou P, Gri- veaud P (1987) Bvolution simultank de bassins Nhgbnes en wmpression et en extension dans un couloir de dhrochement; Hinojar et Mazarr6n (Sud- est de 1'Espagne). Bull Cent Rech Explor Prod Elf- Aquitaine 1 1 : 23-38
Larsen H (1980) Ecoloev of hv~ersaline environments. In: ~isse'nbaum A (edy~~pe%aline brines and evaporitic environments. Develoom Sedimentol 28. Elsevier. Amsterdam, p 2340 '
Lash GG (1985) Recognition of trench fdl in orogenic flysch sequences. Geology 13: 867-870
Lash GG (1988) Along-strike variations in foreland basin evolution: possible evidence for wntinental collision along an irregular margin. Basin Res 1: 78-83
Last WM (1990) Lacustrine dolomite - an overview of modem, Holocene, and Pleistocene occurrences. Earth Sci Rev 27: 221-263
Lawrence DT, Doyle M, Ai ner T (1990) Stratigraphic simulation of sedimentary%asins: concepts and calibra- tion. Am Assoc Petrol Gwl Bull 74: 273-295
Leckie DA (1988) Wave-formed, coarse-grained ripples and their relationship to hummocky cross-stratification. J Sediment Petrol 58: 607622
Leckie DA, Krystinii LF (1989) Is there evidence for geostrophic currents preserved in the sedimentary k r d bf inner to middle shelf deposits? J ~edimeit Petrol 59: 862-870
Lee HJ, Chough SK (1989) Sediment distribution, disper- sal, and budget in the Yellow Sea. Marine Geol 87: 195-205
Lee YL, Friedman GM (1987) Deepburial dolomitization in the Ordovician Ellenbureer G r o u ~ carbonates. west Texas and southeastern New ~ e k c o . J sediment Petrol 57: 544-557
Leeder MR (1982) Sedimentology - process and product. Allen & Unwin, London, 344 p
Leeder MR (1991) Denudation, vertlcal crustal movements and sedimentary basin infill. Geol Rundsch 80: 441- 458
Leeder MR, Gawthorpe RL (1987) Sedimentary models for extensional tilt-blockhalf-graben basins. In: Coward MP, Dewey JF, Hancock PL (eds) Continental exten- sional tectonics. Gwl Soc Spec Pub1 28: 139-152
Lees BG, Cook PG (1991) A conceptual model of lake bamer and compound lunette formation. Palaeogeogr Palaeoclimatol Palaeoecol 84: 271-284
Lefort P, Cuney M, Deniel C, France-Lanord C, Sheppard SMF, Upreti BN, Vidal P (1987) Crustal generation of the Himalayan leuwgranites. Tectonophysics 134: 39-57
Leg 101 Scientific Party (1988) Leg 101 - an overview. In: Austin JA, Schlager W et a]., Proc ODP, Sci Results 101: 455-472, College Station TX (Ocean Drilling Project)

Leg 122 Shipboard Scientific Party (1989) Breakup of Gondwanaland. Nature 337: 209-210
Leggett JK (ed) (1982) Trench-forearc geology: modem and ancient active plate margins. Geol Soc Spec Publ 10, 576 p
Lein R (1985) Das Mesozoikum der Niirdlichen Kalkalpen als Beispiel eines gerichteten Sediientationsverlaufes infolge ibrtschreitender Krustenausdiinnung. Archiv f Laaentrittenforsch Ceol Bundesanst (Wicn) 6: 117-128
L e i n e n ~ , Sarnthein M (eds)(1989) ~al&cl imatolo~~ and paleometeorology: modem and past patterns of global atmos heric transport. NATO AS1 Series C, 282, ~eidef , Dordrecht, 909 p
Leitch EC (1984) Marginal basins of the SW Pacific and the preservation and recognition of their ancient ana- logues: a review. In: Kokehar BP, Howells RE (eds) Marginal basin geology: volcanic and associated sedi- mentary and tectonic rocesses in modem and ancient marginal basins. ~eoi ' soc Spec Publ 16: 97-108
Lemcke K (1974) Vertikalbewegungen des vormesozoi- schen Sockels im niirdlichen Alpenvorland vom Perm bis zur Gegenwart. Eclogae Geol Helv 67: 121-133
Lemcke K (1988) Geologie von Bayern I. Das bayerische Alpenvorland vor der Eiszeit. Schweizerbart, Stuttgart, 175 p
Lemoalle J, Dupont B (1976) Iron-bearing oolites and the present conditions of iron sedimentation in Lake Chad. In: Amstutz GC, Bernard AJ (eds) Ores in sediments. Int Union Geol Sci A3, Springer, Berlin Heidelberg New York, p 167-178
Lemoine M, Triimpy R (1987) Preoceanic rifting in the Alps. Tsctonophysics 133: 305-320
Le Pichon X (1982) Land-locked oceanic basins and con- tinental collision: the eastern Mediterranean as a case example. In: Hsii KJ (ed) Mountain building proces- ses. Academic Press, London, p 201-21 1
Le Pichot X, Cochran IR (eds) (1988) The Gulf of Suez and the Red Sea riftme. Tectonovhvsics 153. 1-4
.a . . (Spec Iss), 320 p
Le Plchon X. S~buet JC (1981) Passive mareins. a model of formation. J Gmphys ~ e s 86: 3708-5720
Lerman A (1980) Geochemical processes. Wiley, New York, 481 p
Lever A, McCave IN (1983) Eolian components in Cretaceous and Tertiary North Atlantic sediments. J Sediment Petrol 53: 81 1-832
Lewis KB (1980) Quaternary sedimentation in the Hikuran- gi oblique-subduction and transform margin, New Zealand. In: Ballance PL, Reading HG (eds) Sedi- mentation in oblique-slip mobile zones. Int Assoc Sediment01 Spec Publ 4, Blackwell, Oxford, p 171- 189
Limarino CO, Spalletti LA (1986) Eolian Permian deposits in west and northwest Argentina. Sediment Geol 49: 109-127
Link GJ, Osborne RH (1982) Sedimentary facies of Ridge Basin. In: Crowell JC, Link GJ (eds) Geologic history of Ridge Basin, southern California. Soc Econ Paleon- to1 Mineral, Pacific Sect p 63-78
Lipman PW, Mullineaux DR (eds) (1981) The 1980 erup- tions of Mount St. Helens Washington. US Geol Surv Prof Pap 1250, 844 p
Lippmann F (1973) Sedimentary carbonate minerals. Sprin- ger, Berlin Heidelberg New York, 226 p
Lisitzin AP (1972) Sedimentation in the world ocean. Soc Econ Palwntol Mineral Spec Publ 17
Liu ~uan~hua(l990)~ermo-~a;boniferous~aleo~eo~ra~h~ and coal accumulation and their tectonic control in the North and South Chiia continental plates. Int J Coal Geol 16; 73-117
Liu Tungshen (1988) Loess in China, 2nd edn. Springer, Berlin Heidelberg New York, China Ocean Press
Beijing, Springer Series in Physical Environments, 224 u
Liu ~hen'xia, Huang Yichang, Zhang Qinian (1989) Tidal current rideges in the southwestern Yellow Sea. J Sediment Petrol 59: 432-437
Livingstone DA (1963) Chemical composition of rivers and lakes. US Geol Surv Prof Pap 440, 64 pp
Locke S, Thunell RC (1988) Paleoceanographic record of the last glaciallinterglacial cycle in the Red Sea and Gulf of Aden. Palaeogeogr Palaeoclimatol Palaeoecol 64: 163-187
Logan BW (1987) The MacLeod evaporite basin western Australia. Am Assoc Petrol Geol Mem 44, 140 p
Long B, Sala M, Durand J, Michaud L (1989) G&mktrie d'un lobe deltaique en contexte dgressif. Bull Cent Rech Explor-Prod Elf-Aquitaine 13 : 189-213
Lotze E (1957) Steinsalz und Kalisalze, 2nd edn, Band 1. Borntriger, Berlin, 466 p
Loutit TS, Hardenbol J, Vail PR, Baum GR (1988) Con- densed sections: the key to age determination and cor- relation of continental margin sequences. In: Sea-level changes - an integrated approach. Soc Econ Paleontol Mineral Spec Pub1 42: 183-213
Lowe DR (1976) Grain flow and grain flow deposits. J Sediment Petrol 46: 188-199
Lowe DR (1979) Sediment gravity flows: their clas- sification and some problems of application to natural flows and deposits. Soc Econom Paleontol Mineral Spec Publ 27: 75-82
Lowe DR (1982) Sediment gravity flows: 11. Depositional models with special reference to the deposits of high- density turbidity currents. J Sediment Petrol 52: 279- 297
Lucas J, Wvot L (1984) Synthbe de l'apatite par voie bacteriknne partir de matikre organique phospha- tke et de divers carbonates de calcium dans des eaux douce et marine naturelles. Chemical Geol 42: 101- 118
Lucia FJ (1972) Recognition of evaporite-carbonate shore line sedimentation. In: Rigby JK, Hamblin WK (eds) Recognition of ancient sedimentary environments. Soc Econ Paleontol Mineral Spec Publ 16: 160-191
Liitzner H (1989) Sedimentation rates of Variscan molasse basins 'in ce;ltral Europe. Z Geol Wissensch (Berlin) 17-9: 859-868
Lyon-Caen H, Molnar P (1985) Gravity anomalies, flexure of the Indian plate, and the structure, support and evolution of the Himalaya and the Ganga basin. Tecto- nics 4: 513-538
Lyons PC, A1 rn B (eds) (1989) Peat and coal: origin, facies, ancf%positional models. Elsevier, Amsterdam, 882 p
Ma Li (1985) Subtle oil pools in Xingshugang Delta, Songliao Basin. Am Assoc Petrol Geol Bull 69: 1123- 1132
Macdonald DIM (1986) Proximal to distal variation in a linear turbidite trough: implications for the fan model. Sedimentology 33: 243-259
Mackenzie FT (1990) Sea level change, sediment mass and flux and chemostratigraphy. In: Ginsburg RN, Beau- doin B (eds) Cretaceous resourceds, events and rhythms. NATO AS1 Series C 304, Kluwer, Dord- recht, p 289-304
MacLwd N, Keller G (1991) Hiatus distribution and mass extinctions at the Cretaceous/Tertiarv boundarv. Gw- logy 19: 497-501
Mader D (ed) (1985) As~ects of fluvial sedimentation in the lower ~ r i a s s k ~intsandstein. Lecture Notes Earth Sci 4, Springer, Berlin Heidelberg New York, 626 p
Magara K (1976) Thickness of removed sedimentary rocks, paleopressure, and palwtemperature, southwestern

part of western Canada Basin. Am Assoc Petrol Geol Bull 60: 554-565
Magara K (1978) Compaction and fluid migration - prac- tical petroleum geology. Elsevier, Amsterdam, 319 p
Maillart J (1989) Differentiation entre tectonique syn ~Mimentaire et compaction differentielle. Thbse 1'Ecole Nationale Superieure des Mines, Paris, 193 p
Maizels J (1989) Sedimentology, paleoflow dynamics and flood history of Jokulhlaup deposits: paleohydrology of Holocene sediment sequences in southern Iceland sandur deposits. J Sediment Petrol 59: 204-223
Malouta DN, Gorsline DS, Thornten SE (1981) Processes and rates of recent (Holocene) basin filling in an ac- tive transform margin: Santa Monica Basin, California continental borderland. J Sediment Petrol 51: 1077- 1096
Manheim lT (1970) The diffusion of ions in uncon- solidated sediments. Earth Planet Sci Lett 9: 307-309
Manheim m, Pratt RM, McFarlin F P (1980) Composition and origin of phosphorite deposits of the Blake Plate- au. In: Bentor YK (ed) Marine phosphorites - geo- chemistry, occurrence, genesis. Soc Econ Paleontol Mineral Spec Pub1 29: 117-137
Mann P, Hempton MR, Bradley DC, Burke K (1983) Development of pull-apart basins. J Geol91: 529-554
Manspeizer W (1985) The Dead Sea Rift: impact of cli- mate and tectonism on Pleistocene and Holocene sedi- mentation. In: Biddle KT, Christie-Blick N (eds) Strike-slip deformation, basin formation, and sedimen- tation. Soc Econom Paleontol Mineral Spec Publ 37: 143-158
Manspeizer W (ed) (1988aj Triassic-Jurassic rifting, parts A and B. Developm Geotectonics 22, Elsevier,Amster- dam, 998 p
Manspeizer W (1988b) Triassic Jurassic rifting and opening of the Atlantic: an overview. In: Manspeizer W (ed) Triassic-Jurassic rifting, parts A and B. Developm Geotectonics 22, Elsevier, Amsterdam, p 41-79
Martin JH, Knauer GA, Karl DM, Broenkow WW (1987) VERTEX: carbon cycling in the northeast Pacific. Deep-Sea Res 34, 2A: 267-285
Martinsen OJ (1989) Styles of soft-sediment deformation on a Namurian (Carboniferous) delta slope, Western Ireland Namurian Basin, Ireland. In: Whateley MKG, P i c k e ~ g KT (eds) Deltas; sites and traps for fossil fuels. Geol Soc Spec Publ 41: 167-177
Martinson DG, Pisias NG, Hays JD, Imbrie J , Moore TC, Shackleton NJ (1987) Age dating and orbital theory of ice ages: development of a high-resolution 0- 3,000,000-year chronostratigraphy. Quat Res 27: 1-29
Marzo M (1986) Secuencias fluvioeolicas en el Buntsand- stein de Macizo de Garraf (Provincia de Barcelona). Cuad Geol M r i c a (Madrid) 10: 207-233
Marzo M, Nijman W, Puigdefabregas C (1988) Architec- ture of the Castissent fluvial sheet sandstones, Eocene, South Pyrenees, Spain. Sedimentology 35: 719-738
Mascle A, Moore JC, et al. (1988) Proc. ODP, Init Repts 110 A. College Station, Texas (Ocean Drilling Pro- ject), 603 P
Mascle G, Htrail G, Van Haver T, Delcaillau B (1986) Structure et 6volution des bassins d'6pisuture et de p6risuture li& h la chAaine Himalayenne. Bull Cent Rech Explor-Prod Elf-Aquitaine 10: 18 1-203
Massari F, Grandesso P, Stefani C, Jobstraibitzer PG (1986) A small polyhistory foreland basin evolving in a context of oblique convergence: the Venetian basin (Chattian to Recent, Southern Alps, Italy). In: Allen PA, Homewood P, Williams G (eds) Foreland basins: an introduction. Spec Publ Int Assoc Sediment01 8: 141-168
Mathews WH (1975) Cenozoic erosion and erosion sur-
faces of eastern North America. Am J Sci 275: 818- 824
Matter A, Douglas RG, Perch-Nielsen K (1975) Fossil preservation, geochemistry, and diagenesis of pelagic carbonates from the Shatsky Rise, Northwest Pacific. In: Larson RL, Moberly R, et al., Init Repts DSDP 32: 891-921, US Govt Print Office, Washington
Matter A, Homewood P, Caron C, Rigassi D, Stuijvenberg J van, Weidmann M, Winkler W (1980) Flysch and molasse of western and central Switzerland. In: Triim- py R (ed) Geology of Switzerland, a guide-book, part B: 261-293. Schweiz Geol Kommission, Wepf, Base1
Matthess G (1973) Die Beschaffenheit des Grundwassen. Lehrbuch der Hydrologic, Bd 2. Borntriiger, Berlin Stuttgart, 324 p
Matthews RK (1974) Dynamic stratigraphy. Prentice Hall, Englewood Cliffs, 370 p
Matthews RK (1984a) Dynamic stratigraphy, an introduc- tion to sedimentation and stratigraphy, 2nd edn. Pren- tice-Hall, Englewood Cliffs, 489 p
Matthews RK (1984b) Oxygen isotope record of icevo- lume history: 100 milhon years of glacioeustatic sea- level fluctuation. In: Schlee JS (ed) Interregional un- conformities and hydrocarbon accumulation. Am As- soc Petrol Geol Mem 36: 97-107
Mattick RE, Phillips RL, Rumpler J (1988) Seismic strati graphy and depositional framework of sedimentary rocks in the Pannonian basin in southeastern Hungary. In: Royden LH, Horvith F ( 4 s ) The Pannonian basin: a study in basin evolution. Am Assoc Petrol Geol Mem 45: 117-145
Mayer L (1987) Subsidence analysis of the Los Angeles basin. In: Ingersoll RV, Ernst WG (eds) Cenozoic basin development of coastal California. Rubey vol6, Prentice-Hall, Englewood Cliffs, p 299-318
Maynard JB (1983) Geochemistry of sedimentary ore depo- sits. Springer, New York Heidelberg, 305 p
Maynard JB, Valloni R, Yu H-S (1982) Composition of modem deep-sea sands from arc-related basins. In: Leggett JK (ed) Trench-forearc geology: modem and ancient active plate margins. Geol Soc Spec Publ 10: 551-561
McArthur JM, Thomson J, Jarvis I, Fallick AE, Birch GF (1988) Eocene to Pleistocene phosphogenesis of wes- tern South Africa. Marine Geol 85: 41-63
McBride EF (1989) Quartz cement in sandstones: a review. Earth Sci Rev 26: 69-1 12
McCarthy J, Scholl DW (1985) Mechanism of subduction accretion along the central Aleutian Trench. Geol Soc Am Bull 96: 691-701
McCave IN (1984) Erosion, transport and deposition of fine-grained marine sediments. In: Stow DAV, Piper DJW (eds) Finegrained sediments: deepwater pro- cesses and facies. Geol Soc Spec Publ 15: 35-64
McDonald DA, Surdam RC (eds)(1984) Clastic diagenesis. Am Assoc Petrol Geol Mem 37, 434 p
McGhee GR, Bayer U (1985) The local signature of sea-le vel changes. In: Bayer U, Seilacher A (eds) Sedimen- tary and evolutionary cycles. Lecture Notes Earth Sci (Springer) 1: 98-1 12
Mchargue TR, Webb JE (1986) Internal geometry, seismic facies, and petroleum potential of canyons and inner fan channels of the Indus submarine fan. Am Assoc Petrol G w l Bull 70: 161-180
McIlreath JA, James NP (1984) Carbonate slopes. In: Walker RG (ed) Facies models, 2nd edn. Geosci Ca- nada Reprint Ser 1: 245-257
McKee ED ( 4 ) (1979) A study of global sand seas. US Geol Sur Prof Pap 1052, 429 p
McKee ED, Ward WC (1983) Eolian environments. In: Scholle PA, Bebout DG, Moore CH (eds) Carbonate

depositional environments. Am Assoc Petrol Geol Mem 33: 131-170
McKenzie DP (1978) Some remarks on the development of sedimentary basins. Earth Planet Sci Lett 40: 25-32
McQueen HWS, Beaumont C (1989) Mechanical models of tilted block basins. In: Price RA (ed) Origin and evo- lution of sedimentary basins and their energy and mineral resources. Geophs Monograph 48, IUGG vol 3, Int Union Geodesy Geophysics, p 65-71
MCgard F (1984) The Andean orogentc period and its major structures in central and southern Peru. J Geol Soc London 141 : 893-900
Meischner KD (1964) Allodapische Kalke, Turbidite in riff-nahen Sedimentations-becken. In: Bouma AH, Brouwer A (eds) Turbidites. Elsevier, Amsterdam, p 156-191
Menard HW, Smith SM, Pratt RM (1965) The Rhone deep sea fan. In: Whitard WF, Bradshaw R (eds) Sub- marine ewloey and aeo~hysics. Butterworths, Lon- - - - don, p f71-2ga
Meulenkamp JE, Wortel MJR, Van Wamel WA, Spakman W, Hoogerduyn Strating E (1988) On the Hellenic subduction zone and thk eeodvnamic evolution of Crete since the Middle ~ i o & n e . - ~ e c t o n o ~ h ~ s i c s 146: 203-215
Meybeck M (1979) Concentration des eaux fluviales en Blements majeurs et apports en solution aux ocRans. Rev G b 1 Dynam G b g r Phys 21: 215-246
Meybeck M (1983) Atmospheric inputs and river transport of dissolved substances. In: Dissolved loads of rivers and surface water quantitylquality relationships. Int Assoc Hydro1 Sci Publ 141: 173-192
Meybeck M (1987) Global chemical weathering of surficial rocks estimated from river dissolved loads. Am J Sci 287: 401-426
Meybeck M (1989) The Quality of riven: from pristine stage to global pollution. Palaeogeogr Palaeoclimatol Palawecol75: 283-309
Meyer AJ, Landais P, Brosse E, Page1 M, Carisey JC, Krewdl D (1989) Thermal history of the Permian for- mations from the Breccia Pi s area (Grand Canyon region, Arizona). Geol R u n g h 78: 427-438
Miall AD (1978) Fluvial sedimentology. Can Soc Petrol Geol Mem 5, 859 p
Miall AD (1980) Cyclicit and the facies model concept in fluvial deposits. B u Y ~ a n Petrol Geol 28: 59-80
Miall AD (1981) Alluvial sedimentary basins: tectonic setting and basin architecture. In: Miall AD (ed) Sedi- mentation and tectonics in alluvial basins. Geol Soc Canada Spec Pap 23: 1-33
Miall AD (1984) Principles of sedimentary basin analysis. Springer, New York Heidelberg, 490 p
Miall AD (1985) Architectural-element analysis: a new method of facies analysis applied to fluvlal deposits. Earth Sci Rev 22: 261-308
Middleton GV, Hampton MA (1976) Subaqueous sediment transport and deposition by gravity flows. In: Stanley DJ, Swift DJP (eds) Manne sediment transport and environmental management. Wdey, New York, p 197- 21 8
~ i l l g h ~ , Barakat H (1988) Geology of the Safaga Concession, northern Red Sea, Egypt. Tectonophysics 153: 125-136
Milliman JD, Meade RJ (1983) World-wide delivery of river sediment to the oceans. J Geol 91: 1-21
Milliman JD, Qin YS, Ren ME, Saito Y (1987) Man's influence on the erosion and transport of sediment by Asian rivers: the Yellow River (Huanghe) example. J Geol95: 751-762
Millot G (1964) Ghlogie des argiles. Masson, Paris, 500 P
Mills HH (1976) Estimated erosion rates on Mount Rai- nier, Washington. Geology 4: 401-406
Mitchell AHG, Reading HG (1986) Sedimentation and tectonics. In: Reading HG (ed) Sedimentary environ- ments and facies, 2nd edn. Blackwell, Oxford, p 471- 519
Mitra S (1988) Effects of deformation mechanisms on reservoir potential in central Appalachian overthrust belt. Am Assoc Petrol Geol Bull 72: 536-554
Moberly R, Shepherd GL, Coulbourn WT (1982) Forearc and other basins, continental margin of northern and southern Peru and adjacent Ecuador and Chide. In: Leggett JK (ed) Trench-forearc geology: modem and ancient active plate margins. G w l Soc Spec Publ 10: 171-189
Molenaar CM, Rice DD (1988) Cretaceous rocks of the Western Interior Basin. In: Sloss LL (ed) The geology of North America, vol D-2: Sedimentary cover - North American craton: US Geol Soc Am, Boulder, p 77-82
Molnia BF (ed) (1983) Glacial-marine sedimentation. Ple- num Press, New York, 844 p
Montadert L , de Charpal 0, Roberts D, Guennoc P, Sibuet JC (1979) Northeast Atlantic continental margins: rifting and subsidence processes. In: Talwani M, Hay W, Ryan WBF (eds) Deep drilling results in the At- lantic ocean: continental margins and aleoenviron- ment. Am Geophys Union, Maurice {wing Ser 3, Washington DC, p 154-184
Montenat C, Ott d'Estevou P, Masse P (1987) Tectonic- sedimentary characters of the Betic Neogene basins evolving in a crustal transcurrent shear zone (SE Spain). Bull Cent Rech Explor-Prod Elf-Aquitaine 11: 1-22
Montenat C, et a1 (1988) Tectonic and sedimentary evo- lution of the Gulf of Suez and the northwestern Red Sea. In: Le Pichot X, Cochran JR (eds) The Gulf of Suez and the Red Sea rifting. Tectonophysics 153,l-4 (Spec Iss): 161-177
Moore CH (1989) Carbonate diagenesis and porosity. D e velopm Sediment01 46, Elsevier, Amsterdam, 338 p
Moore DG (1969) Reflection profiling studies of the Cali fornia continental borderland: structure and Quater- nary turbidite basins. Geol Soc Am Spec Pap 107, 142 p, 18 plates
Moore DG, Buffmgton EC (1968) Transform faulting and the growth of the gulf of California since late Mio- cene. Science 161: 1238-1241
Moore DG, Curray JR, Einsele G (1982) Salado-Vinorama submarine slide and turbidity current off southeast tip of Baja California. In: Curray JR, Moore DG et al, Init R e ~ t s DSDP 64. US Govt Print Office. Washing- - ton, p 1071-1082 '
Moore GF, Curray JR, Emmel FJ (1982) Sedimentation in the Sunda Trench and forearc region. In: Legeett JK (ed) Trench-forearc geology: Godern and ancient active plate margins. Geol Soc Spec Publ 10: 245-258
Moore JC, Byrne T (1987) Thickening of fault zones: a mechanism of mklange formation in accreting sedi- ments. Geology 15: 1040-1043
Moore TC, Van Andel TH, Sancetta C, Pisias N (1978) Cenozoic hiatuses in pelagic sediments. Micropaleon- tology 24: 113-138
Morales C (ed) (1979) Saharan dust-mobilization, trans- port, deposition. Wiey, New York, 316 p
Morgan JP, Shaver RH (eds)(1970) Deltaic sedimentation modem and ancient. S ~ e c Publ Soc Econ Paleontol Mineral 15, 312 pp
Morgenstern NR (1967) Submarine slumping and the initia- tion of turbidity currents. In: Richards AF (ed) Marine geotechnique.-~rbana, Univ Illinois press, p-189-220
Morley CK, Nelson RA, Patton TL, Munn SG (1990) Transfer zones in the East African rift system and their relevance to hydrocarbon exploration in rifts. Am Assoc Petrol G w l Bull 74: 1234-1253
Moms PA (1988) Volcanic arc reconstruction using discri- minant function analysis of detrital cliiopyroxene and amphibole from the New England fold belt, eastern Australia. J G w l 96: 299-31 1
Moms RJ (1987) Turbidite flows as a source of organic matter in deep water marine deposits: evidence from Quaternary sediments on the Madeira abyssal plain. Mkm Soc G h l Fr NS 151: 43-53
Morton RA (1988) Nearshore responses to great storms. G w l Soc Am Spec Pap 229: 7-22
Morton RA. Nummedal D (edsM1989) Shelf sedimentation. shelf sequences and related hydrocarbon accumulation: Gulf Coast Section, Soc Econ Palwntol Mineral 220 P
Moxon IW, Graham SA (1987) History and controls of subsidence in the late Cretaceous-Tertiary Great Val- ley forearc basin, California. Gwlogy 15: 626-629
Mozley PS (1989) Relation between depositional environ ment and the elemental composition of early diagenetic siderite. Gwlogy 17: 704-706
Miiller G (1966) The new Rhine delta in Lake Constance. In: Shirley ML (ed) Deltas in their gwlogic frame- work. Houston G w l Soc 107: 107-124
Miiller G (1988) Salzgesteine (Evaporite). In: Fiichtbauer H (ed) Sedimente und Sedimentgesteine. Schweizer- bart, Stuttgart, p 435-500
Miiller G, Irion G, FBrstner U (1972) Formation and dia- genesis of inorganic Ca-Mg carbonates in the lacus- trine environment. Naturwissenschaften 59: 158-164
Miiller PJ, Suess E (1979) Productivity, sedimentation rate and sedimentaj organic carbon wntent in the oceans. Deepsea Res 26: 1347-1362
Mullins HT, Cook HE (1986) Carbonate apron models: alternatives to submarine fan model for paleoenviron- mental analysis and hydrocarbon exploration. J Sedi- ment G w l 48: 37-79
Mullins HT, Gardulski AF, Hinchey El, Hine AC (1988) The modem carbonate ramp slope of central West Florida. J Sediment Petrol 58: 273-290
Mumpton FA (ed) (1986) Studies in diagenesis. US G w l Surv Bull 1578, US Govt Print Office, Washington, 368 p
Murat A, Got H (1987) Middle and late Quaternary deposi- tional sequences and cycles in the eastern Mediter- ranean. Sedimentology 34: 885-899
Mums RJ (1985) Middle East: Stratigraphic evolution and oil habitat. In: Demaison G, Mums RJ (eds) Petro- leum geochemistry and basin evaluation. Am Assoc Petrol G w l Mem 35: 353-372
Mutti E (1977) Distinctive thin-bedded turbidite facies and related depositional environments in the Eocene Hecho Group (Southcentral Pyrenees, Spain). Sedimentology 24: 107-131
Mutti E (1984) The Hecho Eocene submarine fan system, southcentral Pyrenees, Spain. Gw-Marine Lett 3: 199-202
Mutti E, Normark WR (1987) Comparing examples of mo- dern and ancient turbidite systems: problems and con- cepts. In: Legget JK, Zuffa GG (eds) Marine clastic sedimentology. Graham and Trotman, p 1-38
Mutti E, Ricci Lucchi F (1978) Turbidites of the northern Apennines: introduction to facies analysis. In: Nilsen T (ed) Am G w l Inst Reprint Ser 3: 127-166 (translation of 1972 article in Italian)
Mutti E, Ricci Lucchi F, Seguret M, Zanzucchi G (1984) Seismoturbidites: a new group of resedimented depo- sits. Marine G w l 55: 103-116 .
Mutti E, Remacha E, Sgavetti M, Rose11 J, Valloni R, Zamorano M (1985) Stratigraphy and facies charac- teristics of the Eocene Hecho Group turbidite systems, southcentral Pyrenees. Field-trip guide book, 6th European Meeting Int Assoc Sediment, Lleida, Spain, Excursion 12, p 521600
Naeser CW (1979) Thermal history of sedimentary basins: fission track dating of subsurface rocks. In: Schlolle PA, Schluger PR (eds) Aspects of diagenesis. Soc Econ Palwntol Mineral Spec Publ 26: 109-112
Naidu AS, Mowatt TC, Somayajulu BLK, Sreeramachan- dra Rao K (1985) Characteristics of clay minerals in the bed loads of major rivers in India. Mitt Gwl-Pal& onto1 Inst Univ Hamburg, SCOPE/UNEP Sonderb 58: 559-568
Nairn AEM, Stehli FG (eds) (1975) The ocean basins and margins, vol 3. The Gulf of Mexico and the Carib- bean. Plenum Press, New York London, 706 p
Neev D, Emery KO (1967) The Dead Sea. Depositional processes and environments of evaporites. G w l Surv Israel Bull 41, 147 p
Nelsen TA, Stanley DJ (1984) Variable deposition rates on the slope and rise off the Mid-Atlantic States. Gw- Marine Lett 3: 37-42
Nelson CH, Maldonado A (1988) Factors controlliig depo- sitional patterns of Ebro turbidite system, Mediter- ranean Sea. Am Assoc Petrol G w l Bull 72: 698-716
Nelson CH, Normark WR, Bouma AH, Carlson PR (1978) Thin-bedded turbidites in modem submarine canyons and fans. In: Stanley DJ, Kelling G (eds) Sedimen- tation in submarine canyons, fans and trenches. Dow- den, Hutchinson & Ross, Stroudsburg, p 177-189
Nemec W, Steel RJ (eds)(1988) Fan deltas - sedimentology and tectonic setting. Blackie, Glasgow, 444 p
Neugebauer HJ (1987) Models of lithospheric thinning. Annu Rev Earth Planet Sci 15: 4 2 1 4 3
Neugebauer J (1974) Some aspects of cementation in chalk. In: Hsii KJ, Jenkyns HC (eds) Pelagic sediments: on land and under the sea. Int Assoc Sedimentol, Spec Publ 1: 149-176
Neuzil CE (1986) Groundwater flow in low-permeability environments. Water Resour Res 22: 1 183-1 195
Newell ND, Rigby JK, Fischer AG, Whiteman AJ, Hickox JE, Bradley JS (1953) The Permian reef complex of the Guadelupe Mountains region, Texas and New Mexico. Freeman, San Francisco, 236 p
Nicols MM (1989) Sediment accumulation rates and rela- tive sea-level rise in lagoons. In: Ward LC, Ashley GM (eds) Physical processes and sedimentology of siliciclasticdominated lagoonal systems. Marine Gwl (Spec Iss) 88: 201-219
Nielsen OB, Sorensen S, Thiede J , Skarbo (1986) Ceno- zoic differential subsidence of North Sea. Am Assoc Petrol G w l Bull 70: 276-298
Nikolaev VG, Vass D, Pogacsas D (1989) Nwgene-Qua- ternary Pannonian basin: a structure of labigenic type. In: Pnce RA (ed) Origin and evolution of sedimentary basins and their energy and mineral resources. Gw- phys Monograph 48 (IUGG vol 3), Am Gwphys Union, Washington DC, p 187-196
Nilsen TH (1982) Alluvial fan deposits. In: Scholle PA, Spearing DR ( 4 s ) Sandstone depositional environ- ments. Am Assoc Petrol G w l Mem 31: 4 9 6 6
Nilsen TH, McLau hlin RJ (1985) Comparison of tectonic framework and depositional patterns of the Hornelen strike-slip basin of Norway and the Rid e and little Sulphur Creek strike-slip basins of ~af i fo rn ia In: Biddle KT, Christie-Blick N (eds) Strikeslip defor- mation, basin formation, and sedimentation. Soc Econ Palwntol Mineral Spec Publ 37: 79-103

Nissenbaum A (ed) (1980) Hypersaline brines and evapo- ritic environments. Develo~m Sedimentol 28, Elsevier. Amsterdam, 270 p
Nitecki MH (ed)(1981) Biotic crises in ecological and evolutionary time. Academic Press, New York, 301 p
North CP, odd SP, Turner JP (1989) Alluvial fans and their tectonoc controls. J Gwl Soc London 146: 507- 508
Notholt AJG, Jarvis I (eds)(1990) Phosphorite research and development. Gwl Soc Spec Publ 52, Blackwell Ox- ford
Nottvedt A, Kreisa RD (1987) Model for the combined flow origin of hummocky cross-stratification. Gwlogy 15: 357-361
Nummedal D (1991) Shallow marine storm sedimentation: the oceanographic perspective. In: Einsele G, Ricken W, Seilacher A (4s ) Cycles and events in stratifica- tion. Springer, Heidelberg New York, p 227-248
Nummedal D, Pikey OH, Howard JD (eds) (1987) Sea level fluctuation and coastal evolution. Soc Econ Pale- onto1 Mineral Spec Publ 41, 267 p
Nummedal D, Swift DJP (1987) Transgressive stratigraphy at sequence-bounding unconformities: some principles derived from Holocene and Crehcwus examples. In: Nummedal D, Pilkey OH, Howard JD (4s ) Sea level fluctuation and coastal evolution. Soc Econom Paleon- to1 Mineral Spec Publ 41: 241-260
Nur A, Ben-Avraham Z (1983) Displaced temnes and mountain building. In: Hsii KJ (ed) Mountain building processes. Academic Press, London, p 73-84
Oberhiinsli H, Allen PA (1987) Stable isotope signature of Tertiary lake carbonates, eastern Ebro Basin, Spain. Palawgeogr Palaeoclimatol Palaeoecol 60: 59-75
Oberhiinsli R, Stoffers P (eds)(1988) Hydrothermal activity and metaliferous sediments on the ocean floor. Marine Geol (Spec Iss) 84, 314: 145-284
O'Brien GW, Hams JR, Milnes HR, Veeh HH (1981) Bacterial origin of East Australian continental margin phosphorites. Nature 294: 442-444
Odin GS (ed) (1982) Numerical dating in stratigraphy. Wiey, Chichester, 1094 p
Odin GS (ed) (1988) Green marine clays. Developm Sedimentol 45, Elsevier, Amsterdam, 445 p
Odin GS, Matter A (1 98 1) De glauconiamm origine. Sedi- mentology 28: 61 1-641
Odin GS, Morton AC (1988) Authigenic green particles from marine environments. In: Chilingarian GV, Wolf KH (eds) Diagenesis, 11. Developm Sedimentol 43: Elsevier, Amsterdam, p 213-264
Odin GS, Debenay JP, Masse JP (1988a) The verdine facies deposits identified in 1988. In: Odin GS (ed) Green marine clays. Developm Sedimentol 45, El- sevier, Amsterdam, p 131-158
Odin GS, Knox RW O'B, Gygi RA, Guerrak S (1988b) Green marine clays from the oolitic ironstone facies: Habit, mineralogy, environment. In: Odin GS (ed) Green marine clays. Developm Sedimentol 45, El- sevier, Amsterdam, p 29-52
Ouwehand PJ (1986) Werden Phosphorite wirklich friih- diagenetisch gebildet? Beispiele aus der helvetischen "Mittekeiden der Ostschweiz: In: Bechstidt T, Knit- ter H (4s ) Erstes Treffen deutschsprachiger Sedimen- tologen, Freiburg i.B., p 86-89
Ogg JG, Haggerty J, Sarti M, von Rad U (1987) Lower Cretaceous pelagic sediments of Deep Sea Drilling Project Site 603, western North Atlantic: a synthesis. In: van Hinte JE, Wise SW, et al., Init Repts DSDP 93: 1305-1331, US Govt Print Office, Washington
Ollier C (1969) Weathering. Elsevier, New York Olsen PE (1986) A &million year lake record of Early
Mesozoic orbital climatic forcing. Science 234: 842- 848
Opdyke BN, Wilkinson BH (1990) Paleolatitude diitribu- tion of Phanerozoic marine ooids and cements. Palaeo- gwgr Palaeoclimatol Palawecol 78: 135-148
Ori GG, Friend PF (1984) Sedimentary basins formed and camed piggyback on active thrust sheets. Gwlogy 12: 47547R .,-
Ori GG, Roveri M (1987) Geometries of Gilbert-type deltas and large channels in the Meteora Conglome- rate, Meso-Hellenic basin (Oligo-Miocene), central Greece. Sedimentology 34: 845-859
Orson RA, Simpson RL, Good RE (1990) Rates of sedi- ment accumulation in a tidal freshwater marsh. J Sedi- ment Petrol 60: 859-869
Oschmann W (1991 j Anaerobic - poikiloaerobic - aerobic: a new facies zonation for modem and ancient neritic redox facies. In: Einsele G, Ricken W, Seilacher A (eds) Cycles and events in stratigraphy. Springer, Heidelberg New York, p 565-571
Park WC, Schot EH (1968) Stylolites: their nature and origin. J Sediment Petrol 38: 175-191
Parker A, Sellwood BW ( 4 s ) (1983) Sediment diagenesis. NATO AS1 Series, C, 115, Reidel, Dordrecht, 427 p
Parrish JT (1987) Palaw-upwelling and the distribution of organic-rich rocks. In: Brooks J, Fleet AJ (eds) Marine petroleum source rocks. Gwl Soc Spec Publ 26: 199-205
Pamsh JT, Curtis RL (1982) Atmospheric circulation, upwelling, and organic-rich rocks in the Mesozoic and Cenozoic Eras. Palawgeogr Palaeoclimatol Palaeoecol 40:31-66
Parrish JT, Ziegler AM, Humphreville RG (1983) Upwel ling in the Paleozoic era. In: Thiede J, Suess E (4s) Coastal upwelling - its sediment record. Part B, Sedi- mentary record of ancient coastal upwelling. NATO Conference Ser 4: Marine Sci 10, Plenum Press, New York London, p 553-578
Paul J (1982) Zur Rand- und Schwellenfazies des Kupfer- schiefers. Z Deutsch Geol Ges (Hannover) 133: 571- 605
Paul J (1987) Der Zechstein am Harzrand: Querprofi iiber eine permische Schwelle, Stop 1-23. (Zechstein at the Harz Mountains: a geotraverse across a Permian plat- form.) In: Kulick J, Paul J (eds) Int Symp Zechstein 1987, Exkursionsfihrer (Wiesbaden) 11: 193-276
Payton CE (ed) (1977) Seismic stratigraphy - application to hydrocarbon exploration. Am Assoc Petrol Geol Mem 26
Pedersen TF, Calvert SE (1990) Anoxia vs. productivity: what controls the formation of organic-carbon-rich sediments and sedimentary rocks? Am Assoc Petrol Gwl Bull 74: 454-466
Penland SP, Boyd R, Suter JR (1988) Transgressive depo- sitional systems of the Mississi pi delta plain: a model for bamer shoreline and she8 sand development. J Sediment Petrol 58: 932-949
Pkrez-Arlucea M, Sopena A (1986) Estudio sedimento- logico del Saxoniense y del Buntsandstein entre Mo- lina de Aragon y Albarracin (Cordillera Iberica), Cuad Gwl Ibkrica (Madrid) 10: 117-150
Perrodon A (1988) Bassins saimentaires, provinces p&roli&res et tectonique globale. Bull Cent Rech Explor-Prod Elf-Aquitaine 12, 2: 493-512
Peryt TM (ed)(1987a) The Zechstein facies in Europe. Lecture Notes Earth Sci 10, Springer, Berlin Heidel- berg New York, 272 p
Peryt TM (ed) (198%) Evaporite basins. Lecture Notes Earth Sci 13, Springer, Berlin Heidelberg New York, 188 p

Peryt TM, Hoppe A, Bechstidt T, Kiister J, Pierre C, Richter DK (1990) Late Proterozoic aragonitic cement crusts, Bambui Group, Minas Gerais, Brazil. Sedi- mentology 37: 279-286
Pethick J (1984) An introduction to coastal gwmor phology. Edward Arnold, London
Pettijohn FJ, Potter PE, Siever R (1987) Sand and sand- stone, 2nd edn. Springer, New York Heidelberg, 553 P
Pflug R (1982) Bau und Entwicklung des Oberrheingra- bens. Ertriee der Forschune, Bd 184. Wissensch ~uch~esellscYhaft, Darmstadt, -145 p
Picard MD, High LRJr (1981) Physical stratigraphy of ancient lacustrine demsits. Soc Econ Paleontol Min- eral Spec Publ 31: 233-259
Pickard GL. Emem WJ (1982) DescriDtive ~hvsical o c e - -
anography, 4th edn. 'pergimon P ~ S S , dxfbrd, 249 p Pickering KT, Hiswtt RN, Hein FJ (1989) Deep marine
environments: clastic sedimentation and tectonics. Unwin Hyman, London, 416 p
P i c k e ~ g KT, Stow DAV, Watson MP, Hiscott RN (1986) Deep-water facies, processes and models: a review and classification scheme for modem and ancient sediments. Earth Sci Rev 23: 75-174
Pickford M (1986) Sedimentation and fossil preservation in the Nyanza rift system, Kenya. In: Frostick LE, R e naut RW, Reid I, Tiercelin JJ (4s ) Sedimentation in African r i b . Geol Soc Spec Publ 25: 345-362
Pierre C (1988) Application of stable isotope geochemistry to the study of evaporites. In: Schreiber BC (ed) Eva- porite~ and hydrocarbons. Columbia Univ Press, New York, p 300-344
Pilkey OH, Locker SD, Cleary WJ (1980) Comparison of sand layer geometry on flat floors of 10 modem depo- sitional basins. Am Assoc Petrol Gwl Bull 64: 841- 856
Pinet P, Souridu M (1988) Continental erosion and large- scale relief. Tectonics 7: 563-582
Pigitore NE Jr (1982) The role of diffusion during car- bonate diagenesis. J Sediment Petrol 52: 27-39
Piper DJW, Normark W R (1982) Effects of the 1929 Grand Banks earthquake on the continental slope off eastern Canada. Gwl SUN Canada, Current Res B, Pap 82 - 1B
Piper DJW, Normark W R (1983) Turbidite depositional patterns and flow characteristics, Navy Submarine Fan, California Borderland. Sedimentology 30: 681-694
Piper DJW, Shor AN (1988) The 1929 "Grand Banks" earthquake, slump, and turbidity current. In: Clifton HE (ed) Sedimentologic consequences of convulsive geologic events. Gwl Soc Am Spec Pap 229: 77-92
Piper DJW, Stow DAV (1991) Mud turbidites. In: Einsele G, Ricken W, Seilacher A (4s ) Cycles and events in stratification. Springer, Heidelberg New York, p 360- 376
pis&& KA (1981) Distribution, thermal histories, iso- topic wmpositions and reflection characteristics of siliceous rock recovered by the Deep Sea Drilling Project. Soc Econ Palwntol Mineral Spec Publ 32: 129-147
Pitman WC (1978) Relationship between eustacy and strati- graphic sequences of passive margins. Geol Soc Am Bull 89: 1389-1403
Pitrnan WC 111, Andrews JA (1985) Subsidence and ther- mal history of small pull-apart basins. In: Biddle KT, Christie-Blick N (eds) Strike-slip deformation, basin formation, and sedimentation. Soc Ewn Palwntol Mineral Spec Publ 37: 43-49
Pitrnan WC 111, Golovchenko X (1983) The effect of sea level change on the shelf edge and slope of passive
\ margins. In: Stanley DJ, Moore GT (edsj The shelf- break: Critical interface on continental margins. Soc Econ Paleontol Mineralog Spec Publ 33: 41-58
Pitman WC, Golovchenko X (1988) Sea-level changes and their effect on the stratigraphy of Atlantic-type mar- gins. In: Sheridan RE, Grow JA (eds) The Atlantic continental margin, U.S., The Gwlogy of North Ame rica, vol 112, Geol Soc Am, Boulder, p 429-436
Pliit AG (1988) Sharp-based shoreface sequences and "offshore bars" in the Cardium Formation of Alberta: their relationship to relative changes in sea level. In: Wilgus CK, Hastings BS, Posamentier H, Van Wago- ner J, Ross CA, Kendall CGSC (4s ) Sea-level chan- ges: an integrated approach. Soc Econ Palwntol Mine ral Spec Publ 42: 357-370
Poag CW (ed) (1985) Gwlogic evolution of the United States Atlantic marein. Van Nostrand Reinhold. New - York, 369 p
Poag CW, Swift BA, Schlee JS, Ball MM, Sheets LL (1990) Earlv Cretaceous shelf-edee deltas of the Bal- ?more canion Trough: principal &urces for sediment gravity deposits of the northern Hatteras basin. Geo- logy 18: 149-152
Porada H (1989) Pan-African r i f i and orogenesis in southern to equatorial Africa ancfeastem Brazil. Plb cambrian Res 44: 103-136
Posamentier HW, Vail PR (1988) Eustatic controls on clastic deposition I1 - Sequence and system tract mo- dels. In: Sea-level changes - an integrated approach. Soc Econ Palwntol Mineralog Spec Publ 42: 125-154
Postma G (1986) Classification of sediment gravity-flow deposits based on flow conditions during sedimen- tation. Geology 14: 291-294
Potter PE, Heling D, Shimp NF, VanWie W (1975) Clay mineralogy of modem alluvial muds of the Mississippi River Basin. Bull Cent Rech Pau-SNPA 9: 353-389
Powell RD, Molnia BF (1989) Glacimarine sedimentary processes, facies and morphology of the south-south- east Alaska shelf and fiords. Marine Geol85: 359-390
Prahl FG, Muelhausen LA (1989) Lipid biomarkers as geochemical tools for paleoceanographic study. In: Berger WH et a1 (4s ) Productivity of the ocean: past and present. Life Sci Res Rept 44, Wiey, New York, 27 1-290
Pratt LM (1984) Influence of palmenvironmental factors on preservation of organic matter in Middle Creta- cwus Greenhorn Formation, Pueblo, Colorado. Am Assoc Petrol Gwl Bull 68: 1146-1159.
Pretorius DA (1981) Gold and uranium in Quafiz-pebble conglomerates. In; Skinner BJ (ed) Economic geology: seventy-fifth anniversary vol, Econ Gwlogy, El Paso, p 107-138
Price R 4 (ed) (1989) Origin and evolution of sedimentary basins and their energy and mineral resources. Geophs Monograph 48, IUGG vol3, Int Union Geodesy and Gwphsics
Price SP, Scott B (1991) Pliocene Burdur basin, SW Tur- key: tectonics, seismicity and sedimentation. J Gwl s i c London 148: 345-354
Priesnitz K (1974) Esungsraten und ihre geomorpho- logische Relevanz. In: Poser H (ed) Geomorpho- logische Prozesse und ProzeBkombinationen in der Gegenwart unter verschiedenen Klimabedingungen. Abh Akad Wissensch Giittingen, Math-Physik Klasse, Dritte Folge 29, Vandenhoeck & Ruprecht, Giittingen, p 68-85
Prior DB, Coleman JM (1984) Submarine slope instability. In: Brunsden D, Prior DB (4s ) Slope instability. Wiey, New York, 455 p
Puckett TM (1991) Absolute paleobathymetry of Upper Cretaceous chalks based in ostracodes - evidence from

the Demopolis Chalk (Campanian and Maastrichtian) of the northern Gulf Coastal Plain. Gwlogy 19: 449- 452
Pulham AJ (1989) Controls in internal structure and ar- chitecture of sandstone bodies within Upper Car- boniferous fluvialdominated deltas, County Clare, Western Ireland. In: Whateley MKG, Pickering KT (eds) Deltas: sites and traps for fossil fuels. G w l Soc Spec Publ 41: 167-177
Purdy EG (1963) Recent carbonate facies of the Great Bahama Bank 11. Sedimentary facies. J Gwl71: 472- 497
Purser BH (ed) (1973) The Persian Gulf: Holocene car- bonate sedimentation and diagenesis in a shallow epi continental sea. Springer, Berlin Heidelberg New York, 471 p
Purser BH (1980) SMmentation et diagenkse des car- bonates n6rit'ques recents, tome 1. Publ Inst Francais du petrole, h i t i o n TECHNIP, Paris, 366 p
Purser BH (1985) Coastal evaporite systems. In: Friedman GM, Krumbein WE ( 4 s ) Hypersaline ecosystems. Springer, Berlin Heidelberg New York, p 72-102
Purser BH, Schroeder JH (1986) The diagenesis of reefs: a brief review of our present understanding. In: Schro- eder JH, Purser BH (eds) Reef diagenesis. Springer, Berlin Heidelberg New York, p 424-446
Purser BH, Soliman M, M'Rabet A (1987) Carbonate, evaporite, siliciclastic transitions ~"aternary rift sediments of the northwestern Red Sea. Sediment Geol 53: 247-267
Pve K (1987) Awlian dust and dust de~osits. Academic press, Lbndon, 334
Pye K, Dickson JAD, Scliavon N, Coleman ML, Cox M (1990) Formation of siderite-ME-calciteiron sul~hide ~ n c r k t i o n s in intertidal marsh a i d sandilat sedinients, north Norfolk, England. Sedimentology 37: 325-343
Quinlan G (1987) Models of subsidence mechanism in intracratonic basins and their applicability to North American examples. In: Beaumont C, Tankard AJ ( 4 s ) Sedimentary basins and basin-forming mecha- nisms. Can Soc Petrol G w l Mem 12: 463481
Quinlan GM, Beaumont C (1984) Appalachian thrusting, lithosphere flexure, and the Palwzoic stratigraphy of the eastern interior of North America. Can J Earth Sci 21: 973-996
Quinn HA, Cronin TM (1984) Micropalwntology and d e positional environment of the Imperial and Palm Spring formations, Imperial Valley, California. In: Rigsby CA (ed) The Imperial Basin - tectonics, sedi- mentation, and thermal aspects. Soc Econ Paleontol Mineral Pacific Section, p 71-85
Rad U von (1972) Zur Sedimentologie und Fazies des Allgiiuer Flysches. Gwlogica Bavarica (Miinchen) 66: 92-147
Rad ~ k n , Botz R (1987) Authigenic F e M n carbonates in Cretaceous and Tertiary sediments of the continental rise off eastern North America, Deep Sea Drilling Project Site 603. In: Hinte JE van, Wise SW Jr, et al., Init Repts DSDP, 92: 1061-1077, US Govt Print Office, Washington
Rad U von, Kudrass R ( 4 s ) (1984) Gwlogy of the Catham Rise phosphorite deposits east of New Zea- land. Geol Jahrb Reihe D, H 65, Hannover, 252 p
Rad U von, Wissmann G (1982) Cretaceous-Cenozoic history of the West Saharan continental margin (NW Africa): Development, destruction and gravitational sedimentation. In: Rad U von, Hinz K, Sarnthein M, Seibold E ( 4 s ) Geology of the Northwest African continental margin. Spmger, Berlin Heidelberg New York, p 106131
Rad U von, Thurow J, Haq BU, Gradstein F, Ludden J , and ODP Leg 1221123 shipboard scientific parties (1989) Triasslc to Cenozoic evolution of the N y Australian continental margin and the birth of the Indian Ocean (preliminary results of ODP Legs 122 and 123). G w l Rundsch 78: 1189-1210
Raiswell R (1987) Non-steady state microbiological dia- genesis and the origin of concretions and nodular limestones. In: Marshall JD (ed) Diagenesis of sedi- mentary sequences. Geol Soc Spec Publ 36: 41-54
Raiswell R, Berner RA (1987) Organic carbon losses du- ring burial and thermal maturation of normal marine shales. Gwlogy 15: 853-856
Ramberg H (1981) Gravity, deformation and the Earth's crust, 2nd edn. Academic Press, London, 452 p
Ranganathan V, Hanor JS (1987) A numerical model for the formation of saline waters due to diffusion of dissolved NaCl in subsiding sedimentary basins with evaporites. J Hydro1 92: 97-120
Ranke U, von Rad U, Wissmann G (1982) Stratigraph facies and tectonic development of the on- and o k shore Aaiun-Tarfaya basin - a review. In: Rad U von, Hinz K, Sarnthein M, Seibold E ( 4 s ) Geology of the Northwest African continental margin. Springer, Ber- lin Heidelberg New York, p 86105
Rao CP (1981) Criteria for recognition of cold-water car- bonate sedimentation: Bermiedale limestone (lower Permian), Tasmania, Australia. J Sediment Petrol 51: 49 1-506
Raup DM, Jablonski D ( 4 s ) (1986) Patterns and processes in the history of life. Dahlem Workshop Reports, Life Sciences Res Repts, 36, Springer, Berlin Heidelberg New York, 447 p
Raymond LA (1984) Classification of melanges. In: Ray mond LA (ed) Melanges: their nature, origin and sig- nificance. Geol Soc Am Spec Pap 198: 7-20
Read JF (1982) Carbonate platforms of passive (exten- sional) continental margins: types, characteristics, and evolution. Tectonophysics 81 : 195-212
Read JF (1985) Carbonate platform facies models. Am Assoc Petrol Geol 69: 1-21
Reading HG (1980) Characteristics and recognition of strike-slip fault systems. In: Ballance PL, Reading HG ( 4 s ) Sedimentation in oblique-slip mobile zones. Int Assoc Sediment01 Spec Publ 4, Blackwell, Oxford, p 7-26
Reading HG (ed) (1986a) Sedimentary environments and facies. Blackwell, Oxford, 615 p
Reading HG (1986b) African rift tectonics and sedimen- tation: an introduction. In: Frostick LE, Renaut RW, Reid I, Tiercelin JJ ( 4 s ) Sedimentation in African rifts. G w l Soc Spec Publ 25: 3-7, Blackwell, Oxford
Reineck H-E (1980) Sedimentationsbetriige und Jahres schichtung in einem marinen EinbruchsgebietNordsee. Senckenberg Marit 12: 281-309
Reineck H-E (1984) Aktuogwlogie klastischer Sedimente. W. Kramer, Frankfurt a.M., 348 p
Reineck H-E, Singh IB (1980) Depositional sedimentary environments, 2nd edn. Springer, Berlin Heidelberg New York, 549 p
Reinson GE (1984) Bamer island and associated strand- plain systems. In: Walker RG (ed) Facies models, 2nd edn. Gwsci Canada Reprint Ser 1, Gwl Soc Canada, p 119-140
Reiss Z, Hottinger L (1984) The gulf of Aqaba: ecological micropalwntology. Ecolog Studies, 50, Springer, Berlin Heidelberg New York, 354 p
Reiss Z, Luz B, Almagi-Labina A. Halicz E. Wmter A (1980) Late Quatemary paleoceanography of the Red Sea. Quat Res 14: 294-308
Remane J (1960) Les formations bkhiques dans le Titho- nique du sud-est de la France. Trav Lab G h l Fac Sci Grenoble 36: 6 1 14

Retallack GJ (1990) Soils of the Dast. Unwin Hyman. Bos- - . ton, 520 '
Reutter KJ, Giese P, Giitze H-J, Scheuber E, Schwab K, Schwarz G, Wi er P (1988) Structural and crustal development of%e Central Andes between 21' and 2S0 S. In: Bahlburg H, Breitkreuz C, Giese P (eds) The southern Central Andes. Lecture Notes Earth Sci 17, Springer, Berlin Heidelber New York, p 231-261
Ricci-Lucchi F (1975) ~epcsitionafc~cles in two turbidite formations of northern Avennines (Italv). J Sediment . ., petrol 45: 3-43
Ricci Lucchi F (1986) The Oligocene to Recent foreland basins of the northern Awnnines. In: Allen PA, Homewood P (eds) ~orelaGd basins. Int Assoc Sedi- mentol Spec Publ 8: 105-139, Blackwell, Oxford
Ricci-Lucchi F (1990) Turbidites in foreland and on-thrust basins of the northern Avennines. Palaeoeeogr Palaeo- - - climatol Palaeoecol 77:'51-66
Ricci Lucchi F. Valmori E (1980) Basin-wide turbidites in a ~ i o c e n d "over-suppGedW deep-sea plain: a geome trical analysis. Sedimentology 27: 241-270
Rice RI (1980) Rates of erosion in the Little Colorado valley, Arizona. In: Cullingford RA, Davidson DA, Lewin J (eds) Tiescales in geomorphology. Wiley- Interscience, Chichester, p 3 17-33 1
Richter DK (1985) Die Dolomite der Evaporit- und der Dolcrete-Playasequenz im mittleren Keuper bei Co- burg (NE-Bayern). N Jahrb Geol Paliiontol Abh 170: 87-128
Richter-Bernburg G (1960) Zeitmessung geologischer Vor- ginge nach Warven-Korrelationen im Zechstein. Geol Rundsch 49: 132-149
Richter-Bernburg G (1968) Salzlagerskitten. In Bentz A, Martini HJ ( 4 s ) Lehrbuch der Angewandten Geolo- gie, 2, Teil 1, Borntriiger, Berlin, p 918-1061
Richter-Bernburg G (1985) Zechstein-Anhydrite. Geol Jahrb (Hannover) A 85, 85 p
Ricken W (1986) Diagenetic bedding: a model for marl- limestone alternations. Lecture Notes Earth Sci 6, Springer, Berlin Heidelberg New York, 210 p
Ricken W (1991) T i e span assessment of sequences, beds, and gaps: an overview. In: Eisele G, Ricken W, Seilacher A (1991) Cycles and events in stratigra- phy. Springer, Berlin Heidelberg New York, p 773- 794
Ricken W, Eder W (1991) Diagenetic overprint in cal- careous rocks: modification of stratification and bed- ding rhythm - an overview. In: Einsele G, Ricken W, Seilacher A (eds) Cycles and events in stratification. S ringer, Berlin Heidelberg New York, p 430-449
RiegePw (1991) Coal cyclothems and some models of their origin. In: Einsele G, Ricken W, Seilacher A (eds) Cycles and events in stratigraphy. Springer, Berlin Heidelberg New York, p 733-750
Robaszynski F, Caron M, Dupuis C, AmMro F, Gon A e s Donoso JM, Linares D, Hardenbol J, Gartner S, Calandra F, Deloffre R (1990) A tentative inte- grated stratigraphy in the Turonian of central Tunisia: Formations, zones and sequential stratigraphy in the Kalaat Senan area. Bull Cent Rech Explor-Prod Elf- Aquitaine, 14: 213-384
Robert P (1985) Histoire ghthermique et dia enese or- ganique. Bull Cent Rech Explor-Rod ~ l f ~ ~ u i t a i n e Mem 8, Pau, 345 p
Roberts DG, Backman J, Morton AC, Murray JW, Keene JB (1984) Evolution of volcanic rifted margins: syn- thesis of Leg 81 results on the west margin of Rockall Plateau. Jnit Rept DSDP 81: 883-91 1, US Govt Print Office, Washington
Roberts RG, Sheahan PA (4s ) (1988) Ore deposit models. Geosci Canada, Reprint Ser 3, Geol Assoc Canada Publ, St. John's Newfoundland, 194 p
Roberts WH 111, Cordell RJ (1980) Problems of petroleum migration: introduction. In: Robe& WH 111, Cordell RJ-(eds) Problems of petroleum migration. Am Assoc Petrol Geol. Stud Geol 10: VI-VIII
Robinson D (1987) Transition from diagenesis to metamor- phism in extensional and collision settings. Geology 15: 866-869
Roden GI (1964) Oceanographic aspects of Gulf of Califor- nia. In: van Andel TH, Shor GG (4s ) Marine gw- loev of the Gulf of California. Am Assoc Petrol Geol M& 3: 30-58
Rodine JD. Johnson AM (1976) The abilitv of debris. hea- vily f k i hted with cdarse &tic mat&ls, to fldw on gentle s i p s . Sedimentology 23: 213-234
Roedder E (1984) Fluid inclusions. Reviews in mineralogy 12, Bookcrahrs, Chelsea, Michigan, 644 p
Roehl U (1990) Parallelisierung des norddeutschen oberen Muschelkalks mit dem siiddeutschen Hauptmuschel- kalk anhand von Sedimentationszyklen. Geol Rundsch 79: 13-26
Roll A (1979) Versuch einer Volumenbilanz des Ober- rheiiitalerabens und seiner Schultern. Geol Jahrb (Han- nover) 52: 3-82
Romankevich EA (1984) Gwchemistw of organic matter in the ocean. siring&, Berlin ~ e l d e l b e 6 New York, 334 PP
Rosendahl BR, Reynolds DJ, Lorber PM, Burgess CF, McGill J, Scott D, Lambiase JJ, Derksen SJ (1986) Structural expression of rifting: lessons frum Lake Tanganyika, Africa. In: Frostick LE, Renaut RW, Reid I, Tiercelin JJ (eds) Sedimentation in African rifts. Geol Soc Spec Publ 25: 29-43
Rossignol-Strick M (1985) Mediterranean Quaternary sapropels, an immediate response of the African mon- soon to variation in insolation. Palaeogeogr Palaeo- climatol Palaeoecol 49: 237-263
Rouchet R de (1978) Blkments d'une thhrie ghmecha- nique de la migration de l'huile en phase constituk. Bull Cent Rech Explor-Prod Elf-Aquitaine 2: 337-373
Royden LH (1988) Late Cenozoic tectonics of the Pan- nonian basin system. In: Royden LH, Horvith F (4s ) The Pannonian basin: a study in basin evolution. Am Assoc Petrol Geol Mem 45: 27-48
Royden LH, Horvith F (4s ) (1988) The Pannonian basin: a study in basin evolution. Am Assoc Petrol Geol Mem 45, 394 p
Royden LH, Keen CE (1980) Rifting processes and ther- mal evolution of the continental margin of eastern Ca- nada determined from subsidence curves. Earth Planet Sci Lett 51: 343-361
Royden LH, Horvith F, Burchfiel BC (1982) Transform faulting, extension and subduction in the Carpathian- Pannonian region. Geol Soc Am Bull 93: 717-727
Royden LH, Sclater JG, Von Herzen RP (1980) Conti- nental margin subsidence and heat flow: Important parameters in formation of petroleum hydrocarbons. Am Assoc Petrol Geol Bull 64: 173-187
Ruiz-Ortiz PA, Bustillo MA, Molina JM (1989) Radiolarite sequences of the Subbetic, Betic Cordillera, southern Spain. In: Hein JR, Obradovic J (eds) Siliceous depo- sits of the Tethys and Pacific regions. Springer, New York Heidelberg, p 107-127
Rupke NA, Stanle DJ (1974) Distinctive properties of turbiditic and iemipelagic mud layen in the Algero- Balearic Basin, Western Mediterranean Sea. Smitho- nian Contrib Earth Sci, 13, 40 p
Rust BR (1981) Sedimentation in an arid-zone anas- tomosing fluvial system: Coopers creek, central Australia. J Sediment Petrol 51: 745-755
Rust BR, Koster EH (1984) Coarse alluvial deposits. In: Walker RG (ed) Facies models, 2nd edn. Geosci Ca- nada Reprint Ser 1: 53-69

Rust BR, Legun AS (1983) Modem anastomosing-fluvial deposits in arid central Australia, and a Carboniferous analogue in New Brunswick, Canada. In: Collinson JD, Lewin J (4s ) Modem and ancient fluvial systems. Int Assoc Sediment01 Spec Publ 6: 385-392
Rust BR, Nanson GC (1989) Bedload transport of mud as pedogenic aggregates in modem and ancient rivers. Sedimentology 36: 291-306
Ryer TA (1987) Transgressive-regressive cycles and the occurrence of coal in some Upper Cretaceous strata of Utah. Geology 11: 207-210
Sadler PM, Strauss DJ (1990) Estimation of completeness of stratigraphical sections using empirical data and theoretical models. J Geol Soc London 147: 471-485
Sageman BB, Wignall PB, Kauffman EG (1991) Biofacies models of oxygendeficient facies in epiwntinental seas: tool for paleoenvironrnental analysis. In: Einsele G, Ricken W, Seilacher A (eds) Cycles and events in stratigraphy. Springer, Berlin Heidelberg New York, p 542-564
Sahagian DL (1987) Epeirogeny and eustatic sea level changes as inferred from Cretaceous shore line depo- sits: applications to the central and western United States. J Geophys Res 92: 48954904
Saito Y (1989a) Modem storm deposits in the inner shelf and their recurrence intervals, Sendai Bay, northeast Japan. In: Taira A, Masuda F (4s ) Sedimentary fa- cies in the active plate margin. Terra Scientific Publ, Tokyo, p 331-344
Saito Y (1989b) Storm-built sand ridges on the inner shelf of Kashima-Nada, Northeast Japan. In: Taira A, Ma- suda F (eds) Sedimentary facies in the active plate margin. Terra Scientific Publ, Tokyo, p 319-330
Salop U (1983) Geological evolution of the Earth during the Precambrian. Springer, Berlin Heidelberg New York, 459 p
Sandberg PA (1985) Nonskeletal aragonite and CO in the Phanerozoic. In: Sundquist ET, Broecker W& (4s ) The carbon cycle and atmospheric C02: natural varia- tions Archean to Present. Am Geophys Union Monogr 32, Washington DC, p 585-554
Sang L, You Z (1988) The metamorphic petrolog of the Susong Group and the origin of the Susong piospho- rite deposits, Anhui province. Precambrian Res 39: 65-76
Sarg JF (1988) Carbonate sequence stratigraphy. In: Sea- level changes - an integrated approach. Soc Econ Paleontol Mineral Spec Publ 42: 155-181
Sarnthein M (1972) Sediments and history of the postgla- cia1 transgression in the Persian Gulf and Gulf of Oman. Marine Geol 12: 245-266
Samthein M (1973) Quantitative Daten iiber benthische Karbonatsedimentation in mittleren Breiten. Veriiffentl Univ Innsbruck (Festschrift HeiRel) 86: 267-279
Samthein M (1978) Sand deserts during glacial maximum and climatic optimum. Nature 272 (5648): 43-46
Sarnthein M, Diester-Haass L (1977) Eolian-sand tur- bidites. J Sediment Petrol 47: 868-890
Sarnthein M, Mienert J (1986) Sediment waves in the eastern equatorial Atlantic: sediment record during Late Glacull and Interglacial times. In: Summerhayes CP, Shackleton NJ (4s ) North Atlantic palaeoceano- graphy. Gwl Soc Spec Publ 21: 119-130
Sarnthein M, Walger E (1974) Der aeolische Sandstrom aus der Westsahara zur Atlantikkueste. Gwl Rundsch ~~ ~~-
63: 1065-1087 Sarnthein M, Winn K, Zahn K (1987) Paleoproductivity of
oceanic u~welline and the effect on atmos~heric CO, and climitic chhge during deglaciationA times. 1n; Berger WH, Labeyrie LD (4s ) Abrupt climate chan- ge. Reidel, Dordrecht, p 31 1-337
Samthein M, W i n K, Duplessy JC, Fontugne MR (1988) Global variations of surface water productivity in low- and mid-latutudes on C02 reservoirs of the deep ocean and atmosphere during the last 21,000 years. Pale oceanography 3: 361-399
Savelli C (1988) Late Oligocene to Recent episodes of magmatism in and around the Tyrrhenian Sea: impli- cations for the processes of opening a young inter-arc basin of intra-orogenic (Mediterranean type). Tectono- physics 146: 163-191
Savrda CE, Bottjer DJ (1987) Trace fossils as indicators of bottom-water redox wnditions in ancient sedimentary environments. In: Bottjer DJ (ed) New concepts in the use of biogenic sedimentary structures for paleoen- vironmental interpretation. Soc Ewn Paleontol Mine- ral, Pacific Section, Volume and Guidebook 52, p 3- 26
Savrda CE, Bottjer DJ (1989) Anatomy and implications of bioturbated beds in "black shale" sequences: examples from the Jurassic Posidonienschiefer (Southern Ger- many). Palaios 4: 33G342
Savrda CE, Bottjer DJ, Seilacher A (1991) Redox-related benthic events. In: Einsele G, Ricken W, Seilacher A (eds) Cycles and events in stratigraphy. Springer, Heidelberg New York, p 524-541
Sawyer DS (1988) Thermal evolution. In: Sheridan RE, Grow JA ( 4 s ) The Geology of North America, vol 112, The Atlantic continental margin. US Gwl Soc Am, Boulder, p 417428
Sawyer DS, Hsui AT, Toksiiz MN (1987) Extension, sub- sidence and thermal evolution of the Los Angeles basin - a twodimensional model. Tectonophysics 133: 15-32
Sawyer DS. Swift BA. Sclater JG. Tolsiiz MN (1982) -~xtensi'onal model for the subsidence of the northem United States Atlantic continental marein. Geoloev 10: " ". 134- 140
Saxov S, Nieuwenhuis JK (eds)(1982) Marine slides and other mass movements. NATO Conference Series IV, Marine Sciences, Plenum Press, New York London, 353 p
Schaal S, Ziegler W (eds) (1988) Messel - ein Schaufenster in die Geschichte der Erde und des Lebens. Kramer, Frankfurt a.M., 315 p
Scherer M (1987) Parameters influencing porosity in sandstones: a model for sandstone porosity prediction. Am Assoc Petrol Geol Bull 71: 485-491
Schidlowski M (1987) Ap lication of stable carbon isotopes to early biochemicafevolution on Earth. Annu Rev Earth Planet Sci 15: 47-72
Schidlowski M, Eichmann R, Junge CE (1975) Precamb- rian sedimentary carbonates: carbon and oxygen iso- tope geochemistry and implications for the terrestrial oxygen budget. Precambrian Res 2: 1-69
Schidlowski M, Hays JM, Kaplan JR (1984) Isotopic in- ferences of ancient biochemistry - carbon, sulfur, hydrogen, and nitrogen. In: Schopf JW (ed) Earth's earliest biosphere. Princeton Univ Press, Princeton, New Jersey, p 149-183
Schindler C (1974) Zur Geologie des Ziirichsees. Eclogae Geol Helv 67: 163-196
Schindler E (1990) The late Frasnian (upper Devonian) Kellwasser crisis. In: Kauffman EG, Walliser OH (eds) Extinction events in earth history. Lecture Notes Earth Sci 30, Springer, Berlin Heidelberg New York, p 151-159
Schlager W (1981) The paradox of drowned reefs and carbonate platforms. Geol Soc Am Bull 92: 197-21 1
Schlager W, Camber 0 (1986) Submarine slope angles, drowning unconformities, and shelferosion on limes- tone escarpments. Geology 14: 762-765

Schlager W, Philip J (1990) Cretaceous carbonate plat- fomis. In: Ginsburg RN, Beaudoin B ( 4 s ) Cretaceous resources, events and rhythms. NATO AS1 Ser C 104, Kluwer, Dordrecht, p 173-195
Schlager W, Bourgeois F, Mackenzie G, Smit J (1988) Boreholes at Great Isaac and Site 626 and the history of the Florida Straits. In: Austin JA, Schlager W et al., Proc ODP, Sci Results 101: 425-437, College Station TX (Ocean Drilling Project)
Schlanger SO, Cita MB (eds) (1982) Nature and origin of Cretaceous carbon-rich facies. Academic Press, Lon- don, 229 p
Schlanger SO, Douglas RG (1974) Pelagic ooze-chalk limestone transition and its implications for marine stratigraphy. In: Hsii KJ, Jenkyns HC (4s ) Pelagic sediments on land and under the sea. Int Assoc Sedi- mentol Spec Publ 1: 117-148
Schlanger SO, Premoli Silva I (1986) Oligocene sea-level falls recorded in mid-Pacific atoll and archipelagic apron settings. Geology 14: 392-395
Schlanger SO, Jenkyns HC, Premoli-Silva I (1981) Vol canism and vertical tectonics in the Pacific basin re- lated to global Cretaceous transgressions. Earth Planet Sci Lett 52: 435-449
Schlee JS (ed) (1984) Interregional unwnformities and hvdrocarbon accumulation. Am Assoc Petrol Gwl hiem 36, 184 p
Schlische RW. Olsen PE (1990) Quantitative fdhe model for wntkental extenhonal'b&ins with applica~ions to early Mesozoic rifts of eastern North America. J Geol 98: 135-155
Schmalz R (1969) Deepwater evaporite deposition: a gene- tic model. Am Assoc Petrol Geol Bull 53: 798-823
Schmidt V, McDonald DA (1979) The role of secondary porosity in the wurse of sandstone dia enesis. In: Scholle PA. Schluger PR (eds) Aspects ofdiagenesis. Soc Ewn Paleontol Mineralog Spec Publ 26: 175-207
Schmidt-Witte H, Einsele G (1986) Rezenter und holoziiner Stoffaustrag aus den Keuper-Lias-Einzugs ebieten des Natumrks Schiinbuch. In: Einsele G ( e 8 Das land- scha&iikologische Forschun sprojek . Naturpark Schiinbuch. VCH-Verlag ~ e i n i e i m . D 369-391
Schmincke HU (1988) Pyroklastische G&&me. In: Fiicht- bauer H (ed) Sedimente und Sedimentgesteine. Schweizerbart, Stuttgart, p 731-778
Schmincke H-U, Bogaard P van den (1991) Tephra layers and tephra events. In: Einsele G, Ricken W, Seilacher A (4s ) Cycles and events in stratigraphy. Springer, Heidelberg New York, p 392-429
Schneider HJ, Walter HW (1988) Enlagerstitten in Sedi- menten. In: Fiichtbauer H (ed) Sedimente und Sedi- mentgesteine. Schweizerbart, Stuttgart, p 569-681
Schneider R, Wefer G (1990) Shell horizons in Cenozoic upwelling-facies sediments off Peru: distribution and mollusk fauna in cores from Leg 112. In: Suess E, von Huene R, et al., Proc ODP, Sci Results 112: 335- 352, College Station, TX (Ocean Drilling Program)
Scholle PA, Spearing DR (4s ) (1982) Sandstone depositio- nal environments. Am Assoc Petrol Geol Mem 31, 410 p
Scholle PA, Bebout DG, Moore CH (4s ) (1983a) Car- bonate depositional environments. Am Assoc Petrol Geol Mem 33: 345-440
Scholle PA, Arthur MA, Ekdale AA (1983b) Pelagic en- vironment. In: Scholle PA, Bebout DG, Moore CH (4s ) Carbonate depositional environments. Am Assoc Petrol Geol Mem 33: 619691
Scholle PA, James NP, Read JF (eds)(1989) Carbonate sedimentology and petrology. Short Course in Geolo- gy, 4, Am Geophys Union, Washington DC, 160 p
Schiinenberg R, Neugebauer J (1987) Einfihrung in die Gwlogie Europas, 5th edn. Rombach, Freiburg, 294 P
Scho~f JW (ed) (1983) Earth's earliest bios~here. Princeton ~ n i v Press; Princeton
Schopf JW, Packer BM (1987) Early Archean (3.3-billion to 3.5-billion-vear-old) microfossils from Warrawoona Group, ~ e s t 6 r n ~ust'ralia. Science 237: 70-73
Schopf TJM (1980) Paleoceanography. Harvard Univ Press, Cambridge, Mass, 341 p
Schreiber HC (1986) Arid shorelines and evaporites. In: Reading HG (ed) Sedimentary facies and environment, 2nd edn, Blackwell, Oxford, p 189-228
Schreiber BC (ed) (1988a) Evapontes and hydrocarbons. Columbia Univ Press, New York, 475
Schreiber BC (1988b) Subaqueous evaporite &sition. In: Schreiber BC (ed) Evaporites and hydrocarbons. Columbia Univ Press, New York, p 182-255
Schreiber BC, Hsii KJ (1980) Evaporites. In: Hobson GD (ed) Developments in petroleum geology 2, Applied Science Publishers, London, p 87-138
Schriider B (1982) Entwicklung des Sedimentbeckens und Stratigraphie der klassischen Gerrnanischen Trias. Gwl Rundsch 71: 783-794
Schroeder JH (1988) Spatial variations in the porosity development of carbonate cements and rocks. Facies (Erlangen) 18: 181-204
Schroeder JH, Purser BH (1986) Reef diagenesis. Sprin- ger, Berlin Heidelberg New York, 455 pp
Schumm SA (1981) Evolution and response of the fluvial system, sedimentologic implications. In: Ethridge FG, Flores RM (4s ) Recent and ancient nonmarine depo- sitional systems: models for exploration. Soc Econ Paleontol Mineralog Spec Publ 31: 19-29
Schwab FL (1986) Sedimentary "signatures" of foreland basin assemblages: real or counterfeit? In: Allen PA, Homewood P (eds) Foreland basins. Int Assoc Sedi- mentol Spec Publ 8, Blackwell, Oxford, 395-410
Schwartz FW, Longstaffe FJ (1988) GrounB water and clastic diagenesis. In: Back W, Rosenhein JS, Seaber PR (4s ) Hydrogeology. The geology of North Ame- rica, vol 0-2, Geol Soc Am, Boulder, Colorado, p 413-434
Schwan HU (1975) Sedimentary structures and facies analysis of shallow-marine carbonates. Contributions to sedimentology 3, Schweizerbart, Stuttgart, 100 p
Schwan HU (1982) Subaqueous slope failures - experi- ments and modem occurrences. Contributions to sedi- mentology 11, Schweizerbart, Stuttgart, 116 p
Schwan HU, Einsele G, Hem D (1975) Quartz-sandy, grazing-conoured stromatolites from wastal embay- ments of Mauritania. West Africa. Sedimentology 22: 539-561
Schwarzacher W (1975) Sedimentation models and quan- titative stratigraphy. Developm Sediment01 19, El- sevier, Amsterdam, 382 p
Schwarzacher W (1987) Astronomically controlled cycles in the lower Tertiary of Gubbio (Italy). Earth Planet Sci LeU 84: 22-26
Schwarzacher W, Fischer AG (1982) Limestoneshale bedding and perturbations of the earth's orbit. In: Einsele G, Sellacher A (4s ) Cyclic and event strati- fication. Springer, Berlin Heidelberg New York, p 72- QC
~ch\;arzbach M (1974) Das Klima der Vorzeit, 3rd edn. Enke, Stuttgart, 380 p
Schweller WJ, Kulm LD (1978) Depositional patterns and channelized sedimentation in active eastern Pacific trenches. In: Stanley DJ, Kelling G (eds) Sedimen- tation in submarine canyons, fans and trenches. Hutchinson & Ross, Dowden, p 311-324
Sclater JG, Christie PAF (1980) Continental stretching: an explanation of the post Mid-Cretaceous subsidence of the central North Sea basin. J Geophys Res 85: 371 1- 3739

Sclater JG, Shorey MD (1989) Mid-Jurassic through mid- Cretaceous extension in the Central Graben of the North Sea - part 2: estimates from faulting observed on seismic lines. Basin Res 1 : 201-215
Swffin TP (1987) An introduction to carbonate sediments and rocks. Blackie, Glasgow London, 274 p
Scruton PC (1960) Delta building and the deltaic sequence. In: Shepard FP, Phleger FB, Van Andel TH ( 4 s ) Recent sediments, northwest Gulf of Mexico. Am Assoc Petrol Geol, Symp vol, Tulsa, p 82-102
Seibold E (1952) Chemische Untersuchungen zur Bankung im unteren Malrn Schwabens. Neues Jahrb Geol Paliiontol (Stuttgart) Abh 95: 337-370
Seibold E (1970) Nebenmeere im humiden und ariden Klimabereich. Geol Rundsch 60: 73-105
Seibold E (1978) Deep sea manganese nodules: the chal- lenge since "Challenger". Episodes 4: 3-8
Seibold E, Berger WH (1982) The sea floor. Springer, Berlin Heidelberg New York, 288 p
Seibold E, Exon N, Hartmann M, KBgler FC, Krumm GF, Lutze GF. Newton RS, Werner F (1971) Marine Geo- logy of Kiel Bay. VIIIth Int Sediment01 Congress, Heidelberg, Sedimentology of parts of Central Europe, Guidebook, p 209-235
Seilacher A (1962) Paleontological studies on turbidite sedimentation and erosion. J Geol 70: 227-234
Seiicher A (1991) Events and their signature - an over- view. In: Einsele G, Ricken W, Seilacher A (eds) Cycles and events in stratigraphy. Springer, Heidel- berg New York, p 222-226
Selby MJ (1974) Rates of denudation. New Zealand J Geogr 56: 1-13
Selley & (1976) An Introduction to sedimentology. Academic Press, London, 408 p
Selley RC (1985a) Ancient sedimentary environments and their subsurface dimgenesis, 3rd edn. Chapman & Hall, London, 317 p
Selley RC (1985b) Elements of petroleum geology. Free- man, New York, 449
Sellwood BW (1986) Sha%w-marine carbonate cnviron- ments. In: Reading HG (ed) Sediments environment and facies, 2nd edn. Blackwell. 01;forX p 283-342
Selverstone J (1985) Petrologic constraints on imbrication, metamorphism, and upMt in the SW Tauern Window, Eastern Alps. Tectonics 4: 687-704
Sengiir AMC, Giiriir N, Saroglu F (1985) Strike-slip faulting and related basin formation in zones of tec- tonic escape: Turkey as a case study. In: Biddle KT, Christie-Blick N (eds) Strike-slip deformation, basin formation, and sedimentation. Soc Econ Paleontol Mineral Spec Publ 37: 227-264
Sepkoski JJ Jr (1982) Flat-pebble conglomerates, storm deposits, and the Cambrian bottom fauna. In: Einsele G, Seilacher A (eds) Cyclic and event stratification, Springer, Heidelber New York, p 371-385
Sepkoski JJ Jr (1989) teriodicity in extinction and the problem of catastrophism in the history of life. J Gwl Soc London 146: 7-19
Sepkoski JJ Jr, Bambach RK, Droser ML (1991) Secular changes in Phanerozoic event bedding and the biologic overprint. In: Einsele G, Ricken W, Seilacher A (eds) Cycles and events in stratiera~hy. S~rineer, Heidel- . . . - . 6 r g New York, p 298-312"
Sestini G (1989) Nile Delta: a review of depositional en vironments' and geolo ical history. 1;: Whateley MKG, Pickering KT ( J s ) Deltas; sites and traps for fossil fuels. Gwl Soc Spec Publ 41: 99-127
Shanmugam G, Moiola RJ (1985) Submarine fan models: problems and solutions. In: Bouma AH, Normark WR, Barnes NE ( 4 s ) Submarine fans and related tur- bidite systems. Springer, New York Heidelberg, p 29- 34
Shaver RH (1977) Silurian reef geometry - new dimensions to explore. J Sediment Petrol 47: 1409-1424
Shaw J (1985) Subglacial and ice marginal environments. In: Ashley GM, Shaw J and Smith ND (eds) Glacial sedimentary environments. SEPM Short Course No 16, p 7-84
Shearman DJ (1978) Evaporites of coastal sabkhas. Soc Econ Paleontol Mineral, Short Course 4: 4-42
Shearman DJ, Smith AJ (1985) b i t e , the parent mineral of jarrowitetype pseudomorphs. Proc Geol Assoc London 96: 305-314
Sheldon RP (1981) Ancient marine phosphorites. Annu Rev Earth Planet Sci 9: 251-284
Shepard FP (1973) Submarine geology, 3rd edn. Harper and Row, New York, 551 p
Shepard FP, Dill RF (1966) Submarine canyons and other sea valleys. Rand McNally, Chicago, 381 p
Sheppard RA, Gude 3rd AJ (1986) Magadi-type chert - a distinctive diagenetic variety from lacustrine d In: Mumpton FA (ed) Stud~es in diagenesis. U?$:i Surv Bull 1578: 335-345
Sheridan MF (1979) Emplacement of pyroclastic flows: a review. In: Chapin CE, Elston WE (eds) Ash-fall tuffs. Geol Soc Am Spec Pap 180: 125-136
Sheridan RE (1981) Recent research on passive continental margins. In: Warme JE, Douglas RG, Winterer EL (eds) The Deep Sea Drilling Project: a decade of pro- gress. Soc Econ Paleontol Mineral Spec Publ 32: 39- 55
Sheridan RE (1987) Pulsation tectonics as the control of long-term stratigraphic cycles. Paleoceanography 2: 97-1 18
Sheridan RE, Enos P (1979) Stratigraphic evolution of the Blake Plateau a h r a decade of scientific drilling. In: Talwani M, Hay W, Ryan WBF (1979) Deep drilling results in the Atlantic Ocean: wntinental margins and paleoenvironment. Maurice Ewing Ser 3, Am Geo- phys Union, Washington DC, p 109-122
Shendan RE, Grow JA (eds) (1988) The Geology of North America, vol l-2, The Atlantic wntinental margin. US Geol Soc Am, Boulder
S h i n EA (1983) Tidal flat environment. In: Scholle PA, Bebout DG, Moore CH (4s ) Carbonate depositional environments. Am Assoc Petrol Gwl Mem 33: 171- 210
Shinn AE, Steinen RP, Lidz BH, Swart PK (1989) Whit- ings, a sedimentologic d i i m a . J Sediment Petrol 59: 147-161
Shipboard Scientific Party (1988a) Site 704. In: Gieselski PF, Kristoffersen Y et al. Proc ODP, Init Repts 114: 621-795, College Station, TX (Ocean Drilling Project)
Shipboard Scientific Party (1988b) Synthesis of shipboard resc!ts: Leg 110 transect of the northern Barbados Ridge, In: Mascle A, Moore JC, et al., Proc Init R e (Pt A). ODP 110: 577-587. Colleee Station. TX " , - (ocean rib^ Project)
ShiDboard Scientific Partv (1988~1 Introduction. objectives. and rincipal result4 I& 112, Peru contiekafmargin: In: guess E, von Huene R, et al., Roc ODP, Init Repts 112: 5-22, College Station, TX (Ocean Drilling Project)
Shoemaker EM (1984) Lar e body impacts through geo- logic time. In: Ho l l anbH~, Trendall AF (4s ) Pat- terns of change in Earth evolution, Springer, Berlin Heidelberg New York, p 15-40
Shurr GW (1984) Gwmetry of shelf sandstone bodies in the Shannon sandstone of southeastern Montana. In: Tillman RW, Siemers CT (4s ) Siliciclastic shelf sedi- ments. Soc Econ Paleontol Mineral Spec Publ 3453- 83

Siehl A. Thein J (1978) Gwchemische Trends in der ~ k e t t e (~ura; ~uxembour~ , Lothringen). Geol Rundsch 67: 1054-1977
Simm RW, Kidd RB (1984) Submarine debris flow depo- sits detected by large-range sidescan sonar 1000 km from source. Gw-Marine Lett 3/1:13-16
Simoneit BRT, Stuermer DH (1982) Organic geochemical indicators for sources of organic matter and paleoen- vironmental conditions in Cretaceous oceans. In: Schlanger SO, Cita MB (4s ) Nature and origin of Cretaceous carbon-rich facies. Academic Press, Lon- don, p 145-163
Simonson B (1985) Sedimentological constraints on the origin of Precambrian iron formations. Gwl Soc Am Bull 96: 244-252
Sirocko F, Sarnthein M (1989) Wind-borne deposits in the northwestern Indian Ocean: record of Holocene sedi- ments versus modern satellite data. In: Leinen M, Sarnthein M (4s ) Paleochnatology and palwmeteoro- logy: modem and past pattarns of global atmospheric transport. Kluwer, Dordrecht, p 401-433
Skempton AW (1970) The consolidation of clays by gra- vitational compaction. Quat J Gwl Soc London 125: 373-412
Slansky M (1980) Gblogie des phosphates saimentaires. MBm BRGM 114,94 p
Sloan LC, Barron EJ (1990) Equable climates during Earth history? Gwlogy 18: 489-492
Smith DB (1980) The evolution of the English Zechstein basin. In: Fiichtbauer H, Peryt T (eds) The Zechstein basin with emphasis on carbonate sequences. Contri- butions to sedimentology 9. Schweizerbart, Stuttgart, p 7-37
Smith DG (1983) Anastomosed fluvial deposits, modem examples froin Western Canada. In: Collinson JD, Lewin J (4s ) Modem and ancient fluvial systems. Int Assoc Sediment01 Spec Pub1 6: 155-168
Smith GA (1988) Sedimentology of proximal to distal volcaniclastics dispersed across an active fold belt: Ellensburg Formation (late Miocene), central Was- hington. Sedimentology 35: 953-977
Smith W r , Carlucci AF, Jahnke RA, Craven DB (1987) Organic carbon mineralization in the Santa Catalina Basin: benthic boundarv laver metabolism. Deeu-Sea . . Res 34: 185-211
Smith L. Fonter C. Woodbuw A (1989) Numerical simu- - ----
lati& techniques for mdelini ad"ectively disturbed thermal regimes. In: Beck AE, Garven G, Stegena L (eds) Hydrogwlogical regimes and their subsurface thermal effects. Gwphys Monogr 47, IUGG vol 2, Am Gwphys Union, Washington DC, p 1-5
Smith ND, Ashley GM (1985) Proglacial lacustrine en vironment. In: Ashley GM, Shaw J, Smith ND (4s ) Glacial sedimentary environments. SEPM Short Course 16, p 135-216
Smoot JP (1991) Sedimentary facies and depositional en vironments of early Mesozoic Newark Supergroup basins, eastem North America. Palawgwgr Palaw- climatol Palaeoecol 84: 369-423
Smosna R (1989) Compaction law for Cretacwus sand- stones of Alaskas north slope. J Sediment Petrol 59: 572-584
Snedden JW, Nummedal D, Amos AF (1988) Storm- and fair-weather combined flow on the central Texas con- tinental shelf. J Sediment Petrol 58: 580-595
Solle G (1966) Rezente und fossile Wiiste. Notizbl Hess Landesamt Bodenforsch (Wiesbaden) 94: 54-121
Song T, Gao J (1985) Tidal sedimentary structures from upper Precambrian rocks of the Ming tombs district, Bei'in (Peking), China. Precambrian Res 29: 93-107
Sonnenielf P (1984) Brines and evaporites. Academic Press, Orlando, 613 p
Sonnenfeld P, Perthuisot J-P (1989) Brines and evaporites. Short course in gwlogy 3, Am Gwphys Union, Wa- shington DC, 126 p
Soudry D, Lewy Z (1988) Microbially influenced for mation of phosphate nodules and megafollil moulds (Negev, southern Israel). Palawgeogr Palaeoclimatol Palaeoecol 64: 15-33
Souquet P, Eschard R, Lods H (1987) Facies sequences in largevolume debris- and turbidity-flow deposits from the Dvrenees ~Cretaceous: France. Soah). Geo-Marine , . r
L& 5: 83-96. Southard JB, Lambie JM, Federiw DC, Pile HT, Weid-
man CR (1990) Experiments on bed configurations in f i e sands under bidirectional, purely oscilhtory flow, and the origin of hummocky cross-stratification. J Sediment ~ & o l 6 0 : 1-17 -
Southgate PN (1986) Cambrian phoscrete profiles, coated grains, and microbial processes in phospho enesis. Georgiy basin, Austrah. J Sediment Petrol !k: 429: 44 1
Southgate PN (1989) Relationship between cyclicity and stromatolite form in the late Proterozoic Bitter Springs Formation, Australia. Sedimentology 36: 323-339
Stach E, Mackowsky M-TH, Teichmiiller M, Taylor GH, Chandra D, Teichmiiller R (1982) Coal petrology, 3rd edn. Borntriger, Berlin Stuttgart, 535 p
Stallard RF (1985) River chemistry, gwlogy, gwmor- phology, and soils in the Amazon and Orinoco basins. In: Drever Jl (ed) The chemistry of weathering. NATO AS1 Series C, Math Phys Sci, Reidel, Dord- recht, p 293-316
Stanley DJ (ed) (1972) The Mediterranean Sea: a natural sedimentation laboratory. Dowden, Hutchinson & Ross, Stroudsburg, 765 p
Stanley DJ (1977) Post-Miocene depositional patterns and structural displacement in the Mediterranean. In: Kanes WH, Stehli FG (4s ) The ocean basins and margins, vol 4 A: The eastern Mediterranean. Ple- num, New York London, p 77-150
Stanley DJ (1982) Welded slumpgraded sand couplets: evidence for slide generated turbidity currents. Gw- Marine Lett 2: 149-155
Stanley DJ (1985) Mud depositional processes as a major influence on Mediterranean margin-basin sedimen- tation. In: Stanley DJ, Wezel FC (eds) Gwlogical Evolution of the Mediterranean Basin. Springer, New York Heidelberg, p, 377410
Stanley DJ (1986) Turbidity current transport of organic- rich sediments: Alpine and Mediterranean examples. Marine Gwl70: 85-101
Stanley DJ (1988a) Turbidites reworked by bottom cur- rents: Upper Cretaceous examples from St. Croix, U.S. Virgin Islands. Smithonian Contrib Marine Sci 33, Washington DC, 79 p
Stanley DJ (1988b) Subsidence in the northeastern Nile delta: r a ~ i d rates. mssible causes. and wnseuuences. Sci 240:'497-506 '
Stanlev DJ. Blan~ied C (1980) Late Ouaternarv water eichange &een the'&stek ~edi&rranean~and the Black Sea. Nature 285 (5766): 537-541
Stanley DJ, Kelling G (4~x1978) Sedimentation in sub- marine canyons, fans, and trenches. Dowden, Hut- chiison and Ross, Stroudsburg, 382 ?
Stanley DJ, Wezel FC (4s ) (1985) Geological evolution of the Mediterranean basin. Springer, New York Heidel- berg
Stanton RJ, Fliigel E (1989) Problems with reef models: the late Tnassic Steinplatte "reef" (northern Alps, SalzburgITyrol, Austria). Facies (Erlangen) 20: 1-138
Stearly RF, Ekdale AA (1989) Modem marine bioerosion by macroinvertebrates, northern Gulf of California. Palaios 4: 453-467

Steckler MS, Watts AB, Thorne JA (1988) Subsidence and basin modeling at the U.S. Atlantic passive margin. In: Sheridan RE, Grow JA (eds) The geology of North America, vol112, The Atlantic continental margin. US Geol Soc Am, Boulder, p 399415
Steckler MS, Reynolds DJ, Coakley BJ, Swill BA, Jarrard RD (1990) Dynamics of sedimentary sequence deve- lopment: The implications of flexural, isostacy, com- paction and sediment dynamics for the measurement of sea level change. 13th Intern Sedimentol Congress, Aug 1990, Nottingham, Int Assoc Sedimentol, Ab- stracts of Papers, p 523-524
Steel R, Gloppen TG (1980) Late Caledonian (Devonian) basin formation, western Norway: signs of strike-slip mobile zones. In: Ballance PL, Reading HG (1980) Sedimentation in oblique-slip mobile zones. Int Assoc Sedimentol Spec Publ 4, Blackwell, Oxford, p 79-103
Stein R (1986) Organic carbon and sedimentation rate - further evidence for anoxic deep water conditions in the CenomanianlTuronian Atlantic Ocean. Marine Gwl72: 199-209
Stein R (1991) Accumulation of organic carbon in marine sediments. Lecture Notes Earth Sci 34, Springer, Berlin Heidelberg New York, 217 p
Stein R, Rullkiitter J, Welte D (1986) Accumulation of organic-carbon-rich sediments in the Late Jurassic and Cretacwus Atlantic Ocean - a synthesis. Chemical Gwl56: 1-32
Stein R, Sarnthein M, Suendemann J (1986) Late Nwgene submarine erosion events along the north-east Atlantic continental margin. In: Summerhays CP, Shackleton NJ (eds) North Atlantic palaeogwgraphy. Gwl Soc Spec Publ 21: 103-118
Stein R, Rullkbtter J, Welte D (1989) Changes in palm- environments in the Atlantic Ocean during Cretacwus times: results from black shale studies. Geol Rundsch 78: 883-901
Steininger FF, Riigl F (1984) Palwgeography and palin- spastic reconstruction of the Nwgene of the Mediter- ranean and the Paratethys. In: Dixon JE, Robertson AHF (eds) The geological evolution of the eastern Mediterranean. Gwl Soc Spec Publ 17: 659-668
Stets J, Wurster P (1982) Atlas and Atlantic - structural relations. In: Rad U von, Hinz K, Sarnthein M, Sei- bold E (4s ) Gwlogy of the Northwest African con- tinental margin. Springer, Berlin Heidelberg New York, p 69-85
Stockrnal GS, Beaumont C (1987) Geodynamic models of convergent margin tectonics: the southern Canadian Cordillera and the Swiss Alps. In: Beaumont C, Tankard AJ (eds) Sedimentary basins and basin for- ming mechanisms. Can Soc Petrol Gwl Mem 12: 393- 41 1
Stockrnal GS, Beaumont C, Boutilier R (1986) Gwdynamic models ofwnvergent margin tectonics, transition from rigid mar in to overthrust belt, and consequences for foreland %asin development. Bull Am Assoc Petrol Gwl70: 181-190
Stoffers P, Kiihn R (1974) Red Sea evaporites: a petro- graphic and geochemical study. In: Whitmarsh RB, Weser OE, Ross DA et al, Init Repts DSDP 23, US Govt Print Office, Washington, p 821-865
Stoffers P, Ross DA (1974) Sedimentary history of the Red Sea. In: Whitmarsh RB, Weser OE, Ross DA et al, Init Repts DSDP 23, US Govt Print Office, Washing- ton, p 849-865
Stoffers P, Ross DA (1979) Late Pleistocene and Holocene sedimentation in the Persian Gulf - Gulf of Oman. Sediment Geol23: 181-208
Stoneley R (1981) Petroleum: the sedimentary basin. In: Tarling DH (ed) Economic gwlogy and gwtectonics. Wiley, p 51-71, or in: Foster NH, Beaumont EA (eds,
1987) Gwlogic basins I: classification, modeling, and predictive stratigraphy. Treatise of petroleum geology, Reprint Ser 1, Am Assoc Petrol Geol, Tulsa, p 102- 1 1 1 1 LL
Stoneley R (1987) A review of petroleum source rocks in wrts of the Middle East. In: Brooks J. Fleet kl (eds) ~ a r i n e petroleum source rocks. Gwl'Soc Spec 'Pubi 26: 263-269
Stow DAV (1980) A physical model for the transport and sorting of finegrained sediment by turbidity currents. Sedimentology 27: 3 1-46
Stow DAV (1981) Laurentian fan: morphology, sediments, processes, and growth pattern. Am Assoc Petrol Gwl Bull 65 I: 375-393
Stow DAV (1984) Anatomy of debris-flow deposits. In: Hay WW, Sibuet JC et al, Initial Repts DSDP 75, US Govt Printing Office, Washington, p 801-807
Stow DAV (1986) Deep clastic seas. In: Reading HG (ed) Sedimentary Environments and Facies, 2nd edn. Blackwell, Oxford, p 399-444
Stow DAV, Cochran JR, and ODP Shipboard Scientific Party (1989) The Bengal Fan: some preliminary r e sults from ODP drilling. Gw-Marine Lett 9: 1-10
Stow DAV, Holbmk JA (1984) North Atlantic con- tourites: an overview. In: Stow DAV, Piper DJW (eds) Fine-grained sediments: deepwater processes and facies. Gwl Soc Spec Publ 15: 245-256
Stow DAV, Piper DJW (4s ) (1984) Finegrained sedi- ments: deep-water processes and facies. Geol Soc Spec Publ 15, Blackwell, Oxford, 659 p
Stow DAV, Howell DG, Nelson CH (1985) Sedimentary, tectonic, and sea-level controls. In: Bouma AH, Nor- mark WR, Barnes NE (eds) Submarine fans and re lated turbidite systems. Springer, New York Heidel- berg, p 15-34
Stowe K (1979) Ocean science. Wiley, New York, 610 p Strasser A (1988) Shallowinrr-upward seauences in Pur-
beckian' perkidal carbonates' (lowermbst cretaceous, Swiss and French Jura Mountains). Sedimentology 35: 369-383
Strasser A (1991) Lagoonal-peritidal sequences in car- bonate environments: autoc clic and allocyclic proces- ses. In: Einsele 0 , Ricken Seihcher A (eds) Cyc- les and events in stratigraphy. Springer, Heidelberg New York, p 709-721
Strobe1 J, Cannon R, Kendall CGSC, Biswas G, Bezdek J (1989) Interactive (SEDPAK) simulation of clastic and carbonate sediments in shelf to basin settings. Com- puters & Geosci 15: 1279-1290
Stubblefield WL, McGrail DW, Kersey DG (1984) Recog- nition of transgressive and post-transgressive sand ridges on the New Jersey continental shelf. In: Till- man RW and Siemers CT (eds) Siliciclastic shelf sedi- ments. Soc Econ Paleontol Mineral Spec Publ 34: 1-23
Stum M, Matter A (1978) Turbidites and varves in Lake Brienz (Switzerland): deposition of clastic detritus by density currents. In: Matter A, Tucker ME (eds) Mo- dem and ancient lake sediments. Int Assoc Sedimentol Spec Publ 2: 147-168
Subramanian V (1985) Geochemistry of river basins. Part I: water chemistry, chemical erosion and water-mine- ral equilibria. Mitt Geol-Palionto1 Inst Univ Hamburg, SCOPEIUNEP Sonderb 58: 495-512
Suess E (1980) Particulate organic carbon flux in the o c e ans: surface productivity and oxygen utilization. Nature 288: 260-263
Suess E, Whiticar MJ (1989) Methanederived C02 in pore fluids expelled from the Oregon subduction zone. Palawgwgr Palaeoclimatol Palaml 71 : 119-136
Suess E, Balzer W, Hesse K-F, Miiller PJ, Ungerer CA, Wefer G (1982) Calcium carbonate hexahydrate from organic-rich sediments of the Antarctic shelf: precur- son of glendonites. Science 216: 1 128-1 13 1

Suess E, K u h LD, Killingley JS (1987) Coastal upwelling and a history of organic-rich mudstone deposition off Peru. In: Brooks J, fleet AJ (eds) Marine petroleum source rocks. Gwl Soc S Pub1 26: 181-197
Sullivan R (1985) origin of E s t r i n e rocks of w i s Peak Member, Wyoming. Am Assoc Petrol Gwl Bull 69: 913-922
Summerfield MA (1991) Subaerial denudation of passive margins: regional elevation versus local relied models. Earth Planet Sci Lett 102: 4643-469
Summerhayes CP (1983) Sedimentation of organic matter in upwelling regimes. In: Thiede J, Suess E (eds) Coastal upwelling - its sediment record. Part B, NATO Conference Ser 4: Marine Sci 10, Plenum Press, New York London, p 29-72
Sun Shuncai (1988) Lakes in China and Chinese lacustrine sedimentology - a brief survey. Mitt Geol-Pallontol Inst, Univ Hamburg, SCOPEIUNEP Sonderb 66: 165- * 7 C 1 l J
Suppe J (1985) Principles of structural gwlogy. Prentice- Hall, Englewood Cliffs, 537 p
Surlyk F, Clemmensen LB, Larsen HC (1981) Post-Palw- wic evolution of the East Greenland continental mar- gin. In: Kerr JW, Fergusson AJ (eds) Gwlogy of the North Atlantic borderlands. Can Soc Petrol Gwl Mem 7: 611-646
Suttner U, Dutta PK (1986) Alluvial sandstone com- ~osition and ~alwclimate. I. Framework mineralogy. -- j Sediment Pktrol56: 329-345
Svendsen JI, Mangerud J,.Miller GH (1989) Denudation rates in the Arctic estlrnated from lake sediments on Spitsbergen, Svalbard. Palawgwgr Palawclimatol Palaeoecol76: 153-168
Sverjensky DA (1986) Genesis of Mississippi Valley-type lead-zinc deposits. Annu Rev Earth Planet Sci 14: 177-199
Swift DJP (1985) Response of the shelf floor to flow. In: T i a n RW, Swift DJP, Walker RG (eds) Shelf sands and sandstone reservoirs. Soc Econ Palwntol Mineral Short Course 13: 135-241
Swift DJP, Hudelson PM, Brenner RL, Thompson P (1987) Shelf construction in a foreland basin: stom beds, shelf sandbodies, and shelf-slope depositional sequences in the Upper Cretaceous Mesaverde Group, Book Cliffs, Utah. Sedimentology 34: 423-457
Swift DJP, Rice DD (1984) Sand bodies on muddy shel- ves: a model for sedimentation in the Western Interior Cretaceous seaway, North America. In: Tillman RW and Siemers CT (eds) Siliclastic shelf sediments. Soc Econ Palwntol Mineral Spec Publ 34: 43-62
Swift JH (1984) The circulation of the Denmark Strait and Iceland-Scotland overflow waters in the North Atlan- tic. Deep-sea Res 31 : 1339-1355
Tada R (1991) Compaction and cementation in siliceous rocks and their possible effect on bedding enhance- ment. In: Einsele G, Ricken W, Seilacher A (eds) Cycles and events in stratification. Springer, Heidel- berg New York, p 480-491
Tada R, Siever R (1989) Pressure solution during diagene- sis. Annu Rev Earth Planet Sci 17: 89-118
Taira A, Katto J, Tashiro M, Okamura M, Kodama K (1988) The Shimanto Belt in Shikoku, Japan - evolu- tion of Cretaceous to Miocene aaccretionary prism. Modem Gwl 12: 1-42
Talbot MR, Kelts K (4s ) (1989) The Phanerozoic record of lacustrine basins and their environmental signals. Palawgwgr Palawclirnatol Palaeoecol70, 304 P
Talwani M, Hay W, Ryan WBF (4s ) (1979) Deep d d i n g results in the Atlantic ocean: continental margins and palwenvironment. Maurice Ewing Ser 3, Am Gw- phys Union, Washington DC
Tamrazyan GP (1989) Global peculiarities and tendencies in river discharge and washdown of the suspended sediments - the Earth as a whole. J Hydro1 107: 113- 13 1
Tankard AJ, Balkwill HR (eds)(1989) Extensional tectonics and stratigraphy of the North Atlantic margins. Am Assoc Petrol Gwl Mem 46, 641 p
Tankard AJ, Welsink HJ (1988) Extensional tectonics, structural styles and stratigraphy of the Mesozoic Grand Banks of Newfoundland. In: Manspeizer W ( 4 ) Triassic-Jurassic rifting, parts A and B. Deve lopm Gwtectonics 22, Elsevier, Amsterdam, p 129- 165
Tarkian M, Garbe CD (1988) Geochemistry and genesis of sulfide ore deposits in the volcano-sedimentary se- quence of the western Grauwackenzone (Eastern Alps, Austria). In: Friedrich GH, Henig PM (4s ) Base metal sulfide deposits in sedimentary and volcanic environments. Soc Gwlogy Applied to Mineral Depo- sits, Spec Publ 5, Springer, Berlin Heidelberg New York, p 149-168
Tenhagi K (1925) Erdbaumechanik auf bodenphysikali- scher Grundlage. Deuticke, Leipzig
Teichert C (1958) Concepts of facies. Am Assoc Petrol Gwl Bull 42: 2718-2744
Teichmiiller R (1973) Die pako~wgraphisch-fazielle und tektonische Entwicklung einea Kohlenbeckens am Beispiel des Ruhrkarbons. Z Deutsch Gwl Ges 124: 149-165
Teichmiiller M, Teichmiiller R (1979) Diagenesis of coal (coalification). In: Larsen G, Chilingarian GV (4s) Diagenesis in sediments and sedimentary rocks. Deve- lopm Sedimentol 25A, Elsevier, Amsterdam, p 207- 246
Teichmiiller M, Teichmiiller R, Bartenstein H (1984) In- kohlung und Erdgas - eine neue Inkohlungskarte der Karbon-Oberfiche in Nordwestdeutschland. Fortschr Geol Rheinld Westf (Krefeld) 32: 11-34
Teisserene P, Villemin J (1990) Sedimentary basin of Gabon - gwlogy and oil systems. In: Edwards JD, Santogrossi PA (4s ) Divergent/passive margin basins. Am Assoc Petrol Gwl Mem 48: 117-199
Teller JZ, Last WM (1990) Palwhydrological indicators in playas and salt lakes, with examples from Canada, Australia, and Africa. Palawgwgr Palawclimatol - - palaeo&l 76: 215-240
Ten Haven HL. Baas M. De Leeuw JW. Schenck PA (1987) Late'~uaterna& sa ropels, I - on the origin of organic matter in s a p r o p e f ~ ~ . Marine Gw1 75: 137- 156
Ten Haven HL, Littke R, RullkBtter J, Stein R, Welte DH (1990) Accumulation rates and composition of organic matter in late Cenozoic sediments underlying the ac- tive upwelling area off Peru. In: Suess E, von Huene R et al. F k c ODP, Sci Results 112: 591605, College Station, TX (Ocean Drilling Program)
Teng LS, Gorsline DS (1989) Late Cenozoic sedimentation in California continental borderland basins as revealed by seismic facies analysis. Gwl Soc Am Bull 101 : 27- 4 1
Terwindt JHJ (1988) Palawtidal reconstructions of inshore tidal depositional environments. In: Boer PL de, van Gelder A, Nio SD (4s ) Tide-influenced sedimentary environments and facies. Reidel, Dordrecht, p 233- 263
The Le 116 Shipboard Scientific Party (1987) Himalayan u p k ~ history observed on the equator. Gmtimes 33: 9-12
Thein J, von Rad U (1987) Silica diigenesis in continental rise and slope sediments off eastern North America (Sites 603, Leg 93; Sites 612 and 613, Leg 95). In: Poag CW, Watts AB et al. Init Repts DSDP 95: 501- 525, US Govt Print Office, Washington

Thiede J (1978) Pelagic sedimentation in immature ocean basins. In: Ramberg IB, Neumann ER (eds) Tectonics and gwphysics of continental r i b . Reidel, Dordrecht, p 237-248
Thiede J (1981) Sedimentation und physiographische Ent- wicklung des Nordatlantiks seit dem mittleren Meso- zoikum. Gwl Rundsch 70: 316-326
Thiede J, Suess E (eds) (1983) Coastal upwelling - its sediment record. Part B, NATO Conference Ser 4: Marine Sci 10, Plenum Press, New York London, 610 P
Thiede J, Diesen GW, Knudsen B-E (1986) Patterns of Cenozoic sedimentation in the Norwegian-Greenland Sea. Marine Gwl 69: 323-352
Thiede J, Eldholm 0 , Taylor E (1989) Variability of Ceno- zoic Norwegian-Greenland Sea paleoceanography and northern hemisphere paleoclimate. In: Eldholm 0, Thiede J, Ta lor E et al. Proc ODP, Sci Results 104: 1067-1 118. &llege Station. TX (Ocean Drilling Pro- gram)
Thierstein HR (1979) Paleoceanographic implications of organic carbon and carbonate distribution in Mesozoic deepsea sediments. In: Talwani M, Hay W, Ryan WBF (4s) Deep drilling results in the Atlantic Ocean: continental margins and paleoenvironment. Maurice Ewing Ser 3, Am Gwphys Union, Washington DC, p 249-274
Thomson J, Calvert SE, Mukherjee S, Burnett WC, Brem- ner JM (1984) Further studies on the nature, com- position and ages of contemporary phosphorite from the Namibian shelf. Earth Planet Sci Lett 69: 341-353
Thornburg TM, Kulm LD (1987) Sedimentation in the Chide Trench: depositional morphologies, lithofacies, and stratigraphy. Gwl Soc Am Bull 98: 33-52
Thornes JB. Brunsden D (1977) Gwmomhology and time. . , - -- ~ & ~ e n , London
Thornton SE (1984) Basin model for hemiwlagic sedimen- tation in a: tectdnicall active continenbl margin: Santa Barbara basin, CalifYornia continental borderland. In: Stow DAV, Piper DJW (eds) Fine-grained sediments: deep-water processes and facies. Gwl Soc Spec Publ 15: 377-394
Thunell RC, Locke SM, W i m s DF (1988) Glacioeus- tatic seal-level control on Red Sea salinitv. Nature j34: ~ ~
Thiry M, Milnes AR (1991) Pedo enic and groundwater silcretes at Stuart Creek om1 teld. South Australia. J Sediment Petrol 61 : 1 1 1-f27
Tiercelin JJ. Faure H (1978) Rates of sedimentation and ~ertical'subsidence~in nebrifts and palwrifts. In: Ram- berg B, Neumann ER (eds) Tectonics and gwphysics of continental r i b . Reidel, Dordrecht, p 41-47
Tietze K-W (1982) Zur Gwmetrie einiger Fliisse im Mittleren Buntsandstein (Trias). Gwl Rundsch 71: 8 13-823
Tillman RW, Siemen CT (1984) Siliciclastic shelf sedi- ments. Soc Econ Palwntol Mineral Spec Publ 34
T i a n RW, Swift DJP, Walker RG (eds) (1985) Shelf sands and sandstone reservoirs. Soc Econ Paleontol Mineral Short Course Notes 13, 708 p
Tipper JC (1987) Estimating stratigraphic completeness. J Gwlogy 95: 710-715
Tissot BP, Welte DH (1984) Petroleum formation and occurrence, 2nd edn. Springer, Berlin Heidelberg New York, 699 pp
Tissot BP, Pelet R, Ungerer Ph (1987) Thermal history of sedimentary basins, maturation indices, and kinetics of oil and as generation. Am Assoc Petrol Gwl, Bull 71: 144f-1466
Toomey DF (ed) (1981) European fossil reef models. Soc Econ Palwntol Mineral Spec Publ 30, 546 p
Torrent J , Schwertmann U (1987) Influence of hematite on the color of red beds. J Sediment Petrol 57: 682-686
Toth J (1980) Cross-formational gravity-flow of ground- water: a mechanism of the transport and accumulation of petroleum. In: Roberts WH 111, Cordell RJ (eds) Problems of petroleum migration. Am Assoc Petrol Gwl, Stud in Gwl 10: 121-167
Toy TJ (1982) Accelerated erosion: process, problems, and prognosis. Gwlogy 10: 524-529
Trappe J (1991) Stratigraphy, facies distribution and palw- gwgraphy of the marine Palwgene from the western High Atlas. N Jahrb Gwl Paliiontol Abh (Stuttgart) 180: 279-321
Trendall AF, Morris RC (eds)(1983) Iron-formation: facts and problems. Developm Precambrian Gwl 6, El- sevier, Amsterdam, 558 p
Tmrnit P, Amstutz GC (1979) Die Bedeutung des Riick- standes von Druck-Msungsvorgiingen fir stratigraphi- sche Abfolgen, Wechsellagerung and Lagerstittten- bildung. G a l Rundsch 68: 1 107-1 124
Tmsheh F (1960) Mechanics of salt migration in northern Germany. Am Assoc Petrol Geol Bull 44: 1519-1540
Tucholke BE, Embley RW (1984) Cenozoic regional ero- sion of the abyssal sea floor off South Africa. In: Schlee JS (ed) Interregional unconformities and hydro- carbon accumulation. Am Assoc Petrol Geol Mem 36: 145-164
Tucker ME (1974) Sedimentology of Paleozoic pelagic limestones: the Devonian Griotte (Southern France) and Cephalopodenkalk (Germany). In: Hsii KJ, Jen- kyns HC (eds) Pelagic sediments on land and under the sea. Int Assoc Sedimentol Spec Publ 1: 71-92
Tucker ME (1982) Precambrian dolomites: petrographic and isotopic evidence that they differ from Phanero- zoic dolomites. Gwlogy 10: 7-12
Tucker ME, Wilson JL, Crevello PD, Sarg JR, Read F (eds) (1990) Carbonate platforms: facies, sequences and evolution. Int Assoc Sedimentol Spec Publ 9, Blackwell, Oxford, 328 p
Tucker ME, Wright VP (1990) Carbonate sedimentology. Blackwell, Oxford, 482 p
Tucker RM, Cann JR (1986) A model to estimate the de- positional brine depth of ancient haline rocks: implica- tions for ancient subaqueous depositional environ- ments. Sedimentology 33: 401-412
Turner P (1980) Continental red beds. Developm Sedimen- to1 29, Elsevier, Amsterdam, 562 p
Twidale CR, Milnes AR (1983) Aspects of the distribution and disinte ration of siliceous duricrusts in arid Aus- tralia. Gwf~i jnbouw 62: 373-382
Tye RS, Coleman JM (1989) Depositional processes and stratigraphy of fluvially dominated lacustrine deltas: Mississippi delta plain. J Sediment Petrol 59: 973-996
Tye RS, Kosters EC (1986) Styles of interdistributary basin sedimentation: Mississippi delta lain, Louisiana. Trans Gulf Coast Assoc Gwl Soc f6: 575-588
Uemura T, Mizutani S (1984) Gwlogical structures. Wi- ley, Chichester, 309 p
Vail PR (1987) Seismic stratigra hy interpretation using sequence statigraphy. Part t Seismrc stratigraphy interpretation procedure. In Bally AW (ed) Atlas of seismic stratigraphy. Am Assoc Petrol Gwl, Stud in Gwl27: 1-10
Vail PR, Sangree JB (1988) Sequence stratigraphy interpre- tation of seismic, well and outcrop data workbook. NATO Adv Res Workshop, Sept 1988, Digne, France, Assoc Sedimentol Fr, 19 parts
Vail PR, Hardenbol J, Todd RG (1984) Jurassic unconfor- mities, chronostratigraphy, and sea level changes from

seismic stratigraphy and biostratigraphy. In: Schlee JS (ed) Interregional unwnformities and hydrocarbon accumulation. Am Assoc Petrol Geol Mem 36: 129- 144
Vail PR, Audemard F, Bowman SA, Eisner PN, Perez- Cruz C (1991) The stratigraphic signatures of tec- tonics, eustacy and sediientology. In: Einsele G, Ricken W, Seilacher A (eds) Cycles and Events in stratigraphy. Springer, Heidelberg New York, p 617- 659
Vail -PR, Mitchum RM Jr, Todd RG, Widmier JM, Thompson S, Sangree JR, Bubb JN, Hatlelid WG (1977) Seismic stratigraphy and global changes of sea level. In: Payton CE (ed) Seismic stratigraphy - ap- plication to hydrocarbon exploration. Am Assoc Petrol Geol Mem 26: 49-212
Valeton I (1983) Klimaperioden lateritischer Verwitterung und ihr Abbild in den synchronen Sedimentations- rilumen. Z Deutsch Geol Ges 134: 413-452
Valeton I (1988) Sedimentiire Phosphatgesteine. In: Fiicht- bauer H (ed) Sedimente und Sedimentgesteine. Schweizerbart, Stuttgart, p 543-567
Valloni R, Mezzardi G (1984) Compositional suites of temgenous deep-sea sands of the present continental margins. Sedimentology 3 1 : 353-364
Van Andel TH (1964) Recent marine sediments of the Gulf of California. In: van Andel TH, Shor GG (eds) Marine geology of the Gulf of California - a sympo- sium. Am Assoc Petrol Geol Mem 3: 216-310
Van Andel TH (1983) Estimation of sedimentation and accumulation rates. In: Heath GR (ed) Sedimentology, physical properties and geochemistry in the Initial Reports of the Deep Sea Drilling Project: an over- view. US Dept Commerce, Nat Oceanic and Atmosph Administr, Envrionm Data and Inform Service, Boul- der, p 93-101
Van Andel TH (1985) New views on an old planet. Cam- bridge Univ Press, Cambridge, 324 p
Van Andel TH, Thiede J , Sclater JG, Hay WW (1977): Depositional history of the South Atlantic ocean during the last 125 million years. J Geol 85: 651-698
van Hinte JE (1978) Geohistory analysis - application of micropaleontology in exploration geology. Am Assoc Petrol Geol Bull 62: 201-222
van Hinte JE, Cita MB, van der Weijden CH ( 4 s ) (1987) Extant and ancient anoxic basin conditions in the eas- tern Mediterranean. Marine Geol 75, 114 (Spec Iss), 281 p
Van Houten FB (1964) Cyclic lacustrine sedimentation, U p ~ e r Triassic Lockatone. formation, central New ~ e & e ~ and adjacent ~ennsylvania. Kansas Geol Surv Bull 169: 497-53 1
Van Houten FB (1973) Origin of red beds: a review - 1961-1972. Annu Rev Earth Planet Sci 1: 39-61
Van Houten FB, Arthur MA (1989) Temporal patterns among Phanerozoic oolitic ironstones and oceanic anoxia. In: Young TP, Taylor EG (eds) Phanerozoic ironstones. Geol Soc Spec Publ 46: 33-49
Van Houten FB, Purucker ME (1984) Glauconitic peloids and chamositic ooids - favorable factors, constraints and problems. Earth-Sci Rev 20: 21 1-243
Van Straaten LMJU (1954) Composition and structure of recent marine sediments in the Netherlands. Leidse Geol Mededel 19: 1-110
van Wagoner JC, Mitchum RM, Posamentier HW, Vail PR (1987) Seismic stratigraphy using sequence stratigra- phy. Part 11: Key definitions of squence stratigraphy. In: Bally AW (ed) Atlas of seism~c stratigraphy. Am Assoc Petrol Geol Stud in Geol27: 11-14
Van Wagoner JC, Posamentier HW, Mitchum RM, Vail PR, Sarg JF, Loutit TS, Hardenbol J (1988) An over-
view of the fundamentals of sequence stratigraphy and key definitions. In: Sea-level changes - an inte rated approach. Soc E w n Paleontol Mineral Spec Put1 42: 39-45
Vecsei A, Frisch W, Pirzer M, Wetzel A (1989) Origin and tectonic significance of radiolarian chert in the Austroalpine rifted continental margin. In: Hein JR, Obradovic J (eds) Siliceous deposits of the Tethys and Pacific regions. Springer, New York Heidelberg, p 65-80
Veevers JJ (1988) Gondwana facies started when Gond- wanaland merged in Pan ea. Geology 16: 732-734
Veevers JJ (1990) ~ectonic-cknatic supercycle in the bil- lion-year platetectonic eon: Permian Pangean icehouse alternates with Cretaceous dispersedcontinents green- house. Sediment Geo168: 1-16
Veizer J (1988) The evolving exogenic cycle. In: Gregor CB, Garrels RM, Mackenzie FT, Maynard JB (eds) Chemical cycles in the evolution of the Earth. Wiley, New York, p 175-220
Veizer J , Fritz P, Jones B (1986) Geochemistry of brachio- pods: oxygen and carbon isotopic records of Paleozoid oceans. Geochim Cosmochim Acta 50: 1679-1696
Velbel MA (1985) Mineralogically mature sandstones in accretionary prisms. J Sediment Petrol 55: 685-690
Vessel RK, Davies DK (1981) Nonmarine sedimentation in an active forearc basin. Soc Econ Paleontol Mineral Spec Publ 3 1: 3 1-45
Visser MJ (1980) Neapsprin cycles reflected in Holocene subtidal large-scale d o r m deposits: a preliminary note. Geology 8: 543-546
Von der Borch CC, Lock DE (1979) Geological signi- ficance of Coorong dolomites. Sedimentology 26: 813- 824
Von ~ u e n e R (1986) To accrete o r not accrete, that is the question. Geol Rundsch 75: 1-15
Von Huene R, Lallemand S (1990) Tectonic erosion along the Japan and Peru convergent margins. Geol Soc Am Bull 102: 704-720
Vorren TO, Lebesbye E, Andreassen K, Larsen KB (1989) Glacigenic sediments on a passive continental margin as exemplified by the Barents Sea. Marine Geol 85: 251-272
Wagenbreth 0, Steiner W (1982) Geologische Streifziige - Landschafi und Erdgeschichte zwischen Kap Arkona und Fichtelberg. VEB Deutscher Verlag f i r Grund- stoffmdustrie, Leipzig, 204 P
Walcott RI (1987) Geodetic stram and the deformational history of the North Island of New Zealand during the late Cainozoic. In: Oxburgh ER, Yardley BWD, Eng- land PC ( 4 s ) Tectonic settings of regional metamor- phisms. Philos Trans Royal Soc London A, 321: 163- 181
Walger E (1964) Zur Darstellung von KorngrijDenvertei- lungen. Geol Rundsch 54: 976-1002
Walker BH, Francis EH (1987) High-level emplacement of an olivinedolerite sill into Namurian sediments near Cardenden, Fife. Trans Royal Soc Edinburgh, Earth Sci 77: 295-307
Walker JCG, Drever JI (1988) Geochemical cycles of atmospheric gases. In: Gregor CB, Garrels RM, Mackenzie m, Maynard JB (eds) Chemical cycles in the evolution of the Earth. Wiey, New York, p 55-76
Walker RG (1973) Mopping up the turbidite mess. In: Ginsburg, RN (ed) Evolving concepts in sedimento- logy. Johns Hopkins Univ Press, Baltimore London, p 1-17
~ a l k k ; k G (1978) Deep-water sandstone facies and ancient submarine fans: models for exploration for stratigrphic traps. Am Assoc Petrol Geol Bull 62: 932-966

Walker RG (ed) (1984a) Facies models, 2nd edn. Gwsci Canada Reprint Ser 1, Geol Assoc Canada, 317 p
Walker RG (1984b) Shelf and shallow marine sands. In: Walker RG (ed) Facies models, 2nd edn. Geosci Ca- nada Reprint Ser 1, G w l Assoc Canada, p 141-170
Walker RG (1984~) Turbidites and associated coarse-gram- ed clastic deposits. In: Walker R (ed) Facies models, 2nd edn. Geosci Canada Reprint Ser 1, Geol Assoc Canada, p 171-188
Walker RG, Cant DJ (1984) Sandy fluvial systems. In: Walker RG (ed) Facies models, 2nd edn. Geosci Ca- nada Reprint Ser 1, G w l Assoc Canada, p 71-89
Walker RG, Duke WL, Leckie DA (1983) Hummocky stratification: significance of its variable bedding se- quences - discussion and reply. Geol Soc Am Bull 94: 1245-1251
Walker TR (1967) Formation of red beds in modem and 'ancient deserts. G w l Soc Am Bull 78: 353-368
Walker TR (1976) Diagenetic origin of continental red beds. In: F a k e H (ed) The continental Permian in Central, West, and South Europe. Reidel, Dordrecht, p 240-282
Walker TR (1979) Red color in dune sand. In: McKee ED (ed)(1979) A study of global sand seas. US Geol Surv Prof Pap 1052: 61-81
Walling DE, Webb, BW (1986) Solutes in river systems. In: Trudgill ST (ed) Solute processes. Wiley , Chiches- ter New York, p 251-327
Walsh JJ (1988) On the nature of continental shelves. Aca- demic Press, 515 p
Wanless HR, Tedesco LP, Tyrell KM (1988) Production of subtidal and surficial tempestites by humcane Kate, Caicos platform, British West Indies. J Sediment Pet- rol 58: 739-750
Waples DW (1980) T i e and temperature in petroleum formation: Application of Lopatin's method to petro- leum ex~loration. Am Assoc Petrol Geol Bull 65: 916- 926
Ward LG, Ashley GM (eds)(1989) Physical processes and sedimentology of siliciclasticdominated lagoonal sys- tems. Marine Geol (Spec Iss) 88: 181-364
Ward RF, Kendall CGSC, Hams PM (1986) Upper Per- mian (Guadalupian) facies and their association with hydrocarbons - Permian Basin, West Texas and New Mexico. Am Assoc Petrol Geol70: 239-262
Warme JE (1988) Jurassic carbonate facies of the central and eastern High Atlas Rift, Morocco. In: Jacobs- hagen VH (ed) The Atlas system of Morocco. Lecture Notes Earth Sci 15, Springer. Berlin Heidelberg New . - - . - York, p 169-199
Warren JK (1979) Aeolian Drocesses. In: Embleton C. ~ h o r n e s ' ~ ( d s ) ~rocess-in gwmorphology. ~ r n o l d ; London. D 325-351
Warren JK (1689) Evaporite sedimentology: importance in hvdrocarbon accumulation. Prentice-Hall. Englewood , " dliffs, New Jersey, 285 p
Warren JK (1990) Sedimentology and mineralogy of dolo- mitic Coorong lakes, South Australia. J Sediment Petrol 60: 843-858
Wasson RJ (1986) Geomo~hology and Quaternary history of the Australian contmental dune fields. Geogr Rev Japan 59: 55-67
Watts AB, Steckler MS (1979) Subsidence and eustacy at continental margin of eastern North America. In: Talwani M, Hay W, Ryan WBF (eds) Deep drilling results in the Atlantic Ocean, continental margins and valeoenvironment. Maurice Ewinn Ser 3, Am Geo- phys Union, p 218-234
- Watts AB. Thorne J (1984) Tectonics. global changes in
sea level and th& relationship to Gratigraphi&l se- quences at the U.S. Atlantic continental margin. Ma- rine and Petrol Geol 1 : 319-339
Watts AB, Karner GD, Steckler Ms (1982) Lithospheric flexure and the evolution of sedimentary basins. Philos Trans Royal Soc A, 305: 249-281
Watts KF, Blome CD (1990) Evolution of carbonate plat- form margin slope and its response to orogenic closing of a Cretaceous ocean basin, Oman. In: Tucker ME, Wilson JL, Crevello PD, Sarg JR, Read F (eds) Car- bonate platforms: facies, sequences and evolution. Int Assoc Sedimentol Spec Publ 9, Blackwell, Oxford, p 29 1-323
Weaver CE (1989) Clays, muds, and shales. Developm Sedimentol 44, Elsevier, Amsterdam, 820 p
Weedon GP (1991) The spectral analysis of stratigraphic time series. In: Einsele G, Ricken W, Seilacher A (eds) Cycles and events in stratigraphy. Springer, Heidelberg New York, p 840-854
Wefer G, Heinze P, Suess E (1990) Stratigraphy and sedi- mentation rates from oxygen isotope composition, organic carbon content, and grain-size distribution at the Peru upwelling region: Holes 680B and 686B. In: Suess E, von Huene R et al. Proc ODP, Sci Results 112: 355-362, College Station, TX (Ocean Drilling Program)
Weggen J, Valeton I (1990) Polygenetic lateritic iron ores on BIF's in Minas GeraislBrazil. G w l Rundsch 7912: 301-318
Weimer P (1990) Sequence stratigraphy, facies geometries, and depositional history of the Mississippi fan, Gulf of Mexico. Am Assoc Petrol G w l Bull 74: 425-453
Weimer RJ (1960) Upper Cretacwus stratigraphy, Rocky Mountain area. Am Assoc Petrol G w l Bull 44: 1-20
Weimer RJ (1984) Relation of unconformities, tectonics, and sea-level changes: Cretaceous of Western Interior. In: Schlee JS (ed) Interregional unconformities and hydrocarbon accumulation. Am Assoc Petrol Geol Mem 36: 7-35
Weimer RJ (1986) Relationship of unconformities, tec- tonics, and sea level changes in the Cretacwus of the Western Interior, United States. In: Peterson JA (ed) Paleotectonics and sedimentation in the Rocky Moun- tain region, United States. Am Assoc Petrol Geol Mem 41: 397-422
Weimer RW (1976) Deltaic and shallow marine sandstones: sedimentation, tectonics, and petroleum occurrences. Am Assoc Petrol Geol, Educ Course Note Ser 2, 167 P
Weissert H , McKenzie J , Hochuli P (1979) Cyclic anoxic events in the early Cretacwus Tethys ocean. Geology 7: 147-151
Weller JM (1964) Development of the concept and inter- pretation of cyclic sedientation. In: Merriam DF (ed) symposium dn cyclic sedimentation. Kansas Geol &N Bull 169: 607-621
Wells IT, Coleman JM (1981) Periodic mudflat prograda- tion, northeastern coast of South America: a hypothe- sis. J Sediment Petrol 51: 1069-1076
Wells NA, Dorr JA (1987) A reconnaissance of sedimen- tation on the Kosi alluvial fan of India. In: Ethridge FG, Flores RM, Harvey MD ( 4 s ) Recent develop ments in fluvial sedimentology. Soc Econ Palwntol Mineral Spec Publ 39: 51-61
Welsink HJ, Srivastava SP, Tankard AJ (1989) Basin ar- chitecture of the Newfoundland continental margin and its relationship to ocean crust fabric during extension. In: Tankard AJ, Balkwid HR ( 4 s ) Extensional tec- tonics and stratigraphy of the North Atlantic margin. Am Assoc Petrol Geol Mem 46: 197-213
Wendt J (1988) Condensed carbonate sedimentation in the late Devonian of the eastern Anti-Atlas. Eclogae Gwl - Helv 81: 155-173
Wendt J. Aiener T (1985) Facies t at terns and demsitional envhonkents of ~~laeozoic 'ce~halopod liiestones. Sediment Geol44: 263-300


in Siidwestdeutschland. Eclogae Geol Helv 61: 157- 166
Wurster P, St& J (1982) Sedimentation in the Atlas Gulf 11: Mid-Cretaceous events. In: Rad U von, Hinz K, Sarnthein M, Seibold E (4s ) Geology of the North- west African continental margin. Springer, Berlin Heidelber New York, p 439-458
WyUie PJ (19fl) The dynamic earth. Wiey, New Yorlc, 416 p
Yaalon DM, Dan J (1974) Accumulation and distribution of loessderived deposits in the semidesert and desert fringe of area of Israel. Z Geomorph NF (Suppl) 20: 91-105
Ying Wang, Meie Ren, Dakuei Zhu (1986) Sediment supply to the continental shelf by the major rivers of China. J Geal Soc London 143: 935-944
Yose LA, Heller PL (1989) Sea-level control of mixed- carbonate-siliciclastic, gravity-flow deposition: Lower part of the Keeler Canyon Formation (Pennsylvanian), southeastem California. Geol Soc Am Bull 101: 427- 439
Young TP, Taylor EG (eds)(1989) Phanerozoic ironstones. Geol Soc Spec Pub1 46, 251 p
Zachar D (1982) Soil erosion. Developm in Soil Sci 10, Elsevier, Amsterdam, 547 p
Zafiriou OC, Gagosian RE3 Peltzer ET, Alford JB, Loder T (1985) Air-to-sea fluxes of lipids at Enewetak atoll. J Geophys Res 90: 2409-2423
Zankl H (1971) Upper Triassic carbonate facies in the northern Limestone Alps. In: Miiller G (ed) Sedimen- tology of parts of Central Europe, 8th Int Sediment01 Congr Heldelberg, Guidebook. Kramer, Frankfurt, p 147-185
Zbinden EA, Holland HD, Feakes CR (1988) The Stur- geon Falls paleosols and the composition of the at- mosphere 1.1 Ga BP. Precambrian Res 42: 141-163
Zhao WI, Morgan WJ (1985) Uplift of the Tibetan plateau. Tectonics 4: 359-369
Zharkov MA (1981) Histo of Paleozoic salt ac cumulation. Springer, Be% Heidelberg New York, 309
Zhu J, ZL F, Xu K (1988) Depositional environment and metamorphism of early Proterozoic iron formation in the Liiliangshan region, Shanxi province, China. hecambrian Res 39: 39-50
Zhu X (ed)(1989) Chinese sedimentary basins. Elsevier, Amsterdam, 238 p
Ziegler MA (1989) North German Zechstein facies patterns in relation to their substrate. Geol Rundsch 78: 109- 127
Ziegler MA (1989) North German Zechstein facies patterns in relation to their substrate. Geol Rundsch 78: 109- 127
Ziegler PA (1979) Factors controlling North Sea hydrocar- bon accumulations. World Oil 189 (6): 11 1-124
Ziegler PA (1982) Geological atlas of western and central Europe. Shell Internationale Petrolleum Maatschappij B.V., The Hague. Distrib. Elsevier, Amsterdam, 130 p, 40 Encl
Ziegler PA (1988) Evolution of the Arctic-North Atlantic and the Western Tethys. Am Assoc Petrol Geol Mem 43, 198 p, 30 pl
Ziegler PA (1989) Evolution of Laurussia: a study in late Paleozoic plate tectonics. Kluwer, Dordrecht, 102 p, 14 pl
Zimmerrnan HB, Shackleton HJ, Backman J, Kent DV, Baldauf JG, Kaltenback AJ, Morton AC (1984) His- tory of Plio-Pleistocene climate in the northeastern Atlantic, Deep Sea Drilling Project Hole 552A. In: Roberts DG, Schnitker D et al. Init Repts DSDP 81: 861-875, US Govt Print Off, Washington
Zonenhain LP, LePichon X (1986) Deep basins of the Black Sea and Caspian Sea as remnants of Mesozoic back-arc basins. In: Auboin J, LePichon X, Monin AS (eds) Evolution of the Tethys. Tectonophysics 123: 181-211
Zuffa GG (1987) Unravelling hinterland and offshore pa- leo wgraphy from deep-water arenites. In: Legget JK, ~ u & a GG (eds) Marine clastic sedknentology. Graham and Trotman, London, p 39-61

Subject Index Italized numbers refer to figures, T to tables
abrasion (by ice) 21, 2.3 accretionary wedge (also s.
subduction complex) chaotic layers 468 dBcollement zones 47 1-473,
12.23d, 12.24, 1 2 . 2 5 ~ internal structures 468 sediment budget 466, 12.20 sediment successions 466-467,
473, 12.19ceg, 12.2% specific sedimentary structures
468 tectonic erosion 467
accumulation of sediments general trends 16 lagging behind subsidence 16
accumulation rates (also s. sedimentation rates) 385
conversion into sedimentation rates 10.1
definition 385-386 adjacent sea basins 15, 161-176
"aridw basins 164-165, 4.2b "humid" basin 163-164, 4 . 2 ~ salt precipitation 165 water circulation 163-165, 4.2 calcite compensation depth 190
advection s. compaction flow advective heat transfer 549 Aegean Sea 479, 495 aggregation of clay and mud (also
s. clay pellets) 179, 185 Aleutian trench 471 allodapic limestones s. carbonate
turbidites allogenetic, allocyclic sequences
272 alluvial fans 37-39, 2.8, 2.11
current directions 3 8 facies associations 39 vertical sequences 38-39, 2.12 stream gradients 37
Altiplano, Bolivia 480 amalgamation 280 Amazon River
dissolved load 354, 9 . 4 ~ drainage area, denudation 379,
9.18
Ammonitico Rosso 205 anastomosed rivers 51, 2.18 anchimetamorph zone 509 ancient salt deposits 253 Andaman Sea 479, 12.22 anhydrite precipitation 244, 246 antidunes 3 1, 2.7 anti-estuarine water circulation
164, 168 Apennines
flysch basins 488, 12.31de foreland basins 490
ArabianIPersian Gulf (also s. Persian Gulf) 134
causes of giant oil fields 571 hydrocarbon source rocks 571,
14.12b Mesozoic platform carbonates
and evaporites 568, 571, 14.12bc
structural evolution 571 "aragonite" ocean 305 arc-trench systems 46 1-473
plate-tectonic setting 461, 1.2, 12.18
Atlantic (also s. North Atlantic) 183
conjugate margins 449, 12.13 decreasing clastic sedimentation
420, 11.6bc margin, North America,
subsidence 335, 337, 8.16, 8.17ab
northeastern 136 organic matter in Cretaceous
sediments 10.7 river-supplied calcium and silica
420 shelf, N. America 127, 130
atmosphere, evolution 266-267 atmospheric-oceanic feedback
system 282 aulacogen 5, 1.lc Australia, southern shelf 136 authigenic minerals 203, 206 autogenetic, autocyclic sequences
272 autotrophic organisms 393, 394
Bab el Mandeb, Red Sea 170, 248 backarc (interarc) basins 7, 75,
479-484, 1 . 2 ~ basin evolution 480-484, 12.29 modern examples 479, 483,
1 2 . 2 8 ~ on continental crust 480 on oceanic crust 480 preservation and identification
484 sedimentation rates 480, 482,
483 sediment successions 480-483,
12.28, 12.29 tectonic setting 479, 12.18,
12.19 backarc thrust belt 480 backstripping 322 bacteria, Precambrian 264 bacterial sulfate reduction 168 badlands 359 Bahama archipelago 448 Bahama bank, platform 134
high-salinity water reflux 528 Baikal lake 435 Baltic Sea 163, 182, 4 . 2 ~
carbonate dissolution 190 sediments 164 water circulation 164
Baltimore Canyon trough, thermal history 550, 13.21b banded quartzite 268 banded ironstones 268-269. 6.15 Barbados accretionary wedge 468,
472, 554, 12.23d Barents shelf 28 barrier-island complexes 121-124,
3.9, 3.17 barrier-beach complex 121, 3.17 depositional environments 12 1,
3.17 ebb- and flood tidal sands 123,
3.17 hydraulic regime 123 preservation in geologic record
124 response to sea level change
123-124, 3.16, 3.176

sedimentary structures 121-123, 3.17
tidal channel deposits 123, 3.17 transgressive, regressive systems
124 washover deposits 123, 3. I7
base level of erosion 12, 1.5 basification of the crust 434 basin analysis
tempestites 108 basin dynamics, definition 410 basin fill geometry 12 basin-filling models 409-422
"balanced" basins 422 basic principles 409-410 chemical sediments in closed
basins 414, 11.3 clastics/biogenics ratio 4 13, 11.1 closing basins 420 dynamic models 409 extensional basins 417-420 geometric models 409 over-supplied basins 4 10-413,
422, 424, 1 1 . 1 ~ rift basins, growing 417-4 19,
11.5 riftdrift stage transitions 419-
420 sediment supply moderate to low
413, 11.1 sediment-starved basins 422-423 three-dimensional problems 4 19 various sediment sources 4 13,
11.2 varying subsidence and sediment
supply 422, 11.7 basin plains, abyssal plains 222,
229, 231 basin sediments
between submarine ridges 206, 5.1 Ob
sedimentation rates 206 basin types 5-16, 1.1-1.3
pre-, syn-, postdepositional basins 10, 1.4
morphological, depositional environments 10-13, 1.6 tectonically defined 5-10, 1.1-
1.3 beach ridges 99, 3.2e beach rock 534 beach-shoreface zone 97-99, 3.1-
3.3 beach-shoreface profile 97 bed forms, sedimentary structures
97-99, 3.1, 3.3 gravel 99 offshore sand bars 99, 3.3 sand budget, sand belt 99, 3 . 3 ~ shoreline migration 99 summer, winter beach 97, 3 . 3 ~
vertical sequences 99, 3.3 wave ripples 98-99, 3.1
bedded nodular limestones 278, 13.18
bedding couplets 272 beds and interbeds 271 bedload of rivers 356 bedsets, bundles 272, 7.lg Bengal Fan 468
sediment budget 373-376, 9.16, T9.1
benthic boundary layer 399, 10.5 benthic degradation loss 401, 403,
10.10, 10.12 Bering Sea 125 bioclasts 277 bioerosion 136, 140 bioevents 306 biolamination 280 biologic response to sedimentological events 277 biosiliceous sediments s. siliceous
sediments Black Sea 161, 182, 4.4
Holocene development 168-169 hydrocarbon potential 170 Miocene-Pliocene development
168 organic matter, sapropel 168,
4.4d sediment budget 367-370, 9.13 sediments 164, 483 sedimentary history 168, 4.4 tectonic setting 483 water circulation 164, 4 . 2 ~
black shales 178, 193, 5.4ag definition 407 in redox cycles 282-283 in various environments 404,
407, 10.13 related to sea level changes 306
black smokers 235 Blake Plateau 205, 448 bluegreen algae, cyanobacteria 264 Bosporus 370 bottom life on the sea floor 400
aerobic conditions 400 anaerobic conditions 400
Brahmaputra River, Bangladesh 43 braided rivers, braidplains 33, 43-
46, T2.2, 2.15 grain sizes 43 multistory gravel units 43 proximaldistal trends 43-46 sedimentary structures 45 sheet sandstones 46 vertical sequences 43, 2.15
Brazos delta 149 breakup of supercontinents 304 breakup unconformity (also s.
continental margin) 330
North Atlantic 442 bulk density 386 bundle s. bedset Buntsandstein, Europe 37 Burma, forearc basin 469 bypassing of sediment 290, 410
calcite compensation depth (also s. carbonates, deep-sea) 282
"calcite" ocean 306 calcrete, caliche 48, 347, 534,
9. l a California
continental borderland 230 pull-apart basins 499 pull-apart basins, subsidence 344
Canary Basin 230 cannibalism 280 carbon flux in the oceans 397,
401, 10.10 influence of water depth 397,
T10.2 regional variation 397
carbonate buildups (also s. carbonate sediments or reefs) 134-141
atolls 140 backreef zone, lagoons 140,
3.23, 3.24a, 3.25ab diagenesis s. carbonate diagenesis drowning 141-143 economic significance 143, 146 emergence, karstification 143,
3 . 2 5 ~ evaporites 145, 3 . 2 4 ~ pro- and retrograding 143,
3.25ab omission, condensation 144 pelagic carbonate platforms 143 ramps 134-136, 3 . 2 2 ~ response to sea level changes
141 vertical sequences 143
carbonate diagenesis 144-146, 542- 544, 3.26, 13.18
calcitization of dolomite 257 cement sequences 144-145,
3 . 2 6 ~ dolomite in evaporite sequences
244, 246, 257 dolomitization 145- 146, 542-543 general processes 144 pressure dissolution 145 sea water pumping 144
carbonate-evaporite transitions 254 carbonate platforms s. carbonate
buildups carbonate sediments, shallow water
(also s. carbonate buildups) back-barrier zone 134 carbonate-producing organisms

134, 136 cool-water carbonates 136 depositional environments 133-
134 grainstone belt 134, 3 . 2 2 ~ general aspects 133-134 hardgrounds 134, 144 oolitic sands 134 whitings 140
carbonate turbidites 220, 5.16b chert layers in c.t. 220 hydraulic sorting 220 shell beds in c.t. 220
carbonates, deep-sea 187-191, 5.3b, 5.4
biogenic carbonate production 187
calcite compensation depth, CCD 188, 5.3b
carbonate dissolution 188 CCD in adjacent basins 190 CCD fluctuation 190, 5.4ac lysocline 188, 5.3b production-dissolution
equilibrium 188-190 recycling of carbonate 188
Caribbean Sea 165, 167 sediments 167 water circulation 167
Cascadia subduction zone 471, 554, 12.24, 13.24
Caspian Sea 90, 92, 168, 246 compaction flow refraction 528 mud volcanoes 90 oil and gas 90 sediments 483484 tectonic setting 483
catagenesis (also s. hydrocarbon generation) 509
causes of various cyclic phenomena 275, T7.1
Cayman trough, Caribbean 495 celadonite, celadonitic minerals
235, 6.1 cement mineral sequences 547-548 cement sources 534, 547 cementation s. pore cements Chad basin 459 Chad Lake, Africa 366, 9.12 chalk in deep and shallow seas
190-191 chaotic structures in subduction
zones 556 chemical diagenesis (also s.
diagenesis) 532-540 chemical compaction 533 closed systems (isochemical
diagenesis) 534, 13.17bd diagenetic realms 534, 13.15 open systems (isochemical dia-
genesis) 534, 540, I3.17bce
chemocline 164, 170, 182 chert 146, 3 .26~
in evaporites 259 China, pull-apart basins 50 1
permo-Carboniferous coals 572 Chinese-type basins 7 chloritization 283 clay dunes 63-64, 88 clay minerals 347, 363-365, 9 . 1 ~
as primary detritic minerals 363- 365
authigenetic 363 chlorite 365 illite, muscovite 365 in marine sediments 365-366 in suspended river loads 363,
9.10 kaolinite 365 montmoillonite, smectite 365 neo-minerals 363-365
clay pellets (also s. aggregation) 63, 88, 151
lateral fractionation 15 1, 3.28 climate, early Earth 267 climbing ripples
eolian 57, 2.20 glacifluvial 25, 2 . 4 ~
coal cycles (also s. coal deposits, cyclothems) 309
coal evolution, composition 561, 572-575, 14.4
biogenic methane 572 burial history and degassing of
coal 573, 14.14 coal macerals, ranks 572-573 coalification 572-573, 14.4 huminite, inertinite, liptinite, etc.
572 sulfur content 572
coal deposits in various depositional environments 572
cyclothems with coal, coastal 288, 572
delta sediments 149, 156, 159 fluvial environments 48, 51,
287, 2.17 lagoonal sediments 123 sedimentation rates of peat and
coal 572 coastal dunes 60, 2.22 coastal plains, Texas 46 coastal processes 94-97, 3.1-3.3 coastal sabkhas 114, 116, 123,
165, 246, 250, 253, 3.14, 6.5, 6.7b
coastal upwelling s. upwelling or oceans
coastline evolution 97, 3.2ab migration 25
collapse breccias 257, 6.10J
collapse events, carbonates 210, 212
collision-related basins 7, I. 2c Colombian basin 167 Colorado delta 149 Colorado Plateau, uplift and
cooling 550, 13.21~ compaction 510, 513, 515-521
compaction ratio 5 18, 13.6ab differential compaction 518-5 19,
521, 13.7 purely mechanical 513
compaction flow 521, 524-526, 13.6a, 13.9, 13.10
fresh-water and salt water 524, 13.10
relation to sedimentation rate 524, 13.10~-c
concretions carbonate 278 flint layers in chalk 278 siderite 85 silica 278
condensed sections, hardgrounds 203, 5 . 1 0 ~
conductive heat flow 549, 13.21 consolidation of sediments 510
changes due to burial history 512, 13.2
normal 510, 1 3 . 1 ~ overconsolidated 5 12, 13. I c underconsolidated 510, 13. l b
continentcontinent collision 502, 1.2, 12.39b
continental escape 7 continental margin
Atlantic, North America, subsidence 337, 8.16, 8.1 7ab
southern Australia, subsidence 337, 8.17c, 8.18
continental margin basins (also s. cont. margin sediments)
breakup unconformity 442, 446 young and mature margins 444 post-rift stage 442 post-rift subsidence 445 rift-transform margins 444,
1 2 . 9 ~ sediment traps, outer margin
444,12.11 segmented margins 444 shelf morphology 444, 12.10 syn-rift stage 442 types 44244 , 12.9 volcanic passive margins 444,
12.9b continental margin sediments 444-
449, 455, 12.11 Atlantic-type margins 4 4 5 4 8 carbonate buildups 448, 12.12 conjugate margins 449, 12.13

depocenter 446 influence of salt structures 446,
12.IId outbuilding, lateral progradation
448,12.12de over-supplied margins 450 post-rift sediment successions
445-448, 450, 12.11, 12.14 sediment-starved margins 450,
12.14, 12.15ab
Danube delta 149 Dead Sea 91
subsidence 332 rift 435, 495, 497
debris flows 37, 39, 209-210, 212, 5.13 (also s. mud flows)
cohesive and frictional "freezing" 212
debrites 212, 5 . 1 3 ~ flow mechanism 212 internal structures 212, 218 megabreccia beds 212 olistoliths 2 12 olistostromes 212
decompaction 322, 521, 13.6b, 13.7
deep marine basins 15-16 deep-sea channels 229 deep-sea erosion 231-232 deep-sea fans 210, 222-23 1, 5.18-
5.22 channel deposits 224, 227, 5.18 channel-levee complexes 222,
226,5.18, 5.21 bc channel-lobe transition 224 channelized and unchannelized
systems 222 erosional unconformities 226 overbank deposits 224, 226 proximaldistal trends 224 paleoslope orientation 229 point source and line source
effects 222 response to sea level changes
226, 5.19bc switching of fan lobes 224 thickness of fan sediments 229 type I, 11, Ill turbidite deposits
222, 224, 229 vertical sequences 224, 5.19
deep-sea ponds 16 deep-sea sediments (also s. deep-
sea carbonates) biogenic 187 classification 178 deep plateaus and seamounts
203, 5.10 general significance 178 hemipelagic 185-1 87 loss in ancient record 177, 424
overview 185-1 87 pelagic 187 phosphorites (also s. phospho-
rites) 198-203 red deep-sea clay 19 1, 5.4de sediment sources 178 siliceous 193-198, 5.5, 5.6 slope sediments 205 terrigenous 185- 187, 5 . 3 ~
deep-sea trenches 5-6, 463-473, 1.2ab
d6collement within trench sediments 466, 12.19ceg
identification in ancient record 484
over-supplied trench systems 463, 466, 12.19b
residence time of trench fills 463,12.20
sediment distribution 463, 12.19bdf
sediment-starved trenches 463, 467, 12.19f
sources of sediments 463, 1 2 . 1 9 ~
trench fill and accretionary wedge 463-466, 12.20
deflation 63, 2.20 Delaware river, tidal marsh 114 delta foresets 24-25, 2.4 deltas, marine (also s. delta
sediments) 147- 160 barrier-islands, lagoons 154, 156 beach ridge barrier 149, 151,
152, 3.28, 3 . 2 9 ~ delta plain 149-151, 3.28 delta platform 15 1, 152 depositional environments 147 destruction, reworking 154,
3.30b distributory channels 149, 3.28 fluvialdominated (birdfoot delta)
149-152, 156, 3.31 lakes, lacustrine deltas 150, 152 levees 149, 3.28 lobate deltas 149-152, 3.28 mangrove swamps 152 shallow- and deep-water deltas
157, 158, 3.32b shifting of delta lobes 152, 157,
158, 3.31ab swamps, marshland 149, 152,
156 tidal flats 149, 156 tidedominated 149, 152, 3.29b types (overview) 147-149,
3.2 7ab wavedominated 149, 152, 3 . 2 9 ~
delta sediments, marine deltas (also s. deltas)
bar finger sands 15 1, 3.28b
bay sediments 156 channel fills 156 constructional, destructional
phases 154-156, 3.30, 3.31 crevasse splays 149, 3.28 cyclic sequences 288 delta front sands 151, 3.28 "depobelts" 152 facies architecture 158, 3.31 facies associations 154, 156,
160, 3.32 growth faults 152 isochrones in delta sediments
154 prodelta sediments 151 response to sea level changes
158, 3.32 river mouth bars 151-152, 3.28,
3.29 sand bars, subaqueous 149, 3.28 scale problems 159 sedimentary processes and facies
149-158 sedimentary structures 15 1, 3.28 sedimentation rates 152 "toe thrusts" 152 vertical sequences 152-154, 156,
158, 3.29, 3.30 densities of crust, mantle,
sediments 315-317, 8.la denudation
definition 345, 348 processes 345, 9. lb
denudation rates carbonate rocks 349-350, 9.2 chemical 348-356, 9.2-9.5, 9.6,
9.9 chemical, in morpho<limatic
zones 356, 9.7 chemical versus mechanical 362,
9.6, 9.9 dependent on soil profile 349 extremely low rates 36 1-362 from basin fills, sediment budget
366-376, T9.2 from eroded rock volume 376 glaciated areas 363 global chemical rate 356, 9.6 mechanical, mean values 36 1,
9.6, 9.9 salt rocks and sulfates 349, 9.2 silicate rocks 351
depositional environments "balanced" basins, long-persisting
424 overview 13-16, 1.6 transitional environments 13
depositional events, episodes 272 depositional ridges 23 1 desert drainage basin 250 desert pavement 2.20

deserts 54 desiccation cracks 85 detachment zone 432 dewatering of sediments s.
expulsion of pore water diaclasts 277 diagenesis (also s. carbonate d.,
concretions, diffusion, pore cements, pressure solution, silica d., solute transport)
accelerated by unstable minerals 515
authigenic minerals 541 carbon isotopes 541-542, 13.15b carbonate concretions 54 1-542,
13.15b chemical-mineralogical 509, 5 13 chert layers in turbidites 220 chert nodules 196, 5.6 clay mineral transformation 544,
13.19 definition 509 early (shallow-burial) diagenesis
540-54 1 fresh-water environments 542 mechanical 509, 510 methanogenesis 542 microbial fermentation 542 nitrate reduction 541, 13.15b late (deep-burial) diagenesis 540-
541,544,13.19 oozechalk-limestone transition
513, 13.3ef pelagic carbonates 5 13, 542,
13.3ej 13-18 pyrite 541 siderite (also s. siderite) 544 siliceous sediments (also s. silica
diagenesis) 196, 513, 5.6 subzones of early diagenesis
541, 13.15bc sulfate reduction 541, 13.15b under anoxic, oxic conditions
541, 13.15b diagenesis of evaporites 257-258
brine migration 257 calcitization od dolomite 257 cementation in evaporites 257,
6.10c-f collapse breccias 257, 6.10f differential compaction 257,
6 .1W dolomitization 257 gypsum-anhydrite transformation
257, 258 phase changes of salt minerals
258 subsurface dissolution, subsolu-
tion 257-258, 6.1 1 diagenetic overprint of primary
bedding 277-278
selective cementation and pres- sure dissolution 277-278, 13. I8
differential denudation, geomorpho- logy 378-380, 9.17, 9.18
diffusion, molecular 536-540, 13.16, 13.17b
diffusion coefficients 536, 539 diffusion flux 536, 539, 541,
13.16cd mean diffusion path length 539 influence of sea water 539,
13.16cd influence of evaporites 539,
13.16e discontinuous sedimentation 387,
1 0 . 2 ~ discyclic bedding 272, 276, 279-
280, 284, 7.Ib, 7.3b dissolved river load 348-355
groundwater component 349 in major rivers 252-354, 9.5 solid phaselwater equilibrium
349 specific transport rates 355, 9.6
dolomite, related to organic matter 193
Dolomites (Alps), Triassic 448 dolomitization (also s. diagenesis)
145-146, 3.26b-d carbonate buildups 305
Dorag model (dolomitization) 146 draped lamination 25, 2 . 4 ~ dropstones 23, 25, 2.5 drowning of carbonate buildups
302 dune sequence 60 duricrusts (also s. calcrete, silcrete)
362 dust deposition 64-65 dust transport by wind 55, 2.20
earthquakes 23 1 East African rift
overview 434-435, 12.4 sedimentation rates 437 sediments 437 subsidence 332
Ebro delta 149 Ediacaran fauna 266 elastic rigidity, lithosphere 3 16,
8.3 eolian dust 64
composition 64 distances of migration 64 sources 64
eolian sand 55-63 color 55 composition 55, 60, 63 distinctive features 63 migration 57 provenance 55
texture, sorting 55-57, 63 thickness 62 transport 55-57, 2.20
eolian sediments 15, 54-65 facies associations 62-63, 2 .22~ interaction with marine sediments
62, 2.22 interdune area 60
epeiric seas (see epicontinental seas)
epicontinental seas 15 general characteristics 125, 3.18 physical processes 125-126
equilibrium conditions soil, rock-water 349
equilibrium elevation 383, 9 .20~ erosional base level 12, 1.5 erosional furrows 23 1 erosional unconformities 205 estuarine water circulation 162,
163, 168, 4.1 estuaries 161-163, 4.1
densitiy stratification 162, 4.Icd sediments 163 tidal influence 1 12
Europe Cretaceous paleogeography and
sediments 458, 12.17~ Germanic facies province 456 intracratonic basins 455, 12.17 Jurassic paleogeography and
sediments 458, 12.17bc Mesozoic sediments 456, 459 rift systems 455, 12.1 7ab Triassic carbonate platforms
456, 12.1 7a eustatic sea level change (also s.
sea level) 25 evaporative hardening 5 13 evaporites, marine (also s. diage-
nesis of evaporites) 242-263 brine reflux 244 bull's eye pattern 244, 248, 6 . 4 ~ carbonates 256, 6.10ab chicken-wire pattern 246, 6.5d closed basins 244, 6 . 4 ~ complex evaporite model 248 cyclic evaporite sequences 253,
256, 6.9 cyclic sabkha evaporites 246,
256, 6.5e deep basindeep water model
248 deep basin-shallow water model
248 diagenesis 257 euxinic stage in evaporite basin
248, 253, 257 evaporative drawdown of water
level 250 evaporative pumping 246

lateral evaporite sequences 245, 6 . 4 ~
models for evaporite deposition 242-250, 6.4-6.7
nodular, flaser anhydrite 257 redeposition of evaporites 256 salt lagoon, barred basin 244,
6 . 4 ~ sedimentary structures in evapo-
rites 254, 6.10 sedimentation rates 256 seepage basin 245, 6.4d tear drop pattern 245, 6 . 4 ~ varves in halite, anhydrite, vertical sequences with evaporites
244, 253, 6.4ef event beds s. discyclic bedding excess pore pressure (also s. over-
pressure) 510, 521 expulsion of pore water 554,
13.23bc, 13.24bc extension, stretching model 327,
8.2 Exmouth plateau, Australia,
depositional history 453 Exuma Sound, Bahamas 214 Eyre basin, Australia 459
faceted rocks, gravel 63, 2.20 facies, definition 424 facies and tectonic basin evolution
10 facies architecture 16 facies associations 425
large-scale lateral successions 425
large-scale vertical successions 425
minor vertical successions 425 proximaldistal trends 426
failed rift 5, 1 . 1 ~ fan deltas 37, 39, 147, 2.11b,
2.13, 3 . 2 7 ~ vertical sequences 39, 2. 13 fluctuating water level 39, 2.14
fecal 114, 179, 195, 220, 236
firstcycle fluvial sandstones 52 sedimentary rocks 347 weathering 85, 347
fission tracks 552 fjords, Norwegian 162, 164 flash floods 45 flexure of the lithosphere, down-
warping 317, 326, 333, 337, 8.1, 8.4, 8.17
Florida shelf 134 carbonate platforms 167
flow regimes 29-3 1, 2.7 flow regimes in sediments 528-
532, 13.12 convection 528-529, 13.12cd fresh water flushing 528 in various depositional systems
530, 13.13 in maturing basins 530 meteoric flow 528 thermobaric flow 528, 1 3 . 1 2 ~
fluid inclusions 552 fluvial channels 33, 2.8-2. I 0
avulsion 43 bed-load channels 33, 2.8 channel deposits 43 chute channels 46, 2.10, 2.16 lateral accretion 43, 2.10 meandering 33, 2.8 sinuosity 33, 43, 2.8
fluvial environment 10-1 1, 13-14, 29-53
fluvial sedimentary cycles 287-288 allogenetic cyclic sequences 288 alluvial fans 287, 2.19 braided and meandering rivers
287, 2.9, 2.16 flood episodes 288
fluvial sediments 29-53 bed forms 29-32, 2.7, T 2.1 climatic control 52-53 compositional maturity 52-53 current directions 3 1 facies, architectural elements 34-
35, 46, 2.10, 2.16 facies associations, large-scale
51-53, 2.19 grain size 3 1 lag deposits 29 lateral accretion deposits 2.10 levees 33 overbank deposits 33, 2.10 sedimentary structures 29-32,
2.7, 2.10 fluvial systems 10-12, 33-37, 2.8
bed-load systems 33, 2.9 evolution 51-53, 2.19 mixed-load systems 33, 2.9 suspended load systems 33
flysch 474, 485-488 definition 485 megafacies 12.31de migrating flysch troughs 488,
12.30, 12.31ab esker 21 flowed till (flowtill) 21, 2.1 frozen blocks 21, 2. Ie-f ice-faceted clasts 21 kame terraces 2 1, 2.1 melt-out (ablation) till 21, 23,
2.1 preservation potential 19 till, tillite, orthotill, paratill 19
glaciation, major periods 306, 7.16
glaciers cold-based glaciers 19 wet-based (temperate) glaciers
19 glacifluvial sediments 21
outwash fans, rivers, plains 21, 43, 45, 2.la
jokulhlaups 21-22 glacial-interglacial sequence 22,
2.1 glaciolacustrine sediments 23-25,
2.3, 2.4 graded beds, turbidites 25, 2.4e varves, rhythmites 25, 2.4f-g
glaciomarine sediments 25-28 biogenic productivity 28 cyclic sequences 28, 2.6b-c facies association 25, 2.6a icecontact fans 25, 2 . 5 ~ redeposition 25, 2.5f-g
glauconite 13 1 glauconitic minerals 203, 205,
206, 234, 6.1 glauconitization 233, 234-235 glaucony facies 234-235 glendonites ( i t e ) 25-26, 2.5d Goban Spur, Biscay 337, 450,
8.15c, 12.14ab graben structures 5, 1.lbc grain-to-grain stress 5 10 Grand Banks, mass movements
210, 214 rifted continental margin 12.3e
gravel, fluvial clast-supported 3 1-32 fabric, imbrication 3 1, 2.7 gravel bars 32, 43, T2.1; 2.7,
2.15ad matrix-supported 32 roundness 31
gravity mass movements 24, 2.4 compound mass movements- 209,
5. l l i in deltaic environments 303,
7.15 sites of mass movements 210,
5.12 transport distances 2 10 volume of dislocated masses 212
gravity mass flows 206-214, 224, 231, 232, 5.11-5.13
liquefaction 209 marine deltas 210 mass flow types 207, 209,
5. Ilghi nomenclature 207, 5.14 shear strength of sediments 207 shear stress 207 sliding, slumping 207, 5.11de

transition to turbidity currents 209
Great Bahama Bank 140 Great Barrier Reef 140 Great Salt Lake 79,90, 91 Great Sand Dunes, Colorado 35 Great Valley forearc basin,
California 477-479, 12.27 green marine clays 233-235, 6.1
depositional environments 233- 235, 6.1
lower Cretaceous 234 occurrence in modern oceans
234 green particles, composition 233 greenhouse, icehouse state 305,
306 groundwater chemistry 249-25 1,
9.3 in various rock types 25 1
growth faults 448, 521, 12.16a, 13.8ab
Guatemala forearc basin 477 Guaymas basin, Gulf of Calif. 554
Guaymas basin model 499, 12.37
Gulf of Aden 170 Neogene sediments 170 "glacial" sediments 170
Gulf of Alaska 28 Gulf of California 161, 170, 499-
501, 4.5, 12.37 young passive margin 450 mud turbidites 172, 230 organic carbon in sediments 172 plate tectonic evolution 499 pre-rift, post-rift sediments 164,
370, 9 . 1 5 ~ sea floor topography 170 sediment budget 370-373, 9.14,
9.15 sedimentation rates 172, 370,
9.15e sediments 170 subsidence 335, 8 . 1 2 ~ varves, annual 172 vertical sequences 4.5bc water circulation, upwelling
164, 170 Gulf of Mexico 167
clastic wedge 415-417, 1 1 . 6 ~ sedimentation rate from river
loads 417
halfgraben structures 432, 12. l e , 1 2 . 3 ~
halokinesis s. salt structures hardgrounds (also s. diagenesis)
278, 13.18 Hatteras abyssal plain 214, 224 herringbone stratification 114, 3.12
heterotrophic organisms 293, 394, 395
hiatus s. stratigrphic gaps High Atlas rift 438, 12.3c, 12.6 high-resolution stratigraphy 309 Himalayas, foreland basin 492,
1 2 . 3 3 ~ Himalayas-Bengal Fan 373-376,
9.16 hinge zone 328, 337, 8.17 Holocene transgression 126 hot spots 432 hydrocarbon generation 560-562,
571, 14.3-14.5 catagenesis 560-56 1, 14.4 diagenesis 560, 14.4 generative basins 571 metagenesis 56 1, 14.4 oil kitchen, oil window 560,
561, 571, 14.5 transformation factor, genetic
potential 561-562, 14.6 hydrocarbon habitats 565-572
carbonate shelves with evaporites 568-571
lacustrine environments 565- 566, 14.8
marine deltas 566, 14.9 rift basins, epicontinental seas
560 hydrocarbon index 398, 10.8 hydrocarbon potential 501 hydrocarbon source rocks (also s.
black shales) 407, 557, 558 critical organic carbon contents
407 definition 557 oil shales 557
hydrocarbon storage 548 hydrologically closed basins (also s.
lakes) 419, 1 1 . 5 ~ hydrosphere, early evolution 266,
267 hydrothermal systems 235 hyperconcentrated flows 22, 72,
74 hypersaline basins 16 1 hyposaline basins 16 1
icebergs 28 ice-contact lakes 23, 2.3 ice-rafted sediment components
167 ice-sheet deposits 19-21, 2.1 ignimbrites 67, 2.23b illite crystallinity 552 immature ocean basins 161 Imperial Valley, California 501 inland sabkhas 80, 85, 2.32b intracratonic basins 455-560
definiition 459
examples 459 mechanism of subsidence 459 sag basins 459-460 sediments 459-460
intramontane basins, troughs 7, 480, 1.2b
intratest porosity 5 15 inverted relief 379 Ionian abyssal plain 214 Irish Sea 127 iron ooides 234 iron oxyhydrates 234 island shelves 206 isostasy, isostatic compensation
22, 25, 313-315, 8.1ab regional 329
isostatic rebound 362,382,383
Japan trench 471, 1 2 . 2 1 ~
Kara Bogas Go1 90, 246 karstification 349-351 Kellwasser crisis 306-307 keratophyres 76 kerogen types 567-560, 14.1, 14.2
bitumen 558, 14.2 exinite-type kerogen 559, 572,
14.2 inertinite-type kerogen 558-560,
572. 14.2 liptiAte-type kerogen 558, 572,
14.2 Keuper (Upper Triassic) 64
lake sediments 91-92 Kosi alluvial fan, India 37 Kupferschiefer, Permian 250, 552,
6 . 7 ~
lahar (v~lcanic debris flow) 69, 2.236
lag sediments 293, 7.10ef lagoonal sediments 123- 124, 3.17
climate control 123 sedimentation rates 124
Lake Baikal 81, 88 Chad 91, 9.10 Erie 89 Eyre basin, Australia 51, 91 Geneva 80 Messel, Germany 91 Tanganyika 89, 432, 1 2 . 3 ~ Victoria 89 Ziirich 89
lake chemistry 77, 81, 2.30 hard-water lakes 81 minerlized groundwater 88 post-glacial lakes 83 rare elements 85, 93 residual brines 93 seasonal variations 8 1 soft-water lakes 81
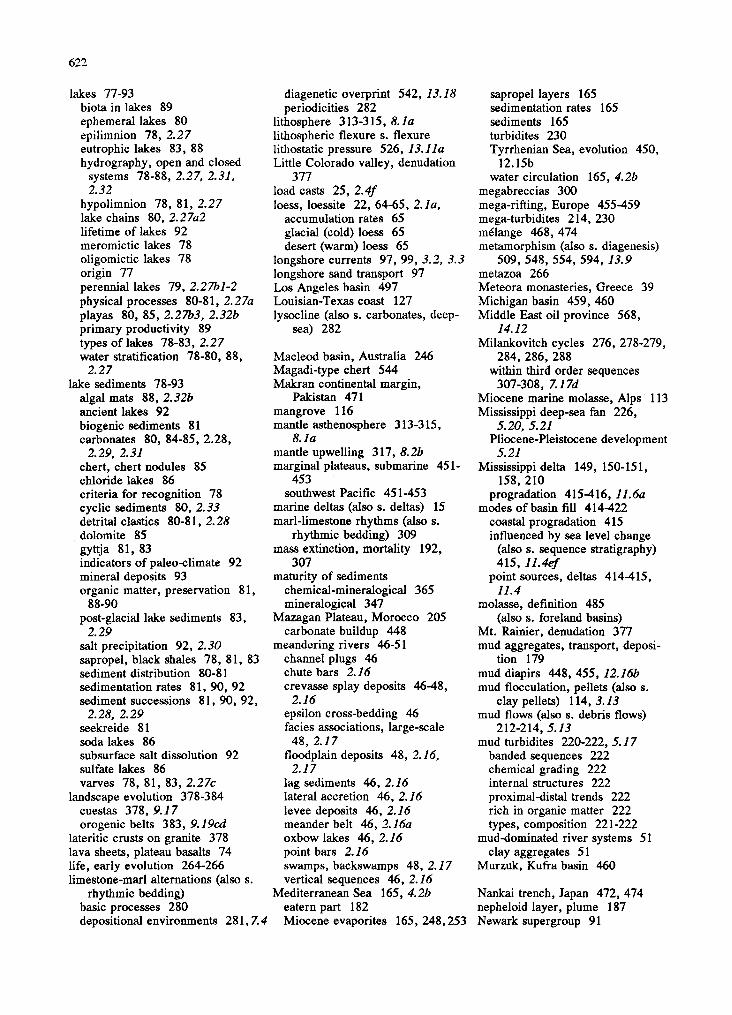
lakes 77-93 diagenetic overprint 542, 13.18 biota in lakes 89 periodicities 282 ephemeral lakes 80 lithosphere 313-3 15, 8. l a epilimnion 78, 2.27 lithospheric flexure s. flexure eutrophic lakes 83, 88 lithostatic pressure 526, 1 3 . 1 1 ~ hydrography, open and closed Little Colorado valley, denudation
systems 78-88, 2.27, 2.31, 377 2.32 load casts 25, 2.4f
hypolimnion 78, 81, 2.27 loess, loessite 22, 64-65, 2 . 1 ~ . lake chains 80, 2 . 2 7 ~ 2 accumulation rates 65 lifetime of lakes 92 glacial (cold) loess 65 meromictic lakes 78 desert (warm) loess 65 oligomictic lakes 78 longshore currents 97, 99, 3.2, 3.3 origin 77 longshore sand transport 97 perennial lakes 79, 2.2761-2 Los Angeles basin 497 physical processes 80-81, 2 . 2 7 ~ Louisian-Texas coast 127 playas 80, 85, 2.27b3, 2.323 lysocline (also s. carbonates, deep- primary productivity 89 sea) 282 types of lakes 78-83, 2.27 water stratification 78-80, 88, Macleod basin, Australia 246
2.27 Magadi-type chert 544 lake sediments 78-93 Makran continental margin,
algal mats 88, 2.32b Pakistan 471 ancient lakes 92 mangrove 116 biogenic sediments 81 mantle asthenosphere 3 13-3 15, carbonates 80, 84-85, 2.28, 8. l a
2.29, 2.31 mantle upwelling 317, 8.2b chert, chert nodules 85 marginal plateaus, submarine 45 1- chloride lakes 86 453 criteria for recognition 78 southwest Pacific 45 1-453 cyclic sediments 80, 2.33 marine deltas (also s. deltas) 15 detrital clastics 80-8 1, 2.28 marl-limestone rhythms (also s. dolomite 85 rhythmic bedding) 309 gyttja 81, 83 mass extinction, mortality 192, indicators of paleoclimate 92 307 mineral deposits 93 maturity of sediments organic matter, preservation 8 1, chemical-mineralogical 365
88-90 mineralogical 347 post-glacial lake sediments 83, Mazagan Plateau, Morocco 205
2.29 carbonate buildup 448 salt precipitation 92, 2.30 meandering rivers 46-5 1 sapropel, black shales 78, 8 1, 83 channel plugs 46 sediment distribution 80-81 chute bars 2.16 sedimentation rates 8 1, 90, 92 crevasse splay deposits 46-48, sediment successions 81, 90, 92, 2.16
2.28, 2.29 epsilon crossbedding 46 seekreide 81 facies associations, large-scale soda lakes 86 48, 2.17 subsurface salt dissolution 92 floodplain deposits 48, 2.16. sulfate lakes 86 2.17 varves 78, 81, 83, 2 . 2 7 ~ lag sediments 46, 2.16
landscape evolution 378-384 lateral accretion 46, 2.16 cuestas 378, 9. I7 levee deposits 46, 2.16 orogenic belts 383, 9.19cd meander belt 46, 2 . 1 6 ~
lateritic crusts on granite 378 oxbow lakes 46, 2.16 lava sheets, plateau basalts 74 point bars 2.16 life, early evolution 264-266 swamps, backswamps 48, 2. I7 limestone-marl alternations (also s. vertical sequences 46, 2.16
rhythmic bedding) Mediterranean Sea 165, 4.2b basic processes 280 eatern part 182 depositional environments 28 1,7.4 Miocene evaporites 165, 248,253
sapropel layers 165 sedimentation rates 165 sediments 165 turbidites 230 Tyrrhenian Sea, evolution 450,
12.15b water circulation 165, 4.2b
megabreccias 300 mega-rifting, Europe 455-459 mega-turbidites 214, 230 melange 468, 474 metamorphism (also s. diagenesis)
509, 548, 554, 594, 13.9 metazoa 266 Meteora monasteries, Greece 39 Michigan basin 459, 460 Middle East oil province 568,
14.12 Milankovitch cycles 276, 278-279,
284, 286, 288 within third order sequences
307-308, 7.1 7d Miocene marine molasse, Alps 113 Mississippi deep-sea fan 226,
5.20, 5.21 Pliocene-Pleistocene development
5.21 Mississippi delta 149, 150-151,
158, 210 progradation 4 15-416, 1 1 . 6 ~
modes of basin fill 414-422 coastal progradation 4 15 influenced by sea level change
(also s. sequence stratigraphy) 415, 11.4ef
point sources, deltas 414-415, 11.4
molasse, definition 485 (also s. foreland basins)
Mt. Rainier, denudation 377 mud aggregates, transport, deposi-
tion 179 mud diapirs 448, 455, 12.16b mud flocculation, pellets (also s.
clay pellets) 114, 3.13 mud flows (also s. debris flows)
212-214, 5.13 mud turbidites 220-222, 5.17
banded sequences 222 chemical grading 222 internal structures 222 proximaldistal trends 222 rich in organic matter 222 types, composition 221-222
muddominated river systems 5 1 clay aggregates 51
Murzuk, Kufra basin 460
Nankai trench, Japan 472, 474 nepheloid layer, plume 187 Newark supergroup 9 1

Niger delta 149, 151, 152 hydrocarbons 566, 14.9
Nile delta 149 nonactualistic sediments 264, 267-
270 North African sag basins 459 North Atlantic rift basins 438-442,
12.3e, 12.7, 12.8 rift zone migration 442 sedimentary history 442, 12.8 sedimentological events 442,
1 2 . 8 ~ structure 440-442, 12.3e, 12.7~ various rifting phases 438-442,
12.8 North Sea 125, 127, 130, 136
mud flats 1 14 oil and gas 566, 14.11 subsidence 332 tides 111-112, 3 . 9 ~ V i n g graben, flow regimes and
diagenesis 13.14 Norwegian fjords 182 Norwegian-Greenland Sea 165,
167, 4.3d climatic change, cyclic sediments
167-168 sediments 167 water circulation 167
ocean, ocean water bottom currents 183, 184 coastal upwelling 184, 5.26 contour currents 184 Coriolis forces 183-184, 5.2b current speeds 184 current systems 183, 5.Ic density of sea water 179, 5 . 2 ~ density stratification 182 downwelling 184, 5.2cd Eckman spiral 184, 5.2b equatorial convergence,
divergence 184, 5. l e , 5 . 2 ~ euphotic zone 185 freezing of sea water 182 mass transport, nutrients 185 salinity 179, 5. lab sediment transport 187 temperature 179,s. lac, 5 . 2 ~ thermo-haline circulation 182-
183, 5. le two-layer ocean 183 winddriven circulation 183-1 84 water circulation 179, 182-188,
5. Ie upwelling 184, 5.2cd
oceanic sag basins 5, 1. l f oceanic sediments s. deep-sea
sediments oceanography, physical, s. oceans oil and gas fields 565-672
oil, generation, expulsion and migration 563-565, 14.7
migration in phase 564-565, 671 oil expulsion efficiency 565 secondary migration 565 temperatures 550 transport distances 566
oil shales s. hydrocarbon source rocks
olistostromes (also s. gravity mass flows) 468
Olympic Mountains, Washington 473, 12.24d
oolitic ironstones 235-237, 6.2 chamosite 235 depositional environments 235-
236, 6.2 in the Earth's history 237 in transgressive-regressive se-
quences 257 minette ores, Lorraine 237 ooid formation 235-236, 6.2b provenance of iron 236 reworking effects 237, 6.1
orbital cycles 276 orders of cyclic phenomena 275-
278, T7.1 ore deposits, diagenetic 552-553
in carbonates 553 leaching of metals 552 metal sulfides 553 Mississippi Valley type 552 related to evaporites 553
organic matter (also s. production) adsorbed onto minerals 396 decomposition, mineralization
395, 10.5 definition, types 393 dissolved in sea water 396 preservation (also s. preservation)
394 redeposition by mass movements
398 terrestrial 393, 398, T1O.l
organominera1 aggregates 396 Oriente backarc basin, South
America 480, 12.281, Orinoco delta 149 overpressure 526, 565, 13.11~
fracturing of rocks 526 subduction zones 556
overthrust belts (also s. thrust sheets) 488, 490, 12.30, 12.31
epidodic thrusting 492, 12.33a oxygen in the early atmosphere
266-267 oxygen minimum, causes 401
Pacific, southwestern, backarc basins 483
paleoceanography 185
paleosols 22, 2. la , 2.2 paleo-wind directions 60 Pangea 305-306
rift systems 455 Pamonian basin, Hungary 493,
499, 12.34 basin evolution 493 general features 493 sediments 493, 12.34g
Pannonian-type basins 7, 492-495, 1 . 3 ~
examples 495 tectonic setting 492
Paradox Basin, evaporite cycles 253
parasequences 272 Paris Basin 567, 14.10 passive margin basins (also s.
continental margin) 5, 1. ld pebbly mudstone 214 peri-basin morphology 15 peri-continental seas s. shelf seas periglacial features - ground, cryoturbation
22, 2.2 ice (frost) wedges 22, 2.lag, 2.2
periodic and discyclic sequences 276
peripheral bulge 316, 8.4 peritidal cyclic sediments 283-284
carbonate cycles 309 Lofer cycles 284, 7.5b shallowing-upward 284, 7.5d Triassic, western Tethys 283
Permian reef complex, Texas 143 Persian (also s. ArabianIPersian)
Gulf 161, 174-176, 4.7 Pliocene-Quaternary development
174-176 reefs, barrier islands 165, 4.7 sedimentation rates 176 sediments 164-165, 174-176 water circulation 164
Peru-Chile trench 210, 466, 468 petroleum generation s. hydro-
carbon generation phase transitions, subsidence 33 1-
332 phosphorites 13 1, 198-203, 206
depositional environments 198, 205, 5.4g, 5.6a, 5 . 7 ~
in specific sequences 198 phosphate precipitation 198-200,
5.6b, 5.76 phosphorite formation through
time 200 secondary enrichment 220, 5.7c,
5.8, 5.9b sources of phosphorus 198-200
phosphorus in sediments 193 plant life 55

plattenkalk facies 282 polyhistory basins 10, 501-506
basin-type transitions 502-505, 12.38, 12.39
convergent margins 502-505, 12.39
porcellanite 196 pore cements (also s. diagenesis)
534, 544, 547, 13.20 overgrowth, meniscus cement
534 silicification 536 source of cement 534, 574 source of silica 547
pore water flow, refraction 526, 13. lode
pore water pressure 510, 526 porosity 386
related to sill-contact 554, 13.236
porositydepth curves (also s. compaction) 513, 13.3, 13.4
analytical equations 515, 13.5 calculation of burial depth 5 17-
519 fresh-water sediments 5 15 influence of clay minerals 513 influence of organic matter 515 pelagic carbonates 5 13, 13.3~-h various young marine sediments
515, 13.4 post-rift sediments 337-338, 8.1 7 Precambrian sediments 267-270
dolomites 268 evaporites 270 paleosols 269 phosphorites 269 placer deposits 269 red beds 269
preservation of organic matter 398-408, 10.10
clastic dilution 402, 403, 10.10 favorable for hydrocarbons 407 in anoxic environments 403,
[email protected] in model basins 403407, 10.12 preservation factor 407-408,
10.14 related to inorganic sedimentation
rate 402403, 10.10, 10.11 pressure solution 533, 13.11b
burial depths 534 carbonates 542, 13.18 dissolution seams 534 effective stress at grain contacts
533, 13.11e factors favoring pressure solution
533 Riecke's principle 533 stylolites 534
production of organic matter
export production 395, 397, 10.6b
high-fertility belts 397 in the oceans 394 new production 395, 397, 10.5,
I0.6b paleofertility 408 plancton blooms 394 primary production 393, 394,
T1O.l regions of high productivity 394,
10.13 standing crop and annual produc-
tivity 394 pull-apart basins 7, 495-501,
1.3bc, 12.35 asymmetric basin fill 497, 12.36 drainage systems 497 identification, recognition 501 intracratonic 497-498 marine basins 498-499 relief 497 sedimentation rates 497 slip rates 495 subsidence 495-497, 12.35de structure and evolution 495,
12.35~-c volcanism 497-498
punctuated aggradational cycles 276
pure shear (also s. rift basins) 429, 12. l a
pycnocline 164, 170, 182, 5.Id pyramids, Egypt 106 Pyrenean foreland basins 490 pyrite 203, 234 pyroclastic flows 67, 2.236 pyroclastic surges 69, 2 . 2 4 ~
radiolarites s. siliceous sediments red beds
brown colored sediments, derived from 239 deltaic red beds 238 depositional environments 238-
239, 6.3 effects of groundwater circulation
24 1 ferric iron reduction 238 fluvial 48 iron release during diagenesis
24 1 primary red beds, lateritic soils
238-239, 6.3 red carbonates, sandstones 241 red deep-sea clay 241 red pigment 238 secondary red beds 239, 6.3
Red Sea 137, 161, 172, 4.2b, 4.6 calcite compensation depth 190 evaporites, Miocene 172-174,
248, 444 fringing reefs 164 lithified layers 174 postevaporite sediments 174,
4.6cd rift-stage sediments 172 sedimentation rates 174 sediments 164, 172-174 tectonic evolution 172, 435
redox cycles, black shale-carbonate 282-283
reefs (also s. carbonate buildups) algal structures 137 bioherms and biostromes 137,
3 . 2 3 ~ chlorazoan association 136 foramol association 136-137 general aspects 136 growth, growth rates 136, 143,
3 .24~-c internal structures 136, 3.24bd reef limestones 141, 3.24cd reef-builders 136-137 types (banks, fringing reefs,
knolls, mounds etc.) 136-137, 3.23, 3.24
regolith, saprolite (also s. soil) 347 relic basins 502, 12.39b remnant basins 7, 485-488, 1.2c,
12,30ab, 12.'31a evolution of sediments 485-488
reservoir rocks 548 retroarc basins 7, 1.2b Rhine delta 149 Rhine graben
sediments 12.2 subsidence 332 structure 435
Rhone delta 149 rhythmic bedding (also s. cyclic
and discyclic bedding) 271- 272, 7.1
banded ribbon radiolarites 283 limestone-marl alternations 280-
282 recurrence time, dating 286 siliceous sediments 283, 5.6
Ries impact crater 9 1 rift basins 5, l . lb-c
ancient examples 437-438 halfgraben basins 435, 12.5 sediments 435-437 transition to margin basins 438-
442, 12.7, 12.8 vertical successions 437
rift graben, shoulders 328, 8.9, 8.10
rift structures, zones 429-432, 12.1, 12.3
asymmetry 432, 12.3 drift stage 429, 442

initial updoming 432 inverted rift zone 438 rift stage 429, 442 segmented rills 432, 12.3ae strike-slip 432 transfer zone 438 volcanism 432, 435, 12.4
rifting time 328, 8.9 rip currents 97, 3.3 ripples, dunes (also s. various
depositional environments) 29- 30, 2.7
ripple drift 25 Rockall Plateau 136, 137 Ruhr district, Carboniferous coal
evolution 573, 14.13, 14.14
saline giants 248, 256 salinity crisis 168, 173, 253 salt deposits in earth history 242,
253 salt minerals s. evaporites
growth of 257 salt structures, diapirism 259-263,
6.12-6.14 buoyancy halokinesis 259 depotroughs atop salt massifs
263, 6.14cd differential loading 259, 6 . 1 3 ~ salt dome evolution 26 1, 6.14f salt flow mechanism 259, 6.13 salt pillows, salt anticlines 261,
6.14 San Andreas Fault system 477,
479, 495, 12.27 sand bars (also s. offshore sand
bars) 32, 45, T2.1, 2.7, 2.15d sand dunes, inland 57-59
barchan dunes 57, 2.21 bed forms 57-59, 2.21 draa 59, 2.21 parabolic dunes 58, 2.21 sedimentary structures 59-60,
63, 2.21 seif dunes 59, 2.21 stabilization of dunes 60-62 truncation of dunes 60, 2.21d
sand ridges, shelf 127 sand seas 54,59 sand waves 127, 2.7 sandstone diagenesis (also s.
diagenesis) 545-548 Sao Francisco delta 149 Sardinia passive margin 450,
12.15ab Sargasso Sea 390, 397 scales of rhythmic and cyclic
phenomena 274, 7.2, T7.1 sea level changes
amplitudes 288, 309 and storm wave base 29 1, 7.9be
high-frequency, low amplitude 284, 309
ice volume-induced changes 309 inflection point 290, 7.7, 7. I2 response to changing subsidence
rates 307, 7.1 7a-c response of sediments 307 rates of sea level fall 307 superposition of shorter and
longer oscillations 307, 7.17cd synchroneity 289 third order 288, T7.1
Sea of Japan 229,483 sea water composition 242, 6.4b seamounts 16 secondary porositjl 548, 13.20cde sediment accomodation potential
290 sediment aggradation 424 sediment budget 366-376, T9.2
closed basin (Lake Chad) 366, 9.12
deep-sea fan 373-376, 9.16 general prerequisites 366, 9. I1 semi-closed basins 367-373,
9.13-9.15 sediment preservation potential 506 sediment ridges, "drifts" 167 sedimentary basins
definitions 3 size, shape 3 classification 3-10, TI. 1, 1.1-
1.3 sedimentary cycles s. cyclic
sequences sedimentary structures s. various
depositional systems preservation in soft and lithified
sediments 13 sedimentation rates 385-393, 10.3
actual and potential rates 388 and spreading 499-501 biogenic sediments 388-390,
10.3 conversion into accumulation
rates 10.1 carbonates, fresh-water 390 carbonates, shallow-marine 39 1,
10.4 compared to denudation rates
391 deep-water carbonates 39 1, 10.4 definition 386 general differences 526 glaciomarine sediments 388 in relation to sea level rise 393 in relation to subsidence 392 mixed carbonate-siliciclastic
sediments 390 peat and coal 390 siliceous sediments 390
sedimentologically open basins 417-419, 1 1 . 5 ~
sensitivity of oceanic circulation 282
separated inflow and outflow, basins 165, 4.3b
sequence stratigraphy (also s. sea level changes) 288-304
chronostratigraphic sequences 290, 7.8, 7.9, 7.1 Ib
carbonatedominated continental margins 300-302, 7.14
coastal offlap, onlap 290, 7.12, condensed sections 293,295,
299, 300, 7.11b, 7.12, 7.13 continental margin settings 297-
301, 7.12-7.14 dating of sequence boundaries
300 downlap, downlap surface 299 epicontinental sea model 293,
295, 7.11 erosional unconformities 290,
293,295,297, 7 . I W 7.13 highstand deposits 299 general principles, terms 288-
290,297-300, 7.12 incised valleys 299 lowstand deposits 299 lowstand deltas 299, 303, 7.15 marine deltas 302-304, 7. I5 maximum sediment starvation
299 parasequences 299, 7.12 recognition of cycles 295-297,
7 . 1 1 ~ sequence boundaries 293, 297,
7.9dg, 7.12 shelf basin model 293, 7.9ab shelf margin deposits 299, 7.12b siliciclastic continental margins
300, 7.13 systems tracts 297-299, 7.12 transgressive deposits 295, 299,
7.12-7.14 transgressive surface 299 vertical sequences 290, 293,
7.8, 7.9dg shallow-marine environment,
significance, long-persisting 424 shallow seas (also s. shelf seas) 15 shallow sea sediments, siliciclastic
biogenic production 130 chert 130 facies models, simple 127-13 1,
3.19, 3.20 facies models, modifications 13 1 lag deposits, hardgrounds 13 1,
3.20 large sand bodies 133, 3.21 marls, lime mud 130

sand ridges 127, 3.19, 11.2 sedimentary structures 130 terrigenous input, sand and mud
126-131 sheet floods 37 shelf-break erosion 210 shelf seas, shallow seas
bottom currents 127-128, 130 equilibrium conditions 126 erosion, reworking 130 general characteristics 125, 3.18 hydraulic regime, high and low-
energy conditions 128-13 1, 3.19, 3.20
oxygen minimum zones 130 shelf sand sheets 131-132, 3.31 shelf ice, Antarctic 28 shell beds, epibenthic 277 Shimanto belt, Japan 474, 12.25 Sibirian Basin, western, oil 568 siderite 234, 544 siderite concretions 48
Black Sea 168 sieve deposits 37, 2 . 1 1 ~ silcrete (also s. duricrusts) 347 silica diagenesis 543-544
chert nodules 544 silicification of carbonate 544
siliceous sediments, marine 193- 198, 5.5, 5.6
bedded cherts 194-196, 5.5 dissolution and preservation of
opaline silica 193-194 distribution in oceans 194 radiolarites 194, 196, 5.5 sequences with siliceous
sediments 196, 5.5 silica diagenesis (also s. dia-
genesis) 196, 6.5 siliceous turbidites 194
sill-sediment complexes 499, 554, 12.37d 13.23d
simple shear 432, 12. lbed slope aprons 232, 5.12 slope collapse, carbonate platforms
300 slope sediments (also s. continental
slope) carbonate slopes 448, 12. I2ade
slumps, olistostromes, in flysch 488
small ocean basins 483 smectite, iron-rich 234 soda ocean 267, 6.15 soil, soil profiles 347, 9.1
bauxite 347 pedalfers 347 pedoclas 347
solid, suspended river load 356- 359, 9.6, 9.9
element partitioning 365
in rletaion to relief and climate 359-361
mineralogical composition 363, 9.10
specific transport rates 359, 9.8 solubility of
prograde minerals 540 retrograde minerals 540 hydrocarbons 540
solute transport in rivers s. dissolved river load
solute transport within sediments (also s. diagenesis)
combined transport mechanisms 540
compaction flow 536 meteoric water, leaching 534-
536, 13.15~ molecular diffusion (also s.
diffusion) 536-540, 13.16 phreatic zone 534, 13.15~ vadose zone 534, 13.15~
Songliao Basin, China, oil 565, 14.8
South America backarc basins 480 forearc basins 477 intra-arc basins 474
Spain, southeastern, Neogene basins 499
spilites 76 spreading troughs (also s. Guaymas
basin) 499, 554, 13.23 interaction spreading-sedimenta-
tion 499, 12.37bc stable isotopes
in evaporites 259, 306 in carbonates 306 temperature determination 552
starved ocean basins 408 storms and storm action 100, 3 . 4 ~
combined flow 100, 3 . 5 ~ geostrophic currents 100 storm erosion 104, 3.6 storm frequency 108 storm generation 100
storm deposits (tempestites) 103- 108, 3.4a, 3.5, 3.7
amalgamation 104-106, 3.5, 3.7 bed forms and sedimentary struc-
tures 104, 3.5 burrow-fill sedimentation 106 composition, petrographic 106 faunal characteristics 106 flat pebble conglomerates 104,
3.6b hummocky cross-stratification
104, 3.51, lag deposits 106 mud tempestites 106 oscillatory ripple marks 104,
3.4b, 3.5 proximaldistal trends 106, 3.5,
3.7 tempestites in basin analysis
108, 3.7 stormdominated seas 127, 130,
3.19, 3.20 stratigraphic correlation 309 stratigraphic gaps 387, 10.2a
in deep-sea sediments 232 in depositional sequences 290 South Atlantic 232, 11.6b
stretching, extension models 327- 330
uniform 327-330 nonuniform 330 two-layer model 335
stretching factor 315, 328, 8.8 stretching mechanisms 432-434,
12. Ie strike-slip basins (also s. pull-apart
basins) 7, 1.3b-c stromatolites 264-265, 269, 6.15 styIoIites s. pressure solution subduction complexes (also s. ac-
cretionary wedges) convergence rates 469-471 growth rate 47 1, 474 sediment budget 47 1-474, 12.24 underthrust sediment thicknesses
471 472, 12.24b, 12.2.5d subduction-related basins 5, 1.2 submarine canyons 210 submarine horst and graben
structures 16 submarine ridges and plateaus 16,
206, 5. lob bank top sediments 206 rocky bottom 206 sedimentation rates 206
subnormal pressure 526 subsidence (also s. stretching) 314-
320 Airy model 3 14-3 15 amplification factor 317, 329 change in subsidence rates 307 influence of rifting time and
lateral heat transfer 328, 8.9, 8.10
initial subsidence 3 15-3 17, 327, 8.2, 8.8
local isostatic compensation 3 15 modified by crustal flexure 3 17-
320, 8.4 sediment-filled basins 3 15-3 17,
320, 328, 8.10, 8.11 tectonic, thermo-tectonic subsi-
dence 320, 326, 335 thermal subsidence 317, 328,
8.2, 8.8 total, cumulative 320

subsidence history (also s. subsi- dence rates) 320, 322, 337, 34 1
subsidence rates, curves 320, 332- 335, 344, 8.5-8.7, 8.12-8.14, 8.18, 8.19
arch-trench systems 344 corrections for compaction 322,
8.6 corrections for paleo-water depth
322, 8.7 corrections for sea level change
325-326, 8.7 foreland basins 341, 8.19 irregular curves, interpretation
326, 8.7h modifications 320-322, 8.5 passive margins 335-341, 8.14-
8.18 pre-molasse subsidence 342 pull-apart basins 344 rift zones 332 uncorrected curves 322, 8.5,
8.7h sulfate reduction
in evaporites 257-258 Sumatra-Mentawai trough 475,
477, 12.22, 12.23b summit elevation 383, 9 . 2 0 ~ Sunda arc-trench system 468-470,
12.22, 12.23abc changes along trench axix 469 forearc basins 469-471, 477,
12.22 outer arc system 12.22, 12.23abc
superposition of cycles 307 Surinam coast 127 suspended river load s. solid river
load suspension sedimentation 2 18 symmetric or asymmetric sedimen-
tary cycles 276, 7.Ief syn-rift sediments 337, 8.17
Tasmania 136 tectonic uplift and denudation
epeirogenic uplift and denudation 381, 9.19ab
orogenic belts 383, 9.19cd uplift rates 383
temperature field in sediments foreland basins 550, 13.22a Illinois basin 550, 1 3 . 2 2 ~ influence of permeability 550,
13.22 tempestites s. storm deposits tepees 85 tephra deposits (also s. volcani-
clastic sediments) 66-76 ash cloud fallout 67 ash turbidites 67, 71, 2.23a, 2.24a
depositional environments 71 diagenesis, metamorphism 76 facies associations '71 -73, 2.26 in basins of various tectonic
settings 74 pumice fall deposits 67 Scoria fall deposits 66-67 submarine tephra 69, 71, 2.244
2 . 2 5 ~ tonstein 67 transport distances 71, 75, 2.25a
terrane-related basins 7 terrestrial organic matter in the sea
398, 10.7-10.9 Tethys Ocean
carbonate platforms s. Europe siliceous sediments 194
Texas continental margin 521, 13.M
thermal history of basin fills 549- 55 1
affecte by meteoric water circu- lation 550, 13.22
foreland basins 550, 13.22a passive continental margins 549,
13.21ab thermal uplift 317, 8.2b thermobaric water 528 thermocatalytic decarboxylation
544 thermocline 182, 5 . 1 ~ thrust sheet migration (also s. over-
thrust belts) 488, 490, 12.33 tidal processes and environments
109-1 12, 3.8, 3.9 sediment transport 113 tidal currents 112-1 13, 127,
130, 3.10b, 3.19, 3.20 tidal ranges 109-113, 121, 3.8,
T3.1 tidal waves 109 tides and coastal morphology
112, 3.9 tidal sediments 1 13-121
algal mats 118, 3.13, 3.14 ancient 119-120 calcareous 1 18, 3.13 channel deposits 1 14 climate control 1 16-1 18 distinctive features 1 19-120 mud clasts, pebbles 113 mud deposition 114 mud drapings 114, 3.11a mud flats, sand flats 113-114 neap-springtide cycles 114, 3.11 response to sea level change
118, 3.16 sand waves 114, 3.11 sediment sources 113 sedimentary structures 114,
3.11-3.15
sedimentation rates 114 siliciclastic 1 16, 3.12 stromatolitic 3.14 tidal rhythmites 121 vertical sequences 3.15
tilted block basins 7 time periods of cyclic phenomena
276, T7.1 Timor-Tanimbar trough 489-490 tonstein 67 trace elements
in evaporites 259 traction carpet deposits 21 8, 224 traction sedimentation 21 8 tractive transport 232 transpression 7, 495 transtension 7, 495 Triassic lakes 90 t u ~ e l valleys 21, 2.la turbidites 214-222, 5.14-5.16
allochthonous organic matter 220, 5 . 1 7 ~
current directions 229 desert sand turbidites 21 8 erosional features 217, 5.15 frequency, recurrence intervals
225-230, 5.22 high- and lowdensity turbidity
currents 214-217 general characteristics 2 14-217 internal structures 2 17-21 8,
5.14ab, 5.15bd mechanisms of deposition 21 8 pre- and postevent trace fossils
218, 5.15f proximaldistal trends 217-2 18 turbidites below the CCD 218 vertical sequences with turbidites
218, 5.16 Turonian carbonates, Tunisia, 302,
T7.2 Tyrrhenian Sea, evolution (also s.
Mediterranean) 450, 479, 12.15b
uplift crustal rebound 342 due to unloading 317, 342 thermal 317, 8.2b
upwelling, sediments 192, 5.4a black shales 192-193 coastal upwelling 192 equatorial upwelling 192 faunal characteristics 193 oxygen minimum 192 sedimentation rates 193 siliceous sediments, chert 193 trace metals 193
Var river, Mediterranean 2 10 varves (also s. lake sediments and

evaporites) in Permian evaporites 286
verdine facies 234, 6.1 verdinization, verdissement 233 vertical facies evolution
general trends 422 in balanced basins 422 in extensional basins 422 in over-supplied basins 424 in sediment-starved basins 422-
423 Vienna basin 493, 499, 12.34bc vitrinite reflectance 552, 573,
14.13 Vsring Plateau 205, 444 void ratio 514, 1 3 . 6 ~ volcanic eruptions 67
phreatomagmatic 67, 69, 2 . 2 3 ~ pyroclastic 67, 2 . 2 3 ~ volume of tephra 75
volcaniclastic sediment components (also s. tephra deposits) 66-76
accessory fragments 66 epiclasts 68, 74
hydroclasts 67 pyroclasts 66 lapilli, bombs 66
volcanism, types of in continental rift zones 74 intraplate 74 oceanic 75 arc volcanism 75
Walther's law 425 water depth curves 290, 7.8,
7.9dg waves 94-97, 3. l a
deep-water waves 94 refraction 98, 3 . 2 ~ shallow-water waves 94 shoaling waves 57 wave base 94, 29 1, 7.9ae
Wealden facies 458 weathering 345-347
boundary, affecting rhythmic sequences 278
chemical-mineralogical 347 climate control 347, 9 . l a
ferrallitic 347 first cycle weathering 347
weathering products climate controlled 347-348, 9. Ic rock-type controlled 347-348
Western Interior seaway 13 1-132, 490-492
wildflysch (also s. m6lange) 485 Wilson cycle 502, T12.1 wind abrasion 2.20 wind-fetch 94 wind ripples 57, 2.20, 2.21 wind-blown dust, sand (also s.
eolian dust, sand) 54 wrench faults 7
Yellow Sea sand ridges 127 sediment fill 413, 11.2b sedimentation rates 413
Yucatan shelf 134
Zechstein basin 250, 253, 6.8
Sedimentary Badiris
Evolutidn, Facies, and Sediment Budget
This book addresses b ~ t h qualitative and quantitatibe aspects of basin analysis in1 the dcpnte4s df" plate tectonics anql sedimentary geology. Large-scalCproceSse$, facie& associations, and; especially sedimentary sequences are stressdd in the book, rather than small-scale sedimentary, biological or petrographical characteristics, which are sufficiently de- scribeQlsew here.