Origin and Context: The Pygmalion Myth and the Victorian Era

1
STUDENTSrsquo IMPRESSIONS EXPECTATIONS AND ACHIEVEMENTS IN BUSINESS
STATISTICS THE PYGMALION EFFECT
Sherwin B Ragos1
Abstract
This study examines the studentsrsquo impressions expectations and
achievements in Business Statistics It revisits self-fulfilling prophecy which is the
Pygmalion effect by relating impressions and expectations to achievements It
involves 121 students enrolled in Business Statistics course The students were
asked about their impressions and expectations in Business Statistics course
characteristics interestingness enjoyability usefulness and difficulty Based on
the findings interestingness enjoyability and usefulness have weak Pygmalion
effect or self-fulfilling prophecy to achievements in the three grading periods
Difficulty however has a strong self-fulfilling prophecy to achievements in the
final grading period The achievements of the students in Business Statistics
course show consistency with their performance Initial impression expectations
for midterms and finals post-course impressions and achievements have an
inter-correlation from very small to very high The findings of the study imply that
the impressions and expectations can be a self-fulfilling prophecy to the studentsrsquo
achievement It is hoped that the findings of this study will have practical
implications for the instructors researchers students and parents to fully
understand the Pygmalion effect or self-fulfilling prophecy to an individual to
help transform hisher behavior in ways that confirm to hisher initial
expectations that will serve as a basis in the attainment of success
Keywords Pygmalion effect achievements impressions expectations
Introduction
A broad range of studies have been conducted in the business disciplines that examine
factors relating to student performance and achievement There are studies that documented gender-specific learning differences in science mathematics statistics finance and economics In the majority of these disciplines female students generally perform less well than their male counterparts While this pattern have been consistently documented in economics such results is less evident in statistics According to Park and Kerr (as cited in Rochelle 2007) found GPA and ACT score to be the most important determinants of success in a Money and Banking Course Class attendance and a studentlsquos perceived value were found to be of lesser importance
There are also several studies that covered on the impacts of mathematics skills and topics on student performance and achievement in Business Statistics However no articles were uncovered dealing with performance in Business Statistics course on the Philippines context
As the mandated by the Philippine Commission on Higher Education CMO 3 series of 2007 and CMO 30 series of 2006 undergraduate business accountancy and hotel and restaurant management students are commonly required to complete a course in Business Statistics as part of their degree program Business statistics emphasizes application requiring the student to
2
analyze a business problem determine the appropriate statistical test and weigh the risks of each alternative These are not necessarily the same skills needed in other business disciplines Before a student enrolls in Business Statistics she is required to take one or more courses both in mathematics and statistics to provide necessary mathematical foundations for statistics However despite the prerequisite math courses many students do poorly in their business and economic statistics (become business statistics) course (Norris and Hudson as cited in Green etal 2009) According to Rochelle amp Dotterweich (2007) Business Statistics courses can be quite challenging for many students particularly those entering college with weak quantitative and critical thinking skills They further argued that students view these required quantitative and critical thinking courses as difficult and major hurdle to overcome and many enter Business statistics with anxiety and even fear According to Green (2009) Business statistics was allegedly the most hated and most unpopular course in the business program because of poor student performance due to statistics anxiety inadequate statistics instruction and inadequate math preparation before matriculation and inadequate math prerequisites prior to taking the statistics course
This paper explores the Pygmalion effect or self-fulfilling prophecy to studentslsquo impression expectations and achievement in Business Statistics class Specifically it sought to determine the studentslsquo impressions expectations and achievements in Business Statistics Class based on the Pygmalion effect or self fulfilling prophecy with regards to their personal profile (sex source of income and socio-economic status) and academic profile (course schedule academic achievement Grade in Algebra and Grade in Math of Investment) This paper also sought to determine the studentslsquo impressions and expectations on the characteristics of the course Business Statistics which focus on interestingness enjoyability usefulness and difficulty The correlation between and among impressions expectations and achievements of students in Business Statistics and the correlation of the same and their profile were also ascertained The main argument of this paper impressions and expectations can be a self-fulfilling prophecy to student achievement in Business Statistics
Several studies have previously examined the impacts of mathematics skills and topics on student performance in Business Statistics (Green 2009) However no study was ever conducted on the Pygmalion effect or self-fulfilling prophecy to student achievement or performance in Business Statistics in the Philippine context This paper only explores the studentslsquo impression expectations and achievements in Business Statistics class The teacher competence teacher characteristics the classroom environment and the materials used were taken as one dimension to characterize the Business Statistics class as interesting enjoyable useful and difficult The author believes that a studentlsquos impression and expectation will lead to achievement in a course particularly in Business Statistics
The Pygmalion Effect or Self Fulfilling Prophecy An Overview
Research shows that people make assumptions about onelsquos credibility professionalism
and sincerity within a few seconds of meeting a person for the first time The way a person
present himself--dress body language attitude behaviormdashall impact on how others perceive
himher (Kirk 2010) According to Bernieri (as cited in Kirk 2010) if your students think the
class will be interesting and useful and that you are a credible professor on the first day they will
tend to think that throughout the semester Bernieri found out in his experiment that he
conducted at Oregon State University where he discussed his syllabus the first day of class and
then had the students filled out a teaching evaluation form At the end of the semester they
completed the same form He found the rating the students gave him at the end of the semester
was essentially the same as that given the first day (Kirk 2010) The finding of Ambady (as
cited in Kirk 2010) concurs with Bernieri She conducted a study at Tufts University where she
showed students a ten second video of professors they had never met Their ratings of the
3
professors in the videos were the same as those given by students who had had the professors in
class for several months In addition the studentslsquo first impression of whether the professor was
an effective teacher predicted how well the students themselves performed on tests
The Pygmalion effect refers to situations in which students perform better than other
students simply because they are expected to do so The expectations you direct towards a
person event or even yourself will eventually come true This Pygmalion effect theory has
transcended to become a key instrument of learning for managers and supervisors in the business
world (Livingston as cited in Grasso 2007) According to Grasso (2007) the way managers treat
their subordinates is subtly influence by what they expect of them The Pygmalion Effect can
either elevate a workers productivity or entirely undermine it For instance workers who receive
continuous verbal praise for their efforts while being supported by non-verbal means will aspire
and ascend to even more productivity In contrast if a worker receives less praise or even
communication from management than their peers or co-workers although nothing is being
conveyed verbally the worker feels as though they are underappreciated and will see a lapse or
decrease in productivity This is also in congruent to learning in the classroom setting If a
studentlsquos expectations have been set even one of the false conceptions they will act in certain
ways that are consisted with that expectation causing the results of the expectation to become
true
According to Machaalani (2005) the Pygmalion effect has come to mean ―you get what
you expect He states further that the main idea concerning the Pygmalion effect is that if you
believe that someone is capable of achieving greatness then that person will indeed achieve
greatness In other words believing in potential is simply creates potential The Pygmalion
effect is a form of self-fulfilling prophecy and in this respect people with poor expectations
internalize their negative label and those with positive labels succeed accordingly
According James Rhem (as cited in youlki22 A learners diary 2011) executive editor
for the online National Teaching and Learning Forum commented
When teachers expect students to do well and show intellectual growth they do
when teachers do not have such expectations performance and growth are not so
encouraged and may in fact be discouraged in a variety of ways
In this study the Pygmalion effect or self-fulfilling prophecy predicts that student beliefs
about Business Statistics class will transform their behaviors in ways that confirm to their initial
expectations According to Brophy and Jussim (as cited in Sarrazin et al 2002) Pygmalion
effect or the self-fulfilling prophecy has been widely explored in classroom settings As applied
in the classroom there is a correlation between teacherslsquo expectations and studentslsquo achievement
(Schugurensky 1968) Some researchers point to a Pygmalion Effect wherein professors
unknowingly communicate different performance expectations to male and female students
which students then fulfill (Buck 1985 Jones and Dindia 2004 as cited in Haley Johnson and
Kuennen 2007) The Pygmalion effect or self-fulfilling prophecy concurs with the constructivist learning
theory the expectancy-value theory and the goal theory The constructivist learning theory which
states that learning is an active process of creating meaning from different experiences In other
words students will learn best by trying to make sense of something on their own with the
teacher as a guide to help them along the way According to the ―expectancy-value theory a
4
learnerlsquos motivation is determined by how much they value the goal and whether they expect to
succeed The motivation is given by the following formula (see figure 1)
Value and expectancy are said to multiply not add (Feather as cited in
teachertoolboxcom (2011)) This means that if a student gives their course an expectancylsquo
score of zero then motivation is zero however large the valuelsquo score Similarly motivation is
zero if they score valuelsquo as zero however high their expectancylsquo score In the expectancy-value
theory the behavior is a function of the expectancies one has and the value of the goal toward
which one is working Such approach predicts that when more than one behavior is possible
the behavior chosen will be the one with the largest combination of expected success and value
According to Geiger et al (as cited in Campbell 2003) present strong evidence
suggesting students from different nations are motivated differently and weight differently the
expectancy of success when deciding to exert academic effort There is a link between National
culture and student motivation Hofstede (as cited in Campbell 2003) observed As almost
everyone belongs to a number of different groups and categories of people at the same time
people unavoidably carry several layers of mental programming within themselves
corresponding to different levels of culture At one level is the national culture but lower levels
of culture also exist including a regional andor ethnic andor religious level a gender level a
generation level a social class level and an organizational level They didnlsquot find no evidence of
gender differences in motivator preferences Their evidence suggests Russian accounting
students tend to focus on the expectancy of success rather than the attractiveness of success in
making their effort-level decisions however this result appears due in part to gender
differences and the predominance of women in Russian university accounting programs Further
they find no evidence of group-level differences in individual effort-level decisions
Pygmalion effect has also something to do with the Goal theory Goal theory developed
as an extension of attribution theory It is believed that students pursue goals and that each goal
is associated with certain behaviors and beliefs Student behaviors are the function of desires to
achieve particular goals The two dominant goals are mastery and performance To attain these
goals a student must be motivated to learn
The Pygmalion Effect can either elevate a student performance achievement or entirely
undermine it For instance student who receives continuous verbal praise for their efforts while
being supported by non-verbal means will aspire and ascend to perform better in a more
productive way In contrast if a student receives less praise although nothing is being conveyed
verbally the student feels as though they are underappreciated and will see a lapse or decrease in
productivity or will be a nonperformer
According to Sanford and Evertson (as cited in Campbell 2003) Achievement gains are
determined to a great degree by time-on-task and time allocated to learning Students who spend
Expectancy
The extent to which the
learner expects success
in the learning
Value
The value of the
learning to the
learning
Motivation = X
Figure 1
Value and Expectancy Formula
5
more time on task tend to demonstrate more achievement gains than students who spend less
time on task It means that our achievement is determined by our goal and expectation to finish a
task on time and as an individual that goal and expectation is known as the Pygmalion effect
The aforementioned theory underpinned this study because impressions and expectations
create views on how students see the world of Business Statistics to achieve a desired result
which is achievement
METHODOLOGY
Research Design
This study was conducted to revisit the Pygmalion effect or Self-fulfilling prophecy in
the Business Statistics classroom setting To explore higher education studentslsquo impressions
expectations and achievement in Business Statistics Pygmalion effect or self-fulfilling prophecy
will be used in the analysis of the data The descriptive method of research is employed in
presenting the present condition which describes phenomena as they exist (Collis and Hussey
2009) The purpose is to find the new truth on the impact of Pygmalion effect or self-fulfilling
prophecy on studentslsquo impression and expectation to attain achievement in Business Statistics
This method is appropriate because the researcher intended to identify and obtain information on
the characteristics of a particular issue or concern which is the studentslsquo impressions
expectations and achievements in Business Statistics However there was still an influential
factor of the teacher to the overall impressions and expectations of the students and hence the
teacher and the course could not be separated
In this paper impressions refer to the studentslsquo perception of the course before the end of
preliminary which could be on the positivenegative one Expectation (or expectancy) refers to
the belief that increased effort that will lead to increase performance (Robbins and Judge 2008)
It is the perceived probability that a student possesses a particular attribute or that a behavior will
have a particular consequences Academic Achievement refers to what a student has learned
from classroom instruction (Family Dictionary of Education terms 2nd
ed 2011) However in
this study achievement refers to the grademark of a student in Business statistics course from
prelims midterms and finals
Descriptive data were collected and the contents were analyzed quantitatively and tested
if there are correlations among variables presented in the study
Description of the Course
Business Statistics is a common mathematics subject to students majoring in business
administration and accountancy As mandated by the Commission on Higher Education (CHED)
CMO 39 series of 2006 business statistics is a course known as Math 4 in the curriculum of
Bachelor of Science in Business Administration major in Marketing Management Financial
Management and Human Resources Development Management Students are required to take
Business Statistics after passing Math 1 (college algebra) Math 2 (mathematics of investment)
and Math 3 (calculus for business) In the curriculum of Bachelor of Science in Accountancy
business statistics is also mandated by the CHED CMO 3 Series of 2007 as the last Math subject
same with the curriculum of Bachelor of Science in Business Administration Business statistics
6
is a part of the quantitative techniques in business It is imperative in higher economics and
accounting subjects
Business statistics classes are lecture-based and have no laboratory sessions The typical
class size is approximately 30 students Business Statistics covers descriptive statistics and an
introduction to inferential statistics It is basically an applied statistics Students are expected to
participate in classroom discussion problem solving activities assignments and seat works
There are written quizzes and major examinations
Participants and Data Collection
A sample of 121 students (composed of 73 Bachelor of Science in Accountancy and 48
Bachelor of Science in Business Administration) enrolled in Business Statistics of the College of
Business and Accountancy from a city college in Pangasinan participated in this study The
students were unevenly distributed to four (4) different Business Statistics Classes For MWF
from 8-9 am class 9-10 am class and 9-11 am class and for TTH 11-1230 pm class The
samples of this study were students of the researcher in his Business Statistics class Those
Business Statistics classes handled by other instructors were excluded in this study This ensured
impressions and expectations of the samples were controlled There was only one course outline
used in the three classes The study determined the strength of correlation between and among
impressions expectations and achievements The impressions and expectations were directed to
the samples and not to the teacher Though in the process the teacher impression had a
contribution to the impressions and expectations on the subject the study was demarcated on it
This study was conducted on the second semester of school year 2009-2010
Instruments
The instrument used in the study the survey questionnaire was developed and
constructed by the researcher There were four sets of survey questionnaires According to Singh
as cited in Ragos (2007) content validity is ascertained by finding out how far a scale captures
the meaning of the various aspects of what is being measured The questionnaires were validated
by the dean of College of Business Administration the former research director of the institution
and a professor in Business Statistics that handled the course at the time of the study Based on
their evaluation it was assumed that the questionnaire was valid The four sets of questionnaires
were administered in four different dates
The first set of questionnaire consisted of two parts the first part of the questionnaire is
about the personal and academic profiles of the students in Business Statistics and the second
part of the questionnaire is consisted of questions about the studentslsquo initial impressions of the
course Business Statistics This set was administered in a survey at the end of the preliminary
period dated December 6-10 2010
The second set of questionnaire which was administered on the second date elicited
responses of the students about their expectations for the Midterms The data was gathered at the
end of the preliminary period dated December 6-10 2010
The third set of questionnaire which was administered on the third date elicited responses
of the subjects about their expectations for the Finals The data was gathered at the end of the
midterm period dated February 7-11 2010
7
The fourth set of questionnaire which was administered on the fourth date elicited post-
course impressions of the students about Business Statistics and it was done on the last meeting
of the semester which was on March 31 2010
The achievements of the students in business statistics were based on their grades in the
prelims midterms and finals
The data gathered in the study were analyzed using SPSS 17 for Windows software
package and MS Excel 2007 The study employed descriptive statistics such as mean frequency
count and percentages It used Spearman Rho coefficient of correlation and t-test for coefficient
correlation of impressions expectations and achievements of students in Business Statistics
classes The Chi-square Phi statistic test and Pearson Product moment correlation were also used
to test the hypothesis that there are no significant correlations of studentslsquo impressions
expectations and achievements on Business Statistics Classes and their profile
Results and Discussions
Samplesrsquo Profile
(a) Personal profile
Gender There are 121 students (composed of 73 Bachelor of Science in Accountancy
and 48 Bachelor of Science in Business Administration) enrolled in Business Statistics of the
College of Business and Accountancy who participated in this study Among the 121 students
great majority (69) is females and some (31) are males
Despite trends suggesting that men are enrolling in and graduating from college at lower
rates than women men continue to outperform andor outnumber women in fields such as
mathematics the sciences engineering finance and economics (Freeman 2004 as cited in
Haley Johnson and Kuennen (2007)) This pattern does not prevail in the statistics wherein
women comprise a higher proportion of undergraduate majors and degree earners than in
mathematics engineering or economics (Scheaffer and Stasny 2004 as cited in Haley Johnson
and Kuennen (2007))This is true with the finding of the study that there are more females than
males in business statistics classes This coincides with the enrolment population pattern of the
College of Business and Accountancy which has more females than males
Source of Income As shown in Table 1 among the samples most (868) of them
depend on ―allowance as a source of income It means that their allowances are from their
parents and guardians who support their education Only few (13) of them mentioned that their
allowance came from salary or wages business income or of mix of these sources income Most
of the samples are full-time students and being supported by their parents or guardians This
means that parents involvements in education or in schooling is of great importance to the
sampleslsquo academic success or achievement This finding is in conformity with the study of
Coleman as cited in Kim (2002) who suggested that family background might be analytically
separated into at least three distinct components financial (physical) capital (family income or
wealth) human capital (parent education) and social capital (relationship among actors)
With respect to subjectslsquo business class achievement the finding of the study is the same
with Kim (2002) that there is a direct relationship between parental financial and human capital
and the successful learning experience of their children However Kim (2002) stressed that
8
while both of these factors are important determinants of children educational success there
remains a substantial proportion of variation in educational success which was unaccounted for
by these variables alone
Socioeconomic Status The mode on ―Socioeconomic status is 44 It means that this is
the top answer of the samples on their socioeconomic status which is being determined by the
household income class of D some (31) are ―Class C and some are ―Class E (26) very
few (3) are ―Class A and very few (4) are ―Class B These classifications are based on the
Philippine socioeconomic classifications (Ragos 2007) The socioeconomic status of a Filipino
individual is determined through his household monthly income as shown in Table 1
This could mean that almost all (93) of the students belong from Class C to Class E
group and have household monthly income anywhere from Php50000 and below It can be said
that the students are from a poor family or lower strata of the Philippine society In the
Philippines parents often insist on the importance of education as something like ang
pinakamahalagang pamana ko sa mga anak kolsquo (the most important heritage that I can give to
my child) They want their children to get high grades to raise the family pride They want their
children to finish college so that they could get a good joblsquo and additionally their preferred
course for children is one that usually runs in the family tree (like medicine law business) or in
demand abroad (like nursing or engineering) Parents would usually do everything ndash even as far
as drowning themselves in debt ndash so that children get the education the parents think worthy of
their arduous efforts and noble intentions (httpdefinitelyfilipinocomblog20110417filipino-
beliefs-contradictions-values) The socio economic profile of the subjects for being in the lower
strata served as the motivator to exert effort to achieve their goal such as high grade in every
grading period in order to have a nice job after graduation The finding of the study implied that
standing in the Philippine society has something to do with the studentslsquo expectation to finish
their studies in order to achieve their goal which is to get a good job The Philippine societal
standing has an effect to the impression and expectation of the student to have a comfortable life
and nice job which is not in consonant with the findings of Iverson and Walberg (as cited in
Achoui 2004) According to Iverson and Walberg (as cited in Achoui 2004) studentslsquo ability
and achievement are more closely linked to the socio-psychological environment and intellectual
stimulation in the home than they are to parental socio-economic status indicators such as
occupation and amount of education Kim (as cited in Achoui 2004) explained this variance by
what he called the ―social capital which mediates the relationship between parents financial and
human capital on the one hand and the development of the human capital of their children on
the other According to Achoui (2004) when the students family financial status was high the
students do not experience any pressure to help their families financially Therefore they
dedicate more time for studying
(b) Academic Profile
Course Among the samples a great majority (60) are from ―Bachelor of Science in
Accountancy (BSA) They outnumbered the ―Bachelor of Science in Business Administration
(BSBA) which accounts for (40) This could be because there are more BSA students than
BSBA students based on the enrollment statistics of the College of Business and Accountancy
9
Academic Achievement Among the samples almost half (44 6) of them in Business
Statistics classes have no academic achievement or recognition as shown on Table 1 It means
that they are regular students without any scholarship being received due to the policy on Grade
Point Average Academic achievement refers to a student being recognized for hisher exemplary
performance in hisher classes and achieved high marks or grades as measured by their
cumulative grade point average (GPA) Cumulative GPA refers to the total quality points the
student had achieved in all courses she had taken since his enrollment at the institution divided
by the total number of credit hours or units assigned for these courses For those students who
being supported by the government or known as Government Scholars they were chosen as poor
but deserving students It means that they have met the requirements such as high grade points
average and belonging to a poor family with a monthly household income of 15 thousands
pesos necessary for them to be a government scholar However many (43) of the sample are
on the ―Deanlsquos list Very few (33) are ―Presidential Scholars (33) ―Government Scholars
and (17) are ―Academic Scholars This could mean that a great majority of the respondents
have academic achievements They had good academic standing in the school year 2008-2009
A bona fide student is included in the Deanlsquos list when he enrolled in not less than 18
units and must have at least a general weighted average of 87 (for the College of Arts Sciences
and Education College of Information and Computing Studies College of Business and
Accountancy and College of Nursing) or 85 (for the College of Engineering) with no grade
below 80 in all his subjects Furthermore student must not have any NFE Dropped and or
INC marks in all his subjects
A Presidential scholar is a student who passed the Presidential scholarship examination
administered by Institution A full presidential scholar must have no dropped marks and NFE
marks Minimum grade in all subjects must be 90 for Accountancy Nursing and Education
while 88 for Engineering An academic scholar is one of the top 3 students per year level in
every college based on his general weighted average A government scholar is a student who
qualified for government scholarship grants Certain agencies of the government like
Commission on Higher Education (CHED) and Department of Science and Technology (DOST)
awards scholarships to deserving students
Table 1
Studentsrsquo Profile
f
n=121
Mean
Course
- Bachelor of Science in Accountancy 73 60
- Bachelor of Science in Business
Administration 48 40
Gender
- Male 38 31
- Female 83 69
Source of Income
- Allowance 105 868
- Business Income and Allowance 6 50
- Business Income 5 41
10
Source Questionnaire Survey 2010
Grade in Algebra and Math of Investment The grades of the students in business
statistics classes in algebra and math of investment their earlier mathematics subject as college
students in Colegio de Dagupan have a grade point average mean of 8552 and 8780
respectively The ranges of the two subjects are the same It means that they have good standing
in their previous math subjects While the highest grades are 96 and 97 in the two subjects those
with 96 and 97 grades they had an excellent standing in their previous math subjects The other
students have a lowest grade of 75 and 76 respectively in the two subjects It also means that
they were not performing well to their math subjects It manifests that their achievements as
represented by their grades on both subjects are normally distributed
Studentsrsquo Impressions and Expectations in Business Statistics
In this section the correlation between and among impressions expectation and
achievements of the students in Business Statistics have been tested using t-test for coefficient
correlation (see Table 2) The students marked Business Statistics class based on the course
characteristics usefulness interestingness enjoyabality and difficulty Utility value or usefulness
refers to how a task fits into an into an individuallsquos future plans for instance taking a math class
to fulfill a requirement for a business degree (Jamieson 1987) Interestingness refers to the
impression and expectation of the students in Business Statistics as interesting It was assumed
- Allowance and others 2 17
- Salary or Wages 1 8
- Salary or Wages and Business Income 1 8
- Salary or Wages Business Income and
Allowance 1 8
Socioeconomic Status (Household monthly income based on Philippine wage)
- Class A (100001 and above income) 4 3
- Class B (50001 to 100000) 5 4
- Class C (15001 to 50000) 37 31
- Class D (8001 to 15000) 44 36
- Class E ( below 8000) 31 26
Academic Achievement
- Deans list 52 430
- Presidential Scholar 4 33
- Government Scholar 4 33
- Academic Scholar and Deans List 2 17
- Academic Scholar 1 8
- Deans List and Government Scholar 2 17
- Presidential Scholar and Academic
Scholar 1 8
- Presidential Scholar and Government
Scholar 1 8
- No Response (means regular student) 54 446
11
that the Business Statistics has a characteristic of interestingness when it strengthened the
studentslsquo interest to feel that they will succeed in a learning task and when the learning process
itself was enjoyable and stimulating and attributed personal significance to the learning content
(Schiefele 1991) Difficulty describes the studentslsquo subjective impression on the problem This
subjective impression expresses the difference between the studentslsquo ability to construct
cognitions in the field of the problem (hisher experiences) and the complexity of the cognitions
which are needed to solve the problem in Business Statistics class Enjoyabality refers to the
impression and expectation of the students in Business Statistics class as enjoyable
Initial Impressions Table 2 shows the initial impressions of the student in business
statistics classes Among the course characteristics ―Usefulness obtained the highest mean of
411 or ―Highly Useful This means that there is a relationship of Business and Statistics which
are mapped or explained in the first meeting up to the early weeks of prelim period The samples
have a high regard on the usefulness of the business statistics courses because it is their chosen
field The samples have impression that Business Statistics is useful because of its importance in
the attainment or completion of their requirements It goes also that for them business statistics
is highly interesting and highly enjoyable with means of 375 360 respectively
As to the studentslsquo initialslsquo impression on the difficulty of the course Business Statistics
they regarded business statistics as ―Moderately Difficult with a mean rating of 328 This might
be due to the topics or lessons which are introduced in the prelim period and seemingly of
moderate difficulty Though it was found moderately difficult it is understandable that is still has
a measure of difficulty even it was not significantly high
Expectations for Midterms Table 2 shows the expectations of the samples in Business
Statistics for the Midterms The expectations are not similar to their initial impressions but rather
there was an increased with their expectations The mean rating that was obtained in Business
Statistics course on expectations for midterms have slightly increased The samples have
expected that Business Statistics is ―Highly Useful with a mean rating of 413 With regard to
the expectation that Business Statistics is an interesting and enjoyable course it was found out
that the course is ―Highly Interesting with a mean rating of 398 and ―Highly enjoyable with a
mean rating of 372 The same findings was found on the expectation on the difficulty the
samples expected that Business statistics is ―Highly difficult with a mean rating of 348
In comparison the means of the initial impressions and expectations on ―interestingness
increased from 375 to 398 on ―enjoyability increases from 360 to 372 on ―usefulness
increases from 411 to 413 and on ―difficulty increases from 328 to 348 This shows that
studentslsquo initial impressions are quite contradictory to their expectations This means that
studentslsquo initial impressions have a quite impact on their expectations in Business Statistics class
except on the difficulty of the course
This finding is not in parallel with the Finals on the course characteristics are ―High the
obtained means for ―Enjoyability and ―Interestingness drop very slightly to 366 and 390
respectively But they are still ―Highly Enjoyable and ―Highly Interesting However
―Usefulness increases its mean to 420 which the classes expect that Business Statistics is ―Very
Highly Useful On ―Difficulty the classes expect that business statistics in the finals would be
of ―Highly Difficult with a mean of 379 which slightly increases when compared to their
Midterms expectations
12
The discrepancies of the expectations in the midterms and finals could mean that
midterms expectations do not follow the pattern of the expectations in the finals
Expectations for Finals As shown also in Table 2 about the the expectations of students
in Business Statistics class for the Finals Although the expectations for the Finals on the course
characteristics are ―High the obtained mean for ―Enjoyability and ―Interestingness dropped
very slightly from 366 and 390 respectively But samples still expected that Business Statistics
is ―Highly Enjoyable and ―Highly Interesting However expectation on the course
―Usefulness mean rating increases to 420 It means that students expected that Business
Statistics is ―very highly useful As to the difficulty of the course the students expected that
course in the finals would be of ―High Difficulty with a mean rating of 379 This shows that
students predicted that Business Statistics is becoming a difficult course compared to their
midterm expectations
It can be observed that there is discrepancy of the expectations of the students in their
midterm and finals It means that studentslsquo expectation do not follow the pattern of the
expectation for the finals
Post-Course Impressions Table 3 shows the studentslsquo post-course impressions in
Business Statistics The impressions on all course characteristics are ―High However it is
noteworthy that the obtained means for ―Interestingness ―Enjoyability and ―Usefulness drop
slightly to 386 364 and 417 respectively when compared to their expectations in the Finals as
shown in Table 2 On ―Difficulty the classeslsquo post-course impression is ―Highly Difficult
which obtained a mean of 384 a slight increase from their expectation in the Finals
In a reprise of the impressions and expectations of the business statistics classes across
the different terms it is remarkable that on ―interestingness the midterm expectation increases
from their initial impression and it decreases through the finals expectation and post-course
impression With regard to ―Enjoyability the midterm expectation increases from their initial
impression and it decreases through the finals expectation and post-course impression With
regard to ―Usefulness the midterm expectation increases from their initial impression and it
also increases in the finals expectation however it decreases in the post-course impression With
regard to ―Difficulty it is increasing from initial impression through the post-course impression
Table 3
Post-Course Impressions of Students in Business Statistics Class Course characteristics Mean Descriptive Value
Interestingness 386 Highly Interesting
Enjoyability 364 Highly Enjoyable
Table 2
Studentsrsquo Initial impressions and Expectations in Business Statistics for Midterm and Finals
Initial Impressions Expectations for Midterms Expectations for Finals
Course
characteristics Mean Descriptive Value Mean Descriptive Value
Mean Descriptive Value
Interestingness 375 Highly Interesting 398 Highly Interesting 390 Highly Interesting
Enjoyability 360 Highly Enjoyable 372 Highly Enjoyable 366 Highly Enjoyable
Usefulness 411 Highly Useful 413 Highly Useful 420 Very Highly Useful
Difficulty 328 Moderately Difficult 348 Highly Difficult 379 Highly Difficult
Legend 420-500 Very High 340-419 High 260-339 Moderate 180-259 Fair 100-179 Slight
13
Usefulness 417 Highly Useful
Difficulty 384 Highly Difficult Legend 420-500 Very High 340-419 High 260-339 Moderate 180-259 Fair 100-179 Slight
Achievements of Business Statistics Classes Table 4 shows the means of prelim
midterm and final grades of students in business statistics It is noteworthy that the highest
grades are high and the lowest grades are very low up to the point of failing Though the ranges
are great there are no outliers in the observations
The greatest mean grade was on the Midterms (8609) and the smallest mean grade was
on the Finals (8180)
Table 4
Achievements of the Students in Business Statistics based on their Grade
Grading Period Lowest Grade Highest Grade Mean
n=121
Prelim Grade 64 95 8560
Midterm Grade 67 95 8609
Final Grade 66 94 8180
Grand Mean 64 95 8450
3) Correlation of Impressions Expectations and Achievements
Initial Impressions and Prelim Grades As shown on Table 5 ―Interestingness and
Prelim Grade have ―positive very small correlation Although the initial impression on
Interestingness was ―High the achievement in the Prelims does not follow the pattern of the
initial impression ―Enjoyability and Prelim Grade have ―positive very small correlation
However their coefficient of correlation of 200 is higher than on ―Interestingness and Prelim
Grade of 128
Furthermore ―Usefulness and Prelim Grade have ―negative very small correlation
This could mean that while the initial impression on ―Usefulness is ―High the achievement on
Prelims does not increase or decrease with the initial impression it does not have an inverse
relationship with ―Usefulness
Also ―Difficulty and Prelim Grade have ―negative very small correlation This could
mean that while the initial impression on ―Difficulty is ―Moderate the achievement on Prelims
does not increase or decrease with the initial impression it does not have an inverse relationship
with ―Difficulty
Table 5
Coefficients of Correlation on Initial Impressions and Prelim Grades
Course Characteristics Coefficient of
Correlation Descriptive Value
Interestingness 128 Positive very small Correlation
Enjoyability 200 Positive very small Correlation
Usefulness -049 Negative very small correlation
Difficulty -109 Negative very small correlation plusmn 100 Perfect Positive or Negative correlation
plusmn 075 to 099 Very High Positive or Negative correlation
14
plusmn 050 to 074 High Positive or Negative Correlation
plusmn 025 to 049 Moderately Small Positive or Negative Correlation
plusmn 001 to 024 Very Small Positive or Negative Correlation
000 No Correlation
Expectations for Midterms Grades As shown on table 6 ―Interestingness and Midterm
Grade have ―positive very small correlation This could mean that although the expectation on
―Interestingness is ―High the achievement in the Midterms has bit increased with the
expectation This is also true with ―Enjoyability and Midterm Grade and ―Usefulness and
Midterm Grade
Furthermore ―Difficulty and Midterm Grade have ―positive very small correlation
This could mean that while the expectation on ―Difficulty is ―High the achievement on
Midterms has bit increased but does not have a direct relationship with ―Difficulty
This reveals that the expectations of students in Business Statistics for the midterms have
―very small self-fulfilling effects to their achievements This is in consonance with Sarrazin
(2001) that ―the teacher expectations have weak self-fulfilling effects This study however
focuses on the expectations of the subjects in Business Statistics class
Expectations for Finals and Grades As shown on table 7 ―Interestingness and Final
Grade have ―positive very small correlation Although the expectation on Interestingness is
―High the achievement in the Finals has not increased with the expectation ―Enjoyability and
Final Grade have ―positive very small correlation While the expectation is ―Highly
Enjoyable it does not increase the achievement in the Finals on their grades
Further ―Usefulness and Final Grade have ―positive very small correlation This could
mean that while the expectation on Usefulness is ―Very High the achievement on Finals has not
increased and does not have a direct relationship with ―Usefulness This again reveals that the
expectations of business statistics classes for the finals have ―very small self-fulfilling effects to
their achievements This is again in consonance with Sarrazin (2001) that ―the teacher
expectations have weak self-fulfilling effects This study however focuses on the expectations
of the classes on the subject
Also ―Difficulty and Final Grade have ―positive very small correlation This could
mean that while the expectation on Difficulty is ―High the achievement on Finals has bit
increased but does not have a direct relationship with ―Difficulty
Table 6
Coefficients of Correlation on Expectations and Midterm Grades and Final Grades
Course
Characteristics
Coefficient
of
Correlation
Descriptive Value
Coefficient
of
Correlation
Descriptive Value
Interestingness 115 Very Small Positive 152 Very Small Positive Enjoyability 132 Very Small Positive 169 Very Small Positive Usefulness 052 Very Small Positive 049 Very Small Positive Difficulty 142 Very Small Positive 223 Very Small Positive
Initial and Post-course Impressions As shown in table 7 the coefficient of correlation
on the Initial and post-course impressions on ―Interestingness and ―Usefulness have ―positive
plusmn 100 Perfect Positive or Negative correlation
plusmn 075 to 099 Very High Positive or Negative correlation
plusmn 050 to 074 High Positive or Negative Correlation
plusmn 025 to 049 Moderately Small Positive or Negative Correlation
plusmn 001 to 024 Very Small Positive or Negative Correlation
000 No Correlation
15
moderately small correlation This could mean that their initial and post-course impressions are
almost not correlated but follow a bit of the same pattern Hence there might be small change in
impressions between the two separate terms
However ―Enjoyability and ―Difficulty have ―positive moderately small correlation
It could mean that on ―Enjoyability the initial and post-course impressions have not changed
much but it does not entail either that it has remained the same
Table 7
Coefficients of Correlation on Initial and Post-course Impressions
Course Characteristics Coefficient of
Correlation Descriptive Value
Interestingness 170 Positive very small correlation
Enjoyability 303 Positive moderately small correlation
Usefulness 187 Positive very small correlation
Difficulty 318 Positive moderately small correlation
Achievements in Prelim Midterm and Final Grades As shown on table 8 there is a
―positive very high correlation on the interrelationships among achievements (as represented by
the grades) of the students in Business Statistics classes These direct interrelationships signify
consistency and reliability of their performance or achievements in Business Statistics It could
mean also that their achievements are consistent with their performance in the class
Table 8
Coefficients of Correlation of Achievements as to Grades of Business Statistics Classes
Business Statistics Grades Coefficient of
Correlation Descriptive Value
Prelim and Midterm 936 Positive very high correlation
Prelim and Final 816 Positive very high correlation
Midterm and Final 854 Positive very high correlation plusmn 100 Perfect Positive or Negative correlation
plusmn 075 to 099 Very High Positive or Negative correlation
plusmn 050 to 074 High Positive or Negative Correlation
plusmn 025 to 049 Moderately Small Positive or Negative Correlation
plusmn 001 to 024 Very Small Positive or Negative Correlation
000 No Correlation
Expectations for Finals and Post-Course ImpressionsAs shown on Table 9 the
expectations for finals and post-course impressions on interestingness enjoyability usefulness
and difficulty have ―positive moderately small correlation This means that the studentslsquo
expectations for finals do not perfectly predict their post-course impressions but their
expectations are not completely different from their impressions It shows further that there is a
stronger correlation of the expectations for finals and post-course impressions than that of initial
plusmn 100 Perfect Positive or Negative correlation
plusmn 075 to 099 Very High Positive or Negative correlation
plusmn 050 to 074 High Positive or Negative Correlation
plusmn 025 to 049 Moderately Small Positive or Negative Correlation
plusmn 001 to 024 Very Small Positive or Negative Correlation
000 No Correlation
16
impressions and post-course impressions This could be because the time interval between final
expectation and post-course impression is short
Table 9
Coefficients of Correlation on Expectations and Final Grades
Course Characteristics Coefficient of
Correlation Descriptive Value
Interestingness 257 Positive moderately small correlation
Enjoyability 258 Positive moderately small correlation
Usefulness 328 Positive moderately small correlation
Difficulty 404 Positive moderately small correlation plusmn 100 Perfect Positive or Negative correlation
plusmn 075 to 099 Very High Positive or Negative correlation
plusmn 050 to 074 High Positive or Negative Correlation
plusmn 025 to 049 Moderately Small Positive or Negative Correlation
plusmn 001 to 024 Very Small Positive or Negative Correlation
000 No Correlation
Correlation Significance between and among Impressions Expectations and
Achievements
Initial Impressions and Prelim Grades As shown on table 10 ―interestingness and
prelim grade ―usefulness and prelim grade and ―difficulty and prelim grade are not
significantly correlated The hypothesis is accepted at 05 level of significance and 119 degrees
of freedom This could mean that the ―high initial impression on interestingness has no direct
correlation with prelim grade Also the ―high initial impression on usefulness and ―moderate
initial impression on difficulty have no inverse correlation with prelim grade
However ―enjoyability and prelim grade are significantly correlated The hypothesis is
rejected at 05 level of significance and 119 degrees of freedom This could mean that ―high
initial impression on enjoyability has a direct correlation with prelim grade The grade has
increased with the increased in initial impression on enjoyability Therefore enjoyability has a
strong self-fulfilling prophecy to prelim grade
Table 10
Spearman Rho Correlation Analysis on Initial Impressions and Prelim Grades
Course Characteristics Coefficient Correlation tcv ttv Decision
Interestingness 128 14079 19803 Accept Ho
Enjoyability 200 22267 19803 Reject Ho
Usefulness -049 -05352 -19803 Accept Ho
Difficulty -109 -11962 -19803 Accept Ho
Legend tcv gtttv Reject Ho tcv lt ttv Accept Ho
Expectations for midterms and Grade As shown on table 11 ―interestingness and
midterm grade ―enjoyability and midterm grade ―usefulness and midterm grade and
―difficulty and midterm grade are not significantly correlated The hypothesis is accepted at 05
level of significance and 119 degrees of freedom This could mean that the ―high expectations
on interestingness enjoyability usefulness and difficulty have no direct correlation with
17
midterm grade The grade has not increased with the increased expectations for midterms on the
course characteristics Therefore interestingness enjoyability usefulness and difficulty have a
weak self-fulfilling prophecy to midterm grade
This does not underpin the study of Sartain (1945) findings that ―Interestingness and
―Usefulness are closely related to achievement In this study no other indicators were used to
determine that ―interestingness ―enjoyability and ―usefulness is closely related to
achievement According to Kim (2003) in order to increase studentslsquo interest options should be
offered to the students in selecting not only school subjects but also classroom tasks the level of
the tasks and so on
Table 11
Spearman Rho Correlation Analysis on Expectations and Midterm Grades
Course Characteristics Coefficient
Correlation tcv ttv Decision
Interestingness 115 12629 19803 Accept Ho
Enjoyability 132 14527 19803 Accept Ho
Usefulness 052 05680 19803 Accept Ho
Difficulty 142 15649 19803 Accept Ho
Legend tcv gtttv Reject Ho tcv lt ttv Accept Ho
Expectations for finals and grades As shown on table 12 ―interestingness and final
grade ―enjoyability and final grade ―usefulness and final grade are not significantly
correlated The hypothesis is accepted at 05 level of significance and 119 degrees of freedom
This could mean that the ―high expectations on interestingness enjoyability and ―very high
expectation on ―usefulness have no direct correlation with final grade The final grade does not
increase with the increased expectations on interestingness enjoyability and usefulness
Therefore interestingness enjoyability and usefulness have a weak self-fulfilling prophecy to
final grade
However ―difficulty and final grade are significantly correlated The hypothesis is
rejected at 05 level of significance and 119 degrees of freedom This could mean that ―high
expectation on difficulty has a direct relationship with final grade The grade has increased with
the increased expectation on difficulty Therefore difficulty has a strong self-fulfilling prophecy
to final grade It could mean that the business statistics classes perform better when they expect
that the course is difficult It proves that the more they expect the business statistics is ―difficult
they are motivated to achieve more The finding of this study recognized the constructivist
theory that studentlsquos prior knowledge may help or hurt the construction of meaning Studentslsquo
prior knowledge comes from their past experiences culture and their environment Generally
prior knowledge is good but sometimes misconceptions and wrong information can be a
hindrance so sometimes there is a need to correct prior knowledge before new learning can
occur (Brooks J and Brooks as cited in httpwwwndt-
edorgTeachingResourcesClassroomTips Constructivist20_Learninghtm
This is in contrast with the findings of Sartain (1945) that ―difficulty and marks (grades)
show a low negative correlation
Table 12
Spearman Rho Correlation Analysis on Expectations and Final Grades
18
Course Characteristics Coefficient
Correlation tcv ttv Decision
Interestingness 152 16776 19803 Accept Ho
Enjoyability 169 18705 19803 Accept Ho
Usefulness 049 05352 19803 Accept Ho
Difficulty 223 24955 19803 Reject Ho
Legend tcv gtttv Reject Ho tcv lt ttv Accept Ho
Initial and Post-course Impressions As shown on table 13 the ―initial and post-course
impressions on ―interestingness are not significantly correlated The hypothesis is accepted at
05 level of significance and 119 degrees of freedom This could mean that the ―high initial
impression on interestingness has no direct correlation with the ―high post-course impression on
interestingness This could mean that the initial impression on interestingness does not follow the
pattern of the post-course impression because the increase in initial impression does not predict
an increase in post-course impression Interestingness may be affected due to other factors which
were not included in this paper
However ―initial impressions and post-course impressions on enjoyability usefulness
and difficulty are significantly correlated The hypothesis was rejected at 05 level of
significance and 119 degrees of freedom This could mean that ―high initial impressions on
enjoyability usefulness and difficulty have a direct correlation with ―high post-course
impressions This could mean that what the studentslsquo initial high impressions are the same
throughout in the business statistics class maybe because of other factors which were not given a
focus on this study This proved that first impression is lasting With regard to the post-course
impressions course characteristics on enjoyability usefulness and difficulty has no effect on the
post course impression maybe due to the fact that they have just finished and experienced the
classroom setting in the Business Statistics class The students have known what the best
teaching and learning style being employed in the class that made it useful enjoyable interesting
and difficult
Table 13
Spearman Rho Correlation Analysis on Initial and Post-course Impressions
Course Characteristics Coefficient
Correlation tcv ttv Decision
Interestingness 170 18819 19803 Accept Ho
Enjoyability 303 34684 19803 Reject Ho
Usefulness 187 20766 19803 Reject Ho
Difficulty 318 36589 19803 Reject Ho
Legend tcv gtttv Reject Ho tcv lt ttv Accept Ho
Achievements in Prelim Midterm and Final Grades As shown on table 14 ―prelim
and midterm grades ―prelim and final grades ―midterm and final grades are significantly
correlated The hypothesis is rejected at 05 level of significance and 119 degrees of freedom
This could mean that there is direct inter-correlation of the achievements of business statistics
classes on the three different grading periods It could mean further that the grades of the classes
have not changed or consistent over the three (3) grading periods maybe because of the level of
performance of the students It was found out that there were students who have academic
19
achievement and so with those who have not This inter-correlation also signifies reliability of
the achievements of business statistics classes
Table 14
Spearman Rho Correlation Analysis on the Grades of Business Statistics Classes
Business Statistics
Grades
Coefficient
Correlation tcv ttv Decision
Prelim and Midterm 936 290073 19803 Reject Ho
Prelim and Final 816 153992 19803 Reject Ho
Midterm and Final 854 179061 19803 Reject Ho
Legend tcv gtttv Reject Ho tcv lt ttv Accept Ho
Expectations for Finals and Post-Course Impressions As shown on table 15
―expectations for finals and post-course impressions on the course characteristics
interestingness enjoyability usefulness and difficulty are significantly correlated The
hypothesis is rejected at 05 level of significance and 119 degrees of freedom This could mean
that the ―high expectations on interestingness enjoyability difficulty and ―very high
expectation on usefulness have a direct correlation with the ―high post-course impressions on
interestingness enjoyability usefulness and difficulty
This could mean that the expectations for finals do not follow the pattern of the post-
course impressions This suggests that the increased of expectations for finals does increase the
post-course impressions It could be because the final expectations and post-course impressions
have very short time interval their overall post-course impressions of Business Statistics classes
very closely resemble their expectations for the finals
Table 15
Spearman Rho Correlation Analysis on the Expectations for Finals and Post Course
Impressions
Course Characteristics Coefficient Correlation tcv ttv Decision
Interestingness 257 29010 19803 Reject Ho
Enjoyability 258 29131 19803 Reject Ho
Usefulness 328 37876 19803 Reject Ho
Difficulty 404 48178 19803 Reject Ho
Legend tcv gtttv Reject Ho tcv lt ttv Accept Ho
Correlation Significance on Impressions Expectations and Achievements of
Business Statistics classes and their Profile
This section presents the correlation analysis on studentslsquo impressions expectations and
achievements in Business Statistics and their profile The Chi-square Phi statistic test and
Pearson Product moment correlation were used to test the hypothesis that there are no significant
20
correlations of studentslsquo impression expectation and achievements on Business Classes and their
profile
Correlation Analysis on Initial Impressions and Personal Profile As shown on table
16 gender and initial impressions on the course characteristics are not significantly correlated at
05 level of significance It could mean that the initial impressions of business statistics are
independent on gender Also source of income and ―interestingness ―enjoyability
―usefulness are not significantly correlated However source of income and difficulty have
significant correlation It could mean that the initial impression of business statistics on
―difficulty is dependent on the ―source of income
Furthermore ―socioeconomic status and ―interestingness ―difficulty are not
significantly correlated at 05 level of significance In contrast ―socioeconomic status and
―enjoyability ―usefulness have significant negative correlation This means that as their
socioeconomic status lowers their initial impressions on ―enjoyability and ―usefulness
increase It could mean that those who are in the lower socioeconomic status (C D E) enjoy
business statistics more and see its usefulness Also this could be because most of the business
statistics students fall under socioeconomic status C D and E
Correlation Analysis on Initial Impressions and Academic Profile As shown on table
16 course and ―interestingness ―usefulness ―difficulty is not significantly correlated at 05
level of significance It could mean that their initial impressions on the said course characteristics
are independent on their course However for course and ―enjoyability it was found out that
there is a significant correlation It could mean that their initial impression on ―enjoyability is
dependent on their course
Table 16
Correlation Analysis on Initial Impressions and Personal Profile Academic Profile Personal Profile Academic Profile
Course Characteristics
Gender Source of Income Socioeconomic Status Course Academic
Achievement
Coefficient
of correlation
Sig
Coefficient
of correlation
Sig
Coefficient
of correlation
Sig
Coefficient
of correlation
Sig
Coefficient
of correlation
Sig
Interestingness 118 199 319 421 -132 149 192 108 452 074
Enjoyability 123 178 306 880 -191 036 271 031 797 000
Usefulness -007 939 386 453 -248 006 138 510 297 991 Difficulty -136 138 516 021 137 134 189 231 339 948
Correlation Analysis on Initial Impressions and Grades in Algebra Math of
Investment As shown further on table 17 grade in algebra and ―interestingness ―usefulness
―difficulty are not significantly correlated at 05 level of significance This means that their
initial impressions on the said course characteristics have neither direct nor inverse correlation
with grade in algebra In contrast grade in algebra and ―enjoyability have significant positive
21
correlation This could mean that their initial impression of Business Statistics on ―enjoyability
has a direct correlation with the grade in algebra
Grade in math of investment and course characteristics on ―interestingness
―enjoyability ―usefulness ―difficulty are not significantly correlated This means that their
initial impressions on the said course characteristics have neither direct nor inverse correlation
with the grade in math of investment
Table 17
Correlation Analysis on Initial Impressions and Grades in Algebra Math of investment
Course
Characteristics
Grade in Algebra Grade in Math of Investment
Coefficient of
correlation Sig
Coefficient of
correlation Sig
Interestingness 156 094 173 061
Enjoyability 191 039 102 271
Usefulness 048 608 021 820
Difficulty -130 164 -110 236
Correlation Analysis on Expectations for Midterms and Personal Profile As shown on
table 18 gender and expectations for midterms on the course characteristics ―interestingness
―enjoyability ―usefulness and ―difficulty are not significantly correlated at 05 level of
significance This means that the expectations for midterms of students in Business statistics are
independent on gender Furthermore source of income and course characteristics are not
significantly correlated at 05 level of significance This means that the studentslsquo expectation for
midterms in business statistics has nothing to do with their source of income
As regards to socioeconomic status it is not significantly correlated to the course
characteristics on ―enjoyability ―usefulness and ―difficulty This means that socioeconomic
status has neither direct nor inverse correlation with the said course characteristics In contrast
socioeconomic status and ―interestingness have significant negative correlation This means that
even a student belongs to a lower standing which is based on the socioeconomic status the
expectation for midterms in Business Statistics becomes more interesting
Correlation Analysis on Expectations for Midterms and Academic Profile As shown
on table 18 course and course characteristics ―interestingness ―enjoyability ―usefulness
―difficulty are not significantly correlated at 05 level of significance This means that the
expectations for midterms on course characteristics are independent of their course
Also academic achievement and course characteristics ―interestingness ―enjoyability
―usefulness ―difficulty are not significantly correlated at 05 level of significance This means
that the expectations for midterms on the said course characteristics are independent of their
academic achievement
Table 18
Correlation Analysis on Expectations for Midterms and Personal and Academic Profile
Course
Characteristics
Gender Source of Income Socioeconomic
Status
Course Academic
Achievement
Coefficient
of Sig
Coefficient
of Sig
Coefficient
of Sig
Coefficient
of Sig
22
correlation correlation correlation correlation
Interestingness 165 070 360 206 -232 011 175 156 429 134
Enjoyability 136 138 321 820 -084 362 202 175 228 100
Usefulness -046 618 360 208 -062 501 198 093 241 972
Difficulty -043 638 414 652 120 188 188 368 418 928
Correlation Analysis on Expectations for Midterms and Grades in Algebra Math of
Investment As shown on table 19 grade in algebra and course characteristics ―interestingness
―enjoyability ―usefulness ―difficulty are not significantly correlated at 05 level of
significance This means that expectations for midterms on the said course characteristics have
neither direct nor inverse correlation with the grade in algebra
Furthermore grade in math of investment and course characteristics ―enjoyability
―usefulness ―difficulty are not significantly correlated at 05 level of significance This means
that expectations for midterms on the said course characteristics have neither direct nor inverse
correlation with the grade in math of investment In contrast grade in math of investment and
―interestingness have significant positive correlation This means that as the grade in math of
investment increases the expectations for midterms on interestingness also increases It could
mean further that those students with higher grade in math of investment expect more that
Business Statistics is interesting in the midterms
Table 19
Correlation Analysis on Expectations for Midterms and Grades in Algebra Math of Investment
Course
Characteristics
Grade in Algebra Grade in Math of Investment
Coefficient of correlation Sig Coefficient of correlation Sig
Interestingness 174 061 198 031
Enjoyability 181 051 094 311
Usefulness 122 188 162 079
Difficulty 029 753 075 422
Correlation Analysis on Expectation for Finals and Personal and Academic Profile As
shown on table 20 gender and course characteristics ―interestingness ―enjoyability
―usefulness ―difficulty are not significantly correlated at 05 level of significance This means
that the expectations for finals on the said course characteristics are independent of their gender
Also source of income and course characteristics are not significantly correlated This means
that the expectations for finals on the said course characteristics are independent of their source
of income
As to socioeconomic status and course characteristics it was found that they are not
significantly correlated at 05 level of significance This means that expectations for finals on the
said course characteristics have neither direct nor inverse correlation with socioeconomic status
Correlation Analysis on Expectations for Finals and Academic Profile As shown also
on table 20 course and course characteristics ―usefulness ―difficulty are not significantly
correlated at 05 level of significance This means that the expectations for finals on the said
course characteristics are independent of their course Usefulness and difficulty were not
correlated with the studentslsquo expectations
23
In contrast course and course characteristics ―interestingness ―enjoyability are
significantly correlated This means that the expectations for finals on interestingness and
enjoyability are dependent on their course
As shown further on table 20 academic achievement and course characteristics
―interestingness ―enjoyability ―usefulness ―difficulty are not significantly correlated This
means that the expectations for finals on the said course characteristics are independent of their
academic achievement
Table 20
Correlation Analysis on Expectation for Finals and Personal Profile Academic profile
Course
Characteristics
Gender Source of Income Socioeconomic Status Course Academic
Achievement
Coefficient of
correlation
Sig Coefficient
of
correlation
Sig Coefficient
of
correlation
Sig Coefficient
of
correlation
Sig Coefficient
of
correlation
Sig
Interestingness -038 676 354 230 -176 053 286 007 312 759 Enjoyability 124 175 455 124 -122 181 318 007 282 996
Usefulness -117 201 370 168 -085 355 108 493 314 748
Difficulty -095 298 345 938 032 727 173 459 353 995
Correlation Analysis on Expectations for Finals and Grades in Algebra Math of
Investment As shown on table 21 grade in algebra and course characteristics ―interestingness
―usefulness ―difficulty are not significantly correlated at 05 level of significance This means
that the expectations for finals on the said course characteristics on being interesting useful and
difficult have nothing to do with their grade in algebra In contrast grade in algebra and
―enjoyability have significant positive correlation This means that students expected that the
final term will be more enjoyable expectation for finals on ―enjoyability increases as grade in
algebra increases It could mean further that those students who have higher grade in algebra
expect more that business statistics is enjoyable
As shown further on table 21 grade in math of investment and course characteristics
―interestingness ―usefulness ―difficulty are not significantly correlated at 05 level of
significance This means that the expectations for finals on the said course characteristics are
independent of their grade in math of investment This means that the expectation for finals on
―enjoyability increases if the grade in math of investment was high It could mean further that
those students who have higher grade in math of investment expect more that business statistics
is enjoyable
Table 21
Correlation Analysis on Expectations for Finals and Grades in Algebra Math of Investment Course
Characteristics
Grade in Algebra Grade in Math of Investment
Coefficient of correlation Sig Coefficient of correlation Sig
Interestingness 158 088 169 067
Enjoyability 208 05 217 018
Usefulness 103 269 178 054
Difficulty 069 459 103 266
Correlation Analysis on Post-course Impressions and Personal Profile As shown on
table 22 gender and course characteristics ―interestingness ―enjoyability ―usefulness
―difficulty are not significantly correlated This means that the post-course impressions on the
said course characteristics are independent of their gender Moreover source of income and
24
course characteristics ―enjoyability ―difficulty are not significantly correlated This means
that the post-course impressions on the said course characteristics are independent of their source
of income In contrast source of income and ―interestingness ―usefulness are significantly
correlated This means that the post-course impressions on ―interestingness and ―usefulness
have strong correlation to source of income
As shown further on table 22 socioeconomic status and course characteristics are not
significantly correlated This means that socioeconomic status has neither direct nor inverse
correlation with post-course impressions of business statistics classes
Correlation Analysis on Post-course Impression and Academic Profile As shown on
table 22 course and course characteristics ―interestingness ―enjoyability ―usefulness
―difficulty are not significantly correlated at 05 level of significance This means that the post-
course impressions on the said course characteristics are independent of their course
As shown further on table 22 academic achievement and course characteristics
―interestingness ―usefulness ―difficulty are not significantly correlated at 05 level of
significance In contrast academic achievement and ―enjoyability are significantly correlated at
05 level of significance This means that post-course impressions on the said course
characteristics are dependent on their academic achievement
Table 22
Correlation Analysis on Post-course Impressions and Personal and Academic Profile
Course
Characteristics
Sex Source of Income Socioeconomic Status course Academic
Achievement
Coefficient
of
correlation
Sig
Coefficient
of
correlation
Sig
Coefficient
of
correlation
Sig
Coefficient
of
correlation
Sig
Coefficient
of
correlation
Sig
Interestingness 002 986 915 000 -071 441 177 432 614 057 Enjoyability 027 773 448 146 -118 198 200 184 649 001
Usefulness -085 352 473 008 014 877 058 816 329 669
Difficulty 005 952 355 645 114 212 129 572 387 799
Correlation Analysis on Post-course Impressions and Grades in Algebra Math of
Investment As shown on table 23 post-course impressions on course characteristics and grades
in algebra and math of investment are not significantly correlated at 05 level of significance
This means that post-course impressions on course characteristics have neither direct nor inverse
correlation with the grades in algebra and math of investment
Table 23
Correlation Analysis on Post-course Impressions and Grades in Algebra Math of Investment Course
Characteristics
Grade in Algebra Grade in Math of Investment
Coefficient of correlation Sig Coefficient of correlation Sig
Interestingness -032 732 057 539
Enjoyability 058 534 -015 872
Usefulness 063 498 041 662
Difficulty -103 267 -036 699
Correlation Analysis on Achievements and Personal and Academic Profile Tables 24
show the correlation analysis on achievements and personal profile It was found that gender and
25
achievements on ―prelims ―midterms ―finals are not significantly correlated at 05 level of
significance This means that the studentslsquo achievements in Business Statistics are independent
to their gender The gender has no impact on the achievements of the students which is having a
high grademark or the other way The finding of the study on the correlation of achievements to
gender was different to the findings of Johnson and Kuennen and Harraway According to
Johnson and Kuenen (2006) the female students outperform male students in an introductory
business statistics course while Harraway (2002) finds no gender difference in performance in
an introductory biostatistics course in New Zealand As to the source of income and
achievements on ―prelims midterms and ―finals are not significantly correlated This means
that the achievements of business statistics classes on the said grading periods are independent of
their source of income In contrast source of income and midterm grades are significantly
correlated This means that the achievements on the midterms have strong correlation to source
of income
With regards to socioeconomic status and achievements in Business Statistics of the
students on ―prelims and ―midterms are not significantly correlated This means that
socioeconomic status has neither direct nor inverse correlation with the prelim and midterm
grades of the students in Business Statistics In contrast socioeconomic status and final grades
have significant positive correlation The impact of socio economic status to the final grades has
something to do with the expectation of the students that they will not be able to continue their
studies or they will repeat the course if in case they will not do their best to fulfill the
requirements of the course In the fulfillment of the requirements of the course the income
which is a variable in the socioeconomic status is very much important Therefore socio-
economic status have significantly positive correlation to final grades
Correlation Analysis on Achievements and Academic Profile As shown on Table 24
course and achievements on ―prelims ―midterms ―finals are significantly correlated at 05
level of significance This means that the studentslsquo achievements in business statistics class on
the said grading periods are dependent of their course
As shown further on Table 24 studentslsquo academic achievement and achievements in
business statistics class on ―prelims ―midterms ―finals are significantly correlated at 05
level of significance This means that the achievements on the said grading periods are
dependent on their academic achievement Those students who are deanlsquos lister or academic
scholar (academic achievement) performed better than those who are not academic scholar
Academic scholars performed better and achieved more because of their abilities which made
them superior It is therefore implied that if the students are academic scholars they will have a
high grade on the said grading period The students who are academically achievers are expected
to perform better that those who are not High grade means expected achievement This finding
of this study concurs with the study of Green (2009) students who had a better grasp of the
material covered (earned higher grades) in their prerequisite math courses regardless of which
sequence they took and of course who had a higher (GPAs had greater probabilities of earning
better grades in the Business Statistics course The Pygmalion effect was observed in the
findings of this study on the correlation of achievement to the studentslsquo academic achievement
Table 24
Correlation Analysis on Achievements and Personal and academic Profile
26
Grading
Period
Gender Source of Income Socioeconomic
Status
Course Academic
Achievement
Coefficient
of
correlation
Sig
Coefficient
of
correlation
Sig
Coefficient
of
correlation
Sig
Coefficient
of
correlation
Sig
Coefficient
of
correlation
Sig
Prelims 056 545 420 264 056 541 565 000 679 000
Midterms 101 268 513 023 072 434 602 000 648 001
Finals 077 402 476 071 193 034 623 000 875 000
Correlation Analysis on Achievements and Grades in Algebra Math of Investment As
shown on table 25 achievements of business statistics classes on ―prelims ―midterms ―finals
and grades in algebra and math of investment are significantly correlated at 05 level of
significance This means that the subjectslsquo achievements in business statistics class on the said
grading periods have direct correlation with the grades in Algebra and Math of investment It
could be said that when the subjectslsquo grade in Algebra and Math of investment is higher than
their expectations their achievement is high It shows that students with a high grade in their
previous Math courses have the same expectations with their grade in Business Statistics to be
high The students have self-prophesized that they will perform or attain success in Business
Statistics and this finding concurs with the findings of Green et al (2009) that students who took
the more rigorous math course prior to taking the Business Statistics course are among the better
students They further argued that prerequisite math course sequences that contain more credit
hours more rigorous coverage and more emphasis on calculus substantially increase the
probabilities that a student will earn better grades and reduce the possibilities of earning a
passing grade of 75 in Business Statistics
Table 25
Correlation Analysis on Achievements and Grades in Algebra Math of Investment
Grading Periods Grade in Algebra Grade in Math of Investment
Coefficient of correlation Sig Coefficient of correlation Sig
Prelims 570 000 613 000
Midterms 621 000 662 000
Finals 651 000 669 000
Conclusions and Recommendations
The finding of this study to some extent is in parallel with the study of Eccles (as cited in
Achoui 2004) that adolescentslsquo beliefs about their Math competence and expectancies for
success in Math most strongly predict their subsequent Math grades even when the effects of
their previous grades are controlled for Studentslsquo valuing of mathematics most strongly predicts
their intentions to continue taking mathematics courses and their actual decisions to enroll in
advance math These findings emphasize the need to understand the influence of both
expectancies and values on individuallsquos achievement behavior In this study it was found out
that impressions and expectations of the students in Business Statistics have no definite self-
fulfilling prophecy to their achievements maybe because of its limitation to include the teacherslsquo
competence the classroom environment and the materials used in the class
The data reveals no salient explanation for the professor-student impression effect
suggesting that there may be more subtle explanations for the correlations There was no theory
that includes the role model effect which submits that students may be inspired by instructors of
27
the same gender to perform better in courses or the Pygmalion effect which suggests that some
students may perform better than others simply because they are expected to by their instructors
(the expectations may be conveyed either overtly or subconsciously) However both of these
effects are extremely difficult to document it is recommended that this study be replicated to
verify the initial findings and to further expound the scope of the study
The studentslsquo achievement observed in the study raises some interesting pedagogical and
institutional issues Given the sizes of the estimates reported in this study the Pygmalion effect
or self fulfilling prophecy have an impact in a way on the relative performance of students
enrolled in Business Statistics in a way that the professor may not realized This finding was in
parallel with the findings of Jamieson et al (1989) that in real classroom studentslsquo expectation
can have a meaningful impact on their own behaviour and performance This study only focuses
on the studentslsquo impressions and expectations and achievement in Business Statistics whom the
author handled It is therefore recommended that conceptual replication of this study be
necessary to explore the prevalence of the phenomenon among students of differing ages
genders and abilities among different instructors and professors at different time of the year with
different and less artificial means of inducing expectancies and with different instructional
subject matters in Business disciplines It is also important to examine teaching and learning
statistics across these different fields to see if any trends or patterns can be consistently observed
In addition to institution-level considerations the results of this study suggest that
departments may wish to consider how student and professorlsquos impression and expectancy
interact to influence the learning environment Departments could pay special attention to the
course structure and skills they value when designing courses and grading schemes
Professorsinstructors themselves may also seek to more carefully consider the skills rewarded in
the courses Further while the author cannot make any general claims based on data anecdotal
evidence in the Business statistics literature suggests that professors may indeed choose methods
of presentation stories and examples that are potentially attractive to their students
Ultimately however this study only evidences the studentslsquo impression expectancy and
achievement using the Pygmalion effect or the self fulfilling prophecy and does not identify the
root causes of student perception to professors Nor does it comment on the likely outcomes of
the knowledge and skills and teaching style of the professor or the knowledge and skills and
learning style of the students Instead the results of the study suggest that there is a Pygmalion
effect or self prophecy effect on studentslsquo impression and expectation that influences them to
achieve academic success It is therefore necessary for the students and professors to know why
it would be beneficial to better understand why this interaction occurs It is suggested that this
may be a fruitful line for future inquiry
References
Achoui M (2004) Family Impact on Studentslsquo Motivation 1 Published in the Second
International Conference on Administrative Sciences Proceedings Retrieved from
facultykfupmedusaMGMmustafaidr_mustapha_achouifiles
Brooks J and Brooks as cited in httpwwwndt-edorgTeachingResources
ClassroomTipsConstructivist20_Learninghtm
28
Campbell Steven V Baronina Tatyana Reider Barbara (2003) Using Expectancy Theory to
Assess Group-Level Differences in Student Motivation A Replication in the Russian Far
East In Issues in Accounting Education Vol 18 2003 Retrieved from
httpwwwquestiacomgoogleScholarqstdocId=5001948568
Collis J and Hussey R (2009) Business Research A Practical Guide to Graduateand
Undergraduate Students (3rd
Edition Palgrave Macmillan in the UK
Grasso B (2007) The Pygmalion Effect Brian Mackenzies Successful Coaching (ISSN 1745-
7513) Issue 47 httpwwwbrianmaccoukarticlesscni47a1htm
Green J Stone C Zegeye Aand Charles T (2009) How Much Math Do Students Need to
Succeed in Business and Economics Statistics An ordered Probit Analysis Journal of
Statistics Education Vol 17 (3) 2009
Jamieson D et al (1987) Pygmalion Revisited New Evidence for student Expectancy Effects
in the Classroom Journal of Educational Psychology Vol 79(4) Dece 19878 461-466
from httppsycnetapaorgindexcfmfa=buyoptionToBuyampid=1988-21668-
001ampCFID=5370119ampCFTOKEN+74654262
Kuennen Eric W et al (2007) Student and Professor Gender Effects in Introductory Business
Statistics Journal of Statistics Education Volume 15 Number 3 (2007)
wwwamstatorgpublicationsjsev15n3kuennenhtml
n _a (2011) Filipino Beliefs Contradictions Values In Definitely Filipino The Bold for Online
Filipinos Retrieved from at httpdefinitelyfilipinocomblog20110417filipino-beliefs-
contradictions-values)
na (2011) Teaching with the Constructivist Learning Theory Retrieved from httpwwwndt-
edorgTeachingResourcesClassroomTipsConstructivist20_Learninghtm
n_a (2011) Family Dictionary of Education Terms Second Edition 2010 - 2011
Office of the Education Ombudsman Governorlsquos Office State of Washington
1-866-256-2597 wwwwaparentslearnorg
Philippines Commission on Higher Education (2006) CHED CMO 39 2006 Business Statistics
is a course known as Math 4 in the curriculum of Bachelor of Science in Business
Administration majors in Marketing Management Financial Management and Human
Resources Development Management
Philippines Commission on Higher Education (2007) CHED CMO 3 series 2007 Business
statistics is mandated as the last Math subject same in the curriculum of Bachelor of
Science in Accountancy
Ragos S (2007) Impact of Internet Cafeacute Industry in Pangasinan Basis for a Socio-economic
Model (unpublished dissertation) Virgen Milagrosa University Foundation (VMUF)San
Carlos City Pangasinan
Robins S and Judge T (2008) Essentials of Organizational Behavior Pearson Education Inc
Rochelle C and Dotterweich D (2007) Student Success In Business Statistics Journal of
Economics and Finance Education Vol 6 (1) Summer 2007
Sarrazin et al (2002) The influence of teacher expectation on student achievement in physical
education classes Pygmalion revisited European Journal of Social Psychology Vol 32
591-607 Retrieved from httponlineliubrarywileycomdoi101002ejsp109abstract
Sartain A (1945) Relation of Marks in College courses to the interestingness value and
difficulty of the courses Journal of Education Psychology Vol 36 (9) Retrieved from
httpwwwsciencedirectcomscience_ob=articleURLamp_udi=B6WYD-4NV6PVD-
29
4amp_user=10amp_coverDate=12311945amp-rdoc=1amp_fmt=highamp-
orig=searchamp_origin=searchamp_sort=damp_docanchor=ampview=camp_searchStrtld=15720190
86amp-rerunOrigin=scholargoogleamp_acct+C000050221amp_version+1amp-urlVersion=0amp-
userid=10ampmd5=822faa9d718b43ef192664ccf081ce1ampsearchtype=a
Schiefele U (1991) Interest learning and Motivation Educational Psychologist 26 (3 amp4)
299-323 Copyright 1991 Lawrence Erlbaum Associates Inc
Schugurensky Daniel (1968)History of Education Rosenthal and Jacobson publish Pygmalion
in the Classroom httpfcisoiseutorontoca~daniel_schugurenskyassignment1
1968rosenjacobhtml
teacherstoolboxcom (2011) The Expectancy-value Theory of Motivation
httpwwwcoukT_Expectancy-valuehtml
youlki22 A learners diary (2011) What is Pygmalion Effect and How Teachers Can Use It to
Achieve Better Performance Among Students Retrieved June 2011
httpwwwyousaytoocomwhat-is-pygmalion-effect-and-how-teachers-can-use-it-to-
achieve-better-948608
Welzel M( n_d) A study on factors determining the difficulty and interestingness of physics
problems PS4-B-paper4 Institute of Physics Education University of Bremen
Germany wwwipnuni-kieldeprojekteeserabook104-welpdf
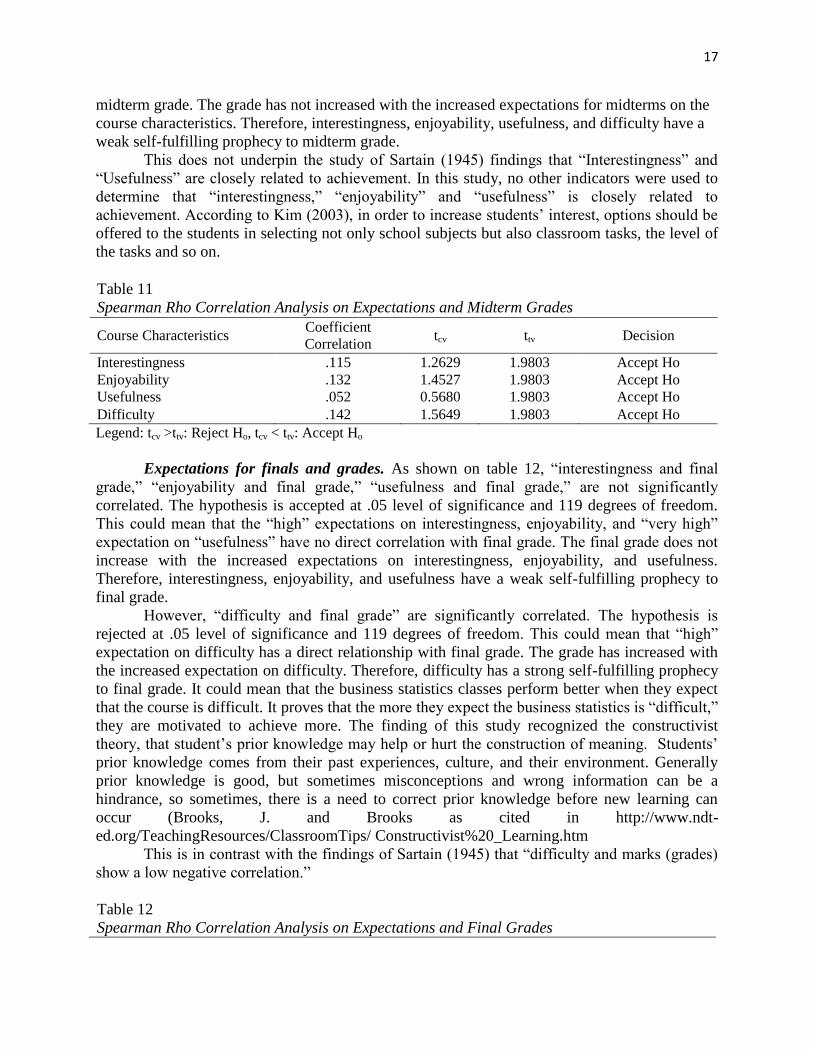
Copyright © 2022 FDOKUMEN