Exploring the supervision of gifted students in open distance e ...
Upload
khangminh22Category
view
1download
0
Digital Commons @ George Fox University
Doctor of Psychology (PsyD) Theses and Dissertations
1-1-2004
Performance of Intellectually Gifted Children onThree Measures of Attention Deficit HyperactivityDisorderKent S. RosengrenGeorge Fox University, [email protected]
This research is a product of the Doctor of Psychology (PsyD) program at George Fox University. Find outmore about the program.
This Paper is brought to you for free and open access by the Theses and Dissertations at Digital Commons @ George Fox University. It has beenaccepted for inclusion in Doctor of Psychology (PsyD) by an authorized administrator of Digital Commons @ George Fox University.
Recommended CitationRosengren, Kent S., "Performance of Intellectually Gifted Children on Three Measures of Attention Deficit Hyperactivity Disorder"(2004). Doctor of Psychology (PsyD). Paper 151.http://digitalcommons.georgefox.edu/psyd/151
Performance of Intellectually Gifted Children on Three Measures of Attention Deficit
Hyperactivity Disorder
by
Kent S. Rosengren
Presented to the Faculty of the
Graduate School of Clinical Psychology
George Fox University
in partial fulfillment
of the requirements for the degree of
Doctor of Psychology
in Clinical Psychology
Newberg, Oregon
January 30, 2004

Gifted Children ii
Performance of Intellectually Gifted Children on Three Measures of Attention Deficit
Hyperactivity Disorder
by
Kent S. Rosengren
has been approved
at the
Graduate School of Clinical Psychology
George Fox University
as a Dissertation for the Psy.D. degree
, Ph.D. , ABPP, Chair
Rodger Bufford, Ph.D.
·�� MM"r QL fu, Margi Macy, Ph.D.
Date:----------

Gifted Children iii
Performance of Intellectually Gifted Children on Three Measures of Attention Deficit
Hyperactivity Disorder
Kent S. Rosengren
Graduate School of Clinical Psychology
George Fox University
Newberg, Oregon
Abstract
While there is a growing awareness of the co-occurrence of giftedness and
Attention Deficit Hyperactivity Disorder (ADHD), little is known about the clinical
presentation of ADHD in intellectually gifted children. Current diagnostic decisions with
this subpopulation are made employing procedures and norms developed using a non
exceptional population. However, it is unknown whether this common practice is
appropriate. This study explored how intellectually gifted children perform on three
commonly used measures of ADHD, specifically: (a) the Test of Variables of Attention
(TOVA); (b) the Conners' Teacher Rating Scale, Revised - Long Form (CTS); and (c)
the Conners' Parent Rating Scale, Revised - Long Form (CPS).

Gifted Children iv
Children who met traditional criteria for giftedness (N=90) were obtained from
nearby public schools. Each was administered the TOV A and their parents and teachers
completed a Conners' rating scale. The performance of these children was compared to
normative data.
It was hypothesized that: (a) gifted children would perform significantly better on
the TOV A than normative children, and (b) no differences would be found between the
performance of gifted children and the normative sample on both the CTS and CPS.
The hypotheses were partially supported by the findings. Gifted children
performed better on three of the five TOV A variables, but only for the younger children
in the sample. In addition, no evidence of differences in scores was found between the
gifted children and the normative sample on the CTS and CPS.
The findings do, however, address the underlying clinical question regarding the
appropriateness of using the normative data provided for the TOV A, CTS and CPS to
assess ADHD in intellectually gifted children. Ultimately, the performance differences
found for gifted children on the TOVA suggest that alternate TOVA norms are likely
needed for younger ages. A rationale for adjusting the TOVA norms is proposed, and a
few simple "rules of thumb" for transforming the age-based are summarized in an
Adjustment Matrix. The differences on the CTS and CPS were found mostly for
variables unrelated to ADHD and suggest that the normative data for the Conners' Scales
can be used when assessing ADHD in gifted children.

Gifted Children v
Acknowledgments
I would like to thank Dr. Wayne Adams for his support, encouragement, and
direction during each phase of this dissertation. I thank Abby and Caleb for their
patience when their Daddy had to work and couldn't play, and Joshua for providing a
deadline to encourage me to finish. I appreciate my parents for their love and support,
and my mother and father-in-law for letting my family stay for extended visits so that I
could have quiet weeks to work. Lastly, I give special thanks to my wife, Jenny, for her
patience during this intense, and occasionally all-consuming, project, and for her
unwavering faith in me as a person.
Gifted Children vi
Table of Contents
Approval Page . . . . . . . . . . . . . . . . . . . . . . . . . . . . . . . . . . . . . . . . . . . . . . . . . . . . . . . . . . . . . . . . . . . . . . . . . . . . .. u
Abstract . . . . . . . . . . . . . . . . . . . . . . . . . . . . . . . . . . . . . . . . . . . . . . . . . . . . . . . . . . . . . . . . . . . . . . . . . . . . . . . . . . . . iii
Acknowledgements v
Table of Contents . . . . . . . . . . . . . . . . . . . . . . . . . . . . . . . . . . . . . . . . . . . . . . . . . . . . . . . . . . . . . . . . . . . . . . . . . . . vi
Table of Tables viii
Table of Figures . . . . . . . . . . . . . . . . . . . . . . . . . . . . . . . . . . . . . . . . . . . . . . . . . . . . . . . . . . . . . . . . . . . . . . . . . .. x
Chapter 1 Introduction
Attention Deficit Hyperactivity Disorder
Assessment and Diagnosis of ADHD
Rating scales
1
3
5
7
Continuous performance tests . . . . . . . . . . . . . . . . . . . . . . . . . . . . . . . . . . . . . . . . . . . . . 9
Gifted Children
Gifted I ADHD Children
Proposed Study and Hypotheses . . . . . . . . . . . . . . . . . . . . . . . . . . . . . . . . . . . . . . . . . . . . . . . . .
Chapter 2 Method . . . . . . . . . . . . . . . . . . . . . . . . . . . . . . . . . . . . . . . . . . . . . . . . . . . . . . . . . . . . . . . . . . . . . . . .
Subjects
Instruments
Test of Variables of Attention (TOV A)
Conners' Rating Scales - Revised . . . . . . . . . . . . . . . . . . . . . . . . . . . . . . . . . . . . . . . . . . .
1 2
1 4
1 5
20
20
2 1
2 1
23
Conners' Teacher Rating Scale - Revised: Long Form (CTS) . . . . . . . . . . . . . 23

Gifted Children vii
Conners' Parent Rating Scale - Revised: Long Form (CPS) . . . . . . . . . . . . . . . 24
Procedure 24
Data Analysis . . . . . . . . . . . . . . . . . . . . . . . . . . . . . . . . . . . . . . . . . . . . . . . . . . . . . . . . . . . . . . . . . . . . . . . 26
Data transformation . . . . . . . . . . . . . . . . . . . . . . . . . . . . . . . . . . . . . . . . . . . . . . . . . . . . . . . . . . . 26
Statistical analysis . . . . . . . . . . . . . . . . . . . . . . . . . . . . . . . . . . . . . . . . . . . . . . . . . . . . . . . . . . . 26
Chapter 3 Results
TOVA
28
28
CTS . . . . . . . . . . . . . . . . . . . . . . . . . . . . . . . . . . . . . . . . . . . . . . . . . . . . . . . . . . . . . . . . . . . . . . . . . 47
CPS . . . . . . . . . . . . . . . . . . . . . . . . . . . . . . . . . . . . . . . . . . . . . . . . . . . . . . . . . . . . . . . . . . . . . . . . . 59
Chapter 4 Discussion . . . . . . . . . . . . . . . . . . . . . . . . . . . . . . . . . . . . . . . . . . . . . . . . . . . . . . . . . . . . . . . . . . . . . . 7 1
Clinical Implications
Previous Research
72
74
Limitations . . . . . . . . . . . . . . . . . . . . . . . . . . . . . . . . . . . . . . . . . . . . . . . . . . . . . . . . . . . . . . . . . . . . . . . . . 76
Future Research . . . . . . . . . . . . . . . . . . . . . . . . . . . . . . . . . . . . . . . . . . . . . . . . . . . . . . . . . . . . . . . . . . . . 77
References
Appendix A Letter to Parents I Guardian
79
86
Appendix B TOVA Administration Instructions . . . . . . . . . . . . . . . . . . . . . . . . . . . . . . . . . . . . . . . . 89
Appendix C Demographic Questionnaire
Appendix D Raw Data
Appendix E Curriculum Vitae
94
96
1 19

Gifted Children viii
Table of Tables
Table 1 DSM-IV Diagnostic Criteria for ADHD . . . . . . . . . . . . . . . . . . . . . . . . . . . . . . . . . . . . 6
Table 2 TOV A Variables, their Definitions and Clinical Meaning . . . . . . . . . . . . . . . 17
Table 3 CTS and CPS Variables . . . . . . . . . . . . . . . . . . . . . . . . . . . . . . . . . . . . . . . . . . . . . . . . . . . . . . . 19
Table 4 Independent Sample t Test Comparisons of Gifted Sample to
Normative Sample on TOVA Variables . . . . . . . . . . . . . . . . . . . . . . . . . . . . . . . . . . . . 29
Table 5 Independent Sample t Test Comparisons by Gender of Gifted Sample
to TOV A Norms . . . . . . . . . . . . . . . . . . . . . . . . . . . . . . . . . . . . . . . . . . . . . . . . . . . . . . . . . . . . . . . . 3 1
Table 6 Independent Sample t Test Comparisons by Age Group of Gifted
Sample to TOV A Norms . . . . . . . . . . . . . . . . . . . . . . . . . . . . . . . . . . . . . . . . . . . . . . . . . . . . . . 32
Table 7 Independent Sample t Test Comparisons, by Gender and Age Group,
of Gifted Sample to TOV A Norms . . . . . . . . . . . . . . . . . . . . . . . . . . . . . . . . . . . . . . . . . . 36
Table 8 Within Sample t-Test by Gender for the Gifted Sample . . . . . . . . . . . . . . . . . . 39
Table 9 Within Sample t-Test by Gender for the Normative Sample . . . . . . . . . . . . . 40
Table 1 0 Independent Sample t-Tests comparing Gifted Sample to Normative
Sample by Age at Yearly Intervals . . . . . . . . . . . . . . . . . . . . . . . . . . . . . . . . . . . . . . . . . . 42
Table 1 1 Independent Sample t Test Comparisons of Gifted Children to Older
Normative Children for Response Time . . . . . . . . . . . . . . . . . . . . . . . . . . . . . . . . . . . . 44
Table 1 2 Independent Sample t Test Comparisons of Gifted Children to Older
Normative Children for Response Time Variability . . . . . . . . . . . . . . . . . . . . . . . 45
Table 1 3 Independent Sample t Test Cbmparisons of Gifted Children to Older
Normative Children for Omission Error Percentage . . . . . . . . . . . . . . . . . . . . . . 46

Gifted Children ix
Table 1 4 Adjustment Matrix, including Cut-Off Ages (yrs) and Age
Adjustments, for Creating TOV A Developmental Norms for use with
Gifted Children . . . . . . . . . . . . . . . . . . . . . . . . . . . . . . . . . . . . . . . . . . . . . . . . . . . . . . . . . . . . . . . . . . 4 7
Table 1 5 Independent Sample t Test Comparisons of Gifted Sample to
Normative Sample on CTS Variables . . . . . . . . . . . . . . . . . . . . . . . . . . . . . . . . . . . . . . 49
Table 1 6 Independent Sample t Test Comparisons by Gender of Gifted Sample
to CTS Norms . . . . . . . . . . . . . . . . . . . . . . . . . . . . . . . . . . . . . . . . . . . . . . . . . . . . . . . . . . . . . . . . . . 5 1
Table 1 7 Independent Sample t Test Comparisons by Age Group of Gifted
Sample to CTS Norms . . . . . . . . . . . . . . . . . . . . . . . . . . . . . . . . . . . . . . . . . . . . . . . . . . . . . . . . . 53
Table 1 8 Independent Sample t Test Comparisons, by Gender and Age Group,
of Gifted Sample to CTS Norms . . . . . . . . . . . . . . . . . . . . . . . . . . . . . . . . . . . . . . . . . . . . . 56
Table 1 9 CPS: Independent Sample t Test Comparisons of Gifted Sample to
Normative Data . . . . . . . . . . . . . . . . . . . . . . . . . . . . . . . . . . . . . . . . . . . . . . . . . . . . . . . . . . . . . . . . . 60
Table 20 CPS: Independent Sample t Test Comparisons by Gender of Gifted
Sample to Normative Data . . . . . . . . . . . . . . . . . . . . . . . . . . . . . . . . . . . . . . . . . . . . . . . . . . . . 62
Table 2 1 CPS: Independent Sample t Test Comparisons by Age Group of
Gifted Sample to Normative Data . . . . . . . . . . . . . . . . . . . . . . . . . . . . . . . . . . . . . . . . . . . . 64
Table 22 CPS: Independent Sample t Test Comparisons, by Gender and Age
Group, of Gifted Sample to Normative Data . . . . . . . . . . . . . . . . . . . . . . . . . . . . . . . 67

Figure 1
Figure 2
Figure 3
Figure 4
Gifted Children x
Table of Figures
TOV A Stimuli . . . . . . . . . . . . . . . . . . . . . . . . . . . . . . . . . . . . . . . . . . . . . . . . . . . . . . . . . . . . . . . 1 1
Floor Effect for Response Time in the TOV A Normative Data . . . . . . 34
Floor Effect for Response Time Variability in the TOVA Normative
Data . . . . . . . . . . . . . . . . . . . . . . . . . . . . . . . . . . . . . . . . . . . . . . . . . . . . . . . . . . . . . . . . . . . . . . . . . . . 34
Floor Effect for Omission Error Percentage in the TOVA Normative
Sample . . . . . . . . . . . . . . . . . . . . . . . . . . . . . . . . . . . . . . . . . . . . . . . . . . . . . . . . . . . . . . . . . . . . . . . . 35

Chapter 1
Introduction
Gifted Children 1
Attention Deficit Hyperactivity Disorder (ADHD) has been the most researched
psychiatric disorder of childhood (Stubbe, 2000). As a consequence, much is known
about this disorder. The overall prevalence of ADHD is estimated to be between 3% and
5% of the pediatric population (American Psychiatric Association, 1994). Gender
differences exist with approximately a 6: 1 ratio of males to females in clinical samples,
and 3 : 1 in non-referred samples (Barkley, 1998; Scahil & Schwab-Stone, 2000). The
larger gender difference in clinical samples is presumed to exist because males are more
likely to be aggressive and antisocial and therefore more likely to be referred for services.
ADHD has been studied in many different special populations, including children
of different ethnicities, socio-economic backgrounds, and having varying comorbidities
including Oppositional Defiant Disorder (ODD), Conduct Disorder (CD), substance
abuse, anxiety disorders, mood disorders, and learning disabilities. However, relatively
little is known about how ADHD is expressed in or affects intellectually gifted children.
A recent review of the literature suggests a growing awareness of the problem, similar to
a trend in the late 1980s when the uniqueness of the gifted I learning disabled child was

Gifted Children 2
first acknowledged (Leroux & Levitt-Perlman, 2000). It is important to study ADHD in
intellectually atypical children because currently diagnostic decisions with these
subpopulations are made employing procedures and norms that were developed using a
non-exceptional population. However, it is unknown whether this common practice is
appropriate. The focus of the investigation that follows is on children with IQ scores in
the upper 2.5% of the population, those commonly labeled as "gifted and talented".
Currently, the recognized standard used to make the diagnosis of ADHD includes
obtaining specific information from multiple sources on the three core features of the
disorder: inattention, hyperactivity, and impulsivity (American Psychiatric Association,
1 994). Most often the information is obtained by standardized questionnaires that
highlight the three core features, and which are completed by a child's teacher(s) and
parents. In addition, a clinician such as a physician or psychologist often observes the
child perform a set of attentionally demanding tasks. The most prevalent and widely
researched task used for this assessment is a continuous performance test (CPT) (Barkley,
1 998). A CPT is a prolonged computerized task that requires the child to attend and
respond when a simple stimulus occurs, and to inhibit responding to irrelevant stimuli.
Analysis of how well the child is able to perform both tasks - responding and inhibiting -
yields measures of the core ADHD features of sustained attention and impulsivity.
As with most empirically based measures, the norms for the most popular ADHD
teacher and parent questionnaires are obtained using stratified sampling of a
representative U.S. population. On the other hand, CPT's do not claim to have norms
that are representative of the general population; their norms are derived from
convenience samples (Riccio, Reynolds, & Lowe, 2001) .

Gifted Children 3
Even if measures for ADHD had acceptable norms, the performance of gifted
children on standardized measures is unknown. In the case of ADHD rating scales, with
their representative normative samples, only 2.5% of the sample would, by definition, be
composed of gifted children. Therefore, the scores obtained from the gifted subsample, if
aberrant, would be undetected because of the modest impact this small number of
participants would have on group averages and standard deviations. In the case of CPTs,
the problem is exacerbated because, at the outset, the norms may not be representative.
It may be that using norms appropriate for the general population could result in
misdiagnosis of gifted children. Therefore, it is important to know how consistent
parent/teacher questionnaire and CPT results are between the general and gifted
populations, and whether any adjustment in those norms is indicated for improved
diagnostic precision. The purpose of this study is to investigate the comparability of the
performance levels of gifted children on commonly used ADHD diagnostic instruments,
specifically popular parent and teacher rating scales as well as a frequently used CPT.
Attention Deficit Hyperactivity Disorder
Symptoms of ADHD include chronic problems within three core domains:
inattention, hyperactivity, and impulsivity (American Psychiatric Association, 1 994).
Attention is a multidimensional construct, and thus "inattention" can stem from
difficulties with initiating attention, selective attention, focusing of attention, sustaining
attention, filtering of attention, distractibility, and response selection (Riccio, et. al. ,
200 1 ; Barkley, 1 998). Hyperactivity is often defined as an "excessive or
developmentally inappropriate level of activity, whether motor or vocal" (Barkley, 1 998,

Gifted Children 4
p. 60). Impulsivity is often associated with the inability to delay gratification or
otherwise inhibit a response (Barkley, 1998).
Problems often associated with childhood ADHD include poor academic
performance, feelings of isolation, social rejection, emotional and family problems,
aggressive behavior, and conflict with authority (Goldman, Genel, Bezman, & Slanetz,
1 998). Long-term outcomes for children with ADHD can include increased risks of
suicide, dropping out of school, substance abuse, divorce, and enduring adjustment
problems. (Goldman et al. , 1998; Barkley, 1998). In addition, children with ADHD have
an increased rate for certain behavior disorders such as Oppositional Defiant Disorder
and Conduct Disorder, as well as an increased risk for affective and mood disorders
(Barkley, 1 991 ) .
The Diagnostic and Statistical Manual of Mental Disorders - Fourth Edition
(DSM-IV; American Psychiatric Association, 1994) provides the most commonly used
system for diagnosing ADHD. The DSM-IV describes three subtypes of the disorder: (a)
predominantly inattentive type, (b) predominantly hyperactive type, and (c) combined
type. In order for a subtype diagnosis of ADHD to be established, a designated group of
symptoms must be verifiable. See Table 1 for these groups of symptoms.
In order to make a diagnosis of ADHD, at least six symptoms in one of the two
domains - inattention or hyperactive/impulsive - must manifest prior to seven years of
age and be present for at least six months. In addition, the symptoms must be
developmentally inappropriate for the child, and there must be clear evidence of
clinically significant impairment in social, occupational, or academic functioning in at
least two different settings (e.g., school, work, or home). Lastly, making the diagnosis

Gifted Children 5
requires that the symptoms are not due to either a general medical condition or the result
of another diagnosable disorder (e.g., mood disorder, anxiety disorder, and Pervasive
Developmental Disorder).
Assessment and Diagnosis of ADHD
There is no definitive "ADHD test" available that makes diagnosing ADHD
precise (Barkley, 1 99 1 ). Current methods for diagnosing ADHD require that the
clinician be familiar with normal development and behavior, and gather meaningful
information from a variety of sources. For most professionals a standard ADHD
assessment will include the use of some or all of the following: medical examination;
clinical interviews with parents, teachers, and the child; clinical observation; parent rating
scales; teacher rating scales; self report rating scales; an objective laboratory assessment
of attention; and, particularly in educational settings, a cognitive/intellectual measure and
an achievement measure (McKinney, Montague, & Hocutt, 1 993; Barkley, 1991) .
While the most thorough evaluation is preferred, financial and time constraints
often necessitate using psychometrically sensitive, yet abbreviated, assessments. One
common, sensitive yet efficient method for obtaining relevant information from people
familiar with a child in a variety of settings is the use of standardized rating scales.
Another efficient method for obtaining precise, objective data on attention and
impulsivity is the use of a CPT.

Gifted Children 6
Table 1
DSM-IV Diagnostic Criteria for ADHD
Inattention Hyperactivity I Impulsivity
1 . Fails to give close attention to work; 1 . Often fidgets with hands, feet; squirms
makes careless mistakes in seat
2. Difficulty sustaining attention during 2. Often leaves seat when sitting is
tasks or play activities expected
3. Does not seem to listen when spoken to 3 . Inappropriately runs and/or climbs
directly excessively
4. Often does not follow through with 4. Often has difficulty playing or engaging
instructions on housework or homework quietly in leisure activities
5. Difficulty with organizing tasks or 5. Often "on the go"; acts as if "driven" by
activities a "motor"
6. Often avoids or dislikes tasks requiring 6. Often talks excessively
sustained mental effort
7. Often loses things necessary for tasks or 7. Often blurts out answer before question
activities is completed
8 . Often easily distracted by extraneous 8 . Often has difficulty awaiting tum
stimuli
9. Often forgetful in daily activities 9. Often interrupts or intrudes on others
Note. DSM-IV =Diagnostic and statistical manual of mental disorders ( 4 ed.); ADHD = Attention
Deficit Hyperactivity Disorder

Gifted Children 7
Rating scales. Rating scales are an integral component in the assessment and
diagnosis of ADHD. It is estimated that ADHD symptoms account for 30% to 50% of
child referrals for mental health services (Stubbe, 2000). Consequently, measures that
provide convenient, inexpensive and time efficient methods to gather rich data, from
people who have known the child for an extended period of time and across a wide
variety of settings, have great appeal.
Two general categories of rating scales have been found useful in the assessment
of ADHD: broad, general scales to assess a wide range of child pathology; and narrow
focused scales specific to the diagnosis of ADHD (Barkley, 1991 ) . Broad-based rating
scales are considered most useful for initial screening for a wide range of pathology,
including ADHD. ADHD-specific rating scales are appropriate when the evaluation is
more focused on ADHD (Barkley, 1 998).
There are several "broad stroke" scales currently available that have excellent
reliability and validity and have been standardized on a representative sample of children
of all ages. Some of the more widely used general scales include (a) the Child Behavior
Checklist (Achenbach, 1 99 1 ), (b) the Behavioral Assessment System for Children
(Reynolds & Kamphaus, 1 992), and (c) the Devereux Scales of Mental Disorders
(Naglierei, LeBuffe, & Pfeiffer, 1994).
Some of the better known narrow-range ADHD rating scales include (a) the
Attention Deficit Hyperactivity Rating Scale - IV (DuPaul, Power, Anastopoulos, &
Reid, 1 998), (b) the Disruptive Behavior Checklist (Barkley & Murphy, 1 998), (c) the
Behavior Assessment System for Children Monitor for ADHD (Kamphaus & Reynolds,
Gifted Children 8
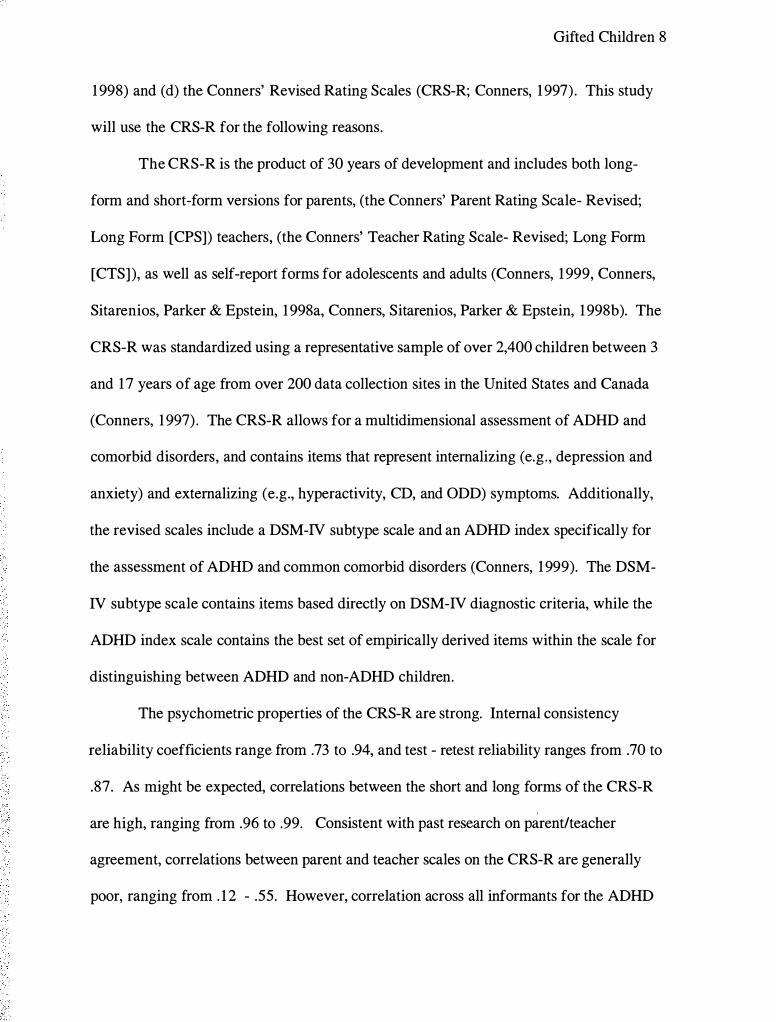
1 998) and (d) the Conners' Revised Rating Scales (CRS-R; Conners, 1 997). This study
will use the CRS-R for the following reasons.
The CRS-R is the product of 30 years of development and includes both long
form and short-form versions for parents, (the Conners' Parent Rating Scale- Revised;
Long Form [CPS]) teachers, (the Conners' Teacher Rating Scale- Revised; Long Form
[CTS]), as well as self-report forms for adolescents and adults (Conners, 1 999, Conners,
Sitarenios, Parker & Epstein, 1 998a, Conners, Sitarenios, Parker & Epstein, 1 998b). The
CRS-R was standardized using a representative sample of over 2,400 children between 3
and 17 years of age from over 200 data collection sites in the United States and Canada
(Conners, 1 997) . The CRS-R allows for a multidimensional assessment of ADHD and
comorbid disorders, and contains items that represent internalizing (e.g., depression and
anxiety) and externalizing (e.g., hyperactivity, CD, and ODD) symptoms. Additionally,
the revised scales include a DSM-IV subtype scale and an ADHD index specifically for
the assessment of ADHD and common comorbid disorders (Conners, 1 999). The DSM
IV subtype scale contains items based directly on DSM-IV diagnostic criteria, while the
ADHD index scale contains the best set of empirically derived items within the scale for
distinguishing between ADHD and non-ADHD children.
The psychometric properties of the CRS-R are strong. Internal consistency
reliability coefficients range from .73 to .94, and test - retest reliability ranges from .70 to
.87. As might be expected, correlations between the short and long forms of the CRS-R
are high, ranging from .96 to .99. Consistent with past research on parent/teacher
agreement, correlations between parent and teacher scales on the CRS-R are generally
poor, ranging from . 1 2 - .55. However, correlation across all informants for the ADHD
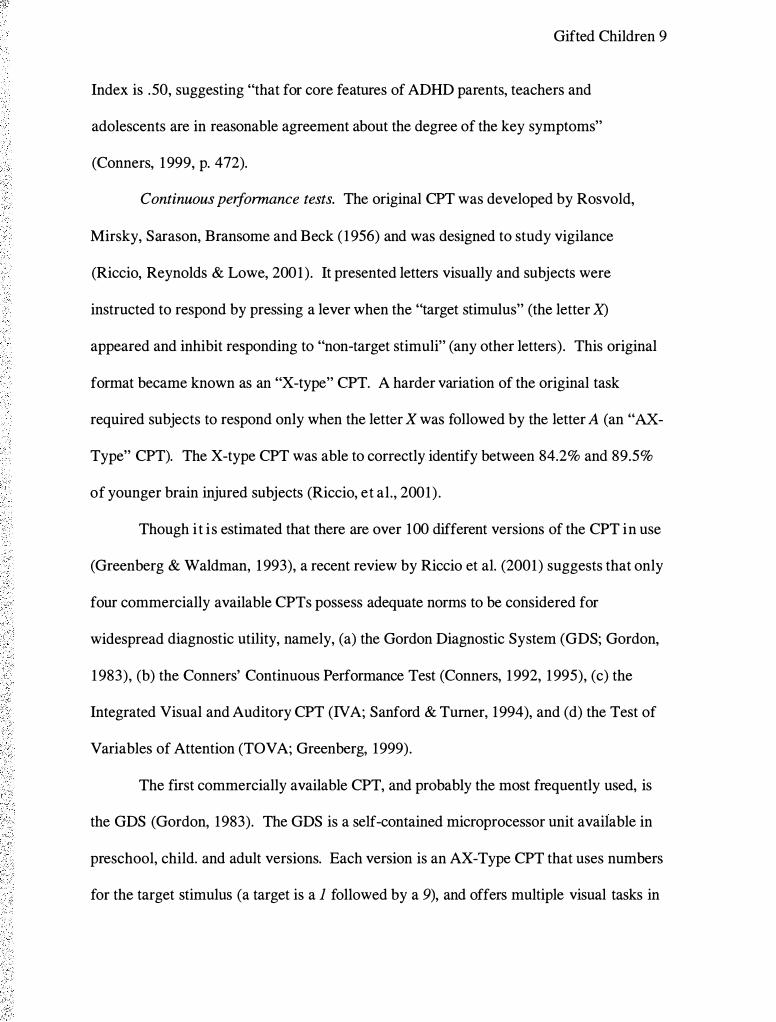
Gifted Children 9
Index is .50, suggesting "that for core features of ADHD parents, teachers and
adolescents are in reasonable agreement about the degree of the key symptoms"
(Conners, 1 999, p. 472).
Continuous performance tests. The original CPT was developed by Rosvold,
Mirsky, Sarason, Bransome and Beck ( 1956) and was designed to study vigilance
(Riccio, Reynolds & Lowe, 2001). It presented letters visually and subjects were
instructed to respond by pressing a lever when the "target stimulus" (the letter X)
appeared and inhibit responding to "non-target stimuli" (any other letters). This original
format became known as an "X-type" CPT. A harder variation of the original task
required subjects to respond only when the letter X was followed by the letter A (an "AX
Type" CPT). The X-type CPT was able to correctly identify between 84.2% and 89.5%
of younger brain injured subjects (Riccio, et al., 2001) .
Though it is estimated that there are over 100 different versions of the CPT in use
(Greenberg & Waldman, 1 993), a recent review by Riccio et al. (2001) suggests that only
four commercially available CPTs possess adequate norms to be considered for
widespread diagnostic utility, namely, (a) the Gordon Diagnostic System (GDS; Gordon,
1 983), (b) the Conners' Continuous Performance Test (Conners, 1 992, 1 995), (c) the
Integrated Visual and Auditory CPT (IV A; Sanford & Turner, 1994), and (d) the Test of
Variables of Attention (TOV A; Greenberg, 1999).
The first commercially available CPT, and probably the most frequently used, is
the GDS (Gordon, 1983). The GDS is a self-contained microprocessor unit available in
preschool, child. and adult versions. Each version is an AX-Type CPT that uses numbers
for the target stimulus (a target is a 1 followed by a 9), and offers multiple visual tasks in

Gifted Children 10
three formats: a delay task, a distractibility task, and the standard vigilance task. The
length of the vigilance tasks vary depending on the version and range from six to nine
minutes. The GDS has been shown to be effective in discriminating between samples
with ADHD and normal samples and is sensitive to medication effects.
The Conners' CPT is a software program that offers a visual task in a "not-X"
format; that is, the subject responds by pressing the space bar for all presented letters
except the letter X. The test lasts for 14 minutes and is divided into six time blocks. The
software enables the user to customize the test by varying the frequency of targets, the
time between stimuli, the length of the test, and the number of trials. This flexibility is
considered a strength of the Conners' CPT, but also a potential liability because no norms
exist for customized variations (Riccio et al. , 2001) .
The IV A is a software program that offers a 1 3 minute long, integrated visual and
auditory task. The IV A uses an X-Type format and presents numbers - 1 is the target and
2 is the non-target - either visually on the screen or audibly via headphones, and the
subject responds by clicking a mouse. The frequency of targets varies at fixed intervals
during the test to create conditions to assess for inattention or impulsivity.
The TOVA is a software program that offers two separate visual and auditory
tasks, each lasting approximately 22 minutes. The TOVA uses an X-type format, but the
stimuli are squares instead of letters. The "target" square has a hole near the top, and the
"non-target" square has a hole near the bottom. Subjects respond by pressing a button
using a hand-held microswitch.
In spite of the growing popularity of using CPTs for diagnostic purposes, some
researchers continue to question the diagnostic utility of CPTs (Barkely, 1998; Trommer,

Gifted Children 1 1
Hoeppner, Lorber, & Armstrong, 1 988). However, Forbes ( 1998) reports that the TOVA
was specifically designed to address the weaknesses found in other CPTs, and, as such,
offers a few clear advantages.
First, the TOY A stimuli are not language based. The other major CPTs use letters
or numbers as stimuli, and this introduces a possible confound with language and/or
numeric processing skills because of the higher rate of comorbid learning disorders in
children with ADHD (Goldman et al. , 1 998). The TOVA avoids this confound by
utilizing shapes for stimuli (see Figure 1) , and is therefore considered by some to be a
purer measure of attention (Leark, Dupuy, Greenberg, Corman, & Kindschi, 1 998).
Nontarget Target
Figure 1 . TOVA stimuli
Secondly, the TOVA uses relatively short stimulus presentations (200
microseconds), short interstimulus intervals (the time between two stimuli), and, with a
test duration of 2 1 .6 minutes, lasts longer than the other CPTs. All three of these
Gifted Children 12
conditions are believed to enhance the utility of a CPT in discriminating between ADHD
and normal children (Forbes, 1998; Corkum, & Siegel, 1993).
A third advantage is that the TOV A records subject responses using a proprietary
hand-held microswitch that is accurate to +1- 1 millisecond (Leark et al. 1 998). This level
of precision is important because differences between groups in the normative sample on
important time-dependent variables such as average response time and response time
variability are quite small, ranging from 60 to 120 milliseconds. In contrast, Greenberg,
Kindschi and Corman (2000) report that the Conners' CPT, which uses a mouse and
computer keyboard as input devices, had an average error of measurement of
approximately +/- 20 milliseconds. Thus, the TOV A software, combined with use of the
microswitch, provides greater measurement accuracy. This study, for the advantages
listed above, will use the TOVA visual CPT.
Gifted Children
Giftedness has been defined in many ways. Some define the gifted as the top
performers on intelligence tests (Terman, 1 925), while others believe the gifted are those
with characteristics that result in creative and productive accomplishments (Renzulli,
1 978). Still others define the gifted as those with high performance capabilities in areas
such as leadership, visual or performing arts, psychomotor abilities, or specific academic
abilities (National Association for Gifted Children: Parent Information, 2002). However,
since most definitions of giftedness include superior intelligence, IQ tests are the most
common methods used to identify gifted individuals (Alvino, McDonnel, & Richert,
1981) . For the purposes of this study, gifted children will be defined as those who

Gifted Children 1 3
qualify for talented and gifted (TAG) program participation by their performance on a
standardized intelligence test.
The literature on the outcome of gifted individuals is mixed but generally
positive. For example, while the outcome for specific gifted individuals depends on the
type of giftedness, the educational fit, and personality characteristics, studies suggest that
gifted people as a group generally tend to be: less depressed and anxious (Garland &
Zigler, 1 999; Neihart, 1 999), healthier, and more coordinated (Sears, 1977 ; Terman &
Oden, 1 959), outgoing, popular (Stanley, 1980), exhibit fewer delinquency and behavior
problems (Garland & Zigler, 1999; Grossberg & Cornell, 1988; Neihart, 1 999), earn
more money, report greater satisfaction with life than the non-gifted (Sears, 1 977;
Terman & Oden, 1 959), and are at least as well-adjusted as average people (Reis &
Renzulli, 2004; Stanley, 1 980). However, Hollingworth ( 1942) suggested that highly
gifted individuals were vulnerable to social isolation and adjustment problems, while
Shaywitz, Holahan, Freudenheim, Flectcher, Makuch and Shaywitz (2001 ) found that
highly gifted boys exhibited behavior problems similar to children with learning
disabilities. Physically, gifted individuals have been found to have significantly faster
scores on measures of reaction time and movement time than individuals of average
intelligence (Carlson & Jensen, 1 982).
Though giftedness is a multifaceted concept, and no individual child is likely to
display all or even most of these characteristics, some general traits of gifted children
include: superior reading abilities, accelerated learning, better independent working
skills, better organization and efficiency, better ability to handle abstraction, and the

Gifted Children 14
ability to sustain attention and concentration for longer periods of time (Clark, 1 988;
Whitmore, 1 985).
Interpersonally, gifted children typically ask more questions; are better at picking
up on non-verbal cues; relate well to parents, teachers, and adults in general; and
frequently display an "I'd rather do it myself' attitude (Maxwell, 1998; Whitmore, 1 985).
Additionally, gifted children are typically more skilled at conceptualizing and
synthesizing information; are more likely to challenge authority; express their own ideas;
openly disagree with peers and adults; tend to be evaluative, skeptical, critical, and quick
to notice inconsistencies (Clark, 1988). Emotionally, gifted children tend to be sensitive,
and are often very aware of their giftedness and how it effects them and others (Baska
( 1989).
Difficulties commonly associated with giftedness can include resistance to
direction, stubbornness, dislike for routine and drill, frustration with inactivity and a lack
of stimulation, critical attitudes of the self and others, hyper-sensitivity to criticism, and a
high need for approval and attention (Whitmore, 1985; Baska, 1989).
Gifted I ADHD children
The diagnosis of ADHD is not precluded by above average intelligence. While
studies have shown that children with ADHD tend to perform somewhat lower on IQ
tests than same aged peers (Barkley, 1998), a recent study by Kaplan, Crawford, Dewey
and Fisher (2000) concluded that the IQs of children with ADHD are normally
distributed; in other words, the "distribution of IQ in children with ADHD probably
represent the entire spectrum from giftedness to mental disability" (p. 426). Additional
literature involving case studies or small subject samples (Flint, 2001; Moon, Zentall,
Gifted Children 1 5
Grskovic, Hall & Stormont, 200 1 ; Zentall, Moon, Hall & Grskovic, 200 1 ; Leroux &
Levitt-Perlman, 2000) indicate a growing awareness of the co-occurrence of ADHD and
giftedness.
Diagnosing ADHD, as noted previously, is a complex task. However, diagnosing
ADHD in a gifted child presents additional challenges because many of the behavioral
symptoms associated with ADHD are intermittently exhibited by gifted children,
including off task activities, hyperactivity, impulsivity, emotional sensitivity, aggression,
and challenging of authority (Webb & Latimer, 1 993 ; Leroux & Levitt-Perlman, 2000).
Because these behaviors may have very different etiologies (e.g., the ADHD child is off
task because he cannot focus, whereas the gifted child is off task because he is bored), it
can be extremely difficult for parents and teachers to distinguish between manifestations
of giftedness and of attention deficits. Leroux and Levitt-Perlman (2000) suggest that in
some cases ADHD may mask giftedness, and in other cases giftedness may mask ADHD.
According to Leroux and Levitt-Perlman, "the difficulty differentiating between
characteristics of giftedness and those of ADHD, and recognizing when they coexist, can
easily lead to inaccurate identification" (p. 172). Additionally, the paucity of research
available on gifted/ AD HD children further suggests the possibility that many of these
children are not being correctly identified (Baum, Olenchak. & Owen, 1 998).
Proposed Study and Hypotheses
This study explored how gifted children perform on procedures commonly used
to diagnose ADHD. Specifically, the following measures were used: a CPT (the TOV A),
a teacher rating form (the CTS), and a parent rating form (the CPS). If the results
obtained from a sample of gifted children are comparable to those obtained from a
Gifted Children 16
normal population, clinicians may use these instruments with greater confidence to assess
ADHD in intellectually gifted children.
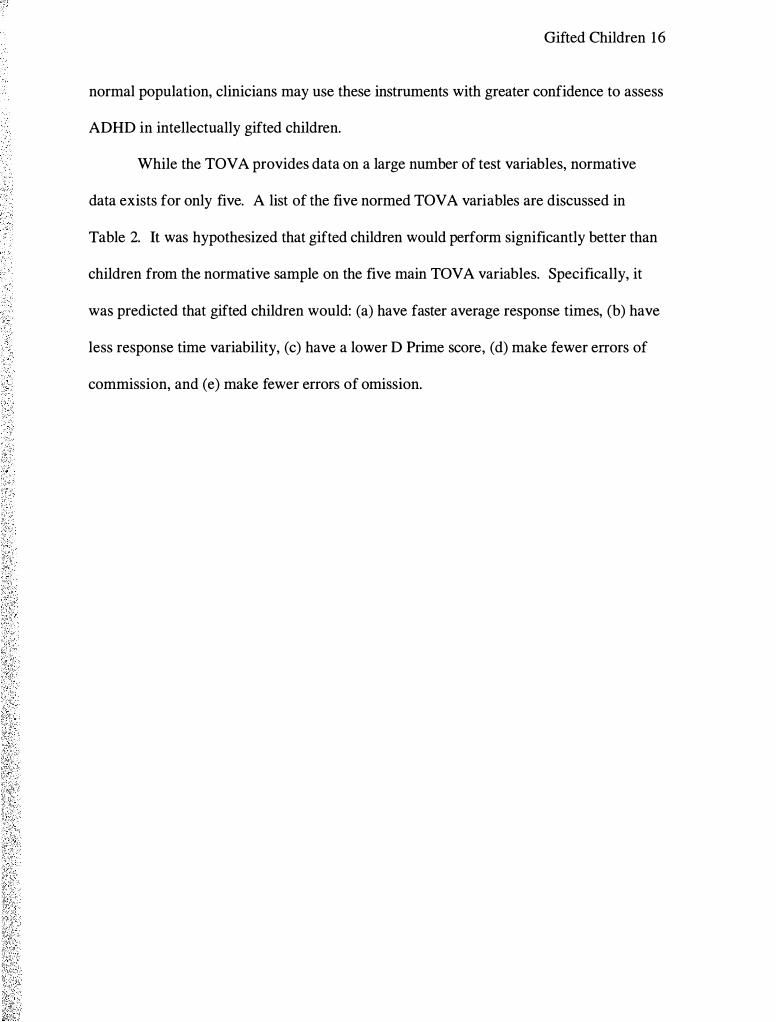
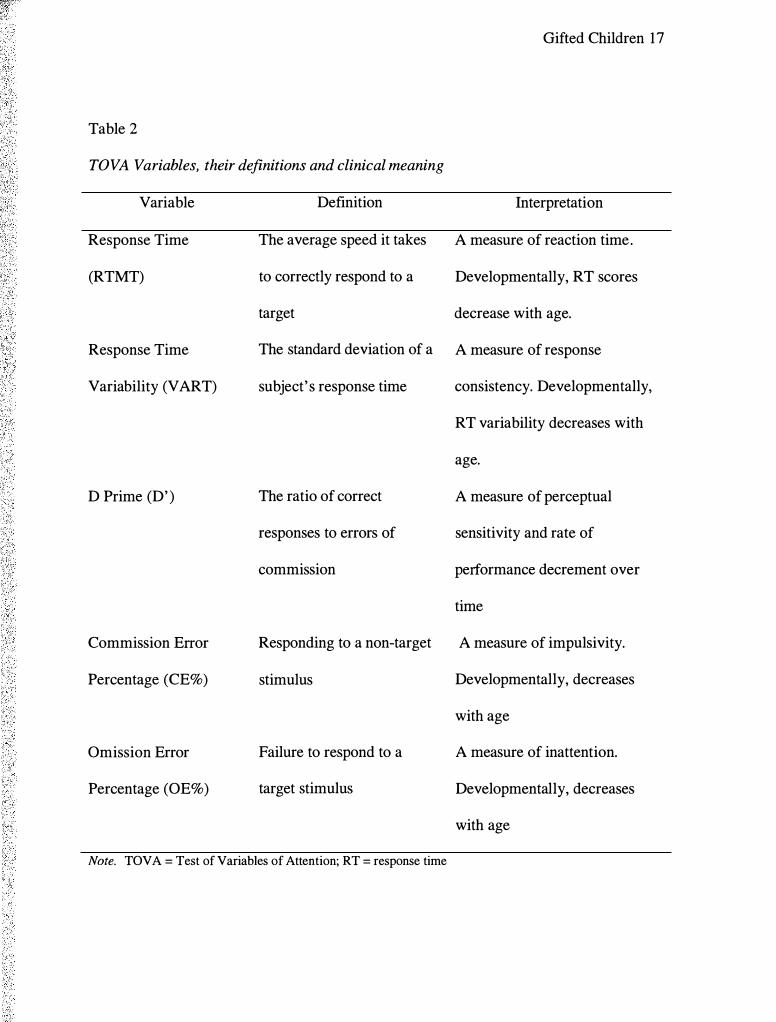
While the TOV A provides data on a large number of test variables, normative
data exists for only five. A list of the five normed TOV A variables are discussed in
Table 2. It was hypothesized that gifted children would perform significantly better than
children from the normative sample on the five main TOVA variables. Specifically, it
was predicted that gifted children would: (a) have faster average response times, (b) have
less response time variability, (c) have a lower D Prime score, (d) make fewer errors of
commission, and (e) make fewer errors of omission.
Gifted Children 17
Table 2
TOVA Variables, their definitions and clinical meaning
Variable
Response Time
(RTMT)
Response Time
Variability (VART)
D Prime (D' )
Commission Error
Percentage (CE%)
Omission Error
Percentage (OE%)
Definition
The average speed it takes
to correctly respond to a
target
Interpretation
A measure of reaction time.
Developmentally, RT scores
decrease with age.
The standard deviation of a A measure of response
subject' s response time consistency. Developmentally,
RT variability decreases with
age.
The ratio of correct
responses to errors of
commission
A measure of perceptual
sensitivity and rate of
performance decrement over
time
Responding to a non-target A measure of impulsivity.
stimulus Developmentally, decreases
with age
Failure to respond to a A measure of inattention.
target stimulus Developmentally, decreases
with age
Note. TOVA = Test of Variables of Attention; RT = response time
Gifted Children 1 8
The main variables for the CTS and CPS are listed in Table 3 . It was
hypothesized that there would be no evidence of differences between the performance of
gifted children and those in the normative sample on these rating scale variables because
research suggests that behavioral outcomes for gifted individuals are generally positive
(Sears, 1 977; Terman & Oden, 1959; Garland & Zigler, 1999; Grossberg & Cornell,
1 988; Neihart, 1 999) . In addition, Gallucci, Middleton, and Kilne ( 1 999) and Garland
and Zigler ( 1 999) found no evidence that scores for gifted children on the Child Behavior
Checklist, a "broad stroke" behavior rating scale, were significantly different from scores
for the normative sample. Since the CTS and CPS are designed to assess problem areas -
as opposed to areas of strength - at home and in the classroom, there is little reason to
assume that gifted children will exhibit increased incidence of internalizing or
externalizing maladaptive behaviors. In fact, it is reasonable to assume that gifted
children may score lower (better) in problem behaviors than the normative sample on
both rating scales.

Gifted Children 1 9
Table 3
CTS and CPS Variables
Parent Rating Scale Teacher Rating Scale
1 . Oppositional 1 . Oppositional
2. Cognitive Problems I Inattention 2. Cognitive Problems I Inattention
3. Hyperactivity 3. Hyperactivity
4. Anxious - Shy 4. Anxious - Shy
5. Perfectionism 5. Perfectionism
6. Social 6. Social
7. Psychosomatic 7. ADHD Index
8. ADHD Index 8. CGI Restless - Impulsive
9. CGI Restless - Impulsive 9. CGI Emotional - Lability
1 0. CGI Emotional - Lability 1 0. CGI Total
1 1 . CGI Total 1 1 . DSM - IV Inattention
1 2. DSM - IV Inattention 12. DSM - IV Hyperactivity
1 3 . DSM - IV Hyperactivity 13 . DSM - IV Total
14. DSM - IV Total
Note: CGI = Conners' Global Index; CTS = Conners' Teacher Scale; CPS = Conners' Parent Scale; ADHD
= attention deficit hyperactivity disorder; DSM-IV = Diagnostic and statistical manual of mental disorders
(4th ed.)

Subjects
Chapter 2
Method
Gifted Children 20
Participants in the study included 90 children, 59 boys and 3 1 girls, between five
and eleven years of age (M= 9.3 years, SD = 1 .4). Each child was identified and enrolled
in a Talented and Gifted (TAG) program within an area school; 1 35 parent permission
forms were initially sent to potential participants and 96 parents gave their permission,
resulting in a participation rate of 7 1 %. One parent subsequently changed his mind and
withdrew his child from the study.
In order to substantiate that participants met the traditional minimum IQ of 1 25
required for participation in this study, IQ test scores were obtained from school district
records. The IQ scores for one child could not be located, and he was excluded from the
study. Furthermore, it was found that seven subjects had IQ scores below 1 20. In an
effort to retain as many participants as possible, subjects were divided by IQ into four
groups, and the group with the lowest IQ scores was compared to the group with the
highest IQ scores. Since no significant differences were found between the high IQ and
low IQ groups on any study variable, the minimum IQ for participation was lowered to
Gifted Children 2 1
1 20. Two volunteers who had IQ scores below 120 were excluded. Two volunteers were
also excluded because they were currently using the psychoactive medication Ritalin.
Participation in this study was voluntary. The parents or guardians of each
potential participant were sent a letter providing an explanation of the study. The
logistics to obtain parental permission conformed to methods suggest by the school
districts. In order to protect the privacy of potential participants, once school district
consent was obtained the TAG teachers for each individual school were provided the
stamped envelopes containing the study information and consent form. The TAG
teachers themselves addressed the envelopes and placed them in the mail. If the child' s
parent or guardian chose to give consent they were instructed to return the signed consent
form and release of information using the stamped envelope provided for this purpose.
Instruments
Instruments used in this study include the TOVA, CPS, and CTS. Each will be
described in tum.
Test of Variables of Attention (TOVA). The TOVA was selected as the CPT
measure because it offers a unique advantage over alternatives. Most CPTs use letters or
numbers as stimuli, which introduces a confound with language and/or numeric
processing skills . In contrast, the TOVA avoids this potential confound by using shapes
for stimuli. It is therefore considered by some to be a purer measure of attention (Leark,
et al. , 1 998).
Second, the TOV A uses a hand-held microswitch that is accurate to + I - one
millisecond. This allows the TOV A to provide precise normative data across gender and
across age. This level of precision is important because age and gender differences in
Gifted Children 22
average response time and response time variability in the normal population are usually
quite small, ranging from 60 to 1 20 milliseconds. To illustrate this point, Greenberg, et
al. , (2000) report that the Conners' CPT has measurement precision of approximately +1-
20 milliseconds using a mouse and keyboard as input devices. Thus, the TOV A software
and microswitch provide greater accuracy.
In addition, the TOV A uses relatively short stimulus presentations (200
microseconds), short inter-stimulus intervals (the time between two stimuli) and, with a
test duration of 2 1 .6 minutes, lasts longer than other CPTs. All three of these conditions
are believed to enhance the utility of a CPT in discriminating between ADHD and normal
children (Forbes, 1 998).
During the first half of the test, the target stimulus is presented at a ratio of one
target to 3.5 non-targets. This "stimulus infrequent" condition is designed to tap
inattention as measured by errors of omission. Conversely, during the second half of the
test the ratio of targets to non-targets is 3 .5: 1 , thereby creating a "stimulus frequent"
condition that taps impulsivity as measured by errors of commission. The TOV A
measures attention and impulse control using the following five variables: (a) Response
Time, (b) Response Time Variability, (c) D prime score, (d) Errors of Commission, and
(e) Errors of Omission.
Psychometric characteristics of the TOV A are provided in the test manual.
Pearson coefficients (r) were computed for reliability for all TOV A variables across both
the stimulus infrequent and stimulus frequent conditions. Test-retest reliability ranged
from .77 to .93 in subjects with a mean age of 8.3 years (Greenberg, et al. , 2000).

Gifted Children 23
According to the TOVA Professional Manual, validity data for the TOVA
consists of sensitivity and specificity data. Sensitivity refers to the TOV A' s ability to
correctly identify true ADHD subjects, whereas specificity refers to the test' s ability to
correctly distinguish non ADHD subjects from those with ADHD. Recommended cutoff
scores yielded a sensitivity rate of .80 and a specificity rate of .80, both acceptable levels
for these measures (Leark, et. al., 1 998).
Conners ' Rating Scales- Revised. This study used the CRS-R for two reasons.
First, it is one of the most commonly used rating scales currently on the market. Second,
the 1 997 revision of the scale added two separate but related scales for the assessment of
ADHD, one composed of items reflecting DSM-IV criteria for diagnosing ADHD and the
other composed of items from the original Conners' ADHD Index.
Conners ' Teacher Rating Scale - Revised: Long Farm ( CTS ). The CTS is
comprised of 59 items that are used to generate the following subscales: (a) Oppositional,
(b) Cognitive Problems I Inattention, (c), Hyperactivity, (d) Anxious-Shy, (e)
Perfectionism, (f) Social Problems, (g) ADHD Index, (h) Conners' Global Index -
Restless I Impulsive, (i) Conners' Global Index - Emotional Lability, (j) Conners' Global
Index - Total, (k) DSM-IV Symptom Subscales - Inattentive, (1) DSM-IV Symptom
Subscales - Hyperactivity, and (m) DSM-IV Symptom Subscales - Total. The CTS
takes approximately 1 0 minutes to complete.
Psychometric properties for the CTS are strong. Cronbach's alpha coefficients for
the CTS ranged from .77 to .96. Test-retest reliability was obtained from a sample that
completed instruments between six and eight weeks apart, and median reliabilities ranged
from .70 to .87 (Conners, 1 999). Factor analysis of the CTS revealed factors that were

Gifted Children 24
mostly consistent with the factors from the Teacher Scale of the original Conners' Scales.
Convergent validity between the ADHD Indexes on the CPS and CTS was .49, a finding
that is consistent with the literature. Correlations among other scales for parents and
teachers range from . 1 2 to .55. Specificity for the ADHD Index ranged from 77% to 98%,
and sensitivity rates ranged from 9 1 % to 100% (Conners, 1999).
Conners ' Parent Rating Scale- Revised: Long Form (CPS). The CPS is
comprised of 80 items that are used to generate the following subscales: (a) Oppositional,
(b) Cognitive Problems I Inattention, (c), Hyperactivity, (d) Anxious-Shy, (e)
Perfectionism, (f) Social Problems, (g) Psychosomatic, (h) ADHD Index, (i) Conners'
Global Index - Restless I Impulsive, (j) Conners' Global Index - Emotional Lability, (k)
Conners' Global Index - Total, (1) DSM-IV Symptom Subscales - Inattentive, (m)
DSM-IV Symptom Subscales - Hyperactivity, and (n) DSM-IV Symptom Subscales
Total. The CPS takes approximately 10 minutes to complete.
Cronbach's alpha coefficients for the CPS ranged from .857 to .938. Test-retest
reliability was determined from a sample that completed instruments between six and
eight weeks apart, and median reliabilities for all ages ranged from .70 - .87 (Conners,
1 999). Factor analysis of the CPS revealed factors that were mostly consistent with the
factors from the Parent Scale of the original Conners' Scales.
Procedure
Letters of introduction were sent to contacts associated with the gifted programs
of two area schools explaining the proposed study and inviting them to allow their gifted
students to participate in the proposed study. Once district permission was obtained,
Gifted Children 25
consent from parents/guardians for their child's participation and for the release of IQ test
scores was obtained using the methods outlined above.
Once consent was obtained from a parent or guardian of each child, the CPS and
the demographic questionnaire were mailed to the parents or guardian. Included in the
mailing was a page of instructions outlining how the CPS should be completed, a
stamped envelope for returning the completed forms, and both a contact phone number
and e-mail address in case there were questions. In addition, the parents I guardians of
each child were asked to complete a short questionnaire designed to obtain information
about current medication use, as children using psychoactive medication were excluded
from the study. Some demographic information was also requested (see Appendix A).
Each child' s homeroom teacher was provided a CTS and a copy of the permission
from the participants' parents/guardians to complete the form. Included was a page of
instructions outlining how to complete the CTS, a stamped envelope for returning the
completed form and both a contact phone number and e-mail address in case there were
questions.
Prior to each child' s actual participation in the study, the procedure for taking the
TOV A was explained to the child, and with his or her agreement the procedure
commenced. TOV A testing was done individually during normal school hours and on
normal school days. This time frame was used in order to comply with the TOV A
norming procedures. Testing was conducted by three graduate students from the
Graduate School of Clinical Psychology at George Fox University who were trained to
administer the TOVA in a standardized fashion (see Appendix B). Testing was
conducted in a quiet space provided by the respective school. The average TOV A testing

Gifted Children 26
time was approximately 25-30 minutes per participant. The TOVA was administered in
the standardized fashion using a PC laptop computer running Windows 98 in MS-DOS
mode. After the testing was completed, the child was thanked and had the opportunity to
choose a small reward - a gel pen - and promptly returned to class. The children were
informed that they had the right to stop testing and withdraw from the study at any time
and for any reason.
Data Analysis
Data Transfonnation. All data analyses were conducted with Statistical Package
for Social Sciences version 1 1 .0 for Windows. All missing data were treated as missing
data in all analyses. Percentile scores for the Ravens Progressive Matrices test were
converted into the lowest standard score equivalent for purposes of conducting analyses
on IQ scores.
Statistical analysis. The original plan for statistical analysis involved obtaining
randomly chosen samples from the archival normative data, matched to the gifted sample
for age and gender. Obtaining the matched samples proved to be problematic because the
raw data was unavailable for the TOVA, CTS and CPS. Additional TOVA data sets
were obtained but, upon analysis, were found to differ significantly from the normative
data. Therefore, the gifted sample was instead compared directly to the published
normative data associated with the three instruments. Independent sample t tests were
conducted comparing the performance of the gifted sample on the TOV A, CTS and CPS
to the respective archival normative data at four levels: (a) by sample, (b) by gender, (c)
by age group, and (d) by gender and age group. Group pooled means and standard
deviations were calculated as necessary for the normative data. Effect sizes were

Gifted Children 27
calculated for significant differences using Cohen's d (Cohen, 1998). To reduce the
probability that a significant difference would be found by chance due to multiple t tests,
a Bonferroni partial correction for related measures was applied to all analyses. To
explore the potential clinical utility of adjusting the TOV A norms to create
developmental norms for use with gifted children, independent sample t tests were
conducted comparing gifted children to older normative children.

Chapter 3
Results
Gifted Children 28
The ultimate purpose of this investigation was to determine whether professionals
using the TOVA, CTS or CPS to assess ADHD in children with IQs above 1 25 could
base clinical decisions on each instrument's norms obtained from a "normal sample" to
address this question. Several domains and variables were analyzed and are reported for
each instrument separately.
TOVA
First, it was hypothesized that gifted children would perform better on the TOV A
than the norm group. The means and standard deviations of the gifted and talented
sample and the TOV A norm group are presented in Table 4. Also included in Table 4 are
the results of analyses between these two groups for the five measures obtained from
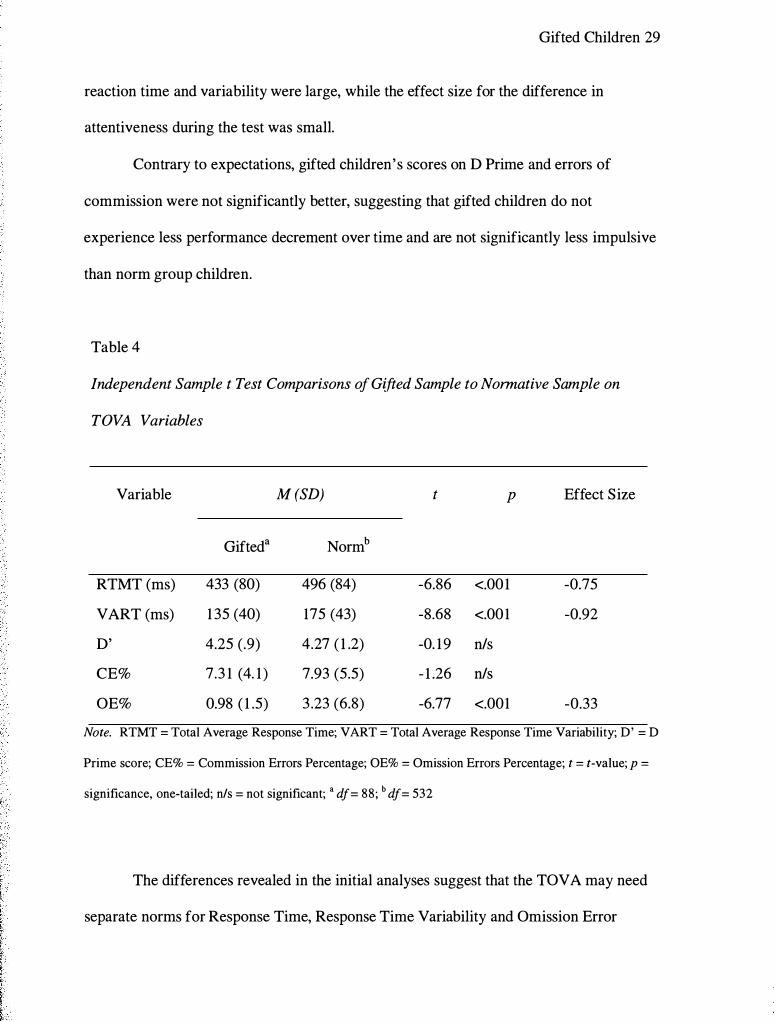
TOV A performance. As expected, gifted children were found to have significantly faster
reaction times, were significantly less variable in their rate of responding throughout the
test, and were, as measured by the percentage of omission errors, significantly more
attentive to target stimuli than non-gifted children. The effect sizes for the differences in
Gifted Children 29
reaction time and variability were large, while the effect size for the difference in
attentiveness during the test was small.
Contrary to expectations, gifted children's scores on D Prime and errors of
commission were not significantly better, suggesting that gifted children do not
experience less performance decrement over time and are not significantly less impulsive
than norm group children.
Table 4
Independent Sample t Test Comparisons of Gifted Sample to Normative Sample on
TOVA Variables
Variable M (SD) t p Effect Size
Gifted a Normb
RTMT (ms) 433 (80) 496 (84) -6.86 <.001 -0.75
VART (ms) 1 35 (40) 175 (43) -8.68 <.001 -0.92
D' 4.25 (.9) 4.27 ( 1 .2) -0. 19 n/s
CE% 7.3 1 (4. 1 ) 7.93 (5.5) - 1 .26 n/s
OE% 0.98 ( 1 .5) 3 .23 (6.8) -6.77 <.001 -0.33
Note. RTMT = Total Average Response Time; VART = Total Average Response Time Variability; D' = D
Prime score; CE% = Commission Errors Percentage; OE% = Omission Errors Percentage; t = t-value; p =
significance, one-tailed; n/s = not significant; • df= 88; b df= 532
The differences revealed in the initial analyses suggest that the TOVA may need
separate norms for Response Time, Response Time Variability and Omission Error
Gifted Children 30
Percentage when used to assess intellectually gifted children. However, to examine
whether these findings remain consistent for both genders, and across the age range
included in this study, further analyses were conducted. Because the literature indicates
that the majority of children diagnosed with ADHD are boys, the differences between
gifted and non-gifted boys were of particular interest.
The results of gender analyses are found in Table 5. Inspection of Table 5 reveals
that the differences found in the original analyses - that gifted children have faster
response times, more consistent response times and are more attentive than non-gifted
children - were also found separately for both gifted boys and gifted girls. The effect
sizes for these differences range from medium for attentiveness to large for response time
and consistency.

Gifted Children 3 1
Table 5
Independent Sample t Test Comparisons by Gender of Gifted Sample to TOVA Norms
Variable Gender M (SD) t p Effect
Size Gifted Norm
RTMT Girls 455 (89) a 5 17 (SOt -3 .66 <.001 -0.78
Boys 422 (73) b 473 (87)d -4.67 <.001 -0.58
VART Girls 1 39 (34) 176 (40) -5.44 <.001 -0.94
Boys 1 34 (42) 173 (46) -5.44 <.001 -0.84
D' Girls 4.33 (.9) 4.48 ( 1 .2) -0.88 n/s
Boys 4.21 (0.9) 4.04 ( 1 .3) 1 . 19 n/s
CE% Girls 6.58 (3 .9) 6.56 (4.4) 0.03 n/s
Boys 7.69 (4.2) 9.36 (6.4) -2.49 n/s
OE% Girls 0.95 ( 1 .8) 2.35 (3 .7) -3.48 .001 -0.42
Boys 0.99 ( 1 .2) 4. 15 (9.0) -5.47 <.001 -0.35
Note. RTMT = Total Average Response Time; VART = Total Average Response Time Variability; D' = D
Prime score; CE% = Commission Errors Percentage; OE% = Omission Errors Percentage; t = t-value; p =
significance, one-tailed; n/s = not significant; • df= 29; b df= 58; c df= 271 ; d df= 261
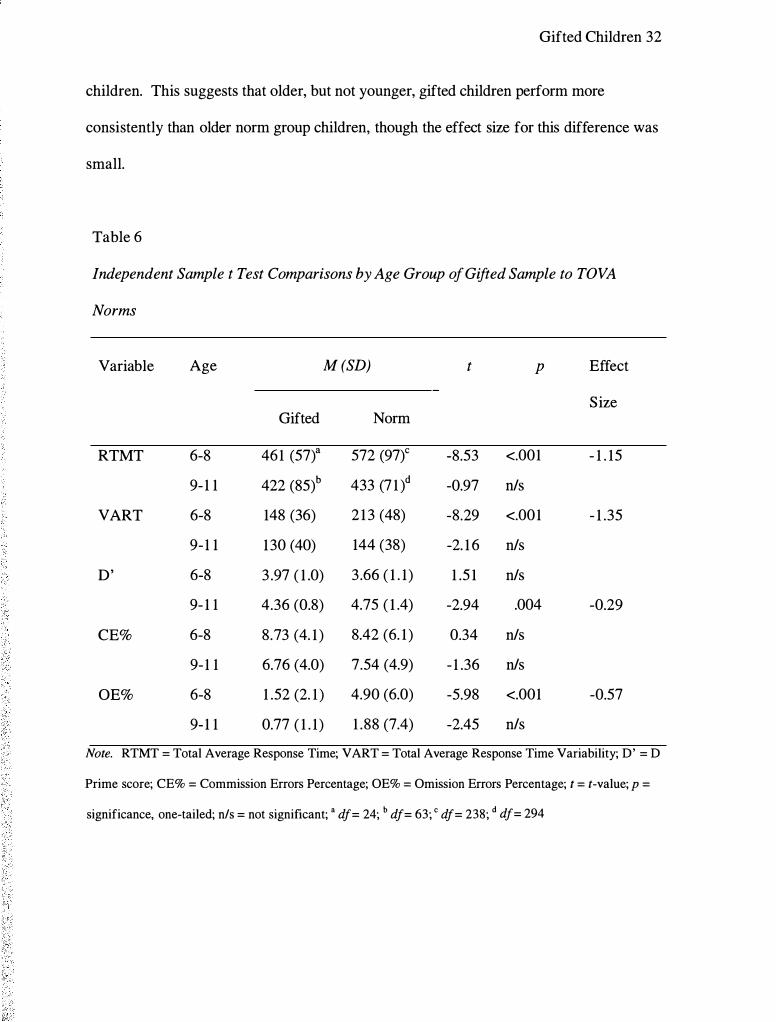
The results of the age group comparison are listed in Table 6. An examination of
Table 6 reveals a distinct change in the pattern of differences found across all age groups
combined. Specifically, only younger gifted children were faster, less variable and less
impulsive than their non-gifted counterparts; these differences did not hold true for older
gifted children. However, the D Prime score was significantly lower for older gifted
Gifted Children 32
children. This suggests that older, but not younger, gifted children perform more
consistently than older norm group children, though the effect size for this difference was
small.
Table 6
Independent Sample t Test Comparisons by Age Group of Gifted Sample to TOVA
Norms
Variable Age M (SD) t p Effect
Size Gifted Norm
RTMT 6-8 461 (57)a 572 (97)c -8.53 <.001 - 1 . 15
9- 1 1 422 (85)b 433 (7 1 )d -0.97 n/s
VART 6-8 148 (36) 2 1 3 (48) -8.29 <.001 - 1 .35
9- 1 1 130 (40) 144 (38) -2. 1 6 n/s
D' 6-8 3 .97 ( 1 .0) 3 .66 ( 1 . 1) 1 .5 1 n/s
9- 1 1 4.36 (0.8) 4.75 ( 1 .4) -2.94 .004 -0.29
CE% 6-8 8.73 (4. 1 ) 8.42 (6. 1 ) 0.34 n/s
9- 1 1 6.76 (4.0) 7.54 (4.9) - 1 .36 n/s
OE% 6-8 1 .52 (2. 1 ) 4.90 (6.0) -5.98 <.001 -0.57
9- 1 1 0.77 ( 1 . 1) 1 .88 (7.4) -2.45 n/s
Note. RTMT = Total Average Response Time; VART = Total Average Response Time Variability; D' = D
Prime score; CE% = Commission Errors Percentage; OE% = Omission Errors Percentage; t = t-value; p =
significance, one-tailed; n/s = not significant; • df= 24; b df= 63; c df= 238; d df= 294
Gifted Children 33
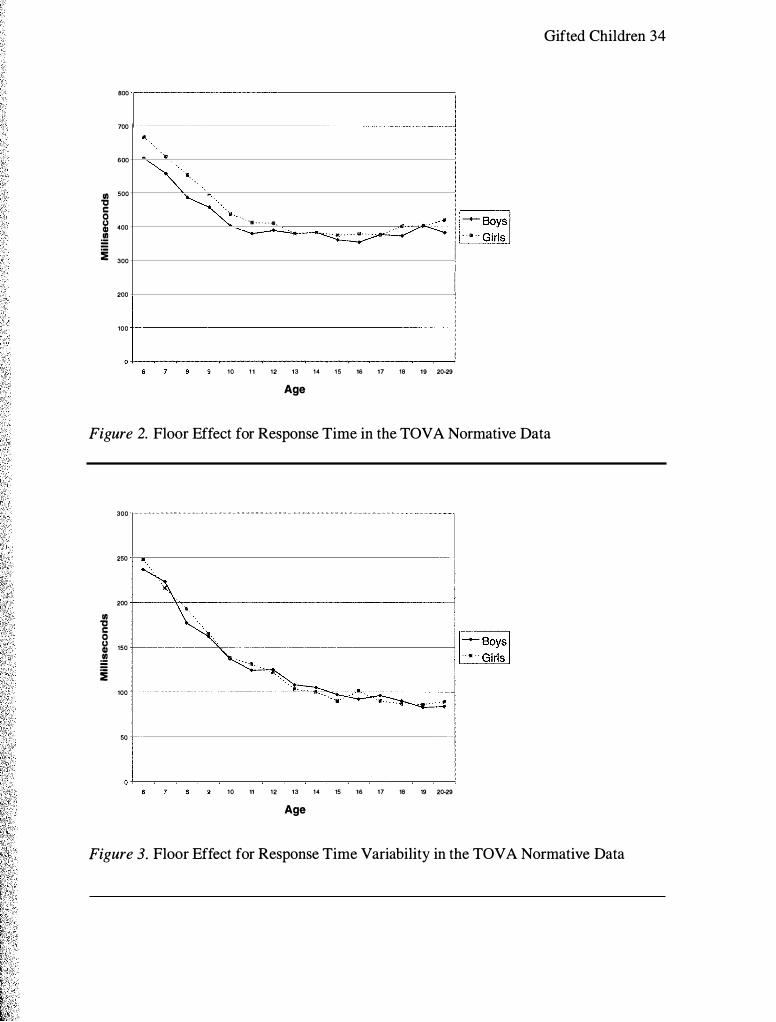
In order to understand the importance of the significant age-related findings, it is
first necessary to consider the age-related performance trends of the normative data. An
examination of the TOV A normative data reveals that, as might be expected, younger
children are slower, less consistent, more impulsive, and less attentive than older
children. As children get older, their TOVA scores gradually improve until performance
"ceilings" and "floors" are reached. There are, for example, limitations to the speed and
consistency with which a person can respond to the visual stimuli of the TOV A. Even
the quickest and most consistent subject must wait long enough to first visually process
stimuli. Likewise, the most attentive and non-impulsive test subject cannot score lower
than zero on commission errors or omission errors. Once these developmental, or
psychometric, ceilings and floors are reached, no further improvement in TOVA
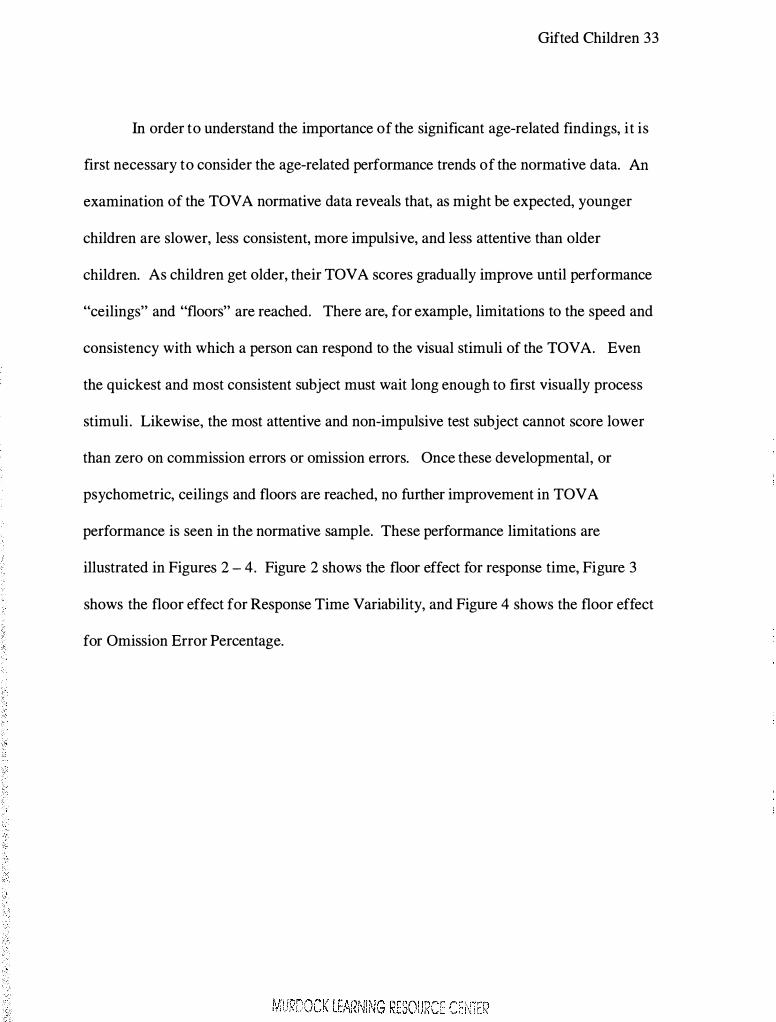
performance is seen in the normative sample. These performance limitations are
illustrated in Figures 2 - 4. Figure 2 shows the floor effect for response time, Figure 3
shows the floor effect for Response Time Variability, and Figure 4 shows the floor effect
for Omission Error Percentage.
Gifted Children 34
BOO
700 •
600
Ill 500 '0 c 0 (.) 400 Gl � :i 300
"
�--. . � • . .. . . . . . ...
· ·,-� .. < I
� I I ! I 200
100
10 1 1 12 13 14 15 16 17 18 19 20-29
Age
Figure 2. Floor Effect for Response Time in the TOV A Normative Data
300
250
200 Ill '0 c 0 (.) 150 Gl � :i
100
50
10 11 12 13 14 15 16 17 18 19 20-29
Age
Figure 3. Floor Effect for Response Time Variability in the TOVA Normative Data

Gifted Children 35
10 11 12 13 14 15 16 17 18 19 20·29 Age
Figure 4. Floor Effect for Omission Error Percentage in the TOVA Normative Sample
Similar age-related trends in TOV A performance were seen in gifted children.
However, the significant differences observed for younger gifted children suggest that
gifted children may reach the performance floors earlier for Response Time, Response
Time Variability and Omission Error Percentage than norm group children. Comparing
the gifted and normative samples by gender and age group further substantiated this
finding (see Table 7).
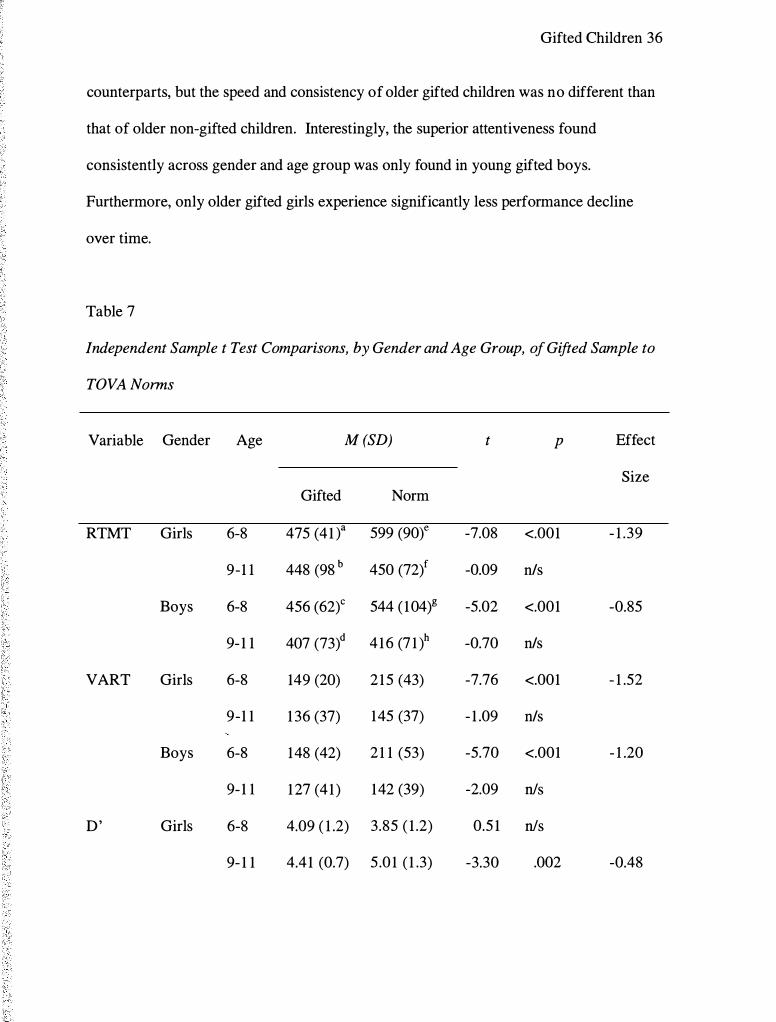
An examination of Table 7 reveals that, consistent with previous analyses, young
gifted boys and girls are significantly faster and more consistent than their normative
Gifted Children 36
counterparts, but the speed and consistency of older gifted children was no different than
that of older non-gifted children. Interestingly, the superior attentiveness found
consistently across gender and age group was only found in young gifted boys.
Furthermore, only older gifted girls experience significantly less performance decline
over time.
Table 7
Independent Sample t Test Comparisons, by Gender and Age Group, of Gifted Sample to
TOVA Norms
Variable Gender Age M (SD) t p Effect
Size Gifted Norm
RTMT Girls 6-8 475 (41 t 599 (90t -7.08 <.001 - 1 .39
9-1 1 448 (98 b 450 (72)f -0.09 n/s
Boys 6-8 456 (62)c 544 ( 104)g -5.02 <.001 -0.85
9- 1 1 407 (73)d 4 16 (7 1 )h -0.70 n/s
VART Girls 6-8 149 (20) 2 15 (43) -7.76 <.001 - 1 .52
9-1 1 1 36 (37) 145 (37) - 1 .09 n/s
Boys 6-8 148 (42) 2 1 1 (53) -5.70 <.001 - 1 .20
9- 1 1 1 27 (41 ) 142 (39) -2.09 n/s
D' Girls 6-8 4.09 ( 1 .2) 3.85 ( 1 .2) 0.5 1 n/s
9- 1 1 4.41 (0.7) 5 .0 1 ( 1 .3) -3.30 .002 -0.48

Gifted Children 37
Variable Gender Age M (SD) t p Effect
Size Gifted Norm
Boys 6-8 3.92 (0.9) 3 .47 ( 1 . 1) 1 .97 nls
9- 1 1 4.33 (0.9) 4.5 ( 1 .4) -0.92 n/s
CE% Girls 6-8 8.5 1 (2.5) 6.78 (4.7) 1 .69 nls
9- 1 1 5.99 (4. 1 ) 6.38 (4.2) -0.43 n/s
Boys 6-8 8.82 (4.6) 10. 14 (7.4) - 1 .03 nls
9- 1 1 7 . 19 (3 .9) 8.74 (5.5) -2.04 n/s
OE% Girls 6-8 2. 12 (3.5) 4.25 (5.4) - 1 .5 1 n/s
9-1 1 0.59 (0.7) 0.79 ( 1 .3) - 1 . 1 3 n/s
Boys 6-8 1 .29 ( 1 .2) 5.56 (6.5) -6.36 <.001 -0.65
9- 1 1 0.87 ( 1 .2) 3 .0 ( 10.5) -2.38 nls
Note. RTMT = Total Average Response Time; VART = Total Average Response Time Variability; D ' = D
Prime score; CE% = Commission Errors Percentage; OE% = Omission Errors Percentage; t = t-value; p =
significance, one-tailed; 'ills = not significant; • df = 6; b df = 22; c df = 17; d df = 40; e df = 122; f df = 149; g df
= 1 16; h df= 145
To summarize the findings, performance differences between gifted and non
gifted children have been found and separate norms for gifted children seem warranted.
However, no such norms exist. Since compiling normative data is a time consuming and
expensive undertaking, such norms are unlikely to be collected. Nevertheless, it would
be advantageous to clinicians working with gifted children to be able to adjust the

Gifted Children 38
existing norms to better evaluate gifted children. Given that gifted children reach the
performance limits for response time, consistency and attentiveness faster than non-gifted
children, it is possible that new norm-estimates for gifted children may be created by
transforming the current age-based norms into developmental norms. In other words,
comparing gifted children to developmentally equivalent instead of age equivalent
children may be a more reliable standard by which to interpret their TOV A performance.
In light of the age and gender differences previously discussed, the prospect of
substituting developmental norms raises several questions. First, are developmental
norms appropriate for each TOV A variable? Second, are separate developmental norms
necessary for boys and girls? Third, at what age would developmental norms become
unnecessary, and is this cut-off age the same for each TOVA variable? Lastly, can the
transformation of the published norms into developmental norms be captured by a simple
adjustment formula?
An examination of the trends in the normative data suggest that developmental
norms would be appropriate for only three TOV A variables; Response Time, Response
Time Variability and Omission Error Percentage. Developmental norms are not
necessary for Commission Error Percentage because no significant age or gender
differences exist between the two samples on this variable. In addition, while it may be
determined in the future that new norms are needed for D Prime, the differences noted in
the analyses do not follow the same kind of developmental trend as the other four
variables. The differences in D Prime appear to be inversely related to age, but since the
upper age limit included in the study is age 1 1 , the inverse relationship cannot be
Gifted Children 39
verified. To do so would require expanding the current investigation to gather data for
pre-adolescent and adolescent gifted children.
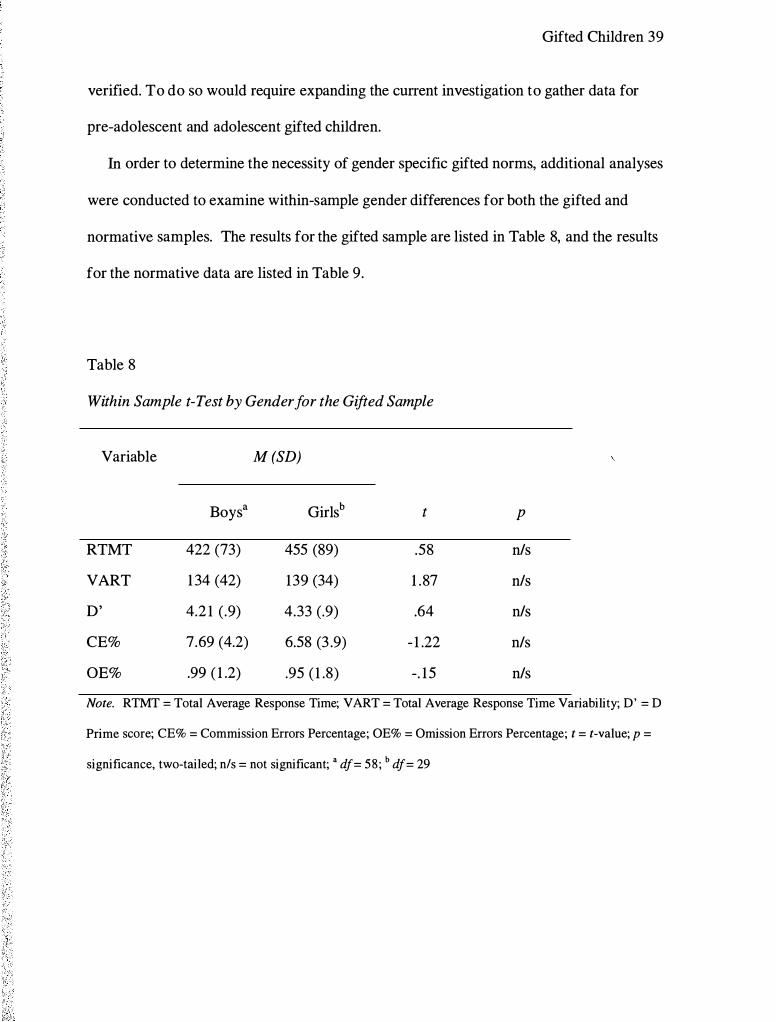
In order to determine the necessity of gender specific gifted norms, additional analyses
were conducted to examine within-sample gender differences for both the gifted and
normative samples. The results for the gifted sample are listed in Table 8, and the results
for the normative data are listed in Table 9.
Table 8
Within Sample t-Test by Gender for the Gifted Sample
Variable
RTMT
VART
D'
CE%
OE%
Boys a
422 (73)
1 34 (42)
4.2 1 (.9)
7.69 (4.2)
.99 ( 1 .2)
M (SD)
Girlsb t
455 (89) .58
139 (34) 1 .87
4.33 (.9) .64
6.58 (3 .9) - 1 .22
.95 ( 1 .8) -. 15
p
n/s
n/s
n/s
n/s
n/s
Note. RTMT = Total Average Response Time; VART = Total Average Response Time Variability; D' = D
Prime score; CE% = Commission Errors Percentage; OE% = Omission Errors Percentage; t = t-value; p =
significance, two-tailed; nls = not significant; • df= 58 ; b df= 29

Gifted Children 40
Table 9
Within Sample t-Test by Gender for the Normative Sample
Variable M (SD) t p Effect Size
Boys a Girls5
RTMT 473 (46) 5 17 (40) - 1 1 .76 <.001 - 1 . 10
VART 173 (87) 176 (80) -.41 n/s
D' 4.04 ( 1 .3) 4.48 ( 1 .2) -4.01 .001 -0.37
CE% 9.36 (6.4) 6.56 (4.4) 5 .87 <.001 0.64
OE% 4. 15 (9.0) 2.35 (3 .7) 3 .00 .003 0.48
Note. RTMT = Total Average Response Time; VART = Total Average Response Time Variability; D' = D
Prime score; CE% = Commission Errors Percentage; OE% = Omission Errors Percentage; t = t-value; p =
significance, two-tailed; n/s = not significant; • df= 503; b df= 521
An examination of Table 8 reveals no gender differences for the gifted sample.
However, the results in Table 9 show that gender differences exist within the normative
sample for four of the five TOV A variables. Given these gender differences found in the
normative sample, it appears that gender specific developmental norms will be necessary
for each TOV A variable, with the exception of response time variability.
In order to determine the cut-off age at which developmental norms become
unnecessary, additional analyses were conducted comparing gifted children to non-gifted
children by age in one-year intervals. The results of these individual age analyses are
found in Table 1 0. An examination of Table 10 indicates that the cut -off ages differ by
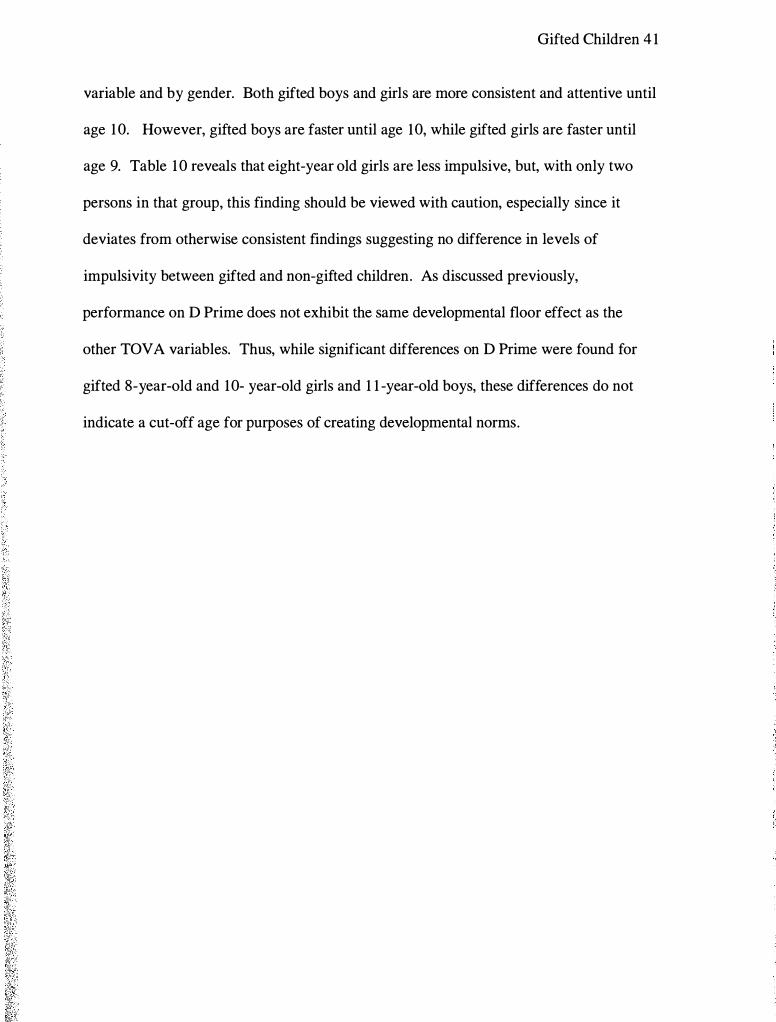
Gifted Children 4 1
variable and by gender. Both gifted boys and girls are more consistent and attentive until
age 1 0. However, gifted boys are faster until age 10, while gifted girls are faster until
age 9. Table 1 0 reveals that eight-year old girls are less impulsive, but, with only two
persons in that group, this finding should be viewed with caution, especially since it
deviates from otherwise consistent findings suggesting no difference in levels of
impulsivity between gifted and non-gifted children. As discussed previously,
performance on D Prime does not exhibit the same developmental floor effect as the
other TOV A variables. Thus, while significant differences on D Prime were found for
gifted 8-year-old and 10- year-old girls and 1 1 -year-old boys, these differences do not
indicate a cut-off age for purposes of creating developmental norms.

Gifted Children 42
Table 1 0
Independent Sample t-Tests comparing Gifted Sample to Normative Sample by Age at Yearly
Intervals
Age Sex RTMT VART D' CE% OE%
t p t p t p t p t p
6a Girls - 10. 14 .001
Boys
7 Girlsb -7.70 <.001 -6.00 <.001 1 .42 n/s .54 n/s -4.41 .007
Boysc -3 .29 .005 1 .79 n/s -.54 n/s -5. 1 5 <.001
8 Girlsd -2.43 .05 -2.96 .004 -2.62 .05 7.00 <.001 .85 n/s
Boyse - 1 .25 n/s -.64 n/s -. 14 n/s - 1 .25 n/s
9 Girl sf - 1 . 16 n/s -3 .80 .004 - 1 .74 n/s -.28 n/s -2.47 .008
Boysg -2. 14 .02 -.30 n/s -.86 n/s - 1 .78 .04
1 0 Girlsh .82 n/s -.28 n/s -2.78 .005 . 14 n/s -.45 n/s
Boys1 .37 n/s -.06 n/s - 1 .09 n/s - 1 .26 n/s
1 1 Girl� .01 n/s -.58 n/s - 1 .63 n/s -.30 n/s .3 1 n/s
Boysk .27 n/s -2.23 .02 - 1 .06 n/s - 1 . 1 5 n/s
Note. RTMT = Total Average Response Time; VART = Total Average Response Time Variability; D' = D
Prime score; CE% = Commission Errors Percentage; OE% = Omission Errors Percentage; t = t-value; p =
significance, two-tailed; n/s = not significant; • df = 1 ; b df = 3 ; c df = 6; d df = 1; • df = 9; f df = 25 g df = 1 1 ; h
df= 8; i df= 17; j df= 7 ; k df= 10

Gifted Children 43
In order to examine the feasibility of developing a few simple "rules of thumb"
that clinicians might apply to transform the published norms into rough developmental
norms for use with gifted children, a few additional analyses were necessary to provide a
reasonable empirical basis. These analyses compared gifted children to older normative
children for Response Time, Response Time Variability and Omission Error Percentage -
the only TOV A variables for which the creation of developmental norms would be
appropriate - based upon previous results of this investigation. The results of these
analyses are listed in Tables 1 1 - 13 . Table 1 1 lists the results for Response Time, Table
1 2 lists the results for Response Time Variability, and Table 1 3 lists the results for
Omission Error Percentage. The findings contained in these three tables suggest that
adjustments necessary to create rough developmental norms are fairly simple, and these
"rule of thumb" adjustments are summarized in Table 14. For example, according to the
Adjustment Matrix, the scores of an 8-year-old gifted boy should be compared to the
published norms for 10-year-old boys, while an 8-year-old gifted girl should be compared
to the norms for 9-year-old girls when evaluating Response Time and to the norms for
1 0-year-old girls when examining both Variability and Omission Error Percentage.

Gifted Children 44
Table 1 1
Independent Sample t Test Comparisons of Gifted Children to Older Normative Children
for Response Time
Gifted Normative t p
Gender Age RMTM Score Gender Age RMTM Score
M SD M SD
Girls 7a 478 (22) Girls 8e 544 (80) -3 .88 .<0 1
9f 499 (72) - 1 .43 . 1 9
lOg 438 (74) 2.38 .03
Boys 7b 453 (77) Boys 8h 487 (86) - 1 .05 .32
9i 459 (8 1 ) -0. 1 9 .85
1oi 402 (58) 1 .66 . 13
Girls 8c 44 1 (57) Girls 9 499 (72) - 1 .40 . 10
10 438 (74) 0.05 .95
1 1k 413 (7 1 ) 0.68 .35
Boys 9d 42 1 (49) Boys 1 0 402 (58) 1 .09 .29
1 1 1 379 (66) 2.5 1 .02
1 2m 390 (74) 1 .66 . 1 1
Note. RTMT = Total Average Response Time; t = t-score; p = significance, two-tailed; • df = 3 ; 6 df = 6; c
df= 1 ; d df= l l ; e df= 37; f df= 54; g df= 33; h df= 35; i df= 56; j df= 32 ; k df= 33; ! df= 54; mdf= 36

Gifted Children 45
Table 12
Independent Sample t Test Comparisons of Gifted Children to
Older Normative Children for Response Time Variability
Gifted Normative t p
Age VART Score Age VART score
M SD M SD
6a 1 5 1 (8) 7e 220 (52) -9.38 <.01
8f 185 (43) -4.50 .02
9g 163 (41 ) - 1 .75 .23
7b 149 (36) 8 185 (43) -3.01 .01
9 163 (41) - 1 .22 .26
lOb 138 (39) -0.93 .37
8c 147 (41 ) 9 163 (41 ) - 1 .29 .21
10 138 (39) 0.7 1 .50
l l i 128 (34) 1 .55 . 1 5
9d 1 30 (33) 10 138 (39) -0.88 .38
1 1 128 (34) 0.24 .81
12j 123 (39) 0.79 .43
Note. V ART = Response Time Variability; t = t-score; p = significance,
two-tailed; a df= 1 ; b df= 10; c df= 1 1 ; d df= 17: e df= 1 22; f df= 74;
g df= 1 32; h df= 67; i df= 1 15;j df= 86

Gifted Children 46
Table 1 3
Independent Sample t Test Comparisons of Gifted Children to Older Normative Children
for Omission Error Percentage
Gifted Normative t p
Gender Age OE% Score Gender Age OE% Score
M SD M SD
Girls 7a 0.69 ( 1 .0) Girls 8e 1 .87 (2.46) - 1 .82 . 1 0
9f 1 .07 ( 1 .50) -0.69 .67
l Og 0.53 (0.90) 0.30 .84
Boys 7b 1 . 19 ( 1 .0) Boys 8h 2. 17 (2.94) - 1 .73 . 1 0
9i 4.35 ( 14.22) - 1 .64 . 1 0
1oi 2.45 (6.87) - 1 .00 .32
Girls 9c 0.5 1 (0.3) Girls 10 0.53 (0.90) -0. 1 1 .91
l lk 0.68 ( 1 .26) -0.89 .38
12' 0.53 (0.92) -0. 12 .90
Boys 9d 0.95 ( 1 . 1) Boys 10 2.45 (6.87) - 1 .22 .23
l lm 1 .93 (7.28) -0.95 .34
12n 0.68 ( 1 . 1 5) 0.75 .46
Note. OE% = Omission Error Percentage; t = t-score; p = significance, two-tailed; a df = 3; 6 df = 6; c df =
5; d dj= l l ; e dj= 37; f dj= 54; g df= 33; h df= 35; i df= 56;j dj= 32 ; k df= 59; I df= 48; mdf= 54; n dj= 36
,, ,
;., I
' ' I

Gifted Children 47
Table 1 4
Adjustment Matrix, including Cut-Off Ages (yrs) and Age Adjustments, for Creating
TOVA Developmental Norms for use with Gifted Children
Response Time Response Time Omission Error
Variability Percentage
Cut Off Age Cut Off Age Cut Off Age
Age Adjustment Age Adjustment Age Adjustment
Boys 1 0 Age 6: +3 1 0 +1 1 0 + 1
Age 7-9 +2
Girls 1 0 Age 6: +3 9 +2 1 0 + 1
Age 7-9 +2
Note: yrs = years
CTS
It was hypothesized that no evidence of differences would be found on the CTS
between gifted and norm group children. The means and standard deviations of the gifted
sample and the CTS normative sample are presented in Table 1 5. The findings listed in
Table 1 5 are generally consistent with the hypotheses and reveal no evidence that gifted
children were significantly different from the children in the normative sample on 1 0 of
the 1 3 variables. Furthermore, while gifted children were found to be more oppositional,
more perfectionist and have fewer cognitive problems, the effect sizes for these
Gifted Children 48
differences are small and, most importantly, these differences are not directly related to
the CTRL-R:L's utility in diagnosing ADHD. The effect size was small/medium for each
difference.
, j ' l

Gifted Children 49
Table 1 5
Independent Sample t Test Comparisons of Gifted Sample to Normative Sample on
CTS Variables
Subscale M (SD) t p Effect Size
Gifted a Normb
Opp 2. 1 6 (3.6) 1 . 12 (2.7) 2.61 .01 0.39
Cog 2.62 (3.8) 4.45 (5.7) -4. 10 <.001 -0.32
Hyp 3 .05 (4.8) 2.50 (3 .0) 1 .05 n/s
Anx 2.90 (2.7) 2.3 1 (4.3) 1 .83 n!s
Per 3 .69 (3.8) 2.54 (3 .6) 2.7 1 .008 0.32
Soc 1 .92 (3 .2) 1 .40 (2.9) 1 .44 n/s
ADHD 6.07 (9.0) 6. 1 6 (8.0) -0.09 n/s
Rest 3 .4 1 (4.8) 3 . 1 3 (4.0) 0.53 n/s
Emo 1 .26 (2.3) 0.93 ( 1 .9) 1 .30 n/s
C-Total 4.64 (6.4) 4.06 (5.2) 0.8 1 nls
D-Inn 4.37 (6.0) 5.38 (6.78 - 1 .49 n/s
D-Hyp 4.02 (6.2) 3 .61 (5.5) 0.60 n/s
D-Total 8.38 ( 1 1 .4) 8.99 ( 1 1 .3) -0.48 n/s
Note. CTS = Connors' Teacher Rating Scale - Revised: Long Form; Subscales of the CTS include: Opp =
Oppositional; Cog = Cognitive Problems I Inattention; Hyp = Hyperactivity; Anx = Anxious I Shy; Per =
Perfectionism; Soc = Social Problems; ADHD = ADHD Index; Rest = Conners' Global Index (Restless -
Impulsive); Emo = Conners' Global Index (Emotional lability); C-Total = Conners' Global Index (Total
Score); D-Inn = DSM-IV Symptom Subscale (Inattention); D-Hyp = DSM-IV Symptom Subscale
(Hyperactivity); D-Total = DSM-IV Symptom Subscale (Total); t = t test score; p = significance, two
tailed; n/s = not significant; • df= 85; b df= 1026
1 1 '
' ' I I

Gifted Children 50
The findings from the initial analyses suggest that, while a few differences
between gifted and non-gifted children were found, it appears that the components of the
CTS designed to help diagnose ADHD are appropriate to use with gifted children.
However, to examine whether these findings remain consistent for both genders, and
across the age range included in this study, further analyses were conducted. The results
of gender analyses are found in Table 1 6. Inspection of Table 1 6 reveals that one of the
differences found in the original analyses, namely that gifted children have fewer
cognitive problems, is found for both gifted boys and gifted girls. However, only gifted
boys were more perfectionistic, and the difference in the Oppositional scale found for the
genders combined disappears when genders were analyzed separately. Consistent with
the findings from the original analyses, no separate gender differences were found for
variables related to the diagnosis of ADHD. The effect sizes for the obtained differences
were small/medium.
' ' ' I' < ,
I I ! '

Gifted Children 5 1
Table 1 6
Independent Sample t Test Comparisons by Gender of Gifted Sample to CTS
Norms
Subscale Gender M (SD) t p Effect
Size Gifted Norm
Opp Girls 1 .20 (3. lt 0.77 (2.2)c 0.76 n/s
Boys 2.68 (3.8)b 1 .50 (3. l )d 2.24 n/s
Cog Girls 1 .63 (2.8) 3 .30 (5. 1 ) -3.00 .004 -0.33
Boys 3 . 14 (4.2) 5.63 (6.2) -3.99 <.00 1 -0.40
Hyp Girls 1 .07 ( 1 .9) 1 .33 (3 . 1 ) -0.70 n/s 1 : 1 ·
Boys 4. 1 1 (5 .5) 3 .72 (5.3) 0.5 1 n/s
Anx Girls 2.53 (2.8) 2.24 (2.9) 0.56 n/s
Boys 3 .09 (2.7) 2.40 (3.0) 1 .79 n/s
Per Girls 3 .93 (3.4) 2.96 (3.8) 1 .49 n/s
Boys 3.55 (4.0) 2. 10 (3.3) 2.62 ' , ,
.0 1 0.44 : ' 1
Soc Girls 1 .07 ( 1 .9) 1 .04 (2.5) 0.08 n/s
Boys 2.38 (3.7) 1 .78 (3.3) 1 . 16 n/s
ADHD Girls 2.50 (4.4) 3.83 (6.2) - 1 .56 n/s
Boys 7.98 ( 10.2) 8 .57 (9.4) -0.41 n/s
Rest Girls 1 .47 (2.3) 1 .92 (3.2) - 1 .00 n/s
Boys 4 .45 (5 .4) 4 .39 (4.7) - 1 .3 1 n/s
Emo Girls 0.67 ( 1 .3) 0.70 ( 1 .6) 0. 12 n/s
Boys 1 .57 (2.6) 1 . 17 (2. 1 ) 1 . 10 n/s
C-Total Girls 2.20 (3.2) 2.62 (4.2) -0.68 n/s

Gifted Children 52
Subscale Gender M (SD) t p Effect
Size Gifted Norm
Boys 5.95 (7.3) 5.56 (6. 1 ) 0.38 n/s
D-Inn Girls 2.47 (4. 1 ) 3 .62 (5.7) - 1 .46 n/s
Boys 5.22 (6.5) 7.21 (7.69) 2. 15 n/s
D-Hyp Girls 1 .37 (2.3) 2. 10 (4.0) - 1 .60 n/s
Boys 5.45 (7. 1) 5 . 1 8 (6.7) 0.27 n/s
D-Total Girls 3 .80 (6. 1 ) 5 .72 (8.8) - 1 .63 nls
Boys 1 0.84 ( 12.7) 12.39 ( 13 .7) -0.86 n/s
Note. CTS = Connors' Teacher Rating Scale - Revised: Long Form; Subscales of the CTS include: Opp =
Oppositional; Cog = Cognitive Problems I Inattention; Hyp = Hyperactivity; Anx = Anxious I Shy; Per =
Perfectionism; Soc = Social Problems; ADHD = ADHD Index; Rest = Conners' Global Index (Restless -
Impulsive); Emo = Conners' Global Index (Emotional lability); C-Total = Conners' Global Index (Total
Score); D-Inn = DSM-IV Symptom Subscale (Inattention); D-Hyp = DSM-IV Symptom Subscale
(Hyperactivity); D-Total = DSM-IV Symptom Subscale (Total); t = t test score; p = significance, two
tailed; n/s = not significant; • df = 29; b df = 55; c df = 522; d df = 504
The results of the age group comparisons are listed in Table 17 . An examination
of Table 17 reveals that older gifted children were more oppositional, and that gifted
children of both age groups exhibited fewer cognitive problems. Interestingly, the
elevation in perfectionism revealed in the original analyses was not found in either age
group. Again, it is noteworthy that no age differences were found for ADHD related
variables. The effect sizes for the differences with older gifted children were medium
and small for the difference in younger gifted children.
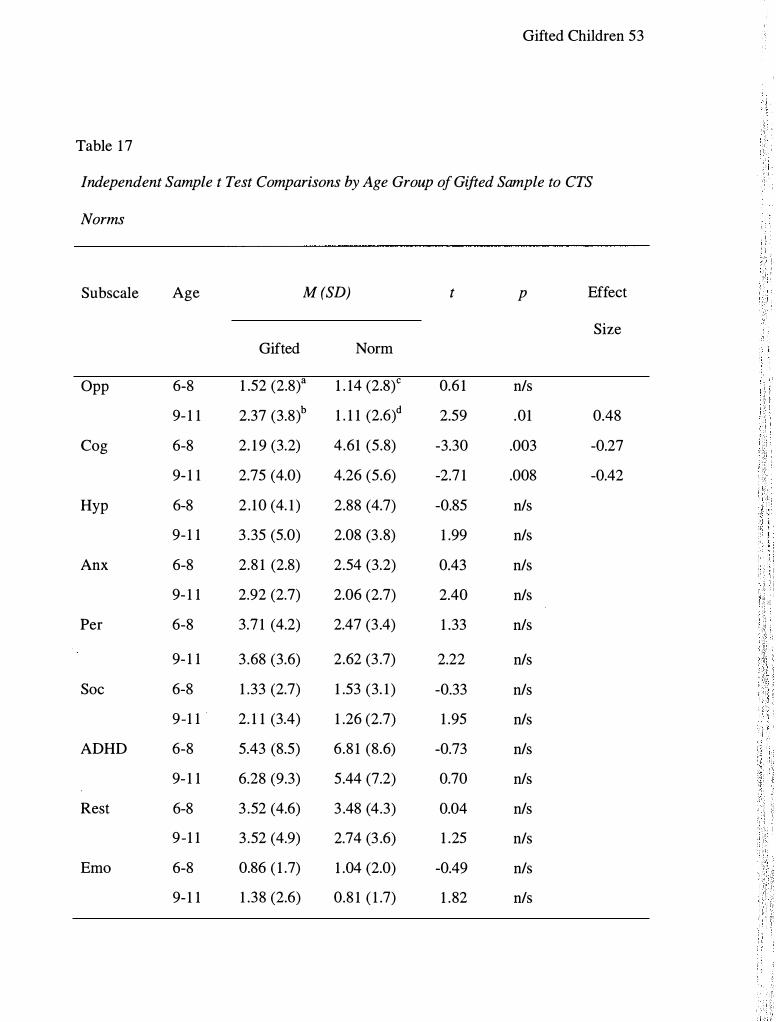
Gifted Children 53
Table 1 7
Independent Sample t Test Comparisons by Age Group of Gifted Sample to CTS
Norms
Subscale Age M (SD) t p Effect
Size Gifted Norm
Opp 6-8 1 .52 (2.8)a 1 . 14 (2.8)c 0.6 1 n/s
9- 1 1 2.37 (3.8) b 1 . 1 1 (2.6)d 2.59 .01 0.48
Cog 6-8 2. 1 9 (3.2) 4.61 (5.8) -3.30 .003 -0.27
9- 1 1 2.75 (4.0) 4.26 (5.6) -2.7 1 .008 -0.42
Hyp 6-8 2 . 10 (4. 1 ) 2.88 (4.7) -0.85 n/s ' : I
9-1 1 3 .35 (5.0) 2.08 (3 .8) 1 .99 n/s
Anx 6-8 2.8 1 (2.8) 2.54 (3.2) 0.43 n/s
9- 1 1 2.92 (2.7) 2.06 (2.7) 2.40 n/s : , i:,
Per 6-8 3.7 1 (4.2) 2.47 (3 .4) 1 .33 n/s
9- 1 1 3 .68 (3.6) 2.62 (3 .7) 2.22 n/s
Soc 6-8 1 .33 (2.7) 1 .53 (3. 1 ) -0.33 n/s
9-1 1 2. 1 1 (3.4) 1 .26 (2.7) 1 .95 n/s
ADHD 6-8 5.43 (8.5) 6.8 1 (8.6) -0.73 n/s
9- 1 1 6.28 (9.3) 5.44 (7.2) 0.70 n/s
Rest 6-8 3 .52 (4.6) 3 .48 (4.3) 0.04 n/s
9-1 1 3 .52 (4.9) 2.74 (3 .6) 1 .25 n/s
Emo 6-8 0.86 ( 1 .7) 1 .04 (2.0) -0.49 n/s
9- 1 1 1 .38 (2.6) 0.8 1 ( 1 .7) 1 .82 n/s

Gifted Children 54
Subscale Age M (SD) t p Effect
Size Gifted Norm
C-Total 6-8 3.90 (6.0) 4.52 (5.6) -0.47 n/s
9- 1 1 4.88 (6.6) 3.55 (4.8) 1 .57 n/s
D-Inn 6-8 3.59 (5.21 ) 5.67 (6.93) 1 .8 1 n/s
9- 1 1 4.58 (6.2) 5 .06 (6.5) -0.58 n/s
D-Hyp 6-8 3 .05 (5.8) 4.02 (6.0) -0.75 nls
9- 1 1 4.34 (6.3) 3 .05 (4.9) 1 .59 n/s
D-Total 6-8 6.7 1 ( 10.5) 9.70 ( 12. 1 ) - 1 .27 n/s
9- 1 1 8.92 ( 1 1 .7) 8.21 ( 10.3) 0.47 n/s
Note. CTS = Connors' Teacher Rating Scale - Revised: Long Form; Subscales of the CTS include: Opp =
Oppositional; Cog = Cognitive Problems I Inattention; Hyp = Hyperactivity; Anx = Anxious I Shy; Per =
Perfectionism; Soc = Social Problems; ADHD = ADHD Index; Rest = Conners' Global Index (Restless -
Impulsive); Emo = Conners' Global Index (Emotional lability); C-Total = Conners' Global Index (Total
Score); D-Inn = DSM-IV Symptom Subscale (Inattention); D-Hyp = DSM-IV Symptom Subscale
(Hyperactivity); D-Total = DSM-IV Symptom Subscale (Total); t = t test score; p = significance, two
tailed; n/s = not significant; a df = 20; b df = 64; c df = 540; d df = 486
Since no significant differences on the CTS affecting ADHD assessment were found
between gifted and norm group children, even when analyzed by group, gender, and age,
it appears that using its norms may be appropriate when assessing ADHD in gifted
children. However, given that the CTS normative data is organized by gender and age at
three-year intervals, additional analyses, by gender and age group at three-year intervals,
were conducted to further substantiate that using the CTS norms is acceptable with gifted
Gifted Children 55
children. The results of these analyses are listed in Table 1 8. An examination of Table
1 8 reveals that fewer cognitive problems were found for younger girls and boys of both
age groups. In contrast to previous analyses, differences were found on ADHD related
variables for younger gifted girls. Specifically, younger gifted girls were significantly
less hyperactive, exhibited fewer social problems, and scored significantly lower on both
the ADHD scale and the DSM-IV Symptoms Scales than non-gifted younger girls. These
differences indicate that young gifted girls are less likely than their normative
counterparts to exhibit classroom behavior indicative of ADHD. It is important to note,
however, the small sample size (N=6) and the medium effect size for these differences.
At best, these findings can be seen as further, albeit somewhat weak, evidence to support
the already solid conclusion that the CTS norms are appropriate when diagnosing ADHD
in gifted children.

Gifted Children 56
Table 1 8
Independent Sample t Test Comparisons, by Gender and Age Group, of Gifted Sample to
CTS Norms
Sub scale Gender Age M(SD) t p Effect
Size Gifted Norm
Opp Girls 6-8 0. 17 (0.41 ) a 0.74 (2. 1 l )e -2.69 n/s
9- 1 1 1 .46 (3.37) b 0.79 (2.20l 0.96 n/s
Boys 6-8 2.07 (3.20) c 1 .52 (3.26)g 0.65 n/s
9-1 1 2.90 (4.00) d 1 .47 (2.99)h 2. 1 6 n/s
Cog Girls 6-8 1 .0 ( 1 .55) 3 .50 (5.39) -3.50 .008 -0.46
9- 1 1 1 .79 (3.02) 3 .09 (4.83) - 1 .93 n/s
Boys 6-8 2.67 (3 .54) 5.69 (6. 1 5) -3.06 .006 -0.49
9- 1 1 3.32 (4.41 ) 5.56 (6.34) -2.78 .007 -0.35
Hyp Girls 6-8 0.33 (0.82) 1 .64 (3 .54) -3.28 .008 -0.37
9- 1 1 1 .25 (2.05) 1 .00 (2.50) .56 n/s
Boys 6-8 2.80 (4.72) 4.08 (5.59) - 1 .01 n/s
9-1 1 4.59 (5.72) 3 .29 (4.92) 1 .37 n/s
Anx Girls 6-8 1 .83 (2.88) 2.5 1 (3. 1 8) -0.57 n/s
9- 1 1 2.7 1 (2.79) 1 .95 (2.52) 1 .29 n/s
Boys 6-8 3.20 (2.78) 2.57 (3 . 13) 0.85 n/s
: t
I

Gifted Children 57
Subscale Gender Age M (SD) t p Effect Size
Gifted Norm
9- 1 1 3 .05 (2.70) 2. 19 (2.9 1 ) - 1 .86 n/s
Per Girls 6-8 1 .83 ( 1 .72) 2.98 (3.52) - 1 .57 n/s
9- 1 1 4.46 (3.59) 2.95 (4.06) 1 .95 n/s
Boys 6-8 4.47 (4.73) 1 .97 (3.28) 2.02 n/s
9- 1 1 3.22 (3.64) 2.25 (3.33) 1 .59 n/s
Soc Girls 6-8 0 (0) 1 . 13 (2.64) -6.98 <.001 -0.43
9- 1 1 1 .33 (2.04) 0.95 (2.39) 0.86 n/s
Boys 6-8 1 .87 (3. 1 1) 1 .92 (3.5 1 ) -0.06 n/s
9- 1 1 2.56 (3.91 ) 1 .62 (3.06) 1 .46 n/s
ADHD Girls 6-8 0.83 ( 1 .60) 4.3 1 (6.88) -4.48 .001 -0.5 1
9- 1 1 2.92 (4.8 1 ) 3 .34 (5.49) -0.40 n/s
Boys 6-8 7.27 (9.41 ) 9.24 ( 10.02) -0.79 n/s ' ' I
9- 1 1 8.24 ( 10.62) 7.77 (8.68) 0.27 n/s I
Rest Girls 6-8 0.83 ( 1 .60) 2. 19 (3.49) - 1 .98 n/s
9-1 1 1 .63 (2.50) 1 .64 (2.82) -0.02 n/s
Boys 6-8 3.93 (5. 18) 4.74 (5.00) -0.59 n/s
9-1 1 4.63 (5.55) 3 .97 (4.30) 0.72 n/s
Emo Girls 6-8 0.5 (0.84) 0.82 ( 1 .72) -0.89 n/s
9- 1 1 0.7 1 ( 1 .37) 0.57 ( 1 .35) 0.48 n/s
Boys 6-8 1 .00 ( 1 .89) 1 .25 (2. 15) -0.50 n/s

Gifted Children 58
Sub scale Gender Age M(SD) t p Effect
Gifted Norm Size
9-1 1 1 .78 (2.85) 1 .07 (2.09) 1 .52 nls
C-Total Girls 6-8 1 .33 (1 .97) 3 .0 1 (4.62) - 1 .97 n/s
9- 1 1 2.42 (3 .45) 2.21 (3 .70) 0.28 n/s
Boys 6-8 4.93 (6.79) 5.99 (6.41) -0.59 n/s
9-1 1 6.32 (7.56) 5.04 (5.72) 1 .03 n/s
D-Inn Girls 6-8 0.67 (0.82) 3 .82 (5.98) -6.34 <.001 -0.53
9- 1 1 2.92 (4.45) 3 .40 (5.39) -0.50 nls
Boys 6-8 4.93 (5.86) 7.47 (7.84) - 1 .60 n/s
9- 1 1 5 .56 (6.90) 6.90 (7.50) - 1 . 1 3 n/s
D-Hyp Girls 6-8 0.5 (0.84) 2.46 (4.60) -4. 14 <.001 -0.43
9- 1 1 1 .58 (2.52) 1 .72 (3 .26) -0.25 n/s
Boys 6-8 4.07 (6.63) 5.54 (7.01 ) -0.83 nls
9- 1 1 5.95 (7.27) 4.75 (6.23) 0.99 n/s
D-Total Girls 6-8 1 .0 ( 1 .55) 6.29 (9.73) -6.08 <.001 -0.54
9- 1 1 4.50 (6.63) 5 . 12 (7.59) -0.43 n/s
Boys 6-8 9.00 ( 1 1 .69) 13 .01 ( 13 .96) - 1 .28 n/s
9- 1 1 1 1 .52 ( 1 3 . 1 8) 1 1 .64 ( 12.63) -0.05 n/s
Note. CTS = Connors' Teacher Rating Scale - Revised: Long Form; Subscales of the CTS include: Opp =
Oppositional; Cog = Cognitive Problems I Inattention; Hyp = Hyperactivity; Anx = Anxious I Shy; Per =
Perfectionism; Soc = Social Problems; ADHD = ADHD Index; Rest = Conners' Global Index (Restless -
Impulsive); Emo = Conners' Global Index (Emotional lability); C-Total = Conners' Global Index (Total
Gifted Children 59
Score); D-Inn = DSM-IV Symptom Subscale (Inattention); D-Hyp = DSM-IV Symptom Subscale
(Hyperactivity); D-Total = DSM-IV Symptom Subscale (Total); t = t test score; p = significance, two
tailed; n/s = not significant; • df= 5; b df= 23; c df= 14; d df= 40; e df= 266; f df= 256; g df= 274; h df= 230
CPS
It was hypothesized that no evidence of differences would be found on the CPS
between gifted and non-gifted children. The means and standard deviations of the gifted
and talented sample and the CTS norm group are presented in Table 19. The findings
listed in Table 1 9 are generally consistent with the hypotheses and reveal no evidence
that gifted children were significantly different from children in the normative sample on
any of 14 CPS variables.
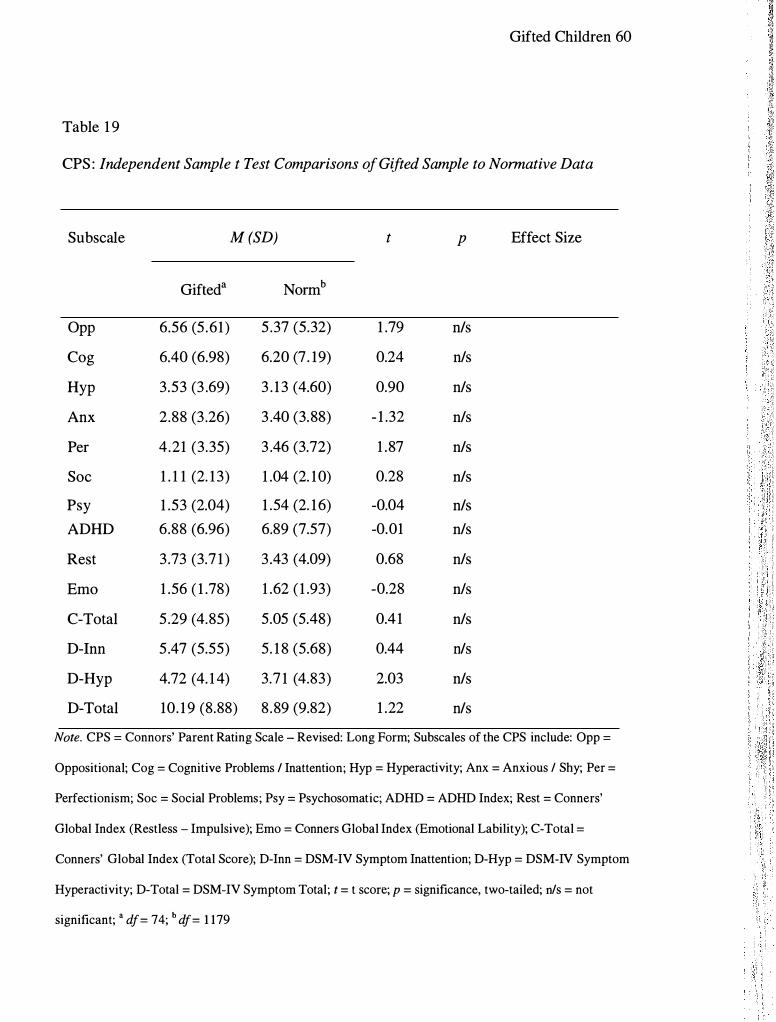
Gifted Children 60
Table 1 9
CPS : Independent Sample t Test Comparisons of Gifted Sample to Normative Data
Subscale M (SD) t p Effect Size
Gifted a Normb
Opp 6.56 (5.61) 5 .37 (5.32) 1 .79 n/s
Cog 6.40 (6.98) 6.20 (7. 19) 0.24 n/s
Hyp 3.53 (3 .69) 3 . 1 3 (4.60) 0.90 n/s
Anx 2.88 (3 .26) 3 .40 (3.88) - 1 .32 n/s
Per 4.21 (3.35) 3 .46 (3.72) 1 .87 n/s
Soc 1 . 1 1 (2. 1 3) 1 .04 (2. 10) 0.28 n/s
Psy 1 .53 (2.04) 1 .54 (2. 1 6) -0.04 n/s
ADHD 6.88 (6.96) 6.89 (7.57) -0.01 n/s
Rest 3 .73 (3.7 1 ) 3 .43 (4.09) 0.68 n/s
Emo 1 .56 ( 1 .78) 1 .62 ( 1 .93) -0.28 n/s
C-Total 5 .29 (4.85) 5.05 (5.48) 0.41 n/s
D-Inn 5.47 (5.55) 5. 1 8 (5.68) 0.44 n/s
D-Hyp 4.72 (4. 1 4) 3.7 1 (4.83) 2.03 n/s
D-Total 10. 1 9 (8.88) 8 .89 (9.82) 1 .22 n/s
Note. CPS = Connors' Parent Rating Scale - Revised: Long Form; Subscales of the CPS include: Opp =
Oppositional; Cog = Cognitive Problems I Inattention; Hyp = Hyperactivity; Anx = Anxious I Shy; Per =
Perfectionism; Soc = Social Problems; Psy = Psychosomatic; ADHD = ADHD Index; Rest = Conners'
Global Index (Restless - Impulsive); Emo = Conners Global Index (Emotional Lability); C-Total =
Conners' Global Index (Total Score); D-Inn = DSM-IV Symptom Inattention; D-Hyp = DSM-IV Symptom
Hyperactivity; D-Total = DSM-IV Symptom Total; t = t score; p = significance, two-tailed; n/s = not
significant; • df = 74; b df = 1 179
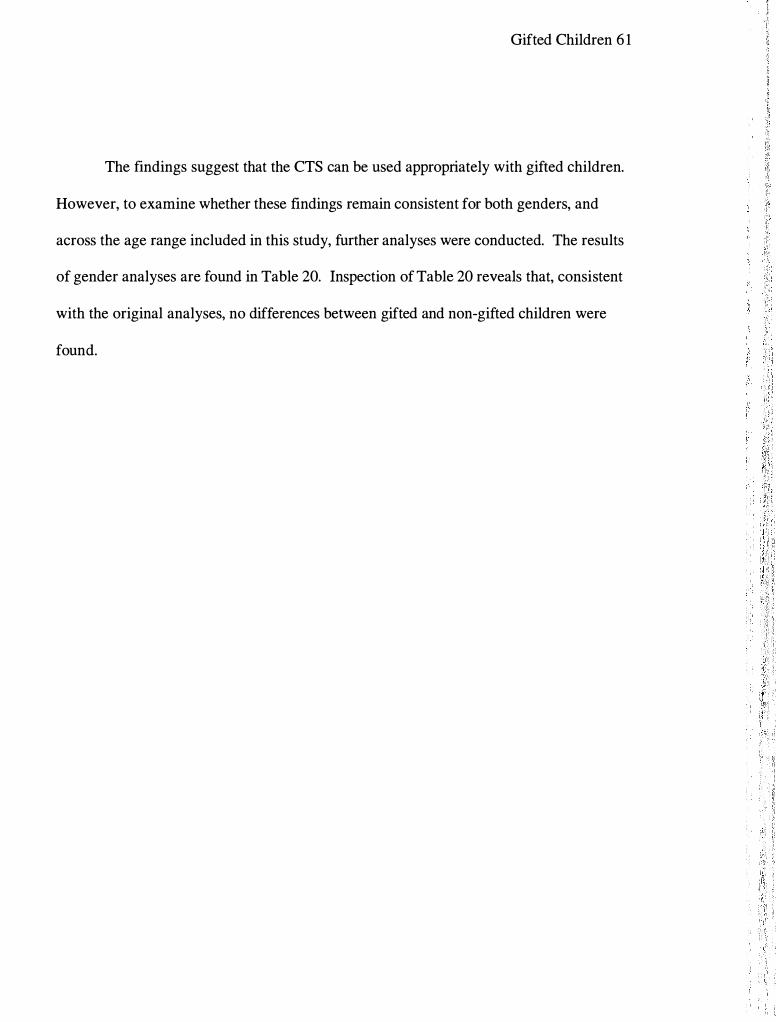
Gifted Children 6 1
The findings suggest that the CTS can be used appropriately with gifted children.
However, to examine whether these findings remain consistent for both genders, and
across the age range included in this study, further analyses were conducted. The results
of gender analyses are found in Table 20. Inspection of Table 20 reveals that, consistent
with the original analyses, no differences between gifted and non-gifted children were
found.
'" I
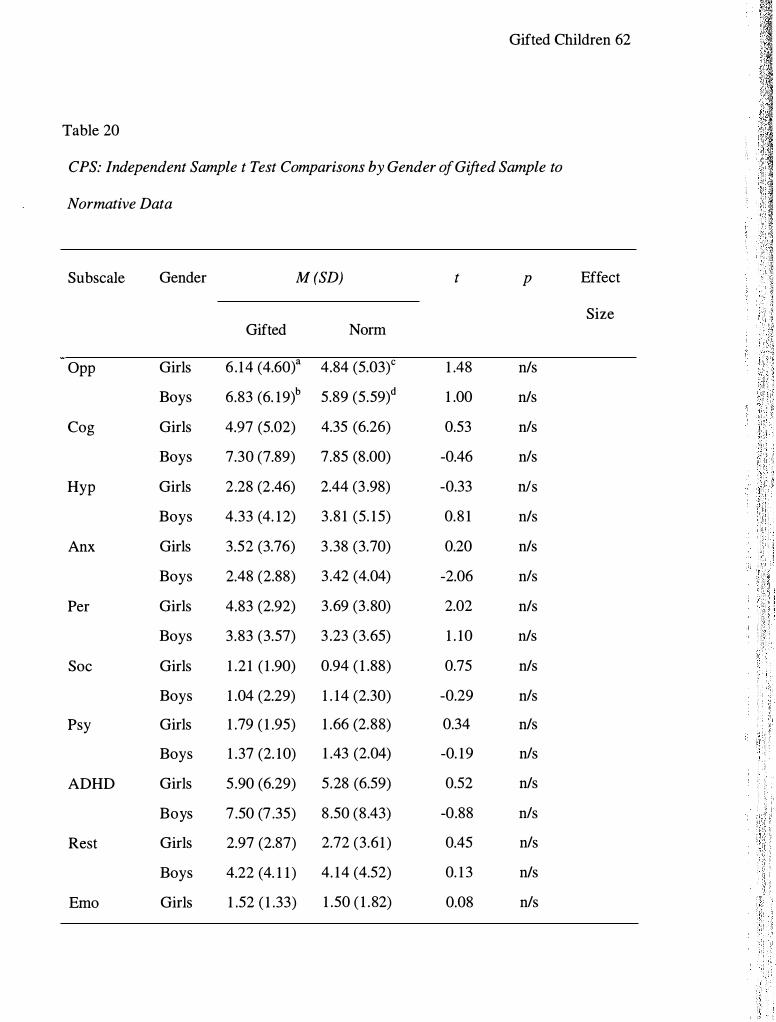
Gifted Children 62
Table 20
CPS: Independent Sample t Test Comparisons by Gender of Gifted Sample to
Normative Data
Subscale Gender M (SD) t p Effect
Size Gifted Norm
Opp Girls 6 . 14 (4.60t 4.84 (5.03)c 1 .48 n/s
Boys 6.83 (6. 19)b 5.89 (5.59)d 1 .00 n/s
Cog Girls 4.97 (5.02) 4.35 (6.26) 0.53 nls
Boys 7.30 (7.89) 7.85 (8.00) -0.46 nls
Hyp Girls 2.28 (2.46) 2.44 (3 .98) -0.33 nls
Boys 4.33 (4. 12) 3.8 1 (5. 15) 0.8 1 n/s
Anx Girls 3.52 (3.76) 3 .38 (3.70) 0.20 n/s
Boys 2.48 (2.88) 3 .42 (4.04) -2.06 nls
Per Girls 4.83 (2.92) 3.69 (3 .80) 2.02 n/s
Boys 3.83 (3.57) 3 .23 (3.65) 1 . 10 n/s
Soc Girls 1 .2 1 ( 1 .90) 0.94 ( 1 .88) 0.75 n/s
Boys 1 .04 (2.29) 1 . 14 (2.30) -0.29 nls
Psy Girls 1 .79 ( 1 .95) 1 .66 (2.88) 0.34 n/s
Boys 1 .37 (2. 10) 1 .43 (2.04) -0. 19 nls
ADHD Girls 5 .90 (6.29) 5.28 (6.59) 0.52 n/s
Boys 7 .50 (7 .35) 8 .50 (8.43) -0.88 nls
Rest Girls 2.97 (2.87) 2.72 (3.6 1 ) 0.45 nls
Boys 4.22 (4. 1 1 ) 4. 14 (4.52) 0. 1 3 n/s
Emo Girls 1 .52 ( 1 .33) 1 .50 ( 1 .82) 0.08 nls

Gifted Children 63
Subscale Gender M (SD) t p Effect
Gifted Norm Size
C-Total Girls 4.60 (3.30) 4.21 (4.84) -0.61 n/s
Boys 1 .59 (2.03) 1 .75 (2.04) -0.52 n/s
Boys 5.80 (5.56) 5.89 (6.04) 0. 1 1 nls
D-Inn Girls 5 . 10 (5.75) 3.3 1 (4.95) 1 .65 nls
Boys 5.70 (5.48) 6.45 (6.32) -0.88 nls
D-Hyp Girls 3 .34 (2.68) 3.01 (4.32) 0.62 n/s
Boys 5.59 (4.66) 4.40 (5.30) 1 .65 n/s
D-Total Girls 8.45 (7.72) 6.92 (8.66) 1 .04 n/s
Boys 1 1 .28 (9.45) 10.85 ( 10.84) 0.29 nls
Note. CPS = Connors' Parent Rating Scale - Revised: Long Form; Subscales of the CPS include: Opp =
Oppositional; Cog = Cognitive Problems I Inattention; Hyp = Hyperactivity; Anx = Anxious I Shy; Per =
Perfectionism; Soc = Social Problems; Psy = Psychosomatic; ADHD = ADHD Index; Rest = Conners'
Global Index (Restless - Impulsive); Emo = Conners Global Index (Emotional Lability); C-Total =
Conners' Global Index (Total Score); D-Inn = DSM-IV Symptom Inattention; D-Hyp = DSM-IV Symptom
Hyperactivity; D-Total = DSM-IV Symptom Total; t = t score; p = significance, two-tailed; nls = not
significant; • df= 28; b df= 54; c df= 588; d df= 591
The results of the age group comparison are listed in Table 2 1 . An examination
of Table 2 1 reveals that young gifted children scored lower on the ADHD index and on
the Inattention domain of the DSM-IV Symptom Scale. Interestingly, older gifted
children were found to be more hyperactive, as rated by the Hyperactivity domain of the
DSM-IV Symptom Scale. The effect sizes for these differences were small to
small/medium.

Gifted Children 64
Table 2 1
CPS: Independent Sample t Test Comparisons by Age Group of Gifted Sample to
Normative Data
Subscale Age M (SD) t p Effect
Size Gifted Norm
Opp 6-8 6.85 (5.95)a 3 .55 (5.22)c 2.45 n/s
9- 1 1 6.45 (5.53)b 5 .40 (5.44)d 1 .34 n/s
Cog 6-8 3.65 (3.70) 6.06 (7.00) -2.76 .01 -0.34
9- 1 1 7.40 (7.63) 6.36 (7.39) 0.97 nls
Hyp 6-8 2.70 (3 .3 1 ) 3 .65 (5 . 10) - 1 .24 n/s
9- 1 1 3.84 (3 .80) 2.52 (3 .95) 2.45 n/s
Anx 6-8 2.70 (3.3 1 ) 3.86 (4.04) - 1 .53 nls
9- 1 1 2.95 (3.27) 2.87 (3 .68) 0. 17 nls
Per 6-8 4.30 (4.03) 3 .42 (3.76) 0.96 n/s
9- 1 1 4. 1 8 (3 . 10) 3.5 1 (3.69) 1 .50 n/s
Soc 6-8 0.95 (2.72) 0.92 ( 1 .94) 0.05 n/s
9- 1 1 1 . 1 6 ( 1 .90) 1 . 17 (2.28) 0.04 n/s
Psy 6-8 0.90 ( 1 .29) 1 .5 1 (2.20) -2.02 n/s
9- 1 1 1 .76 (2.22) 1 .58 (2. 12) 0.58 n/s
ADHD 6-8 3 .75 (3 .45) 7. 1 1 (7.69) -4.05 <.001 -0.44
9- 1 1 8.02 (7.57) 6.64 (7.43) 1 .29 n/s
Rest 6-8 2.50 (2.93) 3.64 (4. 1 8) 1 .69 nls
9- 1 1 4. 1 8 (3 .88) 3 . 1 9 (3 .98) 1 .80 n/s
Emo 6-8 1 .70 ( 1 .95) 1 .74 (2.00) -0.09 n/s

Gifted Children 65
Subscale Age M (SD) t p Effect
Size Gifted Norm
C-Total 6-8 4.29 (4.26) 5.38 (5.62) 1 . 14 n/s
9- 1 1 1 .5 1 ( 1 .73) 1 .48 ( 1 .85) 0. 1 2 n/s
9- 1 1 5 .69 (4.99) 4.76 (5.30) 1 .3 1 n/s
D-Inn 6-8 3.30 (2.70) 5.29 (5.66) -3.09 .006 -0.35
9- 1 1 6.25 (6. 1 1) 5 .06 (5.70) 1 .39 n/s
D-Hyp 6-8 3.80 (3 .02) 4. 19 (5 .20) -0.55 n/s
9- 1 1 5 .05 (4.46) 3 . 1 5 (4.37) 3 .02 .004 0.43
D-Total 6-8 7. 10 (5.41 ) 9.48 ( 10.23) - 1 .87 n/s
9- 1 1 1 1 .3 1 (9.64) 8.21 (9.3 1 ) 2.28 n/s
Note. CPS = Connors' Parent Rating Scale - Revised: Long Form; Subscales of the CPS include: Opp =
Oppositional; Cog = Cognitive Problems I Inattention; Hyp = Hyperactivity; Anx = Anxious I Shy; Per =
Perfectionism; Soc = Social Problems; Psy = Psychosomatic; ADHD = ADHD Index; Rest = Conners'
Global Index (Restless - Impulsive); Emo = Conners Global Index (Emotional Lability); C-Total =
Conners' Global Index (Total Score); D-Inn = DSM-IV Symptom Inattention; D-Hyp = DSM-IV Symptom
Hyperactivity; D-Total = DSM-IV Symptom Total; t = t score; p = significance, two-tailed; n/s = not
significant; a df= 19; b df= 54; c df= 633; d df= 546
Since the CTS normative data are organized by gender and age at three-year
intervals, additional analyses, by gender and age group at three-year intervals, were
conducted to further investigate the differences between the gifted and normative
samples. The results of these analyses are listed in Table 22. An examination of Table
22 reveals only three areas of difference, all of which involve young gifted boys.

Gifted Children 66
Specifically, young gifted boys had fewer cognitive problems and showed fewer
symptoms of ADHD, as indicated by significantly lower scores on both the ADHD index
and the DSM-IV Inattention Symptom Subscale. The effect size for each of the
differences was medium.
I ' " !:

Gifted Children 67
Table 22
CPS: Independent Sample t Test Comparisons, by Gender and Age Group, of Gifted
Sample to Normative Data
Subscale Gender Age M(SD) t p Effect
Size Gifted Norm
Opp Girls 6-8 6.50 (2.88t 4.92 (4.88)e 1 .3 1 n/s
9- 1 1 6.04 (5.00)b 4.76 (5.20/ 1 . 1 8 n/s
Boys 6-8 7.00 (6.96)c 5.75 (5.53)g 0.66 n/s
9- 1 1 6.75 (5.95)d 6.07 (5.67)h 0.61 n/s
Cog Girls 6-8 2.67 (2.80) 4.56 (6.30) - 1 .58 n/s
9-1 1 5 .57 (5.34) 4.50 (6.21) 0.9 1 n/s
Boys 6-8 4.07 (4.05) 7.46 (7.61 ) -2.42 .008 -0.45
9- 1 1 8.72 (8.76) 8.33 (8.47) 0.24 n/s
Hyp Girls 6-8 2.67 (2.88) 3 .04 (4.76) -0.3 1 n/s
9- 1 1 2. 17 (2.41 ) 1 .78 (2.88) 0.73 n/s
Boys 6-8 2.71 (3 .58) 4.22 (5.40) -1 .5 1 n/s
9- 1 1 5 .03 (4. 19) 3 .3 1 (4.83) 2. 1 6 n/s
Anx Girls 6-8 3 .67 (2.88) 3.94 (3 .85) -0.23 n/s
9- 1 1 3 .48 (4.00) 2.78 (3.53) 0.8 1 n/s
Boys 6-8 2.29 (3.50) 3 .79 (4.20) - 1 .56 n/s
9- 1 1 2.56 (2.63) 2.96 (3 .84) -0.77 n/s
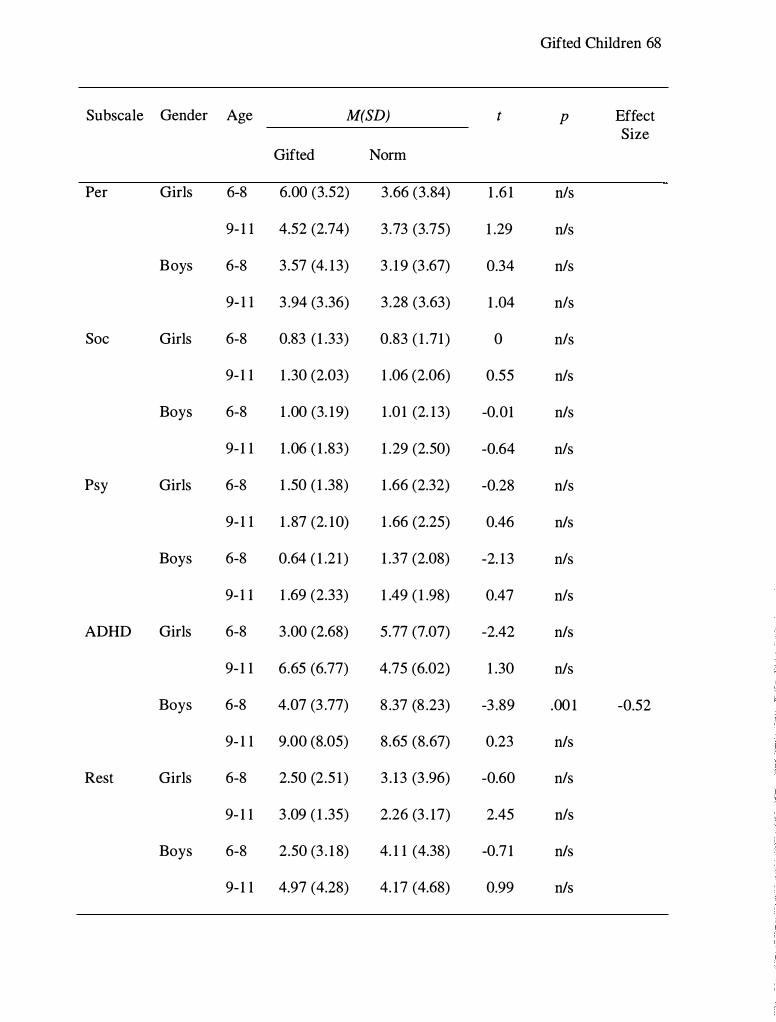
Gifted Children 68
Subscale Gender Age M(SD) t p Effect Size
Gifted Norm
Per Girls 6-8 6.00 (3.52) 3 .66 (3.84) 1 .6 1 nls
9- 1 1 4.52 (2.74) 3 .73 (3.75) 1 .29 nls
Boys 6-8 3.57 (4. 13) 3 . 1 9 (3 .67) 0.34 nls
9- 1 1 3 .94 (3 .36) 3 .28 (3.63) 1 .04 nls
Soc Girls 6-8 0.83 ( 1 .33) 0.83 ( 1 .71 ) 0 nls
9- 1 1 1 .30 (2.03) 1 .06 (2.06) 0.55 nls
Boys 6-8 1 .00 (3. 19) 1 .0 1 (2. 13) -0.01 n/s
9- 1 1 1 .06 ( 1 .83) 1 .29 (2.50) -0.64 nls
Psy Girls 6-8 1 .50 ( 1 .38) 1 .66 (2.32) -0.28 n/s
9- 1 1 1 .87 (2. 10) 1 .66 (2.25) 0.46 n/s
Boys 6-8 0.64 ( 1 .2 1 ) 1 .37 (2.08) -2. 1 3 nls
9- 1 1 1 .69 (2.33) 1 .49 ( 1 .98) 0.47 nls
ADHD Girls 6-8 3.00 (2.68) 5.77 (7.07) -2.42 n/s
9- 1 1 6.65 (6.77) 4.75 (6.02) 1 .30 n/s
Boys 6-8 4.07 (3 .77) 8 .37 (8 .23) -3 .89 .00 1 -0.52
9- 1 1 9.00 (8.05) 8.65 (8.67) 0.23 n/s
Rest Girls 6-8 2.50 (2.5 1 ) 3 . 13 (3 .96) -0.60 nls
9- 1 1 3 .09 ( 1 .35) 2.26 (3 . 17) 2.45 nls
Boys 6-8 2.50 (3 . 1 8) 4. 1 1 (4.38) -0.7 1 n/s
9- 1 1 4.97 (4.28) 4. 17 (4.68) 0.99 n/s

Gifted Children 69
Subscale Gender Age M(SD) t p Effect Size
Gifted Norm
Emo Girls 6-8 2. 17 ( 1 .33) 1 .66 ( 1 .88) 0.92 nls
9- 1 1 1 .30 (4.43) 1 .32 ( 1 .76) -0.02 nls
Boys 6-8 1 .50 (2. 1 8) 1 .83 (2. 1 1 ) -0.56 nls
9- 1 1 1 .63 (2.00) 1 .66 ( 1 .94) -0.08 nls
C-Total Girls 6-8 4.67 (2.34) 4.79 (5.28) -0. 1 2 nls
9-1 1 4.43 (3.60) 3 .58 (4.36) 1 .07 nls
Boys 6-8 4.00 (5.04) 5.94 (5.94) - 1 .40 nls
9- 1 1 6.59 (5.67) 5.82 (6. 15) 0.72 nls
D-Inn Girls 6-8 2.67 (2.66) 4.24 (5.24) - 1 .39 nls
9- 1 1 5 .74 (6.20) 3 .54 (4.6 1 ) 1 .67 nls
Boys 6-8 3.57 (2.77) 6.27 (6.03) -3 .32 .004 -0.45
9- 1 1 6.63 (6. 1 2) 6.68 (6.67) -0.04 n/s
D-Hyp Girls 6-8 3. 17 (2.23) 3 .48 (4.95) -0.33 nls
9- 1 1 3.39 (2.82) 2.49 (3.49) 1 .44 nls
Boys 6-8 4.07 (3.34) 4.86 (5.42) -0.84 nls
9- 1 1 6.25 (5.04) 3.84 (5. 14) 2.55 nls
D-Total Girls 6-8 5.83 (4.79) 7.72 (9.69) -0.93 nls
9-1 1 9 . 1 3 (8.26) 6.06 (7.38) 1 .73 nls
Boys 6-8 7.64 (5.73) 1 1 . 13 ( 10.72) -2. 1 3 nls
9- 1 1 12.88 ( 10.36) 10.52 ( 10.99) 1 .2 1 nls

Gifted Children 70
Note. CPS = Connors' Parent Rating Scale - Revised: Long Form; Subscales of the CPS include: Opp =
Oppositional; Cog = Cognitive Problems I Inattention; Hyp = Hyperactivity; Anx = Anxious I Shy; Per =
Perfectionism; Soc = Social Problems; Psy = Psychosomatic; ADHD = ADHD Index; Rest = Conners'
Global Index (Restless - Impulsive); Emo = Conners Global Index (Emotional Lability); C-Total =
Conners' Global Index (Total Score); D-Inn = DSM-IV Symptom Inattention; D-Hyp = DSM-IV Symptom
Hyperactivity; D-Total = DSM-IV Symptom Total; t = t score; p = significance, two-tailed; n/s = not
significant; a df= 5; b df= 22; c df= 13; d df= 3 1 ; e df= 307; f df= 28 1 ; g df= 326; h df= 265

Chapter 4
Discussion
Gifted Children 7 1
It was hypothesized in this investigation that, on the TOVA, gifted children (a)
have faster average response times, (b) have less response time variability, (c) have a
lower D Prime score, (d) make fewer errors of commission, and (e) make fewer errors of
omission. For the CTS and CPS it was hypothesized that there would be no significant
differences between the scores of gifted children and the normative sample. Each of the
hypotheses for the TOVA, CTS and CPS were generally supported by the findings.
However, the results also suggest that the original hypotheses, namely that gifted children
would perform "better" than non-gifted children on the TOV A and perform "the same"
on the CTS and CPS, were overly simplistic. While each of the original hypotheses was
partially supported by the findings, the findings were too multifaceted to justify a single
conclusion applicable to all variables of each instrument utilized. For example, gifted
children did perform uniformly "better" than the normative sample on three of the five
TOV A variables, and scores on the CTS and CPS were not found to be uniformly
equivalent to the normative sample.

Gifted Children 72
Nevertheless, the findings do address the underlying clinical question regarding
the appropriateness of using the normative data provided for the TOVA, CTS and CPS to
assess ADHD in intellectually gifted children. Ultimately, the performance differences
found for gifted children on the TOVA, that only young gifted children are faster, more
consistent and more attentive, suggest that the TOV A needs alternate norms when used
with young gifted children. On the other hand, the differences between samples on the
CTS and CPS were found almost exclusively for variables unrelated to ADHD,
suggesting that the normative data for the Conners' Scales can be used when assessing
ADHD in gifted children.
Clinical Implications
While this study suggests that alternate TOVA norms are needed for gifted
children, it also shows how the current norms can be adjusted to create developmental
norms which can be used in lieu of actual gifted and talented norms. Therefore, clinicians
who use the TOV A variables of Response Time, Response Time Variability and
Omission Error Percentage to help diagnose ADHD in gifted children can now, by using
Table 14, have a better sense of the nature of what is "normal" gifted performance on the
TOV A. The use of the developmental norms can help clinicians detect manifestations of
ADHD in young gifted children that may otherwise escape notice.
B y making some developmental adjustments, a fairly simple guideline was
generated that allowed use of current TOVA norms for younger gifted children.
However, no corresponding transformational mechanism was provided for the CTS and
CPS. That is because there is less change in scores found across ages on the two
Connors' Scales. In part this is because the Conners' Scales use subjective impressions of

Gifted Children 73
either a teacher or parent. Contributing to the instrument's subjectivity is the
heterogeneous nature of the items that are used to index a given variable. In addition to
the subjectivity of the instrument and the heterogeneity of questions defining a scale, the
norms for the CRS are grouped together by gender in three year blocks, suggesting that
there is not appreciable change in variable scores over time. Finally, the standard
deviation for 96% of CTS and CPS variables is nearly equal to or greater than the
variable mean. This shows that there is little difference in scores between age blocks on
most of the CRS variables, and also that the variability within an age block equals or
exceeds the variability across age blocks. All of these characteristics of the CTS and CPS
scales prevents the creation of any simple transformational guideline that would allow
easy norm adjustments for gifted children. In fact, since there is such minimal difference
from 6 to 1 2 years of age on most of the CTS and CPS variables, there seems to be little
need for any transformation to account for developmental change.
One additional observation relevant to the TOV A is that, while the need for new
norms for young gifted children is an important clinical finding, it is also true that since
the adjusted norms are only needed for gifted children younger than 10, the TOV A can
still be used in its present form with a substantial proportion of gifted individuals.
The findings of this study also have implications for using the TOV A with
children who are mentally retarded. Consistent with the reaction time patterns found in
persons of high intelligence, mentally retarded individuals have generally slower rates of
response time than nonretarded individuals (Lally & Nettlebeck, 1977). It may be that,
due to the developmental nature of reaction time, the TOV A norms may also be

Gifted Children 7 4
inappropriate when assessing ADHD in children with significant intellectual delays, and
that an adjustment matrix might be clinically relevant for this subpopulation as well.
The results of this study give insight into gender differences both between gifted
children and children from the normative samples. For example, the superior
performances found on the TOV A, CTS, and CPS are generally consistent across gender.
The elevated score for gifted boys on the Perfectionism scale of the CTS was the only
gender difference not found for both gifted boy and girls, and this difference appears to
be driven mainly by scores on a single test item with the wording "sets very high goals
for self'. Furthermore, within-sample analyses of the gifted sample found no significant
performance differences between genders on any of the variables, which contrasts with
the numerous gender differences found in the normative samples for these three
instruments.
Contrary to the TOV A findings, results indicate that norms from the CTS and
CPS can be directly used to assess ADHD in gifted children. This is also an important
clinical finding because clinicians working with gifted children have only the normative
guidelines based upon a representative sample of the population, regardless of the
assessment instruments selected. Now that the Conners' Scales have been shown to be
appropriate for gifted and talented children, clinicians can employ them with greater
confidence when assessing this special pediatric population.
Previous Research
While it is important to interpret new research cautiously in the context of
previous findings, there is no previous research examining the performance of gifted
children on the TOV A, CTS and CPS, or any other commonly used measure of ADHD.

Gifted Children 75
However, results from this study can be compared to the findings of indirectly-related
research.
Chae (2000) examined the relationship between TOV A performance and IQ. His
study found no correlation between IQ and TOVA performance. However, Chae's study
was conducted using teenagers. In light of the current finding that TOV A performance
for gifted children only differs from that of non-gifted children prior to age 1 0, Chae' s
findings are consistent, albeit only partially accurate. Similarly, no significant correlation
was found between IQ and TOV A performance for the gifted sample, but that is probably
due to the restricted range of iQ's in the gifted sample. Given the findings of this study,
it is likely that a relationship exists in young children between TOV A performance and
IQ.
Several findings of this study, particularly with the Conners' Scales, are
consistent with the literature on gifted children. For example, Conners' Scales' levels of
oppositional behavior, perfectionism, and a trend for older boys to be more hyperactive
are consistent with known characteristics of gifted children (LoCicero & Ashby, 2000).
The literature also suggests that gifted children have fewer behavioral problems,
including ADHD related behaviors, which was also supported by this study (Garland &
Zigler, 1 999; Grossberg & Cornell, 1988; Neihart, 1999). The finding that gifted
children had fewer cognitive problems is consistent with the definition of intellectual
giftedness. Lastly, it was not surprising to see that gifted girls had significantly lower
scores on several ADHD related variables, given that girls in general are less likely to be
diagnosed with ADHD.

Gifted Children 76
Limitations
Several limitations were present in this study, most of which were methodological
in nature. The initial plan was to obtain matched samples of normative data for each test
so that more robust statistical analyses could be used. Obtaining the desired matched
samples was not possible, so the gifted sample was compared to the published norms
using independent sample t Tests with an applied Bonferroni Correction for multiple t
Tests.
Another aspect of the original plan was to obtain a sample of at least 1 20 gifted
children so the sample could be divided into four sub-groups (two age groups by gender),
each containing 30 subjects. It was found, however, that participating TAG programs
had many more boys than girls, and more older children than younger children.
Therefore, the sample of this study reflected a higher percentage of boys, and older
children.
One unforeseen potential confound in the study was the use of multiple IQ tests to
verify that the children qualified for the study. However, an analysis of these sub-groups
defined by IQ test used found no differences across groups on any of the study variables,
suggesting that the IQ scores obtained from the various instruments could be combined.
The final potential limitation of the study involves the study demographics. The
ethnic homogeneity of the sample (98% were Caucasian) and the geography from which
the sample was taken (all from the Pacific Northwest) are both methodological
weaknesses that may limit the generalizability of these findings to ethnic minorities and
gifted children from other geographic areas of the US. While an ideal sample is
randomly stratified to match US Census data for both location and ethnicity, the current

Gifted Children 77
literature on gifted children does not report any differences in core gifted characteristics
based on geography. Furthermore, while there is much debate about the way various
ethnic minorities are identified as gifted, the literature, again, does not report differences
in core characteristics of giftedness based on race or ethnicity. In sum, there is no
compelling reason to believe that the gifted children in this study are significantly
different than other intellectually gifted children in the United States, and therefore the
findings are likely generalizable.
Future Research
Even with the adapted developmental norms providing a better norm set, using
the TOV A to help diagnose ADHD in gifted children will continue to involve some
clinical intuition until a reasonably large sample of gifted I ADHD children can be tested
to provide useful norms. Until this happens, and it is unlikely to happen because of the
prohibitive cost involved and the minimal demand, there is no way to know what
deviations from the developmental norms might actually indicate about a child. How
much slower or more variable does a gifted child' s performance need to be to raise the
proverbial "red flag?" While answers to this and similar questions are as yet unknown, at
least there are now approximate norms against which clinicians can begin to make
comparisons.
The findings from this study, in fact, can help narrow the focus of future TOV A
research with gifted children. For example, collecting a sample of gifted children with
ADHD becomes an easier task since only children younger than ten would be needed.
Another area for future research is to determine whether the differences found for
intellectually gifted children are true for children enrolled in TAG programs, but are
Gifted Children 78
identified by performance other than IQ. This would be important information to know
because it seems likely that, in the future, increasingly fewer gifted children will actually
be IQ identified. Tight education budgets combined with decreased funding for gifted
programs have changed the way gifted children are identified. For example, in the two
school districts participating in this study, only half of the children in the TAG programs
were IQ identified. The other 50% of the students qualified for the TAG program with
superior scores on standardized tests of reading or mathematics. Furthermore, limited
resources means that children who qualify for TAG programs via reading or math
performance will not be given an IQ test, so, in most cases, the IQ of at least half of the
children in the TAG programs will be unknown.
In summary, the findings answer the underlying clinical question of this
investigation regarding the usefulness of the normative data provided for the TOV A, CTS
and CPS in assessing ADHD in gifted children. The performance differences between
gifted and norms provided on the TOV A suggest the need for alternate TOV A norms for
young gifted children, while no evidence was found to suggest the norms for the CTS and
CPS are inappropriate for gifted children. For the TOV A, developmental norms appear
to be more appropriate than age-based norms for younger gifted children. On the other
hand, the differences on the CTS and CPS were found almost exclusively in variables
unrelated to ADHD, suggesting that the normative data for both Conners' Scales are
appropriate for use in the assessment of ADHD in gifted children.

Gifted Children 79
References
Achenbach, T. ( 1991 ). Integrative guide for the 1991 CBCU4-18, YSR, and TFR
profiles. Burlington, VT: University of Vermont Department of Psychiatry.
Alvino, J . , McDannel, R. C., & Richert, S. ( 1 98 1 ). National survey of identification
practices in gifted and talented education. Exceptional Children, 48, 2, 1 24 - 1 32.
American Psychiatric Association. ( 1 994). Diagnostic and statistical manual of
mental disorders (41h ed.). Washington DC: Author.
Barkley, R. A. ( 1991 ) . The ecological validity of laboratory and analogue
assessment methods of ADHD symptoms. Journal of Abnormal Child
Psychology, 19, 149-178.
Barkley, R. A. ( 1998). Attention-deficit hyperactivity disorder: A handbook for
diagnosis and treatment (2nd ed.). New York: Guilford Press.
Barkley, R. A., & Murphy, K. R. ( 1998). Attention-deficit I hyperactivity disorder: A
clinical workbook (2nd ed.) . New York: Guilford Press.
Baska, L. K. ( 1989). Characteristics and needs of the gifted. In J. F. Feldhusen, J. Van
Tassel-Baska, K. Seeley (Eds.), Excellence in educating the gifted, (pp. 1 5-28).
Denver: Love Publishing.
Baum, S . M., Olenchak, F. R., & Owen, S. V. ( 1 998). Gifted students with
attention deficits: Fact and/or fiction? Or, can we see the forest for the trees?
Gifted Child Quarterly, 42, 2, 96- 104.
Carlson, J . S . , & Jensen, C. M. ( 1 982). Reaction time, movement time, and intelligence:
A replication and extension. Intelligence, 6, 265-274.

Gifted Children 80
Chae, P. K. ( 1 999). Correlation study between WISC-III scores and TOVA
performance. Psychology in the Schools, 36, 3, 179 - 185.
Clark, B . ( 1 988). Growing up gifted: Developing the potential of children at home and at
school (3rd ed.). New York: Macmillan.
Cohen, J. ( 1 998). A power primer. In A. E. Kazdin (Ed.), Methodological issues
and strategies in clinical research (2nd ed., pp. 339 - 349). Washington, DC:
American Psychological Association.
Conners, K. C. ( 1 992) . Conners ' continuous peiformance test users manual.
Toronto, Ontario, Canada: Multi-Health Systems.
Conners, K. C. ( 1995). Conners ' continuous peiformance test users manual.
Toronto, Ontario, Canada: Multi-Health Systems.
Conners, K. C. ( 1 997). Conners ' rating scales - revised technical manual.
North Tonawanda, NY: Multi-Health Systems.
Conners, K. C. ( 1999). Conners rating scales - revised. In M. E. Muruish
(Ed.), The use of psychological testing for treatment planning and outcomes
assessment, (2nd ed., pp. 467-495). Mahwah, New Jersey: Lawrence Earlbaum
Associates.
Conners, K. C., Sitarenios, G., Parker, J. D. A. ,& Epstein, J. N. ( 1998a). The
revised Conners' parent rating scale (CPRS-R): Factor structure, reliability and
criterion validity. Journal of Abnormal Child Psychology, 26, 4, 257-268.
Conners, K. C., Sitarenios, G. , Parker, J. D. A. ,& Epstein, J. N. ( 1998b).

Gifted Children 8 1
Revision and restandardization of the Conners' teacher rating scale (CTRS-R):
Factor structure, reliability and criterion validity. Journal of Abnormal Child
Psychology, 26, 4, 279-29 1 .
Corkum, P . V., & Siegel, L. S . ( 1993). Is the continuous performance task a
valuable research tool for use with children with attention-deficit hyperactivity
disorder? Journal of Child Psychology &Psychiatry &Allied Disciplines, 34,
1 2 1 7 - 1 239.
DuPaul, G. J., Power, T. J., Anastopoulos, A. D., & Reid, R. ( 1 998). ADHD
rating scale--IV: Checklists, norms, and clinical interpretation. New York: The
Guilford Press.
Flint, L. J. (2001 ). Challenges of identifying and serving gifted children with
ADHD. Teaching Exceptional Children, 33, 4, 62-69.
Forbes, G. B . ( 1 998). Clinical utility of the Test of variables of attention (TOV A)
in the diagnosis of attention-deficit/hyperactivity disorder. Journal of Clinical
Psychology, 54, 4, 461 -476.
Gallucci, N. T., Middleton, G., & Kline, A. ( 1999) . Intellectually superior children and
behavioral problems and competence. Roeper Review, 22, 1 8-23.
Garland, A. F., Zigler, E. ( 1 999). Emotional and behavioral problems among highly
intellectually gifted youth. Roeper Review, 22, 4 1 -45.
Goldman, L. S . , Genel, M., Bezman, R. J.,& Slanetz, P. J. ( 1998). Diagnosis
and treatment of attention deficit I hyperactivity disorder in children and
adolescents. Journal of the American Medical Association, 279, 14, 1 100 - 1 007.
Gordon, M. ( 1 983). The Gordon diagnostic system. DeWitt, NY: Gordon

Systems.
Greenberg, L. M. ( 1 999). Test of variables of attention (TOVA). Los
Alimitos, CA: Universal Attention Disorders.
Gifted Children 82
Greenberg, L. M., Kindschi, C. L. , & Corman, C. M. (2000). Test of variables of
attention clinical guide. Los Alimitos, CA: Universal Attention Disorders.
Greenberg, L. M., & Waldman, I. D. ( 1993). Developmental normative data on the test of
variables of attention (T.O.V.A.). The journal of Child Psychology and
Psychiatry, and Allied Disciplines, 34, 6, 1019 - 1030.
Grossberg, I. N., & Cornell, D. G. ( 1 988). Relationship between personality adjustment
and high intelligence: Terman versus Hollingworth. Exceptional Children, 55,
266-272.
Hollingworth, L. S. ( 1942). Children above 180 IQ Stanford-Binet: Origin and
development. Yonkers, NY: World Book.
Kamphaus, R. W., & Reynolds, C. R. ( 1998). BASC ADHD monitor. Circle
Pines, MN: American Guidance Service.
Kaplan, B . J . , Crawford, S. G., Dewey, D. M., & Fisher, G. C. (2000). The IQs of
children with ADHD are normally distributed . Journal of Learning Disabilities ,
33, 5, 425-432.
Lally, M., & Nettelbeck, T. ( 1 977). Intelligence, reaction time, and inspection time.
American Journal of Mental Deficiency, 82, 3, 273-28 1 .
Leark, R. A., Dupuy, M. S. , Greenberg, L. M., Corman, M. D., & Kindschi, C. L.
( 1 998) . Test of variables of attention: Professional guide. Los Alimitos, CA:
Universal Attention Disorders.
Gifted Children 83
Leroux, J. A. , & Levitt-Perlman, M. (2000). The gifted child with attention deficit
disorder: An identification and intervention challenge. Roeper Review, 22, 3, 1 7 1 -
1 76.
LoCicero, K. A., & Ashby, J. S . (2000). Multidimensional perfectionism in middle
school age gifted students: A comparison to peers from the general cohort.
RoeperRreview, 22, 3, 1 82-1 86.
Maxwell, E. ( 1 998). " I can do it myself! " Reflection on early self-efficacy. Roeper
Review, 20, 3, 1 83- 1 88.
McKinney, J . D., Montague, M., & Hocutt, A. M. ( 1 993). Educational assessment
of students with attention deficit disorder. Exceptional Children, 60, 2, 1 25- 1 3 1 .
Moon, S . M., Zentall, S . S . , Grskovic, J . A., Hall, A. & Stormont, M. (2001) .
Emotional and social characteristics of boys with AD/HD and giftedness: A
comparative case study. Journal for the Education of the Gifted, 24, 3, 207-247.
Naglierei, J. A., LeBuffe, P. A., & Pfeiffer, S. I. ( 1 994). Devereux scales of
mental disorders. San Antonio, TX: The Psychological Corporation.
National association for gifted children: parent information. (n.d.). Retrieved
March 13, 2002, from http://www.nagc.org/Parentlnfo.
Neihart, M. ( 1 999). The impact of giftedness on psychological well-being: What
does the empirical literature say? Roeper Review, 22, 1 , 1 0 - 1 8
Reis, S . M., Renzulli, J. S . , (2004). Current research on the social and emotional
development of gifted and talented students: Good news and future possibilities.
Psychology in the Schools, 41, 1, 1 19- 1 30.
Renzulli, J. ( 1 978). What makes giftedness? Reexamining a definition. Phi

Gifted Children 84
Delta Kappan, 60, 1 80 - 1 84, 261 .
Reynolds, C. R., & Kamphaus, R. W. ( 1992). Behavior assessment system for
children. Circle Pines, MN: American Guidance Service.
Riccio, C. A., Reynolds, C. R., & Lowe, P. A. (2001) . Clinical applications of
continuous peiformance tests. New York: John Wiley & Sons.
Rosvold, H. E., Mirsky, A. , Sarason, 1., Bransome, E. D., & Beck, L. H. ( 1 956).
A continuous performance test of brain damage. Journal of Consulting
Psychology, 20, 343 - 350.
Sanford, J. A., & Turner, A. ( 1 994). Integrated visual and auditory (IVA)
continuous peiformance test. Richmond, VA: BrainTrain.
Scahill, L., & Schwab-Stone, M. (2000). Epidemiology of ADHD in school-aged
children. Child and Adolescent Psychiatric Clinics of North America, 9, 3, 541 -
555.
Sears, R. R. ( 1 977). Sources of life satisfaction of the Terman gifted men.
American Psychologist, 32, 1 19 - 129.
Shaywitz, S . E., Holahan, J. M., Freudenheim, D. A., Flectcher, J. M., Makuch R. W., &
Shaywitz, B . A. (2001 ). Heterogeneity within the gifted: Higher IQ boys exhibit
behaviors resembling boys with learning disabilities. Gifted Child Quarterly, 45,
1 6-23.
Stanley, J. C. ( 1980). On educating the gifted. Educational Researchers, 9, 8-12.
Stubbe, D. E. (2000). Attention-deficit/hyperactivity disorder overview:
Historical perspective, current controversies and future directions. Child and
Adolescent Psychiatric Clinics of North America, 9, 3, 469 - 479.

Gifted Children 85
Terman, L. M. ( 1 925). Mental and physical traits of a thousand gifted children. In
L. M. Terman (Ed.), Genetic studies of genius (val. 1 ). Stanford, CA: Stanford
University Press.
Terman, L. M., & Oden, M. H. ( 1959). The gifted group at mid-life: Thirty-five
years ' follow-up of the superior child. Stanford, CA: Stanford University Press.
Trommer, B. L., Hoeppner, J. B . , Lorber, R. , & Armstrong, K. ( 1988). Pitfalls in
the use of continuous performance tests as a diagnostic tool in attention deficit
disorder. Developmental and Behavioral Pediatrics, 9, 339 - 346.
Webb, J. T., & Latimer, D. ( 1 993). ADHD and children who are gifted. Exceptional
children, 60, 2, 1 83- 1 84.
Whitmore, J. R. ( 1985). Characteristics of gifted children. Reston, VA: ERIC
Clearinghouse on handicapped and gifted children. (ERIC Document
Reproduction Service No. ED 262 5 17).
Zentall, S. S . , Moon, S . M., Hall, A. M., & Grskovic, J. A. (2001) . Learning and
motivational characteristics of boys with AD/HD and/or giftedness. Exceptional
Children, 67, 4, 499-5 19 .

Gifted Children 86
Appendix A
Letter to Parent/Guardian

Gifted Children 87
Dear Parent/Guardian:
With the permission of the School District, children in your child' s gifted and talented program are being invited to participate in a study to explore the appropriateness of methods currently used to diagnose ADHD (Attention Deficit Hyperactivity Disorder) in intellectually gifted children. To investigate this, the first step will be finding out how all gifted children perform on commonly used ADHD screening measures. We hope you will allow your child to help out.
In this study, children who participate will be asked to "play" a game-like computer task that requires him/her to respond quickly to targets by pressing a hand held button. The task is designed to measure the ability to pay attention for about 20 minutes. Upon completing the task your child will receive a small gift as a way for us to say "thank you." The attention task will be done individually with a trained George Fox graduate student in a quiet area near your child's classroom. Dr. Wayne Adams is the faculty member supervising this research. We hope to start in May or June of this year.
If you allow your child to participate, you and your child' s teacher will also each be asked to complete a 15-minute questionnaire on your child. For your convenience, the questionnaire will be mailed directly to you along with a self addressed, stamped envelope. In addition, we are asking your permission to view the IQ test scores from your child's school file to verify your child's eligibility to be in the study. All individual information will be kept strictly confidential.
You will also receive a summary of the study' s findings once all data are analyzed.
If you are willing to allow your child to participate in this study, simply complete the attached sheet, and mail it using the provided stamped, preaddressed envelope.
Should you have any questions, please feel free to call me (503-538-1 348). I hope you and your child will be able to help out.
Kent Rosengren, MA
Thank you,
Graduate Student Graduate School of Clinical Psychology George Fox University

Parent Permission Form Please return before May 1 5th
Child' s Name:-----------------
Child' s date of Birth: ___ I ___ I __ _
Month Day Year
Your phone number:----------
Gifted Children 88
Your Address (So we can send you the parent questionnaire and the results of the study.)
Street address city/town zip
I give my permission for my child to participate in the giftedness study described by Kent Rosengren on the attached sheet. Furthermore, I give my permission for my child' s teacher to complete a questionnaire on my child. It is acceptable to provide Mr. Rosengren my child' s IQ test score on file in order to verify eligibility for this study.
parent/guardian signature today' s date
Please place this page in the provided stamped envelope and mail to:
Kent Rosengren Graduate School of Clinical Psychology
George Fox University 414 N. Meridian
Newberg, OR 97132
Thank you for your help.

Appendix B
TOV A Administration
Gifted Children 89

Gifted Children 90
General Requirements As with other assessment tools, it is important for the subject and the examiner to have
developed sufficient interpersonal rapport prior to test administration. Further, the computer should be in a sturdy, comfortable position easily seen by the subject. The testing environment, including seating arrangements, should be comfortable, and lighting must not produce glare off the monitor or LCD. The TOV A was normed with tests administered prior to 1 p.m. to avoid diurnal variations. Test order has not been studied. The examiner should be present at all times during testing (to adhere to norming procedures). Prompting is permitted during the practice session, but not during the actual testing. The test is not language dependent, allowing instructions to be given in the subject' s native language.
Computer Preparation It is recommended that the computer with the TOV A software already be "booted up"
and the software application running when the subject enters the room. Testing begins with the examiner entering the necessary demographic data for the subject. Necessary demographic data for the subject includes (a) name, (b) birth date, (c) gender, (d) subject number (assigned by the examiner), (e) session number (default is 0 1 ), (e) date (default is the current date), (f) time (default is the current time) and (g) examiner. There is also an optional section to record any current medications the subject is taking and a space for examiner comments.
Administration of the Practice Test The examiner will slowly read (or paraphrase) the following:
"This test measures you ability to pay attention. Two different kinds of squares will flash on the computer screen. The squares will differ only in that one of them will have a small hole near the top (indicate with a picture or use the SHOW VISUAL STIMULI function under the TEST menu) and one will have a hole near the bottom (indicate) . We want you to press this button (indicate) every time you see the square with the hole near the top (indicate). (Find out which hand they use for writing.) I want you to hold this button in your writing hand with your thumb resting lightly on the top, like this (indicate) . Here . . . take the button. Let up when you hear the click. Don't hold the button down very long. Push it only once for each correct picture."
"Now we are going to flash the squares on the screen, and your job is the press the button AS FAST AS YOU CAN every time you see a square with a hole near the top (indicate). But the trick is you are NOT to press the button when the hole is near the bottom (indicate). Remember, press the button as fast as you can but only for the square with the hole near the top. The whole idea for this test is for you to be as fast, but also as accurate as you can. Try not to make any mistakes. But, if you do make a mistake . . . don't get upset, don't worry. Everyone can make a mistake on this test. Try and press the button as fast as you

Gifted Children 9 1
can but only for the square with the hole in the top. Don't be too fast - take enough time to see what the picture is. Don't guess. Once you've pressed the button, let up. Don't press it more that once when you see the correct signal. Any questions?"
"Now we are going to have a short practice. After you press the button, you are going to see a dot appear in the middle of the screen. That's where the squares are going to appear. After the dot appears, the numbers 3 . . . 2 . . . l .are going to appear and then the first square will start to flash on the screen. Remember, the whole idea is to be as fast AND as accurate as you can be.
Any questions?"
Starting the Practice Test The examiner then starts the practice test. The practice test lasts for 3 minutes.
Observe to ensure that the subject is doing it correctly and give prompts freely during the practice test. Instruct again if necessary, and rerun the practice if necessary until the subject understands. The examiner may wish to check the practice test results. If errors are excessive, repeat the practice test after reviewing the instructions with the subject.
The examiner is strongly encouraged to keep notes of behavioral observations, especially noting distractibility, attentiveness, mood, compliance, activity level, style of performance, medications and dosages taken within the last 1 2 hours.
Administering the TOVA After the 3-minute practice test is over, the examiner slowly reads (or paraphrases) the following:
"OK, now we are going to do the test for about 20 minutes. Do the best job you can. Also, you should know that your eyes are probably going to get a little tired. Even so, try and do the best job you can . . . press the button as quickly as you can but only for the square with the hole in the top."
"I' ll be staying here while you do the test, but I can't talk to you once the test starts. Do you have any questions before we begin?"
"Ready, here we go . . . start watching the screen."
The examiner then starts the test. Observe to see if the subject is on task, and how the subject is reacting to the test. The examiner is instructed NOT to prompt unless it is absolutely necessary; i.e., only if the test results would be invalid without prompting. Record each time the subject is prompted. When the testing is complete the data is automatically saved, then screen returns to the homepage and is ready for scoring I interpreting.
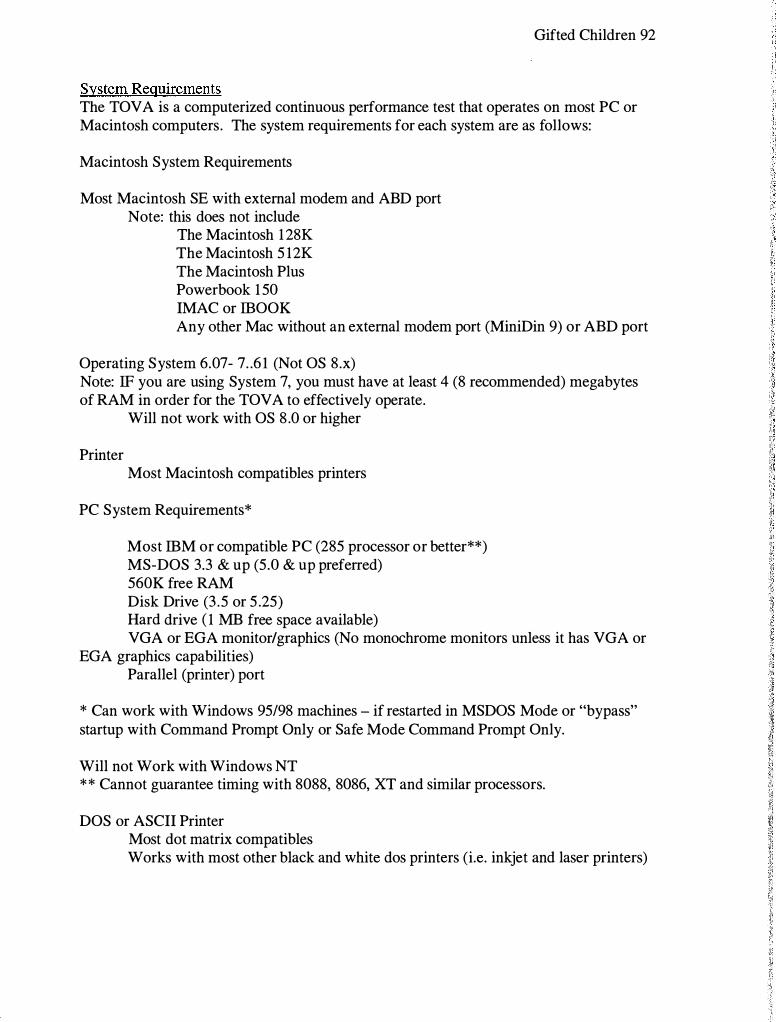
Gifted Children 92
System Requirements The TOV A is a computerized continuous performance test that operates on most PC or Macintosh computers. The system requirements for each system are as follows:
Macintosh System Requirements
Most Macintosh SE with external modem and ABD port Note: this does not include
The Macintosh 128K The Macintosh 5 12K The Macintosh Plus Powerbook 1 50 IMAC or IBOOK Any other Mac without an external modem port (MiniDin 9) or ABD port
Operating System 6.07- 7 . . 6 1 (Not OS 8.x) Note: IF you are using System 7, you must have at least 4 (8 recommended) megabytes of RAM in order for the TOV A to effectively operate.
Will not work with OS 8 .0 or higher
Printer Most Macintosh compatibles printers
PC System Requirements*
Most IBM or compatible PC (285 processor or better**) MS-DOS 3.3 & up (5.0 & up preferred) 560K free RAM Disk Drive (3.5 or 5.25) Hard drive ( 1 MB free space available) VGA or EGA monitor/graphics (No monochrome monitors unless it has VGA or
EGA graphics capabilities) Parallel (printer) port
* Can work with Windows 95/98 machines - if restarted in MSDOS Mode or "bypass" startup with Command Prompt Only or Safe Mode Command Prompt Only.
Will not Work with Windows NT ** Cannot guarantee timing with 8088, 8086, XT and similar processors.
DOS or ASCII Printer Most dot matrix compatibles Works with most other black and white dos printers (i.e. inkjet and laser printers)

Test Materials Software
Gifted Children 93
The TOV A software is installed to the computers hard drive. IT requires the external microswitch/scorebox to execute and requires a printer to print reports, but not to execute or view reports. The storage space for the application is approximately 1 MB, and each report takes 1 2- 15 KB for storage on the hard drive. Microswitch/Scorebox
The TOV A requires the use of an external standardized microswitch/scorebox that is included with the software kit. On the PC, a standardized microswitch/scorebox attaches to the computer via the printer or parallel port (LPT1) . The microswitch/scorebox enables the user to connect their printer to the device, allowing continuous use of the printer port even when the TOV A is not active. On the Macintosh version, the microswitch attaches to the modem port and the scorebox attaches to the ABD or keyboard port.

Appendix C
Demographic Questionnaire
Gifted Children 94

Q 1 . Age of your child' s last birthday: __ years.
Q2. Gender (circle number for your answer)
1 male
2 female
Q3 . Ethnicity:
1 African American
2 Hispanic
3 American Indian
4 Asian
5 Caucasian
6 Other
Gifted Children 95
Q4. List any medications your child is currently taking: , for example, for allergies, asthma, cold or flu, etc.

Appendix D
Raw Data
Gifted Children 96
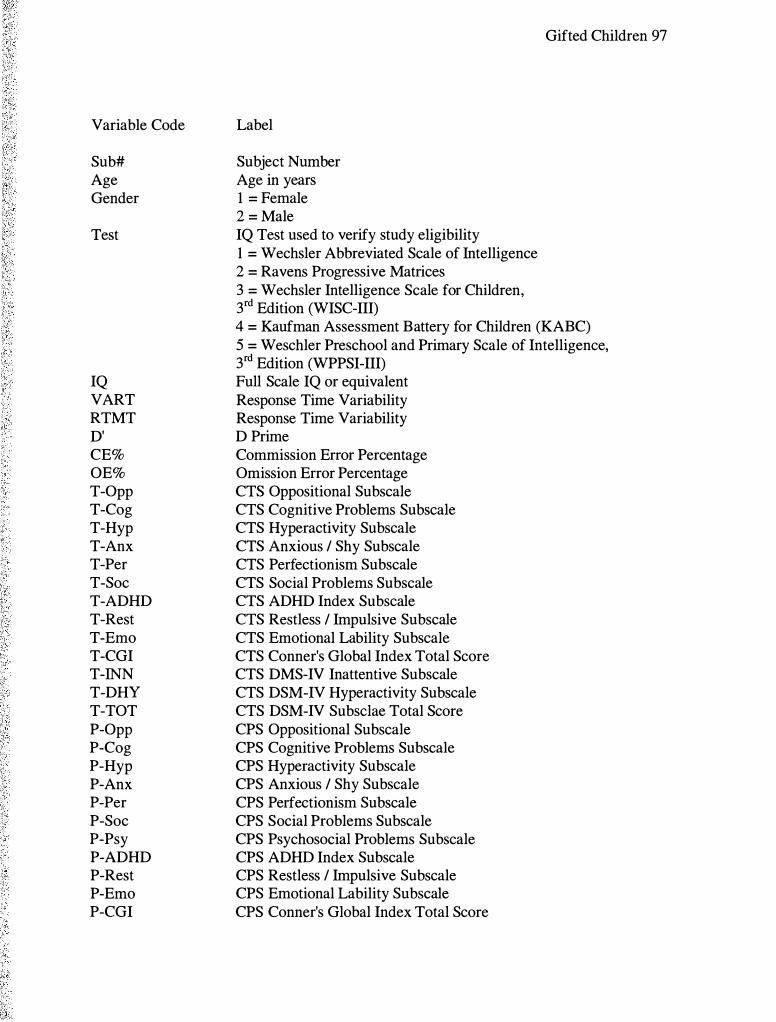
Variable Code
Sub# Age Gender
Test
IQ VART RTMT D' CE% OE% T-Opp T-Cog T-Hyp T-Anx T-Per T-Soc T-ADHD T-Rest T-Emo T-CGI T-INN T-DHY T-TOT P-Opp P-Cog P-Hyp P-Anx P-Per P-Soc P-Psy P-ADHD P-Rest P-Erno P-CGI
Label
Subject Number Age in years 1 = Female 2 = Male IQ Test used to verify study eligibility 1 = Wechsler Abbreviated Scale of Intelligence 2 = Ravens Progressive Matrices 3 = Wechsler Intelligence Scale for Children, 3rd Edition (WISC-III)
Gifted Children 97
4 = Kaufman Assessment Battery for Children (KABC) 5 = W eschler Preschool and Primary Scale of Intelligence, 3rd Edition (WPPSI-III) Full Scale IQ or equivalent Response Time Variability Response Time Variability D Prime Commission Error Percentage Omission Error Percentage CTS Oppositional Subscale CTS Cognitive Problems Subscale CTS Hyperactivity Subscale CTS Anxious I Shy Subscale CTS Perfectionism Subscale CTS Social Problems Subscale CTS ADHD Index Subscale CTS Restless I Impulsive Subscale CTS Emotional Lability Subscale CTS Conner's Global Index Total Score CTS DMS-IV Inattentive Subscale CTS DSM-IV Hyperactivity Subscale CTS DSM-IV Subsclae Total Score CPS Oppositional Subscale CPS Cognitive Problems Subscale CPS Hyperactivity Subscale CPS Anxious I Shy Subscale CPS Perfectionism Subscale CPS Social Problems Subscale CPS Psychosocial Problems Subscale CPS ADHD Index Subscale CPS Restless I Impulsive Subscale CPS Emotional Lability Subscale CPS Conner's Global Index Total Score
Variable Code
P-INN P-DHY P-TOT
Label
CPS DMS-IV Inattentive Subscale CPS DSM-IV Hyperactivity Subscale CPS DSM-IV Subsclae Total Score
Gifted Children 98

Gifted Children 99
Sub# Age Gender Test IQ VART RTMT D' CE% OE%
1 6 1 1 121 157 53 1 3.87 6.50 .93
2 6 2 2 120 145 457 3 .81 4.94 1 .54
3 7 1 5 138 143 503 5 .81 6 .17 .00
4 7 1 1 133 146 458 3 .59 5.88 2. 1 6
5 7 1 3 128 1 14 462 5 .67 8 .03 .00
6 7 1 3 131 159 490 3.79 9.94 .62
7 7 2 3 133 136 405 3.43 1 1 .88 1 .24
8 7 2 1 140 94 367 5.78 6.48 .00
9 7 2 1 145 199 528 3.74 10.87 .62
1 0 7 2 1 157 224 571 3 .29 7.76 3.09
1 1 7 2 1 127 153 41 1 3 .59 10.79 .93
1 2 7 2 1 128 139 394 3.07 16.25 1 .85
1 3 7 2 3 131 133 492 4.04 6.21 .62
14 8 1 1 139 1 82 481 2.49 1 1 .42 9.88
15 8 1 1 136 143 400 3.44 1 1 .60 1 .24
1 6 8 2 1 137 140 414 2.62 16.67 4.94
17 8 2 2 128 1 65 478 3.68 1 2.04 .62
1 8 8 2 2 137 188 527 3.78 5 .31 1 .54
1 9 8 2 3 1 3 1 98 457 5 .83 5.86 .00
20 8 2 2 1 3 1 240 496 3.41 14.55 .93
2 1 8 2 1 136 134 539 4.75 1 .24 .62
22 8 2 1 139 103 365 3.93 7.74 .62
23 8 2 1 132 1 20 47 1 4.99 1 .24 .3 1
24 8 2 3 131 106 446 3.48 6.52 2.47
25 8 2 3 128 147 382 3.40 12.38 1 .24
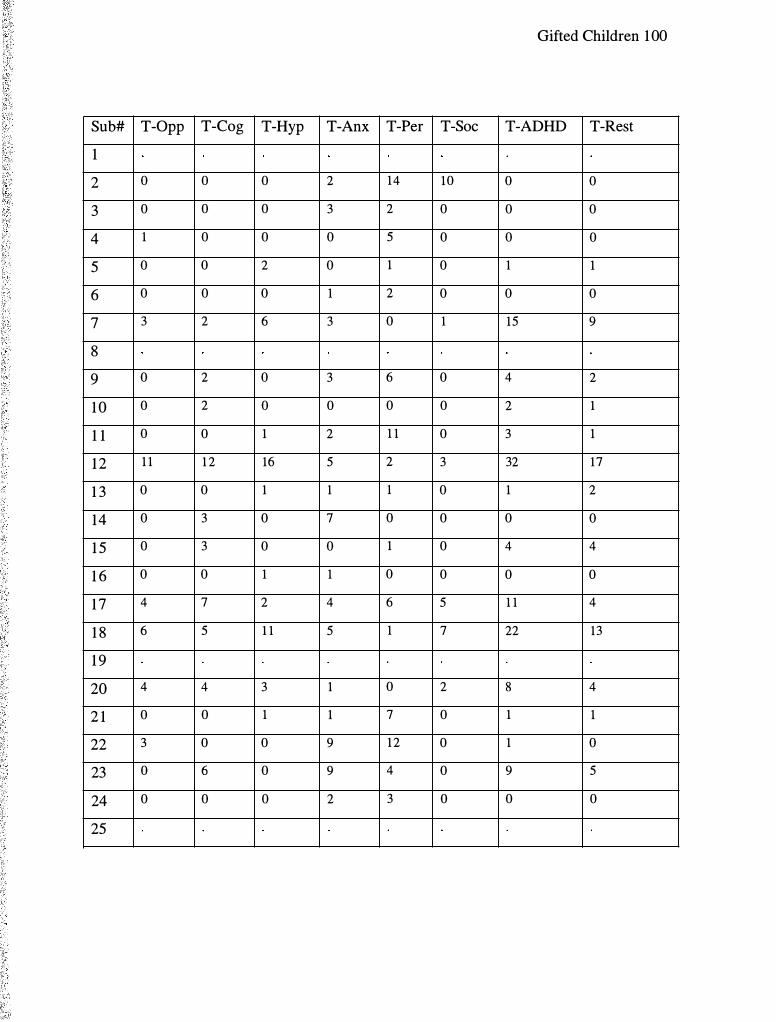
Gifted Children 1 00
Sub# T-Opp T-Cog T-Hyp T-Anx T-Per T-Soc T-ADHD T-Rest
1
2 0 0 0 2 14 10 0 0
3 0 0 0 3 2 0 0 0
4 1 0 0 0 5 0 0 0
5 0 0 2 0 1 0 1 1
6 0 0 0 1 2 0 0 0
7 3 2 6 3 0 1 15 9
8
9 0 2 0 3 6 0 4 2
1 0 0 2 0 0 0 0 2 1
1 1 0 0 1 2 1 1 0 3 1
1 2 1 1 1 2 16 5 2 3 32 17
1 3 0 0 1 1 1 0 1 2
14 0 3 0 7 0 0 0 0
1 5 0 3 0 0 1 0 4 4
1 6 0 0 1 1 0 0 0 0
1 7 4 7 2 4 6 5 1 1 4
1 8 6 5 1 1 5 1 7 22 13
1 9
20 4 4 3 1 0 2 8 4
2 1 0 0 1 1 7 0 1 1
22 3 0 0 9 1 2 0 1 0
23 0 6 0 9 4 0 9 5
24 0 0 0 2 3 0 0 0
25

Gifted Children 101
Sub# T-Emo T-CGI T-INN T-DHY T-TOT P-Opp P-Cog P-Hyp
1 9 4 3
2 1 1 1 0 1 27 6 14
3 0 0 1 0 0 9 0 0
4 0 0 0 0 0 7 0 1
5 0 1 0 1 1 4 4 0
6 0 0 0 0 0 8 7 7
7 0 9 6 8 14 6 8 3
8 4 4 4
9 0 2 3 0 3 0 1 3
1 0 0 1 1 0 1 9 0 0
1 1 1 2 0 4 4 8 3 1
1 2 5 22 17 23 40 7 12 4
1 3 0 2 0 1 1 4 2 2
14 2 2 1 0 1 2 1 5
1 5 1 5 2 2 4
1 6 0 0 1 1 2 0 0 0
1 7 0 4 12 3 15
1 8 6 19 12 15 27
1 9 1 9 0
20 0 4 1 1 4 15 5 0 1
2 1 0 1 0 1 1 5 3 1
22 1 1 0 0 0 7 0 1
23 1 6 10 1 1 1
24 0 0 0 0 0
25 15 9 4

Gifted Children 1 02
Sub# P-Anx P-Per P-Soc P-Psy P-ADHD P-Rest P-Erno P-CGI
1 3 2 0 1 3 3 1 4
2 1 3 15 12 4 6 12 8 20
3 6 10 0 0 2 1 4 5
4 0 2 0 1 0 1 3 4
5 2 5 0 1 2 0 1 1
6 8 8 2 2 8 7 1 8
7 0 2 1 0 4 3 0 3
8 2 4 0 0 1 2 0 2
9 2 5 0 0 3 3 0 3
1 0 0 1 0 0 1 1 1 2
1 1 5 9 0 0 4 4 1 5
1 2 0 0 0 2 15 5 2 7
1 3 0 1 0 0 3 0 2 2
14 3 9 3 4 3 3 3 6
1 5
1 6 4 1 0 0 1 0 0 0
17
1 8
1 9 0 2 1 0 5 1 0 1
20 0 1 0 1 1 0 0 0
2 1 3 5 0 0 2 0 3 3
22 2 4 0 0 3 1 1 2
23
24
25 1 0 0 2 8 3 3 6

Gifted Children 1 03
Sub# P-INN P-DHY P-TOT
1 3 3 6
2 6 1 1 17
3 0 1 1
4 0 1 1
5 4 3 7
6 7 7 14
7 3 6 9
8 5 5 10
9 1 3 4
1 0 1 1 2
1 1 6 4 10
1 2 10 10 20
1 3 4 4 8
14 2 4 6
1 5
1 6 0 0 0
1 7
1 8
1 9 4 0 4
20 0 2 2
2 1 3 2 5
22 2 3 5
23
24
25 5 6 1 1

Gifted Children 104
Sub# Age Gender Test IQ VART RTMT D' CE% OE%
26 9 1 1 124
27 9 1 1 137 140 464 4.07 4.32 .93
28 9 1 1 133 174 590 4.22 4.33 .62
29 9 1 1 127 1 1 1 430 4.61 3.09 .3 1
30 9 1 1 130 104 346 3.44 17.50 .62
3 1 9 1 1 132 109 446 4.57 3.40 .3 1
32 9 1 1 132 161 483 4.71 2.47 . 3 1
33 9 2 1 136 97 395 3 .80 7.43 .93
34 9 2 2 126 142 472 3.89 6.25 .93
35 9 2 3 133 1 15 405 5.83 5.86 .00
36 9 2 1 127 1 16 351 3.47 9.55 1 .54
37 9 2 1 154 71 319 5.89 5 .25 .00
38 9 2 1 137 109 422 4.13 5 .25 .62
39 9 2 1 144 166 423 3.65 12.58 .62
40 9 2 2 143 134 467 4.25 4.01 .62
4 1 9 2 2 124 209 450 2.67 17.8 1 4.01
42 9 2 1 129 150 415 3.30 14.69 1 .24
43 9 2 1 136 105 483 4.36 5 .25 .3 1
44 9 2 2 140 134 454 4.52 2 .17 .62
45 10 1 1 134 86 350 4.25 6.50 .31
46 10 1 1 129 242 602 4.59 1 .85 .62
47 10 1 1 130 154 593 4.57 3.40 . 3 1
48 10 1 1 129 171 619 4.71 2.47 .3 1
49 10 1 1 129 159 522 6. 1 8 2.78 .00
50 10 1 1 148 143 408 3.99 6.81 .62

Gifted Children 1 05
Sub# T-Opp T-Cog T-Hyp T-Anx T-Per T-Soc T-ADHD T-Rest
26 0 6 0 1 0 0 1 1
27 0 1 1 5 5 3 0 0
28 3 1 0 0 0 0 0 0
29 0 0 0 4 7 0 1 0
30 0 0 0 0 12 0 0 0
3 1 0 0 0 0 7 0 0 0
32 0 0 0 0 2 1 0 0
33 0 0 0 0 1 2 1 0
34 1 8 4 2 2 1 14 8
35 0 2 5 6 1 0 4 3
36 0 0 1 4 0 0 1 0
37 7 2 15 4 5 4 19 13
38 0 2 1 4 6 4 2 2
39 0 0 0 0 7 0 0 0
40 0 0 8 5 6 0 6 6
4 1 1 3 4 3 3 1 5 5
42 0 1 0 0 0 0 0 0
43 8 7 5 8 14 12 10 5
44 9 1 8 2 1 7 7 10 35 1 8
45 0 1 1 5 3 0 3 2
46 1 5 1 3 7 3 2 4 15 6
47 0 0 0 5 4 0 0 0
48 0 0 0 9 1 2 2 0 0
49 5 0 2 5 5 5 6 4
50 0 1 0 0 4 0 0 0

Gifted Children 1 06
Sub# T-Emo T-CGI T-INN T-DHY T-TOT P-Opp P-Cog P-Hyp
26 0 1 6 1 7 0 5 1
27 3 3 2 2 4 2 4 0
28 0 0 0 0 0 1 8 1 3 7
29 0 0 0 0 0 7 2 6
30 0 0 0 0 0
3 1 0 0 0 0 0 8 9 5
32 0 0 1 0 1 7 3 0
33 0 0 0 0 0
34 7 9 9 5 14 3 26 1 1
35 1 4 2 5 7
36 0 0 1 2 3 2 5 5
37 4 17 8 19 27 8 10 13
38 0 2 1 0 1
39 0 0 0 0 0 5 1 10
40 1 7 1 12 1 3 1 1 2
4 1 0 5 9 3 12 1 1 12 10
42 0 0 2 0 2
43 8 14 1 1 8 19 12 13 3
44 7 25 21 27 48
45 1 3 2 0 2 6 2 2
46 4 10 17 8 25 15 8 5
47 0 0 0 0 0 2 0 0
48 1 1 0 0 0 8 0 0
49 5 10 2 4 6 0 1 0
50 0 0 1 1 2 6 5 1

Gifted Children 1 07
Sub# P-Anx P-Per P-Soc P-Psy P-ADHD P-Rest P-Erno P-CGI
26 0 5 0 1 3 1 0 1
27 0 2 1 3 2 1 0 1
28 6 8 4 2 1 1 10 4 14
29 7 8 0 0 4 6 2 8
30
3 1 1 3 9 3 3 14 5 0 5
32 1 1 4 1 6 1 2 2 4
33
34 1 1 0 2 24 1 1 0 1 1
35
36 9 5 0 4 7 4 0 4
37 3 2 1 0 14 9 2 1 1
38
39 1 4 0 2 9 8 2 10
40 2 5 0 0 3 1 1 2
4 1 7 2 2 4 15 9 3 1 2
42
43 5 10 5 2 14 7 3 10
44
45 2 4 0 1 3 2 1 3
46 1 5 0 1 9 7 2 9
47 8 5 2 0 0 0 0 0
48 1 9 0 0 1 0 4 4
49 0 3 0 0 2 0 2 2
50 0 3 0 2 5 0 3 3
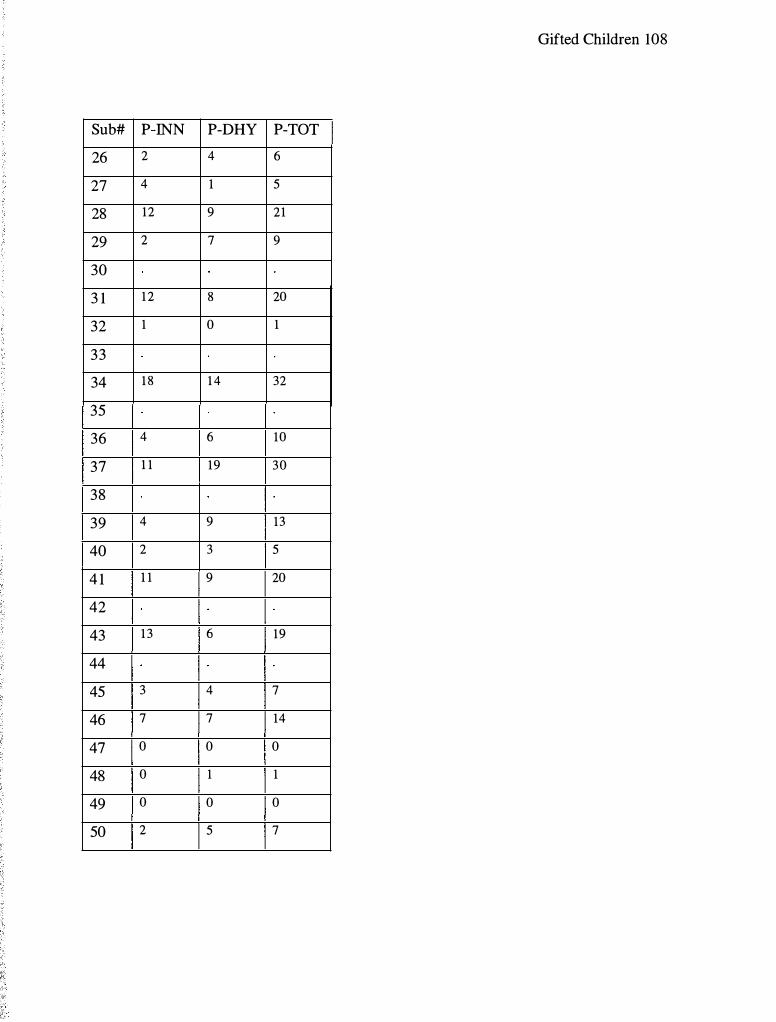
Gifted Children 108
Sub# P-INN P-DHY P-TOT
26 2 4 6
27 4 1 5
28 12 9 21
29 2 7 9
30
3 1 1 2 8 20
32 1 0 1
33
34 1 8 1 4 32
35
36 4 6 10
37 1 1 19 30
38
39 4 9 13
40 2 3 5
4 1 1 1 9 20
42
43 1 3 6 19
44
45 3 4 7
46 7 7 14
47 0 0 0
48 0 1 1
49 0 0 0
50 2 5 7

Gifted Children 1 09
Sub# Age Gender Test IQ VART RTMT D' CE% OE%
5 1 10 1 2 129 78 284 3.83 13.71 . 3 1
52 10 1 4 132 122 442 3.92 5.86 .93
53 10 1 3 128 140 427 3.83 9.26 .62
54 10 2 2 127 7 1 330 5.61 8.95 .00
55 10 2 1 127 66 294 4.22 6.98 . 3 1
56 10 2 1 139 1 1 1 379 3.83 9.29 .62
57 10 2 1 132 104 450 6.29 2 .16 .00
58 10 2 1 136 108 375 4.33 5 .57 .31
59 10 2 1 133 100 356 4.09 5.59 .62
60 10 2 1 129 268 438 2.52 14.75 7 .10
6 1 10 2 1 136 175 625 4.05 2.47 1 .85
62 10 2 2 136 162 488 4.00 4.03 1 .24
63 10 2 2 124 146 401 3.41 10.49 1 .54
64 10 2 1 137 77 293 4.00 6.67 .62
65 10 2 2 130 160 396 5 .50 10.84 .00
66 10 2 1 132 142 542 6. 1 8 2.78 .00
67 10 2 4 128 1 5 1 429 4.07 5.92 .62
68 10 2 3 128 79 303 4.26 6.46 .3 1
69 10 2 1 128 1 52 463 6.01 4.03 .00
70 10 2 1 122 76 314 5 .61 8 .92 .00
7 1 10 2 1 128 195 530 4.52 3.72 .3 1
72 1 1 1 1 128 1 10 369 5.50 10.80 .00
73 1 1 1 4 127 137 561 4.99 1 .24 .31
74 1 1 1 1 141 140 361 3.08 10.58 3.40
75 1 1 1 1 152 161 494 3.74 8.33 .93
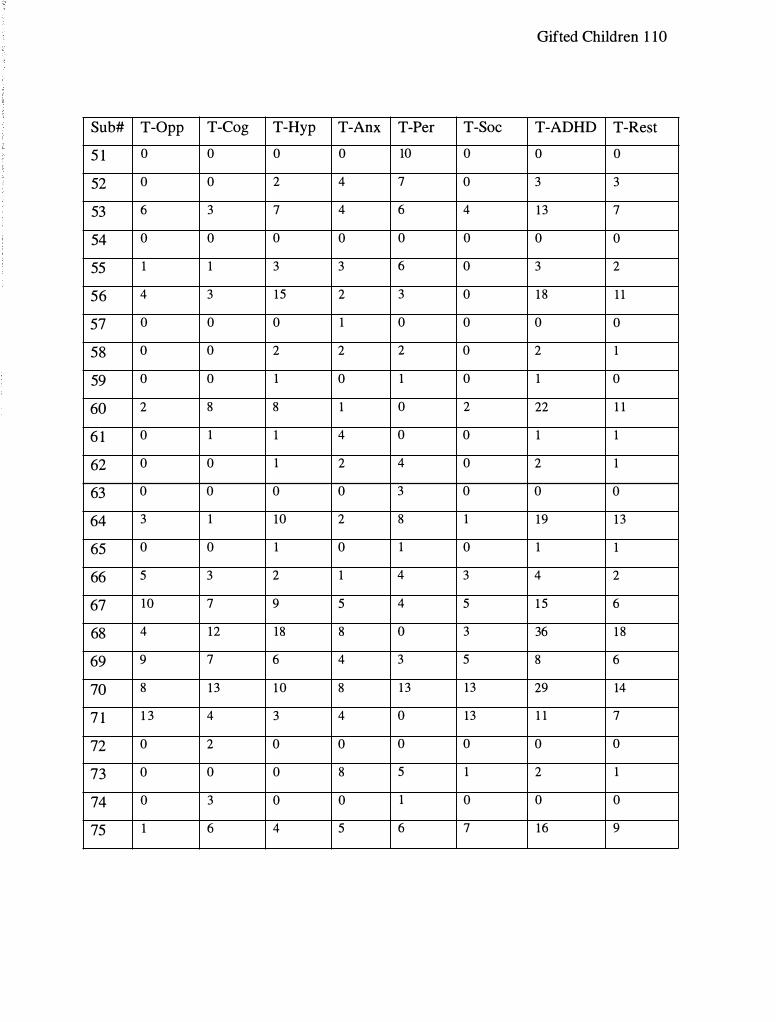
Gifted Children 1 10
Sub# T-Opp T-Cog T-Hyp T-Anx T-Per T-Soc T-ADHD T-Rest
5 1 0 0 0 0 10 0 0 0
52 0 0 2 4 7 0 3 3
53 6 3 7 4 6 4 1 3 7
54 0 0 0 0 0 0 0 0
55 1 1 3 3 6 0 3 2
56 4 3 15 2 3 0 1 8 1 1
57 0 0 0 1 0 0 0 0
58 0 0 2 2 2 0 2 1
59 0 0 1 0 1 0 1 0
60 2 8 8 1 0 2 22 1 1
6 1 0 1 1 4 0 0 1 1
62 0 0 1 2 4 0 2 1
63 0 0 0 0 3 0 0 0
64 3 1 10 2 8 1 19 1 3
65 0 0 1 0 1 0 1 1
66 5 3 2 1 4 3 4 2
67 10 7 9 5 4 5 1 5 6
68 4 12 18 8 0 3 36 1 8
69 9 7 6 4 3 5 8 6
70 8 1 3 1 0 8 1 3 13 29 14
7 1 1 3 4 3 4 0 13 1 1 7
72 0 2 0 0 0 0 0 0
73 0 0 0 8 5 1 2 1
74 0 3 0 0 1 0 0 0
75 1 6 4 5 6 7 16 9
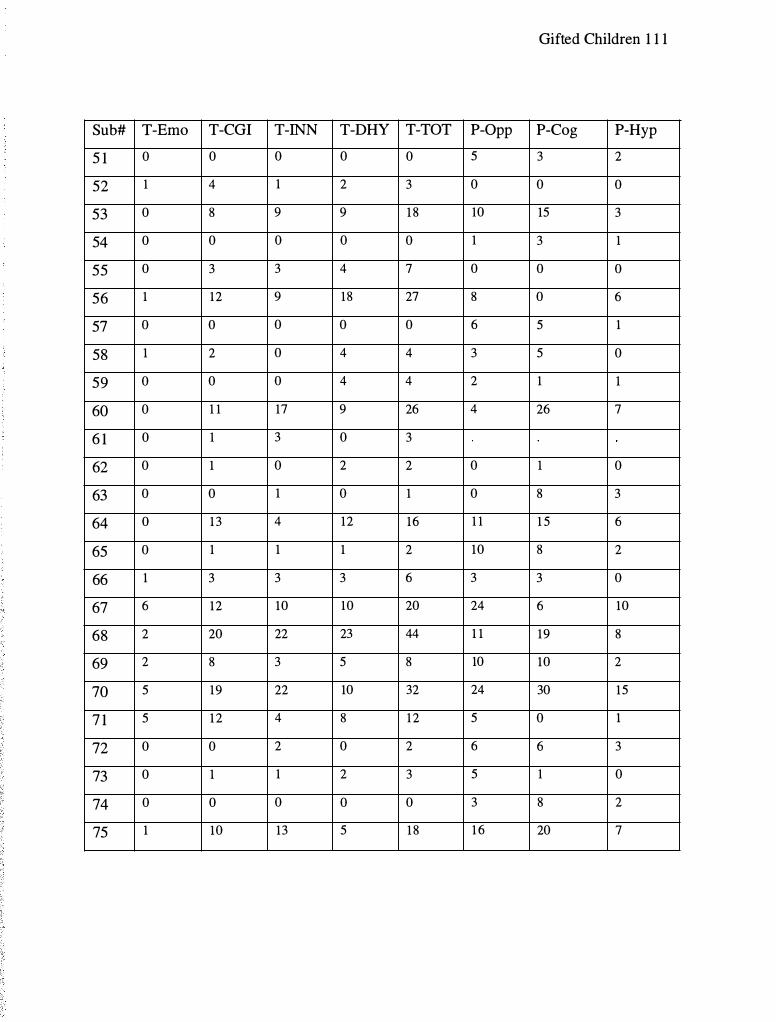
Gifted Children 1 1 1
Sub# T-Emo T-CGI T-INN T-DHY T-TOT P-Opp P-Cog P-Hyp
5 1 0 0 0 0 0 5 3 2
52 1 4 1 2 3 0 0 0
53 0 8 9 9 1 8 10 15 3
54 0 0 0 0 0 1 3 1
55 0 3 3 4 7 0 0 0
56 1 12 9 18 27 8 0 6
57 0 0 0 0 0 6 5 1
58 1 2 0 4 4 3 5 0
59 0 0 0 4 4 2 1 1
60 0 1 1 17 9 26 4 26 7
6 1 0 1 3 0 3
62 0 1 0 2 2 0 1 0
63 0 0 1 0 1 0 8 3
64 0 1 3 4 12 16 1 1 1 5 6
65 0 1 1 1 2 10 8 2
66 1 3 3 3 6 3 3 0
67 6 12 10 10 20 24 6 10
68 2 20 22 23 44 1 1 19 8
69 2 8 3 5 8 10 10 2
70 5 19 22 10 32 24 30 15
7 1 5 1 2 4 8 1 2 5 0 1
72 0 0 2 0 2 6 6 3
73 0 1 1 2 3 5 1 0
74 0 0 0 0 0 3 8 2
75 1 10 13 5 1 8 1 6 20 7
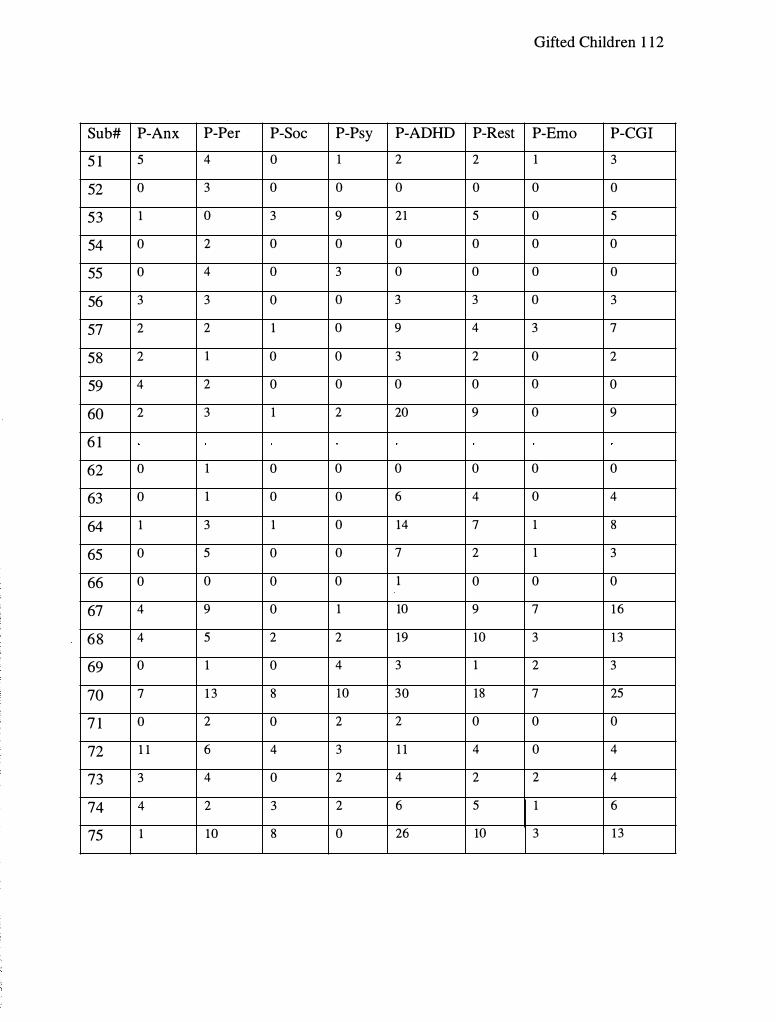
Gifted Children 1 12
Sub# P-Anx P-Per P-Soc P-Psy P-ADHD P-Rest P-Erno P-CGI
5 1 5 4 0 1 2 2 1 3
52 0 3 0 0 0 0 0 0
53 1 0 3 9 21 5 0 5
54 0 2 0 0 0 0 0 0
55 0 4 0 3 0 0 0 0
56 3 3 0 0 3 3 0 3
57 2 2 1 0 9 4 3 7
58 2 1 0 0 3 2 0 2
59 4 2 0 0 0 0 0 0
60 2 3 1 2 20 9 0 9
6 1
62 0 1 0 0 0 0 0 0
63 0 1 0 0 6 4 0 4
64 1 3 1 0 14 7 1 8
65 0 5 0 0 7 2 1 3
66 0 0 0 0 1 0 0 0
67 4 9 0 1 10 9 7 1 6
68 4 5 2 2 19 10 3 1 3
69 0 1 0 4 3 1 2 3
70 7 1 3 8 10 30 18 7 25
7 1 0 2 0 2 2 0 0 0
72 1 1 6 4 3 1 1 4 0 4
73 3 4 0 2 4 2 2 4
74 4 2 3 2 6 5 1 6
75 1 10 8 0 26 10 3 1 3

Gifted Children 1 13
Sub# P-INN P-DHY P-TOT
5 1 2 3 5
52 0 0 0
53 19 5 24
54 1 1 2
55 0 0 0
56 1 5 6
57 4 2 6
58 4 1 5
59 0 1 1
60 20 10 30
6 1
62 0 0 0
63 7 2 9
64 8 7 15
65 7 3 10
66 2 2 4
67 5 12 17
68 14 1 1 25
69 3 4 7
70 1 9 1 8 37
7 1 0 2 2
72 9 4 13
73 3 0 3
74 4 2 6
75 21 7 28

Gifted Children 1 14
Sub# Age Gender Test IQ VART RTMT D' CE% OE%
76 1 1 1 2 121 1 17 364 4.36 5 .31 .31
77 1 1 1 3 133 175 478 4 .18 3 .40 .93
78 1 1 1 3 1 3 1 101 379 4.22 4.32 .62
79 1 1 1 3 1 3 1 87 301 5 .81 6.09 .00
80 1 1 2 2 136 122 428 3.57 6.90 1 .85
8 1 1 1 2 1 135 154 463 4.37 2. 1 8 .93
82 1 1 2 1 130 144 370 3.70 9 .93
83 1 1 2 4 125 1 17 400 4.04 6. 17 .62
84 1 1 2 1 139 132 339 4.20 7.26 .3 1
85 1 1 2 4 127 102 377 3.83 9.29 .62
86 1 1 2 4 125 1 14 402 4.71 2.47 . 3 1
87 1 1 2 4 1 3 1 1 6 1 435 4.00 4.03 1 .24
88 1 1 2 3 128 122 410 3.50 12.65 .93
89 1 1 2 2 125 74 29 1 4.06 4.47 .93
90 1 1 2 2 1 3 1 92 307 5.3 1 14.78 .00

Gifted Children 1 15
Sub# T-Opp T-Cog T-Hyp T-Anx T-Per T-Soc T-ADHD T-Rest
76 0 0 2 1 0 1 2 2
77 1 2 1 0 2 0 2 1
78 0 0 2 1 6 0 3 2
79 4 4 1 5 1 4 3 1
80 1 0 1 3 2 4 0 1
8 1 5 1 3 4 5 0 5 1 8 1 0
82 1 5 7 18 8 5 8 32 15
83 0 1 0 0 0 0 0 0
84 0 1 2 2 0 0 2 1
85 3 3 0 4 1 0 1 0
86 3 2 0 3 2 0 0 0
87 1 1 1 1 0 0 1 1
88 6 5 7 9 10 9 15 8
89 0 0 0 0 0 0 0 0
90 0 0 1 0 8 0 0 0

Gifted Children 1 16
Sub# T-Emo T-CGI T-INN T-DHY T-TOT P-Opp P-Cog P-Hyp
76 0 2 0 1 1 7 3 0
77 0 1 6 1 7 5 5 0
78 0 2 2 2 4 3 1 3 2
79 1 2 5 0 5 0 2 4
80 0 1 1 0 1 1 1 15 9
8 1 4 14 22 8 30 8 28 5
82 9 24 15 23 38
83 0 0 1 0 1 1 1 6 2
84 0 1 4 3 7 8 5 4
85 0 0 3 0 3 4 1 8
86 0 0 3 0 3 5 9 8
87 0 1 1 2 3
88 9 17 1 1 1 3 25 4 7 6
89 0 0 0 0 0 1 0 2
90 0 0 0 1 1

Gifted Children 1 17
Sub# P-Anx P-Per P-Soc P-Psy P-ADHD P-Rest P-Erno P-CGI
76 2 1 0 2 6 1 1 2
77 0 1 0 1 5 2 2 4
78 1 5 1 2 14 3 1 4
79 3 3 0 2 3 3 0 3
80 7 5 2 5 15 6 1 7
8 1 1 0 5 6 24 9 3 1 2
82
83 3 2 1 4 4 2 6 8
84 2 1 3 2 1 12 7 2 9
85 0 4 0 0 2 5 1 6
86 8 3 1 0 7 7 2 9
87
88 2 7 2 0 10 4 2 6
89 2 6 0 0 1 1 0 1
90
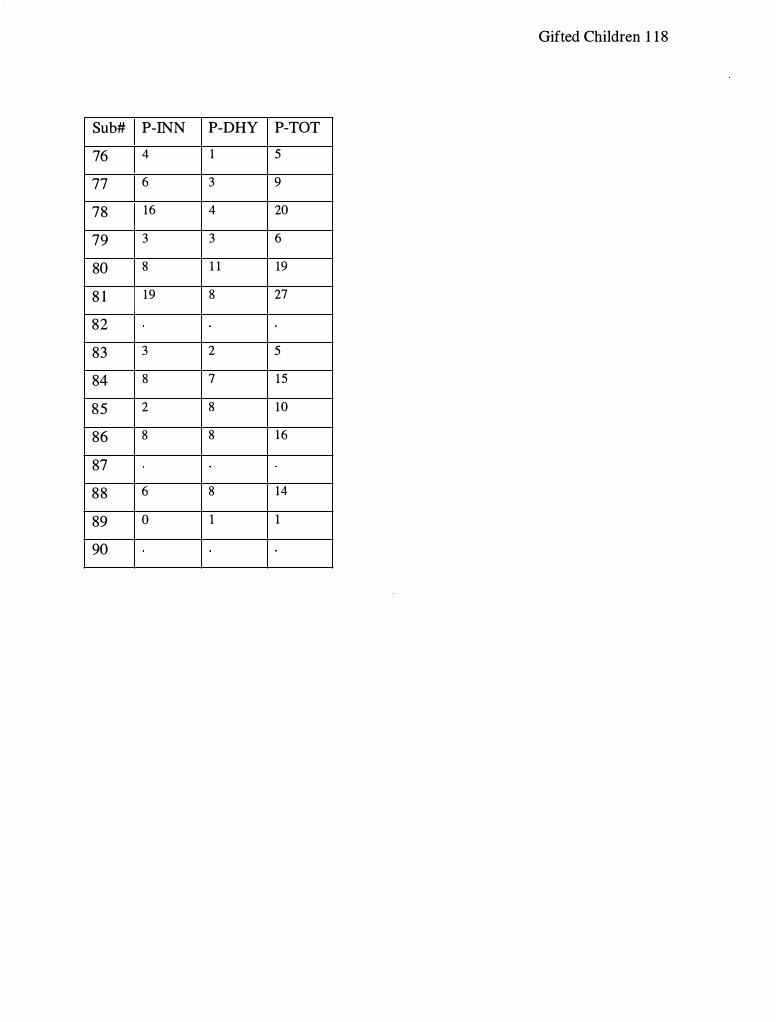
Gifted Children 1 1 8
Sub# P-INN P-DHY P-TOT
76 4 1 5
77 6 3 9
78 16 4 20
79 3 3 6
80 8 1 1 19
8 1 19 8 27
82
83 3 2 5
84 8 7 15
85 2 8 10
86 8 8 16
87
88 6 8 14
89 0 1 1
90
Appendix E
Curriculum Vitae
Gifted Children 1 19

Education
1 999 - Present
April, 2001
December, 1 994
Curriculum Vitae
Kent S. Rosengren, M.A. 7 1 1 Louviers Ave
DuPont, W A 98327 Home: (5253) 964-2357
E-mail: ksroseng@ georgefox.edu
Gifted Children 120
Graduate School of Clinical Psychology: AP A Accredited George Fox University, Newberg, Oregon Student in Clinical Psychology Psy.D. program GPA 3.88
Graduate School of Clinical Psychology: APA Accredited George Fox University, Newberg, Oregon M. A. in Clinical Psychology
Brigham Young University, Provo, Utah B.S. in Psychology GPA 3.6
Supervised Clinical Experience
08/03 - Present
8/02 - 7/03
Intern VA Puget Sound, American Lake Division, Tacoma W A Completed the first of three rotations working with Chronically Mentally Ill patients in group oriented outpatient treatment and research. Future rotations will include the Geriatric Research, Education and Clinical Center and the Mental Health Clinic.
Pre-Intern Kaiser Permanente, Salem, Oregon Practicum experience providing outpatient individual, family and group therapy services in a managed care setting. Experience includes working with primary care providers, psychiatrists, social workers and nurse practitioners in a multi-disciplinary team environment. Clientele presents with a wide range of Axis I and Axis II disorders, with an emphasis on brief therapy and case load management. Receive weekly individual and group supervision. Supervisors: Catherine deCampos, Psy.D./CFNP, Licensed

12/0 1 - 5/02
9/01 - 4/02
110 1 - 6/01
9100 - 110 1
Gifted Children 1 2 1
Psychologist, Robert Schiff, Ph.D., Licensed Psychologist, & Sandra Gonzalez, Psy.D.
Practicum II Peace Health Behavioral Health Care, Vancouver, Washington Outpatient community mental health setting providing individual therapy to a culturally diverse population of adults. Experience includes working with various types of Axis I and II disorders. Receive weekly individual and group supervision. Supervisors: Margaret Smith, Ph.D., Licensed Clinical Psychologist & Shirley Shen, Ph.D.
Practicum II Mobile Crisis Assignment Team, Vancouver, Washington Mobile crisis team serving children and adolescents of Clark County, Washington. Duties include evaluation, consultation, and level of care assessment over the phone, in the office, or on site at schools, hospitals, juvenile detention or in the home for youth at risk for harm to self or others. Additional duties include providing individual therapy, family therapy, and psychological assessment. Tests administered, scored and interpreted include WISC-III, WIAT-II, Rorschach, and TAT. Received weekly group and individual supervision. Supervisors: Margaret Smith, Ph.D., Licensed Psychologist & Shirley Shen, Ph.D.
Practicum I Interchange Drug and Alcohol Treatment Program of Multnomah County Corrections, Hillsboro, Oregon. Six-month inpatient drug and alcohol treatment center in a corrections setting providing psychological assessment and individual therapy for a culturally diverse population of adult males. Duties included administering, scoring, and interpreting various cognitive, personality, neuropsychological and behavioral measures; psychological report writing; and consultation with a multidisciplinary team. Received weekly group and individual supervision. Supervisor: Stephen Huggins, Psy.D. , Licensed Psychologist.
Practicum i Multnomah County Corrections Juvenile Hall, Portland, Oregon. Inpatient practicum experience providing individual therapy and psychological assessment for adolescent inmates in conjunction with corrections health. Experience included working with stress and anger management, suicidal ideation, PTSD, violence and
9100 - 4/01
8/99 - 4/00
Gifted Children 122
substance abuse. Additional duties include administration, scoring and interpreting cognitive and behavioral measures and consultation with staff.
Group Facilitator Parent Care, Inc., Pacific University, Forest Grove, Oregon. Facilitated psychoeducational and support group for parents of children ages 0 to 1 1 years old. Curriculum emphasized the emotional and cognitive development of children and parent-child relationship building. Duties included educating parents regarding developmental issues, modeling parenting techniques and interventions and facilitating supportive group discussion. Received weekly didactic and group supervision. Supervisors: Terri Bennink, Psy.D., Licensed Psychologist & Dawn Williamson, Licensed Clinical Social Worker.
Prepracticum George Fox University, Newberg, Oregon. Provided individual psychotherapy to university students. Developed treatment plans, monitored progress through video tape reviews, and presented cases to supervision group. Received weekly individual and group supervision. Supervisors: Carol Dell'Oliver, Ph.D., Licensed Psychologist & Brandy Liebscher, M.A.
Additional Clinical Experience
8/0 1 - 4/02
Publications
Assessment Specialist Newberg School District, Newberg, Oregon. Paid position in school district. Responsibilities included cognitive and comprehensive assessment, writing psychological reports, and consultation with teachers and parents. Received weekly group supervision. Supervisor: Dionne Bradley, Licensed School Psychologist.
Chapelle, W. & Rosengren, K. (2001). Maintaining composure and credibility as an expert witness during cross-examination, Journal of Forensic Psychology and Practice, L. (3), p.5 1 -69.

Gifted Children 123
Presentations
Kennedy, A., Rosengren, K., Kilzieh, N., Wood, A., & Tapp, A. (2003) . Does Depression Predict Quality of Life in Outpatients with Schizophrenia Spectrum Disorders? Poster presentation submitted to the Society of Biological Psychiatry annual convention, New York, NY.
Kilzieh, N., Rosengren, K. , Kennedy, A., Wood, A. , Kumar, N., & Tapp, A. (2003) Correlation between CDS and P ANSS in depressed and non-depressed SCZ outpatients. Poster presentation submitted to the American Psychiatric Association annual convention, New York, NY.
Bufford, R., Shaver, G., Floyd, R. , Hall, S . , Anderson, J., Rosengren, K., White, S . (2002, August). An Inquiry into the Relationship between Religious Orientation and Spiritual Practices. Poster presentation at the annual convention of the American Psychological Association, Chicago, IL.
Alvord, S . , Adams, W., Shaver, G. , Barker, R., Garner, B. , & Rosengren, K. (2001 , November). Relationship between WRAML and NEPSY subtest performance and reading acquisition in elementary school children. Poster session presented at the annual meeting of the National Academy of Neurosciences, San Francisco, CA.
Aderson, J . , Bufford, R., Floyd, R., Hall, S . , Rosengren, K., Shaver, G., & White, S . , (2001 , June). Religious Orientation and Spiritual Practices. Paper presentation at the annual convention of the Christian Association Psychological Studies, San Diego, CA.
Chapelle, W. , & Rosengren, K. (2000, April). Guidelines and Recommendations for Maintaining Control as a Psychological Expert Witness During Cross-Examination. Poster presentation at the annual convention of the Western Psychological Association., Portland, OR.
Research Experience
8/01 - Present
4/02 - 5/02
Doctoral Dissertation Graduate School of Clinical Psychology, George Fox University, Newberg, Oregon. Title: Performance of Intellectually Gifted Children on three measures of ADHD. Chair: Wayne Adams, Ph.D., ABPP.
Research Technician VA Hospital, Portland, Oregon. Assisted in an ongoing research project investigating neuropsychological effects of methamphetamine abuse. Duties

8/00 - Present
5100 - 08/00
Teaching Experience
1 0/01 - Present
1 0/00
1 1/01
Gifted Children 1 24
consisted of administration and scoring of various neuropsychological assessment instruments.
Vertical Research Team Member Graduate School of Clinical Psychology, George Fox University, Newberg, Oregon. Participate in bi-weekly team meetings to discuss research projects in the area of child and adolescent assessment. Duties include presenting literature reviews and providing consultation with respect to methodology, statistical analyses, and idea clarification. Supervisor: Wayne Adams, Ph.D., ABPP.
Consultant/Field Researcher Riverside Publishing Company, Wood Dale, lllinois. Assisted in the compilation of research data for the Tryout Edition of the Stanford-Binet Intelligence Scales-5th Edition. Responsibilities included administering and scoring Tryout Editions of the test and providing the publishing company with relevant feedback concerning the fairness, clarity, ease, length and practicality of test items. Supervisor: Gale Roid, Ph.D.
Instructor Student Career Services, George Fox University, Newberg, Oregon. Strategies for Successfully Completing the Graduate Record Exam. Developed curriculum and presented group lectures focused on standardized test-taking strategies and major content areas of the ORE.
Guest Instructor Department of Psychology, George Fox University, Newberg, Oregon. PSY 330 Theories of Personality. Presented a lecture on Erik Erikson.
Guest Instructor Department of Psychology, George Fox University, Newberg, Oregon. PSY 150 General Psychology, Presented a lecture on cognition.
Memberships and Professional Affiliations
Sept. 1 999 - Present Graduate Student Affiliate, American Psychological Association.
Copyright © 2022 FDOKUMEN