A Meta-Analysis of Gifted and Talented Identification Practices
61
Purdue University Purdue e-Pubs Department of Education Studies Graduate Student Publications Department of Educational Studies 2018 A Meta-Analysis of Giſted and Talented Identification Practices Jaret Hodges Juliana Tay Purdue University, [email protected] Yukiko Maeda Marcia Gentry Follow this and additional works at: hps://docs.lib.purdue.edu/edstgspubs is document has been made available through Purdue e-Pubs, a service of the Purdue University Libraries. Please contact [email protected] for additional information. Recommended Citation Hodges, Jaret; Tay, Juliana; Maeda, Yukiko; and Gentry, Marcia, "A Meta-Analysis of Giſted and Talented Identification Practices" (2018). Department of Education Studies Graduate Student Publications. Paper 3. hps://docs.lib.purdue.edu/edstgspubs/3
-
Upload
khangminh22 -
Category
Documents
-
view
2 -
download
0
Transcript of A Meta-Analysis of Gifted and Talented Identification Practices

Purdue UniversityPurdue e-PubsDepartment of Education Studies Graduate StudentPublications Department of Educational Studies
2018
A Meta-Analysis of Gifted and TalentedIdentification PracticesJaret Hodges
Juliana TayPurdue University, [email protected]
Yukiko Maeda
Marcia Gentry
Follow this and additional works at: https://docs.lib.purdue.edu/edstgspubs
This document has been made available through Purdue e-Pubs, a service of the Purdue University Libraries. Please contact [email protected] foradditional information.
Recommended CitationHodges, Jaret; Tay, Juliana; Maeda, Yukiko; and Gentry, Marcia, "A Meta-Analysis of Gifted and Talented Identification Practices"(2018). Department of Education Studies Graduate Student Publications. Paper 3.https://docs.lib.purdue.edu/edstgspubs/3

Running head: ID OF NON-TRADITIONAL GT STUDENTS 1
A Meta-Analysis of Gifted and Talented Identification Practices

ID OF NON-TRADITIONAL GT STUDENTS 2
Abstract
Researchers consider the underrepresentation of Black, Hispanic, and Native American students
is largely due to the use of traditional methods of identification (i.e., IQ and standardized
achievement tests). To address this concern, researchers created novel non-traditional
identification methods (e.g., non-verbal tests, student portfolios, affective checklists). This meta-
analysis of 54 studies, consisting of 85 effect sizes representing 191,287,563 students, provides
evidence that non-traditional identification methods, while able to narrow the proportional
identification gap between underrepresented (Black, Hispanic, and Native American) and
represented (Asian and White American) populations, are still unable to address the issue of
education inequity. An overall risk ratio of .34 was calculated for non-traditional methods of
identification in comparison to a .27 risk ratio for traditional methods. While the non-traditional
methods help identify more underrepresented students as gifted, the results of this meta-analysis
show that better identification methods are needed to address inequities in identification.
Keywords: Gifted, identification, equitability, testing, underrepresentation, Black,
Hispanic, Native American
ID OF NON-TRADITIONAL GT STUDENTS 3
A Meta-Analysis of Gifted and Talented Identification Practices
Lack of proportional representation of culturally, linguistically, and economically diverse
(CLED) students in gifted programs is a critical issue in education. The common conception of a
high ability student as an excellent classroom student with high grades and exceptional
achievement on standardized tests ignores the latent potential in students and considers only
manifest abilities (Briggs, Reis, & Sullivan, 2008). High ability and potential masked by
socioeconomic and cultural factors can go undiscovered and underdeveloped (Briggs et al.,
2008).
The lack of proportional representation of traditionally underrepresented groups in gifted
programs within schools is likely the result of the identification methods that fail to accurately
detect all students with high potential, especially students from diverse backgrounds coupled
with inequities in opportunity. Thus, we conducted a meta-analysis to explore how the use of
identification methods influence the proportional representation of Black, Hispanic, and Native
American students as gifted.
Definitions of Giftedness and Identification Methods
The principles of education rest upon the idea of giving children what they need to be
successful and achieve whatever dream they might have (Tyler, 1949). In other words, education
should address the diverse needs of the students. Therefore, educators are morally bound to
provide gifted and talented students with appropriately challenging educational opportunities
tohelp them realize their potentials (Renzulli, & Reis, 1991).
Giftedness is defined by the National Association for Gifted Children (NAGC) (n.d.) as:
Gifted individuals are those who demonstrate outstanding levels of aptitude (defined as
an exceptional ability to reason and learn) or competence (documented performance or

ID OF NON-TRADITIONAL GT STUDENTS 4
achievement in top 10% or rarer) in one or more domains. Domains include any
structured area of activity with its own symbol system (e.g., mathematics, music,
language) and/or set of sensorimotor skills (e.g., painting, dance, sports) (para. 5).
This definition of giftedness extends to include a larger concept of talents from students
from a wide variety of backgrounds and cultures in gifted education (Gentry, 2009). Under this
definition, a child can be considered gifted if he or she shows talent in only one area. This
definition is far more inclusive than more traditional definitions, which rely on strict cut-off
scores based on aptitude measures (Feldhusen & Jarwan, 2000; Van Tassel-Baska, 2005).
Note that we do not intend to discuss in-depth the nuances of different definitions and
conceptions of giftedness, or how they affect the identification of gifted students in this study
because an abundant body of literature has already addressed these issues (e.g., Borland, 2003;
NAGC, 2010; Renzulli, 1978). However, it is important to point out the various definitions
adopted by states as these definitions have implications for the identification process. For
example, a state that has adopted a definition of giftedness focused on intellectual and cognitive
abilities is more likely to have an identification process using standardized achievement tests and
other forms of verbal assessments. Conversely, if a state has a definition of giftedness that
accounts for gifted potential, creativity, and/or implications from socioeconomic differences, the
identification process is likely to include non-verbal assessments and other potentially more
inclusive methods of identification.
Variant definitions of giftedness used by states. From the list of 50 state definitions of
giftedness (NAGC, 2013), we found that 43 of the 50 states placed an emphasis on intellectual
and academic abilities, whereas only half considered potential abilities as part of the definition of
giftedness. As such, many schools still rely on use of traditional test scores as part of their

ID OF NON-TRADITIONAL GT STUDENTS 5
identification processes. The In the State of States by the Council of State Directors of Programs
for the Gifted (CSDPG) and NAGC (NAGC & CSDPG, 2015) pointed out that 17 states used IQ
scores and 15 states used achievement scores as part of the selection criteria. However, it is
important to note that 20 states also reported using a multiple criteria model for their evaluation
process even though they did not provide any information on the specific criteria (NAGC &
CSDPG, 2015).
The variation in the identification methods can be attributed to the various definitions of
giftedness, especially among adherents who support a definition based on a potential of gifts
versus those who support a definition based on a manifestation of gifts. For our study, traditional
identification methods refer to the use of standardized tests of achievement and ability, which
include state-based achievement tests and IQ measures. In contrast, non-traditional methods refer
to the use of assessments that have non-verbal and multiple criteria components aligned with the
inclusive definition of giftedness of NAGC (n.d.). This categorization of the different methods of
identification is what educators commonly use in their identification practices (Krisel, 2012; Van
Tassel-Baska, 2005).
The consideration of talent potential is not new to the field. Passow and Frasier (1994)
suggested the incorporating potential as part of the identification process. They believed that
doing so would help create a more inclusive model for gifted programming as compared to one
heavily reliant on test scores that reflect manifested achievements. Feldhusen and Jarwan (2000)
also urged a more comprehensive method of identification that looks beyond performance and
includes considerations related to “problems, weaknesses, and needs” (p. 279). Further, Renzulli
(1978) highlighted the need to consider on gifted behaviors and characteristics and not only
relying on performance on cognitive ability tests.

ID OF NON-TRADITIONAL GT STUDENTS 6
Another area in which states differ in their definitions of giftedness is the inclusion of
terms that reflect diversity of student populations, such as racial groups and socioeconomic
status, in the definition. For example, some states, such as Florida, North Carolina, and
Washington, explicitly incorporate language concerning different socioeconomic status in their
definitions. Other states, such as Alaska, Kansas, and Nevada, focus their definitions mainly on
children with intellectual and academic giftedness without using other descriptors (NAGC,2013).
Additionally, states, such as Colorado, Iowa, and Maryland, have broader definitions that include
creativity and leadership skills. As such, identification procedures among states may differ,
ranging from more conservative philosophies of aptitude-based identification to liberal
philosophies based on broader definitions of giftedness.
Controversies in identification processes stemming from definitions of giftedness. Gifted
education provides students with the gifted and talented services they require to attain optimal
educational outcomes (Gentry, 2009; Renzulli & Reis, 1991). This education may take place in
the form of acceleration, curriculum compacting, or enrichment programs in areas of interests
(Gentry, 2009; Renzulli & Reis, 1991). Researchers have consistently demonstrated that, without
proper gifted services, students will not achieve their academic potential and in many cases may
underperform (Subotnik, Olszewski-Kubilius, & Worrell, 2011). Therefore, it is imperative for
educators to accurately identify those students who need differentiated services.
In other words, a transparent, research-based, and purposeful identification process is a critical
first process in providing appropriate learning opportunities to gifted youth.
However, the processes for identifying gifted students have often been contentious
(Giessman, Gambrell, & Stebbins, 2013; Lakin & Lohman, 2011; Lee & Olszewski-Kubilius,

ID OF NON-TRADITIONAL GT STUDENTS 7
2006; Lohman, 2005; Lohman, Korb, & Lakin, 2008; Naglieri & Ford, 2003; Naglieri & Ford,
2005; Renzulli & Reis, 2012). For example, how to identify, what to identify, and when to
identify are some of the questions that plague the field (Callahan, 2005; Erwin & Worrell, 2012;
Feldhusen & Jarwan, 2000; McClain & Pfeiffer, 2012; McKenzie, 1986; Passow & Frasier,
1994).
With the differences in defining giftedness, the identification of giftedness can be broadly
classified into two categories: one focusing on exhibited talent and the other on gifted potential
(McKenzie, 1986; Pfeiffer & Blei, 2008). Researchers have focused on defining giftedness and,
in turn, have developed identification procedures to address issues of manifest talents and latent
talents. Manifest talents are talents displayed and readily apparent to the observer, for example,
high scores on aptitude and/or achievement tests or clearly displayed precocious ability in a
domain. In contrast, latent talents reflect unactualized potential that can be masked by
environmental or social factors (e.g., the child who has the potential to be a musical prodigy but
who has no access to a musical instrument).
Researchers (e.g., Pfeiffer & Blei, 2008; Sternberg & Davidson, 2005) have also debated
whether identification should account only for the observed and measurable ability of a child or
whether it should take into account a child's non-manifested potential. Traditionally, when
exhibition of gifts has been considered, IQ scores have been used to define giftedness, with
students scoring above a cut-off point being selected for the gifted programming (Lakin &
Lohman, 2011; Peters & Gentry, 2012; Pfeiffer & Blei, 2008). The Wechsler Intelligence Scale
for Children (WISC, Watkins, Greenawalt, & Marcell, 2002) is frequently used in the
identification process of giftedness in schools across the United States (McClain & Pfeiffer,

ID OF NON-TRADITIONAL GT STUDENTS 8
2012; McKenzie, 1986). In conjunction with cut-off scores from standardized achievement tests,
these scores form the core of identification methods across the nation (NAGC & CSDPG, 2015).
Using IQ tests as the sole instrument to select students for gifted programs has received much
criticism in the field of gifted education, especially when doing so does not account for the
recent changes in the definition of giftedness to include gifted potential and talent development
(Krisel, 2012; Pfeiffer & Blei, 2008). As such, if schools are only using IQ scores to identify
gifted students, Black, Hispanic, and Native American students who may not have the
opportunities to develop their gifted potential are not likely to be identified and served.
Aside from the issue of using IQ as an assessment of giftedness, there is also the issue of
the validity of using IQ tests for identification. In particular, the use of IQ tests has been
considered as one reason for the underrepresentation of gifted minorities (Pfeiffer, 2012).
Robinson (2008) cautioned against using IQ as a sole identification measure given its lack of
context; whereas, Ford (1998) pointed out that many IQ tests are racially biased. Conversely,
Erwin and Worrell (2012) noted that IQ tests might be biased, but that they measure exactly the
constructs they are meant to measure and the question should be whether those constructs should
be the sole traits that identify a child for gifted services. As IQ tests are verbal and quantitative,
Black, Hispanic, and Native American students who do not have the chance to develop their
abilities in these areas, are not likely to be able to excel in these tests. Further, with the high
cutoff scores needed for students to be tested into gifted programs, differences between Black,
Hispanic, and Native American students and their peers only widen, making proportional
representation difficult to achieve.
An alternative definition, one that considers abilities and talents in students may be
underdeveloped but with adequate support can manifest, uses criteria such as aptitude,

ID OF NON-TRADITIONAL GT STUDENTS 9
recommendations by teachers and peers, creativity, and non-verbal assessments for identifying
gifts (Lohman & Nicpon, 2012). Foremost among the non-verbal ability tests are the Naglieri
Non-Verbal Abilities Test (NNAT; Naglieri & Ford, 2003) and the Raven Standard Progressive
Matrices (RAVEN; Raven, 2000), two of the most commonly administered tests by districts as a
means for alternate identification. Raven (2000) highlighted the effect of culture and
environment on intelligence when measured with the traditional standardized tests. Thus, he
focused on two indicators of intelligence, “educative ability” and “reproductive ability” (Raven,
2000, p.2) as measures of intelligence in RAVEN. Naglieri and Ford (2003) also questioned the
identification of gifted students through assessments of their academic abilities because they
believed these assessments disadvantaged students who had limited verbal and quantitative
skills. Rather they chose to focus on reducing cultural bias in their test items. Thus, NNAT and
RAVEN focus on assessing students’ problem solving, reasoning, and observation skills and do
not rely on language or cultural specific content knowledge (Lewis, DeCamp-Fritson, Ramage,
McFarland, & Archwamety, 2007; Naglieri & Ford, 2003).
The NNAT has faced criticism from Lohman (2005) who questioned its effectiveness in
identifying culturally and linguistically diverse students. Lohman claimed that the data presented
by Naglieri and Ford (2003) did not corroborate their conclusions. In response Naglieri and Ford
(2005) argued that more efforts could be spend on addressing the lack of representation rather
than trying to undermine a tool that is used to help close the representation gap.
Some identification methods for giftedness combine elements from traditional and
nontraditional forms of assessment by including a non-verbal component in the testing. This is
done in hope of reducing the language bias that may exist within traditional verbal and
quantitative assessments. The Cognitive Abilities Test (CogAT; Lohman, 2011) is one such test.

ID OF NON-TRADITIONAL GT STUDENTS 10
Currently in its seventh edition, the CogAT Form 7 uses verbal, quantitative, and non-verbal
components to assess a student’s acquired abilities (Lohman, 2011). The inclusion of a non-
verbal component was specifically designed to increase the identification of nontraditional gifted
students.
Nevertheless, these standardized tests not only fail to silent the points of contention, but
their use also raises more questions about the reliability of the data and the validity of the
inferences based on the data they yield (Lewis et al., 2007; Lohman et al., 2008). For example,
when comparing students who were identified based on their achievement on standardized tests
or parents’ nominations with their performance on the ACT (American College Testing), Lee
and Olszewski-Kubilius (2006) found that Hispanic students identified through parents’
nominations did better on the ACT than students who were identified via standardized tests.
Additionally, Giessman et al. (2013) compared students’ performances on CogAT, NNAT, and
WISC and found that the tests yielded different rates of identification for gifted students.
Furthermore, the rates of identification also differed among the various racial groups. For
example, the difference in WISC scores between Black students and their White peers was 17.2
points.
In examining only non-verbal methods of identification, Lewis, DeCamp-Fritson,
Ramage, McFarland, and Archwamety (2007) conducted a study with 175 third to fifth graders
and eighth graders in a Midwestern city and compared the effectiveness of RAVEN, NNAT, and
ITBS in identifying Black, Hispanic, and Native American students. The researchers found that
RAVEN identified a more ethnically diverse group of students than ITBS or NNAT.
Interestingly, Lewis et al. (2007) found no difference in the proportion of Black, Hispanic, and
Native American students identified by ITBS and NNAT, although ITBS as a traditional

ID OF NON-TRADITIONAL GT STUDENTS 11
achievement test is expected to identify fewer underrepresented gifted students than the NNAT
(i.e., non-verbal method). In addition, Lohman (2007) found that of the three components of
CogAT, the non-verbal component is the least correlated to academic achievement and should
not be used as a sole measurement for giftedness. Lohman, Korb, and Lakin (2008) also raised
questions about the validity of the non-verbal tests as an identification method in general. Using
three different non-verbal tests, CogAT-NV, NNAT, and RAVEN, they found much variability
in the scores obtained by the elementary students, which would in turn influence identification
rates. In particular, they noted that the NNAT and CogAT-NV both showed a statistically
significant difference in identification rates between English language learning (ELL) students
and non-ELL students. Hence, even within the various non-verbal methods of identification,
issues of validity are still being debated.
Another non-traditional method of identification involves using teachers to nominate
children for services. Teacher nomination helps identify students who may not perform well on
standardized achievement tests due to reasons such as language or cultural bias (Callahan &
Miller, 2005; Renzulli, 2005). For example, the Having Opportunities Promotes Excellence
(HOPE) Scale (Gentry, Peters, Pereira, McIntosh, & Fugate, 2015; Peters & Gentry, 2012) is an
instrument that measures students’ academic and social characteristics of giftedness as identified
by their teachers. However, such nomination processes by teachers have also been criticized for
subjectivity and possible bias (McBee, 2006; Milner & Ford, 2007). Even if teachers are reliable
identifiers of gifted students of similar cultural backgrounds, it is arguable whether they are able
to reliably identify children from diverse backgrounds (McBee, 2006). Nevertheless, some
researchers argue that teacher nominations should be included as one criterion or pathway in the
identification process.

ID OF NON-TRADITIONAL GT STUDENTS 12
In the past decade, this issue of traditional versus non-traditional identification has often
been debated among researchers (Giessman et al., 2013; Lakin & Lohman, 2011; Lohman et al.,
2008; Naglieri & Ford, 2003). Although numerous researchers (Lakin & Lohman, 2011; Peters,
2012; Winsler & Kim, 2013) have conducted research on the effectiveness of different test
batteries in identifying students for gifted programs, no single way of identifying gifted students
exists because the identification process may include the various issues highlighted above (Reis
& McCoach, 2000).
Further, there is the issue of equitable representation in gifted education, a position taken
up recently by NAGC (2011). For equitable representation to exist, definitions of giftedness and
identification methods must be congruent and concerned with equity. Should the definition focus
only on measurable achievements or should it also take into consideration a student’s potential
for growth? Similarly, is there a match between the identified students and the gifted services
provided, and are the needs of the students being met (Peters, Matthews, McBee, & McCoach,
2013)? These are some questions that need to be addressed as the field moves toward achieving
equitable representation.
Underrepresentation of Students in Gifted Programs
The lack of equitable representation in gifted programs has been an ongoing concern in
the field of gifted education (Daniels, 1998; Ford & Harris, 1994; Naglieri & Ford, 2003; Yoon
& Gentry, 2009). As the population of the United States continues to diversify the need for
equitable representation in gifted programs is paramount. Despite increasing rates of inclusion
for minority students in gifted programs since the 1970s (Donovan & Cross, 2002), CLED
students are still vastly underrepresented compared to their peers (Erwin & Worrell, 2012; Ford,
2014; Konstantopoulos, Modi, & Hedges, 2001; Yoon & Gentry, 2009).

ID OF NON-TRADITIONAL GT STUDENTS 13
For example, Konstantopoulos et al. (2001) reported the odds ratio (OR) for being
identified as gifted for Black, Hispanic and Native American students compared to Asian and
White peers. They found that Black (OR = 0.37), Hispanic (OR = 0.45), and Native American
Students (OR = 0.17) were all identified at lower rates compared to their White peers. Asian
were identified at a higher rate than their White peers (OR = 2.17). Similarly, Yoon and Gentry
(2009) found that Asian and White American students were overrepresented proportionately in
gifted programs throughout the United States. With an in-depth state by state analysis of the
identification of Black, Hispanic, and Native American students for gifted services, Yoon and
Gentry found that Black and Hispanic students were underrepresented proportionately in 47
states and Native American students were underrepresented in 43 states. The recent report by the
Office for Civil Rights (OCR, 2015), which examined the overall representation of students
within the US public school system, supports Yoon and Gentry’s (2009) findings. Similar
findings were also reported by Ford (2014), who used a Relative Difference in Composition
Index to show that more than one-half million Black and Hispanic students remained
unidentified as gifted students. She suggested that if a certain proportion of a school were
comprised of a given minority, then that same proportion should be represented in its gifted
programming.
Sullivan (2011) found that statistically significant predictors for admittance to gifted
programs are not found within academic predictors; in fact, socioeconomic status and race can
more accurately predict a child’s identification as a gifted student than academic predictors.
Interestingly, in Utah, Warne, Anderson, and Johnson (2013) found that when controlling for
academic achievement, there was proportional racial representation in that state in gifted

ID OF NON-TRADITIONAL GT STUDENTS 14
programs; that is, Black, Hispanic, and Native American gifted students were not
underrepresented.
Lack of proportional representation in gifted programs is a critical issue in education. In
2001, the lack of educational equity across the spectrum in U.S. public education led to the
introduction of No Child Left Behind (NCLB; Bush, 2001). However, unequal representation of
races in gifted education continues. Hopkins and Garrett (2010) pointed out that the
overrepresentation of Asian and White American students while Black, Hispanic, and Native
American students were underrepresented constitutes de facto segregation within public schools.
For example, Texas has seen the proportion of Hispanic students enrolled in public schools
increase without a similar increase in Hispanic students identified as gifted (Esquierdo
& Arreguín-Anderson, 2012). Furthermore, many still consider a high-ability student as a model
student with good grades, taking into account only abilities that can be seen and measured by
standards and tests (Briggs et al., 2008). Consequently, student’s socioeconomic and cultural
factors may mask high ability and potential resulting in the student’s ability remaining
undiscovered and underdeveloped by schools (Briggs et al., 2008).
The differing percentages of identified students from various racial groups in a district
are likely to correlate with the decision making of the administrators (Raudenbush, Foitu, &
Cheong, 1998) because school administrators determine the identification methods used in
districts. These decisions can affect not only how students are identified, but also how financial
resources are allocated to gifted education programs (Kettler, Russel, & Puryear, 2015). Thus,
identification of CLED students for gifted services promotes social equity within a school
district, along with funding and staff allocations (Grantham, 2011; Kettler et al., 2015;

ID OF NON-TRADITIONAL GT STUDENTS 15
Raudenbush et al., 1998). Grantham (2011) called for educators to be “upstanders” rather than
just bystanders to the lack of proportional representation in gifted education. In the case of Black
male students, he argued that allowing nearly 150,000 youth to remain unidentified for gifted
services is socially unjust (Grantham, 2011).
Differential identification rates by grade level. Another concern in the field of gifted
education is determining when children should be identified. Researchers have brought to
attention the importance of early identification of gifted children, especially concerning the
children’s cognitive, motivational, and social-emotional development (Heller & Hany, 2004;
Perleth, Schatz, & Mönks, 2000; Shaklee, 1992). The National Association for the Education of
Young Children (NAEYC, 2009) also highlighted the immediate and delayed influence of
experiences and environment on children’s development. As such, it is not surprising that 26 out
of 33 states identified children for gifted services in kindergarten and the elementary grades
compared to 11 states that provided additional identification services during middle school and
nine states during high school (NAGC & CSDPG, 2015).
However, early identification is not without its concerns. When examining the
performance of elementary school students in a longitudinal study using ITBS and CogAT,
Lohman and Korb (2006) found that students’ scores in reading and mathematics differed the
most when they were tested in Grade 4 than when they were tested in Grades 6 and 9. This
shows that students who are identified in Grade 4 based on their ITBS scores may not perform
similarly in Grade 6 and 9.
Another consideration on early identification is about the form of gifted programming
available to the identified students. Olszewski-Kubilius and Limburg-Weber (1999) highlighted
the differences in needs between gifted elementary and gifted middle school students. The

ID OF NON-TRADITIONAL GT STUDENTS 16
requisite for advanced classes in preparation for high school and college, as well as real-life
experiences, are more appropriate for the older students as they prepare for this stage in their
development. In comparison, elementary gifted programs focus on accelerating and enriching
content (NAGC, 2015).
Differential identification rates by geographic location. Implementing a unified
identification process and method across differing states is not an easy feat to achieve. The issue
is further compounded by variations in state laws and regulations concerning identification
methods. The southern region of the United States faced litigation over underrepresentation of
Black, Hispanic, and Native American students in gifted programs and made changes to
identification processes (Stephen, Dudley, & Karnes, 2012). In Lee vs Lee County Board of
Education (2007), the U.S. District Court mandated that the state of Alabama change its gifted
education policy due to underrepresentation of Black students. Following the Office of Civil
Rights investigation of the underrepresentation of Black students in South Carolina, that state
implemented changes to its gifted programming, which led to increased equitable representation
(Swanson, 2007).
In addition, demographic differences among the states exist. Part of the southwest region,
Texas and Arizona have a higher population of Hispanic Americans than other regions.
However, in recent years, the Midwest portion of the United States has also seen a surge in the
Hispanic populations (Brown & Lopez, 2013). In comparison, the southern states have a higher
population of Black Americans. There is little research on the identification of Native American
students and it is unclear how geographic location influences this group of students.
Purpose of the Study

ID OF NON-TRADITIONAL GT STUDENTS 17
Proportional representation of students in gifted programming is a goal of gifted
education researchers and practitioners. Identification methods affect the proportion of students
from different races being served in gifted programs. Differences among the non-traditional
identification tests have also yielded a variety of opinions among researchers about their
effectiveness in identifying underrepresented students. Thus, the goal of this study is to shed
light on the underrepresentation of CLED gifted students, specifically Black, Hispanic, and
Native American students in gifted education programs. More specifically, we used a meta-
analytic technique to gather and synthesize accumulated evidence of the under-identification of
Black, Hispanic, and Native American gifted students reported in literature compared to that of
Asian and White students as well as to examine the influence of traditional and non-traditional
identification methods on the under-identification of these populations.
Given the differing viewpoints on the effectiveness of identification methods in
identifying Black, Hispanic, and Native American gifted students and the number of studies that
have been conducted in the field of gifted education, a meta-analysis was appropriate to
synthesize the wide range of studies. This was done in order to effectively gauge the gap in
identification rates through non-traditional testing of underrepresented students compared to their
counterparts in gifted programs as well as to examine the differences in identification rates
between identification processes. More specifically, this meta-analysis was conducted based on
the hypothesis that the identification methods are partially accountable for the lack of
proportional representation and thus act as a barrier to gifted services among Black, Hispanic,
and Native American students. In our study, Black, Hispanic, and Native American students are
grouped as underrepresented students in gifted programming; whereas, Asian and White
American students are considered as represented students. Specific research questions are:

ID OF NON-TRADITIONAL GT STUDENTS 18
1. How do the proportional identification rates for gifted program services of Asian and
White American students versus rates of Black, Hispanic, and Native American
students differ?
2. How does the identification method (i.e., traditional vs. non-traditional), location and/or
grade level of students moderate the difference in proportional representation between
Black, Hispanic, and Native American students identified as gifted compared to the
proportion of Asian and White American students identified as gifted?
Method
Study Identification
Target literature for this meta-analysis was limited to studies reported only in the United
States because this study is framed around NCLB (Bush, 2001), a law adopted in the United
States. In addition, we chose to focus on studies reported between 2002 and 2015, setting the
dates to coincide with the educational shift that came with the induction of NCLB. Although the
main focus of NCLB was on general students, the policy resulted in a reduced focus on gifted
students and limited funding spent on their special needs (Gentry, 2006). Another influence of
NCLB on gifted students was related to closing the achievement gaps among the various groups
of students, including English language learners, those from different racial groups, and those
from different socioeconomic classes (Gallagher, 2004). Further, we limited the studies to those
conducted in K-12 education because identification instruments and processes are largely used
on students when they are within the K-12 school systems (Heller & Hany, 2004; NAGC &
CSDPG, 2015; Perleth et al., 2000).
The keywords we used in our search were: Gifted, identification, intelligence, I.Q.,
equity, testing, high-ability, talented, representation, underrepresented, underrepresentation,

ID OF NON-TRADITIONAL GT STUDENTS 19
minority, and measurements. Different combinations of keywords and all of the keywords were
used in the search. Some of the keywords (e.g., gifted and talented) were also chosen as they are
often used interchangeably within the field of gifted education.
The meta-analysis commenced first with a search for literature using electronic databases
including Google scholar, ERIC, PsycINFO, Thesis and dissertation platforms such as ProQuest.
These databases have a large inventory of published and unpublished educational and
psychological research. We considered these databases as sufficient starting points to identify
potential studies for our meta-analysis. Potential articles were selected for inclusion through
database searches; this was followed by a review of references in these studies to identify
additional studies for inclusion in the meta-analysis.
Inclusion and exclusion criteria. To be included in the meta-analysis a study needed to
meet the following four criteria:
(a) Studies conducted in the United States with K-12 students after 2002. Studies
concerning populations outside the United States or those dealing with Undergraduates/post
graduates and pre-K students were excluded;
(b) Studies that involved gifted students as their study sample. Studies that included in
their sample both gifted and non-gifted student were included. Given that the meta-analysis was
concerned with the difference in representation of Black, Hispanic, and Native American gifted
students in gifted programming and general populations, those studies that only contained
information about the gifted students in their sample were excluded, unless they indicated the
size and composition of the general population;
(c) Studies that reported the identification information by race. Studies that did not
describe the racial makeup of their sample were excluded; and

ID OF NON-TRADITIONAL GT STUDENTS 20
(d) Studies that reported sufficient and relevant statistics that computed the
identification rate by race. Literature reviews and qualitative studies were excluded. The
proportion of Black, Hispanic, and Native American students in the general population and
gifted population (or data provided to derive them) was necessary for inclusion.
The initial electronic search yielded 7,746 studies potentially related to our study. After
screening the abstracts using the inclusion and exclusion criteria above, the number of articles
potentially included in the meta-analysis was reduced to 183. We also conducted a manual
search for studies that reported in the four major journals in gifted education (Gifted Child
Quarterly, Roeper Review, Journal of Advanced Academics, and Journal for the Education of the
Gifted). This step was put in place to verify that we included any potential articles not found
through the initial search with the electronic databases. Each article published in these journals
between the years 2002 and 2015 (k = 1,526) was scanned and assessed individually for
inclusion in the meta-analysis. Further, we examined available education statistical databases
(OCR, 2015; Texas Education Agency, 2015) and state reports on state education websites. The
two additional search methods identified additional 55 articles and reports for 238 potential
articles identified after the three initial screening. These articles were then examined by reading
the texts carefully to retrieve effect sizes using the provided data in the reports. With the
additional checks and computation, 186 studies were eliminated due to missing information in
reporting of population, study sample, or identification methods. Thus, the final set of the studies
included in this meta-analysis consisted of 45 journal articles, four dissertations, and five state
reports, for a total of 54 studies. Figure 1 shows the search process. From these 54 studies and
reports, that together included 191,322,595 students, we obtained 92 effect sizes. After

ID OF NON-TRADITIONAL GT STUDENTS 21
accounting for dependent effect sizes, 85 independent effect sizes were extracted. The additional
seven effect sizes were retrieved from Texas’ Public Education Information Management System
(PEIMS) and OCR. We used the effect sizes calculated from PEIMS and OCR only for
descriptive purposes. Table 1 lists the characteristics of the studies included in the meta-analysis.
Coding Process and Coded Variables
Before coding articles, a coding sheet was drafted and agreed upon by the team of
researchers consisting of two graduate students, a researcher with expertise in gifted education,
and a researcher with expertise in research methodology including meta-analysis. Following the
development of a coding sheet, an initial pilot examination of 20 articles by the team led to
revisions of the coding sheet for clarity. The revised coding sheet included authorship,
geographic location of the sample, year of publication, grade level, what identification method
the researchers of primary studies employed, demographic data about the student sample, as well
as quantitative information to be used for computing an effect size. In conjunction with the type
of identification method, whether that method constituted a verbal or non-verbal method was
also coded. These variables are described and summarized in Table 1, and are also considered as
potential moderators in the subsequent inferential analyses.
(a) Identification methods. The identification methods reported in examined studies
were first classified into two categories: non-traditional and traditional depending on the
identification tests and procedures used. These methods were further sub-categorized by the
specific test being used into three non-traditional methods (RAVEN, NNAT, and CogAT-NV)
and two traditional methods (IQ tests and achievement tests). This coincides with the literature
since these are the most commonly used identification methods (Giessman et al., 2013; Lakin &
Lohman, 2011; Lohman et al., 2008; NAGC & CSDPG, 2015; Naglieri & Ford, 2003).

ID OF NON-TRADITIONAL GT STUDENTS 22
(c) Geographic location. We coded the location where the data were collected using six
regional categories (i.e., North, Northwest, Southwest, South, West, and Midwest). However, no
studies included samples from the Northwest portion of the United States. In addition, only two
were included from the West, an insufficient number for including it in a moderator analysis.
(d) Grade level. Students in grades Kindergarten to Grade 5 were coded as elementary
students (k = 33); studies that included students in Kindergarten to Grade 8 were coded as
elementary-middle school students (k = 9); and Grades 7-12 as middle-high school students (k =
11). Studies that involved a student sample across all grade levels (K-12) were not included in
moderator analysis for grade level. We coded in this manner to preserve information about
elementary students and how identification and representation differed from upper grade levels.
Testing for gifted services is primarily done during elementary years (Sternberg & Davidson,
2005), and this is evident given the number of studies involving elementary students (k = 42).
Two members of the research team completed the coding. Digital copies of the articles
were kept in a shared folder to provide research team members access to all articles. A common
coding problem encountered by the coding team was that majority of the identified studies did
not provide a clear description of their participants, which necessitated further calculations to
obtain the effect sizes. Studies needing calculations were set aside after the first round of coding
for further evaluation of coding validity. Once initial coding of all studies was completed, one
member of the coding team analyzed the studies with missing data and completed all necessary
computations to conclude coding, while another member of the team worked on keying in the
information into the data sheet. Both members referred to all identified articles to ensure that the
information was recorded correctly, and any disagreement concerning the coding was discussed
between coders. The third research team member confirmed the computation of all effect sizes.

ID OF NON-TRADITIONAL GT STUDENTS 23
The coded data were cross-checked again by the coders and another member of the research
team before conducting inferential analyses.
Definition of Effect Size
Given that inclusion (either a student is identified as gifted or not) is a dichotomous
outcome, a risk ratio (RR; Borenstein, Hedges, Higgins, & Rothstein, 2009) that compares the
rates of inclusion in gifted program between underrepresented and represented populations was
deemed the most appropriate effect size for analysis and most meaningful for interpretation.
First, the subgroups that had been designated by race were consolidated into two groups:
traditionally underrepresented populations (i.e., Black, Hispanic, and Native American students),
which served as our focal group, and traditionally overrepresented populations (i.e., White and
Asian students), which served as the reference group. The RR compares the occurrence of
identification of gifts in the focal group compared to that in the reference group. More
specifically, in our meta-analysis, the overall effect size is defined as:
𝑅𝑖𝑠𝑘 𝑅𝑎𝑡𝑖𝑜 (𝑅𝑅) = 𝑃𝑈𝑅𝐺
𝑃𝑅𝐺
Where 𝑃𝑈𝑅𝐺 = the proportion of Black, Hispanic, or Native American students who were
identified or in a gifted program, 𝑃𝑅𝐺 = the proportion of White or Asian students who were
identified or in a gifted program. We also computed the RR for comparing the proportion in a
gifted program for a specific racial group (e.g., Black) to traditional group, using the above-
described formula.
An RR greater than one indicated that the focal group (i.e., underrepresented group) is
overrepresented in a gifted program relative to the reference group (i.e., overrepresented group);
whereas, a RR less than one indicated underrepresentation of the focal group compared to the

ID OF NON-TRADITIONAL GT STUDENTS 24
reference group. For example, a RR of 2 is interpreted as the probability of being identified for
gifted is as twice as high for the focal group compared to that for the reference group.
Alternatively, a RR of .5 means that the probability of being identified for the focal group is a
half of that in the reference group. A RR of 1 indicates that all demographics are equally
represented in a gifted program in a primary study. Table 1 also reports the RRs obtained from
studies used in the analysis.
Handling multiple effect sizes. In some cases (k = 12), multiple effect sizes were
extracted from a single journal article. For example, Giessman and his colleagues (2013)
examined how identification methods at different cutoff scores led to different levels of
proportional identification. In this case, three different identification methods were examined at
three cutoff scores leading to nine effect sizes. Biased parameter estimates associated with
multiple effect sizes from the same study, when they are dependent of each other, have often
been noted in meta-analysis literature (e.g., Wood, 2008). As remedies, several methods of
handling dependent effect sizes were suggested including selecting one representative effect size
from each uniquely identified sample (e.g., Card, 2012; Steenbergen-Hu & Olszewski-Kubilius,
2016), averaging the multiple effect sizes within the study to obtain a synthetic effect size (e.g.,
Sutton, Abrams, Jones, Sheldon, & Song, 2000), using shifting unit of analysis (Cooper, 2010),
estimating dependency with three-level multilevel modeling (Van den Noortgate, López-López,
Marín-Martínez, & Sánchez-Meca, 2013, 2015), applying multivariate methods to analyze
dependent effect sizes by modeling the covariance structure (e.g., Olkin & Gleser, 2009), using a
robust variance estimation method (e.g., Hedges, Topton, & Johnson, 2010). Although the
multivariate approach is likely to offer minimal estimation errors (Hedges et al., 2010), the
method was not feasible in our study due to the relatively small k for applying the method and

ID OF NON-TRADITIONAL GT STUDENTS 25
limitation of required additional statistical information, such as the covariance structure of
residuals, Hedges et al. (2010) also claim that the method is rarely used in practice for the
additional data requirements and the time-consuming process. Robust variance estimation
method and three-level multilevel model approaches are attractive options for handling
dependencies when clusters of inter-related effect sizes are observed in primary studies
However, Hedges et al.’s method (2010) also requires correlation estimates for any pairs of
effect sizes within a primary study. Furthermore, the application of three-level multilevel
modeling will suffer low statistical power and biased estimation of variance components when
the sample size is small. As our study has only seven studies that reported dependent effect sizes
from 54 studies, and the application of either of these methods may not be feasible for the current
study. Card (2012) noted that the method of selecting the most representative effect size should
be applied only when it is clear that one particular effect size should be included whereas others
should not (p. 193) because the selection decision may be an additional source of bias due to
researchers’ subjectivity (Wood, 2008). Thus, we used the method of averaging the effect sizes
and Cooper’s (2010) shifting units of analysis, depending on the purpose of the analysis.
Although we acknowledge our selections of handling the multiple effect sizes may also have
limitations, Hedges et al. (2010) observes our methods have commonly utilized in practice.
(a) Averaging the effect sizes. A single effect size for each identification method was
extracted by averaging the effect sizes with their associated standard error as weights, assuming
these represent, in some extent, the same population effect size within the study. Then, we
included the synthetic effect sizes (the study-average effect sizes, Hedges et al., 2010, p. 40) to
compute the average effect size across studies. For example, Lohman & Gambrell (2012),
averaged two extracted effect sizes to handle the dependency.

ID OF NON-TRADITIONAL GT STUDENTS 26
(b) Shifting unit of analysis. When calculating the average effect size by study
characteristics (e.g., identification methods), shifting the unit of analysis technique (Cooper,
2010) was employed to preserve k for each follow-up moderator analyses, while handing
dependency. Giessman et al. (2013) applied shifting the unit of analysis method to compute the
weighted average effect sizes by identification methods (i.e., verbal vs. non-verbal) to minimize
the dependency. When conducting the moderator analysis with identification methods, the
average verbal effect size was then removed from the analysis where pertinent. This procedure
was replicated for all cases in which verbal and non-verbal effect sizes were extracted from the
same study.
Outliers. Before inferential analysis was conducted, the distribution of the risk ratios was
examined for any outliers. Outliers should be eliminated when illegitimately present in a dataset;
but their exclusion should be approached with rigor and caution (Barnett & Lewis, 1994). Tukey
(1960, 1977) espoused elimination of outliers that exist three times the interquartile range of
either the 75th or 25th percentiles. One study fit this criterion. Wilson (2015) conducted a study
observing differences between young children with high intellectual abilities and their peers in
cognitive and social play. A sample-adjusted meta-analytic deviancy statistic (Huffcutt & Arthur,
1995) was calculated for the study and indicated that inclusion or exclusion of the study would
have minimal influence on estimating the population parameters due to the small primary sample
size (n = 34) in the Wilson (2015) study. As the study was minimally impactful, it was only
included in analysis for the overall effect size and was excluded from subsequent analysis.
Data Analysis
A random-effects model was used as the theoretical framework for conducting a meta-
analysis. Given that these effect sizes are associated with social science data, no perfect measure

ID OF NON-TRADITIONAL GT STUDENTS 27
can be derived to accurately formulate the parameter that describes the population of analysis,
and thus some of the variation might be simply due to error. However, we view the population
value for the effect sizes retrieved from primary studies as not identical, but follow a
hypothetical distribution. Thus, the observed variation in effect sizes is also caused by
differences of design in the studies, in particular by different methods of identification and
student population in primary studies.
The computation of average RR and exploration of variance in RRs. We computed
the average RR to determine if Black, Hispanic, and/or Native American students are
proportionally represented in gifted programs. In order to compute the average RR, we first
transformed RR to log risk ratio (LRR) by taking the natural logarithm of RR to maintain a
symmetric distribution of effect sizes (Borenstein et al., 2009). The standard error of the LRR is
defined as:
𝑆𝐸𝐿𝑅𝑅𝑖 = √ 1
𝑈𝑅𝐺𝑖 −
1
𝑈𝑅𝑖+
1
𝑅𝐺𝑖−
1
𝑅𝑖
Where, 𝑈𝑅𝑖 is the number of Black, Hispanic, and/or Native American students in study
i, 𝑈𝑅𝐺𝑖 is the number of Black, Hispanic, and/or Native American students who were identified
as gifted among 𝑈𝑅𝐺𝑖, 𝑅𝑖 is the number of White and Asian students in the same study, and 𝑅𝐺𝑖
is the number of White and Asian students who are identified among 𝑅𝑖. We used the weight,
which is the inverse of total variance, to compute the average LRR, so that the primary study
with large sample size will obtain larger weight than that with small sample size. We ran Q test
of heterogeneity to judge if observed variance is beyond sampling errors. Second, we used 𝐼2
(Higgins & Thompson, 2002) and 𝜏2 indices to understand the extent of the variance resulted in
between-study difference relative to total variation in LRR.

ID OF NON-TRADITIONAL GT STUDENTS 28
We repeated the above-mentioned analyses for (a) the combined group of traditionally
underrepresented students (i.e., Black, Hispanic, and Native American students) compared to the
combined group of White and Asian students, and (b) each racial minority group compared
separately to the combined group of White and Asian students. Note that we could not conduct a
subgroup analysis for Native American students because of the small number of effect sizes (k =
9). All results of inferential analyses were transformed back to the original metric and reported in
results section.
Moderator Analysis
Three factors were primarily explored in the moderator analyses to explain the variation
in RRs; 1) type of identification methods (five methods), 2) geographic locations (four regions),
and 3) grade level (three grade levels). To address the second research question, we considered
analyzing all three categorical moderators simultaneously with a Meta-Regression. However,
conducting the regression analysis resulted analyzing nine dummy variables in the model using a
reduced number of effect sizes (k=30). The reduction of the sample size occurs because not all
studies include information for all variables. For example, in the study by Lohman, Korb, and
Lakin (2008), the authors only provided information on Hispanic and white student populations
but did not include any information about the Asian and Black students. As a result, this study
would not be included in the regression analysis. Eliminating studies that did not provide
information on all variables in regression analysis for listwise deletion reduced the sample size,
which would result in lowering the statistical power and affecting the precision and accuracy of
the estimations. In addition, although regression analysis allows researchers to examine an
additive effect of each moderator when controlling other moderators in the model, while the
interpretation of those coefficients become more complex. In fact, we found that the three

ID OF NON-TRADITIONAL GT STUDENTS 29
moderators were relatively independent in our preliminary analyses (i.e., |rIDLocation| = .07-.33,
|rIDGrade| = .01 -.16, |rLocationGrade|=.004 - .14, all are non-significant, except for IQ and Midwest),
suggesting that no specific application of identification method is used at a particular region or
grade level and thus the influence of intercorrelation among moderators was minimal.
Furthermore, Higgins and Thompson (2002) indicated that a meta-regression with multiple
covariates (in our case, nine dummy variables with one intercept) will increase the likelihood of
committing a Type I error when evaluating individual effects. Based on methodological
consideration for the current data conditions and for ease of interpretation, we chose to use Meta-
ANOVA to analyze each moderator separately. In addition, due to the increased possibility of
committing a Type I error with multiple ANOVA analyses, we adjusted alpha level to
alpha=0.01 for statistical evaluation. Comprehensive Meta-Analysis software (Version 3.1.1;
Borenstein, Hedges, Higgins, & Rothstein, 2014). was used for the analyses using Meta-
ANOVA.
Sensitivity Analysis
Publication bias. Since studies with contradictory or null results are less likely to be
published than studies with significant results in the expected direction, description of
unpublished studies is required. Among the studies in the current meta-analysis, 45 of them are
published, four of them are unpublished dissertations, and the remaining five are state and
technical reports. We constructed a funnel plot to describe the distribution of effect sizes in terms
publication bias (Figure 2). The idea behind the funnel plot is that if the effect sizes are
distributed symmetrically in a funnel shape (with the idea that the larger the sample size, the
closer to the true population mean) then there can be assumed to be little publication bias

ID OF NON-TRADITIONAL GT STUDENTS 30
(Cooper, Hedges, & Valentine, 2009). Analysis of the funnel plot showed minimal publication
bias as indicated by the roughly symmetrical shape. A classic fail-safe analysis was conducted as
an alternative test for publication bias and indicated that 4,113,553 studies would be needed for p
> .05 to be observed. Orwin’s fail-safe was also used to test how many studies would need to be
added to the meta-analysis for the null to be accepted (RR = 1). The test results indicated
6,115,182 null studies would need to be added for the observed effect with the current pool of
studies for the null result to be accepted.
Results
Representation of Black, Hispanic, and Native American students in Gifted Program
The overall average RR, that compares the proportion of Black, Hispanic, and Native
American students identified as gifted and/or served in a gifted program to that of the reference
group, was 0.34 with a standard error of 0.01. The RR of 0.34 indicates that the probability of
being identified for Black, Hispanic, and Native American students is about one-third that of the
probability of being identified for White and Asian students. This means that students in the
focal group remain largely under-identified for and underrepresented in gifted programs in the
United States. However, as shown the variability of RRs in Table 2, the Q result also indicated
that the significant variation exists among retrieved RR (Q (84) = 149,293.87, p < 0.0, 𝜏2=
0.081). Because the I2 index of 99.99 % indicates heterogeneity of effect sizes are mainly due
between study variance, this supports the need of moderator analyses (Hox & Leeuw, 2003).
Moderator analyses. Because not all studies reported identification methods, only 56 of
85 effect sizes were associated with a description of the identification procedures used in their
respective studies. For example, a study only containing information on grade level would only
be included in the Meta-ANOVA regarding grade level. A test for heterogeneity supports that

ID OF NON-TRADITIONAL GT STUDENTS 31
significant variability across effect sizes existed (Q (55) = 8,277.60, I2= 99.08, p < .01, 𝜏2=
0.09). As reported in Table 2, the average RR for non-verbal identification methods is 0.34 (k
=28, SE = 0.08); whereas, for 30 effect sizes were aggregated to provide a risk ratio effect size of
0.27 (SE = 0.06) for the traditional methods. However, the difference in the average RRs was not
statistically significant, (Q (1) = 2.31, p > .50). The inclusion of additional effect sizes in the
meta-ANOVA breakdown by a specific identification instrument also suggested that the
difference is not statistically significant (Q (4) = 3.21, p > .50). The average RR was 0.42 for
RAVEN (k = 7, SE = 0.26) while the average RRs were 0.27 for NNAT (k =11, SE = 0.12) and
0.34 (k = 4, SE = 0.26) for the CogAT-NV, respectively. Conversely, the average RR for IQ tests
was 0.31 (k = 10, SE = 0.16) and that of achievement tests was 0.24 (k = 20, SE = 0.08).
This suggests that regardless of the identification instruments, the probability of being identified
for the underrepresented group is persistently about one-third of that for the overrepresented
group. Similarly, the chance of being identified is persistently lower across all grade levels for
underrepresented groups compared to overrepresented group (Q (2) = 3.63, p = .16) in the meta-
ANOVA.
An examination of the effect sizes for location suggested that there existed a difference in
identification rate across location (Q (3) = 31.05, I2 = 99.56, p < .001, see Table 2). We found the
average RR of 0.47 for Southwest (k =19, SE = 0.09) and 0.32 for the South (k = 21, SE = 0.06),
while the RRs for North and Midwest are 0.23 (k = 6, SE = 0.08) and .24 (k = 24, SE = 0.04),
respectively. This indicates that the Southwest had the highest rates of proportional identification
with underrepresented populations being identified at nearly 50% of the rate of populations who
are traditionally identified for services.
Representation of Black Students in Gifted Education Program
ID OF NON-TRADITIONAL GT STUDENTS 32
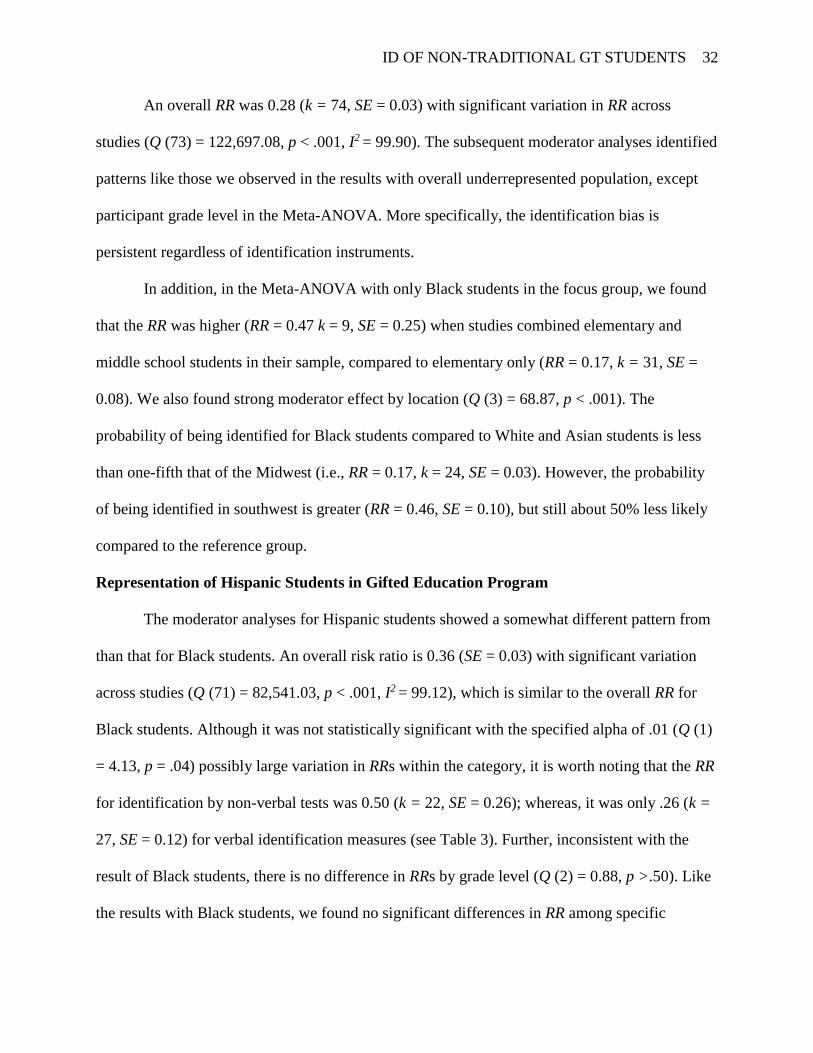
An overall RR was 0.28 (k = 74, SE = 0.03) with significant variation in RR across
studies (Q (73) = 122,697.08, p < .001, I2 = 99.90). The subsequent moderator analyses identified
patterns like those we observed in the results with overall underrepresented population, except
participant grade level in the Meta-ANOVA. More specifically, the identification bias is
persistent regardless of identification instruments.
In addition, in the Meta-ANOVA with only Black students in the focus group, we found
that the RR was higher (RR = 0.47 k = 9, SE = 0.25) when studies combined elementary and
middle school students in their sample, compared to elementary only (RR = 0.17, k = 31, SE =
0.08). We also found strong moderator effect by location (Q (3) = 68.87, p < .001). The
probability of being identified for Black students compared to White and Asian students is less
than one-fifth that of the Midwest (i.e., RR = 0.17, k = 24, SE = 0.03). However, the probability
of being identified in southwest is greater (RR = 0.46, SE = 0.10), but still about 50% less likely
compared to the reference group.
Representation of Hispanic Students in Gifted Education Program
The moderator analyses for Hispanic students showed a somewhat different pattern from
than that for Black students. An overall risk ratio is 0.36 (SE = 0.03) with significant variation
across studies (Q (71) = 82,541.03, p < .001, I2 = 99.12), which is similar to the overall RR for
Black students. Although it was not statistically significant with the specified alpha of .01 (Q (1)
= 4.13, p = .04) possibly large variation in RRs within the category, it is worth noting that the RR
for identification by non-verbal tests was 0.50 (k = 22, SE = 0.26); whereas, it was only .26 (k =
27, SE = 0.12) for verbal identification measures (see Table 3). Further, inconsistent with the
result of Black students, there is no difference in RRs by grade level (Q (2) = 0.88, p >.50). Like
the results with Black students, we found no significant differences in RR among specific

ID OF NON-TRADITIONAL GT STUDENTS 33
identification tests we explored (Q (4) = 1.36, p >.50). We also found that significant variation in
the average RR by geographical location for Hispanic students. Similar to the finding with Black
students, identification bias is less in the South (RR = 0.35, k = 20, SE = 0.11), and Southwest
(RR = 0.49, k = 21, SE = 0.13) (Q (3) = 11.86, p = .01). Thus, the probability of being identified
for Hispanic students living in in south and southwest is greater than for those students in the
same racial group who live in other region in the United States, but still about 50% less likely
compared to the reference group.
Discussion
Scholars in the field of gifted education have observed discrepancies in racial
representation in gifted programming (Yoon & Gentry, 2009) as well as in identification by
traditional testing methods, including state standardized tests and IQ tests (Ford, 2014). With an
overall risk ratio of .34, this means that the probability of historically underrepresented students
being identified is 66% less than for Asian and White students. This supports previous findings
that Black and Hispanic students continue being largely under-identified and underrepresented in
gifted programs in the United States for decades (Daniels, 1998; Erwin & Worrell, 2012; Ford,
2014; Yoon & Gentry, 2009). However, when this risk ratio is examined using a moderator of
location or grade, the results indicate a more positive outlook for some groups in certain regions.
Black students were identified with a risk ratio of 0.28, evidenced their
underrepresentation in gifted programs. This finding is aligned with the body of research that
details the inequity in representation reported by numerous researchers (e.g., Daniels, 1998;
Erwin & Worrell, 2012; Ford, 2014; Ford & Harris, 1994; Lakin & Lohman, 2011; Naglieri &
Ford, 2003, Yoon & Gentry, 2009). Additionally, when this national rate is examined by region,
the Midwest woefully under-identifies Black students (RR = 0.17). In comparison, the South

ID OF NON-TRADITIONAL GT STUDENTS 34
identifies Black students at almost twice the rate of the Midwest (RR =0.30) and the Southwest
identifies them at almost three times the rate of the Midwest (RR =0.46). The identification gap
observed by many researchers for Black students exists across throughout the United States.
Warne et al. (2013) reported an odds ratio (OR) of identification of Black students (OR = 0.81),
Hispanic (OR = 0.95), and Native American (OR = 0.54) students in Utah. An OR of 0.81 meant
that the Black students are being identified at 81% the rate of identification when compared with
their White peers. The researchers used their findings to state that there was no unified
underrepresentation across the United States for traditionally underrepresented populations due
to the comparatively high rates of identification in Utah. In comparison, the identification
statistic calculated for Black students in our study is closer to the one observed by
Konstantopoulos et al. (2001), in which they reported an odds ratio of 0.37 for Black students in
comparison to their White peers. Given that equitable identification of Black students was not
observed in other authors’ studies, it is likely that the findings of Warne et al. (2013) are unique
to the state of Utah. As such, these findings supported the conclusion drawn by the authors that
there was variability in identification by region. These findings also support the work of Yoon
and Gentry (2009), who documented variability by state in identification rates by using the OCR
reporting database. Some explanations for the uneven identification rate could be due to the
litigation leveled within some southern states in particular (Stephen et al., 2012), which has led
to changes in policy and resulting identification practices.
With an overall risk ratio of 0.36, Hispanic students, like Black students, are
underrepresented in gifted programs. In addition, when examined by region, the South (RR =
0.35) and Southwest (RR = 0.49) have higher levels of proportional identification than other
regions, particularly the Midwest (RR = 0.29). Esquierdo and Arreguín-Anderson (2012) voiced

ID OF NON-TRADITIONAL GT STUDENTS 35
their concern over the lack of proportional identification in the Southwest among Hispanic
students, but compared with the national trend, these students are identified as gifted at 33%
greater in this region than in other areas of the country. Using the data presented by Esquierdo
and Arreguín-Anderson (2012), a risk ratio of 0.48 was reported for Hispanic students in the
Southwest. This coincides with the risk ratio found in our study. This higher level of
proportional identification suggests that the education systems in the Southwest are having
success in the methods and policies it uses for identification.
There is also a likely corollary between districts with large numbers of Hispanic students
and higher identification rates (Raudenbush et al., 1998). Consequently, the Midwest, which is
currently experiencing an increase in enrollment in public schools by Hispanic students (Brown
& Lopez, 2013), is below the national average for proportional identification of Hispanic
students. This supports the findings of Yoon and Gentry (2009). In the South and Southwest
regions of the country, despite the increase in identification of Hispanic students, they are still
largely underrepresented in gifted programs.
In comparing the identification rate between Black and Hispanic students, Black students
are identified at lower rates than their Hispanic peers in all regions examined. The greatest
contrast between the two rates in comparison to the overall rate is in the Midwest (Black RR =
0.17, Hispanic RR = 0.29). This is a new finding in the field. Scholars who have examined
underrepresentation have largely focused on the South and Southwest regions of the United
States (Esquierdo & Arreguín-Anderson, 2012; McBee, 2006). As such, a large gap in
proportional identification existing in the Midwest among Black students and their Hispanic
peers is a finding that warrants further investigation.

ID OF NON-TRADITIONAL GT STUDENTS 36
Statistically significant differences in terms of grade level were only observed for Black
students. These students were identified at higher rates in the middle grades (RR = 0.47)
compared to the elementary (RR = 0.17) and high school (RR = 0.18) levels. Consequently, this
suggests that the trend of closing performance gaps on tests at the later elementary and the
middle level observed by Lohman and Korb (2006) may have led to higher identification rates.
The large standard error associated with the effect size for middle grades suggests a large amount
of variance among identification rates of middle school Black students. However, Black students
may have been less likely to be identified as gifted because many enter public school with less
academic exposure than other students (Ford, Grantham, &Whiting, 2008). These students
“catch up” to their peers by late elementary and middle school and are therefore more likely to
be identified as gifted at that time.
The moderator analysis of identification methods provided notable empirical evidence
contradicting the claims of researchers who have developed non-verbal methods as a means to
close the proportional representation gap (Lohman, 2013; Naglieri & Ford, 2003; Pfeiffer &
Jarosewich, 2007; Sarouphim, 2003; Van Tassel-Baska, Johnson, & Avery, 2002). Overall, we
found no statistically significant difference in the risk ratio between verbal and non-verbal
methods of identification. In addition, no statistically significant differences existed for the
testing methods examined in this meta-analysis. The non-verbal tests were specifically created to
address the proportional gap in identification of underserved students (Naglieri & Ford, 2003),
but the gap persists.
An examination of the influence of verbal and non-verbal methods of identification in

ID OF NON-TRADITIONAL GT STUDENTS 37
Black and Hispanic students, separately, revealed a difference in the average risk ratios for the
two groups. Black students were not only being identified at the same rate with regard to verbal
and non-verbal identification methods, but both rates were also remarkably low (RR = 0.17 and
RR = 0.19, respectively). These rates of identification demonstrate that despite researchers’ best
efforts (Lohman, 2013; Naglieri & Ford, 2003; Pfeiffer & Jarosewich, 2007; Sarouphim, 2003;
Van Tassel-Baska et al., 2002), Black students remain under-identified and underserved
regardless of identification method (Erwin & Worrell, 2012; Yoon & Gentry, 2009). This gap in
representation is unlikely to be closed by only a test without further support in the form of
programs and funding (Kettler et al., 2015; Peters et al., 2013)
The findings for Hispanic students were the same as those for Black students. There was
no statistically significant difference between verbal and non-verbal identification methods. This
provides evidence that Hispanic students also experience no increase in proportional
identification rates when non-verbal tests are used in place of traditional identification methods.
As the Hispanic population continues to grow in public schools (Brown & Lopez, 2013), the
results of the meta-analysis show that there has not been similar growth in gifted identification
rates aswell. Esquierdo and Arreguín-Anderson (2012) cautioned against the prospect of
excluding Hispanic students from gifted services. The results from this study demonstrate that
non-traditional methods of identification are unlikely to address the concerns of Esquierdo and
Arreguín-Anderson (2012).
The results of this study coincide with Erwin and Worrell’s (2012) findings, but not with
their conclusion. In their analysis of assessment practices, they found that, when controlling for
achievement, there was no difference in identification rates. Like Warne et al. (2013), they

ID OF NON-TRADITIONAL GT STUDENTS 38
argued that a combination of socioeconomic factors was the cause for under-identification and
not the actual identification methods. This conclusion is supported by the results for Black and
Hispanic students for whom there was no significant difference between the verbal and non-
verbal tests.
Due to the limited number of effect sizes (k = 15), we were unable to conduct similar
analyses for Native American students. Of the 10 retrieved studies, seven were from state reports
and three were from national survey data. An overall RR effect size of 0.49 was obtained from
the available data with a standard error of 0.11. The lack of usable data found through this meta-
analysis of the Native American students is discouraging in many ways. First, this is reflective of
how researchers generally do not report on this population when examining gifted students in
schools (Gentry, Fugate, Wu, & Castellano, 2014). This is troubling as the national information
derived from the state reports and national surveys indicates that Native American students are
underrepresented in gifted programming. However, we do not have information on how
underrepresented they are in comparison to Black and Hispanic students, nor do we know if the
RR for the Native American students is similar to that of the different regions of the country or
among different grade levels. Second, this lack of information makes it difficult for all
stakeholders to implement policies to address representation of Native youth in gifted programs.
In this meta-analysis, we found the use of non-verbal methods were able to identify almost twice
as many Hispanic students for gifted programming than the use of verbal methods. However, the
same cannot be said for Native American students as there is not enough information about their
identification rates on the various methods of scholastic assessments. This makes it difficult to
understand baseline or to measure improvement concerning proportional representation of Native
American students.

ID OF NON-TRADITIONAL GT STUDENTS 39
A final finding is that articles published in gifted education journals lack a standardized
reporting procedure for their samples. Of the 1,526 articles reviewed in the four major gifted
education journals, the methods for reporting samples varied. Some authors reported a sample as
being gifted without any description of how those students were identified as gifted. Given the
broad spectrum of definitions for giftedness and the varied identification methods (Erwin &
Worrell, 2012), trying to draw cohesive inferences about the population is problematic.
In essence, making inferences on a population that is ill-defined frequently leads to error
and/or bias. Two studies might examine gifted populations, but if those two studies drew upon
samples that were identified using different methods and under various definitions, then trying to
generalize between the two samples becomes difficult if not outright impossible. In other words,
the term “identified gifted” has a large amount of variance in what it means. When analyzing the
effects of given interventions and identification methods, researchers should provide greater
clarity concerning the demographics of their sample and the identification procedures used to
determine giftedness.
Limitations
The study has several limitations that affect the generalizability of the results. First, a
relatively small number of effect sizes were used for analysis of the three specific identification
tests (NNAT, RAVEN, and CogAT-NV) as compared to the other moderators (Grade and
Region). This limitation is mitigated by the small standard errors due to the large sample size
within the primary studies, but with an increased number of effect sizes from large samples, the
validity of the results will increase. Further, the small number of effect sizes limits the scope of
moderator analyses. Our analysis could investigate three key moderators. Because these three
moderators are little correlated, our conclusion with Meta-ANOVA maintains a statistical

ID OF NON-TRADITIONAL GT STUDENTS 40
conclusion validity. However, the fact that unexplained variances remain among effect sizes
suggests the possibility for the existence of other moderators which are not revealed in the
current analysis. There are many other factors that can influence proportional identification.
Factors such as the social-economic status of the districts, the effects of poverty and immigration
(e.g. language challenges, cultural differences), as well as systematic racism are likely to
contribute to the underrepresentation of Black, Hispanic, and Native American students
receiving gifted services. If a newly found moderator is related to one of three moderators used
in current investigation, the analysis with Meta-ANOVA does not identify the unique impact of
the moderators without accounting for the correlated moderators. Thus, further investigation of
other potential moderators will not only require additional k, but also require the use of more
sophisticated statistical analysis, such as the application of multilevel modeling (Hedges &
Maier, 2013) to fully entangle the complex phenomena of identification gap in gifted program. It
is also important to mention that further investigation is needed to facilitate our understanding of
the roles these factors play as well as the strength of their influences on identification in primary
studies.
Second, because of the lack of consistency in reporting practices, some effect sizes have
been impossible to calculate. Unless researchers studying gifted students are clear about the
demographics of their sample and how the students were identified as gifted, it will be difficult
to obtain the necessary effect sizes needed to increase the validity of the results.
Third, the samples from the Northeast and Western regions of the United States were not
included in a moderator analysis. This is partially due to the limited number of studies that have
been conducted in these two regions with gifted populations. Since we found that identification
gaps differ by region, without information from the Northeast and Western regions of the

ID OF NON-TRADITIONAL GT STUDENTS 41
country, we do not know if these regions are achieving proportional representation in their gifted
populations. The field of gifted education will benefit from high quality studies conducted on the
gifted population in these regions with detailed reporting that clearly explains the sample
demographics along with the methods used to identify the gifted students.
Finally, we were unable to conduct analyses for Native American students due to a lack
of studies that report statistics for this population. The Native American population is about 1.2%
of the total population of the United States. Although this is a small part of the population, it
does not mean that Native Americans should not receive the same attention that the Black and
Hispanic populations receive from researchers (Gentry et al., 2014). Gifted students can (and
should) be found in all racial groups, and they deserve a chance to develop their potentials. With
few authors including Native students their work, the findings and inferences of this meta-
analysis Native youth are severely limited.
Conclusion
Achieving proportional representation for students identified as gifted is a goal worth
attaining and an issue critical within the field of gifted education. Denying a large proportion of
the public-school children such services is not only socially unjust but also lacks foresight due to
the population trends in the United States.
The results of this study provide evidence that disproportionality in gifted identification
persists across all racial groups regardless of method used to identify the students as gifted.
However, some areas in the United States have better proportional representation. And, on verbal
assessments have mitigated to some degree underrepresentation of Hispanic youth as gifted.
Researchers should examine what the South and the Southwestern regions of the United States
are doing to close the gap in representation, and they should continue to use nontraditional means
ID OF NON-TRADITIONAL GT STUDENTS 42
of identification together with other pathways to address disproportionality. The use of multiple
identification methods and pathways would address the limitation of a single method. However,
it is also important to adopt a more inclusive process in selecting gifted students for services.
This can be done by providing services to students who are identified through any of the methods
used by the schools and not requiring them to only be served when identified through multiple
methods (McBee, Peters, & Waterman, 2014). Implementing talent development programs for
traditionally underserved youth in which they can develop strengths, skills, and interests might
help these students demonstrate and develop their potentials and thereby be identified for further
services. The representation gap will likely take years to close, but this should not discourage
researchers and educators from seeking to improve proportionality in gifted programs.
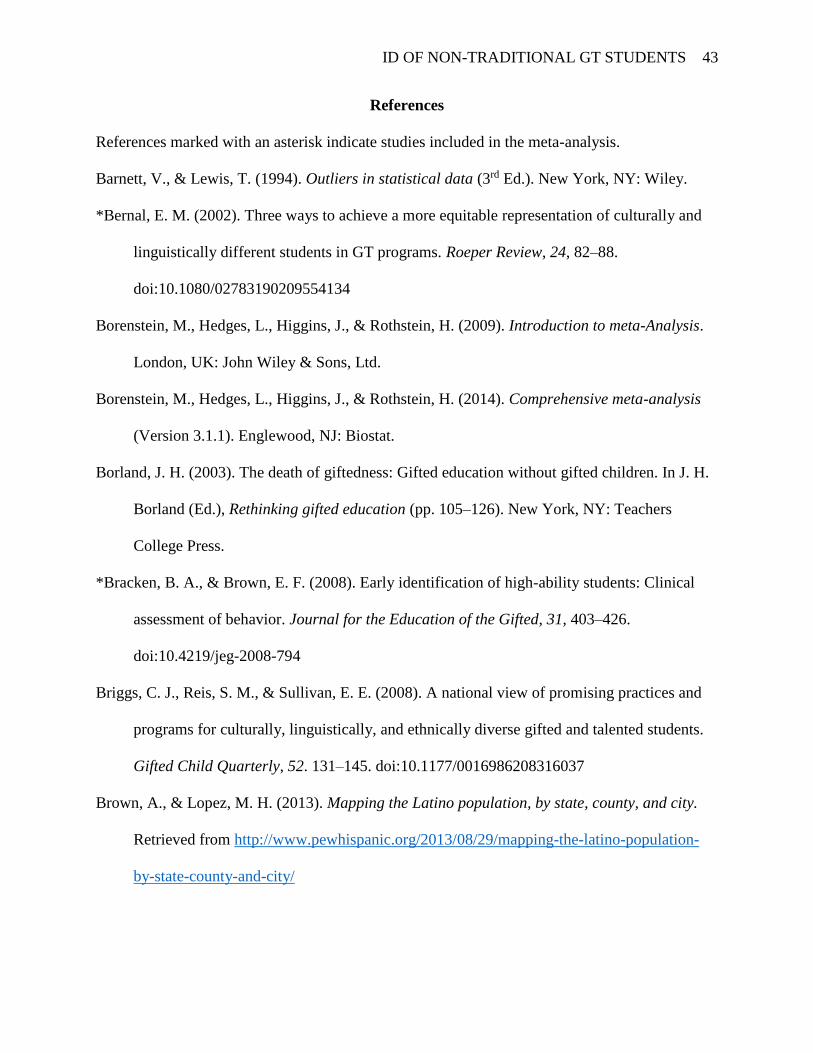
ID OF NON-TRADITIONAL GT STUDENTS 43
References
References marked with an asterisk indicate studies included in the meta-analysis.
Barnett, V., & Lewis, T. (1994). Outliers in statistical data (3rd Ed.). New York, NY: Wiley.
*Bernal, E. M. (2002). Three ways to achieve a more equitable representation of culturally and
linguistically different students in GT programs. Roeper Review, 24, 82–88.
doi:10.1080/02783190209554134
Borenstein, M., Hedges, L., Higgins, J., & Rothstein, H. (2009). Introduction to meta-Analysis.
London, UK: John Wiley & Sons, Ltd.
Borenstein, M., Hedges, L., Higgins, J., & Rothstein, H. (2014). Comprehensive meta-analysis
(Version 3.1.1). Englewood, NJ: Biostat.
Borland, J. H. (2003). The death of giftedness: Gifted education without gifted children. In J. H.
Borland (Ed.), Rethinking gifted education (pp. 105–126). New York, NY: Teachers
College Press.
*Bracken, B. A., & Brown, E. F. (2008). Early identification of high-ability students: Clinical
assessment of behavior. Journal for the Education of the Gifted, 31, 403–426.
doi:10.4219/jeg-2008-794
Briggs, C. J., Reis, S. M., & Sullivan, E. E. (2008). A national view of promising practices and
programs for culturally, linguistically, and ethnically diverse gifted and talented students.
Gifted Child Quarterly, 52. 131–145. doi:10.1177/0016986208316037
Brown, A., & Lopez, M. H. (2013). Mapping the Latino population, by state, county, and city.
Retrieved from http://www.pewhispanic.org/2013/08/29/mapping-the-latino-population-
by-state-county-and-city/

ID OF NON-TRADITIONAL GT STUDENTS 44
*Brulles, D., Peters, S. J., & Saunders, R. (2012). Schoolwide mathematics achievement within
the gifted cluster grouping model. Journal of Advanced Academics, 23, 200–216.
doi:10.1177/1932202X12451439
Bush, G. W. (2001). No Child Left Behind. Washington, DC: Office of the President of the
United States.
Callahan, C. M. (2005). Identifying gifted students from underrepresented populations. Theory
into Practice, 44, 98–104. doi:10.1207/s15430421tip4402_4
Callahan, C. M., & Miller, E. M. (2005). A child-responsive model of giftedness. In R. J.
Sternberg, & J. E. Davidson (Eds.), Conceptions of giftedness (pp. 38–51). Cambridge,
UK: Cambridge University Press.
Card, N. A. (2012). Applied meta-analysis for social science research. New York, NY: Guilford
Publications.
*Carman, C. A., & Taylor, D. K. (2010). Socioeconomic status effects on using the Naglieri
Nonverbal Ability Test (NNAT) to identify the gifted/talented. Gifted Child Quarterly, 54,
75–84. doi:10.1177/0016986209355976
*Civil Rights Data Collection (2010). 2009 Civil rights data collection: Estimated values for
United States. Office of Civil Rights, United States. Retrieved from
http://ocrdata.ed.gov/statenationalestimations/projections_2009_10
Cooper, H. (2010). Research synthesis and meta-analysis: A step-by-step approach (4th ed.).
Thousand Oaks, CA: Sage.
Cooper, H., Hedges, L. V., & Valentine, J. C. (Eds.). (2009). The handbook of research synthesis
and meta-analysis. New York, NY: Russell Sage Foundation.

ID OF NON-TRADITIONAL GT STUDENTS 45
*Cribbs, D. K. (2009). Fourth grade teachers' perceptions of giftedness in Anglo and African
American students (Doctoral dissertation), Retrieved from ProQuest LLC. (3401320)
*Cross, T. L., Neumeister, K. L. S., & Cassady, J. C. (2007). Psychological types of
academically gifted adolescents. Gifted Child Quarterly, 51, 285–294.
doi:10.1177/0016986207302723
*Curby, T. W., Rudasill, K. M., Rimm‐Kaufman, S. E., & Konold, T. R. (2008). The role of
social competence in predicting gifted enrollment. Psychology in the Schools, 45, 729–744.
doi:10.1002/pits.20338
Daniels, V. I. (1998). Minority students in gifted and special education programs: The case for
educational equity. The Journal of Special Education, 32, 41–43.
doi:10.1177/002246699803200107
Erwin, J. O., & Worrell, F. C. (2012). Assessment practices and the underrepresentation of
minority students in gifted and talented education. Journal of Psychoeducational
Assessment, 30, 74–87. doi:10.1177/0734282911428197
*Esquierdo, J. J., & Arreguín-Anderson, M. (2012). The “invisible” gifted and talented bilingual
students: A current report on enrollment in GT programs. Journal for the Education of the
Gifted, 35, 35–47. doi:0162353211432041.
Feldhusen, J. F., & Jarwan, F. A. (2000). Identification of gifted and talented youth for
educational programs. In K. A. Heller, F. J. Mönks, R. J. Sternberg, & R. F. Subotnik
(Eds.), International handbook of giftedness and talent (pp. 271–282). United Kingdom:
Elsevier Science Ltd.

ID OF NON-TRADITIONAL GT STUDENTS 46
Ford, D. (1998). The underrepresentation of minority students in gifted education: Problems and
promises in recruitment and retention. The Journal of Special Education, 32, 4–14.
doi:10.1177/002246699803200102
*Ford, D. (2014). Segregation and the underrepresentation of blacks and Hispanics in gifted
education: Social inequality and deficit paradigms. Roeper Review, 36, 143–154.
doi:10.1080/02783193.2014.919563
Ford, D. Y., Grantham, T. C., & Whiting, G. W. (2008). Culturally and linguistically diverse
students in gifted education: Recruitment and retention issues. Exceptional Children, 74,
289–306. doi:10.1177/001440290807400302
Ford, D. Y., & Harris, J. J. (1994). Promoting achievement among gifted Black students: The
efficacy of new definitions and identification practices. Urban Education, 29(2), 202–229.
doi:10.1177/0042085994029002006
Flynn, J. R. (1999). Searching for justice: The discovery of IQ gains over time. American
Psychologist, 54(1), 5–20. doi:10.1037/0003-066X.54.1.5
Gallagher, J. J. (2004). No child left behind and gifted education. Roeper Review, 26, 121–123.
doi:10.1080/02783190409554255
Gentry, M. (2006). No child left behind: Neglecting excellence. Roeper Review, 29, 24–27.
doi:10.1080/02783190609554380
Gentry, M. (2009). Myth 11: A comprehensive continuum of gifted education and talent
development services. Gifted Child Quarterly, 53, 262–265.
doi:10.1177/0016986209346937

ID OF NON-TRADITIONAL GT STUDENTS 47
Gentry, M., Fugate, C. M., Wu, J., & Castellano, J. (2014). Gifted Native American students:
Literature, lessons, and future directions. Gifted Child Quarterly, 58, 98–110.
doi:10.1177/0016986214521660
Gentry, M., Peters, S., Pereira, N., McIntosh, J., & Fugate, C. (2015). HOPE Teacher Rating
Scale (manual): Involving teachers in equitable identification of gifted and talented
students in K-12. Waco, TX: Prufrock Press Inc.
*Giessman, J. A., Gambrell, J. L., & Stebbins, M. S. (2013). Minority performance on the
Naglieri Nonverbal Ability Test, versus the Cognitive Abilities Test, Form 6: One gifted
program’s experience. Gifted Child Quarterly, 57, 101–109.
doi:10.1177/0016986213477190
Gleser, L. J., & Olkin, I., (2009). Stochastically dependent effect sizes. In H. Cooper & L.
Hedges (Eds.), The handbook of research synthesis and meta-analysis (pp. 357-376). New
York, NY: Russell Sage Foundation.
Grantham, T. C. (2003). Increasing Black student enrollment in gifted programs: An exploration
of the Pulaski county special school district's advocacy efforts. Gifted Child Quarterly, 47,
46–65. doi:10.1177/001698620304700106
Grantham, T. C. (2011). New directions for gifted Black males suffering from bystander effects:
A call for upstanders. Roeper Review, 33, 263–273. doi:10.1080/02783193.2011.603114
Hedges, L.V. & Maier, K.S. (2013). Meta-analysis. In M. A. Scott, J. S. Simonoff, & B. D.Marx,
(Eds.), The SAGE handbook of multilevel modeling (pp.487-502). Thousand Oaks, CA:
Sage.
Hedges, L. V., Shymansky, J. A., & Woodworth, G. (1989). Modern methods of meta-analysis.
Washington, DC: National Science Teachers Association.
ID OF NON-TRADITIONAL GT STUDENTS 48
Hedges, L. V., Tipton, E., & Johnson, M. C. (2010). Robust variance estimation in meta-
regression with dependent effect size estimates. Research synthesis methods, 1(1), 39-65.
doi: 10.1002/jrsm.5
Heller, K. A., & Hany, E. (2004). Identification of gifted and talented students. Psychology
Science, 46(3), 302–323.
Higgins, J., & Thompson, S. G. (2002). Quantifying heterogeneity in a meta‐analysis. Statistics
in medicine, 21, 1539-1558. doi:10.1002/sim.1186
Hopkins, A., & Garrett, K. (2010). Separate and unequal: The underrepresentation of African
American students in gifted and talented programs. Black History Bulletin, 73(1), 24–30.
Hox, J. J., & Leeuw, E. D. d. (2003). Multilevel models for meta-analysis. In S. P. Reise & N.
Duan (Eds.), Multivariate applications. Multilevel modeling: Methodological advances,
issues, and applications (pp. 90-111). Mahwah, NJ: Lawrence Erlbaum Associates.
Huffcutt, A. I., & Arthur, W. (1995). Development of a new outlier statistic for meta-analytic
data. Journal of Applied Psychology, 80, 327–334. doi:10.1037/0021-9010.80.2.327
*Illinois State Board of Education. (2003). Gifted education in Illinois school year 2003.
Retrieved from http://www.isbe.net/research/pdfs/gifted_stats_02-03.pdf
*Jones, N. L. (2010). Culturally and linguistically diverse students and gifted and talented
programs (Doctoral dissertation), Retrieved from ProQuest LLC. (3428485)
*Kettler, T. (2014). Critical thinking skills among elementary school students comparing
identified gifted and general education student performance. Gifted Child Quarterly, 58,
127–136. doi:10.1177/0016986214522508

ID OF NON-TRADITIONAL GT STUDENTS 49
Kettler, T., Russel, J., & Puryear, J.S. (2015). Inequitable access to gifted education: Variance in
funding and staffing based on locate and contextual school variables. Journal for the
Education of the Gifted, 38, 99–117. doi:10.1177/0162353215578277
Konstantopoulos, S., Modi, M., & Hedges, L. V. (2001). Who are America’s gifted?. American
Journal of Education, 109, 344–382. doi:10.1086/444275
Krisel, S. (2012). Characteristics of gifted children as a guide to identification. In S. L. Hunsaker
(Ed.), Identification: The theory and practice of identifying students for gifted and talented
education services (pp. 75–97). Mansfield Center, CT: Creative Learning Press.
Lakin, J. M., & Lohman, D. F. (2011). The predictive accuracy of verbal, quantitative, and
nonverbal reasoning tests: Consequences for talent identification and program diversity.
Journal for the Education of the Gifted, 34, 595–623. doi:10.1177/016235321103400404
*Lange, R. W. (2004). Sources of underrepresentation in the identification of African American
students in elementary school gifted and talented education: A case study of one suburban
school district’s gifted program (Doctoral dissertation), Retrieved from UMI Microform.
(3157995)
*Lee, S. Y., & Olszewski-Kubilius, P. (2006). Comparisons between talent search students
qualifying via scores on standardized tests and via parent nomination. Roeper Review, 28,
157–166. doi:10.1080/02783190609554355
*Lewis, J. D., DeCamp-Fritson, S. S., Ramage, J. C., McFarland, M. A., & Archwamety, T.
(2007). Selecting for ethnically diverse children who may be gifted using Raven's Standard
Progressive Matrices and Naglieri Nonverbal Abilities Test. Multicultural Education,
15(1), 38–42.

ID OF NON-TRADITIONAL GT STUDENTS 50
*Lindsey, C. D. (2012). An investigation of the combined assessments used as entrance criteria
for a gifted English middle school program (Doctoral dissertation), Retrieved from
ProQuest LLC. (3525542)
*Linn-Cohen, R., & Hertzog, N. B. (2007). Unlocking the GATE to differentiation: A qualitative
study of two self-contained gifted classes. Journal for the Education of the Gifted, 31, 227–
259. doi:10.4219/jeg-2007-677
Lohman, D. F. (2005). Review of Naglieri and Ford (2003): Does the Naglieri Nonverbal Ability
Test identify equal proportions of high-scoring White, Black, and Hispanic students?
Gifted Child Quarterly, 49, 19-28. doi:10.1177/001698620504900103
Lohman, D. F. (2011, August). Introducing CogAT Form 7. Retrieved from
http://riversidepublishing.com/products/cogAT7/pdf/CogSpe_v59-28-11.pdf
*Lohman, D. F., & Gambrell, J. L. (2012). Using nonverbal tests to help identify academically
talented children. Journal of Psychoeducational Assessment, 30, 25–44.
doi:10.1177/0734282911428194
Lohman, D. F., & Korb, K. A. (2006). Gifted today but not tomorrow? Longitudinal changes in
ability and achievement during elementary school. Journal for the Education of the Gifted,
29, 451–484. doi:10.4219/jeg-2006-245
*Lohman, D. F., Korb, K. A., & Lakin, J. M. (2008). Identifying academically gifted English-
language learners using nonverbal tests: A comparison of the Raven, NNAT, and CogAT.
Gifted Child Quarterly, 52, 275–296. doi:10.1177/0016986208321808
Lohman, D. F., & Nicpon, M. F. (2012). Ability testing & talent identification. In Scott L.
Hunsaker (Ed.), Identification: The theory and practice of identifying students for gifted

ID OF NON-TRADITIONAL GT STUDENTS 51
and talented education services (pp. 287–335). Mansfield Center, CT: Creative Learning
Press.
*Makel, M. C., Li, Y., Putallaz, M., & Wai, J. (2011). High-ability students’ time spent outside
the classroom. Journal of Advanced Academics, 22, 720–749.
doi:10.1177/1932202X11424880
*Matthews, M. S. (2006). Gifted students dropping out: Recent findings from a southeastern
state. Roeper Review, 28, 216–223. doi:10.1080/02783190609554367
*McBee, M. T. (2006). A descriptive analysis of referral sources for gifted identification
screening by race and socioeconomic status. Journal of Advanced Academics, 17, 103–111.
doi:10.4219/jsge-2006-686
McBee, M. T., Peters, S. J., & Waterman, C. (2014). Combining scores in multiple-criteria
assessment systems: The impact of combination rule. Gifted Child Quarterly, 58, 69–89.
doi:10.1177/0016986213513794
McClain, M. C., & Pfeiffer, S. (2012). Identification of gifted students in the United States
today: A look at state definitions, policies, and practices. Journal of Applied School
Psychology, 28, 59–88. doi:10.1080/15377903.2012.643757
McKenzie, J. A. (1986). The influence of identification practices, race and SES on the
identification of gifted students. Gifted Child Quarterly, 30, 93–95.
doi:10.1177/001698628603000210
*Mills, C. J., & Tissot, S. L. (1995). Identifying academic potential in students from under-
represented populations: Is using the Ravens Progressive Matrices a good idea? Gifted
Child Quarterly, 39, 209–217. doi:10.1177/001698629503900404

ID OF NON-TRADITIONAL GT STUDENTS 52
*Monrad, D. M., McGuiness, P. L., Chandler, D., Gallant, D. J., Gareau, S. J., & Rawls, A. M.
(2005). A descriptive study of South Carolina's gifted and talented program. South
Carolina State Documents Depository.
*Naglieri, J. A., & Ford, D. Y. (2003). Addressing underrepresentation of gifted minority
children using the Naglieri Nonverbal Ability Test (NNAT). Gifted Child Quarterly, 47,
155–160. doi:10.1177/001698620304700206
Naglieri, J. A., & Ford, D. Y. (2005). Increasing minority children’s participation in gifted
classes using the NNAT: A response to Lohman. Gifted Child Quarterly, 49, 29-36. doi:
10.1177/001698620504900104
National Association for Gifted Children. (n.d.). Definitions of Giftedness. Retrieved from
http://www.nagc.org/resources-publications/resources/definitions-giftedness
National Association for Gifted Children. (2010, March). Redefining giftedness for a new
century: Shifting the paradigm. Retrieved from
http://www.nagc.org/sites/default/files/Position%20Statement/Redefining%20Giftedness%
20for%20a%20New%20Century.pdf
National Association for Gifted Children. (2011, November). Identifying and serving culturally
and linguistically diverse gifted students. Retrieved from
http://www.nagc.org/sites/default/files/Position%20Statement/Identifying%20and%20Serv
ing%20Culturally%20and%20Linguistically.pdf
National Association for Gifted Children. (2013, August). State definitions of giftedness.
Retrieved from
http://www.nagc.org.442elmp01.blackmesh.com/sites/default/files/Advocacy/State%20defi
nitions%20(8-1-13).pdf

ID OF NON-TRADITIONAL GT STUDENTS 53
National Association for Gifted Children, & The Council of State Directors of Programs for the
Gifted. (2015). 2014-2015 state of the states in gifted education: Policy and practice
data. Retrieved from https://www.nagc.org/sites/default/files/key%20reports/2014-
2015%20State% 20of%20the%20States%20(final).pdf
*Neumeister, K. L. S., Adams, C. M., Pierce, R. L., Cassady, J. C., & Dixon, F. A. (2007).
Fourth-grade teachers' perceptions of giftedness: Implications for identifying and serving
diverse gifted students. Journal for the Education of the Gifted, 30, 479–499.
doi:10.4219/jeg-2007-503
*Office for Civil Rights. (2015). 2009-10 National and State Estimations. Retrieved from
http://ocrdata.ed.gov/StateNationalEstimations/Projections_2009_10.
Olkin I, & Gleser L. (2009). Stochastically dependent effect sizes. In H. Cooper, L.V. Hedges, &
J.C. Valentine (Eds.), The handbook of research synthesis and meta-analysis (2nd ed, pp.
357-376). New York, NY: The Russell Sage Foundation.
Olszewski-Kubilius, P., & Limburg-Weber, L. (1999). Options for middle school and secondary
level gifted students. Journal of Advanced Academics, 11, 4–10. doi:10.4219/jsge-1999-
615
*Olszewski-Kubilius, P., Lee, S. Y., Ngoi, M., & Ngoi, D. (2004). Addressing the achievement
gap between minority and nonminority children by increasing access to gifted programs.
Journal for the Education of the Gifted, 28, 127–158. doi:10.1177/016235320402800202
*Olszewski-Kubilius, P., & Turner, D. (2002). Gender differences among elementary school-
aged gifted students in achievement, perceptions of ability, and subject preference. Journal
for the Education of the Gifted, 25, 233–268. doi:10.1177/016235320202500303
ID OF NON-TRADITIONAL GT STUDENTS 54
Passow, A.H., & Frasier, M. M. (1994). Toward improving identification of talent potential
among minority and disadvantage students. Roeper Review, 18, 198–202.
doi:10.1080/02783199609553734
*Peairs, K. F., Eichen, D., Putallaz, M., Costanzo, P. R., & Grimes, C. L. (2011). Academic
giftedness and alcohol use in early adolescence. Gifted Child Quarterly, 55, 95–
110. doi:10.1177/0016986210392220
*Pendarvis, E., & Wood, E. W. (2009). Eligibility of historically underrepresented students
referred for gifted education in a rural school district: A case study. Journal for the
Education of the Gifted, 32, 495–514. doi:10.1177/016235320903200403
Perleth, C., Schatz, T, & Mönks, F. J. (2000). Early identification of high ability. In K. A.
Heller, F. J. Mönks, R. J. Sternberg & R. F. Subotnik (Eds.), International handbook of
giftedness and talent (2nd ed., pp. 297–316). Oxford, UK: Pergamon.
*Peters, S. J., & Gentry, M. (2012). Group-specific norms and teacher-rating scales: Implications
for underrepresentation. Journal of Advanced Academics, 23, 125–144.
doi:10.1177/1932202X12438717
Peters, S., Matthews, M., McBee, M., & McCoach, D. B. (2013). Beyond gifted education:
Designing and implementing advanced academic programs. Waco, TX: Prufrock Press
Inc.
Pfeiffer, S. I. (2012). Current perspectives on the identification and assessment of gifted students.
Journal of Psychoeducational Assessment, 30, 3–9. doi:10.1177/0734282911428192
Pfeiffer, S. I., & Blei, S. (2008). Gifted identification beyond the IQ test: Rating scales and other
assessment procedures. In S. I. Pfeiffer (Ed.), Handbook of giftedness in children (pp. 177–
198). New York, NY: Springer US.

ID OF NON-TRADITIONAL GT STUDENTS 55
*Pfeiffer, S. I., & Jarosewich, T. (2007). The Gifted Rating Scales — school form: An analysis
of the standardization sample based on age, gender, race, and diagnostic efficiency. Gifted
Child Quarterly, 51, 39–50. doi:10.1177/0016986206296658
*Pfeiffer, S. I., Petscher, Y., & Jarosewich, T. (2007). The Gifted Rating Scales —
preschool/kindergarten form: An analysis of the standardization sample based on age,
gender, and race. Roeper Review, 29, 206–211. doi:10.1080/02783190709554410
*Pierce, R. L., Adams, C. M., Speirs Neumeister, K. L., Cassady, J. C., Dixon, F. A., & Cross, T.
L. (2007). Development of an identification procedure for a large urban school
corporation: Identifying culturally diverse and academically gifted elementary students.
Roeper Review, 29, 113–118. doi:10.1080/02783190709554394
*Pierce, R. L., Cassady, J. C., Adams, C. M., Neumeister, K. L. S., Dixon, F. A., & Cross, T. L.
(2011). The effects of clustering and curriculum on the development of gifted learners'
math achievement. Journal for the Education of the Gifted, 34, 569–594.
doi:10.1177/016235321103400403
*Ratcliff, N. J., Jones, C. R., Costner, R. H., Knight, C., Disney, G., Savage-Davis, E., Sheehan,
H., & Hunt, G. H. (2012). No need to wait for Superman: A case study of one unique high
school. Journal for the Education of the Gifted, 35, 391–411.
doi:10.1177/0162353212459256
Raudenbush, S. W., Fotiu, R. P., & Cheong, Y. F. (1998). Inequality of access of educational
resources: A national report card for eighth-grade math. Educational Evaluation and
Policy Analysis, 20, 253–267. doi:10.3102/01623737020004253
Raven, J. (2000). The Raven's progressive matrices: change and stability over culture and time.
Cognitive Psychology, 41, 1–48. doi:10.1006/cogp.1999.0735

ID OF NON-TRADITIONAL GT STUDENTS 56
Reis, S. M., & McCoach, D. B. (2000). The underachievement of gifted students: What do we
know and where do we go? Gifted Child Quarterly, 44, 152–170.
doi:10.1177/001698620004400302
Renzulli, J. S. (1978). What makes giftedness? Reexamining a definition. Phi Delta Kappan, 60,
180–184, 261.
Renzulli, J. S. (2005). The three-ring conception of giftedness. In R. J. Sternberg, & J. E.
Davidson (Eds.), Conceptions of giftedness (pp. 246–279). Cambridge, UK: Cambridge
University Press.
Renzulli, J. S., & Reis, S. M. (1991). The reform movement and the quiet crisis in gifted
education. Gifted Child Quarterly, 35, 26–35. doi:10.1177/001698629103500104
Renzulli, J. S., & Reis, S. M. (2012). Defensible and doable: A practical multiple-criteria gifted
program identification system. In S. L. Hunsaker (Ed.), Identification: The theory and
practice of identifying students for gifted and talented education services (pp. 25–56).
Mansfield Center, CT: Creative Learning Press.
*Robertson, J. C. (2013). Self-concept, school satisfaction, and other selected correlates of
subjective well-Being for advanced high school learners enrolled in two challenging
academic settings. Journal for the Education of the Gifted, 36, 461–486.
doi:10.1177/0162353213506068
*Rowe, E. W., Miller, C., Ebenstein, L. A., & Thompson, D. F. (2012). Cognitive predictors of
reading and math achievement among gifted referrals. School Psychology Quarterly, 27,
144–153. doi:10.1037/a0029941

ID OF NON-TRADITIONAL GT STUDENTS 57
*Sarouphim, K. M. (2002). DISCOVER in high school: Identifying gifted Hispanic and Native
American students. Journal of Advanced Academics, 14, 30–38. doi:10.4219/jsge-2002-
385
*Sarouphim, K. M. (2004). DISCOVER in middle school: Identifying gifted minority students.
Journal of Advanced Academics, 15, 61–69. doi:10.4219/jsge-2004-446
*Scott, M. S., & Delgado, C. F. (2005). Identifying cognitively gifted minority students in
preschool. Gifted Child Quarterly, 49, 199–210. doi:10.1177/001698620504900302
Shaklee, B. D. (1992). Identification of young gifted students. Journal for the Education of the
Gifted, 15, 134–144. doi:10.1177/016235329201500203
*Shaunessy-Dedrick, E., Evans, L., Ferron, J., & Lindo, M. (2015). Effects of differentiated
reading on elementary students’ reading comprehension and attitudes toward reading.
Gifted Child Quarterly, 59, 91–107. doi:10.1177/0016986214568718
Steenbergen-Hu, S., & Olszewski-Kubilius, P. (2016). How to Conduct a Good Meta-Analysis in
Gifted Education. Gifted Child Quarterly, 60, 134–154. doi:10.1177/0016986216629545
Stephen, K. R., Dudley, J., & Karnes, F. A. (2012). Identification of the gifted: An overview of
legal issues. In S. L. Hunsaker (Ed.), Identification: The theory and practice of identifying
students for gifted and talented education services (pp. 101–119). Mansfield Center, CT:
Creative Learning Press.
Sternberg, R. J. & Davidson, J. E. (2005). Conceptions of giftedness. Cambridge, UK:
Cambridge University Press.
Subotnik, R. F., Olszewski-Kubilius, P., & Worrell, F. C. (2011). Rethinking giftedness and
gifted education: A proposed direction forward based on psychological science.
Psychological Science in the Public Interest, 12(1), 3–54. doi:10.1177/1529100611418056
ID OF NON-TRADITIONAL GT STUDENTS 58
*Suldo, S. M., & Shaunessy-Dedrick, E. (2013). Changes in stress and psychological adjustment
during the transition to high school among freshmen in an accelerated curriculum. Journal
of Advanced Academics, 24, 195–218. doi:10.1177/1932202X13496090
Sullivan, A. L. (2011). Disproportionality in special education identification and placement of
English language learners. Exceptional Children, 77, 317-334. doi:
10.1177/001440291107700304
Sutton, A. J., Abrams, K. R., Jones, D. R., Sheldon, T. A., & Song, F. (2000). Methods for meta-
analysis in medical research. New York, NY: Wiley and Sons, LTD.
Swanson, J. D. (2007). Policy and practice: A case study of gifted education policy
implementation. Journal for the Education of the Gifted, 31, 131–164. doi:10.4219/jeg-
2007-679
*Swiatek, M. A., & Lupkowski-Shoplik, A. (2003). Elementary and middle school student
participation in gifted programs: Are gifted students underserved? Gifted Child Quarterly,
47, 118–130. doi:10.1177/001698620304700203
*Terry, A. W. (2003). Effects of service learning on young, gifted adolescents and their
community. Gifted Child Quarterly, 47, 295–308. doi:10.1177/001698620304700406
*Texas Education Agency. (June 2011). Advanced placement and International Baccalaureate
examination results in Texas 2009-10. Retrieved from
http://tea.texas.gov/acctres/ap_ib_index.html
*Texas Education Agency. (2015). Public Education Information Management System: School
district data. Retrieved from tea.texas.gov/Reports_and_data/school_district_data/
Tukey, J. W. (1960). A survey of sampling from contaminated distributions. In I. Olkin, S. G.
Ghurye, W. Hoeffding, W. G. Madow, & H. B. Mann (Eds.), Contributions to probability

ID OF NON-TRADITIONAL GT STUDENTS 59
and statistics: Essays in Honor of Harold Hotelling (pp. 448–485). Stanford, CA: Stanford
University Press.
Tukey, J. W. (1977). Exploratory data analysis. Reading, MA: Addison-Wesley.
Tyler, R. W. (1949). Basic principles of curriculum and instruction. Chicago, IL: The University
of Chicago Press.
Van den Noortgate, W., López-López, J. A., Marín-Martínez, F., & Sánchez-Meca, J. (2013).
Three-level meta-analysis of dependent effect sizes. Behavior Research Methods, 45, 576-
594. doi:10.3758/s13428-012-0261-6
Van den Noortgate, W., López-López, J. A., Marín-Martínez, F., & Sánchez-Meca, J. (2015).
Meta-analysis of multiple outcomes: a multilevel approach. Behavior Research Methods,
47, 1274-1294. doi:10.3758/s13428-014-0527-2
Van Tassel-Baska, J. (2005). Domain-specific giftedness: Applications in school and life. In R. J.
Sternberg, & J. E. Davidson (Eds.), Conceptions of giftedness (pp.358–376). Cambridge,
UK: Cambridge University Press.
*Van Tassel-Baska, J., Feng, A. X., & De Brux, E. (2007). A study of identification and
achievement profiles of performance task-identified gifted students over 6 years. Journal
for the Education of the Gifted, 31, 7–34. doi:10.4219/jeg-2007-517
*Van Tassel-Baska, J., Feng, A. X., & Evans, B. L. (2007). Patterns of identification and
performance among gifted students identified through performance tasks a three-year
analysis. Gifted Child Quarterly, 51, 218–231. doi:10.1177/0016986207302717
*Van Tassel-Baska, J., Johnson, D., & Avery, L. D. (2002). Using performance tasks in the
identification of economically disadvantaged and minority gifted learners: Findings from
Project STAR. Gifted Child Quarterly, 46, 110–123. doi:10.1177/001698620204600204

ID OF NON-TRADITIONAL GT STUDENTS 60
*Warne, R. T., Anderson, B., & Johnson, A. O. (2013). The impact of race and ethnicity on the
identification process for giftedness in Utah. Journal for the Education of the Gifted, 36
487–508. doi:10.1177/0162353213506065
*Wilson, H. E. (2015). Patterns of play behaviors and learning center choices between high
ability and typical children. Journal of Advanced Academics, 26, 143–164.
doi:10.1177/1932202X15577954
*Wilson, H. E., & Adelson, J. L. (2012). College choices of academically talented secondary
students. Journal of Advanced Academics, 23, 32–52. doi:10.1177/1932202X11430269
*Woitaszewski, S. A., & Aalsma, M. C. (2004). The contribution of emotional intelligence to the
social and academic success of gifted adolescents as measured by the multifactor
emotional intelligence scale-adolescent version. Roeper Review, 27, 25–30.
doi:10.1080/02783190409554285
Wood, J. (2008). Methodology for dealing with duplicate study effects in a meta-analysis.
Organizational Research Methods, 11(1), 79-95. doi: 10.1177/1094428106296638
Yoon, S. Y., & Gentry, M. (2009). Racial and ethnic representation in gifted programs: Current
status of and implications for gifted Asian American students. Gifted Child Quarterly, 53,
121-136. doi:10.1177/0016986208330564