Using Nonverbal Tests to Help Identify Academically Talented ...
20
Journal of Psychoeducational Assessment XX(X) 1–20 © 2011 SAGE Publications Reprints and permission: sagepub.com/journalsPermissions.nav DOI: 10.1177/0734282911428194 http://jpa.sagepub.com 428194JPA XX X 10.1177/0734282911428194Lohman and Gambrel- lJournal of Psychoeducational Assessment 1 University of Iowa, Iowa City, IA, USA Corresponding Author: David F. Lohman, Department of Psychological and Quantitative Foundations, University of Iowa, Iowa City, IA 52246, USA Email: [email protected] Using Nonverbal Tests to Help Identify Academically Talented Children David F. Lohman 1 and James L. Gambrell 1 Abstract Language-reduced (nonverbal) ability tests are the primary talent identification tools for ELL children. The appropriate use of such tests with low-SES and minority children is more nuanced. Whenever language-reduced tests are used for talent identification, nonverbal tests that measure more than figural reasoning abilities should be employed. For young children, pic- ture-based reasoning tests can significantly broaden the scope of the assessment.We report new data showing that ELL, low SES, and minority children in Grades K to 2 typically perform as well or better on such tests than on figural reasoning tests.We also show that for children in Grades 3 to 6, language-reduced quantitative tests are an often overlooked alternative to figural tests. Finally, inferences about ability require comparison of a child’s performance with the performance of other children who have had similar opportunities to develop skills tested.This is often not the case for ELL, poor, and minority children, even on nonverbal tests. In such cases, multiple normative perspectives can greatly assist in the identification of academically talented children. Keywords gifted identification, nonverbal ability testing, fairness, English language learners Introduction Identification of something presupposes understanding what that something might be. Unfortunately, the term gifted has as many definitions as there are theories of giftedness (Kaufman & Sternberg, 2007). Although we speak of gifted athletes, musicians, and leaders, giftedness is commonly conflated with the sort of innate, unidimensional intelligence that was once thought to be indexed by a Stanford Binet IQ score. Today most theorists—even those who understand giftedness exclusively in terms of intelligence—espouse a much broader, more mul- tidimensional conception of intelligence that changes with age and experience. Furthermore, transforming these developing abilities into competencies that are valued by a society requires many years of deliberate practice and training (Ericsson, Krampe, & Tesch-Römer, 1993; at PENNSYLVANIA STATE UNIV on May 8, 2016 jpa.sagepub.com Downloaded from
-
Upload
khangminh22 -
Category
Documents
-
view
0 -
download
0
Transcript of Using Nonverbal Tests to Help Identify Academically Talented ...
Journal of Psychoeducational AssessmentXX(X) 1 –20
© 2011 SAGE PublicationsReprints and permission:
sagepub.com/journalsPermissions.navDOI: 10.1177/0734282911428194
http://jpa.sagepub.com
428194 JPAXXX10.1177/0734282911428194Lohman and Gambrel-lJournal of Psychoeducational Assessment
1University of Iowa, Iowa City, IA, USA
Corresponding Author:David F. Lohman, Department of Psychological and Quantitative Foundations, University of Iowa, Iowa City, IA 52246, USA Email: [email protected]
Using Nonverbal Tests to Help Identify Academically Talented Children
David F. Lohman1 and James L. Gambrell1
Abstract
Language-reduced (nonverbal) ability tests are the primary talent identification tools for ELL children. The appropriate use of such tests with low-SES and minority children is more nuanced. Whenever language-reduced tests are used for talent identification, nonverbal tests that measure more than figural reasoning abilities should be employed. For young children, pic-ture-based reasoning tests can significantly broaden the scope of the assessment. We report new data showing that ELL, low SES, and minority children in Grades K to 2 typically perform as well or better on such tests than on figural reasoning tests. We also show that for children in Grades 3 to 6, language-reduced quantitative tests are an often overlooked alternative to figural tests. Finally, inferences about ability require comparison of a child’s performance with the performance of other children who have had similar opportunities to develop skills tested. This is often not the case for ELL, poor, and minority children, even on nonverbal tests. In such cases, multiple normative perspectives can greatly assist in the identification of academically talented children.
Keywords
gifted identification, nonverbal ability testing, fairness, English language learners
IntroductionIdentification of something presupposes understanding what that something might be. Unfortunately, the term gifted has as many definitions as there are theories of giftedness (Kaufman & Sternberg, 2007). Although we speak of gifted athletes, musicians, and leaders, giftedness is commonly conflated with the sort of innate, unidimensional intelligence that was once thought to be indexed by a Stanford Binet IQ score. Today most theorists—even those who understand giftedness exclusively in terms of intelligence—espouse a much broader, more mul-tidimensional conception of intelligence that changes with age and experience. Furthermore, transforming these developing abilities into competencies that are valued by a society requires many years of deliberate practice and training (Ericsson, Krampe, & Tesch-Römer, 1993;
at PENNSYLVANIA STATE UNIV on May 8, 2016jpa.sagepub.comDownloaded from
2 Journal of Psychoeducational Assessment XX(X)
Gagne, 2009; Horn & Masunaga, 2006). This in turn requires levels of interest, motivation, and persistence that are also unusual, and that must be well-matched with the kinds of training opportunities available to the individual.
Such complexities have led some theorists to prefer the concept of talent identification and development rather than of giftedness (Gagne, 2009). Our view is similar but grounded in the concept of aptitude as it was developed by the late Richard Snow (Lohman, 2005a; Lohman & Foley-Nicpon, 2012). Aptitude is a word much like talent, but more inclusive. In addition to the cognitive (or physical) characteristics that typically define the term talent, it also includes any other personal characteristics that are required for successful learning (or performance) in a particular environment. Formally, then, aptitude refers to the degree of readiness to learn and to perform well in a particular situation or domain (Corno et al., 2002). An aptitude perspective on talent thus helps counter the common myth that superior general intellectual ability should be sufficient for the attainment of excellence in any cognitively demanding domain.
Our focus in this article is the role that nonverbal ability tests can play in the identification of students who display unusually high levels of aptitude for the kinds of academic competencies that schools develop. The primary aptitudes for academic learning in any domain are reasoning abilities in the symbol systems used to communicate knowledge in that domain, current knowl-edge and skills, interests, and the ability to persist in the pursuit of competence in the available educational systems (Corno et al., 2002). Good measures of the fluid reasoning abilities that are required for academic learning are thus an essential component of any effective talent-identification program, especially for students who, because of age, choice, or circumstances, do not currently display unusually high levels of academic accomplishment.
Nevertheless, an aptitude perspective makes clear that—although critically important—fluid reasoning abilities are not the only aptitudes that are needed for talent development and also that, when administered in isolation, nonverbal reasoning tests measure only one facet of the broad fluid reasoning factor that also includes verbal-deductive and quantitative reasoning abilities (Carroll, 1993). Unfortunately, the word aptitude has an everyday definition that is as problematic as the term gifted. Therefore, although we find an aptitude perspective most theoretically con-genial, we find the narrower term talent less misleading and so we use it instead whenever possible.
Many schools make life-altering decisions about children on the basis of short, often unreli-able screening tests that measure only a limited aspect of cognitive ability. Rather, one needs assessments that would at least measure that subset of abilities and interests that are most indica-tive of current cognitive development and predictive of future academic development. Properly combining test scores and teacher ratings requires more than arraying scores in a matrix and converting them to points that can be summed (see Lohman, 2012b). For example, it is often best to use teacher ratings to provide opportunity, but not to remove it—which is what happens when points for ratings are simply summed with other measures. In addition to measures of mul-tiple aptitudes, we also find multiple normative perspectives useful for talent identification, espe-cially for talent identification among students whose opportunities to learn (OTL) the abilities measured by tests differ markedly from those of other students (Lohman & Foley-Nicpon, 2012). Specifically, we will argue for more routine use of local norms and even simple rank orders of students within groups defined by OTL in addition to national age and grade norms on tests. The question, “Are there students in this school (or class or subgroup) who might have special talents for mathematics or creative writing or science that we could help them develop?” leads to different identification practices than “Who are the gifted students in this school?”
We begin with a brief overview of nonverbal tests and why they have been increasingly popular for gifted identification. We discuss claims that these tests are culture fair and that they level the playing field for poor, bilingual, and minority students. We then briefly address two ongoing
at PENNSYLVANIA STATE UNIV on May 8, 2016jpa.sagepub.comDownloaded from
Lohman and Gambrell 3
challenges for nonverbal testing: the conundrum of short directions and large practice effects. Most of the group-administered nonverbal tests used in schools sample only from the domain of figural-spatial reasoning. However, some experts have claimed that using picture-based nonver-bal tests that sample a broader range of content can improve both construct representation and predictive validity. We examine this claim with data from the recent national standardization of Form 7 of CogAT. Finally, we argue that multiple normative perspectives can increase the effectiveness of talent identification when students come from diverse economic, cultural, and linguistic backgrounds.
Varieties of Nonverbal TestsSince Itard (1801/1962) first used form boards to estimate the abilities of deaf children, nonverbal tasks have played an important role in both individual and group ability testing. Nonverbal assessments come in a wide variety of formats. Some must be administered individually by a trained psychologist, such as the Leiter International Performance Scale–Revised (Leiter-R; Roid, & Miller, 1997) and the Universal Nonverbal Intelligence Test (UNIT; Bracken & McCallum, 1998), whereas others such as the Progressive Matrices Test (Raven, Raven, & Court, 1998) can be administered by test coordinators in schools. Most commonly, nonverbal tests constitute but one component in a larger battery of tests, for example, the Wechsler Scales (WISC-IV; Wechsler, 2004), Stanford–Binet 5 (SB-5; Roid, 2003a), or the Cognitive Abilities Test–Form 7 (CogAT 7; Lohman, 2011). In such cases, the nonverbal battery can be administered and scored alone or combined with other test batteries to form one or more composites.
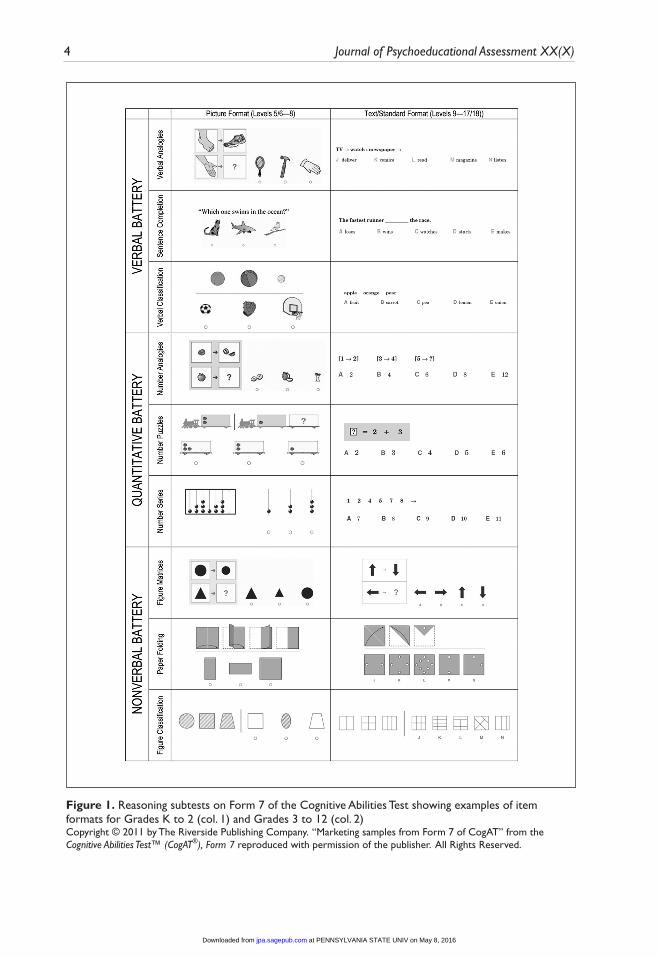
Some nonverbal tests, such as the Naglieri Nonverbal Ability Test (NNAT; Naglieri, 1997), are best described as figural reasoning tests, while others such as the UNIT or the Comprehensive Test of Nonverbal Intelligence (CTONI; Hammill, Pearson & Wiederholt, 1997) or the Picture Analogies and Picture Classification tests on Form 7 of CogAT (see Figure 1) use line drawings of objects, animals, and other stimuli in an effort to sample a broader range of abilities. To avoid confusion, we use the term figural reasoning for tests such as the Raven or the NNAT. We reserve the term nonverbal for the broader category of tests that present various kinds of nonlanguage content. Differences in the range and diversity of cognitive processes and knowledge sampled by the test can impact the utility of the test score as a measure of intellectual ability.
In addition to the breadth of item formats and abilities sampled, nonverbal tests vary in language load. A few (Leiter-R; UNIT) eschew language altogether and communicate directions through pointing, pantomime, and practice items. Other tests use minimal language in the direc-tions. For example, the NNAT-2 (Naglieri, 2008) uses cartoons supplemented with short oral instructions. Finally, some nonverbal tests have fairly extensive oral/written directions in one or more languages. For these tests, the designation “nonverbal” refers only to the items themselves.
The need to eliminate language entirely from the directions is less of an issue when testing children who are being considered for academic enrichment or acceleration than when psycholo-gists are asked to evaluate the mental competence of a prisoner or whether a child who does not speak the examiner’s language is learning disabled (Bracken, 1999). Students who are unable to understand simple oral directions are unlikely to be ready to profit from advanced educational activities in that language. Nonetheless, preparing students to perform their best on a nonverbal ability test is especially difficult when tests are group administered and the examiner cannot provide multiple practice items and individual feedback on each. We return to this issue later.
The multiple scores on modern, individually administered ability tests are useful for diagnos-tic purposes but these tests have some distinct disadvantages for talent identification. Foremost is the problem of equity. Individualized assessments are expensive, which limits the number of
at PENNSYLVANIA STATE UNIV on May 8, 2016jpa.sagepub.comDownloaded from
4 Journal of Psychoeducational Assessment XX(X)
Figure 1. Reasoning subtests on Form 7 of the Cognitive Abilities Test showing examples of item formats for Grades K to 2 (col. 1) and Grades 3 to 12 (col. 2)Copyright © 2011 by The Riverside Publishing Company. “Marketing samples from Form 7 of CogAT” from the Cognitive Abilities Test™ (CogAT®), Form 7 reproduced with permission of the publisher. All Rights Reserved.
at PENNSYLVANIA STATE UNIV on May 8, 2016jpa.sagepub.comDownloaded from
Lohman and Gambrell 5
children who can be tested and advantages those who can afford to pay for testing or retesting (Renzulli, 2005). Testing only those who are nominated by a teacher excludes children who do not conform to the teacher’s personal theory of giftedness. Census testing is thus a better option, especially when the test provides more than a pseudo-IQ score but gives information that teach-ers and parents might use to help all students.
Second, most individually administered tests are designed to measure a broad range of abili-ties and thus are not as focused on measuring high-level reasoning abilities as they once were (Frazier & Youngstrom, 2007). The index or cluster scores on these tests can be less reliable than corresponding scores on group-administered tests that measure the same constructs with a larger number of items and subtests. For example, when placed on a common scale (SD = 16), the standard error of measurement for a 10-year-old examinee on the CogAT 6 Nonverbal is 3.7, compared to 4.2 on the WISC-IV Perceptual Reasoning Index (see Table 49.1 in Lohman, 2009). Individually administered tests are usually designed specifically to help diagnose learning diffi-culties and thus often must be shortened or adapted to be used effectively for gifted identification thereby further reducing content sampling and reliability (National Association for Gifted Children [NAGC], 2008). However, this diagnostic focus means they are clearly superior for assessment of twice-exceptional gifted students (Assouline, Nicpon, & Doobay, 2009).
Why Nonverbal Tests?Increases in the ethnic and linguistic diversity of students in U.S. schools have spurred the use of nonverbal tests for the identification of academic talent. Psychologists have two options when students differ in their opportunities to develop the abilities measured by an ability tests. First, they can use tests that reduce the impact of these factors. Nonverbal tests have long been used in this way, especially for the assessment of examinees who are not fluent speakers of the language of the test. However, if the alternative assessment either does not measure the same construct as the original test or does not completely control for opportunity to learn, then the second option is to control for such factors—either statistically or through the use of separate norms. Although relatively uncommon for individually administered tests, local norms are com-monly computed for group-administered tests. Other within-group norms are also possible. We explore both options in this article. Although each has advantages, we will argue that schools could do a better job of identifying academic talent for poor, minority, and ELL students by making better use of local and subgroup norms.
School psychologists are often called on to administer the tests or to advise schools on which group tests to use and how to interpret the scores. Widely used group-administered ability tests such as the Otis-Lennon School Ability Test (OLSAT; Otis & Lennon, 1997) or the CogAT include a separate nonverbal battery that can be used for evaluation of nonnative speakers of English. However, some schools prefer to screen all children with a figural reasoning test such as the Raven or NNAT to avoid any perceptions of unfairness that might be caused by using different scores for different types of students (e.g., using the OLSAT Nonverbal score for ELL students but both the OLSAT Nonverbal and Verbal scores for everyone else). In such cases, the expectation is that the single-format figural reasoning test will measure cognitive ability as well as more comprehensive test battery but without the bias of language. Although the vast majority of test authors and testing experts caution against basing interpretations of ability only on figural reasoning scores (Anastasi & Urbina, 1997; McCallum, Bracken, & Wasserman, 2001; Raven, 1981; Rhodes, Ochoa, & Ortiz, 2005; Thorndike & Hagen, 1994), some authors encourage users to view figural reasoning tests as exchangeable with (or even superior to) tests that sample a broader range of content and processing. For example, the NNAT is said to be a culture-neutral measure of intelligence that will identify proportions of gifted Black, White, and Hispanic
at PENNSYLVANIA STATE UNIV on May 8, 2016jpa.sagepub.comDownloaded from
6 Journal of Psychoeducational Assessment XX(X)
students that mirror the proportions of each group in the population (Naglieri, 2007; Naglieri & Ford, 2003). Although such promises have enormous appeal for schools that are struggling to diversify their gifted programs, the subsequent failure of the test to perform as advertised can lead to a broader disenchantment with testing (Carman & Taylor, 2010).
Even those who understand the limitations of figural tests for measuring cognitive abilities sometimes screen all children with a short figural reasoning test because they know that such tests are good measure of general ability (g). This overlooks the fact that g underrepresents the domain of human abilities (Braden, 2000). Going beyond g is especially important for talent identification since large discrepancies between even highly correlated abilities become increas-ingly common at the extremes of the score distributions (Achter, Benbow, & Lubinski, 1997; Lohman, Gambrell, & Lakin, 2008). Unsurprisingly, most advocates of nonverbal testing focus exclusively on the measurement of g and the potential distortions in measurement introduced by verbal and, to a lesser extent, quantitative content. Content other than geometric shapes and fig-ures is viewed as contaminated by learning or, at best, a source of specific variance. Oddly, the impact of culture, experience, practice, and directions on the ability to reason with spatial forms and symbols is often ignored. However, once g is accounted for, the remaining variance on fig-ural reasoning tests sometimes correlates negatively with achievement in verbally demanding domains (Lohman, 2005b). Confusing observed scores with latent variables also misleads many test users. Unlike index scores or factor scores that average across tests with different content and formats, individual differences in observed scores on even the best figural reasoning tests reflect influences other than g as much as or more than they reflect the influence of g.
Figural Tests Are not “Culture-Free”Some nonverbal tests are advertised as culture fair or culture neutral. For example, the Leiter-R (Roid & Miller, 1997) is said to be “fair for all cultural and ethnic backgrounds” and the NNAT-2 (Naglieri, 2008) is advertised as a “culture neutral” test. Tests that would later be called “culture fair” were first developed for assessing the abilities of immigrants and other individuals who did not speak English. These tests achieved a new popularity in the 1920s and 1930s in studies of intellectual differences between racial groups. But the effort was almost immediately criticized by measurement experts as hopelessly confounded (see Cronbach, 1990; Degler, 1991; Scarr, 1994). As Boas (1911) had argued many years earlier, group differences in intelligence attributed to race were usually more appropriately attributed to culture.
Controlling for the effects of language does not control for the effects of culture (Rhodes, Ochoa, & Ortiz, 2005). Indeed, in earlier research on cross-cultural testing, figural reasoning tests were often found to be more culturally loaded than appropriately translated verbal tests (Anastasi & Urbina, 1997). Although the memory of these findings seems to have faded, the conclusions are as valid today as they were in the past. Analyses of the standardization data from the WISC-IV Spanish (Wechsler, 2004) provide a recent reminder. The WISC-IV Spanish is designed for Spanish-speaking children in the United States who have attended U.S. schools for no more than 5 years. Weiss, Saklofske, Prifitera, and Holdnack (2006) compared scores on the WISV-IV Spanish of students who had received different amounts of their educations in U.S. schools. The researchers expected that U.S. schooling would have a larger impact on chil-dren’s scores on the Verbal Comprehension Index than on the Perceptual Reasoning index. However, the opposite pattern was observed: children who had received all of their education in U.S. schools scored 2 points higher on the Verbal Comprehension index than those who had receive less than 30% of their education in the United States. The corresponding advantage for the U.S. educated group on the Perceptual Reasoning Index was 10 points. As the authors note, “this is an interesting finding because it is widely assumed that the lack of an adaptation and acculturation primarily affects crystallized knowledge” (p. 47).
at PENNSYLVANIA STATE UNIV on May 8, 2016jpa.sagepub.comDownloaded from
Lohman and Gambrell 7
A second recent study showed similar effects for acculturation. Approximately 2,000 children (40% ELL) in Grades K to 6 in a large southwestern city in the United States were administered the Standard Progressive Matrices, the NNAT, and the CogAT by trained examiners (Lohman, Korb, & Lakin, 2008).1 Directions were given in English or Spanish as appropriate. Large differ-ences between the mean scores of ELL and non-ELL children were reduced only slightly when the researchers controlled for ethnicity and family income. Non-ELL Hispanic students outperformed their ELL Hispanic classmates by 7.5, 7.3, and 9.5 IQ-like points (M = 100, SD = 16) on the Raven, CogAT Nonverbal, and NNAT, respectively. Once again, experience with U.S. culture and language had a substantial effect on figural reasoning test scores.
Effects of SES and EthnicityMany nonverbal tests are advertised as especially appropriate for children whose families live in poverty or otherwise have limited access to social resources. The UNIT, for example, “was designed to provide a fair assessment of intelligence of all children, but especially minority children and children of poverty” (Bracken, 2008, p. 24). Similarly, the NNAT-2 is said to be designed to measure the abilities of students from limited economic or social circumstances.
Although there are exceptions, low-SES students generally perform somewhat better on non-verbal than on verbal reasoning tests. The difference is most noticeable on tests of spatial abili-ties and perceptual speed (Jensen, 1980). However, absolute differences in performance due to SES are often confounded with ELL status and ethnicity. This not only affects inferences about the overall impact of SES on global measures of achievement or ability but also on students’ rela-tive performance on nonverbal as opposed to other types of tests.
Regardless of SES, Asian American students often perform better on nonverbal and quantita-tive than verbal tasks. Conversely, regardless of SES, Black students often perform somewhat better on verbal and quantitative than on nonverbal tests, especially when the nonverbal tests require spatial visualization abilities (Jensen, 1980; Prifitera, Saklofske, Weiss, & Rolfhus, 2005; Sattler, 2008). Lower performance on nonverbal reasoning tests is most pronounced among the most able Black students. Although the average scores of Black students were the same on the Verbal, Quantitative, and Nonverbal batteries of CogAT Form 6, Black students who obtained a median stanine score of 8 across the three batteries were much more likely than other students to show a significant or extreme weakness on the Nonverbal battery (Lohman, 2005b).
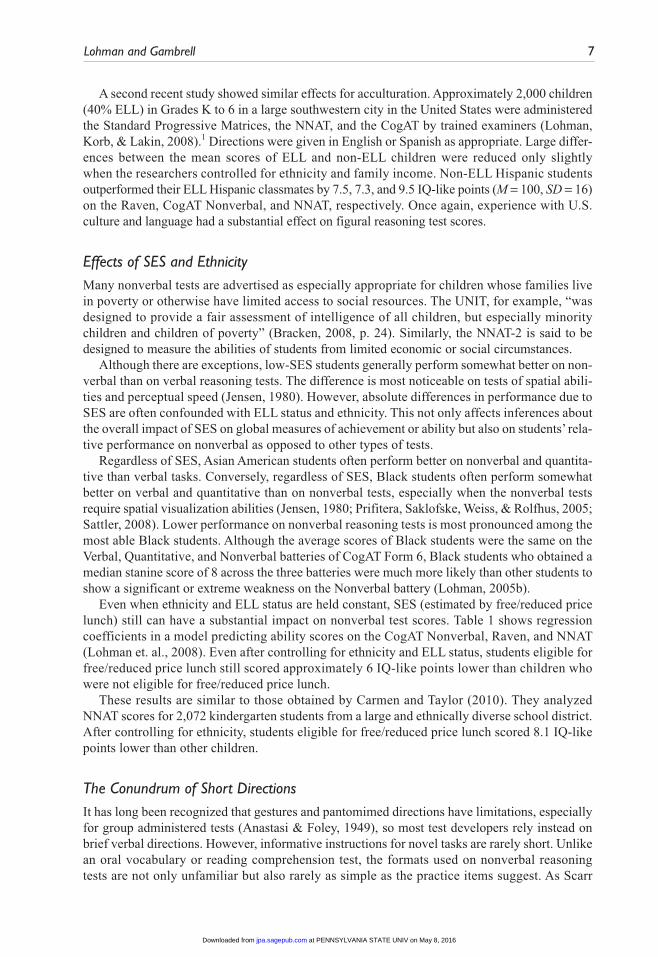
Even when ethnicity and ELL status are held constant, SES (estimated by free/reduced price lunch) still can have a substantial impact on nonverbal test scores. Table 1 shows regression coefficients in a model predicting ability scores on the CogAT Nonverbal, Raven, and NNAT (Lohman et. al., 2008). Even after controlling for ethnicity and ELL status, students eligible for free/reduced price lunch still scored approximately 6 IQ-like points lower than children who were not eligible for free/reduced price lunch.
These results are similar to those obtained by Carmen and Taylor (2010). They analyzed NNAT scores for 2,072 kindergarten students from a large and ethnically diverse school district. After controlling for ethnicity, students eligible for free/reduced price lunch scored 8.1 IQ-like points lower than other children.
The Conundrum of Short DirectionsIt has long been recognized that gestures and pantomimed directions have limitations, especially for group administered tests (Anastasi & Foley, 1949), so most test developers rely instead on brief verbal directions. However, informative instructions for novel tasks are rarely short. Unlike an oral vocabulary or reading comprehension test, the formats used on nonverbal reasoning tests are not only unfamiliar but also rarely as simple as the practice items suggest. As Scarr
at PENNSYLVANIA STATE UNIV on May 8, 2016jpa.sagepub.comDownloaded from
8 Journal of Psychoeducational Assessment XX(X)
Table 1. Unstandardized Regression Coefficients for the Prediction of Ability on Three Nonverbal Ability Tests
n CogAT 6 NNAT Raven
Asian American 34 4.1 3.9 4.1Black 69 −7.6 −12.9 −9.1Hispanic 786 −1.3 −0.6 −2.7Native American 61 −2.8 −0.2 −1.3English language learner 465 −7.3 −10.3 −6.6Free/reduced lunch 1,031 −6.3 −5.5 −5.8
Note. Total N = 1,197. Grades range is K to 6. Reported in SAS Metric (SD = 16).
(1994) put it, “For items . . . such as those . . . on the Raven Progressive Matrices Test, under-standing the task is more than half the battle” (p. 323).
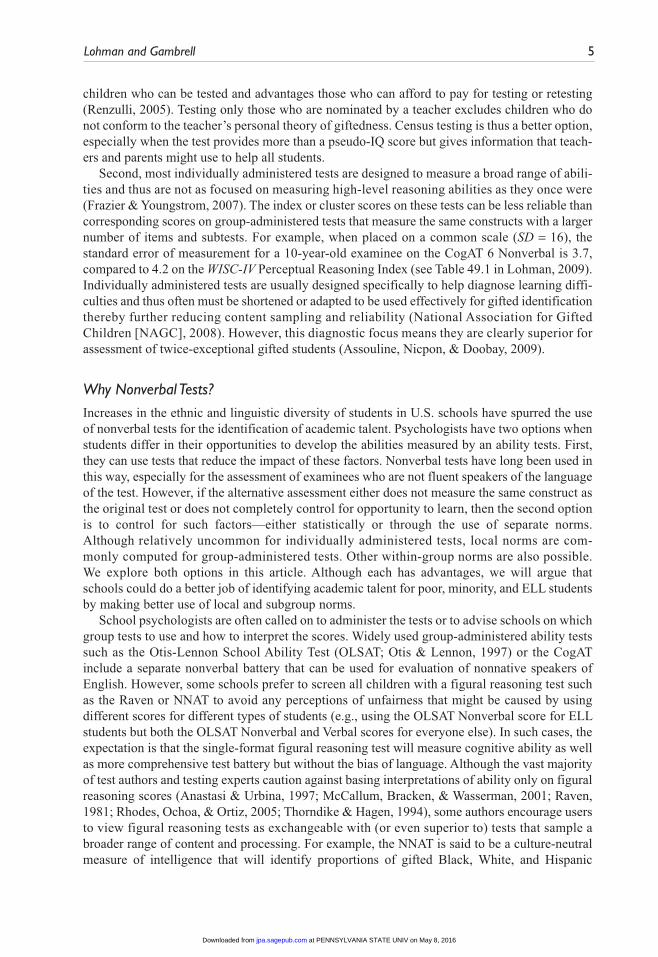
Brief test directions with few practice items may actually mislead children by confirming that a simple but errant test strategy is appropriate. Children may not even be aware that their simple strategy is ineffective as the test progresses because, by accident or design, foils for difficult problems commonly appear to confirm the errant strategy. Poor, bilingual, and minority children are most likely not to understand exactly what it is they are supposed to do or to adopt an over-simplified approach to solving nonverbal items (Budoff, Gimon, & Corman, 1974; Hessels & Hamers, 1993). The consequences can be an unexpectedly large number of children who obtain low scores as in the example shown in Figure 2.
Raven
NNAT
Figure 2. Number of ELL students at each stanine on the Naglieri Nonverbal Ability Test (NNAT) and the Standard Progressive Matrices (Raven) for 465 ELL students in Grades K to 6.
at PENNSYLVANIA STATE UNIV on May 8, 2016jpa.sagepub.comDownloaded from
Lohman and Gambrell 9
The figure shows the number of ELL children at each stanine on the Raven and NNAT in the Lohman et al. (2008) study. Why the preponderance of students with very low NNAT scores? It seems likely that these ELL children did not understand what it was that they were supposed to do on the NNAT since very few of them obtained such low scores on the Raven. Jensen (1980, p. 652) reports the same piling up of scores at the left tail of the distribution when he attempted to administer the Culture Fair Intelligence Test (Cattell & Cattell, 1969) with its short directions to a sample of poor children.
Practice EffectsOne way to encourage better understanding of test directions is to provide all children with more practice items. Practice with feedback on more than one or two items can be provided either as a part of the directions (e.g., as on the UNIT) or as a separate activity (as in the free practice activities that accompany Form 7 of the CogAT).
Practice effects on nonverbal tests can be substantial (Bors & Vigneau, 2001). For example, practice effects on previous editions of the Wechsler Intelligence Test for Children (WISC) were 3.2 and 9.2 IQ points on the Verbal and Performance scales, respectively (Kaufman, 1994). On the group-administered (but longer and less speeded) Cognitive Abilities test, Thorndike and Hagen (1982) found smaller gains of 1.8 and 3.2 SAS points on the Verbal and Nonverbal batter-ies, respectively. Retest gains on the SB-5 Nonverbal IQ were 4.5 points, compared to 3 points on the Verbal IQ (Roid, 2003).
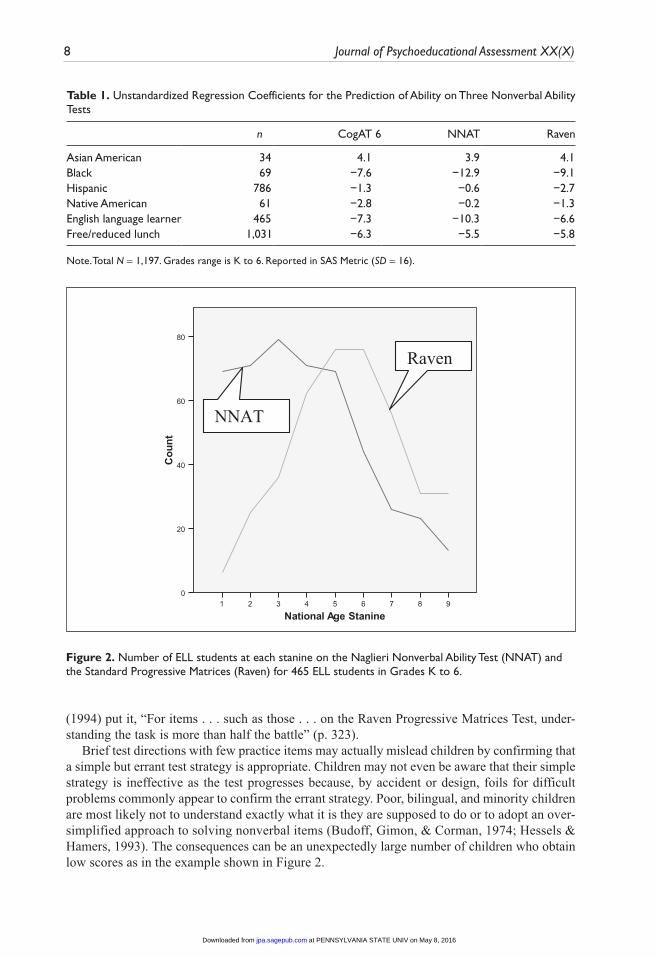
Practice effects also vary by ability level. This was shown in analyses we conducted on the Form 5-Form 6 equating data of CogAT. A total of 6,628 students in 30 schools took both Form 5 and Form 6 of CogAT in a counterbalanced order. Plots of SAS gains on the second test by overall ability level for each of the three CogAT batteries are shown in Figure 3.
Figure 3. Average SAS Score (M = 100, SD = 16) Practice gains for Forms 5 and 6 Grades 3 to 7 by ability quartileNote: Quartiles are defined by Total Composite SAS (<90, 90-100, 100-110, 110+).
at PENNSYLVANIA STATE UNIV on May 8, 2016jpa.sagepub.comDownloaded from
10 Journal of Psychoeducational Assessment XX(X)
On one hand, there were no practice effects on the Verbal battery. On the other hand, practice effects on both the Quantitative and Nonverbal batteries increased linearly across ability levels. Whereas the least able students (SAS < 90) showed no practice effects on either battery, the most able students (SAS > 110) showed gains of 2.3 SAS points and 3.8 SAS points on the Quantitative and Nonverbal batteries, respectively. Of course, practice with feedback might give quite differ-ent results, especially for the less-able students.
The problem of differential novelty of items and item formats used on ability tests has been exacerbated in recent years by the ready Internet availability of practice materials for most group-administered screening tests. Given the magnitude of practice effects on such tests, savvy parents can easily give their child an advantage on the screening test, thereby further disadvan-taging the disadvantaged. The effects of practice and coaching are thus an important consider-ation when nonverbal tests are used for talent identification.
Nonverbal as More Than Figural Reasoning: New Evidence From CogAT Form 7Nonverbal tests that measure more than figural reasoning can improve both construct represen-tation and validity (Bracken & McCallum, 1998). Item formats such as analogies or series problems can be developed using artwork depicting objects other than spatial forms. Examples are shown in the first column of Figure 1. For lack of a better term we will refer to these formats as Picture Verbal.
Simple quantitative reasoning items also can be displayed pictorially in ways that do not require comprehension of numerical symbols and operators. The development of numerical abstraction abilities occurs well before children are old enough to enter kindergarten. Numerical reasoning is commonly observed in preschool children prior to the onset of verbal counting (Starkey, 1992). Ironically, the near-universal exposure of students to basic quantitative concepts both at home and at school, combined with the very limited universe of early mathematics con-cepts, may actually make these tests less sensitive to cultural differences at home than figural tests, especially for bilingual children attending U.S. schools. In this article, the tests in the Picture Quantitative battery on CogAT7 exemplify this kind of reasoning task.
The value of a broader range of nonverbal tests was shown in data that we recently collected as part of the standardization of Form 7 of CogAT. Form 7 differs importantly from previous editions of CogAT, primarily in ways that make the test more accessible to ELL children in the early grades. Only one of the three tests on the Primary Level Verbal Battery (Sentence Completion) and none of the tests on the Primary Level Quantitative or Nonverbal batteries require comprehension of oral language. Furthermore, the oral prompts for the Sentence Completion test can be administered in English or Spanish, or the test can be omitted altogether for ELL students. Example items for each of the nine subtests of CogAT7 are shown in Figure 1, separately for the picture-based primary level tests and the figure/text/alphanumeric based tests used at Grades 3 and above.
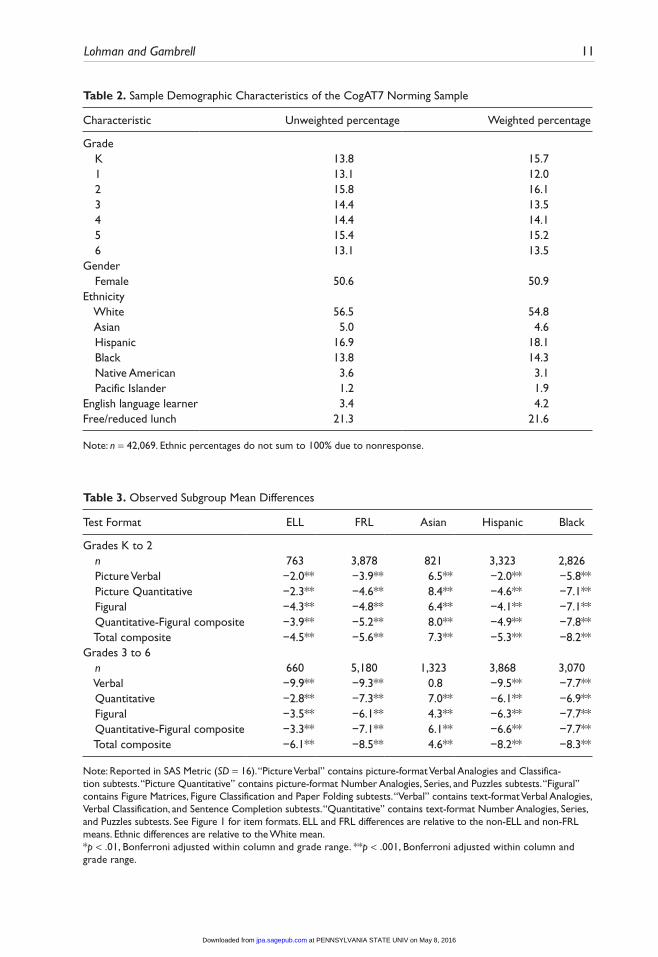
MethodBasic demographic characteristics of the K-6 norming sample are shown in Table 2. We report both observed subgroup mean differences (Table 3) and estimated marginal subgroup differences after controlling for background variables using a multivariate general linear model (Table 4). The marginal differences between groups are easier to interpret because they reduce confound-ing among variables. However, they also can mislead test users as to the magnitude of group differences that are likely to be observed in actual test scores (Carmen & Taylor, 2010). All
at PENNSYLVANIA STATE UNIV on May 8, 2016jpa.sagepub.comDownloaded from
Lohman and Gambrell 11
Table 2. Sample Demographic Characteristics of the CogAT7 Norming Sample
Characteristic Unweighted percentage Weighted percentage
Grade K 13.8 15.7 1 13.1 12.0 2 15.8 16.1 3 14.4 13.5 4 14.4 14.1 5 15.4 15.2 6 13.1 13.5Gender Female 50.6 50.9Ethnicity White 56.5 54.8 Asian 5.0 4.6 Hispanic 16.9 18.1 Black 13.8 14.3 Native American 3.6 3.1 Pacific Islander 1.2 1.9English language learner 3.4 4.2Free/reduced lunch 21.3 21.6
Note: n = 42,069. Ethnic percentages do not sum to 100% due to nonresponse.
Table 3. Observed Subgroup Mean Differences
Test Format ELL FRL Asian Hispanic Black
Grades K to 2 n 763 3,878 821 3,323 2,826 Picture Verbal −2.0** −3.9** 6.5** −2.0** −5.8** Picture Quantitative −2.3** −4.6** 8.4** −4.6** −7.1** Figural −4.3** −4.8** 6.4** −4.1** −7.1** Quantitative-Figural composite −3.9** −5.2** 8.0** −4.9** −7.8** Total composite −4.5** −5.6** 7.3** −5.3** −8.2**Grades 3 to 6 n 660 5,180 1,323 3,868 3,070 Verbal −9.9** −9.3** 0.8 −9.5** −7.7** Quantitative −2.8** −7.3** 7.0** −6.1** −6.9** Figural −3.5** −6.1** 4.3** −6.3** −7.7** Quantitative-Figural composite −3.3** −7.1** 6.1** −6.6** −7.7** Total composite −6.1** −8.5** 4.6** −8.2** −8.3**
Note: Reported in SAS Metric (SD = 16). “Picture Verbal” contains picture-format Verbal Analogies and Classifica-tion subtests. “Picture Quantitative” contains picture-format Number Analogies, Series, and Puzzles subtests. “Figural” contains Figure Matrices, Figure Classification and Paper Folding subtests. “Verbal” contains text-format Verbal Analogies, Verbal Classification, and Sentence Completion subtests. “Quantitative” contains text-format Number Analogies, Series, and Puzzles subtests. See Figure 1 for item formats. ELL and FRL differences are relative to the non-ELL and non-FRL means. Ethnic differences are relative to the White mean.*p < .01, Bonferroni adjusted within column and grade range. **p < .001, Bonferroni adjusted within column and grade range.
at PENNSYLVANIA STATE UNIV on May 8, 2016jpa.sagepub.comDownloaded from
12 Journal of Psychoeducational Assessment XX(X)
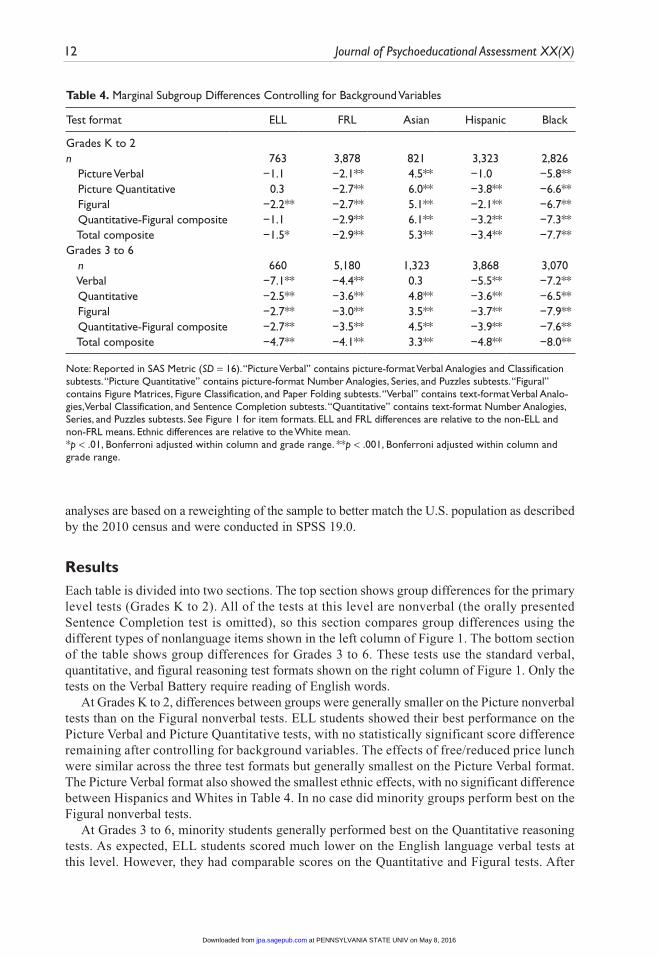
Table 4. Marginal Subgroup Differences Controlling for Background Variables
Test format ELL FRL Asian Hispanic Black
Grades K to 2n 763 3,878 821 3,323 2,826 Picture Verbal −1.1 −2.1** 4.5** −1.0 −5.8** Picture Quantitative 0.3 −2.7** 6.0** −3.8** −6.6** Figural −2.2** −2.7** 5.1** −2.1** −6.7** Quantitative-Figural composite −1.1 −2.9** 6.1** −3.2** −7.3** Total composite −1.5* −2.9** 5.3** −3.4** −7.7**Grades 3 to 6 n 660 5,180 1,323 3,868 3,070 Verbal −7.1** −4.4** 0.3 −5.5** −7.2** Quantitative −2.5** −3.6** 4.8** −3.6** −6.5** Figural −2.7** −3.0** 3.5** −3.7** −7.9** Quantitative-Figural composite −2.7** −3.5** 4.5** −3.9** −7.6** Total composite −4.7** −4.1** 3.3** −4.8** −8.0**
Note: Reported in SAS Metric (SD = 16). “Picture Verbal” contains picture-format Verbal Analogies and Classification subtests. “Picture Quantitative” contains picture-format Number Analogies, Series, and Puzzles subtests. “Figural” contains Figure Matrices, Figure Classification, and Paper Folding subtests. “Verbal” contains text-format Verbal Analo-gies, Verbal Classification, and Sentence Completion subtests. “Quantitative” contains text-format Number Analogies, Series, and Puzzles subtests. See Figure 1 for item formats. ELL and FRL differences are relative to the non-ELL and non-FRL means. Ethnic differences are relative to the White mean.*p < .01, Bonferroni adjusted within column and grade range. **p < .001, Bonferroni adjusted within column and grade range.
analyses are based on a reweighting of the sample to better match the U.S. population as described by the 2010 census and were conducted in SPSS 19.0.
ResultsEach table is divided into two sections. The top section shows group differences for the primary level tests (Grades K to 2). All of the tests at this level are nonverbal (the orally presented Sentence Completion test is omitted), so this section compares group differences using the different types of nonlanguage items shown in the left column of Figure 1. The bottom section of the table shows group differences for Grades 3 to 6. These tests use the standard verbal, quantitative, and figural reasoning test formats shown on the right column of Figure 1. Only the tests on the Verbal Battery require reading of English words.
At Grades K to 2, differences between groups were generally smaller on the Picture nonverbal tests than on the Figural nonverbal tests. ELL students showed their best performance on the Picture Verbal and Picture Quantitative tests, with no statistically significant score difference remaining after controlling for background variables. The effects of free/reduced price lunch were similar across the three test formats but generally smallest on the Picture Verbal format. The Picture Verbal format also showed the smallest ethnic effects, with no significant difference between Hispanics and Whites in Table 4. In no case did minority groups perform best on the Figural nonverbal tests.
At Grades 3 to 6, minority students generally performed best on the Quantitative reasoning tests. As expected, ELL students scored much lower on the English language verbal tests at this level. However, they had comparable scores on the Quantitative and Figural tests. After
at PENNSYLVANIA STATE UNIV on May 8, 2016jpa.sagepub.comDownloaded from
Lohman and Gambrell 13
controlling for background variables, Blacks performed substantially better on the Quantitative than on the Figural battery. Across all groups, the quantitative formats typically had the smallest impact. Indeed, factor models of the CogAT by itself or with other tests (e.g., the Woodcock-Johnson III; Woodcock, McGrew, & Mather, 2001) show that the latent quantitative factor cor-relates close to unity with the general factor (Lohman, 2003; Lohman & Hagen, 2002). This indicates that the quantitative battery is actually almost entirely measuring Gf, not specific math-ematics skills. The quantitative formats are so named because they use the medium of numerical symbols to pose reasoning questions, not because they primarily measure mathematical knowl-edge and skills.
Clearly, nonverbal formats other than figural reasoning (including quantitative reasoning at Grades 3 to 6) often show smaller group differences than the figural reasoning tests (Figure Matrices, Paper Folding, and Figure Classification). But do they predict academic learning? The picture verbal formats might reduce group differences simply because they contain fewer items and may be less reliable. If this were the case, then smaller group differences would come at the expense of smaller correlations with school achievement.
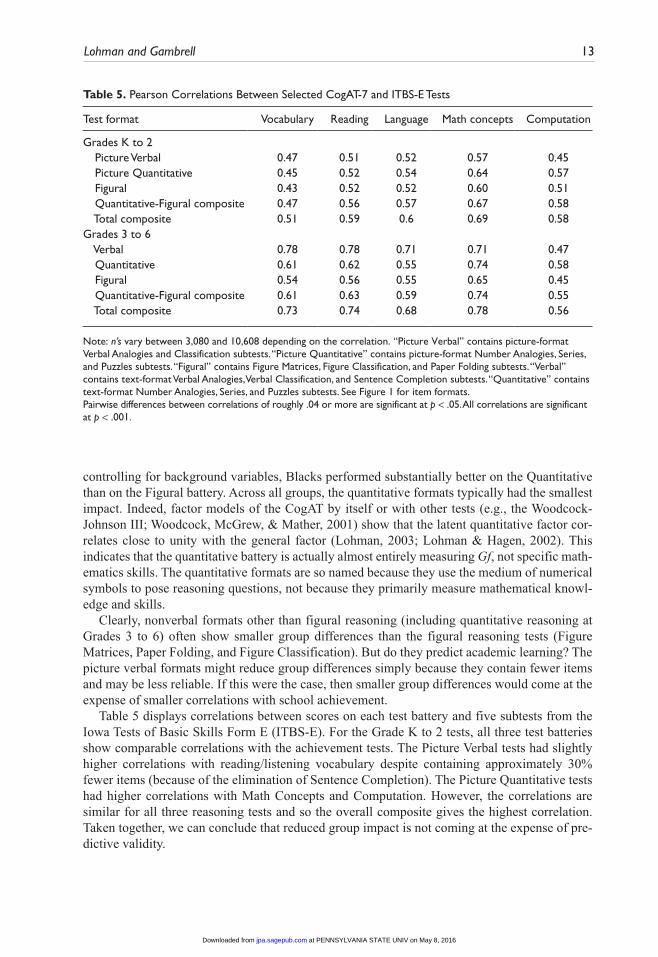
Table 5 displays correlations between scores on each test battery and five subtests from the Iowa Tests of Basic Skills Form E (ITBS-E). For the Grade K to 2 tests, all three test batteries show comparable correlations with the achievement tests. The Picture Verbal tests had slightly higher correlations with reading/listening vocabulary despite containing approximately 30% fewer items (because of the elimination of Sentence Completion). The Picture Quantitative tests had higher correlations with Math Concepts and Computation. However, the correlations are similar for all three reasoning tests and so the overall composite gives the highest correlation. Taken together, we can conclude that reduced group impact is not coming at the expense of pre-dictive validity.
Table 5. Pearson Correlations Between Selected CogAT-7 and ITBS-E Tests
Test format Vocabulary Reading Language Math concepts Computation
Grades K to 2 Picture Verbal 0.47 0.51 0.52 0.57 0.45 Picture Quantitative 0.45 0.52 0.54 0.64 0.57 Figural 0.43 0.52 0.52 0.60 0.51 Quantitative-Figural composite 0.47 0.56 0.57 0.67 0.58 Total composite 0.51 0.59 0.6 0.69 0.58Grades 3 to 6 Verbal 0.78 0.78 0.71 0.71 0.47 Quantitative 0.61 0.62 0.55 0.74 0.58 Figural 0.54 0.56 0.55 0.65 0.45 Quantitative-Figural composite 0.61 0.63 0.59 0.74 0.55 Total composite 0.73 0.74 0.68 0.78 0.56
Note: n’s vary between 3,080 and 10,608 depending on the correlation. “Picture Verbal” contains picture-format Verbal Analogies and Classification subtests. “Picture Quantitative” contains picture-format Number Analogies, Series, and Puzzles subtests. “Figural” contains Figure Matrices, Figure Classification, and Paper Folding subtests. “Verbal” contains text-format Verbal Analogies, Verbal Classification, and Sentence Completion subtests. “Quantitative” contains text-format Number Analogies, Series, and Puzzles subtests. See Figure 1 for item formats.Pairwise differences between correlations of roughly .04 or more are significant at p < .05. All correlations are significant at p < .001.
at PENNSYLVANIA STATE UNIV on May 8, 2016jpa.sagepub.comDownloaded from
14 Journal of Psychoeducational Assessment XX(X)
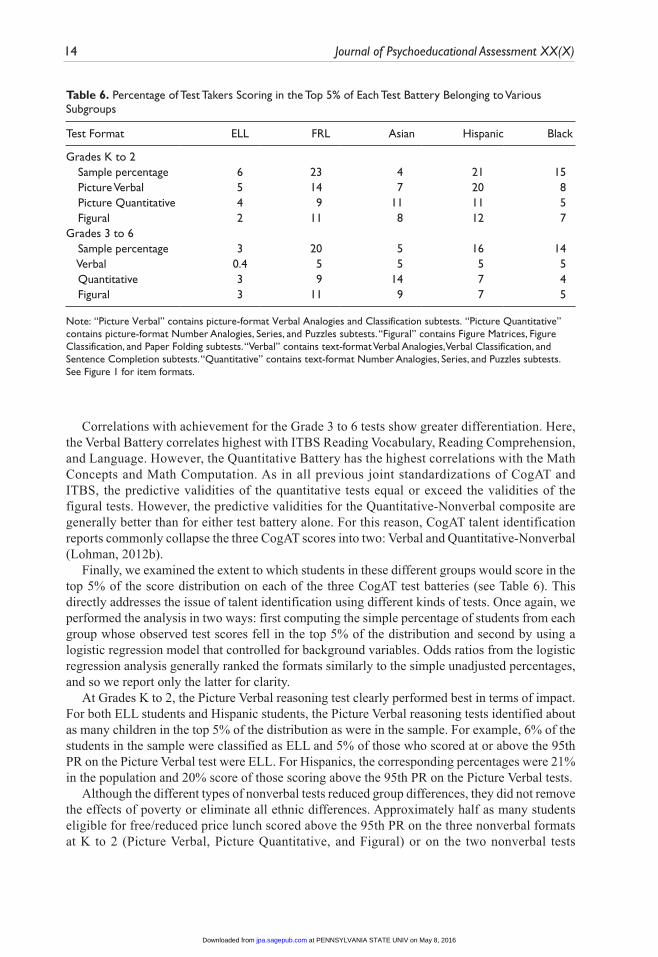
Table 6. Percentage of Test Takers Scoring in the Top 5% of Each Test Battery Belonging to Various Subgroups
Test Format ELL FRL Asian Hispanic Black
Grades K to 2 Sample percentage 6 23 4 21 15 Picture Verbal 5 14 7 20 8 Picture Quantitative 4 9 11 11 5 Figural 2 11 8 12 7Grades 3 to 6 Sample percentage 3 20 5 16 14 Verbal 0.4 5 5 5 5 Quantitative 3 9 14 7 4 Figural 3 11 9 7 5
Note: “Picture Verbal” contains picture-format Verbal Analogies and Classification subtests. “Picture Quantitative” contains picture-format Number Analogies, Series, and Puzzles subtests. “Figural” contains Figure Matrices, Figure Classification, and Paper Folding subtests. “Verbal” contains text-format Verbal Analogies, Verbal Classification, and Sentence Completion subtests. “Quantitative” contains text-format Number Analogies, Series, and Puzzles subtests. See Figure 1 for item formats.
Correlations with achievement for the Grade 3 to 6 tests show greater differentiation. Here, the Verbal Battery correlates highest with ITBS Reading Vocabulary, Reading Comprehension, and Language. However, the Quantitative Battery has the highest correlations with the Math Concepts and Math Computation. As in all previous joint standardizations of CogAT and ITBS, the predictive validities of the quantitative tests equal or exceed the validities of the figural tests. However, the predictive validities for the Quantitative-Nonverbal composite are generally better than for either test battery alone. For this reason, CogAT talent identification reports commonly collapse the three CogAT scores into two: Verbal and Quantitative-Nonverbal (Lohman, 2012b).
Finally, we examined the extent to which students in these different groups would score in the top 5% of the score distribution on each of the three CogAT test batteries (see Table 6). This directly addresses the issue of talent identification using different kinds of tests. Once again, we performed the analysis in two ways: first computing the simple percentage of students from each group whose observed test scores fell in the top 5% of the distribution and second by using a logistic regression model that controlled for background variables. Odds ratios from the logistic regression analysis generally ranked the formats similarly to the simple unadjusted percentages, and so we report only the latter for clarity.
At Grades K to 2, the Picture Verbal reasoning test clearly performed best in terms of impact. For both ELL students and Hispanic students, the Picture Verbal reasoning tests identified about as many children in the top 5% of the distribution as were in the sample. For example, 6% of the students in the sample were classified as ELL and 5% of those who scored at or above the 95th PR on the Picture Verbal test were ELL. For Hispanics, the corresponding percentages were 21% in the population and 20% score of those scoring above the 95th PR on the Picture Verbal tests.
Although the different types of nonverbal tests reduced group differences, they did not remove the effects of poverty or eliminate all ethnic differences. Approximately half as many students eligible for free/reduced price lunch scored above the 95th PR on the three nonverbal formats at K to 2 (Picture Verbal, Picture Quantitative, and Figural) or on the two nonverbal tests
at PENNSYLVANIA STATE UNIV on May 8, 2016jpa.sagepub.comDownloaded from
Lohman and Gambrell 15
(Quantitative and Figural) at Grades 3 to 6 as would be expected from their representation in the population. Similarly, although Black students represented 14% to 15% of the sample, a maxi-mum of 8% scored above the 95th PR on one of the K to 2 nonverbal tests; at Grades 3 to 6, the maximum was only 5%. Controlling for background variables had only small effects on esti-mated selection rates for Blacks. Odds ratios for Black students from the logistic regression (odds of being selected for gifted divided by odds for Whites, controlling for other factors) were highest at K to 2 for the Picture Verbal format (OR = .44), and highest for Quantitative at 3 to 6 (OR = .33).
The Importance of Multiple Normative PerspectivesIn any domain, children who have an aptitude or talent for a particular kind of learning or per-formance will typically learn in a few trials what otherwise similar children take many trials to learn. Inferences about intellectual ability from test scores, classroom activities, and other behav-ioral evidence are thus always judged relative to some larger group of individuals that we assume have had similar opportunities to develop the knowledge, skills, or other characteristics that are observed. Test norms use fine distinctions in age or grade in an effort to account for learning opportunities. Clearly, the intellectual abilities of children who live in poverty, who have had irregular or poor schooling, or who have less experience with the language of instruction will often be underestimated when their behavior is compared with other children of the same age or grade using national norms. Although this disadvantage will be greatest on tests that rely on abilities the child has had lesser opportunities to develop, it can also extend to nonverbal tests that may seem unrelated. Two examples previously discussed were the poor performance of students with little experience in U.S. schools on the Perceptual Reasoning subtests of the WISC-IV Spanish (Prifitera et al., 2005) and the lower performance of Hispanic ELL children on NNAT, Raven, and CogAT Nonverbal in the Lohman et al. (2008) study. Nonverbal tests do not neces-sarily level the playing field so that the same norms can be used for all students.
Alternate normative perspectives provide another way to better control for differences in OTL in addition to the controls that are inherent in age- or grade-based norms. However, most test users rely exclusively on national norms. Often, they are not aware of the limitations of national norms and the extent to which other normative comparisons can assist them. In the early years of ability testing, psychologists did not understand the extent to which IQ scores change with age and experience or the extent to which performance on ability tests was improving across decades—especially for young children on the nonverbal items (Flynn, 1999; Thorndike, 1975).
In the field of gifted education, the exclusive use of national norms stems in part from early definitions of giftedness based on Stanford-Binet IQ scores. The continued reliance on national norms stems in part from state policies established under earlier conceptions of giftedness and from the perceived need to determine whether a child is or is not “gifted.”
Although national norms are critical for determining relative strengths and weaknesses in abilities, they can be misleading if poorly calculated, which seems especially common for ability tests that do not require a high level of professional certification to administer. National norms on many group ability tests used in schools are seriously deficient. Some older nonverbal tests such as the Progressive Matrices Test (Raven, Raven, & Court, 1998) and the Culture-Fair Tests (Cattell & Cattell, 1959) have never been properly normed and routinely give scores that are 10 to 15 IQ points too high. On another widely used nonverbal test, SDs for normative scores that should be fixed at 15 are actually in excess of 20 at the primary grades, thereby vastly overesti-mating the number of very high and very low scoring children (see Lohman et al., 2008). In such cases, national norms can be more harmful than helpful.
at PENNSYLVANIA STATE UNIV on May 8, 2016jpa.sagepub.comDownloaded from
16 Journal of Psychoeducational Assessment XX(X)
Advantages of Local Norms
The need for special gifted programming at the local level depends on the discrepancy between students’ current levels of cognitive or academic development and that of their classmates—not all other students in the nation. In some schools, the average student scores at the 20th national percentile (NPR). In such a school, a student who scores at the 70th NPR is probably significantly mismatched with his or her peers. Conversely, in some very high-achieving schools, a child who scores at the 90th NPR may not be seriously mismatched with the instructional challenges in the classroom. Because schools vary widely in the average ability and achievement of their students, policies that require all students in the district or state to attain the same level of excellence on a nationally normed test result in schools in which no child is served by the talent development program and other schools in which a substantial fraction of the children are labeled “gifted.” Local norms eliminate both of these problems (see Lohman, 2012a, for practical methods to calculate local norms).
Local norms also allow users to focus on how best to measure academic talent rather than on finding a test whose national norms will give the desired percentage of “gifted” students—overall or within subgroups of the population. Often, tests that achieve these goals either have out-of-date (or inaccurate) norms or they measure only a limited aspect of scholastic aptitude. Poorly normed nonverbal tests that measure only figural reasoning abilities suffer on both counts.
Opportunity to LearnIn addition to both national and local norms, normative comparisons that better control for opportunity to learn can be helpful when attempting to identify talent. Measuring opportunity to learn (OTL) requires finding some variable (or set of variables) that not only captures important aspects of learning opportunities but that can be unambiguously coded for all individuals. In the WISC-IV-Spanish norming, for example, number of years attending U.S. schools was used. More refined measures of ELL status are available in schools in which all ELL students are administered the same English Language Proficiency test each year. For measuring economic opportunity, one of the more defensible constructs is family income. This can be estimated by determining whether the child qualifies for free or reduced-price lunch.
Given that one has some way to group children roughly by one or more measures of opportu-nity to learn, separate rank orders can easily be made within the different OTL groups. If there are many students in each group, then separate percentile ranks can also be calculated within each group. The need for precise estimates of ability is a direct consequence of trying to determine whether or not a child is truly “gifted.” However, if the goal is merely to identify poor or ELL children who might profit from special encouragement, projects, or enrichment, then there is no need for such precision. Local, subgroup, and OTL norms also offer the intriguing possibility of using scores from other verbally loaded ability and achievement tests that measure important abilities that should also be considered when making inferences about academic talent.
One of the major stumbling blocks for effective talent identification among poor and ELL children is the presumption that all talented students must receive the same kind of special instruction. In athletics, we would expect that some children who had little experience swimming might have talent for the sport. But we would not think it reasonable immediately to expect them to swim at the same pace as children who had had many years of practice in the sport. Clearly, the inference of talent is distinguishable from a judgment about current level of development of that talent. Schools that have only a pull out program that serves a handful of academically advanced students will find it difficult to fit children into that program who have quite different instructional needs. Thus, any attempt to identify talent within OTL groups must also be coordinated with the redesign of programs that serve the children thus identified.
at PENNSYLVANIA STATE UNIV on May 8, 2016jpa.sagepub.comDownloaded from
Lohman and Gambrell 17
Summary
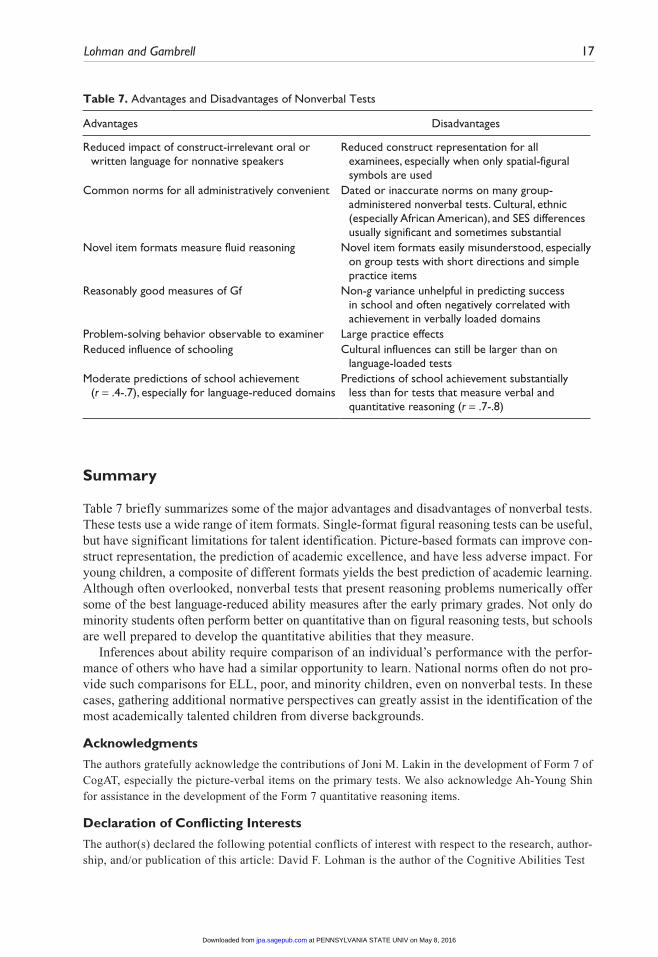
Table 7 briefly summarizes some of the major advantages and disadvantages of nonverbal tests. These tests use a wide range of item formats. Single-format figural reasoning tests can be useful, but have significant limitations for talent identification. Picture-based formats can improve con-struct representation, the prediction of academic excellence, and have less adverse impact. For young children, a composite of different formats yields the best prediction of academic learning. Although often overlooked, nonverbal tests that present reasoning problems numerically offer some of the best language-reduced ability measures after the early primary grades. Not only do minority students often perform better on quantitative than on figural reasoning tests, but schools are well prepared to develop the quantitative abilities that they measure.
Inferences about ability require comparison of an individual’s performance with the perfor-mance of others who have had a similar opportunity to learn. National norms often do not pro-vide such comparisons for ELL, poor, and minority children, even on nonverbal tests. In these cases, gathering additional normative perspectives can greatly assist in the identification of the most academically talented children from diverse backgrounds.
Acknowledgments
The authors gratefully acknowledge the contributions of Joni M. Lakin in the development of Form 7 of CogAT, especially the picture-verbal items on the primary tests. We also acknowledge Ah-Young Shin for assistance in the development of the Form 7 quantitative reasoning items.
Declaration of Conflicting Interests
The author(s) declared the following potential conflicts of interest with respect to the research, author-ship, and/or publication of this article: David F. Lohman is the author of the Cognitive Abilities Test
Table 7. Advantages and Disadvantages of Nonverbal Tests
Advantages Disadvantages
Reduced impact of construct-irrelevant oral or written language for nonnative speakers
Reduced construct representation for all examinees, especially when only spatial-figural symbols are used
Common norms for all administratively convenient Dated or inaccurate norms on many group-administered nonverbal tests. Cultural, ethnic (especially African American), and SES differences usually significant and sometimes substantial
Novel item formats measure fluid reasoning Novel item formats easily misunderstood, especially on group tests with short directions and simple practice items
Reasonably good measures of Gf Non-g variance unhelpful in predicting success in school and often negatively correlated with achievement in verbally loaded domains
Problem-solving behavior observable to examiner Large practice effectsReduced influence of schooling Cultural influences can still be larger than on
language-loaded testsModerate predictions of school achievement
(r = .4-.7), especially for language-reduced domainsPredictions of school achievement substantially
less than for tests that measure verbal and quantitative reasoning (r = .7-.8)
at PENNSYLVANIA STATE UNIV on May 8, 2016jpa.sagepub.comDownloaded from
18 Journal of Psychoeducational Assessment XX(X)
Funding
The author(s) received no financial support for the research, authorship, and/or publication of this article.
Note
1. These data were collected by the staff of project Bright Horizon. Drs. Naglieri and Lohman advised on the design of the study but did not participate in the data collection. Both were given the data to analyze. Analyses by the Iowa team were published by Lohman, Korb, & Lakin (2008).
References
Achter, J. A., Benbow, C. P., & Lubinski, D. (1997). Rethinking multipotentiality among the intellectually gifted: A critical review and recommendations. Gifted Child Quarterly, 41, 5-15.
Anastasi, A., & Foley, J. P. (1949). Differential psychology (Rev. ed.). New York, NY: Macmillan.Anastasi, A., & Urbina, S. (1997). Psychological testing (7th ed.). Upper Saddle River, NJ: Prentice Hall.Assouline, S. G., Nicpon, M. F., & Doobay, A. (2009). Profoundly gifted girls and autism spectrum disorder.
Gifted Child Quarterly, 53(2), 89-105.Boas, F. (1911). The mind of primitive man. New York, NY: Macmillan.Bracken, B. A. (1999). Assessing diverse populations with nonverbal tests of intelligence. Trainers’ Forum:
Periodical of the Trainers of School Psychologists, 17, 6-8.Bracken, B. A. (2008). Nontraditional strategies for identifying nontraditional gifted and talented students.
In J. L. VanTassel-Baska (Ed.), Aternative assessments with gifted and talented students. Waco, Texas: Prufrock Press Inc.
Bracken, B. A., & McCallum, R. A. (1998). Universal nonverbal intelligence test. Itasca, IL: Riverside.Braden, J. P. (2000). Perspectives on the nonverbal assessment of intelligence. Journal of Psychoeducational
Assessment, 18, 204-210.Bors, D. A., & Vigneau, F. (2001). The effect of practice on Raven’s Advanced Progressive Matrices. Learning
and Individual Differences, 13, 291-312.Budoff, M., Gimon, A., & Corman, L. (1974). Learning potential measurement with Spanish-speaking
youth as an alternative to IQ tests: A first report. Interamerican Journal of Psychology, 8, 233-246.Carman, C. A., & Taylor, D. K. (2010). Socioeconomic status effects on using the Naglieri Nonverbal
Ability Test (NNAT) to identify the gifted/talented. Gifted Child Quarterly, 54(2), 75.Carroll, J. B. (1993). Human cognitive abilities: A survey of factor-analytic studies. Cambridge, UK: Cambridge
University Press.Cattell, K. B., & Cattell, A. K. S. (1959). Culture fair intelligence test. Champaign, IL: Institute for Personality
and Ability Testing.Corno, L., Cronbach, L. J., Kupermintz, H., Lohman, D. F., Mandinach, E. B., Porteus, A. W., & Talbert, J. E.
(2002). Remaking the concept of aptitude: Extending the legacy of Richard E. Snow. Hillsdale, NJ: Lawrence Erlbaum.
Cronbach, L. J. (1990). Essentials of psychological testing (5th ed.). New York, NY: HarperCollins.Degler, C. N. (1991). In search of human nature. New York, NY: Oxford University Press.Ericsson, K. A., Krampe, R. T., & Tesch-Römer, C. (1993). The role of deliberate practice in the acquisition
of expert performance. Psychological review, 100, 363-406.Flynn, J. R. (1999). Searching for justice: The discovery of IQ gains over time. American Psychologist,
54, 5-20.Frazier, T. W. & Youngstrom, E. A. (2007). Historical increase in the number of factors measured by
commercial tests of cognitive ability: Are we overfactoring? Intelligence, 35, 169-182.Gagné, F. (2009). Talent development as seen through the differentiated model of giftedness and talent. In
T. Balchin, B. Hymer, & D. J. Matthews (Eds), The Routledge international companion to gifted educa-tion (pp. 32-41). New York, NY: Routledge/Taylor & Francis.
at PENNSYLVANIA STATE UNIV on May 8, 2016jpa.sagepub.comDownloaded from
Lohman and Gambrell 19
Hammill, D. D., Pearson, N. A., & Wiederholt, J. L. (1997). Examiners manual: Comprehensive test of nonverbal intelligence. Austin, TX: Pro-Ed.
Hessels, M. G. P., & Hamers, J. H. M. (1993). A Learning potential test for ethnic minorities. In J. H. M. Hamers, K. Sijtsma & A. J. J. M. Ruijssenaars (Eds.), Learning potential assessment: Theoretical, methodological and practical issues (pp. 285-311). Lisse, Netherlands: Swets & Zeitlinger.
Horn, J., & Masunaga, H. (2006). A merging theory of expertise and intelligence. In K. A. Ericsson, N. Charness, P. J. Feltovich, & R. R. Hoffman (Eds.), The Cambridge handbook of expertise and expert performance (pp. 587-612). New York, NY: Cambridge University Press.
IBM SPSS Statistics. (2010). SPSS 19, Release Version 19.0.0 [Computer software]. New York: Interna-tional Business Machines Corp. Armonk
Itard, J. M. G. (1962). The wild boy of Aveyron. (G. Humphrey & M. Humphrey, Trans.). New York, NY: Appleton-Century-Crofts. (Original works published 1801 and 1806)
Jensen, A. R. (1980). Bias in mental testing. New York, NY: Free Press.Kaufman, A. S. (1994). “Practice effects.” In R. J. Sternberg (Ed.), Encyclopedia of human intelligence:
Vol. 2 (pp. 828-833). New York, NY: Macmillan.Kaufman, S. B., & Sternberg, R. J. (2007). Giftedness in Euro-American culture. In S. N. Phillipson &
M. McCann (Eds.), Conceptions of giftedness: Socio-cultural perspectives. Mahwah, NJ: Lawrence Erlbaum.
Lohman, D. F. (2003). The Woodcock-Johnson III and the Cognitive Abilities Test (Form 6): A concur-rent validity study. Retrieved from http://faculty.education.uiowa.edu/dlohman/pdf/CogAT_WJIII_final_2col%202r.pdf
Lohman, D. F. (2005a). An aptitude perspective on talent identification: Implications for the identification of academically gifted minority students. Journal for the Education of the Gifted, 28, 333-359.
Lohman, D. F. (2005b). The role of nonverbal ability tests in identifying academically gifted students: An aptitude perspective. Gifted Child Quarterly, 49, 111-138.
Lohman, D. F. (2009). Identifying academically talented students: Some general principles, two specific procedures. In L. Shavinina (Ed.), Handbook of giftedness (pp. 971-998). Amsterdam, Netherlands: Elsevier.
Lohman, D. F. (2011). Cognitive Abilities Test (Form 7). Rolling Meadows, IL: Riverside.Lohman, D. F. (2012a). Nontraditional uses of traditional measures. In C. M. Callahan & H. Hertberg-Davis
(Eds.), Fundamentals of gifted education. NY: Taylor & Francis/Routledge.Lohman, D. L. (2012b). Decision strategies. In S. L. Hunsaker (Ed.), Identification: The theory and prac-
tice of identifying students for gifted and talented education services (pp. 217-248). Mansfield Center, CT: Creative Learning Press.
Lohman, D. L., & Foley Nicpon, M. (2012). Ability testing and talent identification. In S. L. Hunsaker (Ed.), Identification: The theory and practice of identifying students for gifted and talented education services (pp. 283-335). Mansfield Center, CT: Creative Learning Press.
Lohman, D. F., Gambrell, J., & Lakin, J. (2008). The commonality of extreme discrepancies in the ability profiles of academically gifted students. Psychology Science Quarterly, 50, 269-282.
Lohman, D. F., & Hagen, E. P. (2002). Cognitive Abilities Test (Form 6): Research handbook. Itasca, IL: Riverside
Lohman, D. F., Korb, K., & Lakin, J. (2008). Identifying academically gifted English language learners using nonverbal tests: A comparison of the Raven, NNAT, and CogAT. Gifted Child Quarterly, 52, 275-296. (Research Paper of the Year Award from the National Association of Gifted Children)
McCallum, R. S., Bracken, B. A., & Wasserman, J. D. (2001). Essentials of nonverbal assessment. John Wiley.
Naglieri, J. A. (1997). Naglieri Nonverbal Ability Test: Multilevel technical manual. San Antonio, TX: Harcourt Brace.
at PENNSYLVANIA STATE UNIV on May 8, 2016jpa.sagepub.comDownloaded from
20 Journal of Psychoeducational Assessment XX(X)
Naglieri, J. A. (2007). Traditional IQ: 100 years of misconception and its relationship to minority repre-sentation in gifted programs. In J. VanTassel-Baska (Ed.), Alternative assessments for identifying gifted and talented students (pp. 67-88). Waco, TX: Prufrock Press.
Naglieri, J. A. (2008). Naglieri Nonverbal Ability Test (2nd ed.). San Antonio, TX: Pearson.Naglieri, J. A., & Ford, D. Y. (2003). Addressing underrepresentation of gifted minority children using the
Naglieri Nonverbal Ability Test (NNAT). Gifted Child Quarterly, 47, 155-160.National Association for Gifted Children. (2008, January). Use of the WISC-IV for gifted identification.
Retrieved from http://www.nagc.org/uploadedFiles/WISC%20IV%20Position%20Paper.pdfOtis, A. S., & Lennon, R. T. (1997). Otis-Lennon School Ability Test (OLSAT) technical manual. San Antonio,
TX: Harcourt Brace Educational Measurement.Prifitera, A., Saklofske, D. H., Weiss, L. G., & Rolfhus, E. (2005). The WISC-IV in the Clinical Assessment
Context. In A. Prifitera, D. H. Saklofske, L. G. Weiss & E. Rolfhus (Eds.), WISC-4 Clinical use and interpretation (pp. 3-32). San Diego, CA: Elsevier Academic Press.
Raven, J. (1981). Manual for Raven’s progressive matrices and Mill Hill vocabulary scales. London, UK: H. K. Lewis.
Raven, J., Raven, J. C., & Court, J. H. (1998). Manual for Raven’s Progressive Matrices and Vocabulary Scales. Oxford, UK: Oxford Psychologists Press.
Renzulli, J. S. (2005). Equity, excellence, and economy in a system for identifying students in gifted education: A guidebook (RM05208). Storrs, CT: The National Research Center on the Gifted and Talented, University of Connecticut.
Rhodes, R. L., Ochoa, S. H., & Ortiz, S. O. (2005). Assessing culturally and linguistically diverse students: A practical guide. New York, NY: Guilford Press.
Roid, G. H. (2003). Stanford-Binet Intelligence Scales Fifth Edition, Technical Manual. Itasca, IL: Riverside.Roid, G. M., & Miller, L. J. (1997). Leiter International Performance Scale–Revised: Examiners manual.
Wood Dale, IL: Stoelting.Sattler, J. M. (2008). Assessment of children: Cognitive foundations (5th ed.). San Diego, CA: Author.Scarr, S. (1994). Culture-fair and culture-free tests. In R. J. Sternberg (Ed.), Encyclopedia of human
intelligence (pp. 322-328). New York, NY: Macmillan.Starkey, P. (1992). The early development of numerical reasoning. Cognition, 43(2), 93-126. doi:10.1016/
0010-0277(92)90034-FThorndike, R. L. (1975). Mr. Binet’s test 70 years later. Educational Researcher, 4(5), 3-7.Thorndike, R. L., & Hagen, E. (1982). Cognitive Abilities Test (Form 3): Technical manual. Chicago, IL:
Riverside.Thorndike, R. L., & Hagen, E. P. (1994). Cognitive Abilities Test (Form 5): Interpretive guide for teachers
and counselors. Itasca, IL: Riverside.Wechsler, D. (2004). WISC-IV Spanish. San Antonio, TX: Pearson.Weiss, L. G., Saklofske, D. H., Prifitera, A., & Holdnack, J. A. (Eds.). (2006). Wechsler Intelligence Scale
for Children-4 advanced clinical interpretation. Burlington, MA: Academic Press.Woodcock, R. W., McGrew, K. S., & Mather, N. (2001). Woodcock-Johnson III Tests of Cognitive Abilities.
Itasca, IL: Riverside.
at PENNSYLVANIA STATE UNIV on May 8, 2016jpa.sagepub.comDownloaded from