
Retinol Dehydrogenase (RDH12) Protects Photoreceptors from Light-induced Degeneration in Mice
Upload
independentCategory
view
4download
0
The Euryhaline Yeast Debaryomyces hansenii has Two CatalaseGenes Encoding Enzymes with Differential Activity Profile
Claudia Segal-Kischinevzky • Beatriz Rodarte-Murguıa •
Victor Valdes-Lopez • Guillermo Mendoza-Hernandez •
Alicia Gonzalez • Luisa Alba-Lois
Received: 6 May 2010 / Accepted: 21 October 2010 / Published online: 9 November 2010
� Springer Science+Business Media, LLC 2010
Abstract Debaryomyces hansenii is a spoilage yeast able
to grow in a variety of ecological niches, from seawater to
dairy products. Results presented in this article show that
(i) D. hansenii has an inherent resistance to H2O2 which
could be attributed to the fact that this yeast has a basal
catalase activity which is several-fold higher than that
observed in Saccharomyces cerevisiae under the same
culture conditions, (ii) D. hansenii has two genes (DhCTA1
and DhCTT1) encoding two catalase isozymes with a dif-
ferential enzymatic activity profile which is not strictly
correlated with a differential expression profile of the
encoding genes.
Introduction
All aerobically growing organisms are subjected to oxi-
dative stress which is caused by exposure to partially
reduced forms of molecular oxygen, known as reactive
oxygen species (ROS). These are highly reactive molecules
that can damage cellular constituents such as DNA, lipids,
and proteins. Exposure to ROS is a consequence of the
aerobic life; organisms have evolved mechanisms to pro-
tect their components against ROS. Oxidant defense sys-
tems have been widely studied [3, 18, 40], and it has been
found that after exposure to oxidative stress cells elicit a
number of inducible adaptive responses which result in
protection from oxidants, such as H2O2, superoxide anion,
and lipid peroxidation products. The oxidative stress
responses appear to be regulated, at least in part, at the
transcriptional level and there is a considerable overlap
between those induced by oxidative stress and those pro-
voked by other stressful conditions, allowing the cell to
integrate a combined response when cells are simulta-
neously affected by various environmental insults [20, 43,
48]. Yeasts can proliferate in the presence of many dis-
turbances in its growth media, and can withstand the
presence of stressors in different ways. In order to cope
with the ROS that are generated during respiration when
O2 is incompletely reduced and during fatty acid metabo-
lism in the peroxisome [24, 40, 45], Saccharomyces cere-
visiae displays an enzymatic and a non-enzymatic
response. The enzymatic adaptation is carried out through
the concerted action of superoxide dismutase and catalase
proteins, which degrade ROS up to oxygen and water [5,
44]. It has been shown that when S. cerevisiae is cultured in
rich media (YP) containing ethanol as a carbon source,
catalase total activity is 12-fold higher than when grown in
the presence of glucose (88.1 ± 21.7 and 7.27 ± 1.69,
respectively) [23].
Saccharomyces cerevisiae has two catalases. CTA1-
encoded catalase A that is confined to peroxisomes which
is involved in the degradation of the ROS generated
during fatty acid degradation [52], and the CTT-encoded
catalase T, which is a cytoplasmic enzyme, that contends
with the H2O2 that reaches the cytoplasm [38, 42]. It has
C. Segal-Kischinevzky � B. Rodarte-Murguıa �V. Valdes-Lopez � L. Alba-Lois (&)
Biologıa Celular, Facultad de Ciencias, Universidad Nacional
Autonoma de Mexico, UNAM, Mexico, Mexico
e-mail: [email protected]
C. Segal-Kischinevzky
e-mail: [email protected]
G. Mendoza-Hernandez
Bioquımica, Facultad de Medicina, UNAM, Mexico, Mexico
A. Gonzalez
Departamento de Bioquımica y Biologıa Estructural, Instituto de
Fisiologıa Celular, UNAM, Mexico, Mexico
123
Curr Microbiol (2011) 62:933–943
DOI 10.1007/s00284-010-9806-z
been reported [16] that only the double null mutant
devoid of Cta1 and Ctt1 is sensitive to oxidative stress,
while single mutants show no stress-related phenotype,
indicating that these activities are at least partially
redundant.
Although S. cerevisiae has been considered to be
the best known and studied eukaryotic organism, the
sequencing of a large number of yeasts has put forward the
possibility that other biological models could provide
important information which could result in biotechno-
logical applications which cannot be derived from studies
with the budding yeast. For many organisms the exposure
to high environmental osmolarity leads to dehydratation of
cells and decreased viability. To overcome this, some cells
have developed mechanisms to adapt the critical osmotic
changes in their environments. Osmoregulation is a com-
plex cellular response and many efforts have been made to
understand the molecular mechanism of this phenomenon
[5, 19, 47]. In Debaryomyces hansenii it has been shown
that glycerol and arabinitol are the main osmolytes
involved in salt resistance response [46]. D. hansenii is a
halotolerant yeast, whose response to oxidative stress has
been recently started to be analyzed [26]. Considering that,
it has developed mechanisms to withstand hyperosmotic
environments; the study of this yeast’s response to oxida-
tive stress could put forward the existence of novel
mechanisms that might simultaneously provide resistance
to both osmotic and oxidative stress. D. hansenii is found
as contaminant of brine food that displays the capacity to
grow in media containing a wide range of salt concentra-
tions, including seawater, from where it was first isolated
[29]. It is also found on meat, wine, hams, dairy products,
fruits, and soil. It could thus be considered that D. hansenii
has evolved protection systems promoting a general
adaptation to various stresses, which are not present in
stress-sensitive organisms like S. cerevisiae, which is able
to transiently respond to stress but not adapted to the
continuous presence of high osmolyte concentration
[4, 36].
Results presented in this article show that D. hansenii
has two catalase-encoding genes (DhCTA1 and DhCTT1),
that DhCta1 activity is selectively increased when the yeast
is grown on YPEthanol (YPE), while DhCtt1 activity is
only observed during stationary phase. Expression analysis
showed that DhCTT1 and DhCTA1 are both expressed
under fermentative conditions while DhCTA1 is most
abundant under respiratory metabolism, and that NaCl
regulates expression of both genes under different cir-
cumstances which not correlate with the salt-dependent
modulation of catalase activity, revealing a potentially dual
role for this metabolite. DhCta1 purification showed that
this enzyme displays kinetic behavior similar to that of
catalases purified from other microorganisms [9, 22, 25].
Materials and Methods
Strains and Growth Conditions
Debaryomyces hansenii Y7426 (kind gift of A. Pena from
IFC, UNAM) and S. cerevisiae S288C wild-type strains
were used throughout this study. Cells were routinely grown
in rich media containing 1% yeast extract, 2% peptone, and
2% glucose (YPD) or 2% ethanol (YPE) when specified.
Growth was monitored by measuring optical density at
600 nm. S. cerevisiae was routinely pre-grown overnight on
YPD and D. hansenii on YPD plus 0.6 M sodium chloride
(NaCl) at 30�C with shaking (180 rpm). Both strains were
inoculated at 0.05 OD600nm in the specified growth media.
Solid media were prepared by the addition of 2% agar. In
this study, exponential growth phase was considered to be
that when cultures reached an OD600nm & of 1.0 (around
10 h for S. cerevisiae and 25 h for D. hansenii). Stationary
phase was defined as the growth reached after 72 h of
continuous culture on rich media.
Preparation of Cell-Free Extracts and Catalase
Determinations
Cells were collected by centrifugation from the pertinent
cultures, washed in sterile deionized water and resuspended
in 0.05 M sodium phosphate buffer, pH 7.0 [6]. Cells were
grinded by vortexing with glass beads and the suspension
was centrifuged for 10 min at 13,000g at 4�C. The extract
was kept on ice and assayed for enzyme activity, a repre-
sentative sample was used for PAGE and zymograms, and
the rest of the crude extract was used for enzyme purification.
H2O2 Sensitivity Assays
To test cell viability after an oxidative shock with H2O2
[8], culture tubes containing YPD media with and without
0.6 M NaCl were supplemented with 0–30 mM hydrogen
peroxide concentrations, and inoculated at an OD600nm =
0.5 with yeast cells (S. cerevisiae and D. hansenii)
collected from the exponential or stationary growth phases.
The inoculated tubes were cultured for 180 min in the
presence of H2O2 at 30�C with shaking. After the oxidative
treatment, H2O2 was removed by centrifugation, cells were
suspended in distilled H2O, the OD was adjusted to an
OD600nm of 0.5, and the cultures were then serially diluted.
Each dilution was spotted into YPD plates, and the plates
were incubated at 30�C for 5 days.
RNA Isolation and Northern Blotting
The RNA extraction was performed using aurintricarb-
oxylic acid (ATA) as nucleases inhibitor [13]. D. hansenii
934 C. Segal-Kischinevzky et al.: The Euryhaline Yeast Debaryomyces hansenii
123
cells precultured in YPD-0.6 M NaCl were inoculated at
OD600nm = 0.05 in YPD, YPE and YPE-0.6 M NaCl. The
cultures were incubated at 30�C with shaking and yeasts
were grown until they reached either exponential or sta-
tionary growth phases. 15 ml of cells was treated with
300 ll of chilled 1.0 M sodium azide (NaN3) and gently
mixed. Samples were centrifuged for 7 min at 3,000 rpm.
Pellets were resuspended in 1 ml of 20 mM NaN3 and
transferred to a microcentrifuge tube, quickly spinned and
decanted. Cells were resuspended in 100 ll of 20 mM
NaN3 and 200 ll of phenol, pH 8.0, 100 ll of ATA lysis
buffer [1% SDS, 2 mM ATA, 0.59 LET and 0.5 mg/ll
dithiothreitol (DTT), all in H2O–DEPC treated] and 0.3 g of
acid clean and sterilized glass beads were added (59 LET
buffer is 50 mM LiCl, 100 mM DTT in 0.5 M Tris buffer,
pH 7.4). Samples were vigorously vortexed for 3 min,
200 ll LET 19 added, mixed, and centrifuged for 15 min at
13,000g. RNAs were precipitated by adding absolute eth-
anol to the supernatant and freezed for at least 1 hour,
washed with 70% ethanol with H2O–DEPC treated and the
pellet were resuspended in 1 mM ATA. RNA was separated
in a 1.5% agarose, 7% formaldehyde gel, transferred to a
nylon membrane, washed, and fixed. Membrane was pre-
hybridized for 2 h at 65�C in 7% SDS and 0.5 M Na2P04,
pH 7.2. Radiolabeled probes were prepared by random
primer labeling with a-32P-dCTP. Hybridization was per-
formed at 65�C in 7% SDS and 0.5 M Na2P04, pH 7.2. The
blot was washed twice in 29 SSC (19 SSC is 0.15 M NaCl
and 0.015 M sodium citrate) containing 1% SDS for 30 min
each and twice in 0.29 SSC and 1% SDS for 30 min each at
65�C. Filters were sequentially hybridized with the different
probes for 18 h, followed by washing with 29 SSC con-
taining 0.1% SDS at 65�C for 30 min. Signal was quantified
using Typhoon 840 and ImageQuant TL.
Catalase Activity
Catalase activity was determined by a method adapted
from Aebi [1]. Briefly, a sample (1–50 ll) of the crude
extract or purified enzyme was transferred into 3 ml quartz
cuvettes and mixed with 2.9 ml assay mixture (100 mM
sodium phosphate buffer, pH 7.0 and Triton X 100 1 ll/
100 ml). The reaction was triggered by addition of 100 ll
of 500 mM hydrogen peroxide to the cuvette (final con-
centration of 16.6 mM), shaking vigorously. The cuvette
was placed in the spectrophotometer cell holder and cata-
lase activity was followed by A240nm decay for 3 min.
Catalase activity was calculated based on the rate of
decomposition of hydrogen peroxide, which is proportional
to the reduction of the absorbance at 240 nm. Catalase
activities of the extracts were normalized to total protein in
the lysate or sample and expressed as units per mg of
protein: Specific activity = m min/e/mg of protein;
m min = average minute slope during 3 min reaction;
e = molar extinction coefficient = 0.0394 M/cm [28].
Catalase activity was also determined by an alternative
method measuring the initial rate of dioxygen production
with a Clark microelectrode [37]. Reaction was started by
injecting crude extract or a purified catalase, usually 5 ll or
less, into a sealed chamber filled with 2 ml of 10 mM H2O2
in 10 mM phosphate buffer, pH 7.8. Units were defined as
micromoles of O2 produced per min per mg of protein
under these conditions.
Catalase Purification
Catalase was purified from 3 l of culture of D. hansenii
grown in YPE. Cells were harvested from stationary growth
phase cultures. Catalase purification was carried out using
the methods described by Aebi [1] and Trindade et al. [49].
Briefly, the crude extract was subjected to ammonium sul-
fate (NH2SO4) precipitation, keeping the 40–70% satura-
tion fraction in which activity was detected, for further
purification. This fraction was dialyzed against 50 mM
sodium phosphate buffer, pH 7.0 and subjected to hydro-
phobic interaction chromatography (HIC) on a phenyl–
sepharose CL-4B column, using 1.7 M NH2SO4–50 mM
sodium phosphate buffer to bind catalases to the column.
The column was washed using a 1.7–0 M NH2SO4 gradient,
and then eluted with 50 mM sodium phosphate buffer, pH
7.0, followed by spectrometric measurements at A280nm of
the eluted samples to detect the protein as it emerges from
the column. Catalase activity was determined in selected
samples. Fractions with activity were pooled and concen-
trated by polyethylene glycol to *0.2 mg/ml of protein and
kept it at 4�C until further use.
Electrophoresis and Stain Activity
Non-denaturing or SDS polyacrylamide gel electrophoresis
was performed on 7.5% slab gels, running slowly at 12 V
for 24 h. Proteins in polyacrylamide gels were visualized
with Coomassie blue. To stain for catalase activity, the
non-denaturing gel was rinsed twice with tap water, incu-
bated in 100 mM H2O2 solution for 10 min, rinsed again
with tap water and soaked in 1:1 iron (III) chloride:
potassium ferricyanide solution until the gel was stained.
Blue color developed in the gel except at zones where
H2O2 was decomposed by catalase [50].
Kinetic Determinations and Effect of Inhibitors
To measure the catalytic parameters of the enzyme, 1 lg of
pure one was mixed with 2.9 ml of 50 mM phosphate
buffer; the reaction was triggered by the addition of dif-
ferent H2O2 concentrations (0–100 mM) [33]. Catalase
C. Segal-Kischinevzky et al.: The Euryhaline Yeast Debaryomyces hansenii 935
123
activity was determined spectrophotometrically measuring
the rate of hydrogen peroxide degradation at 240 nm. The
initial linear rate was used to calculate the specific activity.
Optimum pH was determined in 50 mM potassium
phosphate buffer (pH 4.0–8.5). Kinetic constants, includ-
ing Vmax and KM apparent values, were determined by
Lineweaver–Burk and Eadie Hofstee plot graphs.
The inhibitory effects of various concentrations of NaCl,
3-amino-1,2,4-triazole (3-AT) [14, 25], NaN3, and ethanol
[17, 35] on catalase activity at constant enzyme concen-
trations, were estimated at pH 7.0, using a H2O2 fixed
concentration as a substrate. The enzyme was incubated for
5 min in the presence of the inhibitor; the reaction was
triggered by the addition of 16.6 mM H2O2, and followed
spectrophotometrically.
Protein Determinations
Protein was quantified using the Quick Start Bradford
Protein Assay from Bio-RAD, which is based on the
absorbance at 595 nm of the complex between Coomassie
Brilliant Blue G-250 and protein. Bovine serum albumin
was used as standard.
Tandem Mass Spectrometry (Lc/Esi–Ms/Ms)
The protein band obtained after the purification was
excised from Coomassie stained SDS gel, distained,
reduced, carbamidomethylated, washed, digested with
modified porcine trypsin, and extracted as previously
described [51]. Peptide mass spectrometric analysis was
carried out using a 3,200 Q TRAP hybrid tandem mass
spectrometer, equipped with a nanoelectrospray ion source
(NanoSpray II) and a MicroIonSpray II head. The instru-
ment was coupled on line to a nanoAcquity Ultra Perfor-
mance LC system. Spectra were acquired in automated
mode using Information Dependent Acquisition (IDA).
Precursor ions were selected in Q1 using the enhanced MS
mode (EMS) as survey scans. The EMS was followed by
an enhanced resolution scan (ER) of the three most intense
ions at the low speed of 250 amu/sec, to determine the ion
charge state, and then by an enhanced product ion scan
(EPI). Precursor ions were fragmented by collision-acti-
vated dissociation (CAD) in the Q2 collision cell. The
fragment ions generated were captured and mass analyzed
in the Q3 linear ion trap.
Protein identification was performed by searching MS/
MS spectra datasets using MASCOT (version 1.6b9,
available at http://www.matrixscience.com). Mass toler-
ances of 0.5 and 0.3 Da were used for precursor and
fragment ion masses, respectively. Carbamidomethyl–cys-
teine was the fixed modification and one missed cleavage
for trypsin was allowed. Search was conducted using the
Fungi subset of the NCBInr database (http://www.ncbi.
nih.gov).
Results
D. hansenii Displays a Higher H2O2 Tolerance than
S. cerevisiae
Debaryomyces hansenii has been described as a halotol-
erant yeast [7, 12, 39]. However, we have found that the
Y7426 D. hansenii strain is able to sustain a similar growth
rate in either rich (l = 0.231 h-1) or minimal (l =
0.154 h-1) growth media with or without 1.0 M NaCl [2],
in agreement with previous observations, which classify D.
hansenii as an euryhaline yeast [11, 46]. This characteristic
has allowed us to analyze certain aspects of the NaCl
response of this yeast using salt concentrations, which do
not affect growth rate, ruling out the possibility that the
observed response could be due to an effect of growth rate
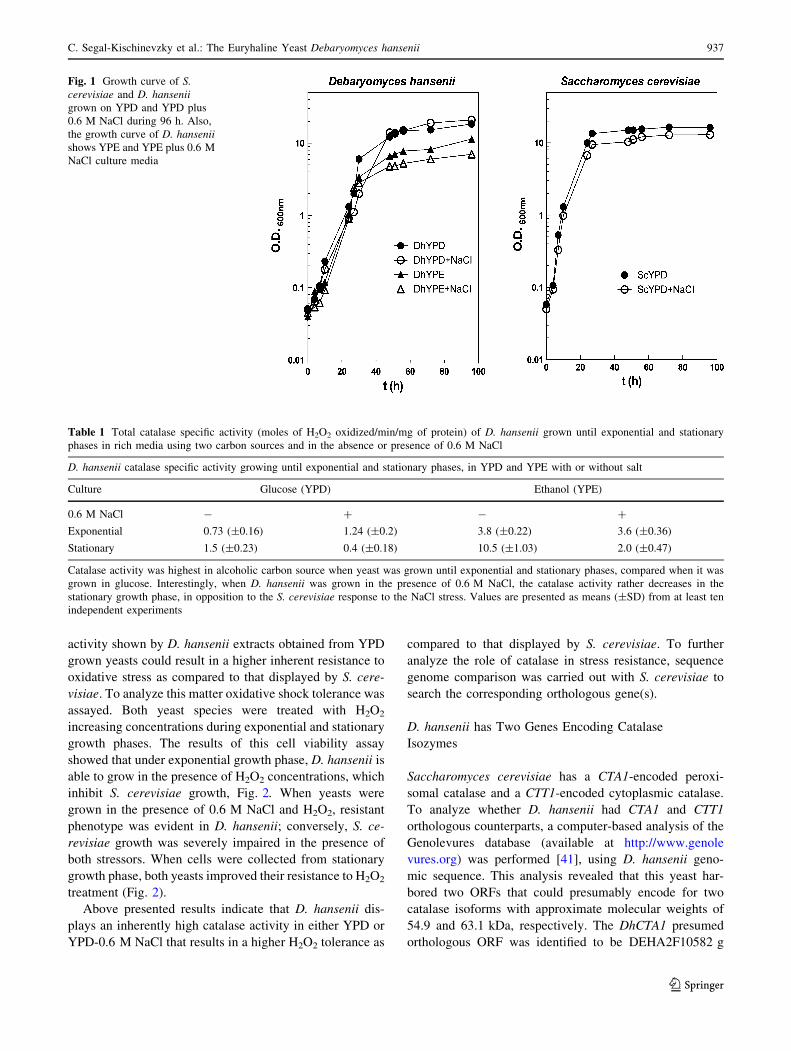
variation. As Fig. 1 shows S. cerevisiae growth pattern is
similar on either YPD or YPD plus 0.6 M NaCl, reaching
the stationary phase after 30 h of incubation. D. hansenii
shows a higher duplication rate as compared to that of S.
cerevisiae but a similar growth kinetics on YPD and YPE
in the presence and absence of 0.6 M NaCl, reaching sta-
tionary phase after 50 h.
It has been shown that in S. cerevisiae, catalase activity
is increased by NaCl induced stress and that D. hansenii
displays high superoxide dismutase activity under these
conditions [15], it could be thus considered that high
H2O2 production through SOD activity could exert a
positive effect on catalase activity or on the expression of
the encoding gene(s). To analyze this matter, we deter-
mined catalase activity in cultures of S. cerevisiae and
D. hansenii grown on rich YPD media without salt or in
the presence of 0.6 M NaCl. Extracts obtained from
S. cerevisiae cultures grown in the presence of salt, dis-
played a fivefold increased catalase activity as compared
to that obtained in extracts from NaCl-free culture con-
ditions (0.03 ± 0.009) versus 0.152 (±0.021). In extracts
prepared from D. hansenii cultures, catalase activity dis-
played nearly a two-fold increase when it was determined
from salt-grown cultures as compared to that found in
the absence of salt (Table 1). In addition, D. hansenii
extracts, obtained from YPD cultures, showed 24-fold
higher catalase activity than those obtained from S. cerevisiae
(0.03 ± 0.009 vs. 0.73 ± 0.16); accordingly, D. hansenii
extracts obtained from cells grown on YPD–NaCl showed
eightfold higher activity than those of S. cerevisiae grown
on same media (0.152 ± 0.021 vs. 1.24 ± 0.02). It could
be thus considered that the higher basal level of catalase
936 C. Segal-Kischinevzky et al.: The Euryhaline Yeast Debaryomyces hansenii
123
activity shown by D. hansenii extracts obtained from YPD
grown yeasts could result in a higher inherent resistance to
oxidative stress as compared to that displayed by S. cere-
visiae. To analyze this matter oxidative shock tolerance was
assayed. Both yeast species were treated with H2O2
increasing concentrations during exponential and stationary
growth phases. The results of this cell viability assay
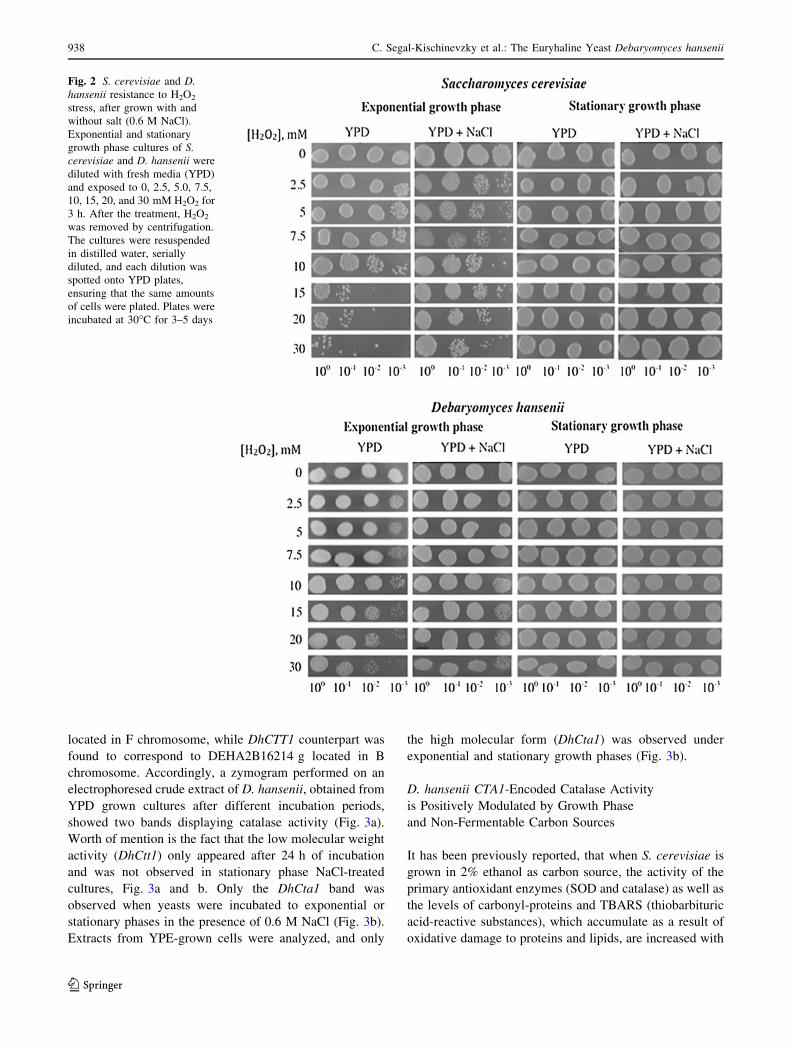
showed that under exponential growth phase, D. hansenii is
able to grow in the presence of H2O2 concentrations, which
inhibit S. cerevisiae growth, Fig. 2. When yeasts were
grown in the presence of 0.6 M NaCl and H2O2, resistant
phenotype was evident in D. hansenii; conversely, S. ce-
revisiae growth was severely impaired in the presence of
both stressors. When cells were collected from stationary
growth phase, both yeasts improved their resistance to H2O2
treatment (Fig. 2).
Above presented results indicate that D. hansenii dis-
plays an inherently high catalase activity in either YPD or
YPD-0.6 M NaCl that results in a higher H2O2 tolerance as
compared to that displayed by S. cerevisiae. To further
analyze the role of catalase in stress resistance, sequence
genome comparison was carried out with S. cerevisiae to
search the corresponding orthologous gene(s).
D. hansenii has Two Genes Encoding Catalase
Isozymes
Saccharomyces cerevisiae has a CTA1-encoded peroxi-
somal catalase and a CTT1-encoded cytoplasmic catalase.
To analyze whether D. hansenii had CTA1 and CTT1
orthologous counterparts, a computer-based analysis of the
Genolevures database (available at http://www.genole
vures.org) was performed [41], using D. hansenii geno-
mic sequence. This analysis revealed that this yeast har-
bored two ORFs that could presumably encode for two
catalase isoforms with approximate molecular weights of
54.9 and 63.1 kDa, respectively. The DhCTA1 presumed
orthologous ORF was identified to be DEHA2F10582 g
Fig. 1 Growth curve of S.cerevisiae and D. hanseniigrown on YPD and YPD plus
0.6 M NaCl during 96 h. Also,
the growth curve of D. hanseniishows YPE and YPE plus 0.6 M
NaCl culture media
Table 1 Total catalase specific activity (moles of H2O2 oxidized/min/mg of protein) of D. hansenii grown until exponential and stationary
phases in rich media using two carbon sources and in the absence or presence of 0.6 M NaCl
D. hansenii catalase specific activity growing until exponential and stationary phases, in YPD and YPE with or without salt
Culture Glucose (YPD) Ethanol (YPE)
0.6 M NaCl - ? - ?
Exponential 0.73 (±0.16) 1.24 (±0.2) 3.8 (±0.22) 3.6 (±0.36)
Stationary 1.5 (±0.23) 0.4 (±0.18) 10.5 (±1.03) 2.0 (±0.47)
Catalase activity was highest in alcoholic carbon source when yeast was grown until exponential and stationary phases, compared when it was
grown in glucose. Interestingly, when D. hansenii was grown in the presence of 0.6 M NaCl, the catalase activity rather decreases in the
stationary growth phase, in opposition to the S. cerevisiae response to the NaCl stress. Values are presented as means (±SD) from at least ten
independent experiments
C. Segal-Kischinevzky et al.: The Euryhaline Yeast Debaryomyces hansenii 937
123
located in F chromosome, while DhCTT1 counterpart was
found to correspond to DEHA2B16214 g located in B
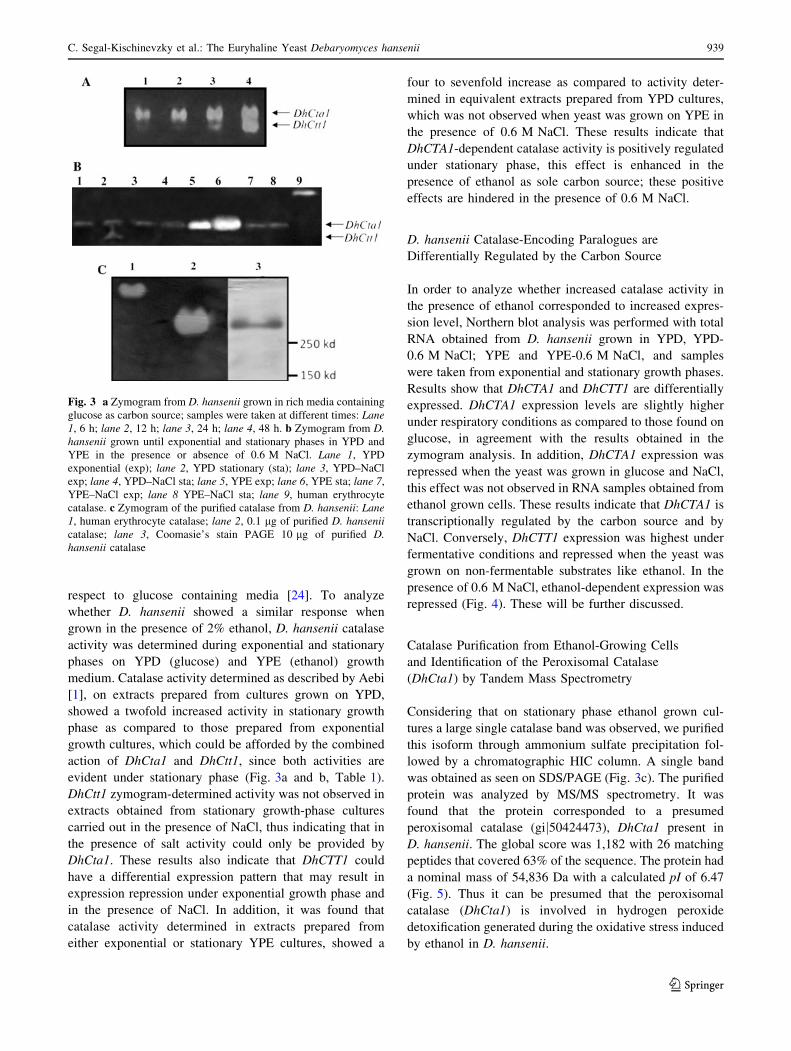
chromosome. Accordingly, a zymogram performed on an
electrophoresed crude extract of D. hansenii, obtained from
YPD grown cultures after different incubation periods,
showed two bands displaying catalase activity (Fig. 3a).
Worth of mention is the fact that the low molecular weight
activity (DhCtt1) only appeared after 24 h of incubation
and was not observed in stationary phase NaCl-treated
cultures, Fig. 3a and b. Only the DhCta1 band was
observed when yeasts were incubated to exponential or
stationary phases in the presence of 0.6 M NaCl (Fig. 3b).
Extracts from YPE-grown cells were analyzed, and only
the high molecular form (DhCta1) was observed under
exponential and stationary growth phases (Fig. 3b).
D. hansenii CTA1-Encoded Catalase Activity
is Positively Modulated by Growth Phase
and Non-Fermentable Carbon Sources
It has been previously reported, that when S. cerevisiae is
grown in 2% ethanol as carbon source, the activity of the
primary antioxidant enzymes (SOD and catalase) as well as
the levels of carbonyl-proteins and TBARS (thiobarbituric
acid-reactive substances), which accumulate as a result of
oxidative damage to proteins and lipids, are increased with
Fig. 2 S. cerevisiae and D.hansenii resistance to H2O2
stress, after grown with and
without salt (0.6 M NaCl).
Exponential and stationary
growth phase cultures of S.cerevisiae and D. hansenii were
diluted with fresh media (YPD)
and exposed to 0, 2.5, 5.0, 7.5,
10, 15, 20, and 30 mM H2O2 for
3 h. After the treatment, H2O2
was removed by centrifugation.
The cultures were resuspended
in distilled water, serially
diluted, and each dilution was
spotted onto YPD plates,
ensuring that the same amounts
of cells were plated. Plates were
incubated at 30�C for 3–5 days
938 C. Segal-Kischinevzky et al.: The Euryhaline Yeast Debaryomyces hansenii
123
respect to glucose containing media [24]. To analyze
whether D. hansenii showed a similar response when
grown in the presence of 2% ethanol, D. hansenii catalase
activity was determined during exponential and stationary
phases on YPD (glucose) and YPE (ethanol) growth
medium. Catalase activity determined as described by Aebi
[1], on extracts prepared from cultures grown on YPD,
showed a twofold increased activity in stationary growth
phase as compared to those prepared from exponential
growth cultures, which could be afforded by the combined
action of DhCta1 and DhCtt1, since both activities are
evident under stationary phase (Fig. 3a and b, Table 1).
DhCtt1 zymogram-determined activity was not observed in
extracts obtained from stationary growth-phase cultures
carried out in the presence of NaCl, thus indicating that in
the presence of salt activity could only be provided by
DhCta1. These results also indicate that DhCTT1 could
have a differential expression pattern that may result in
expression repression under exponential growth phase and
in the presence of NaCl. In addition, it was found that
catalase activity determined in extracts prepared from
either exponential or stationary YPE cultures, showed a
four to sevenfold increase as compared to activity deter-
mined in equivalent extracts prepared from YPD cultures,
which was not observed when yeast was grown on YPE in
the presence of 0.6 M NaCl. These results indicate that
DhCTA1-dependent catalase activity is positively regulated
under stationary phase, this effect is enhanced in the
presence of ethanol as sole carbon source; these positive
effects are hindered in the presence of 0.6 M NaCl.
D. hansenii Catalase-Encoding Paralogues are
Differentially Regulated by the Carbon Source
In order to analyze whether increased catalase activity in
the presence of ethanol corresponded to increased expres-
sion level, Northern blot analysis was performed with total
RNA obtained from D. hansenii grown in YPD, YPD-
0.6 M NaCl; YPE and YPE-0.6 M NaCl, and samples
were taken from exponential and stationary growth phases.
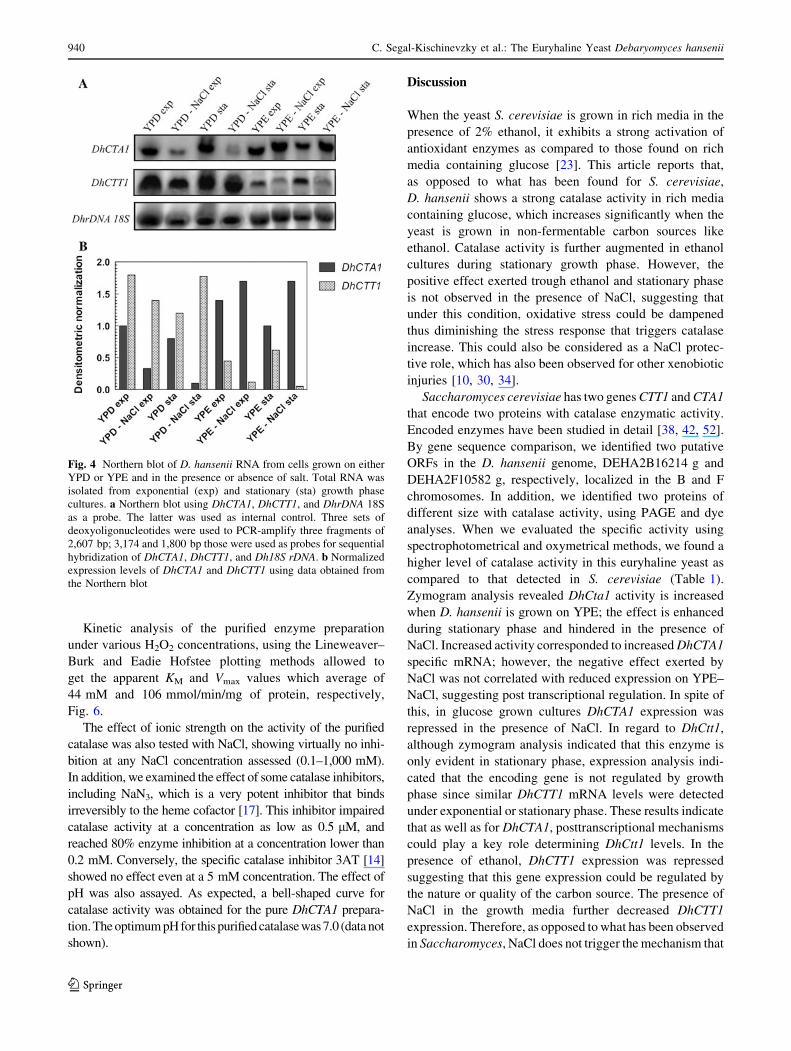
Results show that DhCTA1 and DhCTT1 are differentially
expressed. DhCTA1 expression levels are slightly higher
under respiratory conditions as compared to those found on
glucose, in agreement with the results obtained in the
zymogram analysis. In addition, DhCTA1 expression was
repressed when the yeast was grown in glucose and NaCl,
this effect was not observed in RNA samples obtained from
ethanol grown cells. These results indicate that DhCTA1 is
transcriptionally regulated by the carbon source and by
NaCl. Conversely, DhCTT1 expression was highest under
fermentative conditions and repressed when the yeast was
grown on non-fermentable substrates like ethanol. In the
presence of 0.6 M NaCl, ethanol-dependent expression was
repressed (Fig. 4). These will be further discussed.
Catalase Purification from Ethanol-Growing Cells
and Identification of the Peroxisomal Catalase
(DhCta1) by Tandem Mass Spectrometry
Considering that on stationary phase ethanol grown cul-
tures a large single catalase band was observed, we purified
this isoform through ammonium sulfate precipitation fol-
lowed by a chromatographic HIC column. A single band
was obtained as seen on SDS/PAGE (Fig. 3c). The purified
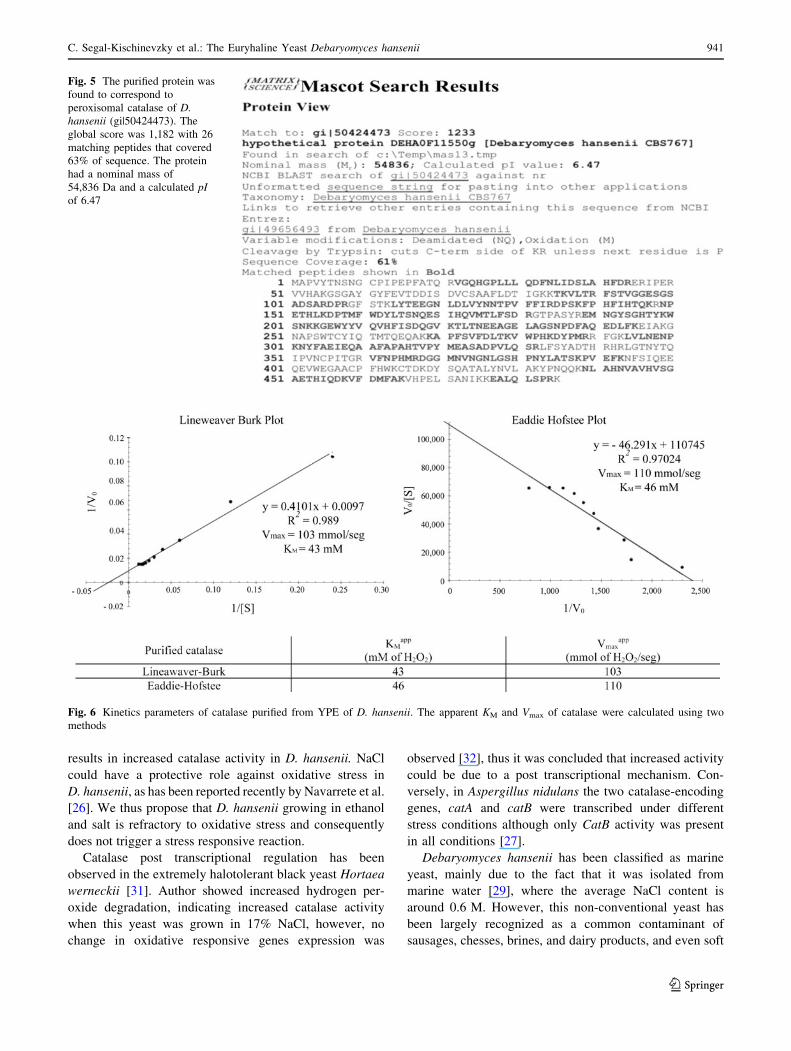
protein was analyzed by MS/MS spectrometry. It was
found that the protein corresponded to a presumed
peroxisomal catalase (gij50424473), DhCta1 present in
D. hansenii. The global score was 1,182 with 26 matching
peptides that covered 63% of the sequence. The protein had
a nominal mass of 54,836 Da with a calculated pI of 6.47
(Fig. 5). Thus it can be presumed that the peroxisomal
catalase (DhCta1) is involved in hydrogen peroxide
detoxification generated during the oxidative stress induced
by ethanol in D. hansenii.
Fig. 3 a Zymogram from D. hansenii grown in rich media containing
glucose as carbon source; samples were taken at different times: Lane1, 6 h; lane 2, 12 h; lane 3, 24 h; lane 4, 48 h. b Zymogram from D.hansenii grown until exponential and stationary phases in YPD and
YPE in the presence or absence of 0.6 M NaCl. Lane 1, YPD
exponential (exp); lane 2, YPD stationary (sta); lane 3, YPD–NaCl
exp; lane 4, YPD–NaCl sta; lane 5, YPE exp; lane 6, YPE sta; lane 7,
YPE–NaCl exp; lane 8 YPE–NaCl sta; lane 9, human erythrocyte
catalase. c Zymogram of the purified catalase from D. hansenii: Lane1, human erythrocyte catalase; lane 2, 0.1 lg of purified D. hanseniicatalase; lane 3, Coomasie’s stain PAGE 10 lg of purified D.hansenii catalase
C. Segal-Kischinevzky et al.: The Euryhaline Yeast Debaryomyces hansenii 939
123
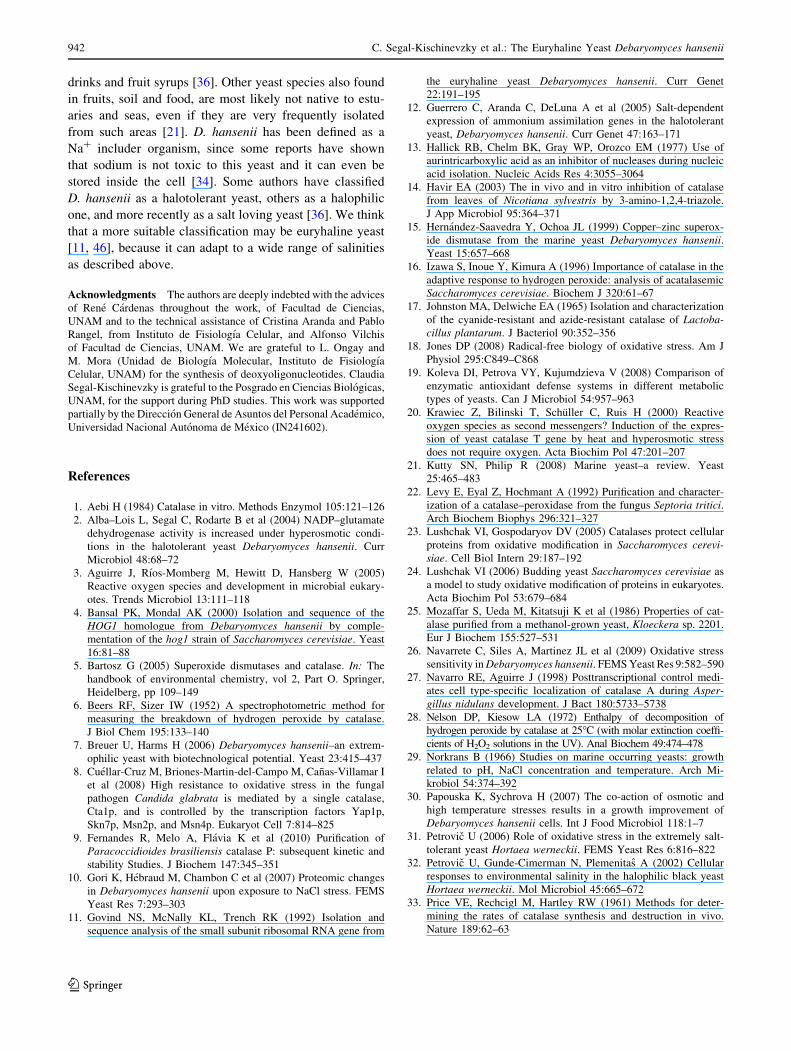
Kinetic analysis of the purified enzyme preparation
under various H2O2 concentrations, using the Lineweaver–
Burk and Eadie Hofstee plotting methods allowed to
get the apparent KM and Vmax values which average of
44 mM and 106 mmol/min/mg of protein, respectively,
Fig. 6.
The effect of ionic strength on the activity of the purified
catalase was also tested with NaCl, showing virtually no inhi-
bition at any NaCl concentration assessed (0.1–1,000 mM).
In addition, we examined the effect of some catalase inhibitors,
including NaN3, which is a very potent inhibitor that binds
irreversibly to the heme cofactor [17]. This inhibitor impaired
catalase activity at a concentration as low as 0.5 lM, and
reached 80% enzyme inhibition at a concentration lower than
0.2 mM. Conversely, the specific catalase inhibitor 3AT [14]
showed no effect even at a 5 mM concentration. The effect of
pH was also assayed. As expected, a bell-shaped curve for
catalase activity was obtained for the pure DhCTA1 prepara-
tion. The optimum pH for this purified catalase was 7.0 (data not
shown).
Discussion
When the yeast S. cerevisiae is grown in rich media in the
presence of 2% ethanol, it exhibits a strong activation of
antioxidant enzymes as compared to those found on rich
media containing glucose [23]. This article reports that,
as opposed to what has been found for S. cerevisiae,
D. hansenii shows a strong catalase activity in rich media
containing glucose, which increases significantly when the
yeast is grown in non-fermentable carbon sources like
ethanol. Catalase activity is further augmented in ethanol
cultures during stationary growth phase. However, the
positive effect exerted trough ethanol and stationary phase
is not observed in the presence of NaCl, suggesting that
under this condition, oxidative stress could be dampened
thus diminishing the stress response that triggers catalase
increase. This could also be considered as a NaCl protec-
tive role, which has also been observed for other xenobiotic
injuries [10, 30, 34].
Saccharomyces cerevisiae has two genes CTT1 and CTA1
that encode two proteins with catalase enzymatic activity.
Encoded enzymes have been studied in detail [38, 42, 52].
By gene sequence comparison, we identified two putative
ORFs in the D. hansenii genome, DEHA2B16214 g and
DEHA2F10582 g, respectively, localized in the B and F
chromosomes. In addition, we identified two proteins of
different size with catalase activity, using PAGE and dye
analyses. When we evaluated the specific activity using
spectrophotometrical and oxymetrical methods, we found a
higher level of catalase activity in this euryhaline yeast as
compared to that detected in S. cerevisiae (Table 1).
Zymogram analysis revealed DhCta1 activity is increased
when D. hansenii is grown on YPE; the effect is enhanced
during stationary phase and hindered in the presence of
NaCl. Increased activity corresponded to increased DhCTA1
specific mRNA; however, the negative effect exerted by
NaCl was not correlated with reduced expression on YPE–
NaCl, suggesting post transcriptional regulation. In spite of
this, in glucose grown cultures DhCTA1 expression was
repressed in the presence of NaCl. In regard to DhCtt1,
although zymogram analysis indicated that this enzyme is
only evident in stationary phase, expression analysis indi-
cated that the encoding gene is not regulated by growth
phase since similar DhCTT1 mRNA levels were detected
under exponential or stationary phase. These results indicate
that as well as for DhCTA1, posttranscriptional mechanisms
could play a key role determining DhCtt1 levels. In the
presence of ethanol, DhCTT1 expression was repressed
suggesting that this gene expression could be regulated by
the nature or quality of the carbon source. The presence of
NaCl in the growth media further decreased DhCTT1
expression. Therefore, as opposed to what has been observed
in Saccharomyces, NaCl does not trigger the mechanism that
Fig. 4 Northern blot of D. hansenii RNA from cells grown on either
YPD or YPE and in the presence or absence of salt. Total RNA was
isolated from exponential (exp) and stationary (sta) growth phase
cultures. a Northern blot using DhCTA1, DhCTT1, and DhrDNA 18S
as a probe. The latter was used as internal control. Three sets of
deoxyoligonucleotides were used to PCR-amplify three fragments of
2,607 bp; 3,174 and 1,800 bp those were used as probes for sequential
hybridization of DhCTA1, DhCTT1, and Dh18S rDNA. b Normalized
expression levels of DhCTA1 and DhCTT1 using data obtained from
the Northern blot
940 C. Segal-Kischinevzky et al.: The Euryhaline Yeast Debaryomyces hansenii
123
results in increased catalase activity in D. hansenii. NaCl
could have a protective role against oxidative stress in
D. hansenii, as has been reported recently by Navarrete et al.
[26]. We thus propose that D. hansenii growing in ethanol
and salt is refractory to oxidative stress and consequently
does not trigger a stress responsive reaction.
Catalase post transcriptional regulation has been
observed in the extremely halotolerant black yeast Hortaea
werneckii [31]. Author showed increased hydrogen per-
oxide degradation, indicating increased catalase activity
when this yeast was grown in 17% NaCl, however, no
change in oxidative responsive genes expression was
observed [32], thus it was concluded that increased activity
could be due to a post transcriptional mechanism. Con-
versely, in Aspergillus nidulans the two catalase-encoding
genes, catA and catB were transcribed under different
stress conditions although only CatB activity was present
in all conditions [27].
Debaryomyces hansenii has been classified as marine
yeast, mainly due to the fact that it was isolated from
marine water [29], where the average NaCl content is
around 0.6 M. However, this non-conventional yeast has
been largely recognized as a common contaminant of
sausages, chesses, brines, and dairy products, and even soft
Fig. 5 The purified protein was
found to correspond to
peroxisomal catalase of D.hansenii (gi|50424473). The
global score was 1,182 with 26
matching peptides that covered
63% of sequence. The protein
had a nominal mass of
54,836 Da and a calculated pIof 6.47
Fig. 6 Kinetics parameters of catalase purified from YPE of D. hansenii. The apparent KM and Vmax of catalase were calculated using two
methods
C. Segal-Kischinevzky et al.: The Euryhaline Yeast Debaryomyces hansenii 941
123
drinks and fruit syrups [36]. Other yeast species also found
in fruits, soil and food, are most likely not native to estu-
aries and seas, even if they are very frequently isolated
from such areas [21]. D. hansenii has been defined as a
Na? includer organism, since some reports have shown
that sodium is not toxic to this yeast and it can even be
stored inside the cell [34]. Some authors have classified
D. hansenii as a halotolerant yeast, others as a halophilic
one, and more recently as a salt loving yeast [36]. We think
that a more suitable classification may be euryhaline yeast
[11, 46], because it can adapt to a wide range of salinities
as described above.
Acknowledgments The authors are deeply indebted with the advices
of Rene Cardenas throughout the work, of Facultad de Ciencias,
UNAM and to the technical assistance of Cristina Aranda and Pablo
Rangel, from Instituto de Fisiologıa Celular, and Alfonso Vilchis
of Facultad de Ciencias, UNAM. We are grateful to L. Ongay and
M. Mora (Unidad de Biologıa Molecular, Instituto de Fisiologıa
Celular, UNAM) for the synthesis of deoxyoligonucleotides. Claudia
Segal-Kischinevzky is grateful to the Posgrado en Ciencias Biologicas,
UNAM, for the support during PhD studies. This work was supported
partially by the Direccion General de Asuntos del Personal Academico,
Universidad Nacional Autonoma de Mexico (IN241602).
References
1. Aebi H (1984) Catalase in vitro. Methods Enzymol 105:121–126
2. Alba–Lois L, Segal C, Rodarte B et al (2004) NADP–glutamate
dehydrogenase activity is increased under hyperosmotic condi-
tions in the halotolerant yeast Debaryomyces hansenii. Curr
Microbiol 48:68–72
3. Aguirre J, Rıos-Momberg M, Hewitt D, Hansberg W (2005)
Reactive oxygen species and development in microbial eukary-
otes. Trends Microbiol 13:111–118
4. Bansal PK, Mondal AK (2000) Isolation and sequence of the
HOG1 homologue from Debaryomyces hansenii by comple-
mentation of the hog1 strain of Saccharomyces cerevisiae. Yeast
16:81–88
5. Bartosz G (2005) Superoxide dismutases and catalase. In: The
handbook of environmental chemistry, vol 2, Part O. Springer,
Heidelberg, pp 109–149
6. Beers RF, Sizer IW (1952) A spectrophotometric method for
measuring the breakdown of hydrogen peroxide by catalase.
J Biol Chem 195:133–140
7. Breuer U, Harms H (2006) Debaryomyces hansenii–an extrem-
ophilic yeast with biotechnological potential. Yeast 23:415–437
8. Cuellar-Cruz M, Briones-Martin-del-Campo M, Canas-Villamar I
et al (2008) High resistance to oxidative stress in the fungal
pathogen Candida glabrata is mediated by a single catalase,
Cta1p, and is controlled by the transcription factors Yap1p,
Skn7p, Msn2p, and Msn4p. Eukaryot Cell 7:814–825
9. Fernandes R, Melo A, Flavia K et al (2010) Purification of
Paracoccidioides brasiliensis catalase P: subsequent kinetic and
stability Studies. J Biochem 147:345–351
10. Gori K, Hebraud M, Chambon C et al (2007) Proteomic changes
in Debaryomyces hansenii upon exposure to NaCl stress. FEMS
Yeast Res 7:293–303
11. Govind NS, McNally KL, Trench RK (1992) Isolation and
sequence analysis of the small subunit ribosomal RNA gene from
the euryhaline yeast Debaryomyces hansenii. Curr Genet
22:191–195
12. Guerrero C, Aranda C, DeLuna A et al (2005) Salt-dependent
expression of ammonium assimilation genes in the halotolerant
yeast, Debaryomyces hansenii. Curr Genet 47:163–171
13. Hallick RB, Chelm BK, Gray WP, Orozco EM (1977) Use of
aurintricarboxylic acid as an inhibitor of nucleases during nucleic
acid isolation. Nucleic Acids Res 4:3055–3064
14. Havir EA (2003) The in vivo and in vitro inhibition of catalase
from leaves of Nicotiana sylvestris by 3-amino-1,2,4-triazole.
J App Microbiol 95:364–371
15. Hernandez-Saavedra Y, Ochoa JL (1999) Copper–zinc superox-
ide dismutase from the marine yeast Debaryomyces hansenii.Yeast 15:657–668
16. Izawa S, Inoue Y, Kimura A (1996) Importance of catalase in the
adaptive response to hydrogen peroxide: analysis of acatalasemic
Saccharomyces cerevisiae. Biochem J 320:61–67
17. Johnston MA, Delwiche EA (1965) Isolation and characterization
of the cyanide-resistant and azide-resistant catalase of Lactoba-cillus plantarum. J Bacteriol 90:352–356
18. Jones DP (2008) Radical-free biology of oxidative stress. Am J
Physiol 295:C849–C868
19. Koleva DI, Petrova VY, Kujumdzieva V (2008) Comparison of
enzymatic antioxidant defense systems in different metabolic
types of yeasts. Can J Microbiol 54:957–963
20. Krawiec Z, Bilinski T, Schuller C, Ruis H (2000) Reactive
oxygen species as second messengers? Induction of the expres-sion of yeast catalase T gene by heat and hyperosmotic stress
does not require oxygen. Acta Biochim Pol 47:201–207
21. Kutty SN, Philip R (2008) Marine yeast–a review. Yeast
25:465–483
22. Levy E, Eyal Z, Hochmant A (1992) Purification and character-
ization of a catalase–peroxidase from the fungus Septoria tritici.Arch Biochem Biophys 296:321–327
23. Lushchak VI, Gospodaryov DV (2005) Catalases protect cellular
proteins from oxidative modification in Saccharomyces cerevi-siae. Cell Biol Intern 29:187–192
24. Lushchak VI (2006) Budding yeast Saccharomyces cerevisiae as
a model to study oxidative modification of proteins in eukaryotes.
Acta Biochim Pol 53:679–684
25. Mozaffar S, Ueda M, Kitatsuji K et al (1986) Properties of cat-
alase purified from a methanol-grown yeast, Kloeckera sp. 2201.
Eur J Biochem 155:527–531
26. Navarrete C, Siles A, Martinez JL et al (2009) Oxidative stress
sensitivity in Debaryomyces hansenii. FEMS Yeast Res 9:582–590
27. Navarro RE, Aguirre J (1998) Posttranscriptional control medi-
ates cell type-specific localization of catalase A during Asper-gillus nidulans development. J Bact 180:5733–5738
28. Nelson DP, Kiesow LA (1972) Enthalpy of decomposition of
hydrogen peroxide by catalase at 25�C (with molar extinction coeffi-
cients of H2O2 solutions in the UV). Anal Biochem 49:474–478
29. Norkrans B (1966) Studies on marine occurring yeasts: growth
related to pH, NaCl concentration and temperature. Arch Mi-
krobiol 54:374–392
30. Papouska K, Sychrova H (2007) The co-action of osmotic and
high temperature stresses results in a growth improvement of
Debaryomyces hansenii cells. Int J Food Microbiol 118:1–7
31. Petrovic U (2006) Role of oxidative stress in the extremely salt-
tolerant yeast Hortaea werneckii. FEMS Yeast Res 6:816–822
32. Petrovic U, Gunde-Cimerman N, Plemenitas A (2002) Cellular
responses to environmental salinity in the halophilic black yeast
Hortaea werneckii. Mol Microbiol 45:665–672
33. Price VE, Rechcigl M, Hartley RW (1961) Methods for deter-
mining the rates of catalase synthesis and destruction in vivo.
Nature 189:62–63
942 C. Segal-Kischinevzky et al.: The Euryhaline Yeast Debaryomyces hansenii
123
34. Prista C, Almagro A, Loureiro-Diaz MC, Ramos J (1997) Phys-
iological basis for the high salt tolerance of Debaryomyceshansenii. Appl Enviromen Microbiol 63:4005–4009
35. Putnam CD, Arvai AS, Bourne Y, Tainer JA (2000) Active and
inhibited human catalase structures: ligand and NADPH binding
and catalytic mechanism. J Mol Biol 296:295–309
36. Ramos J (2005) Introducing Debaryomyces hansenii, a salt loving
yeast. In: Gunde-Cimerman N, Oren A, Plemenitas A (eds)
Adaptation to life at high salt concentrations in Archaea, Bacte-
ria, and Eukarya. Springer, Netherlands, pp 441–451
37. Rørth M, Jensen PK (1976) Determination of catalase activity by
means of the Clark oxygen electrode. Biochim Biophys Acta
139:171–173
38. Ruis H, Koller F (1997) Biochemistry, molecular and cell biology
of yeast and fungal catalases. In: Scandalios JG (ed) Oxidative
stress and the molecular biology of antioxidant defences. Cold
Spring Harbor, New York, pp 309–342
39. Sanchez NS, Arreguın R, Calahorra M, Pena A (2008) Effects of
salts on aerobic metabolism of Debaryomyces hansenii. FEMS
Yeast Res 8:1303–1312
40. Scandalios JG (2002) The rise of ROS. Trends Biochem Sci
27:483–486
41. Sherman DJ, Martin T, Nikolski M, et al. Genolevures Consor-
tium (2009) Genolevures: protein families and synteny among
complete hemiascomycetous yeast proteomes and genomes. Nucl
Acid Res 37, Database issue: D550–D554
42. Schuller C, Brewster JL, Alexander MR et al (1994) The HOG
pathway controls osmotic regulation of transcription via the stress
response element (STRE) of the Saccharomyces cerevisiae CTT1gene. EMBO J 13:4382–4389
43. Steels EL, Learmonth RP, Watson K (1994) Stress tolerance and
membrane lipid unsaturation in Saccharomyces cerevisiae grown
aerobically or anaerobically. Microbiol 140:576–596
44. Switala J, Loewen PC (2002) Diversity of properties among
catalases. Arch Biochem Biophys 401:145–154
45. Tanghe A, Prior B, Thevelein JM (2006) Yeast responses to
stress. In: Rosa CA, Peter G (eds) Biodiversity and ecophysiology
of yeasts. Springer, Berlin, pp 175–195
46. Thome PE, Trench RK (1999) Osmoregulation and the genetic
induction of glycerol-3-phosphate dehydrogenase by NaCl in the
euryhaline yeast Debaryomyces hansenii. Mar Biotechnol 1:
230–238
47. Thome-Ortiz PE, Pena A, Ramirez J (1998) Monovalent cation
fluxes and physiological changes of Debaryomyces hanseniigrown at high concentrations of KCl and NaCl. Yeast 14:
1355–1371
48. Toledano M, Delaunay A, Biteau B et al (2003) Oxidative stress
responses in yeast. In: Hohmann S, Mager WH (eds) Topics
current genetics, vol 1. Springer, Berlin, pp 241–303
49. Trindade H, Karmali A, Pais MS (1988) One-step purification
and properties of catalase from leaves of Zandedeschia aetgio-pica. Biochimie 70:1759–1763
50. Woodbury W, Spencer AK, Stahman MA (1971) An improved
procedure using ferricyanide for detecting catalase isozymes.
Anal Biochem 44:301–305
51. Xolalpa W, Vallecillo AJ, Lara M et al (2007) Identification of
novel bacterial plasminogen-binding proteins in the human
pathogen Mycobacterium tuberculosis. Proteomics 7:3332–3341
52. Zimniak P, Hartter E, Woloszczuk W, Ruis H (1976) Catalase
biosynthesis in yeast: formation of catalase A and catalase T
during oxygen adaptation of Saccharomyces cerevisiae. Eur J
Biochem 71:393–398
C. Segal-Kischinevzky et al.: The Euryhaline Yeast Debaryomyces hansenii 943
123
Copyright © 2022 FDOKUMEN


![Regulation of Lysine Catabolism through Lysine[mdash]Ketoglutarate Reductase and Saccharopine Dehydrogenase in Arabidopsis](https://static.fdokumen.com/doc/165x107/631cc83693f371de19019c93/regulation-of-lysine-catabolism-through-lysinemdashketoglutarate-reductase-and.jpg)
