Motion standstill leads to activation of inferior parietal lobe
Upload
brescia-itCategory
view
0download
0
Multimodal fMRI Resting-State Functional Connectivityin Granulin Mutations: The Case of Fronto-ParietalDementiaEnrico Premi1, Franco Cauda2,3, Roberto Gasparotti4, Matteo Diano2,3, Silvana Archetti5,
Alessandro Padovani1, Barbara Borroni1*
1 Centre for Ageing Brain and Neurodegenerative Disorders, Neurology Unit, University of Brescia, Brescia, Italy, 2 Clinical and Experimental Center for Functional
Magnetic Resonance Imaging, Koelliker Hospital, Turin, Italy, 3 Department of Psychology, University of Turin, Turin, Italy, 4 Neuroradiology Unit, University of Brescia,
Brescia, Italy, 5 III Laboratory Analyses, Brescia Hospital, Brescia, Italy
Abstract
Background: Monogenic dementias represent a great opportunity to trace disease progression from preclinical tosymptomatic stages. Frontotemporal Dementia related to Granulin (GRN) mutations presents a specific framework of braindamage, involving fronto-temporal regions and long inter-hemispheric white matter bundles. Multimodal resting-statefunctional MRI (rs-fMRI) is a promising tool to carefully describe disease signature from the earliest disease phase.
Objective: To define local connectivity alterations in GRN related pathology moving from the presymptomatic(asymptomatic GRN mutation carriers) to the clinical phase of the disease (GRN- related Frontotemporal Dementia).
Methods: Thirty-one GRN Thr272fs mutation carriers (14 patients with Frontotemporal Dementia and 17 asymptomaticcarriers) and 38 healthy controls were recruited. Local connectivity measures (Regional Homogeneity (ReHo), FractionalAmplitude of Low Frequency Fluctuation (fALFF) and Degree Centrality (DC)) were computed, considering age and genderas nuisance variables as well as the influence of voxel-level gray matter atrophy.
Results: Asymptomatic GRN carriers had selective reduced ReHo in the left parietal region and increased ReHo in frontalregions compared to healthy controls. Considering Frontotemporal Dementia patients, all measures (ReHo, fALFF and DC)were reduced in inferior parietal, frontal lobes and posterior cingulate cortex. Considering GRN mutation carriers, an inversecorrelation with age in the posterior cingulate cortex, inferior parietal lobule and orbitofrontal cortex was found.
Conclusions: GRN pathology is characterized by functional brain network alterations even decades before the clinical onset;they involve the parietal region primarily and then spread to the anterior regions of the brain, supporting the concept ofmolecular nexopathies.
Citation: Premi E, Cauda F, Gasparotti R, Diano M, Archetti S, et al. (2014) Multimodal fMRI Resting-State Functional Connectivity in Granulin Mutations: The Caseof Fronto-Parietal Dementia. PLoS ONE 9(9): e106500. doi:10.1371/journal.pone.0106500
Editor: Yu-Feng Zang, Hangzhou Normal University, China
Received March 13, 2014; Accepted August 7, 2014; Published September 4, 2014
Copyright: � 2014 Premi et al. This is an open-access article distributed under the terms of the Creative Commons Attribution License, which permitsunrestricted use, distribution, and reproduction in any medium, provided the original author and source are credited.
Data Availability: The authors confirm that, for approved reasons, some access restrictions apply to the data underlying the findings. The present study hasbeen approved by our local ethics committee, with a specific statement about the utilization of all the data (clinical, radiological and genetic) by third parties thatare not specifically included in the original project. Furthermore, 13 subjects (3 asy-GRN+, 4 yHC and 6 FTD-GRN+) studied in the present work have been includedin the GENFI project (Genetic Frontotemporal Dementia Initiative, http://www.ucl.ac.uk/ion/drc/genfi/index). Raw data are available to all interested researchersupon direct request to the Corresponding Author (Dr. Borroni, [email protected]) as well as to the Head of the Centre for Ageing Brain and NeurodegenerativeDisorders, Neurology Unit, University of Brescia, Italy (Prof. Padovani, [email protected]).
Funding: The authors have no funding or support to report.
Competing Interests: The authors have declared that no competing interests exist.
* Email: [email protected]
Introduction
Frontotemporal Lobar Degeneration (FTLD) is a neurodegen-
erative disorder characterized by behavioural abnormalities,
language impairment, and deficits in executive functions as the
most typical clinical features [1–4]. FTLD is clinically heteroge-
neous, as different prototypical variants have been carefully
described. On the basis of presenting clinical symptoms, behav-
ioural variant FTD (bvFTD), agrammatic variant of Primary
Progressive Aphasia (avPPA), and semantic variant of PPA (svPPA)
represent the most common phenotypes [3,4]. Each one presents
specific neuroimaging hallmarks; bvFTD is characterised by
mesial and dorsolateral frontal damage, prevalent on the right
side, avPPA is defined by involvement of Broca’s area and left
insula, whilst svPPA usually presents left rostral temporal
involvement [5–7].
If clinical pictures are highly correlated with established patterns
of neuroimaging features, on the other hand, no definite
correlation between clinical and pathogenetic mechanisms may
be assessed. Neuropathological classification of Frontotemporal
PLOS ONE | www.plosone.org 1 September 2014 | Volume 9 | Issue 9 | e106500

Dementia (FTD) is based on the major constituents of the cellular
inclusions present, such as tau, TAR-DNA-binding protein-43
(TDP-43) or fused-in-sarcoma (FUS) protein, designated FTLD-
tau, FTLD-TDP or FTLD-FUS respectively [8]. Moreover, a
number of genes have been recognized as causative of autosomal
dominant inherited disorder, such as mutations within MicrotubleAssociated Protein Tau (MAPT) and Granulin (GRN) genes
along with repeat expansion of C9orf72 gene [9,10]. Genetic trait
seems to be characterized by a specific framework of brain
damage; in particular, GRN patients usually had more asymmetric
fronto-temporo-parietal atrophy [11–13], as well as a more severe
impairment of Salience Network connectivity [14] and reduction
of effective connectivity in temporo-parietal regions [15] Further-
more, considering asymptomatic GRN carriers, an altered resting-
state functional connectivity in anterior and posterior regions was
evident [13,16-19]. Recently, we explored resting state fMRI
connectivity with ICA approach in asymptomatic GRN carriers,
showing a reduced connectivity in left Frontoparietal Network and
an increased connectivity in Executive Network compared to
healthy controls [16].
Genetic mutations clearly mirror the underpinnings of the
disease, and give the opportunity to assess its pathogenetic and
biological mechanism. Among others, GRN mutations are
expected to induce a loss of 50% of progranulin, with a
mechanism of haploinsufficiency, and the presence of ubiquiti-
nated TDP-43 protein is the neuropathological hallmark
[8,20,21]. The physiological role of progranulin, as well as the
effect of its reduction in the brain, is still largely unknown,
although it has been recently suggested that progranulin might be
involved in inflammatory pathways and innate immunity [22,23],
and that it acts as a neurotrophic factor [24]. Improved
understanding of the molecular mechanisms of network disinte-
gration will constitute a new paradigm of neurodegenerative
disease and monogenic dementias.
Neuroimaging techniques, such as functional resting state MRI,
represent an in-vivo non invasive tool to study variable intrinsic
brain vulnerability and to follow disease progression from the
preclinical phase to symptomatic stages. In the last few years, a
number of functional parameters have been introduced to study
brain functional network abnormalities. Regional Homogeneity
(ReHo) [25] look at the coherence of focal brain spontaneous low-
frequency (,0.08 Hz) BOLD signal fluctuations at whole-brain
level. Hemodynamic characteristics of every voxel in a functional
cluster would be similar to the neighbor voxels [25,26], and thus
allows the mapping of the whole-brain regional activity [27–29].
The fractional amplitude of low frequency fluctuation (fALFF),
describes the power of the signal in the low frequency range (0.01–
0.08 Hz), as an index of local power of BOLD signal [30,31].
Finally, Degree Centrality (DC) allows the study of the nodes that
form the whole-brain network (also known as functional con-
nectome), and in particular the nodes that are considered
‘‘central’’ within the network [32–34]; DC is an index of local
connectivity by counting the number of direct connections from
one node (voxel) to all other nodes. Higher DC values indicates
key-nodes for the network, and are crucial for the maintenance of
the whole functional network. With regard to brain networks, this
index could correlate with highly associative cortical areas
reflecting the intrinsic cortical organization (Hub architecture).
Damage of one area with high DC leads to more serious damage
in the inter-neuronal connection and to an increase in the
erroneous use of information in reaching the target. Rather than a
group of separate functional brain networks, brain connectome is
based on different inter-related modules that cooperate to achieve
cognitive functioning [35–37]. Indeed, it has become clear that
brain diseases are not strictly related to a single network
dysfunction but multimodal damage can occurs [38].
Elucidating how pathogenic molecules produce specific brain
network disintegration may contribute to the creation of a new
nomenclature of FTD, based on pathogenetic mechanisms. With
this in mind, in the present work we studied a group of subjects
carrying GRN Thr272fs mutation (FTD patients and still
asymptomatic subjects in order to evaluate: 1) the functional
connectivity alterations in the different disease stages, from
preclinical to symptomatic phases; 2) the effect of age on GRNrelated pathology, in order to trace progressive brain damage
during disease course.
Methods
SubjectsSubjects participating in the present study were recruited from
the Centre for Ageing Brain and Neurodegenerative Disorders, at
University of Brescia (Brescia, Italy). The studied sample included
14 patients with FTD carrying GRN Thr272fs mutation (GRN+),
and 16 age and gender-matched healthy subjects (HC). Further-
more, 17 asymptomatic carriers of GRN Thr272fs mutation
(aGRN+) and 22 non-carriers belonging to the same families
(young healthy controls, yHC) were recruited. FTD patients met
current clinical diagnostic criteria either for bvFTD (7 cases) or
avPPA (7 cases) [3,4]. An extensive neuropsychological assessment
in both patients and asymptomatic siblings, including the FTD-
modified Clinical Dementia Rating scale (FTD-modified CDR)
was administered, as described elsewhere [39]. Written informed
consent (from the subject or from the responsible guardian if the
subject was incapable, as demonstrated by clinical and neuropsy-
chological evaluation, showing functional impairment in the
activity of daily living) was obtained, for each procedure, before
study initiation, as well as blood collection byvenous puncture,
genetic analysis, and MRI scanning. The research protocol was
approved by the ethics committee of the Brescia Hospital. The
work conformed to the Helsinki Declaration.
Granulin sequencingGenomic DNA was extracted from peripheral blood using a
standard procedure. All the 12 exons plus exon 0 of GRN, and at
least 30 base pairs (bp) of their flanking introns were evaluated by
polymerase chain reaction (PCR) and subsequent sequencing.
GRN Thr272fs (g.1977_1980 delCACT) was tested as described
elsewhere [40].
MRI acquisitionAll imaging was obtained using a 1.5T Siemens symphony
magnetic resonance scanner (Siemens, Erlangen, Germany),
equipped with a circularly polarized transmit-receive coil. In a
single session, the following scans were collected from each studied
subject: (1) Dual-echo turbo spin echo (TSE) (repetition time
[TR] = 2500 ms, echo time [TE] = 50 ms), to exclude the
presence of macroscopic brain abnormalities, according to
exclusion criteria; (2) 3D magnetization-prepared rapid gradient
echo (MPRAGE) T1-weighted scan (TR = 2010 ms,
TE = 3.93 ms, matrix = 16161, in-plane field of view
[FOV] = 2506250 mm2, slice thickness = 1 mm, flip angle = 15u);and (3) T2*-weighted echo planar (EPI) sensitized to blood oxygen
level dependent (BOLD) contrast (TR = 2500 ms, TE = 50 ms, 29
axial slices parallel to anterior commisure–posterior commissure
line (AC-PC) line, matrix = 64664, field of view = 224 mm, slice
thickness = 3.5 mm) for resting state fMRI. Blood oxygen level
dependent EPI images were collected during rest for an 8-minute
Local Connectivity Measures in Granulin Mutation
PLOS ONE | www.plosone.org 2 September 2014 | Volume 9 | Issue 9 | e106500
period, resulting in a total of 195 volumes. During this acquisition,
subjects were instructed to keep their eyes closed, not to think of
anything in particular, and not to fall asleep.
MRI preprocessingAll preprocessing steps were carried out using Advanced Data
Processing Assistant for Resting-State fMRI (DPARSFA) (http://
rfmri.org/DPARSF) which is based on Resting-State fMRI Data
Analysis Toolkit (REST, http://www.restfmri.net) [41] and
Statistical Parametric Mapping (SPM8) (http://www.fil.ion.ucl.
ac.uk/spm). T1-weighted images from all recruited subjects were
visually inspected for a qualitative assessment of macroscopic
atrophy, and to check for the quality of data before carrying out a
quantitative volumetric analysis. For each subject, an iterative
combination of segmentations and normalizations (implemented
within the ‘‘Segment’’ module in SPM8) produced a GM
probability map [42] in Montreal Neurological Institute (MNI)
coordinates. To compensate for compression or expansion during
warping of images to match the template, GM maps were
modulated by multiplying the intensity of each voxel by the local
value derived from the deformation field (Jacobian determinants)
[43]. All data were then smoothed using a 10 mm FWHM
Gaussian kernel. For each subject the first 4 volumes of the fMRI
series were discarded to allow for T1 equilibration effects. The
remaining 191 volumes were compensated for slice-dependent
time shifts, corrected for geometrical displacements according to
the estimated head movement and realigned to the first volume.
Correction for head motion [44] and head motion scrubbing
regressor [45] was also performed. Any subject who had a
maximum displacement in any direction larger than 1.5 mm, or a
maximum rotation (x,y,z) larger than 1.5u was excluded. All data
were subsequently spatially normalized to the T1 unified
segmentation template in Montreal Neurological Institute coordi-
nates derived from SPM8 software and resampled to 36363 cubic
voxels. A linear regression to remove sources of spurious variances
(motion parameters, linear drift and the average time series in the
cerebrospinal fluid and white matter regions) was performed.
Then, all images were filtered by a phase-insensitive bandpass
filter (pass band 0.01–0.08 Hz) to reduce the effect of low
frequency drift and high frequency physiological noise. Finally, a
spatial smoothing with an isotropic Gaussian kernel (full-width at
half-maximum, 8 mm) was applied [25] to reduce spatial noise.
This last step was used for all the analyses except for Regional
Homogeneity; in fact, previous studies demonstrated that spatial
smoothing artificially enhanced the ReHo intensity [28,46]. For
this reason, in this case, the spatial smoothing was carried out after
ReHo calculation. All the preprocessing steps to obtain the
functional maps below (ReHo, fALFF, DC) were performed with
DPARSFA.
Regional Homogeneity (ReHo)Regional Homogeneity (ReHo) maps regional activity across the
whole brain [25], measuring the degree of regional synchroniza-
tion of fMRI time courses. Greater ReHo values indicate greater
regional synchronization. ReHo was performed on a voxel-by-
voxel basis by calculating Kendall’s coefficient of concordance
[26] of a time series of a given voxel and those of its 26
neighboring voxels within a brain mask (provided by DPARSFA
and excluding non-brain areas). In order to reduce the effect of
individual variability, a global mean normalization was applied, by
dividing ReHo value by the mean ReHo of the whole brain for
each subject [25,28,46,47] as ReHonormalized = ReHo(x,y,z)/
mean(ReHo). As described above, a spatial smoothing was
subsequently applied (FWHM = 86868 mm).
Fractional Amplitude of Low Frequency Fluctuation(fALFF)
fALFF represents the power within the low frequency range
(0.01–0.08 Hz), divided by the total power in the entire detectable
frequency range [30]. After the extraction of power spectra via a
Fast Fourier Transform, the sum of frequencies in the low
frequency band was calculated; the averaged square root of the
power in the low frequency window, normalized by the mean
within-brain values was obtained, and subsequently scaled by total
power across all available frequencies [48].
Degree Centrality (DC)For each subject, each whole-brain voxel’s time-series was
extracted to calculate a temporal correlation matrix. We
computed an individual Degree Centrality mask starting from
study-specific functional volume mask, considering only voxels (in
MNI 152 standard space) present in at least 95% of the
participants, and further constrained by the MNI 152 25% gray-
matter probability mask (r.0.25). Before graph definition, EPI
time-series data were down-sampled to 4 mm isotropic voxel-size
to reduce computational complexity. Then, voxel-based graphs
were generated for each individual. Each voxel was considered as
a node in the graph, and each significant functional connection
(Pearson correlation) between any pair of voxels is an edge. To
obtain each subject’s graph, the correlation between the time-
series of each voxel with every other voxel in the study mask was
calculated (correlation matrix). For each subject, based on the
graph, DC was calculated by counting the number of significant
correlations between each voxel and all other voxels. DC indices
were then transformed to z-scores based on each individual mean
and standard deviation for DC across all voxels [29,33,49].
Biological Parametric Mapping approachThe influence of gray matter (GM) atrophy in functional MRI
analysis and consequently the regression of GM values as nuisance
covariate is still a matter of debate [50–52]. Even if mean gray
matter density is the more common approach to take into account
cortical atrophy, this measure cannot consider regional differences
in cortical atrophy. This is especially of interest in neurodegen-
erative diseases like FTD-GRN+, where cortical atrophy is not
equally distributed between the anterior and posterior part of the
brain and even between the two hemispheres. For this purpose, we
adopted the Biological Parametric Mapping with Robust Regres-
sion (http://www.nitrc.org/projects/rbpm) approach [53,54] (as
toolbox of SPM8) that allowed a multimodal integrative imaging
analysis, using resting-state fMRI data (ReHo, fALFF and DC
maps, respectively) as the primary modality, and the correspond-
ing voxel-based morphometry (VBM) data as imaging covariates
(BPM ANOVA). We evaluated the effect of structural differences
on fMRI data in a voxel-wise setting, using gray matter maps of
each subject as a regressor of structural damage [55,56]. We
considered age and gender as covariates of no interest in the
ANCOVA model. We applied this approach comparing FTD-
GRN+ patients and related controls, as in aGRN+ no VBM
abnormalities have been demonstrated [14,17].
Statistical analysisSPSS package (v. 17.0, Chicago, IL, USA) was employed to run
statistics for group differences in demographic andclinical charac-
teristics and laboratory measures. Group comparisons were
assessed by Mann-Whitney test or x2 test, setting the statistical
threshold to P-values Bonferroni’s corrected #0.05.
Local Connectivity Measures in Granulin Mutation
PLOS ONE | www.plosone.org 3 September 2014 | Volume 9 | Issue 9 | e106500

For resting state fMRI analyses, the statistical significance was
defined at the cluster-level using the non-stationary random field
theory [57]. The A threshold of a p,0.01 uncorrected (cluster-
forming threshold) allowed the identification of spatially contigu-
ous voxels [58,59]; then, false-discovery rate (FDR) correction
(cluster-level, p = 0.05) was applied, and only surviving clusters
were considered. To evaluate differences between groups (aGRN+
vs yHC and GRN+ vs HC), T-test was applied. Taking into
account literature data on age-related changes in resting state
fMRI functional connectivity [60–62], we studied the effect of age
on connectivity measures considering the whole group of GRNcarriers (both aGRN+ carriers and FTD-GRN+ patients) com-
pared to healthy groups (young and old healthy controls).
Difference of slope analysis was used to study the statistical
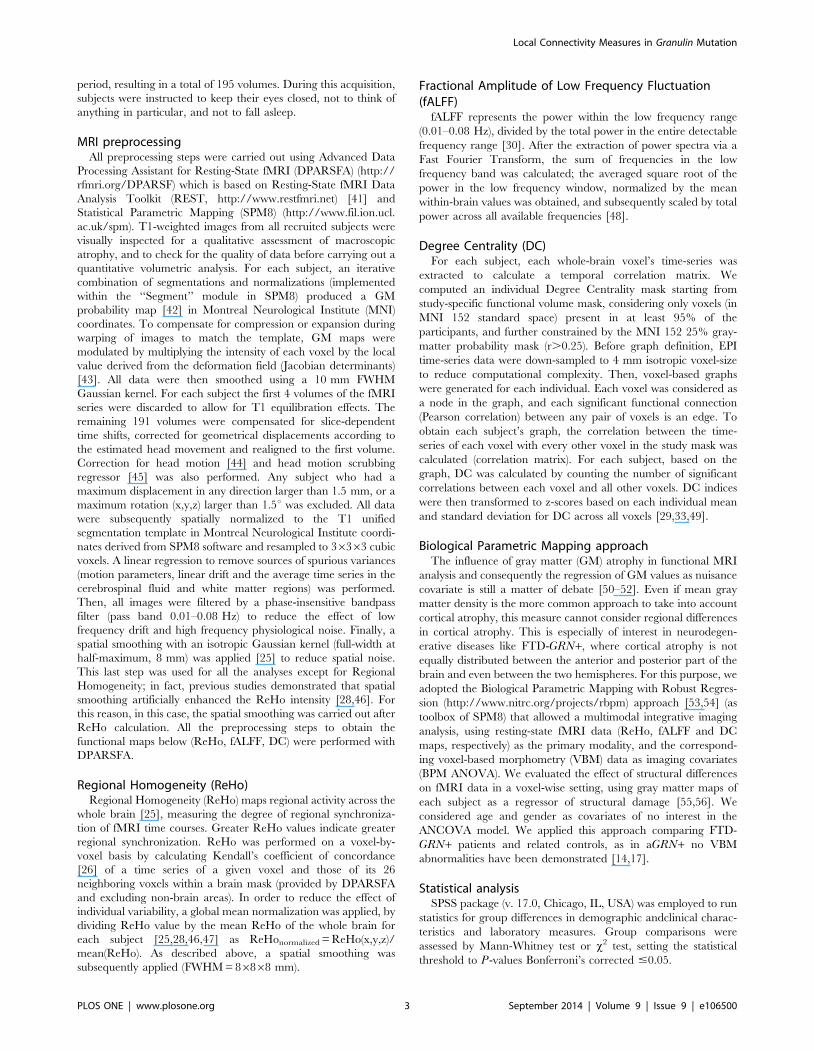
Figure 1. Regional Homogeneity (ReHo) Analysis in Asymptomatic GRN+ carriers (aGRN+) compared to young healthy controls(yHC), showing reduced ReHo index (Panel A) as well as increased ReHo index (Panel B). The results are superimposed on a 3D-standarized T1 brain template. P,0.01 uncorrected, p,0.05 FDR cluster-level. L = left.doi:10.1371/journal.pone.0106500.g001
Table 2. Alterations of brain connectivity parameters in asymptomatic GRN carriers as compared to healthy controls.
Region ReHo (reduced) x y z T P Cluster size
L Postcentral Gyrus 227 236 60 3.90 0.04 145
Region ReHo (increased) x y z T P Cluster size
R Superior Frontal Gyrus 24 39 33 4.75 0.05 119
R Medial Frontal Gyrus 6 54 3 4.10 0.01 189
L Medial Frontal Gyrus 29 51 0 3.87 0.01 -
Talairach coordinates of significant voxels, at P,0.01 uncorrected, FDR-cluster level p,0.05. ReHo: Regional Homogeneity. R = right hemisphere; L = left hemisphere.doi:10.1371/journal.pone.0106500.t002
Table 1. Clinical and demographic characteristics of included subjects.
Variable FTD-GRN+ Healthy Controls aGRN+ Young Healthy Controls
60.465.3 n = 14 n = 16 n = 17 n = 22
Age at evaluation, y 60.465.3 59.768.7 41.669.0* 36.266.8*
Age at onset, y 58.866.2 - - -
Disease duration, y 1.9361.9 - - -
Gender, female % (n) 64.3 (9) 75.0 (12) 47.1 (8) 63.6 (14)
Family history, positive % (n) 85.7 (12) - 100 (17) -
Clinical phenotype, bvFTD %(n) 50.0 (7) - - -
FTD-CDR‘ 6.063.5 - - -
FTD: Frontotemporal dementia; FTD-GRN+: FTD patients carrying Granulin Thr272fs mutation; aGRN+:asymptomatic subjects carrying Granulin Thr272fs mutation; FTD-CDR: Frontotemporal Dementia modified Clinical Dementia Rating scale. * T-test comparison aGRN+vs. young healthy controls p,0.05.doi:10.1371/journal.pone.0106500.t001
Local Connectivity Measures in Granulin Mutation
PLOS ONE | www.plosone.org 4 September 2014 | Volume 9 | Issue 9 | e106500

interaction between age (as continuous variable) and genetic status
(presence of GRN mutation), considering gender and clinical
phenotype (1 = asy-GRN+; 2 = FTD-GRN+; 3 = young HC;
4 = old HC) as nuisance variables, as previously applied by
Garibotto et al. to evaluate cognitive reserve in Alzheimer’s
Disease [63]. Age regression analysis in GRN-mutation carriers
and controls was performed and the statistical difference between
the two regressions calculated (difference of slope analysis). For this
analysis, two statistical thresholds were used: 1) p,0.01 uncor-
rected, 0.05 FDR cluster-level; 2) p,0.001 uncorrected, 0.05 FWE
cluster-level, to evaluate the most significant clusters for each
functional metrics applied (ReHo, fALFF, DC).
Results
SubjectsAs shown in Table 1, there were no statistical differences
between FTD-GRN+ and age matched healthy controls (HC),
Figure 2. Regional Homogeneity (ReHo, Panel A), Fractional Amplitude of Low Frequency Fluctuations (fALFF, Panel B), DegreeCentrality (DC, Panel C) analyses in Frontotemporal Dementia related to GRN (FTD-GRN+) compared to old healthy controls (oHC)using Biological Parametric Mapping Analysis (BPM) showing either reduced and increased significant clusters. The results aresuperimposed on a 3D-standarized T1 brain template. P,0.01 uncorrected, p,0.05 FDR cluster-level. L = left.doi:10.1371/journal.pone.0106500.g002
Local Connectivity Measures in Granulin Mutation
PLOS ONE | www.plosone.org 5 September 2014 | Volume 9 | Issue 9 | e106500

regarding age or gender (for neuropsychological tests of FTD-
GRN+ see Supplementary Data). Considering asymptomatic
subjects, aGRN+ were older than their siblings not carrying
GRN mutation (yHC, p = 0.05).
Multimodal brain connectivityIn aGRN+ compared to yHC, reduced ReHo was found in left
parietal region (Figure 1A, Table 2). Furthermore, an increased
ReHo index in mesial frontal cortex bilaterally, was evident(Fi-gure 1B, Table 2), comparing aGRN+ to yHC. No significant
abnormalities of DC and fALFF indexes were reported.
FTD-GRN+ patients showed a reduced ReHo index in inferior
parietal and frontal lobes, bilaterally, and posterior cingulate
cortex as well as increased ReHo connectivity in cerebellar lobes,
bilaterally (Figure 2A, Table 3).Furthermore, statistical analysis
of fALFF showed a predominant impairment of frontotemporal
regions in FTD-GRN+ patients with increased fALFF index in left
precentral gyrus and hippocampal structures (Figure 2B, Ta-ble 2). Finally, FTD-GRN+ presented a reduced DC index in
frontal pole bilaterally as well as in the posterior cingulate cortex.
At the same time, increased DC index was evident in right
postcentral regions and right dorsolateral prefrontal cortices,
bilaterally (Figure 2C, Table 2). All the previous statistical
analyses survived at the cluster-forming threshold of p = 0.01
uncorrected for multiple comparisons (FWE 0.05 cluster-level); no
clusters survived at the more stringent threshold (cluster-forming
threshold of p = 0.001 uncorrected for multiple comparisons (FWE
0.05 cluster-level)).
Effect of age on brain connectivity measures in GRNmutation carriers (aGRN+ and FTD-GRN+) (difference ofslope analysis)
Considering all the subjects with GRN mutation (aGRN+ and
FTD-GRN+) and healthy controls, a difference of slope analysis
was applied to study the effect of age on ReHo, fALFF, and DC
values. In ReHo analysis, an inverse correlation with age in GRN+carriers compared to HC was evident, with reduced ReHo values
in posterior cingulate cortex,inferior parietal lobule bilaterally, and
anterior frontal regions (Figure 3, panel A; Table 4). Consid-
ering fALFF (Figure 3, panel B; Table 4), comparable results
were found. DC showed an inverse correlation with age in
orbitofrontal and posterior cingulate regions (Figure 3, panel C;
Table 3. Alterations of brain connectivity parameters in FTD-GRN+ as compared to healthy controls.
Region ReHo (reduced) x y z T P Cluster size
L Inferior Frontal Gyrus 242 21 0 7.40 0.003 157
L Superior Frontal Gyrus 239 24 51 6.86 0.013 117
L Inferior Parietal Lobule 263 227 36 6.43 0.015 103
L Medial Frontal Gyrus 0 27 218 6.01 0.053 69
L Posterior Cingulate 23 230 24 5.14 0.001 194
Region ReHo (increased) x y z T P Cluster size
L Posterior Cerebellar Lobe 221 248 233 6.03 0.02 126
R Posterior Cerebellar Lobe 18 245 239 5.18 0.02 106
Region fALFF (reduced) x y z T P Cluster size
L Superior Temporal Gyrus 260 263 18 5.84 0.024 66
R Anterior Cingulate Gyrus 21 218 36 5.15 0.008 94
R Inferior Frontal Gyrus 45 27 3 5.09 0.024 65
L Posterior Cingulate 26 242 27 4.98 0.054 50
L Anterior Cingulate Gyrus 218 26 33 4.53 0.050 53
R Orbital Gyrus 9 45 218 4.52 0.007 106
Region fALFF (increased) x y z T P Cluster size
L Postcentral Gyrus 233 233 60 5.55 0.003 124
L Parahippocampal Gyrus 221 224 224 4.65 0.03 79
R Parahippocampal Gyrus 21 236 23 3.73 0.03 73
Region DC (reduced) x y z T P Cluster size
L Posterior Cingulate 26 266 15 5.40 0.026 61
R Medial Frontal Gyrus 12 66 23 4.80 0.050 41
L Orbital Gyrus 23 48 221 4.31 0.026 53
Region DC (increased) x y z T P Cluster size
R Postcentral Gyrus 39 227 45 6.34 0.005 74
R Middle Frontal Gyrus 27 18 33 4.98 0.005 72
R Anterior Cingulate Gyrus 6 21 15 4.47 ,0.001 155
L Superior Frontal Gyrus 221 45 21 4.39 ,0.001 -
Talairach coordinates of significant voxels, at P,0.01 uncorrected, FDR-cluster level p,0.05. ReHo: Regional Homogeneity; fALFF: Fractional Amplitude of LowFrequency Fluctuation; DC: Degree Centrality. R = right hemisphere; L = left hemisphere.doi:10.1371/journal.pone.0106500.t003
Local Connectivity Measures in Granulin Mutation
PLOS ONE | www.plosone.org 6 September 2014 | Volume 9 | Issue 9 | e106500

Table 4). At a more stringent statistical threshold (p 0.001
uncorrected, FWE 0.05 cluster-level), only the following clusters
survived: (ReHo analysis): right frontal region (x,y,z: 30, 63, 9;
T = 5.26, 238 voxels, P = 0.006; R middle frontal gyrus, BA 10);
(fALFF analysis): left precuneus (x,y,z: 29, 248, 33; T = 5.32, 138
voxels, P = ,0.001; L precuneus, BA 31) and left superior
temporal gyrus (,y,z: 257, 257, 21; T = 4.30, 45 voxels,
P = 0.011; L superior temporal gyrus, BA 39); (DC analysis): left
posterior cingulate region (x,y,z: 215, 263, 12; T = 6.61, 113
voxels, ,P = 0.001; L posterior cingulate cortex, BA 30)
(Figure 3, Panel D).
Discussion
In recent years, great efforts have been made in the field of
neurodegenerative diseases to fill the gap between molecular
dysfunction at neuronal level and the macroscopic pattern of brain
alterations. The application of advanced neuroimaging techniques
especially to the monogenic dementias could represent the ideal
model to test the natural history of proteinopathies and how they
translate to clinical phenotypes [64]. Recently, a work on
monogenic Alzheimer’s Disease showed that decreased brain
connectivity is already detectable in asymptomatic mutation
carriers in those regions typically affected by the disease, with
progressive damage as age increases [65].
If in Alzheimer’s disease the temporo-parietal lobes are
primarily affected, the involvement of frontotemporal areas in
FTLD is largely proved. However, greater heterogeneity has been
reported in the latter disease, depending on genetic traits and
neuropathological features. As already reported, GRN mutations
present asymmetric fronto-parieto-temporal atrophy, with the
selective involvement of long intrahemispheric pathways
[12,13,18,66], mirroring the neuropathological distribution of
TDP-43 type A proteinopathy [67]. A number of studies have
corroborated these findings, demonstrating resting-state functional
connectivity abnormalities since preclinical stages
[13,14,16,17,68].
In the present work, we aimed to corroborate the disease
signature by multimodal rs-fMRI and to assess the natural course
of GRN-disease.
Altogether, these data suggest that the earliest feature of FTD
associated with GRN mutations is the functional impairment of
parietal lobes. Furthermore, looking at the increased functional
connectivity in frontal regions, a potential compensatory mecha-
nism cannot be excluded a priori [54,69], as previously reported
by our group [16].When disease progresses, as demonstrated by
Figure 3. Effect of age on Regional Homogeneity (ReHo, Panel A), Fractional Amplitude of Low Frequency Fluctuations (fALFF,Panel B) and Degree Centrality (DC, Panel C) in GRN+ subjects (aGRN+ and FTD-GRN+) compared to healthy controls (yHC and oHC)(difference of slope analysis). The results are superimposed on a 3D-standarized T1 brain template. P,0.01 uncorrected, p,0.05 FDR cluster-level. L = left. Panel D: presentation of all previous results at a more stringent threshold (p,0.001 uncorrected, p,0.05 FWE cluster-level),superimposed on an axial T1 brain template.doi:10.1371/journal.pone.0106500.g003
Local Connectivity Measures in Granulin Mutation
PLOS ONE | www.plosone.org 7 September 2014 | Volume 9 | Issue 9 | e106500

data obtained in FTD carrying GRN mutation and by regression
analysis with age, more anterior regions, i.e. frontal lobes, are also
involved. The explanation of increased connectivity in FTD-
GRN+ patients is challenging, with the presence of regions not
usually affected by the pathological process (i.e. cerebellar lobes) as
well as regions surrounding the most involved parts of frontal
lobes. Even if the role of hyperactivation in resting state fMRI is
not completely defined, it is possible that regions not primarily
involved, as well as regions in the less affected hemisphere or in the
neighborhood of damaged areas could counteract functional
impairment [54,69,70]. Taken together these results support the
concept of fronto-parietal dementia, calling for a new nosology of
the disease related to GRN mutation. In association with our
previous work on asymptomatic GRN carriers [16], showing a
reduced frontoparietal network connectivity as well an enhanced
executive network connectivity compared to controls the present
work support the idea that GRN related disease is characterized by
an asymmetric (functional and structural) impairment via discon-
nection mechanism involving long white matter bundles connect-
ing anterior/posterior regions, although the local connectivity
approach cannot completely captures the functional alterations of
long-range resting state brain networks. It is likely that the damage
of parietal networks may not be identified by clinical evaluation
and the diagnosis of FTD is made only when more detectable
behavioral and cognitive disturbances depending on frontal
dysfunction are overt.
Indeed, we observed a concordance of data by ReHo, fALFF
and DC, but the former measure showed the higher sensibility in
detecting functional alteration in the preclinical phase. ReHo
analysis presented the highest test-retest reliability as compared to
the other methods [46,71]; furthermore, intra-regional perspective
of Regional Homogeneity analysis captured local dynamics of
network functioning, as a basis for the subsequent broad
alterations of the entire network [54,72–74].
Clearly defining the functional alterations sustaining GRNpathology is crucial both for a better understanding of the disease,
and in order to define biomarkers to test disease-modifying drugs
against TDP43 proteinopathies. In this view, Warren and
colleagues have recently proposed the term of ‘‘molecular
nexopathies’’ as a theoretical paradigm that different proteino-
pathies (i.e., TDP-43 or MAPT) could differently affect neural
networks [66,75].
Our work presents some limitations. First, the described model
of disease progression derives from a cross-sectional approach, and
longitudinal studies with structural and functional imaging are
needed to confirm our hypothesis. Second, in FTD patients we
applied a voxel-by-voxel covariance of gray matter density, to take
into account the presence of focal pattern of brain atrophy
(Biological Parametric Mapping) [53–55], but the role of GM
Table 4. Effect of age on multimodal connectivity measures in GRN+ subjects (aGRN+ and FTD-GRN+) compared to healthycontrols (difference of slope analysis).
Region ReHo x y z T P Cluster size
L Superior Frontal Gyrus 233 57 0 5.75 ,0.001 1611
R Middle Frontal Gyrus 48 33 33 5.50 ,0.001 1611
R Middle Frontal Gyrus 30 63 9 5.26 - -
R Superior Frontal Gyrus 3 51 30 4.71 - -
R Anterior Cingulate Gyrus 6 54 23 4.11 - -
R Middle Temporal Gyrus 51 272 27 5.09 0.054 386
R Inferior Parietal Lobule 54 260 45 4.98 - -
L Posterior Cingulate 215 266 18 4.65 0.009 663
L Precuneus 29 251 27 4.45 - -
L Inferior Parietal Lobule 266 230 33 4.40 0.034 465
L Postcentral Gyrus 266 218 21 4.22 - -
Region fALFF x y z T P Cluster size
L Precuneus 29 248 33 5.31 ,0.001 688
R Posterior Cingulate Gyrus 6 245 33 4.60 - -
L Paracentral Lobule 215 236 48 4.59 - -
R Inferior Parietal Lobule 42 272 39 2.94 ,0.001 224
R Supramarginal Gyrus 39 242 239 3.85 - -
L Superior Temporal Gyrus 257 257 21 4.30 0.005 138
R Anterior Cingulate Gyrus 12 33 30 3.65 0.036 86
Region DC x y z T P Cluster size
L Posterior Cingulate 215 263 12 6.61 0.002 286
L Precuneus 29 269 18 4.94 - -
L Orbital Gyrus 23 45 221 3.98 0.004 224
R Superior Frontal Gyrus 9 57 23 3.28 - -
Talairach coordinates of significant voxels, at P,0.01 uncorrected, FDR-cluster level p,0.05. ReHo: Regional Homogeneity; fALFF: Fractional Amplitude of LowFrequency Fluctuation; DC: Degree Centrality. R = right hemisphere; L = left hemisphere.doi:10.1371/journal.pone.0106500.t004
Local Connectivity Measures in Granulin Mutation
PLOS ONE | www.plosone.org 8 September 2014 | Volume 9 | Issue 9 | e106500

correction is still an open question. Third, the small sample size (14
FTD-GRN+patients (7 bvFTD and 7 avPPA) did not allow a
subanalysis for each clinical phenotype for neuroimaging and
clinical/neuropsychological data.
In conclusion, our work extends previous findings on the brain
functional correlates of GRN related pathology by multimodal rs-
fMRI approach. The prevalent posterior functional impairment in
the preclinical stage, with a progressive involvement of frontal
regions during the course of the disease, moving from the
preclinical to the clinical onset of the disease, suggests that the
term of frontoparietal dementia for GRN related disease may be
considered.
Author Contributions
Conceived and designed the experiments: EP FC BB AP. Performed the
experiments: SA RG EP. Analyzed the data: EP FC MD. Contributed
reagents/materials/analysis tools: SA RG. Contributed to the writing of
the manuscript: EP FC MD BB AP.
References
1. McKhann GM, Albert MS, Grossman M, Miller B, Dickson D, et al. (2001)
Clinical and pathological diagnosis of frontotemporal dementia: report of theWork Group on Frontotemporal Dementia and Pick’s Disease. Arch Neurol 58:
1803–1809.
2. Neary D, Snowden JS, Gustafson L, Passant U, Stuss D, et al. (1998)Frontotemporal lobar degeneration: a consensus on clinical diagnostic criteria.
Neurology 51: 1546–1554.
3. Rascovsky K, Hodges JR, Knopman D, Mendez MF, Kramer JH, et al. (2011)Sensitivity of revised diagnostic criteria for the behavioural variant of
frontotemporal dementia. Brain 134: 2456–2477.
4. Gorno-Tempini ML, Hillis AE, Weintraub S, Kertesz A, Mendez M, et al.
(2011) Classification of primary progressive aphasia and its variants. Neurology
76: 1006–1014.
5. Pereira JM, Williams GB, Acosta-Cabronero J, Pengas G, Spillantini MG, et al.
(2009) Atrophy patterns in histologic vs clinical groupings of frontotemporal
lobar degeneration. Neurology 72: 1653–1660.
6. Rohrer JD, Warren JD, Modat M, Ridgway GR, Douiri A, et al. (2009) Patterns
of cortical thinning in the language variants of frontotemporal lobardegeneration. Neurology 72: 1562–1569.
7. Whitwell JL, Josephs KA, Rossor MN, Stevens JM, Revesz T, et al. (2005)
Magnetic resonance imaging signatures of tissue pathology in frontotemporaldementia. Arch Neurol 62: 1402–1408.
8. Mackenzie IR, Neumann M, Bigio EH, Cairns NJ, Alafuzoff I, et al. (2010)
Nomenclature and nosology for neuropathologic subtypes of frontotemporallobar degeneration: an update. Acta Neuropathol 119: 1–4.
9. Rohrer JD, Lashley T, Schott JM, Warren JE, Mead S, et al. (2011) Clinical andneuroanatomical signatures of tissue pathology in frontotemporal lobar
degeneration. Brain 134: 2565–2581.
10. Rademakers R, Neumann M, Mackenzie IR (2012) Advances in understandingthe molecular basis of frontotemporal dementia. Nat Rev Neurol 8: 423–434.
11. Whitwell JL, Jack CR Jr, Baker M, Rademakers R, Adamson J, et al. (2007)
Voxel-based morphometry in frontotemporal lobar degeneration with ubiquitin-positive inclusions with and without progranulin mutations. Arch Neurol 64:
371–376.
12. Whitwell JL, Jack CR Jr, Boeve BF, Senjem ML, Baker M, et al. (2009) Voxel-
based morphometry patterns of atrophy in FTLD with mutations in MAPT or
PGRN. Neurology 72: 813–820.
13. Borroni B, Alberici A, Premi E, Archetti S, Garibotto V, et al. (2008) Brain
magnetic resonance imaging structural changes in a pedigree of asymptomatic
progranulin mutation carriers. Rejuvenation Res 11: 585–595.
14. Borroni B, Alberici A, Cercignani M, Premi E, Serra L, et al. (2012) Granulin
mutation drives brain damage and reorganization from preclinical tosymptomatic FTLD. Neurobiol Aging 33: 2506–2520.
15. Premi E, Grassi M, Gazzina S, Paghera B, Pepe D, et al. (2013) The
neuroimaging signature of frontotemporal lobar degeneration associated withGranulin mutations: an effective connectivity study. J Nucl Med 54: 1066–1071.
16. Premi E, Formenti A, Gazzina S, Archetti S, Gasparotti R, et al. (2013) Effect of
TMEM106B Polymorphism on Functional Network Connectivity in Asymp-tomatic GRN Mutation Carriers. JAMA Neurol.
17. Dopper EG, Rombouts SA, Jiskoot LC, Heijer T, de Graaf JR, et al. (2013)Structural and functional brain connectivity in presymptomatic familial
frontotemporal dementia. Neurology 80: 814–823.
18. Pievani M, Paternico D, Benussi L, Binetti G, Orlandini A, et al. (2014) Patternof structural and functional brain abnormalities in asymptomatic granulin
mutation carriers. Alzheimers Dement.
19. Jacova C, Hsiung GY, Tawankanjanachot I, Dinelle K, McCormick S, et al.(2013) Anterior brain glucose hypometabolism predates dementia in progranulin
mutation carriers. Neurology 81: 1322–1331.
20. Baker M, Mackenzie IR, Pickering-Brown SM, Gass J, Rademakers R, et al.
(2006) Mutations in progranulin cause tau-negative frontotemporal dementia
linked to chromosome 17. Nature 442: 916–919.
21. Cruts M, Gijselinck I, van der Zee J, Engelborghs S, Wils H, et al. (2006) Null
mutations in progranulin cause ubiquitin-positive frontotemporal dementia
linked to chromosome 17q21. Nature 442: 920–924.
22. Tang W, Lu Y, Tian QY, Zhang Y, Guo FJ, et al. (2011) The growth factor
progranulin binds to TNF receptors and is therapeutic against inflammatoryarthritis in mice. Science 332: 478–484.
23. Toh H, Chitramuthu BP, Bennett HP, Bateman A (2011) Structure, function,
and mechanism of progranulin; the brain and beyond. J Mol Neurosci 45: 538–
548.
24. Van Damme P, Van Hoecke A, Lambrechts D, Vanacker P, Bogaert E, et al.
(2008) Progranulin functions as a neurotrophic factor to regulate neurite
outgrowth and enhance neuronal survival. J Cell Biol 181: 37–41.
25. Zang Y, Jiang T, Lu Y, He Y, Tian L (2004) Regional homogeneity approach to
fMRI data analysis. Neuroimage 22: 394–400.
26. Kendall MG GJ (1990) Rank Correlation Methods. USA. 272 p.
27. He Y, Wang L, Zang Y, Tian L, Zhang X, et al. (2007) Regional coherence
changes in the early stages of Alzheimer’s disease: a combined structural and
resting-state functional MRI study. Neuroimage 35: 488–500.
28. Zhang Z, Liu Y, Jiang T, Zhou B, An N, et al. (2012) Altered spontaneous
activity in Alzheimer’s disease and mild cognitive impairment revealed by
Regional Homogeneity. Neuroimage 59: 1429–1440.
29. Long XY, Zuo XN, Kiviniemi V, Yang Y, Zou QH, et al. (2008) Default mode
network as revealed with multiple methods for resting-state functional MRI
analysis. J Neurosci Methods 171: 349–355.
30. Zou QH, Zhu CZ, Yang Y, Zuo XN, Long XY, et al. (2008) An improved
approach to detection of amplitude of low-frequency fluctuation (ALFF) for
resting-state fMRI: fractional ALFF. J Neurosci Methods 172: 137–141.
31. Di X, Kim EH, Huang CC, Tsai SJ, Lin CP, et al. (2013) The influence of the
amplitude of low-frequency fluctuations on resting-state functional connectivity.
Front Hum Neurosci 7: 118.
32. Wang J, Zuo X, He Y (2010) Graph-based network analysis of resting-state
functional MRI. Front Syst Neurosci 4: 16.
33. Zuo XN, Ehmke R, Mennes M, Imperati D, Castellanos FX, et al. (2012)
Network centrality in the human functional connectome. Cereb Cortex 22:
1862–1875.
34. Zuo XN, Di Martino A, Kelly C, Shehzad ZE, Gee DG, et al. (2010) The
oscillating brain: complex and reliable. Neuroimage 49: 1432–1445.
35. Mesmoudi S, Perlbarg V, Rudrauf D, Messe A, Pinsard B, et al. (2013) Resting
state networks’ corticotopy: the dual intertwined rings architecture. PLoS One 8:
e67444.
36. van den Heuvel MP, Sporns O (2013) An anatomical substrate for integration
among functional networks in human cortex. J Neurosci 33: 14489–14500.
37. Mesulam MM (1998) From sensation to cognition. Brain 121 (Pt 6): 1013–1052.
38. Song J, Qin W, Liu Y, Duan Y, Liu J, et al. (2013) Aberrant functional
organization within and between resting-state networks in AD. PLoS One 8:
e63727.
39. Borroni B, Agosti C, Premi E, Cerini C, Cosseddu M, et al. (2010) The FTLD-
modified Clinical Dementia Rating scale is a reliable tool for defining disease
severity in frontotemporal lobar degeneration: evidence from a brain SPECT
study. Eur J Neurol 17: 703–707.
40. Borroni B, Archetti S, Alberici A, Agosti C, Gennarelli M, et al. (2008)
Progranulin genetic variations in frontotemporal lobar degeneration: evidence
for low mutation frequency in an Italian clinical series. Neurogenetics 9: 197–
205.
41. Song XW, Dong ZY, Long XY, Li SF, Zuo XN, et al. (2011) REST: a toolkit for
resting-state functional magnetic resonance imaging data processing. PLoS One
6: e25031.
42. Ashburner J, Friston KJ (2005) Unified segmentation. Neuroimage 26: 839–851.
43. Ashburner J, Friston KJ (2001) Why voxel-based morphometry should be used.
Neuroimage 14: 1238–1243.
44. Friston KJ, Williams S, Howard R, Frackowiak RS, Turner R (1996)
Movement-related effects in fMRI time-series. Magn Reson Med 35: 346–355.
45. Power JD, Barnes KA, Snyder AZ, Schlaggar BL, Petersen SE (2012) Spurious
but systematic correlations in functional connectivity MRI networks arise from
subject motion. Neuroimage 59: 2142–2154.
46. Zuo XN, Xu T, Jiang L, Yang Z, Cao XY, et al. (2013) Toward reliable
characterization of functional homogeneity in the human brain: preprocessing,
scan duration, imaging resolution and computational space. Neuroimage 65:
374–386.
47. Tian L, Ren J, Zang Y (2012) Regional homogeneity of resting state fMRI
signals predicts Stop signal task performance. Neuroimage 60: 539–544.
Local Connectivity Measures in Granulin Mutation
PLOS ONE | www.plosone.org 9 September 2014 | Volume 9 | Issue 9 | e106500

48. Turner JA, Damaraju E, van Erp TG, Mathalon DH, Ford JM, et al. (2013) A
multi-site resting state fMRI study on the amplitude of low frequencyfluctuations in schizophrenia. Front Neurosci 7: 137.
49. Buckner RL, Sepulcre J, Talukdar T, Krienen FM, Liu H, et al. (2009) Cortical
hubs revealed by intrinsic functional connectivity: mapping, assessment ofstability, and relation to Alzheimer’s disease. J Neurosci 29: 1860–1873.
50. Oakes TR, Fox AS, Johnstone T, Chung MK, Kalin N, et al. (2007) IntegratingVBM into the General Linear Model with voxelwise anatomical covariates.
Neuroimage 34: 500–508.
51. Filippi M, Valsasina P, Misci P, Falini A, Comi G, et al. (2013) The organizationof intrinsic brain activity differs between genders: a resting-state fMRI study in a
large cohort of young healthy subjects. Hum Brain Mapp 34: 1330–1343.52. Wang Z, Yan C, Zhao C, Qi Z, Zhou W, et al. (2011) Spatial patterns of
intrinsic brain activity in mild cognitive impairment and Alzheimer’s disease: aresting-state functional MRI study. Hum Brain Mapp 32: 1720–1740.
53. Yang X, Beason-Held L, Resnick SM, Landman BA (2011) Biological
parametric mapping with robust and non-parametric statistics. Neuroimage57: 423–430.
54. Farb NA, Grady CL, Strother S, Tang-Wai DF, Masellis M, et al. (2013)Abnormal network connectivity in frontotemporal dementia: evidence for
prefrontal isolation. Cortex 49: 1856–1873.
55. Casanova R, Srikanth R, Baer A, Laurienti PJ, Burdette JH, et al. (2007)Biological parametric mapping: A statistical toolbox for multimodality brain
image analysis. Neuroimage 34: 137–143.56. Smieskova R, Allen P, Simon A, Aston J, Bendfeldt K, et al. (2012) Different
duration of at-risk mental state associated with neurofunctional abnormalities. Amultimodal imaging study. Hum Brain Mapp 33: 2281–2294.
57. Hayasaka S, Phan KL, Liberzon I, Worsley KJ, Nichols TE (2004)
Nonstationary cluster-size inference with random field and permutationmethods. Neuroimage 22: 676–687.
58. Petersson KM, Nichols TE, Poline JB, Holmes AP (1999) Statistical limitationsin functional neuroimaging. II. Signal detection and statistical inference. Philos
Trans R Soc Lond B Biol Sci 354: 1261–1281.
59. Poldrack RA, Fletcher PC, Henson RN, Worsley KJ, Brett M, et al. (2008)Guidelines for reporting an fMRI study. Neuroimage 40: 409–414.
60. Onoda K, Ishihara M, Yamaguchi S (2012) Decreased functional connectivityby aging is associated with cognitive decline. J Cogn Neurosci 24: 2186–2198.
61. Mowinckel AM, Espeseth T, Westlye LT (2012) Network-specific effects of ageand in-scanner subject motion: a resting-state fMRI study of 238 healthy adults.
Neuroimage 63: 1364–1373.
62. Mevel K, Landeau B, Fouquet M, La Joie R, Villain N, et al. (2013) Age effect
on the default mode network, inner thoughts, and cognitive abilities. Neurobiol
Aging 34: 1292–1301.
63. Garibotto V, Borroni B, Kalbe E, Herholz K, Salmon E, et al. (2008) Education
and occupation as proxies for reserve in aMCI converters and AD: FDG-PET
evidence. Neurology 71: 1342–1349.
64. Chow TW, Alobaidy AA (2013) Incorporating new diagnostic schemas, genetics,
and proteinopathy into the evaluation of frontotemporal degeneration.
Continuum (Minneap Minn) 19: 438–456.
65. Chhatwal JP, Schultz AP, Johnson K, Benzinger TL, Jack C, Jr., et al. (2013)
Impaired default network functional connectivity in autosomal dominant
Alzheimer disease. Neurology 81: 736–744.
66. Warren JD, Rohrer JD, Hardy J (2012) Disintegrating brain networks: from
syndromes to molecular nexopathies. Neuron 73: 1060–1062.
67. Sieben A, Van Langenhove T, Engelborghs S, Martin JJ, Boon P, et al. (2012)
The genetics and neuropathology of frontotemporal lobar degeneration. Acta
Neuropathol 124: 353–372.
68. Moreno F, Sala-Llonch R, Barandiaran M, Sanchez-Valle R, Estanga A, et al.
(2013) Distinctive age-related temporal cortical thinning in asymptomatic
granulin gene mutation carriers. Neurobiol Aging 34: 1462–1468.
69. Rytty R, Nikkinen J, Paavola L, Abou Elseoud A, Moilanen V, et al. (2013)
GroupICA dual regression analysis of resting state networks in a behavioral
variant of frontotemporal dementia. Front Hum Neurosci 7: 461.
70. Zhou J, Greicius MD, Gennatas ED, Growdon ME, Jang JY, et al. (2010)
Divergent network connectivity changes in behavioural variant frontotemporal
dementia and Alzheimer’s disease. Brain 133: 1352–1367.
71. Maximo JO, Keown CL, Nair A, Muller RA (2013) Approaches to local
connectivity in autism using resting state functional connectivity MRI. Front
Hum Neurosci 7: 605.
72. Buzsaki G, Draguhn A (2004) Neuronal oscillations in cortical networks. Science
304: 1926–1929.
73. Deco G, Jirsa VK, McIntosh AR (2011) Emerging concepts for the dynamical
organization of resting-state activity in the brain. Nat Rev Neurosci 12: 43–56.
74. Cabral J, Hugues E, Sporns O, Deco G (2011) Role of local network oscillations
in resting-state functional connectivity. Neuroimage 57: 130–139.
75. Warren JD, Rohrer JD, Schott JM, Fox NC, Hardy J, et al. (2013) Molecular
nexopathies: a new paradigm of neurodegenerative disease. Trends Neurosci 36:
561–569.
Local Connectivity Measures in Granulin Mutation
PLOS ONE | www.plosone.org 10 September 2014 | Volume 9 | Issue 9 | e106500
Copyright © 2022 FDOKUMEN