A Fast-FENICA method on resting state fMRI data
12
Journal of Neuroscience Methods 209 (2012) 1–12 Contents lists available at SciVerse ScienceDirect Journal of Neuroscience Methods jou rnal h om epa ge: www.elsevier.com/locate/jneumeth Computational Neuroscience A Fast-FENICA method on resting state fMRI data Nizhuan Wang, Weiming Zeng ∗ , Lei Chen College of Information Engineering, Shanghai Maritime University, Shanghai 201306, China h i g h l i g h t s We propose an energy sifting algorithm and a linear candidate networks formation strategy which decreases the scale of candidate networks dramati- cally. Correlation coefficients ranking of network matrix is introduced to further speed-up sharply. The networks detected by Fast-FENICA are ranked based on the spatial consistency at group level. Fast-FENICA is without decreasing the detecting ability of functional networks compared with FENICA. Fast-FENICA is an effective and practical group analysis method and is expected to have wide applicability. a r t i c l e i n f o Article history: Received 23 December 2011 Received in revised form 3 May 2012 Accepted 4 May 2012 Keywords: fMRI ICA FENICA Low frequency energy Correlation coefficients ranking a b s t r a c t For resting-state fMRI data, independent component analysis (ICA) is an excellent method which enables the decomposition of high-dimensional data into discrete spatial and temporal components. Fully exploratory network ICA (FENICA), a fully automated and purely data-driven ICA-based analysis for group assessment of resting-state networks, was proposed by Schöpf et al. (2010). FENICA is a novel and effec- tive group assessment method, but it is not without limitations, such as those related to memory and time costs in running. Here we present Fast-FENICA, which is based on an energy sifting algorithm for inter- ested networks, a linear candidate networks formation strategy and a correlation coefficients ranking algorithm of network matrix. It is demonstrated that the energy sifting algorithm for interested net- works and linear candidate networks formation strategy can transform the stubborn computing time and memory cost limitations of FENICA from a quadratic level to a linear level and thus speed up the group evaluation. Furthermore, the correlation coefficients ranking algorithm can further increase the calculation speed and float up the consistent networks effectively. In comparison to FENICA, the hybrid data and true data experimental results demonstrate that Fast-FENICA not only contributes to the prac- ticability and efficiency without decreasing the detecting ability of functional networks, but also ranks the common functional networks based on the whole spatial consistency at a group level. This proposed effective group analysis method is expected to have wide applicability. © 2012 Elsevier B.V. All rights reserved. 1. Introduction Low frequency fluctuation in blood oxygen level dependent (BOLD) functional magnetic resonance imaging (fMRI) as presented by Biswal et al. (1995) provides the basis of the proposed sponta- neous fluctuation referred to as resting-state networks (RSNs) (De Luca et al., 2006; Damoiseaux et al., 2006; Robinson et al., 2009; Zuo et al., 2010). Specifically, the spontaneous fluctuation of differ- ent cortical areas has revealed some functional connectivity among discrete brain regions. Several methods for analysis of functional connectivity using fMRI have been developed during last decade. ∗ Corresponding author. Tel.: +86 021 38282873; fax: +86 021 38282800. E-mail address: [email protected] (W. Zeng). Generally, these methods can be classified into two categories: model-based methods and data-driven methods (for a review see Li et al., 2009). Currently, RSNs which demonstrate the intrinsic neural activi- ties among many functional networks, have aroused the attention of many scholars. Different approaches for detecting the coher- ent neural activity are used for exploring RSNs (for a review see Cole et al., 2010). The simple and straight-forward method is based on the hypothesis of the priori localizing knowledge, which is subjected to the correlation of the time courses between a seed region and other selected brain voxels. With this seed-based method on resting-state fMRI data, several functional networks have been investigated such as motor, visual, auditory and even certain cognitive networks (Biswal et al., 1995, 1997; Cordes et al., 2001). However, the accuracy of the patterns demonstrated in this 0165-0270/$ – see front matter © 2012 Elsevier B.V. All rights reserved. http://dx.doi.org/10.1016/j.jneumeth.2012.05.007
Transcript of A Fast-FENICA method on resting state fMRI data

C
A
NC
h
�
����
a
ARRA
KfIFLC
1
(bnLZedc
0h
Journal of Neuroscience Methods 209 (2012) 1– 12
Contents lists available at SciVerse ScienceDirect
Journal of Neuroscience Methods
jou rna l h om epa ge: www.elsev ier .com/ locate / jneumeth
omputational Neuroscience
Fast-FENICA method on resting state fMRI data
izhuan Wang, Weiming Zeng ∗, Lei Chenollege of Information Engineering, Shanghai Maritime University, Shanghai 201306, China
i g h l i g h t s
We propose an energy sifting algorithm and a linear candidate networks formation strategy which decreases the scale of candidate networks dramati-cally.Correlation coefficients ranking of network matrix is introduced to further speed-up sharply.The networks detected by Fast-FENICA are ranked based on the spatial consistency at group level.Fast-FENICA is without decreasing the detecting ability of functional networks compared with FENICA.Fast-FENICA is an effective and practical group analysis method and is expected to have wide applicability.
r t i c l e i n f o
rticle history:eceived 23 December 2011eceived in revised form 3 May 2012ccepted 4 May 2012
eywords:MRICAENICAow frequency energyorrelation coefficients ranking
a b s t r a c t
For resting-state fMRI data, independent component analysis (ICA) is an excellent method which enablesthe decomposition of high-dimensional data into discrete spatial and temporal components. Fullyexploratory network ICA (FENICA), a fully automated and purely data-driven ICA-based analysis for groupassessment of resting-state networks, was proposed by Schöpf et al. (2010). FENICA is a novel and effec-tive group assessment method, but it is not without limitations, such as those related to memory and timecosts in running. Here we present Fast-FENICA, which is based on an energy sifting algorithm for inter-ested networks, a linear candidate networks formation strategy and a correlation coefficients rankingalgorithm of network matrix. It is demonstrated that the energy sifting algorithm for interested net-works and linear candidate networks formation strategy can transform the stubborn computing timeand memory cost limitations of FENICA from a quadratic level to a linear level and thus speed up the
group evaluation. Furthermore, the correlation coefficients ranking algorithm can further increase thecalculation speed and float up the consistent networks effectively. In comparison to FENICA, the hybriddata and true data experimental results demonstrate that Fast-FENICA not only contributes to the prac-ticability and efficiency without decreasing the detecting ability of functional networks, but also ranksthe common functional networks based on the whole spatial consistency at a group level. This proposedeffective group analysis method is expected to have wide applicability.© 2012 Elsevier B.V. All rights reserved.
. Introduction
Low frequency fluctuation in blood oxygen level dependentBOLD) functional magnetic resonance imaging (fMRI) as presentedy Biswal et al. (1995) provides the basis of the proposed sponta-eous fluctuation referred to as resting-state networks (RSNs) (Deuca et al., 2006; Damoiseaux et al., 2006; Robinson et al., 2009;uo et al., 2010). Specifically, the spontaneous fluctuation of differ-
nt cortical areas has revealed some functional connectivity amongiscrete brain regions. Several methods for analysis of functionalonnectivity using fMRI have been developed during last decade.∗ Corresponding author. Tel.: +86 021 38282873; fax: +86 021 38282800.E-mail address: [email protected] (W. Zeng).
165-0270/$ – see front matter © 2012 Elsevier B.V. All rights reserved.ttp://dx.doi.org/10.1016/j.jneumeth.2012.05.007
Generally, these methods can be classified into two categories:model-based methods and data-driven methods (for a review seeLi et al., 2009).
Currently, RSNs which demonstrate the intrinsic neural activi-ties among many functional networks, have aroused the attentionof many scholars. Different approaches for detecting the coher-ent neural activity are used for exploring RSNs (for a review seeCole et al., 2010). The simple and straight-forward method isbased on the hypothesis of the priori localizing knowledge, whichis subjected to the correlation of the time courses between aseed region and other selected brain voxels. With this seed-based
method on resting-state fMRI data, several functional networkshave been investigated such as motor, visual, auditory and evencertain cognitive networks (Biswal et al., 1995, 1997; Cordes et al.,2001). However, the accuracy of the patterns demonstrated in this
2 urosci
hw
imdfes
smm(nawoerB(oabwj(mreotimtlwibwrmptwme
s(tkmiubwcbptnsda
N. Wang et al. / Journal of Ne
ypothesis-driven method is susceptible to the priori knowledge,hich needs very strong a priori information of the expected RSNs.
In contrast, data-driven methods do not require any specificnformation of a priori model (Li et al., 2009). Several data-driven
ethods such as principal component analysis (PCA), indepen-ent component analysis (ICA), hierarchical clustering analysis anduzzy clustering analysis (for a review see Li et al., 2009; Cordest al., 2002) have been applied to resting-state fMRI data on theingle subject level.
In order to investigate the commonalities across a group ofubjects, scientists have begun to develop group data analysisethods (for a review see Calhoun et al., 2009) such as the classicalulti-session temporal concatenated group ICA (TCGICA) method
Calhoun et al., 2001) in which single-subject data are concate-ated in the temporal domain. Whether ICA should be performedt a group level or not is still under discussion because the PCAhitening of group data perhaps loses some subtle information
f certain RSNs (Cordes and Nandy, 2004). Moreover, the differ-nt concatenated order can lead to the variable decompositionesults of TCGICA (for details see Zhang et al., 2010). In addition,eckmann and Smith (2005a) also introduced a three dimensional3D) tensor to represent the spatial, temporal and subject-loadingsf each group component. This approach, however, may not works well (without additional preprocessing) if the time courses (TCs)etween subjects are different, such as in a resting-state study inhich the time course is obviously not synchronized between sub-
ects as it is in a task paradigm with similar timing between subjectsErhardt et al., 2011). In order to obtain the key functional spatial
aps from the independent components (IC) produced by ICA, theanking of ICs is also quite important. Toward this end, McKeownt al. (1998) proposed a ranking method based on the contributionf each component to the total variance. But this method provedo be ineffective when the variance of the noises fluctuated heav-ly. Moritz et al. (2003) also developed a power spectrum ranking
ethod which was designed for the task-related activations, buthis method was dependent on the known frequency of the stimu-us, whereas it was a limitation to rank the activation components
ith unknown frequency. On the basis of the spatial reproducibil-ty of component maps, Yang et al. (2008) ranked the componentsy many ICA decompositions that required a huge time cost, whichas also a significant limitation of this analysis. Another automatic
anking method was proposed by Zeng et al. (2009) based on theaximum mean correlation (MMC) of paired ICs in which one com-
onent was extracted from the original data set, and the other fromhe sub-sampled data set. However, a limitation of that techniqueas that uninterested ICs sometimes were ranked in front by MMCethod. From the above examples, it is clear that ranking the ICs
ffectively is an arduous task to achieve.Sorg et al. (2007) performed the group analysis based on the ICs
elected via visual inspection of single-subject level. Greicius et al.2003), Van de Ven et al. (2004), and Calhoun et al. (2008) selectedhe single-subject RSN components based on the published andnown RSNs templates for further group analysis. Thus all the aboveethods for selecting components of RSNs are arbitrary via visual
nspection or subjected to the priori template information. Anotherseful evaluation approach which assessed the spatial consistencyetween component maps was introduced by De Luca et al. (2006),here the spatial correlation coefficients of all components were
omputed. The resulting RSNs produced by the group method wereiased by the visual criterion used for pair-wise correlations andattern selection. For the purpose of developing the spatial consis-ency method, Schöpf et al. (2010) proposed a fully exploratory
etwork ICA (FENICA) method, which was based on single-ubject ICA decomposition and the assumption that the spatialistribution of the same functional signal changes was similarmong group subjects.ence Methods 209 (2012) 1– 12
FENICA is an effective group data analysis method in whichranking and selecting the key ICs at a group level is performedautomatically. However, a drawback is that it takes considerablecomputing time and computer memory space to calculate so manycandidate networks including the majority of ineffective networksalthough spatial correlation between ICs can be used to limit thequantity of candidate networks. Furthermore, the network matrixsorting algorithm of FENICA assisting to remove the duplicatednetworks is not highly efficient.
In this study, we present an improved group analysis method,named Fast-FENICA. At first, based on the fact that differentfunctional networks usually occupy distinct energy features withrespect to the frequency, for example, most energy of each RSNusually occupies the low frequency and the energy of task-relatedfunctional networks usually centers on the corresponding fre-quencies with respect to the stimuli. Thus, we can use this prioriinformation to remove some non-interested networks (non-INs)and retain some candidate interested networks (INs). An efficientlinear candidate networks formation strategy is then proposed todecrease computing time cost and save memory. Furthermore, anefficient and reliable sorting algorithm of the network matrix basedon the sum of all correlation coefficients is introduced in Fast-FENICA, so as to further enhance the performance of FENICA.
The remainder of this paper is organized as follows: a review ofFENICA will be presented firstly, followed by related theory andalgorithms of Fast-FENICA. Finally, we will provide initial testsusing Fast-FENICA on a hybrid data, task-related data and resting-state data, and the corresponding results will be presented togetherwith interpretations and conclusions related to advantages andlimitations of this new group analysis model.
2. Material and methods
2.1. FENICA and its background
FENICA, which is based on the spatial consistency across sub-jects, has been elaborated according to Schöpf’s seminal reports(Schöpf et al., 2010, 2011). Suppose that there are n subjects. Thequantity of components yielded by single-subject ICA of subject k isdenoted by Nk and the number of total components of all subjectscan be referred to as Ntotal =
∑nk=1Nk. The Ntotal components of all
subjects generate the IC series, which is used to form the candi-date networks. Ck,m represents the mth spatial component map ofsubject k. The correlation coefficient of component m1 of subject k1and component m2 of subject k2 is given by
corrcoef (Ck1,m1, Ck2,m2
) =∣∣∣∣∣ cov(Ck1,m1
, Ck2,m2)√
cov(Ck1,m1)cov(Ck2,m2
)
∣∣∣∣∣from Schöpf’s definition (Schöpf et al., 2010). The implementedprocedures of FENICA can be concluded as follows:
(a) All average maps formation: calculate the averagemaps Sl of two ICs belonging to any two distinctsubjects, which is defined as Sl = (Ck1,m1
+ Ck2,m2)/2
for all k1 ∈ {1, ..., n}, k2 ∈ {1, ..., n}/{k1}, m1 ∈ {1, ..., Nk1},
m2 ∈ {1, ..., Nk2} and l ∈ {1, 2, ..., NAVG}, where NAVG =
1/2(
(Ntotal)2 − ∑N
k=1(Nk)2)
.
(b) Network matrix Netmat formation: calculate the networkmatrix Netmat of size n × NAVG , which records the highestcorrelation coefficients between every S and the compo-
lnents of each subject, where Netmat can be formulatedas ∀j∃lNetmat(j, l) : maxm=1,...,Nj
[correcoef (Cj,m, Sl)], for every
j ∈ {1, ..., n} and l ∈ {1, 2, ..., NAVG}. The spatially consistent

uroscie
(
2
coaSwsNwFcstctorn
2
nandqdttttFbws
ctav
aowntf
N. Wang et al. / Journal of Ne
NAVG candidate networks across the group are determinedby Netmat, where the determined networks are denoted asNetworkl, 1 ≤ l ≤ NAVG .
(c) Mean candidate networks formation: calculate the mean maps�(Netmatl) across subjects according to Netmat to form themean candidate networks.
d) Duplicate networks removal: set a spatial correlation equiv-alence threshold to reduce the duplicate networks accordingto the spatial correlation coefficients among the meanmaps �(Netmatl) and then obtain the top Nkeynetworks keyfunctional networks. In this step, sorting Netmat in descend-ing order according to the sum of all absolute t-values�sum(Netmatl) is involved, where �sum(Netmatl) is equal tosum(abs(Networkl/(SD · sqrt(L)))), SD and L are the standarddeviation and size of Networkl respectively.
.2. Theory and algorithms of Fast-FENICA
Before involving the theory and algorithms of Fast-FENICA, let usonsider such situation: suppose that 500 resting-state fMRI dataf different subjects are utilized to do group analysis using FENICA,nd the average quantity of ICs yielded by each subject data is 20.o the size of the candidate networks NAVG is about 1/2 · 10 0002,here Ntotal = 10 000. Even though the candidate networks can be
ifted according to the spatial correlation coefficients between thetotal ICs (Schöpf et al., 2010), the quantity of sifted candidate net-orks is also more than several thousand in this situation. Thus, the
ENICA turned stuck within limited computer memory space andomputing time. This proposed Fast-FENICA aims to transform thistubborn problem from quadratic scale to linear, which is based onhe INs and non-INs division and selection procedure and a linearandidate networks formation strategy. Furthermore, the correla-ion coefficients ranking is proposed in the approach with the aimf further increasing the calculation speed in duplicate networksemoval step of FENICA and floating up the consistent functionaletworks effectively.
.2.1. INs and non-INs division and selectionFrom a view of practicability, computing all the NAVG candidate
etworks takes so much time and should be wasteful in that majority of candidate networks represent the non-interestedetworks and there are enormous candidate networks with a 3Distribution. However, the scale of candidate networks NAVG is auadratic function of the quantity of the total ICs Ntotal. Meanwhile,ifferent functional networks always have distinct frequencies;ake the RSNs for example, their frequencies usually are no morehan 0.1 Hz (Cordes et al., 2000, 2001). For the task-related data, theask-related functional networks are related to the frequency ofhe stimulus. Thus, in order to improve the practicality of applyingENICA, an initial division and selection for INs and non-INs cane a trial based on the priori frequency feature of functional net-orks, which decreases the quantity of the total ICs of all subjects
harply.To begin, we suppose that the power spectrum of the time
ourse corresponding to a spatial map has been retrieved by Fourierransform. Denote the frequency and the power spectrum as und f(u) respectively. For a continuous frequency closed inter-al [a, b], the energy at the specific interval can be calculated
s Energy[a,b] =∫ b
af (u)du. The corresponding discrete formation
f the energy can be denoted as Energydiscrete[u0,uN ] =∑uN
u=u0f (u),
here u = u0, u1, ..., ui, ..., uN . For resting-state data, the INs andon-INs represent the RSNs and non-RSNs respectively. For theask-related data, the INs and non-INs represent the tasked-relatedunctional networks and non-task related networks. So we denote
nce Methods 209 (2012) 1– 12 3
the proportion between energy in the interval [u0, uN] and the totalenergy of a network as
proportion = Energydiscrete[u0,uN ]
Energy[0,+∞](1)
where u0, uN represent the low bound and upper bound of fre-quency level threshold of the INs, which can be adapted subtlyaccording to the specific situation (in this study, for resting-statedata, we set [u0, uN] to [0, 0.1]Hz unless otherwise specified, whichis a rational and empirical threshold for RSNs; for task-related data,we can set the frequency bounds according to the stimulus fre-quency). Thus, all spatial maps of every subject can be dividedinto two groups (candidate INs and non-INs) on the basis of thefrequency-energy criteria corresponding to the proportion level. Ifthe proportion is bigger than a specified p-level, the spatial map canbe a candidate IN; otherwise it is classified as a non-IN. This sift-ing operation is called an energy sifting algorithm. We then selectthe candidate INs and remove the non-INs for every subject. Thepost-processing is only performed on the candidate INs. We callthe above procedure INs and non-INs division and selection.
Suppose further the IncludedICs denotes the selected spatialmaps set, i.e., all candidate INs, and ExcludedICs denotes theexcluded spatial maps set, i.e., all the non-INs. In the followingdescription, the performance analysis of energy sifting algorithmwill be detailed.
Let Ratiok represent the proportion between the selected spatialmaps after division and selection and the total spatial maps of asubject k, Ratiok is expressed as
Ratiok = #{IncludedICs}#{IncludedICs} + #{ExcludedICs} (2)
where # represents the statistic operation of quantity of elementsin a certain data set. We denote Ratio = {Ratio1, Ratio2, ..., Ratiok,..., Ration} for n subjects. Furthermore, we denote the maximumselected ratio as Ratiomax, where Ratiomax = max(Ratio). Let ndenote the number of subjects, and Nk the number of ICs of sub-ject k. Ntotal is the quantity of spatial maps of all subjects withoutselection, and Nselectedtotal represents the quantity of spatial maps ofall subjects corresponding to Ratio after INs and non-INs divisionand selection procedure is implemented, where Nselectedtotal satisfiesfollowing formula.
Nselectedtotal =n∑
k=1
Nk · Ratiok (3)
Accordingly, if Ratiomax is equal to 1/2, Nselectedtotal satisfiesNselectedtotal ≤ Ratiomax · Ntotal = (Ntotal)/2. After the INs and non-INs division and selection is implemented, the candidate INs withthe smaller number Nselectedtotal have been obtained based on thefrequency-energy criteria.
However, the group analysis of resting-state data without spe-cific priori information is always complex in comparison to thetask-related data, which is the main focus in this present study.For resting-state data, as we emphasized before, the RSNs and non-RSNs have the equivalent roles of INs and non-INs respectively.Based on other research (Biswal et al., 1995), low frequency fluc-tuation is an obvious feature for the RSNs. The energy (power)ratios of RSNs between in low frequency interval and in the wholefrequency interval, called low frequency energy ratio (LFER), areusually more than those of non-RSNs. So we can judge from a spatialmap whether it is a candidate RSN by the energy calculation basedon the corresponding time course. The criterion for candidate RSN
is that the proportion of low-frequency energy in the total energyexceeds a certain threshold. So an initial sifting of candidate RSNsand non-RSNs can be retrieved by an energy computing operationof the power spectra corresponding to the time courses.
4 urosci
2
dtdcfmaIocINTst
nstitnp
2
a�aisaa
�
wrpswwcwd
waieotDctFcsmt
C
N. Wang et al. / Journal of Ne
.2.2. Linear candidate networks formation strategyBased on the principle of FENICA, we know the size of the can-
idate networks is NAVG, which is a quadratic function of Ntotal. Ashe scale of IC series increases, the corresponding scale of candi-ate networks grows dramatically. This situation caused a stubbornomputer memory space and computing time limitation to FENICAacing 3D human brain data. Now we present a direct linear for-
ation strategy of candidate networks. After the energy siftinglgorithm is utilized to the Ntotal IC series, the Nselectedtotal candidateNs are retrieved, which is a complete set including all true INs. Inther words, all the true INs at group level can be yielded by theseandidate INs. For Fast-FENICA, we set the Nselectedtotal candidateNs as the candidate networks, whose scale is a linear function oftotal, and upper bound is Ratiomax · Ntotal , where 0 < Ratiomax ≤ 1.he linear formation strategy of candidate networks can be demon-trated iconically in Fig. 1. The candidate INs of Fast-FENICA servehe equivalent role of the NAVG average maps of FENICA.
Based on the energy sifting algorithm and linear candidateetworks formation strategy, the scale of candidate networks isharply reduced from the quadratic level to the linear level andhe group evaluation performance can be improved dramaticallyn computer memory space and computing time. In order to fur-her accelerate FENICA and float up the INs quickly in duplicateetworks removal step, the correlation coefficients ranking is pro-osed in the following part.
.2.3. Correlation coefficients rankingIn order to remove duplicate networks at a certain spatial equiv-
lence and retain the crucial networks, a sorting method calledsum(Netmatl) sorting algorithm has been used in FENICA (labeleds duplicate networks removal step of FENICA). This sorting methods based on the sum of the absolute t-values of the networks corre-ponding to the spatial maps of each subject (Schöpf et al., 2010),nd the sum value of absolute t-values of Networkl can be expresseds
sum(Netmatl) = sum(
abs(
Networkl
SD · sqrt(L)
))(4)
here SD and L are the standard deviation and size of Networklespectively. However, this sorting technique is not high-erformance. One reason is that some networks with the higherum of the absolute t-values have lower correlation coefficientsithin the network matrix. This can lead to that certain key net-orks cannot float up as soon as possible. Another reason is that
alculating �sum(Netmatl) is not effective for 3D human brain data,hile the sorting method should be involved for several times inuplicate networks removal step.
Based on the spatial consistency, we found that sorting the net-ork matrix by the sum of correlation coefficients is an effective
nd useful approach which contributes to the efficiency. Accord-ng to the definition of network matrix in Schöpf’s reports (Schöpft al., 2010), we denote the quantity of all subjects and the scalef candidate networks as n and M respectively, where M is equalo NAVG in FENICA. But in Fast-FENICA, M is equal to Nselectedtotal .enote Ci,kl
the kth spatial map of subject i which most highlyorrelates with the candidate network Sl, where i and l belongso [1, 2, ..., i, ..., n − 1, n] and [1, 2, ..., l, ..., M − 1, M] respectively.urther denote the correlation coefficient between Ci,kl
and Sl asorrcoef (Ci,kl
, Sl), so the column l of network matrix Netmat withize n × M are correlation coefficients between the Sl and the spatialap with the highest correlation within every subject. We denote
he sum operation of the column l of Netmat as following formula.
Csum(Netmatl) =n∑
i=1
corrcoef (Ci,kl, Sl) (5)
ence Methods 209 (2012) 1– 12
Moreover, spatial consistency is the fundamental principle ofFENICA, and is evaluated by the correlation coefficients. Based onsuch a direct principle, we can draw a conclusion that as the value ofCCsum(Netmatl) increases, the corresponding spatial maps of eachsubject are more similar to each other, and more consistent as awhole. Thus, sorting Netmat by CCsum(Netmatl) can help to revealand float up the consistent functional networks more effectively ata group level. We call this ranking method based on CCsum(Netmatl)correlation coefficients ranking.
In the following part, the consistency measurement of func-tional networks are given to evaluate the two different sortingalgorithms of Netmat. We denote the mean and variance value ofthe correlation coefficients of a network networkl as Meannetworkland VARnetworkl
respectively. The formation of Meannetworkland
VARnetworklcan be expressed as
VARnetworkl=
[1n
n∑i=1
(corrcoef (Ci,kl, Sl) − Meannetworkl
)2
]1/2
(6)
Meannetworkl=
∑ni=1corrcoef (Ci,kl
, Sl)
n(7)
where n denotes the number of all the subjects. According to thespatial consistency, we know that as VARnetworkl
becomes smaller,the corresponding spatial maps of all subjects become more cor-related with one another and the networkl is more consistent asa whole. Thus, the variance value of the correlation coefficientsdetermined by the network matrix is an effective measurementfor spatial consistency at group level.
Furthermore, according to the two sorting criteria (formula (4)and (5)), we can draw a conclusion that the correlation coeffi-cients ranking of Fast-FENICA spends less computation time onCCsum(Netmatl) than �sum(Netmatl) and thus has a better per-formance than FENICA. In Fast-FENICA method, we replace the�sum(Netmatl) sorting algorithm in duplicate networks removal stepof FENICA with correlation coefficients ranking algorithm.
2.3. Data acquisition and processing
In this section, experimental tests consist of hybrid data andtrue data experiments. On hybrid data set, we intend to assess thegroup evaluation performance of the simulated functional signalsat a lively level compared with the multi-session Temporal Con-catenated Group ICA (TCGICA, proposed by Calhoun et al., 2001).On true data set, we firstly apply this Fast-FENICA on task-relateddata set to detect task-related functional networks, and then onresting-state data set to detect the RSNs.
2.3.1. Hybrid dataIn order to assess the performance of the Fast-FENICA method in
group analysis, two simulated signals S1 and S2 (marked in Fig. 2A)were added to the normalized original resting-state fMRI data of thethree subjects respectively, at an amplitude equal to 0.5 times of theaverage amplitude of the signal within the brain. For the originalresting-state fMRI data set, the three subjects were informed aboutthe aim of study and given their written informed consent prior toinclusion. BOLD fMRI data were acquired using single-shot SENSEgradient echo EPI with 37 slices providing whole-brain coverage,a SENSE acceleration factor of 2.0, a TR of 2.0 s and scan resolutionof 80 × 80. The in-plane resolution was 3 mm × 3 mm; slice thick-ness was 3 mm; slice gap was 1 mm. Subjects with eyes closed were
instructed to lie still, relax and stay awake. The participants under-went three fMRI scans, each scan of 4 min duration with 120 timepoints. Fig. 2A displays echo planner images with simulated sig-nals S1 and S2. The signal changes in the anterior two regions and
N. Wang et al. / Journal of Neuroscience Methods 209 (2012) 1– 12 5
twork
tf
22sicO1bttuio4odS8w
2d(r
Fiv
Fig. 1. Linear formation strategy of candidate ne
he more posterior two regions respectively, correspond to mixingunction 1 and mixing function 2, as shown in Fig. 2B.
.3.2. True data
.3.2.1. Task-related data. For task-related experimental test, threeubjects were involved in this study. All the three subjects werenformed about the aim of study and given their written informedonsent prior to inclusion. The visual paradigm was OFF-ON-OFF-N-OFF-ON-OFF in 20 s block except that the last OFF block was0 s. At the “ON” state, visual stimulus was corresponding to a radiallue/yellow checkerboard, reversing at 7 Hz. And at the “OFF” state,he participants were required to focus on the cross at the cen-er of the screen. The BOLD fMRI data of one subject was acquiredsing single-shot SENSE gradient echo EPI with 37 slices provid-
ng whole-brain coverage, a SENSE acceleration factor of 2.0, a TRf 2.0 s and scan resolution of 64 × 64. The in-plane resolution was
mm × 4 mm; slice thickness was 4 mm; slice gap was 1 mm. Thether two subjects were acquired using single-shot SENSE gra-ient echo EPI with 40 slices providing whole-brain coverage, aENSE acceleration factor of 3.0, a TR of 2.0 s and scan resolution of0 × 80. The in-plane resolution was 3 mm × 3 mm; slice thicknessas 3 mm; slice gap was 1 mm.
.3.2.2. Resting-state data. The resting-state data set wasownloaded from the public neuroimaging databasehttp://www.nitrc.org/projects/fcon 1000/). This data set waseleased by Dr. James J. Pekar and Dr. Stewart H. Mostofsky.
ig. 2. (A) Hybrid data: echo planar images from resting participant. Boxes indicate whern the anterior two regions and the more posterior two regions respectively. (B) Time couariant function for the hemodynamic response function with delay 1.7 in the function.
s based on candidate INs, where M = Nselectedtotal .
Twenty-three healthy subjects (8 males and 15 females) wereinvolved in this study. The age of these subjects ranged from 20 to40. BOLD fMRI data were acquired on a Philips 3.0 Tesla scannerusing a multi-element receiver coil to allow partially parallelimage acquisition with single-shot SENSE gradient echo EPI with47 slices providing whole-brain coverage and 123 volumes, aSENSE acceleration factor of 2.0, a TR of 2.5 s and scan resolutionof 96 × 96. The in-plane resolution was 2.67 mm × 2.67 mm; slicethickness was 3 mm.
2.3.3. Data processingAll computations of this study were performed on a server with
intel(R) Xeon(R) E5606 2.13 GHz processor and 32 GB RAM. Theoperation system platform was Windows Server Enterprise ServicePack1.
Image preprocessing was performed in SPM8(http://www.fil.ion.ucl.ac.uk/spm/) including slice timing, motioncorrection, spatial normalization and smoothing using a Gaussiankernel (FWHM = 8 mm). All fMRI data sets were performed byhigh pass filter with default value in MELODIC (MultivariateExploratory Linear Decomposition into Independent Com-ponents, version 3.10), using FSL (FMRIB’s Software Library,
http://www.fmrib.ox.ac.uk/fsl). For the hybrid data set, the single-subject ICA and TCGICA were involved. All the single-subject ICAand TCGICA were performed using probabilistic ICA (Beckmannand Smith, 2004) as implemented in MELODIC. The orders ofe the simulated signals S1 and S2 are added. The simulated signals refer to changesrses for the two simulated sources S1 and S2. They are generated by using a gamma

6 N. Wang et al. / Journal of Neuroscience Methods 209 (2012) 1– 12
F S2, wT ods.
IM
iMw2ft
3
3
2mSc
ig. 3. (A) and (B) The spatial maps corresponding to the simulated sources S1 andhe normalized group-level time courses yielded by these two group analysis meth
Cs of all experimental tests were estimated automatically withELODIC.All steps for post processing algorithms of Fast-FENICA were
mplemented in Matlab (Matlab 2008a, Mathworks Inc., Sherborn,A, USA). Furthermore, the location and display of these networksere assessed using the PickAtlas software toolbox (Maldjian et al.,
003, 2004) and MRIcro software (http://www.mricro.com). All theunctional networks displayed were projected to a standard brainemplate.
. Results
.1. Hybrid data result
Single-subject ICA of the three hybrid data yielded 27, 24 and
7 components respectively. Fig. 3A and B displayed the spatialaps detected by Fast-FENICA and TCGICA, which corresponded to1 and S2. The normalized group-level time courses of the two ICsorresponding to S1 and S2 were respectively shown in Fig. 3C and
hich are yielded by TCGICA and the Fast-FENICA method respectively. (C) and (D)
D. According to the experimental results, our Fast-FENICA methodobtained the ICs representing the two simulated sources S1 and S2at a group analysis level, which had the similar spatial and temporalperformance compared with the classical TCGICA method (Calhounet al., 2001). Fig. 3C and D highlighted different amplitudes of thetwo group-level normalized time courses, which highly correlatedwith each other.
3.2. True data results
3.2.1. Task-related data resultIn task-related experimental test, single-subject ICA of the three
task-related data yielded 18, 18 and 17 components respectively.The Fast-FENICA was effective to detect the common functionalnetwork (visual cortex, VC) corresponding to the visual stimulus.
Owing to the correlation coefficients ranking of Fast-FENICA, thecommon VC network was floated up primarily and ranked the first.The VC networks at single-subject level and group level were shownin the flowing Fig. 4.
N. Wang et al. / Journal of Neuroscience Methods 209 (2012) 1– 12 7
(D) Th
3
sest2tlsnti
mnAs2ttms
bi(gp(rHSFamwddm
FFac
about 5 times of Fast-FENICA. As the number of subjects increased,the performance of Fast-FENICA outdistances that of FENICAobviously.
Table 1LFER values and correlation coefficients with respect to power spectra correspond-ing to the 6 common RSNs detected by Fast-FENICA and FENICA methods.
Network Method Measurement
Low frequency energyratio (LFER)
Correlationcoefficient
VIN FENICA 0.6295 0.868281Fast-FENICA 0.8572
DMN FENICA 0.7340 0.934178Fast-FENICA 0.8871
AUN FENICA 0.7003 0.922075Fast-FENICA 0.8467
DPN2 FENICA 0.8353 0.920041Fast-FENICA 0.8753
Fig. 4. (A)–(C) The VC networks at single-subject level.
.2.2. Resting-state data resultThe total 525 components were yielded by the standard
ingle-subject based ICA of twenty-three subjects in resting-statexperimental test. Furthermore, with INs and non-INs division andelection procedure of the components at the single-subject level,he number of total components decreased to 297 with nearly97/525 ≈ 0.57 average selection ratio, where p-level was set tohe mean value of LFER values of all ICs of each subject. Based on theinear candidate networks formation strategy of Fast-FENICA, thecale of candidate networks was 297, whereas the scale of candidateetworks of FENICA was about 1/2 · 5252. These two proceduresransformed the quadratic scale of candidate networks of FENICAnto linear scale of Fast-FENICA effectively.
In order to evaluate correlation coefficients ranking perfor-ance of Fast-FENICA compared with FENICA, all the 297 candidate
etworks were sorted based on these two different ranking criteria. statistic of the value VARnetworkl
was used to evaluate spatial con-istency of the sorted candidate networks, where l ranged from 1 to97. Fig. 5 depicted the spatial consistency contrast evaluation ofhe FENICA and Fast-FENICA methods. There Fast-FENICA can rankhe more consistent networks in the foreground than FENICA. This
erit is benefit to float up the consistent functional networks asoon as possible.
In this experimental test, some typical RSNs were detectedy the improved Fast-FENICA such as VIN (predominantly occip-
tal network, Fig. 6A), DMN (default mode network, Fig. 6B), AUNauditory network, Fig. 6C), BGN (a network involving basal gan-lia regions, Fig. 6D), DPN1 and DPN2 (a network involving dorsalarietal and prefrontal cortex, Fig. 6E and F), LWMN and RWMNa network including the left hemisphere and right hemisphereegions known to be involving in working memory, Fig. 6G and) (described in Beckmann et al., 2005b; Damoiseaux et al., 2006;chöpf et al., 2010). As a comparison, typical RSNs discovered byENICA were also shown in Fig. 7A–F respectively. Meanwhile,ll the correlation coefficients (shown in Table 1) between theean power spectra detected by Fast-FENICA and those by FENICAere more than 0.86, which demonstrated that the common RSNsetected by both methods had similar performance in frequencyomain. The LFER values of these common RSNs detected by bothethods were also calculated and listed in Table 1.Furthermore, the default mode networks determined by Fast-
ENICA of all 23 subjects at single-subject level were shown inig. 8. Based on the comparison between DMNs (shown in Fig. 8)t single-subject level and DMN (in Fig. 6) at group level, wean conclude that the Fast-FENICA has strong robustness to face
e VC network detected by Fast-FENICA at group level.
the distinctions of the equivalent functional networks of differentsubjects.
3.3. Speed analysis
In order to give the noticeable demonstration in speed analy-sis of Fast-FENICA, the consumed CPU times of all experimentaltests were recorded, as shown in Table 2. For reducing the scaleof candidate networks of FENICA, the NAVG candidate networkswere limited to the networks with correlation coefficients no lessthan 0.4 among the correlation coefficients matrix (proposed bySchöpf et al., 2010). So the quantity of selected candidate net-works were limited to 60, 25 and 600 corresponding to the hybriddata, task-related data and resting-state data respectively. For Fast-FENICA, according to the INs and non-INs division and selectionprocedure and linear candidate networks formation strategy, thequantity of candidate networks were decreased to 46, 35 and 297corresponding to the hybrid data, task-related data and resting-state data respectively. According to Table 2, the consumed timeof yielding candidate networks and removing duplicate networksof FENICA was all more than the one of Fast-FENICA. The averagetotal consumed time of FENICA in these experimental tests was
LWMN FENICA 0.7406 0.958859Fast-FENICA 0.8615
RWMN FENICA 0.7102 0.892240Fast-FENICA 0.8826

8 N. Wang et al. / Journal of Neuroscience Methods 209 (2012) 1– 12
Fig. 5. Spatial consistency contrast evaluation between FENICA and Fast-FENICA: the blue FENICA-VAR and red FastFENICA-VAR curves show the variances of correlationcoefficients of all 297 candidate networks ranked by FENICA and Fast-FENICA respectively. The green curve represents the difference between FENICA-VAR and FastFENICA-VAR.(For interpretation of the references to color in this figure legend, the reader is referred to the web version of this article.)
Fig. 6. Eight typical RSNs are detected by Fast-FENICA, where the low frequency threshold and spatial equivalence level is set to 0.1 Hz and 0.65 respectively; all the networksare projected to a standard brain template and the MNI coordinates (in mm) of these functional networks are labeled in this figure.

N. Wang et al. / Journal of Neuroscience Methods 209 (2012) 1– 12 9
Fig. 7. Six typical RSNs are detected by FENICA method involving 600 candidate networks with correlation coefficients no less than 0.4 among the correlation coefficientsm a stana
4
aa
FrnwtlRecdtiattFFedF
srFp
atrix; and the spatial equivalence level is set to 0.60; all networks are projected tore labeled in this figure.
. Discussion
The purpose of this study was to improve the practicabilitynd efficiency of FENICA. We designed the Fast-FENICA method tochieve this goal.
First, we introduced the energy sifting algorithm of our Fast-ENICA method in order to exclude some components that did noteflect interested networks remarkably. Then a linear candidateetworks formation strategy was applied to form the candidate net-orks efficiently. After these two procedures were implemented,
he scale of candidate networks sharply decreased from a quadraticevel NAVG to a linear level Ratiomax · Ntotal at the least, where 0 <atiomax ≤ 1. Compared with Fast-FENICA, FENICA took the strat-gy of limiting the candidate networks forcibly to the ones withorrelation coefficient no less than a certain threshold, which alsoecreased the number of candidate networks and possibly led tohat the scale of candidate networks in FENICA was less than thatn Fast-FENICA when the number of experimental subjects was rel-tively small. However, the average maps calculation of forminghe candidate networks in FENICA usually took more computingime than the linear candidate networks formation strategy in Fast-ENICA. As the number of subjects increased, the performance ofast-FENICA outdistanced that of FENICA obviously. In our differ-nt kinds of experiments, Fast-FENICA was a highly effective groupata analysis method with less computing time cost compared withENICA (shown in Table 2).
Furthermore, during duplicate networks removal step, the
orting algorithm of network matrix Metmat in FENICA waseplaced by the correlation coefficients ranking algorithm in Fast-ENICA. Based on the spatial consistency at a group level, theroposed sorting approach accomplished the ICs sorting taskdard brain template and the MNI coordinates (in mm) of these functional networks
simultaneously. This aspect is especially beneficial for tasked-related data group analysis to search the common task-relatednetworks, which always occupy the high consistency as a whole.This was further verified by our visual stimulus experimental testand there the common VC network corresponding to the visualstimulus was detected and ranked the first (in Fig. 4). Even theresting-state data analysis benefited from the improved sortingalgorithm where the variance measurement of experimental result(in Fig. 5) demonstrated that our approach could reveal the consis-tent RSNs more effectively than FENICA.
Few RSNs may be not discovered by Fast-FENICA with the lowfrequency threshold equal to 0.1 Hz. This phenomenon is possiblydue to such few RSNs having the relatively low LFER values to beexcluded from the candidate networks set during the INs and non-INs division and selection procedure with the 0.1 Hz low frequencythreshold. This deficiency can be overcome by adjusting the lowfrequency threshold. For example, in our resting-state data experi-mental test, we found eight typical RSNs (shown in Fig. 6). However,the resting-state network SMN (a network including bilateral sen-sorimotor cortex, described in Beckmann et al., 2005b; Damoiseauxet al., 2006; Schöpf et al., 2010) was not detected by Fast-FENICAwith the 0.1 Hz low frequency threshold. As a further investiga-tion of Fast-FENICA, it was found that when the low frequencythreshold was increased to 0.15 Hz, the SMN (shown in Fig. 9A)was also detected quickly by Fast-FENICA besides the eight RSNsshown in Fig. 6. According to the mean power spectrum curve ofSMN (Fig. 9B), this power spectrum had relatively high energy in
the interval [0.1, 0.15] Hz, while it also satisfied the strong lowfrequency fluctuation feature. This further investigation demon-strates that Fast-FENICA method has effective group evaluationability with strong robustness.
10 N. Wang et al. / Journal of Neuroscience Methods 209 (2012) 1– 12
etecte
Bltm
Fig. 8. DMNs of all 23 subjects d
According to the RSNs shown in Fig. 7, we could see that the
GN, DPN1 and SMN networks were not discovered by FENICA withimiting the 131 738 candidate networks to 600 ones with correla-ion coefficients no less than 0.4 among the correlation coefficients
atrix (proposed by Schöpf et al., 2010). This phenomenon is
d by ICA at single-subject level.
possibly due to forcibly limiting the huge scale of candidate net-
works to a far lesser one with a certain high correlation coefficientin the FENICA method, whereas the initial scale of candidate net-works of FENICA is always very huge. On the basis of the theory ofFENICA, this deficiency can be resolved by involving more candidate
N. Wang et al. / Journal of Neuroscience Methods 209 (2012) 1– 12 11
Table 2Consumed time of group analysis with FENICA and Fast-FENICA on hybrid data, task-related data and resting-state data.
Consumed time (in seconds) Data sets
Hybrid data Task-related data Resting state data
FENICA Fast-FENICA FENICA Fast-FENICA FENICA Fast-FENICA
Yielding candidate networks 216.22 91.17 64.91 51.96 13 305.65 3670.00Removing duplicate networks 157.05 16.13 14.34 8.28 5695.88 226.90Total consumed time 373.26 107.30 79.25 60.25 19 001.53 3896.90
Fig. 9. (A) and (B) The SMN detected by Fast-FENICA and its corresponding power spectrum respectively, where the low frequency threshold and spatial equivalence levelis set to 0.15 Hz and 0.65 respectively. The network is projected to a standard brain template and the MNI coordinates (in mm) of this functional network are labeled in thisfigure.
F 0 canc platet
ntwt(
Fa
ig. 10. (A) and (B) The BGN and DPN1 discovered by FENICA with involving 115orrelation coefficients matrix. Both networks are projected to a standard brain temhis figure.
etworks with less correlation coefficient. In our experiments, ashe quantity of involved candidate networks increased to 1150,
hose correlation coefficients were no less than 0.35 amonghe correlation coefficients matrix, the BGN and DPN1 networksshown in Fig. 10) were discovered by FENICA with about 17 h
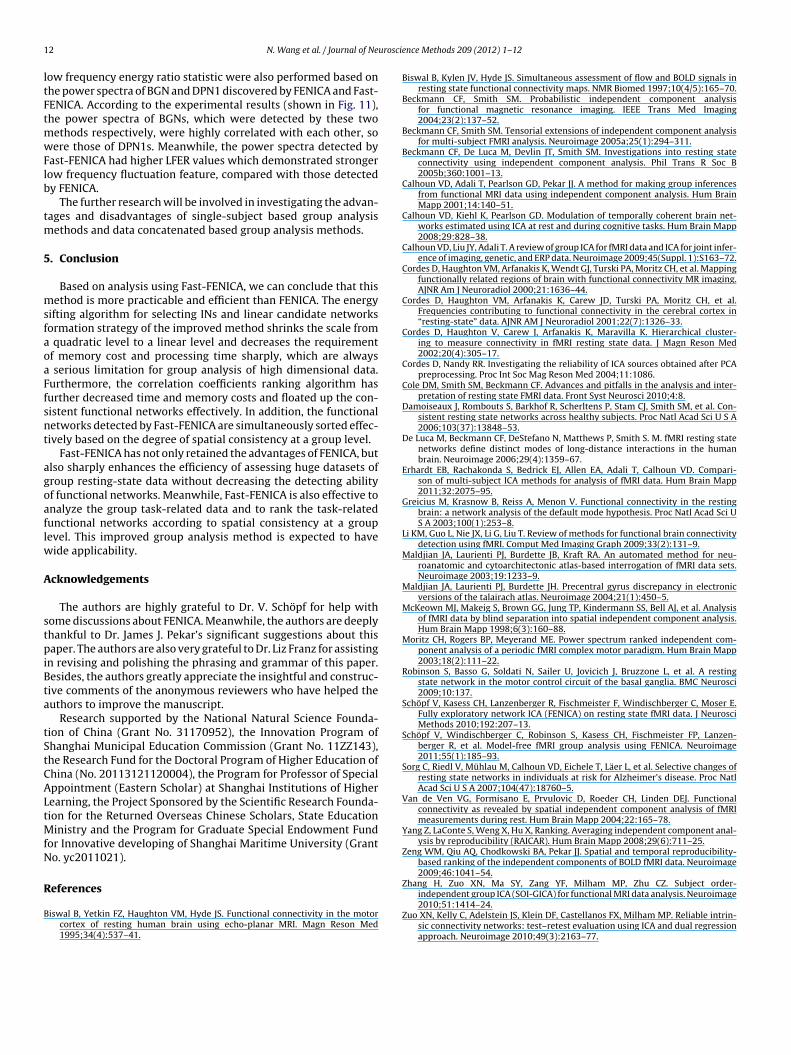
ig. 11. (A) and (B) Power spectra corresponding to BGN and DPN1 detected by Fast-FENICnd their corresponding LFER values are marked in (A) and (B).
didate networks, whose correlation coefficients are no less than 0.35 among the and the MNI coordinates (in mm) of these two functional networks are labeled in
computing time cost. However, the SMN network was still failedto detect. Owing to that FENICA is a fully exploratory method, the
SMN could be obtained by involving even more candidate net-works with more computing time and computer memory costssimultaneously. Furthermore, a further correlation analysis andA and FENICA respectively. The correlation coefficients of these two power spectra
1 urosci
ltFtmwFlb
tm
5
msfaoaFfsnt
agoaflw
A
stpiBta
tStCALtMfN
R
B
2 N. Wang et al. / Journal of Ne
ow frequency energy ratio statistic were also performed based onhe power spectra of BGN and DPN1 discovered by FENICA and Fast-ENICA. According to the experimental results (shown in Fig. 11),he power spectra of BGNs, which were detected by these two
ethods respectively, were highly correlated with each other, soere those of DPN1s. Meanwhile, the power spectra detected by
ast-FENICA had higher LFER values which demonstrated strongerow frequency fluctuation feature, compared with those detectedy FENICA.
The further research will be involved in investigating the advan-ages and disadvantages of single-subject based group analysis
ethods and data concatenated based group analysis methods.
. Conclusion
Based on analysis using Fast-FENICA, we can conclude that thisethod is more practicable and efficient than FENICA. The energy
ifting algorithm for selecting INs and linear candidate networksormation strategy of the improved method shrinks the scale from
quadratic level to a linear level and decreases the requirementf memory cost and processing time sharply, which are always
serious limitation for group analysis of high dimensional data.urthermore, the correlation coefficients ranking algorithm hasurther decreased time and memory costs and floated up the con-istent functional networks effectively. In addition, the functionaletworks detected by Fast-FENICA are simultaneously sorted effec-ively based on the degree of spatial consistency at a group level.
Fast-FENICA has not only retained the advantages of FENICA, butlso sharply enhances the efficiency of assessing huge datasets ofroup resting-state data without decreasing the detecting abilityf functional networks. Meanwhile, Fast-FENICA is also effective tonalyze the group task-related data and to rank the task-relatedunctional networks according to spatial consistency at a groupevel. This improved group analysis method is expected to have
ide applicability.
cknowledgements
The authors are highly grateful to Dr. V. Schöpf for help withome discussions about FENICA. Meanwhile, the authors are deeplyhankful to Dr. James J. Pekar’s significant suggestions about thisaper. The authors are also very grateful to Dr. Liz Franz for assisting
n revising and polishing the phrasing and grammar of this paper.esides, the authors greatly appreciate the insightful and construc-ive comments of the anonymous reviewers who have helped theuthors to improve the manuscript.
Research supported by the National Natural Science Founda-ion of China (Grant No. 31170952), the Innovation Program ofhanghai Municipal Education Commission (Grant No. 11ZZ143),he Research Fund for the Doctoral Program of Higher Education ofhina (No. 20113121120004), the Program for Professor of Specialppointment (Eastern Scholar) at Shanghai Institutions of Higherearning, the Project Sponsored by the Scientific Research Founda-ion for the Returned Overseas Chinese Scholars, State Education
inistry and the Program for Graduate Special Endowment Fundor Innovative developing of Shanghai Maritime University (Granto. yc2011021).
eferences
iswal B, Yetkin FZ, Haughton VM, Hyde JS. Functional connectivity in the motorcortex of resting human brain using echo-planar MRI. Magn Reson Med1995;34(4):537–41.
ence Methods 209 (2012) 1– 12
Biswal B, Kylen JV, Hyde JS. Simultaneous assessment of flow and BOLD signals inresting state functional connectivity maps. NMR Biomed 1997;10(4/5):165–70.
Beckmann CF, Smith SM. Probabilistic independent component analysisfor functional magnetic resonance imaging. IEEE Trans Med Imaging2004;23(2):137–52.
Beckmann CF, Smith SM. Tensorial extensions of independent component analysisfor multi-subject FMRI analysis. Neuroimage 2005a;25(1):294–311.
Beckmann CF, De Luca M, Devlin JT, Smith SM. Investigations into resting stateconnectivity using independent component analysis. Phil Trans R Soc B2005b;360:1001–13.
Calhoun VD, Adali T, Pearlson GD, Pekar JJ. A method for making group inferencesfrom functional MRI data using independent component analysis. Hum BrainMapp 2001;14:140–51.
Calhoun VD, Kiehl K, Pearlson GD. Modulation of temporally coherent brain net-works estimated using ICA at rest and during cognitive tasks. Hum Brain Mapp2008;29:828–38.
Calhoun VD, Liu JY, Adali T. A review of group ICA for fMRI data and ICA for joint infer-ence of imaging, genetic, and ERP data. Neuroimage 2009;45(Suppl. 1):S163–72.
Cordes D, Haughton VM, Arfanakis K, Wendt GJ, Turski PA, Moritz CH, et al. Mappingfunctionally related regions of brain with functional connectivity MR imaging.AJNR Am J Neuroradiol 2000;21:1636–44.
Cordes D, Haughton VM, Arfanakis K, Carew JD, Turski PA, Moritz CH, et al.Frequencies contributing to functional connectivity in the cerebral cortex in“resting-state” data. AJNR AM J Neuroradiol 2001;22(7):1326–33.
Cordes D, Haughton V, Carew J, Arfanakis K, Maravilla K. Hierarchical cluster-ing to measure connectivity in fMRI resting state data. J Magn Reson Med2002;20(4):305–17.
Cordes D, Nandy RR. Investigating the reliability of ICA sources obtained after PCApreprocessing. Proc Int Soc Mag Reson Med 2004;11:1086.
Cole DM, Smith SM, Beckmann CF. Advances and pitfalls in the analysis and inter-pretation of resting state FMRI data. Front Syst Neurosci 2010;4:8.
Damoiseaux J, Rombouts S, Barkhof R, Scherltens P, Stam CJ, Smith SM, et al. Con-sistent resting state networks across healthy subjects. Proc Natl Acad Sci U S A2006;103(37):13848–53.
De Luca M, Beckmann CF, DeStefano N, Matthews P, Smith S. M. fMRI resting statenetworks define distinct modes of long-distance interactions in the humanbrain. Neuroimage 2006;29(4):1359–67.
Erhardt EB, Rachakonda S, Bedrick EJ, Allen EA, Adali T, Calhoun VD. Compari-son of multi-subject ICA methods for analysis of fMRI data. Hum Brain Mapp2011;32:2075–95.
Greicius M, Krasnow B, Reiss A, Menon V. Functional connectivity in the restingbrain: a network analysis of the default mode hypothesis. Proc Natl Acad Sci US A 2003;100(1):253–8.
Li KM, Guo L, Nie JX, Li G, Liu T. Review of methods for functional brain connectivitydetection using fMRI. Comput Med Imaging Graph 2009;33(2):131–9.
Maldjian JA, Laurienti PJ, Burdette JB, Kraft RA. An automated method for neu-roanatomic and cytoarchitectonic atlas-based interrogation of fMRI data sets.Neuroimage 2003;19:1233–9.
Maldjian JA, Laurienti PJ, Burdette JH. Precentral gyrus discrepancy in electronicversions of the talairach atlas. Neuroimage 2004;21(1):450–5.
McKeown MJ, Makeig S, Brown GG, Jung TP, Kindermann SS, Bell AJ, et al. Analysisof fMRI data by blind separation into spatial independent component analysis.Hum Brain Mapp 1998;6(3):160–88.
Moritz CH, Rogers BP, Meyerand ME. Power spectrum ranked independent com-ponent analysis of a periodic fMRI complex motor paradigm. Hum Brain Mapp2003;18(2):111–22.
Robinson S, Basso G, Soldati N, Sailer U, Jovicich J, Bruzzone L, et al. A restingstate network in the motor control circuit of the basal ganglia. BMC Neurosci2009;10:137.
Schöpf V, Kasess CH, Lanzenberger R, Fischmeister F, Windischberger C, Moser E.Fully exploratory network ICA (FENICA) on resting state fMRI data. J NeurosciMethods 2010;192:207–13.
Schöpf V, Windischberger C, Robinson S, Kasess CH, Fischmeister FP, Lanzen-berger R, et al. Model-free fMRI group analysis using FENICA. Neuroimage2011;55(1):185–93.
Sorg C, Riedl V, Mühlau M, Calhoun VD, Eichele T, Läer L, et al. Selective changes ofresting state networks in individuals at risk for Alzheimer’s disease. Proc NatlAcad Sci U S A 2007;104(47):18760–5.
Van de Ven VG, Formisano E, Prvulovic D, Roeder CH, Linden DEJ. Functionalconnectivity as revealed by spatial independent component analysis of fMRImeasurements during rest. Hum Brain Mapp 2004;22:165–78.
Yang Z, LaConte S, Weng X, Hu X, Ranking. Averaging independent component anal-ysis by reproducibility (RAICAR). Hum Brain Mapp 2008;29(6):711–25.
Zeng WM, Qiu AQ, Chodkowski BA, Pekar JJ. Spatial and temporal reproducibility-based ranking of the independent components of BOLD fMRI data. Neuroimage2009;46:1041–54.
Zhang H, Zuo XN, Ma SY, Zang YF, Milham MP, Zhu CZ. Subject order-
independent group ICA (SOI-GICA) for functional MRI data analysis. Neuroimage2010;51:1414–24.Zuo XN, Kelly C, Adelstein JS, Klein DF, Castellanos FX, Milham MP. Reliable intrin-sic connectivity networks: test–retest evaluation using ICA and dual regressionapproach. Neuroimage 2010;49(3):2163–77.