Inhibition of NF-κB in astrocytes is sufficient to delay ...
Upload
independentCategory
view
7download
0
NeuroImage 54 (2011) 2218–2225
Contents lists available at ScienceDirect
NeuroImage
j ourna l homepage: www.e lsev ie r.com/ locate /yn img
Functional connectivity in resting-state fMRI: Is linear correlation sufficient?
Jaroslav Hlinka a,⁎, Milan Paluš a, Martin Vejmelka a, Dante Mantini b,c, Maurizio Corbetta c,d,e
a Institute of Computer Science, Academy of Sciences of the Czech Republic, Pod vodarenskou vezi 2, 18207 Prague, Czech Republicb Laboratory for Neuro- and Psychophysiology, Katholieke Universiteit Leuven, 3000 Leuven, Belgiumc Institute for Advanced Biomedical Technologies, G. D'Annunzio University Foundation, G. D'Annunzio University, 66013 Chieti, Italyd Department of Radiology, Washington University, St. Louis, MO, USAe Department of Neurology, Washington University, St. Louis, MO, USA
⁎ Corresponding author.E-mail address: [email protected] (J. Hlinka).
1053-8119/$ – see front matter © 2010 Elsevier Inc. Aldoi:10.1016/j.neuroimage.2010.08.042
a b s t r a c t
a r t i c l e i n f oArticle history:Received 18 June 2010Revised 9 August 2010Accepted 19 August 2010Available online 25 August 2010
Keywords:fMRIFunctional connectivityGaussianityNonlinearityCorrelationMutual information
Functional connectivity (FC) analysis is a prominent approach to analyzing fMRI data, especially acquiredunder the resting state condition. The commonly used linear correlation FC measure bears an implicitassumption of Gaussianity of the dependence structure. If only the marginals, but not all the bivariatedistributions are Gaussian, linear correlation consistently underestimates the strength of the dependence. Toassess the suitability of linear correlation and the general potential of nonlinear FC measures, we present aframework for testing and estimating the deviation from Gaussianity by means of comparing mutualinformation in the data and its Gaussianized counterpart. We apply this method to 24 sessions of humanresting state fMRI. For each session, matrix of connectivities between 90 anatomical parcel time series iscomputed using mutual information and compared to results from its multivariate Gaussian surrogate thatconserves the correlations but cancels any nonlinearity. While the group-level tests confirmed non-Gaussianity in the FC, the quantitative assessment revealed that the portion of mutual information neglectedby linear correlation is relatively minor—on average only about 5% of the mutual information alreadycaptured by the linear correlation. The marginality of the non-Gaussianity was confirmed in comparisonsusing clustering of the parcels—the disagreement between clustering obtained from mutual information andlinear correlation was attributable to random error. We conclude that for this type of data, practicalrelevance of nonlinear methods trying to improve over linear correlation might be limited by the fact thatthe data are indeed almost Gaussian.
l rights reserved.
© 2010 Elsevier Inc. All rights reserved.
Introduction
Neuroimaging methods play an important role in the process ofextending our understanding of brain structure and function. In thisregard, functional Magnetic Resonance Imaging (fMRI) holds a centralposition, particularly due to its non-invasiveness and its relativelyhigh spatial resolution. Despite the large number of neuroimagingstudies conducted to delineate brain activations related to a widerange of cognitive functions, the fundamental issue of how the brainregions communicate to each other still remains open.
The concept of brain functional connectivity (Friston, 1994) iscentral to the understanding of the organized behavior of corticalregions beyond the simple mapping of their activity. Functionalconnectivity analyses of fMRI data as an approach to study temporalcoherence in activity of distant brain areas, either during taskperformance or in resting state, has been widely applied in the
neuroscience research. Much recent work has focused on measuringand interpreting the spontaneous signal fluctuations typically seenduring rest (Fox and Raichle, 2007). The initial reservations regardingthe neural origin of these fluctuations (and the related connectivity)are now mostly overcome—some of the strongest evidence forrelevance of these signal fluctuations is based on the observed director indirect electrophysiological correlates (Laufs, 2008; Mantini et al.,2007; Miller et al., 2009), although there is still much to be done in thefield of methods for separation of neural and nonneural sources ofresting signal variation. In the context of this paper, we stress that inresting state studies, functional connectivity analysis commonly playsa central role (Fox and Raichle, 2007; van Dijk et al., 2010).
The most widely spread method of measuring functional connec-tivity between a pair of regions is computing a linear correlation ofactivity time series derived from these regions by e.g. simple spatialaveraging across all the voxels in the regions. Linear correlation is alsowidely used to obtain so-called correlation maps by correlating theseed voxel or seed region signal with signal from all the other voxelsin the brain, or constrained to gray matter area. From all possiblebivariate measures of association, linear correlation is clearly amethod of first choice, reflecting the assumption that the relationship

2219J. Hlinka et al. / NeuroImage 54 (2011) 2218–2225
between the fMRI time series can be suitably approximated by amultivariate Gaussian white noise process. Additionally, linearcorrelation is a well-known statistical concept, sufficiently simpleto allow wide use and easy communication of results betweenresearchers of diverse backgrounds.
On the other hand, from the mid-1980s, nonlinear approaches toanalysis of brain signals are getting increased interest of researcheswho consider nonlinearity as an intrinsic property of brain dynamics,see e.g. (Stam, 2005) for a review. Hemodynamic nonlinearities areknown to affect the blood oxygenation level-dependent (BOLD) fMRIsignal (de Zwart et al., 2009). More specifically, non-linearity ofdependence between fMRI time series during resting state has beenreported (Lahaye et al., 2003). Use of non-linear measures of functionalconnectivity for the analysis of resting state data has been proposed(Deshpande et al., 2006; Xie et al., 2008;Maximet al., 2005), particularlyincluding measures based on analysis of chaotic non-linear dynamicalsystems to analyze resting state data, suggesting that the assumptionof linearity might be oversimplifying.
The question arises, to what extent and in what context is itjustified and beneficial to use non-linear measures of functionalconnectivity and more generally any indices such as those motivatedby the assumption of non-linear dynamical system as the underlyingmechanism behind the resting state fMRI signal. When linearcorrelation is used as a measure of functional connectivity, there aresome implicit assumptions made. The first is that the information inthe temporal order of the samples can be ignored (both within eachtime series and the mutual interaction). While the extent ofjustifiability of this assumption deserves exploration of its own, wekeep this interim assumption for the purposes of this paper, not leastin order to keep the comparison of linear correlation to nonlinearmeasures fair. Accepting for now the assumption of no role oftemporal order of samples, we ask if the instantaneous (zero-lag)dependence between the time series, expressed in the probabilitydistribution p(X, Y), is fully captured by the linear correlation r(X,Y).We answer that this is true under the assumption of bivariateGaussianity of the distribution. Indeed, a multivariate normal(Gaussian) distribution is uniquely defined by its correlation—up tolinear shifts and rescaling. To be more precise, bivariate normaldistribution is fully characterised by its mean μ=(μx,μy) and its 2×2covariance matrix Cov(X,Y)—if we allow for linear shifting andscaling, the remaining invariant parameter characterizing fully thedistribution is indeed the correlation r(X,Y). For a bivariate Gaussiandistribution, the correlation also uniquely defines the mutualinformation shared between the two variables X, Y which can becomputed as I(X,Y)= IGauss(r)≡−1
2log(1− r2).On the other side, when the Gaussianity assumption does not
hold, the distribution cannot be fully described by the mean andcovariance. More, possibly infinitely many higher order momentsneed to be specified to determine the distribution. As the correlationis not sufficient to describe the dependence structure, the equationfor I(X,Y) above cannot hold in general. Interestingly, as we detaillater, the notable properties of normal distributions enable aderivation of a useful lower bound on mutual information valid fora broad class of probability distributions. In particular, for a bivariatedistribution p(X,Y) with standard normal marginals p(X), p(Y), itholds that I X;Yð Þ≥ IGaussðrÞ = − 1
2 log 1−r2� �
, where the equalityholds exactly for bivariate Gaussian distributions. This allows us toquantify the deviation from Gaussianity as the difference between thetotal mutual information of the two variables I(X,Y) and the mutualinformation IGauss rð Þ = − 1
2 log 1−r2� �
that correspond to bivariateGaussian distribution with the observed correlation r.
While there are many potential nonlinear FC measure candidates,mutual information holds a specific position among these for itsgenerality. In theory, it is general enough to capture an arbitrary formof dependence relation between the variables without any a priorimodel restrictions on its form. The properties of mutual information
allow us not only to test the suitability of linear correlation throughprobing the Gaussianity of the fMRI time series, but also to constructa quantitative estimate of connectivity information neglected bythe use of linear correlation. This gives the amount of additionalinformation available and bounds the potential contribution of non-linear alternatives over the Pearson correlation coefficient.
We implement the outlined ideas by comparing the total mutualinformation between the signals with the mutual informationbetween the signals in surrogate datasets. These surrogates aregenerated in a way that preserves the linear correlation, but cancelsany nonlinear information by enforcing bivariate Gaussian distribu-tion on the surrogate signal-pair. This approach allows us to both testand quantify the deviation from Gaussianity, providing a principledguide in judging the suitability of linear correlation as a measure ofFC. The focus on bivariate Gaussianity as the crucial condition ofsuitability of use of linear correlation as FC index, along with theillustrative quantitative estimation of the deviation from Gaussianityby means of the mutual information neglected by linear correlation,are the two main contributions of this study to the discussion of fMRIfunctional connectivity methods. We apply the presented methodto parcel-average time series obtained from resting state fMRIBOLD signal of healthy subjects, testing and quantifying the deviationfrom bivariate Gaussianity. We complement this by assessing therelevance of the detected non-Gaussianity through tests of agreementof clustering results obtained from original and Gaussianized data.
Materials and methods
Data
Twelve right-handed healthy young volunteers (5 males and 7females, age range 20–31 years) participated in the study. Participantswere informed about the experimental procedures and providedwritten informed consent. The study designwas approved by the localEthics Committee of Chieti University. Subjects lay in a supine positionand viewed a black screen with a centered red fixation point of 0.3visual degrees, through a mirror tilted by 45 degrees. Each volunteerunderwent two scanning runs of 10 minutes in a resting-statecondition. Specifically, they were instructed to be relaxed, but tomaintain fixation during scanning. The eye position was monitored at120 Hz during scanning using an ISCAN eye tracker system.
Scanning was performed with a 3T MR scanner (Achieva; PhilipsMedical Systems) located at the Institute for Advanced BiomedicalTechnologies in Chieti, Italy. Functional images were obtained usingT2-weighted echo-planar imaging (EPI) with blood oxygenationlevel-dependent (BOLD) contrast using SENSE imaging. EPIs (TR/TE=2000/35 ms) comprised 32 axial slices acquired continuously inascending order covering the entire cerebrum (voxel size=3×3×3.5 mm3). For each scanning run, initial 5 dummy volumes allowingthe MRI signal to reach steady state were discarded. The next 300functional volumes were used for the analysis. A three-dimensionalhigh-resolution T1-weighted image (TR/TE=9.6/4.6 ms, voxelsize=0.98×0.98×1.2 mm3) covering the entire brain was acquiredat the end of the scanning session and used for anatomical reference.
Initial data preprocessing was performed using the SPM5 softwarepackage (Wellcome Department of Cognitive Neurology, London, UK)running under MATLAB (The Mathworks). The preprocessingsteps involved the following: (1) correction for slice-timing differ-ences (2) correction of head-motion across functional images,(3) coregistration of the anatomical image and the mean functionalimage, and (4) spatial normalization of all images to a standardstereotaxic space (Montreal Neurological Institute, MNI) with a voxelsize of 3×3×3 mm3.
Ninety parcels from the Automated Anatomical Labeling (AAL)atlas were used to extract mean BOLD time series after masking outnon-gray matter voxels. The anatomical positions of the parcels are

2220 J. Hlinka et al. / NeuroImage 54 (2011) 2218–2225
described in (Tzourio-Mazoyer et al., 2002). Every parcel time serieswas orthogonalized with respect to motion parameters and globalmean signal and high-pass filtered at 1/120 Hz.
Analysis
As already mentioned in the Introduction, for a bivariatedistribution p(X,Y) with standard normal marginals p(X), p(Y), itholds that
I X;Yð Þ≥ IGauss = −12log 1−r2
� �; ð1Þ
where the equality holds exactly for bivariate Gaussian distributions.The inequality (1) stems from the fact, that normal distribution is themaximum entropy distribution for a given covariance matrix (or for agiven correlation, as we assumewithout loss of generality that σ(X)=σ(Y)=1). From the relation betweenmutual information and entropy(I(X,Y)=H(X)+H(Y)−H(X,Y)) it follows that mutual information ofGaussian distribution IGauss(r) is thenminimal from all distributions ofgiven correlation r, under the assumption of fixed marginal entropies,which is true when the marginals have standard normal distribution.Note that the assumption of normality of the marginals is far lessrestrictive than it might seem. First, approximate data normality iscommonly assumed in areas not restricted to fMRI FC analysis. Moreimportantly, even if we find particular data deviating strongly fromnormality, any sample distribution can be monotonously transformedto match normal distribution.
To assure precise non-Gaussianity estimates, we have indeedcarried out this “normalization” step. First, to each of the values xi ofthe original variable x its sample percentile pi is assigned. Subse-quently, the values xi of the original variable are replaced by values nicorresponding to the respective percentiles pi in the standard normaldistribution N(0,1).
For two discrete random variables X1,X2 with sets of values Ξ1 andΞ2, the mutual information is defined as
I X1;X2ð Þ = ∑x1∈Ξ1
∑x2∈Ξ2
p x1; x2ð Þlog p x1; x2ð Þp x1ð Þp x2ð Þ ;
where the probability distribution function is defined by p(xi)=Pr {Xi=xi},xi∈Ξi and the joint probability distribution function isp(x1,x2) is defined analogously. When the discrete variables X1,X2
are obtained from continuous variables on a continuous probabilityspace, then the mutual information depends on a partition ξ chosento discretize the space. Here a simple box-counting algorithm basedon marginal equiquantization method (Palus et al., 1993) was used,i.e., a partition was generated adaptively in one dimension (for eachvariable) so that themarginal bins become equiprobable. This meansthat there is approximately the same number of data points in eachmarginal bin. In this paper we used a simple pragmatic choice ofQ=8 bins for each marginal variable (Palus and Vejmelka (2007).
For each session, we have computed the mutual information (MI)for each pair of parcels, yielding a symmetric 90-by-90 matrix of MIvalues. Notably, the raw estimates of mutual information suffer fromsome inevitable bias due to finite sample size and discretization ofthe variables. While this bias does not affect the statistical testingframework, it is necessary to correct for it to allow the use of standardscales for reporting the resulting mutual information and for moreaccurate computation of the neglected information.
This correction is carried out with the help of sample mutualinformation estimates for finite-size (N=300) random samples frombivariate Gaussian distributions with known correlations (andtherefore known mutual informations IGauss = − 1
2 log 1−r2� �
). These
are computed for 50000 bivariate random samples (each with sizeN=300) for each correlation in the range from 0 to 1 (in 200 steps of
0.005). The average of the 50000 mutual information estimates givesus an approximate expected sample mutual information estimatecorresponding to each tabulated correlation/mutual information.Thus we obtain a monotonous function transforming the knowntrue correlation (or the respectivemutual information) to its expectednumerical MI estimate for sample size N=300. Once generated, theinverse of this monotonous function can be used to transform eachestimated mutual information to obtain a more accurate bias-corrected estimate of the true mutual information. (The relationshipbetween the true population mutual information and the expectedfinite-sample estimate is shown in Supplementary Fig. 1.)
To compare the (total) mutual information to the portion ofinformation conveyed in the linear correlation, for each dataset, 99random realizations of multivariate time series preserving the linearstructure but canceling the nonlinear structure were constructed,and MI was computed for these surrogates. If the original time seriesdependence structure was Gaussian (and therefore fully captured bythe linear correlation), the MI in the surrogates should not differ fromthe original MI, up to some random error. The alternative case shouldmanifest itself as a decrease in theMI in the surrogates with respect tothe original data.
The surrogates were constructed as multivariate Fourier transform(FT) surrogates (Prichard and Theiler, 1994; Palus, 1997): realizationsof multivariate linear stochastic process which mimic individualspectra of the original time series as well as their cross-spectrum. Themultivariate FT surrogates are obtained by computing the Fouriertransform of the series, keeping unchanged the magnitudes of theFourier coefficients (the amplitude spectrum), but adding the samerandom number to the phases of coefficients of the same frequencybin; the inverse FT into the time domain is then performed. Themultivariate FT surrogates preserve the part of dependence which canbe explained by a multivariate linear stochastic process.
The idea of comparing the MI of data to MI of “linear” surrogatesrather than directly to linear correlation of data has two aspects. First, itallows a direct quantitative comparison of the nonlinear and linearconnectivity, while correlation and mutual information estimatorshave generally different properties. Second, generation of the surrogatesallows direct statistical testing of the difference. However, thisprocedure generates 99 estimates of the linear MI for each parcel pair;one for each surrogate. While these are useful for hypothesis testing,for general presentation of thedifferenceweuse themeanvalueof these99 values. In the following we refer to this as “Gaussian” MI, and itactually closely estimates the MI of a bivariate Gaussian distributionIGauss rð Þ = − 1
2 log 1−r2� �
, where r stands for the correlation of the twovariables (see the close match in Fig. 3, red and purple line). The“neglected”MI is estimated by the difference between data MI and theGaussian MI: Ineglected(X,Y)= I(X,Y)− IGauss(r).
Statistical tests
For each session and each parcel pair, non-Gaussianity was testedat p=0.05 by comparing the data MI against the MI distribution ofthe multivariate FT surrogates. Notably, the parcel-level resultssuffer from heavy multiple comparison problem. As we are primarilyinterested in the bivariate non-Gaussianity in general rather than inits specific allocation to particular parcel-pairs, we further use theresults of the individual tests in a higher-level analysis.
On a session-level, the number of significant parcel-pairs in a givensession was tested against the null hypothesis that the number ofindividual significant entries has a binomial distribution B(n=4005,p=0.05), where n = 4005 = 90 90−1ð Þ
2is the number of all parcel
pairs and p=0.05 is the single-entry false positive rate under thecondition of pure Gaussianity of the bivariate distributions.
As it may be argued that the assumption of pair independence istoo lenient, but the exact level of dependence is difficult to establish,

2221J. Hlinka et al. / NeuroImage 54 (2011) 2218–2225
we also carried out robust group level tests. The group level testsinvolved one-sample t-tests. The first was a test of the percentages ofsignificant pairs in the 24 sessions against the null hypothesis of meanof 5% of significant parcel-pair results; the second was a test of theneglected information session-wise averages (across all parcel-pairs)against the null hypothesis of zero mean.
To explicitly control for any potential bias in the numericalgeneration of the surrogate distributions, the group-level tests werecomplemented by paired t-tests of the same two quantities againsttheir values obtained from a control set of linear, “shadow” datasets.For each session, a shadow dataset was created as a multivariate FTsurrogate of the marginally normalized original dataset. Thus theshadow dataset preserved only the linear (correlation) structure ofthe original dataset of the respective session. Subsequently, eachshadow dataset has undergone the same procedure as originaldata, including the initial normalization, generation of multivariatesurrogates, computation of MI and statistical testing of pair-wise MIagainst surrogates. In this way, we have mimicked the full procedureof processing the original data using a “purely linear FC” shadowdataset, accounting for any potential slight bias in the detection rateintroduced by numerical properties of the algorithm. Apart from thepercentages, we have also tested the mean neglected informationfrom data versus shadow datasets by mean of a paired t-test. All thegroup-level tests used a p=0.05 significance threshold, but we alsoreport the attained significance level.
Relevance for clustering
To explore the relevance of the studied non-Gaussianity for furtherdata analysis, we have assessed the difference in clustering ofanatomical parcels based on two functional connectivity methods:mutual information and linear correlation. To ensure a fair compar-ison, two preparatory steps were carried out here. Firstly, to preventartificial mismatch due to merely different scaling of the twofunctional connectivity measures, we have monotonously rescaledthe correlation values by r↦− 1
2 log 1−r2� �
, effectively yielding anestimate of the “linear” mutual information IGauss. Although trans-formed to share the scale of mutual information, this connectivitymeasure reflects only the linear correlation between the parcel timeseries, unlike the true mutual information computed by theequiquantization method. Secondly, due to random error in estima-tion of functional connectivity measures, we could expect somerandom level of disagreement between connectivity matrices andtherefore between clustering based on different functional connec-tivity measures. To control for this effect, we have tested the specificeffect of nonlinearity included in the original data by comparing theagreement between MI and correlation matrices (represented byIGauss) computed from data with the agreement of MI and correlationcomputed from a multivariate linear surrogate dataset. This waywe effectively test whether the clustering disagreement includes acontribution due to nonlinearity, or is a mere result of the imperfectestimation of the connectivity measures from finite-size samples.
Identification of clustersFunctional networks in the parcel time series were identified using
a spectral clustering technique called Multiclass Spectral Clustering(Yu and Shi, 2003). In this technique clusters (corresponding to thesought functional networks) are found by optimizing the MultiwayNormalized Cut objective, which is based on the Normalized Cutobjective (Shi and Malik, 2000). Formally the applied methodoperates on weighted graphs where the vertices of the graphcorrespond to parcels and the edges of the graph are weighted bythe functional connectivity between the respective parcels. Intuitivelya good clustering is represented by a partition of all vertices to disjointsets (clusters) which satisfies that the sum of weights of edgesbetween vertices in different sets is small and the sum of weights of
edges between vertices in the same set is large. Both of theseproperties are optimized at the same time by the applied algorithm—
we refer the reader to (Yu and Shi, 2003) for details. Thus the optimalpartition computed by the algorithm has clusters which are moreinternally connected and less connected with each other. Thiscorresponds to a grouping of the parcels so that the time series insideone cluster are similar and at the same time series of parcels indifferent clusters are not similar.
Agreement of clusteringsAfter obtaining the two clusterings of the parcels from the two
connectivity methods, we have to quantify their agreement. A naturalprocedure is to view the cluster assignment of a randomly chosenparcel as a discrete random variable, with integer values rangingfrom one to the total number of clusters. Then we can express theagreement between clusterings obtained for the two connectivitymethods as the mutual information between the two discrete randomvariables corresponding to the two generated clusterings. As themutual information between two variables is bounded by entropy ofeach of them, we further normalize the mutual information, dividingit by the minimum of the entropies of the two variables. Thus, if theclusterings are identical, then their normalized mutual informationwill be 1, while normalized mutual information of 0 corresponds tocompletely independent cluster assignments.
To statistically test the nonlinearity effect, we compared theagreements obtained for the original data and linearized “shadow”
data by means of a paired t-test. Visual inspection of the clusteringof the group-average connectivity matrices revealed that the choiceof N=10 clusters provides satisfactory results—see Fig. 1 for theexample clustering results. Therefore, N=10 clusters were used forprocessing each session. For robustness, the analysis was repeatedfor all other cluster counts in the range from N=2 to N=20 withFDRb0.05 correction for multiple comparisons.
Results
Descriptive assessment
In descriptive terms, the data MI has proved very similar to theGaussianMI (see Fig. 2). In particular, averaging across all parcel pairs,the data MI ranged between 0.04 and 0.10 bits for different sessions,while the neglected MI was more than an order of magnitude smaller(0.0005–0.0068 bits). Nevertheless, the neglectedMI was consistentlypositive, which was not the case for shadow datasets (ranging from−0.0007 to 0.0016 bits).
Independently of the strength of coupling, the data MI wasmoreover typically within the range of surrogate MI, as illustrated inFig. 3. Here, each blue dot corresponds to MI of one parcel pair; thesurrogate distribution is represented by red (light blue, green) linesfor mean (1st percentile, 99th percentile) of the surrogate distribu-tion. Although the session with the most non-Gaussianity is depictedhere, the distribution of computed MI for data and the correspondingshadow dataset (Fig. 4) are almost indiscernible. Also, apart fromthe random error due to MI estimation from short time series, whichis shared by data and shadow data, both scatters follow well thetheoretical prediction of dependence of MI on linear correlation(IGauss = − 1
2 log 1−r2� �
, valid exactly under Gaussianity, purple line),which is closely approximated by the surrogate mean.
Statistical tests
The percentage of parcel pairs with significant non-Gaussianitywas slightly elevated in all sessions above the 5% expected under thenull hypothesis (ranging from 5.3 to 10.0% of significant pairs indifferent sessions). If all the parcel pairs were considered independentthis would constitute significant percentage for all but 5 of the
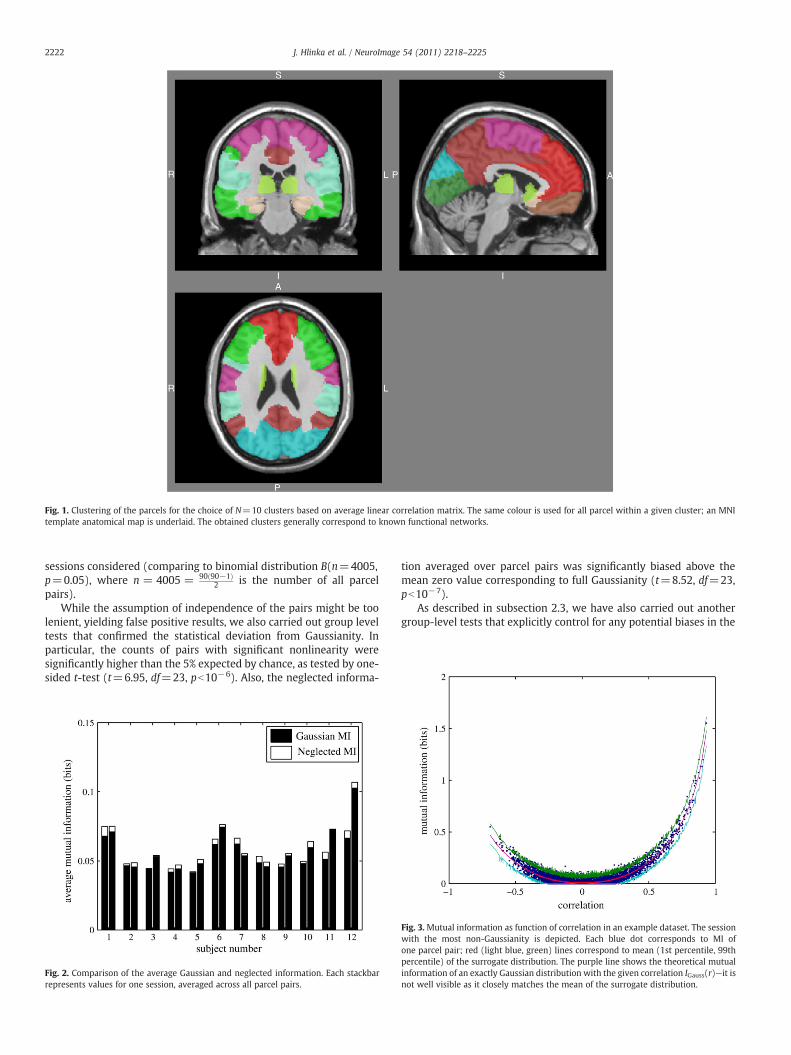
Fig. 1. Clustering of the parcels for the choice of N=10 clusters based on average linear correlation matrix. The same colour is used for all parcel within a given cluster; an MNItemplate anatomical map is underlaid. The obtained clusters generally correspond to known functional networks.
2222 J. Hlinka et al. / NeuroImage 54 (2011) 2218–2225
sessions considered (comparing to binomial distribution B(n=4005,p=0.05), where n = 4005 = 90 90−1ð Þ
2 is the number of all parcelpairs).
While the assumption of independence of the pairs might be toolenient, yielding false positive results, we also carried out group leveltests that confirmed the statistical deviation from Gaussianity. Inparticular, the counts of pairs with significant nonlinearity weresignificantly higher than the 5% expected by chance, as tested by one-sided t-test (t=6.95, df=23, pb10−6). Also, the neglected informa-
Fig. 2. Comparison of the average Gaussian and neglected information. Each stackbarrepresents values for one session, averaged across all parcel pairs.
tion averaged over parcel pairs was significantly biased above themean zero value corresponding to full Gaussianity (t=8.52, df=23,pb10−7).
As described in subsection 2.3, we have also carried out anothergroup-level tests that explicitly control for any potential biases in the
Fig. 3.Mutual information as function of correlation in an example dataset. The sessionwith the most non-Gaussianity is depicted. Each blue dot corresponds to MI ofone parcel pair; red (light blue, green) lines correspond to mean (1st percentile, 99thpercentile) of the surrogate distribution. The purple line shows the theoretical mutualinformation of an exactly Gaussian distribution with the given correlation IGauss(r)—it isnot well visible as it closely matches the mean of the surrogate distribution.

Fig. 4.Mutual information as function of correlation in an example surrogate. Each bluedot corresponds to MI of one parcel pair; red (light blue, green) lines correspond tomean (1st percentile, 99th percentile) of the surrogate distribution. The session withthe most non-Gaussianity is depicted.
2223J. Hlinka et al. / NeuroImage 54 (2011) 2218–2225
surrogate method. The comparison of results from the original datawith those from control (linear) “shadow” datasets confirmed thedetection of non-Gaussianity in the data. The counts of pairs withsignificant nonlinearity were significantly higher in data than similarcounts obtained from shadow datasets, when compared on grouplevel by means of a paired t-test (t=6.26, df=23, pb10−5). Also, theneglected information in data averaged over parcel pairs was positivefor all sessions and on average had value 0.0029 bits while theneglected information in the shadow datasets fluctuated around zerowith mean of 0.0006 bits. This difference was also clearly statisticallysignificant (t=6.51, df=23, pb10−5).
Relevance for clustering
We tested whether the neglected information had a significanteffect on the overall structure of the connectivity, as captured inclustering of the parcels. N=10 clusters were computed for eachsession using the MI and rescaled linear correlation FC matrices andthe agreement of the two clusterings was computed. This was carriedout both for normalized data and their linearized “control” versions.The agreements were generally quite high (0.80±0.07 on the scalefrom 0 to 1) and did not differ significantly from those obtained fromthe “control” linearized data (t=0.39, df=23, pb0.70). This suggestthat the mismatch between the clusterings based on the twomeasures was (similarly as in the case of the “control” dataset)attributable generally to random error in estimation of the functionalconnectivity indices from finite size samples. Repeating the analysisfor all cluster counts in the range N=2 to N=20 confirmed theobservation of no significant difference (pb0.05, FDR corrected).
Discussion
The presented study reveals that the bivariate dependencestructure of the fMRI BOLD regional time series is captured verywell by linear correlation. Indeed, average mutual information wasonly several percent higher than the mutual information in surrogatedata that contained only the linear part of the dependence. This givesexplicit and quantifiable argument for the intuitive choice of linearcorrelation as a measure of functional connectivity for fMRI timeseries.
Nevertheless, we have shown that there is a statistically significantcontribution of non-Gaussian dependencies in the data, although the
effect is so subtle that testing across many pairs or even across manysessions was needed to acquire sufficient power for such tests. Thedetection of non-Gaussian coupling is not surprising in the light of thefact that the dynamics of brain activity as well as the hemodynamicresponse of the vasculature contain many nonlinearities.
We have also carried out tests of the relevance of the neglectedinformation for applications: the marginality of the difference betweenfull mutual information and correlation as FC measures was confirmedin comparisons using clustering of the parcels—the disagreementbetween clustering obtained from mutual information in data andits correlation-based approximation did not exceed the disagreementdue to random error in estimation of the FC.
For testing Gaussianity of the bivariate dependences, we have useda framework based on a comparison of mutual information evaluatedon data and on surrogate time series. Belowwe discuss themotivationof the method choice from the variety of methods available in thewider context of multivariate normality testing. Importantly, theproblem of testing multivariate normality is more complex thanthat of testing univariate normality and for principal reasons there isnot a unique agreement in the statistical community on a single bestmethod for testing multivariate normality. For a recent review ofthe topic we refer the reader to Mecklin and Mundfrom (2004).Many alternative tests for multivariate normality could therefore beconsidered, which may to some extent differ in the power againstparticular alternatives. However, the framework used in this paperhas several important features that make it well suited for the currentstudy. The first reason is practical; mutual information is used both fortesting and direct quantification of the deviation from Gaussianity.Crucially, as mutual information is a widely used and theoreticallygrounded assumption-free measure of dependence, this quantifica-tion also has a general direct and intuitive interpretation. Secondly,many available multivariate normality tests assume independence ofthe samples. This is clearly not valid in the case of fMRI time series.The use of multivariate linear surrogates in our approach controls anybias due to temporal autocorrelation and sidesteps the need toestimate and correct for the reduced degrees of freedom of the test.Also, the test based on mutual information has the advantage of beingconsistent in the sense of being sensitive to virtually any departurefrom Gaussianity of the dependence. This advantageous property isnot shared by many commonly used tests for multivariate normalitysuch as those based on testing the deviation of skewness or kurtosis ofthe distribution from the values valid for normal distribution. Finally,the used framework allows to test the dependence structure itself,independently of the normality of the univariate marginal distribu-tions. This is also not in general true for other multivariate normalitytests, although adaptations may be possible.
Another topic deserving a discussion is the adopted multi-leveltesting strategy and its potential alternatives. As we mentioned, thebinomial test used to assess the Gaussianity null hypothesis onsession-level might be too lenient due to dependence among the 4005lower-level tests. We have avoided speculative estimation of the testinterdependence level within each session and rather robustly testedthe Gaussianity on the group level. Importantly, this was sufficient tostatistically reject the Gaussianity null hypothesis. If further evidenceon the level of individual parcel-pairs or sessions was required, theuse of criteria for hypothesis testing such as the family-wise error rateand the false discovery rate to obtain more detailed and potentiallymore powerful tests could be considered. Nevertheless, their im-plementation may prove prohibitively cumbersome in the currentcontext. In particular, these methods generally involve comparingthe smallest (or each) p-value against the corrected significancelevel p=0.05/4005~10−6. Such a low p-value is clearly below theresolution of the sample histograms capturing the null hypothesiswith 99 surrogates; the minimal required number of surrogateswould be in the order of millions for each test, which is technicallyimpractical to infeasible. Fitting the null distribution from smaller

2224 J. Hlinka et al. / NeuroImage 54 (2011) 2218–2225
number of surrogates by e.g. imposing an assumption of approximatenormality of the MI distribution may seem promising, but may be toocrude and even slight departure from the true null distribution mightcrucially affect the true significance levels, particularly for the criticalvalues of the order of 10−6.
It is important to keep in mind that the observed deviations fromGaussianity might not reflect only a stationary non-Gaussianity inneuronal connectivity. In the presented framework, deviation fromthe null hypothesis could be caused also by nonstationarity of thesignal. Vice versa, non-Gaussianity might lead to false detection ofnonstationarity if the test assumed a linear Gaussian generatingprocess as in (Chang and Glover, 2010). Technically, a precise isolationof these two effects is extremely challenging. A practical considerationallows to reasonably reconcile the two alternative interpretations:heavy nonstationarity could indeed increase the estimated non-Gaussianity, but it would also on its own invalidate the use of simplelinear correlation, leading to the same conclusion about its suitability.On another note, we also should not forget that we are working on thelevel of fMRI BOLD signal rather that with neuronal activations—boththe Gaussian and non-Gaussian contributions to FC are likely to beaffected to some extent by non-neural sources of signal variation.Nevertheless, in the end the estimation of whether this would play infavor of or against the use of linear correlation (and howmuch) seemsto be entirely speculative at this point.
It can be argued that the amount of non-linear mutual informationdetected is likely to depend on the preprocessing of the data andthe acquisition parameters. In this study, we have used standardacquisition and preprocessing, maybe with the exception of not usingany explicit temporal low-pass filtering. The rationale for omission ofthis step was to avoid introduction of temporal averaging that wouldfurther diminish an already small nonlinearity in the data. The choiceof working with several tens of gray matter parcels per hemispherewas motivated by approach of (Lahaye et al., 2003) as well ascomputational feasibility and allowing reproducibility and compara-bility across subjects and datasets. On the other side, incoherence ofvoxel-signals within the parcels might lead to losing some of thenonlinearity on the level of parcel-averaging, and therefore workingon the level of temporal signal of spatial Independent ComponentAnalysis (ICA) components or single voxel signal might in theory bemore sensitive to nonlinearity. Exploring the dependence of the non-Gaussian contribution to FC on the time series extraction method is asubject of future work. Also, the analysis presented in this paper didnot consider any time-lags. This is consistent with comparing to linearcorrelation as a measure of FC. The time lags would have to beincluded were we interested in assessment of causal or “effectiveconnectivity” measures (linear versus nonlinear)—this defines anatural follow-up of the recent study.
Apart from some minor technical aspects such as normalisation ofthe time series, our study differs from the previous probes into thepotential of nonlinear fMRI FC such as (Xie et al., 2008; Maxim et al.,2005; Lahaye et al., 2003; Deshpande et al., 2006) mainly in that weexplicitly focus on the bivariate Gaussianity rather than the linearityassumption as the condition of suitability of use of linear correlationas functional connectivity index. The deviation from this conditionallowed us to quantify the potential available for arbitrary “nonlinear”connectivity measures. This general interpretation is allowed by theuse of a very general dependence measure—mutual information.In theory, this is able to capture virtually any form of statisticaldependence. Of course, some practical limitations stem from theinevitably finite sample size, forcing us to summarize the resultsacross parcel pairs and subjects. Last but not least, we provide anillustrative quantitative estimation of the deviation from Gaussianityby means of the mutual information neglected by linear correlation,that should give a theoretical upper bound on any improvement tobe made by an arbitrary nonlinear connectivity measure. We notethat an earlier attempt towards quantification of the FC “nonlinearity”
was made in (Lahaye et al., 2003), who reported also the explainedvariances by the higher order (nonlinear up to order 5) terms in thepredictor set within a linear regression framework—although thesevariances were not corrected for the effect of extra number ofregressors in the model, and also the considered model could notcapture a more general form of dependence. A similar approach as inLahaye et al. (2003) was previously also applied to assessment of thenon(linear) character of connectivity in EEG data by Pijn et al. (1990).The h2 coefficient applied in that study expresses the proportion ofvariance in one variable explained by another variable using apolynomial fit; the aim was to provide more robust detection ofinteractions than simple linear correlation in case when the linearityassumption is violated.
Despite the differences in the aims and methodology, ourobservations agree qualitatively with the previous studies such asLahaye et al. (2003) and Xie et al. (2008) in that we also reject thespecific hypothesis of stationary multivariate linear Gaussian processas the structure of resting state fMRI signal.
For clarity, we stress again that the above-mentioned Gaussianitycondition, rather than mere linearity of the process, is the key assump-tion for suitability of use of linear correlation. To fully acknowledge thisconsider that as stated e.g. in (Bickel and Buhlmann, 1996), a linearstationary process (Xt)t∈ℤ is usually defined by
Xt = ∑∞
j=0ϕj�t−j; t∈ℤð Þ; ð2Þ
where �t is i.i.d with E[�t]=0,E|�t|2b1 and ∑∞j = 0ϕ
2j b1.
While the definitions of linear process may differ in details, inmost cases they are general enough to include processes with non-Gaussian distribution, which are then not fully described by theircorrelation structure. This may lead to some confusion, pointed out in(Nagarajan, 2006), who showed that some widely used surrogate-based linearity tests such as those used in (Xie et al., 2008) areactually sensitive to non-Gaussianity. Careful examination of theassumptions of these tests reveals that the null hypothesis there isthat the data come from a process that is equivalent to a linearlyfiltered white Gaussian noise. Of course, if the general definition oflinearity is complemented by the condition that the generatingnoise is Gaussian, such a linear process is indeed also Gaussian,with probability distribution fully characterised by the mean andcovariance structure. Discussion of the potential causes of rejection ofthe null hypothesis of “linearity” in the FT-surrogate framework byprocesses that are still linear in the general sense of having the form(2) is also provided in (Palus, 2007).
For completeness, we note that linearity is also often discussed asan alternative to nonlinear, potentially chaotic deterministic dynam-ical systems. In this context caution is warranted with the interpre-tation of many “chaotic” characteristics such as fractional correlationdimension or Lyapunov exponents when the underlying systemmight be of stochastic (non)linear nature rather than deterministic(non)linear dynamical system, and particularly when short timeseries such as those acquired from fMRI are being analyzed.
To summarize, we have assessed the suitability of linear correlationas functional connectivity measure for fMRI time series by testingand quantifying the deviation from bivariate Gaussianity using mutualinformation. The results were as follows: firstly, the quantitativeassessment revealed that the portion of mutual information neglectedbyusing linear correlation instead of considering an arbitrary non-linearform of instantaneous dependence is minor. Secondly, formal group-level test revealed that the percentage of parcel-pairs with significantnon-Gaussian dependence contribution is indeed above random.Overall we conclude that linear correlation of normalized data wellcaptures the full functional connectivity: although existence of non-Gaussian contribution to functional connectivity can be established,practical relevance of nonlinear methods trying to improve over linear

2225J. Hlinka et al. / NeuroImage 54 (2011) 2218–2225
correlation might be limited by the fact that the data are indeed almostGaussian. This was documented by a quantitative estimate of mutualinformation neglected due to the use of linear correlation for typicalresting state fMRI data, as well as by complimentary comparison ofresults of clustering analysis.
Supplementarymaterials related to this article can be found onlineat doi:10.1016/j.neuroimage.2010.08.042.
Acknowledgments
This work has been supported by the EC FP7 project BrainSync (EC:HEALTH-F2-2008-200728, CR: MSM/7E08027); and in part by theInstitutional Research Plan AV0Z10300504. DM was partly supportedby the Research Foundation Flanders (grant FWO A 4/5 SDS 15387).
References
Bickel, P., Buhlmann, P., 1996. What is a linear process? Proc. Natl. Acad. Sci. U. S. A. 93,12128–12131.
Chang, C., Glover, G.H., 2010. Time-frequency dynamics of resting-state brainconnectivity measured with fMRI. NeuroImage 50, 81–98.
de Zwart, J.A., van Gelderen, P., Jansma, J.M., Fukunaga, M., Bianciardi, M., Duyn, J.H.,2009. Hemodynamic nonlinearities affect BOLD fMRI response timing andamplitude. NeuroImage 47, 1649–1658.
Deshpande, G., LaConte, S., Peltier, S., Hu, X.P., 2006. Connectivity analysis of humanfunctional MRI data: from linear to nonlinear and static to dynamic. Med. ImagingAugmented Real. 4091, 17–24.
Fox, M.D., Raichle, M.E., 2007. Spontaneous fluctuations in brain activity observed withfunctional magnetic resonance imaging. Nat. Rev. Neurosci. 8, 700–711.
Friston, K., 1994. Functional and effective connectivity in neuroimaging: a synthesis.Hum. Brain Mapp. 2, 56–78.
Lahaye, P.J., Poline, J.B., Flandin, G., Dodel, S., Garnero, L., 2003. Functional connectivity:studying nonlinear, delayed interactions between BOLD signals. NeuroImage 20,962–974.
Laufs, H., 2008. Endogenous brain oscillations and related networks detected by surfaceEEG-combined fMRI. Hum. Brain Mapp. 29, 762–769.
Mantini, D., Perrucci, M.G., Del Gratta, C., Romani, G.L., Corbetta, M., 2007.Electrophysiological signatures of resting state networks in the human brain.Proc. Natl. Acad. Sci. U. S. A. 104, 13170–13175.
Maxim, V., Sendur, L., Fadili, J., Suckling, J., Gould, R., Howard, R., Bullmore, E., 2005.Fractional Gaussian noise, functional MRI and Alzheimer's disease. NeuroImage 25,141–158.
Mecklin, C.J., Mundfrom, D.J., 2004. An appraisal and bibliography of tests formultivariate normality. Int. Stat. Rev. 72, 123–138.
Miller, K.J., Weaver, K.E., Ojemann, J.G., 2009. Direct electrophysiological measurementof human default network areas. Proc. Natl. Acad. Sci. U. S. A. 106, 12174–12177.
Nagarajan, R., 2006. Surrogate testing of linear feedback processes with non-gaussianinnovations. Physica A 366, 530–538 (Physica A—statistical mechanics and itsapplications).
Palus, M., 1997. Detecting phase synchronization in noisy systems. Phys. Lett. A 235,341–351.
Palus, M., 2007. From nonlinearity to causality: statistical testing and inference ofphysical mechanisms underlying complex dynamics. Contemp. Phys. 48, 307–348.
Palus, M., Vejmelka, M., 2007. Directionality of coupling from bivariate time series: howto avoid false causalities and missed connections. Phys. Rev. E 75, 056211.
Palus, M., Albrecht, V., Dvorak, I., 1993. Information theoretic test for nonlinearity intime series. Phys. Lett. A 175, 203–209.
Pijn, J.P.M., Vijna, P.C.M., da Silva, F.H.L., Boas, W.V.E., Blanes, W., 1990. Localization ofepileptogenic foci using a new signal analytical approach. Neurophysiol. Clin./Clin.Neurophysiol. 20 (1), 1–11.
Prichard, D., Theiler, J., 1994. Generating surrogate data for time series with severalsimultaneously measured variables. Phys. Rev. Lett. 73, 951.
Shi, J., Malik, J., 2000. Normalized cuts and image segmentation. IEEE Trans. PatternAnal. Mach. Intell. 22, 888–905.
Stam, C., 2005. Nonlinear dynamical analysis of EEG and MEG: Review of an emergingfield. Clin. Neurophysiol. 116, 2266–2301.
Tzourio-Mazoyer, N., Landeau, B., Papathanassiou, D., Crivello, F., Etard, O., Delcroix, N.,Mazoyer, B., Joliot, M., 2002. Automated anatomical labeling of activations in SPMusing a macroscopic anatomical parcellation of the MNI MRI single-subject brain.NeuroImage 15, 273–289.
van Dijk, K.R.A., Hedden, T., Venkataraman, A., Evans, K.C., Lazar, S.W., Buckner, R.L.,2010. Intrinsic functional connectivity as a tool for human connectomics: theory,properties, and optimization. J. Neurophysiol. 103, 297–321.
Xie, X.P., Cao, Z.T., Weng, X.C., 2008. Spatiotemporal nonlinearity in resting-state fMRIof the human brain. NeuroImage 40, 1672–1685.
Yu, S.X., Shi, J., 2003.Multiclass spectral clustering. ICCV '03: Proceedings of the Ninth IEEEInternational Conference on Computer Vision, IEEE Computer Society, Washington,DC, USA, p. 313.
Copyright © 2022 FDOKUMEN