Multi-parametric analysis of cell death pathways using live cell microscopy
31
UNIT 4.40 Multi-Parametric Analysis of Cell Death Pathways Using Live-Cell Microscopy Gaurav N. Joshi 1 and David A. Knecht 1 1 Department of Molecular and Cell Biology, University of Connecticut, Storrs, Connecticut ABSTRACT Programmed cell death is a complex process with new forms being discovered with regularity. Each pathway has a distinct and overlapping biochemical and physiological change occurring as the cell prepares for death. Detection of these changes can be facilitated by the availability of various fluorescent probes and advances in microscope systems. By analyzing these probes over time using fluorescence microscopy, the changes that occur in each cell en route to death can be analyzed on a cell-by-cell basis. While the timing of events varies considerably from cell to cell, it has been found that the sequence of events is highly conserved. Transient events, which would be difficult to detect using population averaging techniques, are readily detected when cells are analyzed individually in time lapse. The protocols in this unit describe using probes for real-time imaging of one of the apoptotic cell death pathways using various inducers, as well as the associated hardware necessary for imaging so that the imaging itself is not affecting cell viability. Curr. Protoc. Toxicol. 58:4.40.1-4.40.31. C 2013 by John Wiley & Sons, Inc. Keywords: apoptosis fluorescence microscopy real-time imaging image analysis FRET INTRODUCTION Apoptosis can be subdivided into extrinsic and intrinsic pathways that intersect at the mitochondria. One mechanism to induce intrinsic cell death is the release of cathepsins from lysosomes. Cathepsins in the cytoplasm can cleave Bid, which activates Bax, resulting in mitochondrial outer membrane permeabilization (MOMP) and release of cytochrome c. This is essential for activation of caspases that commits a cell towards death. Lysosomal leakage has been shown to be induced by staurosporine, L-leucyl L- leucine methyl ester (Leu-Leu-O-Me), and the phagocytosis of silica particles. Various fluorescent probes can be helpful in determining a temporal sequence of these events upon exposure to apoptotic inducers. This unit describes basic plating of cells (see Basic Protocol 1) and three different en- vironment chambers (see Basic Protocol 2) that can be used to maintain cells in an appropriate environment during long-term microscopy. Detection of various parameters that signal alterations in cellular physiology are described along with the essential mi- croscopy capabilities needed to perform imaging. These parameters include detection of lysosomal leakage using FITC dextran (see Basic Protocol 3), changes in mitochondria membrane potential (see Basic Protocol 4), translocation of Bax to mitochondria (see Basic Protocol 6), and detection of caspase activation (see Basic Protocol 7). Assays such as phosphatidylserine externalization (see Basic Protocol 8) and change in nuclear morphology (see Basic Protocol 9) can also be used to identify apoptosis as opposed to other forms of cell death. Cell viability can be determined using the propidium iodide assay (see Basic Protocol 10). Current Protocols in Toxicology 4.40.1-4.40.31, November 2013 Published online November 2013 in Wiley Online Library (wileyonlinelibrary.com). DOI: 10.1002/0471140856.tx0440s58 Copyright C 2013 John Wiley & Sons, Inc. Techniques for Analysis of Chemical Biotransformation 4.40.1 Supplement 58
Transcript of Multi-parametric analysis of cell death pathways using live cell microscopy
UNIT 4.40Multi-Parametric Analysis of Cell DeathPathways Using Live-Cell Microscopy
Gaurav N. Joshi1 and David A. Knecht1
1Department of Molecular and Cell Biology, University of Connecticut, Storrs, Connecticut
ABSTRACT
Programmed cell death is a complex process with new forms being discovered withregularity. Each pathway has a distinct and overlapping biochemical and physiologicalchange occurring as the cell prepares for death. Detection of these changes can befacilitated by the availability of various fluorescent probes and advances in microscopesystems. By analyzing these probes over time using fluorescence microscopy, the changesthat occur in each cell en route to death can be analyzed on a cell-by-cell basis. Whilethe timing of events varies considerably from cell to cell, it has been found that thesequence of events is highly conserved. Transient events, which would be difficult todetect using population averaging techniques, are readily detected when cells are analyzedindividually in time lapse. The protocols in this unit describe using probes for real-timeimaging of one of the apoptotic cell death pathways using various inducers, as well asthe associated hardware necessary for imaging so that the imaging itself is not affectingcell viability. Curr. Protoc. Toxicol. 58:4.40.1-4.40.31. C© 2013 by John Wiley & Sons,Inc.
Keywords: apoptosis � fluorescence microscopy � real-time imaging � image analysis� FRET
INTRODUCTION
Apoptosis can be subdivided into extrinsic and intrinsic pathways that intersect at themitochondria. One mechanism to induce intrinsic cell death is the release of cathepsinsfrom lysosomes. Cathepsins in the cytoplasm can cleave Bid, which activates Bax,resulting in mitochondrial outer membrane permeabilization (MOMP) and release ofcytochrome c. This is essential for activation of caspases that commits a cell towardsdeath. Lysosomal leakage has been shown to be induced by staurosporine, L-leucyl L-leucine methyl ester (Leu-Leu-O-Me), and the phagocytosis of silica particles. Variousfluorescent probes can be helpful in determining a temporal sequence of these eventsupon exposure to apoptotic inducers.
This unit describes basic plating of cells (see Basic Protocol 1) and three different en-vironment chambers (see Basic Protocol 2) that can be used to maintain cells in anappropriate environment during long-term microscopy. Detection of various parametersthat signal alterations in cellular physiology are described along with the essential mi-croscopy capabilities needed to perform imaging. These parameters include detection oflysosomal leakage using FITC dextran (see Basic Protocol 3), changes in mitochondriamembrane potential (see Basic Protocol 4), translocation of Bax to mitochondria (seeBasic Protocol 6), and detection of caspase activation (see Basic Protocol 7). Assayssuch as phosphatidylserine externalization (see Basic Protocol 8) and change in nuclearmorphology (see Basic Protocol 9) can also be used to identify apoptosis as opposed toother forms of cell death. Cell viability can be determined using the propidium iodideassay (see Basic Protocol 10).
Current Protocols in Toxicology 4.40.1-4.40.31, November 2013Published online November 2013 in Wiley Online Library (wileyonlinelibrary.com).DOI: 10.1002/0471140856.tx0440s58Copyright C© 2013 John Wiley & Sons, Inc.
Techniques forAnalysis ofChemicalBiotransformation
4.40.1
Supplement 58

Assays mentioned in Basic Protocols 3 through 10 can be combined as long as thereis no spectral overlap between the fluorescent probes. Some of these multi-parametricassays are described in Basic Protocol 11. Use of cell death inducers is described in BasicProtocol 12.
BASICPROTOCOL 1
PLATING OF CELLS
The following protocol describes plating of cells in a 35-mm glass-bottom dish or 8-well chamber slides. For some assays, it is possible to use plastic dishes; however, fordifferential interference contrast (DIC) and oil immersion fluorescence imaging, thin-glass substrates are necessary to be able to use high-numerical-aperture objectives. It isimportant to have properly growing and well-maintained cells, as inducing an apoptoticpathway in cells already under stress may give misleading data. Upon plating, cellscan either be transfected for expression of recombinant proteins probes or loaded withfluorescent dyes, which allow detection of various physiological changes in the cell afterexposure to an agent inducing cell death.
Materials
MH-S alveolar macrophages (ATCC# 2019)RPMI complete medium (see recipe)
37°C, 5% CO2 incubatorPipets35-mm Bioptechs dishes (Fisher scientific, cat. no. 12-071-07), 35-mm
glass-bottom petri dishes (WillCo wells, cat. no. GWSt-3522 or Matek Corp.),or 8-well chamber slide (Thermo Scientific Nunc Lab-Tek II chambered coverglass, cat. no. 12565338)
1. Maintain murine alveolar macrophage (MH-S) (or RAW 264.7) cell line in RPMIcomplete medium in a 37°C, 5% CO2 incubator.
2. Harvest cells by gently triturating them using a pipet.
These cells are not tightly adherent to plastic surfaces therefore are relatively easy todislodge. Many cell lines will require trypsin-EDTA to release them from the surface.Some cell lines may also require coating glass with extracellular matrix molecules likefibronectin, laminin, or collagen to enable them to adhere.
3. Plate 1.2 × 10⁵ MH-S cells in 1 ml RPMI complete medium in either a 35-mmBioptechs or glass-bottom petri dish or plate 3 × 10⁴ cells in a total of 500 µl RPMIcomplete medium per well of an 8-well chambered slide.
4. Allow cells to adhere and grow for 12 hr in a 37°C, 5% CO2 incubator.
5. After 12 hr, check cells to confirm they are �80% confluent and remove any deadcells or debris by aspirating the medium and replacing it with fresh RPMI completemedium.
BASICPROTOCOL 2
ENVIRONMENTAL CHAMBERS FOR TEMPERATURE REGULATION
For live-cell imaging over many hours, it is imperative to have a microscope incubationsystem that maintains cells at appropriate physiological temperature, humidity, and CO2
level. Humidification is especially important, as evaporation of medium from the dish isvery rapid at 37°C and a small change in volume will cause changes in cells. Control ofpH is also critical. Most growth media, if used outside of a 5% CO2 environment, willrapidly result in an increase in pH and stress, or kill cells. There are a number of systemsmarketed for the purpose of microscope environmental control. The setup described
Multi-ParametricAnalysis ofCell Death
4.40.2
Supplement 58 Current Protocols in Toxicology
below works well, but hands-on testing of any system before purchase is recommended.Many systems tested did not provide necessary long-term control.
One solution is to use a medium that maintains its pH in atmospheric air, so onlytemperature control is needed in a sealed chamber. CO2-independent medium (availablefrom Life Technologies) can be used to maintain pH for many cell types. Combinedwith a sealed heating chamber (Bioptechs Delta T), this provides a relatively inexpensivesolution to the problem. A control run of cells in CO2-independent medium loaded withdye, except in the inducer, is necessary to understand if a specific type of cells cantolerate the shift to new medium. The best solution, but more costly, is a microscopestage–top chamber system (Pathology Devices), which provides feedback monitoringof gas, humidity, and temperature and maintains each parameter for the course of theexperiment.
A microscope system with technology to adapt to prevent focus drift associated withtemperature fluctuations (e.g., Nikon Perfect Focus) is highly advantageous for long-term experiments. There are various systems available that allow one to achieve thesegoals. Below are two systems used extensively. They are listed in increasing order of costand complexity. Consulting the institution’s microscopy facility administrator to betterunderstand an appropriate system available is recommended.
Following detailed protocols for use of either of the two options, instructions for cleaningdishes and wells, which should be applied as appropriate depending on the option utilized,are also provided.
More information can be found at the following links: Bioptechs, http://www.Bioptechs.com/Products/Delta_T/delta_t.html; Pathology Devices, http://www.pathologydevices.com/LiveCell.htm; Okolabs, http://www.oko-lab.com/cageIncubator.page.
Materials
CellsAppropriate cell dye(s) (see Basic Protocols 3 to 10)Cell death inducer (see Basic Protocol 12)Mineral oil70% ethanolL-900 detergent (Nalgene)
Delta T dish system (Bioptechs)Zeiss Axiovert 200 M widefield fluorescence microscopePlexiglas full microscope enclosure8-well chambered slide or WillCo dishBold-line cage incubator (Okolab)Live-cell chamber (Pathology Devices)Nikon A1R confocal microscopeBiological safety cabinet equipped with UV sterilizing lamp
Stage temperature control using stage-top heater (option 1)
Delta T (Bioptechs) dishes are designed to fit in the Bioptechs Delta T stage temperaturecontroller. This system works by directly heating the glass coverslip at the bottomof the dish and accurately controlling the temperature of the cells. However, whenimaging with oil-immersion objectives, the temperature will be reduced slightly bythermal conduction unless an objective heater is used, which is not routinely the case. Aheated lid connected to the Bioptechs temperature regulating system sits on top of thedish to prevent condensation of liquid on the lid. A rubber O-ring inside of the lid resultsin a tight fit between the lid and the plate, which prevents evaporation of the medium;
Techniques forAnalysis ofChemicalBiotransformation
4.40.3
Current Protocols in Toxicology Supplement 58
however, this also makes it difficult to remove the lid without disturbing the XY positionof the plate during addition of drug. A gas port located on the side of the lid can be usedto supply CO2 if needed. When CO2-independent medium is used, this port is sealed toprevent evaporation. Because this system is portable, it can be readily used on varioussystems.
1a. Plate cells in Bioptechs Delta T dish (see Basic Protocol 1).
2a. Set the Delta T dish controller box to appropriate physiological temperature requiredby cells.
3a. Before bringing the Bioptechs dish onto the microscope stage, turn on the controllerand allow the heated lid to reach set temperature to prevent condensation of wateron the lid.
4a. Once cells are loaded with appropriate dye, place Bioptechs dish into the Delta Tstage holder and secure it firmly with the thumbscrews.
5a. Place the lid connected to Bioptechs temperature controller unit onto the plate.
6a. Adjust the parameters of software for time-lapse image acquisition.
7a. Remove the heated lid and add appropriate amount of cell death inducer to the cellsas described in Basic Protocol 12.
8a. During time-lapse imaging, periodically check and readjust focus if necessary. Pro-ceed to step 9.
Stage temperature control using stage-top incubator (option 2)
Units like the Pathology Devices LiveCell sit on top of the microscope stage and a dishsits inside a small chamber. The chamber is heated, and heated humidified gas is pumpedcontinuously through the chamber. Sensors in the chamber monitor the ambient CO2
and humidity and feed back to the regulator to maintain the environment at the desiredset point. A CO2 tank is required to provide gas for the system. The advantage of thissystem is that it provides excellent environmental control. The negative is that sincethe microscope is not heated, oil-immersion microscopy will cause the sample to be atless than the setpoint temperature unless an objective heater is used. In addition, thereis a tendency for gaseous water from the environment chamber to condense on coolermicroscope components.
Stage temperature control using Pathology Devices LiveCell plus Okolab fullmicroscope enclosure (option 3)
With this option, the entire microscope is enclosed in a Plexiglass box like the Bold Linecage incubator from Okolab. The Plexiglass enclosure is connected to the temperaturecontrol unit that circulates heated air in the chamber based on the set temperature (usually37°C). These units usually do not regulate the CO2 and humidity of the cell chamber andallow rapid evaporation of medium in a non-sealed dish. Adding a stage-top incubatorlike the Pathology Devices LiveCell (or others) allows control of the local environmentof the cells while the Plexiglass enclosure heats the entire microscope, preventing theobjective from acting as a heat sink and keeping water from condensing on microscopeparts. This combination system provides the best control of the cellular environment, butis the most costly and limits access to the microscope and stage.
1b. Using Pathology Devices LiveCell chamber: Plate cells in either an 8-well chamberedslide or WillCo dish. Proceed to step 3b.
1c. Turn on the LiveCell incubator at least 45 min before the plate is brought to the stagefor imaging to obtain and stabilize the temperature and humidity to the set point.
Multi-ParametricAnalysis ofCell Death
4.40.4
Supplement 58 Current Protocols in Toxicology

At this point, it is recommended to fit the microscope stage with the LiveCell insertspecific for the dish in which cells are plated (i.e., 8-well chambered slide or WillCodish).
2c. If using a LiveCell chamber plus Okolabs Plexiglass full microscope enclosure: Oncethe live-cell instrument in step 1c has reached desired temperature and humidity, turnon the regulator for the Plexiglas box and allow it to reach 37°C before proceeding.Proceed to step 3b.
Note that the Plexiglass enclosure supplements, but does not replace, the heated, humid-ified chamber that the actual dishes/wells sit in. The larger Plexiglass enclosure providesan additional level of localized environmental control.
3b. Load cells with appropriate dye or combination of dyes (see Basic Protocols 3 to10).
4b. Select appropriate objective. If an oil immersion lens is used, then place a drop ofimmersion oil on the objective. If multiple wells of an 8-well chamber slide will beused on an automated stage, apply a coat of oil onto the bottom of an 8-well chamberslide, making sure that no air bubbles are formed.
5b. Place the 8-well chambered slide or the WillCo dish onto the stage.
6b. For multi-dimensional imaging, select different focal planes and different fields ofviews and save them to the Nikon elements software. To prevent focus drift andthermal drift, turn on Perfect Focus System.
7b. Select appropriate settings on the microscope depending on the dye for imagingpurposes.
Clean dishes after use
9. To reuse either the Bioptechs (option 1) or WillCo dishes or 8-well chamber slides(option 2) after an experiment, wipe the oil off the bottom of the dish and then gentlyremove residual oil with a tissue and 70% ethanol.
If the heat-conducting metal strips at the bottom surface of the Bioptechs dish havechanged color or stripped off, do not use these plates.
Clean wells after use
10. To clean the wells, aspirate the medium from the dish and replace it with mild,plastic-compatible detergent (L-900 or equivalent). Allow it to sit for 5 min.
11. Using a cleanroom swab, gently wipe the wells.
It is important not to use excess pressure, as this will detach or break the glass coverslip.
12. Rinse wells with distilled water.
13. Sterilize the plate by filling the wells with 70% ethanol for 10 min or briefly immersethe plate in a beaker or dish containing 70% ethanol.
14. Place plate into a biological safety cabinet and aspirate the ethanol, then leave theplates exposed to UV sterilizing light for 20 min.
BASICPROTOCOL 3
DETECTING LYSOSOMAL LEAKAGE
This method describes loading cells with a fluid phase tracer, fluorescein isothiocyanate-dextran (FITC-dextran), to detect lysosomal leakage. FITC-dextran (488 nm/510 nm,ex/em) is endocytosed into cytoplasmic vesicles. The low pH of this compartmentsuppresses the fluorescence of FITC. Leakage of the dye into the higher pH cy-toplasm causes a dramatic increase in cytoplasmic fluorescence (Fig. 4.40.1). If a
Techniques forAnalysis ofChemicalBiotransformation
4.40.5
Current Protocols in Toxicology Supplement 58

A
B
3
3
3
3
1
1
1
1
2
2
2
2
1
DIC
FD
DIC
FD
Time(min)
Time(min)
14 19 22 32 34 45 49
0 60 105 195
Figure 4.40.1 Detection of endo-lysosomal leakage using FITC-dextran upon exposure to various induc-ers. (A) Cells treated with staurosporine (1 µM) leak as early as 60 min and continue to do so as seen byan increase in fluorescence over time (cell 1). Other cells show similar leakage kinetics although at differenttimes. (B) Cells exposed to silica particles show particle uptake and leakage. Particle uptake is observedin cell 1 at 14 min as indicated by an increase in dextran fluorescence, solid arrow) and leakage at 34 min.Similarly, particle uptake is observed in cell 2 at 19 min and leakage at 45 min.
low-molecular-weight dextran is used, it can enter the nucleus as well, and since thereis no vesicular background fluorescence in this region, it is easy to quantify the increasein fluorescence. Both widefield and confocal microscopes can be used for imaging.However, a widefield microscope is advantageous as it images the entire cytoplasmicvolume.
Materials
FITC-dextran (4-kD) (Sigma) (100 mg/ml stock in water, store at −20°C)RPMI complete medium (see recipe)CO2-independent medium (Invitrogen)Drug or particle (see Basic Protocol 12)
37°C, 5% CO2 incubator37°C ambient air incubatorFluorescence microscope (widefield or confocal; widefield recommended) with
image acquisition capabilities1.5-ml microcentrifuge tubesVortexer
Multi-ParametricAnalysis ofCell Death
4.40.6
Supplement 58 Current Protocols in Toxicology

Additional reagents and equipment for plating cells (see Basic Protocol 1)
1. Plate cells as described in Basic Protocol 1. Replace the medium with 1 mg/ml of4-kD FITC-dextran in RPMI complete medium.
The total volume of the medium should be 1 ml for a 35-mm glass dish and 500 µl/wellfor the 8-well chambered slide.
2. Incubate for 3 hr in a 37°C, 5% CO2 incubator.
3. Aspirate the labeling medium and quickly replace it with fresh RPMI completemedium.
Add the fresh RPMI complete medium quickly to prevent any stress to the cells.
The medium in an 8-well chamber slide creates a meniscus effect leaving more mediumon the edge of the well and little medium in the center. The cells in the center wereobserved to be lost during washing steps; this is believed to be because of the meniscuseffect. To prevent cell loss, aspirate medium while watching the meniscus closely, suchthat a dry spot does not occur at the center.
4. Allow cells to equilibrate for 5 min in a 37°C, 5% CO2 incubator.
5. Repeat RPMI complete medium wash.
6. Aspirate the medium and replace with CO2-independent medium.
7. Allow cells to equilibrate for 5 min at 37°C in an ambient air incubator.
8. Repeat CO2-independent medium wash and replace the medium with 1 ml CO2-independent medium if using a 35-mm dish or 500 µl CO2-independent medium ifusing an 8-well dish.
The plate is now ready to be placed onto a microscope stage, imaged at 488 nm/510 nm(ex/em), and exposed to a drug.
9. Take images every 5 min for the duration of the experiment.
Induce cell death
10. Pipet half of the volume of medium from the dish into a 1.5-ml microcentrifugetube.
11. Add the desired drug or particle to be tested (see Basic Protocol 12 for its effect oncell death) to the medium and vortex.
12. Pipet the medium back into the dish.
13. Restart the automation to acquire time-lapse data.
14. Refer to Support Protocol 1 for analysis instructions.
SUPPORTPROTOCOL 1
QUANTIFICATION OF AN INCREASE IN NUCLEAR FLUORESCENCE
The instructions below are specifically tailored for Basic Protocol 3 (FITC nuclear fluo-rescence quantification), but may also be applicable to other protocols for quantificationof time-lapse fluorescence images.
For use with other staining protocols, the probe stated here (FITC) would be replaced witha relevant probe (e.g., tetramethylrhodamine ethyl ester, TMRE). Likewise, if evaluatingother organelles (e.g., mitochondrion rather than the nucleus), adjust the ROI (region ofinterest) as appropriate. Techniques for
Analysis ofChemicalBiotransformation
4.40.7
Current Protocols in Toxicology Supplement 58

Materials
Data from FITC-dextran and transmitted light or DIC channels (see Basic Protocol3)
Image J (available at http://rsbweb.nih.gov/ij/download.html; Schneider et al.,2012)
Microsoft Excel
Organize data
1. Create the following folders:
a. “Raw”: consisting of raw data files.b. “Analyzed”: consisting of processed data files.
Convert images into stack
2. If a series of images were obtained, convert them into a stack using ImageJ. Accessthe following commands from the menu bar, File → Import → Image sequence →select the “Raw” folder containing individual images for FITC → click on one ofthe images in the folder and click OK.
A new window with all of the FITC images in a stack format will open.
3. Save this data set from the menu bar. File → Save as → Tiff and name appropriately.
4. Repeat steps 2 and 3 for transmitted light or DIC data set.
Quantify dataset by measuring mean pixel intensity of nuclear area
5. Open the FITC image stack.
6. Draw a region of interest (ROI) around the nuclear area using either the oval or thefreehand selection tool in the tool bar.
7. Measure the mean pixel intensity of the cell using Analyze → Measure commandin the menu bar. A new results window will open where the mean pixel intensitycan be found.
8. Repeat this for the entire stack by manually re-positioning ROI over the cell if thecell is moving or changing position.
9. If the cell is not moving from frame to frame, then the measurement can be au-tomated using Multi Measure. Draw an ROI over the cell, go to Tools→ROIManager→More→Multi-Measure. A query asking, “Want to process all imagesin stacks” will appear; say Yes. This will open a new results window with meanpixel intensity for the ROI in every frame.
10. Select all the values from the measure window by using Edit → copy and pastethem into Microsoft Excel.
BASICPROTOCOL 4
EVALUATING CHANGES IN MITOCHONDRIA MEMBRANE POTENTIAL
Tetramethylrhodamine ethyl ester (TMRE) is a dye of choice for studying changes inmitochondria membrane potential for live-cell imaging. This cationic dye accumulates inactive mitochondria and decreases or increases in fluorescence depending on the mem-brane potential. Changes in mitochondrial membrane potential are frequently observedas part of the cellular response to toxicants. The protocol below details the use of TMREfor time-lapse imaging of cells.
Materials
50 µM tetramethylrhodamine ester in DMSO (TMRE, Sigma)RPMI complete medium (see recipe)
Multi-ParametricAnalysis ofCell Death
4.40.8
Supplement 58 Current Protocols in Toxicology

CO2-independent medium (Invitrogen)Oligomycin (Sigma)Carbonyl cyanide 4-(trifluoromethoxy) phenylhydrazone (FCCP, Sigma)Drugs/compounds for testing (see Basic Protocol 12)
37°C incubator37°C, 5% CO2 incubator1.5-ml microcentrifuge tubesFluorescence microscope with image acquisition hardware and software
Load cells with TMRE
1. Plate cells as in Basic Protocol 1.
2. Replace medium with 50 nM TMRE in RPMI complete medium. Incubate 20 minin 37°C, 5% CO2 incubator.
As an alternative to TMRE, other investigators have also used JC-1, a ratiometricfluorescence probe to study mitochondria membrane potential.
3. Wash with RPMI complete medium by aspirating the medium out of the plate andreplacing it with fresh RPMI complete medium.
Make sure that the medium is added quickly to prevent any stress to cells.
4. Incubate 5 min in a 37°C, 5% CO2 incubator.
5. Wash with RPMI complete medium.
6. Incubate 5 min in a 37°C, 5% CO2 incubator.
7. Wash with CO2-independent medium.
8. Incubate 5 min in a 37°C ambient air incubator.
9. Wash with CO2-independent medium and replace the medium with 1 ml CO2-independent medium for a 35-mm petri dish or 500 µl CO2-independent mediumfor an 8-well slide.
The plate is now ready to be placed onto a microscope stage, imaged at 562 nm/624 nm(ex/em), and exposed to a drug.
Induce cell death with controls for mitochondrial depolarization andhyperpolarization
10. Pipet half of the medium volume from dish into a 1.5-ml microcentrifuge tube.
Prepare microcentrifuge tubes for each drug to be tested as well as two additional sets oftubes for FCCP and oligomycin, which are used as positive controls for mitochondrialdepolarization and hyperpolarization, respectively.
11. Add desired drug or particle that need to be tested as in Basic Protocol 12 for itseffect on cell death in to the medium and vortex.
a. To control for mitochondrial depolarization, add FCCP to 10 µM based upon atotal volume in the dish or well.
b. To control for mitochondrial hyperpolarization, add an amount of oligomycinto bring the final concentration of oligomycin to 5 µg/ml in the final volume inthe dish or well.
12. Once all media are prepared, pipet the medium back into appropriate dishes/wells.
For the FCCP positive control, time is particularly critical, as a decrease in TMREfluorescence should be visible within 1 min of addition.
Techniques forAnalysis ofChemicalBiotransformation
4.40.9
Current Protocols in Toxicology Supplement 58

Oligomycin generally requires �15 min of exposure before an increase in mitochondrialfluorescence is visible.
For test compounds, timing will likely vary; ensure accurate time tracking.
13. Restart the automation to acquire time-lapse data.
14. Refer to Support Protocol 1 for quantification instructions.
BASICPROTOCOL 5
TRANSFECTION OF CELLS
Transfection from two different lipid transfection reagents is described. Although meth-ods work to introduce DNA within cells, Fugene HD has been found to cause lower celltoxicity and give higher efficiency, but this will likely be cell-line dependent.
Materials
CellsDNA to be transfected (obtained by midi-prep or maxi-prep)RPMI-1640 incomplete medium (without serum and antibiotic)Lipofectamine 2000 (Invitrogen) or Fugene HD (Promega)RPMI-1640 complete medium (see recipe)
Sterile 35-mm glass-bottom petri dishes (e.g., WillCo dish)37°C, 5% CO2 incubatorFluorescence microscope5-ml sterile polystyrene tubes
Transfection of cells using Lipofectamine 2000
1a. Plate 1.2 × 10⁵ cells in a sterile 35-mm glass-bottom petri dish (e.g., Willco dish)and allow them to grow for 24 hr.
An increase in transfection efficiency has been found when cells are plated for 24 hrrather than 12 hr before carrying out transfection.
2a. Mix �2 µg DNA in a total volume of 100 µl RPMI-1640 incomplete medium.
3a. Add 5 µl Lipofectamine 2000 to 95 µl RPMI-1640 incomplete medium.
4a. Incubate solutions in steps 2a and 3a for 30 min at room temperature.
5a. Mix DNA (from step 2a) and Lipofectamine (from step 3a) solutions together.Incubate 10 min at room temperature.
6a. Replace the medium in plate with 800 µl RPMI-1640 incomplete medium.
7a. Add DNA and Lipofectamine mixture (from step 5a) dropwise to cells.
8a. Swirl the plate and incubate 8 to 12 hr in a 37°C, 5% CO2 incubator.
9a. Remove transfection solution and replace with RPMI complete medium.
10a. Use a fluorescence microscope to check for cellular fluorescence from transientexpression using an appropriate filter set to visualize fluorescent cells. It is difficultto visualize weak expression of the cells through a plastic dish or low-magnificationobjective; therefore, use a glass-bottom dish that can be used with an oil-immersionlens to screen for cells.
For some probes, background fluorescence from the medium can also make it difficultto identify transfected cells. Comparing cells to untransfected cells is helpful, as ischanging the medium to PBS to remove the high background due to medium fluorescence.
Multi-ParametricAnalysis ofCell Death
4.40.10
Supplement 58 Current Protocols in Toxicology

Cells transiently expressing fluorescent protein have been found as early as 7 hr aftertransfection. Peak expression was obtained at 2 days, after which cells show a gradualreduction in expression.
Transfection of cells using Fugene HD
1b. Plate 1.2 × 10⁵ cells in a sterile 35-mm glass-bottom dish and allow them to growfor 24 hr.
An increase in transfection efficiency has been found when cells are plated for 24 hrrather than 12 hr before carrying out transfection.
2b. Mix �2 µg DNA in a total volume of 100 µl RPMI incomplete medium in a 5-mlsterile polystyrene tube.
3b. Add 6 µl Fugene HD transfection reagent to the center of the tube. Make sure thattransfection reagent does not touch the edge of the tube during pipetting. Incubate15 min at room temperature.
4b. Replace medium in the plate from step 1b with 875 µl RPMI complete medium.
5b. Add the contents of tube from step 3b dropwise onto the plated cells.
6b. Swirl plate and incubate 12 hr in a 37°C, 5% CO2 incubator.
7b. Replace medium with RPMI complete medium.
8b. Check with a fluorescence microscope to visualize transfected cells (ex/em: 488nm/510 nm).
Fugene HD was found to be less toxic to MH-S cells compared to Lipofectamine 2000.
BASICPROTOCOL 6
Bax-INDUCED MITOCHONDRIA OUTER MEMBRANEPERMEABILIZATON (MOMP)
This protocol examines the role of pro-apoptotic protein Bax in mitochondrial outermembrane permeabilization. This protocol uses a confocal microscope, as the goal is tosee translocation of cytoplasmic probe to mitochondria. Confocal microscopy eliminatesmuch of the cytoplasmic background signal, so it is easier to determine when the probetranslocates to mitochondria.
Materials
MH-S cellsGFP-hBax DNA (Addgene, cat. no. 19741)Drugs/compounds for treatment (see Basic Protocol 12)
Confocal microscope equipped with a temperature and humidity controlled system60× oil-immersion lens1.5-ml microcentrifuge tubes
Additional reagents and equipment for transfection (see Basic Protocol 5)
Image cells
1. Transfect MH-S cells with GFP-hBax DNA using one of the two transfection ap-proaches detailed in Basic Protocol 5.
2. View cells expressing GFP-hBax using a confocal microscope equipped with atemperature and humidity controlled system.
3. Bring cells into focus using a 60× oil-immersion lens.
Techniques forAnalysis ofChemicalBiotransformation
4.40.11
Current Protocols in Toxicology Supplement 58

0 167 168 169 170 171 210
DIC
TM
RE
Bax
Time(min)
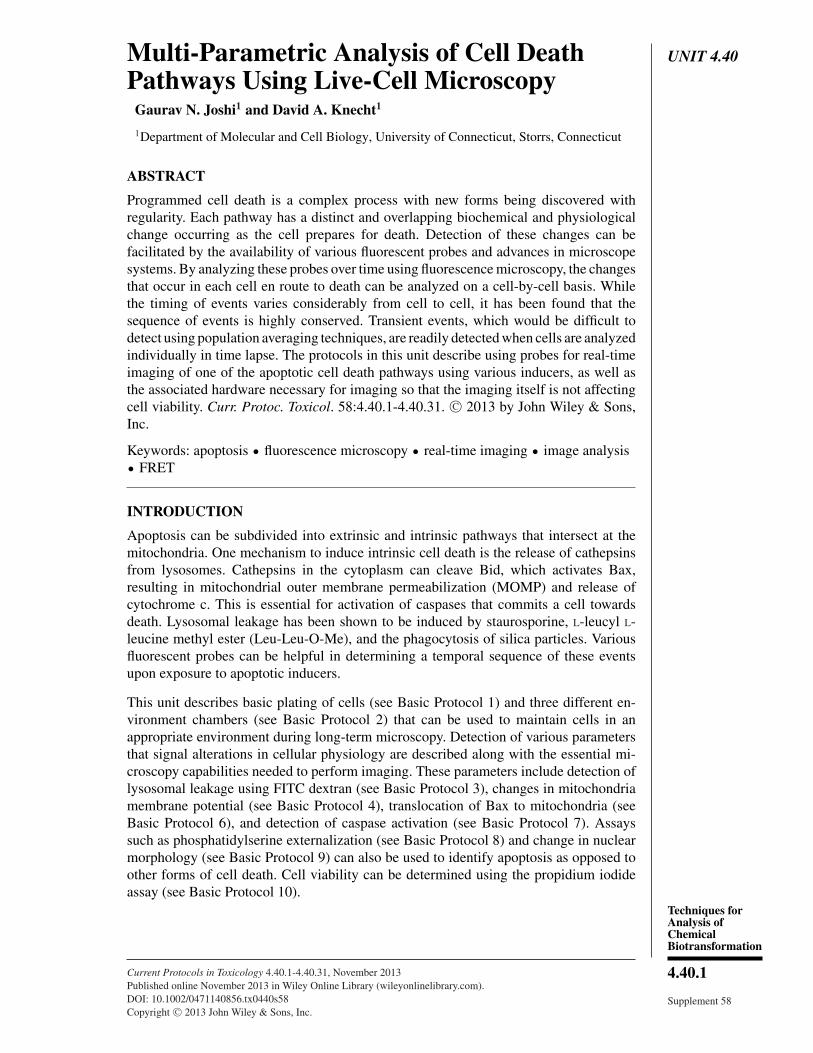
Figure 4.40.2 Mitochondrial outer membrane permeabilization (MOMP) and loss of inner mem-brane potential. Cells expressing GFP-hBax when exposed to staurosporine (1 µM) show a gradualincrease in GFP fluorescence in mitochondrial region followed by a loss of mitochondrial mem-brane potential.
4. Scan and select GFP-hBax-positive fluorescent cells (the signal will be diffuse inthe cytoplasm).
Using cells that are low expressors (dim fluorescence) rather than focusing on thebrightest cells is recommended so that an increase in mitochondrial fluorescence canbe easily distinguished above the cytoplasmic background.
5. Adjust image settings using preset for GFP fluorescence.
It is helpful to open the confocal pinhole to increase the optical section depth andminimize the need for optical sectioning.
6. Capture an image at time zero (without addition of compound or particle to betested).
7. Acquire images every minute for the duration of the experiment.
Induce cell death
8. Remove the heated lid off and pipet half of the volume of medium from the dishinto a 1.5-ml microcentrifuge tube.
9. Add desired drug or particle to be tested (see Basic Protocol 12) to the medium inthe microcentrifuge tube and mix.
10. Pipet the medium back into the dish.
11. Restart the automation to acquire time-lapse data.
During the process of drug exposure, where the lid is removed, if plate is not tightlysecured on the stage, it can result in a change in the field of view from what has beencaptured pre-addition. To prevent this, stick a small piece of double-sided tape to thesurface of the microscope stage before placing the plate onto the stage—this will preventmovement of the plate.
12. Refer to Support Protocol 1 for analysis instructions. See Figure 4.40.2 for anexample of Bax-induced mitochondria outer membrane permeabilization over time.
Multi-ParametricAnalysis ofCell Death
4.40.12
Supplement 58 Current Protocols in Toxicology

BASICPROTOCOL 7
REAL-TIME DETECTION OF CASPASE ACTIVITY
Activation of caspases-9 or -3 can be studied in real time by transfecting cells with Forsterresonance energy transfer (FRET)–based genetically encoded fluorescence caspase spe-cific sensors. The mechanism of the FRET sensor is shown in Figure 4.40.3. Cells mustbe transfected with an appropriate sensor to allow expression of the fluorescent proteinbefore experiment can be carried out. It is advantageous to use a wide-field fluorescencemicroscope for this experiment, as it allows one to image the entire cytoplasmic volumewhere as a confocal microscope will only give data from a particular plane within thecell.
NOTE: Although not validated by the authors, Magic Red caspase-3 (available fromImmunoChemistry Technologies) also allows for detection of caspase activation inreal time (http://www.immunochemistry.com/products/caspase-3-substrate-magic-red-caspase-3-assay-kit.html).
Materials
Effector caspase DNA (CFP-DEVD-YFP) (Addgene, cat. no. 24537)Zeiss Axiovert 200 M wide-field fluorescence microscopeFilter setsCFP imaging (Chroma, cat. no. 31044v2)
CFP (ex): 436/20 nmBeam splitter: 455 nmCFP (em): 480/40 nm
YFP-FRET imaging (Chroma, cat. no. 31052; cyan/topaz energy transfer)
CFP (ex): 436/20 nm
DEVD
caspase-3activation
CFP YFP
DEVD
475 nm 535 nm
475 nm
433 nm
433 nm
CFP YFP
FRET
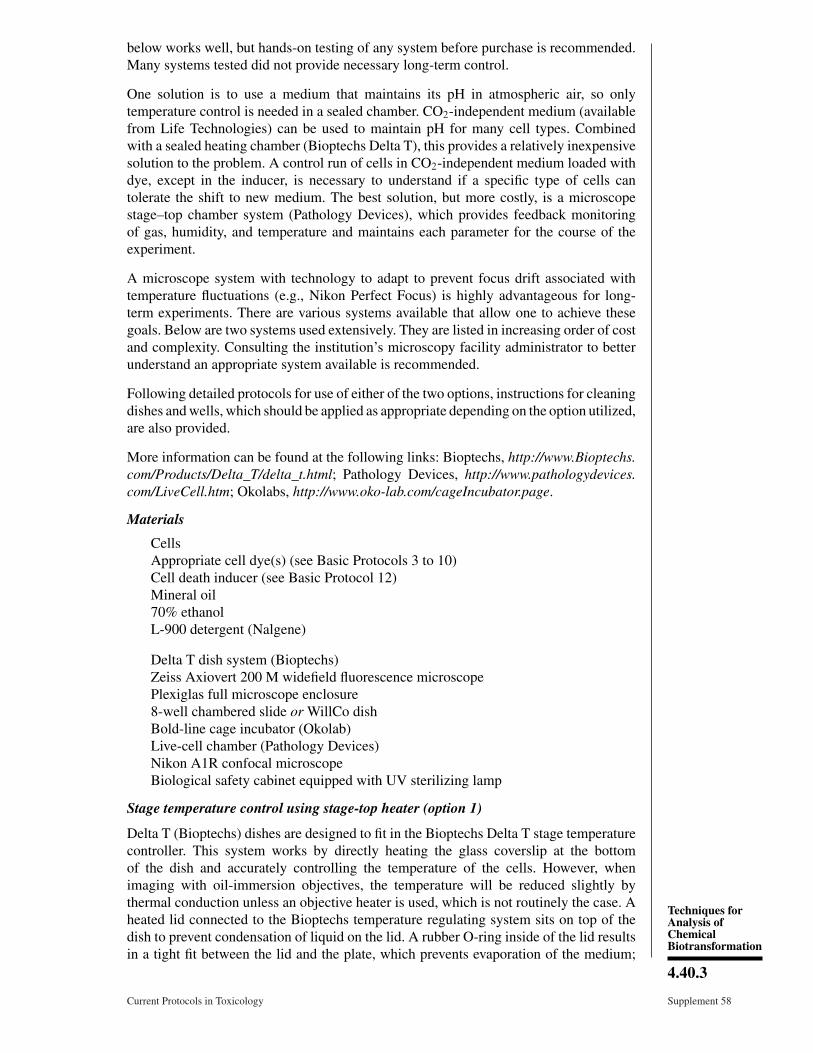
Figure 4.40.3 Detecting caspase activation using FRET. Illustration demonstrates the workingof an effector caspase-3 FRET sensor. Fluorescent proteins, CFP and YFP, are linked by a DEVDsequence leading to a non-radiative transfer of energy upon CFP excitation resulting in excitationof YFP. Upon caspase-3 activation, DEVD linker is cleaved resulting in a decrease in FRET signaland increased CFP emission.
Techniques forAnalysis ofChemicalBiotransformation
4.40.13
Current Protocols in Toxicology Supplement 58
Beam splitter: 455 nmYFP-FRET (em): 535/30 nm
Additional reagents and equipment for plating MH-S cells (see Basic Protocol 1)and FRET-sensor (see Basic Protocol 5)
1. Plate MH-S cells in Bioptechs dish (see Basic Protocol 1).
2. Transfect cells with effector caspase FRET probe DNA as described in Basic Pro-tocol 5.
3. Place cells plated in Bioptechs dish expressing caspase sensor onto the delta T stageholder of the wide-field microscope equipped with appropriate filter sets. Securedish firmly with the screws.
4. Place the lid connected to Bioptechs temperature controller unit onto the plate.
5. Open the image acquisition software and set appropriate filter set parameters in theautomation.
6. Go to the settings for CFP images and adjust proper exposure.
7. Go to the settings for YFP-FRET images (CFP excitation, YFP emission) and adjustproper exposure.
Cells will show maximum YFP-FRET signal under normal physiological conditions, ascaspases are not active and CFP and YFP are at a close proximity (<10 nm).
8. Adjust the exposure for both channels such that average mean pixel intensities forcells in both channels are approximately equal. This will give an initial CFP/YFP-FRET ratio of �1.
Use these exposure values in image acquisition software settings along with appropriatetime intervals.
9. To capture changes in cell morphology, note the exposure levels for transmitted orDIC light channel and insert a DIC or transmitted light channel in automation.
10. Run a mock time-lapse to make sure everything is working well before proceedingto an actual time lapse.
11. Acquire several images and then remove the heated lid and add appropriate amountof cell death inducer to the cells as described in Basic Protocol 12.
12. During time-lapse imaging, make sure that focus drift does not occur. If such is thecase, readjust the focus in between images.
13. Refer to Support Protocol 2 for analysis instructions.
SUPPORTPROTOCOL 2
QUANTIFICATION AND GENERATION OF PSEUDOCOLORRATIOMETRIC IMAGES FROM FRET DATA
This protocol describes steps to quantify the FRET data (see Basic Protocol 7) andgeneration of pseudocolored ratiometric images using the freeware image quantificationsoftware ImageJ. Generation of pseudocolored ratiometric images can also be done usingother commercially available software such as Metamorph, Volocity, or the ones bundledwith microscope image acquisition software.
Materials
Image J (available at http://rsbweb.nih.gov/ij/download.html; Schneider et al.,2012)
Multi-ParametricAnalysis ofCell Death
4.40.14
Supplement 58 Current Protocols in Toxicology
Data from CFP and YFP-FRET channels (see Basic Protocol 7)Microsoft Excel
Organize data
1. Create the following folders:a. Raw: consisting of raw data files.b. Analyzed: consisting of processed data files.
Convert images into stack
2. If a series of images is obtained, convert them into a stack using ImageJ. Accessthe following commands from the menu bar, File → Import → Image sequence →select the Raw folder containing individual images for CFP → click on one of theimages in the folder and then click OK.
3. Observe a new window with all the CFP images in a stack format.
4. Save this data set from the menu bar. File → Save as → Tiff and name appropriately.
5. Repeat steps 2 through 4 for YFP-FRET data set.
Crop a region of interest (ROI)
6. Open the CFP stack.
7. Draw a rectangular ROI around the cell that needs to be analyzed by selecting therectangular selection in the ImageJ tool bar.
8. Save the ROI using File → Save as → selection command from menu bar. It willget saved with an extension .ROI. Alternatively, an ROI can also be recorded in theROI manager, which can be opened by going to Tools → ROI manager. ROIs canbe saved by going to More → Save in the ROI manager.
The reason for saving the ROI is to select the same sized ROI for the rest of the channels,i.e., YFP-FRET, TMRE, or DIC.
9. Go back to the CFP stack file and double click on the ROI file. This should overlaythe ROI on the image.
10. Crop the image using Image → Crop in the menu bar and save the cropped imagein the Analysis folder by renaming the stack.
11. Repeat steps 6 through 10 for YFP-FRET images; however, use the same ROI asthat of CFP stack in step 8 for the YFP-FRET stack.
Measure mean pixel intensity of cell
12. Open the cropped CFP image stack.
13. Draw an ROI on the cell using either the oval or the freehand selection tool in thetool bar.
14. Next, measure the mean pixel intensity of the cell using Analyze → Measurecommand in the menu bar. A new results window will open where the mean pixelintensity can be found.
15. Repeat this for entire stack by manually re-positioning ROI over the cell if the cellis moving or changing position.
16. If the cell is not moving from frame to frame, then this can be done using MultiMeasure. Draw an ROI over the cell and then go to Tools→ ROI Manager → More→ Multi-measure. A query to process all images in stacks will appear; click Yes.
Techniques forAnalysis ofChemicalBiotransformation
4.40.15
Current Protocols in Toxicology Supplement 58

This will open a new results window with the mean pixel intensity for the ROI inevery frame.
17. Select all the values from the measure window by using Edit → copy and pastethem into Microsoft Excel.
Measure mean pixel intensity of background
18. Draw an ROI on the background area using the rectangular selection tool in the toolbar making sure that there is no cell in that area in all frames.
19. Measure mean pixel intensity using the Multi Measure as described in steps 16 and17.
20. Repeat steps 12 through 19 for YFP-FRET image stack.
21. In a new tab in Excel, copy and paste the mean pixel intensity values for cell andthe background for both CFP and YFP-FRET.
22. To clear background, subtract mean pixel intensity of background from the cell forCFP and YFP-FRET and call them “background subtracted values”.
23. Using background subtracted values of CFP and YFP-FRET, divide CFP by YFP-FRET to obtain the CFP/YFP-FRET ratio.
24. Insert a column indicating the relative time point of each image.
25. Draw an XY-scatter plot graph of time versus FRET ratio.
Process stacks to generate ratiometric images
26. Open the cropped CFP and YFP-FRET image stacks.
The goal for steps 27 through 30 is to make sure that the maximum pixel intensity valuefor background does not overlap the minimum pixel intensity value for the cell of interest.
27. In the CFP stack, draw a small ROI in the background area (without cell) and inthe menu select Analyze → Measure. This will open a results window with variousvalues. Focus will be on the mean and maximum pixel intensity values. Repeat, butdraw an ROI on the cell of interest.
28. Return to the CFP stack and clear any ROI by clicking on any area other than theROI itself.
29. Go to Process → Filters → Mean, which will open a new window asking for thevalue in pixel to be entered. Enter a value of “1” and repeat step 27.
30. If the maximum pixel intensity value for background is higher than minimum pixelintensity value for the cell of interest, repeat step 28 and enter a value of “1.5” orhigher until the goal is accomplished (see step 26).
31. Note the maximum pixel intensity of the background and minimum pixel intensityof the cell of interest and bring the background pixel value to a set constant. This isdone by going to Process → Math → Min. A window will open and enter a valuethat is close to the minimum pixel intensity of the cell of interest. This will smoothout the background and be gray in color. When the cursor (+ symbol) is placed onthe background, it will show a constant value in the tool bar.
32. Bring this value to “0“ by going to Process → Math → Subtract and enter thebackground value. This will result in the image appearing completely black. Datacan again be visualized by clicking on “auto” in the brightness/contrast menu—Image → Adjust → Background/Contrast. The background will appear black and
Multi-ParametricAnalysis ofCell Death
4.40.16
Supplement 58 Current Protocols in Toxicology

if the cursor (+ symbol) is placed on the background, it will show a value of “0” inthe tool bar.
33. Smooth the image using Process → Smooth.
34. Save the processed image as “CFP-processed” using File → Save as → tiff commandin menu bar.
35. Repeat steps 26 through 34 for YFP-FRET image stack.
Generate ratiometric pseudocolored images
36. Open CFP-processed and YFP-FRET-processed image stacks.
37. Generate a ratiometric stack by dividing the processed CFP image stack with pro-cessed YFP-FRET image stack from menu: Process → Image calculator → CFPdivided by YFP-FRET (enable “32-bit (float) result”).
38. This will create a new stack. Save this as a “ratiometric” stack.
39. To generate a pseudocolor spectrum image, in menu bar, go to Image → LookupTables → Spectrum. The newly generated spectrum image will have a single colorbackground (e.g., red).
40. To convert the red color background to a black color background, bring up the “LUTEditor” by going to menu bar and following Image → Color → Edit LUT.
41. In LUT Editor window, a range of colors can be seen. Select the top row thatis displaying shades of red and orange by placing the arrow onto each color.This will bring up a new “color entry” window. Here, slide all of the bars forred, green, and blue color to the extreme left to obtain values of “0” for eachcolor.
42. A black area may appear on the cell. Open the brightness/contrast window and bringdown the “maximum” value such that a color appears on the cell.
43. Adjust the color range by going to a time point where caspase is not activated andat a time point where it is activated.
44. To show the range of pixel values associated with a particular color, go to Analyze→ Tools → Calibration bar. Choose from various display options and upon clickingOK, it will generate a new image (not a stack) with a Spectrum LUT and associatedvalues.
45. Either directly copy and paste this LUT and associated values for a figure or alter-nately obtain the spectrum LUT by going to Image → Color → Show LUT.
46. Select the spectrum of LUT by drawing a rectangular ROI, go to Edit → Copyto system and into the choice of image editing software (e.g., Adobe Photoshop,Inkscape, Gimp, etc.) and paste this into the figure.
47. Convert the stack to RGB by going to Image → Type → RGB color and save.This can be used later for movie purposes and copying the cell into image editingsoftware.
BASICPROTOCOL 8
DETECTING PHOSPHATIDYLSERINE EXTERNALIZATION
This protocol describes a method for detecting phosphatidylserine (PS) flipped onto theexternal side of the plasma membrane during the apoptotic process. Annexin V-FITCis added to the medium at a low concentration so that the medium has a low level of
Techniques forAnalysis ofChemicalBiotransformation
4.40.17
Current Protocols in Toxicology Supplement 58

fluorescence. As the dye binds to the membrane of apoptotic cells that expose PS, theprobe is locally concentrated and so provides a strong signal above background for visu-alization. Although the protocol described here is using an epifluorescence microscope,the cells can also be imaged using a confocal microscope.
Materials
AnnexinV-FITC (BD Biosciences), store at 4°CDesired drug or particle (see Basic Protocol 12)
Epifluorescence microscope (or confocal)1.5-ml microcentrifuge tubesVortex
Additional reagents and equipment for plating cells in Bioptechs dishes (see BasicProtocol 1)
Prepare and treat cells
1. Plate cells in Bioptechs dishes as mentioned in Basic Protocol 1.
2. Before the start of the experiment, replace RPMI-1640 complete medium in theplate with CO2-independent medium (CIM) and allow cells to equilibrate 15 min ina 37°C ambient air incubator.
3. Aspirate CIM and replace with 500 µl of CIM.
4. Secure dish onto a wide-field epifluorescence microscope with a Delta T stage holderand cover it with a heated lid.
5. Replace the medium in the plate with 500 µl of medium containing 5 µl of annexinV-FITC.
6. In the image acquisition software, use FITC settings (ex/em: 488 nm/515 nm) toacquire images.
7. Start image acquisition.
Because FITC is sensitive to photobleaching, frequent imaging is not recommended. It istherefore advisable to image every �5 min. If one would like to obtain higher temporalresolution, determine the approximate time of PS flipping and start acquiring images fora shorter duration at time points just before PS flipping.
Induce cell death
8. Remove the heated lid and pipet half of the volume of medium from dish into a1.5-ml microcentrifuge tube.
9. Add desired drug or particle that is to be tested as described in Basic Protocol 12for its effect on cell death into the medium in the microcentrifuge tube and vortex.
10. Pipet the medium back into the dish.
11. Restart the automation to acquire time-lapse data.
AnnexinV-FITC will become localized to part or all of the cell membrane when PSexternalization takes place or the cell becomes permeable.
If AnnexinV conjugated with a different fluorophore is used, check to make sure thatappropriate filter sets are used.
12. Refer to Support Protocol 1 for analysis.Multi-Parametric
Analysis ofCell Death
4.40.18
Supplement 58 Current Protocols in Toxicology

BASICPROTOCOL 9
DETECTING ALTERATIONS IN NUCLEAR MORPHOLOGY USINGHOECHST 33342
Hoechst 33342 is a vital dye that is cell permeable and binds to the AT-rich region ofdsDNA in the nucleus. Because the dye stays bound to DNA throughout the course ofan experiment, it allows visualization of any change in nuclear morphology. It does notmatter the type of microscope used but because the cells are exposed to low-wavelengthlight, phototoxicity should be avoided.
Materials
Hoechst 33342 (5 mg/ml stock in DMSO, Sigma), store at −20°CRPMI complete medium (see recipe)CO2-independent medium (Sigma)Desired drug or particle (see Basic Protocol 12)
1.5-ml microcentrifuge tubes37°C, 5% CO2 incubatorMicroscope with appropriate filter sets
Additional reagents and equipment for cell plating (see Basic Protocol 1)
Prepare and treat cells
1. Plate cells in a Bioptechs dish as described in Basic Protocol 1.
2. In a 1.5-ml microcentrifuge tube, prepare Hoechst 33342 at 5 µg/ml in RPMIcomplete medium.
3. Aspirate the medium out of the dish and replace it with medium containing Hoechst33342.
4. Incubate 30 min in a 37°C, 5% CO2 incubator.
5. Wash with RPMI complete medium by aspirating the medium out of the plate andreplacing it with fresh RPMI complete medium.
Make sure to quickly add fresh RPMI complete medium to prevent any stress to cells.
6. Aspirate complete medium from cells, replace medium with CO2-independentmedium, and place dish in a 37°C ambient air incubator for 5 min, so that cellsequilibrate in new medium.
7. Aspirate CO2-independent medium and replace with fresh CO2-independentmedium. Place dish onto microscope stage.
8. Image cells using the DAPI filter set.
9. Set imaging parameters by exposing cells in a particular field of view.
10. Once imaging parameters are set, move to another field of view and start automationto acquire time-lapse images.
11. After acquiring one of more frames, pause the automation.
Induce cell death
12. Pipet half of the volume of medium from dish into a 1.5-ml microcentrifuge tube.
13. Add desired drug or particle that is to be tested, as described in Basic Protocol 12for its effect on cell death, into the medium and vortex.
14. Restart the automation to acquire time-lapse data.
15. Refer to Support Protocol 1 for analysis.
Techniques forAnalysis ofChemicalBiotransformation
4.40.19
Current Protocols in Toxicology Supplement 58

BASICPROTOCOL 10
PROPIDIUM IODIDE ASSAY
This protocol can be used to measure the amount of cell death. This fluorescent DNAbinding dye cannot penetrate live cell membranes, so only in dead cells will nucleifluoresce brightly. The dye also binds to RNA, so there will usually be diffuse stainingof the cytoplasm as well.
Propidium iodide (PI) staining cannot be used to distinguish between the modes of celldeath unless used along with annexinV-FITC. In this case, annexinV-FITC-positive/PI-negative cells, which transition to annexinV-FITC-positive/PI-positive cells (double pos-itive cells), are indicative of apoptosis, whereas annexinV-FITC-negative and PI-positivecells are indicative of necrotic cells. By using a low concentration of PI in this assay, therewill be some fluorescence from medium in images, but the dye will become concentratedin the nucleus of cells due to the very high amount of DNA, so there will be a strongsignal over background in dead cells.
Materials
RPMI complete medium (see recipe)CO2-independent medium (Sigma)Propidium iodide (1 mg/ml stock in water, Sigma)Desired drug or particle (see Basic Protocol 12)Hydrogen peroxide (30% v/v, Fisher scientific)
37°C incubatorWide-field fluorescence microscope1.5-ml microcentrifuge tubesVortex
Additional reagents and equipment for plating cells (see Basic Protocol 1)
Prepare and treat cells
1. Plate cells in Bioptechs dish as described in Basic Protocol 1.
2. Before the start of the experiment, replace RPMI complete medium in the plate withCO2-independent medium (CIM) and allow cells to equilibrate 15 min in a 37°Cambient air incubator.
3. Aspirate the medium from the dish and replace it with medium containing propidiumiodide (1 µg/ml).
4. Secure dish onto the Delta T stage holder on the wide-field epifluorescence micro-scope and cover with a heated lid.
5. Image at 550 nm/610 nm (ex/em).
Induce cell death
6. Remove the heated lid and pipet half of the volume of medium from dish into a1.5-ml microcentrifuge tube.
7. Add desired drug or particle to be tested, as described in Basic Protocol 12 for itseffect on cell death, into the medium and vortex.
8. Pipet the medium/drug or particle in the microcentrifuge tube back into the dish.
Set fluorescence and exposure settings using hydrogen peroxide as a lethal toxicantcontrol
Before starting time-lapse imaging for the experiment, set (calibrate) fluorescence andexposure settings with a known inducer of cell death since there is no signal to begin
Multi-ParametricAnalysis ofCell Death
4.40.20
Supplement 58 Current Protocols in Toxicology
with (imaging at increased fluorescence settings could result in saturated fluorescenceimages). This can be achieved by exposing cells to hydrogen peroxide (H2O2).
Since this is a positive control to induce cell death, this control must be performed on aseparate set of cells. Calibration should be performed for each experiment.
9. Stain cells with propodium iodide as mentioned previously in step 3.
10. Aspirate half the amount of medium from the dish containing propidium iodide intoa 1.5-ml microcentrifuge tube.
11. Add 30 µl H2O2 (30% v/v) to the microcentrifuge tube and mix well.
Wear gloves at all times while handling H2O2 as exposure to skin will result in burns.
If the medium contains serum, it will quench the effect of H2O2 and a higher concentrationwill be required.
12. Add the contents of the microcentrifuge tube back into the cell dish—cells will diewithin 10 min, making them PI positive (fluorescent red nuclei).
13. Adjust the fluorescence and exposure settings in the software to visualize fluorescentred nuclei/PI-positive cells.
Analyze treated cells
14. Note the exposure values from H2O2-exposed cells and use them to collect datafrom cells exposed to inducers.
15. Restart the automation to acquire time-lapse data.
16. For analysis, count the number of PI-positive cells over the period of time. Occa-sionally, the red fluorescence of PI does not correspond to the cell. It is thereforesuggested to compare the PI fluorescence with that of a cell in brightfield image.
BASICPROTOCOL 11
MULTI-PARAMETRIC ANALYSIS OF APOPTOSIS
Various probes mentioned in Basic Protocols 3 through 9 can be combined to performmulti-parametric analysis of physiological alterations in cells. As long as there is nospectral overlap between fluorescent probes, any combination of these probes can beused. Some of these combinations are described below. More assays can be combinedwith appropriate probes. For instance, annexin V can be purchased with long-wavelengthconjugates (ex: 647 nm) and combined with FITC/GFP and TMRE.
Endo-lysosomal leakage (FITC-dextran) and measurement of mitochondrialmembrane potential (TMRE)
1a. Load cells with FITC-dextran as described in Basic Protocol 3.
2a. Incubate 2 hr in a 37°C, 5% CO2 incubator.
3a. Aspirate medium and replace with fresh medium. Repeat two additional times.
4a. Load cells with TMRE and follow Basic Protocol 4.
Determine mitochondria outer membrane permeabilization (Bax-GFP) andmitochondria membrane potential (TMRE)
1b. Load cells expressing Bax-GFP (see Basic Protocol 6) with TMRE as described inBasic Protocol 4.
2b. Set imaging parameters to image both GFP and TMRE.Techniques forAnalysis ofChemicalBiotransformation
4.40.21
Current Protocols in Toxicology Supplement 58
Caspase activation and measurement of mitochondrial membrane potential
1c. Load cells expressing the caspase FRET sensor probe (see Basic Protocol 7) withTMRE as described in Basic Protocol 4.
2c. Set imaging parameters to image both FRET sensors and TMRE.
Caspase activation and phosphatidylserine externalization
1d. Plate cells expressing the caspase FRET sensor probe.
2d. Follow instructions for setting up the microscope as described in Basic Protocol 7.
3d. Replace the medium with annexinV conjugated to a fluorophore that does not sharethe same fluorescence profile as CFP and YFP (e.g., annexinV 594 or 647) andfollow instructions outlined in Basic Protocol 8. Appropriate filters that match thefluorophore conjugated to annexinV will be necessary.
Measurement of mitochondrial membrane potential and phosphatidylserineexternalization
1e. Load plated cells with TMRE as described in Basic Protocol 4.
2e. Aspirate TMRE and replace with RPMI complete medium.
3e. Incubate 5 min in a 37°C, 5% CO2 incubator.
4e. Aspirate and replace with CO2-independent medium.
5e. Incubate 5 min in a 37°C ambient air incubator.
6e. Aspirate and replace with CO2-independent medium such that final volume is500 µl.
7e. Place plate onto microscopestage.
8e. Load cells with annexinV-FITC as described in Basic Protocol 8.
BASICPROTOCOL 12
INDUCING LYSOSOMAL LEAKAGE AND CELL DEATH
This protocol focuses on the use of various agents that result in lysosomal leakage andcell death. After loading cells with any of the dyes to measure physiological alterationsas described in Basic Protocols 3 through 10, either staurosporine, Leu-Leu-O-Me, orsilica particles can be used to study cell death resulting from lysosomal leakage.
Materials
Staurosporine (1 mM stock in DMSO, Sigma), store at −20°CL-leucyl L-leucine methyl ester (Leu-Leu-O-Me, 500 mM stock in DMSO, Sigma),
store at −20°C3-µm spherical silica particle (Alltech Associates, Grace Davison)
1.5-ml microcentrifuge tubesHeating oven
Staurosporine as an inducer
1a. Plate cells as described in Basic Protocol 1.
2a. Load cells with probes of choice to perform multi-parametric analysis as describedin Basic Protocols 3 through 11.
3a. Adjust image parameters and acquire image at time zero (pre-drug).Multi-Parametric
Analysis ofCell Death
4.40.22
Supplement 58 Current Protocols in Toxicology

4a. Pipet about half the amount of medium from the dish into a 1.5-ml microcentrifugetube and add staurosporine such that final concentration is 1 µM based on the totalamount in the dish.
5a. Pipet medium with drug back into the dish.
6a. Start automation and acquire time-lapse images for 6 hr.
The interval of imaging will vary based on the physiological change one intends tomeasure.
Leu-Leu-O-Me as an inducer
1b. Plate cells as described in Basic Protocol 2.
2b. Load cells with probes of choice to perform single parameter or multi-parametricdetection as described in Basic Protocols 3 through 11.
3b. Adjust image parameters and acquire image at time zero (pre-drug).
4b. Pipet about half the amount of medium from the dish into a 1.5-ml microcentrifugetube and add Leu-Leu-OMe such that final concentration is 3 mM based on the totalamount of medium in dish.
5b. Pipet medium with drug back into the dish.
6b. Start automation and acquire time-lapse images for 5 hr.
Silica particles as an inducer
1c. Bake silica particles 18 hr in an 83°C oven.
2c. Weigh 2 mg silica particles and suspend in 1 ml CO2-independent medium.
3c. Plate cells as described in Basic Protocol 1.
4c. Load cells with probes of choice to perform single parameter or multi-parametricdetection as described in Basic Protocols 3 through 10.
5c. Adjust image parameters and acquire image at time zero.
6c. Pipet half the amount of medium from the dish into a 1.5-ml microcentrifugetube and add 50 µg/cm2 silica particles (based on the surface area on which thecells are plated) from the 2 mg/ml stock of silica particles into the medium. Besure to mix the silica particles well before pipetting as they rapidly settle to thebottom of the tube. Mix well and add the medium plus particles back into thedish.
7c. Start automation and acquire time-lapse images for 12 hr.
REAGENTS AND SOLUTIONSUse Milli-Q-purified water or equivalent in all recipes and protocol steps. For common stocksolutions, see APPENDIX 2A; for suppliers, see SUPPLIERS APPENDIX.
RPMI complete medium
RPMI-1640 supplemented with:2 mM L-glutamine10 mM HEPES10% FBS (Atlanta Biological)100 µg/ml ampicillin/streptomycinStore medium at 4°C
Techniques forAnalysis ofChemicalBiotransformation
4.40.23
Current Protocols in Toxicology Supplement 58

COMMENTARY
Apoptosis or programmed cell death is animportant process essential for development,maintenance of tissue homeostasis, removal ofdamaged cells, and defense against pathogens.The term and the process of apoptosis wasfirst observed and described by J.F. Kerr(Kerr et al., 1972). Apoptosis can further beclassified into intrinsic and extrinsic pathwaysthat converge at mitochondria. The intrinsicpathway can be initiated by damage to cellularorganelles such as lysosome and endoplasmicreticulum (Boya and Kroemer, 2008; Repnikand Turk, 2010). The extrinsic pathway can beinitiated by ligand-receptor interaction suchas TNF-TNFR, Fas-FasR, or TRAIL-TRAILreceptor. Ligand binding results in clusteringof various cytoplasmic adaptor proteinsleading to downstream activation of theapoptotic cascade. Apoptosis is kept in checkby a fine balance of various BCL-2 familiesof proteins that have pro-apoptotic (Bax,Bak) (Wang et al., 1996; Luo et al., 1998;Dussmann et al., 2010), anti-apoptotic (Bcl-2,Bcl-xL) (Vaux et al., 1988; Oltval et al., 1993),and regulatory (Bid, Bad) (Yang et al., 1995;Wang et al., 1996) functions. A complex andill-defined regulatory network maintains theactivity of these and other BCL-2 familiesresulting in cell survival or cell death.
Lysosomes were discovered by Christiande Duve and aptly termed “suicidal bags,” asrelease of lysosomal contents into the cyto-plasm results in cell death (de Duve, 1975).Lysosomes contain various hydrolases andproteases, including cathepsins. Release ofcathepsin D has been shown to be involvedin activation of the regulatory protein Bidresulting in formation of truncated-Bid (t-Bid) (Cirman et al., 2004). t-Bid can di-rectly activate Bax leading to a conforma-tional change in its structure and its insertionin the outer mitochondrial membrane whereit oligomerizes to cause mitochondrial outermembrane permeabilization (MOMP) (Kimet al., 2009). MOMP releases various inter-membrane space proteins from the mitochon-dria, of which cytochrome c is of particu-lar interest as it participates in formation ofthe apoptosome that results in activation ofcaspase-9 (initiator caspase). Caspase-9 in turnactivates caspase-3 (effector caspase), whichsignals a “point of no return” in this path-way. Effector caspase activation also leadsto cell membrane blebbing, nuclear conden-sation, and DNA fragmentation (Tyas et al.,2000; Goldstein et al., 2005; Tait and Green,2010).
A great deal of genetic and biochemicalwork has helped to identify and understandinteraction partners of the above-mentionedproteins. Recent advances in microscopy tech-niques and the creation of fluorescent proteinprobes has helped to understand the dynamicsof these proteins in relation to the physiolog-ical and morphological changes within a cell.The emerging data has shown heterogeneityof the same process between different cellswithin the same population when treated withan inducer.
While the protocols described in this unitcould be applied to a wide range of toxicologi-cal investigations, the specific context has beenlimited to investigation of apoptosis inducedby lysosomal membrane permeabilization, re-sulting in activation of intrinsic cell deathpathway.
Detecting lysosomal leakage (see BasicProtocol 3)
Cells are incubated in medium containingdextran conjugated with a fluorophore. Dex-tran is endocytosed by the cells and gets traf-ficked into endosomes and sorting compart-ments. Dextran conjugated with fluoresceinisothiocyanate (FITC) has been the moleculeof choice for this assay because the fluores-cence of FITC is quenched by the acidic milieuof endosomal and lysosomal vesicles. Uponleakage into the cytoplasm, FITC fluorescenceincreases due to an increase in pH. FITC-dextran is available in various sizes (4 kD to100 kD) but the small size is preferred becausethese molecules can diffuse into the nucleus. Inmany cell lines, the nucleus takes up a substan-tial proportion of the cellular volume. If thedye does not enter the nucleus, it is more chal-lenging to distinguish the increase in cytoplas-mic fluorescence from the quenched vesicularfluorescence. The nucleus is unstained beforeleakage, so it makes an ideal target for quan-tification of the fluorescence increase follow-ing leakage. Analysis of FITC-dextran leak-age is an indirect way of measuring the leak-age of lysosomal proteases such as cathepsinsinto the cytoplasm. These proteases have beenimplicated in activating apoptotic proteins. Ifthis is more directly the goal, then a 70-kDdextran is probably more appropriate, as thepore size in leaking lysosomes may differ de-pending on the cell type and toxicant (Bidereet al., 2003; Thibodeau et al., 2004; Costantiniet al., 2011; Joshi and Knecht, 2013). Leakagecan also be assessed using dextran conjugated
Multi-ParametricAnalysis ofCell Death
4.40.24
Supplement 58 Current Protocols in Toxicology
to TRITC fluorophore (TRITC-dextran). Be-cause TRITC-dextran is pH-insensitive, it doesnot generate a large change in cytoplasmic flu-orescence upon leakage unlike FITC-dextran.
Evaluating changes in mitochondrialmembrane potential (see Basic Protocol 4)
Tetramethylrhoadmine ester (TMRE) is acell-permeable, cationic potentiometric dyethat partitions across the mitochondrial mem-brane based on the Nernst equation. Thegreater the mitochondrial potential, the greaterthe fluorescence observed (Loew et al., 1993).During apoptosis, mitochondrial membranepotential collapses (mitochondrial depolariza-tion), resulting in a decrease in TMRE fluores-cence. Alternatively, there have been instanceswhere a transient increase in TMRE fluores-cence has been observed that results from anincrease in mitochondrial membrane potential(mitochondrial hyperpolarization).
To control for mitochondrial depolariza-tion, cells can be treated with a nonspecificprotonophore and an uncoupler of oxidativephosphorylation, FCCP, resulting in a decreasein TMRE fluorescence. Any fluorescence ob-served after FCCP treatment could be dueto nonspecific binding of TMRE (Joshi andKnecht, 2013).
To control for mitochondrial hyperpolar-ization, cells can be treated with oligomycin,an F1-F0 ATPase (complex V) inhibitor thatcauses an increase in TMRE fluorescence.If cells show mitochondrial hyperpolarizationupon addition of a compound being tested,maximum TMRE fluorescence can be deter-mined using oligomycin and capture settingadjusted accordingly such that images are notoversaturated (Joshi and Knecht, 2013).
Bax-induced mitochondrial outermembrane permeabilization (MOMP) (seeBasic Protocol 6)
Bax (Bcl-2-associated X-linked protein) isa member of Bcl-2 proapoptotic protein familypresent in an inactive form in the cytoplasm.Upon binding of the regulatory BH-3 proteinBid, Bax undergoes a conformational changeand localizes to the outer membrane of mi-tochondria where it inserts and oligomerizesforming pores in the outer mitochondrial mem-brane (known as MOMP). This leads to the re-lease of mitochondria inter-membrane spaceproteins like cytochrome c, which then com-plex with other cytoplasmic proteins to forman apoptosome leading to caspase activation.
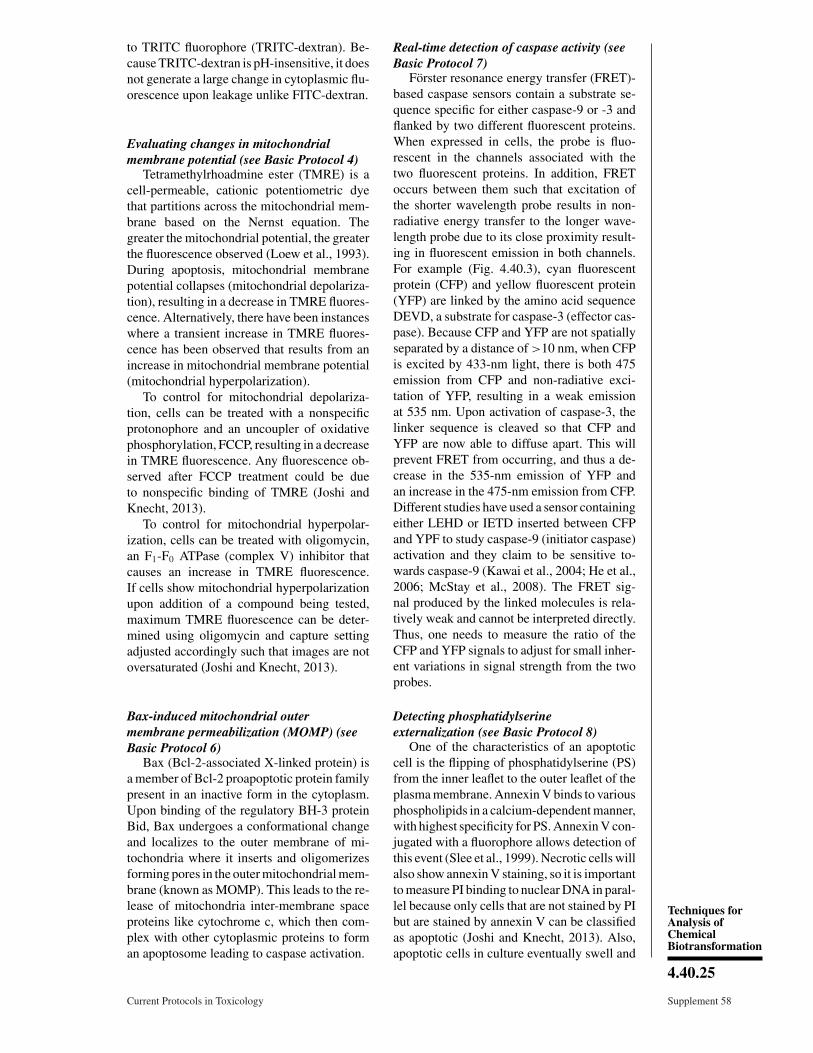
Real-time detection of caspase activity (seeBasic Protocol 7)
Forster resonance energy transfer (FRET)-based caspase sensors contain a substrate se-quence specific for either caspase-9 or -3 andflanked by two different fluorescent proteins.When expressed in cells, the probe is fluo-rescent in the channels associated with thetwo fluorescent proteins. In addition, FREToccurs between them such that excitation ofthe shorter wavelength probe results in non-radiative energy transfer to the longer wave-length probe due to its close proximity result-ing in fluorescent emission in both channels.For example (Fig. 4.40.3), cyan fluorescentprotein (CFP) and yellow fluorescent protein(YFP) are linked by the amino acid sequenceDEVD, a substrate for caspase-3 (effector cas-pase). Because CFP and YFP are not spatiallyseparated by a distance of >10 nm, when CFPis excited by 433-nm light, there is both 475emission from CFP and non-radiative exci-tation of YFP, resulting in a weak emissionat 535 nm. Upon activation of caspase-3, thelinker sequence is cleaved so that CFP andYFP are now able to diffuse apart. This willprevent FRET from occurring, and thus a de-crease in the 535-nm emission of YFP andan increase in the 475-nm emission from CFP.Different studies have used a sensor containingeither LEHD or IETD inserted between CFPand YPF to study caspase-9 (initiator caspase)activation and they claim to be sensitive to-wards caspase-9 (Kawai et al., 2004; He et al.,2006; McStay et al., 2008). The FRET sig-nal produced by the linked molecules is rela-tively weak and cannot be interpreted directly.Thus, one needs to measure the ratio of theCFP and YFP signals to adjust for small inher-ent variations in signal strength from the twoprobes.
Detecting phosphatidylserineexternalization (see Basic Protocol 8)
One of the characteristics of an apoptoticcell is the flipping of phosphatidylserine (PS)from the inner leaflet to the outer leaflet of theplasma membrane. Annexin V binds to variousphospholipids in a calcium-dependent manner,with highest specificity for PS. Annexin V con-jugated with a fluorophore allows detection ofthis event (Slee et al., 1999). Necrotic cells willalso show annexin V staining, so it is importantto measure PI binding to nuclear DNA in paral-lel because only cells that are not stained by PIbut are stained by annexin V can be classifiedas apoptotic (Joshi and Knecht, 2013). Also,apoptotic cells in culture eventually swell and
Techniques forAnalysis ofChemicalBiotransformation
4.40.25
Current Protocols in Toxicology Supplement 58
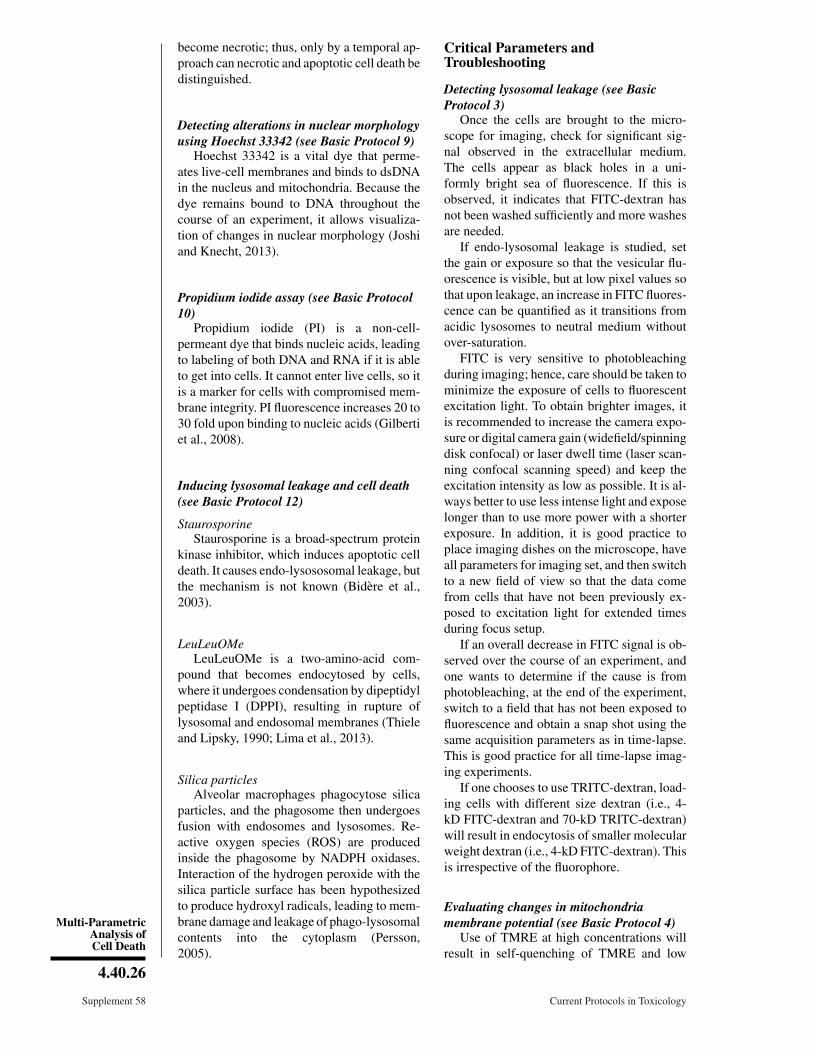
become necrotic; thus, only by a temporal ap-proach can necrotic and apoptotic cell death bedistinguished.
Detecting alterations in nuclear morphologyusing Hoechst 33342 (see Basic Protocol 9)
Hoechst 33342 is a vital dye that perme-ates live-cell membranes and binds to dsDNAin the nucleus and mitochondria. Because thedye remains bound to DNA throughout thecourse of an experiment, it allows visualiza-tion of changes in nuclear morphology (Joshiand Knecht, 2013).
Propidium iodide assay (see Basic Protocol10)
Propidium iodide (PI) is a non-cell-permeant dye that binds nucleic acids, leadingto labeling of both DNA and RNA if it is ableto get into cells. It cannot enter live cells, so itis a marker for cells with compromised mem-brane integrity. PI fluorescence increases 20 to30 fold upon binding to nucleic acids (Gilbertiet al., 2008).
Inducing lysosomal leakage and cell death(see Basic Protocol 12)
StaurosporineStaurosporine is a broad-spectrum protein
kinase inhibitor, which induces apoptotic celldeath. It causes endo-lysososomal leakage, butthe mechanism is not known (Bidere et al.,2003).
LeuLeuOMeLeuLeuOMe is a two-amino-acid com-
pound that becomes endocytosed by cells,where it undergoes condensation by dipeptidylpeptidase I (DPPI), resulting in rupture oflysosomal and endosomal membranes (Thieleand Lipsky, 1990; Lima et al., 2013).
Silica particlesAlveolar macrophages phagocytose silica
particles, and the phagosome then undergoesfusion with endosomes and lysosomes. Re-active oxygen species (ROS) are producedinside the phagosome by NADPH oxidases.Interaction of the hydrogen peroxide with thesilica particle surface has been hypothesizedto produce hydroxyl radicals, leading to mem-brane damage and leakage of phago-lysosomalcontents into the cytoplasm (Persson,2005).
Critical Parameters andTroubleshooting
Detecting lysosomal leakage (see BasicProtocol 3)
Once the cells are brought to the micro-scope for imaging, check for significant sig-nal observed in the extracellular medium.The cells appear as black holes in a uni-formly bright sea of fluorescence. If this isobserved, it indicates that FITC-dextran hasnot been washed sufficiently and more washesare needed.
If endo-lysosomal leakage is studied, setthe gain or exposure so that the vesicular flu-orescence is visible, but at low pixel values sothat upon leakage, an increase in FITC fluores-cence can be quantified as it transitions fromacidic lysosomes to neutral medium withoutover-saturation.
FITC is very sensitive to photobleachingduring imaging; hence, care should be taken tominimize the exposure of cells to fluorescentexcitation light. To obtain brighter images, itis recommended to increase the camera expo-sure or digital camera gain (widefield/spinningdisk confocal) or laser dwell time (laser scan-ning confocal scanning speed) and keep theexcitation intensity as low as possible. It is al-ways better to use less intense light and exposelonger than to use more power with a shorterexposure. In addition, it is good practice toplace imaging dishes on the microscope, haveall parameters for imaging set, and then switchto a new field of view so that the data comefrom cells that have not been previously ex-posed to excitation light for extended timesduring focus setup.
If an overall decrease in FITC signal is ob-served over the course of an experiment, andone wants to determine if the cause is fromphotobleaching, at the end of the experiment,switch to a field that has not been exposed tofluorescence and obtain a snap shot using thesame acquisition parameters as in time-lapse.This is good practice for all time-lapse imag-ing experiments.
If one chooses to use TRITC-dextran, load-ing cells with different size dextran (i.e., 4-kD FITC-dextran and 70-kD TRITC-dextran)will result in endocytosis of smaller molecularweight dextran (i.e., 4-kD FITC-dextran). Thisis irrespective of the fluorophore.
Evaluating changes in mitochondriamembrane potential (see Basic Protocol 4)
Use of TMRE at high concentrations willresult in self-quenching of TMRE and low
Multi-ParametricAnalysis ofCell Death
4.40.26
Supplement 58 Current Protocols in Toxicology

fluorescence. An increase in fluorescence willthen be seen if the membrane potential isreduced, leading to an incorrect conclusionabout changes in mitochondrial potential.Therefore, if no fluorescence is observed af-ter labeling cells, one should check to makesure the correct concentration has been used.TMRE was not found to bleach significantlyduring imaging, and therefore cells could beimaged as frequently as necessary.
Bax-induced mitochondria outer membranepermeabilization (MOMP) (see BasicProtocol 6)
Upon transfection with Bax DNA, cells ex-pressing varying levels of Bax will be ob-served. It is necessary to pick cells with in-termediate or low Bax fluorescence and notfocus on the brightest cells with high Bax fluo-rescence. Picking cells with high Bax fluores-cence will result in low signal-to-noise ratioof mitochondria to cytoplasm and hinder vi-sualization of Bax localizing to mitochondria.Using a confocal microscope is recommendedto improve signal-to-noise ratio. To concludea definitive role of Bax in MOMP, an investi-gator is recommended to transfect cells withBax-GFP and either cytochrome c–RFP orSmac-RFP. Cytochrome c and Smac are mito-chondrial inter-membrane space proteins thatare released simultaneously upon Bax localiz-ing to mitochondria (Albeck et al., 2008). Theauthors have tried to transfect macrophageswith cytochrome c but were unsuccessful inobtaining cells that showed fluorescent signalfrom mitochondria; rather, the entire cell ap-peared fluorescent.
Real-time detection of caspase activity (seeBasic Protocol 7)
Prior to image acquisition, cells should bechecked for successful transfection using epi-fluorescence. It is advisable to also have cellstransfected individually with CFP and YFP toconfirm that signal is due to FRET. CFP cellsshould show less relative signal in the YFPchannel and no signal when excited by 514-nmlight. YFP cells will show some fluorescencewhen excited by the CFP filter set.
Detecting phosphatidylserineexternalization (see Basic Protocol 8)
If the medium in which the experiment isdone does not contain calcium, it is recom-mended to add calcium to a concentration of2.5 mM. If any cell culture medium is usedthis should not be an issue as most containsufficient calcium, but if phosphate buffered
saline (PBS) is used, then addition of calciumis necessary.
Before starting time-lapse imaging for theexperiment, the researcher should test for ex-posure settings with a known inducer of apop-tosis for the particular cell type of interest,as there is no signal to begin with and over-exposure of cells with fluorescent light re-sulting in photo-bleaching of FITC or photo-damage of cells is not desired.
Detecting alterations in nuclear morphologyusing Hoechst 33342 (see Basic Protocol 9)
Frequent exposure of cells loaded withHoechst 33342 to short-wavelength (high-energy) light during time-lapse imaging canresult in a reduced cell viability of untreatedcells. Imaging cells no more than every 15 minfor time-lapse experiments that last >10 hr isrecommended to avoid any photo-toxicity.
Anticipated Results
Detecting lysosomal leakage (see BasicProtocol 3)
During leakage there will be an increasein FITC fluorescence intensity over the wholecell due to exposure of FITC to cytoplasm witha higher pH than the vesicular compartment(Fig. 4.40.1). FITC with a molecular weightof 4 kD can passively diffuse into the nucleus,and therefore the entire cell volume will ap-pear bright. In contrast, when a 70-kD FITC-dextran is used, only the cytoplasm will ap-pear bright and the nucleus will appear as ablack hole since the 70-kD molecule cannotdiffuse into the nucleus. For quantification, aregion of interest (ROI) can be drawn in thenuclear area, and fluorescence change can bequantified over time for cells loaded with 4-kD FITC-dextran. For 70-kD FITC-dextran, achange in fluorescence intensity for the entirecell can be quantified.
Evaluating changes in mitochondriamembrane potential (see Basic Protocol 4)
Depending on the effect of the drug understudy, mitochondria may undergo depolariza-tion or hyperpolarization or both, as evidencedby a decrease or increase in TMRE fluores-cence. When cells are treated with oligomycin,mitochondria are expected to show a gradualincrease in TMRE fluorescence, with a peakincrease after 15 min. When cells are treatedwith FCCP, mitochondria depolarize within 1min and there will be a loss of fluorescence.Cells treated with silica particles show tran-sient hyperpolarization and then later depolar-ization.
Techniques forAnalysis ofChemicalBiotransformation
4.40.27
Current Protocols in Toxicology Supplement 58
�F
RE
TD
ICT
MR
E
0 550 555 560 565 600 [min]
10
8
5
20
A
B C
CF
P/Y
FP
1.0
1.2
1.4
1.6
0
50
150
100
200
250CFP/YFP-FRETTMRE
CF
P/Y
FP
-FR
ET
TM
RE
fluorescence (%)
Time (min) Time (min)
0 100 200 300 400 500 6001.0
1.2
1.4
1.6
0
50
150
100
200
250
CF
P/Y
FP
-FR
ET
TM
RE
fluorescence (%)
540 550 560 570 580
CFP/YFP-FRETTMRE
Figure 4.40.4 Multi-parameter detection of caspase activation, change in mitochondrial membrane potential, andcell morphology. MH-S cells expressing the CFP-DEVD-YFP (effector caspase-3) sensor were pre-labeled withTMRE and exposed to silica particles. (A) At 555 min, simultaneous caspase activation, increase in TMRE fluo-rescence, and initiation of cell blebbing is observed. Cell blebbing and mitochondrial hyperpolarization continue toincrease over time. (B) Quantification of data showing caspase activation and mitochondria hyperpolarization to betemporally closely related and a late apoptotic event. (C) Highlighted region in B is further plotted to show a temporalcloseness of the process.
Bax-induced mitochondria outer membranepermeabilization (MOMP) (see BasicProtocol 6)
Upon activation, cytoplasmic Bax localizesto mitochondria, leading to an increase in mi-tochondrial fluorescence and a decrease in cy-toplasmic fluorescence (Fig. 4.40.2).
Real-time detection of caspase activity (seeBasic Protocol 7)
Activation of caspases has a close temporalcorrelation to changes in mitochondrial mem-brane potential and any cellular morphologicalchanges like blebbing, which occurs duringapoptosis. Thus, one can expect an increasein CFP fluorescence and a decrease in YFP-FRET fluorescence that are usually temporallyclose to alterations in mitochondrial mem-brane potential and morphological changes inthe cell (Fig. 4.40.4).
Detecting phosphatidylserineexternalization (see Basic Protocol 8)
Exposure of phosophatidyl serine on theouter leaflet of plasma membrane will resultin an increase in membrane-associated fluo-rescence. Cells undergoing necrosis or sec-ondary necrosis will not show a typical pat-tern of fluorescence associated with apoptoticcells but show a cytoplasmic fluorescence thatis dim compared to plasma membrane fluo-rescence. Figure 4.40.5 shows cells becom-ing annexin V-FITC-positive upon exposureto staurosporine.
Detecting alterations in nuclear morphologyusing Hoechst 33342 (see Basic Protocol 9)
Hoechst 33342 is a vital dye staining thenucleus of the cells. During cell death, nuclearcondensation and shrinkage can be tracked us-ing live-cell imaging.
Multi-ParametricAnalysis ofCell Death
4.40.28
Supplement 58 Current Protocols in Toxicology
1
1
2
2
DIC
Ann
exin
V-
FIT
CTime(min)
0 205 215 285 355 365
Figure 4.40.5 Detection of phosphatidylserine flipping. Cells incubated with annexin V-FITCand exposed to staurosporine (1 µM) show an increase in fluorescence on the cell membraneindicating phosphatidylserine has been exposed on the outer leaflet of the plasma membrane.The increase in annexin V-FITC fluorescence associated with the cell perimeter is gradual, andthe timing of the exposure varies between cells.
Propidium iodide assay (see BasicProtocol 10)
A bright nuclear signal will be observedupon cell death. This signal is due to the cellsbecoming necrotic. Apoptotic cells do not be-come PI positive until secondary necrosis oc-curs following apoptosis.
Inducing lysosomal leakage and cell death(see Basic Protocol 12)
StaurosporineUpon addition of 1 µM staurosporine, ex-
pect cells to flatten and show filopodia (protru-sion) in the transmitted light image. Leakageof FITC-dextran should be observed within 1hr (Fig. 4.40.1A).
Leu-Leu-OMeUpon addition of 3 mM Leu-Leu-OMe, ex-
pect cells to round up with the appearanceof vacuoles in the cytoplasm. Initially, an in-crease in punctate fluorescence will occur,which is likely due to disruption of lysoso-mal V-ATPase, resulting in an increase in thepH of vesicles. Alternately, pores <4 kD insize could be formed, leading to influx of cyto-plasmic contents in lysosomes, resulting an in-crease in pH and hence the fluorescence. Leak-age is expected to occur within 30 min and celldeath by 3 hr after addition of Leu-Leu-O-Me.If more vacuoles formed in the cells and theyreturn back to normal morphology, increasingthe concentration of Leu-Leu-OMe by 0.5 mMuntil leakage is observed is recommended.
SilicaUpon addition of silica particles, there will
be uptake of the particles. During phagocytosis
there is fusion of endosomes with the phago-some that can be visualized as an increase inparticle fluorescence. This is a transient event,as vATPase quickly results in phagosome acid-ification and hence quenching of fluorescence.When imaged, every minute, an increase inparticle fluorescence will be observed duringuptake. This fluorescence will be quencheddue to phagosomal acidification, and uponleakage an increase in phagosomal fluores-cence will be observed, which transitions tocytoplasmic fluorescence. Approximately 30min after particle uptake, one can expect tosee phago-lysosomal leakage (Fig. 4.40.1B).Cell death will vary any where from 6 to 12 hr.
Time ConsiderationsDue to the number of variables across
experimental parameters, including treatmentduration, microscope setup, number of sam-ples, and analysis complexity, it is difficult toestimate time allotment. Generally, the simple(single probe/single field-of-view) assays arerelatively quick once cells are ready, as treat-ing and imaging a sample can be performed in1 day. Using a fully automated microscope ca-pable of multi-field acquisition, it is possiblein 1 day to acquire data from up to eight dif-ferent samples and/or multiple fields of viewfor each sample in an 8-well chamber slide.This higher throughput method will generatemore data in a shorter time than single field-of-view experiments, but it will take longer toanalyze the data acquired. More complex ex-periments may require a few additional days,such as when recombinant fluorescent probesneed to be expressed after cell transfection.
Techniques forAnalysis ofChemicalBiotransformation
4.40.29
Current Protocols in Toxicology Supplement 58

Literature CitedAlbeck, J., Burke, J., Aldridge, B., Zhang, M., Lauf-
fenburger, D., and Sorger, P. 2008. Quantitativeanalysis of pathways controlling extrinsic apop-tosis in single cells. Mol. Cell 30:11-25.
Bidere, N., Lorenzo, H.K., Carmona, S., Laforge,M., Harper, F., Dumont, C., and Senik, A. 2003.Cathepsin D triggers Bax activation, resultingin selective apoptosis-inducing factor (AIF) re-location in T lymphocytes entering the earlycommitment phase to apoptosis. J. Biol. Chem.278:31401-31411.
Boya, P. and Kroemer 2008. Lysosomal mem-brane permeabilization in cell death. Oncogene27:6434-6451.
Cirman, T., Oresic, K., Mazovec, G.D., Turk, V.,Reed, J.C., Myers, R.M., Salvesen, G.S., andTurk, B. 2004. Selective disruption of lysosomesin HeLa cells triggers apoptosis mediated bycleavage of Bid by multiple papain-like lysoso-mal cathepsins. J. Biol. Chem. 279:3578-3587.
Costantini, L.M., Gilberti, R.M., and Knecht, D.A.2011. The phagocytosis and toxicity of amor-phous silica. PloS One 6:e14647.
de Duve, C. 1975. Exploring cells with a centrifuge.Science 189:186-194.
Dussmann, H., Rehm, M., Concannon, C.G., An-guissola, S., Wurstle, M., Kacmar, S., Voller,P., Huber, H.J., and Prehn, J.H.M. 2010. Single-cell quantification of Bax activation and math-ematical modelling suggest pore formation onminimal mitochondrial Bax accumulation. CellDeath Differ. 17:278-290.
Gilberti, R.M., Joshi, G.N., and Knecht, D.A. 2008.The phagocytosis of crystalline silica particlesby macrophages. Am. J. Respir. Cell Mol. Biol.39:619-627.
Goldstein, J.C., Munoz-Pinedo, C., Ricci, J.-E.,Adams, S.R., Kelekar, A., Schuler, M., Tsien,R.Y., and Green, D.R. 2005. Cytochrome c isreleased in a single step during apoptosis. CellDeath Differ. 12:453-462.
He, L., Wu, X., Siegel, R., and Lipsky, P. 2006.TRAF6 regulates cell fate decisions by induc-ing caspase 8-dependent apoptosis and the acti-vation of NF-kappaB. J. Biol. Chem. 281:11235-11249.
Joshi, G.N. and Knecht, D.A. 2013. Silica phago-cytosis causes apoptosis and necrosis by differ-ent temporal and molecular pathways in alveolarmacrophages. Apoptosis 18:271-285.
Kawai, H., Suzuki, T., Kobayashi, T., Mizuguchi,H., Hayakawa, T., and Kawanishi, T. 2004. Si-multaneous imaging of initiator/effector caspaseactivity and mitochondrial membrane potentialduring cell death in living HeLa cells. Biochim-ica Biophysica Acta 1693:101-110.
Kerr, J.F., Wyllie, A.H., and Currie, A.R. 1972.Apoptosis: A basic biological phenomenon withwide-ranging implications in tissue kinetics. Br.J. Cancer 26:239.
Kim, H., Tu, H.-C., Ren, D., Takeuchi, O., Jeffers,J.R., Zambetti, G.P., Hsieh, J.J.-D., and Cheng,E.H.-Y. 2009. Stepwise activation of BAX and
BAK by tBID, BIM, and PUMA initiates mito-chondrial apoptosis. Mol. Cell 36:487-499.
Lima, H., Jacobson, L.S., Goldberg, M.F., Chan-dran, K., Diaz-Griffero, F., Lisanti, M.P., andBrojatsch, J. 2013. Role of lysosome rupturein controlling Nlrp3 signaling and necrotic celldeath. Cell Cycle 12:1868-1878.
Loew, L.M., Tuft, R.A., Carrington, W., and Fay,F.S. 1993. Imaging in five dimensions: Time-dependent membrane potentials in individualmitochondria. Biophys. J. 65:2396-2407.
Luo, X., Budihardjo, I., Zou, H., Slaughter, C., andWang, X. 1998. Bid, a Bcl2 interacting protein,mediates cytochrome c release from mitochon-dria in response to activation of cell surfacedeath receptors. Cell 94:481-490.
McStay, G.P., Salvesen, G.S., and Green, D.R.2008. Overlapping cleavage motif selectivity ofcaspases: Implications for analysis of apoptoticpathways. Cell Death Differ. 15:322-331.
Oltval, Z.N., Milliman, C.L., and Korsmeyer, S.J.1993. Bcl-2 heterodimerizes in vivo with aconserved homolog, Bax, that accelerates pro-gramed cell death. Cell 74:609-619.
Persson, H.L. 2005. Iron-dependent lysosomaldestabilization initiates silica-induced apoptosisin murine macrophages. Toxicol. Lett. 159:124-133.
Repnik, U. and Turk, B. 2010. Lysosomal-mitochondrial cross-talk during cell death. Mi-tochondrion 10:662-669.
Schneider, C.A., Rasband, W.S., and Eliceiri, K.W.2012. NIH Image to ImageJ: 25 years of imageanalysis. Nat. Methods 9:671-675.
Slee, E.A., Harte, M.T., Kluck, R.M., Wolf, B.B.,Casiano, C.A., Newmeyer, D.D., Wang, H.G.,Reed, J.C., Nicholson, D.W., Alnemri, E.S.,Green, D.R., and Martin, S.J. 1999. Orderingthe cytochrome c-initiated caspase cascade: Hi-erarchical activation of caspases-2, -3, -6, -7, -8,and -10 in a caspase-9-dependent manner. J. CellBiol. 144:281-292.
Tait, S.W.G. and Green, D.R. 2010. Mitochon-dria and cell death: Outer membrane permeabi-lization and beyond. Nat. Rev. Mol. Cell Biol.11:621-632.
Thibodeau, M.S., Giardina, C., Knecht, D.A., Hel-ble, J., and Hubbard, A.K. 2004. Silica-inducedapoptosis in mouse alveolar macrophages is ini-tiated by lysosomal enzyme activity. Toxicol.Sci. 80:34-48.
Thiele, D.L. and Lipsky, P.E. 1990. Mechanismof L-leucyl-L-leucine methyl ester-mediatedkilling of cytotoxic lymphocytes: Dependenceon a lysosomal thiol protease, dipeptidyl pepti-dase I, that is enriched in these cells. Proc. Natl.Acad. Sci. U.S.A. 87:83-87.
Tyas, L., Brophy, V.A., Pope, A., Rivett, A.J., andTavare, J.M. 2000. Rapid caspase-3 activationduring apoptosis revealed using fluorescence-resonance energy transfer. EMBO Rep. 1:266-270.
Vaux, D.L., Cory, S., and Adams, J.M. 1988. Bcl-2gene promotes haemopoietic cell survival and
Multi-ParametricAnalysis ofCell Death
4.40.30
Supplement 58 Current Protocols in Toxicology

cooperates with c-myc to immortalize pre-Bcells. Nature 335:440-442.
Wang, K., Yin, X.-M., Chao, D.T., Milliman,C.L., and Korsmeyer, S.J. 1996. BID: A novelBH3 domain-only death agonist. Genes Dev.10:2859-2869.
Yang, E., Zha, J., Jockel, J., Boise, L.H., Thomp-son, C.B., and Korsmeyer, S.J. 1995. Bad, a het-erodimeric partner for Bcl-XL and Bcl-2, dis-places Bax and promotes cell death. Cell 80:285-291.
Techniques forAnalysis ofChemicalBiotransformation
4.40.31
Current Protocols in Toxicology Supplement 58