Monitoring during anaesthesia and recovery - Mededcoventry.com

, , ,
, ,
*Laboratory of Functional and Metabolic Imaging, Ecole Polytechnique F�ed�erale de Lausanne,
Lausanne, Switzerland
†Center for Radiopharmaceutical Sciences of ETH Zurich, Zurich, Switzerland
‡Department of Radiology, University of Lausanne, Lausanne, Switzerland
§Department of Radiology, University of Geneva, Geneva, Switzerland
AbstractAlthough numerous positron emission tomography (PET)studies with 18F-fluoro-deoxyglucose (FDG) have reportedquantitative results on cerebral glucose kinetics and con-sumption, there is a large variation between the absolutevalues found in the literature. One of the underlying causes isthe inconsistent use of the lumped constants (LCs), thederivation of which is often based on multiple assumptions thatrender absolute numbers imprecise and errors hard toquantify. We combined a kinetic FDG-PET study with mag-netic resonance spectroscopic imaging (MRSI) of glucosedynamics in Sprague–Dawley rats to obtain a more compre-hensive view of brain glucose kinetics and determine a reliablevalue for the LC under isoflurane anaesthesia. Maps of
Tmax/CMRglc derived from MRSI data and Tmax determinedfrom PET kinetic modelling allowed to obtain an LC-indepen-dent CMRglc. The LC was estimated to range from 0.33 � 0.07in retrosplenial cortex to 0.44 � 0.05 in hippocampus, yieldingCMRglc between 62 � 14 and 54 � 11 lmol/min/100 g,respectively. These newly determined LCs for four distinctareas in the rat brain under isoflurane anaesthesia providemeans of comparing the growing amount of FDG-PET dataavailable from translational studies.Keywords: CMRglc, glucose transport, isoflurane, lumpedconstant, magnetic resonance spectroscopic imaging, positronemission tomography.J. Neurochem. (2014) 129, 672–682.
Cerebral glucose metabolism is linked to neurotransmittercycling (Sibson et al. 1998) and therefore indicative ofneuronal activity. It is also known to be altered in variouspathologies, such as hypoxia and ischaemia, Alzheimer’s andParkinson’s diseases (Hellwig et al. 2012; Scheef et al.2012). As energy consumption in the brain is affected bynumerous factors, it is all the more desirable to measure it ina fully quantitative fashion to allow for comparison acrossstudies performed under different conditions in differentlaboratories.Brain glucose consumption in vivo has been determined in
a non-invasive way mostly using 13C magnetic resonancespectroscopy (MRS) with infusion of 13C-enriched glucose,1H MRS upon glycaemia challenges and positron emissiontomography (PET) with the glucose analog 18F-fluoro-deoxyglucose (FDG). Notwithstanding its great merits,
particularly allowing to determine fluxes through a largenumber of metabolic reactions, 13C MRS faces limitationsregarding spatial resolution. Although 1H MRS has been
Received May 15, 2013; revised manuscript received January 22, 2014;accepted January 24, 2014.Address correspondence and reprint requests to Jo~ao M. N. Duarte,
EPFL, Laboratory of Functional and Metabolic Imaging, CH F1 625,Station 6, 1015 Lausanne, Switzerland. E-mail: [email protected] used: CMRglc, cerebral metabolic rate of glucose; DG,
deoxyglucose; FDG, 18F-fluoro-deoxyglucose; GLUT, glucose trans-porter; Gp, plasma glucose concentration; KFDG, FDG uptake rateconstant; Kt, apparent half-saturation constant for glucose transport; LC,lumped constant; MRSI, magnetic resonance spectroscopic imaging;MRS, magnetic resonance spectroscopy; PET, positron emissiontomography; SUV, standard uptake value; Tmax, apparent maximumtransport rate; Tout, glucose efflux rate from tissue; Vd, volume ofdistribution.
672 © 2014 International Society for Neurochemistry, J. Neurochem. (2014) 129, 672--682
JOURNAL OF NEUROCHEMISTRY | 2014 | 129 | 672–682 doi: 10.1111/jnc.12667

mostly restricted to provide information on the ratio ofglucose transport over consumption, recent studies have beendesigned to quantify both transport kinetics and the cerebralmetabolic rate of glucose (CMRglc) from the dynamicmeasurement of brain glucose concentration upon plasmaglucose variation (Gruetter et al. 1996; Shestov et al. 2011;Du et al. 2012; Duarte and Gruetter 2012a). PET with FDGoffers information on the mechanistic basis of CMRglc and isa relatively uncomplicated method, leading to its widespreademployment. However, it is most often used in a semiquan-titative manner, reporting standard uptake values rather thancalibrated kinetic modelling results (Liu et al. 2010; Mizumaet al. 2010; Kreissl et al. 2011). This has been criticized inthe past (Keyes 1995) and is because of two principal issues.The first is the need for a measurement of the FDGconcentration in the blood (the so-called input function),which in rodents is complicated by small blood volume.There are commercially available tools for the real-timemeasurement of the input function in rats (Weber et al. 2002)and mice (Alf et al. 2013a). The second issue relates to theneed of the lumped constant (LC), which accounts for thedifferent affinities of glucose versus its analog, in this caseFDG, to glucose transporters and hexokinase and theirvolumes of distribution. This is particularly needed to derivea value for the consumption of glucose from data describingthe uptake of its analog. A good discussion of why the LC isdifficult to determine can be found in a perspective article byKrohn et al. (2007). Most previous attempts to determine theLC of FDG have been based on an indirect comparison to14C-DG, for which the LC has been determined in theseminal work in the field (Sokoloff et al. 1977), and usedoperational definitions drawing upon average values forsingle rate constants from the literature (Tokugawa et al.2007). The latest reported value for the LC in the awake ratfor FDG is 0.71 � 0.12 (Tokugawa et al. 2007). Although alarge number of FDG-PET studies in rats are performed
under isoflurane anaesthesia (e.g. Shimoji et al. 2004;Backes et al. 2011), there is no consensus on the LC to beused in this condition. Recent efforts to calculate LCs forindividual animals yielded qualitatively meaningful resultsbut failed to provide realistic values of CMRglc (Backes et al.2011). Overall, there are substantial differences betweenpublished results (Table 1) that prohibit comparison betweenstudies from different research groups and suggest a pseudo-quantitative and somewhat arbitrary nature of CMRglc
measurements.Hyder and Rothman (2012) have collected data on CMRglc
from rats mostly from 13C MRS studies that suggest aminimum CMRglc of 10–20 lmol/min/100 g to be requiredto maintain cell viability even at isoelectricity, i.e. in theabsence of electrical activity that can be reached with deeppentobarbital anaesthesia (Crane et al. 1978; Sakabe et al.1985). Although isoflurane has a suppressive effect on neuralactivity, it has been used in stimulation studies (e.g. Barteret al. 2005) and it has been demonstrated to only partiallyreduce haemodynamic signals in rodents at conventionallyused doses (e.g. Takuwa et al. 2012). This suggests that oneshould expect to find a CMRglc somewhere above 20lmol/min/100 g but below the consumption level of theawake state that may be even above 100 lmol/min/100 g(Moore et al. 2000; Tokugawa et al. 2007). Recent studiesin mice anaesthetized with isoflurane have reported values ofCMRglc as low as 13 and 18 lmol/min/100 g (Mizuma et al.2010; Kreissl et al. 2011).These discrepancies suggest the need for a new determi-
nation of the LC under isoflurane anaesthesia. We adopted anentirely new approach to the issue by combining magneticresonance spectroscopic imaging (MRSI) and PET with FDGto determine Tmax/CMRglc and Tmax respectively, in differentbrain structures. With the standard two-tissue compartmentmodel, this allowed to estimate the actual LC underisoflurane anaesthesia (LCisoflurane) without the need of using
Table 1 Values for CMRglc in the cortex (CTX), Hippocampus (HIP) or whole brain (WB) from rodents under isoflurane anaesthesia varyconsiderably across studies. Except for the first four rows, all results are from FDG-PET studies
Authors Species Brain region Tracer LC CMRglc (lmol/min/100 g)
Hansen et al. (1989) Rat CTX
HIP
14C-DG 0.483 (autoradiography) 54 � 2
66 � 2Archer et al. (1990) Rat CTX
HIP
14C-DG 0.483 (autoradiography) 37 � 7 to 48 � 642 � 7 to 63 � 12
Duarte and Gruetter (2012a) Rat CTX+HIP None None (dynamic 1H MRS) 54 � 15Du et al. (2012) Rat CTX None None (dynamic 1H MRS) 44 � 17Shimoji et al. (2004) Rat CTX
WBFDG 0.48 23.9 � 4.8
28.1 � 4.6
Backes et al. (2011) Rat WB FDG Derived from kinetics 20 (no SD reported)Yu et al. (2009) Mouse CTX FDG 0.6 40.6 � 13.3Mizuma et al. (2010) Mouse CTX FDG 0.625 13 � 4
Kreissl et al. (2011) Mouse WB FDG 1 18 (no SD reported)Alf et al. (2012) Mouse WB FDG 0.6 61 � 11 to 75 � 24
© 2014 International Society for Neurochemistry, J. Neurochem. (2014) 129, 672--682
MRS glucose mapping and PET joining forces 673

literature values on the LC for 14C-DG or single rateconstants. As there is an ongoing debate on whether it isappropriate to include a rate constant k4 for dephosphory-lation of FDG-6-phosphate, we derived results for bothmodelling options, i.e. with and without k4 included in themodel. The combined information from PET and MRSI alsoprovided a more complete, quantitative description ofglucose kinetics in the rat brain. These findings contributeto an improvement in the comparability of quantitativeresults on brain glucose metabolism.
Materials and methods
All procedures used in the experiments described here wereaccording to the Swiss animal welfare legislation and approved bythe local ethics committee and performed by licensed investigators.Male Sprague-Dawley rats for MRSI (253 � 23 g, n = 10) andPET (304 � 9 g, n = 6) were purchased from Charles River inFrance and Germany, respectively, and housed under identicalconditions: 12-h light–dark cycle, 20–22°C room temperature, 55–60%humidity, with water and food (Kliba Nafag 3800 from Provimi Kliba)provided ad libitum.
Animal preparation
Rats were anaesthetized using 1.5–2% isoflurane in 30% oxygen inair, breathing autonomously at a rate of 60–75 breaths/min.Polyethylene catheters were inserted into a femoral artery and vein.In MRSI experiments, they were used to monitor blood gases, plasmaglucose (Gp), and lactate concentrations, and to infuse a 20% (w/v)solution of D-glucose (Sigma-Aldrich, Basel, Switzerland), asdescribed previously (Duarte et al. 2009a). In PET experiments, thecatheterswere connected to form a closed shunt loopwith two- to three-way valves in it, for infusion of FDGandGpmonitoring. The shunt wasguided through a coincidence counter (twilite, Swisstrace, Switzerland)for the acquisition of real-time input functions with the respective toolin PMODv3.3 software (PMODTechnologies Inc., Zurich, Switzerland),as described previously (Weber et al. 2002; Alf et al. 2013a).A peristaltic pump (Ismatec, Wertheim-Mondfeld, Germany) ensureda constant flow rate of 300 lL/min through the shunt.
PET imaging
FDG was administered as an infusion of 200 lL at constant speedover 5 min with a syringe pump. The injected radioactive dose was31–39 MBq. Gp was measured before, in the middle and after thescan, i.e. with 30-min interval. For this purpose, plasma sampleswere obtained by centrifugation of 40–50 lL whole blood samplesand Gp was measured with a glucose oxidase/reflectance system(Vitros DT60 II; Ortho Clinical Diagnostics). Respiratory rate andbody temperature were continuously monitored and controlled asdescribed previously (Alf et al. 2013a).
List mode PET data acquisition was performed on a GE VISTAeXplore PET/CT system (GE, Fairfield, CT, USA) with 0.9-mmresolution in full width at half maximum in the centre of field ofview (Alf et al. 2013a,b). Data were collected over 60 min. Animalswere killed at the end of the experiment.
Images were reconstructed using a 3D FORE/2D OSEM algorithmto a nominal voxel volume of 0.3875 9 0.3875 9 0.775 (axial) mm3
as described previously (Alf et al. 2013a,b). Time frames werearranged insuchawaythat theshortest frames (10 s)coincidedwith thefastest changes in blood concentration of radioactivity, i.e. the end ofthe tracer infusion. The longest frames (4 min)were situated at the endof the scan. In Fig. 2a, each data point of the time activity curve (TAC)stems from one reconstructed time frame.
MR Spectroscopic imaging
Measurements of brain glucose concentrations were performed on aDirectDrive spectrometer (Agilent Technologies, Palo Alto, CA,USA) that was interfaced to an actively shielded 9.4 T magnet with a31 cm horizontal bore (Magnex Scientific, Abingdon, UK) and witha 12 cm i.d. actively shielded gradient set that allowed a maximumgradient of 400 mT/m in 120 ls. A quadrature coil with two12-mm-inner-diameter decoupled loops resonating at 400 MHz wasused for the radio-frequency transceiver.
We used a standard rectangular k-space acquisition scheme thatwas accelerated by TR weighting with a 2D-Hamming filter and acircular sampling window as described previously (K€uhn et al.1996; Alf et al. 2012). Multislice T2-weighted (TR = 4 s,TEeff = 52 ms, four scans) images were acquired with a fast spin-echo method (Hennig 1988) for positioning of the volume of interest(VOI) for subsequent MRSI scans. A coronally oriented VOI waschosen with dimensions of 6 mm 9 9 mm with a thickness of2.5 mm. SPECIAL (Spin Echo full Intensity Acquired Localizedspectroscopy; Mlyn�arik et al. 2008) combined with phase encodingin two dimensions was used for the MRSI metabolite signalacquisition with TE = 2.8 ms and a maximum TR of 2.5 s at thecentre of k-space. VAPOR water suppression interleaved with threemodules of outer volume saturation was employed. A 32 9 32k-space data matrix was acquired, covering a field of view of24 mm 9 24 mm. Nominal voxel size was thus 1.4 lL. For the 4averages acquired, metabolite acquisition time was 90 min and theresulting Cramer-Rao lower bounds of glucose were < 30% also inperipheral voxels, except for a few voxels in the corners and bottomrow. After the first MRSI acquisition at baseline Gp, a waterreference map (acquisition time of 30 min) was recorded forabsolute quantification, while glucose was infused to clamp itsplasma concentration to a higher level, as described previously(Duarte and Gruetter 2012a). Once the new Gp was reached, awaiting period of 90 min was observed to ensure for a steady stateof glucose transport in the brain, before a second MRSI acquisitionwas started. The MRSI session took about 5 h altogether: 30 minT2-weighted scan and shimming, 90 min metabolites, 30 min water(during waiting period), 90 min metabolites. During the wholeMRSI session, body temperature, arterial blood pressure, heart rate,and respiratory rate were continuously monitored with an animalmonitoring system (SA Instruments, NY, USA). Temperature wasmaintained at 37.5°C with a warm water circulation system based onthe feedback obtained from a rectal temperature probe. Plasmasamples collected every 20 min as described above were used toquantify concentrations of glucose and lactate, pH, PaO2 and PaCO2,as detailed previously (Duarte and Gruetter 2012a).
Data analysis
PET images and input functions were calibrated to kBq/cm3 bymeans of a phantom scan with known concentration that wasperformed daily. With a rat brain template (Schiffer atlas as
© 2014 International Society for Neurochemistry, J. Neurochem. (2014) 129, 672--682
674 M. F. Alf et al.

implemented in PMOD, Zurich, Switzerland), TACs were generatedfrom the brain structures present in the VOI used for MRSI(Fig. 1a), i.e. somatosensory and retrosplenial cortex, hippocampusand thalamus. TACs and input functions were used to performkinetic modelling with the two-tissue compartment model (Sokoloffet al. 1977; Brooks 1982) in PMOD. In brief, the model comprisesplasma and tissue compartments and four rate constants that are usedto describe FDG metabolism: K1 (mL/min/cm3) and k2 (min�1)represent the rate constants for carrier-mediated transport of FDGfrom plasma to tissue and back from tissue to plasma respectively;k3 (min�1) represents the rate constant for FDG phosphorylation bytissue hexokinase; k4 (min�1) represents the rate constant of FDGdephosphorylation in tissue. In compartment models, K1 can be seenas a rate constant corrected for the plasma/tissue volume ratio or asthe clearance of FDG from plasma (mL/min) per cm3 tissue. Kineticmodelling was performed with two different variants of the two-tissue compartment model: the first variant included dephosphory-lation of FDG-6-phosphate, k4; the other variant did not includedephosphorylation in the model, i.e. irreversible phosphorylation ofFDG by hexokinases was assumed. A fractional blood volume of4.2% was assumed according to synchrotron CT results (Adamet al. 2003). Fitting was done with a Levenberg–Marquardtalgorithm.
The resulting single rate constants were used to compute the FDGuptake constant (KFDG) and cerebral glucose metabolic rate(CMRglc), for which an initial assumption of LCassumed = 0.7 wasmade, as suggested by the literature for awake rats (Tokugawa et al.2007):
KFDG ¼ K1 � k3k2 þ k3
ð1Þ
CMRglc ¼ KFDG � Gp
LCassumed ð2Þ
Glucose transport was calculated with
Tglc ¼ K1;glcGp ð3Þand assumed to be close to the maximum transport velocity (Tmax) asapparent Michaelis half-saturation constant for glucose transport(Kt below 1.5 mM with reversible Michaelis–Menten kinetics) ismuch lower than plasma glucose in this study (Duarte and Gruetter2012a). Thus, Tmax was estimated according to eqn 4 and then used
to determine the ratio of Tmax/CMRglc for the different brainstructures:
Tmax ¼ K1;FDG � K1;glc
K1;FDG� Gp
1:04 g/mLð4Þ
A tissue density of 1.04 g/mL was assumed. The transportcoefficient for FDG versus glucose was K1;FDG
K1;glc= 1.66, which is the
average of the two available literature values for normoglycemicrats: 1.65 at Gp = 9 mM (Fuglsang et al. 1986) and 1.67 atGp = 9.9 mM (Crane et al. 1983).
Data from MRSI were processed with home-written MATLAB(TheMathWorks,Natick,MA,USA) codes as previously detailed (Alfet al. 2012) and metabolite quantification was done with LCModelversion 6.2-0X (Stephen Provencher Inc., Oakville, Ontario, Canada).MRSI data sets were processed independently from PET images(without coregistration) and regions of interest were manuallydelineated based on anatomical T2-weighted MRI scans. As for PETdata, a 4.2% fractional blood volume in the brain was taken intoaccount. The glucose distribution volume Vd was fixed at 0.77 mL/g,consistent with the brain water content for absolute quantification(Lund-Andersen 1979). Metabolite maps of glucose were generated,interpolated and superimposed on anatomic images (Fig. 1b).
The reversible Michaelis–Menten model of steady-state glucosekinetics was then applied using eqn 5 (Gruetter et al. 1998), whichis valid under the range of plasma glucose analysed in this study(Duarte et al. 2009b).
Gbrain ¼ Vd
TmaxCMRglc
� 1� �
Gp � Kt
TmaxCMRglc
þ 1ð5Þ
As the apparent half-saturation constant for glucose transport atthe blood–brain barrier is the poorest estimated parameter whenstudying glucose dynamics in vivo (Duarte et al. 2009b), we firstproceeded with a fit of eqn 5 to all measured voxels simultaneously.The resulting value for Kt was then used to perform data fitting onall individual voxels. Finally, glucose maps were coregistered tocreate a map of Tmax/CMRglc for region-of-interest analysis,analogous to the determination of the ratio from FDG-PET data.
Results from PET and MRSI were then combined to obtain anew, experimental value of the LC as follows. Tmax/CMRglc
(a) (b)
Fig. 1 (a) A typical image of 18F-fluoro-
deoxyglucose (FDG) uptake after 45 min. ROIsfrom which time activity curves (TACs) werederived are shown. Plasma glucose in this animal
was 10.7 mmol/L. Delineated brain areas are asfollows: SS-Ctx, somatosenory cortex; RS-Ctx,retrosplenial cortex; HIP, hippocampus; THA,
thalamus. (b) Typical maps of glucose superim-posed on an anatomic MRI scan (top). In the mapacquired after glucose infusion, Gp was between
16.5 and 17.8 mmol/L.
© 2014 International Society for Neurochemistry, J. Neurochem. (2014) 129, 672--682
MRS glucose mapping and PET joining forces 675

determined with either method must be the same, with the LC in theequation for PET being the only parameter free to choose.LCisoflurane can therefore be determined through eqn 6:
Tmax;PET�LCisoflurane
KFDG�Gp
Tmax;MRSI
CMRglc
¼ 1 ð6Þ
which can be written as follows:
LCisoflurane ¼ Tmax;MRSI
CMRglc� K1;FDG
K1;glc� k3k2 þ k3
ð7Þ
After determining LCisoflurane, correct values of CMRglc werecalculated.
Error propagation was taken into account throughout all layers ofanalysis. All data are shown with associated SD.
Results
PET kinetic modelling
Of the six rats included in the FDG-PET study, five had a Gp
of 10.8 � 0.5 mmol/L. One rat had a lower initial Gp
(7.1 mmol/L) that changed substantially during the scan andwas therefore excluded from the analysis. Kinetic modelfitting using the two-tissue compartment model as imple-mented in PMOD could be performed with an excellent data
fit in all five data sets (example shown in Fig. 2a), with andwithout a rate constant for dephosphorylation, k4, included inthe model. Results for the rate constants, the CMRglc
(determined with LC = 0.7) and Tmax are shown in Table 2.Tmax revealed significant regional variations, with the valuein retrosplenial cortex being significantly higher than that inhippocampus (with model including k4: 149 � 23 vs.105 � 16 lmol/min/100 g, model excluding k4: 152 � 20vs. 108 � 13; n = 5, p < 0.05, two-tailed paired-samplet-test). CMRglc was relatively uniform with differences below10% across different brain regions when calculated with anLC of 0.7 in all regions. Tmax/CMRglc was calculated and isshown in Table 3. The rate constant for dephosphorylation,k4, was found to be close to zero, with its SD being largerthan its absolute value. Omitting k4 from the analysis did notlead to significantly different results.
Parameters from MRSI
Physiologic parameters of the animals used for MRSI aresummarized in Table 4. Plasma lactate increased when Gp
was increased via glucose infusion. This was also visible inbrain lactate maps (not shown). As in previous reports onsingle volume MRS data (Duarte et al. 2009a; Duarte andGruetter 2012a), we did not observe major changes inmetabolites other than glucose and lactate. A few maps hadto be discarded because of issues with poor signal-to-noiseratio or lipid contamination. In the remaining data sets,
(a) (b)
(c) (d) (e)
Fig. 2 (a) Typical hippocampal time activity curve (TAC, circlescorrespond to the centres of reconstructed time frames) and input
function from a positron emission tomography PET experiment withmodel fit. The y-axis shows total 18F activity from 18F-fluoro-deoxyglucose(FDG) and FDG-6-phosphate (FDG6P). The black lines represent
the intracellular pools of free FDG and FDG6P simulated withthe software PMOD. These plus the plasma FDG (red line) withinbrain capillaries result in the total PET signal (shown in blue). (b)
Glucose maps were coregistered for single-voxel regression analysis.A voxel size is illustrated in the lower right corner of the map in front.
(c) Data recorded from the voxel highlighted in figure part bfrom all animals. Linear regression constrained by Kt = 2.1 mmol/Lon data from an example voxel, highlighted in (b) in white. (d)
Quality of regression as indicated by R2 for all voxels included inthe map. (e) Regression results for Tmax/CMRglc visualized in a heatmap.
© 2014 International Society for Neurochemistry, J. Neurochem. (2014) 129, 672--682
676 M. F. Alf et al.
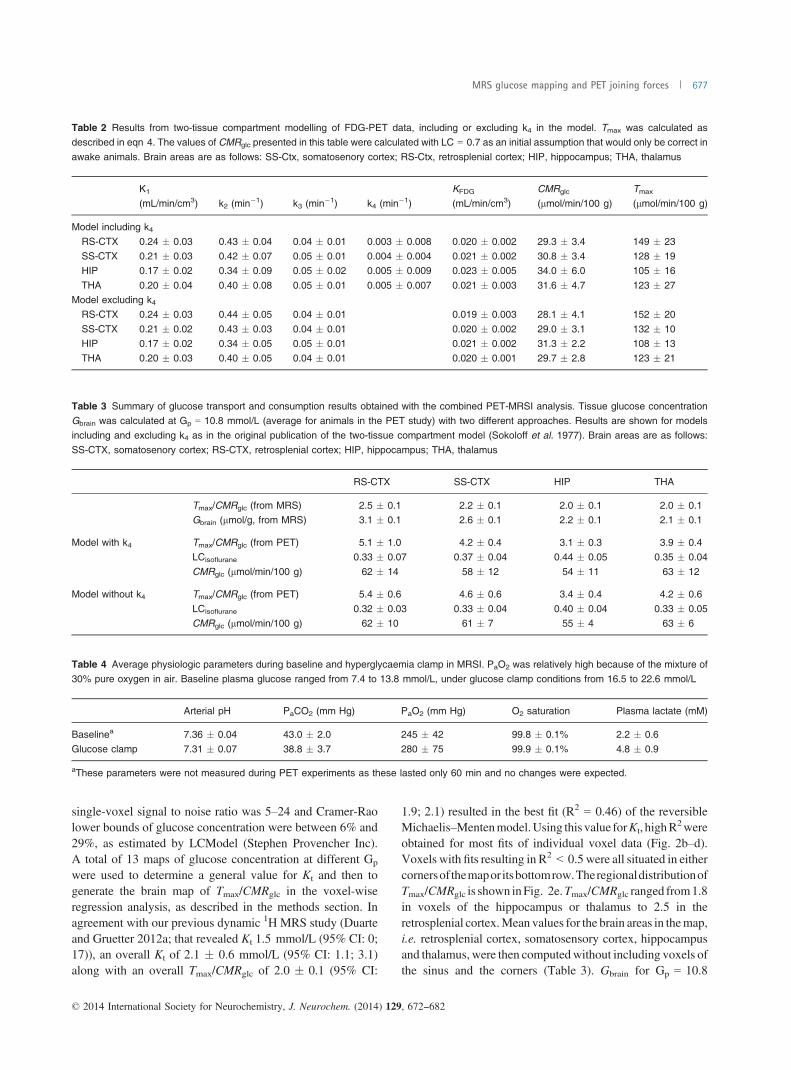
single-voxel signal to noise ratio was 5–24 and Cramer-Raolower bounds of glucose concentration were between 6% and29%, as estimated by LCModel (Stephen Provencher Inc).A total of 13 maps of glucose concentration at different Gp
were used to determine a general value for Kt and then togenerate the brain map of Tmax/CMRglc in the voxel-wiseregression analysis, as described in the methods section. Inagreement with our previous dynamic 1H MRS study (Duarteand Gruetter 2012a; that revealed Kt 1.5 mmol/L (95% CI: 0;17)), an overall Kt of 2.1 � 0.6 mmol/L (95% CI: 1.1; 3.1)along with an overall Tmax/CMRglc of 2.0 � 0.1 (95% CI:
1.9; 2.1) resulted in the best fit (R2 = 0.46) of the reversibleMichaelis–Mentenmodel.Using this value forKt, highR
2wereobtained for most fits of individual voxel data (Fig. 2b–d).Voxels with fits resulting in R2 < 0.5 were all situated in eithercornersof themapor itsbottomrow.TheregionaldistributionofTmax/CMRglc is shown inFig. 2e.Tmax/CMRglc ranged from1.8in voxels of the hippocampus or thalamus to 2.5 in theretrosplenial cortex.Mean values for the brain areas in themap,i.e. retrosplenial cortex, somatosensory cortex, hippocampusand thalamus, were then computedwithout including voxels ofthe sinus and the corners (Table 3). Gbrain for Gp = 10.8
Table 2 Results from two-tissue compartment modelling of FDG-PET data, including or excluding k4 in the model. Tmax was calculated asdescribed in eqn 4. The values of CMRglc presented in this table were calculated with LC = 0.7 as an initial assumption that would only be correct in
awake animals. Brain areas are as follows: SS-Ctx, somatosenory cortex; RS-Ctx, retrosplenial cortex; HIP, hippocampus; THA, thalamus
K1
(mL/min/cm3) k2 (min�1) k3 (min�1) k4 (min�1)KFDG
(mL/min/cm3)CMRglc
(lmol/min/100 g)Tmax
(lmol/min/100 g)
Model including k4RS-CTX 0.24 � 0.03 0.43 � 0.04 0.04 � 0.01 0.003 � 0.008 0.020 � 0.002 29.3 � 3.4 149 � 23SS-CTX 0.21 � 0.03 0.42 � 0.07 0.05 � 0.01 0.004 � 0.004 0.021 � 0.002 30.8 � 3.4 128 � 19HIP 0.17 � 0.02 0.34 � 0.09 0.05 � 0.02 0.005 � 0.009 0.023 � 0.005 34.0 � 6.0 105 � 16
THA 0.20 � 0.04 0.40 � 0.08 0.05 � 0.01 0.005 � 0.007 0.021 � 0.003 31.6 � 4.7 123 � 27Model excluding k4
RS-CTX 0.24 � 0.03 0.44 � 0.05 0.04 � 0.01 0.019 � 0.003 28.1 � 4.1 152 � 20
SS-CTX 0.21 � 0.02 0.43 � 0.03 0.04 � 0.01 0.020 � 0.002 29.0 � 3.1 132 � 10HIP 0.17 � 0.02 0.34 � 0.05 0.05 � 0.01 0.021 � 0.002 31.3 � 2.2 108 � 13THA 0.20 � 0.03 0.40 � 0.05 0.04 � 0.01 0.020 � 0.001 29.7 � 2.8 123 � 21
Table 3 Summary of glucose transport and consumption results obtained with the combined PET-MRSI analysis. Tissue glucose concentrationGbrain was calculated at Gp = 10.8 mmol/L (average for animals in the PET study) with two different approaches. Results are shown for modelsincluding and excluding k4 as in the original publication of the two-tissue compartment model (Sokoloff et al. 1977). Brain areas are as follows:
SS-CTX, somatosenory cortex; RS-CTX, retrosplenial cortex; HIP, hippocampus; THA, thalamus
RS-CTX SS-CTX HIP THA
Tmax/CMRglc (from MRS) 2.5 � 0.1 2.2 � 0.1 2.0 � 0.1 2.0 � 0.1Gbrain (lmol/g, from MRS) 3.1 � 0.1 2.6 � 0.1 2.2 � 0.1 2.1 � 0.1
Model with k4 Tmax/CMRglc (from PET) 5.1 � 1.0 4.2 � 0.4 3.1 � 0.3 3.9 � 0.4LCisoflurane 0.33 � 0.07 0.37 � 0.04 0.44 � 0.05 0.35 � 0.04
CMRglc (lmol/min/100 g) 62 � 14 58 � 12 54 � 11 63 � 12
Model without k4 Tmax/CMRglc (from PET) 5.4 � 0.6 4.6 � 0.6 3.4 � 0.4 4.2 � 0.6
LCisoflurane 0.32 � 0.03 0.33 � 0.04 0.40 � 0.04 0.33 � 0.05CMRglc (lmol/min/100 g) 62 � 10 61 � 7 55 � 4 63 � 6
Table 4 Average physiologic parameters during baseline and hyperglycaemia clamp in MRSI. PaO2 was relatively high because of the mixture of30% pure oxygen in air. Baseline plasma glucose ranged from 7.4 to 13.8 mmol/L, under glucose clamp conditions from 16.5 to 22.6 mmol/L
Arterial pH PaCO2 (mm Hg) PaO2 (mm Hg) O2 saturation Plasma lactate (mM)
Baselinea 7.36 � 0.04 43.0 � 2.0 245 � 42 99.8 � 0.1% 2.2 � 0.6Glucose clamp 7.31 � 0.07 38.8 � 3.7 280 � 75 99.9 � 0.1% 4.8 � 0.9
aThese parameters were not measured during PET experiments as these lasted only 60 min and no changes were expected.
© 2014 International Society for Neurochemistry, J. Neurochem. (2014) 129, 672--682
MRS glucose mapping and PET joining forces 677
mmol/L (PET study average) was then estimated using eqn 5and the parameters for the different structures. Values werebetween 2.1 and 3.1 lmol/g (Table 3).
Estimation of LCisoflurane
Compared to MRSI, the ratio Tmax/CMRglc was overesti-mated by PET with a factor around 2, when based on theinitially assumed LC of 0.7. As a consequence, the actualLCisoflurane must be about half of the initial assumption.Region-specific values for the LC were derived using eqn 6(Table 3). The highest LCisoflurane of 0.44 � 0.05 (k4included in kinetic model, 0.40 when k4 was excluded)was obtained in hippocampus, which was significantly higherthan the LCisoflurane obtained in the other regions (p < 0.05,one-way ANOVA), with the other ones being relatively similar(0.33 � 0.07, 0.37 � 0.04 and 0.35 � 0.04 for retrosplenialand somatosensory cortex and thalamus respectively; with k4excluded from the model: 0.32 � 0.03, 0.33 � 0.04,0.33 � 0.05).When computed with the LCisoflurane determined in this
study, CMRglc was between 54 and 63 lmol/min/100 g inhippocampus and thalamus, respectively, with no majordependence on whether k4 was included in PET kineticmodelling or not (Table 3).
Discussion
The combination of PET and 1H MRSI was used to determineregion-specific LC values in the rat brain under isofluraneanaesthesia. LCisoflurane in the four analysed brain areas waslower than those previously reported for both anaesthetizedand awake animals (Table 1), and yielded CMRglc values thatare close to those determined by autoradiography (Hansenet al. 1989; Archer et al. 1990), as well as by LC-independentMRS (Du et al. 2012; Duarte and Gruetter 2012a).The present approach to estimate LC relies on knowing the
maximum glucose transport rate (Tmax) determined by FDG-PET and on its ratio to glucose consumption (Tmax/CMRglc)measured by 1H MRSI. Both Tmax and Tmax/CMRglc reportedin this study were in good agreement with previousdeterminations in the rat brain under isoflurane anaesthesiaby dynamic measurement of brain and plasma glucoseconcentrations (Du et al. 2012; Duarte and Gruetter 2012a).To allow estimating LC, non-measured parameters were
taken from the literature. Since they apply to calculations inboth MRSI and PET data, such assumptions are devoid ofsubstantial effects on the calculated LC values. Namely, thevolume of distribution of glucose in the brain was assumed tobe equal to brain water content (Lund-Andersen 1979) and avalue for fractional blood volume was taken from synchro-tron radiation CT data (Adam et al. 2003). It is also implicitin the present analysis that glucose homeostasis is identical inMRSI and PET experiments, i.e. that glucose transport andconsumption are invariable within the range of plasma
glucose concentrations of this study, and are not substantiallyaffected by the presence of FDG in tracer amounts. Indeed,variations in glucose transport and phosphorylation rateswere negligible in the mouse brain within the glycaemiarange of the present experiments (Alf et al. 2013b). Incontrast, assumptions that may affect either MRSI or PETdata independently are discussed below.The present FDG-PET data were analysed with two model
variants assuming reversible and irreversible phosphoryla-tion. They yielded similar results (within the reported SD).The difference in LCisoflurane was at most 12% (somatosen-sory cortex). An earlier study in conscious rats using 14C-DGfound that the inclusion of k4 in the CMRglc calculation maylead to a 44% overestimation of CMRglc (Schmidt et al.1995). Such overestimation of CMRglc was not observed inour study under isoflurane. The contrast between the twostudies may arise from the effects of isoflurane in theregulation of brain glucose homeostasis, which are notpresent in awake animals, as well as from the employment ofdifferent glucose analogs (14C-DG vs. FDG).
Estimation of Kt and Tmax/CMRglc from MRSI dataThe apparent half-saturation constant for glucose transportinto brain parenchyma (Kt) was 2.1 � 0.6 mmol/L, inagreement with our earlier work using the reversibleMichaelis–Menten kinetics for glucose carriers (Duarte andGruetter 2012a). This is, however, a parameter that variesconsiderably in the literature as it depends on the kineticmodel attributed to the glucose carrier at the blood–brainbarrier. The employment of the reversible Michaelis–Mentenkinetics to describe glucose transport at the blood–brainbarrier resulted in a Kt lower than that determined using thestandard Michaelis–Menten model in earlier studies (com-parison in Duarte and Gruetter 2012b). In this study, Kt wasdetermined with data pooled from all analysed voxels toachieve higher precision and then constrained for thedetermination of Tmax/CMRglc in a voxel-wise manner. WithKt fixed at 2.1 mmol/L for all brain regions, we measuredhigher Tmax/CMRglc in cortical tissue, especially in theretrosplenial cortex (Fig. 2e), which may be partly owing topial vessels contributing to a higher fractional blood volumein this region, compared to the underlying tissue (Chughet al. 2009). Although voxels of the sinus were not includedin the analysis, partial volume effects causing signal spillover would lead to overestimation of Tmax/CMRglc and thusLCisoflurane. This artefact may be considered negligible as,slightly higher Tmax/CMRglc was indeed found in the ratcortex (Lei et al. 2010) compared to the hippocampus(Duarte et al. 2009a), and CMRglc is generally lower in thecortex than hippocampus (Table 1).Although the physiological variation of Kt within the
analysed brain regions cannot be excluded, simulations of theeffect of Kt on Tmax/CMRglc and thus on LC estimation(Fig. 3a) indicated that variations of 50% in the value of Kt
© 2014 International Society for Neurochemistry, J. Neurochem. (2014) 129, 672--682
678 M. F. Alf et al.

resulted in changes in the LCisoflurane (and Tmax/CMRglc)smaller than 6%. An increase in LCisoflurane of 11% wasfound when doubling the value of Kt to 4.2 mmol/L, which ishigher than any estimation with the reversible Michaelis–Menten model of glucose carriers across different species(Duarte and Gruetter 2012b).
Rate constants and Tmax from FDG-PET data
Kt in the rat brain in vivo determined from MRSI data wasmuch lower than plasma glucose in the animals used for PETexperiments. As such, we assumed that glucose transport(Tglc) estimated from K1 is close to Tmax. The values for Tmax
obtained in this manner (105–152 lmol/min/100 g) wereclose to the Tmax of 137 lmol/min/100 g obtained for the ratbrain (cortex+hippocampus) in a 1H MRS study undersimilar anaesthesia protocol (Duarte and Gruetter 2012a) andin line with LC-independent measurements of Tmax underdifferent experimental conditions, ranging from 91 to135 lmol/min/100 g (Duarte et al. 2011; Du et al. 2012).As this assumption may result in underestimating Tmax fromPET data, we simulated the effect of Tmax on LCisoflurane
(Fig. 3b), which indicated that a 20% increase in Tmax
estimated from PET experiments (relative to values onTable 2) would result in 17–18% decrease in LCisoflurane inthe four regions of interest analysed.Furthermore, sinceK1 for glucose (K1,glc)was notmeasured,
the estimation of Tmax from PET data relied on previousdeterminations of the coefficient of transport rate constantsK1,FDG/K1,glc that was 1.66 for adult rats at a glycaemia of9–10 mM (Crane et al. 1983; Fuglsang et al. 1986), notsubstantially different from the present FDG-PET study(10.8 � 0.5 mmol/L). The value of K1,FDG/K1,glc used in thisstudy seems to be appropriate as it draws upon two indepen-dently achieved results from the literature that differ < 2%from each other, and also K1 remains unchanged relative toawake rats in vivo (Mizuma et al. 2010). Nevertheless, careshould be taken when extrapolating the present data to otherexperimental conditions where K1,FDG/K1,glc may vary, as itwas shown for newborn rats (increase of~16%; Fuglsang et al.1986). In humans, K1,FDG/K1,glc was 1.48 and did not changeunder hypo- or hyperglycaemia (Hasselbalch et al. 1996).Simulations with the data from our study indicated that
variations of K1,FDG/K1,glc have a proportional effect on theestimated LC. For the sake of example, a variation of 10% inK1,FDG/K1,glc in the somatosensory cortex (between 1.49 and1.83) resulted in LC to vary between 0.33 and 0.41 (modelincluding or not k4), which is within the associated variance(Fig. 3c).Based on previous work measuring brain glucose concen-
trations in a vast range of experimental conditions with bothmicrodialysis and MRS methods (reviewed in Barros et al.2007; Duarte and Gruetter 2012b), we consider that Gbrain asassessed with MRSI reflects its true value in the presentwork. Thus, with the measured values of Gbrain by MRSI andthe calculated CMRglc, one can estimate a coefficient ofphosphorylation rate constants k3;FDG
k3;glc , as defined by Craneet al. (1983), using an expression similar to eqn 1:
CMRglc ¼ k3;FDGk3;glck3;FDG
Gbrain � 1:04 g/mL ð8Þ
This analysis resulted in k3;FDGk3;glc
ranging from 0.17 to 0.23across the four regions of interest. This is lower than thecoefficient obtained in other studies in rats with FDG(0.50–0.55; Crane et al. 1983; Fuglsang et al. 1986) or
0 1 2 3 4 5
1.6
2.0
2.4
0.30
0.35
0.40
0.45
Kt (mM)
T max
/CM
Rgl
c
LCis
oflu
rane
LCis
oflu
rane
LCis
oflu
rane
Tmax/CMRglc
LCisoflurane
1.2 1.6 2.0 2.4
0.1
0.3
0.5
0.7
K1,FDG/K1,glc K1,FDG/K1,glc
1.2 1.6 2.0 2.4
RS-CTXSS-CTX
HIPTHA
(a)
(c)
80 140 200 260
RS-CTXSS-CTXHIPTHA
80 140 200 260
0.1
0.3
0.5
0.7
Tmax (µmol/min/100 g) Tmax (µmol/min/100 g)
(b)
Fig. 3 (a) Simulation of the effect of Kt on the determination ofTmax/CMRglc from magnetic resonance spectroscopic imaging (MRSI)data and, consequently, on the estimation of LCisoflurane, using18F-fluoro-deoxyglucose (FDG)-PET rate constants averaged across
the four brain regions (model including k4). The experimentallydetermined Kt = 2.1 mM is represented by the dashed line. (b) Effectof Tmax estimated from FDG-PET data on LCisoflurane. The shaded area
represents the values of Tmax obtained experimentally in this study forthe regions of interest. (c) Effect of varying K1,FDG/K1,glc on thedetermination of Tmax/CMRglc and/or LCisoflurane. The dashed vertical
line represents the value assumed for LC estimation. Regions ofinterest are as follows: RS-CTX, retrosplenial cortex; SS-CTX, soma-tosenory cortex; HIP, hippocampus; THA, thalamus. On panels (b) and
(c), right and left graphs are simulations with FDG-PET rate constantsin models with and without k4, respectively.
© 2014 International Society for Neurochemistry, J. Neurochem. (2014) 129, 672--682
MRS glucose mapping and PET joining forces 679

deoxyglucose (0.37; Cunningham and Cremer 1981), inagreement with the lower LC values determined in this study.In this context, it should be noted that isoflurane substantiallydecreases k3 itself relative to the awake state in the mousebrain (Mizuma et al. 2010).Despite the mentioned shortcomings, our approach repre-
sents a solid basis compared to strategies that rely onadditional assumptions included in operational definitionsand/or hexokinase affinities or single rate constants from theliterature. We therefore argue that the explanation of why ourLCisoflurane is lower than in previous reports is likely to befound in these additional assumptions.
Physiological effects of isofluraneIn this study, we report LC values that may not be applicable toexperiments under anaesthesia protocols other than the widelyused isoflurane. Isoflurane influences brain and peripheralmetabolism, particularly increasing brain and plasma lactateand glucose levels (Saha et al. 2005; Duarte and Gruetter2012a; Boretius et al. 2013). These did not vary during thetime frame of the present PET andMRSImeasurements. Asweuse a glycaemic clamp to control for plasma glucose after thefirst half of theMRSI session, we do not expect the influence ofisoflurane on plasma glucose to be of importance. AlthoughCMRglc has been found to be similar in the rat brain undera-chloralose and isoflurane anaesthesia (Duarte et al. 2011;Duarte and Gruetter 2012a), that are characterized by distinctplasma and brain lactate levels, influence of lactate on otherbrain metabolic processes would benefit from further research.Another effect of isoflurane anaesthesia is that it makesCMRglc
more uniform across the brain than it is in the awake state, asdiscussed previously (Toyama et al. 2004) and as visible in ourdata. This does not prohibit its use in most experimentalprotocols, as long as it is kept in mind. However, in addition tothe above-mentioned effects, it further precludes our resultsfrom being transferable to experiments with other types ofanaesthesia or in the awake state.
Experimental limitationsIn MRSI, slight differences were observed between the leftand right hemispheres. These are probably owing to partialvolume effects, a generalized problem in MR imaging andparticularly in MRSI (discussed in Alf et al. 2012). The realvoxel size of the glucose maps (1.4 lL) is relatively largecompared to the size of brain structures, resulting in voxelsthat are weighted averages of spectra containing differentbrain structures. This kind of image artefacts could bereduced by developing MRSI methods with higher spatialresolution, but with loss in the signal-to-noise ratio within thesame acquisition time, which is important when quantifyinglow concentrated metabolites like glucose.It should also be noted that distinct animals were used for
the MRSI and PET experiments, although strain and housingconditions were identical, thus minimizing metabolic and
physiological variations. The rats were 7 and 8 weeks old forPET and MRSI, respectively, and this age difference has notbeen demonstrated to have an effect on brain energymetabolism, to our knowledge. Nevertheless, more reliableestimations of LC can be envisaged by employment of newlydeveloped instruments that combine both imaging methods(Torigian et al. 2013) for simultaneous FDG-PET anddynamic 13C MRS with infusion of 13C-enriched glucoseas the latter provides independent measures of Tmax, CMRglc
and Kt (Duarte et al. 2011).
Conclusion
This study reports region-specific values for the FDG LC inthe rat brain under isoflurane anaesthesia that wereestimated with as few assumptions as possible. Our resultssuggest that the ratio of the affinities of hexokinase forglucose and FDG may be decreased under isofluranecompared to the awake state or, possibly, under otheranaesthetic agents, which could explain why previousattempts to determine the LC have not resulted in itscorrect assessment. These region-specific LC values maycontribute to a better comparability of quantitative assess-ments of cerebral energy metabolism using FDG-PET.
Acknowledgments and conflict of interestdisclosure
This work was supported (MFA) by the Swiss National CompetenceCenter for Biomedical Imaging (NCCBI). JMND, VM and RG werefunded by the Centre d’Imagerie BioM�edicale (CIBM) of the UNIL,UNIGE, HUG, CHUV, EPFL and the Leenaards and JeantetFoundations.
All experiments were conducted in compliance with the ARRIVEguidelines. The authors have no conflict of interest to declare.
References
Adam J. F., Elleaume H., Le Duc G., Corde S., Charvet A. M., Tropr�esI., Le Bas J. F. and Est�eve F. (2003) Absolute cerebral bloodvolume and blood flow measurements based on synchrotronradiation quantitative computed tomography. J. Cereb. Blood FlowMetab. 23, 499–512.
Alf M. F., Lei H., Berthet C., Hirt L., Gruetter R. and Mlyn�arik V.(2012) High-resolution spatial mapping of changes in theneurochemical profile after focal ischemia in mice. NMRBiomed. 25, 247–254.
Alf M. F., Wyss M. T., Weber B., Buck A., Schibli R. and Kr€amer S. D.(2013a) Quantification of brain glucose metabolism by FDG PETwith real-time arterial and image-derived input function in mice.J. Nucl. Med. 54, 132–138.
Alf M. F., Duarte J. M. N., Schibli R., Gruetter R. and Kr€amer S. D.(2013b) Brain glucose transport and phosphorylation under acuteinsulin-induced hypoglycemia in mice: an FDG PET study.J. Nucl. Med. 54, 2153–2160.
Archer D. P., Elphinstone M. G. and Pappius H. M. (1990) The effectof pentobarbital and isoflurane on glucose metabolism in
© 2014 International Society for Neurochemistry, J. Neurochem. (2014) 129, 672--682
680 M. F. Alf et al.
thermally injured rat brain. J. Cereb. Blood Flow Metab. 10,624–630.
Backes H., Walberer M., Endepols H., Neumaier B., Graf R.,Wienhard K. and Mies G. (2011) Whiskers area as extracerebralreference tissue for quantification of rat brain metabolism using18F-FDG PET: application to focal cerebral ischemia. J. Nucl.Med. 52, 1252–1260.
Barros L. F., Bittner C. X., Loaiza A. and Porras O. H. (2007) Aquantitative overview of glucose dynamics in the gliovascular unit.Glia 55, 1222–1237.
Barter L., Dominguez C. L., Carstens E. and Antognini J. F. (2005) Theeffect of isoflurane and halothane on electronencephalographicactivation elicited by repetitive noxious c-fiber stimulation.Neurosci. Letters 3, 242–247.
Boretius S., Tammer R., Michaelis T., Brockm€oller J. and Frahm J.(2013) Halogenated volatile anesthetics alter brain metabolism asrevealed by proton magnetic resonance spectroscopy of mice invivo. NeuroImage 69, 244–255.
Brooks R. A. (1982) Alternative formula for glucose utilization usinglabeled deoxyglucose. J. Nucl. Med. 23, 538–539.
Chugh B. P., Lerch J. P., Yu L. X., Pienkowski M., Harrison R. V.,Henkelman R. M. and Sled J. G. (2009) Measurement of cerebralblood volume in mouse brain regions using micro-computedtomography. NeuroImage 47, 1312–1318.
Crane P. D., Braun L. D., Cornford E. M., Cremer J. E., Glass J. M.and Oldendorf W. H. (1978) Dose dependent reduction ofglucose utilization by pentobarbital in rat brain. Stroke 9, 12–18.
Crane P. D., Pardridge W. M., Braun L. D. and Oldendorf W. H. (1983)Kinetics of transport and phosphorylation of 2-fluoro-2-deoxy-D-glucose in rat brain. J. Neurochem. 40, 160–167.
Cunningham V. J. and Cremer J. E. (1981) A method for thesimultaneous estimation of regional rates of glucose influx andphosphorylation in rat brain using radiolabeled 2-deoxyglucose.Brain Res. 221, 319–330.
Du F., Zhang Y., Zhu X. H. and Chen W. (2012) Simultaneousmeasurement of glucose blood-brain transport constants andmetabolic rate in rat brain using in-vivo 1H MRS. J. Cereb.Blood Flow Metab. 32, 1778–1787.
DuarteJ.M.N.andGruetterR. (2012a)Characterizationofcerebralglucosedynamics in vivowith a four-state conformational model of transportat the blood-brain barrier. J. Neurochem. 121, 396–406.
Duarte J. M. N. and Gruetter R. (2012b) in neural metabolism in vivo, inCerebral Glucose Transport and Homeostasis (Choi I.-Y. andGruetter R., eds), pp. 655–673. Springer, New York.
Duarte J. M. N., Carvalho R. A., Cunha R. A. and Gruetter R. (2009a)Caffeine consumption attenuates neurochemical modifications inthe hippocampus of streptozotocin-induced diabetic rats.J. Neurochem. 111, 368–379.
Duarte J. M. N., Morgenthaler F. D., Lei H., Poitry-Yamate C. andGruetter R. (2009b) Steady-state brain glucose transport kineticsre-evaluated with a four-state conformational model. Front.Neuroenergetics 1, 6.
Duarte J. M. N., Lanz B. and Gruetter R. (2011) Compartmentalisedcerebral metabolism of [1,6-13C]glucose determined by in vivo 13CNMR spectroscopy at 14.1 T. Front. Neuroenergetics 3, 3
Fuglsang A., Lomholt M. and Gjedde A. (1986) Blood-brain transfer ofglucose and glucose analogs in newborn rats. J. Neurochem. 46,1417–1428.
Gruetter R., Novotny E. J., Boulware S. D., Rothman D. L. and ShulmanR. G. (1996) 1H NMR studies of glucose transport in the humanbrain. J. Cereb. Blood Flow Metab. 16, 427–438.
Gruetter R., Ugurbil K. and Seaquist E. R. (1998) Steady-state cerebralglucose concentrations and transport in the human brain. J.Neurochem. 70, 397–408.
Hansen T. D., Warner D. S., Todd M. M. and Vust L. J. (1989) The roleof cerebral metabolism in determining the local cerebral blood floweffects of volatile anesthetics: evidence for persistent flow-metabolism coupling. J. Cereb. Blood Flow Metab. 9, 323–328.
Hasselbalch S. G., Knudsen G. M., Holm S., Hageman L. P., Capaldo B.and Paulson O. B. (1996) Transport of D-glucose and2-fluorodeoxyglucose across the blood-brain barrier in humans.J. Cereb. Blood Flow Metab. 16, 659–666.
Hellwig S., Amtage F., Kreft A. et al. (2012) [18F]FDG-PET is superiorto [123I]IBZM-SPECT for the differential diagnosis ofparkinsonism. Neurology 79, 1314–1322.
Hennig J. (1988) Multiecho imaging sequences with low refocusing flipangles. J. Magn. Reson. 78, 397–407.
Hyder F. and Rothman D. L. (2012) Quantitative fMRI and oxidativeneuroenergetics. NeuroImage 62, 985–994.
Keyes J. W., Jr (1995) SUV: standard uptake or silly useless value?J. Nucl. Med. 36, 1836–1839.
Kreissl M. C., Stout D. B., Wong K. P. et al. (2011) Influence of dietarystate and insulin on myocardial, skeletal muscle and brain [18F]-fluorodeoxyglucose kinetics in mice. EJNMMI Res. 1, 8.
Krohn K. A., Muzi M. and Spence A. M. (2007) What is in anumber? The FDG lumped constant in the rat brain. J. Nucl.Med. 48, 5–7.
K€uhn B., Dreher W., Norris D. G. and Leibfritz D. (1996) Fast protonspectroscopic imaging employing k-space weighting achieved byvariable repetition times. Magn. Reson. Med. 35, 457–464.
Lei H., Duarte J. M. N., Mlynarik V., Python A. and Gruetter R. (2010)Deep thiopental anesthesia alters steady-state glucose homeostasisbut not the neurochemical profile of rat cortex. J. Neurosci. Res.88, 413–419.
Liu Y. R., Cardamone L., Hogan R. E. et al. (2010) Progressive metabolicand structural cerebral perturbations after traumatic brain injury: Anin vivo imaging study in the rat. J. Nucl. Med. 51, 1788–1795.
Lund-Andersen H. (1979) Transport of glucose from blood to brain.Physiol. Rev. 59, 305–352.
Mizuma H., Shukuri M., Hayashi T., Watanabe Y. and Onoe H. (2010)Establishment of in vivo brain imaging method in conscious mice.J. Nucl. Med. 51, 1068–1075.
Mlyn�arik V., Kohler I., Gambarota G., Vaslin A., Clarke P. G. andGruetter R. (2008) Quantitative proton spectroscopic imaging ofthe neurochemical profile in rat brain with microliter resolution atultra-short echo times. Magn. Reson. Med. 59, 52–58.
Moore A. H., Osteen C. L., Chatziioannou A. F., Hovda D. A. andCherry S. R. (2000) Quantitative assessment of longitudinalmetabolic changes in vivo after traumatic brain injury in theadult rat. J. Cereb. Blood Flow Metab. 20, 1492–1501.
Saha J. K., Xia J., Grondin J. M., Engle S. K. and Jakubowski J. A.(2005) Acute hyperglycemia induced by ketamine/xylazineanaesthesia in rats: mechanisms and implications for preclinicalmodels. Exp. Biol. Med. (Maywood) 230, 777–784.
Sakabe T., Tsutsui T., Maekawa T., Ishikawa T. and Takeshita H. (1985)Local cerebral glucose utilization during nitrous oxide andpentobarbital anaesthesia in rats. Anesthesiology 63, 262–266.
Scheef L., Spottke A., Daerr M. et al. (2012) Glucose metabolism, graymatter structure, and memory decline in subjective memoryimpairment. Neurology 79, 1332–1339.
Schmidt K. C., Mies G., Dienel G. A., Cruz N. F., Crane A. M. andSokoloff L. (1995) Analysis of time courses of metabolicprecursors and products in heterogeneous rat brain tissue:limitations of kinetic modeling for predictions ofintracompartmental concentrations from total tissue activity.J. Cereb. Blood Flow Metab. 15, 474–484.
Shestov A. A., Emir U. E., Kumar A., Henry P. G., Seaquist E. R. andOz G. (2011) Simultaneous measurement of glucose transport and
© 2014 International Society for Neurochemistry, J. Neurochem. (2014) 129, 672--682
MRS glucose mapping and PET joining forces 681

utilization in the human brain. Am. J. Physiol. Endocrinol. Metab.301, E1040–E1049.
Shimoji K., Ravasi L., Schmidt K., Soto-Montenegro M. L., Esaki T.,Seidel J., Jagoda E., Sokoloff L., Green M. V. and Eckelman W. C.(2004) Measurement of cerebral glucose metabolic rates in theanesthetized rat by dynamic scanning with 18F-FDG, the ATLASsmall animal PET scanner, and arterial blood sampling. J. Nucl.Med. 45, 665–672.
Sibson N. R., Dhankhar A., Mason G. F., Rothman D. L., Behar K. L.and Shulman R. G. (1998) Stoichiometric coupling of brainglucose metabolism and glutamatergic neuronal activity. Proc. NatlAcad. Sci. USA 95, 316–321.
Sokoloff L., Reivich M., Kennedy C., Des Rosiers M. H., Patlak C. S.,Pettigrew K. D., Sakurada O. and Shinohara M. (1977) The [14C]Deoxyglucose method for the measurement of local cerebralglucose utilization: theory, procedure, and normal values in theconscious and anesthetized albino rat. J. Neurochem. 28,897–916.
Takuwa H., Matsuura T., Obata T., Kawaguchi H., Kanno I. and Ito H.(2012) Hemodynamic changes during somatosensory stimulation
in awake and isoflurane-anesthetized mice measured by laser-Doppler flowmetry. Brain Res. 1472, 107–112.
Tokugawa J., Ravasi L., Nakayama T., Schmidt K. C. and Sokoloff L.(2007) Operational lumped constant for FDG in normal adult malerats. J. Nucl. Med. 48, 94–99.
Torigian D. A., Zaidi H., Kwee T. C., Saboury B., Udupa J. K.,Cho Z. H. and Alavi A. (2013) PET/MR imaging: technicalaspects and potential clinical applications. Radiology 267,26–44.
Toyama H., Ichise M., Liow J. S. et al. (2004) Absolute quantification ofregional cerebral glucose utilization in mice by 18F-FDG smallanimal PET scanning and 2-14C-DG autoradiography. J. Nucl.Med. 45, 1398–1405.
Weber B., Burger C., Biro P. and Buck A. (2002) A femoralarteriovenous shunt facilitates arterial whole blood sampling inanimals. Eur. J. Nucl. Med. Mol. Imaging. 29, 319–323.
Yu A. S., Lin H. D., Huang S. C., Phelps M. E. and Wu H. M.(2009) Quantification of cerebral glucose metabolic rate in miceusing 18F-FDG and small-animal PET. J. Nucl. Med. 50,966–973.
© 2014 International Society for Neurochemistry, J. Neurochem. (2014) 129, 672--682
682 M. F. Alf et al.
Copyright © 2022 FDOKUMEN