MRI-derived measurements of human subcortical, ventricular and intracranial brain volumes:...
16
MRI-derived measurements of human subcortical, ventricular and intracranial brain volumes: Reliability effects of scan sessions, acquisition sequences, data analyses, scanner upgrade, scanner vendors and field strengths Jorge Jovicich a, ⁎, Silvester Czanner b , Xiao Han c , David Salat d,e , Andre van der Kouwe d,e , Brian Quinn d,e , Jenni Pacheco d,e , Marilyn Albert h , Ronald Killiany i , Deborah Blacker g , Paul Maguire j , Diana Rosas d,e,f , Nikos Makris d,e,k , Randy Gollub d,e , Anders Dale l , Bradford C. Dickerson d,f,g,m, 1 , Bruce Fischl d,e,n, 1 a Center for Mind–Brain Sciences, Department of Cognitive and Education Sciences, University of Trento, Italy b Warwick Manufacturing Group, School of Engineering, University of Warwick, UK c CMS, Inc., St. Louis, MO, USA d Athinoula A. Martinos Center for Biomedical Imaging, USA e Department of Radiology, Massachusetts General Hospital and Harvard Medical School, Boston, MA, USA f Department of Neurology, Massachusetts General Hospital and Harvard Medical School, Boston, MA, USA g Gerontology Research Unit, Department of Psychiatry, Massachusetts General Hospital and Harvard Medical School, Boston, MA, USA h Department of Neurology, Johns Hopkins University School of Medicine, USA i Department of Anatomy and Neurobiology, Boston University School of Medicine, USA j Pfizer Global Research and Development, Groton, CT, USA k Center for Morphometric Analysis, Massachusetts General Hospital, Boston, MA, USA l University of California San Diego, CA, USA m Division of Cognitive and Behavioral Neurology, Department of Neurology, Brigham and Women's Hospital, Boston, MA, USA n CSAIL/HST, MIT, Cambridge, MA, USA abstract article info Article history: Received 19 August 2008 Revised 22 January 2009 Accepted 7 February 2009 Available online 20 February 2009 Keywords: Subcortical brain volumes Reproducibility Reliability Structural MRI Cerebral cortex Morphology Automated MRI-derived measurements of in-vivo human brain volumes provide novel insights into normal and abnormal neuroanatomy, but little is known about measurement reliability. Here we assess the impact of image acquisition variables (scan session, MRI sequence, scanner upgrade, vendor and field strengths), FreeSurfer segmentation pre-processing variables (image averaging, B1 field inhomogeneity correction) and segmentation analysis variables (probabilistic atlas) on resultant image segmentation volumes from older (n =15, mean age 69.5) and younger (both n =5, mean ages 34 and 36.5) healthy subjects. The variability between hippocampal, thalamic, caudate, putamen, lateral ventricular and total intracranial volume measures across sessions on the same scanner on different days is less than 4.3% for the older group and less than 2.3% for the younger group. Within-scanner measurements are remarkably reliable across scan sessions, being minimally affected by averaging of multiple acquisitions, B1 correction, acquisition sequence (MPRAGE vs. multi-echo-FLASH), major scanner upgrades (Sonata–Avanto, Trio–TrioTIM), and segmentation atlas (MPRAGE or multi-echo-FLASH). Volume measurements across platforms (Siemens Sonata vs. GE Signa) and field strengths (1.5 T vs. 3 T) result in a volume difference bias but with a comparable variance as that measured within-scanner, implying that multi-site studies may not necessarily require a much larger sample to detect a specific effect. These results suggest that volumes derived from automated segmentation of T1-weighted structural images are reliable measures within the same scanner platform, even after upgrades; however, combining data across platform and across field-strength introduces a bias that should be considered in the design of multi-site studies, such as clinical drug trials. The results derived from the young groups (scanner upgrade effects and B1 inhomogeneity correction effects) should be considered as preliminary and in need for further validation with a larger dataset. © 2009 Elsevier Inc. All rights reserved. Introduction Techniques that enable the in vivo MRI-derived quantitative characterization of the human brain, such as subcortical brain volumes (including for this purpose the archicortical hippocampal formation and the ventricular system), are beginning to demonstrate NeuroImage 46 (2009) 177–192 ⁎ Corresponding author. Fax: +39 0461 88 3066. E-mail address: [email protected] (J. Jovicich). 1 Authors contributed equally to this work. 1053-8119/$ – see front matter © 2009 Elsevier Inc. All rights reserved. doi:10.1016/j.neuroimage.2009.02.010 Contents lists available at ScienceDirect NeuroImage journal homepage: www.elsevier.com/locate/ynimg
Transcript of MRI-derived measurements of human subcortical, ventricular and intracranial brain volumes:...

NeuroImage 46 (2009) 177–192
Contents lists available at ScienceDirect
NeuroImage
j ourna l homepage: www.e lsev ie r.com/ locate /yn img
MRI-derived measurements of human subcortical, ventricular and intracranial brainvolumes: Reliability effects of scan sessions, acquisition sequences, data analyses,scanner upgrade, scanner vendors and field strengths
Jorge Jovicich a,⁎, Silvester Czanner b, Xiao Han c, David Salat d,e, Andre van der Kouwe d,e, Brian Quinn d,e,Jenni Pacheco d,e, Marilyn Albert h, Ronald Killiany i, Deborah Blacker g, Paul Maguire j, Diana Rosas d,e,f,Nikos Makris d,e,k, Randy Gollub d,e, Anders Dale l, Bradford C. Dickerson d,f,g,m,1, Bruce Fischl d,e,n,1
a Center for Mind–Brain Sciences, Department of Cognitive and Education Sciences, University of Trento, Italyb Warwick Manufacturing Group, School of Engineering, University of Warwick, UKc CMS, Inc., St. Louis, MO, USAd Athinoula A. Martinos Center for Biomedical Imaging, USAe Department of Radiology, Massachusetts General Hospital and Harvard Medical School, Boston, MA, USAf Department of Neurology, Massachusetts General Hospital and Harvard Medical School, Boston, MA, USAg Gerontology Research Unit, Department of Psychiatry, Massachusetts General Hospital and Harvard Medical School, Boston, MA, USAh Department of Neurology, Johns Hopkins University School of Medicine, USAi Department of Anatomy and Neurobiology, Boston University School of Medicine, USAj Pfizer Global Research and Development, Groton, CT, USAk Center for Morphometric Analysis, Massachusetts General Hospital, Boston, MA, USAl University of California San Diego, CA, USAm Division of Cognitive and Behavioral Neurology, Department of Neurology, Brigham and Women's Hospital, Boston, MA, USAn CSAIL/HST, MIT, Cambridge, MA, USA
⁎ Corresponding author. Fax: +39 0461 88 3066.E-mail address: [email protected] (J. Jovicich).
1 Authors contributed equally to this work.
1053-8119/$ – see front matter © 2009 Elsevier Inc. Aldoi:10.1016/j.neuroimage.2009.02.010
a b s t r a c t
a r t i c l e i n f oArticle history:
Automated MRI-derived me Received 19 August 2008Revised 22 January 2009Accepted 7 February 2009Available online 20 February 2009Keywords:Subcortical brain volumesReproducibilityReliabilityStructural MRICerebral cortexMorphology
asurements of in-vivo human brain volumes provide novel insights into normaland abnormal neuroanatomy, but little is known about measurement reliability. Here we assess the impact ofimage acquisition variables (scan session, MRI sequence, scanner upgrade, vendor and field strengths),FreeSurfer segmentation pre-processing variables (image averaging, B1 field inhomogeneity correction) andsegmentation analysis variables (probabilistic atlas) on resultant image segmentation volumes from older(n=15, mean age 69.5) and younger (both n=5, mean ages 34 and 36.5) healthy subjects. The variabilitybetween hippocampal, thalamic, caudate, putamen, lateral ventricular and total intracranial volumemeasures across sessions on the same scanner on different days is less than 4.3% for the older group andless than 2.3% for the younger group. Within-scanner measurements are remarkably reliable across scansessions, being minimally affected by averaging of multiple acquisitions, B1 correction, acquisition sequence(MPRAGE vs. multi-echo-FLASH), major scanner upgrades (Sonata–Avanto, Trio–TrioTIM), and segmentationatlas (MPRAGE or multi-echo-FLASH). Volume measurements across platforms (Siemens Sonata vs. GESigna) and field strengths (1.5 T vs. 3 T) result in a volume difference bias but with a comparable variance asthat measured within-scanner, implying that multi-site studies may not necessarily require a much largersample to detect a specific effect. These results suggest that volumes derived from automated segmentationof T1-weighted structural images are reliable measures within the same scanner platform, even afterupgrades; however, combining data across platform and across field-strength introduces a bias that shouldbe considered in the design of multi-site studies, such as clinical drug trials. The results derived from theyoung groups (scanner upgrade effects and B1 inhomogeneity correction effects) should be considered aspreliminary and in need for further validation with a larger dataset.
© 2009 Elsevier Inc. All rights reserved.
l rights reserved.
Introduction
Techniques that enable the in vivo MRI-derived quantitativecharacterization of the human brain, such as subcortical brainvolumes (including for this purpose the archicortical hippocampalformation and the ventricular system), are beginning to demonstrate

178 J. Jovicich et al. / NeuroImage 46 (2009) 177–192
important potential applications in basic and clinical neuroscience.Alterations in subcortical brain volumes are manifested in normalaging (Mueller et al., 2007; Jack et al., 2005; Szentkuti et al., 2004),Alzheimer's disease (Kantarci and Jack, 2004; Anstey and Maller,2003), Huntington's disease (Douaud et al., 2006; Peinemann et al.,2005, Kipps et al., 2005; Kassubek et al., 2005; Kassube et al., 2004;Rosas et al., 2003; Thieben et al., 2002), and schizophrenia (Makris etal., 2006; Koo et al., 2006; Kuroki et al.; 2006, Shenton et al., 2001).Cross-sectional and longitudinal imaging-based biomarkers of diseasewill likely be of great utility in better understanding brain disordersand in evaluating therapeutic efficacy (Dickerson and Sperling, 2005;DeKosky and Marek, 2003).
The accurate and reliable measurement of subcortical brainvolumes from MRI data is a non-trivial task. Manual measurementsare difficult and time consuming. It can take a trained anatomistseveral days tomanually label a single high-resolution set of structuralMR brain images. In addition, manual measurements are susceptibleto rater bias. To facilitate efficient, operator-independent subcorticalregion-of-interest (ROI) quantification, several automated and semi-automated algorithms have been proposed, including atlas-basedmethods (Haller et al., 1997; Collins et al., 1999, Fischl et al., 2002;Magnotta et al., 2002; Fischl et al., 2004; Alemán-Gómez et al., 2007),voxel-based morphometry using Statistical Parametric Mapping(Ashburner and Friston, 2000), tensor-based morphometry (Stud-holme et al., 2001; Leow et al., 2005) and boundary shift integralmethods (Smith et al., 2002a,b; Camara et al., 2007; Barnes et al.,2007; Anderson et al., 2007).
Although the accuracy validation of automated segmentationmethods has been performed against regional manual measurementsderived from both in vivo and post-mortem brain scans (Fischl andDale, 2000, Fischl et al., 2002), the influence of image acquisition anddata analyses parameters on the reliability of the derived measureshas received relatively little systematic investigation (Leow et al.,2006; Ewers et al., 2006, Smith et al., 2002a,b). Furthermore, themeasurement of reliability also provides a means for assessing theimpact of measurement error on sample size requirements. Definingthe reliability of subcortical morphometric methods is thereforeimportant.
Reliability in MRI-derived automated morphometric measures canbe influenced by several sources of variance, including subject-relatedfactors, such as hydration status (Walters et al., 2001), instrument-related factors, such as field strength, scanner manufacturer, imagingmagnetic gradients (Jovicich et al., 2006), pulse sequence, and dataprocessing-related factors, including not only software package andversion but also the parameters chosen for analysis (Senjem et al.,2005; Han et al., 2006). All of these factors may affect the ability todetect morphometric differences between groups in typical cross-sectional studies (e.g., morphometric differences between two subjectgroups, where each subject is scanned once and all subjects arescanned on the same scanner). Longitudinal studies of normaldevelopment, aging, or disease progression face additional challengesassociated with both subject-related factors as well as instrument-related factors (e.g., major scanner upgrades, across-session systeminstabilities). For studies that combine data acquired from multiplesites it is critical to understand and adjust for instrument-relateddifferences between sites, such as scanner manufacturer, fieldstrength, and other hardware components. Thus, detailed quantitativedata regarding the degree to which each of the factors outlined abovecontributes to variability in morphometric measures would be helpfulfor both study design and interpretation. Recent publications discusssuch studies with regard to the reproducibility of cortical thicknessmeasures (Han et al., 2006) and tensor based-morphometry (Leowet al., 2006).
The goal of the present study is to extend the work from Han et al.(2006) by adding a new dataset and focusing the analysis on theevaluation of the test–retest reliability of subcortical volume mea-
surements (as opposed to cortical thickness reproducibility) in thecontext of mapping brain morphometry changes using the FreeSurfersoftware package, which is an automated method for full brainsegmentation (Fischl et al., 2002, 2004). To keep a manageablenumber of variables this study uses a constant segmentation method(FreeSurfer). Comparisons with other subcortical volume measure-mentmethods have been recently reported (Pengas et al., 2009; Tae etal., 2009) and are beyond the scope of this work. We study a group of15 older healthy subjects (older than 65, Han et al., 2006) to assessanatomic variability related to atrophy and age-related MRI signalchanges. Each subject was scanned four times (twice in a SiemensSonata 1.5 T, once in a GE Signa 1.5 T and once in a Siemens Trio 3 T)using the same protocol in separate sessions within a time period of2 weeks, to include both subject hydration and scanner variabilityeffects. We also study two smaller groups of 5 young subjects (meanages 34 and 36.5) to investigate reproducibility effects across majorscanner upgrades (Siemens Sonata to Avanto, Han et al. (2006) andSiemens Trio to Tim Trio, new dataset), with two separate acquisitionsbefore and after the upgrade. Each dataset is treated independently toderive the volume of various brain structures (hippocampus,thalamus, caudate, putamen, pallidum, amygdala, lateral ventricles,inferior lateral ventricles, intracranial), which for summary purposeswill be referred to as ‘subcortical structures’ when not definedexplicitly. We study how subcortical volume reproducibility dependson MRI acquisition sequences, scanner upgrade, data pre-processing,segmentation analyses methods, MRI system vendor and fieldstrength.
Materials and methods
MRI data acquisition and subject groups
We acquired and analyzed three datasets to characterize howreliability of subcortical volume estimation is affected by variousimage acquisition parameters (see Table 1 for summary), by pre-processing choices (data averaging and B1 inhomogeneity correction)and by segmentation analysis methods (choice of probabilistic atlas).All participants were healthy volunteers with no history of majorpsychiatric, neurological or cognitive impairment, and providedwritten informed consent in accordance with the Human ResearchCommittee of Massachusetts General Hospital. For all subject groupsthe scans were randomized over days over a period of approximately2 months.
Dataset 1This dataset, previously used in Han et al. (2006) to study cortical
thickness reproducibility, was analyzed to evaluate how the reliabilityof subcortical volume estimates in older healthy subjects depends onT1-weighted MRI acquisition sequence (MPRAGE and multi-echoFLASH), scan session, data averaging, segmentation atlas, scannerplatform and field strength.
Fifteen healthy older subjects participated in this dataset (agebetween 66–81 years; mean: 69.5 years; std: 4.8 years). Each subjectunderwent 4 scan sessions at approximately two-week intervals,including two sessions on a Siemens 1.5 T Sonata scanner (SiemensMedical Solutions, Erlangen, Germany), one on a Siemens 3 T Trioscanner, and one on a GE 1.5 T Signa scanner (General Electric,Milwaukee, WI). The Siemens scanners are located at the MartinosCenter for Biomedical Imaging at Massachusetts General Hospital, andthe GE scanner is located at the Brigham and Women's Hospital.
In each Siemens scan session, the acquisition included twoMPRAGEvolumes (bandwidth=190 Hz/pixel, flip angle=7°, TR/TE/TI=2.73 s/3.44 ms/1 s), and two multi-echo multi flip angle (30° and5°) fast low-angle shot (FLASH) volumes (bandwidth=651 Hz/pixel,TR=20ms, TE=(1.8+1.82⁎n) ms, n=0,…,7). In each GE scan session,a customMPRAGE sequencewas programmedwith parameters as similar

Table 1Summary of datasets and acquisition variables used in this study
Dataset MRI platforma Vendor's RF coil 3D T1-weighted MRI acquisitiond Healthy volunteers
Birdcage Phase arrayc MPRAGE Multi-echo FLASH Mean age (years) N
Session 1 Session 2 Session 1 Session 2
S1 S2 S1 S2 S1 S2 S1 S2
1 Siemens Sonataa Yes – √ √ √ √ √ √ √ √ 69.5 15GE Signab Yes – √ √ – – – – – –
Siemens Trioa – 8-ch √ √ – – √ √ – –
2 Siemens Sonataa Yes – √ √ √ √ √ √ √ √ 34.0 5Siemens Avantoa – 12-ch √ √ √ √ √ √ √ √
3 Siemens Trio Yes – √ √ √ √ – – – – 36.5 5Siemens TrioTIM Yes – √ √ √ √ – – – –
See text for more details.a Data acquired at the Massachusetts General Hospital, Boston, MA, USA.b Data acquired at Brigham and Women's Hospital, Boston, MA, USA.c Number of RF coil channels used.d In each session two scans (S1 and S2) are acquired (√). In the case of MPRAGE the two scans are identical. In the case of MEF, each session has two scans (with flip angles of 30°
and 5°). A dash (–) means that no data was acquired.
179J. Jovicich et al. / NeuroImage 46 (2009) 177–192
as possible, and two volumes were acquired. The total scanning timefor each MPRAGE and each multi-echo FLASH (MEF) volume wasroughly the same and about 9 min. All structural scans were 3Dsagittal acquisitions with 128 contiguous slices (imagingmatrix=256×192, in-plane resolution=1×1 mm2, and slicethickness=1.33 mm). In each Siemens session, the acquisitionswere automatically aligned to a standardized anatomical atlas toensure consistent slice prescription across scans (Kouwe van der et al.,2005; Benner et al., 2006).
Dataset 2This dataset, previously used in Han et al. (2006) to study cortical
thickness reproducibility, was analyzed to evaluate how a 1.5 T MRIsystem upgrade (Siemens Sonata to Avanto) affects the reproduci-bility of subcortical volume estimates. This dataset is also used tocompare the reproducibility between the young and older groups.
Five healthy volunteers (age between 29 and 37 years; mean:34 years; std.: 3 years) were each scanned in four sessions, twobefore and two after an MRI scanner upgrade (within 1 week for therepeated scans on the same scanner, and the total time span is about6 weeks). The upgrade was from a Siemens Magnetom Sonata to aMagnetom Avanto, which included the following major changes: a)main magnet (both are 1.5 T, Avanto's length is 150 cm, Sonata's is160 cm), (b) gradient system (Avanto coils are more linear, Sonata40 mT/m @ 200 T/m/s, Avanto 45 mT/m @ 200 T/m/s), c) head RFcoil (circularly polarized on Sonata, 12 channels in Avanto), and d)software upgrade.
The acquisition protocol before and after upgrade was kept thesame and consisted of two sets of 3D acquisitions: two MPRAGE andtwo multi-echo FLASH scans, with the same parameters as used inGroup 1. The head RF coil set-ups are different: circularly polarized forSonata, and 12-channel for Avanto (used in 4 channel mode). Also, forboth platforms brains were automatically aligned to an atlas in eachscanning session for setting the slice prescription in approximatelyAC–PC orientation (Kouwe van der et al., 2005; Benner et al., 2006).
Dataset 3This dataset, an extension to Han et al. (2006), was acquired and
analyzed to evaluate how a 3 T MRI system upgrade (Siemens Trio toTim Trio) affects the reproducibility of subcortical volume estimates.This is a major hardware and software upgrade, similar to the onedescribed above, where essentially the only thing that does notchange across the upgrade is the main static magnet.
Five healthy volunteers (age between 30 and 40 years; mean:36.5 years; std.: 3 years) were each scanned in four sessions, twobefore and two after the upgrade. The MPRAGE data acquisitionprotocol was essentially the same as for Dataset 2; no MEF data was
collected. The vendor's birdcage head RF coil was used for both pre-and post-upgrade scans.
Measures of brain structure volumes
Segmentation of brain structures from T1-weighted 3D structuralMRI data and estimation of structure volumes was performed usingthe FreeSurfer toolkit, which is freely available to the researchcommunity (http://surfer.nmr.mgh.harvard.edu/). This suite ofmethods uses a probabilistic brain atlas of choice, which was initiallyproposed in 2002 (Fischl et al., 2002), and has undergone severalimportant improvements over the years (Fischl et al., 2004; Han et al.,2006). With these updates, the current subcortical segmentationmethod is fully automated and has been recently described forapplicationwithMPRAGE andMEF data, using specific atlases for eachof these image acquisition protocols (Han et al., 2006). Brieflyregarding MEF, each multi-echo FLASH acquisition gives 8 imagebrain volumes (one volume for each gradient echo). The 16 volumesthat are available from the 30° and the 5° MEF acquisitions arecombined using a weighted linear average approach to create a singleT1-weighted volume (Han et al., 2006). The combination of the data isobtained by applying a linear discriminant analysis technique in orderto find an optimal set of weights (a projection vector) such that theweighted average volume has the best contrast to noise ratio betweenwhite and gray matter.
The procedure automatically labels each voxel in the brain as oneof 40 structures (Fischl et al., 2002). Here we focus on only a subset ofthem which are of interest in neurodegenerative diseases and are byfar the largest in volume: hippocampal formation, amygdala, caudatenucleus (caudate), putamen, globus pallidus (pallidum), thalamus,lateral ventricles, inferior lateral ventricles and total intracranialvolume. For each of these structures (except the intracranial volume)the right and left hemisphere volumes are estimated separately.Reproducibility errors in cortical surface structures have beenpreviously discussed in a separate manuscript (Han et al., 2006).
The segmentation atlas used for the automated full brain Free-Surfer segmentation was generated from the following subjects:healthy young (10, 6 females, age 21±2 years), healthy middle age(10, 6 females, age 50±6 years), healthy old (8, 7 females, age 74±7 years), demented old (11, 6 females, age 77±6 years). The atlasdemographics' covers well the demographics of the three datasetsconsidered in this work (summarized in Table 1) so it is not expectedto bias the segmentation results.
All datawasvisually inspected for qualityassuranceprior to analyses.All data was analyzed using the same and latest public FreeSurfersoftware version (4.0). No manual edits were done, the segmentationresults were inspected visually prior to the volume analysis.
180 J. Jovicich et al. / NeuroImage 46 (2009) 177–192
Measures of volume reliability
We examined the test–retest reliability of volume estimates undertwo general conditions: when the volumes compared are derivedfrom repeated identical acquisitions and analyses methods (i.e.,volume repeatability, for example across scan sessions) and whenthe volumes compared are derived from different acquisition oranalysis methods (i.e., volume agreement, for example acrossdifferent scanners). For both assessments we used a Bland–Altmananalysis (Bland and Altman, 1986). In short, for each pair-wisecomparison of volumes (repeatability or agreement), the volumedifferences are plotted (y-axis) against the volume means (x-axis) foreach subject. From this we obtain two metrics, each with its 95%confidence interval: the mean volume difference (±tn−1 SD root(1/n), where tn−1 is the t-statistics for a two-tailed test with 95% powerand n−1 degrees freedom) and the limits of agreement (2 SD± tn−1
SD root(3/n)) of the volume differences (SD: standard deviation ofthe differences, n: number of subjects, Bland and Altman, 1986). Theplots show the spread of data, the mean difference and the limits ofagreement. For excellent reproducibility the mean difference shouldbe ideally zero with a narrow distribution of data around zero acrossthe range of volume measurements. These two metrics (with their95% confidence interval) summarize the reliability of a comparison foreach structure and are then used to compare test–retest reliabilityacross different conditions (next section). An improvement in test–retest reliability will be detected as a significant reduction of themeanvolume difference and/or as a significant reduction of the standarddeviation of the volume differences. The significance test acrossconditions is done using a t-test (two-tailed, pb0.05).
To investigate the sensitivity of our results to the number ofsubjects, a Jacknife method was used to estimate the bias in theconfidence interval of the volume reproducibility due to the numberof subjects used (Efron and Tibshirani, 1993). In other words, weestimate how sensitive the confidence interval of the mean reprodu-cibility is to the number of subjects used by comparing the groupconfidence interval with the mean confidence interval when onesubject is left out. The confidence interval for the group of n subjects isCIgroup= tn−1⁎SDgroup/(n−1), SDgroup is the standard deviation of thereproducibility within the group. In the Jacknife analysis, one at a timeeach subject is left out and the confidence interval is calculated fromthe set of n−1 remaining subjects. For example, when subject j is leftout, confidence interval is CIj= tn−2⁎SDj/(n−2), where SDj is thestandard deviation of the reproducibility without including subject j.The bias is then estimated as:
bias=1
n−1
Xn
j = 1
CIj−CIgroup
This method gives a non parametrical estimate of bias (i.e. noassumptions on the probabilistic distribution of the volumes andhence reproducibility test statistics is used).
Investigation of variables that affect test–retest volume reliability
There are several factors that may affect the test–retest reliabilityof subcortical volumes segmented from structural MRI data acquiredat a single site. These factors include the scan session specific variablessuch as subject positioning, shim settings, hydration status, etc…, thechoice of image acquisition sequence, data analysis methods (whichsometimes may be related to specific additional acquisitions forcorrection purposes) and unavoidable system hardware upgrades.First we considered the situation that is expected to give the bestreproducibility (i.e., multiple scans acquired within the same scansession) with standard processing and no other corrections. Thiswithin-session reproducibility was used as best case scenarioreference when exploring the effects of the other variability factors,
namely, brain segmentation pre-processing (data averaging, correc-tion of intensity inhomogeneities), image acquisition sequence(MPRAGE, MEF), choice of brain atlas for the segmentation, and MRIsystem upgrades (Sonata—Avanto). Finally, we looked at volumereproducibility effects when using data derived from different MRIsystem vendors (Siemens vs. GE at 1.5 T) and different field strengths(1.5 T vs. 3 T).
Effect of scan session on test–retest subcortical volume reproducibilityThe best possible reproducibility is expected to be obtained from
multiple scans acquired within the same session on young subjects(elderly subjects typically move more, and hence data is suboptimal).This situation minimizes variability in the segmentation results thatcould come from changes in the acquisition sequence, scannerhardware/instability and/or the subject (head position, physiology,etc.). Ideally, within and across session reproducibility should becomparable, and the interest is in investigatingwhethermanipulationson the processing can further improve this reproducibility. Weexamined the test–retest repeatability of the two scans acquiredwithin each of the two sessions (test_scan1 vs. test_scan2,retest_scan1 vs. retest_scan2), and also the other four combinationsobtained across sessions (test_scan1 vs. retest_scan1, test_scan1 vs.retest_scan2, test_scan2 vs. retest_scan1 and test_scan2 vs. retest_s-can2). Subcortical volumes were derived from single MPRAGEacquisitions segmented with the standard method (MPRAGE atlas).
Effect of number of acquisitions on subcortical volume reliabilityAveraging of several image acquisitions has the effect of improving
tissue signal-to-noise ratio by canceling out random signal fluctua-tions from the subject and the MR electronics (assuming that all scansaveraged have equally good quality, e.g. negligible motion artifacts).By reducing the noise in the averaged image the tissue contrast-to-noise ratio may also increase, thus improving the accuracy of thetissue segmentation algorithm and potentially the reproducibility ofsubcortical volumes derived from the segmentation. The cost ofaveraging is increased image acquisition time. An additional potentialcost is that averaging may reduced image contrast due to theresampling donewhen the images are co-registered prior to averaging(to minimize motion effects across scans) or also if there is adifferential degree of head motion during one of the two scansaveraged (blurring is introduced). Herewe testedwhether therewas asignificant improvement in test–retest volume reliability for theaverage of two within-session acquisitions as compared to a singleacquisition from the same session. The MPRAGE scans from dataset 1(Sonata, older group, n=15) and dataset 2 (Sonata, young group,n=5) were used to study the effect of different number of imageacquisitions on the subcortical volume reliability. For this purpose,subcortical segmentation and volume estimations were computedstarting from each one of the two MPRAGE acquisitions and also fromthe average of the two within-session acquisitions, for each subject,for each test–retest session. The subcortical volume reliabilities, foreach structure, were then compared between the case of single andaveraged (which is the recommended default approach for use withFreeSurfer) acquisitions.
Effects of B1 RF inhomogeneity correction on subcorticalvolume reliability
Image intensity distortions from radiofrequency (RF) B1 fieldinhomogeneity may affect the reliability of MRI tissue segmentation(Leow et al., 2006, Alecci et al., 2000). To study the effect of B1inhomogeneity we used the MPRAGE data from dataset 2 (Sonata,young group, n=5) in which a B1 correction profile was obtained asdescribed in Leow et al. (2006). Briefly, the sensitivity profile of thereceive RF coil was estimated by dividing an image volume obtainedwith the head RF coil by a corresponding image volume obtained withthe body coil on a voxel-by-voxel basis. With this sensitivity profile all

181J. Jovicich et al. / NeuroImage 46 (2009) 177–192
subsequent volumes can be corrected by dividing each voxel'sintensity by the estimated sensitivity value at that location2. Toevaluate the effects of B1 inhomogeneity correction on test–retestsubcortical volume reproducibility we compared the reproducibilityderived from two single MPRAGE scans on separate sessions, bothscans either with or without the B1 correction. We also investigatedthe effects of the B1 correction when the MPRAGE scan of eachsession was the average of two within-session scans. In this lattercase, the B1 correction was applied to each single MPRAGE scan priorto averaging. Note that this method for correcting intensityinhomogeneity from B1 imperfections only works for MRI systemsin which the body RF coil is used as transmit and the head RF coil asreceive. The method will not work in systems that use multichanneltransmit and receive head RF coils.
Effects of MRI acquisition sequence on subcortical volume reliabilityStructural 3D T1-weighted imaging protocols (typically MPRAGE)
are commonly used for segmentation of cortical gray, white andsubcortical gray matter structures. MEF is an attractive alternative T1-weightedmethodwith the following advantages: A) in themulti-echoapproach, the alternating gradient-echoes are acquired with oppositereadout directions, resulting in less distortions related to the case inwhich echoes are always collected in the same direction. Standardhigh bandwidth MPRAGE or single echo FLASH scans could also beacquired with alternate readout directions, but this would have to besetup by hand in the protocol and is prone for operator's mistakes,while it happens automatically in MEF. Most importantly, multiplesingle echo acquisitions would take N times (N=number of echoes)as much acquisition time as multi-echo acquisitions to achieve thesame SNR). B) Each MEF acquisition gives extra information that canbe used: a T2⁎ map, and with sufficient closely- or unevenly-spacedechoes the B0 field offset can be calculated when the phaseinformation is available. C) In the MEF approach time is used toacquire two different flip angles from which additional informationcan be obtained: T1 and PD tissue maps. D) The combination of theprevious properties has been shown to allow for sequence-indepen-dent segmentation (Fischl et al., 2004). Recently a new multi-echoMPRAGE sequence has been demonstrated to give improved resultsthan the standard MPRAGE (van der Kouwe et al., 2008).
The acquisition time of any one scan of these protocols (MPRAGEor MEF) is essentially the same (approximately 9 min) at the sameresolution and with no acceleration from parallel imaging.
The effects of acquisition sequence on subcortical volumes werestudied in two steps. First we used a Bland–Altman analysis to assessthe within session agreement of the volumes derived from bothsequences. Second we compared the across-session test–retestreproducibility of each sequence. For the comparison we kept thetotal acquisition time approximately constant across imagesequences: subcortical volumes were derived from two averagedMPRAGE volumes and from two MEF volumes with different flipangles (Fischl et al., 2004).
Effects of segmentation atlas choice on subcortical volume reliabilityThe brain probabilistic atlas used for the subcortical segmentation
and volume estimation is typically defined by the same imagingacquisition method (i.e., for segmenting MPRAGE data an MPRAGEatlas is created from a different manually segmented MPRAGEdataset). Since creating the probabilistic atlas is time consuming, it
2 It is important to note that this procedure only corrects for inhomogeneities in thereceive RF field, not the transmit field. This latter inhomogeneity results in change inthe effective flip angle, and thus of image contrast and is much more difficult toaccount for. Fortunately using body transmit coils at 1.5T this effect is negligible,although at 3T it becomes visible, and at higher field strengths such as 7T it is adramatic effect. The correction of transmit inhomogeneities is beyond the scope of thispaper, but will become increasingly important as ultra high field scanners becomemore routinely available.
would be convenient if the segmentation results did not dependstrongly on image acquisition differences between the data to besegmented and the data used to build the atlas. To evaluate this, weused MPRAGE and MEF atlases derived from different manuallylabeled datasets (Fischl et al., 2004) to segment MPRAGE and MEFacquisitions from datasets 1 and 2. We compared the test–retestsubcortical volume reliability derived from MPRAGE data segmentedwith MPRAGE atlas, versus the one derived fromMEF data segmentedwith the MEF atlas and then separately with the MPRAGE atlas.
Effects of MRI system upgrades on subcortical volume reliabilityMRI system upgrades that involve major hardware and software
changes may introduce reliability changes (Han et al., 2006; Jovicichet al., 2005; Czanner et al., 2006). Measurement of these reliabilityeffects is especially important for longitudinal studies. We used twosystem upgrades (dataset 2: Sonata to Avanto upgrade; dataset 3: Trioto Tim Trio upgrade) as opportunities to measure and compare thetest–retest reliability of subcortical volumes before, after and acrossthe upgrade (i.e., using as test one scan acquired before the upgradeand as retest a scan acquired after the upgrade). We also use dataset 2to investigate how subcortical volume reliability depends on MRIsequence choice (3D T1-weighted acquisitions were MPRAGE andMEF) before and after the upgrade.
Effects of MRI vendor platform and field strength on the reproducibilityof subcortical volumes
Multi-center neuroimaging studies usually have to considercombining data acquired from different MRI vendors and fieldstrengths, which may add some variance to the data if the measuresacross systems are not reproducible. To study this, we used Dataset 1to compare the subcortical volume test–retest reproducibility fromtwo averaged MPRAGE scans derived from a single system (Sonata–Sonata) with those from mixed systems (Siemens Sonata–GE Signa,both 1.5 T) and mixed vendors and field strengths (Siemens 1.5 TSonata–Siemens 3.0 T Trio, GE 1.5 T Signa–Siemens 3.0 T Trio). We alsoused a linear regression analysis to investigate whether there arebiases in the volumes derived from different systems and fieldstrengths. The MPRAGE atlas used for all segmentations wasconstructed from Siemens Sonata data.
Power analysis
Statistical power calculations can help approximate the number ofsubjects needed to detect a percent volumetric change with a givenestimation of the measurement error. In the Results section, we focuson sample-size estimates for detecting hippocampal volume effects ofa hypothetical treatment that successfully slows atrophy in Alzheimerpatients. Specifically, assuming that in an untreated Alzheimer's grouphippocampal volume atrophy rate is approximately 4.9%/year, andwith the liberal assumption that a disease modifying therapy may beable to slow it by 50% (Jack et al., 2003), we are interested in detectinga difference between 4.9%/year (in an untreated group) vs. 2.45%/year(in a treated group) to characterize potentially clinically meaningfultreatment effects. Our goal was, from the estimation of variance inhippocampus volume measures, to determine how large a samplewould be needed to detect this net 2.45% effect between the twogroups 1) within the same scanner with no upgrade, 2) within thesame scanner after an upgrade, 3) between scanners of differentmanufacturers, and 4) between scanners of different field strengths.To keep the focus on the reproducibility variables of this study, thestandard deviation of the measurement error was estimated from theraw hemispheric hippocampal volumes as derived from the automaticsegmentation procedure, without adding any other normalizations oradjustments like for total intracranial volume, age or gender (Jack etal., 2003). This type of sample-size determination is an important stepin planning a multi-center clinical trial.

Fig. 1. Sample color-coded subcortical segmentation results (right hemisphere only): hippocampus (yellow), thalamus (green), caudate (light blue), putamen (pink), pallidum (darkblue) and amygdala (turquoise). Top: FreeSurfer derived subcortical labels, from a two-averaged MPRAGE in axial (left), coronal (center) and sagittal (right) views. Bottom: 3Dsurface models created with 3D Slicer derived from the FreeSurfer subcortical segmentations.
182 J. Jovicich et al. / NeuroImage 46 (2009) 177–192
The sample-size is generally estimated by setting the chosensignificance level (the probability of type I error), desired statisticalpower (one minus the probability of type II error), the effect size, andthe standard deviation of measurement error (Cohen, 1988). For allsample-size estimates, a significance level of 0.05 (one-sided) and astatistical power of 0.9 were assumed, as has been done previously(Jack et al., 2003). The computationwas performed using the standardformula as implemented in an online Java software algorithmdeveloped by David A. Schoenfeld at Massachusetts General Hospital(http://hedwig.mgh.harvard.edu/sample_size/size.html). The sam-ple size calculated in this way assumes that there are no losses in thepatients followed up and that for all subjects all image pairs can beused. More conservative sample size estimations can be done as
Table 2Mean subcortical volumes (with standard deviation across subjects), test–retest reproducib
Subcortical structures Dataset 1: Older Group (n=15, age=69.5±4.8 years)
Volume (mm3) Reprod. error (%) Bias in confidence
Hippocampus left 3269±419 3.61 0.11Hippocampus right 3508±436 3.44 0.08Thalamus left 5498±637 3.85 0.08Thalamus right 5587±550 4.26 0.08Caudate left 3315±479 2.43 0.06Caudate right 3407±480 1.48 0.04Putamen left 4654±848 3.56 0.09Putamen right 4357±697 2.59 0.04Pallidum left 1585±218 5.30 0.12Pallidum right 1470±251 7.68 0.25Amygdala left 1324±207 5.68 0.16Amygdala right 1311±267 7.39 0.19Lateral ventricle left⁎⁎ 16696±7440⁎⁎ 2.37 0.07Lateral ventricle right⁎⁎ 15942±7045⁎⁎ 2.38 0.06Inferior lateral ventricle left 1054±409 7.94 0.21Inferior lateral ventricle right 1021±382 10.23 0.42Intracranial 1,501,100±158,900 2.56 0.05
The mean subcortical values are derived from two averaged MPRAGE scans acquired in se(Siemens Sonata system for Dataset 1, Siemens Avanto for Dataset 2). The group reproducibiliwhere for each subject the error is estimated as the absolute test–retest volume percent chadifference (pb0.01) between the old and young groups are indicated with ⁎⁎. The bias dueconfidence interval (see text for more details).
needed from the basic estimates, for example increasing the samplesize by 10% for subject dropout and 10% increase for inadequate scans(Fox et al., 2000).
Spatial reproducibility
Spatial reproducibility was examined using the co-registered test–retest volumes segmented in Dataset 1 to study volume reproduci-bility effects with no system or sequence changes (Sonata MPRAGE:test and retest), with sequence changes (Sonata: MPRAGE and MEF),with vendor changes (1.5 T MPRAGE: Siemens Sonata and GE Signa)and with field strength changes (Siemens MPRAGE: 1.5 T and 3 T).Dice coefficients where computed for the volume overlap (van
ility errors and confidence interval bias for the reproducibility errors
Dataset 2: Younger Group (n=5, age=34±3 years)
interval (%) Volume (mm3) Reprod. error (%) Bias in confidence interval (%)
3877±395 2.34 0.874060±330 1.27 0.556147±628 1.69 0.456233±639 2.04 0.773371±648 0.55 0.403455±528 1.22 0.405880±833 1.93 1.015641±887 1.97 0.551703±201 3.31 1.281593±232 1.72 0.451447±349 6.17 2.671413±307 8.08 3.147780±4010⁎⁎ 1.16 0.637514±4788⁎⁎ 1.80 0.58622±354 10.45 3.58702±316 7.66 2.16
1,484,200±133,700 1.34 0.62
parate sessions on the same scanner with no B1 intensity inhomogeneity correctionsty error for each structure is derived averaging the reproducibility errors across subjects,nge relative to the mean test–retest volume. Structures with a significant mean volumeto the limited sample sizes is estimated with a Jackknife analysis on the reproducibility

183J. Jovicich et al. / NeuroImage 46 (2009) 177–192
Rijsbergen, 1979). In particular, given two different labels (test andretest sessions) of a structure from the same subject, denoted by W1
and W2, and a function V(W), which takes a label and returns itsvolume, the Dice coefficient is given by van Rijsbergen (1979):
D W1;W2ð Þ= V W1 \W2ð ÞV W1ð Þ+ V W2ð Þð Þ=2
For identical spatial labels, D(W1,W2) achieves its maximum value ofone, with decreasing values indicating less perfect overlap. For eachsubject the Dice coefficients were calculated for hippocampus,thalamus, caudate, putamen, pallidum, amygdale and lateral ventricletaking an average across the right and left hemispheres. The groupresults where generated by averaging the Dice coefficients acrosssubjects for each structure.
Results
We analyzed how the test–retest reliability of subcortical volumesderived from structural T1-weighted MRI data is affected by thefollowing factors: scan session (within and across session), brainsegmentation pre-processing (data averaging, correction of intensityinhomogeneities), image acquisition sequence (MPRAGE, MEF), brainsegmentation analyses (brain atlas), MRI system upgrade, and MRI
Fig. 2. Within-session repeatability of volumes: Bland–Altman plots showing volume diffesubjects, n=15). For each brain hemisphere (left: red crosses, right: blue circles) the meadeviations, interrupted horizontal lines) are shown. For reference, zero volume difference i
platform (vendor and field strength). Fig. 1 shows sample subcorticalsegmentation results (right hemisphere only) color coded accordingto structure: hippocampus (yellow), thalamus (green), caudate (lightblue), putamen (pink), pallidum (dark blue) and amygdala (tur-quoise). The subcortical labels are generated by FreeSurfer and shownin three orthogonal views (Fig. 1a). The corresponding surface modelsfor each structure (Fig. 1b) are derived using the freely available 3DSlicer package (http://www.slicer.org/).
To investigate how image quality features varied as function ofthe main parameters manipulated the mean intensity in each ROIwith the standard deviation of the voxels within the ROI werecalculated (Supplementary Fig. 1). These intensity means andstandard deviations are the signal-to-noise ratio (SNR) from asegmentation standpoint. The measures where done using thenormalized images used for the final automated segmentation.Supplementary Fig. 1 has two parts: i) a sample dataset from the oldgroup (Dataset 1) is used to show signal changes as function ofvendor, field strength and pulse sequence and ii) a sample datasetfrom the young group (Dataset 2) is used to show signal changes asfunction of system upgrade and pulse sequence. For each structureright and left hemisphere intensities and standard deviations wereaveraged because they did not show major differences between. Themain observation from these results is that for each structure thereare no major differences in intensity across conditions. The results
rence vs. volume mean (single MPRAGE acquisitions, Siemens Sonata, group of oldern volume difference (solid horizontal line) and the limits of agreement (±2 standards shown as a black dotted line.

184 J. Jovicich et al. / NeuroImage 46 (2009) 177–192
also illustrate the challenges in distinguishing structures based onsignal intensity only. In particular, we found no substantialdifferences between 1.5 T and 3 T data. This may be due to thefact that in the 3 T data an 8-channel surface coil was used, which atthe brain center gives comparable SNR to the 1.5 T birdcage coil.
Table 2 lists the mean volumes of the brain structures studied forDatasets 1 and 2 with their test–retest reproducibility errors andconfidence interval bias estimates. Here the reproducibility errorconsidered is within scanner (Siemens Sonata system for Dataset 1and Siemens Avanto for Dataset 2), across two separate scan sessionsand derived from two-averaged MPRAGE scans with no B1 inhomo-geneity correction. We found that the volumes of the structures in theold and young groups investigated were not significantly differentexcept only for the lateral ventricles (two-sample t-test, pb0.01,smaller lateral ventricle volumes for the young group).
Table 2 shows the group reproducibility errors for each structurederived by averaging the reproducibility errors across subjects, wherefor each subject the error is estimated as the absolute test–retestvolume percent change relative to the mean test–retest volume.Supplementary Fig. 2 shows the percent volume reproducibility foreach structure listed in Table 2, for both groups. Reproducibility ofolder subjects is denoted by star symbols, and that of younger subjectswith full circle symbols. Results from each young subject areconnected with reference lines to facilitate distinction with thereproducibility from the older subjects. We found that the FreeSurfersoftware generated consistent outcome measures for the hippocam-pus, thalamus, caudate, putamen, lateral ventricles and total intracra-nial volume with reproducibility errors 4.3% or less for the oldersubjects and 2.3% or less for the younger subjects. For the smallerstructures (pallidum, amygdala and inferior lateral ventricles) thereproducibility errors were larger, 10.2% or less for older subjects and10.4% or less for younger subjects.
Table 2 shows also the Jacknife bias estimates of the volumereproducibility confidence interval for each structure. We found thatacross all structures the mean proportion of the bias to the volumereproducibility was 1.8% for the old group (n=15) and 46% for the
Fig. 3. Effects of scan session (within session and across sessions) and data averaging on voBland–Altman results of mean volume difference (blue) and limits of agreement (red) for bconfidence intervals for the various repeatability conditions: test session, (1: variability acrosacquisition data mixed from the test–retest sessions (3: first test with first retest acquisitionand 6: second test with second retest acquisitions); and average scans from each session (7:volume differences and the limits of agreement across conditions.
young group (n=5). These results suggest that the volumereproducibility estimates from the old group have a relatively lowbias and that the number of subjects used was adequate. The fewernumber of subjects in the young group gave a higher bias, thussuggesting that the results derived from this group should beconsidered as preliminary.
Effects of scan session scan averaging and B1 correction
The goals in this study were to compare: a) within-session vs.across-session repeatability of single scans, b) single scan vs. two-averaged repeatability across sessions, and c) the across-sessionrepeatability with or without image intensity correction from B1inhomogeneities.
Fig. 2 shows an example of within-session volume repeatabilityanalysis: Bland–Altman plots of mean volume difference versus meanvolume for the two MPRAGE scans acquired in the test session on thegroup of older subjects (Siemens Sonata, n=15). To help visualizationbrain hemispheres are differentiated by colors and symbols (lefthemisphere: red crosses, right hemisphere: blue circles). For eachhemisphere (and corresponding color) the plots show the meandifference volume (solid horizontal line) and the lower and upperboundaries of 95% confidence interval using ±2 SDs (interruptedlines) from the mean difference volume. For all structures thedistribution of difference volumes is approximately symmetric aroundzero (black dotted reference line), with a small constant bias and withboth hemispheres behaving similarly.
From Fig. 2 we can extract, for each structure, the mean differencevolume and the limits of the agreement, each with its 95% confidenceinterval. This analysis was then extended to the other conditions:within and across session combinations as well as for the case whenthe two scans of each test and retest sessions are averaged and thencompared across sessions. The results are summarized in Fig. 3 for allthe conditions, with the mean difference volumes in blue and thelimits of agreement in red (left hemisphere: crosses, right hemi-sphere: circles, error bars denote the 95% confidence intervals). A
lume repeatability in the older group (MPRAGE acquisitions, Siemens Sonata, n=15).oth brain hemispheres (left: crosses, right: circles) are shown with their respective 95%s the two acquisitions); retest session (2: variability across the two acquisitions); singles; 4: first test with second retest acquisitions; 5: second test with first retest acquisitiontwo test scans averaged with two retest scans averaged). Black dotted lines connect the

Fig. 4. Effects of scan session (within, across), data averaging and B1 inhomogeneity corrections in volume reproducibility in the younger group (MPRAGE acquisitions, SiemensSonata, n=5). Bland–Altman results of mean volume difference (blue) and limits of agreement (red) for both brain hemispheres (left: crosses, right: circles) are shown with theirrespective 95% confidence intervals for the various repeatability conditions: test session, (1: variability across the two acquisitions); retest session (2: variability across the twoacquisitions); single acquisition data mixed from the test–retest sessions (3: first test with first retest acquisitions; 4: second test with second retest acquisitions); average scans fromeach session (5: two test scans averaged with two retest scans averaged) and average B1 corrected scans (6: two B1 corrected test scans averaged with two B1 corrected retest scansaveraged).
185J. Jovicich et al. / NeuroImage 46 (2009) 177–192
black dotted line connects each of the mean difference volume andlimits of agreement across conditions to facilitate the visualization ofchanges of the two metrics across conditions. As can be seen, neitherthe volume differences nor the limits of agreement change signifi-cantly across conditions, indicating that within-session reproduci-bility is maintained across sessions and not significantly improvedwhen two scans are averaged in the older group. Similar results wereobtained for the younger group (Fig. 4, dataset 2, Sonata, n=5). Forthe young group we also assessed the effects of correction of B1 imageintensity inhomogeneities (B1 correction applied to each singleMPRAGE prior to averaging within each session), which gave noreproducibility changes.
Effects of image acquisition sequence and probabilisticsegmentation atlas
The goals in this study were twofold: a) assess within-sessionagreement of volumes derived from MPRAGE and MEF acquisitions,and b) compare the across-session test–retest repeatability of the twosequences. MEF segmentations were computed using both the MEFatlas and the MPRAGE atlas.
Fig. 5 shows the Bland–Altman agreement results between thesubcortical volumes derived from two averaged MPRAGE scans andthose derived from the two-flip angle MEF scans (both segmentationsusing the MPRAGE atlas, older group, n=15, Sonata), both sequencesacquired within the same scan session. Similar results where obtainedif the MEF atlas was used to segment the MEF acquisitions. For somestructures there is a clear offset from zero in the mean volumedifferences (putamen, lateral ventricles, inferior lateral ventricles andintracranial). For some of these structures (e.g. putamen and inferiorlateral ventricles) there seemed to be a systematic linear relationshipbetween the difference volumes and the mean volumes across themeasurement range. To investigate this we made linear regression fitsfor each brain structure grouping the data from both hemispheres andcalculated the slopes, which are unitless because both axes have mm3
units (green lines in Fig. 5): hippocampus (0.084±0.001), amygdala(0.015±0.002), caudate (0.133±0.002), putamen (0.216±0.001),
pallidum (−0.155±0.002), thalamus (−0.176±0.001), lateral ven-tricles (0.009±0.0004), inferior lateral ventricles (0.200±0.001) andintracranial (0.022±0.0001). The effects of the estimated slopes arerelatively small when considering the measurement range and theoverall variability. The mean difference volumewas taken as themeanacross the range of measurements ignoring the slope, which will givean overestimation of the limits of agreement for the structures withthe biggest slopes (putamen and inferior lateral ventricles, slopeapproximately 0.2).
Fig. 6 shows the within-session agreement results betweenMPRAGE and MEF as function of the segmentation atlas used for theMEF data (MEF: MEF atlas, MEF_MP: MPRAGE atlas). Volumedifferences (blue) and limits of agreement (red), are shown for eachstructure (left hemisphere: cross symbol, right hemisphere: circlesymbol) with their respective 95% confidence interval. For allstructures the atlas used to segment the MEF data (MPRAGE orMEF) did not significantly affect the mean volume difference (bias)between the two sequences. For hippocampus, amygdala, caudate,pallidum and thalamus the bias between MPRAGE and MEF derived-volumes was not significantly different than zero. For putamen, lateralventricles, inferior lateral ventricles and intracranial volumes themean volume difference was significantly different than zero(pb0.05), indicating that a bias correction would be necessary ifvolumes from these two sequences are to be used in a single analyses.The across-session repeatability results show that the test–retestreproducibility of MPRAGE and MEF (regardless of segmentationatlas) are comparable.
MRI system upgrade effects on subcortical volume reproducibility
One goal of this study was to evaluate whether the reproducibilityof volumes can change significantly as consequence of a major MRIsystem upgrade. Fig. 7 shows MRI system upgrade effects (SiemensSonata–Avanto, 1.5 T, dataset 2, n=5 subjects) on volume reprodu-cibility when the volumes are derived from within-session averagedMPRAGE scans and reproducibility is evaluated: before upgrade acrosssessions (Sonata test–retest: StSrt), across upgrade sessions (Sonata
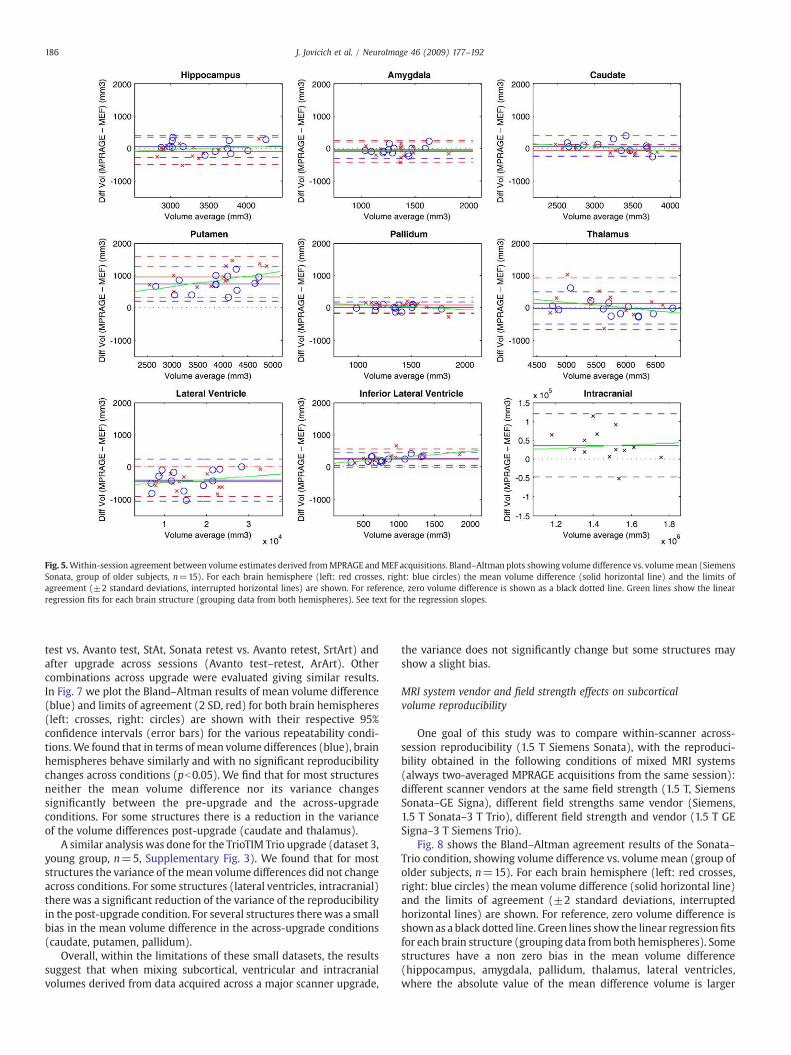
Fig. 5.Within-session agreement between volume estimates derived fromMPRAGE andMEF acquisitions. Bland–Altman plots showing volume difference vs. volumemean (SiemensSonata, group of older subjects, n=15). For each brain hemisphere (left: red crosses, right: blue circles) the mean volume difference (solid horizontal line) and the limits ofagreement (±2 standard deviations, interrupted horizontal lines) are shown. For reference, zero volume difference is shown as a black dotted line. Green lines show the linearregression fits for each brain structure (grouping data from both hemispheres). See text for the regression slopes.
186 J. Jovicich et al. / NeuroImage 46 (2009) 177–192
test vs. Avanto test, StAt, Sonata retest vs. Avanto retest, SrtArt) andafter upgrade across sessions (Avanto test–retest, ArArt). Othercombinations across upgrade were evaluated giving similar results.In Fig. 7 we plot the Bland–Altman results of mean volume difference(blue) and limits of agreement (2 SD, red) for both brain hemispheres(left: crosses, right: circles) are shown with their respective 95%confidence intervals (error bars) for the various repeatability condi-tions.We found that in terms of mean volume differences (blue), brainhemispheres behave similarly and with no significant reproducibilitychanges across conditions (pb0.05). We find that for most structuresneither the mean volume difference nor its variance changessignificantly between the pre-upgrade and the across-upgradeconditions. For some structures there is a reduction in the varianceof the volume differences post-upgrade (caudate and thalamus).
A similar analysis was done for the TrioTIM Trio upgrade (dataset 3,young group, n=5, Supplementary Fig. 3). We found that for moststructures the variance of themean volume differences did not changeacross conditions. For some structures (lateral ventricles, intracranial)there was a significant reduction of the variance of the reproducibilityin the post-upgrade condition. For several structures therewas a smallbias in the mean volume difference in the across-upgrade conditions(caudate, putamen, pallidum).
Overall, within the limitations of these small datasets, the resultssuggest that when mixing subcortical, ventricular and intracranialvolumes derived from data acquired across a major scanner upgrade,
the variance does not significantly change but some structures mayshow a slight bias.
MRI system vendor and field strength effects on subcorticalvolume reproducibility
One goal of this study was to compare within-scanner across-session reproducibility (1.5 T Siemens Sonata), with the reproduci-bility obtained in the following conditions of mixed MRI systems(always two-averaged MPRAGE acquisitions from the same session):different scanner vendors at the same field strength (1.5 T, SiemensSonata–GE Signa), different field strengths same vendor (Siemens,1.5 T Sonata–3 T Trio), different field strength and vendor (1.5 T GESigna–3 T Siemens Trio).
Fig. 8 shows the Bland–Altman agreement results of the Sonata–Trio condition, showing volume difference vs. volume mean (group ofolder subjects, n=15). For each brain hemisphere (left: red crosses,right: blue circles) the mean volume difference (solid horizontal line)and the limits of agreement (±2 standard deviations, interruptedhorizontal lines) are shown. For reference, zero volume difference isshown as a black dotted line. Green lines show the linear regressionfitsfor each brain structure (grouping data fromboth hemispheres). Somestructures have a non zero bias in the mean volume difference(hippocampus, amygdala, pallidum, thalamus, lateral ventricles,where the absolute value of the mean difference volume is larger
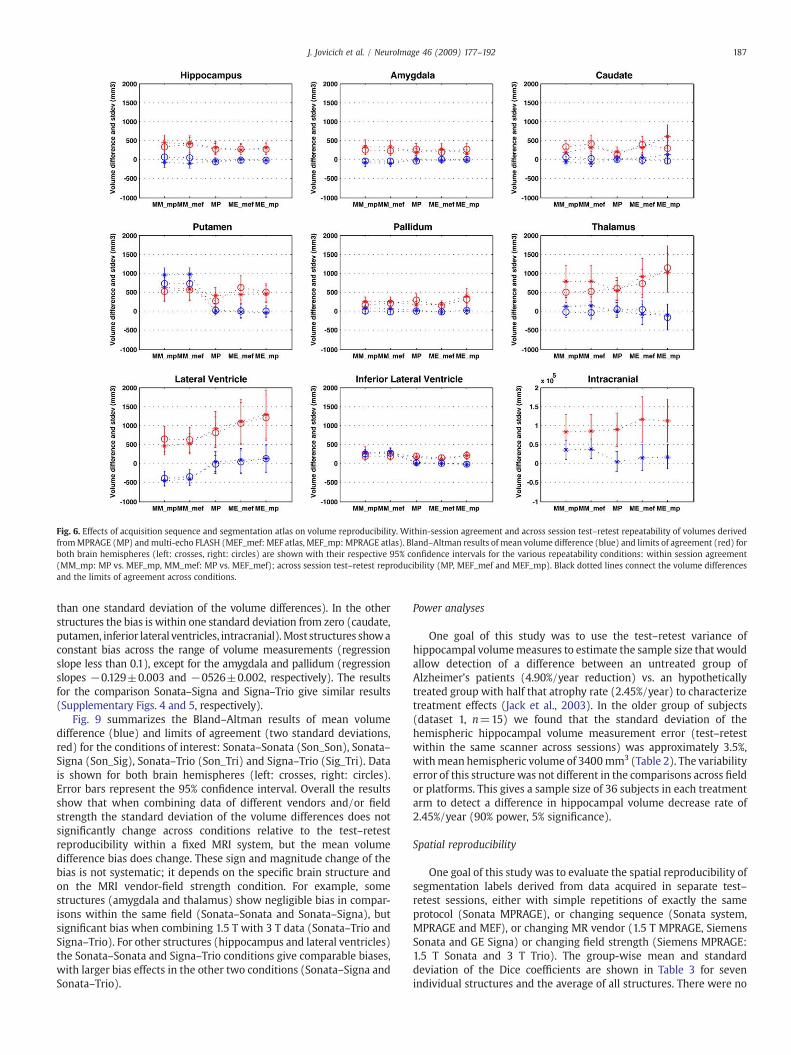
Fig. 6. Effects of acquisition sequence and segmentation atlas on volume reproducibility. Within-session agreement and across session test–retest repeatability of volumes derivedfromMPRAGE (MP) andmulti-echo FLASH (MEF_mef: MEF atlas, MEF_mp: MPRAGE atlas). Bland–Altman results of mean volume difference (blue) and limits of agreement (red) forboth brain hemispheres (left: crosses, right: circles) are shown with their respective 95% confidence intervals for the various repeatability conditions: within session agreement(MM_mp: MP vs. MEF_mp, MM_mef: MP vs. MEF_mef); across session test–retest reproducibility (MP, MEF_mef and MEF_mp). Black dotted lines connect the volume differencesand the limits of agreement across conditions.
187J. Jovicich et al. / NeuroImage 46 (2009) 177–192
than one standard deviation of the volume differences). In the otherstructures the bias is within one standard deviation from zero (caudate,putamen, inferior lateral ventricles, intracranial).Most structures showaconstant bias across the range of volume measurements (regressionslope less than 0.1), except for the amygdala and pallidum (regressionslopes −0.129±0.003 and −0526±0.002, respectively). The resultsfor the comparison Sonata–Signa and Signa–Trio give similar results(Supplementary Figs. 4 and 5, respectively).
Fig. 9 summarizes the Bland–Altman results of mean volumedifference (blue) and limits of agreement (two standard deviations,red) for the conditions of interest: Sonata–Sonata (Son_Son), Sonata–Signa (Son_Sig), Sonata–Trio (Son_Tri) and Signa–Trio (Sig_Tri). Datais shown for both brain hemispheres (left: crosses, right: circles).Error bars represent the 95% confidence interval. Overall the resultsshow that when combining data of different vendors and/or fieldstrength the standard deviation of the volume differences does notsignificantly change across conditions relative to the test–retestreproducibility within a fixed MRI system, but the mean volumedifference bias does change. These sign and magnitude change of thebias is not systematic; it depends on the specific brain structure andon the MRI vendor-field strength condition. For example, somestructures (amygdala and thalamus) show negligible bias in compar-isons within the same field (Sonata–Sonata and Sonata–Signa), butsignificant bias when combining 1.5 T with 3 T data (Sonata–Trio andSigna–Trio). For other structures (hippocampus and lateral ventricles)the Sonata–Sonata and Signa–Trio conditions give comparable biases,with larger bias effects in the other two conditions (Sonata–Signa andSonata–Trio).
Power analyses
One goal of this study was to use the test–retest variance ofhippocampal volumemeasures to estimate the sample size that wouldallow detection of a difference between an untreated group ofAlzheimer's patients (4.90%/year reduction) vs. an hypotheticallytreated group with half that atrophy rate (2.45%/year) to characterizetreatment effects (Jack et al., 2003). In the older group of subjects(dataset 1, n=15) we found that the standard deviation of thehemispheric hippocampal volume measurement error (test–retestwithin the same scanner across sessions) was approximately 3.5%,withmean hemispheric volume of 3400mm3 (Table 2). The variabilityerror of this structure was not different in the comparisons across fieldor platforms. This gives a sample size of 36 subjects in each treatmentarm to detect a difference in hippocampal volume decrease rate of2.45%/year (90% power, 5% significance).
Spatial reproducibility
One goal of this study was to evaluate the spatial reproducibility ofsegmentation labels derived from data acquired in separate test–retest sessions, either with simple repetitions of exactly the sameprotocol (Sonata MPRAGE), or changing sequence (Sonata system,MPRAGE and MEF), or changing MR vendor (1.5 T MPRAGE, SiemensSonata and GE Signa) or changing field strength (Siemens MPRAGE:1.5 T Sonata and 3 T Trio). The group-wise mean and standarddeviation of the Dice coefficients are shown in Table 3 for sevenindividual structures and the average of all structures. There were no
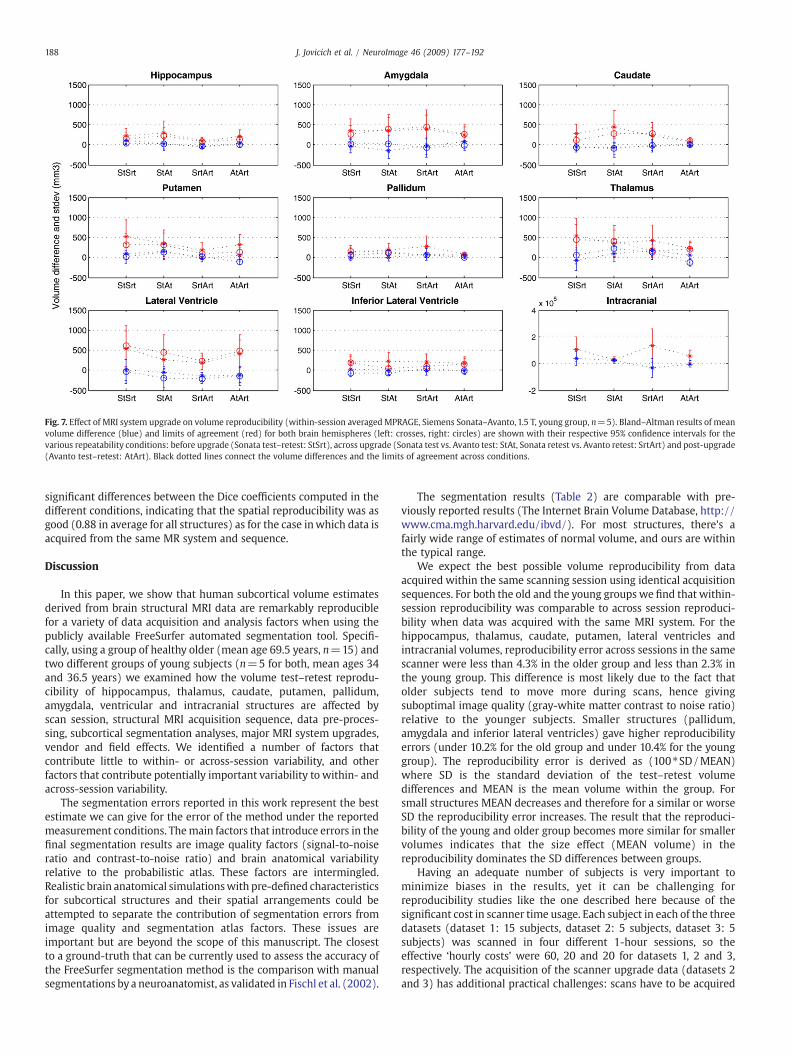
Fig. 7. Effect of MRI system upgrade on volume reproducibility (within-session averagedMPRAGE, Siemens Sonata–Avanto, 1.5 T, young group, n=5). Bland–Altman results of meanvolume difference (blue) and limits of agreement (red) for both brain hemispheres (left: crosses, right: circles) are shown with their respective 95% confidence intervals for thevarious repeatability conditions: before upgrade (Sonata test–retest: StSrt), across upgrade (Sonata test vs. Avanto test: StAt, Sonata retest vs. Avanto retest: SrtArt) and post-upgrade(Avanto test–retest: AtArt). Black dotted lines connect the volume differences and the limits of agreement across conditions.
188 J. Jovicich et al. / NeuroImage 46 (2009) 177–192
significant differences between the Dice coefficients computed in thedifferent conditions, indicating that the spatial reproducibility was asgood (0.88 in average for all structures) as for the case inwhich data isacquired from the same MR system and sequence.
Discussion
In this paper, we show that human subcortical volume estimatesderived from brain structural MRI data are remarkably reproduciblefor a variety of data acquisition and analysis factors when using thepublicly available FreeSurfer automated segmentation tool. Specifi-cally, using a group of healthy older (mean age 69.5 years, n=15) andtwo different groups of young subjects (n=5 for both, mean ages 34and 36.5 years) we examined how the volume test–retest reprodu-cibility of hippocampus, thalamus, caudate, putamen, pallidum,amygdala, ventricular and intracranial structures are affected byscan session, structural MRI acquisition sequence, data pre-proces-sing, subcortical segmentation analyses, major MRI system upgrades,vendor and field effects. We identified a number of factors thatcontribute little to within- or across-session variability, and otherfactors that contribute potentially important variability to within- andacross-session variability.
The segmentation errors reported in this work represent the bestestimate we can give for the error of the method under the reportedmeasurement conditions. Themain factors that introduce errors in thefinal segmentation results are image quality factors (signal-to-noiseratio and contrast-to-noise ratio) and brain anatomical variabilityrelative to the probabilistic atlas. These factors are intermingled.Realistic brain anatomical simulationswith pre-defined characteristicsfor subcortical structures and their spatial arrangements could beattempted to separate the contribution of segmentation errors fromimage quality and segmentation atlas factors. These issues areimportant but are beyond the scope of this manuscript. The closestto a ground-truth that can be currently used to assess the accuracy ofthe FreeSurfer segmentation method is the comparison with manualsegmentations by a neuroanatomist, as validated in Fischl et al. (2002).
The segmentation results (Table 2) are comparable with pre-viously reported results (The Internet Brain Volume Database, http://www.cma.mgh.harvard.edu/ibvd/). For most structures, there's afairly wide range of estimates of normal volume, and ours are withinthe typical range.
We expect the best possible volume reproducibility from dataacquired within the same scanning session using identical acquisitionsequences. For both the old and the young groups we find that within-session reproducibility was comparable to across session reproduci-bility when data was acquired with the same MRI system. For thehippocampus, thalamus, caudate, putamen, lateral ventricles andintracranial volumes, reproducibility error across sessions in the samescanner were less than 4.3% in the older group and less than 2.3% inthe young group. This difference is most likely due to the fact thatolder subjects tend to move more during scans, hence givingsuboptimal image quality (gray-white matter contrast to noise ratio)relative to the younger subjects. Smaller structures (pallidum,amygdala and inferior lateral ventricles) gave higher reproducibilityerrors (under 10.2% for the old group and under 10.4% for the younggroup). The reproducibility error is derived as (100⁎SD/MEAN)where SD is the standard deviation of the test–retest volumedifferences and MEAN is the mean volume within the group. Forsmall structures MEAN decreases and therefore for a similar or worseSD the reproducibility error increases. The result that the reproduci-bility of the young and older group becomes more similar for smallervolumes indicates that the size effect (MEAN volume) in thereproducibility dominates the SD differences between groups.
Having an adequate number of subjects is very important tominimize biases in the results, yet it can be challenging forreproducibility studies like the one described here because of thesignificant cost in scanner time usage. Each subject in each of the threedatasets (dataset 1: 15 subjects, dataset 2: 5 subjects, dataset 3: 5subjects) was scanned in four different 1-hour sessions, so theeffective ‘hourly costs’ were 60, 20 and 20 for datasets 1, 2 and 3,respectively. The acquisition of the scanner upgrade data (datasets 2and 3) has additional practical challenges: scans have to be acquired
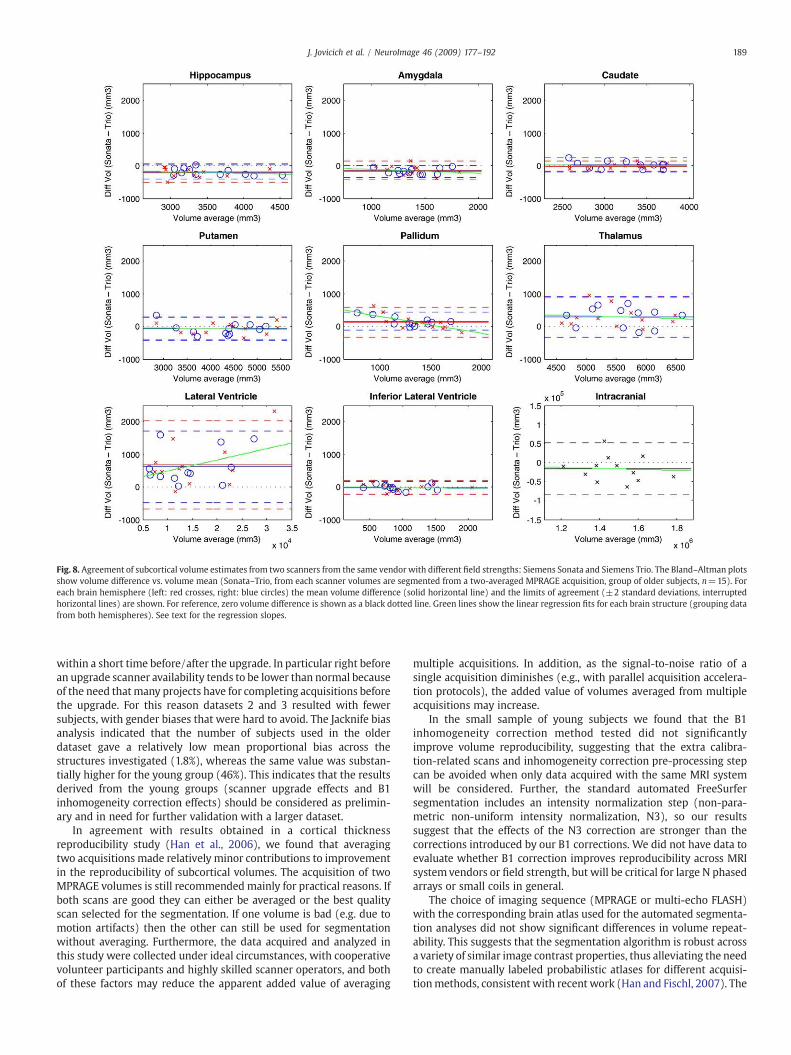
Fig. 8. Agreement of subcortical volume estimates from two scanners from the same vendor with different field strengths: Siemens Sonata and Siemens Trio. The Bland–Altman plotsshow volume difference vs. volume mean (Sonata–Trio, from each scanner volumes are segmented from a two-averaged MPRAGE acquisition, group of older subjects, n=15). Foreach brain hemisphere (left: red crosses, right: blue circles) the mean volume difference (solid horizontal line) and the limits of agreement (±2 standard deviations, interruptedhorizontal lines) are shown. For reference, zero volume difference is shown as a black dotted line. Green lines show the linear regression fits for each brain structure (grouping datafrom both hemispheres). See text for the regression slopes.
189J. Jovicich et al. / NeuroImage 46 (2009) 177–192
within a short time before/after the upgrade. In particular right beforean upgrade scanner availability tends to be lower than normal becauseof the need thatmany projects have for completing acquisitions beforethe upgrade. For this reason datasets 2 and 3 resulted with fewersubjects, with gender biases that were hard to avoid. The Jacknife biasanalysis indicated that the number of subjects used in the olderdataset gave a relatively low mean proportional bias across thestructures investigated (1.8%), whereas the same value was substan-tially higher for the young group (46%). This indicates that the resultsderived from the young groups (scanner upgrade effects and B1inhomogeneity correction effects) should be considered as prelimin-ary and in need for further validation with a larger dataset.
In agreement with results obtained in a cortical thicknessreproducibility study (Han et al., 2006), we found that averagingtwo acquisitions made relatively minor contributions to improvementin the reproducibility of subcortical volumes. The acquisition of twoMPRAGE volumes is still recommended mainly for practical reasons. Ifboth scans are good they can either be averaged or the best qualityscan selected for the segmentation. If one volume is bad (e.g. due tomotion artifacts) then the other can still be used for segmentationwithout averaging. Furthermore, the data acquired and analyzed inthis study were collected under ideal circumstances, with cooperativevolunteer participants and highly skilled scanner operators, and bothof these factors may reduce the apparent added value of averaging
multiple acquisitions. In addition, as the signal-to-noise ratio of asingle acquisition diminishes (e.g., with parallel acquisition accelera-tion protocols), the added value of volumes averaged from multipleacquisitions may increase.
In the small sample of young subjects we found that the B1inhomogeneity correction method tested did not significantlyimprove volume reproducibility, suggesting that the extra calibra-tion-related scans and inhomogeneity correction pre-processing stepcan be avoided when only data acquired with the same MRI systemwill be considered. Further, the standard automated FreeSurfersegmentation includes an intensity normalization step (non-para-metric non-uniform intensity normalization, N3), so our resultssuggest that the effects of the N3 correction are stronger than thecorrections introduced by our B1 corrections. We did not have data toevaluate whether B1 correction improves reproducibility across MRIsystemvendors or field strength, but will be critical for large N phasedarrays or small coils in general.
The choice of imaging sequence (MPRAGE or multi-echo FLASH)with the corresponding brain atlas used for the automated segmenta-tion analyses did not show significant differences in volume repeat-ability. This suggests that the segmentation algorithm is robust acrossa variety of similar image contrast properties, thus alleviating the needto create manually labeled probabilistic atlases for different acquisi-tionmethods, consistent with recent work (Han and Fischl, 2007). The

Fig. 9. Effects of scanner vendor and field strength on volume reproducibility (across-session, each sessionwith a two-averaged MPRAGE, older group, n=15). Bland–Altman resultsof mean volume difference (blue) and limits of agreement (red) for both brain hemispheres (left: crosses, right: circles) are shownwith their respective 95% confidence intervals forthe following conditions: same MRI system (Sonata–Sonata, Son_Son), same field different vendor (Sonata–Signa, Son_Sig), same vendor different field (Sonata–Trio, Son_Tri) anddifferent vendor and field (Signa–Trio, Sig_Trio). Black dotted lines connect the volume differences and the limits of agreement across conditions.
190 J. Jovicich et al. / NeuroImage 46 (2009) 177–192
comparison between subcortical volumes derived from MPRAGE andMEF sequences showed that for some structures (putamen, lateralventricles, inferior lateral ventricles, and intracranial) there weresignificant biases in the mean volume difference given by the twomethods. These differences may be due to the differential sensitivity(acquisition bandwidth) that the sequences have to signal T2⁎ (signalloss, geometric distortions). The MPRAGE sequence has the advantageof being currently more standard than multi-echo FLASH, thus it iseasier to implement it consistently in multi-center studies. It is alsoimportant to recognize that the MPRAGE and multi-echo FLASHsequences have very similar contrast properties, which may not applyto T1 sequences with different contrast properties (e.g., SPGR) or nonT1 sequences.
Within the limits of our small sample sizewe find that inmajorMRIsystem upgrades (Sonata–Avanto and Trio–TrioTIM) combining pre-and post-upgrade data does not significantly worsen the variance butmay introduce a bias in the mean volume differences. Combining thiswith our segmentation atlas results suggests that it is safe to use thesame brain atlas after a system upgrade, which is very convenient. For
Table 3Comparison of average test–retest volume overlap (Dice coefficients) of segmentedstructures in a group of subjects (n=15, mean age 69.5) scanned on separate sessionsunder various conditions: same scanner and sequence (Sonata MPRAGE), same scannerbut different sequences (MPRAGE and MEF), same field/sequence (1.5 T/MPRAGE) butdifferent scanner vendors (Siemens Sonata and GE Signa), and same vendor/sequence(Siemens/MPRAGE) different field strengths (1.5 T and 3 T)
Sonata–Sonata(MPRAGE)
MPRAGE–MEF(Sonata)
Sonata–GE(MPRAGE)
Sonata–Trio(MPRAGE)
Hippocampus 0.87±0.02 0.86±0.04 0.81±0.05 0.83±0.04Thalamus 0.92±0.01 0.90±0.01 0.91±0.01 0.90±0.02Caudate 0.87±0.03 0.83±0.04 0.83±0.05 0.84±0.03Putamen 0.89±0.01 0.85±0.02 0.86±0.02 0.87±0.01Pallidum 0.85±0.04 0.81±0.04 0.82±0.04 0.79±0.11Amygdala 0.84±0.03 0.83±0.05 0.78±0.08 0.80±0.04Lateral ventricle 0.94±0.02 0.93±0.03 0.93±0.03 0.93±0.02All 0.88±0.04 0.86±0.05 0.83±0.12 0.85±0.07
longitudinal studies we believe that it is appropriate to plan a systemupgrade calibration study as part of the design, particularly withsamples from the population under study scanned shortly prior to andimmediately after the upgrade for a correct estimation of potentialbiases. An important practical issue is to know about the upgradesufficiently far in advance to plan for the calibration study, optimallycomplete the study prior to the upgrade. If the longitudinal study willcontinue after the upgrade it should ideally be balanced across relevantstudy groups with respect to number of acquisitions before and afterthe upgrade, since subtle effects of interest in longitudinal studiesmayin fact be within the small range of variance identified in this study(e.g., hippocampal volume differences of 2–5%).
We found that when data from different MRI systems arecombined (same field different vendors, same vendor different fields,or different vendor and fields) then the variance of the volumedifferences doesn't significantly change relative to the test–retestreproducibility from data acquired in a fixed MRI system, but biases ofthe mean volume differences may become significant. All data weresegmented using an atlas from a single MRI system suggesting thatimage contrast differences arising from differences in hardware andfield strength were strong enough to be detected by the segmentationalgorithm. The spatial reproducibility results showed constant andhigh spatial consistency of the segmentation volumes (average Dicecoefficient of 0.88±0.04) for a variety of test–retest conditions,ranging from no MR system and sequence changes to changes ofsystem, sequence or field strength. The spatial overlap results are alsoin good agreement with a previous study (Han and Fischl, 2007) thatcompared Siemens Sonata segmentations of the same structures withmanual segmentations, suggesting that both spatial accuracy andreproducibility and accuracy are high.
One extension of this work would be to test if reproducibilitydifferences across MRI platforms can be reduced by doing thesubcortical segmentationswith a probabilistic atlas that is constructedfrom manual segmentations of data acquired with the various MRIsystems under consideration. Alternatively, statistical models could beused given that they have been proved successful in combining datathat are sufficiently different in acquisition sequence to fail pooling

191J. Jovicich et al. / NeuroImage 46 (2009) 177–192
straight out (Fennema-Notestine et al., 2007). Further, our cross-vendor comparison (Siemens SonataMPRAGE–GE SignaMPRAGE) didnot include potentially significant sources of variation found wheneach vendor uses its own product sequence, which can lead to imagecontrast differences. Therefore our results might underestimate thevariance seen with cross vendor switches that introduce strongsequence changes, as may occur in practice.
The fact that the rest–retest reproducibility variance of thesegmented volumes does not significantly change across platformsand field strengths (particularly in the hippocampus) implies that amulti-center study with these MRI systems does not necessarilyrequire a much larger sample dataset to detect a specific effect. Ofcourse, this is under ideal circumstances with highly motivatedcognitively intact older adults. These conclusions may not generalizeto other brain structures or to patient populations with cognitiveimpairment if there are any reductions in raw data quality related tomovement or other issues. Our power calculations for detecting a net2.45% hippocampal volume reduction rate difference betweenhypothetical non-treated and treated AD groups resulted in anestimate of 49 subjects per group, which was not appreciablyworsened by scanner upgrades or differences in scanner platform orfield strength. These results differ from previous calculations (Jack etal., 2003) which estimate, for the same treatment effect, 21 subjectsper treatment arm with a 2.1% standard deviation. The differencesmay be due to the fact that Jack et al. used various data adjustmentsthat were not applied in our analysis, including normalization for totalintracranial volume, adjustments for age and gender and correctionsfor skew data distributions. These adjustments might help reduce thereproducibility error thereby reducing the sample size.
In addition to their volume, subcortical structures have started to becharacterized also by their 3D shapes (Munn et al., 2007; Wang et al.,2007; Patenaude et al., 2006;Miller, 2004). Combining both volume andshape metrics might improve the power of detecting cross-sectionaldifferences across populations or longitudinal changes. An importantextension of the reproducibility study here presented would be toexamine the reproducibility of shapemetrics. An important limitation ofthis study is the lack of quantification of spatial differences in voxellabeling; that is, different voxelsmay be labeled as the same structure intwo different sessions, but if the volumes do not differ, our analyseswould not demonstrate this potentially important variance effect.
Knowledge of the degree to which different MRI instrument-related factors affect the reliability of metrics that characterize sub-cortical structures is essential for the interpretation of these measuresin basic and clinical neuroscience studies. Furthermore, the knowl-edge of reproducibility is critical if these metrics are to find appli-cations as biomarkers in clinical trials of putative treatments forneurodegenerative or other neuropsychiatric diseases, particularlywith the growth of large sample multi-center studies (Jack et al.,2003; Mueller et al., 2005; Murphy et al., 2006; Belmonte et al., 2008).
To conclude, our results suggest that, for the purpose of designingmorphometric longitudinal studies at a single site, one structuralMPRAGE acquisition segmented with the corresponding MPRAGEatlas can be optimal. Subcortical volumes derived from T1-weightedstructural imaging data acquired at a single 1.5 T site are reliablemeasures that can be pooled even if there are differences in imageacquisition sequence and major system upgrades. However, MRI-instrument specific factors should be considered when combiningdata from different MRI systems (vendors and/or fields). It should benoted that we do not report a random effects study, therefore theresults should not be extrapolated to pulse sequences or scanners notincluded in this study.
Acknowledgments
This research was supported by the following grants: NCRRMorphometry Biomedical Informatics Research Network (U24
RR021382), NCRR P41-RR14075 and RO1-RR16594-01A1, Pfizer Inc.,the NIA (K23-AG22509 and P01-AG04953) and the MIND Institute.We thank Gabriela Czanner, Mark Vangel and David Raunig for usefuldiscussions on the statistical analyses of the data.
Appendix A. Supplementary data
Supplementary data associatedwith this article can be found, in theonline version, at doi:10.1016/j.neuroimage.2009.02.010.
References
Alecci, M., Zhang, Y., Brady, J.M., Jezzard, P., Smith, S., 2000. Image-based evaluation ofa-priori B1 field correction and its effect on MRI tissue segmentation. In Proc. Int.Soc. Magn. Reson. Med. 109.
Alemán-Gómez, Y., Melie-García, L., Valdés-Hernandez, P., 2007. IBASPM: toolbox forautomatic parcellation of brain structures. Human Brain Mapping, 12th AnnualMeeting; Florence, Italy.
Anderson, V.M., Fernando, K.T., Davies, G.R., Rashid,W., Frost, C., Fox, N.C., Miller, D.H., 2007.Cerebral atrophymeasurement inclinically isolated syndromesandrelapsing remittingmultiple sclerosis: a comparison of registration-based methods. J. Neuroimaging 17,61–68.
Anstey, K.J., Maller, J.J., 2003. The role of volumetric MRI in understanding mildcognitive impairment and similar classifications. Aging Ment. Health 7, 238–250.
Ashburner, J., Friston, K.J., 2000. Voxel-basedmorphometry— themethods. NeuroImage11, 805–821.
Barnes, J., Lewis, E.B., Scahill, R.I., Bartlett, J.W., Frost, C., Schott, J.M., Rossor, M.N., Fox, N.C., 2007. Automated measurement of hippocampal atrophy using fluid-registeredserial MRI in AD and controls. J. Comput. Assist. Tomogr. 31, 581–587.
Belmonte, M.K., Mazziotta, J.C., Minshew, N.J., Evans, A.C., Courchesne, E., Dager, S.R.,Bookheimer, S.Y., Aylward, E.H., Amaral, D.G., Cantor, R.M., Chugani, D.C., Dale, A.M.,Davatzikos, C., Gerig, G., Herbert, M.R., Lainhart, J.E., Murphy, D.G., Piven, J., Reiss,A.L., Schultz, R.T., Zeffiro, T.A., Levi-Pearl, S., Lajonchere, C., Colamarino, S.A., 2008.Offering to share: how to put heads together in autism neuroimaging. J. AutismDev. Disord. 38 (1), 2–13.
Benner, T., Wisco, J.J., van der Kouwe, A., Fischl, B., Vangel, M.G., Hochberg, F.H.,Sorensen, A.G., 2006. Comparison of manual and automatic slice positioning ofbrain MR images. Radiology 239, 246–254.
Bland, J.M., Altman, D.G., 1986. Statistical methods for assessing agreement betweentwo methods of clinical measurement. Lancet i, 307–310.
Camara, O., Scahill, R.I., Schnabel, J.A., Crum, W.R., Ridgway, G.R., Hill, D.L., Fox, N.C.,2007. Accuracy assessment of global and local atrophy measurement techniqueswith realistic simulated longitudinal data. Med. Image Comput. Comput. Assist.Interv. Int. Conf. Med. Image Comput. Comput. Assist. Interv. 10, 785–792.
Cohen, J., 1988. Statistical Power Analysis for the Behavioral Sciences2nd edn. AcademicPress, New York.
Collins, D.L., Zijdenbos, A.P., Barré, W.F.C., Evans, A.C., 1999. ANIMAL+INSECT:improved cortical structure segmentation. Proc. of the Annual Symposium onInformation Processing in Medical Imaging. In: Kuba, A., Samal, M., Todd-Pokropek,A. (Eds.), vol. 1613 of LNCS. Springer, Berlin, pp. 210–223.
Czanner, S., Han, X., Pacheco, J., Wallace, S., Busa, E., van der Kouwe, A., Fischl, B.,Jovicich, J., 2006. Test–retest reliability assessment for longitudinal MRI studies:effects of MRI system upgrade on morphometric analysis of structural MRI data.Human Brain Mapping, 12th Annual Meeting; Florence, Italy.
DeKosky, S.T., Marek, K., 2003. Looking backward to move forward: early detection ofneurodegenerative disorders. Science 302, 830–834.
Dickerson, B.C., Sperling, R.A., 2005. Neuroimaging biomarkers for clinical trials ofdisease-modifying therapies in Alzheimer's disease. NeuroRx 2, 348–360.
Douaud, G., Gaura, V., Ribeiro, M.J., Lethimonnier, F., Maroy, R., Verny, C., Krystkowiak, P.,Damier, P., Bachoud-Levi, A.C., Hantraye, P., Remy, P., 2006. Distribution of greymatter atrophy in Huntington's disease patients: a combined ROI-based and voxel-based morphometric study. NeuroImage 32, 1562–1575.
Efron, B., Tibshirani, R.J., 1993. An Introduction to the Boostrap. Chapman & Hall/CRC,New York.
Ewers,M., Teipel, S.J., Dietrich, O., Schonberg, S.O., Jessen, F., Heun, R., Scheltens, P., Pol, L.,Freymann, N.R., Moeller, H.J., Hampel, H., 2006.Multicenter assessment of reliabilityof cranial MRI. Neurobiol. Aging 27, 1051–1059.
Fennema-Notestine, C., Gamst, A.C., Quinn, B.T., Pacheco, J., Jernigan, T.L., Thal, L.,Buckner, R., Killiany, R., Blacker, D., Dale, A.M., Fischl, B., Dickerson, B., Gollub, R.L.,2007. Feasibility of multi-site clinical structural neuroimaging studies of agingusing legacy data. Neuroinformatics 5, 235–245 Nov 13 [Electronic publicationahead of print].
Fischl, B., Dale, A.M., 2000. Measuring the thickness of the human cerebral cortex frommagnetic resonance images. Proceed. Nat. Acad. Sci. 97, 11044–11049.
Fischl, B., Salat, D.H., Busa, E., Albert, M., Dieterich, M., Haselgrove, C., van der Kouwe, A.,Killiany, R., Kennedy, D., Klaveness, S., Montillo, A., Makris, N., Rosen, B., Dale, A.M.,2002. Whole brain segmentation: automated labeling of neuroanatomicalstructures in the human brain. Neuron 33, 341–355.
Fischl, B., Salat, D.H., van der Kouwe, A.J.W., Makris, N., Ségonne, F., Dale, A.M., 2004.Sequence-independent segmentation of magnetic resonance images. NeuroImage22, 1060–1075.
Fox, N.C., Cousens, S., Scahill, R., Harvey, R.J., Rossor, M.N., 2000. Using serial registeredbrain magnetic resonance imaging to measure disease progression in Alzheimer

192 J. Jovicich et al. / NeuroImage 46 (2009) 177–192
disease: power calculations and estimates of sample size to detect treatmenteffects. Arch. Neurol. 57, 339–344.
Haller, J.W., Banerjee, A., Christensen, G.E., et al., 1997. Three dimensional hippocampalMR morphometry with high-dimensional transformation of a neuroanatomic atlas.Radiology 202, 504–510.
Han, X., Fischl, B., 2007. Atlas renormalization for improved brain MR imagesegmentation across scanner platforms. Med. Imaging, IEEE Trans. 26, 479–486.
Han, X., Jovicich, J., Salat, D., van der Kouwe, A., Quinn, B., Czanner, S., Busa, E., Pacheco,J., Albert, M., Killiany, R., Maguire, P., Rosas, D., Makris, N., Dale, A.M., Dickerson, B.,Fischl, B., 2006. Reliability of MRI-derivedmeasurements of human cerebral corticalthickness: the effects of field strength, scanner upgrade and manufacturer.NeuroImage 32, 180–194.
Jack Jr., C.R., Slomkowski, M., Gracon, S., Hoover, T.M., Felmlee, J.P., Stewart, K., Xu, Y.,Shiung, M., O'Brien, P.C., Cha, R., Knopman, D., Petersen, R.C., 2003. MRI as abiomarker of disease progression in a therapeutic trial of milameline for AD.Neurology 60, 253–260.
Jack Jr., C.R., Shiung, M.M., Weigand, S.D., O'Brien, P.C., Gunter, J.L., Boeve, B.F., Knopman,D.S., Smith, G.E., Ivnik, R.J., Tangalos, E.G., Petersen, R.C., 2005. Brain atrophy ratespredict subsequent clinical conversion in normal elderly and amnestic MCI.Neurology 65, 1227–1231.
Jovicich, J., Czanner, S., Greve, D., Pacheco, J., Busa, E., van der Kouwe, A., Morphometry,B.I.R.N., Fischl, B., 2005. Test–retest reproducibility assessments for longitudinalstudies: quantifying MRI system upgrade effects. International Society of MagneticResonance in Medicine; Miami, USA.
Jovicich, J., Czanner, S., Greve, D., Haley, E., van der Kouwe, A., Gollub, R., Kennedy, D.,Schmitt, F., Brown, G., Macfall, J., Fischl, B., Dale, A.M., 2006. Reliability in multi-sitestructural MRI studies: effects of gradient non-linearity correction on phantom andhuman data. NeuroImage 30, 436–443.
Kantarci, K., Jack Jr., C.R., 2004. Quantitative magnetic resonance techniques assurrogate markers of Alzheimer's disease. NeuroRx 1, 196–205.
Kassube, J., Juengling, F.D., Kioschies, T., Henkel, K., Karitzky, J., Kramer, B., Ecker,D., Andrich, J., Saft, C., Kraus, P., Aschoff, A.J., Ludolph, A.C., Landwehrmeyer,G.B., 2004. Topography of cerebral atrophy in early Huntington's disease: avoxel based morphometric MRI study. J. Neurol. Neurosurg. Psychiatry 75,213–220.
Kassubek, J., Juengling, F.D., Ecker, D., Landwehrmeyer, G.B., 2005. Thalamic atrophy inHuntington's disease co-varies with cognitive performance: a morphometric MRIanalysis. Cereb. Cortex 15, 846–853.
Kipps, C.M., Duggins, A.J., Mahant, N., Gomes, L., Ashburner, J., McCusker, E.A.,2005. Progression of structural neuropathology in preclinical Huntington'sdisease: a tensor based morphometry study. J. Neurol. Neurosurg. Psychiatry 76,650–655.
Koo, M.S., Levitt, J.J., McCarley, R.W., Seidman, L.J., Dickey, C.C., Niznikiewicz, M.A.,Voglmaier, M.M., Zamani, P., Long, K.R., Kim, S.S., Shenton, M.E., 2006. Reduction ofcaudate nucleus volumes in neuroleptic-naive female subjects with schizotypalpersonality disorder. Biol. Psychiatry 60, 40–48.
Kouwe van der, A., Benner, T., Fischl, B., Schmitt, F., Salat, D., Harder, M., Sorensen, A.G.,Dale, A.M., 2005. On-line automatic slice positioning for brain MR imaging.NeuroImage 27, 222–230.
Kuroki, N., Kubicki, M., Nestor, P.G., Salisbury, D.F., Park, H.J., Levitt, J.J., Woolston, S.,Frumin, M., Niznikiewicz, M., Westin, C.F., Maier, S.E., McCarley, R.W., Shenton, M.E.,2006. Fornix integrity and hippocampal volume in male schizophrenic patients.Biol. Psychiatry 60, 22–31.
Leow, A.D., Yu, C.L., Lee, S.J., Huang, S.C., Nicolson, R., Hayashi, K.M., Protas, H., Toga,A.W., Thompson, P.M., 2005. Brain structural mapping using a novel hybridimplicit/explicit framework based on the level-set method. NeuroImage 24,910–927.
Leow, A.D., Klunder, A.D., Jack Jr., C.R., Toga, A.W., Dale, A.M., Bernstein, M.A., Britson, P.J.,Gunter, J.L., Ward, C.P., Whitwell, J.L., Borowski, B.J., Fleisher, A.S., Fox, N.C., Harvey,D., Kornak, J., Schuff, N., Studholme, C., Alexander, G.E., Weiner, M.W., Thompson,P.M., 2006. ADNI Preparatory Phase Study. Longitudinal stability ofMRI formappingbrain change using tensor-based morphometry. NeuroImage 31, 627–640.
Magnotta, V.A., Harris, G., Andreasen, N.C., O'Leary, D.S., Yuh, W.T., Heckel, D., 2002.Structural MR image processing using the BRAINS2 toolbox. Comput. Med. ImagingGraph. 26, 251–264.
Makris, N., Goldstein, J.M., Kennedy, D., Hodge, S.M., Caviness, V.S., Faraone, S.V., Tsuang,M.T., Seidman, L.J., 2006. Decreased volume of left and total anterior insular lobulein schizophrenia. Schizophr Res. 83, 155–171.
Miller, M.I., 2004. Computational anatomy: shape, growth, and atrophy comparison viadiffeomorphisms. NeuroImage 23 (Suppl. 1), S19–33.
Mueller, S.G., Weiner, M.W., Thal, L.J., Petersen, R.C., Jack, C., Jagust, W., Trojanowski, J.Q.,Toga, A.W., Beckett, L., 2005. The Alzheimer's disease neuroimaging initiative.Neuroimaging Clin. N. Am. 15, 869–877 (xi–xii.).
Mueller, S.G., Stables, L., Du, A.T., Schuff, N., Truran, D., Cashdollar, N., Weiner, M.W.,2007. Measurement of hippocampal subfields and age-related changes with highresolution MRI at 4 T. Neurobiol. Aging 28, 719–726.
Munn,M.A., Alexopoulos, J., Nishino, T., Babb, C.M., Flake, L.A., Singer, T., Ratnanather, J.T.,Huang, H., Todd, R.D., Miller, M.I., Botteron, K.N., 2007. Amygdala volume analysis infemale twins with major depression. Biol. Psychiatry 62, 415–422.
Murphy, S.N., Mendis, M.E., Grethe, J., Gollub, R., Kennedy, D., Rosen, B.R., 2006. AWebportal that enables collaborative use of advanced medical image processing andinformatics tools through the Biomedical Informatics Research Network (BIRN).AMIA Annu. Symp. Proc. 579–583.
Patenaude, B.M., Smith, S., Kennedy, D., Jenkinson, M., 2006. Automated subcorticalsegmentation using statistical shape models. Human Brain Mapping, 12th AnnualMeeting; Florence, Italy.
Peinemann, A., Schuller, S., Pohl, C., Jahn, T., Weindl, A., Kassubek, J., 2005. Executivedysfunction in early stages of Huntington's disease is associated with striatal andinsular atrophy: a neuropsychological and voxel-based morphometric study. J.Neurol. Sci. 239, 11–19.
Pengas, G., Pereira, J.M.S., Williams, G.B., Nesto, P.J., 2009. Comparative Reliability ofTotal Intracranial Volume Estimation Methods and the Influence of Atrophy in aLongitudinal Semantic Dementia Cohort. J. Neuroimaging 19, 37–46
Rosas, H.D., Koroshetz,W.J., Chen, Y.I., Skeuse, C., Vangel, M., Cudkowicz, M.E., Caplan, K.,Marek, K., Seidman, L.J., Makris, N., Jenkins, B.G., Goldstein, J.M., 2003. Evidence formore widespread cerebral pathology in early HD: an MRI-based morphometricanalysis. Neurology 60, 1615–1620.
Senjem, M.L., Gunter, J.L., Shiung, M.M., Petersen, R.C., Jack Jr., C.R., 2005. Comparison ofdifferent methodological implementations of voxel-based morphometry inneurodegenerative disease. NeuroImage 26, 600–608.
Shenton, M.E., Dickey, C.C., Frumin, M., McCarley, R.W., 2001. A review of MRI findings inschizophrenia. Schizophr Res. 49, 1–52.
Smith, S.M., De Stefano, N., Jenkinson, M., Matthews, P.M., 2002a. Measurement of brainchange over time, FMRIB Technical Report TR00SMS1, http://www.fmrib.ox.ac.uk/analysis/research/siena/siena/siena.html.
Smith, S.M., Zhang, Y., Jenkinson, M., Chen, J., Matthews, P.M., Federico, A., De Stefano,N., 2002b. Accurate, robust, and automated longitudinal and cross-sectional brainchange analysis. NeuroImage 17, 479–489.
Studholme, C., Cardenas, V., Schuff, N., Rosen, H., Miller, B., Weiner, M.W., 2001.Detecting spatially consistent structural differences in Alzheimer's and frontotem-poral dementia using deformation morphometry. MICCAI 41–48.
Szentkuti, A., Guderian, S., Schiltz, K., Kaufmann, J., Munte, T.F., Heinze, H.J., Duzel, E.,2004. Quantitative MR analyses of the hippocampus: unspecific metabolic changesin aging. J. Neurol. 251, 1345–1353.
Tae, W.S., Kim, S.S., Lee, K.U., Nam, E.C., Kim, K.W., 2009. Validation of hippocampalvolumes measured using a manual method and two automated methods(FreeSurfer and IBASPM) in chronic major depressive disorder. Neuroradiology51, 203–204.
Thieben, M.J., Duggins, A.J., Good, C.D., Gomes, L., Mahant, N., Richards, F., McCusker, E.,Frackowiak, R.S., 2002. The distribution of structural neuropathology in pre-clinicalHuntington's disease. Brain 125, 1815–1828.
van der Kouwe, A.J.W., Benner, T., Salat, D.H., Fischl, B., 2008. Brain morphometry withmultiecho MPRAGE. NeuroImage 40, 559–569.
van Rijsbergen, C.J., 1979. Information Retrieval2nd ed. Butterworths, London, U.K.Walters, R.J.C., Fox, N.C., Crum, W.R., Taube, D., Thomas, D.J., 2001. Hemodialysis and
cerebral edema. Nephron 87, 143–147.Wang, L., Beg, F., Ratnanather, T., Ceritoglu, C., Younes, L., Morris, J.C., Csernansky, J.G.,
Miller, M.I., 2007. Large deformation diffeomorphism and momentum basedhippocampal shape discrimination in dementia of the Alzheimer type. IEEE Trans.Med. Imag. 26, 462–470.