Reconstruction of 3D Histology Volumes from Breast ...
145
Reconstruction of 3D Histology Volumes from Breast Lumpectomy Specimens by Rushin Shojaii A thesis submitted in conformity with the requirements for the degree of Doctor of Philosophy Department of Medical Biophysics University of Toronto ©Copyright by Rushin Shojaii (2017)
-
Upload
khangminh22 -
Category
Documents
-
view
0 -
download
0
Transcript of Reconstruction of 3D Histology Volumes from Breast ...

Reconstruction of 3D Histology Volumes from Breast Lumpectomy Specimens
by
Rushin Shojaii
A thesis submitted in conformity with the requirements for the degree of Doctor of Philosophy
Department of Medical Biophysics University of Toronto
©Copyright by Rushin Shojaii (2017)
ii
Reconstruction of 3D Histology Volumes from Breast
Lumpectomy Specimens
Rushin Shojaii
Doctor of Philosophy
Department of Medical Biophysics University of Toronto
2017
Abstract
Three dimensional reconstruction and examination of microscopic images of tissue sections can
enhance the study of normal and disease processes, particularly in studies concerned with
structural changes. 3D histology volumes can also be used as ground truth in validating new
volumetric medical imaging techniques. The accuracy of the histology volume reconstruction is
hindered by sparse sampling of the clinical specimens, the deformation of the tissue during the
histology processes, and variations in staining. The existing methods for histology volume
construction of human breast specimens are either manual or applicable only to small cropped
densely sampled regions.
In this thesis, we hypothesize that by using image registration algorithms, 3D histology volumes
can be automatically reconstructed from stacked 2D images of histology sections. We present an
image registration framework for histology volume reconstruction, which is also extendable for
registration of the histology to ex vivo medical images. The framework is first validated using a
pre-clinical model and then further improved by optimizing the deformable registration for
histology images obtained from highly deformable human breast specimens. Finally, the
histology volumes of five lumpectomy specimens are reconstructed using the proposed
framework to study tumour features in 3D, specifically tumour volume and focality.
The proposed approach is shown to be suitable for 3D histology volume reconstruction from 2D
histology images of breast lumpectomy specimens. The average target registration error for the

iii
breast specimens was measured as 0.47 ± 0.31 mm based on manually selected landmarks and
the optimized deformable registration was shown to significantly improve the registration
comparing to rigid registration. It is also shown that this method has the potential to provide
more accurate information about 3D tumour measurements, such as volume, and presence of
multi-focality.

iv
Acknowledgments
I would like to thank the following people for their help and support throughout my Ph.D. work:
My supervisor Dr. Anne Martel and members of my supervisory committee Dr. Martin Yaffe
and Dr. John Sled for their insightful comments and guidance;
Dr. Sharon Nofech-Mozes and Dr. Naomi Matsuura for lending their expertise to my research;
The past and present members of Dr. Yaffe’s group, Melissa Hill, Gordon Mawdsley, Tigran
Karavardanyan, Sam Shen, Yulia Yerofeyeva, Alison Cheung, Taha Rashed, Kela Liu, Rachel
Peters, Adebayo Adeeko, Cindy Wang and James Mainprize for their great assistance in my
experimental work and scientific discussions;
All past and present members of Dr. Martel’s group for their support and encouragement;
All my friends and fellow graduate students, Nazanin Hosseinkhah, Golnaz Farhat, Hatef
Mehrabian, Janet Arani, Melissa Hill, Rachel Chan, Wendy Oakden, Mahta Karimpoor, Zahra
Faraji-Dana, Laleh Golestanirad, Farzad Khalvati, Cristina Gallego, Mohammad Peikari,
Sharmila balasingham, and Taraneh Azizi for their help, support and useful discussions;
My research collaborators, Dr. Arun Seth, Stephanie Bacopulos, Wenyi Yang, for their valuable
help in my research;
My husband, Ali Tizghadam, for his constant love, support and encouragement;
My son, Pedram Tizghadam, for his patience over many years of my graduate studies;
My sister, Nooshin Shojaei for her endless support and love;
This thesis is dedicated to the memory of my beloved parents, Farkhondeh Mohaghegh and
Kamal Shojaei, whom I miss every day of my life. The completion of this work would not have
been possible without their unconditional support.

v
Table of Contents
Acknowledgments.......................................................................................................................... iv
Table of Contents .............................................................................................................................v
List of Tables ...................................................................................................................................x
List of Figures ................................................................................................................................ xi
List of Abbreviations .................................................................................................................. xvii
Academic Curriculum Vitae ........................................................................................................ xix
Statement of Contributions .......................................................................................................... xxi
1 Introduction and Background ......................................................................................................1
1.1 Background ..........................................................................................................................1
1.1.1 Breast Cancer ...........................................................................................................1
1.1.2 Breast Anatomy, Physiology ...................................................................................1
1.1.3 Cellular Biology .......................................................................................................3
1.1.4 DCIS and its progression to invasive and metastatic disease ..................................3
1.1.5 Histology and Histopathology .................................................................................3
1.1.5.1 H&E Stain .................................................................................................5
1.1.5.2 Other commonly used staining processes ..................................................6
1.1.6 Surgical Pathology ...................................................................................................6
1.1.7 Whole-mount vs Conventional Histopathology .......................................................8
1.1.8 Digital Histology ......................................................................................................9
1.1.9 3D Histology and its Significance .........................................................................10
1.2 Histology Volume Reconstruction .....................................................................................10
1.3 Image Registration .............................................................................................................11
1.3.1 Image Transformations ..........................................................................................12

vi
1.3.1.1 Rigid Registration ....................................................................................12
1.3.1.2 Affine Registration ..................................................................................12
1.3.1.3 Deformable Registration .........................................................................12
1.3.2 Image Registration Metrics ....................................................................................13
1.3.2.1 Point-Based ..............................................................................................13
1.3.2.2 Intensity-Based ........................................................................................13
1.3.2.3 Features-Based ........................................................................................14
1.3.1 Research Context ...................................................................................................14
1.3.2 Challenges ..............................................................................................................18
1.3.2.1 Sparse Sampling of Clinical Specimens ..................................................18
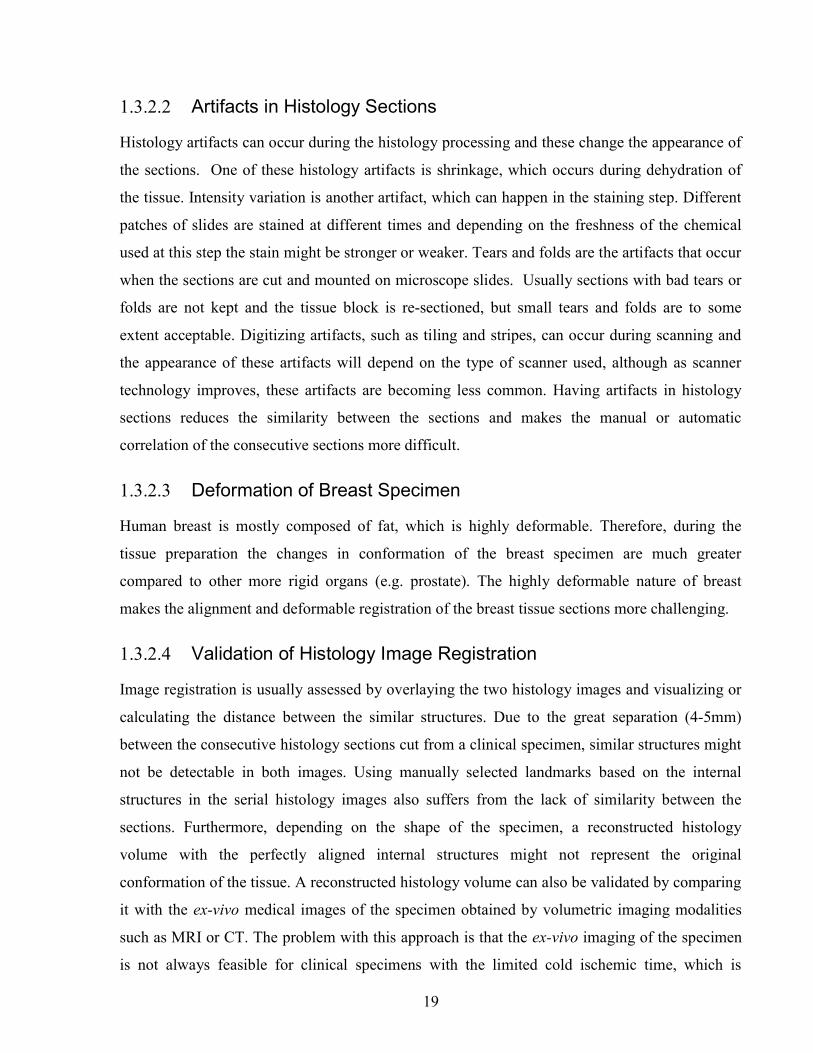
1.3.2.2 Artifacts in Histology Sections ................................................................19
1.3.2.3 Deformation of Breast Specimen ............................................................19
1.3.2.4 Validation of Histology Image Registration ............................................19
1.4 Hypothesis and Outline of this Thesis ...............................................................................20
2 A Pipeline for 3D Histology Volume Reconstruction ..............................................................21
2.1 Introduction ........................................................................................................................21
2.2 Material and Methods ........................................................................................................24
2.2.1 Specimen and Histology and .................................................................................24
2.2.2 Reference Images ...................................................................................................25
2.2.3 Alignment of Blockface Images ............................................................................26
2.2.4 Image Segmentation and Point Selection ..............................................................27
2.2.5 Fourier Descriptors (FDs) ......................................................................................28
2.2.6 Iterative Closest Points (ICP).................................................................................30
2.3 Results ................................................................................................................................30
2.4 Summary and Discussion ...................................................................................................33
3 Registration of Histology with Volumetric Images ..................................................................36

vii
3.1 Introduction ........................................................................................................................36
3.2 Requirements of the Image Registration Pipeline .............................................................38
3.2.1 Deformable Registration ........................................................................................38
3.2.2 Extendable for registration of histology to medical images ..................................39
3.2.3 Validation ...............................................................................................................39
3.3 Material and Methods ........................................................................................................39
3.3.1 Specimen ...............................................................................................................39
3.3.2 Reference Images ...................................................................................................40
3.3.3 A Multi-Modality Fiducial Marker ........................................................................40
3.3.4 Imaging ..................................................................................................................41
3.3.5 Histology ................................................................................................................42
3.3.6 Image Registration Pipeline ...................................................................................43
3.3.6.1 Segmentation, Point Selection, and Rigid Registration ...........................44
3.3.6.2 Deformable Registration .........................................................................47
3.3.6.3 Validation ................................................................................................48
3.3.6.4 Blockface image spacing .........................................................................49
3.4 Results ................................................................................................................................50
3.4.1 Fiducial Markers ....................................................................................................50
3.4.2 Blockface Volume .................................................................................................56
3.4.3 Reconstruction of a 3D histology volume from serial sections .............................56
3.4.4 Correlation of ex vivo MR to Histology ................................................................57
3.5 Summary and Discussion ...................................................................................................60
4 Optimization of Deformable Registration for Breast Histology Images ..................................63
4.1 Introduction ........................................................................................................................63
4.2 Materials and Methods .......................................................................................................65
4.2.1 Specimen ................................................................................................................66

viii
4.2.2 Dense SIFT Features ..............................................................................................67
4.2.3 Affine Registration.................................................................................................68
4.2.4 Deformable Registration ........................................................................................68
4.2.5 SIFTFlow Parameter Optimization ........................................................................69
4.2.6 Registration using Edge Points ..............................................................................71
4.2.7 Validation ...............................................................................................................72
4.3 Results ................................................................................................................................72
4.3.1 Affine Registration.................................................................................................72
4.3.2 Deformable Registration ........................................................................................74
4.3.2.1 Effect of regularization parameters on SIFTFlow registration ................74
4.3.2.2 Identifying paired landmarks for the assessment of deformable registration ...............................................................................................75
4.3.2.3 Comparing edge-based deformable registration with SIFTFlow. ...........77
4.3.3 Accuracy of optimized SIFTFlow on an independent test dataset. .......................80
4.4 Discussion ..........................................................................................................................80
4.5 Summary and Conclusion ..................................................................................................82
5 Breast Histology Volume Reconstruction and 3D Tumour Measurement ...............................83
5.1 Introduction ........................................................................................................................83
5.2 Materials and Methods .......................................................................................................85
5.2.1 Overview ................................................................................................................85
5.2.2 One Specimen and Multiple Tissue Blocks ...........................................................86
5.2.3 Specimen ................................................................................................................87
5.2.4 Alignment of the blockface images .......................................................................89
5.2.5 Outlining the Tumour Regions ..............................................................................90
5.2.6 Histology Image Registration ................................................................................90
5.2.7 Validation ...............................................................................................................90
ix
5.2.8 Tumour 3D Measurements ....................................................................................91
5.2.8.1 Volume ....................................................................................................91
5.2.8.2 Tumour Focality ......................................................................................91
5.3 Results ................................................................................................................................92
5.3.1 Alignment of the blockface images .......................................................................92
5.3.2 Histology Image Registration and Validation........................................................94
5.3.3 Tumour Volume and Multi-focality.......................................................................95
5.4 Summary and Discussion .................................................................................................100
6 Summary and Future Directions .............................................................................................102
6.1 Summary ..........................................................................................................................102
6.2 Future Improvements to the Image Registration Framework ..........................................104
6.2.1 Correlation at Higher Resolutions .......................................................................104
6.2.2 A Generic Modular Image Registration Software ...............................................104
6.3 Future Directions of Applications ....................................................................................105
6.3.1 Correlation of Different Disease Bio-Markers ....................................................105
6.3.2 Correlation of ex vivo Medical Images with Histology .......................................109
6.3.3 Correlation of in vivo Medical Images with Histology ........................................110
6.4 Conclusion .......................................................................................................................112
Bibliography ................................................................................................................................115
x
List of Tables
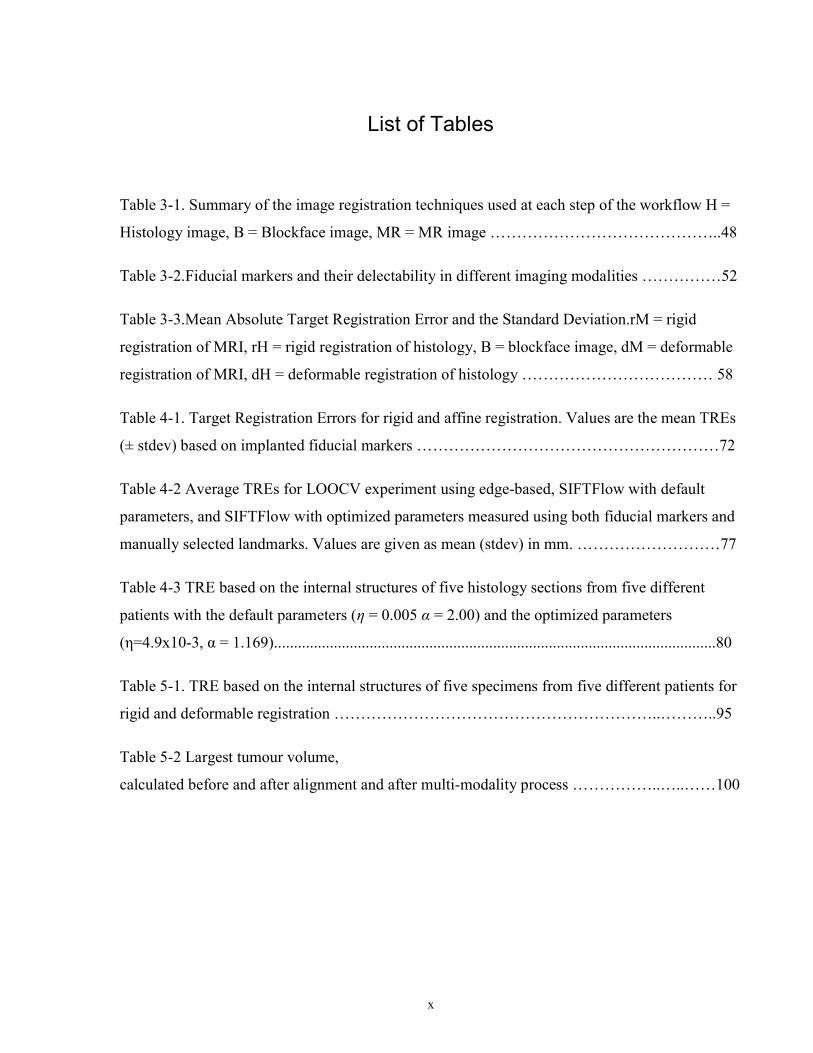
Table 3-1. Summary of the image registration techniques used at each step of the workflow H =
Histology image, B = Blockface image, MR = MR image ……………………………………..48
Table 3-2.Fiducial markers and their delectability in different imaging modalities ……………52
Table 3-3.Mean Absolute Target Registration Error and the Standard Deviation.rM = rigid
registration of MRI, rH = rigid registration of histology, B = blockface image, dM = deformable
registration of MRI, dH = deformable registration of histology ……………………………… 58
Table 4-1. Target Registration Errors for rigid and affine registration. Values are the mean TREs
(± stdev) based on implanted fiducial markers …………………………………………………72
Table 4-2 Average TREs for LOOCV experiment using edge-based, SIFTFlow with default
parameters, and SIFTFlow with optimized parameters measured using both fiducial markers and
manually selected landmarks. Values are given as mean (stdev) in mm. ………………………77
Table 4-3 TRE based on the internal structures of five histology sections from five different
patients with the default parameters (η = 0.005 α = 2.00) and the optimized parameters
(η=4.9x10⁻³, α = 1.169)...............................................................................................................80
Table 5-1. TRE based on the internal structures of five specimens from five different patients for
rigid and deformable registration ……………………………………………………..………..95
Table 5-2 Largest tumour volume,
calculated before and after alignment and after multi-modality process ……………..…..……100

xi
List of Figures
Figure 1-1: “Breast Anatomy Female”: For the National Cancer Institute © 2011Terese Winslow
LLC, U.S. Govt. has certain rights. (Image used by permission from Terese Winslow LLC). ...... 2
Figure 1-2: Duct and its transformation from normal to IDC. (Image used with permission from
Aegis Creative Communications, Inc.) ........................................................................................... 3
Figure 1-3: A part of 4μm thick histology section of breast stained with H&E showing different
structures of the breast. ................................................................................................................... 5
Figure 1-4. General block diagram of image registration workflow ............................................ 11
Figure 1-5.Transformations in Image registration: a) Source image. b) Rigid. c) Affine. d)
Deformable. .................................................................................................................................. 13
Figure 1-6 The coronal view of all ducts and their branches in an autopsy breast, reconstructed
by Going et al. (Going & Moffat, 2004). Each Roman numeral refers to a different independent
duct system. Some colours are used for more than one duct system (Image used by permission
from John Wiley & Sons, Ltd). ..................................................................................................... 15
Figure 1-7 Three-dimensional reconstruction of a nipple by Rusby et al. (Rusby et al., 2007).
Skin in tan, cut edge in yellow and ducts in purple. (A) the ducts are arranged in a central bundle
(B) the bundle narrows to a waist just beneath the skin (C) some ducts originate on the areola or
part way up the nipple (D) most ducts narrow as they approach the tip of the nipple (E) many of
the ducts have a common orifice (Image used by permission from Springer Science + Business
Media, LLC). ................................................................................................................................ 15
Figure 1-8 The selected 3D reconstruction of the subvolume in case B containing DCIS (yellow)
and surrounding invasion (orange). (A) and (B) show the DCIS and the surrounding invasion and
C, the DCIS alone. No continuity between in situ and invasive disease was identified. D shows
the lumina (green) within the DCIS. The lumina were mostly continuous throughout the ductal
xii
structure, with additional multiple small, unconnected lumina (Image used by permission from
John Wiley & Sons, Ltd). ............................................................................................................. 16
Figure 1-9 The scanned whole-mount images aligned manually using Sedeen viewer for volume
measurement. The reconstructed 3D tumour volume in following dimensions: (a) superior to
inferior, (b) medial to lateral (Image distributed under the Creative Commons Attribution
License). ........................................................................................................................................ 18
Figure 2-1 Histology volume reconstruction; histology images are registered to their optical
blockface images, which represent the shape of the specimen before it is cut into histology
sections. ......................................................................................................................................... 24
Figure 2-2. a) Blockface imaging setup with telecentric lens. b) a blockface image of a mouse
mammary gland with three 1mm holes drilled in three corners of the block. .............................. 26
Figure 2-3 Alignment of the blockface images using the registration holes. ............................... 27
Figure 2-4 Block diagram of histology volume reconstruction using boundary points ............... 29
Figure 2-5: a) blockface volume of the wild-type gland. b) histology volume of the wild-type
gland. c) blockface volume of Igfbp7-null gland. d) histology volume of Igfbp7-null gland ...... 31
Figure 2-6. 5x magnification of a cropped region from two aligned consecutive histology images
of the Igfbp7-null mammary gland. Due to large separation between slices structures are not
continuous but that the alignment process has worked as it is clear that the two images are clearly
from the same region. ................................................................................................................... 32
Figure 2-7. A region cut from four aligned consecutive sections at high resolution shows the
continuation of the 3D alveolar structures. Top) Wild-type. Bottom) Igfbp7-null gland. ............ 33
Figure 3-1. Overall pipeline for the histology volume reconstruction and registration of medical
images with histology. .................................................................................................................. 38
Figure 3-2 A mouse kidney with fiducial markers embedded in agarose..................................... 39
Figure 3-3. Images of a mouse tumour with validation fiducial markers: a) ex vivo MRI, b)
blockface image, c) Histology. ..................................................................................................... 42
xiii
Figure 3-4.a) Edge points of a histology image, b) Surface points of the MR volume, c) Surface
points of the Blockface volume. ................................................................................................... 44
Figure 3-5.The block diagram of the 3D histology volume reconstruction. ................................. 46
Figure 3-6.Eliminating pairs of blockface and histology images to increase the spacing. ........... 50
Figure 3-7. Mouse Kidney with Catheter filled with Cuttlefish ink & flour (left) and Liquid iron
& flour (right) ............................................................................................................................... 53
Figure 3-8. a) Optical image of a mouse tumour with three different fiducial markers: Black
Spaghetti, Catheter filled with bronze metallic paint and glue, Catheter filled with ground black
spaghetti and water. b) MR image of the same specimen scanned at 7T scanner. c) x-ray of a
mouse kidney with black spaghetti. .............................................................................................. 54
Figure 3-9. Top: mixture of bronze metallic paint and glue in catheter, a) blockface image b)
histology image. Bottom: black spaghetti in thigh muscle of a mouse, c) blockface image d) and
the histology image. ...................................................................................................................... 55
Figure 3-10. a) Blockface image, b) Blockface volume, arrows show three holes in the corners of
the paraffin tissue block ................................................................................................................ 56
Figure 3-11.a) cross-section of the blockface volume. b) same cross-section on histology volume
reconstructed using blockface images as a reference. c) same cross-section of the histology
volume reconstructed using pairwise registration without the blockface images. ........................ 57
Figure 3-12.a) Registered MR volume, b) blockface volume, c) histology volume. ................... 58
Figure 3-13.a) Registered MR image. b) Blockface image. c) Correspondent deformed Histology
image. ............................................................................................................................................ 59
Figure 3-14.Fitted lines to the centroid of the fiducial markers in 3D; a) rigid MRI in blue and
correspondent histology in red, b) deformed MRI in green and correspondent histology in red . 60
Figure 4-1 (a) 4mm slice of the fresh tissue. (b) Blockface image (90 angle) (c) Blockface
image (oblique angle) (d) H&E stained whole-mount image. ...................................................... 67

xiv
Figure 4-2 Flow chart outlining the joint parameter optimization method ................................... 70
Figure 4-3 Rigid registration of a histology image to the corresponding blockface image; a)
blockface image with boundary in blue (figure best viewed in colour). b) histology image with
manually defined boundary shown in red and blockface boundary in blue. Aligned histology
images: c) using edge-based method and d) using dense SIFT features. The boundary of the
blockface image is overlaid on both aligned histology images for comparison. .......................... 73
Figure 4-4 The deformation fields calculated with different settings for η and α are applied to a
grid image in order to visualize the effects of changing the regularization parameters. The top
row shows that increasing α results in smoother displacement: a) η =0.005, α =1. b) η =0.005, α
=2. The bottom row shows the effect of increasing η: c) η =0.0005,α =2 d) η=0.1, α =2. d was
fixed at the default value of 40 in all cases. .................................................................................. 74
Figure 4-5 Sensitivity of TRE (measured using the implanted fiducial markers) to the SIFTFlow
parameters: a) η, b) α, and c) d. .................................................................................................... 75
Figure 4-6 Two pairs of blockface and histology images with different sizes and composition.
Top row shows the a) blockface and b) histology images of a small section, which mostly
contains fat. Bottom row shows the c) blockface and d) histology images of a larger section with
more fibroglandular tissue and higher number of selected landmarks. The arrows on the
blockface images show the selected landmarks. ........................................................................... 76
Figure 4-7 Images from case # 04; a) Blockface image. b) histology registered using edge-based
method, the circle shows a missing part of the tissue section in histology image, which can
degrade the result of the registration. c) histology registered using default SIFTFlow parameters.
d) histology registered using optimized SIFTFlow. The arrows point to some of the areas that are
more accurately registered when the optimized parameters are used. .......................................... 79
Figure 5-1 Illustration of a) the misalignment of tissue slices, when they are embedded in
paraffin separately, b) the use of fiducial markers inserted in gel around the tissue for correcting
the alignment of the blockface images obtained from multiple tissue slices, d) the guiding device
for accurate insertion of the fiducial markers. .............................................................................. 87
xv
Figure 5-2. (a) The jig to guide the fiducial markers. (b) Tissue block fixed on a platform for CT
scan. (c) 4mm slices of the tissue block. ....................................................................................... 88
Figure 5-3. (a) CT image. (b) 4mm slice of the fresh tissue. (c) Straight blockface image. (d)
Angled blockface image. (e) H&E stained histology image. ........................................................ 89
Figure 5-4.Alignment of the blockface images using the fiducial markers in gel. Centre points of
the fiducial markers are shown in blue and the intersection points of the fitted lines in red. a)
Fiducial markers and the fitted lines before alignment, b) fiducial markers after alignment, c) top
view of the fiducial markers before registration, d) top view of the fiducial markers after
registration. ................................................................................................................................... 93
Figure 5-5. Comparison of the alignment of the fiducial markers in (a) blockface images with (b)
CT images. c) Segmented fiducial markers from CT images ....................................................... 94
Figure 5-6. Screen shot of Sedeen viewer software showing two outlined tumour regions. ........ 96
Figure 5-7 3D stack of the tumour regions. a) before registration. b) Overlay of the tumour
regions on the histology sections after alignment ......................................................................... 96
Figure 5-8. Verification of tumour focality using X-ray images of the tissue blocks. a) Histology
image with one non-overlapping tumour region shown with large arrow. b) X-ray image of the
correspondent block. c) The region with ambiguous connectivity in X-ray image, larger arrow, is
zoomed in and shows no connectivity, small arrow, between the regions. d) The same region in
the X-ray image of the previous block shows no connectivity either. e) A histology image from a
different block with one non-overlapping tumour regions shown with large arrow, f) the
correspondent X-ray image. g) The region with a non-overlapping region is zoomed in and
shows the connection, specified with a small arrow, of the isolated region to the main tumour
region. ........................................................................................................................................... 98
Figure 5-9. 3D tumour volume, a) original tumour regions. b) main tumour after removing the
non-overlapping tumour regions, c) after registration, d) after X-ray assessment. ...................... 99
Figure 6-1 Consecutive histology images with different stains. a) H&E Histology image. b) ER
Histology image .......................................................................................................................... 106

xvi
Figure 6-2 Fusion of the registered images, a) with Liu et al.’s parameters, b) with optimized
parameters. Arrow show the areas, which have been improved with optimized parameters. .... 107
Figure 6-3 Selected regions at high resolution (the images are downsized to fit in this space). a)
H&E region, b) ER region, c) deformed ER using Liu et al.’s parameters, d) deformed ER using
optimized parameters. e) fusion of H&E and the deformed ER using Liu et al.’s parameters, f)
fusion of H&E and the deformed ER using optimized parameters. Arrows mark some of the
places that the deformable registration has been improved by using optimized parameters. ..... 108
Figure 6-4. Correspondent histology (a) and CT (b) images of a human breast specimen. ....... 109
Figure 6-5 Study of the Impact of Tumour Focality on Surgical Management by Tot et al. (Tot &
Gere, 2016). (Image obtained from the open access article distributed under the Creative
Commons Attribution License)................................................................................................... 111
Figure 6-6. Registration of in vivo medical images with histology using the ex vivo images as
intermediate reference images. ................................................................................................... 112

xvii
List of Abbreviations
2D Two-dimensional
3D Three-dimensional
ADH Atypical Ductal Hyperplasia
BIRL Biomarker Imaging Research Laboratory
CT Computed Tomography
DCIS Ductal Carcinoma in Situ
DWI Diffusion Weighted Imaging
ER Estrogen Receptor
FD Fourier Descriptors
H&E Haematoxylin and eosin
ICP Iterative Closest Points
IDC Invasive Ductal Carcinoma
Igfbp7 Insulin-like growth factor-binding protein 7
IHC Immunohistochemistry
ILC Invasive Lobular Carcinoma
ITK Insight ToolKit
kV kilo Voltage (applied to X-ray tube)
LOOCV Leave One Out Cross Validation
xviii
MDA Metastatic Ductal Adenocarcinoma
MI Mutual Information
MRI Magnetic Resonance Imaging
mTRE Mean Target Registration Error
NBF Neutral Buffered Formalin
OCT Optical Coherence Tomography
PR Progesterone Receptor
SCID Severe Combined Immunodeficiency
Sedeen Selective Decoding and Encoding Engine
SIFT Scale Invariant Feature Transform
SRI Sunnybrook research Institute
stdev Standard Deviation
TDLU Terminal Ductal Lobular Unit
TPS Thin Plate Spline
TRE Target Registration Error
US Ultrasound

xix
Academic Curriculum Vitae
Peer Reviewed Publications
The work presented in this thesis is based on the following manuscripts:
Chapter 2:
Rushin Shojaii, Stephanie Bacopulos, Wenyi Yang, Tigran Karavardanyan, Demetri
Spyropoulos, Afshin Raouf, Anne Martel, and Arun Seth, “Reconstruction of 3-Dimensional
Histology Volume and its Application to Study Mouse Mammary Glands”, Journal of Visualized
Experiments (JoVE), (89), e51325, doi: http://dx.doi.org/10.3791/51325, (2014)
Chapter 4:
Rushin Shojaii, and Anne L. Martel, “Optimized SIFTFlow for Registration of Whole-Mount
Histology to Reference Optical Images”, SPIE Journal of medical Imaging (JMI),
doi:http://dx.doi.org/10.1117/1.JMI.3.4.047501, (2016)
Chapter 5:
Rushin Shojaii, Martin J. Yaffe, Anne L. Martel, “Breast Histology Volume Reconstruction from
whole-mount Slides and its Application in Characterization of 3D Features of Tumour” In
submission to Histopathology, (2016)
xx
Conference Presentations and Proceedings
The work presented in this thesis has been shared at the following conferences:
Chapter 3:
Rushin Shojaii, Tigran Karavardanyan, Martin Yaffe, and Anne L. Martel, “Validation of Histology Image Registration”, SPIE Medical Imaging, 2011.
Rushin Shojaii, and Anne L. Martel, “Multi-Modality fiducial marker for validation of registration of medical images with histology”, SPIE, Medical Imaging, 2010.
Rushin Shojaii, and Anne L. Martel, “3D Histology Volume Reconstruction”, Pathology Informatics, September 2010.
Rushin Shojaii, and Anne L. Martel “A Novel Edge Point Selection Method for Registration of Histology Images”, MICCAI (OPTIMHisE) Workshop, 2009.
Additional Collaborative Work:
Melissa L. Hill, Kela Liu, James G. Mainprize, Ronald B. Levitin, Rushin Shojaii, Martin J.
Yaffe, “Pre-clinical Evaluation of Tumour Angiogenesis with Contrast-Enhanced Breast
Tomosynthesis”, IWDM, LNCS 7361, pp. 1-8, 2012

xxi
Statement of Contributions
In chapter 2, I developed the 3D histology volume reconstruction methodology with the
supervision and guidance of my supervisor, Dr. Anne Martel. I also directed the preparation of
the image data in compliance with the developed methodology. Dr. Spyropoulos, Dr. Raouf, and
Dr. Seth were responsible for providing the preclinical animal models, and the biological and
histological findings were analyzed by Stephanie Bacopulos and Wenyi Yang under the
supervision of Dr. Arun Seth.
In chapters 3, 4 and 5, I developed the methodology, and conducted the experiments. The animal
specimen was obtained from Dr. William Tran in Dr. Czarnota’s lab. The human breast
specimens were obtained through a study conducted by Dr. Gina Clarke at Biomarker Imaging
Research Laboratory (BIRL) under the supervision of Dr. Martin Yaffe. All human tissue
processing was carried out by the BIRL, a clinically accredited facility. Image data (digitized
slides, X-ray and CT images) from human specimens was acquired by BIRL and Sam Shan in
Dr.Yaffe’s lab according to the specifications provided by me. For the work in these chapters, I
also developed the multimodality fiducial markers, designed a device to guide and implant the
markers and oversaw the construction of the device.
In Chapter 3 the Ultrasound images were acquired in Dr. Czarnota’s lab, MR images by Dr.
Stanisz’s lab and X-ray images by Dr. Melissa Hill in Dr. Yaffe’s lab.
The blockface imaging used in all chapters was done in collaboration with Mr. Tigran
Karavardanyan under the supervision of Dr. Martin Yaffe and Gord Mawdsley.

1
1 Introduction and Background
This Chapter will outline the motivation for the development of an automatic image registration
workflow for 3D histology volume reconstruction. An overview is given of breast cancer and the
role of pathology in diagnosis and prognosis. A general outline of 3D histology volume
reconstruction and its applications in pathology is also explained. An introduction is given to
different image registration techniques. It is proposed that image registration methods can be
employed to develop an automatic pipeline to accurately reconstruct histology volume from 2D
images of the whole-mount histology sections obtained from clinical specimens.
1.1 Background
1.1.1 Breast Cancer
Breast cancer is the most common cancer among Canadian women after non-melanoma skin
cancer (“Breast cancer statistics,” 2015). It is the second cause of cancer death for women after
lung cancer (“Breast cancer statistics,” 2015). Routine breast screening program with X-ray
mammography has significantly reduced mortality (“National Cancer Institute,” 2015). Breast
cancer is diagnosed through X-ray mammography along with ultrasound and magnetic resonance
imaging for cases with discordant imaging findings (Michell, 2010). There is ongoing research
into new techniques to detect and treat cancer in its earlier stages in order to increase the survival
rate. Cancer diagnosis is always confirmed by surgical pathology as the gold standard. Surgical
pathology is concerned with the diagnosis based on the gross (macroscopic) and histologic
(microscopic) findings and may involve immunohistochemistry for molecular examination of the
excised tissue or other laboratory tests (Weider, 2009).
1.1.2 Breast Anatomy, Physiology
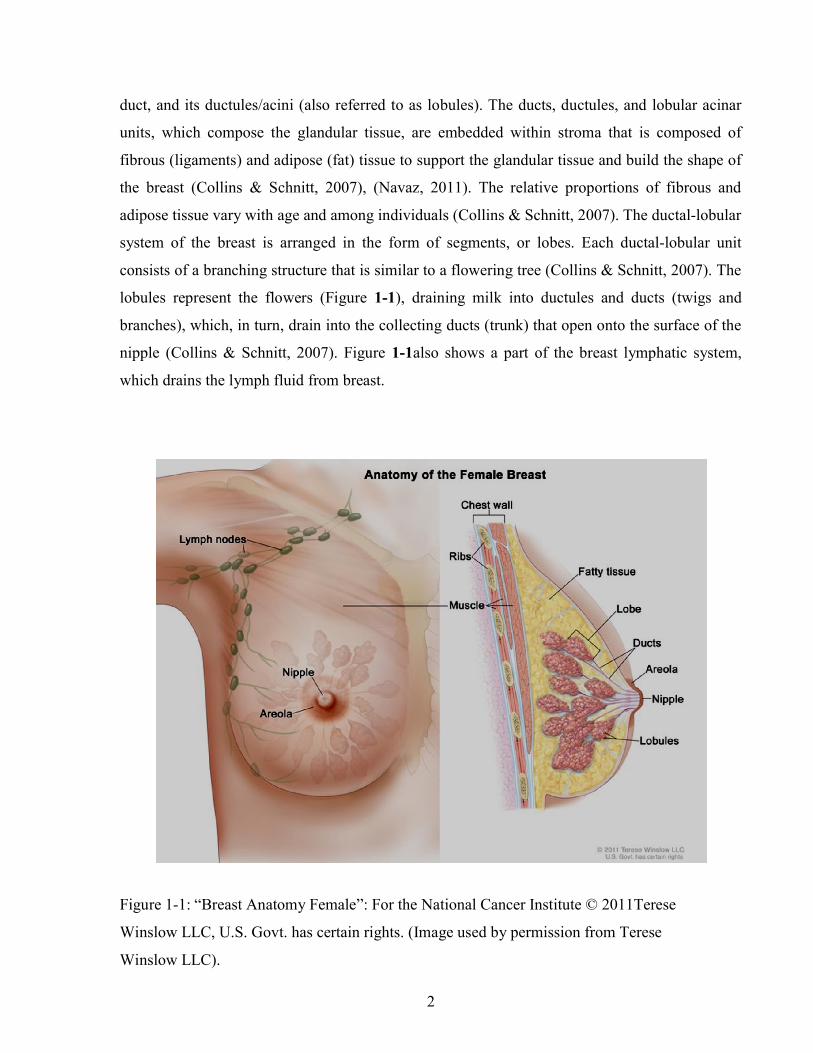
Breast parenchyma (Figure 1-1) consists of 15 to 20 lobes, which drain secretions (milk) into the
ductal system that converges and opens into the nipple (Navaz, 2011). The functional unit of the
breast is the terminal duct lobular unit (TDLU), which is composed of the terminal (intralobular)
2
duct, and its ductules/acini (also referred to as lobules). The ducts, ductules, and lobular acinar
units, which compose the glandular tissue, are embedded within stroma that is composed of
fibrous (ligaments) and adipose (fat) tissue to support the glandular tissue and build the shape of
the breast (Collins & Schnitt, 2007), (Navaz, 2011). The relative proportions of fibrous and
adipose tissue vary with age and among individuals (Collins & Schnitt, 2007). The ductal-lobular
system of the breast is arranged in the form of segments, or lobes. Each ductal-lobular unit
consists of a branching structure that is similar to a flowering tree (Collins & Schnitt, 2007). The
lobules represent the flowers (Figure 1-1), draining milk into ductules and ducts (twigs and
branches), which, in turn, drain into the collecting ducts (trunk) that open onto the surface of the
nipple (Collins & Schnitt, 2007). Figure 1-1also shows a part of the breast lymphatic system,
which drains the lymph fluid from breast.
Figure 1-1: “Breast Anatomy Female”: For the National Cancer Institute © 2011Terese
Winslow LLC, U.S. Govt. has certain rights. (Image used by permission from Terese
Winslow LLC).
3
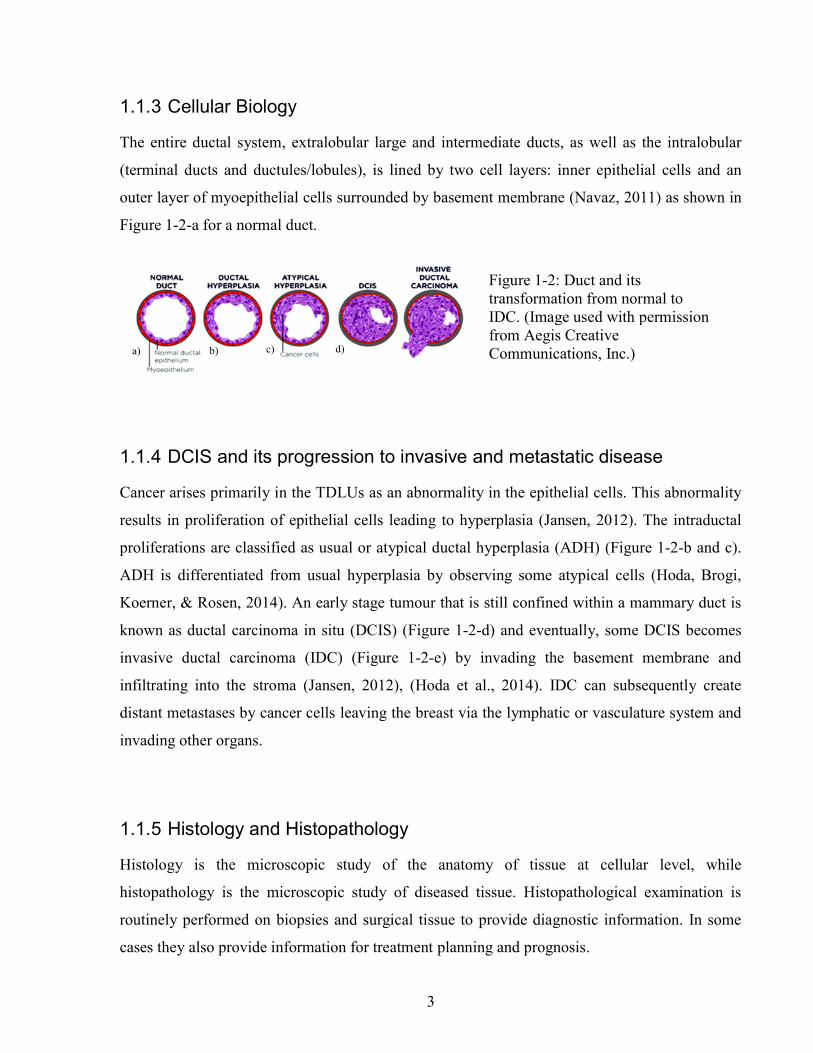
1.1.3 Cellular Biology
The entire ductal system, extralobular large and intermediate ducts, as well as the intralobular
(terminal ducts and ductules/lobules), is lined by two cell layers: inner epithelial cells and an
outer layer of myoepithelial cells surrounded by basement membrane (Navaz, 2011) as shown in
Figure 1-2-a for a normal duct.
1.1.4 DCIS and its progression to invasive and metastatic disease
Cancer arises primarily in the TDLUs as an abnormality in the epithelial cells. This abnormality
results in proliferation of epithelial cells leading to hyperplasia (Jansen, 2012). The intraductal
proliferations are classified as usual or atypical ductal hyperplasia (ADH) (Figure 1-2-b and c).
ADH is differentiated from usual hyperplasia by observing some atypical cells (Hoda, Brogi,
Koerner, & Rosen, 2014). An early stage tumour that is still confined within a mammary duct is
known as ductal carcinoma in situ (DCIS) (Figure 1-2-d) and eventually, some DCIS becomes
invasive ductal carcinoma (IDC) (Figure 1-2-e) by invading the basement membrane and
infiltrating into the stroma (Jansen, 2012), (Hoda et al., 2014). IDC can subsequently create
distant metastases by cancer cells leaving the breast via the lymphatic or vasculature system and
invading other organs.
1.1.5 Histology and Histopathology
Histology is the microscopic study of the anatomy of tissue at cellular level, while
histopathology is the microscopic study of diseased tissue. Histopathological examination is
routinely performed on biopsies and surgical tissue to provide diagnostic information. In some
cases they also provide information for treatment planning and prognosis.
a) b) c) d)
Figure 1-2: Duct and its transformation from normal to IDC. (Image used with permission from Aegis Creative Communications, Inc.)
4
After gross examination, the excised tissue undergoes a series of histological processes to be
observed with light or electron microscopes. The specimen is first bread loafed into 4mm slices
to make it more exposed to the chemical solutions and to increase the diffusion of the chemical
solutions to the tissue (Sun, Wang, Zubovits, Yaffe, & Clarke, 2009). The tissue slices then
undergo different steps of histological processes, which are briefly explained below (Pakurar &
Bigbee, 2004):
Chemical Fixation is the first step of the histological processes, which preserves the
cellular structure and maintains the distribution of the organelles. One of the most
commonly used chemical fixatives is Formaldehyde, which is also referred to as
Formalin in neutral buffered solution. It stabilizes protein by forming cross-link
between primary amino groups.
Dehydration of the tissue is the next step. Tissue water is not miscible with the
embedding solution. The purpose of dehydration of tissue is to replace tissue water
with alcohol at a series of increasingly higher concentrations. The alcohol is then
replaced by an intermediate solvent, which is miscible with both alcohol and
embedding solution.
Infiltration and embedding of the tissue are the two steps which replace the
intermediate solvent with the embedding compound (e.g. paraffin wax or epoxy
plastic) and when the embedding medium is solidified in a mold a tissue block is
built. Infiltration and embedding provide rigidity to the tissue and prepare it for the
next step, which is sectioning the tissue block.
Sectioning of the tissue involves cutting thin sections of the tissue block. The sections
should be thin enough to allow light or electrons to pass through. The thickness of the
sections is between 1μm to 20 μm for light microscopy and 60 μm to 100μm for
electron microscopy.
Staining is one of the important steps of histological processing, which provides contrast to the
tissue section for visualization. The choice of staining dyes depends on the structures to be
visualized (Pakurar & Bigbee, 2004). Some common staining mechanisms are explained in the
next section.

5
1.1.5.1 H&E Stain
Figure 1-3 demonstrates the microscopic appearance of different structures of breast in a 4μm
thick histology section stained with hematoxylin and eosin (H&E). Hematoxylin and eosin are
the most commonly used stains in histology and histopathology for light microscopy.
Hematoxylin binds to the negatively charged basophilic tissue components, mostly nucleic acids
in cell nuclei, and colours them purple-blue. On the other hand Eosin binds to the positively
charged eosinophilic components such as cytoplasm, stroma, and muscle fibers and colours them
pink. Red blood cells are stained red by eosin (Pakurar & Bigbee, 2004).
Collagen
Normal Duct
Blood vessel
Fat
100μm
Ductal Hyperplasia
Normal Ducts
Figure 1-3: A part of 4μm thick histology section of breast stained with H&E showing different
structures of the breast.
6
1.1.5.2 Other commonly used staining processes
Histochemistry localizes chemical groups by using chemical reactions between laboratory
chemicals and different tissue components (Pakurar & Bigbee, 2004).
Immunohistochemistry (IHC) localizes specific antigens by using labeled antibodies. It uses the
principal of the antibody-antigen interaction to visualize the location of the antigens.
In situ hybridization uses labeled nucleotide probes for detection of messenger RNA or genomic
DNA.
Electron microscopy requires staining the tissue sections with salts of heavy metals (i.e. lead
citrate and uranyl acetate). These metals bind to the negatively charged areas and block the
passage of the electrons through the tissue and create a dark area in the electron micrograph. The
structures which bind the metals are electron dense and the structures which do not bind to the
metals are referred to electron lucent.
1.1.6 Surgical Pathology
Biopsies and surgical resections are the main types of specimens which are submitted for
surgical pathology. Surgical pathologists examine the stained section to provide an accurate,
specific, and sufficiently comprehensive diagnosis to enable the clinician to come up with an
optimal treatment plan and, to some extent, estimate prognosis (Connolly, Schnitt, Wang, & Al.,
2003). They complete a gross examination of the fresh excised tissue followed by a thorough
examination of the stained tissue sections in a microscope. At the time of excision the specimen
is marked with clips or sutures to provide anatomic orientation.
The gross examination of the specimen includes the description of its appearance and
characteristics. The specimen is measured in three dimensions. If the lesion is visible, it is also
measured in three dimensions along with the distances between the lesion edges and the excision
margins. Excision margins are marked with ink prior to any dissection, permitting accurate
measurement of these distances later in microscopic examination of the sections. All lymph
nodes associated with a cancer specimen are dissected out, described along with their location,
and processed for histology. In addition, breast specimens with calcification often require
specimen radiography of each breadloaf of tissue. The tissue slices are then coded and correlated

7
with radiographs. After grossing, the tissue slices undergo histological processes for microscopic
examination.
Histology sections are examined by the surgical pathologist and, based on the presence or
absence of cellular abnormalities or invasion they decide whether a neoplasm exists. The
pathologist then classifies the neoplasm based on its origin accompanied by other descriptors
such as the gross and microscopic appearance, the degree of cellular differentiation, and benign
or malignant behavior. The tumours with epithelial cell origin are called adenomas or papillomas
when benign and carcinoma when malignant. The carcinomas originating from glandular
epithelium (e.g. in breast) are termed as adenocarcinoma, and squamous cell carcinoma when
from squamous type of epithelium.
Several different types of tumors may arise within an organ, each with its own special
characteristics, prognosis, and therapy response. Infiltrating ductal carcinoma, which accounts
for ~80% of infiltrating breast cancers, and infiltrating lobular carcinoma, which accounts for
~9% of breast cancers, are the two most common types of malignant breast cancer. These two
types of breast cancer have poorer prognosis than other less common types of breast carcinoma
(i.e. tubular, mucinous or colloid, medullary, papillary, and adenoid cystic carcinomas)
(Connolly et al., 2003).
Malignant epithelial tumors that have not extended through the underlying basement membrane
are reported as in situ carcinomas and are potentially cured by complete excision. Malignant
tumor cells that invade lymphatics and veins and travel by lymph or blood flow to distant sites
can cause metastasis and are reported as metastatic carcinomas.
One of the other important tasks of surgical pathologists is to examine the resection margins to
determine whether resection margins are adequate following the surgery. For some tumours the
margins are evaluated based on the frozen section, which can be prepared rapidly while the
patient is still in surgery, so that additional tissue can be removed immediately. As they arise in
soft tissue, the surgical margins for breast tumours are best evaluated in paraffin embedded
sections. It is difficult to obtain good results when cutting sections from frozen tissues containing
fat, such as breast. Sections cut from paraffin embedded tissue, on the other hand, are thinner
with better quality and provide greater certainty of interpretation. If resection margins are
inadequate then the patient is sent for re-excision. In the case of a discrete mass the margins are
8
easily evaluated, but in the case of diffusely infiltrating tumours (e.g. infiltrating lobular
carcinoma) the margins are hardly defined and more difficult to assess. Usually factors such as
the extent of intraductal growth must also be considered when evaluating resection margins
(Connolly et al., 2003).
Another important role of surgical pathologists is in staging, tumour grading, and receptor status,
which has a great value in treatment planning and prognosis. Staging represents the extent of
cancer based on tumour size, lymph node involvement, and the presence of metastasis. Tumour
grading defines the degree of differentiation of the tumour cells and their growth rate and is
based on the pathologist’s judgment while evaluating tumour-specific factors (e.g. mitotic count,
tubule formation). The pathologist also evaluates the expression of cell receptors and antigens
such as estrogen (ER) and progesterone (PR) receptors, and Her2/nue cell surface antigen. The
status of the receptors has a great impact in treatment planning and prognosis (Jansen, 2012),
(Connolly et al., 2003).There are on-going studies on identifying markers to predict the patient
response to different treatments.
1.1.7 Whole-mount vs Conventional Histopathology
Conventional histopathology is based on small rectangles of tissue, roughly 15 x 15 mm in size,
cut from the breadloafed resection specimen. The samples are taken from the tumour regions
during the gross pathologic assessment and the location of each sample is based on the
pathologist’s or pathology assistant’s judgment. One of the limitations of conventional
histopathology is that the specimen is under-sampled and positive margins or multiple foci of
tumour might not be detected (Gupta, Nath, & Layfield, 2003), (Gina M Clarke, Peressotti,
Mawdsley, & Yaffe, 2006). Furthermore, it is difficult to determine the orientation of sections
obtained from the separate samples with respect to each other and to the original 3D specimen.
In order to overcome these limitations, Clarke et al (Gina M Clarke et al., 2006) developed a
method of embedding entire breadloafed resection specimens in paraffin and then cutting whole-
mount sections form the resulting block in order to provide cross-sections through the whole
specimen. The orientation of tumour regions is intact and surgery margins, and multifocality can
be assessed more precisely in 2D whole-mount sections (Gina M Clarke et al., 2006), (Sun et al.,
2009). Microscopic measurement of tumour size, which is used in staging, can also be more

9
accurate in 2D (maximum extent of tumour) using whole-mount sections and also in 3D (tumour
volume) using reconstructed histology volume from whole-mount sections (G M Clarke et al.,
2012).
Tumour size is one of the strong predictive factors of breast cancer survival and is used for
staging of the disease. It is conventionally measured as the maximum linear extent of the tumour
based on the 2D histology sections from the sampled tissue, which might not represent the whole
tumour extent due to under-sampling. Although the use of whole-mount histology sections
improves the 2D measurement of the maximum tumour diameter, tumour volume may still be a
more accurate surrogate for tumour size (G M Clarke et al., 2012). Tumours with different
shapes can have the same 2D extension, but their volumes might be different. It has been shown
(G M Clarke et al., 2012) that tumour volume estimated based on the maximum tumour diameter
overestimates the volume compared to 3D volumetric calculations.
Multimodality is defined as two or more foci, which are separated by intervening normal breast
tissue (Coombs & Boyages, 2005). Multifocality is another important surrogate for prognosis
and is associated with local recurrence (Leopold et al., 1989) and distant metastasis (Pedersen,
Gunnarsdottir, Rasmussen, Moeller, & Lanng, 2004), (Weissenbacher et al., 2010).
Multifocality also affects the assessment of the tumour extent, which is currently based on the
size of the largest foci (Coombs & Boyages, 2005). The total tumour burden predicts the
tendency of breast tumour to metastasize and ignoring the additional tumour burden from small
foci may under-stage the disease (Coombs & Boyages, 2005). Whole-mount histopathology
reduces the problem of losing small tumour foci due to under-sampling the tumour in
conventional histopathology and therefore improves the detection of multiple tumour foci in 2D
sections. The problem of determining whether separate foci seen in one 2D section are actually
part of a single tumour is not resolved by the use of 2D whole-mount histology however.
1.1.8 Digital Histology
Digital pathology was created as a tool to educate students in histology courses (Pakurar &
Bigbee, 2004). It started as a series of digitized micrographs and evolved rapidly into its present
form, which includes the digitization and visualization of all types of stained tissue sections. The

10
images, which are referred to as virtual slides, can be zoomed in and out to simulate the use of a
microscope. Digital pathology is used for both as educational tool at the universities and as a
substitute for traditional microscope laboratories in clinic. It also facilitates the transfer of slides
between different institutes.
1.1.9 3D Histology and its Significance
Although whole-mount histology has made the microscopic assessment of the specimen easier in
two dimensions, the problems with the accurate orientation of the tissue sections with respect to
each other and to the whole intact specimen and the uncertainty in multifocality are still present.
3D histology volume reconstruction has the potential to vastly improve gross pathology
assessments in the clinic. Tumour size, including maximum tumour diameter and tumour volume
may be more accurately measured in 3D vs 2D. Visualization of 3D histology volume can also
help the pathologist when they report the orientation of the tumour or when investigating the
spatial relationship between the distributions of different disease biomarkers.
Another important application area for 3D histology is in radiology-pathology correlative
studies. There is ongoing research into the development of new volumetric medical imaging
techniques for early detection of cancer. These new techniques are often validated by correlating
the acquired medical images with histology images of tissue specimens obtained from the
corresponding location after imaging. 3D histology volume reconstruction is an important
intermediate step in co-registering histology findings with medical images acquired using 3D
modalities such as MRI or ultrasound.
1.2 Histology Volume Reconstruction
3D histology volumes are reconstructed from 2D images of histology sections. While the
histology sections are being mounted on microscope slides, they will be shifted and rotated with
respect to each other. Furthermore, the sections might expand and deform while they are being
de-wrinkled in hot water bath. In addition to all of these transformations, the tissue sections can
tear and fold, which introduces artefacts. All of these transformations mean that reconstructing a
3D histology volume is far more complicated than simply stacking the series of 2D images.
Manual correction and alignment of histology sections is very challenging and may not even be
possible. Image registration techniques can be employed to automatically align and correct the
11
2D images of the whole-mount histology sections so that they can be used to reconstruct a 3D
histology volume.
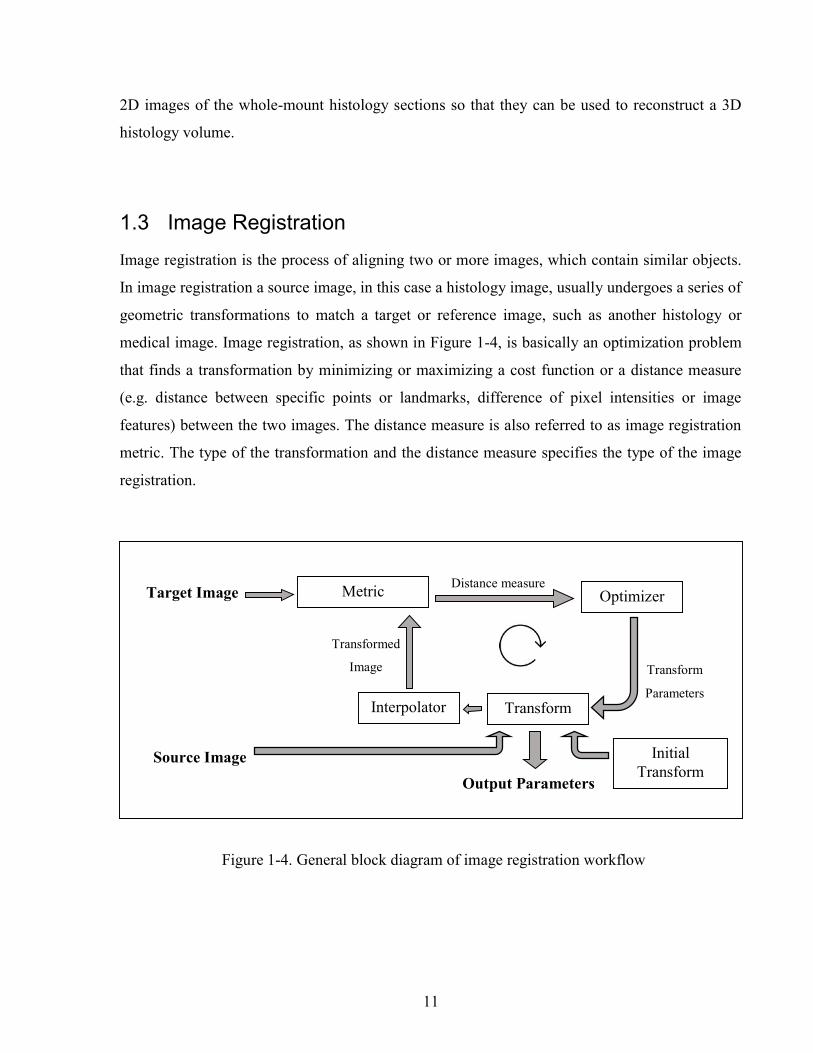
1.3 Image Registration
Image registration is the process of aligning two or more images, which contain similar objects.
In image registration a source image, in this case a histology image, usually undergoes a series of
geometric transformations to match a target or reference image, such as another histology or
medical image. Image registration, as shown in Figure 1-4, is basically an optimization problem
that finds a transformation by minimizing or maximizing a cost function or a distance measure
(e.g. distance between specific points or landmarks, difference of pixel intensities or image
features) between the two images. The distance measure is also referred to as image registration
metric. The type of the transformation and the distance measure specifies the type of the image
registration.
Source Image
Target Image Metric Optimizer
Transform Interpolator
Distance measure
Transform
Parameters
Transformed
Image
Output Parameters
Initial Transform
Figure 1-4. General block diagram of image registration workflow

12
1.3.1 Image Transformations
1.3.1.1 Rigid Registration
Rigid registration finds the global translation and rotation of the source image with respect to the
target image and can therefore correct for the shifts and rotations that occur when tissue sections
are positioned on the microscope slides. This transformation does not change the size and shape
of the objects in the source image (Figure 1-5-a,b). The rigid transformation can be written as a
matrix equation as shown below:
=
cos − sinsin cos0 0 1 1
=cos − sin +sin + cos +
1
Where T is the transformation matrix, θ is the rotation angel and tx and ty are the translation
values in x and y directions. With this transformation all pixels, p(x,y), are rotated and translated
with the same values.
1.3.1.2 Affine Registration
In affine image registration global scaling (i.e. shrinkage and expansion) and global skewing are
also allowed, but parallel lines remain parallel in the transformed image (Figure 1-5-c. Affine
registration of histology images is therefore suitable for correction of shrinkage and expansion of
the tissue sections. The matrix equation for affine transformation is similar to the rigid
transformation with the addition of scale (S) and skew (K) factors to the matrix.
cos − sinsin cos0 0 1
.1
=cos − sin +sin + cos +
1
1.3.1.3 Deformable Registration
Deformable or non-rigid registration corrects the local deformation of the source image.
Deformable registration finds a displacement field or a deformation map for the pixels of the
source image and can vastly change the shape of the objects in the source image (Figure 1-5).
Local deformation of tissue sections can be corrected in the histology images by using
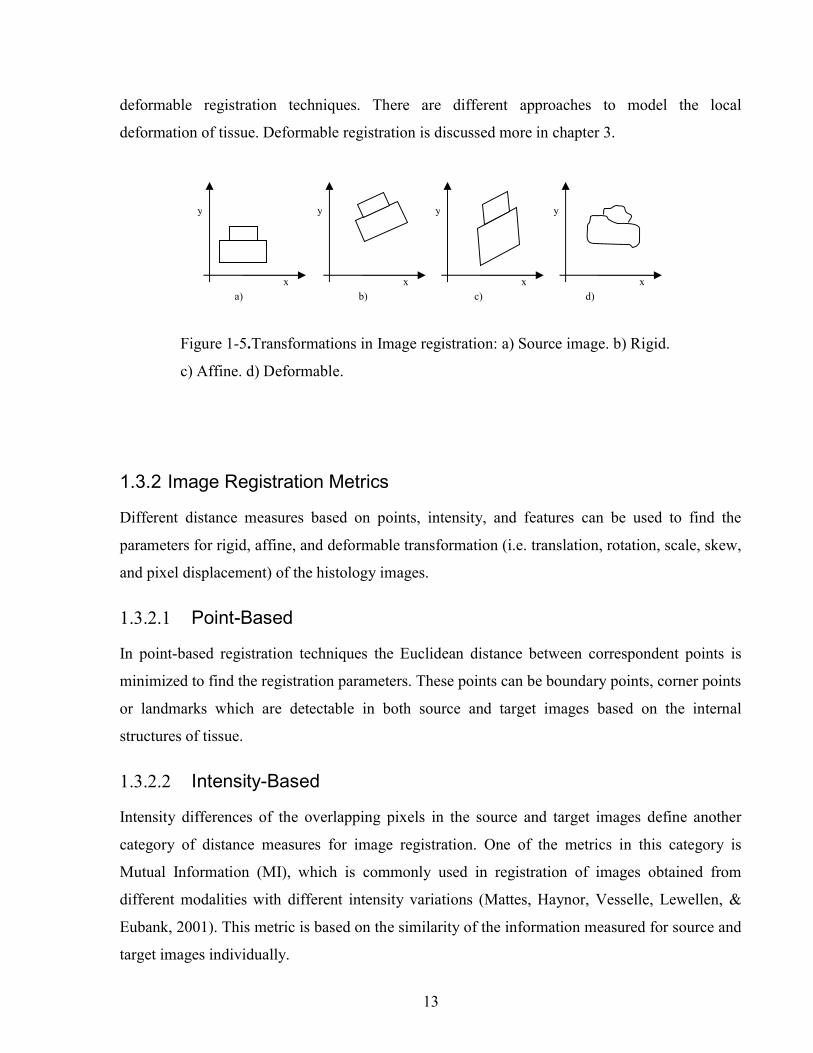
13
deformable registration techniques. There are different approaches to model the local
deformation of tissue. Deformable registration is discussed more in chapter 3.
1.3.2 Image Registration Metrics
Different distance measures based on points, intensity, and features can be used to find the
parameters for rigid, affine, and deformable transformation (i.e. translation, rotation, scale, skew,
and pixel displacement) of the histology images.
1.3.2.1 Point-Based
In point-based registration techniques the Euclidean distance between correspondent points is
minimized to find the registration parameters. These points can be boundary points, corner points
or landmarks which are detectable in both source and target images based on the internal
structures of tissue.
1.3.2.2 Intensity-Based
Intensity differences of the overlapping pixels in the source and target images define another
category of distance measures for image registration. One of the metrics in this category is
Mutual Information (MI), which is commonly used in registration of images obtained from
different modalities with different intensity variations (Mattes, Haynor, Vesselle, Lewellen, &
Eubank, 2001). This metric is based on the similarity of the information measured for source and
target images individually.
x
y
x
y
x
y
x
y
a) b) c) d)
Figure 1-5.Transformations in Image registration: a) Source image. b) Rigid.
c) Affine. d) Deformable.

14
1.3.2.3 Features-Based
The difference between corresponding features extracted from the source and target images
drives another group of image registration algorithms categorized as feature-based registration
methods. Edges and blob-like structures are examples of image features, which can be used for
registration of histology images.
1.3.1 Research Context
In this work, we are particularly interested in automated volume reconstruction for breast whole-
mount histology which has not been previously reported. The highly deformable nature of breast
tissue and the lack of clear boundaries between different tissue types make this a particularly
difficult problem.
Going et al. studied the 3D anatomy of breast ducts and measured the volumes of all 20 complete
duct systems (lobes) by reconstructing the 3D volume of all TDLUs, Figure 1-6, from the
histology images of the 2mm serial sections obtained from an autopsy breast (Going & Moffat,
2004). They traced parenchymal elements from enlarged photographic prints onto transparent
acetate sheets. In order to reconstruct the histology volume of the ductal system they stacked the
printed sheets and manually identified the connected duct segments and trace every duct system
from nipple to periphery, slice by slice.
In order to study the number, diameter and structure of ducts in nipples, Rusby et al.
reconstructed the histology volume of a nipple from the H&E stained 5µm sections with 45µm
separation (Rusby, Brachtel, Michaelson, Koerner, & Smith, 2007). They aligned histology
images by eye in corroboration with microscope examination of the original section,
Figure 1-7.

15
Figure 1-6 The coronal view of all ducts and their branches in an autopsy breast, reconstructed by Going
et al. (Going & Moffat, 2004). Each Roman numeral refers to a different independent duct system. Some
colours are used for more than one duct system (Image used by permission from John Wiley & Sons,
Ltd).
Figure 1-7 Three-dimensional reconstruction of a nipple by Rusby et al. (Rusby et al., 2007). Skin in tan,
cut edge in yellow and ducts in purple. (A) the ducts are arranged in a central bundle (B) the bundle
narrows to a waist just beneath the skin (C) some ducts originate on the areola or part way up the nipple
(D) most ducts narrow as they approach the tip of the nipple (E) many of the ducts have a common orifice
(Image used by permission from Springer Science + Business Media, LLC).

16
Booth et al. (Booth et al., 2015) investigated the use of an automated 3D reconstruction of breast
tissue sections in the study of the biology of DCIS. The sections were cut from a small sample of
breast tissue around the DCIS. They reconstructed the histology volumes, shown in Figure 1-8,
by registering the neighbouring sections to the middle section as reference image (Roberts et al.,
2012) and this relies on having consecutive 4µm thick sections which means that only small
tissue volumes can be processed in this way. There is a much greater separation (i.e. 4-5mm)
between sections from clinical specimens, which highly reduces the similarity between the
sections.
Figure 1-8 The selected 3D reconstruction of the subvolume in case B containing DCIS (yellow)
and surrounding invasion (orange). (A) and (B) show the DCIS and the surrounding invasion and
C, the DCIS alone. No continuity between in situ and invasive disease was identified. D shows
the lumina (green) within the DCIS. The lumina were mostly continuous throughout the ductal
structure, with additional multiple small, unconnected lumina (Image used by permission from
John Wiley & Sons, Ltd).

17
Reis et al. (Reis et al., 2015) investigated the maximum spacing between the breast histology
sections required for 3D histology reconstruction to a specific tolerance. They focused on the
accuracy of reconstruction of individual ductal structures that were extracted from the whole
slide. They also selected the section at the centre of the block as the reference image and used
pair-wise rigid or affine registration approach to align the sections to the reference image. They
concluded that a spacing of 41µm between sections was sufficient to assess ductal structures,
however, in the clinical setting the spacing between the breast sections is about 4mm and
methods that rely on slice to slice registration will likely fail.
All these works show that 3D reconstruction is required for the study of the normal and disease
breast at the cellular level. These methods are either laborious or apply to tissue sections which
are cut from small samples of the excised breast tissue with a very fine separation between the
sections. Clarke et al developed a tissue preparation method for producing whole-mount
histology sections from whole lumpectomy and mastectomy specimens (Sun et al., 2009) and
then manually aligned the histology images to reconstruct the breast histology volume, shown in
Figure 1-9, in order to compare 3D with 2D tumour measurements (G M Clarke et al., 2012). A
3D reference image obtained using MRI or CT can be used as a reference volume for 3D
histology volume reconstruction if it is available (Grégoire Malandain, Bardinet, Nelissen, &
Vanduffel, 2004); in breast Clarke et al. (G. M. Clarke et al., 2008) demonstrated that manually
identified landmarks could be used to align a whole-mount lumpectomy histology image with a
specimen cone-beam CT slice. All these examples reveal that there is a need for an accurate
automatic image registration approach for reconstruction of the histology volumes from 2D
whole-mount histology images of breast specimens.

18
Figure 1-9 The scanned whole-mount images aligned manually using Sedeen viewer for volume
measurement. The reconstructed 3D tumour volume in following dimensions: (a) superior to
inferior, (b) medial to lateral (Image distributed under the Creative Commons Attribution
License).
1.3.2 Challenges
1.3.2.1 Sparse Sampling of Clinical Specimens
A few millimeters separation between the histology sections obtained from clinical specimens
reduces the similarities of the tissue structures on the consecutive sections. These tissue
structures include the cross-section of the blood vessels and fibroglandular tissue. Since image
registration techniques work based on the similarities between the images, this low similarity
between the sections makes the registration of the histology images more challenging.
19
1.3.2.2 Artifacts in Histology Sections
Histology artifacts can occur during the histology processing and these change the appearance of
the sections. One of these histology artifacts is shrinkage, which occurs during dehydration of
the tissue. Intensity variation is another artifact, which can happen in the staining step. Different
patches of slides are stained at different times and depending on the freshness of the chemical
used at this step the stain might be stronger or weaker. Tears and folds are the artifacts that occur
when the sections are cut and mounted on microscope slides. Usually sections with bad tears or
folds are not kept and the tissue block is re-sectioned, but small tears and folds are to some
extent acceptable. Digitizing artifacts, such as tiling and stripes, can occur during scanning and
the appearance of these artifacts will depend on the type of scanner used, although as scanner
technology improves, these artifacts are becoming less common. Having artifacts in histology
sections reduces the similarity between the sections and makes the manual or automatic
correlation of the consecutive sections more difficult.
1.3.2.3 Deformation of Breast Specimen
Human breast is mostly composed of fat, which is highly deformable. Therefore, during the
tissue preparation the changes in conformation of the breast specimen are much greater
compared to other more rigid organs (e.g. prostate). The highly deformable nature of breast
makes the alignment and deformable registration of the breast tissue sections more challenging.
1.3.2.4 Validation of Histology Image Registration
Image registration is usually assessed by overlaying the two histology images and visualizing or
calculating the distance between the similar structures. Due to the great separation (4-5mm)
between the consecutive histology sections cut from a clinical specimen, similar structures might
not be detectable in both images. Using manually selected landmarks based on the internal
structures in the serial histology images also suffers from the lack of similarity between the
sections. Furthermore, depending on the shape of the specimen, a reconstructed histology
volume with the perfectly aligned internal structures might not represent the original
conformation of the tissue. A reconstructed histology volume can also be validated by comparing
it with the ex-vivo medical images of the specimen obtained by volumetric imaging modalities
such as MRI or CT. The problem with this approach is that the ex-vivo imaging of the specimen
is not always feasible for clinical specimens with the limited cold ischemic time, which is

20
calculated from when the tissue is removed from the body to when it is placed into fixative. The
ischemic time should be less than one hour to prevent it from altering the staining intensity of
IHC. Another approach for validating histology image registration is to implant fiducial markers
in the excised tissue and use them as landmarks in histology images for calculating the
registration error. Implanting fiducial markers in the specimen might cause distortion in the
tissue, and is not usually permitted for clinical specimens. Validation of the histology volume
reconstruction is therefore a challenging step.
1.4 Hypothesis and Outline of this Thesis
This work is motivated by the hypothesis, which stated as follows:
Accurate 3D Histology volumes of breast specimens can be automatically reconstructed from 2D
digital images of whole-mount histology slides. These reconstructed volumes have the potential
to assist surgical pathologists with more precise assessment of tumour extent in 3D.
This hypothesis is investigated in four parts in this thesis. Chapter Two introduces the image
registration pipeline developed for 3D histology volume reconstruction. Chapter Three presents
the extension of the pipeline for co-registration of histology with volumetric MRI. This chapter
also includes the introduction of a multi-modality fiducial marker for validation of the image
registration pipeline. Chapter Four describes how a deformable image registration method can be
optimized to correct for breast tissue deformation when registering histology images with respect
to their correspondent blockface images. Chapter Five shows the efficacy of using these
optimum parameters for histology volume reconstruction of different breast specimens and
applies the method to carry out 3D tumour measurement. Chapter Six summarizes the results and
contributions of the work presented in this thesis and highlights some future research
applications in the field of breast histopathology.
21
2 A Pipeline for 3D Histology Volume Reconstruction
Chapter two introduces a novel image registration workflow for 3D histology volume
reconstruction, which overcomes some of the challenges described in chapter 1. This chapter
also demonstrates the utility of the developed methodology in pre-clinical studies. The image
registration workflow is used in a pilot study to characterize the deficiency of Igfbp7 in mouse
mammary glands. 3D-reconstructions of mammary glands were generated for mutant and wild
type mice in order to compare the size and structures of the two.
2.1 Introduction
Histology sections are shifted, rotated, and deformed relative to the original tissue block.
Therefore the 3D conformation of the specimen is lost if the 2D images of the histology sections
are simply stacked up to rebuild the histology volume. Assessment of tumour features in 3D
requires an accurate and realistic histology volume. Accurate reconstruction of the histology
volume is also important in finding and correlating the correspondent histology images to the
slices of volumetric medical imaging. In order to reconstruct the histology volume it is necessary
to find the transformations, which bring the sections back into alignment and correct the
deformation of the sections.
A common approach to histology volume reconstruction consists in the pair-wise registration of
consecutive sections, but this method is typically unable to recover the overall shape of the
reconstructed volume (Malandain et al. 2004) unless additional constraints are applied. This is
true when there is a large separation between the histology sections, which greatly reduces the
similarities between the consecutive sections. Another problem of only registering two slices at a
time is that registration errors may be propagated throughout the volume. If one section is mis-
registered, the next section, which is being registered to this one will be also mis-registered and
22
in the same way the error propagates to the rest of the sections. Methods that take into account
multiple sections simultaneously or add regularization terms have been proposed in order to
overcome these problems. For example, smoothness of the structures of the brain has been used
as a constraint by Cifor et al. (Cifor, Bai, & Pitiot, 2011) to guide the 3D histology volume
reconstruction of the brain. Cahill et al. (Cahill, Noble, & Hawkes, 2010) attempted to regularize
a nearly rigid descriptor feature transformation to be consistent across the neighbourhood
sections. Christensen et al. (Christensen &Johnson, 2001) also estimated the forward and reverse
transformations jointly, and produced a consistent transformation that has low pairwise
registration errors. All of these approaches require that consistent anatomical structures are
visible on neighbouring sections and that their location in the volume can be approximated by a
smoothly varying function. This generally means that the separation between sections must be
small enough for such structures to be tracked and in clinical applications this may require an
impractically large number of sections to be prepared. In order to overcome this problem several
groups (Bardinet et al., 2002; Chakravarty, Bertrand, Hodge, Sadikot, & Collins, 2006; Dauguet
et al., 2007) have employed 2D images of the tissue block as a reference to improve the accuracy
of 3D histology reconstruction. A blockface image is a photographic image of the surface of the
tissue block acquired immediately before the desired section is cut. Since the tissue block is
relatively rigid and is mounted into a microtome during the sectioning process, these blockface
images act as a reference which preserves the conformation of the anatomical structures of the
tissue.
To reconstruct the histology volume, a 2D to 2D image registration is required to register each
tissue section to a reference image regardless of whether a blockface image or another histology
section is used as the reference. Various manual, semi-automatic, and automatic image
registration techniques have been applied to 2D images.
Manual approaches, such as (Deverell et al., 1993), are laborious and time consuming and the
registration accuracy is operator-dependent. Semi-automatic and automatic approaches may
include intensity-based and feature-based methods. Implanted fiducial marker methods have also
been investigated but these may cause tissue distortion. Although a wide range of intensity-based
methods (Kim, Boes, Frey, & Meyer, 1997; Ourselin, Bardinet, Dormont, Malandain, & Roche,
2001) can be used to register two 2-D images, the differences in the appearance of the histology
images and the reference images makes intensity-based approaches challenging. Even when both

23
the section to be registered and the reference image have been stained with the same reagent,
intensity differences still have to be taken into account. These differences make the localization
of the intrinsic landmarks and their correspondences difficult (Zhan et al., 2007), but landmark-
based registration techniques may be more robust. Feature-based methods consist in
automatically extracting features such as points (Guest, Berry, Baldock, Fidrich, & Smith, 2001),
edges (Kim, Frey, Mukhopadhyay, Ross, & Meyer, 1995) or contours (Cohen, Yang, Huang, &
Nissanov, 1998;Weizhao, Young, & Ginsberg, 1993) from the input slices and using them to
guide the 2-D alignment. The accuracy of the registration is dependent upon the accuracy of the
feature extraction methods. These features include boundary points (Jacobs, Windham,
Soltanian-Zadeh, Peck, & Knight, 1999; Weizhao et al., 1993) and/or the features from the
internal anatomical structures. Biomechanical model based methods have been developed for
registration of histology to MRI of prostate (Samavati et al., 2011) by assigning specimen-
specific material properties obtained using an ex vivo quasi-static magnetic resonance
elastography (MRE) technique. This is a very complex technique and it has not been validated on
breast tissue. Although several works have been done to measure the hyperelastic parameters of
various types of breast tissues, further work and statistical analysis is required to obtain accurate
parameters that can be used in reliable correction of breast tissue deformation (Samani & Plewes,
2004) (Samani, Zubovits, & Plewes, 2007).
Because the boundaries of the pre-clinical specimens used in this work are well detectable in
histology, edge-based registration techniques were used in this work to reconstruct the histology
volumes of the specimens. One of the advantages of using boundary points for image registration
is that it makes the pipeline independent from tissue type and also independent from histology
stain as long as the tissue boundary is well detectable. Furthermore, edge-based methods are
more efficient than intensity-based approaches especially when working with large histology
images.
This chapter introduces an image registration workflow for histology volume reconstruction.
Figure 2-1 shows the overall pipeline. Histology images are registered to their correspondent
blockface images to reconstruct a histology volume. The stack of segmented tissue regions in
blockface images represent the shape of the specimen before it is cut into histology sections.

24
2.2 Material and Methods
2.2.1 Specimen and Histology and
The fourth mammary glands of a wild-type CDH1 and an Igfbp7-null mice were surgically
excised three days post onset of lactation. The two glands were spread onto glass slides to help
regain native mammary gland morphology.
The mammary glands were fixed in neutral buffered 4% PFA O/N at 4˚C and stored in 70%
ethanol prior to tissue processing. After the tissue processing and embedding the tissue in
paraffin the sections were cut from the paraffin block with 5 μm thickness and 5 µm separation
between sections. The sections were stained with H&E and then digitized with the magnification
of 20x and the resolution of 0.5μm using a Leica SCN400 slide scanner. The histology images
are then down-sampled to 18µm resolution, which is the resolution of the reference images used
in the pipeline and is explained in the next section.
2D registration
Figure 2-1 Histology volume reconstruction; histology images are registered to their optical
blockface images, which represent the shape of the specimen before it is cut into histology
sections.

25
2.2.2 Reference Images
As it is explained in 1.3.2.1 the sparse sampling of the clinical specimens reduces the similarity
between the sections and therefore makes the image registration more challenging. A common
approach to address this problem is to employ reference images (Bardinet et al., 2002),
(Chakravarty, Bertrand, Hodge, Sadikot, & Collins, 2006), (Dauguet et al., 2007). In the
proposed image registration pipeline optical images of the tissue blocks were used as reference
images. Blockface images are taken from the paraffin blocks of the tissue, mounted on the
microtome, before each section is cut. Since the blockface images are obtained from the tissue
fixed in its place in paraffin block, they represent the correct alignment of the images with
respect to the tissue in block. These optical images are obtained by a telecentric lens to eliminate
the barrel distortion, which usually occurs when using regular lenses. A telecentric lens is a
compound lens which has an entrance pupil placed effectively at infinity (Opto Engineering,
2015). This property makes the chief rays parallel to the optical axis and the image magnification
independent from the object's distance or position in the field of view(Opto Engineering, 2015).
The diameter of the telecentric lens used to image the mammary gland is 4mm and the resolution
of the optical blockface images is 18 μm.
Figure 2-2-a shows the blockface imaging setup used to capture optical images of the tissue
blocks. The images are taken at an oblique angle (≈15°) to use the reflection of the surface of the
block for contrast enhancement between the tissue and paraffin surface and to eliminate the
shadow of the tissue in depth, under the paraffin surface. A photographic filter is also used to
polarize the light coming from the block surface and the tissue to balance the contrast. To correct
for the displacement of the block on the rotary microtome, three vertical 1mm holes are drilled in
three corners of the block using a vertical milling machine. The holes are easily detectable in the
blockface images as shown in Figure 2-2-b. The centroids of these holes are used along with
landmark-based rigid registration to align the blockface images.
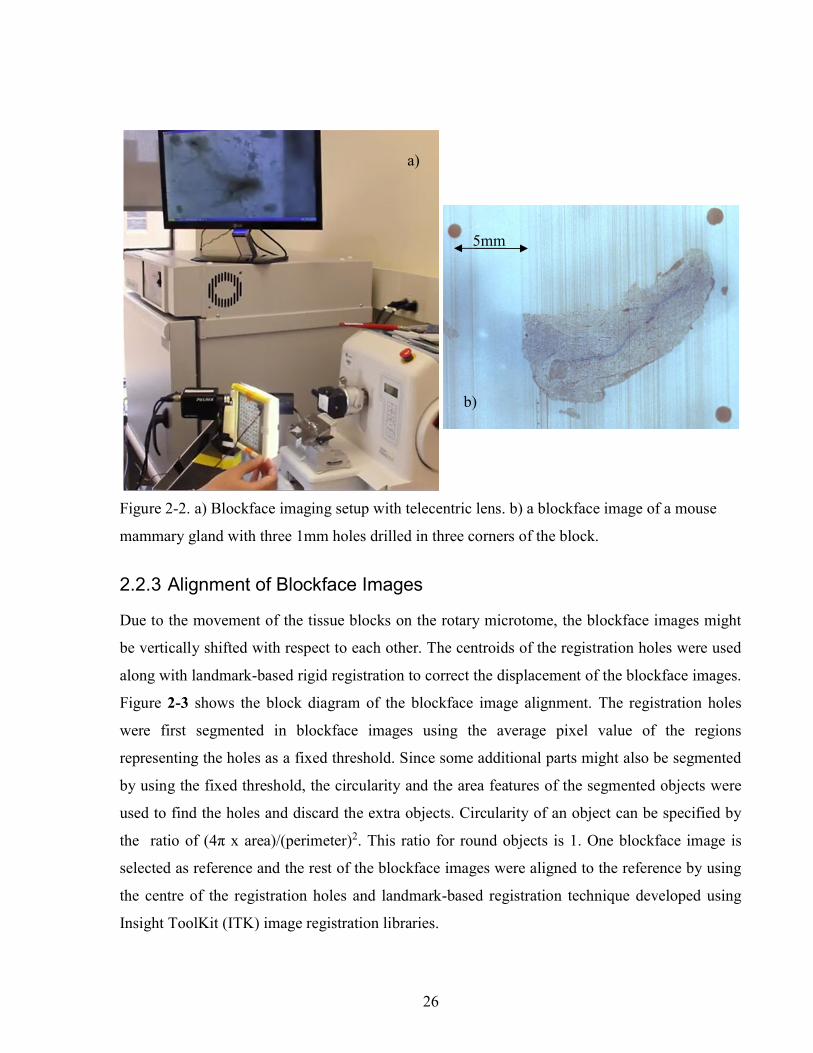
26
2.2.3 Alignment of Blockface Images
Due to the movement of the tissue blocks on the rotary microtome, the blockface images might
be vertically shifted with respect to each other. The centroids of the registration holes were used
along with landmark-based rigid registration to correct the displacement of the blockface images.
Figure 2-3 shows the block diagram of the blockface image alignment. The registration holes
were first segmented in blockface images using the average pixel value of the regions
representing the holes as a fixed threshold. Since some additional parts might also be segmented
by using the fixed threshold, the circularity and the area features of the segmented objects were
used to find the holes and discard the extra objects. Circularity of an object can be specified by
the ratio of (4π x area)/(perimeter)2. This ratio for round objects is 1. One blockface image is
selected as reference and the rest of the blockface images were aligned to the reference by using
the centre of the registration holes and landmark-based registration technique developed using
Insight ToolKit (ITK) image registration libraries.
Figure 2-2. a) Blockface imaging setup with telecentric lens. b) a blockface image of a mouse
mammary gland with three 1mm holes drilled in three corners of the block.
a)
b)
5mm

27
2.2.4 Image Segmentation and Point Selection
In order to use an edge-based registration method it is required to segment the tissue sections and
find their boundary points both in aligned blockface and histology images. Figure 2-4 shows the
block diagram of the image segmentation and registration of the histology images to their
correspondent blockface images.
The tissue sections were manually segmented from the background in the aligned blockface
images. The histology images were first down-sampled to the resolution of the blockface images
Figure 2-3 Alignment of the blockface images using the registration holes.

28
and then segmented using Otsu thresholding technique (Ridler, T.W. Calvard, 1978) to create
binary masks of the histology images.
The largest segmented object in both sets of images was identified by using the histogram of the
labeled objects in the mask images and one pixel wide boundary points were extracted from both
histology and blockface masks. Chain code algorithm (Freeman, 1974) was used to represent the
boundary points by a sequence of piecewise linear fits, and this representation of boundary
points were used for the rest of the steps in the protocol.
2.2.5 Fourier Descriptors (FDs)
Given that some expansion and shrinkage occurs during histology processes, the size of the
histology images is different from the blockface images and an initial registration is required to
achieve an estimate of the scale factor along with the initial translation and rotation. To obtain
this initial transformation we use Fourier Descriptors which are invariant to rotation and
translation of the boundary points and also independent of the starting point (Giardina & Kuhl
1977). We employed normalized Fourier descriptors to find the rotation angle and translation
values as well as the scale factor for initial alignment of the boundaries of the blockface and the
histology images (Duan, Kuester, Gaudiot, & Hammami, 2008).

29
Figure 2-4 Block diagram of histology volume reconstruction using boundary points

30
2.2.6 Iterative Closest Points (ICP)
To refine the alignment we use the Iterative Closest Points (ICP) algorithm (Besl & McKay,
1992). This technique uses point sets to find the transformation parameters (Besl & McKay,
1992). ICP iteratively finds the transformation, which minimizes the average distance between
the moving edge points and their closest points on the fixed point set and transforms the moving
points.
The high curvature edge sections were first removed from the boundary contour using a rolling
ball filter (with a 50 pixel ball structuring element) with the assumption that high-curvature
edges correspond to tears in the section. Five hundred random edge points are then selected from
the remained smooth boundary sections using uniform sampling. These random edge points are
transformed by the transformation parameters obtained from the initial alignment using Fourier
Descriptors.
The transformed histology random points are used as a moving point set and the whole set of
blockface edge points are used as fixed point set. ICP was then employed to refine the rigid
registration with Euclidean distance as similarity measure and Levenberg Marquardt as optimizer
with maximum iteration of 200.
2.3 Results
Figure 2-5 shows the blockface volume and histology volume of the mammary glands. In order
to investigate the tissue structures at 5x magnification, the original histology images were down
sampled to 5x magnification. The region of interest was then cropped from one of the histology
images and using the rigid registration parameters the location of that region in other 5x
histology images were calculated and the regions were cropped. Finally the alignment of this
regions were refined manually. A program was developed in MATLAB to overlay two images
and select the values for rotation and translation of one of the images over the other one. Figure
2-6 shows the 5x magnification of two consecutive histology for Igfbp7-null glands, which
agrees that the image registration pipeline is capable of aligning the images and the cropped
regions are from the same region.
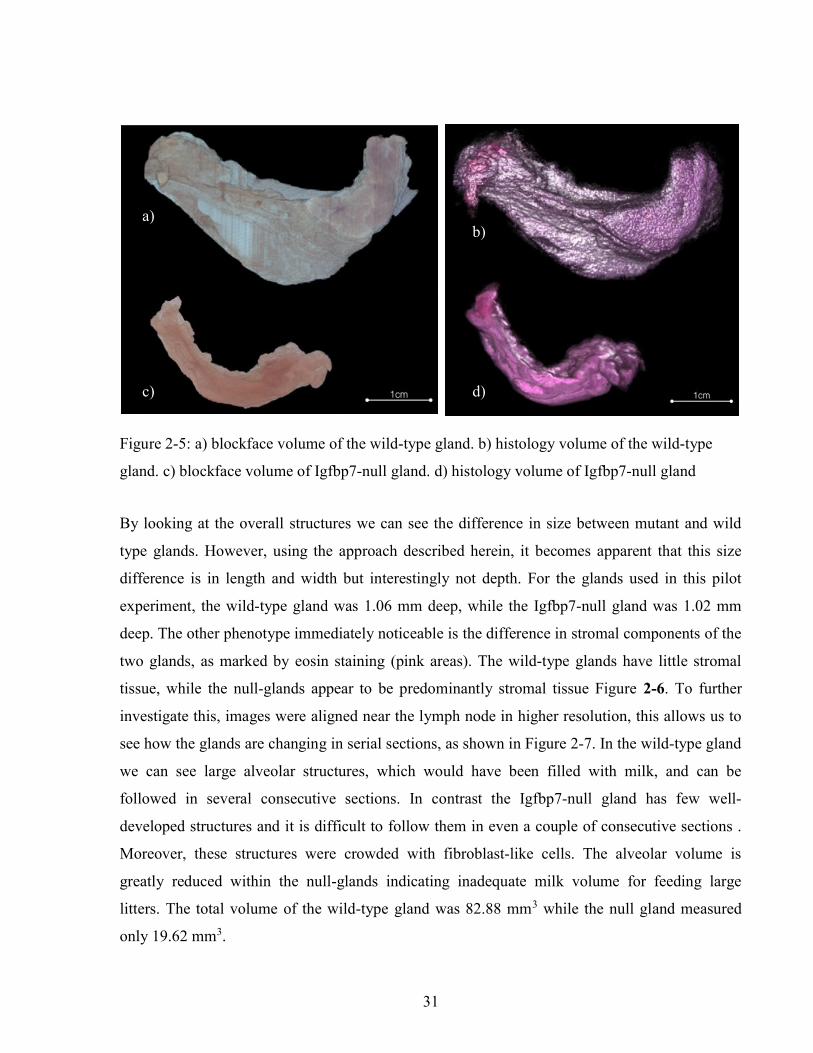
31
By looking at the overall structures we can see the difference in size between mutant and wild
type glands. However, using the approach described herein, it becomes apparent that this size
difference is in length and width but interestingly not depth. For the glands used in this pilot
experiment, the wild-type gland was 1.06 mm deep, while the Igfbp7-null gland was 1.02 mm
deep. The other phenotype immediately noticeable is the difference in stromal components of the
two glands, as marked by eosin staining (pink areas). The wild-type glands have little stromal
tissue, while the null-glands appear to be predominantly stromal tissue Figure 2-6. To further
investigate this, images were aligned near the lymph node in higher resolution, this allows us to
see how the glands are changing in serial sections, as shown in Figure 2-7. In the wild-type gland
we can see large alveolar structures, which would have been filled with milk, and can be
followed in several consecutive sections. In contrast the Igfbp7-null gland has few well-
developed structures and it is difficult to follow them in even a couple of consecutive sections .
Moreover, these structures were crowded with fibroblast-like cells. The alveolar volume is
greatly reduced within the null-glands indicating inadequate milk volume for feeding large
litters. The total volume of the wild-type gland was 82.88 mm3 while the null gland measured
only 19.62 mm3.
a) b)
c) d)
Figure 2-5: a) blockface volume of the wild-type gland. b) histology volume of the wild-type
gland. c) blockface volume of Igfbp7-null gland. d) histology volume of Igfbp7-null gland
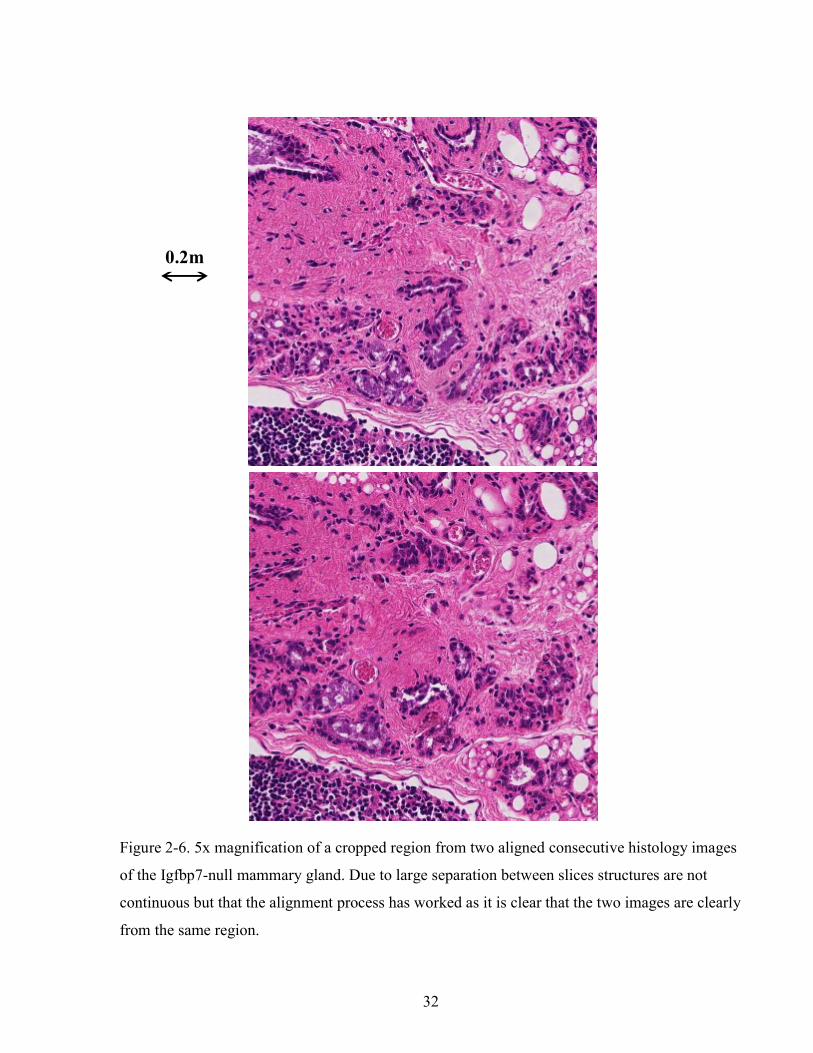
32
0.2m
Figure 2-6. 5x magnification of a cropped region from two aligned consecutive histology images
of the Igfbp7-null mammary gland. Due to large separation between slices structures are not
continuous but that the alignment process has worked as it is clear that the two images are clearly
from the same region.

33
2.4 Summary and Discussion
In this study, we have developed an image registration workflow to reconstruct a 3D histology
volume from serial 2D histology images, which does not require internal manually selected
landmarks or implanted fiducial markers within the tissue, which might distort the tissue. By the
method described, optical blockface images themselves are used as the reference images prior to
sectioning. We use external holes drilled in the paraffin block to aid in aligning the blockface
images and to correct for the 2D transversal movement of the paraffin block in front of the
camera. The 2D histology images are aligned to the corresponding 2D blockface images to
prevent the propagation of the registration error and reconstruct an accurate histology volume,
even when some sections are missing due to problems with tissue section preparations. In order
to make the workflow independent of the type of the tissue and the histology stain used,
boundary points are used to carry out the registration. This point-based approach has the
advantage (over intensity-based approaches) that it is less computationally demanding and
therefore better able to cope with very large digital pathology images. Another advantage of
using blockface images to align the histology images is that the spacing between the histology
images does not affect the quality of their alignment to create the histology volume. This is
Figure 2-7. A region cut from four aligned consecutive sections at high resolution shows the
continuation of the 3D alveolar structures. Top) Wild-type. Bottom) Igfbp7-null gland.

34
important in the clinical setting where the spacing between sections can vary widely, often as
great as half a centimeter.
The important capability of this approach is that it is independent from the tissue type and
intensity variations and thus it can be used to reconstruct the histology volume of different pre-
clinical and clinical specimens. One of the other advantages of this approach is that it is not
dependent on a specific stain. This contour based approach is compatible with any stain, so long
as it provides a clear contour of the whole section or a clear contour of a structure, which is
detectable in both histology and blockface images.
The limitation of the edge-based image registration approach is that it is requires the boundary
points of the tissue sections on both histology and blockface images and therefore an image
segmentation step has to be added to the pipeline. Automatic segmentation of tissue boundaries
might not always be feasible especially for specimens with no clear boundaries in the images,
such as breast. Segmentation error can also contribute to the registration error.
In this work the accuracy of the histology volume reconstruction pipeline was assessed by visual
comparison of the histology volumes with blockface volumes. In order to be able to evaluate the
results of the image registration approach, it is required to have a suitable validation strategy. A
quantitative validation technique is discussed in the next chapter.
Throughout the work of this chapter we have shown that the approach can be used in a research
context as used for the study of the effect of the effect of down-regulation of Igfbp7 protein in
the development of the mammary glands.
A pitfall of traditional microscopy techniques is that the understanding of an organ at the
microscopic level is limited to one field-of-view at a time. Even “total disclosure” slides, which
provide entire slide sections, fail to provide three-dimensional information. To better
characterize the deficiency of the Igfbp7-null mouse, 3D-reconstruction of mammary glands
were performed on glands excised 3 days post commencement of lactation. The reconstructed
histology volumes were used to compare the shape, volume, and structures of the mammary
glands.

35
This chapter presents a point-based rigid registration approach for reconstruction of the histology
volume. The tissue sections also deform during the preparation of the tissue slides. Next chapter
discusses a point-based deformable registration used to correct these deformations. The
capability of the histology volume reconstruction approach for another pre-clinical model, a
mouse tumour, is also further discussed in the next chapter along with the extension of the
pipeline for registration of histology to volumetric medical images.

36
3 Registration of Histology with Volumetric Images
Chapter three gives an overview to the existing approaches for 3D co-registration of histology
medical images, followed by introducing the expansion of the image registration pipeline,
presented in chapter two, for registration of the histology images with volumetric medical
images. This chapter also gives an overview of the required elements and how they are addressed
in the proposed workflow. A multimodality fiducial marker is also introduced, which can be used
to investigate the accuracy of the image registration pipeline. The overall accuracy of the image
registration pipeline is assessed by using a pre-clinical tumour model.
3.1 Introduction
In order to transfer new developments in medical imaging techniques to clinic, they need to be
validated in pre-clinical studies, and this validation is usually done by correlating the acquired
images to the underlying molecular structures in histology (Sztrókay et al., 2012) (Tot & Gere,
2016) (Magnitsky et al., 2005) (Weissleder et al., 2000). For example, correlation of histology
with medical images gives us a better understanding of new contrast mechanisms (Cao, Liang,
Shen, Miller, & Stantz, 2009; Knopp et al., 1999), and the relationship between parameters
derived from medical images and any underlying pathology or physiology (Chopra et al. 2009;
Pauly et al. 2006; Aref et al. 2008). In order to accurately correlate the findings in medical
images with the underlying structures in histology, it is required to compare the correspondent
histology and medical images. Selecting the correspondent 2D histology and medical images
from volumetric images, e.g. MRI and CT, is challenging, and is usually accomplished by first

37
registering the medical image volume with histology volume and then selecting the
correspondent images.
Different methods have been proposed to register ex-vivo and in-vivo volumetric images with
reconstructed 3D histological images. Some techniques involve intensity variations (Alic et al.,
2011; D’Aische et al., 2005; Wachowiak, Smolíková, Zheng, Zurada, & Elmaghraby, 2004).
Alic et al. (Alic et al., 2011) have shown that the contrast of MR images might not completely
correspond with the contrast in histology images and that the combination of different contrast
mechanisms in MRI, such as Diffusion Weighted Imaging (DWI), is required to improve the
correlation. However, the acquisition of specialized MR sequences may not be possible in the
clinic. Other techniques are based on the shape or boundaries of the volumetric images and
histology volume (M. A. Jacobs, Windham, Soltanian-Zadeh, Peck, & Knight, 1999; Taylor et
al., 2004; Zhan et al., 2007). For some specimens the anatomical structures can be used, such as
the bloblike structures of prostate (Zhan et al., 2007) along with landmark-based registration
methods. However these internal structures might not be detectable through the whole volume
and in many cases, e.g. xenografts extracted from animal models, no reliable anatomical
structures can be identified. Extrinsic landmarks, such as needle paths (Breen et al. 2005;
Lazebnik et al., 2003), can cause more distortion and deformation, and may interfere with the
tissue harvesting and processing protocol.
This chapter introduces the expansion of the proposed image registration workflow for histology
volume reconstruction for correlation of histology to volumetric medical images along with the
validation approach. Figure 3-1 shows the overall pipeline. As explained in chapter two, the
histology images are registered to their correspondent blockface images to reconstruct histology
volume. The volumetric ex-vivo MR images are also registered to the blockface volume. Since
both histology and ex-vivo images are registered to the same set of reference images, they will
be registered as well. After resampling the ex-vivo images, the correspondent histology image
can be selected based on the depth of each image.
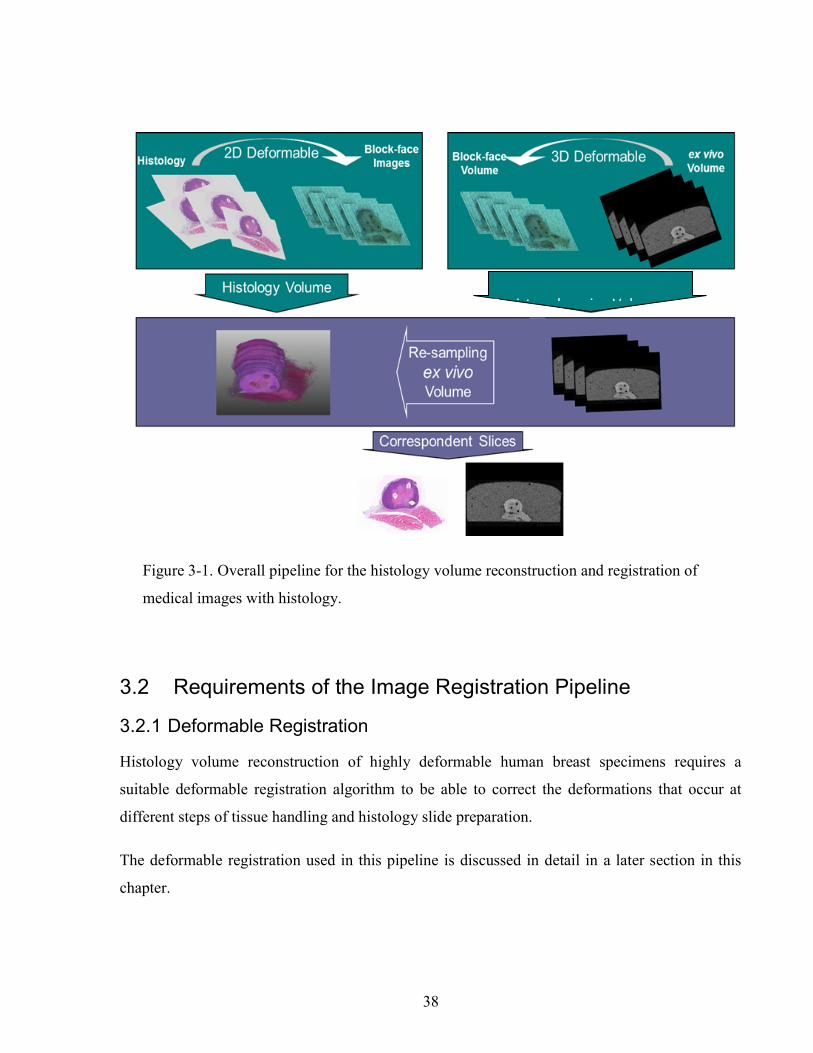
38
3.2 Requirements of the Image Registration Pipeline
3.2.1 Deformable Registration
Histology volume reconstruction of highly deformable human breast specimens requires a
suitable deformable registration algorithm to be able to correct the deformations that occur at
different steps of tissue handling and histology slide preparation.
The deformable registration used in this pipeline is discussed in detail in a later section in this
chapter.
Registered ex vivo Volumee)
Figure 3-1. Overall pipeline for the histology volume reconstruction and registration of
medical images with histology.
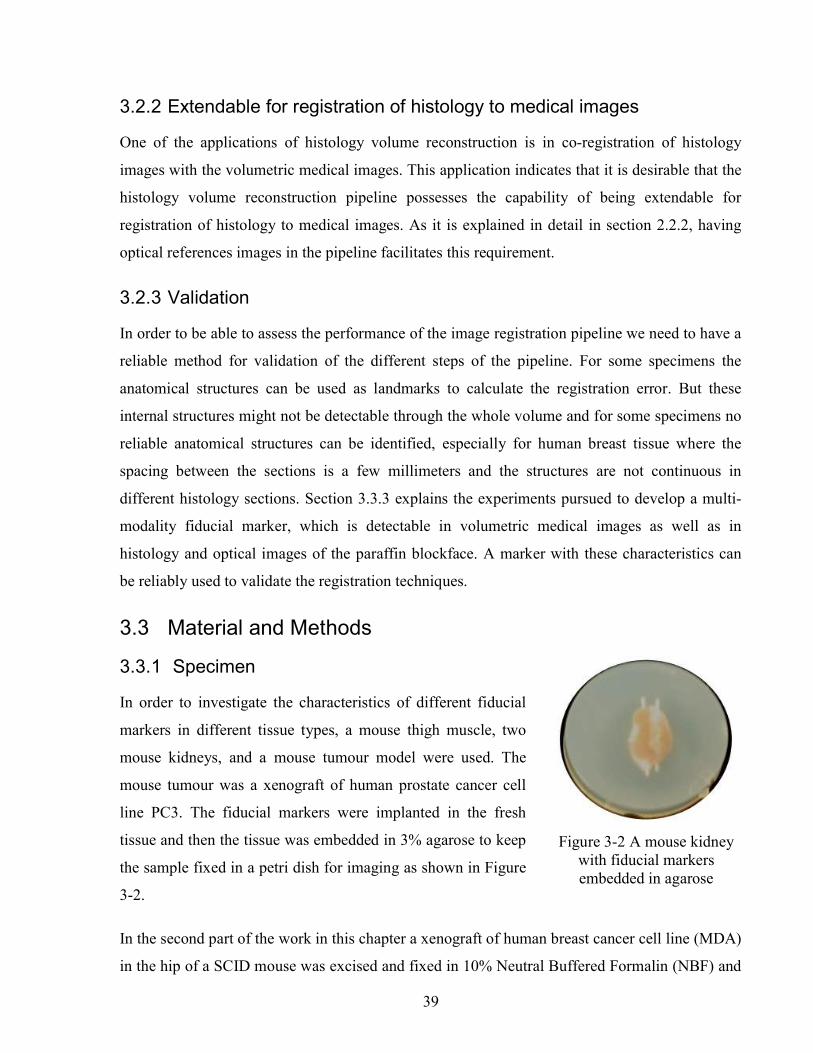
39
3.2.2 Extendable for registration of histology to medical images
One of the applications of histology volume reconstruction is in co-registration of histology
images with the volumetric medical images. This application indicates that it is desirable that the
histology volume reconstruction pipeline possesses the capability of being extendable for
registration of histology to medical images. As it is explained in detail in section 2.2.2, having
optical references images in the pipeline facilitates this requirement.
3.2.3 Validation
In order to be able to assess the performance of the image registration pipeline we need to have a
reliable method for validation of the different steps of the pipeline. For some specimens the
anatomical structures can be used as landmarks to calculate the registration error. But these
internal structures might not be detectable through the whole volume and for some specimens no
reliable anatomical structures can be identified, especially for human breast tissue where the
spacing between the sections is a few millimeters and the structures are not continuous in
different histology sections. Section 3.3.3 explains the experiments pursued to develop a multi-
modality fiducial marker, which is detectable in volumetric medical images as well as in
histology and optical images of the paraffin blockface. A marker with these characteristics can
be reliably used to validate the registration techniques.
3.3 Material and Methods
3.3.1 Specimen
In order to investigate the characteristics of different fiducial
markers in different tissue types, a mouse thigh muscle, two
mouse kidneys, and a mouse tumour model were used. The
mouse tumour was a xenograft of human prostate cancer cell
line PC3. The fiducial markers were implanted in the fresh
tissue and then the tissue was embedded in 3% agarose to keep
the sample fixed in a petri dish for imaging as shown in Figure
3-2.
In the second part of the work in this chapter a xenograft of human breast cancer cell line (MDA)
in the hip of a SCID mouse was excised and fixed in 10% Neutral Buffered Formalin (NBF) and
Figure 3-2 A mouse kidney with fiducial markers embedded in agarose
40
used for validation of the image registration workflow. The MRI, histology and blockface
images of the specimen with implanted fiducial markers were prepared as explained in the
following sections.
3.3.2 Reference Images
As explained in chapter two, optical blockface images are used in this pipeline. The blockface
images were first aligned using the centres of three drilled holes in the three corners of the tissue
block.
3.3.3 A Multi-Modality Fiducial Marker
A multi-modality fiducial marker is introduced in this section, which can be used for validating
the histology volume reconstruction as well as the correlation of histology images with medical
images.
An MR detectable fiducial marker containing metallic elements can create high contrast by
perturbing the main magnetic field and consequently nullifying the signal driven from the
hydrogen nuclei. In conventional radiography and computed tomography a detectable fiducial
marker should contain a material with high atomic number (such as iodine) to produce greater X-
ray attenuation. In Ultrasound the fiducial marker should have different acoustic impedance
which causes the acoustic wave reflection from the interface and as a result the ultrasound signal
from the interface is enhanced. On the other hand, in histology a fiducial marker should be easily
cut and remain stable on positively charged microscope slides. An organic material is suitable for
this purpose. Considering all mentioned requirements we tried different fiducial markers
combining metallic and organic materials. The present work reports on some initial results of the
experiments that we have accomplished on these fiducial markers.
The requirements for a multi-modality fiducial marker to be used for validation as follows. It
should be rigid enough to be implanted in the tissue and also it should be easily cut during
sectioning the tissue. Finally the fiducial marker needs to remain on the positively charged
microscope slides so that it can be located in histology images.
Different fiducial markers were tested for these requirements in this work. First we assessed a
26G catheter filled with a mixture of bronze metallic paint and marine apoxy glue (Rouvière et

41
al., 2006), which is conventionally used as a marker in MRI. The results of the experiment with
this marker showed that it falls off the microscope slide and also causes scratches on the tissue
section while it is being cut. We then tried various markers based on flour, a biological material
that does remain on the final microscope slide, i.e. regular spaghetti, black spaghetti, a 26G
catheter, a mixture of ground black spaghetti and water, a mixture of squid ink and flour, and a
mixture of liquid iron supplement and flour. The two types of spaghetti were implanted directly
in the tissue. For other fiducials a catheter is first placed in the tissue and the mixture is then
injected into the catheter tube to fill it completely. The tube was then cut from the catheter end
and stayed in the tissue. Since the size of the catheter is small, it is suitable for small specimens
such as mouse tumours.
Based on the results shown in section 3.4.1, three 26 Gauge catheters perfused with a mixture of
cuttlefish ink, flour, and water were implanted in the tumour. Since the specimen was fixed
before, the fiducial markers were implanted in the fixed tissue. However, the localization of the
fiducial markers will be more accurate when they are implanted in the fresh tissue. In order to be
able to correct for the displacement of the blockface images due to the movement of the
microtome block holder in front of the lens of camera, three holes were drilled in the three
corners of the paraffin block, in which the tissue is embedded. The centroids of the holes were
then used as landmarks to align the blockface images.
3.3.4 Imaging
After implanting the fiducial markers, the ex-vivo images of the specimens were obtained using
different imaging modalities. In order to characterize the fiducial markers, the samples were
scanned at 7 Tesla from Bruker Biospin or 3 Tesla MR Scanner from GE and using a head coil.
T1 weighted images at 3T were obtained using Fast Spin Gradient Echo with TE= 6.3 and TR =
13.2 and the matrix size of 256 x 256. The visibility of the fiducial markers was investigated
along with the susceptibility artifact. Following MRI the sample was imaged by high frequency
ultrasound (25 kHz) using a VisualSonics Vivo 2100 system. The X-ray images were then
obtained from a GE 2000D mammography system with both low and high energy.

42
For validation of the image registration pipeline, magnetic resonance imaging of the specimen
was carried out using a 3 Tesla MR scanner from GE with the head coil. T1 weighted images
were obtained using Fast Spin Gradient Echo with TE = 6.3 and TR = 13.2 and the matrix size of
256 x 256 Figure 3-3-a. The voxel size was calculated as 100x100x400µm.
3.3.5 Histology
After scanning the tissue, the agarose was peeled off and the tissue was fixed in 10% formalin
for 48 hours. The specimen was processed with an automatic tissue processor and embedded in
paraffin. Sections with 5μm thickness and 20μm separation were cut from the paraffin block and
stained with Hematoxylin and Eosin (H&E). Before each section is cut, an optical blockface
image was also obtained from the surface of the block, Figure 3-3-b. The sections were digitized
by an Aperio ScanScope scanner with a resolution of 0.2µm and then downsampled to 18µm
resolution resulting in an image size of 8400 x 5700 pixels Figure 3-3-c. As shown in Figure 3-3
the fiducial markers in the tumour are detectable on MR, blockface and histology images;
therefore, it is feasible to use them for validation.
1mm 1mm 5mm
a) b) c)
Figure 3-3. Images of a mouse tumour with validation fiducial markers: a) ex vivo MRI, b)
blockface image, c) Histology.
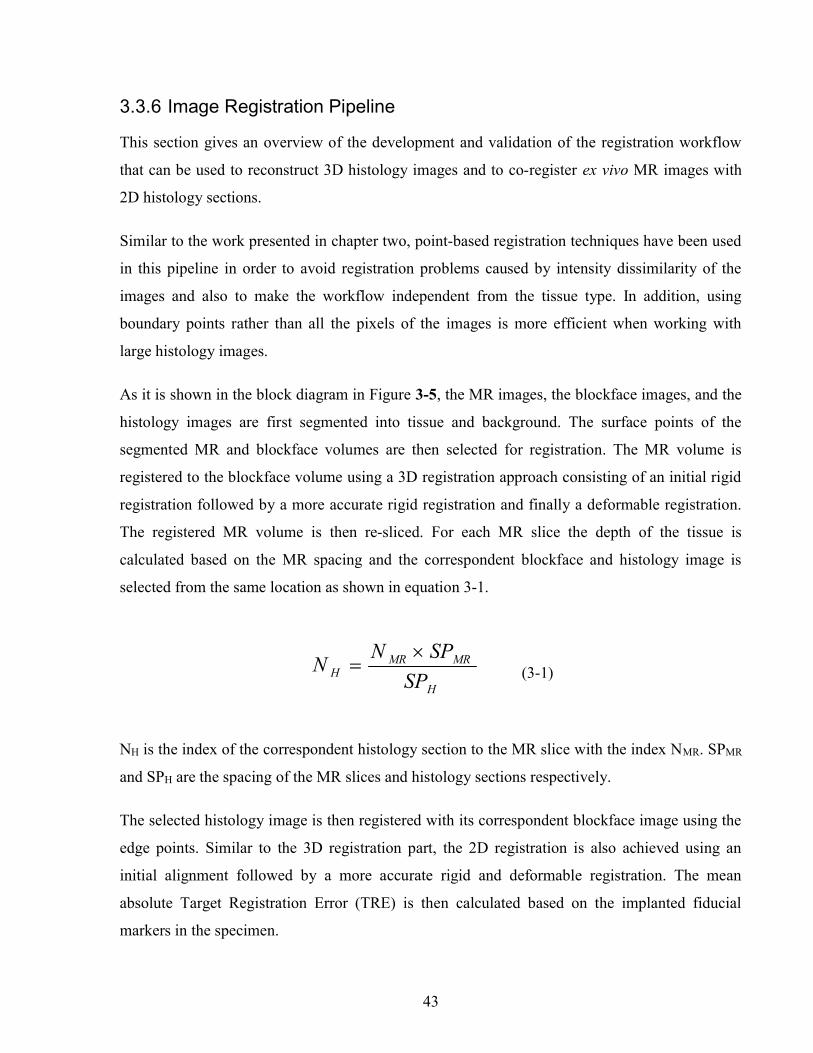
43
3.3.6 Image Registration Pipeline
This section gives an overview of the development and validation of the registration workflow
that can be used to reconstruct 3D histology images and to co-register ex vivo MR images with
2D histology sections.
Similar to the work presented in chapter two, point-based registration techniques have been used
in this pipeline in order to avoid registration problems caused by intensity dissimilarity of the
images and also to make the workflow independent from the tissue type. In addition, using
boundary points rather than all the pixels of the images is more efficient when working with
large histology images.
As it is shown in the block diagram in Figure 3-5, the MR images, the blockface images, and the
histology images are first segmented into tissue and background. The surface points of the
segmented MR and blockface volumes are then selected for registration. The MR volume is
registered to the blockface volume using a 3D registration approach consisting of an initial rigid
registration followed by a more accurate rigid registration and finally a deformable registration.
The registered MR volume is then re-sliced. For each MR slice the depth of the tissue is
calculated based on the MR spacing and the correspondent blockface and histology image is
selected from the same location as shown in equation 3-1.
H
MRMRH SP
SPNN
(3-1)
NH is the index of the correspondent histology section to the MR slice with the index NMR. SPMR
and SPH are the spacing of the MR slices and histology sections respectively.
The selected histology image is then registered with its correspondent blockface image using the
edge points. Similar to the 3D registration part, the 2D registration is also achieved using an
initial alignment followed by a more accurate rigid and deformable registration. The mean
absolute Target Registration Error (TRE) is then calculated based on the implanted fiducial
markers in the specimen.

44
In this workflow, the MR volume and the histology images are registered to the same reference
(blockface images). Additionally, we registered each histology image to its correspondent
blockface image to reconstruct the histology volume.
Each step is explained in the following sections in detail.
3.3.6.1 Segmentation, Point Selection, and Rigid Registration
Segmentation and point selection were pursued using the same approach explained in chapter
two. Histology segmentation was carried out on the blue channel, where the contrast between
different tissue types was higher. To detect the edges of H&E sections, the sections were
segmented from the background using the Otsu thresholding technique (Gonzalez & Woods,
2002).This worked well with H&E histology images, but the contrast between the sample and the
background is lower in blockface images and Otsu thresholding did not perform as well. In this
work, the boundaries of the optical blockface images are segmented manually to minimize the
registration error caused by the segmentation error.
Figure 3-4.a) Edge points of a histology image, b) Surface points of the MR volume, c) Surface
points of the Blockface volume.
The one-pixel wide edges of the binary images were extracted by using the Sobel filter followed
by a thinning operation and then the longest closed boundary in each image was selected (Figure
a) b) c)

45
3-4-a). The closed boundaries were then represented by a sequence of piecewise linear fits using
chain code which is a method to encode boundary points on a closed curve (Freeman, 1974).
The resulting edge points were used for initial alignment by Fourier Descriptors (Giardina &
Kuhl 1977).
The transformed random points of the histology and the complete set of edge points of the
blockface are used in the rest of the 2D image registration steps. MR images are segmented using
seeded region growing technique (Gonzalez & Woods, 2002). The surface points are selected
from the segmented MR images and blockface images in a spiral way as shown in Figure 3-4-b
and Figure 3-4-c. Similar to 2D registration, after initial rigid registration the random MR surface
points are used in the subsequent image registration steps.
As explained in chapter two, 2D Fourier Descriptors (Duan et al., 2008) and Iterative Closest
Points (ICP) algorithm (Besl & McKay, 1992) were employed for initial and refinement of the
rigid alignment of the histology images with their correspondent blockface images. Similarly, 3D
Fourier Descriptors and ICP were used for 3D initial and refinement of the rigid registration of
MR volume with blockface volume.
The point-based deformable registration method is explained in the next chapter.
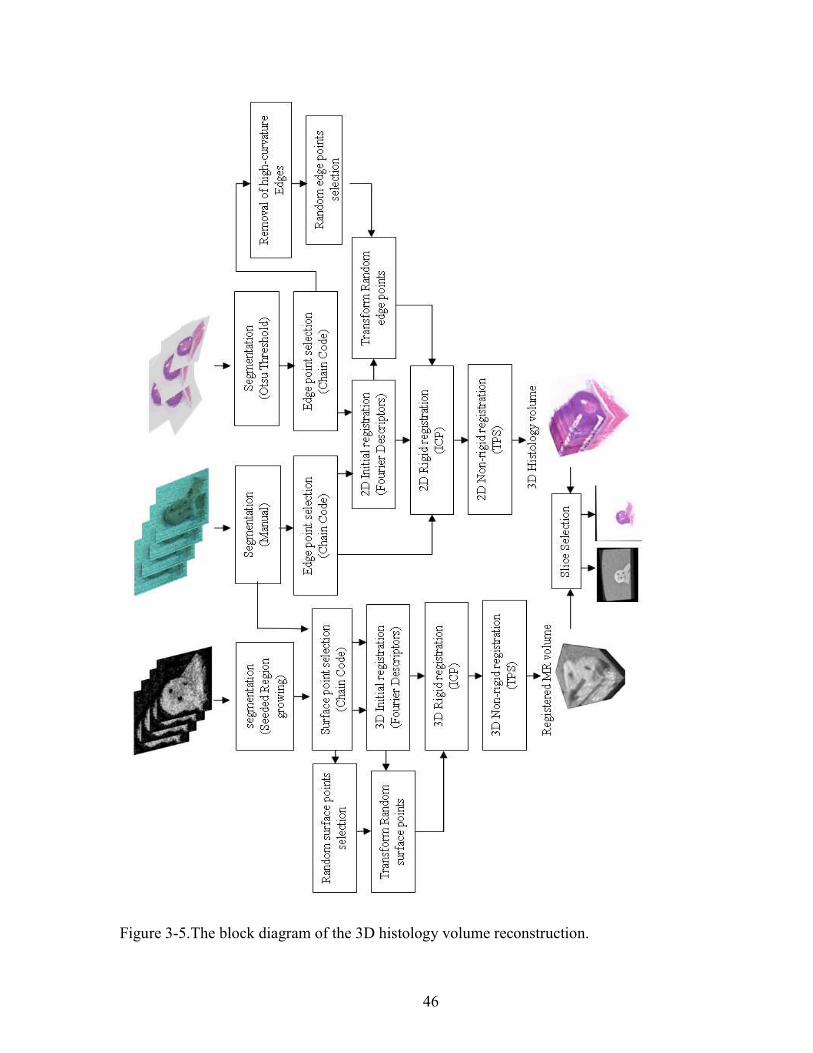
46
Figure 3-5.The block diagram of the 3D histology volume reconstruction.
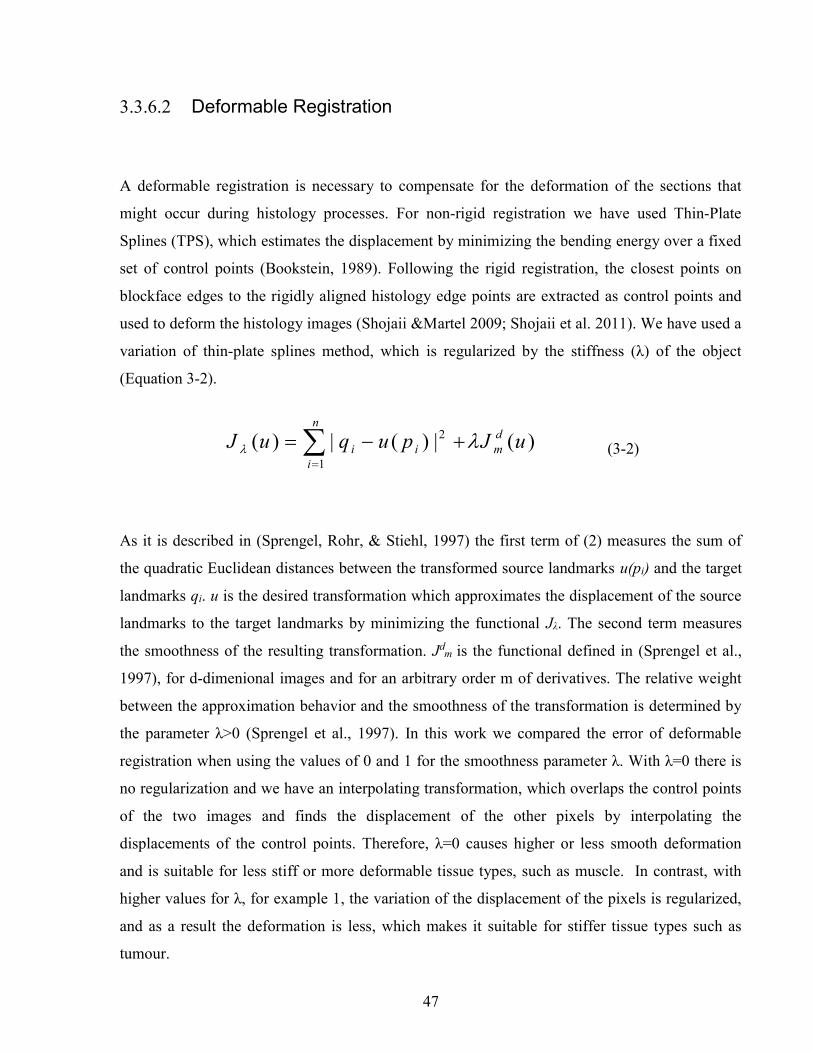
47
3.3.6.2 Deformable Registration
A deformable registration is necessary to compensate for the deformation of the sections that
might occur during histology processes. For non-rigid registration we have used Thin-Plate
Splines (TPS), which estimates the displacement by minimizing the bending energy over a fixed
set of control points (Bookstein, 1989). Following the rigid registration, the closest points on
blockface edges to the rigidly aligned histology edge points are extracted as control points and
used to deform the histology images (Shojaii &Martel 2009; Shojaii et al. 2011). We have used a
variation of thin-plate splines method, which is regularized by the stiffness (λ) of the object
(Equation 3-2).
)(|)(|)(1
2 uJpuquJn
i
dmii
(3-2)
As it is described in (Sprengel, Rohr, & Stiehl, 1997) the first term of (2) measures the sum of
the quadratic Euclidean distances between the transformed source landmarks u(pi) and the target
landmarks qi. u is the desired transformation which approximates the displacement of the source
landmarks to the target landmarks by minimizing the functional Jλ. The second term measures
the smoothness of the resulting transformation. Jdm is the functional defined in (Sprengel et al.,
1997), for d-dimenional images and for an arbitrary order m of derivatives. The relative weight
between the approximation behavior and the smoothness of the transformation is determined by
the parameter λ>0 (Sprengel et al., 1997). In this work we compared the error of deformable
registration when using the values of 0 and 1 for the smoothness parameter λ. With λ=0 there is
no regularization and we have an interpolating transformation, which overlaps the control points
of the two images and finds the displacement of the other pixels by interpolating the
displacements of the control points. Therefore, λ=0 causes higher or less smooth deformation
and is suitable for less stiff or more deformable tissue types, such as muscle. In contrast, with
higher values for λ, for example 1, the variation of the displacement of the pixels is regularized,
and as a result the deformation is less, which makes it suitable for stiffer tissue types such as
tumour.

48
The ex-vivo MR volume represents the shape of the specimen before sectioning and the
blockface volume represent the same specimen after sectioning. Therefore, the 3D surface points
of the two volumes can be used for image registration. Similar to 2D histology to 2D blockface
image registration, for the deformable registration of MR volume with the blockface volume, the
closest surface points from the rigid registration are selected as control points and then 3D TPS is
used to compensate the 3D deformation.
The image registration techniques used at each step of the workflow are summarized in Table
3-1.
Table 3-1. Summary of the image registration techniques used at each step of the workflow H =
Histology image, B = Blockface image, MR = MR image
Source to Target
Type of Registration
Algorithm Cost function Optimizer Interpolator
2D H to B initial rigid FD - - Linear
2D H to B rigid ICP L2 norm Levenberg Marquardt
Nearest Neighbor
2D H to B non-rigid TPS bending energy Gradient Descent
Linear
3D MR to B initial rigid FD - - Linear 3D MR to B
rigid ICP L2 norm Levenberg
Marquardt Nearest Neighbor
3D MR to B non-rigid
TPS Bending energy Gradient Descent
Linear
3.3.6.3 Validation
The mean absolute TRE was calculated at each step of the workflow based on the centres of the
fiducial markers and showed the statistical dispersion by calculating the standard deviation (sd).
In order to evaluate the histology volume reconstruction, the mean absolute TRE was calculated
based on the centres of the fiducial markers manually localized on histology and the
correspondent blockface images. The registration error was measured after the 2D rigid
registration, using FDs and ICP, and also after 2D deformable registration using TPS with two
different stiffness values.

49
To confirm that the blockface images improve the histology volume reconstruction, the histology
images were also registered using the pair-wise approach without using blockface images and
compared the reconstructed volume with the volume made by using the proposed approach.
The MR volume is then registered to blockface volume and re-sliced. Ten slices were selected
from the middle of the MR volume, where the tumour and fiducial markers were detectable. The
mean absolute TRE was then measured using fiducial markers on the 2D MR slices and their
correspondent blockface and histology images. If the correspondent histology image was torn or
had artefacts then the next or previous section was selected as closest section for correlation.
To assess the registration error in 3D, the fitted lines to the centres of the fiducial markers in MR
and histology volumes were also visualized.
3.3.6.4 Blockface image spacing
Since the blockface images are used as reference and play an important role in the workflow, we
have investigated the effect of the spacing of the blockface imaging on the target registration
error of MR slices and their correspondent histology images. This provides us with an estimate
of the registration error with fewer histology sections and enables us to select the number of
histology sections that we need to meet the desired registration accuracy. As it is mentioned in
3.3.5, the original spacing of the blockface images and the histology images is 0.02 mm. To
increase the blockface spacing we have eliminated some of the blockface images from the
registration process. First we increased the blockface spacing to 0.095 mm by including one
image in every four images (Figure 3-6) in the registration process and then we repeated all the
steps to measure the mean absolute TRE of the registration of MR images to the correspondent
histology images. The spacing was further increased to 0.195 mm, 0.395 mm, and 0.795 mm by
including one image in every 8, 16, and 32 images respectively and repeating the whole process.
The measured mean absolute TREs are shown and compared in section 3.4.

50
Figure 3-6.Eliminating pairs of blockface and histology images to increase the spacing.
3.4 Results
3.4.1 Fiducial Markers
This section reports on the preliminary results of a set of experiments for developing a multi-
modality fiducial marker, which can also be identified in histology and optical blockface images.
The purpose of this marker is to validate the registration histology images to their correspondent
optical blockface image. This fiducial marker can also be used in validation of the registration of
medical images with histology images. This fiducial marker can also be used to provide
landmarks for image registration. Among seven fiducial markers, black spaghetti has shown to
be the most suitable for big specimens. For small specimens, such as a mouse tumour, a
promising marker is shown to be a 26G catheter filled with a mixture of the squid ink and the
flour.
The susceptibility artifact in MRI can be eliminated by adjusting the concentration of the squid
ink based on the iron concentration in black spaghetti. The detectability, localization and stability
of black spaghetti in different imaging modalities and blockface images is very good and in
100% of the histology sections it stays on microscope slides after staining. Catheter filled with
the mixture of cuttlefish ink and flour and water is very well visualized, localized and stable in
medical images and blockface images and in around 40% of the sections it remains on
microscope slides after staining. Even when the catheter does not remain on the slide, the hole
caused by the catheter's insertion is visible in the sections. The reason that the catheter falls off is
that paraffin supports the tissue and the fiducial marker during sectioning, but with regular
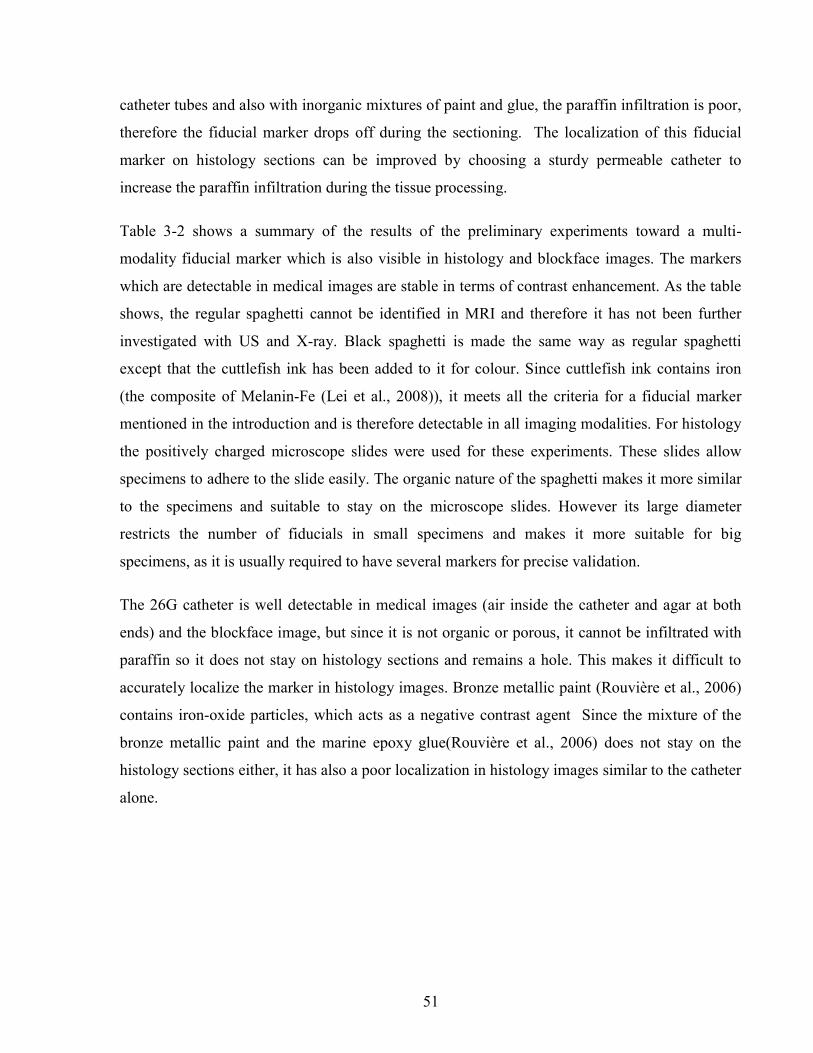
51
catheter tubes and also with inorganic mixtures of paint and glue, the paraffin infiltration is poor,
therefore the fiducial marker drops off during the sectioning. The localization of this fiducial
marker on histology sections can be improved by choosing a sturdy permeable catheter to
increase the paraffin infiltration during the tissue processing.
Table 3-2 shows a summary of the results of the preliminary experiments toward a multi-
modality fiducial marker which is also visible in histology and blockface images. The markers
which are detectable in medical images are stable in terms of contrast enhancement. As the table
shows, the regular spaghetti cannot be identified in MRI and therefore it has not been further
investigated with US and X-ray. Black spaghetti is made the same way as regular spaghetti
except that the cuttlefish ink has been added to it for colour. Since cuttlefish ink contains iron
(the composite of Melanin-Fe (Lei et al., 2008)), it meets all the criteria for a fiducial marker
mentioned in the introduction and is therefore detectable in all imaging modalities. For histology
the positively charged microscope slides were used for these experiments. These slides allow
specimens to adhere to the slide easily. The organic nature of the spaghetti makes it more similar
to the specimens and suitable to stay on the microscope slides. However its large diameter
restricts the number of fiducials in small specimens and makes it more suitable for big
specimens, as it is usually required to have several markers for precise validation.
The 26G catheter is well detectable in medical images (air inside the catheter and agar at both
ends) and the blockface image, but since it is not organic or porous, it cannot be infiltrated with
paraffin so it does not stay on histology sections and remains a hole. This makes it difficult to
accurately localize the marker in histology images. Bronze metallic paint (Rouvière et al., 2006)
contains iron-oxide particles, which acts as a negative contrast agent Since the mixture of the
bronze metallic paint and the marine epoxy glue(Rouvière et al., 2006) does not stay on the
histology sections either, it has also a poor localization in histology images similar to the catheter
alone.

52
Table 3-2.Fiducial markers and their delectability in different imaging modalities
no: not detectable, yes: detectable, NT: not tested
No. Fiducial Markers MRI Ultrasound X-ray Blockface
image Histology
Size (diameter)
1 Spaghetti no NT NT yes yes (100%) ~0.95mm
2 Black spaghetti yes
Size(mm):2.0 ± 0.4 NT yes yes yes (100%) ~1.75mm
3 26G Catheter yes
Size(mm):0.6 ± 0.02 NT yes yes
no (poor localization)
Outer:0.6mm inner:0.4mm
4
Catheter filled with bronze metallic paint and marine epoxy glue (1:2)
yes
Size(mm):0.6 ± 0.05 NT NT yes no (poor localization)
Outer:0.6mm inner:0.4mm
5 Catheter filled with ground black spaghetti and water
yes
Size(mm):0.6 ± 0.05 NT NT yes
yes (83%) (better localization)
Outer:0.6mm inner:0.4mm
6 Catheter filled with liquid iron supplement and flour (1:1)
yes (high susceptibility
artifact)
Size(mm): 1.2 ± 0.5
yes yes yes
yes (44%) (better localization)
size(mm):0.71 ± 0.07
(inner) 0.49 ± 0.06
Outer:0.6mm inner:0.4mm
7 Catheter filled with cuttlefish ink and flour (1.5:1)
yes (susceptibility artifact)
Size(mm): 0.6 ± 0.1
yes yes yes
yes (46%) (better localization)
size(mm):0.69 ± 0.03
(inner) 0.41 ± 0.06
Outer:0.6mm inner:0.4mm
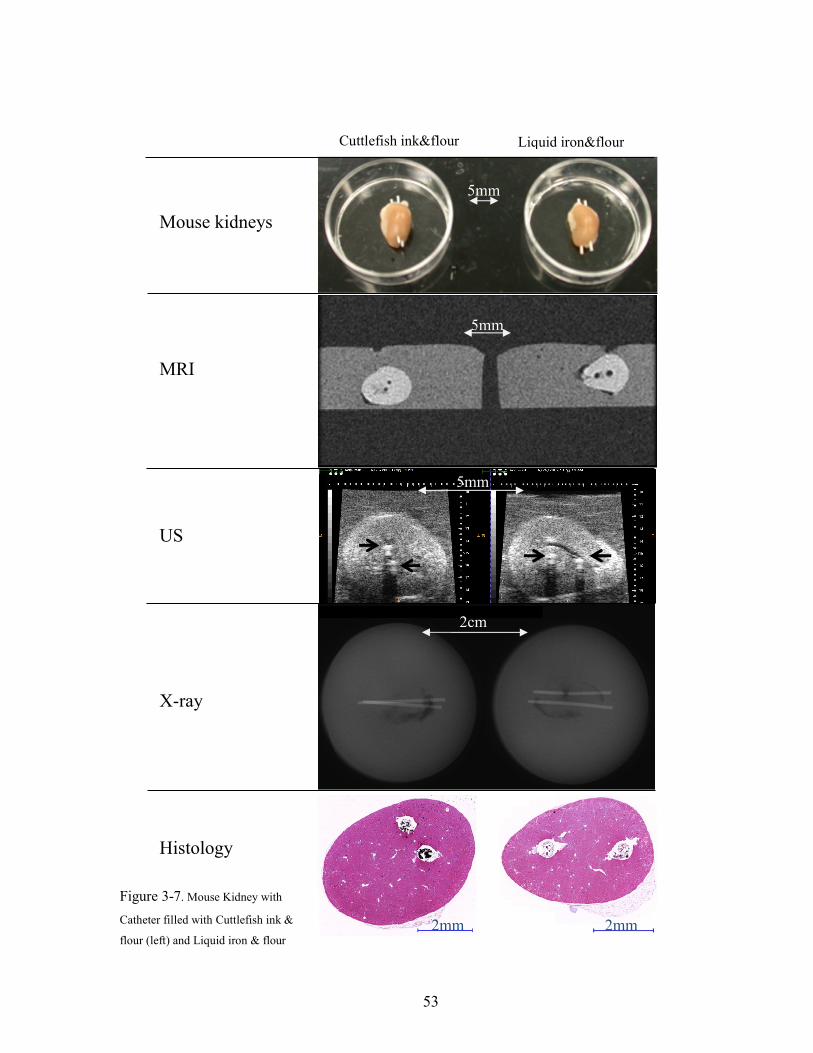
53
2mm 2mm
2cm
X-ray
MRI
US
Mouse kidneys
Histology
Figure 3-7. Mouse Kidney with
Catheter filled with Cuttlefish ink &
flour (left) and Liquid iron & flour
5mm
m
5mm
Liquid iron&flour
5mm
Cuttlefish ink&flour

54
The mixture of the ground black spaghetti with water shows up very well in medical images and
histology and blockface images, but the problem with this marker is that the ground black
spaghetti is not very soluble in water and it is difficult to make a uniform mixture therefore water
gradually separates from the mixture. The localization of this fiducial marker on histology is
good where the mixture is denser (as shown inTable 3-2), but poor where it is less dense. The
mixture of the liquid iron supplement (20 mg elemental iron in 1 ml) with flour was also tested,
but because of the high iron concentration the susceptibility artifact in MRI is high. Since the
black spaghetti presents good characteristics, a mixture of the cuttlefish ink and flour (1.5:1)
wasalso tested as another fiducial marker. The mixtures of cuttlefish ink showed less
susceptibility artifact compared to the liquid iron but higher susceptibility artifact comparing to
the black spaghetti. In order to decrease the susceptibility artifact, the concentration of iron in
black spaghetti (12 ppm) and the condensed squid ink (45 ppm) was measured to determine the
amount of cuttlefish ink required for fiducial marker. Figure 3-7 show a complete set of images
with the 6th and 7th fiducial markers in a mouse kidney.
a)
Black Spaghetti
c)
Figure 3-8. a) Optical image of a mouse tumour with three different fiducial markers: Black
Spaghetti, Catheter filled with bronze metallic paint and glue, Catheter filled with ground black
spaghetti and water. b) MR image of the same specimen scanned at 7T scanner. c) x-ray of a
mouse kidney with black spaghetti.
1mm
Black
Spaghetti
Catheter + Paint
& Glue
Catheter +
Paint & Glue
Catheter +
Ground BS & W
Catheter +
Ground BS & W
b)

55
Figure 3-8-a shows an optical image of three different types of fiducial markers implanted in a
xenograft of human prostate cancer cell line PC3. Figure 3-8-b displays the T1 weighted image
of the tumour, where the fiducial markers can be easily localized. The size of the black spaghetti
in the middle limits the number of implanted fiducial markers especially in small specimens. On
the other hand the size of the 26G catheters is appropriate for small specimens. The mixture of
the ground black spaghetti and water and also bronze metallic paint and marine epoxy glue
facilitate the localization of the catheter. Figure 3-8-c also shows that two black spaghettis
implanted in a mouse kidney are well detectable in the x-ray image of the specimen.
b) a)
c) d)
Figure 3-9. Top: mixture of bronze metallic paint and glue in catheter, a) blockface image b) histology image. Bottom: black spaghetti in thigh muscle of a mouse, c) blockface image d) and the histology image.

56
Figure 3-9-a and Figure 3-9-b show the appearance of a catheter filled with mixture of bronze
metallic paint and glue in blockface and histology images respectively. Although the catheter and
the mixture get washed off during histology processes the location of the fiducial marker remains
detectable in the histology image. The same result was obtained with the mixtures of cuttlefish
ink and flour and water, and the mixture of ground black spaghetti and water, but with more
attachment of the mixture to the microscope slide. Two implanted black spaghettis implanted in
a mouse thigh muscle are shown in Figure 3-9-c and Figure 3-9-d. The localization of the black
spaghetti is feasible in blockface and histology images.
3.4.2 Blockface Volume
Figure 3-10-a shows a blockface image with the three holes in the three corners of the paraffin
block. The stack of the blockface images after the alignment of the drilled holes is shown in
Figure 3-10-b.
3.4.3 Reconstruction of a 3D histology volume from serial sections
As it is shown in Figure 3-11a-c, we can visually detect the registration error propagation or
banana effect, which occurs when a curved 3D object is reconstructed from serial sections. The
Figure 3-10. a) Blockface image, b) Blockface volume, arrows show three holes in the corners
of the paraffin tissue block
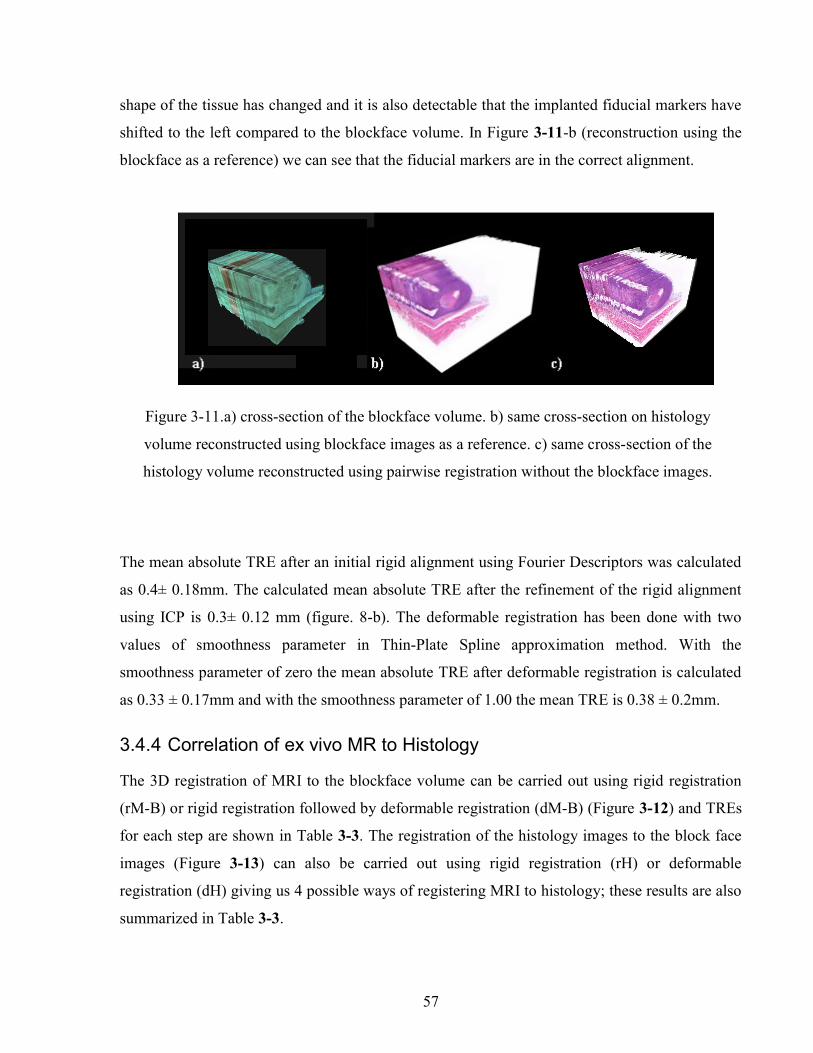
57
shape of the tissue has changed and it is also detectable that the implanted fiducial markers have
shifted to the left compared to the blockface volume. In Figure 3-11-b (reconstruction using the
blockface as a reference) we can see that the fiducial markers are in the correct alignment.
The mean absolute TRE after an initial rigid alignment using Fourier Descriptors was calculated
as 0.4± 0.18mm. The calculated mean absolute TRE after the refinement of the rigid alignment
using ICP is 0.3± 0.12 mm (figure. 8-b). The deformable registration has been done with two
values of smoothness parameter in Thin-Plate Spline approximation method. With the
smoothness parameter of zero the mean absolute TRE after deformable registration is calculated
as 0.33 ± 0.17mm and with the smoothness parameter of 1.00 the mean TRE is 0.38 ± 0.2mm.
3.4.4 Correlation of ex vivo MR to Histology
The 3D registration of MRI to the blockface volume can be carried out using rigid registration
(rM-B) or rigid registration followed by deformable registration (dM-B) (Figure 3-12) and TREs
for each step are shown in Table 3-3. The registration of the histology images to the block face
images (Figure 3-13) can also be carried out using rigid registration (rH) or deformable
registration (dH) giving us 4 possible ways of registering MRI to histology; these results are also
summarized in Table 3-3.
Figure 3-11.a) cross-section of the blockface volume. b) same cross-section on histology
volume reconstructed using blockface images as a reference. c) same cross-section of the
histology volume reconstructed using pairwise registration without the blockface images.

58
The results of a paired t-test indicate that there is a significant improvement in overall
registration accuracy when deformable registration is used to align the MRI volume with the
blockface images compared to the use of simple rigid registration ((dM-rH vs rM-rH, p=0.01);
(dM-dH vs rM-dH, p<0.0001)).
Table 3-3.Mean Absolute Target Registration Error and the Standard Deviation.rM = rigid
registration of MRI, rH = rigid registration of histology, B = blockface image, dM = deformable
registration of MRI, dH = deformable registration of histology
Step Mean ± SD (mm)
rM-B 0.41 ± 0.12 dM-B 0.37 ± 0.11 rM-rH 0.68 ± 0.39 dM-rH 0.54 ± 0.37 rM-dH 1.07 ± 0.4 dM-dH 0.86 ± 0.45
It was shown in section 3.4.3 that the addition of a deformable registration step to align the 2D
histology and blockface images increases the TREs and this is reflected in the higher errors for
(rM-dH) and (dM-dH). The best results were obtained using deformable registration to align the
3D blockface and MR images and a rigid registration for the histology images.
a) b) d)
Figure 3-12.a) Registered MR volume, b) blockface volume, c) histology volume.

59
We also investigated the effect of the spacing of the blockface imaging on the target registration
error of 10 MR slices and their correspondent histology images. A one-way ANOVA test
showed that there is no statistically significant difference between the five groups (p=0.63).
Therefore increasing the spacing of the blockface and histology images up to about 0.8mm has
no significant effect on the accuracy of the registration of MR images to histology images;
however, this may be due to our small sample size and it is required to further investigate it using
more samples.
Figure 3-13.a) Registered MR image. b) Blockface image. c) Correspondent deformed Histology
image.
In order to investigate the through plane error in finding the correspondent histology images to
the re-sliced MR images we plotted the fitted lines to the centroid of the fiducial markers
detected in the re-sliced MR images after rigid (Figure 3-14-a) and deformable registration
(Figure 3-14 -b) and compared them with the fitted lines to the centroid of the fiducial markers
detected in the aligned histology images shown in solid red visually. As it is shown in Figure
3-14, the distances between the fitted lines have been decreased after deformable registration of
MR volume.

60
Figure 3-14.Fitted lines to the centroid of the fiducial markers in 3D; a) rigid MRI in blue and
correspondent histology in red, b) deformed MRI in green and correspondent histology in red
3.5 Summary and Discussion
This chapter reports on the results of a set of experiments for developing a multi-modality
fiducial marker, which can also be identified in histology and optical blockface images. The
purpose of this marker is to validate the registration histology images to their correspondent
optical blockface image. This fiducial marker can also be used in validation of the registration of
medical images with histology images. If required, this fiducial marker can also be used to
provide landmarks for image registration. Among seven fiducial markers, black spaghetti has
shown to be the most suitable for big specimens. For small specimens, such as a mouse tumour, a
promising marker is shown to be a 26G catheter filled with a mixture of the squid ink and the
flour.
The susceptibility artifact in MRI can be eliminated by adjusting the concentration of the squid
ink based on the iron concentration in black spaghetti. The localization and stability of black
spaghetti in different imaging modalities and blockface images is very good and in 100% of the
histology sections it stays on microscope slides after staining. Catheter filled with the mixture of
cuttlefish ink and flour and water is very well visualized, localized and stable in medical images
and blockface images and in around 40% of the sections it remains on microscope slides after
staining. Even when the catheter does not remain on the slide, the hole caused by the catheter's
insertion is visible in the sections. The reason that the catheter falls off is that paraffin supports
a) b)

61
the tissue and the fiducial marker during sectioning, but with regular catheter tubes and also with
inorganic mixtures of paint and glue, the paraffin infiltration is poor, therefore the fiducial
marker drops off during the sectioning. The localization of this fiducial marker on histology
sections improves by choosing a sturdy permeable catheter to increase the paraffin infiltration
during the tissue processing.
This chapter also introduces an image registration workflow to register ex vivo MRI to histology
images of a preclinical model. Optical blockface images are used as reference images. The 2D
histology images are aligned to the correspondent 2D blockface images and the 3D MR image is
registered to the blockface volume. The registered MR volume is then re-sliced and the
correspondent histology image to each MR slice is found. In order to make the workflow
independent of the type of the tissue and the histology stain used, boundary points are used to
carry out the registration. Catheters filled with the mixture of cuttlefish ink and flour and water
were implanted in the specimen as multi-modality validation landmarks and the mean absolute
target registration error was measured based on the centres of these markers.
Another advantage of using a point based approach rather than an intensity based approach is
that it is less computationally demanding and therefore better able to cope with very large digital
pathology images.
In order to evaluate the effect of the spacing on the registration of MR image with histology
images we eliminated some pairs of the histology and blockface images, or in other words
increased the spacing between the histology and blockface images, and repeated all the steps to
measure the registration error of the registration of MR images to the correspondent histology
images. We have shown that increasing the spacing of the blockface and histology images up to
about 0.8mm has no significant effect on the accuracy of the registration of MR images to
histology images of a mouse tumour model. Further investigation into the effect of increasing the
spacing between the blockface images and histology images should be carried out with more
specimens for confirmation.
Deformable registration of MR volume has improved the overall accuracy of the registration of
MRI to histology (0.68 mm vs 0.54 mm). The tissue is highly deformed during fixation,
processing, and embedding. Therefore the 3D deformation of the whole specimen, including the
tumour, between the MR volume (fresh tissue) and the blockface volume (embedded tissue) is

62
high relative to the 2D deformation between the blockface and histology images. The results
show that the 3D deformable registration using the thin-plate spline method has corrected this
deformation to some extent and has improved the overall registration of MRI to histology. The
2D distortions between blockface and histology sections are much smaller than the 3D
distortions between MR and blockface volumes, and as the results show, the 2D deformable
registration using the edge points has not improved the accuracy of the global registration. A
possible reason may be that the tumour is more rigid than the surrounding muscle and the
connective tissue, therefore the tumour deformation is more subtle than the other regions of the
section. The Thin-Plate Spline method assumes that the tissue is homogeneous and assigns one
stiffness value to the whole object and as a result, the deformation field obtained from TPS for
2D images is dominated by the effect of deformation in the muscle.
We have demonstrated that this registration workflow applied to a pre-clinical xenograft model
produces a target registration error of 0.54mm. Whether this registration accuracy is "good
enough" depends on the application and on the smallest structure that is of interest. In (Eli
Gibson, Fenster, & Ward, 2012), Gibson et al. utilized the fractional overlap between the
reference and target volumes to derive a statistical power calculation relating registration error,
sample size, and the minimum detectable difference between the region of interest and
background on imaging, which can be used to assess whether an image registration algorithm has
sufficient accuracy for a particular application. For example, one of the applications is the
validation of the utility of medical imaging for localization of a specific anatomy. For this
application and by using the proposed image registration pipeline, with the registration error of
0.54mm, structures such as breast ducts (~2 mm), prostate glands (3-4cm), and brain cerebral
cortex (1.5-4.5mm) detected in MR images can be reliably registered to histology.
It is difficult to generalize the accuracy of the pipeline to other applications. Different tissue
types have different biomechanical properties, such as highly deformable fat and less deformable
fibroglandular tissue, therefore the registration error is expected to change for different
specimens. Therefore, in chapter four a deformable image registration approach is introduced to
improve the 2D deformable image registration of the pipeline and an optimization strategy is also
presented to enhance the registration of breast lumpectomy specimens.

63
4 Optimization of Deformable Registration for Breast Histology Images
Chapter four explains the work that is done to improve the 2D to 2D deformable registration of
histology to blockface images. An overview is given of the deformable registration of the 2D
image registration of multi-modal images. This chapter shows the feasibility of using densely
sampled scale-invariant feature transform (SIFT) features and a SIFTFlow deformable
registration algorithm for co-registering whole-mount histology images with blockface optical
images. An optimization strategy is also introduced to estimate the optimum parameters for
SIFTFlow objective function and used to determine the most appropriate values for the
registration of breast lumpectomy specimens. The work in this chapter also demonstrates that
tuning the regularization parameters results in significant improvements in accuracy and also
shows that SIFTFlow outperforms the previously described edge-based registration method.
Further evaluation of the optimum parameters is also presented using an independent test set of
images from five different lumpectomy specimens.
4.1 Introduction
An image registration pipeline is presented in chapter two for histology volume reconstruction
and registration of histology with volumetric medical images. The study with edge-based
registration methods in the previous chapter suggests that the 2D deformable registration method
requires improvement. Due to the highly deformable nature of breast tissue, it is important to
employ an effective method to correct the deformation of the tissue sections with respect to the
original form of the tissue. In the proposed pipeline the histology images are registered to their
correspondent optical blockface images with different intensity variation. Therefore, this task
demands for a deformable images registration, which is capable of registering images obtained
from multiple modalities. In the previous chapter the boundary point of the sections were used
64
for registration of images obtained from animal models. Lacking a clear boundary between the
breast tissue and the surrounding gel in histology images and blockface images, rules out using
the edge-based registration methods for human breast tissue.
Several approaches for correcting for the 2D misalignment and deformations have been
described. Some groups have used extrinsic fiducial markers to align the slices (Breen et al.,
2005), (E Gibson et al., 2013), however this is an invasive procedure which has the potential to
affect the pathologists’ ability to interpret the histological sections, and is frequently not
permitted on clinical specimens.
Both intensity-based and landmark-based registration methods have the advantage that they do
not interfere with the appearance of the tissue sections. Intensity based methods have been
shown to be very effective in medical image registration but they may fail in histology, where
the intensities across histology images are not constant (Ju et al., 2006), (Grégoire Malandain et
al., 2004), (Ourselin, Roche, Pennec, & Sattonnet, 1998). Bağci et al. have demonstrated that
intensity variations across images can lead to registration errors and this problem cannot be fixed
through a simple intensity normalization approach (Bağci & Bai, 2008), (Bagci, Udupa, & Bai,
2010). Feature based image registration techniques (Guest, Berry, Baldock, Fidrich, & Smith,
2001), (Cohen, Yang, Huang, & Nissanov, 1998) rely on identifying corresponding features such
as points and lines in both images and the choice of a feature space plays a significant role in
registration quality.
The existing methods have been developed and validated for fairly rigid organs such as prostate
and brain, which also have clear boundaries in the images. Breast tissue is highly deformable and
does not have well defined boundaries. There is no automatic deformable registration technique,
which has been validated for the histology images obtained from large clinical breast specimens.
The aim of the work presented in this chapter is to improve the accuracy of the deformable
registration used to co-register the 2D histology sections to the 2D optical blockface images. In
our previous work, points at the boundary between the tissue specimen and the surrounding
paraffin block were automatically identified in both histology and blockface images and used to
generate a deformation field. Scale Invariant Feature Transform (SIFT) features (Lowe, 2004)
take into account the spatial information obtained from the gradient of the pixel intensities and
are invariant to brightness, rotation, and scale making them a suitable choice for use in histology.

65
Here we propose the use of DenseSIFT, which does not require the detection of key points. Our
proposed approach overcomes two of the problems mentioned above. First, using the reference
optical images acquired from the surface of the tissue blocks, before each section is cut, makes
the alignment of the histology images independent from the problem of dissimilarity of the
sections because of the spacing between them. Second, a noninvasive automatic feature based
image registration method has been used and optimized for breast specimens to find the
parameters suitable for deformation of the whole-mount breast histology sections. Using SIFT
features, which are invariant to brightness, rotation, and scale, eliminates the shortcoming of the
intensity based methods. To evaluate the accuracy of the proposed deformable registration
method, fiducial markers have been implanted in one breast specimen, which allow us to
calculate the target registration error (TRE) at each step of the pipeline accurately. For five
additional specimens, manually selected landmarks are used to validate the approach. The
average Target Registration Error using the optimized parameters are compared with the TRE
using the parameters used by Liu et al. (Liu, Yuen, & Torralba, 2011a) and visual assessments
are shown. Finally we compare the performance of the proposed deformable registration method
with the edge based method described previously.
4.2 Materials and Methods
This section describes the pipeline for co-registration of the histology images and their
corresponding blockface images. Rigid registration parameters are calculated by minimizing the
distance between the densely sampled Scale Invariant Feature Transform (SIFT) features (Lowe,
2004), (Liu, Yuen, Torralba, Sivic, & Freeman, 2008) of the two sets of images. The same
features are used to correct for the deformation of the histology images using a feature-based
image registration technique, SIFTFlow (Liu et al., 2011a). An iterative optimization approach is
used to estimate the optimum parameters for deformable registration of the breast histology and
blockface images. Both rigid and deformable registration are validated by visual assessment and
calculation of average TRE using multi-modality fiducial markers, which are detectable in
histology and reference images (R Shojaii & Martel, 2010). Moreover, manually selected
structural landmarks are also used for validation.
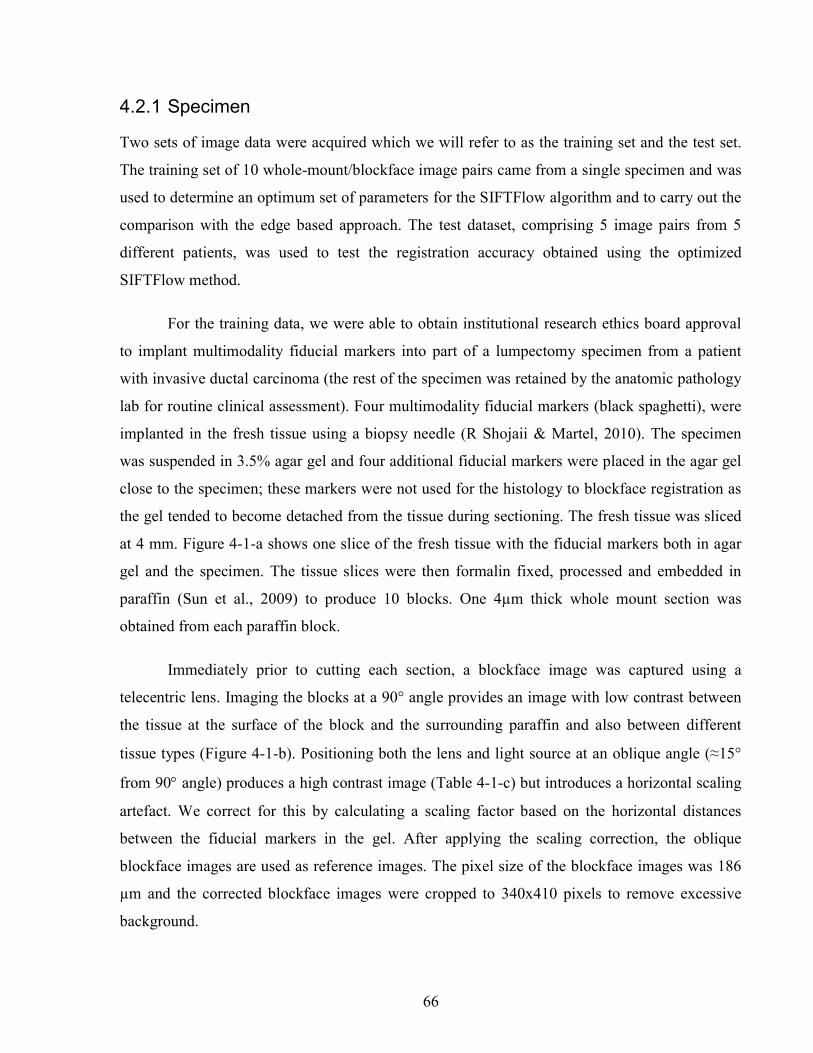
66
4.2.1 Specimen
Two sets of image data were acquired which we will refer to as the training set and the test set.
The training set of 10 whole-mount/blockface image pairs came from a single specimen and was
used to determine an optimum set of parameters for the SIFTFlow algorithm and to carry out the
comparison with the edge based approach. The test dataset, comprising 5 image pairs from 5
different patients, was used to test the registration accuracy obtained using the optimized
SIFTFlow method.
For the training data, we were able to obtain institutional research ethics board approval
to implant multimodality fiducial markers into part of a lumpectomy specimen from a patient
with invasive ductal carcinoma (the rest of the specimen was retained by the anatomic pathology
lab for routine clinical assessment). Four multimodality fiducial markers (black spaghetti), were
implanted in the fresh tissue using a biopsy needle (R Shojaii & Martel, 2010). The specimen
was suspended in 3.5% agar gel and four additional fiducial markers were placed in the agar gel
close to the specimen; these markers were not used for the histology to blockface registration as
the gel tended to become detached from the tissue during sectioning. The fresh tissue was sliced
at 4 mm. Figure 4-1-a shows one slice of the fresh tissue with the fiducial markers both in agar
gel and the specimen. The tissue slices were then formalin fixed, processed and embedded in
paraffin (Sun et al., 2009) to produce 10 blocks. One 4µm thick whole mount section was
obtained from each paraffin block.
Immediately prior to cutting each section, a blockface image was captured using a
telecentric lens. Imaging the blocks at a 90° angle provides an image with low contrast between
the tissue at the surface of the block and the surrounding paraffin and also between different
tissue types (Figure 4-1-b). Positioning both the lens and light source at an oblique angle (≈15
from 90 angle) produces a high contrast image (Table 4-1-c) but introduces a horizontal scaling
artefact. We correct for this by calculating a scaling factor based on the horizontal distances
between the fiducial markers in the gel. After applying the scaling correction, the oblique
blockface images are used as reference images. The pixel size of the blockface images was 186
µm and the corrected blockface images were cropped to 340x410 pixels to remove excessive
background.
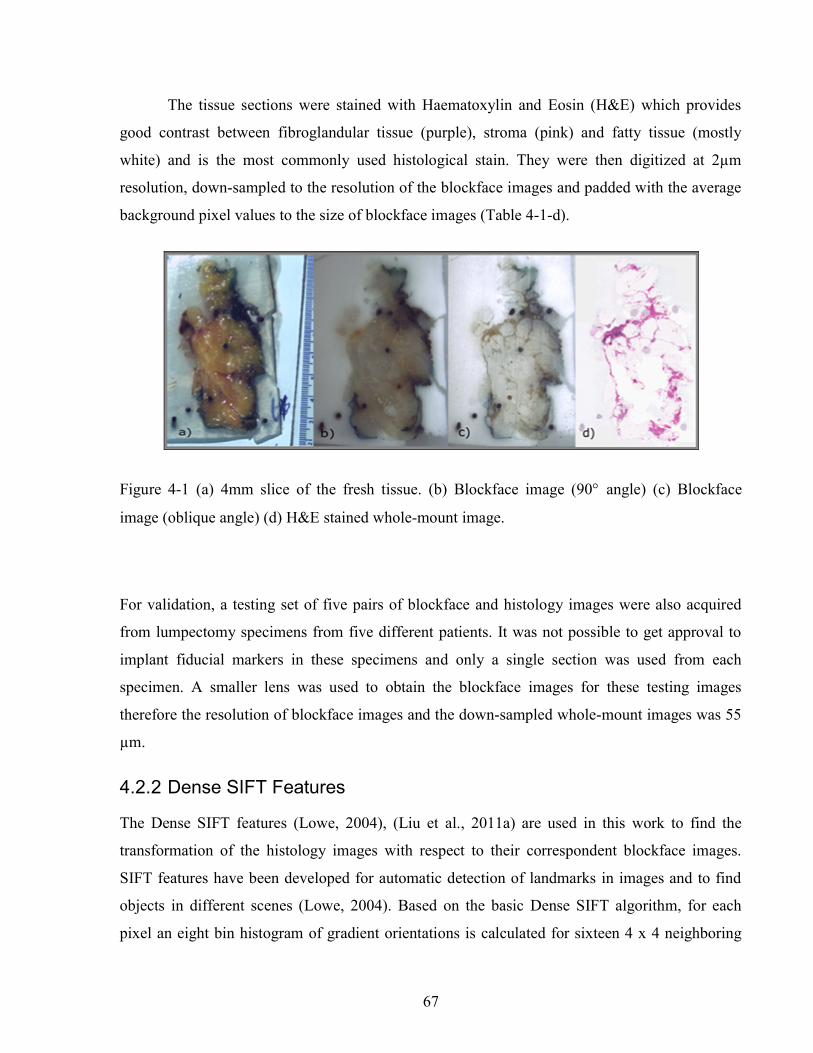
67
The tissue sections were stained with Haematoxylin and Eosin (H&E) which provides
good contrast between fibroglandular tissue (purple), stroma (pink) and fatty tissue (mostly
white) and is the most commonly used histological stain. They were then digitized at 2µm
resolution, down-sampled to the resolution of the blockface images and padded with the average
background pixel values to the size of blockface images (Table 4-1-d).
Figure 4-1 (a) 4mm slice of the fresh tissue. (b) Blockface image (90 angle) (c) Blockface
image (oblique angle) (d) H&E stained whole-mount image.
For validation, a testing set of five pairs of blockface and histology images were also acquired
from lumpectomy specimens from five different patients. It was not possible to get approval to
implant fiducial markers in these specimens and only a single section was used from each
specimen. A smaller lens was used to obtain the blockface images for these testing images
therefore the resolution of blockface images and the down-sampled whole-mount images was 55
µm.
4.2.2 Dense SIFT Features
The Dense SIFT features (Lowe, 2004), (Liu et al., 2011a) are used in this work to find the
transformation of the histology images with respect to their correspondent blockface images.
SIFT features have been developed for automatic detection of landmarks in images and to find
objects in different scenes (Lowe, 2004). Based on the basic Dense SIFT algorithm, for each
pixel an eight bin histogram of gradient orientations is calculated for sixteen 4 x 4 neighboring
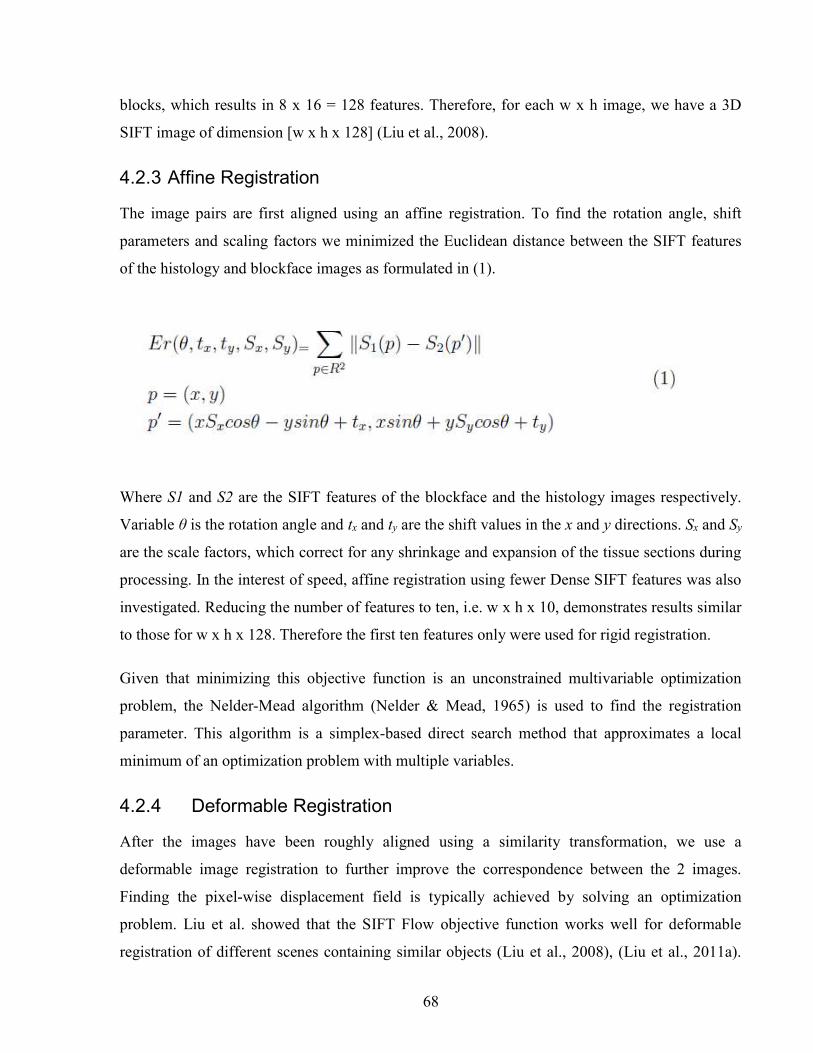
68
blocks, which results in 8 x 16 = 128 features. Therefore, for each w x h image, we have a 3D
SIFT image of dimension [w x h x 128] (Liu et al., 2008).
4.2.3 Affine Registration
The image pairs are first aligned using an affine registration. To find the rotation angle, shift
parameters and scaling factors we minimized the Euclidean distance between the SIFT features
of the histology and blockface images as formulated in (1).
Where S1 and S2 are the SIFT features of the blockface and the histology images respectively.
Variable θ is the rotation angle and tx and ty are the shift values in the x and y directions. Sx and Sy
are the scale factors, which correct for any shrinkage and expansion of the tissue sections during
processing. In the interest of speed, affine registration using fewer Dense SIFT features was also
investigated. Reducing the number of features to ten, i.e. w x h x 10, demonstrates results similar
to those for w x h x 128. Therefore the first ten features only were used for rigid registration.
Given that minimizing this objective function is an unconstrained multivariable optimization
problem, the Nelder-Mead algorithm (Nelder & Mead, 1965) is used to find the registration
parameter. This algorithm is a simplex-based direct search method that approximates a local
minimum of an optimization problem with multiple variables.
4.2.4 Deformable Registration
After the images have been roughly aligned using a similarity transformation, we use a
deformable image registration to further improve the correspondence between the 2 images.
Finding the pixel-wise displacement field is typically achieved by solving an optimization
problem. Liu et al. showed that the SIFT Flow objective function works well for deformable
registration of different scenes containing similar objects (Liu et al., 2008), (Liu et al., 2011a).

69
They adopted a discrete, discontinuity preserving, flow estimation algorithm to match the dense
SIFT features, instead of raw pixels (Liu et al., 2008).
The SIFTFlow objective function (2) comprises three terms; data term, small displacement term,
and smoothness term:
S1 and S2 are the dense SIFT features of the source and target images. Variable
( ) [ ( ), ( )]w p u p v p is the displacement of pixel p=(x,y). Parameter η controls the displacement
of the pixels and α controls the smoothness of this displacement with respect to the neighbouring
pixels. Small values for these parameters allow for high deformations while higher values allow
for milder deformations. The smoothness term, which encourages pairwise smoothness in the
pixel displacements, is controlled by α and is bounded by a threshold parameter d. The use of a
truncated L1 norm for the smoothness term accounts for outliers in the deformation field such as
the presence of large tears where neighbouring pixels may be subject to very different
deformations.
4.2.5 SIFTFlow Parameter Optimization
Liu et al do not discuss their choice of regularization parameter values in their papers (Liu et al.,
2008) (Liu et al., 2011a) suggesting that that the default parameter settings of η=0.005, α=2 and
d=40 used in their software implementation (Liu, Yuen, & Torralba, 2011b) were suitable for the
many image types used in (Liu et al., 2011a) to illustrate the SIFTFlow method. Our task of
registering breast histology images to blockface images, however, is very different to that of
registering natural images due to the presence of tears, folds and other artefacts in the histology
slices and it is necessary to determine what effect the parameter settings have on registration
accuracy and also to identify the most appropriate settings to use.

70
We developed the iterative optimization method summarized in Figure 4-2 to determine the most
appropriate parameter settings for lumpectomy specimens. In the first step, the objective function
(2) is minimized to find the displacement field using the initial parameter values from (Liu,
Yuen, & Torralba, 2011b). In this step the efficient belief propagation method (Felzenszwalb &
Huttenlocher, 2006; Liu et al., 2011a) is used to find the deformation field. In the second step,
the objective function is optimized using the Nelder-Mead optimization algorithm to find
updated parameter estimates for the displacement field obtained from the first step. The new
estimated parameters are then used as inputs to the first step to find a new displacement field.
These two steps iterate until either the change of the function value is lower than an upper limit
or it reaches a maximum number of iterations.
Figure 4-2 Flow chart outlining the joint parameter optimization method

71
Since implantation of the validation fiducial markers was permitted for only one clinical
specimen, which resulted in ten pairs of images, Leave-One-Out Cross Validation (LOOCV) is
adopted to investigate the efficacy of parameter estimation approach. The formulated objective
function with LOOCV is shown in equation (3).
The summation on nImage is added for LOOCV.
In order to make sure that the optimization was not influenced by the presence of the fiducial
markers, the regions of the images with fiducial markers were marked manually for each pair of
histology and blockface images after the rigid alignment of the images and then excluded from
the calculation of the objective function.
4.2.6 Registration using Edge Points
The edge-based registration techniques introduced in chapters two and three are also applied to
the whole-mount lumpectomy images in order to make a comparison with the SIFTFlow method.
For the initial affine registration step, the segmented boundary points are aligned using Fourier
descriptors (Kuhl & Giardina, 1982), (Duan et al., 2008) and then the registration is refined using
the Iterative Closest Points (ICP) (Besl & McKay, 1992) algorithm. The aligned boundary
points are then used as control points to find the non-rigid deformation and a Thin-Plate Spline
(TPS) (Bookstein, 1989) is used to model the deformation field.
The edge-based approach is simple to apply when there is a good contrast between the tissue and
background in both histology and blockface images. In breast histology images, however, there
is very low contrast between the fatty tissue and the background, which makes the automatic
segmentation of the boundary points very challenging. Therefore in this work we manually
segmented the boundaries of the tissue in both sets of images.

72
4.2.7 Validation
The rigid alignment of the image pairs in the training set was assessed by measuring the mean
target registration error (TRE) based on the centre of the four fiducial markers implanted in the
specimen. In order to measure the deformable error we also selected some internal landmarks in
each pair of images and calculated the mean TRE based on these internal points. We attempted
to identify an equal number of evenly distributed landmarks in each image pair for both the
training and the testing datasets.
4.3 Results
4.3.1 Affine Registration
Figure 4-3 shows an example of one pair of blockface and histology images together with the
aligned histology images obtained by using the edge-based and the feature-based methods
respectively. The images are overlaid by grids to facilitate the visual comparison of the image
alignment. The large amount of fatty tissue leads to very poorly defined tissue boundaries,
particularly in the histology images, and it was necessary to manually define boundaries for the
edge based approach.
The TRE calculated using the centre of the implanted fiducial markers in the tissue is reported in
Table 4-1.The improvement in TRE when using dense SIFT feature-based method is small with
respect to the edge-based method, but the feature-based method has the advantage that it is not
dependent on image segmentation. The results in Table 4-1 also show that using a similarity
transformation, which allows for scaling, improves the alignment compared with a simple rigid
transformation.
Table 4-1. Target Registration Errors for rigid and affine registration. Values are the
mean TREs (± stdev) based on implanted fiducial markers
Rigid registration Affine registration
Edge-based Feature-based Edge-based Feature-based
3.88 ± 0.87 mm 3.55 ± 0.5 mm 2.93 ± 1.82 mm 2.88 ± 0.24 mm

73
The histology images were aligned with their correspondent blockface images using dense SIFT
features. The TRE calculated using the centre of the implanted fiducial markers in the tissue is
reported inError! Reference source not found..
Figure 4-3 Rigid registration of a histology image to the corresponding blockface image; a) blockface
image with boundary in blue (figure best viewed in colour). b) histology image with manually defined
boundary shown in red and blockface boundary in blue. Aligned histology images: c) using edge-based
method and d) using dense SIFT features. The boundary of the blockface image is overlaid on both
aligned histology images for comparison.

74
4.3.2 Deformable Registration
4.3.2.1 Effect of regularization parameters on SIFTFlow registration
Figure 4-4 illustrates the effect of changing the parameters controlling the magnitude of the
displacement of the pixels η and the smoothness of this displacement, α. White areas on the
images represent regions where compression has occurred.
Figure 4-4 The deformation fields calculated with different settings for η and α are applied to a
grid image in order to visualize the effects of changing the regularization parameters. The top
row shows that increasing α results in smoother displacement: a) η =0.005, α =1. b) η =0.005, α
=2. The bottom row shows the effect of increasing η: c) η =0.0005,α =2 d) η=0.1, α =2. d was
fixed at the default value of 40 in all cases.

75
The effect of changing each of the regularization parameters was assessed by holding 2 of the
parameters fixed at the default values and then varying the third parameter. The plots in Figure
4-5 show the mean TRE calculated using the fiducial markers in all 10 training image pairs as
each parameter is varied over a range of values. We see that the largest variation is caused by
changes in α, the smoothness parameter, and Figure 4-5-c) suggests that changing d has very
little effect once d>20. We therefore kept d fixed at the default value of 40 when carrying out the
multivariate optimization.
4.3.2.2 Identifying paired landmarks for the assessment of deformable registration
Most of the landmarks were selected at the corners of the fibroglandular tissue and a few at the
cross-section of the blood vessels, where the correspondence of the points in histology and
blockface images could be determined. It was not possible to identify landmarks in the fatty
tissue with confidence. Figure 6 shows two pairs of blockface and histology images. The smaller
section contains mostly fat, while the larger section has more fibroglandular tissue making it
possible for more landmarks to be identified. The number of manually selected landmarks varied
for different sections in the training dataset as there was a wide variation in section size and
composition and, although we attempted to evenly distribute landmarks throughout the images,
Figure 4-5 Sensitivity of TRE (measured using the implanted fiducial markers) to the SIFTFlow
parameters: a) η, b) α, and c) d.
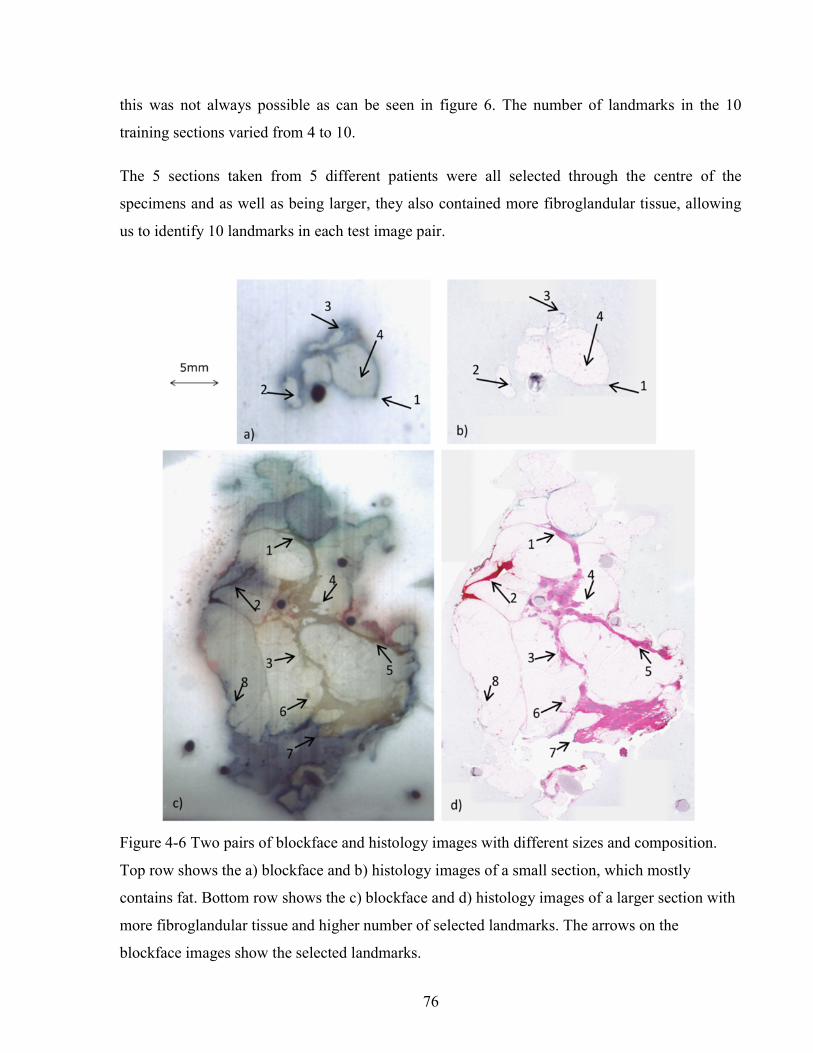
76
this was not always possible as can be seen in figure 6. The number of landmarks in the 10
training sections varied from 4 to 10.
The 5 sections taken from 5 different patients were all selected through the centre of the
specimens and as well as being larger, they also contained more fibroglandular tissue, allowing
us to identify 10 landmarks in each test image pair.
Figure 4-6 Two pairs of blockface and histology images with different sizes and composition.
Top row shows the a) blockface and b) histology images of a small section, which mostly
contains fat. Bottom row shows the c) blockface and d) histology images of a larger section with
more fibroglandular tissue and higher number of selected landmarks. The arrows on the
blockface images show the selected landmarks.

77
4.3.2.3 Comparing edge-based deformable registration with SIFTFlow.
The procedure outlined in Figure 4-2 was used to estimate the optimum parameters η and α in the
SIFTFlow objective function (d was fixed at 40 throughout). The optimized parameters and the
associated mean TREs (calculated using both the implanted fiducials and the manually defined
landmarks) from the LOOCV experiment using ten pairs of images are reported in Table 4-2.
Table 4-2 Average TREs for LOOCV experiment using edge-based, SIFTFlow with default
parameters, and SIFTFlow with optimized parameters measured using both fiducial markers and
manually selected landmarks. Values are given as mean (stdev) in mm.
Mean TRE (mm) Fiducial Markers
Mean TRE (mm) Manual landmarks
Case
# η (e-3) α
# of
land-
marks
Edge-based Default
SIFTFlow
Optimized
SIFTFlow Edge-based
Default
SIFTFlow
Optimized
SIFTFlow
02 5.185 1.149 5 7.46 (0.00) 8.09 (0.00) 7.56 (0.00) 6.82 (0.00) 7.83 (1.80) 6.24 (1.50)
03 5.397 1.129 5 3.1 (0.00) 3.03 (0.00) 0.41 (0.00) 2.97 (0.00) 3.86 (0.95) 0.43 (0.07)
04 5.283 1.137 8 5.39 (0.57) 1.56 (1.78) 0.27 (0.05) 5.13 (1.10) 1.50 (1.53) 0.71 (0.93)
05 5.279 1.137 10 1.22 (0.63) 0.44 (0.49) 0.36 (0.54) 1.09 (0.74) 0.80 (0.88) 0.79 (0.90)
06 5.080 0.913 10 0.54 (0.28) 0.46 (0.25) 0.17 (0.16) 0.98 (0.31) 1.17 (1.60) 0.79 (1.12)
07 5.125 1.160 10 1.38 (0.67) 0.43 (0.22) 0.22 (0.16) 1.14 (0.53) 0.44 (0.63) 0.30 (0.19)
08 5.215 1.149 8 1.56 (0.32) 1.07 (1.17) 0.24 (0.06) 1.52 (0.40) 0.79 (0.70) 0.37 (0.15)
09 5.442 0.862 5 1.89 (0.15) 0.81 (0.64) 0.25 (0.23) 1.78 (0.20) 1.10 (1.25) 0.56 (0.18)
10 5.125 1.160 4 0.81 (0.00) 0.19 (0.00) 0.19 (0.00) 0.76 (0.00) 0.21 (0.15) 0.22 (0.15)
11 5.282 1.137 4 077. (0.00) 0.45 (0.00) 0.18 (0.00) 0.68 (0.00) 0.52 (0.53) 0.51 (0.51)
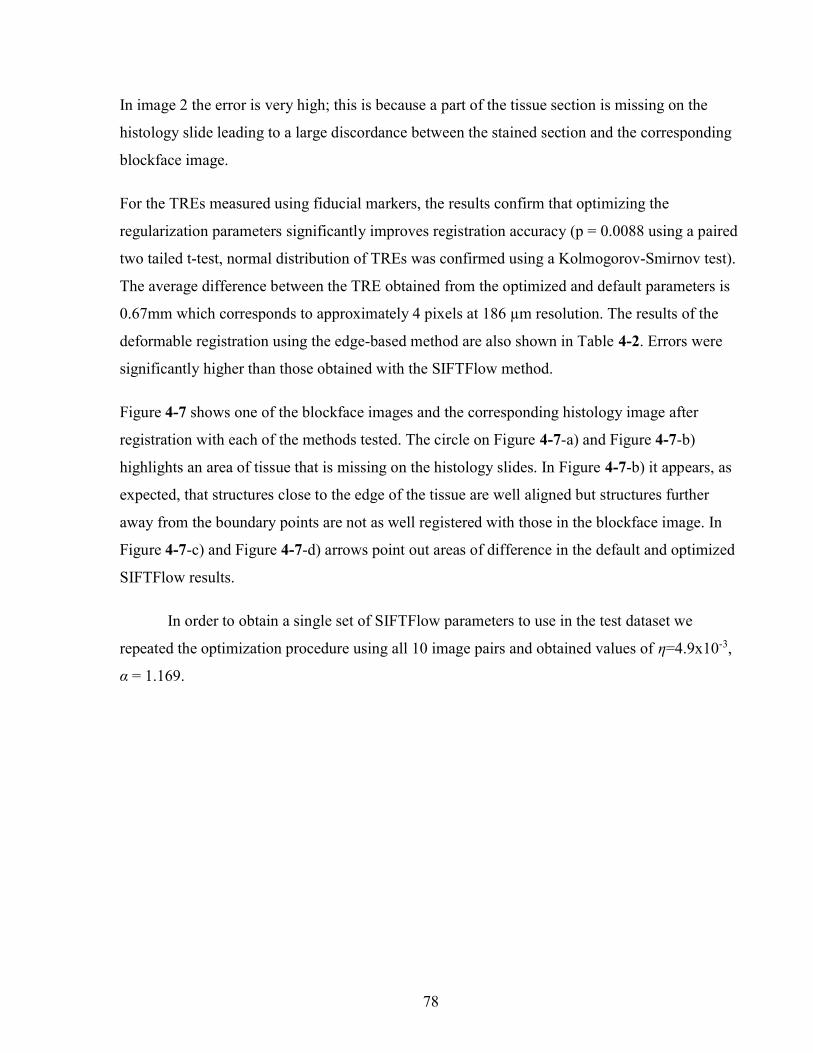
78
In image 2 the error is very high; this is because a part of the tissue section is missing on the
histology slide leading to a large discordance between the stained section and the corresponding
blockface image.
For the TREs measured using fiducial markers, the results confirm that optimizing the
regularization parameters significantly improves registration accuracy (p = 0.0088 using a paired
two tailed t-test, normal distribution of TREs was confirmed using a Kolmogorov-Smirnov test).
The average difference between the TRE obtained from the optimized and default parameters is
0.67mm which corresponds to approximately 4 pixels at 186 µm resolution. The results of the
deformable registration using the edge-based method are also shown in Table 4-2. Errors were
significantly higher than those obtained with the SIFTFlow method.
Figure 4-7 shows one of the blockface images and the corresponding histology image after
registration with each of the methods tested. The circle on Figure 4-7-a) and Figure 4-7-b)
highlights an area of tissue that is missing on the histology slides. In Figure 4-7-b) it appears, as
expected, that structures close to the edge of the tissue are well aligned but structures further
away from the boundary points are not as well registered with those in the blockface image. In
Figure 4-7-c) and Figure 4-7-d) arrows point out areas of difference in the default and optimized
SIFTFlow results.
In order to obtain a single set of SIFTFlow parameters to use in the test dataset we
repeated the optimization procedure using all 10 image pairs and obtained values of η=4.9x10⁻³,
α = 1.169.

79
Figure 4-7 Images from case # 04; a) Blockface image. b) histology registered using edge-based
method, the circle shows a missing part of the tissue section in histology image, which
can degrade the result of the registration. c) histology registered using default SIFTFlow
parameters. d) histology registered using optimized SIFTFlow. The arrows point to some
of the areas that are more accurately registered when the optimized parameters are used.
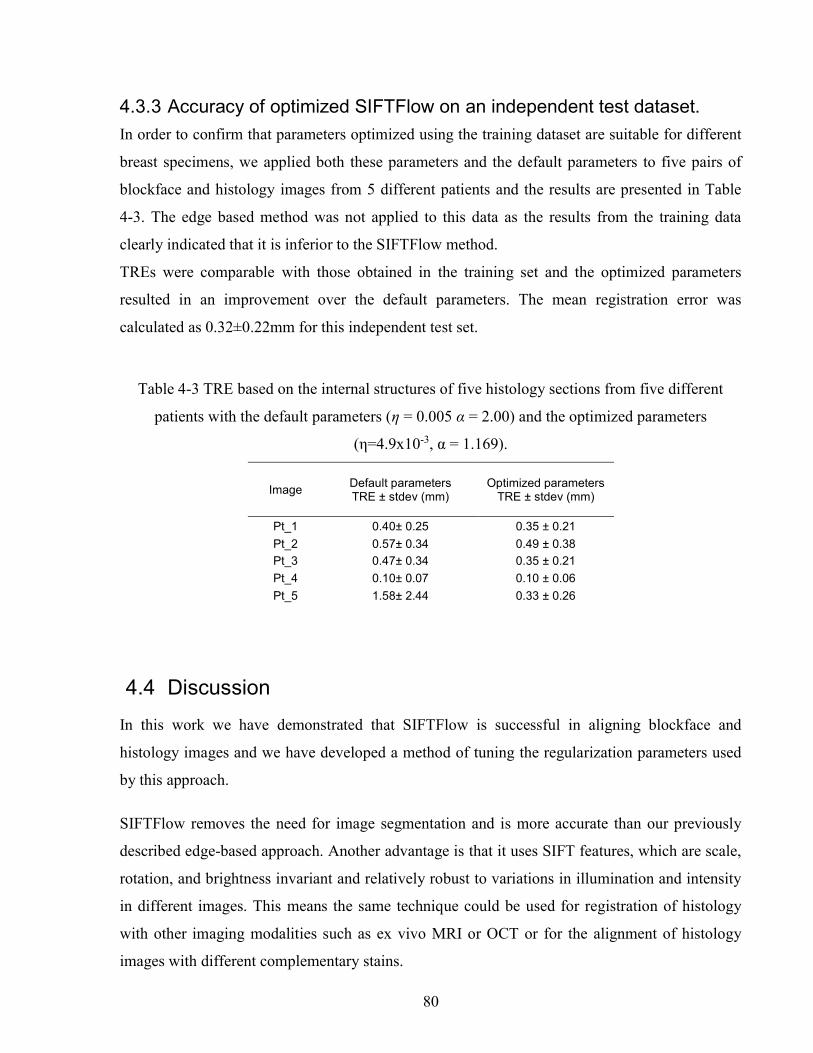
80
4.3.3 Accuracy of optimized SIFTFlow on an independent test dataset.
In order to confirm that parameters optimized using the training dataset are suitable for different
breast specimens, we applied both these parameters and the default parameters to five pairs of
blockface and histology images from 5 different patients and the results are presented in Table
4-3. The edge based method was not applied to this data as the results from the training data
clearly indicated that it is inferior to the SIFTFlow method.
TREs were comparable with those obtained in the training set and the optimized parameters
resulted in an improvement over the default parameters. The mean registration error was
calculated as 0.32±0.22mm for this independent test set.
Table 4-3 TRE based on the internal structures of five histology sections from five different
patients with the default parameters (η = 0.005 α = 2.00) and the optimized parameters
(η=4.9x10⁻³, α = 1.169).
Image Default parameters TRE ± stdev (mm)
Optimized parameters TRE ± stdev (mm)
Pt_1 0.40± 0.25 0.35 ± 0.21
Pt_2 0.57± 0.34 0.49 ± 0.38
Pt_3 0.47± 0.34 0.35 ± 0.21
Pt_4 0.10± 0.07 0.10 ± 0.06
Pt_5 1.58± 2.44 0.33 ± 0.26
4.4 Discussion
In this work we have demonstrated that SIFTFlow is successful in aligning blockface and
histology images and we have developed a method of tuning the regularization parameters used
by this approach.
SIFTFlow removes the need for image segmentation and is more accurate than our previously
described edge-based approach. Another advantage is that it uses SIFT features, which are scale,
rotation, and brightness invariant and relatively robust to variations in illumination and intensity
in different images. This means the same technique could be used for registration of histology
with other imaging modalities such as ex vivo MRI or OCT or for the alignment of histology
images with different complementary stains.
81
For the rigid registration step we found that it was useful to use a similarity transformation model
rather than a rigid transformation suggesting that the tissue sections may expand when they are
placed in a water bath during the mounting procedure. We also found that a lower value of α than
that suggested by Liu et al., significantly improved the results of registration. The mixture of
highly deformable fatty tissue and less deformable fibro-glandular tissue in breast tissue
specimens, together with the presence of folds and tears which inevitably occur when mounting a
very flexible 4µm tissue section onto a glass slide, leads to the presence of more complex
deformation fields in histology images than would have been present in the natural images used
to demonstrate the SIFTFlow method in (Liu et al., 2011a). Lower values for parameter α have
the effect of relaxing the smoothness constraint in the objective function and this allows for
higher variability in the deformation field. Our method for carrying out a joint optimization of
the regularization parameters allows SIFTFlow to be tuned for specific tissue types which could
have very different biomechanical properties leading to differences in the range of deformations.
One of the limiting factors of the proposed parameter estimation approach for SIFTFlow is that it
is sensitive to the initial values. In this work we used the parameters published by Liu et al. as
initial values for optimization. We are currently working on a pre-optimization fast search
algorithm to find suitable ranges for initial values to overcome this problem.
In this work detection of misregistered images due to the convergence of the optimizer to a local
minimum has been done manually. In future, an automatic method for registration error detection
can be employed to automate this process. For example, in order to evaluate the non-rigid
alignment of pre-operative brain MRI with intraoperative images, Fedorov et al. (Fedorov et al.,
2008) measured a modified Hausdorff distance between the edges segmented from both set of
images images. This method can be applied on breast images by measuring the distance between
extracted features from the histology and blockface images. The applicability of this method for
breast images will be investigated in future.
The motivation of this work was to correct for deformations in the histology images prior to
reconstructing a 3D volume. We make the assumption that the blockface images are free from
distortion and can therefore be used as a reference image. In practice significant distortions occur
as a result of the tissue processing steps carried out in order to embed the tissue block in paraffin
and these will also have to be accounted for if the 3D volume is to be subsequently aligned with
3D ultrasound or MRI images.

82
Although our results are encouraging, in applications where a region of interest in an aligned
histology image needs to be assessed at a higher resolution even a sub-millimeter misalignment
could become very significant. For example, when a region of interest in a medical image is
correlated with the correspondent region in a histology image, the assessment of the region at
higher resolution is required to reveal the underlying structures in the histology image. An
average difference of 0.67mm corresponds to an error of four pixels at 186 µm resolution and
335 pixels at 2 µm resolution, which means that zooming in a region of interest selected at low
resolution could lead to the selection of a totally misaligned patch at a higher resolution. In
future the accuracy of the image registration will be further improved by the employment of
multi-scale image registration methods.
4.5 Summary and Conclusion
This chapter presents an automatic approach for correcting for deformations in whole-mount
histology images from human breast lumpectomy specimens. The contribution of the work is
two-fold: 1) it is demonstrated that a noninvasive, automatic, feature-based image registration
method can be applied to the task of aligning histology images with optical blockface images; 2)
a method is proposed for optimizing this method and shown that this significantly reduced target
registration error.
Quantitative and qualitative evaluations of the image registration results for different breast
specimens demonstrate lower registration error when optimized parameters are used. The
optimized feature-based method also outperforms a previously described edge-based method.
This method will be used in the next chapter as a pre-processing step in the generation of 3D
volume reconstructions of whole-mount histology images.

83
5 Breast Histology Volume Reconstruction and 3D Tumour Measurement
Chapter five describes how the image registration approach described in previous chapters, can
be extended to reconstruct 3D histology volumes from 2D whole-mount slides of breast
specimens. In order to achieve this, two main challenges have had to be overcome. In the clinical
setting, the breast specimen is cut into thick breadloaf sections before paraffin embedding which
means that an additional alignment step is required. Furthermore, only a single wholemount
section is cut from each block therefore the sampling is very sparse. This chapter presents an
approach for automatic aligning reference blockface images followed by histology volume
reconstruction from breast wholemount images. The feasibility of using the reconstructed
volumes to assess two 3D tumour features, i.e.tumour volume and tumour focality, is
demonstrated.
5.1 Introduction
In the era of digital pathology, the study of the 3D microscopic features of organs and tissue
structures has been the research topic of different groups. While some groups study the biology
and structure of breast (Going & Moffat 2004), (Rusby et al. 2007), others have focused on the
3D features of breast diseases, e.g. Ductal Carcinoma In Situ (DCIS) (Booth et al. 2015). Clarke
et al. have also shown that tumour volume can be a better estimate of the extent of the disease
when calculated based on the 3D histology volume reconstructed from whole-mount histology
slides compared to the 2D measurements (Clarke et al. 2012).
Reconstruction of 3D histology volumes is also an important intermediate step in co-registration
of pathologic findings in volumetric medical images, such as MRI, CT, and US, with the
histology images as a ground truth (Sztrókay et al., 2012), (Tot & Gere, 2016).
84
An accurate histology volume reconstruction is hindered by the spacing between the sections as
well as the local distortions resulting from histological preparation procedures, including
shrinkage, expansion, tears, and folds. Both the spacing and the local distortions reduce the
similarities between the consecutive sections and consequently make the image registration more
challenging.
While several approaches have been reported for histology volume reconstruction (Gefen,
Tretiak, & Nissanov, 2003), (Ju et al., 2006), (G Malandain, Bardinet, Nelissen, & Vanduffel,
2004), (Nikou, Heitz, Nehlig, Namer, & Armspach, 2003), (Wirtz, Fischer, Modersitzki, &
Schmitt, 2004), there are only a few works in the field of breast histology volume reconstruction.
Clarke et al. have manually aligned breast whole-mount slides to reconstruct the breast histology
volume to correlate it with CT images (G. M. Clarke et al., 2008) or to compare the 3D with 2D
tumour measurements (G M Clarke et al., 2012). Booth et al. (Booth et al., 2015) investigated the
use of 3D reconstruction of DCIS in the study of the biology of DCIS. They reconstructed the
histology volume by selecting the middle section as reference image and registering the
neighbouring sections to this reference image (Roberts et al., 2012). This registration proceeds
out from the centre, with subsequent sections aligned to their neighbours. Hawkes et al. (Reis et
al., 2015) investigated the maximum spacing between the breast histology sections required for
3D histology reconstruction to a specific tolerance. Rather than the volume reconstruction from
the whole-mount sections, Hawkes et al and Booth et al extracted small regions around structures
of interest from the specimen which were then finely sectioned. They selected the section at the
centre of the structure as the reference image and used a pair-wise rigid or affine registration
approach to align the sections from the same structure to the reference image. Since the spacing
between the breast sections in the clinic is about 4mm, the similarity of the sections is
diminished and choosing one section as the reference image for a breast specimen is not
advantageous.
The existing methods for 3D histology volume reconstruction of breast specimens are either
manual or applicable to small samples of the breast tissue, which are finely sectioned to preserve
the continuation of the tissue structures, which are used for image registration.
In chapters two and three an image registration framework was presented for histology volume
reconstruction. The workflow was validated for preclinical applications. As it is explained in
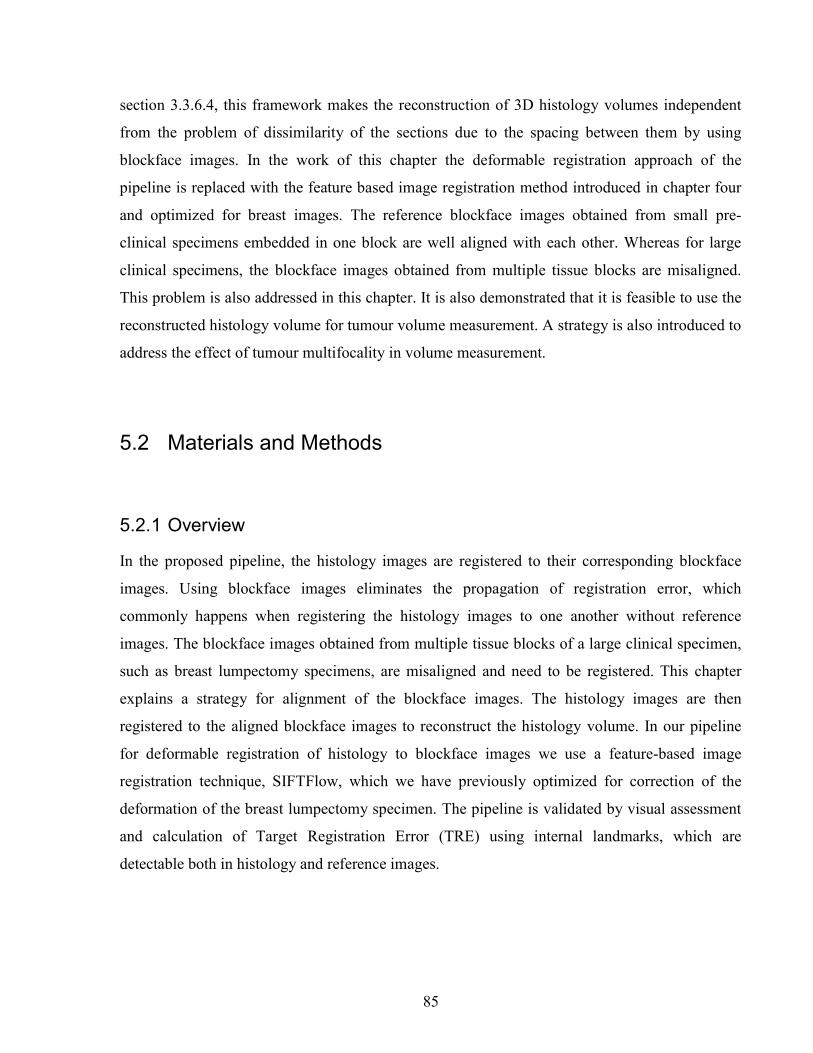
85
section 3.3.6.4, this framework makes the reconstruction of 3D histology volumes independent
from the problem of dissimilarity of the sections due to the spacing between them by using
blockface images. In the work of this chapter the deformable registration approach of the
pipeline is replaced with the feature based image registration method introduced in chapter four
and optimized for breast images. The reference blockface images obtained from small pre-
clinical specimens embedded in one block are well aligned with each other. Whereas for large
clinical specimens, the blockface images obtained from multiple tissue blocks are misaligned.
This problem is also addressed in this chapter. It is also demonstrated that it is feasible to use the
reconstructed histology volume for tumour volume measurement. A strategy is also introduced to
address the effect of tumour multifocality in volume measurement.
5.2 Materials and Methods
5.2.1 Overview
In the proposed pipeline, the histology images are registered to their corresponding blockface
images. Using blockface images eliminates the propagation of registration error, which
commonly happens when registering the histology images to one another without reference
images. The blockface images obtained from multiple tissue blocks of a large clinical specimen,
such as breast lumpectomy specimens, are misaligned and need to be registered. This chapter
explains a strategy for alignment of the blockface images. The histology images are then
registered to the aligned blockface images to reconstruct the histology volume. In our pipeline
for deformable registration of histology to blockface images we use a feature-based image
registration technique, SIFTFlow, which we have previously optimized for correction of the
deformation of the breast lumpectomy specimen. The pipeline is validated by visual assessment
and calculation of Target Registration Error (TRE) using internal landmarks, which are
detectable both in histology and reference images.
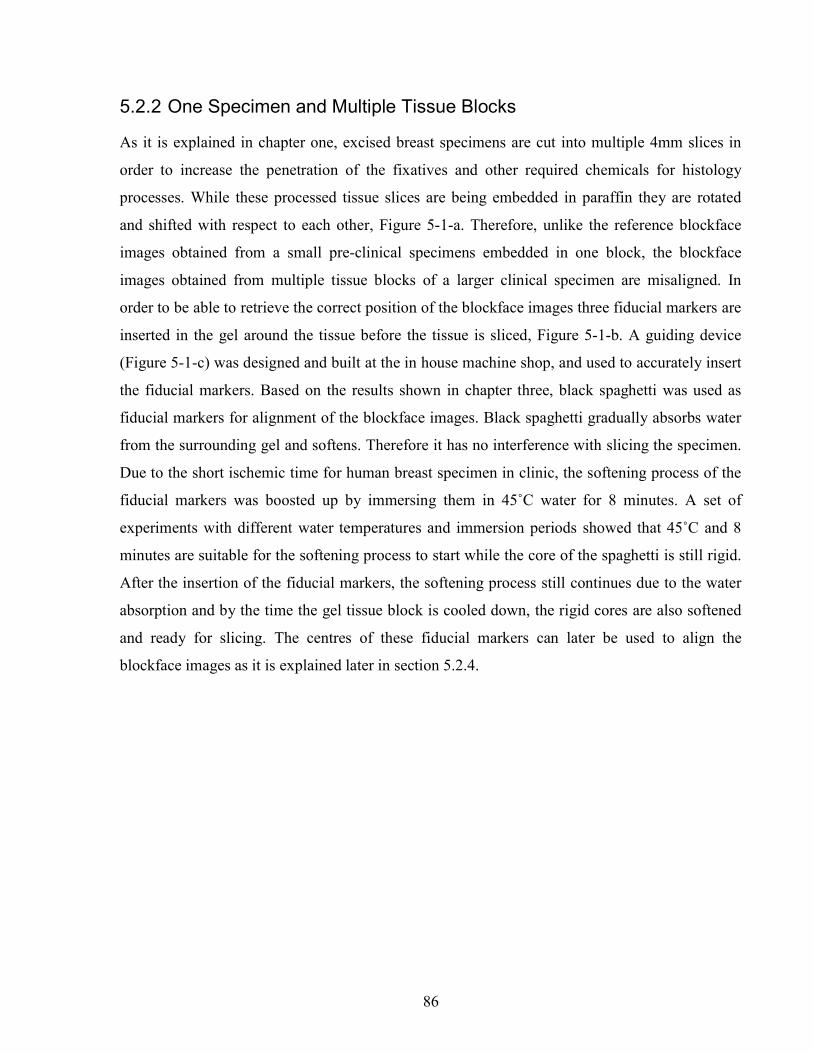
86
5.2.2 One Specimen and Multiple Tissue Blocks
As it is explained in chapter one, excised breast specimens are cut into multiple 4mm slices in
order to increase the penetration of the fixatives and other required chemicals for histology
processes. While these processed tissue slices are being embedded in paraffin they are rotated
and shifted with respect to each other, Figure 5-1-a. Therefore, unlike the reference blockface
images obtained from a small pre-clinical specimens embedded in one block, the blockface
images obtained from multiple tissue blocks of a larger clinical specimen are misaligned. In
order to be able to retrieve the correct position of the blockface images three fiducial markers are
inserted in the gel around the tissue before the tissue is sliced, Figure 5-1-b. A guiding device
(Figure 5-1-c) was designed and built at the in house machine shop, and used to accurately insert
the fiducial markers. Based on the results shown in chapter three, black spaghetti was used as
fiducial markers for alignment of the blockface images. Black spaghetti gradually absorbs water
from the surrounding gel and softens. Therefore it has no interference with slicing the specimen.
Due to the short ischemic time for human breast specimen in clinic, the softening process of the
fiducial markers was boosted up by immersing them in 45˚C water for 8 minutes. A set of
experiments with different water temperatures and immersion periods showed that 45˚C and 8
minutes are suitable for the softening process to start while the core of the spaghetti is still rigid.
After the insertion of the fiducial markers, the softening process still continues due to the water
absorption and by the time the gel tissue block is cooled down, the rigid cores are also softened
and ready for slicing. The centres of these fiducial markers can later be used to align the
blockface images as it is explained later in section 5.2.4.
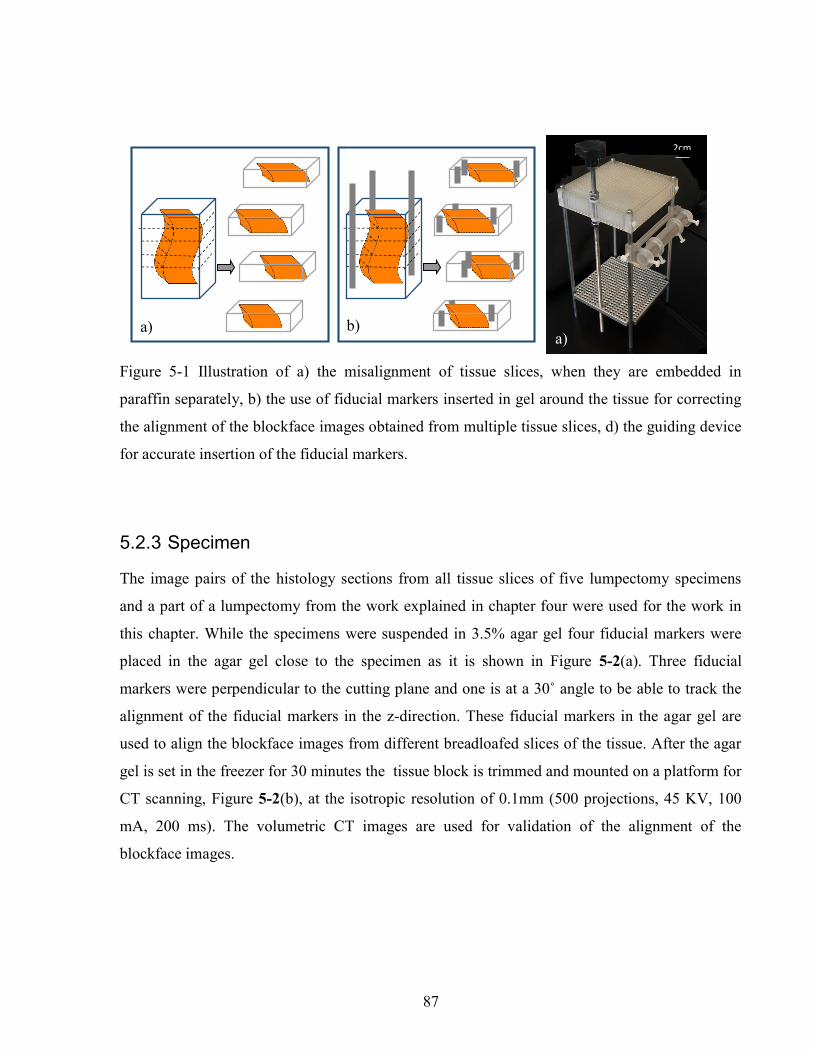
87
Figure 5-1 Illustration of a) the misalignment of tissue slices, when they are embedded in
paraffin separately, b) the use of fiducial markers inserted in gel around the tissue for correcting
the alignment of the blockface images obtained from multiple tissue slices, d) the guiding device
for accurate insertion of the fiducial markers.
5.2.3 Specimen
The image pairs of the histology sections from all tissue slices of five lumpectomy specimens
and a part of a lumpectomy from the work explained in chapter four were used for the work in
this chapter. While the specimens were suspended in 3.5% agar gel four fiducial markers were
placed in the agar gel close to the specimen as it is shown in Figure 5-2(a). Three fiducial
markers were perpendicular to the cutting plane and one is at a 30˚ angle to be able to track the
alignment of the fiducial markers in the z-direction. These fiducial markers in the agar gel are
used to align the blockface images from different breadloafed slices of the tissue. After the agar
gel is set in the freezer for 30 minutes the tissue block is trimmed and mounted on a platform for
CT scanning, Figure 5-2(b), at the isotropic resolution of 0.1mm (500 projections, 45 KV, 100
mA, 200 ms). The volumetric CT images are used for validation of the alignment of the
blockface images.
2cm
a) b) a)
88
The fresh tissue block is then breadloafed into 4 mm slices (Figure 5-2-c). Figure 5-3-a and
Figure 5-3-b show a CT image and a slice of the fresh tissue respectively. The tissue slices were
then formalin fixed, processed and embedded in paraffin (Sun et al., 2009). One 5µm thick
whole mount section was obtained from each paraffin block along with its blockface image with
the resolution of 186 µm for the partial lumpectomy and 55 µm for the five whole lumpectomy
specimens. As explained in chapter four, a telecentric lens was used to capture two sets of
blockface images were captured; one by placing the lens straight in front of the object (Figure
5-3-c) and the other one with both the lens and light source at slight angle (≈15◦) (Figure 5-3-d).
As explained in section 4.2.1, the angled images provide higher contrast between the tissue at the
surface of the block and the surrounding paraffin, but since the lens is at angle, foreshortening
artefact in horizontal direction occurs. The straight images, on the other hand, have lower
contrast between the tissue at the surface of the block and paraffin, but with no foreshortening
artefact and as a result can be used to correct the angled images. The sections were then stained
with H&E (Figure 5-3-e) and digitized at 2µm resolution for the partial lumpectomy and 0.5µm
for the rest of the specimens. The histology images were then down sampled to the resolution of
the blockface images.
Figure 5-2. (a) The jig to guide the fiducial markers. (b) Tissue block fixed on a platform
for CT scan. (c) 4mm slices of the tissue block.
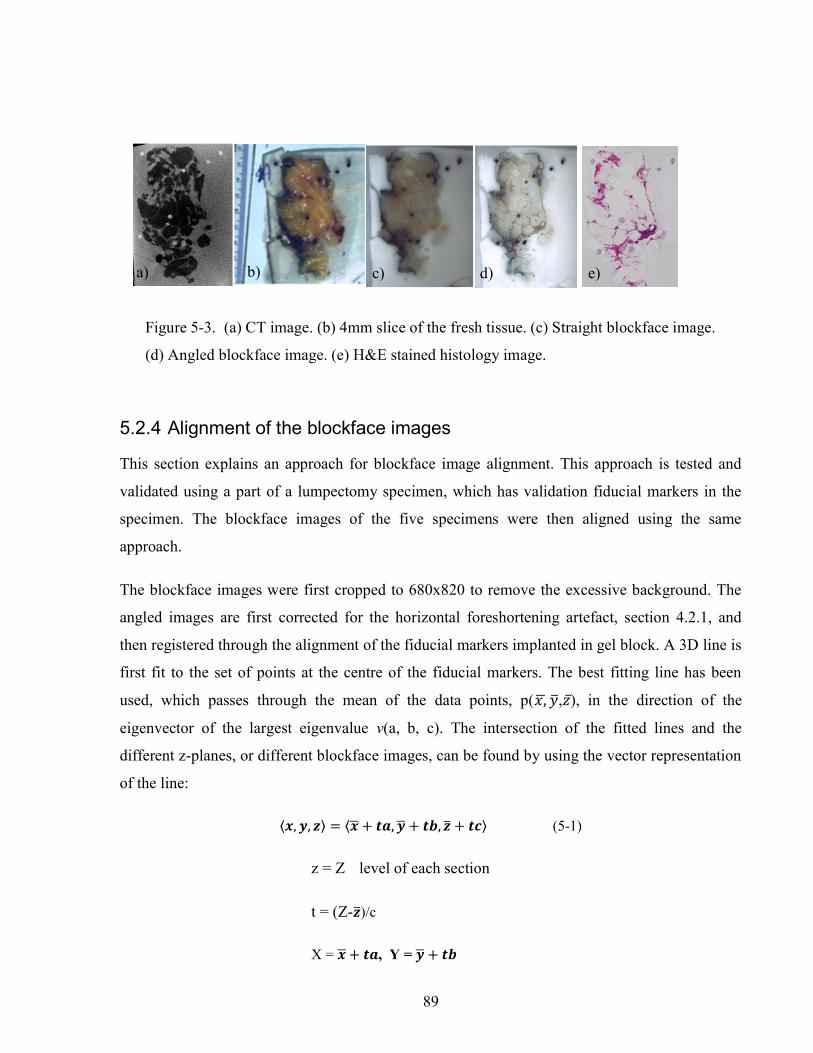
89
5.2.4 Alignment of the blockface images
This section explains an approach for blockface image alignment. This approach is tested and
validated using a part of a lumpectomy specimen, which has validation fiducial markers in the
specimen. The blockface images of the five specimens were then aligned using the same
approach.
The blockface images were first cropped to 680x820 to remove the excessive background. The
angled images are first corrected for the horizontal foreshortening artefact, section 4.2.1, and
then registered through the alignment of the fiducial markers implanted in gel block. A 3D line is
first fit to the set of points at the centre of the fiducial markers. The best fitting line has been
used, which passes through the mean of the data points, p( , , ̅), in the direction of the
eigenvector of the largest eigenvalue v(a, b, c). The intersection of the fitted lines and the
different z-planes, or different blockface images, can be found by using the vector representation
of the line:
⟨ , , ⟩ = ⟨ + , + , + ⟩ (5-1)
z = Z level of each section
t = (Z- )/c
X = + , Y = +
a) b) c) d) e)
Figure 5-3. (a) CT image. (b) 4mm slice of the fresh tissue. (c) Straight blockface image.
(d) Angled blockface image. (e) H&E stained histology image.
90
The rigid transformation parameters, shift value and the angle of rotation, are then obtained by
minimizing the Euclidean distance between the centre points of the fiducial markers and their
correspondent intersection points of the fitted lines at each z-plane. In the next iteration, a line is
fit to the transformed centre points and then the intersect points and the transformation
parameters are recalculated. This iterative process aligns the centres of the fiducial markers along
3D straight lines after approximately three iterations.
The alignment of the blockface images are compared to the 3D orientation of the fiducial
markers segmented from volumetric CT images of the whole specimen in gel block, which
obtained before slicing the tissue.
5.2.5 Outlining the Tumour Regions
The tumour regions were outlined on histology images by a pathology assistant (PA) using
Sedeen Viewing Program (Selective Decoding and Encoding Engine (PathCore, 2016);
developed by Dr. Anne Martel and Danoush Hosseinzadeh at Sunnybrook Research Institute).
5.2.6 Histology Image Registration
To reconstruct the histology volumes, the histology images are registered to their correspondent
blockface images. As explained in chapter four, dense SIFT features were used for both affine
and deformable registration of the histology images. For a few pairs of images with a very few
low contrast structures, rigid registration using dense SIFT failed. Therefore, Mutual Information
(MI) technique (Mattes et al., 2001) was used for the affine alignment of these images. Dense
SIFT technique outperformed MI for the rest of the image pairs.
SIFTFlow deformable registration method, which was optimized for breast images (explained in
chapter four), was used to correct the deformation of the breast histology images with respect to
their correspondent blockface images.
5.2.7 Validation
The alignment of the blockface images are visually assessed using the volumetric CT images.
91
The performance of the image registration is evaluated by calculating the mean TRE based on
ten manually selected anatomical landmarks on both histology and blockface images.
5.2.8 Tumour 3D Measurements
It has been shown that tumour volume may be a more accurate surrogate for size (G M Clarke et
al., 2012). Tumour volume calculated from the 2D measurements, i.e. using the 2D maximum
tumour diameter, might overestimate volume compared to the 3D volumetric calculation (G M
Clarke et al., 2012). We calculated the tumour volume of one of the cases with large Invasive
Lobular Carcinoma (ILC) to show the feasibility of using the 3D histology volumes for 3D
tumour measurements. We also considered the effect of tumour multifocality in volume
calculation and visualization.
5.2.8.1 Volume
The boundary points of the tumour regions, outlined by a pathologist assistant, were used as
surface points of the tumour for 3D shape visualization and measurement of the tumour. The
boundary points were read from an XML files created by Sedeen Viewer and turned into binary
masks. To calculate the tumour volume for the largest foci, the area of the largest connected 3D
object was multiplied by the voxel size. The overlapping tumour regions in 3D were considered
to be connected. On the other hand, non-overlapping tumour regions can either represent
different foci or be branches of a single main foci which are connected deeper in the tissue.
In the latter case, all connected regions should be identified and included in the tumour volume
calculation. The problem of multifocality in volume measurement has been addressed in the next
section.
5.2.8.2 Tumour Focality
Tumour focality has a great impact on the estimation of tumour extent. Isolated tumour regions
in the histology sections are considered as separate foci, but the extension of these regions to the
main tumour deeper in the tissue slice is not clear from the 2D histology sections cut from the

92
surface of the block. To address this problem, X-ray images of the tissue blocks were obtained
and observed to verify the connectivity of the tumour regions detected in the histology section
cut from each block, shown inFigure 5-8. A Faxitron X-ray machine with 30 kV was used to
image the tissue blocks. If the isolated tumour region was not connected in the X-ray image of
the correspondent block, the X-ray image of the previous block was also observed for
connectivity between the regions. The isolated tumour regions, which are connected to the
largest foci are labeled the same as the largest object in the label image created from the binary
masks of the tumour regions and therefore included in the volume measurement of the largest
foci.
5.3 Results
5.3.1 Alignment of the blockface images
The blockface images were aligned by using the implanted fiducial markers in gel. Figure 5-4
shows the fiducial markers and the fitted lines before and after the alignment (images on the left
and on the right respectively).
Figure 5-5-a shows all fiducial markers both in gel and in tissue in a 3D diagram. The bend in the
middle of two fiducial markers corresponds well with the fiducial markers in volumetric CT
images, Figure 5-5-b. In order to have a better 3D view of the fiducal markers in CT images,
Figure 5-5-c, they are segmented using active contour segmentation method in ITK-Snap
(Yushkevich et al., 2006).
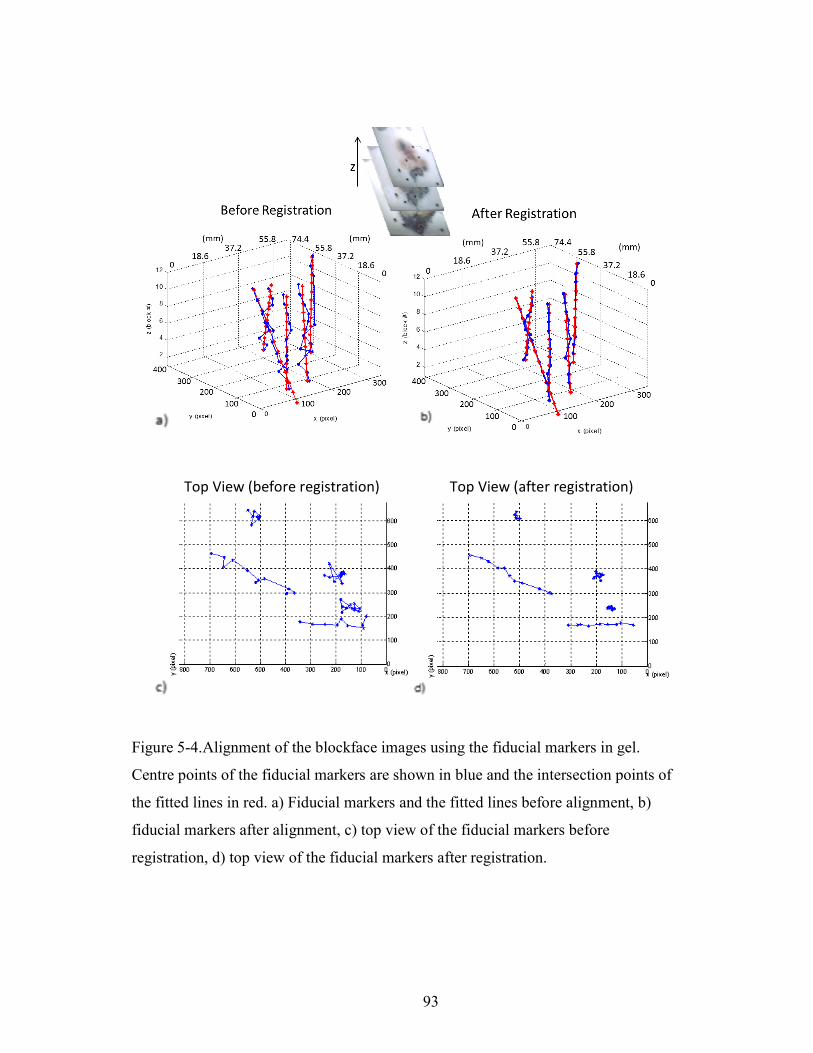
93
Top View (before registration) Top View (after registration)
Figure 5-4.Alignment of the blockface images using the fiducial markers in gel.
Centre points of the fiducial markers are shown in blue and the intersection points of
the fitted lines in red. a) Fiducial markers and the fitted lines before alignment, b)
fiducial markers after alignment, c) top view of the fiducial markers before
registration, d) top view of the fiducial markers after registration.
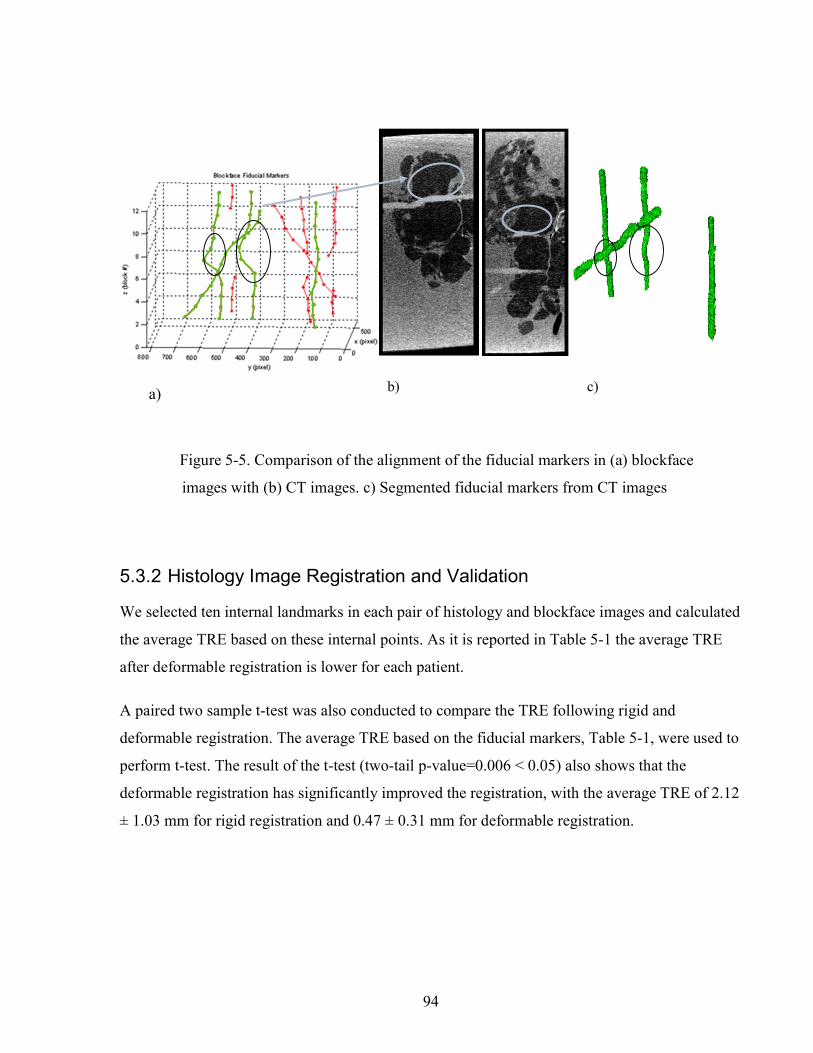
94
Figure 5-5. Comparison of the alignment of the fiducial markers in (a) blockface
images with (b) CT images. c) Segmented fiducial markers from CT images
5.3.2 Histology Image Registration and Validation
We selected ten internal landmarks in each pair of histology and blockface images and calculated
the average TRE based on these internal points. As it is reported in Table 5-1 the average TRE
after deformable registration is lower for each patient.
A paired two sample t-test was also conducted to compare the TRE following rigid and
deformable registration. The average TRE based on the fiducial markers, Table 5-1, were used to
perform t-test. The result of the t-test (two-tail p-value=0.006 < 0.05) also shows that the
deformable registration has significantly improved the registration, with the average TRE of 2.12
± 1.03 mm for rigid registration and 0.47 ± 0.31 mm for deformable registration.
c) b) a)
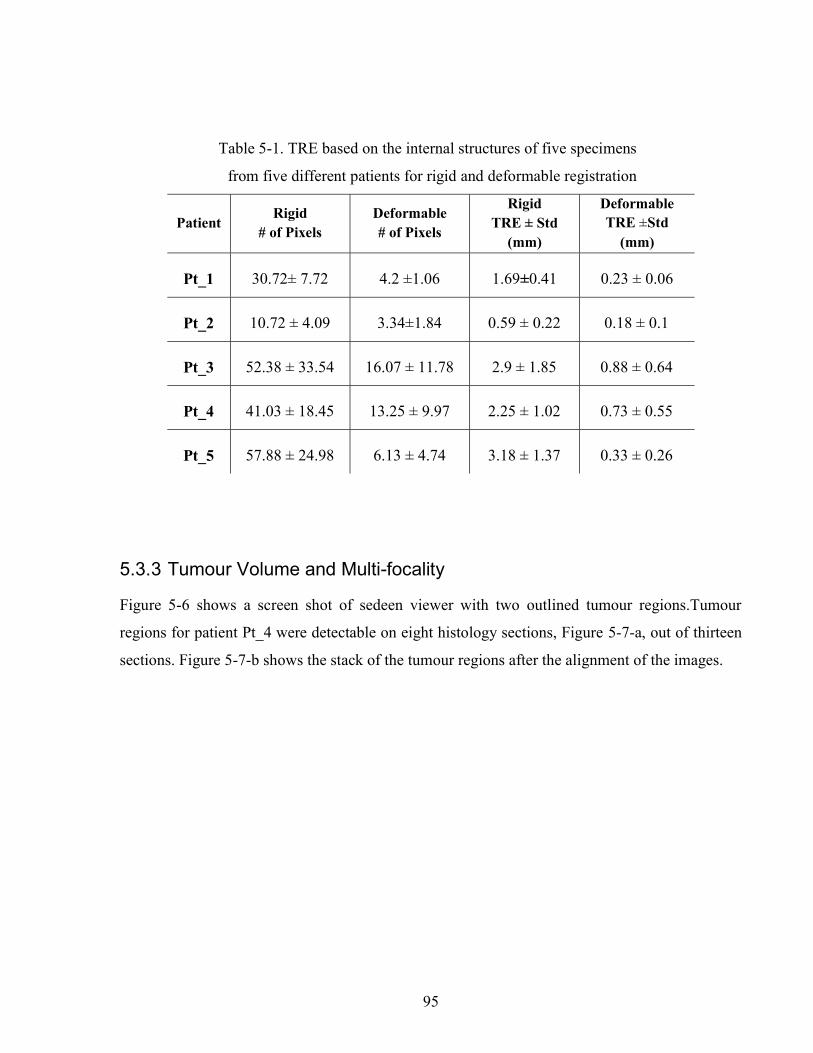
95
Table 5-1. TRE based on the internal structures of five specimens
from five different patients for rigid and deformable registration
Patient Rigid
# of Pixels Deformable # of Pixels
Rigid TRE ± Std
(mm)
Deformable TRE ±Std
(mm)
Pt_1 30.72± 7.72 4.2 ±1.06 1.69±0.41 0.23 ± 0.06
Pt_2 10.72 ± 4.09 3.34±1.84 0.59 ± 0.22 0.18 ± 0.1
Pt_3 52.38 ± 33.54 16.07 ± 11.78 2.9 ± 1.85 0.88 ± 0.64
Pt_4 41.03 ± 18.45 13.25 ± 9.97 2.25 ± 1.02 0.73 ± 0.55
Pt_5 57.88 ± 24.98 6.13 ± 4.74 3.18 ± 1.37 0.33 ± 0.26
5.3.3 Tumour Volume and Multi-focality
Figure 5-6 shows a screen shot of sedeen viewer with two outlined tumour regions.Tumour
regions for patient Pt_4 were detectable on eight histology sections, Figure 5-7-a, out of thirteen
sections. Figure 5-7-b shows the stack of the tumour regions after the alignment of the images.
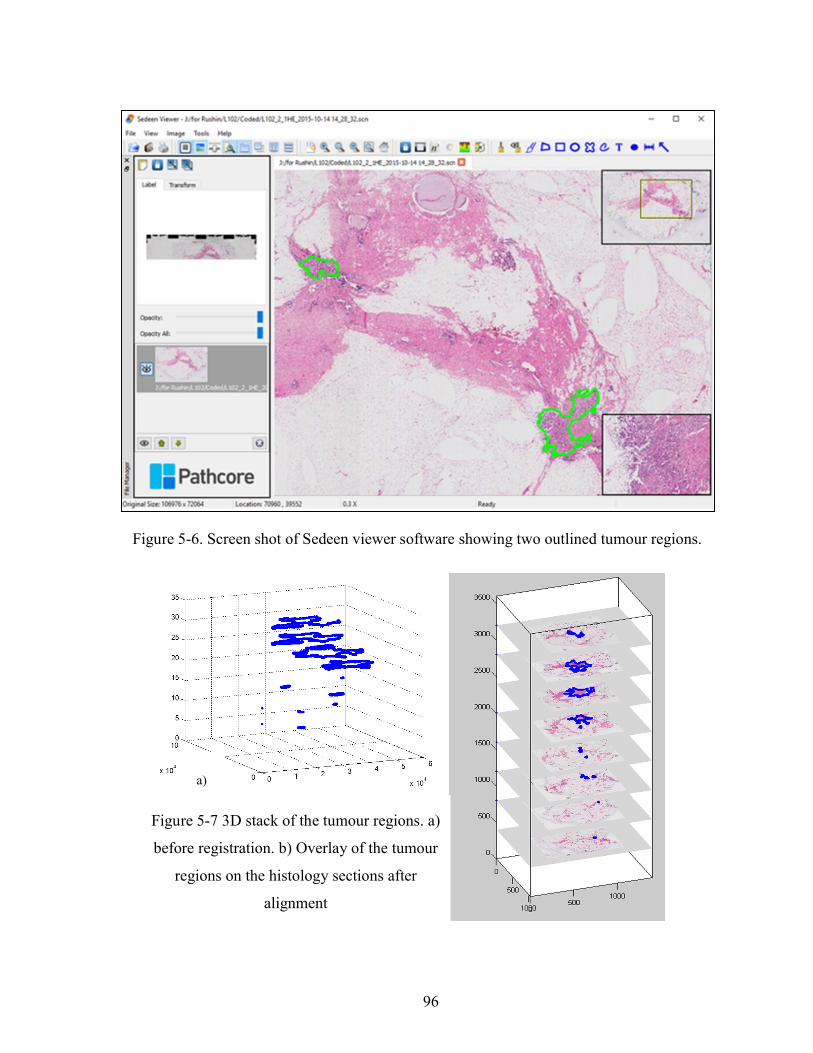
96
a)
b)
Figure 5-7 3D stack of the tumour regions. a)
before registration. b) Overlay of the tumour
regions on the histology sections after
alignment
Figure 5-6. Screen shot of Sedeen viewer software showing two outlined tumour regions.

97
Figure 5-8 shows the X-ray images of two 4mm tissue blocks. Figure 5-8-a to d show the
separation of different tumour regions in the X-ray images of the same tissue block and one
block before. The X-ray image of another block show that a separate tumour region in Figure-e
is connected to the main focus deeper in the tissue, Figure 5-8-f and g. Therefore, it is labeled as
main tumour and included in the volume measurement of the largest focus. The connection of the
tumour regions based on X-ray images is not certain, because they might be overlapping but not
connected. However, the assumption is that the overlapping regions are connected.
The 3D view of the tumour regions is shown in Figure 5-9-a before registration and the largest
focus of the tumour is shown in Figure 5-9-b after removing the non-overlapping tumour
regions.
As it is shown in Figure 9-c more separate regions overlapped the main tumour after image
registration and included in the measurement. Figure 9-d shows the inclusion of a separate region
to the main tumour after X-ray images showed its connection to the main tumour.
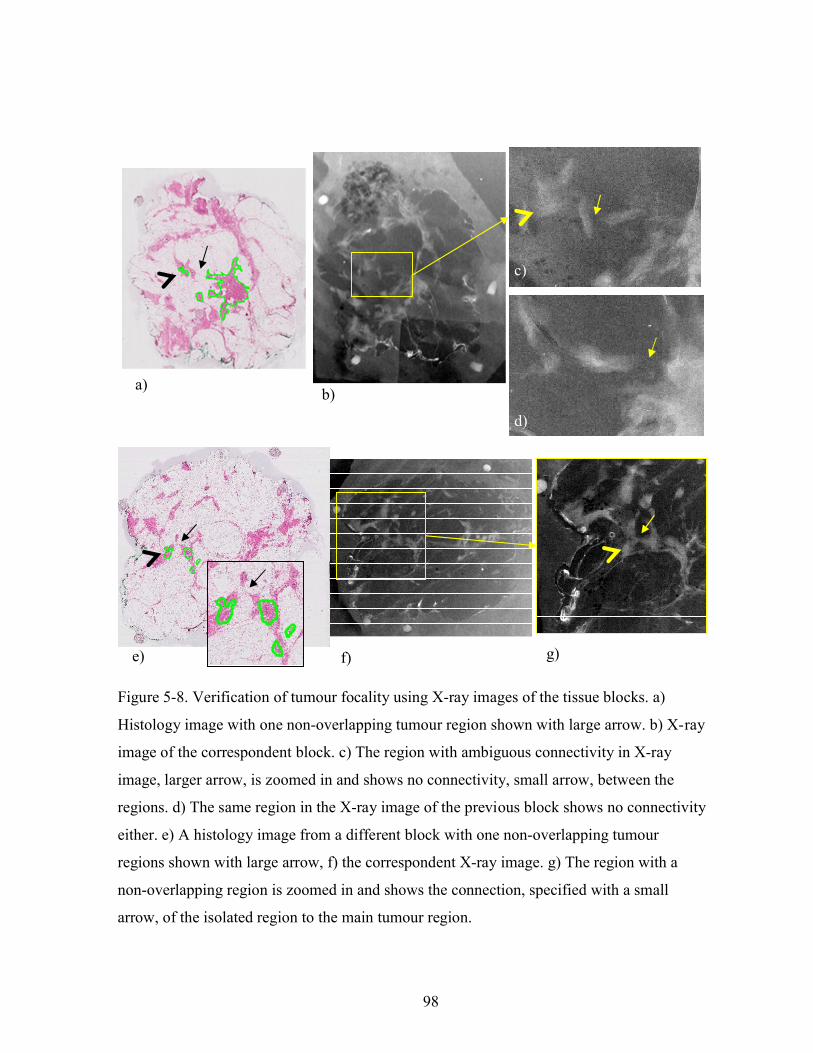
98
f)
b)
c)
d)
e)
a)
g)
Figure 5-8. Verification of tumour focality using X-ray images of the tissue blocks. a)
Histology image with one non-overlapping tumour region shown with large arrow. b) X-ray
image of the correspondent block. c) The region with ambiguous connectivity in X-ray
image, larger arrow, is zoomed in and shows no connectivity, small arrow, between the
regions. d) The same region in the X-ray image of the previous block shows no connectivity
either. e) A histology image from a different block with one non-overlapping tumour
regions shown with large arrow, f) the correspondent X-ray image. g) The region with a
non-overlapping region is zoomed in and shows the connection, specified with a small
arrow, of the isolated region to the main tumour region.

99
Figure 5-9. 3D tumour volume, a) original
tumour regions. b) main tumour after
removing the non-overlapping tumour
regions, c) after registration, d) after X-ray
assessment.
(µm)
(µm) (µm)
(µm)
(µm)
(µm)
(µm)
(µm)
(µm)
(µm)
(µm)
(µm)
a)
(b
(c
(d
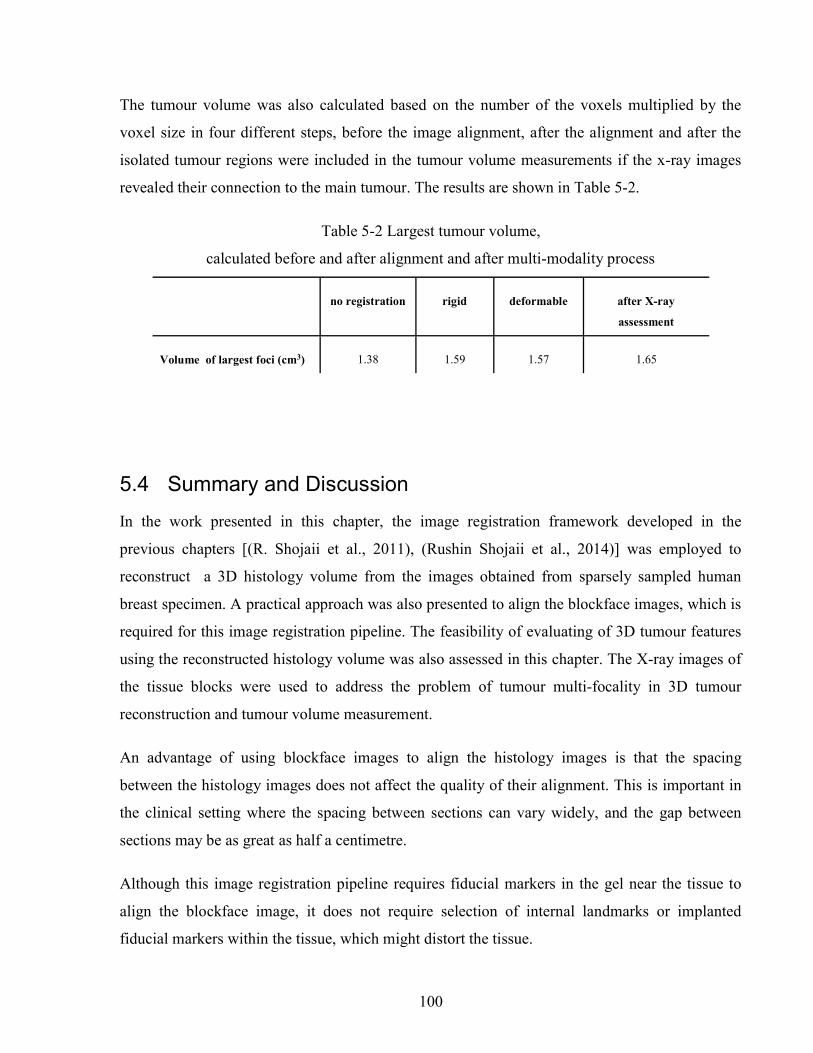
100
The tumour volume was also calculated based on the number of the voxels multiplied by the
voxel size in four different steps, before the image alignment, after the alignment and after the
isolated tumour regions were included in the tumour volume measurements if the x-ray images
revealed their connection to the main tumour. The results are shown in Table 5-2.
Table 5-2 Largest tumour volume,
calculated before and after alignment and after multi-modality process
no registration rigid deformable after X-ray
assessment
Volume of largest foci (cm3) 1.38 1.59 1.57 1.65
5.4 Summary and Discussion
In the work presented in this chapter, the image registration framework developed in the
previous chapters [(R. Shojaii et al., 2011), (Rushin Shojaii et al., 2014)] was employed to
reconstruct a 3D histology volume from the images obtained from sparsely sampled human
breast specimen. A practical approach was also presented to align the blockface images, which is
required for this image registration pipeline. The feasibility of evaluating of 3D tumour features
using the reconstructed histology volume was also assessed in this chapter. The X-ray images of
the tissue blocks were used to address the problem of tumour multi-focality in 3D tumour
reconstruction and tumour volume measurement.
An advantage of using blockface images to align the histology images is that the spacing
between the histology images does not affect the quality of their alignment. This is important in
the clinical setting where the spacing between sections can vary widely, and the gap between
sections may be as great as half a centimetre.
Although this image registration pipeline requires fiducial markers in the gel near the tissue to
align the blockface image, it does not require selection of internal landmarks or implanted
fiducial markers within the tissue, which might distort the tissue.

101
The alignment of the blockface images were evaluated by visual comparison of the alignment of
the fiducial markers in blockface images with the 3D orientation of the fiducial markers
segmented from CT images.
Tumour volume has been calculated based on the number of the voxels from the connected
overlapping tumour regions in 3D with no interpolation. The calculated volumes show that
deformable registration has a small impact in tumour volume calculation comparing to the rigid
registration, and this is consistent with the rigidity of the tumour.
In this chapter we have shown that our proposed approach is capable of reconstructing 3D
histology volumes from 2D whole-mount histology images of breast specimens. This approach
can help the surgical pathologists and researchers in comparison, visualization and analysis of
clinical specimens. Our work here shows that it is feasible to use this approach for investigation
of the tumour shape, volume, and multifocality.
102
6 Summary and Future Directions
6.1 Summary
Histology volume reconstruction may improve the study of anatomy and biology of normal and
diseased tissue. Studies concerned with structural changes and the spatial relationship of disease
biomarkers may particularly benefit from 3D analysis of tissue. Furthermore, cancer diagnosis
and prognosis can be assisted by assessment of 3D tumour features, such as volume and multi-
focality. In addition to the field of pathology, 3D histology volume can be employed as a ground
truth in validating new volumetric medical imaging techniques. Sparse sampling of clinical
specimens and the deformation of specimens during histology processes encumber an accurate
reconstruction of histology volume. Validation of histology image reconstruction is also a
challenging process when working with clinical specimens. The existing methods for histology
volume construction of human breast specimens are either manual or applicable only to small
densely sampled regions, cropped from the specimen.
Throughout the work of this dissertation, an automatic image registration pipeline has been
developed and validated for histology volume reconstruction from 2D images of the whole-
mount histology sections of pre-clinical and clinical specimens, a deformable registration
technique has been optimized to correct the deformation of human breast histology images, and
the application of this framework for assessment of 3D tumour features has been evaluated.
The work in chapter 2 includes the development of the image registration framework for
histology volume reconstruction using a set of reference optical images. The use of the blockface
images prevents registration errors from propagating throughout the reconstructed volume and
therefore maintains the conformation of the tissue. Chapter 2 also provides experimental
103
evidence that this pipeline can be successfully employed in 3D comparison of normal and
diseased tissue of pre-clinical mouse models.
Chapter 3 shows the expansion of the image registration framework for registration of the
histology to ex vivo medical images. In order to make the pipeline independent from different
tissue types and different histological stains, edge-based image registration methods were used in
the work presented in chapter 3. A multimodality fiducial marker was also developed for
validation of the histology volume reconstruction. The framework was validated based on the
Euclidean distance between the implanted fiducial markers in a pre-clinical model. The average
target registration error demonstrated that the improvement of the deformable registration
method of the framework is required.
Chapter 4 describes a feature-based deformable registration method for registration of the
histology images with their correspondent blockface images. This method obtains the pixel
displacement field by minimizing the distance between the densely sampled SIFT features,
which are scale, rotation and illumination invariant. The results confirms that the feature–based
deformable registration performs effectively and can replace the edge-based method used in
chapter 3.The optimum registration parameters for human breast tissue were also estimated by an
iterative optimization approach and it was demonstrated that this improves registration accuracy
significantly.
Furthermore, in chapter 5, the histology volume of five lumpectomy specimens are reconstructed
using the proposed framework, to assess the feasibility of using histology volumes to study the
tumour features in 3D, i.e. tumour volume and focality. The proposed approach is shown to be
suitable for 3D histology volume reconstruction from 2D histology images of breast specimen.
The average target registration error for the breast specimens was measured as 0.47 ± 0.31 mm
based on manually selected landmarks and the optimized deformable registration was shown to
significantly (p-value=0.006 < 0.05) improve the registration comparing to rigid registration. It is
also shown that this method has the potential to provide more accurate information about 3D
tumour measurements, such as tumour volume, and multi-focality.

104
6.2 Future Improvements to the Image Registration Framework
6.2.1 Correlation at Higher Resolutions
Although the image registration accuracy of the presented framework is reasonable at the
resolution of blockface images, at finer resolution the precision of the images registration might
not be acceptable, for example when consecutive histology images are correlated at cellular
level. The accuracy of the image registration at a desired higher resolution can be improved by
the employment of multi-scale image registration methods and the proposed framework can still
provide an initial alignment for these methods, which uses a coarse-to-fine strategy. An example
of this would be registration of consecutive histology images at cellular level to reconstruct the
3D structures such as DCIS.
6.2.2 A Generic Modular Image Registration Software
Different organs of the human body have different structures. For example histology images of
human liver have fewer detectable structures at the resolution of blockface images than a human
brain or breast. The feature-based image registration method, which is proposed in this thesis for
breast histology images, might not perform well for liver images, whereas the edge-based
method might be a better choice for liver images. One of the advantages of the proposed
framework is that it has no limitation on the choice of different types of rigid and non-rigid
image registration methods. The proposed approach can be expanded toward a generic modular
image registration software that can register images from any tissue type and/or imaging
modality. Image registration methods can be developed as separate modules, which can be linked
together to build a proper pipeline based on the application in hand. Segmentation and
visualization modules can also be included in the software to facilitate the image registration and
3D visualization.

105
6.3 Future Directions of Applications
6.3.1 Correlation of Different Disease Bio-Markers
In the era of personalized medicine, target specific drugs are increasingly introduced and
developed for different cancer types. To ensure that cancer patients receive optimal treatment,
tumour response to these targeted drugs is investigated in pathology by using different
established predictive biomarkers, e.g. ER, PR, and Her2/neu for breast. More disease
biomarkers are continuously being studied and developed to clarify the mechanisms of tumour
response and to identify the optimal strategy for drug administration. Additionally, the spatial
correlation of these tumour biomarkers in may also help with the identification and classification
of different cancer subtypes. Currently, surgical pathologists correlate differently stained
histology slides by eye under a microscope by switching between the slides. Automatic image
registration of the histology images with different stains facilitates the correlation of different
disease biomarkers for surgical pathologists.
To investigate the feasibility of automatic registration of the histology images with different
stains, a preliminary experiment was pursued using the image registration methods presented in
chapter 4 of this thesis. Two consecutive differently stained sections from a lumpectomy
specimen were obtained from Biomarker Imaging Research Laboratory (BIRL) at Sunnybrook
Research Institute. The sections were 4μm thick and one was stained with H&E and the other
one was stained for Estrogen Receptors (ER). The sections were scanned at 2μm resolution,
Figure 6-1.

106
Figure 6-1 Consecutive histology images with different stains. a) H&E Histology image. b) ER
Histology image
The images were down-sampled to 40 μm resolution. Since the two sections were well aligned
even before image registration, the rigid registration step was skipped for this pair of images.
Similar structures, which can be detected in the consecutive sections, were used for validation of
the image registration. Figure 6-2 shows the fusion of the registered images both with the
optimized parameters, obtained in chapter 3, and the default parameters. The smooth
continuation of the structures in Figure 6-2-b confirms the superiority of deformable registration
using optimized parameters.
The sections expand differently when they are placed in a hot water bath to remove wrinkles.
Furthermore, different tissue types also shrink or expand differently and this can deform the
sections. Therefore, it is required to register the sections with a suitable deformable registration
method to be able to accurately correlate the distribution of different stains.
1cm

107
Furthermore, a region was selected from both images at the original resolution, 2 μm, and
registered using two sets of registration parameters. The quality of registration was explored at
high resolution, where more structures can be visualized. Figure 6-3 confirms that the optimized
parameters still outperform the default parameters in registration of H&E and ER images at high
resolution.
The result of this preliminary study confirms that the proposed methods can be employed for
automatic correlation of the images scanned from the consecutive breast histology sections
stained for different disease biomarkers. Additional validation experiments in future are required
to confirm the suitability of the proposed methods for this application.
a) b)
a) b)
1cm
Figure 6-2 Fusion of the registered images, a) with Liu et al.’s parameters, b) with
optimized parameters. Arrow show the areas, which have been improved with
optimized parameters.
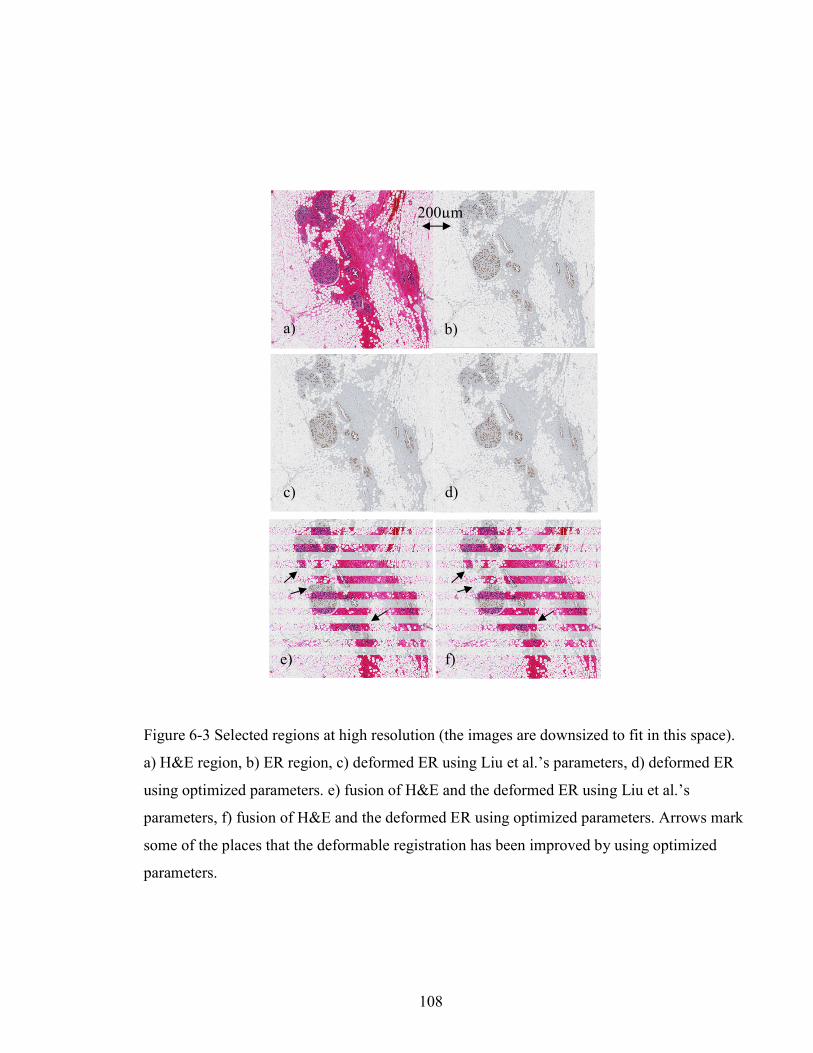
108
a b
c d
e f)
a) b)
c) d)
e) f)
200µm
Figure 6-3 Selected regions at high resolution (the images are downsized to fit in this space).
a) H&E region, b) ER region, c) deformed ER using Liu et al.’s parameters, d) deformed ER
using optimized parameters. e) fusion of H&E and the deformed ER using Liu et al.’s
parameters, f) fusion of H&E and the deformed ER using optimized parameters. Arrows mark
some of the places that the deformable registration has been improved by using optimized
parameters.

109
6.3.2 Correlation of ex vivo Medical Images with Histology
Correlation of ex vivo medical images with histology has been used by scientists for validation
of new improvements in medical imaging field. In order to accurately compare the findings in
medical images with the underlying structures in histology, it is necessary to compare the
correspondent images with each other. Finding the correspondent images manually is
challenging especially when the two volumes are misaligned. 3D image registration of a
reconstructed histology volume with a volumetric medical image of an excised specimen brings
the two volumes in alignment and assists with the selection of the closest correspondent images.
Figure 6-4 shows an example of the correspondent histology and Computed Tomography (CT)
images of a human breast specimen, which are, in this case, manually selected throughout the
two volumes. 3D Registration of ex vivo volumetric images with histology volume can also be
used as the first step of registration of in vivo volumetric images with histology, which is
explained in the next section.
A preliminary experiment in Chapter 3 of this thesis shows that the proposed image registration
framework is capable of accurately finding the correspondent ex vivo MR and histology images
a) b)
Figure 6-4. Correspondent histology (a) and CT (b) images of a human breast specimen.

110
of a small pre-clinical model. In future, additional experiments are required to assess the use of
this pipeline for registration of ex vivo and histology images of clinical specimens.
6.3.3 Correlation of in vivo Medical Images with Histology
Moving further, correlation of histology images with in vivo medical images is desirable for
many different applications. In order to transfer the new improvements in medical imaging
techniques to clinic, it is required for the scientists to first validate their new approaches. The
validation is usually pursued by comparison of the medical images with histology, which is still
the gold standard. A valid comparison requires the correct selection of the correspondent
histology and medical images. For example Sztrókay et al. (Sztrókay et al., 2012) co-registered
high resolution CT images of breast with histology for validation of the use of Phase Contrast
Imaging (PCI) in Computed Tomography for breast cancer imaging. On the reconstructed CT
volumes they investigated several slice orientations to find the best fitting slices to the histology
image that they prepared from the tumour site.
Another example of radiological-pathological correlation is shown in Figure 6-5, which is a work
done by Tot et al. (Tot & Gere, 2016) to investigate the proportion of radiologically occult
extensive disease and its impact on surgical management. They focused on tumors judged as
unifocal based on pre-operative multimodality breast imaging and found out the frequency of
additional radiologically occult malignant lesions in whole slide images of histology tissue
sections.
In these studies, the correspondent histology and radiological slices were found manually based
on the visual similarity assessment, which is a laborious task. These examples reveal the need for
an automatic image registration approach to accurately find the correspondent histology and
medical images.
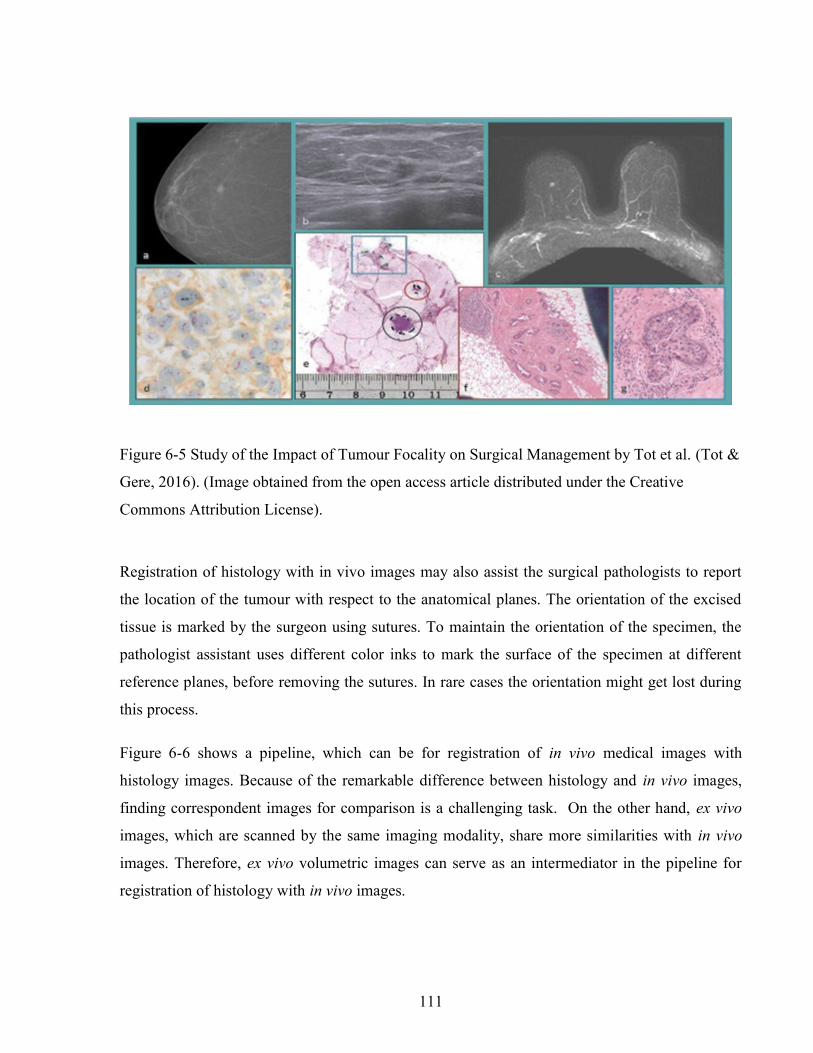
111
Registration of histology with in vivo images may also assist the surgical pathologists to report
the location of the tumour with respect to the anatomical planes. The orientation of the excised
tissue is marked by the surgeon using sutures. To maintain the orientation of the specimen, the
pathologist assistant uses different color inks to mark the surface of the specimen at different
reference planes, before removing the sutures. In rare cases the orientation might get lost during
this process.
Figure 6-6 shows a pipeline, which can be for registration of in vivo medical images with
histology images. Because of the remarkable difference between histology and in vivo images,
finding correspondent images for comparison is a challenging task. On the other hand, ex vivo
images, which are scanned by the same imaging modality, share more similarities with in vivo
images. Therefore, ex vivo volumetric images can serve as an intermediator in the pipeline for
registration of histology with in vivo images.
Figure 6-5 Study of the Impact of Tumour Focality on Surgical Management by Tot et al. (Tot &
Gere, 2016). (Image obtained from the open access article distributed under the Creative
Commons Attribution License).
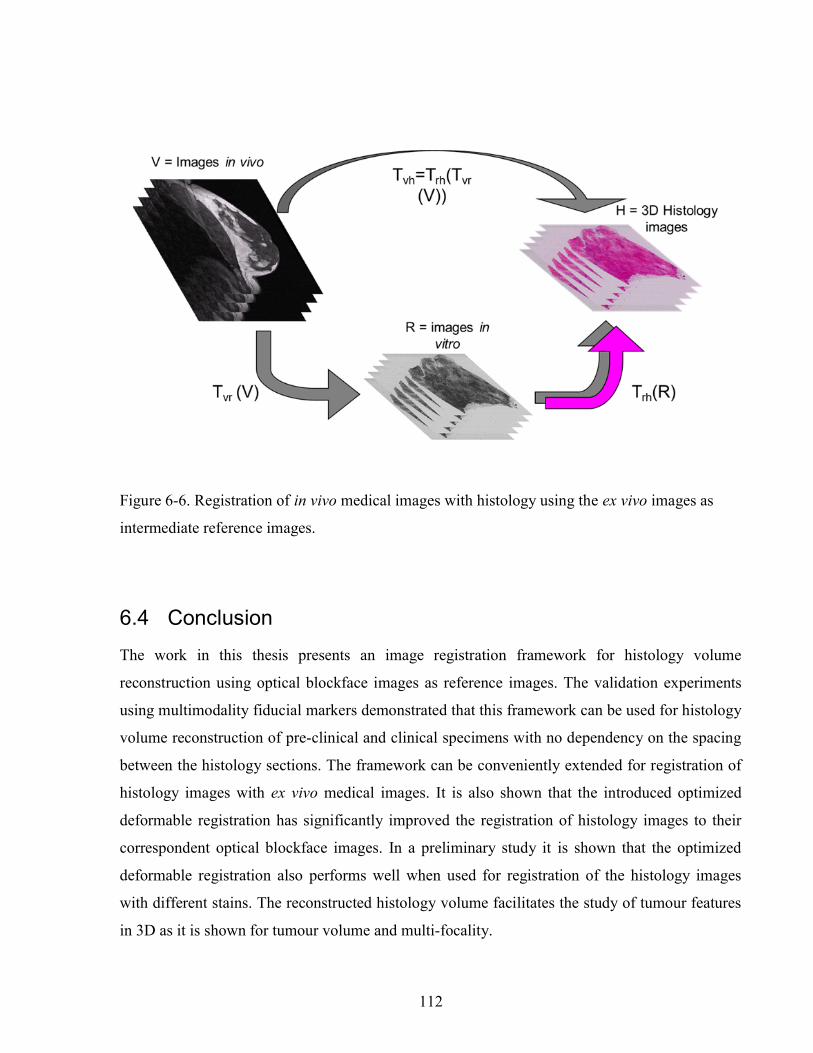
112
6.4 Conclusion
The work in this thesis presents an image registration framework for histology volume
reconstruction using optical blockface images as reference images. The validation experiments
using multimodality fiducial markers demonstrated that this framework can be used for histology
volume reconstruction of pre-clinical and clinical specimens with no dependency on the spacing
between the histology sections. The framework can be conveniently extended for registration of
histology images with ex vivo medical images. It is also shown that the introduced optimized
deformable registration has significantly improved the registration of histology images to their
correspondent optical blockface images. In a preliminary study it is shown that the optimized
deformable registration also performs well when used for registration of the histology images
with different stains. The reconstructed histology volume facilitates the study of tumour features
in 3D as it is shown for tumour volume and multi-focality.
Figure 6-6. Registration of in vivo medical images with histology using the ex vivo images as
intermediate reference images.

113
The contributions of this work can be summarized as follows:
An accurate image registration pipeline for histology volume reconstruction and co-
registration of histology with images ex vivo has been introduced in this thesis. The use
of optical blockface images makes the pipeline independent from the spacing between
the histology sections and avoids the propagation of registration error from one slice to
the next.
It has been shown that increasing the spacing of the blockface and histology images up
to about 0.8mm has no significant effect on the accuracy of the registration of MR
images to histology images of a preclinical tumour model.
A multi-modality fiducial marker has been introduced, which is suitable for validation of
image registration.
The use of dense SIFT features has been introduced for the automatic registration of
histology images.
The use of SIFTFlow deformable registration algorithm has been introduced for
deformable registration of histology images.
An optimization approach has been developed for estimating the optimum parameters for
SIFTFlow. The developed optimization software can be used to optimize SIFTFlow
parameters for deformable registration of histology images obtained from other tissue
types and other organs.
It has been demonstrated that the reconstructed volumes have the potential to assist
surgical pathologists with more precise assessment of tumour extent in 3D by using
tumour volume calculated from 3D histology.
The problem of tumour multi-focality in the assessment of tumour extent has been
partially addressed.
114
A feasibility test has been performed to show that the work in this thesis can be used in
correlation of the histology images of the sections stained for different disease
biomarkers.
The work in this thesis has demonstrated that accurate 3D histology volumes of breast specimens
can be automatically reconstructed from 2D digital images of whole-mount histology slides.
These reconstructed volumes can also assist surgical pathologists with more precise assessment
of tumour extent in 3D.

115
Bibliography
Alic, L., Haeck, J. C., Bol, K., Klein, S., van Tiel, S. T., Wielepolski, P. A., … Veenland, J. F.
(2011). Facilitating tumor functional assessment by spatially relating 3D tumor histology
and in vivo MRI: image registration approach. PloS One, 6(8), e22835.
http://doi.org/10.1371/journal.pone.0022835
Aref, M., Chaudhari, A. R., Bailey, K. L., Aref, S., & Wiener, E. C. (2008). Comparison of
tumor histology to dynamic contrast enhanced magnetic resonance imaging-based
physiological estimates. Magnetic Resonance Imaging, 26(9), 1279–93.
http://doi.org/10.1016/j.mri.2008.02.015
Bağci, U., & Bai, L. (2008). Registration of standardized histological images in feature space. In
J. M. Reinhardt & J. P. W. Pluim (Eds.), SPIE Medical Imaging (p. 69142V–69142V–9).
http://doi.org/10.1117/12.770219
Bagci, U., Udupa, J. K., & Bai, L. (2010). The role of intensity standardization in medical image
registration. Pattern Recognition Letters. http://doi.org/10.1016/j.patrec.2009.09.010
Bardinet, E., Ourselin, S., Dormont, D., Malandain, G., Tand, D., Parain, K., … Yelnik, J.
(2002). Co-registration of Histological , Optical and MR Data of the Human Brain.
MICCAI, 2488, 548–555.
Besl, P., & McKay, N. (1992). A Method for Registration of 3-D Shapes. IEEE Transactions on
Pattern Analysis and Machine Intelligence, 14(2), 239–256.
Bookstein, F. L. (1989). Principal Warps: Thin-Plate Splines and the Decomposition of
Deformations. IEEE Transactions on Pattern Analysis and Machine Intelligence, 11(6),
567–585.
Booth, M. E., Treanor, D., Roberts, N., Magee, D. R., Speirs, V., & Hanby, A. M. (2015). Three-
dimensional reconstruction of ductal carcinoma in situ with virtual slides. Histopathology,
66(7), 966–973. http://doi.org/10.1111/his.12561
116
Breast cancer statistics. (2015). Retrieved September 13, 2016, from
http://www.cancer.ca/en/cancer-information/cancer-type/breast/statistics/?region=on
Breen, M. S., Lazebnik, R. S., & Wilson, D. L. (2005). Three-dimensional registration of
magnetic resonance image data to histological sections with model-based evaluation.
Annals of Biomedical Engineering, 33(8), 1100–12. http://doi.org/10.1007/s10439-005-
5778-8
Cahill, N. D., Noble, J. A., & Hawkes, D. J. (2010). Extending the quadratic taxonomy of
regularizers for nonparametric registration. Image (Rochester, N.Y.), 7623, 76230B–
76230B–12. http://doi.org/10.1117/12.844464
Cao, M., Liang, Y., Shen, C., Miller, K. D., & Stantz, K. M. (2009). Developing DCE-CT to
quantify intra-tumor heterogeneity in breast tumors with differing angiogenic phenotype.
IEEE Transactions on Medical Imaging, 28(6), 861–71.
http://doi.org/10.1109/TMI.2008.2012035
Chakravarty, M. M., Bertrand, G., Hodge, C. P., Sadikot, A. F., & Collins, D. L. (2006). The
creation of a brain atlas for image guided neurosurgery using serial histological data.
NeuroImage, 30(2), 359–76. http://doi.org/10.1016/j.neuroimage.2005.09.041
Chopra, R., Tang, K., Burtnyk, M., Boyes, A., Sugar, L., Appu, S., … Bronskill, M. (2009).
Analysis of the spatial and temporal accuracy of heating in the prostate gland using
transurethral ultrasound therapy and active MR temperature feedback. Physics in Medicine
and Biology, 54(9), 2615–33. http://doi.org/10.1088/0031-9155/54/9/002
Clarke, G. M., Mainprize, J. G., Peressotti, C., Sun, L., Wang, D., Zubovits, J. T., … Yaffe, M. J.
(2008). Validation of cone-beam CT measurements of tumour burden using three-
dimensional histopathology: Initial results for a lumpectomy. Lecture Notes in Computer
Science (Including Subseries Lecture Notes in Artificial Intelligence and Lecture Notes in
Bioinformatics), 5116 LNCS, 440–446. http://doi.org/10.1007/978-3-540-70538-3_61
Clarke, G. M., Murray, M., Holloway, C. M. B., Liu, K., Zubovits, J. T., & Yaffe, M. J. (2012).
3D Pathology Volumetric Technique: A Method for Calculating Breast Tumour Volume
from Whole-Mount Serial Section Images. International Journal of Breast Cancer, 2012,

117
1–9. http://doi.org/10.1155/2012/691205
Clarke, G. M., Peressotti, C., Mawdsley, G. E., & Yaffe, M. J. (2006). Design and
characterization of a digital image acquisition system for whole-specimen breast
histopathology. Physics in Medicine and Biology, 51(20), 5089–103.
http://doi.org/10.1088/0031-9155/51/20/002
Cohen, F. S., Yang, Z., Huang, Z., & Nissanov, J. (1998). Automatic matching of homologous
histological sections. IEEE Transactions on Bio-Medical Engineering.
http://doi.org/10.1109/10.668755
Collins, L. C., & Schnitt, S. J. (2007). Histology for Pathologists. (S. E. Mills, Ed.).
Philadelphia.
Connolly, J., Schnitt, S., Wang, H., & Al., E. (2003). Holland-Frei Cancer Medicine. (D. Kufe,
R. Pollock, R. Weichselbaum, & E. Al., Eds.) (6th ed.). Hamilton (ON). Retrieved from
http://www-ncbi-nlm-nih-gov.myaccess.library.utoronto.ca/books/NBK13237/
Coombs, N. J., & Boyages, J. (2005). Multifocal and multicentric breast cancer: Does each focus
matter? Journal of Clinical Oncology, 23(30), 7497–7502.
http://doi.org/10.1200/JCO.2005.02.1147
D’Aische, A. du B., Craene, M. De, Geets, X., Gregoire, V., Macq, B., & Warfield, S. K. (2005).
Efficient multi-modal dense field non-rigid registration: alignment of histological and
section images. Medical Image Analysis, 9(6), 538–46.
http://doi.org/10.1016/j.media.2005.04.003
Dauguet, J., Delzescaux, T., Condé, F., Mangin, J.-F., Ayache, N., Hantraye, P., & Frouin, V.
(2007). Three-dimensional reconstruction of stained histological slices and 3D non-linear
registration with in-vivo MRI for whole baboon brain. Journal of Neuroscience Methods,
164(1), 191–204. http://doi.org/10.1016/j.jneumeth.2007.04.017
Duan, W., Kuester, F., Gaudiot, J., & Hammami, O. (2008). Automatic object and image
alignment using Fourier Descriptors. Image (Rochester, N.Y.), 26, 1196–1206.
http://doi.org/10.1016/j.imavis.2008.01.009
118
Fedorov, A., Billet, E., Prastawa, M., Gerig, G., Radmanesh, A., Warfield, I. K., …
Chrisochoides, N. (2008). The Use of Robust Local Hausdorff Distances in Accuracy
Assessment for Image Alignment of Brain MRI. In International Symposium on Visual
Computing (ISVC) (pp. 594–603).
Felzenszwalb, P. F., & Huttenlocher, D. P. (2006). Efficient belief propagation for early vision.
International Journal of Computer Vision. http://doi.org/10.1007/s11263-006-7899-4
Freeman, H. (1974). Computer Processing of Line-Drawing Images. ACM Computing Surveys
(CSUR), 6(1), 57–97. http://doi.org/10.1145/356625.356627
Gefen, S., Tretiak, O., & Nissanov, J. (2003). Elastic 3-D alignment of rat brain histological
images. IEEE Transactions on Medical Imaging, 22(11), 1480–9.
http://doi.org/10.1109/TMI.2003.819280
Giardina, C., & Kuhl, F. (1977). Accuracy of Curve Approximation by Harmonically Related
Vectors with Elliptical Loci. Computer Graphics and Image Processing, 6, 277–285.
Gibson, E., Fenster, A., & Ward, A. D. (2012). Registration Accuracy : How Good Is Good
Enough ? A Statistical Power Calculation Incorporating Image Registration Uncertainty.
MICCAI, 7511, 643–650.
Gibson, E., Gaed, M., Gómez, J. a, Moussa, M., Romagnoli, C., Pautler, S., … Ward, A. D.
(2013). 3D prostate histology reconstruction: an evaluation of image-based and fiducial-
based algorithms. Medical Physics, 40(9), 93501. http://doi.org/10.1118/1.4816946
Going, J. J., & Moffat, D. F. (2004). Escaping from Flatland: Clinical and biological aspects of
human mammary duct anatomy in three dimensions. Journal of Pathology, 203(1), 538–
544. http://doi.org/10.1002/path.1556
Gonzalez, R., & Woods, R. (2002). Digital Image Processing. Prentice Hall.
Guest, E., Berry, E., Baldock, R. A., Fidrich, M., & Smith, M. A. (2001). Robust Point
Correspondence Applied to Two- and Three-Dimensional Image Registration. IEEE
Transactions on Pattern Analysis and Machine Intelligence, 23(2), 165–179.

119
Gupta, D., Nath, M., & Layfield, L. J. (2003). Utility of four-quadrant random sections in
mastectomy specimens. The Breast Journal, 9(4), 307–311.
Hoda, S. A., Brogi, E., Koerner, F. C., & Rosen, P. P. (2014). Rosen’s breast pathology.
Jacobs, M. A., Windham, J. P., Soltanian-Zadeh, H., Peck, D. J., & Knight, R. A. (1999).
Registration and warping of magnetic resonance images to histological sections. Medical
Physics, 26(8), 1568–78. Retrieved from http://www.ncbi.nlm.nih.gov/pubmed/10501057
Jansen, S. A. (2012). Breast Cancer Biology for the Radiation Oncologist. (J. Strauss, W. Small,
& G. E. Woloschak, Eds.). Berlin, Heidelberg: Springer Berlin Heidelberg.
Ju, T., Warren, J., Carson, J., Bello, M., Kakadiaris, I., Chiu, W., … Eichele, G. (2006). 3D
volume reconstruction of a mouse brain from histological sections using warp filtering.
Journal of Neuroscience Methods, 156(1–2), 84–100.
http://doi.org/10.1016/j.jneumeth.2006.02.020
Knopp, M. V, Weiss, E., Sinn, H. P., Mattern, J., Junkermann, H., Radeleff, J., … van Kaick, G.
(1999). Pathophysiologic basis of contrast enhancement in breast tumors. Journal of
Magnetic Resonance Imaging : JMRI, 10(3), 260–6. Retrieved from
http://www.ncbi.nlm.nih.gov/pubmed/10508285
Kuhl, F., & Giardina, C. (1982). Elliptic Fourier Features of a Closed Contour. Computer
Graphics and Image Processing, 18, 236–258.
Lazebnik, R. S., Lancaster, T. L., Breen, M. S., Lewin, J. S., & Wilson, D. L. (2003). Volume
registration using needle paths and point landmarks for evaluation of interventional MRI
treatments. IEEE Transactions on Medical Imaging, 22(5), 653–60.
http://doi.org/10.1109/TMI.2003.812246
Lei, M., Xue, C. H., Wang, Y. M., Li, Z. J., Xue, Y., & Wang, J. F. (2008). Effect of squid ink
melanin-Fe on iron deficiency anemia remission. Journal of Food Science, 73(8), H207-11.
http://doi.org/10.1111/j.1750-3841.2008.00930.x
Leopold, K. A., Recht, A., Schnitt, S. J., Connolly, J. L., Rose, M. A., Silver, B., & Harris, J. R.
(1989). Results of conservative surgery and radiation therapy for multiple synchronous
120
cancers of one breast. International Journal of Radiation Oncology, Biology, Physics, 16(1),
11–6.
Liu, C., Yuen, J., & Torralba, A. (2011a). SIFT flow: dense correspondence across scenes and its
applications. IEEE Transactions on Pattern Analysis and Machine Intelligence, 33(5), 978–
94. http://doi.org/10.1109/TPAMI.2010.147
Liu, C., Yuen, J., & Torralba, A. (2011b). SIFT flow: Matlab/C++ code. Retrieved September 8,
2016, from http://people.csail.mit.edu/celiu/SIFTflow/SIFTflow.zip
Liu, C., Yuen, J., & Torralba, A. (2011c). SIFT flow: Matlab/C++ code.
Liu, C., Yuen, J., Torralba, A., Sivic, J., & Freeman, W. T. (2008). SIFT Flow: Dense
Correspondence across Different Scenes. European Conference on Computer Vision
(ECCV), 1(1), 28–42.
Lowe, D. G. (2004). Distinctive Image Features from Scale-Invariant Keypoints. International
Journal of Computer Vision, 60(2), 91–110.
http://doi.org/10.1023/B:VISI.0000029664.99615.94
Magnitsky, S., Watson, D. J., Walton, R. M., Pickup, S., Bulte, J. W. M., Wolfe, J. H., &
Poptani, H. (2005). In vivo and ex vivo MRI detection of localized and disseminated neural
stem cell grafts in the mouse brain. NeuroImage, 26(3), 744–54.
http://doi.org/10.1016/j.neuroimage.2005.02.029
Malandain, G., Bardinet, E., Nelissen, K., & Vanduffel, W. (2004). Fusion of autoradiographs
with an MR volume using 2-D and 3-D linear transformations. NeuroImage, 23(1), 111–
127. http://doi.org/10.1016/j.neuroimage.2004.04.038
Malandain, G., Bardinet, E., Nelissen, K., & Vanduffel, W. (2004). Fusion of autoradiographs
with an MR volume using 2-D and 3-D linear transformations. NeuroImage, 23(1), 111–27.
http://doi.org/10.1016/j.neuroimage.2004.04.038
Mattes, D., Haynor, D. R., Vesselle, H., Lewellen, T. K., & Eubank, W. (2001). Nonrigid
multimodality image registration. In SPIE Medical Imaging (Vol. 4322, pp. 1609–1620).

121
Michell, M. J. (2010). Breast Cancer. (M. J. Michell, Ed.), Asco (1st ed.). Cambridge:
Cambridge University Press. http://doi.org/10.1093/med/9780199363315.003.0020
National Cancer Institute. (2015). Retrieved September 13, 2016, from
http://www.cancer.gov/types/breast/hp/breast-screening-pdq#link/_10_toc
Navaz, S. (2011). Breast Cancer. (L. Jacobs & C. A. Finlayson, Eds.).
Nelder, B. J. a, & Mead, R. (1965). A simplex method for function minimization. Computer
Journal, 7, 308–313.
Nikou, C., Heitz, F., Nehlig, A., Namer, I. J., & Armspach, J.-P. (2003). A robust statistics-based
global energy function for the alignment of serially acquired autoradiographic sections.
Journal of Neuroscience Methods, 124(1), 93–102. http://doi.org/10.1016/S0165-
0270(02)00369-2
Opto Engineering. (2015). Telecentric lenses tutorial. Retrieved September 13, 2016, from
http://www.opto-engineering.com/resources/telecentric-lenses-tutorial
Ourselin, S., Roche, A., Pennec, X., & Sattonnet, C. (1998). Automatic Alignment of Histological
Sections for 3D Reconstruction and Analysis. Analytical Cellular Pathology (Vol. RR-3595,
I).
Pakurar, A. S., & Bigbee, J. W. (2004). Digital Histology. Hoboken, NJ, USA: John Wiley &
Sons, Inc. http://doi.org/10.1002/0471728551
PathCore. (2016). Sedeen Viewer. Retrieved from
http://www.pathcore.ca/products/visualizations
Pauly, K. B., Diederich, C. J., Rieke, V., Bouley, D., Chen, J., Nau, W. H., … Sommer, G.
(2006). Magnetic resonance-guided high-intensity ultrasound ablation of the prostate.
Topics in Magnetic Resonance Imaging : TMRI, 17(3), 195–207.
http://doi.org/10.1097/RMR.0b013e31803774dd
Pedersen, L., Gunnarsdottir, K. a, Rasmussen, B. B., Moeller, S., & Lanng, C. (2004). The
prognostic influence of multifocality in breast cancer patients. Breast (Edinburgh,

122
Scotland), 13(3), 188–93. http://doi.org/10.1016/j.breast.2003.11.004
Reis, S., Eiben, B., Mertzanidou, T., Hipwell, J., Hermsen, M., van der Laak, J., … Hawkes, D.
(2015). Minimum slice spacing required to reconstruct 3D shape for serial sections of breast
tissue for comparison with medical imaging. SPIE Medical Imaging; Digital Pathology,
9420, 94200K. http://doi.org/10.1117/12.2081909
Ridler, T.W. Calvard, S. (1978). Picture Thresholding Using an Iterative Slection Method. IEEE
Transactions on Systems, Man and Cybernetics, 8(8), 630–632.
http://doi.org/10.1109/TSMC.1978.4310039
Roberts, N., Magee, D., Song, Y., Brabazon, K., Shires, M., Crellin, D., … Treanor, D. (2012).
Toward Routine Use of 3D Histopathology as a Research Tool. The American Journal of
Pathology, 180(5), 1835–1842. http://doi.org/10.1016/j.ajpath.2012.01.033
Rouvière, O., Reynolds, C., Le, Y., Lai, J., Roberts, L. R., Felmlee, J. P., & Ehman, R. L. (2006).
Fiducial markers for MR histological correlation in ex vivo or short-term in vivo animal
experiments: a screening study. Journal of Magnetic Resonance Imaging : JMRI, 23(1), 50–
9. http://doi.org/10.1002/jmri.20466
Rusby, J. E., Brachtel, E. F., Michaelson, J. S., Koerner, F. C., & Smith, B. L. (2007). Breast
duct anatomy in the human nipple: Three-dimensional patterns and clinical implications.
Breast Cancer Research and Treatment, 106(2), 171–179. http://doi.org/10.1007/s10549-
006-9487-2
Samani, A., & Plewes, D. (2004). A method to measure the hyperelastic parameters of ex vivo
breast tissue samples. Physics in Medicine and Biology, 49(18), 4395–4405.
http://doi.org/10.1088/0031-9155/49/18/014
Samani, A., Zubovits, J., & Plewes, D. (2007). Elastic moduli of normal and pathological human
breast tissues: an inversion-technique-based investigation of 169 samples. Phys. Med. Biol,
52, 1565–1576. http://doi.org/10.1088/0031-9155/52/6/002
Samavati, N., McGrath, D., Lee, J., van der Kwast, T., Jewett, M., Ménard, C., & Brock, K. K.
(2011). Biomechanical model-based deformable registration of MRI and histopathology for
123
clinical prostatectomy. Journal of Pathology Informatics, 2(2), S10.
http://doi.org/10.4103/2153-3539.92035
Shojaii, R., Bacopulos, S., Yang, W., Karavardanyan, Tigran Spyropoulos, Demetri, Raouf, A.,
Martel, A., & Seth, A. (2014). Reconstruction of 3-Dimensional Histology Volume and its
Application to Study Mouse Mammary Glands. JoVE (Journal of Visualize Experiments).
Shojaii, R., Karavardanyan, T., Yaffe, M., & Martel, A. L. (2011). Validation of histology image
registration. SPIE Medical Imaging, 7962, 79621E–79621E–7.
http://doi.org/10.1117/12.878762
Shojaii, R., & Martel, A. (2009). A Novel Edge Point Selection Method for Registration of
Histology Images. Optical Tissue Image Analysis in Microscopy, Histopathology and
Endoscopy (OPTIMHisE) Workshop, MICCAI.
Shojaii, R., & Martel, A. (2010). Multi-Modality fiducial marker for validation of registration of
medical images with histology. SPIE Medical Imaging, 7623, 762331-762331–8.
http://doi.org/10.1117/12.845551
Sprengel, R., Rohr, K., & Stiehl, H. S. (1997). Thin-Plate Spline Approximation for Image
Registration. IEEE Engineering in Medicine and Biology, 18, 1190–1191.
Sun, L., Wang, D., Zubovits, J. T., Yaffe, M. J., & Clarke, G. M. (2009). An improved
Processing Method for Breast Whole-Mount Serial Sections for Three-Dimensional
Histopathology Imaging. American Journal of Clinical Pathology, 131(3), 383–392.
http://doi.org/10.1309/AJCPVBZZ4IKJHY3U
Sztrókay, A., Diemoz, P. C., Schlossbauer, T., Brun, E., Bamberg, F., Mayr, D., … Coan, P.
(2012). High-resolution breast tomography at high energy: a feasibility study of phase
contrast imaging on a whole breast. Physics in Medicine and Biology, 57(10), 2931–42.
http://doi.org/10.1088/0031-9155/57/10/2931
Taylor, L. S., Porter, B. C., Nadasdy, G., di Sant’Agnese, P. A., Pasternack, D., Wu, Z., …
Parker, K. J. (2004). Three-dimensional registration of prostate images from histology and
ultrasound. Ultrasound in Medicine & Biology, 30(2), 161–8.
124
http://doi.org/10.1016/j.ultrasmedbio.2003.10.005
Tot, T., & Gere, M. (2016). Radiologically Unifocal Invasive Breast Carcinomas: Large-Section
Histopathology Correlate and Impact on Surgical Management. Journal of Cancer Science
& Therapy, 8(3), 50–54. http://doi.org/10.4172/1948-5956.1000389
Wachowiak, M. P., Smolíková, R., Zheng, Y., Zurada, J. M., & Elmaghraby, A. S. (2004). An
Approach to Multimodal Biomedical Image Registration Utilizing Particle Swarm
Optimization. IEEE Transactions on Evolutionary Computation, 8(3), 289–301.
Weider, N. (Ed.). (2009). Modern Surgical Pathology. Elsevier B.V.
Weissenbacher, T. M., Zschage, M., Janni, W., Jeschke, U., Dimpfl, T., Mayr, D., … Dian, D.
(2010). Multicentric and multifocal versus unifocal breast cancer: Is the tumor-node-
metastasis classification justified? Breast Cancer Research and Treatment, 122(1), 27–34.
http://doi.org/10.1007/s10549-010-0917-9
Weissleder, R., Moore, a, Mahmood, U., Bhorade, R., Benveniste, H., Chiocca, E. a, & Basilion,
J. P. (2000). In vivo magnetic resonance imaging of transgene expression. Nature Medicine,
6(3), 351–5. http://doi.org/10.1038/73219
Wirtz, S., Fischer, B., Modersitzki, J., & Schmitt, O. (2004). Super-fast elastic registration of
histologic images of a whole rat brain for three-dimensional reconstruction. Medical
Imaging 2004: Image Processing, Pts 1-3, 5370, 328–334\r2158.
http://doi.org/10.1117/12.534110
Yushkevich, P. A., Piven, J., Hazlett, Heather Cody Smith, R. G., Ho, S., Gee, J. C., & Gerig, G.
(2006). User-guided 3D active contour segmentation of anatomical structures: Significantly
improved efficiency and reliability. Neuroimage, 31(3), 1116–28.
Zhan, Y., Ou, Y., Feldman, M., Tomaszeweski, J., Davatzikos, C., & Shen, D. (2007).
Registering histologic and MR images of prostate for image-based cancer detection.
Academic Radiology, 14(11), 1367–81. http://doi.org/10.1016/j.acra.2007.07.018