Web Meeting: Hurricane Traffic Volumes Pilot Results - The ...
60
IMAGE Web Meeting: Hurricane Traffic Volumes Pilot Results: States’ Experience with Real-time Connected Vehicle Data January 28, 2021
-
Upload
khangminh22 -
Category
Documents
-
view
0 -
download
0
Transcript of Web Meeting: Hurricane Traffic Volumes Pilot Results - The ...

IMAGE
Web Meeting: Hurricane Traffic Volumes Pilot Results: States’ Experience with Real-time Connected Vehicle DataJanuary 28, 2021

Audio Instructions
• Participants will be in “Listen Only” mode throughout the web meeting
• Please press *0 to speak to an operator for questions regarding audio
• Please call Justin for difficulties with the web or audio application
• This web meeting will be recorded
• Presentations will be posted to the Eastern Transportation Coalition website.
Participants will receive a link to the presentations after they are posted.
The Eastern Transportation Coalition - Web Meeting: Hurricane Traffic Volumes Pilot Results: States’ Experience with Real-time Connected Vehicle Data 2January 28, 2021

Make Comments & Ask Questions
IN THE CHAT BOX
• Please pose your questions using the chat box
• Questions will be monitored then answered by the speakers either at the end of their presentation or at the end of the web meeting
Type your question in the box, then click here
January 28, 2021 The Eastern Transportation Coalition - Web Meeting: Hurricane Traffic Volumes Pilot Results: States’ Experience with Real-time Connected Vehicle Data 3

Welcome
Denise Markow, TSMO Program DirectorThe Eastern Transportation Coalition
January 28, 2021 The Eastern Transportation Coalition - Web Meeting: Hurricane Traffic Volumes Pilot Results: States’ Experience with Real-time Connected Vehicle Data 4

AgendaTopic Speaker
Welcome & Introductions Denise Markow, TSMO Program Director, The Eastern Transportation Coalition
Background Stan Young, Advanced Transportation & Urban Scientist, National Reliable Energy Laboratory
Goals and Objectives Stan Young
Overview of Connected Vehicle Data Jaap van den Hoek, Director of Solutions Engineering, Wejo
Accuracy of Real Time Volume Data Kaveh Farokhi Sadabadi, Senior Faculty Specialist, University of Maryland CATT
More Goals and Objectives Stan Young
State FeedbackDenise MarkowSimona Babiceanu, Data Scientist, Traffic Engineering Division, Virginia DOT
Lessons Learned and Summary Findings Stan Young
Wrap Up Denise Markow
January 28, 2021 The Eastern Transportation Coalition - Web Meeting: Hurricane Traffic Volumes Pilot Results: States’ Experience with Real-time Connected Vehicle Data 5

The Eastern Transportation Coalition Sponsored Event
208 Registered
DOTsTurnpike
AuthoritiesMPOs Federal Agencies Universities Vendors Consultants
26 States
The Eastern Transportation Coalition - Web Meeting: Hurricane Traffic Volumes Pilot Results: States’ Experience with Real-time Connected Vehicle Data 6January 28, 2021
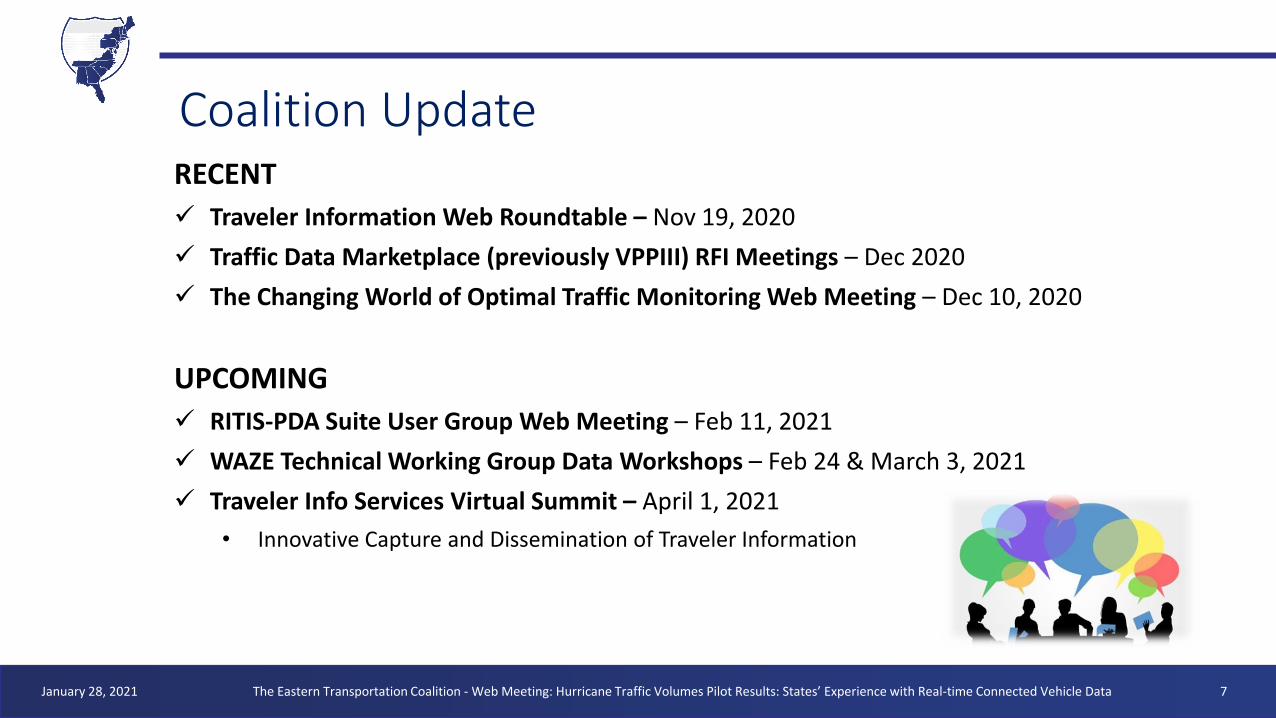
Coalition UpdateRECENT
✓ Traveler Information Web Roundtable – Nov 19, 2020
✓ Traffic Data Marketplace (previously VPPIII) RFI Meetings – Dec 2020
✓ The Changing World of Optimal Traffic Monitoring Web Meeting – Dec 10, 2020
UPCOMING
✓ RITIS-PDA Suite User Group Web Meeting – Feb 11, 2021
✓ WAZE Technical Working Group Data Workshops – Feb 24 & March 3, 2021
✓ Traveler Info Services Virtual Summit – April 1, 2021
• Innovative Capture and Dissemination of Traveler Information
The Eastern Transportation Coalition - Web Meeting: Hurricane Traffic Volumes Pilot Results: States’ Experience with Real-time Connected Vehicle Data 7January 28, 2021

Introductions & Project Team
Stan YoungAdvanced Transportation
& Urban ScientistNational Reliable Energy Laboratory
Jaap Van Den HoekDirector of Solutions
EngineeringWejo
Kaveh Farokhi SadabadiSenior Faculty Specialist
University of Maryland CATT
The Eastern Transportation Coalition - Web Meeting: Hurricane Traffic Volumes Pilot Results: States’ Experience with Real-time Connected Vehicle Data 8January 28, 2021
Zach Vander LaanFaculty Research Assistant
University of Maryland CATT
Eimar BoesjesCEO
Moonshadow Mobile, Inc.
Peter CarnesCEO
Traffax
Wander Boesjes“Agency Support”
Moonshadow Mobile, Inc.

Background, Goals & Objectives
Stan Young, Advanced Transportation and Urban Scientist, National Renewable Energy Laboratory (NREL)
The Eastern Transportation Coalition - Web Meeting: Hurricane Traffic Volumes Pilot Results: States’ Experience with Real-time Connected Vehicle Data 9January 28, 2021

Background
An existing partnership has been researching the viability of accurate traffic volumes derived from probe data
▪ Past studies include:o Florida
o Maryland
o Colorado
o New Hampshire
o Pennsylvania
o Massachusetts
o Tennessee
o USDOT Pooled Fund Study for non-traditional sources for AADT
10TETCoalition.orgJanuary 28, 2021

Background
Real-time volumes are the second dimension
(along side travel time & speed)
for full operational awareness.
HISTORIC volumes are viable.
But what about REAL TIME volume!
11TETCoalition.orgJanuary 28, 2021
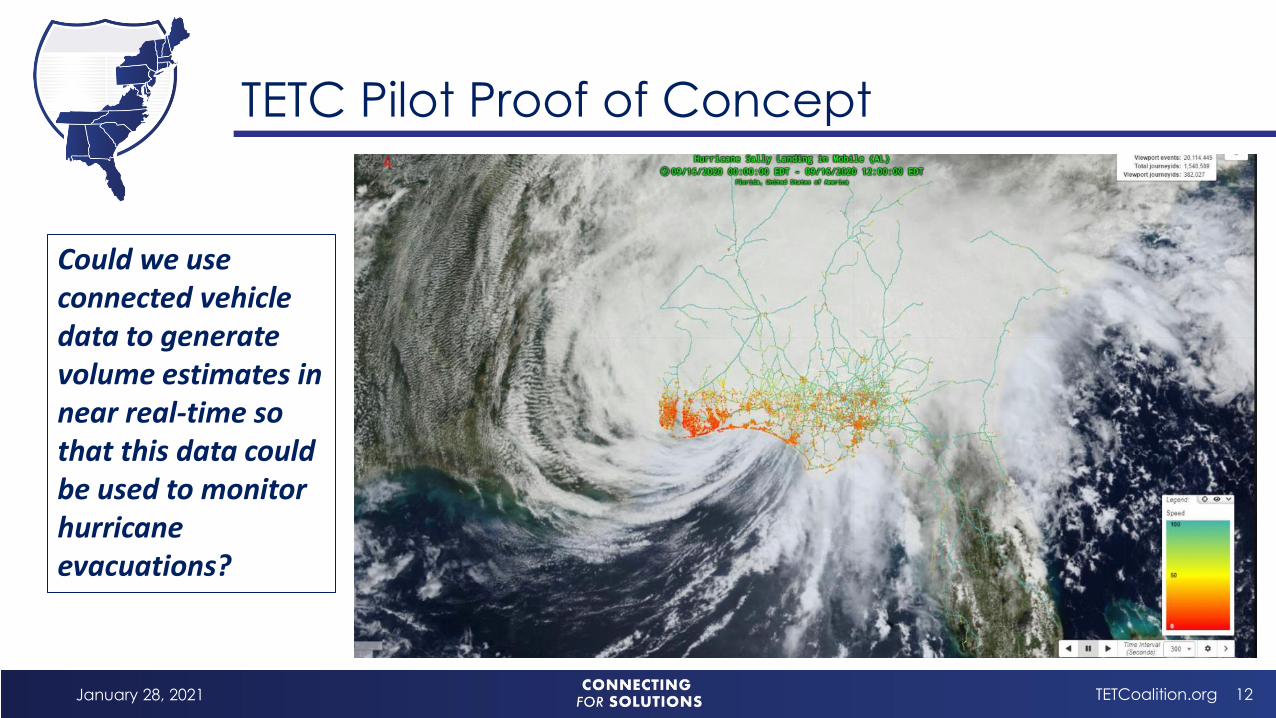
TETC Pilot Proof of Concept
Could we use connected vehicle data to generate volume estimates in near real-time so that this data could be used to monitor hurricane evacuations?
12TETCoalition.orgJanuary 28, 2021

The Players and Framework
PLAYERS FRAMEWORK
Eastern Transportation Coalition Coordination and Funding
Traffax Validation Data Collection Partner
State DOT TETC MembersFlorida, Alabama, Georgia, Tennessee, North Carolina, Virginia
WejoCV Data ProviderMoonshadow – Wejo Partner –Display and processing platform
National Renewable Energy LabCollaborator & Technical Partner for ongoing research
TETCoalition.org 13January 28, 2021

Testing a Solution: Real-Time Vehicle Movements
What?o Connected Vehicle Data – available real-time
➢ 3 second pings, >3% penetration
o 21 licenses to view live stream vehicle movement
o Estimate volumes based on scaling factors
Where?o Alabama, Florida, Georgia, North Carolina, Tennessee,
Virginia
o Interstates, Turnpike and the NHS system (FRC 1,2,&3)
Why?o Take volume research to real-time
14TETCoalition.orgJanuary 28, 2021
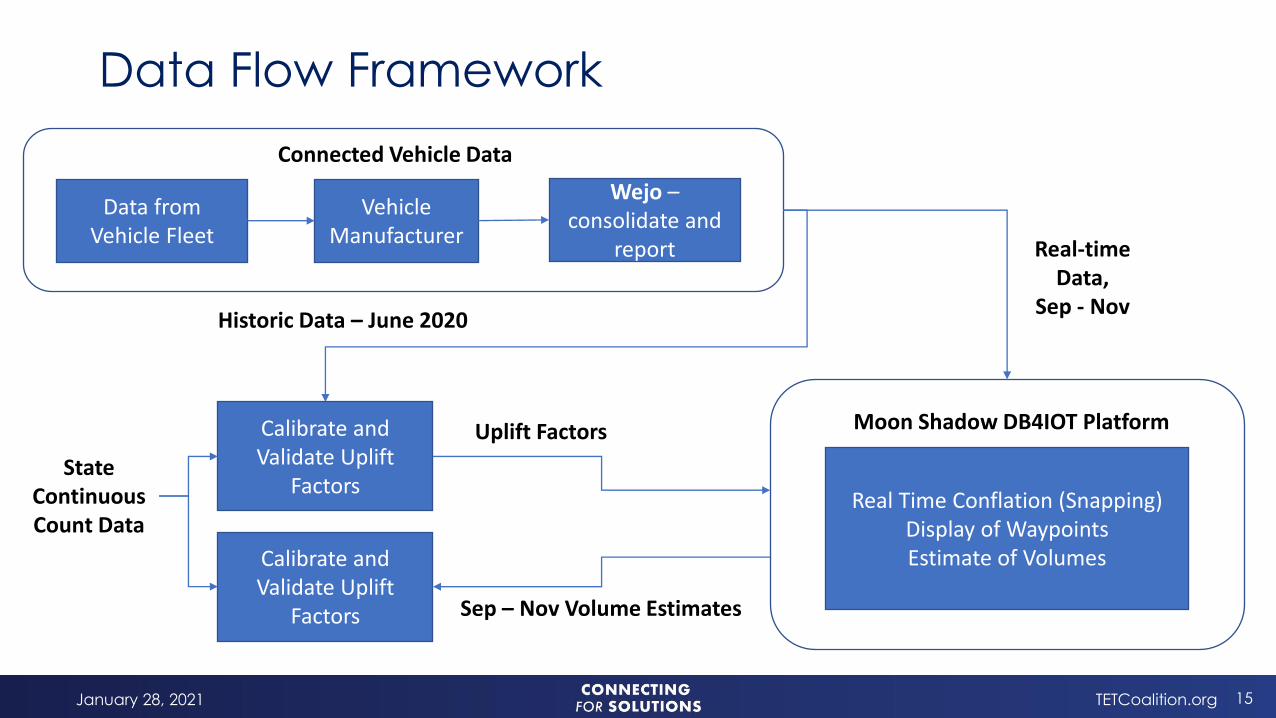
Data Flow Framework
15
Data from Vehicle Fleet
Vehicle Manufacturer
Wejo –consolidate and
report
Connected Vehicle Data
Moon Shadow DB4IOT Platform
Real-time Data,
Sep - Nov
Uplift FactorsCalibrate and Validate Uplift
FactorsState
Continuous Count Data
Real Time Conflation (Snapping)Display of WaypointsEstimate of Volumes
Sep – Nov Volume Estimates
Historic Data – June 2020
Calibrate and Validate Uplift
Factors
TETCoalition.orgJanuary 28, 2021

Goals & Objectives
1. Demonstrate that real-time connected vehicle data representative of about 3% of all vehicular traffic across all seven states can be delivered and visualized in real-time.
2. Process observed CV trips in real time, assigning them to appropriate roadway segments, and obtained counts of probe vehicles from which to estimate traffic volume.
TETCoalition.orgJanuary 28, 2021 16

3. Assess meaningful Volume Measures from
the live data streams by calibrating to known
journey penetrations rates, and relative to
nominal traffic volume conditions.
4. Show that the mobility patterns of people,
where they go and when, change significantly
in the event of a major storm.
TETCoalition.org 17January 28, 2021
Goals & Objectives

Real-time CVD across all states is delivered and visualized in real-time
Source CV Data: Wejo
TETCoalition.org
Proof of Concept Goal #1
January 28, 2021 18
Overview of Connected Vehicle Data
Jaap van den Hoek, Director of Solutions Engineering,Wejo
January 28, 2021 The Eastern Transportation Coalition - Web Meeting: Hurricane Traffic Volumes Pilot Results: States’ Experience with Real-time Connected Vehicle Data 19

WEJO & The Eastern Transportation CoalitionJanuary 28, 2021
20
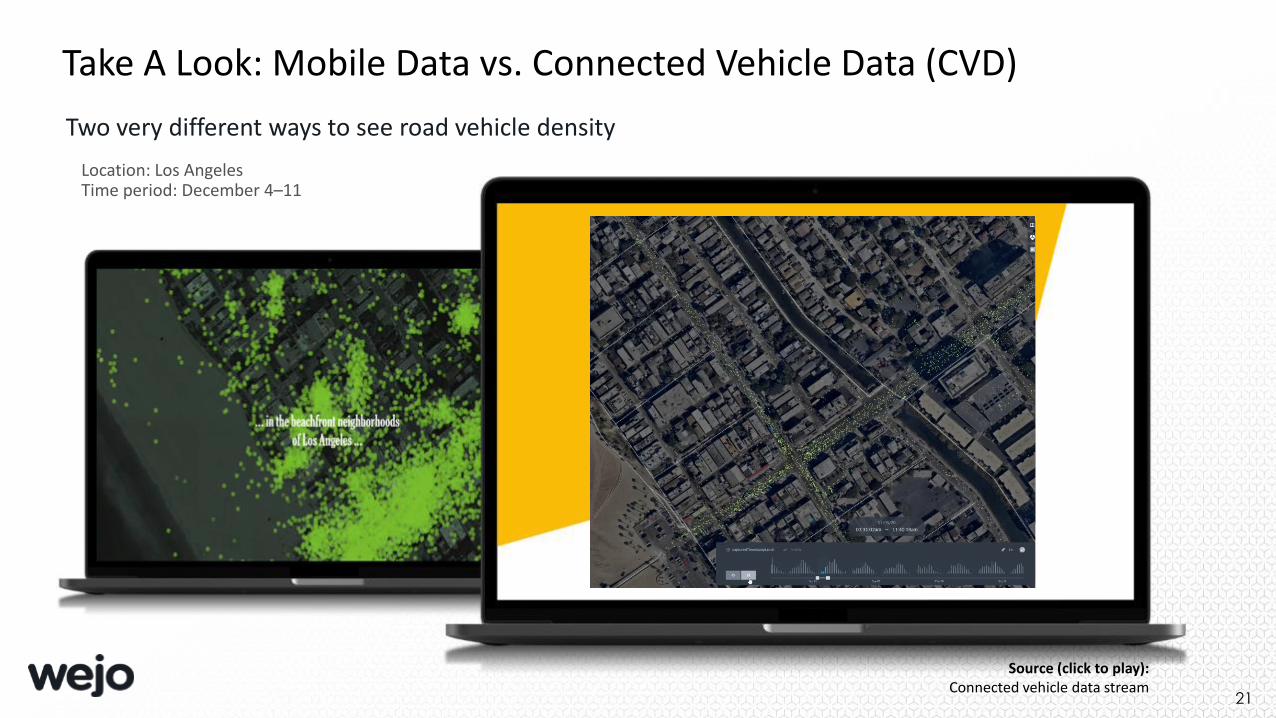
Take A Look: Mobile Data vs. Connected Vehicle Data (CVD)
Two very different ways to see road vehicle density
Location: Los AngelesTime period: December 4–11
Source (click to play): Connected vehicle data stream
21

The Power of CVD: Unlocking Real Value
It’s faster, more in-depth and offers new levels of information
3 second capture rate with 30 second latency
High volume of journeys tracked: 1.3 billion per month
Accurate to 3 meters, which helps identify highway lanes and parking spots
Data from historical events gives insights about incident hotspots, harsh breaking or acceleration, speeding and more
22
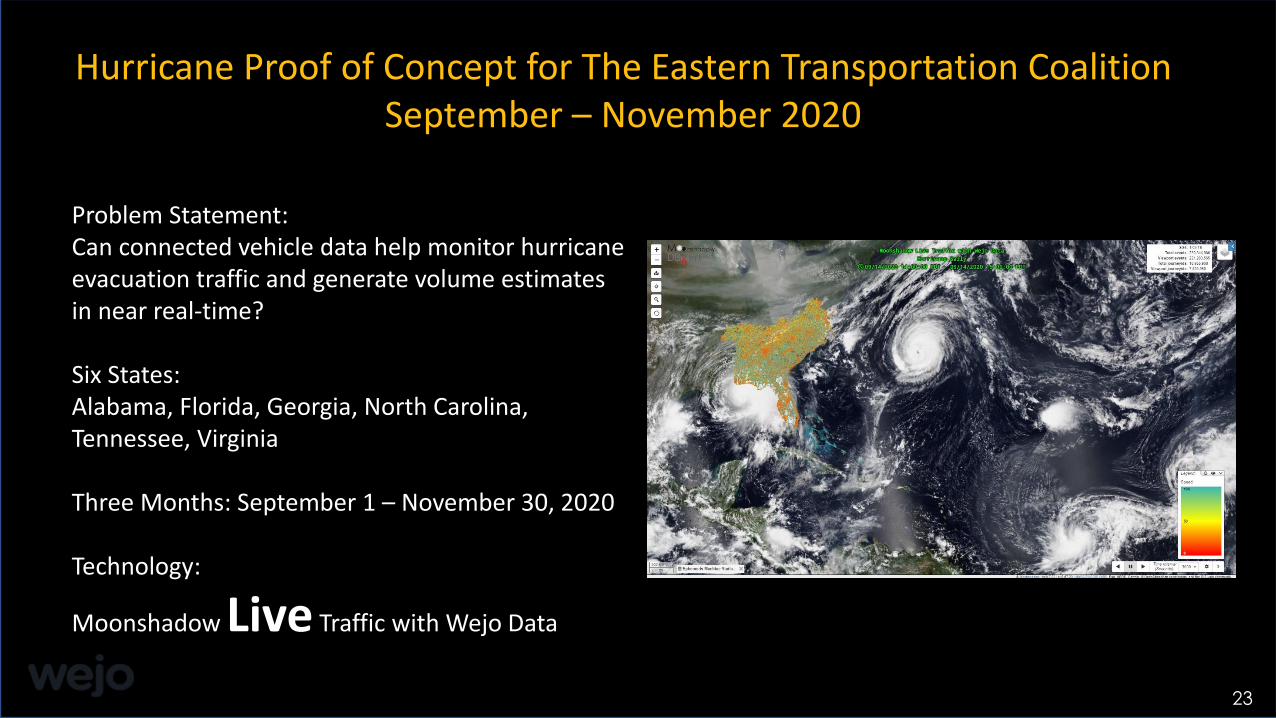
Hurricane Proof of Concept for The Eastern Transportation Coalition September – November 2020
Typically used for…
Understanding point-to-point journey distribution across large geographies
Identifying roads susceptible to potentially dangerous driving behaviors
Understanding and monitoring dwell time around POIs to determine length of stay and purpose of visit
Origin-to-destination studies and driver journey trend analysis
Problem Statement:Can connected vehicle data help monitor hurricane evacuation traffic and generate volume estimates in near real-time?
Six States: Alabama, Florida, Georgia, North Carolina, Tennessee, Virginia
Three Months: September 1 – November 30, 2020
Technology:
Moonshadow Live Traffic with Wejo Data
23
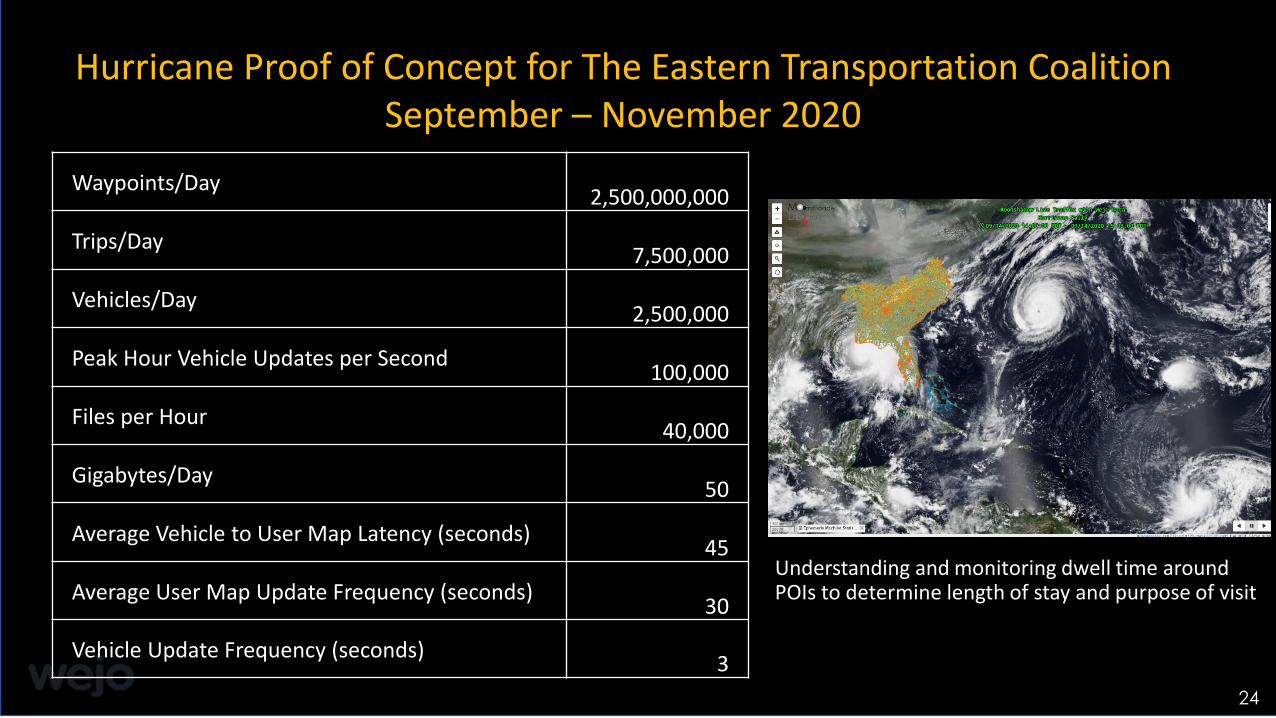
Hurricane Proof of Concept for The Eastern Transportation Coalition September – November 2020
Understanding and monitoring dwell time around POIs to determine length of stay and purpose of visit
Understanding and monitoring dwell time around POIs to determine length of stay and purpose of visit
Waypoints/Day2,500,000,000
Trips/Day7,500,000
Vehicles/Day2,500,000
Peak Hour Vehicle Updates per Second100,000
Files per Hour40,000
Gigabytes/Day50
Average Vehicle to User Map Latency (seconds)45
Average User Map Update Frequency (seconds) 30
Vehicle Update Frequency (seconds)3
2424
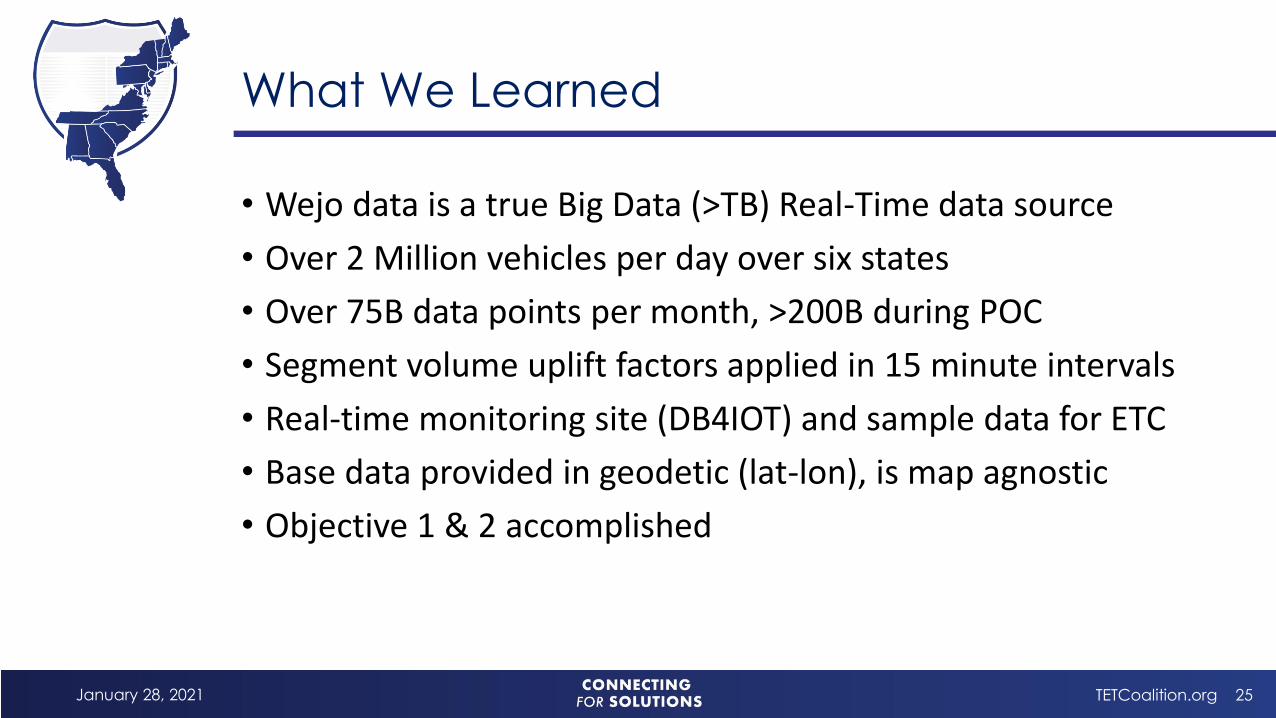
What We Learned
• Wejo data is a true Big Data (>TB) Real-Time data source
• Over 2 Million vehicles per day over six states
• Over 75B data points per month, >200B during POC
• Segment volume uplift factors applied in 15 minute intervals
• Real-time monitoring site (DB4IOT) and sample data for ETC
• Base data provided in geodetic (lat-lon), is map agnostic
• Objective 1 & 2 accomplished
25TETCoalition.orgJanuary 28, 2021

wejo.com
Thank you!
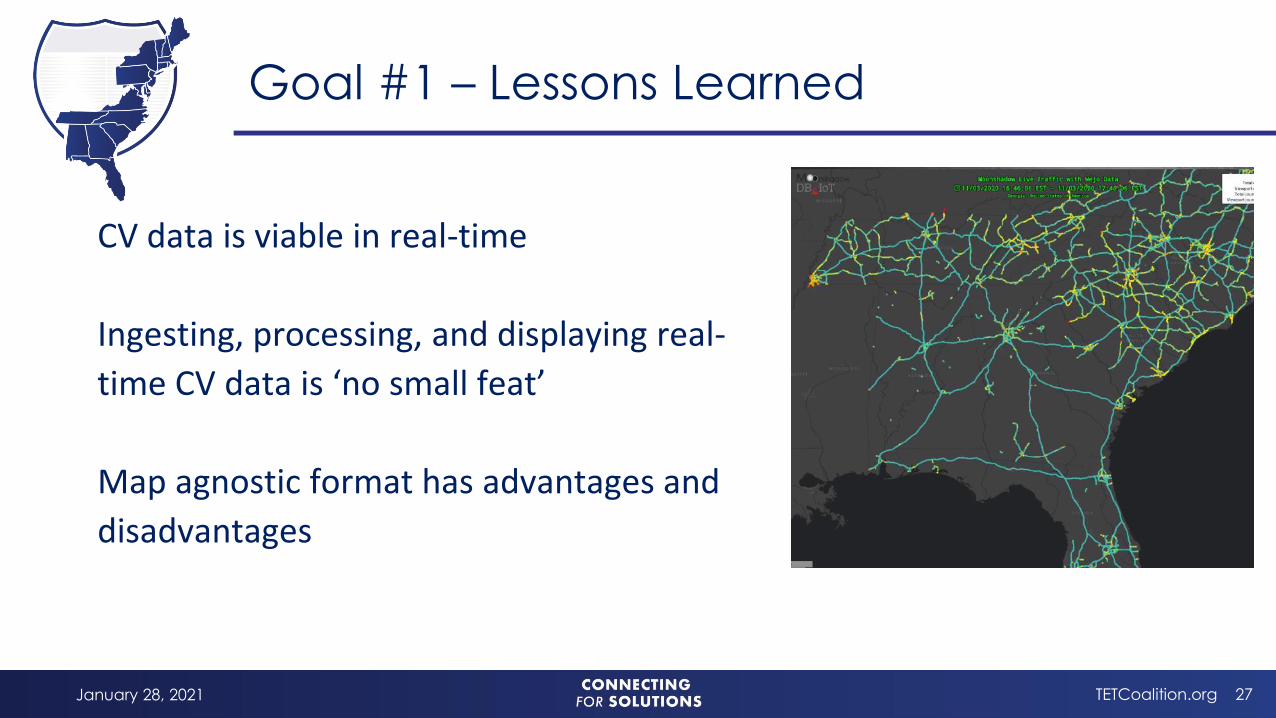
CV data is viable in real-time
Ingesting, processing, and displaying real-
time CV data is ‘no small feat’
Map agnostic format has advantages and
disadvantages
Goal #1 – Lessons Learned
TETCoalition.org 27January 28, 2021
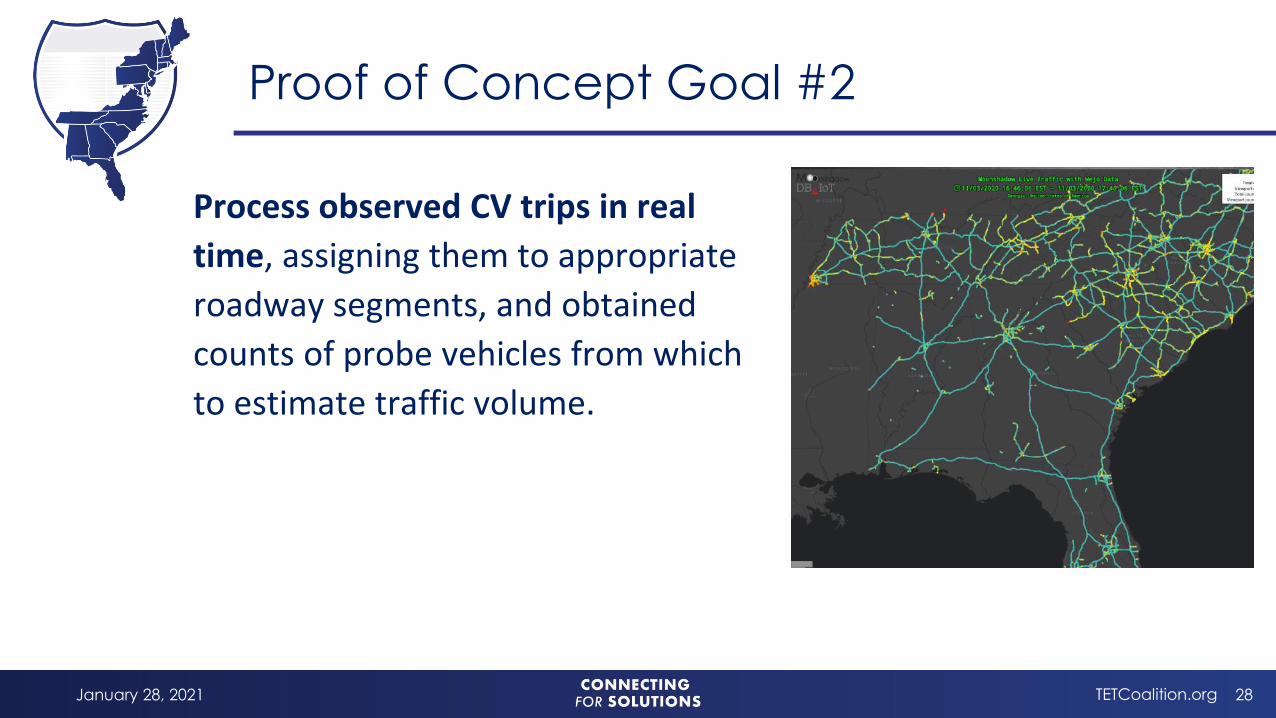
Process observed CV trips in real
time, assigning them to appropriate
roadway segments, and obtained
counts of probe vehicles from which
to estimate traffic volume.
Proof of Concept Goal #2
28January 28, 2021 TETCoalition.org
29January 28, 2021 TETCoalition.org
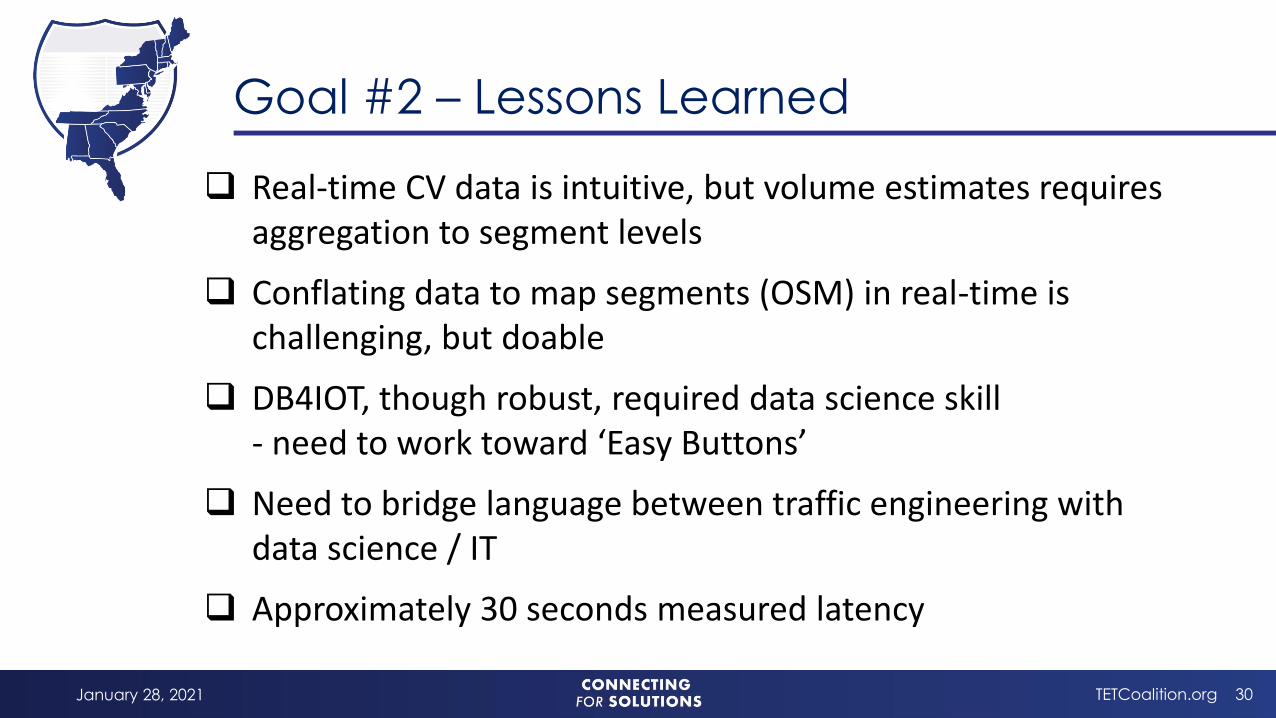
Goal #2 – Lessons Learned
❑ Real-time CV data is intuitive, but volume estimates requires aggregation to segment levels
❑ Conflating data to map segments (OSM) in real-time is challenging, but doable
❑ DB4IOT, though robust, required data science skill- need to work toward ‘Easy Buttons’
❑ Need to bridge language between traffic engineering with data science / IT
❑ Approximately 30 seconds measured latency
TETCoalition.org 30January 28, 2021

Proof of Concept Goal #3
Assess meaningful Volume Measures
from the live data streams by
calibrating to known journey
penetrations rates, and relative to
nominal traffic volume conditions.
TETCoalition.org 31January 28, 2021
Accuracy of Real Time Volume Data
Kaveh Farokhi Sadabadi, Senior Faculty Specialist,University of Maryland CATT
January 28, 2021 The Eastern Transportation Coalition - Web Meeting: Hurricane Traffic Volumes Pilot Results: States’ Experience with Real-time Connected Vehicle Data 32

33TETCoalition.orgJanuary 28, 2021 33TETCoalition.orgJanuary 28, 2021
The Uplift Process
Wejo Data (June 2020)
Waypoints Snapped to OSM
Uplift Factor Calculations @ Count Stations
Uplift Factor Generalizations @ Other Segments
Testing and Evaluation
INPUT DATA
Wejo Data
▪ June 2020 (one month/6 states for uplift factor calculation)
▪ Sep-Nov 2020 (three months for real-time platform and evaluation)
State Count Data used for calibration and testing
▪ June 2020
o States (FL, NC, VA, AL)
OSM Map

34TETCoalition.orgJanuary 28, 2021 34TETCoalition.orgJanuary 28, 2021
The Uplift Factors
• States▪ Florida, North Carolina, Virginia
• Functional Road Class (FRC) 1-31. Motorway2. Trunk3. Primary
• Time of Day (TOD)▪ 15-minute time intervals▪ 96 time intervals per day (0-95)
Day of Week (DOW)0. Sunday1. Monday2. Tuesday3. Wednesday4. Thursday5. Friday6. Saturday
35TETCoalition.orgJanuary 28, 2021 35TETCoalition.orgJanuary 28, 2021
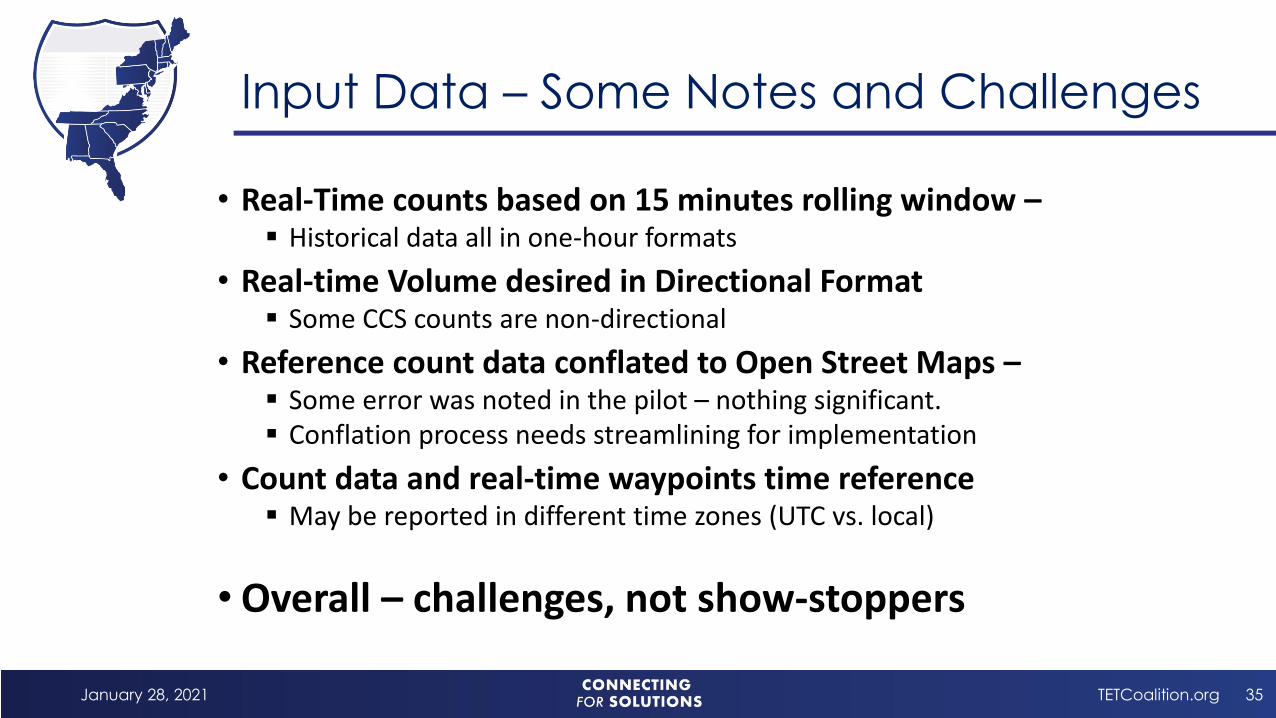
Input Data – Some Notes and Challenges
• Real-Time counts based on 15 minutes rolling window –▪ Historical data all in one-hour formats
• Real-time Volume desired in Directional Format▪ Some CCS counts are non-directional
• Reference count data conflated to Open Street Maps –▪ Some error was noted in the pilot – nothing significant. ▪ Conflation process needs streamlining for implementation
• Count data and real-time waypoints time reference▪ May be reported in different time zones (UTC vs. local)
• Overall – challenges, not show-stoppers

36TETCoalition.orgJanuary 28, 2021 36TETCoalition.orgJanuary 28, 2021
Descriptive Stats
# OSM
Segments
Total
Miles# of CCS
Total
Miles# Hours of Data
FRC 1 9,426 4,754 87 547 52,723
FRC 2 1,432 478 6 7 2,429
FRC 3 37,606 12,818 208 525 84,356
FRC 1 7,095 4,648 47 267 49,361
FRC 2 7,517 3,825 17 69 12,472
FRC 3 12,041 5,582 10 22 3,796
FRC 1 5,874 3,339 548 1,090 388,665
FRC 2 5,588 3,726 69 326 81,472
FRC 3 10,039 4,704 48 393 51,330
All Locations Count Locations
North
Carolina
Virginia
Road ClassState
Florida
37TETCoalition.orgJanuary 28, 2021 37TETCoalition.orgJanuary 28, 2021
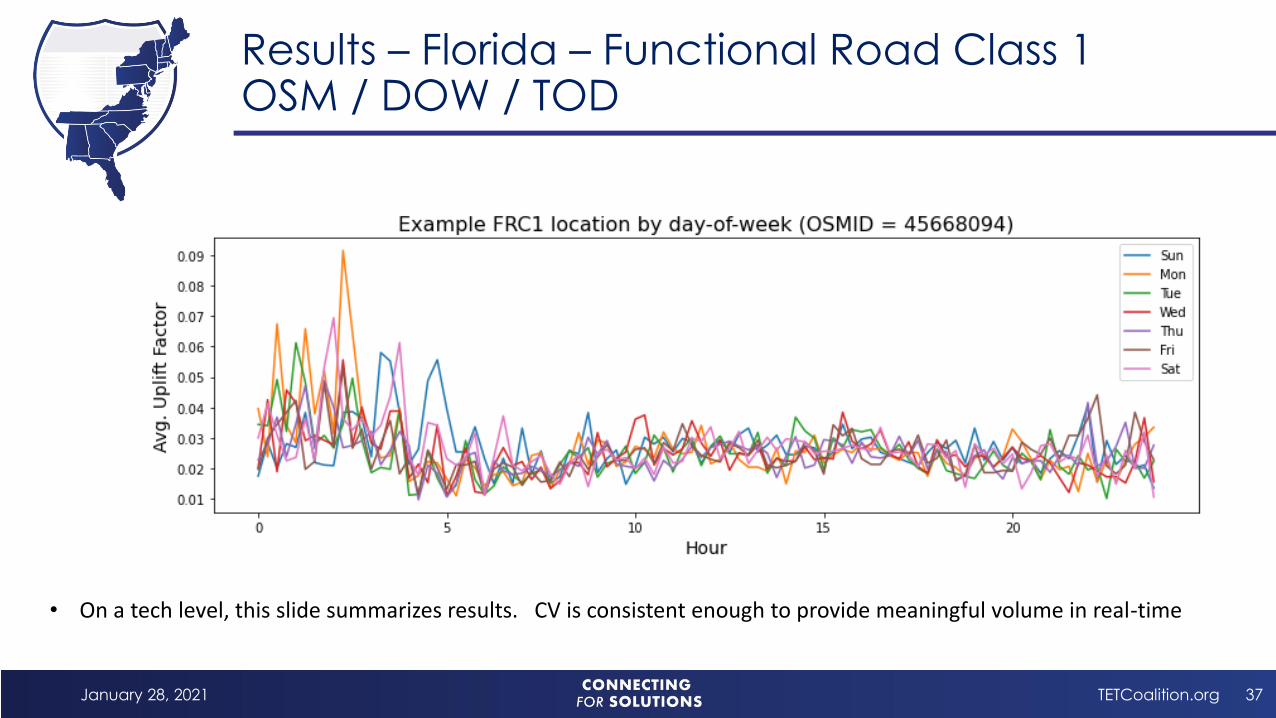
Results – Florida – Functional Road Class 1OSM / DOW / TOD
• On a tech level, this slide summarizes results. CV is consistent enough to provide meaningful volume in real-time

38TETCoalition.orgJanuary 28, 2021 38TETCoalition.orgJanuary 28, 2021
Results – Florida – Functional Road Class 3OSM / DOW / TOD
• Off-peak hours have larger variability can have difference uplift factors –However, core hours (6am to 10pm) are typically quite consistent based on road class, DOW, and TOD

39TETCoalition.orgJanuary 28, 2021 39TETCoalition.orgJanuary 28, 2021
Uplift Factors – Florida FRC / DOW
• There is some fluctuation by DOW, and the box plot provide indication of variance (in turn expected accuracy)• The Inter-Quartile Range is typically 1% - 4%, providing for reasonable accuracy

40TETCoalition.orgJanuary 28, 2021 40TETCoalition.orgJanuary 28, 2021
Summary – Lessons Learned
• Florida, North Carolina, Virginia uplink factors calculated• Size of data proved challenging – three states completed within resources
• Uplink factors variation• Most variation is with road class, DOW, and TOD
• Some variation from State to State
• Initial assumption of 3% uplift is conservative – closer to 5% in lower road classes
• Overnight hours had higher variance (as expected) • Move to hourly (rather than 15 min) during low volume periods
• Conflation and snapping will require more attention in implementation – some errors noticed in POC

41TETCoalition.orgJanuary 28, 2021 41TETCoalition.orgJanuary 28, 2021
Summary – Was the POC Successful?
• Despite the data processing challenges, analysis to date indicates that …▪ Volumes of reasonable accuracy for operations are feasible in real-
time through connected vehicle data
▪ Simple factoring (DOW, TOD, State) provides a workable solution –more advanced ML/AI techniques may only improve
▪ Sheer size and velocity of data will require efficient calibration, calculation, and conflation techniques –
• OVERALL – the POC indicated that real-time CV data is sufficient to provide workable real-time Volume Estimates!

Proof of Concept Goal #4
Show that the mobility
patterns of people, where
they go and when, change
significantly in the event
of a major storm.
TETCoalition.orgJanuary 28, 2021 42

Goal #4 – Lessons Learned
• Trip Origins and Destination (O&D) typically repeatable every day
• During Hurricane, O&D patterns should reveal people getting out of the way (evacuation) or sheltering in place
• Real-Time is not second-to-second, but rather daily di-urnal patterns
• Goals #1 through #3 consumed most resources …. But …..
• Case studies conducted in collaboration with Moon Shadow revealed
• Observable changes in roadway use during onset of Sept tropical storm
• Visitations to home improvement stores (Lowe’s / Home Depot) escalate during hurricane onset
• Real-Time OD behavior is a new – uncharted field – great opportunity
TETCoalition.orgJanuary 28, 2021 43

State Feedback
Denise Markow, TSMO Program Director,The Eastern Transportation Coalition
January 28, 2021 The Eastern Transportation Coalition - Web Meeting: Hurricane Traffic Volumes Pilot Results: States’ Experience with Real-time Connected Vehicle Data 44
Simona Babiceanu, Data Scientist, Traffic Engineering DivisionVirginia DOT

State Participation
January 28, 2021 The Eastern Transportation Coalition - Web Meeting: Hurricane Traffic Volumes Pilot Results: States’ Experience with Real-time Connected Vehicle Data 45
• Identified power users/subject matter experts from participating states
• Asked them to interface with the visualization platform DB4IoT and provide feedback
• Original 21 licenses were provided to a set of pre-determined people.
• Training sessions were held
• After training, other users were identified to better fit the request
• Licenses were transferred to other users who attended training

State Participation
January 28, 2021 The Eastern Transportation Coalition - Web Meeting: Hurricane Traffic Volumes Pilot Results: States’ Experience with Real-time Connected Vehicle Data 46
State Licensees
Alabama Alex Hainen
Brett Sellers
Florida Raj Ponnaluri
Omar Faruk
Michelle Arnold
Georgia Brad Mann
Tom McQueen
Robert Binns
North Carolina Dominic Ciaramitaro
Kelly Wells
Tennessee Brad Freeze
David Lee
Virginia Simona Babiceanu
Chien-Lun Lan
Researchers Alex Hainen
Srinivas Pulugurtha
Dr. Han Lee
Dr. Lei Zhu UNC
Scott Benedict
THANK YOU!

Useful Data Features from a DOT Perspective
Impressive data amount and freshness
• Data set rich in timestamp/location/route detail
Emerging type of data, can provide new insights and meet current needs (ubiquitous volumes, O-D matrices, vehicle trajectories)
• Totally different scale from currently available volume info
• Complements currently available data
Real-time aspect – valuable for TOC and weather event operations
• Capability of understanding more/less frequently used roads
• Compliance with designated evacuation routes
Availability of data from border regions with other states
January 28, 2021 The Eastern Transportation Coalition - Web Meeting: Hurricane Traffic Volumes Pilot Results: States’ Experience with Real-time Connected Vehicle Data 47
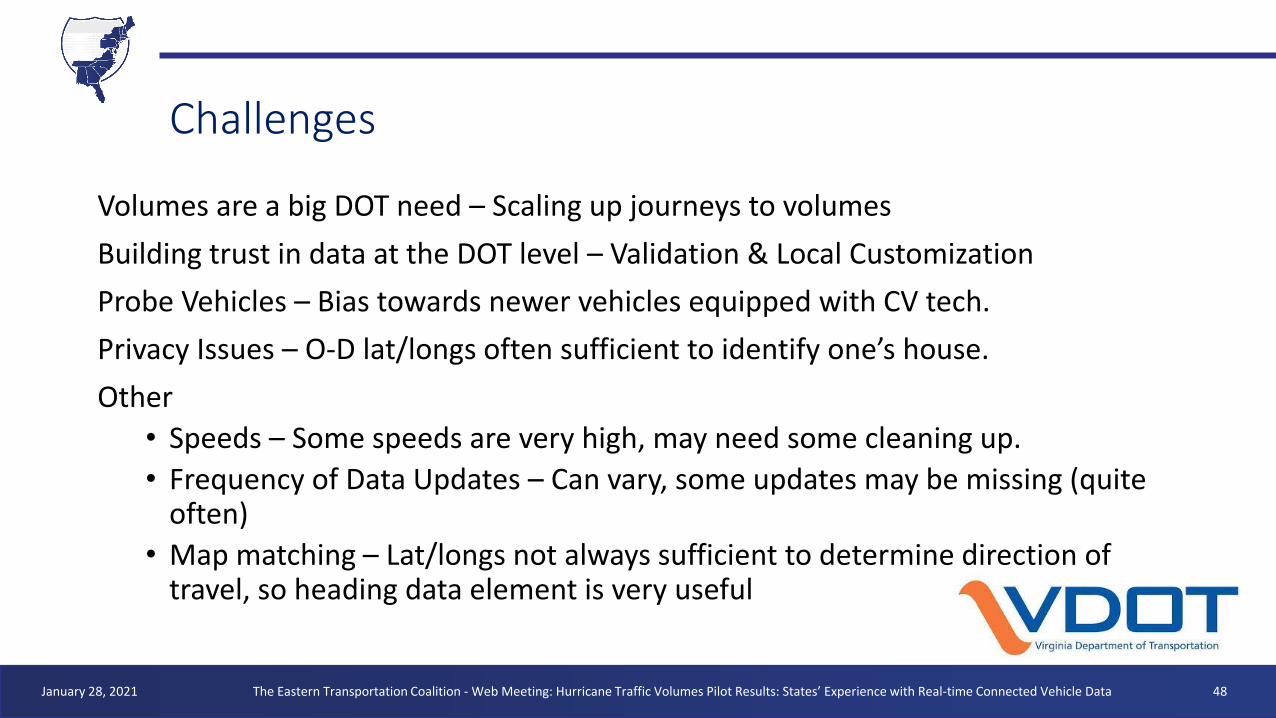
Challenges
Volumes are a big DOT need – Scaling up journeys to volumes
Building trust in data at the DOT level – Validation & Local Customization
Probe Vehicles – Bias towards newer vehicles equipped with CV tech.
Privacy Issues – O-D lat/longs often sufficient to identify one’s house.
Other
• Speeds – Some speeds are very high, may need some cleaning up.
• Frequency of Data Updates – Can vary, some updates may be missing (quite often)
• Map matching – Lat/longs not always sufficient to determine direction of travel, so heading data element is very useful
January 28, 2021 The Eastern Transportation Coalition - Web Meeting: Hurricane Traffic Volumes Pilot Results: States’ Experience with Real-time Connected Vehicle Data 48
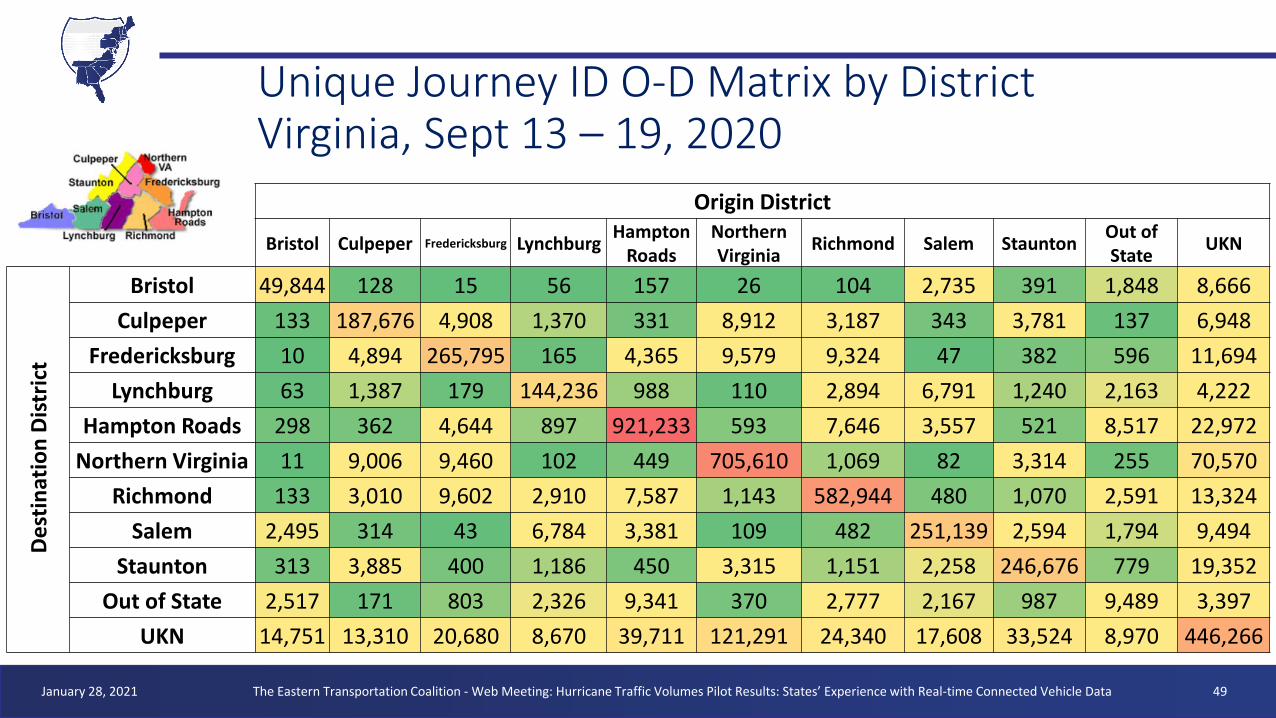
Unique Journey ID O-D Matrix by District Virginia, Sept 13 – 19, 2020
Origin District
Bristol Culpeper Fredericksburg LynchburgHampton
RoadsNorthern Virginia
Richmond Salem StauntonOut of State
UKN
De
stin
atio
n D
istr
ict
Bristol 49,844 128 15 56 157 26 104 2,735 391 1,848 8,666
Culpeper 133 187,676 4,908 1,370 331 8,912 3,187 343 3,781 137 6,948
Fredericksburg 10 4,894 265,795 165 4,365 9,579 9,324 47 382 596 11,694
Lynchburg 63 1,387 179 144,236 988 110 2,894 6,791 1,240 2,163 4,222
Hampton Roads 298 362 4,644 897 921,233 593 7,646 3,557 521 8,517 22,972
Northern Virginia 11 9,006 9,460 102 449 705,610 1,069 82 3,314 255 70,570
Richmond 133 3,010 9,602 2,910 7,587 1,143 582,944 480 1,070 2,591 13,324
Salem 2,495 314 43 6,784 3,381 109 482 251,139 2,594 1,794 9,494
Staunton 313 3,885 400 1,186 450 3,315 1,151 2,258 246,676 779 19,352
Out of State 2,517 171 803 2,326 9,341 370 2,777 2,167 987 9,489 3,397
UKN 14,751 13,310 20,680 8,670 39,711 121,291 24,340 17,608 33,524 8,970 446,266
January 28, 2021 The Eastern Transportation Coalition - Web Meeting: Hurricane Traffic Volumes Pilot Results: States’ Experience with Real-time Connected Vehicle Data 49

User Images – Virginia DOT
Nice bar charts plotting unique journey ID counts against the heading. This was done on only one small stretch of US-50 and adjacent roads and clearly shows the two peaks at about 180 (degrees) difference on the X-axis, corresponding to the bearings the vehicles from the two directions would have. Beautiful!
At a high level of zoom, unique journey ID counts for both directions are visible (good!). Even three colors visible for 495 work (has 4 directions)
January 28, 2021 The Eastern Transportation Coalition - Web Meeting: Hurricane Traffic Volumes Pilot Results: States’ Experience with Real-time Connected Vehicle Data 50

User Images – Georgia DOT
This query shows how color gradient can be changed for roadways (during AM rush)) – also shows 15 min sample data for
number of events
January 28, 2021 The Eastern Transportation Coalition - Web Meeting: Hurricane Traffic Volumes Pilot Results: States’ Experience with Real-time Connected Vehicle Data 51
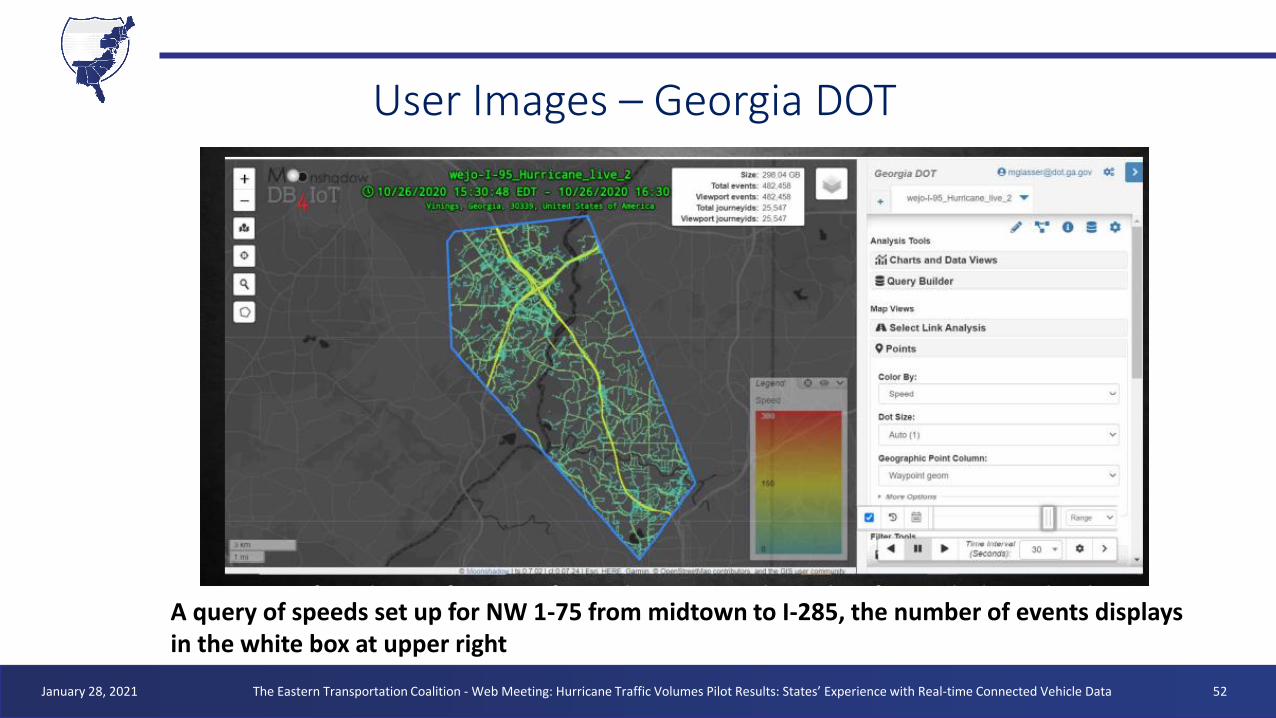
A query of speeds set up for NW 1-75 from midtown to I-285, the number of events displays in the white box at upper rightalso shows 15 min sample data for number of events
User Images – Georgia DOT
January 28, 2021 The Eastern Transportation Coalition - Web Meeting: Hurricane Traffic Volumes Pilot Results: States’ Experience with Real-time Connected Vehicle Data 52

State Feedback – Follow Up Calls
January 28, 2021 The Eastern Transportation Coalition - Web Meeting: Hurricane Traffic Volumes Pilot Results: States’ Experience with Real-time Connected Vehicle Data 53
• Virginia DOT is interested in increased coverage for volume estimates VA-
• Recommendation for potential performance enhancement is to create smaller regions with small buffers across state lines VA-
• Ability to capture O-D patterns caught my attention; wonderful source in tracking O-D patterns or potential changes in traffic volumes NC-
• The visualization tool is not intuitive for transportation FL-
• Benefits of this data is that it gives us a different lens to look at data other than O-D data GA-
Counted Historical Get from NCDOT CalculatedDay of
WeekHours Route
Today's Wejo
Volume
Normal Wejo DOW
HOD Vol
Normal NCDOT DOW
HOW Vol
Estimated
Total Volume
Monday12 noon to 4
pmI-40 3000 1000 30,000 90,000
Sample Table from North Carolina, the Holy Grail
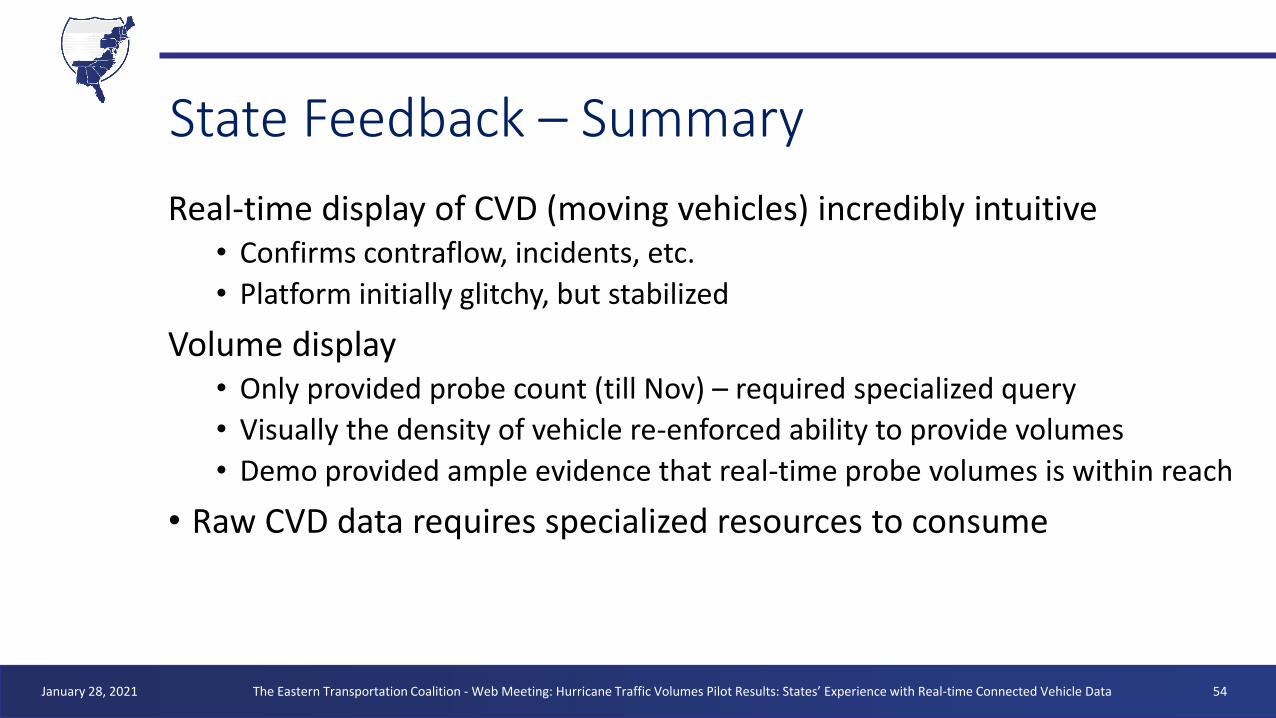
State Feedback – Summary
January 28, 2021 The Eastern Transportation Coalition - Web Meeting: Hurricane Traffic Volumes Pilot Results: States’ Experience with Real-time Connected Vehicle Data 54
Real-time display of CVD (moving vehicles) incredibly intuitive• Confirms contraflow, incidents, etc.
• Platform initially glitchy, but stabilized
Volume display • Only provided probe count (till Nov) – required specialized query
• Visually the density of vehicle re-enforced ability to provide volumes
• Demo provided ample evidence that real-time probe volumes is within reach
• Raw CVD data requires specialized resources to consume
Lessons Learned and Summary Findings
Stan Young, Advanced Transportation and Urban Scientist,National Renewable Energy Laboratory (NREL)
January 28, 2021 The Eastern Transportation Coalition - Web Meeting: Hurricane Traffic Volumes Pilot Results: States’ Experience with Real-time Connected Vehicle Data 55

Proof of Concept Overall Take-Aways
❑ CV data is viable now and will only grow in size and velocity
❑ Managing CV data at scale is challenging for industry, but doable
❑ Visualization of CVD (individual vehicles) brings intuitive value
❑ Real-time volume estimates from CV data appears viable for implementation
❑ Proof of Concept provided valuable insight to …
▪ Specifications for operational systems in terms of use and functionality
▪ Bridge the language between Traffic and Information Technology
▪ Blaze new ground to visualize real-time volume and O&D
January 28, 2021 TETCoalition.org 56

Next Steps
January 28, 2021 TETCoalition.org 57
❑ Base CV data is being procured through the TETC Traffic Data Marketplace
❑ The POC will result in draft Framework, Specifications, and Approach for implementation within the Coalition
❑ Forming Coalition committee for guidance, oversight, and vision of the ETC Traffic Volume Project
❑ Expect additional information in Q2/3 of 2021
Additional Questions?
Remaining Questions from the CHAT Box
The Eastern Transportation Coalition - Web Meeting: Hurricane Traffic Volumes Pilot Results: States’ Experience with Real-time Connected Vehicle Data 58January 28, 2021

Wrap Up
Meeting information & presentations will be posted to
The Eastern Transportation Coalition website.
Participants will receive a link to the presentations after they are posted.
The Eastern Transportation Coalition - Web Meeting: Hurricane Traffic Volumes Pilot Results: States’ Experience with Real-time Connected Vehicle Data 59January 28, 2021

IMAGE
Thank You!For additional information, please contact:Denise Markow, TSMO DirectorThe Eastern Transportation Coalition 301-789-9088, [email protected]