
SPECIAL VOLUMES
604
VOL. 517 SEPTEMBER 26, 1990 COMPLETE IN ONE ISSUE J. Calvin Giddings Honour Volume SPECIAL VOLUMES EDITOR, E. Heitmann (Orinda, CAl EDITORIAL BOARD S. C. Churms (Rondebosch) E. H. Cooper (Leeds) R. Croteau (Pullman, WA) D. H. Dolphin (Vancouver) J. S. Fritz (Ames, IA) K. J. Irgolic (College Station, TX) C. F. Poole (Detroit, MI) R. Teranishi (Berkeley, CAl H. F. Walton (Boulder, CO) C. T. Wehr (Richmond, CAl ELSEVIER
-
Upload
khangminh22 -
Category
Documents
-
view
0 -
download
0
Transcript of SPECIAL VOLUMES

VOL. 517 SEPTEMBER 26, 1990COMPLETE IN ONE ISSUE
J. Calvin Giddings Honour Volume
SPECIAL VOLUMES
EDITOR, E. Heitmann (Orinda, CAl
EDITORIAL BOARD
S. C. Churms (Rondebosch)
E. H. Cooper (Leeds)
R. Croteau (Pullman, WA)
D. H. Dolphin (Vancouver)
J. S. Fritz (Ames, IA)
K. J. Irgolic (College Station, TX)
C. F. Poole (Detroit, MI)
R. Teranishi (Berkeley, CAl
H. F. Walton (Boulder, CO)
C. T. Wehr (Richmond, CAl
ELSEVIER

JOURNAL OF CHROMATOGRAPHY
Scope. The Journal of Chromatography publishes papers on all aspects of chromatography, electrophoresisand related methods. Contributions consist mainly of research pa'pers dealing with chromatographic theory, instrumental development and their applications. The section Biomedical Applications, which is underseparate editorship, deals with the following aspects: developments in and applications of chromatographic and electrophoretic techniques related to clinical diagnosis or alterations during medical treatment;screening and profiling of body fluids or tissues with special reference to metabolic disorders; results frombasic medical research with direct consequences in clinical practice; drug level monitoring and pharmacokinetic studies; clinical toxicology; analytical studies in occupational medicine.
Submission of Papers. Manuscripts (in English; four copies are required) should be submitted to: TheEditor of Journal of Chromatography, P.O. Box 681, 1000 AR Amsterdam, The Netherlands, or to: TheEditor of Journal of Chromatography, Biomedical Applications, P.O. Box 681, 1000 AR Amsterdam, TheNetherlands. Review articles are invited or proposed by letter to the Editors. An outline of the proposedreview should first be forwarded to the Editors for preliminary discussion prior to preparation. Submissionof an article is understood to imply that the article is original and unpublished and is not being consideredfor publication elsewhere. For copyright regulations, see below.
Subscription Orders. Subscription orders should be sent to: Elsevier Science Publishers B.V., P.O. Box211, 1000 AE Amsterdam, The Netherlands, Tel. 5803911, Telex 18582 ESPA NL. The Journal of Chromatography and the Biomedical Applications section can be subscribed to separately.
Publication. The Journal of Chromatography (incl. Biomedical Applications) has 37 volumes in 1990. Thesubscription prices for 1990 are:
J Chromatogr. (incl. Cum. Indexes, Vols. 451-500) + Biomed. Appl. (Vols. 498-534):Ofl. 6734.00 plus Ofl. 1036.00 (p.p.h.) (total ca. USS 3885.00)
J Chromatogr. (incl. Cum. Indexes, Vols. 451-500) only (Vols. 498-524):Ofl. 5616.00 plus Ofl. 75600 (p.p.h.) (total ca. USS 3186.00)
Biomed. Appl. only (Vols. 525~534):
Ofl. 2080.00 plus Ofl. 280.00 (p.p.h.) (total ca. USS 1180.00).Our p.p.h. (postage, package and handling) charge includes surface delivery of all issues, except to sub
scribers in Argentina, Australia, Brasil, Canada, China, Hong Kong, India, Israel, Malaysia, Mexico, NewZealand, Pakistan, Singapore, South Africa, South Korea, Taiwan, Thailand and the U.S.A. who receive allissues by air delivery (S.A.L. - Surface Air Lifted) at no extra cost. For Japan, air delivery requires 50%additional charge; for all other countries airmail and S.A.L. charges are available upon request. Back volumes of the Journal of Chromatography (Vols. 1-497) are available at Dfl. 195.00 (plus postage). Claimsfor missing issues will be honoured, free of charge, within three months after publication of the issue.Customers in the U.S.A. and Canada wishing information on this and other Elsevier journals, please contactJournal Information Center, Elsevier Science Publishing Co. Inc., 655 Avenue of the Americas, New York,NY 10010. Tel. (212) 633-3750.
Abstracts/Contents Lists published in Analytical Abstracts, ASCA, Biochemical Abstracts, BiologicalAbstracts, Chemical Abstracts, Chemical Titles, Chromatography Abstracts, Clinical Chemistry Lookout,Current Contents/Life Sciences, Current Contents/Physical, Chemical & Earth Sciences, Deep-Sea Research/Part B: Oceanographic Literature Review, Excerpta Medica, Index Medicus, Mass SpectrometryBulletin, PASCAL-CNRS, Pharmaceutical Abstracts, Referativnyi Zhurnal, Science Citation Index andTrends in Biotechnology.
See inside back cover for Publication Schedule, Information for Authors and information on Advertisements.
© ELSEVIER SCIENCE PUBLISHERS B.V. -1990 0021-9673/90/S03.50
All rights reserved. No part of this publication may be reproduced. stored in a retrieval system or transmitted in any form or by any means.electronic.•nechanical, photocopying. recording or otherWise, without the prior written permission of the publisher, Elsevier Science Publishers
B.V.. P.O. Box 330. 1000 AH Amsterdam. The Netherlands.Upon acceptance of an article by the journal. the author(s) will be asked to transfer copyright of the article to the publisher. The transfer will ensure
the widest possible dissemmation of information.Submission of an article for publication entails the authors' Irrevocable and exclusive authorization of the publisher to collect any sums orconsiderations for copying or reproduction payable by third parties (as mentioned in article 17 paragraph 2 of the Dutch COPYright Act of 1912and the Royal Decree of June 20,1974 (S. 351) pursuant to article 16 b of the Dutch Copyright Act of 1912) and/or to act 10 or out of Court in
connection therewith.Special regulations for readers in the U.S.A. This journal has been registered with the Copyright Clearance Center, Inc. Consent is given forcopying of articles for personal or internal use, or for the personal use of specific clients. This consent is given on the condItion that the copier paysthrough the Center the per-copy fee stated in the code on the first page of each article for copying beyond that permitted by Sections 107 or 108 ofthe U.S. Copyright Law. The appropriate fee should be forwarded with a copy of the first page of the article to the Copyright Clearance Center,Inc., 27 Congress Street. Salem, MA 01 970, U.S.A. If no code appears in an article, the author has not given broad consent to copy and permissionto copy must be obtained directly from the author. All articles published prior to 1980 may be copied for a per-copy fee of USs 2.25, also payablethrough the Center. This consent does not extend to other kinds of copying, such as for general distnbullon. resale, advertising and promotion
purposes, or for creating new collective works. Special written permission must be obtamed from the publisher for such copying.No responsibility is assumed by the Publisher for any injury and/or damage to persons or property as a mailer of products liability, negligence orotherwise, or from any use or operation of any methods. products, instructions or ideas contained In the materials here'n. Because of rapid
advances in the medical sciences, the Publisher recommends that independent verificatIOn ot diagnoses and drug dosages should be made.Although all advertising material is expected to conlorm to ethi.:al (medical\ st:mdJrds, Incl..JSlOn in !h:s publi,:ation does not constitute a
guarantee or endorsement of the quail!)' or value of sut:h product Of of tile claIms 'l:1d(' of I( by it::> manufacturer.ThiS issue is printed on ac;d fr~( p2;>er
Printed in The Netherlands
For contents see p. VII

JOURNAL OF CHROMATOGRAPHY
VOL. 517 (1990)


JOURNALof
CHROMATOGRAPHYINTERNATIONAL JOURNAL ON CHROMATOGRAPHY,
ELECTROPHORESIS AND RELATED METHODS
SPECIAL VOLUMES
EDITORE. HEFTMANN (Orinda, CAl
EDITORIAL BOARDS. C. Churms (Rondebosch), E. H. Cooper (Leeds), R. Croteau (Pullman, WA), D. H. Dolphin(Vancouver), J. S. Fritz (Ames, IA), K. J. Irgolic (College Station, TX), C. F. Poole (Detroit,MI), R. Teranishi (Berkeley, CA), H. F. Walton (Boulder, CO), C. T. Wehr (Richmond, CAl
ELSEVIERAMSTERDAM - OXFORD - NEW YORK - TOKYO
J. Chromatogr., Vol. 517 (1990)
© ELSEVIER SCIENCE PUBLISHERS B.V. -1990 0021-9673/90/$03.50
All rights reserved. No part of this publication may be reproduced, stored in a retrieval system or transmitted in any form or by any means,electronic, mechanical. photocopying, recording or otherwise, without the prior written permission of the publisher, Elsevier Science Publishers
BY, P.O. Box 330, 1000 AH Amsterdam, The Netherlands.Upon acceptance of an article by the journal, the author(s) will be asked to transfer copyright of the article to the publisher. The transfer will ensure
the widest possible dissemination of information.Submission of an article for publication entails the authors' irrevocable and exclusive authorization of the publisher to collect any sums orconsiderations for copying or reproduction payable by third parties (as mentioned in article 17 paragraph 2 of the Dutch Copyright Act of 1912and the Royal Decree of June 20,1974 (S. 351) pursuant to article 16 b of the Dutch Copyright Act of 1912) and/or to act in or out of Court in
connection therewith.Special regulations for readers in the U.S.A. This journal has been registered with the Copyright Clearance Center, Inc. Consent is given forcopying of articles for personal or internal use, or for the personal use of specific clients. This consent is given on the condition that the copier paysthrough the Center the per-copy fee stated in the code on the first page of each article for copying beyond that permitted by Sections 107 or 108 ofthe U.S. Copyright Law. The appropriate fee should be forwarded with a copy of the first page of the article to the Copyright Clearance Center,Inc., 27 Congress Street, Salem, MA 01970, U.S.A. If no code appears in an article, the author has not given broad consent to copy and permissionto copy must be obtained directly from the author. All articles published prior to 1980 may be copied for a per-copy fee of US$ 2.25, also payablethrough the Center. This consent does not extend to other kinds of copyirig, such as for general distribution, resale, advertising and promotion
purposes, or for creating new collective works. Special written permission must be obtained from the publisher for such copying.No responsibility is assumed by the Publisher for any injury and/or damage to persons or property as a matter of products liability, negligence orotherwise, or from any use or operation of any methods, products, instructions or ideas contained in the materials herein. Because of rapid
advances in the medical sciences, the Publisher recommends that independent verification of diagnoses and drug dosages should be made.Although all advertising material is expected to conform to ethical (medical) standards, inclusion in this publication does not constitute a
guarantee or endorsement of the quality or value of such product or of the claims made of it by its manufacturer.This issue is printed on acid-free paper.
Printed in The Netherlands

SPECIAL VOLUME
HONOUR VOLUMEon the occasion of the 60th birthday of
J. CALVIN GIDDINGS
Guest Editor
L. S. ETTRE(Norwalk, CT)


VOL. 517 JOURNAL OF CHROMATOGRAPHY
CONTENTS
SEPTEMBER 26, 1990
31
131
HONOUR VOLUME ON THE OCCASION OF THE 60TH BIRTHDAY OFJ. CALVIN GIDDINGS
Prefaceby K. Caldwell
Plate height theory for compressible mobile phase fluids and its application to gas, liquid and supercritical fluid chromatographyby D. P. Poe (Duluth, MN, U.S.A.) and D. E. Martire (Washington, DC, U.S.A.) 3
Dispersion in the interstitial space of packed columnsby P. Magnico and M. Martin (Paris, France)
Comparison of methods for the determination of the polarity and selectivity of stationary phases ingas chromatography from a thermodynamic point of viewby R. V. Golovnya and B. M. Polanuer (Moscow, U.S.S.R.) . . . . . . . . . 51
Cryogenic-focusing, ohmically heated on-column trap for capillary gas chromatographyby S. R. Springston (Upton, NY, U.S.A.) . . . . . . . . . . . . . . . . . 67
Enhanced possibilities for identification using series-coupled capillary gas chromatographic columns.II. Retention indices as an identification tool in selectivity tuningby T. Maurer, W. Engewald and A. Steinborn (Leipzig, G.D.R.) . . . . . . . . . .. 77
Oxygen enhancement of thermal electron capture in a non-radioactive discharge source for a quadru-pole mass spectrometerby W. E. Wentworth, E. D. D'sa, C. F. Batten and E. C. M. Chen (Houston, TX, U.S.A.) 87
Comparison of cuticular hydrocarbon profiles of fire ants Solenopsis richteri from the same colony,using capillary column gas chromatography with pattern recognitionby J. H. Brill and W. Bertsch (Tuscaloosa, AL, U.S.A.) . . . . . . . . . . . . . .. 95
Empirical scheme for the classification of gas chromatographic stationary phases based on solvatochromic linear solvation energy relationshipsby J. Li, A. J. Dallas and P. W. Carr (Minneapolis, MN, U.S.A.) . . . . . . . . . . . 103
Capillary gas chromatography with graphitized carbon blackby F. Bruner, G. Crescentini, F. Mangani and L. Lattanzi (Urbino, Italy) . . . . . . . 123
Pesticide analysis by gas chromatography with a novel atomic emission detectorby P. L. Wylie (Avondale, PA, U.S.A.) and R. Oguchi (Tokyo, Japan) . .
Turbulent flow in cappillary gas chromatography-evaluation of a theoretical concept by Golayby A. J. vanEs, J. A. Rijks and C. A. Cramers (Eindhoven, The Netherlands) and M. J. E.Golay (Norwalk, CT, U.S.A.) . . . . . . . . . . . . . . . . . . . . . . . . . . 143
Use of chromatographic models for computerized optimization of coupling-point pressure in dualcolumn gas chromatographyby T. Hevesi and J. Krupcik (Bratislava, Czechoslovakia) and P. Sandra (Ghent, Belgium) 161
Study of rapid reaction kinetics by computerized gas chromatography with stroboscopic samplingby E, Kullik and M. Kaljurand (Estonia, U.S.S.R.) . . . . . . . .. 175
High-performance liquid chromatographic study of ligand-exchange reactions of fluorinated metalf3-diketone che1atesby T. Wang and P. C. Uden (Amherst, MA, U.S.A.) 185

VIII CONTENTS
Silicas chemically bonded with multidentate phenyl groups as stationary phases in reversed-phaseliquid chromatography used for non-planarity recognition of polycyclic aromatic hydrocarbonsby K. Jinno, K. Yamamoto, H. Nagashima, T. Ueda and K. Itoh (Toyohashi, Japan) . .
Gel permeation chromatography-Fourier transform infrared study of some synthetic polymers. II.Instrumentation for the characterization of polyethyleneby K. Nishikida (Yokohama, Japan), T. Housaki (Chiba, Japan) and M. Morimoto and T.Kinoshita (Yokohama, Japan) . . . . . . . . . . . .. . .
Isolation and purification of lecithin by preparative high-performance liquid chromatographyby J. V. Amari and P. R. Brown (Kingston, RI, U.S.A.), C. M. Grill (Wakefield, RI, U.S.A.)and J. G. Turcotte (Kingston, RI, U.S.A.) . . . . . . . . . .. ..
Optimization of the experimental conditions in preparative liquid chromatography with touchingbandsby S. Golshan-Shirazi and G. Guiochon (Oak Ridge, TN, U.S.A.)
Evaluation of the stability of polymer-coated silica-based packing materials for high-performanceliquid chromatographyby T. Takeuchi, W. Hu, H. Haraguchi and D. Ishii (Nagoya, Japan) .
Magnetic resonance imaging in reversed-phase liquid chromatographyby M. Ilg, J. Maier-Rosenkranz, W. Milller and E. Bayer
Non-porous polybutadiene-coated silicas as stationary phases in reversed-phase chromatographyby M. Hanson and K. K. Unger (Mainz, F.R.G.) and G. Schomburg (Millheim, F.R.G.)
. Cumpetition between phenylalanine and acetic acid in a chromatographic column as indicated bytheir adsorption isothermsby S. Levin and S. Abu-Lafi (Jerusalem, Israel) . . . . . . . . . . . . .
Design of liquid chromatography capillary columnsby R. P. W. Scott (Washington, DC, U.S.A.) .
193
209
219
229
257
263
269
285
297
345
Reversed-phase ion-pair chromatography with indirect photometric detection of inorganic anionsfrom residues of low explosivesby D. Woolfson-Bartfeld, E. Grushka, S. Abramovich-Bar, S. Levy and Y. Bamberg (Jerusa-lem, Israel) 305
High-performance liquid chromatography of amino acids, peptides and proteins. C. Characterisationof coulombic interactive regions on hen lysozyme by high-performance liquid anion-exchangechromatography and computer graphic analysisby A. N. Hodder (Clayton, Australia), K. J. Machin (Fitzroy, Australia) and M. I. Aguilarand M. T. W. Hearn (Clayton, Australia) . . . . . . . . . . . 317
Optimization study of octane-in-water emulsions by sedimentation field-flow fractionationby M. E. Hansen and D. C. Short (Cincinnati, OH, U.S.A.) . . . . . . . 333
Potential-barrier field-flow fractionation, a versatile new separation methodby A. Koliadima and G. Karaiskakis (Patras, Greece) . . . . . .
Particle characterization in centrifugal fields. Comparison between ultracentrifugation and sedimentation field-flow fractionationby J. Li and K. D. Caldwell (Salt Lake City, UT, U.S.A.) and W. Miichtle (Ludwigshafen,F.R.G.) . . . . . . . . . . . . . . . . . . . . . . . . . . . . . 361
Retention effects in thermal field-flow fractionationby J. J. Kirkland, L. S. Boone and W. W. Yau (Wilmington, DE, U.S.A.)
Sedimentation field-flow fractionation for pigment quality assessmentby L. Koch, T. Koch and H. M. Widmer (Basle, Switzerland)
Characterization of polymers by thermal field-flow fractionationby M. E. Schimpf (Boise, !D, U.SA) . . . . . . . . .
377
395
405

. 435
. . 491
CONTENTS IX
Evaluation of pinched inlet channel for stopless flow injection in steric field-flow fractionationby M. H. Moon, M. N. Myers and J. C. Giddings (Salt Lake City, UT, U.S.A.) . . 423
Use of field-flow fractionation to study pollutant-eolloid interactionsby R. Beckett, D. M. Hotchin and B. T. Hart (Caulfield East, Australia)
Quantitative correlations between solute molecular structure and solubility in supercritical fluidsby J. W. King and J. P. Friedrich (Peoria, IL, U.S.A.) . . . . . . . . . . . . . .. 449
Use of chromatographic retention measurements to obtain solubilities in a liquid or supercriticalfluid mobile phaseby K. D. Bartle, A. A. Clifford, S. A. Jafar, J. P. Kithinji and G. F. Shilstone (Leeds, U.K.) 459
Element-selective detection after supercritical fluid chromatography by means of a Surfatron plasmain the near-infrared spectral regionby D. R. Luffer and M. Novotny (Bloomington, IN, U.S.A.) . . . . . . . . . . . . . 477
Use of sulfur chemiluminescence detection after supercritical fluid chromatographyby H.-C. K. Chang and L. T. Taylor (Blacksburg, VA, U.s.A.) . . . . .
Static coating of 5 to 50 J.lm J.D. capillary columns for open tubular column chromatographyby S. R. Sumpter, C. L. Woolley, E. C. Huang, K. E. Markides and M. L. Lee (Provo, UT,U.~J ~
Influence of thermal variation of diffusion coefficient on non-equilibrium plate height in capillaryzone electrophoresisby J. M. Davis (Carbondale, IL, U.S.A.) 521
Micellar electrokinetic chromatography employing sodium alkyl sulfates and Brij 35®by H. T. Rasmussen, L. K. Goebel and H. M. McNair (Blacksburg, VA, U.S.A.) . . . . 549
Electrically driven open-tubular liquid chromatographyby G. J. M. Bruin, P. P. H. Tock, J. C. Kraak and H. Poppe (Amsterdam, The Netherlands) 557
High-pressure and supercritical capillary electrophoresisby C. R. Yonker and R. D. Smith (Richland, WA, U.S.A.) 573
Author Index . . . . . . . . . . . . . . . . . . . . . . . 583
******************************************************************************************* *: In articles with more than one author, the name of the author to whom correspondence should be addressed is indicated in the :: article heading by a 6-pointed asterisk (*) :
* **********************~******************************** ************************************


Juurnal a/Chromatography, 517 (1990) 1-2Elsevier Science Publishers B.V., Amsterdam
PREFACE
The magnificent Wasatch Mountains rise precipitously 6000 feet above thefloor of Utah valley. At one time, effluent from the many glaciers covering the rangecollected in the valley and filled the mighty Lake Bonneville. In modern times thevalley is arid. Its population lives by the grace of the mountains as the water collectedby its high peaks in the form of snow and rain is delivered to the lowland via amultitude of roaring creeks.
John Calvin Giddings was born in the shadow of these mountains on September 26, 1930. From early childhood on, the proximity to untamed nature with itsmany challenges became an important factor in shaping his interests and his approach to problem solving.
Cal's schooling took place along the Wasatch front, where he earned a bachelor's degree at Brigham Young University in Provo and a doctorate at the Universityof Utah in Salt Utke City. At the University of Utah he came under the tutelage ofHenry Eyring who, in his persuasive way, convinced his young graduate student toelaborate on some recent thoughts he had had regarding the mechanisms underlyingthe chromatographic process. Although this study became only a small part of Cal'sPh.D. thesis, it was certainly a seed planted in fertile soil.
The years of postdoctoral work with J. S. Hirschfelder at Wisconsin were mainly devoted to expanding the theory of flames, and it was not until Cal returned to theWasatch front, and an Assistant Professorship at the University of Utah, that hisattention became fully focussed on the theory of chromatography. The period from1957 to 1965 saw several important developments, such as the application of therandom walk concept to retention and zone broadening, and the formulation of thenon-equilibrium theory. By treating the plate height as the variance in migrationcreated within a zone during its transport along the separation coordinate, it waspossible to express the broadening as the sum of a variety of discrete plate heightcontributions. Models were developed and tested for a large number of broadeningmechanisms present in different forms of chromatography. With these models inhand, principles for optimizing the chromatographic process were formulated whichstrongly suggested that a gain in efficiency should result from a reduction in thestationary phase particle size, and which therefore paved the way for the introductionof high-performance liquid chromatography. Much of the insight gained during thisperiod was summarized in the book Dynamics of Chromatography that apeared in1965 and quickly sold out.
During the mid-1960s, Cal turned his attention to gas chromatography, andparticularly to the effects of pressure and temperature on the solubilizing power of acarrier gas. His pioneering work on pressure-programmed differential sample solubilization and "dense gas chromatography" became the precursor of today's supercritical fluid chromatography.
While the dense gas studies extended the operating range for the highly efficientgas chromatography technique to moderately large molecules, they most certainlyprovided no help in the fractionation of large macromolecules and particles. Thesearch for an elution technique which could also handle colloidal samples led him in1965 to formulate an entirely new separation principle which he termed field-flowfractionation (FFF). From that time until the present he has devoted most of his

2 PREFACE
scientific attention to the analysis of retention and zone broadening mechanisms forseveral of the fields applicable to FFF and to developing optimization strategies forhis very versatile technique.
Cal's work in FFF has drawn scientists from all over the world to the FFFResearch Center at the University of Utah. Last year, this organization hosted theFirst International Symposium on Field-Flow Fractionation with participants fromtwenty nations.
It would be reasonable to assume that all this creative activity had left no timefor other pursuits. Reasonable, maybe, but entirely wrong. The mountains nearbyhave never ceased to exercise their attraction on Cal, who already as a student haddeveloped significant skills in skiing their deep powder snow and scaling their smoothgranite rock.
As one of the pioneers of ski mountaineering in the Wasatch and as a climberwith several first ascents to his credit, he was a natural choice to serve a term aspresident of the Wasatch Mountain Club. It was during his tenure in this capacitythat he began active work to preserve the wilderness quality of the Wasatch and othermountain ranges in the West. In addition to wilderness issues, his conservation concerns soon expanded to include overpopulation, air and water pollution, as well asproblems presented by the rapid global increase in nuclear waste products and thepersistent threat of nuclear war. His writings on these issues first appeared in severaloutdoor magazines and later culminated in the development of a freshman course inenvironmental chemistry and the publication of a widely used textbook entitledChemistry, Man and Environmental Change (1973).
Of all his outdoor activities, none has appealed more to him than kayaking theraging waters of the many mountain streams in the West, and for several years heserved as president of the American Whitewater Association. However, among hismany daring river trips, none measures up to the expedition which he organized whileon a Fulbright fellowship to Lima, Peru. This was the first expedition to successfullyexplore the Rio Apurimac -headwaters of the Amazon River.
Cal grew up in the shadow of the Wasatch Mountains, and he lived and workedin their vicinity for a large portion of his life. Eventually their pull became so strongthat he designed and built a home in their midst, at the top of a canyon surrounded bythe ubiquitous scrub oak. The year after its completion was an unusually dry periodin the West, and forest fires ravaged vast areas in several states, most notably inYellowstone Park. The Wasatch Mountains did not escape devastation, and for aperiod of several days in September of 1988, the scrub oak of Killyon Canyon was onfire. All residents were evacuated. With characteristic determination and tenacity, Caldefied the evacuation order and returned unseen to his threatened home where heultimately fought alone against the elements for two days and a long night. Withoutthis fight the home would certainly have been lost, for the flames were within a fewfeet of its walls, and burning embers were constantly showering its roof. By daring theauthorities, he saved his home and will hopefully enjoy its tranquility for years tocome.
The courage to question conventional wisdom and the dogged pursuit of goalsand ideas are hallmarks of Cal's scientific and other activities. Regardless of field,these activities have often been those of a pioneer; they have opened new territoriesand new ways of thinking. For that, we gratefully honor Cal on his sixtieth birthday.
KARIN CALDWELL

Journal o/Chromatography, 517 (1990) 3-29Elsevier Science Publishers B.V., Amsterdam
CHROMSYMP. 1908
Plate height theory for compressible mobile phase fluids andits application to gas, liquid and supercritical fluidchromatography
DONALD P. POE*
Department of Chemistry, University of Minnesota, Duluth, MN 55812 (U.S.A.)
and
DANIEL E. MARTIRE
Department of Chemistry, Georgetown University, Washington, DC 20057 (U.S.A.)
ABSTRACT
General expressions for apparent plate height are derived in terms of temporaland spatial average values of local plate height, solute capacity factor and mobilephase density. The general expressions are applied to the appropriate expressions forgas chromatography, liquid chromatography and supercritical fluid chromatographywith open tubular and packed columns. For gas chromatography, the equationsreduce to the equations presented earlier by Giddings. For liquid chromatography,the equations reduce to those for local plate height. Predicted results for supercriticalfluid chromatography are compared to experimental results reported in the literature.
INTRODUCTION
The deleterious effect of large pressure gradients on column efficiency inchromatography with compressible mobile phase fluids has been a long-recognizedproblem. The effect is associated with the fact that, as a solute band traversesa chromatographic column, it experiences varying conditions of mobile phase pressureand velocity, and the apparent plate height at the outlet may be significantly greaterthan the local plate height at any point in the column. In near-ideal gas chromatography (GC) (He or Nz mobile phase and pressures less than 10 atm) this effect may bemeasurable but it is never very great. Giddings et al. 1 provided the fundamentaltheoretical treatment of this effect for gas chromatography, showing that the effect wasdue entirely to expansion of the mobile phase fluid. They showed that, assuming idealgas behavior, the ratio of apparent plate height to local plate height reachesa maximum value of9/8 as the ratio of inlet to outlet pressures approaches infinity. Inliquid chromatography (LC), the compressibility of the mobile phase is so smal1 thatthe effect of pressure drop on column efficiency is negligible.
0021-9673/90/$03.50 © 1990 Elsevier Science Publishers B.Y.

4 D. P. POE, D. E. MARTIRE
The situation for supercritical fluid chromatography (SFC) is quite different.Density gradients associated with large pressure drops may cause excessive bandbroadening, especially for strongly retained solutes. For example, in one study2 thepeak widths for some aromatic hydrocarbons were 2-4 times greater for a packedcolumn operated under a large density gradient (Llp = 0.18 gjcm 3) than for the samecolumn operated under a smaller density gradient (Llp = 0.06 gjcm 3
). This dependenceof column efficiency on density gradients can place significant limits on the resolvingpower of packed columns when high density gradients are produced. There have beena few detailed studies of this effect in packed column SFC2
,3 as well as in SFC withopen tubular columns4
,5, but so far a rigorous theoretical treatment of thephenomenon has been lacking. It is our intention to provide such a treatment with thispaper.
Subsequent to the initial investigations by Giddings et aU, Giddings6,7
developed the theory into a more general form represented by the relation
(I)
where fj is the apparent plate height measured at the column outlet, L the columnlength, and H and Us are the local values of plate height and solute zone velocity,respectively. Under conditions of near-ideal gas chromatography, where the capacityfactor is virtually constant, eqn. I can be evaluated as a function of the pressure drop6.
If however the capacity factor varies with the position in the column, as is commonlythe case in SFC, the situation is more complex. Capacity factor is not a simple functionof pressure. Recent advances in retention theory suggest that mobile phase density (ormore specifically, reduced density) is a fundamental property affecting retention in gaschromatography (GC), LC and SFC8
. Moreover, Martire9 has recently derivedgeneral equations for the spatial and temporal density distribution functions, averagedensities and column profiles of the mobile phase fluid, as well as for the apparentcapacity factors and column profiles of the solute components. It appears desirablethen to rewrite eqn. I in terms of mobile phase density and density-dependent terms.Such an expression would be generally applicable to GC, LC and SFC, but would findits primary application in the area of SFC.
FLOW-RELATED QUANTITIES IN SFC
Because of the high compressibility and non-ideal behavior of supercriticalfluids, careful definition of flow-rates and related quantities is extremely important tosuccessful treatment of plate theory in SFC. Martire9 has presented a generaltreatment of spatial and temporal aspects ofcolumn parameters applicable to GC, LCand SFC. Here we extend that treatment primarily to provide the specific tools neededfor treatment of plate height theory. Throughout the following discussion we shallassume isothermal conditions and constant mass flow-rate of the mobile phase duringa given separation experiment. This is achieved in practice by maintaining fixedpressures at the inlet and outlet of the column. With these restrictions a steady-statecondition will be achieved so that the mass flow-rate, 111, remains constant along thelength of the column. Radial variations, which may be significant under certainconditions1o, are ignored.

PLATE HEIGHT THEORY FOR GC, LC AND SFC 5
Superficial velocity and flow-rateThe volumetric flow-rate, V, which is commonly measured experimentally, is
related to mass flow-rate in by the simple relation
in = Vp
where p is the density of the mobile phase. Horvath and Lin11 define the superficialvelocity Uo as
Uo = (l/A)V
where A is the cross-sectional area of the tube. This is the velocity calculated from thevolumetric flow-rate assuming a tube with no packing. The superficial specific massflow-rate is then
Fo = in/A
Fo is thus the mass flow-rate per unit area assuming no packing is present. It followsfrom the preceding equations that
Fo = uop
Mobile zone (excluded) velocity and flow-rateThe mobile zone, or excluded, velocity Ue is
where Ce = Vel V is the interparticle porosity and Veand V are the interparticle volumeand empty column volume, respectively. The excluded velocity is taken as the actuallinear velocity along the column axis of the moving mobile phase between the particles,or the mobile zone. When microporous packings such as porous silica are used, theintraparticulate mobile phase is assumed to be stagnant. Likewise, the excludedspecific mass flow-rate Fe may be defined as
and it follows that
The solute velocity Us is related to the mobile zone velocity and zone capacityfactor kif by the equation
Us = ue/(l + kif) = Fe/(l + klf)p
where kif is the I:atio of moles of solute in the stationary zone (stagnant mobile phaseplus stationary phase) to moles of solute in the mobile zone (excluded mobile phase).

6 D. P. POE, D. E. MARTIRE
Mobile phase velocity and flow-rateThe mobile phase velocity Um, which is the average linear velocity of a mobile
phase molecule or of a fully permeating, unsorbed solute, is
where Bt = (Ve + Vj)/Vis the total porosity and Vi is the intraparticle volume. This isthe velocity which is typically measured experimentally. The corresponding mobilephase specific mass flow-rate Fm is then
and the solute velocity is
Us = um/(l + k') = Fm/(l + k')p
where k' is the phase capacity factor, which is the ratio of moles of solute in thestationary phase to moles of solute in mobile phase.
Reducedflow-ratesIn order to facilitate the use of reduced densities in the treatment which follows,
two reduced mass flow-rate terms are introduced. The reduced superficial specificmass flow-rate FOR is defined
FOR = Fo/Pref = UOPR
where Pref is the reference density of the mobile phase fluid, and PR = P/Pref is thereduced density. In GC and LC, the mobile phase density at I bar or I atm is used as thereference density. In SFC, we shall use the critical density of the mobile phase fluid asthe reference density. Likewise, the reduced excluded specific mass flow-rate FeR isdefined
and the reduced mobile phase specific mass flow-rate FmR is
For a column of fixed diameter and porosity, FOR, FeR and FmR are constant underisothermal, steady state conditions, and repre.sent the linear velocity which the mobilephase or mobile zone would have at the specified mass flow-rate if it were at itsreference density.
Retention time for an unretained, excluded soluteFor a packed column, the mass of excluded mobile phase me (that which is
moving) is
me = Ve<P>z = BeV<p>z

PLATE HEIGHT THEORY FOR GC, LC AND SFC 7
where < p > z is the spatial average density9. The time to elute one column volume tu is
Incorporating the relations in = FoA and Fo = Fece' we obtain
where L is the length of the column.For an open tubular column
tu = V<P>z/in = L<p>z/Fo L<PR> z/FOR
A verage linear velocityIn some cases the average linear velocity of the mobile phase may be impossible
to measure experimentally due to lack of a suitable unretained solute. The aboveequations for tu allow for its calculation. For a packed column, the average excludedvelocity < Ue > is
For an open tubular column, U = Uo = Ue, and
Noting that D,(p) = pDzCp), it can be shown that < 1/p > t
<U>t = <F/p>/ = F/<p>z
l/<p>" and
Thus it is seen that the average velocity which is usually reported as L/tu is the temporalaverage velocity.
Reduced velocityFor efficiency studies involving packed columns, reduced velocity is best defined
in terms of the excluded reduced velocity, Ve , that is,
where dp is the particle diameter and Drn is the diffusion coefficient of the solute in themobile phase. Therefore, for a packed column,
For an open-tubular column of diameter dc,

8 D. P. POE, D. E. MARTIRE
To the extent that the product of density times diffusion coefficient for gases andsupercritical fluids is roughly constant12
, so is then the reduced velocity alsoapproximately constant. While this product is constant in gas mixtures at lowpressures, some variation is observed at high pressures. Studies on the behavior of theratio pD/PoDo, where the subscript 0 refers to low pressure values, show that at highpressures (in or near the supercritical region) the value of pDfPoDochanges in a fashionthat is not accurately predicted by Enskog-Thorne theory for dense gas mixtures 13, 14.
The product of pDm for benzene and some alkylbenzenes in supercritical carbondioxide13 at 40°C is less than unity at low density (0.1 < p < 0.6 g/cm3
) and increasesto approximately unity at a CO2 density of about 0.6 g/cm 3
, above which it remainsnearly constant. Similar behavior is observed for naphthalene under the sameconditions 1 S, with pDm changing from 0.00072 to 0.00097 g cm -1 s -1 for CO2
densities from 0.28-0.60 g/cm3. Therefore the variation in reduced velocity with
density can be significant at low densities. This variation notwithstanding, theassumption that v is constant can greatly simplify the equations for apparent plateheight (vide infra). The question of whether this assumption leads to significant errorswill be addressed later in this paper.
PLATE HEIGHT THEORY
The fundamental theory for relating apparent plate height to local plate heightfor non-uniform columns has been developed by Giddings6 , 7. The apparent (not local)plate height at any point in the column is defined as H = z(T2/ t 2), where z is distancetravelled, T is the standard deviation of the band in time units, and t is elapsed time.Normally His measured at the outlet, where L, T and t refer to column length, standarddeviation of the eluting band and retention time, respectively. If the column is dividedinto infinitesimally small segments, the local plate height for each segment is H j =
LiT?/t?, where L j is the length of the segment, T? the contribution to variance withinthat segment, and t i the time required for the solute band to traverse that segment.Noting that the addition rules for T and t differ (T 2 = L:T? and t = L:ti), Giddingsshowed that
and performing the appropriate transformations, obtained the general relationpresented above in eqn. 1.
Under usual conditions the column is assumed to be uniform with respect to tubediameter, stationary film thickness, particle diameter, packing structure and otherstationary phase parameters. For compressible mobile phases, however, a pressure ordensity gradient is inevitably present, which results in variations in both the solute zonevelocity and local plate height. As noted above, we desire the equivalent expression toeqn. I expressed in terms of density.
We begin by recalling that Us = F/O + k)p, where Fand k represent either Fe andk", or Fm and k'. Under isothermal conditions and constant mass flow-rate, eqn. 1 cantherefore be written as
L L
H = LlfHO + k)2p2dZ]/lfO + k)pdzF
° 0
(2)

PLATE HEIGHT THEORY FOR GC, LC AND SFC 9
The variable terms in H can all be expressed as functions of mobile phase density. Thefinal step then in achieving the desired equation requires a transformation of variablefrom z to p, for which we invoke the relation dz = D/p)dp, where Dz(p) =(P/I1)(I5P/l5ph is the spatial distribution function relating z and p for the mobile phasefluid 9 (11, P and T represent viscosity, pressure and temperature, respectively).Dividing numerator and denominator in eqn. 2 by L 2 = [JdzF, and substituting dz =
D/p)dp, we obtain
(3a)
which is the desired expression, where, once again, k represents either k' or k", and thebrackets < > z represent the spatial average of the enclosed terms. An expressionwhich is equivalent to eqn. 3a involving both temporal and spatial average quantities is
(3b)
which is arrived at by an alternative approach in the Appendix.Dividing eqns. 3a and 3b by de (column diameter) or dp (particle diameter) yields
the equivalent expressions for apparent reduced plate height ii,
(4a)
and
(4b)
The significant contribution of these equations is that they provide a usable formof Giddings' general expression which is directly applicable to GC, LC and SFC.
APPLICATIONS AND DISCUSSION
In the following discussion we will demonstrate how eqns. 3 and 4 may be used topredict the impact of solute zone velocity gradients in GC, LC and SFC. Because themost significant area of application is expected to be in SFC, that case will be treated ingreatest detail.
Plate height equationsFor chromatography with open tubular columns, the Golay equation 16
describes plate height exactly under conditions of laminar flow. For packed columnsnumerous variations of the van Deemter equation have been proposed 11.17-19. ForLC and SFC in columns packed with microparticulate porous silica stationary phases,we employ the equations developed by Knox and Scott 17 and by Horvath and Lin18
.
For GC, in which the stationary phase is a distinct liquid phase on a solid support, weemploy the coupled form of the equation proposed by Giddings 19
. We shall refer tothese as the Golay, Knox, Horvath-Lin and Giddings equations, respectively. Thesefour equations may be written in general form as follows.The Golay equation:
(5a)


PLATE HEIGHT THEORY FOR GC, LC AND SFC
The Knox (or simplified Horvath-Lin) equation:
The Horvath-Lin equation:
11
(5b)
The Giddings equation:
(5d)
The factors A-D contain constant column parameters, while C(p) contain terms whichmay show some dependence on mobile phase density, including Dm , k, dr (stationaryphase film thickness) and Ds (solute diffusion coefficient in the stationary phase). Theexpressions for the various parameters are given in Table 1. Note in particular that the'product DmP or Dsp appears in each expression for ((p). Y, A, K, q, w, e, ¢ and ¢K arecolumn constants as defined in refs. 7, 17 and 18 (see Symbols section). We haveneglected terms involving adsorption kinetics.
The terms in the Knox equation given in Table I represent a simplified form ofthe equation. The complete A term given by Knox and Scott is
where Ym and Ys are the obstruction factors to solute diffusion in the mobile andstationary phases. Likewise, the more general form of the C term is
where D sz is the diffusion coefficient of the solute in the stationary zone, and isa complex function of k", ¢K, Ysm, Dm, Ys and D" where Ysm is the obstruction factor inthe stagnant mobile phase17
. Ifwe assume that Ds/Dm« I, the A and C terms in theKnox equation simplify to the expressions given in Table 1. This assumption isreasonable for GC, and probably for SFC, where diffusivities in the mobile phase arerelatively large. In LC, where Ds/Dmmay be closer to unity17.Z0, the more general formof the Knox equation may provide a better description of band spreading processes.
At sufficiently low reduced velocities, which are of practical interest, the B termof the Horvath-Lin equation is simplified and the D term becomes negligible18
, so thatthe Horvath-Lin equation reduces to a form similar to the Knox equation, bothrepresented byeqn. 5b. The A and B terms in the Knox and simplified Horvath-Linequations are identical with the minor difference that Horvath and Lin have providedan explicit expression for the constant B. The major difference appears to be in theC term, given by the expressions
Knox:Horvath-Lin:
(l/30Ysm¢K)[k"/(1 + k"W(l - ¢K)Ve
[e/30¢(l + ¢f][(¢ + k' + ¢k')/(l + k'Wve

12 D. P. POE, D. E. MARTIRE
The apparent difference between these terms arises from the definition of the cP and cPKterms. Knox's cPK = Vsm/ Vm, whereas Horvath and Lin's cP = cPsm Vsm/ Vmz, where Vsm,Vmz and Vm are the volumes of stagnant mobile phase, excluded mobile phase ormobile zone and total mobile phase, respectively. cPsm is the fraction of the stagnantmobile phase which is accessible to the solute. For a fully permeating solute (cPsm = 1),cPK = cP/(l + cP), and given that l
? k" = (k' + cPK)/(l - cPK), it can be shown that
The tortuosity factor used by Horvath and Lin is () = cJYsm, where Cj is the intraparticleporosityll. Thus for the conditions, (l) the solute is fully permeating, and (2) Ds/ Dm ::::::
0, the Knox equation is essentially identical to the simplified form of the Horvath-Linequation, the C term differing only by the constant factor Cj.
The corresponding expressions for apparent plate height are obtained byapplication of eqn. 3 or 4 to eqns. 5a-d for local plate height. We prefer to use the forminvolving temporal averages because certain chromatographic parameters, includingcapacity factor, are typically measured as temporal average quantities.For the Golay equation:
fI = (l/G4)[(A/F) <g3(P) . fl(p», + BdeF<g3(P) . f 2(p», +
+ CF<g3(P) . f3(p»,] (6a)
The Knox (or simplified Horvath-Lin) equation:
fI = (l/G4)[(A/Fe)<g3(P) . fl(p», + (Bd:13 /F;/3) <g3(P) . f 2(p», +
+ Cd;Fe <g3(P) . f3(p»,] (6b)
The Horvath-Lin equation:
The Giddings equation:
fI = (l/G4){(A/Fe)<g3(P)' fl(p», + Bdp<g3(P)/[l + B/(wdpFcf2Cp))]>, +
+ CFe <g3(P) . f3(p»,} (6d)
where G4 = < 1 + k > ,2 < P> z and g3(P) = (I + k)2 p. In general, k = k' except in theKnox version of eqn. 6b, where k = k".
We will show that in many situations the above expressions can be greatlysimplified to yield more familiar results. In near-ideal gas chromatography, k is nearlyindependent of density and may be treated as a constant. At high mobile phasedensities, the product DmP is approximately constant. Finally, although there is

PLATE HEIGHT THEORY FOR GC, LC AND SFC 13
evidence that high mobile phase densities may cause swelling of the stationary phase21,
we shall assume that dr and Ds remain constant for the purpose of generatingapproximate expressions for apparent plate height.
Gas-liquid chromatographyGC is most commonly performed under near-ideal conditions with inlet
pressures not exceeding 5 atm and an outlet pressure at ambient atmospheric pressure.Based on a review ofavailable data on diffusivity of moderately large organic solutes ingases such as He and N 2 , Giddings 22 concluded that DmP remains constant atpressures up to about 20 atm, consistent with the prediction of Chapman-Enskogtheory23. The capacity factor varies only slightly with mobile phase density at theselow pressures. Data for isooctane and several other compounds on squalane show thatfor N 2 as carrier gas at an inlet pressure of 5 bar and an outlet pressure of 1 bar, thevariation in k' from inlet to outlet is about 5% compared to a five-fold change indensity24. With this rather small variation in k', eqn. 3a may be approximated by
(7)
which upon application to eqn. 5a or 5d, assuming that k', dr, Ds and DmP are constant,yields
(8)
where H L and H M represent the longitudinal diffusion (A) term and mobile phasemixing (B) term, respectively, as they appear in eqns. 5a and 5d and C' = Cf3(p)p,which is constant. For an ideal gas it can be shown that
and•
l/<p>z = J~(p) = (3/2)[(r2- l)/(r3
- l)](Pout)-l
wherer = Pin/pou(,and,ingeneral,J~(p) = (n/m)(rm -l)/(rn -l).Notingthatforanideal gas Pin/Pout = Pin/Pout' eqn. 8 is identical to the expression reported by Giddingset al. l
• At higher pressures and with non-ideal carrier gases, where the variation incapacity factor can be quite large, it may be necessary to invoke eqn. 6. This situation istreated in the section on SRC.
Liquid chromatographyBecause of the low compressibility ofliquids, the case for liquid chromatography
appears to be trivial, i.e., the largel?ressure drops which are common in high-performance liquid chromatography (HPLC) provide little if any contribution to bandspreading. In this section we provide general arguments as to why this should be thecase for HPLC with packed columns, and estimate the effect under extreme conditions.
Under ordinary HPLC operating conditions with high-pressure pumps and

14 D. P. POE, D. E. MARTIRE
microparticulate packings, the inlet and outlet densities will differ no more than about5%, and under these circumstances9
(9)
Likewise, the capacity factor in LC is nearly independent of the operating pressure25 .For the moment let us also assume that DmP is constant. Therefore eqn. 7 isappropriate, which when applied to eqn. 5 for columns with porous silica packings,yields
(10)
where H represents the entire right-hand side ofeqn. 5b or 5c. Now it can be shown that
which, based on earlier observations9 , is approximately unity under normal LCconditions. Thus it appears that in LC the apparent plate height may be adequatelydescribed by the equation for local plate height using simple averages for density andrelated quantities.
The conclusion just reached is in agreement with the observation that there hasbeen no general concern raised about the effect of pressure drop on resolution in liquidchromatography. A further test of this conclusion is provided by evaluating the effectofpressure drop in an extreme situation. For this purpose we use published data for theelution of benzyl acetate in a mobile phase of 5% ethyl acetate in n-hexane in a25 x 0.46 em J.D. column packed with silica gel (Partisil 10 with a 7.8 pm particlediameter)26. This solvent system was chosen by the authors of the cited study in partbecause of the relatively high compressibility of n-hexane, a property which shouldalso contribute to gradient-induced band spreading. Based on data provided inTable II of ref. 26, this system would yield a flow-rate of approximately 25 ml/min atan inlet pressure of 40 MPa (400 bar). Assuming an interparticle porosity of 0.4 andbased on Pref = Pout = 0.6603 g cm- 3 for n-hexane (density at 1 bar, ignoring thepresence of ethyl acetate) at 25°C, this flow-rate corresponds to FeR = 6.52 em S-I,
which is equal to the excluded linear velocity at the outlet. The local and apparent plateheights under these conditions were estimated from the simplified Horvath-Linversion of eqns. 5b and 6b, respectively. This required the estimation of variouspressure-dependent parameters as described below. For a more precise treatment ofthe pressure dependence of density and viscosity, the reader is referred to otherpublished work 12,2 5.
(I) Approximate expressions for the spatial and temporal distribution functions, which are Dz(p) = (I/1J)(p -18p/8P)i 1 and D,(p) = (p/1J)(p - 18p/8P)i 1, wereobtained by assuming that viscosity and compressibility are independent of pressure,yielding DzCp) = p and DtCp) = p2, the same expressions as for an ideal gas.
(2) The isothermal compressibility for n-hexane was assumed to remainconstant at the handbook value27 of 1.67' 10- 3 MPa -1, the value at 1 atm. In fact, thecompressibility decreases by about 25% at 40 MPa. Our calculation would thereforepredict a slightly greater change in density than would actually occur, which would in

PLATE HEIGHT THEORY FOR Gc. LC AND SFC 15
turn exaggerate the effect of pressure drop on plate height. Defining the referencedensity Pref as the density at 1 bar, PR,out = 1, an inlet pressure of 40 MPa correspondsto PR,in = 1.0651, or LlPR = PR,in - PR,out = 0.0651.
(3) The effect ofdensity on capacity factor was estimated from the k' VS. Pin dataprovided in Table VI of ref. 26 and the isothermal compressibility ofn-hexane, yieldingthe following relation for pressures from 0.1 to 40 MPa:
k' = k'o - 2[0.00343 MPa- 1/(p- 1<5p/<5P)]LlpR= k'o - 4.llL1PR
where k' ° = 1.526 is the value at 1 bar. The factor 0.00343 MPa -1 is the slope for thedependence of k' on Pin' This factor is doubled because the average column pressurewould be about one-half of Pin' Thus the average column pressures studied in ref. 26never exceeded 20 MPa, and the above relation represents an extrapolation to 40 MPa.At an inlet pressure of 40 MPa, then, k' = 1.295 at the inlet, and the column-averagedvalue is 1.410, which is consistent with the value of 1.389 calculated from the regressionequation given by Katz et al. 26. Note that the change in k' from inlet to outlet is about18%. Katz et al. 26 attributed this to an increase in column temperature at higherpressures, even for a thermostated column. Thus one extreme is to assume that k'remains constant throughout the column (i.e., it is independent of density), whichwould contribute nothing to gradient-induced band spreading. The other extreme,which we have adopted here, is to assume that the column is efficiently thermostated,and that the change in k' is due to the density gradient in the column. The truthprobably lies between these two extremes, so that our assumption again has the resultof exaggerating the effect of pressure drop on band spreading.
(4) The effect of mobile phase density on the diffusion coefficient (Dm) of ethylacetate was estimated from Dm VS. P data28 to yield the expression
Dm = D~ - [2.14' 10- 7 cm2S-l Pa- 1/(p- 1<5p/<5PhJLlpR
= 'D~ - (1.28' 1O- 4)LlPR
where D~ = 3.097 . 10- 5 cm2S-l is the value at 1 bar.
Based on the approximations outlined above, the spatial averages of theexpressions in the equation obtained by application of eqn. 3a to eqn. 5b (i.e., thespatial average analogue to eqn. 6b) were evaluated by numerical integration toa precision of 1 part in 105, and a value for fI was obtained for the conditions statedabove (Pin = 40 MPa) using the values of the column constants stated earlier.A corresponding value for local plate height was calculated from eqn. 5b using spatialaverage values for PR, k' and Dm, which are the simple average values that would beroutinely observed or calculated. The resulting values were fI = 7.274' 10- 3 cm andH = 7.256 . 10- 3 cm, a difference of less than 0.3%. This calculation was based onrather extreme operating conditions; results for lower inlet pressures and flow-ratesproduced even smaller differences between fI and H. Thus the theory correctly predictswhat is generally observed in practice, that for an LC column operated isothermally ata constant mass flow-rate, the effect of pressure drop on plate height is insignificant.


18 D. P. POE, D. E. MARTIRE
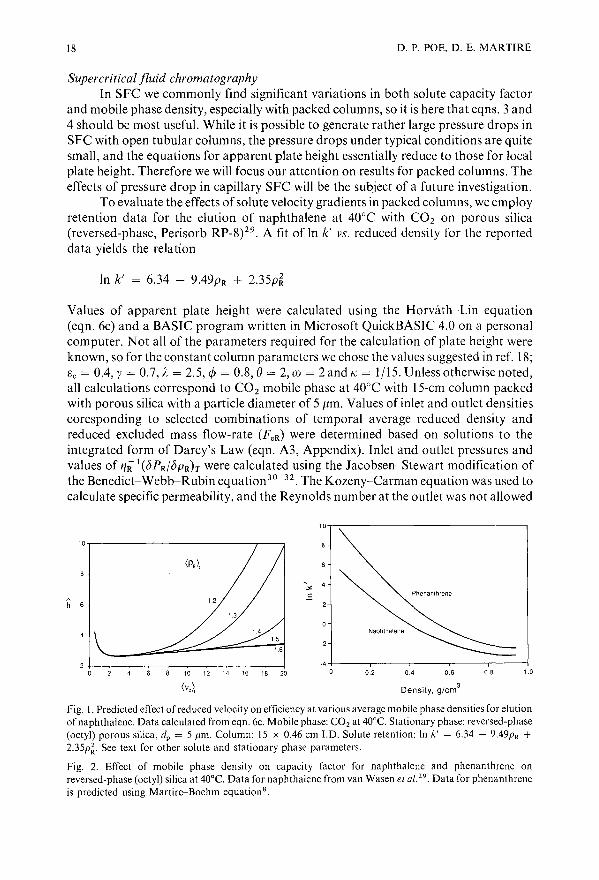
Supercritical fluid chromatographyIn SFC we commonly find significant variations in both solute capacity factor
and mobile phase density, especially with packed columns, so it is here that eqns, 3 and4 should be most useful. While it is possible to generate rather large pressure drops inSFC with open tubular columns, the pressure drops under typical conditions are quitesmall, and the equations for apparent plate height essentially reduce to those for localplate height. Therefore we will focus our attention on results for packed columns. Theeffects of pressure drop in capillary SFC will be the subject of a future investigation.
To evaluate the effects of solute velocity gradients in packed columns, we employretention data for the elution of naphthalene at 40°C with CO2 on porous silica(reversed-phase, Perisorb RP_8)29, A fit of In k' vs. reduced density for the reporteddata yields the relation
In k' = 6.34 - 9.49PR + 2.35p~
Values of apparent plate height were calculated using the Horvath-Lin equation(eqn. 6c) and a BASIC program written in Microsoft QuickBASIC 4.0 on a personalcomputer. Not all of the parameters required for the calculation of plate height wereknown, so for the constant column parameters we chose the values suggested in ref. 18;Ge = 0.4, y = 0.7, A = 2.5, cjJ = 0,8, e= 2, ill = 2 and /( = IllS. Unless otherwise noted,all calculations correspond to CO2 mobile phase at 40°C with 15-cm column packedwith porous silica with a particle diameter of 5 ,urn. Values of inlet and outlet densitiescoresponding to selected combinations of temporal average reduced density andreduced excluded mass flow-rate (FeR) were determined based on solutions to theintegrated form of Darcy's Law (eqn. A3, Appendix), Inlet and outlet pressures andvalues of 1JR 1(bPR/bpRh were calculated using the Jacobsen-Stewart modification ofthe Benedict-Webb-Rubin equation30- 32 . The Kozeny-Carman equation was used tocalculate specific permeability, and the Reynolds number at the outlet was not allowed
10..-:------------------,
10,-------------,----,
h 6
1.5
16
Naphthalene
-2
Phenanthrene
100.80.60.40.2
-4+-----r---,.---,.---,----jo10 12 14 16 18 20
Density, g/cm3
Fig. I. Predicted effect of reduced velocity on efficiency at various average mobile phase densities for elutionof naphthalene. Data calculated from eqn. 6c. Mobile phase: CO 2 at 40°C. Stationary phase: reversed-phase(octyl) porous silica, dp = 5 J1m. Column: 15 x 0.46 cm J.D. Solute retention: In /(' = 6.34 - 9.49PR +2.35p~. See text for other solute and stationary phase parameters.
Fig. 2. Effect of mobile phase density on capacity factor for naphthalene and phenanthrene onreversed-phase (octyl) silica at 40°C. Data for naphthalene from van Wasen el a/29 . Data for phenanthreneis predicted using Martire-Boehm equations.

PLATE HEIGHT THEORY FOR GC, LC AND SFC 19
to exceed 20. Reduced values of viscosity, pressure and density were employed tosimplify the numerical calculations. Diffusion coefficient data for naphthalene in CO2
at 40°C from ref. 15 were fit to a second order polynomial to yield the relation
Viscosity values were calculated from a fourth order polynomial fit to publisheddata 3o,33.
Predicted results for the effect of average operating density on efficiency withnaphthalene as solute are shown in Fig. I; selected data corresponding to these plotsare presented in Table II. It is seen that the effect of pressure drop is most severe at lowaverage column density. This is consistent with the experimental results of earlierstudies2
,34. This behavior is quite reasonable considering that at low densities dpldPcan be quite large, leading to large changes in density and significant expansion of themobile phase. The effect of this expansion, ignoring effects on k', is represented by< P> rI < P> z· For the data shown in Table II, values of this ratio are largest at< PR > t = 1.20, but they are, in general, not large enough to induce effects of themagnitude shown in Fig. I. Second, we note that the effect of density changes oncapacity factor are greatest at low carrier density (Fig. 2). A result of the latter effect isthat at <PR>t = 1.20, <k'>t increases as Ve increases due to the lower densities andtherefore higher values ofk' experienced near the column outlet. The combined effectsof mobile phase expansion, as measured by < P> II <P > z, and the significant changesin capacity factor at low average carrier density, result in the very rapid rise in the Ii vs,Ve curve beyond the optimum velocity at low average carrier densities. At < PR > t =lAO, the changes in the ratio < PR > tl < PR > z and values of < k' > t are significantlysmaller. For <PR> I = 1.60, where dpldP is relatively small, < PR > tl < PR > z ~ 1.00even at high velocities, and < k' > t remains approximately equal to the value forconstant density, so that the gradient-induced band broadening is negligible (Fig. I).
A family of curves similar to those in Fig. I has been reported for the elution ofphenanthrene at 50°C at much higher average pressures2
• We were able to reproducethis behavior at higher pressures also by (I) adjusting the parameters in our equationsfor capacity factor and diffusion coefficient to yield the values reported in ref. 2 forphenanthrene at 50°C, and (2) using a particle size of 211m in a 15-cm column. Oneeffect of raising the temperature is that the maximum compressibility of CO 2 occurs athigher pressure, The smaller particle size results in a larger pressure drop. Thecombined effect (higher temperature, smaller particle size) is to induce significantchanges in k' at higher average operating pressures. Thus our equations are consistentwith expected and observed behavior in this respect.
To evaluate the effect of k' on efficiency, we made an estimate of the parametersfor phenanthrene in the equation
In k' = In k'o - apR + bp~
where k' 0 is the capacity factor under ideal GC conditions. Although the theory behindthis equation strictly applies to absorption chromatography9, it should serve asa reasonable basis for estimating the effect of solute properties on coefficients a and b,since these are largely mobile phase parameters. Accordingly, estimates of a and h were


22
45,--------------.,
D. P. POE, D. E. MARTIRE
10,-----------r-----,---.,40
35
30
h 25
20
15
10
h 6
10 12 14 16 18 20
(V,),
ot:=::::::===:::~==::~o 2 4 6 8 10 12 14 16 18 20 22 24 26
(V,),
2+-_-~~~-~~~-~~___+
o
Fig. 3. Predicted effect of reduced velocity on efficiency at various average mobile phase densities for elutionof phenanthrene. Ln k' = II - 13.32PR + 3.30p;. Other conditions as in Fig. I.
Fig. 4. Predicted effect of solute on efficiency at < PR > = 1.2. Conditions as in Fig. I.
made by multiplying each by the ratio of the Van der Waals volume ofphenanthrene tothat of naphthalene, yielding a = 13.32 and b = 3.30. The value of In k' 0 was thenincreased to 11, the smallest integral value for which the In k' vs. PR curve forphenanthrene does not intersect that for naphthalene (Fig. 2). The diffusion coefficientfor phenanthrene was estimated by applying a factor of 0.826 to the values fornaphthalene, which is the ratio of D m values for phenanthrene to naphthalene at240 bar and 50°C2
• Plots of Ii. vs. < Ve > t are shown in Fig. 3, with corresponding datapresented in Table III. Two aspects about these curves are immediately obvious. Firstis that, at a given average density, Ii. for phenanthrene rises much more rapidly than itdoes for naphthalene (Fig. 4). This is expected because of the larger values of capacityfactor. On the basis of the approximate expressions
which we examine below, fI should increase with k', since the expression has the formof the average of the square divided by the square of the average. This is consistent withthe experimental results obtained by Schoenmakers and Uunk34
, who observed muchgreater losses in efficiency with pressure drop for naphthalene (average k' ;::::; 1.3) andbiphenyl (average k' ;::::; 1.1) than for ethylbenzene (average k' ;::::; 0.3) under identicalconditions.
The second interesting aspect of the curves for phenanthrene in Fig. 3 is that, forlarge values of < Ve > t, they change in curvature, and even intersect one another. Theseresults are predictions based on the model and remain to be verified experimentally.
It is important to emphasize that the data presented in all of the tables andfigures are based for the most part on models rather than experimental data, and assuch depend on the assumptions made. This distinction is especially important withrespect to the effect of solute size on mass transfer in the stationary phase.Experimental results2 have shown that, at high average densities where gradientinduced band spreading should be insignificant, the reduced plate height curve risesmore rapidly for naphthalene than for phenanthrene at reduced velocities above the

PLATE HEIGHT THEORY FOR GC, LC AND SFC 23
optimum. This was attributed to a combination of factors involving the effects ofsolute size and capacity factor on the magnitude of the C term. These factors are nottaken into account in the present treatment.
We now investigate the possibility of simplifying eqn. 6c by assuming that DmPR,and therefore v, can be assumed to remain constant. This results in the attractivelysimple expression
hest = (G3/G4)[A/ve + B/(1 + wv; 1/3)] + (F2/G4)[Cv e + Dv;J3] (12)
where F2 = «cP + k' + cPk')2PR>tG3 = <(1 + k')2 PR >tG4 = < 1 + k'>t<PR>Z
The same treatment applied to eqn. 6b results in even simpler expressions. The ratiosh/hest and h/hest are listed in Tables II and III along with other parameters includingG3/G4 and F2/G4. hest is a simple estimate of the reduced plate height calculated fromthe local plate height equation, using <k'>t in place of k', and <DmPR>t for DmPR'Thus h/hest is a measure of the overall effect of solute velocity gradients on efficiency.The data in Tables II and III show that hest is a good approximation of hexcept for thecombination of high velocities and low average density. Considering that theevaluation of hest requires evaluation of spatial and temporal averages just as does h,there appears to be little advantage in utilizing this estimate in actual calculations.However, the expression for hest may serve some purpose as an aid in understanding theimpact of solute velocity gradients on the different band-broadening processes.
Considering eqns. 11 and 12, and that the C and D terms in eqn. 12 should besignificant only at high velocities, the ratio G3/G4 should provide a reasonableindicator of the onset of departure of h from the corresponding value assuming nodensity drop (hest)' In fact, we find that the departure ofG3/G4 from unity parallels thatof h/hest' although the latter increases more rapidly. It is useful to note that as long asG3/G4 = 1.00, there is no significant loss of efficiency due to solute velocity gradients.The rapid increase in h/hest at higher velocities appears to be related to the relativevalues of the ratios G3/G4 and F2/G4. At low velocities, where only the A and B termsare important, h/hest ~ G3/G4. At higher velocities the C and D terms becomesignificant, and these are multiplied by the ratio F2/G4. This ratio increases muchmore rapidly than does G3/G4, resulting in an additional increase in h/hest . Anotherpossible indicator of the loss of efficiency might be the ratio < PR > ,/ < PR > z. In theabsence ofchanges in k' as in near-ideal GC, this would be the case (see eqn. 8). In SFC,however, the added effect ofchanges in k' make this ratio a rather poor indicator of theonset of loss of resolution. Data for phenanthrene in Table III show that rather largevalues of h/hest are attained before <PR>t/<PR>z increases appreciably.
Upon further examination of the data for the naphthalene and phenanthrenemodels in Tables II and III, the outlet pressure appears to be a simple, reliableindicator of the onset of loss of efficiency, regardless of the average density. Loss ofefficiency is experienced at Pout::::; 82 bar for the naphthalene model, and at Pout ~90 bar for the phenanthrene model. The use of outlet'pressure or density as a guide toavoid loss of resolution has been noted earlier3
.34
.
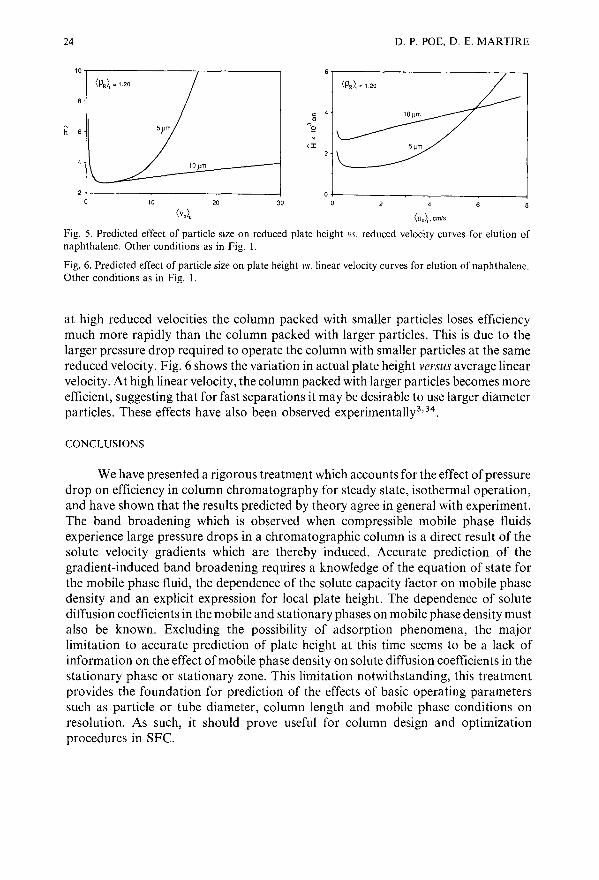
Figs. 5 and 6 show the effect ofparticle size for two columns operated at the sametemporal average density and keeping all other parameters constant. Fig. 5 shows that
24 D. P. POE, D. E. MARTIRE
10,---------,-------,
(PR), " 1.20
h 6
<:I;
(v,>,302010
2+----~----_--_ ___Io
Fig. 5. Predicted effect of particle size on reduced plate height vs. reduced velocity curves for elution ofnaphthalene. .other conditions as in Fig. I.
Fig. 6. Predicted effect of particle size on plate height vs. linear velocity curves for elution of naphthalene.Other conditions as in Fig. I.
at high reduced velocities the column packed with smaller particles loses efficiencymuch more rapidly than the column packed with larger particles. This is due to thelarger pressure drop required to operate the column with smaller particles at the samereduced velocity. Fig. 6 shows the variation in actual plate height versus average linearvelocity. At high linear velocity, the column packed with larger particles becomes moreefficient, suggesting that for fast separations it may be desirable to use larger diameterparticles. These effects have also been observed experimentally3,34.
CONCLUSIONS
We have presented a rigorous treatment which accounts for the effect of pressuredrop on efficiency in column chromatography for steady state, isothermal operation,and have shown that the results predicted by theory agree in general with experiment.The band broadening which is observed when compressible mobile phase fluidsexperience large pressure drops in a chromatographic column is a direct result of thesolute velocity gradients which are thereby induced. Accurate prediction of thegradient-induced band broadening requires a knowledge of the equation of state forthe mobile phase fluid, the dependence of the solute capacity factor on mobile phasedensity and an explicit expression for local plate height. The dependence of solutediffusion coefficients in the mobile and stationary phases on mobile phase density mustalso be known. Excluding the possibility of adsorption phenomena, the majorlimitation to accurate prediction of plate height at this time seems to be a lack ofinformation on the effect of mobile phase density on solute diffusion coefficients in thestationary phase or stationary zone. This limitation notwithstanding, this treatmentprovides the foundation for prediction of the effects of basic operating parameterssuch as particle or tube diameter, column length and mobile phase conditions onresolution. As such, it should prove useful for column design and optimizationprocedures in SFC.

PLATE HEIGHT THEORY FOR GC, LC AND SFC
ACKNOWLEDGEMENTS
25
This work was supported by National Science Foundation Grants CHE8305045 and CHE-8902735, and by the Bush Sabbatical Program of the University ofMinnesota, which provided partial support for D.P. while on sabbatical leave atGeorgetown University. The authors also are grateful for helpful discussions withRichard Boehm and Rebecca Riester of Georgetown University, for equation of statedata from Thomas Bruno ofNIST at Boulder, CO, and for software routines providedby Abul Hussam (George Mason University) and Rebecca Riester.
APPENDIX
Alternative derivation of the apparent plate height equationThe basic approach taken here is similar to that used by Giddings et al, 1 for the
effect of pressure drop on plate height in gas chromatography, but with considerationof non-ideal behavior of the mobile phase fluid, as well as the effect of mobile phasedensity on solute capacity factors. It is applicable to gas, liquid and supercritical fluidchromatography under conditions of constant temperature and constant massflow-rate.
Let us define a solute zone as a region containing a fixed mass of solute. Ata constant mobile phase specific mass flow-rate Fm, the width W of the solute zone, andtherefore its velocity, will vary as a result ofchanges in mobile phase density and solutecapacity factor. The velocity of the mobile phase Um is inversely proportional to itsdensity through the relation
The velocity of the solute is some fraction of the mobile phase velocity and is related tothe capacity factor k' by the relation
Us = um/(l + k')
At any point in the column then
Us = Fm/(l + k')p (AI)
Let us divide the column into increments of variable width W which correspond to thewidths of a solute zone as it traverses the column. Let LIt be the average time requiredfor a solute molecule to pass through increment} of width Wj, so that
where Us,j is the velocity of the solute in increment}. During the subsequent and equaltime period LIt, the solute traverses increment} + I of width Wj+ band

26
Invoking eqn. AI,
D. P. POE, D. E. MARTIRE
We now define (Jj as the contribution to solute zone width which occurs withinsegment j. As the solute zone moves through incrementj + 1, the contribution (Jj tosolute zone width which occurred in segment j becomes
In the absence of a velocity gradient, the variance at the outlet is
In the presence of a gradient, noting that we can replace Wj+ 1 with the width of thesolute zone at the outlet, the variance becomes
Letting z equal the distance travelled by the solute band, substituting (J2 = Hz, andsumming over a column oflength L in the limit of infinitesimally small increments, weobtain
L
(J;ut f{(H(l + k'?p 2)/[(1 + k~ut)2p;ut]}dzo
The standard deviation of an eluting peak in elution time~r is
The apparent or measured plate height fI is then
(A2)L
[L/(uout Pout tr)2] fH(l + k')2p2dz
o
A <,;hange in variable from z to p is possible using Darcy's law;
where B O is specific permeability, 1J is viscosity and P is pressure. Rearranging, weobtain
(A3)

PLATE HEIGHT THEORY FOR GC, LC AND SFC 27
where Dz(p) is the spatial distribution function for the mobile phase fluid 9.
Substituting for dz in eqn. A2,
(A4)
where the integration limits are from P = Pout at z = L to P = Pin at z = O.Also noting that dt is related to the temporal distribution function9 DcCp) by the
relation
and that the solute retention time tt = (I + k')t u , where tu is the time required to elutean unretained solute, we obtain
and
(A5)
Combining eqns. A4 and A5,
(A6)
where the integration limits are Pin to Pout. Also noting that
and that pDzCp) = D,(p), making the appropriate substitutions in eqn. A6, we obtain
(A7)
or in reduced parameters
(AS)
where < >, and < > z represent the temporal and spatial averages, respectively, of theenclosed functions, and d is the column diameter (dc) for open tubular columns or theparticle diameter (dp ) for packed columns.
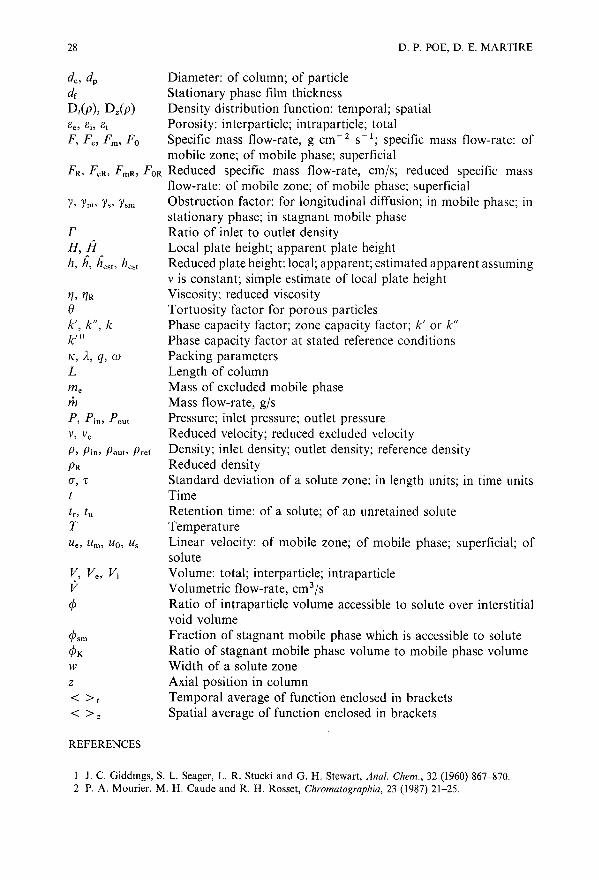
SYMBOLS
AA,B,C,DBOD m , D., D sz
AreaConstants in plate height equationSpecific permeability of a packed bedDiffusion coefficient of solute, cm2 S-l: III mobile phase; III
stationary phase; in stationary zone
28 D. P. POE, D. E. MARTIRE
zw
< >t< >z
T
Diameter: of column; of particleStationary phase film thicknessDensity distribution function: temporal; spatialPorosity: interparticle; intraparticle; totalSpecific mass flow-rate, g cm - 2 S-1; specific mass flow-rate: ofmobile zone; of mobile phase; superficial
FR, FeR, FmR , FOR Reduced specific mass flow-rate, cm/s; reduced specific massflow-rate: of mobile zone; of mobile phase; superficialObstruction factor: for longitudinal diffusion; in mobile phase; instationary phase; in stagnant mobile phaseRatio of inlet to outlet densityLocal plate height; apparent plate heightReduced plate height: local; apparent; estimated apparent assumingv is constant; simple estimate of local plate heightViscosity; reduced viscosityTortuosity factor for porous particlesPhase capacity factor; zone capacity factor; k' or k"Phase capacity factor at stated reference conditionsPacking parametersLength of columnMass of excluded mobile phaseMass flow-rate, glsPressure; inlet pressure; outlet pressureReduced velocity; reduced excluded velocity
P, Pin, Pout, Pref Density; inlet density; outlet density; reference densityReduced densityStandard deviation of a solute zone: in length units; in time unitsTimeRetention time: of a solute; of an unretained soluteTemperatureLinear velocity: of mobile zone; of mobile phase; superficial; ofsoluteVolume: total; interparticle; intraparticleVolumetric flow-rate, cm3 IsRatio of intraparticle volume accessible to solute over interstitialvoid volumeFraction of stagnant mobile phase which is accessible to soluteRatio of stagnant mobile phase volume to mobile phase volumeWidth of a solute zoneAxial position in columnTemporal average of function enclosed in bracketsSpatial average of function enclosed in brackets
rH,fIh, h, hesb hest
k', k", kk'o
K, A, q, ill
L
8e , 8i, 8t
F, Fe, Fm, Fa
dc, dp
df
Dt(p), Dz(p)
11, I1Re
(J, ,
REFERENCES
1 J. C. Giddings, S. L. Seager, L. R. Stucki and G. H. Stewart, Anal. Chern., 32 (1960) 867-870.2 P. A. Mourier, M. H. Caude and R. H. Rosset, Chromatographia, 23 (1987) 21-25.

PLATE HEIGHT THEORY FOR GC LC AND SFC 29
3 P. J. Schoenmakers, in R. M. Smith (Editor), Supercrilical Fluid Chromatography, Royal Society,London, 1988, Ch. 4.
4 P. A. Peaden and M. L. Lee, J. Chromatogr., 259 (1983) 1-16.5 S. M. Fields and M. L. Lee, J. Chromatogr., 349 (1985) 305-316.6 J. C. Giddings, Anal. Chem., 35 (1963) 353-356.7 J. C. Giddings, Dynamics ofChromatography, Part I, Principles and Theory, Marcel Dekker, New York,
1965, pp. 79-82.8 D. E. Martire and R. E. Boehm, J. Phys. Chem., 91 (1987) 2433-2446.9 D. E. Martire, J. Chromatogr., 461 (1989) 165-176.
10 P. J. Schoenmakers, P. E. Rothfusz and F. C. C. J. G. Verhoeven, J. Chromatogr., 395 (1987) 91-110.II Cs. Horvath and H.-J. Lin, J. Chromatogr., 126 (1976) 401-420.12 R. C. Reid, J. M. Prausnitz and B. R. Poling, The Properties of Gases and Liquids, McGraw-Hill,
New York, 4th ed., 1987.13 I. Swaid and G. M. Schneider, Ber. Bunsenges. Phys. Chem., 83 (1979) 969-974.14 Z. Balenovic, M. N. Myers and J. C. Giddings, J. Chem. Phys., 52 (1970) 915-922.15 R. Feist and G. M. Schneider, Sep. Sci. Technol., 17 (1982) 261-270.16 M. J. E. Golay, in D. H. Desty (Editor), Gas Chromatography 1958, Butterworths, London, 1958, Ch. 3.17 J. H. Knox and H. P. Scott, J. Chromatogr., 282 (1983) 297-313, and references cited therein.18 Cs. Horvath and H.-J. Lin, J. Chromatogr., 149 (1978) 43-70.19 J. C. Giddings, Dynamics ofChromatography, Part I, Principles and Theory, Marcel Dekker, New York,
1965.20 R. W. Stout,J. J. DeStefano and L. R. Snyder, J. Chromatogr., 282 (1983) 263-286.21 S. R. Springston, P. David, J. Steger and M. Novotny, Anal. Chem., 58 (1986) 997-1002.22 J. C. Giddings, Dynamics ofChromatography, Part I, Principles and Theory, Marcel Dekker, New York,
1965, p. 238.23 S. Chapman and T. G. Cowling, The Mathematical Theory of Non-Uniform Gases, Cambridge
University Press, Cambridge, 3rd ed.,. 1970, p. 258.24 S. Wicar, J. Novak, J. Drozd and.J. Janak, J. Chromatogr., 142 (1977) 167-175.25 M. M. Martin, G. Blu and G. Guiochon, J. Chromatogr. Sci., II (1973) 641-u54.26 E. Katz, K. Ogan and R. P. W. Scott, J. Chromatogr., 260 (1983) 277-295.27 R. A. Weast (Editor), Handbook of Chemistry and Physics, CRC Press, Boca Raton, Florida, 65th ed.,
1984.28 E. D. Katz and R. P. W. Scott, J. Chromatogr., 270 (1983) 29-50.29 U. van Wasen, I. Swaid and G. M. Schneider, Angew. Chem., 19 (1980) 575-587.30 D. E. Martire, R. L. Riester, T. J. Bruno, A. Hussam and D. P. Poe". in preparation.31 R. T. Jacobsen and R. J. Stewart, J. Phys. Chem. Ref Data, 2 (1973) 757.32 1. F. Ely, Proceedings of the 63rd Gas Processors Association Convention, Gas Processors Association,
Tulsa, OK, 1984, pp. 9-22.33 K. Stephan and K. Lucas, Viscosity of Dense Fluids, Plenum Press, New York and London, 1979.34 P. J. Schoenmakers and L. G. M. Uunk, Chromatographia, 24 (1987) 51-57.

Journal of Chromatography, 517 (1990) 31-49Elsevier Science Publishers RV., Amsterdam
CHROMSYMP. 1980
Dispersion in the interstitial space of packed columns
PIERRE MAGNICO and MICHEL MARTIN*
Ecole Superieure de Physique et Chimie Industrielles, Laboratoire de Physique et Mecanique des MilieuxHeterogenes, URA CNRS 857, 10 rue Vauquelin, 75231 Paris Cedex 05 (France)
ABSTRACT
In order to study the dispersion mechanism occurring in the interstitial space ofa porous medium, a column was packed with large (210 {lm) impenetrable particles bya special dry-packing procedure, designed to obtain a permeable bed that is as uniform as possible. The experimental conditions are selected so as to eliminate as far aspossible any other source of dispersion and focus essentially on that arising in themoving fluid. A linear regression analysis of the dispersion data for non-retainedsolutes shows that the Huber and the Horvath and Lin models fail to describe correctly the experimental results whereas the Giddings model provides a good fit to thedata. The reduced plate height becomes constant and equal to 2 at high reducedvelocities. It reaches a minimum value of 1 at a reduced velocity of about 3. Themodels and some previously published experimental data are discussed at the light ofthese results.
INTRODUCTION
The quality of chromatographic resolution depends on the extent of thebroadening of the individual component zones as much as on the retention gapbetween adjacent zones. The control of this zone broadening, and hence of thedispersion of the zones as they migrate along the chromatographic column, has alwaysbeen an essential goal in optimization studies of chromatographic separations. Thezone dispersion in the column is due essentially to two broad classes of phenomena: (i)longitudinal molecular diffusion as a result of longitudinal solute concentrationgradients and (ii) resistance to mass transfer between regions of the cross-section withdifferent velocity components along the direction of flow. The former dependsessentially on the time spent by the solute in the column. The latter can occur becauseof the retention of the solute on, or in, a stationary phase or because of the presence ofa stagnant region of the mobile phase inside the pores of the particles. The contributionto the band broadening arising from these different sources is relatively welldocumented, especially when one is specifically concerned with their dependence onthe carrier flow-rate. Flow non-uniformities in the cross-section of the column are alsopresent in the interstitial space between the particles because of the shear forces
0021-9673/90/$03.50 © 1990 Elsevier Science Publishers B.V.

32 P. MAGNICO, M. MARTIN
associated with the viscous flow and ofthe more or less erratic path followed by theflow streamlines in the complex geometry of the porous bed. These flow inequalitiescontribute to the zone dispersion but the dependence of this contribution on theflow-rate is relatively complex. Several equations based on different approaches anddiffering mainly in the exponent of the velocity have been developed to account for thiscontribution. Exponents 1, 1/2 and 1/3 appear in the eddy diffusion coupling term ofthe models developed by Giddings1
, Huber and Hulsman 2,3 and Horvath and Lin4
,
respectively. In spite of the practical importance of the corresponding term in theplate-height equation (it has a major influence on the coordinates of the minimum ofthe Van Deemter curve), no definitive proof of the correctness of any of these modelscan yet be established from experimental liquid chromatographic measurements asvarious and sometimes conflicting conclusions about this contribution have beenderived by different authors.
It seems that these discrepancies arise mainly because the relatively slightdifferences between the three models are obscured by other contributions to bandbroadening (resistance to mass transfer in the stagnant carrier fluid within the pores ofthe particles or in the stationary phase, influence of retention on dispersion,extra-column band broadening) or because it was erroneously assumed that thedispersion coefficient was constant along the column whereas, in fact, a lengthaveraged coefficient is experimentally measured. This might be the case in liquidchromatography with packings of small particles as the relatively large pressuresapplied at the column inlet may affect the values of the diffusion coefficients. Further,under these conditions, the radial dissipation of the heat generated by the friction ofthe liquid on contact with the particles induces a radial viscosity profile and,consequently, a velocity profile which contributes to the broadening of the zones.Preliminary calculations indicate that the contribution of this effect to the plate heightmight increase with the fifth power of the velocity for a fully developed temperatureprofiles.
The aim of this study was to determine the best model describing the physicaldispersion process occurring in the interstitial space of the chromatographic packing.The experimental conditions are designed so as to focus essentially on this source ofband broadening by eliminating, as far as possible any other contribution to thedispersion, except, of course, the irreducible longitudinal molecular diffusion. Theseconditions include the use of sieved, impervious and spherical particles, very lowpressure drops, non-retained solutes and a packing procedure that provides a packingthat is as regular as possible. Special attention was paid to the column arrangement toavoid any disturbing fluid instability and to the initial filling of the packing by theliquid to ensure that no air pockets remain entrapped within the packing.
THEORY
If structural heterogeneities present in the porous medium have a length scalewhich is small in comparison with the column length, the dispersion of the solute isdescribed by the classical convection-diffusion equation:
(I)

DISPERSION IN PACKED COLUMNS 33
which is a combination of the phenomenological Fick's law and of the massconservation law. Although dispersion occurs in all directions, one is concerned hereonly with dispersion along the longitudinal flow direction. The variable x is thedistance along the column from the inlet, t the time, U the mean mobile phase velocity,C the cross-sectional average concentration of the solute and D the overall solutedispersion coefficient. In order for these terms to be defined, one has to assume theexistence of a scale beyond which the porous medium is homogeneous, i.e., thevariables c, U, D and x are averaged over a volume known as the representativeelementary volume, which must be of a small size compared with the column volume.
In the situation where one injects a continuous solution of solute witha concentration Cm.., starting at time t = 0, at the inlet of the column previously filled
.with a solution of concentration Cmin, which corresponds to the experimental set-up ofthis study, the limiting conditions for concentration in time and space are, respectively,
rex,t = 0) = °rex = 0, t) = 1
and, assuming a semi-infinite medium:
rex -> 00, t) = °
(2)
(3)
(4)
In these equations r is the dimensionless concentration (c - Cmin)/(Cmax - Cmin)' Thesolution of eqn. 1 with these limiting conditions is6
1[ (x - Ut) (ux) (x + Ut)]rex, t) ="2 erfc 2JDt + exp D erfc 2JDt (5)
which, when Ux/D is larger than 100, becomes, with a good approximation, equal to6
1 (x - Ut)rex, t) = -2 erfc ----=-2JDt
(6)
In eqns. 5 and 6, erfc represents the complementary error function. The approximationrepresented by eqn. 6 fully applies under the present experimental conditions whereUx/D lies in the range 2 . 103-2 . 106 when x is taken as the column length.
The study of the dispersion of the solute reveals different properties of themedium depending on the flow-rate. When the mean velocity is very low, the solutedispersion is the same as the molecular diffusion which would be observed ifa concentration gradient of the solute was established between the inlet and the outletof the column without flow. The dispersion coefficient, D, measured is thenproportional to the molecular diffusion coefficient, Dm and
D=Dm
T(7)

34 P. MAGNICO, M. MARTIN
The factor T is known as the tortuosity and is larger than 1. The tortuosity can bedetermined by measurements of the electrical conductivity of the packing. It is foundthat, in the porosity range encountered in bead packings, T ~ 1:-1/2, where I: is theporosity of the packing7
•8 .
When the carrier flow-rate increases, the dispersion coefficient is no longerconstant but becomes a function of the mean velocity. More generally, this functiondepends on the dimensionless reduced velocity, or Peclet number, Pe, which is the ratioof the times required to transport the solute along one particle by diffusion and byconvection:
(8)
where dp is the particle diameter and U the mean velocity.It is convenient to express the dispersion in terms of the dispersion length, L d :
L d = DIU (9)
This length represents half the plate height frequently used in the field of separationscience.
Various equations, or models, have been proposed to represent the dependenceof the dispersion length on the operational parameters and, especially, the carriervelocity. The models relevant in the context of this study are presented below assumingthat there is no interaction of the solute with the packing, i.e., no retention, and that thepacking is made of impervious rigid spheres (no internal pores). Accordingly,dispersion will only occur in the space occupied by the carrier fluid between theparticles and, apart from the molecular diffusion term arising from the existence ofa longitudinal concentration gradient and expressed by the eqn. 7, is due to flowvariations associated with structural heterogeneities of this space.
The Giddings modelThe velocity field in a packed bed is much more complex than that in a capillary
tube. Consequently, apart from the Taylor-like dispersion arising in an interstitial flowchannel because of the transversal velocity variations within this channel, solutedispersion can also come from the erratic flow pattern associated with the presence ofa more or less regular array ofparticles. These two kinds ofdispersion processes can becalled hydrodynamic dispersion and geometric (or mechanical) dispersion, respectively. One notes in passing that the latter process is also known as the anastomosis and,more commonly in the chromatographic literature, as the "eddy diffusion", a termwhich we prefer to avoid as it has mistakenly been associated in the past by someauthors with the eddies induced by a turbulent flow. Clearly, the geometric dispersionmechanism appears in the laminar flow regime at low values of the Reynolds number.
The influence of these two kinds of dispersion was recognized in one of earliestmodels of peak broadening in chromatography by Van Deemter et al. 9 , who simplyadded their respective contributions to the dispersion length. Later, this model wasmodified by Giddings!, who noted that these contributions are not independent andthus additive but. instead. are coupled.

DISPERSION IN PACKED COLUMNS 35
In this model, five different levels of flow heterogeneities are considered forpackings of porous particles 1. In the present study dealing with non-porous particlespacked by a special procedure to ensure a packing as regular as possible, one will beconcerned mainly with the trans-channel level and, to a lesser extent, with theshort-range inter-channel level. The characteristic length scale of these velocityvariations is assumed to be proportional to the particle diameter.
This model assumes that the dispersion due to the velocity variations is similar toa random walk process. The time corresponding to an elementary step, or correlationtime, is defined as the time necessary for a solute molecule to travel from one velocitydomain to another. Two mechanisms allow this transport, molecular and convection,which both have a specific correlation time. The corresponding dispersion lengthsLd.hydro and L d •geo for the diffusive (hydrodynamic dispersion) and convective(geometric dispersion) mechanisms are, respectively,
(10)
(11)
where A and C are dimensionless parameters which depend on the scale and amplitudeof flow non-uniformities.
Basically, the coupling theory assumes that the total numbers of steps in therandom walk is the sum of the number of steps for each of the individual processes.Then, the resultant correlation time and the resultant dispersion length appear to bethe harmonic, rather than the arithmetic, sum of their respective individual contributions. Accordingly, the overall dispersion length is, combining eqns. 7, 9, 10 and 11:
(12)
or
(13)
where ld is the reduced dispersion length, which is half the reduced plate height. In theseequations, the individual contributions of the longitudinal concentration gradient andtransversal flow non-uniformities to the dispersion length have been added as they actindependently to disperse the solute. At large values of the Peclet number, thedispersion is controlled by the convective mechanism and then the coupling termbecomes constant while the diffusive process is dominant at lower Pe values.
The Huber modelA model based on the mass balance equation was developed by Huber and

36 P. MAGNICO, M. MARTIN
Hulsman 2,3. It uses a correlation obtained through dimensional analysis of experimental data by Hibi 0 to express the dispersion term arising from the flownon-uniformities, which gives
or
1 __1_d - TPe + 1 I
A+ CPe l / 2
(14)
(15)
This equation differs from the Giddings equation by the exponent 1/2 of the Pecletnumber in the last term and in the numerical value of the dimensionless coefficient C.
The Horvath and Lin modelThe dispersion model developed by Horvath and Lin is based on the postulate
that a stagnant layer of fluid surrounds the particles and occupies a fraction of theinterstitial fluid volume4
. According to the free surface theory of Happe11 1 and Pfefferand Happel 12
, the thickness of this layer is proportional to Pe- l /3.
The model assumes that the peak broadening of a non-retained solute is due tothe geometric dispersion process during the flow-dependent time spent by the solute inthe streaming part of the carrier fluid, which gives for the complete dispersion lengthexpression
or
IId = -TP-e + -1---1-
A+ CPe l / 3
(16)
(17)
It also differs from the Giddings equation by the exponent of the Peclet number in thesecond term on the right-hand side and in the numerical value of the dimensionlesscoefficient C. It must be clear that, in spite of the close similarity of eqns. 13 and 17, thelatter is not based on a coupling effect and completely neglects the diffusive transportmechanism in the second term due to the velocity unequalities. Nevertheless, it isinteresting that, if one wants to modify the Horvath and Lin model by introducinga coupling effect between the diffusive process in the stagnant layer and the convectiveprocess either in the whole interstitial fluid or only in its streaming part, by the

DISPERSION IN PACKED COLUMNS 37
harmonic addition of the corresponding correlation times, one obtains an expressionwhich has exactly the form of eqn. 14, obviously with different values of thedimensionless coefficients A and C. Moreover, as indicated by Horvath and Lin in thenote added in the proof of their paper4
, the same form is found if one includes in thedispersion length expression the additional, and independent, peak broadeningcontribution due to diffusion into the stagnant layer by properly taking into accountthe flow-dependent "capacity factor" which reflects the distribution of the solutebetween the streaming and stagnant parts of the interstitial fluid (however, we founda term which is numerically three times smaller than that of Horvath and Lin).
More recently, Koch and Brady13 derived the dispersion coefficient associatedwith the presence of a boundary layer around the particles, which, according toAcrivos and Taylor14
, is also found to have a thickness proportional to Pe- 1/3
, andobtained a dispersion length expression which is a linear function of In Pe. Such an InU dependence was previously obtained by Saffman 15 using a different model.
The Bouchaud and Georges modelA general theory of the dispersion of solute species due to the spatial fluctuations
of the velocity field has been recently developed by Bouchaud and Georges l6 by meansof models with a very simple geometry. In order to study the dispersion due to flowinhomogeneities in a porous medium, they use the idealized model represented in Fig.I, which consists of a succession of identical cells in series. In each cell, two flow pathsof different lengths and permeabilities are connected in parallel. Let V and I'V be thevelocities in the fast and slow branches of lengths ~ and A~, respectively (y < I).A solute molecule entering a given cell has a probability P of entering the slow branchin which its mean residence time is < r >, while the time spent in one fast branch issimply ~/V. Assuming that the dispersion process is ergodic, i.e., that the time spent ina given region is proportional to the volume of this region, a relationship is foundbetween the probability P, <r> and the volume fractionjofthe slow branches. Usinga statistical approach, Bouchaud and Georges derived a general expression for thedispersion length in terms of the first and second moments of the distribution law of theresidence times in the slow paths.
A particular expression is found in the case where the residence time is unique,which corresponds to a Dirac distribution. According to this model, each path doesnot contribute to the dispersion, but the overall dispersion of the transit times alonga large number of cells arises from combination of the paths followed by a molecule,
yv
Fig. I. Schematic model suggested by Bouchaud and Georges16 Two channel types (branches) areconnected in parallel in one of a succession of cells connected to each other cell in series. In channel I oflength ~, the microscopic velocity V leads the transport process whereas, in channel 2 oflength ;.~, the localvelocity yV (y < I) and the molecular diffusion both control the solute transport.

38 P. MAGNICO, M. MARTIN
which is described by a binomial law. This model has been extended by Bouchaud 1 7 tothe case where r, the constant residence time in a slow branch, is the result of thecombination of the diffusive and connective transport processes according to theharmonic coupling law:
(18)
Using the relationship between U, the average migration velocity of a solute moleculealong the cell pattern, and V resulting from the ergodicity hypothesis, the dispersionlength is found in the limit oflarge cell numbers and for an equal path length of the twobranches (A = 1):
or
D 1L d = - = ---,-----
U 2y 4Dm
gel -f) + ~2fU
L d 1ld = T = 2y 4
----'----+-fi1 - f) fPe
(19)
(20)
if the Peclet number is defined as U~/Dm. These equations do not include thelongitudinal molecular diffusion term. However, regarding the more important term,in the present context, due to flow inequalities, they are similar to the correspondingGiddings' equations as far as the U dependence of the dispersion length is concerned.Clearly, this is due to the similarity of the ways in which the coupling between thediffusive and convective transports are introduced in the two approaches. However,eqns. 19 and 20, corresponding to the idealized, very simple geometric modelrepresented in Fig. 1, show that when such a coupling occurs at a microscopic level (theindividual slow branch), it manifests itself in the dispersion process at the macroscopiclevel. Further the Bouchaud and Georges model provides a physical meaning for thenumerical coefficients which enter the dispersion equation. This is especially true forpackings of porous particles.
EXPERIMENTAL
Packing procedureA 16.6 cm x 2.4 cm J.D. column was packed with the 200-220-flm sieving
fraction of glass beads by a special dry packing procedure designed to obtain a porousbed that is as regular as possible (Fig. 2). A vibrating distributor induces a constantflow ofparticles falling onto a short column packed with large (5 mm 1.0.) glass beads,which ensures a homogeneous distribution of the particles across the wholecross-section. Then the particles pass through a set of parallel, vertical, 2.5 mm J.D.tubes, which help to keep the particles flowing homogeneously in the whole

DISPERSION IN PACKED COLUMNS 39
\./-----
A
B
c
D
Fig. 2. Experimental set-up for column packing. A = hopper pouring the particles at a constant flow; B =
packing of 5-mm glass beads; C = fixed set of 2.5 mm I.D. tubes; D = column section being packed; E =
column section already packed with particles; F = support which allows the column to move and rotatearound its axes.
cross-section of the packing assembly, before falling into the column to be packed.This column is moved down during the packing process in such a way as to maintaina constant falling height and avoid the formation of a longitudinal permeabilitygradient. At the same time, the column is rotating around its axis in order to avoidradial stratification of the packing.
Materials and methodsIn order to avoid any trapping of bubbles which may significantly affect the
dispersion process, the column, vertically orientated, is completely saturated withcarbon dioxide, then filled upwards with water until the signal of an electricalconductivity cell monitoring the acidification of the water effluent due to thedissolution of the carbon dioxide bubbles becomes negligible. The volume ofliquid inthe column is of 28.5 cm 3
, which gives a porosity of 38.0%. This porosity valueconsiderably exceeds the corresponding value (26%) for a dense and perfectcrystal-like arrangement of identical spheres but lies well within the range of porositiesexperimentally obtained when randomly packing by various techniques a very largenumber of particles (here about 107
). It is believed that the packing procedure used inthis study leads to a packing that is as uniform as possible.
Dispersion measurements are performed by frontal analysis of a solution ofa mixture of NaCI and CaClz, rather than of a single salt solution, for eliminating ionexchange between the glass beads and the solution. A relative high concentration in theinitial solution (0.5 gil NaCI, 0.5 gil CaClz) is used in order to avoid further adsorptionand ion exchange of the solute mixture, which would otherwise lead to retention and toa significant effect on the profile, as previously observed. Then, a continuous step ofsolution at a different salt concentration is introduced in the column by switching thepump head of a dual-piston syringe pump (Model 919, Harvard Apparatus, South

40 P. MAGNICO, M. MARTIN
Natick, MA, U.S.A.) by means of a four-way switching valve. The flow-rate rangeinvestigated was 33 J1l/min-20 mllmin, which corresponds to Peclet numbers between0.5 and 300. The pressure drop in the column was always less than 0.2 bar. In allinstances the Reynolds number was lower than 0.4, which prevents any dispersionperturbation associated with the onset of turbulence.
The displacing solution is made more concentrated (I gil NaCI, I gil CaCI 2
aqueous solution) than the initial solution to avoid the viscous fingering effect(Saffman-Taylor instability) which may occur when a more viscous solution isdisplaced by a less viscous solution. Further, the liquid moves upwards, rather thandownwards, in order to avoid the Rayleigh-Taylor instability associated with thepresence ofa denser solution above a lighter one. These precautions are necessary withthe relatively high concentration used in this study as these two effects have beenshown to induce both an increase in the dispersion coefficient and a characteristictailing of the elution profiles.
The concentration change of the column effluent is continuously monitored bya conductivity detector (Model 30063, Dionex, Sunnyvale, CA, U.S.A.). Thetemperature of the effluent is also measured in order to take into account thetemperature dependence of the conductivity (2%;aC around 20G C), especially for theslowest analyses. The total dead volume of the pre- and post-column connectingcapiUary tubes, of the flow distributor and collector located at the column extremitiesand of the conductivity cell is 0.28 cm 3
, i.e., about 1% of the liquid volume in thecolumn.
In the calculations, the particle diameter is assumed to be equal to 0.021 cm and1IT equal to 0.6. The diffusion coefficient, Dm , is taken as equal to 1.336 . 10 - 5 cm 2 Is,which corresponds to the average of the individual coefficients of the two salts 18. Fordispersion coefficient determinations, the step between the two plateaux is normalizedbetween 0 and 1 and measurements are performed in the 5-95% range of the front. Ateach time in this range, the experimental normalized concentration value gives, usingeqn. 6 and the tabulated error function, the value of the reduced parameter X = (L Ut)12jDi, where t is the elution time. Plotting Xjt vs. t gives a straight line fora Gaussian curve. The dispersion coefficient is obtained by linear regression from theintercept of this plot and the mean velocity from the slope. This mean least-squaremethod of determination of D has the advantage of taking into account aUexperimental data for the front in the 5-95% range of the concentration step ratherthan the peak width at some more or less arbitrary selected concentration level, asclassically performed in the small-pulse injection method.
RESULTS
The results obtained experimentally by this procedure are reported in Fig. 3,which shows the plot of the reduced dispersion length, ld' vs. the Peclet number ona logarithmic scale. This curve has the characteristic shape of the classical VanDeemter curves with a minimum at a Peclet number of ca. 3 for a reduced dispersionlength ofabout 0.5. This corresponds to a reduced plate height of 1, which is lower thanthat usually observed in packed chromatographic columns. Clearly, this low value isdue to the use of impervious particles and to the quality of the homogeneity of thepacking. With increasing Peclet number the dispersion length increases until it reachesa constant value of about 1 at large Peclet numbers.

DISPERSION IN PACKED COLUMNS
10.--------------------,
41
** +
+ .. ++
Pe
Fig. 3. Log-log plot of the reduced dispersion length versus Peclet number for a 16.6 cm x 2.4 cm 1.0.column packed with 2IO-Jlm glass beads.
The models described above all predict a constant ld value at large velocities, asobserved, but they differ essentially in the exponent of the velocity in the hydrodynamic dispersion term of the dispersion length equation. The various equations canall be expressed by the following form:
(21)
with n = 1/3, 1/2 and 1 for the Horvath and Lin, Huber and Giddings (or,equivalently, Bouchaud and Georges) models, respectively. The parameter A = Adp
represents the convective (geometric) dispersion process for the three models (eqns. 12,14 and 16). It is the limiting value of the dispersion length for large velocities. TheB coefficient, taking into account the hydrodynamic dispersion, differs from onemodel to another. Looking for a linear relationship as an easy visual, and alsoquantitative, test to check the validity of the agreement between experimental (D, U)data and the theoretical expressions described above, one can transform eqn. 21 asfollows:
if 1y=-+-
A B
where Y is defined as:
U,,+lY=--
DmD- T
(22)
(23)
Then a plot of Yvs. if should give a straight line if the corresponding model is correct.These plots are shown in Fig. 4 for the three values ofn. In these plots, only data pointscorresponding to Peelet numbers larger than 1 are used in order to reduce the influence
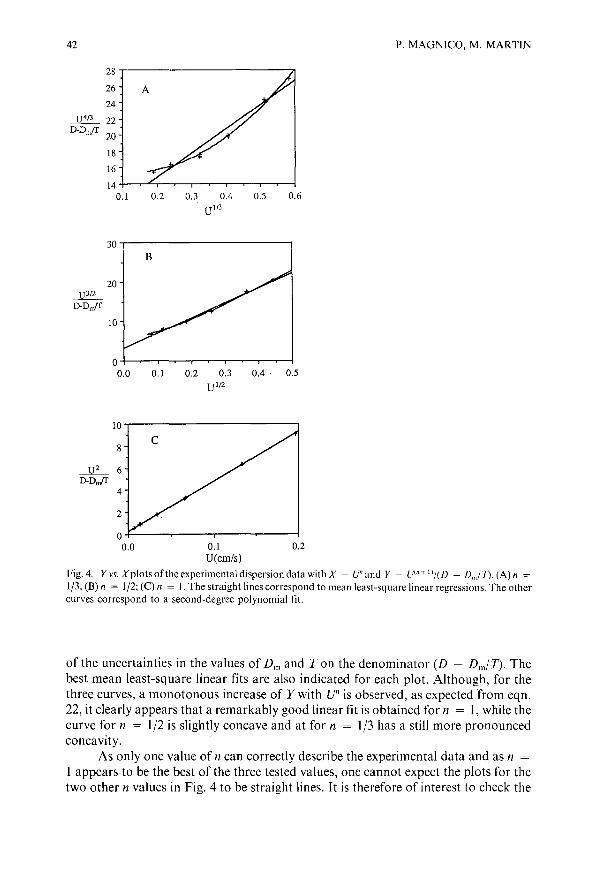
P. MAGNICO, M. MARTIN42
28
26
24
~22D-Dn/T
20
18
16
140.1 0.2 0.3 0.4 0.5 0.6
U I /3
30B
20U3/2
D-Dn/T
10
00.0 0.1 0.2 0.3 0.4 0.5
UII2
10
4
2
0.1 0.2U(cm/s)
Fig. 4. Yvs. Xplots of the experimental dispersion data with X = U" and Y = U"·+ 11/(D - DnJD. (A) 11 =
1/3; (B) 11 = 1/2; (C) 11 = I. The straight lines correspond to mean least-square linear regressions. The othercurves correspond to a second-degree polynomial lit.
of the uncertainties in the values of Dmand T on the denominator (D - DmlT). Thebest mean least-square linear fits are also indicated for each plot. Although, for thethree curves, a monotonous increase of Y with un is observed, as expected from eqn.22, it clearly appears that a remarkably good linear fit is obtained for n = I, while thecurve for n = 1/2 is slightly concave and at for n = 1/3 has a still more pronouncedconcavity.
As only one value of n can correctly describe the experimental data and as n =1 appears to be the best of the three tested values, one cannot expect the plots for thetwo other n values in Fig. 4 to be straight lines. It is therefore of interest to check the

DISPERSION IN PACKED COLUMNS 43
coherence of the shapes of the curves in Fig. 4, i.e., to check that the observed shapes ofthe curves in Fig. 4A and B are in agreement with the shape that takes the theoreticalvariation corresponding to n = 1, when it is plotted according to the transformation ofeqns. 22 and 23 but with another value of the parameter n (we shall take n = 1/3 andn = 1/2). For n = 1, eqn. 22 becomes
Combining eqns. 23 and 24, one obtains
X 1Y = A+ BX(l n)/n
with
X= un
(24)
(25)
(26)
Eqn. 25 clearly shows that the Yvs. X curve should not be a straight line ifn =1= 1. Whenn < 1, it has a minimum, for:
(27)
The shape of the Yvs. X curves should therefore be concave for n < 1, which is indeedwhat is observed in Fig. 4A and B. The linear regression of the data according to eqn.23 for n = 1gives A = 0.022 and B = 3.40 (all dimensional values are in c.g.S. units).With these values, eqns. 25 and 27 give XOPl = 0.24 and Yopt = 16 for n = 1/3 andXOPl = 0.081 and Yopt = 7.3 for n = 1/2. Although the number ofexperimental pointsat low velocities in Fig. 4 is too small to show definite evidence of the presence ofa minimum in the plots for n = 1/3 and n = 1/2, the coordinates of the minima for thetwo curves correspond roughly to those ofpoints obtained at low velocity, which againagrees with the fact that the best of the three n values is I.
Of the three n values for which dispersion models have been developed, n =
1 appears to be the best. One may wonder, however, if another value of n, notnecessarily corresponding to a previous model, could provide a still better fit of theexperimental data according to eqn. 21. This can be done by writing this equation inthe form
(28)
Then, a plot of Z vs. In U should give a straight line, the slope of which should be equalto n. In fact, such a plot is very sensitive to the value of A which has to be stated. This is

44 P. MAGNICO, M. MARTIN
4,...---.,----------------.
Ln(---.1l..- - .1..) 3D-DnJT A
-1-2-4 -3Ln(U)
-52+-~-r_~~-~__.~-~....::::>--l
-6
4,...---.0-------------,
3
0-6 -5 -4 -3 -2 -1
Ln(U)
4
3
U 1 2Ln(----)D-DnJT A
1
0
-1-h -5 -4 -3 -2
Ln(U)
Fig. 5. Z V.I'. In(U) plots of the experimental dispersion data with Z = In [U/(D - Dm/T) - l/A] fordifferent values of l/A. (A) l/A = 38.2; (B) 1/A = 45.0; (C) [/A = 48.0. The straight lines correspond tomean least-square linear regression. The other curves correspond to a second-degree polynomial fit.
demonstrated in Fig. 5, where such plots are shown for three different values of I/A.The first two (l/A = 38.2 and I/A = 45.0) correspond to the slopes given by the linearregression of the experimental (Y, U") data according to eqn. 22 for n = 1/2 and n = 1,respectively [for n = 1/3, one obtains I/A = 29.8, which gives a strongly non-linear(2, In U) plot, which, for this reason, is not shown in Fig. 5]. For the sake ofcomparison, a plot for a larger I/A value (l/A = 48) is also shown. Fig. 5 indicates thatthe curve is concave for relatively low values of I/A, then becomes convex for larger

DISPERSION IN PACKED COLUMNS 45
I/A values. Eventually, it becomes linear for a given value of I/A. A computer searchfor the I/A value giving the best linear fit of the da.ta provides I/A = 45, which isprecisely the value obtained by the procedure mentioned above for n = I. With this1/A value, a linear regression of the (Z, In U) data gives, for the slope n, a value of0.994,which, as expected, is very close to 1. Further, this I/A value corresponds to a limitingdispersion length at large P6c1et numbers equal to 0.022 cm, i.e., to 1.06 dp, which ascan be seen in Fig. 2 is close to the experimentally obtained value, while the A valuesobtained by linear regression ofeqn. 22 for the Horvath and Lin model (n = 1/3, A1.60 dp) and the Huber model (n = 1/2, A = 1.25 dp) are too large.
DISCUSSION
All these results provide a strong indication that eqn. 21 gives a correctrepresentation of the flow dependence of the dispersion length and that the Giddingsmodel with n = I is the most appropriate model for describing the experimental data.This suggests that, among the five different levels of flow non-uniformities distinguished by Giddings, either only one is affecting significantly the dispersion length or,if two or more of them are influencing this length, they have similar values of A/B (or,equivalently, A/C). Indeed, in the latter instance, adding two coupling terms withidentical A/e values in eqn. 13 is equivalent to multiplying one coupling term by someappropriate constant. One finds, from a linear regression of the experimental data,a A value of 1.06, while the values estimated by Giddings are 0.5, 0.5 and 0.1 forthe trans-channel, short-range inter-channel and long-range inter-channel effects,respectively. The B value derived by linear regression in Fig. 4C is equal to 3.40 s,corresponding to a e value in eqn. 10 of 0.103. The corresponding e valuesapproximately estimated by Giddings for the three above effects are 0.005, 0.25 and I,which gives A/e values of 100, 2 and 0.1, respectively, while the experimental A/evalue is 10. From a comparison of these estimated and experimental values it seemsthat the column does not contain long-range inter-channel non-uniformities, whichgives some indication of the quality of the packing procedure. However, theexperimental A, e and A/e values do not correspond closely to the estimated values foreither the trans-channel effect or the short-range inter-channel effect. If only one levelof flow irregularities is present, as suggested above, it would have to be thetrans-channel level which is present even in a crystal-like array of identical spheres. It isdifficult, however, to imagine that the short-range inter-channel effect is totally absentbecause the packing procedure cannot be perfect. These remarks suggest, therefore,that our data reflect some combination of the trans-channel and inter-channel effectsand that the A/e ratios for these two effects are not as different as the correspondingvalues estimated by Giddings.
It is of interest to interpret these experimental data by means of the Bouchaudand Georges model, which gives the same flow dependence of the dispersion length asthe Giddings model but which is based on a simple geometric construction. This modelhas three parameters, f, y and ~, while the linear regression provides only twocoefficients. If one assumes ~ is equal to the particle diameter, dp , which seems to bea reasonable cell size to be used, then one obtains! = 0.41 and y = 0.11. As y is thevelocity ratio between the two branches which have been assumed to have the samelength, y represents a permeability ratio and can be assumed to be equal to the ratio of

46 P. MAGNICO, M. MARTIN
the squares of the diameters of the two branches, according to the Poiseuilleexpression. This size ratio is then found to be equal to 1/3. The Bouchaud and Georgesmodel allows the dispersion behaviour of an extremely complex system such asa porous medium to be represented by that of a simple geometric system.
One should not be surprised that the Giddings model provides the best fit to theexperimental data. Indeed, the model developed by Huber is not based on a physicalmodel for dispersion but relies on the empirical mass transport correlation by Hiby,the accuracy of which has been questioned 19,20. Further, this correlation is based ondispersion data obtained for Pec1et numbers between 30 and 105
• This does not allowa full description of the curvature of the ld vs. Pe curve associated with the couplingeffect for Peclet numbers between 5 and 100.
The discrepancy with the Horvath and Lin equation is even greater than thatwith the Huber expression. As already noted, this comes, in part, from the fact that theflow-dependent expression according to Pfeffer and Happel 12 for the stagnantboundary layer thickness, on which their equation is based, is only valid at large Pecletnumbers and should therefore be used only for Pe > 50 (ref. 21). At lower Pe, thestagnant layer approaches a constant value and so should the corresponding term inthe dispersion length equation. Further, the implicit approximation made in theHorvath and Lin derivation of the volume fraction of the free-streaming fluid [I/(l +x) = I - x, where x represents the ratio of the stagnant film volume to the total fluidvolume] requires that the stagnant layer is small and thus that Pe is large. For thesereasons, the Horvath and Lin equation should not be applied for Peclet numbers lowerthan 50-100. However, it is seen in Fig. 3 that the convex part of the ld vs. Pe curve,which reflects the velocity dependence of the flow non-uniformities contribution to thedispersion length, is mainly found for Pe values between 5 and 100. It is therefore notsurprising that the Horvath and Lin equation cannot fit the experimental datasatisfactorily.
Although the Giddings model provides the best fit of the experimental data inthis study, one may wonder why it has not been found satisfactory in some previoussimilar studies with non-retained solutes and non-porous particles. In one of the firstexperimental proofs of the correctness of the then disputed coupling concept, Knox 22
found that the slope of the log ld vs.log Pe curves was much smaller than I, as a result ofthe coupling effect. However, he did not find a constant limiting value for ld at large Pebut, instead, that ld decreased after reaching a maximum value around Pe =5000-30000, depending on the experimental conditions. This decrease was attributedto the onset of turbulence at large Pe. For all Peclet numbers, the ld values weresignificantly affected by the dc/dp ratio of the column diameter to particle diameter,which was lower than in the present experiment. One can expect that a low dc/dp valuewill induce, first, a non-random porosity variation across the column radius, as notedby Cohen and Metzner23 for dc/dp values lower than 30 in the case of newtonian fluidsand, second, an important trans-column effect and, consequently, a relatively largeA value. This can explain why the Knox data are better fitted by a modification ofeqn.13 obtained with an integral form in which A is constant while contributions fromdifferent C values are weighted inversely with C. Knox also found that A is of the orderof magnitude of the column diameter, rather than of the particle diameter as found inthis study.
In their experiments with dc/dp values of about 100, as in this present study,

DISPERSION IN PACKED COLUMNS 47
Horvath and Lin found that (ld, Pe) data in the Pe range 0.5-10000 are better fitted toeqn. 17 than to eqn. 13 or 15 (ref. 4). One can note that, at large Pe, they obtained ldvalues 6-7 times larger than those in Fig. 3, which indicates a significant A value.However, the A values should be the same for the three models. Therefore, thisprobably reflects the fact that various levels of flow non-uniformities contribute topeak broadening and that the overall dispersion length is the result of trans-channel,short-range inter-channel, long-range inter-channel and, perhaps, trans-columneffects. Then the A values ofeach individual effect add together at large Pe. Further, lddoes not reach a constant value at Pe up to 10 000, which indicates that at least one ofthese effects is characterized by a very large AIC value. Indeed, it can be shown fromeqn. 13 that ld - IITPe reaches 90% of its limiting A value when Pe is equal to 9Ale.In addition, it must be remembered that ld vs. Pe data represent average dispersion dataalong the column length whereas eqns. 13, 15 and 17 are local expressions of thedispersion length, i.e., ofhalf the rate of increase of the variance of the zone or front perunit column length. If the Peclet number, for instance, is not constant all along thecolumn, then the experimentally measured dispersion coefficient reflects some averagevalue of the dispersion length over the range ofPeclet numbers scanned from the inletto the outlet of the column. In Horvath and Lin's experiments, where the pressuredrops at the largest Pe were probably of the order of magnitude of several hundredbars, the pressure dependence of the diffusion coefficient may have led significantvariations of Pe along the column. Similar longitudinal gradients in Pe are correctlytaken into account in gas chromatography by means of appropriate compressibilityfactors when they are due to the mobile phase compressibility, but they are generallyneglected in liquid chromatography where the experimentally determined dispersioncoefficient (or dispersion length) is plotted as a function of the Peclet numbercalculated using the value of the diffusion coefficient at atmospheric pressure. Sucha practice has been shown to induce a significant increase in the apparent dispersionlength over the true local value, especially at large Peclet numbers24
.
Finally, it is of interest, for optimization purposes, to note the minimum value ofthe reduced dispersion length, ld,min and the corresponding Peclet number, Peopt. Fromderivation of eqns. 13 and 21 with n = 1, one obtains
and
1Peopt = _ C
-JCT-A
fi CI . -2 --d,mm - T AT
(29)
(30)
The coordinates of the optimum appear to be highly sensitive to the values of C butonly to a much smaller extent to the value of A. This reflects the fact that, at therelatively low Pe corresponding to this minimum, the diffusive mechanism is the mostactive process for relaxation of the transversal flow inequalities. With the present

48 P. MAGNICO, M. MARTIN
values of A (1.06), C (0.103) and IIT(0.6), one obtains Peopt = 3.15 and ld,min = 0.44.This minimum dispersion length, which corresponds approximately to the observedminimum in Fig. 3, is about half the value obtained by Horvath and Lin and also thebest reported values for high-performance liquid chromatographic (HPLC) columns(reduced plate height of2). This indicates that there is no precisely defined lower limitfor the minimum dispersion length and that it depends strongly on the quality of thepacking.
CONCLUSION
The study of the dispersion of a non-retained solute in a column packed withimpervious spherical particles and an appropriate data treatment of the experimentallymeasured values have revealed that the experimental data are correctly fitted by theGiddings coupling equation whereas they deviate from the behaviour predicted by theHuber and, especially, the Horvath and Lin expressions, in spite of the relatively smalldifferences between these equations. This validates the physical model of the couplingof the convective and diffusive transport processes on which the Giddings equation isbased.
Although the present study has dealt only with a packing of non-porousparticles, this conclusion should also hold for packings of porous particles as the bandbroadening arising from the interstitial space is believed to be the same for these twokinds of packings.
It must be emphasized that such a conclusion can be drawn because greatprecautions have been taken to obtain a packing that is as regular as possible and toeliminate, as far as possible, any other source of dispersion than that arising from theflow non-uniformities in the interstitial space of the bed, especially the bandbroadening contributions associated with the solute retention, the porous space insidethe particles, the thermal effect due to the viscous dissipation and the pressuredependence of the diffusion coefficient.
In liquid chromatographic columns packed with small porous particles, all theseeffects will give a more or less pronounced contribution to the overall dispersion. Inaddition, the usual packing procedure with these columns (filtration under pressure ofa slurry of particles) probably leads to a longitudinal porosity gradient which mayaffect the scale and the amplitude of the flow non-uniformities and also inducea longitudinal cross-sectional average velocity gradient. Hence, the actual dispersionlength is continuously changing along the column and the experimentally determinedvalue corresponds to some average column length. This provides some explanation ofthe fact that HPLC experiments have not allowed the models to be distinguished.Accordingly, in kinetic optimization studies of the experimental HPLC conditions forwhich a relationship between dispersivity and flow velocity is required, a semiempirical dispersion equation such as the Knox equation 25
, in which the relativelycomplicated coupling term for the dispersion length in the interstitial space is replacedwith a simple Pe rn (m ~ 1/3) expression, will generally be satisfactory.
ACKNOWLEDGEMENT
Fruitful discussions with Jean-Pierre Hulin are greatly appreciated.

DISPERSION IN PACKED COLUMNS
REFERENCES
49
I J. C. Giddings, Dynamics of Chromatography, Marcel Dekker, New York, 1965.2 J. F. K. Huber and J. A. R. J. Hulsman, Anal. Chim. Acta, 38 (1967) 305.3 J. F. K. Huber, J. Chromatogr. Sci., 7 (1969) 85.4 Cs. Horvath and H.-J. Lin, J. Chromatogr., 126 (1976) 401.5 M. Martin, unpublished results.6 K. H. Coats and B. D. Smith, Soc. Pet. Eng. J., March (1964) 73.7 P.-Z. Wong, J. Koplik, J. P. Tomanic, Phy.l'. Rev. B, 30 (1984) 6606.8 J. N. Roberts, L. M. Schwartz, Phys. Rev. B, 31 (1985) 5990.9 J. J. van Deemter, F. J. Zuiderweg and A. Klinkenberg, Chem. Eng. Sci., 5 (1956) 271.
10 J. W. Hiby, in P. A. Rottenburg (Editor), Proceedings ofthe Symposium on Interaction between Fluids andParticles, Institution of Chemical Engineers, London, 1962, p. 312.
II 1. Happel, AIChE J., 4 (1958) 197.12 R. Pfeffer and J. Happel, AIChE J., 10 (1964) 605.13 D. L. Koch and J. F. Brady J. Fluid Mech., 154 (1985) 399.14 A. Acrivos and T. D. Taylor, Phys. Fluids, 5 (1962) 387.15 P. G. Saffman, J. Fluid Mech., 6 (1959) 321.16 J.-P. Bouchaud and A. Georges, C.R. Acad. Sci., II, 307 (1988) 1431.17 J.-P. Bouchaud, personal communication.18 R. C. Weast (Editor), Handbook of Chemistry and Physics, CRC Press, Boca Raton, FL, 60th ed.
1979-80, p. F-62.19 R. S. Deelder, J. Chromatogr., 47 (1970) 307.20 R. Tijssen, Ph.D. Thesis, Technical University of Delft, 1979, p. 12.21 F. H. Arnold, H. W. Blanch and C. R. Wilke, J. Chromatogr., 330 (1985) 159.22 J. H. Knox, Anal. Chem., 38 (1966) 253.23 Y. Cohen and A. B. Metzner, AIChE J., 27 (1981) 705.24 M. Martin and G. Guiochon, Anal. Chem., 55 (1983) 2302.25 J. N. Done, G. J. Kennedy and J. H. Knox, in S. G. Perry (Editor), Gas Chromatography 1972, Applied
Science, London, 1972, p. 145.


Journal of Chromatography, 517 (1990) 51-66Elsevier Science Publishers B.V., Amsterdam
CHROMSYMP. 1974
Comparison of methods for the determination of the polarityand selectivity of stationary phases in gas chromatographyfrom a thermodynamic point of view
R. V. GOLOVNYA*
A. N. Nesmeyanov Institute ofOrgano-Element Compounds o/the U.S.S.R. Academy ofSciences, ul. Vavilova 28, MoscolV (U.S.S.R.)
and
B. M. POLANUER
All-Union Institute for Genetic and Selection of Industrial Microorganisms, Ministry of Medical Industry ofthe U.S.S.R., 1st Dorozny pr., Moscow (U.S.S.R.)
ABSTRACT
Different scales proposed for the evaluation of polarity and selectivity in gaschromatography as relative and absolute values were compared. It is shown that thescale including six parameters, L1G(X), L1G( y), L1G(Z), L1G(U), L1G(S) and L1G(CH2), ismore suitable and allows a unified system to be obtained for the polarity and selectivity of conventional stationary phases, organic and inorganic salts and polymersorbents. The main equation for the calculation of the partial molar free energy ofsorption, L1G, is simplified for capillary gas chromatography.
INTRODUCTION
Progress in gas chromatography (GC) has greatly increased the number ofavailable stationary phases and sorbents. Some of these stationary phases havesimilar or identical chemical structures and sorption properties L2. The mainchromatographic suppliers usually offer up to 200 stationary phases with differentproperties3,4. In recent years, new groups of stationary phases, including organicsaIts 5
,6 and crystal hydrates of inorganic salts7,8, have been described. Usually theselection of a suitable stationary phase for solving different problems is difficult andone needs a classification system suitable for comparison of stationary phases. Theproblem of a unified method for the selection and comparison of sorbents in GC stillremains.
Many different approaches have been used to compare and classify differentstationary phases and sorbents. All of them operate with the term "polarity". Polarityis used in GC to describe the ability of the sorbent to enter into different types ofinteractions with sorbates. The concepts of polarity and selectivity in GC are not
0021-9673/90/$03.50 © 1990 Elsevier Science Publishers B.V.

52 R.V.GOLOVNYA,B.M.POLANUER
clearly defined and are interpreted in different ways by different investigators. In ouropinion, GC polarity should be defined as the capacity of the sorbent for variousintermolecular interactions: dispersive, inductive, orientative and donor-acceptor9
.
The problem of polarity is still debated and many papers have been devoted to it.These can be divided into several groups. In some papers polarity is evaluatedon the basis of relative parameters: values of retention indices of several testcompounds 1,2,lO-16, sometimes in combination with the effective molecular weights ofthe sorbates 17
-19
, or on the basis of the ratio of retention parameters of neighbouringn_alkanes 20- 23 .
Evaluation of polarity utilizing thermodynamic values has often been undertaken. Such values are the excess free energy of sorption of a methylene unit in ann-alkane or any other monofunctional homologous series24
-28
; the partial molar freeenergy of sorption of a methylene unit itself29
,30 or divided on stationary phasedensity31 [LlG(CH 2)]; excess partial molar enthalpies32 and partial molal freeenergies33 of selected functional groups; and the six-parameter scale based on partialmolar free energies of five test compounds and the methylene unit9
,34-36.
In this paper we compare from the thermodynamic viewpoint different methodsfor the evaluation of polarity in order to reveal the physical meaning of some scales.We also consider the advantages and shortcomings of the thermodynamic polarityscales. The aim of this paper is to propose a convenient quantitative thermodynamicscale for the evaluation of stationary phase polarity that will be suitable for capillaryGC.
There are great differences between the definition of a "polar substance" inphysical chemistry and the concept ofa polar sorbate and sorbent in chromatography.In physical chemistry "polarity" is a property of one individual substance. Thisproperty is associated with the dipole moment of a molecule. The ability of thismolecule to interact with other molecules and the change in their properties duringinteraction is not considered. Hence compounds without dipole moments are termednon-polar. In chromatography some non-polar compounds from the physico-chemical viewpoint such as benzene, p-dinitrobenzene, pyrazine and 1,4-dioxane areassumed to be polar sorbates. The retention times of these compounds may increaseowing to complex formation and donor-acceptor interactions with some stationaryphases.
In chromatography, retention is determined primarily by the energy ofintermolecular interactions between the analyte substances and the liquid stationaryphases or adsorbents. The partial molar free energy of solution or adsorption isessentially a total of the energies of intermolecular interactions, both non-specific,determined by physical forces, and specific electron donor-acceptor interactions ofa chemical nature. When all experimental conditions are equal, a polar sorbate isretained longer on a more polar than on a less polar column21
.
It must be considered that the partial molar free energy of sorption is the result ofall types of interactions. It is not possible to determine separately any part of it,dispersive, inductive, orientative or donor-acceptor. To evaluate the polarity one mustuse several test compounds which simulate the principal types of intermolecularinteractions9
. From this viewpoint we shall discuss some approaches to the evaluationof polarity in GC.

POLARITY AND SELECTIVITY OF GC STATIONARY PHASES 53
EVALUATION OF POLARITY USING THE METHYLENE UNIT OF A HOMOLOGOUS SERIES
n-Alkanes are capable of dispersive and weak inductive interactions. In spite ofthis, n-alkanes are used predominantly for the determination of the polarity ofstationary phases, e.g., their ability to enter into all types of intermolecular interactionsincluding orientation and donor-acceptor forces. A priori it is assumed that thedecrease in the energy of dispersive interactions of the sorbents with n-alkanes isproportional to their ability to enter into other types of interactions.
In initial studies it was proposed to estimate the polarity ofa sorbent by using thespecific retention volumes of n-octane or the ratio of the retentions of twoneighbouring homologues of any homologous seriesz1 . A similar approach wasproposed by Chovin and Lebbezo . In their scale, the polarity of[3,[3'-oxydipropionitrilewas considered to be equal to unity (polar reference stationary phase) and the polarityof squalane was considered to be equal to zero (non-polar reference phase). Thepolarity (P) of a phase of interest was then calculated as follows:
(1)
where t~ + 1 and t~ are the adjusted retention times of n-alkanes with n + I and n carbonatoms, respectively, and squ, [3,[3' and x refer to the stationary phases squalane,[3,[3'-oxydipropionitrile and the tested stationary phase x, respectively. It wasmentioned that the polarity of some stationary phases might be larger than 1. Theexistence of stationary phases with polarities lower then zero was not consideredzo .
In order to understand the physical meaning of eqn. 1, let us modify it in' thefollowing way:
2.3RTlog (tn+ dt~)squ - 2.3RTlog (t;,+ l/t~)x
Px = 2.3RTlog(t~+1/t~)squ - 2.3RTlog(t~+dt~)p.p'(2)
where R is the universal gas constant and Tis the absolute temperature of the analysis.Eqn. 2 shows that the polarity in the scale of Chovin and Lebbezo is equivalent to thepartial molar free energy of sorption of a methylene group for n-alkanes, LfG(CHh,since LfG(CHh may be calculated as follows:
(3)
where Vg,n+ 1 and Vg,n are the specific retention volumes for n-alkanes with n + 1 andn carbon atoms, respectively.
If homologues are analysed under the same chromatographic conditions, eqn.3 can be simplified to
LfG(CHz) = -2.3RTlog(t~.1J+1/t~,n) (4)
As was demonstrated previously9, LfG(CHz) is a measure of the capacity ofa stationary phase for dispersive interactions.

54 R.V.GOLOVNYA,B.M.POLANUER
Eqn. 2 can be transformed to the following equation using eqn. 3 or 4:
(5)
In eqn. 5, the numerator is the difference in the capacity of n-alkanes for dispersiveinteractions with the stationary phase x and with squalane, while the denominator isthe difference in the capacity of n-alkanes for dispersive interactions with the tworeference stationary phases. Hence the scale of Chovin and Lebbe20 really evaluatesthe possibility of stationary phases for dispersive interactions in relative units. On thisscale a lower LlG(CH2) value corresponds to a higher polarity P. Consequently, thisscale ranks stationary phase according to their capacity for dispersive interactions withn-alkanes. The energy of dispersive interactions depends on the polarity of thestationary phase, but will change in a non-proportional manner with capacity fororientative and donor-acceptor interactions. This correlation is not as simple as wasassumed previously20.
The scale of polarity ITre !, based on a methylene group, was proposed bySidorov22
. The value of the polarity parameter tCH is defined as follows:,
(6)
where t~ + 1 and t~ are the adjusted retention times of n-alkanes with n+ I and n carbonatoms, respectively. On the basis of tCH , the relative polarity IT rei for the studiedstationary phase was calculated using the equation
IT = 100' [log (tCH)squ - log (tcH,LJreI I (' )og tCH2 squ
Considering eqns. 4 and 6, we can easily transform eqn. 7 into
(7)
(8)
which is similar to eqn. 5. The main difference between the polarity scales in refs. 20and 22 is that in the latter only one reference stationary phase, squalane, is used but thepractical meaning of the two scales are the same. They reflect only the energy ofdispersive interactions of a methylene unit with a sorbent in relative units.
The thermodynamic polarity scale proposed by Novak et at. 24 also utilizes theretention of a methylene unit for ranking ofstationary phases, but does not include anyreference stationary phase. According the concept of "reluctance", there aredifferences in properties between an ideal solution and a real solution of a sorbent ina stationary phase. These differences are minimal for the solution of an n-alkane ina hydrocarbon stationary phase such as squalane. It was accepted that more polarstationary phases have higher values of the excess Gibbs partial molar free energy ofsolution for n-alkanes. The measurement of the total excess Gibbs partial molar freeenergy of sorption of molecules is difficult, and therefore polarity was defined as the

POLARITY AND SELECTIVITY OF GC STATIONARY PHASES 55
excess Gibbs partial molar free energy ofsorption for a methylene group, LlGE(CHz)Z4.The values of LlGE(CH z) can be calculated using the equation
(9)
where Vg•n + 1 and Vg•n are the specific retention volumes and P~+ 1 and P~ are thesaturated vapour pressures of two pure liquid homologues (with n+ I and n carbonatoms, respectively) of any homologous series selected as test compounds.
To determine the values of the excess energies for sorption, one requiresinformation about the vapour pressures of two test compounds at the temperature ofthe analysis, which are usually calculated by empirical equations of low precision. Theaccuracy in the determination of LlGE(CHz) values is generally poor.
It was assumed that the LlG(CHz) value does not change for any series ofhomologues with n > 5, analysed on any stationary phase at any temperature. Thisassumption is not correct. Experimental dataZ4 show the differences in the values ofthe excess partial molar Gibbs free energies for sorption of homologous series. Forexample, on squalane LlGE(CHz) = - 35 kcal/mol for n-alkanes, - 17 kcal/mol forn-alkyl acetates and - 23 kcal/mol for n-alkanols. An investigation of surfactants asstationary phases demonstrated that for different series ofhomologues the LlGE(CHz)values may differ significantly. In some instances the excess partial molar Gibbs freeenergy for a methylene group in different homologous series may differ 5-6-foldz6
,27.
Let us compare the advantages of the scales of Novak et al. Z4 and Chovin andLebbezo . For this purpose we transform eqn. 9 into
(10)
Thus, according to eqn. 3, one can obtain from eqn. 10 the equation
(11)
The second term in eqn. II is proportional to the ratio of the saturated vapourpressures of two pure homologues. The ratio P~+ dP~ does not depend on the type ofstationary phase. Hence it becomes clear that the excess energy of sorption fora methylene group, LlGE(CHz), and the partial molar Gibbs free energy of sorption,LlG(CHz), differ only by the constant, which depends on the vapour pressures of thetest compounds and does not depend on the nature of the stationary phase. In general,the scales ofNovak et al. Z4 and Chovin and Lebbezo estimate the ability of a stationaryphase for dispersive interactions with a methylene group.
Recently, Poole and co_workersZ9.30.37 used the value of the partial molar Gibbsfree energy of sorption for a methylene group, LlG(CHz), to measure the polarity ofstationary phases and liquid organic salts. This scale, like the scale based on the excesspartiat'molar Gibbs free energy of sorption for a methylene groupZ4, does not use anyreference stationary phase. The LlG(CHz) value can be calculated easily and with highprecision using, for example, eqn. 4. The LlG(CHz) scalez9 ,30 utilizes the same a prioriassumption that the decrease in energy of dispersive interactions on a polar phase isdirectly proportional to the capacity of that phase for polar interactions.
Of course, the LlG(CHz) value is connected with the polarity of a stationary
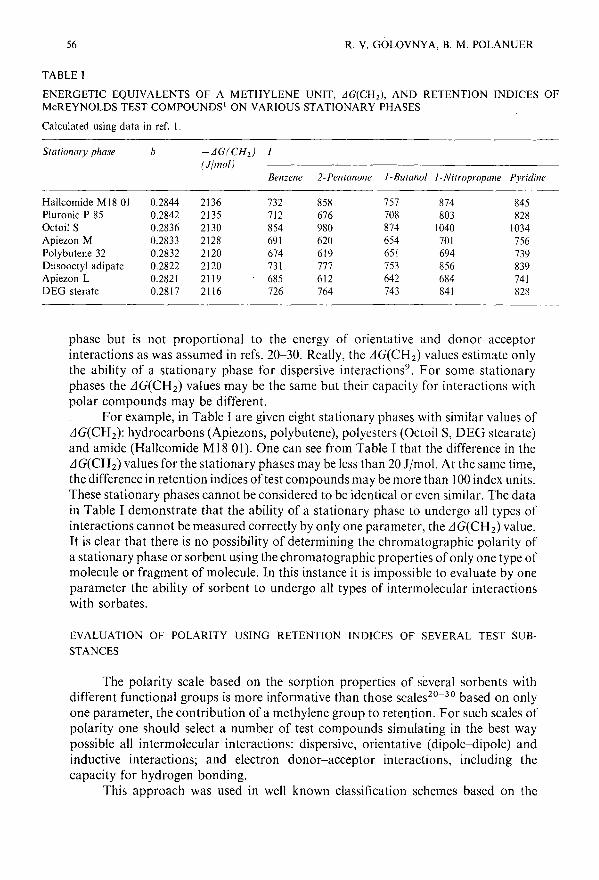
56 R.V.GOLOVNYA,B.M.POLANUER
TABLE I
ENERGETIC EQUIVALENTS OF A METHYLENE UNIT, LlG(CH z), AND RETENTION INDICES OFMcREYNOLDS TEST COMPOUNDS' ON VARIOUS STATIONARY PHASES
Calculated using data in ref. I.
Stationary phase h -LlG(CHz) I(Jlmo!)
Benzene 2-Pentanone I-Butanol I-Nitropropane Pyridine
Hallcomide MI8 01 0.2844 2136 732 858 757 874 845Pluronic P 85 0.2842 2135 712 676 708 803 828Octoil S 0.2836 2130 854 980 874 1040 1034Apiezon M 0.2833 2128 691 620 654 701 756Polybutene 32 0.2832 2120 674 619 651 694 739Diisooctyl adipate 0.2822 2120 731 777 753 856 839Apiezon L 0.2821 2119 685 612 642 684 741DEG sterate 0.2817 2116 726 764 743 841 828
phase but is not proportional to the energy of orientative and donor-acceptorinteractions as was assumed in refs. 20-30. Real\y, the LlG(CH 2 ) values estimate onlythe ability of a stationary phase for dispersive interactions9
. For some stationaryphases the LlG(CH2 ) values may be the same but their capacity for interactions withpolar compounds may be different.
For example, in Table I are given eight stationary phases with similar values ofLlG(CH2): hydrocarbons (Apiezons, polybutene), polyesters (Octoi! S, DEG stearate)and amide (Hal\comide MI8 01). One can see from Table I that the difference in theLlG(CH2) values for the stationary phases may be less than 20 limo!. At the same time,the difference in retention indices of test compounds may be more than 100 index units.These stationary phases cannot be considered to be identical or even similar. The datain Table I demonstrate that the ability of a stationary phase to undergo al\ types ofinteractions cannot be measured correctly by only one parameter, the LlG(CH 2 ) value.It is clear that there is no possibility of determining the chromatographic polarity ofa stationary phase or sorbent using the chromatographic properties of only one type ofmolecule or fragment of molecule. In this instance it is impossible to evaluate by oneparameter the ability of sorbent to undergo all types of intermolecular interactionswith sorbates.
EVALUATION OF POLARITY USING RETENTION INDICES OF SEVERAL TEST SUB
STANCES
The polarity scale based on the sorption properties of several sorbents withdifferent functional groups is more informative than those scales2o- 3o based on onlyone parameter, the contribution of a methylene group to retention. For such scales ofpolarity one should select a number of test compounds simulating in the best waypossible al\ intermolecular interactions: dispersive, orientative (dipole-dipole) andinductive interactions; and electron donor-acceptor interactions, including thecapacity for hydrogen bonding.
This approach was used in well known classification schemes based on the

POLARITY AND SELECTIVITY OF GC STATIONARY PHASES 57
TABLE II
TEST COMPOUNDS USING FOR MEASUREMENT POLARITY ON THE McREYNOLDS SCALE
Definition
xy
ZU
s
Test compound
BenzeneI-Butanol2-Pentanone1-Nitropropane
Pyridine
Types of interaction tested
Dispersive and n-complex formationOrientative with proton-donor and proton-acceptor capabilities"Orientative and proton-acceptor without proton-donor capability"High capability for orientative interactions (dipole moment, /l =
3.60), weak proton acceptor"Weak orientative and strong proton acceptor"
" In combination with dispersive and orientative interactions.
retention indices of several test compounds proposed by Rohrschneider10 andmodified by McReynolds1
. On this scale, polarity and selectivity may be describedusing five basic test compounds, benzene, I-butanol, I-nitropropane, 2-pentanone andpyridine. The polarity was measured by AI. It was also assumed that the energy ofdispersive interactions of a test compound determined on squalane is the same as thaton any other stationary phase. In reality there must be differences in the dispersiveinteractions of test compounds with different stationary phases. However, on thisscale10
, this fact was not considered.This classification system gained widespread popularity because about 200
widely used stationary phases were characterized using McReynolds constants 1. Now
about 400 stationary phases have been classified using this scale2- 4 •38 ,4o. Theprinciples of polarity and selectivity determination with this scale are reviewedelsewhere39 ,4o.
Many criteria related to McReynolds constants have been recommended. Forexample, in catalogues of chromatographic suppliers and handbooks the sum of the
5
first five constants, L: Ali, is often used to describe general polarity of stationaryi~ 1
phases 13 ,19,26.27,35,38. Similar to this parameter is the polarity index, CP3 ,15, whichcan be calculated using the equation
cP=
5
L:AIs1at.Phase1 . 1005
IAlov-2751
(12)
It is obvious that the scale based on the CP index, unlike the McReynolds scale,is restricted from both sides by squalane and OV-275.
Tarian et at. 14 recommended describing the polarity of a stationary phase usingthe parameter PT which can be calculated as:
±[p - [sq
PT = 1 I sq. 100
5(13)

58 R.V.GOLOVNYA,B.M.POLANUER
TABLE III
COMPARISON OF McREYNOLDS CONSTANTS AND EM, CP AND PT CRITERIA FORVARIOUS STATIONARY PHASES
Stationary phase X Y Z U S L:M CP P.,.
OV-22 160 188 191 283 253 1075 25 33Triton X-200 117 289 172 266 237 1081 26 34Polypropylene glycol 2000 128 294 173 264 226 1085 26 34Estinox 136 257 182 285 227 1087 26 34Trimeric acid 94 271 163 182 378 1088 26 34Pluracol-20 10 129 295 174 260 227 1091 26 34Poly 101 115 357 151 262 214 1099 26 34Alpel200 108 282 186 235 289 1100 26 35Amin 220 117 380 181 293 133 1105 26 35
Maximum difference 64 198 40 101 255 30 2
To compare the informativity of the McReynolds scale with the scales obtainedusing eqns. 12 and 13, we considered data given as examples for eight stationary phases
5
in Table III. It is seen that maximum difference in L M i values is less than 30 i.u. for alli= 1
phases (see Table III), whereas the differences in CP values, calculated by eqn. 12, are5
less than 2 relative units. Consequently, stationary phases with similar values of L LJ1ii= 1
and CP are not interchangeable in practice. Obviously such parameters are less5
informative than the McReynolds constants. The L M i, CP, PT and other similari= 1
parameters fail in the evaluation of the specific properties of a sorbent because ofcompensation effects.
In scalesl,lO-14 which have a reference stationary phase (squalane, hydrogenated Apiezon, Apolan-87), polarity is evaluated simultaneously with the selectivityof a studied stationary phase in comparison with a reference stationary phase.
The problem of a reference stationary phase is eliminated in Evans and Haken'ssystem of "selectivity indices"19. In this approach, the retention index of sorbate isdivided into two parts, a dispersive index 1m and a selectivity index 1*:
I = 1m + 1* (14)
The dispersive index may be calculated as the retention index of a hypotheticaln-alkane with the same molecular mass as the sorbate:
M - 2.0161m = -0-.-14-02-6- (15)
where M is the molecular mass of the sorbate. The 1m value characterizes only the test

POLARITY AND SELECTIVITY OF GC STATIONARY PHASES 59
substance and is constant for any set of analytical conditions. The selectivity index 1*depends on the type of sorbate, sorbent and analytical conditions. There is somecorrelation between the selectivity indices of selected sorbates and the polarity ofstationary phases l9 . However, the scale 19 which uses a hypothetical n-alkanemolecular mass cannot be interpreted thermodynamically.
The retention index percentage contribution IP was introduced 15 to relate thesolute retention index to the sum of ten retention indices corresponding to onestationary phase:
lOOIpIP = -1-0-
L IiP=1
(16)
Using the IP parameter calculated from eqn. 16, most stationary phases were classifiedand separated into clusters containing groups of stationary phases with similarproperties15.
The main disadvantage of scalesl.l0-19 that use iJI and I values has beenextensively discussed9,z9,30.34.36.37. This disadvantage is connected with the greatdifference in the energetic equivalent of one index unit on different stationary phases9.The energetic equivalent of one index unit is calculated from
(17)
where t~+ 1 and t~ are the adjusted retention times of two neighbouring homologues.The values of the energetic equivalent of a retention index unit at the same
column temperature may vary from -24 to -5.2 J/molz9 . This means that for twostationary phases a sorbate may have the same retention index but a different energy ofsorption9. This fact does not allow the interpretation of iJI values to find a physicalmeaning for polarity with such scales.
EVALUATION OF POLARITY OF SORBENTS USING L1G' VALUES
Different approaches have been proposed for evaluating polarity from a thermodynamic point of view. Earlier we considered a thermodynamic scale of polarity basedon the excess partial molar Gibbs free energy of sorption for a methylene group,iJGE(CH z) (ref. 24). It was also assumed that the polarity and selectivity of stationaryphases can be defined in terms of the partial molar enthalpies of solution for certainfunctional groups, which were determined from the temperature dependence of thespecific retention volumes of test compounds3z . However, an evaluation of thecapacity of stationary phases to retain polar substances without considering theentropy of sorption is not correct. Solution of polar compounds on polar stationaryphases is accompanied not only by changes in the heat of solution but also witha decrease in the degree of freedom for the sorbate molecule. Neglecting thecontribution of entropy can lead to a faulty conclusion.
This circumstance was considered by Reinbold and Risby3z. The polarity ofstationary phases was evaluated from the partial molal Gibbs free energies of sorption

60 R.V.GOLOVNYA,B.M.POLANUER
for different functional groups33. This approach also is not correct, because thecontribution of the same functional group in various molecules to the total energy ofsorption may be different. The low informativity of LlGc=o and LlGOH parameters forthe evaluation of the polarity of polyoxyethylene esters has been reported35 .
Considering that five McReynolds test compounds adequately simulate themain types of intermolecular interactions (Table II), it was proposed tb describe thepolarity of sorbents using the partial molar Gibbs free energies of sorption for thesecompounds9,34. The capacity of the stationary phases for dispersive interactions onthis scale was measured by a sixth parameter, the partial molar Gibbs free energy ofsorption for a methylene group9,34.
The partial molar Gibbs free energy of solution for substances may bedetermined using the equation
LlG = - RTln (VgTp/273) (18)
where Vg is the specific retention volume of the solute and p is the density of thestationary phase at the column temperature r 1
.
To simplify the problems relating to the determination of the specific retentionvolumes of all sorbates, it was recommended to calculate the partial molar Gibbs freeenergy of sorption using another equation:
LlG = RT' (1 - lOOn). b + RTln(VgIITP)100 273
(19)
where 1 is the retention index of the solute, b the natural logarithm of the ratio of thespecific retention volumes or adjusted retention times of n-alkanes eluted just beforeand after this solute, Tthe column temperature and VglI the specific retention volume ofan n-alkane with n carbon atoms34.
The measurement of the density of the stationary phase at the columntemperature may be a problem in many instances. Therefore, it was recommended touse the value of LlG' calculated for each test substance using eqn. 20:
LlG' = LlG + RTln P
LlG' = R,J(I - lOOn). b + In (VgIIT)J1L 100 273
(20a)
(20)
Such an assumption in the calculation of the values of LlG' does not afffect theoverall picture for the evaluation of the polarity of stationary phases9,34 in comparisonwith LlG values (eqn. 18), which give the correct evaluation of the polarity of thestationary phases.
The comparison of LlG(CH2) and five values of LlG' for McReynolds testcompounds permits the quantitative evaluation of the capacity ofstationary phases forintermolecular interactions: dispersive, orientative and donor-acceptor.
The advantages of this scale9 are the elimination of a reference stationary phaseand the poSsibility of using retention indices and specific retention volumes of

POLARITY AND SELECTIVITY OF GC STATIONARY PHASES 61
n-alkanes from the literature. This method of calculating thermodynamic polarity issimple and may be used not only for stationary phases but also for adsorbents9
. Thisscale was successfully used for the evaluation of the properties of ordinary stationaryphases36
. It was also used to investigate the ability of melted organic salts for undergointermolecular interactions under gas chromatographic conditions6
.
CALCULATION OF POLARITY USING ENERGETIC EQUIVALENTS OF RETENTION
INDICES, L1G(f) VALUES
It is well known that the partial molar free energy of sorption is related to theretention index by a very simple relationship:
AG = A + BI (21)
where A and B are constants under fixed chromatographic conditions4z . The physicalmeaning of constant B was considered earlier43
. It was demonstrated that B is theenergetic equivalent of an index unit. Thus BI is the energetic equivalent of theretention index of a sorbate, AG(l). Consequently, eqn. 21 may be transformed t0 8
,44
AG = AGi.u.I + A = AG(l) + A (22)
Thus, using energetic equivalents of the retention indices [A G(X), AG( Y), AG(Z),AG( U), AG(S)] oftest compounds it is possible to compare the capacity of a stationaryphase to undergo different kinds of intermolecular interactions9 but quantitative andcorrect evaluations are not possible because of different values of A in eqn. 22 fordifferent stationary phases. On such a scale only the capacity for dispersiveinteractions may be measured quantitatively by a sixth parameter, AG(CH z)calculated according eqn. 3 or 4.
In Table IV are given the values for calculating the polarity of stationary phases,molten salts and polymer sorbents. The calculation of the capacity of sorbates fordifferent types of interactions is rough because AG(l) =f= AG.
Using AG(l) values for McReynolds test compounds, one can compare theproperties of sorbents and stationary phases. It was mentioned previously that theretentions of sorbates on conventional stationary phases at lOOGC and on porouspolymers at I50-200GC are similar40
. This assumption is confirmed by the AG(l)values for test compounds given in Table IV. In all instances the energetic equivalentsof the index values of test compounds on porous polymers are higher.
Recently a parameter similar to the energetic equivalent of a retention index wasproposed for evaluating the selectivity of stationary phases and organic salts30
, usingthe equation
f(P) = -2.3RT[(IB)squ - (IBhp] + 2.3RT(A,qu - Asp) (23)
where Asqu , Asp, Bsqu and Bsp are constants that may be determined from the specificretention volumes of n-alkanes determined on squalane (squ) and the tested stationaryphase (SP), respectively.
Considering eqn. 22, we transformed eqn. 23 to
f(P) = AG(l)squ - AG(l)sp + (A squ - Asp) (24)

62 R. Y. GOLOYNYA, B. M. POLANUER
TABLEIY
CALCULATION OF POLARITY OF STATIONARY PHASES, ORGANIC SALTS AND POLYMERSORBENTS USING ENERGETIC EQUIYALENTS OF RETENTION INDICES OF TEST COMPOUNDS,Ll G(I), AT l200C
The LlG(CH 2 ) and LlG(1) values were calculated using data from refs. 1, 6, 8, 27, 33 and 41.
Stationary phase -LlG(CH2 ) - LlG(J) (llmol)(llmol)
Benzene 2-Pentanone I-Butanol I-Nitropropane Pyridine
Butyl stearate 2191 15211 15321 15 167 16746 16877Squa1ane 2172 14 185 12817 13620 14 163 15 184Hallcomid MI8 2149 15731 18438 16268 18782 18 159Apolane 87 2140 14429 12844 13487 14215 15499Hallcomid M18 0 2136 15856 18592 16455 19041 18464Octyldecy1 adipate 2130 15593 16381 15891 18000 17745Apiezon M 2128 14560 13028 13666 14518 15731Diocty1 sebacate 2125 15411 16 113 15624 17686 17473Apiezon L 2119 14520 12973 13608 14499 15707DEG stearate 2116 15 177 16574 15515 16828 18839Triton X-305 2111 19320 22318 19869 24070 23 838Diocty1 phthalate 2097 15629 16280 16301 18629 18 168Dexy1400 2081 15798 15361 16 172 18 191 18 379SKTFT-50 2058 14947 15071 17 171 18900 17932PFMS-4 2058 15627 15 194 15997 17994 18 180Flexo18N8 2053 15381 17332 16244 18729 18030Zinc stearate 2048 14625 16817 14051 15362 25461Silbor-1 1991 15611 25010 16507 18578 19295Yersamid 940 1947 14841 17607 15036 16828 17684OY-7 1931 13943 13576 14252 15893 15970Diglycerol 1929 19759 27 323 22904 25625 29967OY-11 1925 14534 14092 14862 16768 16883OY-3 1913 13339 12937 13550 14851 15062Tergitol NPX 1909 16229 18635 16897 19876 20048Triton X-100 1894 16215 18734 16954 19966 20098SE-30 1874 12542 12092 12580 13442 13892Sucrose acetate 1870 15429 17206 16421 19263 18590OY-101 1866 12505 12076 12543 13 420 13849Silar 10C 1546 18 136 20826 19883 24645 23 176OY-1 1855 12435 12008 12472 13 344 13 771OY-22 1849 15040 1:1 393 15 133 17297 17611NPGA 1786 15849 18 136 16778 19905 20316OY-225 1709 15060 16393 16496 19556 18 547NPGS 1703 15808 18090 16932 20356 20237XE-60 1680 14405 16321 16254 19246 17918Carbowax 20M 1679 16374 18910 16710 20556 20304FFAP 1656 16445 19376 18614 20767 21 960Carbowax 1000 1633 16335 19554 17071 20877 21 040DEGA 1581 16307 18870 17 193 20831 21464EGA 1573 16112 18393 17009 20565 20958TCEP 1338 16675 19364 18454 22482 21 599Tetrabuty1ammonium picrate 1672 16317 18524 17821 21 132 20613Tetrabuty1ammonium chloride 1588 16245 28394 16849 22566 21 136KF' 2H 2 0 sorbent" 440 2944 3947 4435 3687 3855Porapak Qb 3457 21 328 20982 22503 22607 23021Chromosorb 102b 3187 19825 19379 20813 21 837 21 228
" At 100°C.b At 140°C.

POLARITY AND SELECTIVITY OF GC STATIONARY PHASES 63
One can see from eqn. 24 that the approach proposed by Poole et al. 30,45 is comparableto the L1G(J) scale8 but needs a reference stationary phase, squalane. It is morecomplicated because it is based on assumptions about the linear dependence of theretention volumes of n-alkanes on the number of carbon atoms, which is underdiscussion46
-48
.
THERMODYNAMIC SELECTIVITY OF SORBENTS
The "selectivity" in GC, like polarity, is not clearly defined and is interpreted indifferent ways by different investigators. To characterize the selctivity ofa sorbent thisterm is used in two ways: (I) to compare the capacity of an investigated sorbent toretain two sorbates (selectivity of one column); and (2) to compare capacity of twosorbents to retain one or several sorbates (selectivity of two columns). In the firstinstance the selectivity of the sorbents for a pair of sorbates X and Y can be calculatedas the difference in their partial molar Gibbs free energies of sorption:
b(L1Gh,y = L1Gx - L1Gy (25)
It is better to measure the selectivity of a sorbent using the energetic equivalentsof retention indices, L1 G(J). The partial molar Gibbs free energies of sorption areconnected with the energetic equivalents of retention indices (see eqn. 17). Thus,considering that A is a constant for one sorbent under fixed analytical conditions, weobtain
b(L1Gh,y = L1G(J)x - L1G(J)y (26)
Let us consider the second case, the selectivity of two stationary phases, i.e., theircapacity to retain one substance x. The selectivity of two sorbents, Sl and Sz, withrespect to one sorbate may be measured as the difference in their partial molar Gibbsfree energies of sorption:
(27)
Considering, that for different stationary phases I and 2 the value of the constant A isusually different, the use of energetic equivalents of retention indices, L1G(J), in thisinstance gives only an approximate estimation of the selectivity of the comparedcolumns. Consequently, quantitative measurements of selectivity for one column (seeeqn. 26) and the approximate estimation of the selectivity for two columns can becarried out using L1G(J) values.
EVALUATION OF POLARITY AND SELECTIVITY OF STATIONARY PHASES IN CAPILLARYCOLUMNS
Capillary columns are now widely used in GC and the determination of thepolarity of stationary phases in this type of column is therefore required.
A thermodynamic approach to the polarity of capillary columns is alsopreferable. In this instance it is possible to use the partial molar Gibbs free energies of

64 R.V.GOLOVNYA,B.M.POLANUER
sorption for several test compounds. For capillary columns, we have transformed theeqn. 18 for the calculation of LtG to a more convenient form.
Let us define some parameters for capillary columns. The volume of the emptypart of the column without stationary phase will be termed the void volume or deadvolume, Vo, and the total volume of the column is V. VL is the volume of stationaryphase in the column. These parameters are calculated using the following equations:
v = Lnd2 /4
Vo = Ln(d - 2dr)2/4
(28)
(29)
(30)
where d is the diameter of the capillary column, dr the film thickness of the stationaryphase in the capillary column and L the length of the capillary column. On the otherhand, the dead volume of the column can be determined from the carrier gas flow-rate,w, and the column dead time, to.
The specific retention volume of a sorbate X in GC is calculated using theequation
v = 273t'w. '(1 _P~20)g,X 'T' j P
m1 r 0(31)
where t' is the adjusted retention time of a solute X, w the carrier gas flow-rate (ml/min)measured at room temperature, Tn m the mass of stationary phase in the column,} thegas compressibility factor, P~20 the water vapour pressure at room temperature and Pothe inlet gas pressure. Considering the parameters in eqn. 31, one can reach theconclusion that some of them are not related to properties of the stationary phase, andthe equation may be written as
_ 273t'w. 'j;
Vg,x - T jsm r(32)
where ~ is the correction for the pressure of water vapour at room temperature ifcarrier gas flow-rate was measured with a bubble flow meter; ~ = (l - P~,o/Po).
The partial molar Gibbs free energy of sorption of a substance X may becalculated using the equation
TI (273t'WTPR)
LtGx = -R n 273Trm
We made some simplifications of eqn. 33 assuming that
P
and
w = Vo/to
(33)
(34)
(35)

POLARITY AND SELECTIVITY OF GC STATIONARY PHASES
Thus, eqn. 33 may be transformed to
(t' V T )AG = -RTIn -'~'-'Rto V j Tr
65
(36)
The ratio of the adjusted retention time, t', of a solute to the retention time of anunretained compound, to, is the capacity factor, k', so the final expression for thecalculation of the partial molar Gibbs free energy of sorption in capillary chromatography will be described by
AG = -RTln(k" Vo
- :£'R). V j Tr
(37)
Eqn. 37 provides an opportunity to calculate the energy of sorption using thecapacity factor ofa solute, k'. It is clear from eqn. 37 that to calculate the partial molarfree energy of sorption of substance X it is necessary to determine the capacity factor,k', and to measure accurately the experimental conditions (column temperature, roomtemperature, inlet and outlet pressure of carrier gas). As a rule, using modernchromatographic equipment it is not a problem to determine these parameters. Thedead volume and the volume ofstationary phase in the column may be calculated fromvalues of the column length, inner diameter, d, and stationary phase film thickness, dr,in the capillary column. These parameters are common characteristics ofcolumns usedin capillary Gc. It is seen from eqn. 37 that the calculation of the partial molar freeGibbs energy of sorption for test compounds is simpler in capillary chromatographythan for packed columns. One does not need to determine the density of the stationaryphase under analytical conditions, the mass of stationary phase or the carrier gasflow-rate.
Eqn. 37 can be recommended for the determination of the polarity andselectivity of stationary phases in capillary GC on the basis of the partial molar Gibbsfree energies of sorption AG(X), AG(Y), AG(Z), AG(D), AG(S) and AG(CH2 ) of testcompounds according to the scale given in ref. 9. This scale does not use any referencestationary phase and allows stationary phases to be ranked by all main types ofintermolecular interactions. If necessary, the list oftest compounds may be modifiedor expanded. The scale9 also may be used to measure the selectivity of one capillarycolumn for several sorbates or the selectivity of two capillary columns for one sorbatein accordance with eqn. 24 or 25.
The scale based on eqn. 37 can describe the specificity of any liquid stationaryphase and is recommended for practical use. The quantitative thermodynamicmeasurement of polarity proposed here gives the opportunity to create a unified scaleof liquid stationary phases of both organic and inorganic origin. The six-parameterthermodynamic scale, based on eqn. 18 or eqns. 19 and 37 is more informative than allprevious scales proposed for the evaluation of the polarity of sorbents in Gc.

66
REFERENCES
R. V. GOLOVNYA, B. M. POLANUER
I W. O. McReynolds, J. Chromalogr. Sci., 8 (1970) 695.2 J. K. I-Iaken, J. Chromalogr., 73 (1972) 419.3 Chrompack General Calalog, Chrompack, Middelburg, 1988.4 AI/lech Associales Catalog 92, Alltech, Deerfield, IL, 1988.5 C. F. Poole, 1-1. T. Butler, M. E. Coddens, S. C. Dhanesar and F. Pacholec, J. Chromalogr., 289 (1984)
299.6 K. G. Furton and C. F. Poole, 1. Chromalogr., 399 (1987) 47.7 V. G. Berezkin, V. R. Alishoyev, E. N. Victorova, V. S. Gavrichev and V. M. Fatceva, J. High Resolul.
Chromalogr. Chromalogr. Commun., 6 (1983) 42.8 B. M. Polanuer, R. V. Golovnya, I. L. Zhuravleva and V. K. Gordeev, Izv. Akad. Nauk SSSR. Ser.
Khim., (1987) 2348.9 R. V. Golovnya and T. A. Misharina, J. High Resolu/. Chroma/ogr. Chroma/ogr. Commun., 3 (1980)
4 and 51.10 L. Rohrschneider, J. Chromalogr., 22 (1966) 6.II F. Vernon, J. Chromalogr., 148 (1978) 397.12 F. Vernon and P. L. Gopal, J. Chromalogr., 150 (1978) 45.13 G. Castello and G. D'Amato, 1. Chromalogr., 51 (1986) 366.14 G. Tarian, A. Kiss, G. Kocsis, S. Meszaros and J. M. Takacs, 1. Chroma/ogr., 119 (1976) 327.15 J. A. Garcia-Dominguez, J. Garcia-Munoz, V. Menendez, M. 1-1. Molera and J. M. Santiuste, 1.
Chroma/ogr., 393 (1987) 209.16 L. R. Snyder, J. Chroma/ogr. Sci., 16 (1983) 223.17 M. Evans, Chromalographia, II (1978) 183.18 J. K. Haken and D. Srisukh, J. Chromatogr., 199 (1980) 199.19 M. B. Evans and J. K. Haken, J. Chromalogr., 406 (1987) 105.20 P. Chovin and J. Lebbe, in J. Tranchant (Editor), Separalion Immedia/e el Chromalographie, GAMS.
Paris, 1961, p. 69.21 A. B. Littlewood, J. Chromatogr. Sci., I (1963) 16.22 R. I. Sidorov, Zh. Fiz. Khim., 56 (1982) 1057.23 J. Sevcik and M. S. H. Lowentap, J. Chroma/ogr., 217 (1981) 139.24 J. Novak, J. Ruzichkova, S. Wicar and J. Janak, Anal. Chem., 45 (1973) 1365.25 P. Alessi, I. Kikis and A. Papo, J. Chroma/ogr., 131 (1977) 3I.26 A. Voelkel, J. Chromalogr., 435 (1988) 29.27 A. Voelkel, 1. Chromalogr., 457 (1988) 73.28 M. Roth and 1. Novak, J. Chromalogr., 234 (1982) 337.29 B. R. Kersten, C. F. Poole and K. G. Furton, J. Chromalogr., 411 (1987) 43.30 S. K. Poole, B. R. Kersten, R. M. Pomaville and C. F. Poole, LC GC, 6 (1988) 400.31 B. R. Kersten, S. K. Poole and C. F. Poole, 1. Chromalogr., 468 (1989) 235.32 B. L. Reinbold and T. H. Risby, J. Chromalogr. Sci., 13 (1975) 372.33 C. E. Fiddings, T. H. Risby and P. C. Jurs, J. Chromalogr. Sci., 14 (1976) 453.34 R. V. Golovnya, Chromalographia, 12 (1979) 533.35 A. Voelkel, J. Szymanovski, J. Berger and K. Ebert, J. Chromalogr., 391 (1987) 373.36 B. V. Stolyarov and L. A. Kartseva, Zh. Anal. Khim., 39 (1984) 883.37 C. F. Poole and S. K. F. Poole, Chem. Rev., 89 (1989) 377.38 E. Leibnits and Kh. G. Shtruppe (Editors), Praklicheskoe Rukovodslvo po Gazovoi Khromalographii
(Gas Chromalography Praclical Handbook), Mil', Moscow, 1988.39 L. S. Ettre, Chromalographia, 6 (1973) 489: 7 (1974) 39 and 26 I.40 W. Supina, Packed Columns in Gas Chromatography (in Russian), Mil', Moscow, 1977.41 D. H. Desty and W. T. Swanton, J. Phys. Chem., 65 (1966) 766.42 S. S. Ufit, B. A. Rudenko, Zh. A. Krasnaya and V. F. Kucherov, Dokl. Acad. Nauk SSSR, 188 (1969)
156.43 R. V. Golovnya and D. N. Grigoryeva, Chromalographia, 17 (1983) 613.44 R. V. Golovnya and T. A. Misharina, J. Chromalogr., 190 (1980) I.45 B. R. Kersten and C. F. Poole, J. Chroma/ogr., 452 (1988) 19 I.46 S. J. Hawkes, Chromalographia, 28 (1989) 237.47 R. V. Golovnya and D. N. Grigorieva, Chromalographia, 18 (1984) 449.48 A. Touabet, M. Maeck, A. Y. Badjian Habi Ahmed and B. E. Meklati, Chroma/ographia, 25 (1988) 389.49 J. R. L. Smith, A. H. H. Tameesh and D. J. Waddington, J. Chromatogr., 148 (1978) 365.

Journal of Chromatography, 517 (1990) 67-75Elsevier Science Publishers B.V., Amsterdam
CHROM. 22295
Cryogenic-focusing, ohmically heated on-column trap forcapillary gas chromatography
STEPHEN R. SPRINGSTON
Environmental Chemistry Division, Department of Applied Science, Brookhaven .National Laboratory, Upton, NY 11973 (U.S.A.)
ABSTRACT
A new method is presented for thermally desorbing solutes which have beencryogenically trapped on a capillary column. The trap heater is a thin layer of metallicgold applied to columns near their inlet. This layer is ohmically heated to initiate theseparation. The temperature within the trap is related to the resistance of the goldlayer. The trap is shown to not lower column performance relative to a split injection.Other advantages are discussed. Examples showing trace analyses of alkanes in airare given.
INTRODUCTION
Samples must be introduced as a narrow concentration pulse in elution chromatography, or column performance is compromised. Simplistically, the width of thepulse entering the column must be small relative to emerging peak widths. In the caseof capillary gas chromatography (GC), geometric factors place stringent demands onthe concentration profile delivered by the injector. A wide variety of inlet sytemscapable of meeting these demands have been developed 1
,2. The sample characteristicsare an important factor in selecting the appropriate injector. If an analyte of interestis present at low concentrations, the injection volume may contain less than a minimum detectable quantity. Cryogenic trapping is one method for increasing theamount of sample introduced without lowering column efficiency. Dilute componentsin a more volatile matrix are effectively concentrated within a cooled section of thestream. Subsequent warming of the trap initiates the separation as the narrow plugbegins to migrate through the analytical column. The sample width is thus controlledby how fast the trap is heated rather than by the initial injection volume.
A variety of cryogenic sample traps have been described for capillary Gc.Hopkins and Pretorius3 demonstrated that electrically heating the trap was fasterthan using a heated gas stream4
. This and other ohmically heated traps5,6 were usedto collect samples in a conductive tube connected to the analytical column. Burgerand Munro 7 describe a thermal desorption system consisting of a length of metaltubing which was ohmically heated to desorb material from a I-m fused-silica trapinside the heater, thus eliminating sample contact with heated metal. The trap wasconnected to the analytical column where further trapping was performed. Kolb et

68 S. R. SPRINGSTON
al. 8 used cold nitrogen to concentrate the sample directly on the analytical capillaryand then allowed the carrier gas to warm the trap, obviating any dead volume between the trap and column. A lO-cm section of aluminum coated fused silica wasohmically heated by Van Es et al. 9 to rapidly desorb samples from a 50-,um capillarypassing through the heater. Input widths as short as 1 ms were reported. As with theapparatus of Kolb et al. trapping directly on the analytical column eliminates thedead volume of a connection.
This paper reports a simple on-column cryogenic trap that can be adapted toexisting capillaries. The heating element is an integral part of the column. Samplescan be concentrated and then separated without diminishing chromatographic performance. Several other unique features are described. The trap operation is demonstrated by analyzing some dilute samples of organic compounds in ambient air.
EXPERIMENTAL
A capillary column was prepared from untreated fused silica manufactured byPolymicro Technologies (Phoenix, AZ, U.S.A.). The empty capillary was purged withhelium for 2 h at 250°C before statically coating with a 0.4% (w/v) solution of SE-30(GC grade, Alltech Associates, Deerfield, IL, U.S.A) in pentane. The final columnlength was roughly 14 m with an internal diameter of250 ,urn. This column was testedat 100°C and exhibited a coating efficiency of 93% for dodecane. The column wasthen split into two sections, 11.0 and 1.92 m in length.
An ohmically heated trap about 10 cm in length was fashioned on the exteriorof both capillaries, starting 15 cm from the inlet of the Il.O-m column and 10 cm fromthe inlet of the 1.92-m column. Metallic gold was applied by depositing Liquid BrightGold (No. 7621, Engelhardt, Hanovia Liquid Gold Division, East Newark, NJ,U.S.A.) directly on. the polyimide outer coating and heating to 3l00C for 20 min.Liquid Bright Gold is a true solution of gold in an organic matrix. At elevatedtemperatures, the organic liquid pyrolyses leaving a thin metallic film. During theheating step, the column interior was purged with helium while the exterior remainedin air. The deposition and curing process was repeated three times. The resultingconductive layer is clearly visible and resists abrasion. Electrical leads were attachedto the gold layer ca. 5 cm apart. Connections to the gold were made through electrically conductive fibers surrounding the capillary at each end of the trap. When installed, the gold layer did not contact the oven walls or the injection port.
The cryogenic focusing trap was evaluated chromatographically using a VarianVISTA 4600 GC (Varian Instruments, Walnut Creek, CA, U.S.A.) equipped with asplit/splitless capillary injector. Solutes were detected by flame ionization detection(FID) with the capillary positioned flush with the flame jet tip. Chromatograms weredigitally recorded using a CHROM-l analog-to-digital board (Metrabyte, Taunton,MA, U.S.A.) operating within a PC's 286 microcomputer (PC's Ltd., Austin, TX,U.S.A.). The software controlling the data acquisition was Labtech Notebook (Laboratory Technologies Corporation, Wilmington, MA, U.S.A.). Detector sensitivitywas set at 4 . 10- 12 A full scale. Detector output was digitized at 20 Hz. Momentanalysis of the resulting data was performed with software written in Pascal (BorlandInternational, Scotts Valley, CA, U.S.A.).
Columns were connected to the split/splitless injector and the FID system in the

CRYOGENIC TRAPPING FOR GC 69
normal fashion. The conductive column section was then placed in a cryogenic vesselpartially filled with liquid nitrogen such that the trap was roughly 2 to 3 cm above theliquid level. The capillary entered and exited at the lid through constricted openingswith most of the vapor vented well away from the column to prevent ice forming onthe capillary outside the cryogenic container. Both electrical connections remainedoutside the vessel and were not cooled. Electrical currents through the trap werebetween 50 and 150 rnA for these experiments. These currents required voltagesbetween 10 to 15 V. Except for the variable-voltage power supply and switch, theentire trap assembly was located in the column oven.
Gas-phase samples containing a mixture of four normal alkanes were preparedat four different concentrations. A stock mixture containing pentane, hexane, heptane, and octane was made by adding the individual neat liquids to a 1-1 flask. Theliquid volumes were adjusted to produce an equimolar mixture of 2000 parts-permillion-by-volume (ppmv) of each alkane in ambient air. Single stage dilutions of thestock mixture produced samples containing 50, 100 and 200 parts-per-billion(l09)by-volume (ppbv) of each component. The samples were thoroughly mixed by amagnetic stirring bar.
All chromatographic separations were performed isothermally at 35°C. Theinjection volume was 5 ,ul for the 2000-ppmv stock mixture. Split injections werealways used for this concentrated sample. For the three dilute mixtures, the injectionvolume was 1 ml. Dilute samples were injected with the split flow off for the first 90 s.The amount of each compound introduced into the capillary column is given in TableI for both injection procedures taking into account losses due to splitting. The valuesfor the dilute samples are only an estimate, as they assume quantitative transfer ofsample from the injector to the column before the split valve is opened.
The effect of sample trapping on elution profiles was investigated using the1.92-m column. A plug injection was approximated by injecting 5,ul of the 2000-ppmvgas mixture under split conditions. By cryogenically trapping the sample and thenheating the trap to initiate the separation, any decrease in performance relative to anormal split injection should be apparent. The split flow was maintained at 1.03 mIlsthroughout these separations. Vapor phase injections of 5 ,ul were thus split 70: 1 witha linear flow-rate through the column of30 cm/s. After collecting the sample for 120 sin the cooled trap, the sample zone was rapidly heated by passing a current of 120 rnAthrough the trap. Heating continued until all peaks were detected. Chromatogramsrecorded under these conditions were compared with chromatograms taken without
TABLE I
SAMPLE MASS INTRODUCED INTO CAPILLARY COLUMN ASSUMING QUANTITATIVEMASS TRANSFER FOR THE I-ml INJECTIONS
Sampleconcentration
2000 ppmv200 ppbv100 ppbv50 ppbv
Injectionvolume
5 JlIImlImlIml
Split
100:1NoneNoneNone
Solute mass (pg)
Cs C6 C7 Cs
290 350 410 460590 700 810 930290 350 410 460150 180 200 230

70 S. R. SPRINGSTON
trapping or heating. Trapping occurred at the temperature above the liquid nitrogen,about - 150°C in this experiment. During the heating step, the temperature wasestimated to be above 150°C.
The dilute samples were separated on the 11.0-m column by concentratingvirtually the entire sample in the trap. For these dilute mixtures, the gas phase injection volume of 1 ml was injected by syringe over a lO-s interval with the split flowoff. After 90 s, the split flow valve was opened to purge the injector body of anyremaining sample. At 120 s after the start of the injection, the trap was heated toinitiate solute migration along the column. For comparison, a 5-I.tl split injection ofthe stock solution was separated without trapping.
Finally, measurements were made to establish whether the temperature of anelectrically heated trap could be determined from its resistance. For this experiment,the trap was broken off from the column so that a miniature thermocouple, 0.013 mmdiameter (Omega Engineering, Stamford, CT, U.S.A.), could be placed inside thecapillary. The trap temperature could then be directly measured. The chromatographic oven was programmed from 35 to 240°C at 5°C/min while a constant voltageof 1.000 V was applied across the trap. By measuring the current through the trap, theresistance across the trap could be calculated from Ohm's law. After measuring theresistance as a function of temperature during external heating, the trap was heatedohmically by increasing the current in a stepwise fashion. With the oven held at 3SOC,the resistance was again taken from simultaneous measurement of current and voltage while directly measuring the trap temperature.
RESULTS AND DISCUSSION
To ascertain the contribution to peak variance due to the cryogenic trap, theshortest possible column was studied to maximize the effects from all sources ofextra-column band broadening. The separations were also performed isothermally toprevent the solute focusing encountered with temperature programming. Under suchdemanding conditions, the trap must be capable of rapid heating to vaporize thesample components in a narrow plug. Heating that is slow relative to the temporallength of a split injection would be readily apparent as an increase in peak variance,commonly measured as the second statistical moment. Any injection perturbationswhich asymmetrically distort the plug will also lead to asymmetric distortions in the
TABLE II
SECOND AND THIRD STATISTICAL MOMENTS FOR NORMAL AND TRAPPED SPLIT INJECTIONS ON A 1.92-m COLUMN
Mean ± 1 standard deviation (n = 7).
Sample 2nd Moment. 102 (S2) 3rd Moment. 102 (S3)
Normal Trapped Normal Trapped
Cs 6.11 ± 0.49 5.33 ± 0.19 2.31 ± 0.48 1.78 ± 0.15C6 8.68 ± 0.59 7.81 ± 0.55 4.26 ± 0.64 3.58 ± 0.71C7 9.39 ± 1.81 9.95 ± 0.86 3.64 ± 2.96 5.30 ± 1.14C8 20.59 ± 0.55 17.56 ± 0.73 2.68 ± 0.34 2.40 ± 0.29

CRYOGENIC TRAPPING FOR GC
C5J C6
I
C7J
A
CBI
71
___JI-.JIof.__I ...... ...I '-
Iloj
Iloj
I-1 Trap on
Retention Time (min)
Fig. 1. Chromatograms of pentane, hexane, heptane and octane on an 11 m x 250-pm LD. capillarycolumn coated with 0.4% (w/v) SE-30. (A) 5 pI vapor phase injection of 2000 ppmv, split 100:1. (B) 1 mlvapor phase injection of 50 ppbv, no split, trapped for 2 min. The additional peaks are presumably due tothe air dilution.
resulting solute peaks. Such peaks will have a third statistical moment greater thanzero.
Split injections performed without trapping were compared with split injectionswhich were trapped for 120 s. Mean values for the second and third statistical moments of each peak are given in Table II for normal and trapped injections. It is clearthat sample trapping does not impair the peak shape relative to a normal split injection. The larger values for heptane arose from a very small impurity eluted on thetail of the peak. The precision undoubtedly suffers from the limited digitizationrates10 imposed by this equipment for these rapid elution times (to < 6 s), but is stillbetter than 10% relative standard deviation (R.S.D.) for the second moment and20% R.S.D. for the third. The demands of an injector for this short column aresevere. The absence of band broadening for trapped injections relative to normal splitinjections demonstrates the ability of this trap to rapidly vaporize solutes.
A longer column was used for separating dilute gas samples in order to provideadequate resolution between the compounds of interest and extraneous trace components present in the sample matrix. A typical split-injection separation of the sampleat a concentration of 2000 ppmv is shown in Fig. lA. In this case, a 5-,u1 vapor phaseinjection is split at a ratio of 100:1. This chromatogram is featureless except for the 4solutes.
Fig. 1B demonstrates the trapping and subsequent analysis of a I-ml sample ata concentration of 50 ppbv (a dilution of 40 000 from A). The gaseous sample isinjected without benefit of splitting 2 min before initiating the separation. Over a 90-speriod, the sample slowly passes into the column at the carrier flow-rate of 0.0123ml/s, moving from the injector into the oven to be trapped in the cooled section of thecapillary. The injection port volume cannot be quantitatively swept at this flow-ratein 90 s, therefore, the splitter valve is opened after 90 s to completely flush the port

72
TABLE III
FIRST STATISTICAL MOMENTS FOR AN Il.O-m COLUMN
Mean ± 1 standard deviation (n ~ 5).
S. R. SPRINGSTON
Sample Split injection(2000 ppmv),first moment (s)
58.27 ± 0.1179.52 ± 0.23
134.78 ± 0.37277.46 ± 0.35
Trapped injection(50, 100, 200 ppbv),first moment (s)
57.68 ± 0.2078.83 ± 0.22
133.04 ± 0.24272.12 ± 0.33
before warming the trap. The action of the valve creates a slight baseline disturbance.The separation begins when current is applied to the trap, indicated as time zero inFig. IB. Other components of ambient air present in the sample are also concentratedand then detected by FID. Even with these background peaks, the four componentsof interest are eluted at this level without significant interference.
Because these samples were prepared from ambient air, the absence of methanein the chromatograms was initially puzzling. Methane is present at a concentration ofroughly 1.6-1.7 ppmv11 in the atmosphere, or about 40 times greater than the dilutealkane samples. However, the vapor above liquid nitrogen only cools the trap to- 150aC. This is well above the boiling point of methane. Thus, methane is notconcentrated within the trap and is eluted as a broad peak indistinguishable from thebaseline.
The reproducibility ofretention times, as given by the standard deviation of thefirst statistical moment, is shown in Table III for split and trapped injections. Theprecision is comparable for the two methods. No differences were observed betweenthe 50-, 100- and 200-ppbv samples. The mean retention times are slightly less for thetrapped injections because the separation begins at the trap, about IS cm downstreamfrom the inlet.
A plot of peak area vs. sample concentration is shown in Fig. 2 for two compounds with greatly different retention ratios. The precision is indicated by error bars
lE4
.~c 8000"~ 6000
0OJ
~ 4000
-'"0OJ 2000
Q
a+---t-------t---+----+-----jo ~ 100 1~ 200 2~
Concentration (ppbv)
Fig. 2. Peak area vs. concentration for an II m x 250 /lm J.D. capillary column coated with 0.4% (wjv)SE-30. 0 = Pentane, k = 0.305; • = octane, k = 5.16. Samples were trapped for 2 min. Mean ± 1standard deviation (n = 3 or 4).

CRYOGENIC TRAPPING FOR GC
85,.---------------,
2 80
73
OJoc.8(Il
.iiiOJ
0::
75
70 ..
25050 100 150 200
Trap Temperature (Oc)
Fig. 3. Trap resistance vs. trap temperature. The trap temperature was measured inside the capillary. - =
Trap resistance measured as trap was heated externally. 0 = Trap resistance measured as trap was heatedohmically.
of ± one standard deviation. If peak areas were reported relative to an internalstandard the precision would improve considerably. Digitization error for these smallsignals also contributes to the scqtter. Even so, the precision for all solutes at 50 ppbvis better than 10% R.S.D. For replicate split injections with much larger signals, theprecision is 3% R.S.D.
The trap resistance varies linearly with the temperature when heated externallyas shown by the line in Fig. 3. The stepwise increase is due to the digitization limitations in reading the current through the trap. The circles in Fig. 3 show how theresistance changes with temperature when the trap was ohmically heated. As expected, the correspondence between the two sets of data is quite good. This confirms thatthe relationship between the trap's resistance and temperature is independent of howthe trap is heated. The tedious operation of inserting the thermocouple into the trapwas required to establish this independence. In practice, it is not necessary to measurethe temperature within the capillary directly, even for calibration. The trap temperature can be easily determined as a functitln of resistance by assuming the oven andthe trap to be at the same temperature during calibration. Because the thermal massof the trap is extremely low, this assumption is valid.
The relationship between trap resistance and temperature is an attractive feature of this cryogenic trap. The temperature can be determined from the voltage andcurrent used to heat the trap. No external thermal sensor, which would cause a coldspot, is needed. With a suitable feedback system, the temperature of the trap could beeasily controlled to within SOc. This should facilitate trace level capillary columnseparations of volatile, thermally labile compounds such as peroxyacetic nitric anhydride (PAN)12. This compound can be analyzed isothermally without cryogenically cooling the column, but some means of concentrating the sample at the columnhead is required. The applicability of the cryogenic trap is being explored. It is reasonable to expect the sensitivity for PAN to be increased two or three orders of magnitude relative to the alkanes by substituting an electron-capture detector (ECD) for theFID. This should make it possible to perform PAN determinations in ambient air atthe parts-per-trillian level.
Other trap heating profiles may also be desirable for certain samples. A multistep, or temperature-programmed trap warming would crudely prefractionate sam-
74 S. R. SPRINGSTON
pies. The least volatile components could be retained and later removed during backflushing while heating the trap. The negligible thermal mass of the trap allows rapidcycling between the temperature limits set by the cooling chamber and the decomposition of the polyimide layer on the capillary.
Accurately controlled trap heating should be equally applicable for supercritical fluid chromatography (SFC). In this separation technique, the partition ratio ofsolutes also changes with temperature, however, higher temperature causes the mobile phase density to decrease and the solute partition coefficient to favor the stationary phase. Thus, unlike GC, increased temperature causes longer retention. To trapsolutes in SFC, the trap would be warmed. Solute migration would commence whenthe trap was allowed to cool. Here, the speed of cooling is important and the lowthermal mass of this trap should prove ideal. The concept of concentrating soluteswithin a heated zone of a capillary SFC column was suggested several years ago 13,but a suitable trap with low thermal mass was unavailable at that time. A capillarytrap could also be connected upstream from a packed SFC column to concentratesamples and sharpen the concentration profile of the injection.
Phillips et al. 14 have described a thermal desorption modulator for GC basedon an electrically conductive metallic paint. The design requirements of a modulatorare similar to those of a cryogenic trap15,16. Conversely, the trap presented hereinshould be useful for multiplex chromatography. The gold layer is an excellent thermalconductor and has a thickness on the order of nanometers as opposed to 40 )lm forpaint14. In addition, the gold layer is free from any binders present in paint. Thesenon-metallic components conduct heat poorly compared with gold and could slowthe cooling cycle of a modulator. They may also possibly limit the maximum allowable modulator temperature. Thus, a cryogenic trap based on a thin layer of metallicgold has inherently faster thermal slew rates and may provide certain advantages asan injection modulator.
CONCLUSIONS
The cryogenic trap described in this paper exhibits a variety of attractive characteristics. Its low thermal mass allows rapid heating and cooling. This quality permits samples to be vaporized on a short enough time scale for isothermal analysiswithout contributing to band broadening. Rapid cooling should also render the trapuseful for thermal modulation chromatography and SFC. Unlike some other cryogenic traps, the chromatographic stream is free from connections. All trapping occurswithin the column itself. This also eliminates any sample contact with heated metalsurfaces. Although a heated splitter was used for this study, gentler methods couldeasily be substituted.
Other positive features arise from the electrical properties of the gold layer.Because the layer is so thin, its resistance is high and it can be heated with minimalcurrents. Thus, only thin wire leads and voltages between 10 and 15 V are required.Such currents and voltages can be easily controlled without elaborate circuitry. Because of these features, this trap could readily be used in a fully automated system.Resistance across the trap leads varies directly with the trap temperature, in effectforming a resistance thermometer. By measuring the trap current and voltage, thetrap temperature can be determined. With an appropriate feedback circuit, the tem-
CRYOGENIC TRAPPING FOR GC 75
perature could be accurately controlled. Since the gold layer itself poses no pr:lcticalthermal limits, the trap temperature may range from that of the cryogenic bath to themaximum operating temperature of the column.
Capillaries can be equipped with the cryogenic trap after they have been coated.Thus, commercially prepared columns may be retroactively fitted with a trap. If thestationary phase cannot tolerate the required curing temperature, it should be possible to locally heat only the trap section while purging with an inert gas from thedetector end. The gold layer, once applied, is quite durable and can easily be installedbefore coating if heating would damage the phase or column deactivation. Becausethe gold coating does not prevent the use of any other injection technique, all capillaries could have the thermal trap applied near the inlet before coating. The goldapplication step is simple and inexpensive, less than US$ 1.00 of gold solution wasneeded to prepare the traps described above.
ACKNOWLEDGEMENT
This research was performed under the auspices of the U.S. Department ofEnergy under Contract No. DE-AC02-76CHOOOOI6.
REFERENCES
I W. Jennings and M. F. Mehran, 1. Chromatogr. Sci., 24 (1986) 34.2 J. V. Hinshaw, J. Chromatogr. Sci., 26 (1988) 142.3 B. J. Hopkins and V. Pretorius, J. Chromatogr., 158 (1978) 465.41. Droze, J. Novak and J. A. Rijks, J. Chromalogr., 158 (1978) 471.5 B. A. Ewels and R. D. Sacks, Anal. Chem., 57 (1985) 2774.6 L. A. Lanning, R. D. Sacks, R. F. Mouradian, S. P. Levine and J. A. Foulke, Anal. Chern., 60 (1988)
1994.7 B. V. Burger and Z. Munro, J. Chrornatogr., 370 (1986) 449.8 B. Kolb, B. Liebhardt and L. S. Ettre, Chromatographia, 21 (1986) 305.9 A. van Es, J. Janssen, C. Cramers and J. Rijks, 1. High Resoilit. Chromatogr. Chromalogr. COmmlin., II
(1988) 852.10 S. N. Chesler and S. P. Cram, Anal. Chem., 43 (1971) 1922.II B. J. Finlayson-Pitts and J. N. Pitts, Jr., Atmospheric Chemistry, Wiley-Interscience, New York, 1986,
p.974.12 J. M. Roberts, R. W. Fajer and S. R. Springston, Anal. Chem., 61 (1989) 771.13 S. R. Springston, Ph.D. Thesis, Indiana University, Bloomington, IN, 1984, p. 46.14 J. B. Phillips, D. Luu, J. B. Pawliszyn and G. C. Carle, Anal Chem., 57 (1985) 2779.15 J. B. Phillips, D. Luu and R. Lee, J. Chromatogr. Sci., 24 (1986) 396.16 S. Mitra and J. B. Phillips, J. Chromatogr. Sci., 26 (1988) 620.


Journal a/Chromatography, 517 (1990) 77-86Elsevier Science Publishers B.V., Amsterdam
CHROMSYMP. 1881
Enhanced possibilities for identification using series-coupledcapillary gas chromatographic columns
II. Retention indices as an identification tool in selectivitytuning
T. MAURER, W. ENGEWALD* and A. STEINBORN
Department 0/ Chemistry, Analytical Centre, Karl Marx University Leipzig, Talstrasse 35, DDR 7010Leipzig (G.D.R.)
ABSTRACT
For calculating retention (tR) times from retention indices in series-coupledcolumn systems with different flow-rates in the individual columns, the dependence ofthe dead time and of the parameters a and b of the log tR versus carbon number plotsfor n-alkanes on the pressure of the medium is discussed. It is shown that the intercepta of the log tR versus carbon number plots is composed additively of an easily determinable flow-independent term and a flow-dependent term. On this basis, a methodwas developed for the precalculation of the retention times of any substances fromtheir retention indices under the conditions of selectivity tuning by varying the flowrates in a system of series-coupled GC columns. The method allows statements on thepresence or absence of compounds of interest by comparing calculated and measuredsystem retention times. By repeating the identification algorithm at different pressuresettings and, consequently, flow-rates, the peak shifts expected in selectivity tuningcan be pursued on the one hand; on the other, a degree of certainty about the positiveidentification of compounds can be achieved owing to the feasible avoidance of peakoverlapping, which is not possible by means of the classical retention index concept.
INTRODUCTION
High-resolution gas chromatography (HRGC) implies the optimization of thecolumn efficiency, the selectivity and the capacity ratio. With the introduction ofcapillary columns, the main emphasis was laid on their high efficiency, whereas theoptimization of the selectivity was not so closely observed for a long period. Only whenit was recognized that many samples were more complex than had been originallythought did the necessity arise to produce capillary columns with specializedselectivity. A system with specialized selectivity can be obtained by selectivity tuning.
0021-9673/90/$03.50 © 1990 Elsevier Science Publishers B.V.

78 T. MAURER, W. ENGEWALD, A. STEINBORN
Sandra et al. 1 suggested that in capillary GC selectivity tuning can be accomplished inon of three ways: by using tailor-made stationary phases; bu using mixed phases; or byserial coupling of columns with different stationary phases.
The last variant seems to be the most elegant method for producing a tunableselectivity because, in addition to the column length and the phase ratio, {3, asvariables, the very easily accessible variables temperature and/or carrier gas flow-ratecan be used for setting the desired selectivity, and this method offers the chance to usestandardized stationary phases with known retention properties and retention values.
However, the use of selectivity tuning for changing the selectivity in a seriescoupled system places high demands on the identification in the sense of refinding thepeaks in the individual chromatograms because in the case of selectivity changes it isalways necessary to take account of a change in the retention sequence ofcomponentsand, consequently, also of the removal ofpeak overlappings and the occurrence of newinterferences.
Therefore, considerable experience and possibly also a certain amount ofintuition are necessary for analysing complex mixtures if optimum separation is to beachieved. This especially applies to series-coupled systems in which the number ofvalues to be varied is greater. This makes searching for a resolution optimum a verytime-consuming process and it is desirable that the extent of experiments for findingthis optimum should be considerably reduced by suitable simulation programs.
One precondition for optimization is the knowledge of the connection betweenretention and pressure of the medium or flow-rates in the column system used. Thistopic has been discussed in a few papers (see refs. 2 and 3 and papers cited therein).Another possibility is the use of system retention indices in directly series-coupledsystems for identification4
-7
. However, these system indices have the disadvantagesthat they are not directly correlated with a thermodynamic value, that they aredependent on the behaviour of the flow-rates in the two columns and that the functionon which their determination is based is not linear but, depending on the individualcolumns used, a more or less bent curves. As an alternative to this we suggest that thesystem retention times should be calculated in advance by means of known (tabulated)retention index values of the substances on the two individual columns and thatidentification be achieved by comparing measured and precalculated retention times atdifferent pressure settings of the medium.
In this way it should be possible to use with advantage the existing valuableexperience with retention values for many substances on different stationary phases inthe form of Kovats retention index libraries, in spite of the known disadvantages of theretention index system2
.
For this purpose, the fundamentals for the conversion of tabulated index datainto retention times are presented. In the following, it will be shown how theidentification of sample components (in the sense of refinding already knowncompounds or for establishing the presence or absence of compounds of interest) canbe achieved under the conditions of selectivity tuning by comparing measured andprecalculated system retention times.
EXPERIMENTAL
The schematic representation of a series-coupled system in Fig. I shows thevalues necessary for its description and their indices.

SERIES-COUPLED CAPILLARY GC COLUMNS. II.
1M
COllimn 1 column 2
L1, v1 ' T1 L2 , v2 , T2lR(S)
1'1 t R(2( IR(S) - 1R(1)
11'1(2)=11'1(5) - 11'1(1)IM(S)
I R(1)
t M (1)
79
Fig. I. Schematic diagram of the series-coupled two-column system used without intermediate trapping.I = Sample injection; S = coupling device (live T-piece) with additional carrier gas supply; M = monitordetector (FID I); D = main detector (FID 2).
The instrument used was a Sichromat 2 (Siemens, Karlsruhe, F.R.G.), equippedwith a split injector, a live T-piece and two flame ionization detectors. The carrier gaswas hydrogen.
In system A (a values), column 1 was fused silica, 40 m x 0.32 mm J.D.,containing WG-ll (WGA, Pfungstadt, F.R.G.) and column 2 was fused silica, 50m x0.32 mm J.D., containing WG-PBl (OV-l), with temperatures and pressures asindicated in Table J. In system B (prediction), column 1a was glass, 67 m x 0.24 mmLD., containing 2-[4-(4-pentylbenzoyloxy)phenyl]-5-hexylpyrimidine (PBHPt andcolumn 2 was glass, 32m x 0.32 mm J.D., containingOV-l, with the temperatures andpressures as indicated in Fig. 4 and Table II.
RESULTS AND DISCUSSION
Dead times in series-coupled column systemsAs is known, in a series-coupled column system without intermediate trapping,
both the retention times (tR) and the dead times (tM ) for the total system are composedadditively of the contributions for the individual columns:
tM(S)
tR(S)
tR(S)
tM(l) + tM(2)
tR(l) + tR(2)
tR(l) + tR(2)
(I)(2)(3)
The dead time of a capillary separation column is dependent on its geometricaldimensions and the average linear flow-rate of the carrier gas, which is determined bythe difference in the pressure existing at the inlet and the outlet of the column. The deadtime can be calculated according to the following equation3
:
32 L2'1(T)tM = 3 r2
p~ - p;,(Pr - p~)2
(4)
a The column was made available by courtesy of Dr. G. Kraus of the Chemistry Department of theMartin Luther University, Halle, G.D.R.
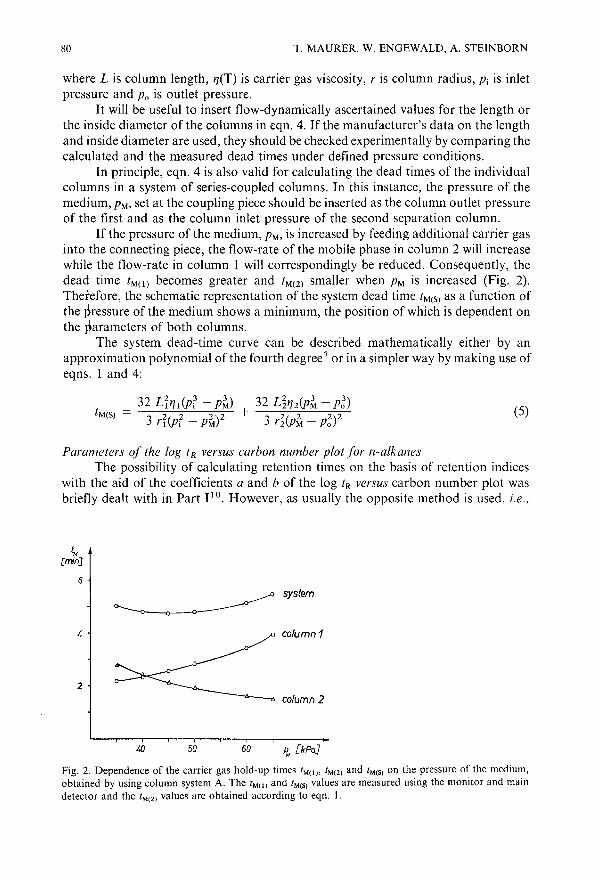
80 T. MAURER, W. ENGEWALD, A. STE1NBORN
(5)
where L is column length, IJ(T) is carrier gas viscosity, r is column radius, Pi is inletpressure and Po is outlet pressure.
It will be useful to insert flow-dynamically ascertained values for the length orthe inside diameter of the columns in eqn. 4. If the manufacturer's data on the lengthand inside diameter are used, they should be checked experimentally by comparing thecalculated and the measured dead times under defined pressure conditions.
In principle, eqn. 4 is also valid for calculating the dead times of the individualcolumns in a system of series-coupled columns. In this instance, the pressure of themedium, PM, set at the coupling piece should be inserted as the column outlet pressureof the first and as the column inlet pressure of the second separation column.
If the pressure of the medium, PM, is increased by feeding additional carrier gasinto the connecting piece, the flow-rate of the mobile phase in column 2 will increasewhile the flow-rate in column I will correspondingly be reduced. Consequently, thedead time tM(l) becomes greater and tM(2) smaller when PM is increased (Fig. 2).Theiefore, the schematic representation of the system dead time tM(S) as a function ofthe ressure of the medium shows a minimum, the position of which is dependent onthe arameters of both columns.
The system dead-time curve can be described mathematically either by anapproximation polynomial of the fourth degree 7 or in a simpler way by making use ofeqns. 1 and 4:
32 LflJ 1(Pf - p~) 32 L~1J2(P~ - p~)tM(S) = + 2 2 2
3 rf(Pf - p~)2 3 d(PM - Po)
Parameters of the log tR versus carbon number plot for n-alkanesThe possibility of calculating retention times on the basis of retention indices
with the aid of the coefficients a and b of the log tR versus carbon number plot wasbriefly dealt with in Part 110. However, as usually the opposite method is used, i.e.,
t,.[min]
6
~system
I,
2
column 1
column 2
50 60 P,., [kPa]
Fig. 2. Dependence of the carrier gas hold-up times IM(I), IM(2) and IM(S) on the pressure of the medium,obtained by using column system A. The IM(I) and IM(S) values are measured using the monitor and maindetector and the I M(2) values are obtained according to eqn. I.

SERIES-COUPLED CAPILLARY GC COLUMNS. II. 81
calculating retention indices by means of retention times, the theoretical foundationsof this process will be briefly described here.
The retention index concept according to Kovats is based on the, for highern-alkanes, undisputed linear increase in the logarithm of the adjusted retention time(tp.) with increase in carbon number for higher n-alkanes:
log t~ = a + bZ (6)
where Z is the carbon number of the n-alkane used and the constants a and b are theintercept and the slope, respectively, of the n-alkane plot.
By means of regression methods!!, the constants a and b can be easily calculatedfrom the retention times of an n-alkane mixture.
The slope b = log [t~(z+ l)jt~(d is correlated with the partial molar free sorptionenergy of the methylene group in the n-alkane!2. According to this, b is dependent onthe structure of the stationary phase and on the column temperature!3 but isindependent of the set flow-rate.
Nothing has been said in the literature so far about the thermodynamicimportance ofconstant a. However, it can be easily shown that, amongst other things,the dependence of the retention times on the set flow-rate will be incorporated inconstant a. For the precalculation of retention times under the conditions of selectivitytuning by varying the flow-rates, it is therefore necessary to know the dependence ofthe a value on the carrier gas flow-rate or a value proportional to it.
If on both sides of eqn. 6 the term log tM is subtracted:
log t~ - log t M = a - log tM + bZ (7)
the logarithm of the k' value of the respective n-alkane will be obtained on the left-handside ofeqn. 7. As this is a flow-independent value, the term a - log tM on the right-handside must also be independent of flow-rate. If this flow-independent "basic value" istermed ak> the following connections are valid for an n-alkane of carbon number Z:
log k' = ak + b + Zlog t~ = a + b + Z'a = ak + log tM
(8)(9)
(10)
According to eqn. 10 a is composed additively of a flow-independent term ak and theflow-dependent term log tM •
The validity of this relationship was examined using a C6-Cll n-alkane mixture.The ak values of the individual columns were determined at PM = 50 kPa according toeqn. 8 from the capacity factors of the n-alkanes. Table I shows the high degree ofagreement of the a values precalculated for various pressures of the medium with thecorresponding experimental values.
Using as a basis the well known fact that the retention index (I) of any chosensubstance i can be considered to be 100 times the carbon number of a hypotheticaln-alkane with the same retention time, Haken et al.!4 formulated:
Ii = 100(log t~,i - a)jb (11)

82 T. MAURER, W. ENGEWALD, A. STEINBORN
TABLE I
DEPENDENCE OF THE DEAD TIMES I MIl ) AND IM(21 ON THE PRESSURE OF THE MEDIUM,PM, AND COMPARISON OF PREDICTED AND MEASURED a VALUES WITH COLUMNSYSTEM A AT T, = T2 = 100°C AND PI = 100 kPa
PM 1M !,)a
I M (2)a ak(l) Log I MIl ) at(l)culc. al(])mcu~" ak(21 Log I M (2) at (2)ClIlc. G t (2jmeas.
(kPa) (min) (min)
35 2.21 2.80 0.79 -6.14 -6.17 1.02 -4.32 -4.3140 2.39 2.45 0.87 -6.06 -6.11 0.90 -4.44 -4.4745 2.58 2.19 0.95 -5.98 -5.95 0.78 -4.56 -4.5750 2.85 1.98 -6.93 1.05 -5.88 -5.88 -5.34 0.68 -4.66 -4.6660 3.49 1.67 1.25 -5.68 -5.70 0.51 -4.83 -4.8565 3.97 1.53 1.38 -5.55 -5.60 0.43 -4.91 -4.91
a Dead times lM(1), IM(2) were calculated by a regression method according to Kaiser andRackstraw".
The inversion of this equation and combination with eqn. 10 results in
log tJ""i
log tJ""i
a + O.Olb!;ak + log tM + O.OlbI;
(12)(13)
This offers a chance of the precalculation of retention times of any substances fromtheir retention indices at different flow-rates, on the condition that the parameters ak
and b of the n-alkane straight line were determined at one given flow-rate.
Precalculation ofsystem retention times at different pressure settings in a series-coupledGC system
On the basis of the fundamentals presented above for'the calculation of deadtime from column parameters and of retention times from tabulated retention indices,a program was developed which allows the prediction of system retention times ina series-coupled column system at different pressure settings, thus offering newpossibilities both for pursuing the peak shifts required in selectivity tuning and for thereliable proof of the presence or absence of substances of interest in complex mixtures.
The program is based on the following conditions: the geometrical parameters,i.e., length and inside diameter, of the separation columns used are sufficientlyaccurately known or have been determined according to flow-dynamic methods; thestationary phases used are standard phases with different retention properties, whichcan be generated in a reproducible form and for which retention index libraries areavailable which should be as comprehensive as possible; and on each individualcolumn the chromatogram of an n-alkane mixture was recorded at the operatingtemperature and at one defined inlet and outlet pressure of the column. Fig. 3 showsthe structure of the program in principle.
First, the parameters ak and b of the n-alkane plot are calculated for bothcolumns on the basis of the retention times of the n-alkane runs. Then the dead timesfor the individual columns are precalculated for the pressure settings of the coupledsystem for which the retention times of any substances are intended to be precalcu-

SERIES-COUPLED CAPILLARY GC COLUMNS. II. 83
INPUT
column parameters for thesingle columns:length: Ll. L2column radius: rI, r2temperature: Ti, T2
retention indices of the compoundson both single columns:
111 IKl[[2 [K2
retention times of a singlen-alkane-run on both columns:
tRl l ... tRNl
inlet ,medium and outlet pressureused for the n-alkane run
Pi, pm, Po
inlet ,medium and outlet pressuresettings for the prediction ofsystem retention times:
Pi-, Pm-, po·
CALCULA nONS
-regression parameters for the nalkane plots at pl. pm, Po (on both
columns) <11. a2. ak!, ak2. bl, b2:log t'R "'" a + b Zlog k' .. a k+ b Z
-dead times for the first and secondcolumn;
-calculation of a values for thecalculated dead times:
al - akl + log tNtl)a2 .. ak2 + log tM(2)
-predicted retention times on the
Single columns:tRC!) ., exp(al + bl Iii /100) + tM(I)tRCZ) ,.. exp(az + b2 liZ /100) + tM(Z)
-predicted system retention times:
tR(SJ ... tR([) + tRCZ)
OUTPUT
system retention
times of thecompounds at thepressure settings
Pi-, Pm-, po·
Fig. 3. Computer program for calculation of retention times for series-coupled columns.
lated. Then follows the calculation of the a values from the ak values according toeqn. 10.
All the conditions have been given for calculating the retention times on theindividual columns for all the components of interest in the mixture (whose retentionindices must, of course, be known on both individual columns). The addition of theseprecalculated adjusted retention times to the likewise precalculated dead times for thetwo columns yields the system retention times to be expected for the substances ofinterest at the chosen pressure setting.
Fig. 4 shows the chromatogram of an a1ky1benzene test mixture at differentpressure settings of the medium, PM, and constant inlet pressure, Pi.
The applied column system B is a combination of two glass capillary columnswith a significantly different separation powers. The stationary phases used includeda liquid-crystalline phase (PBHp9
) in which the solute retention is determined by itsgeometry (shape or length to breadth ratio), and a methy1silicone (OV-I) stationaryphase in which the retention is determined by the vapour pressure (boiling point) of thesolute. The retention indices given in the legend to Fig. 4 demonstrate the differentelution sequences resulting for the test substances used. The liquid-crystallinestationary phase has an excellent selectivity for meta and para isomers which, as isknown, cannot be or can hardly be separated on non-polar stationary phases.
The chromatograms in Fig. 4 show some different selectivities of the systemwhich can be achieved with the indicated values of the pressure of the medium, PM, i.e.,with different shares of the two columns to the total selectivity of the system.A retention inversion of the o-xylene-isopropylbenzene pair can be observed. Tn
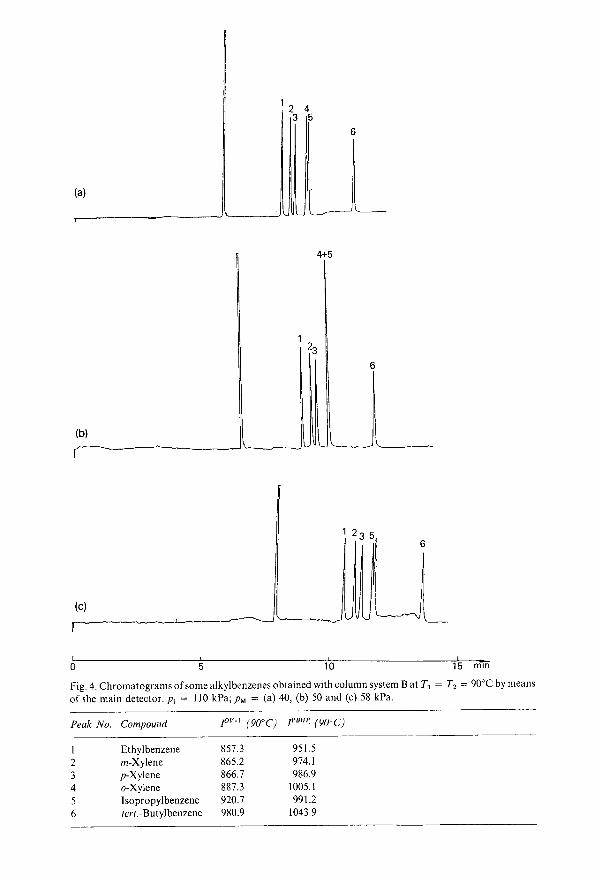

SERIES-COUPLED CAPILLARY GC COLUMNS. II. 85
TABLE II
COMPARISON OF PREDICTED AND MEASURED SYSTEM RETENTION TIMES, tR(s), FORTHE SERIES-COUPLED COLUMN SYSTEM B AT DIFFERENT PRESSURE SETTINGS OF THEMEDIUM
For experimental conditions, see Fig. 4.
Compound PM = 40 kPa PM = 50 kPa PM = 58 kPa
[R(S) meas. lR(S) calc. Llt aIR(S) meas. IR(S) calc. Llt a
tR(S) meas. lR(S) calc. Llt a
(min) (min) (s) (min) (min) (s) (min) (min) (s)
Ethylbenzene 10.525 10.57 3 11.297 11.35 3 12.395 12.30 5m-Xylene 10.958 10.99 2 11.759 11.71 3 13.010 12.92 5p-Xylene 11.188 11.22 2 12.022 11.98 3 13.314 13.23 5a-Xylene 11.765 11.83 4 12.589 12.58 I 13.938 13.90 3lsopropylbenzene 11.869 11.95 5 12.589 12.58 I 13.826 13.80 2tert.-Butylbenzene 14.294 14.33 2 14.993 15.06 4 16.191 16.08 6
a LIt = tRmca~. - [Reale.-
Table II the predicted retention times are compared with the measured retentiontimes.
The good agreement between the precalculated and the measured valuesconfirms the fundamental suitability of the method presented. The error in predictingthe retention time is less than 2% and is partially due to the fact that for this firstexample the outlet pressure Po was considered to be constant and equal to the standardpressure.
CONCLUSIONS
The method presented for the precalculation of the retention times of anysubstances under the conditions of selectivity tuning by varying the flow-rates ina system of series-coupled GC columns allows the identification of componentsexpected in a mixture by comparing the precalculated and the measured systemretention times.
By repeating the identification algorithm at different pressure settings and,consequently, flow-rates it is possible, on the one hand, to pursue the peak shiftsexpected in selectivity tuning (identification in the sense of a refinding of alreadyknown compounds under changed chromatographic conditions according to therepetition of the analysis on a second and third column with changed polarity). On theother hand, owing to the avoidability of overlapping peaks, a degree of reliability canbe reached in the positive identification of compounds which is not possible with theclassical retention index concept. The combina'tion of such a GC identification systemwith a spectrometric detector should permit a reliable qualitative analysis in manyinstances.
A clear advantage of the method suggested is the unlimited applicability ofalready existing retention index libraries for single-column systems.
An extension of the method by including selectivity tuning by varying thecolumn temperatures is currently under investigation. Further, there are interesting

86 T. MAURER, W. ENGEWALD, A. STEINBORN
possibilities of coupling this method with an optimization algorithm for finding thecolumn combinations and pressure settings that allow the maximum separation ofa mixture of known composition.
REFERENCES
P. Sandra, F. David, M. Proot, G. Dirricks, M.Verstappe and M. Verzele, J. High Resolut. Chromatogr.Chromatogr. Commun., 8 (1985) 782.
2 J. V. Hinshaw and L. S. Ettre, Chromatographia, 21 (1986) 561, 669.3 J. H. Purnell and P. S. Williams, J. Chromatogr., 292 (1984) 197.4 J. Krupcik, G. Guiochon and J. M. Schmitter, J. Chromatogr., 213 (1981) 189.5 T. Toth and F. Garay, in P. Sandra (Editor), Proceedings ofthe 8th International Symposium on Capillary
Chromatography, Riva del Garda, May 19-21, 1987, 1987, pp. 585-595.6 D. Repka, J. Krupcik, E. Benicka, P. A. Leclercq and J. A. Rijks, J. Chromatogr., 463 (1989) 243.7 R. E. Kaiser and R. I. Rieder, Labor-Praxis, 9 (1985) 1465.8 T. Maurer, Th. Welsch and W. Engewald, J. Chromatogr., 471 (1989) 245.9 E. Matisova, E. Kovacicova, J. Garaj and G. Kraus, Chromatographia, 27 (1989) 494.
10 W. Engewald and T. Maurer, J. Chromatogr., 520 (1990) in press.II R. E. Kaiser and A. J. Rackstraw, Computer Chromatography, Vol. I, Hiithig, Heidelberg, 1983.12 R. V. Golovnya, Chromatographia, 12 (1979) 533.13 G. Tarjan, S. Nyiredy, M. Gyiir, E. R. Lombosi, T. S. Lombosi, M. V. Budahegyi, S. Y. Meszaros and J.
M. Takacs, J. Chromatogr., 472 (1989) I.14 J. K. Haken, M. S. Wainwright and R. S. Smith, J. Chromatogr., 133 (1977) I.

Journal of Chromatography, 517 (1990) 87-94Elsevier Science Publishers B.V., Amsterdam
CHROMSYMP. 1907
Oxygen enhancement of thermal electron capture in a nonradioactive discharge source for a quadrupole massspectrometer
W.E. WENTWORTH*, ELA DESAI D'SA and c.P. BATTEN
Chemistry Department, University of Houston, 4800 Calhoun, Houston, TX 77004 (U.S.A.)
and
EDWARD C.M. CHEN
School ofSciences and Applied Sciences, University of Houston CL, 2700 Bay Area Boulevard, Houston, TX77058 (U.S.A.)
ABSTRACT
The electron-capture detector (ECD) is the most sensitive gas chromatographicdetector available for certain compounds, In the process of developing a non-radioactive ECD based upon photoionization, we studied the enhancement of the ECDresponse by the addition of oxygen, This paper describes the results obtained bycoupling the non-radioactive photoionization ECD to a quadrupole mass spectrometer. It describes the use of oxygen enhancement of the production of halide ions in athermal electron-capture process. The production of the halide ions from aliphaticchloro compounds is much greater in the non-radioactive ECD than has been observed in typical radioactive ECDs. Indeed, the response to methylene chloride is equal tothat of carbon tetrachloride. This result was unexpected. The exact mechanism forthis enhancement is not known. The enhanced signal is smaller for bromobenzeneand chlorobenzene.
INTRODUCTION
The electron-capture detector (ECD) is generally recognized as the mostsensitive detector available for gas chromatography. However, it is also notorious forits difference in sensitivities!. For example, at room temperature, the response forcarbon tetrachloride is 105 times that of methylene chloride2
. One method formodifying this is to add oxygen to the carrier gas to enhance the response of themethylene chloride3
. However, even the enhanced response of methylene chloride isless than that of carbon tetrachloride at 523 K. The enhanced response of methylenechloride does increase with decreasing temperature and would be closer to that ofcarbon tetrachloride at the temperature of our experiments.
We have recently described the development of a non-radioactive photoioniza-
0021-9673/90/$03.50 © 1990 Elsevier Science Publishers B.V.

88 W. E. WENTWORTH et al.
tion electron-capture detector (PI_ECD)4,5. In this paper, we describe the use of thisdetector as a source for a quadrupole mass spectrometer. The first objective was tomerely determine the relative production of ions from various compounds. Theseresults were as expected. However, the study was extended to determine theenhancement ofelectron capture and these results were quite different from that whichhas been observed in the conventional radioactive ECD.
In this article we describe the coupling of the chromatographic detector to a massspctrometer and present the relative values of the normal response versus the enhancedresponses for aliphatic and aromatic chloro and bromo compounds. Finally, wepresent the optimum temperatures for the use of the selective-ion mode for the halideions and show the relationship between the 02" ion current and the halide ion current.
EXPERIMENTAL
The mass spectrometer and the basic atmospheric pressure ionization (API)source have been described previously6. In addition, an improved version of themicrowave discharge ECD has been given4,5. The work on the oxygen enhancementwas carried out with an earlier version of the microwave discharge source which will bedescribed here. Briefly, the thermal electrons are generated through the interaction ofenergetic species with the carrier gas, helium-methane. The response of the detector ismeasured with and without oxygen. Both the halide ion intensity and the 02" currentare measured in the selected-ion mode. The details of the data collection programshave been given earlier6. The mass spectrometer used in these experiments was anExtranuclear SpectraEL (Extranuclear Labs., Pittsburgh, PA, U.S.A.) having anominal mass range of 2-400 a.m.u. It was modified to allow analysis ofeither positiveor negative ions from an external high-pressure ionization source. The overall diagramof the various components is shown in Fig. 1. Two vertical cross sections of the actual
He CH402 AIR
T:~~~LAR'£...., NON-RADIOACTIVEECD CELL
_ _ FOCUSSING LENSES----MASSSPECTROMETER
SIGNAL
PRINTER
Fig. I. Basie diagram of the experimental set up.

OXYGEN ENHANCEMENT OF THERMAL ELECTRON CAPTURF 89
CAPILLARY ->
HELIUM JDNIZATJONLAMP
'------- PINHOLE <l80U)
TO MASS SPECTROMETER
THERMOCOUPLE CARTRIDGE
PROBE ~TERS
TO \
VACUUM ~ ~ \PUMP
(---- ELECTRODE
(---- PRESSURE
GAUGE
'------- PINHOLE <l80u)
TO MASS SPECTROMETER
Fig. 2. Cross-sectional view of the interface; two views shown at right angles.
detector are shown in Fig. 2. The carrier gas for the chromatograph is 99.998% purehelium (Big 3 Industries, Houston, TX, U.S.A.). In Fig. I, it can be seen that there arefive entrances into the reaction zone. One serves as an inlet for the pre-mixed reactantgases to enter the reaction zone at 35°C to the horizontal plane. A second at the sameangle serves as an inlet for the discharge lamp which produces the excited species. Thethird port serves as an inlet for the thermocouple and an exit for the gases. The fourth isan inlet for a stainless-steel electrode for the collection of electrons and the fifth isa connection to a pressure gauge.
The lamp is made of an outer quartz tube, 1/4 in. in diameter, with an entrancefor the helium gas connected by means of a Kovar-Pyrex fitting and an inner quartztube that is 18 in. in length that allows the excited species formed in the larger quartztube to migrate down into the reaction zone. The gas flows exiting the fused-silicacapillary column and the inner quartz tube intersect each other in the center of thereaction zone right above the pinhole below which stand the quadrupole of the massspectrometer. The discharge tube is positioned inside an air-cooled microwave cavity(Opthos Instruments, Rockville, MD, U.S.A.) and is adjusted both in the position onthe outer quartz tube as well as its entire length to give the minimum reflected power.The power used is generally about 40 W with a reflected power of 2 W. Helium
90 W. E. WENTWORTH et al.
discharge is seen to be a very intense peach color and minor leaks in the system caneasily be detected and correlated because of the change in the discharge from peach topurple, probably due to nitrogen in the air.
The high-pressure source is separated from the mass spectrometer by a O.OOI-in.thick stainless-steel disk (Optimation, Windham, NH, U.S.A.) with a pinhole apertureof 180 lim. The mass spectrometer pressure is 1 . 10 - 4 Torr while the source pressure isabout 10-20 Torr. The temperature in the ion source is measured with a thermocouple1/16 in. in diameter (Type K Omega Engineering, Stamford, CT, U.S.A.). All of thefive entrances are made leak-tight by having the lower flanges welded on to the main(top) flange of the mass spectrometer.
The data were collected as follows: the temperature of the detector was graduallyraised from room temperature to 250°C and readings were taken every 15-20°e. Pureoxygen and pure methane were used as reagent gases both from Union Carbide, LindeDivision (Somerset, NJ, U.S.A.). Once the optimum temperature was established,enhancement measurements were made first by taking measurements without oxygenand then taking them with oxygen. In order to remain in the linear region of theresponse, dilutions of the samples were made for the readings for the low-capturecompounds. The gas in the reaction cell was about 20% methane and 80% helium or20% methane, 40% helium and 40% oxygen.
The low-electron-capturing species such as methylene chloride were introducedas a solution through the gas chromatograph and the flow was adjusted to getadequate resolution of the peaks. Since actual flows at low pressures cannot bemeasured, they were approximated by flows at atmospheric pressure and read in termsof the number of Torr so as to be consistent from day to day.
All the compounds were reagent grade and were obtained from Baker, FisherScientific or Aldrich (U.S.A.). Of course, since samples are separated on the gaschromatograph, absolute purities are less significant. In addition, in the case of theenhancement values, the results are ratios and therefore any error due to purity will becancelled out. The samples were diluted in reagent-grade hexane. All samples wereinjected with a 0.06-/i1 liquid sampling valve to obtain good reproducibility.
All of the chromatograms were taken with a DB-5 Durabond column, 30 mm x0.32 mm J.D., with a film thickness of 1 lim at 298 K and a nominal flow-rate of1 ml/min. The exact column conditions are not critical since the enhancement valuesare ratios, providing the compound under investigation is separated from itsimpurities.
RESULTS
The absolute responses of the PI-ECD, the enhanced responses and theenhancement ratios are given in Table J. For comparison, the enhancement ratios fora standard ECD 7 are given in the last column of Table J. Eight compounds withvarying degrees of ECD sensitivity have been studied. The absolute responses arecalculated from the ion counts per mole calculated using the following formula:
R = Ix -. peak Wl/2/moles injected
where R is the response, Ix-. peak is the halide ion intensity at the peak, including all of
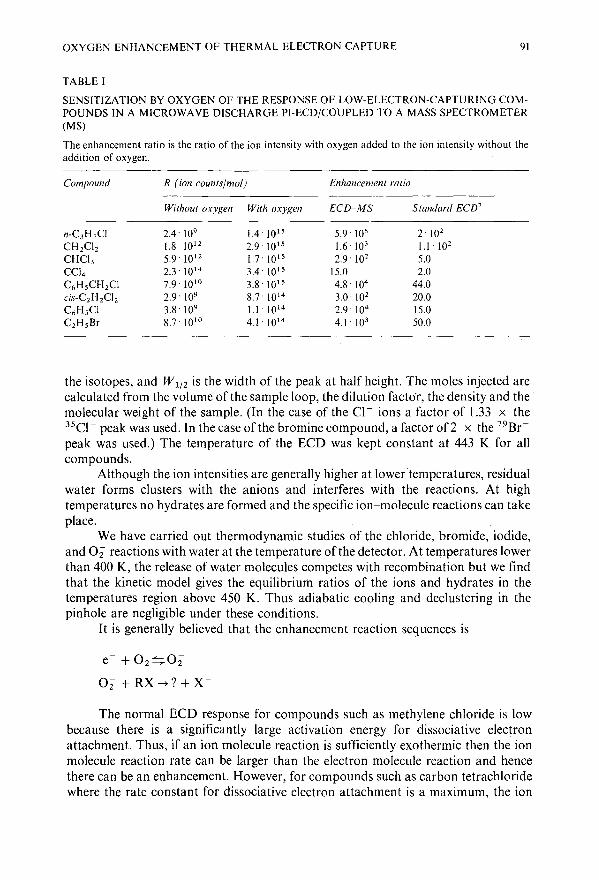
OXYGEN ENHANCEMENT OF THERMAL ELECTRON CAPTURE 91
TABLE I
SENSITIZATION BY OXYGEN OF THE RESPONSE OF LOW-ELECTRON-CAPTURING COMPOUNDS IN A MICROWAVE DISCHARGE PI-ECD/COUPLED TO A MASS SPECTROMETER(MS)
The enhancement ratio is the ratio of the ion intensity with oxygen added to the ion intensity without theaddition of oxygen.
Compound
n-C 3 H 7ClCH 2C1 2
CHCI 3
CCI 4
C6 HsCH 2 Clcis-C2H2C1 2C6 HsClC2HsBr
R (ion counts/mol) Enhancement ratio
Without oxygen With oxygen ECD-MS Standard ECD7
2.4 109 1.4 1015 5.9 105 2' 102
1.8 1012 2.9 1015 1.6 103 1.1 . 102
5.9 1012 1.7 lOIS 2.9 102 5.02.3 1014 3.4 1015 15.0 2.07.9 . 10 10 3.8 1015 4.8' 104 44.02.9 109 8.7 . 1014 3.0 102 20.03.8 109 1.1 1014 2.9' 104 15.08.7 1010 4.1' 1014 4.1' 103 50.0
the isotopes, and W1(2 is the width of the peak at half height. The moles injected arecalculated from the volume of the sample loop, the dilution facto'r, the density and themolecular weight of the sample. (In the case of the Cl- ions a factor of 1.33 x the35Cl- peak was used. In the case of the bromine compound, a factor of2 x the 79Brpeak was used.) The temperature of the ECD was kept constant at 443 K for allcompounds.
Although the ion intensities are generally higher at lower temperatures, residualwater forms clusters with the anions and interferes with the reactions. At hightemperatures no hydrates are formed and the specific ion-molecule reactions can takeplace.
We have carried out thermodynamic studies of the chloride, bromide, iodide,and 02" reactions with water at the temperature of the detector. At temperatures lowerthan 400 K, the release of water molecules competes with recombination but we findthat the kinetic model gives the equilibrium ratios of the ions and hydrates in thetemperatures region above 450 K. Thus adiabatic cooling and declustering in thepinhole are negligible under these conditions.
It is generally believed that the enhancement reaction sequences is
e- + 02~02"
02" + RX --+? + X-
The normal ECD response for compounds such as methylene chloride is lowbecause there is a significantly large activation energy for dissociative electronattachment. Thus, if an ion molecule reaction is sufficiently exothermic then the ionmolecule reaction rate can be larger than the electron molecule reaction and hencethere can be an enhancement. However, for compounds such as carbon tetrachloridewhere the rate constant for dissociative electron attachment is a maximum, the ion

92 W. E. WENTWORTH el al.
molecule reaction rate should be at most equal to that for the electron moleculereaction. The neutral products of the reaction are not specified. However, onepossibility is the radical ROO. Alternatively, the reaction could be one between anexcited O2 and RX. In addition to the change from an endothermic reaction to anexothermic reaction, there must also be a change in the concentration of the reactiv.especies. This is because the electron molecule rate constants are significantly larger
·than ion molecule reactions even if the reaction is exothermic. We do not know theanswers to these points at present but it is known that the oxygen enhancementreaction takes place even in the radioactive ECD at atmospheric pressure.
From the data given in Table I, it is clear that the relative responses for thePI-ECD are as expected for an ECD. For example, the response for carbontetrachloride is the greatest while that for chloropropane is the smallest. The relativevalues are about lOS which is also observed in a standard ECD. The major differencesare in the enhancement ratios. The enhanced response for the PI-ECD is much greaterthan that for the standard ECD. The enhanced responses for all eight compounds varyby about an order of magnitude. Indeed, if chlorobenzene and ethyl bromide areexcluded, then the response factors vary by slightly less than an order of magnitude.On the other hand, the enhanced response in the standard ECD still varies by three
15 -- 15 --
a. m/e = 37 a. m/e = 37
Ion Intensity Ion Intensity
0 -- 0 --time
time 50 --50 --
b. m/e = 35b. m/e ~ 35
Ion Intensity Ion Intensity
0
0 -- time
time
200-- 1 --
c. m/e = 32 c. m/e = 32
Ion Intensity Ion Intensity
0 --0 -- time
time
A20% O2 B No O2
Fig. 3. Chromatograms for the injection of (A) 10 pmol of carbon tetrachloride with 20'Yo oxygen O2 and(B) 100 pmol of carbon tetrachloride without oxygen. Attenuations: (A) x 15 (a), x 50 (b), x 200 (c); (B)x I. ECD temperature 441 K.

OXYGEN ENHANCEMENT OF THERMAL ELECTRON CAPTURE 93
orders of magnitude. We do not understand this but recognize the value of using thePI-ECD in conjunction with a mass spectrometer as a non-selective halocarbondetector. By monitoring the intensity of the °2 , confirmation of the reaction can bemade.
In Fig. 3 the selected-ion currents are shown for the injection of 10 pmol ofcarbon tetrachloride with oxygen and the injection of 100 pmol ofcarbon tetrachloridewithout oxygen. In Fig. 4, the selected-ion currents for the injection of 10 pmol ofl-chloropropane with oxygen and 105 pmol of I-chloropropane without oxygen areshown. The plots are ion intensities at m/e 32, 35 and 37 versus time. It is obvious thatthe responses for the two compounds are about the same in the system where oxygen isadded and quite different without the oxygen. In Fig. 4, the differences in the ·peakshapes for the chromatograms with and without oxygen should be noted. Withoutoxygen, the peak is not symmetrical as expected for the large amount injected. Therelative intensities of the chlorine isotopes is about 3: I when the relative attenuationsare taken into account. These chromatograms show that the increase in the halide ion
2 --
a. m/e = 37
Ion Intensity h0time
time 2
b. m/e = 35
Ion Intensity
0time
time
c. m/e = 32
Ion Intensity
--~0time
time
o --
o -- __~IIoIIiIlI""""
200--
c. m/e = 32
b. m/e = 35
o -25 --
Ion Intensity
a. m/e = 37
Ion Intensity
4 --
Ion Intensity
Fig. 4. Chromatograms for the injection of (A) to pmol of I-chloropropanc with 2U'Iu oxygen and (B) 10"pmol of 1-ch1oropropane without oxygen. Attenuations: x 4 (a), x 25 (b) and x 200 (c); (B) x 2 (a), x 4(b) and x I (c). ECD temperature = 441 K.

94 W. E. WENTWORTH et al.
occurs at the same time that there is a decrease in the O2 current. It should be notedthat the decrease in the oxygen peak is less than the amount by which the chloride ionsincreases. No other peaks were observed in the mass spectrum as mass scans weretaken during the time of elution of the gas chromatographic peak of interest.
It was also observed that the intensity of the halide ions varied linearly with theamount of compound injected.
CONCLUSIONS
The ion intensities observed in a microwave discharge PI-ECD are similar toa standard ECD when no oxygen is added to the system. When oxygen is added to thesystem, the production of the halide ions is enhanced. For the aliphatic chIorocompounds, the enhanced response is about constant. This is different from oxygenenhancement in a standard ECD. The enhanced response of olefinic and aromaticchloro compounds is less than that for aliphatic chloro compounds. This system offerspotentialfor the development ofa chloride-specific detector by using the PI-ECD witha mass spectrometer as a gas chromatographic detector. The response can be verifiedby observing the decrease in the O2 ion.
ACKNOWLEDGEMENT
The authors acknowledge the financial support of the Robert A. WelchFoundation, Grant E095.
REFERENCES
A. Ziatkis and C. F. Poole (Editors), Electron Capture- Theory and Practice in Chromatography (JournalolChromatography Library, Vol. 20), Elsevier, Amsterdam, 1981.
2 E. C. M. Chen and W. E. Wentworth, 1. Chromatogr., 68 (1972) 302.3 E. P. Grimsrud and D. A. Miller, Anal. Chem., 50 (1978) 19.4 W. E. Wentworth, T. Limero, C. F. Batten and E. C. M. Chen, J. Chromatogr., 441 (1988) 45.5 W. E. Wentworth, T. Limero, C. F. Batten and E. C. M. Chen, 1. Chromato/?r., 468 (1989) 215.6 W. E. Wentworth, E. D. D'sa, C. F. Batten and E. C. M. Chen, J. Chromatogr., 390 (1987) 249.7 D. A. Miller and E. P. Grimsrud, Anal. Chem., 50 (1978) 1141.

Journal of Chromatography, 517 (1990) 95-101Elsevier Science Publishers B.V., Amsterdam
CHROMSYMP. 1941
Comparison of cuticular hydrocarbon profiles of fire antsSolenopsis richteri from the same colony, using capillarycolumn gas chromatography with pattern recognition
J. H. BRILL"·a and W. BERTSCH
Department of Chemistry, University of Alabama, Tuscaloosa, AL 35487-0336 (U.S.A.)
ABSTRACT
The cuticular hydrocarbon profiles of workers of similar age and sub-caste ofthe black fire ant, Solenopsis richteri Forel, were examined by capillary gas chromatography and computer-based pattern recognition procedures. The data show statistically significant and reproducible differences in the hydrocarbon profiles of workersof similar age and sub-caste from the same colony.
INTRODUCTION
It is well known that cuticular hydrocarbons in insects playa role in chemicalcommunication l
-4. The literature on cuticular hydrocarbons is extensive. It includesthe chemical characteristics of materials extracted from the genus Solenopsis (fireants). The cuticular hydrocarbons of these ants are chemically characterized by thepresence of alkanes, primarily homologous series of n-alkanes and internallybranched monomethyl- and dimethylalkanes3,4. Studies have also been conducted tocorrelate gas chromatographic (GC) patterns of the cuticular hydrocarbons tovariables such as colony, caste, etc. 5-8. The primary tools for such investigations areembodied in the science of pattern recognition. Pattern recognition is a general analysis method where data sets obtained from samples are treated by appropriate algorithms for correlation to elements of individuality or to functional group properties9-
11. In the study of cuticular hydrocarbons, gas chromatograms from different
groups of insects are compared. Similarities or differences that are not easily observable by the human eye are pointed out. This process is most efficiently done bycomputer. Dozens of chromatograms, each consisting of a hundred components ormore, can readily be processed. After suitable data pre-treatment, the pattern recognition system looks for natural groupings or clusters. The end result of such manip-
a Present address: Department of Chemistry, University of Missouri-Columbia, Columbia, MO65211, U.S.A.
0021-9673/90/$03.50 © 1990 Elsevier Science Publishers B.V.
96 J. H. BRILL, W. BERTSCH
ulations is the observance of specific chromatographic peaks or groups of peaks thatare indicative of the individual sample sets.
In a series of previous papers, we have examined cuticular hydrocarbon patterns for two of the four species of the genus Solenopsis 5
• Further studies on the blackfire ant (Solenopsis richteri) showed that statistically significant differences appearedbetween the GC profiles of insects from different castes and those originating fromseparate colonies6
-8
. The variations between different colonies are generally small.Careful examination, however, shows that somewhat larger differences can be observed between neighboring colonies7
. It has been reported recently that harvesterants (Pogonomyrmex barbatus) can distinguish between neighbors and strangers12
.
In classical sample preparation methods, a large number of insects are usuallyextracted. The nature of this batch process tends to equalize differences that may existbetween smaller sub-sets or individual insects. We have introduced a sensitive procedure that permits establishment of profiles for single insects13
. During our studies, wehave noted that individual workers from the same colony produced slight but reproducible differences in their hydrocarbon profiles.
In this last of four communications, we present evidence for statistically significant variations that cannot be ascribed to experimental error. We do not know ifthese observations have biological significance.
EXPERIMENTAL
Sample preparationIndividual foragers from the same colony were homogenized in a 250-.u1 boro
silicate glass Potter-Elvehjem tissue grinder (Fisher Scientific, Norcross, GA, U.S.A.)with approximately 200 .ul of redistilled n-hexane. After the ant was thoroughlyground up, I .ul of internal standard (containing 250 ng/.ul each of docosane, n-C22 ,
and dotriacontane, n-C32 , in n-hexane) was added to the liquid. The supernatant wastransferred to a I-ml vial. The residue was washed several times with small quantitiesoffresh n-hexane, and the washings added to the vial. Finally, the extract was madeup to 200.u1 with n-hexane (due to evaporation during the workup). A total of eightforagers of approximately the same size were treated in this manner. The experimentswere repeated using foragers from five different colonies of the black fire ant.
ControlThe sampling and workup procedure was also performed without the use of a
forager: approximately 200 .ul of n-hexane were placed in the tissue grinder and thehomogenation step was performed by grinding the pestle in the solvent for a fewminutes. The internal standard was added and the solution transferred, together withthe washings, to a sample vial.
Gas chromatographyThe extracts were examined by capillary GC using the splitless injection mode.
The gas chromatograph was a Hewlett-Packard 5830A instrument, equipped with aGrob-type split/splitless injection port and a flame ionization detector. The columnwas a 10 m x 0.25 mm J.D. glass capillary, coated with a 0:25-.um film of SE-30. Thiscolumn was produced in-house, following standard procedures8
. Initial oven temper-

COMPARISON OF HYDROCARBON PROFILES OF FIRE ANTS 97
ature was 40°C. Thirty seconds after injection, the injector purge was activated andthe oven heated rapidly to 85°C. Thereafter, the oven was temperature-programmedto 300°C at a rate of 8°Cfmin. The helium carrier gas was set at a flow-rate ofapproximately 1 ml/min. Five replicate injections, of 1.8 ,ul each, were made fromeach sample.
The samples were also examined by GC-mass spectrometry (MS), using a Hewlett-packard 5895A GCfMS system operated in the electron impact mode (70 eV). A15 m x 0.32 mm LD. fused-silica capillary column, coated with a O.lO-,um film of 5%phenylmethylpolysiloxane (DB-5, J&W Scientific, Folsum, CA, U.S.A.) was used.
Data analysisThe retention times and peak areas from the integrated GC reports were sub
mitted to a mainframe computer (UNIVAC 1100). The ARTHUR chemometricssystem package that contains several pattern recognition subroutines was used toanalyze the data14. To avoid bias, unsupervised learning procedures were used; thatis, the computer was not supplied with the category (colony source of individualforagers) to which each of the gas chromatograms belonged. Seven marker peaks(consisting of the two internal standards and five peaks from the cuticular hydrocarbons) were encoded with the data set, which was then transduced into multivariateform s.1s . The marker peaks are necessary in order to normalize chromatograms andto correct for small shifts in retention time. The raw data consisted of 41 data vectors,each comprised of 26 features. The data were then autoscaled, to prevent bias fromfeatures having greatly differing magnitudes 14
, and then submitted to two graphicaldisplay routines contained in the ARTHUR package. Autoscaled data were displayed in two-dimensional space using the non-linear mapping (NLM) procedure9
.
The autoscaled data were also transformed using the Karhunen-Loeve (KL) projection, a method based on principal components analysis9
, and then plotted usingcombinations of the first three principal components.
RESULTS AND DISCUSSION
It has been shown in the black fire ant that hydrocarbon profiles obtained byhomogenation in solvent such as n-hexane are nearly identical with those obtained bytopical washing with the same solvent, despite the fact that one method probes primarily the surface of the insect, whereas the other extracts both the surface and theinternal body parts8
•16
. The methods differ only in the total amount of hydrocarbonsthat can be recovered in a given period of time. Replicate analyses of small numbersof insects produce virtually identical results. We have previously described a sensitivemethod for examining the profiles of single insects, using a pyroprobe to generateheadspace samples13 However, in the application described herein, the headspaceprocedure proved unsatisfactory, since it was not possible to obtain replicate samplesfrom a single fire ant which were suitable to run on the pyroprobe. The most satisfactory method, therefore, was solvent extraction.
To minimize or exclude extraneous effects, care was taken to eliminate extraneous variables. It has been reported that cuticular hydrocarbons of adult insectschange with agel 7. Since hydrocarbons remain relatively unchanged in older adults 18,
it was decided to use foragers in this study. Foragers constitute the oldest workers inthe colony.

98
NLM Axis 1
J. H. BRILL, W. BERTSCH
Fig. 1. Non-linear map (NLM) of the autoscaled data set obtained from hydrocarbon profiles of eightforagers, each from the same colony.
AA AAA •.il\9. ". .It AA
AA
¥ A
liIll
, ..•,~ ~. lJ
lJ f. 19lJ • 0 dJIII
;:l CL c;:;r::c .. · 0
tl A tl B
AA
•!;
AA
A
lJ .:9 8a.
lJ lJ x
C;:;p .,. 0
t2 C
Fig. 2. Principal components (KL) plots (A-C) of the hydrocarbon profiles of eight foragers, each from thesame colony. tl = First principal component; t2 = second principal component; t3 = third principalcomponent. The symbols are the same as in Fig. I.

COMPARISON OF HYDROCARBON PROFILES OF FIRE ANTS 99
The results of these studies show statistically significant and reproducible differences in the hydrocarbon profiles of foragers from the same colony. Fig. I shows theNLM plot of the autoscaled data. The profiles for each of the foragers form distinctand well-defined clusters. The computer had no information concerning the differentcategories in the data set. The groupings observed in the NLM plot are thereforenatural clusterings, which have not been enhanced by feature weighting, feature selection, or other mathematical manipulations that might lead to distortions. Only theinvestigator knew the categories (i.e., individual foragers) to which the objects (chromatographic profiles) belonged. It is statistically significant, therefore, that these natural clusters also correspond to the various categories (individual foragers) in thedata set. The cluster designated by the open squares shows a rather large spread. It islikely that the data point at the top right of the cluster is an outlier (due to anexperimental error). When a sixth replicate was examined, it was located approximately at the center of the cluster, making it more likely that the aforementioned datapoint is an outlier.
The principal components (PC) analysis of the data set (using the KL projec-
51
51
51
5a
1 A
5a
5a51
5a
III 11 III I l Ci i R'a i i i 3'0 i I i i min
DIii 2'e iii i 3'a iii i Dun
Fig. 3. Sample chromatograms of the hydrocarbon profiles of four foragers from the same colony of theblack fire ant. 81 and S2 are internal standards (docosane and dotriacontane, respectively). A, B, C and Dindicate the profiles of four different forgers from the same colony.

100 J. H. BRILL, W. BERTSCH
tion) also shows good correlation for each of the ant profiles, although the groupingswere not as well focussed as in the NLM method. This is in accordance with previousobservations7. Fig. 2 shows the KL plots of the autoscaled data set. Together, the firstthree principal components accounted for 83.7% of the explained variance in the dataset. Some of the clusters in Fig. 2 show less than five objects. This is because two ormore objects were "overlapping" in the two-dimensional data space, a phenomenonthat sometimes occurs with linear transformation methods when projecting multidimensional data onto a two-dimensional space.
Sample hydrocarbon profiles of four foragers from the 'Same colony are shownin Fig. 3. GC-MS analyses indicated that the components eluting between the twointernal standards (Sl and S2) were hydrocarbons. The unusually large peak for thesecond internal standards (S2) relative to Sl in Fig. 3D was due to the forager possessing the same compound in its own hydrocarbon profile. Visual inspection revealsdifferences among the profiles of the foragers. The relative standard deviation amongreplicates from the same sample was less than 0.08, indicating that the reproducibilityamong the sample replicates was good and within expected experimented error. Theobserved differences in the profiles are therefore due to the samples themselves andnot to sampling or instrumental errors. The control experiment was devoid of anyextraneous material. When the GC profiles of foragers from several other colonieswere examined, reproducible differences among the hydrocarbon profiles of foragersfrom the same colony were also evident.
The results of all these experiments are summarized in Table I. The chromatograms from each experiment were first normalized, to eliminate any bias caused bydifferences in sample size. Then the variation (relative standard deviation, R.S.D.) inthe normalized peak area for each of the 26 features was compared for each sample.The resulting 26 R.S.D. values were then averaged to obtain an average relativestandard deviation for each sample, which was then compared to that for othersamples, as indicated in Table I. The results for category I of Table I indicate that thesampling procedure is highly reproducible. In category 2, replicate analyses from thehomogenate extracts of individual foragers are compared. Category 3 compares thehomogenate extracts of different foragers.
These studies show detectable differences in the hydrocarbon patterns of different foragers from the same nest. It is not known whether these differences have afunctional significance. Individual recognition of nestmates has been reported insome ant species where workers are few in number and maintain dominance hierarchies 19-21.
TABLE I
VARIATIONS WITHIN AND BETWEEN REPLICATES FOR DIFFERENT SAMPLE CATEGORIES
Category
(I) Internal standard mixture (control) (7 replicates)(2) Extract of homogenate from single fire ant workers (35 replicates)(3) Extracts of homogenates from different fire ant workers (35 replicates)
AverageR.S.D.
0.130.120.42

COMPARISON OF HYDROCARBON PROFILES OF FIRE ANTS
ACKNOWLEDGEMENTS
101
We would like to thank D. J. C. Fletcher for helpful discussions and T. Mar forhelp with the data treatment.
REFERENCES
I R. W. Howard and G. L. Blomquist, Ann. Rev. Entomol., 27 (1982) 149.2 R. K. Vander Meer and D. P. Wojcik, Science (Washington, D.C.). 218 (1982) 806.3 J. B. Lok, E. W. Cupp and G. L. Blomquist, Insect Biochem., 5 (1975) 821.4 D. R. Nelson, C. L. Fatland, R. W. Howard, C. H. McDaniel and G. L. Blomquist, Insect Biochem., 10
(1980) 409.5 J. H. Brill, H. T. Mayfield, T. Mar and W. Bertsch, J. Chromatogr., 349 (1985) 31.6 J. H. Brill, T. Mar, H. T. Mayfield and W. Bertsch, J. Chromatogr., 349 (1985) 39.7 J. H. Brill, T. Mar and W. Bertsch, Analyst (London), 111 (1986) 711.8 J. H. Brill, Dissertation, University of Alabama, Tuscaloosa, AL, 1985.9 B. R. Kowalski (Editor), Chemometrics: Theory and Applications (ACS Symposium Series, No. 52),
American Chemical Society, Washington, DC, 1977.to M. A. Sharaf, D. L. Illman and B. R. Kowalski, Chemometrics, Wiley, New York, 1986, p. 219.11 D. L. Massart, B. G. M. Vandeginste, S. N. Deming, Y. Michotte and L. Kaufman, Chemometrics: A
Textbook, Elsevier, Amsterdam, 1988, p. 371.12 D. Gordon, Oecologia, 81 (1989) 198.13 1. H. Brill and W. Bertsch, Insect Biochem., 15 (1985) 49.14 D. L. Duewar, J. R. Koskinen and B. R. Kowalski, Documentation of ARTHUR Version 1-8-75(Che
mometrics Society Report, No.2), Laboratory for Chemometrics, Department of Chemistry, Universityof Washington, Seattle, WA, 1975.
15 H. T. Mayfield and W. Bertsch, Computer Appl. Lab.. 2 (1983) 130.16 J. H. Brill and W. Bertsch, J. Entomol. Sci., 20 (1985) 435.17 L. L. Jackson and G. L. Baker, Lipids,S (1970) 239.18 D. J. C. Fletcher, personal communication.19 N. R. Franks and E. Scovell, Nature (London), 304 (1983) 724.20 B. J. Cole, Science (Washington, D.C.), 212 (1968) 83.21 A. Bonavita-Cougourdan, J. L. Clement and C. Lange, J. Entomol. Sci., 22 (1987) I.


Journal of Chromatography, 517 (1990) 103-121Elsevier Science Publishers B.V., Amsterdam
CHROMSYMP. 1952
Empirical scheme for the classification of gaschromatographic stationary phases based on solvatochromiclinear solvation energy relationships
JIANJUN LT, ANDREW J. DALLAS and PETER W. CARR·
Department ofChemistry, University of Minnesota, Kolthoff and Smith Halls, 207 Pleasant Street, Minneapolis, MN 55455 (U.S.A.)
ABSTRACT
Due to the plethora of materials that have been used as stationary phases in gaschromatography it is clearly necessary to have some method for classifying phases tofacilitate systematic method development. The most popular classification scheme isthe Rohrschneider-McReynolds procedure which is based on the Kovats retentionindices of a variety of probe solutes. Although this is a very useful approach, it ishighly empirical and has been criticized on several grounds. In this work we exploredthe use of solvatochromic measures of solute dipolarity-polarizability (n~), hydrogenbond donor acidity (0:2) and hydrogen bond acceptor basicity ({32) to classify a varietyof common capillary gas chromatographic stationary phases. Preliminary studiesshow that the use of only the solvatochromic parameters as explanatory variablesleads to rather poor precision. However, when log capacity factors on two extremetypes of phases are included among the explanatory variables quite high precision,typically an average standard deviation ofless than 0.07 log units, is obtained and allcolumns tested were easily classified. The two reference phases should be a lowpolarity phase and a high-polarity, hydrogen bond acceptor phase.
INTRODUCTION
Currently more than 200 liquid phases suitable for use as stationary phases in gaschromatography (GC) are commercially available. This huge number of materialsmandates that they be classified. Consequently it is not surprising that there have beenmany studies aimed at identifying and quantifying their retention characteristics. Themost common of these, and perhaps that which is chemically most appealing, is themultiple probe solute method developed by Rohrschneider l
-3 and later extended by
McReynolds4. This approach has been used as the basis for choosing a small set of
stationary phases that should accommodate a very wide variety of samples5. It is,
however, based on the Kovats retention index scheme for quantifying retention.
0021-9673/90/$03.50 ell 1990 Elsevier Science Publishers B.V.
104 J. L1, A. J. DALLAS, P. W. CARR
Among others, Poole has criticized the Kovats index based classification methods, inpart because they rely on the normalization of the retention of the polar solutes relativeto the retention of n-alkanes6 ,
7. In essence, for polar stationary phases the change in
the retention index of a polar solute relative to its value on a non-polar phase is due asmuch to the decrease in retention of the reference alkanes, relative to their retention ona non-polar phase, as it is to the increase in retention of the polar solute. Clearly thiscomplicates the chemical interpretation of the change in retention index from phase tophase. To avoid or minimize this problem, many investigators8 have used series ofhomologuesother than the n-alkanes as the basis for retention index schemes.
Other classification schemes have been investigated9-
16. For example, Howery
and co-workers9-11 have used factor analysis to classify GC phases. Laffort and
Patte12 ,13 developed the use of "solubility factors" to characterize liquid stationaryphases. However, because some of these classification methods are based on retentionindices or they used the retention of alkanes as a reference, they suffer from some of theproblems mentioned above.
In this study we used solvatochromically based linear solvation energyrelationships (LSER) to explore and rationalize retention relationships on a variety ofcommon capillary columns that span a full polarity range. This set of columns does notcover all the possible GC phases. Most notably none of the phases has strong hydrogenbond donor properties. We choose to study the properties of fused-silica basedcapillary columns because they have a low ratio of surface area to phase volume andafford a less sorptive underlying solid surface relative to the porous supports used inpacked columns. This helps minimize interfacial adsorption effects. It should be notedthat capillary columns are not entirely free of gas-liquid interfacial adsorptioneffects 17
- 19 , nor can one disregard the potential for interaction with the silica surface.The solvatochromic parameters used in this work are the Kamlet-Taft solute
dipolarity-polarizability (nD, hydrogen bond donor acidity (0:2) and hydrogen bondacceptor basicity ({32)' The solute parameter is different from the solvent parameterand is differentiated from a solvent parameter by a subscript 2. The dipolarity-polarizability scale (n* or nD is primarily a measure of the ability of a species to stabilizea neighboring dipole by virtue of its own dipolarity and secondarily by itspolarizability2o,21. It is a relative scale defined as n* or n~ (cyclohexane = 0) and n* orn~ (dimethyl sulfoxide = 1.00). Because aliphatic, aromatic and polyhalogenatedspecies have very different polarizabilities it is often necessary to apply a "polarizability correction factor" (b) to n* or n~ (ref. 22). The 15 parameter is convenientlydefined to be 0 for aliphatics, 0.5 for polyhalogenated and 1.0 for aromatic species,whether it acts as a solvent or a solute. The 0: (0:2) and {3 ({32) scales define the ability ofa species to interact with an acceptor and a donor, respectively, via hydrogen bondformation 21
,23,24. The above are referred to as solvatochromic parameters because ingeneral they were first established via the study of some spectroscopic property of anappropriate indicator molecule22
-24 in a variety of solvents. The solute hydrogen bond
acidity and basicity parameters have been obtained by hydrogen bond complexationconstants as welI 25
,26. These parameters have been used to correlate, rationalize andexplore the chemistry of more than 600 different chemical systems21 ,27-29. Studies ofimmediate relevance to this work include retention in reversed-30
-34 and normal-phase
liquid chromatography35 and gas-liquid partition coefficients in both low-molecularweight and polymeric liquids36
-38
. Tn an early solvatochromic study Brady et al. 39
CLASSIFICATION OF GC STATIONARY PHASES 105
measured the bulk phase n* of a series of methyl and phenyl silicone oils and showedthat, after correction for the configurational entropy, excellent linear correlations forthe residual free energy of transfer of polar solutes from liquid to gas phase against n*were obtained.
In this work we measured the retention of 53 solutes on 8 different polymericphases. In a sense this approach is similar to that taken by Rohrschneider andMcReynolds in their use of probe solutes. However, it markedly differs from theirmethodology in that a large number of polar, hydrogen bond donor and hydrogenbond acceptor solutes were used. More importantly the test solutes were chosento span an extremely wide range in chemical characteristics. In comparison toRohrschneider we included such extremely strong hydrogen bond donor acids astrifluoroethanol (az = 0.57) and phenol (az = 0.60) and bases as strong as dimethylsulfoxide ({3z = 0.78) and dimethylacetamide ({3z = 0.74). These are considerablystronger than the strongest acids and bases used by Rohrschneider (ethanol, dioxane,methyl ethyl ketone). Our solutes encompass nearly the entire range in availabledipolarity (n!), hydrogen bond acidity (az) and hydrogen bond basicity ({3z). At thesame time we were interested in the behavior within a series of homologues, so weincluded several members ofeach class. This expands the solutes set to over the 30 or socompounds needed to precisely characterize a phase by regression methods. Inprinciple, the coefficients of any regression model can be numerically determined assoon as one has as many data points as parameters in the model. Thus we really onlyneed data for a handful of solutes. However, we deem this approach to be chemicallyunacceptable. First in order for the regression coefficients to be precisely defined eachparameter should be varied over a reasonably wide range. Second the explanatoryvariables are imprecise since in general they are obtained by measurement. In order toaverage out the effect of this imprecision it is necessary to use a minimum of three tofour solutes per parameter. We choose to vastly over-determine the system so as togenerate a high degree of statistical and chemical confidence in the meaning of theparameters. As shown in Table I, this is an extremely diverse, variegated data set. Inaccord with the general LSER formalism for a study in which the solute is varied whilethe solvent environment is fixed the appropriate LSER regression equation is:
SP = SPo + mV./lOO + sn~ + db z + aaz + b{3z (1)
SP is some solute property linearly related to its energy of solvation. Inchromatography, it may be taken as the logarithm of the capacity factor (log k'). SPo isa solute independent constant. m, s, a, band d are regression coefficients. VI in eqn. I isthe solute intrinsic (Van der Waals) molar volume (the same as the solvent value),computer calculated by the method of Leahy46 or Pearlman47
, or estimated by simpleadditivity methods such as those of Bondi48 or Abraham and McGowan49 . Them V./IOO term is needed to account for the endoergic (unfavorable) energy of cavityformation. A scale of 1/100 for VI was used so that the parameter measuring the cavityterm will cover roughly the same range as the other independent variables. This alsomakes it easier to evaluate the relative contributions of the various solute-solventinteractions to the property (SP) being studied.
When a very cohesive liquid, such as water, is used as the mobile phase thecoefficient m should be large and positive leading to an increase in retention in

TABLE I
SOLUTE SOLVATOCHROMIC PARAMETERS
Compound name log L '6a V,;100 d nOd (h fJ2" Ci,2 c2
Cyclohexane 2.913 0.598 0.00 0.0 0.00 0.00I-Hexene 2.547 0.624 0.08 0.0 0.Q7 0.00Pentane 2.162 0.553 -0.08 0.0 0.00 0.00Hexane 2.668 0.648 -0.04 0.0 0.00 0.00Octane 3.677 0.842 0.01 0.0 0.00 0.00Decane 4.686 1.036 0.03 0.0 0.00 0.00Undecane 5.191 1.134 0.04 0.0 0.00 0.00Tetradecane 6.705 1.423 0.07 0.0 0.00 0.00Pentadecane 7.209 1.521 0.07 0.0 0.00 0.00Ethyl acetate 2.376 0.521 0.55 0.0 0.45 0.00Propyl acetate 2.878 0.622 0.53 0.0 0.45 0.00Diethyl ether 2.061 0.505 0.27 0.0 0.45J 0.00Dipropyl ether 2.989 0.699 0.27 0.0 0.46 0.00Dibutyl ether 4.001 0.893 0.24 0.0 0.46 0.00Acetonitrile 1.560 0.271 0.75 0.0 0.42" 0.09Propionitrile 1.940 0.369 0.70 0.0 0.43" 0.00Acetone 1.760 0.380 0.71 0.0 0.50J 0.042-Butanone 2.287 0.477 0.67 0.0 0.48 0.032-Pentanone 2.755 0.574 0.65 0.0 0.48 0.03Dimethylformamide 3.173 0.444 0.88 0.0 0.66J 0.00Dimethylacetamide 3.717 0.543 0.88 0.0 0.74" 0.00Dimethyl sulfoxide 3.437 0.466 1.00 0.0 O.78J 0.00Propionaldehyde 1.815 0.381 0.65 0.0 0.41 0.00Tetrahydrofuran 2.534 0.455 0.58 0.0 0.51 0.00Triethylamine 3.077 0.704 0.14 0.0 0.67J 0.00Nitromethane 1.892 0.348 0.85 0.0 0.25 0.12"Nitroethane 2.367 0.455 0.80 0.0 0.25 0.00Nitropropane 2.710 0.542 0.78 0.0 0.25 0.00Methanol 0.922 0.205 0.40 0.0 0.41 h 0.37/Ethanol 1.485 0.305 0.40 0.0 0.441
' 0.33/I-Propanol 2.097 0.402 0.40 0.0 O.4Y' 0.33/2-Propanol 1.821 0.401 0.40 0.0 0.47h 0.321
2-Methyl-2-propanol 2.018 0.498 0.40 0.0 0.49h 0.3tTrif1uoroethanol 1.224 0.376 0.73 0.0 0.18" 0.57'Hexaf1uoroisopropanol 1.392 0.546 0.65 0.0 0.03 h 0.77/Acetic acid 1.750h 0.323 0.60 0.0 0.45 0.55/Aniline 3.993 0.562 0.73 1.0 0.50 0.26N-Methylaniline 4.492' 0.660 0.73 1.0 0.47 0.12Phenol 3.856 0.536 0.72 1.0 0.33 0.60'Benzyl alcohol 4.443 0.634 0.99 1.0 0.42h 0.39m-Cresol 4.329 0.634 0.68 1.0 0.34 0.58Ethylamine 1.677 0.335 0.32 0.0 0.70 0.00Propy1amine 2.141 0.433 0.31 0.0 0.69 0.00Butylamine 2.618 0.535 0.31 0.0 0.69 0.00Benzene 2.803 0.491 0.59 1.0 0.13" 0.00Toluene 3.344 0.592 0.55 1.0 0.14" 0.00Ethylbenzene 3.765 0.668 0.53 1.0 0.12 0.00Propylbenzene 4.221 0.769 0.51 1.0 0.12 0.00p-Xylene 3.858 0.668 0.5! 1.0 0.12 0.00Benzaldehyde 3.935' 0.606 0.92 1.0 0.44 0.00Benzonitrile 3.913" 0.590 0.90 1.0 0.37 0.00N, N-Dimethylaniline 4.754 0.752 0.90 1.0 0.43 0.00Carbon tetrachloride 2.823 0.514 0.28 0.5 0.10 0.00
a From ref. 40 unless otherwise indicated. b From ref. 41.' From ref. 42. d From refs. 21 and 43.e From refs. 21 and 43 unless otherwise indicated. J From ref. 45." These are {J~ values provided to us byProfessor R. W. Taft, University ofCalifornia, Irvine, CA. h These are {J~ values from ref. 44. i From ref. 25.

CLASSIFICATION OF GC STATIONARY PHASES 107
a non-polar stationary phase upon an increase in solute size. Such was invariably thecase in studies of reversed-phase liquid chromatography31.33. Abraham and coworkers50 ,51 in a study of gas partition coefficients into several non-polar liquidsshowed that eqn. I did not provide an acceptable correlation. This is due in part to thefact that in studies ofliquid-liquid transfer processes the energy of dispersion betweenthe solute and the two bulk liquid phases are to a first approximation similar andlargely cancel out. This cancellation cannot occur in a gas to liquid or gas to solidtransfer process, Eqn. 1 does not contain any explicit dependence on the energy ofdispersion although it can be shown for a wide range of solutes that there is a highdegree of covariance between molar refractivity (MR) (a dispersion interactionparameter) and VI (ref. 50). In addition detailed studies of the thermodynamics ofretention in gas chromatography make it clear that there is a significant configurational entropy contribution to k'. Solvatochromic LSER regressions do not, at present,explicitly include a configurational entropy term but it too is expected to covary withVI.
Another distinction between liquid-liquid transfer and gas-condensed phasetransfer processes is the fact that the free energy of transfer of a gas to water becomesless favorable as the gas increases in size whereas in all common organic liquids the freeenergy of transfer becomes more favorable, that is retention increases, as the size of thegas increases Z7
,51. This comes about due to the trade-off in increasingly unfavorablecavity formation and favorable dispersion energy with solute size.
Each of the solvatochromic coefficients (s, a and b) in eqn, I has a distinctchemical interpretation. On a phase that has no hydrogen bond donor acidity, e,g.hexadecane or squalane, a solute's hydrogen bond acidity and basicity should have noeffect on its retention in which instance the a and b coefficients should be zero orstatistically negligible, In contrast if the stationary phase were to have an activehydrogen bond donor group, such as a hydroxyl group, then one expects theb coefficient of this material to be positive, That is, an increase in solute basicity shouldlead to an increase in retention, By the same concept, for a highly dipolar but hydrogenbond donor inert phase one expects the s coefficient to be significant and an increase insolute dipolarity should lead to an increase in retention.
To overcome the problems inherent in eqn. 1 Abraham and co-workers Z7,51
have recommended that a new solute parameter log L 16 be used to replace VI in eqn,I when dealing with gas-condensed phase processes.
SP = SPo + !log U 6 + sn~ + df>z + aaz + bfJz (2)
L 16 is the partition coefficient ofthe solute from the gas phase to n-hexadecane at298 K, It takes into account both solute-condensed phase dispersion interactions andthe work needed to create a cavity in the condensed phase. They have shown that thisprovides much better correlations for gas-liquid transfer processes than does eqn, 1.A similar approach was taken in this work. The initial motivation for this work was toexplore the utility of the LSER given in eqn. 2 and ultimately to classify a variety ofcapillary columns and at the same time to see if their chemical properties as defined bythe coefficients I, s, a and b could be rationalized.

108
EXPERIMENTAL
J. LI, A. J. DALLAS, P W. CARR
Unless otherwise stated, all solutes were general laboratory or analytical grade inthe highest purity available. The capillary columns, which span the whole polarityscale (not including DB-23), were all a gift from J&W Scientific (Folsom, CA, U.S.A.).Their specifications and chemical structures are given in Table IT. All columns usedhere were l5-m widebore columns. An HP-7620A gas chromatograph with heatedon-column injector and flame ionization detector were used. Both the injector and thedetector temperatures were kept at 250°C. Data were collected at 45, 60, 80, 115 and150°C. The column oven temperature was stable to within 0.02°C. Helium (carrier gas)flow was adjusted as necessary to make the retention times adequate. The samples wereinjected either as headspace vapors (for liquid solutes) or as very dilute solutions of thesolids. Sample sizes were varied to insure that the retention times were independent ofthe amount injected. All data were collected on an HP-3390 integrator. Correctedretention times and capacity factors were calculated referenced to the retention ofmethane. Data were analyzed via a multivariable linear least square regressionprogram run on a Zenith computer.
TABLE II
PROPERTIES OF THE CAPILLARY COLUMNS USED IN THE STUDY
The polarity increases from columns I to 8.
Megabore column
1 DB-l2 DB-53 DB-13014 DB-17015 DB-176 DB-2107 DB-2258 DB-WAX
Phase
Methylsilicone5% Phenyl methylsilicone6% Cyanopropylphenyl methylsilicone14% Cyanopropylphenyl methylsilicone50% Phenyl methylsilicone50% Trifluoropropyl methylsilicone50% Cyanopropylphenyl methylsiliconePolyethylene glycol
Film thickness( /1111)
1.51.51.01.01.01.01.01.0
RESULTS AND DISCUSSION
The results of preliminary correlations using eqn. I for eight different columnsare shown in Table III. For brevity the results are given only at 115°C. The standarddeviations and correlation coefficients shown in Table III when compared to thoseobtained in related studies, particularly reversed-phase liquid chromatography,indicate that these correlations are very imprecise. This is especially true of the morepolar stationary phases. The correlations for the DB-WAX column are particularlypoor (see below).
Even though the correlations are not as precise as we desire or can ultimatelyachieve (see below) the various solvatochromic coefficients m, S, a, band darestatistically significant and should be interpreted. The coefficients m. s. band dare

CLASSIFICATION OF GC STATIONARY PHASES 109
TABLE III
REGRESSION COEFFICIENTS BASED ON V, AND SOLVATOCHROMIC PARAMETERS
Standard deviations of the coefficients are given in parentheses. Eqn. I is the regression equation employed.
Column T(OC) SPo m s a b d S.D." rb n' f"
OB-1 115 -2.41 2.60 0.47 0.46 0.51 0.17 0.9677 53 0.22(0.11) (0.12) (0.11) (0.13) (0.07)
OB-5 115 -2.54 2.64 0.63 0.44 0.49 0.19 0.9617 53 0.23(0.12) (0.13) (0.13) (0.15) (0.07)
OB-1301 115 -2.78 2.69 0.89 0.31 0.42 0.44 0.21 0.9575 52J 0.24(0.14) (0.15) (0.14) (0.15) (0.16) (0.08)
OB-1701 115 -2.76 2.59 1.13 0.50 0.37 0.40 0.21 0.9537 53 0.26(0.14) (0.15) (0.14) (0.16) (0.17) (0.08)
OB-17 115 -2.88 2.57 1.03 0.60 0.59 0.26 0.9390 52J 0.28(0.16) (0.18) (0.17) (0.20) (0.10)
OB-210 115 -2.79 2.14 1.51 0.54 0.18 0.23 0.9296 53 0.28(0.15) (0.16) (0.15) (0.18) (0.09)
OB-225 115 -2.90 2.30 1.72 0.79 0.49 0.42 0.26 0.9400 53 0.31(0.17) (0.18) (0.17) (0.19) (0.21) (0.10)
DB-WAX 115 -2.83 2.11 1.73 1.79 0.64 0.55 0.31 0.9371 53 0.34(0.20) (0.22) (0.20) (0.23) (0.24) (0.12)
a Standard deviation of the fit.b Correlation coefficient., Number of data points.d Goodness-of-fit statisticS2
e These coefficients were found to be not significantly different from zero and were omitted in the final fit.J Propionaldehyde was excluded from OB-1301 data sets, acetic acid was excluded from OB-17, due to their
being outliers at all temperatures on the respective column.
significant on all phases. The coefficients a is insignificant on four phases. The signsand magnitudes of s make chemical sense. In general s increases as the phase becomesmore polar. This means that solute dipolarity causes a greater increase in retention ona more dipolar phase. The m coefficient first increases then decreases as the phasebecomes more polar. This can be rationalized by viewing m as being the result ofdispersive and inductive solute-solvent interactions, the configurational entropy andthe cavity formation processes in the solvent. The a coefficients for the DB-I, DB-5,DB-17 and DB-210 columns are not significant. The functional groups in these phasesare known to be very weak acceptors of hydrogen bonds based on their effect on thespectra of Kamlet-Taft indicators that are able to donate hydrogen bonds53
.
However, the standard deviations of the fit are too large to let us see the low basicity ofthese phases. In contrast, .3-cyanopropylphenyl methylsilicone has a significantbasicity [f3(propyl cyanide) = 0.43], thus the a coefficients for the three cyano phases(DB-l301, DB-l701 and DB-225) are significant and as expected increase as thepercentage of the 3-cyanopropyl group increases. DB-WAX is both the most acidic[a(ethylene glycol) = 0.90] and basic [f3(ethylene glycol) = 0.52] phase studied so itsa and b coefficients are the largest. These coefficients agree well with the qualitativebasicity, acidity, polarity and London potential of the similar phases given by Chong etal. 54
• Thus despite the overall poor precision of these fits all the coefficients can berationalized.


112 J. L1, A. J. DALLAS, P. W. CARR
What is most important to note is the nearly monotonic deterioration in thegoodness of fit as measured by either the root mean square residual (S.D.) or thecorrelation coefficient (r) as the phase polarity increases (see Table III). Because wewill compare various models and data sets in terms of the overall standard deviationsall of the important comparisons are compiled in Table IV for easy reference. Incomparing the various models only the worst case results at the extreme temperature(45°C) are given in Table IV. The results at other temperatures using eqn. 2 are alsogiven in this table.
As expected, based on the work of Abraham and co-workers27,51, all correla
tions improved significantly when log L 16 was used in place of VI (see Ftest52 in TableV). In all cases, the/ratio R is greater than Rerit.. In fact for the non-polar phases (theDB-I a~d DB-5 columns) quite acceptable correlations versus log U 6 were obtained.The regression coefficients (s, a and b) of the solvatochromic parameters are slightlydifferent when eqn. 2 is used compared to eqn. I. First, the b coefficient is insignificantfor all phases, and not all of the d coefficients are significant. The I, s and a coefficientsmake chemical sense for the same reasons as stated for the VI regression (eqn. I), withthe exception of the small negative a coefficient for DB-210. We also note (see TablesIV and V) that the fit quality still decreases as the phase polarity increases. Again wewant to point out that the DB-WAX column gave particularly poor results. A detailedexamination of the data set for this column showed that a large part of the variance forthe DB-WAX phase at lower temperatures was due to the amine solutes. We note herethat the amines gave very respectable peak shapes on all the other columns at alltemperatures but they gave broad tailed peaks on the DB-WAX column at lowtemperatures. It is quite possible that the peak maximum is not a good measure ofretention under these conditions and consequently the data for the amines may beinvalid. However, we did not want to bias the results by deleting them from theanalysis. When we do so the S.D. values for the DB-WAX phase drop to the level of theother phases as shown in the last column in Table IV.
There are two distinct categories of explanations for the lack of fit. First, ourexperimental k' values might be imprecise. Second, the model itself might be wrongand/or the parameters inaccurate. The lack of fit exhibited in the above sets of data isdefinitely not due to random experimental errors in the measurements of k'. If all ormostofthe variance in the fits were due to random errors in the measurement of the k'values then fits oflog k' to I/T(Van 't Hoffplots) should be only marginally better thanfits to any model dependent correlations such as eqns. I and 2. In fact we examinedplots oflog k' vs. I/Tfor each solute on each column and invariably obtained very goodstraight lines. The S.D. values for fits of log k' vs. I/T for a single compound rangedfrom as low as 0.005 to in some cases as high as 0.04. Typically the S.D. values for thistype of fit were about 0.02. These are far better than any of the results reported forregressions of log k' vs. either model equation. We are convinced that the averagestandard deviations reported in Tables III, IV and V are not due to the experimentalprecision in the measurement of log k'.
One possible source of model error in this study, not previously encountered inother linear solvation energy studies, is that the data (k' values) were not obtained at25°C. We note that the solvatochromic parameters n*, ex and fJ are generally measuredat room temperature and they are known to be at least somewhat temperaturedependent55
,56. The results given in Table IV indicate that, if anything, the fits at 45°C

CLASSIFICATION OF GC STATIONARY PHASES 113
are worse than the fits at higher temperatures. Thus we felt this explanation to beunlikely. This was confirmed by using the above-mentioned Van 't Hoff plots toextrapolate the log k' values to 25°e. These data were then regressed vs. eqn. 2. Asshown in Table IV the average standard deviations at 25°C are, if anything, worse thanthose at higher temperatures. We must conclude that either eqn. 2 is an invalid modelof retention or that the parameters are incorrect.
At this point we want to emphasize a purely empirical but very usefulobservation. We tested a "double" linear regression model 57
, that is, retention data ontwo extremely different columns were used as the explanatory variables. Theregression equations tested were:
logk'(1) = SPa + llogkoB-1,115°C + wlogkoB-WAX.115'C
logk'(1) = SPa + llogL16 + wlogkoB-wAx.115"C
(3)
(4)
where kOR-1,115'C and kOR-WAX,115'C denote the capacity factors on the DB-l andDB-WAX columns obtained at a temperature of 115°e.
Refer to Table IV for a comparison to the preceding regressions. As expectedthere were improvements in the fits for the polar phases, but not for the phases ofintermediate and low polarity. For the non-polar phase, either log L 16 or the retentionon DB-l give about the same results. The Ftest shows that log L 16 is slightly betterthan DB-l for 4 data sets. Use ofjust the double regression cannot explain all the data,that is, the average S.D. is not yet at 0.02.
Finally we added the solvatochromic parameters as additional explanatoryvariables (eqns. 5 and 6).
logk' = SPa + llogL 16 + wlogkoll_WAX.115'C + sn~ + dl5 z + GlY.z + b/3z (5)
logk' = SPa + lIogkoR_1,115°C + wlogkoR_wAX,115°C + sn~ + d6 z + GlY.z + b/3z (6)
The results are given in Tables VI and VII. Again see Table IV for a summary. Clearlythe use of retention on two extremely different types of columns in addition to thesolvatochromic parameters as explanatory variables significantly improved thegoodness of fit. The average standard deviations for all the columns are nowconsiderably better than in any of the preceding fits although they still exceed 0.02,which we feel represents the level of exhaustive fitting, as obtained in fits of log k' toliT. In any case the fits are now as good as those observed in previous studies ofliquidchromatography.
The improvement in the fits is purely statistical. By using retention on twoextreme types of columns we have weakened the dependence of log k' on all of thesolvatochromic parameters. That is, the fitting coefficients Sf G and b in eqns. 5 and6 are a good deal smaller than those in eqns. 1 and 2. Consequently the values ofnt IY.zand /3z, and therefore errors in these parameters, now have less influence on thecomputed log k' values. Obviously experimental imprecision in the measuredretentions on the DB-l and the DB-WAX columns will be reflected in the precision ofthe computed log k' values.
The above is admittedly a highly empirical approach in that retention on the


118 J. LI, A. J. DALLAS, P. W. CARR
more polar reference column depends on and correlates with the solvatochromicparameters. The degree of coveriance is not so high as to cause excessive varianceinflation (see below) in the regression coefficients.
All of the results shown in Tables VI and VII are much more precise than theresults given in Tables III and V. Before discussing the details of these results we shouldstate that other pairs of "reference" columns were evaluated. There are no appreciabledifferences in the quality of the fits whether we use log L 16 or the retention on DB-I.Since retention data on commercial permethyl silicone oil columns are easier to obtainthan are data on hexadecane columns and for very polar solutes are less likely to showinterfacial effects, we opted to use the data obtained with a DB-I column instead of thelog U 6 data. Second, we found that the DB-WAX column was the best polar"reference" column. By this we mean that it gave good fits for all other types ofcolumns while columns of intermediate polarity only served to correlate results forlesser and equally polar phases but failed to correlate the results for more polarcolumns. Thus the overall quality of the regression markedly improved as the polarityof the second reference column increased.
The above "double-reference" column empirical approach greatly complicatesthe chemical interpretation of the coefficients s, d, a and b in eqns. 5 and 6. Thiscomplication comes about because both the signs and the magnitude of thesecoefficients now have meaning only in relation to the nature of the reference columns.If retention on .the non-polar reference column were utterly insensitive to solutehydrogen bond acidity and basicity then the observed a and b coefficients for eqns.5 and 6 would depend only on the characteristics of the test column and the more polarreference column. However, sand d do vary between different non-polar references(log k~B-1,115°C and log L I6
), thus sand dwill, in general, depend upon the properties ofboth reference columns.
Despite the chemical complications in interpreting the solvatochromic coefficients obtained when retention data are fit to equations such as 5 and 6, the approachdoes lead to an empirical scheme for precise classification of phases. Phases withsimilar chemical structures will have similar phase coefficients (I, w, s, d, a and b). Wheneqn. 6 is used the most important coefficients will be I and w. Phases which chemicallyresemble DB-I will have a significant I coefficient and a small value for w. a and b.Similarly, a phase which is identical to the DB-WAX column will have a largew coefficient and statistically negligible values for I, s, d, a and b. For intermediatepolarity phases, the I and w coefficients will lie between the above two extre!TIe cases.Solute-stationary phase interactions different from those in DB-WAX will be reflectedin the respective coefficients of the solvatochromic parameters.
In order to see how the solvatochromic regression method can be used to classifycolumns, consider the data plotted in Fig. I. The column type is displayed on the x-axisand the two most important coefficients (I and w) are plotted on the y-axis. Note the''I'' bars indicate the precision of the I and wcoefficients. Only data for 45°C are shownin the figure. It is evident that the DB-I and DB-5 columns are numerically very similarsince both I and ware identical for both columns. This is hardly surprising since DB-Iand DB-5 are chemically very similar (see Table II). We also note that the DB-I 701 andDB- I7 columns have both I and w values which are statistically indistinguishable.Table II indicates that these two columns ought to be chemically distinct since theDB-1701 is a 14% cyanopropylphenyl methyl silicone oil and the DB-J7 is a 50%
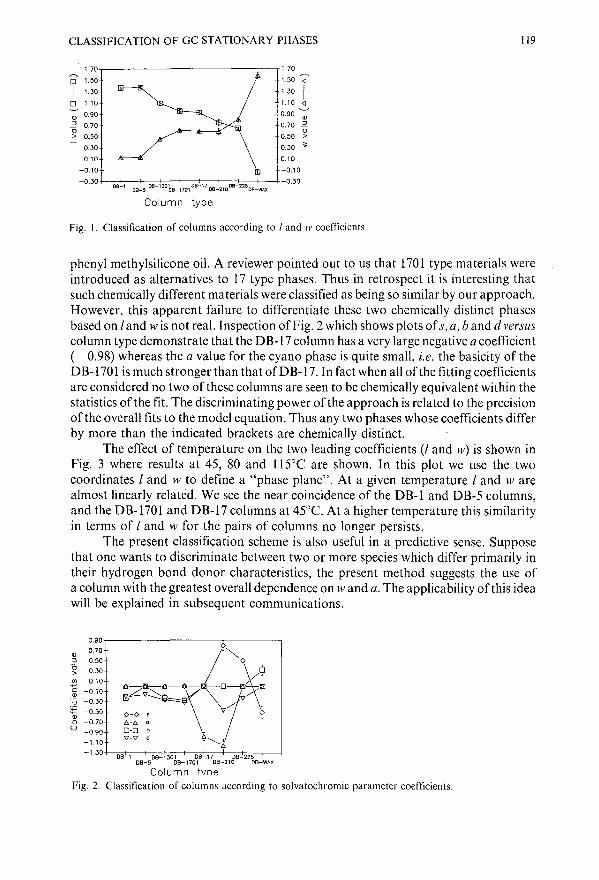
CLASSIFICATION OF GC STATIONARY PHASES
1.70,---------------:---,1.70
o 1.50 1.50 :;'
I 1.JO~ 1.J0 ID 1.10' 1.10 <I
Q) 0.90 0.90 :;
::J 0.70 0.70 ~o 0> 0.50 0.50 >
~~ ~~ .0.10 0.10
-0.10 -0.10
-0.30 -0.3008-1 08-5 08-13018_1701 OB-17 D8_2100B-2250B_WAX
Column type
Fig. I. Classification of columns according to I and w coefficients.
119
phenyl methylsilicone oil. A reviewer pointed out to us that 170 I type materials wereintroduced as alternatives to 17 type phases. Thus in retrospect it is interesting thatsuch chemically different materials were classified as being so similar by our approach.However, this apparent failure to differentiate these two chemically distinct phasesbased on I and w is not real. Inspection of Fig. 2 which shows plots ofs, a, band d versuscolumn type demonstrate that the DB-17 column has a very large negative a coefficient( - 0.98) whereas the a value for the cyano phase is quite small, i.e. the basicity of theDB-170 I is much stronger than that ofDB-17. In fact when all of the fitting coefficientsare considered no two of these columns are seen to be chemically equivalent within thestatistics of the fit. The discriminating power of the approach is related to the precisionof the overall fits to the model equation. Thus any two phases whose coefficients differby more than the indicated brackets are chemically distinct.
The effect of temperature on the two leading coefficients (l and w) is shown inFig. 3 where results at 45, 80 and 115°C are shown. In this plot we use the twocoordinates I and w to define a "phase plane". At a given temperature I and warealmost linearly related. We see the near coincidence of the DB-I and DB-5 columns,and the DB-170 I and DB-17 columns at 45°C. At a higher temperature this similarityin terms of I and w for the pairs of columns no longer persists.
The present classification scheme is also useful in a predictive sense. Supposethat one wants to discriminate between two or more species which differ primarily intheir hydrogen bond donor characteristics, the present method suggests the use ofa column with the greatest overall dependence on wand a. The applicability of this ideawill be explained in subsequent communications.
0.90,-------------,------,
Q) 0.70 /?""'o D'.OJ 0.50 .
~ 0.30 lL~
1=~:i~ ~L~~~ :\~"":1~~~~ -0.50 0-0 s ?o -0.70 6.-6, a
U -0.90 D-D b-1.10 \1-"\1 d t;;.'--....'6,
-1.J0+-----c0=Br.-,---i-,0=B_-+13~O.,.-, +-0=B+",""7-+-cc.OB""_'='5o-+-I08-5 08-1701 08-210 DB-WAX
Column tvnpFig. 2. Classification of columns according to solvatochromic parameter coeflicients.

120
1.60
1.40
2 1.20cQ.l 1.00
~ 0.80Q)
o 0.60o" 0.40
0.20
0.00
-0.20 +---I---+--I------I---I--+--/--t-'-0.20 0.00 0.20 0.40 0.60 0.60 1.00 1.20 1.40
I Coefficients
J. Ll, A. J. DALLAS, P. W. CARR
Fig. 3. Column polarity (I and lI'coefficients) 1'.1'. temperature. A = DB-I; B = DB-5; C = DB-DOl; D =DB-1701; E = DB-17; F = DB~210; G = DB-225; H = DB-WAX.• = 45°C;" = 80°C;. = 115°C.
ACKNOWLEDGEMENT
This work was supported in part by grants to the University of Minnesota fromthe National Science Foundation and the Petroleum Research Foundation.
SUPPLEMENTARY MATERIAL AVAILABLE
All the log capacity factors are available either on a computer disk or on paperupon request.
REFERENCES
I L. Rohrschneider, J. Chromatogr., 22 (1966) 6.2 L. Rohrschneider, Adv. Chromatogr., 4 (1967) 333.3 L. Rohrschneider, J. Chromatogr., 39 (1969) 383.4 W. O. McReynolds, J. Chromatogr. Sci., 8 (1970) 685.5 1. A. Yancey, 1. Chromatogr. Sci., 24 (1986) 117.6 C. F. Poole and S. K. Poole, Chem. Rev., 89 (1989) 377.7 C. F. Poole, S. K. Poole, R. M. Pomaville and B. R. Kersten, J. High Re.l'olut. Chromatogr. Chromatogr.
Commun., 10 (1987) 670.8 M. B. Evans and J. K. Haken, J. Chromatogr., 472 (1989) 93.9 P. H. Weiner and D. G. Howery, Anal. Chem., 44 (1972) 7.
10 P. H. Weiner, C. J. Dack and D. G. Howery, J. Chromatogr., 69 (1972) 249.I I P. H. Weiner and D. G. Howery, Canadian J. Chem., 50 (1972) 448.12 P. ~affort and F. Patte, J. Chromatogr., J26 (1976) 625.13 F. Patte, M. Etcheto and P. Laffort, Anal. Chem., 54 (1982) 2239.14 L. R. Snyder, 1. Chromatogr. Sci., 16 (1978) 223.15 R. V. Golovnya and T. A. Misharina, J. High Re.l'olut. Chromatogr. Chromatogr. Commun., 3 (1980) 51.16 M. B. Evans and J. K. Haken, J. Chromatogr., 406 (1987) 105.17 P. Farkas, L. Sojak, M. Kovac and J. Janak, J. Chromatogr., 471 (1989) 251.18 V. G. Berezkin and A. A. Korolev, Chromatographia, 22 (1985) 482.19 T. Juutilainen and J. Enqvist, J. Chromatogr., 279 (1983) 91.20 M.1. Kamlet, J. L. Abboud and R. W. Taft, J. Am. Chem. Soc., 99 (1977) 6027.21 M. J. Kamlet, R. M. Doherty, M. H. Abraham, Y. Marcus and R. W. Taft, J. Ph)'.I'. Chem., 92 (1988)
5244.22 R. W. Taft, J. L. Abboud and M. J. Kamlet, J. Am. Chem. Soc., 103 (1981) 1080.23 R. W. Taft and M. J. Kamlet, J. Am. Chem. Soc., 98 (1976) 2886.24 M. J. Kamlet and R. W. Taft, J. Am. Chem. Soc., 98 (1976) 377.25 M. H. Abraham, P. P. Duce, P. L. Grellier, D. V. Prior, J. J. Morris and P. J. Taylor, Tetrahedron Lett.,
29 (1988) 1587.

CLASSIFICATION OF GC STATIONARY PHASES 121
26 M. H. Abraham, P. L. Grellier, D. V. Prior, P. J. Taylor, C. Laurence and M. Berthelot, TetrahedronLelt., 30 (1989) 2571.
27 M. H. Abraham, P. L. Grellier, R. A. McGill, R. M. Doherty, M. 1. Kamlet, T. N. Hall, R. W. Taft, P.W. Carr and W. J. Koras, Polyrner, 28 (1987) 1363.
28 R. W. Taft, J.-L. M. Abboud, M. J. Kamlet and M. H. Abraham, 1. Solution Chern., 14 (1985) 153.29 M. 1. Kamlet and R. W. Taft, Acta Chern. Scand., B 39 (1985) 61 I.30 P. C. Sadek and P. W. Carr, J. Chrornatogr., 288 (1984) 25.31 P. C. Sadek, P. W. Carr, R. M. Doherty, M. J. KamIet, R. W. Taft and M. H. Abraham, Anal. Chern., 57
(1985) 2971.32 P. W. Carr, R. M. Doherty, M. J. Kamlet, R. W. Taft, W. Melander and C. Horvath, Anal. Chern., 58
(1986) 2674.33 1. H. Park, P. W. Carr, M. H. Abraham, R. W. Taft, R. M. Doherty and M. J. Kamlet,
Chrornatographia, 25 (1988) 373.34 M. J. Kamlet, M. H. Abraham, P. W. Carr, R. M. Doherty and R. W. Taft, 1. Chern. Soc .. Perkin Trans.
2, (1988) 2087. I
35 J. H. Park and P. W. Carr, 1. Chrornatogr., 465 (1989) 123.36 W. J. Cheong and P. W. Carr, 1. ChrornalOgr., 500 (1990) 215.37 S. C. Rutan, P. W. Carr and R. W. Taft, J. Phys. Chern., 93 (1989) 4293.38 M. J. Kamlet, R. W. Taft, P. W. Carr and M. H. Abraham, J. Chern. Soc. Faraday Trans. 1,78 (1982)
1689.39 J. E. Brady, D. Bjorkman, C. D. Hextcr and P. W. Carr, Anal. Chern., 56 (1984) 278.40 M. H. Abraham, P. L. Grellier and R. A. McGill, J. Chern. Soc., Perkin Trans. 2, (1987) 797.41 M. H. Abraham, University of Surrey, personal communication, 1989.42 Y. Zhang, A. J. Dallas and P. W. Carr, in preparation.43 M. J. Kamlet, Solute Solvatochrornic Pararneters for Use in Solubility, Partition and Toxicology
Correlations, May, 1987, unpublished work.44 C. Laurence, M. Berthelot, M. Herbert and S. Sraidi, J. Phys. Chern., 93 (1989) 3799.45 M. H. Abraham, P. J. Grellier, D. V. Prior, R. W. Taft, J. J. Morris, P. J. Taylor, C. Laurence, M.
Berthelot, R. M. Doherty, M. J. Kamlet, 1. M. Abboud, K. Sraidi and G. Guiheneuf, J. Arn. Chern. Soc.,110 (1989) 8534.
46 D. E. Leahy, 1. Pharrl1. Sci., 75 (1986) 629.47 R. S. Pearlman, in W. J. Dunn, J. H. Block and R. S. Pearlman (Editors), Partition Coefficient
Deterrnination and Estirnation, Pergamon Press, New York, 1986, p. 3.48 S. Bondi, J. Phys. Chern., 68 (1964) 441.49 M. H. Abraham and J. C. McGowan, Chrornatographia, 24 (1987) 242.50 M. H. Abraham and R. Fuchs, J. Chern. Soc.. Perkin Trans. 2, (1988) 523.51 M. H. Abraham, G. 1. Buist, P. L. Grellier, R. A. McGill, R. M. Doherty, M. J. Kamlet, R. W. Taft and
S. G. Maraldo, J. Chrornatogr., 409 (1987) 15.52 S. Ehrenson, 1. Org. Chern., 44 (1979) 1783.53 J. E. Brady, Ph.D. Thesis, University of Minnesota, Minneapolis, 1984.54 E. Chong, B. deBriceno, G. Miller and S. Hawkes, ChrornalOgraphia, 20 (1985) 293.55 P. Nicolet and C. Laurance, 1. Chern. Soc., Perkin Trans. 2, (1986) 1071.56 C. Laurance, P. Nicolet and M. Helbert, J. Chern. Soc., Perkin Trans. 2, (1986) 1081.57 M. H. Abraham, M. J. Kamlet, R. W. Taft, R. M. Doherty and P. K. Weathersby, J. Med. Chern., 28
(1985) 865.


Journal of Chromatography, 517 (1990) 123-129Elsevier Science Publishers B.V., Amsterdam
CHROMSYMP. 1943
Capillary gas chromatography with graphitized carbon black
F. BRUNER*, G. CRESCENTINI, F. MANGANI and L. LATTANZI
Istituto di Scienze Chimiche, Universita di Urbino, Piazza Rinascimento 6. 61029 Urbino (Italv)
ABSTRACT
The outstanding properties offused-silica capillary columns coated with graphitized carbon black impregnated with liquid phases are described together with thedetails of their preparation. HETP VS. u curves are reported, together with someseparations of industrial and environmental interest. Fast and more effective analysesmay be achieved with such columns.
INTRODUCTION
The technology ofcapillary columns has reached highly sophisticated levels andthe main research in the field of capillary gas chromatography (GC) is addressedtoward two main aspects: extremely high performance in terms of HETp1
, anda search for very selective stationary phases and the development of high-temperatureGC 2
•
We have been studying selective stationary phases for GC through thedevelopment of columns containing graphitized carbon blacks (GCB) coated withsuitable percentages and quality of stationary phases3
•4
.
The success of this technique, cal1ed gas-liquid-solid chromatography (GLSC),is due to the peculiar properties of GCB and to the particular working mechanism,involving adsorption and interaction with the liquid stationary phase3
. Further, linearelution and a low HETP are obtained for polar compounds using polar stationaryphases. Very selective packed columns have been developed, which are nowadayswidely used in environmental and industrial analysis4
.
In the last few years, our efforts have been devoted to the preparation offused-silica capil1ary columns with the aim of coupling the high separation factors ofGLSC with the large number of theoretical plates achievable in capillary chromatography, In early works 5
,6 we showed that high performance and fast analysis can beachieved with these columns. In a recent paper? we also showed that very highreproducibility can be obtained in the preparation of these columns.
In this paper we report further progress made in the preparation of fused-silicacapillary columns with GCB, which is mainly due to the use of an extremely fineparticle size.
0021-9673/90/$03.50 © 1990 Elsevier Science Publishers B.V.

124
EXPERIMENTAL
F. BRUNER et at.
The preparation of the columns is based on a two-step procedure that can besummarized as follows: (a) preparation ofa slurry where the adsorbent (GCB) and theliquid phase (SP1000) are mixed together in a suitable solvent and sonicated; (b)coating of the capillary columns by means of a static method.
Step (a) has been greatly modified with the aim of obtaining a slurry with a veryfine particle size. This can be accomplished by considering that the maximum power ofthe sonicator is obtained when the slurry solvent is water and that a high sonicationpower is required when an organic solvent is used. The GCB (Carbopack B in thisinstance) is wet-sieved via a multi-stadium sieving cascade using water as medium. Thematerial of finest particle size ( < 20 /lm) is sonicated in water by means of high-powersonicator (Model 450, Branson, Danbury, CT, U.S.A.) for 30 min. The slurry is thendried by means of a vacuum pump and methylene chloride-n-pentane (50:50)containing 35% (w/w) (with respect to the carbon black) of SP1000 is added. Thecontainer is shaken and sonicated again for 30 min.
The coating step (b) does not differ substantially from that described previously4, which is a modification of the method of Xu and Vermeulen8 (free-releasestatic coating) for the preparation of glass capillaries. Essentially the slurry is pushedinto the capillary by heating the slurry reservoir at 60°C and the solvent is thenevaporated while the column is kept at a temperature higher than the boiling point ofthe solvent mixture4.
Two types ofcolumn with different J.D. (0.25 and 0.53 mm) were tested. A CarloErba Model 5160 Mega chromatograph equipped with both split-splitless andon-column injectors and a Dani Model 8510 chromatograph equipped with a PTVinjector were used. Fused-silica tubing and Carbopack B were kindly supplied bySupelco (Bellefonte, PA, U.S.A.).
RESULTS AND DISCUSSION
Fig. 1 shows scanning electron micrographs of the carbon black layer on theinner wall of the fused-silica capillary. The particle dimensions cannot be easilyevaluated but they seem to be in the region of 10 - 2 /lm. With the procedure describedpreviously dimensions of about two orders of magnitude larger were obtained4. Thegraphite layer appears to be homogeneous.
In Fig. 2 the Van Deemter plots of three columns with two different innerdiameters (0.53 mm for columns A and Band 0.25 mm for column C) are shown. Thecolumns contained Carbopack B coated with SPIOOO to different extents. The surfacecoverage values (8), obtained by using a method described in detail elsewhere7
, are 1.2for column A and 4.5 for columns Band C. The obvious difference in the B term of theVan Deemter equation for columns of different diameter is shown by the largedifference in both the value of the minimum HETP (Hmin) and of the resistance to masstransfer term, C. Column B shows a lower H min than column A but a higher value of C.The latter may be due to the lower homogeneity of the adsorbing layer containinga small amount of stationary phase, but the former is more difficult to explain.
The behaviour of the 0.53-mm J.D. columns is more like that of a packed thana capillary column. The only advantage of these large-bore capillary columns seems to

CAPILLARY GC WITH GRAPHITIZED CARBON BLACK 125
Fig. I. Scanning electron micrographs of the inner wall of fused-silica capillary columns (C and A, see Fig. 2)coated with Carbopack B + SPIOOO.
be that the inlet pressure is of course much lower than for a packed column, with thepossibility of making longer columns. There is also an increase in sample capacityowing to the larger surface area, which is, however, difficult to evaluate.
Further, as these columns are used in GLSC, where the mechanism is controlledby adsorption, the advantages of using wide-bore columns are even less importantthan in conventional capillary gas-liquid chromatography (GLC). It is concluded.

126
HEll'(mnt
1.7
1.5
1.3
1.1
A
10 20 30 40 50
B
60 70 _ 80 90u(cm/sl
F. BRUNER el al.
Fig. 2. Van Deemter plots obtained with three fused-silica capillary columns coated with Carbopack B +SPIOOO: (A) 33 m x 0.53 mm J.D.; (B) 33 m x 0.53 mm J.D.; (C) 24 m x 0.25 mm J.D. Sample, n-dodecane(k' = 7); carrier gas, hydrogen.
from a theoretical and kinetic point of view, that wide-bore columns seem not torepresent progress in capillary chromatography.
Column C shows outstanding properties from the kinetic point of view. H min
occurs at about 40 cmls and shows a coating efficiency of about 80% with a measuredH min of 0.29 mm.
10
~\78911
2
ro 1 2 5 6 MIN
Fig. 3. Separation with a fused-silica capillary column (24 m x 0.25 mm J.D.) coated with Carbopack B +5% SPIOOO. Peaks: I = benzene; 2 = toluene; 3 = ethylbenzene; 4 = p-xylene; 5 = l1l-xylene;6 = isopropylbenzene; 7 = a-xylene; 8 = n-propylbenzene; 9 = 1.3.5-trimethylbenzene; 10 = p-cymene;'11 = n-butylbenzene. Column temperature: 1.5 min at 70°C, then heated at 20v C!min to l60v C and held tothe end. Carrier gas, hydrogen; linear velocity, 40 cm/s; sample volume, 0.1 JlI; splitting ratio, I: 100; flameionization detection (FID).

CAPILLARY GC WITH GRAPHITIZED CARBON BLACK
A
127
C13
C17(\0
'~ '.':::::../~r/-
'/~,
~~~
0 1 2 3 4 5 7 8 9 1.0 .l1 12 13 14 15 min
DC24
(;20
tlL~Phytane C17 em
Pristane
Jl '" ~,L
0 4 8 12 16 20 24 28 32 36 40 44 48 min
Fig. 4. (A) Separation with a fused-silica capillary column (24 m x 0.25 mm J.D.) coated with Carbopack B + SPIOOO. Column temperature: 2 min at 60°C, then heated at 20°C/min to 230°C and held to theend. Carrier gas, hydrogen; linear velocity, 50 cm/s; sample, 0.05 pI of Iran crude oil; splitting ratio, I; 100;FID (8' 10'" a.u.f.s.). (B) Separation with an SE-54 fused-silica capillary column (30 m x 0.25 mm J.D.).Column te.uperature, 2 min at 100°C, then heated at 5°C/min to 270°C and held to the end. Carrier gas,hydrogen; linear velocity, 42 cm/s; sample, 0.1 pi of crude shale oil; splitting ratio, 67:1; FID (810- 11 a.u.f.s.).
In a theoretical treatment, Giddings9 showed that for a highly porous andhomogeneous adsorbent the C term should be as low as 10 -7, provided that the surfacearea of the adsorbent is very high (103 m2 /g). In practice, however, an adsorbent withboth of these properties is not available, but GCB represents a good compromise,being a non-porous and homogeneous adsorbent. In this instance it is reasonable4
,9 toassume C = 10- 4
. In fact, the value calculated from the Van Deemter plot is 2.2' 10- 4,
which is very close to the theoretical value. It should be pointed out that this value ishardly reached in GLC, so that GLSC capillary columns can yield a better resolutionin a shorter time.

128
TABLE I
LIST OF PRIORITY POLLUTANTS SEPARATED
No. Compound No. Compound
] Chloromethane 19 Irans-I,3-Dichloropropene2 Dichlorodifluoromethane 20 Toluene3 Bromomethane 21 Tetrachloroethylene4 Vinyl chloride 22 cis-I,3-Dichloropropene5 Trichlorofluoromethane 23 I-Chloro-2-bromopropane6 ],I-Dichloroethylene 24 2-Chloroethyl vinyl ether7 Irans-I ,2-Dichloroethylene 25 Bromodichloromethane8 1,1,1-Trichloroethane 26 Ethylbenzene9 Carbon tetrachloride 27 Chlorobenzene
10 cis-I,2-Dichloroethylene 28 1,1,2-TrichloroethaneII I,I-Dichloroethane 29 Dibromochloromethane12 Methylene chloride 30 1,4-Dichlorobutane13 Benzene 31 Bromoform14 Trichloroethylene 32 I, I,2,2-Tetrachloroethane15 Chloroform 33 1,3-Dichlorobenzene16 Bromochloromethane 34 1,4-Dichlorobenzene]7 1,2-Dichloropropane 35 1,2-Dichlorobenzene18 1,2-Dichloroethane
F. BRUNER el al.
In Fig. 3 the separation of some aromatic compounds is illustrated and the highresolving power of the GLSC capillary column is shown. An almost baselineseparation of the three xylenes is obtained in less than 6 min without any overlappingof possibly interfering compounds.
10
3
2633
28
27
15 25 29
:t I~6 7
34
32
53
35
31
9 10 HI N
Fig. 5. Separation of 35 priority pollutants. Peak numbers as in Table I. Fused-silica capillary column(33 m x 0.53 mm I.D.) coated with Carbopack B + SPIOOO. Column temperature, 2 min at 30°C, thenheated at 20°C/min to 200°C and held to the end. Carrier gas, hydrogen; linear velocity, 30 cmjs; samplevolume, 0.1 Ill; splitting ratio, 1:100; FID.
CAPILLARY GC WITH GRAPHITIZED CARBON BLACK 129
In Fig. 4 the separation of the components of a crude oil with the critical pairsn-C 17-pristane and n-C 1s-phytane is shown and compared with that obtained witha GLC column with the same resolving power. The operating conditions were differentas they were adjusted in each instance to obtain the best performance. The separationof interest is obtained more than twice as fast on the Carbopack B column. Of course,as our column is more retentive the overall analysis is stopped at CZ4 •
In order to show the high resolving power of these columns, a separation of 35priority pollutants (Table I) is shown in Fig. 5. This separation, obtained in only10 min, is one of the fastest and the most effective reported for this kind ofmixture. Theseparations in Figs. 4 and 5were obtained with columns A and B in Fig. 1, respectively.
In conclusion, the results given here represent the most recent achievements inGLSC with capillary columns and in our opinion provide the best demonstration thatour aim of coupling a high value of (J. with a large number of theoretical plates hasalmost bean achieved. More research with the use of different stationary phases isneeded in order to achieve more complete results.
REFERENCES
1 P. A. Leqlercq and C. A. Cramers, J. High Resolut. Chrornatogr. Chrornatogr. Cornrnun., 8 (1985) 764.2 E. Gearaert and P. Sandra, J. High Resolut. Chrornatogr. Chrornatof(r. Cornrnun., 8 (1985) 415.3 F. Bruner, G. Crescentini, F. Mangani and M. Xiang, Ann. Chirn. (Rome), 77 (1987) 745.4 F. Bruner, G. Crescentini, F. Mangani, P. Palma and M. Xiang, J. Chrornatogr., 399 (1987) 87.5 F. Bruner, P. Ciccioli, G. Crescentini and M. T. Pistolesi, Anal. Chern., 45 (1973) 1851, and references
cited therein.6 A. Di Corcia and A. Liberti, Adv. Chrornatogr., 14 (1976) 305, and references cited therein.7 F. Bruner, G. Crescentini, F. Mangani and L. Lattanzi, J. Chrornatogr., 473 (1989) 93.8 B. Xu and N. P. E. Vermeulen, Chrornatographia, 18 (1984) 520.9 J. C. Giddings, Anal. Chern., 36 (1964) 1170.


Journal of Chromatography, 517 (1990) 131-142Elsevier Science Publishers B.V., Amsterdam
CHROMSYMP. 2000
Pesticide analysis by gas chromatography with a novelatomic emission detector
PHILIP L. WYLIE*
Hewlett-Packard Co., P.O. Box 900, Rt. 41 and Starr Road, Avondale, PA 19311 (U.S.A.)
and
RIMIKO OGUCHI
Yokogawa Electric Corporation, 2-9-32 Nakacho, Musashino-shi, Tokyo 180 (Japan)
ABSTRACT
An atomic emission detector, consisting of a microwave-induced helium plasmaand atomic emission spectrometer, has been used for the gas chromatographic analysis of pesticides. In principle, it is possible to detect any element in the periodic table(except helium) which can elute from a gas chromatograph. Detection limits for C, H,D, N, 0, Br, CI, F, S, Si, P, Sn and Hg were found to range from 0.1 to 75 pg/s withselectivities over carbon of 5000 or more. The gas chromatography-atomic emissiondetection system has been used for the detection and elemental characterization of 27different pesticides by obtaining element-specific chromatograms for C, H, N, 0, Br,CI, F, P and S. By performing quantitative analysis for each element, it was possibleto calculate the approximate empirical formulas for 20 different herbicides in twodifferent mixtures. An extract from an apple doped with three pesticides was analyzedby gas chromatography-atomic emission detection.
INTRODUCTION
Several United States Environmental Protection Agency (EPA)-approvedmethods exist for the gas chromatographic (GC) analysis of pesticides includingMethods 505 (ref. 1), 608 (ref. 2) and 8080 (ref. 3) (organohalide pesticides andpolychlorinated biphenyls), 507 (ref. 4, 69 pesticides), 508 (ref. 5, 32 chlorinatedpesticides), 515 (ref. 6; chlorinated acid herbicides), 8140 (ref. 3, organophosphoruspesticides) and 8150 (ref. 3, chlorinated herbicides). Numerous methods exist for theanalysis of pesticide residues on foods. Two popular multi-residue methods are thosedeveloped by Luke7
,8 and the California Department of Food and Agriculture'}.Four different selective detection methods are used in these methods: electron
capture detection (ECD) or electrolytic conductivity detection (ELCD) for halogenated compounds, nitrogen-phosphorus detection (NPD) for nitrogen- and phosphorus-containing pesticides, and flame photometric detection (FPD) for sulfur orphosphorus compounds.
While the above-mentioned detectors have proven to be very useful for the
0021-9673/90/$03.50 © 1990 Elsevier Science Publishers B.V.

132 P. L. WYLIE, R. OGUCHI
selective detection of heteroatoms in pesticides, each has certain inherent limitations.ECD is the most sensitive GC detection method for polyhalogenated compounds, butit is not very selective, responding strongly to other electronegative functional groups.Even for halogenated compounds, ECD response is not proportional to the numberof halogens in a molecule and it is typically not linear beyond about two orders ofmagnitude. NPD sensitivity can vary over time and some types of chemical bondingcan greatly reduce its sensitivity to nitrogen. For sulfur, FPD response is not linearand suffers from quenching of the signal by co-eluting compounds. Of the detectionmethods mentioned, ELCD is perhaps the most difficult to operate, requiring frequent maintenance and strict avoidance of contaminants.
Pesticides almost always contain heteroatoms and often have several in a singlemolecule. The most frequently encountered elements are C, H, 0, P, S, N, Cl, Br, Fand metals such as As, Hg and Zn lO
• For the analysis of complex environmentalsamples containing pesticides, it would be useful to have a single GC detector capableof specific element detection for any element encountered in a pesticide; indeed, acomplete profile of all the elements in a pesticide molecule would greatly aid in itsidentification.
Detectors which combine plasma excitation with optical emission spectroscopyhave been used for the selective detection of many organic and inorganic elements.Three recent reviews describe various plasma-atomic emission spectroscopy (AES)systems which have been developed as GC detectors ll
-13
. Several investigators havereported analyzing pesticides using GC-plasma-AES systems14
-18
.
The Hewlett-Packard (HP) 592IA atomic emission detection (AED) systemused for this investigation has been described elsewhere19
-24
. The detector employs amicrowave-induced helium plasma as the atomization and excitation source. Thisdesign was chosen because the energy of the helium plasma was sufficient to excite allelements in the periodic table and because it only required 100-200 ml/min of helium.In contrast, inductively coupled plasmas typically require many liters of argon orhelium per minute.
This paper describes the use of this new GC-AED system for the analysis ofpesticides. An objective was to show specific element detection for all of the mostcommon elements found in pesticide formulations. Therefore a variety of insecticidesand herbicides was analyzed showing specific element detection ofC, H, N, 0, P, F,CI and Br. Typical detection limits and selectivities were determined for several elements.
By performing quantitative analyses on every element in an unknown moleculeit should be possible to calculate its empirical formula. Several researchers havereported the results of such calculations with mixed results2
4-26. This work representsan initial investigation into the feasibility of determining complete empirical formulasfor pesticides using this commercially available GC-AED system.
EXPERIMENTAL
GC-AED systemA prototype of the HP 592IA atomic emission detector was coupled to an HP
5890A gas chromatograph. Papers detailing the design and performance of the GCAED system have appeared elsewhere19
•2o
.

GC-AED OF PESTICIDES 133
The HP 5890A GC system was equipped with a HP 7673A automatic injectorand split-splitless capillary injection port which was operated at 200-300°C, depending on the sample. Three HP columns were employed: (A) 25 m x 0.32 mm I.D. x0.17 J1.m film HP-l operated at a helium flow-rate of 1.05 ml/min (21.8 cm/s), (B) 50 mx 0.2 mm I.D. x 0.5 J1.m film HP-5; helium flow-rakO.39 ml/min (21 cm/s) and (C)25m x 0.32mmI.D. x 0.17 J1.mfilmHP-5; helium flow-rate 0.95 ml/min (19.7 cm/s).
Samples·Diazinon (VAP Special Products), alachlor (Monsanto), metolachlor (Ciba
Geigy), chlorpyrifos (Dow), and prometon (Ciba-Geigy) were all obtained as commercial pesticide preparations from local suppliers. They were received as 25, 45.1,86.4,40.7 and 25% solutions, respectively, which were diluted 1:100 in hexane ormethanol. Capillary GC was performed with a 100: 1 split ratio. Two herbicide mixtures containing nine and thirteen compounds, respectively, were obtained from Supelco (Bellefonte, PA, U.S.A.) as solutions of 100 J1.g/ml each in ethyl acetate. Theherbicide mixtures were analyzed as received using a 55: 1 split ratio for the detectionof C, H, N, Cl, Br and S and a 12: 1 split ratio for the F and 0 analyses.
The analysis of pesticides. spiked into an apple was conducted as follows. Asolution of chlorpyrifos, endosulfan I and endosulfan II was injected into a 20-gwedge-shaped apple slice so that the pesticides would be present at 680, 337 and 330ppba
, respectively. The apple was chopped up and blended for 3 min with 40 ml ofacetonitrile in a Sorvall Omni Mixer. The solution was filtered rapidly by suction intoa flask containing about 10 g of sodium chloride and the layers were allowed toseparate. A 4-ml aliquot of the organic layer was evaporated to near-dryness with astream of nitrogen and the residue was taken up in 2 ml of acetone. Analysis of theacetone solution was performed by GC-AED using l-J1.l splitless injections.
RESULTS AND DISCUSSION
When extracted from water, soil or plant material, pesticides are often isolatedtogether with numerous other synthetic and natural organic compounds. Contamination from laboratory ware (especially phthalates from plastics) and solvents is another source of concern. Element-selective detection methods such as ECD, FPD,NPD and ELCD are used for GC analysis as a way of "isolating" the halogen-,sulfur-, nitrogen- or phosphorus-containing pesticides from these contaminants. Ofcourse, when a contaminant contains the monitored heteroatom or when the detection method (particularly ECD) is not sufficiently selective, spurious peaks arise.
Pesticides are usually very rich in heteroatoms with most having two to fourelements present in addition to C and H. Using GC-AED it is possible to monitorevery element in a pesticide (albeit, with varying sensitivities) providing multiplechannels of corroborative data.
Table I lists several elements by groups which could be observed simultaneouslyalong with detection limits (MDL) and selectivities which have been obtained withthis system. As is commonly done for plasma detectors, the MDL values are expressed as pg/s of the element which gives a signal-to-noise ratio of 2. These values
a Throughout this article, the American billion (109) is meant.

134 P. L. WYLIE, R. OGUCHI
TABLE I
TYPICAL DETECTION LIMITS AND SELECTIVITIES OBTAINED USING GC-MIP-AES
Group Element Wavelength MDL Selectivity(nm) (pg/.I')
N 174.2 7.0 6000S .180.7 1.7 150000Hg 184.9 0.1 > 1000000C 193.1 0.5
II P 177.5 1.5 250001II C 247.9 2.6
Si 251.6 7.0 90000Hg 253.7 0.1 > 1000000
IV Br 478.6 75 19000Cl 479.5 39 25000H 486.1 2.2C 247.9 (2nd order) 12
V D 656.1 2.5 6001'.1'. HH 656.3 3.0
VI F 685.6 40 30000VII 0 777.2 75 25000
can be easily converted to the detection limit for a compound (in pg). The detectionlimit for a given element from Table I is multiplied by the GC peak width and thecompound's molecular weight divided by the gram atoms of the element in the anaIyte. Selectivities are with respect to C except for deuterium which is relative to H.
Fig. I shows a multi-element-specific chromatogram of diazinon(C12H21N20~PS).Three sequential chromatographic runs were required to obtainchromatograms for C, S, N, P and H. The chromatograms for C, Sand N wereobtained simultaneously using oxygen and hydrogen scavenger gases. While the emission line for P falls in the same region (177.5 nm), it required hydrogen as the only
121084 6Ti me (mi n )
2
5 of DRT : RIZ NEN.DC of DRT RIZ- NEN.D:
P of OAT RIZ-
NEP.DH of OAT RIZ- NEH.O- PHOSPHORUS I
SULFUR ~
NITROGEN
.1.. CARBON
HYDROGENi i , i i i '---'---'----'o
o
1000
3000
N of DRTR:DRIZ NEN.D4000
2000
Fig. 1. GC-AED analysis of diazinon using column A. Oven temperature program: 100·C (1 min), IOT/min to 250T; inlet and transfer line/cavity temperatures 200·C.

GC-AED OF PESTICIDES 135
scavenger gas and, therefore, had to be determined separately. The H chromatogramwas obtained in a third run at 486.1 nm using only oxygen as scavenger. The threesequential runs were fully automated from the GC-AED system's controller.
Current procedures for the analysis of pesticides typically obtain only one element-specific chromatogram providing two-dimensional data (presence of the element plus retention time). In addition to the retention time, the presence of fiveconstituent elements was confirmed using AED. Of particular interest are the chromatograms for S, Nand P. Their presence combined with the retention time wouldusually be sufficient to identify the pesticide. Quantitation could be done using any(or all) of the elements present. This flexibility can be very useful if interfering compounds appear in one element channel but not in another.
Fig. 2 shows four element-specific traces for alachlor (C14H20ClN02); C, Hand Cl were obtained simultaneously in a single run and N from a second run. Thecontroller's software automatically combined data from these two injections into asingle file for integration, plotting or for incorporation into a report.
At the time that diazinon and alachlor were analyzed, the experimental software did not allow the collection of oxygen-specific chromatograms. Using softwaremodified to include oxygen detection, a mixture of prometon (CloH19NsO), chlorpyrifos (Cg H llC13N03PS) and metolachlor (ClsH22ClN02) was analyzed. A completeelemental profile was obtained in four sequential analyses; seven element-specificchromatograms (C, H, N, 0, Cl, P and S) are shown in Fig. 3.
Chlorpyrifos and metolachlor were not separated on an HP-l column (columnA; cf Experimental) but could be partially resolved with a 50-m HP-5 column (column B). Since the three pesticides contain different atoms, it is a trivial matter todistinguish between them. In addition to C and H prometon has Nand 0 whilemetolachlor has Cl, Nand O. Chlorpyrifos has all seven elements.
With less than perfect resolution, quantitation of metolachlor and chlorpyrifoswould be difficult using a universal, nitrogen-specific or halogen-specific detectorsince both compounds would respond. However, using GC-AED, chlorpyrifos could
3000
2000
1000
o
H of DRTF :RLCHR CL.DC I of DR "1:RLCHR CL.DN of DRTF :RLCHR C2.D
I NITROGEN
HYDROGEN
;
J CHLORINE
jl CRRBON
---.- I I I I I
o 2 4 6Time (m in)
8 10
Fig. 2. GC-AED analysis of alachlor using column A. Oven temperature program: IOO"C (I min), lOT/min to 250"C; inlet and transfer line/cavity temperatures 200"C.
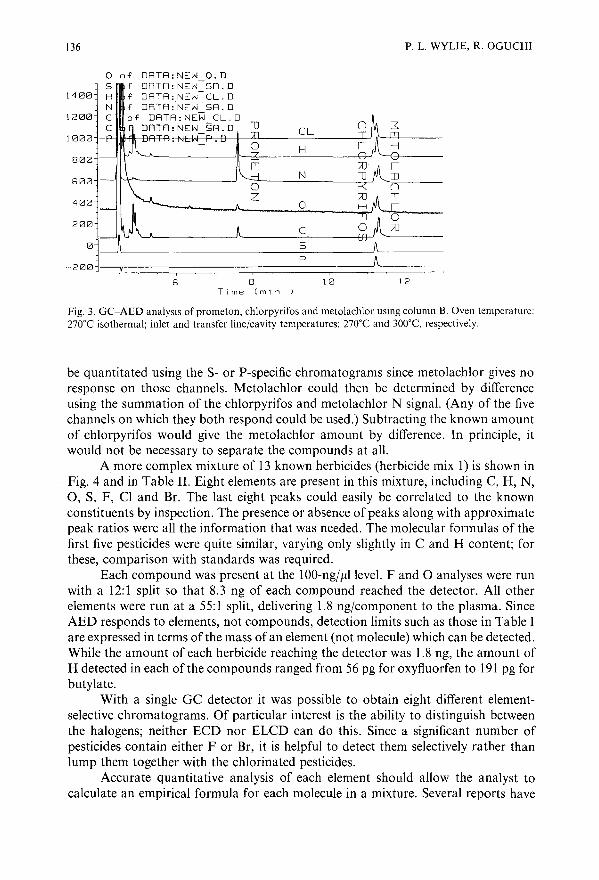
136
o of DRTR:NEH O.D5 f DRTR:NEH-SR.D
1400 H f DRTR:NEH-CL.DN f DRTR:NEH-SR.D
1200 C of DRTR:NEN CL.DC DATA: NEH SA. D lJ
o800
400
200
o
6 8Time (m in)
P. 1. WYLIE, R. OGUCHI
CL =fTlH I -I
/0 IN lJ ]J
nI
0 ,-0
C /0
5
P
10 12
Fig. 3. GC-AED analysis of prometon, chlorpyrifos and metolachlor using column B. Oven temperature:270"C isothermal; inlet and transfer line/cavity temperatures: 270"C and 300"C, respectively.
be quantitated using the S- or P-specific chromatograms since metolachlor gives noresponse on those channels. Metolachlor could then be determined by differenceusing the summation of the chlorpyrifos and metolachlor N signal. (Any of the fivechannels on which they both respond could be used.) Subtracting the known amountof chlorpyrifos would give the metolachlor amount by difference. In principle, itwould not be necessary to separate the compounds at all.
A more complex mixture of 13 known herbicides (herbicide mix 1) is shown inFig. 4 and in Table II. Eight elements are present in this mixture, including C, H, N,0, S, F, CI and Br. The last eight peaks could easily be correlated to the knownconstituents by inspection. The presence or absence of peaks along with approximatepeak ratios were all the information that was needed. The molecular formulas of thefirst five pesticides were quite similar, varying only slightly in C and H content; forthese, comparison with standards was required.
Each compound was present at the 1OO-ng/Jlllevel. F and °analyses were runwith a 12:1 split so that 8.3 ng of each compound reached the detector. All otherelements were run at a 55: I split, delivering 1.8 ng/component to the plasma. SinceAED responds to elements, not compounds, detection limits such as those in Table Iare expressed in terms of the mass of an element (not molecule) which can be detected.While the amount of each herbicide reaching the detector was 1.8 ng, the amount ofH detected in each of the compounds ranged from 56 pg for oxyfluorfen to 191 pg forbutylate.
With a single GC detector it was possible to obtain eight different elementselective chromatograms. Of particular interest is the ability to distinguish betweenthe halogens; neither ECD nor ELCD can do this. Since a significant number ofpesticides contain either F or Br, it is helpful to detect them selectively rather thanlump them together with the chlorinated pesticides.
Accurate quantitative analysis of each element should allow the analyst tocalculate an empirical formula for each molecule in a mixture. Several reports have

GC-AED OF PESTICIDES 137
C of DRTR:HERBI S3.D5 of RTR:HERBI-S3.DN of RTR:HERBI-S3.D
HERBICIDES MIXI
3000
2000
N
S
1000
0,o 2 4 6 8 10
Ti me (m in)12 14
C
16
o
F
Br
MIXIHERBICIDESH of DRTR:HERBI BR.Do of RTR:HERBI-O.DBr of DRTR:HERBI BR.DCl of DRTR:HERBI-BR.DF of TR:HERBI F.D
300
200 H
?00
500
400
600
l C 1100 LJ1r
0 2 4 6 8 10Time (min )
12 14 16
Fig. 4. GC-AED analysis of a mixture containing 13 herbicides using column C. Two plots were requiredto show all eight element-specific chromatograms. Compound identities and calculated elemental ratios aregiven in Table II. Oven temperature program: 150°C (3 min), 10°C/min to 300°C; inlet and transferline/cavity temperatures: 280°C and 300°C, respectively.
appeared in the literature in which this has been accomplished for a limited number ofelements with varying degrees of success.
Recent reports by Widmer24 and by Sullivan and Quimby22 have shown examples using the Hewlett-Packard GC-AED system. Widmer discussed an example forwhich the approximate empirical formula was generated for a compound containingC, H, 0 and Cl. Sullivan and Quimby used 15 different Co, H-, N- and O-containingcompounds and found that approximate empirical formulas could be determined forunknowns when heteroatoms were present and certain assumptions were made aboutthe size of the molecule. It was of interest to see if empirical formulas could begenerated for the herbicides in this mixture, since between them, they contained eightdifferent elements.
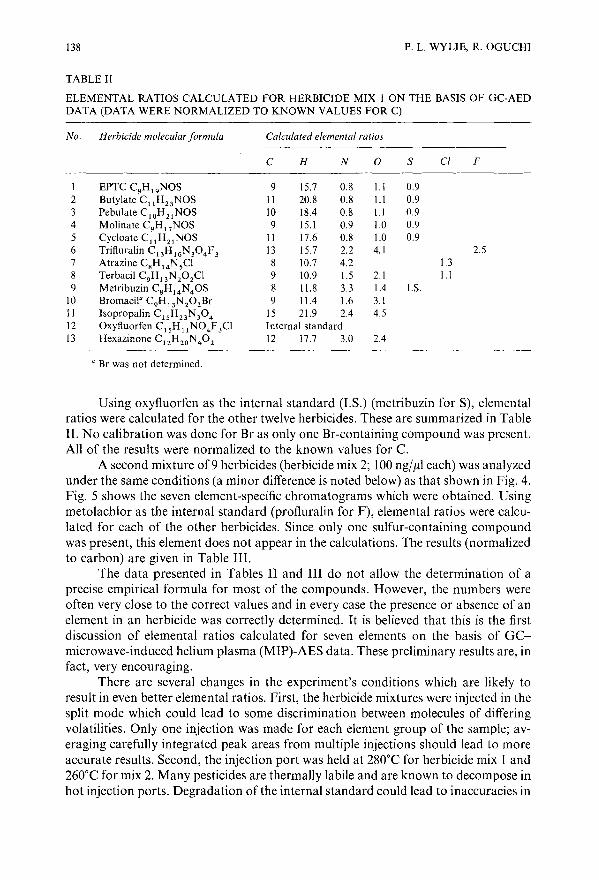
138 P. L. WYLIE, R. OGUCHI
TABLE II
ELEMENTAL RATIOS CALCULATED FOR HERBICIDE MIX I ON THE BASIS OF GC-AEDDATA (DATA WERE NORMALIZED TO KNOWN VALUES FOR C)
No. Herbicide molecular formula Calculated elemental ratios
C H N 0 S CI F
I EPTC C9H 1gNOS 9 15.7 0.8 1.1 0.92 Butylate C llH 23 NOS II 20.8 0.8 1.1 0.93 Pebulate C'OH 21 NOS 10 18.4 0.8 1.1 0.94 Molinate C9H 17NOS 9 15.1 0.9 1.0 0.95 Cycloate C 11 H 21 NOS II 17.6 0.8 1.0 0.96 Trifluralin C13H16N304F3 13 15.7 2.2 4.1 2.57 Atrazine C BH 14N sCI 8 10.7 4.2 1.38 Terbacil C9H'3N202Cl 9 10.9 1.5 2.1 1.19 Metribuzin CBH 14N4OS 8 11.8 3.3 1.4 I.S.
10 Bromacil" CgH 13N 2°2Br 9 11.4 1.6 3.1II Isopropalin ClsH23N304 IS 21.9 2.4 4.512 Oxyfluorfen ClsHllN04F3Cl Internal standard13 Hexazinone C12H20N402 12 17.7 3.0 2.4
" Br was not determined.
Using oxyfluorfen as the internal standard (I.S.) (metribuzin for S), elementalratios were calculated for the other twelve herbicides. These are summarized in TableII. No calibration was done for Br as only one Br-containing compound was present.All of the results were normalized to the known values for C.
A second mixture of9 herbicides (herbicide mix 2; 100 ng/1l1 each) was analyzedunder the same conditions (a minor difference is noted below) as that shown in Fig. 4.Fig. 5 shows the seven element-specific chromatograms which were obtained. Usingmetolachlor as the internal standard (profluralin for F), elemental ratios were calculated for each of the other herbicides. Since only one sulfur-containing compoundwas present, this element does not appear in the calculations. The results (normalizedto carbon) are given in Table III.
The data presented in Tables II and III do not allow the determination of aprecise empirical formula for most of the compounds. However, the numbers wereoften very close to the correct values and in every case the presence or absence of anelement in an herbicide was correctly determined. It is believed that this is the firstdiscussion of elemental ratios calculated for seven elements on the basis of GCmicrowave-induced helium plasma (MIP)-AES data. These preliminary results are, infact, very encouraging.
There are several changes in the experiment's conditions which are likely toresult in even better elemental ratios. First, the herbicide mixtures were injected in thesplit mode which could lead to some discrimination between molecules of differingvolatilities. Only one injection was made for each element group of the sample; averaging carefully integrated peak areas from multiple injections should lead to moreaccurate results. Second, the injection port was held at 280°C for herbicide mix I and260°C formix 2. Many pesticides are thermally labile and are known to decompose inhot injection ports. Degradation of the internal standard could lead to inaccuracies in
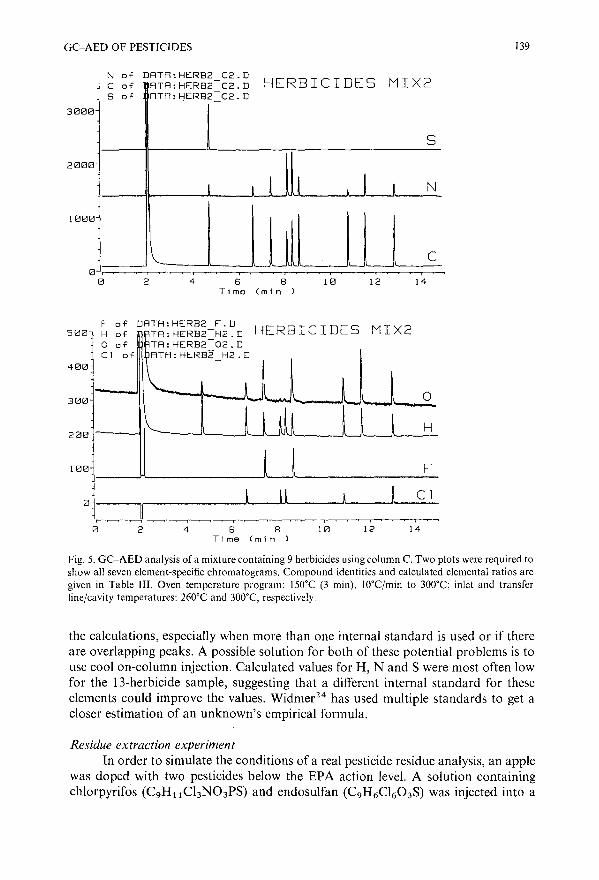
GC-AED OF PESTICIDES 139
141210
HERBICIDES MIX2
6 8Time (m in)
42
C of RTR:HERB2 - C2.D5 of RTR:HERB2 - C2.D
S
I I I I I I I N
~ C, , , , , , , ,o
o
1000
N of DRTR:HERB2 C2.D
2000
3000
500F of DRTR:HERB2 F.D HERBICIDES MIX2H of TR:HERB2-H2.Do of TR:HERB2-02.DCl of RTR:HERB2 H2.D
400
300 0
200H
100 F
01LJJ Cl
I
0 2 4 6 8 10 12 14Time (min )
Fig. 5. GC-AED analysis of a mixture containing 9 herbicides using column C. Two plots were required toshow all seven element-specific chromatograms. Compound identities and calculated elemental ratios aregiven in Table III. Oven temperature program: 150°C (3 min), lOoC/min to 300T; inlet and transferline/cavity temperatures: 260°C and 300T, respectively.
the calculations, especially when more than one internal standard is used or if thereare overlapping peaks. A possible solution for both of these potential problems is touse coolon-column injection. Calculated values for H, Nand S were most often lowfor the l3-herbicide sample, suggesting that a different internal standard for theseelements could improve the values. Widmer24 has used multiple standards to get acloser estimation of an unknown's empirical formula.
Residue extraction experimentIn order to simulate the conditions of a real pesticide residue analysis, an apple
was doped with two pesticides below the EPA action level. A solution containingchlorpyrifos (C9H llChN03PS) and endosulfan (C9H 6CI60 3S) was injected into a
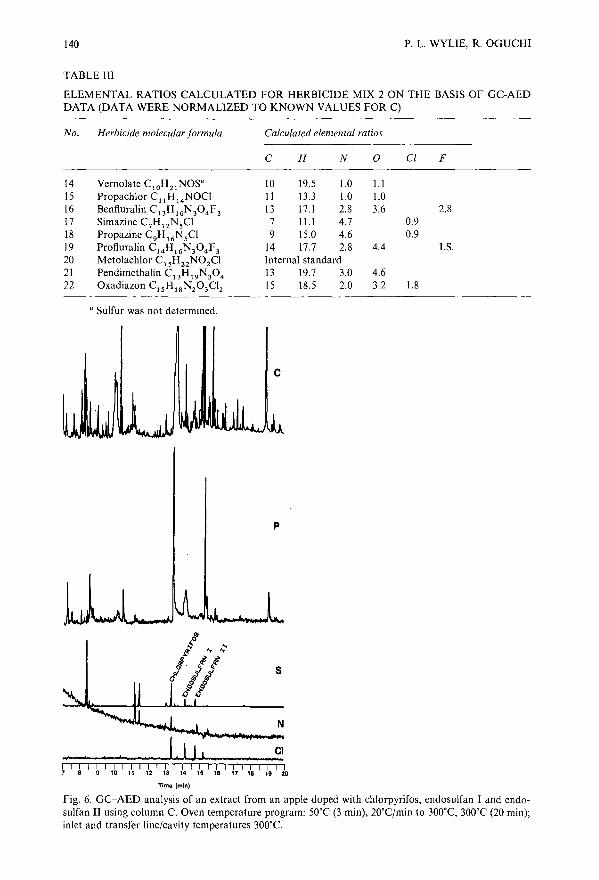
140 P. L. WYLIE, R. OGUCHI
TABLE III
ELEMENTAL RATIOS CALCULATED FOR HERBICIDE MIX 2 ON THE BASIS OF GC-AEDDATA (DATA WERE NORMALIZED TO KNOWN VALUES FOR C)
No. Herbicide molecular formula Calculated elemental ratios
C H N 0 CI
14 Vernolate C ,oH 2 , NOSa 10 19.5 1.0 1.115 Propachlor C"H,4NOCI 11 13.3 1.0 1.016 Benfluralin C13H,6N304F3 13 17.1 2.8 3.617 Simazine C7H'2NsCI 7 11.1 4.7 0.918 Propazine C9H'6NsCI 9 15.0 4.6 0.919 Profluralin C,4H,6N304F3 14 17.7 2.8 4.420 Metolachlor C, sH 22N02Cl Internal standard21 Pendimethalin C13H19N304 13 19.7 3.0 4.622 Oxadiazon C,sH,sN2 0 3C12 15 18.5 2.0 3.2 1.8
a Sulfur was not determined.
F
2.8
I.S.
c
p
s
N
I I I. I I I I I I I I I I I I I I I I I I I I7 9 10 11 12 13 14 15 18 17 18 19 20
Time (min)
Fig. 6. GC-AED analysis of an extract from an apple doped with chlorpyrifos, endosulfan I and endosuIfan II using column C. Oven temperature program: 50"C (3 min), 20"C/min to 300"C, 300T (20 min);inlet and transfer line/cavity temperatures 300"C.

GC-AED OF PESTICIDES 141
20-g wedge-shaped slice of an apple to give concentrations of 0.68 and 0.67 ppm,respectively. In apples, the EPA allows a maximum residue limit of 1.5 ppm forchlorpyrifos and 2.0 ppm for endosulfan2
7. Endosulfan was obtained as a 51 :49mixture of isomers endosulfan I and endosulfan II. In the apple their respectiveconcentrations were 0.34 and 0.33 ppm.
Pesticides were extracted from the apple employing a slight modification ofprocedures used by the California Department of Food and Agriculture9
. The carbon-selective chromatogram of the extract shown in Fig. 6 is similar to that whichwould be obtained from a flame ionization detector. The complexity of this chromatogram makes it clear why selective detectors are necessary for residue analyses in theabsence of extensive clean-up steps.
Also shown in Fig. 6 are the element-selective chromatograms for S, N, Cl andP which were obtained from three successive injections. All of these elements arepresent in the chlorpyrifos peak while the endosulfan isomers show only Sand Cl asexpected. Oxygen was not run on this sample. In spite of the complexity of the dirtyextract, these pesticides are readily seen on each of the appropriate element channelsof the AED system. Coupled with the retention time, this elemental information mayoften be sufficient to confirm the presence of a pesticide. In other cases where similarcompounds elute close together, confirmation by GC-mass spectrometry would stillbe required.
CONCLUSIONS
GC detectors most commonly used for pesticide methods are limited to thedetection of halogens, S, Nand P. ECD and ELCD cannot differentiate between F,Cl and Br. These detection methods may lack selectivity (ECD), suffer from quenching (FPD) and lack linearity (ECD and FPD). In contrast, GC-AED can, in principle, selectively detect any element in the periodic table so long as it can be analyzed byGC.
Pesticides are particularly good candidates for GC-AED analysis since they arerich in heteroatoms. Using a GC-AED system, the analyst has the choice of detectingany individual element in a molecule or of obtaining a multi-element profile.
It was possible to determine the approximate elemental composition at thelow-ng level for molecules containing up to seven different elements.
The GC-AED technique shows potential as a sensitive, element-selective detector, applicable to th~ analysis of pesticides and many other organic and organometallic molecules. Additional work is in progress to evaluate the system for quantitativeanalysis and for residue analysis using a variety of pesticides doped into various fruitsand vegetables. Methods for obtaining more accurate empirical formulas are alsobeing investigated.
ACKNOWLEDGEMENT
The authors wish to thank Bruce Quimby for providing the data shown inTable I and for helpful discussions.

142
REFERENCES
P. L. WYLIE, R. OGUCHI
Method 505: Analysis of Organohalide Pesticides and Arochlors in Drinking Water by Microextractionand Gas Chromatography, Physical and Chemical Methods Branch, Environmental Monitoring andSupport Laboratory, U.S. Environmental Protection Agency, Cincinnati, OH, September 1986.
2 Method 608: Organochlorine Pesticides and PCBs, Fed. Reg., 49, No. 209, October 26 (1984) 89.3 Test Methods For Evaluating Solid Waste, Vol. 1B, Laboratory.Manual, Physical/Chemical Methods,
SW 846, U.S. Environmental Protection Agency, Office of Solid Waste and Emergency Response,Washington, DC, 3rd ed., November 1986.
4 Method 507: Determination ofNitrogen- and Phosphorus-Containing Pesticides in Ground Water by GasChromatography with a Nitrogen-Pho!>phorus Detector, Physical and Chemical Methods Branch, Environmental Monitoring and Support Laboratory, US. Environmental Protection Agency, Cincinnati,OH, September 1986.
5 Method 508: Determination ()fChlorinated Pesticides in Ground Water by Gas Chromatography with anElectron Capture Detector, Physical and Chemical Methods Branch, Environmental Monitoring andSupport Laboratory, U.S. Environmental Protection Agency, Cincinnati, OH, September 1986.
6 Method 515: Determination ()lChlorinatedHerbicides in Drinking Water, Physical and Chemical Methods Branch, Environmental Monitoring and Support Laboratory, U.S. Environmental ProtectionAgency, Cincinnati, OH, September 1986.
7 L. D. Sawyer, J. Assoc. Off. Anal. Chem., 68 (1985) 64.8 M. A. Luke and G. M. Doose, Bull. Environ. Contam. Toxicol., 30 (1983) 110.9 Multi-Residue Pesticide Screens, California Department of Food and Agriculture, Chemistry Lab
oratory Services Branch, Pesticide Residue Laboratories, Sacramento, CA, December 14, 1987.10 C. R. Worthing and S. B. Walker (Editors), The Pesticide Manual: A World Compendium, Thc British
Crop Protection Council, Thornton Heath, 8th ed., 1987.II L. Ebdon, S. Hill and R. W. Ward, Analyst (London), III (1986) 1113.12 P. C. Uden, Chromatogr. Forum, Nov./Dec. (1986) 17.13 J. P. Matousek, B. J. Orr and M. Selby, Prog. Anal. Atom. Spectrosc., 7 (1984) 275.14 M. A. Eckhoff, T. H. Ridgway and J. A. Caruso, Anal. Chem., 55 (1983) 1004.15 T. Hanie, S. Coulombe, M. Moisan and 1. Hubert, in R. M. Barnes (Editor), Developments in Atomic
Plasma Spectrochemical Analysis, Heyden, London, 1981, pp. 337-344.16 Y. Talmi and D. T. Bostick, Anal. Chem., 47 (1975) 2145.17 D. L. Haas and J. A. Caruso, Anal. Chem., 57 (1985) 846.18 K. E. Markides, R. J. Skelton, Jr., P. B. Farnsworth, M. L. Lee and F. J. Yang, in P. Sandra (Editor),
Proceedings ()f the 8th International Symposium on Capillary Chromatography, May 1987, Huethig,Heidelberg, 1987, pp. 921-933.
19 B. D. Quimby and J. J. Sullivan, Anal. Chem., 62 (1990) 102720 J. 1. Sullivan and B. D. Quimby, Anal. Chem., 62 (1990) 1034.21 P. L. Wylie and B. D. Quimby, J. High Resolut. Chromatogr. Chromatogr. Commun., 12 (1989) 813.22 J. J. Sullivan and B. D. Quimby, J. High Resolut. Chromatogr. Chromatogr. Commun., 12 (1989) 282.23 R. L. Firor, Am. Lab.. (Shelton, Conn.), May (1989) 40.24 H. M. Widmer, Chimia, 43.0989) 18.25 P. C. Uden, K. J. Slatkavitz, R. M. Barnes and R. L. Deming, Anal. Chim. Acta., 180 (1986) 401.26 K. J. Slatkavitz, P. C. Uden, L. D. Hoey and R. M. Barnes, J. Chromatogr:, 302 (1984) 277.27 Tolerances and Exemptionsfrom Tolerancesfor Pesticide Chemicals in or on Raw Agricultural Commod
ities, Code of Federal Regulations 40, part 180, revised July 1,1987, pp. 245--415.

Journal of Chromatography, 517 (1990) 143-159Elsevier Science Publishers B.V., Amsterdam
CHROMSYMP. 1970
Turbulent flow in capillary gas chromatography evaluation of a theoretical concept by Golay
A. J. VAN ES, J. A. RIJKS and C. A. CRAMERS*
Eindhoven University of Technology, Laboratory of Instrumental Analysis, P.O. Box 513, 5600 MB Eindhoven (The Netherlands)
with appendix by
M. J. E. GOLAY"
Perkin-Elmer Corporation, Norwalk, CT 06859 (U.S.A.)
ABSTRACT
Early in 1989, the late Marcel Golay derived a theory for turbulent flow capillary gas chromatography, He assumed that the flow pattern under turbulent conditions consists of a turbulent core separated from the tube wall by a very thin laminarflow layer. Further, it was assumed that the viscosity and the diffusion constant areuniform within the turbulent core. The core radius is a fraction p of the tube radius;the core viscosity is m times the laminar flow viscosity and the core diffusivity isassumed to be d times the laminar flow diffusion constant. Values for p, m and dhaveto be calculated from experimental data; p, m and d are essentially functions ofReynolds number (Re).
Using experimental data obtained in the laboratory, Golay's plate-height theory was evaluated for turbulent flow gas chromatography. In this verification an empirical relationship was used for the average turbulent diffusion constant as a function of Reynolds number and an empirical relationship for the thickness of thelaminar sublayer. Further, it was assumed that m = d (Reynolds' analogy). Theexperiments and theory agree fairly well at Re = 6200; at lower and higher values ofRe the agreement is much poorer. The disagreement may be due to the empiricalrelationships used or to the postulations in the theory: Golay assumed a discontinuous change from laminar to turbulent viscosity and diffusion constants. In engineering literature often a gradual change in properties from the laminar sublayer to theturbulent and in the turbulent core is assumed.
" Author deceased.
0021-9673/90/$03.50 © 1990 Elsevier Science Publishers B.V.

144
INTRODUCTION
A. J. VAN ES et al.
An efficient way to increase the speed of analysis in capillary gas chromatography (GC) is to reduce the column diameter!. However, minimization of the columndiameter is limited by the drastic reduction in the working range. With present stateof-the-art detectors this point is reached at a column diameter of about 10 !lm.
The foregoing approach lowers the contribution of the velocity profile (emterm) to the chromatographic dispersion. In addition to a reduction in column diameter, this contribution can also be lowered by changing the velocity profile.
A possible way is to coil the column into a helix, which induces a secondaryflow. This effect has been extensively described by Tijssen 2 and Tijssen et al. 3 for GCand LC. Another way is to create turbulent flow. With turbulent flow the velocityprofile is largely flattened, thus decreasing flow inequalities. Further, the effectivediffusion coefficient is considerably increased by convective contributions. As a consequence, peak broadening arising in the mobile phase as a result of the velocityprofile is expected to be substantially reduced. In a recent paper4
, we described aninstrumental set-up that permits the study of turbulent flow capillary Gc. The experimental instrumentation included previously developed sample introduction, detection and recording systems compatible with peak widths in the millisecond range 5,6.
Existing theoretical models7-9 were evaluated experimentally. Only the Tijssenand Wittebrood theory9 gave acceptable agreement with the experimental plateheights at various capacity factors. For unretained components reduced plate heights,h < 1, were obtained at an average linear velocity of 15 mjs for column diameters of320 !lm. For a capacity factor k = I the reduced plate height increased by a factor of15. Therefore, it was concluded that the gain in speed of analysis by turbulent GC islimited to solutes with low capacity factors.
During these experiments, we asked M.J.E. Golay, former Extraordinary Professor in our laboratory, for expert advice concerning the several contradictionarytheories on turbulent chromatography. He immediately became extremely interestedin the subject. During the last months of his life he visited our laboratory several timesand he derived a theory for turbulent dispersion in capillary Gc. His manuscript"Calculations Relative to Turbulent Capillary Gas Chromatography" was meant toconstitute his opening lecture at the 10th International Meeting on Capillary Chromatography in Riva del Garda, Italy, in May 1989. We were shocked by the messageof his sudden death in his native country of Switzerland during the night of April28-29, 1989. As a tribute to the great scientist Marcel Golay, inventor of capillarychromatography, we evaluate his postulates in this paper.
THEORY
In 1989, Golay derived a theory for turbulent dispersion in capillary GC ID inorder to explain the experimental results to be presented in the following Experimental section. He extended the theory of Tijssen and Wittebrood 9 towards generalsth power velocity profile:
(1)

TURBULENT FLOW IN CAPILLARY GC 145
where u is the velocity as a function of the radial coordinate and ro is the columnradius.
This velocity profile has proved to be a good approximation for turbulent flow,where s changes from 5 to 10 for Reynolds numbers (Re) in the range 3000 < Re <105 . For turbulent dispersion this finally leads to
r~ 4 + (4s + l6)k + (S2 + lOs + 20)k2C = - .------'---------'------'-----:;---'---
m Do 4(s + 4)(2s + 4) (1 + k)2(2)
For a parabolic velocity profile (s = 2), eqn. 2 reduces to the well known em term inthe Golay-Giddings plate-height equation. For s= 10, eqn. 2 gives the same result asthat derived by Tijssen and Wittebrood9
.
Later, Golay extended the theory in order to account for the laminar sublayeralong the column wall. His original text, written in April 1989 (ref. 11), is given here inthe Appendix.
The calculations are based on the assumption that the flow pattern under turbulent conditions consists of a turbulent core separated from the tube wall by a thinlaminar flow layer (Fig. 1). It is also assumed that the diffusion constant and viscosityare uniform within the turbulent core. Data for the following variables have to beentered in the resulting equations:
(1) the core radius rt as a function of the tube radius ro:
rt = pro; p < 1;
(2) the core viscosity Ilt as a function of the known laminar flow viscosity 110:
Ilt = milo ; m > 1;
(3) the core diffusivity Dt as a function of the known laminar flow diffusionconstant Do:
D t = dDo ; d > 1.
Implied is also the postulate that p, m and d are essentially functions of the Reynolds
TURBULENT CORE
LAMINAR SUB LAYEA Do J-Lo
0t • dO o d> 1J-Lt=mJ-Lo m>1
Fig. I. Postulates made by Golay in his description of turbulent flow capillary Gc.

146 A. J. VAN ES el at.
number. Fortunately, Re is invariant within the tube as we pass from the high-pressure inlet side to the low-pressure outlet side.
IfPi and Po are the inlet and outlet pressures, respectively, the gas velocity u inthe laminar flow region at a distance r from the tube center (r> rt) is given by
p2 2i-Po ( 2 2)
U = ro - r8poJ.loL
The velocity within the turbulent core is given by
P2 _ p2(r2 _ r2 r2 _ r2)u = I o_O__t + _1__
8poL J.lo J.lt
(3)
(4)
The velocity profile is depicted schematically in Fig. 2.Finally the plate height for turbulent dispersion can be written als follows 11 :
The turbulent core:
2dD p2 U Jr2(r:x 2p4 r:x p6 p8 )H1
= 0 +~ _1 1_+ __
Uo dD o 4 3m 8m2
where
I0.50
0.40
0.30
::J
0.20
0.10
0.00-1.00 -0.60 -0.20 0.20
rlr 0 )
Fig. 2. Turbulent velocity profile. m = d = 10; P = rtlro = 0.8.
0.60 1.00
(5)
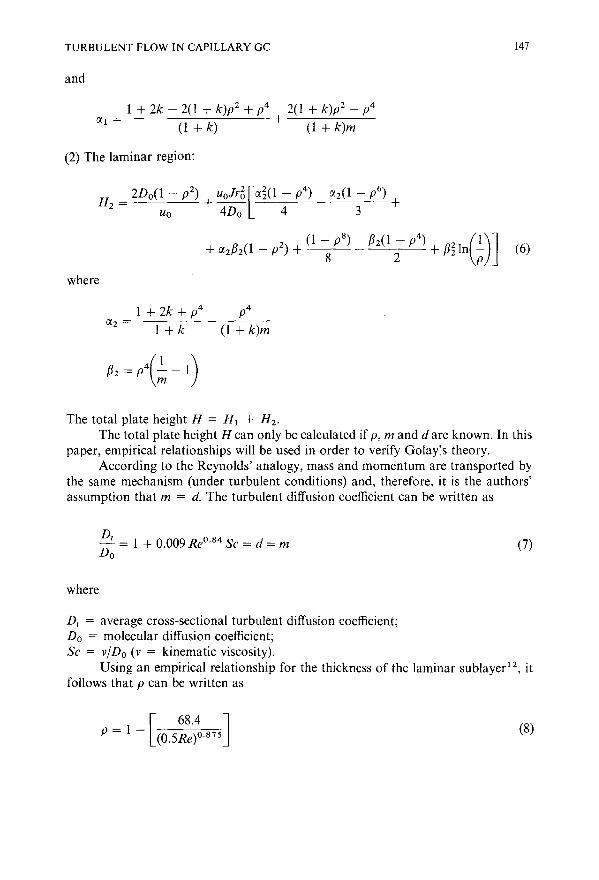
TURBULENT FLOW IN CAPILLARY GC
and
I + 2k - 2(1 + k)pZ + p4 2(1 + k)pZ _ p4!Xl = (1 + k) + (1 + k)m
(2) The laminar region:
147
where
I + 2k + p4!Xz = I + k (1 + k)m
The total plate height H = HI + Hz.The total plate height H can only be calculated if p, m and d are known. In this
paper, empirical relationships will be used in order to verify Golay's theory.According to the Reynolds' analogy, mass and momentum are transported by
the same mechanism (under turbulent conditions) and, therefore, it is the authors'assumption that m = d. The turbulent diffusion coefficient can be written as
where
~~ = I + 0.009 ReO. 84 Sc = d = m (7)
Dr = average cross-sectional turbulent diffusion coefficient;Do = molecular diffusion coefficient;Sc = vlDo (v = kinematic viscosity).
Using an empirical relationship for the thickness of the laminar sublayer12 , itfollows that p can be written as
[68.4 ]
p = I - (0.5Re)O.875 (8)

148 A. J. VAN ES et al.
A computer program based on eqns. 5-8 was used to calculate the plate height as afunction of the Reynolds number.
Under Results and Discussion, the results will be compared with experimentallydetermined plate heights.
EXPERIMENTAL
Experiments under turbulent flow conditions4 were performed with fused-silicacolumns of I.D. 320 flm, lengths ranging from 25 to 5m and a stationary phase filmthickness of 0.12 flm (CP SIL 5-CB; Chrompack, Middelburg, The Netherlands).
The sample introduction system consists of a pneumatically actuated Valcofour-port valve (VICr AG; Valco, Schenkon, Switzerland) with an internal rotor (6nl), which allows input band widths as low as I ms. The valve is mounted on top of aCarlo Erba (Milan, Italy) Model 4/60 gas chromatograph. The carrier gas (nitrogen)pressure was controlled with a Tescom (MN, U.S.A.) Model 44-1100 high-pressureregulator (up to 100 bar). A flame ionization detector could not be used as the flamewas extinguished by the large carrier gas flow-rates. Therefore, a low-cell-volume (40fll) photoionization detector (HNU Systems, Newton, MA, U.S.A.) was usedthroughout. The amplifier was modified to lower the time constant to about 2 ms.
Considering the high column flow-rates involved (> II/min), peak broadeningdue to the cell volume will be extremely small. As ordinary chart-speed recorders arefar too slow, chromatograms were recorded on a Model 3091 digital storage oscilloscope (Nicolet, Madison, WI, U.S.A.), capable of sampling at a maximum rate of IMHz.
RESULTS AND DISCUSSION
Using the theory of Golay (eqns. 5-8), which accounts for a laminar sublayer,the plate height could be calculated as a function of Re for various capacity factors.Under laminar conditions (p = I, m = I and d = I), it can be calculated that H l = 0and Hz is equal to the value predicted by the Golay-Giddings equation for laminarflow.
At Re = 6200 the results of the Golay theory accouting for a laminar sublayerare compared with the measured plate height as a function of k in Fig. 3. A very goodfit is obtained. However, just as in the other theories9 and Golay using an sth powerflow profile (eqn. 2), the fit becomes poorer at different Re numbers (see Table I). Thereason is probably that in reality there is a gradual change of diffusion coefficient andviscosity from the laminar sublayer to the turbulent core. The theory assumes adiscontinuous change from a molecular diffusion coefficient and viscosity to a turbulent diffusion coefficient and viscosity. More accurate diffusion and viscosity profileshave to be used. Another reason might be the empirical relationships used for p, mand d.
It should be noted that so far, the resistance to mass transfer in the stationaryphase has been neglected. Considering the high carrier gas velocities involved (up to15 m/s), the reliability of this assumption must be verified. The resistance to masstransfer in the stationary phase is not affected by the flow profile in the mobilephases.13
. Assuming a liquid diffusion coefficient D1 ~ 10- 5 cmZ/s (ref. 13), k = I

TURBULENT FLOW IN CAPILLARY GC
l 120
100 B
II1)u 80 0~
60.r:.
400':
rr20 /
/
/
00 2 3
) K
4 5
149
Fig. 3. Turbulent dispersion (reduced plate height, h) versus capacity factor (Re = 6200). 0 = Experimental; A = measured according to the theory of Golay for an sth power flow profile; B = measuredaccording to the theory of Golay accounting for a laminar sublayer.
TABLE I
REDUCED PLATE HEIGHTS, h
Calculated h11 Measured h
Re k=O k=1 k=O k=1
3000 1.2 42 7 636200 0.5 44 2.6 38
10 000 0.3 46 I 22
and u = 15 mjs (Re = 104), the reduced plate height of the resistance to mass transfer
in the stationary phase is calculated to be hs = 0.22. This may be considered negligible with respect to the foregoing results.
APPENDIX
Calculations relative to turbulent capillary gas chromatographya
M. J. E. GOLAY
Perkin-Elmer Corporation, Norwalk, CT 06859 (U.S.A.)
a This manuscript was compiled by Dr. Golay during the first week of April 1989, with the intentionthat, after some experiments and calculations, he would present it at the 10th International Symposium onCapillwT Chromatography, May 22-25, 1989, in Riva del Garda. His sudden death during the night ofApril 28-29, 1989, prevented the fulfillment of these plans.

150 A. J. VAN ES et al.
We base these calculations on the assumption that the flow pattern under turbulent conditions consists of a turbulent core separated from the tube wall by a verythin laminar flow layer. We assume that the diffusion constant and viscosity withinthe turbulent core are uniform, and our essential task will be to calculate from experimental data:
(I) the core radius, r" as a fraction of the tube radius, ro:
r, = pro; p < I;
(2) the core viscosity, f.l" as a function of the known laminar flow viscosity, f.lo:
f.l, = mf.lo ; m > I;
(3) the core diffusivity, D" as a function of the known laminar flow diffusion constant,Do:
D, = d Do ; d > 1.
Implied is also the postulate that p, m and d are essentially functions of theReynolds number, Re; fortuitously, the Reynolds number is an invariant within thetube as we pass from the high-pressure inlet side to the low-pressure outlet side.
We shall assume that the resistance to mass transfer in the fixed phase, the term,
in eqn. 22a in a previous paper14 is negligible, although it will be included in themathematical derivations.
The pattern of the calculations will be to obtain three equations from which tocalculate p, m and d under identical flow conditions (inclusion of the mass transferterm would require a fourth equation):
(I) the flow resistance equation;(2) an equation connecting the observed HETP, ho, with the postulated p, m and dinthe absence of retention (k = 0);(3) another equation connecting the observed HETP with p, m and d in the presenceof some nominal retention, e.g., k = 1.
The checks of the calculation should be:
(I) under the same flow conditions predict and verify h for different retentions, k;(2) under various flow conditions observe the variations of p, m and d as functions ofRe.

TURBULENT FLOW IN CAPILLARY GC 151
The flow resistance equationThe average carrier gas velocity, in cm s-1, in a tube of length L, in cm, for the
case of laminar flow, is given by
2 2Pi - Po. 2
Uo = ro16pof.1L
where Pi and Po are the inlet and outlet pressure and f.1 is the molecular dynamicviscosity, in poise (g cm - 1 S-1).
In the case of turbulent flow, designating rt = pro, the radius of the turbulentcore, the gas velocity in a point in the thin laminar flow region, at a distance r fromthe tube centre (r> rt) will be given by
2 2Pi - Po ( 2 2)U= ro - r
8pof.1L
and the velocity within the turbulent core will be given by
The average velocity will be given by
and the total flow will be given by
(AI)
(A2)
(A3)
(A3a)
(A3b)
As velocities, flows and the HETP (h) can be fairly accurately determined,whereas, Pi. Po and u cannot, the experimental procedure should consist in taking atube of much greater length, sL, where s~ 1, and, applying the same pressure differential across it, determine the velocity and flow, which are given by
(p 2 2) 4F . i-Po ro
L=TC16Pof.1sL
(A3c)
(A3d)
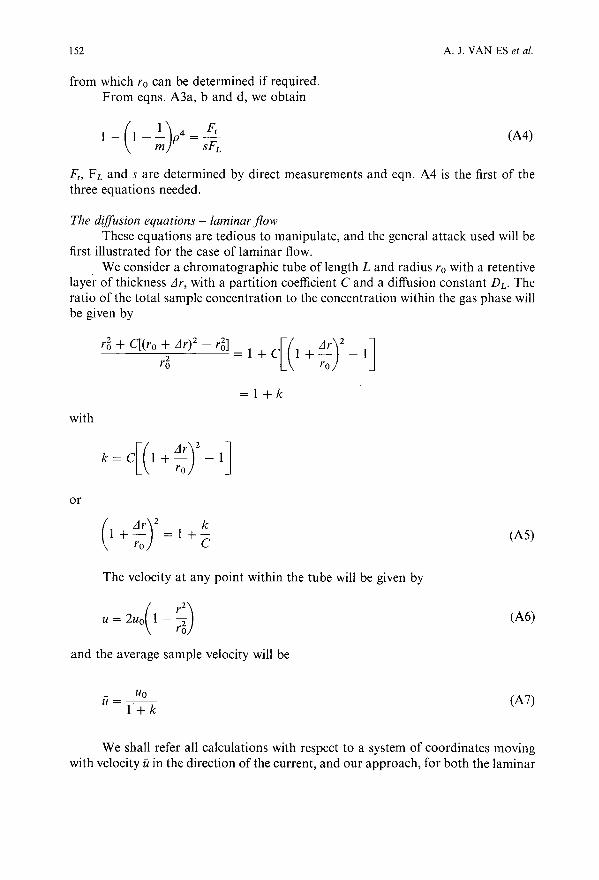
152
from which ro can be determined if required.From eqns. A3a, band d, we obtain
( 1) 4 Ft1- 1-- p =-m sFL
A. J. VAN ES et al.
(A4)
Ft , FLand s are determined by direct measurements and eqn. A4 is the first of thethree equations needed.
The diffusion equations - laminar flowThese equations are tedious to manipulate, and the general attack used will be
first illustrated for the case of laminar flow.We consider a chromatographic tube of length L and radius ro with a retentive
layer of thickness ,1r, with a partition coefficient C and a diffusion constant DL . Theratio of the total sample concentration to the concentration within the gas phase willbe given by
r6 + C[(ro + ,1r)2 - r6] [( ,1r)2 ]----"-'---=-2-'----= = 1 + C 1 + - - I
ro ro
=1+k
with
or
(,1r)2 k1+- =1+-ro C
The velocity at any point within the tube will be given by
and the average sample velocity will be
_ Uou=---
I+k
(A5)
(A6)
(A7)
We shall refer all calculations with respect to a system of coordinates movingwith velocity uin the direction of the current, and our approach, for both the laminar

TURBULENT FLOW IN CAPILLARY GC 153
and turbulent cases, will be to postulate a general sample concentration of the form
f = _1 ex [_ [x - e(r)FJjt p 4D't (AS)
and to apply to it the diffusion equation with the eventual aim of obtaining e(r). Thisequation is usually given in the form
D!J2j= dfdt
(A9)
which presupposes that D is a constant throughout. When D is not eqn. A9 shouldproperly be written as
D!J2f + grad D x gradf = df/dt (A9a)
but if D is constant within certain given zones, we may still use eqn. A9 within eachzone, while introducing the boundary condition that at the interfaces of zones I andII, e.g., we should have
(A9b)
where D and D 1 designate the respective diffusion constants of the two zones, Sissome coordinate normal to the zones interface and c designates the ratio of concentrations which are in equilibrium across the interface.
The application of eqn. A9 to eqn. AS yields one expression without x - e(r)and one with it. The first is, after eliminating common coefficients,
(A 10)
and the second is
(All)
In the first expression, the dimensionless (de/dr)2 represents a kind of entropyincrease, and is therefore an extensive quantity which, with unity added, should beintegrated throughout the tube cross-section and weighted everywhere by the appropriate diffusion times the partition coefficient when the latter differs from unity. Theoverall result, divided by the total effective tube cross-section, rgO + k) (n is omittedin practice), yields the desired value of D' when the flow has proceeded for somedistance so that f has became substantially a Gaussian distribution for all r values.

154 A. J. VAN ES el al.
The value of de/dr is obtained from the solutions of eqn. All, which are
e(r) = - (1/D)L1- 2(U - uo)
for the free"flowing zone, and
e(r) = (1/DdL1- 2u
(AI2)
(A12a)
for the fixed zone.The values of de/dr obtained from this operation are, for the free-flowing inner
part of the tube,
de _ Uo (1 + 2k . r3
)-- -- -- r-~
dr 2D 1 + k r6
and for the fixed phase of thickness L1r,
de = Uo [r _ r6(1 + k/C)]dr 2(1 + k) r
(AI3)
(A13a)
It can be readily verified that these expressions satisfy eqns. Al2 and A12a, respectively, in addition to the boundary condition of eqn. A9b, at the interface. Further,eqn. A13a satisfies the condition de/dr = 0 at the end of the fixed phase zone, where r= ro + L1r, which results from the proper choice of uas given by eqn. A7.
Integration of (de/dr)2 in the free-flowing zone yields a first contribution L1Di toD';
, __1_[ u6r6. 1 + 6k + Ilk2
]
L1D, - 1 + k D + D 48(1 + k)2(A14)
Integration and weighting of (de/dr)2 in the stationary phase yields a second contribution, L1Di,:
(A14a)
When k/C ~ 1, In(1 + k/C) can be replaced by the first three terms of its developmentand we obtain
(AI4b)

TURBULENT FLOW IN CAPILLARY GC 155
The parentheses in eqns. AI4 and AI4b correspond exactly to the parentheses on theleft-hand side of eqn. 22a in a previous paper14
, except for the limitation k/C ~ I,which was not included at that time.
The diffusion equation -turbulent flowFor the discussion of this case we adopt again the flow distribution of eqn. A8
and set about determining de(r)/dr for the three zones:Zone I, the turbulent core, of radius r, = pro, with viscosity /ll = mIl and
diffusivity D, = dD;Zone II, the thin laminar layer next to the tube wall;Zone III, the stationary phase, of thickness Llr, diffusivity Db and with a con
centration c times greater than in the free-flowing zones I and II.. The diffusion equations governing the concentration behaviour in these three
zones can be solved as formerly and we obtain the following:for Zone I, for r < rl :
e = (I/D,)Ll- Z (u - it)
from which
de = _ Pf - P~ [(I +2k)rti - 2(1 + k)r"6r~ + ri. r +drl 32poD,Lr"6 (1 + k)/l
+ 2(1 + k)r"6r~r - rir - (1 + k)r"6r3](1 + k)/l,
Observing the boundary condition:
(AI5)
Dlde/drD = D(de/drn)
we find for Zone II, for rl< r< ro :
e = - (I/D)Ll- Z (u - u)
from which
And observing the boundary condition expressed by eqn. A9b, we find for the stationary zone:
ro<r<ro + r:
(1 + k/C)rg - (1 + k/C)r"6ri _ I + k/C] (AI7)(1 + k)W J1rY

156 A. J. VAN ES et al.
As can be verified by inspection, the expressions given for de/dr in eqns. A15,AI6 and AI? satisfy the three diffusion equations in their respective zones, plus thetwo boundary conditions at the I-II and II-III interfaces, plus the end condition:
at r = ro + Jr: (de/drIll) = 0
the latter begin secured by our proper choice of u.When calculating the contributions of Zone I to D', we first set r = rox and
rewrite eqn. A15:
de = _ (P; - p;)r6 [(I + 2k - 2(1 + k)p2 + p4 + 2(1 + k)p2 - p4)X _ x3Jdr 32porLdD (1 + k) (1 + k)m m
or, with eqn. A3c, and denoting by 0::1 the coefficient of x within the brackets:
I + 2k - 2(1 + k)p2 + p4 2(1 + k)p2 _ p40::1 = (1 + k) + (1 + k)m
(AI5a)
We calculate the contribution of Zone I to D' by applying
D' = DI [1 + (de/dr)2
to eqn. A15a, to obtainr,
JDi = r~fdD[1 + G;)]rdro
__2_ [ . p2 s2u~r~ ( 2p2 _ 0:: 1p6 L)J- I + k dD 2 + 4dD 0::1 4 3m + 8m2 (AI8)
We now do likewise for Zone II and, setting again r = rox, we rewrite eqn. A16:
de (P; - p;)r6 [(I + 2k + p4 p4) 3 p4( I)Jdrn = - 32poJ..lLD I + k - (1 + k)m x - x +~ - I + -;

TURBULENT FLOW IN CAPILLARY GC 157
or, with eqn. A3c, and denoting by a2 and f32 the respective coefficients of x and l/xwithin the brackets:
de SUtrO 3- = - -[a2x - x + f32(1/x)]dXII 2D
(A16a)
We now calculate the contribution of Zone II to D' by applying eqn. AlO toeqn. A16a to obtain:
~ L
I 2f [(de)2J 2 [1 - p2 s2u~r6 ~( 3 f32)2 JLlDII = ri D 1 + dr rdr = 1 + k' D -2- + 4D2 Ya2 X - x +~ xdx
~ 0
= _2_{D. l - p2 + S2Utr6[aW _ p4)_1 + k 2 4D 4
a2(l; p6) + a2f3il _ p2) + 1 ~p8 _ f32(1; p4) + f3~ln(lIP)J} (A19)
Theoretically we should determine the contribution of Zone III to D', whichwill give us a term containing eD l in its denominator, but this would imply that thisterm is not negligible and constitutes a fourth parameter to be added to m, p and d, sothat four equations would be required to determine all four parameters. This, however, implies the difficulty of using two columns in which the same sample has different k values but the same C2D 1 term. At present it would appear more expeditious tomake the measurements with columns having a negligible mass transfer term. Thuswe would have only the difficulty of finding two columns which, for the same sample(to ensure that Dt for k = 0 is the same for both experiments) have appreciable kvalues but negligibly small terms containing l/(C2Dd. In conclusion, we form D'from the two contributions:
LID; + LID;, = D' (A20)
We measure D' experimentally and set the values found as equal to the quantitiescalculated from the known UJ, ro and S and from the unknown m, p and d and, addingthese two equations derived from the cases k = 0, for exampe, and k = k (a known k)to the flow equation, determine the three unknown quantities just said.
SYMBOLS
c Ratio of concentrations in two zonesC Partition coefficientd Factor relating core diffusivity (D t) to laminar flow diffusion constant (Do)
(d> 1)

158
m
PiPor
ror t
LlrResSt
U
Uo
U
Uj
0(1. 0(2
/32eIlIltIloP
A. J. VAN ES et al.
Diffusion constantDiffusion constant in the stationary phaseCore diffusivityLaminar flow diffusion constantSample concentration functionTotal flowFlow through a tubeHeight equivalent to a theoretical plate (HETP) in generalObserved HETPCapacity factor (retention factor)Tube lengthFactor relating core viscosity (Ilt) to laminar flow viscosity (Il) (m> I)Inlet pressureOutlet pressureDistance from the tube centre (r > rt)
Tube radiusCore radiusThickness of retentive layer (liquid-phase film thickness)Reynolds numberFactor increasing tube length (s ~ 1)A coordinate related to the interface of zonesTimeCarrier gas velocityAverage carrier gas velocityAverage sample velocityVelocity in a tubeCoefficientsCoefficientA factorMolecular dynamic viscosityCore viscosityLaminar flow viscosityFactor relating core radius (rt ) to tube radius (ro) (p < I)
REFERENCES
1 C. A. Cramers and P. A. Leclerq, CRC Crit. Rev. Anal. Chel11., 20 (1988) 1172 R. Tijssen, Sep. Sci., 13 (1978) 681.3 R. Tijssen, N. van den Hoed and M. Kreveld, Anal. Chel11. 59 (1987) 1007.4 A. van Es, J. Rijks and C. Cramers. 1. Chrol11atogr., 477 (1989) 39.5 A. van Es, J. Janssen, C. Cramers and J. Rijks, J. High Resolut. Chrol11atogr. Chrol11atogr. COl11mull., 11
(1988) 852.6 A. van Es, J. Janssen, R. Bally, C. Cramers and J. Rijks, J. High Resolut. Chromatogr. Chrol11atogr.
COl11mun., 10 (1989) 273.7 V. Pretorius and T. Smuts, Anal. Chel11., 38 (1966) 274.8 M. Martin and G. Guiochon, Anal. Chel11., 54 (1982) 159.9 R. Tijssen and R. T. Wittebrood, Chromatographia, 5 (1972) 286.
10 M. J. E. Golay, personal communication.

TURBULENT FLOW IN CAPILLARY GC 159
Il M. J. E. Golay, unpublished paper (see Appendix).12 R. Bird, W. Stewart and E. Lightfoot, Transport Phenomena, Wiley, New York, 1960.13 C. A. Cramers, C. van Tilburg, C. Schutjes, J. Rijks, G. Rutten and R. de Nijs, in P. Sandra (Editor),
Proceedings of the 5th International Symposium on Capillary Chromatography, Riva del Garda, Huethig,Heidelberg, 1983, p. 76.
l4 M. J. E. Golay, in D. H. Desty (Editor), Gas Chromatography 1958, Butterworths, London, 1958, pp.36--55.


Journal oj Chromatography, 517 (1990) 161-173Elsevier Science Publishers RV.. Amsterdam
CHROMSYMP. 1993
Use of chromatographic models for computerizedoptimization of coupling-point pressure in dual-column gaschromatography
T. HEVESI and J. KRUPCIK*
Department ojAnalytical Chemistry, Faculty oj Chemical Technology, Slovak Technical University, Radlinskeho 9, 812 37 Bratislava (Czechoslovakia)
and
P. SANDRA
Laboratory oj Organic Chemistry, UniversityojGhent, Krijgslaan, 281 (S4), B-9000 Ghent (Bel[?ium)
ABSTRACT
A novel computer-assisted procedure is presented for optimization of the coupling-point pressure (Pm) of a column for the gas chromatographic separation ofmulti-component samples on two capillary columns of fixed dimensions and stationary phase polarities operated at constant temperature with constant inlet (PD andoutlet (Po) pressures. The retention of all solutes in the system is monitored by thechromatographic model
where k is the capacity factor obtained on the polar column (A), the non-polarcolumn (B) and on the columns coupled in series (S) and XB is the weight factordetermined from column characteristics and carrier gas pressures (Pj, Pm and Po)' Theoptimization procedure is monitored by a dependence of the optimization criterion(Cp) against the column coupling-point pressure (Pm):
for both column series AB and BA. The optimization criterion is based on a numberof peaks resolved equal to or better than the required resolution factor (primary part)in the shortest analysis time (secondary part).
Comparison of the novel optimization procedure with those based on windowdiagrams shows that the new model is superior as it gives unambiguously the maximum number of peaks that can be resolved under the given conditions equal to orbetter than the required resolution in the shortest analysis time.
0021-9673/90/$03.50 © 1990 Elsevier Science Publishers B.V.

162
INTRODUCTION
T. HEVESI, J. KRUPCIK, P. SANDRA
It is well known that optimization of selectivity is the key to high-resolution gaschromatographyl-4. For directly coupled columns, a study of selectivity tuning byvariation of column length was performed by Purnell and co-workers5
-7
, withparticular emphasis on a correction for compressibility effects.
Selectivity optimization or tuning can be performed by coupling two columns offixed dimensions and different polarities in series l - 4 ,8-15. The overall polarity ofserially coupled columns can be adjusted as required by tuning the carrier gasflow-rates through the individual columns 2- 4 ,8,9,14,15, which was first proposed byDeans and Scott8
; by adjusting the temperatures (isothermal, programmed temperature or a combination) of both columns l - 4 ,10,ll,13.14 or by simultaneous tuning ofcarrier gas flow-rates and temperatures2
,14. If the selectivity of two coupled capillarycolumns is tuned, all solutes pass through both columns and no intermediate trappingis used. The two coupled columns act as a single column, the selectivity of which isa composite of the selectivities of the individual columns. Sandra et al. 2 have describedthe selectivity tuning of two directly coupled capillary columns. They stated thata OV-I-PEG 20M tandem is less polar than a PEG 20M-OV-l tandem. The retentionis higher owing to gas compressibility effects in the polar column when this column isplaced first and thus a higher polarity is obtained2
. Equal polarities were obtained forPEG 20M-OV-I and OV-I-PEG 20M columns in series when the correspondingcarrier gas pressure drops were kept constant on changing the column order2 . Thus, ifthe gas flow-rates of each column can be adjusted independently, gas compressibilityeffects are avoided.
For the separation of a multi-component sample, Hinshaw and Ettre 3 ,4
proposed optimizing the overall selectivity of two columns coupled in series and placedin one oven by tuning the carrier gas flow-rates in the individual columns and/or theoven isothermal temperatures. An optimization procedure based on a chromatographic model and on window diagrams according to Laub and Purnell 12 was used.
Computer-assisted procedures for the adjustment of optimum selectivity bytuning the intermediate pressure 14,15 or temperatures13 ,14 for serially coupledcolumns placed in a separately heated dual oven system have been described 13-15. Theoptimization procedures were based on mathematical models in which the dependences of the retention indices of all solutes on the optimized parameters weredescribed by polynomial equations. New threshold criteria for the evaluation of thegas chromatographic (GC) separation of multi-component samples were advanced 15.
The aim of this paper is to introduce a computer-assisted procedure for theoptimization of selectivity by tuning the coupling-point pressure (Pm) of two capillarycolumns of different polarities (A and B) coupled in series (either AB or BA) andoperated at constant temperature. The optimization procedure is based on a chromatographic model which is evaluated by a threshold criterion, The validity of theoptimization procedure has been verified by the separation of a mixture of 33hydrocarbons and the new procedure is compared with the computer-assistedprocedure based on window diagrams.

OPTIMIZATION OF COUPLING-POINT PRESSURE IN GC
THEORY
163
It has been shown by Smuts et al. 16, Hinshaw and Ettre3 and Purnell and
Williams S, 7 that the capacity factor of a solute, separated in a system (S) consisting oftwo columns coupled in series (ki,s), can be calculated from the capacity factors of thissolute in the individual columns (ki,A and ki,B):
(1)
where XA and XB are weight factors calculated from the following equations 3,14:
(2)
and
(3)
hence
(4)
From eqns. 1-3 it follows that solute retention in columns in tandem (ki,s) can be tunedby changing both physical and thermodynamic parameters.
From eqns. 1-3, it is obvious that the capacity factor found for a solute incolumns in tandem does not depend on the column order. However, if two capillarycolumns of fixed lengths (LA, L B) and inner diameters (rA, rB) are coupled in series andoperated with constant inlet (Pi) and outlet pressures (Po), owing to the carrier gascompressibility different carrier gas flow-rates are established in both individualcolumns for column orders AB and BA.
If two columns of fixed dimensions are coupled in series, the ki,s value can betuned by changing parameters that influence the carrier gas flow-rates and capacityfactors in the individual columns. The carrier gas flow-rates in both individualcolumns can be tuned by changing the nature of the carrier gas and the inlet (Pi),column coupling-point (Pm) and outlet (Po) pressures and temperatures (TA , TB). Thecapacity factor of a solute in the individual columns of a fixed column series can beinfluenced only by temperature.
Kaiser et al. 9 and Hinshaw and Ettre3,4 have shown that the overall selectivity of
two capillary columns coupled in series can be effectively tuned by changing thecolumn coupling point pressure (Pm), keeping all other variables constant.
For an average carrier gas flow-rate (it) in a single capillary column operatedunder isothermal conditions, Guiochon 17 derived the following equation:
(5)

164 T. REVESI, J. KRUPCIK, P. SANDRA
where Ko is the column permeability, I] the dynamic viscosity of the carrier gas, L thecolumn length and Pi the inlet and Po the outlet pressures. The permeability ofa capillary column (Ko) can be calculated from the column radius (r) by17
(6)
Guiochonl7 and T6th and Garayll have shown that the average carrier gas flow-rates,calculated from eqns. 5 and 6, differ considerably from experimentally obtainedvalues. As the overall selectivity of columns coupled in series strongly depends on thecarrier gas flow-rates in the individual columns, these values should be knownprecisely. It was shown that solute retention in two columns in tandem can be predictedaccurately if the permeability of the individual columns is determined experimentallyinstead of by calculation 11,1 7.
From eqn. 5, it follows that the average carrier gas flow-rate increases withincrease in the driving force (P) and decrease in the resistance (R):
- Pu=-R
(7)
where P = (P? - p;)2/(Pr - p~) and R = 4I]L/3Ko . Substitution of ii = L/tM intoeqn. 7 gives
(8)
which can be substituted into eqns. 2 and 3 for calculation of XA:
(9)
(10)
PA/PBcan be written as
(P? _ p~)2(p~ _ p~)
(Pr - p~)(P~ - p;)2(11)
Eqn. 8 allows the resistance (RA and RB) to be determined from experimental data(P, tM, L). The values of XA and XB can be predicted for two columns in tandem at anyPA/PB ratio.
EXPERIM,ENTAL
Gas chromatographic instrumentationThe gas chromatographic system consisted of two independently controlled

OPTIMIZATION OF COUPLING-POINT PRESSURE IN GC 165
COLUMN A COlUMN B
Fig. I. Experimental set-up for a two column system with mid-point pressure tuning.
ovens (Fractovap 2350 and Fractovap 4180; Carlo Erba, Milan, Italy) interfaced witha separately heatad stainless-steel tube as described by Laub and Purnell 12
. The basicscheme of the column series polar column A (Nukol)-non-polar column B (PONA) inthe order AB is shown in Fig. 1. In this work both columns were placed in theFractovap 4180 GC oven as the oven temperature control is better than that with theFractovap 2350 GC oven.
A sample of hydrocarbons was injected into the first column by using an all-glassinlet stream splitter port mounted in the Fractovap 2350 instrument. Two flameionization detectors were used to monitor the solutes eluted from the first (FID 1 withthe Fractovap 4180) and second (FID 2 with the Fractovap 2350) columns. The list ofsample constituents with their capacity factors on individual columns is given in Table I.The inlet (Pi) and column coupling-point (Pm) pressures were controlled by a pressurecontroller with the Fractovap 2350 and Fractovap 4180 instruments, respectively.
The signals from FID 1 and FID 2 were recorded by an HP 3392 integrator(Hewlett-Packard, Palo Alto, CA, U.S.A.) and by a Chromatopac CR-3A computingintegrator (Shimadzu, Kyoto, Japan), respectively. Two T press-fit connectors, T 1 andT2 (MEGA, Milan, Italy), were used for coupling the columns with the pressurecontroller Pm and FID 1.
Capillary columns. Column A was a 60 m x 0.25 mm I.D. fused-silica capillarycolumn coated with a 0.25-,um film of Nukol stationary phase (Supeko, Bellefonte,PA, U.S.A.). Column B was a 50 m x 0.20 mm J.D. fused-silica capillary columncoated with a 0.5-,um film of immobilized polydimethylsiloxane (PONA) (HewlettPackard).
Operating conditionsHydrogen was used as the carrier gas with constant inlet (Pi = 320 kPa) and
outlet (Po ~ 101 kPa) pressures for the column orders AB and BA. The carrier gasflow-rates through the individual columns were changed by varying the intermediatepressure (for AB series from Pm = 250 to 290 kPa and for BA series from Pm = 210 to250 kPa) in steps of 10 kPa. Both columns were operated isothermally with anarbitrarily chosen temperature TA = TB = 70°C.
A sample ofhydrocarbons (Table I) was diluted with n-pentane to 0.03% (v/v) ofeach compound. A l-,ul volume was injected with a 10-,ul Hamilton syringe.

166 T. HEVESI, J. KRUpciK, P. SANDRA
TABLE I
CAPACITY FACTORS FOUND FOR SAMPLE COMPONENTS AT 70°C ON POLAR (k A ) ANDNON-POLAR (kn) FUSED-SILICA CAPILLARY COLUMNS BY CORRELATING k s AND XB
ACCORDING TO EQN. 17
Peak No. Compound k A k B
I 2,3,4-Trimethylpentane 0.151 1.8162 2,2,5-Trimethylhexane 0.138 2.3303 n-Octane 0.195 2.5934 2,3,5-Trimethylhexane 0.198 2.9865 2,4-Dimethylheptane 0.198 3.1406 4,4-Dimethylheptane 0.223 3.2167 3,5-Dimethylheptane 0.233 3.4978 3,3-Dimethylheptane 0.244 3.5459 2,3-Dimethylheptane 0.279 4.062
10 rx-3,4-Dimethylheptanea 0.298 4.148II f3-3,4~Dimethylheptanea 0.298 4.14812 3,4-Diethylheptane 0.406 4.75213 Isopropylbenzene 2.689 6.15214 n-Nonane 0.369 5.61115 4,4-Dimethyloctane 0.405 6.62916 n-Propylbenzene 3.369 7.63317 2,6-Dimethyloctane 0.423 7.34218 3,3-Dimethyloctane 0.455 7.41719 3,4-Diethylhexane 0.501 7.64920 2-Methyl-3-ethylhexane 0.480 7.76121 1,3,5-Trimethylbenzene 4.250 8.54522 1,2,4-Trimethylbenzene 5.395 10.21623 lerl. -Butylcydohexane 1.058 10.31924 1,2,3-Trimethylbenzene 7.608 12.37225 n-Decane 0.709 12.06626 sec.-Butylcydohexane 1.414 13.84727 1,3-Diethylbenzene 5.963 15.36828 n-Butylbenzene 6.307 16.03629 n-Butylcydohexane 1.365 14.67930 1,4-Diethylbenzene 6.389 16.16931 1,2-Diethylbenzene 7.226 16.61332 1,2-Dimethyl-4-ethylbenzene 8.641 18.98833 n-Undecane 1.377 25.644
a rx and f3 are diastereoisomers.
ComputationSoftware for the optimization procedure and also for the window method was
written in Turbo Pascal language for a Toshiba TllOO Plus IBM PC/XT-compatiblecomputer.
RESULTS AND DISCUSSION
The resistances of the individual columns (RA and RB) were determined at 70°Cby substituting the experimental data in eqn. 8. The results obtained were RA =
8.7 kPa min m- 1 (0" = 0.3 kPa min m- 1) for column A and RB = 7.8 kPa min m- 1
(0" = 0.6 kPa min ill - 1) for column B.

OPTIMIZATION OF COUPLING-POINT PRESSURE IN GC 167
1.0
~1 09
0.8
0.7
0.6
0.5
0.4
0.3
0.2
0.1
0.01.0 1.2 1.4
o
1.6 1.8 20 2.2 2.4 2.6 2.8 3.0 3.2
- 5Pm, 10 PaFig. 2. Dependence of Xo on Pm, constructed for the column series AB using data calculated from eqn. 13.The circles correspond to data found for corresponding Pm values from eqn. 8.
The individual columns were then coupled in AB or BA series and operated at70°C with constant hydrogen inlet (Pi = 320 kPa) and outlet (Po ~ 101 kPa) pressures,changing the column coupling-point pressure for series AB from Pm = 250 to 290 kPaand for series BA from Pm = 210 to 250 kPa in steps of 10 kPa.
The dependence ofXB on Pm, constructed from the corresponding data calculatedwith eqn. 8 for the column series AB, is shown in Fig. 2. The circles in Fig. 2 representvalues of XB found for Pm from eqn. 3 using gas hold-up times (tM,A and tM.B) measuredin the corresponding series using the signals from FID 1 and FID 2. The deviationsbetween the predicted and experimental XB values probably arise from the pooraccuracy and reproducibility of pressure tuning on the available pressure controllers.Similar results were obtained for the column series BA.
From the results obtained it follows that the changes in Pm in the chosenexperimental ranges lead to the changes in XB from 0.15 to 0.35 for column series ABand from 0.40 to 0.60 for column series BA. Deans and ScottS, Smuts et al. 16
, Kaiser etal. 9 and Hinshaw and Ettre3
,4 have shown that, if necessary, XB can be varied ina broader range both for AB and BA column series if another experimentalarrangement as shown in Fig. 1 is used. It should be noted, however, that the carriergas flow-rates (itA, us) are usually too far from the optimum values if XB is varied in toobroad a range.
A separation of sample components can be achieved by tuning the selectivity ofa column series if the sample is not too complex. In that case an optimum XB can befound for both AB and BA column series. If the sample is very complex, however, bothoptimum selectivity and maximum separation power are needed. In this eventa column order should be chosen that gives the highest separation power at theoptimum selectivity.
A combination of eqns. 1 and 4 leads to
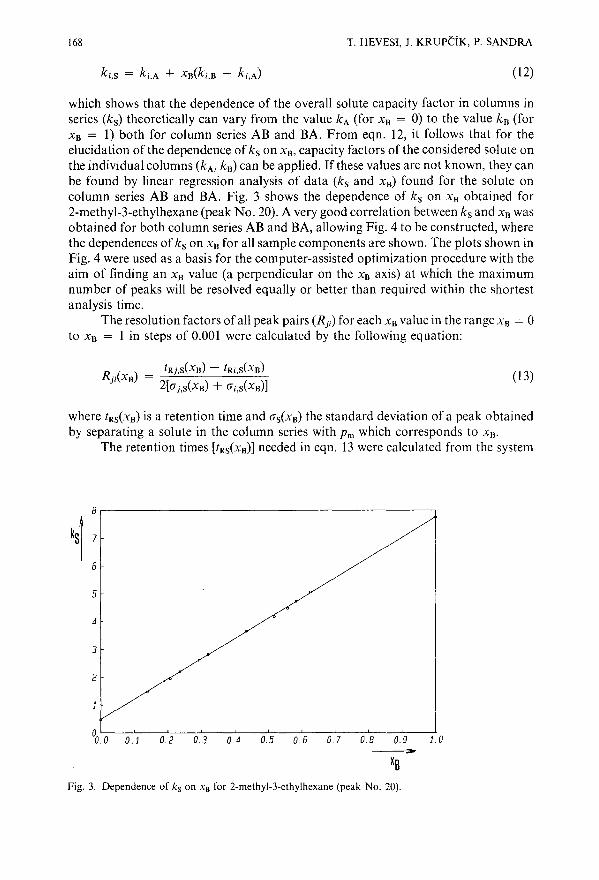
168 T. HEVESI, J. KRUPCIK, P. SANDRA
(12)
which shows that the dependence of the overall solute capacity factor in columns inseries (ks) theoretically can vary from the value kA (for XH = 0) to the value kH (forXH = 1) both for column series AB and BA. From eqn. 12, it follows that for theelucidation of the dependence of ks on XH, capacity factors of the considered solute onthe individual columns (kA , kH) can be applied. If these values are not known, they canbe found by linear regression analysis of data (ks and XH) found for the solute oncolumn series AB and BA. Fig. 3 shows the dependence of k s on XH obtained for2-methyl-3-ethylhexane (peak No. 20). A very good correlation between ks and XH wasobtained for both column series AB and BA, allowing Fig. 4 to be constructed, wherethe dependences of ks on XB for all sample components are shown. The plots shown inFig. 4 were used as a basis for the computer-assisted optimization procedure with theaim of finding an XH value (a perpendicular on the XH axis) at which the maximumnumber of peaks will be resolved equally or better than required within the shortestanalysis time.
The resolution factors of all peak pairs (Rji ) for each XH value in the range XH = 0to Xu = I in steps of 0.001 were calculated by the following equation:
(13)
where tRS(XB) is a retention time and (}S(XB) the standard deviation of a peak obtainedby separating a solute in the column series with Pm which corresponds to XH.
The retention times [tRS(XB)] needed in eqn. 13 were calculated from the system
8.-------------------------,
ksl'6
5
4
3
2
o. J 0.2 0.3 0.4 0.5 o 6 0.7 0.8 0.9 1.0
Fig. 3. Dependence of ks on XB for 2-methyl-3-ethylhexane (peak No. 20).

OPTIMIZAnON OF COUPLING-POINT PRESSURE IN GC
26,-------------------,33
124
~ 22
2032
18
169
0.2 0.4 0.6 0.8 1.0..
Fig. 4. Dependence of ks on CD for all sample constituents. For identification see Table 1.
capacity factors [kS(XB)] and gas hold-up times [tMS(XB)] from the equation
(14)
tM,S(XB) was calculated as the sum of tM,A(XB) and tM,B(XB) using eqn. 8.Correlating the standard deviations (ITs) of all peaks obtained from all
experiments in a system with the experimental variables (Pm, XB, tRS)' we found that thestandard deviation ofany peak in a chromatogram can be predicted from the followinglinear equation:
ITs = a + btRS (15)
where a and b are coefficients which, in the experimental Pm ranges given above, did notdepend on either XB or the column order.
From the resolution factors of all peak pairs calculated from eqn. 13 at each XBvalue, an optimization criterion Cp was determined from an equation alreadydescribed 14,15:
n
Cp = I mi + (lmax - tR,n)/tmax1
(16)

170 T. HEVESI, J. KRUPCjK, P. SANDRA
33 r--------------------------,
30
29
28
27
26
251. 4 1.5 1.6 1.7 1.8 1.9 2.0 2.1 2.2 2.3 2.4 2.5
"" 5Pm- 10 PaFig. 5. Dependence of the optimization criterion (Cp) on column coupling point pressure (Pm) obtained forcolumn series BA.
where n is the number of solutes in a sample, mi = I if R ji > Rji,req for j = i ± 1,otherwise mi = 0, tR,n is the retention time of the last-eluting peak and tmax is themaximum acceptable analysis time, which is arbitrarily chosen so that tmax > tR,n' Inthis work Rji,req = 1.00 and tmax = 120 min were chosen for both column series, Theretention time of the last peak was read from the retention times calculated by eqn. 14for all XB values.
As in this work Pm was an independently variable parameter, for practicalreasons Pm was used instead of XB in the final computer-assisted optimizationprocedures. Moreover, as follows from eqns. 13 and 14 and from Fig. 2, it is very easyto recalculate XB values to Pm values.
The dependence of the optimization criterion (Cp ) on the coloumn couplingpoint pressure is shown in Fig. 5 for column series BA. The dependence of Cp on Pm forcolumn series AB looks like a mirror image of Fig. 5, owing to the similar columnresistances and efficiencies. From these results it follows that 31 peaks can be resolvedequal to or better than Rji,req at different Pm values with both AB and BA columnorders. The second term on the right-hand side of eqn. 16 helps to localize the globaloptimum among the local optima, in order to choose a Pm value such that 31 peaks aresufficiently resolved within the shortest time. A maximum Cp thus corresponds to anoptimum Pm. Different Cp maxima are obtained for column orders AB and BA: themaximum Cp is localized in the Pm range 2.20 . 105~2.35 . 105 Pa for AB and of 1.95 .105-2.05 . 105 Pa for BA. Both optima are, however, flat and broad enough to allowthe Pm value to be reset in optimum pressure ranges as the set-up reproducibility of thepressure regulator built in the Fractovap 4180 instrument is ±2.5 . 103 Pa.
A window diagram 12 could be used as an alternative optimization procedure tolocalize the optimum Pm value. The basis of this is the construction of the dependences

OPTIMIZATION OF COUPLING-POINT PRESSURE IN GC
1.015,------------------------,
rLf f- -
1.012
k=l
171
- -1.009 - -
- -
- -1.006
-rn
-~-
- -
k=2= k=3- -k=4
- - -k==
1.003
/1/
/1. 0001. 4 1. 5 1.6 1.7 1.8 1.9 2.0 2.1 2.2
Fig. 6. Dependence of relative retentions (a) on column coupling-point pressure (Pm) obtained for columnseries SA (window diagram for SA column series).
of the relative retentions (!Xj;) of all peak pairs against the column coupling-pointpressure (Pm)' Relative retention can be calculated, e.g., from capacity factors (k):
1. 07 rr-------------------------,
1106
1.05
1. 04
1. 03
1. 02
1. 01
1 000l----'----'=2----'3,.---4"-----=-5---'=6---'7,.---8'----'--9--'-10------'11
k'SI.
(17)
Fig. 7. Relationship between critical relative retention (ad corresponding to Rji,,,q = 1.00 and capacityfactor of the first peak in a considered pair (k s,,) for both col umn series AS and BA.

172 T. HEVESI, J. KRUpcIK, P. SANDRA
Hence the window diagram could be drawn from the data taken from Fig. 4 as thedependence of exji against XB' As Pm was the optimized parameter, window diagramswere constructed for the dependence of exji versus Pm. The window diagram for columnseries BA is given in Fig. 6. According to Laub and Purnell 12 , the optimum of Pmcorresponds to the tallest window. At this optimum value of Pm, the best possibleseparation of the least separated pairs ofcompounds is expected 12. The same optimumintervals ofPm values were found from window diagrams as were found above with theproposed method both for column order AB (2.20 . 105-2.35 . 105 Pa) and for columnorder BA (1.95' 105-2.05' 105 Pa). As the maximum value of ex corresponding to Pm,opt
in Fig, 6 is relatively small (ex < 1.01), from the window diagram it is not possible todeduce if pea~s j and i with such a relative retention are sufficiently resolved or not,because window diagrams do not contain any information about the separationpower. The value of relative retention (exc) which corresponds to the requiredresolution (Rji,req) is not constant and depends on the number of theoretical plates (n;)and the capacity factor of the first peak (kD according to
(18)
The relationship between the critical relative retention (exc) corresponding to Rji,req =1.00 and the capacity factor of the first peak in a considered pair (ki,s) is the same forboth column orders AB and BA and is given in Fig. 7. From Fig. 7 it is evident that for
5
8 10 12 1415
I~ 19 23 2520
9 il4 26
29
216
21 2430
28 31 32313 22
27
I
33
~ ~
10 20 30 40 50 60 70 80 90
Time [min]
Fig. 8. Computer-simulated separation of the hydrocarbon sample for column series BA at Pm,opt = 2.0 .105 kPa. For peak identification see Table I.

OPTIMIZATION OF COUPLING-POINT PRESSURE IN GC 173
the peak pairs eluted at very low capacity factors a relatively high (Xc corresponds toRji,req = 1.00 and as we do not know from window diagrams at which capacity factorspeak pairs are eluting, we also do not know if peaks are sufficiently resolved or not.
From the dashed lines drawn in Fig. 6 for different capacity factors (k) whichcorrespond to (Xc, it can be concludeed that the peak pair separated in the window(Pm = 1.95 . 105-2.05 . 105 Pa) will be resolved with Rji,req = 1.00 only if k i > 2. Theuse of a proper optimization criterion can help to distinguish if the peaks in thewindows are sufficiently resolved or not l8
.
Fig. 8 shows the chromatogram of the sample separation simulated by computerfor column series BA at Pm,opt = 2.0' 105 Pa. All compounds in the sample, except thediastereoisomers, are resolved with Rj,i better than 1.00 within 90 min. For theseparation of diastereoisoners lower temperatures are needed l5
.
ACKNOWLEDGEMENTS
We thank Dr. W. Supina (Supeko, Bellefonte, PA, U.S.A.) for the donation ofa Toshiba TIIOO Plus computer and a Nukol fused-silica capillary column and Mr. M.Galli (Mega, Milan, Italy) for the gift of press-fit connectors.
REFERENCES
I R. E. Kaiser and R. I. Rieder, J. High Resolut. Chromatogr. Chromatogr. Commun., 3 (1979) 416.2 P. Sandra, F. David, M. Proot, G. Diricks, M. Verstappe and M. Verzele, J. High Resolut. Chromatogr.
Chromatogr. Commun., 8 (1985) 782.3 J. V. Hinshaw and L. S. Ettre, Chromatographia, 21 (1986) 561.4 J. V. Hinshaw and L. S. Ettre, Chromatographia, 21 (1986) 669.5 J. H. Purnell and P. S. Williams, J. Chromatogr., 321 (1985) 249.6 J. H. Purnell, M. Rodrigues and P. S. Williams, J. Chromatogr., 323 (1985) 402.7 J. H. Purnell and P. S. Williams, J. Chromatogr., 358 (1986) 39.8 D. R. Deans and I. Scott, Anal. Chem., 45 (1973) 1137.9 R. E. Kaiser, R. I. Rieder, Lin Leming, L. Blomberg and P. Kusz, J. High Resolut. Chromatogr.
Chromatogr. Commun., 8 (1985) 92.10 T. T6th, H. van Cruchten and J. Rijks, in P. Sandra (Editor), Proceedings of the 6th International
Symposium on Capillary Chromatography, Hiithig, Heidelberg, 1985, p. 769.I I T. T6th and F. Garay, in P. Sandra (Editor), Proceedings of the Eighth International Symposium on
Capillary Chromatography, Hiithig, Heidelberg, 1987, p. 585.12 R. J. Laub and J. H. Purnell, J. Chromatogr., 112 (1975) 71.13 D. Repka, J. KrupCik, E. Benicka, P. A. Leclercq and J. A. Rijks, J. Chromatogr., 463 (1989) 243.14 D. Repka, J. KrupCik, E. Benicka, F. Garay, T. Maurer and W. Engewald, in P. Sandra and G. Redant
(Editors), Proceedings of the 10th International Symposium on Capillary Chromatography, Hiithig,Heidelberg, 1989, p. 682.
15 E. Benicka, J. KrupCik, D. Repka, P. Kuljovsky and R. E. Kaiser, Anal. Chem., 62 (1990) 985.16 T. W. Smuts, K. de Clerck, T. G. du Toit and T. S. Buys, J. High Resolut. Chromatogr. Chromatogr.
Commun., 3 (1980) 125.17 G. Guiochon, Chromatogr. Rev., 8 (1966) l.18 P. J. Schoenmakers, Optimization of Chromatographic Selectivity, Elsevier, Amsterdam, 1986, p. 202.


Journal of Chromatography, 517 (1990) 175-184Elsevier Science Publishers B.V., Amsterdam
CHROMSYMP.1992
Study of rapid reaction kinetics by computerized gaschromatography with stroboscopic sampling
E. KULLIK* and M. KALJURAND
Institute of Chemistry, Estonian Academy of Sciences, Tallinn, Estonia (U.S.S.R.)
ABSTRACT
The range of application of stroboscopic sampling is extended to two completely different chemical processes: catalysis of the conversion of alcohols to olefins inphosphoric acid (with a time resolution of 1 s and ignition ofpolypropylenes containing different amounts of flame retardants (with a temperature resolution of 2YC).The required frequency of analysis of the flows whose composition changes with timeis considered. It is demonstrated how stroboscopy coupled with computerized chromatography can provide information that is otherwise difficult, expensive or evenimpossible to obtain.
INTRODUCTION
Depepding on the methods used to study reaction kinetics, the chemicalreactions may be classified as slow and fast. A characteristic running time for slowreactions exceeds 100 s and is shorter than 10 s for fast reactions!. An importantparameter in this kind of study is the time resolution of kinetic curves, i.e., the shortesttime interval in which an analytical device used in a particular experiment needs inorder to process a sampled reaction mixture. For example, using the chromatograph asan analytical device, the time resolution is determined by the sample separation time inthe column (its value being usually measured in minutes). To characterize the reactionthoroughly, the reaction mixture must be sampled with a frequency determined fromthe Nyquist sampling theorem (also known as Kotelnikov's theorem)2. It is evidentthat for fast reaction studies, instruments with a rapid response are needed. In studyingcomplicated macrokinetic reactions, an exact composition in the reaction componentsat a particular moment in time is also of interest. Chromatography can provide anexcellent separation of the reaction components (reagents and products), but at theexpense of separation time. Thus, common chromatographic techniques cannot beapplied to rapid reaction studies.
Recently, a new technique for providing samples to the chromatograph,stroboscopic sampling, was proposed3
. This latter enables one to overcome the
0021-9673/90/$03.50 © 1990 Elsevier Science Publishers B.V.

176 E. KOLLIK, M. KALJURAND
restrictions caused by long separation times in rapid reaction studies. The principle ofstroboscopic sampling is simple. The process under study is initiated many times andafter each initiation a certain time interval pass. The sample is then taken from thereaction vessel and introduced into the chromatograph. By scanning the intervalbetween initiation and sampling from zero to the end of the reaction, it is possible torecord concentration curves for reactants and products with an adequate timeresolution. The only requirement for effecting stroboscopic sampling is reproducibilityof the process under investigation. For most chemical reactions the latter can berealized at the expense of a more or less sophisticated exerimental set-up.
The idea of stroboscopic sampling is fairly old, dating back to the beginning ofthe century. It has been applied successfully to many optical measurements of rapidphenomena but, to the authors' knowledge, its first application to the case when thesignal carrier is mass flow was demonstrated by Kaljurand et al. 3. Computerization ofthe experiment is crucial; although several manual kinetic experiments can beconsidered as "stroboscopic" (see, e.g., ref. 4), human capabilities for generatingprecise time intervals and complicated sequences of injections (required in stroboscopic sampling) are limited.
Theoretical5 and preliminary experimental2•3 investigations of the stroboscopic
sampling method appeared to be promising. However, for further validation of thesampling method more thorough studies are needed. In this work, the range ofapplication of stroboscopic sampling was extended to two completely differentchemical processes: catalysis of the conversion of alcohols to olefins on phosphoricacid and ignition of polypropylenes containing different amounts of flame retardants.This paper aims to demonstrate how stroboscopy coupled with contemporarycomputerized chromatography can provide information that is otherwise difficult,expensive or even impossible to obtain.
THEORETICAL
A change in the concentration of the volatile product of a chemical liquid-phasereaction which is carried out by the inert gas passing above the liquid is described bythe following equation6
:
CCt) = Co[exp (-at) - exp (-kt)] (I)
where CCt) is the concentration at time t, Co is a constant and a and k are mass flow andchemical reaction rate constants respectively. Eqn. 1 can be used as the firstapproximation to describe processes in H3P04 catalysis. We used eqn. 1 to calculatethe time resolution necessary for the following stroboscopic experiments. According tothe sampling theorem 2
, a continuous function can be adequately represented by theset of function values sampled with an interval Llt if Llt < 1/(2fm), where fm is themaximum frequency in the power spectrum of the function. Omitting straightforwardbut long Fourier transform calculations, the power spectrum ofeqn. 1can be written asfollows:
(2)

STUDY OF REACTION KINETICS BY GC 177
where Pm is the maximum value of the power spectrum. As follows from eqn. 2, there isno maximum frequency in the spectrum. At the expense of some small error, P(j)1Pm
can be considered as zero when it is less than, say, 10-2 and the correspondingfrequency set equals fm. Omitting again simple but time-consuming calculations, weobtain the following for two extreme cases: if a~k, then ilt < 11k, and a~k, thenilt < (ak)-1/2. Thus, taking t=O.l s (a common switching time for mechanical valves),the rate of the processes that can be studied by a given equipment is k< 10 S-l. On theother hand, ifamoreexact value is needed, say P(j)IPm < 10-4
, then ilt should be aboutthree times smaller.
EXPERIMENTAL
EquipmentFor catalysis studies, the following chromatographic system was used. The
reaction column was a 70 mm x 3 mm J.D. glass column filled with a catalyst. Theanalytical column was a 2 m x 3 mm J.D. metal column filled with Porasil Eadsorbent, which is suitable for the separation of light olefins. Two mechanical valves(Valco C6TX) were used in the experiment. One valve performed the injection of thereagent pulses from the reagent stream supply vessel to the reactor and the otherinjected the products from the end of the reactor column to the top of the analytialcolumn. The chromatograph used in this study was an LHM-80 with a flameionization detector. The experimental set-up is described in more detail elsewhere3
.
In ignition experiments generation of the continuous re~gent flow necessary toeffect stroboscopic sampling is not as straightforward as with gaseous or liquidreagents because the polymer sample is a solid. According to contemporary ideas ofpolymer ignition, a polymer itself does not burn, but its pyrolysis products areresponsible for ignition and burning. The last process provides the heat flow necessaryfor generation of the degradation products7
. In our experiment, the heat flow to thesample was generated by an external oven whose temperature was set high enough toform a stream of sample degradation products but the ignition of the products wasperformed in the ignition reactor separated spatially from the oven where thedegradation products were formed. The ignition reactor was a quartz tube (30 mmx 3 mm J.D.) and the process was initiated by passing the current impulse through theplatinum wire wound around the tube, thus heating rapidly (about 80°C/s) the reagentflow inside the reactor. Sampling from the reactor to the 15 m x 0.5 mm J.D. metalcapillary column coated with SE-30 liquid stationary phase (Perkin-Elmer) wasperformed with a laboratory-made Deans-type pneumatic switch. The pneumaticswitch was controlled by a General Valve magnetic valve. By testing the valve we foundthat it was able to make reproducible injections with a duration as short as 50 ms.However, in this work such a short time resolution was not necessary. Thechromatograph was an Intersmat IGC 121C FL with a flame ionization detector. Theexperimental set-up is described in more detail elsewhere2
.
Chemicalsn-Propanol and n-butanol used as reagents in the catalysis study were of
"chemically pure" grade. For catalyst preparation, 85% phosphoric acid ("pure"grade) was used, Porasil E (Waters Assoc.) was used as a solid support for the acid. The

178 E. KULLIK, M. KALJURAND
H 3 P04 catalyst was prepared according to a literature procedureM. For ignition
studies, a propylene--ethylene copolymer containing about 10% of ethylene was used.Four samples contained 0,10,20 and 40% ofa flame retardant (Masterflam AF 709 byVAMP, Milan, Italy).
Computer and softwareAll experiments were controlled by an Apple lIe computer through laboratory
made interfaces and software. The built-in software-controlled relays used in Apple lIegame controllers appeared to be a convenient means for "on-off' switching valves andcurrents. The detector signal was digitized and read to the Apple lIe memory viaa laboratory-made analogue-to-digital converter. The Apple lIe started the experiment by switching "on" the reagent sampling valve or current in the ignition reactor.Then, after a predetermined time interval, the computer took the sample from thereactor and switched all currents and valves "off'. After recording the detector signal,the computer started a new cycle with different (from a previous cycle) time intervalsbetween the reaction initiation and sampling.
RESULTS AND DISCUSSION
Catalysis on phosphoric acidA typical set ofchromatograms is shown in Fig. 1. By measuring peak areas for
Jo 20 40 60 80 100
time (min)
Fig. I. Set of chromatograms of reaction products from n-butanoldehydration reaction. Catalyst, PorasilEcovered with H 3P04 . Time resolution, I s. Reactor temperature, 283°C. Identification of peaks in triplets(from left to right): I-butene, cis,trans-2-butene and 2-methylpropene. Detector response in arbitrary units.

STUDY OF REACTION KINETICS BY GC
•
179
timeFig. 2. Fitting of cis-butene peak areas (from Fig. l)with the function in eqn. 1. Rate constants: a=0.940 S-I
and k = 0.193 5-1. Interval between points, 1 s.
B
0.2512
0.1585 -
0.1000 -0.0631 -
0.0398 -0.0251 -
oL
.... 0.0158 -c:.E 0.0100 -"'c:c
0.0063 -v
.2: 0.0040 -<:>...0.0025 - 0
0.0016 -
0.0010 -
0.0006 -0.0004 -
C0.0003
200 220 240
c8e
260 280
8
300
temperatu re (t)
Fig. 3. Rate constant (5- 1) of n-butanol, k, as a function of temperature (note the logarithmic scale for k).The Arrhenius plot for these data gives the function log k = 31.01-18.74 . 103/ RT with a correlationcoefficient of 0.998.

180 E. KOLLIK, M. KALJURAND
different products it is possible to construct concentration curves for differentproducts and fit the curves to the model in eqn. 1 by the least-squares method. Tominimize the difference between the experimental values and the theoretical model, weused both a random search for the best fit and the gradient method. Both proceduresare standard in computational mathematics. An example of the best fit obtained isshow in Fig. 2. As can be seen, the fit is perfect for the falling part of the curve butproblems arise with the rising part of the curve. The error depends strongly on howmany experimental points from the beginning of the curve are used for fitting. Hencethe model in eqn. I is not the best one to describe catalysis in our system and more exactmodels must be sought. A discussion of the different models that can be used todescribe the processes in the reactor is the topic of another paper9
. However, for thepurpose of this paper, the model in eqn. 1 is suitable.
By fitting eqn. 1 to the experimental data we obtain two rate constants, but fromthe results obtained it is not possible to decide which of the constants i~ a and which isk. From theory6, it follows that a depends linearly on the inert carrier gas velocity andis independent of temperature. For k as a chemical reaction rate contstant the oppositeapplies. Hence by varying the temperature and the carrier gas velocity it is possible todifferentiate between rate constants obtained by the least-squares fitting of experimental data. In Fig. 3, the temperature dependence of log k is presented as afunction of temperature for butanol reactions. It can be seen that stroboscopic
2
19
1.8
1.7
1.6
1.5
1.4
"" 1.3""- 1.2~...- 1.1c:0:> 1...-"c: 0.90u
0.8
2 0.70:>..
0.6
0.5
0.4
0.3
0.2
0.1
0
0 20
flew-rate (mljmin)
40 60
Fig. 4. Mass flow-rate constant, a, as a function of the carrier gas flow-rate through the reactor. Reactortemperature,283°C. C, II-Propanol (k=O.OI S-1); 0, II-butanol (k=0.007 S-1).

STUDY OF REACTION KINETICS BY GC 181
sampling permits the measurement of reaction rate constants ofmore than three ordersof magnitude of k and over a wide temperature range.
In Fig. 4, the dependence of a on the carrier gas velocity is presented. Evidentlythe function is non-linear, again demonstrating the contradiction with theory, whichpredicts a linear function. Hence the catalyst used in this work cannot be considereda pure H 3P04 liquid catalyst and the support has a strong influence on the reactioncourse. A complete analysis of the results of this work together with computations ofthe activation energies, etc., and chemical interpretation of the results will be presentedelsewhere9
.
Ignition of polypropylenesThe system performance was tested by oxidation ofethanol. The reproducibility
of the overall system was tested by repeating the same experiment many times andrecording the product peak height at a certain temperature (450°C). The product peakheight reproducibility was 0.3%. The result can be considered acceptable, taking intoaccount that at the ignition temperature the amount of product depends critically onthe reaction temperature.
According to the measurement procedure it was possible to record thetemperature dependence of the product/reagent concentration curves even underconditions of very rapid self-heating. However, no temperature effects were observedin this experiment. This may be explained by a low concentration of the evolved gasesin the carrier stream which, being oxidized, does not provide sufficient heat for theself-heating of the reaction environment. Therefore, in this experiment, the rapidexternal ballistic heating imitates conditions of self-heating during ignition.
All the samples were analysed in helium and air; O.l-g samples, when heated at300°C, provided a continuous and almost constant stream of evolved gases for severalhours. Only at the very beginning of the sample heating did the evolution rate oscillateirregularly for the flame retardant-containing samples. Also, it was possible to observevisually extensive foaming of these samples at the experimental temperatures, whichmay be the reason for the irregular evolution of the degradation products from thepolymer samples.
A typical set ofchromatograms recorded in air as a function of temperature witha resolution of 25°C or the sample without the flame retardant is shown in Fig. 5. Thefirst peak belongs to the lightest degradation products, probably C1-C3 hydrocarbons. It follows from Fig. 5 that the height of the first peak starts to increase after500°C and the intensity of the other peaks decreases. This is the temperature at whichextensive thermal degradation of the evolved products to the lightest compoundsbegins. The intensity of the first peak passes through a maximum and disappears at700°C, indicating complete oxidation of the degradation products to water and carbondioxide. As a flame ionization detector was used, the end products are invisible on thechromatograms. In helium the degradation starts above 540°C and the intensity of thefirst peak reaches a constant value, as expected.The effect of the flame retardant is demonstrated in Fig. 6, in which particulartemperature points are plotted for samples containing 0 and 40% of the flameretardant as a function of the polymer heating time. It follows from Fig. 6 that theflame retardant influences the heating only at the beginning. A new peak appeared inthe chromatogram the intensity of which decreased rapidly and after I h the samplebehaved like a sample with no flame retardant.


STUDY OF REACTION KINETICS BY GC 183
650
640
630
620
610
600
590
580
Q) 570...~ 560-0Q> 550Q.
E 540
2 530
520
510
500
490
480
470
460
450
a
b
c
o 40 80 120 160
time (min)
200 240 280
Fig. 6. Particular temperature points on polypropylene ignition thermochromatograms as a function ofsample heating time. (a) Temperature of the maximum intensity of the first peak; (b) temperature of thebeginning of pyrolysis ofthe degradation products in helium; (c) temperature of the beginning ofpyrolysis ofthe degradation products in air. 0 = 0% flame retardant; D = 40% flame retardant. Temperature in 0c.
A more detailed analysis of ignition data together with the interpretation of theresults from the viewpoint of polymer chemistry will be published in the near future.
So far gas chromatography has been used for the analysis of slow chemicalreactions. Recent developments in high-speed chromatography have made possibleseparations in a few seconds. However, this requires the design ofspecial fast-responsechromatographic equipment1o. As follows from the results of this work, stroboscopicsampling enables common chromatographic equipment to be used.
ACKNOWLEDGEMENTS
The authors thank A. Bureiko for performing the H 3P04 catalysis measurements, Dr. B. V. Stolyarov and Dr. A. N. Marinichev of Leningrad University forfruitful discussions and providing the catalyst and Dr. M. Elomaa of HelsinkiUniversity for providing the polypropylene samples and for discussions on polymerignition problems.

184
REFERENCES
E. KULLlK, M. KALJURAND
E. A. Denisoff, Kinetics of Homogeneous Chemical Reactions (in Russian), Vyshaya Schola, Moscow,1988, p. 19.
2 M. Kaljurand, Proc. Estonian AS, Chemistry, 38 (1989) 25.3 M. Kaljurand, M. Lamberg and E. KiiBik, Proc. Estonian AS, Chemistry, 37 (1988) 78.4 A. F. Shushunova and L. Y. Prokhorova, J. Chromatogr., 283 (l984) 365.5 M. Kaljurand and E. KiiBik, Computerised Multiple Input Chromatography, EBis Horwood, Chichester,
1989.6 A. N. Marinitchev and B. V. loffe, J. Chromatogr., 454 (1988) 327.7 N. Grassie and G. Scott, Polymer Degradation and Stabilization, Cambridge University Press,
Cambridge, 1984.8 B. V. Ioffe, N. A. Katsanos, L. A. Kokovina, A. N. Marinitchev and B. V. Stolyarov, Kinet. Katal., 28
(1987) 805.9 A. N. Bureiko, M. Kaljurand, A. N. Marinichev and B. V. Stolyarov, Kinet. Kalal., in press.
10 C. A. Cramers and P. A. Leclerq, CRC Cril. Rev. Anal. Chem., 20 (1988) 117.

Journal oj Chromatography, 517 (\990) 185-192Elsevier Science Publishers B.Y., Amsterdam
CHROMSYMP. 1981
High-performance liquid chromatographic study of ligandexchange reactions of fluorinated metal j1-diketonechelates
TAO WANG and PETER C. UDEN*
Department oj Chemistry, Lederle Graduate Research Towers, University oj Massachusetts, Amherst, MA01003 (U.S.A.)
ABSTRACT
Ligand redistribution reactions among gallium, indium, copper and nickel fluorinated p-diketonates were investigated by normal-phase high-performance liquidchromatography on a silica column. Reactions taking place at ambient temperaturein tetrahydrofuran-heptane solutions were shown to proceed with statistical ligandexchange. Good chromatographic characteristics were seen for the range of initialand product gallium chelates. Although other complexes were not eluted under theconditions used, the reactions which occurred in mixed-metal systems could be inferred from examination of gallium chelate chromatograms.
INTRODUCTION
Gas chromatographic (GC) separation of neutral metal chelates is limited byrequirements of adequate volatility and thermal stabilityl. High-performance liquidchromatography (HPLC), however, allows appplication to metal chelates that areless volatile or thermally stable, and provides selectivity through suitable choice ofstationary and mobile phases.
HPLC of metal complexes was first reported by Huber and Kraak 2 who employed liquid-liquid partition chromatography in a ternary solvent system, consistingof water, ethanol and 2,2,4-trimethylpentane. They established conditions necessaryto separate as many as six metal acetylacetonates, among them those of Be(ll),Al(III), Cr(Ill), Fe(III), Co(III), NI(II), Cu(ll), Zn(II), Zr(IV) and Ru(III). Reportsin which high-performance bonded phase or liquid-solid chromatography have beenapplied to metal complexes have included separations of metal chelates of tetradentate p-ketoamines3
-6
, metal p-diketonates6-
9, metal cluster complexes10
, organoironcomplexes ll
, Rh and Ir triphenylphosphine complexes 12, metal8-hydroxyquinoline
complexes 13,14, dialkyldithiocarbamates 15
.t6 and crown ether complexes1 ? Review
papers have further detailed the research on this subject 18•19 .
In addition to the application to the separation of non-volatile and thermallyunstable metal chelates, HPLC can be used to study their reactions, such as ligand
0021-9673/90/$03.50 © 1990 Elsevier Science Publishers B.Y.

186 T. WANG, P. C. UDEN
exchange between two metal chelates with different ligands. A study of ligand-exchange reactions between fluorinated gallium, indium and aluminum fi-diketonatechelates has been reported by GC with microwave-induced plasma (MIP) detection 20
. However, there is the possbility that the ligand-exchange reactions did notoccur in the solution, but took place at least in part, in the gaseous phase in the heatedinjection port of the gas chromatograph. To investigate and confirm that the Iigandexchange reactions did occur in the liquid phase, the use of HPLC was necessary.
No HPLC study of ligand-exchange reactions of fluorinated gallium fi-diketonates has previously been reported. In our study, a normal-phase separation modewas used to investigate these reactions between fluorinated gallium, indium, copperand nickel fi-diketonates, and to prove that they did occur in the liquid phase. Theligands tested were 1,1, I-trifluoropentane-2,4-dione (HTFA), I, I, I-trifluoro-hexane-2,4-dione (HTFEA), 1,1, I-trifluoro-5,5-dimethylhexane-2,4-dione (HTTB) and1, I, l-trifluoro-6-methylheptane-2,4-dione (HTIB).
EXPERIMENTAL
InstrumentationA HPLC system (Perkin-Elmer, Norwalk, CT, U.S.A.), equipped with a Series
100 pump and a TriDet detector was employed. The mobile phase wastetrahydrofuran-heptane (specific compositions of the mobile phase are listed in Table I and in the chromatograms). UV detection was at 254 nm. The column was aSpherisorb S5W silica column (5 /lm, 150 x 4.6 mm J.D.) (Keystone Scientific, Bellefonte, PA, U.S.A.). A 1O-/l1 sample loop was used and chromatograms were recordedon an Omniscribe recorder (Houston Instruments, Austin, TX, U.S.A.).
Materials and proceduresThe procedures for the preparation of Ga(TFAh and In(TFAh have been
described20. Ga(TFEAh, Ga(TTBh and Ga(TIB)3 were prepared in a similar way to
that for Ga(TFAh, A procedure similar to that given by Berg and Truemper21 wasused to prepare Cu(TFA)z and Ni(TFA)z. This involved shaking an alcoholic solution of the ligand with a 5% nitrate solution of the corresponding metal, buffered
TABLE I
CONDITIONS OF LIGAND-EXCHANGE REACTIONS STUDIED WITH HPLC
Temperature was 25T.
Initial Molar Solvent Reaction timechelates ratio (THF-heptane, I'll') (h)
Ga(TFAl3/Ga(TIBl3 3:2 15:85 24Ga(TFAl3/Ga(TFEAl3 1:1 15:85 24Ga(TTBl3/Ga(TFEAl31
Ga(TFAl3 7:10:14 7.5:92.5 28Ga(TlBliln(TFAl3 0.5:J 13:87 330Ga(TTBl3/Cu(TFAl2 2:5 J4:86 24Ga(TFAh/Cu(TTBl2 I:J J5:85 J6Ga(TTBl3/Ni(TFAl2 0.5:J J3:87 330

LIGAND-EXCHANGE REACTIONS OF METAL CHELATES 187
with sodium acetate (5 g for every 100 ml of solution). After precipitation, the chelatewas collected by filtration, air-dried, recrystallized from benzene, and air-dried again.
Ligand-exchange reactions were carried out by dissolving the initial metal chelates in a portion of the mobile phase and allowing the reactions to take place underthe conditions described in Table 1. These conditions were such that no further changes in the chromatograms obtained were observed for longer reaction times. Since thechelates were difficult to dissolve directly in the mobile phase, they were first dissolvedin tetrahydrofuran (THF) and then diluted with heptane to bring the solvent compositions to those of the mobile phases employed in HPLC. The concentrations of thechelates in these solutions of reaction mixtures were in the mmol/I range. The reactionmixtures were analyzed after the time periods specified in Table 1.
RESULTS AND DISCUSSION
Ligand-exchange reaction between two gallium che/atesGa(TFAh and Ga(TIBh undergo ligand exchange. The equilibrium process
may be described as follows:
Ga(TFAh + Ga(TIBh ¢ Ga(TFAh(TIB) + Ga(TFA)(TIBh
After the reaction procedure described in Table I was carried out, the reaction mixture was chromatographed. Fig. I shows the separation of four resultant galliumchelates under the experimental conditions indicated. THF-heptane (3:17, v/v)proved to be a suitable mobile phase for baseline separation and good peak shapewith elution in < 4 min. Peaks 1 and 4 were identified as Ga(TIBh and Ga(TFAh,respectively, by retention-time comparison with pure chelates. Peaks 2 and 3, elutedbetween peaks 1 and 4, were identified as Ga(TIBh(TFA) and Ga(TIB)(TFAh Sincea normal-phase mode was employed, chelate species with ligands of greater carbonnumber and molecular weight tended to be eluted earlier; the elution order ofGa(TIBh < Ga(TIBh(TFA) < Ga(TIB)(TFAh < Ga(TFAh showed this trend.The redistribution had clearly occurred during the 24-h liquid-phase reaction; thegood resolution and peak shapes obtained indicated that no discernable furtherredistribution occurred during the chromatographic elution process.
Ligand-exchange reaction between Ga(TFAh and Ga(TFEAh was then carried out under similar conditions. Fig. 2 illustrates the separation of the resultingmixture. The sequence of the peaks, based on retention-time comparison with purechelates, was in an order similar to that in the previous redistribution reaction, andliquid-phase reaction at room temperature had certainly taken place. Again, excellentpeak shape and resolution indicated no discernable on-column redistribution.
Ligand-exchange reaction among three gallium che/atesA ligand-exchange reaction between Ga(TTBh, Ga(TFEAh and Ga(TFAh
was then carried out to serve as an example of a triple exchange among three differentchelates. Following the procedure listed in Table I, the chromatogram shown in Fig. 3was obtained with seven baseline-separated peaks. Identifications of these peaks weremade by comparing retention times with those of the products obtained separatelyfrom ligand-exchange reactions between Ga(TTBh and Ga(TFAh, between

188
2
3
4
o 1 234
Time (min)
T. WANG, P. e. UDEN
Fig. I. HPLC separation of mixture of ligand-exchange reaction products formed from Ga(TFA)3 andGa(TIB)3' Column 5 11m silica, 150 x 4.6 mm J.D.; mobile phase THF-heptane (3:17, v/v); flow-rate 1.0ml/min; UV detection 254nm; reaction time 24 hat 2Ye. Peaks: I = Ga(TIB)3; 2 = Ga(TFA)(TIB)2; 3 =
Ga(TFAMTIB); 4 = Ga(TFA)3'
Ga(TTBh and Ga(TFEAh, and between Ga(TFEAh and Ga(TFAh Peaks 3, 4 and 5are each considered to consists of two unresolved gallium chelates. An interestingobservation is that peak 3 consists of Ga(TTB)(TFEA)2 and Ga(TTB)(TTB)(TFA),the underlined parts of the two chelates being designated to show the differencebetween them. Since the two chelates had virtually identical retention, the two chelated ligands (TFEA)z contribute the same overall retention as the two chelated ligands(TTB)(TFA) present together. A similar effect is also noted in peak 5, which consistsof Ga(TTB)(TFA)(TFA) and Ga(TFEAhCTFA). Again the underlined parts(TFEA)z and (TTB)(TFA) show the only difference between these two similarly retained chelates.
The complex which contained three different ligands, Ga(TTB)(TFEA)(TFA),was expected to be produced from the ligand-exchange reaction among the threechelates, Ga(TTBh, Ga(TFEAh and Ga(TFAh However, since it could not beproduced by ligand-redistribution reactions between any two of these three chelatesonly, its direct identification, by retention-time comparison with such reaction products, was impossible. Therefore, retention of Ga(TTB)(TFEA)(TFA) was deduced byarguments similar to those for peaks 3 and 5. Since the only difference between

LIGAND-EXCHANGE REACTIONS OF METAL CHELATES
2
3
4
o 234
Time (min)
o
189
4
3
52
6
7
2 3 4 5 6
Time (min)
Fig. 2. HPLC separation of mixture of ligand-exchange reaction products formed from Ga(TFA)3 andGa(TFEA)3' Conditions as in Fig. I. Peaks: I = Ga(TFEA)3; 2 = Ga(TFA)(TFEA)2; 3 = Ga(TFA)2(TFEA); 4 = Ga(TFA)3'
Fig. 3. HPLC separation of mixture of ligand-exchange reaction products formed from Ga(TTB)3' Ga(TFEA)3 and Ga(TFA)3' Column 5 Jim silica, 150 x 4.6 mm J.D.; mobile phase THF-heptane (7.5:92.5,v/v); flow-rate 1.0 ml/min; UV detection 254 nm; reaction time 28 h, at 25"C. Peaks: I = GA(TTB)3; 2 =Ga(TTB)2(TFEA); 3 = Ga(TTB)(TFEA)2 and Ga(TTBlz(TFA); 4 = Ga(TFEA)3 and Ga(TTB)(TFEA)(TFA); 5 = Ga(TTB)(TFA)2 and Ga(TFEA)2(TFA); 6 = Ga(TFEA)(TFA)2; 7 = Ga(TFA)3'
Ga(TFEAh(TFEA) and Ga(TTB)(TFA)(TFEA) is that between the two underlinedparts and since these were previously observed to give the same overall retention,peak 4 which was identified as containing Ga(TFEAh(TFEA) [i.e. Ga(TFEAh],should also contain Ga(TTB)(TFA)(TFEA) [which is Ga(TTB)(TFEA)(TFA)]. Themagnitude of the response observed for peak 4 also indicated the presence of Ga(TTB)(TFEA)(TFA) in addition to Ga(TFEAh; only a small peak would be expectedfor the latter as a result of the statistical nature of the redistribution reaction. In thereaction described, the molar ratio of Ga(TTBh Ga(TFEAh and Ga(TFAh waschosen as 7: 10: 14, in order to present a clear redistribution chromatogram with peaksof significant scale for all species. However, for the equimolar case, the statisticalresponse ratio, shown in parentheses (assuming identical molar absorptivities for allchelates at 254 nm), for peaks 1-7 (Fig. 3) would be predicted as peak I (1), peak 2 (3),peak 3 (3 + 3), peak 4 (9 + 1), peak 5 (3 + 3), peak 6 (3) and peak 7 (1). The lowestrelative amounts of redistributed chelates are for the symmetrical complexes. AI-

190 T. WANG, P. C. UDEN
though the experiment described gives skewed response data, the general trend isclearly shown as consistent with the foregoing analysis.
Ligand-exchange reactions between gallium and indium chelatesGa(TIBh and In(TFAh were chosen to exemplify the HPLC study of ligand
exchange reactions between gallium and indium chelates. After allowing the twochelates to react according to the procedure listed in Table I, the reaction productswere chromatographed (Fig. 4) to give four symmetrical baseline-resolved peaks. Bycomparing the retention times of the peaks with those obtained from ligand-exchangereaction between Ga(TIBh and Ga(TFAh, peaks 1, 2, 3 and 4 were identified asGa(TIBh,Ga(TIBh(TFA), Ga(TIB)(TFAh and Ga(TFAh, respectively. Althoughit has been shown by GC2D that the mixture of ligand-exchange reaction productsobtained from Ga(TIB)3 and In(TFAh did contain In(TIBh and In(TFAh in addition to the four gallium chelates, the indium chelates could not be eluted from theHPLC system under the conditions employed. However, the HPLC study proved thatthe ligand-exchange reactions between gallium and indium fluorinated f3-diketonechelates did proceed in the liquid phase. Again there was no chromatographic evi-
2
3
·4
o 1 234
Time (min)
Fig. 4. HPLC separation of mixture of ligand-exchange reaction products formed from Ga(TIB)3 andIn(TFA)3' Column 5 JIm silica, 150 x 4.6 mm I.D.; mobile phase THF-heptane (13:87, v/v); flow-rate 1.0ml/min; UV detection 254 nm; reaction time 330 h at 2Ye. Peaks: I = Ga(TIB)3; 2 = Ga(TFA)(TIB)2;3 = Ga(TFA)2(TIB); 4 = Ga(TFA)3'

LIGAND-EXCHANGE REACTIONS OF METAL CHELATES 191
dence of on-column redistribution although degradation of the indium did presumably occur.
Ligand~exchange reactions between gallium and copper chelatesCu(TFAh was allowed to react with Ga(TTBh in a 1: 1 molar ratio according
to the conditions described in Table I and the reaction products were chromatographed. Four resultant peaks are shown in Fig. 5, identified by comparing the retention times with those of the peaks obtained from the reaction between Ga(TFAh andGa(TTBh Copper chelates could not be eluted under the experimental conditionsemployed and therefore only the gallium chelates appeared on the chromatograms.
2
3
4
a 234
Time (min)
Fig. 5. HPLC separation of mixture of ligand-exchange reaction products formed from Ga(TTB)3 andCu(TFA)2' Column 5 pm silica, 150 x 4.6 m I.D.; mobile phase THF-heptane (14:86, v/v); flow-rate 1.0ml/min; UV detection 254 nm; reaction time 24 h at 2SOe. Peaks: I = Ga(TTB)3; 2 = Ga(TFA)(TTB)2; 3= Ga(TFA)iTTB); 4 = Ga(TFA)3'
Ga(TFAh was then allowed to react with Cu(TTBh (1:1) to yield a chromatogram which was virtually identical with that in Fig. 5. The reaction between Cu(TFAh and Ga(TTBh apparently proceeded to give products identical to those fromthe reaction between Ga(TFAh and Cu(TTB)z.
It was concluded that the ligand-exchange reactions between gallium and copper fluorinated f3-diketone chelates occurred in liquid phase with no ligand distribution bias due to the difference in structure between the gallium (octahedral) andcopper (tetrahedral) complexes.
Ligand-exchange reaction between gallium and nickel chelatesGa(TTBh was allowed to react with Ni(TFAh (1:1) under conditions de
scribed in Table I, giving rise to a chromatogram similar to that in Fig. 5. Althoughthe nickel chelates were not eluted from the column, the ligand-exchange reaction wasshown to have occurred in the liquid phase. In this case, the reactant nickel complexwas probably trimeric, but this did not appear to perturb the redistribution pattern.

192
CONCLUSION
T. WANG, P. C. UDEN
This study shows that the normal-phase HPLC for these metal complexes ishighly dependent upon the metal atom present. However, all of the ligand redistributions investigated were shown to have taken place in the liquid phase under theambient temperature reaction conditions employed. The kinetics of representativeligand-redistribution reactions may be obtained from further HPLC studies.
ACKNOWLEDGEMENTS
This work was supported in part by Baxter Healthcare Inc. and by Merck,Sharp and Dohme Research Laboratories.
REFERENCES
I P. C. Uden, J. Chromatogr., 313 (1984) 3.2 J. F. K. Huber and J. C. Kraak, Anal. Chem., 44 (1972) 1554.3 P. C. Uden, D. M. Parees and F. H. Walters, Anal. Lett., 8 (1975) 795.4 E. Gaetani, C. Laureri, A. Maugin and G. Parolari, Anal. Chem., 48 (1976) 1725.5 P. C. Uden and F. H. Walters, Anal. Chim. Acta, 79 (1975) 175.6 P. C. Uden, B. D. Quimby, R. M. Barnes and W. G. Elliott, Anal. Chim. Acta, \01 (1978) 99.7 P. C. Uden, 1. E. Bigley and F. H. Walters, Anal. Chim. Acta, 100 (1978) 555.8 R. C. Gurira and P. W. Carr, J. Chromatogr. Sci., 20 (\982) 461.9 C. A. Tollinche and T. H. Risby, J. Chromatogr. Sci., 16 (1978) 448.
10 C. T. Enos, G. 1. Geoffroy and T. H. Risby, J. Chromatogr. Sci., 15 (1977) 83.II R. E. Graf and C. P. LiBya, J. Organometal. Chem., 47 (1973) 413.12 C. T. Enos, G. 1. Geoffroy and T. H. Risby, Anal. Chem., 48 (1976) 990.13 C. S. Hambali and P. R. Haddad, Chromatographia, 13 (1980) 633.14 P. R. Haddad and S. Valeenuwat, J. High Resolut. Chromatogr. Chromatogr. Commun., 9 (1986) 127.15 Z. G. Schwedt, Anal. Chem., 288 (1978) 50.16 P. C. Uden and 1. E. Bigley, Anal. Chim. Acta, 94 (1977) 29.17 A. Mangia, G. Parolari, E. Gaetani and C. F. Laureri, Anal. Chim. Acta, 92 (1977) II I.18 J. W. O'Laughlin, J. Liq. Chromatogr., 7(S-I) (1984) 127.19 R. M. Cassidy, in J. F. Lawrence (Editor), Trace Analysis, Vol. I, Academic Press, New York, 1981, p.
121.20 P. C. Uden and T. Wang, J. Anal. Atom. Spectr., 3 (1988) 919.21 E. W. Berg and J. T. Truemper, J. Phys. Chem., 64 (1960) 487.

Journal of Chromatography, 517 (1990) 193-207Elsevier Science Publishers B.Y., Amsterdam
CHROMSYMP.1901
Silicas chemically bonded with multidentate phenyl groups asstationary phases in reversed-phase liquid chromatographyused for non-planarity recognition of polycyclic aromatichydrocarbons
KIYOKATSU JlNNO*, KUNIHIKO YAMAMOTO, HIDEO NAGASHIMA, TAKANORI UEDAand KENJI ITOH
School of Materials Science, Toyohashi University of Technology, Toyohashi 441 (Japan)
ABSTRACT
Multidentate phenyl-bonded phases have been evaluated as stationary phaseswhich can recognize molecular non-planarity of polycyclic aromatic hydrocarbons.The results clearly indicate that these multidentate silicas give a higher non-planarityrecognition capability than that with typical octadecylsilicas such as polymeric andmonomeric phases. The reason for this mechanism can be interpreted by the molecular-molecular interaction between a solute and a stationary phase and this kind ofapproach will open the possibility of designing new stationary phases which offermore selective or specific separations.
INTRODUCTION
As planarity recognition is directly related to the physico-chemical propertiesand biological activities of polycyclic aromatic hydrocarbons (PAHs)1-3, it is necessary to have good separation and analytical methods for this recognition. Generallyin the separation of PAHs by reversed-phase liquid chromatography (LC), whichseems to be the most powerful and useful method, chemically bonded octadecylsilica(ODS) phases have been used as the stationary phase of choice because of theircapability and applicability. ODS phases can be divided into two categories, onepolymeric and the other monomeric. Polymeric phases are normally synthesized byusing polyfunctional silanes in the presence of water (or sometimes even under conditions carefully controlled to exclude water) based on polymeric surface modificationchemistry, whereas monomeric phases are obtained by using monofunctional silanesas the starting material. A number of papers have reported the differences in thechromatographic properties of the two types of ODS phases for PAH separations4
-10 . The conclusion was that polymeric phases have a greater capability of
recognizing molecular planarity of PAHs. Non-planar molecules were eluted fasterthan planar molecules with polymeric phases because the phases have a "slit-like"
0021-9673/90/$03.50 © 1990 Elsevier Science Publishers B.Y.
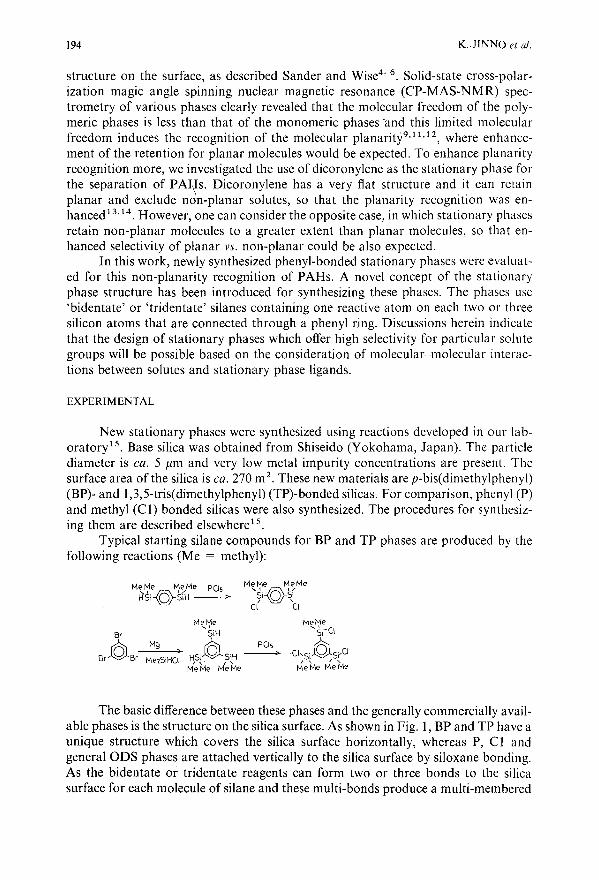
194 K.. jlNNO el al.
structure on the surface, as described Sander and Wise4-
6. Solid-state cross-polar
ization magic angle spinning nuclear magnetic resonance (CP-MAS-NMR) spectrometry of various phases clearly revealed that the molecular freedom of the polymeric phases is less than that of the monomeric phases 'and this limited molecularfreedom induces the recognition of the molecular planari ty9, 11,12, where enhancement of the retention for planar molecules would be expected. To enhance planarityrecognition more, we investigated the use of dicoronylene as the stationary phase forthe separation of PA~s. Dicoronylene has a very flat structure and it can retainplanar and exclude non-planar solutes, so that the planarity recognition was enhanced 13
,14. However, one can consider the opposite case, in which stationary phasesretain non-planar molecules to a greater extent than planar molecules, so that enhanced selectivity of planar vs. non-planar could be also expected.
In this work, newly synthesized phenyl-bonded stationary phases were evaluated for this non-planarity recognition of PAHs. A novel concept of the stationaryphase structure has been introduced for synthesizing these phases. The phases use'bidentate' or 'tridentate' silanes containing one reactive atom on each two or threesilicon atoms that are connected through a phenyl ring. Discussions herein indicatethat the design of stationary phases which offer high selectivity for particular solutegroups will be possible based on the consideration of molecular-molecular interactions between solutes and stationary phase ligands.
EXPER1MENTAL
New stationary phases were synthesized using reactions developed in our laboratory I
5. Base silica was obtained from Shiseido (Yokohama, Japan). The particle
diameter is ca. 5 !-lm and very low metal impurity concentrations are present. Thesurface area of the silica is ca. 270 m2
• These new materials are p-bis(dimethylphenyl)(BP)- and 1,3,5-tris(dimethylphenyl) (TP)-bonded silicas. For comparison, phenyl (P)and methyl (Cl) bonded silicas were also synthesized. The procedures for synthesizing them are described e1sewhere I5
.
Typical starting silane compounds for BP and TP phases are produced by thefollowing reactions (Me = methyl):
MeMe MeMe" '-<Q}'/Si Si
I \CI Cl
PCl,------;>-
The basic difference between these phases and the generally commercially available phases is the structure on the silica surface. As shown in Fig. 1, BP and TP have aunique structure which covers the silica surface horizontally, whereas P, Cl andgeneral ODS phases are attached vertically to the silica surface by siloxane bonding.As the bidentate or tridentate reagents can form two or three bonds to the silicasurface for each molecule of silane and these multi-bonds produce a multi-membered

LC OF PAHs
A
195
1 1 [-Si-CH3 H CH3~Si-CH3 H (H3-Si-
I I I I Io 0 000I I I I I
-Si--5;--5;--5;--Si-
:::::::::::::::::::::;:::;:::::;:: (R"C'8H37) :=:=:=:=::
1 01HO--t---QH 1
H0--S1---o-SI-OH Ho--Si----QH
b b ?H bI I I I--';--';--51--';--
"';~"'E
Fig. 1. Bonded-phase structures investigated. (A) P; (B) BP; (C) TP; (D) monomeric ODS; (E) polymericODS.
ring with the silica structure, they should lead to increased stability of the attachedligand. The materials synthesized are summarized in Table la, which presents the datafor elemental analysis of carbon. An important consideration with the multidentatesilanes is whether each silicon atom from the silane has reacted with the surface SiOHgroups for a true multidentate attachment, or whether the silane connects by only oneSi-O-Si bond to the surface. In order to confirm the structural differences of the threephenyl-group-bonded phases, P, BP and TP, both solution- and solid-state NMRmeasurements were performed.
13C MAS-NMR spectra were obtained on a Model JNM GX270 FT-NMRspectrometer (lEOL, Tokyo, Japan). The magic angle was set by minimizing the linewidth of the side-bands of the 79Br or 81 Br satellite transitions in KBr. For 13CCP-MAS-NMR, the Hartmann-Hahn matching condition for cross-polarization wascalibrated with admantane and, in order to eliminate spinning side-bands, the TOSSmethod was used. The measurement conditions used were basically the same as thosereported by Kirkland et al. 16
• Solution-state NMR measurements were performed onthe same NMR spectrometer.
Fig. 2 shows the 29Si solution-state NMR spectra of the authentic methoxysilanes (although in the actual synthetic reactions we used chlorosilanes instead of themethoxysilanes), i.e., phenyldimethylmethoxysilane for P, p-bis(dimethylmethoxysilyl)benzene for BP and 1,3,5-tri(dimethylmethoxysilyl)benzene for TP. The spectraindicate that they have almost identical structures with regard to the silicon atoms,because a ca. lO-ppm signal can be assigned to the silicon atom desired. The signal at- 4 ppm is due to 1,1',3,3'-tetramethylsiloxane as the internal standard.
The similar chemical shifts in these spectra suggest that the three silanes havethe same silicon structure because the silicon atoms are connected to two methyl, one

196
TABLE I
STATIONARY PHASES USED IN THIS WORK
(a) Newly synthesized phases"
K. JINNO et al.
Abbrev. Bonded phase
P PhenylBP p-Bis-phenylTP 1,3,5-Tris-phenylCI Methyl
(b) Other phases"
Carbon content (wt.-%)
8.047.977.464.46
Abbrev.
DPDCl8VCI8LCI8FCI8CCl8
Bonded phase
DiphenylOctadecylOctadecylOctadecylOctadecylOctadecyl
Remarks
Ref. 17Develosil-ODS, monomericVydac 201 TPB5-0DS, polymericLC Packings RP-18 180IC89'FineSIL CI8T-5"Capcell Pak CIS' monomeric'
a All phases were packed into the 150 mm x 0.53 mm I.D. fused-silica capillary by the slurrytechnique.
/> All phases except LCI8 were packed into the 150 mm x 0.53 mm I.D. fused-silica capillary by theslurry technique.
, Commercially available microcolumn (150 mm x 0.32 mm I.D.)." Trifunctional phase but looks like a monomeric phase., Polymer-coated CIS phase.
phenyl and one methoxy group as the active site, although the tris-phenylsilane hasthree silicon atoms, the bis-phenylsilane has two and the phenylsilane has only one.
Fig. 3 illustrates the l3C solution-state NMR spectra for these three silanes.Depending on the location of carbon atoms within these silanes, the signals aroundl30-l50ppm are different from each other. The spectra clearly indicate that TP andBP have two positionally different carbon atoms, whereas P has four chemicallydifferent carbon atoms, although the signal intensities do not accurately suggest thenumber of these carbon atoms. In Fig. 4 l3C CP-MAS-NMR spectra are summarizedfor the three bonded silicas. Even though the signal peaks are much broader thanthose of the authentic silanes because these are solid-state NMR spectra, the signalsare consistent with those which appeared in the solution-state spectra. The correspondence can be found by the peak numbers marked in Figs. 3 and 4.
The 29Si CP-MAS-NMR spectra shown in Fig. 5 suggest some different information about the synthesized phases. The signals appearing at ca. 2 ppm for P, BPand TP can be assigned to silicon atoms connected to the phenyl ring and the silicasurface by siloxane bonds and the two signals around - 100 ppm are caused by SiOHand SiO- bondings in the substrate silica. The spectrum for P suggests that it has onlyone such connecting silicon atom, whereas the spectra ofTP and BP indicate that theyhave another type of silicon atom in their structure because of the signals at ca. 1.6ppm.
As Kirkland et 01. 16 reported similar 29Si NMR spectra for bidentate bonded

LC OF PARs 197
phases, it seems that these spectra are not unusual. The presence of the two low-fieldpeaks could be explained by the following two assumptions: dimerization of TP andBP oc:.:urred in the synthetic reaction or different bond angles and conformations ofthe Si-0-Si bonds led to positionally different silicon atoms. However, it is apparentfrom the spectrometric data that the synthesized bonded phases are the desired materials.
For comparison, five different commercially available ODS phases, DevelosilODS (Nomura Chemicals, Seto, Japan; DC18), Vydac 201 TPB5-0DS (SeparationsGroup, Hesperia, CA, U.S.A.; VC18), LC Packings RP-18 (Zurich, Switzerland;LC18), FineSIL C18T-5 (Jasco, Tokyo, Japan; FC18) and Capcell Pak C18 (Shiseido,Yokohama, Japan; CC18), and a diphenyl (DP) phase synthesized in a previousstudy1? were also evaluated. The reason for adding the DP phase for comparison isthat it has been found to have some unique chromatographic properties when compared with ODS phases. These phases are listed in Table lb.
A
A
10 -10
B
ppm
200
B
150 100
ppm
c
ppm
200
c
200
150
150
100
100
50
50
a ppm
a ppm
Fig. 2. 29Si solution-state NMR spectra of the authentic silanes. (A) 1,3,5-Tris(dimethylmethoxysilyl)benzene; (B) p-bis(dimethylmethoxysilyl)benzene; (C) dimethylmethoxysilylbenzene.
Fig. 3. 13C solution-state NMR spectra of the authentic silanes. (A) 1,3,5-Tris(dimethylmethoxysilyl)benzene; (B) p-bis(dimethylmethoxysilyl)benzene; (C) dimethylmethoxysilylbenzene.

198
A
B
3
2
4
5
K. JINNO el al.
c8 6.7
9
Fig. 4. l3C CP-MAS solid-state NMR spectra of the chemically modified silicas. (A) TP; (B) BP; (C) P.
All the phases except LC18 were packed into fused-silica capillaries of (150 mmx 0.53 mm J.D.) by a slurry technique. LC18 was used as supplied by the manufacturer in a 150 mm x 0.32 mm J.D. fused-silica capillary.
The microcolumn LC system consisted of a microfeeder MF-2 as a pump (Azuma Electric, Tokyo, Japan), a Rheodyne (Cotati, CA, U.S.A.) Model 7513 injectorand a Jasco Uvidec .100-III UV detector set at 254 nm. The mobile phases weremixtures of methanol and water and the typical flow-rate used was 2 JlI/min. Chromatographic measurements were performed at least in triplicate. The retention data used

LC OF PAHs
A
V
A.m • . 11 l1.rII. ,.. HI •. "". i \, .II, "~ "11"II"" l' "'VI'
- - OU -15U Pl
B
~
..... J 'N. .J", ." I..I"
- - -
c
199
Fig. 5. 29Si CP-MAS solid-state NMR spectra of the chemically modified silicas. (A) TP; (B) BP; (C) P.
for the evaluation were mean values of these experimental data. For the columndead-volume measurements, sodium nitrite solution (l00 ppm) was used.
PARs used for the evaluation were commercially available, except benzo[a]pyrene (BaP), tetrabenzonaphthalene (TBN) and phenanthro[3,4-c]phenanthrene(PhPh), which were obtained as a gift from J.e. Fetzer of Chevron Research (Richmond, CA, U.S.A.).
RESULTS AND DISCUSSION
Recognition of molecular sizeTo understand the basic chromatographic characteristics of the synthesized
materials, the separation of four small, planar PARs, naphthalene, anthracene, pyrene and chrysene, was attempted. The retention data obtained with methanol-water(70:30) as the mobile phase are summarized in Table II. The chromatogram obtained
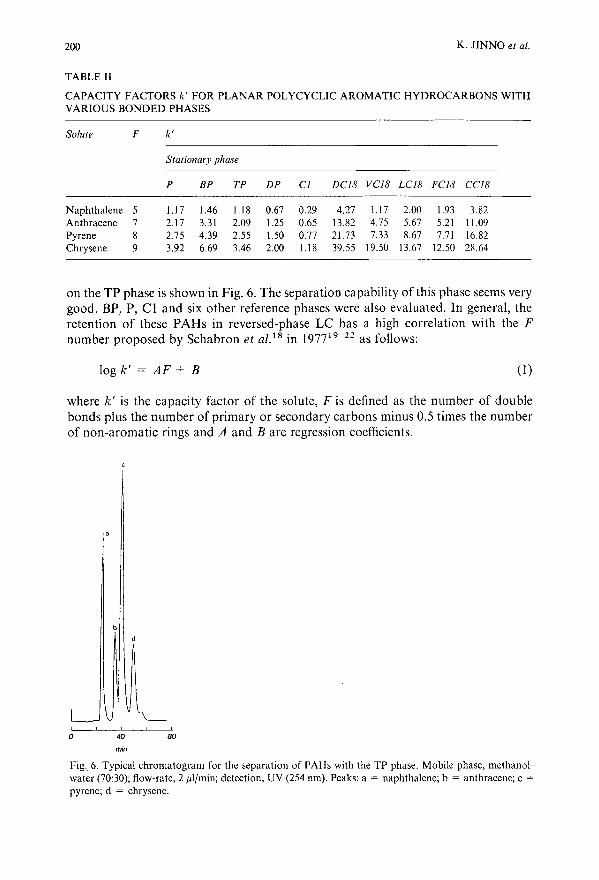
200 K. JINNO et al.
TABLE II
CAPACITY FACTORS k' FOR PLANAR POLYCYCLIC AROMATIC HYDROCARBONS WITHVARIOUS BONDED PHASES
Solute F k'
Stationary phase
P BP TP DP Cl DC18 VC18 LC18 FC18 CCl8
Naphthalene 5 1.17 1.46 1.18 0.67 0.29 4.27 1.17 2.00 1.93 3.82Anthracene 7 2.17 3.31 2.09 1.25 0.65 13.82 4.75 5.67 5.21 11.09Pyrene 8 2.75 4.39 2.55 1.50 0.77 21.73 7.33 8.67 7.71 16.82Chrysene 9 3.92 6.69 3.46 2.00 1.18 39.55 19.50 13.67 12.50 28.64
on the TP phase is shown in Fig. 6. The separation capability of this phase seems verygood. BP, P, Cl and six other reference phases were also evaluated. In general, theretention of these PAHs in reversed-phase LC has a high correlation with the Fnumber proposed by Schabron et al. 18 in 197719
-22 as follows:
log k' = AF + B (1)
where k' is the capacity factor of the solute, F is defined as the number of doublebonds plus the number of primary or secondary carbons minus 0.5 times the numberof non-aromatic rings and A and B are regression coefficients.
80
min
Fig.. 6. Typical chromatogram for the separation of PAHs with the TP phase. Mobile phase, methanolwater (70:30); flow-rate, 2 ttl/min; detection, UV (254 nm). Peaks: a = naphthalene; b = anthracene; c =
pyrene; d = chrysene.

LC OF PAHs 201
TABLE III
RESULTS OF THE REGRESSION ANALYSIS FOR THE CORRELATION BETWEEN LOG k'ANDF
Log k' = AF + B.
Stationary A B F-ratio"phase
P 0.1292 -0.5772 0.999 669BP 0.1630 -0.6440 0.998 529TP 0.1150 - 0.4996 0.998 532CI 0.1482 -1.2663 0.992 128DP 0.1173 -0.7501 0.996 254DCI8 0.2393 -0.5590 0.999 lOISVCI8 0.2953 -1.4159 0.994 158LCI8 0.2087 -0.7304 0.999 922FCI8 0.2015 -0.7143 0.999 1179CCI8 0.2169 -0.4953 0.999 1128
"Statistical significance.
Therefore, the correlation study on the data in Table II was performed by usinga multiregression analysis. The results are summarized in Table III, where regressioncoefficients A and B, correlation coefficients r and statistical F-ratio values are given.The correlation coefficients in all instances are extremely high (> 0.992). However,close examination of the data reveals the difference between ODS phases and phenylbonded phases. The regression coefficients A and B in the eqn. 1 were plotted asshown in Fig. 7. Two main clusters are found: one for ODS phases and the other for
o
phenyl
eCl
:";;c1s'": eDCls/'
1,~~t!S_/ //octadecyl
e velS
-2.0 L-------------- --l
oparameter A
Fig. 7. Plot of parameter A vs. parameter B.
0.40

202 K. JINNO et at.
phenyl-bonded phases. Cl and VC18 are located far from these two groups. Thesetwo unique points can be explained as follows: VCl8 has been reported to be a uniquestationary phase for PAH separations7-10 and Cl is a totally different stationaryphase to the various alkyl-chain-bonded phases with regard to its surface coverageand properties. The large difference between the phenyl-bonded phases and the ODSphases should come from the retention mechanisms, where the hydrophobic interactions and n-n interactions are dominant for the former but only hydrophobic interactions are the main contributor to retention for the latter.
It is clear that, even though TP and BP have unique structures on the silicasurface compared with the P and DP phases, the molecular size recognition capabilityof the former is similar to that of the latter but slightly different to that for the ODSphases.
Recognition 0/ molecular planarityTanaka and co-workers23
-25 investigated the differences in the chromato
graphic properties of various ODS phases with regard to PAH planarity recognitioncapability, and found that ODS phases can be categorized into two main groups, onewith a strong and the other with a low planarity recognition capability. They used theseparation factor between triphenylene and o-terphenyl (k'triphenylene/k'o-terphenyl) asthe indicator, where the former is a planar solute and the latter is non-planar. Theratio of the capacity factors of these two PAHs suggests that the values for polyfunctional ODS phases are larger than 2.0 and those for monofunctional phases are lessthan 2.0. This measure can be useful for evaluating the PAH non-planarity recognition capability of the newly synthesized materials.
TABLE IV
CAPACITY FACTORS k' FOR TRIPHENYLENE (Tri) AND o-TERPHENYL (Ote) AND THE SEP-ARATION FACTORS (a) WITH THREE MOBILE PHASE COMPOSITIONS FOR TEN STATION-ARY PHASES
Mobile phases: methanol-water (80:20, 70:30 and 60:40).
Stationary phase k' a = k'T,Jk'ote
Tri Ote 80:20 70:30 60:40
80:20 70:30 60:40 80:20 70:30 60:40
P 1.23 3.50 11.00 1.08 3.92 13.67 1.14 0.89 0.80BP 1.53 5.58 16.58 1.27 5.50 17.33 1.20 1.0l 0.96TP 0.92 3.36 14.82 1.08 4.55 22.91 0.85 0.74 0.65DP 0.69 1.83 5.00 0.77 2.00 5.42 0.90 0.92 0.92CI 1.00 4.80 a 1.29 7.07 0.78 0.68DCI8 7.50 30.18 115.4 4.67 20.00 69.25 1.61 1.51 1.67VCI8 3.08 10.75 38.50 1.15 4.50 15.42 2.68 2.39 2.50LCI8 3.33 11.33 41.67 2.50 9.83 39.00 1.33 1.15 1.07FCI8 3.46 11.64 2.39 8.43 1.45 1.38CCI8 24.82 19.00 1.31
a Not retainedb _, Not examined.

LC OF PAHs 203
The experimental data obtained with the phases listed in Table I are summarized in Table IV, where the capacity factors of triphenylene and o-terphenyl and theseparation factors with three different compositions of methanol-water mobile phases are shown. It is remarkable that the elution order of the two solutes on the ODSphases is reversed with the TP phase.
As reported by Tanaka and co-workers23-
25, polymeric Vel8 gave separation
factors larger than 2.0 and monomeric ODS phases gave the values between I and 1.7.The values in Table IV for the ODS phases are in good agreement with those reportedby them 23
-25
. For the phenyl-bonded phases, the separation factors are smaller thanthose for the ODS phases. P, BP and DP gave similar values and it appears that theydo not have any recognition capability for the planarity difference between triphenylene and o-terphenyl. The TP phase, however, shows a unique property among thephenyl-bonded phases in its non-planarity recognition capability. The separationfactors are smaller than 0.90, especially with the mobile phase methanol-water(60:40), where the value is 0.65. This means that o-terphenyl has an almost 50% largerretention than triphenylene.
The reason for this unique enhancement of the retention of o-terphenyl with theTP phase can be explained by interpretation of molecular-molecular interactionsbetween the two solutes and the TP. In Fig. 8 a computer molecular graphics technique was applied to this problem. Fig. 8A shows that the methyl groups favour theplanar solute by hydrophobic interaction and they maintain the distance between thesolute and TP to reduce possibility of n-n interactions, where triphenylene can interact with the phenyl ring of the TP phase. However, as shown in Fig. 88, o-terphenyl
A BFig. 8. Molecular-molecular interactions drawn by computer graphics. (A) Interaction between triphenylene and the TP phase; (B) interaction between o-terphenyl and the TP phase.

204 K. llNNO et al.
has a suitable steric structure which can interact well with the phenyl ring of the TPphase. 0-Terphenyl has a high possibility of retention with the TP phase by twomechanisms, hydrophobic interaction of the methyl groups with two phenyl rings ofthe solute and n-n interaction of the phenyl ring of the phase with the central phenylring. This means that, in addition to the hydrophobic interaction between the methylgroups and the solute, more pronounced n-n interactions induce a larger retention ofo-terphenyl with the TP phase than those with other phases.
This theory can also explain the small difference in the separation factors observed with Cl and with TP, where the factors with TP are smaller than those withCl. The larger absolute retention for the solutes with TP than those with Cl shouldalso be noted.
Interpretation of the experimentally obtained data by using the concept ofmolecular-molecular interaction clearly explains the retention mechanism that occursin the separation system and this kind of theoretical approach can open up the possibility of designing new stationary phases suitable for particular separation problemssuch as isomer separations or chiral separations.
The difference between BP and TP is also found in the experimental data. BP ismore similar to the DP than the P phase with respect to the separation factor betweentriphenylene and o-terphenyl. However, other information in Table V indicates a verycomplicated similarity among these stationary phases. The separation factors between triphenylmethane and o-terphenyl are almost identical for seven phases butsmall differences are seen between P and DP and between BP and TP. The separationfactors between p-terphenyl and o-terphenyl show some differences among the phases. VC-l8 prefers to retain rod-like molecules and DCl8 also has a similar but smallerpreference. DP, P and Cl also have similar preference and TP and BP have intermediate preference between the former and the latter phases. Therefore, the molecularrecognition properties of the stationary phases are related to each other in a complexmanner.
In summary, the TP phase has a unique property of recognizing non-planarsolutes in addition to a size recognition capability. Some properties are similar tothose of ODS, but some are similar to those of normal phenyl- or diphenyl-bonded
TABLE V
RETENTION RATIOS AMONG TRIPHENYLMETHANE, o-TERPHENYL AND p-TERPHENYLWITH VARIOUS STATIONARY PHASES
Mobile phase: methanol-water (60:40).
Stationaryphase
Retention ratio
Triphenylmethanelo-terphenyl p-Terphenyllo-terphenyl
PBPTPC1DPDC18VC18
1.441.221.221.191.371.201.21
1.251.551.531.321.292.204.38

LC OF PAHs
BaP TBN
69QjC)
PhPh
205
Fig. 9. Three PAHs used in the stationary phase evaluation.
phases with a characteristic non-planarity recognition capability. Differences betweenCI and TP are also found.
Another useful factor for indicating the planarity recognition capability of stationary phases is the capacity factor ratio between BaP and TBN, suggested by Sander and Wise6,lO,26. They proposed a new solute group for the evaluation of thecapability of planarity recognition in reversed-phase LC, which consists of threePAHs as shown in Fig. 9. BaP is a planar molecule, TBN is bulky and rather nonplanar and PhPh is more non-planar than TBN. These three PAHs can be used tocategorize various ODS phases with respect to their capability to recognize molecularplanarity.
In order to evaluate the capability of the new phases, measurements have beenperformed by using these three PAHs as test samples with methanol-water (90: 10) asthe mobile phase. The results are shown in Table VI. As Sander and Wise suggestedthat the separation factor between TBN and BaP should be lower than 0.7 for polymeric ODS phases and larger than 1.0 for monomeric phases, the experimental datain Table VI seem to be in reasonable agreement for VC18 and DC18, because theformer is a polymeric and the latter a monomeric ODS phase. As the values for theTP and CI phases are similar to that for DCI8, it seems that there is no difference inproperties between CI and TP. They have similar properties with respect to molecularsize discrimination to the monomeric ODS phases. However, one can calculate otherseparation factors between PhPh and BaP and between PhPh and TBN in order toobtain more information about these differences. The separation factors betweenPhPh and BaP indicate the degree of capability for molecular size and planarityrecognition. There are some differences between P and TP, because the values aredifferent from each other. ODS phases gave a more pronounced planarity recognition
TABLE VI
RETENTION DATA FOR BaP, TBN AND PhPh WITH VARIOUS STATIONARY PHASES
Mobile phase: methanol-water (90:10).
Stationary k' G(
phaseBaP TBN PhPh TBN/BaP PhPh/BaP PhPh/TBN
P 0.23 0.48 0.28 2.09 1.22 0.58TP 0.35 0.58 0.47 1.66 1.34 0.81CI 0.13 0.24 0.18 1.85 1.38 0.75DCI8 6.06 9.86 3.60 1.63 0.59 0.37VCI8 6.79 3.64 1.43 0.54 0.21 0.39

206 K. JINNO et al.
TBN
Fig. 10. Relative retentions of three PAHs with various phases. (a) TP; (b) CI; (c) P; (d) YCI8; (e) DCI8.
for BaP. With TP, P and CI, the retention of PhPh is larger than that of BaP. Thisphenomenon was also observed in the retention study on triphenylene and o-terphenyl. The CI phase seems to behave similarly to TP in this instance. Therefore, hydrophobic interactions between PhPh and the methyl groups of CI and TP may be themain contributors to the retention. The ratio for PhPh and TBN suggests some smalldifference between CI and TP. As o-terphenyl is retained longer with TP than withCI, the same retention mechanism caused by n~n interaction should be added to thisproblem for the TP system. As PhPh is more non-planar than TBN, it can be concluded that TP has a much higher non-planarity recognition capability than has CI .
Fig. 10, where the relative retentions of PhPh and BaP to TBN are plotted,illustrates the above discussion more clearly. The similarity between TP and CI seemsto be very high. However, it is possible to conclude that the TP phase is much superiorto the CI phase in chromatographic performance, because the absolute retentionswith TP are higher than those with CI and Kirkland et al. 16 reported that multidentate phases are more stable towards long-term usage for separations.
ACKNOWLEDGEMENTS
The authors express their sincere thanks to Y. Ohtsu of Shiseido for supplyinghigh-purity silica gels and to J. C. Fetzer and W. R. Biggs of Chevron Research foruseful discussions and the provision of some of the PAHs for evaluation. The financial support of a Grant-in-Aid for Scientific Research (C) No. 63550564 from theJapanese Ministry of Education, Science and Culture is also acknowledged.
REFERENCES
I R. G. Harvey (Editor), Polycyclic Hydrocarbons and Carcinogenenis (ACS Symposium Series, Yol. 283),American Chemical Society, Washington, DC, 1985.
2 I. A. Smith, G. D. Berger, P. G. Seybold and M. P. Serve, Cancer Res., 38 (l978) 2968.3 G. H. Loew, J. Phillips, 1. Wong, L. Hieldmeland and G. Pack, Cancer Biochem. Biophys., 2 (1978) 113.4 L. C. Sander and S. A. Wise, Anal. Chern. 56 (l984) 504.

LC OF PAHs 207
5 L. C. Sander and S. A. Wise, J. Chromatogr., 316 (1984) 163.6 L. C. Sander and S. A. Wise, Anal. Chem., 59 (1987) 2309.7 K. Jinno, T. Ibuki, N. Tanaka, M. Okamoto, J. C. Fetzer, W. R. Biggs, P. R. Griffiths and 1. M.
Olinger, J. Chromatogr., 461 (1989) 209.8 K. Jinno, T. Nagoshi, N. Tanaka, M. Okamoto, J. C. Fetzer and W. R. Biggs, J. Chromatogr., 392
(1987) 75. .9 K. Jinno, S. Shimura, N. Tanaka, K. Kimata, J. C. Fetzer and W. R. Biggs, Chromatographia, 27
(1989) 285.10 L. C. Sander and S. A. Wise, LCGC, 8 (1990) 378.11 K. Jinno, J. Chromatogr. Sci., 27 (1989) 729.12 P. Shah, L. B. Rogers and J. C. Fetzer, J. Chromatogr., 388 (1987) 411.13 K. Jinno, S. Shimura, J. C. Fetzer and W. R. Biggs, J. High Resolut. Chromatogr. Chromatogr. Com-
mun., II (1988) 673.14 K. Jinno, S. Shimura, J. C. Fetzer and W. R. Biggs, Poly. Arom. Comp., I (1990) 151.15 H. Nagashima, T. Veda and K. Itoh, in preparation.16 J. J. Kirkland, J. C. Glaich and R. D. Farlee, Anal. Chem., 61 (1989) 2.17 K. Jinno and M. Okamoto, Chromatographia, 18 (1984) 495.18 J. F. Schabron, R. J. Hurtubise and H. F. Silver, Anal. Chem., 49 (1977) 2253.19 K. Jinno and K. Kawasaki, Chromatographia, 18 (1984) 44.20 K. Jinno and K. Kawasaki, Chromatographia, 17 (1983) 445.21 K. Jinno and K. Kawasaki, J. Chromatogr., 316 (1984) I.22 K. Jinno and M. Okamoto, Chromatographia, 20 (1985) 112.23 N. Tanaka, Y. Tokuda, K. Iwaguchi and M. Araki, J. Chromatogr., 239 (1982) 761.24 N. Tanaka, K. Sakagami and M. Araki, J. Chromatogr., 199 (1980) 327.25 K. Kimata, K. Iwaguchi, S. Onishi, K. Jinno, R. Eksteen, K. Hosoya, M. Araki and N. Tanaka, J.
Chromatogr. Sci., 27 (1989) 721.26 L. C. Sander and S. A. Wise, Anal. Chem., 61 (1989) 1749.


Journal o[Chromatography, 517 (1990) 209-217Elsevier Science Publishers B.V., Amsterdam
CHROMSYMP.1956
Gel permeation chromatography-Fourier transform infraredstudy of some synthetic polymers
II. Instrumentation for the characterization of polyethylenea
KOICHI NISHIKIDA*Perkin-Elmer Japan Co. Ltd., 2-8-4 Kitasaiwai, KN Bldg., Nishi-ku, Yokohama 220 (Japan)
TATSUYA HOUSAKI
Polymer Research Laboratory, Idemitsu Petrochemical Co. Ltd., 1-1 Anesaki-Kaigan, Ichihara, Chiba 29901 (Japan)
and
MITSUHIKO MORIMOTO and TOSHIO KINOSHITA
Perkin-Elmer Japan Co. Ltd., 2-8-4 Kitasaiwai, KN Bldg., Nishi-ku, Yokohama 220 (Japan)
ABSTRACT
A high-temperature gel permeation chromatography-Fourier transform infrared (GPC-FT-IR) system was developed to characterize commercially availablepolyethylene. High-temperature transfer tubing was used to connect the highctemperature flow cell of an FT-IR spectrophotometer and a high-temperature GPC system.The GPC-rFT-IR system was calibrated to determine the molecular weight distribution (MWD) and the short-chain branching (SCB) for high-density polyethylene(HDPE) and linear low-density polyethylene (LLDPE). The MWD and SCB of acommercial LLDPE determined using the present GPC-FT-IR system comparedfavourably with those measured with a solvent gradient elution fractionation technique where l3C NMR spectrometry was employed to determine the SCB for thesame PE.
INTRODUCTION
Gel permeation chromatography (GPC) has often been used to characterizesynthetic polymers. GPC separates molecules according to size difference. Themolecular weight distribution (MWD) obtained from GPC is often used to characterize synthetic polymers. In the polymer industry, GPC is commonly used to inspect
a For Part I, see ref. 1.
0021-9673/90/$03.50 © 1990 Elsevier Science Publishers B.V.

210 K. NISHIKIDA el 01.
the molecular weights (MW) and the MWO of polymers for quality controlpurpose2 ,3.
Whereas molecular weights and distributions are convenient parameters tocorrelate with the physical properties of polymers, such as mechanical strength andstress cracking resistance, other properties such as branching, formation of multiplebonds and inversion of head-to-tail sequences also influence not only the chemicalproperties but also the physical properties of synthetic polymers4
. Therefore,spectroscopic methods such as infrared (IR)5 and nuclear magnetic resonance(NMR)6 have been widely adopted as alternative methods for characterizing bulksynthetic polymers.
When an IR spectrometer is connected to a GPC system as a detector, it ispossible to obtain spectroscopic information regarding the chemical composition ofthe polymer fraction in each elution volume instantly. Using a dispersive IRspectrometer as a GPC detector in a stop-and-go mode, Mirabella and Barrall wereable to determine the chemical composition distribution of some copolymers asa function ofMW. Their study showed that there is a drift of the chemical compositionwith respect to molecular weight, although the information obtained by their methodis rather primitive compared with that obtained by complete chemical compositionanalysis. However, information obtained by GPC-IR still provides valuable data onchemical composition as a function of MW for certain polymer manufacturers.A Fourier transform IR (FT-IR) system is the most suitable detector for such studies,as it is capable of obtaining a full-range (4000-700 cm -1) IR spectrum within1 s without stopping the flow.
Recently, linear low-density polyethylene (LLOPE) has become commerciallyimportant, and the distribution of the short-chain branching (SCB) of LLOPE hasbeen found to be heterogeneous. It is claimed in a recent patent application 8 that thedistribution of SCB in the case of high-density polyethylene (HOPE), exhibiting aheterogeneous chemical composition, is related to the physical properties ofPE such asresistance to stress cracking.
We wished to develop a GPC-FT-IR system to determine the SCB as a functionof MW for commercial HOPE and LLOPE. In this paper, the details of sucha GPC-FT-IR system are described, in which GPC is used to separate HOPE andLLOPE on the basis of molecular size and an FT-IR spectrophotometer is used toobtain information on the chemical structure during the GPC analysis. Several kindsof PE were included in this study.
EXPERIMENTAL
InstrumentationA Perkin-Elmer Model 1700 FT-IR spectrometer, equipped with a narrow-band
mercury-eadmium-telluride (MCT) cold detector, and a Model 7700 computer withCDS-3 software for post-run data handling and interfacing to the GPC system, wasused as a detector in combination with a Waters Assoc. Model150C high-temperaturegel permeation chromatograph. A 60-cm TSK-GMH4 column (Toyo Soda) with1,2,4-trichlorobenzene (TCB) or o-dichlorobenzene (ODCB) as solvent was used forpolymer separation. These solvents do not show strong absorption of infrared light inthe range 3000-2700 cm -1 (see below).

GPC-FT-IR OF SYNTHETIC POLYMERS 211
The GPC system, including autosampler, injector, column and refractive index(RI) detector, was operated at l35°C. The column eluate was directed to a heated flowcell (quartz windows, 1 mm optical path length, ca. 30 J11 cell volume). A GPC curvetypically appears ca. 1O~15 min after injection of 1 ml of PE solution. A series ofIRspectra were measured and accumulated for 15 s (seventeen scans) and each piece ofaccumulated data was stored as one file of time-sliced GPC data. Usually ca. 30 fileswere stored for one run, including a few files before and after the peak. It was necessaryto inject 1ml ofsolution to obtain a strong IR signal, although the usual GPC analysisrequires the injection of smaller sample volumes.
In order to ensure that the GPC pattern is free from distortion due to thediffusion in the flow cell and overloading of the sample, the flow was returned to thebuilt-in RI detector through a two-way heated transfer tube. The temperatures of boththe flow cell and the transfer tubing were maintained at 135°C.
MWD, were calculated from GPC curves obtained with the RI and IR detectorsusing a universal calibration method which uses polystyrene standards9
. In this study,the GPC curve constructed from the IR spectra, i.e., the peak area of the C-Hstretching vibration appearing in the range 3000-2700 cm - I, was plotted against theMW of the PE fraction for each retention volume, assuming that the Lambert-Beerlaw holds in this region.
All the stored spectra were automatically processed by the system computer togenerate a report.
Measurement of GPC-FT-IR spectraCommercial samples of LLDPE, HDPE and high-pressure, low-density poly
ethylene (HP-LDPE) dissolved in TCB at a concentration of 3 mg/ml at 135°C wereused. A single-beam IR spectrum was observed before PE was eluted from the columnas a background spectrum and each time-sliced single-beam spectrum of the eluate wasdivided by this background spectrum to give the PE spectrum in the range 30002700 cm -I. All of the IR spectra were measured at 8 cm -I resolution. Thesetime-sliced IR spectra were used to calculate the number of methyl groups per 1000carbon atoms based on the intensity ratio between methyl and methylene groups at2965 and 2928 cm- 1, respectively.
Fractionation and cross-fractionation of PESolvent gradient elution fractionation (SGEF) of 5 g ofa commercial LLDPE-A
(l-octene as co-monomer) was carried out using a column filled with 250 g of Celite(Johns Manville)10.11. Eight fractions were collected and each fraction was characterized by l3C NMR and GPC methods. The detailed procedure for the SGEF-NMRmethod was described in Part II.
Fractionation of LLDPE-A was performed by the temperature-rising elutionfractionation (TREF) technique to cross-fractionate the resin by crystallinity1
2. The
two-step technique involves the deposition of LLDPE from xylene solution at l40°Con inert glass beads by gradually cooling the solution, so that the glass beads will becoated by fractions with poor solubility to xylene as the inner layers and gradually byfractions with higher solubility in the outer layers. When all of the resin had beenprecipitated on the glass beads, the coated polymer layer was extracted with xylene.The extraction was carried out by increasing the temperature slowly from ambient to

212 K. N1SHlKlDA el al.
130°C. A 5-g amount of LLDPE gave twelve fractions. The MWD of the PE resin ineach fraction was measured with the GPC system.
In order to obtain information of the number of methyl groups per 1000 carbonatoms at different MWs, each TREF eluate ofLLDPE-A was fed to the GPC systemand several fractions were collected from each GPC run. PE was drawn from solvent toprepare a PE film and the number of methyl groups was determined using the1381 cm - 1peak intensity due to methyl groups, and their MWs were calculated fromthe GPC data. The experimental procedure and the three-dimensional display of thedata from TREF technique have been described elsewhere13.14.
RESULTS AND DISCUSSION
Determination ofSCE as afunction ofMWD by the GPC-FT-IR method as comparedwith the SGEF-NMR method
The SCB of LLDPE is intentionally introduced by the addition of certain olefinmonomers such as I-butene, I-hexene, I-octene or 4-methyl-I-pentene. For example,I-butene introduces an ethyl side-chain into PE molecules. Hence both the methylgroup in this short chain and the terminal methyl group give rise to a C-H stretchingvibration in the IR spectrum. As the absorptions of methyl and methylene C-Hstretching vibrations appear at 2965 and 2928 cm -1, respectively, the ratio of thenumber of methyl to methylene groups will be given by the intensity ratio of CH3andCH 2 absorptions, A2965(CH3)jA2928(CH2). As the signal intensity of the methylgroup is too weak to be recognized as a peak, the self-deconvolution technique15 wasadopted to reduce the line width and to separate the absorption of methyl groups fromthe intense absorption of methylene groups. The deconvoluted spectrum givesa sufficient signal intensity to be able to calculate the number of methyl groups.
In order to evaluate the branching of PEs, the numbers of methyl groups per1000 carbon atoms, njIOOOC, are calculated in the PE industry. A series of standard PEsolutions were injected into the GPC system without a column and their IR spectrawere measured to give A 2965 and A 2928 values for comparison of the njlOOOC values.
These standards were obtained from I-butene-modified LLDPE using theabove-mentioned cross-fractionation method. We obtained a linear relationshipbetween the number of methyl groups per 1000 carbons and the absorption ratioA2965jA2928. PE standards with similar MWs of ca. 100000 were selected for thispurpose in order to avoid any possible errors due to low- and high-molecular weightextremes.
As one of the two termini of the PE molecule is regarded as a methyl group andanother as a vinyl group16, the degree of SCB was equal to the calculated amountsminus one. The number of terminal methyl groups per 1000 carbon atoms, n(t)jIOOOC,was therefore calculated with the equation
n(t)jI000C = 14000jM (I)
where M is the molecular weight of PE in the eluate.In addition, with LLDPE-A, one co-monomer molecule introduces an addi
tional five CH2 groups, whereas an additional CH 2 group was introduced for theI-butene-modified LLDPE. Therefore, a proper correction should be made in order to

GPC-FT-IR OF SYNTHETIC POLYMERS 213
calculate the SCB accurately when the co-monomers of the standard and the sampleLLDPE are different, as determination of the number of methyl groups depends notonly the methyl group intensity but also on the methylene intensity. For instance, whenI-butene-modified LLDPE is used as a standard and l-octene-modified LLDPE-A isanalysed for SCB, the n/1000C value should be modified to take account of four extramethylene groups which lower the calculated number of methyl groups in l-octenemodified LLDPE. With the assumption that the methylene groups in the side-chainand those in the molecular chain exhibit the same molar absorptivity, the contributionof an extra four in 1000 methylene groups (0.004) should be removed from thecalibration equation. Therefore, the actual value ofSCB, n/IOOOqact), for l-octenemodified LLDPE should be calculated from the observed value, n/lOOOqobs),according to the equation
n/lOOOqact) = n/1000qobs)/{1 - 0.004[n/1000qobs)]} (2)
Fig. 1 shows the SCB as a function of MW determined with the presentGPC-FT-IR method (open circles) and with the SGEF-NMR method (solid circles).The results obtained with these two independent methods coincide completelya. This isalso true even when there is a discontinuity in the MWD of SCB near the top of thepeak in the GPC curve. The results indicate that the proposed GPC-FT-IR methodcan be regarded as more efficient than the SGEF method. Usually the SGEF techniquetakes 2-3 weeks to complete, whereas the present method takes only 1 h to achieve thesame results.
Characterization of LLDPE by GPC~FT-IR
As indicated in the literatures, the TREF method fractionates the PE accordingto the SCB15
, the SGEF method according to molecular weight 16 and the GPCmethod according to molecular size. As stated in the Introduction, the molecular sizedistribution can be approximated as the MWD, as shown in the previous section wherethe GPC-FT-IR method gave identical results with the SGEF-NMR method. In orderto interpret the GPC-FT-IR data, we carried out the cross-fractionation ofLLDPE-Aby the TREF method and compared the data with those given by GPC-FT-IR.
Fig. 2 is a three-dimensional display of the relationship between the MW andSCB of LLDPE-A. Each of the twelve fractions given by the SGEF method wasanalysed by GPC for its MWD. Fig. 2 shows that the fraction with a small n/1000Cvalue (1.4-2) has a narrow MWD and a higher average MW, whereas the MWDbecomes wider and the average MW becomes smaller as the n/1000C value becomeslarger. The average MW determined by GPC analysis of each fraction collected in theTREF method shown in Fig. 2 was plotted against the n/lOOOC value (Fig. 3). Fig. 3indicates that the degree of SCB decreases as the MW of the resin increases, which
a The discrepancy of ca. one methyl group between the GPC-FT-IR and fractionation methodsindicated in Part l' can be explained by the fact that two methyl groups were subtracted from the calculatedvalues in the previous paper, instead of one methyl group as assumed in this paper, Also, the fourth line fromthe bottom of p, 527 in Part II previous paper, should read, "the GPC-FT-IR method always gives onemethyl less than the NMR method",

214
dWd LogM
0.8
0.6
0.4
0.2 0
K. NISHIKIDA et al.
25
20
o 03 4 5
Log M6 7
Fig. I. Molecular weight distribution curve (solid line) detected by GPC-RI and molecular weightdependence of the degree of SCB per 1000 C as determined by (0) GPC-FT-IR and (0) SGEF-NMRmethods.
illustrates a similar relationship between MW and njlOOOC value to that in Fig. I. Thedifference between Figs. 1 and 3 is not surprising, as the GPC-FT-IR methoddetermines the degree of SCB for the narrow MW, whereas the TREF methoddetermines the MWD of the PE fractions at a certain value of SCB.
Application of GPC-FT-IR method to some LLDPE and HDPEAs the present GPC-FT-IR method was found to give the same relationship
between the SCB and MW as those determined from SGEF-13C NMR for thel-octene-modified LLDPE-A, we carried out the characterization of some LLDPEand HDPE samples. Although the SCB of I-butene-modified LLDPE (LLDPE-B)decreased monotonously from 20 to 8 methyl groups per 1000 carbons with increase inmolecular weight, another kind ofcommercial LLDPE (LLDPE-C) showed an almostconstant SCB of 9.5 methyl groups per 1000 carbons over the entire MW range.According to Hosoda16
, LLDPE polymerized with TiCI4 and triethylaluminiumsupported on MgCh as catalysts shows a monotonous decreases in SCB with increaseof MW, whereas the SCB of LLDPE, which is polymerized under homogeneousconditions with a soluble catalyst such as triethylaluminium sesquichloride andvanadium chloride, is almost independent of MW.
As HDPE is reported to have few branchings and, in addition, the branching isconsidered to be SCB17,18, attempts to utilize the present GPC-FT-IR method tocharacterize HDPE were carried out. First, we chose NBS SRM 1475 high densitypolyethylene (HDPE-A) for characterization. The SCB was indeed small (average 2.8methyl groups per 1000 carbons) and was indpendent of MW.

GPC-FT-IR OF SYNTHETIC POLYMERS 215
76
'--::=~ 1.4'-- 2.03.2
""'-----15.6
'-----18.3 (l)
'------f 10.1 CJCo
'-------113.1 i'5''-------115.0 /jj
~.'::::====-::1 18.3 d'...... 19.4
------""121.3
~-------f25.6
5432
Log (molecular weight)
Fig. 2. Three-dimensional display of weight fractions (z-axis) cross-fractionated in terms of molecularweight (x-axis) and short-chain branching (y-axis).
Another material that we have characterized using the GPC-FT-IR method isa commercially available HDPE-B, which is used to make thin film for wrapping bags.Fig. 4 shows two peaks on the GPC curve, whereas the SCB is almost constant, with anaverage value of 5.2 methyl groups per 1000 carbons, over the entire MW range orincreases slightly with an increase in MW. As it is abnormal to observe two peaks onthe GPC curve of PE, the presence of two peaks suggests either that the material isa mixture of two different polymers or that two-step polymerization was carried out tomanufacture the HDPE-B. The above-mentioned patent applicationS suggests thesuperiority of the physical properties of this HDPE-B from the fact that the SCB isindependent of MW.
Finally we shall consider the results for HP-LDPE. As is well known, HP-LDPEhas long-chain branching (LCB) in addition to SCB. As it is not possible to distinguishbetween LCB and SCB by IR spectroscopy, the number of methyl groups per 1000carbon atoms was plotted against MW. It was demonstrated that the average value forHP-LDPE, ca. 26.9 methyl groups per 1000 carbons, is larger than those for LLDPEand HDPE and that the number of methyl groups per 1000 carbon atoms is nearlyindependent 16 of MW. The present results are in agreement with the chemical natureof HP_LDPE l 7,1s.

216
U 20000
~
'".s-ecu(J).....0
'"~Cl 10'"I:)
•
•• •
••••
•
K. NISHIKIDA et al.
4 5
• ••Log (molecular weight)
Fig. 3. Degree of short-chain branching per 1000 carbon atoms of LLDPE-A as a function of molecularweight distribution determined by the TREF method.
35 0.07c:0-e 30 0.06cou
0g 25 •• 0.05 '"- • ••• ••• •• u
•• c:co
Cl ••• 0.04 ..Clc: 20 • ~:c •u • ..Clc: • <l:E 15 o. 0.03
..Cl • 0:c: 0'iij • •.<:: 10 • 0.02ue • 00 •0 • 0.<:: o 0 0.01(J) 5 00 0 0
0 00000 0 000 00 •o 0
0102
I I I I0
103 104 105 106 107
Molecular weight
Fig. 4. Extent ofshort-chain branching per 1000 carbon atoms ofHDPE-B as a function ofmolecular weight(0, left-hand ordinate) and GPC curve as measured by IR absorbance (., right-hand ordinate).

GPC-FT-IR OF SYNTHETIC POLYMERS
CONCLUSION
217
The GPC-FT-IR method was found to be an excellent substitute for theSGEF-NMR method and can differentiate several kinds of LLDPE and HDPEaccording to the SCB. However, the GPC-FT-IR method, which is a two-dimensionalanalysis, gives only the variation of the average chemical composition, such as the ratioof co-monomer to ethylene monomer as a function of MW. Even with sucha limitation, the method can differentiate several types of polyethylene for industrialpurposes.
REFERENCES
1 T. Housaki, K. Satoh, K. Nishikida and M. Morimoto, Makromol. Chern. Rapid Commun., 9 (1988) 525.2 1. C. Moore, l. Polym. Sci., Part A2, (1964) 835.3 L. H. Tung (Editor), Fractionation of Synthetic Polymers, Marcel Dekker, New York, 1977.4 Asahi Kasei, lpn. Pat., SH060-26049 and SH060-26050 (1985).5 D. O. Hummel, Atlas of Polymer and Plastics Analysis, Vol. 2, Part bll Text, Carl Hanser Verlag,
Munich, 2nd ed., 1988.6 F. A. Bovey, High Resolution NMR of Macromolecules, Academic Press, New York, 1972, and
references cited therein.7 F. M. Mirabella, Jr. and E. M. Barrall, II, l. Appl. Polym. Sci., 19 (1975) 2131.8 Showa Denko, lpn. Pat., SH061-43379 (1986).9 S. Mori, l. Appl. Polym. Sci., 18 (1974) 2391.
10 L. H. Tung, l. Polym. Sci., 20 (1971) 1607.11 R. Chinag, l. Phys. Chern., 69 (1965) 1636.12 L. Wild, T. Ryle, D. Knobelock and I. Peat, l. Polym. Sci., Polym. Phys. Ed., 20 (1982) 441.13 S. Nakano and Y. Goto, J. Appl. Polym. Sci., 26 (1981) 4217.14 F. M. Mirabella, Jr. and E. A. Ford, J. Polym. Sci., Part B, 25 (1987) 777.15 D. W. Maya, L. J. Bellamy, G. T. Merkin and R. W. Hannah, Spectrochim. Acta, Part A, 41 (1985) 335.16 S. Hosoda, Polym. J., 20 (1988) 383.17 K. Shirayama, T. Okada and S. Kita, J. Polym. Sci., Part A3, (1977) 907.18 W. D. Hoffman, G. Eckhardt, E. Brauer and F. Keller, Acta Polym., 31 (1980) 233.


Journal of chromatography, 517 (1990) 219-228Elsevier Science Publishers B.V., Amsterdam
CHROMSYMP. 1948
Isolation and purification of lecithin by preparative highperformance liquid chromatography
JOHN V. AMARI and PHYLLIS R. BROWN*
Department of Chemistry, University of Rhode Island, Kingston, RI02881 (U.S.A.)
CHARLES M. GRILL
Separations Technology, Inc., Wakefield, RI02879 (U.S.A.)
and
JOSEPH G. TURCOTTE
Department of Medicinal Chemistry, University of Rhode Island, Kingston. RI02881 (U.S.A.)
ABSTRACT
Mixed-chain, multispecies, egg yolk-derived lecithin was isolated and purifiedon a silica column with isocratic elution. A method development column (20 x 0.46cm J.D.) packed with YMC 15-'-30 ,urn, 120 A spherical silica and a mobile phaseconsisting of 5 mM ammonium acetate in acetonitrile-2-propanol-methanol--water(80:13:5:12) was used to separate the lecithin from other phospholipids. The mobilephase conditionsJ8!"the method development system was adopted for two types ofpreparative HPLC systems: a Separations Technology SepTech NovaPrepTM 5000system with a 20 x 1.93 cm J.D. column and a ST j800A system with a 20 x 5.00 cmJ.D. Annular Expansion™ (A/E) column. The maximum load was 50 ,ul of crudesolution (2 mg) for the method development column, 0.90 ml (35 mg) for the 20 x1.93 cm J.D. column and 6.0 ml (240 mg) for the 20 x 5.00 cm J.D. AjE column. Theflow-rates were 2, 35 and 235 mljmin, respectively. The fractions col1ected from thepreparative systems were analyzed for purity by analytical-scale high-performanceliquid chromatography and by thin-layer chromatography with selective detectionwith molybdenum blue for phospholipids and detection of al1 organic compounds bysulfuric acid. Purity of the recovered lecithin was greater than 99%.
INTRODUCTION
Natural lecithin does not exist as a discrete compound but is composed ofa choline polar head and multimolecular species of varying fatty acid chain lengths anddegrees of unsaturation1 (Fig. I). Besides being a naturally occurring emulsifier andsurfactant, lecithin is also of interest as starting material for the synthesis of novelanti-viral and anti~tumordrugs2
-6
. Since purified lecithin was needed for the synthesis
0021-9673/90/$03.50 © 1990 Elsevier Science Publishers B.V.
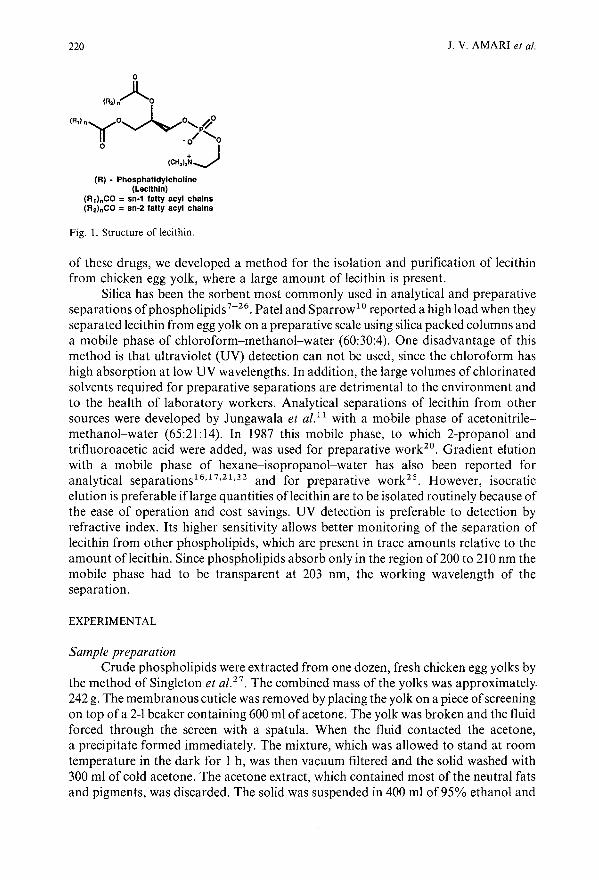
220
(R) - Phosphatldylcholine(Lecithin)
(R')nCO = sn-1 fatty acyl chains(R')nCO = sn-2 fatty acyl chains
Fig. 1. Structure of lecithin.
J. V. AMARI et al.
of these drugs, we developed a method for the isolation and purification of lecithinfrom chicken egg yolk, where a large amount of lecithin is present.
Silica has been the sorbent most commonly used in analytical and preparativeseparations ofphospholipids7-26. Patel and Sparrowl °reported a high load when theyseparated lecithin from egg yolk on a preparative scale using silica packed columns anda mobile phase of chloroform-methanol-water (60:30:4). One disadvantage of thismethod is that ultraviolet (UV) detection can not be used, since the chloroform hashigh absorption at low UV wavelengths. In addition, the large volumes of chlorinatedsolvents required for preparative separations are detrimental to the environment andto the health of laboratory workers. Analytical separations of lecithin from othersources were developed by Jungawala et al. ll with a mobile phase of acetonitrilemethanol-water (65:21:14). In 1987 this mobile phase, to which 2-propanol andtrifluoroacetic acid were added, was used for preparative work20
. Gradient elutionwith a mobile phase of hexane-isopropanol-water has also been reported foranalytical separations l6 ,l7,2l,12 and for preparative work 25 . However, isocraticelution is preferable iflarge quantities oflecithin are to be isolated routinely because ofthe ease of operation and cost savings. UV detection is preferable to detection byrefractive index. Its higher sensitivity allows better monitoring of the separation oflecithin from other phospholipids, which are present in trace amounts relative to theamount oflecithin. Since phospholipids absorb only in the region of200 to 210 nm themobile phase had to be transparent at 203 nm, the working wavelength of theseparation.
EXPERIMENTAL
Sample preparationCrude phospholipids were extracted from one dozen, fresh chicken egg yolks by
the method of Singleton et al. 2 7. The combined mass of the yolks was approximately242 g. The membranous cuticle was removed by placing the yolk on a piece ofscreeningon top of a 2-1 beaker containing 600 ml ofacetone. The yolk was broken and the fluidforced through the screen with a spatula. When the fluid contacted the acetone,a precipitate formed immediately. The mixture, which was allowed to stand at roomtemperature in the dark for I h, was then vacuum filtered and the solid washed with300 ml of cold acetone. The acetone extract, which contained most of the neutral fatsand pigments, was discarded. The solid was suspended in 400 ml of95% ethanol and

HPLC OF LECITHIN 221
stored in the dark for 2 h. The mixture was vacuum filtered and the solids washed with100 ml 95% ethanol. The ethanol extracts were combined and dried at 30-40°C. Todissolve the phospholipids, two (l00 ml) portions of petroleum ether were added to theresidue. The petroleum ether solutions were combined and reduced in volume withrotary vacuum distillation by a factor of 3 to approximately 70 ml. When the solutionwas poured into a beaker containing 400 ml of cold acetone, a precipitate formedimmediately. The mixture was allowed to stand in the dark at room temperatureovernight until the solution cleared. The clear solution was decanted and the yellowsolid (11.9 g) was washed with cold acetone. The phospholipids were dissolved inmethylene chloride, dried and stored in the freezer under nitrogen.
MaterialsAll solvents and reagents (Fisher, Pittsburgh, PA, U.S.A.) used for the
extraction, method development and analytical analysis were of HPLC grade. Thewater was doubly distilled and deionized. Each solvent was filtered through a 0.45-/lmNylon-66 filter (AllTech, Deerfield, IL, U.S.A.). For the preparative separationsreagent grade solvents also from Fisher were used.
Standard egg yolk phospholipids, i.e. lecithin, lysophosphatidylethanolamine(LPE) and sphingomyelin (SPH) were obtained from Sigma (St. Louis, MO, U.S.A.);phosphatidylethanolamine (PE) and lysolecithin from Avanti Polar Lipids (Birmingham, AL, U.S.A.). These standards were used to characterize the phospholipids anddetermine retention times on the method development and analytical systems. Theconcentration of each standard was 1 mg/ml.
A stock solution of phospholipids from the egg yolks was prepared: 2.01 g of theegg yolk phospholipids were dissolved in 5 ml of absolute ethanol and 4.9 ml ofmethanol. To the alcohol solution, 0.1 ml of 10% butylated hydroxytoluene (BHT) inmethanol was added as an antioxidant. The stock solution was filtered througha 0.45-/lm filter. From the stock solution, 3 ml were removed and diluted with 15 ml ofmethanol. This working solution contained 40.3 /lg of phospholipids/Ill.
Method developmentThe chromatographic system used for the method development studies consisted
of a Waters 6000A pump (Waters Division, Millipore, Milford, MA, U.S.A.),a Rheodyne 7125 injector (Rheodyne, Berkeley, CA, U.S.A.), a Knauer variablewavelength detector set at 203 nm with a sensitivity of0.64 a.u.f.s. (Sonntek, WoodcliftLake, NJ, U.S.A.), and a method development column 20 x 0.46 em J.D., packed withYMC 15-30 /lm, 120 Aspherical silica (Yamamura, Kyoto, Japan). The column waspacked using a Haskel Pump (Haskel, Burbank, CA, U.S.A.). The isocratic mobilephase was 5 mM ammonium acetate in acetonitrile-2-propanol-methanol-water(80:13:5:12) at a flow-rate of 2.0 ml/min. The chromatograms were recorded on anHP 3393A integrator (Hewlett-Packard, Avondale, PA, U.S.A.) at 0.2 em/min, and anOmniscribe recorder (Houston Instruments, Austin, TX, U.S.A.) at 0.5 em/min. Allseparations were achieved at ambient temperature.
Preparative high-performance liquid chromatography (HPLC)Two preparative systems were used for the isolation of lecithin: a SepTech
NovaPrepTM 5000 (NovaPrep) and a SepTech ST/800A (800A) (Separations Tech-

222 J. V. AMARI et al.
nology, Wakefield, RI, U.S.A.). With the NovaPrep a ST/2001A column (20 x1.93 cm J.D.) was used; with the 800A, a ST/3002B Annular Expansion™ (A/E)column (20 x 5.00 cm J.D.). Each column was packed with YMC 15-30 ~m, 120 Aspherical silica. The NovaPrep column was packed under high pressure using a Haskelpump, while the A/E column was slurry packed.
The NovaPrep column was equilibrated with the mobile phase at a flow-rate of35 ml/min. A Knauer variable-wavelength detector set at 203 nm, with a sensitivity of0.64 a.u.f.s., was used to monitor the separation. The NovaPrep was under computercontrol, utilizing TurboPrepTM software (Separations Technology). The program wasset for an equilibration time of 10 min, injection time of 0.3 min and a run time of60 min. The working solution was manually injected with a syringe. Data wererecorded on both a strip chart recorder and an HP 3393A integrator.
The 800A column was operated under manual control and the A/E columnequilibrated with a mobile phase of 5 mM ammonium acetate in acetonitrile2-propanol-methanol-water (80: 13:5: 12) for 20 min at a flow-rate of 235 ml/min(percent flow-rate 56%). The Knauer detector with the same settings was used.
Analytical analysisEach fraction was analyzed for purity with a Waters 6000A pump, Rheodyne
7125 injector, a Schoeffel Spectro Flow Monitor SF 770 variable-wavelength detectorset at 203 nm, with a sensitivity of 0.1 a.u.f.s. (Schoeffel Instrument Division, Kratos,Westwood, NJ, U.S.A.) and a 10 x 0.46 cm J.D. column containing 8-12 ~m Gracesilica (W. R. Grace, Baltimore, MD, U.S.A.). The flow-rate was 2.5 ml/min and themobile phase consisted of acetonitrile-methanol-water (40:9:6).
Prior to HPLC analysis, the fractions were concentrated by rotary vacuumdistillation at a temperature range of 30 to 40°C (Table I). Of each fraction 100 ~I wereanalyzed. The fractions containing purified lecithin were pooled and the remainingsolvent was removed by lyophilization. A yellowish-white solid was left, which wasa mixture of the purified lecithin and ammonium acetate. The lecithin was extractedwith methylene chloride. The methylene chloride solution was reduced in volume toless than 10m!. The final traces of the solvent were removed by a stream of nitrogen.The mass of the lecithin was then determined.
Each fraction was also analyzed with thin-layer chromatography (TLC) sincethe spots could be detected visually. The mobile phase was composed of chloroformmethanol-water (60:30:4)11. The fractions were spotted on silica plates (Fisher)against the phospholipid standards and working solution. The plates were developed
TABLE I
VOLUME OF COLLECTED AND CONCENTRATED FRACTIONS
System Volume collectedper fraction(ml)
Method development 4NovaPrep 5000 70ST/800A 230
Reduced volume(ml)
0.51040

HPLC OF LECITHIN 223
by two methods: molybdenum blue (Sigma, St. Louis, MO, U.S.A.) which is specificfor phospholipids, and sulfuric acid which visualizes all organic compounds.
RESULTS AND DISCUSSION
The mobile phase composition was optimized to provide a reasonable capacityfactor for the lecithin and the best selectivity for the separation of lecithin from otherphospholipids which are present in egg yolk. Since the mobile phase had little low endUV absorption, the separation of phospholipids could be monitored in the 200206 nm region. A l-,ug/,ul mixture of the standards was analyzed using the methoddevelopment column. The PE and LPE, which had retention times of 4.7 and 7.8 min,
,....ss::
~ 3'-'
tilU
~til0CI.l~ .. 5
o 5 10 15 20 25 30 35 40TIME, min
Fig. 2. Method development chromatograms of phospholipid standard mixture, 100 pI of l pg of eachphospholipid/pI. Peak identification: I = PE,2 = LPE,3 = lecithin,4 = SPH and 5 = lysolecithin.Conditions as given in Experimental section.
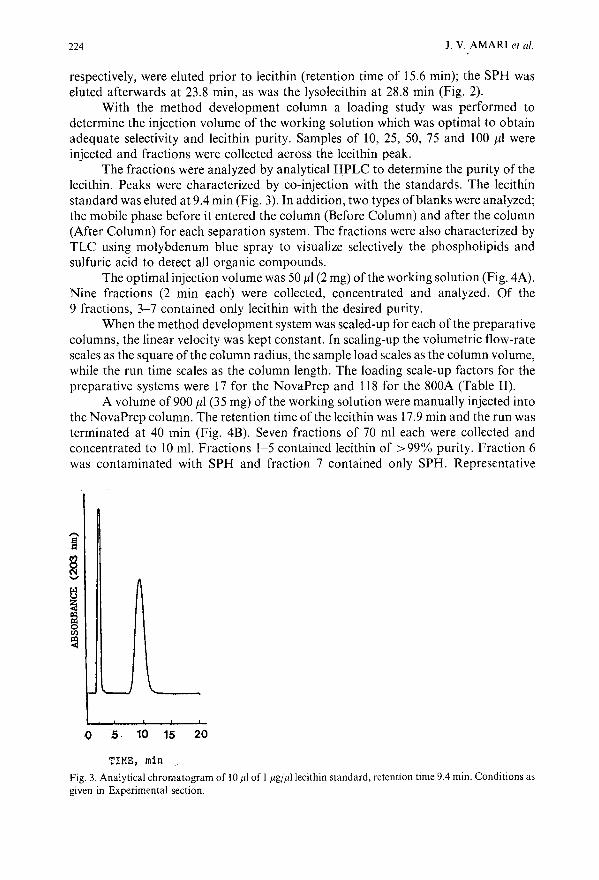
224 J. V. AMARI et al.
respectively, were eluted prior to lecithin (retention time of 15.6 min); the SPH waseluted afterwards at 23.8 min, as was the lysolecithin at 28.8 min (Fig. 2).
With the method development column a loading study was performed todetermine the injection volume of the working solution which was optimal to obtainadequate selectivity and lecithin purity. Samples of 10, 25, 50, 75 and 100 J11 wereinjected and fractions were collected across the lecithin peak.
The fractions were analyzed by analytical HPLC to determine the purity of thelecithin. Peaks were characterized by co-injection with the standards. The lecithinstandard was eluted at 9.4 min (Fig. 3). In addition, two types ofblanks were analyzed;the mobile phase before it entered the column (Before Column) and after the column(After Column) for each separation system. The fractions were also characterized byTLC using molybdenum blue spray to visualize selectively the phospholipids andsulfuric acid to detect all organic compounds.
The optimal injection volume was 50 III (2 mg) of the working solution (Fig. 4A).Nine fractions (2 min each) were collected, concentrated and analyzed. Of the9 fractions, 3-7 contained only lecithin with the desired purity.
When the method development system was scaled-up for each of the preparativecolumns, the linear velocity was kept constant. In scaling-up the volumetric flow-ratescales as the square of the column radius, the sample load scales as the column volume,while the run time scales as the column length. The loading scale-up factors for thepreparative systems were 17 for the NovaPrep and 118 for the 800A (Table II).
A volume of900 J11 (35 mg) of the working solution were manually injected intothe NovaPrep column. The retention time of the lecithin was 17.9 min and the run wasterminated at 40 min (Fig. 4B). Seven fractions of 70 ml each were collected andconcentrated to 10 m!. Fractions 1-5 contained lecithin of > 99% purity. Fraction 6was contaminated with SPH and fraction 7 contained only SPH. Representative
05 10 15 20
TIME, minFig. 3. Analytical chromatogram of 10 Jil of I Jig!Jillecithin standard, retention time 9.4 min. Conditions asgiven in Experimental section.

HPLC OF LECITHIN 225
3 5 7 9
A
c
B
25 3Q 35 40 4513
o 5 1015 20 25 30 35 40 45
3 5
"EC
8e<ilu~gj0<Ilo:l«:
0 5 10
o 5 10 15 20 25 30 35 40 45TIME. min
Fig. 4. Chromatograms of crude egg yolk phospholipids: (A) method development chromatogram (2 mg).(B) NovaPrep 5000 separation (35 mg), (C) ST/800A separation (241 mg). Retention time oflecithin; 14.9,17.9 and 18.0 min, respectively. Conditions as given in Experimental section.

226
TABLE II
HPLC SCALE-UP
J. V. AMARI et 01.
Column J.D. Length Load Flow-rate Run time Solvent(em) (em) (g/run) (ml/min) (h) usage (I/run)
ST/2020 0.46 20.00 0.002 2.0 0.83 0.10ST/2001A 1.93 20.00 0.035 35.2 0.83 1.76ST/3002B 5.00 20.00 0.236 236.3 0.83 11.81
analytical chromatograms of the fractions are shown in Fig. 5. Confirmation of puritywas made by using TLC with two staining methods. For each fraction there was onlyone spot whose RF factor corresponded to that of the standard sample of lecithin. Inthe pooled fractions (1-5) 25 mg of pure lecithin was recovered (72% recovery).
When 6 ml (241 mg) ofthe working solution were manually injected directly ontothe AlE column, the lecithin was eluted at 18.0 min and the run was terminated at43 min (Fig. 4C). Fifteen fractions of 230 ml each, 1 min in length, were manuallycollected. Each fraction was concentrated to 40 ml and an aliquot analyzed. Fraction Icontained a minor component which was eluted prior to the lecithin. Fraction 13contained only a very small amount of lecithin, whereas 14 and 15 did not have anydetectable amounts oflecithin; therefore fractions I and 13-15 were not included in thepooled fractions. Representative chromatograms of the analyzed fractions are shown(Fig. 6). The amount of lecithin recovered was 130 mg (54% recovery).
The lecithin from each preparative system was dissolved separately in 1 ml ofabsolute ethanol and aliquots of 10 III of each sample were reanalyzed. The lecithin
,.... ,.... ,....e e ec c c
8 M M0 0 C('II A ('II B ~~ ~
~ ~ ~u u uz z z<l; <l; <l;<l:l <l:l <l:lp:; p:; p:;0 0 0tJ) tJ) tJ)<l:l <l:l <l:l<l; <l; <l;
o 5 10 ·15 20
TIME, min
05101520
TIME, min
o 5 10 15
TIME, min
20
Fig. 5. Analytical HPLC of lecithin containing fractions obtained from the NovaPrep 5000: (A) mobilephase (After Column) blank, (B) fraction I, (C) fraction 3. For conditions see Experimental section.
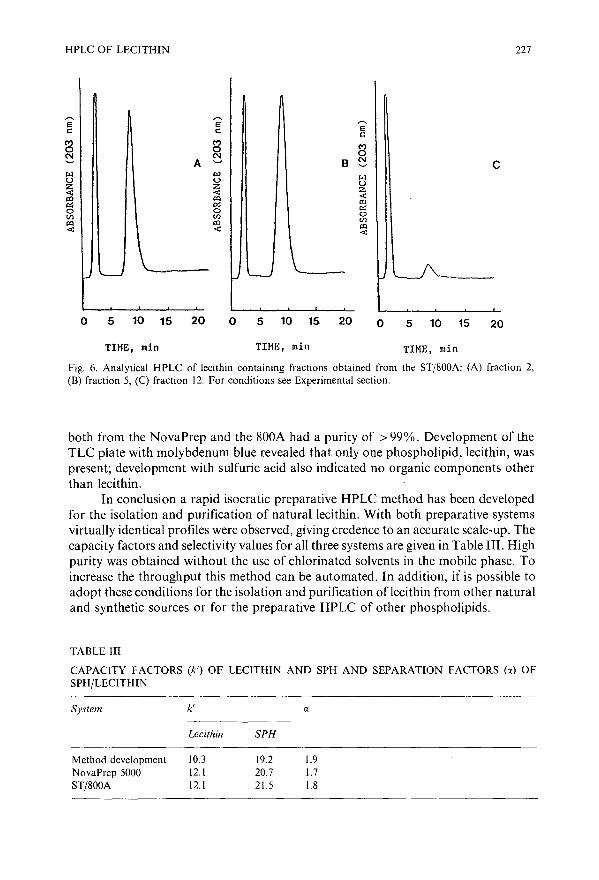
HPLC OF LECITHIN
,....E! E Ec c c
M M Ma a~ C'l a
A '--' B C'lC'--'
ILl ILl ILlU UZ Z U..,; ..,; Z
<t:l:Q l:Q l:Q~ ~
~0 0Vl Vl 0
Vl<Q <Q <Q..,; <t: <t:
227
o 5 10 15 20
TIME, min
o 5 10 15 20
TIME, min
o 5 10 15
TIME, min
20
Fig. 6. Analytical HPLC of lecithin containing fractions obtained from the ST/800A: (A) fraction 2,(B) fraction 5, (C) fraction 12. For conditions see Experimental section.
both from the NovaPrep and the 800A had a purity of > 99%. Development of theTLC plate with molybdenum blue revealed that only one phospholipid, lecithin, waspresent; development with sulfuric acid also indicated no organic components otherthan lecithin.
In conclusion a rapid isocratic preparative HPLC method has been developedfor the isolation and purification of natural lecithin. With both preparative systemsvirtually identical profiles were observed, giving credence to an accurate scale-up. Thecapacity factors and selectivity values for all three systems are given in Table III. Highpurity was obtained without the use of chlorinated solvents in the mobile phase. Toincrease the throughput this method can be automated. In addition, it is possible toadopt these conditions for the isolation and purification oflecithin from other naturaland synthetic sources or for the preparative HPLC of other phospholipids.
TABLE III
CAPACITY FACTORS (k') OF LECITHIN AND SPH AND SEPARATION FACTORS (0:) OFSPH/LECITHIN
System k' 0:
Lecithin SPH
Method development 10.3 19.2 1.9NovaPrep 5000 12.1 20.7 1.7ST/800A 12.1 21.5 1.8

228
ACKNOWLEDGEMENTS
1. V. AMARI et al.
We thank YMC, Inc. of Morris Plains, NJ, U.S.A. for donating the SiOz used inthe method development, semi-preparative and preparative columns. We also thankScott Lawing of SepTech for packing the method development and preparativecolumns. This research was supported in part by a grant from the U.S. NationalInstitute of Allergy and Infections Diseases (AI25690), National Coorperative DrugDiscovery Group for the treatment of AIDS.
REFERENCES
I Y. 1.-K. Hsieh, D. K. Welch and 1. G. Turcotte, Lipids, 16 (1981) 761.2 C. R. H. Raetz, M. Y. Chu, S. P. Srivastava and 1. G. Turcotte, Science (Washington, D.C.), 196 (1977)
303.3 1. G. Turcotte, S. P. Srivastava, W. A. Meresak, B. A. Rizkalla, F. Louzon and T. P. Wunz, Biochim.
Biophys. Acta, 619 (1980) 604.4 1. G. Turcotte, S. P. Srivastava, 1. M. Steim, P. Calabresi, L. M. Tibbetts and M. Y. Chu, Biochim.
Biophys. Acta, 619 (1980) 619.5 V. C. M. Yang, 1. G. Turcotte and 1. M. Steim, Biochim. Biophys. Acta, 68 (1982) 375.6 M. S. Bermel, 1. G. Turcotte, 1. M. Steim and R. H. Notter, J. Col/oid Inter! Sci., 115 (1987) 167.7 K. Aitzetmuller, J. Liq. Chromatogr., 113 (1975) 231.8 A. Kuksis and 1. 1. Myher, J. Chromatogr., 379 (1986) 57.9 F. G. Hegardt and L. 1. Vicedo, Revista De La Academia De Ciencias Exactas, Fisico-Quimics
Y Naturales, 29 (1974) 119.10 K. M. Patel and 1. T. Sparrow, J. Chromatogr., 150 (1978) 542.II F. B. 1ungalwala, 1. E. Evans and R. H. McCluer, Biochem. J., 155 (1976) 55.12 M. L. Rainey and W. C. Purdy, Anal. Chim. Acta, 93 (1977) 211.13 1. R. Nielsen, Lipids, 15 (1980) 481.14 W. S. M. Geurts van Kessel, M. Tieman and R. A. Demel, Lipids, 16 (1981) 58.15 R. W. Gross and B. E. Sobel, J. Chromatogr., 197 (1980) 79.16 V. L. Hanson, 1. Y. Park, T. W. Osborn and R. M. Kiral, J. Chromatogr., 201 (1981) 393.17 1. R. Yandrasitz, G. Berry and S. Segal, J. Chromatogr., 255 (1981) 319.18 S.-S. Chen and A. Y. Kou, J. Chromatogr., 227 (1982) 25.19 T. L. Kaduce, K. C. Norton and A. A. Spector, J. Lipid Res., 24 (1983) 1398.20 S. Bahrami, H. Gasser and H. Redl, J. Lipid Res., 28 (1987) 596.21 W. S. M. Geurts van Kessel, W. M. A. Hax, R. A. Demel and 1. DeGier, Biochim. Biophys. Acta, 486
(1977) 524. .22 W. M. A. Hax and W. S. M. Geurts van Kessel J. Chromatogr., 142 (1977) 735.23 R. S. Fager, S. Shapiro and B. 1. Litman, J. Lipid Res., 18 (1977) 704.24 N. A. Porter, R. A. Wolf and 1. R. Nixon, Lipids, 14 (1978) 20.251. S. Ellingson and R. L. Zimmerman, 1. Lipid Res., 28 (1987) 1016.26 1. Boswart, T. Schmidt, P. Kostiuk, V. Pacakova and K. Stulik, J. Chromatogr., 495 (1989) 61.27 W. S. Singleton, M. S. Gray, M. L. Brown and 1. L. White, J. Am. Oil Chem. Soc., 42 (1965) 53.

Journal of Chromatography, 517 (1990) 229-256Elsevier Science Publishers B.V., Amsterdam
CHROMSYMP. 1929
Optimization of the experimental conditions in preparativeliquid chromatography with touching bands
SADRODDIN GOLSHAN-SHIRAZI and GEORGES GUIOCHON*
*Department of Chemistry, University of Tennessee, Knoxville, TN 37996-1600 and Division of AnalyticalChemistry, Oak Ridge National Laboratory, Oak Ridge, TN 3783 1-6120 (U.S.A.)
ABSTRACT
Relationships are derived between the sample size permitting the elution of thecomponents ofa binary mixture as two touching bands and the parameters characterizing the separation and the column performance. These equations take into accountthe competitive interactions of the mixture components. They permit the determination of the optimum experimental conditions for maximum production rate withtouching band elution.
The production rate increases monotonically with increasing inlet pressureavailable, provided that the column of optimum characteristics is used. For a givencolumn, there is an optimum flow velocity and hence an optimum inlet pressure.Because of the competition between the mixture components for interaction with thestationary phase, the production rate under touching band conditions can be larger(under conditions of a predominant displacement effect) or lower (under conditionsof a predominant tag-along effect) than the value derived when this competition isignored.
INTRODUCTION
The optimization of experimental conditions for preparative chromatographyis an important subject which has been actively studied in the recent years 1.
Experimentalists have tried to generalize their observationsz- s. Various theoreticalapproaches have been used to derive either qualitative rules6- 10 or quantitativeprocedures for the calculation of optimum values of the parameters of a chromatographic separation6-8,1o. Considerable confusion and some level of controversy arestill understandably observed in an area where even the objectives are not alwaysclarified. Depending on the type of work conducted, very different strategies arepossible ll . The preparation of small amounts of purified material needed for furtherinvestigations of its properties cannot be carried out following the same methods andprinciples as the industrial production oflarge amounts of pure compounds to be soldas drugs or fine chemicals. The time spent in developing and optimizing the separation
0021-9673/90/$03.50 © 1990 Elsevier Science Publishers B.V.

230 S. GOLSHAN-SHIRAZI, G. GUIOCHON
is a major cost in the former instance and must itself be minimized. More subtleproblems are still poorly understood. The optimum conditions for maximumproduction rate are very different for the first and the second component of a pair ofcomponents, especially if their relative concentration is far from unitylo. Finally,specific requirements regarding the recovery yield and the fraction purity may affectconsiderably the outcome of the optimization process.
We have discussed recently the optimization of the experimental conditions forthe purification of the second component of a bin,ary mixture7,8. We took into accountthe competition between the two components for interaction with the stationary phaseand the finite column efficiency. We also allowed slight band overlap by consideringthe cases when the required purity of the prepared product can be 99% or lower andaccepting low recovery yields (e.g., 60%). We showed that a considerable increase inthe production rate is permitted by the use of high-performance columns at highreduced flow velocities8 ,lo,12.
Nevertheless, there is still great interest among practitioners in the "touchingbands" case6
. This permits the achievement of a recovery yield close to 100% and atthe same time the production of nearly 100% pure compounds. The determination ofthe cutting time is straightforward and all the information required for the operationof the chromatograph is available from the detector signal. No separate on-lineanalysis of the eluate is necessary for the proper operation of the instrument. Theinfluence of minor fluctuations in column temperature, sample size, mobile phasevelocity and possibly composition has little consequence on the degree of bandinterference, so the control of the chromatograph is much simpler.
Knox and Pyper6 discussed the optimization of the experimental parameters inthe touching band case. They made two restrictive assumptions: first they assumedthat both band profiles are right triangles and second they neglected the competitionbetween the two components and assumed that their elution is independent of eachother. These assumptions are necessary for a simple, general solution of the problem.The extent to which they affect the end result has never been investigated. Recently,Snyder and COX
13 reformulated the equations derived by Knox and Pyper6,
multiplying the number of non-independent equations and obfuscating the issuewithout contributing to the solution.
The purpose of this paper is the investigation of the solution of the optimizationproblem in the case of touching bands for components havinga Langmuir competitiveisotherm and a separate assessment of the errors introduced by the two assumptionsmade by Knox and Pyper6
. The problem is investigated first with the ideal model, forwhich an exact solution can be derived under close form 14
. Then corrections areintroduced into the ideal model solution to account for the effect of the finite columnefficiency, as was done in previous papers6 ,8.
This paper is not intended to be a critique of the landmark paper by Knox andPyper6
, but rather an extension of it. Within the limits of the assumptions they made,their results were correct and they provided an excellent first-order approximation.They were aware that neglecting the competitive interactions between the mixturecomponents could not provide a better result 6
. Similarly_ this paper attempts to takecompetitive interactions into account, but for the lack of a better model uses theLangmuir competitive isotherms. This isotherm model itself is only a first approximation. convenient for simulations, but which fits accurately the equilibrium data of few

OPTIMIZATION OF PREPARATIVE LC 231
systems 15 ,16, Accordingly, our results provide a second-order approximation, notexact values of the optimum experimental conditions, The accuracy of our predictionsdepends on the degree of agreement between the experimental isotherms and thecompetitive Langmuir modeL
THEORY
Touching hands with the ideal model
The ideal model of chromatography neglects the axial dispersion and assumesthat the mass transfers between phases are infinitely fast, i.e., it assumes that thecolumn efficiency is infinite, whatever the mobile phase velocity. Hence the onlyparameter to optimize is the loading factor, which is independent of the column length.In this section, we first derive the close-form equations giving the loading factor forwhich touching bands is achieved, in three successive cases: (i) in the general case, (ii)when competition between the two components is ignored and (iii) when competitionis ignored and the elution profiles are right triangles.
The fundamental equationsWe derive the equation giving the loading factor for touching bands in the
general case, then introduce the simplifications brought by the assumptions made byKnox and Pyper6
.
In the general case. We assume for the sake of simplicity that the equilibrium ofthe two components in the chromatographic system used is correctly described bybinary Langmuir isotherms:
(1)
where qi is the amount of compound i adsorbed at equilibrium with a mobile phasewhere the concentrations of the components I and 2 are C1and Cz, respectively. ai andhi are numerical coefficients characteristic of the compounds and the chromatographicsystem which can be derived from the pure compound isotherms.
We have shown previously14 that the loading factor, Lj,z, for the secondcomponent (i.e., the ratio of the amount of second component in the sample injected tothe column saturation capacity for this compound) which corresponds to exactseparation of the two component bands, i.e., to touching bands, is given by thefollowing equation:
(2)
where rx is the relative retention of the two compounds (rx = azla1 = k'o,zlk(J.1) and 1'1
is the positive root of the characteristic equation of the problem (ref. 8, eqn. II-3). In

232 S. GOLSHAN-SHIRAZI, G. GUIOCHON
practice, rl almost always is nearly equal to CO,I/CO,2, the ratio of the concentrationsof the two components in the feed, so the loading factor for touching bands is given by
(3a)
where qs,; = aJb;, is the specific column saturation capacity. Solving eqn. 3a for LJ ,2
gIves
(a - 1)2
LJ ,2 = -a-Lr,l
a(3b)
where LJ,I is the loading factor for the first component. Depending on the relativeconcentration of the two components (i.e., CO,dCO,2), the loading factor for the secondcomponent corresponding to touching bands in the ideal model decreases from[(a - 1)/aF (when CO,I is close to 0) to 0 (when CO,2 is close to 0). The correspondingvalues of the loading factor of the first component are 0 and (a - 1)2/11, respectively.
When the competition is ignored. In this instance we have two independent bands,the equilibrium isotherms of each compound being given by a simple one-componentLangmuir isotherm. The condition for touching bands is that the band profile of thelesser retained component ends when the second component front is eluted. The firstcomponent band ends at the time te ,1> given byl7
(4a)
where tp is the width of the injection pulse, tRO,1 and tRO,2 are the limiting retentiontimes of the two compounds at infinite dilution and to is the hold-up time of thecolumn. The retention time of the front of the second component 17, tR ,2, is
The condition for touching bands is obtained by writing te,l
loading factor value for the second component:
_(~ _1)2L J,2 - ~
(4b)
tR,2. This gives the
(5)
When the competition is ignored and the bandprofiles are right triangles. We haveshown that right triangles are the asymptotic solution of the ideal model in the case ofLangmuir isotherms l7
. The exact solution of the ideal model for a parabolic isothermis also a right triangle profile I
8• This parabolic isotherm is the two-term Taylor
expansion of the Langmuir isotherm. In this case, the retention time of the band frontis given byl8
(6)

OPTIMIZATION OF PREPARATIVE LC 233
Writing that this retention time for the second component is equal to the elution timeof the end of the first component band gives the loading factor of the secondcomponent corresponding to touching bands in this assumption:
(IX 1)2
L j ,2 = -IX- /4 (7)
This equation is equivalent to that derived by Knox and Pyper6,
P'roduction rate and throughput. It is remarkable that both eqns. 5 and 7 areindependent of the concentration of the first component in the mixture, whereas theexact eqn, 3 depends on the composition of the binary mixture.
If we assume that the cycle time is equal to the corrected retention time of thesecond component, tc = tRO ,2 - to, we obtain the following general equations for theproduction rate of the two components, Prl and Pr2, respectively:
(8)
and
(9)
where eis the packing porosity, S the geometrical column cross-sectional area and u themobile phase linear velocity. The throughput is given by
(10)
In the case when a different definition is chosen for the cycle time, the results of eqns.8-10 should be multiplied by (tRO ,2 - to)!tc' The following discussions are based on theuse of the 'production rate for the second component. Obviously, in the case oftouching bands the production rate for the first component of a binary mixture is theproduct of the production rate for the second multiplied by the relative concentrationof the two compounds.
Consequence of the first assumption made by Knox and PyperAs we have shown in a previous discussion, a right triangle is the asymptotic
solution of the ideal model 17. It is a good approximation of the band profile obtained
with this model for a Langmuir isotherm when the loading factor is less than 1%. Wehave also shown that the elution profile obtained for real columns (i.e., with a finiteefficiency) can be approximated by right triangles for still larger values of the loadingfactor, in fact as long as bCMax ~ 0.1 (ref. 18).
We can expect that for low values of the relative retention, IX, the value of theloading factor corresponding to touching bands is small and this first approximationhas no serious influence on the result. At higher values of IX, in contrast, theconsequence could be more significant. Figs. I and 2 illustrate this effect. On bothfigures are plotted the individual elution profiles obtained with the loading factorsgiven by eqn. 5 (no competition, correct Langmuir profiles) and by eqn. 7 (Knox andPyper value, no competition, right triangles). Fig. 1 corresponds to IX = 1.20 and Fig..


OPTIMIZATION OF PREPARATIVE LC 235
2 to IX = 1.70. In the former instance the differences are small but in the latter they arefairly important. This shows that the assumption that the band profiles are righttriangles is reasonably satisfactory if the relative retention is close to unity (difficultseparations). If the relative retention is large, the assumption may contribute to someextent to the large difference between the production rates predicted by the Langmuircompetitive and the parabolic non-competitive models.
Consequence of the second assumption made by Knox and PyperA much more profound and important source of error comes from the
assumption of an independent behavior of the two bands during their migration. Innon-linear chromatography, the competition between the different components of themixture cannot be neglected4 ,19,zo. As long as the column is overloaded, i.e., behavesnon-linearly for one component, it behaves similarly for all the components whosebands interfere with the band of that compound. In agreement with the independenceassumption, the loading factor for touching bands (eqns. 5 and 7) and thecorresponding values of the production rates for the two compounds (eqns. 8 and 9) donot depend on the composition of the feed. This is not realistic, and eqn. 3 shows that,on the contrary, the loading factor does depend strongly on this composition when thecompetition is taken into account.
Comparing eqns. 3 and 7 shows that the values ofthe loading factors they predictare equal only for LJ,dIXLr,z = b1Co.dbzCo,z = 3, When the ratio LJ,dIXLJ,z issmaller than 3 (dominant displacement effect), the loading factor corresponding totouching bands (eqn, 3) is larger than predicted by the Knox and Pyper model (eqn, 7),whereas the reverse is true for values of that ratio larger than 3 (dominant tag-alongaffect). Ifwe inject the amount derived from eqn. 7, we obtain well resolved bands inthe former instance and overlapping bands in the latter.
Figs. 3-5 show two chromatograms each. They have been obtained for threedifferent feed compositions, under the same simulated experimental conditions withthe sample sizes predicted by eqns. 3 and 7, respectively. In all instances, the bandprofiles are obtained as the analytical solutions of the ideal model for binary Langmuirisotherms14
. Fig. 3 is obtained with a relative feed composition such that Lf,1/IXLJ.z issmaller than 3. As expected, the sample size predicted by eqn. 3 is the larger and thesample size predicted by eqn. 7 leads to well resolved bands (re~olution 1.2), whereasthe nearly four times larger sample size which is predicted by eqn. 3 leads to touchingbands, A strong displacement effect is observed. The rear profile of the'first componentis convex upward whereas the rear profile of the second band is convex downward, as isconventional with Langmuir iS,otherms, for single components. For Fig. 4, the feedcomposition is such that LJ,l/IXLJ,Z is equal to 3 and the two sample sizes are equal.Note, however, that the profile predicted by the ideal model is different from the righttriangle assumed by Knox and Pyper6
. For Fig, 5, the ratio LJ,daLJ,z is larger than 3.Now the sample amount predicted by eqn. 7 is too large. The chromatogram obtainedcorresponds to strongly overlapping bands, To obtain touching bands, the smallersample given by eqn. 3 should be used. It is nearly half the one predicted by eqn. 7. Thecolumn is still strongly overloaded and a marked tag-along effect is observed.
The previous discussion concerns only ideal chromatography. With realcolumns, the elution bands are wider and shorter than predicted by the ideal model.The concentration shock is damped by the finite rates of the axial diffusion and the

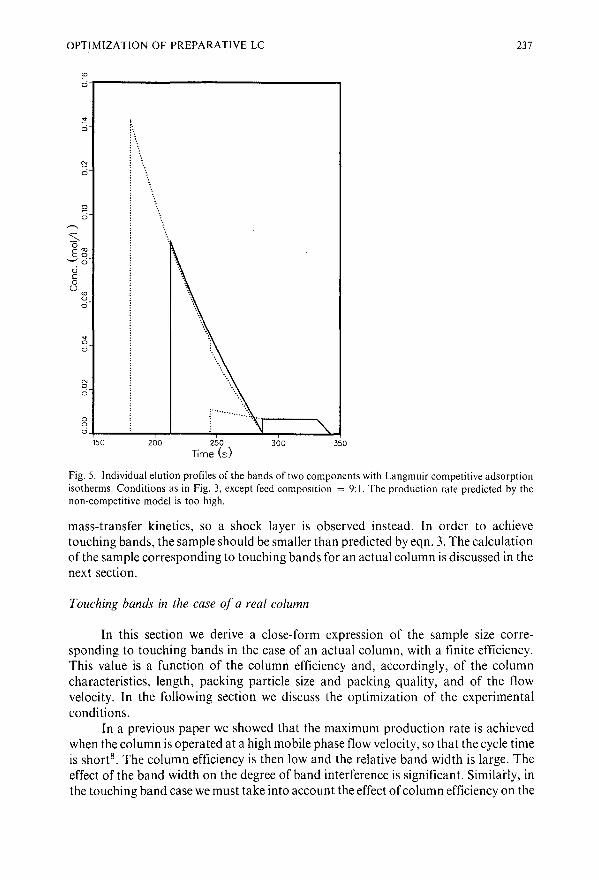
OPTIMIZATION OF PREPARATIVE LC
~c:i-r-------------------,
237
;'!:c:i
~
c:i
52c:i
"-0E~
'--'6Uc0
U'"06
""06
N06
00c:i
150 200 250Time (5)
...... :...,..-----..
300 350
Fig. 5. Individual elution profiles of the bands of two components with Langmuir competitive adsorptionisotherms. Conditions as in Fig. 3, except feed composition = 9: I. The production rate predicted by thenon-competitive model is too high.
mass-transfer kinetics, so a shock layer is observed instead. In order to achievetouching bands, the sample should be smaller than predicted by eqn. 3. The calculationof the sample corresponding to touching bands for an actual column is discussed in thenext section.
Touching bands in the case of a real column
In this section we derive a close-form expression of the sample size corresponding to touching bands in the case of an actual column, with a finite efficiency.This value is a function of the column efficiency and, accordingly, of the columncharacteristics, length, packing particle size and packing quality, and of the flowvelocity. In the following section we discuss the optimization of the experimentalconditions.
In a previous paper we showed that the maximum production rate is achievedwhen the column is operated at a high mobile phase flow velocity, so that the cycle timeis shorts. The column efficiency is then low and the relative band width is large. Theeffect of the band width on the degree of band interference is significant. Similady, inthe touching band case we must take into account the effect of column efficiency on the

238 S. GOLSHAN-SHIRAZI, G. GUIOCHON
band profile. A further difficulty is in the definition of the touching band condition.With the ideal model, the elution of a band begins and ends at well defined times.Before and after, the concentration of the compound in the mobile phase is zero. Thereis no such thing with real columns: the beginning and end of a band elution depend onthe sensitivity of the detection. We shall neglect these effects, however, and write thatthe difference between the elution times of the rear of the second and first bands isequal to the total band width of the second component.
Derivation of the band width of the second componentThe effect of the finite column efficiency on the band broadening during its
elution can be accounted for by following the procedure first suggested by Haarhoffand Van der Linde21 and later used by Poppe and Kraak 22 and Knox and Pyper6 . Weassume that the two contributions to the elution band width with which we areconcerned, the thermodynamics (i.e., the non-linear behavior of the phase equilibrium)and the kinetics (finite rates of mass transfer between phases and of axial dispersion)can be treated as two independent contributions. Therefore, their variances areadditive and we h\lve
(11)
where (J?ot = w?ot/16 is the variance of the elution profile, (J?h W?h/l6 the variancecontribution due to the non-linear behavior of the isotherm and (J~in = w~in/16 thevariance contribution of the mass-transfer kinetics and of the axial dispersion, wherethe ws are the corresponding baseline band widths. By definition of the column heightequivalent to a theoretical plate, Htot> we have
The kinetic contribution is given by
2 16(k~'2 + 1)2 2Wkin = Pi k' (tRO,2 - to)
° 0,2
(12)
(13)
where No is the column plate number under linear conditions (in practice, for a verysmall size sample), k~,2 is the column capacity factor at infinite dilution (i.e., k~,2 =a2F, where F is the phase ratio) and tRO ,2 and to are the limiting retention time atinfinite dilution of the second component and the hold-up time, respectively.
The thermodynamic contribution is calculated from the band width of thesolution of the ideal model 14
. In this work we are interested in the width of the secondcomponent band. There are two cases. The ideal model solution shows that the band ofthe second component has completely recovered from its interaction with the firstcomponent band and achieved the same profile as if the same amount of second.component was injected alone when the loading factor is equal to or smaller thanLr.2.rI4, as given by
L f ,2,r = (1:t)2rxLr.2
(14)
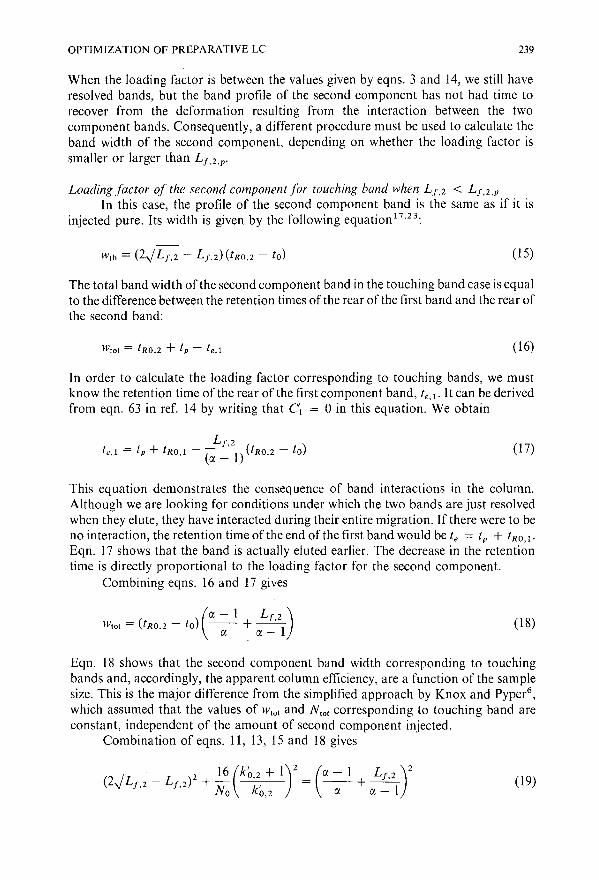
OPTIMIZATION OF PREPARATIVE LC 239
When the loading factor is between the values given by eqns. 3 and 14, we still haveresolved bands, but the band profile of the second component has not had time torecover from the deformation resulting from the interaction between the twocomponent bands. Consequently, a different procedure must be used to calculate theband width of the second component, depending on whether the loading factor issmaller or larger than Lf ,2.p'
Loading factor of the second component for touching band when L f ,2 < Lf.2,p
In this case, the profile of the second component band is the same as if it isinjected pure. Its width is given by the following equation l7
,23:
(15)
The total band width of the second component band in the touching band case is equalto the difference between the retention times of the rear of the first band and the rear ofthe second band:
(16)
In order to calculate the loading factor corresponding to touching bands, we mustknow the retention time of the rear of the first component band, te,l' It can be derivedfrom eqn. 63 in ref. 14 by writing that C't. = 0 in this equation. We obtain
(17)
This equation demonstrates the consequence of band interactions in the column.Although we are looking for conditions under which the two bands are just resolvedwhen they elute, they have interacted during their entire migration. If there were to beno interaction, the retention time of the end of the first band would be te = tp + tRO •l '
Eqn. 17 shows that the band is actually eluted earlier. The decrease in the retentiontime is directly proportional to the loading factor for the second component.
Combining eqns. 16 and 17 gives
(a - 1 LJ,2 )
Wtol = (tRO.2 - to) -a- + a-I (18)
Eqn. 18 shows that the second component band width corresponding to touchingbands and, accordingly, the apparent column efficiency, are a function of the samplesize. This is the major difference from the simplified approach by Knox and Pyper6
,
which assumed that the values of Wtol and Ntol corresponding to touching band areconstant, independent of the amount of second component injected.
Combination of eqns. 11, 13, 15 and 18 gives
(2 /L _ L )2 ~(k~.2 + 1)2 = (a - 1 LJ,2 )2V f.2 f.2 + N k' + 1a 0,2 a a -
(19)

240 S. GOLSHAN-SHIRAZI, G. GUIOCHON
Solvingeqn. 19 for LJ ,2 and putting the solution into eqn. 8 gives the production rate ofthe second component.
Simplified equationsSeveral simplifications are possible. We can assume that the loading factor is
relatively small and neglect L J.2 in comparison with .JL J.2 in eqn. 19. This amounts toassuming that the band profile of the second component is a right triangle, as did Knoxand Pyper6
, but still conserves the competitive interaction between the two components which is introduced by the competitive Langmuir isotherms. In this case, it iseasy to solve the modified eqn. 19 and to obtain
2 { 1L J.2 = (0: - 1) 2 - ~ - 4(~) + 1i[ k~.2 + I J2}0: No k~,2(0: - I)(20)
Inserting the value of L J .2 into eqn. 8 gives the production rate:
4(~) + 1i[ k~.2 + 1J2}0: No k~.2(0: - 1)(21)
If, in addition, we assume that the competitive interaction between the twocomponel1ts of the mixture is negligible, we ignore the term LJ,2j(o: - I) on theright-hand side ofeqn. 19 and LJ ,2 compared with its square root on the left-hand side.We then obtain
[16(k~'2 + 1)2 ]
L = (~)2 k~,2 /4'J,2 '0: No
Combination of eqns. 8 and 22 gives the production rate:
(22)
Pr2 qs,2U [(0: _ 1)2(l - e)S = 4k~,2 -0:-
(23)
This equation is the same as that given by Knox and Pyper6 (combination of their eqns.40, 47, 63, 67) in the case when the cycle time is equal to tRO ,2 - to.
Loading factor of the second component for touching hand when LJ,2 > L r,2,p
Eqn. 19 is valid only as long as the loading factor obtained is lower than thethreshold value (or equal to it), LJ ,2,p derived from eqn. 14. In contrast, when L r,2 islarger than L J ,2,p, a plateau remains on the top of the second elution band, at leastwithin the ideal model approximation. This plateau is more or less eroded by the axialdiffusion and the finite rate of the mass-transfer processes. In this instance, neither thefirst nor the second component band profiles are identical with the band profileobtained with a pure component sample. The first band is modified by the

OPTIMIZATION OF PREPARATIVE LC 241
displacement effect and the second has not yet recovered from the tag-along effect.Because the concentration of the second component is constant during elution of
the plateau, we can assume, as a first approximation, that the finite column efficiencydoes not affect the contribution of the length of this plateau to the band width8
. Hence,the total band width in this instance should be calculated as
(24)
where Wplateau is the width of the plateau (see below). As we have shown elsewhere8, we
have
(25)
where Lf.Z,p is given by eqn. 14 and Wtot for touching bands is given by eqn. 18.The width of the plateau can be calculated by writing that the area of the second
component band is equal to the area injected in the column, i.e., that mass is conserved.Thus,
tRO,2+ t p
C~ Wplateau + f Czdt = L f ,z(tRO,2 - to)/b2
to'
(26)
where C~, tw and Cz are given by eqns. 28, 48 and 47, respectively, in ref. 14. The firstterm on the left-hand side of eqn. 26 is the area under the plateau, the second term, thearea under the continuous profile, the right-hand side ofeqn, 26 is the area Co,ztp of therectangular pulse of second component injected (see eqn. 42, ref. 14), The calculationgives
Combination of eqns. 13, 18, 24, 25 and 27 gives
(IJ. - I)Z [
IJ. Z IJ. + 1Lf,2 = X(l + X)2 X + 3X + -IJ.-
(28)

242
with
x = qs,2 CO,1= Lf,l
rt.qs, 1 CO,2 rt.Lf ,2
S. GOLSHAN-SHIRAZI, G. GUIOCHON
(28a)
Eqn, 28 gives the loading factor for touching bands for values of the loading factorbetween those given by eqns. 3 and 14. The production rate is then calculated usingeqn.8.
Optimization of the experimental conditions
The optimization requires the use of a plate-height equation to relate the columnefficiency to the mobile phase flow velocity. There are two possibilities at this stage. Wecan use a very simplified equation which assumes that the column is operated at a highreduced flow velocity. We have shown previously that the optimum flow velocity formaximum production is very high 8
. In this instance, we can also solve the optimizationproblem in close form and give a detailed, classical analysis of the effect of eachparameter. Alternatively, we can use the classical Knox equation24 and solve theproblem numerically. These two approaches are discussed below.
Optimization with a simple plate-height equationWe know that the linear mobile phase velocity, u, is related to the column design
and operating parameters by the following equation:
koiJPd~u=----'--
1]L(29)
where k o is the column specific permeability (of the order of 1 . 10 - 3), iJP is thepressure drop between the column inlet and outlet, dp is the average particle size of thepacking material used, 1] is the mobile phase viscosity and L is the column length.
As the column is operated at a high reduced mobile phase velocity, we assumethat the height equivalent to a theoretical plate height (HETP) of the column, is givenby the simplified equation6
:
h = Cv (30)
where h is the reduced plate height (h = H/dp) and v is the reduced velocity (v =
udp/Dm). The limiting column efficiency at infinite sample dilution (i.e., L/Hkin ) istherefore
(31)
As u and No depend on the ratio d~/L, not separately on the column length and theparticle size, so does the production rate. As long as eqn. 30 is valid, in both thetouching band and the overlapping band cases8
, long columns packed with coarse

OPTIMIZATION OF PREPARATIVE LC 243
particles may give the same production rate as short columns packed with fineparticles, if they have the same value of the ratio d~/L. Provided that the column lengthcan be adjusted easily, a variety of packing materials of different sizes can be used(within reason). The existence of an optimum particle size at constant length has beendemonstrated experimentally in a recent papers, in agreement with the results ofa previous study19.
Depending on the value of the optimum sample size, we have two different cases.When the optimum loading factor is less than Lf,2,p, we should calculate it using eqn.19. When the optimum loading factor is greater than Lf .2 ,p, eqn. 19 is no longer valid,and we must use eqn. 28. This condition is awkward to use. We show later that inpractice ~qn. 19 must be used to calculate the optimum loading factor for touchingband when Lf ,1/aLf ,2 is lower than 0.4 (and the displacement effect is dominant)whereas eqn. 28 must be used when Lf.l/aLf,2 is larger than 0.4 (and the tag-alongeffect predominates). We discuss successively the cases when Lf,daLf,2 is smaller andlarger than 0.4.
Optimization with a simple plate-height equation: displacement effect dominantCombining eqns. 8, 19,29 and 31 gives the production rate. Differentiation with
respect to d~/L permits the calculation of the optimum column configuration fora certain value of the pressure drop available. The equations could not be solved inclose form, but the numerical calculation is easy.
If we assume that the band profiles are right triangles, as we have shown abovethat this assumption is reasonable when the relative retention a is close to I and theloading factor is small, we perform the same calculation as above, but using eqns. 20and 21 instead ofeqn. 19. Then it is easy to solve the equation giving the optimum valueof the ratio d~/L. We obtain
(d~) = (a - I)J(a - 1/2)Ja2
- a + 1/36 ~ (a2
- a - 1/12)· (32)
L opt a 4(k'o'2 + I) 2ko!'JPCk'o,2 .3Dmry
Combination of eqns. 20, 31 and 32 gives the optimum value of the loading factor fortouching bands:
[(a - 1)2J 2
Lf ,2,opt = 3 2a (a - 1/2 - Ja - a + 1/36) (33)
The value of the production rate is obtained by combining eqns. 21, 29, 32 and 33:
Pr2 [3qs,2(a - 1)3J 3ko!'JPDm J 2(I - e)S = 8a2(l + k'o,2) 2ryC (a - 1/2 - a - a + 1/36) x
J(a - 1/2)Ja2 - a + 1/36 - (a 2 - a - 1/12) (34)
Finally, if we ignore the competitive interactions between the two components of the

244 S. GOLSHAN-SHIRAZI, G. GUIOCHON
mixture and assume right triangle band profiles, we can use the value of the loadingfactor given by eqn. 22. A calculation similar to those made using eqn. 19 or 20 anddescribed above gives in this case the following optimum value of the ratio d;/L:
rx - 1
and the optimum value of the loading factor is
l(rx - 1)2L f ,2,oPt ="6 -rx-
Inserting eqn. 35 into eqn. 31 gives the optimum column efficiency:
(rx )2 (1 + k' )2
NO,opt = 48 rx _ I k'o,20'2
and the maximum production rate is
Pr2 q",2 (rx - 1)3 koLJPD rn
(1 - 8)S = 24(1 + k'o,2) -rx- 3'1 C
which are equivalent to the equations derived by Knox and Pyper6.
(35)
(36)
(37)
(38)
Optimization with a simple plate-height equation: tag-along effect dominantThe optimum loading factor is now higher than the threshold (Lf ,2,P) given by
eqn. 14 and, as we show later, the ratio Lf,1/(rxLf,2) is larger than 0.4. The value of theoptimum loading factor for touching bands is given by eqn. 28. Eqns. 29, 30 and 31 stillgive the mobile phase flow velocity, the column plate height and the plate number ofthe column at infinite sample dilution, respectively. Combining eqns. 8, 28, 29 and 31gives the production rate. Writing that the differential of the production rate withrespect to d;/L is zero gives the optimum value of this ratio:
rx: I(X2 + 3X + rx : I)-----'--------====x8(k'o~ + I) (1 + X)2 JkoLJPC
kO,2 Drn '1
(39)

OPTIMIZATION OF PREPARATIVE LC 245
where X is given by eqn. 28a. When X becomes large, the square-root term on theright-hand side of eqn. 39 is almost equal to unity and the equation simplifiesconsiderably:
r:t. - 1
(39a)
This result is now independent of the feed composition.Inserting the optimum value of d~/L given by eqn. 39 into eqn. 31 gives the
optimum limiting column efficiency (at negligible sample size). Combination of theseequations with eqn. 28 gives the optimum sample size:
2 X2
+ 3X +~ [ ( 2X +~ ) jLJ.2.opt=(r:t.:l) 4X(1+X/ 3- 1+8 r:t.r:t.+l
X 2 + 3X +-- (40)r:t.
In the case when X is large, the optimum column efficiency and loading factor are
(r:t. )2(1 + k~.2)
No.opt = 64 r:t. _ 1 k~.2
Ijr:t. - 1)2LJ,2,opt = 2X\-r:t.-
(40a)
(40b)
This value is equal to that predicted by the non-competitive model for X = 3, lowerwhen X is larger than 3 and larger when X is smaller than 3.
Finally, combination of eqns. 8, 29, 39 and 40 gives the maximum productionrate which can be achieved with a certain value of the inlet pressure.
Optimization with the Knox plate-height equationMore accurate results could be obtained using the classical Knox plate-height
equation24:
L B 1(3h = -- = - + Av + Cv
dpNo v(41)
It is easy to calculate numerically the optimum values of the column length and particlesize, flow velocity and sample size for any problem, but a close-form solution cannot bederived.

246
RESULTS AND DISCUSSION
S. GOLSHAN-SHIRAZI, G. GUIOCHON
We have performed a number of calculations in the two cases when either thedisplacement or the tag-along effect predominates, using the simplified and the moreaccurate plate-height equations, and we report the results in Tables I-IV, discussed inthe following sections. We then compare these results with previously published data.
Optimization with a simple plate-height equation: displacement effect dominant
In this instance, the optimum sample size is given by eqn. 19. We see that, asassumed by Knox and Pyper6
, the optimum values of the sample size and of thelimiting column efficiency do not depend on the composition of the feed.
Table I compares the results derived from our present approach (eqns. 8, 19,29and 31) and those calculated using the model derived by Knox and Pyper6 (eqns.35-38). The optimum values of the limiting column efficiency, of the value of the ratiod~/L, of the mobile phase flow velocity and of the loading factor are given togetherwith the maximum production rate that can be achieved. A maximum value of the inletpressure of200 atm has been assumed. The comparison between the two sets ofresultsshows little difference between the optimum values of the ratio d~/L, usually 10-20%larger with the Knox and Pyper assumptions than with our more exact approach. Thedifference in the values of the optimum limiting column efficiency is greater; ourapproach requires a column efficiency roughly 35% larger than that of Knox andPyper6
. Correspondingly, the optimum value of the mobile phase velocity is lower with
TABLE I
OPTIMUM VALUE OF THE RATIO d;/L AND MAXIMUM PRODUCTION RATE UNDERTOUCHING BAND CONDITIONS
. q,.zCO•1 Lf .1h = C\'.First case: --- = -- < 0.4.
aq.'.I CO.Z aLp
a No d;/L u Lf •Z Prz/(l - c:)5 Prz"/ Przb
x 108 (cm) (cm/s) (%) (I1mol/ (cm 2 s)J
1.1" 10500 2.2 0.44 0.41 2.721.1 b 7700 2.55 0.51 0.138 1.06 2.571.2" 3100 4.0 0.8 1.37 15.21.2b 2260 4.7 0.94 0.46 6.1 2.511.3" 1600 5.55 1.1 2.62 37.41.3b 1150 6.6 1.3 0.89 15.0 2.301.5" 760 8.1 1.6 5.41 97.61.5b 550 9.55 1.9 1.88 39.8 2.451.7" 530 9.75 1.95 8.45 161.6I.7 b 350 12.0 2.4 2.83 66.8 2.42
" Calculated with the simple HETP equation h = Cv, using the model described in this work.Conditions: C = 0.1; k~.1 = 6, LlP = 200 atm, Dm = I . 10- 5 cmz/s, IJ = I cP, q,.z = 10. The cycle time isgiven by I, = I Ro.2 - 10'
b Calculated with the same plate-height equation, using the model of Knox and Pyper6, which
ignores the competition and assumes right triangular band profiles.

OPTIMIZATION OF PREPARATIVE LC 247
our results, by ca. 15-20%. However, the major difference between the two sets ofresults is the loading factor. Knox and Pyper neglect the band interaction. Because ofthe importance of the displacement effect, a nearly three times larger sample size isneeded to achieve touching bands when we take into account the competitiveinteraction between the two components of the mixture (Table I). The end result isa production rate which is ca. 2.5 times larger than that predicted by the noncompetitive model 6
.
If we ignore the competition between the mixture components, the optimumvalues of d;/L, No and L j ,2.opt and the maximum production rate are proportional to(a - l)/a, [(a -'1)/ar 2
, [(a - 1)/af, and [(a - 1)/aF, respectively (see eqns. 35,36,37 and 38). When we take the competitive interaction between the two componentsinto account, the exact dependence of these parameters on the relative retention ismore complicated. The analysis of the data in Table I shows, however, that in practicethe optimum sample size is given by
(a - 1)2
L j ,2 = 0.5 -a- (42)
instead of L r ,2 = 0.166 [(a -l)/af, as predicted by the approximate eqn. 376. This
important increase is not surprising. The first component band is pushed forward bythe second band. Eqn. 17 shows the reduction in the retention time of the rear of thatband, proportional to the amount of second component injected. Accordingly, inorder to reach touching band conditions, we need a wider second component band,hence a larger sample size.
Further, we see that the limiting efficiency req uired, No, is equal to four times theefficiency, N*, necessary for the separation of the mixture with a resolution of I underlinear (i.e., analytical) conditions, instead of three times as predicted by thenon-competitive model of Knox and Pyper6
. In other words, the column should affordthe separation of a very small sample with a resolution of 2.0, not 1.7.
As the optimum sample size for touching bands under a dominant displacementeffect is given by eqn. 42, the threshold condition, L r.2 < L j,2,p where L r.2 .p is given byeqn. 14, can be rewritten as
or, by combining eqns. 14 and 42:
(a - 1)2
(a - 1)2 -a
0.5 -a- ~ ( L)21+~
aLj .2
which gives
L -~~J2-1aLj ,2
(43a)
(43b)
(43c)

248 S. GOLSHAN-SHIRAZI, G. GUIOCHON
which is the condition mentioned above (Lf,1/aLf,2 < 0.4). When condition 43c is notsatisfied, eqn. 28 or 40 should be used instead of eqn. 19 for the optimization.
Optimization with a simple plate-height equation: tag-along effect dominant
In this case, the optimum sample size is not given by eqn. 19 but by eqn. 40. Thetag-along effect dominates, so the second component band is spread over a wide rangeof retention times. In the ideal model approximation it exhibits a plateau whose widthdepends on the loading factor (see eqn. 27). The second component individual elutionprofile is different from the profile observed for the same amount of pure secondcomponent. Especially noteworthy is the fact that, in contrast to what happens in theprevious instance, the optimum conditions depend on the feed composition.
Calculations were performed using our approach (eqns. 8,29,31,39 and 40) andthat of Knox and Pyper6 for binary mixtures of different compositions and the samerelative retention, a = 1.20. The results are reported in Table II. As in the previousinstance, the differences between the optimum values of the limiting column efficiency,the ratio d~/L and the mobile phase flow velocity are relatively small. Compared withthe optimum values predicted by Knox and Pyper, the optimum values of the column
TABLE"
g~~~I~i'b~~LUEOF d~/LANDMAXIMUM PRODUCTION RATE UNDER TOUCHING BAND
q,.2CO.l Lj . 1Second case: --- = -- > 0.4". h = C\!.
aq,.l CO.2 aLr.2
6.08 n.a.15.2 2.50
Pr2/( 1 - c:)S Pr2"/Pr,"/pmol/(cm 2 s)}
13.2 2.176.8 1.122.36 0.39
1.031.01.001.00
14.813.26.762.36
1.141.00.510.18
No d~/L U Lj . 2
x lOB (em) ( cm/s) (%)
2100 4.9 0.98 0.982000 5.0 1.0 0.492470 4.5 0.9 0.189
2260 4.7 0.94 0.463100 ' 4.0 08 1.37
2260 4.7 0.94
Feed composition
1:1"3:1"9:1"For comparison:
Conditions in ref. 6"This work,with L j .,/aLf,2 < 0.4"
Knox and Pyper columnwith:
L r.,/aLf,2 < 0.4'I: 1<'3: I'9: I'
a Values calculated with the Langmuir competitive adsorption model, using the simplified simpleHETP equation h = C\!. Same conditions as for Table I, except a = 1.20.
b Values calculated using the non-competitive model and the simplified HETP equation andassuming right triangular band profiles. The same results are obtained, regardless of the mixturecomposition.
<' Values calculated for a column designed with the approach suggested by Knox and Pyper6
(d~/L = 4.7) and using the same velocity (u = 0.94) but the much larger sample size predicted by thecompetitive model.

OPTIMIZATION OF PREPARATIVE LC 249
efficiency range between - 10 and +40%, those of the ratio d~/L between - 15 and+7% and those of the mobile phase velocity between -15 and +7%. On the otherhand, the loading factor required to achieve touching bands decreases rapidly withdecreasing concentration of the second component. The sample sizes and productionrates predicted by the two methods are nearly equal for a 3: 1 mixture. For mixturesricher in the second component, the sample size and the production rate are higherthan those predicted by the Knox and Pyper model, because of the displacement effect,whereas for mixtures richer in the first component, the production rate is lower,because of the tag-along effect.
The optimization of the column efficiency, of its conformation and of the mobilephase velocity are not very critical and nearly identical results are obtained with thecolul1111swhich have either the optimum characteristics calculated in this work or thosecalculated after Knox and Pyper, provided that they are both operated with theoptimum sample size as calculated in this work. This is illustrated by the comparisonbetween the data at the top and bottom of Table II.
Optimization with the Knox plate-height equation
Numerical calculations were carried out using the Knox plate-height equationwith conventional values of the coefficients, A = 1, B = 2 and C = 0.1, whichcorresponds to an average quality packing material packed properly into a chromatographic column (minimum reduced plate height 2.40; optimum analytical reducedvelocity 2.7). The optimization procedure is as follows. Values of the column lengthand particle size are selected and the mobile phase velocity is calculated (eqn. 29). The
TABLE III
OPTIMUM VALUE OF COLUMN LENGTH AND MAXIMUM PRODUCTION RATE UNDERTOUCHING BAND CONDITIONS
F q",2 CO,1 Lr,lh = 2/1' + 1'0,33 + 0.11'.Irst case: --- = -'- < 0.4.
aq,.l CO.2 aL!.2
a No L L r,2 PI'2/( I - oJS PI'z"/ P1'2·(em) (%) Ipmol/(em2 s) /
1.1" 8880 59. 34 0.375 1.931.1 h 6850 50.5 39.5 0.129 0.775 2.491.2" 2750 29.6 67.5 1.28 12.0I.2h 2050 25.2 79.0 0.443 4.88 2.461.3" 1480 20.9 96 2.51 30.8I.3 b 1070 17.4 [ [5 0.85 12.6 2.44IS' 700 13.8 145 51.8 83.51.5h 500 11.5 174 1.79 34.6 2.41I.7" 450 10.9 [83 7.84 141.11.7" 320 9.0 222 2.72 59.4 2.38
" Values calculated using the Langmuir competitive adsorption model and the general Knox HETPequation. Same parameters as for Table I except particle size dp = to 11m. The cycle time is I, = I
RO. 2 ~ 1o,
h Values calculated using the non-competitive model, assuming that the band profilcs are righttriangles and using the general Knox HETP equation.

250 S. GOLSHAN-SHIRAZI, G. GUIOCHON
TABLE IV
OPTIMUM VALUE OF THE COLUMN LENGTH AND MAXIMUM PRODUCTION RATEUNDER TOUCHING BAND CONDITIONS
q,.2 CO,1 Lf,l17 = 2/1' + 1'0.33 + 0.11'.Second case: --- =-- > 0.4.
aq,.ICO•2 aLf .2
Feed compositio/1 No L L f ,2 Pr2/( / - B)S(cm) (%) [/1/110//(cm2 s) j
I: Ia 1920 24.2 82.5 0.94 10.73: Ia 1810 23.4 no 0.46 5.59: I" 2180 26.0 85.5 0.18 1.9For comparison:
L1.J!aL72 < 0.4 2750 29.6 67.5 1.28 12.0(this work)Knoxb 2060 25.2 79.0 0.44 4.9
a Values calculated with the Langmuir competitive adsorption model, using the general KnoxHETP equation (17 = 2/1' + 1'0.33 + 0.11'). Same conditions as for Table II, except particle size dp = 10 Im1.
b Values calculated with the non-competitive model, assuming right triangle band profiles and usingthe general Knox HETP equation. The values are constant, regardless of the feed composition.
reduced plate height is then derived (eqn. 41) and the plate number introduced in eqn.19 or in eqn. 28, depending on whether Lu/aLr,z is smaller or larger than 0.4. Thisgives the sample size, Inserting the sample size and the velocity in eqn. 8 gives theproduction rate. The calculation is repeated for successive values of the column lengthat constant particle size to determine the optimum column length giving the maximumproduction rate. Alternately, the particle size could be varied at constant columnlength or the calculation could be made for the columns currently available in thelaboratory to find which will give the highest production rate. Although this procedureof optimization is generally not correct, it gives a result which is satisfactory inpractice, because particles are available in only a small number of sizes and thevariation of the production rate near its optimum is fairly flat. The same procedure isfollowed for the calculation of the optimum conditions within the frame of the Knoxand Pyper model, but eqn. 22 is used to calculate the sample size.
Tables III and IV summarize the data obtained. Optimum values of the limitingcolumn efficiency, the column length, the reduced flow velocity and the loading factorsare given in Table III for different values of the relative retention between 1.10 and 1.70for binary mixtures having a composition such that Lj,I!(aLj,z) is smaller than 0.40,We have assumed the particle size to be 10 /tm. Also given in Table III is the maximumproduction rate. Comparison between the exact values and those derived from theKnox and Pyper model again shows fairly small differences between the optimumvalues of the limiting column efficiency (30-40%), the column length (10-20%) andthe reduced velocity (15-20%). The loading factor, on the other hand, is 2.5-3 timeslarger than that predicted by the Knox and Pyper model and the production rate isabout 2.20 times higher. As expected, comparison between the results in Tables I andIII shows general agreement for the optimum limiting column efficiency and loadingfactor and for the maximum production rate at high values of a when the mobile phasevelocity is very high. The difference increases, however, with decreasing values of a and

OPTIMIZATION OF PREPARATIVE LC 251
TABLE V
OPTIMUM VALUE OF {~/L AND MAXIMUM VALUE OF THE PRODUCTION RATE UNDEROVERLAPPING BAND CONDITIONS" FOR DIFFERENT FEED COMPOSIT[ONS
Feed composition No (~/L U Lf.2b Prz/( f - f:)Sx 108 (em) ( cmls) (%) (Ilmoll(cm2 s)J
[:9 380 11.5 2.3 4.8 91.61:3 490 10.1 2.0 3.05 52.01:1 630 8.9 1.8 1.822 26.63: I 910 7.4 1.5 0.875 10.29: I 1200 6.5 1.3 0.343 3.1Knox' 2260 4.7 0.94 0.46 6.1
a Values calculated with the competitive model and the simple HETP equation h = Cv, with C =
0.1. Same conditions as for Table II except required product purity, 99%. cx = 1.2; q-d = q,.1 = 10. In allinstances the recovery yield is about 60%. I 1- I/CX)2 (I -PUZ)I/Z
b Values calculated from the equation L/. z = -- , where x = --- ,(I + blrt/bz) I - x Puzcxr,
Puz being the required purity of the product. This equation is derived in ref. 7. ., Values calculated with the non-competitive model, assuming right triangle band profiles and
a simple HETP equation 6. The results are the same, regardless of the feed composition.
for IX = l.l0, the production rate predicted is 40% less with the correct plate-heightequation (eqn. 41) than with the simplified eqn. 30. A significant difference between theresults obtained with the two plate height equations is expected in this case: IX is low,a relatively high efficiency is needed, leading to a moderate reduced velocity (TableIII). Obviously, the difference between eqns. 30 and 41 is larger at low flow velocities.
Table IV reports similar data calculated for binary mixtures of differentcompositions, such that LJ .tI(IXLj,2) is larger than 0.4, for different compositions andIX = 1.20. As with the simplified plate-height equation, the production rate predictedby the Knox and Pyper model is lower than that given by the more exact approachwhen the relative concentration of the second component exceeds about 0.25 and is toolarge when the relative concentration of the second component is smaller than 0.25.The production rates are about 20% lower than those calculated with the simplifiedplate-height equation and reported in Table II, because of the influence of the twoneglected terms of the plate-height equation.
Comparison with previous results
Depending on the required degree of purity of the prepared products and thedesired recovery yield, there are two extreme strategies and a variety of possiblecompromises between them25. The first strategy is to achieve a total recovery yield (ca.100%). In this instance the touching band approach as discussed in this paper must beused. The second strategy consists into looking for the maximum possible productionrate without concern for the value of the recovery yield. We have previously discussedthis strategy which can give recovery yields as low as 60%8,12. For example, data havebeen calculated and are reported in Table V illustrating the advantages andinconveniences of this strategy. A purity of 99% of the product was required and nocondition was placed on the recovery yield.

252 S. GOLSHAN-SHIRAZI, G. GUIOCHON
TABLE VI
OPTIMUM VALUE OF d;/L AND MAXIMUM PRODUCTION RATE UNDER OVERLAPPINGBAND CONDITIONS" FOR DIFFERENT VALUES OF a
a No d;/L U Lf.2 PI"2/( 1 - I:)SX 108 (em) (el11/s) (%)" [/1mol/(em2 s)}
1.1 1150 6.6 1.3 1.47 17.91.2 380 11.5 2.3 4.80 91.61.3 240 14.4 2.9 9.0 205.21.5 145 18.5 3.7 18.0 461.21.7 105 21.8 4.4 26.6 679.2
" Values calculated with the competitive model, using the simple HETP equation h = Cv, with C =0.1. Same conditions as for Table I, except required product purity, 99%, relative feed composition, 1:9,q".2 = q,., = 10. In all instances the recovery yield is about 60%.I I- l/a)2 (I -PU2)'/2
b Values calculated from the equation L f .2 = -- , where x = ---(I + b,l",/h2) I - x PU2al" ,
Comparison between the results in Tables II and Y shows that when the relativeconcentration of the first component is small, the production rate is much greater whenthe overlapping-band approach is used, the column is overloaded and the individualelution bands exhibit a degree of overlap than when the touching band strategy is used.As shown in Table Y, for a 1:9 mixture the production rate is six times larger withoverlapping bands than with touching bands (and fifteen times larger than thatpredicted by the model of Knox and Pyper6
). The ratio of the production rate withoverlapping bands to the production rate with touching bands decreases withdecreasing relative concentration of the second component. It is still three times fora 1:3 mixture, two times for a 1: 1 mixture, 1.5 times for a 3: 1 mixture and only 1.3 timesfor a 9: I mixture. In all instances the yield is ca. 60%.
The comparative advantage of using the first or the second strategy depends verymuch on the composition of the feed. If the second compound is in large excess, the
TABLE VII
OPTIMUM VALUE OF THE COLUMN LENGTH AND MAXIMUM PRODUCTION RATEUNDER OVERLAPPING BAND CONDITIONS" FOR DIFFERENT VALUES OF a
a No L Lf .2 PI"2/(J - o)S( el11) (%)b [/111101/(cI11 2 s)}
1.1 1000 16 120 1.47 15.01.2 360 9.6 210 4.80 811.3 220 7.3 275 9.0 1861.5 130 5.6 357 18.0 4251.7 95 4.7 425 26.6 630
" Values calculated with the competitive model, using the Knox general HETP equation, h = 2/1' +1'0,33 + 0.1 v, and the same conditions as for Table VI, except the particle size, dp = 10 Ilm. In all instancesthe recovery yield is about 60%. I I- l/a)2 (I -PU2)'/2
h Values calculated from the equation Lf .2 = ---, where x = ---(1 + b,l",/b 2 ) I - x PU2al",

OPTIMIZATION OF PREPARATIVE LC 253
overlapping band approach permits, compared with the touching band approach,a much higher production rate, for which the penalty is a decrease in yield. Thisadvantage, however, decreases rapidly with increasing relative concentration of thefirst compound. Then it is reasonable to adopt an intermediate approach, where thedegree of band overlapping accepted decreases with decreasing concentration of thesecond component, with a parallel increase in the recovery yield.
Finally, Tables VI and VII give the optimal experimental conditions in the caseof overlapping bands for a series of 1/9 mixtures with different values of the selectivity,a, using either the simple plate height equation (eqn. 30) or the more general Knoxplate height equation (eqn. 41), respectively. Comparison of these two sets ofdata withthe data in Tables I and III show that when the ratio of the component concentrationsin the feed, Co. t/CO•2 , is small, the overlapping-band strategy has the followingadvantages over the touching-band strategy: a lower optimum column efficiency,a larger optimum ratio d~/L, a larger optimum reduced velocity, and a higherproduction rate of the second component. The production rate increases rapidly with
increasing value of the selectivity, nearly in proportion to (a: lr, in both the
touching-band case (Table III) and the overlapping-band case (Table VI).
CONCLUSION
As our previous discussion of the overlapping band strategy has shown, themaximum production rate with the touching band strategy increases indefinitely withincreasing permissible column pressure drop, provided that the column of optimumgeometry is used. For a given column, in contrast, there is an optimum pressure drop asthere is an optimum flow velocity. The maximum production rate is usually achieved atvery high values of the reduced flow velocity, much in excess of that which correspondsto the maximum column efficiencys,12. We note, however, that the optimum velocity islower for touching bands than for overlapping bands.
For values of the ratio Lf ,t/(aLr,2) less than 0.4, the optimum sample size isindependent of the feed composition and the sample size should be such that LJ,2 =0.5[(a - 0/a]2, i.e., approximately three times larger than that predicted by the simplemodel of Knox and Pyper6
, which neglects the interaction between the twocomponents of the mixture during the separation. In this instance, the analyticalresolution under the conditions selected for the separation should be 2, larger than thevalue of 1.7 suggested by Knox and Pyper. For values of the ratio Lf .t/(aLf.2) between0.4 and 3, the sample size depends markedly on the feed composition but is still largerthan the value predicted by the Knox and Pyper model. Finally, for values ofLf ,1/(aLf .2 ) larger than 3, the sample size should be less than that predicted by Knoxand Pyper. It depends strongly on the composition of the mixture and decreasesrapidly with increasing concentration of the first component. In preparative chromatographya system eluting the main component first and the impurities later should beavoided as much as possible.
The use of the overlapping strategy entails a recovery yield of the order of 60%but permits a considerable increase in production rate for both components when thedisplacement effect predominates, a result which has already been observed experimentally and is well documented4
,19.2o. The gain in production rate decreases rapidly

254 S. GOLSHAN-SHIRAZI, G. GUIOCHON
with decreasing concentration of the second component in a binary mixture. Theoverlapping band strategy has no special advantage for the production rate of thesecond component when this compound is the minor one.
The quantitative accuracy of the present results depends on the extent to whichthe equilibrium isotherms of the components of the mixture are approximated by thecompetitive Langmuir model. On the other hand, the accuracy of our results isconsiderably better than those given by models, computerized or not, which do nottake the competitive interactions of the mixture components into account properly9.As shown above, the production rate predicted by these models can be three times toolow or too high, depending on the composition of the feed.
SYMBOLS
AaiBbi
CCi
CMax
CO•i
C2
C~Dm
dp
H kin
H th
H tot
Iikok'o.i
No
opt..1PPfi
qi
qs,i
fl
Coefficient in the Knox plate-height equationNumerical coefficient in the competitive Langmuir isothermCoefficient in the Knox plate-height equationNumerical coefficient in the competitive Langmuir isothermCoefficient of mass-transfer resistance in the plate-height equationMobile phase concentration of component iMaximum concentration of a compound in the eluentConcentration of component i in the feedConcentration of the second component during its elution. In eqn. 26,concentration of the second component in the last zone, where it is pureConcentration of the elution plateau of the second componentMolecular diffusion coefficient of the mixture componentsAverage particle size of the packing material usedHETP of the elution profile of a Dirac pulse under linear conditionsHETP of the elution profile of a Dirac pulse predicted by the ideal modelunder non-linear conditionsHETP of the elution profile of a Dirac pulse under non-linear conditionsReduced plate height (h = H/dp )
Column specific permeability (of the order of I 10 - 3)Column retention factor or capacity factor of component i under linearconditions; k'o.i = (tRO,i - to)/toColumn lengthLoading factor for component iLoading factor for the second component corresponding to the elution ofa band profile for which the tag-along effect has just disappearedColumn plate number under linear conditions (in practice, for a very smallsize sample)The subscript opt represents the optimum value of a parameterPressure drop between the column inlet and outletProduction rate of component iAmount of compound i adsorbed at equilibrium with the mobile phaseSpecific column saturation capacity for component i; qs,i = a;fbiPositive root of the characteristic equation of the problem (ref. 8, eqn.II-3). In practice, fl ~ CO.dCO,2

OPTIMIZATION OF PREPARATIVE LC 255
STtwte
te, !
totP
tR,i
tRO,i
u
Wplateau
xaf.
Yf
V
(J"~in
Geometrical column cross-sectional areaTotal feed throughputElution time of the end of the plateau of the second componentCycle timeElution time of the rear of the first component bandHold-up time of the columnWidth of the injection pulseRetention time of the front of component iLimiting retention time of component i at infinite dilutionMobile phase linear velocityBaseline band width of the elution profile of a Dirac pulse under linearconditionsWidth of the elution plateau of the second component; Wplateau = tR,z
tB'Baseline band width of the elution profile ofa Dirac pulse predicted by theideal model under non-linear conditionsTotal baseline band width of the elution profile of a Dirac pulse undernon-linear conditionsDummy parameter in eqns, 28 and 39-40Relative retention of the two compounds (a azla!)Packing porosityMobile phase viscosityReduced velocity (v = udplDm)
Variance contribution of the mass-transfer kinetics and the axial dispersionVariance contribution due to the non-linear behavior of the isotherm(thermodynamics)Variance of the elution profile
ACKNOWLEDGEMENTS
This work was supported in part by Grant CHE-890 1382 of the National ScienceFoundation and by the cooperative agreement between the University of Tennesseeand the Oak Ridge National Laboratory. We acknowledge support of our computational efforts by the University of Tennessee Computing Center.
REFERENCES
G. Guiochon and L. R. Snyder (Editors), Preparative Chromatography, including the Proceedings of the6th Symposium on Preparative Chromatography, Washington, DC, May 1989; J. Chromalogr., 484(1989).
2 P. Gareil, C. Durieux and R. Rosset, Sep. Sci. Technol., 18 (1983) 441.3 L. R. Snyder, G. B. Cox and P. E. Antle, Chromatographia, 24 (1987) 82.4 1. Newburger and G. Guiochon, 1. Chromatogr., 484 (1989) 153.5 J. A. Perry and T. 1. Szczerba, J. Chromalogr., 484 (\989) 267.6 J. H. Knox and M. Pyper, J. Chromatogr., 363 (1986) I.7 S. Golshan-Shirazi and G. Guiochon, Anal. Chem., 6\ (1989) \276.8 S. Golshan-Shirazi and G. Guiochon, Anal. Chem., 6\ (1989) \368.9 L. R. Snyder, J. W. Dolan, D. C. Lommen and G. B. Cox, 1. Chromatogr., 484 (1989) 425.

256 S. GOLSHAN-SHIRAZI, G. GUIOCHON
10 S. Golshan-Shirazi and G. Guiochon, Am. Biotechnol. Lab., 8(8) 1990) 26.11 G. Guiochon and A. M. Katti, Chromatographia, 24 (1987) 165.12 S. Ghodbane and G. Guiochon, ChrOll1(1{ogrophio, 26 (1989) 53.13 L. R. Snyder and G. B. Cox, J. Chro/11otogr., 483 (1989) 85.14 S. Golshan-Shirazi and G. Guiochon, J. Phy.\'. Chem., 93 (1989) 4143.15 Z. Ma, A. M. Katti and G. Guiochon, J. Phy.\'. Chem., in press.16 S. Jacobson, S. Golshan-Shirazi and G. Gliiochon, J. Am. Chem. Soc., in press.[7 S. Golshan-Shirazi and G. Guiochon, J. Phys. Chem., 94 (1990) 495.18 S. Golshan-Shirazi and G. Gliiochon, J. Chro/11atogr., 506 (1990) 495.19 J. Newburger, L. Liebes, H. Colin and G. Guiochon, Sep. Sci. Technol., 22 (1987) 1933.20 J. Newburger and G. Guiochon, J. Chromotogr., in press.21 P. C. Haarhoff and H. J. Van der Linde, Anal. Chem., 38 (1966) 573.22 H. Poppe and J. Kraak, J. Chro/11atogl'., 255 (1983) 395.23 S. Golshan-Shirazi and G. Guiochon, Anal. Che/11., 60 (1988) 2364.24 J. H. Knox, J. Chrom(l{ogr. Sci., 15 (1977) 352.25 S. Golshan-Shirazi and G. Guiochon, J. Chl'omatogr., in press.

Journal of Chromatography, 517 (1990) 257-262Elsevier Science Publishers B.Y., Amsterdam
CHROMSYMP. 1958
Evaluation of the stability of polymer-coated silica-basedpacking materials for high-performance liquidchromatography
TOYOHIDE TAKEUCHI*
Research Centre for Resource and Energy Conservation, Nagoya University, Chikusa-ku, Nagoya 464(Japan)
and
WENZHI HU, HIROKI HARAGUCHI and DAIDO ISHII
Department or Applied Chemistry, School or Engineering, Nagoya University, Chikusa-ku, Nagoya 464(Japan)
ABSTRACT
The stability of polymer-coated silica-based packing materials for high-performance liquid chromatography was examined. Linear relationships between the pHof the eluent and the logarithm of the concentration of silicic acid dissolved in theeffluent, log CS1L , were observed, and the slope of the lines was dependent on thesurface properties of the packing materials. A lower solubility was observed for polymer-coated silica and glass beads in comparison with common porous bare silicabeads. A linear relationship between the specific surface area and log CS1L was observed for porous silica beads, and the plots for polymer-coated silica and glass beadsdeviated from linearity.
INTRODUCTION
Silica-based packing materials are widely used in high-performance liquidchromatography (HPLC) because of the high column efficiencies and wide applicability. However, silica-based packing materials are unstable in aqueous mobile phases,especially at high pH 1,2. This drawback is overcome by employing polymer-basedmaterials3
•4 or coating the silica gel surface with a layer of polymerS- 9 , and such
stationary phases are now commercially available. Another strategy for improving thestability of silica-based materials is to use an eluent saturated with silica. Otherparameters affecting the stability involve flow-rate, temperature, eluent modifier,etc. 1
•2 .
This paper compares the stability of polymer-coated silica-based materials withthat of common silica-based materials and glass beads under various operatingconditions.
0021-9673/90/$03.50 © 1990 Elsevier Science Publishers B.Y.
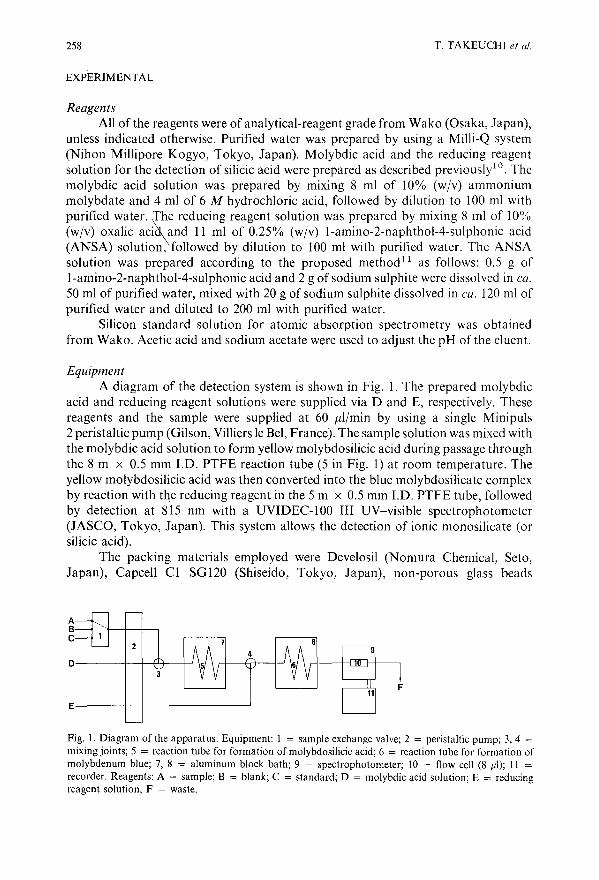
258
EXPERIMENTAL
T. TAKEUCHI et al.
ReagentsAll of the reagents were of analytical-reagent grade from Wako (Osaka, Japan),
unless indicated otherwise. Purified water was prepared by using a Milli-Q system(Nihon Millipore Kogyo, Tokyo, Japan). Molybdic acid and the reducing reagentsolution for the detection of silicic acid were prepared as described previouslylo. Themolybdic acid solution was prepared by mixing 8 ml of 10% (wjv) ammoniummolybdate and 4 ml of 6 M hydrochloric acid, followed by dilution to 100 ml withpurified water. ~h~ reducing reagent solution was prepared by mixing 8 ml of 10%(wjv) oxalic ac~~and II ml of 0.25% (wjv) l-amino-2-naphthol-4-sulphonic acid(ANSA) solution, followed by dilution to 100 ml with purified water. The ANSAsolution was prepared according to the proposed method!! as follows: 0.5 g ofl-amino-2-naphthol-4-sulphonic acid and 2 g of sodium sulphite were dissolved in ca.50 ml of purified water, mixed with 20 g of sodium sulphite dissolved in ca. 120 ml ofpurified water and diluted to 200 ml with purified water.
Silicon standard solution for atomic absorption spectrometry was obtainedfrom Wako. Acetic acid and sodium acetate were used to adjust the pH of the eluent.
EquipmentA diagram of the detection system is shown in Fig. I. The prepared molybdic
acid and reducing reagent solutions were supplied via D and E, respectively. Thesereagents and the sample were supplied at 60 J.lljmin by using a single Minipuls2 peristaltic pump (Gilson, Villiers Ie Bel, France). The sample solution was mixed withthe molybdic acid solution to form yellow molybdosilicic acid during passage throughthe 8 m x 0.5 mm J.D. PTFE reaction tube (5 in Fig. I) at room temperature. Theyellow molybdosilicic acid was then converted into the blue molybdosilicate complexby reaction with the reducing reagent in the 5 m x 0.5 mm J.D. PTFE tube, followedby detection at 815 nm with a UVIDEC-IOO III UV-visible spectrophotometer(JASCO, Tokyo, Japan). This system allows the detection of ionic monosilicate (orsilicic acid).
The packing materials employed were Develosil (Nomura Chemical, Seto,Japan), Capcell CI SGI20 (Shiseido, Tokyo, Japan), non-porous glass beads
ABC
D----1--!---fL1c---+-'
E----+--+--------'
Fig. I. Diagram of the apparatus. Equipment: I = sample exchange valve; 2 = peristaltic pump; 3, 4 =
mixing joints; 5 = reaction tube for formation ofmolybdosilicic acid; 6 = reaction tube for formation ofmolybdenum blue; 7, 8 = aluminum block bath; 9 = spectrophotometer; 10 = flow cell (8 iiI); II =
recorder. Reagents: A = sample; B = blank; C = standard; D = molybdic acid solution; E = reducingreagent solution; F = waste.

STABILITY OF SILICA-BASED MATERIALS FOR HPLC 259
(Whatman, Clifton, NJ, U.S.A.) and porous glass beads PSG-lOll (Fuji-DavisonChemical, Kasugai, Japan). Develosil and Capcell Cl SG120 are bare silica andpolymer-coated silica beads, respectively. Develosil LOP ODS (Nomura Chemical)and Capcell CI8 SG 120 (Shiseido) were examined as examples of octadecyl-bondedsilica gel. The base material of the latter is Capcell Cl SG120.
Table I lists the packing materials examined and their dimensional data as givenby the manufacturers. The materials were packed into 50 mm x 4.6 mm J.D. columnsby a dry packing method. The eluent was supplied at 0.5 ml/min by using an LC-6ADHPLC pump (Shimadzu, Kyoto, Japan), unless indicated otherwise. The effluent wassucked via A in Fig. 1.
RESULTS AND DISCUSSION
The detection system was evaluated by using the standard silicon solution anda calibration graph was prepared from steady-state signals. The steady-state signalswere proportional to the concentration of silicon up to 1 ppm. The limit of detectionwas 1.6 ppb (109
) at a signal-to-noise ratio of 3, and the relative standard deviation ofthe signal intensity was 1.0% for ten measurements of 10 ppb silicon. When theconcentration of silicic acid in the effluent exceeded 1 ppm, the solution wasappropriately diluted with purified water.
Fig. 2 demonstrates linear relationships between the pH of the eluent and thelogarithm of the concentration of silicic acid in the effluent (log Cs,d for bare silica gel,polymer-coated silica gel and glass beads. The concentration is expressed as ppm byweight of silicon (or Ilg/ml). The pH was adjusted with acetic acid and sodium acetate.As the dissolution behaviours of the packing materials were independent of theconcentration of acetate in the eluent between 20 and 100 mM, 60 mM was adopted asthe concentration of acetate throughout this work. For a series of porous bare silicabeads, the slopes of the straight lines were nearly the same, and a material with a larger
TABLE I
PACKING MATERIALS EMPLOYED
Packing material Type Particle Pore Specificdiameter size surface area(11m) (A) (m 2 /g)
Develosil 30-5 Silica 5 30 704Develosil 60-5 Silica 5 60 437Develosil 100-5 Silica 5 100 324Develosil 300-5 Silica 5 300 152Develosil NP silica-5 Silica 4.5 NP" 0.6Capcell CI SG 120 Silica 5 120 200PSG-lOll Glass beads 11.5 178 157Glass beads (Whatman) Glass beads 40 NPDevelosil LOP 60 Silica 30 60 500Develosil LOP ODS ODS 30 100 150Capcell CI8 SGI20 ODS 5 120 140
a NP = non-porous.

260 T. TAKEUCHI et at.
Ec.~
0.1
0.01
875 6
pH
Fig. 2. Relationships between pH of the eluent and the logarithm of the concentration of silicic acid in theeffluent (log CSIIJ. Column, 50 x 4.6 mm 1.0.; eluent, 60 mM acetate; now-rate, 0.5 mJjmin; columntemperature, 20°C. Packing materials: I = Oevelosil 30-5; 2 = Oevelosil 60-5; 3 = Oevelosil 100-5;4 = OevelosiI300-5; 5 = OeveJosil NP silica-5; 6 = Capcell CI SG 120; 7 = PSG-lOll; 8 = non-porous glassbeads (Whatman).
100,..----------------...,
10
4
Ea.a.~...III 1U 5
"'7
0.1
o 200 400 600
SURFACE AREA(m2/g)
Fig. 3. Plots oflog CSIL as a function of specific surface area. Column, 50 x 4.6 mm 1.0.; packing materials,as in Fig. 2; pH, 7.0; now-rate, 0.5 mljmin; column temperature, 20°e.

STABILITY OF SILICA-BASED MATERIALS FOR HPLC
10
A
261
E0.0. 1...Vi
U
0.1
5 6
pH7 8
Fig. 4. Relationships between pH of the eluent and log CSIL for ODS columns. Columns, 50 x 4.6 mm I.D.;(A) Develosil LOP ODS and (B) Capcell CI8 SG120; eluent, 60 mM acetate; flow-rate, 0.5 ml/min; columntemperature, 20°C.
specific surface area gave a larger log CS1L value. A smaller dependence of the pH on logCS1L was observed for the polymer-coated silica gel in comparison with other materials.The log CSIL values for the polymer-coated silica gel were much lower than those ofporous bare silica beads, especially at higher pH. Bleeding at a concentration of10 ppm corresponds to the dissolution of 6.4 mg of silica gel for a 10-h operation.
Fig. 3 shows plots of log CS1L versus specific surface area when the pH of theeluent was fixed at 7. The plots lie on a straight line for a series of porous silica beads.The plots for glass beads, polymer-coated silica gel and non-porous silica gel deviatefrom linearity. The largest deviation was observed for the polymer-coated silica gel,which may be the result ofprotection of the surface with a poly(dimethylsiloxane) film.
Column temperature, eluent flow-rate and eluent composition affected thedissolution behaviour. These effects were similar to those reported in the literature 1,2 .
Fig. 4 illustrates linear relationships between log CS1L and the pH ofthe eluent forODS materials. The results shown in Figs. 2 and 4 indicate that the concentration ofdissolved silicic acid is substantially decreased for Develosil LOP ODS in comparisonwith its original silica gel, whereas a large difference in the log CSIL value is notobserved between Capcel1 CIS SGI20 and its base material, Capcel1 Cl SG120. Thesurfaces ofCapcel1 CIS SG 120 are coated with a poly(dimethylsiloxane) film, whereasDevelosil LOP ODS is prepared from bare silica gel. The signal was enhanced when theeffluents were treated with sodium hydrogencarbonate at elevated temperature. Sucha treatment is recommended to allow the detection of soluble and/or colloidalspecies11. In addition, the signals for silica gel columns were not changed by the abovetreatment.
REFERENCES
I A. Wehrli, J. C. Hildenbrand, H. P. Keller, R. Stampfli and R. W. Frei, J. Chromatogr., 149 (1978) 199.2 J. C. Atwood, G. J. Schmidt and W. Slavin, J. Chromatogr., 171 (1979) 109.3 H. W. Stuurman, J. Koehler, S. O. Jansson and A. Litzen, Chromatographia, 23 (1987) 341.4 J. V. Dawkins, L. L. Lloyd and F. P. Warner, J. Chromatogr., 352 (1986) 157.5 G. Shomburg, A. Deege, J. Koehler and U. Bien-Vogelsang, J. Chromatogr., 282 (1983) 27.

262 T. TAKEUCHI et al.
6 G. Shomburg, 1. Koehler, H. Figge, A. Deege and U. Bien-Vogelsang, Chromatographia, 18 (1984) 265.7 H. Figge, A. Deege, J. Koehler and G. Shomburg, l. Chromatogr., 351 (1986) 393.8 M. N. Schmuck, M. P. Nowlan and K. M. Gooding, l. Chromatogr., 371 (1986) 55.9 Y. Ohtsu, H. Fukui, T. Kanda, K. Nakamura, M. Nakano, O. Nakata and Y. Fujiyama,
Chromatographia, 24 (1987) 380.10 M. Goto, W. Hu and D. Ishii, Bunseki Kagaku, 38 (1989) 419.11 Japanese Industrial Standards Committee, Testing Methods for Industrial Water lIS K 0101-1986,
Japanese Standards Association, Tokyo, 1986, p. 172.

Journal of Chromatography, 517 (1990) 263-268Elsevier Science Publishers B.V., Amsterdam
CHROMSYMP.1925
Magnetic resonance imaging in reversed-phase liquidchromatography
MARTIN ILG, JURGEN MAIER-ROSENKRANZ, WINFRIED MULLER and ERNST BAYER*lnstitut fur Organische Chemie der Universitiit, Auf der Morgenstel/e 18. D-7400 Tiibingen (F.R.G.)
ABSTRACT
The observation of band profiles on preparative columns in liquid chromatography was hitherto not possible in real time. With the help of nuclear magneticresonance imaging it has been possible to reveal band profiles of a reversed-phasechromatographic system completely non-invasively. The wall effect, which has beentheoretically predicted, was confirmed in these proton images for the first time. Additionally, thermal effects could be revealed directly on the column. This technique isexpected to have great potential for future investigations in chromatography.
INTRODUCTION
Within the last decade, nuclear magnetic resonance imaging (MRI) has becomea powerful tool in medical diagnosis!. This imaging technique is based on the samephysical properties as nuclear magnetic resonance spectroscopy, and with the help ofmagnetic field gradients yields an image of any desired volume element in an objece.At present, it is mainly limited to the visualization of protons in gel-like states.Whereas the application of MRI in the medical field has experienced rapiddevelopment, its application to non-medical problems has been less extensive and hascentred largely on materials science investigations 3
•
MRI, however, also offers a means of investigating elution profiles andinteractions in liquid chromatography, all in real time and completely non-invasively.This is of special interest with preparative columns, where even coloured substancesprovide information only about the zone boundaries and afford no insight into theprofile within the column. In a recent publication, we demonstrated the feasibility ofusing MRI for the investigation of size-exclusion and ion-exchange chromatography4.
This paper deals with the observation of elution profiles in reversed-phase liquidchromatography (RPLC) with the help of fast proton MRI. RPLC is based on thespecific and non-specific interactions between the sample, the solute and the surface ofthe stationary phase.
Using two-dimensional imaging, a slice is selected in the object first. The signalintensities of the picture elements ("pixels") that form the image of the slice are
0021-9673/90/$03.50 © 1990 Elsevier Science Publishers B.V.

264 M. fLO el al.
primarily dependent on the proton density and the relaxation times T 1 and T 2 in theselected volume elements of the object. Differences in these parameters lead to a highcontrast image. As T 1 and T2 are influenced differently by the interactions betweeneluent and mobile phase, the band profile becomes visible. As a sample we chose thediethylenetriaminepentaacetic acid-gadolinium complex, Gd(DTPA). This compound, in which seven unpaired electrons in Gd3+ strongly accelerate the relaxationtimes of the mobile phase by means of electron-nucleus interaction, resulting in highcontrast images, is a widely used contrast agent in medical MRI 5
. As the mobile phasewe used water-acetonitrile (80:20) because we found water to offer the best contrast forimaging the columns. With this eluent and modified silica gel, Gd(DTPA) hasa capacity factor (k') of 0.05, which indicates weak interactions between the solute andthe stationary phase.
EXPERIMENTAL
NMRExperimen ts were performed on a 1.5-T Magnetom (Siemens, Erlangen,
F.R.G.) whole-body system. The imaging technique was a 2D-FLASH pulsesequence6
. The parameters were as follows: echo time, 10 ms; repetition time, 22 ms;flip angle, 30°; slice thickness, 5 mm; pixel matrix 256 x 256; spatial resolution, ca.1 mm; and imaging time for one image, 6 s. The chromatographic column waspositioned horizontally in the head coil and the images were recorded in the horizontalplane as central longitudinal slices through the column (see Fig. I).
ChromatographyWe injected 400 pI of a 10% aqueous solution of Gd(DTPA) (Magnevist;
Schering. Berlin, F.R.G.) using a Merck (Darmstadt. F.R.G.) Lobar six-port valve
Fig. I. Schematic diagram of the imaging slice selected in the column.

MAGNETIC RESONANCE IMAGING IN LC 265
Fig. 2. MR image of the complete column.
Fig. 3. Four magnified images of the band profiles at different states of elution.
injector onto a Merck Superformance preparative glass column (300 x 26 mm 1.D.)packed with reversed-phase silica gel (LiChroprep RP-8, 40-63 J.Lm). The mobile phasewas water-acetonitrile (80:20, v/v).
By means ofa Bischoff(Leonberg, F.R.G.) Model 2200 HPLC pump a flow-rateof 2.0 ml/min was generated, which resulted in a pressure of 2 bar. Gd(DTPA) wasdetected with a Kontron (Ziirich, Switzerland) Uvikon 720 LC UV-VIS detector at215 nm. The dead volume was determined by a separate injection of uraciI7.
The elution lasted 25 min, within this time we were able to record 256 images,which were combined into a video film 8
.

266
4-
8-
12 -
16 -
20-
24-
28 -
32 -
36 -
40 -
44 -
M. ILG el al.
48 - stop
Fig. 4. Chromatogram from Gd(DTPA). Glass column (300 x 26 mm J.D.); Dow-rate, 2.0 ml/min; mobilephase, acetonitrile-water (20:80); detection, 215 nm. Retention times are in min..
RESULTS
Fig. 2 shows the whole column when about one third of the elution time hadelapsed. The column appears to be homogeneous, with some dark spots (diameterbetween 0.5 and 4 mm), which we interpret as regions that failed to be adequatelywetted. The diminished contrast at the lower end of the column is due to the columnexceeding the imaging range of the head coil. The chromatographic band is clearlyvisible. Magnified images offour selected elution profiles are shown in Fig. 3A-D. Thepositions of the bands on the column are indicated with the corresponding letters inFig. 2. Fig. 4 shows the chromatogram. It is noteworthy that the band profiles weresimilar with flow-rates of both 0.5 and 20.0 mlfmin.

MAGNETIC RESONANCE IMAGING IN LC
DISCUSSION
267
The appearance of Gd(DTPA) as a black band with white edges is the result ofa concentration phenomenon: phantom studies, using aqueous solutions of differentGd(DTPA) concentrations, revealed that in those regions where the concentration ofGd3+ is very high, the protons of surrounding liquid relax so rapidly that they are nolonger detectable by MRI and the signal from this volume is eliminated. In those areaswhere the Gd3+ concentration is lower, the relaxation of these protons is slightlyaccelerated in comparison with uninfluenced protons. In FLASH imaging this resultsin a brighter signal. This effect, which is in fact the basis for the use of Gd(DTPA) asa medical contrast agent, allows an approximate estimation of the sample concentration on the column.
The interpretation of the elution profile reveals first the so-called wall effect9.1o
.
This effect had been studied theoreticallyll and in practice after elution by examiningthe peak shapes on the chromatogram. Here it was possible for the first time to studythe peak on the fly. The wall effect is mainly attributed to steel columns12, but it alsoappears in glass columns. Unfortunaly, with this imaging technique we are restricted tothe observation ofnon-metal columns and are therefore not able to compare this effecton both types of column. The wall effect is explained by a lower packing density andthus higher flow velocity in the vicinity of the walls, leading to an inverted V shapedprofile. This profile, however, cannot develop completely in our system: the sample isobserved to move most rapidly through the centre of the column. This effect can beascribed to the higher temperature at the core of the column. The reason for this mightbe the heat of adsorption 13 of the solute on the stationary phase or the heat of frictioncaused by the viscosity of the solvent and pressure drop on the column 7.14,15. Thecolumn material cannot transfer the heat rapidly enough to the walls and this thermalinertia reduces the viscosity of the mobile phase thus causing an increase in flowvelocity.
Both effects counterbalance in the upper part of the column, leading to thecharacteristic M-shaped profile, after which the thermal effect prevails the band finallyleaving the column heavily V-shaped. In addition, the band becomes broadened andmore blurred on its way owing to inevitable diffusion.
Despite this band profile, the chromatogram reveals an almost symmetricalGaussian peak. This is indicated by the calculation of the asymmetry factor:
T = bo.dao.1 = 0.92
Although we have not derived any concrete figures from these first results, it isobvious that MRI offers new possibilities for basic investigations in liquid chromatography, for example to study the effects of temperature, diffusion, flow velocity andpacking methods. With the help of faster imaging techniques, at present underdevelopment, we hope to be able to investigate faster elutions and systems with higherpressures in the near future.
ACKNOWLEDGEMENT
We thank B. Buszewski for fruitful discussions.

268
REFERENCES
M. ILG et al.
F. W. Wehrli, D. Shaw and 1. B. Kneel (Editors), Biochemical Resonance Imaging, VCH, New York,1988.
2 P. C. Lauterbur, Nature (London), 2421973) 190.3 B. Bliimich, Angew. Chem., Inl. Ed. Engl., 27 (1988) 1406.4 E. Bayer, W. Miiller, M. Ilg and K. Albert, Angew. Chem., Inl. Ed. Engl., 28 (1989) 1029.5 H. J. Weinmann, M. Laniado and W. Mutzel, Physiol. Chem. Phys. Med. NMR, 16 (1984) 167.6 A. Haase, J. Frahm, D. Matthaei, K. Merboldt and W. Hiinicke, J. Magn. Reson., 67 (1986) 217.7 H. Poppe and J. C. Kraak, J. Chromatogr., 282 (1983) 399.8 E. Bayer, Lecture and video presentation at the 13th Symposium on Column Liquid Chromatography,
Stockholm, June 25-30, 1989.9 E. Bayer, Chimia, 17 (1963) 414.
10 W. M. Skea, in P. R. Brown and R. A. Hartwick (Editors), High Performance Liquid Chromatography,Wiley, New York, 1989, Ch. 12.
II J. H. Knox, G. R. Laird and P. A. Raven, J. Chromatogr., 122 (1976) 129.12 B. Versino and H. Schlitt, Chromatographia, 5 (1972) 332.13 G. Hesse and H. Engelhardt, J. Chromalogr., 21 (1966) 223.14 H.-J. Lin and Cs. Horvath, Chem. Eng. Sci., 36 (1981) 47.15 I. Halasz, R. Endele and J. Asshauer, J. ChromalOgr., 112 (1975) 37.

Journal o/Chromatography, 517 (1990) 269-284Elsevier Science Publishers B.V., Amsterdam
CHROMSYMP. 1965
Non-porous polybutadiene-coated silicas as stationary phasesin reversed-phase chromatography
M. HANSON* and K. K. UNGER
lnstitutfiir Anorganische Chemie und Analytische Chemie, Johannes Gutenberg-Universitiif, 1. J. BecherWeg 24, D-6500 Mainz (F.R.G.)
and
G. SCHOMBURG
Max Planck-Institutfiir Kohlenforschung, Kaiserplatz I, D-4330 Miilheim (F.R.G.)
ABSTRACT
Non-porous silica of mean particle diameter 1.7 ,urn (Monospher) was coatedwith polybutadiene (PBD) following a published procedure. The silicas were preparedwith graduated polymer loads up to 8% (w/w). Examination of the PBD-coatedpackings by means of electron spectroscopy for chemical analysis, scanning electronmicroscopy, diffuse reflection infrared fourier transform spectroscopy and differentialthermal gravimetry indicated that the optimum polymer load was between I and 3%(w/w) with regard to a dense coverage corresponding to an average layer thickness ofabout 4 nm. No silanophilic interactions could be monitored using 1-3% (w/w)coated silicas under reversed-phase conditions. The small particle diameter combinedwith the chemically stable polymer coating allowed extremely fast and efficient separations of peptides and polypeptides under gradient elution conditions in less than 1min.
INTRODUCTION
Major advances have occurred in recent years in the design and development ofhigh-performance liquid chromatographic (HPLC) stationary phases. One focus wason the elucidation of the pore and particle structure ofHPLC packings with regard tobetter mass transfer kinetics, higher column performance and faster analysis. This ledto the family of macroporous packings of mean pore diameter of > 50 nm and tonon-porous packings1,2. Both types have been shown to generate outstanding separation capabilities for large biomolecules. The other focus was on novel conceptsand improvements of the stationary phase chemistry of HPLC packings.
The objectives were to prepare stationary phases with defined and accessiblefunctional groups, to minimize or eliminate adsorptive effects of the matrix, concur-
0021-9673(90($03.50 © 1990 Elsevier Science Publishers B.V.

270 M. HANSON, K. K. UNGER, G. SCHOMBURG
rently improving the chemical stability and lifetime of the packing whilst maintaininga high mechanical stability. The most successful approach is to immobilize definedpolymer layers at the surface of the rigid inorganic packing in such a way that asolute-impermeable layer results, which, a priori, carries functional ligands or appropriate ligands were introduced by chemical reactions. Numerous polymer-load typesof HPLC packings made by different immobilization chemistries3
-8 are available.
Although the immobilization procedures have advanced, few attempts havebeen made to assess the properties of the immobilized polymer layers in terms ofchemical structure, physical structure and morphology, and to demonstrate the wayin which variation of these structural parameters affect the chromatographic properties.
This work was aimed at elucidating the structural properties of a well knownpolymer coating, polybutadiene (PBD), on non-porous microparticulate silicas. Thelack of pores and the spherical nature of the particles provide suitable conditions forimmobilizing PBD layers of different thicknesses and for studying their layer composition and morphology by surface analytical methods. Chromatographic tests withappropriate polar solutes permit residual silica adsorptivities to be monitored, thusindicating the quality of the coating. The products obtained were most suited for therapid analysis of peptide mixtures owing to their extremely small particle size of 1.7/lm. Such packings were required for rapid peptide monitoring in process control andallow analyses to be performed in much less than I min.
EXPERIMENTAL
Chemicals and materialsMonospher, support (non-porous silica of mean particle diameter 1.7 /lm),
methanol, acetonitrile, n-pentane and trifluoroacetic acid were obtained from E.Merck (Darmstadt, F.R.G.). The peptides for the reversed-phase test and silanolmonitoring were obtained from the Department of Biochemistry, University of Alberta, Canada. Polybutadiene and dicumyl peroxide were supplied by Aldrich Chemie (Steinheim, F.R.G.). Proteins were supplied by Boehringer (Mannheim, F.R.G.)and Serva (Heidelberg, F.R.G.). Paracelsine peptides were donated by the Institut fUrLebensmitteltechnologie, UniversiHit Hohenheim, F.R.G. ODS and TMS silanization reagents, alkylbenzenes and the polarity test mixture were donated by the MaxPlanck-Institut fiir Kohlenforschung (Miilheim, F.R.G.).
Water was deionized with a Milli-Q system (Millipore-Waters, Eschborn,F.R.G.).
SupportTo clean the surface of the Monospher support from impurities caused by the
manufacturing process and to remove remaining micropores, the material was calcined at 1273 K for 48 h in a shallow bed. After cooling to room temperature, 200 g ofcalcined Monospher were suspended in 500 ml of nitric acid (15%, v/v) and refluxedfor 18 h to rehydroxylate the surface. The material was washed with deionized wateruntil the pH of the washings was neutral. The material was then dried at 440 K undervacuum (0.1 mbar) for 30 h.

POLYBUTADIENE-COATED SILICAS AS STATIONARY PHASES 271
Coating of silica with polybutadiene (PBD )The apparatus consisted of a Rotavapor, a chamfered flask and an argon purge
system. Dried Monospher (15 g) was stirred in n-pentane (30 ml) until a homogeneoussuspension was obtained. Defined amounts of polybutadiene (molecular weight 4500,45% vinyl, 55% 1,4-cis/trans) and dicumyl peroxide (DCP) were added according tothe desired loading. The batches made were as follows:
PBD batch No. PBD (mg) DCP (mg)
0.2 30.0 1.50.5 75.0 3.81.0 150.0 7.52.0 300.0 15.03.0 450.0 22.55.0 750.0 37.5
10.0 1500.0 75.5
The solvent in each batch was evaporated and the PHD was immobilized in achamfered flask at 440 K for 4 h, the mixture being rotated at 30 rpm in a dry argonatmosphere. The loaded silicas were suspended in dioxane-toluene (1:1, v/v) andsubjected to ultrasonic treatment. The suspension was then filtered through a porousPTFE membrane of 0.2 /lm porosity (Cartridge system; Sartorious, Gottingen,F.R.G.), applying a pressure of 0.4-0.5 MPa. The product was washed with tetrahydroforan, methanol and diethyl ether consecutively to remove the oligomers ofpolybutadiene. The reaction scheme is shown in Fig. 1.
Silanization of silicaTMS presilanization. Monospher was silanized with trimethylsilyl enol ether
l,2-PBD
" Prepolymerization~ to MW=4500
trans-l,4-PBD cis-l,4-PBD
II +Monospher (support)~ +DCP
Immobilized Polybutadiene onMonospher
Fig. I. Reaction scheme of the coating procedure. MW = Molecular weight.

272 M. HANSON, K. K. UNGER, G. SCHOMBURG
OH +N(CII:S)2
IH:sC-Si-CH:s
ICJ.8 H:S7
l··"·",CH:s
l-lCH 2 )J.7 -CH:s
CIl:s
(ell) (b)
Fig. 2. Reaction scheme for the TMS and ODS modifications.
(TMS) following a procedure described by Schomburg et al. 9 (Fig. 2b). SilanizedMonospher was also coated by the procedure described above.
ODS silanization. The same procedure was used to immobilize octadecylsilyl(ODS) residues on Monospher. Dimethyl(dimethyloctadecylsilyl)amine was used under the conditions described in ref. 9 (Fig. 2a).
Characterization of the bulk MonospherElemental analyses of parental and coated Monospher were obtained on a
model 240 B Elemental Analyzer (Perkin-Elmer, Uberlingen, F.R.G.). Duplicateanalyses for carbon and hydrogen were performed. The reproducibility of the measurements was within ± 0.2% (absolute standard deviation).
Thermogravimetric analysis (TGA), differential thermal analysis (DTA) anddifferential scanning calorimetric (DSC) measurements were conducted with a DuPont ModeJ 2100 TGA-Analyzer. The temperature was increased to 1120 K at 2K/min in a dry air atmosphere. The samples were maintained in the analyser until nofurther weight loss was observed 1o.
Diffuse reflection infrared Fourier transform (DRIFT) spectroscopy was performed on a Series 7000 FT-IR spectrometer (Nicolet, Offenbach, F.R.G.).
Electron spectroscopy for chemical analysis (ESCA) was carried out by Dr.Herzog (Hoechst Frankfurt/Main, F.R.G.) on a modified Leybold Hereaus ESCAinstrument.
A Chemscan Cambridge, U.K. Series 4 scanning electron microscope was usedfor morphological investigations.
Chromatographic experimentsChromatographic experiments were performed with two sets of equipment.
With set 1, the screening experiments were performed with a Merck-Hitachi systemequipped with a ModeJ 655A-12 pump system, an L-5000 controller, a Model 655 AUV detector and a Rheodyne 7125 injector with a 20 J.ll-Ioop (E. Merck). The chromatograms were plotted with a C-R3A integrator (Shimadzu Europa, Duisburg,F.R.G.).
With set 2, rapid peptide separations were performed with a Bischoff (Leon-

POLYBUTADIENE-COATED SILICAS AS STATIONARY PHASES 273
berg, F.R.G.) LC unit consisting of an Autochrom 300 benchtop gradient controllersystem/terminal, two Model A2200 LC pumps and a Rheodyne 7410 injector with a 1f.ll-loop. A Shimadzu SPD-6VA UV detector with a 0.6-f.ll cell and a time constant of<50 ms and a Shimadzu C-R3A integrator were also used.
All eluents were degassed with a stream of helium leading through the solventreservoirs.
Stainless steel columns of 33 x 4.6 mm I.D. (Bischoff) were used with compression fittings composed of metal screens and paper filters (Type 827; Schleicher andSchull, Dassel, F.R.G.). The following materials were packed: (a) polybutadienecoated Monospher (mean particle diameter 1.7 f.lm) with loadings of PBD between0.2 and 8% (w/w); (b) PBD-coated Monospher presilanized with TMS; (c) ODSbonded Monospher; (d) Monospher coated with a styrene-vinylsiloxane copolymer1 1,1z. The columns were slurry packed using toluene-dioxane-eyclohexanol(1:1:1, v/v/v). The slurry, containing 1-2% (w/w) of modified Monospher, was treated ultrasonically for 4 h in a cooled bath. Columns were packed at a constant flowrate under a constant pressure of 60 MPa.
Several test mixtures were applied in chromatographic experiments:(a) Alkylbenzenes: ethylbenzene (C z), propylbenzene (C3), butylbenzene (C4 ),
n-pentylbenzene (n-Cs), isopentylbenzene (i-Cs) and n-hexylbenzene (C6) were dissolved at a concentration of 1 mg/ml in methanol. The injection volume was 1-2 'Illand produced satisfactory chromatographic peak sizes at a detection wavelength of254 nm. The flow-rate was 0.5 ml/min.
(b) Polarity test: 1 mg/ml of acetophenone, benzophenone, benzyl benzoate andn-octylpyridine were dissolved in methanol. The chromatographic conditions werethe same as in (a).
(c) Reversed-phase peptides: the following decapeptides (SI-S5), synthesizedby C. T. Mant and R. S. Hodges (University of Alberta, Canada), were used in areversed-phase test13-15:
SI: Arg-Gly-Ala-Gly-Gly-Leu-Gly-Leu-Gly-Lys;S2: Arg-Gly-Gly-Gly-Gly-Leu-Gly-Leu-Gly-Lys;S3: Arg-Gly-Ala-Gly-Gly-Leu-Gly-Leu-Gly-Lys;S4: Arg-Gly-Val-Gly-Gly-Leu-Gly-Leu-Gly-Lys;S5: Arg-Gly-Val-Val-Gly-Leu-Gly-Leu-Gly-Lys;
All peptides contained an Na-acetylated N-terminal and a C-terminal amide, exceptpeptide SI, which was identical with peptide S3 but had a free a-amino group. Theseparations were carried out in the gradient mode, using acetonitrile-water-O.l %trifluoracetic acid (TFA) as eluent. The flow-rate was 1 ml/min and the detectionwavelength was 214 nm.
(d) Monitoring free silanol groups: as described in ref. 16, a method for freesilanol monitoring was applied by using a mixture of undecapeptides differing in thenumber of lysine residues:
1: Gly-Gly-Gly-Leu-Gly-Gly-Ala-Gly-Gly-Leu-Lys;2: Lys-Tyr-Gly-Leu-Gly-Gly-Ala-Gly-Gly-Leu-Lys;3: Gly-Gly-Ala-Leu-Lys-Ala-Leu-Lys-Gly-Leu-Lys;4: Lys-Tyr-Ala-Leu-Lys-Ala-Leu-Lys-Gly-Leu-Lys;
Each peptide contained an Na-acetylated N-terminal and a C-terminal amide. Gradient elution was performed at pH 2, using acetonitrile-water-D.l % TFA as eluent.The chromatographic conditions were the same as in (c).

274 M. HANSON, K. K. UNGER, G. SCHOMBURG
(e) Paracelsine is a membrane-active polypeptide with antibiotic activity and issecreted by the mould Trichoderma reesi. Its composition has a light inhomogeneity,consisting of four peptides (A-D), differing only in two positions:
A: Ac-Aib-Ala-Aib-Ala-Aib-Ala-GIn-Aib-Val-Aib-GIy-Aib-Aib-ProVal-Aib-Aib-Gln-Gln-Pheol
B: Ac-Aib-Ala-Aib-Ala-Aib-Ala-Gln-Aib-Leu-Aib-Gly-Aib-Aib-ProVal-Aib-Aib-Gln-Gln-Pheol
C: AC-Aib-Ala-Aib-Ala-Aib-A ib-Gln-Aib-Val-Aib-Gly-Aib-Aib-ProVal-Aib-Aib-Gln-Gln-Pheol
D: Ac-Aib-Ala-Aib-Ala-Aib-Aib-Gln-Aib-Leu-Aib-Gly-Aib-Aib-Pro-Val-Aib-Aib-Gln-Gln-Pheol
The peptides were N-terminal acetylated and C-terminated with phenylalaninol. Acetonitrile-water (36:64, v/v) containing 0.1 % TFA was used as the mobile phase forthe isocratic separation. The peptides were detected at a wavelength of 214 nm. Theflow-rate was varied from 1 to 3 ml/min.
(f) The separation of proteins was carried out by gradient elution with acetonitrile-water-O.l % TFA using the following proteins: (I) Ribonuclease A, (2) lysozyme, (3) transferrin, (4) conalbumin, (5) f3-lactoglobulin and (6) ovalbumin.
RESULTS AND DISCUSSION
Characterization ofpolybutadiene-coated silicasElemental analysis. In the immobilization procedure the load of PBD on silica
was adjusted to discrete values between 0.2 and 10% (w/w). There are two additionalmeans of assessing the load of PBD: elemental analysis of carbon and weight lossduring ignition by TGA. The carbon content of the coated silica measured by elemental analysis should correspond to the load adjusted for the immobilization, assuming that no losses of PBD occurred during the procedure. Table I gives the data
TABLE I
POLYMER LOAD OF SILICA DERIVED FROM THE WEIGHT OF IMMOBILIZED PBD, CARBON ELEMENTAL ANALYSIS AND THE CALCULATED PBD CONTENT AND THERMOGRAVIMETRY
d, = apparent layer thickness of PBD according to elemental analysis.
Sample
PBD 0.2PBD 0.5PBD 1.0PBD 2.0PBD 3.0PBD 5.0PBD 10.0
PBD employed Carbon Calculated PBD Weight d,(%, IV/IV) content content" loss (/1/11)
(%, IV/IV) (%, IV/IV) (%, IV/IV)
0.2 0.14 0.16 0.28 0.80.5 0.35 0.39 1.81.0 0.83 0.93 1.19 4.12.0 1.59 1.79 2.31 7.93.0 2.42 2.72 2.87 12.05.0 3.77 4.25 5.13 18.8
10.0 7.38 8.31 9.48 36.9
a From carbon elemental analysis.

POLYBUTADIENE-COATED SILICAS AS STATIONARY PHASES 275
derived fr"om different methods. It also includes the apparent film thickness, d., ofPBD-coatedsilicas calculated with the equation
where XPBD is the load of PBD (%, w/w) derived from carbon analysis, PPIlD is thedensity of PBD (g/ml) and as the specific surface area of the silica according to theBET method (as = 1.8 m2/g). The load obtained on the basis of the carbon content isless than the amount of PBD employed in the immobilization procedure even whencorrected by a factor of 1.l26 to take the content of hydrogen in PBD into account.The weight loss of loaded silicas derived from TGA is seen to be slightly higher thanthe amount of PBD loaded, which is probably due to the removal of non-carboneousconstituents from the silica during ignition. The apparent layer thickness increasesproportionally with the load of PBD and ranges from about 1 nm at low loads to 40nm at high loads.
Thermal analysis. The TGA data showed that the burning of PBD started atabout 200°C and was completed at 50o-C. Above 600°C no further weight loss occurred. In differential thermal analysis (DTA) of the PBD silicas three peaks appeared at 120, 300 and 500°C. DTA and differential scanning calorimetric (DSC)experiments on pure PBD as reference material gave nearly the same pattern asobserved for PBD-coated silicas. Therefore, apart from the weight loss, no conclusions can be drawn from thermal analysis about the homogeneity of the PBD coating.
Diffuse reflection infrared Fourier transform spectroscopy (DRIFT). DRIFTwas carried out on PBD-coated silicas in the range 1600-3200 cm -[ (Fig. 3). For theidentification and semi-quantitative determination of PBD the C-H absorption bandat 2916 cm - [ was employed. The intensity of this band was found to be proportionalto the load ofPBD. Owing to the lack of molar absorption coefficients, the quantification of PBD load from FT-IR measurements was not possible. Whereas the absorbance of the band at 2916 cm -[ increased with increase in the PBD load, the absorption band at 1869 cm-[ assigned to the silica diminished. Normally additionalinformation would be obtained by monitoring the absorbance at 3750 cm -[, assignedto the stretching vibration of free silanols. However, owing to the low surface area of
1~_
I 1 I3200 2400 1600
WAVENUMBERS (cm-')
Fig. 3. DRIFT spectra of silicas with increasing PBD load in the range 1600-3200 em-I. PBD silicasamples: 1,0.5; 2, 1.0; 3, 2.0; 4, 5.0; 5, 10.0 (pure samples, no KBr).

276 M. HANSON, K. K. UNGER, G. SCHOMBURG
TABLE II
DISTRIBUTION OF CARBON, SILICON AND OXYGEN IN THE LAYER OF PBD-COATEDSILICAS
Sample Amount of Csurface Sisur!uce. °surface
PBD" (atom-%) (atom-%) (atom-%)(%,11'/11')
Monospher 12.38 30.22 57.40PBD 0.5 0.39 43.35 21.60 35.05PBD 1.0 0.93 59.80 15.40 24.80PBD 3.0 2.72 69.30 10.00 20.70PBD 5.0 4.25 65.50 9.78 24.72PBD 10.0 8.31 70.05 7.10 22.85RP-18,,,. 26.97 26.88 46.15
a From carbon elemental analysis.
non-porous silica, the absolute concentration of free silanols is so low that they couldnot be detected by DRIFT.
DRIFT serves as a means of identifying the polymer used for coating andallows a crude estimate of the extent of loading, but it cannot be utilized for theassessment of the homogeneity or defects of the coating.
Electron spectroscopy or chemical analysis (ESCA) .ESCA provides a sensitive
oXIIIa.u
o
1150.01155.01140.01135.0 1145.0 1150.0K.ENEROY eV
Fig. 4. Intensity of the X-ray photoelectron spectroscopic band at 1147.5 eV due to silicon at various loads:I = PBD 0.5; 2 = PBD 1.0; 3 = PBD 3.0; 4 = PBD 10.0.
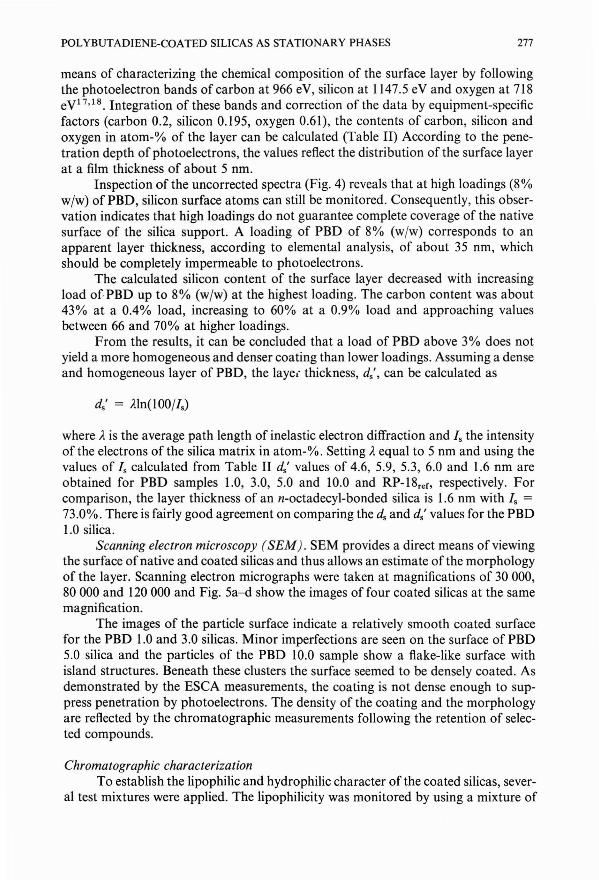
POLYBUTADIENE-COATED SILICAS AS STATIONARY PHASES 277
means of characterizing the chemical composition of the surface layer by followingthe photoelectron bands of carbon at 966 eV, silicon at 1147.5 eV and oxygen at 718eV 17,18. Integration of these bands and correction of the data by equipment-specificfactors (carbon 0.2, silicon 0.195, oxygen 0.61), the contents of carbon, silicon andoxygen in atom-% of the layer can be calculated (Table II) According to the penetration depth of photoelectrons, the values reflect the distribution of the surface layerat a film thickness of about 5 nm.
Inspection of the uncorrected spectra (Fig. 4) reveals that at high loadings (8 %wjw) ofPBO, silicon surface atoms can still be monitored. Consequently, this observation indicates that high loadings do not guarantee complete coverage of the nativesurface of the silica support. A loading of PBO of 8% (wjw) corresponds to anapparent layer thickness, according to elemental analysis, of about 35 nm, whichshould be completely impermeable to photoelectrons.
The calculated silicon content of the surface layer decreased with increasingload of. PBO up to 8% (wjw) at the highest loading. The carbon content was about43% at a 0.4% load, increasing to 60% at a 0.9% load and approaching valuesbetween 66 and 70% at higher loadings.
From the results, it can be concluded that a load of PBO above 3% does notyield a more homogeneous and denser coating than lower loadings. Assuming a denseand homogeneous layer of PBO, the layei thickness, do', can be calculated as
do' = Aln(lOOjIs)
where A is the average path length of inelastic electron diffraction and Is the intensityof the electrons of the silica matrix in atom-%. Setting Aequal to 5 nm and using thevalues of Is calculated from Table II do' values of 4.6, 5.9, 5.3, 6.0 and 1.6 nm areobtained for PBO samples 1.0, 3.0, 5.0 and 10.0 and RP-18rer, respectively. Forcomparison, the layer thickness of an n-octadecyl-bonded silica is 1.6 nm with Is =73.0%. There is fairly good agreement on comparing the ds and do' values for the PBO1.0 silica.
Scanning electron microscopy (SEM). SEM provides a direct means of viewingthe surface of native and coated silicas and thus allows an estimate of the morphologyof the layer. Scanning electron micrographs were taken at magnifications of 30000,80000 and 120000 and Fig. 5a-d show the images of four coated silicas at the samemagnification.
The images of the particle surface indicate a relatively smooth coated surfacefor the PBO 1.0 and 3.0 silicas. Minor imperfections are seen on the surface of PBO5.0 silica and the particles of the PBO 10.0 sample show a flake-like surface withisland structures. Beneath these clusters the surface seemed to be densely coated. Asdemonstrated by the ESCA measurements, the coating is not dense enough to suppress penetration by photoelectrons. The density of the coating and the morphologyare reflected by the chromatographic measurements following the retention of selected compounds.
Chromatographic characterizationTo establish the lipophilic and hydrophilic character of the coated silicas, sever
al test mixtures were applied. The lipophilicity was monitored by using a mixture of

Fig.
5.S
cann
ing
elec
tron
mic
rogr
aphs
of
(a)
PH
D1.
0,(b
)P
HD
3.0,
(c)
PH
D5.
0an
d(d
)P
HD
10.0
.
tv -.I
00 ~ ::c :> z en ~ ?<: ?<: ~ Q tTl ?' P en (j ::c o ?i:: o:l c:: ;;a Q

POLYBUTADIENE-COATED SILICAS AS STATIONARY PHASES 279
..k' ...
k'50
•30
20
to • ••••
I I I I4 6 6 10
PBD loading (% w/w)
Fig. 6. Dependency of the capacity factor, k' (alkylbenzenes), as a function of the PBD loading on Monospher: I = ethylbenzene 2 = n-propylbenzene; 3 = n-butylbenzene; 4, = isopentylbenzene; 5 = n-pentylbenzene; 6 = n-hexyIbenzene.
Fig. 7. Plot of the capacity factor, k', of n-octylpyridine versus the PBD loading on Monospher.
n-alkylbenzenes. A polarity test aiming at measuring the residual adsorptivity of thesilica was carried out using acetophenone, benzophenone, benzyl benzoate and noctylpyridine.
To assess the separation capabilities of thePBD-coated silicas for peptide separation, two standard peptide mixtures were chromatographed with an acidic mobilephase under gradient elution conditions with acetonitrile as the organic solvent. Anisocratic separation was carried out with paracelsine peptides using a binary acidicmobile phase (water-acetonitrile). Finally, a protein mixture was separated under thesame conditions as in the standard peptide test.
Test with n-alkylbenzenes. The capacity factors, k', of a homologous series ofn-alkylbenzenes (ethyl to n-hexyl) were measured on columns packed witp PBDcoated silicas with a constant mobile phase composition. For comparison the samemeasurements were performed on an n-octadecyl-bonded non-porous siliqa. Fig. 6depicts the dependence of k' on the PBD loading of the stationary phasel A linearrelationship is obtained for each solute up to a 4% PBD loading. Above' 4% PBDeach curve shows an upward swing to higher retention. This additional inotease in theretention ofn-alkylbenzenes on the PBD 10.0 silica is probably due to thJfact that an
Iadditional partitioning of solute takes place with the bulky clusters of PIBD attachedto the underlying PBD coating.
The retention behaviour of the n-octadecyl-bonded silica is similar to those ofthe PBD 0.5 and 1.0 silicas.
Polarity test. Basic compounds such as amines are sensitive markers for monitoring the residual adsorptivity of reversed-phase materials. In this instance n-octylpyridine was employed. The plot of k' of n-octylpyridine versus the PBD loading ofthe silicas showed that the retention declines from PBD 0.5 silica to a minimum atPBD 1.0 silica and then increases proportionally at higher loadings (Fig. 7). In thefirst part of the curve n-octylpyridine is mainly retained by silanophilic interactionswith the stationary phase, which reaches a minimum at the PBD 1.0 silica. On theright-hand side of the curve the lipophilic interactions dominate because the silicasupport is nearly completely covered by the PBD.
Further evidence of the absence of residual adsorptivity of the silica is provided

280
CXXY
3.5
~3.0
2.5
°432.0 X III Ii! 9
0 °32
M. HANSON, K. K. UNGER,G. SCHOMBURG
(0)1 (b) (e)1
PBD1.0 RP 18 C -PBDO.S
3
3 4
4 3
2
2
4
1.5 rr"'l'" ' I ' , , , I ' , , , I ' , , , I ' , , , I ' , , , I ' , , , Io 1 2 3 4
Polymer loading (% w/w).-
r------l min ~ min r---l mino 4 0 4 0 5
Fig. 8. Plot of the selectivity coefficients, a, of two pairs of solutes versus the PBD loading on Monospher.
Fig. 9. Chromatograms for the polarity test (I = acetophenone, 2 = benzophenone,3 = benzyl benzoate,4 = n-octylpyridine) for the following columns: (a) PBD 1.0 silica, (b) RP-18 (n-octadecyl-bonded, notend-capped) silica and (c) presilanized PBD silica (CI-PBD 0.8). Chromatographic conditions: mobilephase, acetonitrile-water (45:55, v/v); flow-rate, 0.5 ml/min; detection wavelength, 254 nm.
by Fig. 8, where the selectivity coefficients, IX, of two pairs of solutes, IX43 = k'(noctylpyridine)/k' (benzyl benzoate) and IX32 = k' (benzyl benzoate)/k' (benzophenone), is plotted against the PBD load of the silica. IX43 decreases from 3.5 to about 2from the PBD 0.5 to thePBD 2.0 silica and then remains constant.
Fig. 9 compares the chromatograms, obtained under constant conditions, for
b 4
a
J
45
,......,....,~T'-,-,..--.'I,...'""""--'--"I I ' I' 'I1 0 1
Retention time (minutes)
Fig. 10. Chromatograms of reversed-phase peptide standards on (a) PBD 1.0 silica and (b) PBD 3.0 silica.Chromatographic conditions: gradient from 100% A to 75% A-25% B in 1.5 min, where A = 0.1 %aqueous TFA and B = acetonitrile-water (75:25, v/v) containing 0.1 % TFA; flow-rate, 1.0 ml/min; detection wavelength, 214 nm (Peak numbers correspond to peptides SI-S5, p. 273).

POLYBUTADIENE-COATED SILICAS AS STATIONARY PHASES 281
a b5
o 1,20
Retention time (minutes)
1,2
Fig. II. Chromatograms of reversed-phase peptide standards on (a) n-octadecyl-bonded silica and (b)polystyrene-vinylsiloxane-coated silica. For chromatographic conditions, see Fig. 10 (Peak numbers correspond to peptides SI-S5, p. 273).
the test mixture applied to three columns: the PBD 1.0 silica, the n-octadecyl-bondedsilica and the presilanized PBD 0.8 silica. The PBD 1.0 silica shows a baseline separation and the last eluted peak (n-octylpyridine) is fairly symmetrical. The resolutionwith the other two stationary phase is much worse.
Tests with peptide standard mixtures. The first set of five standard decapeptidesenabled us to monitor the hydrophobic character of the stationary phase. Four stationary phases were selected for comparison: PBD 1.0 and PBD 3.0 silica, the noctadecyl-bonded silica and the polystyrene-vinylsiloxane-coated silica. The last material was prepared following the procedure of Kurganov and co-workers 11
,12. Themobile phase was an acidic acetonitrile-water gradient. The chromatograms obtainedwith the PBD 1.0 and PBD 3.0 silicas are shown in Fig. 10. The first three peptides
a 24
3b 2
3 4
,.-~~,....~-',.,..t~~.,...".I t,.-·~~,.-~~.,.-,-~,..."1 0
Retention time '(minutes)
Fig. 12. Chromatograms of the "silanol monitoring" peptide test: (a) PBD LO silica and (b) PBD 3.0 silica.For chromatographic conditions, see Fig. 10 (Peak numbers correspond to peptides 1-4, p. 273).

282 M. HANSON, K. K. UNGER, G. SCHOMBURG
a 2 b1
34
l. l,! ~__JIJ~,_~_-+__-'. I __,_J ',___
0 1, b 1,5
Retention time (minutes)
Fig, 13, Chromatograms of the "silanol monitoring" peptide test: (a) n-octadecyl-bonded silica and (b)polystyrene-vinylsiloxane-coated silica, For chromatographic conditions, see Fig. 10 (Peak numbers correspond to peptides 1-4, p. 273),
elute closely together as a triplet, followed by peptides 4 and 5 as a doublet. Theresolution with the n-octadecyl-bonded silica is not as good as that with the twoPBD-coated silicas. With the polystyrene-vinylsiloxane-coated silica the triplet is notresolved and the eluted peaks are broader than those in the other columns (Fig. II).
5
4
I ' I" Io 1
Retention time (minutes)
II
Retention time (minutes)
Fig. 14.1socratic separations ofparacelsine peptides on a PBD 1.0 silica column. Chromatographic conditions: Mobile phase, acetonitrile-water (36:64, v/v) containing 0.1 % TFA; flow-rate, 3.0 ml/min; detectionwavelength, 214 nm (Peak numbers correspond to Paracelsine peptides A-D, p. 274).
Fig. 15. Separation of proteins on a PBD 1.0 silica column. Chromatographic conditions: gradient from100% A to 100% B in 1.0 min, where A = 0.1 % aqueous TFA and B = acetonitrile-water (75:25, v/v)containing 0.1 % TFA; flow-rate, 2.0 ml/min; detection wavelength, 214 nm (Peak numbers correspond toproteins, p. 274).

POLYBUTADiENE-COATED SILICAS AS STATIONARY PHASES 283
The second set of standard peptides serves for silanol monitoring. The basiccharacter of the peptides increases in the sequence 1 < 2 < 3 < 4 owing to theincreasing content of lysine. All four peptides are baseline separated on the PBD 1.0and PBD 3.0 silica columns (Fig. 12) with almost no tailing. The n-octadecyl-bondedsilica exhibits slightly tailed peaks for the basic peptides. Pronounced peak tailing,particularly of the last-eluting peptide, was observed with the polystyrene-vinylsiloxane-coated silica (Fig. 13).
Paracelsine peptides. This peptide mixture consists of four peptides which differslightly in two positions. A baseseparation of the four peptides was achieved by Lorket al. 19 using a ternary mobile phase and isocratic conditions. Fig. 14 shows thechromatogram of the mixture on a PBD 1.0 silica column with water-acetonitrile(64:36, v/v) as the mobile phase under isocratic conditions, obtained in less than 1mIn.
Protein test mixture. A test mixture containing six proteins (1, ribonuclease A;2, lysozyme; 3, transferrin; 4, conalbumin; 5, fj-Iactoglobulin; 6, ovalbumin) waschromatographed under the same conditions as applied to the peptide standards.Short gradient times of about 1 min and high flow-rates above 1 ml/min allowed veryefficient, high-resolution separations, as already demonstrated by Unger and coworkerszo - z3 on n-alkyl-bonded non-porous silica. An example is shown in Fig. 15.
CONCLUSIONS
The combination of various physico-chemical methods applied to the characterization of PBD-coated non-porous silicas provided a detailed insight into thechemical structure of the polymer layer and its morphology. For the non-poroussilicas investigated, loadings ofPBD between 1 and 3% (w/w) provide the most denseand homogeneous coatings.
Chromatographic measurements with various test mixtures indicate a similarlipophilic character of the PBD silica with ca. 1% (w/w) of PBD and the n-octadecylbonded derivative. The polymer clusters formed on the coated PBD 10.0 silica giverise to a substantially higher retention for lipophilic solutes, as expected when extrapolating from lower PBD loadings. This additional retention is probably due topartitioning of the solute between the mobile and bulk polymer phases in addition tothe solute-surface interaction with the thin underlying PBD layer.
A minimum load of PBD of about 1-3% (w/w) is required to eliminate theresidual adsorptivity of the silica support, as shown by the retention of n-octylpyridine in isocratic and basic peptides in gradient elution experiments.
The PBD silicas studied are particularly suitable for rapid chromatographicseparations of peptides and proteins under gradient elution conditions in less than 1min.
ACKNOWLEDGEMENTS
The authors express their thanks to Dr. Herzog of Hoechst (Frankfurt/Main,F.R.G.) for allowing M.H. to work with his group on ESCA measurements, Dr.Krebs of E. Merck (Darmstadt, F. R.G.) for the thermoanalytical measurements andDr. Bruckner (lnstitut fUr Lebensmitteltechnologie, UniversiUit Hohenheim, F.R.G.)for the generous donation of the paracelsine peptides.

284
REFERENCES
M. HANSON, K. K. UNGER, G. SCHOMBURG
1 H. Giesche, Disser/a/ion, Johannes Gutenberg-Universitat, Mainz, 1987.2 H. Giesche, K. K. Unger, U. Esser, B. Eray, U. Trudinger and J. N. Kinkel, J. Chroma/ogr., 465 (1989)
39.3 G. Schomburg, LeGC, 6 (1987) I.4 G. Schomburg, J. Kohler and P. Kolla, Chroma/ographia, 23 (1987) 465.5 G. Schomburg, J. Kohler and G. Heinemann, Chromatographia, 23 (1987) 435.6 G. Schomburg, J. Kohler, H. Figge, A. Deege and U. Bien-Vogelsang, Chroma/ographia, 18 (1984) 265.7 G. Schomburg, H. Figge, A. Deege and J. Kohler, J. Chromatogr., 351 (1986) 393.8 G. Schomburg, U. Bien-Vogelsang, A. Deege, H. Figge and J. Kohler, Chromatographia, 19 (1984) 170.9 G. Schomburg, A. Deege, 1. Kohler and U. Bien-Vogelsang, J. Chroma/ogr., 282 (1983) 27.
10 R. C. MacKenzie, Differential Thermal Analysis, Academic Press, New York, 1982.II A. Kurganov, O. Kuzmenko, V. A. Davankov, B. Eray, K. K. Unger and U. Trudinger, J. Chroma-
togr., in press.12 V. A. Davankov, A. Kurganov and K. K. Unger, J. Chromatogr., in press.13 C. T. Mant and R. S. Hodges, LC Mag., 4 (1986) 250, 252 and 254.14 J. M. R. Parker, C. T. Mant and R. S. Hodges, Chroma/ographia, 24 (1987) 832.15 C. T. Mant, T. W. L. Burke and R. S. Hodges, Chromatographia, 24 (1987) 565.16 C. T. Mant and R. S. Hodges, Chromatographia, 34 (1987) 805.17 K. Siegbahn, Nova Acta Regiae Soc. Sci. Ups., Ser. IV, (1967) 20.18 W. Herzog, Farbe Lack, 90, No.2 (1984) 102.19 K. D. Lork, K. K. Unger, H. Bruckner and M. T. W. Hearn, J. Chromatogr., 476 (1989) 135.20 K. K. Unger, G. Jilge, R. Janzen, H. Giesche and J. N. Kinkel, Chromatographia, 22 (1986) 7.21 G. Jilge, K. K. Unger, U. Esser, H. 1. Schiifer, G. Rathgeber and W. Muller, J. Chromatogr., 476 (1989)
37.22 K. K. Unger, G. Jilge, 1. N. Kinkel and M. T. W. Hearn, J. Chromatogr., 359 (1986) 61.23 R. Janzen, K. K. Unger, H. Giesche, J. N. Kinkel and M. T. W. Hearn,J. Chromatogr., 397 (1987) 81.

Journal of Chromatography, 517 (1990) 285-295Elsevier Science Publishers B.V., Amsterdam
CHROMSYMP. 1959
Competition between phenylalanine and acetic acid in achromatographic column as indicated by their adsorptionisotherms
SHULAMIT LEVIN* and SALEH ABU-LAFI
Pharmaceutical Chemistry Department, School of Pharmacy, The Hebrew University ofJerusalem, Jerusalem 91120 (Israel)
ABSTRACT
Competition between phenylalanine and acetic acid was investigated throughtheir adsorption isotherms when both compounds were used as mobile phase additives. Acetic acid was the acid component of an acetate buffer of pH 3.7. The systempeak corresponding to phenylalanine was used for measurement of its adsorptionisotherms at four different buffer concentrations, during detection at 254 nm. Theadsorption isotherms showed a considerable influence of the acetic acid on the retention of phenylalanine. Therefore, acetic acid was considered to be a mobile phaseadditive that modifies the stationary phase and competes with the phenylalanine. Thesolubility of the phenylalanine was measured at four different buffer concentrations,and appeared to be constant. Therefore, a decrease in retention due to solubilitychanges was ruled out. The system peak corresponding to the acetic acid was used forthe determination of the adsorption isotherm of acetic acid using detection at 220 nm.Phenylalanine enabled the visualization of the same system peak at 254 nm. Comparison of the capacity factor of the acetic acid system peak, obtained in the presence ofphenylalanine in the mobile phase, with that of the same peak without phenylalanineshowed very small differences over a wide range of concentrations. Therefore, it wasconcluded that distribution of acetic acid was not much affected by the presence ofthe other component in the mobile phase. Phenylalanine was injected at overloadconcentrations into mobile phases containing the acetate buffer only. The peakshapes and retentions behaved generally as expected from the adsorption isotherms.
INTRODUCTION
The chromatographic separation of ionizable solutes such as amino acids isusually optimized by changing the buffer concentration in the mobile phase. Acetatebuffer is commonly used for the separation of ionizable compounds l
. The buffer isused to maintain a constant degree of ionization of the solute and to maintaina constant ionic strength. However, acetic acid can also modify the stationary phase
0021-9673/90/$03.50 © 1990 Elsevier Science Publishers B.V.

286 S. LEVIN, S. ABU-LAFI
and change the retention of solutes. In this work we studied the influence of the bufferconcentration on the capacity ratio of ionizable solutes as a result of competitionbetween them. The ionizable component chosen for this purpose was phenylalanine,an amino acid that shows absorption at 254 nm.
A mobile phase that contains buffer is multi-component. It has at least threecomponents in addition to water, the acid or base in their molecular form and thecations and anions of the salt. In the case of the acetate buffer in our system, the pHwas 3.7, and it contained acetic acid and sodium acetate in the ratio of 9: I. Molecularacetic acid is adsorbed on the stationary phase to some extentZ- 4 and therefore itmodifies the surface of the column. At high concentrations and a constant pH, theacetic acid can be seen as a component that plays the role of an organic solventmodifier, at least in terms of competition with the solute on the stationary phase. Theinteraction between acetic acid and phenylalanine was studied here by using bothcompounds in the mobile phase at various compositions. Competition was investigated by studying the system peaks of phenylalanine and acetic acid in the vacancymode.
System peaks appear in the chromatograms in addition to solute peaks when asample different from the mobile phase is injected, under the following circumstances:the mobile phase is multi-component; some or all the mobile phase components showa high detector background; and part or all of the mobile phase components areadsorbed on the stationary phase. All types of chromatographic systems display thesepeaks: reversed- and normal-phase5- 1o, ion-pair with UV detection1,11-Z7, ionexchangeZ8- 31 and even gel permeation3Z- 36 systems.
Some background on the origins, significance and behaviour of system peaks hasbeen described previouslyZ-5,ZZ-27,37-39,4o-42. When a mobile phase component isadsorbed on the stationary phase, its corresponding system peak has a capacity factorgreater than zero. Identification and quantitative treatment of system peaks permittedthe calculation of the capacity factors ofmobile phase componentsZ- 4. It has also beenshown that the adsorption isotherm of a particular mobile phase component can becalculated from the corresponding system peak3.
A theoretical and experimental treatment of system peaks in non-linearchromatography was undertaken by Golshan-Shirazi and Guiochon37- 39, usingconditions in which competition between the solute and mobile phase componentsoccurs. It was shown that injection of a solute into a binary mobile phase wasaccompanied by two system peaks in addition to the solute peak. One of the twosystem peaks was eluted according to the capacity factor of the corresponding mobilephase component and the other accompanied the solute peak. Therefore, in principle,a mobile phase component can show up in more than one system peak.
System peaks were used in ion-pair chromatography with UV detection ofsolutes with no chromophorezl- 27 . An ion-pairing UV-absorbing agent was added tothe mobile phase to manipulate the selectivity and to reveal the solutes. The samplecomponents were eluted according to their particular capacity factors, and could showup in the chromatogram owing to the presence of the detection agent in the mobilephase. Peaks of solutes with no chromophore could be revealed in this chromatographic system owing to the presence ofan excess or a lack ofmobile phase componentin each of the solute zones. An excess or lack of a mobile phase component, exhibitedas a peak, is actually a system peak. As the detector was selective only for the mobile

COMPETITION BETWEEN PHE AND ACETIC ACID IN A COLUMN 287
phase additive, the recorded chromatograms displayed only system peaks. Thus, inchromatography with UV detection, where the solute is detected via the detectionagent owing to ion pairing or competition, the peak recorded in the chromatogram asthe solute peak is actually a system peak.
Phenylalanine was used as the detection agent in this work; the detector,operating at 254 nm, was selctive for phenylalanine only. The strongly adsorbedadditive in the mobile phase was phenylalanine and acetic acid served as the weaklyadsorbed component. Various buffer and phenylalanine concentrations were used,with different degrees of interference or competition between them.
THEORY
When the mobile phase is introduced into the chromatographic column, aceticacid and phenylalanine are partitioned between the two phases according to theiradsorption isotherms. Equilibrium is obtained when the ratio between the amounts ofthe components in the mobile and the stationary phases remains constant. At thatpoint, the composition of the effluent is constant, the concentration of the mobilephase component is Ceq and the amount on the stationary phase is Qeq- At low mobilephase additive concentrations, the dependence of the amounts of phenylalanine andacetic acid in the stationary phase, Qeq,P and Qeq,A, respectively, on their concentrations in the mobile phase, Ceq,P and Ceq,A, respectively, is described by the individualadsorption isotherm of each component. However, at high concentrations, Qeq,P mayalso depend on the concentration of the acetic acid, Ceq,A;and Qeq,A might depend alsoon Ceq .p. In this case a competitive adsorption isotherm can describe the mutualdependence39 ,
Tn this work we used system peaks in the vacancy mode of chromatography tostudy competitive conditions. A pure solvent with no additives is injected in this mode,i.e., the injection volume becomes vacant of phenylalanine and acetic acid relative tothe equilibrium state. The relative vacancy induces desorption of net amounts of dQpand dQA moles from the extraction layer on the stationary phase for re-equilibration.The amount on the stationary phase within the injection volume after re-equilibrationis Qi> rather than Qeq,i' so that
i= A,P (1)
In the vacancy mode, dQ > 0, the amount being released from the stationary phaseinto the injection volume to compensate for the vacancy. The difference dC; betweenthe equilibrium concentration and the new concentration within the injection volumeis minute when the sample volume is very small:
Ceq,; - Cm•i = dC; (2)
The small disturbance dC; of the particular component moves down the column ata constant velocity, dictated by its adsorption properties [uo/(l + dQ;/dCi)]. Thisdisturbance is called the system peak. As mentioned above, Golshan-Shirazi andGuiochon 39 showed that injection of a solute can result in more than one system peakfor a mobile phase component. Nevertheless, there is always one system peak that

288 S. LEVIN, S. ABU-LAFI
elutes according to a particular component's capacity factor, ki, which can serve for themeasurement of its adsorption isotherm.
The ratio dQ;/dC i of each solute is actually its ki, which is directly proportionalto the slope of its adsorption isotherm. Hence the adsorption isotherm can bemeasured from ki of the respective system peak, using the following equation:
CCq,i
Qeq,i = fki dCi
o
(3)
This is the principle on which the minor perturbation or system peak method foradsorption isotherm measurements is based. The concentration of the particularcomponent in the mobile phase is changed, then the respective k' of the system peak ismeasured experimentally according to the equation k' = (tR - to)/to. The capacityfactor corresponding to the particular components ki is multiplied by the difference inits concentration, dCi, in each step, and summation is done over the range ofconcentrations from 0 to the particular point Qeq,i'
EXPERIMENTAL
MaterialsThe mobile phase was prepared by dissolving the appropriate amounts of
phenylalanine (Merck, Darmstadt, F.R.G.) in acetate buffer (pH 3.7). The acetatebuffer consisted of analytical-reagent grade sodium acetate (Merck)-acetic acid(Frutarom, Haifa, Israel) (I :9).
InstrumentationThe high-performance liquid chromatographic (HPLC) system that was used in
most of the experiments included a Model 880-UP single-line high-pressure pump(lasco, Tokyo, Japan) with a Rheodyne injection valve using a 20-pl loop. Thechromatograms were detected with a UV-I single-path monitor (Pharmacia, Bromma,Sweden) at 254 nm in most instances and at 280 nm in some of the adsorption isothermmeasurements when the background of the mobile phase was too high for the detectorto balance. An SP8300 UV detector (Spectra-Physics, Santa Clara, CA, U.S.A.)operated on 254 nm was used when high concentrations of phenylalanine wereinjected. All the chromatograms were recorded on a single-pen Unicorder U-228recorder (Pantos, Nippon Danshi Kagashu, Japan).
Adsorption isotherms of acetic acid were measured using another chromatographic system: the solvent delivery system was a Hitachi L-6200 (Merck) and thedetector was an HP series 1050 (Hewlett Packard, Palo Alto, CA, U.S.A.) operating at220 nm, with an HP 3396A integrator (Hewlett Packard).
The temperature was kept constant to within ±O.soC using a circulatingwater-bath.
ProcedureAll the chromatographic runs were done with a LiChrosorb RP-18 cartridge
(250 x 4 mm J.D.) (Merck). The temperature was kept constant at 30°C throughout

COMPETITION BETWEEN PHE AND ACETIC ACID IN A COLUMN 289
the experiments and the flow-rate was 1.5 ml/min. The system was thoroughly washedwith acetonitrile-water occasionally, especially between changes in the mobile phasecomposition. At least 15 column volumes were eluted until a stable baseline wasobtained, when phenylalanine was added to the mobile phase.
Measurements of adsorption isothermsAdsorption isotherms of phenylalanine and sodium acetate were measured by
integration of the system peak capacity factors. The concentration of phenylalanine inthe mobile phase, Ceq, was gradually changed at each buffer concentration and thesystem peak capacity factors were measured. The calculation is explained in theTheory section.
Solubility ofphenylalanineAn excess amount of phenylalanine (0.005 mol) was added to 25 ml of the four
buffer concentrations, 0.01,0.1,0.5 and 1 mol/I, to obtain precipitates. The saturatedsolutions were stirred overnight, filtered, diluted (1 :40) and re-injected into the HPLCsystem, with aIM buffer concentration in the mobile phase. Peaks areas wereconverted to concentrations by a calibration graph.
RESULTS AND DISCUSSION
Measurements of adsorption isotherms from system peaksThe chromatographic system described here consisted of a reversed-phase
column and an aqueous solution of acetate buffer and phenylalanine as the mobilephase. The chromatograms obtained at four buffer concentrations are shown in Fig. I.Detection was effected at 254 nm, so phenylalanine could serve for the detection of allthree system peaks, marked A, Band C in Fig. 1. Peak A corresponds to an unretainedspecies, whereas Band C can both be related to species adsorbed on the stationaryphase. The retention times of peaks A and B can be related to acetate salt and aceticacid, respectively, in agreement with a previously described system, which includedacetate buffer3
. Peak C eluted at a capacity factor corresponding to phenylalanine.The peaks could appear negative or positive. Peaks A and B at buffer concentrations0.5 and 1 Mhad a derive-like shape, probably due to interference from the acetate or torefractive index: perturbations in the flow cell at the extremely high concentration.A peak appears negative when the detector response to the sample zone is lower thanthat to the mobile phase. At low acetate concentrations peaks A and B were smallbecause the interference of phenylalanine with the other components was small.
Phenylalanine. Adsorption isotherms of phenylalanine were calculated from thecapacity factors of system peak C at increasing phenylalanine concentrations in themobile phase. Four adsorption isotherms, measured at different concentrations of theacetate buffer in the mobile phase, are shown in Fig. 2. In addition, the adsorptionisotherm of the acetic acid was calculated from peak B capacity factors at increasingbuffer concentrations with no other additives. The parameters a and b for phenylalanine and acetic acid, which were calculated according to the Langmuir expression:
(4)

290 S. LEVIN, S. ABU-LAFI
o1M
O.5M
O.1M
Time (min)
Fig. I. Chromatograms obtained when water was injected into the mobile phase. The buffer concentrationsare marked on the chromatograms. The phenylalanine concentration was 0.005 M and full-scale was 0.04absorbance in all four instances.
0.10 ~--------------------...,.----.
0.08
0.06
Q
0.04
0.02
0.0250.020O.oJ50.0100.0050.00 ~=------r------r'-----,.-------.,.-------l
0.000
[phe] mole/l
Fig. 2. Adsorption isotherms of phenylalanine at four different phenylalanine concer,trations in the mobilephase. Buffer concentrations: 0 = 0.01; • = 0.1; I::, = 0.5; .. = 1.0 M.

COMPETITION BETWEEN PHE AND ACETIC ACID IN A COLUMN 291
TABLE I
ADSORPTION ISOTHERM PARAMETERS OF PHENYLALANINE AT FOUR DIFFERENTACETATE BUFFER CONCENTRATIONS AND THE INDIVIDUAL ADSORPTION ISOTHERMOF ACETIC ACID
Compound
Phenylalanine
Acetic acid
Burfer concentration (mol/I) a b
0.01 5.85 19.650.1 5.35 13.760.5 3.66 9.6I 3.14 6.89No phenylalanine 1.04 1.91
are given in Table I. Parameter a is actually the slope of the isotherm close to the origin,where it is linear. Parameter b is proportional to the saturation concentration in thecolumn, namely the concentration where the isotherm levels off. It can be seen thatboth a and b were affected by the buffer concentration. The capacity factor ofphenylalanine decreased at the origin and over the whole range of concentrations, inaddition to the saturation concentration. These effects were caused by the increase inthe acetic acid concentration. The acetic acid served as an organic modifier thatcompetes with the phenylalanine on the stationary phase partition sites. In order toverify that the decrease in the retention of phenylalanine was not due to the effect ofionic strength on the solubility, a test was made. Solubility was measured by preparingsaturated solutions of phenylalanine at the four buffer concentrations. The phenylalanine solubility, as shown in Table II, was not significantly changed, hence itcertainly could not be responsible for the considerable change in the retention.
The isotherm parameters ai and bi used in eqn. 4 should actually be expressed inmathematical terms to depict the competition between the solutes over the whole rangeof compositions. For that purpose, there is a need for measurements of an appropriateset of adsorption isotherms at various mobile phase compositions to represent thewhole range of competitive conditions. A systematic measurement of k' of the systempeaks of phenylalanine and acetic acid at various concentration ratios is the key for theoverall competitive isotherm. A competitive adsorption isotherm was used byGolshan-Shirazi and Guiochon39
;
(5)
TABLE II
SOLUBILITY OF PHENYLALANINE IN FOUR ACETATE BUFFER CONCENTRATIONS (pH3.7) AT ROOM TEMPERATURE
Bl!{fer concentration(mol/I)
0.010.10.51.0
Phenylalaninesolubility (mol/I)
0.1580.1350.1410.153

292 S. LEVIN, S. ABU-LAFI
In our system component I was acetic acid and 2 was phenylalanine. Here, the termsa and b from each individual adsorption isotherm, measured with no competitors,should be used. We took the parameters a and b obtained at 0.01 M buffer, i.e., theconditions with the minimum competition, as the parameters of the individualisotherm ofphenylalanine. Q values were calculated at buffer concentrations of0.1 ,0.5and 1 M according to eqn. 5 using the isotherm parameters for acetic acid in Table I.Poor agreement was found between the calculated values and Qeq,P values measured byintegration of the system peak capacity factor. The measurement of the individualisotherm of phenylalanine and the fit of eqn. 5 to the experimental isotherms obtainedat various mobile phase compositions is currently under study.
Acetic acid. The capacity factor of peak B was not affected much by changes inthe phenylalanine concentration in the mobile phase, as can be seen from Fig. 3. Thisfigure shows the curves for k' of peak B as a function of acetic acid concentration withand without phenylalanine. Integration of the curve with no phenylalanine gave theindividual adsorption isotherm of acetic acid from which the a and b values in TableI were calculated. The other curves show k' for peak B as function of the concentrationof acetic acid at four concentrations (0.009, 0.09, 0.45 and 0.9 M). Each curvecorresponds to a different phenylalanine concentration in the mobile phase asindicated.
The curves lie very close together, indicating that the presence of phenylalaninehad almost no effect on the distribution ofacetic acid. This observation is in agreementwith a previous publication, in which the column void volume was calculated from the
1.2.--------------------------,
1.0
0.8
k' 0.6
0.4
0.2
a 0.001
o 0.002
• 0.003c 0.004
.. 0.005
.. 0.006
• 0.008+ om
• 0.012
lC 0.014
.. 0.016
II 0.018
• 0,02
o no phenylalanine
1.00.80.60.40.20.0 +--~-....,--~----,--~-_,__---__,_-~-___l
0.0
[HOAc]Fig. 3. Capacity factor of peak B as function of the acetic acid (HOAc) concentration in the mobile phase atvarious phenylalanine concentrations (as specified, in M).

COMPETITION BETWEEN PHE AND ACETIC ACID IN A COLUMN 293
acetic acid system peak4. In this work, the presence of various alkylsulphonates had
little influence on the capacity factor of the acetic acid.Adsorption isotherms of mixtures can also be measured by frontal analysis,
provided that the inflection points in the breakthrough curves are distinguishable.Comparison of adsorption isotherms obtained by system peaks with other methodsare under investigation.
Peak shape under overload conditionsThe relationship between adsorption isotherms and peak shape in non-linear
chromatography was intensively investigated by Guiochon43. The chromatograms of
phenylalanine at an overloading concentration (0.1 M) injected into four differentmobile phases are shown in Fig. 4. The concentrations of the buffer in the mobile phaseare specified on the chromatograms. The most important points to note are the peaksshapes and retention. The peaks have sharp fronts and diffuse rears, as expected fromtheir adsorption isotherms.
Retention of the phenylalanine peak in Fig. 4 decreased with increase in bufferconcentration. This decrease in retention agrees with the behaviour of the adsorptionisotherms due to higher concentrations of acetic acid in the mobile phase.
~'M
O.5M
~O.IM
O.OIM
I I T To 3 6 9
Time (minl
12 15
Fig. 4. Overload concentration (0.1 M) of phenylalanine injected into four different buffer concentrations,indicated.

294
CONCLUSION
S. LEVIN, S. ABU-LAFI
When using an organic buffer in the mobile phase, it should be taken intoaccount that the buffer can modify the stationary phase, in addition to its role inkeeping the degree of ionization of the solute constant. The retention of ionizablesolutes can be affected by the molecular acid or base component of the buffer, whichmay act like an organic modifier in the mobile phase. This point is especially importantin the non-linear range of chromatography, where competition between componentsdictates parameters such as the separation efficiency and solute purity. Therefore,competitive adsorption isotherms are needed in order to predict the conditions and theextent of competition among the solutes, and between solutes and mobile phasecomponents. However, the measurement of an overall competitive adsorptionisotherm is not a trivial task. We suggest here that system peaks can be used for thispurpose, provided that the right set of representative adsorption isotherms at variouscompetitor compositions is chosen. The set presented in this paper is just a firstexample.
ACKNOWLEDGEMENTS
We are grateful to Prof. E. Breuer for allowing us to use his HPLC system tomeasure the adsorption isotherms of the acetic acid, and to Prof. R. Mechoulam forlending us his UV detector.
REFERENCES
I S. Levin and E. Grushka, Anal. Chem., 57 (1985) 1830-1835.2 S. Levin and E. Grushka, Anal. Chem., 58 (1986) 1602-1607.3 S. Levin and E. Grushka, Anal. Chem., 59 (1987) 1157-1164.4 S. Levin and E. Grushka, Anal. Chem., 61 (1989) 2428-2433.5 D. J. Solms, T. W. Smuts and V. Pretorius, J. Chromatogr. Sci., 9 (1971) 600-603.6 R. M. McCormick and B. L. Karger, 1. Chromatogr., 199 (1980) 259-273.7 W. R. Melander, J. F. Erard and Cs. Horvath, 1. Chromatogr., 282 (1983) 229-248.8 D. Berek, T. Bleha and Z. Pevna, J. Chromatogr. Sci., 14 (1976) 560.9 D. Berek, M. Chalanyova and T. Macko, J. Chromatogr., 286 (1984) 185-192.
10 R. P. W. Scott, C. G. Scott and P. Kucera, Anal. Chem., 44 (1972) 100-10411 B. A. Bidlingmeyer and F. V. Warren, Jr., Anal. Chem., 54 (1982) 2351-235612 F. V. Warren and B. A. Bidlingmeyer, Anal. Chem., 56 (1984) 487-491.13 M. Denkert, L. Hackzell, G. Schill and E. Sjogren, J. Chromatogr., 218 (1981) 31-43.14 L. Hackzell and G. Schill, Chromatographia, 15 (1982) 437.15 L. Hackzell, T. Rydberg and G. Schill, J. Chromatogr., 282 (1983) 179-191.16 P. Herne, M. Renson and J. Crommen, Chromatographia, 19 (1984) 274.17 W. E. Barber and P. W. Carr, 1. Chromatogr., 260 (1983) 89-96.18 W. E. Barber and P. W. Carr, J. Chromatogr., 301 (1984) 25-38.19 W. E. Barber and P. W. Carr, J. Chromatogr., 316 (1984) 211-225.20 J. J. Stranahan and S. N. Demings, Anal. Chem., 54 (1982) 1540-1546.21 B. A. Bidlingmeyer, S. N. Deming, W. P. Price, Jr., B. Sachok and M. Petrusek, J. Chromatogr., 186
(1973) 419-434.22 B. Sachok, S. N. Deming and B. A. Bidlingmeyer, J. Liq. Chromatogr., 5 (1982) 389-402.23 A. Sokolowski, T. Fornstedt and D. Westerlund, J. Liq. Chromatogr., 10 (1987) 1629-1662.24 J. Crommen, G. Schill, D. Westerlund and L. Hackzell, Chromatographia, 24 (1987) 252.25 T. Takeuchi, S. Watanabe, K. Murase and D. Ishii, Chroma/ographia, 25 (1988) 107.26 M. Johansson and D. Westerlund, J. Chromatogr., 452 (1988) 241-255.

COMPETITION BETWEEN PHE AND ACETIC ACID IN A COLUMN
27 E. Arvidsson, 1. Crommen, G. Schill and D. Westerlund, J. Chroma/ogr., 461 (1989) 429.28 R. M. Cassidy and M. Fraser, Chroma/ographia, 18 (1984) 369.29 1. S. Fritz, D. T. Gjede and R. M. Becker, Anal. Chem., 52 (1980) 1519-1522.30 H. Hershcovitz, Ch. Yarnitzky and G. Schmuckler, J. Chromatogr., 244 ([982) 217-224.31 N. E. Skelly, Anal. Chem., 54 (1982) 712.32 N. Yoza, T. Ogata, Y. Ueno and S. Ohashi, J. Chroma/ogr., 62 (1971) 295-305.33 T. Deguchi, A. Hisanaga and H. Nagai, J. Chroma/ogr., 133 (1977) 173-179.34 M. Shibukawa and N. Ohta, Anal. Chem., 54 (1985) 265-271.35 I. Katime, A. Campos and 1. M. T. Rivera, Eur. PolYIn. J., 15 (1979) 291-293.36 A. Campos, L. Borque and 1. E. Fiqueruelo, J. Chroma/ogr., 140 (1977) 219-227.37 S. Golshan-Rhirazi and G. Guiochon, J. Chromatogr., 461 (1989) 1-18.38 S. Golshan-Shirazi and G. Guiochin, J. Chroma/ogr., 461 (1989) 19-34.39 S. Golshan-Shirazi and G. Guiochon, Anal. Chem., 61 (1989) 2373-2380.40 F. Riedo and E. Sz. Kovats, J. Chroma/ogr., 239 (1982) 1-28.41 N. Le Ha, J. Ungvaral and E. Sz. Kovats, Anal. Chem., 54 (1982) 2410-2421.42 W. R. Melander, J. F. Erard and Cs. Horvath, J. Chroma/ogr., 282 (1983) 211.43 G. Guiochon arid A. Kalli, Chroma/ographia, 24 (1987) 165-189.
295


Journal a/Chromatography, 517 (1990) 297-304Elsevier Science Publishers B.V., Amsterdam
CHROMSYMP.1972
Design of liquid chromatography capillary columns
RAYMOND P. W. SCOTT
Chemistry Department, Georgetown University, Washington, DC 2001 (U.S.A.)
ABSTRACT
The theory of open tubular columns is extended to liquid chromatographywithout regard to the limitations of the associated chromatographic equipment.Methods are given to permit the optimum column length, radius and film thickness tobe calculated to provide the minimum analysis time for any given separation. Thebasic data required are the separation ratio of the critical pair, the distribution coefficient between the stationary and mobile phase of the first eluted solute of the criticalpair, its diffusion coefficient in the mobile phase, the separation ratio of the last elutedpeak to the first eluted solute of the critical pair, the viscosity of the mobile phase andthe maximum available inlet pressure. It is shown that, with the phase system considered, if the separation is to be achieved in the minimum time then the first solute ofthe critical pair should be eluted at a capacity factor (k') of 2.7 irrespective of theseparation ratio of the critical pair. Consequently the optimum film thickness depends solely on the optimum radius and the distribution coefficient of the solutebetween the two phases. Due to an optimum value for k' being identified the equations for analysis time and column length are greatly simplified.
INTRODUCTION
Liquid chromatography (LC) column theory is now well established andequations have been developed for packed columns that allow the column length,radius and particle diameter to be calculated, that provides the minimum analysis timefor any given separation!. These equations were derived employing the Van Deemterequation2 to describe the dispersion taking place in a packed column. The VanDeemter equation has been shown to accurately predict the plate height at, andaround, the optimum mobile phase velocity from basic chromatographic and physicaldata of the solute-solvent system employed3
. The equations necessary to designcapillary columns have not, so far, been developed to the same extent for LC and it isthe purpose of this pager to examine capillary column design and to developprocedures to calculate the column length, radius and stationary phase film thicknessthat will achieve a specific separation in the minimum time.
To develop these procedures, the reduced chromatogram will be employed thatcontains the closest eluted pair of solutes (the critical pair) and the last eluted solute of
0021-9673/90/$03.50 © 1990 Elsevier Science Publishers B.V.

298 R. P. W. SCOTT
any given complex mixture. 1f the closest eluted solute pair is separated and the lastpeak of the mixture eluted then it is assumed that the mixture has been completelyresolved. There may be rare exceptions where this may not be the case, possibly if thetwo solutes of the closest eluted pair differ widely in molecular weight4
, but in the vastmajority of separations the assumption will be correct. The basic data that will beemployed will be the separation ratio of the critical pair, the distribution coefficient ofthe first solute of the critical pair between the stationary phase and the mobile phase, itsdiffusion coefficient in the mobile phase, the separation ratio of the last eluted peak tothat of the first solute of the critical pair, the viscosity of the mobile phase and themaximum inlet pressure.
Although capillary, or open tubular columns are the most efficient forchromatographic separations, the demands they make on the associated chromatographic equipment are so stringent that, at this time, their effective use is largelyconfined to gas chromatographic separations. Although much research is beingcarried out in this area, at this time, there are few, if any, LC capillary columnchromatographs commercially available. Small volume sample valves have beendeveloped and the detector cell volumes have been much reduced, but despite this, thecolumn diameters must be made much above the optimum size for effective LCseparations to be successfully carried out. In due course, instrumentation will no doubtmeet the demands of the optimized, very small diameter, LC capillary columns. Asa result, in this paper the shortcomings ofcontemporary apparatus are largely ignoredand thus, by developing LC capillary column design, very fast and highly efficientcolumns will be ready and available when the appropriate instrumentation isdeveloped.
THEORY
The basic equation describing the dispersion that takes place in an open tubularcolumn was developed by Golay 5,6 and takes the following form:
where H is the variance per unit length of the column for the given solute, k' is thecapacity factor of the eluted solute, K is the distribution coefficient of the solutebetween the two phases, DM is the diffusivity of the solute in the mobile phase, Ds is thediffusivity of the solute in the stationary phase, r is the radius of the column, and u isthe linear velocity of the mobile phase. The Golay equation can be put in the reducedform:
H = Bju + Cu (2)
where B = 2DM ju and C = (1 + 6k' + Ilk'2)r2j24(1 + k')2DM + k'3r2j6(l +k')2K2Ds. Differentiating eqn. 2 with respect to u:
dHjdu = - Bju2 + C

DESIGN OF LC CAPILLARY COLUMNS
Thus, when H = Hmin:
-Bju2 + C = 0
and
Uopt = (BjC)°'s
Furthermore,
Hmin = Bjuopt + CUopt
= Bj( BjC)°'s + C(BjC)°'sor
Hmin = 2(BC)°'s
299
(3)
(4)
Eqns. I, 3 and 4 are all well established and important in column design.The equation that allows the number of theoretical plates required to effect
a given separation was derived from the plate theory by PurnelJ? and is as follows:
n = [4(1 + k')jk'(a - l)F (5)
where a is the separation factor of the critical pair, n is the number of theoretical plates,and k' is as previously defined. It should be noted that k' refers to thefirst eluted solutenot the second which is also often used and results in a slightly different equation for n.
Now the time required to elute the first of the critical pair, which will be simplyrelated to the total analysis time, is given by:
t = l(l + k')juopt (6)
where t, is the elution time for the first solute of the critical pair and I, is the length of thecolumn. Now, 1 = nHmin, thus,
t = nHmin(l + k')juopt
= n2(BC)°,s(l + k')j(BjC)°'s
= 2nC(1 + k')
Substituting for C and n from eqns. I and 5,
(7)
(8)
which can be simplified to,

300 R. P. W. SCOTT
where f3 = Ds(DM• Now it would appear at first sight, that by differentiating eqn.9 with respect to r and equating to zero, an expression would be obtained that wouldgive an optimum value r for minimum analysis time. However k' is a function of bothdr, the film thickness of stationary phase and r.
It is, therefore, necessary to obtain an expression for t that does not includeeither k' or dr. Now k' = K(a, where a is the phase ratio of the column. Furthermore,the volume of mobile phase in the column is nr21and the volume of stationary phase is2nrldr. Consequently a is given by, nr21(2nrldr = r(2dr and
k' = 2Kdrlr
Substituting for k' in eqn. 9 from eqn. lOa and simplifying,
(10a)
Now in order to solve for r or dr for a minimum value of the analysis time (t) thena further relationship must be obtained between r and dr. From Poiseuille's equationI = Pr2 ((8I]uoPt )' thus I = nHmin = 2n(BC)°'s = Pr2([81](B(C)°'S]; thus, 2nB =Pr2((81]), where P is the inlet pressure and I] is the solvent viscosity.
Now from the Golay equation B = 2DM , thus,
(11 )
It is interesting to note from eqn. 11 that when a column is run at its optimumvelocity, the efficiency attainable from a capillary column is directly proportional tothe inlet pressure and the square ofthe radius and inversely proportional to the solventviscosity and the diffusivity of the solute in the mobile phase.
Substituting for n in eqn. II from eqn. 5,
Substituting 2Kdrlr for k' and simplifying,
dr = r((2K(rt/t - 1)
where,
(12)
(13)
Eqn. 12 gives the required independent rela'tionship between r and dr. Thus,substituting in eqn. 10 for dr from eqn. 12,

DESIGN OF LC CAPILLARY COLUMNS 301
In order to determine the optimum value of the column radius r for the minimumvalue ofanalysis time t eqn. 14 should be differentiated and equated to zero and solvedfor r. However, the algebra becomes extremely clumsy and the solution difficult ifnotimpossible to identify. A simple and practical alternative is to employ a computer withan iterative program that will calculate t for a range of values of r and identify thatvalue of r that gives the minimum value of t. Thus, by employing the appropriateequations the optimum values of dr and k' can also be calculated.
After identifying the optimum values of r, dr and consequently k' the columnlength can be determined as follows:
1= nHmin
Substituting for nand H min from eqns. 5 and 4,
1= {[4(l + k')/k'(a - l)j2}2(BC)°·s
= {[4(1 + k')/k'(a - l)j2}2{(2DM)[(l + 6k' + llk'2)r2/24(l + k')2DM +
+ k'3r2/6(l + k')2K2DsUO· s (15)
DISCUSSION OF THEORY
Eqns. 1-8 are well established and although essential for the subsequentdevelopment of the equations necessary to calculate optimum column parameters, donot in themselves deserve comment. Eqns. 9 and 10 are similar to those developed byScott and Hazeldine8 for gas chromatographic separations on nylon capillarycolumns. The treatment given here, however, avoids the assumption of a given columnradius and then the optimum film thickness calculated. In this case the optimum radiusis directly determined. Consequently, the optimum film thickness appropriate/or theoptimum column radius can be calculated. In effect, both column radius and stationaryphase film thickness are considered variables.
Eqn. II demonstrates that the number of theoretical plates available froma capillary column depends on its radius, inlet pressure, viscosity of the mobile phaseand, perhaps a little surprisingly, the diffusivity of the solute in the stationary phase.Taking a viscosity value of0.003967 P (the viscosity ofn-heptane at 2YC), a diffusivityvalue of 2.5· 10- 5 (the diffusivity of benzyl acetate in n-heptane) the efficiencyobtainable from columns of different diameter can be calculated for an inlet pressureof 1000 p.s.i. The results are shown in Table 1.
It is seen that changing the radius of the column from I to 100 J.lm results in anefficiency change from about two hundred thousand theoretical plates to twothousand million plates. It is also seen that the smaller the column radius the lower themaximum number o/theoretical plates obtainable from the column. This is contrary tothe general impression of many workers in the field who consider that the maximumefficiency is always obtained using columns with the smallest radius. A similarsituation has been shown to be true for a packed column where it has beendemonstrated 1 that the smaller the particle diameter of the packing the less themaximum number of theoretical plates obtainable for a given inlet pressure. This is

302 R. P. W. SCOTT
TABLE I
MAXIMUM EFFICIENCIES ATTAINABLE FROM COLUMNS OF DIFFERENT RADIUS
Column radius(pm)
I10
100
Inlet pressureViscosity of mobile phaseDiffusivity of solute in the mobile phase
Column efficiency(rheorerical piares)
2.17' 105
2.17 10'2.17 109
1000 p.s.i.0.00397 P2.5' 10- 5 cm 2/s
a result ofa limited pressure being available and if the fastest separation is obtained byoperating at the optimum velocity on a particular column, then to increase the numberof theoretical plates the column must be made longer. It follows, that a longer columnwill have too high an impedance to permit the optimum velocity to be achieved andthus the radius must be increased. In summary, narrow capillary columns should beused for simple separations (large cc) and wide columns for difficult separations (smallcc).
Employing eqn. 14 the analysis time was calculated using a simple iterativecomputer program that identified both the optimum radius and the optimum filmthickness that provided the minimum analysis time. The physical values of the systemstated previously were employed with an inlet pressure of 1000 p.s.i. Calculations werecarried out for a range of separation ratios for the critical pair extending from 1.01 (adifficult separation) to 1.1 (a moderately simple separation). Three different values 50,250 and 500 were taken for the distribution coefficient of the first solute of the elutedpair. The value of the capacity factor (k') was also calculated for each separation. Theresults obtained are shown in Table II.
It is seen that the optimum column radius depends only on the separation ratio ofthe critical pair and is independent of the distribution coefficient. It is also seen that the·optimum separation ratio is constant at 2.7 and is independent of both the separationratio of the critical pair and the distribution coefficient of the first eluted solute. Asa consequence the optimum film thickness is defined by the optimum radius and thedistribution coefficient.
The value of 2.7 agrees well with the values for the optimum mobile phasevelocity predicted by Grushka and Cooke9
. In the hypothetical design of a capillarycolumn there would be two approaches that would provide the optimum filclthickness. One alternative could be to adjust the phase system until the first solute ofthe critical pair was eluted at a k' of 2.7 and then calculate the optimum radius thatwould provide the minimum analysis time by the iterative procedure. A secondalternative, could be to measure or estimate the magnitude of the distributioncoefficient of the first solute and calculate the optimum film thickness afterdetermining the optimum radius. The former method appears more practical, as itemploys the column with whatever film thickness it happens to have, and adjusts thephase system to ensure that, that particular film thickness, is optimum for theseparation.

DESIGN OF LC CAPILLARY COLUMNS 303
TABLE II
OPTIMUM RADIUS AND FILM THICKNESS FOR CAPILLARY COLUMNS CHROMATOGRAPHING SOLUTES OF DIFFERENT SEPARATION RATIOS AND DIFFERENT DISTRIBUTION COEFFICIENTS
Inlet pressure 1000 p.s.i. Viscosity of mobile phase 0.003967 P. Diffusivity of solute in mobile phase2.5' 10- 5 cm2(s. K is the distribution coefficient of the first solute of the critical pair between the mobile andstationary phase.
Separation Optimum radius Optimum k' Optimum film thickness (10 - 6 cm)ratios (pm)
K=50 K= 250 K= 500
1.01 1.175 2.7 3.175 0.635 0.3181.02 0.588 2.7 1.588 0.318 0.1591.03 0.392 2.7 1.058 0.2l7 0.1061.04 0.294 2.7 0.794 0.159 0.0791.05 0.235 2.7 0.635 0.126 0.0641.06 0.196 2.7 0.529 0.106 0.0531.07 0.167 2.7 0.454 0.091 0.0451.08 0.147 2.7 0.397 0.079 0.0401.09 0.13l 2.7 0.353 0.071 0.Q351.10 0.118 2.7 0.318 0.064 0.032
It also follows, that as k' is a constant, with an optimum value of 2.7 for thephysical conditions assumed, then the equations for the analysis time and the columnlength for those conditions can be greatly simplified. Now,
Substituting 2.7 for k' in the equation for t, then tmin is given by:
(16)
where r~PI is determined by the iterative program described above.Now as stated before, I = nHmin . Thus substituting for nand H min from eqns.
4 and 5,
where, again, r;pt is determined by the iterative program described above.It is clear that the column properties determined in this report, depend on the
physical constants associated with the phases employed. The effect of solvents ofdifferent viscosities, solutes of different diffusivities and columns with different inletpressures on the optimum column and chromatographic parameters must, in duecourse, also be identified. It may then be possible, to completely define the fullyoptimized capillary column and, perhaps, to identify those types of separation thatmay be amenable to analysis by capillary column LC, employing equipment that ispresently available.

304
REFERENCES
R. P. W. SCOTT
1 E. Katz, K. L. Ogan and R. P. W. Scott, J. Chromatogr., 289 (1984) 65.2 J.1. Van Deemter, F. J. Zuiderweg and A. Klinkenberg, Chem. Eng. Sci., 5 (1956) 24.3 E. Katz, K. L. Ogan and R. P. W. Scott, J. Chromatogr., 270 (1983) 51.4 E. D. Katz and R. P. W. Scott, J. Chromatogr., 270 (1983) 29.5 M. J. E. Golay, in H. J. Nobels and I. S. Fagerson (Editors), Gas Chromatogr.aphy, Academic Press, New
York, 1958, p. I.6 M. J. E. Golay, in D. H. Desty (Editor), Gas Chromatography /958, Butterworths, London, 1958, p. 36.7 J. H. Purnell, Nature (London), 184 (1959) 2009.8 R. P. W. Scott and G. S. F. Hazeldine, in R. P. W. Scott (Editor), Gas Chromatography 1960,
Butterworths, London, 1960, p. 4.9 E. Grushka and W. D. Cooke, J. Chromatogr. Sci., 9 (1971) 310.

Journal of Chromatography, 517 (1990) 305-315Elsevier Science Publishers B.V., Amsterdam
CHROMSYMP. 1937
Reversed-phase ion-pair chromatography with indirectphotometric detection of inorganic anions from residues oflow explosivesa
D. WOOLFSON-BARTFELD and ELI GRUSHKA*
Department of Inorganic and Analytical Chemistry, The Hebrew University. Jerusalem (Israel)
and
SARA ABRAMOVICH-BAR, SHLOMO LEVY and YAIR BAMBERGER
Division of Criminal Identification, National Police Headquarters, Jerusalem (Israel)
ABSTRACT
The analysis of inorganic anions found in residues of low explosives present adifficult forensic problem. Current methods are neither quantitative nor sensitive.While the liquid chromatographic separation of these anions is relatively easy, theirdetection is difficult since they cannot be detected by conventional high-performanceliquid chromatography detectors. We report a method that can detect inorganicanions, which are commonly found in combustion residues of low explosives, byreversed-phase ion-pair liquid chromatography, using indirect UV detection. Theion-pair reagent is benzyltributylammonium chloride. In addition, the phosphatebuffer mobile phase contains hexane sulfonate. There is little sample preparationsince no interferences were encountered while testing real samples from explosiveresidues. Detection limits are low and selectivity is high compared with existing techniques. Analysis time is short and the separation can be repeated immediately.
INTRODUCTION
Low explosive residues are difficult to analyze since they contain inorganic saltswhich originate from the oxidizers. For example, the most popular oxidizers areusually nitrate and chlorate salts with potassium or ammonium as the co-ion1,2. Sincethese explosives are frequently improvised (home made), and since there is no way topredict the ingredients and their amounts in the bomb, they present a complex analytical problem. Additional difficulties in the analysis involve (a) handling the traceswhich are left for analysis after an explosion, and (b) interferences that result from
a This paper was delivered in parts at the 3rd Symposium on Analysis and Detection of Explosives,Mannheim-Neuostheim, F.R.G., July 1V-13, 1989.
0021-9673/90/$03.50 © 1990 Elsevier Science Publishers B.V.

306 D. WOOLFSON-BARTFELD et at.
debris and other impurities that are collected together with the sample at the scene ofthe explosion 2
.
The analysis of post explosion samples involves techniques such as extractionwith water (for inorganic compounds) or acetone (for organic compounds), spottests, Fourier-transform infrared spectroscopy, mass spectrometry and ion-exchangechromatography. Other methods are microsGopic analysis and X-ray diffraction 3-5 .
These methods, while useful, are frequently not specific or sensitive enough for theanalysis of inorganic anions. There is a need to develop an analytical method that willbe able to detect inorganic anions of explosives and explosive residues.
The method which is described here can separate and detect inorganic anions,which are commonly found in combustion residues of low explosives, by reversedphase ion-pair liquid chromatography, using indirect UV detection. Inorganic anionsare difficult to detect by conventional UV detectors because they are UV transparent.The problem is solved in the present work by using a mobile phase containing aUV-absorbing ion-pair reagent (IPR). Due to adsorption of the IPR on the stationaryphase, the reversed-phase column becomes a dynamically coated anion exchanger.The solutes interact with the IPR and, as a result, zones of IPR deficiencies areformed in the column6
. The inorganic anions are detected indirectly as a result of thedetector response to this deficiency of IPR in the mobile phase. The continuous flowof the IPR ensures the stability of the column and of the separation. Indirect detection in high-performance liquid chromatography (HPLC) has been used previously inthe forensic laboratory for the analysis of many anions; see for the example the workofWheals7
.
Reversed-phase columns are commonly used in modern chromatography andare available at a reasonable cost. The instrumentation needed for this method consists of an HLPC system, which is very common in many forensic laboratories. Thus,this new method can be used in many laboratories immediately and without anymajor expenses which are associated with new instrumentation or columns.
EXPERIMENTAL
MaterialsThe mobile phase was prepared using deionized water which was filtered
through a OA5-,um Schleicher & Schull membrane filter membrane. Benzyltributylammonium chloride (BTA) and hexane sulfonate were obtained from Sigma Israel(Tel-Aviv, Israel). All chemicals were of analytical-reagent grade.
The column (50 mm x 4.5 mm J.D.) and the guard colum (25 mm x 4.5 mmJ.D.) were LiChrospher RP-18 cartridges (Merck, Darmstadt, F.R.G.).
The mobile phase consisted of 4 mM BTA, 0.14 mM hexane sulfonate and 7mM phosphate buffer (pH 5).
InstrumentationThe chromatographic system consisted of a SP 8000 HPLC system (Spectra
Physics) with a Rheodyne injector (lO-,ulloop). The detector was a Perkin-Elmer 85BUV-VIS variable-wavelength detector. The recorder and integrator were part of theHPLC system. The column was thermostated at 35 ± 0.1 0c.
The spectrum of BTA was obtained with a Perkin-Elmer Lambda 5 UV-VISspectrophotometer.

IPC OF ANIONS FROM EXPLOSIVES 307
Sample preparationSamples containing post-explosive residues were extracted with water and then
filtered and concentrated over a water bath. The solids which remained in the flaskwere weighed (between 15-30 mg) and diluted to 5-10 m!. Samples were filtered andinjected immediately.
RESULTS AND DISCUSSION
In this study we have examined the behavior of nitrite, nitrate, chlorate, sulfate(as sodium salts), thiocyanate and perchlorate (as potassium salts) ions as the inorganic anions. The chromatographic method is a modification of the system describedby Barber and Carr6
. The modifications were made to fit the needs of a forensiclaboratory.
Characterization of the ion-pair reagentThe UV spectrum of BTA is shown in Fig. 1. BTA has three absorption maxi
ma: at 269, 262 and 257 nm. We chose 262 nm as the working wavelength of detectionsince at this wavelength BTA absorbs the most and it should provide the most sensitive detection. Another wavelength, 222 nm, was investigated to detect nitrite andnitrate. The high native absorbance of these anions at this wavelength ensures highsensitivities.
To maintain short analysis times, we used a 5-cm column. This short columndid not affect the selectivity but shortened the retention times of most anions and gavesharper peaks. Phosphate buffer was used in order to further ensure sharp chromatographic peaks. The buffer was kept at pH 5 due to the better buffering capacity atthat pH. To better control the analysis time and the selectivity of the column, hexanesulfonate was added to the mobile phase. Fig. 2 shows a typical chromatogram of thissystem with a standard mixture of anions.
Before describing the actual separations, we will examine the effects of some ofthe experimental parameters. Many parameters influence the retention and selectivity
1.0
0.8
0.6
A
0.4
02
0220 240 260 280 300
A
Fig. 1. The UV spectrum of BTA. The solvent is water. }. = Wavelength in nm.

308
A82
C164
,~,1D
240
9~6 F1119
D. WOOLFSON-BARTFELD et al.
Fig. 2. Chromatogram showing the separation of all six anions studied. Chromatographic conditions aregiven in the heading of Table 1. Peaks: S = system peak; A = nitrite; B = nitrate, C = chlorate; D =sulfate; E = thiocyanate; F = perchlorate. Numbers at peaks are retention times in s.
of the chromatographic system. To optimize the chromatographic system, these experimental parameters must be studied and understood.
Temperature effectsThe effect of the temperature on the retention is shown in Fig. 3 which plots In
k' (k' = capacity factor) of five anions as a function of the reciprocal of the temperature (T). The nitrate, chlorate, perchlorate and thiocyanate behave in the 'normalfashion'; namely, the retention times of these solutes decrease as the temperatureincreases. The retention of sulfate, on the other hand, increase with increasing temperatures. As will be shown throughout this paper, the sulfate ion behaves in a different fashion than the rest of the anions. It is thought that in the present chromatographic system the adsorption isotherm of the sulfate ion is not linear.
The slopes of the perchlorate and thiocyanate lines are close in value (2140 as
+ {:, 0 + •NO; CIO; SO:- SCN' CIO;
4.50
3.75
~ 3.00of:
0 e e e e 062.25
& ~
b- & 6 8 60I-
I I I I
1.502.90 3.00 3.10 3.20 3.30
lIT (K -') x 10. 3
Fig. 3. Dependence of In k' on lIT. The mobile phase contained 4 mM BTA, 5 mM phosphate buffer pH4.6 and 0.25 mM hexane sulfonate. The flow-rate was 2 ml/min. Detection at 262 nm.
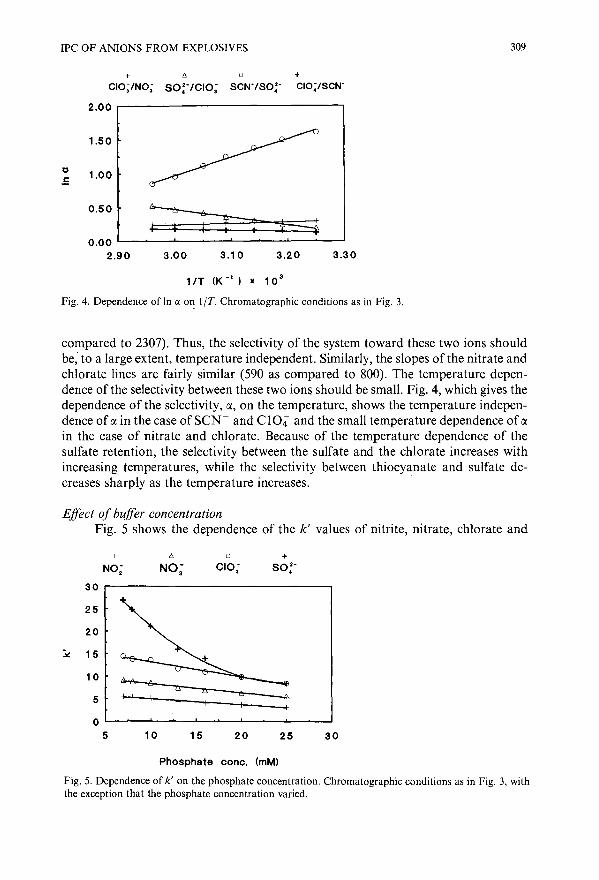
IPC OF ANIONS FROM EXPLOSIVES 309
+ 60+
CIO;INO; SO:-/CIO; SCN-/SO:- CIO~/SCN-
2.00
1.50
1.00
0.50
3.303.203.103.00
0.00 l..-,-~---''--~-''''''''-~--'--~--'
2.90
Fig. 4. Dependence of In IX o~ liT. Chromatographic conditions as in Fig. 3.
compared to 2307). Thus, the selectivity of the system toward these two ions shouldbe; to a large extent, temperature independent. Similarly, the slopes of the nitrate andchlorate lines are fairly similar (590 as compared to 800). The temperature dependence of the selectivity between these two ion& should be small. Fig. 4, which gives thedependence of the selectivity, (x, on the temperature, shows the temperature independence of (X in the case of SCN- and ClOi and the small temperature dependence of (X
in the case of nitrate and chlorate. Because of the temperature dependence of thesulfate retention, the selectivity between the sulfate and the chlorate increases withincreasing temperatures, while the selectivity between thiocyanate and sulfate decreases sharply as the temperature increases.
Effect of buffer concentrationFig. 5 shows the dependence of the k' values of nitrite, nitrate, chlorate and
+ {, 0 +NO; NO; CIO; SO:-
30
25
20
~ 15
10 :: ~ n n5
& ---..-."'""
05 10 15 20 25 30
Phosphate cone. (mM)
Fig. 5. Dependence of k' on the phosphate concentration. Chromatographic conditions as in Fig. 3, withthe exception that the phosphate concentration varied.

310
+ 6. 0
NO; /NO; CIO; /NO; 80:- ICIO;
2.000
ih~ :1.50
g 1.00
0.50
0.005 10 15 20 25 30
Phosphate cone. (mMI
D. WOOLFSON-BARTFELD et al.
Fig. 6. Selectivity, IX, as a function of phosphate concentration. Chromatographic conditions as in Fig. 3,with the exception that the phosphate concentration varied.
sulfate on the buffer concentration. As expected, the k' values of the solutes decreaseas the phosphate concentration increases. The greatest change occurs in the case ofthe sulfate ions. This great change in the retention of sulfate ions with buffer concentration is in agreement with the non-linearity of its adsorption isotherm.
Fig. 6 shows the dependence of the selectivity on the buffer concentration. Theselectivity between nitrate and nitrite increases a little with increasing buffer concentrations. The selectivity between chlorate and nitrate decrease a little with increasingphosphate concentrations. However, the selectivity between sulfate and chlorate decreases drastically with buffer concentrations. In fact, at high amounts of phosphate,the resolution between these two solutes disappears completely. Similar behavior ofthe retention of sulfate was observed by Barber and Carr8
. Clearly, for the chromatographic system at hand, running at low buffer concentration is advantageous.
+
NO;
25
20
153.:
10
5
00.00
6.
NO;
0.05 0.10
oCIO;
0.15
+80:-
0.20 0.25
Hexane sulfonate cone. (mMl
Fig. 7. Dependence of k' on the hexane sulfonate concentration. Chromatographic conditions as in Fig. 3,with the exception that the hexane sulfonate concentration varied.

IPC OF ANIONS FROM EXPLOSIVES 311
+ '" 0
NO; /NO; CIO; /NO; 80:- ICIO;
2.000
1.75
a 1.50
1.25
1.000.00 0.05 0.10 0.15 0.20 0.25
Hexane sulfonate conc. (mM)
Fig. 8. Dependence of ex on the hexane sulfonate concentration. Chromatographic conditions as in Fig. 3,with the exception that the hexane sulfonate concentration varied.
Effect of hexane sulfonate concentration.The effect of increasing the concentration of the hexane sulfonate in the mobile
phase is similar to the effect of changing the buffer concentration. As the hexanesulfonate concentration increases, the retention of the solutes decrease. Fig. 7 showsthe k' values of four anions as a function of the sulfonate concentration. Again, thesulfate ions show the greatest dependence on the concentration of the sulfonate.
The selectivity dependence on hexane sulfonate is given in Fig. 8. In all cases,the selectivity decreases with increasing sulfonate in the mobile phase. However, incases where sulfate ions are not involved, the decrease in the selectivity is small. Figs.7 and 8 indicate that is is more advantageous to achieve the separation at low concentration of the sulfonate.
Based on the above studies, the chromatographic system which we chose for theseparation of nitrite, nitrate, chlorate and sulfate ions, found in post-explosive residues, consisted of an RP-18 column, 4 mM BTA, 7 mM phosphate buffer at pH 5,0.14 mM hexane sulfonate and temperature of 3SOC.
Detection linearity and detection limitsThe linearity and the detection limit of the present chromatographic system was
examined by preparing calibration curves for all anions at both 262 and at 222 nm. Inthe concentration range between 0.05 to 10 mM, the response was linear for allanions. However, there was a difference in detection limits between the two wavelengths. Table I gives the regression parameters obtained from correlating the peakareas to the concentrations of nitrite, nitrate, chlorate and sulfate. Also given in thetable are the detection limits of these four solutes in both wavelengths. The' betterdetection limit toward nitrite and nitrate at 222 nm is due to the strong UV absorption by these two anions. Chlorate and sulfate, on the other hand, show better detection limits at 262 nm. It is felt that the high background absorption of BTA at 222 nmhinders in the detection of low amounts of chlorate and sulfate ions.

312 D. WOOLFSON-BARTFELD et 01.
TABLE I
REGRESSION PARAMETERS OF PEAK AREAS VS. CONCENTRATION (mM)
Mobile phase contained 4 mM benzyltributylammonium chloride, 7 mM phosphate bulfer (pH 5), and 0.14mM hexane sulfonate in water. Flow-rate was 2 ml/min. Detection wavelengths were 222 and 262 nm.Temperature was 35 ± 0.1 'c. All anions were determined in the present of the other three. a = Slope(divided by 104
); b = intercept (divided by 103); R = correlation coefficients; n = number of different
concentrations used to calibrate; DL = detection limits.
Anion a b R n DL (ppm)
Wavelength 222 nmNitrite 17.2 -3.87 0.9997 10 2.8Nitrate 12.4 -4.07 0.9985 10 0.8Chlorate 0.85 -3.48 0.9906 6 21.3Sulfate l.15 -4.80 0.9930 5 28.4
Wavelength 262 nmNitrite 1.03 -1.11 0.9996 5 48.3Nitrate 1.16 -2.01 0.9974 7 8.5Chlorate 1.05 -2.59 0.9976 7 10.7Sulfate 1.59 -3.23 0.9973 7 14.2
Concentration effects of the solutesIt has been reported6
,9 that the retention times of the solutes can be a functionof their injected concentration. In general, as the concentration of the solute increasedthe retention time decreased. This effect was observed in our system for the sulfateanion and it caused a problem in the identification and quantification of sulfate ionsin samples where its concentration was not known (as is the case in explosive residues). To overcome this problem, we have used the sulfate calibration curve andanother curve which is obtained by plotting the retention time of sulfate as a functionof the injected concentration. Fig. 9 shows the dependence of the area and of theretention time of sulfate on the concentration of that anion. The two curves are usedas follows: The concentration of a suspected sulfate peak is ascertained by extrapolation from the retention time. This concentration is correlated to the peak area from
150 300
'"120 C
I :§0 20090
Ul
" <I)
III 60 :S<I)
< 100 ....<I)
30 a:
0 00 2 4 6 8
Sulfate Cone. (mMl
Fig. 9. Dependence of sulfate peak area (+) and retention time (6) on that anion concentration.

IPC OF ANIONS FROM EXPLOSIVES
s
B122
s
313
Fig. 10. Chromatogram of water extract from sample 1. The chromatographic conditions are given inTable I. Peaks: S = system peak; B = nitrate; C = chlorate; D = sulfate.
Fig. 11. Chromatogram of water extract from sample 2. Conditions as in Fig. 3. Peaks: S = system peak;B = nitrate; C = chlorate; D = sulfate.
the calibration curve. The calculated peak area is then compared with the experimental value. Agreement between the two values established the concentration andidentification of the sulfate anion. In the present work it was found that, at 222 nm,the line correlating the retention to the concentration is described by the equation:
tR = 267 - 5.24C
and at 262 nm:
tR = 269 - 4.84C
In these two expressions, the retention time tR is given in s and the concentration C inmM. The correlation coefficients are 0.995 and 0.979, respectively.
Applications of the methodThe utility of the chromatographic method for identification and quantitation
of post-explosive residues was examined by analyzing several explosive residues fromactual cases. Fig. 10 shows the chromatogram obtained from the remains of an explosive charge which was found and detonated by the police. The remains from theexplosion were sent for an analysis. Spot test identified potassium chlorate and sulfur.The chromatogram confirmed the presence of these anions. In addition, the presenceof nitrate was found as well.
Fig. 11 shows the chromatogram of another sample which was obtained fromthe remains of a bomb, again, discovered and detonated by the police. The samplewas extracted from parts of a pipe which made up the bomb. Conventional analysisfound only traces of KCI03 . The chromatogram confirmed the presence of chlorate

314
B122
A85
D252
395
D. WOOLFSON-BARTFELD et al.
B121
755
Fig. 12. Chromatogram of water extract from sample 3. Conditions as in Fig. 3. Peaks: S = system peak;A = nitrite, B = nitrate; D = sulfate.
Fig. 13. Chromatogram of water extract from sample 4. Conditions as in Fig. 3. Peaks: S = system peak;A = nitrite; B = nitrate; D = sulfate.
ion. The chromatography was also able to detect the presence of nitrate and sulfateions.
Fig. 12 shows a chromatogram of a third example. It was obtained from thecenter of an explosion. Spot test analysis indicated the presence of minute amounts ofKN02 and sulfur. the chromatographic analysis confirmed the presence of these twoions as well as of nitrate ion. Spot tests and IR techniques cannot differentiate easilybetween nitrate and nitrite. No such difficulty exists in the method described here. Thepresence of sulfate, nitrate and nitrite may be indicative of black gunpowder.
Fig. 13 shows a chromatogram of a fourth example. The sample collected from
TABLE II
QUANTITATIVE ANALYSIS OF EXPLOSIVE RESIDUES
See Tab1e I for conditions. Results are in % of the total sample weight.
No. ofsample Nitrite Nitrate Chlorate Sulfate
Wavelength 222 nm1 (Fig. 10) - 0.11 1.70 5.272 (Fig. 11) - 0.27 3.15 11.073 (Fig. 12) 0.53 6.61 18.854 (Fig. 13) 0.12 3.27 23.27
Wavelength 262 nm,I (Fig. 10) - 1.68 4.822 (Fig. II) - 0.69 3.73 12.223 (Fig. 12) - 22.54 22.134 (Fig. 13) 0.63 29.89 20.63

IPC OF ANIONS FROM EXPLOSIVES 315
the site of an explosion. Spot test analysis found traces of potassium nitrite andsulfur. the chromatogram shows nitrite, nitrate and sulfate ions. In Figs. 12 and 13chlorate ion is missing. However, in both figures there is an unidentified peak whichelutes at 395 s.
A comparison between Figs. 10 and 11 and Figs. 12 and 13 shows that differentexplosives were used in the two groups of explosions. In all chromatograms there is aclear indication of the various anions, and identification is immediate and withoutinterferences. The sulfate anion was identified and quantified according to the method described above.
Table II shows the 'results of the quantitative analysis of the samples. Theanalysis was based on the calibration curves that were described in Table I. Thequantitation was done both at 262 and 222 nm. It is of interest to note that thequantitative results for chlorate and sulfate agree quite well at both wavelengths. Theagreement in the results of nitrite and nitrate is less satisfactory. The reasons for thedisagreement in the quantitation of nitrite and nitrate at the two wavelengths is notclear to us.
CONCLUSIONS
The new chromatographic method for the analysis of nitrite, nitrate, chlorateand sulfate ions in explosive residues is fast, selective and sensitive. The system has alinear response for all these anions. It shows selectivity toward nitrate and chlorate,which presents a problem in conventional ion chromatography. There is no need forelaborate sample preparation and the sample can be injected into the chromatogniphimmediately after water extraction from the bulk sample. Samples from explosiveresidues yield clean chromatogram with no interferences. A chromatographic systemthat will identify and quantify thiocyanate and perchlorate is now under development.
ACKNOWLEDGEMENT
This research would not have been possible without the help and the support ofthe Israeli Police Force Forensic Laboratory and its team of analytical chemists.
REFERENCES
1 J. G. Grasselli, Anal. Chem., 55 (1983) 1468A2 D. J. Reutter and R. C. Buechele, Proceedings of the International Symposium on the Analysis and
Detection of Explosives, Quantico, VA, 1983, U.S. Government, 1983, p. [99.3 J. Yinon and S. Zitrin, The Analysis of Explosives (Pergamon Series in Analytical Chemistry, Vol. 3),
Pergamon Press, Oxford, [981.4 T. 1. Rudolph, Proceedings of the International Symposium on Analysis and Detection of Explosives,
Quantico, VA, 1983, U.S. Government, 1983, p. 213.5 D. D. Garner, M. 1. Fultz and E. B. Byall, J. Energ. Mater., 4, (1986) 133.6 W. E. Barber and P. W. Carr, J. Chromatogr., 260 ([983) 89.7 B. B. Wheals, J. Chromatogr., 262 (1983) 61.8 W. E. Barber and P. W. Carr, J. Chromatogr., 30[ (1984) 25.9 B. Sachok, S. N. Deming and B. A. Bidlingmeyer, J. Liq. Chromatogr., 5 (1982) 389.


Journal of Chromatography, 517 (\990) 317-331Elsevier Science Publishers B.V., Amsterdam
CHROM. 22552
High-performance liquid chromatography of amino acids,peptides and proteins
c.a Characterisation of coulombic interactive regions on henlysozyme by high-performance liquid anion-exchangechromatography and computer graphic analysisb
A. N. HODDER
Department of Biochemistry and Centre for Bioprocess Technology, Monash University, Clayton. Victoria3168 (Australia)
K. J. MACHIN
St. Vincent's Institute of Medical Research, Princess Street, Fitzroy, Victoria 3065 (Australia)
and
M. 1. AGUILAR and M. T. W. HEARN*
Department of Biochemistry and Centre for Bioprocess Technology. Monash University, Clayton, Victoria3168 (Australia)
ABSTRACT
The molecular characteristics of the dominant anion-exchange binding site ofhen egg white lysozyme (HEWL) has been investigated using a combination of highperformance liquid chromatographic techniques and computer graphic analysis ofthe X-ray crystallographic structure. These studies have indicated that the site ofhighest electrostatic potential, in terms of the density of negatively charged aminoacid side chains, is located around the catalytic cleft area. The four residues tentatively identified to be involved in the electrostatic binding domain were aspartic acid 48,52,101 and glutamic acid 35. The number of these charged groups correlated with themaximum value of the chromatographically determined retention parameter (Zc value). Variations in the range of experimental Zc values obtained under different elutionconditions have been interpreted in terms ofconformational flexibility of the structural domains of HEWL which result in the opening or closure of the catalytic cleftduring the retention process.
a For Part XCIX. see ref. 47.b It is with great pleasure that the authors submit this manuscript to the Honour Volume for
Professor J. Calvin Giddings as a token of their good wishes on his 60th birthday. As an outstandingscientist and inspired wilderness traveller. he has provided a great stimulus to the field of separationsciences on an international front. Acknowledging the intellectual innovation which he has represented forover three decades, this manuscript is dedicated to the scientific objectives which he has so incisivelychampioned.
0021-9673/90/$03.50 © 1990 Elsevier Science Publishers B.V.

318
INTRODUCTION
A. N. HODDER el al.
Protein retention in high-performance ion-exchange chromatography (HPIEC)arises from electrostatic interactions between the solute and the stationary phasesurface. In analytical chromatography the retention behaviour of protein solutes iscommonly characterised by the dependence of the capacity factor, k', on theconcentration, e, of the displacer salt. Over a limited range of the salt concentration thedependence of log k' on log (lIe) can be approximated by a linear relationship in theform
log k' = log K + Ze log (lIe) (1)
where K is the ion-exchange distribution coefficient obtained by extrapolation of plotsoflog k' versus log (lie). While the precise physicochemical significance of the Ze termremains to be determined, this parameter has frequently been taken to represent thenumber of charged interactive binding sites established between unique ionic patcheson the protein surface, called ionotopes 1
, and the stationary phase support.In anion-exchange systems the magnitude of Ze has been found to be influenced
by a number of mobile phase components, such as buffer pH2,3, the salt concentra
tion4 ,s, the type of displacer salt4 - 6 , the buffer concentration and the elution mode 3,s.Variation in the magnitude of Ze is associated with subtle changes in the interactivesurface structure or ionotope of the protein. The non-uniform distribution of chargedgroups arising from the unique primary structure of the protein results in patches ofhigh electrostatic potential, which participate in binding to the support surface. Theseareas of localised charge can occur as a result of either sequentially linked amino acidsor via topographic arrangements involving through space alignment of amino acidside chains. Under a particular set of chromatographic conditions the distribution,charge density and surface accessibility of these groups generate a specific chargevector which controls the orient,ation, the contact area A eont , and the approachdistance a, of the ionotope in the interaction established between the protein and thestationary phase 1
,8. Furthermore, the molecular composition of these interactivesegments, which present themselves at the chromatographic surface, ultimatelydetermines the thermodynamic properties of the solute binding at the solid-liquidinterface. The ability to locate these interactive sites on the surface of a protein soluteunder a defined set of experimental parameters would therefore provide significantinsight and predictive power into the chromatographic behaviour of a particularprotein.
In the present study the X-ray crystallographic structures determined forlysozyme variants9 ,lO have been analysed to locate potential anion-exchange bindingsites on the surface of hen egg white lysozyme (HEWL). The three-dimensionalstructure of this protein was visualised by computer simulated graphics of the X-raystructural atomic coordinates. Patches or clusters of glutamic acid and aspartic acidresidues, which are negatively charged under the chromatographic elution conditions,were located and assessed on the basis of their surface accessibility, charge density andsteric interference. This information was then utilised in the development of ananion-exchange binding model for HEWL.

HPLC OF AMINO ACIDS, PEPTIDES AND PROTEINS. C.
MATERIALS AND METHODS
319
All chromatographic experiments were performed with a Pharmacia (Uppsala,Sweden) fast protein liquid chromatography (FPLC) system as previously described 7
.
Computer assisted molecular modellingA Silicon Graphics (Mountain View, CA, U.S.A.) Iris 3120 computer system
combined with a University of California, San Diego, U.S.A. (UCSD) MolecularModelling System (version 1.3) was used to visualise the three-dimensional structure ofvarious proteins. X-ray crystallographic coordinates for HEWL were obtained fromthe Brookhaven protein database. Photographs of these computer simulated molecular models were taken directly from the monitor using a Nikon F3 SLR 35 mmcamera with a 55 mm lens. The camera aperture was set at f 2.8 and shutter speeds of1/4 or 1/8 s were used.
RESULTS AND DISCUSSION
HEWL is a small enzyme made up of a single polypeptide chain of 129 aminoacids, the primary structure of which is shown in Fig. 1. X-ray crystallography studies9
have revealed that the HEWL molecule is approximately ellipsoidal with dimensions45 x 30 x 30 A. A deep cleft located on one side divides the molecule into twodomains. The smaller domain is sheet-like with the thickness of only one chain and iscomprised mainly of hydrophilic residues which are exposed to the outside solvent orthe cleft of the molecule. Hydrophobic residues are found mainly in the larger domainwhere they form a central core. HEWL is involved in the destruction of gram-negativebacteria by cleaving the polysaccharide component of their cell walls. X-raycrystallographic12 and solution13
,14 studies on enzyme-substrate and enzyme-inhibitor complexes have identified the cleft as the active site for the degradation ofparticular gram-negative bacterial cell wall polysaccharides, where negatively chargedresidues located in the cleft playa major role in the degradation process. In particular,Asp 52 and Glu 35 are thought to contribute directly to the cleavage of the glucosidicbond via an acid-base catalysis mechanism. Furthermore, Asp 101, Trp 62 and Trp 63are believed to support the polysaccharide substrate in the cleft through hydrogenbonding interactions.
HEWL is a basic protein with an isoelectric point (pIHEwd of 11.0. Inanion-exchange chromatographic systems where the buffer pH is less than pIHEwL,
* * * * * *KVFGRCELAAAMKRHGLDNYRGYSLGNWVCAAKFESNFNTQATNRNTDGSTDYGILQINS
* * * * * *RWWCNDGRTPGSRNLCNIPCSALLSSDITASVNCAKKIVSDGNGMNAWVAWRNRCKGTDV
*QAWIRGCRL
Fig. 1. Primary structure of hen egg white lysozyme.

320 A. N. HODDER ei al.
HEWL will have an overall net positive charge and on the basis of the net chargehypothesis is not expected to be retained. However, as shown in our earlier studies6 ,7
on the HPIEC of proteins, HEWL is retained on high-performance anion-exchangesupports at high pH, through interaction of localised areas of negative charge. Theselocalized areas ofnegative-charge groups will be manifested as coulombic patches -orionotopes- accessible to the chemical moeities of complementary charge present onthe sorbent surface. These quaternary ammonium ligands, in the case of stronganion-exchange systems, thus function as molecular probes for the region(s) of highestelectron density. The interaction will be characterised, in part, by the parameter Zc,which will vary according to the extent of ionisation and the extent of ion-interactionof the dominant ionotope. As such, the value of Zc is anticipated to correlate with thenumbers ofcharge groups on the ionotope and its accessibility to the chromatographicligand. Table J shows Zc values, representing the number of charged interactionsbetween HEWL and the positively charged Mono-Q column, derived with elutionsystems of pH 9.60 and a variety of neutral salts. Values of Zc were found to varybetween ca. 0.5 and 4.5 over these elution conditions. While it is known that themagnitude of the Zc value may also be influenced by hydrophobic interactioneffects 2
,3,6, experimental conditions can be chosen (e.g. as used in the present study) tomaximise the electrostatic effects and thereby minimising the contribution ofhydrophobic effects to Zc. Under such conditions, a high correlation in the linearity ofthe log k' versus log (lie) plots is predicted from thermodynamic, near equilibrium andstoichiometric models for electrostatic retention behaviour of proteins in HPIEC. Thecorrelation coefficient for the derivation of Zc values in Table J was R 2 ~ 0.90 which isin accord with the concept that electrostatic effects dominate the retention behaviour.
TABLE I
Z, VALUES FOR LYSOZYME AT pH 9.60
Salt Elution mode
Varied tGa Variedflow b /soeratie'
LiCI 2.50 ± 0.26 4.46 ± 0.25 0.80 ± 0.20LiBr 4.21 ± 0.66 3.96 ± 0.77
1.96 ± 0.091
NaF 2.99 ± 0.31 2.91 ± 0.12 0.74 ± 0.31NaCI 1.48 ± 0.17 1.88 ± 0.23NaBr 2.41 ± 0.44 3.30 ± 0.33 1.59 ± 0.21
0.56 ± 0.001
KF 3.58 ± 0.14 3.23 ± 0.50KCl 1.16 ± 0.15 1.73 ± 0.1 IKBr 3.28 ± 0.24 4.52 ± 0.75
0.98 ± 0.141 2.53 ± 0.281
a Varied gradient time, constant flow elution conditions.b Varied flow-rate, constant gradient time elution conditions., Constant flow-rate isocratic elution conditions.d Not eluted with this salt.e Mixed modal retention.I A non-linear dependency of log k' on log (lie) resulted in more than one Z, value.

HPLC OF AMINO ACIDS, PEPTIDES AND PROTEINS. C. 321
The origins of the differences between Zc values obtained by isocratic and gradientelution have been discussed in detail elsewhere4
, 7.
Several studies14-
16 have shown good correlation between the number ofcharged groups on highly charged biomolecules, such as oligonucleotides, and theresultant chromatographically derived Zc values. However, when solute molecules aresufficiently large that they can adopt some degree of tertiary structure, lowercorrelation between Zc and the total number of charges on the molecule has beenreported 17. In terms of average charge interactions, one positive charge at the surfaceof the quaternary ammonium sorbent will be required for full electrostatic interactionand the establishment of charge electroneutrality with a unitary negative chargeassociated with an ionised amino acid side chain at the surface of the protein.Experimentally observed non-integer values could conceivably arise from (1) systemeffects such as the precision of instrumental measurement, (2) solute effects such as thedistribution, orientation and solvation of charged or polarised groups in themicro-environment of the contact regions, (3) changes in the hydrogen bondingstructure associated with salt bridges and (4) restricted accessibility and clustering ofthe positively charged ligands on the sorbent. In the current study, the distribution ofnegatively charged Glu and Asp residues at the surface of the net positively chargedHEWL molecule, allows a unique opportunity to examine the relationship of thechromatographically derived Zc values with the number of potential interactingresidues on the protein surface. This correlation also gives valuable insight into theanion-exchange retention mechanisms for proteins.
Fig. 2 shows the computer simulated structure of HEWL and the location of allglutamic acid (yellow) and aspartic acid (orange) residues which may be involved in theretention process. Noticeably, the acidic side chain groups are sparsely located over thesurface of the molecule except for Asp 101, Glu 35, Asp 52 and Asp 48. All of theselatter group of amino acid residues lie in close proximity to each other and arepositioned in, or adjacent to, the active site cleft area. If it is assumed thatstoichiometric interactions occur between HEWL and the chemical ligands on thestationary phase surface, i.e. one quarternary ammonium group is required to bind toeach acidic amino acid side chain, then the number of charged groups in this cleft areaaccessible to the ligands would be between one and four depending on the salt or pHcondition. These values correlate well with the range of Zc values shown in Table I.From spatial considerations, the remaining amino acid side chains are sufficientlydistant or on opposite faces of the protein to preclude simultaneous interaction aswould be required for a Zc value of 4. Fig. 3 shows the distribution of positivelycharged arginine (blue) and lysine (pink) groups in HEWL. X-ray crystallographic9
and enzyme-activity18 studies have determined that the six lysyl amino groups are onthe surface of the molecule and not in the active-site cleft. Fig. 4 also shows that accessto the cleft is not obstructed to any great extent by arginine residues wich project awayfrom the plane of the four acidic amino acids. Furthermore, Blake et al. 9 noted thatintermolecular contacts observed in the protein crystal may also represent theattachment sites during the dimerisation and polymerisation of HEWL reported tooccur in solution at high pH19
. Again these intermolecular contacts would notobstruct access to the cleft.
In Figs. 5 and 6 the topography of the cleft is further examined. It can be seen inFig. 4 that a number of additional amino acid residues may enhance or interfere with

322 A. N. HODDER et al.
Fig. 2. Computer graphic simulation of the X-ray crystal structure of HEWL indicating the location of allglutamic acid -(yellow) and aspartic acid (orange) residues. Residues Asp 101, Glu 35, Asp 52 and Asp 48were identified as the dominant anion-exchange binding domain. Picture produced by a computer programwritten by Lesk and Hardman46
.
Fig. 3. Computer graphic simulation of the HEWL crystal structure showing the distribution of positivelycharged lysine (pink) and arginine (blue) residues. Picture produced by a computer program written by Leskand Hardman46
.

323
Fig. 4. Computer graphic representation of the spatial proximity of Arg 61 and Arg 73 (blue) around thenegatively charged groups in the active site. Picture produced by a computer program written by Lesk andHardman46
.
Fig. 5. Computer simulation demonstrating the spatial topography ofTrp 62, 63 and 108 (light blue) aroundthe active cleft. Contour lines have been drawn to measure the distances between Asp 101. Glu 35 andAsp 52. The area of the dotted triangle was used to calculate the charge density of 0.55 charge per 10 A2
Similarly, the charge density of the binding domain encompassing Glu 35, Asp 52 and Asp 48 was calculatedto be 0.85 charge per 10 A'. Picture produced by computer program written by Lesk and Hardman46
.

324 A. N. HODDER et al.
Fig. 6. Computer graphic representation of the spatial proximity of Asn 46 and Asn 59 (blue) around theactive cleft of HEWL.
the electrostatic interactions at the protein-stationary phase interface. Three of the sixtryptophan residues of HEWL (that is, Trp 62, 63 and 108) are located in the activesite!!. Trp 62 has been identified as the most surface accessible of these three residuesvia X-ray crystallographic methods and its reactivity in solution with N-bromosuccinomide20 . Fig. 5 shows the spatial arrangement ofTrp 62 and Trp 63 (light blue)which are the closest to the four negatively charged amino acid residues in the cleft.Both tryptophan residues occupy a substantial volume and would be expected tosterically interfere with the ion-exchange binding process. However, binding studiesinvolving HEWL and polysaccharide inhibitors have found that the alicyclic rings insugars and the tryptophan rings in the enzyme rotate to accomodate each other whenthe cleft is occupied2!. Rotation of these tryptophans induced by specific saltinteractions could also occur during HPIEC to facilitate the binding of the negativelycharged residues in the cleft to the support surface. Studies with lysozyme2!,22 andother proteins23, in salt solutions using intrinsic fluorescence quenching techniqueshave demonstrated this behavioural characteristic of tryptophan residues. Furthermore, as aromatic residues can potentially act as electron donors, the tryptophanresidues may also enhance the binding process through ion-induced dipole interactions.
The amino acid residue Asp 48 has been shown not to be involved with

HPLC OF AMINO ACIDS, PEPTIDES AND PROTEINS. C. 325
enzyme-substrate binding due to its location outside the bottom of the cleft. If Zcdoesreflect the total number of electrostatic interactions occurring between the solute andstationary phase, then the chromatographic data in Table I indicate that up to fournegatively charged groups are involved in the electrostatic binding. Since Asp 48 islocated in close proximity to the cleft and is spatially aligned with the other side-chaincarboxyl groups this amino acid residue has been assigned to be the fourth negativelycharged group participating in the HPIEC retention process. However, severalneighbouring (but not charge interacting) residues may hinder its participation in thebinding process. From Fig. 6, which illustrates views taken from above and oppositethe cleft, it can be concluded that Asp 48, Asp 52 and Glu 35 have an essentially lineartopographic arrangement. However, the side chains of Asn 59 and Asn 46 (light blue)are both located close to the space occupied by Asp 48 and Asp 52. If a rigid structure isassumed, according to the known atomic coordinates of lysozyme9 , then t)J.e sidechains of these two amino acid residues could sterically interfere with a linearelectrostatic binding site incorporating Asp 48, Asp 52 and Glu 35. As evident fromFig. 4 the interactive capability of Asp 48 may be further diminished by the closeproximity of the positively charged Arg 61 and Arg 73 residues. If Asp 48 doesparticipate in the binding process (i.e., when Zc ~ 4) these positively charged arginineresidues may be instrumental in determining the orientation of the cleft at thestationary phase surface.
During ion-exchange chromatography, localised areas of high electrostaticpotential on the protein surface will generate an overall charge vector, which willcontrol the approach and the orientation of the protein solute to the stationary phasesurface. The identification of these areas of high electrostatic potential will assist indetermining the chromatographic retention mechanisms of protein solutes. In Figs. 5and 6 dotted three-dimensional contours have been drawn between the negativelycharged residues in and around the cleft. The areas of these three-dimensionalcontours were then calculated and used to estimate the charge density in these tworegions. For the area incorporating Asp 101, Glu 35 and Asp 52 a charge density of0.55 negative charge per 10 A2 was determined. The area encompassed by Glu 35,Asp 52 and Asp 48 was estimated to have a higher charge density of 0.85 negativecharge per 10,&,2 and hence should playa more dominant role in steering lysozymetoward the stationary phase surface from the bulk solvent. The concept that highelectrostatic charge density, arising from the sequential or spatial clustering ofchargedgroups, can direct the site of electrostatic interaction has been used to design specificprotein purification protocols. For example, a recombinant protein, f3-urogastronehas been produced with a C-terminal polyarginine (polyArg) tail which enhanced itspurification on a cation exchanger24
. This polyArg tail functions to define a uniqueregion within the total three-dimensional structure which directs and orientates therecombinant f3-urogastrone to the cationic surface of the sorbent. In terms of the totalnumber of amino acids in the folded protein, the polyArg region was small, i.e. only6 amino acids out of a total 59 residues. Nevertheless, binding still occurs mainlythrough the alignment of the arginine residues with the cationic ligands, whilst theother side-chain groups on the polypeptide surface create secondary interactivepreferences. In the case of HEWL, once the molecule is in the vicinity of the doublelayers of the solvated ligand and during the final stage ofadsorption, other amino acidgroups on the protein surrounding the active site cleft, such as Arg 61 and Arg 73, can

326
Fig. 7. Diagramatic representation of the hinge-bending mechanism for HEWL.
A. N. HODDER el al.
be anticipated to influence in an analogous manner the orientation and magnitude ofthe interactive ionotope on the protein surface.
The adsorption of proteins onto the stationary phase surface involves dynamicprocesses which may also induce conformational changes in the protein solute. Theseprocesses could involve the motion ofonly a few atoms or could result in movements ofentire structural subunits or domains. If the negatively charged residues in the cleftparticipate in the ion-exchange binding process, then the fluctuation in Zc values,between ca. I and 4, with various elution conditions suggests that there is a change inaccessibility to these residues. More specifically, the degree of structural fluctuationsarising from conformational changes in the interactive ionotope, and induced by theelution conditions, can be assessed through changes observed in protein Zc values. It iswell known that portions of polypeptide chains frequently fold into compact, localsemi-independent units or domains. There are numerous examples of proteins,including HEWL, that have elongate double-lobed structures comprising two domainsseparated by an active cleft25
-27
. X-ray crystallographic studies have shown, for somedouble-lobed enzymes, that these domains can move relative to each other througha hinge-bending mode of vibration as shown in Fig. 7. This hinge-bending mode alsoplays an important role in their catalytic function 28
,31. For example, when glucosebinds to yeast hexokinase the small lobe of the enzyme molecule rotates by 12° relativeto the large lobe, moving the polypeptide backbone as much as 8 A(ref. 30). Theseconformational rearrangements result in the closure of the cleft and a reduction in theradius of gyration for hexokinase31
. There is substantial experimental evidence thatthe two structural domains in HEWL can also move relative to each other viaa hinge-bending mode ofvibration32
-34
. In the absence of solvent molecules and withan unoccupied cleft, the hinge-bending mode for HEWL has been calculated33 to havea vibrational frequency of 1.3' 1011 Hz. Furthermore, energy calculations indicate thathinge-bending rotations of several degrees are permissible in the HEWL molecule. Insolution the lobe vibration is reported to be dampened by the hydrodynamic friction ofthe lobe motion and the two domains move relative to each other in a diffusive manner.
As regions of highest charge density and electrostatic potential represent thepossible site of electrostatic interaction, the range of Zc values suggests that theinteraction ofHEWL with the charged anion-exchange sorbent may also be mediatedby a similar hinge-bending mechanism associated with the catalytic cleft as showndiagrammatically in Fig. 7. The number of negatively charged residues in the cleft areathat interact with the stationary phase surface will then be determined by the extent ofdomain motion. The Zc value will, therefore, reflect the degree ofopening or closure ofthe cleft on HEWL. A similar retention mechanism has also been proposed by Chicz

HPLC OF AMINO ACIDS, PEPTIDES AND PROTEINS. C.
1.6 ,..--------------------,
1.2 Zc = 0.98 {~ cleft closed
0"1 0.80
}0.4 Zc = 3.28
cleft open0.0
-0.41.0 1.3 1.6 1.9 2.2
log 1Ie
327
Fig. 8. Plots of log k' versus log (l/e) for lysozyme separated on a Mono-Q anion exchanger by gradientelution at pH 9.6 with KBr as displacer salt, with gradient times between 8.6 and 171 min and a flow-rate of1 ml/min. The Zc values corresponding to the open cleft and closed cleft were 3.28 ± 0.24 and 0.98 ± 0.14respectively.
and Regnier35 for subtilisins chromatographed on a cation exchanger where thestructural state of an ion bridge on the surfac of subtilisin was observed to bedependent on the ionic strength of the displacer salt.
Various studies36-
38 have shown that neutral salts influence the stability,solubility and biological activity of macromolecules in solution. Neutral salts can alsointerfere with the intermolecular forces involved in the association/dissociation ofproteins and their subunits39
,40. The resulting changes in the structure of themacromolecule arise as a consequence ofcomplex processes which regulate the layer ofhydration and electrostatic potential about the surface of the molecule. In addition toresponding to these subtle changes in structure, HEWL is also known to polymerise athigh pH. Hence, the choice of neutral salt wil1 regulate the approach to, andorientation of, HEWL at the stationary phase surface through manipulation of the sizeand shape of the monomer and also of the degree of polymerisation.
As is evident from Table I, Zc values ofHEWL were found to vary as a result ofa number of systematic changes to the mobile phase composition. As discussedelsewhere4
, the type of displacer salt and the elution mode can have a profoundinfluence on the magnitude of Zc. This behaviour is particularly evident with HEWL.For example, as demonstrated in Fig. 8, the magnitude of Zc for HEWL was observedto be dependent on the concentration of bromide salts under varied flow or variedgradient time elution conditions. Similarly, a non-linear dependence of log k' on log(l/e) has been reported for subtilisins eluted with sodium chloride35 . In these instances,retention plots oflog k' versus log (l/e) can be divided into two linear regions (i.e., withdifferent slopes) with a distinct inflexion point. The dependence of the Zc value ofHEWL on the bromide salt concentration is consistent with the chaotropic orwater-structure-breaking properties of bromide ions. Unlike heavily hydrated anionssuch as fluoride, bromide ions are relatively less hydrated. In aqueous-basedchromatographic systems bromide ions can reduce the surface area of the soluteexposed to water molecules by preferentially binding to the stationary phase or protein

328 A. N. HODDER et al.
surfaces. Therefore, at higher bromide concentrations, it is possible that the cleft ofHEWL is forced open by a large number of bromide ions condensing onto the surfaceof the cleft which results in the larger Zc values observed in Table I. At a criticalconcentration, differing for each bromide salt, the number of bromide ions in the cleftis sufficiently reduced to allow hinge movement and the relative closure of the cleft.This behaviour will result in a decrease for Zc observed for the lower bromideconcentrations. The observation that ion-exchange-adsorbed HEWL and otherenzymes show decreased catalytic activity which is restored on elution with salts andthat substrate-specific elution can be achieved for enzyme adsorbed to ion-exchange orbiomimetic-affinity sorbents41
,42 provides further support to the concept that, in the
mobile phase
o
[A]n
'"
o
[Al
n
'"
stationary phase
mm cleft open
119 cleft closed
o
o
unbound
bound
Fig. 9. Schematic representation of the structural equilibria associated with the binding of lysozyme to theanion-exchange surface, involving the opening and closure of the active cleft as a result of a hinge-bendingmechanism.

HPLC OF AMINO ACIDS, PEPTIDES AND PROTEINS. C. 329
case of HEWL, the cleft region is involved with coulombic recognition with thecationic ligand.
Inspection of the data in Table I also reveals that the choice of elution mode, i.e.either varied gradient time, varied flow-rate or isocratic elution, can influence thebinding process and the hinge-bending movement ofHEWL. For example, as shownin Table I, the elution ofHEWL with Liel results in significantly different Zc values forthese two different elution modes. Hence, the length of exposure to the stationaryphase surface which is controlled by the rate of change in the displacer-saltconcentration also determines the extent of opening or closure of the lysozyme cleft.
In this study, changes in Zc value have been quantitatively related to themovement of the catalytic cleft of HEWL. Fig. 9 schematically depicts the structuralequilibria associated with the binding of HEWL to the anion-exchange surface.Assuming HEWL is a monomer, i.e. when n = 1, the binding process which occurs atthe cleft-stationary phase interface can be characterised in terms of the degree ofopening or closing of the cleft and will be governed in part by the nature of thedisplacer-salt. The variation in entropy resulting from these salt-induced structuralchanges will contribute toward the free energy required for hinge-movement inHEWL. The hinge-bending process will be governed by the rate constants k 1 to kg.When the cleft is closed, i.e. when Zc = 1 only the surface residue will be accessiblewhilst the negatively charged groups located inside the cleft are sterically preventedfrom direct electrostatic interaction with the support surface (i.e. the structure on theright-hand side of Fig. 9). In contrast, larger Zc values, i.e. Zc = 3-4 correspond to theopened cleft which results in maximal electrostatic interactions (the left-hand side ofFig. 9). The thermodynamics and kinetics of adsorption will be further complicatedunder conditions where the polymerisation ofHEWL can be induced, i.e. when n > 1.The dependence of the hinge-movement equilibria on the bromide concentration,which is reflected by non-continuous retention plots such as the data shown in Fig. 8,can also be accomodated by this model where the interconversion process will becontrolled by the rate constants k 3 , k 4 , k s and k 6 .
CONCLUSIONS
The present study introduces an approach to the correlation of anion-exchangechromatographic data with protein three-dimensional structures in order to allow theidentification and characterisation of the molecular identity of the electrostaticinteractive binding site on proteins. In the case of HEWLs, the mechanism by whichHEWL approaches and orientates itself at the stationary phase surface can bedetermined through the analysis of the spatial disposition of neighbouring positivelycharged and hydrophobic residues. The existence of conformationally flexiblestructures and analysis of the influence of elution conditions on the underlyingequilibrium processes also provide significant insight on the experimental factorswhich can be used to control the interaction between proteins and chromatographicsurfaces. The interactive behaviour of lysozyme variants on both a cation-exchangeresin and a hydrophobic interaction stationary phase has been recently investigated43
,44 and partly correlated with amino acid sequence differences. The potentialtherefore now exists to chromatographically map the surface topography of proteinsthrough the correlation of retention properties in different interactive modes with thethree-dimensional structure of a protein.
330 A. N. HODDER et al.
The identification, analysis and prediction of the surface-accessible interactive. regions of biomacromolecules is also central to a wide range of biological systemswhich are controlled by biorecognition, interfacial phenomena or surface-surfaceinteractions. For example, the residues Asp 48 and 52 of HEWL, which are located inthe anion-exchange binding site, have also been implicated as forming part of theantigenic determinants recognised by specific T-cell hybridomas4s . While the intrinsicchemical and stereospecific features which immunologically distinguish the mostreactive and the least reactive sites of a protein are not fully understood, the mostfrequently recognised antigenic and immunogenic sites form three-dimensionalsuperassemblies characterised by high local mobility, convex surface shape andnegative electrostatic potential. Furthermore, the prevalence of complementaryhydrophobic and aromatic residues in the binding sites ofantibodies40 also suggests animportant binding role for buried hydrophobic side chains. Clearly, high-performanceliquid chromatographic techniques have the potential to characterise the relativespatial disposition of amino acid residues within the three-dimensional structure ofe.g., a protein. Definition of the molecular basis of the interactions between thebiomacromolecule and a biological or synthetic surface has not only significantimplications for the optimisation of separation performance per se but also wouldimpact on the design and development of synthetic peptidic vaccines and new peptidicanalogues for use in therapy.
ACKNOWLEDGEMENTS
Research grants to M.T.W.H. from the National Health and Medical Council ofAustralia, the Australian Research Council and the Monash University ResearchFund Committee are gratefully acknowledged.
REFERENCES
I M. T. W. Hearn, A. N. Hodder and M. 1. Aguilar, J. Chromatogr., 458 (1988) 45.2 M. T. W. Hearn, A. N. Hodder, P. G. Stanton and M. 1. Aguilar, Chromatographia, 24 (1987) 769.3 W. Kopaciewicz, M. A. Rounds, J. Fausnaugh and F. E. Regnier, J. Chromatogr., 266 (1983) 3.4 A. N. Hodder, M. 1. Aguilar and M. T. W. Hearn, J. Chromatogr., 512 (1990) 41.5 W. Kopaciewicz and F. E. Regnier, Anal. Biochem., 133 (1983) 251.6 A. N. Hodder, M. 1. Aguilar and M. T. W. Hearn, J. Chromatogr., 443 (1988) 97.7 A. N. Hodder, M. T. W. Hearn and M. 1. Aguilar, J. Chromatogr., 458 (1988) 27.8 A. N. Hodder, M. 1. Aguilar and M. T. W. Hearn, J. Chromatogr., 476 (1989) 391.9 C. C. F. Blake, G. A. Mair, A. C. T. North, D. C. Philips and V. R. Sarma, Proc. Roy. Soc., BI67 (1967)
365.10 D. C. Philips, Proc. Natl. Acad. Sci. U.S.A., 57 (1967) 484.II C. C. F. Blake, L. N. Johnson, G. A. Mair, A. C. T. North, D. C. Philips and V. R. Sarma, Proc. Roy.
Soc., BI67 (1967) 378.12 N. Sharon, Proc. Roy. Soc., BI67 (1967) 402.13 J. A. Rupley, Proc. Roy. Soc., BI67 (1967) 416.14 R. R. Drager and F. E. Regnier, J. Chromatogr., 359 (1986) 147.15 E. D. Green and J. V. Baenziger, Anal. Biochem., 158 (1986) 42.16 T. Tsuji and T. Osawa, J. Biochem., 101 (1987) 241.17 W. Kopaciewicz, M. A. Rounds, J. Fausnaugh and F. E Regnier, J. Chromatogr., 266 (1983) 3.18 1. 1. Geschwind and C. H. Li, Biochim. Biophys. Acta, 25 (1957) 171.19 A. J. Sophianopoulos, C. K. Rhodes, D. N. Holcomb and K. E. Van Holde, J. Bioi. Chem., 237 (1962)
1107.

HPLC OF AMINO ACIDS, PEPTIDES AND PROTEINS. C. 331
20 K. Hayashi, T. Imoto and M. Funatsu, J. Bioi. Chem. (Japan), 54 (1963) 381.21 R. E. Bruccoleri, M. Karplus and J. A. McCammon, Biopolymers, 25 (1986) 1767.22 C. Formoso and L. S. Forster, J. Bioi. Chem., 250 (1975) 3738.23 N. K. Vyas, M. N. Vyas and F. A. Quiocho, Science (Washington, D.C.), 242 (1988) 1290.24 H. M. Sassenfeld and S. J. Brewer, Biotechnology, 2 (1984) 76.25 R. D. Banks, C. C. F. Blake, P. R. Evans, R. Haser, D. W. Rice, G. W. Hardy, M. Merrett and A. W.
Philips, Nature (London), 279 (1979) 773.26 G. L. Gilliland and F. A. Quiocho, J. Mol. Bioi., 146(1981) 341.27 S. C. Harrison, A. J. Olson, C. E. Schutt, F. K. Winkler and G. Bricogne, Nature (London), 276 (1978)
368.28 S. Remington, G. Wiegand and R. Huber, J. Mol. Bioi., 158 (1982) Ill.29 W. S. Bennet and T. A. Steitz, J. Mol. Bioi., 140 (1980) 211.30 W. S. Bennet and T. A. Steitz, Proc. Natl. Acad. Sci. U.S.A., 75 (1978) 4848.31 R. C. McDonald, T. A. Steitz and D. M. Engelman, Biochemistry, 18 (1978) 338.32 M, J. E. Sternberg, D. E. P. Grace and D. C. Philips, J. Mol. Bioi., 130 (1979) 231.33 J. A. McCammon, B. R. Gelin, M. Karplus'and P. G. Wolynes, Nature (London), 262 (1976) 325.34 J. Janin and S. J. Woodak, Prog. Biophys. Molec. Bioi., 42 (1983) 21.35 R. M. Chicz and F. E. Regnier, J. Chromatogr., 443 (1988) 193.36 P. H. Von Hippel and T. Schleich, in S. N. Timasheff and G. D. Fasman (Editors), Structure and
Stability of Macromolecules, Vol. II, Marcel Dekker, New York, 1969, p. 417.37 F. A. Long and W. F. McDevit, Chem. Rev., 51 (1952) 119.38 W. A. P. Luck, in A. Pullman, V. Vasileui and L. Packer (Editors), Water and Ions in Biological Systems,
Plenum Press, New York, 1985, p. 95.39 T. T. Herskovits and M. G. Hamilton, Biochim. Biophys. Acta, 915 (1987) 157.40 T. T. Herskovits and G. B. Villanueva, Biochemistry, 25 (1986) 931.41 R. K. Scopes, Protein Purification: Principles and Practice, Springer, Berlin, Heidelberg, New York,
2nd ed., 1987.42 B. Anspach, A. Johnston, H.-J. Wirth, K. K. Unger and M. T. W. Hearn, J. Chromatogr., 476 (1989)
205.43 J. L. Fausnaugh and F. E. Regnier, J. Chromatogr., 359 (1986) 131.44 J. L. Fausnaugh-Pollit, G. Therenon, L. Janis and F. E. Regnier, J. Chromatogr., 443 (1988) 221.45 E. D. Getzoff, H. M. Geyson, S. J. Rodda, H. Alexander, J. A. Tainer and R. A. Lerner, Science
(Washington, D.C.), 235 (1987) 1191.46 A. M. Lesk and K. D. Hardman, Science (Washington, D.C.), 216 (1982) 539.47 M. Fridman, M. I. Aguilar and M. T. W. Hearn, J. Chromatogr., 512 (1990) 57.


Journal of Chromatography, 517 (1990) 333-344Elsevier Science Publishers B.V., Amsterdam
CHROMSYMP.1945
Optimization study of octane-in-water emulsions bysedimentation field-flow fractionation
MARCIA E. HANSEN"" and DAVID C. SHORT
The Procter & Gamble Company, Packaged Soap and Detergent Division, 5299 Spring Grove Avenue.Cincinnati, OH 45217 (U.S.A.)
ABSTRACT
The droplet size distributions of octane-in-water emulsions have been studiedby sedimentation field-flow fractionation (SdFFF). Initially, the experimental parameters of the SdFFF experiment were examined to optimize these conditions for anoctane emulsion stabilized by sodium dodecyl sulfate (SDS). The carrier flow-ratehad a large impact on sample recovery. Resolution of the various size species wasoptimized by using the appropriate field strength and relaxation parameters. Comparison of the SDS emulsion to a similar SDS emulsion with added sodium chlorideand to an non-ionic system, Brij 35, confirmed the sensitivity of the SdFFF method todifferences in size distribution. Examination of the droplet size distribution over a70-h period provided insights into the stability of these systems.
INTRODUCTION
In order to characterize the efficiency of surfactants in stabilizing oil droplets insolution, we developed a method for monitoring oil droplet size distributions. Weexpected that information about the initial droplet size and the demulsificationkinetics of oil-in-water emulsions would provide insights into the structure of thesurfactant-oil interface as well as the overall performance ofeach individual surfactantsystem in suspending oil droplets in aqueous solutions. As a first approach, we chosen-octane as a model oil and studied n-octane emulsions as prepared by ultrasonicdispersion of octane in the presence of simple surfactant systems. These surfactantsystems included anionic and non-ionic surfactants. Specifically, sodium dodecylsulfate (SDS) and Brij-35 (a polyethylene glycol ether of lauryl alcohol) systems atconcentrations slightly above their critical micelle concentrations (CMC) were studied.The effect of salt in the anionic surfactant system was also investigated. The sonicationof octane in the presence of surfactant was expected to generate a system of large oil
" Present address: FFFractionation, Inc., P.O. Box 58718, Salt Lake City, UT 84158-0718, U.S.A.
0021-9673/90/$03.50 © 1990 Elsevier Science Publishers B.V.

334 M. E. HANSEN, D. C. SHORT
droplets, formally termed a macro-emulsion. Differences in the packing of surfactantmolecules at the surfactant-octane interface should lead to differences in the dropletsize resulting from sonication. Also, the physical structure of the surfactant-octaneinterface should be reflected by the stability of the system of oil droplets againstdemulsification into larger droplets.
For the analysis of the oil droplet size distributions, a sedimentation field-flowfractionation (SdFFF) technique was optimized. This technique has been extensivelyused for the determination of particle size distributions oflatex particles1,2 . Since oildroplets are more delicate than typical particle samples, we could not assume that thissample would behave as a "hard sphere". Therefore, in this study, we report theoptimization of the experimental parameters of the SdFFF technique, such as the fieldstrength, the carrier flow-rate, relaxation time, and injection method.
SdFFF is a high-resolution particle sizing technique, which separates samplespecies according to their buoyant mass. This technique has been described in greatdetail elsewhere 1
. Basically, in SdFFF a centrifugal field is imposed perpendicularlyacross a thin, open flow channel. SdFFF channelS are typically 80 cm x 2.0 cm x0.025 cm. Sample species are deposited in zones of a characteristic thickness accordingto their interaction with the field. The buoyant mass of the sample species and thecentrifuge rpm and rotor radius determine the sample-field interaction. The laminarflow profile across the thin dimension of the channel allows sample species to bedifferentially eluted due to their varying zone thicknesses. In the case of emulsions, thelarger, more buoyant oil droplets form a more compressed sample zone near the upperchannel wall. This sample zone is eluted after the less dense sample zones of smallerdroplets.
SdFFF is potentially superior to competing particle sizing methods for theanalysis of emulsions. This technique was applied to commercial emulsions ofsafflower and soybean oils by Yant et al. 3. The buoyancy of the sample causes noproblem, as in other methods; oil droplets are deposited at the top channel wall, but arefractionated just like the particles with negative buoyancy which are deposited at thebottom wall. Light-scattering and centrifugal techniques4
. 5 have been most commonlyapplied to the study of emulsion droplet size. However, as samples must not be stirredfor light-scattering measurements, results are possibly biased due to the differentialfloat-rate of the droplets of varying diameter. Also, analysis ofemulsions with generalcentrifugal techniques is difficult as these systems are designed for particles heavierthan the suspension media. Alternatively, application of microscopic techniques to thesizing of emulsion droplets is cumbersome and droplets below 0.5 ).lm are not readilydetected. With SdFFF it is additionally possible to obtain true distribution data, asopposed to the mean diameter and polydispersity data provided by light-scatteringtechniques. Sample species are separated into mass-based fractions in SdFFF.Following separation, the turbidimetric response of a UV detector individuallyquantifies each fraction.
Another advantage of the SdFFF separation scheme is the inherent flexibility ofthe system. Retention of a sample may be fine-tuned by adjusting the centrifuge speed.Increased retention yields greater resolution between particles of similar diameter,although experiment run time is concomitantly increased. Offset of the time factor maybe accomplished by increasing carrier flow-rate.
The trends described above hold only for the idealized "hard-sphere" particle

OPTIMIZATION STUDY OF OCTANE-IN-WATER EMULSIONS 335
sample. For the delicate type of sample studied in this report, increases in field strengthand flow-rate may adversely affect the integrity of the droplets. At higher fieldstrengths the zone thickness of the sample is decreased. The zone is concentrated andcompressed towards the channel wall so that there is a danger of oil droplets coalescingor sticking irreversibly to the channel wall. At increasing flow-rates, shearing the oildroplets is risked. Alternatively, higher flow-rates may encourage total recovery ofsample as the droplets attached to the channel wall are dislodged. The present studyexamines these trade-offs between field strength and flow-rate conditions with theultimate goal of producing optimal size distribution data in the shortest time underconditions that maintain the integrity of the oil droplets.
EXPERIMENTAL
InstrumentationThe SdFFF unit used was a DuPont SF3 2000 which is similar to the systems
described previously2,6, except for the data station. For this upgraded model an IBMcomputer and software are used. Otherwise, the instrumental components are the sameas in other sedimentation field-flow fractionators 3
. Typically, the instrument consistsof the SdFFF channel which fits inside a centrifuge, a high-performance liquidchromatography-type pump, and a UV detector set at 254 nm. The channel length andwidth were 56 and 2.5 cm, respectively. The channel volume, 2.92 ml, was measuredusing the retention time of a non-retained marker eluted at low flow-rate. The channelthickness, 0.021 cm, was calculated using the channel volume, length, and widthmeasurements.
MethodsThe carrier composItIOn used for the elution of the emulsion sample was
identical to the surfactant system used in generating the emulsion, unless otherwisenoted. Doubly distilled water was equilibrated with octane prior to the addition of theappropriate surfactant and salt. After the surfactant was thoroughly dissolved, thecarrier solution was vacuum-filtered through a 0.22-.um filter. The carrier was spargedwith helium.
The octane emulsions were prepared using the method described by Avranas etal. 7. A 5-ml portion of octane was added to 25 ml of the surfactant system prepared asdescribed above. Emulsions were generated with a sonic probe (Branson Model 184Vultrasonic power supply with a Branson Model A410 watt meter), operating at 1000 Wand 20 000 KHz under an atmosphere of nitrogen.
THEORY AND CALCULATIONS
Retention equationsAs the theoretical aspects ofretention in SdFFF have been adequately explored
and reported earlier!, we will only briefly discuss those aspects of SdFFF pertinent tothis study. In normal SdFFF, sample particles interact with the externally imposedsedimentation field so as to form zones with an exponential profile according to thefollowing equation
C = Co exp( -xii) (1)
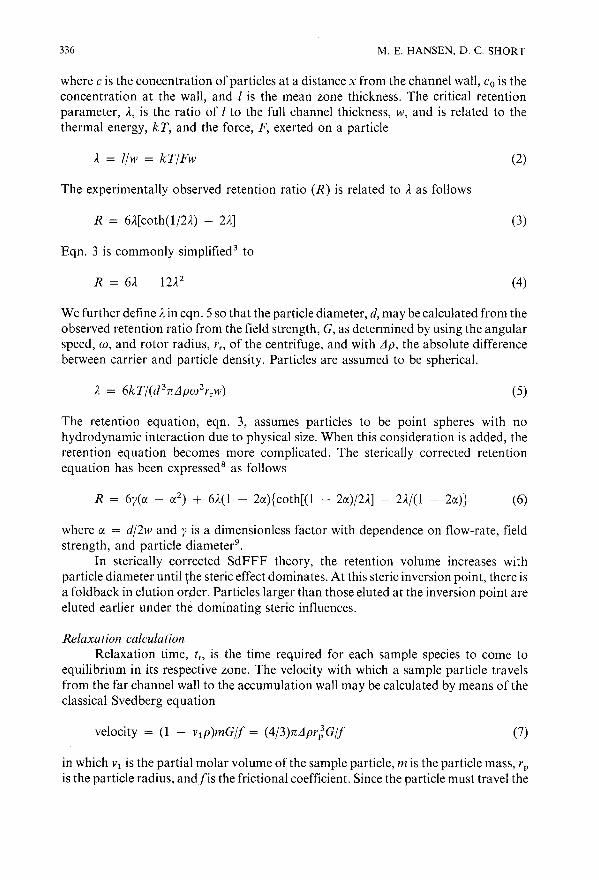
336 M. E. HANSEN, D. C. SHORT
where c is the concentration of particles at a distance x from the channel wall, Co is theconcentration at the wall, and I is the mean zone thickness. The critical retentionparameter, A, is the ratio of I to the full channel thickness, w, and is related to thethermal energy, kT, and the force, F, exerted on a particle
A = Ijw = kTjFw
The experimentally observed retention ratio (R) is related to Aas follows
R = 6A[coth(lj2A) - 2A]
Eqn. 3 is commonly simplified 3 to
R = 6A - l2A2
(2)
(3)
(4)
We further define Ain eqn. 5 so that the particle diameter, d, may be calculated from theobserved retention ratio from the field strength, G, as determined by using the angularspeed, w, and rotor radius, r" of the centrifuge, and with Llp, the absolute differencebetween carrier and particle density. Particles are assumed to be spherical.
(5)
The retention equation, eqn. 3, assumes particles to be point spheres with nohydrodynamic interaction due to physical size. When this consideration is added, theretention equation becomes more complicated. The sterically corrected retentionequation has been expressed 8 as follows
R = 6y(a - ( 2) + 6A(l - 2a){coth[(l - 2a)j2A] - 2Aj(l - 2a)} (6)
where a = dj2w and y is a dimensionless factor with dependence on flow-rate, fieldstrength, and particle diameter9
.
In sterically corrected SdFFF theory, the retention volume increases withparticle diameter until ~he steric effect dominates. At this steric inversion point, there isa foldback in elution order. Particles larger than those eluted at the inversion point areeluted earlier under the dominating steric influences.
Relaxation calculationRelaxation time, t" is the time required for each sample species to come to
equilibrium in its respective zone. The velocity with which a sample particle travelsfrom the far channel wall to the accumulation wall may be calculated by means of theclassical Svedberg equation
velocity = (l - vlP)mGlf = (4j3)nLlpr;Gjf (7)
in which VI is the partial molar volume of the sample particle, m is the particle mass, r p
is the particle radius, andfis the frictional coefficient. Since the particle must travel the

OPTIMIZATION STUDY OF OCTANE-IN-WATER EMULSIONS 337
distance of the channel thickness, W, we calculate the relaxation time, t" by using theStoke's approximation for the friction coefficient.
(8)
The viscosity of the carrier solution is represented by 1].
Peak dispersion calculationsPeak dispersion in SdFFF has been characterized in terms similar to that of
liquid chromatography!. Plate height, H, which is variance, (J 2, per channel length, L,is expressed by
H = 2DjR[v] + xw2 [v]jD + LHi (9)
where D is the diffusion coefficient of the sample particles, [v] is the average carrierlinear flow velocity, Xis a non-equilibrium term as described below, and Hi includes allother miscellaneous contribution to peak dispersion, such as sample injection effects,channel irregularities, and dead volume effects. Xis a complicated term, but in the limitof high retention, this factor is reduced to a simple function of
X = 24..1.3
RESULTS AND DISCUSSION
(10)
Optimization of experimental parametersIn general, we found that the octane emulsions, as generated by sonic dispersion,
had bimodal particle size populations. These emulsions were unstable in that the sizedistribution changed with time. Initially, the emulsions had a single mode of smallerdroplets which grew into larger droplets. In order to track this aging process, weoptimized the SdFFF method so that the broad size range of droplets could bemonitored under a single set of conditions, i.e. field strength, flow-rate, and relaxationtime. At the lower end of the distribution, sufficient relaxation time and field strengthwere required to allow resolution of the small particles from the void. Optimization forthe larger particles present in the distribution required a minimization offield strengthor retention so that sample recovery was acceptable and analysis time was notexcessive. A retention range of R = 0.15-0.05 has been recommended for optimumrecovery and accuracy in the analysis of polystyrene lattices lO
. We used these limits asa guideline for our optimization study.
Optimization offield strengthAs relaxation time is strongly dependent on field strength, we first scanned
a range of centrifuge speeds to determine the optimum for the expected oil droplet sizerange. Assuming the density of the oil droplets at 0.7, the density of n-octane, weapproximated an initial rpm for beginning the scan. Using a limiting upper diameter of1 /lm and a minimum retention ratio of 0.05, we calculated from eqns. 4 and 5 a fieldstrength of 2.39 g, which requires a centrifuge speed of 150 rpm.
In Fig. 1 we compare the resolution and retention obtained by scanning from 150
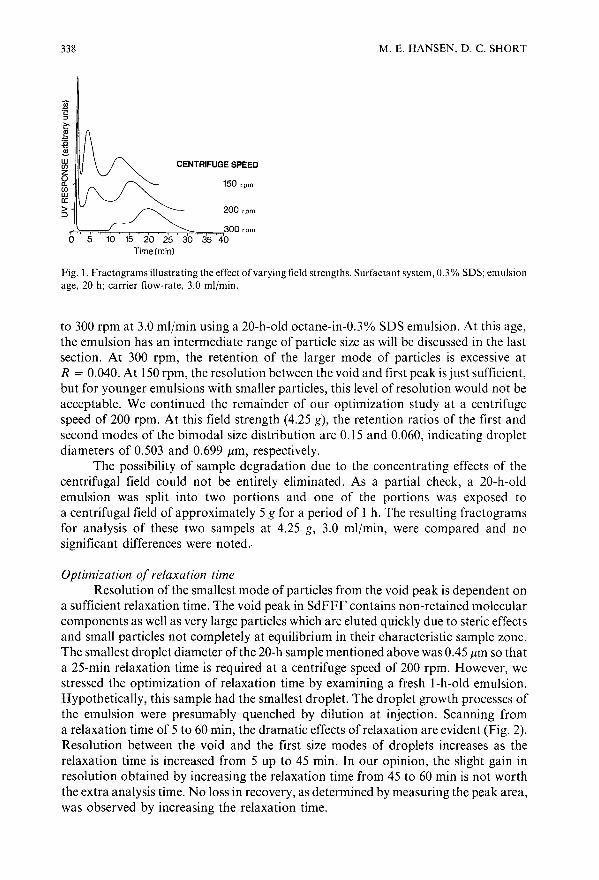
338 M. E. HANSEN, D. C. SHORT
CENTRIFUGE SPEED
150 rpm
200 rpm
-r'--"'=;=""'='r"'--'---r-'-::r:c~,--.---==r=,-,..-.-,.300rpmo 5 10 15 20 25 30 35 40
Time(min)
Fig. 1. Fractograms illustrating the effect of varying field strengths. Surfactant system, 0.3% SDS; emulsionage, 20 h; carrier flow-rate, 3.0 ml/min.
to 300 rpm at 3.0 ml/min using a 20-h-old octane-in-0.3% SDS emulsion. At this age,the emulsion has an intermediate range of particle size as will be discussed in the lastsection. At 300 rpm, the retention of the larger mode of particles is excessive atR = 0.040. At 150 rpm, the resolution between the void and first peak is just sufficient,but for younger emulsions with smaller particles, this level of resolution would not beacceptable. We continued the remainder of our optimization study at a centrifugespeed of 200 rpm. At this field strength (4.25 g), the retention ratios of the first andsecond modes of the bimodal size distribution are 0.15 and 0.060, indicating dropletdiameters of 0.503 and 0.699 /lm, respectively.
The possibility of sample degradation due to the concentrating effects of thecentrifugal field could not be entirely eliminated. As a partial check, a 20-h-oldemulsion was split into two portions and one of the portions was exposed toa centrifugal field of approximately 5 g for a period of I h. The resulting fractogramsfor analysis of these two sampels at 4.25 g, 3.0 ml/min, were compared and nosignificant differences were noted.
Optimization of relaxation timeResolution of the smallest mode of particles from the void peak is dependent on
a sufficient relaxation time. The void peak in SdFFF contains non-retained molecularcomponents as well as very large particles which are eluted quickly due to steric effectsand small particles not completely at equilibrium in their characteristic sample zone.The smallest droplet diameter of the 20-h sample mentioned above was 0.45 /lm so thata 25-min relaxation time is required at a centrifuge speed of 200 rpm. However, westressed the optimization of relaxation time by examining a fresh I-h-old emulsion.Hypothetically, this sample had the smallest droplet. The droplet growth processes ofthe emulsion were presumably quenched by dilution at injection. Scanning froma relaxation time of 5 to 60 min, the dramatic effects of relaxation are evident (Fig. 2).Resolution between the void and the first size modes of droplets increases as therelaxation time is increased from 5 up to 45 min. In our opinion, the slight gain inresolution obtained by increasing the relaxation time from 45 to 60 min is not worththe extra analysis time. No loss in recovery, as determined by measuring the peak area,was observed by increasing the relaxation time.

OPTIMIZATION STUDY OF OCTANE-IN-WATER EMULSIONS 339
RELAXATION TIME
60min
45m;n
~--25min
~--10mjn
0,1-.--0:-5 --:':'Oo---,15c---;2"'"0--'-:2;:5=':;30. 5 min
Time (min)
Fig. 2. Fractograms resulting from use of varying relaxation times. Surfactant system, 0.3% SOS; emulsionage, 1.0 h; field strength, 4.25 g; carrier flow-rate, 3.0 ml/min.
Injection flow-rate optimizationIn the DuPont SF3 2000 system the sample is introduced via an injection valve,
connected to the head of the SdFFF channel with approximately 80 cm of polystyrenetubing, at a volume of 0.55 m!. The flow-rate for the injection process is an optionalparameter. It is automatically continued so until a total of 1.1 ml is washed through theinjection valve and connecting tubing. The centrifuge field is on during sampleinjection so that sample begins relaxation as it enters the channel and theoretically doesnot travel an appreciable distance down the channel during the injection period. Thedefault injection flow-rate in the SF3 2000 is 0.1 ml/min. This low flow-rate shouldminimize the migration of sample down the channel, but allow for band broadening inthe 0.55 ml of tubing.
INJECTION FLOW-RATE
1.0 m~min
0.5 m~min
5or'-.--,~--,~----,-~----r_----r==>0.1 m~min
10 15 20 25 30Time(min)
Fig. 3. Fractograms resulting from the use of varying injection flow-rates. Surfactant system, 0.3% SOS;emulsion age, 20 h; field strength, 4.25 g; carrier flow-rate, 3.0 ml/min.
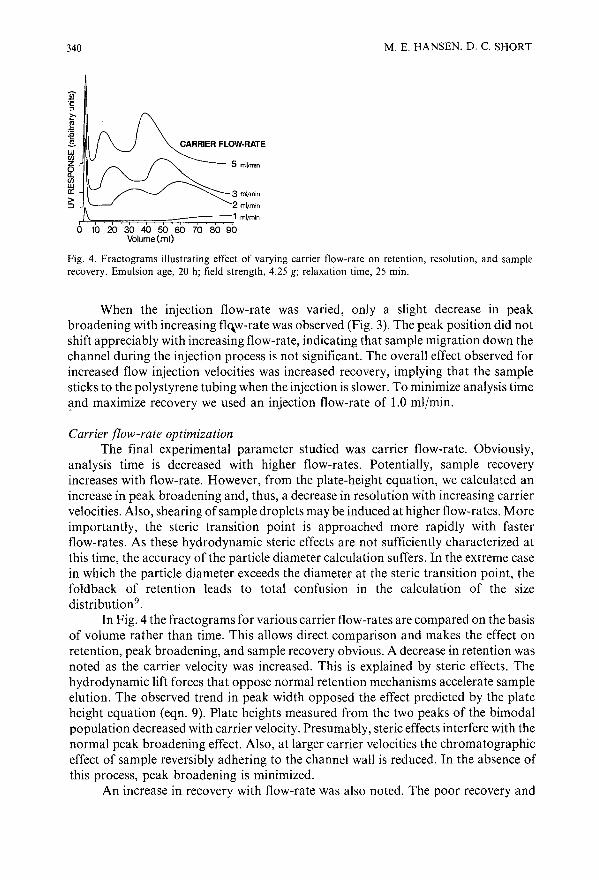
CARRIER FLOW·RATE
340
20 30 40 50 ~70Volume(ml)
5 mlimin
3 ml;min
2 ml;min
1 ml;min
8'0 90
M. E. HANSEN, D. C. SHORT
Fig. 4. Fractograms illustrating effect of varying carrier flow-rate on retention, resolution, and samplerecovery. Emulsion age, 20 h; field strength, 4.25 g; relaxation time, 25 min.
When the injection flow-rate was varied, only a slight decrease in peakbroadening with increasing fl~w-rate was observed (Fig. 3). The peak position did notshift appreciably with increasing flow-rate, indicating that sample migration down thechannel during the injection process is not significant. The overall effect observed forincreased flow injection velocities was increased recovery, implying that the samplesticks to the polystyrene tubing when the injection is slower. To minimize analysis timeand maximize recovery we used an injection flow-rate of 1.0 ml/min.
Carrier flow-rate optimizationThe final experimental parameter studied was carrier flow-rate. Obviously,
analysis time is decreased with higher flow-rates. Potentially, sample recoveryincreases with flow-rate. However, from the plate-height equation, we calculated anincrease in peak broadening and, thus, a decrease in resolution with increasing carriervelocities. Also, shearing ofsample droplets may be induced at higher flow-rates. Moreimportantly, the steric transition point is approached more rapidly with fasterflow-rates. As these hydrodynamic steric effects are not sufficiently characterized atthis time, the accuracy of the particle diameter calculation suffers. In the extreme casein which the particle diameter exceeds the diameter at the steric transition point, thefoldback of retention leads to total confusion in the calculation of the sizedistribution9
.
In Fig. 4 the fractograms for various carrier flow-rates are compared on the basisof volume rather than time. This allows direct comparison and makes the effect onretention, peak broadening, and sample recovery obvious. A decrease in retention wasnoted as the carrier velocity was increased. This is explained by steric effects. Thehydrodynamic lift forces that oppose normal retention mechanisms accelerate sampleelution. The observed trend in peak width opposed the effect predicted by the plateheight equation (eqn. 9). Plate heights measured from the two peaks of the bimodalpopulation decreased with carrier velocity. Presumably, steric effects interfere with thenormal peak broadening effect. Also, at larger carrier velocities the chromatographiceffect of sample reversibly adhering to the channel wall is reduced. In the absence ofthis process, peak broadening is minimized.
An increase in recovery with flow-rate was also noted. The poor recovery and

OPTIMIZATION STUDY OF OCTANE-IN-WATER EMULSIONS 341
j!l.1'::>
~:e~wen
~enwII:>::::>
EMULSION AGE
Oh
1h
3h
EMULSION AGE
Oh
1 h
~---- 3h
'----20h
~==r~~~.--~~~~50ho 5 10 15 20 25 30
Time(minl
Fig. 5. Fractograms for emulsions of octane in 0.3% SDS at varying ages. Field strength, 4.25 g; carrierflow-rate, 3.0 ml/min; relaxation time, 45 min; injection flow-rate, 1.0 ml/min.
Fig. 6. Fractograms for emulsions of octane in 0.3% SDS with 0.2% sodium chloride at varying ages. Fieldstrength, 4.25 g; carrier flow-rate, 3.0 ml/min; relaxation time, 45 min; injection flow-rate, 1.0 ml/min.
excessive retention at a flow-rate of 1.0 ml/min illustrates the definite advantage ofusing higher flow-rates to dislodge the sample. The previous set of experiments foroptimizing the injection flow-rate further validate this effect. As a compromisebetween the advantages of higher flow-rates and the problems ofsteric effects inducedat elevated flow-rates, an intermediate flow-rate, 3.0 ml/min, was chosen for the studyof the dynamics of the octane emulsions.
Effect of surfactant system on the size distribution of octane-in-water emulsionsThe sensitivity of the SdFFF method, as optimized above, was tested by
examining the droplet size distribution of octane emulsions prepared in three differentsurfactant sytems. Two anionic systems at 0.3% SDS and 0.3% SDS with 0.2%sodium chloride, and a non-ionic system, 0.10% Brij 35, the polyethylene glycol etheroflauryl alcohol, CH3(CH2hoCH2(OCH2CH2h30H, were studied. These surfactantconcentrations are slightly above the CMC of each system. The fractograms soobtained were reproducible for emulsions of similar age and composition. Carriercomposition was found to affect the analysis. Emulsions generated in the presence of0.3% SDS with 0.2% sodium chloride, but analyzed in a saltless carrier behavedsimilar to the emulsions generated and analyzed in solutions without sodium chloride.Possibly, the effects noted with salt are reversible.
The surfactant systems aged similarly, with a few notable differences (cl Figs.5-7). In all cases, the emulsions appeared to be dynamic: droplet diameter distributions changed with sample age. The most dramatic effects were noted in the first severalhours. Immediately following sonication, the emulsions showed a monomodal size

342
EMULSION AGE
Oh
2h
-----20h
r'---,-_-r-....-......:::;:=;=~.,.........,50h10 15 20 25 30
TIme (min)
M. E. HANSEN, D. C. SHORT
Fig. 7. Fractograms for emulsion of octane in 0.1 % Brij 35 at varying ages. Field strength, 4.25 g; carrierflow-rate, 3.0 ml/min; relaxation time, 45 min; injection flow-rate, 1.0 ml/min.
population. A second mode ofoil droplet diameters generally developed within the 3 h.For the surfactant system with 0.3% SDS plus 0.2% sodium chloride, only
a small amount of the second population developed in 3 h. The 0.1 % Brij 35 system, onthe other hand, showed a bimodal population immediately, but thereafter changed lessrapidly with time than the other surfactant systems. Superior performance of the Brijsystem in stabilizing oil droplet is implied by the slower kinetics of droplet growth.According to a similar line of reasoning, the addition of sodium chloride to the 0.3%SDS solution increases the stability of the emulsion system: the small mode of dropletdiameters is apparently more resistant to droplet growth. The current models foremulsion instability due to droplet growth are coalescence and molecular diffusion ofthe oil through the surfactant barrier4
. At this point, we cannot distinguish betweenthese models.
Table I shows the droplet diameters calculated for a larger range of emulsion ageusing the sterically corrected retention equation with a constant y of I. Again. the
TABLE 1
COMPARISON OF DROPLET DIAMETERS (11m) FOR VARIOUS OCTANE EMULSIONS VERSUS EMULSION AGE
Field strength, 4.25 g; carrier flow-rate, 3.0 ml/min; relaxation time, 45 min; injection flow-rate, 1.0 ml/min.
0.3% SDS + 0.2% NaCIEmulsion 0.3% SDSage (h)
1st Mode 2nd Mode
0 0.376I 0.438 0.63123 0.448 0.6436 0.445 0.666
20 0.503 0.69950 0.627 0.70970 0.641 0.721
1st Mode
0.4080.4640.4710.4740.4800.5220.5800.580
2nd Mode
0.6610.6790.7160.7380.740
0.1% Brij 35
1st Mode 2nd Mode
0.344 0.500
0.365 0.524
0.379 0.5160.396 0.5220.404 0.522

OPTIMIZATION STUDY OF OCTANE-IN-WATER EMULSIONS 343
results for the non-ionic Brij system are notably different from those of the anionicsystems. Droplet diameters are smaller and more stable over the 70-h time span tested.Presumably, differences in the structure of the non-ionic micelle versus an anionicmicelle generate these effects. The packing of non-ionic surfactant molecules aroundthe octane droplet is possibly tighter than the packing of anionic surfactant molecules,and this may protect the droplets from coalescence. Alternatively, a thicker coat ofsurfactant may be a less penetrable barrier to molecular diffusion. The presence of saltin the SOS system initially led to larger droplets. We suggest that sodium chloride alsochanges the structure of surfactant packing in the micelle. The increase in ionicstrength allows the surfactant to pack more closely, decreasing the curvature at theoctane-SOS interfaces. Thus the resulting droplet assumes a larger diameter.
CONCLUSIONS
In this optimization study the experimental parameters used in analyzing thedroplet size distribution of octane emulsions were found to impact the resultssignificantly. Additionally, the calculations and considerations needed to search forthe optimum conditions were expressed. The major effect noted involved theflow-rates used and the implication on sample recovery.
Both carrier and injection flow-rate had to be optimized. Apparently, the octaneemulsions tested adhere extensively to the surfaces of the channel wall and polystyrenetubing. Relaxation time of sample in the system was also crucial for the resolution ofthe lower end of the particle size distribution.
The surfactant systems tested with the optimized experimental parametersillustrated the sensitivity of this method to changes in the size distribution. Bimodalpopulations were prevalent. These types ofdistributions are difficult to characterize bylight-scattering techniques. The non-ionic surfactant system studied, Brij 35, showeddifferences in droplet diameter as well as droplet growth dynamics. As opposed to theanionic SDS system, the diameter ofdroplets in the non-ionic system were smaller andchanged less with emulsion age. A comparison of anionic surfactant systems with andwithout sodium chloride showed the theoretically expected differences in the micellestructure. The droplets were initially larger in the system with salt due to the closersurfactant packing possible in the presence of salt and the resulting decrease· incurvature at the octane-surfactant interface. The emulsions generated with salt werealso more resistant to particle growth. This substantiates the hypothesized thickerpacking of surfactant molecules.
Overall, the study confirmed the feasibility of using SdFFF for the study ofemulsion dynamics. Sensitivity to the two populations of droplet diameters wasdemonstrated. Analysis time was not so excessive that the dynamics of the changingsystem could not be observed.
ACKNOWLEDGEMENTS
The authors wish to thank the Procter & Gamble Company for financial supportand for allowing them to publish this material. Also, thanks are due to the FabricatedProducts Department ofE. 1. du Pont de Nemours & Company for use of the SF3 2000sedimentation field-flow fractionator.

344
REFERENCES
M. E. HANSEN, D. C. SHORT
I J. C. Giddings, F. J. F. Yang and M. N. Myers, Anal. Chem., 47 (1975) 126.2 J. J. Kirkland, W. W. Yau and W. A. Dorner, Anal. Chem., 50 (1980) 1944.3 F. S. Yang, K. D. Caldwell, M. N. Myers and J. C. Giddings, J. Colloid Interface Sci., 93 (1982) 115.4 H. M. Cheung, Langmuir, 3 (1987) 744.5 M. L. Robbins, J. Bock and 1. S. Huang, J. Colloid Interface Sci., 126 (1988) 114.6 1. J. Kirkland, S. W. Rementer and W. W. Yau, Anal. Chem., 51 (1981) 1730.7 A. Avranas, G. Stalidis and G. Ritzoulis, Colloid Polym. Sci., 266 (1988) 937.8 M. N. Myers and J. C. Giddings, Anal. Chem., 54 (1982) 2284.9 S. Lee and J. C. Giddings, Anal. Chem., 60 (1988) 2328.
10 K. D. Caldwell and J. Lee, presented at the First International FFF Symposium, Park City, UT, June1988.

Journal of Chromatography, 517 ([990) 345-359Elsevier Science Publishers B.Y., Amsterdam
CHROMSYMP.1944
Potential-barrier field-flow fractionation, a versatile newseparation method'
A. KOLIADIMA and G. KARAISKAKIS*
Department of Chemistry, University olPatras, GR-26110 Patms (Greece)
ABSTRACT
A new method called potential-barrier fIeld-flow fractionation, which is a combination of potential-barrier chromatography and sedimentation field-flow fractionation (SdFFF), is presented for the separation and characterization ofcolloidal materials, The separation is based either on particle size differences or on Hamakerconstant, surface potential and Debye-Hiickel reciprocal distance differences~ Tn itssimplest form the technique consists in changing the ionic strength of the carriersolution from a high value, where only one of the colloidal materials of the binarymixture subjected to separation is totally adsorbed at the beginning of the SdFFFchannel wall, to a lower value, where the total number of adhered particles is released.The method was applied to the separation of haematite and titanium dioxide spherical colloidal particles and to the separation of haematite spherical particles withdifferent sizes. At the same time as separation was occurring, the particle sizes of thecolloidal materials of the mixture were determined. The experimental values of particle diameters were in good agreement with those obtained by transmission electronmicroscopy or determined by normal SdFFF. Finally, the retention perturbationsdue to particle (ct-FeZ03 and TiOz)-wall interactions in SdFFF were investigated.
INTRODUCTION
During the last few years, interest has arisen in methods for the separation ofsuspended particles, in analogy with techniques used for matter in solution, Hydrodynamic chromatographyl, gel chromatographyz, potential-barrier chromatography3and field-flow fractionation (FFF)4-S have already been studied, and potential-barrier FFF (PBFFF) has recently been suggested9
•lo . The latter is a combination of
FFF and poJ:ential-barrier chromatography.Basically, FFF is a one phase-chromatographic system in which an external
field or gradient replaces the stationary phase. The applied field can be of any typethat interacts with the sample components and causes them to move perpendicular tothe flow direction in the open channel. The most highly developed of the various FFFmodes is sedimentation FFF (SdFFF), in which the separations of suspended parti-
0021-9673/90/$03.50 © 1990 Elsevier Science Publishers B.Y.

346 A. KOLIADIMA, G. KARAISKAKIS
cles are performed with a single, continuously flowing mobile phase in a very thin,open channel under the influence of an external centrifugal force field 4
.
SdFFF yields experimental data in the form of a fractogram, which is a plot ofthe detector response of the emerging sample versus the time or volume of its emergence. For constant field conditions, the retention volume (or time) in SdFFF isimmediately related to the particle mass. Thus, in normal SdFFF, where the particlewall interactions are negligible, the separation is based on particle size differences.
Potential-barrier chromatography (PBC) can be applied to separate particlesbased on differences in size or in any of the physico-chemical parameters involved inthe potential energy of interaction between the particles and the packing of the column. This method, which is based on the existence of a surmountable potentialbarrier between particles and deposition surface, is classified as an FFF methodrather than a chromatographic method, because the selective interaction is experienced in one phase. Thus, by combining PBC with normal SdFFF one could separateaccording to two mechanisms, one governed by the depth of the potential energy wellfor the different particles and the other determined by the interactive force betweenthe particles and the external field.
The purpose of this work was to study the interactions between the particle andthe channel wall in SdFFF and to show the applicability of PBFFF in the separationof colloidal particles.
THEORY
In normal SdFFF, where the particle-wall interactions are absent, the potentialenergy of a spherical particle is given by the relation 1o
(1)
where d is the diameter and Ps the density of the spherical particle, P is the carrierdensity, G is the sedimentation field strength expressed as acceleration and x is thecoordinate position of the centre of particle mass.
The retention ratio, R, in SdFFF is given by the ratio of the column voidvolume, Vo, to the component retention volume, VR • For highly retained peaks andspherical particles, R can be expressed as
(2)
where I is the characteristic mean layer thickness of the solute, w is the channelthickness, A(= l/w) is a dimensionless retention parameter, k is Boltzmann's constantand T is the absolute temperature.
When the colloidal particles interact with the SdFFF channel wall, the potentialenergy given by eqn. 1 must be corrected by considering the potential energy of

POTENTIAL-BARRIER FFF 347
interaction V(h). The latter can be estimated by the sum of the contributions of theVan der Waals, V6 (h), and double-layer, VDL(h), forces:
where h is the separation distance between the sphere and the channel wall.The Van der Waals interaction energy is approximated by3
V (h) = A 132 [ln (h + 2a) _ 2a(h + aJ]6 6 h h(h + 2a)
(3)
(4)
where a is the particle radius and A 132 is the effective Hamaker constant for media 1and 2 interacting across medium 3. Combining laws are frequently used for obtainingapproximate values for unknown Hamaker constants in terms of known values. Theconstant A 132 can be approximately related to A 131 and A 232 viall
(5)
where A 131 represents the interaction of two nearby bodies of material 1, separatedby medium 3. A corresponding meaning applies to A 232 . Two other useful relationshipsdeveloped by Israelachvili 11 are the following:
(6)
(7)
which when combined with eqn. 5 give
(8)
The Hamaker constants can be calculated on the basis of the Lifshitz theoryfrom the relationship 11

348 A. KOLIADIMA, G. KARAISKAKIS
where n1, nz and n3 are the refractive indices of the three media, £1> £Z and £3 are thecorresponding static dielectric constants and Ve is the mean value of the absorptionfrequency of the three media.
The Hamaker constants A ii can also be determined experimentally by measuring the corresponding surface tensions, since 11
(10)
where 'Yii is in mJ m- z and A in J.Eqn. 4 shows that the energy V6(h) depends on the Hamaker constant and on
the particle radius, IX.
The double-layer interaction potential, resulting from the development of electrical double layers at the solid-liquid interfaces is given by3
(II)
where £ is the dielectric constant of the liquid phase, e is the electronic charge, t/J 1 andt/Jz are the surface potentials of the solid surfaces and Kis the reciprocal Debye length.
For oxides in water, as is the case here, the surface potential, t/J, is determinedby the pH of the solution, as H+ and OH- are potential-determining ions. Thepotential is given by1z
(12)
where pHzpc is the pH at which the net charge on the surface is zero.For comparison purposes, apart from the surface potential, one could use the (
potential calculated from the electrophoretic mobility, u, via the equations 13
6nnu(=-
£
4nnu(=-
£
(KIX« 1)
(KIX» 1)
(13)
(14)
where n is the viscosity and £ is the dielectric constant of the suspending medium.The reciprocal double-layer thickness is given by the expression
(15)
where B is a constant and I is the ionic strength of the suspending medium.Eqns. II and 15 show that the energy VDL(h) is influenced from the surface
potentials, t/J1 and t/Jz, the ionic strength, I, and the particle radius, IX.
The total potential energy, VIOl> of a spherical particle in PBFFF will equal thesum of the expressions in eqns. 1, 4 and ll:

POTENTIAL-BARRIER FFF
4 3 A 13Z[ (h + 2rx) 2rx(h + rx)]VIOl = 31trx L1pGx + -6- In -h- - h(h + 2rx) +
(kT)Z (el/J 1) (el/Jz) h+ 168rx --;- tanh 4kT tanh 4kT e-
K
349
(16)
The last equation shows that the energy VtO! in PBFFF (at a given SdFFF system,where the surface potential of the walll/Jz is constant) is a function of the size and ofthe surface potential of the particle, of the Hamaker constant and of the ionicstrength of the carrier solution.
EXPERIMENTAL
The experimental procedure has been described in detail elsewhere6•B
•14
. Thetwo SdFFF systems used in this work had the following dimensions: system I, 38.4 x2.05 x 0.0262 cm3 with a channel void volume of 2.06 cm3, measured by the elutionof the non-retained peak of sodium benzoate; system II, 38.5 x 2.3 x 0.0181 cm3
with a channel void volume of 1.60 cm3. In both systems the column was 6.85 cmfrom the centre of rotation. A Gilson Holochrome UV detector was used for detection at 254 nm and a Gilson Minipuls 2 peristaltic pump was used to pump the carriersolution and the sample to the channel.
The electrophoretic mobilities of rx-FeZ03 and TiOz particles were measured ina microelectrophoresis apparatus (Rank, Mark II) by using a four-electrode capillarycell. The velocities of at least twenty particles in each direction of the electric fieldwere measured at the two stationary layers with an accuracy of ± 10%. The pH of thecolloidal suspensions was measured by using a combination glass-saturated calomelelectrode (Metrohm).
For the identification of the type of modification of TiOz, a Philips Model PW1130/00 X-ray diffractometer was used. The form of TiOz was found to be anatase.The transmission electron microscopic (TEM) pictures for the rx-FeZ03 and TiOzparticles, some examples of which are shown in Fig. 1, were taken with a JEOL ModelJSM-2 transmission electron microscope.
The surface tensions of the titanium dioxide and haematite colloidal particleswere measured with a torsion balance from White Electrical Instruments.
Titanium dioxide monodisperse colloidal particles from PolySciences with anaverage diameter (obtained by TEM) of 0.388 fJ.m, and haematite nearly monodisperse colloidal particles of two sizes (rx-FeZ03(I) with d = 0.148 fJ.m and rx-Fez03(II)with d = 0.248 fJ.m, supplied by Prof. J. Lyklema (Agricultural University, Wageningen, The Netherlands) were used as samples.
The carrier was triply distilled water containing 0.5% (v/v) of detergent FL-70and 0.02% (w/w) sodium azide as bacteriocide. The electrolyte added to this carriersolution in order to adjust its ionic strength was potassium nitrate from Riedel-deHaen. The ionic strength of FL-70 alone was taken to be 10 - 3 M from conductivitymeasurements.
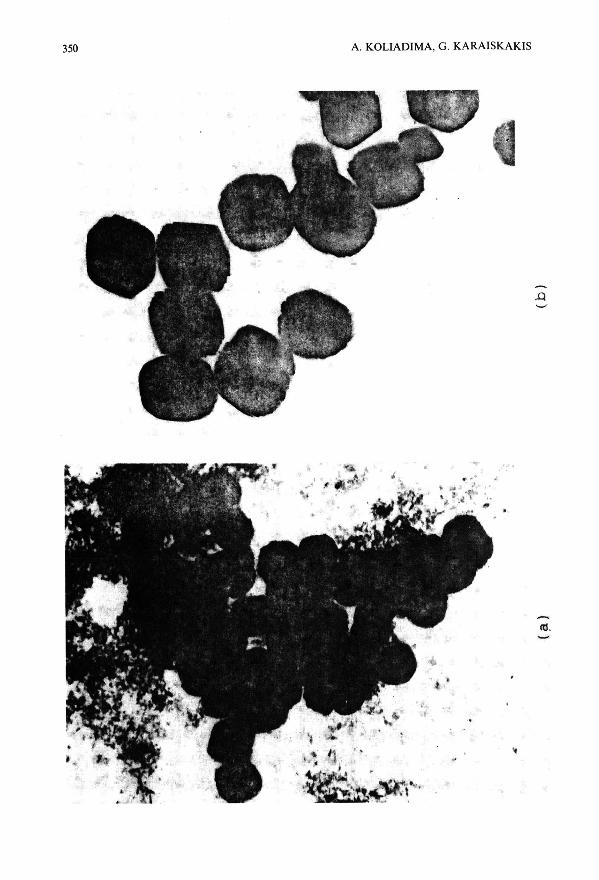


352 A. KOLIADIMA, G. KARAISKAKIS
RESULTS AND DISCUSSION
Interactions between haematite and the SdFFF channel wallHaematite-I (H-I, dTEM = 0.148 pm). In order to select the optimum experi
mental conditions for minimizing the interactions between H-I and the SdFFF channel wall, the retention ratios or the particle diameters of the H-I particles were measured at various field strengths and at a constant flow-rate, and also at variousflow-rates and at a constant field strength.
Fig. 2a, in which the variation of the experimental diameter, r.fxp., with the field
strength and the constant theoretical diameter, cfEM (determined by TEM) are presented, shows that the optimum field strength for H-I is G = 15212 cm S-2 (450rpm). The optimum flowrate found from Fig. 2b, which shows the variation of r.f xp
,
with the carrier flow-rate at a constant field strength and constant cfEM value, is ca.150 cm 3 h -1. Ideally, no differences should be observed with varying field and flowconditions. However, with increasing field strength the interaction between the particles and the SdFFF channel wall is intensified. Further, the increase in flow-rateoffsets the interaction, as the hydrodynamic lift forces accelerate elution. Of course,more experimental work is necessary in order to investigate these variations.
Using the optimum experimental conditions found (G = 15212 cm S-2, V =
150 cm3 h - 1) the variation of the retention ratio or of the particle diameter with theionic strength of the carrier solution was investigated. Fig. 3 illustrates the results of aseries of retention measurements at different ionic strengths for the heamatite sampleH-I with a nominal diameter of 0.148 /lm in the stainless-steel channel wall and withtwo carrier flow-rates. At both carrier flow-rates for the more concentrated solutions(ca. 3 . 10- 2 M KN0 3), the retention ratio decreased and the particle diameter washigher than the theoretical value, although the data points in Fig. 3a have a relativelylarge random error.
The above observations are in accord with the analysis of particle-wall interactions presented under Theory. It was predicted there that at higher ionic strengths the
1.10.8
(bl
0.5
0.17
0.140.2
0.18
~;;; 0.15
36271890.14 '--__-"-__-'-__-'-__--1
o
0.17
0.16
3. 0.15;;;
-1u (cm.s )
Fig. 2. Variation of particle diameter for the haematite-I sample (a) with the field strength at a constantflow-rate and (b) with the carrier flow-rate at a constant field strength. In both instances the SdFFF systemI was used.

POTENTIAL-BARRIER FFF 353
0.16
0.15
0.14o 10 20 30
0.17
0.16
0.154
(bl
18 32
Fig. 3. Variation of the particle diameter for the haematite-I sample with the ionic strength of the carriersolution at 450 rpm. Flow-rate: (a) 150 and (b) 60 cm 3 h -'. In both instances the SdFFF system I was used.
attractive forces play an increasing role, eventually leading to a decrease in the Rvalue and subsequently to an increase in the d value. Changing the carrier solution toone containing a higher concentration of KN03 (ca. 5 . 10- 2 M) led to the adsorption of all of the' H-I particles on the stainless-steel channel wall, as no elutioncurve was obtained. In the system under investigation, in which the a-Fe203 particlesand the collector (stainless-steel channel wall) carry charges of the same sign (both arenegative), the deposition of the particles on the SdFFF channell wall at high electrolyteconcentrations is due to the compression of the double layer. When the carrier solution was changed to one containing a lower ionic strength (ca. 10 - 3 M KN0 3), asample peak appeared as a consequence of the desorption of the H-I particles. Themean diameter of the H-I particles (0.148 J!m) is identical with that (0.148 J!m) obtained by TEM or found (0.148 J!m) by the direct injection of the H-I particles intothe channel using the carrier in which no adsorption occurs.
These data show that the adsorption of the H-I particles on the channel walltook place at the beginning of the column, thus making possible the use of the realvalue of Vo for the calculation of d. Another important point to examine is whetherthe deposition of the particles of H-I is fully reversible because, if some particles arestill deposited on the channell wall after the change of carrier solution, then thechannel wall will gradually be fouled. A strong indication for the desorption of all ofthe material was the fact that no' elution peak was obtained, even when the fieldstrength was reduced to zero.
Haematite-II (H-II, dTEM = 0.248 J!m). Fig. 4 illustrates the variation of theretention ratio or of the calculated particle diameter for the H-II particles with thefield strength at a constant flow-rate, and with the carrier flow-rate at a constant fieldstrength. Using the optimum experimental conditions found (G = 9202 cm S-2, V =
171 cm3 h- 1), the variation of the retention ratio or of the particle diameter for theH-II sample with the ionic strength of the carrier solution was investigated. Whereasat low ionic strengths the H-II-wall interactions are negligible, at higher electrolyteconcentrations there is a limiting critical concentration (ca. 3 . 10- 2 M KN0 3) at

354
0.26
0.24
0.22
A. KOLIADIMA, G. KARAISKAKIS
0.27
(b)
0.26
0.25 Theoretical
0.24
0.20 0'----~9---1~8--~27------l36 0.230.2 0.4 0.6 0.8 1.0
Fig. 4. Particle diameter for the haematite-II sample versus (a) field strength and (b) flow-rate. In bothinstances the SdFFF system IJ was used.
which adsorption of all of the H-II colloidal particles occurs at the beginning of thecolumn. Variation of the carrier solution to one containing a lower electrolyte concentration (ca. 10- 3 M KN0 3) released the total number of adherent H-JI particlesand gave a particle size (0.245 flm) in good agreement with that obtained by TEM(0.248 flm) or found (0.245 flm) when the colloidal particles were injected into thechannel with the carrier solution in which no adsorption occurs.
0.38
0.34
0.30
,-------------------------:1 0.04
Theoretical
0.03
0.02
Theoretical---------------- -------
0.26 '-- --'~ ___L __.J 0.01
0.0 0.4 0.8 1.2-1u(cm.s )
Fig. 5. Particle diameter (0) and retention ratio (6) versus carrier flow-rate for the Ti02 colloidal samplein the SdFFF system II.

POTENTIAL-BARRIER FFF 355
Interactions between titanium dioxide and the SdFFF channel wallFig. 5 shows the variation of the retention ratio and of the particle diameter for
the Ti02 particles with the carrier flow-rate at constant field strength (G = 9202 cms- 2). Although the optimum flow-rate from Fig. 5 was found to be ca. 45 cm3 h- 1,the investigation of the variation of the retention ratio or of the particle diameter forthe TiOz sample with the ionic strength of the carrier solution was carried out at ca.170 cm3 h-1 in order to avoid long analysis times and broad peaks (Fig. 6).
The latter investigation showed that the critical electrolyte concentration forthe total adsorption of the Ti02 particles on the stainless-steel channel wall was thatcontaining 3 . \0-2 M KN03. Variation of the carrier solution to one containing alower electrolyte concentration (ca. \0 - 3 M KN03) released all of the adherent Ti02
particles and gave a particle size (0.302 /lm) in good agreement with that (0.298 /lm)obtained when the colloidal Ti02 particles were injected into the channel with thecarrier solution in which no adsorption occurs.
Fractionation of titanium dioxide and haematite-I by PBFFFFig. 7a shows the fractionation of the Ti02 and H-I particles by the normal
SdFFF procedure, which is based on the particle size difference, and Fig. 7b showsthe fractionation of the same particles by the PBFFF technique, which is based on thetotal potential energy, VIOl (given by eqn. 16), difference. In the PBFFF technique themixture was injected in the carrier solution containing 3· \0- 2M KN03. At this highelectrolyte concentration all of the Ti02 colloidal particles adhered at the beginningof the SdFFF stainless-steel channel wall, whereas all of the Ti02 colloidal particles
0.032
0.030
0.028
0.026 o 4 8 12
I x 10 3
Fig. 6. Variation of the retention ratio for the Ti02 sample with the ionic strength of the carrier solution.The SdFFF system II was used.


POTENTIAL-BARRIER FFF 357
adhered at the beginning of the H-I particles were eluted from the channel. Theaverage diameter of the eluted H-I particles was found (by the PBFFF technique) tobe 0.143 /lm, in good agreement with that obtained by TEM (0.148 /lm) or determined by normal SdFFF (0.150 /lm) during the fractionation of TiOz and H-I particles. It must be pointed out that the particle diameter was obtained from eqn. 2 whenthe particles were run in the normal SdFFF mode, after the total adsorption following the PBFFF mode.
Changing the carrier solution to one containing only 0.5% detergent FL-7!)released all of the adherent TiOz particles and gave a particle diameter (0.302 /lm) ingood agreement with that (0.298 /lm) obtained during the fractionation of TiOz andH-I particles by the normal SdFFF technique.
The desorption of all of two colloids during the PBFFF procedure was verifiedby the fact that no elution peak was obtained even when the field strength wasreduced to zero, A second indication for the desorption all of the material was the factthat the peaks ofo:-Fez03 and TiOzafter adsorption and desorption ofthe particles (cf,Fig. 7b) emerge without degradation, in contrast to the peaks in Fig. 7a. The differentlimiting electrolyte concentrations for the total adsorption of the TiOz and H-I colloidal particles onthe SdFFF stainless-steel channel wall and hence the separation of theabove particles by the PBFFF technique are due to the different total potential energies, Vtot. given by eqn. 16. Therefore, the separation of TiOz and H-I colloidalparticles by the PBFFF technique is based on the particle size difference and/or on theHamaker constant and the surface potential difference of the particles. The differencein diameters for the TiOz and H-I particles is known from the TEM pictures. Let usexamine now whether or not the two samples have different Hamaker constants andsurface potentials.
The Hamaker constant A 13Z (= 1.02· 10 - zo J) for the system steel-water-iron(III) oxide was calculated from eqn. 8, by taking 2.2 . 10- 19 J (A 11) for steel, which isthe Hamaker constant for iron15
, 4.4 . 10- zo J (A 33 ) for water, as calculated from theLifshitz theory11 (e/, eqn. 9), and 6.2 . lO- z0 J (An) for haematite 15 . The Hamakerconstant for haematite was also determined from eqn. 10 by surface tension measurements. This value (7.0 . lO- z0 J), which was found to be equal to the value forTiOz, appears to be much too high. As pointed out by Hogg et alY, it seems reasonable to assume that the Hamaker constant is approximately the same for inorganicoxides dispersed in an aqueous medium, as the surface are essentially similar, beingcomposed primarily of oxygen anions. Thus, the Hamaker constant for the systemsteel-water-titanium dioxide approaches that for the system steel-water-iron (III)oxide and the separation of TiOz and H-I colloidal particles is not based on theHamaker constant difference.
The surface potentials of haematite and TiOz were calculated from eqn. 12 byusing for pHzpc the values given by Hunter16
; pHzpc(o:-Fez03) = 8.5 and pHzpc(TiOz,rutile) = 5.8. Therefore l/!(o:-FeZ03) = -15.6 mV and l/!(TiOz) = -45.7 mY. Thelatter values show that the total potential energy, Vtot. at a given Hamaker constant,particle size and Debye-Hiickel parameter, is less for the haematite sample than forTiOz, contrary to our experimental results, according to which the heamatite sampleis more stable than TiOz at an electrolyte concentration of 3· lO- z M KN03. This isprobably due to the fact that the value of pHzpc used is referred to the rutile modification of TiOz and not to the anatase form. For this reason, the electrophoretic

358 A. KOLIADIMA, G. KARAISKAKIS
mobilities of the TiOz and iX-Fez03 particles were measured at various ionic strengthsof the carrier solution.
From the latter, the' potentials were determined by using eqns. 13 and 14. Atthe critical electrolyte concentration 3 . lO- z M KN03, where the TiOz colloidalparticles adhered to the SdFFF channel wall, whereas the iX-Fez03 particles were
Voidpeak
+
(a)
o
j j j
o...'""Eoj
u
o~'"0.
Peak
Peaka- Fe Z0 3 (I) ~
\..
100
Peak
o
'"QJ• ..-j
><><<tlU
dP<J)
200
oIICl
(b)
oIIt:>
150 100 50 o 150 100 50 o
Fig. 8. Fractionation of haematite-I and haematite-II coloidal particles by (a) the normal SdFFF and (b)the PBFFF technique.

POTENTIAL-BARRIER FFF 359
eluted from the channel, the (potentials were found to be ((a-Fe203) = - 20.4 mVand ((Ti02) = -19.1 mY. These values are consistent with the experimental resultsshowing that the fractionation of Ti02 and H-I particles by the PBFFF technique isbased on the particle size and the surface potential differences.
In the second example of fractionation by the PBFFF technique we used twosamples of haematite with different particle diameters (Fig. 8). Here the separation isbased only on the particle size difference, as the Hamaker constants and the surfacepotentials of the two samples are identical. Fig. 8a shows the fractionation of thehaematite samples with different particle diameters by the normal SdFFF technique,and Fig. 8b that of the same samples by the PBFFF technique. The particle diametersobtained from eqn. 2 in the latter instance (0.151 Jlm for H-I and 0.244 Jlm for H-II)are in good agreement with those found by normal SdFFF (0.145 Jlm fOf"H-I and0.237 Jlm for H-II) or determined by TEM (0.148 Jlm for H-I and 0.248 Jlm for B-II).
ACKNOWLEDGEMENTS
We are grateful to Professor J. Calvin Giddings (University of Utah, U.S.A.),who supplied the SdFFF system, to Professor J. Lyklema (University ofWageningen,The Netherlands), who supplied the haematite samples, and to M. Barkoula for herkind assistance.
REFERENCES
[ H. Small, 1. Colloid Interface Sci., 48 (1974) 147.2 V. K. F. Krebs and W. Wunderlich, Angew. Makromol. Chern., 20 (1971) 203.3 E. Ruckenstein, A. Marmur and W. N. Gill, J. Colloid Interface Sci., 61 (1977) [83.4 J. C. Giddings, F. J. F. Yang and M. N. Myers, Anal. Chern., 46 (1974) [917.5 J. C. Giddings, G. Karaiskakis, K. D. Caldwell and M. N. Myers, J. Colloid Interface Sci., 92 (1983) 66.6 E. Dalas and G. Karaiskakis, Colloids Surf, 28 (1987) 169.7 G. Karaiskakis and E. Da[as, J. Chromatogr. Sci., 26 (1988) 29.8 A. Koliadima and G. Karaiskakis, J. Liq. Chromatogr., [1 (1988) 2863.9 G. Karaiskakis and A. Koliadima, Chromatographia, 28 ([ 989) 31.
LO M. E. Hansen and J. C. Giddings, Anal. Chern., 61 (1989) 811.II J. N. Israelachvili, Intermolecular and Surface Forces, Academic Press, London, [987, pp. 144-158.12 R. Hogg, T. W. Healy and D. W. Fuerstenau, Trans. Faraday Soc., 62 (1966) 1638.13 P. C. Hiemenz, Principles of Colloid and Surface Chemistry, Marcel Dekker, New York, 1977, pp.
457-467.14 E. Dalas, P. Koutsoukos and G. Karaiskakis, Colloid. Polym. Sci., 268 ([990) 155.[5 R. J. Kuo and E. Matijevic, J. Colloid Interface Sci., 78 (1980) 407.16 R. J. Hunter, Zeta Potential in Colloid Science, Academic Press, London, 198[, p. 279.


Journal o/Chromatography, 517 (1990) 361-376Elsevier Science Publishers B.V., Amsterdam
CHROMSYMP. 1940
Particle characterization in centrifugal fields
Comparison between ultracentrifugation and sedimentationfield-flow fractionation
JIANMIN LI and KARIN D. CALDWELL'
Department 0/ Bioengineering, University 0/ Utah, Salt Lake City, UT 84112 (U.S.A.)
and
WALTER MAcHTLE
Kunststotflaboratorium, BASF AG, D-6700 Ludwigshafen (F.R.G.)
ABSTRACT
A ten-component mixture of polystyrene latex particles in the 67-1220 nm sizerange was subjected to analysis by analytical ultracentrifugation (AVe) and sedimentation field-flow fractionation (SdFFF) using programmed and constant fields.The AVe analysis of the mixture yielded diameter values in good agreement withdata determined on the separate components; the relative amounts of each component in the mixutre were likewise closely reproducing the sample's known composition. Diameters determined by SdFFF, either in a constant- or programmed-fieldmode, were in good agreement with the AVe for particles smaller than about 500 nm.For the sample's larger components, however, particularly the programmed modeshowed diameter values smaller than expected. In addition, field programming resulted in incomplete recoveries of the larger particles, leading to more or less distortedmass distributions for the complex sample.
. The observed discrepancies, which are thought to result from events at theanalytical wall in the FFF channel, suggested a protocol for accurate sizing, as opposed to fingerprinting, of samples with broad size distribution. By tracking sizes andamounts of the different components at different but constant field strengths, andretaining as analytically valid only those data recorded in a retention range from fiveto about thirty column volumes, it was possible to determine sizes and amounts ingood agreement with known parameters for the sample.
Unlike the AVe procedure, SdFFF produces fractions of a high degree ofuniformity, which lend themselves to a secondary analysis, e.g. by electron microscopy, as shown in the study.
0021-9673/90/$03.50 © 1990 Elsevier Science Publishers B.V.

362
INTRODUCTION
J. L1, K. D. CALDWELL, W. MACHTLE
Since the days of Svedberg, centrifugal fields have been used routinely todetermine sizes and size distributions for particulate samples in the diameter range10-5000 nm!. TraditionalIy, such measurements are performed on dilute particlesuspensions using the analytical ultracentrifuge, the opticalIy transparent sample celIof which alIows the operator to folIow the unobstructed radial migration of a sample'scomponents under the influence of the field. The rate of sedimentation at a given fieldstrength is a measure of a spherical component's buoyant mass, which is convertibleinto an actual size if the densities of particle and suspension medium araknown. Sinceamplitudes of the optical signals associated with each sedimenting species are measuresof their relative amounts, the analytical ultracentrifugation (ADC) study leads toa determination of the sample's size distribution. Through the use of sensitivedetection techniquesZ
-4 it is possible to perform the analysis at low sample
concentration to avoid particle interactions and other non-ideal behavior. Thetechnique is non-intrusive, and at the end of an analysis the sample can be retrieved forsubsequent evaluation by other analytical methods. However, removing the fieldcauses the components to remix, and any information relating size to, e.g.,composition or biological function, is not normalIy available by this route.
An alternate way of utilizing the field was proposed by Giddings, who in 1965introduced the concept of field-flow fractionation (FFF)5. In the FFF mode ofoperation, the centrifugal field is applied perpendicularly to a laminar flow ofsuspension medium through a thin, flat channel. As in the ultracentrifugationexperiment, particles injected into the FFF channel wilI migrate under the influence ofthe sedimentation field. However, their migration across the thin (typicalIy 250 ,um)channel is stopped by its outer walI where the particles are forced to accumulate andrapidly equilibrate. The field affects each particle in proportion to its mass, so that themore massive particles will form distributions that are more compact than those oflesser mass. Thus, a fulIy equilibrated polydisperse sample wil1 consist of severalexponential1y distributed particle clouds superimposed on one another, each characterized by a thickness which relates to the mass of its constituents and to the strength ofthe applied field. This equilibration is normalIy alIowed to occur with the liquid at rest,and as flow is resumed at the end of the relaxation period, the various particle zones arecarried downstream with minimal disturbance oftheir equilibrium distributions. In theparabolic velocity profile maintained by the thin channel, zones of different degree ofcompression wilI move at different rates, so that the downstream transport results ina mass-based separation. At the end of the channel, the effluent is routed through oneor more detectors, and the separated components may subsequently be collected forfurther analysis or evaluation.
The ability to fractionate polydisperse samples into cuts of a uniform andquantifyable particle size makes the FFF a powerful tool for particle characterization6 ,7. Ideal1y, the technique is applicable to samples ranging in size from a few tens ofnanometers to welI over a micrometer. Ap accurate sizing based on existing theory forso calIed "normal" FFF8
,9 requires that the particles behave as point masses, free frominteractions with neighboring particles or with the accumulation wall. In practice, thiscondition may be difficult to meet for alI components of a highly polydisperse sample.Often, the strong fields necessary to retain a distribution's finer particles to such
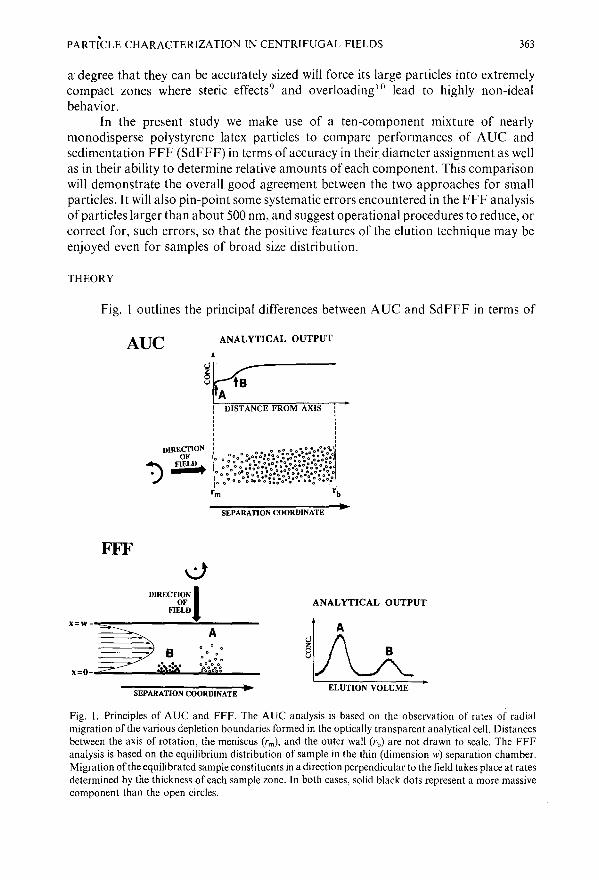
PARTicLE CHARACTERIZATION IN CENTRIFUGAL FIELDS 363
a degree that they can be accurately sized will force its large particles into extremelycompact zones where steric effects9 and overloading to lead to highly non-idealbehavior.
In the present study we make use of a ten-component mixture of nearlymonodisperse polystyrene latex particles to compare performances of AVe andsedimentation FFF (SdFFF) in terms of accuracy in their diameter assignment as wellas in their ability to determine relative amounts of each component. This comparisonwill demonstrate the overall good agreement between the two approaches for smallparticles. It will also pin-point some systematic errors encountered in the FFF analysisof particles larger than about 500 nm, and suggest operational procedures to reduce, orcorrect for, such errors, so that the positive features of the elution technique may beenjoyed even for samples of broad size distribution.
THEORY
Fig. 1 outlines the principal differences between AVe and SdFFF in terms of
Ave
SEPARATION COORVlNATE
FFF
DIRECTION}OFFlELD
x=w-...,,=------~----A
..o 0 0 0
0 0 0 0
x=0 ...-.;;;;;..__...:;iII:i_.....'~',.~••&i.'--__
SEPARATION COORDINATE ..
ANALYTICAL OUTPUT
ELUTION VOLUME
Fig. l. Principles of AUC and FFF. The AUC analysis is based on the observation of rates of radialmigration of the various depletion boundaries formed in the optically transparent analytical cell. Distancesbetween the axis of rotation, the meniscus (rm), and the outer wall h) are not drawn to scale. The FFFanalysis is based on the equilibrium distribution of sample in the thin (dimension IV) separation chamber.Migration of the equilibrated sample constituents in a direction perpendicular to the field takes place at ratesdetermined by the thickness of each sample zone. In both cases, solid black dots represent a more massivecomponent than the open circles.

364 1. L1, K. D. CALDWELL, W. MACHTLE
their use of the centrifugal field. In both applications, a particle of mass m and densityp" which is suspended in a medium of density p, will experience a force F in thedirection of the field. Under a gravitational acceleration G, the force is expressed by:
F = m(LJplps)G (I)
where LJp is the density difference between particle and suspension medium. Forspherical particles of diameter d, the mass m can be replaced by the product of volumeand density:
(2)
Stokes' law specifies the relationship between the particle's friction coefficientf, itsdiameter d, and the viscosity 11 of the medium:
f= 3n11d (3)
which implies that the field induces the particle to move with a steady state velocity U,equal to:
(4)
In AUC, this motion is quantified from observations of the movement of the variousdepletion boundaries which are created at the meniscus and transported outwardtowards the bottoml of the cell. In evaluating d from the observed U, it is necessary toaccount for the fact that the boundary moves a significant fraction of the distancebetween the axis of rotation and the bottom of the ce1l 4
, and that G therefore will varywith position r as measured from the axis:
(5)
Here, ill is the angular velocity of the rotor.In FFF, the thin channel is positioned far enough from the axis of rotation that
its thickness dimension w becomes a negligible fraction of r, and G therefore remainsconstant across the channel. Under the influence of the field, particles in 'the FFFchannel will move radially, as in AUC. Due to the small gap width, their transportacross the channel is rapid, and for particles denser than the medium accumulationtakes place at the outer wall. After a brief relaxation period, the field inducedconcentration at the wall is exactly balanced by dispersion due to Brownian motion,and the particle zone is at equilibrium with a concentration distribution c(x) in thedirection of the field (x-axis), which is described by8,11:
c(x) = c(O) exp( - xl Jew) (6)
In this equation, Je is a dimensionless layer thickness related to the particles' driftvelocity U and diffusivity D:
Je = DIUw = kTIFw (7)

PARTICLE CHARACTERIZATION IN CENTRIFUGAL FIELDS 365
where k and T have the usual meaning of Boltzmann constant and temperature.The concentration at the accumulation wall, expressed as c(O) in eqn. 6, is rapidly
increasing with decreasing A; even for weakly retained samples, characterized bymoderately large values of this parameter, c(O) is well approximated bylo:
c(O) = <c> /..1 (8)
where <c> is the average sample concentration across the channel in the fielddirection.
Initiation ofa laminar flow of liquid along the length dimension of the channel,i.e. in a direction perpendicular to the field, will transport the equilibrated particlezones downstream at rates determined by their respective }, values. Due to differencesin zonal compression, resulting from differences in size and/or density, a mixture ofparticles will separate into its components during migration through the channel. Theseparated zones will emerge from the channel at different elution volumes Ve , whicheach bears a direct relationship to the characteristic layer thickness A, and thus to theparticle's diameter d (ref. 12) via eqns. 2 and 7:
ValVe = R = 6A[coth(l/2A) - 2A] (9)
The retention ratio R, defined as the ratio ofaverage carrier velocity to sample velocity,is determined experimentally as the ratio of the channel's void volume Va to the elutionvolume Ve.
Eqn. 9 presumes the particles to be point masses, moving independently of oneanother without interactions with the wall. Larger particles become sterically excludedfrom the wall region, and corrections for this effect lead to a modified retentionequation 13 .
14:
R = 6y(a - a2) + 6A(l - 2a) {coth[(l - 2a)/2A] - 2..1/(1 - 2a)} (10)
Here, a symbolizes d/2w, and y is a factor the value of which appears close to unity. Aswill be discussed below, eqn. 10 fails to fully describe the retention of large particles,and attempts are presently under way to further modify the retention equation tocorrect for velocity and size dependent lift forces induced by the presence of thechannel wall.
EXPERIMENTAL
SamplesThe major focus of this study is a ten-component mixture of nearly mono
disperse polystyrene (PS) latex spheres, prepared by BASF in the form of two nearlyidentical samples, referred to as "5" and "5R". The two mixtures are made up from thesame close to monodisperse components, with the exception of the smallest particleswhich derive from different batches. The relative concentration of each component inthese mixtures is 10% (w/w), and the density of the particles is reported to be 1.057g/ml. In addition, the study uses monodisperse PS latex standards from Seragen.

366 J. LI, K. D. CALDWELL, W. MACHTLE
Suspension medium (carrier)For the AUC procedure, the medium is a 0.05% (wjv) solution of the ionic
surfactant K30 (sodium salt of a [14C]alkyl sulfonate from Bayer) in deionized water.In the case of SdFFF, the carrier is a 0.1 % (vjv) solution in deionized water of thesurfactant FL-70 from Fisher Scientific.
EquipmentThe analytical ultracentrifuge at the Kunststofflaboratorium of BASF is an
in-house modified version of a preparative ultracentrifuge (Model Omega 2) equippedwith an analytical 8-cell rotor, both from Hereaus-Christ, which has been described indetail elsewhere3 . Each 3-mm wide sector cell has a volume of 0.25 ml; the contents ofall eight cells are monitored pseudo-continuously with a detection system based on theresponse by a photomultiplier to light traversing the cell, in a direction parallel to theaxis of rotation, from a source emitting at 546 nm. An apertured mask with a 0.2-mmslit is positioned in the middle ofeach cell. The AUC detector response is corrected forMie scattering, as described elsewhere3 ,4, using n(25°C, 546 nm) = 1.59 forpolystyrene.
As the meniscus region becomes depleted with respect to particles of a given size,a concentration boundary is established the migration of which in the radial direction(across the perpendicular slit) can be followed as a function of time. The distancebetween meniscus and outer wall in these cells is kept constant at 1.30 em, so that thedistances between the axis of rotation and the meniscus, slit and outer wall are fixed at5.85, 6.50 and 7.15 cm, respectively. Each cell is loaded with 0.25 ml of a 0.1 % (wjv)sample suspension.
The SdFFF system was built at the University of Utah, essentially according tothe description in ref. 15, although the rotor radius r in the present system is 15.5 cm,permitting the accommoda tion of a longer separation chamber; the dimensions of thepresent channel are 94 cm x 2.0 cm x 0.0254 cm for a measured void volume of 4.78ml. The effluent from this system is monitored by a Linear Modell 06 UV detector witha 254-nm light source, the output of which is fed to the system's IBM compatible ATpersonal computer. Elution volumes are based on weight, as described elsewhere16 ,and are continuously input to the computer's RS232 port by the system's Ohaus ModelC501 electronic balance. The field strength, relaxation time, and rate of carrier flowfrom the system's Minipuls 3 peristaltic pump Model 312, are all controlled by thecomputer. In the present study, sample volumes were 5111 (1 % solids), unless otherwisespecified; the samples were manually injected at the head of the channel and allowed torelax for periods of 20 to 30 min. Absence of any effects of the length of the relaxationperiod on the level of retention was assured through multiple runs under differentconditions. At the end ofeach run, diameters were evaluated from the elution positionat peak maximum in accordance with eqns. 9 or 10, as specified by the operator. Whenneeded, the detector response was corrected for Mie scattering as described in ref. 17,using 1.7685 (ref. 17) and 0.012 (ref. 18) as values for the real and imaginary parts of therefractive index for polystyrene, and 1.3702 as the real part of the refractive index forthe carrier at 254 nm (the imaginary part being zero). The extinction cross sectionscalculated as described in ref. 17 were verified experimentally using polystyrene latexstandards of accurately known concentrations. The area under each scatteringcorrected peak in the recorded fractogram was then found by integration after baseline

PARTICLE CHARACTERIZATION IN CENTRIFUGAL FIELDS 367
adjustment, and was considered proportional to the number of particles of the sizedetermined from the peak elution volume; multiplication by the particle volumecomputed for this size gave the mass-based relative amount of the component.
The studies of recovery involved the observation fixed loads (4 J11 of a samplesuspension containing I % solids) of standard polystyrene latices from Seragen. Theareas under the elution peaks, recorded at different field strenths, were normalized bydivision with the area under a peak at no field. The small size of the void peak infractograms collected at high particle retention obviated any correction for thepresence of low-molecular-weight contaminants. As these studies involved comparisons of the behavior of one particle type at the time, there was no need to correct thedetector response for Mie scattering.
Analysis of collected fractionsA BI-90 fixed-angle (90°) photon correlation spectrometry (peS) system from
Brookhaven Instruments was used routinely (in cases where the concentration of
D50% = 1220nm
l.or------,,---------,---~--~~---'-:::-~-,
0.8
0.4
0.2
O-l-"--"--"-'-L-'<-L~--'-----"¥'---"-''----r-'''-~''-_::>''''''_---J
o 300 600 900 1200 1500
DIAMETER, OJ (nm)
BFig. 2. (Al Size distribution curves for ten different polystyrene latex samples (density 1.057 gjml)determined separately by AUC: The ordinate reflects the cumulative mass of particles below a given size D;,indicated on the abscissa. (Bl Size distribution curve for a mixture of the ten polystyrene latex samplesanalyzed separately in (Al (upper curve). Also shown (lower curve) is the derivative of the distributionfunction, the peak values of which indicate the average diameter for each component. The upper profile isa composite of two analyses run simultane\lusly in different cells, one at a sample concentration of 0.35 gil(for the heavier components), and the other at3.5 gil. The heavy dot in the diagram represents the "couplingpoinC'4, indicating that data for larger diameters, Db derive from the lower concentration cell and smallerdiameters from the higher.


PARTICLE CHARACTERIZATION IN CENTRIFUGAL FIELDS 369
eluting particles was sufficient to permit a pes analysis) to verify the diameterscalculated from SdFFF.
Electron microscopy was performed on collected samples using a lEOL lFM 35scanning electron microscopy (SEM) system. Prior to analysis, the collected fractionswere concentrated on Nucieopore filters with pore sizes of 0.1 or 0.2 J1m. The filteredsamples were mounted on copper stubs and gold coated prior to imaging.
RESULTS AND DISCUSSION
Aue of each of the ten polystyrene latices prepared by BASF yields the sizedistributions shown in Fig. 2A; particle diameters reported in Table I as "Sample 5",and "Sample 5R", respectively, are determined from the midpoints of such distribution curves. Fig. 2B shows the result of an AUe analysis ~f that mixture of the tencomponents, referred to as "Sample 5". In order to produce this distribution curve, therotor was ramped up during the 1.5-h run in an essentially exponential fashion 4
, fromo rpm via weak fields suitable for generating readily measurable sedimentationvelocities for the largest particles in the mixture, to a final spin rate of 40 000 rpm. Thesizes determined for each constituent in the Aue analysis of the two sample mixturesare listed as AUe 5 and Aue 5R in Table 1. The duration of these runs ranged fromI to ~ h. As is seen from this table, the AUe is faithfully reproducing both the numberof components in the mixture as well as their sizes and relative amounts.
In contrast to the AUe analysis just described, field-programmed SdFFF beginsat a high spin rate, which produces retention even of small particles, and progresses toweaker fields where, ideally, the more massive particles are being transported throughthe channel at measurable rates 19. Fig. 3 represents a 4-h SdFFF run of the sampleusing the time-delayed exponential program introduced by Yau and Kirkland 20
. Theexperimental parameters chosen to produce Fig. 3 were not optimized for highresolution; yet, the run is clearly informative as to the complexity of the sample. Thepresence ofat least nine components is indicated, and the tenth could presumably havebeen resolved, had we been able to spin our system at a higher speed than the 2000 rpm(692 g) which is our current upper limit.
The ten-component sample (Sample 5) was also submitted for a routine analysis(analytical conditions not optimized) to DuPont. whose SF3 Particle Fractionator was
O. 2===------J'---__--'- ---l- ~ 2000
1000 lI>:
o'-- ,--- ---,. -,..- ---! 0
o 61.5 123.0 184.5 246.0
ELUTION VOLUME (ml)
Fig. 3. Screening of the ten-component polystyrene latex sample, using field-programmed SdFFF. Theform of the program was a time-delayed exponential, with an initial field of2000 rpm and a time constant of20 min; the flow-rate was 1.0 ml/mill.

370 J. LJ, K. D. CALDWELL, W. MACHTLE
the first SdFFF instrument to be ·produced commercially. In contrast to the Utahsystem, DuPont's SF3 is capable of handling spin rates of 18 000 rpm (35 000 g), andcould therefore resolve and quantify even the smallest particles of the mixture, as seenin Table I; the duration of this analysis was around an hour. Although diameterassignments for the smaller particles (less than 500 nm) were in good agreement withthe AUC data, the table shows an increasing departure from the nominal diametervalues with an increase in size. From Table I it is also clear that quantification of thelarger components is less accurate, as recoveries appear to decrease with increasingparticle size.
As seen from eqn. 8 above, the exponential distribution of sample in the fielddirection implies a concentration at the accumulation wall which is inversely related toA. Since A, in turn, is an inverse function of the product d3G, it follows that an increasein G has a strongly compressing effect, particularly on zones containing large particles;hence, any tendency of the particles to adsorb at the solid-liquid interface will bepromoted by increased wall concentrations, i.e. by increasing the strength of thesettling field. It is therefore easily seen that the strong fields needed to resolve the fines
100
~80
....gl 60...0Ufool 40Ill:
A20
0 260 520 780 1040 1300FIELD (RPM)
100
B75
~....co:
50r.l;>0Ur.lco:
25
00 0.02 0.Q4 0.06 0.08 0.10
RETENTION RATIO, R
Fig. 4. (A) Sample recovery in SdFFF as function of lield strength and particle size. All data representinjections of 4 ,ul of suspensions containing I% solids; the flow-rate is constant at 1.0 ml/min. Diameters ofthe three polystyrene standard particles (Seragen) are indicated in the figure. (B) Sample recovery plotted V.I'.
retention ratio, R for the 895-nm standard particle. Experimental conditions are the same as in (A).Significant losses are seen to occur at retentions larger than 25-30 column volumes, corresponding toR values of 0.03-0.04.

PARTICLE CHARACTERIZATION IN CENTRIFUGAL FIELDS 371
in a broadly distributed sample may severely hamper recovery and distort quantification at the high end of the distribution. This effect is clearly illustrated in Fig. 4A,where relative recovery is plotted as a function of field strength for three monodispersePS latex standards analyzed at different spin rates. The trend of increased sample losswith increasing retention is further demonstrated in Fig. 48, using the data collectedfor the largest of the three particles in Fig. 4A. It should be noted that both the metalwall of the channel and the PS beads carry negative charges21 at neutral pH, whichwould make this sample less prone to adhesive particle-wall interactions than manyother colloidal systems in which the two interact by Van der Waals forces alone or inaddition to attractive Coulombic forces. Operation at strong fields must therefore beused judiciously, ifquantification oflarge diameter components is the desired outcomeof an FFF analysis.
An alternative way, although more cumbersome than the one presented in Fig. 3,to approach the analysis of broadly distributed samples is to make several consecutiveruns at different fields, and only determine size/quantity data for particles of moderatezonal compression; for this purpose, analytically useful retentions appear to rangefrom 5 to ca. 30 column volumes. The lower end of this "accuracy window" marks theposition in the fractogram where, on the average, transients due to sluggish diffusionseize to playa major role22 and retentions therefore fairly reflect the diameter of theparticle, while the upper end, which is strongly size dependent, is defined by the onsetof sample losses of the type shown in Fig. 48, as well as by other non-ideal behaviordiscussed below. An example of this strategy, applied to the ten-component samplefocused on in the present study, is seen in Fig. 5. Here, three fractograms were collectedat constant fields in the "weak", "intermediate", and "strong" range for the
field orr•
tfield orr
tfield orr
4
5
500, j:I:
t;~ ~z'"~.~
~! lll,
~
28'~~o 60 120 180 240
ELUTION VOLUME (ml)
Fig. 5. Sequential SdFFF analyses of the ten-component polystyrene latex sample at constant fields ofdifferent strength. The numbers in the fractograms refer to specific components, as defined in Table I. Theweak (28 g) field analysis was able to visualize component 10. but provided poor resolution of the smallercomponents. By contrast. the strong (500 g) field resolved several of the smaller components. but failed todemonstrate the presence of component 10. The now-rate was maintained at 2.8 ml/min.

372 J. LI, K. D. CALDWELL, W. MACHTLE
instrument at hand; the flow-rate was kept constant throughout. Each component inthe figure is numbered from I to 10 in accordance with Table I. The weak field (28 g)permitted detection and quantification of component 10, which was otherwise
OriginalSample
Fig. 6. SEM record of the starting material (top), as well as of the resolved fractions 2 through 10. Sizesmeasured for the four largest particle types from these micrographs are included in Table I.

PARTICLE CHARACTERIZATION IN CENTRIFUGAL FIELDS 373
undetectable, while this field strength clearly was inadequate for resolution of the finerparticles resolved by the stronger fields. During the process, fractions were collectedwithin the "window" for further analysis by SEM (see Table I) and pes, where theconcentration reached above the detection limit for our BI-90 instrument. The SEMimages compiled in Fig. 6 give a clear indication that the fractionation is efficient, andproduces highly monodisperse cuts without any evidence ofcontamination from othercomponents in the sample. While the magnification is insufficient to permit accuratesizing of the smaller components, Table I contains SEM size assignments for the fourlargest particle types separated by SdFFF. These sizes are in good agreement withthose determined by AVe.
In addition to affecting sample recovery, as discussed above, the presence of theanalytical wall in FFF results in steric exclusion from the interfacial region, as well asin the establishment of a velocity and size dependent lift force directed towards thecenter of the channel. While the former effect was recognized and modelled byGiddings 13 over a decade ago, the latter is just recently gaining attention, as efforts areunder way to expand the range of particle sizes which can be profitably handled by thehigh resolution SdFFF technique. The present ten-component mixture of monodisperse particles proved to be an ideal sample for demonstrating the existence of such walleffects, as illustrated by Fig. 7. In carrying out the procedure ofsize analysis at differentfield strengths described above, it became evident that diameters determined for thelarger particles were strongly dependent on the chosen gravitational acceleration G.This obvious anomaly, which was not present for small particles, is an indication thateqn. 9 does not adequately describe the retention of all particles in what is oftenreferred to· 9 as the "normal" (as opposed to "steric") mode of FFF operation.
The need for a steric correction to eqn. 9 was realized early on by Giddings andco-workers I3
,14, who proposed the modified form of the retention equation listedabove as eqn. 10. Further studies by Lee and Giddings23 supported the notion thatparameter y in this equation had the magnitude of unity, although its actual value wasshown to vary with particle size and the chosen experimental conditions. An attempt atre-processing the data in Fig. 7, using eqn. 10 together with values for y in the range
1200
1000
E-=- 800ll:r.lEoor.l 600
'"<...Q 400
680nm- ~'"'<>-""-o~-o-." 486 nm
3S6nm
800600200 L-_,--_~_..---_-,-_-,-_-,-..::.3.:.:18:..:n::;::m=-----.J
o 200 400FIELD (gravities)
Fig. 7. Effect of field strength on diameters determined by SdFFF using eqn. 9. The small particles behaveideally, and show no effect ofG, while a progressively non-idealbehavior is seen for the larger particles. Forthe four largest particles the diameters listed in Table I were determined by extrapolation to zero field usinga fourth order polynomial fit of the data; linear extrapolations were used for the smaller particles. Theflow-rate was held constant at 2.8 ml/min.
374 1. LT, K. D. CALDWELL, W. MACHTLE
0.5-2.0, was nQt successful in removing the influence offield strength on the calculateddiameters.
The lack of success in a direct evaluation of particle diameter from retentionforced a more detailed analysis of the field effect than first envisioned. Thus, the dataset in Fig. 7 is reflecting the sample's behavior under a large number of different fieldstrengths, chosen to allow an extrapolation of diameter data for each particle to a valueat zero field, presumably free from wall effects. For the four largest particles, a fourthdegree polynomial fit was shown to represent the data with a 99% confidence level,while sizes of the smaller particles were determined by linear extrapolation to zerofield. Extrapolated diameters obtained in this way are listed in Table I under theheading "SdFFF-C", and are seen to compare well with those from the AUC over theentire size range. The smallest particle was barely retained even at our maximum fieldstrength of 2000 rpm (692 g), and was therefore excluded from this extrapolationprocedure.
Also listed in Table I are relative amounts of nine out of the sample's tencomponents, calculated from areas under the scattering-corrected peaks in thedifferent fractograms. Only baseline resolved peaks with retentions ranging from 5 to30 column volumes were considered suitable for this analysis, in keeping with thenotion ofan "accuracy window" mentioned above. Due to its weak retention and poorresolution from the void peak, the smallest particle was not included in thisquantification.
Although the relative amounts determined by this approach of multiple runs atdifferent, but constant, field strengths are closer to the true values than thosedetermined by the faster exponential decay method used in the DuPont analysis, theyfall short of indicating the actual 10% in relative weight of each component. This isprobably due both to difficulties in correctly assessing the position of the baseline whendetermining the area under a given peak, as well as to the incomplete recovery at highretention illustrated by Fig. 4.
CONCLUSION
One run in the AUC is shown to accurately determine both sizes and relativeamounts for complex spherical samples of known density, as in the case of the presentten-component mixture of polystyrene latex particles. Concentration non-idealitiesare absent in this type of analysis, which involves the observation of freely movingparticles, far from any interface and unperturbed by fluid flow. In SdFFF the analysisis complicated by the sample's compression into thin layers at the solid/liquidinterface. For small particles at modest retention, the complications are minimal, andgood agreement is seen between diameters determined by the SdFFF and AUCtechniques. By contrast, particles with diameters above about 500 nm showincreasingly severe departures from ideal FFF behavior with increasing field.
For multi-modal samples, such as the one focused on in the present study,diameters can be correctly determined by a systematic observation of valuesdetermined at different field strengths, followed by an extrapolation to zero field. Thisapproach is clearly not available for more· realistic samples which are oftenmonomodal and highly polydisperse, so that tracking of the field-dependent migrationof a particular component becomes impossible. In order to correctly analyze such

PARTICLE CHARACTERIZATION IN CENTRIFUGAL FIELDS 375
samples, it is necessary to develop a modified retention equation which accounts forboth the lift forces and steric exclusion effects known to influence the behavior oflargeparticles. Efforts in this regard are currently under way in several laboratories.
The times required for the different approaches were comparable in the cases ofAUe and the DuPont SF3 analysis using an exponentially decaying field. However,unlike in SF3
, the AUe rotor simultaneously accommodates up to seven differentsamples, which significantly reduces the time per sample. The constant-field approachto SdFFF proposed here is by its very nature time consuming, as it involves multipleruns with relaxation periods of tens of minutes and run times of 1-2 h. It does,however, provide good recoveries of particles in a broad size range, and should be usedwhenever fractions of exactly sized particles are required.
Despite the wall-related complications discussed above, SdFFF has a clearadvantage over AUe in the analysis ofsamples which require correlations between sizeand some other sample property, e.g. chemical composition or biological activity.Here, one relies on the SdFFF system's proven ability to separate a sample intofractions of uniform size, which can be subjected to one or several secondary analysissteps. To this end, viral infectivity has been associated with fractions representinga given molecular weight24
, X-ray fluorescence in conjunction with SEM has beenused to correlate chemical composition with size in an analysis ofparticulates in streamwater25
, and pes has been used to determine the size associated with particularfractions of samples with unknown density 7. Although both AUe and SdFFF havebeen successfully used to analyze samples of unknown density by systematic variationsin the density of the carrier or suspension medium26
,27, this approach is onlyapplicable to stable samples that remain unperturbed by changes in the environment.For emulsions and other fragile systems of unknown density it is often appropriate tolet SdFFF produce fractions using a highly sample compatible medium, andsubsequently size these fractions by an independent method such as pes or SEM.
ACKNOWLEDGEMENTS
K.D.e. wishes to express her gratitude to Dr. J. Calvin Giddings for many yearsof educational collaboration. Support for this work via grant number GM 38008-02from the National Institutes of Health is gratefully acknowledged.
REFERENCES
I T. Svedberg and H. Rinde, J. Am. Chem. Soc., 46 (1924) 2677.2 W. Scholten and H. Lange, Kolloid-2. 2. Polym" 250 (1972) 782.3 W. Miichtle, Makromol. Chem., 185 (1984) 1025.4 W. Miichtle, Angew. Makromol. Chem., 162 (1988) 35.5 1. C. Giddings, Sep. Sci., I (1966) 123.6 F.-S. Yang, K. D. Caidwell, M. N. Myers and J. C. Giddings, J. Colloid Jnle1Iace Sci .. 92 (1983) 81.7 K. D. Caldwell and J.-M. Li, J. Colloid Jnle1j'ace Sci., 132 (1989) 256.8 J. C. Giddings, J. Chem. Ed., 50 (1973) 667.9 M. N. Myers and J. C. Giddings, Anal. Chem., 54 (1982) 2284.
10 K. D. Caldwell, S. L. Brimhall, Y-S. Gao and J. C. Giddings, J. Appl. Polymer Sci., 36 (1988) 703.11 J. C. Giddings and K. D. Caldwell, in B. W. Rossiter and 1. F. Hamilton (Editors), Method~ in Phvsical
Chemistry, Vol. 3B, Wiley, 1989, p. 867. .12 J. C. Giddings, F. J. F. Yang and M. N. Myers, Anal. Chem., 46 (1974) 1924.13 J. C. Giddings. Sep. Sci. Tee/mol.. 13 (1978) 241.

376 J. LI, K. D. CALDWELL, W. MACHTLE
14 K. D. Caldwell, T. T. Nguyen, M. N. Myers and J. C. Giddings, Sep. Sci. Technol., 14 (1979) 935.15 J. C. Giddings, M. N. Myers, K. D. Caldwell and S. R. Fisher, in D. Glick (Editor), Me/hods of
Biochemical Analysis, Vol. 26, Wiley, 1980, p. 79.16 J.-M. Li and K. D. Caldwell, J. Chroma/ogr., submitted for publication.17 M. R. Schure, Anal. Chem., 61 (1989) 2735.18 T. Depireux, F. Dumont and A. Watillon, J. Colloid In/erface Sci., 118 (1987) 314.19 J. C. Giddings and K. D. Calwell, Anal Chem., 56 (1984) 2093.20 W. W. Yau and J. J. Kirkland, Sep. Sci. Technol., 16 (1981) 577.21 M. E. Hansen and J. C. Giddings, Anal. Chon., 61 (1989) 81 I.22 M. R. Schure, Anal. Chem., 61 (1989) 2735.23 S. Lee and J. C. Giddings, Anal. Chem., 60 (1988) 2328.24 K. D. Caldwell, G. Karaiskakis and J. C. Giddings, J. Chroma/ogr., 215 (1981) 323.25 G. Karaiskakis, K. A. Graff, K. D. Caldwell and J. C. Giddings, In!. J. Environ. Anal. Chem., 12 (1982) I.26 W. Miichtle, Colloid Polymer Sci., 262 (1984) 270.27 J. C.Oiddings, G. Karaiskakis and K. D. Caldwell, Sep. Sci. Technol., 16 (1981) 607.

Journal of Chromatography, 517 (199Q) 377-393Elsevier Science Publishers B.V., Amsterdam
CHROM. 22327
Retention effects in thermal field-flow fractionationa
J. J. KIRKLAND', L. S. BOONE" and W. W. YAU
E. 1. Du Pont de Nemours & Co., Inc., Central Research and Development Department, ExperimentalStation, B-228 Wilmington, DE 19880-0228 (U.S.A.)
ABSTRACT
While the basis of the thermal field-flow fractionation (TFFF) method presumably is thermal diffusion, predicting retention for different polymer types in differentsolvents is generally not possible. To clarify the TFFF retention mechanism, wedeveloped a data base for a range of experimental conditions. Retention is strongly afunction of polymer and carrier solvent types, and is proportional to solvent viscosity.Studies suggest that polymer retention significantly increases when using a mixedcarrier solvent that has a higher concentration of "poor" solvent relative to "good"solvent. Although no apparent correlation was found between retention and variousphysical properties of the system, more effective practical TFFF experiments can bedone because of these studies.
INTRODUCTION
Quantitative molecular-weight distributions (MWD) of a wide range oforganic-soluble l
-6 and certain water-soluble 7 polymers are possible with the high
resolution separation method called thermal field-flow fractionation (TFFF). Becauseof higher resolution, TFFF generally has higher molecular-weight accuracy than thewidely used size-exclusion (or gel permeation) method6
. Especially attractive is theability of TFFF to characterize fragile polymers of very high molecular weight4 •8 .
TFFF separations typically use a single carrier liquid by applying a large thermalgradient across a very thin channel formed from two highly polished, parallel plates.Because of this temperature difference, sample components are pushed against onewall (the accumulation wall). Higher-molecular-weight (MW) materials are forcedcloser to the wall compared to lower-MW components. The essentially laminar flowprofile created within the thin channel creates a very steep velocity profile near thewalls. Higher-MW components that are closer to the accumulation wall are swept
a Presented in part at the First International Symposium on Field Flow Fractionation, Park City, UT,U.S.A., June 14-16, 1989.
" Present address: Chemistry Department, Universityof Chicago, Chicago, IL, U.S.A.

378 J. J. KIRKLAND, L. S. BOONE, W. W. YAU
down the channel by slower flow streams near the wall. They lag behind and elute afterlower-MW components. Thus, retention differences result from the different redistribution of solutes from fast- to slow-moving flow streams within the laminar flowprofile.
Previous studies have shown that TFFF retention is dependent on the chemicalcomposition and molecular size of the polymer investigated 1 ,2,6,9. TFFF retentionallows the determination of thermal diffusion coefficients in different solvents1o. Alsoreported is the effect of temperature on thermal diffusion, to provide a better basis forchoosing optimum conditions for TFFF experiments 11
. Still, even with these studies,the a priori prediction of TFFF retention characteristics of new or previouslyuncharacterized polymers is not possible.
The purpose of this study was to develop data for a range of polymer types andsolvents. The expectation was that this information might lead to a better fundamentalunderstanding of thermal diffusion and the TFFF retention process. Retentionrelationships were determined with the time-delay, exponential-decay programmingmethod. After an initial period of constant temperature difference between the twochannel faces, the temperature difference decreases exponentially during the separation. With this method, TFFF retention follows a simple log MW liS. solute retentiontime relationship that provides a convenient way to organize and analyze data.
The results of this study still do not allow quantitative predictability of polymerretention. Nevertheless, improved techniques for carrying out TFFF experimentsresulted, with a clearer definition of some strengths and limits of TFFF.
EXPERIMENTAL
EquipmentThe apparatus was essentially the same as that previously described 5, with one
exception. A Model 150 computer equipped with Model 5088-2057 and Model61012Ainterface components (Hewlett-Packard, Palo Alto, CA, U.S.A.) remotely controlledthe setpoint of the temperature controllers during programming. Instrument controlwas by in-house-developed Basic software. A Hewlett-Packard Model 18652Aanalog-to-digital converter digitized the outputs from a UV absorption detector(Model 783, KratosAnalytical Instruments, Ramsey, NJ, U.S.A.) and a refractiveindex detector (Optilab Model 5902, Tecator Instruments, Herndon, VA, U.S.A.).Signals were processed with a Hewlett-Packard Model 3357 LAS system equippedwith in-house-developed software6
. Time-delayed exponential-decay (TDE)-TFFFcalibration data were log-linear regressed and plotted with a Vectra Model 45 personalcomputer (Hewlett-Packard), using Graphwriter 11 software (Lotus DevelopmentCorporation, Cambridge, MA, U.S.A.) and a Model 7475 plotter (Hewlett-Packard).
ReagentsHPLC-grade solvents were from Fisher Scientific (Fair Lawn, NJ, U.S.A.) or
American Burdick and Jackson (Muskegon, MI, U.S.A.). Polymer MW standardswere from Polymer Labs. (Amherst, MA, U.S.A.). All other materials were fromDuPont.

RETENTION EFFECTS IN THERMAL FFF
THEORY OF RETENTION IN TIME-DELAYED EXPONENTIAL-DECAY TFFF
379
TDE-TFFF permits the separation of a wide range of polymer molecularweights with a single experiment in a convenient time. With this approach, thetemperature difference between the plates decreases exponentially during the run 5
.
Temperature programming speeds up the elution of higher MW components, reducesanalysis time, and improves the detection of later-eluting species 12
. Previous studieshave shown some advantages of using time-delayed exponential-decay temperatureprogramming in thermal field flow fractionation 5
-7
. With this approach, uniformresolution and MW accuracy occurs over a wide dynamic MW range in a practicalanalysis time. A similar form of force field programming is used in sedimentationFFF13 •14 .
In the TDE-TFFF experiment, the separation begins with an initial temperaturedifference between the two plates, (Ll T)o, that is held constant for a time r. Then, Ll Tdecreases exponentially also with a time-constant r. With this approach, retentiontimes of well-retained solutes can be described by5,6
tR = cn(ln M) + Tin[e Vo(Ll T)o/6 Flh] (1)
When f3 = h/DT , where b is a constant and DT is the thermal diffusion coefficient, then
(2)
where, tR is the retention time of the eluted component; a ~ 0.6 for random-coilpolymer conformations; r is the time-delay, exponential-decay time constant; M is themolecular weight; F is the flow-rate; Vo is the volume of the separating channel; and(Ll T)o is the initial temperature difference between the hot and cold blocks. Eqns. land2 suggest that a plot of retention time tR vs. In M is a straight-line relationship witha slope set by the time-delay/decay constant r. Other operating parameters such as theflow-rate Fand the initial temperature difference (Ll T)o determines the intercept of thisplot. The value of r primarily controls the elution of sample components, with smallerinfluence by the other operating parameters.
The relationship in eqn. 2 provides a convenient and accurate method forcalibrating and measuring the MWD of polymers over a wide MW range. TheTDE-TFFF method permits convenient data handling for quantitative MWDanalyses6 . Accurate peak-position calibrations follow from the simple log MW vs.retention time relationship. Also, the valuable single- or two-broad-standard calibration procedures 15 are readily used. Further, eqn. 2 predicts exact changes in the elutionof components with variations in the various operating parameters such as r, F and(Ll T)o. Nomographs simplify this calculation16.
The relationships in eqn. 2 are convenient to obtain certain physical data onpolymers of interest. For example, eqn. 1 suggests that the slope of the log-linearTDE-TFFF calibration curve can be used to find the a value for a polymer ina particular solvent system. Since the slope = liar, the a value is easily calculated, asindicated later in this paper. This a value is related to the well-known Mark-Houwinka constant. This constant is, in turn, related to polymer intrinsic viscosity by theexpression 15
[11] = KMa (3)

380 J. J. KIRKLAND, L. S. BOONE, W. W. YAU
where ['1] is the polymer intrinsic viscosity in a particular solvent, K is a constant for thesystem, M is the polymer molecular weight, and a is the Mark-Houwink constantdescribing polymer conformation15 . Now,
(4)
and
(5)
where, Rg is the radius of gyration of the polymer molecule in the solvent. Because ofthese correlations,
D ~ IjRg~ M-[(1 +a)/3j
and
It can be calculated that
a = [(1 + a)j3]
and
a = (3a - 1)
(6)
(7)
(8a)
(8b)
where, D is the familiar solute-solvent diffusion coefficient, and the constant b isproportional to Ij'1solvenl' Therefore, the well-recognized Mark-Houwink a constantdirectly relates to the a value of eqns. 1 and 2. The a value also can be used to describethe conformational characteristics of a polymer molecule in a particular solvent.
RESULTS AND DISCUSSION
Effect ofpolymer typePrevious studies show that retention in TFFF varies with both polymer type and
the solvent used in the separation 1,2,6,16. With TDE-TFFF this effect is shown by thesomewhat constant slopes of the log-linear calibration plots for different random-coilpolymers and for different organic solvents. However, the intercept of the calibrationplots can vary5,6, 16. Fig. 1 illustrates these effects for four different sets of polymerstandards fractionated with toluene as the mobile phase. All calibration curves werelinear with essentially the same slopes. The same general effect occurs for the samepolymer fractionated in different solvents, as discussed below.
Effect of carrier solvent typeWe initially proposed that solvent effects on polymer solubility might be

RETENTION EFFECTS IN THERMAL FFF 381
1 000000
...o:;~ 100000-0~
PolystyrenePMt.lA---~---
Poly(isoprene)·······e··..··Poly(THF)--11>-
80702010 000 L-~....L..~_L...-~....L..~_L...-~....L..~_L...-~....L..---J
10 30 40 50 60
Retention TIme, min
Fig. I. TDE-TFFF calibration plots for several polymers. Carrier, toluene; flow-rate, 0.15 ml/min; channel,132 11m; Initial hot block temperature, 90°C; cold block temperature, 20°C; exponential time delay/constant,r = 25.0 min; sample, 50 or 100 III of I mg/ml in carrier solvent; PMMA = poly(methyl methacrylate);poly(THF) = poly(tetrahydrofuran).
a central feature of TFFF retention phenomena. Our approach in defining thissupposition was to develop a data base for polymer-solvent systems, in the hope thatkey elements regarding TFFF retention and thermal diffusion coefficients might berevealed. Fig. 2 illustrates the effect of solvent type on retention for polystyrenestandards fractionated with a variety of solvents. Again, the slopes of the TDE-TFFFcalibration plots are similar, suggesting approximate constancy of polymer conformation in these solvents. The greatest difference in retention was between toluene andchloroform, with the former showing the highest retention of these solvents. Fig.3 shows similar data developed for the more polar polymer, poly(methyl methacrylate)(PMMA). For this system, greatest retention was in toluene, least in N,N'-dimethylformamide (DMF). The slope of the TDE-TFFF calibration plot appears somewhatdependent on the type of polymer and solvent. The slope also is characterized by thevalue of rx from eqn. I, as discussed later.
1 000000
""..c:0''iii~...0:;u 100000"-0~
TolueneP'= 2.4-Dioxanep'= 4.8.._~---
OMFp'= 6.0......·e......
DichlororethaneP'= 3.5--11>-
ChloroformP'= 4.1-'
20 30 40 50 60
Retention TIme, min
70 80
Fig. 2. Effect of carrier solvent on polystyrene calibration plots, Solute, polystyrene; other conditions as inFig. I; DMF = N,N'-dimethylformamide.

382 1. J. KIRKLAND, L. S. BOONE, W. W. YAU
1 000000...J:
'"'ijj~l-e"3u 100000Q)
(5:::li
r---------------------, TolueneP'·2.4
-+-DioxaneP'·4.8---0---
OlAFP'= 6.0····B····
20
Fig. 3. Effect of carrier solvent on poly(methyl methacrylate) calibration plots. Solute, poly(methylmethacrylate standards); other conditions as in Fig. I.
What is the retention change that occurs when a polymer is dissolved in solventsof highly different characteristics? The answer to this question depends on theparticular solvent and the polymer of interest. Still, insight can be gained by observingthe retention characteristics of a polymer that is soluble in both organic and aqueoussystems. We have previously shown that retention occurs for certain water-solublepolymers, permitting their characterization by TFFF 7
. For example, poly(ethyleneoxide) shows TFFF retention in both organic and aqueous media. This polymerprovides an interesting test case for studying retention changes as a function of mobilephase effects. Fig. 4 shows the TDE-TFFF calibration plots for poly(ethyleneoxide)standards in water and chloroform. In this instance. similar calibration plots occur in
No polystyrene sulf.in 5 m'" sod.sulfate
----0---Poly(othylonooxido.)
in chloroform......{3....
r-------------------, Poly(othylonooxido.)in waterCD,'
000 000 ,,6/ ..1::1"... /,'6 ..··0J:
'"'ijj~ (IiI- "e 100 000 ,8'"3uQ)
(5:::li
10 000
10 20 30 40 50 60 70 BO 90Retention Time, min
Fig. 4. Comparison of calibration plots for aqueous- and organic-soluble polymers. Poly(ethyleneoxide)standards: in water: 254 Ilm channel; flow-rate, 0.30 ml(min; 25 Ill, 2 mg(ml each; in chloroform; 136 Ilmchannel; flow-rate, 0.15 ml(min; 50 Ill, I mg/ml each; sodium polystyrene sulfonate standards: 254 Ilmchannel; flow-rate, 0.30 ml(min; 25 Ill, ] mg(ml each in 5 mM Tris-sodium sulfate, pH 7.5. Other conditionsas in Fig. I.

RETENTION EFFECTS IN THERMAL FFF 383
both solvents; retention also is similar in the very different solvents, water andchloroform.
However, strikingly different polymer retention differences occur for otherwater-soluble polymers. For example, sodium polystyrene sulfonate exhibits unusualretention characteristics in a very dilute salt solution7
. The steep calibration curvefound for this ionic polymer (Fig. 4), whose conformation should be rodlike in lowionic-strength media l
7, is decidedly uncharacteristic, as discussed below.Data in this report and elsewhere9.18 support the conten tion that the mass of the
solute and its normal diffusion characteristics primarily govern the MW dependencyofTFFF retention. An MW increase decreases the diffusion coefficient and increasesretention because normal diffusion cannot overcome the force pushing molecules tothe accumulation wall. The result is that larger molecules remain in slower flowstreams near the wall and elute later. One can speculate that, for this effect to occur, theforce created by thermal diffusion to push components to the accumulation wall mustbe largely independent of solute mass (see also refs. 9, 10 and 18).
On the other hand, the data for sodium polystyrene sulfonate in Fig. 4 suggestthat this picture is not so simple for some systems. At the ionic strength used, thiscompound extends to a rod-like conformation, with a resulting smaller diffusioncoefficient than for non-ionic, random-coil polymers (e.g., poly(ethyleneoxide) of thesame MW in organic solvents. Based on this, one would expect that the poorerdiffusion of the extended polymer would result in greater retention, not less retention,as in Fig. 4 (also, see discussion below). Clearly, the mechanism ofTFFF retention iscomplex for some systems and not satisfactorily understood.
Effect of solvent strengthThe variability of polymer TFFF retention in different solvents previously has
been documented 1,2,6,9. Yet, explanations for the physical reasons for this variabilityare lacking, other than a change in solvent causes a change· in thermal diffusioncoefficientsl,lO,19. Unfortunately, the molecular basis for thermal diffusion still isunknown. We need the means to calculate thermal diffusion coefficients in order topredict TFFF retention for new systems.
Data in Fig. 2 strongly suggest that solvent strength is not the main feature thatcontrols solute retention in TFFF. Solvent strength P' values calculated according toSnyder20 and shown on Fig. 2 show no relationship to retention characteristics. Theweakest solvent, toluene, with a P' value of 2.4 shows highest retention. But, thestrongest solvent, DMF, with a P' value of 6.0, causes intermediate retention.Dichloroethane and chloroform with intermediate P' values of 3.5 and 4.1, respectively, produce similar weaker retention.
The strength (P' values) of mixed "good" and "poor" solvents for the polymeralso do not correlate with TDE-TFFF retention, as illustrated by the data in Fig. 5.Here, plots obtained for three "good" solvents diluted with an equal volume ofheptane, a "poor" solvent, still show the general relationship of Fig. 2 for undilutedsolvents, Mixed dioxane still shows the highest retention, and mixed chloroform thelowest retention, as in Fig. 2.
It appears, therefore, that solvent strength per se does not directly correlate withTFFF retention.

..........
1. 1. KIRKLAND, L. S. BOONE, W. W. YAU
......
.---------------------, 1:1 Dioxone-HeptaneP' - J.O---.jE-
1:1 Dichloroeth-HeptP'_ 1.9---0---
1:1 Chlorolorm-HeplP' = 2.2......E]-....
384
10000000
-oJ.<:
'" 1 000 000'iii~...c"3u
""0 100 000:::;;
.....
10 000 .......__'_~...1-.......J.......__'_~...1-.......J.......--'-~_'_......~....J10 20 JO 40 50 60 70 80 90 100 110
Retention TIme. min
Fig. 5. Effect of carrier solvent strength on retention (different solvent types). Dioxane, dichloroethane,chloroform carrier solvents diluted with heptane. Conditions as in Fig. I, except: polystyrene standards, 25JII, I mg/m!; initial hot block temperature, 90°C; initial cold block temperature, 20D C; final temperature ofboth blocks after programming, 35°C. Solvent strength r values calculated according to Snyder20
E.ffect of solvent viscosityCarrier solvent viscosity has a significant effect on TDE-TFFF retention. Fig.
6 illustrates this for two polystyrene MW standards fractionated in four pure solvents,dioxane (1'/ = 1.2), cyclohexane (1'/ = 0.90), dichloroethane (1'/ = 0.78), and chloroform (1'/ = 0.53). A straightline relationship appears for these systems, with a smallerslope for the plot of the higher-MW polymer. TFFF theory anticipates this trend, sinceretention is dependent on the relative strength of the interaction between the appliedthermal force field and the opposing diffusion of the solute l
. As suggested by eqns.2 and 7, retention time, tR , in TDE-TFFF is proportional to In (lID). Therefore, ascarrier solvent viscosity increases, the diffusion coefficient decreases for the polymer.Molecules with poorer diffusion cannot overcome the thermal force field. Retentionthen increases because polymer molecules are forced closer to the accumulation wall.Slower flow streams intercept molecules close to the accumulation wall so that they
1. 6r---------------------, IIW = 87 000
1.4
n. 1.2u
i-'iiio~ 0.85
0.6
0.4
Solvents in order of increasing viscosity:Chloroform; Oichloroethone; Cyclohexone: Dioxane .-
If:>'/
if'/"/
• 0 ../
.--6///
---+IIW = 515 000
----0-_.
605020O. 2 '--~---I.-~---'--~--'--~--'--~-'
10
Fig. 6. Effect of carrier solvent viscosity on polystyrene retention (different solvent types). Conditions as inFig. 5, with different dilutions with hexane; solutes, 87000 and 515000 MW polystyrene standards.

RETENTION EFFECTS IN THERMAL FFF
1. 4r------------------, Dioxane-Heptane
385
1.2
D..u
i- 0.8'OJo~ 0.6:>
0.4
0.2
*;;;'%__---..;,-0.------
1.5 2.5 3
--ofo-Dichloroethane-Hepl
---0--'Chloroform -Heptane
Fig. 7. Effect of solvent viscosity on band width. Solute, 87000 MW polystyrene standard; sigma values =
band standard deviation; conditions as in Fig. 5.
elute later. These results strongly suggest that thermal diffusion is not viscositydependent, and that viscosity only affects conventional diffusion, which, in turn,strongly influences TFFF retention.
Note for the data in Fig. 5 that we used a "dual-mode" form of exponentialtemperature programming which was slightly different from previous experiments. Toobtain these data the initial L1 Twas 70°C, as usual, with the initi;i\ hot and cold blocktemperatures of 90 and 20°C, respectively. However, the cold block temperature wasnot held constant during the experiments. Using appropriate computer softw~re, thetemperature ofboth the hot and cold blocks was programmed to a final temperature of35°C (hot block temperature decreased, cold block temperature increased). In thismanner, the L1 T again was exponentially decreased with the desired T value.
The results obtained with "dual-mode" exponential time delay/decay programming are similar to those of the traditional mode of holding the cold blocktemperature constant. But, sometimes there may be a practical advantage indual-mode programming, since demands on precise temperature control are relaxedsomewhat.in experiments with small T values (fast temperature decrease).
The viscosity of the carrier solvent also affects the standard deviation (width) ofthe solute peak, as might be predicted21
. Fig. 7 shows that the peak width (in sigmavalues, min, where sigma is the standard deviation of the TDE-TFFF band) increaseswith increasing viscosity. This effect is because of poorer diffusion and increasedresistance to mass transfer. Least change in sigma values occurs with the chloroformheptane mixtures, since the viscosities of these two solvents are similar.
Effect ofpolymer solubilityAll the solvents used to obtain the data in Fig. 2 are "good" solvents for
polystyrene22• This leads to the question: Does the level of polymer solubility in the
carrier solvent influence thermal diffusion and resultant TFFF retention? In anattempt to answer this question, we measured TDE-TFFF retention for polystyrenewith "good" carrier solvents mixed with varying amounts of heptane, a "poor" solvent(actually, a non-solvent for polystyrene). Fig. 8 shows retention results from mixingheptane separately with dioxane. Increasing the concentration of the heptane diluent

386 J. J. KIRKLAND, L. S. BOONE, W. W. YAU
10000000.-------------------,
...
.s::
.'" 1 000000
~...C:;u
"~ tOO 000
tOOX DioxaneP' a 4.e----¥-
75llllioxone-2511HeplP' - 3.7---0---
60XOioxane-4QXHept.P' - 3.0......g......
50XOioxone-50XHept.P' ~ 2.5--~-
10000 L.-....-'-~-'---...........~-'-~~o-J.~-'-~ ..........--'---'--o.J10 20 30 40 50 60 70 eo 90 100 ltO
Retention TIme, min
Fig. 8. Effect of solvent composition on retention. Solutes, polystyrene standards; dioxane diluted withheptane; conditions as in Fig. I.
significantly increased retention. But, the slopes of the calibration curves remainedessentially constant with increasing heptane content (potential decrease in polymersolubility).
Fig. 9 illustrates the increase in retention by diluting several "good" solventswith a "poor" solvent. Significant increases in polymer retention time occur as thevolume fraction of heptane increases. Solubility of the polymer in the mixed solventultimately limits this effect. In the systems of Fig. 9, volume fractions of heptaneexceeding about 0.5 precipitated the polymer and prevented TFFF characterization.
We believe that the results in Figs. 8 and 9 might be explained by changes in thethermal diffusion of the polymer, rather than by solvent power effects on molecularsize and the normal diffusion coefficient. The reasoning is that the level of retentionchanges seen in Figs. 8 and 9 are much more than could be anticipated by changes inpolymer diffusion due to solvation conformational changes. Increased diffusion ispredicted for a decrease in polymer hydrodynamic radius due to less solvation
...c:~o
III
'0ooP 0.8'0c:o~ 0.6c
G::
"~ 0.4~
Dioxane-Heptane
-0-Oichloroethone- Hepl
----0---Chloroform - Heptane
10 20 30 40 50 60Retention TIme. min
Fig. 9. Increased retention with higher "poor" solvent concentrations. Dioxane, dichloroethane andchloroform carrier solvents diluted with heptane; solute, 87 000 MW polystyrene standard; conditions as inFig. 1.

RETENTION EFFECTS IN THERMAL FFF 387
resulting from diluting "good" solvents with a "poor" solvent. Such an increase indiffusion would reduce retention and, therefore, would not account for the retentionincreases observed in experiments with higher "poor" solvent concentrations.
The results from above study may not significantly contribute to our quantitative understanding of thermal diffusion. However, they do furnish useful guidelines forincreasing the scope ofTFFF applicability for solving real problems in determining themolecular weight distribution of polymers. For example, the data of Figs. 8 and9 suggest that a significant increase in polymer retention occurs by using mobile phasesthat result in very high thermal diffusion, here, by diluting "good" solvents with"poor" solvents for the polymer. This is a practical approach when additionalretention is needed, especially if the Va channel "dead" volume peak interferes withlow-MW components. Fig. 10 shows the significantly increased retention afforded bythis technique for a mixture of polystyrene standards. Note the significant increase inresolution between the channel dead volume Va peak and the first-eluting 87 000 MWpolystyrene standard peak, as heptane dilutes the carrier.
Effect of temperature difference, L1 TMaintaining a constant temperature difference L1 Tbetween the channel walls by
varying the temperature level affects TFFF retention, as previously noted11. Fig. I Idemonstrates this effect for an 87 000 MW polystyrene standard fractionated incyclohexane with a L1 T of 30 and 40°C. Here, the polymer is more strongly retained atthe lowest temperature range with the hot block at 50 and 60oe, respectively, and thecold block at 200 e (Fig. lla and e). At the highest temperature levels (Fig. lId and h),retention slightly decreases. The tailing, broad bands seen in Fig. lla and e apparentlyare associated with poor solubility of polystyrene in cyclohexane at lower temperatures.
Correlation of retention with certain physical propertiesLimited attempts to correlate TDE-TFFF retention with four pure carrier
solvents (toluene, dichloroethane, dioxane and cyclohexane) with other physicalproperties produce no meaningful results. Fig. 12 shows that TDE-TFFF retentionfailed to correlate with carrier solvent thermal conductivity, heat capacity, surface
87000 MW a
UJVIZ0Q.VIUJa::a::
Ab
~
L0UJ
~I-UJQ
0 24 48 72 96RETENTION TIME. MIN
Fig. 10. Retention increase by diluting "good" carrier solvent with "poor" solvent. (a) 100% chloroformcarrier; (b) chloroform-heptane (50:50) carrier; polystyrene standards; conditions as in Fig. 1.
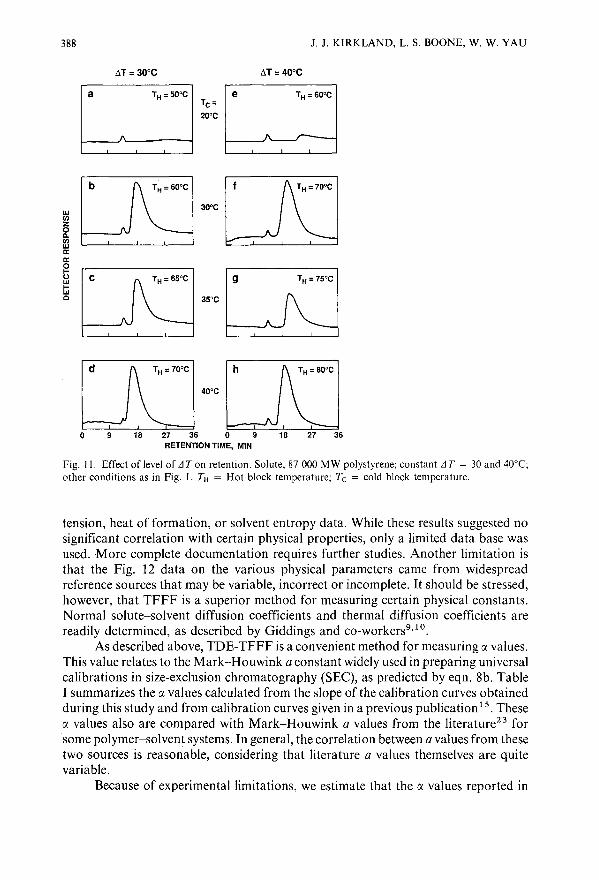
388 J. J. KIRKLAND, L. S. BOONE, W. W. YAU
"'T =30°C "'T =40°C
a eTC=20'C
b
30'Cwrnz00..rnwII:II:
fl0 c 9 TH=75'Cw...wc 35'C
o
d
9
h
40'C
18 27 36 0 9RETENTION TIME, MIN
Fig. II. Effect of level of Ll T on retention. Solute, 87 000 MW polystyrene; constant Ll T = 30 and 40°C;other conditions as in Fig. I. Til = Hot block temperature; Tc = cold block temperature.
tension, heat of formation, or solvent entropy data. While these results suggested nosignificant correlation with certain physical properties, only a limited data base wasused. More complete documentation requires further studies. Another limitation isthat the Fig. 12 data on the various physical parameters came from widespreadreference sources that may be variable, incorrect or incomplete. It should be stressed,however, that TFFF is a superior method for measuring certain physical constants.Normal solute-solvent diffusion coefficients and thermal diffusion coefficients arereadily determined, as described by Giddings and co-workers9
,lO.
As described above, TDE-TFFF is a convenient method for measuring IX values.This value relates to the Mark-Houwink a constant widely used in preparing universalcalibrations in size-exclusion chromatography (SEC), as predicted by eqn. 8b. TableI summarizes the IX values calculated from the slope of the calibration curves obtainedduring this study and from calibration curves given in a previous publication 1
5. TheseIX values also are compared with Mark-Houwink a values from the literature23 forsome polymer-solvent systems. In general, the correlation between a values from thesetwo sources is reasonable, considering that literature a values themselves are quitevariable.
Because of experimental limitations, we estimate that the IX values reported in

RETENTION EFFECTS IN THERMAL FFF 389
THERMAL CONDUCTIVITY HEAT OF FORMATION1.6,---------------,
~1.4u"-;:E 1.2
,,I
II
i{ "I \. f
I ~
d
-40(;E
'""-
~ -30
~/ ", \
d "f:!,.
40,---------------,SURFACE TENSION HEAT CAPACITY
,r--./,
//
/
o.df-20
40
'"(;E
'" 30"-
"8
"III
I
q "'tr AJ§"-V> 30
~"0
20 L-..L..--'------'---'--'--'----'------L-----'------'
ENTROPY80,---------------,
290':----'--:2:':-0----'-----::'c30
:-'----J40L-'--:5:':.0--'---'60
Retention Time, minutes
60
~, \, \/ \
n ' \.....' \
'0 "\\.•
20 30 40 50Retention Time. minutes
40
30L-..L..--'------'---'---'--'----'------L-----'------'10
~ 70oE'" 60.."0
::: 50ou
Fig. 12. Effect of physical parameters of carrier solvents on retention. Conditions as in Fig. 5; 0 =
chloroform; 0 = dichloroethane; /::, = cyclohexane;. = dioxane; physical data obtained from literaturesources, based on 20°C, where appropriate.
Table I probably have a precision of about 0.08 (20) for all the polymers studied.(Variations are significantly less for some polymers, particularly those with narrowmolecular weight distributions.) Therefore, the precision for calculated a values by thisapproach is three-fold poorer, or no better than about 0.24, since a is proportional to3a (eqn. 8b). This level of experimental error makes it difficult to recognize slightchanges in the slope of Fig. 8 plots that may result from polymer conformationalchanges by diluting a "good" solvent with a "poor" solvent.
The exception to correlation of the a values are data for sodium polystyrenesulfonate at the bottom of Table I. The near zero value calculated by TDE-TFFF fora is completely erroneous. This peculiar result is in keeping with the curious, very steepcalibration curve for this polymer in Fig. 4. The rod-like structure for this polymer inlow ionic-strength aqueous solution would be expected to produce a plot with a slopeless than for poly(ethyleneoxide) (Fig. 4) in an aqueous solvent. Rod-like moleculesshould have a less-steep calibration plot because of the expected strong dependence ofthe diffusion coefficient on molecular weight. The data in Fig. 4 show just the oppositeeffect. The sodium polystyrene sulfonate plot is steeper, rather than less steep, than thecalibration plot for a random coil molecule. Clearly, TFFF retention in aqueous mediasometimes does not follow the same pattern as in organic solvents. This result suggests

390 J.1. KIRKLAND, L. S. BOONE, W. W. YAU
TABLE I
COMPARISON OF TDE-TFFF IY. VALUES WITH MARK-HOUWINK CONSTANT a VALUES
Polymer Solvent Measured Calculated LiteratureIY. a value" a valueb
Polystyrene Toluene 0.58 0.73 0.79DMF 0.59 0.76Dioxane 0.56, 0.57 0.67, 0.72 0.69Dioxane-heptane (75:25) 0.59 0.77Dioxane-heptane (60:40) 0.62 0.86Dioxane-heptane (50:50) 0.59 0.76Dichloroethane 0.54 0.63 0.66Dichloroethane-heptane (75:25) 0.59 0.76Dichloroethane-heptane (50: 50) 0.60 0.80Chloroform 0.55 0.64 0.76Chloroform-heptane (75:25) 0.62 0.86Chloroform-heptane (50:50) 0.60 0.80
Poly(methyl methacrylate) Toluene 0.62, 0.62 0.86, 0.86 0.73Dioxane 0.55 0.66DMF 0.58 0.75
Polyisoprene Toluene 0.62, 0.54 0.85, 0.61 0.77Cyclohexane 0.61 0.82 0.70
Poly(tetrahydrofuran) Toluene 0.54 0.63 0.78Poly(ethyleneoxide) Chloroform 0.58 0.74 0.50
Water 0.70 1.10 0.78Sodium polystyrene 5 mM Na2S04 0.33 0('1) 0.93
sulfonate
" From eqn. 8.b From ref. 19.
that a different retention TFFF mechanism may dominate for particular polymers inaqueous systems.
Universal calibration curve for TFFFThe plots of Figs. 1-3 conclusively show that the intercept of TDE-TFFF log
MW vs. retention time calibration plots vary with polymer and with solvent. This effectis also characteristic of SEC plots of log MW vs. retention volume, when polymer typeor solvent varies. Similarly, different plots occur with log [11] (intrinsic viscosity) vs.retention volume or retention time plots, respectively, for SEC and TDE-TFFF, asillustrated for the latter in Fig. 13. However, it is well-known in SEC that a plot of log([11] . M) vs. retention volume produces a universal calibration plot that is the same forall polymers and solvents16
. This is not so in TDE-TFFF, as illustrated by the data inFig. 14. Changes in polymer type and solvent produce significant changes in theintercepts of the calibration plots. This effect largely shows the change in polymerthermal diffusion coefficients. Therefore, the consequences of thermal diffusion arenot normalized for the polymer hydrodynamic volume by using ([11] . M) as a plottingparameter.
One means of obtaining an equivalent universal calibration in TDE-TFFF is toinclude the normal polymer diffusion coefficient and the polymer thermal diffusion

RETENTION EFFECTS IN THERMAL FFF 391
Polystyrenein Toluene-+--
Polystyrene
0.5 in Dioxane._-..--_.
~ PMMA'iii in Toluene0 ---......-u., 0 PMMA5
in Dioxaneu ---.......'iiic:s -0.5E010-'
20 30 40 50 60 70 80
Retention TIme. min.
Fig. 13. Log intrinsic viscosity vs. retention time calibration plots. Solutes, narrow polystyrene andpoly(methyl methacrylate) standards; conditions as in Fig. I.
coefficient in the calibration relationship. Fig. 15 shows that this can be done byplotting polymer retention time vs. log (So' M), where the Soret coefficienez So isDT / D (ref. 24). Ref. 10 supplied data for calculating the Soret coefficients in Fig. 15.Unfortunately, such data for polymers are not generally available, so that theapproach of Fig. 15 now has limited practical utility.
4 -
7
:;:::::;
'~6ou.,5u'iii
:5 5E0'o-'
,----------------, Polystyrenein Toluene--Polystyrenein Dioxane_.--.---
PMMAin Toluene--PMMAin Dioxane----...---
20 30 40 50 60 70 80·
Retention TIme. min
Fig. 14. Log ([1/] . M) vs. retention time calibration plots. Conditions as in Fig. 13.

392 J. J. KIRKLAND, L. S. BOONE, W. W. YAU
0.5,--------------, PolystyreneIn Toluene
o
0
0'III
*3 -0.5~
'"0-'
-1
•
..". "
~
"•..
o
"•
•Polystyrenein Dioxane.•
PMMAin Toluene
"PMMA
in Dioxane..
20 30 40 50 60 70 BORetention TIme, min.
Fig. 15. Universal calibration plot for TDE-TFFF. Conditions as in Fig. 13; So = Soret coeflicient, DIDT •
CONCLUSIONS
While thermal diffusion significantly influences TFFF retention, the mechanismfor this effect is not well understood. Predicting TFFF retention is generally notpossible for different polymer types in various solvents. We have studied TFFFretention over a range of experimental conditions, using the time-delay exponentialdecay operating mode. Here, after an initial period of constant temperature differencebetween the two faces of the channel, the temperature decreases exponentially duringthe separation. A plot of log molecular weight vs. polymer retention time showsa linear relationship that provides a convenient way to organize and interpret TFFFretention data. Polymer and carrier solvent types strongly influence TFFF retention.Retention also appears directly proportional to solvent viscosity. Diluting "good"polymer solvents with certain "poor" solvents significantly increases polymerretention, presumably because of large changes in polymer thermal diffusioncoefficients. No obvious correlation exists between TFFF retention and carrier solventthermal conductivity, heat capacity, heat of formation, surface tension and solvententropy. These studies still do not allow a quantitative prediction ofTFFF retentionfor unknown systems, but they do provide a basis for conducting more effective TFFFexperiments. For example, diluting a "good" solvent with a "poor" solvent providesa convenient way of increasing the retention of low molecular weight components.This is especially useful in resolving lightly-retained components from the channeldead volume Va peak.
ACKNOWLEDGEMENTS
We thank V. E. Burton and C. H. Dilks, Jr. for their skillful assistance in thisstudy.

RETENTION EFFECTS IN THERMAL FFF
REFERENCES
393
I M. N. Myers, K. D. Caldwell and J. C. Giddings, Sep. Sci., 9 (1974) 47.2 J. C. Giddings, M. N. Myers and J. Janca, J. Chromatogr., 186 (1979) 37.3 S. L. Brimhall, M. N. Myers, K. D. Caldwell and J. C. Giddings, Sep. Sci. Technol., 16 (1981) 671.4 Y. S. Gao, K. D. Caldwell, M. N. Myers and J. C. Giddings, Macromolecules, 18 (1985) 1272.5 J. J. Kirkland and W. W. Yau, Macromolecules, 18 (1985) 2305.6 J. J. Kirkland, S. W. Rementer and W. W. Yau, Anal. Chem., 60 (1988) 610.7 J. J. Kirkland and W. W. Yau, J. Chromatogr., 353 (1986) 95.8 1. 1. Kirkland and R. M. McCormick, Chromatographia, 24 (1987) 58.9 M. E. Schimpf and 1. C. Giddings, Macromolecules, 20 (1987) 1561.
10 J. C. Giddings, K. D. Caldwell and M. N. Myers, Macromolecules, 9 (1976) 106.II S. T. Brimhall, M. N. Myers, C. D. Caldwell and 1. C. Giddings, J. Polym. Sci., Polym. Phys. Ed., 23
(1985) 2443.12 J. C. Giddings, L. K. Smith and M. N. Myers, Anal. Chem., 48 (1976) 1587.13 W. W. Yau and J. J. Kirkland, Sep. Sci. Technol., 16 (1981) 577.14 J. J. Kirkland and W. W. Yau, U.S. Pat., 4 285 810 (Aug. 25, 1981).15 W. W. Yau, J. J. Kirkland and D. D. Bly, Modern Size-Exclusion Liquid Chromatography, Wiley, New
York, 1979, Ch. 9.16 J. J. Kirkland and W. W. Yau, J. Chromatogr., 499 (1990) 655.17 H. Morawetz, Macromolecules in Solution, Wiley, New York, 2nd ed., 1975, p. 358.18 J. J. Gunderson and J. C. Giddings, Macromolecules, 19 (1986) 2618.19 J. C. Giddings, M. E. Hovingh and G. Thompson, J. Phys. Chem., 74 (1970) 4291.20 L. R. Snyder, J. Chromatogr. Sci., 16 (1978) 223.21 L. K. Smith, M. N. Myers and J. C. Giddings, Anal. Chem., 49 (1977) 1750.22 J. Brandrup and E. H. Immergut (Editors), Polymer Handbook, Wiley, New York, 2nd ed., 1975, p~
IV-6.23 A. H. Emery, in M. J. R. Cantow (Editor), Polymer Fractionation, Academic Press, New York, 1967.24 1. J. Kirkland and W. W. Yau, 9th International Symposium on Column Liquid Chromatography,
Edinburgh, U.K., July 1-5, 1985, poster.


Journal o/Chromatography, 5[7 (1990) 395-403Elsevier Science Publishers B.Y., Amsterdam
CHROMSYMP. [969
Sedimentation field-flow fractionation for pigment qualityassessment
L. KOCH', T. KOCH" and H. M. WIDMER
Central Analytical Department, CIBA-GEIGY Ltd., CH-4002 Basle (Switzerland)
ABSTRACT
Sedimentation field-flow fractionation is presented as an alternative method forpigment particle size characterization for the purpose of industrial quality control.The technique is demonstrated for three pigments of variously broad particle sizedistributions having average particle diameters ranging from ca. 0.1 to 0.6 /lm. Theanalysis times compared favourably with those of disc centrifugation, and the reproducibility of the shape and mean particle size distributions were sufficient to obtain areliable quality standard "fingerprint" with which samples of unknown quality couldbe compared.
INTRODUCTION
Pigments are always virtually insoluble materials that exist in the form of verysmall crystals that are incorporated into a colourless binding agent in the solid state.Whereas the properties of dyestuffs (soluble colorants) are determined by theirmolecular structure and by their interaction with the substrate, the properties ofpigments are determined to a large extent by their physical characteristics. Throughcontrolled changes in these physical characteristics, especially the particle sizedistribution, the properties of pigments can be optimized for certain applications orshifted in a desired direction. In certain instances, these physical properties can havesuch a significant impact on the final properties of the pigment that a certain pigmentmust be preferentially selected for use in an application where the chemically identicalpigment in another physical form led to problems in processing or other unsatisfactoryapplication results in the coloured medium.
As pigments are not soluble compounds but rather dispersed, microscopicallysmall crystals, the particle size influences all application properties, albeit to variousextents. Hue and strength, important properties of both pigments and dyestuffs, areprimarily a function of the absorption wavelength region and the molar absorptioncoefficient. With pigments, however, the particle size also plays a significant role. After
" Present address: Heinz Schlegel Ltd., CH-43[3 Mohlin, Switzerland.
0021-9673/90/$03.50 © [990 Elsevier Science Publishers B.Y.
396 L. KOCH, T. KOCH, H. M. WIDMER
synthesis, the pigment aggregate must be reduced in size through milling. Down toa certain level, the smaller are the pigment particles, the stronger is the colour of thepigment. In addition, the particulate structure of the pigment gives rise to lightscattering which is responsible for the extremely important application property ofhiding power, i.e., the ability to obliterate from view a background substrate. In manyinstances, unattractive substrates are covered through painting or lacquering, whichalso acts to provide protection against corrosion or degradation. The more stronglythe non-absorbed light is scattered, the better is the covering power of the pigment.There is a need for pigments possessing either high or low hiding power, depending ontheir intended use. For example, pigment systems with high hiding power are requiredfor heavy-duty industrial paints for machinery, whereas a transparent packaging filmnecessitates a low hiding power. The hiding power can be influenced through thechoice of the pigment, the particle size distribution and additives.
Unfortunately, physical or physico-chemical measurements on dry pigmentpowder usually provide no real relevant conclusions on the final application propertiesof the pigment system. Untreated pigment powder is always in an aggregated state,and these aggregates and agglomerates must undergo a multi-step process ofdispersion, through which they are wetted, reduced in size, dispersed and stabilized, inorder to attain and maintain a sufficiently fine distribution. Almost all importantproperties of pigments or pigmented systems are, in fact dependent on how successfulthis dispersing process is. The optimum dispersed state of a pigment distribution isobtained when all primary particles, i.e., either pigment aggregates or crystals ascolloidal stabilized single particles, are homogeneously distributed. A series ofdifferent methods are suitable for the determination of the dispersibility as a functionof various parameters, and most of these methods accomplish this through evaluationof the particle size distribution. These methods commonly include electron microscopy, various light-scattering techniques rheological measurements, Joyce-Loeblphotosedimentometry, sedigraphic methods and Coulter Counter measurements. Ouraim is to develop and utilize field-flow fractionation (FFF) methods and relatedtechniques, i.e., split-flow lateral transport thin (SPLITT)! separation cells, to helpsolve industrial particle sizing problems in situations where more conventionaltechniques have not yielded satisfactory results. When the pigment is most effectivelyanalysed in a specific medium, or when the particle size distribution is characterized bymulti-modality or shows non-Gaussian behaviour, FFF is likely to be the analyticalmethod ofchoice. In this paper we propose and, using several examples from practice,demonstrate the use of sedimentation field-flow fractionation for the determination ofparticle size distributions for the purpose of pigment quality assessment in industry.
Sedimentation field-flow fractionation (SdFFF) has emerged as a versatiletechnique for the characterization ofboth simple and complex particle populations2- s.A particulate sample is entrained in a stream of liquid within the flat, circular channelof a specially designed, flow-through centrifuge rotor. The spinning of the centrifugeproduces a field, oriented perpendicular to the direction of longitudinal channel flow,which causes sample particles denser than the mobile carrier to sediment radiallyoutward towards the outer channel wall. Larger, or denser, particles interact morestrongly with this applied field than the smaller, or less dense, particles in the samplemixture. Opposing this accumulation at the outer wall is the diffusion of the particlestowards the centre of the flow channel. The combination of these two phenomena

SdFFF OF PIGMENTS 397
culminates in the formation of thin steady-state concentration layers, or particle"clouds", which lie parallel to the accumulation wall, and which exhibit a characteristic degree of compression known as the steady-state layer thickness. The extent towhich this layer protrudes into the parabolic flow streamlines on initiation of flowdown the channel determines the average downstream particle velocity and thus theresulting elution sequence. The elution times can therefore be related by exact theory toparticle size, mass and density6.
However, although this separation principle has been used successfully toanalyse a variety of submicron-sized particles relatively very few of the numerous FFFpublications have dealt with its use in industrial applications. Our aim is to make use ofFFF or related methods where other, more conventional techniques do not yieldsatisfactory results, e.g., for multi-modal particle size distributions or in cases wherea particular dispersing agent is required to ensure retention of certain particleproperties.
Although Joyce-Loebl photosedimentometry (disc centrifugation), CoulterCounter and light-scattering methods are frequently used for pigment characterization, they all exibit certain intrinsic limitations which restrict their applicability. Byrequiring the use of density modifiers in the spin fluids, disc centrifugation cannotprovide an analysis of the particles in their "as marketed" state. In contrast, byallowing an almost unrestricted choice of carrier, field-flow fractionation techniquesare able to maintain the most meaningful environment for the pigment in terms ofapplication properties. In addition, the use of the optimum carrier type greatly reducesthe possibility of inducing additional aggregation and flocculation of the sample. TheCoulter Counter has the disadvantage of not providing a particle size continuum. Thislimits the use of the instrument for quality assurance purposes, for which an accurate"fingerprint" of the sample, i.e., a continuous particle size distribution curve, would bedesirable for comparison with a standard "fingerprint" already on file. Lightscattering is not an elution technique, i.e., it does not separate as it analyses, and henceit cannot provide samples for further analysis by microscopy. This latter possibility canbe extremely useful when, for example, it is necessary to determine whether anomaliesin the particle size distribution are due purely to multi-modalities in size or if theparticle shape is a contributory factor.
EXPERIMENTAL
InstrumentationAll measurements were performed on a DuPont SF3 Model 1000 sedimentation
field-flow fractionator (DuPont Instrument Systems) with a Hewlett Packard9000/217 data-processing system. The initial temperature of the SdFFF system was23°C (room temperature) in all instances. A temperature probe inserted in thecentrifuge served to monitor the temperature of the air around the channel throughoutthe runs.
The various mobile phases were prepared with either Tween 20 (Fluka) orTeepol (Fluka) and doubly distilled water to the specifications given in Table I; 0.01 %sodium azide (Merck) was added to retard bacterial growth. Samples were prepared bydilution in the mobile phase to ca. I% by weight. Immediately before injection into theSdFFF channel, all samples were sonicated for precisely I min using a Branson Model

398 L. KOCH, T. KOCH, H. M. WIDMER
250 Sonifier, on high power, fitted with a micro-tip for use directly within the sampletubes.
For the evaluation of the fractogram in terms of actual particle diameters it isessential to know the density of both the sample and the carrier very accurately. Mobilephase densities were determined on a Paar Model DMA-60/602 densitometer, andfound to be 1.00 glml in all instances. The densities of solid samples were preciselymeasured in the Physics Department at CIBA-GEIGY. Pigment A, an organic DPP(diketopyrrolopyrrole) colorant, was thereby found to possess a density of 1.55 g/ml.Pigments Band C, both azo colorants, each possessed a density of 1.3 g/ml. Whenanalysing pigments, it is particularly important that the solid density be determined onthe same crystal modification as that to be analysed by FFF. As the purpose of thisstudy was to demonstrate "fingerprinting" of the particle size distribution ofa particular pigment type by SdFFF, exact values for the particle and carrier densitiesare not required. They were necessary later, however, to evaluate the instrumentperformance when retention times were in question.
The injection volumes were 50 .ul, and injection was carried out automaticallywith two Rheodyne pneumatically activated injection valves that had been fixed insidethe system to minimize the prechannel dead volume. These valves were connected toa Gilson Model 221 sample changer which controlled the injection procedure, anda Gilson Model 401 diluter, which served to pump the sample very accurately onto thechannel for the relaxation process. The eluate was detected at 254 nm witha Spectroflow Model 783 programmable absorbance detector (Applied Biosystems).
As most of the sample preparation was not performed within our laboratory,e.g., the dispersion step was done in the plant, the concentrations varied slightly fromsample to sample. However, the detector response is dependent on both particleconcentration and size ((is a consequence of their light scattering), which necessitatesa correction of the response if a true concentration distribution is to be obtained fromthe fractogram 7. Through moment analysis one may calculate the area under theretained peak, which reflects the total amount of retained particles, and the centre ofthe peak, reflecting the average diameter of retained particles. Future implementationof this in our data collection system will permit accurate computer comparison offractograms.
Fractions for subsequent electron microscopy were collected with a GilsonModel 203 fraction collector.
Operating conditionsTime-delayed, field-decay programming was used in all instances. The proper
functioning of the SdFFF equipment was routinely checked by injection of a mixtureof Seragen Diagnostics standard polystyrene latex sphere particles of known densityand diameter [0.460 ± 0.0048 .um, 0.318 .urn (standard deviation unknown) and 0.204± 0.0020 .um]. The resulting fractograms were evaluated in terms of consistency inposition of the void peak and the particle peak and shape of the particle peak.
All runs for a given pigment type were performed under identical FFF operatingconditions. These conditions are given in Table 1.
The fractogram obtained from all three pigment systems were repeatable andshowed no undue noise or apparent distortion other than that which could beattributed to the properties of the particle populations themselves. The raw data

SdFFF OF PIGMENTS
TABLE I
FFF OPERATING CONDITIONS
399
Pigmentcode
ABC
Initialrpm
60020003000
Relaxation time(min)
101010
Time constant Carrier(= delay time)(min)
8 0.01 % Tween 203 0.01 % Teepol5 0.01 % Teepol
Flow-rate(mllmin)
3.02.02.0
(fractograms) were examined to identify and evaluate the void peak, which contains allparticles and macromolecules small enough to be unaffected by the centrifugal field asthey pass through the channel and the particle peak.
RESULTS AND DISCUSSION
The average particle diameters of the three pigments ranged from ca. 0.1 to 0.6JLm. The shape of the particle size distributions, as previousl)' determined by eitherCoulter Counter or disc centrifugation measurements, also varied. The samples werecrystalline and, while primary particles of pigment A were small, stable aggregates,Band C consisted ofsingle crystals. Thus, any measurement ofpigment A was actuallya measurement of aggregate size. This made the decision to sonicate these samplesbefore running them in the FFF particularly difficult, as it was not our intention todisrupt the particles from their natural states. In fact, SdFFF experiments on pigmentA showed significant reductions in the mean particle size with increasing sonicationtime, leading us to believe that, with extended sonication time, aggregates had beenreduced to an artificially high degree of fineness.
Electron micrographs ofthe three original samples (after I min ofsonication) areshown in Fig. I. Micrographs ofsamples Band C showed that they contained particlesfrom the submicron range up to more than 100 JLm in diameter, and thus spanned theranges of both normal and steric FFF. For these cases, a more meaningful particle sizedetermination would include either an off-line preseparation step (filtration), or anon-line preseparation realized by performing two subsequent runs at differentconditions. The latter strategy permits the analyis of the submicron particles separatelyfrom the particles larger than I JLm. This can be very useful for complex mixtures, andensures that a steric foldback 8
, which distorts the fractograms and limits theirinformation content, is avoided.
By adhering to a fixed set of experimental conditions for each of the threepigments A, Band C, the fractograms become directly· comparable for a rapidevaluation of similarities or differences in the particle size distributions. Our approachwas thus to obtain a reproducible fractogram in which sample components were wellretained, and for which the total run time had been reasonably well optimized, and touse this as a standard fractogram with which others could be compared. Thesestandard fractograms are shown as solid lines in Fig. 2a, band c. The traces denoted bydashed lines in Fig. 2a represent additional samples of pigment A which were drawnfrom the same production line at periodic intervals. Even small differences in meanparticle diameter could be seen by comparing fractograms. Concentration differences,

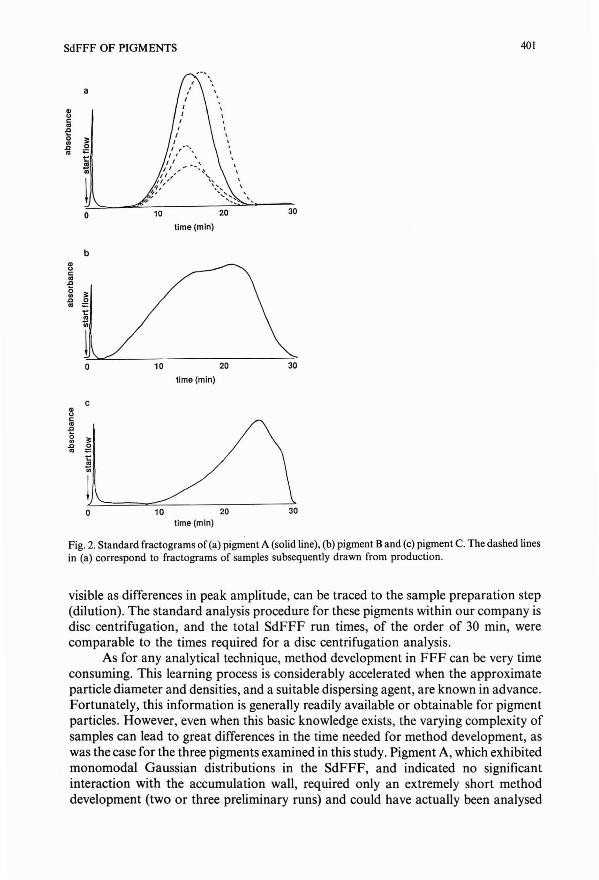
SdFFF OF PIGMENTS 401
a
Gl()c...c(;
~ gt:oS..
o
b
10
lime (min)
20
,,30
Gl()
c..of!o
~ ~t:..iii
o
c
o
10
10
time (min)
20
20time (min)
Fig. 2. Standard fractograms of (a) pig~ent A (solid line), (b) pigment Band (c) pigment C. The dashed linesin (a) correspond to fractograms of samples subsequently drawn from production.
visible as differences in peak amplitude, can be traced to the sample preparation step(dilution). The standard analysis procedure for these pigments within our company isdisc centrifugation, and the total SdFFF run times, of the order of 30 min, werecomparable to the times required for a disc centrifugation analysis.
As for any analytical technique, method development in FFF can be very timeconsuming. This learning process is considerably accelerated when the approximateparticle diameter and densities, and a suitable dispersing agent, are known in advance.Fortunately, this information is generally readily available or obtainable for pigmentparticles. However, even when this basic knowledge exists, the varying complexity ofsamples can lead to great differences in the time needed for method development, aswas the case for the three pigments examined in this study. Pigment A, which exhibitedmonomodal Gaussian distributions in the SdFFF, and indicated no significantinteraction with the accumulation wall, required only an extremely short methoddevelopment (two or three preliminary runs) and could have actually been analysed

...~
402 t. KOCH, T. KOCH, H. M. WIDMER
Fig. 3. Electron micrographs of fractions collected during a SdFFF run of pigment A, (a) at t = 20 min and(b) at 1=30 min.
after the first run. In contrast, samples Band C, with very broad, complexdistributions, required several days of method development before a satisfactory,reproducible fractogram could be obtained. It should be noted that the systemparameters for the last two pigments were not necessarily optimized, but rathera stable, reproducible fractogram was produced which could serve for comparisonwith latter fractograms. Whether the phenomenon leading to the non-Gaussianparticle size distributions is adsorption, steric fold back or multi-modality in particlesizes remains unknown and is not of significant importance to this study. In fact, theshapes of the particle size distributions were in good agreement with those obtained bylight scattering and disc centrifugation. There was, however, some discrepancy in themean particle diameter.
In all instances the particles were considerably under-retained in SFFF. Thismay be a consequence of an incorrect value for the channel void volume. The effect

SdFFF OF PIGMENTS 403
became more pronounced with increasing diameter, culminating in a size discrepancyof up to 30% for particles eluting at the peak maximum. In order to gain an insight intothis discrepancy, we collected fractions of the continuously eluting sample for furtheranalysis by electron microscopy. Fig. 3a shows a fraction collected from sample A att = 20 min and Fig. 3b a fraction collected at t =30 min. While the microscopy clearlyserved to verify the separation, the mean diameters of the particle population weredifficult to assess with microscopy because of the non-spherical nature of the particles.However, careful evaluation of the microscopy data supported the disc centrifugationparticle size data. The cause of the observed under-retention is still being investigated.
The results obtained show that SdFFF, when used as part of a "fingerprinting"strategy, is suitable for the quality assessment of pigments within the particle diameterrange studied. Further developments are necessary to ensure that the excellentreproducibility of the distributions is coupled with reliable particle size data. Carefulstudy is required to locate the cause of the discrepancies between actual andexperimental particle size, likewise exhibited in runs with polystyrene standards.
Because the analysis times were comparable to those for disc centrifugationanalyses, and because field-flow fractionation systems lend themselves to fullyautomated operation with an autoinjector (difficult to implement in a disc centrifugation system), SdFFF shows great promise for unattended, constant use for qualitycontrol purposes in the production plant itself. The realization of this goal would befacilitated by the development ofsimple, inexpensive FFF analysers which monitor theindustrial pigment milling process through periodic, automated analyses and actuallyserve to determine the end-point of the milling process. This would provide aconsiderable advantage over the present method of allowing the milling process toproceed for an extended time to ensure that the particles have definitely reached thedesired size. In addition, the high densities of pigment particles could ideally beexploited with the development of a simple SdFFF system which utilizes onlygravitational force as the applied field. With such a simple system it would be feasibleto couple an analyser to each mill in production.
REFERENCES
I J. C. Giddings, Sep. Sci. Technol., 23 (1987) 119.2 S. M. Mozersky, K. D. Caldwell, S. B. Jones, B. E. Maleeff and R. A. Barford, Anal. Biochem., 172
(1988) 113.3 L. E. Schallinger, E. C. Arner and J. J. Kirkland, Biochim. Biophys. Acta, 966 (1988) 231.4 H. K. Jones, B. N. Barman and J. C. Giddings, J. Chromatogr., 455 (1988) I.5 L. E. Oppenheimer and G. A. Smith, Langmuir, 4 (1988) 144.6 J. C. Giddings, G. Karaiskakis, K. D. Caldwell and M. N. Myers, J. Colloid Interface Sci., 92 (1983) 66.7 F. S. Yang, K. D. Caldwell and J. C. Giddings, J. Colloid Intel/ace Sci., 92 (1983) 81.8 S. Lee and J. C. Giddings, Anal. Chem., 60 (1988) 2328.


Journal oj Chromatography, 517 (1990) 405-421Elsevier Science Publishers B.Y., Amsterdam
CHROMSYMP. 1988
Characterization of polymers by thermal field-flowfractionation
MARTIN E. SCHIMPF
Department oj Chemistry, Boise State University, Boise, [D 83725 (U.S.A.)
ABSTRACT
Thermal field-flow fractionation (ThFFF) is a useful technique for separatingcomplex polymer mixtures. The unique features of ThFFF make it applicable tomany polymers that are difficult to characterize by conventional methods. Advancesin channel design, spearheaded by work at the University of Utah's Field-Flow Fnictionation Research Center, have recently culminated in the introduction of a commercially available instrument. Motivated by this progress, ThFFF is reviewed in thispaper with an emphasis on implementation. Theories governing retention, zone dispersion and optimization are summarized. Procedures for obtaining accurate molecular-weight distributions on polymers are reviewed along with sample handling techniques. Also discussed is the application of ThFFF to studies of thermal diffusion inpolymer solutions. The paper concludes with a discussion of current trends in thefield.
INTRODUCTION
Great strides have been made in the understanding, implementation, andoptimization of thermal field-flow fractionation (ThFFF) since its introduction over20 years ago!. In characterizing polymeric materials, ThFFF benefits from the openwell-defined geometry of the separation channel. Polymer scientists have becomeincreasingly aware of the advantages ofThFFF, catalyzing the recent introduction ofa commercial instrument (FFFractionation, Salt Lake City, UT, U.S.A.).
In ThFFF, a temperature gradient is used to drive polymer components intoslower flow regions near the cold wall (Fig. 1). This process, termed thermal diffusion,is opposed by ordinary (Fickian) diffusion. The resulting distribution of polymerconcentration across the bullet-shaped velocity profile is governed by the balance ofthe two diffusional processes. Like all FFF subtechniques, movement of componentsdown the channel toward the detector is determined by their mean steady-stateposition in the velocity profile.
The unique features of ThFFF give it several advantages over size-exclusionchromatography (SEC). The ThFFF channel is open and lacks a stationary phase.
0021-9673/90/$03.50 © 1990 Elsevier Science Publishers B.Y.

accumulation:o~oooooo .-- wall~~o~ r
'-- low- molecularweight polymer
406
INLET
~
jFLOW PROFILE
I temperature(enlarged) gradient
~J U~';::R :,..,:,... I
hlgh-molecularweight polymer
M. E. SCHIMPF
Fig. I. Illustration of the principles of polymer separation by ThFFF (reprinted from ref. 44 courtesy of ACSPublications).
Thus, the flow profile of the carrier liquid and the dispersion of the sample zone arewel1 characterized. Known equations relate zone retention and dispersion to transportcoefficients of the polymer-carrier liquid system and to experimental parameters.These equations are used to compensate for zone dispersion in obtaining highlyaccurate information on molecular weight distributions (MWDs). The equations arealso used to obtain values of the transport coefficients from retention data.Furthermore, they designate the experimental conditions that optimize individualseparation problems. The unique channel features also provide excel1ent separationreproducibility; in the separation of > 90 polymers in 7 solvents using the sameinstrument, both retention and zone broadening were highly consistent2
-4
• Final1y,retention volume, limited to one column volume in SEC, is theoretically unlimited inThFFF (for practical reasons, however, retention volume is limited to approximately20 channel volumes). This feature offers the ability to separate significantly morecomponents in a single mixture (large peak capacity).
Among the factors that influence retention in ThFFF is the magnitude of theexternal1y applied temperature gradient. This can be varied rapidly and precisely toaccommodate molecular weights from 1000 (ref. 5) to > 20' 106 (ref. 6). By changingthe temperature gradient continuously (programming), polymer mixtures containingcomponents with a wide range in molecular weight can be handled in a single run7
.
While retention is also governed by the molecular weight of the polymer, the additionalinfluence of chemical composition gives ThFFF an added dimension not present inSEC. This is il1ustrated in Fig. 2, which compares the resolving power of ThFFF andSEC on two polymers of similar molecular weight but varying chemical composition.The polymers coelute with SEC but are resolved by ThFFF because of differences inchemical composition.
Final1y, separation in ThFFF is gentle; there is no interfacial transport or strongshear gradients. Thus, ThFFF is an ideal tool for characterizing fragile molecules suchas high-molecular-weight polymers.

ThFFF CHARACTERIZAnON OF POLYMERS 407
Thermal FFF SEC
inj.
PMMA240000and -----.
PS 200000 ""PS200000
I
11'-_'---,'-'_-,- I ! I ! I ! ! ! ! ! ! !
3 0 2 4 6 8 10
(ml ) VOLUME (ml )
Fig. 2. Elution profiles of 2.0 . 105 MW polystyrene (PS) and 2.4' 105 MW poly(methyl methacrylate)(PMMA) by ThFFF and SEC (reprinted from ref. 20 courtesy of Pergamon Press).
This paper reviews the application of ThFFF for characterizing polymers.Additional discussions on the conceptual basis and implementation of FFF andThFFF are contained elsewhere8
-21
.
THEORY
ThFFF theory is well-developed and has been described in a number ofpapers22
-32
. Summarized below are theories relevant to the understanding andimplementation of ThFFF.
RetentionThe opposing forces of thermal and ordinary diffusion result in an exponential
profile in polymer concentration, with decreasing concentration away from the coldwall (coordinate x). The center of mass of the concentration profile is defined by itsdistance I from the cold wall. For mathematical convenience, parameter I is expressedin the dimensionless form A. = ljw, where w is the channel thickness. Retentionparameter A. is related to the transport coefficients by
(1)
where dTjdx is the temperature gradient across the channel, and D and D T are theordinary and thermal diffusion coefficients, respectively, of the polymer-carrier liquidsystem.
As in chromatography, the extent to which an ana1yte component is retained inFFF can be specified by the "retention ratio" R, defined as
R (2)

408 M. E. SCHIMPF
where VO is the volume of the channel and Vr is the volume ofcarrier liquid required toelute the component. By considering the profiles across the channel of both analytecomponent and carrier-liquid velocity, R can be related to retention parameter A.Values of A, computed from experimental R values, are used to calculate transportcoefficients from eqn. 1. Accurate values of Aare also crucial in establishing the columndispersion function, as discussed below.
For most FFF subtechniques the shape of the velocity profile is parabolic, andthe dependence of R on A is
1R = 6A(coth 2A - 2A) (3)
In ThFFF the temperature gradient and attendant carrier-liquid viscosity changes inthe channel result in a velocity profile that is skewed, with maximum flow shiftedtoward the hot wall. Motivated by the need for accurate Avalues the following relationbetween R and A was derived 28
, accounting for the skewed velocity profile:
R - {- 5 hi (1
Li~l U+l)
Parameters hi are defined as
where
(4)
(5a)
(5b)
(5c)
(5d)
(5e)
and p,arameters hi are defined as
(6)
(7a)
(7b)
(7c)

ThFFF CHARACTERIZATION OF POLYMERS 409
(7d)
Here Te is the cold wall temperature, Ke is the thermal conductivity of the carrier liquidat the cold wall, dK/dTis the rate of change in thermal conductivity with temperature,and
1 dK (,11)2S = ,1T + - ---
Kc dT 2(8)
where ,1 T is the temperature difference between the hot and cold walls. Parameters aD
and at are the linear least-squares-fit parameters that describe the dependence ofcarrier-liquid fluidity, 1/11, on temperature according to
1
11(9)
The relationship between R and A can be significantly altered in accounting for thetemperature dependence of viscosity. Fig. 3 compares the dependence of R onA according to eqn. 4 (for a specific case) with the isoviscous dependence (eqn. 3).
Zone broadeningDispersion of a solute band in FFF and chromatography is characterizd by plate
height H, the variance of the band relative to the distance traveled. The majorcontributions to plate height in ThFFF have been studied in detai129~34. Thedispersion of a monodisperse sample is represented by the channel or columncontribution to plate height He. For a polydisperse polymer, there is in addition tocolumn dispersion, a selective dispersion arising from the tendency of the highermolecular-weight species to migrate behind the lower-molecular-weight species. Thispolydispersity contribution is represented by H p • Thus, the observed plate height is thesum of the two terms
0.2 0.4 0.6 0.8 1.0
A
1.0 r--.,------.--_-----,-r--------'-----~--'-Is-ov-isc-o-us---,
"," - \ Ethylbenzene" Tc =20°C
/ ~T=IOO°CI
II,,,,,
IfI,
I0.2 I
0.6
0.8
R
Fig. 3. Retention ratio R as a function of }, for the isoviscous system (eqn. 3) and ethylbenzene at Tc = 20°Cand IJT = 100°C, according to eqn. 4.

410
H = H p + He
M. E. SCHIMPF
(10)
For narrow MWDs, the polydispersity contribution is approximated by29
H p = LS~(f1 - 1) (11)
where L is the channel length, f1 is the polydispersity, and SM is the mass-basedselectivity, defined as the dependence of retention volume Vr on molecular weightM according to
d logVr
SM = d logM(12)
Zone dispersion in ThFFF is usually dominated by polydispersity (Hp ~ He)because of the open channel geometry and high resolving power inherent to ThFFF.However, column dispersion is significant when characterizing ultra-narrow polymerstandards. Column dispersion is also significant for broad MWDs when highcarrier-liquid flows are used to shorten analysis time. For ThFFF, He is described by
(13)
The first term on the right side of eqn. 13 accounts for broadening due to longitudinaldiffusion. This term generally is negligible because of the slow diffusion ofmacromolecules. The second term on the right is the non-equilibrium (mass transfer)term. This term arises because sublayers of the sample zone are displaced unequally bythe non-uniform vdocity profile. Under appropriate conditions, the non-equilibriumterm dominates column dispersion in ThFFF. The third term on the right accounts fordispersion that occurs while the sample zone is "relaxing" to its steady state profile atthe accumulation wall after injection. During relaxation, the zone is briefly subjectedto a greater than normal range oflongitudinal flow velocities. While this term is usuallynegligible, it can be significant at high carrier-liquid velocities. Relaxation effects canbe avoided by using a stop-flow procedure in which flow is halted during relaxation29
.
The last term in eqn. 13 accounts for the influence of extra-channel volume on plateheight. This unwanted effect can be kept negligible by using minimum lengths ofnarrow-bore tubing between the sample valve and channel head, and between thechannel outlet and detector cell. Large-volume detector cells must also be avoided.
The non-equilibrium contribution to plate height H N is expressed as22
(14)
where <v) is the average carrier-liquid velocity and Xis a complicated function of AandR34
. Martin and Giddings23 developed an approximation for Xbased on a third-degreepolynomial expression for the velocity profile with one adjustable parameter v. Theresulting equation for X is
(15)

ThFFF CHARACTERIZAnON OF POLYMERS
Here
411
F = 2A[6(I +v) - (1/,,1,) - (A/A) + 36vA2 - 6,,1,(1 +6v) +18Ae- lfJ'(1 + IOvA)] + 72,,1,2[(1 +V? - 10,,1,(1 +4v+3v2) +4A2(7+69v+90v2) - 672vA3 (1+3v) + 4464v2A4
] - 72A2e-I/A[7 - 2v +
v2 + 2A(5-68v+I5v2) + 4A2(7-69v+I80v2) - 672vA3(1-3v) +4464v2A4] (16)
and
(17)
The value of v corresponding to the skewed velocity profile present in ThFFF can beapproximated by32
hIV = 5 hi
61:;=1 (i + 1)
(18)
Substitution of eqn. 15 into eqn. 14 yields
(19)
(20)
Previous studies29 •32 confirm that column dispersion in ThFFF is dominated by
non-equilibrium dispersion which is accurately defined by eqns. 14-19. Whencharacterizing narrow polymer samples, HN can be simply subtracted from the overallplate height, and polydispersity information calculated from eqn. 11. In the separationof polydisperse samples, however, column dispersion cannot be accounted for bya single value of He because He varies with retention volume. To account for columndispersion in the separation of polydisperse samples, the following column dispersionfunction was derived 32
:
VO (DT (1 - e-1/A)Ll T)t
G(V'vr) = - x2wVr AnFVr<v)Bw
[-(V - Vr)2DT(VO?(1 - e-1
/A)LlTJ
exp4AFV;<v)Bw3
Here B is the channel breadth and Vis the volume of carrier liquid eluting through thechannel. Eqn. 20 defines the volume-based response of non-equilibrium dispersion asa function of retention volume V" By deconvoluting this function from a ThFFFfractogram 32
, the "ideal" elution profile is obtained. Here "ideal" refers to the elutionprofile that would be obtained if all dispersion in the channel were molecular-weightselective, directly reflecting the MWD.
Most polymer samples have relatively broad MWDs. The development ofdeconvolution methods for removing column dispersion was motivated by the goal ofshortening the time required to analyze broad polymers without losing accuracy in theresulting MWD. Temperature programming, discussed in detail below, is another wayto achieve this goal. By decreasing the temperature throughout the run, analysis time is
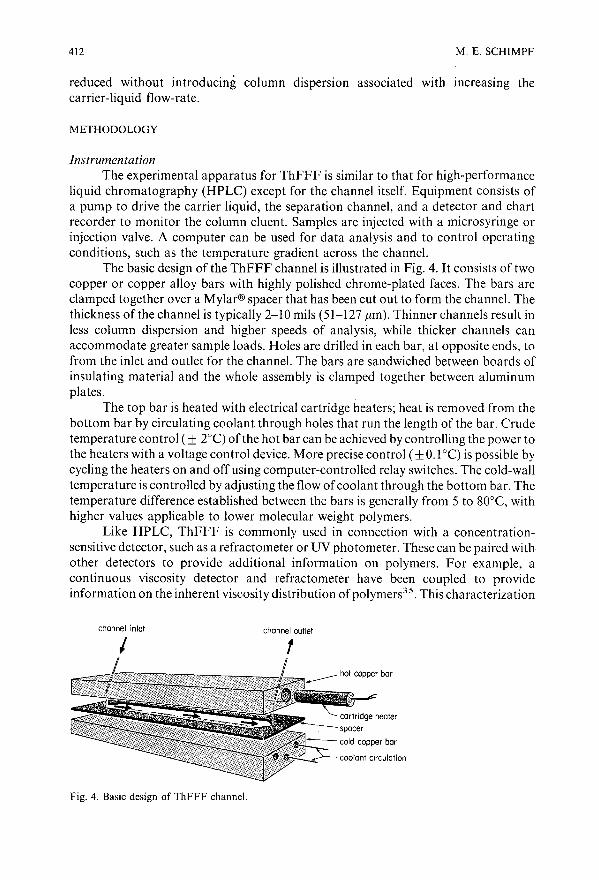
412 M. E. SCHIMPF
reduced without introducing column dispersion associated with increasing thecarrier-liquid flow-rate.
METHODOLOGY
InstrumentationThe experimental apparatus for ThFFF is similar to that for high-performance
liquid chromatography (HPLC) except for the channel itself. Equipment consists ofa pump to drive the carrier liquid, the separation channel, and a detector and chartrecorder to monitor the column eluent. Samples are injected with a microsyringe orinjection valve. A computer can be used for data analysis and to control operatingconditions, such as the temperature gradient across the channel.
The basic design of the ThFFF channel is illustrated in Fig. 4. It consists of twocopper or copper alloy bars with highly polished chrome-plated faces. The bars areclamped together over a Mylar® spacer that has been cut out to form the channel. Thethickness of the channel is typically 2-10 mils (51-127 lim). Thinner channels result inless column dispersion and higher speeds of analysis, while thicker channels canaccommodate greater sample loads. Holes are drilled in each bar, at opposite ends, tofrom the inlet and outlet for the channel. The bars are sandwiched between boards ofinsulating material and the whole assembly is clamped together between aluminumplates.
The top bar is heated with electrical cartridge heaters; heat is removed from thebottom bar by circulating coolant through holes that run the length of the bar. Crudetemperature control (± 2°C) of the hot bar can be achieved by controlling the power tothe heaters with a voltage control device. More precise control (±0.1 0C) is possible bycycling the heaters on and off using computer-controlled relay switches. The cold-walltemperature is controlled by adjusting the flow ofcoolant through the bottom bar. Thetemperature difference established between the bars is generally from 5 to 80°C, withhigher values applicable to lower molecular weight polymers.
Like HPLC, ThFFF is commonly used in connection with a concentrationsensitive detector, such as a refractometer or UV photometer. These can be paired withother detectors to provide additional information on polymers. For example, acontinuous viscosity detector and refractometer have been coupled to provideinformation on the inherent viscosity distribution ofpolymers35
. This characterization
channel inlet
I
Fig. 4. Basic design of ThFFF channel.
channel outlet
f
coolant circulation

ThFFF CHARACTERIZAnON OF POLYMERS 413
property is often more directly relevant to end use than are MWD data. The use ofa light-scattering photometer as a ThFFF detector has also been studied36
.
Sample loadingTransport coefficients vary with polymer concentration. Since these changes
affect the retention ratio, it is important to use a range of polymer concentrations whenmeasuring retention-derived parameters (such as D). Values are then extrapolated tozero concentration for accurate definition. The effect of polymer concentration ontransport coefficients is particularly strong near the critical concentration, wherepolymer solutions undergo an abrupt transition from "dilute" to "semidilute"behavior37 . When the polymer zone in the ThFFF channel is near the criticalconcentration, overloading effects are observed38
. Sample overloading in ThFFFgenerally is accompanied by peak "fronting" and a shift toward higher retentionvolumes. Excessive overloading gives rise to additional peaks at higher retentionvolumes, probably due to polymer aggregation. Whenever overloading is suspectedthe sample should be run at more than one concentration, and the individualfractograms should be examined for consistency in retention volume and peak shape.
The mass of polymer that can be injected without overloading increases with thesolvating power of the carrier liquid and with the thickness of the channel; themaximum amount is also inversely proportional to the molecular weight and sampleconcentration. Thus when overloading is a concern, it is better to inject a large volumeat low concentration than to inject a small volume at high concentration 38
.
Signal enhancement using splittersThe analysis of high-molecular-weight polymers (> I . 106
), requires the use ofdilute solutions « 1 mg/ml) to prevent overloading. If the MWD is broad, therequired concentration may be too dilute to be detected because the eluting zone isspread over a wide range in retention volume. To overcome this problem, theconcentration of the sample in the detector can be increased with the use of a streamsplitter39
. A stream splitter divides the carrier flowstream at the outlet end of thechannel such that the concentrated sample layer near the accumulation wall is splitaway from the bulk of the carrier stream. The concentrated sample stream is routed tothe detector for a greatly enhanced signal.
Temperature programmingSelectivity SM is relatively constant for R > 0.3, but decreases rapidly40 as
R approaches I. To optimize the resolution ofall components in a polymer sample, thefield strength must be sufficient to retain each component for at least three channelvolumes. When separating polymer samples that span a broad molecular weight range,the field strength required to sufficiently retain the lowest-molecular-weight component may lead to excessive retention times of higher-molecular-weight species.Therefore, it is prudent to program the temperature gradient, beginning at a high valueand decreasing continuously during the run. The initial high-temperature gradientoptimally resolves the low-molecular-weight components; as the gradient drops tolower values the high-molecular-weight components are resolved.
A variety of mathematical functions have been used to program a decreasingtemperature gradient. In the first report of temperature programming41 , Giddings et

414 M. E. SCHIMPF
al. used a time-delay parabolic decay function to separate nine polymers ranging inmolecular weight from 4000 to 7.1 . 106
. The use of a linear function was also reportedin this work. An exponential decay function developed by Kirkland and coworkers42
.43 produces a linear calibration plot of log M vs. retention time. Morerecently, Giddings et al. 44 have reported the development of a power function forprogramming temperature gradients in ThFFF.
In power programming the field strength ST is changed with time t according tothe function
(21)
where S¥ is the initial field strength, ta is an arbitrary time constant, t1 is the predecaytime between the start of the run and the beginning ofdecay, and p is the decay power.These parameters are subject to the constraints t ~ t1 > ta and p > O. When p = 2 andta = -2t1, the fractionating power (defined as the resolution of two componentsdivided by their relative difference in molecular weight) is nearly independent ofmolecular weight. A constant fractionating power is desirable when highly polydisperse samples are characterized. Fig. 5 illustrates the use of power programming toseparate 7 polymers ranging in molecular weight from 9000 to 5.5 . 106
.
OPTIMIZATION
The greatest accuracy in measurements of MWDs can be obtained bymaximizing the ratio P of the polydispersity plate-height contribution to thenon-equilibrium contribution. Parameter P is equivalent to the square of theresolution between molecular-weight components located at ± 2 standard deviationsfrom the mean of the MWD. Using eqns. 11 and 14, P can be written in the followingform
2520
5480k
------
5 10 15
TIME (min)
Fig. 5. Separation of 7 polymers of indicated molecular weights (in thousands, k) by power-programmedThFFF (reprinted from ref. 44 courtesy of ACS Publications).
o
80

ThFFF CHARACTERIZATION OF POLYMERS
If X is approximated34 as 24A3, and A by R/6 (ref. 45), then
415
(22)
(23)
Parameter P increases with the ratio L/<v). Although channel length L (typically about 50 cm) is fixed, flow-rates can be reduced to increase the accuracy ofMWDs or the resolution between components. However, this has the simultaneouseffect of increasing run time. Thus, a trade-off exists between accuracy or resolution,and speed. This situation is illustrated in Fig. 6, where the resolution between twocomponents from five- and one-minute separations (in the same channel) iscompared46. The former shows superior resolution but takes longer. The reducedresolution of the latter results from the proportionality of H N to the meancarrier-liquid velocity <v).
Eqn. 23 shows that retention ratio R and channel thickness ware the mosteffective optimization parameters. For highest resolution, channel thickness should beminimized while the temperature gradient is maximized to reduce R. The cost of usingthinner channels is reduced sample capacity. Lower R values increase run time, andtemperature programming is used to optimize this trade-off. In characterizingindustrial polymers, temperature programming is often essential to achieving accurateMWDs in a reasonable time.
APPLICAnONS
ThFFF has been applied to a wide variety of lipophilic polymers, includingpolystyrene 1-7,29.32-35,41-46, poly(methyl methacrylate)3,47,48, polyisoprene3,47,48,poly(tetrahydrofuran)47, polypropylene49, polyethylene49 and nitrocellulose50 . Al-
inject
TIME (min)
i5
inject
to
i0.75
TIME (min)
i1.0
Fig. 6. Illustration of trade-off between resolution and speed in the separation of a three-component mixtureof polystyrenes by ThFFF. Experimental conditions: L1 T = 60°C, w = 5I J1m, and <v> = 0.56 cm/s (left) or3.05 cmls (right) (reprinted from ref. 20 courtesy of Pergamon Press).

416 M. E. SCHIMPF
though thermal diffusion is generally weak in aqueous systems33,45,51, some non-ionic
materials such as poly(ethylene oxide), poly(vinyl pyrrolidone) and poly(ethyleneglycol) are sufficiently retained in water to permit characterization52
. The advantagesof ThFFF are particularly suited to the analysis of very-high-molecular-weightpolymers, copolymers and polymers that interact with surfaces. Polymers needingcorrosive solvents or high temperatures for solvation, and narrow-MWD polymersthat require an accurate determination of polydispersity are also well handled byThFFF. With the introduction of an instrument into the commercial marketplace,ThFFF is now being used for routine polymer analysis in several laboratories.
Polymer characterizationsThFFF currently relies on a calibration curve to relate molecular weight to
retention volume. When the temperature gradient is held constant, calibration curvestake the following form
(24)
where SM is the selectivity defined by eqn. 12. ThFFF is more accurate than SEC formeasuring MWDs because selectivity in ThFFF is higher (typical SM values are in therange 0.5-0.6) and column dispersion is well-defined. The high degree of accuracy ofThFFF has been clearly demonstrated in its application to polymer standards29
,32.
When characterizing narrow polymer fractions, polydispersity is obtained fromH p using eqn. 11. Accurate values of H p are obtained by subtracting H N from the plateheight of the elution profile, provided H r is negligible. To obtain H N from eqn. 19, thediffusion coefficient of the polymer fraction and several carrier-liquid parameters arerequired. If these values are unavailable, H p can be determined by plotting plate heightversus flow velocity. If H r is negligible, a linear plot will be obtained with H p as theintercept. Fig. 7 shows such a plot for a narrow polystyrene standard29
. On theright-hand side of this plot, the ordinate is expressed in terms of J1 - I, illustrating thatany J1 value significantly above 1.01 can be unambiguously ruled out. This is muchsmaller than the ceiling value of 1.06 determined by the supplier using SEC. The plot inFig. 7 has a high degree oflinearity and the slope is within 3% of its theoretical value,suggesting that the value J1 = 1.003 is reasonably accurate.
With broad MWDs, column dispersion is negligible when low flow-rates areused. If column dispersion is significant, it can be removed by deconvolution to obtainthe "ideal" elution profile. To obtain the MWD m(M), the fractogram or "ideal"elution profile is transformed using the following equation 53
(25)
where c( Vr) is the detector trace of the mass-based concentration c (if a mass-sensitivedetector is used); the scale factor [d Vr(M)/dM] is related to the selectivity by
(26)

ThFFF CHARACTERIZATION OF POLYMERS 417
0.010.10
°f--'-'_'e""'~' '- - am
0.30 0.03
H(em) fl-I
~o omfl =1.02
o l----L---'-_L---'---'------.Jl_--'---L--'-_~ 0o 2.0 4.0 6.0 8.0 10.0
(v) (em/min)
Fig. 7. Plot of plate height vs.l1ow velocity for a 1.7' 105 MW polystyrene sample illustrating polydispersityvalue /i. = 1.003 (reprinted from ref. 20 courtesy of Pergamon Press).
Thermal diffusion studiesSeparation in ThFFF is governed by differences in the ordinary and thermal
diffusion coefficients of polymer components. Although the underlying physicochemical parameters important to ordinary diffusion are well understood, thosegoverning the thermal diffusion of polymers in solution are less clear. By increasingour understanding ofthermal diffusion, and its dependence on polymer properties, wegain access to more information on polymers through ThFFF. Theories on thethermal diffusion of polymers in solution vary widely in conceptual basis and oftenpredict contradictory results; experimental data lack consistency and wide applicability, partly due to the difficulty of conventional methodology. Fortunately, ThFFFis capable of producing accurate values of thermal diffusion parameters in polymersolutions, making it the best technique for the systematic study of thermal diffusionand thus of its own foundations.
In the first of a three-part study of thermal diffusion in polymer solutions, theThFFF retention of a variety of linear and branched polystyrenes was examined withethylbenzene as the carrier liquid2
. A linear dependence ofret~ntion parameter Aondiffusion coefficient D was found, as illustrated in Fig. 8. According to eqn. 1, the slopeof this plot is (wDT dTldxt l
. Since wand dTldx were identical for all runs, theconstant slope demonstrates that DT is independent of both polymer size andbranching configuration.
Next, DT values were obtaned for 17 polymer-solvent systems3,54. The results
were used to search for correlations between DT and physiochemical parameters of thepolymer and carrier liquid. DT was found to be inversely proportional to the viscosityand solvating power of the carrier liquid. These correlations have been supported insimilar studies by Kirkland et al. 55. DT was also found to increase with polymer densityand with the thermal conductivity difference of the polymer and carrier liquid. DT alsocorrelates inversely with the activation energy of the solvent viscous flow 3 .
In the third part of the study4, the thermal diffusion of several copolymers intoluene was characterized. For random copolymers, DT values apparently assume theweighted average of the corresponding homopolymer values, where the weighting
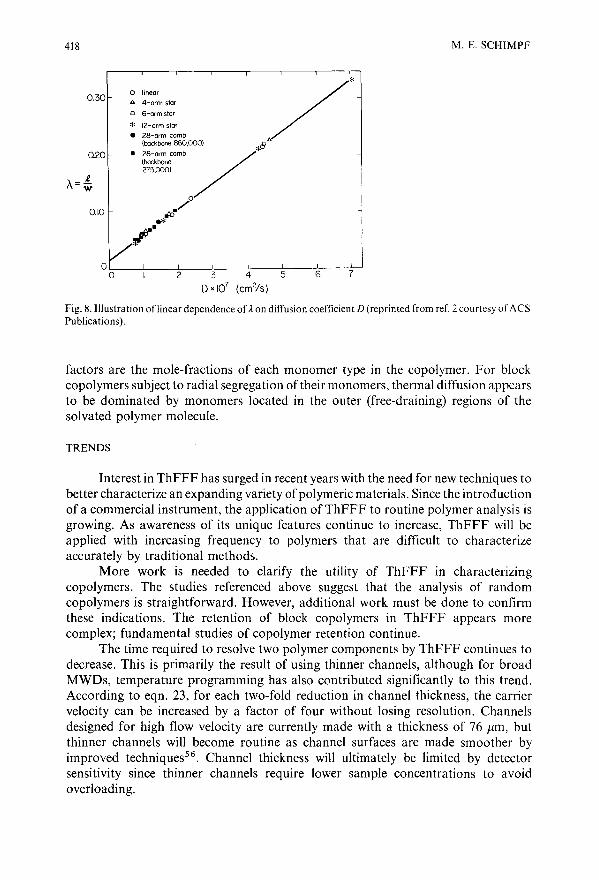
418 M. E. SCHIMPF
0.10
0.20
0.30
A= J..w
o linear /*.6 4-arm star
o 6-orm star
* 12-arm star
• 28-orm comb "(backbone 860.0001 ,Ii
- 28-orm comb /(backbone275.0001
o./
e*iO,.-V'
O~_--.L_----I:------!:-----":-----!c-----,';,---~o 234567
D x 107 (cm2,!s)
Fig. 8. Illustration oflinear dependence of Aon diffusion coefficient D (reprinted from ref. 2 courtesy of ACSPublications).
factors are the mole-fractions of each monomer type in the copolymer. For blockcopolymers subject to radial segregation of their monomers, thermal diffusion appearsto be dominated by monomers located in the outer (free-draining) regions of thesolvated polymer molecule.
TRENDS
Interest in ThFFF has surged in recent years with the need for new techniques tobetter characterize an expanding variety ofpolymeric materials. Since the introductionof a commercial instrument, the application of ThFFF to routine polymer analysis isgrowing. As awareness of its unique features continue to increase, ThFFF will beapplied with increasing frequency to polymers that are difficult to characterizeaccurately by traditional methods.
More work is needed to clarify the utility of ThFFF in characterizingcopolymers. The studies referenced above suggest that the analysis of randomcopolymers is straightforward. However, additional work must be done to confirmthese indications. The retention of block copolymers in ThFFF appears morecomplex; fundamental studies of copolymer retention continue.
The time required to resolve two polymer components by ThFFF continues todecrease. This is primarily the result of using thinner channels, although for broadMWDs, temperature programming has also contributed significantly to this trend.According to eqn. 23, for each two-fold reduction in channel thickness, the carriervelocity can be increased by a factor of four without losing resolution. Channelsdesigned for high flow velocity are currently made with a thickness of 76 pm, butthinner channels will become routine as channel surfaces are made smoother byimproved techniques56
. Channel thickness will ultimately be limited by detectorsensitivity since thinner channels require lower sample concentrations to avoidoverloading.

ThFFF CHARACTERIZATION OF POLYMERS
SYMBOLS
419
aAbBcDDT
FGhHHeHD
HEeHN
Hp
HR
KKeI
Lm(M)MpPRSSMSTS~f
f 1
faTTeV
<v)VVOVr
W
X
t1T
IJ
coefficient of fluidity dependence on temperatureterm defined by eqn. 17term defined by eqn. 7channel breadthconcentrationdiffusion coefficientthermal diffusion coefficientterm defined by eqn. 16non-equilibrium dispersion functionterm defined by eqn. 5plate heightcolumn dispersion contribution to plate heightlongitudinal diffusion contribution to plate heightextra-column volume contribution to plate heightnon-equilibrium contribution to plate heightpolydispersity contribution to plate heightrelaxation contribution to plate heightcarrier-liquid thermal conductivitycarrier-liquid thermal conductivity at the cold-wall temperaturealtitude of the center of gravity of the analyte zone above the accumulationwallchannel lengthmolecular weight distributionmolecular weightpower programming decay poweroptimization ratio Hp/HN
retention ratio VO/Vr
term defined by eqn. 8mass-based selectivityfield strengthinitial field strength in temperature programmingtimepredecay-time constant in power programmingdecay-time constant in power programmingtemperaturecold-wall temperaturevelocity profile term defined by eqn. 18average velocity of the carrier liquid in the channelelution volumevoid volume of the channelretention volumechannel thicknessaltitude above the accumulation (cold) walltemperature drop across the channelviscosity
420 M. E. SCHIMPF
() term defined by eqn. 6A retention parameter l/wJ.l polydispersityX non-equilibrium coefficient
REFERENCES
1 G. H. Thompson, M. N. Myers and J. C. Giddings, Sep. Sci. Technol., 2 (1967) 797-800.2 M. E. Schimpf and J. C. Giddings, Macromolecules, 20 (1987) 1561-1563.3 M. E. Schimpf and J. C. Giddings, J. Polym. Sci., Polym. Phys. Ed., 27 (1989) 1317-1332.4 M. E. Schimpf and J. C. Giddings, J. Polymer Sci., Polym. Phys. Ed., in press.5 J. C. Giddings, L. K. Smith and M. N. Myers, Anal. Chem., 47 (1975) 2389-2394.6 Y. S. Gao, K. D. Caldwell, M. N. Myers and J. C. Giddings, Macromolecules, 18 (1985) 1272-1277.7 J. C. Giddings, L. K. Smith and M. N. Myers, Anal. Chem., 48 (1976) 1587-1592.8 J. C. Giddings, S. R. Fisher and M. N. Myers, Am. Lab. (Fairfield, Conn.), 10 (1978) 15-31.9 J. C. Giddings, M. N. Myers, K. D. Caldwell and S. R. Fisher, in D. Glick (Editor) Methody of
Biochemical Analysis, Vol. 26, Wiley, New York, 1980, pp. 79-136.10 E. N. Lightfoot, A. S. Chiang and P. T. Noble, Annu. Rev. Fluid Mech., I3 (1981) 351.II J. C. Giddings, Anal. Chem., 53 (1981) 1170A-1175A.12 J. C. Giddings, M. N. Myers and K. D. Caldwell, Sep. Sci. Technol., 16 (1981) 549-575.13 J. C. Giddings, K. A. Graff, K. D. Caldwell and M. N. Myers, in C. D. Craver (Editor), Advances in
Chemistry Series, No. 203, American Chemical Society, Washington, DC, 1983, Ch. 14, pp. 257-269.14 T. Hoshino, Bunseki, 12 (1985) 856-864.15 J. Janca, Chem. Listy, 81 (1987) 1034-1057.16 J. C. Giddings, Chem. Eng. News, 66 (1988) 34-48.17 K.-G. Wahlund, Eur. Chromo News, 2 (1988) 12-15.18 K. D. Caldwell, Anal. Chem., 60 (1988) 959A-971A.19 1. C. Giddings, J. Chromatogr., 470 (1989) 327-335.20 J. J. Gunderson and J. C. Giddings, in C. Booth and C. Price (Editors), Comprehensive Polymer Science,
Vol. I, Polymer Characterization, Pergamon, Oxford, 1989, pp. 279-291.21 M. Martin and P. Reynaud, Anal. Chem., 52 (1980) 2293.22 1. C. Giddings, J. Chem. Phys., 49 (1968) 81-85.23 M. Martin and J. C. Giddings, J. Phys. Chem., 85 (1981) 727-733.24 J. C. Giddings, M. R. Schure, M. N. Myers and G. R. Velez, Anal. Chem., 56 (1984) 2099-2104.25 J. M. Davis and J. Calvin Giddings, Sep. Sci. Technol., 20 (1985) 699-724.26 J. C. Giddngs, Anal. Chem., 58 (1986) 735-740.27 M. Martin and A. Jaulmes, Sep. Sci. Technol., 16 (1981) 691.28 J. J. Gunderson, K. D. Caldwell and J. C. Giddings, Sep. Sci. Tee/mol., 19 (1984) 667-683.29 M. E. Schimpf, M. N. Myers and J. C. Giddings, J. Appl. Polym. Sci., 33 (1987) 117-135.30 L. K. Smith, M. N. Myers and J. C. Giddings, Anal. Chem., 49 (1977) 1750-1756.31 M. Martin, M. N. Myers and J. C. Giddings, J. Liq. Chromatogr., 2 (1979) 147-164.32 M. E. Schimpf, P. S. Williams and J. C. Giddings, J. Appl. Polym. Sci., 37 (1989) 2059-2076.33 M. E. Hovingh, G. E. Thompson and J. C. Giddings, Anal. Chem., 42 (1970) 195-203.34 J. C. Giddings, Y. H. Yoon, K. D. Caldwell, M. N. Myers and M. E. Hovingh, Sep. Sci. Technol., 10
(1975) 447-460.35 J. J. Kirkland, S. W. Rementer and W. W. Yau, J. Appl. Polym. Sci., 38 (1989) 1383-1395.36 M. Martin, Chromatographia, 15 (1982) 426-432.37 P. G. DeGennes, Macromolecules, 9 (1976) 594.38 K. D. Caldwell, S. L. Brimhall, Y. Gao and J. C. Giddings, J. Appl. Polym. Sci., 36 (1988) 703-719.39 J. C. Giddings, H. C. Lin, K. D. Caldwell and M. N. Myers, Sep. Sci. Technol., 18 (1983) 293-306.40 J. J. Gunderson and J. C. Giddings, Anal. Chim. Acta, 189 (1986) 1-15.41 J. C. Giddings, L. K. Smith and M. N. Myers, Anal. Chem., 48 (1976) 1587-1592.42 J. J. Kirkland and W. W. Yau, Macromolecules, 18 (1985) 2305-2311.43 J. J. Kirkland, S. W. Rementer and W. W. Yau, Anal. Chem., 60 (1988) 610-616.44 J. C. Giddings, V. Kumar, P. S. Williams and M. N. Myers, in C. D. Craver and T. Provder (Editors),
Polymer Characterization by Interdisciplinary Methods, American Chemical Society, Washington, DC,in press.

ThFFF CHARACTERIZATION OF POLYMERS 421
45 M. N. Myers, K. D. Caldwell and J. C. Giddings, Sep. Sci. Technol., 9 (1974) 47-70.46 J. C. Giddings, M. Martin and M. N. Myers, J. Chromatogr., 158 (1978) 419-435.47 J. C. Giddings, M. N. Myers and J. Janca J. Chromatogr., 186 (1979) 37-44.48 J. J. Gunderson and J. C. Giddings, Macromolecules, 19 (1986) 2618-2621.49 S. L. Brimhall, M. N. Myers, K. D. Caldwell and J. C. Giddings, Sep. Sci. Technol., 16 (1981) 671-689.50 M. E. Schimpf, S. L. Brimhall and J. C. Giddings, Thermal Field-Flow Fractionation olNitrocellulose,
Report to USAAMCCOM - LCWSL, University of Utah, Salt Lake City, UT, October 25, 1985.51 F. J. Bonner, Chern. Scr., 3 (1973) 149.52 J. J. Kirkland and W. W. Yau, J. Chromatogr., 353 (1986) 95-107.53 J. C. Giddings, M. N. Myers, F. 1. F. Yang and L. K. Smith, in M. Kerker (Editor), Mass Analysis of
Particles and Macromolecules by Field-Flow Fractionation, Colloid and Inte~lace Science, Vol. IV,Academic Press, New York, 1976, pp. 381-398.
54 M. E. Schimpf and J. C. Giddings, presented at the 192nd National ACS Meeting, Anaheim, CA,September 1986.
55 J. J. Kirkland, L. S. Boone and W. W. Yau, presented at 1st International Symposium on Field-FlowFractionation, Park City, UT, June 15, 1989.
56 J. C. Giddings, K. D. Caldwell and L.F. Kesner, in A. R. Cooper (Editor), Molecular WeightDetermination (Chemical Analysis Series, Vol. 103), Wiley-Interscience, New York, 1989, Ch. 12.

Journal of Chromatography, 517 (1990) 423-433Elsevier Science Publishers B.V., Amsterdam
CHROMSYMP.1949
Evaluation of pinched inlet channel for stopless flow injectionin steric field-flow fractionation
MYEONG HEE MOON, MARCUS N. MYERS' and J. CALVIN GIDDINGS
Field-Flow Fractionation Research Center, Department of Chemistry, University of Utah, Salt Lake City,UT 84JJ2 (U.S.A.)
ABSTRACT
In this article the concept of utilizing a pinched inlet channel for field-flowfractionation (FFF), in which the channel thickness is reduced over a substantial inletsegment to reduce relaxation effects and avoid stopflow, is evaluated for steric FFFusing one conventional channel and two pinched inlet channels. It is shown that withthe proper adjustment of flow-rate, the stopflow process in FFF can be completelyavoided, thus bypassing the flow interruption associated with stopflow and reducingseparation time. The maximum flow-rate that can be used for stopless flow operationwithout incurring zone distortion is shown to agree reasonably well with simple theory; slight departures from theory are attributed to the existence of reduced transportrates of large particles through thin channel structures.
INTRODUCTION
In a previous paper it was suggested that the relaxation process in field-flowfractionation (FFF) can be hastened by reducing the thickness of the FFF channel atthe inlet end 1. The use of such a modified channel structure, designated by the term"pinched inlet channel", has the potential of reducing separation time in FFF,reducing th'e adhesion of sample material to the channel walls and, in some instances,simplifying the FFF procedure. The object of this work is to achieve the firstimplementation of pinched inlet FFF. The system chosen for this study is a steric FFFchannel utilizing a gravitational driving force.
FFF is generally carried out by using a stopflow procedure2. Here, following
sample introduction, the channel flow is stopped for a time of sufficient duration topermit the sample material, under the influence of the driving force, to accumulate inthe vicinity of one of the channel walls. After accumulation, the flow is restarted andthe separation process is carried out. The purpose of the stopflow procedure is toreduce the band broadening associated with the accumulation or "relaxation"process2
. However, the stopflow procedure has two or three negative side-effects.First, stopflow lengthens the time required for completion of the run, sometimes by
0021-9673/90/$03.50 © 1990 Elsevier Science Publishers B.V.

424 M. H. MOON, M. N. MYERS, J. C. GIDDINGS
a substantial amountJ. Second, stopflow requires the interruption of flow, which is not
only experimentally awkward but is capable of causing baseline perturbations due tothe pressure transients associated with the flow changes. Third, the static conditionsencountered in stopflow are conducive to the adhesion of sample particles to thechannel wall, which may cause sample loss. For all these reasons it would be desirableto eliminate the stopflow procedure providing excessive band broadening couldsomehow be avoided.
By reducing the channel thickness at the inlet end, the relaxation time, equal tothe time required for a given component to be transported across the thickness of thechannel, is reduced. Therefore the stopflow time tsf can be correspondingly decreased.Even if the channel flow is maintained and stopflow avoided, the incremental bandbroadening associated with relaxation in such a system is greatly reduced relative to itsmagnitude in conventional FFF channels of uniform thickness. Specifically, theoryindicates that the increment in the variance in elution time of a component carried ata given flow-rate in an FFF channel increases with the fourth power of channelthickness w providing the relaxation process is confined to a segment of constantthickness!. In order to take full advantage of this strong dependence on w, it isnecessary to reduce the channel thickness at the inlet end. Moreover, in order to realizefull relaxation within the confines of this pinched inlet or relaxation segment withoutstopping the flow, the pinched segment must extend a substantial distance into thechannel. It is very likely that pinched inlet segments that occupy approximately 50% ofthe channel length will prove highly practical in the implementation of the pinchedinlet concept. In the present study, 40% of the channel length is utilized for therelaxation segment.
While the pinched inlet concept will be most ideally realized by using a constantand uninterrupted flow throughout the FFF process, there will be occasions in whichthe relaxation time is so large that full relaxation cannot be achieved in the pinchedinlet section at normal channel flow-rates. In that instance, the channel flow-rate canbe reduced to a value that will allow for the full relaxation of the slowest component inthe pinched sector. Following the relaxation of all components, normal flow isresumed. With this slow flow injection procedure, there is still an abrupt flow change(although the magnitude of the change is reduced), but one would still have theadvantage of a reduced analysis time associated with the reduced relaxation time.Alternatively, one could revert to the normal stopflow procedure while using a pinchedinlet, again realizing the advantage of a reduced relaxation time and faster analysis.
The pinched inlet concept appears to be applicable to all of the normal operatingmodes ofFFF, including sedimentation FFF, thermal FFF, flow FFF, and electricalFFF!. It would appear to be particularly advantageous for programmed fieldoperation. It should also be applicable to the characterization of larger particles (? I.urn diameter) by steric FFF. The simplicity ofa steric FFF channel system designed toutilize the earth's gravity as a driving force is an important factor in choosing stericFFF for the initial evaluation of the pinched inlet concept.
THEORETICAL
The essential equations governing the behavior of a pinched inlet system used inthe steric FFF mode are summarized below. We start with the central parameter, therelaxation time !, given by the following expression

PINCHED INLET CHANNEL FOR FFF
wr=-
U
425
(1)
where w is the "hannel thickness and U is the field-induced velocity of the particledriven across the channel. Because of the finite relaxation time, the particle bandbroadens out into a bimodal distribution along the flow coordinate4
. The distance hobetween band extremities is given by
Vho = bU (2)
whereV is the volumetric flow-rate through the channel and b is the channel breadth.We note that this expression for band width is independent of channel thickness w.
Because of relaxational band broadening represented by ho, the peak emergingfrom the FFF system is incrementally broadened in time units. The time-basedvariance of the peak induced by relaxation is given by!
(3)
where R is the retention ratio of the particle band in the pinched segment of thechannel. With the help of eqn. I this expression assumes the form
17 w2
(l12= 140 U2R2
(4)
This equation is generally valid for most operating forms ofFFF. For steric FFF, wesubstitute the applicable expression for R (ref. 5)
3ydR=
w
which converts eqn. 4 into the previously derived expression for steric FFF!
(5)
(6)
Under the influence of a sedimentation field of acceleration G, the settlingvelocity for a particle obeying Stokes equation is given by6
(7)
where LIp is the density difference between the particle and the liquid carrier and '1 is theviscosity. With the help of this expression, eqns. I, 2 and 6 become
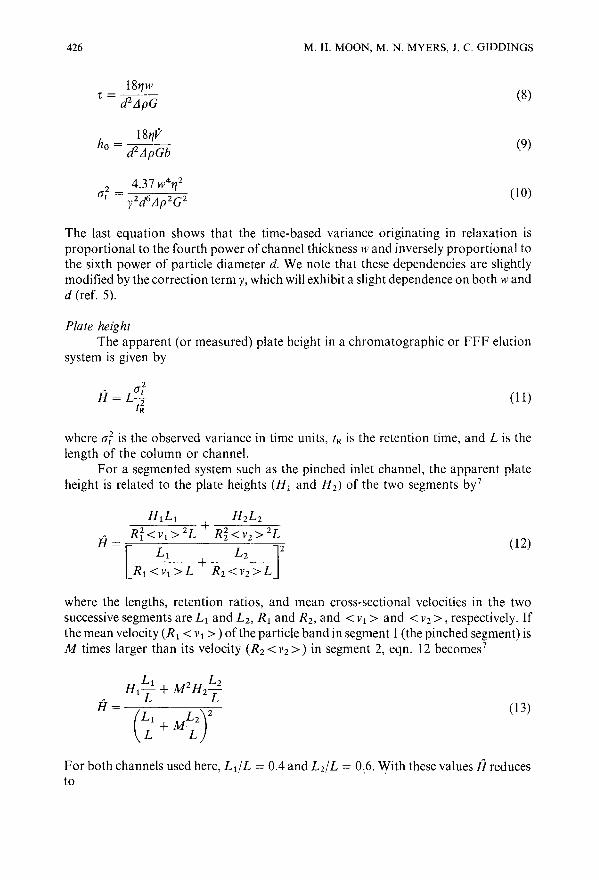
426
181]Wr=---
d2 /JpG
4.37 W 41]2
"/cf> /Jp 2G2
M. H. MOON, M. N. MYERS, J. C. GIDDINGS
(8)
(9)
(10)
The last equation shows that the time-based variance originating in relaxation isproportional to the fourth power of channel thickness wand inversely proportional tothe sixth power of particle diameter d. We note that these dependencies are slightlymodified by the correction term y, which will exhibit a slight dependence on both wandd (ref. 5).
Plate heightThe apparent (or measured) plate height in a chromatographic or FFF elution
system is given by
, (JlH=L
t~(11)
where (Jl is the observed variance in time units, tR is the retention time, and L is thelength of the column or channel.
For a segmented system such as the pinched inlet channel, the apparent plateheight is related to the plate heights (H j and H 2) of the two segments by7
(12)
where the lengths, retention ratios, and mean cross-sectional velocities in the twosuccessive segments are L j and L 2 , R j and R 2 , and < Vj > and < V2 >, respectively. Ifthe mean velocity (R j < Vj > ) of the particle band in segment I (the pinched segment) isM times larger than its velocity (R 2 < V2 > ) in segment 2, eqn. 12 becomes7
(13)
For both channels used here, LdL = 0.4 and L 2 / L = 0.6. With these values f! reducesto

PINCHED INLET CHANNEL FOR FFF 427
(14)
Because < v> and R (see eqn. 5) are both inversely proportional to channelthickness w (a conclusion valid for normal as well as steric FFF), M can be written as
Thus for channel I, for which M = 4, fr is
fr = 0.0510H1 + 1.2245H2
For channel II, for which M = 100/9, we get
fr = 0.0080H1 + 1.4833H2
(15)
(16)
(17)
These equations show (by way of specific examples) that excessive band broadening(large HI) due to relaxation effects is largely cancelled out by the small weightingfactors associated with the rapid transit through the constricted relaxation segment.Furthermore, it can be shown that HI due to relaxation approaches a maximum of0.1214 L 1 for particles whose relaxation distance ho -t L 1• (The justification for theweighting factor for H 2 exceeding unity can be found in ref. 7.)
Plate height HI consists of contributions both from relaxation (which becomesthe dominant term when ho is a significant fraction of L 1) and from normal bandbroadening processes. To a first approximation, HI can be expressed as the sum of thetwo contributions
(18)
where H 1(relaxation) is based on the variance obtained from eqns. 3,4,6, or 10 andH 1(stop flow) is the plate height observed under stopflow conditions in which bandbroadening due to relaxation is eliminated.
EXPERIMENTAL
For the purposes ofcomparison two channel geometries were used, one with andone without the pinched inlet configuration. The channel volumes were cut out of thinplastic spacers and sandwiched between glass plates, then clamped together betweenLucite bars. This general structure, described in an earlier publication8 , has been foundsuitable for steric FFF using gravity as the driving force.
A Teflon spacer of 254/tm thickness was used for the uniform channel (lackinga pinched inlet). The channel, cut from the spacer, has a tip-to-tip length L of 38.4 emand a breadth b of 2 em. The void volume, measured as the elution volume of anunretained sodium benzoate peak, is 1.84 m!.
Two pinched inlet channels were constructed. Both utilized two sheets of Mylar

428 M. H. MOON, M. N. MYERS, J. C. GIDDINGS
in their construction, one with the full channel length removed and the other cut insuch a way that a "blocking element" was left in place. The blocking element is a stripof material that occupies the inlet end of the channel in order to reduce its thicknessand thus realize the pinched inlet geometry!. The construction of the systems isillustrated in Fig. 1. The combined thickness of the two films is 254 J.lm in both cases,the same as the thickness of the uniform channel. For pinched inlet channel I, the twothicknesses are both 127 J.lm. For channel II, the film with the blocking element is 178J.lm thick and the film from which the pinched inlet is cut is 76 J.lm thick. The length(38.4 cm) and breadth (2 cm) of the pinched inlet channel systems are identical to thoseused for the uniform channel. The length L! of the blocking element, measured fromthe channel tip to the blocking edge, is 15.4 cm in both cases, 40% of the total length.The void volumes, also measured with a non-retained peak, are 1.52 ml for channelI and 1.41 ml for channel n.
The samples used in this study were polystyrene latex beads (Duke Scientific,Palo Alto, CA, U.S.A.) with mean diameters of 15 and 20 J.lm. The carrier liquid wasdoubly distilled water with 0.01 % FL-70 detergent (Fisher Scientific, Fairlawn, NJ,U.S.A.) and 0.02% sodium azide used as a bacteriocide. All runs were carried out atroom temperature, 293 ± 1 K. From 15 to 20 J.lI of the sample suspension (containing2 . 104-3 . 104 particles) was injected into the channel through a septum by means ofa microsyringe.
For the stopflow method the sample was slowly carried to the head of thechannel with a Gilson (Madison, WI, U.S.A.) Minipuls 2 pump. The flow was thencompletely stopped for a period adequate to allow the particles to relax to theaccumulation wall. The relaxation time was calculated from the Stokes-Einsteinequation. Following relaxation, flow was resumed.
In the case of stopless flow injection, the sample was introduced by syringedirectly into the carrier stream. The flow of the latter was held constant, withoutchange or interruption.
The eluted sample was monitored by a Model 106 UV detector, from Linear
~---------I~ ~_____~~C~mUlatian, wal~ - - - - - - - --,
,=-- - - -'- - ~~~, -----~::-'i
Mylarspacers
Fig. I. Layers assembled to form pinched channel system.

PINCHED INLET CHANNEL FOR FFF 429
Instrument (Reno, NV, U.S.A.) at a wavelength of229 nm. A strip chart recorder fromHouston Instrument (Austin, TX, U.S.A.) was used to record the emerging peaks.
RESULTS AND DISCUSSION
Fig. 2 shows three different elution profiles for the l5-.um polystyrene latexspheres run at the same flow-rate, 0.73 mllmin, equivalent to a linear flow velocity of0.24 cmls in the separation segment of the channel where the channel thickness (254.urn) is greatest. Fig. 2a shows the concentration profile of the particles emerging fromthe reference (uniform or non-pinched) channel after application of the stopflowprocedure. For this case the stopflow time was 42 s, equal to the calculated relaxationtime of the particles across the full channel thickness (254 .urn). Fig. 2b shows theresults of a run identical in all respects to that of Fig. 2a except that the stopless flowprocedure was used to bypass the flaw interruption of stopflow. The emerging peak inthis case shows a substantial loss of sharpness as expected for stopless flow operation.(For smaller particles with longer relaxation times than that of the I5-.um particle, thestopless flow profile would be much broader and would have a bimodal shape.) Wealso observe that the trailing edge of the peaks in Fig. 2a and b nearly coincide in theirpositions; the leading edge of the Fig. 2b profile, however, appears considerably earlierthan that for the Fig. 2a peak as a consequence of the accelerated elution of thoseparticles starting the run near the top wall of the channel where relaxation effects aremaximal.
Fig. 2c shows the profile of the l5-.um beads emerging from pinched inlet channelsystem I after stopless flow injection. We observe that the excessive band broadeningill ustrated by Fig. 2b has been eliminated through the use of the pinched inlet channel.The band width is comparable to that in Fig. 2a for normal stoptlow operation. More
JUOld
peak
a.stop flow,uniform channel
JLrLb.stopless flow,uniform channel
III ~;oPless flowpinched inlet
I\ channel I
: I I'
o 10 20 30RETENTION TIME (min)
Fig. 2. Elution profiles for IS-/lm latex particles at a Ilow-rate 01'0.73 ml/min. Runs a and b are made in theconventional channel of uniform thickness with and without stopflow, respectively. Run c was also executedwithout stopflow, but in this case with pinched inlet channel system I.
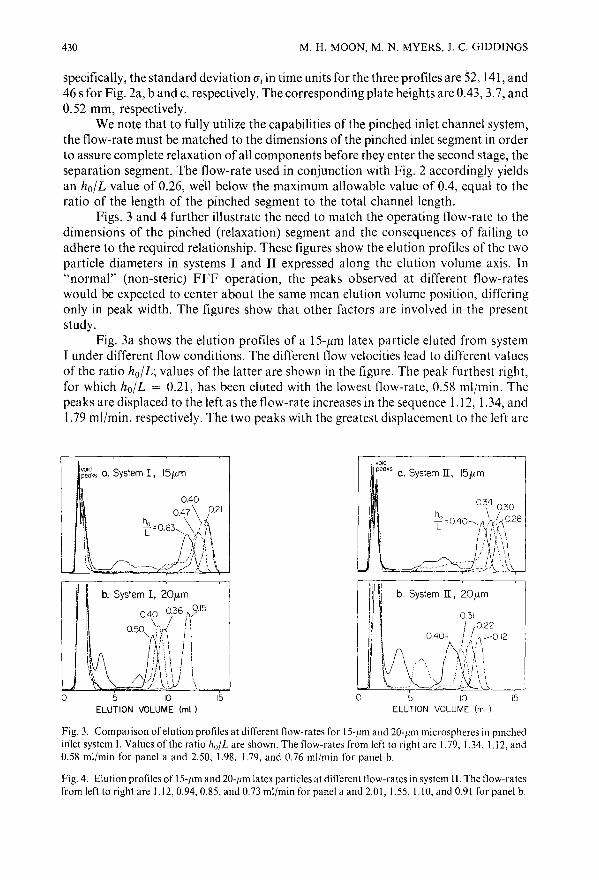
430 M. H. MOON, M. N. MYERS, J. C. GIDDINGS
specifically, the standard deviation (it in time units for the three profiles are 52, 141, and46 s for Fig. 2a, band c, respectively. The corresponding plate heights are 0.43,3.7, and0.52 mm, respectively.
We note that to fully utilize the capabilities of the pinched inlet channel system,the flow-rate must be matched to the dimensions of the pinched inlet segment in orderto assure complete relaxation of all components before they enter the second stage, theseparation segment. The flow-rate used in conjunction with Fig. 2 accordingly yieldsan holL value of 0.26, weIl below the maximum allowable value of 0.4, equal to theratio of the length of the pinched segment to the total channel length.
Figs. 3 and 4 further illustrate the need to match the operating flow-rate to thedimensions of the pinched (relaxation) segment and the consequences of failing toadhere to the required relationship. These figures show the elution profiles of the twoparticle diameters in systems I and II expressed along the elution volume axis. In"normal" (non-steric) FFF operation, the peaks observed at different flow-rateswould be expected to center about the same mean elution volume position, differingonly in peak width. The figures show that other factors are involved in the presentstudy.
Fig. 3a shows the elution profiles of a 15-,um latex particle eluted from systemI under different flow conditions. The different flow velocities lead to different valuesof the ratio hoiL; values of the latter are shown in the figure. The peak furthest right,for which holL = 0.21, has been eluted with the lowest flow-rate, 0.58 ml/min. Thepeaks are displaced to the left as the flow-rate increases in the sequence 1.12, 1.34, and1.79 mllmin, respectively. The two peaks with the greatest displacement to the left are
~&ks a. System I, 15/.1-mvoid
!peoks a. System II, 15/.1-m
5 10 15ELUTION VOLUME (ml )
15
031
1(022
.\. 0.12"I'J 'j \
:\i" \I ~. \ \
\ .\ \
034030
f=O.4O~ \{(026,,I, \I l, \ \/ !\ \\
-,--:,-. ".\.\
0.40...
b. System II, 20/.l-m
5 10ELUTION VOLUME (ml)
o
0.400.47\ 0.21
ho \ ,-/L =0.63" ,/ i\
'Ii \.;;/h\
b. System I, 20/.l-m
0.40 0.36 y.15
\. / i,0.50" in i \
./: \ .',; " I!
~iji/ \\o
Fig. 3. Comparison of elution profiles at different flow-rates for 15-/1111 and 20-/1m microspheres in pinchedinlet system I. Values of the ratio holL are shown. The flow-rates from left to right are 1.79, 1.34, 1.12, and0.58 ml/min for panel a and 2.50, 1.98, 1.79, and 0.76 ml/min for panel b.
Fig. 4. Elution profiles of 15-/1m and 20-/1m latex particles at different flow-rates in systeml!. The flow-ratesfrom left to right are 1.12,0.94,0.85, and 0.73 ml/min for panel a and 2.01, 1.55, 1.10, and 0.91 for panel b.

PINCHED INLET CHANNEL FOR FFF 431
further distorted by satellite peaks or bumps preceding the main peak. These spuriouspeaks represent the early elution of a portion of the injected sample that has not beenfully relaxed. Such distortions are expected when halL exceeds the critical value 0.4. Asseen in the figure, the critical haiL ratio is greater than 0.4 for both of the distortedpeaks; in the worst case this ratio is 0.63 and the corresponding peak is associated witha prominent early satellite peak.
While the appearance of satellite peaks is associated with the failure to achievecomplete relaxation, some other mechanism must be sought to explain the shift in theposition of the main peak with changes in flow-rate. While not expected in the normaloperating mode of FFF, such shifts are common in steric FFF9 and reflect theincreasing influence of lift forces with increasing flow-rate.
Fig. 3b, involving 20-/lm particles in system I, shows much the same effect. In thiscase, too, the leading satellite peaks are associated with the larger haiL values.However, we note that a small satellite peak is still found when haiL reaches itsthreshold value of 0.40. This may be due to the fact that the actual relaxation ofparticles in a confined channel, particularly when they are very near the channel walls,is somewhat slower than that calculated from the Stokes equation which serves as thebasis for eqn. 7. Thus relaxation times, particularly for larger particles, may besomewhat longer than calculated, giving haiL values somewhat greater than the ideallycalculated values shown in the figure. In accordance with this hypothesis, the satellitepeak has disappeared by the time haiL has dropped only slightly to 0.36.
Similar results are shown in Fig. 4 for system II, in which the relaxation segmentis even thinner, 76 /lm in place of 127 /lm. While the same overall effects are apparent inthe two figures, the satellite peaks have become more prominent in Fig. 4. Thus in Fig.4a, a significant satellite bump is still present for the case in which haiL has dropped to0.34, well below the threshold. Only when this ratio drops to 0.30 does the satelliteprofile become largely eliminated. This heightened departure from ideal relaxation inFig. 4 is again consistent with the hypothesis that an anomaly arises due to thedecreased transport rate and increased relaxation time expected for large particles inthin channels. Since the thickness of the relaxation segment has dropped from 127 to76 /lm in going from Fig. 3 to Fig. 4, the increasing departure from ideal relaxation isexpected. This conclusion is further reinforced by Fig. 4b, showing runs with 20-/lminstead of 15-/lm particles. Here, a major satellite is still found with haiL = 0.31, buthas disappeared by the time this ratio reaches 0.22.
In general, the departure from the ideally calculated haiL value will increase withthe ratio of the particle diameter to the thickness of the relaxation segment. Fig. 4b hasthe largest ratio and, correspondingly, the largest departure. For particles ofsubmicron size separated by the normal operating mode of FFF, the departure shouldbe negligible for almost any practical thickness of the relaxation segment. We note thatthe anomaly unique to the relatively large particles subject to analysis by steric FFFcan be neutralized by dropping to slightly lower flow-rates than those calculated on thebasis of eqn. 9 subject to the condition ho ~ L 1 •
We note that lift forces, as such, should not lead to anomalous satellite peaks.With strong lift forces, the particles will not settle to a position where they makecontact with the accumulation wall. Instead, the particles will be pushed by lift forcesaway from the wall, where they will form a thin band or hyperlayer. Upon passagefrom the relaxation to the separation segment. the equilibrium hyperlayer position

432 M. H. MOON, M. N. MYERS, J. C. GIDDINGS
........
1.5 ...... Theory___ ~~~~;; flow, uniform channel) +.:/
(stopless flow, channel I)
_ Base plot(Slop flow, uniform channel) ..
E~ 1.0~I
'"WI
W
~--,0.5(L
......• ~=04
~..~.............. _1-------::,.O~~~~~:::=~=::J
o 0.1 0.2 03 04 0.5 06FLOW VELOCITY (em/5)
Fig. 5. Observed plate height versus mean tlow velocity plots contrasting performance of pinched inletchannel I and uniform channel under stopless tlow conditions. Experimental data: (+) stopless tlow,uniform channel; (.i.) stopless tlow, channel I; (0) stoptlow, uniform channel.
may change significantly relative to the various streamplanes in the channel. However,as long as all particles emerge from the relaxation segment in a thin band, the transitionshould lead to little additional dispersion no matter what the relative positions of thebands in the two segments are. Thus, in general, the object of the relaxation segment isto rapidly gather component particles into a thin lamina whose position can lieanywhere between the channel walls.
The efficacy of the pinched inlet structure is further illustrated in the plate heightversus velocity plots of Fig. 5, obtained for the IS-Jim latex. The lower plot is based onmeasured values (open circles) of plate height (H based on eqn. 11) obtained for theuniform (non-pinched) channel structure under the stopflow conditions. The plotimmediately above applies to pinched inlet channel J operated under stopless flowconditions. The experimental points (solid triangles) do not lie significantly higherthan those of the lower plot, despite the stopless flow operation. The dashed line,calculated from eqn. 18 [where the lower plot is taken as the base plot corresponding toHI (stopflow)], verifies that there is little increase in the plate height when the pinchedinlet configuration is used for stopless flow. However, stopless flow operation with theuniform channel displays a dramatic rise in plate height as illustrated by theexperimental points (solid diamonds) and theoretical curve (dotted line) of the upperplot. These plots clearly illustrate the potential usefulness of the pinched inletconfiguration for a stopless flow operation in FFF.
ACKNOWLEDGEMENT
This work was supported by Grant GM 10851-33 from the National Institutes ofHealth.
REFERENCES
I J. C. Giddings, Sep. Sci. Tee/mol., 24 (1989) 755.2 F. J. Yang, M. N. Myers and J. C. Giddings, Anal. Chem., 49 (1977) 659.3 J. C. Giddings, Anal. Chem., 57 (1985) 945.4 M. E. Hovingh, G. H. Thompson and 1. C. Giddings, Anal. ('hem .. 42 (1970) 195.

PINCHED INLET CHANNEL FOR FFF 433
5 R. E. Peterson II, M. N. Myers and J. C. Giddings, Sep. Sci. Tee/mol., 19 (l9S4) 307.6 C. A. Price, Centrifugation in Density Gradient, Academic Press, New York, 1982.7 J. C. Giddings, Anal. Chern., 35 (1963) 353.8 J. C. Giddings, M. N. 'Myers, K. D. Caldwell and S. R. Fisher, in D. Glick (Editor), Methods of
Biochemical Analysis, Vol. 26, Wiley, New York, 1980, p. 79.9 T.,Koch and J. C. Giddings, Anal. Chern., 58 (1986) 994.


Journal of Chromatography, 517 (1990) 435-447Elsevier Science Publishers B.V., Amsterdam
CHROMSYMP. 1979
Use of field-flow fractionation to study pollutant-colloidinteractions
RONALD BECKETT*, DEIRDRE M. HOTCHIN and BARRY T. HART
Water Studies Centre, Monash University, Caulfield East, Victoria (Australia)
ABSTRACT
A new approach has been developed utilizing field-flow fractionation (FFF)methods to determine adsorption density distributions across the size spectrum of aparticulate sample. The approach has been tested using sedimentation FFF to separate colloidal matter, concentrated from river water, to which radiolabelled pollutants (orthophosphate, glyphosate, atrazine) have been adsorbed. It is expected thatthe methodology will be expanded to cover the broad size range from 1 nm to 100 J.tmby using a number of FFF subtechniques (including sedimentation FFF): the use ofvarious sensitive analytical methods will extend the range of adsorbates that can bestudied. This provides a powerful new method for studying the pollutant-particleinteractions occurring in environmental samples, as well as other similar systems.
INTRODUCTION
The association of pollutants and other trace elements and compounds withparticle surfaces plays a dominant role in determining their transport, fate, biogeochemistry, bioavailability and toxicity in natural waters, sediments and soils 1
,2. Anexample that has received much attention over a number of years is the adsorption ofvarious pollutants (e.g. trace metals, nutrients and toxic organics) to suspendedparticulate matter in river water3
; such interactions affect the transportation andeventual deposition of these pollutants in bottom sediments. The pollutants may thenconcentrate. at certain locations, such as in reservoirs and estuaries, with importantecological and even human health implications. Another example, is the role of soiland rock in adsorbing materials such as fertilizers, pesticides and radionuclides, whichinfluences their bioavailability to plants and pests and their transport through soilsand groundwater aquifers4
.
Despite the general awareness of the importance of both particulateS andcolloidal6 matter in pollutant transport, most work has been confined to the study ofparticulate matter-pollutant interactions. Even this work is dominated by the study ofmodel surfaces such as clays and iron, aluminium and manganese oxides rather thanthe more complex natural samples. This lack of study of the interactions between
0021-9673/90/$03.50 © 1990 Elsevier Science Publishers B.V.

436 R. BECKETT, D. M. HOTCHIN, B. T. HART
pollutants with natural colloidal matter is understandable given the difficulties inseparating colloidal matter from the aqueous solution. Here we use a fairly general, butsomewhat arbitrary, definition for particulate matter as material greater than I J1m insize and colloidal matter as material in the range 0.001-1 J1m. The colloidal fractionwill therefore include very small particles and macromolecules, and in most studies willbe included as part of the "filterable" or "dissolved" fraction 7
.
Thus, in the many studies undertaken to measure the uptake of a pollutant bynatural waters where the solid phase is separated from the liquid phase by eitherfiltration or centrifugation, the interactions between colloidal matter and the pollutantwill not have been measured accurately. In particular, those cases where significantcolloidal matter-pollutant interaction occurs, the proportion of the pollutantassociated with surfaces will be seriously underestimated. This may have significantimplications regarding predictions of the toxicity, since surface-bound pollutants aregenerally found to be less toxic than uncomplexed pollutants.
It is well known that particle size has a major influence on the properties ofsedimentary material and their associated pollutants8
. It directly affects the specificsurface area, settling rates, resuspension and the mechanism and extent of aggregationin natural water, as well as the ability of colloidal matter to permeate through soils androck.
The adsorption of pollutants to sediments depends on the specific surface areaand the nature of the particle surface. Although the sediment mineralogy is of someimportance, particularly in the case ofclay minerals and Fe and Mn oxides, we contendthat the ubiquitous coatings of these oxides and organic matter, which is invariablypresent on the surface of natural particles9
, may well be the dominant factor indetermining the surface adsorption density (i.e. amount adsorbed per unit area).Evidence exists suggesting that in a given sediment sample different mineral andorganic phases may be concentrated in different size ranges10
.
Although there are many useful techniques available for particle size determination and fractionation all suffer from quite serious limitations making this a difficultarea of scientific endeavour. The limitations include; the limited size range covered,inaccuracies in the theory, lack of resolution, and inability to fractionate as well as sizethe sample. These deficiencies in the commonly used separation methods havehindered attempts to gather information on the distribution of mineral phases andpollutant species within a sediment sample.
The development of a range offield-flow fractionation (FFF) techniques11 overrecent years now provides new experimental methods for separating particulate,colloidal and macromolecular (e.g. humic matter) materials from natural waters.These techniques show much promise in eliminating or at least reducing most of theshort comings noted above 12
. Sedimentation FFF has been successfully applied to theseparation and characterisation ofcolloidal matter from natural waters13 . Additionally, flow FFF has been utilised for the characterisation of macromolecules 14
, humicmatter15
,16 and smaller colloidal particles17 .
With the advent of these new FFF techniques, there now exists the possibilitythat uptake studies can be undertaken using real water samples, with the final mixtureseparated using the appropriate FFF technique. One problem that still exists is that,with a few exceptions, the FFF techniques available can only process very smallquantities of sample. Thus extremely sensitive analytical methods are required to

USE OF FFF TO STUDY POLLUTANT-COLLOID INTERACTIONS 437
detect the often small amounts of pollutant associated with the colloidal ormacromolecular matter. One such technique involves the use of radiolabelledpol1utants.
In this paper we report some preliminary results of work undertaken to study theinteraction of the nutrient orthophosphate C2 p label1ed) and the herbicides glyphosateand atrazine (both 14C labelled) with natural col1oidal matter, in which sedimentationFFF was used as the separation technique. This work illustrates a very promisingapproach that will make it possible to obtain detailed information on the distributionof pol1utants in natural sediment and soil samples.
THEORY
Sedimentation FFFThe mechanism and theory of FFF has been detailed ful1y elsewhere1 l.18-20.
The general retention equation relates the conventional retention ratio R, defined by
(1)
to a retention parameter A as follows 21
(2)
where VO and Vr are the carrier volumes required to elute unretained or retainedsamples respectively through the FFF channel; to and tr are the corresponding voidtime and retained sample elution time, assuming the carrier flow-rate is constant.
In this work a simplified approximate expression was usual1y used for theretention ratio22
R = 6A(1 - 2A) (3)
In the case of sedimentation FFF the retention parameter for sample particles ofequivalent spherical diameter d and density p is given by23
A = 6kT1WJ
2rw(p - Ps)d3 (4)
where k = Boltzmann's constantT = absolute temperaturew = centrifuge angular velocityr = centrifuge radiusw = channel thicknessPs = carrier density
Thus for constant field sedimentation FFF experiments, the diameter ofparticles eluting at a given Vr can be calculated by combining eqn. 2 or 3 with eqn. 4.
438 R. BECKETT, D. M. HOTCHIN, B. T. HART
For samples with a broad size distribution such as the suspended particulatematter used in this study it is almost mandatory to use some form of field decay duringthe run 24. Since in programmed field runs a given sample component will experiencea decreasing field strength during its elution, the value of Awill also decrease. This isaccounted for by applying the general expression in eqn. 5 (assuming the carrierflow-rate is constant)25 to obtain specific equations for a given program form.
t,
(5)
In previous work on river-borne colloids we used a time delayed exponential decayfield program 13. However, in the work presented here a time delayed power program26was used, where the centrifugal field [G(I) = w2 r] takes the form
(f 1 - f a)8G(r)=Go -f - fa
(6)
where Go = the initial field, f 1 = the constant field period before decay begins, fa =a constant with the restriction that f ~ f 1 > fa.
The advantage of this field program is that by choosing suitable parameters forGo, flo and fao it can be made to yield a fairly constant resolving power or fractionatingpower27 over the size range of interest26 .
The elution time (or volume) for a particular component can be used to calculatethe particle diameter as follows: (I) for f ~ f 1: the eqns. 1,3 and 4, which are applicablefor constant field conditions, were used; (2) for f, > f1: in all runs fa was set to -8f lo
hence the simplified equation
3foA, = ----,------,-
2(f, - fa)(7)
can be used to calculate the retention parameter of the particles, An at their time ofelution (see eqn. 41 of ref. 26). Application ofeqn. 6 above to evaluate the field strengthat elution and then eqn. 4 yields the value of d.
FracfogramsThe fractogram is a plot of the particular detector response versus volume or
time. The ordinate should be a measure of the amount of sample (or samplecomponent) per unit volume, i.e. dm/d V. The most common method for monitoringthe concentration of particles eluting from a sedimentation FFF channel is a conventionalliquid chromatography UV light detector most often operated at a wavelengthof 254 nm. This measures the attenuation of light in a small cell volume which, forparticle sizes the same order of magnitude as the wavelength of the light, will beprimarily caused by a scattering mechanism rather than absorption. As dictated by thequite complex Mie theory37 of light scattering, the relationship between solutionturbidity and particle mass concentration will be size dependent, with a sample of
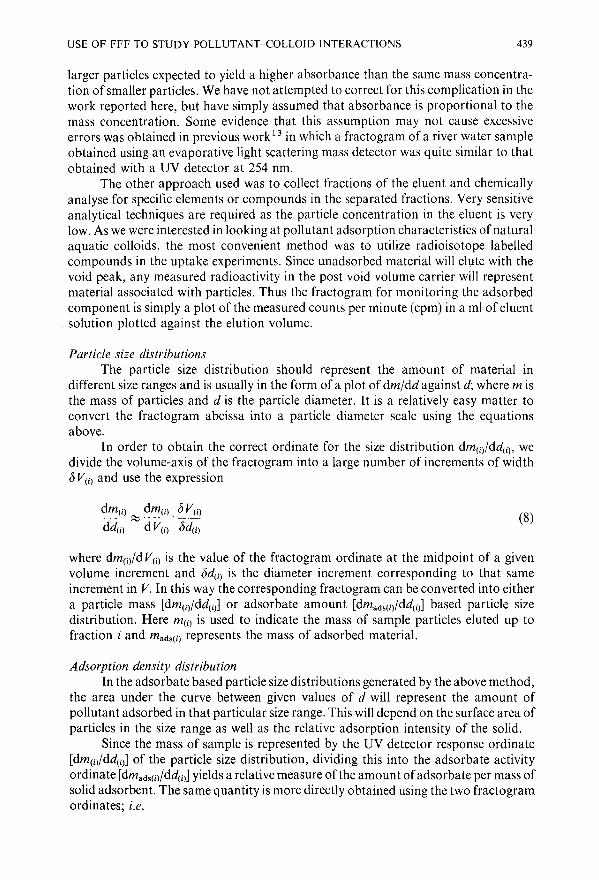
USE OF FFF TO STUDY POLLUTANT-COLLOID INTERACTIONS 439
larger particles expected to yield a higher absorbance than the same mass concentration of smaller particles. We have not attempted to correct for this complication in thework reported here, but have simply assumed that absorbance is proportional to themass concentration. Some evidence that this assumption may not cause excessiveerrors was obtained in previous work 13 in which a fractogram of a river water sampleobtained using an evaporative light scattering mass detector was quite similar to thatobtained with a UV detector at 254 nm.
The other approach used was to collect fractions of the eluent and chemicallyanalyse for specific elements or compounds in the separated fractions. Very sensitiveanalytical techniques are required as the particle concentration in the eluent is verylow. As we were interested in looking at pollutant adsorption characteristics of naturalaquatic colloids, the most convenient method was to utilize radioisotope labelledcompounds in the uptake experiments. Since unadsorbed material will elute with thevoid peak, any measured radioactivity in the post void volume carrier will representmaterial associated with particles. Thus the fractogram for monitoring the adsorbedcomponent is simply a plot of the measured counts per minute (cpm) in a ml of eluent
. solution plotted against the elution volume.
Particle size distributionsThe particle size distribution should represent the amount of material in
different size ranges and is usually in the form of a plot of dm/dd against d; where m isthe mass of particles and d is the particle diameter. It is a relatively easy matter toconvert the fractogram abcissa into a particle diameter scale using the equationsabove.
In order to obtain the correct ordinate for the size distribution dm(i)/dd(i), wedivide the volume-axis of the fractogram into a large number of increments of width1J V(i) and use the expression
(8)
where dm(i)/d V(il is the value of the fractogram ordinate at the midpoint of a givenvolume increment and 1Jd(i) is the diameter increment corresponding to that sameincrement in V. In this way the corresponding fractogram can be converted into eithera particle mass [dm(i)/dd(i)] or adsorbate amount [dmads(i)/dd(i)] based particle sizedistribution. Here m(i) is used to indicate the mass of sample particles eluted up tofraction i and mads(i) represents the mass of adsorbed material.
Adsorption density distributionIn the adsorbate based particle size distributions generated by the above method,
the area under the curve between given values of d will represent the amount ofpollutant adsorbed in that particular size range. This will depend on the surface area ofparticles in the size range as well as the relative adsorption intensity of the solid.
Since the mass of sample is represented by the UV detector response ordinate[dm(i)/dd(i)] of the particle size distribution, dividing this into the adsorbate activityordinate [dmads(il/dd(i)] yields a relative measure of the amount of adsorbate per mass ofsolid adsorbent. The same quantity is more directly obtained using the two fractogramordinates; i.e.

440
dmads(i) _ dmads(i)/d V(i)
dm(i) - dm(i)/d V(i)
R. BECKETT, D. M. HOTCHIN, B. T. HART
(9)
Furthermore, if spherical particles are assumed the particle area A(i) is given byMm(i)/d(i)p. Thus, by affecting a change of variable to eqn. 9 and assuming a samplewith constant density, we can compute the adsorption density [amount adsorbed perunit particle surface area (A)] for each increment by
(10)
Note that dmads(i)/dA(i) is expressed in arbitrary units as the absolute value ofdm(i)/d V(i)is not known with the UV detector response being used as a measure of this quantityand the term p/6 is assumed to be constant across the size distribution and is thusomitted from eqn. 10. The adsorption density distribution is a plot of dmads(i)/dA(i)versus d(i)'
EXPERIMENTAL
Sample collectionSuspended particulate matter from two Australian rivers was studied. Water
from the Darling River was sampled near its confluence with the Murray River inNSW, and the Yarra River was sampled at Dights Falls in Melbourne. These riversystems were chosen because of their high suspended solids load (Darling River: 254mg/I; Yarra River: ca. 70 mg/I) at the time of sampling28 .
Darling River water was fractionated and concentrated about one hundred-foldusing a continuous flow centrifuge and tangential flow filtration. A nominal particlesize cutoff of approximately I Jim is expected for the continuous flow centrifuge5
(centrifuge speed: 8200 rpm giving 5260 g; assumed particle density: 2.5 g/ml). With thetangential flow filtration apparatus, a nominal particle size cutoff of 0.2 Jim wasobtained using Millipore polysulphone membrane filters 28 ,29.
The water from the Yarra River was concentrated about one hundred-fold bya coagulation and settling procedure 13
. The raw sample was initially passed througha Whatman GF/C glass fibre filter to remove particles of size greater than about 1 Jim.CaCh solution was added to the water sample in sufficient quantity to give a finalconcentration of 0.03 M. The mixture was stirred for I h and allowed to settle for 24 h.The supernatant was removed and the aggregate added to a small amount of deionizedwater. This mixture was aggitated and allowed to settle. The clarified water was drawnoff, and once again deionized water introduced. This washing procedure was repeatedthree times to remove excess CaCI 2 .
River water concentrates were stored at 4°C and prior to use were subject toultrasound to break up any aggregates present.
Adsorption procedure32p in its orthophosphate form was obtained from Australian Nuclear Science
and Technology Organization (ANSTO). An aliquot of 0.3 ml of stock solution

USE OF FFF TO STUDY POLLUTANT-COLLOID INTERACTIONS 441
containing 0.02 mg/ml H 3P04 was added to 1 ml of Darling or Yarra River colloidconcentrate. The resultant activity was approximately 0.06 MBq.
14C labelled glyphosate and atrazine were obtained from Amersham Australia.A small volume (0.01 ml) of the radiolabelled glyphosate solution (7.4 MBq/ml or0.661 mg/m!) was added to 1 ml of Darling River colloid concentrate. Similarly, 0.02ml of atrazine solution (3.7 MBq/ml or 0.862 mg/ml) was added to another 1 ml ofDarling River colloid concentrate.
In each case an adsorption equilibration time of several hours was allowedbefore separation by sedimentation FFF was commenced.
Sedimentation FFF apparatusThe sedimentation FFF apparatus was essentially the same as described
previously13.18. The FFF channel was made by clamping two concentric nickelchromium rich alloy (Hastalloy C) rings with a 0.0254-cm thick mylar spacer (whichhad the channel shape cut out) sandwiched between them. The channel was 93.1 cmlong (inlet to outlet) and 2.1 cm in breath. The channel void volume was 5.30 ml anddetector dead volume was 0.54 m!. From these measurements, the channel thicknesswas calculated to be 0.0266 cm.
The channel was fitted inside a centrifuge basket so that its radius was 15.5 em.O-ring seals at the ends of the axle allowed liquid to flow through the channel while thecentrifuge rotated. The rotor was powered by a DC motor and speed controller, typeDPM-6130E from the Bodine Electric Company. Rotation speed was computercontrolled using hardware and software from FFFractionation, UT. The speed wasmeasured by a photocell whose light path was interrupted as the rotor spun bya notched disc attached to the end of the centrifuge axle. This enabled the centrifugespeed to be kept constant or in the case of field programming, to be decayed during therun.
The carrier solution was pumped by a Gilson Minipuls 2 peristaltic pump andthe outlet stream from the channel was passed through a Waters 441 UV detectoroperating at 254 nm. The detector signal was monitored on an Omniscribe chartrecorder (Houston Instruments). A Gilson Microcol TDC80 fraction collector wasused throughout these experiments.
FFF run parametersAn injection volume of 10/11 was introduced onto the channel through a septum.
To relax the sample, an initial field of 1000 rpm was maintained for 20 min understop-flow conditions. The channel flow was then started and the field decay programcommenced according to the power program outlined in the theory section above,using the following parameters. The initial field of 1000 rpm was held for a time lag t 1
of 10 min. A decay parameter ta of - 80 min reduced the field to a hold value of 10 rpmat 205 min. It should be noted that the time required to reach the hold rpm was far inexcess of that needed for the completion of these experiments.
An aqueous solution of 0.1 % sodium dodecylsulphate and 0.02% sodium azideat a flow-rate of2 ml/min was used as the carrier. Detector sensitivity ranged between0.02 to 0.05 a.u.f.s. The chart recorder was maintained at 10 cm/h. Fractions werecollected over 4 min intervals for the phosphate experiments and over 2.5 min intervalsfor the herbicide experiments.

442 R. BECKETT, D. M. HOTCHIN, B. T. HART
Analysis of activityFractions collected during these experiments were further analyzed for f3 radia
tion activity using a scintillation counter (Packard tri-carb 300 CD). An aliquot of oneml of the fractions collected during the sedimentation FFF experiment was placed ina scintillation vial. Toluene based PPO-POPOP-teric X10 scintillation fluid (5 ml) wasthen added (PPO = 2,5-diphenyloxazole, POPOP = phenyloxazolylphenyloxazolylphenyl, teric X10 == a non-ionic surfactant from ICI, Australia). After aggitation eachsample was measured for 10 min in the scintillation counter. The data collected wasuncorrected for quenching.
RESULTS AND DISCUSSION
Fig. 1 shows the raw fractograms for the adsorption experiments performed inthis work. The solid lines show the UV detector response, which were used asa measure of the mass concentration of particles being eluted, and the points show theconcentration of adsorbed material as measured by the radioactivity (cpm/ml) of thesuspension at various elution volumes. It should be noted that the elution time isproportional to the elution volume for constant flow-rate runs. The error bars on thepoints indicate the calculated counting statistic errors. Fig. 2 depicts the corresponding
Diameter
a 1 0.2 0.3 0.4 0.5 pm 0.1 0.2 0.3 0.4 0.5 pm
100 150 100 150
80 II 80j 11 111'"..., ! I 100 100c 60 60 ! II::>
>-c...
40 III I!~ 40
"
50 II 50.c
20 Iiic... 20"''" IIIE
E.=: a a 0 aa "-~ 40 80 120 160 200 ml a 40 80 120 160 200 ml ~
D-"- 2'"'" >-"'..5 ...,
o 1 a 2 o 3 a 4 a 5 pm 0.1 0.2 a 3 0.4 a 5 pm >'" ...,'"5 100 500 100
uQ. 100 "'"'"'" Ia:
80c...
"400 80 80
.su
50 'I I 300~
50 600
>- 40 200 40 40::JI I\ I
20
~100 20
II~20
ii, I I
0'. . ...
a 0 aa 40 80 120 150 200 ml a 40 80 120 160 200 ml
Volume
Fig. 1. Fractograms showing the sedimentation FFF separation of natural colloid samples with adsorbedradiolabelled pollutant: (A) orthophosphate onto Darling River colloid concentrate; (B) orthophosphateonto Yarra River colloid concentrate; (C) glyphosate onto Darling River colloid concentrate; (D) atrazineonto Darling River colloid concentrate. Solid lines give the UV detection response and points give theradioactivity (cpm/ml) in the effluent.

USE OF FFF TO STUDY POLLUTANT-COLLOID INTERACTIONS 443
Volume40 80 120 160 200 ml 40 80 120 160 200 ml
25 60
10 I 50
20A 50 8
~II 40
40
c 15I, 'I::>
30 6 30
~ 10 II I,'"c... I 20 4 I 20~
.c II,II
~ 510 2 1'1 10
c... , , EQ.> .. '"~
0 0 0 ----Q.> 0 '"E 0.0 0.1 0.2 0.3 0.4 0.5 um 0.0 0.1' 0.2 0.3 0.4 0.5 um ~.::: xC> :::E
~0-2
'"§ 40 80 120 160 200 ml 40 80 120 160 200 ml 17Q.> 10 20 10 10 ><nc ~
0 C U0. <:<nQ.>
15ccc....euQ.>
10~ IQ.>Cl ,>=>
0 0 0 00.0 0.1 0.2 0.3 0.4 0:5 um 0.0 0.1 0.2 0.3 0.4 0.5 um
Diameter
Fig.2. Particle mass based and adsorbate based size distributions for the corresponding colloid samples andadsorbed radiolabelled pollutants given in Fig. lA-D. Solid lines give the particle size distributions andpoints give the amount of pollutant adsorbed per unit mass of adsorbent (arbitrary units).
mass based (solid lines) and adsorbate based (points) particle size distributionscalculated from the fractograms in Fig. 1 as outlined in the theory section. The massbased particle size distribution for the two samples (Darling and Yarra Rivers) showa broad size distribution between 0.05 and 0.5 {tm. The upper limit is controlled by thecontinuous flow centrifuge conditions used to concentrate the samples from riverwater. The fact that particles less than the O.2-{lm filter cutoff are present is most likelydue to partial blockage of the pores during filtration or perhaps variations in theparticle density, from the value of 2.5 g/ml assumed, which would affect the calculatedparticle size. The data show that the Darling River sample contains a higherproportion of smaller particles than the Yarra River sample as evidenced by themaxima in the particle size distributions of approximately 0.08 {lm and 0.14 {lm,respectively. The Darling River samples are from the same stock except that the sampleused in Fig. Ie and D are more dilute than for Fig. IA.
Both the fractograms and adsorption distributions (points in Figs. 1and 2) showthat significant amounts ofphosphate and glyphosate adsorbs to the particles, but verylittle of the less polar herbicide atrazine is adsorbed. This is consistent with the resultsfrom conventional adsorption isotherm experiments that have recently been conducted in our laboratory3o.
The adsorption distributions given in Fig. 2 show clearly the general trend often

444 R. BECKETT,D. M. HOTCHIN, B. T. HART
observed for sediment samples, with the smaller particles containing the highestpollutant content. This is an important point for pollutant transport in aquaticsystems, since these particles will usually remain in suspension until an aggregationprocess occurs to induce settling and deposition. The two reasons often advanced toexplain this trend in pollutant sorption are the increase in specific surface area asparticle size decreases and changes in the geochemistry of the particles with size.Organic matter and reactive hydrous iron and manganese oxides would be the mostsignificant phases influencing pollutant sorption, since both are known to be strongscavengers of many pollutants.
The surface adsorption density distributions calculated for these experiments aregiven in Fig. 3. These plots show the amount of adsorbate per unit area of particlesurface (arbitrary units) as a function of particle size, calculated as outlined in thetheory section.
A model that explains many of the properties of natural particles is one in whichall particles irrespective of their core mineralogy are assumed to be coated witha common layer of organic matter and perhaps iron and ll1anganese hydrous oxides8 .
For example, this model explains the observation that (with few exceptions) all naturalaquatic particles are negatively charged, and that within a given sample they havea very narrow range ofelectrophoretic mobilities9
. Of relevance to the studies reportedhere, this model would predict that the adsorption density for a given pollutant-colloidsystem would be constant across the size range investigated. This was found to be thecase for the adsorption of orthophosphate onto Darling River suspended particulatematter (Fig. 3A).
1.0 2.5
0.8 2.0 Ien I...., 0.6 1.5co
">- 0.4 1.0 I I'-rn
I Ib111 11"1 I I I I I!
D 0.2 I 0.5 III'- I !llIftl llirn
~ 0.0 0.0
----0.0 0.1 0.2 0.3 0.4 0.5 0.6 0.0 0.1 0.2 0.3 0.4 0.5 0.6
~-S
4.0 1.0>-....,
"'co
I 0.8<U 3.0 !""co I0
I I 0.6....,0- 2.0 III I'- IIg
III' 0.4"0<C I
1.0 I0.2
I I""'1 1 •
0.0 0.00.0 0.1 0.2 0.3 0.4 0.5 0.6 0.0 0.1 0.2 0.3 0.4 0.5 0.6
Diameter ImicrometrelFig. 3. Adsorption density distributions (amount adsorbed per unit area versus particle diameter) calculatedusing the data shown in Fig. I.

USE OF FFF TO STUDY POLLUTANT-COLLOID TNTERACTIONS 445
However, in contrast to the orthophosphate Darling River experiment, theadsorption density distributions for the other systems showed a distinct increasetowards the larger diameter end of the range (Fig. 3B-D). This is not an anomolyintroduced by the use of the UV detector to monitor particle mass, since lightscattering effects would in fact tend to down weight the large diameter end of thedistribution. However, it is feasible that changes in shape factor could cause thespecific surface area to be greater than expected for the larger particles as thecalculations here are based on a constant spherical shape. Scanning electronmicrographs ofa limited number of Yarra River suspended particulate matter samplesseparated by sedimentation FFF did show higher proportions ofclay-like plates in the0.3-0.4,um fraction 3!. However, the samples used in this series ofexperiments have notbeen examined by electron microscopy.
Perhaps the most likely explanation for the upwards trend in the adsorption density distributions is a change in mineralogy or coating density across the size range. Wedo not have information on this at present although two current collaborative projects,one with Dr. H. Taylor (US Geological Survey, Denver) using inductively coupledplasma-mass spectroscopy (ICP-MS) and the other with Dr. D. Chittleborough(Waite Agricultural Research Institute, University of Adelaide) using transmissionelectron microscopy and diffraction techniques, should provide some insights into thisquestion.
One further point that should be noted is that the experiments performed in thisstudy will only monitor adsorbate species which are strongly bound to the adsorbentsurface. During the FFF separation processes, the colloid sample is continuallywashed with fresh carrier giving ample opportunity for desorption to occur. However,it is possible that equilibrium experiments could be performed by including a fixedconcentration of the adsorbate in the carrier liquid. This approach would be feasibleprovided the experimental conditions are such that significant adsorption to theparticles occurs causing the adsorbate concentration in the eluent to be elevated abovethe background carrier solution level, so that the changes can be detected.
The size range that can be conveniently covered using the sedimentation FFFinstrument we are using (FFFractionation) is approximately 0.05-1 ,urn in diameter.Higher speed centrifuges (e.g. Dupont SF3) may reduce the lower size limit to perhaps0.01 ,urn. The methodology developed here could equally be applied to data producedfrom other high resolution separation techniques. For example, we have used flowFFF to determine molecular weight distributions of humic substances!s.!6. Considering the recent interest in the association of trace metals and toxic organic compoundswith humic substances in natural waters32.33 this should be a valuable tool forinvestigating the molecular size dependence of such association.
Although sedimentation FFF is capable of separating particles of diametergreater than I ,urn using the steric mode34, this has lower resolution and theoreticalexactness than the normal mode generally used for particles less than I ,urn in size.However, recent work reported from Giddings' laboratory in Utah3s.36 has shownexcellent resolution and reproducibility for the larger particles (1-100 ,urn) using a newhyperlayer mode of FFF.
Thus, it is conceivable that a combination of these FFF techniques [hyperlayerFFF (1-100 ,urn); sedimentation FFF (0.05-1 ,urn); Flow FFF (0.001-0.05 ,urn)] couldallow particles in the ranges between I ,urn to 100 ,urn to be separated, permitting the

446 R. BECKETT, D. M. HOTCHlN, B. T. HART
complex relationship between size, geochemistry and pollutant binding in naturalaquatic systems to be unravelled.
CONCLUSIONS
Previous work 13 has demonstrated that aquatic colloids can be separated withhigh resolution and sized using sedimentation FFF. In this study we have shown howadsorption experiments using radiolabelled compounds can be used to computesurface adsorption density distributions to yield hitherto unobtainable informationabout the adsorption of various pollutants to natural particles. The use of othersensitive analytical techniques such as ICP-mass spectrometry or electrochemicaldetectors should extend the range ofadsorbates that can be studied. In this preliminarystudy we have demonstrated the general methodology using sedimentation FFF,however, the size range that can be covered should be able to be extended by the use ofdifferent FFF subtechniques or other high resolution separation methods.
ACKNOWLEDGEMENTS
This research was supported by a grant from the Australian Research Council.We wish to thank Professor Giddings for his continued help and encouragement in ourefforts to establish an FFF research program.
REFERENCES
I W. Stumm, Water Sci. Technol., [4 (1982) 481.2 B. T. Hart (Editor), The Role ofParticulate Maller in the Transport and Fate ofPollutants, Water Studies
Centre, Chisholm Institute of Technology, Melbourne, 1986.3 B. T. Hart, Hydrobiologia, 91 (1982) 299.4 R. P. Schwarzenbach and J. WestalI, Environ. Sci. Technol., [5 (1981) 1360.5 P. Sinclair, R. Beckett and B. T. Hart, Hydrobiologia, 176/177 (1989) 239.6 J. C. Means and R. Wijaratne, Science (Washington, D.C.), 215 (1982) 968.7 W. Sa[omons and U. Forstner, Metals in the Hydrocycle, Springer-Verlag, Berlin, 1984, p. 10.8 R. Beckett, B. T. Hart (Editor), The Role of Particulare Maller in the Transport and Fate o/Pollutants,
Water Studies Centre, Chisholm Institute of Techno[ogy, Melbourne, 1986, p. 113.9 R. Beckett and N. P. Le, Colloids Swf, 44 (1990) 35.
10 R. J. Gibbs, J. Sed. Petrology, 47 (1977) 237.II J. C. Giddings, Chern. Eng. News, 66 (1988) 34.12 R. Beckett, Environ. Technol. Lett., 8 (1987) 339.13 R. Beckett, G. Nicholson, B. T. Hart, M. Hansen and 1. C. Giddings, Water Res., 22 (1988) 1535.14 K. G. Wahlund, H. S. Winegarner, K. D. CaldwelI and J. C. Giddings, Anal. Chern., 58 (1986) 735.15 R. Beckett, Z. Jue and 1. C. Giddings, Environ. Sci. Technol., 21 (1987) 289.16 R. Beckett, J. C. Bigelow, Z. Jue and 1. C. Giddings, in I. H. Suffet and P. MacCarthy (Editors), Aquatic
Humic Substances (Advances in Chemistry Series, Vol. 219) American Chemical Society, Washington,DC, 1989, p. 65.
17 J. C. Giddings, G. C. Lin and M. N. Myers, J. Colloid Interface Sci., 65 (1978) 67.18 J. C. Giddings, M. N. Myers, K. D. Ca[dwelI and S. R. Fisher, in D. Glick (Editor), Methods of
Biochemical Analysis, Vol. 26, Wiley, New York, 1980, p. 79.19 J. C. Giddings, Sep. Sci. Technol., 19 (1984) 831.20 J. Janca, Field-Flow Fractionation Analysis ofMacromolecules and Particles (Chromatographic Science
Series, Vol. 39), Marcel Dekker, New York, 1988.21 M. E. Hovingh, G. H. Thompson and J. C. Giddings, Anal. Chern., 42 (1970) 195.22 J. C. Giddings, J. Chern. Educ., 50 (1973) 667.

USE OF FFF TO STUDY POLLUTANT-COLLOID INTERACTIONS 447
23 J. C. Giddings, G. Karaiskakis, K. D. Caldwell and M. N. Myers, J. Colloid Inteljilce Sci., 92 (1983) 66.24 1. C. Giddings and K. D. Caldwell, Anal. Chem., 56 (1984) 2093.25 F. J. Yang, M. N. Myers and J. C. Giddings, Anal. Chem., 46 (1974) 1924.26 P. S. Williams and J. C. Giddings, Anal. Chem., 59 (1987) 2038.27 J. C. Giddings, P. S. Williams and R. Beckett, Anal. Chem., 59 (1987) 28.28 G. B. Douglas, R. Beckett and B. 1. Hart, Hydrological Processes, (1990) submitted.29 A. J. Hor~witz, Environ. Sci. Tee/mol., 20 (1986) 155.30 G. M. Day, M. App. Sci. Thesis, Chisholm Institute of Technology, Melbourne, 1990.31 G. J. Nicholson, M. App. Sci. Thesis, Chisholm Institute of Technology, Melbourne, 1987.32 B.1. Hart, Environ. Technol. Lell., 2 (1981) 95.33 J. Buffle, Complexation Reactions in Aquatic Systems, Ellis Horwood, Chichester, 1988.34 1. Koch and J. C. Giddings, Anal. Chem., 58 (1986) 994.35 S. K. Ratanathanawongs and J. C. Giddings, J. Chromatogr., 467 (1989) 341.36 B. N. Barman, M. N. Myers and J. C. Giddings, Powder Tee/mol., 59 (1989) 53.37 M. Kerker, The Scallering of Light and Other Electromagnetic Radiation, Academic Press, New York,
1969.


Journal of Chromatography, 517 (1990) 449-458Elsevier Science Publishers RV., Amsterdam
CHROMSYMP. 1924
Quantitative correlations between solute molecular structureand solubility in supercritical fluids
JERRY W. KING* and JOHN P. FRIEDRICH
Northern Regional Research Center, Agricultural Research Service, United States Department of Agriculture, 1815 North University Street, Peoria, 1L 61604 (U.S.A.J
ABSTRACT
There is a current need in the fields of supercritical fluid extraction and supercritical fluid chromatography (SFC) for rapid and simple methods of estimating asolute's solubility level in the dense gaseous solvent. Utilizing the solubility parametertheory developed by Giddings, we have developed a method which permits the quantitative estimation of solute solubility levels in dense and liquefied gas media over arange of pressure and temperatures. The described method incorporates the ratio ofthe solubility parameter of the extraction gas to that of the dissolved solute, therebypermitting correlations to be made for a number of solute-gas combinations. Techniques are also presented that permit solute solubilities to be estimated from a knowledge of the solute's molecular structure. The above methods have been applied tosuch applications as the extraction of organic solutes from aqueous media with liquefied carbon dioxide and supercritical fluid chromatography.
INTRODUCTION
The modern era of supercritical fluid extraction (SFE) has spawned a widenumber of diverse applications in the areas of natural product extraction and foodprocessing. As in many fields of technological endeavor, theoretical developments insupercritical fluid technology have trailed experimental and application studies. Thistrend is most unfortunate since there is a critical need for basic thermodynamic andkinetic models upon which to optimize extraction and separation conditions. Currenttheoretical developments in this field have included the application of statisticalmechanical models 1,2 , equation of state methods3,4 and a diverse array of solutionthermodynamic conceptsS
-7 to explain and correlate phase equilibria and solubility
phenomena in supercritical fluids. In general, the above approaches require extensivephysicochemical data to characterize solute-solvent (gas) interactions and they havebeen applied mostly to a limited number of structurally-simple solutes dissolved insupercritical carbon dioxide. Such theoretical methods currently find limited use inpractical applixcations, in part due to the molecular complexity of the solutes that are

450 J. W. KING, J. P. FRIEDRICH
being extracted and the lack of physical property data on these moieties.Over the past seven years, we have applied solubility parameter theory8,
interaction parameters9 and corresponding states methods to explain the salientfeatures of SFE. One advantage of the above approach is the availability of requireddata for both the solvent gas and extracted solutes that are required by the regularsolution or corresponding states theory. Utilizing critical property data and solutesolvent solubility parameters, one can estimate the required gas pressures (or density)to affect maximum solute solubility in the dense gas phase. Prediction of this solubilitymaximum can be determined bylO
(1)
where Xis the total interaction parameter, Xs is the entropic interaction parameter, 15 1 isthe solubility paramete!:. of the gas as a f(T, P), 15 2 is the solubility parameter of thesolute as a f(T, P), and VI is the molar volume of the gas as a f(T, P), R is the molar gasconstant, T is the absolute temperature and P is the pressure.
Similarly, miscibility of the solute in the supercritical fluid can be predicted tooccur at a discrete pressure, which can be ascertained by solving for the intersection ofXand Xc as a function of pressure, where the Flory critical interaction parameter, Xc, isgiven by
(2)
and x = V2 /Vb where V2 is the molar volume of the solute.The above equations have been tested in a number of cases involving
supercritical fluid equilibria and have been found to predict results that agree withexperimental data, provided that the temperature and pressure dependence ofsolubility parameters and molar volumes are utilized in the calculations. Pertinentapplications have included vegetable oil extraction 11 polymer solution thermodynamics 12 and supercritical fluid chromatography (SFC)10,13.
HISTORICAL BACKGROUND
Correlation of a solute's molecular structure with its solubility in a supercriticalfluid has been qualitatively attempted by several investigators. Stahl et al. 14
, utilizingthe results from his extensive micro-extraction studies, formulated several extractionrules based on changes in a solute's molecular structure to qualitatively predict theextent of a solute's dissolution in supercritical carbon dioxide. Qualitative trends insolute solubilities have also been summarized by Hyatt 15 and byDandge et al. 16 whosupplemented the extensive liquid carbon dioxide data of Francis1
? with additionaldata from their experimental studies. A concise summary of solubility in liquid carbondioxide has also been reported by Sims l8
. In a recent extensive review Rizvi et al. 19
have discussed the current state of knowledge regarding solute solubilities insupercritical fluid media.
There is currently a need for methods that allow the rapid quantitativeassessment of a solute's solubility in a supercritical fluid. Such information is criticalfor rendering decisions regarding the feasibility of applying supercritical fluid

STRUCTURE-SOLUBILITY CORRELATIONS IN SFs 45\
extraction to an array of engineering and analytical problems. As noted by McHughand Krukonis20 , there have been several bizarre attempts to apply SFE to theextraction ofcompounds exhibiting limited solubility in supercritical fluid media. Suchquestionable applications could be avoided if correlations existed between a solute'smolecular structure and its recorded solubility in a particular supercritical fluid. Thedevelopment of simple predictive methods to address the above problem is difficultdue to the limited solubility data bases available and the diversity of units in whichsolute solubility data are frequently reported.
THE REDUCED SOLUBILITY PARAMETER CONCEPT
In this study, we have utilized the concept of the reduced solubility parameter, L1,to correlate solubilities and their distribution coefficients in supercritical andnear-critical fluids under a variety of extraction conditions. The reduced solubilityparameter is defined as21
(3)
where b1 can be calculated by methods described below and b2 is determined fromstandard sources22
. It should be noted that this definition of "reduced solubilityparameter" differs from that utilized by Prausnitz23 and Allada24 who defined theterm as the solubility parameter of the gas divided by the square root of the gas criticalpressure. The ratio of the solubility parameter of the solvent (gas) to that of the soluteacutely reflects the strength of the solute-solvent interactions under a variety ofpressure and temperature conditions and was first suggested by Giddings et al. 21 in1969. As an aid in our correlations we have employed the group contribution methodof Fedors25 to compute the solubility parameters for'many structurally complexsolutes such as carotenoids, alkaloids, pesticides, sterols and antibiotics. By incorporating this latter concept into our method, we have made b2 a function of molecularstructure and therefore L1 sensitive to changes in solute structure relative to the solventgas.
To Qescribe the solvent power of the dense gas, we have used the equationproposed by Giddings et al. 26 in whiCh the solubility parameter of the gas is given by
(4)
where Pc is the fluid critical pressure, Pr, SF the reduced density of the critical fluid, andPr, liquid is the reduced density of the fluid in the liquid state. This equation has beenshown to reflect the variance in solvent power of the gas as a function of pressure andtemperature and is dependent on the chemical nature of the extraction fluid throughPc. Reduced densities for a variety of fluids can be determined by using gas densitiesand the appropriate critical constant, or in the absence of actual gas density data,through corresponding states relationships. Reduced densities of fluids in their liquidstate are computed at infinite pressure and the proper reduced temperature fromcorresponding states tables,

452
RESULTS AND DISCUSSION
J. W. KING, J. P. FRIEDRICH
Solute solubilities in supercritical fluids depend not only on a variance in themolecular structure, between solutes, but also on the pressure and temperature atwhich the extraction is performed. Such factors can make a solute's solubility in thedense gas phase vary over many orders of magnitude. However, in general, solubilitiesrecorded in supercritical fluids are less than those recorded in liquid solvents. Anexample of this solubility trend is shown in Fig. 1where weight fraction solubilities forvarious solutes dissolved in supercritical fluid ethylene are plotted against the reducedsolubility parameters ,1. The solubility data were obtained from the "classical Zosel"patent issued to SGK27 and encompass a variety of solutes of varying polarity thesolubility parameters of which are known. The reported solubility data in ethylene forthese compounds encompassed a wide range of reduced pressures (1.19-3.96) andessentially isothermal conditions (20-25°C). The wide variation in reported solubilitiesis conveniently handled by using a logarithmic concentration scale for the ordinatewhile the variation in solute solubility parameters (7.77-14.4 caI 1
/2 jcm3
/2
) and gassolubility parameters (3.84--6.4 caI 1
/2 jcm3
/2
) is encompassed in the reduced solubilityparameter scale on the abscissa. Note that as the ratio of the solubility parameter of thegas to that of solute increases, there is a substantial increase in the recorded solubilityup to a reduced solubility parameter of0.5. To a large extent, the recorded trend in thesolubility data is reflective of the changing chemical nature of the solute molecule withmaximum solubilities being recorded as the reduced solubility parameter tends tounity. The data shown in Fig. 1 appear to obey a functional form that can beconveniently fitted by a polynomial equation over the entire range of experimentaldata.
As indicated in Fig. 1, solute solubilities recorded at reduced solubilityparameter values ofless than 0.5 are extremely sensitive to changes in solute molecularstructure. The results presented in Fig. 2 for supercritical carbon dioxide-solutesystems further corroborate this trend, even among polar solutes of varying molecular
-1.0
-2.0
c: -3.0o
~ -4.0
.E -5.0Cl
~ -6.0
~ -7.0
-8.0
-9.0
0.1 0.20.3 0.4 0.5 0.6 0.7 0.8 0.9!:J.
Fig. I. Natural logarithm of solute weight fraction solubility in ethylene vs. reduced solubility parameter(based on experimental solubility data by ZoseJ27).

STRUCTURE-SOLUBILITY CORRELAnONS IN SFs 453
-4.0
-5.0
c -6.000g
-7.0~:E -8.0en
~ -9.0
~ -10.0
-11.0
-12.0
Coumarin
trans-Cinnamic acid
Hydroquinone
p-Hydroxybenzoic acid
0.1 0.2 0.3 0.4 0.5 0.6 0.7 0.8 0.9/j,
Fig. 2. Natural logarithm of solute weight fraction solubility in carbon dioxide (100 atm, 40°C) vs. reducedsolubility parameter.
structure. The recorded weight fractions for the compounds (taken at 100 atm and40°C), in Fig. 2 were interpolated from the studies of Schilz28 , while the solutesolubility parameters were computed by the Fedors method. Fig. 2 shows therelationship between the natural logarithm of the weight fraction solubility and thecorresponding reduced solubility parameter Ll for the designated solutes in carbondioxide at 100 atm and 40°C. The data presented range in magnitude from a weightfractionof7.7·1O- 3forcoumarin(62 = 10.5call/2/cm3/2)toavalueof5.5·1O-6forpolar p-hydroxybenzoic acid (15 2 = 13.94 caJl/2/cm3/2). A similar correlation has alsobeen found to hold for phenolic solutes dissolved in supercritical carbon dioxide inwhich the solubility parameters of the solutes ranged from 13.96 to 21.4 caI 1
/2/cm3/2.
Such correlations are valuable for they permit the rapid estimation of solutesolubilities under similar extraction conditions when knowledge of the solute'ssolubility parameter and molecular structure are available.
TABLE I
CALCULATION OF THE SOLUBILITY PARAMETER FOR CAFFEINE
Group LIs, (cal/em3) Llv, (em 3/mol)
~Y33 CH 3 3375 100.52C= 2060 -11.0
~N IN) I CH= 1030 13.53N 3000 -27.0
o~ NI-N= 2800 5.02C=O 8300 21.6
N 2 5-6-member 500 32.0ICH3
rings2 conjugated 800 -4.4
02 = 12.96 double bonds21 865 130.2

454 J. W. KING, J. P. FRIEDRICH
An example of the above approach using the group contribution method ofFedors is given in Table 1. Here the solubility parameter for caffeine has beencomputed by summing the individual group contributions for the energy ofvaporization Llej and molar volume Llvj to the overall structure of the solute molecule.The solute's solubility parameter is calculated by taking the square root of the ratio ofthe sum of the energy contributions over the sum of respective group molar volumes24,15 2 = (ELleJ[Llvj)1 /2. For caffeine, which has been extracted industrially withsupercritical carbon dioxide, the solubility parameter value is 12.96 call12/cm312.Interpolating in Fig. 2 using a reduced solubility parameter of 0.44 yields a value of4.0' 10- 4 for the weight fraction solubility of caffeine under the same extractionconditions. This value compares favorably with the experimentally determined valueof 3.3 . 10- 4 determined by Schilz28.
Fedors' method is extremely valuable in ascertaining the cohesional energydensity of complex molecules. With this method one does not even have to depend onthe type of relationships noted above to reach seminal conclusions regarding thepotential for extracting a compound under SFE conditions. Applications of this groupcontribution method to bioactive molecules, such as imipenum and efrotomycin whichhave been extracted by Larson and King29 with supercritical carbon dioxide at 40°Cand 5000 p.s.i.g. (15 1 = 8.2 call12/cm3f2), supports the correspondence between solutesolubility parameter and solute solubility levels in supercritical fluids. For example,efrotomycin, a large molecule exhibiting antibiotic activity, has a solubility parameterof 12.1 cal1/2/cm3f2 and a weight fraction solubility in the dense gas phase of3.0 . 10- 4.By comparison, imipenum, whose molar volume is 6.5 times smaller then efrotomycin's has a solubility parameter of 16.4 call12/cm312 and exhibits no recordedsolubility in carbon dioxide under the above-cited conditions. Good agreement is alsorecorded when one compares solubility parameters computed from Fedors' methodwith those obtained from other sources. As shown in Table II, the solubilityparameters determined by Fedors' method for sterols agree well with the values givenby Wong and Johnston3o .
Reduced solubility parameter correlations can provide a better understanding ofthe solubility trends in liquefied gases. Fig. 3 shows the correlation between Ll and themolar distribution coefficients, K (m), of various solutes partitioning between waterand liquefied carbon dioxide held at 16°C (15 1 = 7.15 call12/cm312). The distributioncoefficient data presented in Fig. 3 were taken from the studies of Schultz andRanda11 31 , in which odoriferous alcohols and esters were recovered from aqueous
TABLE II
COMPARISON OF SOLUBILITY PARAMETERS CALCULATED BY TWO DIFFERENTMETHODS FOR STEROLS
Sterol Solubility parameter (cap l 2 /CI11 3/2 )
CholesterolStigmasterolErgosterol
Wong and Johnston 30
9.28.89.1
Fedors25
9.69.59.4

STRUCTURE-SOLUBILITY CORRELATIONS IN SFs
1000 c::---------::-:--------,
455
0.1 L----l_--l._---L_-.L_---"--_--'---'0.2 0.4 0.6' 0.8 1.0 1.2
L1
Fig. 3. Molar distribution coefficient vs. reduced solubility parameter for solutes partitioning betweenwater and liquid carbon dioxide (16°C). Symbols: • = alcohols; 0 = esters.
media by partitioning into liquid carbon dioxide. The semilogarithmic relationshipbetween distribution coefficients and L1 is exemplified by the fit of a linear regressionline to the data in Fig. 3. The value of such a correlation becomes apparent when one isconsidering the recovery ofother candidate solutes from aqueous media. For example,the small distribution coefficients (0.002-0.010) found for polar solutes such as aceticacid, dimethylformamide and ethylene glycol are predicted by use of the reducedsolubility parameter scale. Extraction of these solutes into liquefied carbon dioxide is'somewhat impractical, in part due to the high solvent-to-feed ratio requirements.Nevertheless, their removal by critical fluid extraction has been proposed and cited inthe literature32 ,33.
The comprehensive solubility studies performed in liquefied carbon dioxide byFrancis17 over three decades ago have been cited by numerous investigators asa qualitative guideline for predicting solute solubilities in supercritical carbon dioxide.Such a data base, consisting of over 260 binary systems, is potentially correlatable byusing the reduced solubility parameter concept. Unfortunately, much of the solubilitydata consisted of visual observations concerning total or complete immiscibility,determined in an era when appropriate quantitative analytical methods were limited.However, for certain cited systems, compositions were determined for both theliquefied carbon dioxide and second component layers. By using the weight fractioncompositions for each of the respective phases, we have been able to definea distribution coefficient K(w) as:
weight fraction of solute in the liquefied carbon dioxide phaseK(w) = . h f . fl' h d h (5)welg traction 0 so ute III t e secon p ase

456 J. W. KING, J. P. FRIEDRICH
which is a measure of solute (second component) partition into the liquid carbondioxide phase. Thirty-four of these solute distribution coefficients for an array ofsolutes partitioning into liquefied carbon dioxide have been plotted versus L1 ona semi-logarithmic graph in Fig. 4. Upon initial examination of Fig. 4, the data appearto yield no recognizable trend. However, classification of the individual systems bytype of compound and their respective solubility parameters allows some conclusionsto be drawn. The filled circle symbols represent very polar solutes, such as glycols,amides and amines, the solubility parameter values of which fall between 13 and 18cal 1
/2 /cm 3
/2 and which have a L1 of 0.2-0.5. Distribution coefficients for these
compounds appear generally to lie below 0.01, consistent with their low solubility inliquefied carbon dioxide. Solutes of intermediate polarity (open circles), appear tohave a L1 that falls between 0.5 and 0.7. Compounds in this group include substitutedaromatic moieties, halogenated solutes and alcohols. Finally, solutes having solubilityparameters less than 9.0 cal 1
/2 /cm 3
/2 (half-filled circles) tend to exhibit distribution
coefficients greater than 0.1. These include hydrocarbons, which partition partiallyinto liquefied carbon dioxide or exhibit total miscibility with the liquefied gas. Whenthe results of Fig. 4 are viewed in the above context, one has only to obtain a solute'ssolubility parameter to ascertain that solute's propensity for partitioning into theliquefied qubon dioxide phase.
Currently, the field of SFC is undergoing a renaissance due largely toimprovements in instrumentation that can conviently handle highly compressedsupercritical fluid eluents. Here, as in the above cases, a knowledge of the relativesolubilities or partitioning behavior of the injected solutes in the column is critical tomaximizing component resolution in the minimum amount of analysis time. The
1.0~------------,
o 0
oo o.
0.1 b-
]: 0.01 b-
'"
0.001 t:- •
00
oo
eo.oo
31.8-12.7 12.7-10.610.6-9.1 9.1-7.9 7.9-7.1
0.0001 '-----'_----'-_......J-_-'-_--'-_...J---l0.3 0.4 0.5 0.6 0.7 0.8
11
Fig. 4. Distribution coefficient vs. reduced solubility parameter for solutes partitioning into the liquidcarbon dioxide phase (2YC).

STRUCTURE-SOLUBILITY CORRELATIONS IN SFs
0.10
~I ><0.08
,z
.E 0.06 . "INN\--'0 ..Cl:> 0.04 "" ., .0.02 ..
,r"
I".
I
0.0 0.1 0.2 0.3 0.4,1
457
Fig. 5. RTIV2i5~ In(Kid"dK) vs. the reduced solubility parameter for solutes partitioning betweensupercritical carbon dioxide and squalane (40°C). Symbols:. = benzene; ... = methanol; • = ethanol.
relative partitioning behavior of solutes with respect to each other and a low-pressurereference state (Kideal) was formalized by Giddings et al. 21
(6)
where K is the chromatographic partition coefficient. Eqn. 6 is expressed in reducedcoordinates and predicts a general parabolic dependence of the solute's partitioncoefficient ratio on ,1. To illustrate the usefulness of the above concept, datainterpolated from the studies ofSie et al. 34 have been used (Fig. 5) to construct a graphfrom Eqn. 6 for three solutes partitioning between squalane and carbon dioxide held at40°C over the pressure range of 1-70 atm. By using the reduced solubility parameter asthe ordinate of this figure, all of the data points for the solutes having significantlydifferent solubility parameters can be made to conform to the same equation over theentire experimental pressure range. This conformity suggests that the partitioncoefficients could be predicted for additional solutes chromatographed under similarconditions if their reduced solubility parameters were computed. The above relationship has been shown to apply to other solute-column combinations, and its generalapplicability shows that pressure-induced changes in solute distribution coefficientsare primarily independent of the chromatographic stationary phase. A similar methodhas been used by Ziger and Eckert35 to describe solubility enhancement of solutes insupercritical fluids.
CONCLUSION
The cited examples show that it is possible to correlate a large body ofsupercritical fluid extraction data in a quantitative manner by relating the data tochnges in the molecular structure of the extracted solute. This can be accomplishedreadily by using the reduced solubility parameter concept as a measure of thesolute-solvent interaction in the supercritical state. The advocated method is relatively

458 J. W. KING, J. P. FRIEDRICH
simple, requmng a mInImum of experimental and physical data for the rapidestimation of solute solubilities in supercritical fluids. Such a concept is a valuabletechnical aid to the chromatographer faced with the need to make rapid decisiDns inutilizing SFE or SFC and for understanding the general solubility characteristics ofthese unique solvents.
REFERENCES
1 D. J. Vezzetti, J. Chern. Phys., 77 (1982) 1512.2 S. K. Kumar, R. C. Reid and V. W. Suter, in T. G. Squires and M. E. Paulaitis (Editors), SupercriTical
Fluid1: Chemical Engineering Principles and ApplicaTions, American Chemical Society, Washington, DC,1987, p. 88.
3 U. Deiters and G. M. Schneider, Bel'. Bunsen-Ges. Phys. Chern., 80 (1976) 276.4 W. B. Whitting and J. M. Prausnitz, Fluid Phase Equi/ib., 9 (1982) 119.5 J. Chrastil, J. Phys. Chern., 86 (1982) 3016.6 R. T. Kurnik and R. C. Reid, Fluid Phase Equilib., 8 (1982) 93.7 G. A. Mansoori and J. F. Ely, J. Chern. Phys., 82 (1985) 406.8 J. W. King, 16th ACS Annual GreaT Lakes Regional Meeting, Normal, lL. June 9.1982, Abstract No. 245.9 J. W. King and J. F. Friedrich, 20th ACS Annual GreaT Lakes Regional MeeTing, Milwaukee, WI, June 2,
1986, Abstract No. 170.10 J. W. King, J. Chromatogr. Sci., 17 (1989) 355.II J. W. King, J. Am. Oil Chern. Soc., 60 (1983) 711.12 J. W. King, Polymeric Materials Sci. Eng. Preprints, 51 (1984) 707.13 J. W. King and 1. F.Friedrich, 13th Annual Meeting of the Federation of Analytical Chemistry and
Spectroscopy SocieTies, ST. Louis, MO, Sept. 29, 1986, Abstract No. 32.14 E. Stahl, W. Schilz, E. Schultz and E. Willing, Angell'. Chem., InT. Ed. Engl., 17 (1978) 731.15 J. A. Hyatt, J. Org. Chern., 49 (1984) 50n16 D. K. Dandge, J. P. Heller and K. V. Wilson, Ind. Eng. Chem. Prod. Des. Dev., 24 (1985) 162.17 A. W. Francis, J. Phys. Chem., 58 (1954) 1099.18 M. Sims, Chern. Eng., 89 ([982) 50.19 S. S. H. Rizvi, J. A. Daniels, A. L. Benado and J. A. Zollweg, Food Technol. (Chicago), 40, NO.7 (1986)
57.20 M. A. McHugh and V. J. Krukonis, Supercritical Fluid EXTraction, Butterworths, Boston, MA, 1986.21 J. C. Giddings, M. N. Myers and J. W. King, J. Chromatogr. Sci., 7 (1969) 276.22 A. F. M. Barton, Handbook olSolubi/Uyand Other Cohesional Parameters, CRC Press, Boca Raton, FL,
1983.23 J. M. Prausnitz, in T. S. Storvick and S. I. Sandler (Editors), Phase Equilibria and Fluid Properties in The
Chemical IndusTry, American Chemical Society, Washington, DC, 1977, p. II.24 S. R. Alada, Ind. Eng. Chern. Process Des. Dev., 23 (1984) 344.25 R. F. Fedors, Polym. Eng. Sci., 14 (1974) 147.26 J. C. Giddings, M. N. Myers, L. McLaren and R. A. Keller, Science (WashingTon, D.C.), 162 (1968) 67.27 K. Zosel, U.S. Pat., 3969 196 (1976).28 W. Schilz, Ph.D. Thesis, University of Saarland, Saarbriicken, 1978.29 K. A. Larson and M. L. King, Biotechnol. Prog., 2 (1986) 73.30 J. M. Wong and K. P. Johnston, Biotechnol. Prog., 2 (1986) 29.31 W. G. Schultz and J. M. Randall, Food Technol. (Chicago), 24, No. 11 (1970) 94.32 R. P. DeFilippi and J. M. Moses, in C. D. Scott (Editor), Fourth Symposium on Biotechnology on Energy
Production and Conservation, Interscience, New York, 1982, p. 205.33 E. J. Shimshick, Chern. Tech., 13 (1983) 374.34 S. T. Sie, W. van Beersum and G. W. A. Rijnders, Sep. Sci., I (1966) 459.35 D. E. Ziger and C. A. Eckert, Ind. Eng. Chern. Process. Des. Dev., 22 (1983) 582.

Journal of Chromatography, 517 (1990) 459-476Elsevier Science Publishers B.V., Amsterdam
CHROMSYMP.1961
Use of chromatographic retention measurements to obtainsolubilities in a liquid or supercritical fluid mobile phase
KEITH D. BARTLE, ANTHONY A. CLIFFORD", SAAD A. JAFAR, JACOB P. KITHINJI andGAVIN F. SHILSTONE
School of Chemistry, University of Leeds. Leeds LS2 9JT (U.K.)
ABSTRACT
A thermodynamic analysis is given of the relationship between the capacityfactor in high-performance liquid chromatography (HPLC) and supercritical fluidchromatography (SFC) and the solubility of the solute in the mobile phase. Theanalysis shows that in certain circumstances, where particular assumptions are valid,.there is a simple inverse relationship between the two quantities. In these circumstances the proportionality constant has a fixed value for a particular column, temperature and solute, and is independent of the mobile phase. Furthermore, the logarithm of the constant is approximately linearly related to the inverse of the absolutetemperature over a limited temperature range. Some experimental studies are thendescribed which show that practical conditions exist where these relationships arevalid. It is shown that the same equation-of-state, with the same parameters, can beused to predict quantitatively both supercritical fluid solubilities and the temperaturedependence of retention in SFC. Experimental results illustrate the inverse relationship between solubility and retention where the same column was used in both SFCand HPLC. Results are also given for the variation of the proportionality constantwith temperature. The various ways .in which these relationships could be used tomeasure solubilities are discussed and examples of experimental measurements aregiven for some methods.
INTRODUCTION
The degree of retention ofa solute in supercritical fluid chromatography (SFC),as measured by the capacity factor, k', is at least qualitatively inversely related to thesolvating power of the mobile phase for that solute: the more soluble it is in the mobilephase, the less it will be retained. The relationship has been used qualitatively and alsoto obtain quantitative information related to solubilities for both liquids andsupercritical fluids. In one study chromatographic retention has been used to obtainpressure thresholds for the solubilities of various compounds at different temperatures!. In another, the relative solvating power of supercritical CO2 compared withthat of hexane has been discussed in terms of the differences in retention when the two
0021-9673/90/$03.50 © 1990 Elsevier Science Publishers B.V.

460 K. D. BARTLE el al.
fluids were used as mobile phases2. A preliminary study has been carried out of solute
fugacities in a stationary phase in SFC, with a view to obtaining by chromatographysolute fugacities or enhancement factors (relating to solubilities) in a supercriticalfluid 3 . High-performance liquid chromatography (HPLC) is used to obtain hydrophobicity constants, and also solubilities of organic electrolytes have been estimatedusing HPLC retention data to obtain parameters in the modified Hildebrand-Scottequation4
• Normal-phase HPLC has been used to obtain oil-water partitioncoefficients, and "ideal solubilities" have been calculated from the ratios 5
.
In this paper it will be argued that in some situations at constant temperature,solubility of solid solutes in the mobile phase can be inversely proportional to k'. Whenthis is the case, chromatographic retention can be used to measure solubilitiesrelatively rapidly in both liquids and supercritical fluids. The relationship between thetwo quantities is investigated theoretically and experimentally, before discussing thevarious routes for obtaining solubilities from chromatographic retention measurements. These measurements could provide an important source of solubility data,particularly for supercritical fluids, and the studies are very much in the tradition of theuse of chromatography for obtaining physical and chemical data, in which ProfessorGiddings has been a pioneer.
THERMODYNAMIC ANALYSIS
Thermodynamic analyses of the type given below have appeared previously ina number of publications. However, it is necessary to detail a treatment of this type,which is directly relevant to the present situation, in order to identify the assumptionswhich must be made to arrive at the eventual simple equation. In general we must allowfor the fact that the solubility and chromatographic experiments will be carried out atdifferent pressures, Ps and Pc, respectively. This will not be the case for supercriticalfluid experiments, where solubilities refer to a particular pressure, and the corresponding retention measurements must be made at the same pressure. But it will be thecase for liquids, where pressures of the order of 100 bar are needed to pass the mobilephase through the column in HPLC, whereas solubilities are usually and most easilydone at low (atmospheric) pressure. For both types of mobile phase, pressure isdecreasing along the column though much less so for SFC. For HPLC the argumentsbelow refer to one point in the column, but for SFC pressure is assumed to be constantalong the column, and this subject is discussed later as an experimental problem.
We begin by discussing the situation for chromatography. At equilibrium atconstant pressure and temperature, equating the chemical potentials of the solute inboth phases gives
p,
J1~ + f Vmdp + RTln am = J1~ +o
p,
fVstdp + RT In as!
o
(1)
where J1~ and J1~ are the standard chemical potentials of the solute in the mobile andstationary phases, respectively, and refer to infinite dilution and standard pressure. Inall cases, but importantly in the case of a supercritical fluid, the state at the standard

CHROMATOGRAPHIC MEASUREMENTS TO OBTAIN SOLUBILITIES 461
pressure of I atm is a hypothetical and ideal one, where the activity coefficient, definedas being unity in the limit ofzero pressure, is also unity in the standard state. Vm and Vst
are the partial molar volumes at infinite dilution of the solute, am and ast are theactivities of the solute in the corresponding phases, R is the molar gas constant and Tisthe temperature. Rearrangement of eqn. 1 gives
p,
J1~ - J1~ + f(Vm - Vst)dp
o
(2)
Ifwe assume that chromatography is carried out under conditions which approximateto infinite dilution, the activities can be replaced in eqn. 2 by the concentrations dividedby standard concentrations, cm/c~ and CSI/C~. The standard concentrations are shownas different, in general, for the two phases, as will necessarily be the case for adsorptionchromatography, where c~ will be a surface concentration. For partition chromatography the standard concentrations will usually be identical amounts of solute per unitvolume. Analytical chromatography is normally carried out at very low dilution and, ifit is not the case, is observable as a distortion of the chromatographic peak shape anda variation of the degree of retention with the amount of solute injected. The ratio ofthese concentrations is related to k' by
(3)
where r is the stationary to mobile phase ratio, which in the simplest case of partitionchromatography, when the standard concentrations in the two phases are identical,will be the ratio of the volumes of the two phases. For adsorption chromatography ora bonded stationary phase r will involve an area-to-volume ratio. r will be a constantfor a particular chromatographic column. Substitution of eqn. 3 into eqn. 2, with theactivities replaced by concentration ratios, gives the following expression:
J1~ - J1~ + J(Vm - Vst)dp
o
RT In (k'c~/rc~) (4)
We now consider solubility and a saturated solution of the solute in the mobilephase. Discussion is restricted to conditions where the solid solutes remain as solids inthe presence of the mobile phase, i.e. do not form a solute-rich liquid phase, and thesolids are assumed not to absorb the mobile phase, and thus the chemical potential ofthe solute can be considered to be a constant at constant pressure and temperature.After equating chemical potentials in both phases, we obtain
p,
J1~ - J1~ + f(Vs - Vm)dp
o
(5)

462 K. D. BARTLE el al.
where Jl~ and Vs are, respectively, the chemical potential and molar volume of thesolid, and a~at the activity of the solute at saturation in the solvent or mobile phase. (Insituations where different allotropic forms of the solid can exist, there will be nodifficulty at the transition temperature, where the chemical potentials and solubilitiesof the two forms will be identical. At other temperatures one form will be the stableallotrope and have the lower chemical potential, and this is the form to which thisthermodynamic analysis strictly applies. However, it may be possible to studysolubilities of metastable allotropes by the methods described in this paper, bydetermining the constant, C, defined below, from solubilities of the metastableallotrope.) Eqns. 4 and 5 are then added to obtain:
Jl~ - Jl~ + J(Vs -
o
(6)
In the case of a supercritical fluid Pc = p" and the integral terms cancel, if it is assumedthat the partial molar volume of the solute in the stationary phase, Vst , is equal to itsmolar volume, V" and eqn. 6 becomes:
(7)
For the case of a liquid, where Pc and Ps are different, eqn. 7 may also be obtained, butin this case it must be assumed that the partial molar volumes of the solute in both thestationary and mobile phases are equal to the molar volume (and that this is the case atall points in the column). The assumptions that must be made about partial molarvolumes are not unreasonable in many cases, where the interaction between the soluteand the phases are not strong as is often the case.
Eqn. 7 may be rearranged to give the following expression for the activity of thesolute at saturation:
a~tc~ = (rc~ exp [(Jl~ - Jl~)/RT](l/k') (8)
The quantity Jl~, which is the chemical potential of the solute in the stationary phase atinfinite dilution and standard pressure and at a particular temperature, will bea constant for a given solute and chromatographic column, provided that theinteraction of the solute and stationary phase is not affected by the nature of the mobilephase. This will often not be the case, for example with cross-linked polymer phasesused in SFC, which absorb the mobile phase and swell to an extent dependent uponpressure and change their solvating properties6
,7. However, it is likely to be true foroctadecylsilyl (ODS) bonded phases and CO2 , as it will be shown below that it is notnecessary to take into account effects of the mobile phase on the stationary phase toquantitatively account for the dependence ofretention on temperature. Adsorption ofcarbon dioxide on an ODS phase has been observed and this is maximised in the regionof the critical points. However, it does not follow that this affects the adsorption ofsolutes, and the effect is such that the environment of the ODS phase does not changeas much with a drop in pressure as it would if this adsorption did not occur. Tn cases

CHROMATOGRAPHIC MEASUREMENTS TO OBTAIN SOLUBILITIES 463
where the above assumption can be made, the right-hand side ofeqn. 8, apart from thefactor (1lk') is therefore a constant for a particular system and temperature. Eqn. 8 cantherefore be written as
(9)
where C is a constant for a particular solute, column and temperature.If the assumption is now made that the activity coefficient of the solute in the
mobile phase is constant (i.e. unity) from infinite dilution up to the solubility limit, theactivity can be replaced by concentration (which for the saturated solution will be thesolubility, S) divided by the standard concentration, and eqn. 9 can be rewritten as
S = Cjk' (10)
This assumption will not always be valid in liquids, as will be seen from theexperimental results below. For supercritical fluids, such as carbon dioxide, whereinteractions are not strong or specific, the activity coefficient can be calculated fromequations of state with reasonable confidence and here it is known that the assumptionis a good approximation, especially as supercritical solubilities are usually low.
Returning to the problem of pressure drop in SFC, equations have beenobtained for the average capacity factor in a column with pressure d rop9.10, andcalculations have been carried out for a model system of the percentage difference ofthe true average and the value at the average of the inlet and outlet pressures10. Theseshow that differences of up to a factor of two are obtained for a 30-bar drop I K abovethe critical temperature and near the critical pressures. The effect decreases with rise intemperature, with the peak effect rising to higher pressures. For the quantitativemeasurements described in the last section a short column and low flow-rates wereused to reduce the pressure drop to around 2 bar and the critical region avoided.
The constant C, introduced in eqn. 9, is given by
C = rc~ exp [(.u~ - .u~)IRT] (11)
The difference in standard chemical potentials in eqn. II corresponds to the standardGibbs function change for the precipitation of the solid solute from solution at infinitedilution in the stationary phase. In common with other types of equilibria, it may beassumed, therefore, that the constant C is given approximately by
C = A exp (BIT) (12)
where A and B are constants over a limited temperature range for a particular columnand solute. This equation allows the possibility of limited interpolation or extrapolation to obtain values of C, by plotting In C versus liT.

464 K. D. BARTLE el al.
PREDICTON OF SOLUBILITY AND RETENTION BASED ON THE SAME EQUATION OF
STATE FOR A SUPERCRITICAL FLUID
Prediction of solubilitiesPrediction of solubilities may be made on the basis of eqn. 5. This can be
modified by assuming, firstly, that the solid molar volume does not change withpressure and, secondly, that as before, as the saturated solutions are dilute, a~t can bereplaced by the mole fraction ysat. The choice of mole fraction, rather than theconcentrations used earlier, is correct if it is consistent wihtin the present calculationand implies different numerical values of the chemical potentials. Eqn. 5 becomes
p,fVmdp + RT In ysat
o
(13)
Vm is a quantity which varies greatly from the solute molar volume (becoming largeand negative in the critical region), but can be calculated from an appropriate equationof state. Expressions are given usually in published equations of state for the fugacitycoefficient, ¢ (in this case the fugacity coefficient at infinite dilution), which is relatedto the integral on the left side of eqn. 13. This equation can now be expressed as
(14)
In the absence of any supercritical fluid, Ps = p" the vapour pressure of the solute, ysatis unity and as the pressure is low and ¢ is also approximately unity, eqn. 14 becomesapproximately
(15)
The solubility, S, in concentration terms, is related to ysat by SV = ysat, where Vis themolar volume, approximately the molar volume of the pure supercritical fluid.Substitution of this relationship and eqn. 15 into eqn. 14 gives
In S = In (Pv/Ps) - In ¢ - In V + pVs/RT (16)
This equation can then be used to calculate supercritical solubilities, providedthe vapour pressure is known, using a suitable equation-of-state for predicting thefugacity coefficient. In the studies described here the Peng-Robinson equation-ofstate is used 11, which, in common with other possibilities, requires knowledge of aninteraction parameter for each pair of components. These interaction parameters areempirical fine-tuning parameters for the bimolecular interactions to which predictedsolubilities are very sensitive. Fig. 1 shows solubilities predicted for naphthalene basedon a range of the interaction parameter, d, for naphthalene and CO2 at twotemperatures, which illustrate this sensitivity along with the published experimentalresults 12, 13. In principle, the parameter d is a constant independent of temperature. Ina comprehensive study, Haselow et al. 14 have shown that the use of temperature-

CHROMATOGRAPHIC MEASUREMENTS TO OBTAIN SOLUBILITIES 465
independent parameters ·often give poor predictions of solubility, and Fig. I alsoillustrates this. However, Yamato et alY have shown that the use of a temperaturedependent parameter can fit some of the experimental data more accurately. Theapproach used here is therefore to obtain temperature-dependent interaction parameters, d, from published experimental solubility data where available and interpolatethese graphically. All published solubility data have been treated by us in this way,where vapour pressures and parameters for the equation of state were available andsome of the results have already been published 16
. Fig. 2 shows smoothed plots of theinteraction parameters obtained from published solubilities12 ,13,17-2o for fourpolynuclear aromatic compounds, which will be of use in the next section. For the twocompounds fluorene and pyrene, the variation of d with temperature is inside theexperimental error and constant values are shown.
Using values of d obtained in this way, good predictions of solubility can bemade, which fit the experimental data well. In the interest of minimising the number offigures given, this can be appreciated from Fig. IB, where it can be seen that usinga value for d of about 0.09 will give good agreement.
A
oD52d:O~---~
0.0680.. ·········-
3.o.------.------,---"'7--:~,71
.,'.,JI'" .
,4 ." ./", ....;J: .I I,I
I /1/,/:tIII'
't',f,i!i!i
2AL-------:,;!.;0:::-O---l~-----:20~0----.J
<f2.8E'0
~f
2.6
p/bar
B
---_.---------_ .. .. " .....
000-
d:o.10__
0.15_ ..........
... _._! ~ ~ - - -fl',,'" - -•I
I .'
':•
100 200
p/bar
Fig. 1. Dependence of predicted values of the solubility, S, of naphthalene in CO2 as a function of pressure,p, on the Peng-Robinson interaction parameter, d. A is at 55°C and B at 35°C. Experimental results:[] = McHugh and Paulaitis 12
; 0 = Tsekhanskaya13.

466 K. D. BARTLE et al.
I
0.21---------------1
d
.....'-""--------------
Oj~:~. . . _
--"11\
'.....' ...._.... _---_ ............. - ... - .. ----
400350
0'------_-'- --'
300
T/K
Fig. 2. Smoothed values of the Peng-Robinson parameter, d, obtained from experimental solubilitiesplotted as a function of temperature. -- = Pyrene; ---- = phenanthrene; -.-.-.-.- = fluorene;... - - - - = naphthalene.
Prediction of the temperature dependence of retention in SFCAt constant pressure, k' is observed to pass through a maximum with increasing
temperature2l . The qualitative explanation of this phenomenon is as follows. Therising portion of the curve is due to the decreasing density of the supercritical fluid,decreasing its solvating effect. The rising portion of the curve occurs when theincreasing volatility of the solute outweighs this earlier effect. Quantitative analyses ofthis effect have been made22 ,23. The purpose here is to show that the same equation ofstate used to predict solublities, described above can also give a good quantitativeexplanation of such results. Fig. 3 shows some experimental results obtained in ourlaboratory for the retention of four polynuclear hydrocarbons as a function oftemperature24. A 25-cm ODS column was used with pure CO2 as the mobile phase atan average pressure of 130 bar and a pressure drop along the column of 36 bar. Underthe conditions used, the error caused by the pressure drop is not too important,although having studied the effect ofpressure dropl 0, shorter columns and much lowerpressure drops were used in subsequent experiments.
The equation used for the analysis of the experimental results can be obtainedfrom eqn. 2. To obtain the appropriate chemical potentials, which will give the Gibbsfunction change for vaporisation from solution in the stationary phase, the activitiesare replaced, assuming dilute conditions, by cst/c?t and y = Cm V, respectively. The ratioas1/am is therefore equal to (using eqn. 3) k'/c?tV. Making also the assumptions,described earlier, that Vst is independent of pressure and equal to the molar volume, V.,and that the integral involving Vm can be replaced by RT In (PccP/pQ), eqn. 2 can berewritten as
(17)

CHROMATOGRAPHIC MEASUREMENTS TO OBTAIN SOLUBILITIES
•
60
467
40
••
• •
• • •• •20 ••• ... ...... ...• ...
• • ...• • ......~ 1
... •• • • • •• • I •50 100
TIOC
Fig. 3. Dependence of the capacity factor, k', on temperature for an ODS column and CO2 as the mobilephase. • = Pyrene; • = phenanthrene; ... = fluorene; • = naphthalene.
Eqn. 17 can be rearranged to
In k' - In ¢ - In Vc;t = D - (PcVs + J.l~ - J.l~)/RT
where
(18)
(19)
is a constant at constant pressure. The terms J.l~ - J.l~ are equal to the standard Gibbsfunction change for solution of the solute from the vapour to the stationary phase,which can be expressed in terms of the entropy, LI~, and enthalpy, Lllf; components.Eqn. 18 becomes
In k' - In ¢ - In Vc;( = D + LI~/R - (PcVs + Lllf;)/RT (20)
If it can be assumed that the enthalpy and entropy changes are not very sensitive totemperature, a graph of the left side of eqn. 20 against I/T should give anapproximately straight line.


CHROMATOGRAPHIC MEASUREMENTS TO OBTAIN SOLUBILITIES 469
Fig. 4 shows the calculation of the left side of eqn. 20 for fluorene, with the curvein the experimental points becoming an approximately straight line as the terms inV and especially ¢ are added. Fig. 5 shows the final curves for the four polynuclearhydrocarbons, from the slopes of which values for ij}{~ are obtained and given inTable I. These are compared in the table with enthalpies of vaporisation of the solidsolutes25
, and there is agreement within experimental error, indicating that theenthalpies of solution of the solid solutes in the stationary phase are small.
The success of this analysis, with data obtained from solubilities, indicates thevalidity of the assumptions made in the thermodynamic derivations for theseparticular systems and confirms the strong relationship between retention andsolubility. In particular, it shows that for an ODS column the stationary phase doesnot appreciably change its solvation properties towards these solutes, either withtemperature or with supercritical fluid density.
TABLE I
VALUES OF dH';, THE ENTHALPIES OF SOLUTION FROM THE VAPOUR INTO THE ODSPHASE, OBTAINED FROM FIG. 5, COMPARED WITH THE ENTHALPIES OF VAPOURISATION OF THE SOLID, dI-t; (REF. 25)
-dff;lkJ ma/- 1 dJr:lkJ mar 1
NaphthaleneFluorenePhenanthrenePyrene
70 ± 382 ± 387 ± 295 ± 3
70838794
DIRECT INVESTIGATION OF THE RELATIONSHIPS S = Ilk' AND C = A exp (BIT) FOR SOME
SYSTEMS
The relationship S = 11k'In this section direct experimental tests of the inverse relationship between the
solubility and capacity factor for both SFC and HPLC are described. These results arerepresentative ofa more extensive study26, in which the same type ofODS column wasused as before, but of shorter length (10 cm) to reduce the pressure drop. Thepolyaromatic hydrocarbons, naphthalene, fluorene, anthracene, pyrene and chrysene,were used as the solutes with the same column throughout for both types of mobilephase. CO 2 was used as the mobile phase in the SFC measurements at pressures forwhich published solubility data for the solutes in CO2 are available. For the HPLCmeasurements mixtures of methanol and water were used as the mobile phase andsolubilities of the solutes in the same methanol-water mixtures were also measured byUV absorption. The systems chosen constitute a severe test of the inverse relationship.Polyaromatic hydrocarbons tend to associate in a hostile polar environment, whichcould have a large effect on their activity coefficients, even at low concentrations. Atthe same time, the environment of the stationary phase covers a wide range from thenon-polar pressurised CO 2 fluid to a polar liquid the dielectric constant of which willvary markedly with composition.

470 K. D. BARTLE el al.
As k' is related to retention volumes for the solute and mobile phase, VR and VM,respectively, by k' = (VR - VM)/VM, a test of the relationship k' = CjSis therefore thelinearity of plots of l/S against (VR - VM). It is better to use these plots rather thanplots of S versus l/(VR - VM), because the estimated errors in (VR - VM) containa constant element and their percentage errors increase as the values fall.
Some results for naphthalene are shown in Fig. 6. Because of the wide range ofvalues, two plots are given with different scales to show the low and high values. (Thealternative of a log-log plot is a less obvious test oflinearity.) The lines drawn on bothparts of the figure have the same slope and correspond to a value for S(VR - VM)/mgof35. In spite ofdeviations due in part to experimental error, the figure is a remarkabledisplay of linearity, in view of the fact that the data cover a range of 2.5 orders ofmagnitude, two different types of mobile phase or solvent, and a wide range of solventpolarity. The major deviations from the straight line may be explained as follows. Thehighest point arises from a very low supercritical fluid solubility which may be less
0.5(a)
0.4
- 0.3'",.l<
ME.... 0.2,<Il
0.1
5 10 15
(VR -VM)/cm3
•4(b)
3
'",.l< 2
ME.....,<Il
50 100 150
(VR -VM)/cm3
Fig. 6. The reciprocal solubility, liS, plotted against VR - VM for naphthalene at 318.2 K. 0 = Liquid;• = supercritical fluid. Lower and higher values are shown in (a) and (b), respectively and the lines drawn inthe two parts are of the same slope equal to 1/35.

CHROMATOGRAPHIC MEASUREMENTS TO OBTAIN SOLUBILITIES 471
accurate in percentage terms than the other values. The SFC points which lie below thecurve in Fig. 6a are from low retention volumes which will be more erroneous. Thus,the assumptions listed in the introduction appear to be valid for these systems and, inparticular, the assumption that the solvating effect of the stationary phase does notseem to be greatly affected by the nature of the mobile phase in the case of naphthaleneand therefore probably in the case of the other solutes. Results at 308.2 K show similarlinearity, although measurements at lower pressures were not made because of theerrors introduced by the proximity of the critical point.
For the other solutes studied, the linear relationship was found to hold well forsupercritical CO 2 , but the plots for the methanol-water mixtures, which weresometimes curved, did not coincide with the supercritical fluid curves. An example isgiven for phenanthrene in Fig. 7. This can be explained as follows. In supercriticalfluids, because calculations based on equations of state indicate that activitycoefficients in supercritical fluids do not change markedly with concentration over therange up to the solubility limit, the inverse relationship of solubility and capacity factorholds well for all solutes. The deviations for the methanol-water mixtures are causedby molecular association (which sometimes increases with water content) reducing theactivity coefficients. In conclusion, it appears that the relationship ofeqn. 10 is valid insome situations, but not in others. It holds fairly well for naphthalene in both HPLCand SFC, but for the other solutes for SFC only.
The relationship C = A exp (BIT)The validity ofeqn. 12 is tested in Fig. 8 for phenanthrene by plotting the natural
logarithm of the mean values of the product S(VR - VM) = CVM at each temperatureagainst liT. The values deviate from the straight line by less than 5% of S(VR - VM).
50
(VR-VM)/cm3
Fig. 7. The reciprocal solubility, I/S, plotted against VR - VM for phenanthrene at 318.2 K. /',. = Liquid;• = supercritical fluid.
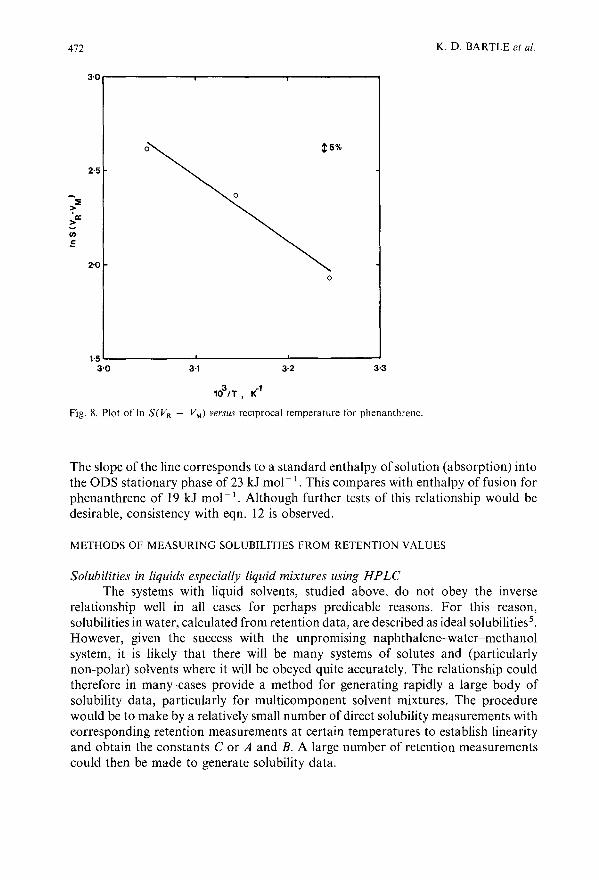
472 K. D. BARTLE et al.
3·0.--------r--------r-----......,
2·5
::;;;>~~
(J)
.=
2·0
0
3·33·23'11·5~-----...L--------'--------'
3'0
103fT. K·
1
Fig. 8. Plot of In S(VR - VM) versus reciprocal temperature for phenanthrene.
The slope of the line corresponds to a standard enthalpy of solution (absorption) intothe ODS stationary phase of 23 kJ mol-t. This compares with enthalpy of fusion forphenanthrene of 19 kJ mol-t. Although further tests of this relationship would bedesirable, consistency with eqn. 12 is observed.
METHODS OF MEASURING SOLUBILITIES FROM RETENTION VALUES
Solubilities in liquids especially liquid mixtures using HPLCThe systems with liquid solvents, studied above, do not obey the inverse
relationship well in all cases for perhaps predicable reasons. For this reason,solubilities in water, calculated from retention data, are described as ideal solubilities5
.
However, given the success with the unpromising naphthalene-water-methanolsystem, it is likely that there will be many systems of solutes and (particularlynon-polar) solvents where it will be obeyed quite accurately. The relationship couldtherefore in many cases provide a method for generating rapidly a large body ofsolubility data, particularly for multicomponent solvent mixtures. The procedurewould be to make by a relatively small number of direct solubility measurements witheorresponding retention measurements at certain temperatures to establish linearityand obtain the constants C or A and B. A large number of retention measurementscould then be made to generate solubility data.

CHROMATOGRAPHIC MEASUREMENTS TO OBTAIN SOLUBILITIES 473
Solubilities in supercritical fluids at low pressures using SEC and vapour pressuresIf retention measurements are made in SFC which extend down to lower
(subcritical) pressures, it may be possible to extrapolate k' to obtain a value, k~,
corresponding to zero mobile phase pressure. The corresponding "solubility", So, willarise from the vapour pressure and will be equal to Pv/f?T. Thus the constant C can beobtained from
c = k~ Pv/RT (21)
The method of extrapolating k' is obtained by first writing eqn. 18 for the condition ofzero mobile phase pressure, where since ¢ and Pc are essentially unity and zero,respectively, and V = RT/pv, it becomes
In k~ - In '(RTc~/pv) = In r + In (Pv/pG) - Cu~ - f.-l~)/RT
Subtraction of eqn. 22 from eqn. 18 and rearranging gives
In k' + PcVs/RT = In k~ + In ¢ + In (PcV/RT)
(22)
(23)
For extrapolation to low pressures the virial equation of state may be used to give anexpression for ¢, which is
In ¢ = In (RT/pcV) + (2jV)B 12 + (2/3V 2)C112 + (24)
where B 12 and C112 are virial coefficients. At pressures below 5 MPa, the second virialcoefficient alone is sufficient27
, and after substituting a simplified eqn. 24 into eqn. 23we obtain
In k' + PcVs/RT = In k~ + (2jV)B 12 (25)
This equation shows that k~ can be obtained by extrapolating the left-hand side ofeqn. 25 against I/V, from which the second mixed virial coefficient can alsoincidentally be obtained.
Retention measurements have been made to show the feasibility of the method,and results for I-methylnaphthalene in CO 2 are reported here. The column used wasan open stainless-steel tube, 0.5 m x 0.5 mm LD. Solubility results are shown in Fig. 9and compared to results obtained by freezing a known volume of saturated solution inliquid nitrogen, allowing the CO2 to evaporate and measuring the amount of solute bygas chromatography. The solubilities, measured directly at the lowest pressures, wherelittle solute was recovered, are accurate to only around 50% and the values obtainedfrom retention appear to be superior.
Generation ofa larger body ofsupercritical solubility datafrom a small number ofdata atthe same temperature
If, in principle one solubility, or better a few solubililty results, obtained byconventional methods, are available at one temperature, a value for the constant C canbe obtained at that temperature by making retention measurements under corre-

474 K. D. BARTLE et al.
40
0
2
0
0
<? t"0E • CD
~ - 2 0)'0E
++0
0
-4
0 2 4 6 6
P/l03 mol m-3
Fig. 9. Solubility, S, of l-methylnaphthalene in CO2 versus density, p = 1/ v. 0 Retention results;o = trapping results.
sponding conditions. This value can then be used to generate a larger body of datarelatively rapidly, by making a large number of retention measurements. Thesupercritical data shown in Fig. 7 were used to determine C for phenanthrene in anODS column at 318 K. In fact the second lowest point was not used as this gavea constant out of line from those obtained from the other three points. From theaverage value of C from the other three points and further retention measurementsa large number of solubilities were obtained and shown in Fig. 10 in terms of molefraction (the square solid points). Also shown are the conventionally measured valuesas open squares, which naturally fall on the same line except for the point which wasnot used in the calculation of C. (This is an indication that this published datum pointcould be in error.) The procedure described was also carried out at 308 and 328 K, inthese cases by using all the published solubilities, and the results are also shown inFig. 10.
Measurement of supercritical solubilities at a temperature close to other temperatureswhere solubility data are available
If conventially measured solubility data are not available at the temperature ofinterest, but are at two or more close temperatures, interpolation of In C versus liTmay be used to obtain C at the required temperature. An example is given here, wherethe proportionality constant has been obtained for phenanthrene in CO2 at 323 Kfrom the plot shown in Fig. 8. The results obtained by this method are given as the solidtriangles in Fig. 10.
Measurement of solubilities in modified supercriticalfluidsThe use of modified supercritical fluids, such as by the addition of some

CHROMATOGRAPHIC MEASUREMENTS TO OBTAIN SOLUBILITIES
3.0 r---------r-------r------.
475
2.5
2.0
M
~)(
c 1.5.2UjgGl"0:E
1.0
0.5
140
Pressure, bar
210 280
Fig. 10. Solubility of phenanthrene in supercritical carbon dioxide. Present work: 0 = 308.2 K; [] =
318.2 K; A = 323.2 K; T = 328.2 K. Dobbs et a/. Is : 0 = 308.2 K. Kurnik et a[l9: 0 = 318.2 K;\l = 328.2 K.
methanol to CO 2 , adds another dimension to the range of conditions to be covered,and relatively little published data are available. The use of chromatography could beof great advantage here as in many systems values of C obtained for the pure fluidswould be applicable to the modified fluids. Of course, this would have to be tested forrepresentative systems, including the effect of the modifier on the solvating propertiesof the stationary phase.
Measurement of supercritical fluid solubilities from SEC, HPLC and liquid solubilitymeasurements
The most promising use of the relationship is perhaps the fact that supercriticalfluid solubilities could in the right circumstances be obtained from SFC and HPLCretention measurements and the more easily measured liquid solubilities. No resultsare published for this method, although in principle the results obtained fornaphthalene and given in Fig. 6 could be used to obtain supercritical solubilities.However, as so many data are available for the naphthalene-carbon dioxide system,this would not be worthwhile. It seems likely, though, that the method would work for

476 K. D. BARTLE et al.
many systems, even for the polynuclear hydrocarbons, if the chromatography werecarried out in normal- rather than reversed-phase mode (e.g. with an amino-bondedcolumn and a non-polar solvent, such as hexane). It is possible, perhaps likely, that therelationship given in eqn. 10 would hold for both SFC and HPLC. Where the methodcould be used, it would be considerably easier and quicker than the convential methodsfor supercritical fluid solubilities.
ACKNOWLEDGEMENTS
The authors would like to thank the Science and Engineering Research Council,British Gas and the Royal Society of Chemistry for financial support and Dr. T.Boddington for discussions.
REFERENCES
I R. D. Smith, H. R. Usdeth, B. W. Wright and C. R. Yonker, Sep. Sci. Tech., 22 (1987) 1065.2 J. H. Phillips and R. J. Robey, J. Chromatogr., 465 (1989) 177.3 B. O. Brown, A. J. Kishbaugh and M. E. Pautaitis, Fluid Phase Equiiibria, 36 (1987) 247.4 T. L. Hafkenscheid and E. Tomlinson, J. Chromatogr., 218 (1981) 409.5 S. H. Yalkowsky and S. C. Valvani, J. Pharm. Sci., 69 (1980) 912.6 M. Novotny and P. David, J. High Resolut. Chromatogr. Chromatogr. Commun., 9 (1986) 647.7 J. Shim and K. P. Johnston, AIChE J., 35 (1989) 1097.8 J. R. Strubinger and J. F. Parcher, Anal. Chem., 61 (1989) 951.9 D. E. Martire, J. Chromatogr., 461 (1989) 165.
10 K. D. Bartle, T. Boddington, A. A. Clifford and G. F. Shilstone, J. Chromatogr., 471 (1989) 347.II D. Y. Peng and D. B. Robinson, Ind. Eng. Chem. Fundam., 15 (1976) 59.12 M. McHugh and M. E. Paulaitis, J. Chem. Eng. Data, 25 (1980) 326.13 Yu. V. Tsekhanskaya, M. B. Iomtev and E. V. Mushkina, Russian 1. Phys. Chel11. (Engl. Transl.), 38
(1964) 1173.14 J. S. Haselow, S. J. Han, R. A. Greenkorn and K. C. Chao, in K. C. Chao and R. Robinson (Editors),
Equations of State Theories and Applications (ACS Symposium Series, No. 300), American ChemicalSociety, Washington, DC, 1986, Ch. 7.
15 H. Yamato, F. Kanegae, K. Mishima, Y. Iwai and Y. Arai, Mel11. Fac. Eng., Kyushi Unil'., 47 (1987) 95.16 K. D. Bartle, A. A. Clifford and G. F. Shilstone, J. Supercritical Fluids, 2 (1989) 30.I7 K. P. Johnston, D. H. Ziger and C. A. Eckert, Ind. Eng. Chel11. Fundal11., 21 (1982) 191.18 1. M. Dobbs, J. M. Wong and K. P. Johnston, J. Chem. Eng. Data, 31 (1986) 303.19 R. T. Kurnik, S. J. Holla and R. C. Reid, J. Chel11. Eng. Data, 26 (1981) 47.20 J. Kwiatkowski, Z. Lisicki and W. Majewski, Bel'. Bunsenges. Phys. Chon., 88 (1984) 865.2J E. Klesper and D. Leyendecker, Int. Lab., I7 (1985) 18.22 T. L. Chester and D. P. Innis, 1. High Resolut. Chromatogr. Chromatogr. Commun., 8 (1985) 561.23 C. R. Yonker, R. W. Gale and R. D. Smith, J. Phys. Chem., 91 (1987) 3333.24 K. D. Bartle, A. A. Clifford, J. P. Kithinji and G. F. Shilstone, J. Chel11. Soc., Faraday Trans. J, 84 (1988)
4487.25 R. C. Weast (Editor), CRC Handbook ofChemistry and Physics, CRC Press, Boca Raton, FL, 62nd ed.,
1981, p. C690.26 K. D. Bartle, A. A. Clifford and S. A. Jafar, J. Chel11. Soc., Faraday Trans., 86 (1990) 855.27 I. K. Barker, K. D. Bartle and A. A. Clifford, Chem. Eng. COl11l11un., 84 (1988) 4487.

Journal of Chromatography, 517 (1990) 477-489Elsevier Science Publishers B.V., Amsterdam
CHROMSYMP. 1939
Element-selective detection after supercritical fluidchromatography by means of a Surfatron plasma in the nearinfrared spectral region
DEBRA R. LUFFER and MILOS NOVOTNY*
Department of Chemistry, Indiana University, Bloomington, IN 47405 (U.S.A.)
ABSTRACT
A microwave-induced plasma, known as the Surfatron, is evaluated as a detector for supercritical fluid chromatography. The spectral range that is investigated isthe near-infrared region because of its relative freedom from many spectral interferences, compared to the UV and visible regions. A novel method of heating the columnrestrictor is described, which is compatible with the very limited space and inaccessibility of the discharge tube configuration in the Surfatron cavity. Sensitivities andselectivities are determined for sulfur, chlorine, and bromine, using both a carbondioxide and a nitrous oxide mobile phase. The detector is also evaluated in the "universal detection" mode by monitoring the carbon line when a nitrous oxide mobilephase is used. An application is demonstrated through the analysis of a mixture ofsulfur-containing pesticides.
INTRODUCTION
During the 1980s, supercritical fluid chromatography (SFC) has graduallyrealized its potential, as predicted by the pioneering studies of Klesper et al. 1, Sie andRijnders2,3, and Giddings and co-workers4
-6. The detection scope of this method had
been significantly expanded by the adaptation of "gas chromatography (GC)-like"detectors, primarily because of the advantages inherent in small-bore SFC, both incapillary and packed column systems7.8. The flame-based detectors have proven to bea key to both the universal detection (i.e., flame ionization detection, FID), andelement-selective measurements, such as the flame photometric detecti()n (FPD)9-11and thermionic detection (TID)lZ-15 principles. A major drawback of both of thesedetectors is that they are limited to certain specific elements, and therefore lackversatility. For example, an unsuccessful attempt was made16 to modify TID forselective detection of elements, such as B, Cl, and S. However, electron-capturedetection (ECD) was recently successfully coupled with capillary SFC for the detectionof halogenated and nitro compounds17.
0021-9673/90/$03.50 © 1990 Elsevier Science Publishers B.V.
478 D.R. LUFFER, M. NOVOTNY
Alternatively, consideration of plasma-based devices appears logical due to theirincreasing technological availability. In principle, the selectivity of plasma detectorsshould be adjustable to various elements simply by "dialing in" the wavelength byeither scanning a monochromator, or selecting an appropriate filter. In addition, thesedetectors are believed to be less prone to concomitant spectral interferences than theflame-based detectors. For this reason, plasma detection has been investigated in ourlaboratory18,19, and, more recently by Skelton et al. 20. Both of these systems exploitedthe near-infrared spectral region because it is especially suitable for non-metaldetection, due to a limited number of molecular bands such as CO and C2 acting asspectral interferences21 .
Skelton et al. 20 adapted radio-frequency plasma detection (RPD) for thedetection of sulfur and chlorine, with both CO2 and N20 mobile phases; detectionlimits ranged from 50 to 300 pgjs. Luffer et al. 18 evaluated the Surfatron microwaveplasma detector for sulfur and a CO2mobile phase. The Surfatron had been developedand investigated by others for GC22- 24, and recently, a thorough spectroscopicinvestigation was performed on a He-C02Surfatron plasma; detection limits of6.3 ngwere found for sulfur in the visible region [S(II), 545.3 nm]25.
Based on these results, it seemed promising to evaluate the Surfatron further inthe near-infrared region, with respect to the detection of non-metals other than sulfur,such as CI and Br. In addition, it was suggested19 that N20 might be a better choicethan CO2because it was thought to produce fewer troublesome molecular bands thanCO2, and universal detection possibilities were available through the use of a carbonwavelength channel. The present work summarizes the results of these continuedstudies, and reports sensitivities and selectivities for S, CI, and Br. In addition,a pesticide mixture is separated and compared to a similar analysis by SFC-TID12.
EXPERIMENTAL
Chromatographic equipmentMost. of the system has been described previously18,19. The changes that have
been made will be noted below.In addition to the SE-30 stationary phase, a different column was used in the
analysis of the pesticide mixture (SB-Cyanopropyl-50, Lee Scientific, Salt Lake City,UT, U.S.A.); this 10 m x 50 ,um J.D. column contained a 0.15-,um film ofa 50%-substituted cyanopropyl methylpolysiloxane. The restrictors were of the frittype, obtained from Lee Scientific.
The circulating bath (Haake Buchler, Saddle Brook, NJ, U.S.A.) that replacesthe column oven was filled with Therminol 6, a heat-exchange fluid (Monsanto, St.Louis, MO, U.S.A.). All unions were purchased from Scientific Glass Engineering(SGE, Austin, TX, U.S.A.). The gases were CO2 and N20 of supercritical fluid gradefrom Scott Specialty Gases (Plumsteadville, PA, U.S.A.).
The injection volume was 60 nl (without split), which ensured improvedquantitation. A 60 em x 50,um J.D. fused-silica capillary was used as a retention gap;the capillary was positioned as close to the injection rotor as possible at one end, andconnected to the column at the other end. With this configuration, no overloading ofthe column was noted and the solvent peak did not exhibit significant tailing.

ELEMENT-SELECTIVE DETECTION AFTER SFC 479
Spectroscopic systemThe Surfatron was constructed by our departmental machine shop according to
the design of Abdallah et al. 26. The microwave generator was a Microtron 200operating at 2450 MHz (Electro-Medical Supplies, Wantage, U.K.). Typical powersused ranged from 110 to 120 W. Since the spectroscopic system was designed for thenear-infrared region, a glass lens of 50 mm diameter and 180 mm focal length was usedto focus the axial (end-on) image of the plasma with a magnification of 1.2 on thevariable entrance slit of the HR-320 monochromator (Instruments, SA, Metuchen,NJ, U.S.A.). The height of the slit was adjusted to match the diameter of the plasmaimage. The holographic grating was blazed 1 /lm and had 1200 grooves/mm. The R632photomultiplier tube (PMT) from Hamamatsu (Middlesex, NJ, U.S.A.) was biased at- 1400 V by a power supply (Products for Research, Danvers, MA, U.S.A.) andmounted in a thermoelectrically-cooled housing (Products for Research). The outputfrom the PMT was converted by a picoammeter (Keithley Instruments, Cleveland,OH, U.SA.). A 4-pole filter, constructed in-house, was used to filter high-frequencynoise by setting the cut-off to 0.5 or I Hz. Data were collected on a strip chart recorder.
The helium gas was high-purity (Air Products, Tamaqua, PA, U.S.A.). Themodel compounds used to evaluate the system (Fig. 1) were obtained from Aldrich(Milwaukee, WI, U.S.A.).
The apex of each emission line was found by scanning the wavelength regionwith a stepper motor controller (Instruments, SA). A volatile compound containingthe element of interest was bled into the plasma by way of a headspace samplingdevice27
. In order to simulate the operating conditions of the system, the appropriatemobile phase gas was doped into the headspace vapor mixture during the scans. Thecolor of the plasma was indicative of the content of the mixture; i.e., a helium-onlyplasma was pink-orange, a helium-carbon dioxide plasma was blue-green, anda helium-nitrous oxide plasma was purple-pink. These colors agree with those notedfor a He-RP020
.
Development of a heated interfaceThe original interface between SFC and microwave-induced plasma consisted of
pre-heating the helium and passing the effluent plus support gas through the apertureofa small nozzle inserted in the discharge tube 18
. However, it was determined that, dueto the low heat capacity of helium and the low flow-rate of gas, the helium was losingmost of the heat by the time it arrived at the tip of the restrictor. The directconsequences of insufficient heating of the restrictor are condensation of the mobilephase and detector "spiking", caused by condensed effluent erratically spurting intothe plasma. Work with other SFC detectors has indicated that a restrictor temperature
1 2 3 4Fig. l. Model solutes used, and their respective molecular weights. 1 = 2-Chlorobenzothiazole, 170 g/mol;2 = dibenzothiophene, 184 g/mol; 3 = 2-chlorophenothiazine, 234 g/mol; 4 = 5-bromoindole, 196 g/mol.

480 D.R. LUFFER, M. NOVOTNY
He in
\
J
Fig. 2. Schematic diagram of the restrictor heating device (not to scale). A = Quartz discharge tube, 4 mmI.D.; B = quartz nozzle insert, 3 mm I.D.; C = heating coil, I em long, and coated with high-temperaturecement; D = ceramic insulating tube with 4 holes; E = Swagelok 1/4-in. nut wit PTFE ferrule;F = Swagelok 1/4-in. reducing union; G = SGE 1/l6-in. male nut silver-soldered to union F; H = SGE1/1 6-in. female nut with Vespel ferrule; I = frit restrictor sleeved through and terminating at C; ] = fine gagethermocouple wires exiting F; K = heater wires exiting F; L = 1/1 6-in. stainless-steel tubing silver-solderedinto F.
of at least 300°C is warranted. This minimum operating temperature is also requiredfor the elution of high-molecular-weight analytes. A suggested means of overcomingthe heating problem was to increase the mass flow-rate of helium as it passes throughan intensely heated length of stainless-steel tubing situated right at the tip of therestrictor. Unfortunately, this attempt was unsuccessful because the plasma does notoperate optimally at very high helium flow-rates, and the maximum temperature thatcould be reached was still only 175°C.
A different approach that was taken involved the coating of the restrictors witha solution of gold in an organic matrix (Liquid Bright Gold), in a manner describedelsewhere28
. The goal was to attach electrical leads of small dimensions directly to thisgold coating, however, the connection proved to be too difficult due to the fragility ofthe restrictor configuration.
The successful design is based upon the construction ofa very small wire coil thatis resistively heated, in a manner very similar to that utilized by Reinhold et al. 29 fordirect chemical ionization in SFC-mass spectrometry. The entire assembly is shownschematically in Fig. 2. The coil was prepared by wrapping a length of No. 34copper~nickel wire (Wilbur Driver, Newark, NJ, U.S.A.) around a post of slightlylarger diameter. The strand of wire was doubled, wrapped in one direction for aboutI cm, and then wrapped in the opposite direction until returning to the point of origin.The wire assembly is then removed from the post on which it was wound, producinga coil consisting of two very closely wound layers that becomes a region of very highcurrent density when heated. The wire also possesses a high temperature (260°Cmaximum) enamel coating, which allows the tightly wound coil to be resistively heatedwithout shorting out; however, the temperature range of the heating coil assembly wastargeted to be greater than 300°C. This problem was surmounted by conditioning thecoil with slow increments to the applied voltage, which allows the gradual formation ofa protective oxide layer capable of sustaining the higher temperatures.

ELEMENT-SELECTIVE DETECTION AFTER SFC 481
The wire leads of the coil were subsequently threaded through 2 of the 4 holes(1/64 in. diameter) of a ceramic rod (1/16 in. 0.0.) made of Omegatite 200 (OmegaEngineering, Stamford, CT, U.S.A.) (0 in Fig. 2). The leads of an unsheathed finegauge (0.005 in. diameter) Chromel-Alumel thermocouple (Type K, Omega Engineering) are threaded through the other two holes of the rod. The exit holes for thefour wires were drilled through a nut in the assembly (F in Fig. 2), so that theconnections can be made far from the area of intense heating. The restrictor is sleevedthrough one of the four holes and exists just past the end of the coil. It is held firmly inplace by an SGE nut and ferrule at the back of the assembly (H in Fig. 2). The ceramicrod is sleeved through a small plug ofPTFE (not shown in schematic) that has a hole(1/16 in. diameter) drilled through its side. The PTFE plug (1/8 in. diameter) is placedsideways in the nut and wedged firmly in place, which centers the ceramic rod in thequartz tube (William A. Sales, Wheeling, IL, U.S.A.) while allowing the passage ofhelium gas around it. A quartz nozzle insert surrounds the coil and rod, as shown inFig. 2.
Temperature stability of the coil was improved by coating it and the junction ofthe thermocouple with a high temperature cement (Omega Engineering) and letting itcure for 24 h. A typical coil that is being swept by 300 ml/min of helium easily attains320°C, requiring only 1.0 A and 13 V from a d.c. power supply. The high flow ofmobilephase through the restrictor does not lower the temperature of the coil device, althoughthe helium support gas flow exterts a dramatic effect. Monitoring the temperature atthe tip of the coil was accomplished by connecting the leads from the thermocouple toa digital volt meter, which typically reads 12 mV for a temperature of 320°C.
A coil assembly, once conditioned, can last indefinitely, unless a high-voltagespark from a Tesla coil causes it to short out. For this reason, the plasma was ignited byinserting a length of copper wire a short distance into the discharge tube in order toseed the plasma with electrons. This method is superior to the tungsten wire methodpreviously used18 ,19 because the latter leaves a substantial oxide film on the walls ofthe discharge tube, whereas copper does not.
It may seem surprising that a resistively heated wire coil placed approximately2 cm from the plasma discharge does not disrupt or degrade the performance of theplasma. However, the additional insulating effects of the quartz inner nozzle and thehigh-temperature cement coating appear to be sufficient to prevent any problems. Themain consequence of including the heating device is a stabilization of the plasmadischarge because of the elimination of condensation of mobile phase at the tip of therestrictor, and therefore, a less "noisy" introduction of the heated effluent into theplasma.
It should be noted that this heating device is superior to simply inserting therestrictor into the plasma, as seen in other studies20
, because the temperature at the tipof the restrictor is known, stable, and damage to the frit material is virtuallyimpossible. In addition, the very small size of the assembly « 3 mm 0.0.) makes ituseful in any type of application where space and accessibility are limiting factors.
RESULTS AND DISCUSSION
It was ascertained in our earlier work 18 that the quartz nozzle inserted into thedischarge tube was essential for high-sensitivity detection of sulfur due to the

482 D.R. LUFFER, M. NOVOTNY
(A)
(8)
o 9 minf-- -1
143 191 aIm
2
o 10 minI--- -1
153 201 atm
Fig. 3. Sulfur-selective detection of 2-chlorobenzothiazole and methanol solvent (denoted by S). (A)Without nozzle; (B) with nozzle.
Fig. 4. Variation of baseline as a function of helium support gas flow for the separation of compounds 1,2,and 3 (Fig. I) using S(I) line and CO 2 mobile phase at l30cC. Helium flow-rate: (A) 100 ml/min; (B) 300ml/min.
"focusing" of effluent into the plasma. In the present study, however, the use of theheating element directly on the frit restrictor was thought to produce a similar effect,which would preclude the use of a nozzle. In order to test this hypothesis, twoinjections of a sulfur-containing compound in methanol were performed underidentical conditions, except that in one case the nozzle was present and in the other caseit was absent. Fig. 3A illustrates the effect of removing the nozzle; both the solvent andsolute peaks are severely reduced in intensity, compared to those in Fig. 3B. Hence, inall subsequent work, the nozzle insert was present, as shown in the schematic in Fig. 2.
A major impediment to the acceptance of the Surfatron as a detector for SFCapplications was the sloping baseline occurring during density-programmed runs 18.While methods of background correction were originally proposed and attempted,a simpler and more efficient manner of eliminating this effect was discovered and isillustrated by Fig. 4. A separation of model compounds was performed at a low (100ml/min) and high (300 ml/min) flow-rate of helium. Fig. 4A exhibits the decreasingbaseline that we have noted previously18, while Fig. 4B exemplifies the opposite trend.From this information it seemed likely that an intermediate flow of helium wouldproduce stable baseline during a density-programmed separation. A similar findinghas been noted recently for RPD for SFC2o. Once the optimum helium flow had beendetermined, separations were performed to illustrate the sensitivity and selectivity ofdifferent lines, initially with a carbon dioxide mobile phase. Fig. 5A illustrates sucha separation using the sulfur line (921.3 nm). However, when the same separation wasperformed using the chlorine line at 837.6 nm, the baseline exhibited a serious declineat this helium flow-rate. Therefore, it was determined that there exists an optimumflow ofhelium for each line, which probably depends on the background near that line.

ELEMENT-SELECTIVE DETECTION AFTER SFC 483
o 9 minI-- ----l
150 214 aIm
(8)
o 9 mint-- --.,
150 214 atm
Fig. 5. Selective detection of compounds 1,2, and 3 (Fig. I) with CO2 at 130°C. (A) S(I) line (921.3 nm),125-flm slits, 180 ml/min He; (B) Cl(I) line (837.6 nm), 125-flm slits, 280 ml/min He.
In addition, this optimum flow is completely different when nitrous oxide issubstituted for carbon dioxide, which is further proof that the background determinesthe ideal support gas flow. For example, the maintenance of the level baseline shown inFig. 5B required a much higher (280 ml/min) flow of helium than that in Fig. 5A (180ml/min). The other point to note concerning this separation is the absence of peak 2 inFig. 5B, which illustrates the good selectivity of this line since this compound containsno chlorine atoms. No comparisons were made with the other strong chlorine line inthe near-infrared (912.1 nm) because the signal-to-background and signal-to-noiseratios were rather poor.
Evaluation of the system was repeated using a nitrous oxide mobile phase.A comparison of the sensitivity and selectivity of different lines in the near-infraredregion is shown in Fig. 6. The first point of note is the positive solvent peak formethanol on all four lines. This is entirely logical in the case of the ql) line depicted inFig. 6A, however, it portends poor selectivity for the other lines. The existence ofa large, positive solvent signal can be attributed to the intense CN-band emissionthroughout the near-infrared region; evidently, the carbon from methanol iscombining with the abundant nitogen from NzO to produce a large signal. Theseparation shown in Fig. 60 illustrates high-sensitivity sulfur detection, whereas theseparations on the two chlorine lines in Fig. 6A and 6B are discouraging because of thenoticeable peak in both cases for dibenzothiophene, which contains no chlorine atoms.Apparently, the CN-band emission is a significant problem when a nitrous oxidemobile phase is used because it is not possible to know how much of the signal is due toanalyte emission, and how much is from carbon. This problem was found for all linesexamined, except for one; Fig. 7B illustrates the elution of 5-bromoindole using the889.8 nm line and the corresponding negative solvent peak, in contrast with the sameinjection using the 827.2 nm Br(l) line, with a corresponding positive solvent peak (Fig.7A).
Sensitivities and selectivities for all these lines, in conjunction with both mobilephases, are summarized in Table I. The molar selectivities listed in Table I werecalculated using naphthalene, unlike some other studies that used an alkane, such as
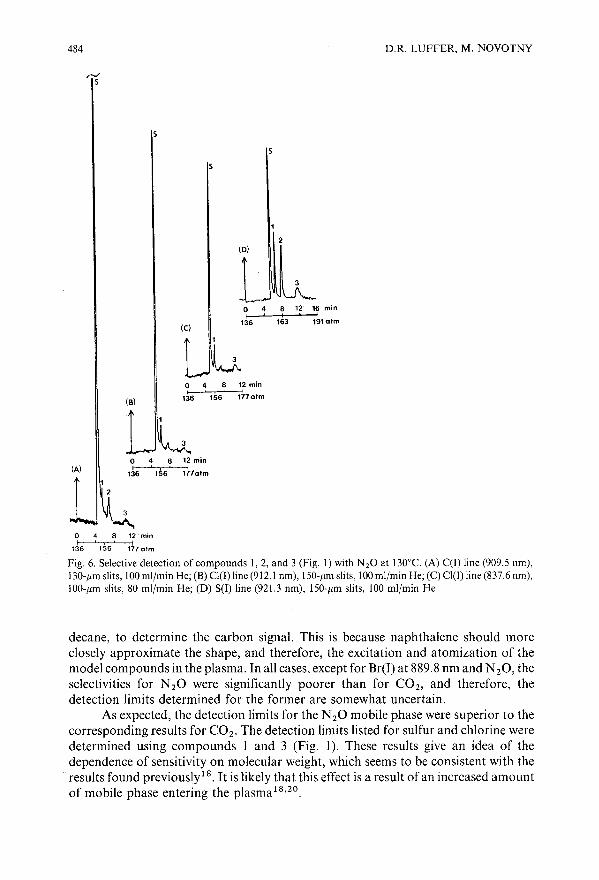
484
r--/S
(C)
(0)
o 4 8 12' 16 minI t I ' I
136 163 191 aIm
D.R. LUFFER, M. NOVOTNY
(8)
o 4 8 12 minI I
136 156 177alm
(A)048
1~6 ' 156'
12 minI
177atm
o 8 12'min
1~f--6~""15-6~--I1~7aIm
Fig. 6. Selective detection of compounds 1,2, and 3 (Fig. I) with N 20 at l30a C. (A) C(I) line (909.5 nm),130-pm slits, 100 ml/min He; (B) CI(l) line (912.1 nm), ISO-pm slits, 100 ml/min He; (C) Cl(l) line (837.6 nm),IOO-pm slits, 80 ml/min He; (D) S(I) line (921.3 nm), ISO-pm slits, 100 ml/min He.
decane, to determine the carbon signal. This is because naphthalene should moreclosely approximate the shape, and therefore, the excitation and atomization of themodel compounds in the plasma. In all cases, except for Br(I) at 889.8 nm and NzO, theselectivities for NzO were significantly poorer than for COz, and therefore, thedetection limits determined for the former are somewhat uncertain.
As expected, the detection limits for the NzO mobile phase were superior to thecorresponding results for COz. The detection limits listed for sulfur and chlorine weredetermined using compounds I and 3 (Fig. I). These results give an idea of thedependence of sensitivity on molecular weight, which seems to be consistent with theresults found previously18. It is likely that this effect is a result of an increased amountof mobile phase entering the plasma 18,ZO.

ELEMENT-SELECTIVE DETECTION AFTER SFC 485
(A)
o 7 min
1~4alm
(8)
o 7 minr---- -1
156 184 otm
Fig. 7. Injection of 5-bromoindole in methanol, with N 20 at l30De. (A) Br(I) line (827.2 nm), 100-/lm slits,100 ml/min He; (B) Br(I) line (889.8 nm), 125-pm slits, 80 ml/min He.
TABLE I
SENSITIVITIES AND SELECTIVITIES OF VARIOUS ELEMENTS AS A FUNCTION OF MOBILEPHASE
Mobile phase
CO 2
N 20
Element Line (11m) Sensitivity" (pg/s) Molar selectivity"
S(l) 921.3 73 140 325CI(I) 837.6 210 250 100Br(1) 827.2 780 110Br(l) 889.8 780 165
S(I) 921.3 26 85 185CI(I) 837.6 110 400 50CI(I) 912.1 97 550 45Br(I) 827.2 300 20Br(I) 889.8 520 >500C(I) 909.5 550 2600
" The values listed on the left were obtained from either 2-chlorobenzothiazole or 5-bromoindole;the values on the right were obtained from 2-chlorophenothiazine.
b Molar selectivities were all calculated from the response of either 2-chiorobenzothiazole or5-bromoindole over naphthalene.

486 D.R. LUFFER, M. NOVOTNY
In general, detection in the near-infrared region does not seem as promising as itwas initially for non-metal selective detection with the Surfatron, as evidenced by theresults for sulfur 18
. In addition, the potential for universal detection with the carbonline and NzO is limited because of the high detection limits found for the strongest linein this spectral region (909.5 nm), and the decrease in sensitivity as molecular weight ofthe solute increases (Table I).
As an example of an application, the separation of four pesticides (Fig. 8) isillustrated. Since they contain both phosphorus and sulfur atoms, this permitsa comparison with the results obtained with a thermionic detector, in the P-mode, forSFC 1Z
. It was determined in that study that these compounds exhibited only limitedsolubility in COz, so that only a nitrous oxide mobile phase was used. For the sake ofcomparison, this mixture was separated in N zO and detected using the sulfur channel.The resultant separation is shown in Fig. 9, where the stationary phase utilized wasa 50% cyanopropyl-substituted methylpolysiloxane. As expected, the sensitivity ofeach compound is dependent on the number of sulfur atoms in each molecule.
A point that has not yet been mentioned explicitly is that the condition of thedischarge tube affects the detection limit for each element. This is because thebackground increases and the baseline becomes much noisier as the discharge tubeages. For this reason, a new length of tubing was used each day. The effect isexemplified by Fig. 10, where Fig. lOA shows the separation of the pesticide mixture atthe end of one day, where the discharge tube is qui te old and devitrified; Fig. 108 is thesame separation performed the next day under identical chromatographic conditions,using a new discharge tube.
By means of comparison, the results recently reported for SFC-TID, SFCFPD, and SFC-ECD will be briefly described here, and evaluated with respect to theSFC-Surfatron results reported in the present study.
The thermionic detector has been shown to possess very high selectivities fornitrogen and phosphorus, in conjunction with very low detection limits, i.e. < 2 pg/sand < I pg/s, respectivelylz. In addition, this detector was shown to be extremelyuseful for detection of biological compounds and their metabolites in physiologicalfluids, using COz and NzO (refs. 13-15). FPD has been characterized in the dual-flamemode9 as well as in the single-flame mode 10 ,11 for a wide variety of organosulfurcompounds, with corresponding high selectivity and low detection limits (8 pg/s)
4
S
(c H '0) -~-S-CH -s-c H252 2 25
1
S 0
(CH 0) -~-S-CH-~-O-CH3 2 I 2 S
CH -C-O-C H2 II 2 5
o3
S
(c H 0) -~-S-(CH) -S-C H252 2225
2
Fig. 8. Pesticides used, and their respective molecular weights. I = Phorate, 260 g/mol; 2 = di-syston, 274gjmol; 3 = malathion, 330 g/mol; 4 = ethion, 384 g/mol.


488 D.R. LUFFER, M. NOVOTNY
utilizing an improved design 11. ECD yields detection limits of high femtograms forhalogenated compounds containing chlorine and bromine 17
.
The combination of SFC with the Surfatron, in the near-infrared region,demonstrates more versatility than the previous three detection methods because ofa theoretically limitless selection of elements. Plasma detection is superior to FPD forthe determination of sulfur because the latter suffers from a non-linear response,whereas the former is linear for all elements studied over 2-3 orders of magnitude, andthe effective linear concentration range is 10-4-10-2 M, corresponding to an unsplit60-nl injection volume. More concentrated samples can be detected with largerinjection volumes, but the calibration curve would no longer be linear in this range.However, the drawbacks of the Surfatron detector are that sensitivity suffers froma dependence on solute molecular weight, and that selectivity suffers from a dependence on the chosen mobile phase.
The cost of assembling this detection system was approximately US$ 20000,which is not as expensive as some laser-based detectors used for LC, especiallyconsidering that the plasma detector is capable of simultaneous multielement selectivedetection, ifequipped with a photodiode array. In addition, the detector appears usefulfor the detection of low nanogram quantities of compounds containing variousnon-metals, with simultaneous universal detection by FID, if necessary. Furtherinvestigation of other plasma sources and spectral regions appears worthwhile.
ACKNOWLEDGEMENTS
This research was supported by the National Science Foundation through GrantCHE 86-05935. The authors would like to acknowledge Robert Ensman (ElectronicInstrument Services, Indiana University) and Douglas M. Sheeley (Department ofNutrition, Harvard School of Public Health, Boston, MA, U.S.A.) for invaluablesuggestions in the construction of the heating device. We would also like to thankLarry Sexton in our machine shop for the construction of the Surfatron cavity, StevenR. Springston (Brookhaven National Laboratory, Upton, NY, U.S.A.) for his help inthe gold-coating of restrictors, and members of Professor G. M. Hieftje's researchgroup for helpful suggestions. D. R. L. would like to acknowledge financial supportthrough a Doctoral Research Fellowship from the Indiana University GraduateSchool, and an American Chemical Society Analytical Division Full-Year Fellowship,sponsored by the DuPont Company.
REFERENCES
I E. Klesper, A. H. Corwin and D. A. Turner, J. Org. Chem., 27 (1962) 700.2 S. T. Sie and G. W. A. Rijnders, Sep. Sci., 2 (1967) 729.3 S. T. Sie and G. W. A. Rijnders, Sep. Sci., 2 (1967) 755.4 M. N. Myers and J. C. Giddings, Sep. Sci., I (1966) 761.5 L. McLaren, M. N. Myers and J. C. Giddings, Science (Washington, D.C.), 159 (1968) 197.6 J. C. Giddings, M. N. Myers, L. McLaren and R. A. Keller, Science (Washington, D.C.), 162 (1968) 67.7 M. Novotny, S. R. Springton, P. A. Peaden, J. C. Fjeldsted and M. L. Lee, Anal. Chem., 53 (1981) 407A.8 Y. Hirata, J. Chromatogr., 315 (1984) 39.9 K. E. Markides, E. D. Lee, R. Bolick and M. L. Lee, Anal. Chem., 58 (1986) 740.
10 L. A. Pekay and S. V. Olesik, Anal. Chem., 61 (1989) 2616.II S. V. Olesik. L. A. Pekay and E. A. Paliwoda, Anal. Chem .. 61 (1989) 58.

ELEMENT-SELECTIVE DETECTION AFTER SFC 489
12 P. A. David and M. Novotny, Anal. Chem., 61 (1989) 2082.13 P. A. David and M. Novotny, J. Chromatogr., 452 (1988) 623.14 P. A. David and M. Novotny, J. Chromatogr., 461 (1989) Ill.15 P. A. David and M. Novotny, Anal. Chem., in press.16 P. A. David, Ph. D. Dissertation, Indiana University, Bloomington, IN, 1989.17 H.-C. K. Chang and L. T. Taylor, J. Chromatogr. Sci., 28 (1990) 29.18 D. R. Luffer, L. J. Galate, P. A. David, M. Novotny and G. M. Hieftje, Anal. Chem., 60 (1988) 1365.19 L. 1. Galante, M. Selby, D. R. Luffer, G. M. Hieftje and M. Novotny, Anal. Chem., 60 (1988) 1370.20 R. J. Skelton. Jr., P. B. Farnsworth. K. E. Markides and M. L. Lee. Anal. Chem., 61 (1989) 1815.21 J. E. Freeman and G. M. Hieftje, Spectrochim. Acta, 40B (1985) 475.22 G. Chevrier, T. Hanai, K. C. Tran and J. Hubert, Can. J. Chem., 60 (1982) 898.23 T. Hanai, S. Coulombe, M. Moisan and J. Hubert, in R. M. Barnes (Editor), Developments in Atomic
Plasma Spectrochemical Analysis, Heyden, London, 1981, p. 337.24 Y. Takigawa, T. Hanai and J. Hubert, J. High Resolut. Chromatogr. Chromatogr. Commun., 9 (1986)
698.25 B. Riviere, J.-M. Mermet and D. Deruaz, J. Anal. At. Spectrom., 3 (1988) 551.26 M. H. Abdallah, S. Coulombe, J.-M. Mermet and J. Hubert, Spectrochim. Acta, 37B (1982) 583.27 J. E. Freeman and G. M. Hieftje, Spectrochim. Acta, 40B (1985) 653.28 S. R. Springston, J. ChromalOgr., 517 (1990) 67.29 V. N. Reinhold, D. M. Sheeley, J. Kuei and G.-R. Her, Anal. Chem., 60 (1988) 2719.


Journal of Chromatography, 517 (1990) 491-501Elsevier Science Publishers B.V., Amsterdam
CHROMSYMP. 1989
Use of sulfur chemiluminescence detection after supercriticalfluid chromatography
H.-C. KAREN CHANG and LARRY T. TAYLOR'
Department of Chemistry, Virginia Polytechnic Institute and State University. Blacksburg. VA 24061(U.S.A.)
ABSTRACT
A newly developed sulfur chemiluminescence detector is evaluated for supercritical fluid chromatography (SFC). The detection chemistry for sulfur chemiluminescence detection (SCD) is based on the chemiluminescent reaction between sulfurmonoxide, which is produced from the decomposition of sulfur-containing analytesin a H 2/Oz-reducing flame and ozone. Detection limits are determined to be 12 pgsulfur via capillary-column SFC-SCD. Detector linearity is three orders of magnitude, and a selectivity of at least 107 was obtained. Quenching of SCD signals resulting from both the supercritical-f1uid mobile phase and co-eluting hydrocarbons isdiscussed. Separation of thermally labile pesticides, and the determination of theethylene oxide distribution for a thioethoxylate surfactant are demonstrated.
INTRODUCTION
Specific detection of sulfur-containing compounds, such as polycyclic aromaticcompounds and pesticides, is important because of their natural toxicity or mutagenicity. The separation and detection of sulfur-containing compounds has beenmost often accomplished with gas chromatography (GC) coupled with different sulfur-selective detectors1,2. In these studies, excellent separation and detection of sulfurcompounds was achieved. However, many sulfur-containing compounds are difficultto analyze by GC due to either their thermal instability or their non-volatility.
Supercritical fluid chromatography (SFC) offers some advantages over GC foranalytical problem solving. For example, analysis of thermally unstable and relativelynon-volatile compounds which cannot be achieved in GC has been performed bySFC3- S
• Furthermore, because SFC employs supercritical mobile phases like CO2,which is a gas under ambient conditions, it is relatively easy to interface SFC toGC-like detectors6
. A variety of sulfur-selective detections have been coupled toSFC, such as flame photometric detection (FPO) 7~9, surface-wave-sustained microwave-induced plasma detection (surfatron MIP)IO, radio-frequency plasma detection(RPD)ll and fluorine-induced sulfur chemiluminescence detection (SCD)12,13. Good
0021-9673/90/$03.50 © 1990 Elsevier Science Publishers B.Y.

492 H.-C. K. CHANG, L. T. TAYLOR
performance with certain limitations has been shown from each coupling.In spite of its non-linear response to sulfur compounds, FPD is the most pop
ular sulfur-selective detector used in Gc. Detailed characterization and optimizationofFPD for use after capillary SFC has been recently studied8
. A detectivity of8.2 pgSis for dibenzothiophene was reported. In another study, analysis of thermally labileand relatively high-molecular-weight compounds was demonstrated using capillarySFC~FPD9. A detection limit of 150 pgls (or 26 pg Sis) of dibenzothiophene wasreported via a capillary SFC-surfatron MIP system 10. Detector linearity was reported to be only two orders of magnitude and signal quenching from COz was severe.However, it was reported that improved performance could be obtained if the SFCsurfatron MIP system was optimized. The element-selective RPD when operated inthe sulfur mode provided detection limits ranging from 50 to 300 pg Sis depending onthe mass flow of COz into the detectorI 1. The advantage for the surfatron MIP andRPD is that both can provide selective detection to other elements, such as chlorine,bromine and nitrogen.
Fluorine-induced SCD in which the detection chemistry is based on the gasphase reaction of Fz with organic sulfur compounds is probably the most sensitivesulfur-selective detector that has been reported for SFC12,13. A 0.72 pg Sis detectionlimit for dodecanethiol 13 was obtained, and a selectivity of 104 was observed. Thefluorine-induced SCD is, however, somewhat limited in that it shows strong responseonly for those organic sulfur compounds that have certain structural configurations lZ
. For example, a sulfur compound whose structure is represented as RI-S-Rz,yields a very strong response if the R-groups bonded to the sulfur are hydrogen orhave an alkyl group which contains hydrogen.
Recently, a new sulfur chemiluminescence detector was developed for analyzingsulfur-containing compoundsl4
. Its detection principle is based on the chemiluminescence reaction of ozone gas with sulfur monoxide (SO) which is produced in aHz/Oz-reducing flame that contains the sulfur-containing analyte. This reactionmechanism can be summarized as follows:
S-compounds + Hz/O z -+ SO + other products
SO! -+ SOz + hv
(1)
(2)
(3)
Reaction (2) is highly exothermic, and the energy produced is large enough toexcite SOz at the same time. The wavelength of the emitted light ranges from 260 to480 nm with a peak maximum at 350 nm. Unlike the fluorine-induced SCD, thisozone-induced SCD responds to all sulfur-containing compounds. Nearly equimolarresponse to various sulfur compounds and a selectivity (g Sig C) greater than 107 wasobserved from the GC-SCD studies l 4-I6. A detection limit of 400 fgls of sulfur wasreported by Shearer et al. Is In addition, it was found that the SCD sensitivity w~s notaffected significantly by environmental COz and water vapor, which are the twomajor interferences in FPD.
This report describes the direct interfacing of this newly developed SCD to opentubular and packed capillary column SFC employing both COz and 2% (w/w) meth-

SULFUR CHEMILUMINESCENCE DETECTION FOR SFC 493
anol-modified CO2 as the mobile phase. Signal quenching from the mobile phase isaddressed. Applications of the SFC-SCD to the analyses of thermally labile pesticides and a sulfur-containing surfactant are given.
EXPERIMENTAL
ChromatographyThe flame sampling probe of the sulfur chemiluminescence detector (SCD 350,
Sievers Research, Boulder, CO, U.S.A.) was mounted directly on top of the flameionization detector of the Lee Scientific 50 I supercritical-fluid chromatograph [LeeScientific (LSI), Salt Lake City, UT, U.S.A.]. The FID temperature was maintainedat 375°C. Grade 4.3 oxygen (Airco, Murray Hill, NJ, U.S.A.) was used as the ozonegenerator gas. SFC-grade CO2 and 2% (w/w) methanol-modified CO2 were obtainedfrom Scott Specialty Gases (Plumsteadville, PA, ~.S.A.).
Both 50-pm and 100-pm J.D. frit restrictors (LSI) were used to control thecapillary column and packed-capillary-column flow, respectively. Direct injectionwith a helium actuated Valco (Houston, TX, U.S.A.) injector (60-nl rotor) was employed as the sample introduction method17
. Exact chromatographic conditions arecited in the figure legends. All data were recorded by a Spectra-Physics 4290 integrator.
ColumnsBoth capillary columns (50 pm J.D. coated with a 0.25-pm film thickness; LSI)
and packed-capillary columns (250 pm J.D. packed with 5 pm Deltabond-CN; Keystone, Bellefonte, PA, U.S.A.) were used to achieve chromatographic separations.The packed-capillary columns were slurry-packed in-house. A 3-5% (w/w) slurry ofstationary phase in methanol was used as the packing medium. A Haskel air pumpwas used to deliver the methanol. A pressure of 6000 p.s.i. was employed for packingthe column. The pressure was increased to 7000 p.s.i. for 4-5 h after packing in orderto condition the column.
ReagentsDimethyl sulfide (49.9 ppm in nitrogen; Scott Specialty Gases) was used for the
signal-quenching study. Sulfur-containing pesticides were purchased from ChemicalService (West Chester, PA, U.S.A.). Benzo[b]thiophene and dibenzothiophene wereobtained from Aldrich (Milwaukee, WI, U.S.A.). These pesticides and chemicals wereused as-received without further purification. The surfactant (ethoxylated thiols) wasobtained from Shell (Houston, TX, U.S.A.). Garlic oil (Nature Made NutritionalProduct, Los Angeles, CA, U.S.A.) was purchased from a local store. HPLC-gradesolvents (Fisher, Raleigh, NC, U.S.A.) were used for preparing standard solutions.
RESULTS AND DISCUSSION
Without any modification, the SCD system was used after capillary SFC employing CO 2 or 2% (w/w) methanol-modified CO 2 as the mobile phase. A schematicdiagram of this SFC-SCD is given in Fig. I. AU the flame-decomposed products weredrawn from FID to SCD via a ceramic sampling probe and a transfer line by a

494
7
23
6
H.-C. K. CHANG, L. T. TAYLOR
14
12
Fig. 1. Schematic diagram of SFC-sulfur chemiluminescence detector. Key: I = SFC grade CO 2 or 2%(w/w) methanol-modified CO2 ; 2 = syring pump; 3 = chromatographic oven; 14 = flame ionizationdetector; 5 = flame sampling probe; 6 = transfer line; 7 = oxygen; 8 = ozone generator; 9 = reaction cell;10 = vacuum pump; II = chemical trap; 12 = photomultiplier tube; 13 = integrator; 14 = SCD 350 mainbody.
vacuum pump. In order to efficiently transfer the short-lived sulfur monoxide to thereaction cell, pressure inside the SCD system was maintained at 15 Torr. This lowpressure system also prevented water condensation from occurring inside the transferline and reaction chamber and reduced the collisions of other molecular species withsulfur monoxide.
The flame chemistry involved in SCD is expected to be as complex as that inFPD. It has been reported 18 that the major combustion products from sulfur analytesare SO, SH, SOz, SZ, HzS and some non-sulfur-containing products when a hydrogen-rich reducing flame is employed. The relative abundances of these species arestrongly dependent on the flame gas composition (ratio of the Hz/O z) and the position in the flame. It was also reported 13 that in a hydrogen-rich flame, SOz, was thedominant sulfur species and SO accounted for at least 20% of the total products whilethe amount of Sz, was less than 1%.
The suggested hydrogen and air flows for obtaining maximum selectivity inGC-SCD are arround 200 and 380 ml min -1, respectively15. It was found that SCDsensitivity was more dependent on the air flow-rate than the hydrogen flow-rate.While decreasing air flows increased sensitivity, it was accompanied by a loss ofselectivity. This phenomenon was also observed in the SFC-SCD system. At a fixedhydrogen flow (205 ml min -1), the optimum air flow was found to be lower inSFC-SCD than that in GC-SCD. An air flow of 330 ml min -1 and a hydrogen flowof205 ml min -1 were used throughout this SFC-SCD study. Further investigation ofthe optimized flame gas composition for SCF-SCD may be necessary.
SULFUR CHEMILUMINESCENCE DETECTION FOR SFC 495
Signal quenchingIt is believed that quenching resulting from collisions between the primary
monitored species, S~, and other molecular species produced in the flame are the mainfactors that cause signal quenching in FPD I6
. Quenching ofSO~ emission is probablya considerable problem in SCD because the reaction mechanism can be consideredsimilar for both FPD and SCD. However, it is important to note that the chemiluminescence is occurring in the hot flame at atmospheric pressure in FPD, and itoccurs downstream at reduced pressure and room temperature in SCD. Consequently, collisional quenching in SCD would be expected to be less than in FPD. Indeed,this reaction in SCD quenching has been observed 14, 15.
A significant signal quenching in FPD results from co-eluting hydrocarbons.Co-eluting hydrocarbons can serve as fuel gas in the flame, hence, they change theflame temperature which consequently perturbs the flame chemistry and therefore,changes the distribution of sulfur species. In addition, if the amount of hydrocarbonsis large enough, the probability ofcollisions between the monitored sulfur species, e.g.S~ in FPD and SO~ in SCD, and the flame-decomposed products (such as CH4 , COzor HzO) is increased. In order to examine the quenching from co-eluting hydrocarbons in SFC-SCD, an experiment was designed such that benzol[b]thiophene (1 nginjected) co-eluted with 20 nl of either n-hexane, methanol, or toluene (~ 20 /lg) usinga capillary column (1 m x 50/lm I.D.; SB-Methyl-l00). A decompressed COz gasflow of less than 1 ml min -I was controlled by frit restrictor. It was found thatquenching resulting from co-elution of the sulfur-containing analytes with n-hexaneor methanol was not significant. However a 15% decrease in signal was observed ifthe component co-eluted with toluene. This quenching from toluene has also beenobserved with SFC-FPD8
.
Another quencher which is thought to be important in SFC-SCD is the mobilephase employed in SFC. Most of the mobile phases used in SFC are polyatomic, e.g.COz, NzO or modified COz. These mobile phases are more effective quenchers thanmost of the mobile phases used in GC such as monoatomic He or diatomic Hz.Furthermore, the decompressed mobile phase gas flow-rates (at their high densities)at the outlet of the column are usually higher in SFC than those from GC using acolumn with the same dimensions. It has been reported l9 that a 15% signal decreasewas observed from a redox chemiluminescence detector by comparing the signalgenerated from decompressed COz at a flow-rate of 0.75 ml min -I with -that fromhelium.
Quenching of the SCD signal resulting from the SFC mobile phase was examined for COz, which is the most widely used mobile phase. Curve a in Fig. 2 is theSCD background signal at different decompressed COz gas flow-rates. The reasonwhy the SCD signal increases with increasing COz flows is not clear. It may be due tothe CH* emission (at 390 nm) resulting from hydrocarbon contaminants (less than 5ppm) in COz (ref. 18). Curve c in Fig. 2 is the hypothetical SCD response for lownanogram level (49.9 ppm) of dimethyl sulfide. This curve is plotted under the assumption that no quenching was obtained from COz. However, the experimentalSCD response of the dimethyl sulfide (49.9 ppm) is shown in curve b which indicatesthat COz does quench the signal at a decompressed flow-rate above 5 ml min - I.
From the difference between curves band c, this quenching becomes more and moresevere with increasing COz gas flow above 15 ml min -1. About 70% of the signal is

496 H.-C. K. CHANG, L. T. TAYLOR
SCD Response (mV)·60 ~~':":"="::"::"':":""'::"----':'~-----------------,
x C
50
40.x·· b
a·x X:
x·'
30
20
205 10 15Decompressed C02 Gas Flow (ml Imin)
1 0 -I-- ---r .,-- ~-----,__-...J
o
Fig. 2. Quenching ofSCD signals resulting from different decompressed CO2 gas flow-rates. a = CO2
; b =
dimethyl sulfide (49.9 ppm) in CO2 (experimental data); c = dimethyl sulfide (49.9 ppm) in CO 2 (hypothetical data obtained by adding 15 mY, SCD response of 49.9 ppm dimethyl sulfide, to curve a.
SCD Response (mV)
55 xC
x·
45
35
)( .....
xx o
a
b
25
~..
15 L-.L- --.J --L ....L. ...L..-_...J
o 5 10 15
Decompressed Gas Flow (ml Imin)
20
Fig. 3. Quenching ofSCD signals resulting from different decompressed 2% (w/w) methanol-modified CO2
gas flow-rates. (a) 2% (w/w) methanol-modified CO2 ; (b) dimethyl sulfide (49.9 ppm) in 2% (w/w) methanol-modified CO 2 (experimental data); (c) dimethyl sulfide (49.9 ppm) in 2% (w/w) methanol-modifiedCO2 (hypothetical data obtained by adding 15 mY, SCD response of 49.9 ppm dimethyl sulfide, to curve a.

SULFUR CHEMILUMINESCENCE DETECTION FOR SFC 497
lost at a CO 2 gas flow of 20 ml min -1. This suggests that a packed column (J.D. ~ 1mm), which produces gas flow higher than 20 ml min -1, is not compatible with thecurrent SFC-SCD configuration.
In contrast to the high gas flow, the quenching in SCD is not significant whenthe gas flow is less than 5 ml min -1. For typical capillary column (i.e. 50 /lm J.D.)SFC operating conditions, the measured decompressed CO2 gas flow was less than 3ml min -1 (which corresponds to 390 atm CO 2 pressure). Hence, the signal quenchingdue to the presence of CO 2 should not be a significant problem when a capillarycolumn is employed for SCF-SCD analysis.
The quenching phenomenon resulting from the SFC mobile phase was alsostudied for 2% methanol-modified CO2 • The flame gas compusition and chromatographic conditions were the same as those used in the study of quenching from100% CO 2 . The results are shown in Fig. 3. For low decompressed flow-rates «4 mlmin - 1), quenching does not appear to be a problem. However, the rate of SCD signaldecrease was faster in this case than that observed with 100% CO2 at flow-rateshigher than 10 ml min -1. It was also noticed that quenching from either CO2 or 2%methanol-modified CO2 was even more severe when a higher concentration of dimethyl sulfide was used.
Although quenching is significant at high gas flows for both CO 2 and modifiedCO2 , a packed capilIary column (250 /lm J.D.) can be used in SFC-SCD because itshighest decompressed CO2 flow is typicalIy less than 10 ml min -1. One advantage ofusing a packed capilIary column is that a higher sample capacity can be obtained thanwith an open tubular capilIary column, although some loss of the SCD sensitivity anddetector linearity are observed.
Detector performanceA detection limit was found to be 12 pg S (signal-to-noise ratio 3) or 2 pg Sis
with dibenzothiophene in capilIary SFC-SCD. Detector linearity was at least threeorders of magnitude (0.07-70 ng of dibenzothiophene) using a packed capilIary column. Almost equimolar response was observed when injecting benzo[bthiophene,dibenzothiophene, and tri-alIate (a thiocarbamate) using identical chromatographicconditions. Selectivity of seven orders of magnitude was determined by comparingmethanol response and benzo[bthiophene response. It is interesting to note that hexane did not give a response, and toluene gave a negative response under these conditions.
Fig. 4 demonstrates the superior selectivity afforded by SCD. It is known thatgarlic oil contains many sulfur-containing compounds, many of which are thermallylabile. The garlic oil analyzed here was sealed in a gel tablet in which the garlic oil hadbeen premixed with vegetable oil. The garlic oil was then dissolved in n-hexane afterbeing removed from the tablet. One advantage of using this SCD system is that thesignals from both FID and SCD could be obtained simultaneously when employing100% CO 2 as the SFC mobile phase. The FID and SCD chromatograms are shownin Fig. 4. These volatile sulfur compounds were detected by SCD (Fig. 4a). However,they were not detected using FID either because they had low response in FID orco-eluted with solvent (Fig. 4b). Non-sulfur triglycerides (micrograms were injected)contained in the vegetable oil were detected by FID; however, they were not detectedby SCD.

498
/ Hexane
(a)
Triglycerides
H.-C. K. CHANG, L. T. TAYLOR
(b)
0.2 0.2I !
o
0.5I
I40
0.8I
g/ml
min
Fig. 4. Detection of sulfur-compounds from garlic oil by (a) FID and (b) SCD. Chromatographic conditions: CO
2density programmed from 0.20 to 0.8 g ml- 1 at 0.015 g m! - 1 min - 1 after a 3-min isoconfertic
period; oven temperature at 80°C; packed capillary column was used.
ApplicationsThe separation of C1z-ethoxylated thiols by capillary SFC-SCD is demon
strated in Fig. 5. Ethoxylated alcohols or thiols are widely used as non-ionic surfactants. Determination of the distribution of oligomers and average number of ethylene

SULFUR CHEMILUMINESCENCE DETECTION FOR SFC 499
0.3Io
0.45
40
0.58 g/mlI
85 minFig. 5. Capillary supercritical fluid chromatogram of C 12-ethoxylated thiols. Chromatographic conditions:CO
2density programmed from 0.30 to 0.45 g ml- 1 at 0.004 g ml- 1 min - after a 5-min isoconfertic period,
then to 0.58 g ml- 1 at 0.003 g ml- 1 min -; oven temperature held at 100"C; column was SB-Phenyl-5.
oxide (EO) units is important because they affect the chemical properties and performance of the surfactant. SFC has been shown to be an effective method for separating the oligomers in ethoxylated alcohols using FID20
. Because SCD respondsonly to the amount of the sulfur contained in each oligomer (i.e. one sulfur atom permolecule), the average number of EO units per mole of ethoxylate can be determineddirectly employing SCD. Since the response factors vary in the separated oligomerssuch a direct analysis via FID is not possible. By integrating each broad peak (eachpeak was comprised of many branched isomers) which represents one oligomer (Fig.5), the calculated average EO unit was 6.8, which was in good agreement with thenumber provided by a combination of other techniques.
Analysis of thermally labile and polar sulfur-containing pesticides with 2%methanol-modified CO2 is demonstrated in Fig. 6. A low nanogram amount of eachpesticide was injected. It was found that these pesticides started to decompose whenthe analysis temperature was increased above 70°C; therefore, their separation anddetection using GC was precluded. It was also difficult to chromatograph these compounds from the same column using 100% CO2 because of the irreversible adsorptionbetween these polar pesticides and the stationary phase21
. Methanol, however,changes the surface activity of the packing material, thus enabling the polar compounds to be eluted.

500 H.-C. K. CHANG, L. T. TAYLOR
2 5 5t •1 (C,H,O), - P - 5 - CH, - 5 - P - (OC,H,),
2 -0- ~CI ~ # S-CH,-S-P-(OC,H,),
5II
N-N-CH,-S-P-(OCH,),
3 CH,O)lS~O5
54 ° •
4 C)=S-P-(OC,H,),
3S-P-(OC,H,),
° +50
5 II
5 C'rN -P - (OC,H,),
0.75 g/ml,0.45I 'o 20
min
Fig. 6. Separation of five thermally labile sulfur-containing pesticides. Chromatographic conditions: density programmed from 0.45 to 0.75 g ml- 1 at 0.015 g ml- 1 min- 1 after a 3-min isoconfertic period; oventemperature at 50·C; 2% (w/w) methanol-modified CO 2 was the mobile phase; packed capillary columnwas used. Peaks: I = ethion; 2 = carbophenothion; 3 = methidathion; 4 = dioxathion; 5 = phosfolan.
CONCLUSIONS
The ozone-based sulfur chemiluminescence detector, which was originally designed for GC, has been found to be suitable for use in capillary SFC without anymodification. It affords the most selective detection for sulfur that has been reportedfor capillary SFC. In addition, this detector has been demonstrated to be useful forSFC employing 2% methanol-modified CO 2 as the mobile phase, thus increasing theSFC-SCD capability for analyzing polar compounds and relatively non-volatile compounds. Although suffering some loss of sensitivity, SCD also has been shown to becompatible for use after packed-capillary-column (250 .urn J.D.) SFC. A study of thecomplex flame chemistry involved in this· ozone-based SCD is necessary in order tomore efficiently utilize this detector in SFC employing modified CO 2 as the mobilephase.

SULFUR CHEMILUMINESCENCE DETECTION FOR SFC
ACKNOWLEDGEMENTS
501
Financial support from the United States Environmental Protection Agency isgratefully appreciated. Special thanks go to Shell Development Company for promoting this study.
REFERENCES
[ M. Dressler, Selective Gas Chromatographic Detectors, Elsevier, Amsterdam, 1986, Ch. 7-9.2 R. J. Skelton, Jr., H.-C. K. Chang, P. B. Farnsworth, K. E. Markides and M. L. Lee, Anal. Chem., 61
(1989) 2292.3 M. Novotny, S. R. Springston, P. A. Peaden, J. C. Fje[dsted and M. L. Lee, Anal. Chem., 53 (1981)
407A.4 K. D. Bartle, in R. M. Smith (Editor), Supercritical Fluid Chromatography, St. Edmundsbury Press,
England, 1988, pp. 1-28.5 R. D. Smith, B. W. Wright and C. R. Younker, Anal. Chem., 60 (1988) 1323A.6 B. E. Richter, D. J. Bornhop, J. T. Swanson, J. G. Wangsgard and M. A. Andersen, J. Chromatogr.
Sci., 27 (1989) 303.7 K. E. Markides, E. D. Lee, R. Bolick and M. L. Lee, Anal. Chem., 58 (1986) 740.8 S. V. Olesik, L. A. Pekay and E. A. Pa[iwoda, Anal. Chem., 61 (1989) 58.9 L. A. Pekay and S. V. Olesik, Anal. Chem., 6[ (1989) 2616.
10 D. R. LuIfer, L. J. Galante, P. A. David, M. Novotny and G. M. Hieftje, Anal. Chem., 60 (1988) 1365.I I R. J. Skelton, Jr., P. B. Farnsworth, K. E. Markides and M. L. Lee, Anal. Chem., 61 (1989) 1815.12 W. T. Foreman, C. L. Shellum, J. W. Birks and R. E. Sievers, J. Chromatogr., 465 (1989) 23.13 D. J. Bornhop, B. J. Murphy and L. Krieger-Jones, Anal. Chem., 6[ (1989) 797.14 R. L. Benner aznd D. H. Stedman, Anal. Chem., 61 (1989) 1268.[5 R. L. Shearer, D. L. O'Neal, R. Rios and M. D. Baker, J. Chromatogr. Sci., 28 (1990) 24.16 M. Legier, Sievers Research, Inc., personal communication.17M. L. Lee, B. Xu, E. C. Huang, N. M. Djordjevic, H-C. K. Chang and K. E. Markides, J. Microcol.
Sep., I (1989) 7.[8 S. O. Farwell and C. J. Barinaga, J. Chromatogr. Sci., 24 (1986) 483.19 W. T. Foreman, R. E. Sievers and B. W. Wenclawiak, Fresenius Z. Anal. Chem., 330 (1988) 231.20 P. R. Geiss[er, J. Am. Oil Chem. Soc., 66 (1989) 685.21 M. Ashraf-Khorassani and L. T. Taylor, in C. M. White (Editor), Modern Supercritical Fluid Chroma
tography, Hiithig, Heidelberg, 1988, pp. liS.


Journal of Chromatography, 517 (1990) 503-5[9Elsevier Science Publishers RV., Amsterdam
CHROMSYMP. 1975
Static coating of 5 to 50 /lm I.D. capillary columns for opentubular column chromatography
S. R. SUMPTER, C. L. WOOLLEY", E. C. HUANGb, K. E. MARKIDES and M. L. LEE'
Department of Chemistry, Brigham Young University, Provo, UT 84602 (U.S.A.)
ABSTRACT
Dichlorofluoromethane, trichlorofluoromethane and tetramethylsilane wereused in the static coating of small diameter capillary columns (5 to 50 f.lm I.D.) inorder to obtain highly efficient columns for gas and supercritical fluid chromatography. Capillary columns of 5-, 10-, 25-, and 50-f.lm I.D. were coated with stationaryphase films of SE-33, SE-54, OV-215, 50% n-octyl, 45% phenoxypolyethyl ether,50% liquid crystal, 25% biphenyl, 50% pentafluorophenyl and 50% cyanopropylpolysiloxane stationary phases. Resultant evaluations of these columns in gas chromatography gave approximately 9000, 66 000, 45 000, and 19000 plates m -1, respectively, for the different internal diameters. Important parameters which affect coatingefficiency are identified and discussed in detail.
INTRODUCTION
Several advantages are realized from the use of small diameter (~100 f.lm I.D.)open tubular columns in gas chromatography (GC) and supercritical fluid chromatography (SFC). The Golay equation indicates that small internal diameter columnsshould yield higher numbers of theoretical plates than larger I.D. columns. Fields etal. 1 showed that experimental height equivalent to a theoretical plate (HETP) data fora 50 f.lm I.D. column closely matched the theoretical values, and that the experimentalHETP data for a 25 f.lm I.D.column were about 1.5 times higher than the theoreticalvalues in SFC. These authors also showed experimental and theoretical plots of platesm-1 vs. the capacity ratio, k, for 25 to 100 f.lm I.D. columns. Results revealed that thepractical efficiencies for the 25 f.lm I.D. columns were significantly better than those forthe larger diameter columns.
In SFC, open tubular columns can be operated with relatively small pressure
" Present address: Supelco Inc., Supelco Park, Bellefonte, PA [6823-0048, U.S.A.b Present address: Equine Drug Testing and Toxicology, New York State College of Veterinary
Medicine, Cornell University, 925 Warren Drive, Ithaca, NY 14850, U.S.A.
0021-9673/90/$03.50 © 1990 Elsevier Science Publishers B.V.

504 S. R. SUMPTER el al.
drops along the length of the column. Pressure drop is important in SFC becausea change in pressure not only changes the mobile phase density and solvating power,but also the selectivity and resolution in a separation. Roth andAnsorgova2 calculatedpressure drops with a CO2 mobile phase at 107°C for 10,25, and 50 pm J.D. columns inSFC. Using inlet pressures of74 and 148 atm, and linear velocities of2 and 5cm S-I, thegreatest pressure drop was 16.2 atm for a 10 m x 25 pm J.D. column.
The use ofsmall diameter capillary columns in GC is restricted by the low samplecapacities of these columns. In addition, conventional GC inlet systems are notdesigned for the high pressures required for small J.D. columns (up to 27 atm for 25 pmJ.D. columns). SFC, on the other hand, is performed under high-pressure conditions(from 60-400 atm) and requires the use of 100 pm J.D. and smaller columns3.4.Extremely small diameter columns must be used in open tubular column liquidchromatography (LC) because of the slow diffusion rates of solutes in the mobilephase. Such columns must have internal diameters in the range of 2-15 pm 5-7. Thepreparation of efficient columns with such small internal diameters is extremelydifficult.
Several methods have been used to prepare small J.D. columns for open tubularcolumn chromatography. First, the dynamic coating methodS is the oldest coatingmethod, and was originally used to coat 200 pm to 1 mm J.D. columns. Desty et al. 9
and Gaspar et al. 10 used this method to coat 35 and 67 pm J.D. columns, respectively.The problem associated with the dynamic coating of small J.D. tubing is that thesolutions required for reasonably thick films (> 0.25 pm) are extremely viscous andrequire high filling pressures.
Second, the chemical bonding method of coating involves the bonding ofmonomeric reagents to the column wall. Alkyl groups are covalently bonded byreacting alkylchlorosilanes with surface silanol groups. The problem associated withthis method is that the column sample capacity is low, and the tubing must first beetched· to produce a greater surface area for the stationary phase films. Currently,fused-silica etching processes are not well developed, and there are an insufficientnumber of silanol groups on the column wall for the bonding of alkyl groups.Therefore, borosilicate or soda-lime glass columns are more often used. St. Claire andJorgenson 11 have prepared a 126 cm long, 8 pm J.D. borosilicate glass column yielding175000 theoretical plates in LC using this method.
Third, a precipitation coating method developed by Dluzneski and Jorgenson 12
is based on the variable solubilities of the stationary phase polymer in selected solventsystems at various temperatures. Using this method, OV-17 was dissolved inheptane-eyclohexane (70:30) at 70°C. Then the fused-silica tubing was filled with thissolution. After the column was filled, the temperature was reduced to roomtemperature, and the polymer was precipitated onto the column wall. Finally, thesolvent was purged out of the column, and the stationary phase was dried andcross-linked. The process was reportedly quite simple and was used to coat columnsdown to 5 pm J.D. and 4 m long. This coating procedure was reported for LC, but itcould be easily applied in the preparation of SFC and GC capillary columns. The maindisadvantage is that there is presently no satisfactory method to control the filmthickness in this coating process. The stationary phase film thickness is adjusted bychanging the temperature used during the precipitation process.
Fourth, the static coating process13 also requires viscous stationary phase

STATIC COATING OF CAPILLARY COLUMNS 505
solutions for coating adequate film thicknesses on the inner walls of small diametercolumns. These solutions require high pressures to fill the tubing, and once the tubingis filled, evacuation of the solvent is troublesome. Even with these problems, the staticcoating process is widely used because the method generally produces the mostefficient capillary columns, and film thicknesses are easy to control. Rutten andLuyten14 compared the static and dynamic coating methods. They found that thestatic coating method consistently produced higher efficiencies. Later, Alexander etal. 1s confirmed these results.
Various techniques have been applied to improve the static coating procedurefor small diameter columns. Coating at temperatures much higher than the normalboiling point of the solvent, and under vacuum conditions, often produces suddenexpansion in the stationary phase solution in the column. This expansion leavessections of solution and vapor in the column, which destroys the process. Xu andVermeulen16 developed a free release static coating procedure which is done at hightemperature (75-85°C), at relatively high pressure (atmospheric), and with a buffercolumn at the free end of the column (the end not sealed during the evaporationprocess). They reported that "bumping" was subdued, and that coating speeds werefaster than conventional coating speeds.
EXPERIMENTAL
Column materialFused-silica capillary tubing (5, 10,25,50 and 200 Jim J.D.) was obtained from
Polymicro Technologies (Phoenix, AZ, U.S.A.).
Polysiloxane stationary phasesAll stationary phases used in this study have previously been reported. The 25%
biphenyl (poly-25-biphenyl)17, 50% liquid crystal (poly-50-LC)1s, 50% n-octyl(poly-50-Cs)19, 50% pentafluorophenyl (poly-50-F5)20,45% phenoxypolyethyl ether(poly-45-PPEE)21 and 50% cyanopropyl (poly-50-cyano)22 stationary phases weresynthesized as reported. Commercially available OV-215 (50% trifluoropropyl, SE-33(I % vinyl, 99% methyl), and SE-54 (1 % vinyl, 5% phenyl) were obtained from Alltech(Deerfield, IL, U.S.A.).
Coating solventsThe following coating solvents were used: dichlorofluoromethane (CHCI2F,
Freon 21®), 99.9% pure, Alphagaz (Denver, CO, U.S.A.); trichlorotluoromethane(CCl3F, Freon ll®), 99.9% pure, MG Industries (Valley Forge, PA, U.S.A.); andtetramethylsilane (TMS), 99.9% pure, Petrarch Systems, (Bristol, PA, U.S.A.). Thedich10rofluoromethane and trichlorotluoromethane were both filtered into 1 dramvials with PTFE seals in the caps before use. The CHCI2F was maintained at -15°Cbefore use due to its low boiling point.
Preparation of stationary phase solutionsThe concentration of polymer needed for a desired film thickness was calculated
from the following equations23 :
(1)

506 S. R. SUMPTER et at.
where C is the concentration (mg ml-1) and p is the specific density (g ml-1) of the
stationary phase, r is the column internal radius (J.lm), and dr is the desired filmthickness (J.lm). When the desired film thickness was insignificant compared to thecolumn internal diameter (200 J.lm J.D. columns with 0.25-J.lm films), the followingequation was used to calculate the concentration of the coating solutions:
C = 2000 (pdr)jr (2)
The stationary phase solutions were prepared by weighing out an appropriate amountof polymer into a crimp-seal vial (Supelco, Bellefonte, PA, U.S.A.). An aliquot of I mlof solvent was added, and the vial was sealed. The solutions were sonicated for about10 min to dissolve the polymers.
Column pretreatment and deactivationBefore deactivation, the fused-silica tubing required a hydrothermal treatment
followed by dehydration. However, several of the columns (::::; 25 J.lm J.D.) were notpretreated, but were coated as received. Distilled water was passed through the tubing,and the tubing was flame sealed at both ends before being heated to 250°C for 4 h.Dehydration at 250°C for 2 h was performed by purging a stream of dry nitrogenthrough the tubing after removing the seals. Deactivation of the pretreated tubing with50% phenyl polyhydrosiloxane at 350°C for 10 h24 or 50% cyanopropyl polymethylhydrosiloxane at 250°C for 10 h25 was performed as decribed in the literature.The polymers were dissolved in dichloromethane in concentrations of about 1% (wjv)prior to being coated by the dynamic method.
Filling and coating of columnsFused-silica tubing that was to be filled with a stationary phase solution was
wrapped on a column basket, so that one end could unwind freely, after the tubing wason the basket. This end is herein defined as the front of the tubing (or column). Thetubing to be filled was placed in a constant temperature bath filled with propyleneglycol (for coating temperatures greater than 40°C) or water (when coating temperatures were close to room temperature). The coating bath temperature was maintainedusing a thermoregulating pump. The front end of the tubing was pushed into thecrimp-seal vial containing the coating solution, which was then placed in a stainlesssteel filling device. Pressure to the filling apparatus was controlled by a high-pressureregulator on a nitrogen gas tank. Pressures ranging from 10-51 atm were used to pushthe coating solution into the fused-silica tubing. When the solution emerged from theend of the tubing, the end of the tubing was sealed by pushing it into a septum, orforceps were used to push the end into a tube of Apiezon (M or N) grease which waskept cold in a Dewar flask filled with water and ice.
After the tubing was filled with the coating solution, the front end was pulled outof the filling apparatus and connected to a vacuum apparatus equipped with a vacuummeter and gauge tube (DV-6M type; Teledyne Hastings-Raydist, Hampton, VA,U.S.A.), which were used to monitor the vacuum pressure. The minimum observablepressure was 8 J.lm Hg. As the solvent evaporated, the illuminated tubing changed fromthe dark, dull color to a shiny, light color. The column baskets had a circumference of50 cm and nine equally spaced posts, 5.6 cm apart. One post was designated as the
STATIC COATING OF CAPILLARY COLUMNS 507
observation point, and each time the solvent front reached it, the time and pressurewere recorded. When the entire column was coated, the front was pulled free of thevacuum, and the end was pulled out of the septum or Apiezon grease. After a columnwas coated, the front was connected to a nitrogen line and the column was purged forI to 2 h at about 10-20 atm to ensure that the solvent was removed.
Stationary phase immobilizationStationary phases were cross-linked using an azo-tert.-butane-argon purge26
for 1 to 4 h. The purging pressures ranged from 2 atm for 50 {tm I.D. columns to 4 atmfor 10 and 25 {tm I.D. columns. Both ends of the column were flame sealed, and thecolumn was heated from 40 to 220°C at 4°C min-I, and held at 220°C for 1 h. Then, thecolumns to be used in SFC were rinsed overnight with 3 ml of dichloromethane orn-pentane.
Column evaluationA Carlo Erba Fractovap 4160 gas chromatograph was modified by replacing the
split valve with a high-pressure regulating valve. The helium head pressure wasadjusted using a high-pressure regulator at the helium tank to accommodate high splitflows (500-600 ml min-I) and high head pressure (up to 100 atm). Before evaluation,the columns were purged with helium at about 7 atm during a temperature programfrom 40 to 225°C at 4°C min-I. The evaluation was started after a stable baseline wasobtained at 200°C. Carrier flow was adjusted to 24 cm S-1, and 1 {tl of an n-alkane testmixture (about 10 mg ml- l each of C 1S-C24) was injected (split injection) with a 10 {tlgas-tight syringe. The flame ionization detector sensitivity was 1 to 2 . 10-11 A fullscale. Injector and detector temperatures were 275 and 300°C, respectively. Peakwidths at half height and retention times were recorded using a Hewlett-Packard3388A integrator.
Two 50 {tm I.D. columns were cut into short pieces (l.5-m segments) to evaluatethe efficiencies and retention characteristics of the various sections of the column. Thefront and the end of the columns (1.5 meters each) were evaluated using a HewlettPackard 5890 GC (flame ionization detector) equipped with a Hewlett-Packard 3392Aintegrator which was used to record peak widths, heights, areas and retention times.Helium carrier gas linear velocities were between 23.1 and 24.6 cm S-1 with split flowsof245 to 351 ml min-1
. The temperatures of the oven, injector and detector were 200,275 and 300°C, respectively. Efficiencies were calculated from the following equation:
(3)
where n is the total number of theoretical plates, tr is the retention time of the test soluteand W l/2 is the peak width at half height. Theoretical plate heights, htheon werecalculated using the simplified Golay-Giddings equation27
:
(4)
where r is the column radius, and k is the capacity ratio.A Lee Scientific (Salt Lake City, UT, U.S.A.) Model 501 supercritical fluid
chromatograph equipped with a flame ionization detector was used in this study for

508 S. R. SUMPTER et al.
SFC measurements. The injection port consisted of a Valco CI4W (Valco, Houston,TX, U.S.A.) high-pressure 4-port injector with a 0.2-J.d sample loop rotor anda standard SGE (Austin, TX, U.S.A.) stainless steel splitter. Split ratios were adjustedto about 30: I by varying the length of either a 25 /lm J.D. or a 50 /lm J.D. fused-silicatube connected to the split line after an on/offvalve. The SFC operating conditions arecited in the text.
Samples were obtained from the following: alcohol ethoxylate was obtainedfrom Shell Development (Houston, TX, U.S.A.); tricaproin, tricaprylin, tricaprin,trilaurin, trimyristin, tripalmitin, tristearin, triarachidin, tribehenin and n-alkaneswere obtained from Sigma (St. Louis, MO, U.S.A.). All samples were used as received.
RESULTS AND DISCUSSION
There are several problems, both theoretically and practically, with thepreparation of small-diameter open tubular columns. Bartle et al. 28 describeda phenomenon called Rayleigh instability as one of the driving forces behindstationary phase rearrangement and loss of efficiency. This rearrangement results frominfinitesimal perturbations in the stationary phase. Ultimately, stationary phasedroplets can be formed in the column from the growth in amplitude of a standing wavein the stationary phase. The rate of growth of this standing wave is given by thefollowing equation:
(5)
where boand b are the wave amplitudes at times zero and t, respectively, r is the radiusof the column (cm), and y, dr and 1] are the surface tension (mN m-1
), film thickness(cm) and viscosity (P) of the stationary phase, respectively. Typical values for 1] rangefrom 1-107 P; values for r, for small J.D. columns, range from 1.5-50 /lm; values fory range from 20-50 mN m-1
; and values for dr range from 0.05-1 /lm.During evacuation of the solvent, in the column coating process, the stationary
phase begins to rearrange, and efficiency decreases. Efficiency half-life is defined as thepoint when one half of the original column efficiency is lost; at this point, t = t 1/2'
Woolley23 studied the change in efficiency with time at 100°C for a 200 /lm J.D. columncoated with OV-17. The efficiency decreased by one half after 2.7 h, indicating thata 7% increase in the standing wave amplitude in the stationary phase had occurred.Rearranging eqn. 5 and solving for t at t 1/2 with a 7% amplitude increase gives:
(6)
Efficiency half-life values for 5 to 50 /lm J.D. columns are found in Table J. Thesevalues indicate that the stationary phase films in small internal diameter open tubularcolumns are very susceptible to Rayleigh instability. Theoretically, rearrangementoccurs so quickly that these columns are impractical, unless a highly viscous stationaryphase is coated and immobilized (cross-linked) in a short period of time. Eqn. 5 showsthat there are several parameters which can be adjusted (some easier than others) toproduce a more stable stationary phase on a column of given radius: the surfacetension of the stationary phase, the viscosity of the stationary phase, the time requiredto coat a column, and the film thickness of the stationary phase.

STATIC COATING OF CAPILLARY COLUMNS 509
TABLE I
THEORETICAL EFFICIENCY HALF-LIVES OF SMALL DIAMETER COLUMNS COATEDWITH OV-17 STATIONARY PHASE AT 22°C
The 11
/2
values were calculated using eqn. 6. Values for '1 and y were 12.20 P and 33 mN m-1, respectively.
These values for '1 and y were determined experimentallyB
Column J.D. (pm) 11/ 2 (s)
5 0.0710 I25 5050 700
The critical surface tension, Yc, of the surface to be coated, must be greater thanor equal to the surface tension of the stationary phase, Y, or the surface is not wetted.There are no wettability problems associated with untreated fused silica due to its highYc of 50-70 mN m-l , and the stationary phases used in this study all had surfacetensions less than the critical surface tensions of the deactivated surfaces. Therefore,poor wettability could not be blamed for any lower than theoretical coating efficienciesthat were achieved.
Increased coating bath temperatures enhance the movement of solvent molecules toward the vacuum region, thereby increasing coating velocities and reducing thetendency for column plugging. The utilization of higher temperatures in the staticcoating of small-diameter tubing was pioneered by Kong and Lee29
. The static coatingof SE-54 in a 50 /lm LD. column, using n-pentane as the coating solvent at 50°C,provided high efficiency (16700 plates m-l) in Gc. However, lower column efficiencies(1000-6000 plates m-l) were reported for 50% phenyPO, 25% biphenyl3l and 50%polymethylsiloxanes under the same high temperature static coating conditions.Woolley et at. 31 proposed that the major factor leading to such poor columnefficiencies was linked to the drastically low viscosities of these stationary phases andtheir solutions at the higher coating temperatures. They suggested that the viscositiesof alkylsubstituted (methyl and n-octyl) polysiloxanes are only marginally reducedwith increasing temperature, while phenyl and biphenyl polymethylsiloxanes undergodramatic viscosity losses (from about 109 to 103 cP for a temperature change of 20 to50°C, respectively). In spite of the improved coating velocities at high temperatures,the increase in Rayleigh instability more than offsets this advantage.
Woolley et at?l found that the solution to this coating efficiency problem wassolved by addressing the variable (1/11) in eqn. 5. A highly volatile coating solvent(trichlorofluoromethane, b.p. = 23.7°C), capable of dissolving the polarizable phenylor biphenyl polysiloxanes, could be used at low coating temperatures. Utilizing highlyviscous polysiloxane gums and higher polysiloxane solution viscosities at lowercoating temperatures proved to increase the stability of the stationary phase filmduring coating. The static coating of 50 {lm LD. columns at 22-38°C3l with 50%phenyl or 25% biphenyl polysiloxanes yielded higher numbers of theoretical plates(12000-15000 plates m- l in GC) than those coated at higher temperatures. Theseresults provided evidence that appropriate conditions for the static coating of

510
TABLE II
PROPERTIES OF COATING SOLVENTS
Data taken from ref. 40.
S. R. SUMPTER et al.
Dichlorofluoromethane CHCl 2F 6,287 8.9(Freon 21)
Trichlorofluoromethane CCl3 F 6,424 23.8(Freon 11)
Tetramethylsilane SiC4 H,2 6,439 26.5(TMS)
n-Pentane CSH 12 6,595 36.1Dichloromethane CH 2Cl2 7,572 40.0
a Density at 20°C.
Coating solvent Chemicalformula
dHvap(cal mol-1
)
B.p.(OC at I atm)
Dipole Densitymoment at 25°C(debye) (gmt')
1.29 1.366
0.46 1.467
0.00 0.648
";0.05 0.626a
1.60 1.327
small-diameter columns with selective stationary phases include low bath temperatures, highly volatile solvents and highly viscous polysiloxanes.
Thus, a most important parameter in the static coating process is the type ofsolvent used during the coating process. In the coating solution, the solvent facilitatesthe dispersion of the highly interwoven polymer strands and decreases the viscosity ofthe solution. The higher the solvent to polymer ratio, the less viscous is the solution,and the easier is the filling and coating of a capillary tube. A good universal coatingsolvent is one which would dissolve a wide range of polymers to give a non-viscoussolution. Many studies have been done to find polymer-solvent systems that will bothmake a less viscous coating solution, and facilitate the evacuation of the solvent.Several authorsz9 ,3z-37 have used single solvents that are volatile and that yieldefficient coatings. Janak et al. 36 reported that the use of volatile coating solventsincreased the coating speed of a column and decreased the viscosity of the coatingsolution. The tubing is filled easier with a less viscous coating solution and the solventis easier to evacuate. Other authors38,39 have tried using mixed solvents with varyingdegrees of success.
Table II lists some of the physical properties of two commonly used coatingsolvents, n-pentane and dichloromethane, as well as the physical properties of the threevolatile coating solvents used in this study. The most notable difference is in the boilingpoints of the solvents. Dichlorofluoromethane has the lowest boiling point (8.9°C) ofall of the solvents listed. The dipole moment of the solvent also has an effect on theviscosity of the coating solution. Table II lists the dipole moments of the solvents usedin this study. Dichlorofluoromethane clearly has the highest dipole moment, 1.29debye, of the three solvents examined in this study, while TMS has the lowest, 0.00debye, due to its symmetry. All of the polymeric stationary phases used in this studydissolved readily into CHClzF, fewer dissolved into CChF, and only the non-polarphases dissolved into TMS, and then only slowly. The use ofCHClzF and TMS in thecoating of open tubular columns has not been reported before in the literature.
As shown previously in eqn. 1, decreasing the column radius, r, increases the

TA
BL
EII
I
CO
AT
ING
VE
LO
CIT
IES
FO
R50
/lm
J.D
.C
OL
UM
NS
Stat
iona
ryph
ase
Solv
ent
Coa
ting
Coa
ting
velo
citi
es(c
mm
in-I
)C
oati
ngpr
essu
re(m
mH
g)
Len
gth
Fil
mth
ickn
ess
tem
pera
ture
(m)
(/lm
)(O
C)
Star
tM
iddl
eE
nd
Avg
.aSt
art
Mid
dle
End
Pol
y-50
-LC
CH
CI 2
F35
.622
.224
.661
.229
.830
1510
120.
10SE
-33
CC
I 3F
54.0
22.2
6.8
17.1
9.5
3514
1210
0.10
SE-3
3C
HC
I 2F
22.6
12.9
12.1
46.3
13.5
1912
107
0.10
Pol
y-45
-PP
EE
CH
CI 2
F38
.430
.717
.713
627
.028
1412
150.
11P
oly-
50-C
sT
MS
38.2
27.3
5.7
52.6
9.9
3216
1213
0.25
Pol
y-25
-bip
heny
lC
CI 3
F60
.031
.223
.629
228
.628
1310
200.
25
aA
vg.
=A
vera
geco
atin
gve
loci
ty.
Thi
sis
the
obse
rved
leng
tho
ftu
bing
(in
cm)
that
isco
ated
,di
vide
dby
the
tim
ere
quir
edfo
rit
toco
at(i
nm
in).
~ ;l> ::l (J (J o ;l> ...., Z a o 'Tl
(J ;l> '"t:I t= ~ :;e -< (J o r' c: ~ z (
/) ~

512 S. R. SUMPTER et 01.
required polymer concentration in the coating solution. For example, a 0.15 J.Lm filmthickness in a 25 J.Lm J.D. column required a 29 mg ml- l solution for the poly-5-LCstationary phase. The solution was viscous and cloudy at 30.2°C, while it was lessviscous and clear at 70°C. A 10 J.Lm J.D. column with a 0.1 J.Lm film thickness required83 mg ml- l ofan SE-54 coating solution. This solution was extremely viscous. Clearly,as the diameter decreases, and even when using a thinner stationary phase film, thecoating solution concentration must increase. At film thicknesses greater than 0.25J.Lm, the poly-25-biphenyl stationary phase formed polymer aggregates at the requiredconcentration.
From eqn. 5, the relationship of coating speed to stationary phase stability isreadily observed. Since coating speed is one of the parameters that qm be manipulatedto minimize Rayleigh instability, coating solvents that provide fast coating speedsshould be used. The three solvents used in this study had relatively fast average coatingvelocities in 50J.Lm J.D. columns (10-30 cm min-I). This led to the followingobservation: the coating velocity decreased from the starting rate, and then increaseddramatically in the last few meters of the column. Table III lists coating speed data for50 J.Lm J.D. columns and several selective stationary phases. The starting, middle andending coating velocities are reported. These range from 12.9 to 30.7 cm min- l at thestart, 5.7 to 24.6 cm min- l in the middle and 17.1 to 292 em min- l at the end of thecolumn. Coating pressures in the vacuum line between the vacuum pump and columnare also listed for the start, middle and end sections of the columns. This same changein coating velocity was observed for 25 J.Lm J.D. columns. However, a dramatic changein coating velocity was not observed in the coating of 200 J.Lm J.D. columns. Table IVshows the observed starting, middle and ending coating velocities for several 200 J.LmJ.D. columns. Not only are the average coating velocities slower for the 200 J.Lm J.D.columns (5 to 12 times slower), but the coating velocity steadily decreases to the end ofthe column. The average coating velocities of200 J.Lm J.D. columns with n-pentane anddichloromethane are 2.5 to 5 times slower than the average coating velocity of thecolumn coated with the more volatile TMS.
To understand why coating velocities changed for these 50 J.Lm J.D. columns,a 14 m x 50 J.Lm J.D. column coated with a 0.25 J.Lm film thickness of poly (50% n-octyl)methyl siloxane stationary phase was cut into 1.5-m sections and then evaluated in Gc.
TABLEIY
COATING YELOCITIES FOR 200 /lm J.D. COLUMNS
Stationary Solvent Coating Coating velocities (cm min-I) Length Filmphase temperature (m) thickness
(0C) Start Middle End Avg.a. (/lm)
Poly-50-cyano CH 2C1 2 22.3 4.3 2.6 1.9 2.5 7 0.25OY-17v CH 2Cl 2 24.1 4.8 2.2 1.6 2.3 10 0.25Poly-50-LC CH 2C1 2 23.5 3.3 2.8 1.2 1.3 9 0.25OY-17v n-Pentane 21.8 4.7 3.4 1.5 2.1 8 0.10SE-33 TMS 21.9 9.4 8.6 5.4 6.4. II 0.25
a Avg. = Average coating velocity. This is the observed length of tubing (in cm) that is coated,divided by the time required for it to coat (in min).

STATIC COATING OF CAPILLARY COLUMNS
TABLE V
MEASURED k VALUES FOR SEGMENTS OF 50 pm J.D. COLUMNS
Segment location (in m)" Measured k
Column ]b
0.0-1.5 23.93.0-4.5 20.46.0-7.5 15.09.0-10.5 7.3
12.5-14.0 2.6
Column 2'0.0-1.5 21.7
10.5-12.0 2.4
513
" The 1.5-m column segments are reported by their location in the original column before being cutout, with 0.0 m being the front of the original column.
b Column I was a 14.0 m x 50 pm 1.0. column coated with poly-50-Ca stationary phase (dr = 0.25pm).
, Column 2 was a 12.0 m x 50 pm 1.0. column coated with poly-25-biphenyl stationary phase (dr= 0.25 pm).
Table V shows that the values of k were found to fall between 23.9 at the front of thecolumn to 2.6 at the end of the column. Table V also gives the k values for two, 1.5m sections cut from a 12.0 m x 50,um J.D. column coated with poly-25-biphenyl (dr= 0.25 ,urn) as evaluated by GC. Again, the same decrease in kvalues was observed; thek values at the front and end of the column were 21.7 and 2.4, respectively. Bothcolumns produced k values at the front of the column which were 9 times higher thank values at the end of the column. These results indicate that the static coating of 50,umJ.D. columns does not yield a uniform film, but rather, a decreasing film thickness withlength.
One explanation for the formation of this phase ratio gradient is that as thepolymer solution is pushed through the front of the column when it is being filled, thesolution becomes less and less concentrated as it nears the end of the column becausethe polymer precipitates onto the tubing surface. Fresh solution entering the front ofthe column continues to deposit stationary phase, becoming less concentrated, as itprogresses toward the end of the column. Thus, a phase ratio gradient is developed.A less concentrated solution at the end of the column would also lead to faster coatingvelocities, since solution viscosity is decreased, and there is less resistance to theescaping solvent. The surface area to volume ratio is four times higher for a 50,um 1.0.column than for a 200,um J.D. column, so there is less relative polymer-surface contactin 200 ,um 1.D. tubing. Thus, phase ratio gradients in 200 ,um 1.D. columns are notexpected to be as significant. The consistently decreasing coating velocities in 200 ,umJ.D. columns tend to support this explanation.
The presence ofphase ratio gradients in small J.D. capillary columns present twoimportant, practical considerations. First, if two or more 50,um J.D. columns are to bemade from one long column after it is coated, the front piece of the column will alwaysproduce higher k values than the next piece of column, and the end of the column will

514 S. R. SUMPTER et 01.
TABLE VI
CALCULATED RATIOS OF STATIONARY PHASE FILM THICKNESS RESULTING FROMSLIGHT VARIATIONS IN COLUMN DIAMETER
Column J.D. df/df(/-1m)
5 6.810 5.425 4.050 3.2
100 2.6
give the lowest k values of all. Second, phase ratio focusing of solutes may beaccomplished by putting the lowest k value end of a column at the injector and thehighest k value end at the detector. If the column is connected opposite to this, bandbroadening will take place over the length of the column.
Other influences on coating ofcapillaries, described by Giddings41, are capillary
forces. These forces are one of the principal means of retaining the stationary phase onthe column surface. Giddings explained that stationary phase accumulates in thecolumn where slight negative deviations in the radius of curvature occur. In a capillarycolumn that has a fractional difference in radius ofcurvature r' and r, where r' > r, andassuming r ~ dr, the stationary phase film thickness, the following equation wasderived:
(7)
where J was approximated by Giddings to be nearly the same value for all liquids andto be in the order of 10- 5; L1r/r is the fractional variation in tube size; and r is thecolumn radius (cm). Differences in starting and ending diameters on rolls offused-silica tubing are commonly 1 .urn, so L1r/r ranges from 0.20 to 0.02 for 5 to 50 .urnJ.D. columns, respectively. Choosing L1r/r as 0.01 and dr = 2.5 . 10-5 cm, calculatedvalues for the ratio of stationary phase film thicknesses at the two sites (drldf) are foundin Table VJ. Clearly, column diameter plays a significant role in the calculated ratios.The smaller the column internal diameter, the higher the ratio. Just a slight variation inthe radius of curvature is enough to cause stationary phase voids on some parts of thesurface and thick films of phase on other parts of the surface, especially when 5 to 25.urn J.D. columns are considered. Rayleigh instability would have a more pronouncedeffect on the thick film areas in the column, and column efficiency would bediminished. These thick film areas, combined with Rayleigh instability in theseregions, partially explain the low efficiency observed for the 5 .urn J.D. column in TableIX. Giddings predicted that L1r/r must be kept to within several parts in 105 to havea film thickness within a 10% tolerance. Thus column efficiency and coating capacityare directly related to the inner surface of the tubing.
Although there are several problems associated with the successful preparationof highly efficient small J.D. columns, optimization of the coating parameters has ledto some successful results. Tables VII, VIII and IX show coating data and GC
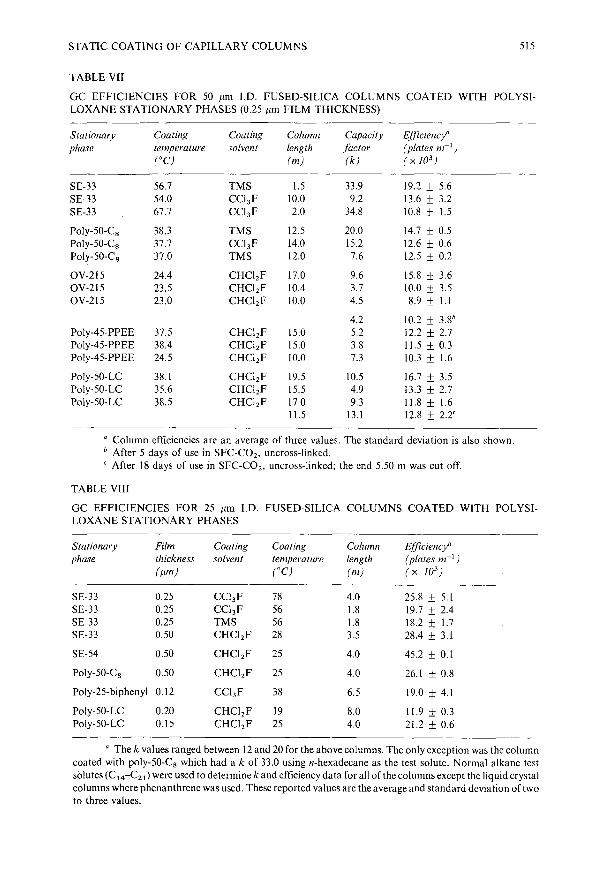
STATIC COATING OF CAPILLARY COLUMNS 515
TABLEYII
GC EFFICIENCIES FOR 50 /lm J.D. FUSED-SILICA COLUMNS COATED WITH POLYSl-LOXANE STATIONARY PHASES (0.25 /lm FILM THICKNESS)
Stationary Coating Coating Column Capacity Efficiency"phase temperature solvent length factor (plates m-1
)
(OC) (m) (k) ( x 103)
SE-33 56.7 TMS 1.5 33.9 19.2 ± 5.6SE-33 54.0 CCI3 F 10.0 9.2 13.6 ± 3.2SE-33 67.7 CCI3 F 2.0 34.8 10.8 ± 1.5
Poly-50-Cs 38.3 TMS 12.5 20.0 14.7 ± 0.5Poly-50-Cs 37.7 CCI3 F 14.0 15.2 12.6 ± 0.6Poly-50-Cs 37.0 TMS 12.0 7.6 12.5 ± 0.2
OY-215 24.4 CHCI 2F 17.0 9.6 15.8 ± 3.6OY-215 23.5 CHCI 2F 10.4 3.7 10.0 ± 3.5OY-215 23.0 CHC1 2F 10.0 4.5 8.9 ± l.l
4.2 10.2 ± 3.8b
Poly-45-PPEE 37.5 CHCl 2F 15.0 5.2 12.2 ± 2.7Poly-45-PPEE 38.4 CHCl 2F 15.0 3.8 I1.5 ± 0.3Poly-45-PPEE 24.5 CHCl 2F 10.0 7.3 10.3 ± 1.6
Poly-50-LC 38.1 CHCl2 F 19.5 10.5 16.7 ± 3.5Poly-50-LC 35.6 CHCl 2F 15.5 4.9 13.3 ± 2.7Poly-50-LC 38.5 CHCl 2F 17.0 9.3 11.8 ± 1.6
11.5 13.1 12.8 ± 2.2'
" Column efficiencies are an average of three values. The standard deviation is also shown.b After 5 days of use in SFC-C02 , uncross-linked., After 18 days of use in SFC-C02 , uncross-linked; the end 5.50 m was cut off.
TABLE YIII
GC EFFICIENCIES FOR 25 ILm 1.0. FUSED-SILICA COLUMNS COATED WITH POLYSI-LOXANE STATIONARY PHASES
Stationary Film Coating Coating Column Efficiency"phase thickness solvent temperature length (plates m-1
)
(ILm) (OC) (m) (x 103)
SE-33 0.25 CCl3 F 78 4.0 25.8 ± 5.1SE-33 0.25 CC1 3 F 56 1.8 19.7 ± 2.4SE-33 0.25 TMS 56 1.8 18.2 ± 1.7SE-33 0.50 CHC1 2 F 28 3.5 28.4 ± 3.1
SE-54 0.50 CHCI 2F 25 4.0 45.2 ± 0.1
Poly-50-Cs 0.50 CHCI 2 F 25 4.0 26.1 ± 0.8
Poly-25-biphenyl 0.12 CCI3 F 38 6.5 19.0 ± 4.1
Poly-50-LC 0.20 CHCI 2F 19 8.0 11.9 ± 0.3Poly-50-LC 0.15 CHCI2 F 25 4.0 21.2 ± 0.6
" Thek values ranged between 12 and 20 for the above columns. The only exception was the columncoated with poly-50-Cs which had a k of 33.0 using n-hexadecane as the test solute. Normal alkane testsolutes (C 14-C21 ) were used to determine k and efficiency data for all of the columns except the liquid crystalcolumns where phenanthrene was used. These reported values are the average and standard deviation of twoto three values.

516 S. R. SUMPTER et al.
TABLE IX
GC EFFICIENCIES FOR 5 AND 10 Jim J.D. FUSED-SILICA COLUMNS COATED WITBPOLYSILOXANE STATIONARY PBASES
Stationary Film Coating Coating Column Capacity Efficiency·phase thickness solvent temperature length factor (plates m~l )
(Jim) (OC) (m) (k) ( x f0 3)
fO Jim f.D. columnsPoly-25-biphenyl 0.05 CBCl2 F 26.6 2.0 3.7 13.3 ± 1.3Poly-50-F5 0.05 CBCl2F 26.4 2.0 14.2 62.9 ± 7.5Poly-50-F5 0.05 CBCl2F 27.2 2.1 17.3 53.0 ± 9.4
5 Jim J.D. columnPoly-50-Fs 0.15 CBCl2F 27.8 0.9 3.3 9.2 ± 6.4
• Columns were evaluated at 175°C or 200°C. The average and standard deviation of threemeasurements are shown.
efficiencies of 50,25, 10 and 5 Jim J.D. columns, respectively. The static coating of 50Jim J.D. columns with solute-selective stationary phases at lower temperatures withany of the three selected volatile coating solvents (TMS, CCl 3F or CHCI 2 F) yieldedhighly efficient columns. Stationary phases, such as poly-25-biphenyl or poly-50-LCpolymethylsiloxanes, that have been traditionally difficult to coat on small-diametercapillaries with dichloromethane as the coating solvent, presented no problems whencoated at low-to-moderate temperatures with CCl3 F or CHCl 2 F (13000-16000 and12000-17000 plates m-I, respectively, which is up to 75% of the theoreticalefficiency). The poly-45-PPEE polysiloxane stationary phase that contains polarpolyethyl ether side groups dissolved well in CHCI2 F and coated almost as well(10000-12000 plates m- I
) as the more easily-coated poly-50-Cs (13000-15000 platesm- I
), or SE-33 (19000 plates m-I, up to 90% of the theoretical efficiency) stationaryphases. In addition, OV-215, a commercially available stationary phase that isgenerally quite difficult to coat with more conventional solvents (ethyl acetate, b.p.= n.2°C, and acetone, b.p. = 56.2°C), was readily dissolved in CHCl 2 F anduniformly coated on 50 Jim J.D. columns to yield high numbers of theoretical plates(9000-16000 plates m- I in GC, up to 75% of the theoretical efficiency). By coatingthese solute-selective polysiloxanes at low bath temperatures and at rapid coatingspeeds, highly efficient 50 Jim J.D. capillary columns were prepared for GC and SFC.
Several 25 Jim J.D. columns were successfully coated using the low boilingsolvents. Film thicknesses, coating temperatures, column lengths, k values, and GCefficiencies are listed in Table VIIJ. The column coated with SE-33 using TMS hadabout the same efficiency as the column coated using CCl3 F at the same temperatureand with the same film thickness. The 56-78°C coating temperatures for three of theSE-33 columns appeared to have little effect on coating efficiency. The high efficienciesof these columns (18000-25000 plates m- I
) can be attributed to the high viscosity ofthis stationary phase, even at the higher temperatures. Fig. I is a chromatogram of anethoxylated alcohol sample (ethoxylated Cl2 and CI3 alcohols) which shows the highefficiency separation possible on a 25 Jim J.D. column. The number of ethylene oxidegroups in the starting alcohols ranged from 0 to 27. This chromatogram shows that the

STATIC COATING OF CAPILLARY COLUMNS
0:10
0:5
\
n=OI
517
0:27/
0.20.2I I
°
0j6 or g/ml
I60 min
Io
I15 MIN
Fig. l. SFC chromatogram of ethoxylated C ,2 and C 13 alcohols. Column: 5 m x 25 Jim I.D. fused-silicacolumn coated with a poly-25-biphenyl stationary phase (d, = 0.25 {1m). Conditions: CO2 at 120°C; andlinear density program from 0.2 g ml- I to 0.71 g ml- 1 at 0.0075 g ml-1 min-I after an initial5-min isopycnicperiod.
Fig. 2. SFC chromatogram of triglycerides (T 18-60). Column: 0.7 m x 10 Jim I.D. fused-silica columncoated with a poly-50-cyano stationary phase (d, = 0.1 Jim). Conditions: solvent backflush injection; injectat 0.3 g ml-1, ramp down to 0.1 g ml-1 at 0.096 g ml- I min-I, then, ramp from 0.1 g ml-1 to 0.3 g ml-1 at 0.068g ml-1 min-I; the chromatographic analysis was started at 0.3 g ml-1 and ramped at 0.01 g ml-1 min- 1 to 0.7g ml- l
25 pm I.D. column has adequate sample capacity for this sample when coated witha 0.25 J1m film thickness.
An important parameter in Rayleigh instability and column efficiency is the filmthickness of the stationary phase. Although the coating of thick films in 25 pm I.D.tubing is difficult, a film thickness of 0.5 pm was coated on short pieces of 25 pm I.D.tubing. Table IX shows that three columns were successfully coated with thick films ofnon-polar stationary phases, and yielded high efficiencies (up to 103% of thetheoretical efficiency). Columns longer than 4 m were difficult to coat with a filmthickness of 0.5 J1m because the coating velocity decreased to zero. Often, only2 m lengths coated successfully. The effects of increased polymer concentration andcolumn length on coating efficiency is seen in the two columns coated with the liquidcrystal stationary phase. Increasing the film thickness (from 0.15 to 0.20 pm) andcolumn length (4 to 8 m) resulted in decreased coating efficiency.
The 10 pm I.D. columns were coated with poly-50-Cs, poly-25-biphenyl,poly-50-cyano, poly-50-F s, and SE-54 stationary phases. Table IX lists the coating

518 S. R. SUMPTER et al.
data for the 10 {lm J.D. columns that were evaluated by GC. The poly-50-F 5 columnscoated well and resulted in efficiencies up to 59% of the theoretical efficiency. The 10{lm J.D. columns coated with poly-50-cyano and SE-54 were not successfully evaluatedby Gc. For 10 and 5 {lm J.D. columns that were I to 2 m long, the problem was not incoating the columns, but in evaluating these columns. Extremely high pressures wererequired for the GC carrier gas (100 atm), and the GC injector proved to be totallyinadequate; the carrier gas leaked around the septum and a seal on the split valvefailed. The poly-50-F5 polysiloxane statically coated on a 5 {lm J.D. column quiteeasily. The chromatogram in Fig. 2 shows a separation ofa triglyceride mixture in SFCon a 0.7 m x 10 {lm J.D. column. The solvent backflush injection method described byLee et al. 42 was used to inject the sample onto the column. Although the injectionvolume diminished the resolution of this separation, the analysis time was less than 15min, and 6 of the 9 components had baseline resolution. Injection and detectionmethods presently limit what can be done with these small J.D. columns in GC andSFC and must be improved before use of these columns becomes practical.
ACKNOWLEDGEMENTS
This work was supported by the Gas Research Institute (Contract No.5088-260-1640).
REFERENCES
S. M. Fields, R. C. Kong, J. C. Fjeldsted, M. L. Lee and P. A. Peaden, J. High Resolut. Chromatogr.Chromatogr. Commun., 7 (1984) 312.
2 M. Roth and A. Ansorgova, J. Chromatogr., 465 (1989) 176.3 C. P. M. Schutjes, E. A. Vermeer, J. A. Rijks and C. A. Cramers, J. Chromatogr., 253 (1982) 1.4 P. A. Peaden and M. L. Lee, J. Chromatogr., 259 (1983) 1.5 F. J. Yang, J. Chromatogr. Sci., 20 (1982) 241.6 J. H. Knox and M. T. Gilbert, J. Chromatogr., 186 (1979) 405.7 G. Guiochon, Anal. Chem., 53 (1981) 1318.8 G. Dijkstra and J. de Goey, in D. H. Desty (Editor), Gas Chromatography, Academic Press, New York,
1958, p. 56.9 D. H. Desty, A. Goldup and W. T. Swanton, in N. Brenner, J. E. Callen and M. D. Weiss (Editors), Gas
Chromatography, Academic Press, New York, 1962, p. 105.10 G. Gaspar, P. Arpino and G. Guiochon, J. Chromatogr., 15 (1977) 256.11 R. L. St. Claire and J. W. Jorgenson, J. Chromatogr. Sci., 23 (1985) 186.12 P. R. Dluzneski and J. W. Jorgenson, J. High Resolut. Chromatogr. Chromatogr. Commul1., II (1988)
332.13 J. Bouche and M. Verzele, J. Gas Chromatogr., 6 (1968) 501.14 G. A. F. M. Rutten and J. A. Luyten, J. Chromatogr., 74 (1972) 177.15 G. Alexander, G. Garzo and G. Palyi, J. Chromatogr., 91 (1974) 25.16 B. Xu and N. P. E. Vermeulen, Chromatographia, 18 (1984) 520.17 J. C. Kuei, J. I. Shelton, L. W. Castle, R. C. Kong, B. E. Richter, J. S. Bradshaw and M. L. Lee, J. High
Resolut. Chromatogr. Chromatogr. Commun., 7 (1984) 13.18 J. S. Bradshaw, L. Schregenberger, H-C. K. Chang, K. E. Markides and M. L. Lee, J. Chromatogr., 358
(1986) 95.19 J. C. Kuei, B. J. Tarbet, W. P. Jackson, J. S. Bradshaw, K. E. Markides and M. L. Lee, Chromatographia,
20 (1985) 25.20 J. S. Bradshaw, R. S. Johnson, N. W. Adams, M. A. Pulsipher, K. E. Markides and M. L. Lee, J.
Chromatogr., 357 (1986) 69.21 C. A. Rouse, A. C. Finlinson, B. J. Tarbet, J. C. Pixton, N. M. Djordjevic, K. E. Markides, 1. S.
Bradshaw and M. L. Lee, Anal. Chem., 60 (1988) 901.

STATIC COATING OF CAPILLARY COLUMNS 519
22 B. E. Richter, 1. C. Kuei, L. W. Castle, B. A. Jones, J. S. Bradshaw and M. L. Lee, Chromatographia, 17(1983) 570.
23 C. L. Woolley, Ph. D. Dissertation, Brigham Young UHiversity, Provo, UT, [987.24 K. E. Markides, B. J. Tarbet, C. L. Woolley, C. M. Schregenberger, J. S. Bradshaw and M. L. Lee, J.
High Resolut. Chromatogr. Chromatogr. Commun., 8 (1985) 378.25 K. E. Markides, B. J. Tarbet, C. M. Schregenberger, J. S. Bradshaw, M. L. Lee and K. D. Bartle, J. High
Resolul. Chromalogr. Chromalogr. Commun., 8 ([985) 741.26 R. C. Kong, S. M. Fie[ds, W. P. Jackson and M. L. Lee, J. Chromatogr., 289 (1984) [05.27 J. C. Giddings, Anal. Chem., 36 (1964) 741.28 K. D. Bartle, C. L. Woolley, K. E. Markides, M. L. Lee and R. S. Hansen, J. High Resolut. Chromalogr.
Chromatogr. Commun., [0 (1987) [28.29 R. C. Kong and M. L. Lee, J. High Resolut. Chromatogr. Chromatogr. Commun., 6 (1983) 319.30 C. L. Woolley, K. E. Markides, M. L. Lee and K. D. Bartle, J. High Resolut. Chromatogr. Chromatogr.
Commun.,9 (1986) 506.31 C. L. Woolley, B. J. Tarbet, K. E. Markides, J. S. Bradshaw, M. L. Lee and K. D. Bartle,'!. High Resolut.
Chromatogr. Chromatogr. Commun., II (1988) 1[3.32 K. Grab and B. Grab, J. High Resolul. Chromatogr. Chromatogr. Commun., 8 (1985) 856.33 K. Grab, J. High Resolut. Chromatogr. Chromatogr. Commun., 1 ([978) 93.34 T. Wiinnman, L. Blomberg and S. Schmidt, J. High Resolut. Chromatogr. Chromatogr. Commun.,
8 (1985) 32.35 B. L. Goodwin, J. Chromatogr., [72 (1979) 31.36 K. Janak, V. Kahle, K. Tesarik and M. Horka, J. High Resolut. Chromatogr. Chromatogr. Commun.,
8 (1985) 843.37 B. Xu and N. P. E. Vermeulen, J. High Resolut. Chromatogr. Chromatogr. Commun., 8 ([985) 181.38 R. Kong and M. L. Lee, Chromatographia, 17 (1983) 451.39 B. Xu and N. P. E. Vermeulen, J. High Resolut. Chromatogr. Chromatogr. Commun., I [ (1988) 7[3.40 R. L. Weast (Editor), Handbook ofChemistry and Physics, CRC Press, Boca Raton, FL, 67th ed., 1986.41 J. C. Giddings, Anal. Chem., 4 (1962) 458.42 M. L. Lee, B. Xu, E. C. Huang, N. M. Djordjevic, H-C. K. Chang and K. E. Markides, 1. Microcolumn
Sep., [ (1989) 7.


Journal of Chromatography, 517 (1990) 521-547Elsevier Science Publishers B.Y., Amsterdam
CHROMSYMP. 1938
Influence of thermal variation of diffusion coefficient on nonequilibrium plate height in capillary zone electrophoresis
JOE M. DAYIS
Department of Chemistry and Biochemistry, Southern Illinois University at Carbondale, Carbondale. /L6290/ (U.S.A.)
ABSTRACT
A numerical algorithm is developed by which the radial profiles of temperatureand mobility in an electrophoretic capillary can be computed from the steady-stateequation of heat conduction. To determine these profiles accurately, the viscosity atany temperature is calculated to four significant figures from an expression differentfrom the commonly used Andrade equation. The profiles so computed are used in atheory derived here, which addresses the impact of the thermal variation of diffusioncoefficient on the axial dispersion of analyte ions in capillary zone electrophoresis.The magnitude of this dispersion is expressed as the non-equilibrium plate height.The numerical computation of this plate height indicates that this variation becomessignificant only when the difference in temperature between the capillary center andwall exceeds ca. 5°C. The plate heights computed here can differ by more than a factorof two from those based on the Andrade equation, even when the variation of thediffusion coefficient is ignored. These differences originate from the relative inaccuracy of this equation.
INTRODUCTION
This paper addresses the influence of the thermal vanatlOn of diffusioncoefficient on the non-equilibrium plate height of analyte ions in capillary zoneelectrophoresis (CZE). The origin ofnon-equilibrium dispersion in CZE is the gradientin temperature caused by the Joule heating of the capillary contents. Becauseelectrophoretic mobilities increase with temperature, analyte ions migrate faster nearthe capillary center, where the temperature is higher, than near the capillary wall,where the temperature is lower. The resultant dispersion is mitigated by the radialdiffusion of analyte ions, which averages out these differences in velocity to somedegree.
Other theories for the non-equilibrium plate height or the effective diffusioncoefficient, which is proportional to this plate height, in CZE have been derived. (Asshown below, the effective diffusion coefficient is a calculated measure of the axialdispersion caused by the radial variation of analyte velocity.) Many of these theories
0021-9673/90/$03.50 © 1990 Elsevier Science Publishers B.Y.

522 J. M. DAVIS
differ only slightly from one another. By representing the Poiseuille flow in an opentube by three discrete components, Konstantinov and Oshurkova 1 derived anapproximate effective diffusion coefficient analogous to that ofTaylor2
,3. Martin andEveraerts4 suggested an analogy between the effective diffusion coefficient forchromatography, as derived by Golay 5, and that for CZE. Cox et a/. 6 approximatedthe radial variation of analyte velocity by an equation derived by Hjerten 7; he thensolved the equation of continuity, from which the plate height was calculated, bymaking an analogy with the work of Aris8
. In a work closely related to that ofKonstantinov and Oshurkova l
, Virtanen9 calculated an effective diffusion coefficientfor CZE by modifying Taylor's effective diffusion coefficient for dispersion in opentubes. Similarly, Knox and Grant lO modified Taylor's theory ofdispersion to calculatethe non-equilibrium plate height. Most recently, Grushka et a/. ll adapted the theoryof Reejhsinghani et a/. 12 to calculate from the equation of continuity an effectivediffusion coefficient, from which the non-equilibrium plate height was evaluated.
A common attribute among these theories is the calculation (by a variety ofmeans) of the mean square axial displacement of the analyte from the mean analyteposition. The random-walk theory of dispersion shows that this result is proportionalto the time required for ions to diffuse between two characteristic positions in thecapillary, at which their velocities significantly differ13
. In all of the above theories, thistime is approximated as a constant. Because the diffusion coefficient of analyte ionsincreases with temperature, however, the time required for ions to diffuse from oneposition to another is reduced near the capillary center, where the temperature ishigher, relative to that near the capillary wall, where the temperature is lower. In otherwords, this time is not constant but varies with the radial position in the capillary. Noattempt has been made to determine under what conditions this approximation breaksdown and the radial variation of the diffusion coefficient becomes important. Thispaper does so.
In some of the theories referenced above, detailed equations for plate height wereevaluated with analytical expressions for the temperature and electrophoretic mobilityof analyte ions in the capillary. In general, these expressions apply when the differencein temperature between the capillary wall and center is vanishingly small. They areonly approximately correct, however, when this temperature difference is large, i.e.,when non-equilibrium dispersion is large. Because the temperature difference, abovewhich the variation of diffusion coefficient is important, is unknown (indeed, itsdetermination is the goal of the paper), one does not know a priori if these expressionsare appropriate for this study. To obtain a fairly rigorous solution, these expressionsare not used here except in limiting cases. Instead, expressions for the temperature andelectrophoretic mobility are computed numerically from the steady-state equation ofheat conduction. These expressions are free of all but the most fundamentalassumptions and are, in principle, applicable over a wide range of temperatures.
THEORY
The theory of this paper is composed of two parts. In Part I, the profiles oftemperature and electrophoretic mobility are computed from the steady-stateequation of heat conduction. In Part II, an expression for the non-equilibrium plateheight is derived, in which the radial variation of the diffusion coefficient is addressed.

NON-EQUILIBRIUM PLATE HEIGHT IN CZE 523
Numerical values of this expression are then evaluated with the temperature andmobility profiles computed in Part I.
Part I: Determination of radial temperature and electrophoretic-mobility profilesHere, one will assume that thermal convection, thermal diffusion, and heat
transfer from electroosmotically induced forced convection are negligible. One willalso assume the analyte concentration is vanishingly small, such that the electrical andthermal properties of the capillary contents are determined by the buffer only, and theanalyte does not alter the electric field strength. Finally, one will assume that theequilibrium constants governing the dissociation of the buffer and analyte do not varyover the range of temperatures experienced by the buffer. (These assumptions will becritiqued later.) The radial temperature profile in the capillary is then governed by thesteady-state equation of heat conduction14.15
(1)
where I' is the radial coordinate, T(r) is temperature, klr) and ke(r) are the thermal andelectrical conductivities of the buffer, and E is the electric field strength. Although oneshould strictly interpret the conductivities ke(r) and kt(r) as functions of radialcoordinate 1'14,15, one alternatively can (as commonly does) interpret them asfunctions of temperature T(r) (ref. 15). By introducing the variables
y = ~; 8(y) = T(y) - Toa To
one can reexpress eqn. 1 in the dimensionless form 14
(2)
(3)
where a is the capillary radius, To is the temperature at the (inner) capillary wall, k to andk eo are the thermal and electrical conductivities of the buffer at this wall, and B is
(4)
Several solutions to eqn. 3 have been developed, which differ in the approximations chosen for the reduced conductivities ke(y)jkeo and kb)jkto' When theseapproximations equal the constant, one (i.e., when the conductivities are independentof temperature); the solution to eqn. 3 is simply
B 28(y) = -(1 - y )
limB~O 4(5)
Others have solved eqn. 3 more rigorously to address the dependences of ke(y)jkeo and

524 J. M. DAVIS
kt(y)/kto on temperature. Broer14 expressed these functions as two-term expansions inB(y) and so accounted for the linear variations with temperature of the electrical andthermal conductivities. By equating kb)/kto to one and ke(y)/keo to a two-termexpansion in B(y), Coxon and Binder16
, Brown and Hinckley1?, and Jones andGrushka18 obtained Bessel functions as solutions to eqn. 3. These functions accountfor only the linear variation with temperature of the electrical conductivity.
The most general solution to eqn. 3, subject to the boundary conditionsdB(y)/dy = Oly=o (because of radial symmetry) and B(y) = Oly=1 (because T = To atthe wall), is
(6a)
(6b)
where the ratios, ke(y)/keo and kt(y)/kto , are now represented by the functions fey) andhey), respectively. These functions vary with the radial coordinate y because theconductivities vary with temperature. In other words, hey) and fey) vary with T(y) =To[1 + B(y)]. But B(y) is unknown; it is the function one seeks. In solving eqn. 6a, one issaddled with the circular task ofdetermining e(y) from two functions which themselvesdepend on B(y).
A general solution to eqn. 6a is developed here, but not because the solutions toB(y) referenced above are inadequate. Rather, as will be shown below, the nonequilibrium plate height depends on the function fey), which describes the radialvariation of the electrophoretic mobility. By judiciously developing the solution toeqn. 6a, one can determine fey) without any assumptions beyond those outlined at thebeginning of this section. To achieve this objective, one must sacrifice analytical rigorfor numerical methods. As compensation, however, one circumvents the shortcomingsthat others have encountered in the derivation ofapproximations to fey), especially forlarge values of B.
An iterative numerical algorithm by which fey) can be computed is now outlined.For any value ofB, one can solve eqn. 6a numerically by initially equating fey) and hey)to one. In this case, the solution to B(y) is eqn. 5, within numerical error. For any valueof To, this solution to B(y) defines the temperature Tat all values ofy (in this case, T =
To[1 + B(l - y2)/4], from which new approximations to fey) and hey) can then becalculated from empirical functions of temperature for the electrical and thermalconductivities. In other words, the temperature at any coordinate y defines the valuesof the electrical and thermal conductivities at that coordinate; the ratios of thatelectrical conductivity to k eOl and that thermal conductivity to kto, define the values ofthe functions fey) and hey), respectively, at that coordinate. One can then substitutethese new approximations to fey) and hey) into eqn. 6a, numerically integrate withrespect to y, and compute a new solution to B(y). This solution will differ from theprevious one, because the functions fey) and hey) now differ from one. From this newsolution to B(y), one can again calculate the temperature at all values of y and newapproximations to fey) and hey), as before. One can iteratively repeat this algorithm,

NON-EQUILIBRIUM PLATE HEIGHT IN CZE 525
until f(y), h(y), and 8(y) converge to constant values. When this convergence isreached, then onehasan excellent approximation to the function f(y) that one needs todescribe the radial variation of electrophoretic mobility.
To implementthis algorithm, one must have accurate functions for h(y) and f(y)at different temperatures. These functions will be represented by h[T(y)] = h[To, 8(y)]and f[T(y)] = f[To,8(y)], respectively. Over the temperature range, 7-97°C, thefunction h[To,8(y)] for water can be described with an accuracy of one part perthousand [at least, for the values 280, 290, 300, ... , 370 K (ref. 19)] by the quadratic
(7)
where
(X2 = -7.555' 10- 6 T;jtJ
tJ = -0.5390 + 6.090' 10- 3 To - 7.555' 10- 6 T;
(7a)
(7b)
(7c)
and where To is expressed in degrees Kelvin. These equations were determined byfitting a quadratic function of T to tabulated values of the thermal conductivity ofwater19 and then by reexpressing T = T(y) in terms of 8(y), eqn. 2. The functiontJ (eqn. 7c) is the quadratic approximation to the thermal conductivity of water at thetemperature To, in Wj(mK). Lest any ambiguity exist in the use of eqn. 7, one shouldperhaps again state that the value of h[To,8(y)] at coordinate y in a given iteration isdetermined from To and the value of 8(y) computed at that coordinate in the previousiteration. Eqn. 7, although determined for water, is also adequate for electrolyticbuffers, because salts contribute to the thermal conductivity by an amount less than 2 .10- 5 Wj(mK) or so per ion, as long as their molar concentration is less than 0.1 (ref.20), a concentration which is rarely exceeded in CZE.
The function f[To,8(y)] is developed from the electrical conductivity kc(T), which
(8)
where F is the Faraday constant; e is the fundamental electrical charge; and Zi f..I.i, Ci,
and Iri are the unsigned number of charges, the electrophoretic mobility, theconcentration, and the friction coefficient of the ith ion, respectively. If one neglectsthe variation of Zi and Ci with temperature (the former, from changes in screening bythe electrical double layer, extent of ionization, etc.; the latter, from volumeexpansion), then eqn. 8 may be expressed as
(9)
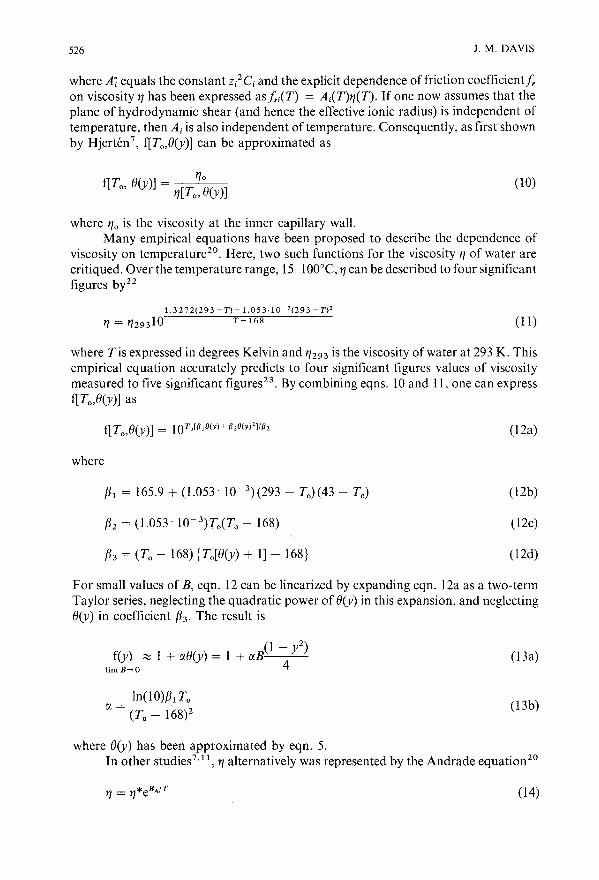
526 J. M. DAVIS
where Ai equals the constant Zi2C and the explicit dependence of friction coefficient/,.
on viscosity lJ has been expressed as/"i(T) = Ai(T)lJ(T). If one now assumes that theplane of hydrodynamic shear (and hence the effective ionic radius) is independent oftemperature, then Ai is also independent of temperature. Consequently, as first shownby Hjerten7, f1To,B(y)] can be approximated as
(10)
where lJo is the viscosity at the inner capillary wall.Many empirical equations have been proposed to describe the dependence of
viscosity on temperature20 . Here, two such functions for the viscosity lJ of water arecritiqued. Over the temperature range, IS-100°C, '1 can be described to four significantfigures by22
1.3272(293 - T) -1.053·1 0~ '(293 - 1')2
lJ = lJ29310 T 168 (11)
where Tis expressed in degrees Kelvin and lJ293 is the viscosity of water at 293 K. Thisempirical equation accurately predicts to four significant figures values of viscositymeasured to five significant figures 23 . By combining eqns. 10 and 11, one can expressf1To,B(y)] as
where
/31 = 165.9 + (1.053' 10- 3)(293 - To)(43 - To)
/32 = (1.053' 1O- 3)To(To - 168)
/33 = (To - 168) {To[B(y) + 1] - 168}
(I2a)
(12b)
(12c)
(12d)
For small values of B, eqn. 12 can be linearized by expanding eqn. 12a as a two~term
Taylor series, neglecting the quadratic power of B(y) in this expansion, and neglectingB(y) in coefficient /33, The result is
feY) ::::: 1 + aB(y) = 1 + aB(1 - y2)limB-->O 4
InC10)/31 Toa = (To _ 168)2
(I3a)
(13b)
where B(y) has been approximated by eqn. 5.In other studies7,11, lJ alternatively was represented by the Andrade equation20
(14)

NON-EQUILIBRIUM PLATE HEIGHT IN CZE
for which
527
(15)
where BA is an empirical temperature commonly equated to 2400 K. By representingthis equation by a two-term Taylor-series expansion and expressing e(y) in thisexpansion by eqn. 5, others showed7.l 1
(16)
The expansions, eqns. 13 and 16, are clearly different; they are equal only whenTo satisfies the equation
(17)
or when To ~ 4°C(BA = 2400 K). At all other temperatures, eqns. 13 and 16 willpredict different values for the variation of electrophoretic mobility with temperatureand consequently the non-equilibrium plate height. .
In spite of its common use, eqn. 14 describes the variation of tJ with temperaturesomewhat poorly. In support of this assertion, Table I reports estimates of tJ calculatedfrom eqns. 11 and 14 for selected temperatures grouped in intervals of two degrees.This two-degree interval was chosen as an arbitrary upper limit to the temperaturedifference between the capillary center and wall that one might encounter in CZE,under experimental conditions where Joule heating is marginal. For each group, theparameter tJ* was computed by fitting to eqn. 14 (BA = 2400 K) with least-squaresmethods the three values of tJ computed from eqn. 11. The tJ values so calculated agreewith those calculated from eqn. 11 only to within two significant figures. Also, thevariation of tJ* from group to group is substantial, which indicates that a largertemperature range could not be spanned by eqn. 14 with any accuracy. Theseequations predict different values of tJ at different temperatures, principally becausethey have different values of dtJJdT.
The differences between these values raise some doubts about the accuracy ofelectrophoretic mobilities calculated from the Andrade equation. In this paper, eqn. 11will be used for this task, unless otherwise stated. As will be shown below, thesedifferences are so substantial that eqn. 16 predicts non-equilibrium plate heights thatcan be 150% larger than those predicted by eqn. 13, other factors being equal.
Part II: Derivation of non-equilibrium plate height for radially dependent diffusioncoefficient
Here, the dispersion theory of Reejhsinghani et alY is used to address theinfluence of the radial variation of the analyte diffusion coefficient on the nonequilibrium plate height in CZE. This theory draws heavily on Taylor's studies ofdispersionz.3 and was also used by Grushka et al. 11 in a recent calculation of plateheight, in which this variation was ignored. In essence, this theory simplifies the

528 J. M. DAVIS
TABLE I
COMPARISON OF VISCOSITIES '1 CALCULATED FROM EQNS. II AND 14
Parameter '1* was determined by least-squares regression.
TtC) Eqn. 11 Eqn.14 '1* . /0 4
reP)
25 0.8905 0.894226 0.8705 0.8704 2.84327 0.8513 0.8475
35 0.7194 0.723136 0.7053 0.7051 2.98637 0.6916 0.6877
45 0.5960 0.599546 0.5856 0.5855 3.16347 0.5755 0.5719
55 0.5041 0.507456 0.4962 0.4962 3.36957 0.4885 0.4854
65 0.4335 0.436566 0.4274 0.4275 3.60067 0.4214 0.4187
75 0.3781 0.380576 0.3732 0.3731 3.84877 0.3685 0.3658
85 0.3337 0.335986 0.3298 0.3297 4.11987 0.3259 0.3236
equation of continuity to an ordinary differential equation, whose solution determinesan effective diffusion coefficient from which the plate height is calculated. The theorydeveloped below may be construed as an extension of these more fundamental works.
One develops this ordinary differential equation from the equation of continuityin radial coordinates, which is14
oc 1 a oNz- + --(rNy ) + - = 0at ror oz
where Ny and N z are respectively the one-dimensional radial and axial fluxes
(18)
(19)
(20)

NON-EQUILIBRIUM PLATE HEIGHT IN CZE 529
and where Z is the axial coordinate, t is time, e = e(r,z,t) is the analyte concentration,and Vr and Vz (Dr and Dz) are the analyte velocities (diffusion coefficients) in the radialand axial directions. No angular flux appears, because of radial symmetry. Ifone againassumes that thermal convection and thermal diffusion are negligible, then Vz = vz(r) is
vz(r) = [/l(r) + /leo]£ (21)
where /l(r) is the electrophoretic mobility at coordinate r and /leo is the electroosmoticflow coefficient (both /l and /leo are signed quantities). Here, one has assumed thatcapillary diameters are sufficiently large that one can neglect the variation ofelectroosmotic flow in the electrical double layer at the capillary-buffer interface.Hence, the electroosmotic flow equals /leo£. One has also assumed that the steady-stateequation of heat conduction applies and that Vz does not vary with t, as it does duringa brief initial transient16
.
The mobility can be expressed as /l(r) = - 8(/'1(r) (ref. 24), where 8 and ( are theelectrical permittivity of the buffer and the zeta potential of the analyte. If one neglectsthe variation of these parameters with temperature, eqn. 21 may be expressed as7
,11
(22)
where /lo = - 8(/'10 is the electrophoretic mobility of the analyte at the capillary walland fer) is the equivalent of f(y), but now expressed in terms of the dimensionedcoordinate, r, instead of the dimensionless coordinate, y = ria. (For the moment,equations in r are more convenient than equations in y; the final results will beexpressed in terms ofy.) Eqn. 22 marks the first appearance of the function fer) [or f(y)],which is determined numerically as described in Part I.
If one now assumes that Dz is independent of Z and that thermal diffusion isnegligible (i.e., that Vr = 0), then the substitution ofeqns. 19 and 20 into eqn. 18 yields
(23)
where the dependence of Dr = Dr(r) on radial coordinate r is expressed explicitly.By defining the coordinate Z 1 = Z - ilt, where iI is the average analyte velocity in
the axial direction, one can implement the standard coordinate transformation
with which eqn. 23 can be expressed as
oe oe 1 o[ oe] 02e;;- + [vz(r) - VJ-;- = -;;- rDr(r);;- + Dz;::-'jut UZl rur ur uZl
(24)
(25)

530 1. M. DAVIS
The theory of Reejhsinghani et al. 12 is now used to simplify eqn. 25. First, theconcentration C is approximated by the two-term expansion
where cm(z1) is the cross sectional average concentration (2)
a
Cm(ZI) = ~2 frcdr
o
(26)
(27)
and g(r) is a function to be determined. By combining eqns. 26 and 27, one can show 12
a
frg(r)dr = 0
o
(28)
which will prove useful later.Because cm(z1) is independent of 1', and derivatives of cm(z1) with respect to Z1 of
order two or greater are negligible compared to aCm(Zl)/aZ l (ref. 12), the followingadditional approximations hold
aC acm(z 1) dg(r)(29a)
ar~~&
a2c aCm(Zl)d 2g(r)(29b)
ar2~~~
ac acm(zd(29c)
aZl~~
aC-~O (29d)at
By substituting eqn. 29 into eqn. 25 and neglecting derivatives of cm(z 1) withrespect to Zl of order two or greater, one obtains the ordinary differential equation
1 d [ dg(r)]vzCr) - v= ~ dr rDr(r)&
which integrates to
rr dg(r)j'[vz(r) - ilJdr = rDr(r)&
o
(30)
(31)

NON-EQUILIBRIUM PLATE HEIGHT IN CZE 531
where the right-hand side, rDr(r)dg(r)/dr, equals zero at r = 0 (the lower limit of theintegral on the left-hand side), because dg(r)/dr equals zero at r = O. (Obviously, theright-hand side is also zero at r = 0, because the first factor of this function is r.) Thefunction dg(r)/dr equals zero at r = 0, because the diffusive flux
_ .)oc _ _ ()ocm(Z 1) dg(r)Dr(1 0 - Dr rod
r Zl r(32)
is zero at r = 0, because of radial symmetry. Because neither D,(r) nor OCm(Z1)/OZ1 iszero at r = 0, eqn. 32 equals zero at r = 0 only if dg(r)/dr equals zero at r = O. Thisfunction is also zero at r = a, because analyte cannot diffuse across the capillary wall.This latter equality will prove most useful later.
If the radial gradient in temperature is the only cause of the radial variation ofD,(r) , one can express this variation as20.25
Dr(r)'7(r) = A'T(r)
(33)
where A' is a constant, whose value depends on the physical properties of the analyteand buffer. The theoretical origin of this expression is the Nernst-Haskell equation,which describes the mutual diffusion coefficient of a salt at infinite dilution2o,25. Eqn.33 is also theoretically justified for molecular species by the Stokes-Einsteinequation2o ,25, which in turn forms the basis of the empirical equations for the mutualdiffusion coefficient of Wilke and Chang20,25; Tyn and Calus20; Nakanishi20; King,Hsueh and Ma025 ; and Reddy and Doraiswamy25.
With eqn. 33, one can express the ratio of Dr(r) to Dro , the value of Dr(r) at thecapillary wall, as
D,(r) = A/~(r)/'7(r) = f(r{~') = f(r)[8(r) + I]Dro A To/'7o 10
from which one concludes
D,(r) = DrJ(r)[8(r) + 1]
where 8(r) is the equivalent of 8(y), but expressed in terms of r, instead of y.By substituting eqn. 35 for Dr(r) in eqn. 31, one can show
r r
g(r) - g(O) = ~rJ~f(r)[8;r) + l]fr[vz(r) - V]drdr
o 0
(34)
(35)
(36)
where g(O) is the value of g(r) at r = O. Eqn. 36 alternatively can be expressed in termsof coordinate y = ria as
a2J.loEf
Y1 fY [ 1 ]
g(y) - g(O) = JJ:: yf(y)[8(y) + I] y feY) - 2!yf(y)dy dydy
o 0
(37)

532
where vz(r) is expressed by eqn. 22 and the average zone velocity v is
1 1
V = 2JyvzCy)dy = [2Ito(Jyf(y)dy + lteo]Eo 0
J. M. DAVIS
(38)
in accordance with this equation. One observes that Iteo subtracts out in this result; theelectroosmotic flow causes no dispersion.
A brief outline of the calculation of the non-equilibrium plate height from eqn.37 may be appropriate here, because Reejhsinghani et at. 12 provide little detail in theirwork, and Grushka et at. 11 simply cite their result (actually, its negative). The analysisbelow differs from that of Reejhsinghani et at. 12 as best as the author can tell, but itparallels that of Giddings in his plate-height studies of chromatography13 andfield-flow fractionation 26
. In any case, the result is the same as that derived byReejhsinghani et at. The average convective flux, < cvz(r) >, in the axial direction canbe expressed with eqn. 26 as
(39)
The first term in this equation equals the average convective flux, Cm(Zl)V, whichrepresents the translation of the average zone concentration at the average zonevelocity. The second term represents a dispersive flux, which alternatively can beexpressed by Fick's first law, -:?&Ocm(Zill0z1' where :?& is an effective diffusioncoefficient equal to
a
:?& = - :2 frg(r)VzCr)dr
o
1
= - 2Jyg(y)vz(y)dyo
(40a)
(40b)
and from which the non-equilibrium plate height H is calculated as 2:?&Iv (refs. 11, 13and 26)
a 1
H = - ~Jrg(r)vz(r)dr = -~fyg(y)Vz(y)dYa vJ' v
o 0
(41)
So far, the theory developed here parallels that of Grushka et at. 11, except thatthe radial variation of diffusion coefficient has been included. Now, a slight departureis taken. One does not need to determine the constant of integration g(O) in eqn. 37, asdid Grushka et atY, to evaluate eqn. 41, because this latter equation also equals
1
H = -~fy[g(y) - g(O)][vzCy) - V]dy
o
(42a)

NON-EQUILIBRIUM PLATE HEIGHT IN CZE
1
4/1 Ef [1 ]= ---t- y[g(y) - g(O)] feY) - 2!yf(y)dy dy
o
To demonstrate this equality, one expands eqn. 42a to the result
4[1 1 1 1 JH = --:: Jyg(Y)vzCY)dy - iiJyg(y)dy - g(O)Jyvz(y)dy + g(O)iiJydy
v 0 0 0 0
533
(42b)
(43)
The second term in this expansion equals zero, by virtue ofeqn. 28. The third andfourth terms respectively equal - g(0)iij2 and +g(0)iij2 and cancel one another,regardless of the value of g(O). (In fact, they cancel one another, regardless of the lowerlimit of the outermost integral in eqn. 37. Advantages accrue if one chooses y = 0 asthe lower limit, however, as will be shown below.) Only the first term, which equalseqn. 41, remains. This simplification of theory is identical to that developed byGiddings26 in his non-equilibrium theory of field-flow fractionation.
By combining eqns. 37 and 42b, one can express Has
1 y y
4(a/1 E)2f [ 1 J1 1 f [ 1 JH = - Dr:V y fey) - 2!yf(Y)dy yf(y)[O(y) + 1] Y fey) - 2!yf(Y)dy dydydy
o 0 0
(44)
This cumbersome result fortunately can be simplified substantially by integration by parts, in a manner identical to that developed by Giddings27 in thenon-equilibrium theory of field-flow fractionation. If one lets
y y
U = fyf(y) [O~) + l]fy[f(y) - 2~Yf(y)dY}ydY
o 0
and
then eqn. 44 can be expressed as
(45)
(46)
(47)
1
where UVI implies that U(y = 1) and V(y = 1), and U(y = 0) and V(y = 0), areo
multiplied, and that the latter product is subtracted from the former. The function

534 J. M. DAVIS
(48)
is the dimensionless equivalent of eqn. 31, which is zero at both r = 0 and r = a (y =o and y = 1), because dg(r)/dr equals zero at both these limits (see discussion
1
immediately following eqn. 31). Therefore, the first term, UVI, equals zero, and eqn.o
47 reduces to
where one has now taken advantage of the equality, V(y = 0) = 0, to express theproduct of two integrals as the square of the same integral.
Eqn. 49 can be expressed in the dimensionless form
1 y
HDroV f I {f [ 1 J}2(all
oE)2 = 4 yf(y) [8(y) + 1] y f(y) - 2~Yf(y)dY dy dy
o 0
(50)
which is the desired theoretical result.In general, eqn. 50 must be evaluated numerically, because f(y) and 8(y) are
computed numerically, as detailed in Part I. For small values of B, however, ananalytical solution can be determined by approximating 8(y) and fey) in eqn. 50 byeqns. 5 and 13, respectively. In this case, eqn. 50 integrates to the somewhat awkwardresult
(51)
where (J. is defined by eqn. 13b. By using the expansion
(52)
where y is any real number, one can approximate eqn. 51 by
(53)
Jim B-tO

NON-EQUILIBRIUM PLATE HEIGHT IN CZE 535
where To is in degrees Kelvin, (X has been explicitly expressed, and [31 is defined by eqn.12b.
To test this theory, one should compare eqn. 50 to the analytical result derived byGrushka et at. 11. To make this comparison, one must "turn off' the radial variation ofthe diffusion coefficient in eqn. 50 by equating the functions f(y) and B(y) to one andzero, respectively, in the expression, {yf(y)[B(y) + In -1. In this case, eqn. 50 becomes
1 y
_H_D_ro--;:-V2= 4f!{fY[f(y) - 2SYf(Y)dyJdy }2dy(alloE) Y 0
o 0lim D,(r) -+ D ro
(54)
Iff(y) in eqn. 54 is now equated to eqn. 16, the approximation to f(y) used by Grushkaet at,u, then eqn. 54 integrates to the simple analytical result
(55)
lim B-ODr(r)-Dro
At first glance, eqn. 55 seems quite different from the result of Grushka et at. 11, whichin dimensionless terms is
lim B-+OD,(r)-Dro
1 (BBA/To)2
24 (8 + BBA/To)2(56)
(This equation, as expressed in ref. II, actually has a minus sign in the denominator,instead of a plus sign; this appears to be a typographical error.) The apparentdifference between eqns. 55 and 56 arises from the neglect ofelectroosmotic flow in thederivation of eqn. 56, which makes the mean analyte velocity Urn different from themean analyte velocity ,v described here. One can easily show
(57)
limB-OD,(r)-+Dro
when Ileo = 0 and vis calculated from eqns. 16 and 22. By substituting eqn. 57 into eqn.55, one does obtain eqn. 56, as expected. One should perhaps observe that the inclusionof the electroosmotic flow is essential to an accurate description of plate height, eventhough it causes no dispersion. The flow does affect the analyte residence time andconsequently the number of diffusive steps which partially average out differences inanalyte velocity.
In conclusion of this section, one should note that the accuracy of the theorydeveloped by Grushka et at. 11 should be substantially improved by substituting theright-hand side of eqn. 17 for BA in eqns. 55 and 56. This substitution corrects these

536 J. M. DAVIS
authors' otherwise sound work for the shortcomings of the Andrade equation, with theresult
Jim B-+ODr(r)--+Dro
[ (In 10)/31 ToBj(To - l68)2J2HDro 1
a2Um = -24O=[o-'8~+-(-ln-l-0-)/3-1-To-B-j(-T-o---1-68-=')'-=2J=2
(58a)
(58b)
where /31 is defined by eqn. 12b. One notes that eqn. 58a is simply the first of the twoterms comprising eqn. 53, which approximately corrects for the radial variation of thediffusion coefficient. The percentage error between eqns. 55 and 58a is
(59)limB-OD,(r)-Dro
and is a function of To only.
PROCEDURES
Numerical approximations to 8(y), eqn. 6a, were computed for specific values ofB and To as detailed in Part I of the Theory section. Unless otherwise stated, f[To, 8(y)]was calculated from eqn. 12. Numerical solutions to 8(y) were iteratively calculated,until 8(y) differed by less than one part in two thousand from its predecessor. For smallB values (e.g., B = 0.0001), only two or three iterations were required; for largeB values (e.g., B = 0.40), 20 to 25 iterations were required. The dimensionlessnon-equilibrium plate height, HDrovj(aJloE)2, was then calculated from eqn. 50 withthe numerical approximations to f(y) and 8(y) so determined. For purposes ofcomparison, HDroV/(aJloE)2 was also computed from eqn. 54, in which the radialvariation of the diffusion coefficient is ignored. Here, f(y) was also computediteratively. This sequence of calculations was then repeated for other values of BandTo. All numerical integrations were implemented with Simpson's rule and 399 discretevalues of y, f(y), h(y), and 8(y). The computer program prerequisite to thesecomputations was written in double-precision FORTRAN 77 and executed on theIBM 3081-GX computer at Southern Illinois University.
RESULTS AND DISCUSSION
Fig. 1 is a plot of log B vs. To for select values of radius a and 0.01 and 0.05 Mphosphate buffers (pH 7.0), which are representative of those used by Jorgenson andLukacs in their initial studies28.29 . These B values were calculated from eqn. 4 with the

NON-EQUILIBRIUM PLATE HEIGHT IN CZE 537
0.01 M phosphate, pH = 7.0.1 E = 50000 Vim
a=250~m
!XlCl -2
.!:? - a = 75 ~m
-3 a = 37.5 ~m
a = 25 ~m
70I_-==t==::;:==:;===a~-~-~12~.5~~~m~-I-4+
10 20 30 40 50 60
T °c0'
o 0.05 M phosphate, pH = 7.0E =50000 Vim
!Xl .1Cl
.!:?-2
a=250~m
- a = 125 ~m
a = 75 ~m
a 37.5 b'm
-3a _ 12.5 ~m
706020 30 40 50
T °c0'
-4 +---1---+---/--1--+---110
Fig. I. Plots of log B vs. To for select capillary radii a, E = 50000 Vim, and 0.01 and 0.05 M phosphatebuffers (pH 7.0). Values of B were calculated from eqn. 4 as detailed in the text.
indicated a values, appropriate values of kto(To) and keo(To), and E = 50000 V1m. Inthese calculations, kto(To) was calculated from eqn. 7c, whereas keo(To = 25°C) wascalculated from eqn. 8, the electrophoretic mobilities of the H 2POi, HPO~-, andPO~ - ions at infinite dilution30
, and the concentrations of these ions, which weredetermined from the acid dissociation constants of phosphoric acid at 25°C31 andmass balance. The values of keo at other temperatures were then estimated bycorrecting keo (To = 25°C) for the variation of viscosity with temperature. Because therelationship between viscosity and temperature is almost exponential, the graphs oflogB vs. To are almost linear. Although the field strength E one uses in these calculations isarbitrary, only a few studies have been carried out with E values greater than 50 000Vim (ref. 32). Hence, almost all B values actually will be smaller than these, underotherwise identical conditions. These plots show that under typical experimentalconditions (e.g., buffer concentrations less than 0.05 M; radii less than 37.5 ,urn; fieldstrengths less than 50 000 V1m), B is less than O.oI.
Fig. 2 is a plot ofe(Y)1B vs. y for select values ofB and To = 25°C. The lowermostbold curve is a graph of eqn. 5, which applies as B approaches zero. The other curveswere computed with the iterative numerical algorithm described in Part I. To confirmthis algorithm, the numerical solutions to e(y) so computed were compared to theBessel functions proposed by Coxon and Binder16
, Brown and Hinckley 17, and Jonesand Grushka18. No substantial difference exists between these solutions, as long asB < 0.20; for larger B values, the variation of fey) with e(y) is no longer linear andBessel functions no longer apply. (These comparisons were actually made by setting

538
0.6In;::;. 0.5>-CD 0.4
T- __
0.3~~~~~0.2 ~
0.1
0.2 0.4 0.6 0.8Y
J. M. DAVIS
Fig. 2. Plot of 8(y)jB vs. y for select values of B and To = 25°C. The lowermost bold curve was calculatedfrom eqn. 5; the other curves were computed numerically.
h[To,8(y)] to unity, since Bessel functions apply when the thermal conductivity isconstant. If one allows h[To,8(y)] to vary with temperature, the Bessel functions areactually acceptable solutions up to B = 0.30 or so, because this variation partiallycompensates for error.) It is unlikely that a flawed algorithm would make predictionsthat so closely agree with theory. In general, the algorithm always appears to convergeto the appropriate global solution to 8(y); no erroneous local solutions were evercomputed in these comparisons.
One can conclude from Fig. 2 that eqn. 5 is a fairly good approximation to 8(y)for values of B less than 0.01 or so. For much larger B values, however, this solution isclearly inadequate. By comparing the numerical solutions to 8(y)/B for variousB values, one infers that their departure from eqn. 5 is non-linear in B (e.g., thedifference between the values of 8(y)/Bat y = 0 for B = 0.40 and B = 0.20 is morethan twice the corresponding difference for B = 0.20 and eqn. 5, which applies as B ->
0). The principal relevance of these departures to this work is the inadequacy of theanalytical approximations to f(y), eqns. 13 and 16, when B is greater than 0.01 or so.These approximations are inadequate because they were derived with eqn. 5, which isinvalid under these circumstances.
Fig. 3 is a plot of [f(y)-I]/B vs. y for select values of B and To = 25°C. Thelowermost bold curve in the upper figure (Fig. 3a) was calculated from eqn. 13, theanalytical approximation to f(y) derived here. The dashed bold curve in this figure, andthe lowermost bold curve in the lower figure (Fig. 3b), were calculated from eqn. 16(BA = 2400 K), the analytical approximation to f(y) derived from the Andradeequation. Clearly, these approximations differ at this To, and this difference increaseswith increasing To (see below). Because this figure effectively represents the variationof electrophoretic mobility (less the mobility at the wall) with the radial coordinate,one concludes that substantial differences will exist between plate heights calculatedfrom these two functions, even for vanishingly small values of B.
The remaining curves in Fig. 3a and b were computed numerically. In Fig. 3a,flTo,8(y)] was calculated from eqn. 12, whereas in Fig. 3b, f[To,8(y)] was calculatedfrom eqn. 15. The numerical solutions to f(y) do not substantially differ from theappropriate analytical one, as long as B is less than 0.01 or so. This finding is perhapsnot surprising, because the function 8(y), on which f[To,8(y)] depends, can beapproximated under these conditions by eqn. 5. For larger values of B, however, thenumerical solutions to f(y) differ substantially from the analytical ones. As with 8(y),

NON-EQUILIBRIUM PLATE HEIGHT IN CZE 539
5lD B =0.40 a::: 4 = 25°C,
~3
2
eqn.13
00 0.2 0.4 0.6 0.8
Y
10bB =0.30
lD 8-,...,~
4
2
00 0.2 0.4 0.6 0.8
Y
Fig. 3. Plots of [f(y) -1]fB vs. y for select values of B and To = 25°C. The lowermost bold curve in (a) wascalculated from eqn. 13; the dashed bold curve in (a), and the lowermost bold curve in (b), were calculatedfrom eqn. 16. The other curves were computed numerically, with I1To,lI(y)] expressed by eqn. 12 for thecurves in (a) and by eqn. 15 for those in (b).
the departures of the numerical solutions to f(y) from the analytical ones are non-linearin B. More importantly, significant deviations between Fig. 3a and b are found asB increases. For example, when B = 0.30, the value of[f(y)-I]/B aty = 0 in Fig. 3a is3.10, whereas the corresponding value in Fig. 3b is 8.73. These large deviations indicatethe necessity of describing 11 correctly for large B values. The principal origin of thesedeviations is the overestimation of flTo,B(y)] by eqn. 15, which in turn causes thefunctions B(y) and f(y) to be overestimated. By the time these functions haveconverged, after many iterations of the numerical algorithm, these overestimationshave been amplified many times.
As another test of the algorithm developed here, a numerical solution to f(y) forB = 0.000 I was iteratively computed and compared to the analytical solution, eqn. 13.One would expect little difference between these solutions, since B ~ 0.0 I. In fact,these solutions differed beyond only the seventh or eighth significant figure. In otherwords, an extremely accurate solution to f(y) was calculated numerically. The authorbelieves that this test confirms this algorithm beyond any reasonable doubt.
Fig. 4 is a plot of the logarithm of the dimensionless plate height, logHD~ov/(aJ.loE)2, vs. log B for select values of To. The abscissa, log B, in each graph islimited by the boiling point of the buffer; therefore, log B is largest for the smallest Tovalues. Because the curves only slightly differ for different To values, they are graphedeither on different axes or in different plots. The solid curves are graphs of eqn. 50,which corrects for the radial variation of the diffusion coefficient; the dashed curvesare graphs of eqn. 54, in which this variation is ignored. For B values less than 0.01 or

1. M. DAVIS
0
-I
-2
·3
-4
-5
0--I <C
:I:
-2 C
o~
·3 Dl0-'::m
-4 ...-5
-I
-2
-3
-4
+------£---+-----+-5o
Fig. 4. Plots oflog HD<ov/(a!J.oE)2vs.log B for select values of To. Solid curves were computed from eqn. 50;dashed curves were computed from eqn. 54. The former equation corrects for the radial variation of thediffusion coefficient; the latter does not.
so, HDrov!(apoE)2 varies linearly with B2(i.e., the slope of the log HDro v!(apoE)2 vs. logB plot is two), although this variation is not shown to avoid the loss of other details.Furthermore, the radial variation of the diffusion coefficient has no significant effecton the plate height. For B values greater than 0.01 or so, however, HDrov!(apoE)2varies more rapidly with B than B2
, because 8(y) and f(y) vary with a power ofB greaterthan one (see above). More importantly, for Bvalues greater than 0.01 or so, the radialvariation of the diffusion coefficient also affects the plate height, and this effectincreases with increasing B. In these cases, the temperature near the capillary centerrises sufficiently above To to substantially increase diffusion in this region, relative tothat near the wall. Because the time required for analyte ions to diffuse between variouspositions in the capillary is correspondingly reduced, the differences in analyte velocityat these positions are more effectively averaged out and the plate height decreases.
Because the radial variation of the diffusion coefficient does not significantlyaffect HDroV/(apoE)2 unless B is greater than 0.01 or so, one concludes that eqns. 51and 53, which analytically correct for this variation, have little use. This lack of utilityexists, because the analytical approximations to f(y) and 8(y) with which theseequations were derived are themselves not valid, when B is greater than 0.01 or so.

NON-EQUILIBRIUM PLATE HEIGHT IN CZE 541
30
PE
20T :: 35°C6T = 7.1 °c
-1.25log B
-0.5
Fig. 5. Plot of percentage error PE between eqns. 50 and 54 vs. log B for select values of To. The formerequation corrects for the radial variation of the diffusion coefficient; the latter does not.
A comparison of the values of HDrovj(aJ-loE) 2 computed numerically from eqn. 50 tothose calculated from eqn. 53 confirms this finding. (Much numerical error isencountered in the evaluation of eqn. 51 for small B values, even in double-precisionFORTRAN; hence, these results are not compared to eqn. 50.) Unfortunately, withthe theory developed here, one cannot determine a simple analytical correction to plateheight theory which holds when the radial variation of the diffusion coefficient isimportant.
The differences between the corrected and uncorrected values of HDrovj(aJ-loE)2in Fig. 4 are perhaps underemphasized because of the logarithmic scale. Fig. 5 is a plotof the percentage error, PE, between eqns. 50 and 54 vs. log B for select values of To.The radial variation of the diffusion coefficient is accounted for in the former equation,whereas this variation is "turned off' in the latter equation. To evaluate bothequations, the functions feY) and 8(y) were computed numerically, because B is greaterthan 0.01. The percentage error between these equations is less than one or so, whenB is less than 0.01, but rapidly increases with increasing B. The rapid rate of thisincrease is not apparent from the figure, which is compressed in the vertical direction toavoid loss of detail. For example, the value of PE for To = I5°C and log B = -0.40(B = 0.40) slightly exceeds 150.
An arbitrary percentage error, above which one might wish to correct for thevariation of the diffusion coefficient, is indicated in Fig. 5 by the horizontal line atPE = 10. The calculated temperature differences LlTbetween the capillary center andwall at this threshold are indicated in the figure for the various To values. Thesedifferences, which are greater than 5°C, are nearly a linear function of To (theincrement is 0.8°C per 10°C increase in To). By and large, this threshold is not crossed,unless B is greater than 0.08 (log B > -1.1) or so. Because experimental values ofB almost invariably will be less than this value (see Fig. 1), one can typically neglect thevariation of the diffusion coefficient and use the simpler equations for plate heightreferenced in the Introduction, in which this variation is ignored. Thus, in one sense,the extensive theory derived above may seem somewhat academic. Yet, one must bearin mind that the numerical rigor supporting the conclusion just drawn would not havebeen possible without it.
Fig. 6 is a plot of HDro vj(aJ-loE)2 vs.log B for select values of To. Unlike in Fig. 4,the curves here are not corrected for the variation of the diffusion coefficient. The solidcurves, the curves comprised of short dashes, and the curves comprised of long dashes

J. M. DAVIS
:I:-3 C
0<'-4 ;:;
III-,:
°·5 m
-1
·2
-3
·4
-5
·6
·1
-2 0-lC
~
-6
-1
-2
-3
·4
·5
-60
542
-2eqn.54
-3 eqn. 58aeqn.55
·4
-5
-6
·7
-2N
eqn. 54
W -3 eqn. 58a0 eqn. 55='-
'"i> ·4 T = 35°Ce °
c -5 .J: .
..Ol -6 = 45°C.2 ..-7
-2eqn.54
·3 eqn. 56aeqn.55
-4 T = 55°C°
-5 .-6 = 65 °c
-7·3 -2 -1
log B
Fig. 6. Plots of log HD,ov!(a)1oE) 2 V.I. log B for select values of To. The solid curves, the curves comprised ofshort dashes, and the curves comprised of long dashes are graphs of eqns. 54, 55 (BA = 2400 K) and 58a,respectively. None of these curves corrects for the radial variation of the diffusion coefficient.
are graphs ofeqns. 54, 55 (BA = 2400 K) and 58a, respectively. The last two equationsare analytical approximations to the first, which was evaluated numerically. Eqn. 58a,in which feY) is expressed by eqn. 13, agrees well with this numerical solution, when B is
eqn. 54, B = 0.0001
eqn. 59
160
PE 140
120
100
80
60
40
20 +-<14--1---+--f-+--+-+---l10 20 30 40 50 60 70 80 90
T ,oco
Fig. 7. Plot of percentage error PE between the solutions of Grushka el al. 11 and those developed here V.I. Tofor small Bvalues. Circles represent computations from eqn. 54 and B = 0.0001; the curve is a graph of eqn.59 (BA = 2400 K).

NON-EQUILIBRIUM PLATE HEIGHT IN CZE 543
less than 0.01 or so, but differs with increasing B. Furthermore, the predictions ofeqns.55 and 58a significantly differ, even when B ~ 0.01. (Eqn. 55, in which feY) is expressedby eqn. 16, is equivalent to the result derived by Grushka et alY, except thatelectroosmotic flow is included.) This difference increases with increasing To andoriginates solely from the choice of the function feY) with which one evaluates eqn. 54.Because eqn. 16 is greater than eqn. 13 (see Fig. 3a), the values of HDro v/(aJ1.oE)2predicted by eqn. 55 are greater than those predicted by eqn. 58a.
The differences between the values of HDro v/(aJ1.oE)2 derived here and predictedby Grushka et al. ll are perhaps underemphasized in Fig. 6, because of the logarithmicscale. Fig. 7 is a plot of the percentage error PE between these values vs. To forB ~ 0.01. The circles represent the percentage error computed numerically from eqn.54, when B = 0.0001 and f[To,8(y)] was alternatively represented by eqns. 12 and 15.The solid curve is a graph of eqn. 59 (BA = 2400 K), which clearly approximates thiserror. This error substantially increases with increasing To and is greater than 100% forTo > 50Ge or so, a value that is not that uncommon experimentally33.34.
CONCLUSIONS
The principal significance of this work is its validation· of previous analyticalsolutions to the non-equilibrium plate height in capillary zone electrophoresis. Thefairly rigorous treatment developed here, which is based on an iterative solution to thesteady-state equation of heat conduction and the inclusion in the continuity equationof the radial variation of diffusion coefficient, does not differ from simpler analyticalones, unless the temperature difference between the capillary center and wallsubstantially exceeds that encountered in practice. This work also establishes the rangeof the parameter B over which these analytical solutions apply and suggests that theAndrade equation can mislead one about values of electrophoretic mobility andnon-equilibrium plate height, especially at elevated temperatures.
A shortcoming of this work is the lack of any relationship between thetemperature To of the capillary wall and the ambient temperature of the capillarysurroundings. The latter is easily measured, whereas the former is not. Therefore, somerelationship between the two is prerequisite to the testing of this theory. Others haveaddressed this problem l 1.l 6
-l8 and their results can be easily adapted here.
No theory is better than the assumptions on which it rests. Most of theassumptions made here (e.g., the absence of thermal diffusion, the absence of heattransfer from electroosmotically induced forced convection, and the independence ofchemical equilibria of temperature) are fairly reasonable ones. The assumption ofa vanishingly small analyte concentration may be subject to criticism, since in practiceone works with detectable levels of analyte, which can affect plate numbe~s29. Forbetter or worse, others have made this assumption and the author has made it as well.Perhaps in this light, this study should be viewed as more comparative than definitive.
One may wish to investigate more closely the assumption of negligible thermal(i.e., free) convection, because the AT values reported in Fig. 5 are somewhatsubstantial. Experiments in wide-bore capillaries have clearly demonstrated thenecessity of rotating the capillary contents to minimize dispersion by free convection7
•
A detailed evaluation of the expected amount of free convection is beyond the author's

544 J. M. DAVIS
ability. A rough evaluation is gained by calculating the dimensionless free-convectiveNusselt number14
Nu ~ 0.5(PrGr)1/4 (60)
where Pr = Cp1]/kt and Gr = a3g(jiJT/A2 are the dimensionless Prandtl and Grashofnumbers. (In these definitions, the parametersg, Cpr (j, and Aare the acceleration due togravity and the constant-pressure heat capacity, thermal coefficient of expansion, andkinematic viscosity of the buffer.) At 25°C, the Prandtl number of dilute aqueousbuffersisabout6.l6[Cp = 4l80J/kgK,1] = 8.90' 1O- 4 kg/ms, and k t = 0.605W/mK(ref. 35)], whereas the Grashof number can be approximated as 3.16 . 109 iJTa3 [g =
. 9.81 m/s2 , (j = 2.57' 10- 4 K -1, and A = 8.93' 10- 7 m2/s (ref. 35)]. Fig. 5 indicates thatiJ Twill rarely exceed 10°C = 10 K, whereas a will rarely, if ever, exceed 2.5 . 10- 4 m.Thus, Nu is expected to be less than 0.65 or so. According to the author of ref. 36, thisvalue of Nu indicates that free convection should be minor.
In spite of the rigor of these calculations, they remain at best approximate,because the viscosities of the buffers used in capillary zone electrophoresis are greaterthan the viscosity of pure water. Furthermore, the variations with temperature of theviscosities of pure water and buffers most probably differ. In these calculations, onehas implicitly assumed they are equal. In general, the error so introduced depends onthe buffer type and concentration and consequently is difficult to quantify. One can,however, gauge the magnitude of this error by a simple calculation. The viscosity of a0.051 M solution ofphosphoric acid at 20°C is about 1.010 cp (ref. 35), which is 0.008 cpgreater than the viscosity of water at this temperature (1.002 cp). If one modifies thenumerical algorithm to increment 1] by 0.008 cp during each iteration, such that flTo ,
B(y)] is appropriately adjusted, one finds that the values ofHD ro ii/(a!J.oE)2 so computeddiffer from previous computations by less than 4%, when 15°C < To < 65°C andB < 0.01. Clearly, this calculation is greatly oversimplified. It does suggest, however,that the increased viscosity has only a small effect, as long as the buffer concentration isless than 0.05 M.
SYMBOLS
Ai
AiA'aBBA
cCm(Zl)C;Cp
Dr(r)Dro
f,J1] (m)Zi2Ci (mol/m 3
)
Dr(r)1](r)/T(r) (kg m/s2 K)capillary radius (m)k eoa
2£2 /ktoToempirical temperature in Andrade equation, commonly equated to2400 Kanalyte concentration (mol/m 3
)
cross sectional average concentration (mol/m3)
concentration of ith buffer ion (mol/m 3)
constant-pressure heat capacity (J/kg K)radial diffusion coefficient (m2 /s)radial diffusion coefficient at inner capillary wall (m2/s)

NON-EQUILIBRIUM PLATE HEIGHT IN CZE 545
eEfeY); fer)f[To,e(y)]f,.; f,.iFgg(y); g(r)g(O)heY)h[Tme(y)]HHD rov/(afloE)2kerr); keCY)keokt(r); ktCY)k to
N r
Nz
rtTToUrn
V
2i
21
IX
1X1, 1X2
f3 b f32' f33bAATe,"I"10"1*e(y); e(r)A
axial diffusion coefficient (m2/s)effective diffusion coefficient (m2 /s)fundamental electrical charge (C)electric field strength (V/m)ke(y)/keo; ke(r)/keoke[To,e(y)]/keo = "Io/"I[To,e(y)]friction coefficient; friction coefficient of ith ion (kg/s)Faraday (Cjmol)acceleration due to gravity (m/s2
)
function defined by eqns. 36 and 37 (m)value of g(y) and g(r) at y = r = 0 (m)kt(y)/ktokt[To,e(y)]/ktonon-equilibrium plate height (m)dimensionless non-equilibrium plate heightelectrical conductivity (mho/m)electrical conductivity at inner capillary wall (mho/m)thermal conductivity (W/m K)thermal conductivity at inner capillary wall (W/m K)radial flux (mol/m2 s)axial flux (mol/m2 s)radial coordinate (m)time (s)temperature (K or 0C)temperature at inner capillary wall (K or 0C)average elctrophoretic mobility in theory ofGrushka et ai. 11 (m2/V s)average zone velocity (m/s)radial velocity (m/s)axial velocity (m/s)riaaxial coordinate (m)unsigned charge number of ith ion2 - vt (m)In(lO)f31 To/(To - 168)2coefficients of h(To,e) defined by eqn. 7a and bcoefficients of h(To,e) defined by eqn. 12b-dcoefficient of thermal expansion of buffer (K -1)thermal conductivity of water (W/m K)temperature difference between capillary center and wall (0C)electrical permittivity (F/m)zeta potential (V)viscosity (kg/m s)viscosity at inner capillary wall (kg/m s)"Ie-BAIT (kg/m s)[T(y)- To]/To; [T(r)- To]/Tokinematic viscosity (m2/s)

546
J.leoJ.lo
J. M. DAVIS
electrophoretic mobility (m2IV s)electroosmotic flow coefficient (m 2IV s)electrophoretic mobility at inner capillary wall (m2IV s)
ACKNOWLEDGEMENT
The author gratefully acknowledges Dr. David W. Kammler of the Departmentof Mathematics at Southern Illinois University for his suggestion of an iterativenumerical solution to eqn. 6a.
REFERENCES
I B. P. Konstantinov and O. V. Oshurkova, Sov. Phys.-Techn. Phys., II (1966) 693.2 G. Taylor, Proc. Roy. Soc. (London), 219A (1953) 186.3 G. Taylor, Proc. Roy. Soc. (London), 225A (1954) 473.4 A. J. P. Martin and F. M. Everaerts, Proc. Roy. Soc. (London), 316A (1970) 493.5 M. J. E. Golay, in D. H. Desty (Editor), Gas Chromatography, 1958, Academic Press, New York, NY,
1958.6 H. C. Cox, J. K. C. Hessels and J. M. G. Teven, 1. Chromatogr., 66 (1972) 19.7 S. Hjerten, ChromalOgr. Rev., 9 (1967) 122.8 R. Aris, Proc. Roy. Soc. (London), 235A (1956) 67.9 R. Virtanen, Acta Polytech. Scand., 123 (1974) 7.
10 J. H. Knox and I. H. Grant, ChromalOgraphia, 24 (1987) 135.lIE. Grushka, R. M. McCormick and J. J. Kirkland, Anal. Chem., 61 (1989) 241.12 N. S. Reejhsinghani, A. J. Barduhn and W. N. Gill, J. A1ChE, 14 (1968) 100.13 J. C. Giddings, Dynamics of Chromatography, Marcel Dekker, New York, NY, 1965.14 R. B. Bird, W. E. Stewart and E. N. Lightfoot, Transport Phenomena, Wiley, New York, NY, 1960,
p.272.15 H. S. Carslaw and J. C. Jaeger, Conduction o/Heat in Solids, Clarendon, Oxford, 2nd ed., 1986.16 M. Coxon and M. J. Binder, J. Chromatogr., 101 (1974) 1.17 J. F. Brown and J. O. N. Hinckley, J. Chromatogr., 109 (1975) 218.18 A. E. Jones and E. Grushka, J. Chromatogr., 466 (1989) 219.19 R. W. Powell, C. Y. Ho and P. E. Liley, in R. C. Weast (Editor), CRC Handbook of Chemistry and
Physics, CRC Press, Boca Raton, FL, 69th ed., 1988, p. E-Il.20 R. C. Reid, J. M. Prausnitz and B. E. Poling, The Properties o/Gases and Liquids, McGraw-Hill, New
York, 4th ed., 1987.21 A. J. Bard and L. R. Faulkner, Electrochemical Methodv, Wiley, New York, NY, 1980.22 J. F. Swindells, in R. C. Weast (Editor), CRC Handbook of Chemistry and Physics, CRC Press, Boca
Raton, FL, 69th ed., 1988, p. F-40.23 J. R. Coe Swindells, Jr. and T. B. Godfrey, J. Res., 48 (1952) 1.24 R. J. Hunter, Zeta Potelllial in Colloid Science: Principles and Applications, Academic Press, London,
1981.25 T. K. Sherwood, R. L. Pigford and C. R. Wilke, Mass Trans/er, McGraw-Hill, New York, NY, 1975.26 J. C. Giddings, J. Chem. Phys., 49 (1968) 81.27 J. C. Giddings, Y. H. Yoon, K. D. Caldwell, M. N. Myers and M. E. Hovingh, Sep. Sci., 10 (1975) 447.28 J. W. Jorgenson and K. D. Lukacs, Anal. Chem., 53 (1981) 1298.29 K. D. Lukacs and J. W. Jorgenson, J. High Resolut. Chromatogr. Chromatogr. Commun., 8 (1985) 407.30 C. M. Mason and J. B. Culvern, J. Am. Chem. Soc., 71 (1949) 2387.31 D. A. Skoog, D. M. West and F. J. Holler, Fundamentals o/Analytical Chemistry, Saunders College
Publishing, New York, 5th ed., 1988.32 F. Foret, M. Deml and P. Becek, 1. Chromatogr., 452 (1988) 601.

NON-EQUILIBRIUM PLATE HEIGHT IN CZE 547
33 S. Terabe, K. Otsuka and T. Ando, Anal. Chem., 57 (1985) 834.34 J. W. Jorgenson, in J. W. Jorgenson and M. Phillips (Editors), New Directions in Electrophoretic
Me/hods, (ACS Symposium Series, No. 335), American Chemical Society, Washington, DC, 1987.35 R. C. Weast (Editor), CRC Handbook ofChemistry and Physics, CRC Press, Boca Raton, FL, 69th ed.,
[988.36 H. A. Pohl, Dielectrophoresis, Cambridge University Press, Cambridge, 1978.


Journal o/Chromatography, 517 (1990) 549-555Elsevier Science Publishers B.V., Amsterdam
CHROMSYMP. 1978
Micellar electrokinetic chromatography employing sodiumalkyl sulfates and Brij 35®a
HENRIK T. RASMUSSEN, LISA K. GOEBEL and HAROLD M. McNAIR*
Department 0/ Chemistry, Virginia Polytechnic Institute and State University, Blacksburg, VA 24061(U.S.A.)
ABSTRACT
Sodium decyl and dodecyl sulfates were evaluated as micellar phases for themicellar electrokinetic chromatographic separation of ASTM test mixture LC-79-2.Selectivity was similar in each system but differed from the selectivity obtained inreversed-phase high-performance liquid chromatography. Despite separation efficiencies of approximately 150 000 theoretical plates per 50 cm, benzene and benzaldehyde coeluted in all concentrations of both surfactants employed. Separationwas, however, readily achieved by addition of Brij 35® [polyoxyethylene(23)dodecanoll to the micellar phase.
INTRODUCTION
Micellar electrokinetic chromatography (MEKC), as introduced by Terabe andco-workers l.2, is a method of microscale chemical separation based on the electrokinetic effects which occur when a buffer-filled fused-silica capillary is subjected to anelectric field 3
. The electrokinetic phenomena cause two dissimilar phases (a chargedmicellar phase and an aqueous buffer) to migrate at different velocities. Specifically,the aqueous phase migrates at a velocity dictated by electroosmotic flow and themicellar phase at a velocity that is the vector sum of the electroosmotic flow and themicelle's electrophoretic mobility. Solutes are separated in such a system based onpartitioning between each phase. Therefore, MEKC may be considered analogous toconventional chromatography; the only exception being that the conventionalstationary phase is replaced by a micellar phase, which is itself mobile. As a result,modifications must be made to conventional definitions of chromatographic parameters. In MEKC the capacity factor, k', may be expressed as!
(I)
a Brij35@ is a Registered Trademark of ICI Americas, Inc.
0021-9673/90/$03.50 © 1990 Elsevier Science Publishers B.V.

550 H. T. RASMUSSEN, L. K. GOEBEL, H. M. McNAIR
where tR is the retention time of an analyte, to the retention time of a solute whichdistributes exclusively into the aqueous phase and tmc the retention time of a solutewhich distributes exclusively into the micellar phase. Accordingly, the masterresolution equation for MEKC becomes2
N1
j2 (rx - 1)( k~ )[ 1- to/tmc ]Rs = -4- --rx- 1 + k~ 1 + (to/tmc)k'J
(2)
where Rs is the resolution, N the number of theoretical plates, k'z and k'l the capacityfactors of solutes 2 and 1, respectively, and rx the selectivity (rx = k~/k'l)'
By examining the master resolution equation, the mobility of the micellar phaseis seen to be detrimental to resolution. However, since electroosmotic flow can bechanged via changes in the capillary surface4-6, buffer pH 7
-9 and buffer concentra
tion 1o, this limitation may be overcome. The remaining parameters appear favorable
in comparison to conventional high-performance liquid chromatography (HPLC).The flat flow profile created by electroosmotic flOW 11 can provide for chemicalseparations with efficiencies in excess of 500 000 theoretical plates per m (ref. 12).Additionally, a vast number of micellar phases are available for optimization ofselectivity.
To date most applications have employed sodium dodecyl sulfate (SDS) as themicellar phase13
-1
7. However, the use of sodium decyl sulfate (STS), sodiumtetradecyl sulfate, sodium dodecanesulfonate, dodecyltrimethylammonium chloride,cetyltrimethylammonium chloride and sodium n-dodecanoyl-L-valinate have alsobeen briefly explored 2 ,18-2o. The addition of tetraalkyl ammmonium salts21
, methano1 22
,23 and metal ions24 to SDS micelles has also been shown to alter selectivity.The purpose of the research described here is to further characterize SDS and
STS micellar phases, and to compare the selectivity obtained in each system with theselectivity observed in reversed-phase HPLC. The influence of Brij 35® [polyoxyethylene(23)dodecanol] on selectivity is also briefly explored.
EXPERIMENTAL
Surfactant solutions of SDS and STS (Aldrich, Milwaukee, WI, U.S.A.) wereprepared at the specified concentrations in 0.01 M disodium hydrogenphosphate,pH 7.00. To obtain data which can readily be compared with reversed-phase HPLC,ASTM test mixture LC-79-2 (refs. 25, 26), dissolved in each of the surfactant solutionsunder investigation, was used as the sample. This test mixture contains 1.5 mg/mlbenzyl alcohol, 0.02 mg/ml benzaldehyde, 0.025 mg/ml acetophenone, 1.04 mg/mlbenzene, 0.4 mg/ml methyl benzoate and 0.054 mg/ml dimethyl terephthalate. Tocalculate thermodynamic parameters, 1% (v/v) methanol and a small amount ofSudan III were added to the conventional test mix, to mark, respectively, the elutiontimes of completely unretained and completely retained solutes (i.e., to and tmc)2.
MEKC analyses were performed, at ambient temperature, in an 80 cm x 100 /lmLD. fused-silica capillary (Polymicro, Phoenix, AZ, U.S.A.) with a sample introduction-detector distance (effective length) of 50 cm. Separations were performed at+ 15 kV, as supplied by a Spellman Model RHR 30 high-voltage power supply(Spellman, Plainview, NY, U.S.A.) and monitored by means of an ISCO Model CV4

MEKC EMPLOYING SODIUM ALKYL SULFATES AND BRIJ 35 551
capillary electrophoresis absorbance detector (ISCO, Lincoln, NE, U.S.A.) set at254 nm. Samples were introduced into the capillary by siphoning for 10 s at anelevation of 3.8 cm. This provides a sample volume of approximately 10 nl.
To evaluate the effect of Brij 35 on the separation of benzaldehyde and benzenea 0.025 M SDS-0.025 M Brij 35 (Fisher Scientific, Raleigh, NC, U.S.A.) solution wasprepared as above. Benzene (0.84 mg/ml) and benzaldehyde (0.17 mg/ml) wereanalyzed as described, at a wavelength of 215 nm.
RESULTS AND DISCUSSION
The separation of ASTM test mixture LC-79-2 obtained in 0.05 M SDS is shownin Fig. 1. All components with the exception of benzene and benzaldehyde are shownto be adequately resolved. To resolve these coeluting components, optimization inaccordance with the master resolution equation for MEKC (eqn. 2) was attempted. Anapproach similar to that applied in conventional HPLC was employed2 7; thus, initialefforts focused on changing the SDS concentration to effect a more favorable capacityfactor for the separation. As seen from the coefficients of correlation in Table I, solutecapacity factors are readily predicted as a function of SDS concentration. However,for the range of concentrations utilized (0.025-0.075 M), it was not possible to effectthe separation of benzene and benzaldehyde.
This observation is in agreement with the master resolution equation. Makingthe assumption that k'l = k~, the optimum capacity factor for separation of the criticalpair is given by the maximum of the function 2
f(k') - (_k')[ 1 - fo/fmc ]- 1 + k' 1 + (to/fmc)k'
(3)
For a fo/fmc value of 0.291 ± 0.003, as observed for 0.05 M SDS, the maximum (0.3)occurs at a capacity factor of approximately 1.85. However, f(k') is constant to within1% from k' = 1.6-2.2; thus the capacity factor is essentially optimized in 0.075 M SDS(k' = 1.63). This maximum provides an enhancement in resolution by a factor of only1.08 compared to 0.05 M SDS (k' = 1.03) and it is therefore not surprising thatresolution is not effected by increasing the micellar concentration.
2,3
to i tmc
II I I I I I0 5 10 15 20 25
Time (minutes)
Fig. l. MEKC separation of ASTM test mixture LC-79-2. Conditions: 80 cm x 100 11m 1.0. fused-silicacapillary (effective length 50 cm); 0.05 M SDS in 0.01 MNa2HP04 (pH 7.00); + 15 kV applied voltage; UVabsorbance detection at 254 nm. Peaks: I = benzyl alcohol; 2,3 = benzene and benzaldehyde; 4 =
acetophenone; 5 = methyl benzoate; 6 = dimethyl terephthalate.

552 H. T. RASMUSSEN, 1. K. GOEBEL, H. M. McNAIR
TABLE I
SOLUTE CAPACITY FACTORS AND lo/Im , RATIOS VS. SDS CONCENTRATION
All values are based on four determinations.
Solute SDS concenlralion
0.025 M 0.050 M 0.075 M
Benzyl alcoholBenzeneAcetophenoneMethyl benzoateDMT"lo/Im,
0.28 ± 0.010.54 ± 0.020.84 ± 0.021.67 ± 0.045.38 ± 0.080.350 ± 0.008
0.551.09I:713.47
10.70.291
± 0.02± 0.02± 0.03± 0.05± 0.3± 0.003
0.85 ± 0.011.63 ± 0.032.52 ± 0.035.16 ± 0.03
15.7 ± 0.50.292 ± 0.003
0.999850.999980.999800.999840.99982
a Dimethyl terephthalate.
Based on the results of Terabe et al., who noted a decrease in to/tmc with anincrease in surfactant concentration, it may be argued that as surfactant concentrationis increased from 0.05 to 0.075 M, an increase in the maximum of f(k') should result.Thus an enhancement in resolution greater than predicted above may be possible. Inthis work, the experimentally observed to/tmc was 0.292 ± 0.003 in 0.075 M SDS,indicating that the optimum capacity factor is unaltered. However, in 0.025 M SDS theto/tmc ratio did increase. By virtue of a decreased tmc value the observed ratio was0.350 ± 0.008. Reasons for these results are currently under investigation. Speculatively, the variations may be due to a combination of the numerous temperaturedependent parameters which can change as a result of Joule heating as voltage isapplied to the capillary. The current drawn and therefore the Joule heat generated,increased with increasing SDS concentration. Under the conditions employed(80 cm x lO0.um capillary; 15 kV applied voltage), the currents drawn in the 0.025,0.05 and 0.075 M SDS solutions were 90, 110 and 135 .uA, respectively.
In light of the reduction in resolution caused by the mobility of the micellarphase, it is interesting to compare resolution in MEKC with the resolution obtainablein HPLC. Rewriting eqn. 2 as
(4)
and invoking that the same resolution is required of each separation procedure, itfollows that
(5)
where the subscripts Hand M denote HPLC and MEKC, respectively. When SDS wasused as the micellar phase the maximum of f(k')M was 0.3 and the efficiency (NM)obtained in a capillary with an effective length of 50 cm approximately 150 000 plates.Assuming that a similar separation can be achieved by HPLC at a capacity factor of 1O.

MEKC EMPLOYING SODIUM ALKYL SULFATES AND BRIJ 35
TABLE II
SELECTIVITY (IX) BETWEJ:':N SELECTED SOLUTE PAIRS IN 0.05 M SDS AND 0.05 M STS
All values are based on four determinations.
553
Solute pair
Benzyl alcohol-benzeneBenzene-acetophenoneAcetophenone-methyl benzoateMethyl benzoate-DMT
IX in 0.05 M SDS
1.97 ± 0.031.569 ± 0.0032.03 ± 0.023.09 ± 0.04
IX in 0.05 M STS
1.92 ± 0.011.48 ± 0.021.91 ± 0.022.73 ± 0.04
f(k')H = 0.91. Thus if selectivity is the same in each system (i.e., IXH = IXM), theresolution obtained by MEKC is similar to the resolution provided by an HPLCcolumn generating' 16 000 theoretical plates.
To improve the resolution provided by MEKC, NM may be increased byemploying a capillary with a longer effective length, or by optimizing the operatingparameters governing dispersion28
. Alternatively, efforts may be made to improveselectivity or decrease the to/tmc ratio. In an attempt to obtain these advantages, 0.05 MSTS was used instead of SDS as the micellar phase. STS provides an extended elutionrange by virtue of increased electrophoretic mobility (to/tmc of STS = 0.235 ± 0.006)and as a result of a shorter alkyl chain length may perhaps be expected to providedifferent selectivity than SDS. As experimentally observed, 0.05 M STS also failed toseparate benzene and benzaldehyde. In fact, as shown in Table II, differences inselectivity between SDS and STS are minor. Similar results have been reported byBurton et al. 19.
Attempts to improve resolution by employing STS of different concentrationswere not feasible. The sample was insoluble in 0.025 M STS and 0.075 M STS causedan appreciable decrease in the signal-to-noise ratio. The latter is attributed to thegeneration ofJoule heat which is not effectively dissipated by the detector. The currentdrawn, for an applied potential of 15 kV, was 210 JlA for the 0.075 M STS solution.
Additional studies showed that other sodium alkyl sulfates are not suitable forMEKC at ambient temperature. Sodium octyl sulfate at a concentration of 0.075 Mdid not dissolve the sample, presumably because this concentration is below thesurfactant's critical micelle concentration29
. Sodium tetradecyl sulfate was insoluble inthe operating buffer at a concentration of 0.025 M. It should be noted, however, thatthe solubility increases markedly at elavated temperatures. As shown by Terabe et al. 2
0.05 M sodium tetradecyl sulfate may be used at 35°C.For ASTM test mixture LC-79-2, the selectivity obtained in SDS and STS does
however differ from that obtained by conventional reversed-phase HPLC and byreversed-phase HPLC employing Brij 35 as the mobile phase26 . The orders of elutionare listed in Table III. Notably, benzene elutes at different relative times in eachseparation mode.
Since solvent-micelle partitioning is responsible for part of the selectivitymechanism in micellar chromatography and under the premise that the polar headgroup changes selectivity in MEKC 19
, it is logical to explore the use of Brij 35 asa micellar phase for MEKC. However, because Brij 35 is non-ionic, it cannot migrate

554 H. T. RASMUSSEN, L. K. GOEBEL, H. M. McNAIR
TABLE III
ORDER OF ELUTION OF ASTM LC-79-2 SAMPLE COMPONENTS UNDER VARIOUS LCSEPARATION CONDITIONS
"Stationary phase": RP-18
Mobile phase: 30:70 (vjv)acetonitrile-water
Elution. order:
From r~r 26
(l) benzyl alcohol(2) benzaldehyde(3) acetophenone(4) methyl benzoate(5) benzene(6) dimethyl terephthalate
From ref 26
RP-18
6% Brij 35
(l) benzyl alcohol(2) benzaldehyde(3) acetophenone(4) benzene(5) methyl benzoate(6) dimethyl terephthalate
This work
SDS and STS
0.01 M Na2HP04pH 7.00
(I) benzyl alcohol(2, 3) benzaldehyde and
benzene(4) acetophenone(5) methyl benzoate(6) dimethyl terephthalate
electrophoretically. Therefore it is of little use by itself in MEKC. However, thefeasibility of adding Brij 35 to a charged micelle, forming charged mixed micelles,remains. The separation of benzene and benzaldehyde obtained in 0.025 M SDS0.025 M Brij 35 is shown in Fig. 2. Benzene is retained longer than benzaldehyde,indicating that the nature of the surfactant's polar head group plays an important rolein solute retention. It is unclear, however, specifically why selectivity is changed.Several different models for the solubilization of benzene in micelles have beenproposed30
.
The specific attributes of SDS-Brij 35 mixed micelles as micellar phases forMEKC will be investigated in a subsequent paper. However, a major advantage ofBrij 35, as opposed to charged additives, is that it may be added to the micellar phasewithout an increase in Joule heating. The current resulting from both the 0.025 M SDSand the 0.025 M SDS-0.025 M Brij 35 solutions was 90 /lA. Additionally, as notedpreviously26, Brij 35 has a high cloud-point temperature (approximately 100°C) andlow molar-absorptivity values in the low UV region. These features allow for Brij 35 tobe used at the high temperatures which may result from Joule heating and at the lowwavelengths which may be required to effect the detection of many compounds.
2
Io
I I I I5 10 15 20
Time (minutes)
I25
Fig. 2. MEKC separation of benzaldehyde and benzene. Conditions: 80 cm x 100 Jim J.D. fused-silicacapillary (effective length 50 cm); O.oz5 M SDS--{).025 M Brij 35 in O.oI M Na2HP04 (pH 7.00); + 15 kVapplied voltage; UV absorbance detection at 215 nm. Peaks: I = benzaldehyde; 2 = benzene.

MEKC EMPLOYING SODIUM ALKYL SULFATES AND BRIJ 35
ACKNOWLEDGEMENT
The authors acknowledge J. O. Glanville for helpful discussion.
REFERENCES
555
1 S. Terabe, K. Otsuka, K. Ichikawa, A. Tsuchiya and T. Ando, Anal. Chem., 56 (1984) 111.2 S. Terabe, K. Otsuka and T. Ando, Anal. Chem., 57 (1985) 834.3 J. W. Jorgenson and K. D. Lukacs, Anal. Chem., 53 (1981) 1298.4 S. Hjerten, J. Chromatogr., 347 ([985) 191.5 S. Terabe, H. Utsumi, K. Otsuka, T. Ando, T. Inomata, S. Kuse and Y. Hanoaka, 1. High Resolut.
Chromatogr. Chromatogr. Commun., 9 (1986) 666.6 A. T. Balchunas and M. J. Sepaniak, Anal. Chem., 59 (1987) 1470.7 K. D. Lukacs and J. W. Jorgenson, J. High Resolut. Chromatogr. Chromatogr. Commun., 8 ([985) 407.8 H. T. Rasmussen and H. M. McNair, J. High Resolut. Chromatogr., 12 (1989) 635.9 K. Otsuka and S. Terabe, J. Microcolurnn Sep., I (1989) [50.
10 S. Fujiwara and S. Honda, Anal. Chem., 58 ([986) [8[1.II M. Martin, G. Guiochon, Y. Walbroehl and J. W. Jorgenson, Anal. Chern., 57 (1985) 561.12 K. H. Row, W. H. Griest and M. P. Maskarinec, J. Chrornatogr., 409 (1987) 193.13 K. Otsuka, S. Terabe and T. Ando, J. Chrornatogr., 348 (1985) 39.14 D. F. Swaile, D. E. Burton, A. T. Balchunas and M. J. Sepaniak, J. Chromatogr. Sci., 26 ([988) 406.[5 D. E. Burton, M. J. Sepaniak and M. P. Maskarinec, J. Chromatogr. Sci., 24 ([986) 347.16 S. Fujiwara, S. [wase and S. Honda, J. Chromatogr., 447 (1988) [33.17 R. A. Wallingford and A. G. Ewing, J. Chromatogr., 441 ([988) 299.[8 K. Otsuka, S. Terabe and T. Ando, J. Chrornatogr., 332 (1985) 219.[9 D. E. Burton, M. J. Sepaniak and M. P. Maskarinec,J. Chromatogr. Sci., 25 ([987) 514.20 A. Dobashi, T. Ono, S. Hara and 1. Yamaguchi, Anal. Chem., 6[ (1989) [984.21 H. Nishi, N. Tsumagari and S. Terabe, Anal. Chem., 6[ (1989) 2434.22 M. M. Bushey and J. W. Jorgenson, Anal. Chern., 61 (1989) 491.23 1. Gorse, A. T. Balchunas, D. F. Swai[e and M. J. Sepaniak, J. High Resolut. Chrornatogr. Chrornatogr.
Commun., 1[ (1988) 554.24 A. S. Cohen, S. Terabe, J. A. Smith and B. L. Karger, Anal. Chem., 59 (1987) 1021.25 Subcommittee E-19.08 Task Group on Liquid Chromatography of the American Society for Testing
and Materia[s, J. Chromatogr. Sci., 19 (1981) 338.26 M. F. Borgerding and W. L. Hinze, Anal. Chem., 57 (1985) 2[83.27 L. R. Snyder, J. L. Glajch and J. J. Kirk[and, Practical HPLC Method Development, Wiley, New York,
1988, ch. 4.28 S. Terabe, K. Otsuka and T. Ando, Anal. Chem., 61 (1989) 251.29 M. J. Rosen, Surfactants and Interfacial Phenomena, Wiley, New York, 2nd ed., 1989, ch. 3.30 R. Nagarajan, M. A. Chaiko and E. Ruckenstein, J. Phys. Chern., 88 (1984) 2916.


Journal oJ Chromatography, 517 (1990) 557-572Elsevier Science Publishers RY., Amsterdam
CHROMSYMP.1971
Electrically driven open-tubular liquid chromatography
G.J. M. BRUIN*, P. P. H. TOCK, J. C. KRAAK and H. POPPE
Laboratory Jor Analytical Chemistry, University oj Amsterdam, Nieuwe Achtergracht 166, 1018 WV Amsterdam (The Netherlands)
ABSTRACT
Electrically driven (ED), as opposed to pressure-driven (PD), open-tubularliquid chromatography (OTLC) was evaluated for different types of open-tubularcolumns, with inner diameters in the range 5-25 J.lm. The efficiency of ED-OTLC wasfound to be better than that of PD-OTLC by a factor of ca. 2, in agreement withtheory. Injection of the sample in ED-OTLC by electromigration appears to be muchsimpler than that with the split-injection procedures in PD-OTLC. Electroosmoticmobility was found to depend little on the application of an ODS coating. With themobile phase used at 60000 V/m, the maximum linear velocity was 1.4 mm/s. Thepotential of ED-OTLC in 10--25 J.lm J.D. capillaries is demonstrated.
INTRODUCTION
Open-tubular liquid chromatography (OTLC) has been extensively investigatedboth theoretically and experimentallyl-16 in the last 20 years. Efforts have been madein column preparation3
-9 and in developing injection and detection systems8
-16.
Although the performance of OT columns has proved to be much better than that ofpacked columns, at present OTLC is used only in university laboratories and researchinstitutes. Commercial OTLC instruments are still not available, which can beattributed to the experimental difficulties in efficiently operating OTLC, owing to theextremely small dimensions of the system. It has been found that the inner diameter ofOTLC columns should be smaller than 10 J.lm2
•3 and that the injection and detection
volumes should be about 40 and 100 pi, respectively. These small volumes imply theneed for a very specialized type of detector, e.g., on-column laser-based opticaldetectors, electrochemical detectors and mass spectrometric devices10- 16 . Althoughsuch detection systems have been tried, the insufficient sensitivity and the low massloadability of OT columns9,17 still inhibit the interest of instrument manufacturers indeveloping an OTLC instrument.
In contrast to the lack of commercial development of OTLC, that of capillaryelectroseparation techniques has expanded since the introduction of capillary zoneelectrophoresis around 1980 by Mikkers et al. 18 and Jorgenson and Lukacs19. Interestin these techniques is growing rapidly, as demonstrated by the enormous increase in
0021-9673/90/$03.50 © 1990 Elsevier Science Publishers RY.

558 G. J. M. BRUIN et al.
the number of publications and the introduction of several commercial instruments.In capillary electroseparation techniques, a high electric potential is applied
across a capillary, filled with a buffer, and separations of charged species, based ona difference in charge/mass ratio can be carried out by an electrophoretic process. Inaddition to charged species, uncharged species can also be transported by theelectroosmotic flow, which is induced by the electric field. Currently five capillaryelectroseparation techniques have been demonstrated experimentallyI8-28:
(i) (free solution) capillary zone electrophoresis (CZE);(ii) capillary gel electrophoresis;(iii) capillary micellar electrokinetic chromatography;(iv) isoelectric focusing; and(v) capillary electroosmotic chromatography.These techniques are normally carried out in 10-100 Ilm LO. fused-silica
capillaries and in most instances on-column detection is used18-28. As with OTLC, thedetection is one of the major problems. However, considering the great interest incapillary electroseparation techniques, renewed research efforts27- 30 in micro detection will certainly lead in the near future to commercially available ultramicrodetectors having better characteristics with respect to sensitivity.
In pressure-driven (PO) OTLC, sample introduction is usually effected by splitinjection, which requires a relatively large sample volume. When the sample volume isextremely small, the split technique cannot -be applied and another means ofintroducing the sample is necessary, e.g., by disconnecting the column and injecting thesample into the capillary with a microsyringe, as demonstrated by Kennedy andJorgenson 31 .32
. However, this complicates the techniques. In capillary electroseparation techniques the sample introduction is performed by means of electromigration 33 .34 or by the vacuum suction method3s . Both techniques lend themselves toautomation. However, the vacuum suction technique may fail with the small LD.capillaries used in OTLC. Therefore, the electromigration injection is the method ofchoice for electrically driven (ED) OTLC. The method is very simple, applicable toneutral species and allows manipulations of small sample volumes. Moreover, themethod is also applicable to charged species, but the amount of injected solute isaffected by the electrophoretic mobility of the solute.
Capillary electroosmotic chromatography in open-tubular columns will henceforth be termed electrically driven OTLC (EO-OTLC). It was first demonstrated in30-200 Ilm LO. columns by Tsuda et al. 24 in 1982. They found larger plate heights thanexpected theoretically and showed some separations ofpolycyclic aromatics in a 30 IlmLD. capillary. Capillary electroosmotic chromatography in packed fused-silicacapillaries was demonstrated by Knox and Grant36 in 1987. They observed animprovement in plate height by a factor of 2 when comparing ED and POchromatography in the same column. They also argued that an ED system allows theuse of much smaller particles for column packings.
In OTLC, plug flow, as opposed to Poisseuille flow, leads to a smallercontribution from slow equilibration in the mobile phase, the em term. We thereforeconsidered it worthwhile to assess the possibilities of using electroosmotic flow as thedriving force for OTLC in 10-25 Ilm LD. capillaries, and to explore the use ofelectromigration injection in combination with ED-OTLC.

ELECTRICALLY DRIVEN OPEN-TUBULAR LC
THEORY
559
ElectroosmosisThe driving force for an ED system is electroosmosis, which results from the
existence of the electric double layer. If a surface is in contact with an electrolyte, therewill be an excess of charge near that surface. With fused silica, the excess charge isnormally positive. Because of the presence of the excess ofcharge, the application ofanelectric field will bring about movement ofthe liquid, which is called the electroosmoticflow. This phenomenon has been treated in more detail by Rice and Whitehead37 andVan de Goor et al. 38
• The electroosmotic flow has a linear velocity Voo , which isgiven by
(1)
where J.Leo is the electroosmotic mobility, E is the applied electric field, 1] is the viscosity,CoCr is the dielectric constant of the electrolyte and' is the zeta potential near thewa1l 37,38. The electroosmotic mobility depends on the viscosity, pH and ionic strengthof the electrolyte and on the character (charge density) of the surface of the capillary.The flow profile is virtually rectangular. A deviation from the rectangular shape occursin the wall region, the size of which is of the order of the size of the diffuse electricdouble layer, 1-100 nm39 . Because of the finite size of the double layer, in extremelynarrow ( :>; 1 J.Lm) channels and at low ionic strengths, the plug flow and eqn. I may notbe valid (double-layer overlap)37,39. However, such conditions did not occur in ourwork.
Comparison of plate height between pressure- and electrically driven systemsAxial diffusion and slow equilibration in the mobile and stationary phase are the
main processes contributing to band broadening in OTLC. This is expressed in thetheoretical plate height equation derived by Golay40 for a PD system, and by Martinand Guiochon41 and Giddings42 for an ED system. These two equations are verysimilar and deviate only in the function of k',j(k')m' This is attributed to the differencein the flow profiles between the two systems, viz., a plug flow profile in an ED systemand a parabolic flow profile in a PD system. The overall plate height equation is validin both PD and ED systems:
H = 2Dm + f(k')m . de2
u + f(k')s . dl uu Dm D s
(2)
where H is the plate height, u is the linear velocity, k' is the capacity factor, D m and Ds
are the diffusion coefficients in the mobile and stationary phase, respectively, de is theinner diameter of the column, dris the thickness of the stationary phase layer andf(k')mand f(k')s are functions of k'.
f(k')m for the PD system is
f(k,)PD = (I + 6k' + Ilk'2)
m 96 (I + k')2(3)

560
and for an ED system, assuming a perfectly flat flow profile,
. 'ED k'Zj(k)m = 16 (l + k')Z
G. J. M. BRUIN et al.
(4)
The main difference between an ED and a PD system is, as mentioned before, theflow profile. This is expressed in different plate height curves, calculated witheqns. 2-4, as shown in Fig. IA and B for a 25 and a lO,um I.D. capillary, respectively,for three k' values. As can be seen, for a 25 ,urn I.D. capillary the gain in efficiency byusing an ED system instead of a PD system is by a factor of ca. 3. Knox and Grant36
pointed out that with capillary electroosmotic chromatography in wider borecapil1aries, the en term, as in OTLC, increases rapidly when retention occurs. For a 10,urn I.D. capil1ary the same phenomenon occurs but, owing to the smal1er insidediameter, the slow mass transfer term is much smal1er and less significant. If a 25 ,urnI.D. capil1ary in an ED system is compared with a 10 ,urn I.D. capil1ary in a PD system,the loss in plate height is by only a factor of 3. This phenomenon opens up thepossibility of using larger diameters in ED-OTLC, which has the advantage that thereare fewer practical problems with regard to detection, loadability and columnpreparation.
In Fig. 2,f(k')~D andf(k')~D are plotted versus k'. It is clear that both functionsincrease with increasing retention. Also, it is clear that f(k' )~D is always smal1er thanf(k' )~D. The improvement is very large at low k' values, but is still greater by a factor of11/6 for k' up to infinity. The 10werr(k')~D results in a lower plate height for an EDsystem compared with a PD system.
EXPERIMENTAL
ApparatusIn Fig. 3 an ED-OTLC system is shown, which in principle is similar to a CZE
system. It consists of a 0-60 kV d.c. high-voltage power supply (Model R603/05P;Wallis, Worthing, U.K.). Platinum electrodes are used for the connection of the supplywith the buffer reservoirs, located at each end of the capillary. The total set-up wasplaced in a laboratory-built polycarbonate box, which was thermostated in thefol1owing way: a radiator, mounted in one of the side wal1s of the box, was connectedto a circulating liquid thermostat (Model TL 1620; Haake, Berlin, F.R.G.), and an airfan was placed in front of the radiator to ensure an air flow of constant temperaturearound the capil1ary. On-column detection was carried out at the cathodic side, usinglaser-induced fluorescence detection as described previousll. Sample injection wasperformed by the electromigration technique 33
. Acetonitrile-phosphate buffer (0.05or 0.1 M, pH 7.0) (2:3, v/v) and methanol-phosphate buffer (0.05 M, pH 7.0) (I: I, v/v)were used as mobile phases.
Materials and chemicalsThe solvents used were analytical-reagent grade methanol and toluene (Merck,
Darmstadt, F.R.G.), acetonitrile (Rathburn, Walkerburn, U.K.) and distilled water,freshly deionized by passage through a PSC filter assembly (Barnstead, Boston, MA,U.S.A.). Prior to use al1 solvents were filtered by vacuum suction through 0.5-,um


ELECTRICALLY DRIVEN OPEN-TUBULAR LC 563
filters (Model FH; Millipore, Bedford, MA, U.S.A.). The polycyclic aromatics used astest compounds were obtained from Janssen (Beerse, Belgium) and Aldrich (Brussels,Belgium). Stock solutions of the test compounds were prepared in the mobile phase.The 10, 25 and 50 Ilm LD. fused-silica capillaries were obtained from PolymicroTechnology (Phoenix, AZ, U.S.A.). Monochlorodimethyloctadecylsilane (ODS) wasobtained from Aldrich (Beerse, Belgium).
Preparation of the capillaryThe etched and the porous silica layered (PSL) fused-silica capillaries were
prepared according to Tock and co-workers8•9
. The capillaries were dried at 200°C forat least 2 h while being purged with helium.
Chemical mOdificationThe dried capillary was filled with a 5% (w/v) solution of ODS in toluene. Both
ends were sealed in a flame and the capillary was heated at 140°C for 6 h. Finally, thecapillary was rinsed with toluene and acetonitrile or methanol before use.
RESULTS AND DISCUSSION
Electroosmotic mobility measurementsOne of the most important parameters in ED-OTLC is the electroosmotic
mobility in chemically modified capillaries under reversed-phase conditions. Thesevalues can be used to predict the accessible linear velocity in ED-OTLC. Theelectroosmotic flow measurements were carried out according to the method ofHuanget al. 43
. Briefly, this method is as follows: the used electrolyte is replaced with anelectrolyte with a lower conductivity, which results in a gradual decrease in the currentwhen a high voltage is applied until the capillary is completely filled with the newelectrolyte. The time, tm , necessary to reach the new current level can be used tocalculate the electroosmotic mobility, Ilea' according to
LIlea = tE
m
(5)
where L is the total length of the capillary. It should be noted that changes in theconcentration of the electrolyte must be small (not more than 10%) to avoid changes inthe zeta potential during the Ilea measurements, as shown by Zare et al.43
. Table Isummarizes the electroosmotic flow measurements in 5-50 Itm LD. capillaries. Thesemeasurements were carried out at a sufficiently weak applied electric field to be surethat thermal effects were excluded. It can be seen that Ilea is independent of the innerdiameter of the capillary. It can also be observed that Ilea is virtually the same forODS-treated and bare surfaces, and is not influenced by the presence of porous silicawith the mobile phase used. The difference in Ilea observed when methanol andacetonitrile are used as the organic modifier in the electrolyte can be explained bydifferences in the viscosity and dielectric constant of the electrolytes.
Band broadening due to injectionIn order to rule out the possibility of extra-column contributions to band

564 G. J. M. BRUIN e/ al.
TABLE I
ELECTROOSMOTIC MOBILITY, Ileo, MEASURED IN VARIOUS CAPILLARIES
Values are averages of at least duplicate measurements.
Capillary
Type
ODSODSPSL-ODSb
ODSODSEtched
de (11m)
51010255050
Ace/onilrile~buffer"(2:3)
2.402.382.182.492.432.37
Me/hanoi-buffer"(1'1)
1.16
1.13
o 0.1 M phosphate buffer (pH 7).b PSL = capillary with a por.ous silica layer8 .9 .
broadening, some conditions governing the injection procedure are discussed.As shown in Fig. lA and B, theoretical plate heights for k' = 0 as low as 1.5 pm
can be obtained. The distance variance, CT;,col (= LH), is 0.75 mm 2 for a 50-cmcapillary. When a 5% increase in peak width by external broadening effects isaccepted, the following should hold:
orCT;,tot ~ 1.1 03 CT;,col
(6)
(7)
The extra band broadening due to on-column laser-induced fluorescence detection canbe neglected 10, and hence CT;,lot = CT;,co] + CT;,inj, where CT;,inj is the extra variance causedby the injection zone length. To preserve efficiency, CT;,inj is not allowed to exceed 0.077mm2
. The variance CT;,inj can be expressed as
CT;,inj (8)
where linj is the length of the injection plug and K 2 is the injection profile factor44. This
means that the length of the injection plug should be less than 0.96 mm (the injectionvolume for an unretained solute would be 75 pi in a 10 pm J.D. capillary) wheninjection of a rectangular plug is assumed with K 2 = 12. The restrictions on theinjection zone length become even more critical when the injection profile approachesan exponential profile. In this instance one will find a lower K 2 value and thus a smallermaximum acceptable injection zone length.
Using the electromigration technique as described in detail by Rose andJorgenson 33
, it is possible to inject very small sample volumes, For capillary zoneelectrophoresis, capillary micellar electrokinetic chromatography and capillary gelelectrophoresis, discrimination between the sample components appears becausecharged compounds migrate with a different velocity into the column as a result of

ELECTRICALLY DRIVEN OPEN-TUBULAR LC 565
their different electrophoretic mobilities. This implies that the amount of samplecomponents injected depends on their electrophoretic mobility. However, in EDOTLC electroosmotic chromatography preferably neutral compounds are separatedand they all migrate with the same electroosmotic velocity into the capillary. It shouldbe noted that retained components will focus during the sample introduction bya factor of I + k'. Hence for these components larger volumes can be tolerated.
In Fig. 4 the square of the injection volume, Vi~j, is plotted versus the columnvariance, 0-;,101' for a 10,um J.D. capillary and a pair of solutes with small retention. Thecolumn variance is calculated with the measured time standard deviation at 0.6 of thetotal peak height multiplied by the electroosmotic flow. V inj is varied between 19 and280 pi by increasing the injection time from 2 to 30 s at a constant injection voltage of2.4 kV for anthracene (k' = 0.13) and 9-anthracenecarbonitrile (k' = 0.09). Values forthe injection volume were calculated by means of eqn. I. The electroosmotic flowduring the separation was 95 plls (veo = 1.08 mm/s), The slope ofthe plotted lines in thegraph of 0-;,101 versus Vi~j equals the reciprocal of K 2 and an average value of K 2 = 8.0was found in this experiment. Various phenomena might be responsible for thedeviation in K 2 value from the value for a block, 12. In the first place, the rise and falltimes in the voltage28 may have influenced the amount injected. We also found that theangle at which the capillary is cut is critical: with obliquely cut capillaries K 2 values aslow as 3 were found. Finally, Grushka et al.45 found that spontaneous, not electricallyinduced sample introduction takes place. However, for the present experiments weconsidered the observed value of 8 to be satisfactory.
14 -,--------------------------/'1
10
Uluc
'"Ul::Ja.ct:.
+
'"a.a 6
~J
2-r---~---r_--,__--__.--___r---~--_,_--____1
o 20 40 60 80
2 2Vinj (pi) (Thousands)
Fig. 4. Total volume variance, a;.lol' versus t,he square of the injection volume for a 50.0 cm x 10 pm I.D.PSL-ODS capillary. Injection voltage = 2.4 kV; linj.d" = 25.0 cm; separation voltage = 24.6 kV; current =2.2 pA. Compounds: +, 9-anthracenecarbonitrile (k' = 0.09); 6, anthracene (k' = 0.13). The lines weredrawn from calculations by the linear square root method.

566 G. J. M. BRUIN et al.
Band broadening by thermal effectsThe effects of self-heating on efficiency in an ED system can be expressed as
(9)
where H ED is the plate height for an ED system as shown in eqn. 2 and H th is the plateheight caused by thermal effects. The latter can be a significant source of bandbroadening in capillary electroseparation techniques. The magnitude of the temperature gradient from the centre of the capillary to the inner wall, Ll T, can be calculatedfrom 39,46
LlT = Q d;/l6K (10)
where K is the thermal conductivity of the electrolyte, de is the inner diameter of thecapillary and Q is the power densi ty39,4 7 :
Q = 4E11nd; (II)
where 1 is the current. Combination of eqns. 10 and II yields a general relationshipbetween the power per unit length (E1) and the temperature gradient:
LlT = E114nK (12)
Jones and Grushka46 assumed that a Ll T of less than I K across the bore of thecapillary will not seriously decrease the efficiency. For LlT = I K and K = 0.4 WI(m' K), E1 = 5.02 W1m. In ED-OTLC, E1 is much smaller because of the low currentin 10 tim J.D. capillaries. Applying a field of 68.4 kV1m across a 10 tim J.D. capillaryfilled with, e.g., phosphate buffer (0.1 M)-acetonitrile results in a current of 3.42 tiAand E1 in this instance is 0.23 W/m. Hence it can be said that very small thermalgradients can be expected in 10 tim J.D. capillaries.
Knox39 derived an expression for HTH :
(13)
where ), is the equivalent conductivity and c is the concentration of the electrolyte.Using some typical parameters (some of the values are rough estimates) from Table IIshows that thermal band broadening caused by heating effects can be neglected fordiameters smaller than 100 tim.
Apart from the thermal non-uniformity of the liquid, problems may also arise asa result ofthe mean temperature rise of the liquid, due to slow heat transfer through thetube material and cooling bath medium. Such temperature increases may affect thereproducibility and stability of components. In contrast to the internal thermalprofiles, these effects can be diminished by applying cooling, as shown by variousworkers 39
,47. The demands on temperature control become more severe when largerinner diameters are used, but even with 25 tim J.D. capillaries in ED-OTLC the entirecapillary may heat up by several degrees, as will be shown below.
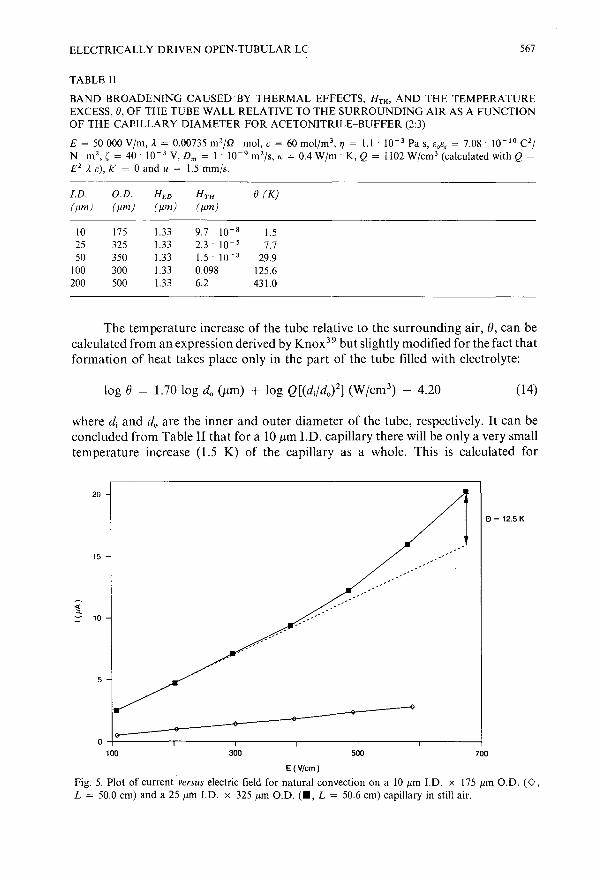
ELECTRICALLY DRIVEN OPEN-TUBULAR LC 567
TABLE II
BAND BROADENING CAUSED BY THERMAL EFFECTS, Hm AND THE TEMPERATUREEXCESS, e, OF THE TUBE WALL RELATIVE TO THE SURROUNDING AIR AS A FUNCTIONOF THE CAPILLARY DIAMETER FOR ACETONITRILE-BUFFER (2:3)
E = 50000 Vim, A = 0.00735 m2/Q. mol, c = 60 mol/m 3, '1 = 1.1' 10- 3 Pa s, 00 0, = 7.08' 10- 10 C2
/
N' m2, ( = 40' 10- 3 V, Dm = l' 10- 9 m2/s,,, = 0.4 W/m . K, Q = 1102 W/cm 3 (calculated with Q =
£2 ), c), k' = 0 and U = 1.5 mm/s.
I.D. O.D. H ED H'fH e(K)(11m) (11m) (11m) (11m)
10 175 1.33 9.7' 10- 8 1.525 325 1.33 2.3' 10- 5 7.750 350 1.33 1.5 . 10- 3 29.9
100 300 1.33 0.098 125.6200 500 1.33 6.2 431.0
The temperature increase of the tube relative to the surrounding air, e, can becalculated from an expression derived by Knox39 but slightly modified for the fact thatformation of heat takes place only in the part of the tube filled with electrolyte:
(14)
where d j and do are the inner and outer diameter of the tube, respectively. It can beconcluded from Table II that for a 10)lm J.D. capillary there will be only a very smalltemperature increase (1.5 K) of the capillary as a whole. This is calculated for
20
e = 12.5K
15
'{- 10
5
--"---~__---------oe...-- a-$
700500300
o +-<l- ,-- -. r- -,- --, ----1
100
E(V/cm)
Fig. 5. Plot of current verSUq electric field for natural convection on a 10 11m 1.0. x 175 11m 0.0. (0,L = 50.0 em) and a 25 11m J.D. x 325 11m 0.0. (., L = 50.6 em) capillary in still air.

568 G. J. M. BRUIN et al.
A 10 --r------r~-------------------------...,
E"J:
5
t:.
'. fz •••••• -- .¢.••.•.••.. 'J ..••••.•.•.••.•.••.
0
0 0.4 0.8 1.2 1.6
v ee(mm/s)
B
8
6
E"-J: 4
2
•
o 0.4 0.8
Vee( mm/s)
1.2 1.6
Fig. 6. H versus Voo curves fOJ (A) a 10-l1m J.D. PSL-ODS capillary and (B) an etched ODS 10-l1m I.D.capillary. Mobile phase: phosphate buffer (pH 7.0)-acetonitrile (3:2). V;nj = 50 pI; T = 21.0 ± 0.2°C. (A)L = 50.0 cm, I;ni-dot = 25.0 cm. \J, 9-Anthracenecarbonitrile (k' = 0.09); 6, anthracene (k' = 0.13); thelines are theoretical lines. (8) L = 45.0 cm, I;ni-dot = 22.0 cm.•, 9-Anthracenemethanol (k' = 0); +,9-methylanthracene (k' .=.0.12); <>, I ,2-benzanthracene (k' = 0.24); 6, 9-phenylanthracene (k' = 0.42).

ELECTRICALLY DRIVEN OPEN-TUBULAR LC
2
3
569
240 260 280
-+ time(s)
Fig. 7. Chromatogram of three polycyclic aromatics obtained with a 1O-/lm J.D. ODS-capillary. Appliedvoltage = 17.5 kV; curtent = 0.9 /lA; L = 45.9 em, l;nj-dot = 22.0 em. Peaks: 1 = 9-anthracenemethanol(k' = 0); 2 = anthracel}e (k' = 0.03); 3 = 9-methylanthracene (k' = 0.06). Other details as in Fig. 6.
a situation without a cooling device in the experimental set-up. As shown by Nelson etal.47
, the current will increase faster than in proportion to the increase in appliedvoltage, as a result of poor heat dissipation in still air in 50 flm J.D. and largercapillaries. In Fig. 5 the current, I, is plotted against the applied electric field, E, for 25and 10 flm J.D. capillaries. It was found that with the 25 flm J.D. capillary there isa small tendency to deviate from linearity, whereas with the 10 flm J.D. capillarya linear relationship holds. Applying a field of 67.6 kV/m (Q = 2.01 . 103 W/cm3
) ina 25 flm J.D. x 325 flm O.D. capillary gives a calculated value for the temperatureincrease of e = 14 K. Fig. 5 shows that a 25% positive deviation from linearity in thecurrent occurs at this electric field strength. It is known that the conductivity changesby 2% per degree47
. Hence we find an experimental estimate for eof 12.5 K.
ChromatographyIn Fig. 6A a H versus Veo curve is shown for a 1O-flm J.D. PSL-OOS capillary with
an injection volume of about 20 pI. It can be seen that the minimum observed plateheights were 1.4 flm for 9-anthracenecarbonitrile and 1.7 flm for anthracene, and alsothat good agreement with theory is obtained. Results with another 10 flm 1.0. ODS

570
2
3
5
6
7
B
G. J. M. BRUIN et al.
4
Io
I5
I6
I7
--__• t(min)
Fig. 8. Chromatogram of·eight polycyclic aromatics obtained with a IO-Jlm I.D. PSL-ODS capillary.Applied voltage = 20 kV;,L' = 49.0 cm; lin;-de< = 26.5 cm; current = 0.7 JlA; T = 25°C; Vinj = 9 pI. Mobilephase: 0.05 M phosphate buffer (pH 7.0)-methanol (1:1). Peaks: I = naphthoquinone (k' = 0); 2 =9-anthracenemethanol (k' = 0.03); 3 = 9-anthracenecarbonitrile (k' = 0.06); 4 = anthracene (k' = 0.09);5 = 7,8-benzotlavone (k' = 0.12); 6 = tluoranthene (k' = 0.16); 7 = pyrene (k' = 0.19); 8 = 9-vinylanthracene (k' = 0.24).
capillary are shown in Fig. 6B. Again, plate heights as low as 1.2,um could be observedfor the unretained 9-anthracenemethanol and 2.3 ,urn for 1,2-benzanthracene (k' =
0.24). These values correspond to plate numbers of 183 000 and 94 000, respectively.The data in Fig. 6B show good agreement with theory for solutes of low retention.However, at high velocity and retention, a deviation of increasing magnitude occurs,amounting to a factor ofnearly 2 in the worst case. This deviation is a:; yet unexplained.
ELECTRICALLY DRIVEN OPEN-TUBULAR LC 571
Some examples of the high performance of ED-OTLC can be seen in Fig. 7,where a sample of three polycyclic aromatics was injected. The peaks show a Gaussianshape and are baseline resolved, despite the small differences in k' values. Anotherexample of a separation is shown in Fig. 8, where eight polycyclic aromatics areseparated in less than 400 s, while the group of peaks appears baseline resolved ina time interval of only 90 s.
CONCLUSIONS
It has been shown for the first time that it is possible to perform ED-OTLC inchemically modified 10-25 /lm J.D. capillaries near the optimum of the H versus Veo
curve. An advantage of ED-OTLC is that injection is easier than in a PD-OTLCsystem, where dynamic or static split injection devices are necessary in order to obtaina sufficiently small injection volume. It is found that very small volumes of unchargedcomponents can be introduced with the electromigration injection technique. It givesthe opportunity to analyse very small volumes of sample, e.g., sampling directly fromtissue or individual cells. The use oflarger I.D. capillaries in ED-OTLC without losingto much efficiency gives better prospects for loadability, optical detection systems andpreparation of stationary phases.
The electroosmotic mobility has been found to be independent of the innerdiameter of the capillary. Its value in ODS-treated tubes is hardly different from that inuntreated tubes and allows adequate mobile phase velocities when typical reversedphase mobile phases are used.
ACKNOWLEDGEMENTS
The authors thank Miss M. .L. V. Pietersen for practical assistance and H.Brugman and T. van Goudoever for the construction of part of the equipment.Support for this work (P.P.H.T.) was provided by the Netherlands Foundation forChemical Research (SON) with financial aid from the Netherlands Organization forthe Scientific Research (NWO) under grant 700-344-003.
REFERENCES
I J. H. Knox and M. Saleem, J. Chromatogr. Sci., 7 (1969) 614.2 J. H. Knox and M. T. Gilbert, J. Chromatogr., 186 (\979) 405.3 J. Jorgenson and E. J. Guthrie, J. Chromatogr., 255 (1983) 335.4 M. J. Sepaniak, J. D. Vargo, C. N. Kettler and M. P. Maskarinec, Anal. Chem., 56 (\984) 1252.5 S. Folestad, B. Josefsson and M. Larsson, J. Chromatogr., 391 (1987) 347.6 O. van Berkel, J. C. Kraak and H. Poppe, Chromatographia, 24 (1987) 739.7 P. R. Dluzneski and J. W. Jorgenson, J. High Resolut. Chromatogr. Chromatogr. Commun., II (1988)
332.8 P. P. H. Tock, G. Stegeman, R. Peerboom, H. Poppe, J. C. Kraak and K. K. Unger, Chromatographia,
24 (\987) 617.9 P. P. H. Tock, C. Boshoven, H. Poppe, J. C. Kraak and K. K. Unger, J. Chromatogr., 477 (1989) 95.
10 H. P. M. van Vliet and H. Poppe, J. Chromatogr., 346 (1985) 149. .11 L. A. Knecht, E. J. Guthrie and J. Jorgenson, Anal. Chem., 56 (1984) 479.12 M. D. Oates and J. W. Jorgenson, Anal. Chem., 61 (1989) 1977.13 R. T. Kennedy and J. W. Jorgenson, Anal. Chem., 60 (1988) 1521.

572 G. J. M. BRUIN et al.
14 A. Manz and W. Simon, J. Chromatogr., 387 (1987) 187.15 W. M. A. Niessen and H. Poppe, J. Chromatogr., 394 (1987) 21.16 J. S. de Wit, K. B. Tomer and J. W. Jorgenson, J. Chromatogr., 462 (1989) 365.17 P. P. H. Tock, P. P. E. Duijsters, J. C. Kraak and H. Poppe, J. Chromatogr., 506 (1990) 185.18 F. E. P. Mikkers, F. M. Everaerts and Th. P. E. M. Verheggen, J. Chromatogr., 169 (1979) 11.19 J. W. Jorgenson and K. D. Lukacs, J. Chromatogr., 218 (1981) 209.20 R. A. Wallingford and A. G. Ewing, J. Chromatogr., 441 (1988) 299.21 A. S. Cohen and B. L. Karger, J. Chromatogr., 397 (1987) 409.22 S. Terabe, K. Otsuka and T. Ando, Anal. Chem., 57 (1985) 834.23 F. Kilar and S. Hjerten, J. Chromatogr., 480 (1989) 351.24 T. Tsuda, K. Nomura and G. Nakagawa, J. Chromatogr., 248 (1982) 241.25 1. W. Jorgenson, Trends Anal. Chem., 3 (1984) 51.26 H. H. Lauer and D. McManigill, Anal. Chem., 58 (1986) 166.27 M. Yu and N. J. Dovichi, Appl. Spectrosc., 43 (1989) 196.28 W. G. Kuhr and E. S. Yeung, Anal. Chem., 60 (1988) 2642.29 R. A. Wallingford and A. G. Ewing, Anal. Chem., 59 (1987) 1762.30 J. P. Chervet, M. Ursem, J. P. Salzman and R. W. Vannoort, J. High Resolut. Chromatogr. Chromatogr.
Commun., 12 (1989) 278.31 R. T. Kennedy and J. W. Jorgenson, Anal. Chem., 60 (1988) 1521.32 R. T. Kennedy and J. W. Jorgenson, Anal. Chem., 61 (1989) 436.33 D. J. Rose and J. W. Jorgenson, Anal. Chem., 60 (1988) 642.34 R. A. Wallingford and A. G. ewing, Anal. Chem., 59 (1987) 678.35 S. E. Moring, J. C. Colburn, P. D. Grossmann and H. H. Lauer, LC' GC Int., 3 ([990) 46.36 J. H. Knox and I. H. Grant, Chromatographia, 24 (1987) 135.37 C. L. Rice and R. Whitehead, J. Phys: Chem., 69 (1965) 4017.38 A. A. A. M. van de Goor, B. J. Wanders and F. M. Everaerts, J. Chromatogr., 470 (1989) 95.39 J. H. Knox, Chromatographia, 26 (1988) 329.40 M. J. E. Golay, in D. H. Desty (Editor), Gas Chromatography 1958, Butterworths, London, 1958,
pp. 36-55.41 M. Martin and G. Guiochon, Anal. Chem., 56 (1984) 614.42 J. C. Giddings, Dynamics of Chromatography, Marcel Dekker, New York, 1965.43 X. Huang, M. J. Gordon and R. N. Zare, Anal. Chem., 60 (1988) 1837.44 J. C. Sternberg, Adv. Chromatogr., 2 (1966) 205.45 E. Grushka, R. M. McCormick, J. J. Kirkland, Anal. Chem., 61 (1989) 241.46 A. E. Jones and E. Grushka, J. Chromatogr., 466 (1989) 219.47 R. J. Nelson, A. Paulus, A. S. Cohen, A. Guttman and B. L. Karger, J. Chromatogr., 480 (1989) Ill.

Journal of Chromatography, 517 (1990) 573-581Elsevier Science Publishers B.V., Amsterdam
CHROMSYMP. 1986
High-pressure and supercritical capillary electrophoresis
CLEMENT R. YONKER' and RICHARD D. SMITH
Chemical Methods and Separations Group, Chemical Sciences Department, Pacific Northwest Laboratory(Operated by Battelle Memorial Institute) , Richland, WA 99352 (U.S.A.)
ABSTRACT
Preliminary results are reported for high-pressure and supercritical capillaryelectrophoresis. The fluid system investigated was methanol [critical temperature (Tc )
= 240T, critical pressure (Pc) = 80,9 bar] containing a small concentration of background electrolyte, The temperature and pressure regions studied ranged from 25280°C and 67.1-295,7 bar, respectively, during the course of experimentation. Initialresults of electrophoretic separations of 1-naphthol-4-sulfonic acid sodium salt andthymol blue as a function of temperature and pressure will be described and discussed.
INTRODUCTION
Capillary electrophoresis (CE) has proven itself to be a technique of highseparation efficiency and of potentially extreme importance in the area of bioseparations l
-5
. The applications of CE to the separation of peptides, proteins andnucleic acids continue to increase. The enhanced separation efficiencies and decreasedanalysis times for complex solute molecules have proven advantageous for CE ascompared to other separation methodologies.
The separation efficiency ultimately obtainable by CE depends upon the ratio ofelectrophoretic mobility to the diffusion coefficient. Although very high speedseparations (~ 1.5 s) have been demonstrated by capillary zone electrophoresis6 , thesehave required extremely small sample volumes and have yet demonstrated only limitednumbers of theoretical plates. Continued improvement of high-speed separationsencounters fundamental limitations. To obtain short analysis times the appliedpotential across the length of the capillary column should be high 7; in the absence ofheating effeGts separations improve in direct proportion to electric field strength.However, an excessively high applied potential can lead to deleterious effects due toheating of the capillar buffer solution, causing decreased separation efficiency andpossible vaporization of the buffer solutions. Decreased separation efficiencies canoccur through an increase of the parabolic nature in the electroosmotic velocity flowprofile with the increased radial temperature gradientS
,9. Decreasing the buffer

574 C. R. YONKER, R. D. SMITH
conductivity to limit heating effects, proportionally limits sample size, due to practicallimits placed on the conductivity difference between the buffer and sample.
An increase in the mass transfer characteristics of a solute molecule couldimprove the separation efficiency in a mass transfer limited system. In a separationwhich is not mass transfer limited an increase in the diffusion coefficient could proveproblematic, leading to increased zone broadening. In capillary electrophoresis whereaxial diffusion can define the zone broadening limit in some cases, increasing thediffusion coefficient of the solute would not prove beneficial. This could also be true insupercritical-fluid capillary electrophoresis (SCE) for non mass transfer limitedsituations.
True plug flow is not achieved in electroosmotic flow 9. Therefore, the shear layer
at the capillary wall can contribute to solute zone broadening in capillar electrophoresis. Increasing radial mass transport through this shear layer could decrease theoverall zone broadening in the system. This will be dependent on the interplay betweenion molecular diffusion in the radial and axial direction in the capillary. SCE couldprove to be an interesting technique to study these physicochemical processes forelectroosmotic flow.
One might anticipate that electrophoretic mobilities will increase linearly withmolecular diffusion coefficients, providing a basis for faster separations. Othersecondary benefits might arise from such an experimental approach. For example,increasing pressure in the system would increase the solvent's boiling point, thusdecreasing solvent vaporization. Vapor generation during CE separations generallyleads to (often dramatic!) failure of the separation. This approach could allow higherelectric fields to be used. Therefore, high-pressure capillary electrophoresis (HPCE)and SCE could prove beneficial in mass transfer limited systems and in obtainingshorter analysis times. From a fundamental viewpoint, SCE and HPCE present thenovel opportunity to study the effects of fluid density (pressure and temperature) onsolute mass transfer in electroosmotic flow. SCE and HPCE can contribute to theunderstanding of the effect of fluid viscosity changes on electrophoretic andelectroosmotic mobilities. Changes in the capillary surface double layer as a functionof pressure and temperature can be studied. Any changes in the zeta potential of thesurface and the solute molecule with density which can affect solute migration can bestudied. Finally, the thermodynamics of equilibrium for the charged solute species asa function of pressure and temperature can be determined.
In this manuscript, we present initial data involving our preliminary experimentswith high-pressure and supercritical capillary electrophoresis. The discussion centerson the effects of pressure and temperature on solute selectivity and separationefficiency.
THEORY
Capillary electrophoresis involves the electrophoretic migration of a solutespecies in a capillary in the presence of an electric field. In the high-pressure orsupercritical fluid capillary electrophoresis arrangement we have selected for initialinvestigation, the electrophoretic migration of the solute occurs in a capillaryconnected between two high-pressure solvent reservoirs. Therefore, the total velocityof a solute species can be described as

HPCE AND SCE 575
(1)
where VT is the total velocity of the solute: vep and Veo are the electrophoretic andelectroosmotic velocity of the solute, respectively: vp is the velocity of the solute due toa pressure difference (potentially caused by any leakage in the pressurized system andwould be detrimental to obtaining high efficiencies): and 1,2... refers to the number ofsolutes. The electrophoretic velocity of the solute is
Vep = Pep £ (2)
where flep is the electrophoretic mobility of the solute and £ is the electric field strength.The electric field strength is the ratio of the applied voltage to the capillary length(V/L). The electrophoretic mobility of the solute is
Pep = [8(/4nl1] (3)
where 8 is the dielectric constant, 11 is the viscosity of the solvent, and ( is the zetapotential at the solute/solvent interface. These molecular parameters control theelectrophoretic mobility for a specific solute molecule. A similar relationship can bedescribed for the electroosmotic mobility; in this case, the zeta potential refers to thepotential at the liquid/solid interface on the capillary surface 1,10, 11. In the case ofHPCE and SCE, the physicochemical parameters of 8, ( and 11 will be a function oftemperature, pressure, and fluid density. The dielectric constant and viscosity ofa supercritical fluid are clearly a function of temperature and pressure 12
-14
. Thus, onecan expect to observe changes in the electrophoretic and electroosmotic velocity of thesystem when using a supercritical fluid compared to conventional liquids.
The separation of two solute molecules will be dependent on differences in theirmigration velocity. Eqn. I describes the total velocity of the solute in a CE experiment.The difference in migration velocities for two solutes (Ll) is determined by subtractingtheir respectively total velocities. Assuming v~o = v~o and v~ = v~, then at constantpressure or temperature,
The difference in migration velocity (selectivity) is dependent on field strength (E) andtwo other terms; one term is dependent on molecular differences «(2 - (1), and thesecond term is dependent on the solvent (8/4nl1). The change in selectivity, Ll, asa function of pressure and/or temperature in the supercritical-fluid region could bea sensitive indicator of the change in physical or chemical environment about thesolute molecules.
The difference in migration time for two solutes as a function of Ll can be writtenas,
LltLlL
fll fl2£2(5)

576 C. R. YONKER, R. D. SMITH
where fl.! and fl.2 represent the mobility for the two solutes, respectively. The differencein migration time can be related to the fundamental parameters of (, E, '1 and Vonappropriate substitution and rearrangement of eqn. 5 yielding,
(6)
Therefore, the difference in migration time can be related to the applied potential andspecific solute or solvent effects as stated in the above discussion. While thedetermination of LIt is an oversimplification of the parameters governing solutemigration, some insight into the effects of pressure, temperature and applied potentialin HPCE and SCE can be obtained from this value.
EXPERIMENTAL
The supercritical capillary electrophoresis system is basically similar to lowpressure systems published in the literature4
. A schematic of the SCE system is shownin Fig. 1. This system has two high-pressure SS316 solvent reservoirs; one at the anodeend of the capillary column and one at the grounded end of the column. The system ispressurized using an high-performance liquid chromatography (HPLC) syringe pump(Varian 8500) under microprocessor control. A variable-wavelength UV-visibledetector (ISCO) was used for on-line detection of the solute after a section of thepolyimide coating of the capillary had been removed. A high-voltage power supply(Glassman) was used to supply the positive potential to the anodic end of the capillarycolumn. A muffle furnace with a temperature controller was used to hold the capillarycolumn at a constant temperature. A hydrostatic line was used between the twohigh-pressure reservoirs to facilitate sample loading and pressurization. The hy-
high-voltagepowersupply
high-pressure pump
heated region
~ ~ '" " '" freeze
2 : --4-Plug-I~-o--+-""'.---------i.-t-4-.. injector
~ ill
hydrostatic pressure line
highpressurereservoir
highpressurereservoir
currentmeter
Fig. 1. Schematic of supercritical-fluid capillary electrophoresis system.

HPCE AND SCE 577
drostatic line was connected to the pressurized solvent reservoirs through twohigh-pressure 1/16-in. stainless-steel 316 tees. These fittings contained connections forthe analytical CE column, the hydrostatic line and the solvent delivery line from thepump (see Fig. 1).
Sample injection was accomplished by dipping the end of the analytical capillarycolumn in the solute-electrolyte solution. Then a small section ( < 1.5 cm) ofthe columnwas frozen using liquid nitrogen. The contraction of the solvent in the capillary pulleda sample plug into the column. The column segment was kept frozen while the systemwas reconnected to the high-pressure reservoir and then pressurized with the HPLCpump. The hydrostatic line was needed to equalize the pressure on both sides of thefrozen column plug, such that on thawing the sample plug would remain positioned atthe end of the analytical column. The system temperature and pressure could beequilibrated to the appropriate conditions chosen for study while the column segmentwas frozen. The "freeze plug" injection technique was necessary because the largevolume of typical HPLC sample valves and difficulties arising from the metal andgraphite surfaces in these valves which affected the potential gradient down thecolumn. Work is proceeding on the design and construction of more appropriatehigh-pressure, low dead volume valves for use in the SCE system.
The analytical capillary column used was fused silica, 150 flm J.D. by 360 flma.D. and ca. 100 cm in length. The hydrostatic column was 50 flm J.D. x 210 flm a.D.fused silica which had a bonded coating of SE-54 on the surface. This organic coatingprecluded any electroosmotic flow but maintained the two high-pressure reservoirs ata similar pressure value, independent of any electroosmotic flow in the analyticalcapillary when the system was pressurized. The solvent used was methanol (Tc
= 240°C, Pc = 80.9 bar) having an electrolyte concentration of 10 mM acetic acid and10 mM sodium acetate. This electrolyte system had a current of ca. 40 flA at roomtemperature and 296 bar at +30 kV applied across the column. The solutes used wereI-naphthol-4-sulfonic acid sodium salt (Kodak Chemical) and thymol blue (Aldrich).Both molecules were soluble in the methanol electrolyte solvent and showedelectrophoretic migration at room temperature and pressure. After the determinationof the net electroosmotic and electrophoretic flow velocities in the system at roomtemperature and pressure, initial experiments were undertaken to determine the effectof high-pressure and supercritical conditions on the electrophoretic separation.
RESULTS AND DISCUSSION
There have been several reports of electrochemistry and ion-mobility insupercritical fluids which demonstrate that electrophoretic separations in a supercritical fluid should be feasible 1s
-20
. This work has entailed voltammetry studies insupercritical carbon dioxide by Wightman and co-workers I6
-18 and electrochemical
studies in supercritical water and other non-aqueous solvents by Flarsheim et al. 19 andCrooks2o . These studies demonstrate that a supercritical fluid can dissolve anelectrolyte and can have sufficient ionic strength (i.e., carry sufficient current) neededfor supercritical-fluid capillary electrophoresis.
SCE presents the novel opportunity to study directly the effect of fluid density(i.e., pressure and temperature) on the capillary surface double layer, the zeta potentialof the capillary surface and the solute molecule, the effect of changing viscosity on the

578 C. R. YONKER, R. D. SMITH
mass transport properties of the charged solute in the supercritical fluid, theelectrostriction of the solvent about the solute ion 21
,22, and the change in equilibriumof the charged solute. In addition, use of high pressures would allow higher electricfield gradients to be applied to the analytical column for potentially obtaining shorteranalysis times. We note potential difficulties could still arise due to the increasedresistive heating of the buffer solution and the effect of the radial temperature gradienton the fluid density and flow velocity profile. In mass transfer limited electrophoreticseparations in liquids where the slight parabolic nature of the flow velocity profileleads to decreased separation efficiencies, the use of a supercritical fluid could provebeneficial as shown in supercritical-fluid chromatography. The study of the physicochemical parameters governing SeE could lead to an improved understanding of ionsolvation and capillary electrophoresis as practiced today.
Initial data for high-pressure and supercritical capillary electrophoresis arelisted in Table I. The change in migration time between the two solutes, Jt, is given asa function of pressure, temperature and voltage potential. At constant pressure andtemperature, as the applied potential increases Jt between the two peaks decreases.This decrease in the difference in the migration time between the peaks is due to theincrease in potential applied to the system. As shown in eqn. 6, there is a inverserelationship between applied potential (V) and LIt. Therefore, as the potential isincreased at constant pressure and temperature, the migration time difference betweenthe solutes would be expected to decrease which is seen in Table I. For HPCE atconstant temperature and applied potential, a slight decrease in Jt is noted withincreasing pressure. Pressure can effect the solvent viscosity and dielectric constant orthe zeta potential between the solute-solvent and solvent-surface. Over the pressurerange'studied at this temperature, these effects could be expected to be either slight or
TABLE I
SOLUTE SELECTIVITY (LIt) AS A FUNCTION OF POTENTIAL, PRESSURE AND TEM-PERATURE
Conditions LIt (s) Potential (k V) Atm T(OC) i (flA)
136 bar, 21°C 270 ± IO + 15 33282 ± 20 +20 45[80 ± 20 +25 57180 ± 10 +30 70
21°C, + 20 kV 264 ± 20 67 45252 ± 20 [37 45216 ± 20 206 45204 ± 20 278 43
296 bar, + 30 kV 249 ± 9 21 41265 ± 9 55 44234 ± 9 105 48238 ± 9 150 49204 ± 9 200 50180 ± 9 217 48160 ± 18 250 43189 ± 9 280 31

HPCE AND SCE 579
negligible. Therefore, the change in LIt would be expected to be very small. At constantpressure and applied potential LIt changes with increasing temperature. This change inLIt is significant and falls outside the experimental error (listed in Table I). In thesub-critical and near-critical regions an increase in temperature would be expected todecrease solvent viscosity which should lead to a decrease in LIt. As temperatureincreases LIt shows a monotonic decrease. At constant pressure, above the criticaltemperature, furth<;r increases in temperature will decrease solvent viscosity. Therefore, LI t would be expected to decrease based on solvent viscosity arguments as shownin Table I. Density variations in the critical region would affect the zeta potential of themolecules and the viscosity and dielectric constant of the fluid. All these physicochemical parameters would affect the selectivity obtainable between peaks, but at thecrude present level of experimental sophistication it is difficult to isolate theseindividual parameters. Further studies at constant density are planned which willbetter characterize these physical parameters in HPCE and SCE, but there are someinteresting preliminary trends.
The observed electrical current in the analytical column as a function ofpotential, pressure and temperature is also listed in Table I. Perhaps the mostinteresting behavior involves the change in current which occurs as a function oftemperature at constant pressure. Column current increases with increasing temperature, with a maximum being reached at ca. 200°C. Beyond this value the currentdecreases as one proceeds into the critical region for methanol. This decrease in currentcould be due to a decrease in solubility of the background electrolyte as temperatureincreases. In the critical region, the background electrolyte solubility (or dissociationto ionic species for weaker electrolytes) will be a function of fluid density. As the fluiddensity decreases with increasing temperature at constant pressure, the backgroundcurrent was seen to drop very rapidly.
A representative separation in SCE is shown in Fig. 2. This figure shows theseparation of l-naphthol-4-sulfonic acid sodium salt and thymol blue at roomtemperature and 280°C at 296 bar and a blank run at 280°C, 296 bar. The blankexperiment under supercritical conditions shows a possible "system" peak. If this is
cB
A
Fig. 2. Supercritical fluid electrophoretic separations of l-naphthol-4-sulfonic acid sodium salt (first peak)and thymol blue (second peak) at atm 296 and +30 kV; (A) 21°C, 42 /lA; (B) 280°C, 30 /lA; and (C) blank280°C, 31 /lAo

580 C. R. YONKER, R. D. SMITH
indeed the case, a systematic study of the "system" peak's migration velocity and itsdependence on temperature and pressure could provide information about the surfacedouble layer in the supercritical region. At present it is unclear as to the true nature ofthis "system" peak, e.g., the "system" peak is not seen at ambient temperatures only athigher temperatures. Further experimental characterization of this "system" peak isbeing undertaken at this time to determine its exact nature and behavior. Anotheradditional aspect of the results shown in Fig. 2 is the broadening of the peaks in thesupercritical fluid as compared to the HPCE separation. One would expect thisbehavior due to enhanced axial molecular diffusion in a non mass transfer limitedseparation.
CONCLUSIONS
The preliminary results discussed in this manuscript demonstrate the feasibilityof supercritical-fluid electrophoresis. This technique could potentially be used toenhance resolution, separation efficiency, or speed in mass transfer limited systems. Ofmajor interest is the physicochemical study of the surface double layer as a function ofpressure and temperature. Specific changes in the zeta potential of the capillary surfaceand probe molecule with density can also be studied. The effects on the electrophoreticand electroosmotic mobilities by changing fluid viscosity and dielectric constant, andthe e1ectrostriction of solvent about an ion in a supercritical fluid can be investigated.Studies of these types should be amenable with SCE, leading to a better understandingof the physicochemical parameters governing solute separation by capillary electrophoresis.
HPCE and SCE are techniques in their infancy and their ultimate usage asanalytical separation methodologies is still in question. But, they could prove useful incertain separation schemes. Their use in the investigation of density effects on thephysicochemical parameters governing ion mobility in a liquid could prove to beimportant. Further research characterizing these parameters is continuing at this time.
ACKNOWLEDGEMENTS
The authors acknowledge the support of the U.S. Army Research Office underContract DAAL03-87-K-0042. The content of this report does not necessarily reflectthe position or the policy of the Government, and no official endorsement should beinferred.
REFERENCES
1 J. W. Jorgenson and K. D. Lukacs, J. Chromatogr., 281 (1981) 209.2 T. Tsuda, G. Nakagawa, M. Sato and K. Yagi, J Appl. Biochem., 5 (1983) 330.3 H. H. Lauer and D. McManigill, Anal. Chem., 58 (1986) 166.4 M. J. Gordon, X. Huang, S. L. Pentoney and R. N. Zare, Science (Washington, D.C.), 242 (1988) 224.5 F. E. P. Mikkers, F. M. Everaerts and Th. P. E. M. Verheggen, J. Chromatogr., 169 (1979) II.6 M. A. Mosely, L. J. Deterding, K. B. Tomer and J. W. Jorgenson, J. Chromato~r., 516 (1990) 167.7 J. W. Jorgenson and K. D. Lukacs, Science (Washington, D.C.), 222 (1983) 266.8 E. Grushka, R. M. McCormick and J. J. Kirkland, Anal. Chem., 61 (1989) 241.9 M. Martin and G. Guiochon, Anal. Chem., 56 (1984) 614.
10 V. Pretorius, B. J. Hopkins and J. D. Schieke. J. Chromato~r., 99 (1974) 23.

HPCE AND SCE 581
II A. S. Cohen, A. Paulus and B. L. Karger, Chrornatographia, 24 (1987) 15.12 J. M. St-Arnaud and T. K. Bose, J. Chern. Phys., 71 (1979) 4951.13 T. K. Bose and R. A. Cole, J. Chern. Phys., 52 (1970) 140.14 E. U. Franck, Bel'. Bunsen Ges. Phys. Chern., 88 (1984) 820.15 N. Gee and C. R. Freeman, Can. J. Chern., 58 (1980) 1490.16 M. E. Philips, M. R. Deakin, M. V. Novotny and R. M. Wightman, J. Phys. Chern., 91 (1987) 3934.17 D. Niehaus, M. Philips, A. Michael and R. M. Wightman, J. Phys. Chern., 893 (1989) 6232.18 A. C. Michael and R. M. Wightman, Anal. Chern., 61 (1989) 2193.19 W. M. Flarsheim, Y. Tsow, I. Trachtenberg, K. P. Johnston and A. J. Bard, J. Phys. Chern., 90 (1986)
3857.20 R. M. Crooks, Ph. D. Dissertation, University of Texas at Austin, Austin, TX, 1987.21 K. R. Atkins, Phys. Rev., 116 (1959) 1339.22 S. D. Hamann, in R. C. Bradley (Editor), High Pressure Physics and Chernistry, Vol. 2, Academic Press,
London, 1963, pp. 146-147.


JOURNAL OF CHROMATOGRAPHY
Author IndexAbramovich-Bar, S., see Woolfson-Bartfeld,
D. 305Abu-Lafi, S., see Levin, S. 285Aguilar, M. I., see Hodder, A. N. 317Amari, J. V.--, Brown, P. R., Grill, C. M. and Turcotte, J. G.
Isolation and purification of lecithin by preparative high-performance liquid chromatography 219
Bamberger, Y., see Woolfson-Bartfeld, D. 305Bartle, K. D.--, Clifford, A. A., Jafar, S. A., Kinthinji, J. P.
and Shilstone, G. F.Use of chromatographic retention measurements to obtain solubilities in a liquid or supercritical fluid mobile phase 459
Batten, C. F., see Wentworth, W. E. 87Bayer, E., see Ug, M. 263Beckett, R.-, Hotchin, D. M. and Hart, B. T
Use offield-flow fractionation to study pollutant--eolloid interactions 435
Bertsch, W., see Brill, J. H. 95Boone, L. S., see Kirkland, J. J. 377Brill, J. 1.
-~ and Bertsch, W.Comparison of cuticular hydrocarbon profilesof fire ants Solenopsis richteri from the samecolony, using capillary column gas chromatography with pattern recognition 95
Brown, P. R., see Amari, J. V. 219Bruin, G. J. M.--, Tock, P. P. H., Kraak, J. C. and Poppe, H.
Electrically driven open-tubular liquid chromatography 557
Bruner, F.--, Crescentini, G., Mangani, F. and Lattanzi, L.
Capillary gas chromatography with graphitized carbon black 123
Caldwell, C. D., see Li, J. 361Carr, P. W., see Li, 1. 103Chang, H.-C. K.-- and Taylor, L. T.
Use of sulfur chemiluminescence detection after supercritical fluid chromatography 491
Chen, E. C. M., see Wentworth, W. E. 87Clifford, A. A., see Bartle, K. D. 459Cramers, C. A., see Van Es, A. J. 143Crescentini, G., see Bruner, F. 123Dallas, A. 1., see Li, J. 103
583
Davis, J. M.Influence of thermal vanatlon of diffusioncoefficient on non-equilibrium plate height incapillary zone electrophoresis 521
D'sa, E. D., see Wentworth, W. E. 87Engewald, W., see Maurer, T 77Es, A. J. van, see Van Es, A. J. 143Friedrich, J. P., see King, J. W. 449Giddings, J. c., see Moon, M. H. 423Goebel, L. K., see Rasmussen, H. T 549Golay, M. J. E., see Van Es, A. J. 143Golovnya, R. V.-- and Polanuer, B. M.
Comparison of methods for the determinationof the polarity and selectivity of stationaryphases in gas chromatography from a thermodynamic point of view 51
Golshan-Shirazi, S.--, and Guiochon, G.
Optimization of the experimental conditionsin preparative liquid chromatography withtouching bands 229
Grill, C. M., see Amari, J. V. 219Grushka, E., see Woolfson-Bartfeld, D. 305Guiochon, G., see Golshan-Shirazi, S. 229Hansen, M. E.-- and Short, D. C.
Optimization study of octane-in-water emulsions by sedimentation field-flow fractionation 333
Hanson, M.--, Unger, K. K. and Schomburg, G.
Non-porous polybutadiene-coated silicas asstationary phases in reversed-phase chromatography 269
Haraguchi, H., see Takeuchi, T. 257Hart, B. T, see Beckett, R. 435Hearn, M. T W., see Hodder, A. N. 317Hevesi, T.--, Krupcik, J. and Sandra, P.
Use of chromatographic models for computerized optimization of coupling-point pressurein dual-column gas chromatography 161
Hodder, A. N.--, Machin, K. J., Aguilar, M. I. and Hearn, M.
T W.High-performance liquid chromatography ofamino acids, peptides and proteins. C. Characterisation of coulombic interactive regionson hen lysozyme by high-performance liquidanion-exchange chromatography and computer graphic analysis 317
Hotchin, D. M., see Beckett, R. 435

584
Housaki, T., see Nishikida, K. 209Hu, W., see Takeuchi, T. 257Huang, E. C, see Sumpter, S. R. 503Ilg, M.--, Maier-Rosenkranz, J., Muller, W. and Bayer,
E.Magnetic resonance imaging in reversedphase liquid chromatography 263
Ishii, D., see Takeuchi, T. 257Itoh, K., see Jinno, K. 193Jafar, S. A., see Bartle, K. D. 459Jinno, K.--, Yamamoto, K., Nagashima, H., Ueda, T.
and Itoh, K.Silicas chemically bonded with multidentatephenyl groups as stationary phases in reversed-phase liquid chromatography used fornon-planarity recognition of polycyclic aromatic hydrocarbons 193
Kaljurand, M., see Kullik, E. 175Karaiskakis, G., see Koliadima, A. 345King, J. W.
-- and Friedrich, J. P.Quantitative correlations between solute molecular structure and solubility in supercriticalfluids 449
Kinoshita, T., see Nishikida, K. 209Kirkland, J. J.--, Boone, L. S. and Yau, W. W.
Retention effects in thermal field-flow fractionation 377
Kithinji, J. P., see Bartle, K. D. 459Koch, L.--, Koch, T. and Widmer, H. M.
Sedimentation field-flow fractionation for pigment quality assessment 395
Koch, T., see Koch, L. 395Koliadima, A.-- and Karaiskakis, G.
Potential-barrier field-flow fractionation, aversatile new separation method 345
Kraak, J. C, see Bruin, G. J. M. 557Krupcik, J., see Hevesi, T. 161Kullik, E.-- and Kaljurand, M.
Study of rapid reaction kinetics by computerized gas chromatography with stroboscopicsampling 175
Lattanzi, L., see Bruner, F. 123Leem, M. L., see Sumpter, S. R. 503Levin, S.-- and Abu-Lafi, S.
Competition between penylalanine and aceticacid ina chromatographic column as indicated by their adsorption isotherms 285
Levy, S., see Woolfson-Bartfeld, D. 305
AUTHOR INDEX
Li, J.--, Caldwell, K. D. and Miichtle, W.
Particle characterization in centrifugal fields.Comparison between ultracentrifugation andsedimentation field-flow fractionation 361
--, Dallas, A. J. and Carr, P. W.Empirical scheme for the classification of gaschromatographic stationary phases based onsolvatochromic linear solvation energy relationships 103Luffer, D. R.
Luffer, D. R.-- and Novotny, M.
Element-selective detection after supercriticalfluid chromatography by means of a surfatronplasma in the near-infrared spectral region 477
Machin, K. J., see Hodder, A. N. 317McNair, H. M., see Rasmussen, H. T. 549Miichtle, W., see Li, J. 361Magnico, P.
-- and Martin, M.Dispersion in the interstitial space of packedcolumns 31
Maier-Rosenkranz,J., see Ilg, M. 263Mangani, F., see Bruner, F. 123Markides, K. E., see Sumpter, S. R. 503Martin, M., see Magnico, P. 31Martire, D. E., see Poe, D. P. 3Maurer, T.--, Engewald, W. and Steinborn, A.
Enhanced possibilities for identification usingseries-coupled capillary gas chromatographiccolumns. II. Retention indices as an identification tool in selectivity tuning 77
Moon, M. H.--, Myers, M. N. and Giddings, J. C
Evaluation of pinched inlet channel for stopless flow injection in steric field-flow fractionation 423
Morimoto, M., see Nishikida, K. 209Muller, W., see Ilg, M. 263Myers, M. N., see Moon, M. H. 423Nagashima, H., see Jinno, K. 193Nishikida, K.--, Housaki, T., Morimoto, M. and Kinoshita,
T.Gel permeation chromatography-Fouriertransform infrared study of some syntheticpolymers. II. Instrumentation for the characterization of polyethylene 209
Novotny, M., see Luffer, D. R. 477Oguchi, R., see Wylie, P. L. 131Poe, D. P.-- and Martire, D. E.
Plate height theory for compressible mobilephase fluids and its application to gas, liquidand supercritical fluid chromatography 3

AUTHOR INDEX
Polanuer, B. M., see Golovnya, R. V. 51Poppe, H., see Bruin, G. J.M. 557Rasmussen, H. T.--, Goebel, L. K. and McNair, H. M.
Micellar electrokinetic chromatography employing sodium alkyl sulfates and Brij35® 549
Rijks, J. A., see Van Es, A. J. 143Sandra, P., see Hevesi, T. 161Schimpf, M. E.
Characterization of polymers by thermal fieldflow fractionation 405
Schomburg, G., see Hanson, M. 269Scott, R. P. W.
Design of liquid chromatography capillarycolumns 297
Shilstone, G. F., see Bartle, K. D. 459Short, D. c., see Hansen, M. E. 333Smith, R. D., see Yonker, C. R. 573Springston, S. R.
Cryogenic-focusing, ohmically heated on-column trap for capillary gas chromatography 67
Steinborn, A., see Maurer, T. 77Sumpter, S. R.--, Woolley, C. L., Huang, E. c., Markides, K.
E. and Lee, M. L.Static coating of 5 to 50 /lm I.D. capillary columns for open tubular column chromatography 503
Takeuchi, T.--, Hu, W., Haraguchi, H. and Ishii, D.
Evaluation of the stability of polymer-coatedsilica-based packing materials for high-performance liquid chromatography 257
Taylor, L. T., see Chang, H.-C. K. 491Tock, P. P. H., see Bruin, G. J. M. 557Turcotte, J. G., see Amari, J. V. 219
585
Uden, P. c., see Wang, T. 185Ueda, T., see Jinno, K. 193Unger, K. K., see Hanson, M. 269Van Es, A. J.--, Rijks, J. A., Cramers, C. A. and Golay, M. J.
E.Turbulent flow in capillary gas chromatography-evaluation of a theoretical concept byGolay 143
Wang, T.-- and Uden, P. C.
High-performance liquid chromatographicstudy of ligand-exchange reactions of fluorinated metal tJ-diketone chciates 185
Wentworth, W. E.--, D'sa, E. D., Batten, C. F. and Chen, E. C. M.
Oxygen enhancement of thermal electron capture in a non-radioactive discharge source of aquadrupole mass spectrometer 87
Widmer, H. M., see Koch, L. 395Woolfson-Bartfeld, D.--, Grushka, E., Abramovich-Bar, S., Levy, S.
and Bamberger, Y.Reversed-phase ion-pair chromatographywith indirect photometric detection of inorganic anions from residues of low explosives 305
Woolley, C. L., see Sumpter, S. R. 503Wylie, P. L.-- and Oguchi, R.
Pesticide analysis by gas chromatographywith a novel atomic emission detector 131
Yamamoto, K., see Jinno, K. 193Yau, W. W., see Kirkland, J. J. 377Yonker, C. R.-~ and Smit, R. D.
High-pressure and supercritical capillary electrophoresis 573

Computer-Assisted Method Development forHigh-Performance Liquid Chromatographyedited byJ.1. Glajch and 1.R. Snyder(Spin~offfrom the Journal ofChromatography Vol. 485 plus an additional chapter, index and glossary)
This book deals with the use of the computer as anaid in selecting adequate or optimum conditions for agiven analytical separation. Originally published asVolume 485 of the Journal of Chromatography, ithasnow been reprinted in book form, since theinformation is so useful that many chromatographerswant a copy readily available in the lab.An extensive Introduction is added to the bookedition. This surveys the field and refers to the pageswhere particular items are discussed in the book. Theaddition of a Glossary of Terms, an Author Index anda Subject Index make this book an invaluable sourceof easily consulted information for the practisingchromatographer.For the purpose of this book, computer-assistedmethod development will be limIted to specificprocedures whIch are intended to be used with acomputer - rather than their manually appliedprecursors. In that sense, the subject can beconsidered to have begun around 1980.The ongoing, intense research activity into variousforms of computer assisted HPLC methoddevelopment provides the assurance that thisapproach can really assist the practicalchromatographer working in an industriallaboratory.
Contents. Introduction Chapter: Computer-assisted methoddevelopment for HPLC (fL. G1Jljch & L.R. Snyder). Foreword(G.L. Gllljch & L.R. Snyder). Simplex optimization of HPLCseparations (f.e. Berridge). Computer-assisted optimization inHPLC method development (S.N. Deming et al.). Selection ofmobile phase parameters and their optimization inreversed-phase LC (H.AH. BiIliet & L. de Ga1Jln). Methoddevelopment in HPLC using retention mapping andexperimental design techniques (1.L. G1Jljch & 1.J. Kirk1Jlnd).lsocratic elution (L.R. Snyder et al.). Drylab computersimulation for HPLC method development. I. Isocraticelution (L.R. Snyderet al.). II. Gradient elution (f. W.Do1Jln et al.). Predictive calculation methods for optimizationof gradient elution using binary and ternary solventgradients (P. landera). Computer-assisted retention predictionfor HPLC in the ion-exchange mode (Y. Baba). Multivariatecalibration strategy for reversed-phase chromatographicsystems based on the characterization of stationary-mobilephase combinations with markers (AK. Smilde et al.).Computer-aided optimization of HPLC in theph~m:ace.uticalindust:r (E.P. Lankmayret al.). Comparison ofoptImIZation methods In reversed-phase HPLC usingmixture designs and multi-<:riteria decision making(PM.J. Coenegracht et al.). Explanations and advice providedby an expert system for system optimization in HPLC(P.I. Schoenmakers & N. Dunand). Expert system for theselection of HPLC methods for the analysis of drugs (M. DeSmet et al.). Expert system for the selection of initial HPLCconditions for the analysis of pharmaceuticals(R Hindriks et al.). Expert system program for assistance inHPLC method development (5.5. Williams et al.). Expertsystem for method vafidation in chromatography(M. Mulholland et al.). Knowledge-based expert system for
troubleshooting HPLC assay methods (K. Tsuji &KM. lenkins). Uniform shell designs for optimization inreversed-phase LC (Y. Hu & DL. Massart). Retentionprediction of analytes in reversed-phase HPLC based onmolecular structure (RM. Smith & CM. Burr). Cathie: expertinterpretation ofchromatographic data (R Milne). Predictionof retention of metabolites in HPLC by an expert systemapproach (K. Valk6 et al.). Reversed-phase chromatographicmethod development for peptide separations using thecomputer simulation program ProDigest-LC(e.T. Mant et al.). Rule-based approach for the determinationof solute types in unknown sample mixtures as a first step ofoptimization parameter selection in reversed-phase ion-pairchromatography (A Bartha & G. Vigh). Rationalization of theselection of the type of the organic modifier(s) for selectivityoptimization in reversed-phase ion-pair chromatography(A. Barthaet al.). Predicting reversed-phase gradient elutionseparationsby computer simulation (f. Schmidt).Computer-assisted optimization with NEMROD software(G. Mazerolles et al.). Multi-<!imensional interpolation by themoving least squares approach for modelling ofchromatographic retention data (M. Otto et al.).Microcom puter-assisted LC separation system (MCASYS1)for method development and data handling (K. linno et al.).Objective functions in experimental and simulatedchromatographic optimization (R. Ce1Jl et al.). Optimizationstrategies for solutes exhibiting peak tailing (5. Sekulic &P.R Haddad). Computer-assisted selection of the optimumgradient programme in TLC (W. Markowski). Prediction ofretention times in ion-exchange chromatography(T. Sasagawaet al.). Solvent modulation in LC: optimizationstrategies (rH. Wahl & VL. McGuffin). Recent advances infuzzy peak tracking jn HPLC (E.P. Lankmayr et al.). Peaktracking in HPLC based on normal ized band areas. Aribosomal protein sample as an example (1. Molnaret al.).Development ofa HPLC method for fluroxypyr herbicideand metabolites using computer simulation with Drylab Gsoftware (RG. Lehmann & I.R Miller). Computer-assistedoptimization of a HPLC separation for chlorpromazine andthirteen metabolites (f.S. Klel et al.). Practical approach forHPLC method development: assaying syntheticintermediates ofa leukotriene inhibitor (J. Fulper).Computer-assisted development of a HPLC method forfractionating selected nitro derivatives of polyaromatichydrocarbons (O.J. Thompson & W.D Ellenson).Reversed-phase LC retention and selectivity surfaces.II. Deoxyribonucleosides (E. Grushkaet al.). Effects of differentorganic modifiers in optimization of reversed-phase HPLCgradient elution ofa mixture of natural secoiridoidcompounds(F. Dondi et al.). Optimization of gradients inanion-exchange separations of oligonucleotides usingcomputer-assisted retention prediction and a HPLCsimulation system (Y. Baba & M.K. Ito). Separation of mixturesof o-phthalaldehyde-<!erivatized amino acids byreversed-phase gradient e.1ution (J.D. Stuart et al.). Glossary ofterms. Author index. Subject index.
1990 xxx + 676 pagesPrice: US$ 79.75/ Dfl.175.00ISBN ()"444-88748-2
Elsevier Science PublishersP.O. Box 330, 1000 AH Amsterdam, The Netherlands
In the USA/Canada: P.O. Box 882, Madison Square Station, New York, NY 10159, USA

il~7i~;~'~:!~'f;;i~~~f:!J!.m.mffJf!:il@1Ix·]j;F€~lYJ111iW1J~)""'<·· "'.
Chromatography and Modificationof Nucleosides
editedby C.W. Gehrke andK.C.T. Kuo, DepartmentofBiochemistry, University ofMissouri-Columbia, and CancerResearch Center, P.O. Box 1268, Columbia, MO, U.S.A
I~IAnalytical Methods for Major and
Modified NucIeosides • HPLC, GC, MS,NMR, UV and Ff·IR
Chromatography and ModifICation ofNucleosides is afour-volume work which provides state-of-the-artchromatography and analytical methods for use in a widespectrum ofnucleic acid modification research.
The focus of Part A, is the presentation of advancedmethods for modification research on tRNAs, mRNAs,mtRNAs, rRNAs and DNAs. HPLC-UV, GC-MS,NMR, Fr-IR and affinity chromatography approachesto nucleic acid modification studies are presented, as arenucleoside, oligonucleotide and nucleic acid isolationtechniques.
Contents: Introduction and Overview (C.W. Gehrke,K.C. Kuo). 1. Ribonucleoside analysis by reversedphase high performance liquid chromatography(C.W Gehrke, K.C. Kuo). 2. HPLC of transfer RNAsusing ionic-hydrophobic mixed-mode and hydrophobic-interaction chromatography (R. Bischoff.L.WMcLaughlin). 3. Nucleic acid chromatographicisolation and sequence methods (G. Keith). 4. Affmitychromatography ofmammalian tRNAs on immobilizedelongation factor Tu from Thermus thermophilus(M. Sprinzl, K.-H. Derwenskus). 5. Structural elucidationofnucleosides in nucleic acids (C.W Gehrkeet aI.).6. Three dimensional dynamic structure of tRNAs bynuclear magnetic resonance spectroscopy (P.P. Agris,H. Sierzputowska-Gracz). 7. Codon recognition: evaluation of the effects of modified bases in the anticodonloop of tRNA using the temperature-jump relaxationmethod (H. Grosjean. C. Houssier). 8. High-performance liquid chromatography ofCap structures and nucleoside composition in mRNAs (K.C. Kuo et al.).9. Inununoassays for modified nucleosides of ribonucleic acids (B.s. Void). 10. Chromatography ofsyntheticand natural oligonucleotides (H. Eckstein, H. Schott).Subject Index.
1990 lUI + 400 pages, ISBN 0-444-88540-4Price: US$141.00 I Dfl. 275.00
~Biological Roles and Function of
ModificationPart B, the second of the four-volume work Chromatography andModifICation ofNucleosides, has as its centraltheme the modified nucleosides of tRNA and the currentanalytical means for studying rRNAmodifications.Modified nucleoside synthesis, function, structural conformation, biological regulation, and occurrence ofmodification in a wide range of tRNAs are presented, as is achapter on DNA modification and a chapter on solidphase immunoassay for determining a particular modification.
The chapters are written by leading scientists in their respective fields and present an up-to-date review on theroles ofmodified nucleosides in nucleic acids which willbe extremely useful for workers in chromatography,molecular biology, genetics, biochemistry, biotechnology and the pharmaceutical industry.
Contents: Introduction and Overview (D.G. Soli). 1. Synthesis and function of modified nucleosides (G.R. Bjork,J. Kohli). 2. Biosynthesis and function of queuine andqueuosine (H. Kersten, W. Kersten). 3. Codon usage andQ-base modification in Drosophila melanogaster(E. Kubli). 4. Solid phase immunoassay for determiningthe inosine content in transfer RNA (E.P. Yamasaki.AA. Wani, R.W Trewyn). 5. Site directed replacement ofnucleotides in the anticodon loop oftRNA: application tothe study of inosine biosynthesis in yeast tRNAAla
(K.A. Kretz. R.W Trewyn, G. Keith, H. Grosjean).6. tRNA and tRNA-like molecules: structural peculiarities and biological recognition (R .L. Joshi,AL.Haenni). 7. Mitochondrial tRNAs-structure,modified nucleosides and codon reading patterns(G. Dirheimer,RP.Martin). 8. Themodifiednucleotidesin ribosomal RNA from man and other eukaryotes(B.ER.Maden). Modified uridines in the first positionsofanticodons oftRNAs and mechanisms ofcodon recognition (S. Yokoyama, T. Miyazawa). 10. Natural occurringmodified nucleosides in DNA (M. Ehrlich, X.Y. Zhang).Subject Index.
1990 xliv + 370 pages, ISBN 0-444-88505-6Price: US$153.75/Dfl. 300.00
Elsevier Science PublishersP.O. Box 211,1000 AE Amsterdam,The Netherlands
Elsevier Science Publishing Co. Inc.P.O. Box 882, Maqison Square Station,
New York, NY 10159, U.S.A

by S. Ohe, Department ofAppliedChemistry. Tokai University.
Kanagawa. Japan(physical Sciences Data, 37)
Vapor-liquid equilibrium (VLE) data are necessary forthe design and operation of distillation processes. It isabsolutely impossible to detennine a distillation process without VLE data.The author of this book: has had much experience designing and constructing distillation processes and towers and knows that VLE data must be easilyretrievable, readily comprehensible, and precise. Thisvolume contains the most important VLE data for1,446 binary systems with Wilson parameters determined by computer processing. The data are alsopresented graphically.The Wilson equation, which is known as one of themost applicable to multicomponent systems, is employed for computer-aided detennination of the optimum parameters using the non-linear least squaresmethod. The data for each system include the substance names and the chemical formulae for the binarycomponents, literature references. the Antoine vaporpressure constants or vapor pressures of the components, optimized values of the parameters for the Wilson equation, the errors, tables with smoothed valuesof vapor and liquid compositions and temperatures orpressures, and phase diagrams for visual comparisonof the experimental data and calculated values. Thesystems are arranged according to the Chemical Abstracts system. An alphabetical index of systems isgiven at the end of the book for convenient retrieval.Thus the VLE of binary or multicomponent systemscan be computed from the Wilson parameters shown inthe tables of this book. The book also presents a multicomponent VLE computer program written in BASICand examples obtained using the program. With theprogram and parameters provided, VLE can be directlycomputed on a personal computer. Furthermore, whenthe Wilson parameters are used as input data for a distillation computer program, the number of theoreticalplates (NTP) of distillation columns can be obtained.
Contents: Part I. Equations for Calculation of theVapor-Liquid Equilibrium. 1. Fundamentals Equations for the Vapor-Liquid Equilibrium Relation.2. Excess Free Energy of Non-Ideal Solutions. 3. Equations for Calculation. 4. Accuracy of Calculation byWilson's Equation. 5. Examples Executed by Computer Program. References. Part II. Data Sheets.Guide to Graphs and Tables. Data Sheets 1-1446.fudex.
1989 xxx +742 pages ISBN 0-444-98876-9Price: US$ 253.75/ Oft 495.00Exclusive sales rights in Japan: Kodansha Ltd.• Tolcyo
by S. Ohe, Department ofAppliedChemistry. Tokai University.
Kanagawa. Japan(Physical Sciences Data, 42)
High pressure vapor-liquid equilibrium data areimportant when very pure compounds are to beprepared, and they are also needed for high pressure liquid or supercritical chromatography.This volume is a compilation of high pressurevapor-liquid equilibrium data for 700 binary system, processed and plotted by computer for readyinspection of the whole spectrum. The information given for each system comprises: the components' names, chemical formulae, cited literature,and critical temperature, critical pressures, acentric factors of the components, optimized valuesof the parameters for the Peng-Robinson equations, the errors, and phase diagrams for visualcomparison of the experimental data and calculated values.An alphabetical index by system name is includedin the book which will be a useful reference forchemical engineers, research chemists, and graduate students who are interested in the chemicalprocess industry.
Contents: Part I. Equations for Calculation ofthe Vapor-Liquid Equilibrium at HighPressure. 1. Method for Predicting Vapor-LiquidEquilibrium at High Pressure. 2. PredictionExamples for Binary and Multicomponent VaporLiquid Equilibria at High Pressure. 3. PredictionProgram for Multicomponent Vapor-LiquidEquilibrium at High Pressure. References. PartII. Data Sheets. Guide to Graphs and Tables.Data Sheets 1-700. fudex.
1990 xxviii + 356 pages ISBN 0-444-98797-5Price: US$ 202.50 I 00. 395.00Exclusive sales rights in Japan: Kodansha Ltd.• Tolcyo
ELSEVIERSCIENCEPUBLISHERS
P.O. Box 211, 1000 AE Amsterdam,The Netherlands
P.O. Box 882, Madison Square Station,New York, NY 10159, USA

1988 xli + 458 pagesUS$ 123.00 Ion. 240.00ISBN 0-444-42881·X
1989 xii + 394 pagesUS$ 136.00 Ion. 265.00ISBN 0-444-88327-4
Contents: I. Preconcentration andChromatography on Chemically ModifiedSilicas with Complexation Properties.II. Sample Handling in IonChromatography. m. Whole Blood SampleClean-Up for Chromatographic Analysis.IV. Radio-Column Liquid Chromatography.V. Modem Post-Column ReactionDetection in High-Performance LiquidChromatography. VI. New LuminescenceDetection Techniques. VII. ContinuousSeparation Techniques in How-InjectionAnalysis. Subject Index.
Selective Sample Handling and Detection inHigh-Performance Liquid Chromatography
Journal of Chromatography Library, 39~}}}}:~~~~~~/parf~~~~~J\}}}}}}}/~::}}://::~:/:~~~~::}}}}}})}:/~:}:////~~:::::/::/~}:::::~:::::::~::~~:~::~:~~:/~}::}:::::/::~}//~:~}}}://}:~/~::::::.:.::::::::::~:<~:::'rt'::::::::::::
edited by R.W. Freit, Free University. Amsterdam. Contents: 1. On-line sample handling andThe Netherlands. and K. Zech, Byk Gulden trace enric~~t in liquid c!rromatograph~.Pharmaceuticals Konstanz FRG The detemunatton of orgamc compOlmds m
.' '. water samples. 2. Determination of drugsPart A of thIS two-volume project attempts to treat the and their metabolites in biological samplessample handling and detection processes in a liquidchroma- by fully automated HPLC with on-linetographic system in an integrated fashion. The need for more solid-liquid extraction and pre-columnselective and sensitive chromatographic methods to help switching. 3. Immobilization of compoundssolve the numerous trace analysis problems in complex f~r ~lective interaction with m:'alytes insamples is undisputed. However, few workers realize the liq~d chro~atography ..4. DesIgn andstrong interdependence of the various steps' sample hand- ~ho~ce of SUItable labelling reag~ts forling, separation and detection _which must be considered if liqUId.chromatograp~~. 5..Ph~todlode array
. 'mal I' B' trod· detectton and recognItton mhigh-one wants to arrIve at an .0t;>11 so ul1on. .y 10 U~lDg a performance liquid chromatography.strong element ?f selecl1Vlty and trace ennch- ment 10 the 6. Electrochemical techniques for detectionsample preparal10n step, fewer demands are placed on the in HPLC. 7. Solid-phase reactors in highquality of the chromatography and often a simple UV detec- performance liquid chromatography.torcan be used. By using aselective detection mode, Le. are- 8. Commercial aspects of post-columnaction detector, the sample handling step can frequently be reaction detectors for ~quidsimplified and more easily automated. The impact ofsuch a chromatography. SubJect Index."total system" approach on handling series of highly complex samples suchas environmental specimensorbiologicalfluids can be easily imagined.::~~}:/:}~:~/part:~~~~B:~~}}}}://:} ::::::::::::::::::::::::::::::::::::::::: ::)}:C::::::.::::::::::::::::~~~:~~~~::::::))~{:::.:.:. :.::.: ...~:~:~:~:~::~:~::~:~:~:::::>:::}:::::::::::::::::}} ::::::::::::::::::::::::::~::::::::::::.:.:.:. :::::::::::::::::::::::::::::::::
edited by K. Zech, Byk Gulden Pharmaceuticals.Konstanz. FRG. and R.W. Freit , Free University.Amsterdam, The NetherlandsPart B completes the treatment of the handling, separationand detection ofcomplex samples as an integrated, interconnected process. On the basis of this philosophy the editorshave selected those contributions which demonstrate thatoptimal sample preparation leads to a simplification of detection or reduced demands on the separation process.Throughout the book emphasis is on chemical principleswith minimum discussion of the equipmentrequired -an approach which reflects the editors' view that the limiting factor in the analysis of complex samples is an incompleteknowledge of the underlying chemistry rather than the hard-ware available. This lack of knowledge becomes more evi-dent as the demands for lower detection limits grow, assolving complex matrix problems requires a greater understanding of the chemical interaction between the substanceto be analysed and the stationary phase.
Written by experienced practitioners, these volumes will beofinterest to investigators in many areas of application, including environmental scientists andthose active in the clinical, pharmaceutical and bioanalytical fields.For more information, please write to:
Elsevier Science PublishersP.O. Box 211, 1000 AE Amsterdam, The NetherlandsP.O. Box 882, Madison Square Station, New York, NY 10159, USA

PUBLICATION SCHEDULE FOR 1990
Journal of Chromatography and Journal of Chromatography, Biomedical Applications
MONTH J F M A M J J A S 0 N D"
Journal of 498/1 500 502/2 504/2 505/2 508/2 511 514/1 516/1 518/2 519/2Chromatography 498/2 502/1 503/1 505/1 506 509/1 512 514/2 516/2 519/1 520
499 503/2 507 509/2 513 515 517 521/1504/1 508/1 510 518/1 521/2
Cumulative 501Indexes,Vols.451-500
Bibliography 524/1 524/2 524/3 524/4 524/5Sprt;nn
Biomedical 525/1 525/2 526/1 526/2 527/2 528/1 529/1 529/2 530/2 531 532/2Applications 527/1 528/2 530/1 532/1 533
"The publication schedule for further Issues will be published later.
INFORMATION FOR AUTHORS
(Detailed Instructions to Authors were published in Vol. 513, pp. 413-416. A free reprint can be obtained byapplication to the publisher, Elsevier Science Publishers B.V., P.O. Box 330, 1000 AH Amsterdam, TheNetherlands. )
Types of Contributions. The following types of papers are published in the Journal of Chromatographyand the section on Biomedical Applications: Regular research papers (Full-length papers), Notes, Reviewarticles and Letters to the Editor. Notes are usually descriptions of short investigations and reflect the samequality of research as Full-length papers, but should preferably not exceed six printed pages. Letters to theEditor can comment on (parts of) previously published articles, or they can report minor technical improvements of previously published procedures; they should preferably not exceed two printed pages. For reviewarticles, see inside front cover under Submission of Papers.
Submission. Every paper must be accompanied by a letter from the senior author, stating that he is submitting the paper for pu blication in the Journal of Chromatography. Please do not send a letter signed bythe director of the institute or the professor unless he is one of the authors.
Manuscripts. Manuscripts should be typed in double spacing on consecutively numbered pages of uniformsize. The manuscript should be preceded by a sheet of manuscript paper carrying the title of the paper andthe name and full postal address of the person to whom the proofs are to be sent. As a rule, papers shouldbe divided into sections, headed by a caption (e.g., Abstract, Introduction, Experimental, Results, Discussion, etc.). All illustrations, photographs, tables, etc., should be on separate sheets.
Introduction. Every paper must have a concise introduction mentioning what has been done before on thetopic described, and stating clearly what is new in the paper now submitted.
Abstract. Full-length papers and Review articles should have an abstract of 50--100 words which clearlyand briefly indicates what is new, different and significant. (Notes and Letters to the Editor are publishedwithout an abstract.)
Illustrations. The figures should be submitted in a form suitable for reproduction, drawn in Indian ink ondrawing or tracing paper. Each illustration should have a legend, all the legends being typed (with doublespacing) together on a separate sheet. If structures are given in the text, the original drawings should besupplied. Coloured illustrations are reproduced at the author's expense, the cost being determined by thenumber of pages and by the number of colours needed. The written permission of the author and publishermust be obtained for the use of any figure already published. Its source must be indicated in the legend.
References. References should be numbered in the order in which they are cited in the text, and listed innumerical sequence on a separate sheet at the end of the article. Please check a recent issue for the layoutof the reference list. Abbreviations for the titles of journals should follow the system used by ChemicalAbstracts. Articles not yet published should be given as "in press" (journal should be specified), "submitted for publication" (journal should be specified), "in preparation" or "personal communication".
Dispatch. Before sending the manuscript to the Editor please check that the envelope containsfour copies of the paper complete with references, legends and figures. One of the sets offigures must be the originals suitable for direct reproduction. Please also ensure that permission to publish has been obtained from your institute.
Proofs. One set of proofs will be sent to the author to be carefully checked for printer's errors. Correctionsmust be restricted to instances in which the proof is at variance with the manuscript. "Extra corrections"will be inserted at the author's expense.
Reprints. Fifty reprints of Full-length papers, Notes and Letters to the Editor will be supplied free of charge.Additional reprints can be ordered by the authors. An order form containing price quotations will be sent tothe authors together with the proofs of their article.
Advertisements. Advertisement rates are available from the publisher on request. The Editors of the journalaccept no responsibility for the contents of the advertisements.

(Data Handling in Science and Technology, 5)
PCs for Chemistsedited by: J. Zupan, University of Ljubljana, Yugoslavia
PCs for Chemists is a handbookon how, Vfhen and with what kindof s~ftware a chemist should usea P9. Being a beginners' guide, itdoes not require any specifickl)owledge about computers. Thebook covers word processors,
. spreadsheets, compilers anddatabases for chemicalapplications, and it comprises tencontributions each describing oneor two different applications and asuggestion for the best choice.Information on how a PC can belinked to instruments, othercomputers and data networks isalso provided.
•PCs for. Chemists should prove.invaluable for all courses coveringcomputer applications tochemistry, pharmacy, biology, andmetallurgy.
1990 xvi + 212 pagesPrice: US$ 100.00/ Off. 195.00ISBN 0-444-88623-0
Contents:Introduction.
1. Word Processors Devoted toScientific Publishing (W T. Wipke).
2. Databases and Spreadsheets(D.L. Massart, N. VandenDriessche, A. Van Dessel).
3. Principal Component Analysis ofChemical Data (K. Varmuza,H. Lohninger).
4. Manipulation of ChemicalDatabases by Programming(J. Zupan).
5. Reduction of the InformationSpace for Data Collections(M. Razinger, M. Novic).
6. Prolog on PCs for Chemists(H. Moll, J. T. Clerc).
7. Reaction Pathways on a PC(E. Fontain, J. Bauer, I. Ugi).
8. Data Acquisition in Chemistry(H. Lohninger, K. Varmuza).
9. PCs and Networking (E. Ziegler).10. The Future of Personal
Computing in Chemistry(G.C. Levy).
Index.
ELSEVIER SCIENCE PUBLISHERSP.O. Box 211, 1000 AE Amsterdam, The NetherlandsP.O. Box 882, Madison Square Station, New York, NY 10159, USA