Mounting Cover JITV - Scientific Journals of ICARD
81
-
Upload
khangminh22 -
Category
Documents
-
view
0 -
download
0
Transcript of Mounting Cover JITV - Scientific Journals of ICARD

CV. Bina LaksanaJl. Raya Pajajaran No. 100 BogorPRD1924
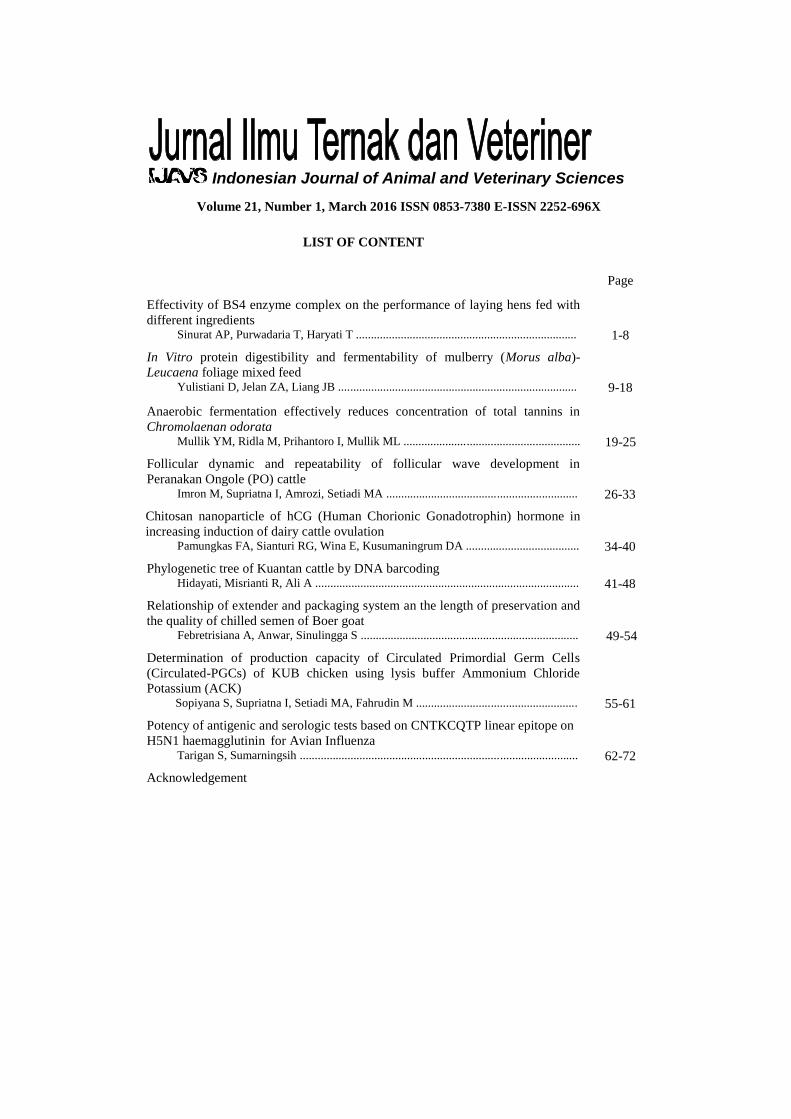
Indonesian Journal of Animal and Veterinary SciencesVolume 21, Number 1, March 2016 ISSN 0853-7380 E-ISSN 2252-696X
LIST OF CONTENT
Page
Effectivity of BS4 enzyme complex on the performance of laying hens fed with different ingredients
Sinurat AP, Purwadaria T, Haryati T .......................................................................... 1-8
In Vitro protein digestibility and fermentability of mulberry (Morus alba)-Leucaena foliage mixed feed
Yulistiani D, Jelan ZA, Liang JB ................................................................................ 9-18
Anaerobic fermentation effectively reduces concentration of total tannins in Chromolaenan odorata
Mullik YM, Ridla M, Prihantoro I, Mullik ML ........................................................... 19-25Follicular dynamic and repeatability of follicular wave development in Peranakan Ongole (PO) cattle
Imron M, Supriatna I, Amrozi, Setiadi MA ................................................................ 26-33Chitosan nanoparticle of hCG (Human Chorionic Gonadotrophin) hormone in increasing induction of dairy cattle ovulation
Pamungkas FA, Sianturi RG, Wina E, Kusumaningrum DA ...................................... 34-40
Phylogenetic tree of Kuantan cattle by DNA barcodingHidayati, Misrianti R, Ali A ........................................................................................ 41-48
Relationship of extender and packaging system an the length of preservation and the quality of chilled semen of Boer goat
Febretrisiana A, Anwar, Sinulingga S ......................................................................... 49-54
Determination of production capacity of Circulated Primordial Germ Cells(Circulated-PGCs) of KUB chicken using lysis buffer Ammonium Chloride Potassium (ACK)
Sopiyana S, Supriatna I, Setiadi MA, Fahrudin M ...................................................... 55-61Potency of antigenic and serologic tests based on CNTKCQTP linear epitope on H5N1 haemagglutinin for Avian Influenza
Tarigan S, Sumarningsih ............................................................................................. 62-72Acknowledgement
Registered in:

Indonesian Journal of Animal and Veterinary Sciences
JITV Volume 21 Number 1 Page 1-72 Bogor, March 2016 ISSN 0853-7380
E-ISSN 2252-696X
Editor PREFACE
On February 10, 2016, Indonesian Journal of
In this edition, volume 21 no. 1 March 2016, we
proudly present articles from various disciplines such as
Animal reproduction; feed and nutrition technology;
forages technology; and veterinary technology. The
articles published in this edition are: "Effectivity of BS4
enzyme complex on the performance of laying hens fed
with different ingredients”; “In Vitro protein digestibility
and fermentability of mulberry (Morus alba)-Leucaena
foliage mixed feed"; "Anaerobic fermentation effectively
reduces concentration of total tannins in Chromolaenan
odorata"; "Follicular dynamic and repeatability of
follicular wave development in Peranakan Ongole (PO)
Cattle"; “Chitosan nanoparticle of hCG (Human
Chorionic Gonadotrophin) hormone in increasing
induction of dairy cattle ovulation"; "Phylogenetic tree of
Kuantan cattle by DNA barcoding”; “Relationship of
extender and packaging system an the length of
preservation and the quality of chilled semen of Boer
goat”; “Determination of production capacity of
Circulated Primordial Germ Cells (Circulated-PGCs) of
KUB chicken using lysis buffer Ammonium Chloride
Potassium (ACK)" and “Potency of antigenic and
serologic tests based on CNTKCQTP linear epitope on
H5N1 haemagglutinin for Avian Influenza".
Hopefully these articles would offer any benefit to
readers and the end-users of technological innovation, and
attract interests from other authors to contribute in the
future.
Chief Editor;
Bogor, March 2016
Advisor:
Head of Indonesian Center for Animal Research and Development
Chief Editor:
Prof. Dr. Ismeth Inounu, M.S. (Animal Breeding and Genetic)
Vice Chief Editor: Dr. Dra. M.B. Tresnawati Purwadaria (Agricultural Biotechnology)
Editorial Members:
Dr. Ir. R.A. Yeni Widiawati (Animal Feed and Nutrition)
Prof. Dr. Sofjan Iskandar, M.Rur.Sc. (Animal Feed and Nutrition)
Ir. Bambang Setiadi, M.S. (Animal Breeding and Genetic)
Dr. Ir. Dwi Yulistiani, M.App.Sc. (Ruminant Nutrition) Dr. Ir. L. Hardi Prasetyo, M.Agr. (Animal Breeding and Genetic)
Dr. Drs. Simson Tarigan, M.Sc. (Pathology)
drh. Suhardono, M.V.Sc., Ph.D. (Parasitology)
Dr. Raphaella Widiastuti, B.Sc. (Toxicology and Mycology)
Technical Editors: Linda Yunia, S.E.
Rahmawati Elvianora Pulungan
Ahmadi Riyanto, Sm.Hk.
M. Indra Fauzy, A.Md.
English Editor:
Ir. Nurhasanah Hidajati
English Translator Cahyatina Tri Rahayu, S.Pt
Published by:
Indonesian Center for Animal Research and Development
Indonesian Agency for Agricultural Research and
Development, Ministry of Agriculture
Collaborated with:
Secretariat of IJAVS:
Jalan Raya Padjajaran Kav. E. 59, Bogor 16128 - Indonesia
Telephone (0251) 8322185
Fax (0251) 8380588
E-mail: [email protected]; [email protected]
Website: http://medpub.litbang.pertanian.go.id/index.php/jitv
Indonesian Journal for Animal and Veterinary Sciences is
published four times a year in March, June, September and December.
Complete paper may be accessed through:
http://medpub.litbang.pertanian.go.id/index.php/jitv or
http://peternakan.litbang.pertanian.go.id/index.php?option=com_content&view=article&id=3633&Itemid=119 or
through database CAB DIRECT (www.cabdirect.org) or
Indonesian Scientific Journal Database (isjd.pdii.lipi.go.id)
Indonesian Society of Animal Science
JITV Vol. 14. No. 2, Th. 2009
Indonesian Journal of Animal and Veterinary Sciences
Volume 21, Number 1, March 2016 ISSN 0853-7380 E-ISSN 2252-696X
LIST OF CONTENT
Page
Effectivity of BS4 enzyme complex on the performance of laying hens fed with
different ingredients
Sinurat AP, Purwadaria T, Haryati T .......................................................................... 1-8
In Vitro protein digestibility and fermentability of mulberry (Morus alba)-
Leucaena foliage mixed feed
Yulistiani D, Jelan ZA, Liang JB ................................................................................ 9-18
Anaerobic fermentation effectively reduces concentration of total tannins in
Chromolaenan odorata
Mullik YM, Ridla M, Prihantoro I, Mullik ML ........................................................... 19-25
Follicular dynamic and repeatability of follicular wave development in
Peranakan Ongole (PO) cattle
Imron M, Supriatna I, Amrozi, Setiadi MA ................................................................ 26-33
Chitosan nanoparticle of hCG (Human Chorionic Gonadotrophin) hormone in
increasing induction of dairy cattle ovulation
Pamungkas FA, Sianturi RG, Wina E, Kusumaningrum DA ...................................... 34-40
Phylogenetic tree of Kuantan cattle by DNA barcoding Hidayati, Misrianti R, Ali A ........................................................................................ 41-48
Relationship of extender and packaging system an the length of preservation and
the quality of chilled semen of Boer goat
Febretrisiana A, Anwar, Sinulingga S ......................................................................... 49-54
Determination of production capacity of Circulated Primordial Germ Cells
(Circulated-PGCs) of KUB chicken using lysis buffer Ammonium Chloride
Potassium (ACK)
Sopiyana S, Supriatna I, Setiadi MA, Fahrudin M ...................................................... 55-61
Potency of antigenic and serologic tests based on CNTKCQTP linear epitope on
H5N1 haemagglutinin for Avian Influenza
Tarigan S, Sumarningsih ............................................................................................. 62-72
Acknowledgement
Sinurat et al. Effectivity of BS4 enzyme complex on the performance of laying hens fed with different ingredients
1
Effectivity of BS4 Enzyme Complex on the Performance of Laying Hens Fed
with Different Ingredients
Sinurat AP, Purwadaria T, Haryati T
1Indonesian Research Institute for Animal Production, PO Box 221, Bogor 16002, Indonesia
E-mail: [email protected]
(received 06-01-2016; revised 21-03-2016; accepted 29-03-2016)
ABSTRAK
Sinurat AP, Purwadaria T, Haryati T. 2016. Pengujian efektifitas enzim BS4 terhadap performan ayam petelur yang diberi jenis
bahan pakan yang berbeda. JITV 21(1): 1-8. DOI: http://dx.doi.org/10.14334/jitv.v21i1.1389
Penelitian dilakukan untuk menguji efektifitas enzim BS4 yang dihasilkan dengan pembiakan Eupenicilium javanicum
terhadap performan ayam petelur yang diberi jenis pakan yang berbeda. Tiga ransum dengan kandungan gizi yang sama (protein
kasar, ME, lysine tercerna, methionine + cystine tercerna, tryptophan tercerna, Ca and P tersedia) disusun sesuai dengan
kebutuhan ayam petelur. Ketiga ransum tersebut mengandung 3 bahan pakan utaman yang berbeda yaitu jagung dan bungkil
kedelai (kontrol), dedak 30% atau bungkil inti sawit (BIS) 20%. Ketiga ransum kemudian ada yang ditambahkan enzim BS4 dan
ada yang tidak. Setiap ransum diberikan kepada 24 ekor (6 ulangan @ 4 ekor) ayam Isa Brown mulai umur 19 hingga 37 minggu
dan diamati performannya. Data dianalisa secara statistik dengan rancangan faktorial 2 (enzymes) X 3 (bahan pakan). Hasil
menunjukkan bahwa penambahan multi enzim BS4 kedalam ransum ayam petelur tidak mempengaruhi perubahan bobot badan,
konsumsi pakan, mortalitas, berat telur dan tebal kerabang telur. Suplementasi enzim BS4 kedalam ransum ayam petelur nyata
meningkatkan produksi telur (P<0.05) dan memperbaiki FCR (P<0.01), pada ketiga jenis bahan pakan yang diuji (jagung, dedak
dan BIS). Penambahan enzim BS4 juga nyata meningkatkan warna kuning telur pada ransum yang mengandung 20% BIS. Ayam
yang diberi BIS 20% menghasilkan telur yang lebih banyak dibandingkan dengan yang diberi jagung atau 30% dedak. Namun,
kerabang telur ayam yang diberi pakan 30% dedak lebih tebal dari ayam yang diberi jagung atau BIS. Disimpulkan bahwa
penambahan multi enzim BS4 dalam ransum cukup efektip meningkatkan performan ayam petelur.
Kata Kunci: Enzim BS4, Bungkil Inti Sawit, Dedak, Produksi Telur, Kualitas Telur
ABSTRACT
Sinurat AP, Purwadaria T, Haryati T. 2016. Effectivity of BS4 enzyme complex on the performance of laying hens fed with
different ingredients. JITV 21(1): 1-8. DOI: http://dx.doi.org/10.14334/jitv.v21i1.1389
An experiment was carried out to evaluate the effectivity of an enzyme complex produced by Eupenicilium javanicum BS4
on the performance of laying hens fed with different feed ingredients. Three diets were formulated with similar nutrients
(protein, ME, digestible amino acids, Ca and available P) value to meet the nutrient requirement of laying hens. Diets were
formulated based on maize, palm kernel cake (PKC) or rice bran. The diets were either supplemented or not with BS4 enzyme
complex and fed to Isa Brown pullet from 19 to 37 weeks old. Each diet was fed to 24 birds and the performances were
recorded. Data were analysed statistically with 2 X 3 factorial design with six replicates. Results showed that supplementation of
BS4 enzyme into laying hens diet did not influence body weight change, feed intake, mortalities, egg weight and egg shell
thickness but significantly increased egg production (P<0.05) and the FCR (P<0.01) in any feedstuff tested. It also improved egg
yolk color score on diet contained 20% PKC. Laying hens fed 20% PKC produced more eggs than those fed maize or rice bran.
The egg shell of laying hens fed rice bran were thicker than those fed with maize or PKC. It is concluded that BS4 enzyme
complex is effective when supplemented into laying hens diet.
Key Words: BS4 Enzyme, Palm Kernel Cake, Rice Bran, Egg Production, Egg Quality
INTRODUCTION
Exogenous enzymes are widely used as feed
additives in poultry diet nowadays. Although some
enzymes such as amylase, are produced naturally for
digestion of feed in the gastro-intestinal tract of poultry,
supplementation of enzymes are meant to complement
the endogenous enzymes to maximize nutrients
utilization from feed, hence improve the feed
efficiency.
Some feed ingredients were known to contain anti-
nutritional factors which caused poor digestibility for
monogastric animal. Two feed ingredients which are
produced abundantly in Indonesia and commonly
included in poultry diet, i.e., rice bran and palm kernel
cake (PKC) also contain some anti-nutritional factors.
Rice bran contains high crude fibre (13.0%) which

JITV Vol. 21 No 1 Th. 2016: 1-8
2
consists of cellulose, hemicellulose and lignin that are
poorly digested by poutry (Gallinger et al. 2004; Batal
& Dale 2012). According to Sundu et al. (2006) PKC
contains 21-23% crude fibre. In more detail, Knudsen
(1997) showed that PKC contains high (42%) non-
starch polysaccharides (NSPs) in which, 33.6% was
insoluble NSPs. The high NSPs in the diet is considered
as antinutritional factors since it can have negative
effects on the digestibility and rate of absorption of
carbohydrates, fat and protein or amino acids in poultry
(Choct et al. (2010).
Inclusion of more than 10% rice bran in broiler diets
(Gallinger et al. 2004) or laying hens diet (Samli et al.
2006) or more than 20% in laying quail diet
(Abeyrathna et al. 2014) have shown significant
reduction on their performances. Chong et al. (2008)
reported that inclusion of 12.5 % PKC in the diet
significantly impaired the feed convertion ratio of
laying hens and inclusion of 25% PKC impaired the
FCR and eggs size, although the level of egg production
was not affected. Sinurat et al. (2011) also showed that
inclusion of 20% PKC in the diet, slightly reduced the
egg production of laying hens.
Supplementation of exogenous enzyme, especially
carbohydrases into poultry diet have been reported
successfully to degrade NSPs in poultry diet and the
effect of enzyme supplementation is more obvious
when cereal with poor digestibility is present in the diet
(Bedford 2000). Altough supplementation of enzymes
also capable of improving the performance and
intestinal physiological parameters of laying hens fed
with high digestible feedstuffs such as corn-soy (Lee et
al. 2014).
An enzyme complex, produced by Eupenicilium
javanicum BS4 has been developed in our laboratory.
The enzyme was aimed to improve nutrients
digestibility of local feedstuffs with low quality such as
palm oil by products (palm oil sludge and palm kernel
cake). The enzyme was produced by cultivating
Eupenicillium javanicum on coconut meal and consist
of β-mannanase, CMCase (cellulase), β-mannosidase,
β-glucosidase and α-galactosidase (Haryati et al. 1997)
which effectively digest cellulose and hemicellulose in
palm kernel cake and palm sludge (Purwadaria et al.
2004). The effectivity of the enzyme to improve,
metabolisable energy, dry matter and protein
digestibilities of palm oil sludge (Sinurat et al. 2007;
Sinurat et al. 2009; Pasaribu et al. 2009) and palm
kernel cake (Sinurat et al. 2013; Sinurat et al. 2014;
Sinurat et al. 2015) have been reported. The present
study was designed to test the effectivity of the enzyme
(BS4 enzyme) in improving the performance of laying
hens when the feed was formulated to consist different
feedstuffs, generally known to have low (maize) or high
(PKC and rice bran) anti-nutritional levels.
MATERIALS AND METHODS
Three (3) diets consist of feedstuffs which are
known to have different ANFs level, i.e., maize (low
ANFs level), 30% rice bran (high ANFs level) and 20%
PKC (high ANFs level) were formulated with similar
nutrient values (iso- ME, Iso- protein and digestible
amino acids) to meet the nutrient requirement of laying
hens. The nutrient contents of the diet were: 17% crude
protein, 2750 kcal/kg ME, 3.9% calsium (Ca), 0.38%
available phosphorous (Av. P), 0.740% digestible
lysine, 0.440% digestible methionine, 0.635%
digestible metionine + cystine, 0.160% digestible
tryptophan and 0.523% digestible threonine. The
formula and the composition of the diets are presented
in Table 1. Each diet was either supplemented or not
with BS4 enzyme. The enzyme was produced by
Eupenicillium javanicum using coconut cake as
substrate (Rakhmani et al. 2015). The level of enzyme
supplemented was based on the results of previous
experiment, i.e., 150 Unit/kg substrate (Sinurat et al.
2014; Sinurat et al. 2015).
One hundred and fourty four (144) Isa brown
pullets, aged 16 weeks were allocated randomly, reared
in individual wire cages and fed similar diet (pre-lay
diet) for three (3) weeks. Each four (4) birds were
provided with one feeder and therefore considered as
one replicate. The birds were then fed with
experimental diets from age 19 weeks to the end of
experiment (37 weeks). Each treatment was fed to 24
hens (6 replicates with 4 birds/replicate). The
production parameters were start measured a week later
(age 20 weeks) for the next 18 weeks. Variables
measured were body weight changes, feed intake, hen-
day egg production, feed convertion ratio (calculated by
dividing g feed intake by g egg produced) and egg
quality (egg shell thickness and yolk color score). Body
weight changes were measured by weighing the birds
before and after the trial. Feed intakes were measured
weekly. Eggs produced were collected and weighed
daily. After 10 weeks treatment (birds aged 29 weeks),
the egg quality were measured. All data were subject to
analyses of variance in a 2 X 3 factorial design, i.e., 2
levels of enzyme supplementation (with or without
enzyme supplementation) X 3 feedstuffs inclusion in
the diet (maize, PKC and rice bran). The comparisons
between treatment means were calculated by Duncan’s
multiple range test when the ANOVA was significant or
P<0.05 (Steel & Torrie 1997).
Sinurat et al. Effectivity of BS4 enzyme complex on the performance of laying hens fed with different ingredients
3
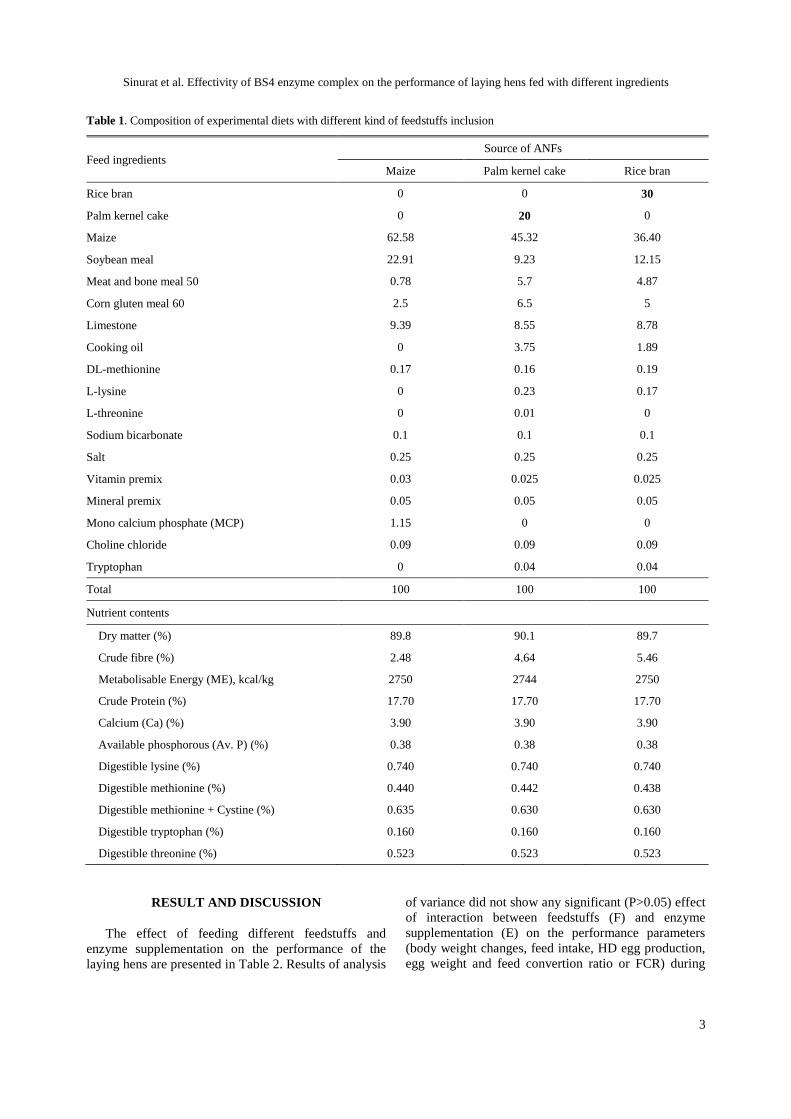
Table 1. Composition of experimental diets with different kind of feedstuffs inclusion
Feed ingredients Source of ANFs
Maize Palm kernel cake Rice bran
Rice bran 0 0 30
Palm kernel cake 0 20 0
Maize 62.58 45.32 36.40
Soybean meal 22.91 9.23 12.15
Meat and bone meal 50 0.78 5.7 4.87
Corn gluten meal 60 2.5 6.5 5
Limestone 9.39 8.55 8.78
Cooking oil 0 3.75 1.89
DL-methionine 0.17 0.16 0.19
L-lysine 0 0.23 0.17
L-threonine 0 0.01 0
Sodium bicarbonate 0.1 0.1 0.1
Salt 0.25 0.25 0.25
Vitamin premix 0.03 0.025 0.025
Mineral premix 0.05 0.05 0.05
Mono calcium phosphate (MCP) 1.15 0 0
Choline chloride 0.09 0.09 0.09
Tryptophan 0 0.04 0.04
Total 100 100 100
Nutrient contents
Dry matter (%) 89.8 90.1 89.7
Crude fibre (%) 2.48 4.64 5.46
Metabolisable Energy (ME), kcal/kg 2750 2744 2750
Crude Protein (%) 17.70 17.70 17.70
Calcium (Ca) (%) 3.90 3.90 3.90
Available phosphorous (Av. P) (%) 0.38 0.38 0.38
Digestible lysine (%) 0.740 0.740 0.740
Digestible methionine (%) 0.440 0.442 0.438
Digestible methionine + Cystine (%) 0.635 0.630 0.630
Digestible tryptophan (%) 0.160 0.160 0.160
Digestible threonine (%) 0.523 0.523 0.523
RESULT AND DISCUSSION
The effect of feeding different feedstuffs and
enzyme supplementation on the performance of the
laying hens are presented in Table 2. Results of analysis
of variance did not show any significant (P>0.05) effect
of interaction between feedstuffs (F) and enzyme
supplementation (E) on the performance parameters
(body weight changes, feed intake, HD egg production,
egg weight and feed convertion ratio or FCR) during
JITV Vol. 21 No 1 Th. 2016: 1-8
4
the 18 weeks of trial. Therefore the performance data
are presented only to show the main effects of the
treatment. Lack of significant interactions effect
between E x F means that the effect of enzyme
supplementation is applicable to all feedstuffs (maize,
PKC and rice bran) used in this experiment. The
mortality of the birds during the 18 weeks trial was very
few (only 2 birds). The mortality was not considered as
the effect of the treatments and therefore was not
analysed statistically.
Supplementation of BS4 enzyme complex did not
significantly (P>0.05) affect body weight changes, feed
intake and egg weight, but significantly (P<0.05)
influenced the HD egg production and feed convertion
ratio (FCR) of laying hens (Table 2). Although the body
weight gain is not the main output of laying hens, the
measurement of body weigh changes is important as an
indication of nutrients adequacy for the hens. The result
showed that the BS4 enzyme supplementation did not
cause nutrients imbalance in the laying hens diet. This
is also supported by the feed intake data which showed
no effect due to enzyme supplementation. The BS4
enzyme has been shown to increase the metabolisable
enery (ME) but also the protein digestibility of PKC
(Sinurat et al. 2011; Sinurat et al. 2013) and the amino
acids digestibility of fermented-PKC (Sinurat et al.
2014).
Supplementation of the BS4 enzyme increased hen
day egg productions significantly (P<0.05). Since the
enzyme supplementation did not affect the feed intake,
the increase in HD egg production (from 87.26% to
90.03%) could be the effect of improvement in overall
nutrients (energy, protein and amino acids) utilization
by the hens as reported previously (Sinurat et al. 2011;
Sinurat et al. 2013; Sinurat et al. 2014). As a result,
the BS4 enzyme showed a significant (P<0.01)
improvement in the feed efficiency or FCR. Chong
et al. (2008) reported that commercial enzyme
supplementation did not show improvement in egg
production of laying hens fed PKC diet, but improve the
FCR. Different kind and activities of enzyme used in
both studies explained this discrepancy.
Although the mortalities of hens fed diet without
enzyme was higher (2.7%) than those fed enzyme diet
(0%). It is not considered as the effect of enzyme
supplementation. Mortalities about 2% during the
period of the experiment (age 19 to 37 weeks old) are
common for Isa brown laying hens (Hendrix-Genetic
2007).
Supplementing exogenous enzymes into poultry diet
have been reported by many authors in order to
minimize the ANFs in poultry diet (Ravindran 2013).
Based on some researches finding, Ravindran (2013)
suggested that multiple enzymes may give a better
results in improving nutrients utilization in poultry diet
as compared to single enzyme. The presence of multi
enzyme (more than one enzyme) may give additive or
synergistic effect on nutrient utilization and animal
performances. Saenphoom et al. (2013) reported that
enzyme treatment effectively hydlrolyzed the fibre
components of PKC and increase the TME of PKC in
broilers.
As shown in Table 2, the body weight changes of
laying hens were all positive or all birds gained some
weight. The body weight changes were neither affected
(P>0.05) by inclusion of different feedstuffs nor by
enzyme supplementation. Body weight gain is not the
main output of laying hens. However, body weigh
changes can be a reflection of nutrients imbalance in the
diet. Imbalances of dietary amino acids (methionine and
cystine) have been reported to have a quadratic effect
on body weight gain of laying hens (Narvaez-Solarte et
al. 2005). Similar body weight changes in this
experiment showed that inclusion of different feedstuffs
and supplementation of BS4 enzyme did not affect the
amino acids balance in the diet. This might be due to
diet formulation applied in this experiment, i.e., based
on digestible amino acids rather than on total amino
acids.
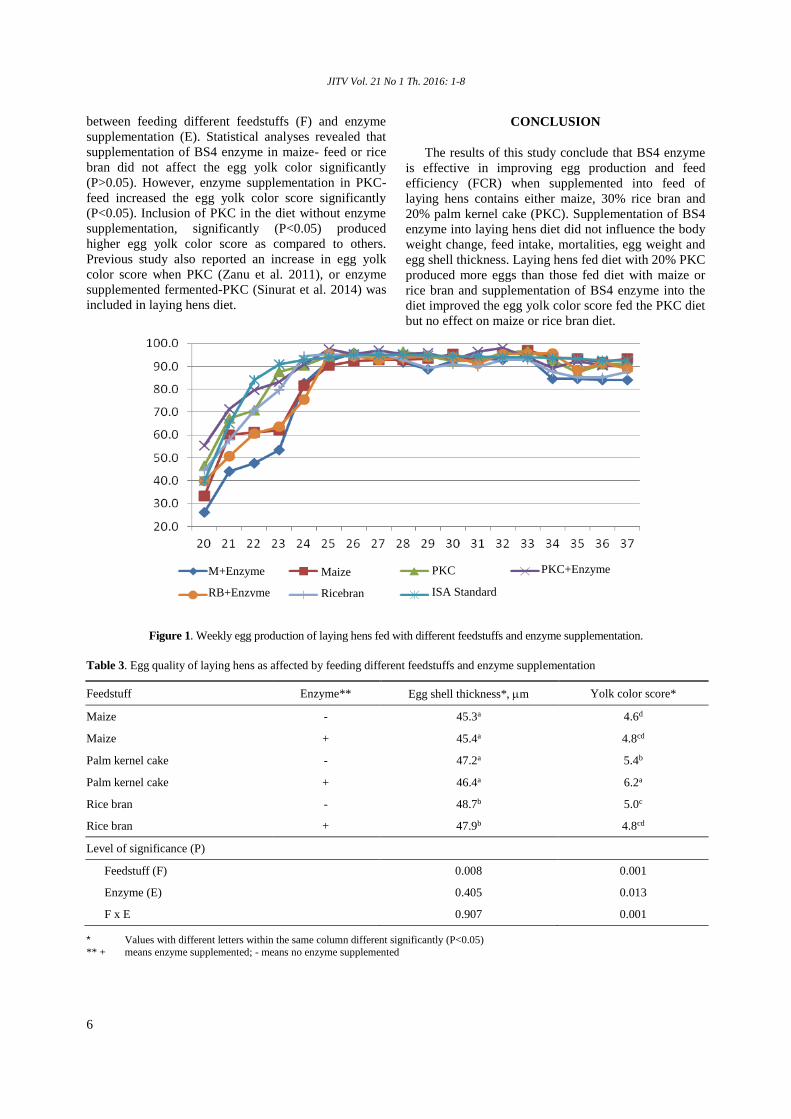
The weekly egg production of laying hens for each
treatment and comparison with the standard is provided
in Figure 1. The rate of egg production was normal,
when compared to Isa brown standard performance. In
general, the egg production pattern and the average HD
egg production of laying hens in this experiment was
similar to the standard of Isa brown hens. The average
HD egg production during the same period (age 20 to
37 weeks) according to Hendrix-Genetic (2007) was
88.6%.
Inclusion of 20% PKC in laying hens diet showed
significantly (P<0.05) higher hen-day egg production as
compared to inclusion of maize or rice bran, although
all diets were formulated to have similar nutrient
values. Similar finding was also reported by Sinurat et
al. (2011) when 5% PKC but not 20% PKC included in
the diet. Zanu et al. (2012) also reported an
improvement in HD egg production when 5% or 10%
PKC was included in laying hens diet. It is possible that
inclusion of PKC in the diet has contributed some
prebiotic that improve the health of gastro intestinal
tract of the hens, improve nutrients absorbtion and and
subsequently increase the egg production. PKC is
known as a good source of β-mannan or its hydrolysed
product oligomannan which can be functioned as
prebiotics (Utami et al. 2013; Jahromi et al. 2016)
which may improve the immune system of the birds.
Inclusion of 20% PKC in broiler’s diet has been
reported to be as effective as commercial prebiotic in
reducing intestinal bacteria (Escherichia coli)
populations (Navidshad et al. 2015). Jahromi et al.
(2016) also reported that supplementation of
oligosaccharide (1 g/kg diet) extracted from PKC
increased the populations of beneficial bacteria
Sinurat et al. Effectivity of BS4 enzyme complex on the performance of laying hens fed with different ingredients
5
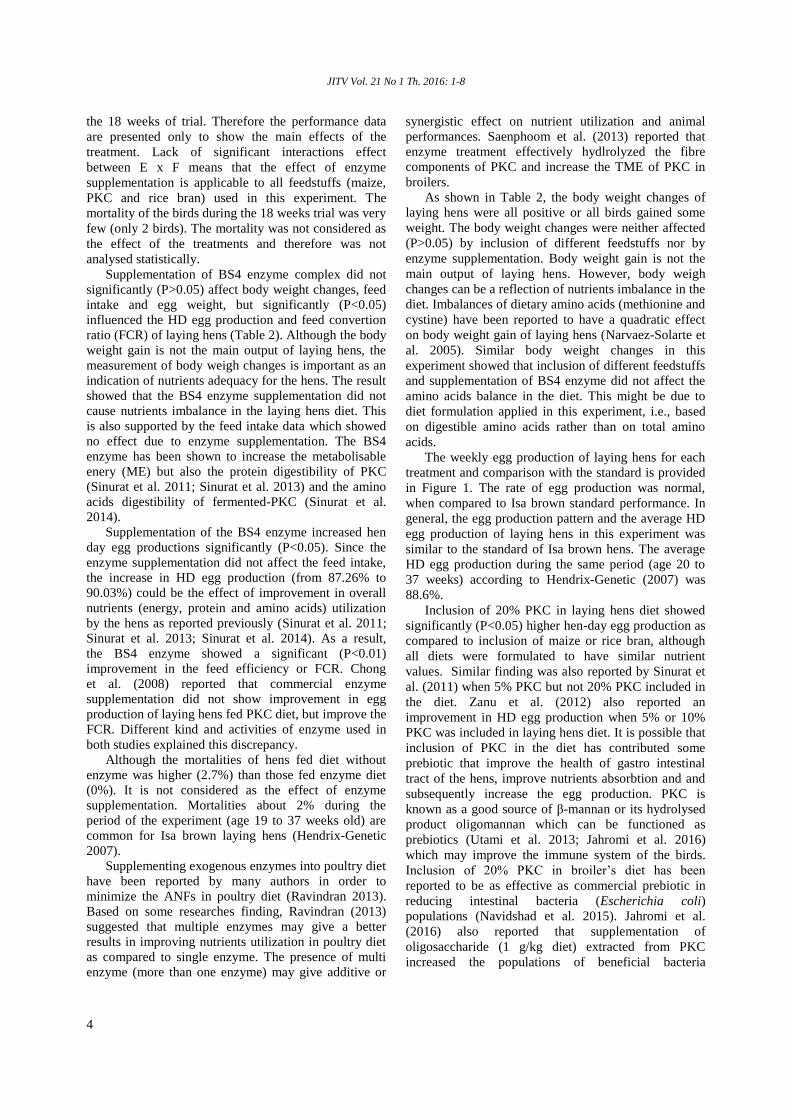
Table 2. Production performance of laying hens as affected by feeding different feedstuffs and enzyme supplementation
Feedstuff Body weight change,
(g/bird)
Egg production
% HD
Egg weight
(g)
Feed intake
(g/d) FCR
Mortality
(%)
Effect of different feedstuffs
Maize 285.3 86.77a 56.50 114.2a 2.424 0
Palm kernel cake 264.3 91.43b 55.99 117.4b 2.326 2.1
Rice bran 294.1 87.73a 55.89 113.1a 2.408 2.1
Effect of enzyme supplementation
- Enzyme* 290.6 87.26a 56.13 114.7 2.453b 2.7
+ Enzyme* 271.8 90.03b 56.12 115.1 2.319a 0
Level of significance (P)
Feedstuff (F) 0.647 0.009 0.601 0.001 0.147 n.a**
Enzyme (E) 0.485 0.028 0.078 0.672 0.004 n.a
E x F 0.940 0.515 0.667 0.661 0.221 n.a
* + means enzyme supplemented; - means no enzyme supplemented
** n.a = not analysed statistically
Different superscript in the same column and treatment means significantly different (P<0.05)
(Lactobacillus, Bifidobacterium and Enterococcus) and
suppressed the populations of pathogenic (E. coli and
Enterobacter) bacteria in the cecum of broiler chickens.
Feed intake of laying hens was significantly
(P<0.01) affected by inclusion of different feedingstuff
in the diet. The feed contained PKC were consumed
more than those contained maize and rice bran. Chong
et al. (2008) also reported an increase in feed intake
when 12.5% or 25% PKC were included in the diet of
of laying hens. However, this was not found by Sinurat
et al. (2011) and Zanu et al. (2012). The incresase in the
egg production as described earlier could be speculated
as the effect of the increase in feed intake, since the
feed convertion ratio (FCR) was not significantly
(P>0.05) affected by inclusion of different feedstuff in
the diet. It is commonly known that feed intake in
poultry is dominantly controlled by energy level in the
diet. Since all diet in this experiment was formulated
iso- energy, the mechanism of feed intake increases in
this case is not clearly understood. Whether the
presence of prebiotic or oligosaccharide contributed by
PKC in the diet stimulate the feed intake or not, needs
to be investigated further. Navidshad et al. (2015)
showed a slightly (2%) increase in feed intake of
broilers when 20% of PKC was included in the diet.
The inclusion of different feedstuff in the diet did
not significantly (P>0.05) affect the egg weight, FCR
and mortalities. Feedstuffs contain high ANFs (crude
fibre or NSPs) are included in the poultry diet in limited
amount. In general, feed mills in Indonesia only
included maximum of 20% rice bran and 5% PKC in
laying hens diet. The present study showed that
inclusion of 30% rice bran or 20% PKC did not impair
the productivity of laying hens. Other reports showed
that inclusion of 10% (Sinurat et al. 2011; Zanu et al.
2012), 20% (Perez et al. 2000), or 25% PKC (Chong et
al. 2008) in the diet can support a good productivity
performance of laying hens. Therefore, in countries
with high production of rice bran and or PKC such as
Indonesia, it is encouraged to use these feedstuffs as it
may reduce the cost of production.
The effect of inclusion of different feedstuffs and
enzyme supplementation on the egg quality is presented
in Tabel 3. The egg shell thickness was significantly
(P<0.01) affected by inclusion of different feedstuffs
but not by enzyme supplementation in the diet nor by
the interaction between the two factors. Inclusion of
rice bran significantly produced thicker egg shell than
others. According to Zita et al. (2009) egg shell
thickness of Isa brown was 37-38 m. Nutritionally,
egg shell thickness were mainly influenced by calcium
(Ca), available phosphorus (Av. P) and D vitamin. All
diets have been formulated to to contain similar levels
of those nutrients (Table 1). Rice bran is known to
contain high P levels but very low Av. P. Improper
balance between Ca and Av. P may affect the egg shell
thickness. Although all diets were formulated to contain
similar available P (0.38%), it might be that the
calculated value of the Av. P of rice bran was over
estimated and the diet with rice bran was lower than
expected. Abubakar et al. (2007) also reported an
increase in egg shell thickness of laying hens when 30%
rice bran was included in the diet as compared to the
control (without rice bran).
As shown in Table 3, the egg yolk color score was
significantly (P<0.01) affected by the interaction
JITV Vol. 21 No 1 Th. 2016: 1-8
6
between feeding different feedstuffs (F) and enzyme
supplementation (E). Statistical analyses revealed that
supplementation of BS4 enzyme in maize- feed or rice
bran did not affect the egg yolk color significantly
(P>0.05). However, enzyme supplementation in PKC-
feed increased the egg yolk color score significantly
(P<0.05). Inclusion of PKC in the diet without enzyme
supplementation, significantly (P<0.05) produced
higher egg yolk color score as compared to others.
Previous study also reported an increase in egg yolk
color score when PKC (Zanu et al. 2011), or enzyme
supplemented fermented-PKC (Sinurat et al. 2014) was
included in laying hens diet.
CONCLUSION
The results of this study conclude that BS4 enzyme
is effective in improving egg production and feed
efficiency (FCR) when supplemented into feed of
laying hens contains either maize, 30% rice bran and
20% palm kernel cake (PKC). Supplementation of BS4
enzyme into laying hens diet did not influence the body
weight change, feed intake, mortalities, egg weight and
egg shell thickness. Laying hens fed diet with 20% PKC
produced more eggs than those fed diet with maize or
rice bran and supplementation of BS4 enzyme into the
diet improved the egg yolk color score fed the PKC diet
but no effect on maize or rice bran diet.
Figure 1. Weekly egg production of laying hens fed with different feedstuffs and enzyme supplementation.
Table 3. Egg quality of laying hens as affected by feeding different feedstuffs and enzyme supplementation
Feedstuff Enzyme** Egg shell thickness*, m Yolk color score*
Maize - 45.3a 4.6d
Maize + 45.4a 4.8cd
Palm kernel cake - 47.2a 5.4b
Palm kernel cake + 46.4a 6.2a
Rice bran - 48.7b 5.0c
Rice bran + 47.9b 4.8cd
Level of significance (P)
Feedstuff (F) 0.008 0.001
Enzyme (E) 0.405 0.013
F x E 0.907 0.001
* Values with different letters within the same column different significantly (P<0.05)
** + means enzyme supplemented; - means no enzyme supplemented
Maize
Ricebran
M+Enzyme
RB+Enzyme
PKC
ISA Standard
PKC+Enzyme
Sinurat et al. Effectivity of BS4 enzyme complex on the performance of laying hens fed with different ingredients
7
ACKNOWLEDGEMENT
The authors appreciate all the technicians who
helped to produce the enzyme and looking after the
animal. Those were Mr Helmi Hamid, Mrs Emi
Sujatmika, Mr Kadiran and Mr Agus.
REFERENCES
Abeyrathna HMWN, Atapattu NSBM, Gunawardane
WWDA. 2014. Effects of the level of dietary rice bran
with or without phytase on performance and egg
parameters of laying Japanese quail. Trop Agric Res.
26:39-47.
Abubakar A, Tukur HM, Sekoni AA, Hassan WA. 2007.
Performance and egg quality characteristics of laying
birds fed diets containing rice bran with and without
yeast supplementation. Asian J Anim Sci. 1:1-9.
Batal A, Dale N. 2012. Ingredient analysis table: 2011
Edition. Feedstuffs, 15 September 2010. [accessed
August 9th 2014]. Available from: http://fdsmagissues.
feedstuffs.com.
Bedford MR. 2000. Mechanism of action and potential
environmental benefits from the use of feed enzymes.
Anim Feed Sci Tech. 53:145-155.
Choct M, Derrsjant-Li Y, McLeish J, Peisker M. 2010. Soy
oligosaccharides and soluble Non-starch
polysaccharides: A Review of digestion, nutritive and
anti-nutritive effects in pigs and poultry. Asian-Aust J
Anim Sci. 23:1386-1398.
Chong CH, Zulkifli I, Blair R. 2008. Effects of dietary
inclusion of palm kernel cake and palm oil and enzyme
supplementation on performance of laying hens. Asian-
Aust J Anim Sci. 21:1053-1058.
Gallinger CI, Suarez DM, Irazusta A. 2004. Effects of rice
bran inclusion on performance and bone mineralization
in broiler chicks. J Appl Poult Res. 13:183-190.
Haryati T, Purwadaria T, Darma J, Tangendjaja B. 1997.
Production of extracellular glycosidase by
Eupenicillium javanicum and Aspergillus niger NRRL
337 on the coconut meal substrate. Proceeding Second
Conference on Agricultural Biotechnology. Jakarta
(Indones): IAARD. p. 517-522.
Hendrix-Genetics. 2007. Performance of Isa Brown final
product. [accessed March 22th 2012]. http://www.
hendrix-genetics.com.
Jahromi MF, Liang JB, Abdullah N, Goh YM, Ebrahimi R,
Shokryazdan P. 2016. Extraction and characterization of
oligosaccharides from palm kernel cake as prebiotic.
Bio Resources. 11:674-695.
Knudsen KEB. 1997. Carbohydrate and lignin contents of
plant materials used in animal feeding. Anim Feed Sci
Tech. 67:319-338.
Narvaez-Solarte W, Rostagno HS, Soares PR, Silva MA,
Velasquez LFU. 2005. Nutritional requirements in
methionine + Cystine for White- egg laying hens during
the first cycle of production. Int J Poult Sci. 4:965-968.
Navidshad B, Liang JB, Jahromi MF, Akhlaghi A, Abdullah
N. 2015. A comparison between a yeast cell wall extract
(Bio-Mos®) and palm kernel expeller as mannan-
oligosac-charides sources on the performance and ileal
microbial population of broiler chickens. Ital J Anim
Sci. 14:3452.
Pasaribu P, Sinurat AP, Purwadaria T, Ketaren P. 2009.
Peningkatan nilai gizi solid heavy phase sebagai
pengganti jagung dalam pakan unggas. JITV. 14:167-
176.
Perez JF, Gernat AG, Murillo JG. 2000. The effect of
different levels of palm kernel meal in layer diets. Poult
Sci. 79:77-79.
Purwadaria T, Nirwana N, Ketaren PP, Pradono DI,
Widyastuti Y. 2003. Synergistic activity of enzymes
produced by Eupenicillium javanicum and Aspergillus
niger NRRL 337 on palm oil factory wastes. Biotropia.
20:1-10.
Rakhmani SIW, Pangestu Y, Sinurat AP, Purwadaria T. 2015.
Carbohydrate and protein digestion on palm kernal cake
by Mannanase BS4 and papain cocktail enzymes.
Indones J Anim Vet Sci. 20:268-274.
Ravindran V. 2013. Feed enzymes: The science, practice, and
metabolic realities. J Appl Poult Res. 22:628-636.
Saenphoom P, Liang JB, Ho YW, Loh TC, Rosfarizan M.
2013. Effects of enzyme treated palm kernel expeller on
metabolizable energy, growth performance, villus
height and digesta viscosity in broiler chickens. Asian-
Aust J Anim Sci. 26:537-544.
Samli HE, Senkoylu N, Akyurek H, Agma A. 2006. Using
rice bran in laying hen diets. Cent Eur Agric. 7:135-140.
Sinurat AP, Purwadaria T, Bintang IAK, Pasaribu T,
Manurung BP, Manurung N. 2008. Substitution of corn
with enzymes treated palm oil sludge in laying hens
diet. Proceedings XXIII World’s Poultry Science
Congress. Brisbane (Australia): World’s Poultry
Science Association.
Sinurat AP, Purwadaria T, Pasaribu T, Ketaren P. 2011.
Performances of laying hens fed with enzyme
supplemented palm kernel cake diets. Proceedings 9th
Asia Pacific Poultry Conference. Taipeh (Taiwan):
World’s Poultry Science Association.
Sinurat AP, Purwadaria T, Pasaribu T. 2013. Peningkatan
nilai gizi bungkil inti sawit dengan pengurangan
cangkang dan penambahan enzim. Indones J Anim Vet
Sci. 18:34-41.

JITV Vol. 21 No 1 Th. 2016: 1-8
8
Sundu B, Kumar A, Dingle J. 2006. Palm kernel meal in
broiler diets: Effect on chicken performance and health.
World Poult Sci J. 62:316-325.
Utami W, Meryandini A, Wiryawan KG. 2013.
Characterization of bacterial mannanase for hydrolyzing
palm kernel cake to produce manno-oligosaccharides
prebiotics. Media Peternakan. 36:192-196.
Zanu HK, Abangiba J, Arthur-Badoo W, Akparibo AD, Sam
R. 2012. Laying chickens’ response to various levels of
palm kernel cake in diets. Int J Livest Prod. 3:12-16.
Zita L, Tumova E, Stolc L. 2009. Effects of genotype, age and
their interaction on egg quality in brown-egg laying
hens. Acta Vet BRNO. 78:85-91.
Yulistiani et al. In Vitro protein digestibility and fermentability of mulberry (Morus alba)-Leucaena foliage mixed feed
9
In Vitro Protein Digestibility and Fermentability of Mulberry (Morus alba)-
Leucaena Foliage Mixed Feed
Yulistiani D1, Jelan ZA2, Liang JB3
1Indonesian Research Institute for Animal Production, PO Box 221 Bogor 16002, Indonesia 2Department of Animal Science, Faculty of Agriculture, Universiti Putra Malaysia, Serdang, Selangor 43400, Malaysia
3Institute of Tropical Agriculture, Universiti Putra Malaysia, Serdang, Selangor 43400, Malaysia
E-mail: [email protected]
(received 22-12-2015; revised 27-01-2016; accepted 16-02-2015)
ABSTRAK
Yulistiani D, Jelan ZA, Liang JB. 2016. Kecernaan protein in vitro dan fermentabilitas pakan campuran hijauan murbei dan
leucaena. JITV 21(1): 9-18. DOI: http://dx.doi.org/10.14334/jitv.v21i1.1352
Penelitian dilakukan untuk mengevaluasi pengaruh campuran hijauan murbei dengan leucaena terhadap kecernaan protein
dan produksi VFA (asam lemak volatile) yang diukur secara in vitro produksi gas. Hijauan murbei dicampur dengan dua varietas
leucaena (Leucaena leucocephala hibrida dan Leucaena leucocephala lokal) pada tiga aras (0, 25 dan 50%). Penelitian
dilakukan menggunakan rancangan acak lengkap. Tepung hijauan murbei, leucaena dan campuran hijauan murbei-leucaena
diinkubasi dalam gelas syringe selama 24 jam. Parameter yang diamati adalah produksi gas, kecernaan sejati in vitro bahan
kering (IVTDMD), kecernaan N in vitro (IVND), dan produksi VFA. Hasil penelitian menunjukan bahwa suplementasi hijauan
leucaena pada hijauan murbei menurunkan produksi gas, kecernaan bahan organik, dan kecernaan protein dalam rumen buffer.
Campuran hijauan murbei dengan leucaena hibrida pada rasio 50% menghasilkan kecernaan protein terendah dalam rumen
buffer dibandingkan dengan perlakuan yang lain. Namun demikian terjadi peningkatan kecernaan protein dalam pepsin HCl
yang merupakan indikator prakiraan kecernaan protein dalam usus. Total produksi gas terjadi penurunan pada campuran hijauan
murbei leucana yang diikuti dengan penurunan produksi total VFA. Suplementasi leucaena hibrida pada murbei dengan rasio 1 :
1 paling efektif untuk menurunkan kecernaan protein ruminal dan meningkatkan kecernaan protein yang diinkubasi pada pepsin
HCl. Dapat disimpulkan bahwa pencampuran leucaena hybrid mampu memproteksi degradasi protein murbei di dalam rumen.
Kata Kunci: Murbei, Leucaena, Kecernaan Protein, In Vitro
ABSTRACT
Yulistiani D, Jelan ZA, Liang JB. 2016. In Vitro protein digestibility and fermentability of mulberry (Morus alba)-Leucaena
foliage mixed feed. JITV 21(1): 9-18. DOI: http://dx.doi.org/10.14334/jitv.v21i1.1352
This experiment was carried out to determine the effect of mulberry-leucaena foliage mixed feed on protein digestibility and
VFA production using an in vitro gas production study. Mulberry was mixed with one of 2 leucaena varieties (Leucaena
leucocephala hybrid and Leucaena leucocephala local) at 3 levels (0, 25 and 50%). Study was conducted in completely
randomized design. Mulberry foliage, leucaena and mixtures of mulberry-leucaena were incubated for 24 hours in glass syringes.
Parameter recorded were gas production, in vitro true dry matter digestibility (IVTDMD), in vitro N digestibility (IVND) and
VFA production. Results of the study showed that supplementation of leucaena to mulberry decreased IVOMD, gas production
and protein digestibility in the rumen buffered medium. The mixture of mulberry and leucaena hybrid at ratio 50% resulted in
the lowest IVND than other treatment. However it increased protein digestibility in acid pepsin incubation as an estimate of
protein availability in intestine. Gas production decreased in mulberry leucaena mixtures was followed by decreased total VFA
production. Tannin derived from leucaena hybrid supplementation to mulberry at ratio 1 : 1 was most effective to decrease
protein digestion in the rumen and to increase protein digestibility in acid pepsin incubation. In conclusion mixing of hybrid
leucaena hybrid with mulberry foliage was able to protect protein degradation from mulberry in the rumen.
Key Words: Mulberry, Leucaena, Protein Digestibility, In Vitro
INTRODUCTION
The key of successful and sustainable ruminant
farming in tropical conditions is dependent on the
attempt to formulate reliable cheap feeding strategy
based on resource availability. This is due to the
scarcity and fluctuation in quantity and quality of year
round supply of conventional feeds. The situation is
exacerbated by the increase human population and
decrease land availability for forage crop production
that cause ruminants feeding depends on crop residue
and agricultural by products with “low nutritional
quality”. One of the methods to maximize the
utilization of fibrous agricultural residues is by
supplementing essential nutrients in the basal feed
to correct the nutrients imbalances. Several
JITV Vol. 21 No 1 Th. 2016: 9-18
10
supplementation strategies have been developed using
commercial concentrate, this supplementation could
improve crop residues digestibility, intake and animal
performance. However, although the above method is
effective, the using of concentrate by small farmers is
limited by cost particularly when it is imported. The
high cost of imported concentrate led to seeking for
alternative locally available forages for ruminants feed.
This effort has practical implication because it is easy to
adopt by small scale farmers. Tree foliages, shrubs and
agro-industrial by-products are important in animal
production in the tropics because they do not compete
with human food and can provide significant protein
supplements (Makkar 2003). Recently, there is
increasing interest on the use Mulberry as ruminants
feed due to its biomass production potency, palatability
and nutritive value. Supplementation of pelleted
mulberry leaves was able to improve rumen
fermentation and nutrient digestibility of cattle fed on
rice straw basal diet (Huyen et al. 2012), recently
Yulistiani et al. (2015) also reported that in urea treated
rice straw basal diet, mulberry supplementation can
replace urea and rice bran as energy and protein
sources. However, protein degradability of mulberry
was very high. After 24 hours incubation, the protein of
mulberry was degraded more than 80% in the rumen
regardless of dietary treatments of the sheep (Yulistiani
et al. 2008). Gemeda & Hassen (2015) also reported
that, in vitro incubation of mulberry (Morus alba)
produced highest NH3N among the tropical browse
plants from South Africa, indicating that protein in
mulberry was highly degradable in the rumen resulting
in the loss of valuable essential amino acid sources for
host animals (Bach et al. 2005)
There are many methods to reduce protein feed
degradability in the rumen Saddul et al. (2004) reported
that heating of mulberry foliage could reduce its protein
degradability. Compared to other treatments, Protein
protection using tannin is better and give positive
response, Getachew et al. (2008) reported addition of
quebraco tannin or tannin acid ranges from 5-15%
reduced in vitro rumen degradability of protein in
alfalfa forage.
Leucaena, one of leguminous trees can be used as
tannin source to protect protein degradability of soy
bean meal (Cortes et al. 2009). Hybrid Leucaena
developed in Malaysia has been reported to have high
content of condensed tannin (13%) (Khamseekhiew
2006) and moderate amount (2.0-4.5% DM) of
condensed tannin has a beneficial effect on protein
metabolism in ruminants and give better nutritional
value of tree fodder species (Comacho et al. 2010).
Condensed tannin decreased rumen degradation of
dietary protein and increased absorption of amino acids
in the small intestine (Barry & McNabb 1999). The
mixture of mulberry, Leucaena and Tectona grandis
leaves could result in increase rumen escape protein
(Anbarasu et al. 2004), which can be utilized by the
host animals. The objectives of this study were to
evaluate the digestibility and protein degradability in
mixture of Leucaena and mulberry by in vitro gas
production technique and to determine the best ratio of
Leucaena to mulberry in reducing protein degradation
in the rumen.
MATERIALS AND METHODS
Feed
Mulberry foliage
Mulberry grown at the experimental plot of the
Department of Animal Science, Universiti Putra
Malaysia, Serdang, Selangor, Malaysia, was harvested
after about 5-7 weeks re-growth. Foliage was air-dried
under shed for 3 days, chopped then ground using
hammer mill and passed through a 1mm sieve.
Leucaena foliage
The foliage was harvested at 8 weeks of re-growth
(from previous cutting), oven-dried at 45°C for 2 days,
chopped, ground using hammer mill and passed through
a 1mm sieve. Leucaena leucocephala local variety and
Leucaena leucocephala hybrid variety contained
condensed tannin (CT) 9.6 and 13.1% respectively
(Khamseekhiew 2006), while mulberry foliage
contained CT 0.16% (Saddul 2005).
Preparation of diets
Mulberry foliage was mixed with each of two
varieties of Leucaena (hybrid or local) at 2 levels: 25%
and 50% on DM basis as shown in Table 1 and the
nutrient composisition of the diets presented in Table 2.
In vitro OM digestibility
A 24 hours gas production test was carried out to
determine truly degradable fermented substrates (in
vitro true dry matter degradability/IVTDMD). In this
incubation, 500 mg sample was incubated in 40 ml of
medium. The medium was prepared according to
Makkar et al. (1997). Each diets treatment was
incubated in 4 syringes as replication. Gas volume was
recorded at 2, 4, 6, 8, 10 and 24 h incubation. After
terminating the incubation, five ml of supernatant from
each syringes was taken for volatile fatty acid (VFA)
analysis, prior the residue in the syringe was transferred
into a 600 ml spoutless beaker. The syringe was washed
with a total of 70 ml of NDS solution. The procedure of
Yulistiani et al. In Vitro protein digestibility and fermentability of mulberry (Morus alba)-Leucaena foliage mixed feed
11
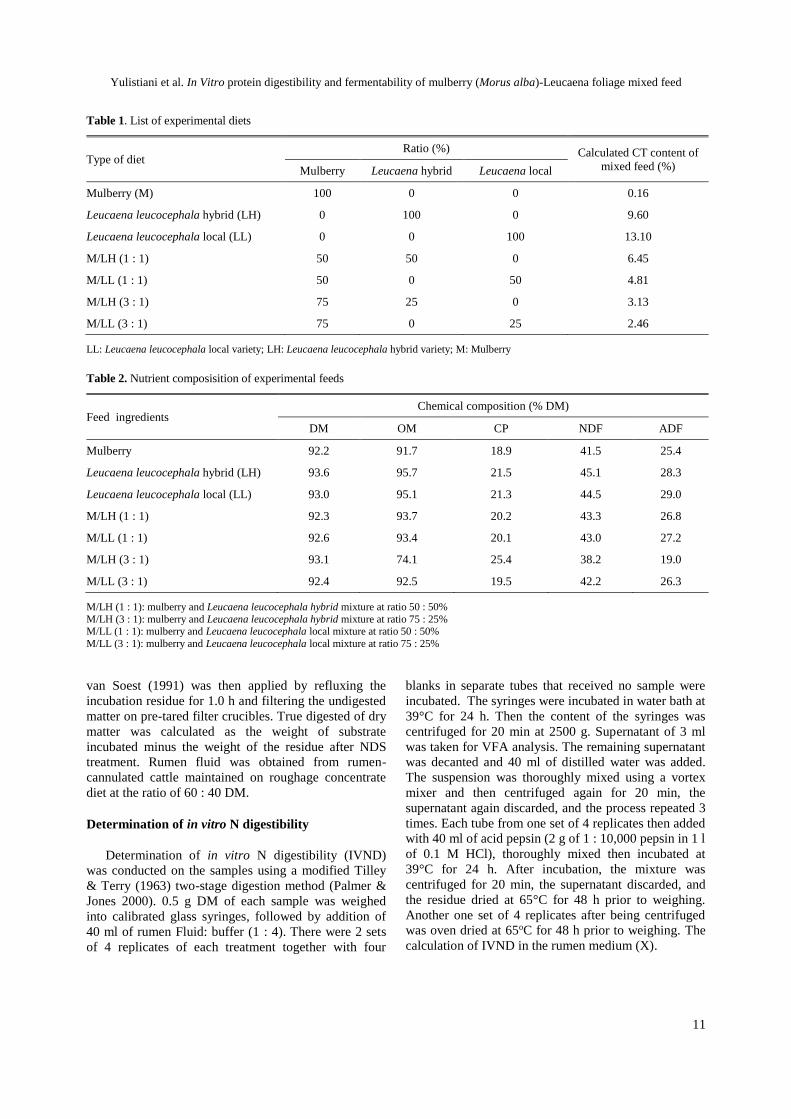
Table 1. List of experimental diets
Type of diet Ratio (%) Calculated CT content of
mixed feed (%) Mulberry Leucaena hybrid Leucaena local
Mulberry (M) 100 0 0 0.16
Leucaena leucocephala hybrid (LH) 0 100 0 9.60
Leucaena leucocephala local (LL) 0 0 100 13.10
M/LH (1 : 1) 50 50 0 6.45
M/LL (1 : 1) 50 0 50 4.81
M/LH (3 : 1) 75 25 0 3.13
M/LL (3 : 1) 75 0 25 2.46
LL: Leucaena leucocephala local variety; LH: Leucaena leucocephala hybrid variety; M: Mulberry
Table 2. Nutrient composisition of experimental feeds
Feed ingredients Chemical composition (% DM)
DM OM CP NDF ADF
Mulberry 92.2 91.7 18.9 41.5 25.4
Leucaena leucocephala hybrid (LH) 93.6 95.7 21.5 45.1 28.3
Leucaena leucocephala local (LL) 93.0 95.1 21.3 44.5 29.0
M/LH (1 : 1) 92.3 93.7 20.2 43.3 26.8
M/LL (1 : 1) 92.6 93.4 20.1 43.0 27.2
M/LH (3 : 1) 93.1 74.1 25.4 38.2 19.0
M/LL (3 : 1) 92.4 92.5 19.5 42.2 26.3
M/LH (1 : 1): mulberry and Leucaena leucocephala hybrid mixture at ratio 50 : 50%
M/LH (3 : 1): mulberry and Leucaena leucocephala hybrid mixture at ratio 75 : 25% M/LL (1 : 1): mulberry and Leucaena leucocephala local mixture at ratio 50 : 50%
M/LL (3 : 1): mulberry and Leucaena leucocephala local mixture at ratio 75 : 25%
van Soest (1991) was then applied by refluxing the
incubation residue for 1.0 h and filtering the undigested
matter on pre-tared filter crucibles. True digested of dry
matter was calculated as the weight of substrate
incubated minus the weight of the residue after NDS
treatment. Rumen fluid was obtained from rumen-
cannulated cattle maintained on roughage concentrate
diet at the ratio of 60 : 40 DM.
Determination of in vitro N digestibility
Determination of in vitro N digestibility (IVND)
was conducted on the samples using a modified Tilley
& Terry (1963) two-stage digestion method (Palmer &
Jones 2000). 0.5 g DM of each sample was weighed
into calibrated glass syringes, followed by addition of
40 ml of rumen Fluid: buffer (1 : 4). There were 2 sets
of 4 replicates of each treatment together with four
blanks in separate tubes that received no sample were
incubated. The syringes were incubated in water bath at
39°C for 24 h. Then the content of the syringes was
centrifuged for 20 min at 2500 g. Supernatant of 3 ml
was taken for VFA analysis. The remaining supernatant
was decanted and 40 ml of distilled water was added.
The suspension was thoroughly mixed using a vortex
mixer and then centrifuged again for 20 min, the
supernatant again discarded, and the process repeated 3
times. Each tube from one set of 4 replicates then added
with 40 ml of acid pepsin (2 g of 1 : 10,000 pepsin in 1 l
of 0.1 M HCl), thoroughly mixed then incubated at
39°C for 24 h. After incubation, the mixture was
centrifuged for 20 min, the supernatant discarded, and
the residue dried at 65°C for 48 h prior to weighing.
Another one set of 4 replicates after being centrifuged
was oven dried at 65oC for 48 h prior to weighing. The
calculation of IVND in the rumen medium (X).

JITV Vol. 21 No 1 Th. 2016: 9-18
12
X = A - (B-D) x 100
A
whereas calculation of total IVND (Y) was:
Y = A - (C-D)
x 100 A
A = N in sample before incubated
B = N in residue after samples incubated in the
rumen buffered medium
C = N residue after samples incubated in acid pepsin
solution
D = N residue of the blank after incubation
P = R x 100 A
where:
P = The IVND in the acid pepsin
R = total IVND (X) - IVND in the rumen (Y)
The predicted N digestibility was also calculated
from the incubation of individual feeds which then
extrapolated, this calculation was done to see the
synergistic effect of mulberry and leucaena mixture.
Chemical analyses
The feed samples were analyzed for DM, OM and
CP according to the procedures of AOAC (2000). ADF
and NDF were determined using the method of Van
Soest et al. (1991).
The volatile fatty acid (VFA) and molar proportions
of acetic, propionic and butyric acids of supernatant
from incubated samples were determined by gas
chromatography (Model G1540N, Agilent
Technologies, USA) fitted with a flame ionization
detector (FID) and a packed column 5% Thermon-3000,
Shincarbon A 60/80. Nitrogen was used as the carrier
gas at 40 ml/min and the oven temperature was
maintained at 220°C. Injection and FID temperature
were fixed at 260°C.
Statistical analysis
The experiment was carried out in a completely
randomized design and data were analysed using Anova
of SAS package version 9.1 (2002). Means were
compared by Duncan’s multiple range test.
RESULT AND DISCUSSION
Result
The effect of Leucaena mixed with mulberry on gas
production, IVDMD and amount of substrate fermented
is shown in Table 3. Gas production and true organic
matter digestibility were significantly (P<0.05) lower in
mulberry mixed with Leucaena than mulberry alone.
However, the the amount drry matter being fermented
was not significantly decreased when mulberry was
mixed with hybrid Leucaena at 50% level. Hybrid
Leucaena had significantly (P<0.05) higher gas
production, digestibility and amount of substrate
fermented than the local variety of Leucaena.
Table 4 shows the effect of mulberry mixed with
Leucaena on protein digestibility in rumen buffer
media, acid pepsin solution and total protein
digestibility. Protein degradation in the buffered rumen
media was significantly decreased in mixture of
mulberry and Leucaena compared to mulberry alone.
The decrease of protein degradation was highest in
mulberry mixed with 50% hybrid Leucaena M/LH
(1 : 1). The decrease of protein degradation in rumen
buffered media caused the increased protein
degradation in the acid pepsin incubation. The M/LH
(1 : 1) mixture had the highest protein digestion in acid
pepsin. However, other mixtures, their protein digestion
was significantly lower M/LH (3 : 1) and M/LL (3 : 1)
or similar M/LL (1 : 1) to Leucaena. Total protein
digestibility was significantly (P<0.05) decreased in
mulberry mixed Leucaena at all supplementation levels.
The total protein digestibility of M/LH (3 : 1) and M/LL
(3 : 1) was comparable to both Leucaena hybrid and
local. The protein digestibility of M/LH (1 : 1) and
M/LL (1 : 1) were comparable but they were higher
than M/LH (3 : 1) and M/LL (3 : 1) mixture.
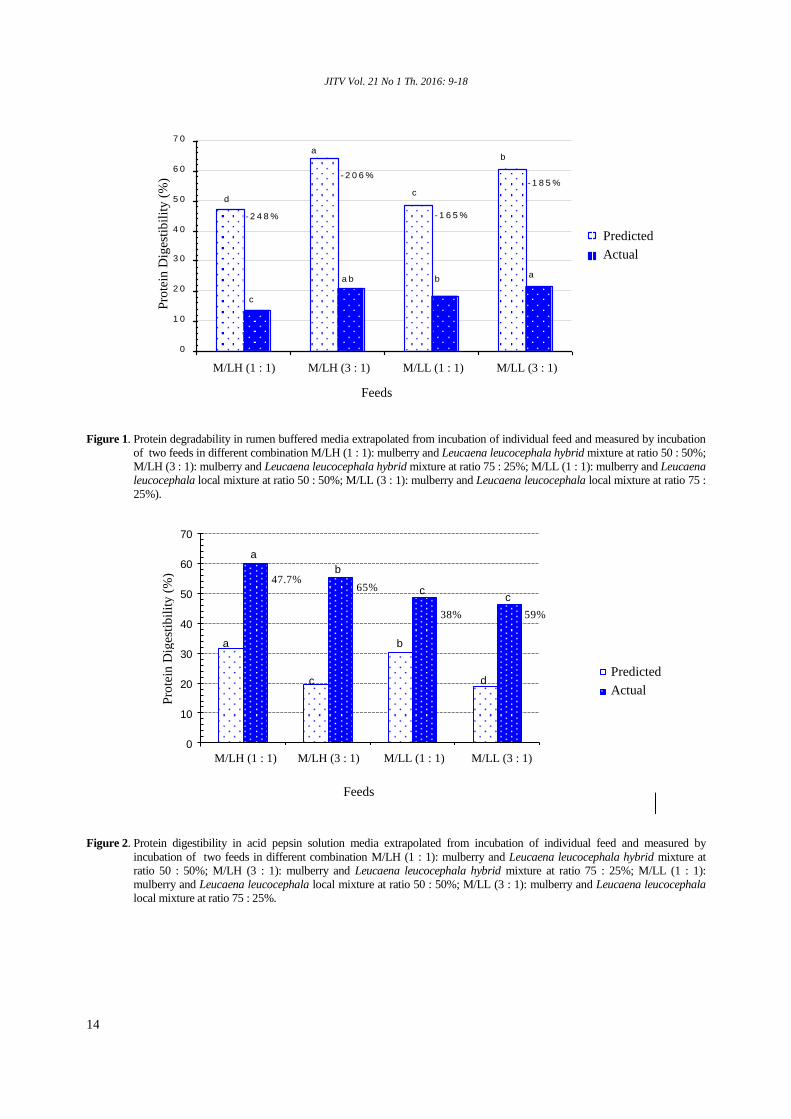
Figure 1 shows the measured and predicted value of
protein digestibility in the rumen from different mixture
of mulberry and Leucaena at different level. The
predicted values were calculated from the incubation of
individual feeds which then extrapolated. It shows that
the measured value in protein degradation of mulberry
and Leucaena mixture in buffered rumen media was
lower than the predicted value. The highest difference
between measured and predicted protein degradation
was observed at M/LH (3 : 1) (42%).
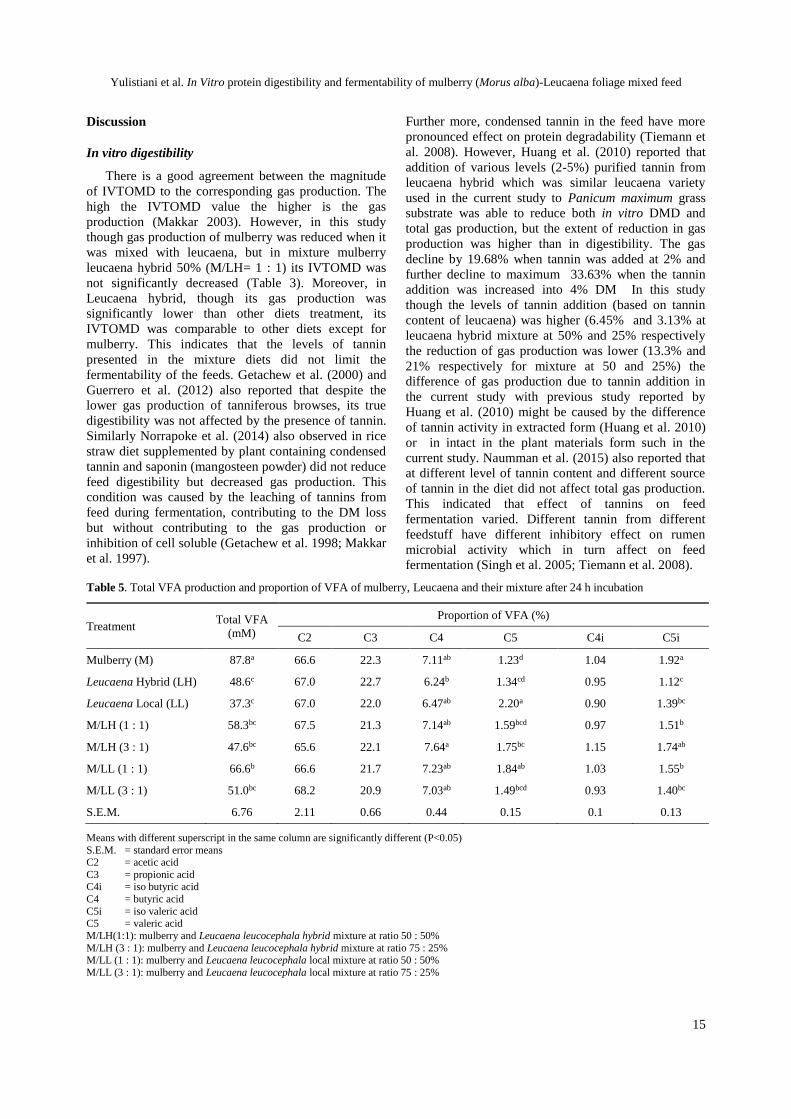
Figure 2 shows the measured and predicted values
of protein digestibility in acid pepsin from the mixture
of mulberry and Leucaena. It shows that the measured
of protein digestibility was higher than the predicted
values. The highest difference between measured and
predicted values was in the M/LH (3 : 1) (65%).
The effect of Leucaena mixed with mulberry on
VFA production is shown in Table 5. The mixture of
mulberry and Leucaena significantly decreased total
VFA compared to mulberry alone. However, the total
VFA production was not significantly different between
the mixture with different Leucaena varieties and ratios.
Total VFA production of all mixtures was not
significantly different to Leucaena variety alone except
for M/LL (1 : 1) mixture.
Yulistiani et al. In Vitro protein digestibility and fermentability of mulberry (Morus alba)-Leucaena foliage mixed feed
13
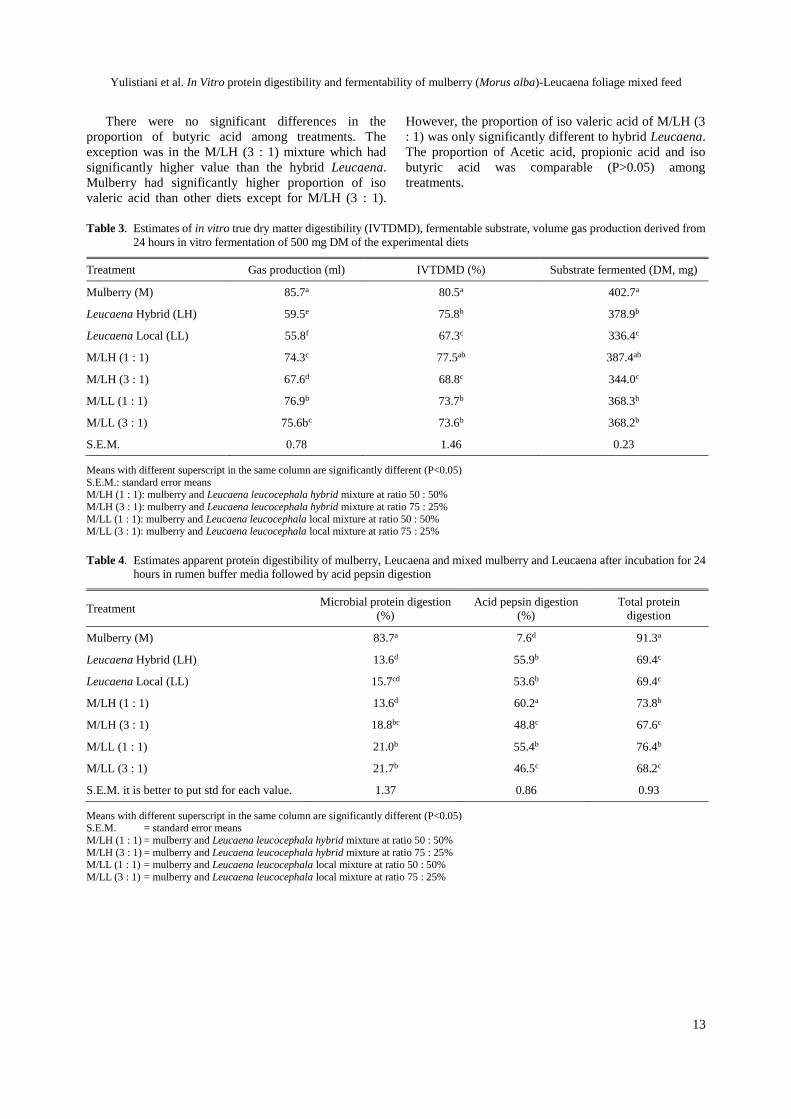
There were no significant differences in the
proportion of butyric acid among treatments. The
exception was in the M/LH (3 : 1) mixture which had
significantly higher value than the hybrid Leucaena.
Mulberry had significantly higher proportion of iso
valeric acid than other diets except for M/LH (3 : 1).
However, the proportion of iso valeric acid of M/LH (3
: 1) was only significantly different to hybrid Leucaena.
The proportion of Acetic acid, propionic acid and iso
butyric acid was comparable (P>0.05) among
treatments.
Table 3. Estimates of in vitro true dry matter digestibility (IVTDMD), fermentable substrate, volume gas production derived from
24 hours in vitro fermentation of 500 mg DM of the experimental diets
Treatment Gas production (ml) IVTDMD (%) Substrate fermented (DM, mg)
Mulberry (M) 85.7a 80.5a 402.7a
Leucaena Hybrid (LH) 59.5e 75.8b 378.9b
Leucaena Local (LL) 55.8f 67.3c 336.4c
M/LH (1 : 1) 74.3c 77.5ab 387.4ab
M/LH (3 : 1) 67.6d 68.8c 344.0c
M/LL (1 : 1) 76.9b 73.7b 368.3b
M/LL (3 : 1) 75.6bc 73.6b 368.2b
S.E.M. 0.78 1.46 0.23
Means with different superscript in the same column are significantly different (P<0.05)
S.E.M.: standard error means M/LH (1 : 1): mulberry and Leucaena leucocephala hybrid mixture at ratio 50 : 50%
M/LH (3 : 1): mulberry and Leucaena leucocephala hybrid mixture at ratio 75 : 25%
M/LL (1 : 1): mulberry and Leucaena leucocephala local mixture at ratio 50 : 50% M/LL (3 : 1): mulberry and Leucaena leucocephala local mixture at ratio 75 : 25%
Table 4. Estimates apparent protein digestibility of mulberry, Leucaena and mixed mulberry and Leucaena after incubation for 24
hours in rumen buffer media followed by acid pepsin digestion
Treatment Microbial protein digestion
(%)
Acid pepsin digestion
(%)
Total protein
digestion
Mulberry (M) 83.7a 7.6d 91.3a
Leucaena Hybrid (LH) 13.6d 55.9b 69.4c
Leucaena Local (LL) 15.7cd 53.6b 69.4c
M/LH (1 : 1) 13.6d 60.2a 73.8b
M/LH (3 : 1) 18.8bc 48.8c 67.6c
M/LL (1 : 1) 21.0b 55.4b 76.4b
M/LL (3 : 1) 21.7b 46.5c 68.2c
S.E.M. it is better to put std for each value. 1.37 0.86 0.93
Means with different superscript in the same column are significantly different (P<0.05) S.E.M. = standard error means
M/LH (1 : 1) = mulberry and Leucaena leucocephala hybrid mixture at ratio 50 : 50%
M/LH (3 : 1) = mulberry and Leucaena leucocephala hybrid mixture at ratio 75 : 25% M/LL (1 : 1) = mulberry and Leucaena leucocephala local mixture at ratio 50 : 50%
M/LL (3 : 1) = mulberry and Leucaena leucocephala local mixture at ratio 75 : 25%
JITV Vol. 21 No 1 Th. 2016: 9-18
14
d
c
a
c
b
a bb
a
0
1 0
2 0
3 0
4 0
5 0
6 0
7 0
M /L H ( 1 :1 ) M /L H ( 3 :1 ) M /L L ( 1 :1 ) M /L L ( 3 :1 )
F e e d s
Pro
tein
de
gra
da
bil
ity
(%
)
Pr e d ic te d
A c tu a l
- 2 4 8 %
- 2 0 6 %
- 1 6 5 %
- 1 8 5 %
d
c
a
c
b
a b ba
Figure 1. Protein degradability in rumen buffered media extrapolated from incubation of individual feed and measured by incubation
of two feeds in different combination M/LH (1 : 1): mulberry and Leucaena leucocephala hybrid mixture at ratio 50 : 50%;
M/LH (3 : 1): mulberry and Leucaena leucocephala hybrid mixture at ratio 75 : 25%; M/LL (1 : 1): mulberry and Leucaena
leucocephala local mixture at ratio 50 : 50%; M/LL (3 : 1): mulberry and Leucaena leucocephala local mixture at ratio 75 :
25%).
0
10
20
30
40
50
60
70
M/LH (1:1) M/LH (3:1) M/LL (1:1) M/LL (3:1)
Pro
tein
dig
est
ibil
ity (
%)
Feeds
Predicted
Actual
47.7%65%
38% 59%
a
a
c
b
b
c
d
c
Figure 2. Protein digestibility in acid pepsin solution media extrapolated from incubation of individual feed and measured by
incubation of two feeds in different combination M/LH (1 : 1): mulberry and Leucaena leucocephala hybrid mixture at
ratio 50 : 50%; M/LH (3 : 1): mulberry and Leucaena leucocephala hybrid mixture at ratio 75 : 25%; M/LL (1 : 1):
mulberry and Leucaena leucocephala local mixture at ratio 50 : 50%; M/LL (3 : 1): mulberry and Leucaena leucocephala
local mixture at ratio 75 : 25%.
Feeds
Predicted
Actual
M/LH (1 : 1) M/LH (3 : 1) M/LL (1 : 1) M/LL (3 : 1)
Feeds
M/LH (1 : 1) M/LH (3 : 1) M/LL (1 : 1) M/LL (3 : 1)
Pro
tein
Dig
esti
bil
ity
(%
) P
rote
in D
iges
tib
ilit
y (
%)
Predicted
Actual
Yulistiani et al. In Vitro protein digestibility and fermentability of mulberry (Morus alba)-Leucaena foliage mixed feed
15
Discussion
In vitro digestibility
There is a good agreement between the magnitude
of IVTOMD to the corresponding gas production. The
high the IVTOMD value the higher is the gas
production (Makkar 2003). However, in this study
though gas production of mulberry was reduced when it
was mixed with leucaena, but in mixture mulberry
leucaena hybrid 50% (M/LH= 1 : 1) its IVTOMD was
not significantly decreased (Table 3). Moreover, in
Leucaena hybrid, though its gas production was
significantly lower than other diets treatment, its
IVTOMD was comparable to other diets except for
mulberry. This indicates that the levels of tannin
presented in the mixture diets did not limit the
fermentability of the feeds. Getachew et al. (2000) and
Guerrero et al. (2012) also reported that despite the
lower gas production of tanniferous browses, its true
digestibility was not affected by the presence of tannin.
Similarly Norrapoke et al. (2014) also observed in rice
straw diet supplemented by plant containing condensed
tannin and saponin (mangosteen powder) did not reduce
feed digestibility but decreased gas production. This
condition was caused by the leaching of tannins from
feed during fermentation, contributing to the DM loss
but without contributing to the gas production or
inhibition of cell soluble (Getachew et al. 1998; Makkar
et al. 1997).
Further more, condensed tannin in the feed have more
pronounced effect on protein degradability (Tiemann et
al. 2008). However, Huang et al. (2010) reported that
addition of various levels (2-5%) purified tannin from
leucaena hybrid which was similar leucaena variety
used in the current study to Panicum maximum grass
substrate was able to reduce both in vitro DMD and
total gas production, but the extent of reduction in gas
production was higher than in digestibility. The gas
decline by 19.68% when tannin was added at 2% and
further decline to maximum 33.63% when the tannin
addition was increased into 4% DM In this study
though the levels of tannin addition (based on tannin
content of leucaena) was higher (6.45% and 3.13% at
leucaena hybrid mixture at 50% and 25% respectively
the reduction of gas production was lower (13.3% and
21% respectively for mixture at 50 and 25%) the
difference of gas production due to tannin addition in
the current study with previous study reported by
Huang et al. (2010) might be caused by the difference
of tannin activity in extracted form (Huang et al. 2010)
or in intact in the plant materials form such in the
current study. Naumman et al. (2015) also reported that
at different level of tannin content and different source
of tannin in the diet did not affect total gas production.
This indicated that effect of tannins on feed
fermentation varied. Different tannin from different
feedstuff have different inhibitory effect on rumen
microbial activity which in turn affect on feed
fermentation (Singh et al. 2005; Tiemann et al. 2008).
Table 5. Total VFA production and proportion of VFA of mulberry, Leucaena and their mixture after 24 h incubation
Treatment Total VFA
(mM)
Proportion of VFA (%)
C2 C3 C4 C5 C4i C5i
Mulberry (M) 87.8a 66.6 22.3 7.11ab 1.23d 1.04 1.92a
Leucaena Hybrid (LH) 48.6c 67.0 22.7 6.24b 1.34cd 0.95 1.12c
Leucaena Local (LL) 37.3c 67.0 22.0 6.47ab 2.20a 0.90 1.39bc
M/LH (1 : 1) 58.3bc 67.5 21.3 7.14ab 1.59bcd 0.97 1.51b
M/LH (3 : 1) 47.6bc 65.6 22.1 7.64a 1.75bc 1.15 1.74ab
M/LL (1 : 1) 66.6b 66.6 21.7 7.23ab 1.84ab 1.03 1.55b
M/LL (3 : 1) 51.0bc 68.2 20.9 7.03ab 1.49bcd 0.93 1.40bc
S.E.M. 6.76 2.11 0.66 0.44 0.15 0.1 0.13
Means with different superscript in the same column are significantly different (P<0.05)
S.E.M. = standard error means C2 = acetic acid
C3 = propionic acid C4i = iso butyric acid
C4 = butyric acid
C5i = iso valeric acid C5 = valeric acid
M/LH(1:1): mulberry and Leucaena leucocephala hybrid mixture at ratio 50 : 50%
M/LH (3 : 1): mulberry and Leucaena leucocephala hybrid mixture at ratio 75 : 25% M/LL (1 : 1): mulberry and Leucaena leucocephala local mixture at ratio 50 : 50%
M/LL (3 : 1): mulberry and Leucaena leucocephala local mixture at ratio 75 : 25%
JITV Vol. 21 No 1 Th. 2016: 9-18
16
In vitro N digestibility
The mixture of mulberry with 50% hybrid Leucaena
resulted in the lowest IVND than other treatments.
When the level of the Leucaena decreased, the N
degradability was increased by 50%, indicating that the
level of tannin content in Leucaena affect the N
degradability in the rumen (Table 4). Huang et al.
(2010) reported addition of 2% purified tannin from
Leucaea hybrid reduce degradability by 17.65% of
protein Panicum maximum grass, further increased of
tannin addition up to 4% did not resulted in further
decreased of the protein substrate. Anti nutritional
effect of tannin is exerted through reduction of feed
protein digestion and a depression of proteolytic
enzyme activities (Jones et al. 1994). A reduction in
crude protein degradability is the consequence of
condensed tannin (CT) binding to dietary constituents
and to bacteria. In addition, the CT can reduce
attachment of bacteria to plant particle (McAllister et al.
1994). Getachew et al. (2000) reported that IVDN
increased when PEG (tannin binding agent) was added
to the tannin-rich browse. The increase of the extent of
N digestibility by rumen microbial due to PEG addition
indicates the amount of protein protected by tannin
from microbial degradation. In the present study, the
protein degradability of mulberry-Leucaena mixture
was reduced compared to mulberry alone. The decrease
of protein degradability could be due to the effect of
tannin from Leucaena. Previously Williams et al.
(2011) reported that total mixed ration of sainfonin hay
based-diet contained 3.8% tannin, rumen ammonia
nitrogen content of the diet was lower compared to
alfalfa hay based-diet with low tannin content (0.2%),
the lower rumen ammonia nitrogen as indication of
protein protection by tannin in the rumen. The in vitro
protein degradability in M/LH (1 : 1) mulbery-
Leucaena mixture was lower than other mixtures
(Table 3). It shows that hybrid Leucaena has higher
effect in decreasing protein degradability than Leucaena
local (M/LL). The Leucaena varieties used in this study
was similar tree reported by Khamseekhiew (2005) and
Huang et al. (2010). Khamseekhiew (2005) reported
that hybrid Leucaena had higher CT content than
Leucaena local, which caused the lower N degradability
in the former. In addition, CT in hybrid Leucaena had
stronger binding affinity than Leucaena local (Huang
et al. 2010). The CT which have stronger affinity and
have higher molecular weight have higher ptotein
binding affinity than those with lower molecular weight
(Saminathan et al. 2015). Similar results was also
reported by Kariuki & Norton (2008) that within
Leucaena genus has different ability in protecting
protein. Moreover Cortes et al. (2009) also observed
that effect of tannin in protecting protein beside affected
by source of tannin also by ratio of tannin added.
The protein degradability of mulberry alone was
higher, however when it was mixed with leucaena the
protein degradability was reduced though the protein
content of this mixture was higher than mulberry (Table
2). The measured protein degradability was lower than
the predicted value, indicating that there was an
associative effect between mulberry and leucaena when
it was incubated together. According Getachew et al.
(2005) combination of different feed ingredients
incubated together with condition that one feed is not
independent to other feed will results in associative
effect which can be detected when the response of the
combination is not linear. This associative effect caused
by the presence of feed ingredients stimulate rumen
fermentation and consequently its affect the digestibility
of other feed ingredients. Through the positive
associative effect, the present study shows that protein
digestibility in acid pepsin was higher in the measured
values than in the predicted value. Protein availability
for digestion in the intestines (acid pepsin) increased
from only 8% in mulberry to 82% in M/LH (1 : 1)
mulberry-Leucaena mixture rate. Although the total
protein digestibility decreased from 91.3% in mulberry
to 73.8% in M/LH (1 : 1) or 76.4% in M/LL (1 : 1), the
protein digestion was available for the absorption in the
intestine. The acid pepsin digestible protein could be
regarded as a potential rumen by pass protein.
McSweeney et al. (1999) reported that in browse
(Lucerne) containing no tannin, accumulation of NH3-N
has strong correlation with N degradation. On the other
hand, in tannin containing shrub legumes had lower
potential N digestibilities in the rumen. However, a
large portion is available following the acid pepsin
digestion compared to Lucerne, this was due to protein
tannin complex would be dissociated post-ruminally.
McLeod (1974) as referred by Norton & Ahn (1997)
observed that tannin bind protein in the rumen at pH
5.8-6.8 and the linkages are strongly dependent on pH.
The linkage being stable at pH 3.5-7.0, but this tannin-
protein complexes should be dissociated in the
abomasum (pH 2.5-3.5) and in small intestine (pH 7.5-
8.5). Therefore protecting protein from digestion in the
rumen is the advantage of the presence protein-tannin
complex in the diet thereby increasing total supply of
feed protein for absorption (Makkar 2003).
VFA production
The higher total VFA production in mulberry than
other diets (Table 5) was a results from the high
IVTDMD of mulberry (Table 3) this due to VFA is one
of the products beside gases and microbial cell from
carbohydrates fermentation (Makkar 2000). Mixing
leucaena to mulberry resulted in the decreased of total
VFA production. The decrease of total VFA was also
reflected in lower IVTDMD and gas production of
Yulistiani et al. In Vitro protein digestibility and fermentability of mulberry (Morus alba)-Leucaena foliage mixed feed
17
mulberry-leucaena mixed diets (Table 3). The decrease
of fermentability these diets could be caused by the
present of tannin from leucaena. Tannin decrease
attachment of fibre digesting microbes to feed particles
(McAllister et al. 1994) therefore decrease rate of
digestion which in turn decreased VFA production.
This is consistent with the previous study that showed
the tannin content in tree browse reduced the gas and
total VFA production (Getachew et al. 2002;
Khamseekhiew 2005). However, the molar proportion
of acetic and propionic, and iso butyric acid was not
affected by treatment. On the other hand, the molar
proportion of iso-valeric in mulberry-leucaena mixed
diet was significantly decreased compared to mulberry.
The decreased of iso-valeric which mostly from
deamination of some amino acid (Copani et al. 2015) in
mixed mulberry leucaena suggest that protein of
mulberry was protected by condensed tannin from
leucaena. Simlar result was also reported by Copani et
al. (2015) in mixture of Timothy grass and Sainfonin,
and by Niderkorn et al. (2012) in mixture of cocksfood
and sainfonin.
CONCLUSION
Supplementation of Leucaena to mulberry
decreased in vitro true dry matter digestibility
(IVDMD) and decreased protein digestibility in the
buffered rumen fluid media. Leucaena supplementation
could increase protein digestibility in acid pepsin
incubation as indicator of protein availability in
intestine. Hybrid Leucaena supplementation to
mulberry at ratio 1 : 1 was the most effective level to
decrease protein digestion in the rumen and to increase
protein digestibility in acid pepsin incubation.
REFERENCES
Anbarasu C, Dutta N, Sharma K, Rawat M. 2004. Response
of goats to partial replacement of dietary protein by a
leaf meal mixture containing Leucaena leucocephala,
Morus alba and Tectona grandis. Small Rum Res.
51:47-56.
[AOAC] Association of Official Analytical Chemist. 2000.
Official method of analysis. 17th ed. Washington DC
(USA): Association of Official Analytical Chemist.
Barry TN, McNabb WC. 1999. The implications of condensed
tannins on the nutritive value of temperate forages fed
to ruminants. Br J Nutr. 81:263-272.
Williams CM, Eun JS, MacAdam JW, Young AJ, Fellner V,
Min BR. 2011. Effects of forage legumes containing
condensed tannins on methane and ammonia production
in continuous cultures of mixed ruminal
microorganisms. Anim Feed Sci Technol. 166-167:364-
372.
Camacho LM, Rojo R, Salem AZM, Mendoza GD, López D,
Tinoco JL, Albarrán B, Monta˜nez-Valdez OD. 2010. In
vitro ruminal fermentation kinetics and energy
utilization of three Mexican tree fodder species during
the rainy and dry period. Anim Feed Sci Technol.
160:110-120.
Copani G, Ginane C, Le Morvan A, Niderkorn V. 2015.
Patterns of in vitro rumen fermentation of silage
mixtures including sainfoin and red clover as bioactive
legumes. Anim Feed Sci Technol. 208:220-224.
Cortés JE, Moreno B, Pabón ML, Avila P, Kreuzer M, Hesse
HD, Carulla JE. 2009. Effects of purified condensed
tanins extracted from Calliandra, Flemingia and
Leucaena on ruminal and postruminal degradation of
soybean meal as estimated in vitro. Anim Feed Sci
Technol. 151:194-204.
Gemeda BS, Hassen A. 2015. Effect of tannin and species
variation on In vitro digestibility, gas, and methane
production of tropical browse plants. Asian-Australas J
Anim Sci. 28:188-199.
Getachew G, Pittroff W, Putnam DH, Dandekar A, Goyal S,
DePeters EJ. 2008. The influence of addition of gallic
acid, tannic acid, or quebracho tannins to alfalfa hay on
in vitro rumen fermentation and microbial protein
synthesis. Anim Feed Sci Technol. 140:444-461.
Getachew G., Blummel M, Makkar HPS, Becker K. 1998. In
vitro gas measuring techniques for assessment of
nutritional quality of feeds: a review. Anim Feed Sci
Technol. 72:261-281.
Getachew G, DePeters EJ, Robinson PH, Fadel JG. 2005. Use
of an in vitro rumen gas production technique to
evaluate microbial fermentation of ruminant feeds and
its impact on fermentation products. Anim Feed Sci
Technol. 123-124:547-559.
Getachew G, Makkar HPS, Becker K. 2000. Effect of
polyethylene glycol on in vitro degradability of nitrogen
and microbial protein synthesis from tannin-rich browse
and herbaceous legumes. Br J Nutr. 84:73-83.
Getachew G, Makkar HPS, Becker K. 2002. Tropical
browses: contents of phenolic compound and
stoichiometric relationship between short chain fatty
acid and in vitro gas production. J Agr Sci Camb.
139:341-352.
Huang XD, Liang JB, Tan HY, Yahya R, Khamseekhiew B,
Ho YW. 2010. Molecular weight and protein binding
affinity of Leucaena condensed tannins and their effects
on in vitro fermentation parameters. Anim Feed Sci
Technol. 159:81-87.
Huyen NT, Wanapat M, Navanukraw C. 2012. Effect of
Mulberry leaf pellet (MUP) supplementation on rumen
fermentation and nutrient digestibility in beef cattle fed
on rice straw-based diets. Anim Feed Sci Technol.
175:8-15.
Jones GA, McAllister TA, Mair AD, Cheng KJ. 1994. Effect
of sainfonin (Onobrychis viciaefolia Scop) condensed
tannin on growth and proteolysis by four strains of
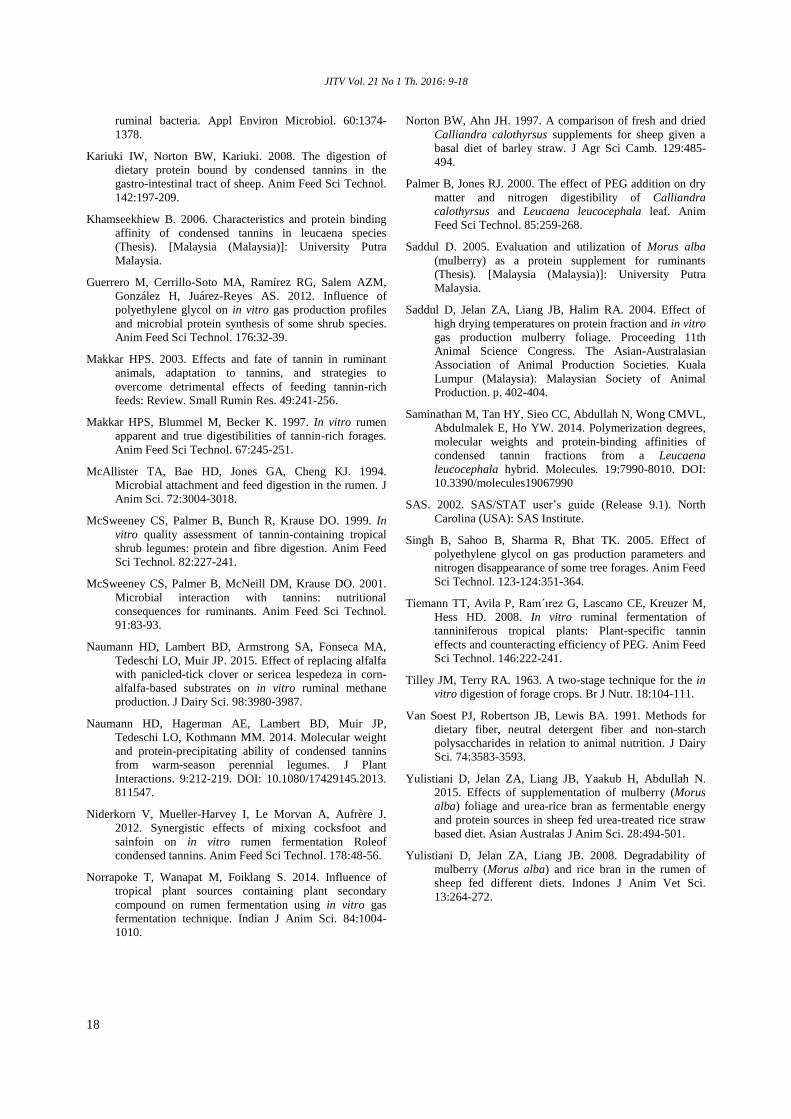
JITV Vol. 21 No 1 Th. 2016: 9-18
18
ruminal bacteria. Appl Environ Microbiol. 60:1374-
1378.
Kariuki IW, Norton BW, Kariuki. 2008. The digestion of
dietary protein bound by condensed tannins in the
gastro-intestinal tract of sheep. Anim Feed Sci Technol.
142:197-209.
Khamseekhiew B. 2006. Characteristics and protein binding
affinity of condensed tannins in leucaena species
(Thesis). [Malaysia (Malaysia)]: University Putra
Malaysia.
Guerrero M, Cerrillo-Soto MA, Ramírez RG, Salem AZM,
González H, Juárez-Reyes AS. 2012. Influence of
polyethylene glycol on in vitro gas production profiles
and microbial protein synthesis of some shrub species.
Anim Feed Sci Technol. 176:32-39.
Makkar HPS. 2003. Effects and fate of tannin in ruminant
animals, adaptation to tannins, and strategies to
overcome detrimental effects of feeding tannin-rich
feeds: Review. Small Rumin Res. 49:241-256.
Makkar HPS, Blummel M, Becker K. 1997. In vitro rumen
apparent and true digestibilities of tannin-rich forages.
Anim Feed Sci Technol. 67:245-251.
McAllister TA, Bae HD, Jones GA, Cheng KJ. 1994.
Microbial attachment and feed digestion in the rumen. J
Anim Sci. 72:3004-3018.
McSweeney CS, Palmer B, Bunch R, Krause DO. 1999. In
vitro quality assessment of tannin-containing tropical
shrub legumes: protein and fibre digestion. Anim Feed
Sci Technol. 82:227-241.
McSweeney CS, Palmer B, McNeill DM, Krause DO. 2001.
Microbial interaction with tannins: nutritional
consequences for ruminants. Anim Feed Sci Technol.
91:83-93.
Naumann HD, Lambert BD, Armstrong SA, Fonseca MA,
Tedeschi LO, Muir JP. 2015. Effect of replacing alfalfa
with panicled-tick clover or sericea lespedeza in corn-
alfalfa-based substrates on in vitro ruminal methane
production. J Dairy Sci. 98:3980-3987.
Naumann HD, Hagerman AE, Lambert BD, Muir JP,
Tedeschi LO, Kothmann MM. 2014. Molecular weight
and protein-precipitating ability of condensed tannins
from warm-season perennial legumes. J Plant
Interactions. 9:212-219. DOI: 10.1080/17429145.2013.
811547.
Niderkorn V, Mueller-Harvey I, Le Morvan A, Aufrère J.
2012. Synergistic effects of mixing cocksfoot and
sainfoin on in vitro rumen fermentation Roleof
condensed tannins. Anim Feed Sci Technol. 178:48-56.
Norrapoke T, Wanapat M, Foiklang S. 2014. Influence of
tropical plant sources containing plant secondary
compound on rumen fermentation using in vitro gas
fermentation technique. Indian J Anim Sci. 84:1004-
1010.
Norton BW, Ahn JH. 1997. A comparison of fresh and dried
Calliandra calothyrsus supplements for sheep given a
basal diet of barley straw. J Agr Sci Camb. 129:485-
494.
Palmer B, Jones RJ. 2000. The effect of PEG addition on dry
matter and nitrogen digestibility of Calliandra
calothyrsus and Leucaena leucocephala leaf. Anim
Feed Sci Technol. 85:259-268.
Saddul D. 2005. Evaluation and utilization of Morus alba
(mulberry) as a protein supplement for ruminants
(Thesis). [Malaysia (Malaysia)]: University Putra
Malaysia.
Saddul D, Jelan ZA, Liang JB, Halim RA. 2004. Effect of
high drying temperatures on protein fraction and in vitro
gas production mulberry foliage. Proceeding 11th
Animal Science Congress. The Asian-Australasian
Association of Animal Production Societies. Kuala
Lumpur (Malaysia): Malaysian Society of Animal
Production. p. 402-404.
Saminathan M, Tan HY, Sieo CC, Abdullah N, Wong CMVL,
Abdulmalek E, Ho YW. 2014. Polymerization degrees,
molecular weights and protein-binding affinities of
condensed tannin fractions from a Leucaena
leucocephala hybrid. Molecules. 19:7990-8010. DOI:
10.3390/molecules19067990
SAS. 2002. SAS/STAT user’s guide (Release 9.1). North
Carolina (USA): SAS Institute.
Singh B, Sahoo B, Sharma R, Bhat TK. 2005. Effect of
polyethylene glycol on gas production parameters and
nitrogen disappearance of some tree forages. Anim Feed
Sci Technol. 123-124:351-364.
Tiemann TT, Avila P, Ram´ırez G, Lascano CE, Kreuzer M,
Hess HD. 2008. In vitro ruminal fermentation of
tanniniferous tropical plants: Plant-specific tannin
effects and counteracting efficiency of PEG. Anim Feed
Sci Technol. 146:222-241.
Tilley JM, Terry RA. 1963. A two-stage technique for the in
vitro digestion of forage crops. Br J Nutr. 18:104-111.
Van Soest PJ, Robertson JB, Lewis BA. 1991. Methods for
dietary fiber, neutral detergent fiber and non-starch
polysaccharides in relation to animal nutrition. J Dairy
Sci. 74:3583-3593.
Yulistiani D, Jelan ZA, Liang JB, Yaakub H, Abdullah N.
2015. Effects of supplementation of mulberry (Morus
alba) foliage and urea-rice bran as fermentable energy
and protein sources in sheep fed urea-treated rice straw
based diet. Asian Australas J Anim Sci. 28:494-501.
Yulistiani D, Jelan ZA, Liang JB. 2008. Degradability of
mulberry (Morus alba) and rice bran in the rumen of
sheep fed different diets. Indones J Anim Vet Sci.
13:264-272.
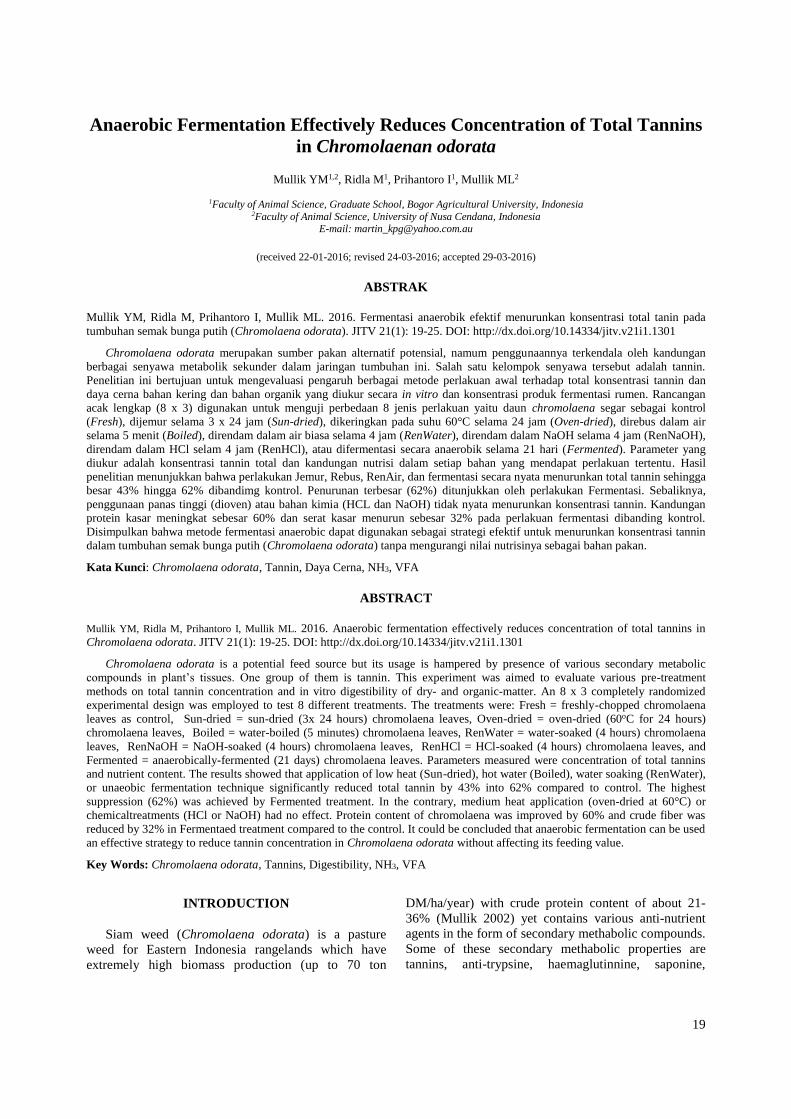
Mullik et al. Anaerobic fermentation effectively reduces concentration of total tannins in Chromolaena odorata
19
Anaerobic Fermentation Effectively Reduces Concentration of Total Tannins
in Chromolaenan odorata
Mullik YM1,2, Ridla M1, Prihantoro I1, Mullik ML2
1Faculty of Animal Science, Graduate School, Bogor Agricultural University, Indonesia 2Faculty of Animal Science, University of Nusa Cendana, Indonesia
E-mail: [email protected]
(received 22-01-2016; revised 24-03-2016; accepted 29-03-2016)
ABSTRAK
Mullik YM, Ridla M, Prihantoro I, Mullik ML. 2016. Fermentasi anaerobik efektif menurunkan konsentrasi total tanin pada
tumbuhan semak bunga putih (Chromolaena odorata). JITV 21(1): 19-25. DOI: http://dx.doi.org/10.14334/jitv.v21i1.1301
Chromolaena odorata merupakan sumber pakan alternatif potensial, namum penggunaannya terkendala oleh kandungan
berbagai senyawa metabolik sekunder dalam jaringan tumbuhan ini. Salah satu kelompok senyawa tersebut adalah tannin.
Penelitian ini bertujuan untuk mengevaluasi pengaruh berbagai metode perlakuan awal terhadap total konsentrasi tannin dan
daya cerna bahan kering dan bahan organik yang diukur secara in vitro dan konsentrasi produk fermentasi rumen. Rancangan
acak lengkap (8 x 3) digunakan untuk menguji perbedaan 8 jenis perlakuan yaitu daun chromolaena segar sebagai kontrol
(Fresh), dijemur selama 3 x 24 jam (Sun-dried), dikeringkan pada suhu 60°C selama 24 jam (Oven-dried), direbus dalam air
selama 5 menit (Boiled), direndam dalam air biasa selama 4 jam (RenWater), direndam dalam NaOH selama 4 jam (RenNaOH),
direndam dalam HCl selam 4 jam (RenHCl), atau difermentasi secara anaerobik selama 21 hari (Fermented). Parameter yang
diukur adalah konsentrasi tannin total dan kandungan nutrisi dalam setiap bahan yang mendapat perlakuan tertentu. Hasil
penelitian menunjukkan bahwa perlakukan Jemur, Rebus, RenAir, dan fermentasi secara nyata menurunkan total tannin sehingga
besar 43% hingga 62% dibandimg kontrol. Penurunan terbesar (62%) ditunjukkan oleh perlakukan Fermentasi. Sebaliknya,
penggunaan panas tinggi (dioven) atau bahan kimia (HCL dan NaOH) tidak nyata menurunkan konsentrasi tannin. Kandungan
protein kasar meningkat sebesar 60% dan serat kasar menurun sebesar 32% pada perlakuan fermentasi dibanding kontrol.
Disimpulkan bahwa metode fermentasi anaerobic dapat digunakan sebagai strategi efektif untuk menurunkan konsentrasi tannin
dalam tumbuhan semak bunga putih (Chromolaena odorata) tanpa mengurangi nilai nutrisinya sebagai bahan pakan.
Kata Kunci: Chromolaena odorata, Tannin, Daya Cerna, NH3, VFA
ABSTRACT
Mullik YM, Ridla M, Prihantoro I, Mullik ML. 2016. Anaerobic fermentation effectively reduces concentration of total tannins in
Chromolaena odorata. JITV 21(1): 19-25. DOI: http://dx.doi.org/10.14334/jitv.v21i1.1301
Chromolaena odorata is a potential feed source but its usage is hampered by presence of various secondary metabolic
compounds in plant’s tissues. One group of them is tannin. This experiment was aimed to evaluate various pre-treatment
methods on total tannin concentration and in vitro digestibility of dry- and organic-matter. An 8 x 3 completely randomized
experimental design was employed to test 8 different treatments. The treatments were: Fresh = freshly-chopped chromolaena
leaves as control, Sun-dried = sun-dried (3x 24 hours) chromolaena leaves, Oven-dried = oven-dried (60oC for 24 hours)
chromolaena leaves, Boiled = water-boiled (5 minutes) chromolaena leaves, RenWater = water-soaked (4 hours) chromolaena
leaves, RenNaOH = NaOH-soaked (4 hours) chromolaena leaves, RenHCl = HCl-soaked (4 hours) chromolaena leaves, and
Fermented = anaerobically-fermented (21 days) chromolaena leaves. Parameters measured were concentration of total tannins
and nutrient content. The results showed that application of low heat (Sun-dried), hot water (Boiled), water soaking (RenWater),
or unaeobic fermentation technique significantly reduced total tannin by 43% into 62% compared to control. The highest
suppression (62%) was achieved by Fermented treatment. In the contrary, medium heat application (oven-dried at 60°C) or
chemicaltreatments (HCl or NaOH) had no effect. Protein content of chromolaena was improved by 60% and crude fiber was
reduced by 32% in Fermentaed treatment compared to the control. It could be concluded that anaerobic fermentation can be used
an effective strategy to reduce tannin concentration in Chromolaena odorata without affecting its feeding value.
Key Words: Chromolaena odorata, Tannins, Digestibility, NH3, VFA
INTRODUCTION
Siam weed (Chromolaena odorata) is a pasture
weed for Eastern Indonesia rangelands which have
extremely high biomass production (up to 70 ton
DM/ha/year) with crude protein content of about 21-
36% (Mullik 2002) yet contains various anti-nutrient
agents in the form of secondary methabolic compounds.
Some of these secondary methabolic properties are
tannins, anti-trypsine, haemaglutinnine, saponine,
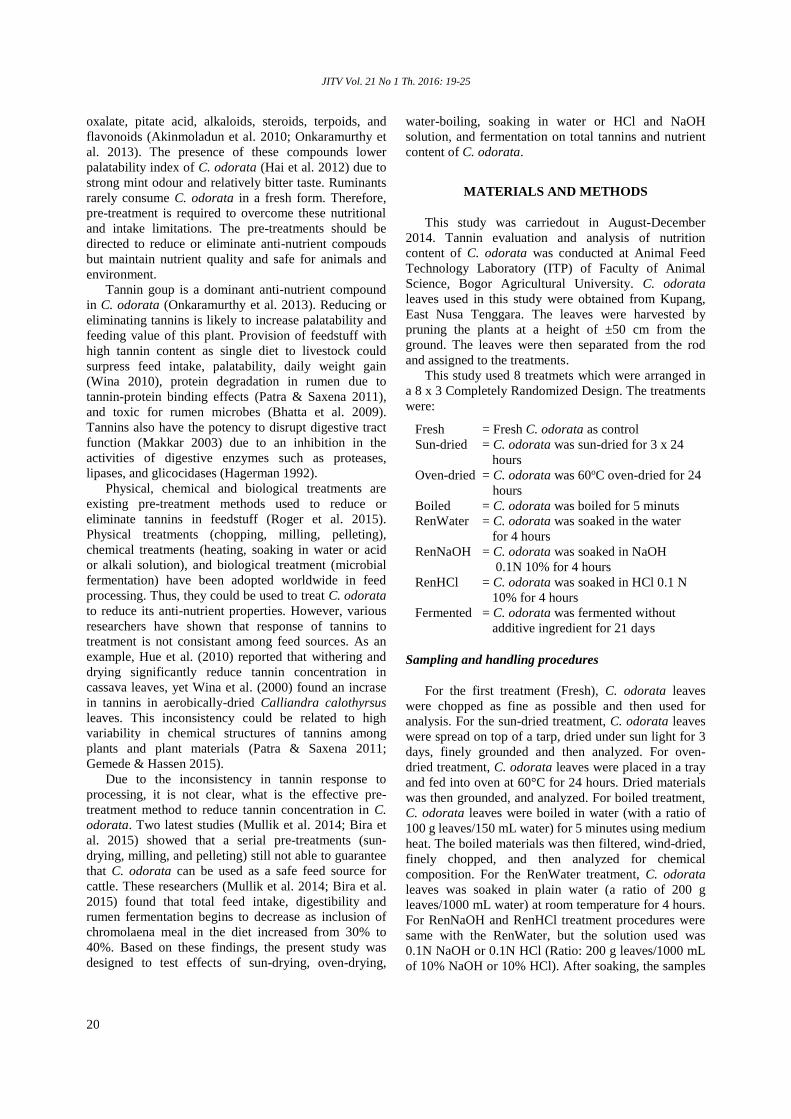
JITV Vol. 21 No 1 Th. 2016: 19-25
20
oxalate, pitate acid, alkaloids, steroids, terpoids, and
flavonoids (Akinmoladun et al. 2010; Onkaramurthy et
al. 2013). The presence of these compounds lower
palatability index of C. odorata (Hai et al. 2012) due to
strong mint odour and relatively bitter taste. Ruminants
rarely consume C. odorata in a fresh form. Therefore,
pre-treatment is required to overcome these nutritional
and intake limitations. The pre-treatments should be
directed to reduce or eliminate anti-nutrient compouds
but maintain nutrient quality and safe for animals and
environment.
Tannin goup is a dominant anti-nutrient compound
in C. odorata (Onkaramurthy et al. 2013). Reducing or
eliminating tannins is likely to increase palatability and
feeding value of this plant. Provision of feedstuff with
high tannin content as single diet to livestock could
surpress feed intake, palatability, daily weight gain
(Wina 2010), protein degradation in rumen due to
tannin-protein binding effects (Patra & Saxena 2011),
and toxic for rumen microbes (Bhatta et al. 2009).
Tannins also have the potency to disrupt digestive tract
function (Makkar 2003) due to an inhibition in the
activities of digestive enzymes such as proteases,
lipases, and glicocidases (Hagerman 1992).
Physical, chemical and biological treatments are
existing pre-treatment methods used to reduce or
eliminate tannins in feedstuff (Roger et al. 2015).
Physical treatments (chopping, milling, pelleting),
chemical treatments (heating, soaking in water or acid
or alkali solution), and biological treatment (microbial
fermentation) have been adopted worldwide in feed
processing. Thus, they could be used to treat C. odorata
to reduce its anti-nutrient properties. However, various
researchers have shown that response of tannins to
treatment is not consistant among feed sources. As an
example, Hue et al. (2010) reported that withering and
drying significantly reduce tannin concentration in
cassava leaves, yet Wina et al. (2000) found an incrase
in tannins in aerobically-dried Calliandra calothyrsus
leaves. This inconsistency could be related to high
variability in chemical structures of tannins among
plants and plant materials (Patra & Saxena 2011;
Gemede & Hassen 2015).
Due to the inconsistency in tannin response to
processing, it is not clear, what is the effective pre-
treatment method to reduce tannin concentration in C.
odorata. Two latest studies (Mullik et al. 2014; Bira et
al. 2015) showed that a serial pre-treatments (sun-
drying, milling, and pelleting) still not able to guarantee
that C. odorata can be used as a safe feed source for
cattle. These researchers (Mullik et al. 2014; Bira et al.
2015) found that total feed intake, digestibility and
rumen fermentation begins to decrease as inclusion of
chromolaena meal in the diet increased from 30% to
40%. Based on these findings, the present study was
designed to test effects of sun-drying, oven-drying,
water-boiling, soaking in water or HCl and NaOH
solution, and fermentation on total tannins and nutrient
content of C. odorata.
MATERIALS AND METHODS
This study was carriedout in August-December
2014. Tannin evaluation and analysis of nutrition
content of C. odorata was conducted at Animal Feed
Technology Laboratory (ITP) of Faculty of Animal
Science, Bogor Agricultural University. C. odorata
leaves used in this study were obtained from Kupang,
East Nusa Tenggara. The leaves were harvested by
pruning the plants at a height of ±50 cm from the
ground. The leaves were then separated from the rod
and assigned to the treatments.
This study used 8 treatmets which were arranged in
a 8 x 3 Completely Randomized Design. The treatments
were:
Fresh = Fresh C. odorata as control
Sun-dried = C. odorata was sun-dried for 3 x 24
hours
Oven-dried = C. odorata was 60oC oven-dried for 24
hours
Boiled = C. odorata was boiled for 5 minuts
RenWater = C. odorata was soaked in the water
for 4 hours
RenNaOH = C. odorata was soaked in NaOH
0.1N 10% for 4 hours
RenHCl = C. odorata was soaked in HCl 0.1 N
10% for 4 hours
Fermented = C. odorata was fermented without
additive ingredient for 21 days
Sampling and handling procedures
For the first treatment (Fresh), C. odorata leaves
were chopped as fine as possible and then used for
analysis. For the sun-dried treatment, C. odorata leaves
were spread on top of a tarp, dried under sun light for 3
days, finely grounded and then analyzed. For oven-
dried treatment, C. odorata leaves were placed in a tray
and fed into oven at 60°C for 24 hours. Dried materials
was then grounded, and analyzed. For boiled treatment,
C. odorata leaves were boiled in water (with a ratio of
100 g leaves/150 mL water) for 5 minutes using medium
heat. The boiled materials was then filtered, wind-dried,
finely chopped, and then analyzed for chemical
composition. For the RenWater treatment, C. odorata
leaves was soaked in plain water (a ratio of 200 g
leaves/1000 mL water) at room temperature for 4 hours.
For RenNaOH and RenHCl treatment procedures were
same with the RenWater, but the solution used was
0.1N NaOH or 0.1N HCl (Ratio: 200 g leaves/1000 mL
of 10% NaOH or 10% HCl). After soaking, the samples
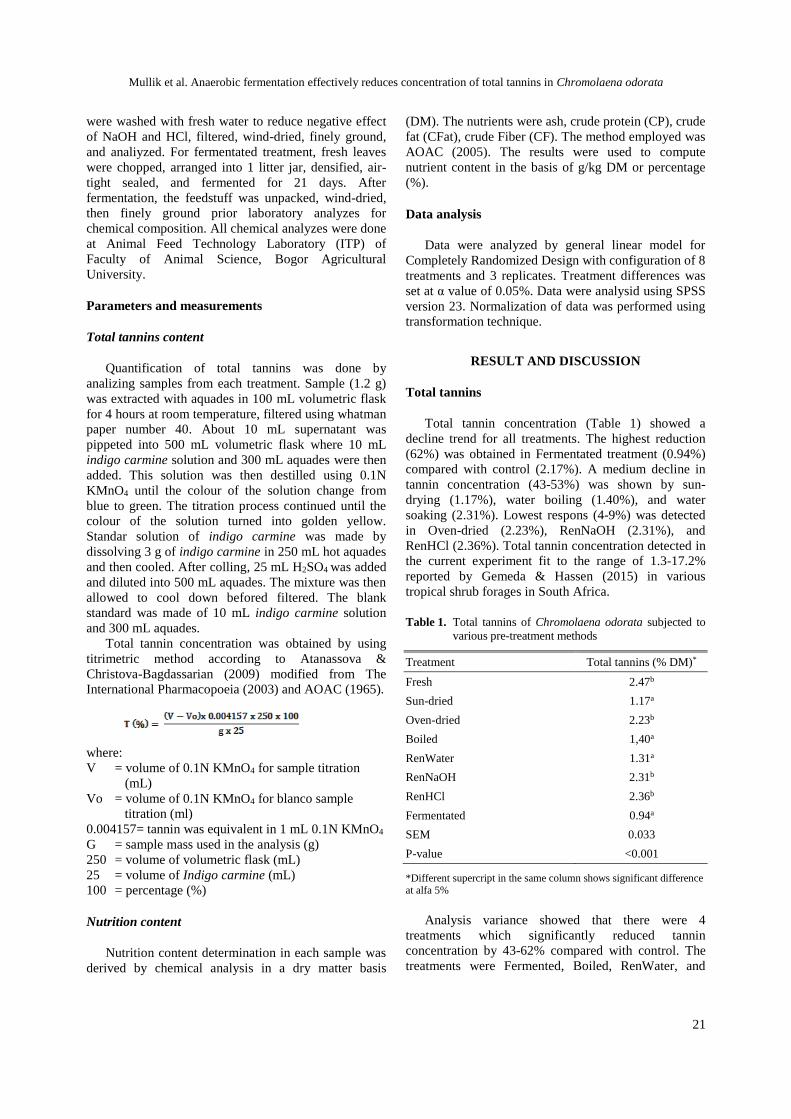
Mullik et al. Anaerobic fermentation effectively reduces concentration of total tannins in Chromolaena odorata
21
were washed with fresh water to reduce negative effect
of NaOH and HCl, filtered, wind-dried, finely ground,
and analiyzed. For fermentated treatment, fresh leaves
were chopped, arranged into 1 litter jar, densified, air-
tight sealed, and fermented for 21 days. After
fermentation, the feedstuff was unpacked, wind-dried,
then finely ground prior laboratory analyzes for
chemical composition. All chemical analyzes were done
at Animal Feed Technology Laboratory (ITP) of
Faculty of Animal Science, Bogor Agricultural
University.
Parameters and measurements
Total tannins content
Quantification of total tannins was done by
analizing samples from each treatment. Sample (1.2 g)
was extracted with aquades in 100 mL volumetric flask
for 4 hours at room temperature, filtered using whatman
paper number 40. About 10 mL supernatant was
pippeted into 500 mL volumetric flask where 10 mL
indigo carmine solution and 300 mL aquades were then
added. This solution was then destilled using 0.1N
KMnO4 until the colour of the solution change from
blue to green. The titration process continued until the
colour of the solution turned into golden yellow.
Standar solution of indigo carmine was made by
dissolving 3 g of indigo carmine in 250 mL hot aquades
and then cooled. After colling, 25 mL H2SO4 was added
and diluted into 500 mL aquades. The mixture was then
allowed to cool down befored filtered. The blank
standard was made of 10 mL indigo carmine solution
and 300 mL aquades.
Total tannin concentration was obtained by using
titrimetric method according to Atanassova &
Christova-Bagdassarian (2009) modified from The
International Pharmacopoeia (2003) and AOAC (1965).
where:
V = volume of 0.1N KMnO4 for sample titration
(mL)
Vo = volume of 0.1N KMnO4 for blanco sample
titration (ml)
0.004157= tannin was equivalent in 1 mL 0.1N KMnO4
G = sample mass used in the analysis (g)
250 = volume of volumetric flask (mL)
25 = volume of Indigo carmine (mL)
100 = percentage (%)
Nutrition content
Nutrition content determination in each sample was
derived by chemical analysis in a dry matter basis
(DM). The nutrients were ash, crude protein (CP), crude
fat (CFat), crude Fiber (CF). The method employed was
AOAC (2005). The results were used to compute
nutrient content in the basis of g/kg DM or percentage
(%).
Data analysis
Data were analyzed by general linear model for
Completely Randomized Design with configuration of 8
treatments and 3 replicates. Treatment differences was
set at α value of 0.05%. Data were analysid using SPSS
version 23. Normalization of data was performed using
transformation technique.
RESULT AND DISCUSSION
Total tannins
Total tannin concentration (Table 1) showed a
decline trend for all treatments. The highest reduction
(62%) was obtained in Fermentated treatment (0.94%)
compared with control (2.17%). A medium decline in
tannin concentration (43-53%) was shown by sun-
drying (1.17%), water boiling (1.40%), and water
soaking (2.31%). Lowest respons (4-9%) was detected
in Oven-dried (2.23%), RenNaOH (2.31%), and
RenHCl (2.36%). Total tannin concentration detected in
the current experiment fit to the range of 1.3-17.2%
reported by Gemeda & Hassen (2015) in various
tropical shrub forages in South Africa.
Table 1. Total tannins of Chromolaena odorata subjected to
various pre-treatment methods
Treatment Total tannins (% DM)*
Fresh 2.47b
Sun-dried 1.17a
Oven-dried 2.23b
Boiled 1,40a
RenWater 1.31a
RenNaOH 2.31b
RenHCl 2.36b
Fermentated 0.94a
SEM 0.033
P-value <0.001
*Different supercript in the same column shows significant difference at alfa 5%
Analysis variance showed that there were 4
treatments which significantly reduced tannin
concentration by 43-62% compared with control. The
treatments were Fermented, Boiled, RenWater, and

JITV Vol. 21 No 1 Th. 2016: 19-25
22
Sun-dried. Other treatments (Oven-dried, RenNaOH,
and RenHCl) had no significant effect (P>0.05)
compared with control. These results are in line with
Roger et al. (2005) who showed that fermentation
reduces total tannin concentration. Conclusive
explanation about treatment effects on tannin
concentration could not be established in the present
experiment since types of tannins were not
characterized or have not been published elsewere.
However, reduction in tannin concentration in
Fermented treatment could be the effect of chemical
activities from enzymes produced by various
fermentative microbes. These enzymes might damage
tannin-enzyme and protein-tannin complex to release
protein from tannin in the residual solution (Taylor &
Duodu 2014). Furthermore, there was a possibility of
continuing hydrolysis of soluble tannins by microbial
enzymes to form other compounds during anaerobic
fermentation.
A siginificant decreased in tannin concentration for
water-boiled and water-soaked treatments could be
related to dissolution of soluble tannin compounds
(gallotannin goup) in the water. Unknown tannin
composition (types of tannins) in the present study
results in unknown proportion of soluble tannins
compared with other three groups (ellagitannins,
complex tannins dan condensed tannins). Dissolution of
tannins in the water in the current study could be
possible since most gallotannins have polyol residues
derived from D-glucose (Khanbabaee & Van Ree
2001). Khanbabaee & Van Ree (2001) reported that
gallotonnins type 2,3,4,6-tetra-O-galloyl-D-
glucopyranose and 1,2,3,4,6-penta-O-galloyl-β-D-
glucopyranose are intermediary key compounds which
have a crucial role in biosythesis of almost all phenolic
compounds in plants. Available water would be a good
medium for chemical reactions related to tannin
hydrolysis.
Low heat application (sun-dried) also significantly
reduced tannin concentration by about 53% in C.
odorata. This is clearly different from medium heat
application (oven-dried at 60°C) which showed an
insignificant effect (only 9%) compared with control.
Lesser tannin reduction (3.4%) was also reported by
Rakić et al. (2004) who oven-drying oak skin at 60°C
temperature. Djordjevic (1995) proposed that important
reactions occur due to heating are hydrolysis, oxidation,
polymerization, and interaction of composition and
decomposition processes.
Different response of tannins to heat application
could be explained by using statement of Hagerman
(2002) that tannins reactions is highly affected by
temperature. High temperature stimulate condensation
reaction of tannins to form complex bond with other
compounds. Slow drying at a low temperature, such as
in Sun-dried treatment, might allow hydrolysis and
decomposition of tannins (Makkar & Becker 1996). As
tannins have hydrophobic bonds, it will form a strong
ionic bond at high temperature (Haslam 1989). This
might be the explanation to the insignificant reduction
in Ovened-dried treatment.
No different in NaOH or HCl treatmet with control
showed that tannins are less reactive to strong acid or
basic solution. Lack of tannin response to strong acid
(2M HCl) and base (2M NaOH) was also reported by
Osawa & Walsh (1993) for tanic acid. This might
related to ionization in hydroxyl phenol group in
tannins (Hagerman 2002) hence protecting it from
hydrolysiss processes.
Nutrition content
The effects of various treatments on nutrient content
of C. odorata is shown in Table 2. There are three
essential nutrient variables determining biological value
of C. odonata which were affected by treatment i.e
organic matter, crude protein, and crude fiber. Data in
Table 2 shows that the highest organic matter was
obtained in RenHCl treatment (922 g/kg DM) and the
lowest one was in Fermented treatment (879 g/kg DM).
Organic matter usually has high hydrogen thus increase
opportunity for tannins to bind to other organic
materials such as cellulose and hemicellulose
(McSweeney et al. 2001). Theoritically, soaking of feed
materials in acid solution, such as HCl, could cause
hydrolysis of complex chemical bonds in organic
compunds including tannin-protein or tannin-other
organic materials. However, acid or basic affect in the
present study was very low compared with other
treatments. Data in Table 1 showed that HCl ability to
reduce tannins in C. odorata was much lower than
Fermented treatment. This possibly related to mode of
hydrolysis between the two treatments. For RenHcl
treatment, the only mode of hydrolysis was by acid
effect since most of fermentative microbes might have
died in strong acid solution. In contrast, hydrolysis
processes in Fermented treatment is mostly done by a
variety of fermentative microbes. Released organic
matter in HCl treatment might not undergo further
decomposition. In the Fremented treatment, even
though it has a high ability to reduce tannins causing
high amount of organic matter released from the
complex, this organic matter might undergo further
hydrolysis by microbe during fermentation hence
reduces its proportion in the residu. In such a condition,
addition of soluble carbohydrates (SCs) is trongly
recommended. The SCs are important in fermentation
processes as it will improve nutrient value and reduce
Mullik et al. Anaerobic fermentation effectively reduces concentration of total tannins in Chromolaena odorata
23
Table 2. Nutrient content of C. odorata due to treatments
Treatment Nutrient content
Dry material Organic material Crude protein Crude fat Crude fiber BETN
------------------------------ g/kg DM ----------------------------------
Fresh 266b 908c 174f 30e 127c 578a
Sun-dried 839a 866f 258b 48d 108b 452d
Oven-dried 863a 888d 250c 67c 99b 471bc
Boiled 245b 914b 196e 106a 135c 477b
RenWater 271b 914b 228c 109a 145d 433e
RenNaOH 247b 867f 199de 62c 130c 474b
RenHCl 183c 922a 202d 107a 151d 462cd
Fermented 243b 879e 290a 75b 86a 429e
SEM 0.002 0.002 0.012 0.006 0.006 0.002
P-value <0.001 <0.001 <0.001 <0.001 <0.001 <0.001
*Different supercrpit in the same column showssignificant different at alfa value of 5%
dry material losses (McDonald et al. 1991). The
strategy is very crucial in silage making particularly for
feedstuff with low C : N ratio.
The highest crude protein content (290 g/kg DM)
was shown in Fermented treament and the lowest (174
g/kg DM) was in control (Fresh). Data in Table 2 shows
that all treatments increased protein content above
control. This might be explained by data in Table 1 that
all treatments were able to decrease tannin
concentration hence an increase in tannin free proteins.
Fermentation increase crude protein of C. odorata due
to its capability disrupt tannin-protein complex.
Besides, chemical activity of fermentative microbes and
lysis of tennin-enzyme and tannin-protein complexes
(Taylor & Duodu 2014). It is presumed that an increase
in protein content in the Fermented treatment is likely
due to contribution of microbial proteins synthesized
during fermentation process. Crude protein content in
water-boiled treatment (196 g/kg DM) was higher than
control but lower than other treatments. This possibly
related to dissolution of tannin-protein complex. Heat
from boiling likely to cause denaturation of protein
hence releases proteins from protein-tannin linkage in
C. odorata.
Lowest crude fiber (86 g/kg DM) was found in
fermented treatment and the highest (145 g/kg DM)
content was in RenWater treatment. A decline of crude
fibre in Fermented ttreatment likely to be caused by
fiber-digested bacterial activities during fermentation.
Among cellulotic species, there are fiber digested
bacteria to diegst cellulose, hemicellulose, and starch
(Kana-Hau et al. 2005). Water soaking (RenWater) had
a very poor capability to reduce crude fiber content.
Fiber consists of cellulose, hemicellulose, and lignine.
Usualy, cellulose and hemicellulose would be degraded
with the help of cellulose and hemicellulose enzymes,
whereas water has no direct effect on crude fiber
degradtion.
Crude fat of fresh C. odorata was 30 g/kg DM and
tended to increase after treatment. Highest fat content
detected in RenWater treatment (109 g/kg DM). This
increase might be caused by a significant loss in non-fat
compounds, particularly carhohydrates due to
fermentation and other processes. Reduction in non-fat
organic compounds will automatically increase
proportion of crude fat in feed materials.
BETN consist of highly digestible carbohydrate
compounds. BETN content of fresh C. odorata was 578
g/kg DM. Lowest BETN content (429 g/kg DM) was in
the Fermented treatment. BETN content in fresh C.
odorata was very high since all soluble carbohydrates
have not been degraded, whereas in the Fermented
treatment, soluble carbohydrates have been degraded by
microbes during the fermentation processes. Provision
of additives such as soluble carbohydrate is highly
recommended in fermentation (McDonald et al. 1991).
CONCLUSION
Fermentation was the most effective technique to
reduce tannin concentration yet improves nutrient value
of C. odorata. Fermentation decreased total tannin
concentration by 62%, reduced crude fiber from 127
g/kg DM into 86 g/kg DM (32% improvement), and
increased crude protein from content from 175 g/kg DM
to 290 g/kg DM (60% improvement). This study
showed that anaerobic fermentation is the best method
JITV Vol. 21 No 1 Th. 2016: 19-25
24
to treat C. odorata to improve its biological value as a
potential animal feed.
REFERENCES
Atanassova M, Christova-Bagdassarian V. 2009. Short
Communication: Determination of tannins content by
titrimetric method for comparison of different plant
species. J Univ Chem Technol Metallurgy. 44:413-415.
Akinmoladun AC, Obuotor EM, Farombi EO. 2010.
Evaluation of antioxidant and free radical scavenging
capacities of some Nigerian indigenous medicinal
plants. J Med Food. 13:444-451.
Bhatta R, Uyeno Y, Tajima K, Takenaka A, Yabumoto Y,
Nonaka I, Enishi O, Kurihara M. 2009. Difference in
the nature of tannins on in vitro ruminal methane and
volatile fatty acid production and on methanogenic
archaea and protozoal populations. J Dairy Sci.
92:5512-5522.
Bira GA, Mullik ML, Jelantik IGN, Maranatha G, Mullik
YM, Sudarma I-MA, Dahlanuddin. 2015. Incremental
levels of C. odorata in complete diet does not impar
intake, rumen fermentation and microbial crude protein
synthesis in cattle. Proceeding 3rd International Seminar
on Animal Industry. Bogor (Indones): Bogor
Agricultural University. p. 229-232.
Borchani C, Besbes S, Masmoudi M, Blecker C, Paquot M,
Attia H. 2011. Effect of drying methods on physico-
chemical and antioxidant properties of date fibre
concentrates. Food Chemist. 125:1194-1201.
Djordjevic S, Pace CP, Stankovich MT, Kim JJ. 1995. Three-
dimensional structure of butyryl-CoA dehydrogenase
from Megasphaera elsdenii. Biochemistry. 34:2163-
2171.
Gemede BS, Hassen A. 2015. Effects of tannin and species
variation on in vitro digestibility, gas and methane
production of tropical browse plants. AJAS. 28:188-
199.
Hagerman AE. 1992. Tannin-protein interaction. In: Chi-Tang
H, ChangYL, Mou-Tuan H, editors. Phenolic
compounds in food and their effect on health I.
Washington DC (USA): American Chemical Society. p.
237-247.
Hagerman AE. 2002. Tannins chemistry. Tannin Handbook.
Oxford (USA): Miami University.
Hai PV, Everts H, Tien DV, Schonewille JT, Hendriks WH.
2012. Feeding Chromonaela odorata during pregnancy
to goat dams affects acceptance of this feedstuff by their
offspring. Appl Anim Behav Sci. 137:30-35.
Haslam E. 1989. Chemistry and significance of condensed
tannins. In: Plant polyphenols. Hemingway RW,
Karchesy JJ, editors. Plenum. Cambridge (UK):
Cambridge University Press.
Hue KT, Van DTT, Ledin I, Spörndly E, Wredle E. 2010.
Effect of feeding fresh, wilted and sun-dried foliage
from cassava (Manihot esculenta Crantz) on the
performance of lambs and their intake of hydrogen
cyanide. Livest Sci. 131:155-161.
Kana-Hau D, Nenobais M, Nulik J, Katipana NGF. 2005.
Pengaruh probiotik terhadap kemampuan cerna mikroba
rumen sapi Bali. Mathius I-W, Bahri S, Tarmudji,
Prasetyo LH, Triwulanningsih E, Tiesnamurti B,
Sendow I, Suhardono. Prosiding Seminar Nasional
Teknologi Peternakan dan Veteriner. Bogor (Indones):
Pusat Penelitian dan Pengembangan Peternakan. p. 171-
180.
Khanbabaee K, Van Ree T. 2001. Tannins: Classification and
definition. Nat Prod Rep. 18:641-649.
Makkar HPS, Becker K. 1996. Effect of pH, temperature, and
time on inactivation of tannins and possible implications
in detannification studies. J Agric Food Chem.44:1291-
1295.
Makkar HPS. 2003. Quantification of tannins in three and
shrub foliage. A laboratory manual. Dordrech
(Nethrelands): Kluwer Academic Publisher.
McDonald P, Henderson AR, Heron SJE. 1991. The
biochemistry of silage. 2nd ed. Marlow (USA):
Chalcombe Publication.
McSweeney CS, Palmer B, Mcneil DM, Krause DO. 2001.
Microbial interactions with tannins: nutritional
consequences for ruminants. Anim Feed Sci Technol.
91:83-93.
Mullik ML. 2002. Laporan penelitian: Strategi pemanfaatan
semak bunga putih (Chromolaena odorata) untuk
meningkatkan produksi ternak dan pendapatan peternak
di daerah lahan kering. Kerjasama Fakultas Peternakan
Universitas Nusa Cendana dan Kementrian Riset dan
Teknologi Republik Indonesia melalui Riset
Pengembangan Kapasitas.
Mullik ML, Jelantik I-G, Mullik YM, Dahlanuddin, Wirawan
I-GO, Permana B. 2014. Pemanfaatan semak bunga
putih (Chromolaena odorata) sebagai pakan lokal
sumber protein untuk ternak sapi: konsumsi, daya cerna
dan fermentasi rumen. Zain M, Sowmen S, Rusfidra,
Rusdimansyah, Wati R, Amizar R, editors. Prosiding
Seminar Nasional III HITPI. Padang (Indones):
Universitas Andalas. p. 312-320.
Ngozi II, Ikewuchi CJ, Ikewuchi. 2009. Chemical profile of
Chromolaena odorata Linn (King and Robinson)
leaves. Pak J Nutr. 8:521-524.
Onkaramurthy M, Veerapur VP, Thippeswamy BS,
Madhusudana Reddy TN, Rayappa H, Badami S. 2013.
Anti-diabetic and anti-cataract effects of Chromolaena
odorata Linn in streptozotocin-induced diabetic rats. J
Ethnopharmacol. 145:363-372.
Osawa R, Walsh TP. 1993. Effects of acidic and alkaline
treatments on tannic acid and its binding property to
protein. J Agric Food Chem. 41:704-707.
Patra AK, Saxena J. 2011. Exploitation of dietary tannins to
improve rumen metabolism and ruminant nutrition. J
Sci Food Agric. 91:24-37.
Mullik et al. Anaerobic fermentation effectively reduces concentration of total tannins in Chromolaena odorata
25
Rakić S, Maletić R, Perunović M, Svrzić G. 2004. Influence
of thermal treatment on tannin content and antioxidation
effect of oak acorn quercus cerris extract. J Agric Sci.
49:97-107.
Roger T, Léopold TN, Funtong MC. 2015. Nutritional
properties and antinutritional factors of corn paste
(kutukutu) fermented by different strains of lactic acid
bacteria. Int J Food Sci. 2015:1-13.
Taylor JR, Duodu KG. 2014. Effects of processing sorghum
and millets on their phenolic phytochemicals and the
implications of this to the health-enhancing properties
of sorghum and millet food and beverage products.
95:225-237.
Wina E. 2010. Utilization of tannin containing shrub legumes
for small ruminant production in Indonesia. Wartazoa.
20:21-30.
Wina E, Tangedjaja B, Palmer B. 2000. The effect of drying
condition on condensed tannin estimater (CT) in
Calliandra calothyrsus. Brooker JD, editor. Tannins in
Livestock and Human Nutrition. ACIAR Proceeding.
92:106-110.
JITV Vol. 21 No 1 Th. 2016: 26-33
26
Follicular Dynamic and Repeatability of Follicular Wave Development in
Peranakan Ongole (PO) Cattle
Imron M1, Supriatna I2, Amrozi2, Setiadi MA2
1Livestock Embryo Center, Cipelang, Bogor PO Box 485 Bogor 16004 2Division of Reproduction and Toxicology, Department of Pathology and Reproduction Clinic, Faculty of Veterinary, Bogor Agricultural
University, Jl. Agatis, Kampus IPB Dramaga-Bogor 16680
E-mail: [email protected]
(received 11-01-2016; revised 29-02-2016; accepted 07-03-2016)
ABSTRAK
Imron M, Supriatna I, Amrozi, Setiadi MA. 2016. Dinamika folikel dan repeatabilitas pertumbuhan gelombang folikel pada sapi
peranakan ongole (PO). JITV 21(1): 26-33. DOI: http://dx.doi.org/10.14334/jitv.v21i1.1349
Perlakuan superovulasi pada sapi PO (Bos indicus) memiliki respon yang rendah dibandingkan dengan rumpun Bos taurus
yang mungkin berhubungan dengan perbedaan dinamika folikel antara kedua rumpun sapi. Penelitian ini dilakukan untuk
mengetahui dinamika folikel dan repeatabilitas pola pertumbuhan gelombang folikel pada sapi PO. Pada tahap awal, penelitian
menggunakan 9 ekor sapi PO berumur 5-7 tahun. Pengamatan dilakukan dengan menggunakan ultrasonografi (USG) setiap hari.
Hasil pengamatan menunjukkan sapi PO memiliki pola 3 (66%) dan 4 (34%) gelombang pertumbuhan folikel dalam satu siklus.
Gelombang folikel pertama dari pola gelombang 3 dan 4 terlihat berturut-turut hari ke 0,4±0,9 dan 1,4±1,1 relatif terhadap
terjadinya ovulasi. Gelombang kedua terjadi berturut-turut hari ke 9,8±1,5 dan 7,4±1,9 pada pola 3 dan 4 gelombang, relatif
terhadap terjadinya ovulasi. Pola 3 gelombang memiliki durasi folikel dominan lebih panjang (11,6±1,5 hari) dibandingkan pola
4 gelombang (10±2,9 hari). Kecepatan pertumbuhan folikel dominan tidak berbeda antara pola 3 dan 4 gelombang folikel
(0,87±0,23 dan 0,94±0.25 mm/hari). Diameter folikel ovulatori antara pola 3 dan 4 gelombang folikel tidak berbeda yaitu
berturut-turut 12,24±0,71 dan 12,30±0,22 mm. Diameter CL juga tidak berbeda antara pola 3 dan 4 gelombang folikel, yaitu
18,94±0,47 dan 19,44±0,87 mm. Pengamatan repeatabilitas pola gelombang yang dilakukan menggunakan 6 ekor menunjukkan
sapi PO memiliki repeatabilitas tinggi pada pola gelombang (0,88) dan jumlah folikel yang berkembang (0,91). Penelitian ini
menunjukkan data dinamika perkembangan folikel, pola gelombang dan repeatabilitasnya yang diharapkan membantu
mendesain protokol perlakuan superovulasi atau teknologi reproduksi yang lain berbasis dinamika folikel sapi PO agar
memperoleh respon yang lebih baik.
Kata Kunci: Sapi PO, Gelombang Folikel, Repeatabilitas, Interovulatori Interval
ABSTRACT
Imron M, Supriatna I, Amrozi, Setiadi MA. 2016. Follicular dynamic and repeatability of follicular wave development in
Peranakan Ongole (PO) Cattle. JITV 21(1): 26-33. DOI: http://dx.doi.org/10.14334/jitv.v21i1.1349
Superovulation treatment on PO cattle (Bos indicus) was less responsive compared to Bos taurus breed. It might due to the
difference of their follicular dynamic. This study was conducted to investigate the follicular dynamics and its repeatability in PO
cattle. Follicular dynamics observations conducted on 9 cows trough ultrasound scanning every day. Observations of wave
patterns repeatability were performed in 6 cows which its wave pattern already known on the next consecutive IOI. Research
result indicated that PO cattle had 3 (66%) and 4-waves (34%) pattern. The first wave of 3 and 4-waves pattern emerged on day -
0.4+0.9 and 1.4+1.1 respectively. The second wave of 3 and 4-wave pattern emerged on day 9.8+1.5 and 7.4+1.9 respectively.
The pattern of 3 waves has a longer follicle dominant duration (11.6+1.5 day) in the first wave of estrous cycle, compared with 4
waves pattern (10+2.92 and 7+1.00 day respectively). The growth rate of dominant follicle was not different significantly
between the 3 and 4-waves pattern (0.87+0.23 and 0.94+0.25 mm/day respectively). Similarly, ovulatory follicle diameter
between 3 and 4-waves pattern was also not different significantly (12.24+12.34 and 12.30+12.23 mm respectively).
Observation of wave patterns repeatability in 6 PO cows indicated that PO cattle had high repeatability in follicular wave pattern
(0.88) and the number of growing follicle was 0.91. This study resulted data for dynamic of follicular development, wave
pattern, its repeatability which be expected to design the protocol of superovulation treatment or other reproduction technologies
based on follicular dynamic to improve its result in PO cattle.
Key Words: PO Cattle, Follicular Wave, Repeatability, Interovulatory Interval
Imron et al. Follicular dynamic and repeatability of follicular wave development in Peranakan Ongole (PO) cattle
27
INTRODUCTION
Follicular wave was identified by growth of a small
group follicle with diameter by 3-4 mm (Taylor &
Rajamahendran 1991). Wave growth pattern of follicle
might be observed in prepubertal (Melvin et al. 1999),
during pregnancy (lactating period) (Taylor &
Rajamahendran 1991), post-partum (Murphy et al.
1990), and during estrus cycle (Roche et al. 1999).
Growth of follicular wave was began with increase of
concentration of FSH serum and followed by sudden
growth of 8-41 small follicles in 2-3 days (Ginther et al.
1997). One follicle would be selected to continuously
grow to be dominant follicle (DF), meanwhile the
smaller follicles would be subordinate follicle (SF) and
would undergo an atresia. If there was a luteolysis in
the growing-phase DF, follicle would undergo final
maturation process continued by ovulation. If there was
no lutheolysis in the growing DF, the DF would
undergo an atresia (Vasenna et al. 2003; Jaiswal et al.
2004; Adam et al. 2008).
Most of cattle breed showed 2 and 3 follicular wave
pattern in one estrous cycle (Adam et al. 2008) although
sometimes showed 1, 4, and 5 follicular wave pattern
(Bleach et al. 2004; Viana et al. 2000). Follicular
dynamic was one of research subjects which have been
much studied in Europe breed (Bos taurus) but
information of zebu cattle (Bos indicus) was very
limited. Bó et al. (2003) has reviewed that reproduction
characteristic of B. indicus cattle was different from B.
taurus such as in length of estrous cycle, estrous time,
estrous behavior, growth of dominant follicle and CL.
Superovulation program at Cipelang Livestock
Embryo Center (LET) performed to PO cattle (Bos
indicus) as donor showed lower ration of transferable
embryo per total embryo collected (1.5 embryos) than
Angus, Simmental and Limousine cattle (Bos taurus)
which had ratio by 4.75, 3.37 and 2.96 embryos
respectively (BET 2012). Hormone injection in
superovulation was undifferentiated between donor
from Bos taurus (Simmental and Limousine cattle) and
donor from Bos indicus (PO cattle). Bó & Mapletoft
(2014) said that response of superovulation would be
optimal if follicle super-stimulation treatment was
started in the beginning of follicular growth wave
emergence. One day earlier or later gonadotropin
treatment from initial follicular wave would decrease
superovulation response compared to starting treatment
right at the time of the initial follicular wave emergence
(Bó et al. 2008). It was assumed that there was a
relation of difference of reproduction characteristic
between both cattle breeds especially in follicular wave
pattern with the obstacles faced in superovulation
program in PO cattle. Information of characteristic of
ovulary dynamic and its repeatability are needed to
optimize superovulation program in PO cattle.
This study was conducted to determine
characteristic of ovulary dynamic during estrous cycle
and repeatability rate of follicular growth wave pattern
in Peranakan Ongole (PO) cattle.
MATERIALS AND METHODS
Materials
In this study 9 five-seven years old PO cows with
body weight of 375-450 kg were used. All cows had
Body Condition Value (BCV) ranged in 2.7-3.2 of scale
1-5 with normal estrous cycle. Diet was provided as 30-
40 kg of grass per head per day and 2-3 kg of
commercial diet per head per day.
Ovulation synchronization
This study was started by ovulation synchronization
to synchronize initial observation of ovulary dynamic
through installation of intra-vaginal progesterone
preparate (Cuemate®, consisted of 1.56 mg
progesterone in 2 pod silicon, Bioniche Animal Health
(A/Asia) Pty.Ltd., Australia) followed by injection of
100 µg GnRH (Fertagyl®, Intervet Schering-Plough
Animal Health, German) in the first day. Cuemate® was
entered into vagina for 7 days using special applicator
oiled by isotonic gel. PGF2α (Prostavet® C, 5 mg of
etiprostone per 2 ml of solution; Virbac Animal Health,
France) was injected intramuscularly along with
Cuemate® releasing in vagina. Two days later, 100 µg
GnRH (Fertagyl®, Intervet Schering-Plough Animal
Health, German) was added intramuscularly to induce
ovulation synchronization.
Observation of follicular dynamic
Observation of follicular dynamic was performed
once a day at the same time and operator using portable
ultrasonic (EasyScan Lite, England) equipped with
goggle monitor and probe with dynamic frequency by
4-8 Mhz. The main unit of ultrasound was connected to
computer and data were recorded in video version.
Measurement of diameter of follicle was conducted
using Microsoft image tool. Daily observation using
ultrasound was started when PO cattle injected by
PGF2α. One inter-ovulatory interval (IOI) was defined
as time period between 1 ovulation with the next
ovulation. First ovulation observed after ovulation
synchronization was assumed as day-0 in 1 IOI.
In the initial step, observation was conducted to
obtain characteristic of follicular dynamic and for wave
pattern in 1 IOI mapping. Nine cows were used in the
initial study. To obtain repeatability of follicular wave
growth, observation of follicular dynamic was
continued in the next1 IOI without a break using 6 cows
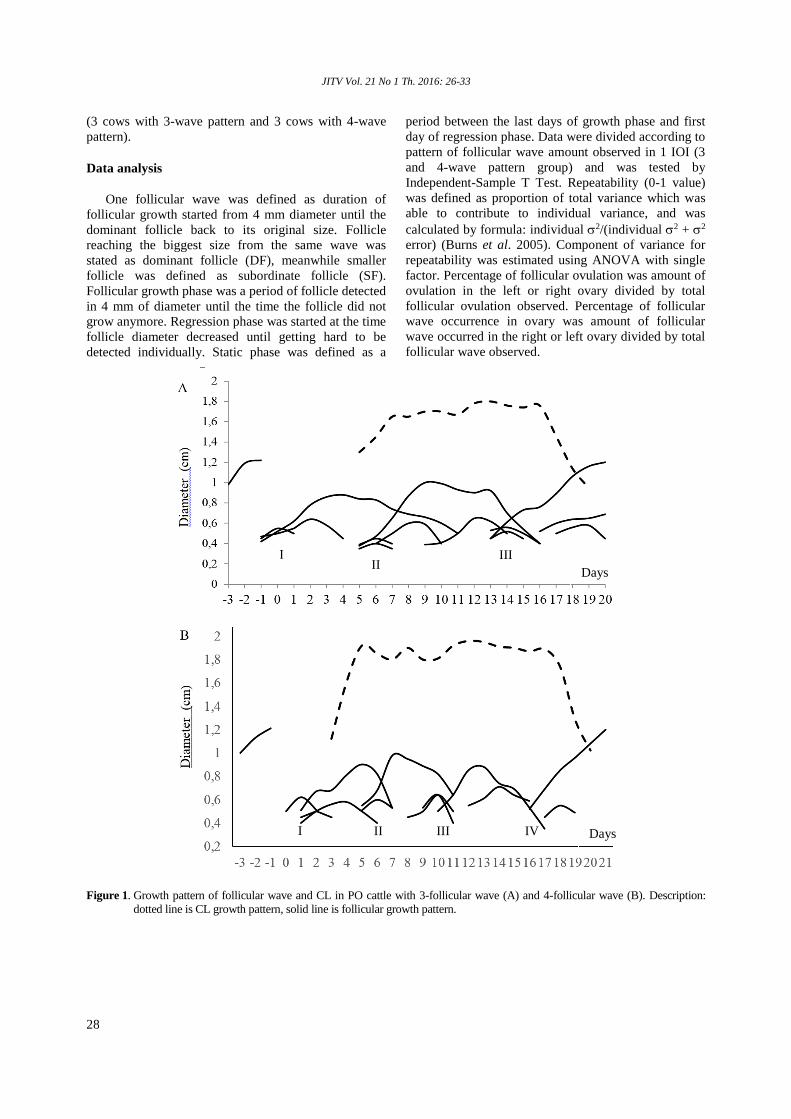
JITV Vol. 21 No 1 Th. 2016: 26-33
28
(3 cows with 3-wave pattern and 3 cows with 4-wave
pattern).
Data analysis
One follicular wave was defined as duration of
follicular growth started from 4 mm diameter until the
dominant follicle back to its original size. Follicle
reaching the biggest size from the same wave was
stated as dominant follicle (DF), meanwhile smaller
follicle was defined as subordinate follicle (SF).
Follicular growth phase was a period of follicle detected
in 4 mm of diameter until the time the follicle did not
grow anymore. Regression phase was started at the time
follicle diameter decreased until getting hard to be
detected individually. Static phase was defined as a
period between the last days of growth phase and first
day of regression phase. Data were divided according to
pattern of follicular wave amount observed in 1 IOI (3
and 4-wave pattern group) and was tested by
Independent-Sample T Test. Repeatability (0-1 value)
was defined as proportion of total variance which was
able to contribute to individual variance, and was
calculated by formula: individual 2/(individual 2 + 2
error) (Burns et al. 2005). Component of variance for
repeatability was estimated using ANOVA with single
factor. Percentage of follicular ovulation was amount of
ovulation in the left or right ovary divided by total
follicular ovulation observed. Percentage of follicular
wave occurrence in ovary was amount of follicular
wave occurred in the right or left ovary divided by total
follicular wave observed.
Figure 1. Growth pattern of follicular wave and CL in PO cattle with 3-follicular wave (A) and 4-follicular wave (B). Description:
dotted line is CL growth pattern, solid line is follicular growth pattern.
I II
III
I II III IV Days
Days
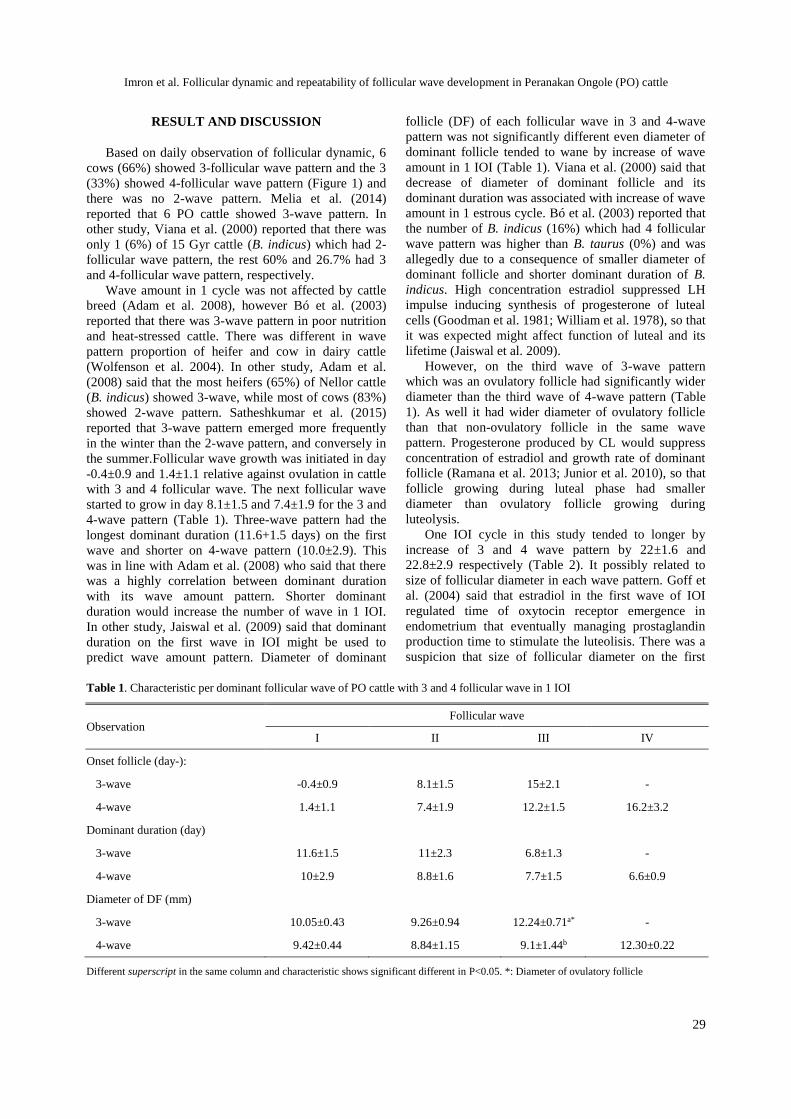
Imron et al. Follicular dynamic and repeatability of follicular wave development in Peranakan Ongole (PO) cattle
29
RESULT AND DISCUSSION
Based on daily observation of follicular dynamic, 6
cows (66%) showed 3-follicular wave pattern and the 3
(33%) showed 4-follicular wave pattern (Figure 1) and
there was no 2-wave pattern. Melia et al. (2014)
reported that 6 PO cattle showed 3-wave pattern. In
other study, Viana et al. (2000) reported that there was
only 1 (6%) of 15 Gyr cattle (B. indicus) which had 2-
follicular wave pattern, the rest 60% and 26.7% had 3
and 4-follicular wave pattern, respectively.
Wave amount in 1 cycle was not affected by cattle
breed (Adam et al. 2008), however Bó et al. (2003)
reported that there was 3-wave pattern in poor nutrition
and heat-stressed cattle. There was different in wave
pattern proportion of heifer and cow in dairy cattle
(Wolfenson et al. 2004). In other study, Adam et al.
(2008) said that the most heifers (65%) of Nellor cattle
(B. indicus) showed 3-wave, while most of cows (83%)
showed 2-wave pattern. Satheshkumar et al. (2015)
reported that 3-wave pattern emerged more frequently
in the winter than the 2-wave pattern, and conversely in
the summer.Follicular wave growth was initiated in day
-0.4±0.9 and 1.4±1.1 relative against ovulation in cattle
with 3 and 4 follicular wave. The next follicular wave
started to grow in day 8.1±1.5 and 7.4±1.9 for the 3 and
4-wave pattern (Table 1). Three-wave pattern had the
longest dominant duration (11.6+1.5 days) on the first
wave and shorter on 4-wave pattern (10.0±2.9). This
was in line with Adam et al. (2008) who said that there
was a highly correlation between dominant duration
with its wave amount pattern. Shorter dominant
duration would increase the number of wave in 1 IOI.
In other study, Jaiswal et al. (2009) said that dominant
duration on the first wave in IOI might be used to
predict wave amount pattern. Diameter of dominant
follicle (DF) of each follicular wave in 3 and 4-wave
pattern was not significantly different even diameter of
dominant follicle tended to wane by increase of wave
amount in 1 IOI (Table 1). Viana et al. (2000) said that
decrease of diameter of dominant follicle and its
dominant duration was associated with increase of wave
amount in 1 estrous cycle. Bó et al. (2003) reported that
the number of B. indicus (16%) which had 4 follicular
wave pattern was higher than B. taurus (0%) and was
allegedly due to a consequence of smaller diameter of
dominant follicle and shorter dominant duration of B.
indicus. High concentration estradiol suppressed LH
impulse inducing synthesis of progesterone of luteal
cells (Goodman et al. 1981; William et al. 1978), so that
it was expected might affect function of luteal and its
lifetime (Jaiswal et al. 2009).
However, on the third wave of 3-wave pattern
which was an ovulatory follicle had significantly wider
diameter than the third wave of 4-wave pattern (Table
1). As well it had wider diameter of ovulatory follicle
than that non-ovulatory follicle in the same wave
pattern. Progesterone produced by CL would suppress
concentration of estradiol and growth rate of dominant
follicle (Ramana et al. 2013; Junior et al. 2010), so that
follicle growing during luteal phase had smaller
diameter than ovulatory follicle growing during
luteolysis.
One IOI cycle in this study tended to longer by
increase of 3 and 4 wave pattern by 22±1.6 and
22.8±2.9 respectively (Table 2). It possibly related to
size of follicular diameter in each wave pattern. Goff et
al. (2004) said that estradiol in the first wave of IOI
regulated time of oxytocin receptor emergence in
endometrium that eventually managing prostaglandin
production time to stimulate the luteolisis. There was a
suspicion that size of follicular diameter on the first
Table 1. Characteristic per dominant follicular wave of PO cattle with 3 and 4 follicular wave in 1 IOI
Observation Follicular wave
I II III IV
Onset follicle (day-):
3-wave -0.4±0.9 8.1±1.5 15±2.1 -
4-wave 1.4±1.1 7.4±1.9 12.2±1.5 16.2±3.2
Dominant duration (day)
3-wave 11.6±1.5 11±2.3 6.8±1.3 -
4-wave 10±2.9 8.8±1.6 7.7±1.5 6.6±0.9
Diameter of DF (mm)
3-wave 10.05±0.43 9.26±0.94 12.24±0.71a* -
4-wave 9.42±0.44 8.84±1.15 9.1±1.44b 12.30±0.22
Different superscript in the same column and characteristic shows significant different in P<0.05. *: Diameter of ovulatory follicle
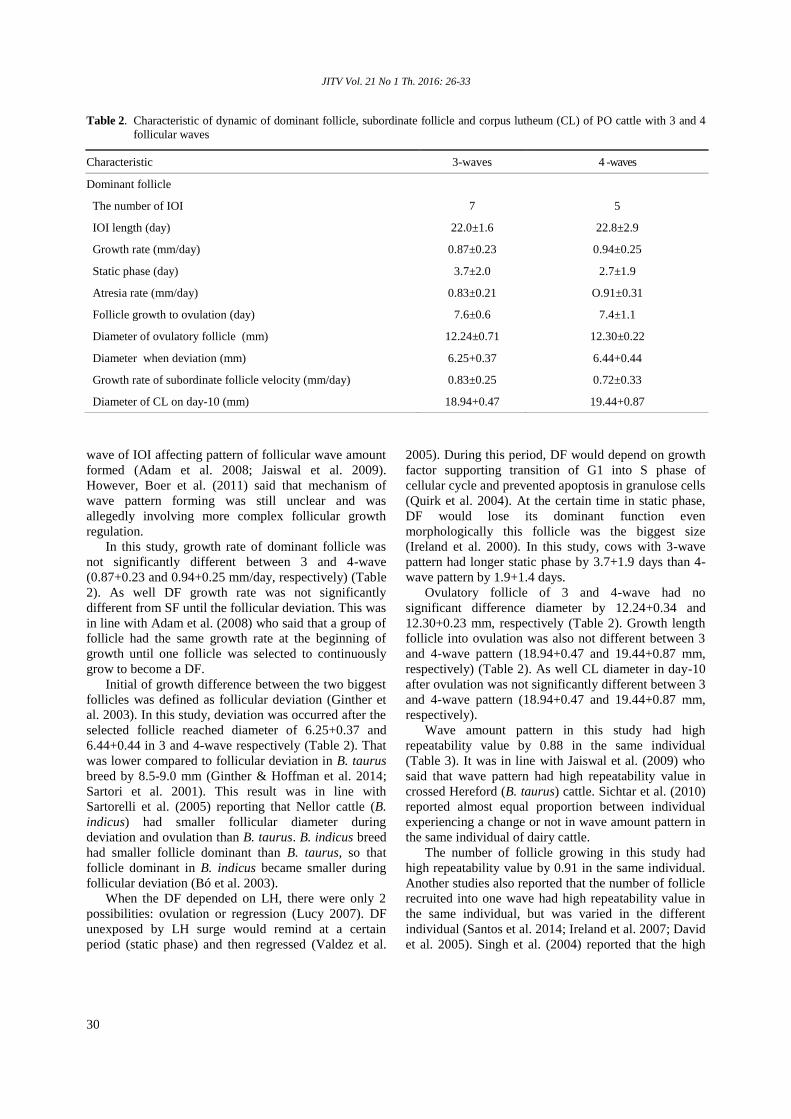
JITV Vol. 21 No 1 Th. 2016: 26-33
30
Table 2. Characteristic of dynamic of dominant follicle, subordinate follicle and corpus lutheum (CL) of PO cattle with 3 and 4
follicular waves
Characteristic 3-waves 4 -waves
Dominant follicle
The number of IOI 7 5
IOI length (day) 22.0±1.6 22.8±2.9
Growth rate (mm/day) 0.87±0.23 0.94±0.25
Static phase (day) 3.7±2.0 2.7±1.9
Atresia rate (mm/day) 0.83±0.21 O.91±0.31
Follicle growth to ovulation (day) 7.6±0.6 7.4±1.1
Diameter of ovulatory follicle (mm) 12.24±0.71 12.30±0.22
Diameter when deviation (mm) 6.25+0.37 6.44+0.44
Growth rate of subordinate follicle velocity (mm/day) 0.83±0.25 0.72±0.33
Diameter of CL on day-10 (mm) 18.94+0.47 19.44+0.87
wave of IOI affecting pattern of follicular wave amount
formed (Adam et al. 2008; Jaiswal et al. 2009).
However, Boer et al. (2011) said that mechanism of
wave pattern forming was still unclear and was
allegedly involving more complex follicular growth
regulation.
In this study, growth rate of dominant follicle was
not significantly different between 3 and 4-wave
(0.87+0.23 and 0.94+0.25 mm/day, respectively) (Table
2). As well DF growth rate was not significantly
different from SF until the follicular deviation. This was
in line with Adam et al. (2008) who said that a group of
follicle had the same growth rate at the beginning of
growth until one follicle was selected to continuously
grow to become a DF.
Initial of growth difference between the two biggest
follicles was defined as follicular deviation (Ginther et
al. 2003). In this study, deviation was occurred after the
selected follicle reached diameter of 6.25+0.37 and
6.44+0.44 in 3 and 4-wave respectively (Table 2). That
was lower compared to follicular deviation in B. taurus
breed by 8.5-9.0 mm (Ginther & Hoffman et al. 2014;
Sartori et al. 2001). This result was in line with
Sartorelli et al. (2005) reporting that Nellor cattle (B.
indicus) had smaller follicular diameter during
deviation and ovulation than B. taurus. B. indicus breed
had smaller follicle dominant than B. taurus, so that
follicle dominant in B. indicus became smaller during
follicular deviation (Bó et al. 2003).
When the DF depended on LH, there were only 2
possibilities: ovulation or regression (Lucy 2007). DF
unexposed by LH surge would remind at a certain
period (static phase) and then regressed (Valdez et al.
2005). During this period, DF would depend on growth
factor supporting transition of G1 into S phase of
cellular cycle and prevented apoptosis in granulose cells
(Quirk et al. 2004). At the certain time in static phase,
DF would lose its dominant function even
morphologically this follicle was the biggest size
(Ireland et al. 2000). In this study, cows with 3-wave
pattern had longer static phase by 3.7+1.9 days than 4-
wave pattern by 1.9+1.4 days.
Ovulatory follicle of 3 and 4-wave had no
significant difference diameter by 12.24+0.34 and
12.30+0.23 mm, respectively (Table 2). Growth length
follicle into ovulation was also not different between 3
and 4-wave pattern (18.94+0.47 and 19.44+0.87 mm,
respectively) (Table 2). As well CL diameter in day-10
after ovulation was not significantly different between 3
and 4-wave pattern (18.94+0.47 and 19.44+0.87 mm,
respectively).
Wave amount pattern in this study had high
repeatability value by 0.88 in the same individual
(Table 3). It was in line with Jaiswal et al. (2009) who
said that wave pattern had high repeatability value in
crossed Hereford (B. taurus) cattle. Sichtar et al. (2010)
reported almost equal proportion between individual
experiencing a change or not in wave amount pattern in
the same individual of dairy cattle.
The number of follicle growing in this study had
high repeatability value by 0.91 in the same individual.
Another studies also reported that the number of follicle
recruited into one wave had high repeatability value in
the same individual, but was varied in the different
individual (Santos et al. 2014; Ireland et al. 2007; David
et al. 2005). Singh et al. (2004) reported that the high
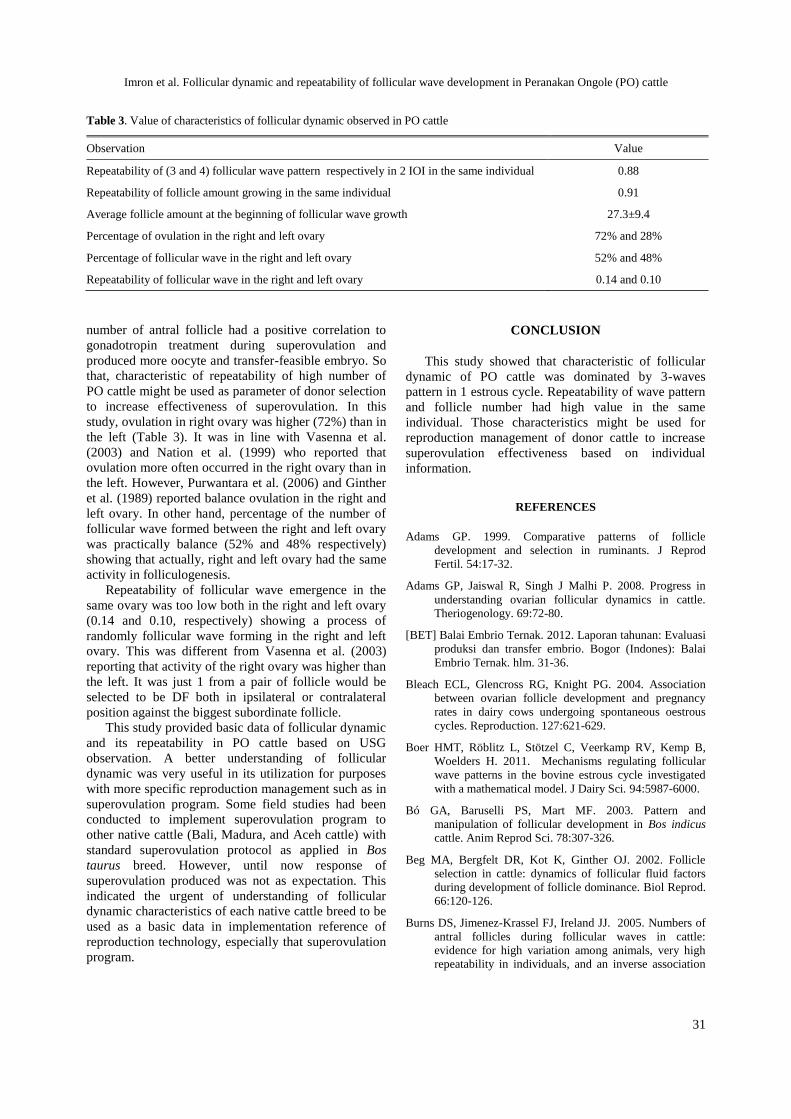
Imron et al. Follicular dynamic and repeatability of follicular wave development in Peranakan Ongole (PO) cattle
31
Table 3. Value of characteristics of follicular dynamic observed in PO cattle
Observation Value
Repeatability of (3 and 4) follicular wave pattern respectively in 2 IOI in the same individual 0.88
Repeatability of follicle amount growing in the same individual 0.91
Average follicle amount at the beginning of follicular wave growth 27.3±9.4
Percentage of ovulation in the right and left ovary 72% and 28%
Percentage of follicular wave in the right and left ovary 52% and 48%
Repeatability of follicular wave in the right and left ovary 0.14 and 0.10
number of antral follicle had a positive correlation to
gonadotropin treatment during superovulation and
produced more oocyte and transfer-feasible embryo. So
that, characteristic of repeatability of high number of
PO cattle might be used as parameter of donor selection
to increase effectiveness of superovulation. In this
study, ovulation in right ovary was higher (72%) than in
the left (Table 3). It was in line with Vasenna et al.
(2003) and Nation et al. (1999) who reported that
ovulation more often occurred in the right ovary than in
the left. However, Purwantara et al. (2006) and Ginther
et al. (1989) reported balance ovulation in the right and
left ovary. In other hand, percentage of the number of
follicular wave formed between the right and left ovary
was practically balance (52% and 48% respectively)
showing that actually, right and left ovary had the same
activity in folliculogenesis.
Repeatability of follicular wave emergence in the
same ovary was too low both in the right and left ovary
(0.14 and 0.10, respectively) showing a process of
randomly follicular wave forming in the right and left
ovary. This was different from Vasenna et al. (2003)
reporting that activity of the right ovary was higher than
the left. It was just 1 from a pair of follicle would be
selected to be DF both in ipsilateral or contralateral
position against the biggest subordinate follicle.
This study provided basic data of follicular dynamic
and its repeatability in PO cattle based on USG
observation. A better understanding of follicular
dynamic was very useful in its utilization for purposes
with more specific reproduction management such as in
superovulation program. Some field studies had been
conducted to implement superovulation program to
other native cattle (Bali, Madura, and Aceh cattle) with
standard superovulation protocol as applied in Bos
taurus breed. However, until now response of
superovulation produced was not as expectation. This
indicated the urgent of understanding of follicular
dynamic characteristics of each native cattle breed to be
used as a basic data in implementation reference of
reproduction technology, especially that superovulation
program.
CONCLUSION
This study showed that characteristic of follicular
dynamic of PO cattle was dominated by 3-waves
pattern in 1 estrous cycle. Repeatability of wave pattern
and follicle number had high value in the same
individual. Those characteristics might be used for
reproduction management of donor cattle to increase
superovulation effectiveness based on individual
information.
REFERENCES
Adams GP. 1999. Comparative patterns of follicle
development and selection in ruminants. J Reprod
Fertil. 54:17-32.
Adams GP, Jaiswal R, Singh J Malhi P. 2008. Progress in
understanding ovarian follicular dynamics in cattle.
Theriogenology. 69:72-80.
[BET] Balai Embrio Ternak. 2012. Laporan tahunan: Evaluasi
produksi dan transfer embrio. Bogor (Indones): Balai
Embrio Ternak. hlm. 31-36.
Bleach ECL, Glencross RG, Knight PG. 2004. Association
between ovarian follicle development and pregnancy
rates in dairy cows undergoing spontaneous oestrous
cycles. Reproduction. 127:621-629.
Boer HMT, Röblitz L, Stötzel C, Veerkamp RV, Kemp B,
Woelders H. 2011. Mechanisms regulating follicular
wave patterns in the bovine estrous cycle investigated
with a mathematical model. J Dairy Sci. 94:5987-6000.
Bó GA, Baruselli PS, Mart MF. 2003. Pattern and
manipulation of follicular development in Bos indicus
cattle. Anim Reprod Sci. 78:307-326.
Beg MA, Bergfelt DR, Kot K, Ginther OJ. 2002. Follicle
selection in cattle: dynamics of follicular fluid factors
during development of follicle dominance. Biol Reprod.
66:120-126.
Burns DS, Jimenez-Krassel FJ, Ireland JJ. 2005. Numbers of
antral follicles during follicular waves in cattle:
evidence for high variation among animals, very high
repeatability in individuals, and an inverse association
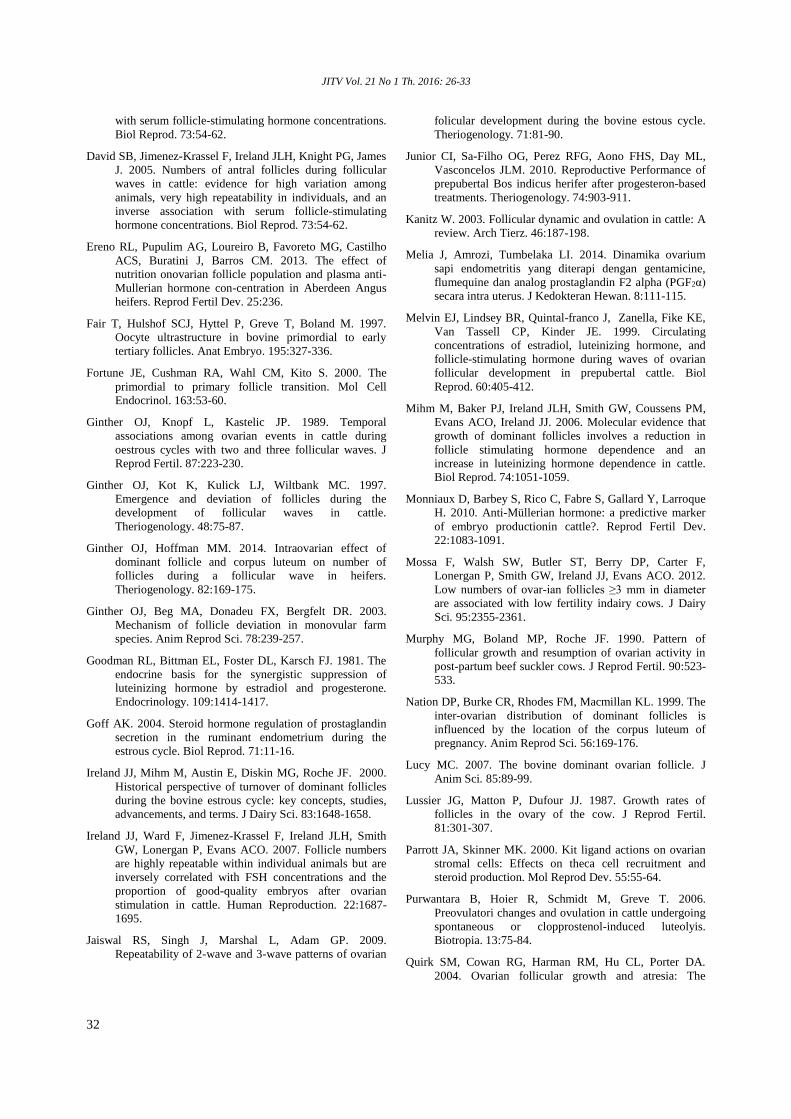
JITV Vol. 21 No 1 Th. 2016: 26-33
32
with serum follicle-stimulating hormone concentrations.
Biol Reprod. 73:54-62.
David SB, Jimenez-Krassel F, Ireland JLH, Knight PG, James
J. 2005. Numbers of antral follicles during follicular
waves in cattle: evidence for high variation among
animals, very high repeatability in individuals, and an
inverse association with serum follicle-stimulating
hormone concentrations. Biol Reprod. 73:54-62.
Ereno RL, Pupulim AG, Loureiro B, Favoreto MG, Castilho
ACS, Buratini J, Barros CM. 2013. The effect of
nutrition onovarian follicle population and plasma anti-
Mullerian hormone con-centration in Aberdeen Angus
heifers. Reprod Fertil Dev. 25:236.
Fair T, Hulshof SCJ, Hyttel P, Greve T, Boland M. 1997.
Oocyte ultrastructure in bovine primordial to early
tertiary follicles. Anat Embryo. 195:327-336.
Fortune JE, Cushman RA, Wahl CM, Kito S. 2000. The
primordial to primary follicle transition. Mol Cell
Endocrinol. 163:53-60.
Ginther OJ, Knopf L, Kastelic JP. 1989. Temporal
associations among ovarian events in cattle during
oestrous cycles with two and three follicular waves. J
Reprod Fertil. 87:223-230.
Ginther OJ, Kot K, Kulick LJ, Wiltbank MC. 1997.
Emergence and deviation of follicles during the
development of follicular waves in cattle.
Theriogenology. 48:75-87.
Ginther OJ, Hoffman MM. 2014. Intraovarian effect of
dominant follicle and corpus luteum on number of
follicles during a follicular wave in heifers.
Theriogenology. 82:169-175.
Ginther OJ, Beg MA, Donadeu FX, Bergfelt DR. 2003.
Mechanism of follicle deviation in monovular farm
species. Anim Reprod Sci. 78:239-257.
Goodman RL, Bittman EL, Foster DL, Karsch FJ. 1981. The
endocrine basis for the synergistic suppression of
luteinizing hormone by estradiol and progesterone.
Endocrinology. 109:1414-1417.
Goff AK. 2004. Steroid hormone regulation of prostaglandin
secretion in the ruminant endometrium during the
estrous cycle. Biol Reprod. 71:11-16.
Ireland JJ, Mihm M, Austin E, Diskin MG, Roche JF. 2000.
Historical perspective of turnover of dominant follicles
during the bovine estrous cycle: key concepts, studies,
advancements, and terms. J Dairy Sci. 83:1648-1658.
Ireland JJ, Ward F, Jimenez-Krassel F, Ireland JLH, Smith
GW, Lonergan P, Evans ACO. 2007. Follicle numbers
are highly repeatable within individual animals but are
inversely correlated with FSH concentrations and the
proportion of good-quality embryos after ovarian
stimulation in cattle. Human Reproduction. 22:1687-
1695.
Jaiswal RS, Singh J, Marshal L, Adam GP. 2009.
Repeatability of 2-wave and 3-wave patterns of ovarian
folicular development during the bovine estous cycle.
Theriogenology. 71:81-90.
Junior CI, Sa-Filho OG, Perez RFG, Aono FHS, Day ML,
Vasconcelos JLM. 2010. Reproductive Performance of
prepubertal Bos indicus herifer after progesteron-based
treatments. Theriogenology. 74:903-911.
Kanitz W. 2003. Follicular dynamic and ovulation in cattle: A
review. Arch Tierz. 46:187-198.
Melia J, Amrozi, Tumbelaka LI. 2014. Dinamika ovarium
sapi endometritis yang diterapi dengan gentamicine,
flumequine dan analog prostaglandin F2 alpha (PGF2α)
secara intra uterus. J Kedokteran Hewan. 8:111-115.
Melvin EJ, Lindsey BR, Quintal-franco J, Zanella, Fike KE,
Van Tassell CP, Kinder JE. 1999. Circulating
concentrations of estradiol, luteinizing hormone, and
follicle-stimulating hormone during waves of ovarian
follicular development in prepubertal cattle. Biol
Reprod. 60:405-412.
Mihm M, Baker PJ, Ireland JLH, Smith GW, Coussens PM,
Evans ACO, Ireland JJ. 2006. Molecular evidence that
growth of dominant follicles involves a reduction in
follicle stimulating hormone dependence and an
increase in luteinizing hormone dependence in cattle.
Biol Reprod. 74:1051-1059.
Monniaux D, Barbey S, Rico C, Fabre S, Gallard Y, Larroque
H. 2010. Anti-Müllerian hormone: a predictive marker
of embryo productionin cattle?. Reprod Fertil Dev.
22:1083-1091.
Mossa F, Walsh SW, Butler ST, Berry DP, Carter F,
Lonergan P, Smith GW, Ireland JJ, Evans ACO. 2012.
Low numbers of ovar-ian follicles ≥3 mm in diameter
are associated with low fertility indairy cows. J Dairy
Sci. 95:2355-2361.
Murphy MG, Boland MP, Roche JF. 1990. Pattern of
follicular growth and resumption of ovarian activity in
post-partum beef suckler cows. J Reprod Fertil. 90:523-
533.
Nation DP, Burke CR, Rhodes FM, Macmillan KL. 1999. The
inter-ovarian distribution of dominant follicles is
influenced by the location of the corpus luteum of
pregnancy. Anim Reprod Sci. 56:169-176.
Lucy MC. 2007. The bovine dominant ovarian follicle. J
Anim Sci. 85:89-99.
Lussier JG, Matton P, Dufour JJ. 1987. Growth rates of
follicles in the ovary of the cow. J Reprod Fertil.
81:301-307.
Parrott JA, Skinner MK. 2000. Kit ligand actions on ovarian
stromal cells: Effects on theca cell recruitment and
steroid production. Mol Reprod Dev. 55:55-64.
Purwantara B, Hoier R, Schmidt M, Greve T. 2006.
Preovulatori changes and ovulation in cattle undergoing
spontaneous or clopprostenol-induced luteolyis.
Biotropia. 13:75-84.
Quirk SM, Cowan RG, Harman RM, Hu CL, Porter DA.
2004. Ovarian follicular growth and atresia: The
Imron et al. Follicular dynamic and repeatability of follicular wave development in Peranakan Ongole (PO) cattle
33
relationship between cell proliferation and survival. J
Anim Sci. 82:40-52.
Ramana KV, Rao KV, Supriya K, Rajanna N. 2013.
Postpartum ovarian follicular dynamics and estrus
activity in lactating Ongole cows. J Res Angrau. 41:51-
55.
Roche JF, Austin EJ. Ryan M, O'rourke M, Mihm M, Diskin
MG. 1999. Regulation of follicular waves to maximize
fertility in cattle. J Reprod Fertil. 54:61-71.
Santos KC, Santos GMG, Siloto LS, Morotti F, Marcantonio
TN, Seneda MM, 2014. Comparison of antral and
preantral ovar-ian follicle populations between Bos
indicus and Bos taurus cows with high or low antral
follicles counts. Reprod Dom Anim. 49:48-51.
Sartori R, Fricke PM, Ferreira JCP, Ginther OJ, Wiltbank
MC. 2001. Follicular deviation and acquisition of
ovulatory capacity in bovine follicles. Biol Reprod.
65:1403-1409.
Sartorelli ES, Carvalho LM, Bergfelt DR, Ginther OJ, Barros
CM. 2005. Morphological characterization of follicle
deviation in Nelore (Bos indicus) heifers and cows.
Theriogenology. 63:2382-2394.
Satheshkumar S, Brindha K, Roya A, Devanathan TG,
Kathiresan D, Kumanan K. 2015. Natural influence of
season on follicular, luteal, and endocrinological
turnover in Indian crossbred cows. Theriogenology.
84:19-23.
Sichtar J, Tolman R, Rajmon R, Klabanová P, Berka P, Volek
J. 2010. A comparison of the follicular dynamics in
heifers of the Czech Fleckvieh and Holstein breeds.
Czech J Anim Sci. 55:234-242.
Silva-Santos KC, Santos GMG, Siloto LS, Morotti F,
Marcantonio TN, Seneda MM. 2014. Comparison of
antral and preantral ovarian follicle populations between
Bos indicus and Bos indicus-taurus cows with high or
low antral follicles counts. Reprod Dom Anim. 49:48-
51.
Siddiqui MAR, Ginther OJ. 2014. Switching of largest follicle
from dominant to subordinate status when follicle and
CL are in same ovary in heifers. Theriogenology.
82:259-265.
Taylor C, Rajamahendran R. 1991. Follicular dynamics,
corpus luteum growth and regression in lactating dairy
cattle. Canadian J Anim Sci. 71:61-68.
Valdez KE, Cuneo SP, Turzillo AM. 2005. Regulation of
apoptosis in the atresia of dominant bovine follicles of
the first follicular wave following ovulation.
Reproduction. 130:71-81.
Viana JHM, Ademir MF, Wanderlei FS, Almeida LS,
Camargo. 2000. Follicular dynamics in zebu cattle. Pesq
Agropec Bras. 35:2501-2509.
Williams MT, Marsh JM. 1978. Estradiol inhibition of
luteinizing hormone-stimulated progesterone synthesis
on isolated bovine luteal cells. Endo. 103:1611-1618.
Wolfenson D, Inbar G, Roth Z, Kaim M, Bloch A, Braw R.
2004. Follicular dynamics and concentrations of
steroids and gonadotropins in lactating cows and
nulliparous heifers. Theriogenology. 62:1042-1055.
Vasenna R, Mapletoft RJ, Allodi S, Singh J, Adams GP. 2003.
Morphology and developmental competence of bovine
oocytes relative to follicular status. Theriogenology.
60:923-932.
JITV Vol. 21 No 1 Th. 2016: 34-40
34
Chitosan Nanoparticle of hCG (Human Chorionic Gonadotrophin) Hormone
in Increasing Induction of Dairy Cattle Ovulation
Pamungkas FA, Sianturi RG, Wina E, Kusumingrum DA
1Indonesian Research Institute for Animal Production, PO Box 221, Bogor 16002 E-mail: [email protected]
(received 29-12-2015; revised 08-03-2016; accepted 25-03-2016)
ABSTRAK
Pamungkas FA, Sianturi RG, Wina E, Kusumaningrum DA. 2016. Nanopartikel chitosan hormon hCG (Human Chorionic
Gonadotrophin) dalam meningkatkan induksi ovulasi pada sapi perah. JITV 21(1): 34-40. DOI:
http://dx.doi.org/10.14334/jitv.v21i1.1343
Suatu sistem rilis hormon hCG (human chorionic gonadotropin) yang terkontrol membantu mengatasi degradasi hormon
hCG yang cepat dalam darah dan menghindari penggunaan injeksi hormon berkali-kali untuk tujuan induksi ovulasi serta
meningkatkan efektifitas reproduksi. Penelitian bertujuan mempersiapkan nanopartikel chitosan hormon hCG (CS-NPh) serta
mengetahui efektifitas penggunaannya melalui nasal spray. Paramater yang diamati meliputi karakteristik sifat fisikokimia CS-
NPh dan pengamatan ukuran folikel, korpus luteum, waktu ovulasi dan onset berahi setelah pemberian CS-NPh secara nasal
spray dibandingkan dengan hCG secara intramuskular (kontrol) dengan dosis 1.000 IU pada sapi perah. Hasil penelitian
menunjukkan bahwa karakteristik sifat fisikokimia CS-NPh masih dalam rentang ukuran nanopartikel dengan distribusi massa
molekul yang baik dan lebih stabil, sehingga dapat digunakan sebagai komponen pembawa hormon. Hasil penelitian diperoleh
bahwa waktu ovulasi setelah pemberian hormon hCG secara intramuskular (hari ke 3,13±0,35) dan CS-NPh secara nasal spray
(hari ke 3,33±0,49) dengan ukuran folikel yang diovulasikan berturut-turut sebesar 1,62±0,22 dan 1,76±0,28 cm tidak
menunjukkan perbedaan yang nyata (p>0,05), begitu juga untuk ukuran korpus luteum dan onset berahi. Hal ini menunjukkan
bahwa pemberian CS-NPh secara nasal spray dapat digunakan dalam meningkatkan induksi ovulasi pada sapi perah.
Kata Kunci: Nanopartikel, hCG, Nasal Spray, Ovulasi
ABSTRACT
Pamungkas FA, Sianturi RG, Wina E, Kusumaningrum DA. 2016. Chitosan nanoparticle of hCG (Human Chorionic
Gonadotrophin) hormone in increasing induction of dairy cattle ovulation. JITV 21(1): 34-40. DOI:
http://dx.doi.org/10.14334/jitv.v21i1.1343
A controlled release delivery system of human chorionic gonadotropin (hCG) hormone helps to overcome the rapid
degradation of hCG hormone in the blood, to avoid the use of multiple injections for ovulation induction and to enhance
reproductive efficacy. This study aimed to prepare chitosan nanoparticles hCG (CS-NPh) and to determine its efficacy as nasal
spray of CS-NPh. The observed parameters include physico-chemical characteristics of CS-NPh and the follicle size, corpus
luteum, the time of ovulation and onset of estrus performed after administration of CS-NPh as a nasal spray compared with
intramuscular hCG (control) at a dose of 1,000 IU in dairy cattles. The result showed that the formation of the hormone hCG
nanoparticles is still in the size range of nanoparticles with a well and more stable molecular mass distribution, so it can be used
as a carrier component of hormones. The result showed that the time of ovulation after hCG by intramuscular (day to 3.13±0.35)
and CS-NPh as a nasal spray (days to 3.33±0.49) with the follicle size by 1.62±0.22 and 1.76±0.28 cm showed no significant
differences (p> 0.05), likewise the size of the corpus luteum and onset of oestrus.. This indicates that administration of CS-NPh
as a nasal spray can be used in enhancing the induction of ovulation in dairy cattles.
Key Words: Nanoparticles, hCG, Nasal Spray, Ovulation
INTRODUCTION
Estrus synchronization in dairy cattle is used for
facilitating artificial insemination application, saving
labor and time in detecting estrus. Estrus
synchronization is one way of controlling estrus, to
synchronize pre-ovulation condition, minimize
variation of follicle maturity, luteolysis and increase
estrus at the same time which around 20.5 days of
estrus interval and ovulation (Cavalieri et al. 2004). In
general, pregnancy rate of Artificial Insemination (AI)
after an estrus synchronization in cattle was not as
expected or not consistent due to varied of estrus and
ovulation time determination due to long estrous cycle
in cattle (Roelofs et al. 2005).
Induction of ovulation using Human Chorionic
Gonadotropin (hCG) hormone injection together with
estrus synchronization program enabled to determine
accuracy of estrus and ovulation time which eventually
gets improving animal fertility (Johnson et al. 2010).
Pamungkas et al. Chitosan nanoparticle of hCG (Human Chorionic Gonadotrophin) hormone in increasing induction
35
Beside giving stress to animal, hCG has fast
degradation of endopeptidase and exopeptidase in
pituitary. Another approach is using slow release
delivery system through implantation method. Hormone
content packed or attached on matrix nanoparticle using
biodegradable polymer has been used as potential
hormone carrier by its capability to improve hormone
stability and protected from rapid degradation during
hormone transportation and controlling of bioactive
agent releasing (Bhadra et al. 2002; Vila et al. 2002;
Kommareddy et al. 2005; Rather et al. 2013).
The nasal route has received a great deal of attention
as a convenient and reliable method for the systemic
administration of drugs. Nasal delivery has been
explored as an alternative administration route to target
drugs directly to the brain via the olfactory neurons
(Ulrika et al. 2005). Nasal mucociliary clearance is one
of the most important limiting factors for nasal drug
delivery. It severely limits the time allowed for drug
absorption to occur and effectively rules out sustained
nasal drug administration. However, bioadhesive
polymers can be used to increase the nasal residence
time, thus allowing longer absorption times, and to
achieve a more intimate contact with the nasal mucosa,
which results in a higher concentration gradient and
subsequent increased absorption (Ugwoke et al. 2005).
Another important limiting factor in the nasal
application is the low permeability of the nasal mucosa
for the drugs. It seems to be necessary to consider an
absorption enhancement mechanism for co-
administration of drugs with either mucoadhesive
polymers or penetration enhancers or combination of
the two (Vasir et al. 2003). Chitosan nanoparticle may
strongly bind negatively charged materials such as cell
surface and mucosal fluid. Mucosal fluid contained
mucin which had different chemical composition,
however, some consisted of significant proportion from
sialic acid. In physiological condition, sialic acid
carried negative charge causing strong electrostatic
interaction between mucin and chitosan in soluble
(Dhawan et al. 2004).
The purposes of this study were to prepare chitosan
nanoparticle of hCG hormone and to determine its
effectivity through its use as nasal spray by observing
the functional response such as follicle growth,
ovulation time, and emergence of estrous signs.
MATERIALS AND METHODS
Preparation and characterization of chitosan
nanoparticle of hCG hormone (CS-NPh) were
conducted in the Reproduction Laboratory of the
Indonesian Research Institute for Animal Production
(IRIAP) and Nanotechnology Laboratory of Indonesian
Center for Agricultural Post Harvest Research and
Development (ICAPOSTRD). At the same time, in
vitro examination was conducted in of the Animal
House of IRIAP.
Formulation of chitosan nanoparticle of hCG
hormone
Chemical materials used in formulation of chitosan
nanoparticle of hCG were Chitosan (degree of
deacetylation ≥75%) and sodium tripolyphosphate
(TPP) produced by Sigma-Aldrich Corporation (St.
Louis, MN), acetic acid (glacial) produced by Merck
Millipore Corporation (Darmstadt, Jerman), hCG
hormone (Choluron®) produced by Intervet/Merck
Animal Health, Holland.
Chitosan nanoparticle of hCG hormone was
arranged by ionic interaction process, in accordance
with modified procedure performed by Wang et al.
(2008). Two solution were prepared, namely 0.2% b/v
of chitosan in 1% v/v acetat acid, and TPP (0.1% b/v)
that diluted in aquadest. TPP (2.0 ml) solution was
slowly added using syringe into acetic acid chitosan
solution (5.0 ml) under 1500-rpm speed magnetic
stirring until nanoparticle formed. Then hCG hormone
(Choluron®) was added slowly into chitosan
nanoparticle solution with concentration established
was 500 IU/ml under 1500 rpm speed magnetic stirring
for 10 minutes. As 1 N HCL or NaOH solution was
added to manage suspension pH at 5.5.
Characteristics of physicochemical properties of
chitosan nanoparticle of hCG hormone
Average size of particle and distribution were
measured by photon correlation spectroscopy (PCS,
dynamic light scattering, DLS) technique which is a
multipurpose tool to estimate distribution of fine
particle size of a material in range 0.6 nm – 7 µm. As 5
µm nanoconjugate suspension was diluted in 5 ml
deionized water and be shaken slowly and then put into
analyzer. After reaching expected intensity, analysis
was conducted to obtain average particle size and
polydispersity index (PDI) of the samples.
Measurement of zeta potential was a way to know the
stability of every coloid system which determined by
electrophoretic light scattering (ELS).
Evaluation of entrapment efficiency of chitosan
nanoparticle of hCG hormone
Entrapment efficiency (EE) process was determined
by separating nanoparticle from suspension that
consisting hCG non-entraped with ultra-centrifugation
at 12.000 rpm, 10ºC for 10 minutes. The amount of free
hCG hormone in supernatant was measured by
spectrophotometry UV at λ = 260 nm (Katas et al.
JITV Vol. 21 No 1 Th. 2016: 34-40
36
2013). Entrapment efficiency (EE%) of hCG in CS-NPh
was calculated according the following formula:
EE % = hCG amount – free hCG in supernatant x 100
Total amount of hCG
Estrus-ovulation synchronization
Cows used were 2-5 years old Friesian Holstein
(FH), at least experienced once bear, non pregnant one,
and had normal estrus cycle. They were ultrasound
(USG) first, to monitor ovaries and examine their
follicles and corpus luteum (CL) condition, Cows, then
injected with Prostaglandin / PGF2α (Lutalyse® 5-ml)
intramuscularly (IM) and repeated at day 11. Then, they
were divided into 2 groups as following:
Group A : Injected by 1.000 IU hCG hormone
intramuscularly at day 2 after the last
Prostaglandin (PGF2α) injection
Group B : Chitosan nanoparticle of hCG (CS-
NPh) providing at 1.000 IU by nasal
spray at day 2 after the last PGF2α
injection
Ultrasonography
USG was conducted to observe the ovarian
dynamics, by measuring diameter of follicles and CL
development. Diameter development pattern of follicles
and CL were monitored using Ultrasonography (brand
SIUI Veterinary model CST 7700V with 10.4 inchi
monitor LCD and Linier Rectal Probe 7.5 MHz). USG
observation was performed everyday started from
second PGF2α injection until ovulation. Before the
transrectal USG observation, cow’s feces were emptied
and dragged first from the rectum. Scanning was
conducted to right and left ovarium, and diameter of
entire visible follicles and CL were measured one by
one.
Estrus observation
Observation of estrus was conducted along with
USG observation. It was focusedon physical changes of
outside reproduction organs during estrus observation
such as swelling of vulva, mucus discharged from
vulva, reddening of vagina mucous, and it was warm if
touched.
Data analysis
Data were analysed by Analysis of Variance
(ANOVA) and then continued by Dunnet further
testing. Data were processed by SPSS version 19.
RESULT AND DISCUSSION
Chitosan nanoparticle of hCG in this study was
prepared according to ionic interaction process (ionic
gelation), where the process of nanoparticle production
depend on positively charged particles dissolved in
chitosan molecule while pH had an important role
during its production process. Characteristic of
physicochemical properties of chitosan nanoparticle -
hCG hormone was showed in Table 1.
Table 1. Characteristic of physiochemical properties of
chitosan nanoparticle of hCG hormone
Parameters Value
Particle size (nm) 226.17±26.27
Polydispersity index 0.301±0.03
Zeta potential (mV) +21.22±1.51
entrapment efficiency (%) 54.11±12.94
Acidity of chitosan nanoparticle-hCG hormone
formed was at initial pH 3.79±0.04 (not shown in the
table) and adjusted to pH 5.5. Therefore, the uptake of
nanoparticle close to neutral pH may prove useful in the
controlled release of a drug from a pH-sensitive. Low
pH is a well known sensory irritant in pathological
conditions such as inflammation in the nasal mucosa.
Acid exposure cause marked nasal irritation via a
specific subset of sensory nerves (Dalton et al. 2010).
Chitosan in acid media might interact with negatively
charged TPP form inter and intra-moleculs producing
crossed ionic-chitosan nanoparticle (De Campos et al.
2001; Xu & Du 2003). Mi et al. (2003) reported that
TPP diluted in water separated hydroxide ion (OH-) and
tripolyphosphoric (P3O105-and HP3O104) at pH 9. At
basic pH, both hydroxide and tripolyphosphoric ions
competed in ionic reaction with protoned-amino group
(NH3+) from chitosan solution (pH 3.5) with
deprotonation or crossed-ion. Availability of protoned-
amino group caused crossed-ionic process easier for
chitosan with high deacetilation rate (Agnihotri et al.
2004). Ionic gelation method, nanoparticle was
produced by spontantenous formation from smaller size
with positive charge (De Campos et al. 2001; Pan et al.
2002) at room themperature (Hu et al. 2002).
Nanoparticle formation by conditioning TPP at acid
pH (<6) resulting low cutting level of phosphor chain
and formation of nanoparticle by crossed-ion
processing. Dudhani & Kosaraju (2010) reported that
formation of chitosan nanoparticle at pH 4.5, reduced
the size of particle and increasing zeta potential than the
one formed at pH 5.5. Zengshuan et al. (2002) reported
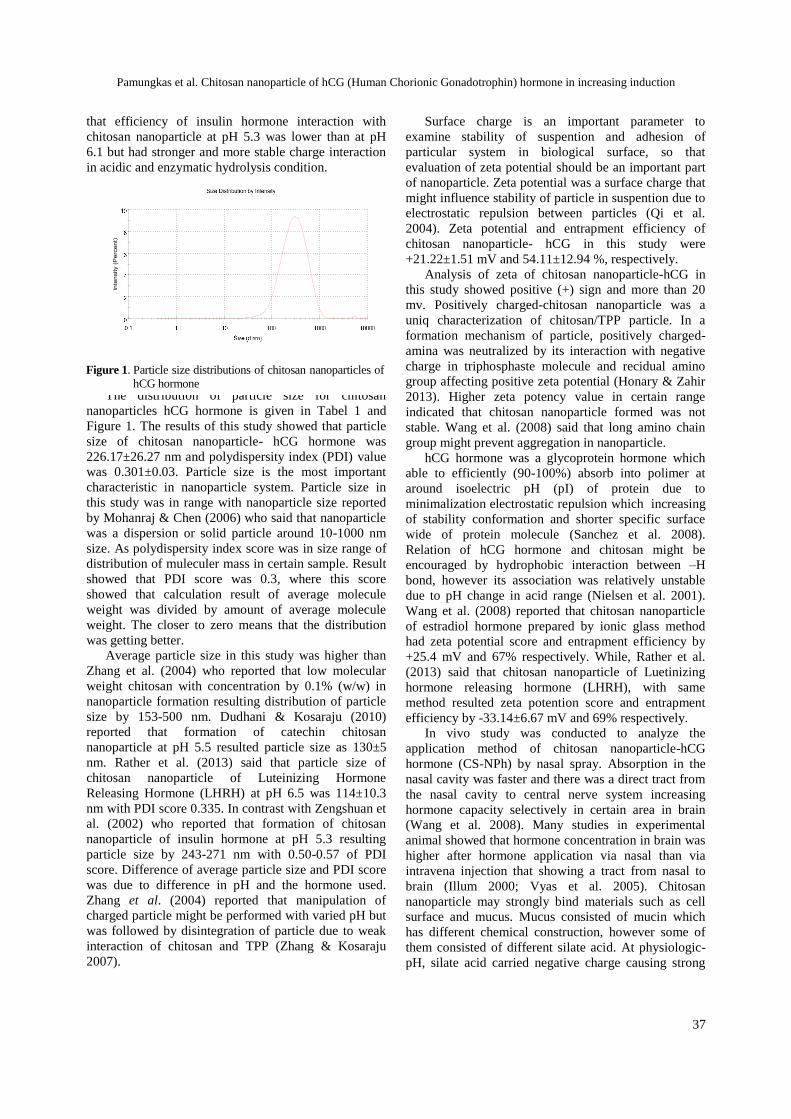
Pamungkas et al. Chitosan nanoparticle of hCG (Human Chorionic Gonadotrophin) hormone in increasing induction
37
that efficiency of insulin hormone interaction with
chitosan nanoparticle at pH 5.3 was lower than at pH
6.1 but had stronger and more stable charge interaction
in acidic and enzymatic hydrolysis condition.
The distribution of particle size for chitosan
nanoparticles hCG hormone is given in Tabel 1 and
Figure 1. The results of this study showed that particle
size of chitosan nanoparticle- hCG hormone was
226.17±26.27 nm and polydispersity index (PDI) value
was 0.301±0.03. Particle size is the most important
characteristic in nanoparticle system. Particle size in
this study was in range with nanoparticle size reported
by Mohanraj & Chen (2006) who said that nanoparticle
was a dispersion or solid particle around 10-1000 nm
size. As polydispersity index score was in size range of
distribution of muleculer mass in certain sample. Result
showed that PDI score was 0.3, where this score
showed that calculation result of average molecule
weight was divided by amount of average molecule
weight. The closer to zero means that the distribution
was getting better.
Average particle size in this study was higher than
Zhang et al. (2004) who reported that low molecular
weight chitosan with concentration by 0.1% (w/w) in
nanoparticle formation resulting distribution of particle
size by 153-500 nm. Dudhani & Kosaraju (2010)
reported that formation of catechin chitosan
nanoparticle at pH 5.5 resulted particle size as 130±5
nm. Rather et al. (2013) said that particle size of
chitosan nanoparticle of Luteinizing Hormone
Releasing Hormone (LHRH) at pH 6.5 was 114±10.3
nm with PDI score 0.335. In contrast with Zengshuan et
al. (2002) who reported that formation of chitosan
nanoparticle of insulin hormone at pH 5.3 resulting
particle size by 243-271 nm with 0.50-0.57 of PDI
score. Difference of average particle size and PDI score
was due to difference in pH and the hormone used.
Zhang et al. (2004) reported that manipulation of
charged particle might be performed with varied pH but
was followed by disintegration of particle due to weak
interaction of chitosan and TPP (Zhang & Kosaraju
2007).
Surface charge is an important parameter to
examine stability of suspention and adhesion of
particular system in biological surface, so that
evaluation of zeta potential should be an important part
of nanoparticle. Zeta potential was a surface charge that
might influence stability of particle in suspention due to
electrostatic repulsion between particles (Qi et al.
2004). Zeta potential and entrapment efficiency of
chitosan nanoparticle- hCG in this study were
+21.22±1.51 mV and 54.11±12.94 %, respectively.
Analysis of zeta of chitosan nanoparticle-hCG in
this study showed positive (+) sign and more than 20
mv. Positively charged-chitosan nanoparticle was a
uniq characterization of chitosan/TPP particle. In a
formation mechanism of particle, positively charged-
amina was neutralized by its interaction with negative
charge in triphosphaste molecule and recidual amino
group affecting positive zeta potential (Honary & Zahir
2013). Higher zeta potency value in certain range
indicated that chitosan nanoparticle formed was not
stable. Wang et al. (2008) said that long amino chain
group might prevent aggregation in nanoparticle.
hCG hormone was a glycoprotein hormone which
able to efficiently (90-100%) absorb into polimer at
around isoelectric pH (pI) of protein due to
minimalization electrostatic repulsion which increasing
of stability conformation and shorter specific surface
wide of protein molecule (Sanchez et al. 2008).
Relation of hCG hormone and chitosan might be
encouraged by hydrophobic interaction between –H
bond, however its association was relatively unstable
due to pH change in acid range (Nielsen et al. 2001).
Wang et al. (2008) reported that chitosan nanoparticle
of estradiol hormone prepared by ionic glass method
had zeta potential score and entrapment efficiency by
+25.4 mV and 67% respectively. While, Rather et al.
(2013) said that chitosan nanoparticle of Luetinizing
hormone releasing hormone (LHRH), with same
method resulted zeta potention score and entrapment
efficiency by -33.14±6.67 mV and 69% respectively.
In vivo study was conducted to analyze the
application method of chitosan nanoparticle-hCG
hormone (CS-NPh) by nasal spray. Absorption in the
nasal cavity was faster and there was a direct tract from
the nasal cavity to central nerve system increasing
hormone capacity selectively in certain area in brain
(Wang et al. 2008). Many studies in experimental
animal showed that hormone concentration in brain was
higher after hormone application via nasal than via
intravena injection that showing a tract from nasal to
brain (Illum 2000; Vyas et al. 2005). Chitosan
nanoparticle may strongly bind materials such as cell
surface and mucus. Mucus consisted of mucin which
has different chemical construction, however some of
them consisted of different silate acid. At physiologic-
pH, silate acid carried negative charge causing strong
Figure 1. Particle size distributions of chitosan nanoparticles of
hCG hormone
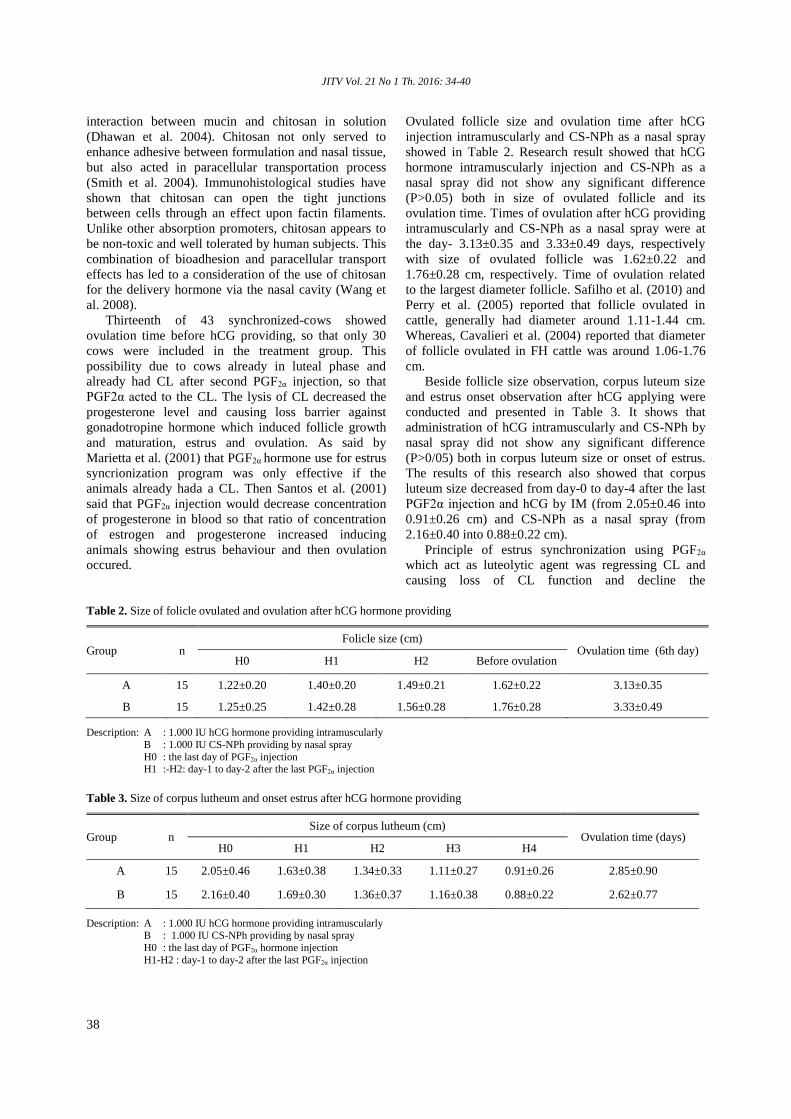
JITV Vol. 21 No 1 Th. 2016: 34-40
38
interaction between mucin and chitosan in solution
(Dhawan et al. 2004). Chitosan not only served to
enhance adhesive between formulation and nasal tissue,
but also acted in paracellular transportation process
(Smith et al. 2004). Immunohistological studies have
shown that chitosan can open the tight junctions
between cells through an effect upon factin filaments.
Unlike other absorption promoters, chitosan appears to
be non-toxic and well tolerated by human subjects. This
combination of bioadhesion and paracellular transport
effects has led to a consideration of the use of chitosan
for the delivery hormone via the nasal cavity (Wang et
al. 2008).
Thirteenth of 43 synchronized-cows showed
ovulation time before hCG providing, so that only 30
cows were included in the treatment group. This
possibility due to cows already in luteal phase and
already had CL after second PGF2α injection, so that
PGF2α acted to the CL. The lysis of CL decreased the
progesterone level and causing loss barrier against
gonadotropine hormone which induced follicle growth
and maturation, estrus and ovulation. As said by
Marietta et al. (2001) that PGF2α hormone use for estrus
syncrionization program was only effective if the
animals already hada a CL. Then Santos et al. (2001)
said that PGF2α injection would decrease concentration
of progesterone in blood so that ratio of concentration
of estrogen and progesterone increased inducing
animals showing estrus behaviour and then ovulation
occured.
Ovulated follicle size and ovulation time after hCG
injection intramuscularly and CS-NPh as a nasal spray
showed in Table 2. Research result showed that hCG
hormone intramuscularly injection and CS-NPh as a
nasal spray did not show any significant difference
(P>0.05) both in size of ovulated follicle and its
ovulation time. Times of ovulation after hCG providing
intramuscularly and CS-NPh as a nasal spray were at
the day- 3.13±0.35 and 3.33±0.49 days, respectively
with size of ovulated follicle was 1.62±0.22 and
1.76±0.28 cm, respectively. Time of ovulation related
to the largest diameter follicle. Safilho et al. (2010) and
Perry et al. (2005) reported that follicle ovulated in
cattle, generally had diameter around 1.11-1.44 cm.
Whereas, Cavalieri et al. (2004) reported that diameter
of follicle ovulated in FH cattle was around 1.06-1.76
cm.
Beside follicle size observation, corpus luteum size
and estrus onset observation after hCG applying were
conducted and presented in Table 3. It shows that
administration of hCG intramuscularly and CS-NPh by
nasal spray did not show any significant difference
(P>0/05) both in corpus luteum size or onset of estrus.
The results of this research also showed that corpus
luteum size decreased from day-0 to day-4 after the last
PGF2α injection and hCG by IM (from 2.05±0.46 into
0.91±0.26 cm) and CS-NPh as a nasal spray (from
2.16±0.40 into 0.88±0.22 cm).
Principle of estrus synchronization using PGF2α
which act as luteolytic agent was regressing CL and
causing loss of CL function and decline the
Table 2. Size of folicle ovulated and ovulation after hCG hormone providing
Group n Folicle size (cm)
Ovulation time (6th day) H0 H1 H2 Before ovulation
A 15 1.22±0.20 1.40±0.20 1.49±0.21 1.62±0.22 3.13±0.35
B 15 1.25±0.25 1.42±0.28 1.56±0.28 1.76±0.28 3.33±0.49
Description: A : 1.000 IU hCG hormone providing intramuscularly
B : 1.000 IU CS-NPh providing by nasal spray
H0 : the last day of PGF2α injection H1 :-H2: day-1 to day-2 after the last PGF2α injection
Table 3. Size of corpus lutheum and onset estrus after hCG hormone providing
Group n Size of corpus lutheum (cm)
Ovulation time (days) H0 H1 H2 H3 H4
A 15 2.05±0.46 1.63±0.38 1.34±0.33 1.11±0.27 0.91±0.26 2.85±0.90
B 15 2.16±0.40 1.69±0.30 1.36±0.37 1.16±0.38 0.88±0.22 2.62±0.77
Description: A : 1.000 IU hCG hormone providing intramuscularly B : 1.000 IU CS-NPh providing by nasal spray
H0 : the last day of PGF2α hormone injection
H1-H2 : day-1 to day-2 after the last PGF2α injection
Pamungkas et al. Chitosan nanoparticle of hCG (Human Chorionic Gonadotrophin) hormone in increasing induction
39
progesterone concentration, against gonadotropine and
there was a growth and maturation of follicle. Beside
regressing CL, PGF2α also decreased concentration of
progesterone to less than 1.0 ng/ml within 24 hours
(Yoshida & Nakao 2005). During estrus cycle, CL was
an important structure in the term of size and duration.
Appearance and disappearance of CL were responsible
to estrus cycle (Hafez & Hafez 2001; Senger 2005).
Estrus syncrhonization in animal was aimed to
simultaneous their estrus in the same time. Research
result showed that the emergence of estrus signs
(swelling of vulva, mucus discharged from vulva,
reddening of vagina mucousm, and it was warm if
touched) after hCG providing intramuscularly and nasal
spray was at the day- 2.85±0.90 and 2.62±0.77,
respectively did not showing any significant difference
(P>0.05).
CONCLUSION
Characteristic of chemical properties of particle
size, polydispersity index, zeta potential and entrapment
efficiency of chitosan nanoparticle of hCG hormone
showed that nanoparticle formation of hCG hormone
using chitosan polimer was still in nanoparticle size
range and might be used as hormone carrier component.
Research result showed that time of ovulation after
hCG providing intramuscularly (day- 3.13±0.35) and
CS-NPh by nasal spray (day- 3.33±0.49) with size of
follicles ovulated were 1.62±0.22 and 1.76±0.28 cm,
respectively. Size of corpus luteum decreased from day-
0 to day-4 after hCG providing intramuscularly (from
2.05±0.46 into 0.91±0.26 cm) or CS-NPh as a nasal
spray (from 2.16±0.40 into 0.88±0.22 cm). As well as
estrus onset and level of progesterone hormone after
hCG providing intramuscularly did not show any
significant difference (P>0.05) with CS-NPh as a nasal
spray. This showed that CS-NPh providing as a nasal
spray can be used in increasing induction of ovulation
in dairy cattle.
ACKNOWLEDGEMENTS
This study was supported in part by DIPA from
Indonesian Research Institute for Animal Production
T.A. 2015 No. 1806.018.003/K-4/APBN 2015. The
authors wish to thank M. Syaeri, Enok Mardiyah, Aqdi
Faturahman Arrazy, Nia and Yanti for technical
assistance and performing assays.
REFERENCES
Agnihotri SA, Mallikarjuna NN, Aminabhavi TM. 2004.
Recent advances on chitosan-based micro- and
nanoparticles in drug delivery. J Controlled Release.
100:5-28.
Bhadra D, Bhadra S, Jain P, Jain NK. 2002. Pegnology: a
review of PEG-ylated systems. Pharmazie. 57:5-29.
Cavalieri J, Hepworth G, Macmillan KL. 2004. Ovarian
follicular development in Holstein cows following
synchronisation of oestrus with oestradiol benzoate and
an intravaginal progesterone releasing insert for 5–9
days and duration of the oestrous cycle and
concentrations of progesterone following ovulation.
Anim Reprod Sci. 81:177-193.
Dalton PH, Opiekun RE, Gould M, McDermott R. Wilson T,
Maute C, Ozdener MH, Zhao K, Emmett E, Lees PSJ,
Herbert R, Moline J. 2010. Chemosensory loss:
functional consequences of the world trade center
disaster. Environ Health Perspect. 118:1251-1256.
De Campos AM, Sanchez A, Alonso MJ. 2001. Chitosan
nanoparticles: A new vehicle for the improvement of the
delivery of drugs to the ocular surface. Application to
cyclosporin A. Int J Pharm. 224:159-168.
Dhawan S, Singla AK, Sinha VR. 2004. Evaluation of
mucoadhesive properties of chitosan microspheres
prepared by different methods. AAPS Pharm Sci Tech
5:122-128.
Dudhani AR, Kosaraju SL. 2010. Bioadhesive chitosan
nanoparticles: Preparation and characterization.
Carbohydrate Polymer. 81:243-251.
Hafez ESE, Hafez B. 2001. Reproduction in farm animals. 7th
ed. Philadelphia (USA): Lippincot Williams & Wilkins.
Honary S, Zahir F. 2013. Effect of zeta potential on the
properties of nano-drug delivery systems - a review
(Part 1). Trop J Pharm Res. 12:255-264.
Hu Y, Jiang X, Ding Y, Ge H, Yuan Y, Yang C. 2002.
Synthesis and characterization of chitosan–poly (acrylic
acid) nanoparticles. Biomaterials. 23:3193-3201.
Illum L. 2000. Transport of drugs from the nasal cavity to the
central nervous system, Eur J Pharm Sci. 11:1-18.
Johnson R, William AB, Evelin JC, Victor N, Yoonsung J,
Melissa M. 2010. Roles of hCG in advancing follicular
growth to ovulation after concurrent injections of
PGF2α and GnRH in postpubertal Holstein heifers
bearing a CL. Vet Medic Int. 2010:1-7.
Katas H, Raja MAG, Lam KL. 2013. Development of
chitosan nanoparticles as a stable drug delivery system
for protein/siRN. Int J Biomater 2013:1-9. doi:
http://dx.doi.org/10.1155/2013/146320.
Kommareddy S, Tiwari SB, Amiji MM. 2005. Long-
circulating polymeric nanovectors for tumor-selective
gene delivery. Technol Cancer Res Treat. 4:615-625.
Marietta FW, Sayre B, Inskeep EK, Flores JA. 2001.
Prostaglandin F2α Regulation of the Bovine Corpus
Luteum Endothelin System during the Early and
Midluteal Phase. Biol Reprod. 65:1710-1717.
JITV Vol. 21 No 1 Th. 2016: 34-40
40
Mi FL, Sung HW, Shyu SS, Su CC, Peng CK. 2003.
Synthesis and characterization of biodegradable
TPP/genipin co-crosslinked chitosan gel beads.
Polymer. 44:6521-6530.
Mohanraj VJ, Chen Y. 2006. Nanoparticles - a review. Tropic
J Pharm Res. 5:561-573.
Nielsen L, Khurana R, Coats A, Frokjaer S, Brange J, Vyas S,
Uversky V, Fink AL. 2001. Effect of environmental
factors on the kinetics of insulin fibril formation:
Elucidation of the molecular mechanism. Biochemistry.
40:6036-6046.
Pan Y, Li Y, Zhao H, Zheng J, Xu H, Wei G. 2002.
Bioadhesive polysaccharide in protein delivery system:
Chitosan nanoparticles improve the intestinal absorption
of insulin in vivo. Int J Pharm. 249:139-147.
Perry GA, Smith MF, Lucy MC, Green JA, Parks TE,
Macneil MD, Roberts AJ, Geary TW. 2005.
Relationship between follicle size at insemination and
pregnancy success. Proc Natl Acad Sci. 102:5268-5273.
Qi L, Xu Z, Jiang X, Hu C, Zou X. 2004. Preparation and
antibacterial activity of chitosan nanoparticles.
Carbohydrate Res. 339:2693-2700.
Rather MA, Rupam S, Subodh G, Ferosekhan S, Ramya VL,
Sanjay BJ. 2013. Chitosan-Nanoconjugated Hormone
Nanoparticles for Sustained Surge of Gonadotropins and
Enhanced Reproductive Output in Female Fish. Plos
One. 8:1-11.
Roelofs JB, van Eerdenburg FJCM, Soede NM, Kemp. 2005.
Various behavioral signs of estrous and their
relationship with time of ovulation in dairy cattle.
Theriogenology. 63:1366-1377.
Safilho MF, Crespilho AM, Santos JEP, Perry GA, Baruselli
PS. 2010. Ovarian follicle diameter at timed
insemination and estrous response influence likelihood
of ovulation and pregnancy after estrous
synchronization with progesterone or progestin-based
protocols in suckled Bos indicus cows. Anim Reprod.
Sci. 120:23-30.
Sanchez S, Roldan M, Perez S, Fabregas E. 2008. Toward a
fast, easy, and versatile immobilization of biomolecules
into carbon nanotube/polysulfone-based biosensors for
the detection of hCG hormone. Anal Chem. 80:6508-
6514.
Santos JEP, Thatcher WW, Pool L, Ovrton MW. 2001. Effect
of human chorionic gonadotropin on luteal function and
reproductive performance of high producing lactating
Holstein dairy cow. J Anim Sci. 79:2881-2894.
Senger PL. 2005. Pathways to Pregnancy and Parturition, 2nd
ed. Moscow (Russia): Current conception Inc.
Smith J, Edward W, Michael D. 2004. Effect of Chitosan on
Epithelial Cell Tight Junctions. Pharm Res. 21:43-49.
Ugwoke MI, Agu RU, Verbeke Nb, Kinget R. 2005. Nasal
mucoadhesive drug delivery: Background, applications,
trends and future perspectives. Adv Drug Deliv Rev.
57:1640-1665.
Ulrika W, P. Elena, J. Björn. 2005. Transfer of morphine
along the olfactory pathway to the central nervous
system after nasal administration to rodents. Eur J
Pharm Sci. 24:565-573.
Vasir JK, Tambwekar K, Garg S. 2003. Bioadhesive
microspheres as a controlled drug delivery system. Int J
Pharm. 255:13-32.
Vila A, Sanchez A, Tobio M, Calvo P, Alonso MJ. 2002.
Design of biodegradable particles for protein delivery. J
Control Release. 78:15-24.
Vyas TK, Aliasgar S, Sudhanva M, Ambikanandan M.
2005. Intranasal drug delivery for brain targeting.
Current Drug Delivery. 2:165-175.
Wang, X.M, N. Chi, X. Tang. 2008. Preparation of estradiol
chitosan nanoparticles from improving nasal absorption
and brain targeting. Eur J Pharma Biopharma. 70:735-
740.
Xu Y, Du, Y. 2003. Effect of molecular structure of chitosan
on protein delivery properties of chitosan nanoparticles.
Int J Pharm. 250: 215-226.
Yoshida C, Nakao T. 2005. Response of plasma cortisol and
progesterone after ACTH challenge in ovariectomized
lactating dairy cows. J Reprod Dev. 51:99-107.
Zengshuan MA, Yeoh HH, Lee YL. 2002. Formulation pH
modulates the interaction of insulin with chitosan
nanoparticles. J Pharm Sci. 91: 1396-1404.
Zhang Q, X. Jiang, W. Jiang, W. Lu, L. Su, Z. Shi. 2004.
Preparation of nimodipineloaded microemulsion for
intranasal delivery and evaluation of the targeting
efficiency to brain. Int J Pharm. 275:85-96.
Zhang H, Oh M, Allen C, Kumacheva E. 2004. Monodisperse
chitosan nanoparticles for mucosal drug delivery.
Biomacromolecules. 5:2461-2468.
Zhang L, Kosaraju SL. 2007. Biopolymeric delivery system
for controlled release of polyphenolic antioxidants. Eur
Polymer J. 43:2956-2966.
Hidayati et al. Phylogenetic tree of Kuantan cattle by DNA barcoding
41
Phylogenetic Tree of Kuantan Cattle by DNA Barcoding
Hidayati1,2, Misrianti R1,2, Ali A2
1Breeding and Genetic Laboratory, Agricultural and Animal Science Faculty 2Agricultural and Animal Science Faculty
State Islamic University of Sultan Syarif Kasim - Riau
Kampus II Raja Ali Haji Jl. HR.Soebrantas Nomor 15 Simpang Baru Panam Pekanbaru 28293 E-mail: [email protected]
(received 05-01-2016; revised 15-03-2016; accepted 21-03-2016)
ABSTRAK
Hidayati, Misrianti R, Ali A. 2016. Pohon filogenetik sapi Kuantan menggunakan DNA barcode. JITV 21(1): 41-48. DOI:
http://dx.doi.org/10.14334/jitv.v21i1.1351
Sapi kuantan merupakan breed sapi potong lokal Riau yang belum diketahui asal usulnya. Sapi kuantan banyak ditemukan di
daerah Kabupaten Indargiri Hulu dan Kabupaten Kuantan Singingi. Berdasarkan tampilan fenotipe, sapi kuantan mirip dengan
sapi pesisir (bangsa sapi potong lokal Sumatera Barat). Menurut beberapa peternak, asal-usul sapi kuantan merupakan sapi
pesisir yang dibawa oleh perantau minang ke daerah ini. Tujuan penelitian ini untuk membuktikan apakah asal usul sapi kuantan
merupakan sapi pesisir melalui analisis keragaman genetik menggunakan DNA barcode. DNA barcode yang digunakan adalah
gene Cytochrome oxidase sub unit I, merupakan salah satu gene yang ditemukan pada DNA mitochondria. Isolasi DNA berhasil
dilakukan pada 25 sampel darah sapi kuantan betina dewasa dan 18 sampel darah sapi pesisir betina dewasa. Amplifikasi ruas
gene COI menggunakan metode Polymerase Chain Reaction. Primer forward yang digunakan dalam penelitian ini adalah F’5
TTCTCAACCAACCATAAAGATATTGG-3’ dan primer reverse 5’-TAGACTTCGGGGTGTCCAAAGAATCA-3’, mengapit
ruas gene COI sapi kuantan dan sapi pesisir dari basa 5711 - 6420 (Genebank nomor akses NC_005971) sepanjang 710 bp.
Hasil analisis sekuens menggunakan Program MEGA 5.2 menunjukkan bahwa ditemukan 6 titik polimorpik yang membentuk 7
haplotype pada sapi kuantan dan 9 titik polimorfik yang membentuk 12 haplotype pada sapi pesisir. Hasil analisis jarak genetik
dan phon filogenetik menunjukkan bahwa sapi kuantan dan sapi pesisir berada pada kelompok yang sama dengan Bos indicus.
Mutasi pada ruas gene COI sangat kecil dan belum dapat menjelaskan perbedaan diantara breed. Hasil penelitian ini juga
menegaskan bahwa berdasarkan garis keturunan induk asal usul sapi kuatnan adalah dari Bos indicus sama seperti sapi pesisir.
Kata Kunci: Gene COI, Polimorfik, Sapi Kuantan, Jarak Genetik, Pohon Filogenetik
ABSTRACT
Hidayati, Misrianti R, Ali A. 2016. Phylogenetic tree of Kuantan cattle by DNA barcoding. JITV 21(1): 41-48. DOI:
http://dx.doi.org/10.14334/jitv.v21i1.1351
Kuantan cattle is one of local beef cattle breed of Riau Province which its origin was unknown. Kuantan cattle are
commonly found in Indragiri Hulu and Kuantan Singingi Regency. Based on phenotype characterizations, kuantan cattles are
similar with pesisir cattle (West Sumatera beef cattle). Historically, kuantan cattle were pesisir cattle brought by “minang”
immigrants (Immigrant from West Sumatera) to this region. The purpose of this study was to analyze the origin of the kuantan
cattle through genetic diversity analysis using DNA barcode. DNA barcode used was Cytochrome oxidase subunit I gene which
was found in the mtDNA. DNA isolation was done on 25 kuantan’s blood samples and 18 pesisir blood samples. Amplification
of COI gene segment used Polymerase Chain Reaction technique. The forward primer sequence used in this study was F’5
TTCTCAACCAACCATAAAGATATTGG-3’ and the reverse primer sequence used was reverse 5’-
TAGACTTCGGGGTGTCCAAAGAATCA-3. It squeezed kuantan and pesisir sequence 5711 - 6420 base (GeneBank accession
number NC_005971) with length by 710 bp. Analysis result of sequence using MEGA 5.2 Program showed that there were 6
polymorphic sites establishing 7 haplotypes on kuantan cattle and 9 polymorphic sites establishing 12 haplotypes on pesisir
cattle. Based on genetic distance and phylogeney tree, kuantan and pesisir cattle were in same group with Bos indicus. Mutation
in the COI gene segment in this study was too small and was not able to distinguish the difference of those breeds. The result of
neighbor joining analyze indicated that kuantan cattle origin was from Bos indicus just like pesisir cattle.
Key Words: COI Gene, Polymorphic, Kuantan Cattle, Genetic Distance, Phylogenetic Tree
INTRODUCTION
Kuantan cattle, one of local beef cattle breed of
Riau Province which was registered as
No.1052/Kpts/S.R.120/10/2014 by Ministry of
Agriculture on 14 October 2014, has been designated
as one of Indonesian native cattle breed.
Morphologically, kuantan bull had body length by
103.78 cm; chest girth by 126.22 cm; and shoulder
height by 99.28 cm, while kuantan cow had body length
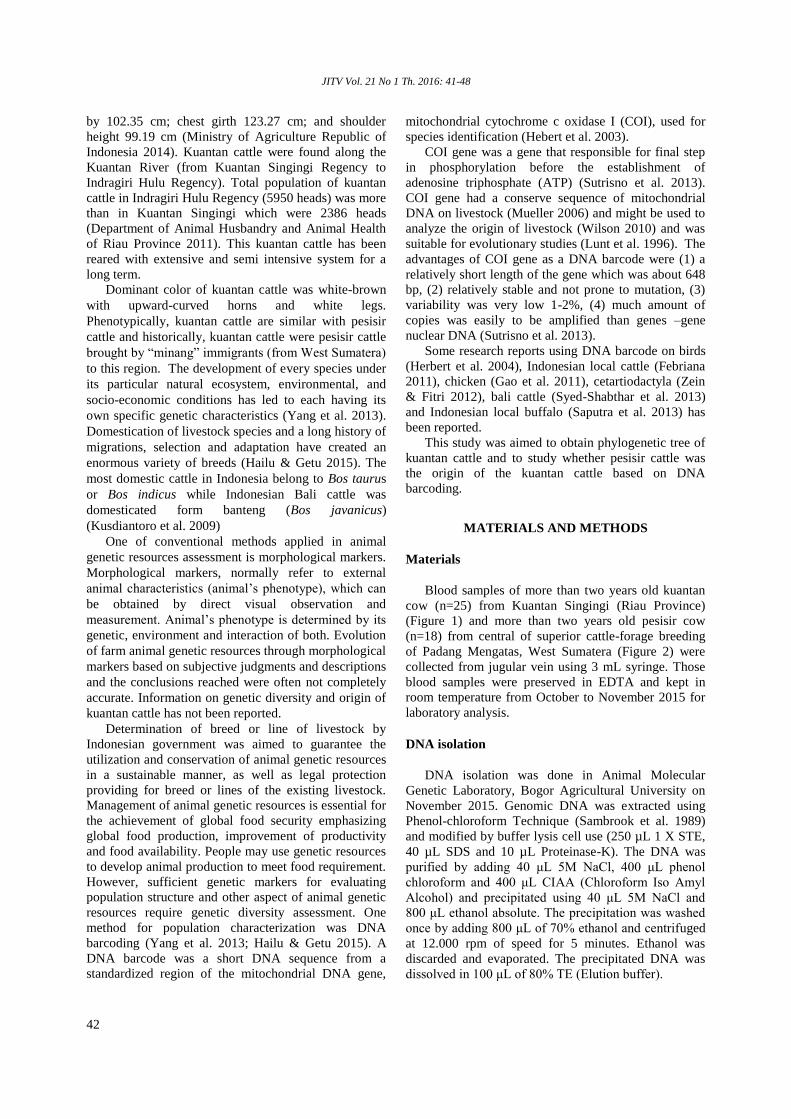
JITV Vol. 21 No 1 Th. 2016: 41-48
42
by 102.35 cm; chest girth 123.27 cm; and shoulder
height 99.19 cm (Ministry of Agriculture Republic of
Indonesia 2014). Kuantan cattle were found along the
Kuantan River (from Kuantan Singingi Regency to
Indragiri Hulu Regency). Total population of kuantan
cattle in Indragiri Hulu Regency (5950 heads) was more
than in Kuantan Singingi which were 2386 heads
(Department of Animal Husbandry and Animal Health
of Riau Province 2011). This kuantan cattle has been
reared with extensive and semi intensive system for a
long term.
Dominant color of kuantan cattle was white-brown
with upward-curved horns and white legs.
Phenotypically, kuantan cattle are similar with pesisir
cattle and historically, kuantan cattle were pesisir cattle
brought by “minang” immigrants (from West Sumatera)
to this region. The development of every species under
its particular natural ecosystem, environmental, and
socio-economic conditions has led to each having its
own specific genetic characteristics (Yang et al. 2013).
Domestication of livestock species and a long history of
migrations, selection and adaptation have created an
enormous variety of breeds (Hailu & Getu 2015). The
most domestic cattle in Indonesia belong to Bos taurus
or Bos indicus while Indonesian Bali cattle was
domesticated form banteng (Bos javanicus)
(Kusdiantoro et al. 2009)
One of conventional methods applied in animal
genetic resources assessment is morphological markers.
Morphological markers, normally refer to external
animal characteristics (animal’s phenotype), which can
be obtained by direct visual observation and
measurement. Animal’s phenotype is determined by its
genetic, environment and interaction of both. Evolution
of farm animal genetic resources through morphological
markers based on subjective judgments and descriptions
and the conclusions reached were often not completely
accurate. Information on genetic diversity and origin of
kuantan cattle has not been reported.
Determination of breed or line of livestock by
Indonesian government was aimed to guarantee the
utilization and conservation of animal genetic resources
in a sustainable manner, as well as legal protection
providing for breed or lines of the existing livestock.
Management of animal genetic resources is essential for
the achievement of global food security emphasizing
global food production, improvement of productivity
and food availability. People may use genetic resources
to develop animal production to meet food requirement.
However, sufficient genetic markers for evaluating
population structure and other aspect of animal genetic
resources require genetic diversity assessment. One
method for population characterization was DNA
barcoding (Yang et al. 2013; Hailu & Getu 2015). A
DNA barcode was a short DNA sequence from a
standardized region of the mitochondrial DNA gene,
mitochondrial cytochrome c oxidase I (COI), used for
species identification (Hebert et al. 2003).
COI gene was a gene that responsible for final step
in phosphorylation before the establishment of
adenosine triphosphate (ATP) (Sutrisno et al. 2013).
COI gene had a conserve sequence of mitochondrial
DNA on livestock (Mueller 2006) and might be used to
analyze the origin of livestock (Wilson 2010) and was
suitable for evolutionary studies (Lunt et al. 1996). The
advantages of COI gene as a DNA barcode were (1) a
relatively short length of the gene which was about 648
bp, (2) relatively stable and not prone to mutation, (3)
variability was very low 1-2%, (4) much amount of
copies was easily to be amplified than genes –gene
nuclear DNA (Sutrisno et al. 2013).
Some research reports using DNA barcode on birds
(Herbert et al. 2004), Indonesian local cattle (Febriana
2011), chicken (Gao et al. 2011), cetartiodactyla (Zein
& Fitri 2012), bali cattle (Syed-Shabthar et al. 2013)
and Indonesian local buffalo (Saputra et al. 2013) has
been reported.
This study was aimed to obtain phylogenetic tree of
kuantan cattle and to study whether pesisir cattle was
the origin of the kuantan cattle based on DNA
barcoding.
MATERIALS AND METHODS
Materials
Blood samples of more than two years old kuantan
cow (n=25) from Kuantan Singingi (Riau Province)
(Figure 1) and more than two years old pesisir cow
(n=18) from central of superior cattle-forage breeding
of Padang Mengatas, West Sumatera (Figure 2) were
collected from jugular vein using 3 mL syringe. Those
blood samples were preserved in EDTA and kept in
room temperature from October to November 2015 for
laboratory analysis.
DNA isolation
DNA isolation was done in Animal Molecular
Genetic Laboratory, Bogor Agricultural University on
November 2015. Genomic DNA was extracted using
Phenol-chloroform Technique (Sambrook et al. 1989)
and modified by buffer lysis cell use (250 µL 1 X STE,
40 µL SDS and 10 µL Proteinase-K). The DNA was
purified by adding 40 μL 5M NaCl, 400 μL phenol
chloroform and 400 μL CIAA (Chloroform Iso Amyl
Alcohol) and precipitated using 40 μL 5M NaCl and
800 μL ethanol absolute. The precipitation was washed
once by adding 800 μL of 70% ethanol and centrifuged
at 12.000 rpm of speed for 5 minutes. Ethanol was
discarded and evaporated. The precipitated DNA was
dissolved in 100 μL of 80% TE (Elution buffer).
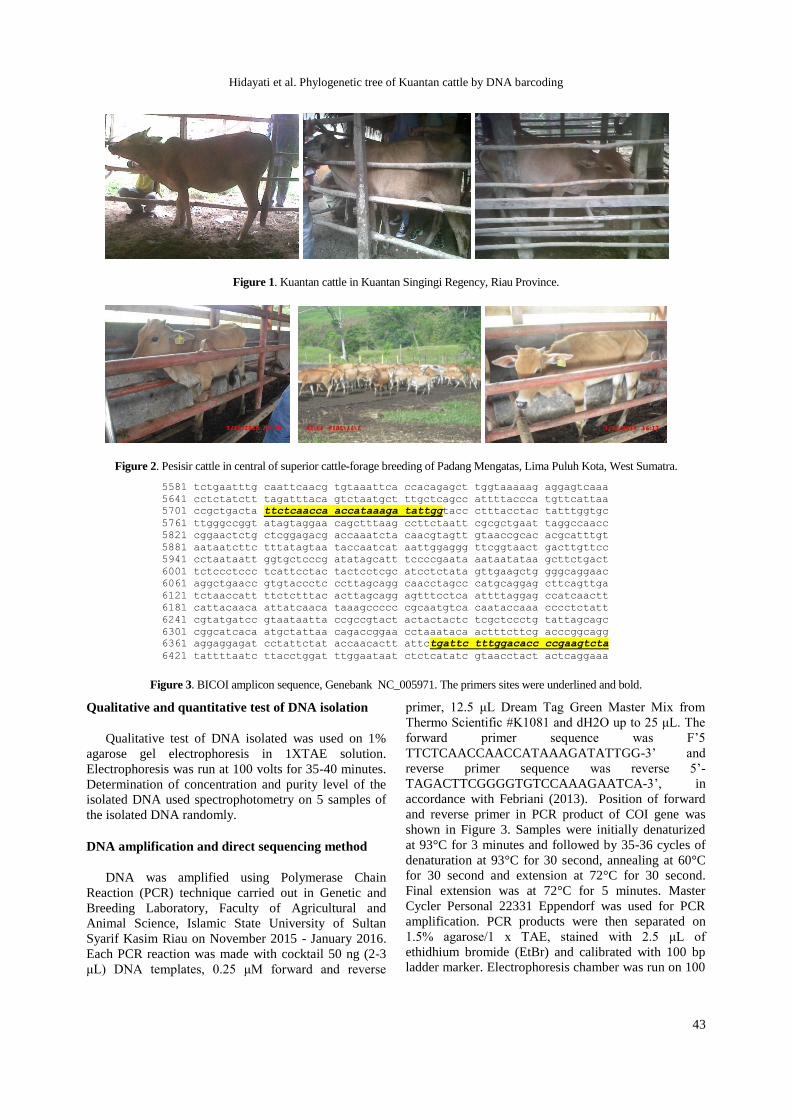
Hidayati et al. Phylogenetic tree of Kuantan cattle by DNA barcoding
43
Figure 1. Kuantan cattle in Kuantan Singingi Regency, Riau Province.
Figure 2. Pesisir cattle in central of superior cattle-forage breeding of Padang Mengatas, Lima Puluh Kota, West Sumatra.
5581 tctgaatttg caattcaacg tgtaaattca ccacagagct tggtaaaaag aggagtcaaa
5641 cctctatctt tagatttaca gtctaatgct ttgctcagcc attttaccca tgttcattaa
5701 ccgctgacta ttctcaacca accataaaga tattggtacc ctttacctac tatttggtgc
5761 ttgggccggt atagtaggaa cagctttaag ccttctaatt cgcgctgaat taggccaacc
5821 cggaactctg ctcggagacg accaaatcta caacgtagtt gtaaccgcac acgcatttgt
5881 aataatcttc tttatagtaa taccaatcat aattggaggg ttcggtaact gacttgttcc
5941 cctaataatt ggtgctcccg atatagcatt tccccgaata aataatataa gcttctgact
6001 tctccctccc tcattcctac tactcctcgc atcctctata gttgaagctg gggcaggaac
6061 aggctgaacc gtgtaccctc ccttagcagg caacctagcc catgcaggag cttcagttga
6121 tctaaccatt ttctctttac acttagcagg agtttcctca attttaggag ccatcaactt
6181 cattacaaca attatcaaca taaagccccc cgcaatgtca caataccaaa cccctctatt
6241 cgtatgatcc gtaataatta ccgccgtact actactactc tcgctccctg tattagcagc
6301 cggcatcaca atgctattaa cagaccggaa cctaaataca actttcttcg acccggcagg
6361 aggaggagat cctattctat accaacactt attctgattc tttggacacc ccgaagtcta
6421 tattttaatc ttacctggat ttggaataat ctctcatatc gtaacctact actcaggaaa
Figure 3. BICOI amplicon sequence, Genebank NC_005971. The primers sites were underlined and bold.
Qualitative and quantitative test of DNA isolation
Qualitative test of DNA isolated was used on 1%
agarose gel electrophoresis in 1XTAE solution.
Electrophoresis was run at 100 volts for 35-40 minutes.
Determination of concentration and purity level of the
isolated DNA used spectrophotometry on 5 samples of
the isolated DNA randomly.
DNA amplification and direct sequencing method
DNA was amplified using Polymerase Chain
Reaction (PCR) technique carried out in Genetic and
Breeding Laboratory, Faculty of Agricultural and
Animal Science, Islamic State University of Sultan
Syarif Kasim Riau on November 2015 - January 2016.
Each PCR reaction was made with cocktail 50 ng (2-3
μL) DNA templates, 0.25 μM forward and reverse
primer, 12.5 μL Dream Tag Green Master Mix from
Thermo Scientific #K1081 and dH2O up to 25 μL. The
forward primer sequence was F’5
TTCTCAACCAACCATAAAGATATTGG-3’ and
reverse primer sequence was reverse 5’-
TAGACTTCGGGGTGTCCAAAGAATCA-3’, in
accordance with Febriani (2013). Position of forward
and reverse primer in PCR product of COI gene was
shown in Figure 3. Samples were initially denaturized
at 93°C for 3 minutes and followed by 35-36 cycles of
denaturation at 93°C for 30 second, annealing at 60°C
for 30 second and extension at 72°C for 30 second.
Final extension was at 72°C for 5 minutes. Master
Cycler Personal 22331 Eppendorf was used for PCR
amplification. PCR products were then separated on
1.5% agarose/1 x TAE, stained with 2.5 μL of
ethidhium bromide (EtBr) and calibrated with 100 bp
ladder marker. Electrophoresis chamber was run on 100
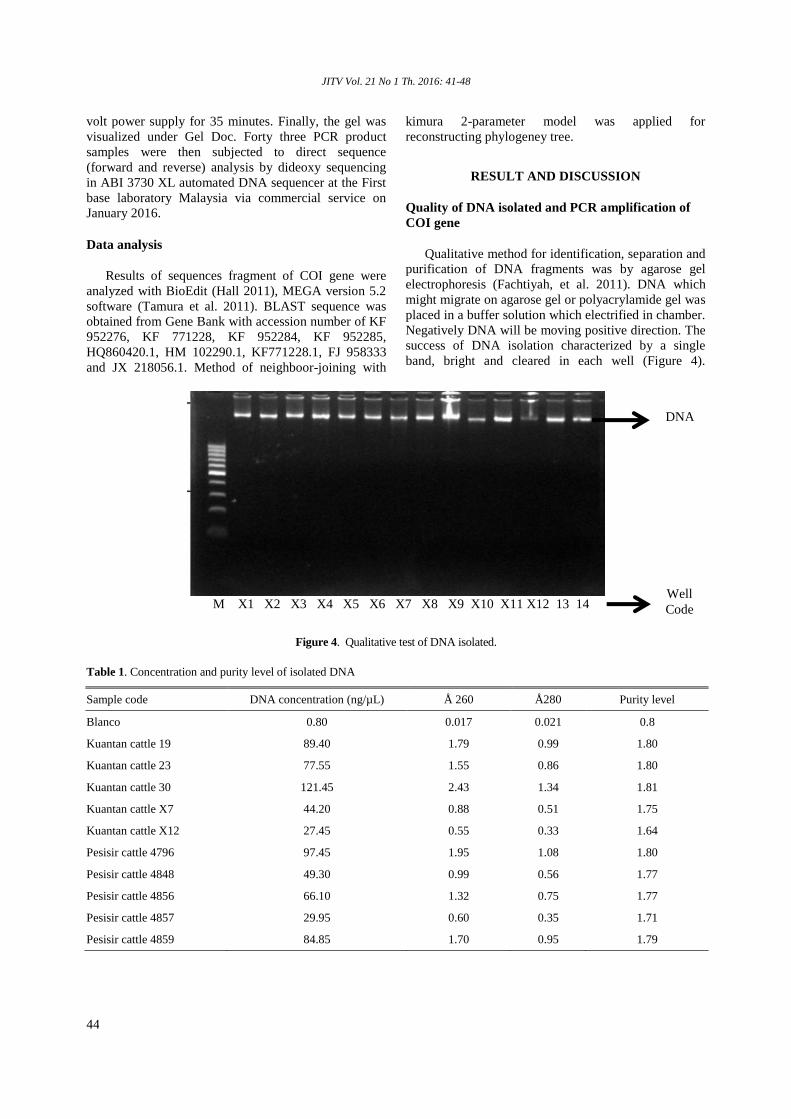
JITV Vol. 21 No 1 Th. 2016: 41-48
44
volt power supply for 35 minutes. Finally, the gel was
visualized under Gel Doc. Forty three PCR product
samples were then subjected to direct sequence
(forward and reverse) analysis by dideoxy sequencing
in ABI 3730 XL automated DNA sequencer at the First
base laboratory Malaysia via commercial service on
January 2016.
Data analysis
Results of sequences fragment of COI gene were
analyzed with BioEdit (Hall 2011), MEGA version 5.2
software (Tamura et al. 2011). BLAST sequence was
obtained from Gene Bank with accession number of KF
952276, KF 771228, KF 952284, KF 952285,
HQ860420.1, HM 102290.1, KF771228.1, FJ 958333
and JX 218056.1. Method of neighboor-joining with
kimura 2-parameter model was applied for
reconstructing phylogeney tree.
RESULT AND DISCUSSION
Quality of DNA isolated and PCR amplification of
COI gene
Qualitative method for identification, separation and
purification of DNA fragments was by agarose gel
electrophoresis (Fachtiyah, et al. 2011). DNA which
might migrate on agarose gel or polyacrylamide gel was
placed in a buffer solution which electrified in chamber.
Negatively DNA will be moving positive direction. The
success of DNA isolation characterized by a single
band, bright and cleared in each well (Figure 4).
M X1 X2 X3 X4 X5 X6 X7 X8 X9 X10 X11 X12 13 14
Figure 4. Qualitative test of DNA isolated.
Table 1. Concentration and purity level of isolated DNA
Sample code DNA concentration (ng/µL) Å 260 Å280 Purity level
Blanco 0.80 0.017 0.021 0.8
Kuantan cattle 19 89.40 1.79 0.99 1.80
Kuantan cattle 23 77.55 1.55 0.86 1.80
Kuantan cattle 30 121.45 2.43 1.34 1.81
Kuantan cattle X7 44.20 0.88 0.51 1.75
Kuantan cattle X12 27.45 0.55 0.33 1.64
Pesisir cattle 4796 97.45 1.95 1.08 1.80
Pesisir cattle 4848 49.30 0.99 0.56 1.77
Pesisir cattle 4856 66.10 1.32 0.75 1.77
Pesisir cattle 4857 29.95 0.60 0.35 1.71
Pesisir cattle 4859 84.85 1.70 0.95 1.79
Well
Code
DNA
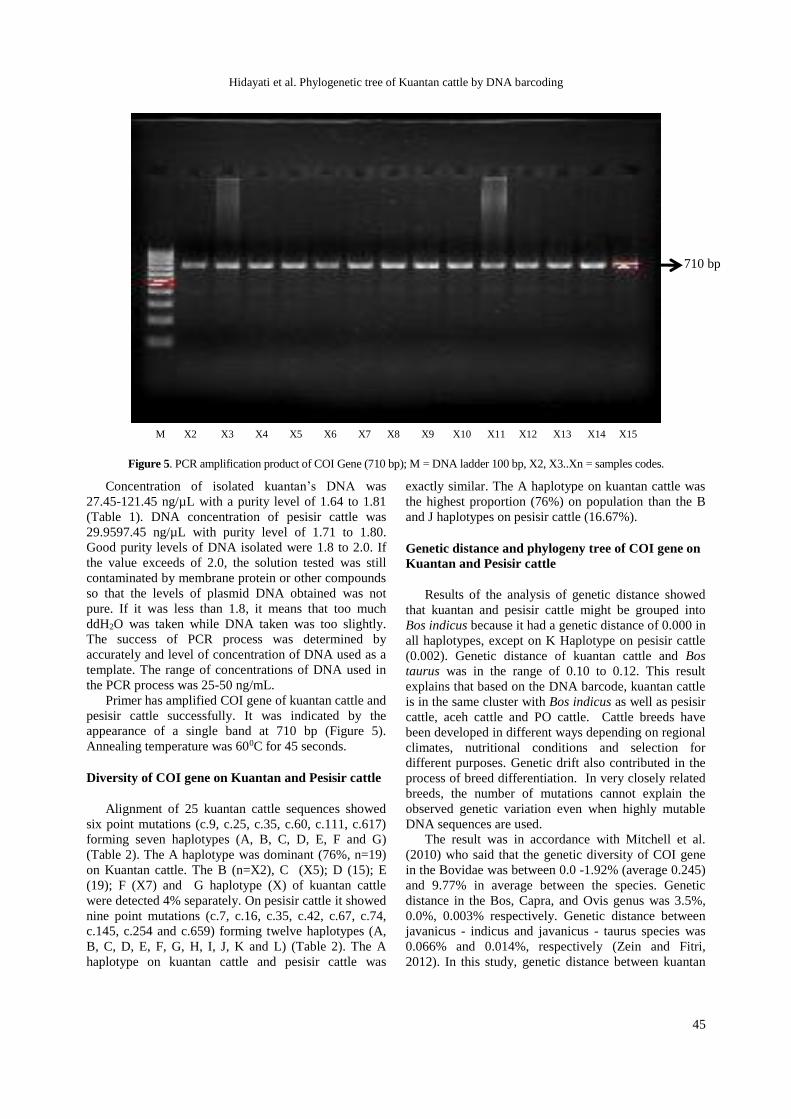
Hidayati et al. Phylogenetic tree of Kuantan cattle by DNA barcoding
45
Figure 5. PCR amplification product of COI Gene (710 bp); M = DNA ladder 100 bp, X2, X3..Xn = samples codes.
Concentration of isolated kuantan’s DNA was
27.45-121.45 ng/µL with a purity level of 1.64 to 1.81
(Table 1). DNA concentration of pesisir cattle was
29.9597.45 ng/µL with purity level of 1.71 to 1.80.
Good purity levels of DNA isolated were 1.8 to 2.0. If
the value exceeds of 2.0, the solution tested was still
contaminated by membrane protein or other compounds
so that the levels of plasmid DNA obtained was not
pure. If it was less than 1.8, it means that too much
ddH2O was taken while DNA taken was too slightly.
The success of PCR process was determined by
accurately and level of concentration of DNA used as a
template. The range of concentrations of DNA used in
the PCR process was 25-50 ng/mL.
Primer has amplified COI gene of kuantan cattle and
pesisir cattle successfully. It was indicated by the
appearance of a single band at 710 bp (Figure 5).
Annealing temperature was 600C for 45 seconds.
Diversity of COI gene on Kuantan and Pesisir cattle
Alignment of 25 kuantan cattle sequences showed
six point mutations (c.9, c.25, c.35, c.60, c.111, c.617)
forming seven haplotypes (A, B, C, D, E, F and G)
(Table 2). The A haplotype was dominant (76%, n=19)
on Kuantan cattle. The B (n=X2), C (X5); D (15); E
(19); F (X7) and G haplotype (X) of kuantan cattle
were detected 4% separately. On pesisir cattle it showed
nine point mutations (c.7, c.16, c.35, c.42, c.67, c.74,
c.145, c.254 and c.659) forming twelve haplotypes (A,
B, C, D, E, F, G, H, I, J, K and L) (Table 2). The A
haplotype on kuantan cattle and pesisir cattle was
exactly similar. The A haplotype on kuantan cattle was
the highest proportion (76%) on population than the B
and J haplotypes on pesisir cattle (16.67%).
Genetic distance and phylogeny tree of COI gene on
Kuantan and Pesisir cattle
Results of the analysis of genetic distance showed
that kuantan and pesisir cattle might be grouped into
Bos indicus because it had a genetic distance of 0.000 in
all haplotypes, except on K Haplotype on pesisir cattle
(0.002). Genetic distance of kuantan cattle and Bos
taurus was in the range of 0.10 to 0.12. This result
explains that based on the DNA barcode, kuantan cattle
is in the same cluster with Bos indicus as well as pesisir
cattle, aceh cattle and PO cattle. Cattle breeds have
been developed in different ways depending on regional
climates, nutritional conditions and selection for
different purposes. Genetic drift also contributed in the
process of breed differentiation. In very closely related
breeds, the number of mutations cannot explain the
observed genetic variation even when highly mutable
DNA sequences are used.
The result was in accordance with Mitchell et al.
(2010) who said that the genetic diversity of COI gene
in the Bovidae was between 0.0 -1.92% (average 0.245)
and 9.77% in average between the species. Genetic
distance in the Bos, Capra, and Ovis genus was 3.5%,
0.0%, 0.003% respectively. Genetic distance between
javanicus - indicus and javanicus - taurus species was
0.066% and 0.014%, respectively (Zein and Fitri,
2012). In this study, genetic distance between kuantan
M X2 X3 X4 X5 X6 X7 X8 X9 X10 X11 X12 X13 X14 X15
710 bp
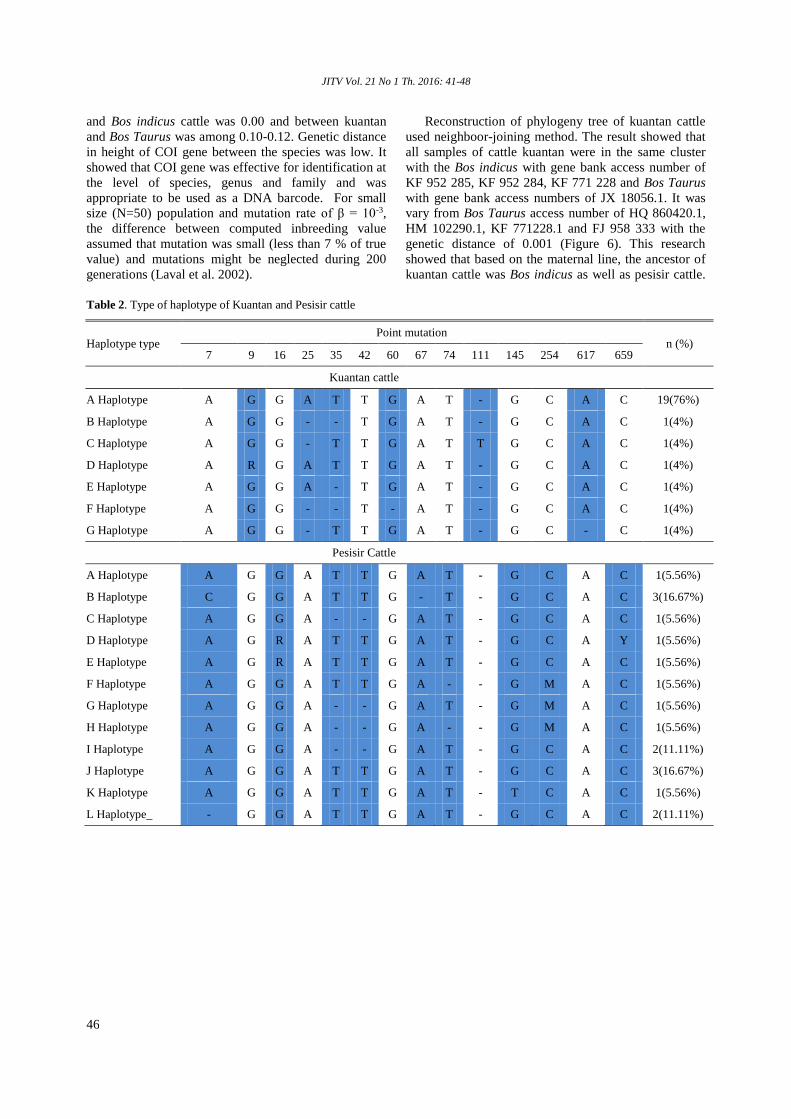
JITV Vol. 21 No 1 Th. 2016: 41-48
46
and Bos indicus cattle was 0.00 and between kuantan
and Bos Taurus was among 0.10-0.12. Genetic distance
in height of COI gene between the species was low. It
showed that COI gene was effective for identification at
the level of species, genus and family and was
appropriate to be used as a DNA barcode. For small
size (N=50) population and mutation rate of β = 10-3,
the difference between computed inbreeding value
assumed that mutation was small (less than 7 % of true
value) and mutations might be neglected during 200
generations (Laval et al. 2002).
Reconstruction of phylogeny tree of kuantan cattle
used neighboor-joining method. The result showed that
all samples of cattle kuantan were in the same cluster
with the Bos indicus with gene bank access number of
KF 952 285, KF 952 284, KF 771 228 and Bos Taurus
with gene bank access numbers of JX 18056.1. It was
vary from Bos Taurus access number of HQ 860420.1,
HM 102290.1, KF 771228.1 and FJ 958 333 with the
genetic distance of 0.001 (Figure 6). This research
showed that based on the maternal line, the ancestor of
kuantan cattle was Bos indicus as well as pesisir cattle.
Table 2. Type of haplotype of Kuantan and Pesisir cattle
Haplotype type Point mutation
n (%) 7 9 16 25 35 42 60 67 74 111 145 254 617 659
Kuantan cattle
A Haplotype A G G A T T G A T - G C A C 19(76%)
B Haplotype A G G - - T G A T - G C A C 1(4%)
C Haplotype A G G - T T G A T T G C A C 1(4%)
D Haplotype A R G A T T G A T - G C A C 1(4%)
E Haplotype A G G A - T G A T - G C A C 1(4%)
F Haplotype A G G - - T - A T - G C A C 1(4%)
G Haplotype A G G - T T G A T - G C - C 1(4%)
Pesisir Cattle
A Haplotype A G G A T T G A T - G C A C 1(5.56%)
B Haplotype C G G A T T G - T - G C A C 3(16.67%)
C Haplotype A G G A - - G A T - G C A C 1(5.56%)
D Haplotype A G R A T T G A T - G C A Y 1(5.56%)
E Haplotype A G R A T T G A T - G C A C 1(5.56%)
F Haplotype A G G A T T G A - - G M A C 1(5.56%)
G Haplotype A G G A - - G A T - G M A C 1(5.56%)
H Haplotype A G G A - - G A - - G M A C 1(5.56%)
I Haplotype A G G A - - G A T - G C A C 2(11.11%)
J Haplotype A G G A T T G A T - G C A C 3(16.67%)
K Haplotype A G G A T T G A T - T C A C 1(5.56%)
L Haplotype_ - G G A T T G A T - G C A C 2(11.11%)
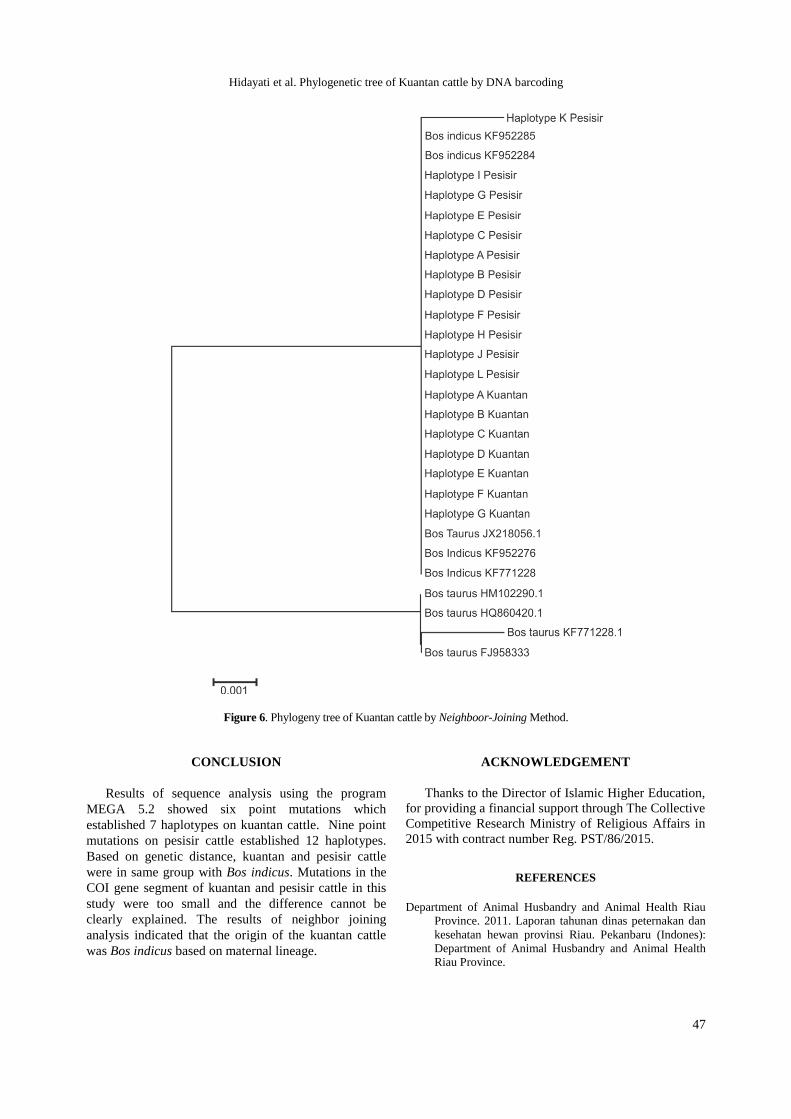
Hidayati et al. Phylogenetic tree of Kuantan cattle by DNA barcoding
47
Figure 6. Phylogeny tree of Kuantan cattle by Neighboor-Joining Method.
CONCLUSION
Results of sequence analysis using the program
MEGA 5.2 showed six point mutations which
established 7 haplotypes on kuantan cattle. Nine point
mutations on pesisir cattle established 12 haplotypes.
Based on genetic distance, kuantan and pesisir cattle
were in same group with Bos indicus. Mutations in the
COI gene segment of kuantan and pesisir cattle in this
study were too small and the difference cannot be
clearly explained. The results of neighbor joining
analysis indicated that the origin of the kuantan cattle
was Bos indicus based on maternal lineage.
ACKNOWLEDGEMENT
Thanks to the Director of Islamic Higher Education,
for providing a financial support through The Collective
Competitive Research Ministry of Religious Affairs in
2015 with contract number Reg. PST/86/2015.
REFERENCES
Department of Animal Husbandry and Animal Health Riau
Province. 2011. Laporan tahunan dinas peternakan dan
kesehatan hewan provinsi Riau. Pekanbaru (Indones):
Department of Animal Husbandry and Animal Health
Riau Province.
JITV Vol. 21 No 1 Th. 2016: 41-48
48
Fachtiyah, Rumingtyas ELA, Widyarti S, Rahayu S. 2011.
Biologi molekular. Jakarta (Indones): Erlangga.
Febriana A. 2011. Filogenei berdasarkan sekuens DNA
Mitokondria gene Cytochrome oxidase I (gene COI)
pada beberapa bangsa sapi lokal Indonesia (Skripsi).
[Bogor (Indones)]: Institut Pertanian Bogor.
Gao YS, Tu YJ, Lu JX, Zhang XY. 2011. Studies on the DNA
barcoding of two newly discovered chiecken breeds by
mtDNA COI gene. J Anim Vet Adv. 10:1711-1713. doi:
10.3923/javaa.2011.1711.1713.
Hailu A, Getu A. 2015. Breed characterization tools and their
applications. Int J Genet. 5:7-14. doi: 10.5829/idosi.ijg.
2015.5.1.92187
Hall T. 2011. BioEdit: An important software for molecular
biology. GERF Bull Biosci. 2:60-61.
Hartl DL, Clark Ag. 1997. Principles of population genetic.
Massachusetts (USA): Sinauer Associates Inc.
Hebert PDN, Cywinska A, Ball SL, de Waard JL. 2003.
Biological identification through DNA barcodes. Philos
Trans Ser B. 270:313-321. doi: 10.1098/rspb.2002.
2218.321.
Kusdiantoro M, Olsson M, van Tol HTA, Mikko S, Vlamings
BH, Andersson G, Rodriguez-Martinez H, Purwantara
B, Paling RW, Colenbrander B, Lenstra JA. 2009. On
the origin of Indonesian cattle. PLos One. 4:1-6.
Laval G, San Cristobal M, Chevalet C. 2002. Measuring
genetic distance between breeds: Use of same distances
in various short term evolution models. Genet Sel Evo.
34:481-507. doi: 10.1051/gse:2002019.
Li W, de Graur D. 1991. Fundamental of molecular evolution.
Sunderland (UK): Sinauer Associates, Inc.
Lunt DH, Zhang DS, Zhimura DM, Dewit GM. 1996. The
insect cytochrome oxidase I gene: evolutionary pattern
and conserve primer for phylogenetics studies. Insect
Mol Biol. 5:153-165. doi: 10.1111/j.1365-
2583.1996.tb00049.x.
Mitchell JE, Greta LM, Sergion OK, Mathew SL, Andrew
PM, George A. 2010. Barcoding busmeat: Molecular
identification of Central African and South American
Harvested Vertebrates. Conserv Genet. 11:1389-1404.
Mueller RL. 2006. Evolutionary rates, divergenece dates, and
the performance of mitochondrial genes in Bayesian
phylogenetic analysis. Syst Biol. 55:289-300. doi:
10.1080/10635150500541672.
Sambrook J, Fritsch EF, Maniatis T. 1989. Molecular
Clonning: A laboratory manual. 2nd ed. USA: Cold
Spring Harbor Laboratory Press.
Saputra F, Jakaria, Sumantri C. 2013. Genetic variation of
mtDNA cytochorome oxidase sub unit I (COI) in local
swamp buffaloes in Indonesia. Media Peternakan.
36:165-170. doi: 10.5398/medpet.2013.36. 3.165.
Sutrisno H, Zein MSA, Sulandari S. 2013. DNA barcode. In:
Zein MSA, Prawiradilaga DM, editors. DNA barcode
fauna Indonesia. Jakarta (Indones): Kencana.
Syed-Shabthar SM, Rosli MK, Mohd-Zin NA, Romaino SM,
Fazly-Ann ZA, Mahani MC, Abas-Mazni O, Zainuddin
R, Yaakop S, Md-Zain BM. 2013. The moleculer
phylogenetic signature of Bali cattle revealed by
maternal and paternal markers. Mol Biol Rep. doi:
10.1007/s11033-013-2619-y.
Taberlet P. 1996. The use of mitochondrial DNA control
region sequencing in conservation genetics. In: Smith
TB, Wayne RK, editors. Molecular genetic approaches
in conservation. New York (USA): Oxford University
Press. p. 125-142.
Tamura K, Dudley J, Nei M, Kumar S. 2011. MEGA software
(version 5): Molecular evolutionary genetics analysis.
Center of Evolutionary Functional Geneomics
Biodesign Institute. Arizona State University.
Wilson JJ. 2010. Assessing the value of DNA barcodes and
other priority gene regions for molecular phylogenetics
of Lepidoptera. PLos One. 5:e10525. doi:
10.1371/journal.pone.0010525.
Yang W, Kang X, Yang Q, Lin Y, Fang M. 2013. Review on
the development of genotyping methods for assessing
farm animal diversity. J Anim Sci Biotech. 4:1-6.
Yuwono T. 2006. Teori dan aplikasi polymerase chain
reaction. Yogyakarta (Indones): Andi.
Zein MSA, Fitriana YS. 2012. Teknik molekuler untuk
identifikasi species ordo cetartiodactyla menggunakan
DNA barcode. Zoo Indonesia. 21:1-8.
Febretrisiana et al. Relationship of extender and packaging system ant the length of preservation and the quality
49
Relationship of Extender and Packaging System an the Length of
Preservation and the Quality of Chilled Semen of Boer Goat
Febretrisiana A, Anwar, Sinulingga S
Indonesian Goat Research Station, PO Box I Sei Putih, Galang 20585, North Sumatra
(received 22-01-2016; revised 08-03-2016; accepted 16-03-2016)
ABSTRAK
Febretrisiana A, Anwar, Sinulingga S. 2016. Hubungan jenis pengencer dan sistem pengemasan terhadap lama simpan dan
kualitas semen cair kambing Boer. JITV 21(1): 49-54. DOI: http://dx.doi.org/10.14334/jitv.v21i1.1350
Tujuan penelitian ini adalah untuk membandingkan penggunaan bahan pengencer yang berbeda (Triladyl dan Tris kuning
telur (TKT)) serta pengaruh cara pengemasan semen cair (pool dan straw) terhadap kualitas semen cair kambing Boer. Semen
ditampung menggunakan vagina buatan yang berasal tiga ekor kambing pejantan Boer berumur 2 tahun dengan bobot hidup 50-
55 kg. Semen dievaluasi kemudian diencerkan dengan menggunakan pengencer Triladyl dan TKT kemudian disimpan di lemari
pendingin dengan suhu 5⁰C dalam kemasan yang berbeda yaitu dalam bentuk pool dan straw. Evaluasi dilakukan setiap hari
selama 5 hari. Hasil penelitian menunjukkan motilitas sperma yang lebih baik diperoleh dengan menggunakan pengencer
Triladyl dan dengan sistem pengemasan pool, lebih tinggi (P<0,05) bila dibandingkan menggunakan sistem pengemasana straw
dan lebih tinggi bila menggunakan pengencer TKT dengan kedua sistem penyimpanan (masing-masing 45,8%, 26,1%, 32,1%
dan 9,1%). Hal sama juga terlihat pada integritas membran spermatozoa yang terlihat lebih tinggi (P<0.05) bila menggunakan
pengencer Triladyl baik dengan sistem penyimpanan pool (75,2%) maupun dengan straw (77,2%). Viabilitas spermatozoa
dengan menggunakan pengencer Triladyl baik dengan pengemasan pool maupun straw mulai mengalami penurunan setelah 3
hari penyimpanan (77,1% dan 76,2%; P<0,05) sedangkan dengan pengencer TKT viabilitas spermatozoa menurun setelah 4 hari
penyimpanan (73,2% dan 58,0%; P<0,05). Kesimpulan dari penelitian ini adalah kualitas semen cair kambing Boer menurun
seiring dengan bertambahnya waktu penyimpanan dan pengencer Triladyl dengan sistem pengemasan pool menjadi metode
terbaik untuk preservasi semen cair kambing Boer.
Kata Kunci: Semen Cair, Boer, Triladyl, Tris Kuning Telur, Straw
ABSTRACT
Febretrisiana A, Anwar, Sinulingga S. 2016. Relationship of extender and packaging system an the length of preservation and
the quality of chilled semen of Boer goat. JITV 21(1): 49-54. DOI: http://dx.doi.org/10.14334/jitv.v21i1.1350
The aim of this research was to compare the effectiveness of different extender (either Triladyl or Tris Egg Yolk extender)
and different packaging method (pool and straw) of chilled semen an the length of preservation and the quality of chilled semen
of Boer goat. Semen was collected using an artificial vagina from 3 two years old Boer bucks with body weight of 50-55 kg. It
was evaluated under a microscope, then each was diluted either in Tris egg yolk extender (TEY) or Triladyl. Those diluted
sperms were then packed either in pool or straw and preserved at 5⁰C refrigerator. Sperm motility, viability and membrane
integrity of each group were evaluated every 24 h for up to 5 days. Results showed that sperm motility in Triladyl of pool
packaging system up to 3 days was higher than straw packaging system or TEY in pool or straw packaging system which were
45.8%, 26.1%, 32.1% and 9.1%, respectively (P<0.05). Percentage of sperm membrane integrity showed the same pattern to
Triladyl both in pool and straw packaging system which was higher than TEY group (75.2% and 77,2%; P<0.05). Sperm
viability in Triladyl both in pool or straw packaging system decreased (P<0.05) after 3 days of preservation (77.1% and 76.2%)
but TEY significanly decreased after 4 days of preservation either in pool or straw packaging system (73.2% and 58.0%;
P<0.05). It was concluded that sperm quality decreased with increasing of the length of preservation while Triladyl extender in
pool packaging system showed the best quality.
Key Words: Chilled Semen, Boer, Triladyl, Tris Egg Yolk, Straw
INTRODUCTION
Artificial insemination program is one of
reproduction technologies aimed to increase pregnancy
rate in animal. It encourages crossing program of
selected buck. The artificial insemination is used
intensively in goat breeding system, especially in
crossbreeding program to increase meat or milk yield
and litter size. It was also used to optimize selection
program and facilitate to control time of birth (Leboeuf
et al. 2000). Generally, artificial insemination use
frozen semen. Limited liquid nitrogen due to
distribution or evaporation is an issue in frozen semen
use. Limited container availability and late in reporting
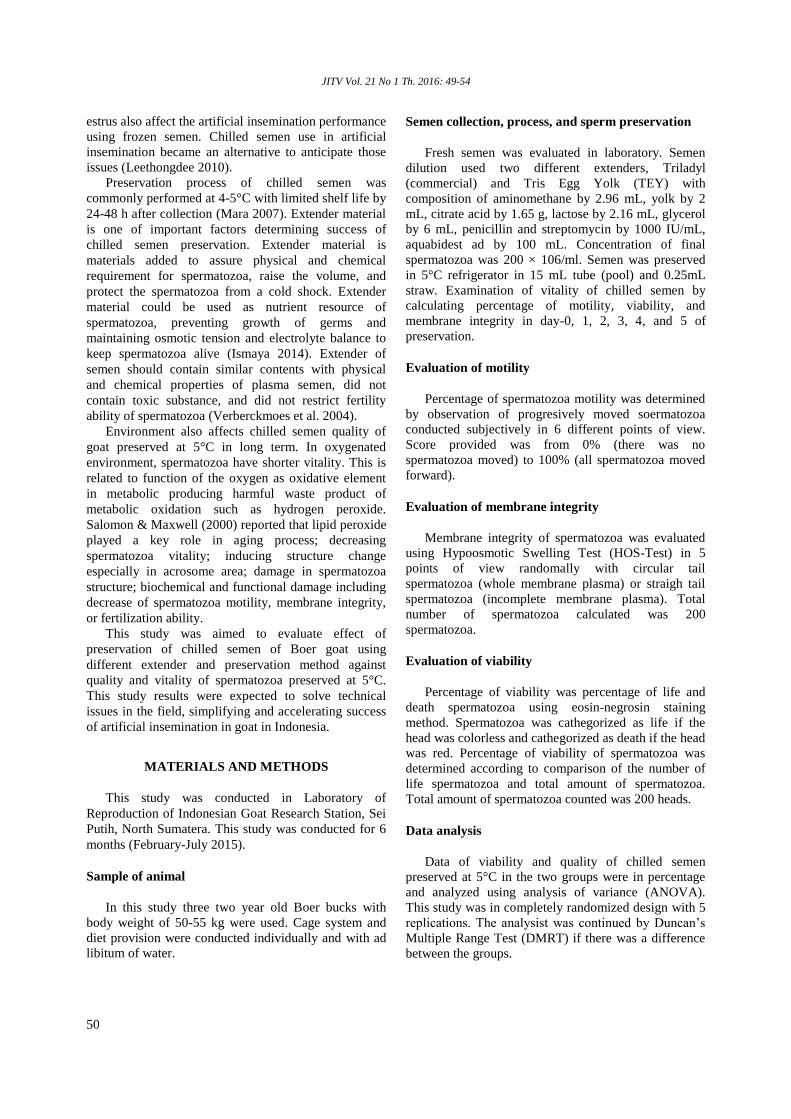
JITV Vol. 21 No 1 Th. 2016: 49-54
50
estrus also affect the artificial insemination performance
using frozen semen. Chilled semen use in artificial
insemination became an alternative to anticipate those
issues (Leethongdee 2010).
Preservation process of chilled semen was
commonly performed at 4-5°C with limited shelf life by
24-48 h after collection (Mara 2007). Extender material
is one of important factors determining success of
chilled semen preservation. Extender material is
materials added to assure physical and chemical
requirement for spermatozoa, raise the volume, and
protect the spermatozoa from a cold shock. Extender
material could be used as nutrient resource of
spermatozoa, preventing growth of germs and
maintaining osmotic tension and electrolyte balance to
keep spermatozoa alive (Ismaya 2014). Extender of
semen should contain similar contents with physical
and chemical properties of plasma semen, did not
contain toxic substance, and did not restrict fertility
ability of spermatozoa (Verberckmoes et al. 2004).
Environment also affects chilled semen quality of
goat preserved at 5°C in long term. In oxygenated
environment, spermatozoa have shorter vitality. This is
related to function of the oxygen as oxidative element
in metabolic producing harmful waste product of
metabolic oxidation such as hydrogen peroxide.
Salomon & Maxwell (2000) reported that lipid peroxide
played a key role in aging process; decreasing
spermatozoa vitality; inducing structure change
especially in acrosome area; damage in spermatozoa
structure; biochemical and functional damage including
decrease of spermatozoa motility, membrane integrity,
or fertilization ability.
This study was aimed to evaluate effect of
preservation of chilled semen of Boer goat using
different extender and preservation method against
quality and vitality of spermatozoa preserved at 5°C.
This study results were expected to solve technical
issues in the field, simplifying and accelerating success
of artificial insemination in goat in Indonesia.
MATERIALS AND METHODS
This study was conducted in Laboratory of
Reproduction of Indonesian Goat Research Station, Sei
Putih, North Sumatera. This study was conducted for 6
months (February-July 2015).
Sample of animal
In this study three two year old Boer bucks with
body weight of 50-55 kg were used. Cage system and
diet provision were conducted individually and with ad
libitum of water.
Semen collection, process, and sperm preservation
Fresh semen was evaluated in laboratory. Semen
dilution used two different extenders, Triladyl
(commercial) and Tris Egg Yolk (TEY) with
composition of aminomethane by 2.96 mL, yolk by 2
mL, citrate acid by 1.65 g, lactose by 2.16 mL, glycerol
by 6 mL, penicillin and streptomycin by 1000 IU/mL,
aquabidest ad by 100 mL. Concentration of final
spermatozoa was 200 × 106/ml. Semen was preserved
in 5°C refrigerator in 15 mL tube (pool) and 0.25mL
straw. Examination of vitality of chilled semen by
calculating percentage of motility, viability, and
membrane integrity in day-0, 1, 2, 3, 4, and 5 of
preservation.
Evaluation of motility
Percentage of spermatozoa motility was determined
by observation of progresively moved soermatozoa
conducted subjectively in 6 different points of view.
Score provided was from 0% (there was no
spermatozoa moved) to 100% (all spermatozoa moved
forward).
Evaluation of membrane integrity
Membrane integrity of spermatozoa was evaluated
using Hypoosmotic Swelling Test (HOS-Test) in 5
points of view randomally with circular tail
spermatozoa (whole membrane plasma) or straigh tail
spermatozoa (incomplete membrane plasma). Total
number of spermatozoa calculated was 200
spermatozoa.
Evaluation of viability
Percentage of viability was percentage of life and
death spermatozoa using eosin-negrosin staining
method. Spermatozoa was cathegorized as life if the
head was colorless and cathegorized as death if the head
was red. Percentage of viability of spermatozoa was
determined according to comparison of the number of
life spermatozoa and total amount of spermatozoa.
Total amount of spermatozoa counted was 200 heads.
Data analysis
Data of viability and quality of chilled semen
preserved at 5°C in the two groups were in percentage
and analyzed using analysis of variance (ANOVA).
This study was in completely randomized design with 5
replications. The analysist was continued by Duncan’s
Multiple Range Test (DMRT) if there was a difference
between the groups.
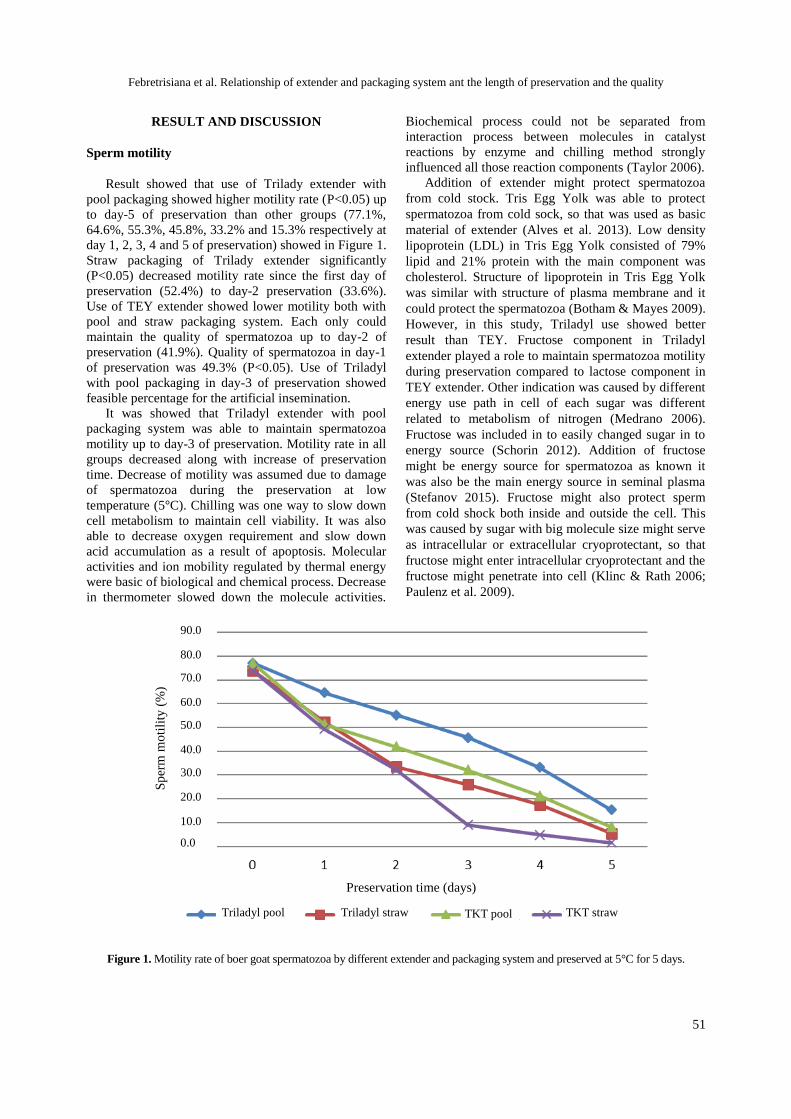
Febretrisiana et al. Relationship of extender and packaging system ant the length of preservation and the quality
51
RESULT AND DISCUSSION
Sperm motility
Result showed that use of Trilady extender with
pool packaging showed higher motility rate (P<0.05) up
to day-5 of preservation than other groups (77.1%,
64.6%, 55.3%, 45.8%, 33.2% and 15.3% respectively at
day 1, 2, 3, 4 and 5 of preservation) showed in Figure 1.
Straw packaging of Trilady extender significantly
(P<0.05) decreased motility rate since the first day of
preservation (52.4%) to day-2 preservation (33.6%).
Use of TEY extender showed lower motility both with
pool and straw packaging system. Each only could
maintain the quality of spermatozoa up to day-2 of
preservation (41.9%). Quality of spermatozoa in day-1
of preservation was 49.3% (P<0.05). Use of Triladyl
with pool packaging in day-3 of preservation showed
feasible percentage for the artificial insemination.
It was showed that Triladyl extender with pool
packaging system was able to maintain spermatozoa
motility up to day-3 of preservation. Motility rate in all
groups decreased along with increase of preservation
time. Decrease of motility was assumed due to damage
of spermatozoa during the preservation at low
temperature (5°C). Chilling was one way to slow down
cell metabolism to maintain cell viability. It was also
able to decrease oxygen requirement and slow down
acid accumulation as a result of apoptosis. Molecular
activities and ion mobility regulated by thermal energy
were basic of biological and chemical process. Decrease
in thermometer slowed down the molecule activities.
Biochemical process could not be separated from
interaction process between molecules in catalyst
reactions by enzyme and chilling method strongly
influenced all those reaction components (Taylor 2006).
Addition of extender might protect spermatozoa
from cold stock. Tris Egg Yolk was able to protect
spermatozoa from cold sock, so that was used as basic
material of extender (Alves et al. 2013). Low density
lipoprotein (LDL) in Tris Egg Yolk consisted of 79%
lipid and 21% protein with the main component was
cholesterol. Structure of lipoprotein in Tris Egg Yolk
was similar with structure of plasma membrane and it
could protect the spermatozoa (Botham & Mayes 2009).
However, in this study, Triladyl use showed better
result than TEY. Fructose component in Triladyl
extender played a role to maintain spermatozoa motility
during preservation compared to lactose component in
TEY extender. Other indication was caused by different
energy use path in cell of each sugar was different
related to metabolism of nitrogen (Medrano 2006).
Fructose was included in to easily changed sugar in to
energy source (Schorin 2012). Addition of fructose
might be energy source for spermatozoa as known it
was also be the main energy source in seminal plasma
(Stefanov 2015). Fructose might also protect sperm
from cold shock both inside and outside the cell. This
was caused by sugar with big molecule size might serve
as intracellular or extracellular cryoprotectant, so that
fructose might enter intracellular cryoprotectant and the
fructose might penetrate into cell (Klinc & Rath 2006;
Paulenz et al. 2009).
Figure 1. Motility rate of boer goat spermatozoa by different extender and packaging system and preserved at 5°C for 5 days.
Sp
erm
mo
tili
ty (
%)
Preservation time (days)
Triladyl pool Triladyl straw TKT pool TKT straw
90.0
80.0
70.0
60.0
50.0
40.0
30.0
20.0
10.0
0.0
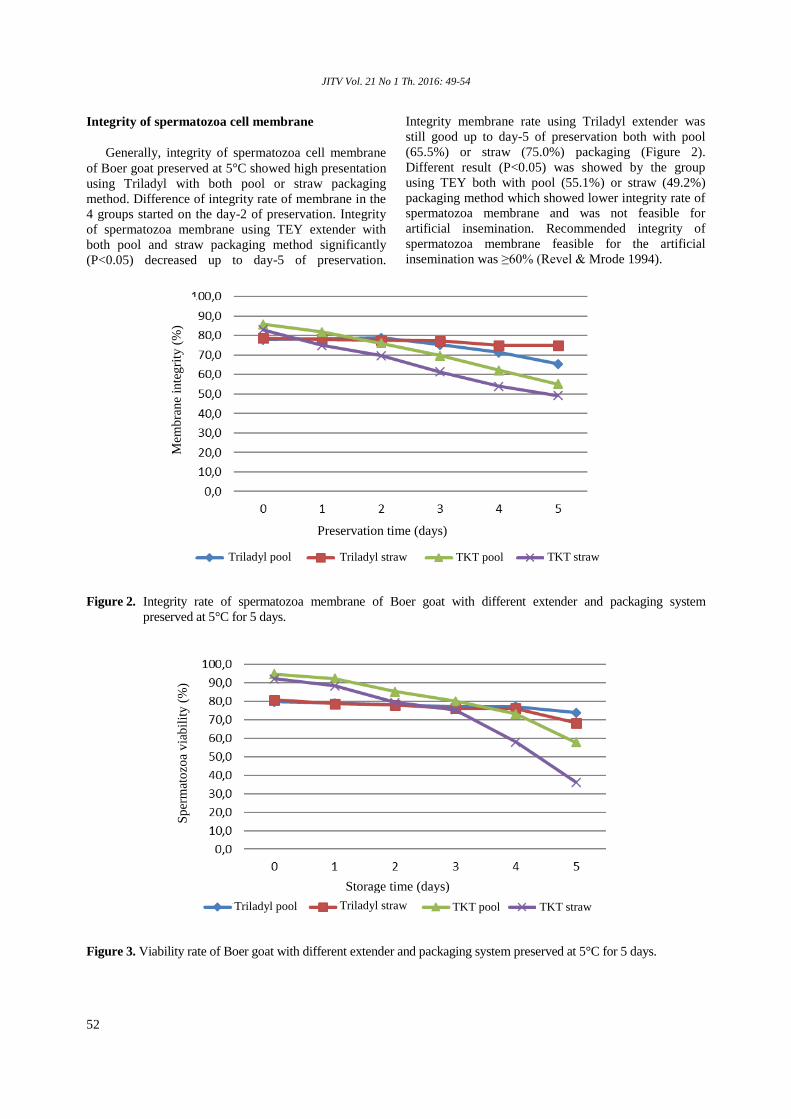
JITV Vol. 21 No 1 Th. 2016: 49-54
52
Integrity of spermatozoa cell membrane
Generally, integrity of spermatozoa cell membrane
of Boer goat preserved at 5°C showed high presentation
using Triladyl with both pool or straw packaging
method. Difference of integrity rate of membrane in the
4 groups started on the day-2 of preservation. Integrity
of spermatozoa membrane using TEY extender with
both pool and straw packaging method significantly
(P<0.05) decreased up to day-5 of preservation.
Integrity membrane rate using Triladyl extender was
still good up to day-5 of preservation both with pool
(65.5%) or straw (75.0%) packaging (Figure 2).
Different result (P<0.05) was showed by the group
using TEY both with pool (55.1%) or straw (49.2%)
packaging method which showed lower integrity rate of
spermatozoa membrane and was not feasible for
artificial insemination. Recommended integrity of
spermatozoa membrane feasible for the artificial
insemination was ≥60% (Revel & Mrode 1994).
Figure 2. Integrity rate of spermatozoa membrane of Boer goat with different extender and packaging system
preserved at 5°C for 5 days.
Figure 3. Viability rate of Boer goat with different extender and packaging system preserved at 5°C for 5 days.
Preservation time (days)
Storage time (days)
Mem
bra
ne
inte
gri
ty (
%)
Sp
erm
ato
zoa
via
bil
ity
(%
)
Triladyl pool Triladyl straw TKT pool TKT straw
Triladyl pool Triladyl straw TKT pool TKT straw
Febretrisiana et al. Relationship of extender and packaging system ant the length of preservation and the quality
53
Figure 2 shows that percentage of integrity of
spermatozoa membrane added by Triladyl both with
pool and straw packaging method is higher than other
group. It was known that spermatozoa viability was
related to integrity of spermatozoa membrane. It was
possible that Triladyl extender able to maintain plasma
membrane requirement during preservation. It was due
to plasma membrane played a role in managing in and
out traffic of all substrate and electrolyte needed in
metabolic process (Ariantie 2014). Damage in plasma
membrane might affect motility and causing death in
semen due to aspartate aminotransferase enzyme
(AspAT) which was the primary enzyme in
mitochondria producing ATP would be released from
cell into seminal plasma which would interfere ATP
production (Arifiantini & Purwantara 2010).
Sperm viability
Percentage of sperm viability using Triladyl
extender started to significantly (P<0.05) decrease in
day-3 of preservation both with pool (77.1%) and straw
(76.2%) packaging method (Figure 3). Therefore,
viability of spermatozoa using TEY extender both with
pool or straw packaging decreased after day-4 of
preservation. Figure 3 shows that decrease of sperm
viability percentage using TKT both with pool and
straw packaging is significantly (P<0.05) lower than
sperm viability percentage using Triladyl in day-3 of
preservation (73.2% and 58.0%, respectively). The
lowest (P<0.05) viability was showed by spermatozoa
preserved by TEY extender with straw method after
day-5 of preservation (36.1%).
Figure 3 shows that Triladyl was able to maintain
spermatozoa better than TEY extender. Yolk
concentration was lower in Triladyl extender than the
Tris. It was assumed that Tris played a role in
maintaining spermatozoa viability. Holt et al. (1996)
reported that higher concentration of yolk would give
negative effect to motility and viability. Especially in
goat, phospholipase A enzyme in plasma semen
secreted by bulbo-urethralys gland would easily damage
semen extender medium especially the one containing
of yolk. It caused death of spermatozoa. High
concentration of lysolecithin from hydrolysis of yolk
lecithin through phospholipase A enzyme snapping in
spermatozoa environment caused toxic effect in goat
spermatozoa. Leboeuf et al. (2000) said that
bulbouretralis gland (Cowper gland) of buck
synthesized an enzyme and secreted in plasma semen
where coagulation might be occurred if it interacted
with yolk. This enzyme was identified as phospholipase
A which might hydrolyze lecithin of yolk into fatty acid
and lysolecithin poisoning for spermatozoa. Change of
spermatozoa viability during preservation for a long
term was also strongly related to condition of
mitochondria membrane of spermatozoa cell (Love et
al. 2003). Mitochondria membrane would damage if
there was a composition change in phospholipid and if
there was a temperature fluctuation during incubation
(Kasimanickam et al. 2012).
The result of this study showed that generally,
Triladyl extender was able to maintain chilled semen
longer than TEY extender. This was assumed due to the
commercial Triladyl extender had better and more
complete composition than TEY extender. The result
also showed that pool packaging method was better
than the straw. It might be caused by difference of ratio
of amount extender and concentration or amount
spermatozoa in the straw and pool. Concentration of
spermatozoa in extender influenced the competition of
spermatozoa in nutrient consumption. Metabolism
persisted during preservation and causing accumulation
of lactic acid increasing pH of medium and causing
damage and degrading quality of spermatozoa along
with longer time for preservation (Munsi et al. 2007).
CONCLUSION
Triladyl extender with pool packaging was the best
method to maintain chilled semen quality of Boer goat
which could persist up to day-3 of preservation at 5°C.
ACKNOWLEDGEMENT
Author thanked to Fitra Aji Pamungkas, Rian
Rosartio, and technicians who helped during this study.
REFERENCES
Ariantie OS, Yusuf TL, Sajuthi D, Arifiantiny RI. 2014.
Kualitas semen cair kambing Peranakan Etawah dalam
modifikasi pengencer tris dengan trehalosa dan rafinosa.
J Vet. 15:11-22.
Arifiantini RI, Purwantara B. 2010. Motility and viability of
Fresian Holstein spermatozoa in three different extender
preserved at 5°C. J Indones Trop Anim Agric. 35:222-
226.
Alves HM, Oliveira IR, Castelo TS, Lima GL, Souza AL,
Moreira AL, de Paula VV, Silva AR. 2013. Comparison
of different glycerol and egg yolk concentrations added
to tris-based extender for the collared peccaries
(Tayassu tajacu) semen freezing. Reprod Domest Anim.
48:506-511.
Botham KM, Mayes PA. 2009. Pengangkutan dan
penyimpanan lipid. In: Murray RK, Granner DK,
Rodwell VW, editors. Harper’s Illustrated
Biochemistry. 27th ed. Pendit BU, penerjemah. Jakarta
(Indones): EGC. p. 225-238.
Holt WV, Abaigar T, Jabbour HN. 1996. Oestrus
synchronization, semen preservation and artificial
JITV Vol. 21 No 1 Th. 2016: 49-54
54
insemination in the Mohor Gazelle (Gazella dama
mhorr) for the establishment of a genome resource bank
programme. Reprod Fertil Dev. 8:1215-1222.
Ismaya. 2014. Bioteknologi inseminasi buatan pada sapi dan
kerbau. Yogyakarta (Indones): Gadjah Mada University
Press.
Klinc P, Rath. 2006. Aplication of flowcytometrically sexed
spermatozoa in different farm animal species: a review.
Archiv Tierzuch Dummerstorf. 49:41-54
Kasimanicham VR, Kasimanicham RK, Memon MA. 2012.
Effect of extenders on sperm mitcondrial membrane,
plasma membrane and sperm kinetics during liquid
preservation of canine semen at 5°C. J Amin Reprod
Sci. 136:139-145.
Leboeuf B, Restall B, Salamon S. 2000. Production and
storage of goat semen for artificial insemination. Anim
Reprod Sci. 62:113-141.
Leethongdee S. 2010. Development of trans-cervical artificial
Insemination in sheep with special reference to anatomy
of cervix. Suranaree J Sci Technol. 17:157-169.
Love CC, Thompson JA, Brinsko SP, Rigby SL, Blanchard
TL, Lowry VK, Varner DD. 2003. Relationship
between stallion sperm motility and viability as detected
by two fluorescence staining techniques using flow
cytometry. Theriogenology. 60:1127-1138.
Mara L, Dattena M, Pilichi S, Sanna D, Branca A, Cappai P.
2007. Effect of different extender on sperm motility:
collection and goat semen fertility, evaluation of semen.
Anim Reprod Sci. 102:152-157.
Medrano A, Garcia-Gill N, Ramio L, Montserrat RM, Pinart
E, Concha II, Bonet S, Rigau T, Rodriguez-Gill JE.
2006. Hexose-specificity of hexokinase and ADP-
dependence of pyruvate kinase play important roles in
the controlof monosaccaride utilization in freshly
diluted boar spermatozoa. Mol Reprod Dev. 73:1179-
1194.
Munsi MN, Buiyan MMU, Alam MGS. 2007. Effects of
exogenous gluthathione on the quality of chilled bull
semen. Reprod Domest Anim. 42:358-362
Paulenz H, Soderquist L, Perez R, Berg KA. 2009. Effect of
different extenders and sorage temperature on sperm
viability of liquid ram semen. Theriogenology. 57:823-
836.
Revell SG, Mrode RA. 1994. An osmotic resistance test for
bovine semen. Anim Reprod Sci. 36:77-86.
Salomon S, Maxwell WMC. 2000. Preservation of ram
semen. Anim Reprod Sci. 62:77-111.
Stefanov RG, Anev G, Abadjieva DV. 2015. Effect of
different extenders and strage periods on motility and
fertility of ram sperm. Mac Vet Rev. 38:85-89.
Schorin, Marilyn D, Sollid, Kris RD, Edge, Marianne MS,
Bouchoux, Ann MSW. 2012. The science of sugar part
1: A closer look at sugars. Nurt Today. 3:96-101.
Taylor MJ. 2006. Biology of cell survival in the cold: The
basis for biopreservation of tissues and organs. CRC-
Taylor & Francis. p. 15-62.
Verberckmoes S, Van Soom A, Dewulf J, De Pauw I, de
Kruif A. 2004. Preservation of fresh bovine semen in
extender based on the ionic composition of cauda
epydidimal plasma. Reprod Domest Anim. 39:1-7.
Sopiyana et al. Determination of production capacity of circulated primordial germ cells (circulated-PGCs) of KUB chicken
55
Determination of Production Capacity of Circulated Primordial Germ Cells
(Circulated-PGCs) of KUB Chicken using Lysis Buffer Ammonium Chloride
Potassium (ACK)
Sopiyana S1, Supriatna I2, Setiadi MA2, Fahrudin M3
1Indonesian Research Institute for Animal Production, Bogor PO BOX 221, Bogor 16002 2 Department of Reproduction and Pathology Clinic, Faculty of Veterinary Sciences
Bogor Agricultural University, Jl. Agatis Kampus IPB Darmaga, Bogor 16680 3 Department of Anatomy, Physiology, and Farmacology, Faculty of Veterinary Sciences
Bogor Agricultural University, Jl. Agatis Kampus IPB Darmaga, Bogor 16680 E-mail: [email protected]
(received 03-02-2016; revised 27-02-2016; accepted 09-03-2016)
ABSTRAK
Sopiyana S, Supriatna I, Setiadi MA, Fahrudin M. 2016. Penentuan kapasitas produksi primordial germ cell sirkulasi (PGC-
sirkulasi) pada ayam KUB menggunakan metode buffer lisis ammonium chloride potassium (ACK). JITV 21(1): 55-61. DOI:
http://dx.doi.org/10.14334/jitv.v21i1.1315
Pada embrio unggas, primordial germ cell (PGC) merupakan sel progenitor untuk gamet yang memiliki jalur migrasi yang
unik. Primordial germ cell pertama kali muncul dari epiblast di daerah germinal crescent, kemudian bersirkulasi melalui
pembuluh darah dalam periode waktu yang singkat, dan bermigrasi menuju gonad. Penelitian ini bertujuan menentukan kapasitas
potensi produksi PGC-sirkulasi embrio ayam KUB pada stadia perkembangan embrio yang berbeda untuk mengisolasi dan
mengoleksi PGC-sirkulasi menggunakan metode yang cepat dan sederhana. Dalam penelitian ini digunakan 75 butir telur fertil
ayam KUB yang dibagi menjadi lima kelompok perlakuan, dan diinkubasi pada suhu 38,5 0C dengan kelembaban 60%.
Pemanennan embrio diatur sesuai dengan tahapan perkembangan embrio 14-18. Pengambilan darah embrio dilakukan melalui
aorta dorsalis dengan menggunakan mikropipet di bawah mikroskop. Darah yang terkumpul ditempatkan pada tabung eppendorf
1,5 ml yang telah diisi dengan 100 µl larutan phosphate buffered saline tanpa Ca2+ dan Mg2+ (PBS-) yang dicampur dengan fetal
bovine serum (FBS) dengan perbandingan 90%:10%. PGC dimurnikan dengan menggunakan proses buffer lisis ammonium
chloride potassium (ACK). Hasil penelitian menunjukkan bahwa rataan produksi PGC-sirkulasi per embrio dipengaruhi oleh
stadia perkembangan embrio (P<0,05). Rataan produksi PGC-sirkulasi dari stadia perkembangan embrio dari 14, 15, 16, 17, dan
18 pada ayam KUB berturut-turut adalah 37,9; 53,5; 49,8; 38,3; dan 33,5 sel per embrio. Produksi PGC-sirkulasi antara stadia
14, 17, dan 18 tidak berbeda nyata (P>0,05). Produksi PGC-sirkulasi terbanyak didapatkan pada stadia 15, sehingga isolasi dan
koleksi PGC melalui sirkulasi darah disarankan pada stadia 15.
Kata Kunci: Ayam KUB, PGC, Stadia Perkembangan Embrio, Ammonium Chloride Potassium
ABSTRACT
Sopiyana S, Supriatna I, Setiadi MA, Fahrudin M. 2016. Determination of production capacity of circulated primordial germ
cells (circulated-PGCs) of KUB chicken using lysis buffer ammonium chloride potassium (ACK). JITV 21(1): 55-61. DOI:
http://dx.doi.org/10.14334/jitv.v21i1.1315
In poultry embryos, primordial germ cells (PGCs) are progenitor cells for gametes, which have unique migration pathway.
Primordial germ cells arise from epiblast in germinal crescent and circulate through the bloodstream for a short period of time,
then leave blood vessel to migrate toward gonads. The aim of this study was to determine the potential production capacity of
circulated-PGCs of KUB chicken at different developmental stages of embryo using a rapid and simple method. Seventy five
KUB chicken fertile eggs were divided into five groups and incubated at 38.5 0C with a humidity of 60%. Hatching was set to
the embryonic development stage of 14-18. The blood was collected through dorsal aorta using micropipette under microscope.
The collected blood was placed in a 1.5 ml eppendorf tube which was previously filled with 100 µl phosphate buffered saline
without Ca2+ and Mg2+ (PBS-) mixed with fetal bovine serum (FBS) with a ratio of 90%:10%. The PGCs were purified using
lysis buffer ammonium chloride potassium method. The results showed that average production of circulated-PGCs per embryo
of KUB chicken were significantly affected by stage of embryonic development (P <0.05). The average production of circulated-
PGCs at stage 14, 15, 16, 17, and 18 were 37.9; 53.5; 49.8; 38.3; and 33.5 respectively. The number of circulated-PGCs was not
different among stages 14, 17 nor 18. The highest number of circulated-PGCs of KUB chicken was obtained at stage 15, so that
the isolation and collection of PGCs through the blood circulation was recommended in stage 15.
Key Words: KUB Chicken, PGCs, Embryonic Development Stage, Ammonium Chloride Potassium
JITV Vol. 21 No 1 Th. 2016: 55-61
56
INTRODUCTION
Indonesia is known as one of world
megabiodiversities. Indonesian native poultry is one of
animal genetic resources which potential for egg and
meat, and fancy animal. Sartika & Iskandar (2007)
reported that there were 43 recognized native chicken
breeds in Indonesia, which can be further developed
and preserved in-situ and ex-situ. Since 2012
Indonesian Research Institute for Animal Production
has developed a strain derived from native Kampung
chicken breed as improved egg producers strain. KUB
chicken is the name of the strain which was able to
produce 44.33% henday production, reaching peak
production of 60% (Iskandar & Sartika 2014). As a new
strain, KUB chicken may be categorized as new genetic
resources that is needed to be conservated.
Conservation activity was generally done through
in-situ method where the maintenance was conducted in
its natural habitat and ex-situ method by maintaining
live animals outside its natural habitat. Somehow, in-
situ and ex-situ conservations of live animals require
high maintainance cost and disease risks.
Conservation technique on semen, ovum even
embryo in bird did not come to satisfy than when
applied in mammal. Blesbois & Labbe (2003) reported
that percentage of live sperm after thawing was only
60%. Ovum freezing in bird still was not succeeded
regarding its big size and complexity and high fat
content in bird (Blesbois & Labbe 2003). Bird’s ovum
had some issues causing cryopreservation might not be
done (Hagedorn et al. 2004). An approach currently
developed to solve limitation on in-situ and ex-situ
conservations especially in bird is primordial germ cells
(PGCs) cryopreservation. Cryopreserved primordial
germ cells might be preserved for unlimited time and
might be used everytime needed.
Primordial germ cells were gamet progenitor cells
for or spermatozoa and ovum progenitor and were early
development of gamet cells (Qian et al. 2010; Glover &
McGrew 2012; Tajima 2012). Qian et al. (2010)
reported that PGCs was formed out of gonad and
migrated toward gonad during embryogenesis which
will be developed into spermatozoa and ovum.
Primordial germ cells might be used as genetic source
and for establishing transgenic chicken (Furuta 2012).
Primordial germ cells were cells with plurypotent
characteristic making the PGCs as a good model to
study embryonic development by in-vitro (Wang et al.
2010).
Primordial germ cells were first detected in chicken
embryo in the end of gastrulation (Ginsburg 1997) and
first appeared from epiblast and first located in ventral
part of pelucyde area of embryo stage X, then it was
translocated into dorsal side of hypoblast in stage XI-
XIV or stage 2 to 6 (Hamburger & Hamilton 1951),
then was migrated into germinal crescent area in stage 4
through bottom layer. PGCs migration was stoped at the
end of gastrulation (Ginsburg 1997). During blood
vessel forming, PGCs entered blood vessel between
stage 10 and 12 and begun to circulate in bloodstream.
During stage 12 to 16, PGCs was stay still in
bloodstream and migrated into gonad in stage 20-24,
where they begin to differentiate into male and female
gametes (Chojbacka-Puchta et al. 2012).
Chojbacka-Puchta et al. (2012) reported that PGCs
might be divided into 3 types based on time and place
of isolation, there were (1) blastoderm or stage X; (2)
circulation of embryo blood after eggs incubated for 2.5
to 3 days (stage 13-16 HH) known as circulated-PGCs);
(3) gonad embryo after eggs incubated for 5.5 to 6 days
(stage 26-28 HH) known as gonad-PGCs.
Unique migration path of chicken PGCs easy PGCs
collection based on its place. A method to collect PGCs
from chicken widely used was by isolating PGCs from
2.5-3 days old embryo blood (Yamamoto et al. 2007;
Nakamura et al. 2007). The number of circulated-PGCs
would be different in every embryonic development
stage (Tajima et al. 1999; Li et al. 2001). Zhao &
Kuwana (2003) reported that the number of circulated-
PGCs in embryonic development stage would be
affected by variated egg production.
The most embryonic development stage with
circulated-PGCs of chicken was in stage 13-18 (Tajima
et al. 1999), stage 13 in quail (Li et al. 2001), stage 15
in White Leghorn chicken (Kuwana et al. 2006), and
stage 14 in Kureko Dori chicken (Qian et al. 2010).
Information of embryonic development stage and
circulated-PGCs in native chicken was varied among
15-29 cells. The most number of circulated-PGCs was
found in Indonesian native Gaok chicken in stage 15 by
51 cells per embryo (Kostaman 2013a).
This study was to determine embryonic
development stage with the highest circulated-PGCs
production of KUB chicken using buffer lysis ACK.
This study result was expected to be basic of proper
embryonic development stage determination in native
chicken in isolating PGCs through blood vessel using
buffer lysis ammonium chloride potassium (ACK)
method.
MATERIALS AND METHODS
Time and place
This study was conducted on April to August 2015
in Laboratory of Genetic and Livestock Animal
Germplasm, Indonesian Research Institute for Animal
Production (IRIAP), Ciawi-Bogor.
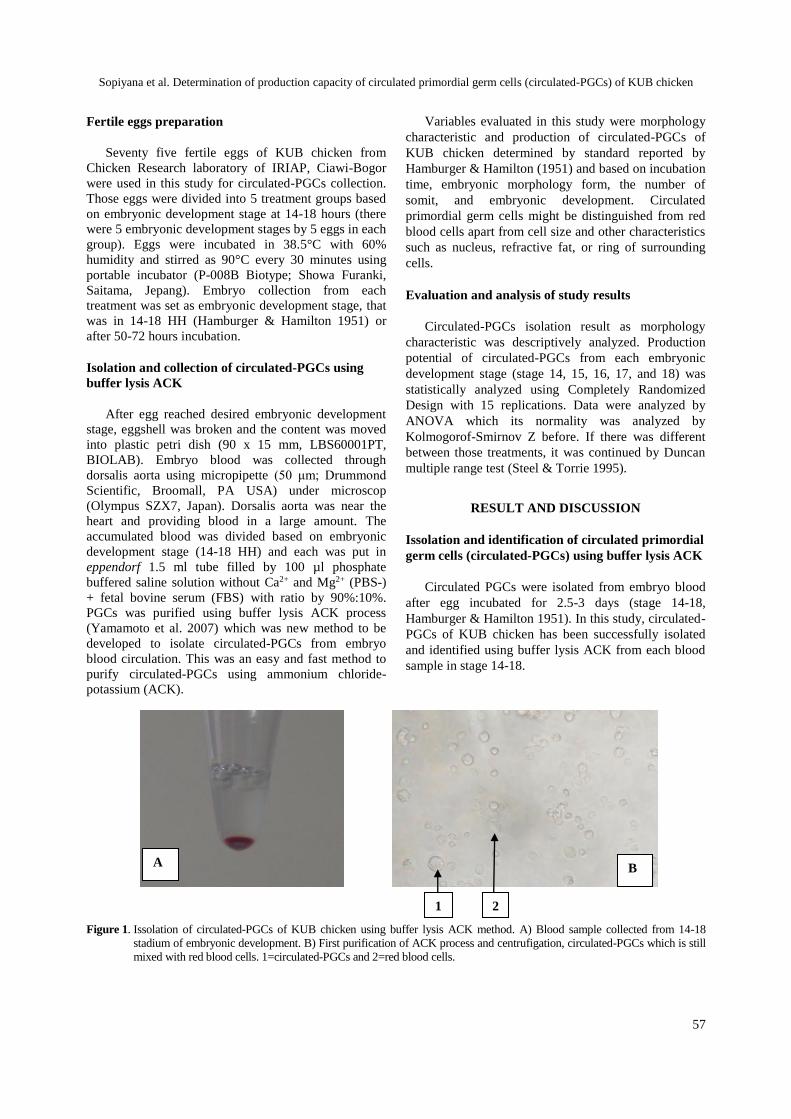
Sopiyana et al. Determination of production capacity of circulated primordial germ cells (circulated-PGCs) of KUB chicken
57
Fertile eggs preparation
Seventy five fertile eggs of KUB chicken from
Chicken Research laboratory of IRIAP, Ciawi-Bogor
were used in this study for circulated-PGCs collection.
Those eggs were divided into 5 treatment groups based
on embryonic development stage at 14-18 hours (there
were 5 embryonic development stages by 5 eggs in each
group). Eggs were incubated in 38.5°C with 60%
humidity and stirred as 90°C every 30 minutes using
portable incubator (P-008B Biotype; Showa Furanki,
Saitama, Jepang). Embryo collection from each
treatment was set as embryonic development stage, that
was in 14-18 HH (Hamburger & Hamilton 1951) or
after 50-72 hours incubation.
Isolation and collection of circulated-PGCs using
buffer lysis ACK
After egg reached desired embryonic development
stage, eggshell was broken and the content was moved
into plastic petri dish (90 x 15 mm, LBS60001PT,
BIOLAB). Embryo blood was collected through
dorsalis aorta using micropipette (50 μm; Drummond
Scientific, Broomall, PA USA) under microscop
(Olympus SZX7, Japan). Dorsalis aorta was near the
heart and providing blood in a large amount. The
accumulated blood was divided based on embryonic
development stage (14-18 HH) and each was put in
eppendorf 1.5 ml tube filled by 100 µl phosphate
buffered saline solution without Ca2+ and Mg2+ (PBS-)
+ fetal bovine serum (FBS) with ratio by 90%:10%.
PGCs was purified using buffer lysis ACK process
(Yamamoto et al. 2007) which was new method to be
developed to isolate circulated-PGCs from embryo
blood circulation. This was an easy and fast method to
purify circulated-PGCs using ammonium chloride-
potassium (ACK).
Variables evaluated in this study were morphology
characteristic and production of circulated-PGCs of
KUB chicken determined by standard reported by
Hamburger & Hamilton (1951) and based on incubation
time, embryonic morphology form, the number of
somit, and embryonic development. Circulated
primordial germ cells might be distinguished from red
blood cells apart from cell size and other characteristics
such as nucleus, refractive fat, or ring of surrounding
cells.
Evaluation and analysis of study results
Circulated-PGCs isolation result as morphology
characteristic was descriptively analyzed. Production
potential of circulated-PGCs from each embryonic
development stage (stage 14, 15, 16, 17, and 18) was
statistically analyzed using Completely Randomized
Design with 15 replications. Data were analyzed by
ANOVA which its normality was analyzed by
Kolmogorof-Smirnov Z before. If there was different
between those treatments, it was continued by Duncan
multiple range test (Steel & Torrie 1995).
RESULT AND DISCUSSION
Issolation and identification of circulated primordial
germ cells (circulated-PGCs) using buffer lysis ACK
Circulated PGCs were isolated from embryo blood
after egg incubated for 2.5-3 days (stage 14-18,
Hamburger & Hamilton 1951). In this study, circulated-
PGCs of KUB chicken has been successfully isolated
and identified using buffer lysis ACK from each blood
sample in stage 14-18.
Figure 1. Issolation of circulated-PGCs of KUB chicken using buffer lysis ACK method. A) Blood sample collected from 14-18
stadium of embryonic development. B) First purification of ACK process and centrufigation, circulated-PGCs which is still
mixed with red blood cells. 1=circulated-PGCs and 2=red blood cells.
A
1 2
B
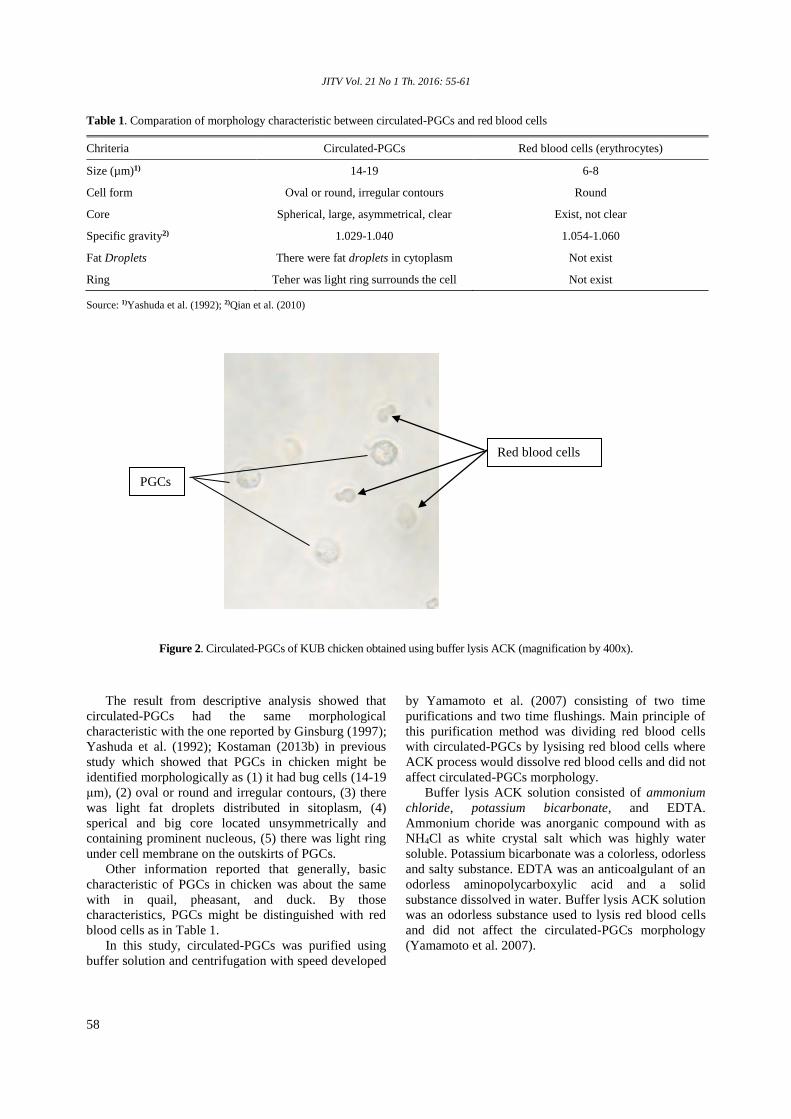
JITV Vol. 21 No 1 Th. 2016: 55-61
58
Table 1. Comparation of morphology characteristic between circulated-PGCs and red blood cells
Chriteria Circulated-PGCs Red blood cells (erythrocytes)
Size (µm)1) 14-19 6-8
Cell form Oval or round, irregular contours Round
Core Spherical, large, asymmetrical, clear Exist, not clear
Specific gravity2) 1.029-1.040 1.054-1.060
Fat Droplets There were fat droplets in cytoplasm Not exist
Ring Teher was light ring surrounds the cell Not exist
Source: 1)Yashuda et al. (1992); 2)Qian et al. (2010)
Figure 2. Circulated-PGCs of KUB chicken obtained using buffer lysis ACK (magnification by 400x).
The result from descriptive analysis showed that
circulated-PGCs had the same morphological
characteristic with the one reported by Ginsburg (1997);
Yashuda et al. (1992); Kostaman (2013b) in previous
study which showed that PGCs in chicken might be
identified morphologically as (1) it had bug cells (14-19
μm), (2) oval or round and irregular contours, (3) there
was light fat droplets distributed in sitoplasm, (4)
sperical and big core located unsymmetrically and
containing prominent nucleous, (5) there was light ring
under cell membrane on the outskirts of PGCs.
Other information reported that generally, basic
characteristic of PGCs in chicken was about the same
with in quail, pheasant, and duck. By those
characteristics, PGCs might be distinguished with red
blood cells as in Table 1.
In this study, circulated-PGCs was purified using
buffer solution and centrifugation with speed developed
by Yamamoto et al. (2007) consisting of two time
purifications and two time flushings. Main principle of
this purification method was dividing red blood cells
with circulated-PGCs by lysising red blood cells where
ACK process would dissolve red blood cells and did not
affect circulated-PGCs morphology.
Buffer lysis ACK solution consisted of ammonium
chloride, potassium bicarbonate, and EDTA.
Ammonium choride was anorganic compound with as
NH4Cl as white crystal salt which was highly water
soluble. Potassium bicarbonate was a colorless, odorless
and salty substance. EDTA was an anticoalgulant of an
odorless aminopolycarboxylic acid and a solid
substance dissolved in water. Buffer lysis ACK solution
was an odorless substance used to lysis red blood cells
and did not affect the circulated-PGCs morphology
(Yamamoto et al. 2007).
PGCs
Red blood cells
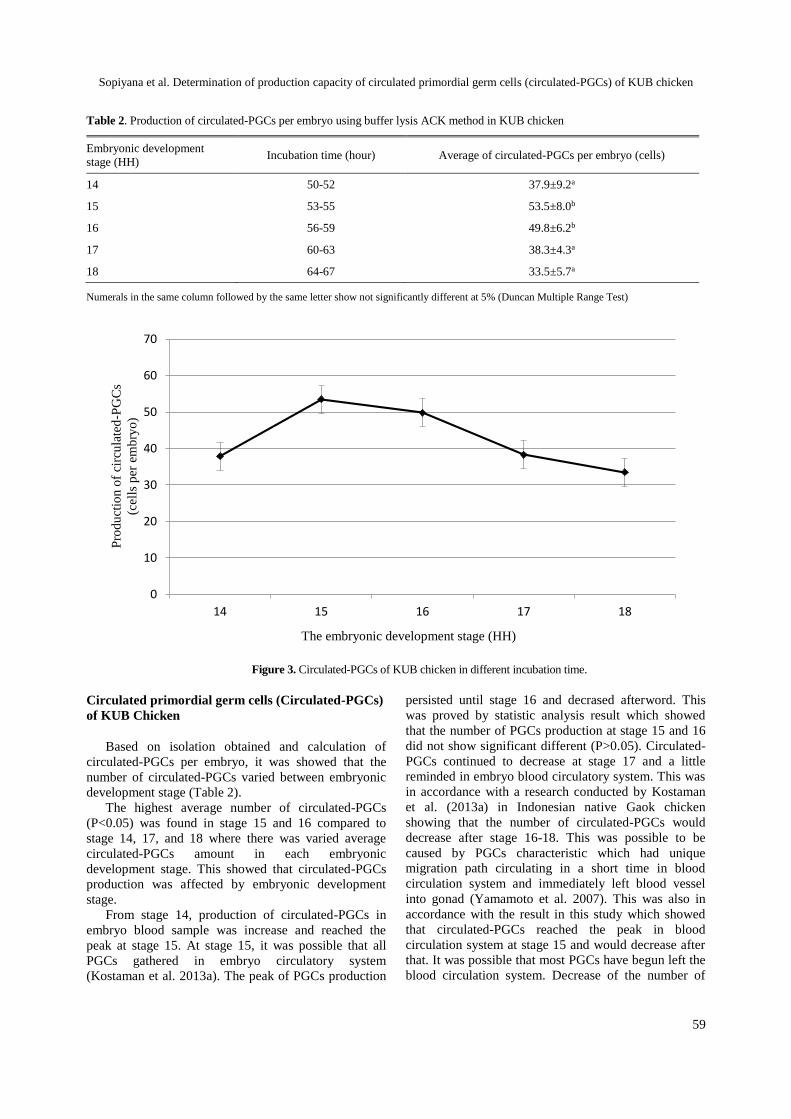
Sopiyana et al. Determination of production capacity of circulated primordial germ cells (circulated-PGCs) of KUB chicken
59
Table 2. Production of circulated-PGCs per embryo using buffer lysis ACK method in KUB chicken
Embryonic development
stage (HH) Incubation time (hour) Average of circulated-PGCs per embryo (cells)
14 50-52 37.9±9.2a
15 53-55 53.5±8.0b
16 56-59 49.8±6.2b
17 60-63 38.3±4.3a
18 64-67 33.5±5.7a
Numerals in the same column followed by the same letter show not significantly different at 5% (Duncan Multiple Range Test)
0
10
20
30
40
50
60
70
14 15 16 17 18
Pro
du
ctio
n o
f ci
rcu
late
d-P
GC
s
(cell
s p
er e
mb
ry
o)
The embryonic development stage (HH)
Fi
Figure 3. Circulated-PGCs of KUB chicken in different incubation time.
Circulated primordial germ cells (Circulated-PGCs)
of KUB Chicken
Based on isolation obtained and calculation of
circulated-PGCs per embryo, it was showed that the
number of circulated-PGCs varied between embryonic
development stage (Table 2).
The highest average number of circulated-PGCs
(P<0.05) was found in stage 15 and 16 compared to
stage 14, 17, and 18 where there was varied average
circulated-PGCs amount in each embryonic
development stage. This showed that circulated-PGCs
production was affected by embryonic development
stage.
From stage 14, production of circulated-PGCs in
embryo blood sample was increase and reached the
peak at stage 15. At stage 15, it was possible that all
PGCs gathered in embryo circulatory system
(Kostaman et al. 2013a). The peak of PGCs production
persisted until stage 16 and decrased afterword. This
was proved by statistic analysis result which showed
that the number of PGCs production at stage 15 and 16
did not show significant different (P>0.05). Circulated-
PGCs continued to decrease at stage 17 and a little
reminded in embryo blood circulatory system. This was
in accordance with a research conducted by Kostaman
et al. (2013a) in Indonesian native Gaok chicken
showing that the number of circulated-PGCs would
decrease after stage 16-18. This was possible to be
caused by PGCs characteristic which had unique
migration path circulating in a short time in blood
circulation system and immediately left blood vessel
into gonad (Yamamoto et al. 2007). This was also in
accordance with the result in this study which showed
that circulated-PGCs reached the peak in blood
circulation system at stage 15 and would decrease after
that. It was possible that most PGCs have begun left the
blood circulation system. Decrease of the number of
The embryonic development stage (HH)
Pro
du
ctio
n o
f ci
rcu
late
d-P
GC
s
(cel
ls p
er e
mb
ryo
)

JITV Vol. 21 No 1 Th. 2016: 55-61
60
circulated-PGCs in embryonic development stage 14-18
HH (Figure 3). This result was not significantly different with
previous study in Indonesian native Gaok chicken
reporting that the number of circulated-PGCs, when
purified by nicodenz density gradient sentrifugation
method reached peak amount at stage 15 to of 51.0 cells
per embryo (Kostaman 2013a). That result was a
considerably lower than previous research result
reported that the most circulated-PGCs in Rhode Island
Red (RIR) chicken blood circulation system was 67-73
cell at the stage of 15 (Nakamura et al. 2007), and it
was different from Silky chicken where the circulated-
PGCs peak amount was at stage 14 by 65 cells (Qian et
al. 2010). Setioko (2007) reported that average amount
of PGCs in White Leghorn chicken was 84.2 cells.
Some research results showed that the number of PGCs
of native chicken was varied between 15-51 cells
(Setioko et al. 2010; Kostaman 2013a). It also showed
that appropriate time to harvest the circulated-PGCs
was in stage 15 (53.5 cells). At that stage, circulated-
PGCs might be obtained in the largest number. This
was an appropriate time to preservate PGCs and form
germline chimera.
In this study, embryo blood collection did not begin
at stage 13, but at stage 14 where the amount of
circulated-PGCs at stage 13 was lower due to the
extremely smooth blood vessel of embryo (Li et al.
2001). Collection of embryo blood was terminated on
stage 19 because the PGCs still remained in the blood
vessels. The stage 20 of the most PGCs had left the
blood vessels and had begun to arrive in the gonadal
anlage (Ukeshima et al. 1991; Ginsburg 1997).
Collection of embryo blood at the stage 19 would be
difficult due to the blood vessel already thickened, so
that it would be difficult to inject and would be broken
when imposed.
CONCLUSION
The highest number of circulated-PGCs in KUB
chicken was in stage 15 and this stage was the best time
to isolate PGCs to obtain maximum circulated PGCs.
ACKNOWLEDGEMENT
Authors thanked to Dr. Tatan Kostaman, Dr. Tike
Sartika, Prof. (R) Dr. Sofjan Iskandar, and Dr. L. Hardi
Prasetyo who helped both material and non-material
until this research and article finished.
REFERENCES
Blesbois E, Labbé C. 2003. Main improvements in semen and
embryo cryopreservation for fish and fowl. In:
Planchenault D, editor. Cryopreservation of Animal
Genetic Resources in Europe, Paris, France. p. 55-65.
Chojbacka-Puchta L, Kasperczyk K, Plucienniczak G,
Sawicka D, Bednarczyk. 2012. Primordial germ cells
(PGCs) as a tool for creating transgenic chickens. Polish
J Vet Sci. 15:181-188.
Furuta H. 2012. Establishing germline chimeric chickens
using primordial germ cells. J Poult Sci. 49:1-4.
Ginsburg M. 1997. Primordial germ cells development in
avians. J Poult Sci. 76:91-95.
Glover JD, McGrew MJ. 2012. Primordial germ cells
technologies for avian germplasm cryopreservation and
investigating germ cell development. J Poult Sci.
49:155-162.
Hagedorn M, Peterson A, Mazur P, and Kleinhans FW. 2004.
High ice nucleation temperature of zebrafish embryos:
slow-freezing is not an option. Cryobiology. 49:181-
189.
Hamburger V, Hamilton HL. 1951. A series of normal stages
in development of the chick embryo. J Morphol. 88:49-
92.
Iskandar S, Sartika S. 2014. KUB Chicken: The first
Indonesia Kampung chicken selected for egg
production. Proceedings of the 16th AAAP Animal
Science Congress Vol II 10-14 November 2014.
Yogyakarta (Indones): Gadjah Mada University. p. 157-
160.
Kostaman T, Yusuf TL, Fahrudin M, Setiadi MA. 2013a.
Isolasi dan jumlah primordial germ cell sirkulasi (PGC-
sirkulasi) pada stadium perkembangan embrio ayam
Gaok. JITV. 18:27-33.
Kostaman T. 2013b. Isolasi dan kriopreservasi primordial
germ cell (PGC) menggunakan kriopotektan DMSO
untuk pembentukan germline chimera ayam Gaok
(Dissertation). [Bogor (Indones)]: Institut Pertanian
Bogor.
Kuwana T, Kawashima T, Naito M, Yamashita H, matsuzaki
M, Takano T. 2006. Conservation of a threathened
indigenous fowl (Kureko Dori) using the germline
chimeras transpanted from primordial germ cells. J
Poult Sci. 43:60-66.
Li HC, Matsui K, Ono T. 2001. Population of circulating
primordial germ cells in early Japanese quail embryos. J
Poult Sci. 38:175-180.
Nakamura Y, Yamamoto Y, Usui F, Mushita T, Ono T,
Setioko AR, Takeda K, Nirasawa K, Kagami H, Tagami
T. 2007. Migration and proliferation of primordial germ
cells in the early chicken embryo. J Poult Sci. 86:2182-
2193.
Qian C, Zhau Z, Han H, Zhao C, Jin X, Zhao H, Zhang Y,
Chen W, Yang N, Li Z. 2010. Influence of microgravity
on the concentration of circulating primordial germ cells
in Silky chicken offspring. J Poult Sci. 47:65-70.
Sopiyana et al. Determination of production capacity of circulated primordial germ cells (circulated-PGCs) of KUB chicken
61
Sartika T, Iskandar S. 2007. Mengenal plasma nutfah ayam
Indonesia dan pemanfaatannya. Edisi Pertama. Bogor
(Indones): Balai Penelitian Ternak.
Setioko AR, Tagami T, Tase H, Nakamura Y, Takeda K,
Nirasawa K. 2007. Cryopreservation of primordial germ
cells (PGCs) from White Leghorn embryo using
commercial cryoprotectants. J Poult Sci. 44:73-77.
Setioko AR, Kostaman T, Sopiyana S. 2010. Jumlah
primordial germ cell (PGC) pada beberapa tingkat umur
embrio yang berbeda pada ayam buras dan ras.
Prosiding Seminar Nasional Biologi. Bandung
(Indones): Universitas Padjajaran. hlm. 133-141.
Steel RGD, Torrie JH. 1995. Prinsip dan prosedur statistika:
Suatu pendekatan biometrik. Sumantri B, penerjemah.
Principles and procedurs of statistics: A biometrical
approach. Jakarta (Indones): Gramedia Pustaka Utama.
Tajima A, Hayasi H, Kamizumi A, Ogura J, Kuwana T,
Chikamune T. 1999. Study on the concentration of
circulating primordial germ cells (cPGCs) in early chick
embryos. J Exp Zool. 28:759-764.
Tajima A. 2012. Conservation of avian genetic resources. J
Poult Sci. 50:1-8.
Ukeshima A, Yoshinaga K, Fujimoto T. 1991. Scanning and
transmission electron microscopic observations of chick
primordial germ cells with special reference to the
extravasation in their migration course. J Elec Micros.
40:124-128.
Wang Y, Hou L, Li C, Guan W, Chen L, Li X, Yue W, Ma
YH. 2010. Isolation, culture, and biological
characteristics of primordial germ cells from Beijing
Fatty chicken. J Reprod Dev. 56:303-308.
Yamamoto Y, Usui F, Nakamura Y, Ito Y, Tagami T,
Nirasawa K, Matsubara Y, Ono T, Kagami H. 2007. A
novel method to isolate Primordial Germ Cells and its
use for the generation of germline chimeras in chicken.
Biol Reprod. 77:115-119
Yashuda Y, Tajima A, Fujimoto T, Kuwana T. 1992. A
method to obtain avian germline chimeras using isolated
primordial germ cells. J Reprod Fertil. 96:521-528.
Zhao DF, Kuwana T. 2003. Purification of avian circulating
primordial germ cells by Nycodenz density gradient
centrifugation. Br Poult Sci. 44:30-35.
JITV Vol. 21 No 1 Th. 2016: 62-72
62
Potency of Antigenic and Serologic Tests Based on CNTKCQTP Linear
Epitope on H5N1 Haemagglutinin for Avian Influenza
Tarigan S, Sumarningsih
Indonesian Research Center for Veterinary Sciences E-mail: [email protected]
(received 18-11-2015; revised 23-02-2016; accepted 03-03-2016)
ABSTRAK
Tarigan S, Sumarningsih. 2016. Potensi tes antigen dan tes serologi yang didasarkan pada epitope linier CNTKCQTP pada
haemagglutinin H5N1 untuk Avian Influenza. JITV 21(1): 62-72. DOI: http://dx.doi.org/10.14334/jitv.v21i1.1251
Alat diagnosa cepat atau point-of-care (POC) test sangat dibutuhkan dalam usaha pengendalian dan pemberantasan high
pathogenic avian influenza (HPAI) H5N1 di Indonesia. Akurasi alat diagnosa POC ditentukan oleh spesifitas antibodi yang
merupakan komponen utama dari semua alat diagnosis cepat. Baru-baru ini dilaporkan bahwa epitop CNTKCQTP yang terletak
pada residu asam amino 274-281 protein hemaglutinin H5 hanya dimiliki oleh virus H5N1 dan semua clade virus subtipe H5N1
memiliki epitop tersebut. Penelitian ini bertujuan memproduksi dan mengevaluasi spesifitas poliklonal antibodi terhadap epitope
tersebut. Antibodi diproduksi dengan cara mengimunisasi kambing dengan peptida tersebut dalam bentuk multiple antigen
peptide (MAP). Spesifitas antibodi diukur dengan cara menganalisis reaktivitasnya terhadap virus influenza subtipe H3N3,
H4N4, H5N1, H6N5, H7N7, H9N2, H10N7 dan H11N9, dan rekombinan hemagglutinin H1-H12, H14 dan H15 dengan ELISA
dan immunoblot. Hasil ELISA dan immunoblot menunjukkan bahwa antibodi CNTKCQTP tidak spesifik terhadap
haemagglitinin H5 karena memiliki reaksi silang dengan haemgglutinin lain terutama H7, H8 dan H9. Potensi peptida yang
mengandung epitop, GNCNTKCQTPMGAINSS. sebagai reagen ELISA untuk mengukur antibodi H5 pada ayam yang
sebelumnya telah divaksin dan ditantang dengan virus H5N1 juga dievaluasi dalam penelitian ini. Berbeda dengan hasil peneliti
sebelumnya, ELISA yang menggunakan peptida tersebut sebagai coating atau pelapis tidak sensitif mendeteksi antibody
haemagglutinin H5 pada ayam.
Kata Kunci: Virus AI, Hemagglutinin H5, Epitop CNTKCQTP, MAP, Immunoassay
ABSTRACT
Tarigan S, Sumarningsih. 2016. Potency of antigenic and serologic tests based on CNTKCQTP linear epitope on H5N1
haemagglutinin for Avian Influenza. JITV 21(1): 62-72. DOI: http://dx.doi.org/10.14334/jitv.v21i1.1251
Rapid diagnostic tools or point-of-care (POC) test is needed in the effort to control and eradicate the high pathogenic avian
influenza (HPAI) H5N1 in Indonesia. Accuracy of a POC test is determined by the specificity of antibodies, which is the main
component of a POC test. Recently a linear epitope, CNTCKQTP epitope, located at 274-281 amino acid residue of H5
hemagglutinin has been confirmed to be present all clade of H5N1 viruses. This study aimed at producing and evaluating the
reactivity of a monospecific, polyclonal antibody against the epitope. The Antibody was produced by immunizing a goat with
the peptide in the form of multiple antigen peptide (MAP). The specificity of the antibody was estimated by assaying its
reactivity against influenza virus subtypes H3N3, H4N4, H5N1, H6N5, H7N7, H9N2, H10N7 and H11N9; and recombinant
hemagglutinins H1-H12, H14 and H15 with ELISA and immunoblot. The results of the assay showed that CNTKCQTP
antibody was not specific for H5 haemagglitinin because it cross-reacted with other haemagglutinins especially H7, H8 and H9.
The potential of the peptide containing the epitope, GNCNTKCQTPMGAINSS. as an ELISA reagent for assaying H5 antibodies
in chickens previously vaccinated and challenged with the H5N1 virus was also evaluated in this study. In contrast the results of
previous studies, the ELISA using GNCNTKCQTPMGAINSS as coating antigen was not sensitive in detecting antibody to
haemagglutinin H5 in chickens.
Key Words: AI Virus, Hemagglutinin H5, CNTKCQTP Epitope, MAP, Immunoassay
INTRODUCTION
In the early 2000s, highly pathogenic avian
influenza (HPAI) H5N1 influenza was detected in many
parts of the world causing concerns particularly after
eighteen people were hospitalized, six of whom died,
after contracting the H5N1 virus from infected chickens
(Claas et al. 1998). Between December 2003 and
January 2004, outbreaks of H5N1 sprang up
simultaneously in eight countries in the East and
Southeast Asia (Sims et al. 2005). Within three years,
the disease has spread to 63 countries (FAO 2012) and
caused death and culling of about 400 million domestic
poultry globally with estimated economic losses of
about US $20 billion (FAO 2012). Most of the 63
affected countries were able to eliminate H5N1 virus
Tarigan et al. Potency of antigenic and serologic tests based on CNTKCQTP linear epitope on H5N1 haemagglutinin
63
rapidly except for China, Indonesia, Vietnam, India,
Bangladesh and Egypt, where eradication of the disease
proven to be difficult and subsequently has become
endemic (FAO 2011).
One of the most important factors for those
countries that successfully eradicated H5N1 virus was
their ability to quickly recognise the disease enabling
rapid elimination of all infected birds. To be able to
recognize a disease quickly, the availability of
appropriate diagnostic techniques is of paramount
importance. For countries where the H5N1 has became
endemic, two types of diagnostic tests are necessary;
the first type that includes virus isolation and real time
PCR, is intended for confirmatory, unambiguous
diagnosis, whereas the second type is the point-of-care,
or pen-site test intended for rapid diagnosis and to guide
in determining actions needed to be taken for control or
eradication of disease (Tarigan 2015). Most tests of the
second type are immunological test based on the use of
an antibody to detect the presence of H5N1 antigen.
To obtain an immunological test with high
specificity, the use of monoclonal antibody is the
preferred choice (Ho et al. 2009; Lin et al. 2015).
However, production of suitable monoclonal antibody
is expensive and requires high technical skills.
On the other hand however, the specificity, which is
the main advantage of monoclonal antibody, may in
some circumstances become a disadvantage. A
monoclonal antibody may be so specific that it could
not tolerate even a minute change (single amino acid
change) in its epitope and this reduces its sensitivity
when used in a diagnostic test (Khan 2014; Singh et al.
2014). Thus, in some instances a polyclonal antibody is
more suited than a monoclonal antibody, especially
when the polyclonal antibody has been generated
against a small, unique antigen.
Recently, a linear epitope at amino acid residues
274-281 (CNTKCQTP) in the in HA1 region of the
haemagglutinin specific for the H5N1 subtype viruses
has been identified (Prabakaran et al. 2009). The
epitope was shown to be 100% conserved among 163
human isolate and 96.9% in 906 avian isolate of H5N1
viruses. This epitope is not present in H2, H3, H4 and
H6 - H16 subtypes of influenza viruses, or that the same
sequence is present only in a small number (2.3%) of
H1 subtype strains. The CNTKCQTP epitope, in the
form of a synthetic peptide, immobilized on a
microtitre-plate reacted in ELISA with sera from birds
vaccinated with different clades of H5N1 viruses
(Velumani et al. 2011). The ELISA was reported to be
100% specific and recommended to be use as a tool in
surveillance of H5N1 influenza in human and animals
(Velumani et al. 2011).
The fact that the CNTKCQTP epitope is specific for
the haemagglutinin of H5N1 viruses leads us to
assumption that an antibody raised to that epitope may
be useful as a diagnostic reagent in particular for pen-
site test intended for rapid H5N1 diagnosis in poultry.
In this study we generated an antibody by immunizing a
goat with a synthetic peptide CNTKCQTP and analyzed
its reactivity against haemagglutinins of different
subtypes of avian influenza viruses. The ultimate goal
of this study was to evaluate the potency of the goat-
anti- CNTKCQTP epitope as the main reagent for
immunodiagnostic test for H5N1 avian influenza.
MATERIAL AND METHODS
Peptide
Two forms of CNTKCQTP peptide were used in
this study. The first was as a multiple antigenic peptide
(MAP), a four-symmetrical-branched, 8-amino-acid
(aa)-long (CNTKCQTP) peptide with unknown purity.
This aa sequence is found in the haemagglutinin of all
H5N1 viruses at aa position 274-281 (Prabakaran et al.
2009; Velumani et al. 2011). The second form was as a
single linear 17-aa-long (GNCNTKCQTPMGAINSS)
peptide with >95% purity. This aa sequence is found in
the haemagglutinin of all H5N1 viruses, at aa position
272-288 (Prabakaran et al. 2009; Velumani et al. 2011).
Both peptides were synthetised by VCPBIO Ltd.
Shenzhen City, China.
Production and measurement of anti-CNTKCQTP-
antibody
A one year old, Ettawah-cross breed, male goat was
purchased from a nearby farm. The goat was kept in a
stilted, slitter floor isolated from other animal species,
fed on natural foliage and grass supplemented with
commercial concentrate (0.1 kg/day). After adapting to
the laboratory condition for 3 weeks, the goat was
immunized subcutaneously with 2 mg CNTKQTP MAP
in complete Freund’s adjuvant. Booster Immunisations
was carried out at 4 and 8 weeks after the first
immunization with the same amount of peptide but with
incomplete Freund’s adjuvant. The fourth immunization
was carried out 12 week after the first immunization
with 4 mg CNTKQTP MAP and Quil A adjuvant
(Superfos Biosector, Denmark) intramuscularly. The
goat was bled before each vaccination. Two weeks after
the last immunization, the goat was humanely
exsanguinated. Serum was aliquoted in 10 ml tubes and
stored at -20°C.
The level of anti-CNTKCQTP antibody in the
serum of the goat before and after immunizations was
measured with an indirect ELISA. The CNTKQTP
MAP or GNCNTKCQTPMGAINSS single peptide was
first diluted in 0.1 M carbonate-bicarbonate buffer (pH
9.6) at 5 µg/ml. Microtitre plates (Nunc MaxisorpR)
JITV Vol. 21 No 1 Th. 2016: 62-72
64
were coated with the peptide at 100 µl/well at 4°C
overnight. After blocking with non-fat skim milk (5
mg/ml) for 2 hours, serially diluted goat serum in PBS
containing normal rabbit serum (20 µl/ml) was added
and incubated at room temperature (25°C) for 2 hrs.
After washing four times with PBST (0.05% Tween-20
in PBS, pH 7.2), rabbit- anti-goat-IgG- HRP conjugate
(Sigma Co. Singapore), diluted in PBS-NRS at 1:4000,
was added. After washing four times with
PBST, solution of ABTS [2,2'-azino-bis(3-
ethylbenzothiazoline-6-sulphonic acid) and H2O2
substrate was added and the absorbance (A420)
measured with a microtitre-plate reader.
Measurement of antibody level to CNTKCQTP in
naïve, vaccinated and challenged chickens
Sera
Sera from naïve, vaccinated and H5N1 infected
chickens were obtained from an experiment conducted
in our Laboratory and described previous (Tarigan et al.
2015). Briefly, layer chickens were vaccinated with a
commercial-killed-H5N1 vaccine (Medivac-AI®
, PT
Medion, Bandung, Indonesia). Two weeks after the last
vaccination, birds were challenged with an isolate of
H5N1 virus (A/Chicken/WestJava/Sbg-29/2007). Birds
were bled one day before vacciation, two week after the
first, second and third vaccination, and every week,
from 1 to 8 weeks, after challenge. For the current
study, 20 randomly selected sera were used from each,
prevaccination (naïve sera), after 1st, 2nd and 3rd
vaccination (vacinated sera), one week after H5N1
challenge (early stage infection sera), 2- or 3- weeks
after challenge (mid stage of infection sera) and >4
week after infection (late stage of infection sera). In
addition, sera from two specific pathogen-free (SPF)
chicken were also included in the assays (PT Vaksindo
Satwa Nusantara, Indonesia).
Measurement of antibody level to CNTKCQTP
Antibody to CNTKCQTP in the bird’s sera was
measured by an indirect ELISA. Microtitre plate was
coated with CNTKQTP MAP or
GNCNTKCQTPMGAINSS single peptide and blocked
as described previously for the immunized-goat sera.
Bird’s sera diluted 1 : 100 were added to the plates and
incubated for 2 hours. After washings four times with
PBST, rabbit-anti-chicken IgG- HRP- conjugate (Sigma
Co. Singapore) diluted at 1 : 5000 in PBST was added,
then incubated at 37°C for 2 hours. In addition to the
sera from the experimental birds, serum from SPF
chickens were also added to the plates, as additional
negative control. After washings, solution of substrate
and chromogenic ABTS was added and the absorbance
(A420) meassured with a microtitre plate reader.
Immunoblotting
Immunoblot assay was used to analyse the reactivity
of the CNTKQTP- goat antiserum with the different
sub-types avian influenza viruses. The first immunoblot
was between the serum and proteins of whole avian
influenza viruses. The avian influenza virus subtypes
available for this study included: (1)
A/Avian/669/WA/78 (H3N8), (2) A/Grey
Teal/WA/1840 (H4N4) (3) A/Chicken/WestJava/Sbg-
29/2007(H5N1), (4) (A/Shearwater/Australia/1/72
(H6N5), (5) A/Duck/Victoria/76/Keysborough (H7N7),
(6) A/Turkey/Wisconsin/66 (H9N2), (7) CSIRO,
AAHL GI (H10N7), (8) A/Tern/Aust/75 (H11N9). All
viruses had been inactivated as they were prepared and
used in haemagglutination inhibition (HI) test. All
viruses, except for the H5N1 subtype viruses, were a
kind gift from Dr. Peter Durr (Australian Animal Health
Laboratory, Geelong, Australia). Before loading to the
SDS-PAGE, the inactivated viruses were treated
according to a previous method (Rosenberg, 1996b).
Briefly, 400 µl methanol was added to 100 µl virus
suspension, vortexed briefly and spun at 14000 x G for
10 second in a microfuge. After adding 150 µl
chloroform, the samples were vortexed and spun at
14000 x G for 10 seconds. After adding 300 µl distilled
H2O and vortex, the samples were spun at 14000 x G
for 30 second. The liquid above the protein band at the
interface between H20 and chloroform was discarded,
and 300 µl methanol was added. Protein was pelleted at
14000 x G for 60 second. The supernatant was
discarded and the protein pellet was dissolved with 100
µl SDS PAGE sample buffer, heated in boilling water
for 5 minutes and loaded into the SDS PAGE gel (15
µl/5-mm-wide well.).
The second immunoblot was between the
CNTKQTP-immunised-goat serum and recombinant
haemagglutinins of all known haemagglutinins H1-H12,
H14 and H15. The recombinant heamagglutinins, which
were expressed in mammalian cells were purchased
from Sinobiologicals Inc. China (Table 1). Each
recombinant haemagglutinin was dissolved in SDS-
PAGE sample buffer at 200 µg/ml, heated in boiling
water for 5 minutes and loaded into the SDS PAGE gels
5 µl/3.4-mm-wide well.
Protein samples were separated on 10% separating
gels then transfered onto a nitrocellulose membrane.
Reversible staining with Ponceau S was carried out to
confirm the successful transfer and to asses the amount
of each haemagglutinin on the membrane (Rosenberg
1996a). After blocking with skimmed milk (5 mg/ml in
what?, 2 hours), serum from the CNTKQTP-immunised
goat diluted at 1 : 200 in PBS containing 5% normal
Tarigan et al. Potency of antigenic and serologic tests based on CNTKCQTP linear epitope on H5N1 haemagglutinin
65
rabbit serum were added and incubated at 25°C for 2
hours. After washings four times with PBST, rabbit-
anti-goat-IgG- -HRP-conjugate (Sigma Co. Singapore)
diluted at 1 : 5000 was added and incubated for 2 hrs.
After washing four times, chromogenic DAB (3,3’-
diaminobenzidine tetrahydrochloride) substrate (H2O2)
was added to detect bound antibody.
Sequence analysis
The alignment of CNTKCQTP epitope with the
amino acid sequence of haemagglutinins used in this
study was analysed using a bioinformatics software,
Genious (Biomatters Ltd, Auckland, New Zealand).
The amino-acid sequences of the recombinant
haemagglutinins were download from Genebank
(NCBI) based on the accession number provided by the
vendor (Sino Biological Inc.). The similarity or percent
of identity of of the CNTKCQTP epitope to its
analogue in each haemagglutinin was determined by the
percentage of identical amino acid.
Table 1. Recombinant Haemagglutinin (HA) from Sinobiological Inc., China used in this study
HA Source of gene Purity Mr on SDS-
PAGE/length Catalog No.
H1 HA1+HA2, 2 aa deletion, uncleaved) from
A/California/07/2009 (H1N1), >95%
75-85 kDa
529 aa 11085-V08H
H2 HA1+HA2, uncleaved) from (A/Japan/305/1957(H2N2) >97% 75-85 kDa
525 aa 11088-V08H
H3 Native, HA1+HA2, uncleaved) from
A/Brisbane/10/2007(H3N2) >97%
90-100 kDa
531 aa 11056-V08H
H4 HA1+HA2, uncleaved) from A/Swine/Ontario/01911-
1/99(H4N6) >92%
65-75 kDa
528 aa 11706-V08H
H5 cleavage site mutated (RESRRKKR→ TETR, HA1+HA2,
uncleaved) from A/Indonesia/5/2005(H1N1) >98%
70-80 kDa
531 aa 11060-V08H1
H6 HA1+HA2, uncleaved) from A/northern
shoveler/California/HKWF115/2007(H6N1) >93%
65 KDa/
529 aa 11723-V08H
H7 Native, HA1+HA2) from A/Netherlands/219/03(H7N1) >87% 59 kDa/
536 aa 11082-V08B
H8 HA1+HA2, uncleaved) from A/pintail
duck/Alberta/114/1979(H8N4) >95%
53.1 kDa
529 aa 11722-V08B
H9 HA1+HA2, uncleaved) from
A/chicken/Korea/164/04(H9N8) >95%
58.2 kDa/
523 aa 40183-V08B
H10 HA1+HA2, uncleaved) from A/duck/Hong
Kong/786/1979(H10N3) >95%
60-65 kDa/
525 aa 11693-V08H
H11 HA1+HA2, uncleaved) from
(A/mallard/Alberta/294/1977(H11N9) >97%
65-70 kDa/
528 aa 11704-V08H
H12 HA1+HA2, uncleaved) from A/green-winged
teal/ALB/199/1991(H12N5) >97%
80-90 kDa/
527 aa 11718-V08H
H13 HA1+HA2, uncleaved) from A/black-headed gull/
Netherlands/1/00 (H13N8) >95%
60-70 kDa/
528 aa 11721-V08H
H15 HA1+HA2, uncleaved) from
A/duck/AUS/341/1983(H15N8) >97%
75 kDa/
534 aa 11720-V08H
JITV Vol. 21 No 1 Th. 2016: 62-72
66
RESULTS AND DISCUSSIONS
Results
CNTKCQTP antibody
The titre of antibody to CNTKCQTP epitope in sera
before and after vaccination with CNTKCQTP MAP is
presented in Figure 1. As shown in the Figure, no
antibody was detected in sera before vaccination
using either CNTKCQTP MAP or
GNCNTKCQTPMGAINSS single peptide as antigens.
After four vaccinations the serum had a high titre of
antibodies as it recognised the CNTKCQTP MAP at
high 1 : 125,600 dilution. However, the titre with
GNCNTKCQTPMGAINSS single peptide was much
lower than the CNTKCQTP MAP. The serum could not
recognize the single peptide at dilution higher than 1 :
400. This means that the titer against the MAP peptide
were higher by 126600/400 = 314 times compared to
that of single peptides.
Figure 1. Antibody titre in CNTKCQTP MAP antiserum as detected in ELISA using the CNTKCQTP MAP (pre - and post- vac
MAP) and GNCNTKCQTPMGAINSS single peptides (pre- and post-vac) as antigens.
Figure 2. Reaction of CNTKCQTP MAP antisera with H5N1whole virus and recombinant H5 haemagglutinin protein in
immunoblotting. H5N1whole virus proteins (H5N1) and recombinant H5 haemagglutinin (H5) separated on SDS-PAGE
gel and (A) stained with Coomasie-blue. SDS-PAGE separated protein transferred to a nitrocellulose membrane and reacted
with (B) normal, pre-immune goat serum (B) and (C) goat CNTKCQTP-MAP antiserum. Arrows = H5N1 haemagglutinin.
ELISA
OD
Serum Dilution
Tarigan et al. Potency of antigenic and serologic tests based on CNTKCQTP linear epitope on H5N1 haemagglutinin
67
Figure 3. Reactivity of recombinant avian influenza haemagglutinins of different subtypes with serum from normal, non-immunised
(B, D) and CNTKCQTP-MAP immunised goats (C). The amount of each recombinant haemagglutinin transferred onto the
membrane was equal as shown by the intensity of Ponceau-stained band (A).
JITV Vol. 21 No 1 Th. 2016: 62-72
68
Figure 4. Reactivity of various subtypes of avian influenza virus proteins with sera from non-immune (A) and CNTKCQTP-MAP
immunised goat (B). Notice that serum from non-immunised goat recognized strongly a protein band of H6N5 virus
(arrow), the molecular weight of that protein was smaller than that of haemagglutinin (double head arrows).
The CNTKCQTP MAP antiserum recognised not
only the peptide, but also recombinant haemagglutinin
H5 and haemagglutinin protein from H5N1 virus. The
antiserum recognized only one of the H5N1-virus
proteins, which was supposedly haemagglutin because
its molecular weight was similar to that of the
recombinant H5. None of H5N1-virus proteins was
recognised by the CNTKCQTP MAP antiserum (Figure
2C). Based on the thickness and stain intensity of
immunoblot band, the recognition of the recombinant
H5 protein by CNTKCQTP MAP antiserum was much
stronger than that for H5N1-virus hemagglutinin. The
differences could be attributed to the bigger amount of
recombinant H5 than that of H5N1 haemagglutinin
transferred onto the membrane (Figure 2A). The pre-
immune serum was negative for any antibody to
H5N1virus as it did not recognized any of the H5N1-
virus proteins and the recombinant H5 proteins (Figure
2B).
The CNTKCQTP-MAP anti-serum recognized not
only recombinant haemagglutinin H5, but also
haemagglutinins H7, H8, H9, and to a lesser extend,
H13 (Figure 3C). Serum from pre-immunised goat did
not recognize haemagglutinin H5, but it recognised
haemagglutinins H4, H7, H8, H9 and H13 (Figure 3B).
Serum from a normal, non-vaccinated goat that had
been kept frozen at -20o for five years, also recognized
haemagglutinins H7, H8, and H9 (Figure 3D).
The negative results in the immunoblot assay was
convincingly attributed to the absence of binding
between haemagglutinin and specific antibody in the
sera. It was not due to the absence or limited amount of
haemagglutinin transferred onto the membrane. Based
on the thickness of Ponceaou-stained bands, the amount
of each haemagglutinin transfered onto the
nitrocellulose membrane was more or less equal (Figure
3A). The purities of the recombinant haemagglutinins
which were claimed by the vendor to be >95% for most
haemagglutinins, and the diversity of the molecular
weights were approved by the Ponceaou-stained (Table
1).
When reacted with whole virus, the CNTKCQTP-
MAP antiserum recognized a protein from H5N1,
H3N8, H6N5, H7N7, H9N2, H10N7 and H11N9.
Protein in each virus subtype recognized by the
antiserum has the same molecular weight, which was
about 85 kDa. Serum from normal or preimmunised
goat recognised a H6N6 protein band of MW which is
of smaller size than expected MW of H6N5
haemagglutinin (Figure 4, arrow).
Antibody to CNTKCQTP in chicken
The presence or absence of antibody to
CNTKCQTP epitope in H5N1 immune chicken sera is
presented in Figure 5. The levels of exposure of
Tarigan et al. Potency of antigenic and serologic tests based on CNTKCQTP linear epitope on H5N1 haemagglutinin
69
Figure 5. Antibody levels to CNTKCQTP-MAP in H5N1 immune chicken sera. 0= SPF (specific pathogen-free), 1= prevaccinated,
2= vaccinated once with killed AI vaccine (MedivacR), 3= vaccinated twice, 4= vaccinated three times, 5= vaccinated then
challenged with H5N1 and sera collected ≤ 7 dpi (day post infection), 6= vaccinated then challenged, sera collected 14-21
dpi, 7= vaccinated then challenged, sera collected ≥35 dpi. Bars= mean and 95% confidence interval of the means from 20
birds (groups 1-70, and from 3 birds (group 0).
Table 2. Alignment CNTKCQTP epitope with analogue epitopes in haemagglutinin
Haem-
agglutinin Subtype Gene Bank Acc No. Amino acid sequence Position Identity (%)
H1 H1N1 ACP44189.1 CNTTCQTP 292-299 87.5
H2 H2N2 AAA43185.1 CETKCQTP 288-295 87.5
H3 H3N2 ABW23353.1 CNSECITP 293-300 62.5
H4 H4N6 AAG17429.1 CVSKCHTD 291-298 50
H5 H5N1 ABW06108.1 CNTKCQTP 290-297 100
H6 H6N1 ACE81692.1 CDATCQTI 292-299 50
H7 H7N7 AAR02640.1 CEGDCYHS 293-300 25
H8 H8N4 AAG38554.1 CNTKCQTY 298-305 87.5
H9 H9N8 ABH12262.1 CVVQCQTE 286-293 50
H10 H10N3 BAF46762.1 CESKCFWR 287-294 37.5
H11 H11N9 ABB87228.1 CSTKCQSE 290-297 62.5
H12 H12N5 ABB88110.1 CVTECQLN 290-297 50
H13 H13N8 AAV91212.1 CNTKCQTS 290-297 87.5
H15 H15N8 ABB88132.1 CEGECFYS 296-303 25
EL
ISA
´s O
D
Chicken Group
JITV Vol. 21 No 1 Th. 2016: 62-72
70
chickens to H5N1 virus ranged from being anybody
free as represented by SPF sera (group 0) to the those
being exposed and represented by sera from chickens
vaccinated multiple times and sera obtained following
challenged with live H5N1 virus. The level of antibody
to CNTKCQTP, as indicated by the ELISA’s OD, in the
SPF chicken was marginal lower compared to other
groups. There were no differences in ODs between sera
from pre-vaccinated (group 2) and post vaccinated birds
(groups 2, 3, 4), and between pre-vaccinated (group 2)
and post-challenged birds (groups 5, 6, 7). The low
ELISA ODs indicated the absence of antibody to
CNTKCQTP in all groups of the chicken.
Amino-acid sequence alignment
Alignment of CNTKCQTP epitope with analogue
epitope in the amino acid sequence of haemagglutinins
used in this study is presented in Table 2. Except for
H5, none of the haemagglutinin had 100% similarity
with the CNTKCQTP epitope. Four haemagglutinins
(H1, H2, H8 and H13) had analogue epitopes with only
one amino acid different with the CNTKCQTP epitope.
The analogue epitope in the haemagglutinins H7 and
H15, which had had only two identical amino acids,
were the most divergent.
Discussion
This study shows that the linear CNTKCQTP
epitope, which is located in the amino acid residue 274-
281 of H5N1 haemagglutinin is immunogenic as high
antibody titre was obtained following immunization
with the CNTKCQTP MAP. The goat-CNTKCQTP-
antisera would be useful as a reagent in the
development of diagnostic test for H5N1 avian
influenza because it recognized H5N1 haemagglutinin,
either as a recombinant protein or as a native protein
present in the H5N1 virus particle. The production of
goat-CNTKCQTP-antisera was technically simple and
inexpensive and this is important to overcome obstacles
of using CNTKCQTP-monoclonal antibody that is
expensive for routine diagnostic use (Velumani et al.
2011).
Interest in developing diagnostic tools for influenza
has been great because the disease has been one of the
most important diseases in human and animals. Point-
of-care (POC) tests, most of which belong to the group
of rapid immunological tests, have been the most
widely developed tests because their benefits in the
control of influenza either in animals or in human have
been proven. In human, the ability to confirm that an
illness is or is not caused by an influenza virus, using a
POC test, can be a lifesaving undertaking because
effective anti-influenza drugs are available (Gavin &
Thomson 2003). The importance of a POC test in the
control measure of HPAI has been demonstrated in the
PDSR (participatory Disease Survellance and
Response) project, a successful HPAI control program
in sector-4 poultry in Indonesia (Hawkes et al. 2014;
Tarigan 2015).
The accuracy of an immunological test depends on
the specificity of antibody used in the test. Being very
specific, because it recognized only one epitope in the
antigens, monoclonal antibodies have been used widely
in the development of POC tests. For this reason, a
large number of attempts have been made to produce
monoclonal antibodies against influenza viruses (Wang
et al. 2000; Rai et al. 2010; Wei et al. 2011; Bhat et al.
2013). Sometimes, however, a monoclonal antibody is
too specific that it can not tolerate even a minor
variation in its epitope, which reduce its diagnostic
sensitivity when used in dignostic assay (Khan 2014;
Singh et al. 2014).
The CNTKCQTP -polyclonal antibody produced in
this study was also expected to be highly specific
because its was produced against a short peptide
expected to contain only a few antigenic epitopes.
Additionaly polyclonal antibodies are considered to be
more tolerant of antigenic variation in the epitope, and
therefore when used in immunoassy, it should have
higher sensitivity than monoclonal antibody.
As shown in this study, the polyclonal antibody no
longer recognized the sequence (analogous epitope)
even only one amino acid different, either the
difference in the middle (haemagglutinins H1 and H2)
or at the end of the sequence (haemagglutinins H8 and
H13). This results may indicate that the CNTKCQTP-
MAP used to immunised the goat contains only a single
epitope.
Previous study reported that monoclonal antibody to
CNTKCQTP epitope, 5F8, had high specivicity
(Prabakaran et al. 2009) and when used in an epitope-
blocking ELISA against recombinat H5N1
haemagglutinin (HA0), the ELISA could identify
specifically chicken that had been vaccinated against
H5N1 virus and no cross reactions were observed with
subtypes H1-H4, H6-H16 influenza viruses.
Unlike the 5F8-monoclonal antibody, the
CNTKCQTP-MAP polyclonal antibody produced in
this study was not specific for haemagglutinin of H5N1,
because it also recognised haemagglutinin of other AIV
subtypes, including H3N8, H4N4, H6N5, H7N7, H9N2,
H10N7 and H11N9.
The use of recombinant haemagglutinins in
immunoblot assay in the present study failed to
establish the specificity of CNTKCQTP-MAP
antiserum. This was because the goat used in the
antibody production already had antibody to
hemagglutinin of some isolates especially H7, H8 and
H9 before immunisation. It is unknown how common it
is normal or non-vaccinated goats being seropositive to
Tarigan et al. Potency of antigenic and serologic tests based on CNTKCQTP linear epitope on H5N1 haemagglutinin
71
H7, H8 and H9 haemagglutinins. However, the fact that
serum from a non-immunised, heathy goat, collected
five years ago, was also positive to those
haemagglutinins when tested similarly may indicates
that the condition is common. However, It is unknown
whether the seropositivity was caused by infection with
related subtypes of influenza-viruses or induced by
other immunologically cross-reactive agents . The later
possibility was more likely because it was supported by
the results of other immunoblot assay using whole
inactivated-influenza viruses in which the same non-
vaccinated serum did not recognise haemagglutinin
from H7N7 and H9N2 subtypes influenza viruses.
Before immunisation with the CNTKCQTP -MAP,
the goat had been tested and it was seronegative to
H5N1 virus. We did not, however, test the goat against
hemagglutinin of other subtypes. In addition to our
failure to envisage the possibility of the goat
seropositive to haemagglutinin of other serotypes, the
array of recombinant haemagglutins used in detection
of the antibodies was not available untill the goat
exsanguinated. This study, therefore, convinced the
vital importance of testing animals to be used in the
production of antiserum to be tested against
haemagglutinin of subptypes all influenza virus before
used.
The second aspect of the CNTKCQTP-peptide
evaluated in this study, the use of the linear peptide in
indirect ELISA to detect antibody, also generated
results that are different to those of previous study
(Velumani et al. 2011). In that study, the peptide-
ELISA was able to specifically identify chicken that
had been vaccinated with H5N1 virus of various clades.
In the present study, on the other hand, a similar ELISA
could not detect the present of specific antibody in
chicken that had been vaccinated once, twice, thrice, or
even in vaccinated chicken that had been challenged
with a life H5N1 virus. There are three things that were
different between ELISA in this study and that in
previous study. First, the concentration of peptide used
to coat the microtitre plate was 5 µg/ml in this study
and 10 µg/ml in previous one. We are convinced that
this concentration difference could not attributed to
differences in the results because in our preliminary
experiment, we found that no differences between both
concentrations (data not presented). Second, in this
study non-fat-skimmed milk was used as a blocking
reagent whereas in previous study, bovine serum
albumin was used. In our previous study, we found that
non-fat-skimmed milk was effective as blocking agent
and therefore the blocking reagent could not also be
attributed to the differences result of this study and
previous study (Tarigan et al. 2015). Third, in this study
the chicken were immunised with a commercial H5N1
vaccine, whereas, in previous study the vaccine was
prepared by the authors themselves. Because the
vaccine was prepared by the authors themselves, the
purity and the amount of immunogen contained in the
vaccine were known with certainty. The purity and the
amount of immunogen in the commercial vaccine in the
present study were unknown.
In summary, immunisations of goat with the
CNTKCQTP epitope, in the form of MAP, produced
antibody that recognised H5 haemagglutinin but only
H5N1 virus. The antibody is useful as the main reagent
in development of rapid test for H5N1 avian influenza.
Some apparently pre-immunised goats are seropostive
for some influenza haemagglutinins, therefore testing
goats against all influenza haemagglutinins before used
for antibody production is vitally important. This study
fail to demonstrate the presence of antibody to
CNTKCQTP epitope in chicken that had been
vaccinated or infected with H5N1 virus.
CONCLUSION
High titre antibody to CNTKCQTP epitope was
produced by immunising goat with CNTKCQTP MAP.
The serum recognised haemagglutinin H5 and therefore
is useful as a reagent for detection of H5N1 virus.
However, unlike CNTKCQTP monoclonal antibody
generated previously, the serum is not specific for
H5N1 haemagglutinin as it also recognises
haemagglutinin of other influenza virus subtypes. Some
apparently pre-immunised goats are seropostive for
some influenza haemagglutinins, therefore testing goats
against all influenza haemagglutinins before used for
antibody production is vitally important. ELISA using
peptide containing the epitope sequence,
GNCNTKCQTPMGAINSS, cannot be used to detect
anti-H5N1 antibody in chicken immunised with
commercial-H5N1 vaccine.
ACKNOWLEDGMENT
Some apparently pre-immunised goats are
seropostive for some influenza haemagglutinins,
therefore testing goats against all influenza
haemagglutinins before used for antibody production is
vitally important. This work was supported by the Australian Centre
for International Agricultural Research under Grant
AH/2010/039. The authors thank Mrs Gita Sekarmila,
Mr Achpas and the animal caretakers for their excellent
technical assistance.
REFERENCES
Bhat S, Bhatia S, Sood R, Bhatnagar H, Pateriya A,
Venkatesh G. 2013. Production and characterization of
monoclonal antibodies against nucleoprotein of avian
JITV Vol. 21 No 1 Th. 2016: 62-72
72
influenza virus. Monoclon Antib Immunodiagn
Immunother. 32:413-418.
Claas EC, de Jong JC, van Beek R, Rimmelzwaan GF,
Osterhaus AD. 1998. Human influenza virus
A/HongKong/156/97 (H5N1) infection. Vaccine.
16:977-978.
[FAO] Food and Agriculture Organization. 2011. Approaches
to controlling, preventing and eliminating H5N1 Highly
Pathogenic Avian Influenza in endemic countries. FAO
Animal Production and Health Paper No. 171.
[FAO] Food and Agriculture Organization. 2012. H5N1 HPAI
global overview, January–March 2012. Issue No. 31.
[accessed April 16th 2015]. http://www.fao.org
/docrep/015/an388e/an388e.pdf
Gavin PJ, Thomson RB. 2003. Review of rapid diagnostic
tests for influenza. Clin Appl Immunol Rev. 4:151-172.
Hawkes P, Echalar R, Budiharta S, Soenarjo S. 2014.
USAID/Indonesia Avian And Pandemic Influenza (API)
program evaluation: 2009–2014. GH Tech Project
Bridge IV, Report No. 14-B4-009.
Ho HT, Qian HL, He F, Meng T, Szyporta M, Prabhu N,
Prabakaran M, Chan KP, Kwang J. 2009. Rapid
detection of H5N1 subtype influenza viruses by antigen
capture enzyme-linked immunosorbent assay using H5-
and N1-specific monoclonal antibodies. Clin Vaccine
Immunol. 16:726-732.
Khan FH. 2014. Antibodies and their applications. In: Verma
AS, Singh A, editors. Animal biotechnology-model in
discovery and translation. Amsterdam (NL): Acad
Press. p. 473-490.
Lin J, Wang R, Jiao P, Li Y, Li Y, Liao M, Yu Y, Wang M.
2015. An impedance immunosensor based on low-cost
microelectrodes and specific monoclonal antibodies for
rapid detection of avian influenza virus H5N1 in
chicken swabs. Biosens Bioelectron. 67:546-552.
Prabakaran M, Ho HT, Prabhu N, Velumani S, Szyporta M,
He F, Chan KP, Chen LM, Matsuoka Y, Donis RO,
Kwang J. 2009. Development of epitope-blocking
ELISA for universal detection of antibodies to human
H5N1 influenza viruses. PLoS One. 4:e4566.
Rai M, Bhatia S, Malik YP, Dubey SC. 2010. Production and
characterization of monoclonal antibodies against NS1
protein of H5N1 avian influenza virus. Hybridoma
(Larchmt). 29:183-186.
Rosenberg IM. 1996a. Protein analysis and purification.
benchtop techniques. Boston (USA): Birkshauser
Boston. p. 158-159.
Rosenberg IM. 1996b. Protein analysis and purification.
benchtop techniques. Boston (USA): Birkhauser
Boston. p. 130.
Sims LD, Domenech J, Benigno C, Kahn S, Kamata A,
Lubroth J, Martin V, Roeder P. 2005. Origin and
evolution of highly pathogenic H5N1 avian influenza in
Asia. Vet Rec. 157:159-164.
Singh A, Chaudhry S, Agarwal A, Verma AS. 2014.
Antibodies: Monoclonal and Polyclonal. In: Verma AS,
Singh A, editors. Animal biotechnology-model in
discovery and translation. Amsterdam (NL): Acad
Press. p. 265-287.
Tarigan S. 2016. Peranan Point-of-Care-Test dalam
pengendalian High Pathogenic Avian Influenza di
Indonesia. Wartazoa. 26:39-50.
Tarigan S, Indriani R, Durr PA, Ignjatovic J. 2015.
Characterization of the M2e antibody response
following highly pathogenic H5N1 avian influenza virus
infection and reliability of M2e ELISA for identifying
infected among vaccinated chickens. Avian Pathol.
44:259-268.
Velumani S, Ho HT, He F, Musthaq S, Prabakaran M, Kwang
J. 2011. A novel peptide ELISA for universal detection
of antibodies to human H5N1 influenza viruses. PLoS
One. 6:e20737.
Wang X, Castro AE, Castro MD, Lu H, Weinstock D, Soyster
N, Scheuchenzuber W, Perdue M. 2000. Production and
evaluation criteria of specific monoclonal antibodies to
the hemagglutinin of the H7N2 subtype of avian
influenza virus. J Vet Diagn Invest. 12:503-509.
Wei J, Yan B, Chen Z, Li T, Deng F, Wang H, Hu Z. 2011.
Production and characterization of monoclonal
antibodies against the hemagglutinin of H5N1 and
antigenic investigation of avian influenza H5N1 viruses
isolated from China. Can J Microbiol. 57:42-48.
AUTHOR GUIDELINES
Indonesian Journal of Animal and Veterinary
Sciences, or IJAVS contains:
(i) Primary scientific manuscript of unpublished
research results.
(ii) Elucidation of research methodes and innovative
techniques which is useful for research
development.
AUTHOR GUIDANCE Manuscript is written in good English, accompanied
with abstract in English and Indonesian. Manuscript is
typewritten on the A4 paper size with 2 spaces
distance and 4 cm from left side, 3 cm from right side,
3 cm from top and buttom sides. We provide you with
IJAVS Template that you can find in our website:
http://medpub.litbang.pertanian.go.id/index.php/jitv.
SCRIPTWRITING SYSTEMATICS
1. Title:
Should be comprehensive, but it is made as short
as possible. Subtitle can be given if it needed.
2. Name and Address of Author: Author’s name is written completely (without
degree) and typewritten by CAPITAL letter. If
the author is more than 1 person with different
address, Arabic numbers superscript shouk be
given behind each name. Author’s address
written under author’s name, consisting of
institution name and its complete address, made
in line with number of index on behalf of the
author and typewritten by ITALIC.
3. Abstract:
Abstract is gift of manuscript, written in
Indonesian or English, do not more than 250
words and stated in one paragraph. Abstract
consists of backgound, purpose, material and
methode, result and conclution. The author’s
name (in CAPITAL form), publication year,
manuscript title and journal name are listed
before abstract content with layout as reference.
Keywords are listed under the abstract,
maximum 5 words.
4. Introduction:
Is consisting of research background, issue,
efforts which have been made, approach taken to
solve the problem and research purpose.
5. Material and Method:
Elucidating clearly about materials used and
method carried out. If the material using animals
in the experiment, please indicate that the
animals are performed according to animal ethics
and welfare. See ethical statement in the
attachment.
6. Result and Discussion:
It presents and discuss clearly and completely
achieved research results based on the purpose.
Result and discussion may be presented
separated or united. Result description may be
completed by consise tables and cleare
ilustrations (black and white graphics, figures or
photos) on separated page. Tabel description (on
top) and ilustration (in bottom) should be clear
and independent, so readers may easily
understand the table without read the text.
Discussion description consists of description of
result and research mean and benefit associated
with issue which will be solved. Measurement
units both in table or ilustration use metric
system.
7. Conclusion:
It is a manuscript final summary.
8. Acknowledgement:
It can be written if needed.
9. References:
The author is recommended to use Mendeley
Program (http://www.mendeley.com) and
citation style of Taylor & Francis - Council of
Science Editors (author-date). Mendeley
program utilization is aimed to avoid mistakes in
citations and references writting. Cited
references (preferebly, 80% is primary article
and the last 10 years publication). and should
not from unpublished articles such as practical
guidance and research report, except thesis and
dissertation. Download is allowed if it is from
electronic magazine, genom database or patent.
Citation in the references:
Literatures in reference are written
alphabetically based on the author’s name. Same
author is written sequentially starting from
earlier order.
Example of reference writing
Primary paper:
Bhanja SK, Anjali DC, Panda AK, Sunder GS.
2009. Effect of post hatch feed deprivation on
yolk-sac utilization and young broiler chickens.
Asian-Aust J Anim Sci. 22:1174-1179.
Book:
a. Lawrence TLJ, Fowler VR. 2002. Growth of
farm animals. 2nd ed. New York (USA):
CABI Publishing.
b. Bamualim A, Tiesnamurti B. 2009.
Konsepsi sistem integrasi antara tanaman
padi, sawit, dan kakao dengan ternak sapi di
Indonesia. In: Fagi AM, Subandriyo,
Rusastra IW, penyunting. Sistem integrasi
ternak tanaman padi, sawit, kakao. Jakarta
(Indones): LIPI Press. p. 1-14.
c. Paloheimo M, Piironen J, Vehmaanpera J.
2010. Xylanases and cellulases as feed
additives. In: Bedford MR, Partridge GG,
editors. Enzymes in farm animal nutrition.
2nd ed. New York (USA): CABI Publishing.
p. 12-53.
Proceeding:
Umiyasih U, Antari R. 2011. Penggunaan
bungkil inti sawit dan kopra dalam pakan
penguat sapi betina berbasis limbah singkong
untuk pencapaian bobot badan estrus pertama
>225 kg pada umur 15 bulan. Prasetyo LH,
Damayanti R, Iskandar S, Herawati T, Priyanto
D, Puastuti W, Anggraeni A, Tarigan S,
Wardhana AH, Dharmayanti NLPI, editors.
Prosiding Seminar Nasional Teknologi
Peternakan dan Veteriner. Bogor (Indones):
Pusat Penelitian dan Pengembangan Peternakan.
p. 192-199.
Thesis:
Krisnan R. 2008. Kombinasi penggunaan
probiotik mikroba rumen dengan suplemen
katalitik pada pakan domba (Tesis). [Bogor
(Indones)]: Institut Pertanian Bogor.
Electronic magazines:
Wina E, Tangendjaja B, Dumaria. 2008. Effect
of Calliandra calothyrsus on in vitro
digestibility of soybean meal and tofu wastes.
Livest Res Rural Develop. Vol. 20 Issue 6.
http://www.lrrd.org/lrrd20/6/wina 20098.htm.
Institution:
a. [NRC] National Research Council. 1985.
Nutrient requirements of sheep. 6th revised.
Washington DC (USA): National Academic
Press.
b. [CDC] Centers for Disease Control. 2006.
Standard operating procedure for the direct
Rapid Immunohistochemistry Test (dRIT) for
the detection of rabies virus antigen. [accessed
December 20th 2011]. http://www.rabiesblue
print.com/IMG/pdf/DRIT_SOP.pdf.
Patent:
Blanco EE, Meade JC, Richards WD. 1990.
Ophthalmic ventures, assignee. Surgical stapling
system. United States patent US 4,969,591. 1990
Nov 13.
10. Citation in text:
Citation consists author’s last name and
publication year.
Example:
a. One author: .......... grow slower than lamb fed
cattle’s milk (Supriyati 2012). Supriyati
(2012) formulates..........
b. Two authors: .......... expect, end maintenance
weight (Khasrad & Rusdimansyah 2012).
Khasrad & Rusdimansyah (2012)
argued..........
10. c. Three authors or more: ......... based on DNA
mitochondria analysis (Mtileni et al. 2011).
Mtileni et al. (2011) reports.....
d. Same author cited from 2 different papers:
(Purwadaria et al. 2003a, 2003b).
e. Author with same family name is written
consecutive: (Dawson J 1986; Dawson M
1986).
f. Several different authors are written
consecutive: (Kannan et al. 2000; Grandin
2007; Santosa et al. 2012).
g. Institution: BPS (2011)............
11. Table:
a. Standard word used is Times New Roman
with 1 space distance and 11 of font size.
b. Title is simple, clear, and understable
sentence without reads the manuscript.
c. Each colum from table should has headling.
Its unit separated from title by coma, in
parentheses, or at its bottom.
d. Table description is written under the table
with 1 space distance and 11 of font size. Data
source is written under the table or in the table
in own header.
Dividing line is made in form of horizontal.
12. Figure and graphic:
a. Title uses Times New Roman with 1 space
distance and 11 of font size. It is a simple and
clear sentence which is laid under the figure or
graphic.
b. Line in graphic should show clearly difference
of one and others, if there is more than one
curve.
c. Clear contrast figure with proportionate size
and high resolution to present the best
performance.
Write figure or graphic source under the title.
1. If written manuscript is more than one, it needed an
approval from the other authors by enclose initial
behind each name.
2. Complate manuscript is sent in three copies to
Editorial Board of IJAVS and its electronic file, or
by online: http://medpub.litbang.pertanian.go.id/
index.php/jitv
The author is entitled to 1 original journal and 10 its
reprints.
Note:
Please sent statement letter with original signed and stamped by post to:
Technical Editor of Indonesian Journal of Animal and Veterinary Sciences
Pajajaran St. Kav. E59 Bogor 16128. Phone: (0251) 8322185 Fax. (0251) 8380588
Email: [email protected]/[email protected]
Website: http://medpub.litbang.pertanian.go.id/index.php/jitv/index
Indonesian Journal of Animal and Veterinary Sciences Center for Animal Research and Development Indonesian Agency for Agricultural Research and Development Padjajaran St. Kav. E59, Bogor 16128 Phone: 0251 - 8322185 | Fax: 0251 - 8380588 e-mail: [email protected]/[email protected] http://medpub.litbang.pertanian.go.id/index.php/jitv/index
Dear Editorial Board of Indonesian Journal of Animal and Veterinary Sciences Indonesian Center for Animal Research and Development Padjajaran St. Kav. E59, Bogor 16128
ETHICAL STATEMENT
Respect to paper submission to Indonesian Journal for Animal and Veterinary Science, by following this letter, I here:
Name : Institution : Title of Paper :
Acknowledging that the paper submitted is my own or team work, that:
It is original or free from: a) fabrication; b) falsificasin; c) plagiarism; d) duplication; e) fragmentation; and f) data/content copyright infringement.
It is obtained through true scientific meeting or free from: a) engineered scientific meeting; and b) not attended meeting.
It is ensure the studies involving animals that are performed according to animal ethics and welfare.
It is unpublished in other publications.
This acknowledgment is made honestly and responsible based on Regulation of Head of Indonesian Institute of Science Number 06/E/2013 about Code of Ethic of Researcher. , 20 March 2016
Applicant,
Author’s colleague:
Name Sign
This form should be signed by all authors and returned to the Editorial Board. The form may
be sent by post or email.
Indonesian Journal of Animal and Veterinary Sciences Indonesian Center for Animal Research and Development Indonesian Agency for Agricultural Research and Development Padjajaran St. Kav. E59, Bogor 16128 Phone: 0251 - 8322185 | Fax: 0251 – 8380588 e-mail: [email protected]/[email protected] http://medpub.litbang.pertanian.go.id/index.php/jitv/index
COPYRIGHT TRANSFER FORM
Title of Paper :
Author : This paper is original and the author diverts its copyright to Indonesian Journal of Animal and Veterinary Sciences, incase if and when this paper is accepted.
Everyone listed as author in this paper had contributed to substation and intellectual and should be responsible to public. In case is notified a copyright infringement, it is responsible to the author, not responsible to Indonesian Journal of Animal and Veterinary Science.
This paper content is unpublished before and not being considered to be published in other journals.
, 2016
Approved by
Primary Author
Author’s colleague:
Name Sign

Acknowledgement
Editorial board and executive editor of Indonesian Journal for Animal and Veterinary Science (IJAVS) extent
high appreciation to the expertises of peer reviewer of IJAVS (Volume 21 No. 1 2016).
1. Prof. Dr. Abubakar : Postharvest Agriculture Technology - ICAPRD
2. Prof. Dr. drh. Retno D. Soejoedono, M.S. : Microbiology - Bogor Agricultural University
3. Dr. drh. Michael Haryadi Wibowo, M.P. : Microbiology - Gadjah Mada University
4. Rintis Noviyanti, Ph.D. : Biomedical Science – Eijkman Institute
We hope this good collaboration would be continued in the future in improving IJAVS quality.
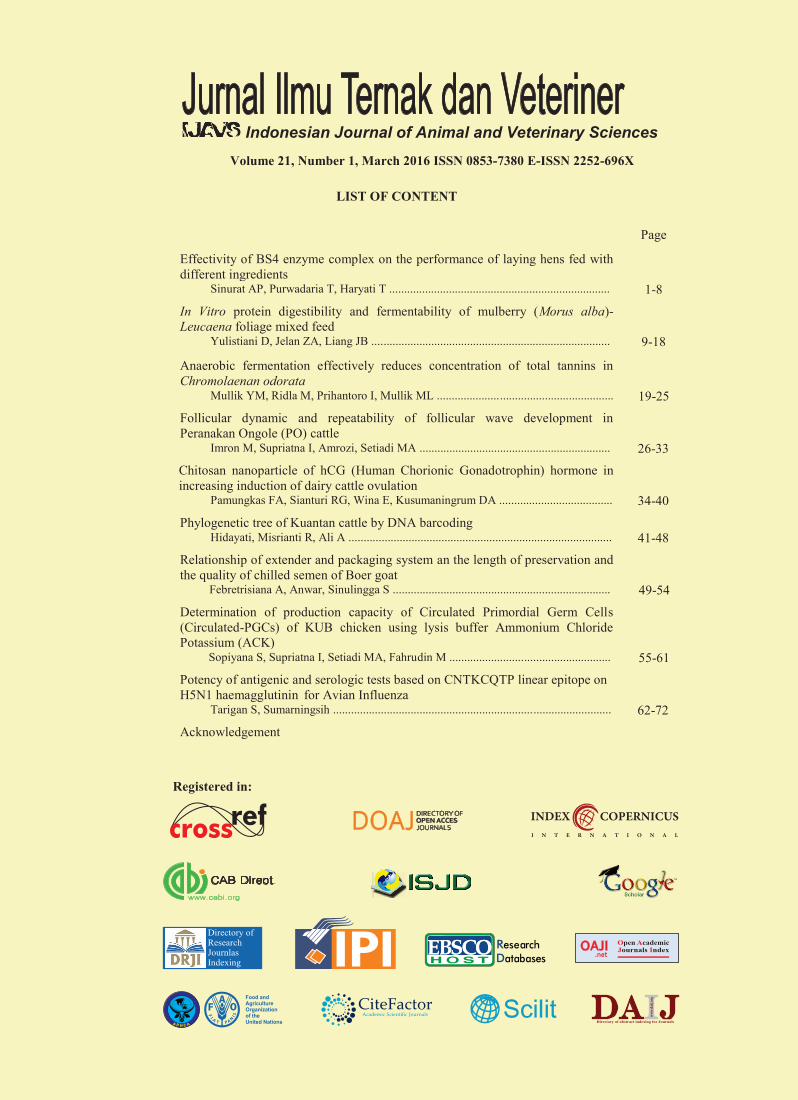
CV. Bina LaksanaJl. Raya Pajajaran No. 100 BogorPRD1924
Indonesian Journal of Animal and Veterinary SciencesVolume 21, Number 1, March 2016 ISSN 0853-7380 E-ISSN 2252-696X
LIST OF CONTENT
Page
Effectivity of BS4 enzyme complex on the performance of laying hens fed with different ingredients
Sinurat AP, Purwadaria T, Haryati T .......................................................................... 1-8
In Vitro protein digestibility and fermentability of mulberry (Morus alba)-Leucaena foliage mixed feed
Yulistiani D, Jelan ZA, Liang JB ................................................................................ 9-18
Anaerobic fermentation effectively reduces concentration of total tannins in Chromolaenan odorata
Mullik YM, Ridla M, Prihantoro I, Mullik ML ........................................................... 19-25Follicular dynamic and repeatability of follicular wave development in Peranakan Ongole (PO) cattle
Imron M, Supriatna I, Amrozi, Setiadi MA ................................................................ 26-33Chitosan nanoparticle of hCG (Human Chorionic Gonadotrophin) hormone in increasing induction of dairy cattle ovulation
Pamungkas FA, Sianturi RG, Wina E, Kusumaningrum DA ...................................... 34-40
Phylogenetic tree of Kuantan cattle by DNA barcodingHidayati, Misrianti R, Ali A ........................................................................................ 41-48
Relationship of extender and packaging system an the length of preservation and the quality of chilled semen of Boer goat
Febretrisiana A, Anwar, Sinulingga S ......................................................................... 49-54
Determination of production capacity of Circulated Primordial Germ Cells(Circulated-PGCs) of KUB chicken using lysis buffer Ammonium Chloride Potassium (ACK)
Sopiyana S, Supriatna I, Setiadi MA, Fahrudin M ...................................................... 55-61Potency of antigenic and serologic tests based on CNTKCQTP linear epitope on H5N1 haemagglutinin for Avian Influenza
Tarigan S, Sumarningsih ............................................................................................. 62-72Acknowledgement
Registered in: