money attitudes, economic locus of control - TTU DSpace Home
115
MONEY ATTITUDES, ECONOMIC LOCUS OF CONTROL, AND FINANCIAL STRAIN AMONG COLLEGE STUDENTS by JOHN V. HAYES, B.S., M.B.A., CFP® A DISSERTATION IN CONSUMER ECONOMICS AND ENVIRONMENTAL DESIGN Submitted to the Graduate Faculty of Texas Tech University in Partial Fulfillment of the Requirements for the Degree of DOCTOR OF PHILOSOPHY Approved Dorothy Bagwell Chairperson of the Committee Arturo Olivarez So Hyun Joo Bill Gustafson Sterling Shumway Accepted John Borrelli Dean of the Graduate School August, 2006
-
Upload
khangminh22 -
Category
Documents
-
view
2 -
download
0
Transcript of money attitudes, economic locus of control - TTU DSpace Home
MONEY ATTITUDES, ECONOMIC LOCUS OF CONTROL,
AND FINANCIAL STRAIN AMONG
COLLEGE STUDENTS
by
JOHN V. HAYES, B.S., M.B.A., CFP®
A DISSERTATION
IN
CONSUMER ECONOMICS AND ENVIRONMENTAL DESIGN
Submitted to the Graduate Faculty of Texas Tech University in
Partial Fulfillment of the Requirements for
the Degree of
DOCTOR OF PHILOSOPHY
Approved
Dorothy Bagwell Chairperson of the Committee
Arturo Olivarez
So Hyun Joo
Bill Gustafson
Sterling Shumway
Accepted
John Borrelli Dean of the Graduate School
August, 2006

Copyright 2006, John V. Hayes

ii
ACKNOWLEDGEMENTS
This project represents a significant amount of time from the many people who
helped me complete it. From the original concept of what I thought I wanted to
investigate, through the numerous revisions required by the funnel vision necessary for
such a project, the comments and contributions of my committee were of invaluable help.
Special thanks are due to Dr. William Gustafson for his remarkable memory and
unrelenting efforts toward holding me to the specific task at hand; to Dr. Sterling
Shumway for his most welcomed contributions to the structure and flow of the project; to
Dr. So-Hyun Joo for her help identifying scales applicable and survey instrument
considerations; and to Dr. Arturo Olivarez for the extensive thought provoking
discussions regarding various methods and procedures for this type of analysis.
And to my chair, Dr. Dorothy Bagwell, whose patience and tolerance never
wavered while continuing to drive both the project and myself as necessary, I would like
to express a very special thank-you. By helping me take the time to recognize this as the
learning experience it was, you have helped me with the current project, but just as
importantly, the learning experience has helped me immensely with future research
projects identified herein.

iii
TABLE OF CONTENTS
ACKNOWLEDGEMENTS . . . . . . . . . . . . . . . . . . . . . . . . . . . . . . . . . . . . . . . . . . . . . . . .ii
LIST OF TABLES . . . . . . . . . . . . . . . . . . . . . . . . . . . . . . . . . . . . . . . . . . . . . . . . . . . . . . .v
ABSTRACT. . . . . . . . . . . . . . . . . . . . . . . . . . . . . . . . . . . . . . . . . . . . . . . . . . . . . . . . . . . .vi
CHAPTER
I. INTRODUCTION Statement of the Problem . . . . . . . . . . . . . . . . . . . . . . . . . . . . . . . . . . . 2 Purpose of the Study . . . . . . . . . . . . . . . . . . . . . . . . . . . . . . . . . . . . . . . 5 Justification for the Study. . . . . . . . . . . . . . . . . . . . . . . . . . . . . . . . . . . 6 Theoretical Framework. . . . . . . . . . . . . . . . . . . . . . . . . . . . . . . . . . . . . .8 Research Questions . . . . . . . . . . . . . . . . . . . . . . . . . . . . . . . . . . . . . . . . 9 Assumptions and Conditions of the Study . . . . . . . . . . . . . . . . . . . . . 10 Limitations of the Study . . . . . . . . . . . . . . . . . . . . . . . . . . . . . . . . . . . 10 Definitions . . . . . . . . . . . . . . . . . . . . . . . . . . . . . . . . . . . . . . . . . . . . . .11 Summary. . . . . . . . . . . . . . . . . . . . . . . . . . . . . . . . . . . . . . . . . . . . . . . 12
II. REVIEW OF LITERATURE
Historical Synopsis of the Attitude – Behavior Relationship . . . . . . . .14 Money Attitudes . . . . . . . . . . . . . . . . . . . . . . . . . . . . . . . . . . . . . . . . . .21 Financial Practices . . . . . . . . . . . . . . . . . . . . . . . . . . . . . . . . . . . . . . . . 29 Locus of Control . . . . . . . . . . . . . . . . . . . . . . . . . . . . . . . . . . . . . . . . . .31 Financial Stress. . . . . . . . . . . . . . . . . . . . . . . . . . . . . . . . . . . . . . . . . . . 34 Cultural Differences . . . . . . . . . . . . . . . . . . . . . . . . . . . . . . . . . . . . . . . 37 Summary. . . . . . . . . . . . . . . . . . . . . . . . . . . . . . . . . . . . . . . . . . . . . . . . 41
III. METHODS AND PROCEDURES
Survey Design. . . . . . . . . . . . . . . . . . . . . . . . . . . . . . . . . . . . . . . . . . . . 42 Sample Selection . . . . . . . . . . . . . . . . . . . . . . . . . . . . . . . . . . . . . . . . . 43
Instrumentation. . . . . . . . . . . . . . . . . . . . . . . . . . . . . . . . . . . . . . . . . . . 44 Variables in the Study . . . . . . . . . . . . . . . . . . . . . . . . . . . . . . . . . . . . . 48 Data Analysis Procedures . . . . . . . . . . . . . . . . . . . . . . . . . . . . . . . . . . 48 Summary . . . . . . . . . . . . . . . . . . . . . . . . . . . . . . . . . . . . . . . . . . . . . . . 50
IV. RESULTS
Sample Demographics . . . . . . . . . . . . . . . . . . . . . . . . . . . . . . . . . . . . . 51 Analysis of the Sub Dimensions of the Three Major Scales . . . . . . . . 55 Analysis of the Research Questions. . . . . . . . . . . . . . . . . . . . . . . . . . . 58 Ancillary Questions. . . . . . . . . . . . . . . . . . . . . . . . . . . . . . . . . . . . . . . . 67

iv
Summary of Results and Findings. . . . . . . . . . . . . . . . . . . . . . . . . . . . . 69
V. DISCUSSION, CONCLUSIONS, AND IMPLICATIONS
Research Questions . . . . . . . . . . . . . . . . . . . . . . . . . . . . . . . . . . . . . . . .72 Conclusions of the Study. . . . . . . . . . . . . . . . . . . . . . . . . . . . . . . . . . . .78 Implications and Recommendations for Future Research . . . . . . . . . .80
REFERENCES. . . . . . . . . . . . . . . . . . . . . . . . . . . . . . . . . . . . . . . . . . . . . . . . . . . . . . . . . 86 APPENDICES
A. Human Subjects Proposal . . . . . . . . . . . . . . . . . . . . . . . . . . . . . . . . . . 96 B. Survey Instrument . . . . . . . . . . . . . . . . . . . . . . . . . . . . . . . . . . . . . . . . .98

v
LIST OF TABLES
4.1 Continuous variable demographics . . . . . . . . . . . . . . . . . . . . . . . . . . . . 52
4.2 Categorical variable demographics . . . . . . . . . . . . . . . . . . . . . . . . . . . . 53
4.3 Factor demographics . . . . . . . . . . . . . . . . . . . . . . . . . . . . . . . . . . . . . . . 54
4.4 Variables with significant differences between schools . . . . . . . . . . . . 55
4.5 Reliability and descriptive statistics . . . . . . . . . . . . . . . . . . . . . . . . . . . . 56
4.6 Scale dimension correlations . . . . . . . . . . . . . . . . . . . . . . . . . . . . . . . . . .57
4.7 Economic Locus of Control Scale MANCOVA . . . . . . . . . . . . . . . . . 59
4.8 Discriminant analysis, Economic Locus of Control Scale and Gender. . 60
4.9 Interaction of cultural and class rank factors . . . . . . . . . . . . . . . . . . . . . 62
4.10 Financial Strain Scale Mancova . . . . . . . . . . . . . . . . . . . . . . . . . . . . . . .63
4.11 Discriminant analysis, Financial Strain Scale and Gender . . . . . . . . . . 64
4.12 Money Attitude Scale MANCOVA. . . . . . . . . . . . . . . . . . . . . . . . . . . . 66
4.13 Discriminant analysis, Money Attitude Scale and Gender . . . . . . . . . . 67

vi
ABSTRACT
The relationship between attitudes and behavior has been studied extensively, yet
research on money attitudes, perceptions of economic locus of control, and financial
strain among college students is less abundant. Toward a better understanding of college
student’s attitudes and perceptions about money, an investigation of student money
attitudes and perceptions of economic locus of control is advanced.
Research favors the validity of Furnham’s assertion that money attitudes are
clearly not one-dimensional, and encompass a multitude of dimensions. Assessing these
attitudes yields clearly defined constructs that may be influenced through additional
stimuli. Numerous studies support the contention that money attitudes are learned
dispositions, initially developed through parental teachings and observation of family
money practices, later refined through socialization and experience. Thus it might be
considered that money behavior change may be best accomplished through money
attitude change, the latter accomplished by additional focused stimuli.
Results of this study indicate significant differences in attitudes and perceptions
of control over money matters between female and male college students, differences in
the perceptions of influence over money matters between students from the Mexican
American, Latino / Latina cultures and students from the Anglo American cultures, and
differences in attitudes and practices between freshman students and upper class students.
This analysis suggests female students tended to feel less personal control over
positive outcomes compared to male students, yet perceived uncontrollable chance as less
influential on their financial circumstances. Female students indicated less difficulty in
vii
meeting current obligations than did male students, while placing less importance on
planning for future financial circumstances. Female students feel higher levels of anxiety
over financial issues, have lower scores in financial literacy, and use money to impress or
influence others less than male students.
This analysis found that freshman students from the Mexican American and
Latino / Latina cultures felt a significantly higher influence over their financial situation
from Powerful Others; this influence increasing as the student advanced through class
levels. The analysis also indicates junior and senior level students spend significantly
higher amounts of time working (including work study), and have a much higher
probability of reducing class load or withdrawing from class due to financial constraints.
Implications of the study and recommendations for further research are discussed.

1
CHAPTER I
INTRODUCTION
A child’s perception of money begins at an early age. Money attitudes are learned
dispositions, initially developed through parental teachings and observation of family
money practices, later refined through socialization and experience. While discussions of
sex and drugs have become commonplace, discussions of money remain scarce, perhaps
the last taboo. One result is that many people learn about money almost exclusively from
personal practice, and this not until the late teenage years.
For many entry-level college students, college life is the first time they are
exposed to a significant degree of personal responsibility for their day-to-day finances.
Many students in high school have part time jobs and manage personal issues such as
automobile and some clothing expenses, but the parents or family handles, for the most
part, major living expenses. Upon entering college, significant budget constraints may be
placed upon the student, yet all too often the student has limited knowledge of budgeting
procedures. Combined with the pervasive culture of credit and the proliferation of credit
card marketing to this age group, it is little wonder so many college students succumb to
extensive credit card and consumer debt before they leave school (Hayhoe, Leach, Allen,
& Edwards, 2005; Norvilitis, Szablicki, & Wilson, 2003).
Matriculation periods for a college bachelor’s degree are receiving increased
scrutiny by both school administrators and taxpayers. For students who graduated from
high school in 1992 and completed their bachelor’s degree by December 2000, only one
third of the students earned a bachelor’s degree from the same school they had started in

2
within four years. Between 54% and 58% of students who completed their bachelor’s
degree in the same school as they started completed their program within six years
(Adelman, 2006). As a result, numerous financial incentive programs have been
developed with the specific purpose of motivating students to finish their program within
four years. Three examples illustrate the types of programs being explored.
The state of New Mexico will pay up to 100% of the cost of tuition for eight
semesters for students who meet eligibility requirements (New Mexico Higher Education
Department, 2006). The state of Pennsylvania offers financial incentives direct to the
college or university if the school succeeds in graduating at least 40% of the in-state
students within four years (O’Beirne, 2002). Texas Tech University provides student
loans to be forgiven if the student graduates within four years (for most majors) with a
grade point average of at least 3.0 (Texas Tech University, 2006).
Statement of the Problem
Extended matriculation periods require additional costs borne by the taxpayer for
the extended time to degree completion. In addition to the taxpayer funded direct costs,
there is a substantial opportunity cost to the student for the extended matriculation period.
From a financial perspective, both parties will likely benefit financially from student
class loads sufficient to ensure a four-year degree. While the student must forgo increased
income opportunities for higher class loads while in school, the combination of the
financial incentives available and the significant increases in income potential upon
completion of their program present a compelling case for the four-year program.

3
While each of the three incentive programs discussed above represents a
substantial financial motivation for students to complete their bachelor’s degree within a
prescribed period of time, they also necessitate an increase in class load for many.
However, a decrease in employment activities resulting from increased class load may
pose a problem for many students. To further complicate matters for students reducing
employment in order to increase class loads, research suggests that college students
generally face a wide range of financial problems such as credit card abuse, lack of
spending plans and budgeting practices, limited understanding of investment basics and
limited knowledge of consumer rights and responsibilities (Bernheim & Garrett, 1996;
Gorham, DeVaney, & Bechman, 1998; Joo, Grable, & Bagwell, 2003; Roberts & Jones,
2001). These financial problems and constraints suggest that a student’s ability to cope
with reduced income resulting from increased class loads may be moderated through the
inclusion of some type of financial education program.
Dominguez and Robin (1999) argue that sound financial practices are founded on
a money personality, or money ethic, consistent with an individual’s perception of the
monetary value of their “life force”. Similarly, Bachrach (1999, 2001) suggests the
financial choices and decisions we make in life are a function of a deep-seated belief we
hold for the meaning and importance of money. Publications from both authors suggest
an individual’s money personality and value system is the very foundation for aligning
the individual’s money with their values, and that this is the necessary first step toward
sound financial practices. Sound financial practices may also be influenced by money
attitudes. Voluminous research indicates a direct relationship between attitudes and
4
behavior (i.e., Ajzen & Fishbein, 1980; Doob, 1947; LaPiere, 1934), and more recent
research investigates relationships between attitudes and perceptions of behavioral
control (Ajzen, 1985, 1991; Fazio, 1990).
No empirical research has been found that supports a proposition that money
attitudes and perceptions of control over financial circumstance play a significant role in
the financial practices of college students. However, research of attitude—behavior
relationships does support a working hypothesis that assessing money attitudes and
perceptions of control over financial circumstance is an initial step toward helping
students overcome issues related to financial stress that may result from a reduction in
income as a result of higher class loads and shorter matriculation periods.
Financial stress has been suggested as a primary reason for many freshmen
students to seek employment during their first year of school, perhaps significantly
contributing to extended matriculation periods. Lindholm, Astin, Choi, and Gutierrez-
Zamano (2002) found that about 65% of students are concerned about how to pay for
their education, with over 47% of freshmen students expecting to seek employment as a
means of offsetting these stressful costs. In a study identifying sources of stress in college
students, Ross, Niebling, and Heckert (1999) found that 71% of students in their study
reported financial difficulties as a major source of stress. While financial difficulties were
not one of the top five stressors, the need to seek employment as a result of financial
difficulties may have increased the levels of four of the top five stressors: change in
sleeping and eating habits, increased work load, and new responsibilities. Similar results
were reported in an earlier study by Frazier and Schauben (1994), finding the two most
5
frequently experienced stressors among the all-female respondents were financial
problems and test anxiety.
Purpose of the Study
The purpose of this research is to identify money attitudes, perceived economic
locus of control, and dimensions of financial strain among college students in two
southwestern United States universities. Money beliefs and attitudes, along with financial
practices and habits, may have a direct relationship with financial literacy levels. Personal
responsibility for an individual’s financial success requires financial literacy at some base
level. Yet Dara Duguay, former executive director for the Jump$tart Coalition for
Financial Literacy argues that only about 10% of students report learning about money in
school (Harr, 2000). Bernheim and Garrett (1996) explored the relationship between
savings and financial literacy and suggest “education policy may prove to be a powerful
tool, either in isolation or in combination with tax incentives, for stimulating rates of
saving” (p. 1). Gorham et al. (1998) found that an individual’s perception of their
personal financial competency was one of the four major factors for predicting the
number of financial practices utilized.
Acquiring a sufficient level of personal financial competency depends on
education. During a symposium sponsored by the National Endowment for Financial
Education (NEFE), personal financial literacy was defined as “the ability to read,
analyze, manage, and communicate about the personal financial conditions that affect
material well being. It includes the ability to discern financial choices, discuss money and
financial issues without (or despite) discomfort, plan for the future, and respond
6
competently to life events that affect everyday financial decisions, including events in the
general economy” (NEFE, 2002). This definition suggests a focus on functional financial
literacy. The financial issues students face, perhaps for the first time in their lives as
independent or at least quasi-independent individuals, necessitate a need for the practical
application of money management topics. Noting deficits in personal financial literacy
through all ages, the participants of the symposium agreed that the most optimal setting
for financial literacy programs is as early as possible within the schools. Until the
inclusion of financial literacy is mandated at the primary or secondary education levels,
programs at the college level offer the best chance of helping students with the financial
difficulties they may face.
As a preliminary step toward any further investigation of financial literacy levels
of college students, money attitudes and control beliefs of students will be assessed.
Additionally, given the impact of changing demographics on student populations
(Murdock, White, Hoque, Pecotte, You, & Balkan, 2002), cultural differences in money
attitudes and beliefs are identified. The results of this investigation may foster the
development of a comprehensive financial education program to help students from
diverse backgrounds avoid the need of seeking employment as a result of financial
difficulties, and take advantage of the potential financial benefits provided by the
incentive programs focused on reducing matriculation periods.
Justification for the Study
The relationship between attitudes and behavior has been studied extensively, yet
research on money attitudes, perceptions of economic locus of control, and financial
7
stress among college students is less abundant. Early psychologists (Allport, 1935;
LaPiere, 1934) questioned the ability of attitudes to predict behavior. However, attitude—
behavior research gained significant ground as a result of investigations by Doob (1947).
Doob argues that since attitudes are learned predispositions, the resulting response to the
attitude must also be learned. The relationship between attitudes and locus of control has
limited empirical support. Although the literature both supports (Furnham, 1986) and
rejects (Ajzen, 2002; Kraft, Rise, Sutton, & Roysamb, 2005) the influence of locus of
control in the attitude—behavior relationship, Furnham (1986) presents an empirically
sound case for the inclusion of locus of control if the measure is specific to money and
economics.
Toward a better understanding of college student’s attitudes and perceptions about
money, an investigation of student money attitudes and perceptions of economic locus of
control is advanced. Research favors the validity of Furnham’s (1984) assertion that
money attitudes are clearly not one-dimensional, and encompass a multitude of
dimensions. Assessing these attitudes yields clearly defined constructs that may be
influenced through additional stimuli. Katona (1972) contends “attitudes constitute
important intervening variables; they are generalized viewpoints with affective
connotation, indicating what is good and favorable or bad and unfavorable. Attitudes are
learned, that is, acquired and modified by past experience” (p. 550). Thus it might be
considered that money behavior change may be best accomplished through money
attitude change, the latter accomplished by additional focused stimuli.
Certainly culture is a fundamental aspect of past experience. Barajas (2003)

8
presents compelling evidence of significant differences in money attitudes of Mexican
American individuals compared to Anglo individuals. Tseng (2004) identifies significant
differences such as the high priority given to assisting family members experiencing
difficult times among families from Asian and Latino cultures. The author reported that
attitudes toward family obligations contributed to increased educational motivation, but
that the fulfillment of the obligations resulted in decreased academic achievement.
Similarly, Saunders and Serna (2004) identify the increased difficulty Latino students
face as a result of the assistance given to family. These studies, combined with the
changing demographic characteristics of college students (Murdock et al., 2002), suggest
the need to explore culturally defined perceptions and attitudes.
Theoretical Framework
The theoretical framework for this study is based on the economic theory of
opportunity cost. Originally introduced by Friedrich von Wieser in 1876 as the Austrian
alternative cost and later translated by economists such as D. L. Green (1894), the theory
is grounded in the economic reality that most resources are limited and scarce. As such, if
a resource is used in one manner, any alternative use is forgone. The value of the forgone
alternative use is called the opportunity cost. This is not the net value of the two (or
more) alternatives, but simply the entire value of the forgone opportunity to use the
resource differently.
The costs of an additional two years of education for a bachelor’s degree entail
numerous aspects. In addition to the actual costs involved, the opportunity cost of the
additional two years includes the forgone income potential at the supposedly much higher

9
rate supported by degree completion. For students in most disciplines, this amounts to
many thousands of dollars each year. Of course this value is reduced by the amount of
income the student earns through employment during their program of study, but for most
students, pre-degree hourly income potential is limited. Additionally, comparing these
two values is likely beyond the capabilities of most students, perhaps leading many to
value the two alternatives incorrectly. Although studies of college students (Chen &
Volpe, 2002; Roberts & Jones, 2001) do not specifically measure a student’s ability to
apply the analysis necessary to compare costs of alternative matriculation periods, the
studies do suggest limitations on college students’ ability to analyze this kind of question.
Although the value of the financial incentives for early matriculation is beyond
the scope of this study, it is the income at the expense of increased class load that the
financial incentives for earlier matriculation attempt to replace. Indeed, for some
students, the value of the incentives will be significantly higher than the income forgone.
Combined with the value of the increased earnings potential for even one year, this
presents an opportunity for substantial cost reduction for those who complete their degree
within four years.
Research Questions
The following research questions were developed for this study.
1. In a population of college students with different income levels, is there a
statistically significant mean attitudinal difference among groups by
gender, class level, and culture as these relate to perceptions of economic
locus of control?

10
2. In a population of college students with different income levels, is there a
statistically significant mean attitudinal difference among groups by
gender, class level, and culture as these relate to financial strain?
3. In a population of college students with different income levels, is there a
statistically significant mean attitudinal difference among groups by
gender, class level, and culture as these relate to money attitudes?
Assumptions and Conditions of the Study
Three methodological assumptions were made.
1. Students who completed the research questionnaire were not different
from those within their respective schools who did not complete it.
2. Students who completed the questionnaire did so accurately and
completely.
3. Students who completed the questionnaire responded to the questions
based on their own individual attitudes, beliefs, and practices and their
responses were not influenced by perceptions of social desirability.
Limitations of the Study
1. The sample selection for this study was limited to college students within
Texas Tech University and New Mexico Highlands University. Results of
this study may not generalize to a broad population of college students.
2. The significant difference in size of the student population between the
two schools is a limitation of this study. During the spring semester of
2006, New Mexico Highlands University had a student population of

11
approximately 3,550 students enrolled, while Texas Tech University had a
population of about 28,000 students enrolled.
3. The survey was administered on-line within a self-report environment.
4. The data selection procedures constituted a convenience sampling.
5. In addition to potential social response bias, the data represent what the
students were able and willing to disclose with respect to their own
perceptions, beliefs, attitudes, and financial practices.
Definitions
The following are operational definitions for terms as they are used in this research:
Accessibility. The strength of the association between evaluation (see below) and the
object (Fazio & Williams, 1986).
Attitudes. Attitudes are learned dispositions toward an object along a single continuum,
ranging from favorable to unfavorable.
Economic Locus of Control. The perception of the factors responsible for the outcome of
an event, with the additional condition that the event is monetary or financially defined.
Evaluation. The process by which an individual uses cognitive (thoughts) and affective
(feelings) as a basis of judgment.
Financial literacy. The knowledge and understanding of financial topics sufficient to
handle one’s own personal finances successfully.
Financial strain. Financial strain is the anxiety, pressure, or stress associated from
personal or family financial difficulties.
Latino / Latina. Used to describe a non-Anglo individual of Hispanic culture. This term

12
includes many individuals not necessarily Mexican-American.
Materialism. The desire for material possessions and wealth to the detriment of a values-
defined quality of life (see values definition below).
Mexican-American. This term describes an individual of Mexican ancestry. Often
differentiated from other Latino / Latina or Hispanic populations as Chicanos.
Stress. Stress is the mental and/or physical condition resulting from a perceived threat or
demand that cannot be readily handled (Furnham, 1997).
Valence. The degree of attractiveness an individual, activity, or thing possess as a
behavioral goal (http://www.britannica.com/).
Values. Values measure the relative worth and significance of the fundamental principles
and standards that define one’s identity.
Volitional control. The power of an individual to exercise free will over choices and
decisions.
Summary
Increasing costs of higher education have prompted administrators of many public
higher-education institutions to search for ways to motivate students to complete their
bachelor’s degree in shorter time. Matriculation periods for many students in public
institutions have reached six years, with taxpayers footing much of the bill for the
extended time over the traditional four-year bachelor’s degree. In an attempt to motivate
students to increase their class load and complete their degree sooner, many states and
institutions have implemented financial incentive programs. Ideally the programs’
monetary incentives will replace a good portion of the extra income students are currently
13
earning through employment, and allow the student to increase their class load instead.
Literature suggests students participate in a number of detrimental financial
practices, which may prevent them from participating in the incentive programs.
Research of financial literacy levels and money management practices indicate many
students may lack an understanding of the true opportunity costs of a bachelor’s degree
that takes six years to complete instead of four. Helping students overcome many of their
financial difficulties while at the same time reducing employment and increasing class
load may help reduce the total cost of the education to both the student and the taxpayer.
The efficacy of any particular program toward helping students overcome or manage
their financial difficulties must begin with an understanding of the money attitudes the
student has, and the extent to which the individual perceives control over their finances.

14
CHAPTER II
REVIEW OF LITERATURE
One of the main functions of this study was the assessment of money attitudes.
Toward this goal, a review of the literature on attitudes with attention to the attitude–
behavior relationship has been completed. Additionally, consistent with the purpose and
justification for the study, economic locus of control, cultural influence, and financial
stress were all reviewed. Electronic databases available through EBSCO and PsycINFO
were used extensively. Results of these searches indicated numerous journals and texts
with related literature specific to the variables used, as well as literature reviewing the
development of scales for the variable’s measure. Many studies were found in the
microfiche files of the New Mexico Highlands University library, as well as a substantial
collection available from on-line sources. An examination of the reference section in
recent sources was used to identify the journals or other locations of specific works.
Historical Synopsis of the Attitude—Behavior Relationship
A thorough review of the literature on the attitude—behavior relationship was
beyond the scope of this study. However, an understanding of the applicability of the
attitude—behavior relationship to the present study requires at least an overview of the
difficulties social psychologists have had in assessing this relationship. Between
LaPiere’s research (1934) and Wicker’s extensive review (1969), many studies suggested
a specific lack of relationship between attitudes and behavior. Indeed Wicker claims,
“taken as a whole, these studies suggest that it is considerably more likely that attitudes

15
will be unrelated or only slightly related to overt behaviors than that attitudes will be
closely related to actions” (p. 65).
Perhaps the greatest difficulty centered on the measurement techniques employed.
Too often an assessment of how the behavior would scale was unavailable. A major
advancement in attitude—behavior research resulted from research by Fishbein and
Ajzen (1976) who argued that general attitude measures were very poor predictors of
specific behavior. They reasoned that the behavior and attitude measures must be
assessed on the same scale. Their research including this condition provided a significant
increase in attitude—behavior correlations.
Earlier advances in the attitude—behavior relationship were the result of research
by Doob (1947), who questioned the position that attitudes were one-dimensional
(favorable—unfavorable). He argues that since attitudes are learned predispositions, the
resulting response to the attitude must also be learned. Thus, Doob presents a case for the
position that attitudes and behavior can be unrelated. Indeed it would seem they must be,
since two or more people may share the same attitude about a particular entity, yet may
behave in uniquely different ways.
One major critique of Doob’s theory centered on the argument that his theory was
in fact support for the conclusion that if two or more people shared the same behavior
relative to some entity, then they must share the same attitude. In Chein’s (1948) critique
of Doob’s theory, the author argues that two people may share the same favorable or
unfavorable position, yet enjoy widely differing beliefs, consistent with the definition of

16
attitude as entailing cognitive, affective, and conative dimensions. Chein’s position was
that differences in any dimension between individuals result in different attitudes.
Fishbein (1966) extrapolates from Doob’s theories to develop a model that
disunites beliefs and intentions from attitudes, instead hypothesizing “beliefs and
behavioral intentions are determinants or consequents of an individual’s attitude” (p.
479). Support for this may be found in Chein’s example above, since differences in any
of the three dimensions suggest differences in attitude. Fishbein argues that behavior is a
function of many variables, including situational factors and individual differences, and
contends attitude, specifically disunited from beliefs and intentions, is just one of many
variables influencing behavior. This position will help develop the foundation of the later
theory of reasoned action.
Another significant advancement in the attitude—behavior relationship centers on
the concept of correspondence between the attitude and the ultimate behavior target
(Ajzen & Fishbein, 1977). This poses significant problems when the instrument fails as a
behavior evaluation measure, and instead measures intention (LaPiere, 1934). The
authors note “an attitudinal predictor is said to correspond to the behavioral criterion to
the extent that the attitudinal entity is identical in all four elements with the behavioral
entity” (p. 890). The four elements are defined as an action, the context in which the
specific action is performed, a time element, and a target of the action. For purposes of
debt reduction, if measuring an attitude toward a target of debt reduction, a behavioral
criteria may be the value of the payments made through the implementation of a debt
reduction plan, in varying contexts (credit card, equity loan), at varying times. The

17
authors argue that correspondence between two of the four elements, target and action, is
necessary for relationships between attitude and behavior to occur. After reviewing 109
investigations of the attitude—behavior relationship, the authors conclude “to predict
behavior from attitude, the investigator has to assure high correspondence between at
least the target and action elements of the measures he employs” (p. 913).
Certainly a number of variables have been found to influence the attitude—
behavior model, most notably attitude accessibility, individual characteristics as defined
by self-monitoring measures, attitude strength, amount of information about the attitude
object, confidence and direct experience with the attitude object, motivation and
opportunity, and Ajzen’s more recent conception of perceived behavioral control as a
function of perceived self-efficacy and perceived controllability.
Attitude accessibility (Berger, 1992; Fazio & Williams, 1986; Fazio, Powell, &
Williams, 1989; Holland, Verplanken, & Knippenberg, 2003) has a significant influence
on the attitude—behavior relationship. The investigation by Fazio and Williams (1986)
led the authors to suggest “a relatively accessible attitude is likely to bias interpretations
of subsequently received information because it is likely to be activated automatically
upon observation or mention of the attitude object” (p. 512). This leads to their assertion
that the accessible attitude will enjoy greater attitudinal consistency over a period of time.
Indeed, Fazio et al. (1989) argue that attitude accessibility is a greater influence on the
strength of attitude dimension than other measures such as amount of information
(Davidson, Yantis, Norwood, & Montano, 1985) or direct experience and confidence

18
(Fazio & Zanna, 1978b). The authors suggest this is a result of the construct operation at
the information processing level.
Attitude strength, as measured by accessibility is a clear determinant in the
MODE model proposed by Fazio (1990). Fazio argues that behavior is a function of the
perceptions regarding the immediate situation, thus accessibility functioning at the
processing level supports consistency in behavior. The MODE model incorporates into
the attitude—behavior relationship the influence of opportunity and motivation. Fazio
argues that motivation and opportunity are prerequisites for the deliberative, reasoned
process of behavior choice.
Berger (1992) argues that attitude accessibility alone is not sufficient to increase
influence over behavior by attitudes. He argues that the degree of confidence in the
attitude is essential to understanding the influence over behavior. This is supported by
Holland et al. (2003), arguing that “the confidence with which an attitude is held may be
inferred from the ease with which the attitude come to mind, in very much the same way
as accessibility affects confidence in answering knowledge questions” (p. 594). Their
investigations suggest the repeated expression of an attitude increases the attitude’s
accessibility in memory, increasing the confidence in the memory resulting in a low
probability of changing the attitude later.
Self-monitoring measures have been shown to influence the attitude—behavior
relationship. High self-monitors are described as individual with the ability to adapt to the
particular situation and circumstances life provides. These individuals tend to react to the
influence of social norms. In contrast, low-self monitors generally make decision based

19
on individual beliefs, feelings, or values, resulting in decision based more on attitude to
the object (DeBono & Omoto, 1993). The DeBono and Omoto study supported earlier
work by Snyder and Tanke (1976) finding evidence of a moderating affect of self-
monitoring measures on the attitude—behavior relationship. Citing concerns regarding
the psychometric properties of instruments previously used to measure the construct of
self-monitoring, Snyder and Gangestad (1986) found the measure taps a unique
interpretable and meaningful variable with a causal relationship to influence on behavior.
DeBono (1987) also found support for the moderating affect of self-monitoring on
attitude. Their investigations support expectations that “high self-monitoring individuals
expressed more attitude change after exposure to a message said to address a social-
adjustive function, and low self-monitoring individuals experienced more attitude change
after listening to a message presumably directed at a value-expressive function (p. 279).
The theory of reasoned action proposed by Ajzen and Fishbein (1980) argues that
behavior is influenced by intention, and intention is influenced by the attitude toward the
behavior and a measure of subjective norms. Weights, the authors argued, would be
determined based on different behaviors. Trafimow and Finlay (1996) found that
individually defined differences play a significant role in determining intentions. Results
from their study indicated 79% of the respondents indicated intentions as a result of
attitudes rather than subjective norms. Research by Sheeran and Orbell (1999) found the
strength of the attitude-intention relationship had a positive relationship with the
intention-behavior relationship. The norm-intention relationship and the intention-
behavior relationship were not significantly correlated. As a result, the authors find
20
support for the proposition that intentions resulting from attitudes have a greater
predictive power over behavior than intentions resulting from subjective norms. These
studies all support the increased predictive potential of attitudes given increased attitude
strength.
As noted above, Fazio et al. (1989) argue accessibility has a greater influence on
the strength of an attitude than other measures such as the amount of information, direct
experience, or attitude confidence. However, Davidson et al. (1985), while conceding
limitations of variability over behavior and situations, argue for the “relative
predominance of information and experience in determining attitude—behavior
consistency” (p. 1196-1197). Additionally, Fazio, Powell, and Herr (1983) and Fazio and
Zanna (1978a) argue for the significant influence of direct experience (Fazio & Zanna)
and direct experience combined with confidence (Fazio et al.) on the strength of attitude
measures.
This brief summary of the relatively early research on the attitude—behavior
relationship will hopefully give the reader an appreciation of the applicability of attitudes
on behavioral intentions and the subsequent actual behavior. Obviously few people would
intend to amass overwhelming credit card debt during their college years, or indeed even
suspect their educational program would require six years instead of the preconceived
four. However, this is a common position for many college students before ultimate
program completion. Therefore, assessing student attitudes toward money without
assessing the student’s perception of control over their finances would likely fall short in

21
helping to develop a financial education program with the goal of affecting matriculation
periods.
Money Attitudes
Early work assessing the relationship between money and human behavior
describe a number of relationships. Freud (1908) suggested many individuals
subconsciously equate money to feces. Fenichel (1938) argues money represents
unlimited power and respect, while Murray (1938), and McClelland and Winters (1971)
suggested a strong relationship between money and personal achievement and
recognition. Adler (1964) suggests the psychology and mentality resulting in the hoarding
of wealth stems from inalterable feelings of insecurity and inferiority.
The work by Yamauchi and Templer (1982) was perhaps the first investigation
toward the development of an empirically validated money attitude measurement scale.
Earlier work by Goldberg and Lewis (1978) identified a number of constructs people tend
to associate money with, including security, power, love, and freedom. Also advanced are
numerous attitudes and actions the authors suggest are related to the irrational use of
money, for instance unnecessary purchases that would not have been purchased except
that they were on sale, feeling anxious and defensive when asked about money, or feeling
money can solve all of one’s problems. The measurement tool, however, was never
psychometrically evaluated through empirical investigation. But as an initial step toward
and empirically grounded measurement tool, it holds significant value. Yamauchi and
Templer later used many of the questions (although, perhaps not word-for-word) in the
development of their money attitude scale. For instance, Goldberg and Lewis (1978)

22
include in their irrationality money behavior section “you automatically say, “I can’t
afford it”, whether you can or not” (p. 100). This very question is part of the retention
dimension of the money attitude scale in Yamauchi and Templer’s work (1982, p. 524).
Other earlier works with no empirical support include the investigations of Price
(1968). Her research resulted in what she called an economic value system. Her work was
more in line with that of work by Tang (1992), who developed the money ethic scale.
Like Tang, Price’s research was focused less on attitudes, accessing instead a measure of
the fundamental values, or ethic ascribed to money. However, unlike Tang’s money ethic
scale, Price’s work was never empirically evaluated.
Citing minimal research on the meaning of money, and a specific lack of
investigation into the “relevant variables or probable “meanings” of money” (p. 219),
Wernimont and Fitzpatrick (1972) reported seven factors resulting from their analysis.
The authors titled these seven factors as 1) shameful failure, 2) social acceptability, 3)
pooh-pooh attitude, 4) moral evil, 5) comfortable security, 6) social unacceptability, and
7) conservative business values. Of specific interest to the present investigation are the
findings by Wernimont and Fitzpatrick that college students “seem to take a tense,
worrisome, unhappy view of money, yet they tend to downgrade or play down the
importance of it in terms of economic values and to look down on those who do value
money more highly” (p. 225). The authors employed a modified semantic differential in
11 different groups differing in terms of life experiences. Thus, their groups ranged from
college students and trainees, to scientists, technical supervisors, and sales-persons. The
results support a significant difference in the perception of money across biographic

23
lines, but do not investigate specific relationships between money attitudes and other
phenomena (i.e., financial stress).
As relationships between money attitudes and behavior were explored, it became
clear that numerous dimensions, often at times at odds with each other, resided within the
money attitude. Yamauchi and Templer (1982) propose three broad content areas, “(a)
security, which concerns optimism, confidence, comfort, and its reverse, pessimism,
insecurity, and dissatisfaction; (b) retention, which includes parsimony, hoarding, and
obsessive personality traits; and (c) power-prestige, which comprises aspects of status,
importance, superiority, and acquisition” (p. 522). Certainly many of these dimensions
and sub-dimensions were not new in the study of the relationship between money and
human behavior (i.e., Freud, 1908; Fenichel, 1938), but items measuring the constructs
included in one psychometrically evaluated scale for the specific assessment of money
attitude—behavior relationships had not previously been compiled.
Various money personalities have been advanced as the relationships between
money and attitude expanded. From the security, power, love, and freedom constructs
reported in the Goldberg and Lewis (1978) research, the authors suggested a
classification system that attempted to align certain behaviors with these four constructs.
“Security collectors” is the term given to individuals that exhibit a distrust of others
verging on paranoia, and feel lower levels of anxiety as a result of their perception of
independence on people as a result of an increased money supply. Indeed, the authors
suggest for these individuals, “despite any pretense to the contrary, money is more
important to the security collector than people” (p. 120). “Power grabbers” consider

24
money exclusively for its potential as a source of power and strength, feeling that without
it, they would be helpless. “Love dealers” see money as a means of buying, selling,
stealing or trading love, and use it as a defense against interpersonal emotional
commitment. “Autonomy worshipers” are those who “fear dependency and seek to avoid
it by adhering to a life-style based on independence and freedom” (p. 199-200). These
individuals use see money as a foundation of freedom. Finding similar underlying
dimensions, Forman (1987) advances the money personalities of the spendthrift, the
miser, the gambler, the bargain hunter, and the tycoon.
Although college students were not the specific population of interest in
Yamauchi and Templer’s (1982) investigations, the range in age of their sample from 17
to 75 with a mean age of 32 would include the age of the majority of college students. Of
course, as with the earlier study by Wernimont and Fitzpatrick (1972), income was a
significant factor, since most college students would fall into the lower income ranges.
Results reported the extraction of 18 factors, loading into five substantive factors instead
of the three dimensions hypothesized. Their first factor was labeled power-prestige. The
authors suggest individuals who score high on this factor would “hold attitudes that
indicate the importance of status seeking, competition, external recognition, and
acquisition” (p. 523). Individuals scoring high on the second factor, labeled time-
retention suggested an attitude encompassing clear planning, or preparedness behavior.
Their third factor was labeled distrust. Individuals scoring high on this dimension
indicated a clear distrusting attitude in matters regarding their financial practices. The
fourth factor, labeled quality, entailed a fairly one-dimensional construct regarding the

25
value of quality in consumer purchases and the tendency to pay for the higher quality.
Factor five, labeled anxiety, measured the amount of worry or anxiety associated with
money or financial circumstance. This is the first time an empirically evaluated
measurement of the money—attitude relationship identified a dimension of anxiety. This
is of particular interest to the present study, since anxiety and stress will likely be
positively correlated.
Since income may very well be a factor in research involving college students
(Yamauchi & Templer, 1982), note that positive relationships with income were found
for the power-prestige (r = .16), and time-retention (r = .11) dimensions, while negative
relationships with income were found for the distrust (r = -.06) and anxiety (r = -.09)
dimensions. Thus, the four resulting dimensions are essentially independent of income.
Reliability and validity of the Yamauchi and Templer (1982) instrument suggests
a psychometrically sound measure. Twenty-nine items, resulting in the four factors of
Power-Prestige, Retention-Time, Distrust, and Anxiety constitute the final form of the
money attitude scale (MAS). Reliability of the final MAS, as measured by coefficient
alpha, is reported as .77, certainly reasonable given the pioneering nature of their attitude
scale development. Construct validity was accessed through correlation analysis between
their money attitude scale and existing instruments predicted to measure similar
constructs. These include the Machiavellianism scale (Christie & Geis, 1970) measuring
manipulation tendencies in interpersonal interactions was hypothesized to correlate
positively with the power-prestige dimension, the Personality or Anal Character Test
(Klein, 1971) was hypothesized to correlate positively with the time-retention dimension,

26
the State-Trait Anxiety Inventory was hypothesized to correlate positively with the
anxiety dimension, and the Paranoia subscale of Kincannon’s (1968) Mini-Mult was
hypothesized to correlate positively with the distrust dimension.
Following Yamauchi and Templer (1982), the next money attitude scale
developed was the Money Beliefs and Behavior Scale (Furnham, 1984). Attempting to
measure the relationship between money beliefs and behaviors, and measures of social,
work, and demographic characteristics, Furnham identified the six factors of obsession,
power/spending, retention, security/conservative, inadequate, and effort/ability. One
limitation of the study as applicable to the present investigation is that Furnham’s money
attitude scale was developed in Great Britain.
Furnham’s measure was a compilation of previous work on money madness by
Goldberg and Lewis (1978), survey research by Rubinstein (1981), and items from the
money attitude scale developed previously by Yamauchi and Templer (1982). Furnham
reported significant differences in the perception of money in the future between older
and younger respondents. Older individuals displayed higher levels of anxiety and worry
over money, but as Furnham noted, this was perhaps a function of the increases financial
responsibilities older participants had compared to younger participants. Those with more
money were also more concerned with the future. Consistent with findings by Rubinstein
(1981), Furnham found significant differences across political beliefs. Political
conservatives tended to see few constraints on their financial situation, while political
liberals considered the future to pose financial worries. Results from Furnham’s (1984)
study also indicate concern for money was higher among older people, females, those

27
with higher levels of neurosis, and those considered as coming from lower socio-
economic groups.
A fairly new dimension of money attitude not measured or reported by earlier
money attitude research was Furnham’s dimension of effort/ability. This dimension is of
particular interest to the present study because it measures a specific attitude toward the
future acquisition of money. One of the premises of the current investigation is the
perceived transitory nature of the financial circumstances students may have given their
perceived ability to significantly increase their income upon program completion.
One limitation of Furnham’s (1984) study is the lack of psychometric analysis.
No reliability measures were reported for his six scales. Certainly external validity may
pose a problem when using the measurement in other cultures. However, Bailey (1987)
used a modified version of Furnham’s measure and reported only three factors with
acceptable reliability using Cronbach’s alpha. Dimensions of obsession (α = .79),
inadequacy (α = .77), and retention (α = .48) were the three reliable factors reported.
Bailey (1987) notes the differences in the characteristics of his sample compared to
Furnham’s (1984) sample. Bailey’s sample was younger, less affluent, more religious,
better educated, and had a higher proportion of both single participants and fewer
employed. Perhaps most important, unlike Furnham’s (1984) study, all of the participants
in Bailey’s investigation were college students with limited income.
The third money attitude scale identified in the literature is the money ethic scale
developed by Tang (1992), primarily for use within the field of organization behavior.
Citing limitations due to limited representation to broader populations and relatively low

28
correlations between constructs, Tang identified positive attitudes, evil (negative)
attitudes, power, achievement, money management, and self-esteem dimensions. His
hypotheses, clearly defined from previous research, were mostly supported. More
affluent people tended to see money as less evil, and more for its representation of
achievement. Citing Allport, Vernon and Lindzey (1970), Tang suggests “the economic
man is interested in what is useful, whereas the political man is interested primarily in
power” (1992, p. 198). His findings supported this hypothesis; achievement was
positively correlated with economic value, and power and self-esteem were positively
correlated with political values. Lastly, as hypothesized, religious values were negatively
correlated with power and achievement, and positively correlated with the management
of money and evil (negative) attitudes toward money.
Extending his work and attempting to access the validity of the money ethic scale
across cultures, Tang (1993) translated his scale for use in Taiwan. From his study, he
argues that students with happier and less stressful lives were those with lower
expectations of money.
Further extending his investigations across varied cultures, Tang, Furnham, and
Davis (as cited in Furnham and Argyle, 1998), explored the differences in money ethic
between participants in America, Britain, and Taiwan. American workers’ money ethic
was positively correlated with the money management factor, and negatively correlated
with the evil (negative) attitude. Respondents from Great Britain had money ethic scores
suggested a high relationship between money and power. Workers in Taiwan held money
attitudes that correlated positively with the achievement dimension.

29
Financial Practices
Measuring constructs such as attitudes and beliefs, as in the discussion above, has
enjoyed reasonable success, and these have been studied across varied dimensions.
Dimensions of financial strain (anxiety), budgeting and savings/accumulation, obsession,
and power-prestige have all been identified. Other dimensions include security, financial
well-being, inadequacy, distrust, and competency as a consumer. From the obsession
dimension, a potential path to compulsive spending might be traced. Roberts and Jones
(2001) found that the path from the three dimensions of power, anxiety and distrust to
compulsive purchasing behavior was moderated by credit card use, and further advance
financial education as a potential solution to the problems of burgeoning credit debt
among college students.
Relationships between credit attitudes and money attitudes including sub-
dimensions of affective, cognitive, and behavioral attributes (Norvilitis, Szablicki, &
Wilson, 2003; Xiao, Noring, & Anderson, 1995), differences in spending habits related to
credit usage (Hayhoe, Leach, Turner, Bruin, & Lawrence, 2000), relationships between
materialism and credit card use (Pinto, Parente, & Palmer, 2001), relationships between
compulsive buying and credit use and the proliferation of varied financial institution
credit card sponsors within and partnered with the university administration (Roberts &
Jones, 2001), levels of credit card use and numbers of credit cards carried (Hayhoe,
Leach & Turner, 1999; Joo et al., 2003), and money ethic, ethnicity, and credit use by
parents when students were children (Joo et al.,) have all been explored. Numerous trends
have been identified, but since differing variables, both dependent and independent have
30
been measured, a consensus of factors leading to attitudes and practices is difficult to
identify. While most studies found that students overall had favorable attitudes toward
credit cards, research by Joo et al. found that about half of their sample of college
students had limited knowledge of the finance charges and fees assessed by their card
sponsor. The study by Hayhoe et al. (1999), suggests that the unfavorable cognitive
attitude found in their study by students with four or more credit cards may be the result
of having taken a class in personal finance. Age however was a factor for those with
numerous cards (4 or more), thus historical behavior with subsequent consequences may
have an affect on the cognitive attitude of older students who have had credit cards for
longer periods of time, consistent with the Davies and Lea (1995) study. Hayhoe et al.
(2000) found that participating in fewer financial management practices was a significant
factor in the number of credit cards carried by students, and argue that perhaps students
need to feel the stressful consequences of credit abuse before they seek help and
implement good financial practices.
Although age has been found to be a significant factor in some studies, no clear
consensus has been identified with regard to relationships between gender and credit use
or money management practices. Hayhoe et al. (2000) found that for particular purchases
and financial practices, females displayed lower credit card use and better financial
practices, but a clear trend is hard to find. Chen and Volpe (2002) found that males
scored significantly higher on a measure of financial literacy, and further that males
placed a higher value on the financial literacy than did female participants. Gender was
also found significant in the Hayhoe et al. (1999) study. Contrary to other findings with

31
regard to gender, Lim, Teo, and Loo (2003) found men to experience higher levels of
financial stress, in addition to viewing money as a higher power source. The findings also
suggest that those who had experienced financial hardship were more likely to consider
money as a source of power and have a higher external locus of control. This seems
consistent with theory of marriage positions within family economics that indicate men
with higher external locus of control, who value money for the power it represents, tend
to experience higher levels of financial stress given financial hardship. Research by Pinto,
Mansfield, and Parente (2004) may support this, as their findings suggest that perceived
financial well-being is related to a higher internal locus of control.
Pinto et al. (2001) found a significant relationship between credit card attitudes
and a materialism measure, finding that those with higher scores (more materialistic) held
a more favorable attitude toward credit card use. However, the study found no
significance in the relationship between the materialism score and either the number of
credit cards used or the balances carried on the cards. Roberts and Jones (2001) found a
significant relationship between compulsive buying and the use of credit cards, and
present a good case for the inclusion of financial education programs at the high school
level in an attempt to limit the problems associated with credit-abusive and compulsive
purchases. Additional support for financial education can be found in the Chen and Volpe
(2002) study.
Locus of Control
Many students would agree with Ajzen’s (2002) conclusion that “perceived
control over performance of a behavior can account for a considerable variance in

32
intentions and actions” (p. 679). While control over a particular behavior requires an
inspection of the internal and external forces in play that will either advance or hinder
achievement of the behavior, Ajzen makes a strong case for the specific differentiation
between perceived behavioral control and measures of locus of control. Indeed, research
by Kraft, Rise, Sutton, and Roysamb (2005) support Ajzen’s conclusions, and report
negligible differences when the locus of control items are excluded as indicators of
perceived behavioral control. Within the literature on specific money attitudes, Furnham
argues for a measure of locus of control specific to financial behaviors, and advances an
economic locus of control measure. From Fishbein and Ajzen (1976), one conjecture may
be that the reason for the position by Ajzen (2002) and Kraft et al. (2005) is their
measures were not specific to the behavior being measured, which of course is the
position of Furnham.
Financial education may be of little value if personal responsibility is not
included. Attribution of responsibility, often measured as a locus of control, has been
studied extensively, generally (Rotter, 1966; Weiner, 1986) and with specific focus on
stress, academic performance, and credit usage and attitudes. Davis and Davis (1972)
found that while both internals and externals take credit for success, only internals tended
to take personal responsibility for failures. Brewin and Shapiro (1984) argue that the
differences in accepting responsibility for failures between internals and externals suggest
the need to distinguish between locus of control for positive and negative outcomes,
rather than as on one continuum. As does Furnham (1986), Brewin and Shapiro (1984)
contend that the traditional locus of control measure should not be used to measure an

33
individual’s responsibility for poor financial habits such as high credit card debt, and any
potential financial stress resulting from these habits. Furnham’s (1986) investigation of
the relationship between the locus of control concept and economic behavior is perhaps
the most significant to the present investigation. Citing research in organizational
behavior using generalized locus of control scales (Rotter, 1966), Furnham contends
these traditional locus of control measures are not situation specific, and suggests an
economic locus of control measure is better suited to the situation specific behaviors of
purchasing, saving, and investment behaviors.
Bernardi (1997) found a significant relationship between perceived stress and
self-control. Although the participants within the study were entry-level workers in the
accounting profession and out of school, the relative age similarities should allow for
generalization to college students. As in the Bojuwoye (2002) study, the Bernardi study
found gender to have a significant positive relationship to college stress, with females
relating the stress they had perceived in college higher than males had. The study
explored the relationships between stress, self-control, and higher achievement. Crocker
and Luhtanen (2003) studied freshmen students specifically, finding low self-esteem did
not predict financial problems or academic difficulties. Their findings suggest that
students whose self-esteem is contingent on academics actually experienced higher
financial stress. This may the natural result of paying more attention to academics and
less to income-producing activities, but the amount of perceived control the student feels
over academics would very likely exceed the amount of perceived control they feel over
their finances.

34
Norvilitis et al. (2003) found no direct relationship between debt ratios and self-
control. The research did however suggest that perceived financial well-being is related
to a more internal locus of control. In a similar study of college students, Pinto et al.
(2004) found no relationship between self-control and credit usage. The lack of
significant findings in both studies may be due to the increased feeling of empowerment
and self esteem during college years (Pascarella & Terenzini, 1991).
Financial Stress
One potential result of an individual college student’s money attitudes and
perceptions of control over their money are financial behaviors leading to increased
levels of financial stress and strain. Although not generally recognized as a specific
problem, financial stress has a tremendous affect on life. Financial stress has been shown
to be a major component of overall stress. Bailey, Woodiel, Turner, and Young (1998)
investigated the relationship between financial stress and overall stress, and found
significant positive correlation between financial stress and overall stress. In their study,
perceptions of low personal financial security were significantly related to all of the
factors making up the personal stress scale. Davies and Lea (1995) found that many of
the students exhibiting financial stress as a result of high debt loads felt the stress would
be temporary and controllable, for the most part being eliminated when post-education
employment opportunities were realized. Norvilitis, Szablicki, and Wilson (2003) found
that students in their study did not see debt as a long-term stressor event, suggesting, “it is
possible that most students in financial trouble view money as just one circumscribed
area of life” (p. 943). It would seem from both of these studies that students consider the

35
stress related to high debt levels as transitory, and easily remedied upon completion of
the education and the ability to pay down debt from employment.
The perception that debt loads and financial problems are transitory, and simply
another reality of college life imply many students may view the opportunity cost of debt
today, and the resulting increased stress and strain, as part of the path to the benefits that
will result in employment opportunities tomorrow. Indeed, the discussions on money
attitudes and financial practices above suggest many students do not recognize the full
range of costs of their college-experience financial behaviors. The irrational use of
money dimensions suggested by Goldberg and Lewis (1978), combined with the credit
attitudes and practices of students (Davies & Lea, 1995; Hayhoe et al., 1999; Joo et al.,
2003) would seem to support the acceptance of both financial difficulties and the
resulting stress and strain identified by Norvilitis, Szablicki, and Wilson (2003).
Other studies of financial stress (Bojuwoye, 2002; Dickinson, 1996; Kim &
Garman, 2003; Kim & Garman, 2004) all support a significant inverse relationship
between financial stress and varying measures of well being, although neither of the Kim
and Garman studies included college students as participants or respondents. Bojuwoye
(2002) sampled students randomly in eight universities in South Africa. Financial
difficulties and/or lack of financial support were rated highest of the stress induced
factors in four of the five schools. Although not specific to college students, researchers
of consumer credit counseling clients (Garman et al., 1999) revealed that financial stress
was responsible for poor sleep patterns in almost 80% of the sample. Sixty-five percent
36
of the sample reported eating habit changes and 10% reported an increase in alcohol
consumption.
Financial stress has been shown to have a detrimental impact on academic
performance (Anderson & Cole, 1988) and overall well being (Bojuwoye, 2002;
Dickinson, 1996). This may be a significant factor in the length of time required to
complete the educational program since employment opportunities often interfere with
class schedules and pose time constraints.
Although the early research by Trueblood (1957) suggests otherwise, subsequent
studies have found an inverse relationship between employment hours worked and
academic performance (Anderson & Cole, 1988; Devadoss & Foltz, 1996; Stewart, Lam,
Betson, Wong, & Wong, 1999; Gavala & Flett, 2005). Additionally, the Gavala and Flett
study found that the student’s total stress score could account for 43% of the variability in
well being. Finding stress as a strong predictor of well being, and threading this through
comfort within the university environment as a strong predictor of academic
enjoyment/motivation leading to academic performance, the authors argue for the
implementation of stress management programs to help reduce stress and thereby
increase academic performance. Stewart et al. (1999) found “subtle indicators” (p. 249)
that effective stress management can positively affect academic performance.
As found in research by Devadoss and Foltz (1996) and Anderson and Cole
(1988), academic performance is significantly influenced by class attendance. Thus,
missing class either as a result of poor health (perhaps a result of financial stress) or
employment responsibilities (almost certainly a result of financial stress) contributes to

37
reduced academic performance. Financial stress has been linked to health problems.
Skinner, Zautra, and Reich (2004) found increased levels of financial stress to be a
significant predictor of health declines in arthritis patients. In an earlier study by Fox and
Chancey (1998), the authors argue that increased financial stress significantly contributes
to poor physical health, conflict within families, marital dissolution, psychological
distress, and decreased self-satisfaction.
Whether or not the assertion of Henry, Weber, and Yarbrough (2001) that
“university students are vulnerable to financial crisis” (p. 246) may be applied to all
college students, certainly students face increasing financial pressures and difficulties
resulting in varying levels of financial stress.
Cultural Differences
Barajas (2003) identifies 10 barriers he suggests act as culturally derived
constraints on financial success.
1. The Patron-Peon system: Depending on others to take care of you.
2. Mattress and mayonnaise jars: Storing rather than investing money.
3. Mi Compadre: Consulting (non) experts.
4. Business on a handshake: The trap of informality.
5. Machismo: More ego can mean less money.
6. Don’t be a crab: Scarcity and abundance.
7. Fatalism: A divine excuse for doing nothing.
8. The lotto mentality: Getting something for nothing.
9. The Mañana syndrome: The pain of procrastination.

38
10. Pobrecito Me: Conflicting beliefs and attitudes about money.
Although the argument can certainly be made that some of these barriers, for
instance “the lotto mentality: getting something for nothing” (p.81) apply to people from
a wide variety of cultures, other barriers tend to “sabotage ourselves—with our beliefs
about money, our abilities, and what’s possible an impossible for us” (p. 8). Literature on
the money attitudes and habit of Latinos, specifically those of Mexican American
heritage support a number of these barriers. Acknowledging that the sample of Mexican
American participants with their study would perhaps not generalize to the Mexican
American population in general, Medina, Saegert, and Gresham (1996) found significant
support for the mañana syndrome with regard to money practices. From their results, the
authors suggest Mexican American individuals tended to use credit cards and personal
debt to provide for immediate needs at the expense of long term planning. The authors
assert Mexican American individuals “are less likely to engage in behaviors involving
medium-to long-term personal gain – savings, investing, and speculating with money – at
the expense of present consumption. Consistent with findings by Barajas (2003), Medina
et al. argue Mexican Americans have a lower propensity to engage in long-term financial
planning.
Medina et al. (1996) used a modified version of Yamauchi and Templer’s (1982)
money attitude scale, suggesting the modification resulted in a considerable increase in
the amount of variance explained by the four subscales of power/prestige, retention/time,
distrust/anxiety, and quality. From a sample of former students of a southwestern
university with a large Mexican American population, no significant differences were

39
found in demographic variables of income, gender, or age between the Mexican
American and Anglo American groups. Education, found by Furnham (1984) to be a
moderating variable in money attitudes, was not measured since the entire sample was
college educated. Although response bias was considered a potential problem due to a
response rate of 16.5%, it was argued that the similar response ratios between both the
Mexican American and Anglo American groups moderated this problem. Medina et al.
modified Yamauchi and Templer’s (1992) original money attitude scale by collapsing the
third construct (distrust) with the fifth construct (anxiety) into a single dimension. The
resulting reliability measures, as reported by Cronbach’s alpha, ranged from .79 to .83,
suggesting a fairly good reliability.
Mirowsky and Ross (1984) measured the previously asserted tendency of
Mexicans and Mexican Americans to believe in external control (i.e., Madsen, 1973).
Mirowsky and Ross found significant differences in the perception of external control
between Mexican American and Anglo American participants. They further noted
income and poverty levels accounted for very little in the variance, arguing that little of
the increased tendencies of external locus of control in Mexican American individuals
can be ascribed to poverty. This is consistent with later findings by Barajas (2003), who
argues the Latino culture advocates the fatalistic lack of control over one’s own life and
finances.
Rabow and Rodriguez (1993) measured differences in money attitudes, money
education, and financial practices among Mexican American sibling-pair (sister-brother)
students whose parents had been born in Mexico. Their findings suggest no differences in

40
the amount of education concerning money the parents had provided, nor any significant
differences in the perception of money and its value between siblings. This seems to
argue for a cultural factor in view of findings by Chen and Volpe (2002) indicating a
significant higher level of financial literacy for males in a study of American college
students, and the Hayhoe et al. (2000) finding of no significant differences in credit card
practices between male and female American college students.
Quintana, Vogel, and Ybarra (1991) found 20 years of research indicated Latino
students displayed higher levels of financial stress than did Anglo students during their
college years. Financial issues included student loan repayment, ability of their parents to
provide financial support, and availability and qualification for financial aid. The latter
two suggest the potential for these students to seek employment provided income
sources. Quintana et al. (1991) found gender to be significant in their meta-analysis,
citing Latina females reported higher levels of stress, a finding supported by later
research by Bernardi (1997) and Bojuwoye (2002).
The discussion above suggests culture may play a significant role in the money
attitudes, financial practices, and financial stress levels among college students.
Additionally, fatalistic money attitudes (Barajas, 2003; Mirowsky & Ross, 1984) may
impede the perceived behavioral control influence of Ajzen’s (1985) theory of planned
behavior model, or the motivation and opportunity components of Fazio’s (1990) MODE
model. Indeed, beliefs in external locus of control may certainly have a detrimental affect
on the deliberative, reasoned process of behavior choice.

41
Summary
The literature review suggests a number of issues facing individuals with regard
to their financial lives. College students in particular must deal with reduced income, the
expansion of consumerism and the culture of credit (Muldrew, 1998), rapidly escalating
costs of education, and a distinct lack of financial education programs available to them
in high school (Harr, 2000).
Clearly the interactions between financial stress, money attitudes, and economic
locus of control have a significant impact on college students. Identifying these
relationships may provide insight into the money attitudes and behaviors of college
students, and assist with the development of an effective tool to help students overcome
many of the financial problems they face.

42
CHAPTER III
METHODS AND PROCEDURES
The purpose of this research was to identify money attitudes, perceived economic
locus of control, and dimensions of financial strain among college students in two
southwestern United States universities. Matriculation periods for many students to
complete a bachelor’s degree are six years (Adelman, 2006). A number of states and
institutions have developed and implemented programs designed to offer financial
incentives with the hope of motivating students to increase their class load to a level
sufficient to complete their bachelor’s degree within four years. In consideration of the
numerous financial issues and difficulties many students may face as a result of the
reduction in income due to increased class loads, some type of assistance program may
need to be developed.
This chapter explains the methods and procedures that were used in this research.
Survey procedures, sample selection, instrumentation, data collection strategies, and
analytical procedures are discussed.
Survey Procedures
Approval from the Institutional Review Boards of Texas Tech University and
New Mexico Highlands University was requested in Spring 2006 and obtained under
exempt status before survey administration. See Appendix A for the Human Subjects
Protocol.
Consistent with the research objectives, only currently enrolled college students
were surveyed. The literature suggests culturally defined differences in all three variables

43
of interest, thus two universities were surveyed. One university, New Mexico Highlands
University, a Hispanic Serving Institution (HIS) in northern New Mexico was surveyed
to ensure a sufficiently large sample of Mexican American participants. The other
university, Texas Tech, is a predominantly Anglo institution in west-central Texas.
Sample Selection
The data were collected through an Internet survey (see Appendix B) as
recommended by Nesbary (2000) during the last two weeks of April 2006. The
instrument was developed using survey software that facilitates web-based survey
research. The link to the survey site was given to professors at New Mexico Highlands
University for administration to students within the School of Business, and to professors
at Texas Tech University for administration to students within the College of Human
Sciences. Teachers were asked to tell students participation was voluntary, and they could
drop out of the survey at any time. No personally identifying information was obtained
through the survey. Colleges and classes from both universities were selected based on
convenience. The student gave informed consent when they clicked on the link to
participate. Extra credit for participation may have been awarded by some faculty as an
incentive to participate.
The following research questions were investigated:
1. In a population of college students with different income levels, is there a
statistically significant mean attitudinal difference among groups by
gender, class level, and culture as these relate to perceptions of economic
locus of control?
44
2. In a population of college students with different income levels, is there a
statistically significant mean attitudinal difference among groups by
gender, class level, and culture as these relate to financial strain?
3. In a population of college students with different income levels, is there a
statistically significant mean attitudinal difference among groups by
gender, class level, and culture as these relate to money attitudes?
Instrumentation
Money attitudes were measured using Yamauchi and Templer’s (1982) money
attitude scale (MAS). Although Furnham’s (1984) money beliefs and behavior scale
(MBBS) appears more comprehensive, problems with psychometric attributes and cross-
cultural issues persist (Bailey, 1987; Yang & Lester, 2002). Additionally, Tang’s (1992)
money ethic scale (MES) does not include an “anxiety” dimension identified in
Yamauchi and Templer’s (1982) work.
As noted previously, reliability and validity of the Yamauchi and Templer (1982)
instrument suggest a psychometrically sound measure. Reliability of the final scale, as
measured by coefficient alpha, was reported as .77. Reliability coefficients for the four
factors of the final MAS; Power-Prestige, Retention-Time, Distrust, and Anxiety were
reported as .80, .78, .73, and .69 respectively. Construct validity was accessed through
correlation analysis between the MAS and existing instruments predicted to measure
similar constructs. Test-retest reliability was assessed through the administration of the
final form of the MAS on two occasions five weeks apart. The test-retest reliability
coefficient for the total score was reported as .88. Coefficients of the test-retest reliability

45
for the four factors of the final form of the MAS were reported as .95, .92, .87, and .88
respectively. Thus the measurement has good reliability. For this study, the 29 items of
the MAS were measured on a continuous, five-point strongly disagree to strongly agree
Likert-type scale.
The Financial Strain Survey (FSS) developed and tested for psychometric
qualities by Aldana and Liljenquist (1998) was used to assess financial strain. Items were
measured on a continuous, five-point never to always Likert-type scale. Reliability for the
FSS (Aldana & Liljenquist) was reported based on Cronbach’s alpha. The FSS resulted in
five factors:
1. Education (α = .62) assessed a general feeling of financial knowledge, and
the specific knowledge of how interest applies to credit cards.
2. Relationships (α = .87) assessed the influence of financial practices on
interpersonal relationships.
3. Physical (α = .89) assessed the influence of financial worries and stress on
sleep, muscle pain, headaches, and heartburn.
4. Credit Card Use (α = .82) assessed credit card purchase and payment
practices.
5. Meeting obligations (α = .87) assessed the respondents’ ability to pay bills
on time.
Reliability coefficients suggest the subscales of the measurement reliably assess the
construct.
Aldana and Liljenquist (1998) utilized a number of validity tools. Predictive

46
validity was established through the use of discriminant analysis (Field, 2005). With the
exception of the education factor, the two groups used in their research (consumer credit
counseling clients and a control group) scored significantly different values for each of
the other four dimensions, in addition to scoring significantly different total strain scores.
A comparison of debt to income ratios for the two groups assessed concurrent validity.
The authors reported significant differences between groups in the debt to income ratios.
Credit counseling clients had statistically significant higher debt to income ratios as well
in addition to their higher overall financial strain scores.
Research indicating the lack of significant influence on attitudes from broad locus
of control measures (Ajzen, 2002; Kraft et al., 2005) suggests the use of a situation-
specific measurement such as Furnham’s (1986) Economic Locus of Control Scale
(ELCS). Considering the influence on both intentions and intention-driven behavior from
perceived behavioral control, it seems clear some form of individually attributive
influence should be considered (Ajzen, 1985, 1987). Citing results from research in the
application of locus of control to organizational behavior, Furnham (1986) summarizes
by suggesting “the more a person is orientated toward internal control, the more he or she
will feel that his/her performance will lead to desired outcomes, while the more he is
orientated to external control, the less likely he or she is to have high performance-to-
outcome expectancy” (p. 31). From this, Furnham developed a situation-specific
measurement of internal-external control over financial issues. This scale was used
toward an assessment of perceived control over money matters among college students.
Psychometric properties for the scale suggest a valid and reliable instrument.

47
Giving the 40-item instrument to ten people, one week apart assessed test-retest
reliability. A reliability coefficient of .86 was recorded. Reliability of the full instrument
was assessed by Cronbach’s alpha. Furnham (1986) reports an alpha coefficient of .78 for
the whole scale.
As an assessment of validity, Furnham used correlation analysis between the
ELCS and Rotter’s original (1966) locus of control measurement. Rotter’s (1966) internal
locus of control beliefs showed significant positive correlation with Furnham’s (1986)
ELCS measurement, but negatively with beliefs that powerful others controlled economic
status. Of the 40 items, 22 items resulted in four factors, defined by Furnham as an
internal dimension, a chance dimension, an external/denial dimension, and a powerful
others dimension. For this study, economic locus of control (ELCS) was measured on a
continuous, five-point strongly disagree to strongly agree Likert-type scale.
The review of literature suggests gender, age, and culture may all be significant
variables in the assessment of financial stress, differing money attitudes, and differing
perceptions of control over the financial circumstances students have. Therefore,
measures of demographic characteristics were also included. A recent study (Hayes,
2005) suggests college students experience increasing levels of financial strain as they
advance through class years. Additional questions regarding the student’s satisfaction
with their current standard of living, and perceptions of frequency, adequacy, and
dependability of income were included as additional attitudinal measures. Including these
factors in this study adds to the body of literature with regard to college students
specifically.

48
Original survey questions (see appendix B) were randomly ordered prior to
administration to help control for acquiescence and pattern. The survey was then
administered to eight graduate students and four faculty members of Texas Tech
University as a pilot test before it was posted to the website for student participation.
Recommendations from pilot study participants regarding clarification of items and
instructions were accepted, and the survey was modified prior to administration to
students. The final survey consisted of 88 questions and took approximately 30 minutes
to complete.
Variables in the Study
The dependent variables for this research were developed through the creation of
a summed score for each of the subscales from the three major scales used: Money
Attitude Scale (MAS), Economic Locus of Control Scale (ELCS), and the Financial
Strain Scale (FSS). Independent variables included cultural identification, class level, and
gender. A monthly expenses variable, as a proxy for income, was used as a covariate.
Data Analysis Procedures
This research entailed a causal comparative study. In addition to descriptive
analysis procedures, multivariate analysis of covariance (MANCOVA) procedures within
a related factorial design were used to determine cultural, class level, and gender
differences among the dependent variable subscales measuring money attitudes,
economic locus of control, and financial stress among college students. The multivariate
analysis of covariance is appropriate because a student’s income level, as measured by
49
monthly expenses, may act as a confounding variable and no random assignment to
groups has been used. One limitation of the procedure is that the groups may differ as a
result of influence from other factors not measured, in addition to the influence of the
monthly expenses covariate.
In an effort to minimize Type I error and provide a multivariate analysis of effects
through considering the correlation between subscales of each of the three main
measurement scales while controlling for the affects of varying income levels, the
MANCOVA examines the main effects of the three factors on the various subscales, and
any interaction effects of the factors on the dependent variables. The multivariate analysis
of variance can detect when groups differ across interrelationships between variables
(Huberty & Morris, 1989). Analyzed within multiple univariate procedures, dependent
variables may not reveal differences across the groups. Analyzed as a system defining
different constructs, differences within the groups as a result of the factors may be
evident. Requirements for multivariate analysis of covariance, specifically multivariate
normality, homogeneity of the covariance matrices, independence of observations, and
absence of multicollinearity among the dependent variables were all examined.
Discriminant analysis was used as a follow up given significant MANCOVA’s.
Since the use of the multiple ANCOVA’s as a follow up procedure does not account for
the relationship between the sub constructs (dependent variables) of each scale analysis,
discriminant analysis was used to find the linear combination of the dependent variables
that best separated the groups (Field, 2005).
50
Mathematically, there is no difference between multivariate analysis of variance
and discriminant analysis. Using univariate procedures as a follow up to a significant
omnibus F from a multivariate design can not account for differences based on some
linear combination of the sub dimensions. Discriminant analysis preserves this
relationship, and seeks the best linear combination that discriminates significant factor
groups. Discriminant analysis procedures using categorical variables as the dependent
variable produce results similar to multiple regression procedures used when dependent
variables are continuous. The significant independent (categorical) variable from the
MANCOVA procedure becomes the dependent variable in the discriminant analysis
procedure. The sub dimensions of the scale form a linear function, with beta coefficients
indicating the strength of the sub dimension’s power to separate the groups of the
dependent variable.
Summary
This chapter provided a description of the sample origin, instrumentation, and
methods and procedures of this study. A causal comparative study was employed to help
develop a clearer understanding of college students’ money attitudes, perceived economic
control beliefs, and financial strain. Using monthly expenses as a proxy for income as the
covariate, multivariate analysis of covariance procedures were conducted to determine
attitudinal and perception differences among different cultural, class level, and gender
groups as these relate to the various subscales of the Money Attitude Scale, Economic
Locus of Control Scale, and Financial Strain Scale.

51
CHAPTER IV
RESULTS
This chapter reports the findings of the research. The data from this study were
used in the investigation of money attitudes, perceptions of economic locus of control,
and financial strain among a sample of college students. The following sections will be
used to report the results: (a) sample demographics of continuous variables, categorical
variables, and the three factors used in the MANCOVA analysis, (b) analysis of the sub
dimensions representing the Money Attitude Scale, the Economic Locus of Control
Scale, and the Financial Strain Scale, (c) analysis of the research questions, and (d)
ancillary questions.
Sample Demographics
Descriptive statistics were used to describe the sample. A total of 260 students
from Texas Tech University (TTU) and New Mexico Highlands University (NMHU)
completed the web survey over a two-week period during the end of April 2006. Seven
participants from TTU and three from NMHU were deleted since they were graduate
students and outside the interest of this research. Due to the significant interference of
outliers within the covariate variable in multivariate analysis of covariance (Tabachnick
& Fidel, 2001), 16 extreme outliers within the monthly expenses variable were deleted.
The resulting sample included 49 students from NMHU and 185 students from TTU, for
a total of 234 students. Tables 4.1 – 4.3 describe the characteristics of the final sample
used for analysis.

52
As described in Table 4.1, the data suggest the typical respondent was about 22
years old, took between four and five classes during spring and fall semesters, worked
less than 20 hours each week including work study, and had slightly better than a 3.0
grade point average. Table 4.3 identifies additional characteristics of the sample. Of the
total sample, 79 % were from Texas Tech. The data are skewed with regard to both
gender (66.7% female) and class rank (only 9% freshman). Two-thirds of the sample
identified their culture as Anglo American, while about 18% identified with the Mexican
American or other Latino / Latina culture.
As shown in table 4.2, a little more than half of the students surveyed indicated
they could only afford some of the things they want, but not all. Almost 18% of the
sample indicated they are only able to meet necessities, and a little more than 6% either
feel they can afford everything they want with money left over or feel their income is not
adequate at all.
Table 4.1. Continuous variable demographics.
Variable N Min Max Mean SDAge 234 18 56 22.46 5.75GPA 234 1.2 4 3.14 0.49Current semester hours 234 6 23 14.4 2.78Last semester hours 234 0 21 13.8 3.62Hours worked 234 0 60 17.33 14.01Monthly expenses 234 75 2870 822.76 497.7

53
Table 4.2. Categorical variable demographics.
Variable Categories n N %School attended TTU 185 234 79.1
NMHU 49 20.9
First generation college student Yes 86 234 36.8No 148 63.2
TTU students aware of the Aware 123 181 68Graduate on Time program Not aware 58 32
TTU students participating Participant 30 180 16.7in the Graduate on Time program Non-participant 150 83.3
NMHU students participating Participant 16 48 33.3in the education lottery Non-participant 32 66.7
Adequacy of income Afford everything 15 234 6.4Afford about everything 41 17.5Afford only some things 123 52.6Meet necessities only 41 17.5Not adequate at all 14 6
Lifestyle compared to peers now Worse 21 234 9Same 128 54.7Better 85 36.3
Lifestyle compared to parents now Worse 87 234 37.2Same 101 43.2Better 46 19.7
Reduced class load to work more Yes 44 234 18.8No 190 81.2
Dropped out to work more Yes 15 234 6.4No 219 93.6

54
Table 4.3. Factor demographics.
Table 4.4 identifies those variables with significant differences between the two
schools. The data indicate the average age of students at New Mexico Highlands
University is older by about six years, t(232) = 6.98, p < .001, with a slightly higher GPA
t(232) = 2.24, p = .026. Additionally, first generation college students, students with
neither parent having graduated from college, are more likely to attend NMHU (71.4%
compared to 27.5% at TTU), chi-square(1) = 32.06, p < .001, and as expected the
population from NMHU has a significantly higher proportion of students who identified
with the Mexican American and Latino / Latina cultures, chi-square(6) = 112.23, p <
.001.
Variable Categories n N %Gender Female 156 234 66.7
Male 78 33.3
Culture Mexican American 27 234 11.5Other Latino / Latina 15 6.4African American 7 3Anglo American 156 66.7American Indian 8 3.4Asian 5 2.1Other non-white 16 6.8
Class rank Freshman 21 234 9Sophomore 57 24.4Junior 76 32.5Senior 80 34.2

55
Table 4.4. Variables with significant differences between schools.
Analysis of the Sub Dimensions of the Three Major Scales
The reliability coefficients and descriptive statistics for the three major scales and
the sub dimensions of each are detailed in Table 4.5. Where available, reliability
coefficients have been provided within the table for comparison purposes. For example,
Furnham (1986, 2002) did not report reliability coefficients for the sub dimensions of the
Economic Locus of Control Scale, and no reliability coefficient for the total Financial
Strain Scale was reported by Aldana and Liljenquist (1998).
Mean MeanVariable TTU NMHU t df sig.Age 21.23 27.1 6.98 232 <.001GPA 3.1 3.28 2.24 232 0.026Monthly expenses 858 689 -2.129 232 0.034
Frequency FrequencyVariable TTU NMHU chi -square df sig.
1st generation college student 51 / 185 35 / 49 32.06 1 <.001Culture 112.23 6 <.001
Mexican American 9 / 185 18 / 49Other Latino / Latina 3 / 185 12 / 49African American 6 / 185 1 / 49Anglo American 148 / 185 8 / 49American Indian 1 / 185 7 / 49Asian 5 / 185 0 / 49Other non-White 13 / 185 3 / 49

56
Table 4.5. Reliability and descriptive statistics.
All questions were measured on a scale of 1 – 5. For instance, the credit card use
dimension of the Financial Strain Scale would measure from 3 – 15. A mean value of
4.94 might be considered low compared to the 10.96 average score on the Education
dimension measured on the same 3 – 15 scale. Reliability coefficients for the sample are
very similar to the coefficients reported by the scale developers. With the exception of
the External-Denial and Chance dimensions of the Economic Locus of Control Scale,
reliability coefficients for the sample are all .64 and above.
Sample OriginalCronbach's Cronbach's Dimension
N=234 Mean SD Alpha Alpha itemsMoney Attitudes 0.82 0.77 29
Power-Prestige 19.07 6.21 0.85 0.81 9Retention-Time 21.47 4.51 0.76 0.78 7
Distrust 21.27 4.33 0.74 0.73 7Anxiety 18.64 4.07 0.69 0.69 6
Economic Locus of Control 0.75 0.78 22Internal 27.01 3.11 0.64 n/a 7
External-Denial 12.12 2.81 0.58 n/a 5Chance 13.93 3.21 0.62 n/a 6
Powerful-Others 10.77 2.63 0.75 n/a 4
Financial Strain 0.88 n/a 18Education 10.96 2.31 0.78 0.62 3
Relationships 8.52 3.01 0.81 0.87 4Physical 8.07 3.41 0.84 0.89 4
Credit Card Use 4.94 2.34 0.79 0.82 3Meeting Obligations 7.01 3.42 0.89 0.87 4

57
Correlation analysis is required due to the use of sub-scales measuring different
dimensions of the three major scales. Given the use of multivariate analysis of covariance
to answer the primary research questions, some correlation between the sub dimensions is
expected. And while some correlation is not a significant problem, correlations above .5
(note the correlations of the Financial Strain Scale dimensions) indicate a potential
limitation of the procedures using this data. Correlations between the various sub-
dimensions of each scale are listed in Table 4.6. Significance is determined at either the
.01 level or the .05 level.
Table 4.6. Scale dimension correlations.
Money Attitudes PP RT D APower Prestige 1 0.02 .28** .42**Retention Time - 1 0.11 -.14*
Distrust - - 1 .42**Anxiety - - - 1
Economic Locus of Control I ED C POInternal 1 0.12 -.16* .14*
External Denial - 1 .44** .39**Chance - - 1 .52**
Powerful Others - - - 1
Financial Strain E R P CCU MOEducation 1 -.14* -.16* -.12 -.24**
Relationships - 1 .63** .59** .48**Physical - - 1 .57** .60**
Credit Card Use - - - 1 .64**Meeting Obligations - - - - 1
N=234 for all correlations** Significant at the .01 level
* Significant at the .05 level
58
Analysis of the Research Questions
The research questions for this study focused on differences in Money Attitudes,
Economic Locus of Control, and Financial Strain across the factors of culture, gender,
and class rank in a sample of college students from two universities. A factorial
multivariate analysis of covariance (MANCOVA) procedure was employed using
monthly expenses as a covariate, factors including gender, culture, and class rank, and
dependent variables of the sub dimensions of the major scales. Due to the final sample
size (N = 234) and minimum cell size requirements, the culture variable was recoded into
three categories; 1) those of the Mexican American and Latino / Latina culture, 2) those
of the Anglo American culture, and 3) those of other non-White cultures. As a result of
the unequal group sizes in all three factors, Pillai’s Trace test statistic is used. The first
research question is related to perceptions of economic locus of control:
1. In a population of college students with different income levels, is there a
statistically significant mean attitudinal difference among groups by
gender, class level, and culture as these relate to perceptions of economic
locus of control?
Table 4.7 describes the findings of the omnibus F of the MANCOVA analysis for
the dimensions of the Economic Locus of Control Scale. Only gender, F(4, 207) = 2.61, p
= .036, and the interaction between culture and class rank, F(24, 840) = 1.57, p = .04,
were found significant. Box’s Test indicates the homogeneity of variance condition was
not met in this analysis, F(140, 4216.95) = 1.25, p < .03. Levene’s Test of equality of
error variance for the individual sub dimensions are as follows:

59
Internal dimension: F(22, 211) = 1.77 p = .02
Chance dimension: F(22, 211) = 1.51 p < .001
External Denial dimension: F(22, 211) = 1.17 p = .331
Powerful Others dimension: F(22, 211) = 1.00 p = .472
Table 4.7. Economic Locus of Control Scale MANCOVA.
The follow up discriminant analysis procedure, summarized in Table 4.8,
indicates all dimensions of the Economic Locus of Control Scale discriminate by gender.
The tests of equality of group means for the four dimensions all result in significant
differences, all with p values of .031 or less. Wilks’ Lambda describes the strength of the
discriminating power of the dimension; lower values suggesting a higher ability to
Factor: Gender Female Male PartialDimension n = 156 n = 78 F p Eta sq.
Economic Locus of Control 62.86 65.98 2.61 0.036 0.048Internal 26.66 28.5 7.93 0.005 0.036Chance 14.06 13.9 0.147 0.702 0.001
External Denial 11.99 12.31 0.166 0.684 0.001Powerful Others 10.15 11.27 3.32 0.07 0.016
Interaction Culture * Class --- --- 1.57 0.04 0.043
Non-significant factorsMonthly expenses --- --- 0.212 0.931 0.004
Culture --- --- 1.72 0.092 0.032Class --- --- 1.1 0.419 0.019
Culture * Gender --- --- 0.896 0.52 0.017Gender * Class --- --- 1.12 0.344 0.021
Culture * Gender * Class --- --- 1.44 0.095 0.034

60
discriminate between gender groups. The structure matrix (values increase as power
increases), which accounts for collinearity between dimensions, indicates the Powerful
Others dimension has the most discriminating power, followed by the External Denial,
Chance and Internal locus dimensions.
Table 4.8. Discriminant analysis, Economic Locus of Control Scale and Gender.
The classification function coefficients indicate females perceive levels of
influence over their money matters from all dimensions. Compared to male students,
female students tend to feel less personal control over positive outcomes, perceive
uncontrollable chance as less influential on their financial circumstances, and consider
poverty more real and controllable.
This analysis suggests that the function of the four dimensions correctly classifies
Test of equality of group means.Wilks'
Dimension Lambda F df1 df2Internal 0.98 4.72 1 232Chance 0.979 5.02 1 232
External Denial 0.964 8.74 1 232Powerful Others 0.958 10.06 1 232
Structure Matrix Classification function coefficientsDimension Female Male
Internal 0.523 Internal 3.15 3.24Chance 0.539 Chance 1.86 1.9
External Denial 0.711 External Denial 0.33 0.41Powerful others 0.763 Powerful others -0.15 -0.05
(Constant) -56.49 -61.62

61
females 96.2% of the time, but misclassifies males 14.1% of the time, resulting in an
overall classification of about 68.8%. Other significant differences within the Powerful
Others dimension result from the interaction between the cultural factor and the class
rank factor. As reported in Table 4.9, this suggests there is a linear combination that
produces significant differences when interaction effects between the factors of class rank
and culture occur.
For freshmen, the data suggest differences in the Powerful Others dimension
across culture and class levels. The strength of the influence of the Powerful Others
dimension found in the discriminant analysis is supported through inspection of the
interaction effect. Freshman students indicate a significantly lower influence over their
money matters from Powerful Others within the Anglo American and Other non-white
cultures, while freshman students from the Mexican American, Latino / Latina culture
exhibit a surprisingly high influence over their money matters from Powerful Others.

62
Table 4.9. Interaction of cultural and class rank factors.
The second research question is related to levels of financial strain:
2. In a population of college students with different income levels, is there a
statistically significant mean attitudinal difference among groups by
gender, class level, and culture as these relate to financial strain?
Gender is the only factor that shows significant differences, F(5, 206) = 4.45, p =
.001. Table 4.10 describes the findings of the omnibus F of the MANCOVA analysis for
the dimensions of the Financial Strain Scale. Box’s Test indicates the homogeneity of
variance condition is not met in this analysis, F(180, 4752.40) = 1.49, p < .001. Levene’s
Test of equality of error variance for the individual sub dimensions are as follows:
PartialDimension Culture Class rank Mean F p Eta sq.Powerful Others Mexican Amerian
Latino / Latina Freshman 12.83 2.726 0.014 0.072Sophomore 9.72 " " "Junior 10.37 " " "Senior 11.03 " " "
AngloAmerican Freshman 10.59 " " "
Sophomore 11.37 " " "Junior 10.9 " " "Senior 10.85 " " "
Othe nonWhite Freshman 6.93 " " "
Sophomore 9.24 " " "Junior 11.5 " " "Senior 12.43 " " "

63
Education dimension: F(22, 211) = 1.19 p = .262
Relationships dimension: F(22, 211) = 2.01 p < .01
Physical dimension: F(22, 211) = 1.82 p = .016
Credit Card Use dimension: F(22, 211) = 1.31 p = .168
Meeting Obligations dimension: F(22, 211) = 1.68 p = .033
Table 4.10. Financial Strain Scale Mancova.
Discriminant analysis for the gender group and the five dimensions of the
Financial Strain Scale indicate a significant difference in the Relationships, Education,
and Meeting Obligations dimensions. Table 4.11 summarizes the output. The dimensions
Factor: Gender Female Male PartialDimension n = 156 n = 78 F p Eta sq.
Financial Strain 37.44 42.36 4.45 0.001 0.097Education 10.84 11.76 2.94 0.08 0.014
Relationships 7.52 9.62 10.21 0.002 0.046Physical 7.44 8.31 1.36 0.245 0.006
Credit Card Use 5 5.14 0.06 0.81 0Meeting Obligations 6.64 7.53 1.71 0.19 0.008
Non-significant factorsMonthly expenses --- --- 1.05 0.389 0.025
Culture --- --- 0.635 0.784 0.015Class --- --- 1.35 0.169 0.032
Culture * Gender --- --- 1.02 0.425 0.024Culture * Class --- --- 1.26 0.161 0.035Gender * Class --- --- 0.865 0.604 0.021
Culture * Gender * Class --- --- 1.51 0.054 0.035

64
of Physical and Credit Card Use in the Financial Strain Scale are not found significant in
the discriminant analysis. After controlling for collinearity with the dimensions (note that
six correlations within the Financial Strain Scale were above .5), the structure matrix
indicates the Relationships dimension has the greatest power to differentiate gender
groups. The Education and Meeting Obligations dimensions follow. The analysis
suggests that females tend to have slightly lower scores on financial education and
awareness of issues such as debt interest, feel that money has a lower negative influence
on their relationships resulting from arguments or disagreements over money, and have
less difficulty meeting their financial obligations. It should be noted that an analysis of
monthly income fails to find any significant differences by gender. The discriminant
model correctly identifies females almost 93% of the time, but misclassifies males almost
20% of the time. This results in a correct classification 68.4% of the time.
Table 4.11. Discriminant analysis, Financial Strain Scale and Gender.
Test of equality of group means.Wilks'
Dimension Lambda F df1 df2Internal 0.98 4.72 1 232Chance 0.979 5.02 1 232
External Denial 0.964 8.74 1 232Powerful Others 0.958 10.06 1 232
Structure Matrix Classification function coefficientsDimension Female Male
Internal 0.523 Internal 3.15 3.24Chance 0.539 Chance 1.86 1.9
External Denial 0.711 External Denial 0.33 0.41Powerful others 0.763 Powerful others -0.15 -0.05
(Constant) -56.49 -61.62
65
The third research question is related to money attitudes.
3. In a population of college students with different income levels, is there a
statistically significant mean attitudinal difference among groups by
gender, class level, and culture as these relate to money attitudes?
Table 4.12 describes the findings of the omnibus F of the MANCOVA analysis
for the dimensions of the Money Attitude Scale. Again, gender is the only factor with
significant differences across the four dimensions of the Money Attitude Scale, F(4, 207)
= 4.11, p = .003. Unlike the dimensions of the Economic Locus of Control Scale and the
Financial Strain Scale, the multivariate test for homogeneity of dispersion matrices,
Box’s Test, results in a lack of significance, F(140, 4216.95) = .92, p = .74. Levene’s
Test of equality of error variance for the individual sub dimensions are as follows:
Power Prestige dimension: F(22, 211) = 1.2 p = .248
Retention Time dimension: F(22, 211) = 1.29 p = .178
Distrust dimension: F(22, 211) = 1.40 p = .116
Anxiety dimension: F(22, 211) = .69 p = .849

66
Table 4.12. Money Attitude Scale MANCOVA.
Discriminant analysis fails to find significant differences in the Distrust
dimension, F(1, 232) = 1.21, p = .273. The other three dimensions all suggest significant
power to differentiate gender. Table 4.13 describes the results of the discriminant analysis
for the Money Attitude Scale. The structure matrix and the tests of equality of group
means find the same order in dimensions, as expected due to the lack of any correlation
coefficients greater than .42 within the Money Attitude Scale dimensions. This condition
suggests a lower likelihood of collinearity issues.
The results of the discriminant analysis suggest female students tend to use money
to impress others or as a success symbol significantly less than male students. The
preparedness or planning constructs of the Time Retention dimension seem very similar
Factor: Gender Female Male PartialDimension n = 156 n = 78 F p Eta sq.
Money Attitudes 78.17 81.74 4.11 0.003 0.074Power Prestige 18.26 20.33 2.92 0.014 0.014Retention Time 20.3 22.09 2.43 0.011 0.011
Distrust 20.73 21.94 1.56 0.007 0.007Anxiety 18.88 17.38 3.39 0.016 0.016
Non-significant factorsMonthly expenses --- --- 0.751 0.558 0.014
Culture --- --- 0.663 0.725 0.013Class --- --- 1.06 0.39 0.02
Culture * Gender --- --- 1.14 0.331 0.022Culture * Class --- --- 1.28 0.165 0.036Gender * Class --- --- 0.747 0.705 0.014
Culture * Gender * Class --- --- 1.28 0.18 0.03
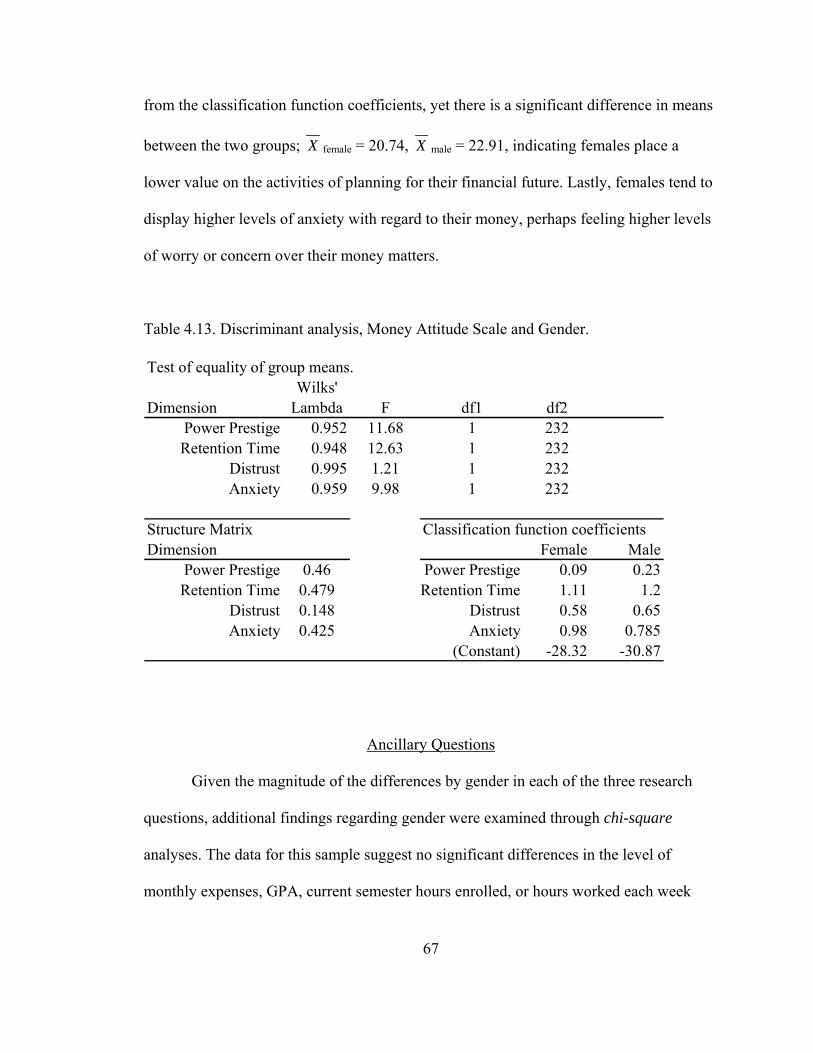
67
from the classification function coefficients, yet there is a significant difference in means
between the two groups; X female = 20.74, X male = 22.91, indicating females place a
lower value on the activities of planning for their financial future. Lastly, females tend to
display higher levels of anxiety with regard to their money, perhaps feeling higher levels
of worry or concern over their money matters.
Table 4.13. Discriminant analysis, Money Attitude Scale and Gender.
Ancillary Questions
Given the magnitude of the differences by gender in each of the three research
questions, additional findings regarding gender were examined through chi-square
analyses. The data for this sample suggest no significant differences in the level of
monthly expenses, GPA, current semester hours enrolled, or hours worked each week
Test of equality of group means.Wilks'
Dimension Lambda F df1 df2Power Prestige 0.952 11.68 1 232Retention Time 0.948 12.63 1 232
Distrust 0.995 1.21 1 232Anxiety 0.959 9.98 1 232
Structure Matrix Classification function coefficientsDimension Female Male
Power Prestige 0.46 Power Prestige 0.09 0.23Retention Time 0.479 Retention Time 1.11 1.2
Distrust 0.148 Distrust 0.58 0.65Anxiety 0.425 Anxiety 0.98 0.785
(Constant) -28.32 -30.87

68
including work-study between females and males. Additionally, the data from this sample
suggest no significant differences between females and males in the frequency to reduce
class load in order to work more due to financial constraints, nor does the analysis find
any significant differences between females and males in the frequency to drop out for a
semester in order to work more due to financial constraints. Almost 19% of the sample
report they have had to reduce their class load in order to work more due to income /
expense constraints during at least one semester, while a little over 6% have had to drop
out of class for at least one semester in order to earn more income.
The data do not indicate any differences in the GPA or current semester hours
enrolled between the four class levels, however significant differences were noted in the
monthly expenditures and hours worked each week between freshman and juniors, and
freshman and seniors. Freshman students spent significantly less each month than either
junior or senior students, X freshman = $382, X junior = $945, X senior = $913; t(3, 230) =
10.27, p < .001, and freshman students worked significantly fewer hours each week
including work study than do either juniors or seniors, X freshman = 8.3 hours, X junior =
18.4 hours, X senior = 20 hours; t(3, 230) = 4.57, p < .005. Additionally, chi-square
analysis suggests a significantly higher frequency for senior students to reduce class load
to work more, chi-square(3) = 10.84, p < .02, and a higher frequency for senior students
to drop out for a semester due to the need to work more, chi-square(3) = 8.61, p < .035.
The data do not indicate any differences between cultures in any of these
characteristic variables. It should be noted that although the cross-tabulation procedures
resulting in the chi-square statistic are questionable, given the seven categories of the

69
culture variable, no significant differences were found from the chi-square procedure
between the three categories of the collapsed culture variable.
Summary of Results and Findings
Based on a multivariate analysis of covariance using monthly expenses as a
covariate and factors of gender, culture, and class rank, only gender was found to be a
significant factor from this college student data with respect to the sub dimensions of the
Economic Locus of Control Scale, the Financial Strain Scale, and the Money Attitude
Scale. The interaction of culture and class rank was found significant in the Economic
Locus of Control Scale analysis, but no other interaction affects were identified in any of
the scales used.
Data from the Economic Locus of Control Scale suggest female students tended
to feel less personal control over positive outcomes compared to male students. Female
students also perceived uncontrollable chance as less influential on their financial
circumstances, and considered poverty more real and controllable through economic
policy than the male students. The discriminant function developed from the four
dimensions of the scale correctly differentiate females from males about 96% of the time,
yet only correctly classify males about 84% of the time. From the significant interaction
of culture and class rank, the data suggest freshman students from the Mexican American
and Latino / Latina cultures felt a significantly higher influence over their financial
situation from Powerful Others, while freshman from the other cultures felt significantly
less influence over their financial situation from Powerful Others. It should be noted that
the data result in a disproportionately low number of freshman students, perhaps

70
contributing to the surprisingly high perception of influence over their financial
circumstances from Powerful Others by students from the Mexican American, Latino /
Latina cultures.
Data from the Financial Strain Scale indicate female students tended to feel less
disruptive interference caused by money in their relationships compared to male students.
Results also show that female students exhibited lower scores on financial education and
awareness, but had significantly less difficulty in meeting their financial obligations
compared to male students. No significant differences were found in the Credit Card Use
dimension.
Results of the analysis of the Money Attitude Scale indicate female students
viewed money as a success symbol or use it to impress others to a significantly lesser
degree than do male students. Female students also tended to display significantly higher
levels of anxiety or worry over their money, yet showed a significantly lower tendency to
prepare or plan for future financial difficulties.
From this sample of college students, the average student had a GPA of about
3.14, took four or five classes during regular spring or fall semesters while working about
17 hours each week (including work study) and spent, on average, $822 each month.
Difference testing procedures indicate freshman students spent significantly less each
month than did junior or senior students, but they also worked significantly fewer hours
each week (including work study). Additionally, senior level students showed a
significantly higher frequency of both reducing class load levels and dropping out for a
semester during spring or fall semesters in order to work more due to financial

71
requirements. From the entire data set, about 37% of the students were first generation
college students (although the inclusion of New Mexico Highlands University students,
with a 71.4% first generation college student frequency may skew this value), and about
24% of the students surveyed indicated their income was either not adequate at all or only
sufficient to cover necessities.

72
CHAPTER V
DISCUSSION, CONCLUSIONS, AND IMPLICATIONS
This chapter provides a discussion of the findings of the study. The summary
addresses three major areas: (a) primary and ancillary research questions as they relate to
the review of literature, (b) conclusions of the study, and (c) implications and
recommendations for future research.
Research Questions
With the exception of an interaction effect between culture and class rank on the
Powerful Others dimension of the Economic Locus of Control Scale, gender was
identified as the only factor of significance in this study of college students from two
Southwestern Universities when controlling for monthly expenses. This is consistent with
the literature review, however the lack of significance in all dimensions of the scales used
from the culture factor (interaction effect noted above exempted) is surprising. Of course,
this may be due to sample size issues and a large number of Anglo American students in
the survey.
Results of the analysis of research question one suggest differences as a result of
the culture and class rank factor. Consistent with literature (Barajas, 2003; Medina et al.,
1996), an interesting finding of the current study is differences in the Powerful Others
dimension between students from the Mexican American, Latino / Latina culture
compared to other cultures as a result of the interaction effect of culture and class rank. It
appears that freshman students from the Mexican American and Latino / Latina cultures
tend to feel increased influence over their money matters from Powerful Others compared

73
to freshman students from the Anglo American or Other non-white cultures.
Additionally, freshman students from the Mexican American and Latino / Latina cultures
feel stronger influence over their money matters from Powerful Others compared to other
class groups within their culture. Put in perspective, with the exception of freshman from
the Mexican American and Latino / Latina cultures, students from all cultures tend to feel
increased influence over their money matters from Powerful Others as they advance
through the class ranks. Other cultural differences identified by the literature are not
supported by the current study. Higher perceptions of external locus of control
(Mirowsky & Ross, 1984), and higher levels of financial stress (measured here by the
Anxiety dimension) as reported by Quintana et al. (1991) can neither be confirmed nor
rejected by the current analysis.
Results of the analysis of research question two identify differences resulting
only from the gender factor. Chen and Volpe (2002) reported males in their sample
scored higher on measures of financial literacy, in addition to placing a higher value on
financial literacy than the females in the study. While these two constructs were not
measured directly here, the analysis indicates that female students feel less educated and
less aware of financial topics. Even though one of the questions of the Education
dimension referred specifically to knowledge of how interest works on credit cards, the
difference in feelings of financial education do not affect credit card usage, as reported by
Hayhoe et al. (2000).
The increased levels of anxiety and concern for current money matters among
female students may partially explain the differences in the ability to meet current

74
financial obligations. Although no differences are identified between female and male
students in reported monthly expenses, female students report less difficulty in their
ability to meet current obligations. Combined with a lack of significant differences in the
number of hours worked each week between female and male students, the lesser
difficulty of meeting current obligations for female students may simply be the result of
the time dimension; current obligations must be dealt with even at the expense of future
considerations.
Results of the analysis of research question three suggest differences in
dimensions of Power Prestige, Retention Time, and Anxiety are all influenced by gender.
Female students tend to use money to influence others less than do male students.
Yamauchi and Templer (1982) argue those scoring low on this dimension maintain
perceptions that minimize the belief that money can be equated with status or levels of
success. Alternatively, the authors suggest those with higher scores on this dimension
tend to “hold attitudes that indicate the importance of status seeking, compensation,
external recognition, and acquisition (Yamauchi & Templer, p. 523). The lower scores
females display on the Time Retention dimension in the present study indicate they place
lower importance on planning for their financial future and financial preparedness
compared to males in the study. This seems to contradict results indicating females
display higher levels of anxiety with regard to their money, supporting similar findings
reported by Furnham (1984). However, this seeming contradiction may be the result of
the time dimension. Questions from the Time Retention dimension focus more on future
money issues, while questions from the Anxiety dimension focus on current money

75
issues. It would seem female students tend to be more concerned and anxious about
current financial circumstances, resulting in increased concern with current issues at the
expense of planning for future money concerns.
The increased levels of anxiety among female students are also contrary to
findings by Lim, Teo, and Loo (2003), citing higher levels of financial stress among
males when the time dimension entailed future considerations instead of current
concerns. Cultural factors may be an influence with regard to differences in financial
stress between male and female individuals. Research by Lim et al. is based on a survey
of respondents from Singapore, and does not include respondents from other cultures.
Higher levels of anxiety regarding money among female students in the current analysis
are consistent with research by Quintana et al. (1991), Bernardi (1997), and Bojuwoye
(2002), whose findings were all based on data including individuals of the Mexican
American culture. Given the size of the group of students combined from the Mexican
American and Latino / Latina cultures in the current study, findings of increased anxiety
among females are consistent.
In light of the increasing attention to the length of time most college students take
to complete a traditional bachelor’s degree, data on the propensity to reduce class load or
drop out of school for a semester as a result of the need to work more are of particular
interest. From the sample, almost 19% reported they have had to reduce their class load
in at least one regular semester in order to work more due to financial constraints. The
analysis suggests this generally happens during the junior or senior class years. Many
schools require the student to live on campus during the first and second years of school;

76
perhaps contributing to lower overall costs and the lack of additional income need. This
analysis suggests junior and senior student have significantly higher monthly expenses
that are more than triple the expenses of their lower classmen, and not surprisingly, work
more than twice as many hours each week.
Certainly numerous factors influence the length of time a student spends
completing a bachelor’s degree. One factor not measured in the present study centers on
the influence of finding a husband and mate on female students. Glenn and Marquardt
(2001) report that about 83% of female students surveyed in their study consider being
married a very important goal, while about 63% said they hoped to meet a husband while
at college. Leppel (2002) argues data from her study suggests women “may feel that their
education is less critical since their husbands serve as primary breadwinner” (p. 446). If
marriage is in fact an important issue for female students in the junior and senior classes,
one result may be increasing matriculation rates. Regardless of the many factors
contributing to the phenomena, extended matriculation periods have been receiving
increased attention. Many schools and states are implementing programs to motivate
students to complete their program in four years. The program at Texas Tech University
establishes student loans that will be completely forgiven if the student graduates within
four years (five years for Engineering or Architecture degrees) and the student complete
their program with at least a 3.0 grade point average. Considering the average GPA for
students at TTU in this sample was currently about 3.1, this seems like a remarkable
opportunity. In order to complete a traditional program in four years, class loads may
need to be increased to five or six classes from the current four to five class average, but

77
if student loans and grants help eliminate the need for additional work hours, hours
currently being spent on work could easily cover the additional time required to complete
the program.
Of the 68% of respondents who knew about the Graduate on Time Program with
the Be on Time Loan provisions at TTU, only about 6% of the students survey currently
participate in the program. Of course, since the program is available only to freshman
students who enter into an agreement at the beginning of their program, the 9% freshman
sample may be skewing the participation rate. Further research may provide significant
results to help the school achieve a higher participation rate in the Graduate on Time
program.
A similar program is offered by the state of New Mexico to freshman students.
The program will pay for eight semesters of tuition to students who maintain at least a 2.5
grade point average. Like the program at TTU, the intent is to reduce matriculation
periods for students. Knowledge of the statewide program is broad, yet only one third of
the students at New Mexico Highlands University are currently participating in the
program. Participation rates suggest additional research may provide insight into ways to
effectively increase participation in both school’s programs. Considering the trends
identified from this survey indicating increased time working and higher monthly
expenses for students in their junior and senior year, financial education programs during
the first year of college may prove effective as a way to help college students adopt
spending strategies that may reduce the need for additional employment during their
junior or senior class years.

78
The adequacy of income for most students is what might be expected from full
time college students. It is interesting that although there is no significant difference in
the perceptions of income adequacy between students of the two different schools,
students of NMHU report significantly reduced monthly expenses compared to students
at TTU. Students from NMHU report their monthly expenses are only about 80% of the
monthly expenses of students from TTU, with no significant differences in the number of
hours spent working including work-study.
Conclusions of the Study
As a representation of a larger population, the data in the current study have a
number of shortcomings. The data resulted in 9% of the students classified as freshman.
This is not representative of the typical college demographic. The Institutional Research
Department of Texas Tech University (personal communication, May 2nd, 2006) reports
that for the current semester, freshman at TTU constitute 23.12 % of the undergraduate
population, while the sophomore, junior and senior populations are 21.13 %, 23.37 %,
and 30.40 % respectively. The lower percentage of freshman students is perhaps the
result of the type of classes where surveys were administered. The College of Human
Sciences classes surveyed at TTU are considered upper level classes, although freshman
and sophomore students often enroll. Even though the introductory economics and some
of the other business classes surveyed at NMHU are considered lower level as measured
by class numbers, during the semester the survey was administered the proportion of
freshman was less than expected.
Further issues with the data can be found in the proportion of female students.

79
General populations do not include females consisting of two-thirds of the population,
indicating a bias toward females since two-thirds of the respondents in this study are
female. Cultural identification of the survey participants is more like national trends,
although a higher proportion of Mexican American – Latino / Latina students might be
expected given the geographic region of the two schools. Student population of Hispanic
students at Texas Tech for the 2005-2006 academic year was just over 11% according to
the Institutional Research Department of Texas Tech University (personal
communication, May 2nd, 2006).
Outliers can have significant effects on procedures requiring normality, as is the
case in any analysis of variance. Multivariate analyses of covariance procedures are
extremely sensitive to outliers in the covariate. Elimination of these outliers, while
correcting for the problems of normality in the covariate, resulted in a reduction of data.
Additional difficulties with normality are found in the dependent variables of the study.
Inspection suggests both skewed distributions and outliers in many of the dimensions of
all three primary scales. While the analysis is not too sensitive to data with skewed
distributions, outliers pose a significant problem. However, the elimination of the outliers
would have resulted in significant manipulation and data loss. And while some of the
individual responses were outliers in multiple dimensions of the three scales, the total
number across all 13-scale dimensions was deemed too high to eliminate them all. Since
none of the individual dimensions contained excessive extreme outliers from a univariate
perspective, and no ranking of importance of dimensions is applicable, it was determined
that fewer issues would likely arise by not eliminating the outliers in all scale dimensions.

80
Implications and Recommendations for Future Research
Future research of this topic should include a larger sample. Ideally, each class
cohort should be representative of the broad population. Cultural identification, while
certainly influenced by the geographic location of the college or school, should be
focused directly on those cultures of interest. The current analysis, perhaps as a result of
the geographic location of the two schools, did not reflect a true African American, Asian
American, or American Indian proportion. Future studies may be able to identify schools
with a significant population of students from the cultures of interest, such as Tribal
Colleges and Universities, Historically Black Colleges and Universities, Hispanic
Serving Institutions, and those that serve Asian Americans and Pacific Islanders.
Administering the survey to college students within this type of structured sampling
frame may help identify differences in money attitudes and perceptions of control over
financial matters without the sample representation limitations constraining the current
study.
While noting the limitations of the data and the procedures used, this analysis
provides a number of implications. One of the most significant implications of the
research is the need to address the increased tendency of junior and senior students to
reduce class load or drop out for a semester in order to earn more money through
employment. While many factors either directly contribute or merely influence a
student’s matriculation period, the need to reduce class load or drop out for one or more
semesters in order to work more due to financial constraints may be open to other types
of influence. Findings from the current study suggest additional research into gender-

81
financial strain relationships may yield insight for college administrators trying to
motivate students toward shorter matriculation periods. While the current study does not
find significant differences in credit card usage between male and female students, higher
levels of anxiety due to current financial circumstances is consistent with findings by
Lyons (2004), who found that female students have a higher risk of succumbing to
difficulties with credit card payments. And while increased difficulties meeting credit
card obligations do not necessarily lead to more time spent in employment, there is an
increased potential for reduced class loads given difficulties meeting credit card
payments among female students from the Lyons study combined with findings in the
current study indicating female students feel higher levels of anxiety over current money
matters.
Incentive programs aimed at shortened matriculation periods offer financial
rewards for those who complete their degree within a prescribed period of time.
However, the additional class load and study time required to meet incentive program
conditions argues for less time allotted to employment. Program requirements for a
bachelor’s degree vary, but a common number of credit hours required are about 136. In
order to accomplish this within four years, the student would need to enroll for at least 15
hours in half of the semesters, and at least 18 hours in the other half. This analysis
indicated the average hours enrolled in by students responding to the survey is about 14.4
hours.
Considering the significant increases in both the monthly expenditures and the
hours devoted to employment between freshman students and junior or senior students,

82
program administrators may find financial education programs focusing on attitude –
behavior relationships of significant value in helping students manage their finances
while enrolling for enough credit hours to complete their degrees according to incentive
program requirements. The student will reap significant financial benefits while in
school, in addition to the reduced opportunity cost resulting from shortened matriculation
periods.
While the survey did not gather extensive financial practices data, the findings
that females tend to do significantly less planning for future financial circumstances
suggest a need for focused education and awareness programs. The role of women in
society has changed significantly, and many are taking on increased responsibility for
employment activities and family financial well-being. Educational and awareness
programs focused on planning for future financial conditions will help prepare these
female students for the time in most women’s lives when they are totally responsible for
their own finances, or for the finances of an entire family. And while female students in
this study indicated less difficulty in meeting current financial obligations compared to
male students, they do so at the price of higher levels of anxiety over their current money
matters. This is consistent with the significantly lower scores in their perceptions of how
financially educated they are. Given the lower levels of financial education, the female
student’s feelings of limited influence over positive outcomes is perhaps not surprising,
but combined with their perceptions that their personal finances are less influenced by
chance or uncontrollable circumstances, financial education programs specifically
developed to differentiate gender issues seem warranted.

83
As noted in the results section, no direct differences were observed between
students of different cultures. There were, however, intimations that further research may
yield culturally defined perceptions of money and individual control over money given
sufficient sample sizes. Leppel (2002) espouses the inclusion of programs specifically
focused on students from “educationally disadvantaged backgrounds” (p. 445) and
specifically identifies Black women as a potential audience for such programs. As a result
of the increasing proportion of non-white students enrolling in colleges and universities
across the country, numerous programs are being developed with specific attention to
multicultural emphasis. But not only are students today coming from different cultures,
they are increasingly first generation college students, those coming from families whose
parents never completed a college degree. It seems clear that traditional financial
education programs, teaching various economic and financial topics to a homogenous
audience, must now be replaced with programs that are developed with attention to the
specific gender and cultural differences in money matters among a population of students
from families perhaps less sophisticated than the families of college students of previous
generations.
The efficacy of financial education programs continues to be reviewed. At a
policy level, financial literacy issues are being welcomed with alacrity by state
legislatures, many of which may soon join trends among other states to reintroduce
economics and basic personal finance into high school requirements. However, education
alone may not suffice without further research into the attitude – behavior relationship
84
specific to college students. It is during the college years when many young people, often
for the first time, must accept the primary responsibility for most daily living expenses.
Perhaps most promising is Ajzen’s (1985) theory, which argues that an
individual’s perception of control over a particular behavior is a function of the necessary
opportunities and resources available to the individual. These perceptions of
controllability influence both the ultimate behavior and the behavioral intentions. Ajzen’s
model does not consider the amount of actual control an individual has in a particular
situation. The model is influenced by the “possible effects of perceived behavioral
control on achievement of behavioral goals” (Ajzen, 1987, p. 45). One of the problems in
the application of the theory of reasoned action in Ajzen’s (1987) study was the theory’s
reliance on individual volitional control. Indeed, this is one of the foundations of
intention. However, very often an individual is precluded from exercising volitional
control due to external constraints. An attempt to solve this issue was the inclusion of the
influence that perceived behavioral control exercises over both intention and behavior,
resulting in Ajzen’s (1991) Theory of Planned Behavior.
The current analysis suggests Furnham’s (1986) Economic Locus of Control
Scale may prove useful in ascertaining some level of perceived control over financial
circumstances. Future research using Ajzen’s Theory of Planned Behavior (2002) model
with inputs from money attitude dimensions of anxiety and time-retention, combined
with the internal and chance dimensions of Furnham’s (1986) scale may help define an
attitude – behavior relationship as the foundation of financial education program success.

85
This study may help illuminate college students’ money attitudes and perceptions
of control over money and financial circumstances, and perhaps give future researchers a
starting point into effective financial education program development. The development
would necessitate an examination of specific behaviors and the relationship these
behaviors have to specific attitudes.
While the scales used in this study were not developed specifically for this study,
results of the analyses using these scales are encouraging. A study designed to examine
attitude – behavior relationships using Ajzen’s Theory of Planned Behavior (2002) and
measuring perceptions of behavioral control using a money specific measure such as
Furnham’s (1986) Economic Locus of Control Scale may help identify the attitudes
related to detrimental financial practices. This may help advance the development of an
educational program to address the specific money attitudes of college students from
diverse populations, and help clarify any relationships between these money attitudes and
the perceptions of control the student has over their money and financial matters.

86
REFERENCES
Adelman, C. (2006). The toolbox revisited: Paths to degree completion from high school through college. Washington, D.C.: U.S. Department of Education.
Adler, A. (1964). Problems of neurosis: A book of case histories. New York: Harper and
Row. Ajzen, I. (1985). From intentions to actions: A theory of planned behavior. In J. Kuhl &
J. Beckmann, (Eds.) Action-control: From cognition to behavior. Heidelberg: Springer.
Ajzen, I. (1987). Attitudes, traits, and actions: Dispositional prediction of behavior in
personality and social psychology. In L. Berkowitz, (Ed) Advances in Experimental Social Psychology. New York: Harcourt Brace Jovanovich.
Ajzen, I. (1991). The theory of planned behavior. Organizational Behavior and Human
Decision Processes, 50, 179-211. Ajzen, I. (2002). Perceived behavioral control, self-efficacy, locus of control, and the
theory of planned behavior. Journal of Applied Social Psychology, 32(4), 665-683.
Ajzen, I., & Fishbein, M. (1977). Attitude-behavior relations: A theoretical analysis and
review of empirical research. Psychological Bulletin, 84, 888-918. Ajzen, I., & Fishbein, M. (1980). Understanding attitudes and predicting social behavior.
Englewood Cliffs, NJ: Prentice-Hall. Aldana, S., & Liljenquist, W. (1998). Validity and reliability of a financial strain survey.
Financial Counseling and Planning, 9(2), 11-18. Allport, G. (1935). Attitudes. In C. M. Murchison (Eds.) Handbook of social psychology.
Worcester, MA: Clark University Press. Anderson, E., & Cole, B. (1988). Stress factors related to reported academic performance
and burnout. Education, 108(4), 497-503. Bachrach, B. (1996). Values-based selling. San Diego: Bachrach & Assoc. Bachrach, B. (2000). Values-based financial planning: The art of creating an inspiring
financial strategy. San Diego: Aim High Publications.

87
Bailey, W. (1987). An exploratory examination of the relationship between personality factors and attitudes toward money. (Doctoral dissertation, Texas Tech University, 1987).
Bailey, W. C., Woodiel, D. K., Turner, M. J., & Young, J. (1998). The relationship of
financial stress to overall stress and satisfaction. Personal Finances and Worker Productivity, 2(2), 198-206.
Barajas, L. (2003). The Latino journey to financial greatness. New York: HarperCollins. Berger, I. (1992). The nature of attitude accessibility and attitude confidence: A
triangulated experiment. Journal of Consumer Psychology, 1(2), 103-123. Bernardi, R. A. (1997). The relationships among self-control, perceptions of stress, and
performance. Journal of Applied Business Research, 13(4), 1-9. Bernheim, B. D., & Garrett, D. M. (1996). The determinants and consequences of
financial education in the workplace: Evidence from a survey of households. NBER Working Paper No. 5667. Cambridge, MA: National Bureau of Economic Research.
Bojuwoye, O. (2002). Stressful experiences of first year students of selected universities
in South Africa. Counseling Psychology Quarterly, 15(3), 277-290. Brewin, C., & Shapiro, D. (1984). Beyond locus of control: Attribution of responsibility
for positive and negative outcomes. British Journal of Psychology, 75, 43-49. Chein, I. (1948). Behavior theory and the behavior of attitudes: some critical comments.
Psychological Review, 55, 175-188. Chen, H., & Volpe, R. (2002). Gender differences in personal financial literacy among
college students. Financial Services Review, 11, 289-307. Christie, R., & Geis, F. (1970). Studies in Machiavellianism. New York: Academic Press. Crocker, J., & Luhtanen, R. (2003). Level of self-esteem and contingencies of self-worth:
Unique effects on academic, social, and financial problems in college students. Personality and Social Psychology Bulletin, 29(6), 701-712.
Davidson, A., Yantis, S., Norwood, M., & Montano, D. (1985). Amount of information
about the attitude object and attitude-behavior consistency. Journal of Personality and Social Psychology, 49(5), 1184-1198.

88
Davies, E., & Lea, S. (1995). Student attitudes to student debt. Journal of Economic Psychology, 16, 663-679.
Davis, W., & Davis, D. (1972). Internal-external control and attribution of responsibility
for success and failure. Journal of Personality, 40, 123-136. DeBono, K. (1987). Investigating the social-adjustive and value-expressive functions of
attitudes: Implications for persuasion process. Journal of Personality and Social Psychology, 52(2), 279-287.
DeBono, K., & Omoto, A. (1993). Individual differences in predicting behavioral
intentions from attitude and subjective norm. The Journal of Social Psychology, 133(6), 825-831.
Devadoss, S., & Foltz, J. (1996). Evaluation of factors influencing student class
attendance and performance. American Journal of Agricultural Economics, 78, 499-508.
Dickinson, A. (1996). The financial well-being of women and the family. The American
Journal of Family Therapy, 24(1), 65-73. Dominguez, J., & Robin, V. (1992). Your money or your life. New York: Penguin Books. Doob, L. (1947). The behavior of attitudes. Psychological Review, 54, 135-156. Fazio, R. (1990). Multiple processes by which attitudes guide behavior: The MODE
model as an integrative framework. Advances in Experimental Social Psychology, 23, 75-107.
Fazio, R., Powell, M., & Herr, P. (1983). Toward a process model of the attitude-
behavior relation: Accessing one’s attitude upon mere observation of the attitude object. Journal of Personality and Social Psychology, 44(4), 723-735.
Fazio, R., Powell, M., & Williams, C. (1989). The role of attitude accessibility in the
attitude-to-behavior process. The Journal of Consumer Research, 16(3), 280-288. Fazio, R., & Williams, C. (1986). Attitude accessibility as a moderator of the attitude-
perception and attitude-behavior relations: An investigation of the 1984 presidential election. Journal of Personality and Social Psychology, 51, 505-514.
Fazio, R., & Zanna, M. (1978a). Direct experience and attitude-behavior consistency. In
L. Berkowitz, (Ed.) Advances in Experimental Social Psychology. New York: Harcourt Brace Jovanovich.

89
Fazio, R., & Zanna, M. (1978b). On the predictive validity of attitudes: The roles of direct experience and confidence. Journal of Personality, 46, 228-243.
Fenichel, O. (1938). The drive to amass wealth. Psycho-analytic Quarterly, 7, 67-95. Field, A. (2005). Discovering statistics using SPSS for Windows. London: Sage
Publications. Fishbein, M. (1966). Attitude and the prediction of behavior. In M. Fishbein, (Ed.)
Readings in attitude theory and measurement. New York: Wiley. Fishbein, M., & Ajzen, I. (1975). Belief, attitude, intention, and behavior. New York:
Wiley. Fishbein, M., & Ajzen, I. (1976). Attitudes toward objects as predictors of single and
multiple behavioral criteria. Psychological Review, 81, 59-74. Forman, N. (1987). Mind over money. Toronto: Doubleday. Fox, G., & Chancey, D. (1998). Sources of economic distress: Individual and family
outcomes. Journal of Family Issues, 19(6), 725-749. Frazier, P., & Schauben, L. (1994). Stressful life events and psychological adjustment
among female college students. Measurement and Evaluation in Counseling and Development, 27, 280-292.
Freud, S. (1908). Character and anal eroticism. In J. Strachey, (Ed.) Complete
Psychological works, standard edition Vol. 9. London: Hogarth Press. Furnham, A. (1984). Many sides of a coin: The psychology of money usage. Personality
and Individual Differences, 5, 95-103. Furnham, A. (1986). Economic locus of control. Human Relations. 39(1). 29-43. Furnham, A. (1997). The psychology of behavior at work. London: Psychology Press. Furnham, A. (2002). Factor analysis of Furnham’s money attitude scale. Psychological
Reports, 91, 457-458. Furnham, A., & Argyle, M. (1998). The psychology of money. New York: Rutledge. Garman, E., Camp, P., Kim, J., Bagwell, D., Redican, K., & Baffi, C. (1999). Credit
delinquencies: A portrait of pain for employers' bottom lines - Preliminary findings. Personal Finance and Worker Productivity, 3(1), 165-168.

90
Gavala, J. R., & Flett, R. (2005). Influential factors moderating academic enjoyment/motivation and psychological well-being for Maori University students at Massey University. New Zealand Journal of Psychology, 34(1), 52-57.
Glenn, N., & Marquardt, E. (2001). Hooking up, hanging out, and hoping for Mr. Right:
College women on dating and mating today. New York: Institute for American Values. Retrieved June 22, 2006, from http://www.americanvalues.org/html/a-pr_hooking_up.html.
Goetting, M. A. (2004, July). Teens gain financial skills and confidence through the high
school financial planning program (HSFPP). Retrieved December 4, 2004, from http://www.montana.edu/extensionecon/ family/pdf/impactresults.pdf.
Goldberg, H., & Lewis, R. (1978). Money madne$$: The psychology of saving, spending,
loving, and hating money. New York: William Morrow and Co. Gorham, E. E., DeVaney, S. A., & Bechman, J. C. (1998). Adoption of financial
management practices: A program assessment. Journal of Extension, 36(2), 1-9. Retrieved October 16, 2004, from http://www.joe.org/joe/1998april/a5.html.
Grable, J., & Joo, S. (1999). Financial help-seeking behavior: Theory and applications.
Financial Counseling and Planning, 10(1), 13-24. Green, D. (1894). Opportunity cost and pain cost. Quarterly Journal of Economics, 218-
229. Harr, L. (2000, January). If financial literacy is so important, surely it’s taught in school.
Credit Union Magazine, 11A-12A. Hayes, J. (2005). Perceived financial stress, employment status, and academic
performance among college students. Paper presented at the annual meeting of the Academy of Financial Services, Chicago, IL.
Hayhoe, C., Leach, L., Allen, M, & Edwards, R. (2005). Credit cards held by college
students. Financial Counseling and Planning, 16(1), 1-10. Hayhoe, C., Leach, L., & Turner, P. (1999). Discriminating the number of credit cards
held by college students using credit and money attitudes. Journal of Economic Psychology, 20, 643-656.
Hayhoe, C., Leach, L., Turner, P., Bruin, M., & Lawrence, F. (2000). Differences in
spending habits and credit use of college students. The Journal of Consumer Affairs, 34(1), 113-133.

91
Henry, R., Weber, J., & Yarbrough, D. (2001). Money management practices of college students. College Student Journal, 4, 244-247.
Holland, R, Verplanken, B, & Knippenberg, A. (2003). From repetition to conviction:
Attitude accessibility as a determinant of attitude certainty. Journal of Experimental Social Psychology, 39, 594-601.
Huberty, C., & Morris, J. (1989). Multivariate analysis versus multiple univariate
analyses. Psychological Bulletin, 105, 302-308. Joo, S., Grable, J., & Bagwell, D. (2003). Credit card attitudes and behaviors of college
students. College Student Journal, 37(3), 405-419. Katona, G. (1972). Theory of expectations. In B. Strumple, J. Morgan, & E. Zahn, (Eds.)
Human behavior in economic affairs: Essays in honor of George Katona. San Francisco: Jossey-Bass Inc.
Kim, J., & Garman, E. T. (2003). Financial stress and absenteeism: An empirically
derived model. Financial Counseling and Planning, 14(1), 31-42. Kim, J., & Garman, E. T. (2004). Financial stress, pay satisfaction and workplace
performance. Compensation & Benefits Review, 36(1), 69-78. Kincannon, J. (1968). Prediction of the standard MMPI scale scores from 71 items: The
mini-mult. Journal of Consulting and Clinical Psychology, 32, 319-325. Klein, P. (1971). Experimental manual for Ai3Q: A measure of the obsessional
personality or anal character. Windsor, England: N.F.E.R. Publishing. Kraft, P., Rise, J., Sutton, S., & Roysamb, E. (2005). Perceived difficulty in the theory of
planned behavior: Perceived behavioral control or affective attitude? British Journal of Social Psychology, 44, 479-496.
LaPiere, R. (1934). Attitudes vs. actions. In M. Fishbein, (Ed.) Readings in attitude
theory and measurement. New York: John Wiley & Sons. Lindholm, J., Astin, H., Choi, J., & Gutierrez-Zamano, E. (2002). The educational paths
of recent high school graduates: College, work, and future plans. Los Angeles: Higher Education Research Institute.
Leppel, K. (2002). Similarities and differences in the college persistence of men and
women. The Review of Higher Education, 25(4), 433-450.

92
Lim, V. K., Teo, T. S., & Loo, G. L. (2003). Sex, financial hardship and locus of control: an empirical study of attitudes towards money among Singaporean Chinese. Personality and Individual Differences, 34, 411-429.
Lyons, A. (2004). A profile of financially at-risk college students. The Journal of
Consumer Affairs, 38(1), 56-80. Madsen, W. (1973). The Mexican-Americans of south Texas. New York: Holt, Rinehart,
and Winston. McClelland, D., & Winter, D. (1971). Motivating economic achievement: Accelerating
economic development through psychological training. New York: Free Press. Medina, J, Saegert, J, & Gresham, A. (1996). Comparison of Mexican-American and
Anglo-American attitudes toward money. The Journal of Consumer Affairs, 30(1), 124-145.
Mirowsky, J., & Ross, C. (1984). Mexican culture and its emotional contradictions.
Journal of Health and Social Behavior, 25(1), 2-13. Muldrew, C. (1998). The economy of obligation: The culture of credit and social
relations in early modern England. New York: St Martin’s Press. Murdock, S., White, S., Hoque, N., Pecotte, B., You, X., & Balkan, J. (2002). A summary
of the Texas challenge in the twenty-first century: Implications of population change for the future of Texas. Austin: Texas Legislative Counsel.
Murray, H. (1938). Explorations in personality. New York: Oxford University Press. National Endowment for Financial Education. (2002). Financial literacy in America:
Individual choices, National Consequences. Retrieved March, 2006, from http://www.nefe.org/pages/whitepaper2002symposium.html.
Nesbary, D. (2000). Survey research and the World Wide Web. Boston: Allyn and Bacon. New Mexico Higher Education Department. (2006). Lottery success scholarships.
Retrieved March, 2006, from http://www.hed.state.nm.us/collegefinance/lotto.asp. Norvilitis, J. M., Szablicki, P. B., & Wilson, S. D. (2003). Factors influencing levels of
credit-card debt in college students. Journal of Applied Social Psychology, 33(5), 935-947.

93
O’Beirne, K. (2002). The six-year plan: How students linger on campus and universities stiff the taxpayer. Retrieved February, 2006, from http://www.nationalreview.com/flashback/flashback-kob051002.asp.
Pascarella, E., & Terenzini, P. (1991). How college affects students: Findings and
insights from twenty years of research. San Francisco: Jossey-Bass. Pinto, M., Mansfield, P. M., & Parente, D. H. (2004). Relationship of credit attitude and
debt to self-esteem and locus of control in college-age consumers. Psychological Reports, 94, 1405-1418.
Pinto, M., Parente, D., & Palmer, T. (2001). College student performance and credit card
usage. Journal of College Student Development, 42(1), 49-58. Price, D. (1968). A technique for analyzing the economic value system. Journal of
Marriage and the Family, 30, 467-472. Quintana, S., Vogel, M., & Ybarra, V. (1991). Meta-analysis of Latino students’
adjustment to higher education. Hispanic Journal of Behavioral Sciences, 13(2), 155-168.
Rabow, J., & Rodriguez, K. (1993). Socialization toward money in Latino families: An
exploratory study of gender differences. Hispanic Journal of Behavioral Sciences, 15(3), 324-341.
Roberts, J. A., & Jones, E. (2001). Money attitudes, credit card use, and compulsive
buying among American college students. The Journal of Consumer Affairs, 35(21), 213-240.
Ross, S., Niebling, B., & Heckert, T. (1999). Sources of stress among college students.
College Student Journal, 33(2), 312-317. Rotter, J. (1966). Generalized expectancies for internal versus external control of
reinforcement. Psychological Monographs: General and Applied, 80, 1-28. Rubinstein, C. (1981). A Psychology Today survey report: Money, self-esteem,
relationships, secrecy, envy, satisfaction. Psychology Today, 15(5), 29-44. Saunders, M., & Serna, I. (2004). Making college happen: The college experiences of
first-generation Latino students. Journal of Hispanic Higher Education, 3(2), 146-163.

94
Sheeran, P., & Orbell, S. (1999). Implementation intentions and repeated behaviour: Augmenting the predictive validity of the theory of planned behaviour. European Journal of Social Psychology, 29, 349-369.
Skinner, M., Zautra, A., & Reich, J. (2004). Financial stress predictors and the emotional
and physical health of chronic pain patients. Cognitive Therapy and Research, 28(5), 695-713.
Snyder, M., & Gangestad, S. (1986). On the nature of self-monitoring: Matters of
assessment, matters of validity. Journal of Personality and Social Psychology, 51(1), 125-139.
Snyder, M., & Tanke, E. (1976). Behavior and attitude: Some people are more consistent
than others. Journal of Personality, 36(5), 502-517. Stewart, S., Lam, T., Betson, C., Wong, C., & Wong, A. (1999). A prospective analysis
of stress and academic performance in the first two years of medical school. Medical Education, 33, 243-250.
Tabachnick, B., & Fidell, L. (2001). Using Multivariate Statistics. Needham Heights,
MA: Allyn & Bacon. Tang, T. (1992). The meaning of money revisited. Journal of Organizational Behavior,
13(2), 197-202. Tang, T. (1993). The meaning of money: Extension and exploration of the Money Ethic
Scale in sample of university students in Taiwan, Journal of Organizational Behavior, 14(1), 93-99.
Texas Tech University (2006). Graduate on time. Retrieved February, 2006, from
http://www.depts.ttu.edu/graduateontime/. Trafimow, D., & Finlay, K. (1996). The importance of subjective norms for a minority of
people. Personality and Social Psychology Bulletin, 22, 820-828. Trueblood, D. (1957). Effects of employment on academic achievement. The Personnel
and Guidance Journal, 36, 112-115. Tseng, V. (2004). Family interdependence and academic adjustment in college: Youths
from immigrant and U.S.-born families. Child Development, 75, 966-983. Weiner, B. (1986). An attributional theory of achievement motivation and emotion. New
York: Springer-Verlag.

95
Wernimont, P., & Fitzpatrick, S. (1972). The meaning of money. Journal of Applied Psychology, 56(3), 218-226.
Wicker, A. (1969). Attitudes versus actions: The relationship of verbal and overt
behavioral responses to attitude objects. Journal of Social Issues, 25, 41-78. Yamauchi, K., & Templer, D. (1982). The development of a money attitude scale.
Journal of Personality Assessment, 46(5), 522-528. Yang, B., & Lester, D. (2002). Furnham’s money attitude scale. Psychological Reports,
90, 699-700. Xiao, J. J., Noring, F. E., & Anderson, J. G. (1995). College students’ attitudes towards
Credit cards. Journal of Consumer Studies and Home Economics, 19, 155-174.

96
APPENDIX A
Human Subjects (IRB Protocol)
Dr. Dorothy Bagwell, Ph.D., AFC® (Primary Investigator) Assistant Professor, Personal Financial Planning
John V. Hayes, MBA, CFP®
Doctoral Candidate, Applied and Professional Studies Proposal Title: Money Attitudes, Economic Locus of Control, and Financial Strain
Among College Students I. Rationale
The purpose of this research is to identify money attitudes, perceptions of economic locus of control, and dimensions of financial strain among college students in two southwestern United States universities. Matriculation periods for many students to complete a bachelor’s degree now exceed six years. For students who started in a four year college, one third of the students earned a bachelor’s degree from the same school within four years. Between 54% and 58% of students who completed their bachelor’s degree in the same school as they started completed their program within six years (Adelman, 2006). As a result, numerous financial incentive programs have been developed with the specific purpose of motivating students to finish their program within four years.
Extended matriculation periods require additional costs borne by the taxpayer for the extended time to degree completion. Additionally, in addition to direct costs, there is a substantial opportunity cost to the student for the extended matriculation period. From a financial perspective, both parties will likely benefit financially from student class loads sufficient to ensure a four-year degree. While the student must forgo increased income opportunities for higher class loads while in school, the combination of the financial incentives available and the significant increases in income potential upon completion of their program present a compelling case for the four-year program.
Money beliefs and attitudes, along with financial practices and habits, may have a direct relationship with financial literacy levels. As a preliminary step toward any further investigation of financial literacy levels of college students, money attitudes and control beliefs of students need to be assessed. Additionally, given the impact of changing demographics on student populations (Murdock et al., 2002), cultural differences in money attitudes and beliefs should be identified. II. Subjects Subjects for this research project will be selected on a voluntary basis from students of Texas Tech University and New Mexico Highlands University. No structured sampling

97
procedures will be used; it will constitute a convenience sample. III. Procedures Data will be collected through the use of an internet survey. Thus, there will be no physical harm to the participants. The survey instrument will include general demographic data (i.e. age, gender, class level), and questions from three previously developed instruments accessing money attitudes (Money Attitude Scale), beliefs of economic locus of control (Economic Locus of Control Scale), and perceptions of financial strain (Financial Strain Scale). Additional questions will gather data on employment, income and expenses, income frequency, adequacy, and dependability, the propensity to reduce class load in order to seek employment opportunities, and the propensity to withdraw from school for one or more semesters in order to seek employment opportunities. The instrument includes a provision requiring responses to every question in each section before the student can advance to the following section. As a result of the sensitive nature of divulging financial practices and data, students may feel uncomfortable during their survey experience. However, participants will be fully informed of the confidentiality of their responses, and since no personal identifying information will be collected, the students will be assured of anonymity. IV. Adverse Events and Liability The students understand participation is completely voluntary and the researchers assure anonymity, thus no potential adverse affects or liability issues are foreseen.

98
APPENDIX B
Survey Instrument
Thank you very much for taking the time to complete this survey. All answers will be
kept completely confidential. Each question will allow only one response, and you will
not be able to advance to the next page if you leave any questions unanswered on the
current page.
This research is an attempt to identify money attitudes, beliefs of economic locus of
control, and financial stress among college students with specific attention to cultural
differences. Please be assured of complete anonymity, as no personally identifying
information will be collected.
Again, thank you for your participation.
Contact information:
John V. Hayes, CFP®, Ph.D. candidate, Texas Tech University, [email protected]
Dorothy Bagwell Ph.D., College of Human Sciences, Applied and Professional Studies,
Texas Tech University, [email protected]
Survey link: http://www.surveymonkey.com/s.asp?u=961831776850
Demographics
1. What school do you attend?
New Mexico Highlands University Texas Tech University
2. What is your age?
______

99
3. What is your gender?
Female Male
4. What culture do you most identify with?
Mexican American Other Latino/Latina African American
Anglo American American Indian Asian
Other non-white
5. What is your current GPA?
_______
6. How many credit hours are you enrolled for this semester?
________
7. How many credit hours did were you enrolled for last fall?
________
8. What class level best describes your current rank?
Freshman Sophomore Junior Senior Graduate student
9. Including work-study or other financial aid, how many hours each week do you
work?
________
10. On average, how much do you spend per month? (total of: education, housing,
transportation, food, entertainment, etc.).
__________
11. During a Spring or Fall semester, have you ever had to drop one or more classes
in order to work more? For how many semesters has this happened?

100
________
12. Have you ever had to drop out for a Spring or Fall semester in order to earn more
money through employment?
Yes No
13. Looking back over all the places you received income from during the past 12
months, describe how dependable your income was.
a. Income not dependable at all. You never or seldom know how much more
than a month in advance how much you would have, and when or if you
would get any.
b. Income received regularly but amount varies a lot.
c. Income dependable part of the year but not all of the year. This would be
seasonal income, such as summer and holiday break employment.
d. Dependable amount received regularly, plus a fluctuating amount above
that. Even though it may have been small, you always knew you would
get a certain amount regularly (such as monthly help from parents or
scholarship), in addition to other income that was not so dependable.
e. Steady income. You knew how much you could count on getting and
when you would get it.
14. Is your lifestyle the same, better, or worse off now than your parents’ lifestyle is
now?
Worse Same Better

101
15. Is your lifestyle the same, better, or worse off now than the lifestyle of your
fellow students now?
Worse Same Better
16. To what extent do you think your income is enough to live on?
a. Can afford everything I want and still have money.
b. Can afford about everything I want.
c. Can afford some of the things I want, but not all I want.
d. Can meet necessities only.
e. Not at all adequate.
17. Did either of your parents graduate from college?
Yes No
18. For Texas Tech students, (NMHU students please mark not applicable) do you
know about the Graduate on Time program with the Be on Time student loan
provisions?
Yes No Not Applicable
19. For Texas Tech students, (NMHU students please mark not applicable) do you
participate in the Graduate on Time program?
Yes No Not Applicable
20. For Highlands University students, (TTU students please mark not applicable) do
you participate in the New Mexico lottery scholarship?
Yes No Not Applicable

102
Money Attitude Scale (MAS) Measurement Scale: Strongly disagree Disagree Neutral Agree Strongly agree This data will be used to evaluate money attitudes. Please answer each question by
selecting the answer you think BEST describes your honest attitudes, beliefs, and
practices.
Power-Prestige dimension
1. I use money to influence other people to do things for me.
2. I must admit that I purchase things because I know they will impress others.
3. In all honesty, I own nice things in order to impress others.
4. I behave as if money were the ultimate symbol of success.
5. People I know tell me that I place too much emphasis on the amount of money a
person has as a sign of his success.
6. I seem to find that I show more respect to people with more money than I have.
7. Although I should judge the success of people by their deeds, I am more
influenced by the amount of money they have.
8. I often try to find out if other people make more money than I do.
Retention-Time dimension
1. I do financial planning for the future.
2. I put money aside on a regular basis for the future.
3. I save now to prepare for my old age.
4. I keep track of my money.

103
5. I follow a careful financial budget.
6. I am very prudent with money.
7. I have money available in the event of another economic depression.
Distrust dimension
1. I argue or complain about the cost of things I buy.
2. It bothers me when I discover I could have gotten something for less elsewhere.
3. After buying something, I wonder if I could have gotten something for less
elsewhere.
4. I automatically say, “I can’t afford it” whether I can or not.
5. When I buy something, I complain about the price I paid.
6. I hesitate to spend money, even on necessities.
7. When I make a major purchase, I have the suspicion that I have been taken
advantage of.
Anxiety dimension
1. It’s hard for me to pass up a bargain.
2. I am bothered when I have to pass up a bargain.
3. I spend money to make myself feel better.
4. I show signs of nervousness when I don’t have enough money.
5. I show worrisome behavior when it comes to money.
6. I worry I will not be financially secure.

104
Economic Locus of Control Scale (ELCS) Measurement Scale: Strongly disagree Disagree Neutral Agree Strongly agree The data from this section will be used to measure economic locus of control beliefs.
Please answer each question by selecting the answer you think BEST describes your
honest beliefs and practices.
Internal dimension
1. Saving and careful investing is a key factor in becoming rich.
2. Whether or not I get to become wealthy depends mostly on my ability.
3. In the long run, people who take very good care of their finances stay wealthy.
4. If I become poor, it is usually my own fault.
5. I am usually able to protect my personal interests.
6. When I get what I want, it is usually because I worked hard for it.
7. My life is determined by my own actions.
Chance dimension
1. There is little one can do to prevent poverty.
2. Becoming rich has nothing to do with luck.
3. Regarding money, there isn’t much you can do for yourself when you are poor.
4. It’s not always wise for me to save because many things turn out to be a matter of
good or bad fortune.
5. It is chiefly a matter of fate whether I become rich or poor.
6. Only those who inherit or win money can possible become rich.

105
External/Denial dimension
1. People’s poverty results from their own idleness.
2. The seriousness of poverty is overstated.
3. When I get what I want, it is usually because I am lucky.
4. In the Western world, there is really no such thing as poverty.
5. Politicians can do very little to prevent poverty.
Powerful Others dimension
1. I feel that my finances are mostly determined by powerful people.
2. Although I might have ability, I will not become better off without appealing to
those in positions of power.
3. People like myself have little chance of protecting our personal interests when
they are in conflict with those of strong pressure groups.
4. Getting what I want financially requires pleasing those people above me.
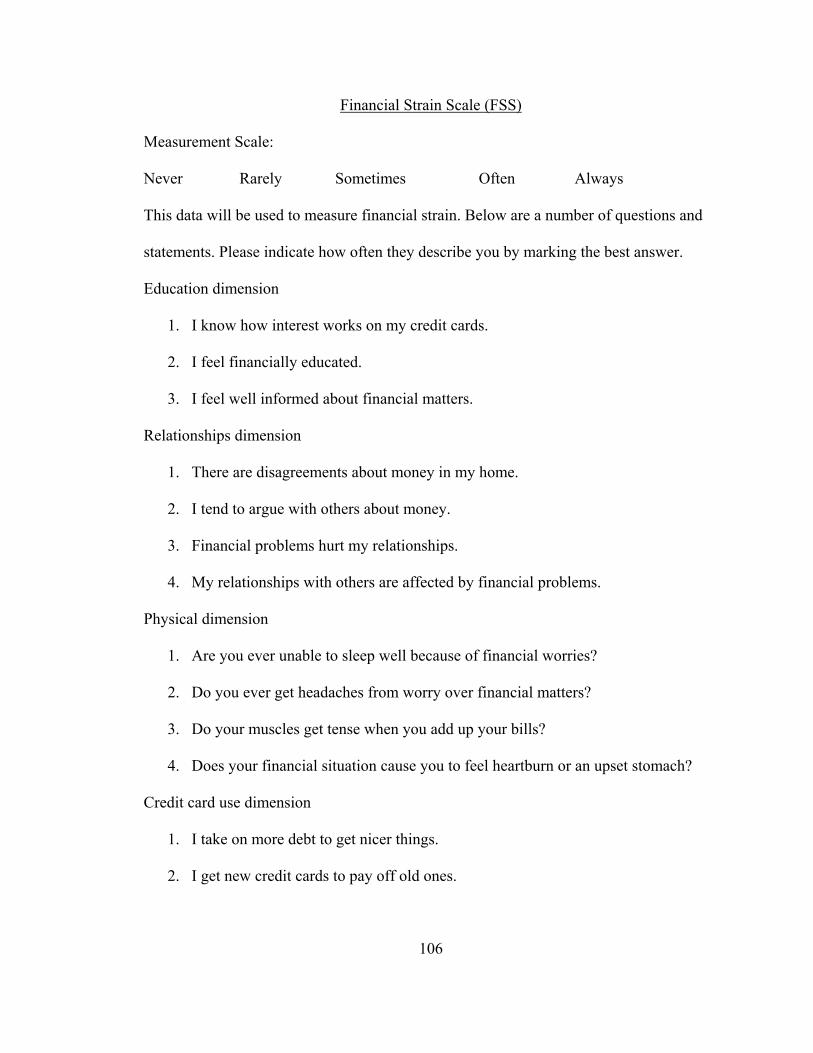
106
Financial Strain Scale (FSS) Measurement Scale: Never Rarely Sometimes Often Always This data will be used to measure financial strain. Below are a number of questions and
statements. Please indicate how often they describe you by marking the best answer.
Education dimension
1. I know how interest works on my credit cards.
2. I feel financially educated.
3. I feel well informed about financial matters.
Relationships dimension
1. There are disagreements about money in my home.
2. I tend to argue with others about money.
3. Financial problems hurt my relationships.
4. My relationships with others are affected by financial problems.
Physical dimension
1. Are you ever unable to sleep well because of financial worries?
2. Do you ever get headaches from worry over financial matters?
3. Do your muscles get tense when you add up your bills?
4. Does your financial situation cause you to feel heartburn or an upset stomach?
Credit card use dimension
1. I take on more debt to get nicer things.
2. I get new credit cards to pay off old ones.

107
3. I make purchases on credit cards hoping that I will have the money later.
Meeting obligations dimension
1. I pay my bills on time.
2. I find it difficult to pay my bills.
3. Many of my bills are past due.
4. I don’t have enough money to pay my bills.