แนวทางส่งเสริมการเรียนรู้ตลอดชีวิตของโรงเรียนผู้สูงอายุ - DSpace ...
Upload
khangminh22Category
view
4download
0
CHILDREN AS CONSUMERS: INFLUENCING PARENTAL
PRODUCT-PURCHASING AND THE INFLUENTIAL
ROLE OF LICENSED PROGRAMMING CHARACTERS
by
RATHNA BROOKE SENGHEU, B.A.
A THESIS
IN
MASS COMMUNICATIONS
Submitted to the Graduate Faculty of Texas Tech University in
Partial Fulfillment of the Requirements for
the Degree of
MASTER OF ARTS
Approved

4VA7c
^ ^ f ACKNOWLEDGEMENTS
I would like to thank my committee chair. Dr. Keith Johnson and Dr. Roger
Saathoff for their time, commitment, and contributions to my research project. I
would also like to thank Dr. Sabrina Neeley for her help and input.
First and foremost, I would like to attribute the completion of this thesis to
my faith in God and the strength He granted me when the going got rough.
To my mother and father, thank you for all your love and support. I could
not have made it this far without your inspiration and example. To my sister and
brother, thanks for listening and understanding.
I would also like to express my appreciation to the Gray Family for their
constant support and endless words of encouragement.
Thanks to all my friends, especially THE CIRCLE, who put up with my
endless thesis traumas. Remember there are two new Barbies: Master's Barbie
and PhD Barbie.
Lastly, to my husband-to-be, Lawrence Wayne Gray, words cannot
articulate what your support and love has meant to me. I will always be grateful
to have someone like you in my corner. With all my love, thank you.

TABLE OF CONTENTS
ACKNOWLEDGEMENTS ii
LIST OF TABLES vi
CHAPTER
I. INTRODUCTION 1
History of Children's Media and Product Consumption 1
1900-1940 1
1940S-1950S 2
1960s 4
1970s 6
1980s-1990s 7
Purpose of Study 11
II. LITERATURE REVIEW 12
Children as a Market 12
Children's Influence on Parental Purchases 14
Information Sources 16
Content of Children's Commercials 17
Saturday Morning Commercials 22
Licensed Programming Characters 23
Influence of Licensed Character 26
Children's Research Studies and Issues 29

Advantages of Interviewing Parents 30
Problems Surveying Children 31
Theoretical Framework: Consumer Socialization 31
Summary 36
III. RESEARCH QUESTIONS 38
Research Questions and Hypotheses 40
IV. METHODOLOGY 42
Methods Used In Children's Research 42
Method Selection 45
Telephone Survey Overview 46
Sample 46
Instruments 47
Measures 48
V. DATA ANALYSIS 53
Demographics: Parents 53
Demographics: Children 54
Licensed Characters: Product Demand Influence 55
Influence on Parental Product Purchasing 62
VI. CONCLUSIONS 98
Review 98
Children As A Market 98
Influence of Licensed Character 99
IV

Theoretical Framework 99
Research Questions and Findings 100
Research Question 1 100
Hypothesis 1 100
Hypothesis 2 102
Hypothesis 3 103
Research Question 2 104
Analysis of Findings 106
Future Implications and Research 113
Limitations 114
REFERENCES 116
APPENDIX: QUESTIONNAIRE 120

LIST OF TABLES
1. Respondent Marital Status 66
2. Respondent Education Level 66
3. Respondent Income 66
4. Respondent Gender by Age 67
5. Number Of Children Between Ages 6-11 67
6. Gender of Child 67
7. Age of Child 68
8. Birth Order of Children 68
9. Commercials Make My Child Want Advertised Items 68
10. Commercials Make My Child Want Advertised Items by Gender 69
11. Commercials Make My Child Want Advertised Items by Age 69
12. Child Television Viewing 70
13. Child Television Viewing by Gender 70
14. Child Television Viewing by Age 71
15. Recall of Television Program Characters 71
16. Watches Television Programs with Licensed Characters 72
17. Watches Television Programs with Licensed Characters by Gender 72
18. Watches Television Programs with Licensed Characters by Age 73
19. Child Asks For Licensed-Character Toys 73
VI

20. Child Asks For Licensed-Character Toys by Gender 74
21. Child Asks For Licensed-Character Toys by Age 74
22. Child Owns Licensed-Character Toys 74
23. Child Owns Licensed-Character Toys by Gender 75
24. Child Owns Licensed-Character Toys by Age 76
25. Parental Recall of Licensed-Character Toys Owned by Child 77
26. Advertised Items Perceived as More Desirable 77
27. Advertised Items Perceived as More Desirable by Gender 77
28. Advertised Items Perceived as More Desirable by Age 78
29. Advertised Items Perceived as More Desirable By Parent's Gender 79
30. Level of Difficulty of Playing with Other Children Without Advertised Toys 79
31. Level of Difficulty of Playing with Other Children Without Advertised Toys by Gender 79
32. Level of Difficulty of Playing with Other Children
Without Advertised Toys by Age 80
33. Purchasing Products with a Friend 80
34. Purchasing Products with a Friend by Gender 81
35. Purchasing Products with a Friend by Age 82
36. Friend Influence on Purchase 82
37. Friend Influence on Purchase by Gender 83
38. Friend Influence on Purchase by Age 83
39. Child Understands Intent of Commercials 84
VII

40. Child Understands Intent of Commercials by Gender 84
41. Child Understands Intent of Commercials by Age 85
42. Child Happier Owning Advertised Items 85
43. Child Happier Owning Advertised Items by Gender 86
44. Child Happier Owning Advertised Items by Age 87
45. Parent Asks Child's Product Preference 87
46. Asking Child's Product Preference by Parent's Gender 88
47. Store Trips 88
48. Store Trips by Gender 88
49. Product Selections 89
50. Product Selections by Gender 89
51. Product Selections by Age 90
52. Parental Recall of Product Selections Made by Child 90
53. Product Suggestions 91
54. Product Suggestions by Gender 91
55. Product Suggestions by Age 92
56. Parental Recall of Product Suggestions Made by Child 92
57. Buying the 'Right' Things 93
58. Buying the 'Right' Things by Parent's Gender 93
59. Causes of Wrong Product Purchase 93
60. Asking Child's Opinion 93
61. Asking Child's Opinion by Parent's Gender 94
VIII

62. Child Prefers to Purchase Products 94
63. Child Prefers to Purchase Products by Gender 94
64. Child Prefers to Purchase Products by Age 95
65. Parental Recall of Child's Desire to Purchase Products 95
66. Child Asks to Purchase Advertised Items 96
67. Child Asks to Purchase Advertised Items by Gender 96
68. Child Asks to Purchase Advertised Items by Age 97
IX

CHAPTER 1
INTRODUCTION
History of Children's Media and Product Consumption
Regarding children as consumers is a post-WWll concept (McNeal, 1992).
From a market-place perspective, children must have desires and wants, cash to
spend, and a significant population base to be considered consumers (McNeal,
1992). Children have since been defined as a specialized consumer market due
to their growing population, expanse of market research, and creation of a niche
within a profit-driven media atmosphere (Pecora, 1998).
1900-1940
Between 1900 and 1940, children either influenced family purchases or
were advised to spend their money with caution. Advertisers in the 1920s and
1930s established two major consumerism trends. Through the use of media
outlets, advertisers attempted to reach and influence parents through their
children. Radio advertisers specifically developed this strategy of using children
to influence purchases of their mothers. Advertisers also targeted household and
food product advertisements to children (Pecora, 1998).
In the 1930s, radio advertisers arranged dramas and adventure shows to
be played in the early afternoon to create product demand by children. National
corporations such as Kellogg, General Mills, Campbell Soup, and Quaker Oats

used radio to advertise household goods and products. Children's purchasing
power had been considered restricted to only disposable goods, which satisfied
their consumption and immediate wants (Pecora, 1998).
1940s-1950s
Interest in the youth market increased with the onset of the 1946 baby
boom and the introduction of television (Pecora, 1998). The number of children
in the U.S. doubled over a five-year period and the estimated population reached
10 million. Therefore, marketers took notice when the number of children and
money increased (McNeal, 1992). This ushered in a more aggressive approach
in marketing to youngsters (Pecora, 1998). Researchers wanted to examine
children's "understanding of money and their influence on parental purchasing"
(Pecora, 1995, p. 355).
Alexander, Benjamin, Hoerrner, and Roe (1998) conducted a content
analysis of television commercial advertisements from the 1950s. The
researchers provided a description of television advertisements seen in children's
shows and explored the events surrounding the 1950s when television
advertising to children began. The results indicated advertisements in the 1950s
are significantly different from subsequent decades due to the development of a
child audience and the acknowledgment from advertisers that children were a
promising market. For example, standardized time slots used in today's
programming and commercials did not exist in the 1950s. Television

programming ranged fi-om a quarter hour, to a half hour, to a full hour.
Commercials, station identifications, and public service announcements filled in
programming time when shows ran short. Also, commercial advertisements
ranged from 11 seconds to 3 minutes and 24 seconds (Alexander et al., 1998).
Yet advertisements in the fifties did have three main commonalities with
present-day ads: (1) Promotional content remains relatively the same;
advertisers sfill use fun appeals to attract children to products; (2) selling
strategies are no more controversial today than they were in the fifties; and (3) a
preponderance of commercials have been, and continues to be, live action
(Alexander etal., 1998).
During the late 1940s and early 1950s, creating an audience for television
shows and a market for television sets became television's top priority
(Signorielli, 1991). With the birth of television, children became consumers and
an audience by their own merit (Pecora, 1995; Alexander et al., 1998). Kids
were presented with desired products such as Big Wheels, Barbie dolls, and
sugared cereals through this new technological innovafion and, consequently,
had a positive effect in the growth of television (McNeal, 1992). Customary
products such as snacks, cereals, candy, and toys appeared only 44 percent of
the time in children's programming (Alexander et al., 1998).
The 1950s brought about distinct classifications in the toy market with the
development of television. Toys were licensed to represent a television or film
icon and then advertised to parents or children (Seiter, 1993).

Marketers motivated families to acquire television sets by producing
appealing shows aimed at children, as well as viewers of all age groups
(Signorielli, 1991; Alexander et al., 1998). Also, families with children were more
apt to want televisions first because television provided mothers a respite firom
their children (Seiter, 1993).
When the public purchased television sets and a disfinct television
audience emerged, programming was developed mainly to enfice sponsors and
to provide efficient avenues for advertising. The field of advertising grew due to
television (Alexander et al., 1998). By the late 1950s, Saturday morning became
a niche for children's programming (Signorielli, 1991).
The fifties also brought about product expansion and different child-rearing
ideas. Child experts such as Dr. Spock encouraged parents to let their kids take
on more responsibility and freedom. Increased responsibility and freedom
translated to more input in the decision-making process of family purchases.
Advertisers began to increase and enlarge the children's market to promote
brand loyalty and to establish a future market. Due to the expanding market of
the 1950s and the baby boom, children and teenagers were seen as a viable
consumer market (Pecora, 1998).
1960s
An important period for children's marketing emerged during the 1960s.
The birthrate of children and family income steadily increased and families

accrued more discretionary income (Pecora, 1998). Kids spent over $2 billion a
year of their own money on desired products and infiuenced billions of dollars
more of their parents' purchases. The money power children held gained
attenfion (McNeal, 1992). According to Pecora, "As children's discretionary
income rose, they no longer were regarded as peripheral to the consumer market
or merely as a conduit to parental habits" (1995, p. 354).
McNeal (1992) indicates the first publication noting children as a distinct
market surfaced during the sixties. He also asserts two events affirmed children
as a consumer market. First, the Federal Trade Commission became more
observant of advertising towards children and, secondly, academic institutions
such as Harvard University took notice of children's consumer behavior (McNeal,
1987).
Children's television programming also experienced changes during the
1960s. Once thought of as a financial drain, children's programming became a
profitable business. The majority of children's commercial programming in the
mid-sixties appeared on Saturday morning, a poor time to reach adults, but not
children. Kids between the ages of two and five were normally targeted during
the early morning hours from 6 a.m. to 9 a.m. Re-runs were usually shown in the
early morning time slot, while programs aired following 9 a.m. were generally
new shows produced to appeal to six to eleven-year-old kids. Cartoon shows
such as BUGS BUNNY. JOHNNY QUEST. PORKY PIG and BULLWINKLE aired during
the early sixties (Signorielli, 1991).

The National Association of Broadcasters allowed up to sixteen minutes
per hour commercial time during Saturday morning programming. Advertisers
used the minutes as effecfively as possible, offering toys and sugar-coated
treats. The spokespersons for many of the advertised products were cartoon
characters (Signorielli, 1991).
1970s
The 1970s likewise became a sanctioned time for children as consumers.
The first generafion of baby boomer kids obtained parental blessings to be
consumers and marketers regarded them as an individual market of buyers and
influencers. Subsequently, marketers created an abundance of new products
and services for children to want and purchase. Kids underwent a marketing blitz
of new products urging them to buy or have their parents buy (McNeal, 1992).
The seventies also brought about a new concept for toy merchandising
which introduced itself through Geoffrey Giraffe, a spokescharacter for the now
popular Toys 'R' Us stores. Parents and children shopped for toys like they
shopped for groceries (McNeal, 1992).
Kids commercial programming for Saturday morning in the 1970s still
aired action-packed cartoons, but brief commercial segments concentrated on
prosocial messages and education-based information. For example, commercial
segments such as ABC's SCHOOLHOUSE ROCK and IN THE NEWS on CBS

encompassed informational material. Children's television became proacfive
during the seventies (Signorielli, 1991).
Yet business regulators and consumer advocates tried to remove
television advertisements aimed at children because ads were viewed as
manipulative (McNeal, 1992). John (1999) reports the controversy surrounding
children's advertising centered on the unfair nature of advertisements.
Consumer researchers and child psychologists formed theories discovered
through exploratory research suggesfing children have little comprehension of
the influential nature of advertising. They view advertising as, "informative,
truthful, and entertaining" (John, 1999, p. 3). Furthermore, pressure groups
during the 1970s received support for suggested changes in children's
advertising (Signorielli, 1991). Advocates viewed children as consumers, but
strived to implement consumer education to protect them (McNeal, 1992).
1980s-1990s
With the number of children and products increasing, the 1980s created a
more market-sawy child (McNeal, 1992). In 1987, the population of children
aged 15 and under reached 52.5 million and the number of kids between the
ages of 4 and 12 in 1990 reached 32 million. By the year 2000, the populafion of
kids 15 and under was estimated to peak at 55.9 million (Wartella, 1995) and in
2005, children between the ages of 3 and 17 are esfimated to be 60.4 percent of
the American population (Sabir, 1996).

During this time, parents placed their children in the consumer role and
marketers supplied them with additional market information through more
innovative promotions. The eighties also bestowed upon kids more market
validity. They were almost on equal par with adults (McNeal, 1992).
McNeal offers a sociological perspective which partially credits children's
new economic standing to social changes in the eighties (1992). These social
changes occurred within the family unit directly. During this decade family
structures underwent several changes (McNeal, 1992).
Parents had fewer children due to active careers and strenuous
schedules. Economic strain also caused families to decrease the number of kids
for each household. The children of baby boomers had approximately less than
two kids per family. Parents felt better equipped to provide their children with
more if they had fewer kids (McNeal, 1992).
Also, more parents raised their children alone (McNeal, 1992; Stoltman,
1999). One-parent homes increased due to unwed mothers and divorces.
Children assumed additional consumer responsibility in these households and
became a partner in household duties. Kids cleaned, shopped, prepared meals
and dealt with money at an earlier age. They learned to buy not only for
themselves, but also for the household (McNeal, 1992).
Furthermore, people waited to have children later in life. Some people
delayed having children to enhance flnancial stability, while others were more
8

career-oriented. Older parents cherished their children and valued the
anticipation of having a baby (McNeal, 1992).
Moreover, a rise in two-income households (McNeal, 1992; Guber &
Berry, 1993; Wright-lsak, 1999) occurred in the eighties (McNeal, 1992). Both
mom and dad worked to earn more money, but spent less time with the kids
(McNeal, 1992; Stoltman, 1999). The longer the hours parents spent at work the
more children influenced consumption decisions (Jenkins, 1979). The extra
income allowed parents to spend more money on their children, which alleviated
some guilt of not spending as much time with them (McNeal, 1992). Children in
two-income homes took on more household responsibility (McNeal, 1992; Guber
& Berry, 1993), which led to a higher degree of independence and consumerism
at an earlier age (McNeal, 1992).
Kids were regarded as a principal consumer for many different products
(Pecora, 1998). Children's products were no longer limited to food products, fast
food, or toys, but spread to other types of retail. Kids had their own clothing line
at Gap Kids, books at Walden Kids, and their own checking account at First
Children's Bank (McNeal, 1992). Children were encouraged to think in terms of
brand labels (Pecora, 1998). Expensive items ranging from phones, brand name
shoes, and cameras were targeted to children. Prior to the eighties these items
were viewed as adult products (McNeal, 1992).
Due to character licensing and the rapid growth of specialty stores such as
Toys 'R' Us, development of products made available to children also increased.

Children bought products because of recognizable characters, not because of
quality or expense. Identifiable figures such as Ronald McDonald cultivated
brand loyalty and launched associations between media characters and product
merchandising (Pecora, 1998).
Media for children has grown astronomically. Children not only have their
own television shows, but entire television networks (such as NICKELODEON) are
designed for them (McNeal, 1992; Wartella, 1995). Kids also had access to their
own magazines such as Sports Illustrated for Kids. Children could also become
members of the many new clubs intended for their membership such as the Kraft
Cheese and Macaroni Club, Fox Kids Club and Burger King Kids Club (McNeal,
1992).
Research regarding children increased due to changes in advertising and,
perhaps, in children. Scholars assert a new social and economic order has
developed because of technological advancement (Stoltman, 1999). Children
are learning new technologies at a younger age (Wright-lsak, 1999). The
computer and the internet have changed the parameters between children and
advertising (Stoltman, 1999). The internet pemnits children to have more social
contact with the outside world on a global level (Wright-lsak, 1999). Social
changes in lifestyles and demographics from the past 25 years may affect
knowledge and information known about children (Stoltman, 1999).
10

Purpose of Study
This research project surveyed parents of children between the ages of 6
to 11, examining the relationship between licensed characters and their influence
on children's desire for endorsed merchandised products, and explores the
degree of influence children have on the parental decision-making process for
products purchased for them.
11

CHAPTER II
LITERATURE REVIEW
Children as a Market
Children are seen as a primary market, a market of influencers, and a
future market. Kids have a distinct niche with money, wants and needs (McNeal,
1992). They are considered a primary market with many products created for
them and targeted to them by numerous businesses (Stoltman, 1999). The
advertising and television industries view kids as a potentially profitable market
with ever-changing trends, remaining perpetually unpredictable (Seiter, 1993).
McNeal (1999) indicated that during the 1960s, 1970s, and 1980s,
children's spending almost doubled. During the 1990s, spending tripled
(McNeal, 1999). Children have an estimated $7.3 billion to spend in the market
place (Guber & Berry, 1993). Additional figures estimate children actually have
$8 billion of their own money and they spend $6 billion on clothes, candy, toys,
and various other products, while saving the rest (McNeal, 1992). Snyder
(1995) supports these estimates with a range indicating children spend between
$7.2 to $8.8 billion of their own money on products. Wolf (1998) provides other
figures, which revealed that children will spend $11 billion each year on food,
beverages, clothes, games, and toys. A more recent statistic estimated kids
spend approximately $20 billion yearly and the number continues to increase
12

(Stoltman, 1999; McGrath, 1998). In 1997, children spent roughly $24.4 billion
and it is estimated by 2001 children will spend $35 billion on products (McNeal,
1999).
Children have both direct and indirect influence on billions of dollars
annually (Stoltman, 1999). Kids directly influence more than $130 billion in
purchasing household items and indirectly influence much more (McNeal, 1992).
McNeal defines direct influence as, "children making requests for goods and
services, suggesting where to eat out, telling mom to buy a certain brand or
flavor of ice cream, or making a selection when the family is shopping" (p. 15).
Indirect influence refers to a parent's consideration of their child's preferences
when buying products (McNeal, 1992).
The market with the greatest potential is the future market. Children, as
they mature, will become consumers over a broad range of goods and services.
Many companies and businesses invest up to 20 years in the children's market
for the opportunity to convert them into adult customers (McNeal, 1992).
Marketers have the chance to instill brand loyalty in young children early,
consequently guaranteeing future buyers (Seiter, 1993).
McNeal found corporations in America are generating new products for
children (1999). Children have computer technology, food items, cosmetics, and
licensed-cartoon characters designed especially for them. Many products made
for adults now have a child's version (McNeal, 1999).
13

Children's Influence on Parental Purchases
Kids learn to acquire products by asking their parents. As stated earlier,
with children's influence parents spend approximately $130 billion on products
requested by their kids (McNeal, 1992). Other figures suggest parents actually
spent $160 billion (Wolf, 1998) to $200 billion on merchandise requested by
their children (McGrath, 1998). Advertising agencies and retailers examine this
relationship due to the significant amount of money children influence (McNeal,
1992).
Children ask their parents for products approximately 15 times during a
shopping trip. Children also influence where their family shops, which indirectly
affects the number and types of products purchased during a store visit.
Children make requests for products at home, in the car, watching television and
at dinner. They are most likely to ask for products when they see commercial
advertisements (McNeal, 1992).
McNeal (1964) found independent purchasing became more prominent
about age seven and increased with age. As children became older, parents
also allowed more independent shopping. Also, the majority of kids age five,
seven, and nine made independent selections when they did shop with their
parents. By age nine, children were active consumers. They participated in
purchasing in part because they observed materialism through advertisements,
peers, and business (McNeal, 1964).
14

Kids have influence on toys, snacks, clothing and electronics (McNeal,
1992; Heubusch, 1997). Eighty-seven percent of boys between the ages of 6
and 14 request and influence the purchase of action figures. Eighty percent of
girls attempt to influence the purchase of dolls and stuffed animals (Guber and
Berry, 1993).
They also influence household and non-household products. Household
products range from furniture and electronic equipment to mealtime groceries
(McNeal, 1992). Children influence 78 percent of cereal purchases and 57
percent of activity drinks (Guber and Berry, 1993). Non-household products
include cars, restaurants, and vacation or recreation items (McNeal, 1992).
Jenkins (1979) conducted an exploratory study which examined parents'
perceptions of their children's function in the family decision-making process
over a variety of different product lines. These include high-ticket items such as
cars, furniture, family vacations, life insurance and savings, to basic family
decisions on groceries. Jenkins addressed children's patterns of influence
pertaining to demographic, socio-economic, personality, and attitudinal variables
(1979).
Yet these results indicate children yield little influence in areas such as
choosing a family doctor or life insurance, keeping up with bills, money, and
savings. Kids also have little effect on decisions concerning groceries, cars,
furniture, and major appliances (Jenkins, 1979).
15

Information Sources
Information sources for children have increased significantly in the 1990s.
Children can be reached by marketers in school or through media
advertisements and catalogs. A company often sponsors education materials
and programs and then a company representative may be sent to make a
classroom visit. Television advertisements appear in the classroom and posters
are hung in school hallways to promote and provide product information. Kids
also make store visits to check out new and different products. Children receive
information through direct mail, advertisements on rental videos, and product
placements within movies (McNeal, 1992).
Ward, Wackman, and Wartella (1977) discovered children's awareness of
television as a product information source increased with age. They also found
as children became older they were more conscious of the purpose of
commercials and were more likely to choose more practical and useful elements
of products when deliberating about product purchases. Children's brand recall
also increased with age, as well as their awareness of advertising as an
information source (1977). John indicated children utilize television as an
information source for items such as "toys, candy, food products, and
restaurants" (1999, p. 21).
Children are significantly influenced by their own peer group (McNeal,
1987; Guber & Berry, 1993). Kids regard their friends as an information source
in areas from styles and entertainment to language, popular trends, and
16

activities. They use clothes, toys, and food to identify themselves and their
relationship with peers (Guber & Berry, 1993).
While children use friends, television commercials, or other media outlets
as information sources, they are also seen as an information source for parents.
Nelson (1979) investigated the role children play as an information source in the
family decision-making process of eating out-of-home meals across six
dimensions: "recognition, providing information, deciding on restaurant type,
deciding on a particular restaurant, deciding how much money will be spent, and
making the final decision" (1979, p. 419). The research focused on whether
children were important information sources, if demographic differences within a
family affected influence, and if the influence children exert has some bearing on
the family decision process. The study revealed parents ultimately "reserve the
right" to have the final say in decisions and determine the amount of money to
spend when eating out (Nelson, 1979, p. 419). Yet both parents and children
over the age of five were equally involved in choosing the type and specific
restaurant and were capable of identifying the problem and offering information
about the eating out process (Nelson, 1979).
Content of Children's Commercials
Ward, Wackman, and Wartella determined children generally want what
they see advertised on television (1977). Stipp and Goerlich reported young
consumers especially "are more likely to consume products heavily advertised
17

on network TV" (1995, p. 31). Advertisers consider children a major target
market (Snyder, 1995) and are continuously bombarding them with television,
newspaper, magazine, and radio advertisements promoting products from
clothing and fast foods to toiletries (McNeal, 1992). Commercials targeting kids
explicitly influence types of products children want, request and eat (Ward,
Wackman, & Wartella, 1977). Advertisers attract consumer dollars by using
children to compel their parents to purchase advertised items (Van Evra, 1990;
McNeal, 1992).
Kids watch a significant amount of television, which makes them an
important audience who influences and makes purchasing decisions.
Commercials aired during children's shows undergo extensive research to
maximize their effect. Television's key objective is to attract an audience
essentially for the commercials (Signorielli, 1991).
Advertisers allocate many dollars to the children's market. In 1987,
advertisers spent about $325 million on commercials during children's television
programming (Snyder, 1995). Advertising made networks $180 million in 1989
and syndication revenues from advertising accrued $160 million. By 1990,
network revenues increased to $500 million due to advertising (Seiter, 1993) and
climbed to $575 million in 1992 (Snyder, 1995). McGrath (1998) states that
according to Competitive Media Reporting, between 1993 and 1996, advertising
to children increased 50 percent to $1.5 billion.
18

Networks catering to children compete for a portion of the $1 billion
advertisers spend yearly on television. NICKELODEON ranks as the leading
network for children between the ages of 6 and 11. The network attracts
approximately 642,000 child viewers daily and secured $300 million of
"advertising inventory" in the "upfront market" in 1999 (Flint, 2000, p. B18).
Seiter said the network has "extolled the appetites of children, as well as their
influence over parents on consumer purchases from dog food to cars" (1993, p.
103). In 1999, the CARTOON NETWORK sold approximately $130 million of
advertising. Fox KIDS earned $70 million, while the Fox FAMILY CHANNEL only
obtained $20 million. KIDS W B acquired approximately $75 million and ABC
earned $60 million in advertising dollars in 1999 (Flint, 2000).
Advertisements targeting children contain several similar commercial
themes. Commercials advertising toys contain live action scenes, which show
different aspects of the toy (Signorielli, 1991). Animated characters often appear
in food commercials interacting with real children. Jingles play an integral part
in commercials because the music allows children to aurally recognize the
product (Signorielli, 1991).
Van Evra indicated the special effects in children's commercials are made
to generate "moods, images and impressions" not necessarily to communicate
pertinent information regarding a product (1990, p. 137). Jingles, slogans, visual
effects, animation, and repetition are advertising tools used to catch the viewer's
attention (Van Evra, 1990; Seiter, 1993). Young children often depend on these
19

tools to understand a commercial's meaning or gain information. Appealing
commercials are more likely to induce buying behavior, while products
represented by less attractive commercials may receive little attention and
product recall (Van Evra, 1990). Commercials correspond well with young
children's capabilities. Television advertisements are energetic, brief, and shown
over and over again (Seiter, 1993). Heubusch (1997) found that children like to
watch television advertisements because they think the ad is funny and they
"like to see the toys and things" (p. 55).
Ellen Seiter (1993), author of Sold Separately, differentiates between toy
advertisements designed for parents and toy advertisements made for kids.
Seiter states three main points are stressed in advertisements produced for
parents: Advertisers appeal to parents to buy products to please the child; to
facilitate the child's social advancement; or to educate the child.
Advertisements created for children do not contain these points and
different messages are used within the ad to motivate the selection of a toy.
Advertisements made for kids usually do not give children reasons to buy a
product or toy. Ads are more entertaining and as pleasant as the program within
which the ad appears (Seiter, 1993). Seiter developed a list of commercial types
advertisers often use (1993). These include: "musicals, animals and magic
helpers (fantasy/animation); explorers (adventure); boy genius (science fiction);
girls at home (soap opera); boys' toys (westerns and crime films); and slice of
life (realist drama)" (Seiter, 1993, p. 121).
20

Klines (1993) results about child development and toy consumption from
parents revealed that character-toy commercials differentiate themselves from
other toy advertisements on television. This was due to the portrayals of
interactive play among children (peers) in the commercials, allusions to
imaginative interaction with the toys, and the production costs (Kline, 1993).
Kline also indicated children are able to gain insight into their peers when
they watch commercials of child actors interacting with one another (1993).
These child actors represent themselves as real kids with which child viewers
can relate. These scenes within commercials give child viewers an avenue to
observe what play means to their peers. Most character-toy commercials are
usually child-oriented without the presence of an adult, revealing children
playing with one another. Nine percent of commercials with non-character toys
show children in a family setting. Toy commercials also infer that pretending
and make believe play is more stimulating with the right toy. A common premise
of character-advertisements suggests that toy features will create more
interesting recreational play for children. Also, commercials created for children
are compact with various styles to attract the child viewer. Action sequences,
slogans, along with music and graphics are used to gain the child's attention
(Kline, 1993).
Children's commercials also sell more than products. They sell lifestyles
and social messages (Ward, Wackman & Wartella, 1977; Signorielli, 1991).
Commercials emphasize how much fun children can have with ownership of the
21
particular product. Kid commercials center on popular child-related products
such as snacks, cereals, sweets, and toys (Signorielli, 1991).
Saturday Morning Commercials
Commercials on Saturday morning symbolize the most rigorous
advertising time for children (Seiter, 1993). Snyder (1995) reports on the effects
the 1990 Children's Television Act had on Saturday morning commercials. The
study found that during the first year of the Children's Television Act, children
saw one less 30-second commercial per hour in 1992 than in 1991 (Snyder,
1995).
Swan (1998) conducted a content and critical analysis of Saturday
morning programming from three television networks on September 15, 1990,
and June 9, 1992, from 8 a.m. to 11 a.m. Although the Commercial Television
Act restricted commercial time to two minutes per half-hour during Saturday
morning programming by 1994 children were seeing, on average, the same
minutes and commercials per hour they had seen before the Act (Snyder, 1995;
Swan, 1998).
Swan found 40 percent of commercials aired during Saturday morning in
1990 promoted toys, while more than half of the total number of commercials
aired promoted food and beverage products (1998). By 1992, 80 percent of
Saturday morning commercials advertised food and beverage products. Toy
commercials decreased by 10 percent from the overall total commercials
22

broadcasted (Swan, 1998). According to researchers from the University of
Minnesota, approximately half of the food products advertised on Saturday
morning were, "candy, soft drinks, syrups, dessert toppings, cookies, chips,
cakes, and other desserts" (Current Health. 1995, p. 2).
Between 1990 and 1992, commercials stayed relatively the same in terms
of images and transitions. Yet commercial message length decreased from 30
seconds to 15 seconds (Swan, 1998).
Every cartoon show broadcast on Saturday morning in 1990 and 1992,
excluding one, offered product merchandising ranging from clothes and games
to books. These cartoon series also carry action figures and accessories
marketed for and to children. New cartoons are created along with character
toys. Though toy commercials decreased by 20 minutes from 1990 to 1992,
cartoon shows themselves convey hours of advertising (Swan, 1998).
Licensed Programming Characters
The toy industry's most important change involved the increased number
of characters available. The industry created product lines instead of individual
toys to compensate for uncertainties of the business (Pecora, 1998). To ensure
the success of product lines, multiple characters were introduced with
accessories (Pecora, 1998; Seiter, 1993). Line extensions allowed new
accessories and characters to supplement already profitable toys (Seiter, 1993).
Children could purchase wedding cakes for Barbie or a comb and brush set for
23

MY LITTLE PONY and enjoy the MUPPETS and MUPPET BABIES or the CARE BEARS
and their Cousins (Pecora, 1998).
The concept of licensing has existed for over 100 years. The Disney
dynasty introduced characters such as Mickey Mouse in the 1930s, but licensing
became more prevalent and legitimate in the late 1970s. Early licensed
characters include the CARE BEARS. GUMMI BEARS, and SMURFS in the 1980s.
The LooNEY TUNES group was introduced during the late 1980s and the1990s
introduced characters such as DOUG, the RUGRATS. and REN AND STIMPY. The
Disney dynasty has also expanded its repetoire of licensed characters to include
the LITTLE MERMAID and MY LITTLE PONY, as well as the continued use of Mickey,
Minnie, Goofy, Donald Duck, and Winnie-the-Pooh (Pecora, 1998). According
to Seiter, character licensing is defined as, "the use of popular fictional
characters for a fee or share of the profits as the design or decoration on toys"
(1993, p. 194).
Licensed spokescharacters profited toys in several ways. Characters
presented recognizable toys and story lines (Pecora, 1998). Providing the
product with an identifiable spokescharacter could elevate the product above its
competitors (Seiter, 1993). For instance, action-figures from movies and
television animated series such as BATMAN. SUPERMAN, and STARS WARS have
experienced a long product lifespan (Guber & Berry, 1993).
As stated earlier, licensed characters also offer a line of accessories and
collectible items (Pecora, 1998). Seiter reports characters lengthen their shelf-
24

life through "lunchboxes, clothing, school supplies, and home decorations"
(1993, p. 198).
Furthermore, royalties from the character toys also became a secondary
source of income (Pecora, 1998). For example, toy companies such as
Playmates and Mattel created a TV program. SWANS CROSSING, during the fall of
1992 to promote character dolls. Federal advertising rules prevented the
advertising of the dolls and accessories during the show, but Playmates and
Mattel hoped the program's potential success would attract children to want the
dolls. Donna Gibbs, media relations director of Mattel, said, "Our goal in using
TV programs is to help build a story and a theme around these dolls, so little
girls get a good idea of the product and its character. TV brings the toys to life"
(Fitzgerald, 1992).
Marketers also altered advertising through merchandising and
promotions. The CARTOON NETWORK, NICKELODEON, and Fox KIDS are cable
channels devoted completely to the children's market. The youth market has
expanded beyond Saturday morning cartoons (Stoltman, 1999).
Business giants such as Disney and the CHILDREN'S TELEVISION
WORKSHOP reach children through their merchandising of goods and services.
Disney created a licensing unit through the success of Mickey Mouse in the
1930s (Pecora, 1998) and became a power-house due to prudent management
of these character licenses (Seiter, 1993). Children now have their choice of
licensed toys, theme parks, and school supplies (Stoltman, 1999).
25

Licensing has become a distinct business with marketers,
representatives, and trade shows (Seiter, 1993). During the late 1970s,
licensing received industry recognition and status. Prior to the 1980s,
agreements occurred between media producers and/or creators for the use of
characters intended for product manufacturing (Pecora, 1998). Toy producers
currently have 15 percent of the licensing market. This covers sports
organizations, television shows, logos, trade names, and the fictional characters
(Seiter, 1993).
Influence of Licensed Character
Licensed characters are created and shown in abundance on television
(Acuff & Reiher, 1997; Guber & Berry, 1993). Statistics indicate that from 1977
to 1987 toy advertisements increased from 20 percent to 70 percent in its use of
cartoon characters to sell toy products (Economist. 1996).
The entertainment industry has been accused of using cartoon characters
to simply sell an assortment of goods and products to children during recent
years (Pecora, 1998). The products advertisers promoted (such as, G.l. Joe and
Barbie) and the place where messages were conveyed (Saturday morning
programming) were questioned by critics in the eighties (Wright-lsak, 1999).
Other issues arose regarding licensed toy-lines and action figures associated
with television programs. Critics considered these television shows program-
length advertisements (John, 1999). Pecora indicates products such as
26

clothing, cereals, and vitamins made especially for kids are peddled by
"anthropomorphic animals and cartoon characters" (1998, p. 7).
These characters are not only utilized to solicit products, but are an
integral part of the product. The media character evolves into the brand name
(Pecora, 1998). Children observe and admire movie and television characters
displayed on lunchboxes and t-shirts around the snack table. When young kids
become devoted to a specific toy, mothers are asked to purchase the toys, rent
the videos, and go to the movies (Seiter, 1993). Alexander and Morrison (1995)
wrote, "During the 1980s, the licensing of the characters meant that personas
crafted for television became the predominant social identities children played
with and wore" (p. 347).
Kids favor characters to whom they can relate (Guber & Berry, 1993;
Acuff & Reiher, 1997). Children's reactions to a television advertisements are
shaped by who is conveying the message. A character representing a product
can considerably influence the assessment of a product based on the child's
opinion of the character (Van Evra, 1990).
Schneider (1987) indicates licensed cartoon characters are not
originating from television shows as in the past, but from toy manufacturers. The
toy companies create these toy products first and then create television shows
based on the toys. For example, toy products of years past (such as. HE-MAN.
SHE-RA. G.l. JOE. TRANSFORMERS, and GOBOTS) were converted into cartoon
shows for children. The thought behind creating television shows is if children
27

like the toys, they will like the show. In 1986, it was estimated licensing
increased to over $40 billion in sales (Schneider, 1987).
Kideo Productions patented the technology of specializing in a
personalized Barney video made for a specific child. Barney will say the child's
name throughout the video and the video cover will include the child's name on
the label. The president of Kideo Productions, Richard Bulman, said such
product and promotion strategies, "provide higher [profit] margins for
companies...[to] sell a video for $34.95 as opposed $9.95. But most important,
kids love it. It is something special and meaningful for them, and it's different
than what their friends have" (Schroeder, 1997, p. 72).
McDonald's and Kraft Foods teamed up for an approximate $50 million
promotional blitz on DISNEY'S ABC. ONE SATURDAY MORNING, time slot. The
campaign focused on the block of animated programming aired on Saturday
mornings. McDonalds specifically targeted the animated series. RECESS, for
February sweepstakes. McDonald's produced 50 million action figures
representing RECESS characters to be placed in Happy Meals. The marketing
stint also included a licensing line and Mattel toy line created to promote the
RECESS characters for a limited time. Other promotional tools included Kraft's
packaged instant-win game, which offered 15, 000 prizes from the animated
DOUG cartoon show (Stanley, 1998).
28

Children's Research Studies and Issues
An estimated 1400 citations on children's research and media of which
approximately 143 advertising studies are on children appeared between 1900
to 1990 (Pecora, 1998). Very little academic research on children's advertising
existed before 1970 (McNeal, 1987). Following 1970, advertising research
claimed a larger proportion of children's media research (Pecora, 1998).
Research studies explored topics such as social effects, media content,
and consumer behavior (Pecora, 1998). During the seventies, researchers
frequently investigated the role of media and children as consumers (Pecora,
1998; McNeal, 1992), revealing a more in-depth understanding of children's
consumerism (Pecora, 1998). Other studies investigated aspects of
consumption behavior and how the function of advertising and media affect
consumer socialization (Ward, 1976; Ward, Wackman, & Wartella, 1977;
Arnett, 1995; Bush, Smith, & Martin 1999; Stoltman, 1999; Wright-lsak, 1999).
Researchers have also examined the role parents and family communication
patterns play in consumer socialization of children (Moschis, 1985; Carlson &
Grossbart, 1988; Carlson, Walsh, Laczniak, & Grossbart, 1994; Rose, Bush &
Kahle, 1998; Bush, Smith, & Martin 1999).
Fields such as marketing and communications, as well as sociology and
psychology, have conducted many studies on the cognitive (Stoltman, 1999;
Wright-lsak, 1999), emotional, social, and behavioral effects of advertising on
children (Stoltman, 1999; Ward, 1976; Ward, Wackman, & Wartella, 1977). Most
29

of these studies concentrated on children's comprehension of the nature of
advertising (Stoltman, 1999). Academics also explored how children process
commercial information (Wright-lsak, 1999).
Studies involving children have widened, but objectives have stayed
constant: Researchers study children to measure economic behavior, brand
awareness and its effect. They investigate kids to evaluate media tendencies, to
review responses to new products and services, and to analyze reactions to
marketing promotions (McNeal, 1992). Researchers also explore children's
influence on parental purchases (McNeal, 1992; Ward, 1976).
Advantages of Interviewing Parents
When research involves children and estimates of how much or how
many, parents are a more ideal candidate to question. Acquiring information
about kids through parents occurs commonly in several areas. These areas
include information pertaining to children's economic behavior, media habits,
and product use by children (McNeal, 1992).
Researchers also utilize parents when pursuing information on children's
influence on parental purchases. Parents are customarily questioned about their
children's direct influence on parental purchases and other product requests.
Children are also asked about influence and purchase requests, but parental
assessment and memory appear more accurate, though both are subjective
(McNeal, 1992).
30

Problems Surveying Children
Using children for research brings up several issues. Adults may have
difficulty communicating efficiently with children. Kids often view adults as
authority figures and may have a hard time maintaining a conversation with them
(McNeal, 1992). Also, discriminating between what a child is really thinking and
what he or she says to please the researcher is difficult (Seiter, 1993). Children
also have language barriers. They have trouble articulating themselves and
what they know, especially about personal matters. Kids have a hard time
understanding research measurements and abstractions (McNeal, 1992).
Furthermore, children are difficult to reach. Children are either sleeping,
eating at daycare, or in school. Likewise, some people think children should be
protected from research. Due to these problems many businesses choose to
conduct more research with parents and minimal research with children.
Parents can be used for research for their kids and are often utilized (McNeal,
1992).
Theoretical Framework: Consumer Socialization
Consumer socialization is defined as "the gradual development of a broad
range of attitudes, knowledge, and skills which are related to consumption"
(Ward, Wackman, & Wartella, 1977, p.18). Sociologists define socialization as
a "process in which individuals are prepared to enter and play acceptable parts
in various kinds of groups. They learn norms, roles, systems of ranking, and
31

procedures of social control" (Lowery & DeFleur, 1983, p. 458). Socialization
involves a learning and teaching process where socialization agents such as
parents, peers, teachers, schools, and media (Ward, Wackman, & Wartella,
1977; Lowery & DeFleur, 1983; Carlson & Grossbart, 1988; McNeal, 1987; Bush,
Smith, & Martin, 1999) play a part in conveying various aspects of society or
conventional behaviors to other individuals who then become altered in some
way (Lowery & DeFleur, 1983).
Consumer socialization theory is a sociological idea which predominantly
concentrates on the effects of social agents on children's learning of consumer
behavior, as well as where and what kids are able to learn (McNeal, 1987).
Consumer socialization theory has been employed in many research studies
which focused on how the role of parents and family communication patterns
affect consumer socialization of children and their attitudes toward advertising
(Moschis, 1985; Carlson & Grossbart, 1988; Carlson, Walsh, Laczniak, &
Grossbart, 1994; Rose, Bush, & Kahle, 1998; Bush, Smith, & Martin, 1999).
Other research studies concentrated on how television advertising and media
influences the consumer socialization process of children (Ward, 1976; Ward,
Wackman, & Wartella, 1977; Arnett, 1995; Bush, Smith, & Martin, 1999).
Carlson and Grossbart (1988) explored the differences of parental
tendencies and how they can be predicted from socialization techniques used by
parents. The study revealed wide-ranging patterns of parent-child interactions to
several particular practices, consisting of the restriction and supervising of
32

children's media use and consumption, and the development of autonomous
consumption (Carlson & Grossbart, 1988).
Rose, Bush, and Kahle (1998) used consumer socialization as the
theoretical framework to investigate family communication patterns and attitudes
towards television advertising between U.S. and Japanese mothers with children
between the ages of three and eight. They applied a four-category typology to
categorize U.S and Japanese mothers as having a laissez-faire, protective,
pluralistic, or consensual outlook based on concept and socio-orientation.
Laissez-faire refers to a parental approach which demonstrates little
communication between parent and child, thus exhibiting the smallest amount of
influence in forming children's consumption behavior. Parents who use the
protective approach insist on peace and obedience. They have high levels of
communication with their children and restrict other information sources from
their kids. Pluralistic parents are inclined to emphasize issue-oriented
communication and uphold a horizontal relationship with their children. Parents
employing the consensual approach tend to also exercise issue-oriented
communication, but have parental control. The researchers found that U.S.
mothers were evenly spread among the four parental approaches, while
Japanese mothers were either laissez-faire or protective (Rose, Bush, & Kahle
1998).
Moschis (1985) investigated how the family communication process
influences children and adolescents' consumer learning. He also refers to the
33

four-category typology in his research. He found that parents do play an integral
part in children's consumer socialization directly and indirectly, but noted that
influence is situational. Parents' influence on children's socialization differs
across product categories and varies with consumer personality (Moschis,
1985).
Carlson, Walsh, Laczniak, and Grossbart (1994) studied the association
between "family communication patterns (FCP) and mothers' marketplace
motivations, attitudes, and behaviors (MAB) and examined adolescents'
prediction accuracy of mothers' consumption motivations" (Carlson et al., 1994,
p. 25). Results revealed family communication patterns are tied to shopping
habits and materialistic attitudes of mothers. Family communication patterns
also affect attitudes toward advertising, the use of information, and consumption
motivations. The data proposes family communication patterns may be included
in acquiring marketplace motivations, attitudes, and behaviors (Carlson, Walsh,
Laczniak, & Grossbart 1994).
Bush, Smith, and Martin (1999) examined how consumer socialization
variables affected the attitudes of African-Americans and Caucasians toward
advertising. The study used race, gender, peer/parental communication, and
mass media as socialization agents. They determined African-Americans view
advertising more positively and watch television more than Caucasians. The
researchers discovered a strong association between socialization agents and
attitudes toward advertising. Their research also supported previous findings
34
that children learn consumer skills from parents, mass media, and peers (Bush,
Smith, and Martin, 1999).
Researchers suggest kids learn consumer skills from various sources,
which include the mass media, peers, and parents (Carlson & Grossbart, 1988,
Ward et al., 1977). Companies and producers of children's products use
television advertising as the principal channel to influence children's consumer
behavior (McNeal, 1987).
The current study focuses on television advertising, specifically licensed
programming characters, as the socialization agent which may influence children
in their consumer socialization and product requests of their parents. This study
posits that children use licensed programming characters as a socialization
agent (information source), which influences them through television
commercials to want and desire character products or endorsed products
represented by licensed characters. Once the licensed character has influenced
the child to desire the product, children then attempt to exert influence on their
parents to purchase the item (Figure 1).
35

Child i=:I> Method of cz=^ Medium forizzv'Socialization cz:^ Outcomes Consumer Learning Learning Agent
Child 1^^Watch TV (-—KTelevision |—-KLicensed |-—»vChild Influenced: Consumer Commercials Programming Makes Purchase
Character Request/Influences Parent.
Figure 1. Consumer Socialization Process (Incidental Learning Model: McNeal, p. 13, 1987)
Summary
Kids commonly want what they view on television. Advertisers
appropriate a substantial amount of dollars to children's advertising. They use
television commercials as an avenue to sell products to kids, as well as to their
parents. Advertisers specifically use licensed characters as an advertising tool
within commercials to attract and influence children to want advertised products.
The evaluation of a product can be considerably affected based on the child's
opinion of the character representing it. The use of animated characters in
commercials has increased in children's advertisements over the last 30 years
due to its effect on the sale of products.
Children have also established themselves as a viable market. They
have wants, needs, and money. Advertisers and marketers continue to create
products specifically for kids to want and buy. They also attempt to utilize
children to influence their parents to purchase advertised products. Children's
36

influence on products range from toys to restaurant choice. Advertisers and
marketers alike realize the potential of sales of products if they can reach both
child and parent.
37

CHAPTER 111
RESEARCH QUESTIONS
According to Ward, Wackman, and Wartella (1977), children's confinual
contact with television commercials and programs make television
advertisements a principal information source. They also determined children
usually want what they see advertised on television (1977). Advertising tools
used to gain the attenfion of young viewers consist of visual effects, jingles,
repetifion, slogans and animation (Van Evra, 1990; Seiter, 1993). Animated
licensed characters are used to embody and solicit the product (Pecora, 1998).
The literature review revealed most children favor licensed characters with whom
they can identify (Guber & Berry, 1993; Acuff & Reiher, 1997) and the judgment
of a product can largely be affected by the child's opinion of the character (Van
Evra, 1990), therefore indicating the possibility that children desire products more
when a licensed character they like represents the product.
McNeal (1964), in his study of children aged five, seven, and nine, found
that when children seek out self-reliance and freedom from their parents, kids
tend to give more authority and area of influence to their peers pertaining to
preferences and mannerisms. Kline indicates more specifically that children are
attracted to toys based on their assessments and views of their peers. He also
reports social judgment of peers performs a vital funcfion in affecfing children's
38
preferences for a product (1993), which implies kids are more likely to want
licensed character products if their peers own them as well.
In addifion, Kline said, "children's preferences in toys and computer
games and their access to television guides most of their free-fime activifies and
these acfivifies are profoundly linked to their sense of happiness" (1993, p. 15).
Children like to observe other kids achieving happiness. Most advertisements
have the underlying theme of happy kids within the commercial scenes. These
scenes are frequent among cereal, snack, soft-drink, and toy advertisements
(Kline, 1993). Kline found 43% of commercial scenes displayed the portrayal of
real kids, to which young viewers relate, within the advertisement (1993). Ninety-
eight percent of scenes in toy advertisements show children playing with toys or
observing the toys. These scenes give children (viewers) insight into the world of
their peers, as well as express the emotional states associated with toys or
illustrated through toys in make believe play (Kline, 1993), consequenfly
suggesfing children think owning licensed character products will bring them
happiness.
Kids learn to obtain products by asking their parents (McNeal, 1992).
Children's earliest consumer behavior occurs when they attempt to influence
parental purchases (Ward, Wackman, & Wartella, 1977).
Parents are an acfive part of their children's lives. They observe their
children at rest and at play. Through purchase requests made by their children,
parents can assess the types of products their children want and desire. They
39

are better able to determine and remember how often and what types of products
their child requests, especially in the various shopping environments, than young
children.
Research Questions and Hypotheses
The following research questions and hypotheses will be used to gather
data for this research study.
RQi: Do parents of 6-11-year-old children feel the use of licensed characters
from television advertising and programming (i.e., animated or fictional
characters such as Rugrats) have a product demand influence on their
children's consumption desires?
Hi: Parents will report that their 6-11-year-olds perceive licensed
character products (or products advertised using such characters)
as more desirable.
H2: Parents will report their 6-11 -year-old children are more likely to
want licensed character products (or products advertised using
such characters) if their children's peers have the product.
H3: Parents of 6-11-year-olds will report their children think having
licensed character products (or products advertised using such
characters) will bring great happiness by ownership of such
products.
40

RQ2: Do parents of 6-11-year-olds feel their children exert a major
influence on the parental decision-making process for products
purchased speciflcally for the child's consumption.
41

CHAPTER IV
METHODOLOGY
Methods Used in Children's Research
Most methods employed in children's studies seldom deviate from the
survey research and experimental approaches (Stoltman, 1999). Quantitative
research supplies the researcher with quantity and a knowledge base. Guber
and Berry said the size of study is contingent upon "project needs, regional
variations, age differences, and cost" (1993, p. 57). Interviewing 300 to 400 kids
allows a margin of error of 3 to 5 percent, which indicates 95 percent accuracy in
the study's conclusions (Guber & Berry, 1993, p.57).
Marketers apply the quantitative research approach in many areas. The
approach can be used to examine product assumptions or children's
comprehension of essential product elements. Quantitative research can also
supply data results that could induce new thoughts about a product line (Guber &
Berry, 1993).
Kline (1993) used the telephone survey methodology and content
analysis of toy advertisements to collect data about child development and toy
consumption from parents. Kline presents a description of children's cultural
industries to contest the idea that socialization lies completely on the shoulders
of parents and school. He believes an invisible hand within the market affects
children's formative years by determining what they use and the media through
42
which they learn about products. Kline also reasons that market strategies are
determined by economic gain to influence the characteristics of children's culture
(Kline, 1993).
Rossiter and Robertson (1976) also conducted a telephone survey with
parents of first-, third-, and fifth-grade children who participated in an open-
ended, personal interview. The researchers examined Piaget's theory to
determine the effects of "developmental, social, and experiential factors" on
children's understanding of television advertisements using canonical correlation
analysis (Rossiter & Roberson, 1976, p. 317).
McNeal (1964) examined children's knowledge, attitudes, and participation
in specific elements of the consumer role, and attempted to determine the degree
to which these factors differ with age and sex roles, by interviewing children aged
five, seven, and nine.
Ward, Wackman and Wartella (1977) examined the norms and patterns of
children's spending behavior through interviewing 615 mother-child sets.
Mothers also completed a separate questionnaire after being interviewed in the
home and interviewers left a second questionnaire for fathers to complete. The
researchers proposed advertising yields substantial influence on consumer
learning. They determined children's information processing in reference to
product-purchase circumstances became more involved and complex as children
age (Ward, Wackman, & Wartella, 1977).
43

Alexander (1979) conducted a convenience sample study of 32
Columbus, Ohio, kindergarteners and third graders, as well as their mothers.
The study investigated persuasive techniques children employ in consumer
request circumstances and the relationship between these techniques.
Examining the child' s cognitive development and interaction within the home
served as two other focal points of the study. Both mother and child were
interviewed and audio taped for the study. Mothers also completed an additional
paper questionnaire (Alexander, 1979).
Ward (1976) presents an overview of research, methodologies, and
signiflcant findings discovered in his research project investigating the effects of
television advertising on children and teenagers between the ages of 5 to 18
years old. The research project examined what children and teenagers learn
from advertisements on television and attempted to correlate television
advertisements to various levels of learning pertaining to age groups (Ward,
1976).
The research project applied three surveys and one clinical exploration.
The first questionnaire surveyed 1,094 high school juniors and seniors in April
1970 to collect information about advertising and commercial attitudes, level of
family interaction concerning consumption issues, commercial effects on buying
behavior, and attitudes about materialism. The second questionnaire,
administered in the spring of 1974, involved 134 mothers of children between the
ages of 5 to 12. Mothers observed the television and commercial viewing of one
44

of their children for 6 to 10 hours during customary viewing periods over a course
of 10 days (Ward, 1976). In the third survey, 134 mothers were sent a mail
questionnaire concerning their perspective of commercial influence on their
child's behavior in regards to influencing purchases and how often parents
concede to these requests (Ward, 1976). The exploratory research comprised of
four groups of five children from kindergarten, second, fourth, and sixth grade.
The research gauged the effects of commercials on young children and linked
these effects to the various levels of cognitive development (Ward, 1976).
The three areas of major research exploring children ages 5 to 12
included: commercial watching behavior, effects on cognitive development, and
effects on interpersonal relationships. The third area of research regarding
interpersonal relationships targeted the degree to which children try to influence
their parents' purchases of goods.
Method Selection
The telephone survey method was employed in the current study. This
research design was selected because of several factors. The survey method
provides more control for the researcher. The researcher, through simple
observation, can monitor phone calls made by interviewers and can instruct
interviewers how to approach participants on the phone to limit bias. Bias can
also be reduced through carefully worded, detailed questions. Additionally, the
45

method is economical, minimal and inexpensive and allows the use of many
people to gather data in a short amount of time.
Telephone Survey Overview
A telephone survey was conducted at the Institute for Communications
Research at Texas Tech University in the School of Mass Communications.
Callers consisted of undergraduate Mass Communications summer school
students and Texas Tech alumnus. Callers attended a training session 30
minutes before the survey began each night. The sessions provided pertinent
information to help callers understand how to conduct the survey, code the call
sheet, deal with potential problems from respondents, and address any
unanswered questions. The telephone survey began on Monday, June 12, 2000
and ended Friday, June 23, 2000. Phone calls were made from June 12 to June
15 and from June 19 to June 23 starting at 6 p.m. and ending at 9 p.m. Phone
calls made on Saturday. June 17 started at 12 p.m. and ended at 3 p.m. Two
Sunday sessions occurred on June 18 from 2 p.m. to 5 p.m. and from 6 p.m. to 9
p.m.
Sample
Parents with elementary aged children between 6 and 11 were selected
randomly from the Lubbock population to participate in the phone survey. Maritz
Marketing Research, a third-party research sampling service, provided random
46

phone numbers. The computer generated phone numbers had an approximate
90 percent working number rate. Maritz Marketing Research provided 2000
phone numbers. Callers attempted to reach 1,225 phone numbers, but 905
phone numbers resulted in a busy signal or no answer, an answering machine, a
refusal, a terminated or disconnected number, an accidental business number, a
language barrier, or no children in the household. Callers completed 320
questionnaires, but 20 were only partially completed. Callers collected 300
usable, completed questionnaires (15% completion rate). The margin of error
was +/- 2.9 percent.
The purpose of the study was to identify parental responses of children
between the ages of 6-11 on the use of licensed characters from television
advertising and programming, to determine if these characters influence their
children's product consumption desires, and to identify how much influence
children have over the parental-decision making process for products purchased
speciflcally for children.
Instruments
Each question in the telephone survey related to the research questions or
the hypotheses. The survey examined how parents perceive their children's
influence on product purchases and how influential, if at all, licensed characters
are on children's product demand.
47
Most questions originated from published research using: Ward,
Wackman, and Wartella (1977, pp. 221-222), Kline (1993, pp. 354-367), and
McNeal's (1964) Marketing study series no. 9 in Children as Consumers.
McNeal's questions were reworded by the researcher from the child's
perspective to the parent's perspective. Added to this survey were demographic
questions and instructions. See complete questionnaire. Appendix A.
The following questions listed below were used within the survey. The
research questions, hypotheses, and specific questions used to measure the
hypotheses are listed and presented in the subsequent paragraphs.
Research Question 1, Hypotheses 1 and 3 are worded in the form of a
question to ask respondents directly about the issue.
1. Does your child perceive advertised items they see on TV as more
desirable?
2. Does your child think owning advertised items on TV will make them
happier?
Measures
The specific questions listed below were used within the survey. The
research questions, hypotheses, and questions used to measure the hypotheses
are presented in the following paragraphs.
48
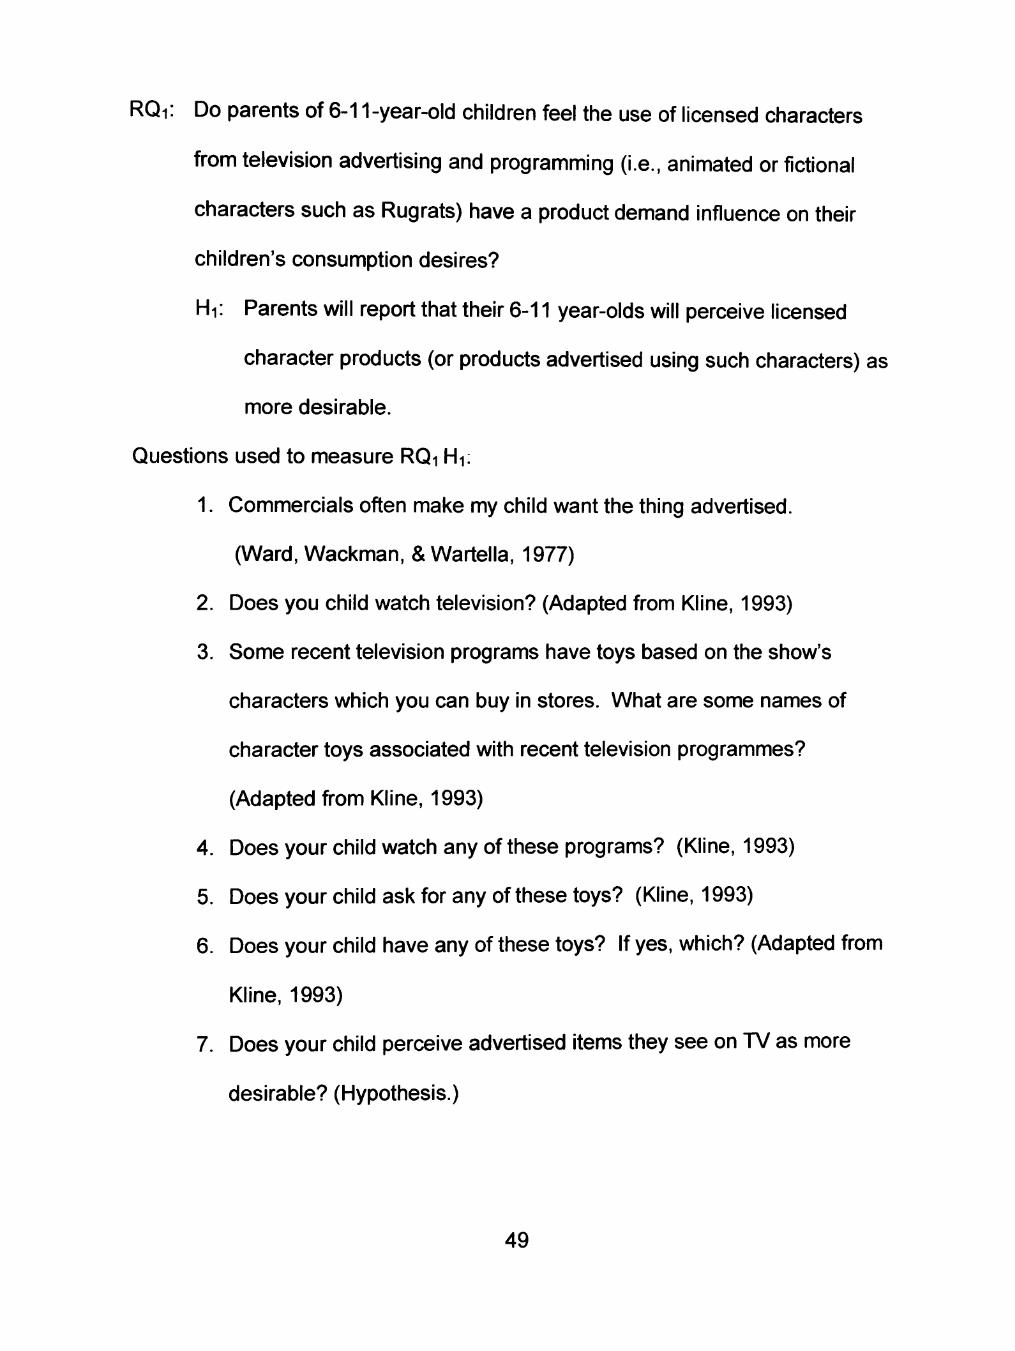
RQi: Do parents of 6-11-year-old children feel the use of licensed characters
from television advertising and programming (i.e., animated or fictional
characters such as Rugrats) have a product demand influence on their
children's consumption desires?
Hi: Parents will report that their 6-11 year-olds will perceive licensed
character products (or products advertised using such characters) as
more desirable.
Questions used to measure RQi Hi:
1. Commercials often make my child want the thing advertised.
(Ward, Wackman, & Wartella, 1977)
2. Does you child watch television? (Adapted from Kline, 1993)
3. Some recent television programs have toys based on the show's
characters which you can buy in stores. What are some names of
character toys associated with recent television programmes?
(Adapted ft"om Kline, 1993)
4. Does your child watch any of these programs? (Kline, 1993)
5. Does your child ask for any of these toys? (Kline, 1993)
6. Does your child have any of these toys? If yes, which? (Adapted from
Kline, 1993)
7. Does your child perceive advertised items they see on TV as more
desirable? (Hypothesis.)
49

Questions used to measure RQi H2:
H2: A majority of parents will report their 6-11-year-old children are more likely
to want licensed character products (or products advertised using such
characters) if their children's peers have the product.
1. Do you feel that if your child does not have popular toys he/she will
experience many, some, few or no difficulties in playing with other
children? (Adapted from Kline, 1993.)
2. Does your child ever go buy things with a friend? (Adapted from
McNeal, 1964)
3. If yes, does your child's friend help your child decide on things?
(Adapted from McNeal, 1964)
Questions used to measure RQi H3:
H3: Parents of 6-11-year-olds will report their children will think having
licensed character products (or products advertised using such
characters) will bring greater happiness by ownership of such products.
1. My child understands what commercials on children's shows are trying
to do. (Ward, Wackman, & Wartella, 1977)
2. Does your child think owning advertised items on TV will make them
happier? (Hypothesis)
RQ2: Do parents of 6-11-year-olds feel their children exert a major influence on
the parental decision-making process for products purchased specifically for the
child's consumption?
50

Questions used to measure RQ2:
1. Do you ask your child what their preference is when you are buying
something for them? (Adapted from: Ward, Wackman, & Wartella,
1977)
2. When you go to the store, does your child wish to go with you or stay
at home? (Adapted from McNeal, 1964)
3. Does your child make certain selections? If yes, for which products?
(Adapted from McNeal, 1964)
4. Does your child make various suggestions? If so, for what products?
(Adapted from McNeal, 1964)
5. Do you ask for your child's opinion about purchases you make?
(Adapted from McNeal, 1964)
6. When you buy things for your child, do you usually get the 'right'
things? If no, why? (Adapted from McNeal, 1964)
7. Would your child like to do the buying of the items for themselves? If
yes, why? (Adapted from McNeal, 1964)
8. Does your child ask you to buy many of the things they see advertised
on television? (Adapted from McNeal, 1964)
51

The alpha level for accepting or rejecting hypotheses was determined at
.05. The majority of questions used to measure the hypotheses must be
statistically significant to accept the hypothesis. Hypotheses directiy asked must
also be tested for statistical significance to be accepted. OthenA ise, the
hypothesis will be rejected, though there may be other statistically significant
data.
52

CHAPTER V
DATA ANALYSIS
Demographics: Parents
The questionnaire addressed two issues: parental views on licensed
characters from television advertising and programming and their product
demand influence on children's consumption desires. It also examined the
influence children exerted on the parental-decision making process for products
bought specifically for them.
The majority of survey respondents were female and between the ages of
31 and 45 (Table 4). The survey was administered during the evenings from
June 12, 2000, to June 15, 2000, and from June 19, 2000, to June 23, 2000.
The time of year and different time periods the survey was administered may
have resulted in more females participating in the survey than males.
A total of 300 Lubbock County residents (Table 1) participated in the
telephone survey. The questionnaire provided demographic information
regarding the respondent's gender, age, marital status, education, and income
level.
The demographic information presented in Tables 1-4 represents
respondent attributes. A total of 300 respondents identified their gender and age
bracket (Table 4). The largest proportion of respondents were married (92%,
276, Table 1). The largest percentage of respondents who reported their
education level indicated they had received a Bachelor's Degree (Table 2). The
53

majority of respondents reported an annual income of $50,000 and above (Table
3). Nineteen respondents (6%) did not disclose their annual income.
Demographics: Children
The survey respondents were parents who had children between the ages
of 6-11 (Table 7). An alternating pattern was established to keep the birth order
distribution of children between the ages of 6-11 as equal as possible. When a
family had more than one child in the 6-to-11 age group, each interviewer was
assigned to inquire about either the oldest or youngest child. The majority of
respondents indicated having only one child between the ages of 6-11 to
represent in the survey (65%, 195, Table 5). Twenty percent (59) of respondents
represented their oldest child and 22% (66) represented their youngest child.
The largest percentage of respondents (65%) indicated having only one child
between the ages of 6-11 in the household.
The demographic attributes of children are shown in Table 6-8. A total of
300 respondents indicated their child's gender (Table 6). A slightiy higher
percentage of male children were represented (51%).
A total of 287 respondents clearly reported their child's age (Table 7).
While the largest proportion of respondents reported having a 10-year-old in their
household (20%), the ages of the children represented are from 6-11.
The chi-square test was used to assess ordinal and nominal level data; an
alpha of .05 was set. After chi-square tests were performed, some survey
54
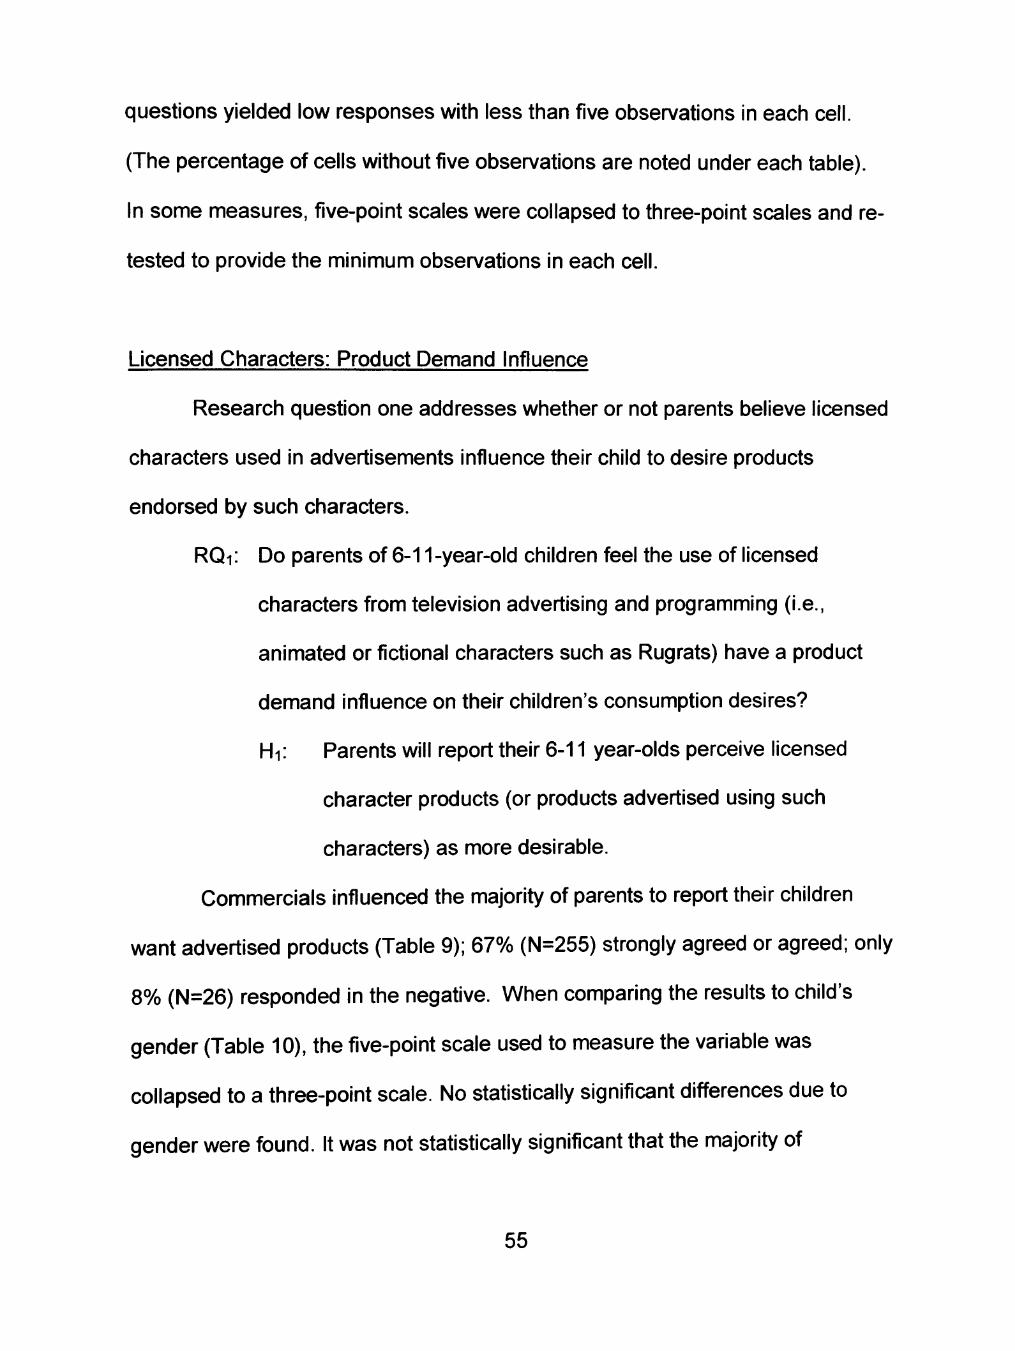
questions yielded low responses with less than five observations in each cell.
(The percentage of cells without five observations are noted under each table).
In some measures, five-point scales were collapsed to three-point scales and re-
tested to provide the minimum observations in each cell.
Licensed Characters: Product Demand Influence
Research question one addresses whether or not parents believe licensed
characters used in advertisements influence their child to desire products
endorsed by such characters.
RQi: Do parents of 6-11-year-old children feel the use of licensed
characters from television advertising and programming (i.e.,
animated or fictional characters such as Rugrats) have a product
demand influence on their children's consumption desires?
Hi: Parents will report their 6-11 year-olds perceive licensed
character products (or products advertised using such
characters) as more desirable.
Commercials influenced the majority of parents to report their children
want advertised products (Table 9); 67% (N=255) strongly agreed or agreed; only
8% (N=26) responded in the negative. When comparing the results to child's
gender (Table 10), the five-point scale used to measure the variable was
collapsed to a three-point scale. No statistically significant differences due to
gender were found. It was not statistically significant that the majority of
55

respondents who reported they agreed commercials made their child want
advertised items had a male child.
A total of 287 respondents indicated their child's age (Table 11). Thirty-
two percent (N=91) of respondents had a 6- or 7-year-old child in their
household. Thirty-four percent (N=97) of respondents had an 8- or 9-year-old
child in their home and 34% percent (N=99) of respondents reported they had a
10- or 11-year-old child in their household.
Children's age groups were originally divided into six categories, but were
collapsed to three categories to meet assumptions of the Chi-square test. The
age categories were grouped as: 6- and 7-year-olds, 8- and 9-year-olds, and 10-
and 11-year-olds. Also, the five-point scale used to measure responses was
collapsed to a three-point scale. Both scales were collapsed because the
variables yielded less than 5 observations in each cell.
A statistically significant percentage of respondents (85%, N=242)
indicated they agreed or strongly agreed commercials made their child desire
advertised products (X^= 10.2, df=4, p=.04), although two cells still had less than
five observations each. Only 9% (N=26) of respondents disagreed or strongly
disagreed.
The majority of respondents (54%) reported their child watches television
often (Table 13); 5% (N=14) of respondents reported their child rarely watches
television. There was no statistically significant difference in the amount of
viewing by gender.
56

While not statistically significant, more parents of 6-7 and 10-11-year-olds
reported their children watch television often; parents report 8-9-year-olds watch
television sometimes. The highest percentage of respondents who reported their
child often watches television had a 10- or 11-year-old in their household.
Though the age groups were collapsed, 3 cells had less than 5 expected
observations.
Almost all (293) parent respondents could name a television program
offering merchandised toys centered on the show's characters (Table 15). The
majority of respondents indicated their child watches Pokemon (33%, N=98); 8%
(N=23) of the respondents reported their child watches Rugrats and 7% percent
said their child watches Power Rangers (N=21). Television shows with few
responses were collapsed to a new category of other. Twenty percent (N=58) of
the respondents' answers fell into this category.
A majority (67%) of parents indicated their child watches television
programs with merchandised products often or sometimes (Table 16). Only 40
parents (13%) reported their children never watched such shows. There was no
statistically significant difference in exposure to these shows by gender (Table
17). A statistically significant difference occurs when comparing the frequency of
watching such shows by age (Table 18). It appears that, as children get older,
viewership of such programs declines (X^=22, df=8, p= .005).
A majority of respondents reported their child asks for character toys often
(27%) or sometimes (30%), a total of 57% (Table 19). Only 18% (N=55) of the
57
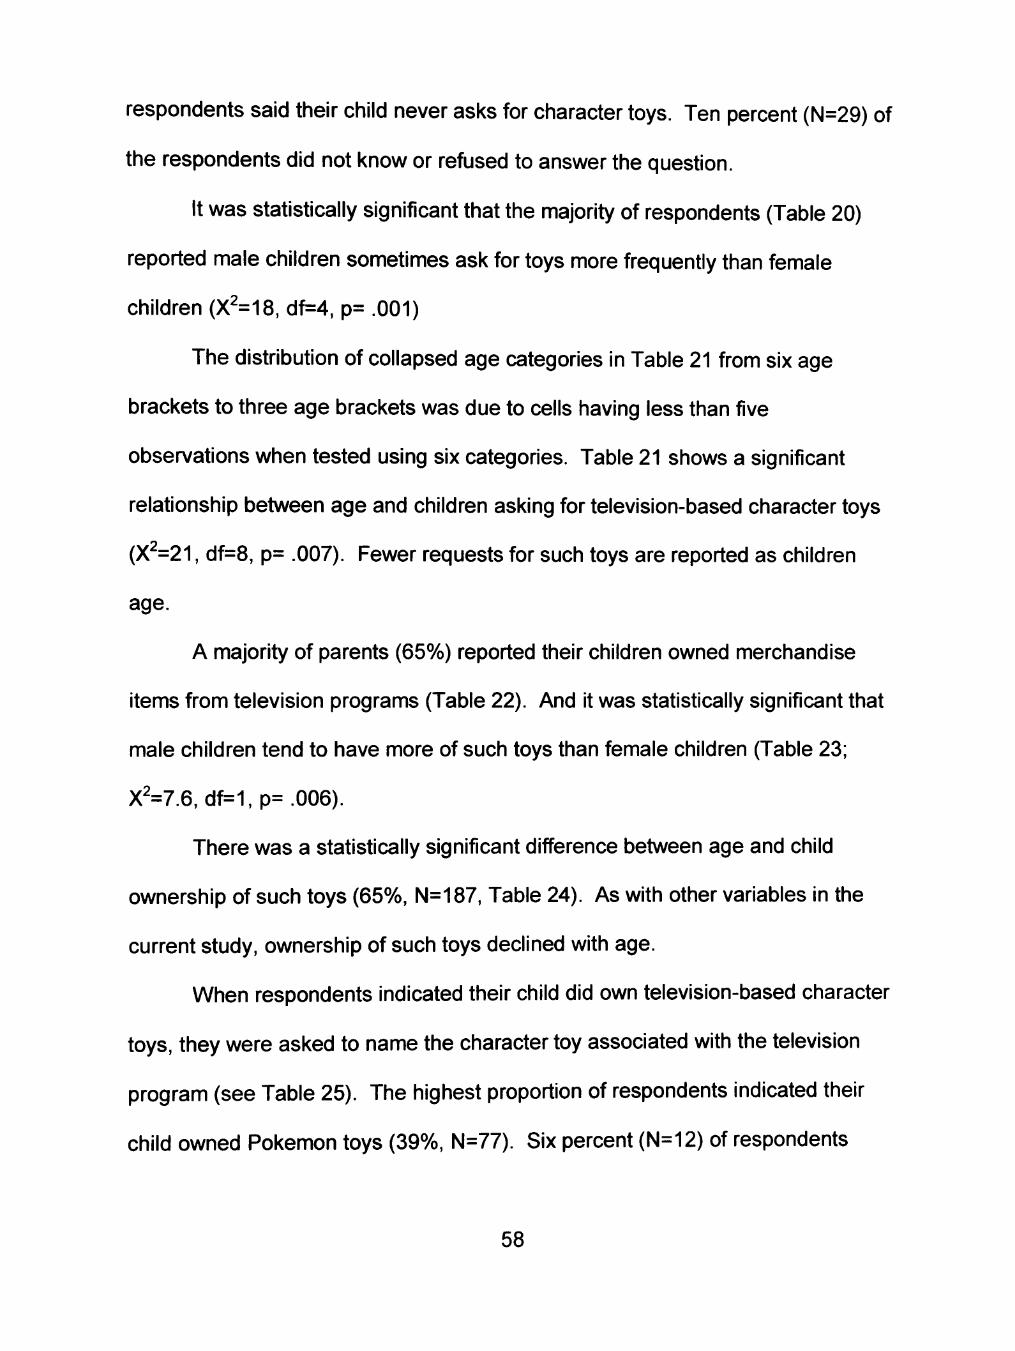
respondents said their child never asks for character toys. Ten percent (N=29) of
the respondents did not know or refused to answer the question.
It was statistically significant that the majority of respondents (Table 20)
reported male children sometimes ask for toys more frequentiy than female
children (X^=^S, df=4, p= .001)
The distribution of collapsed age categories in Table 21 from six age
brackets to three age brackets was due to cells having less than five
observations when tested using six categories. Table 21 shows a significant
relationship between age and children asking for television-based character toys
(X^=21, df=8, p= .007). Fewer requests for such toys are reported as children
age.
A majority of parents (65%) reported their children owned merchandise
items from television programs (Table 22). And it was statistically significant that
male children tend to have more of such toys than female children (Table 23;
X2=7.6, df=1,p=.006).
There was a statistically significant difference between age and child
ownership of such toys (65%, N=187, Table 24). As with other variables in the
current study, ownership of such toys declined with age.
When respondents indicated their child did own television-based character
toys, they were asked to name the character toy associated with the television
program (see Table 25). The highest proportion of respondents indicated their
child owned Pokemon toys (39%, N=77). Six percent (N=12) of respondents
58

reported their child had Power Rangers toys and 6% (N=12) of respondents said
their child had Rugrats toys.
Of the 300 respondents, 65% disclosed they believed their child thought
advertised items were more desirable (Table 26). Both male and female
children, as reported by their parents, believed advertised items were more
desirable by a 2-to-1 margin; however, the distribution was not statistically
significant (Table 27). Nor was there statistically significant differences of the
perceived desirability of advertised items in terms of age (Table 28).
The highest percentage of respondents who indicated their child perceived
advertised items as more desirable were female parents (Table 29). Female
parents were more likely to report their children perceived advertised items as
more desirable than male parents (68% of females versus 56% of males; X^=3.6,
df=1,p=.06).
Hypothesis 1 was partially supported, but was rejected. The data yielded
results which were both statistically and not statistically significant. The
hypothesis was directiy asked in the form of a question and though the majority
of parents reported their child viewed products represented by licensed
characters as more desirable, it was not statistically significant. Therefore the
hypothesis must be rejected.
However, it was statistically significant that 85% (N=242) of parents
indicated they agreed or strongly agreed commercials made their child desire
advertised products. Also, a statistically significant difference occurs when
59

measuring the frequency of watching licensed character shows by age. It seems
as children get older, viewership of such programs decline. It was statistically
significant as well, that the majority of parents reported male children sometimes
ask for toys more often than female children. Though a statistically significant
relationship between age and children asking for television-based character toys
exists, requests for characters toys lessens as children grow older. It was also
found that a larger percentage of parents (65%) indicated their children owned
merchandise items from television shows, and it was statistically significant that
male children were more apt to have more of such toys than female children.
H2: Parents will report their 6-11-year-old children are more likely to
want licensed character products (or products advertised using
such characters) if their children's peers have the product.
A total of 300 respondents reported the level of difficulty their child may or
may not have due to popular toys (Table 30). The four-point scale used to test
the variable was collapsed to a three-point scale due to results yielding less than
five observations per cell.
The majority of respondents (59%) reported their child would have no
difficulties playing with other children if their kids did not own popular toys (Table
31). While not statistically significant, parents also reported these difficulties
were not gender-specific nor age-specific (see Tables 31 and 32).
A majority of respondents (78%) indicated their child does not go and buy
products with a friend (Table 34). While there was no statistically significance in
60

buying with a friend by child gender (Table 34), it was statistically significant by
age (Table 35). Again, as age increases, children are more likely to shop in the
presence of peers (X^=25.8, df=5, p= .00).
A total of 65 respondents reported their child does go shop and buy
products with a friend (Table 36). A majority. 69% (N=45) indicated their child's
friend had an influence on purchases. This influence was not gender-specific
(Table 37) nor age-specific (Table 38).
Hypothesis 2 is not supported. Due to the lack of measures, hypothesis 2
could not be accurately determined.
Hs: Parents of 6-11-year-olds will report their children will think having
licensed character products (or products advertised using such
characters) will bring great happiness by ownership of such
products.
A majority of parents (77%) indicated their child understands the intent of
commercials (Table 39). There was no statistical significance of this
understanding by child's gender (Table 40) nor age (Table 41). However, a
majority (57%) indicated their children do not think owning advertised items will
make them happier (Table 42). Female children are more likely to not think such
toys will make them happier than are male children (Table 43), but not at the .05
alpha level (X^= 3.3, df=1, p=. 07). There was no statistical significant difference
of this happiness by age (Table 41).
Hypothesis three is partially supported.
61

Influence on Parental Product Purchasing
Research question two focuses on whether or not parents feel their child
influences their purchase decisions for child-related products.
RQ2: Do parents of 6-11-year-olds feel their children exert a major
influence on the parental decision-making process for products
purchased specifically for the child's consumption.
A total of 300 respondents reported whether they asked their child for their
product preference (Table 45). Sixty-eight percent (N=204) of parents ask their
child often, 26% (N=77) of parents ask their child sometimes, 5% rarely asks
their child and 2% (N=5) never asks their child for their product preferences. The
4-point scale was collapsed to a 2-point scale due to too few observations per
cell when the variable was tested using the 4-point scale. Asking for preferences
by parent gender was not statistically significant (Table 46).
A majority of parents (71%) take their children shopping with them (Table
47) and 94% ask their child's preference in selecting products (Table 46). While
there was no statistical difference in asking children's preference by gender of
the parent (Table 46), there was somewhat of a difference in store trips by child's
gender (Table 48; X^=3.5, df=1, p=.06).
A total of 300 respondents reported whether or not they allowed their child
to make product selections. Eighty-four percent of parents (N=252) allow their
child to make their own product selections (Table 49). It was found to be
significant that more female children were allowed to make their own product
62

selections than were male children (X^=5.38, df=7, p=.02); Table 50). There was
no significance in self-product selection by age (Table 51).
Respondents who allowed their child to make product selections listed the
types of products their child could select (Table 52). Forty-eight percent (N=119)
of respondents allowed their child to select grocery store products, 26% (N=64)
allowed their child to make toy selections and 12% let their child choose clothing
items.
The majority of respondents (86%) reported their child makes product
suggestions (Table 53). While it was not found to be statistically significant that
child product suggestions were gender specific (Table 54), product suggestions
as a factor of age was found to be statistically significant (X^=12.8, df=5, p= .03;
Table 55).
Forty-two percent of parents indicated their child made product
suggestions regarding grocery items; 23% of respondents reported their child
makes suggestions concerning toy products, while 11% of respondents said their
child makes suggestions about clothes (Table 56).
The majority of parents (91%) indicated they buy the "right" things for their
child (Table 57). There was no statistically significant difference of parent gender
and the purchase of "right" products (Table 58; an operational definition of the
term "right" was not supplied, likewise, it was not defined in the original study;
McNeal, 1964).
63

A total of 26 respondents reported why they felt they did not purchase the
"right things" for their child (Table 59). Respondents presented various answers.
Eleven percent (N=3) of respondents simply stated they buy the wrong products
for their child, 11% (N=3) reported that their child has different tastes in products
and another 11% (N=3) of respondents indicated they search for bargain
products which do not coincide with the child's expectations.
Table 60 reveals that the highest proportion of respondents (66%) ask
their child's opinion about purchases they make. Female parents are more likely
to ask for their child's opinions than male parents (X^=10.6, df=1, p= .001; Table
61).
Table 62 shows a higher proportion of respondents (67%) reported their
child preferred to buy products for themselves. Preferring to buy products for
themselves was not significant when looked at by child gender (Table 63) or child
age (Table 64).
A total of 199 respondents reported why their child prefers to buy products
for themselves (Table 65). The majority of the answers could not be categorized
and fell into a mixed category (40%). Sixteen percent (N=31) of respondents
indicated children would prefer to shop for themselves so they can get exactly
what they want, 11% (N=22) reported their child feels a sense of independence
when they shop for themselves, and 9% each (N=17) of respondents said either
their child feels in control when they get to purchase items for themselves or their
child feels more adult when they do so.
64

The majority of respondents (57%) indicated their child asks to buy
advertised items (Table 66). While there was no difference in children asking for
advertised products based on the child's gender (Table 67), the distribution by
age was statistically significant (Table 68). Children tend to ask for advertised
items less as they grow older (X^=14, df=5, p= .02).
Research question two examines whether parents of 6- to 11-year-old
children feel their children exert a major influence on the parental decision
making process for products purchased specifically for the child's consumption.
Several of the results were not statistically significant, but several of the results
were statistically significant.
It was statistically significant that the majority of respondents allowed their
child to make product selections (X^=5.4, df=1, p= .02) when shopping. During
these shopping trips to the store, children also made product suggestions. And it
was determined to be statistically significant that children in these age groups
participate in making suggestions (X^=12.8, df=5, p= .03). Furthermore, it was
statistically significant that the majority of respondents ask their child's opinion
about product purchases (X^=10.6, df=1, p= .001). ft was also statistically
significant that the majority of respondents reported their child, ages 6 to 11, asks
for advertised products (X^=14, df=5, p= .02). Though influence exerted on
parents cannot be measured numerically, the data indicates children do exert
some influence on parental purchases.
65

Table 1: Respondent Marital Status
Marital Status F3 %" Single 24 8" Married 276 92 Total 300 100
Table 2: Respondent Education Level
Education Level GED High school diploma Some college Bachelors degree Masters degree PhD Vocation training Other Total
N 8
43 94
111 31 4
CO C
D
300
%
3 14 31 37 10
1 1 2
100
'Does not add up to 100% due to rounding
Table 3: Respondent Income
Income Under 10,000 10,000-14,000 15,000-19,000 20,000-24,000 25,000-34,000 35,000-39,000 40,000-44,000 45,000-49,000 50,000 and above Refused Total
N 2 5 2
13 16 27 24 17
175 19
300
%
1 2 1 4 5 9 8 6
58 6
100
66

Table 4: Respondent Gender by Age
Parent Age Under 21 21-25 26-30 31-35 36-40 41-45 46-50 Over 50 Total
Parent Gender
Male Female N 0 2 3
12 25 19 8 4
73
% N 0 2 1 1 1 13 4 62 8 82 6 47 3 17 1 3
24 227
%
1 0 4
21 27 16 6 1
76
Total N 2 3
16 74
107 66 25 7
300
%
1 1 5
25 36 22 8 2
100
Table 5: Number Children between Ages 6-11
Number Children 6-11 N %
One Two Three Four Five Total
195 90 13
1 1
300
65 30
4 0 0
100
*Does not add up to 100% due to rounding
Table 6: Gender Child
Child Gender N %
Male Female Total
154 146 300
51 49
100
67

Table 7: Age Child
Child Age 6 7 8 9
10 11 Total Missing Total
N 48 43 46 51 59 40
287 13
300
%
16 14 15 17 20 13 96 4
100
'Does not add up to 100% due to rounding
Table 8: Birth Order Children
Birth Order Children Ages 6 to 11 Oldest Youngest Only Total
N
59 66
175 300
%
20 22 58
100
Table 9: Commercials Make My Child Want Advertised Products
Scale N % 44 43
6 8 0
100
*Does not add up to 100% due to rounding
strongly agree Agree Neutral Disagree strongly Disagree Total
125 130
19 25 1
300
68

Table 10: Commercials Make My Child Want Advertised Products by Gender
Child Gender Male
Female
Total
N % Child Gender % Commercials % Total N % Child Gender % Commercials % Total N % Child Gender % Commercials % Total
strongly Agree/Agree
134 87 53 45
121 83 47 40
255 85
100 85
Neutral
9 6
47 3
10 4
53 3
19 6
100 6
Strongly Disagree/Agree
11 7
42 4 15 10 58 5
26 9
100 9
Total
154 100 51 51
146 100 49 49
300 100 100 100
(X2=1.1,df=2, p=.57)
Table 11: Commercials Make My Child Want Advertised Products by Age
Child Age
6/7
8/9
10/11
Total
N %
%
%
N %
%
%
N %
%
%
N %
%
%
Child Gender Commercials Total
Child Gender Commercials Total
Child Gender Commercials Total
Child Gender Commercials Total
Strongly Agree/Agree
79 87 33 28 83 86 34 29 80 81 33 28
242 85
100 85
Neutral
9 10 47 3 6 6
32 2 4 4
21 1
19 6
100 6
Strongly Disagree/ Disagree
3 3
12 1 8 8
31 3
15 15 58 5
26 9
100 9
Total
91 100 32 32 97
100 34 34 99
100 34 34
287 100 100 100
(X2=10.2, df=4, p=.04)
69

Table 12: Child Television Viewing
Scale Often Sometimes Rarely Total
N 161 125
14 300
%
54 42
5 100
'Does not add up to 100% due to rounding
Table 13: Child Television Viewing by Gender
Child Gender Male
Female
Total
N %
%
%
N %
%
%
N %
%
%
Child Gender Child Total
Child Gender Commercials Total
Child Gender Commercials Total
Often
85 55 53 28 76 52 47 25
161 54
100 54
Sometimes
61 40 49 20 64 44 51 21
125 42
100 42
Rarely
8 5
57 3 6 4
43 2
14 5
100 5
Total
154 100 51 51
146 100 49 49
300 100 100 100
(X2=.65, df=2, p= .72)
70

Table 14: Children Television Viewing By Age
Child Age 6/7
8/9
10/11
Total
N %
%
%
N %
%
%
N %
%
%
N %
%
%
Child's Age Child Watches TV Total
Child's Age Child Watches TV Total
Child's Age Child Watches TV Total
Child's Age Child Watches TV Total
Often
48 53 32 17 43 44 29 15 59 60 39 21
150 52
100 52
Sometimes
41 45 33 14 46 47 37 16 36 36 29 13
123 43
100 43
Rarely
2 2
14 1 8 8
57 3 4 4
29 1
14 5
100 5
Total
91 100 32 32 97
100 34 34 99
100 34 34
287 100 100 100
(X2=7.5, df=4, p=.11)
A. 3 cells (33.3%) have expected count less than 5.
Table 15: Recall of Television Program Characters
Television Program Names Barney Blues Clues Digimon Pokemon Power Puff Girls Power Rangers Rugrats Teletubbies Other None Total
N 9 12 8 98 7 21 23 12 58 45 293
_ % _
3 4 3 33 2 7 8 4 20 15 100
71

Table 16: Watches Television Programs with Licensed Characters
Scale N _ % _ Often ~ 87 ~29~ Sometimes 114 38 Rarely 29 io Never 40 13 DK/Refused 30 10 Total 300 100
Table 17: Watches Television Programs with Licensed Characters by Gender
Male
Female
Total
N % Child Gender % Programs % of Total N % Child Gender % Programs % of Total N % Child Gender % Programs % of Total
Often 48 31 55 16 39 27 45 13 87 29
100 29
Sometimes 64 42 56 21 50 34 44 17
114 38
100 38
Rarely 14 9
48 5
15 10 52 5
29 10
100 10
Never 16 10 40 5
24 16 60 8
40 13
100 13
DK/Refused 12 8
40 4
18 12 60 6
30 10
100 10
Total 154 100 51 51
146 100 49 49
300 100 100 100
(X2=5.26, df=4, p= .26)
72

Table 18: Watches Television Programs with Licensed Characters by Age
6/7
8/9
10/11
Total
N % Child Age % Programs % of Total N % Child Age % Programs % of Total N % Child Age % Programs % of Total N % Child Age % Programs % of Total
Often 33 36 41 12 21 22 26 7
26 26 33 9
80 28
100 28
Sometimes 39 43 35 14 41 42 37 14 31 31 28 11
111 39
100 39
Rarely 11 12 41 4 9 9
33 3 7 7
26 2
27 9
100 9
Never 4 4 10 1
14 14 36 5
21 21 54 7
39 14
100 14
DK/Refused 4 4
13 1
12 12 40 4
14 14 47 5
30 10
100 10
Total 91
100 32 32 97
100 34 33 99
100 34 34
287 100 100 100
(X2=22, df=8, p= .005)
*Does not add up to 100% due to rounding
Table 19: Child Asks For Licensed-Character Toys
Scale N Often Sometimes Rarely Never DK/Refused Total
82 89 45 55 29
300
%
27 30 15 18 10
100
73

Table 20: Child Asks For Licensed-Character Toys by Gender
Male
Female
Total
N % Child Gender % Asks For Toys % of Total N % Child Gender % Asks For Toys % of Total N % Child Gender % Asks For Toys % of Total
Often 56 36 68 19 26 18 32 9
82 27
100 27
Sometimes 48 31 54 16 41 28 46 14 89 30
100 30
Rarely 17 11 38 6
28 19 62 9
45 15
100 15
Never 21 14 38 7
34 23 62 11 55 18
100 18
DK/Refused 12 8
41 4
17 12 59 6
29 10
100 10
Total 154 100 51 51
146 100 49 49
300 100 100 100
(X2=18, df=4, p=.001)
Table 21: Child Asks For Licensed-Character Toys by Age
6/7
8/9
10/11
Total
N % Child Age % Asks for toys % of Total N % Child Age % Asks for toys % of Total N % Child Age % Asks for toys % of Total N % Child Age % Asks for toys % of Total
Often 34 37 43 12 23 24 29 8
22 22 28
8 79 28
100 28
Sometimes 29 32 35 10 34 35 41 12 20 20 24 7
83 29
100 29
Rarely 14 15 33 5
12 12 28 4
17 17 40 6
43 15
100 15
Never 10 11 19 3
16 16 30 6
27 27 51 9
53 18
100 18
DK/Refused 4 4
14 1
12 12 41 4
13 13 45 5
29 10
100 10
Total 91
100 32 32 97
100 34 34 99
100 34 34
287 100 100 100
(X2=21,df=8, p=.007)
Table 22: Child Owns Licensed-Character Toys
Yes No Total
N 196 104
% 65 35
74

Table 23: Child Owns Licensed-Character Toys by Gender
Child Gender Male
Female
Total
N % Child Gender % Child Own Toys % of Total N % Child Gender % Child Own Toys % of Total N % Child Gender % Child Own Toys % of Total
Yes 112 73 57 37 84 58 43 28
196 65
100 65
No 42 27 40 14 62 42 60 21
104 35
100 35
Total 154 100 51 51
146 100 49 49
300 100 100 100
(X2=7.64, df=1,p=.006)
75

Table 24: Child Owns Licensed-Character Toys by Age
Child Age 6
7
8
9
10
11
Total
N % Child Age % Own Toys % of Total N % Child Age % Own Toys % of Total N % Child Age % Own Toys % of Total N % Child Age % Own Toys % of Total N % Child Age % Own Toys % of Total N % Child Age % Own Toys % of Total N % Child Age % Own Toys
% of Total
Yes 39 81 21 14 31 72 17 11 28 61 15 10 33 65 18 11 41 69 22 14 15 38 8 5
187 65
100 65
No 9
19 9 3 12 28 12 4 18 39 18 6 18 35 18 6 18 31 18 6
25 63 25 9
100 35
100 35
Total 48
100 17 17 43
100 15 15 46
100 16 16 51
100 18 18 59
100 21 21 40
100 14 14
287 100 100 100
(X2=20.73, df=5, p= .001)
76

Table 25: Parental Recall of Licensed-Character Toys Owned by Child
Toys
Barbie Barney Batman Blues Clues Digimon Pokemon Power Rangers Rugrats Scooby Winnie the Pooh Other Total
N 4 6 5 5 4 77 12 12 4 6
61 196
%
2 3 3 3 2 39 6 6 2 3
31 100
Table 26: Advertised Items Perceived as More Desirable
N %
Yes No Total
196 104 300
65 35
100
Table 27: Advertised Items Perceived as More Desirable by Gender
Child Gender Male
Female
Total
N % Child Gender % Advertised Items % of Total N % Child Gender % Advertised Items % of Total N % Child Gender % Advertised Items % of Total
Yes 100 65 51 33 96 66 49 32
196 65
100 65
No 54 35 52 18 50 34 48 17
104 35
100 35
Total 154 100 51 51
146 100 49 49
300 100 100 100
(X2=.02, df=1,p=.88)
77

Table 28: Advertised Items Perceived as More Desirable by Age
Child Age Yes No Total 6
7
8
9
10
11
Total
N % Child Age % Advertised Items % of Total N % Child Age % Advertised Items % of Total N % Child Age % Advertised Items % of Total N % Child Age % Advertised Items % of Total N % Child Age % Advertised Items % of Total N % Child Age % Advertised Items % of Total N % Child Age % Advertised Items % of Total
29 60 16 10 34 79 18 12 28 61 15 10 35 69 19 12 38 64 20 13 23 58 12 8
187 65
100 65
(X2=5.8, df=5, p= .32)
19 40 19 7 9
21 9 3
18 39 18 6
16 31 16 6
21 36 21 7
17 43 17 6
100 35
100 35
48 100
17 17 43
100 15 15 46
100 16 16 51
100 18 18 59
100 21 21 40
100 14 14
287 100 100 100
78

Table 29: Advertised Items Perceived as More Desirable by Parent's Gender
Parent Gender Male
Female
Total
N % Parent Gender % Advertised Items % of Total N % Parent Gender % Advertised Items % of Total N % Advertised Items % Child Own Toys % of Total
Yes 41 56 21 14
155 68 79 52
196 65
100 65
No 32 44 31 11 72 32 69 24
104 35
100 35
Total 73
100 24 24
227 100 76 76
300 100 100 100
(X2=3.6, df=1,p=.06)
Table 30: Level of Difficulty Playing with Other Children Without Advertised Toys
Scale N %
Many Difficulties Some Difficulties Few Difficulties No Difficulties Total
4 44 76
176 300
1 15 25 59
100
Table 31: Level of Difficulty Playing with Other Children Without Advertised Toys by Gender
Child Gender Male
Female
Total
N % Child Gender % Level of Difficulty % of Total N % Child Gender % Level of Difl iculty % of Total N % Child Gender % Level of Difficulty % of Total
Many/Few Difficulties
28 18 58 9
20 14 42 7
48 16
100 16
Some Difficulties
37 24 49 12 39 27 51 13 76 25
100 25
No Difficulties
89 58 51 30 87 60 49 29
176 59
100 59
Total
154 100 51 51
146 100 49 49
300 100 100 100
(X2=1.2, df=2, p=.55)
79

Table 32: Level of Difficulty Playing with Other Children Without Advertised Toys bv A n ^ ' by Age
Child Age Yii "6 • N
0
7 N
8 N
0
No Total
% Child Age 19 25 % Level of Difficulty 20 16
9 12 27 56 16
4 9 % of Total 3
8 9 26 % Child Age 19 21 60 % Level of Difficulty 18 12 15 % of Total 3 3 9
6 12 28 % Child Age 13 26 61 % Level of Difficulty 14 16 16 % of Total 2 4 10
9 N 6 18 27 % Child Age 12 35 53 % Level of Difficulty 14 25 16 % of Total 2 6 9
10 N 10 13 36 % Child Age 17 22 61 % Level of Difficulty 23 18 21 % of Total 3 5 13
11 N 5 9 26 % Child Age 13 23 65 % Level of Difficulty 11 12 15 % of Total 2 3 9
Total N 44 73 170 % Child Age 15 25 59 % Level of Difficulty 100 100 100 % of Total 15 25 59_
(X2=4.97, df=10, p=.89)
Table 33: Purchasing Products with a Friend
N ~%" Yes 65 22 No 235 78 Total 300 100
80
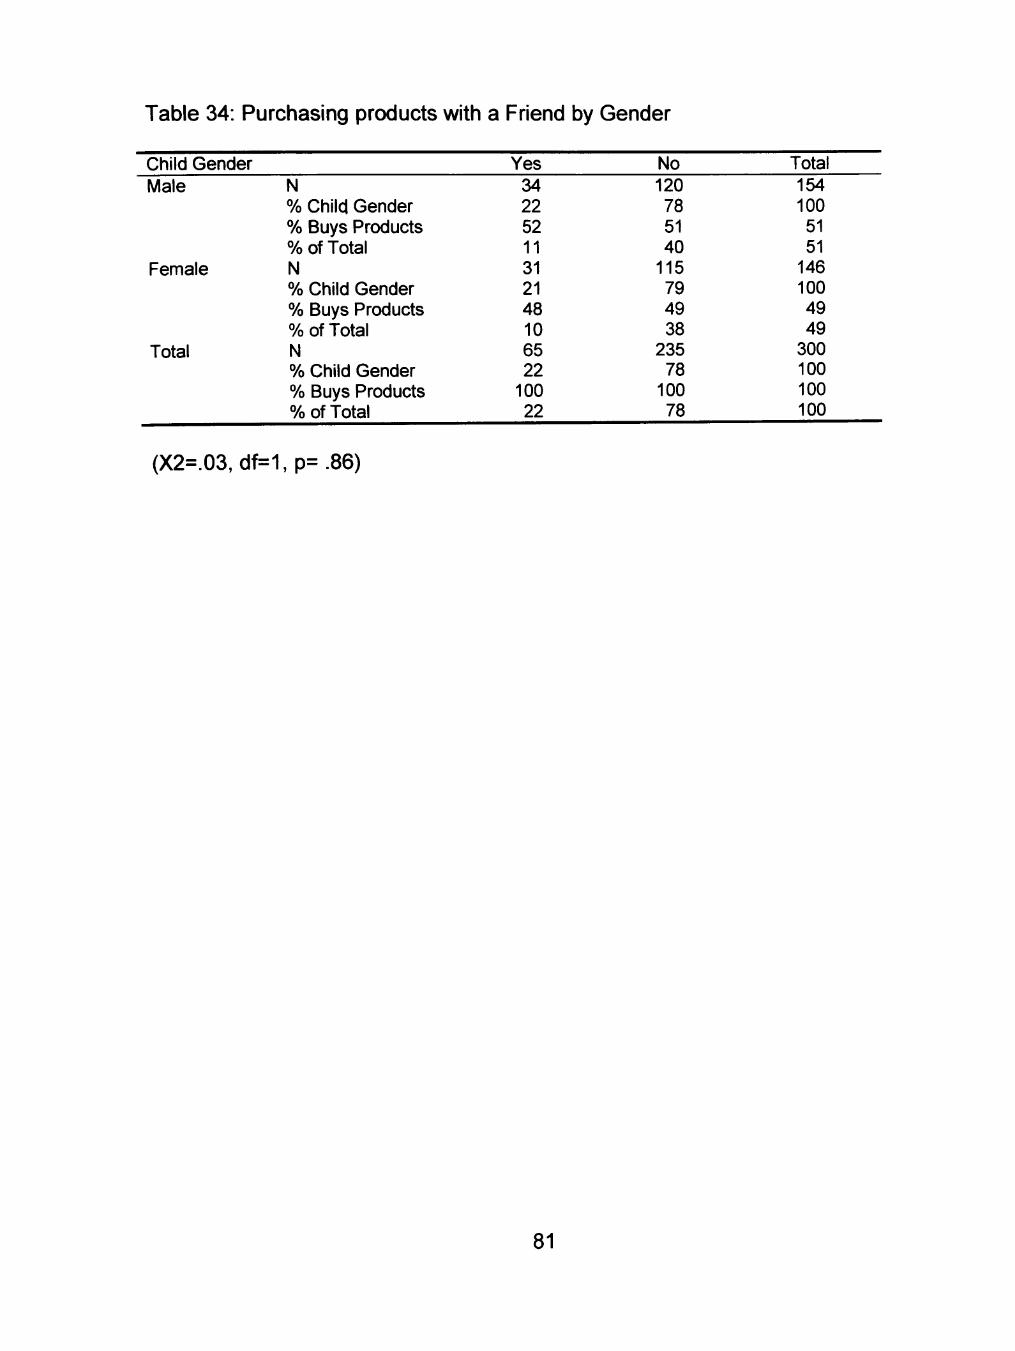
Table 34: Purchasing products with a Friend by Gender
Child Gender Male
Female
Total
N % Child Gender % Buys Products % of Total N % Child Gender % Buys Products % of Total N % Child Gender % Buys Products % of Total
Yes 34 22 52 11 31 21 48 10 65 22
100 22
No 120 78 51 40
115 79 49 38
235 78
100 78
Total 154 100 51 51
146 100 49 49
300 100 100 100
(X2=.03, df=1,p=.86)
81

Table 35; Purchasing Products with a Friend by Age
Child Age Yes No Total
8
10
11
Total
N % Child Age % Buys Products % of Total N % Child Age % Buys Products % of Total N % Child Age % Buys Products % of Total N % Child Age % Buys Products % of Total N % Child Age % Buys Products % of Total N % Child Age % Buys Products % of Total N % Child Age % Buys Products % of Total
4 8 6 1
12 28 19 4 4 9 6 1
12 24 19 4
13 22 20 5
19 48 30 7
64 22
100 22
44 92 20 15 31 72 14 11 42 91 19 15 39 76 17 14 46 78 21 16 21 53 9 7
223 78
100 78
48 100
17 17 43
100 15 15 46
100 16 16 51
100 18 18 59
100 21 21 40
100 14 14
287 100 100 100
(X2=25.8, df=5, p= .00)
Table 36: Friend Influence on Purchase
' "M ~ y^ ' 45 69" No 20 31 Total 65 100.
82

Table 37: Friend Influence on Purchase by Gender
Child Gender Male
Female
Total
N % Child Gender % Friend Influence % of Total N % Child Gender % Friend Influence % of Total N % Child Gender % Friend Influence % of Total
Yes 21 62 47 32 24 77 53 37 45 69
100 69
No 13 38 65 20 7
23 35 11 20 31
100 31
Total 34
100 52 52 31
100 48 48 65
100 100 100
(X2=1.87, df=1,p=.17)
Table 38: Friend Influence on Purchase by Age
Child Age 6/7
8/9
10/11
Total
N % Child Age % Friend Influence % of Total N % Child Age % Friend Influence % of Total N % Child Age % Friend Influence % of Total N % Child Age % Friend Influence % of Total
Yes 11 69 25 17 9
56 20 14 24 75 55 38 44 69
100 69
No 5
31 25 8 7
44 35 11 8
25 40 13 20 31
100 31
Total 16
100 25 25 16
100 25 25 32
100 50 50 64
100 100 100
(X2=1.75, df=2, p=.42)
83

Table 39: Child Understands Intent of Commercials
Scale Strongly agree Agree Neutral Disagree Strongly Disagree Total
N 75
156 19 43 7
300
%
25 52 6
14 2
100
Table 40: Child Understands Intent of Commercials by Gender
Child Gender Male
Female
Total
N % Child Gender % Commercials % Total N % Child Gender % Commercials % Total N % Child Gender % Commercials % Total
Strongly Agree/Agree
125 81 54 42
106 73 46 35
231 77
100 77
Neutral
7 5
37 2
12 8
63 4
19 6
100 6
Strongly Disagree/Agree
22 14 44 7
28 19 56 9
50 17
100 17
Total
154 100 51 51
146 100 49 49
300 100 100 100
(X2=3.39, df=2, p=.18)
84

Table 41: Child Understands Intent Commercials By Age
Child Age 6/7
8/9
10/11
Total
N %
%
%
N %
%
%
N %
%
%
N %
%
%
Child Gender Commercials Total
Child Gender Commercials Total
Child Gender Commercials Total
Child Gender Commercials Total
Strongly Agree/Agree
60 66 27 21 78 80 35 27 85 86 38 30
223 78
100 78
Neutral
9 10 50 3 5 5
28 2 4 4
22 1
18 6
100 6
Strongly Disagree/Disagree
22 24 48 8
14 14 30 5
10 10 22 3
46 16
100 16
Total
91 100 32 32 97
100 34 34 99
100 34 34
287 100 100 100
(X2=11.5, df=4, p=.02)
Table 42: Child Happier Owning Advertised Items
Yes No Total
N 129 171 300
%
43 57
100
85

Table 43: Child Happier Owning Advertised Items by Gender
Child Gender Male
Female
Total
N % Child Gender % Own Advertised Items % of Total N % Child Gender % Own Advertised Items % of Total N % Child Gender % Own Advertised Items % of Total
Yes 74 48 57 25 55 38 43 18
129 43
100 43
No 80 52 47 27 91 62 53 30
171 57
100 57
Total 154 100 51 51
146 100 49 49
300 100 100 100
(X2=3.3, df=1,p=.07)
86

Table 44: Child Happier Owning Advertised Items by Age
Child Age 6
7
8
9
10
11
Total
N % Child Age % Own Advertised Items % of Total N % Child Age % Own Advertised Items % of Total N % Child Age % Own Advertised Items % of Total N % Child Age % Own Advertised Items % of Total N % Child Age % Own Advertised Items % of Total N % Child Age % Own Advertised Items % of Total N % Child Age % Own Advertised Items % of Total
Yes 27 56 22 9
19 44 15 7
18 39 15 6
23 45 19 8
22 37 18 8
15 38 12
5 124 43
100 43
No 21 44 13 7
24 56 15 8
28 61 17 10 28 55 17 10 37 63 23 13 25 63 15 9
163 57
100 57
Total 48
100 17 17 43
100 15 15 46
100 16 16 51
100 18 18 59
100 21 21 40
100 14 14
287 100 100 100
(X2=5.1,df=5, p=.4)
Table 45: Parent Asks Child's Product Preference
Scale Often Sometimes Rarely Never Total
N 204
77 14 5
300
%
68 26 5 2
100
87

Table 46: Asking Child's Product Preference by Parent's Gender
Parent Gender
Male
Female
Total
N % Parent Gender % Product Preference % of Total N % Parent Gender % Product Preference % of Total N % Parent Gender % Product Preference % of Total
Yes 68 93 24 23
213 94 76 71
281 94
100 94
No 5 7
26 2
14 6
74 5
19 6
100 6
Total 73
100 24 24
227 100 76 76
300 100 100 100
(X2=.04, df=1,p=.84)
A. 1 cell (25.0%) had expected count less than 5.
Table 47: Store Trips
N %
Stay at Home Go with You Total
87 213 300
29 71
100
Table 48: Store Trips By Gender
Child Gender Male
Female
Total
N % Child Gender % Store/Home % of Total N % Child Gender % Store/Home % of Total N % Child Gender % Store/Home % of Total
Stay at Home 52 34 60 17 35 24 40 12 87 29
100 29
Go with You 102 66 48 34
111 76 52 37
213 71
100 71
Total 154 100 51 51
146 100 49 49
300 100 100 100
(X2=3.5, df=1,p=.06)
88

Table 49: Product Selections
N %
Yes No Total
252 48
300
84 16
100
Table 50: Product Selections by Gender
Child Gender Male
Female
Total
N % Child Gender % Product Selections % of Total N % Child Gender % Product Selections % of Total N % Child Gender % Product Selections % of Total
Yes 122 79 48 41
130 89 52 43
252 84
100 84
No 32 21 67 11 16 11 33 5
48 16
100 16
Total 154 100 51 51
146 100 49 49
300 100 100 100
(X2=5.38, df=1,p=.02)
89

Table 51: Product Selections By Age
Child Age 6
7
8
9
10
11
Total
N % Child Age % Own Toys % of Total N % Child Age % Own Toys % of Total N % Child Age % Own Toys % of Total N % Child Age % Own Toys % of Total N % Child Age % Own Toys % of Total N % Child Age % Own Toys % of Total N % Child Age % Own Toys % of Total
Yes 40 83 17 14 38 88 16 13 35 76 15 12 47 92 20 16 48 81 20 17 32 80 13 11
240 84
100 84
No 8
17 17 3 5
12 11 2
11 24 23 4 4 8 9 1
11 19 23 4 8
20 17 3
47 16
100 16
Total 48
100 17 17 43
100 15 15 46
100 16 16 51
100 18 18 59
100 21 21 40
100 14 14
287 100 100 100
(X2=5.9, df=5, p=.31)
Table 52: Parental Recall of Product Selections Made By Child
Products N ^ %_ 12 4
48 3
26 8
100
Clothes Entertainment Grocery Item Sports Related Toys Other Total
30 9
119 7
64 20
249
90

Table 53: Product Suggestions
N %
Yes No Total
258 42
300
86 14
100
Table 54: Product Suggestions by Gender
Child Gender Male
Female
Total
N % Child Gender % Product Suggestion % of Total N % Child Gender % Product Suggestion % of Total N % Child Gender % Product Suggestion % of Total
Yes 135 88 52 45
123 84 48 41
258 86
100 86
No 19 12 45 6
23 16 55 8
42 14
100 14
Total 154 100 51 51
146 100 49 49
300 100 100 100
(X2=.73, df=1,p=.39)
91

Table 55: Product Suggestions by Age
Child Age 6
7
8
9
10
11
Total
N % Child Age % Product Suggestion % of Total N % Child Age % Product Suggestion % of Total N % Child Age % Product Suggestion % of Total N % Child Age % Product Suggestion % of Total N % Child Age % Product Suggestion % of Total N % Child Age % Product Suggestion % of Total N % Child Age % Product Suggestion % of Total
Yes 45 94 18 16 38 88 15 13 36 78 15 13 42 82 17 15 46 78 19 16 39 98 16 14
246 86
100 86
No 3 6 7 1 5
12 12 2
10 22 24 3 9
18 22 3
13 22 32 5 1 3 2 0
41 14
100 14
Total 48
100 17 17 43
100 15 15 46
100 16 16 51
100 18 18 59
100 21 21 40
100 14 14
287 100 100 100
(X2=12.77, df=5, p= .03)
Table 56: Parental Recall of Product Suggestions Made By Child
Products N % Beauty Items 6 2 Clothing 28 11 Entertainment 16 6 Grocery Item 106 42 Sports Items 6 2 Toys 58 23 Other 32 13 Total 252 100
92

Table 57: Buying the 'Right' Things
N %
Yes No Total
273 27
300
91 9
100
Table 58: Buying the 'Right' Things by Parent's Gender
Child Gender Male
Female
Total
N % Parent Gender % Buys the Right things % of Total N % Parent Gender % Buys the Right things % of Total N % Parent Gender % Buys the Right things % of Total
Yes 67 92 25 22
206 91 75 69
273 91
100 91
No 6 8
22 2
21 9
78 7
27 9
100 9
Total 73
100 24 24
227 100 76 76
300 100 100 100
(X2=.07, df=1,p=.79)
Table 59: Causes of Wrong Product Purchase
N %
Other Wrong Product Different Tastes Dislikes Bargain Product Different Desires Product Failure Total
11 3 3 2 3 2 2
26
42 12 12 8
12 8 8
100
Table 60: Asking Child's Opinion
Yes No Total
N 199 101 300
_ % _ 66 34
100
93
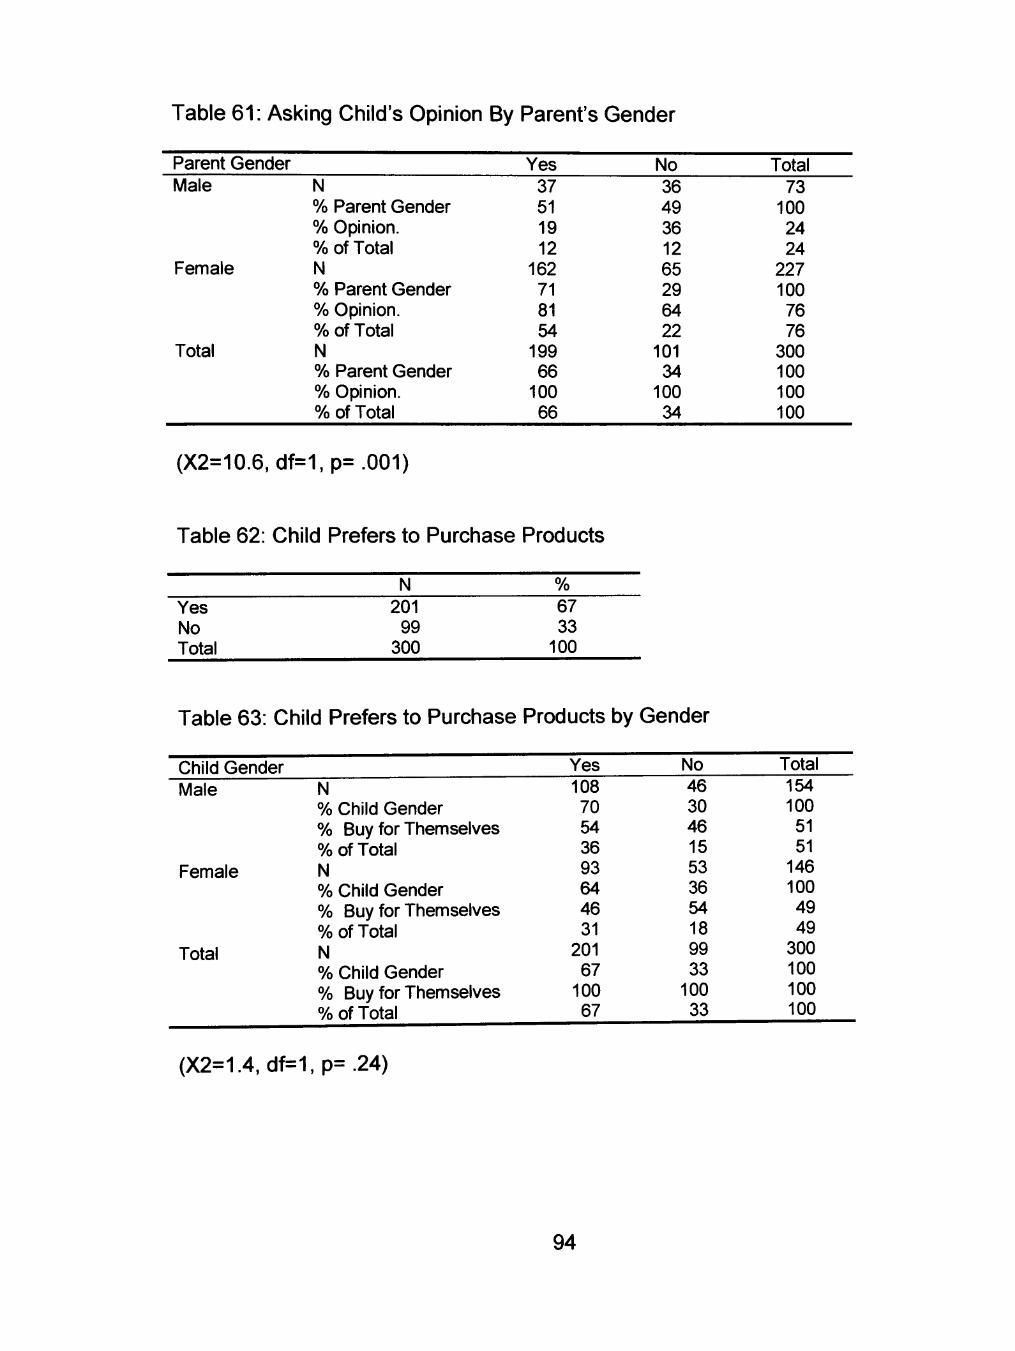
Table 61: Asking Child's Opinion By Parent's Gender
Parent Gender Male
Female
Total
N % Parent Gender % Opinion. % of Total N % Parent Gender % Opinion. % of Total N % Parent Gender % Opinion. % of Total
Yes 37 51 19 12
162 71 81 54
199 66
100 66
No 36 49 36 12 65 29 64 22
101 34
100 34
Total 73
100 24 24
227 100 76 76
300 100 100 100
(X2=10.6, df=1,p=.001)
Table 62: Child Prefers to Purchase Products
Yes No Total
N 201
99 300
%
67 33
100
Table 63: Child Prefers to Purchase Products by Gender
Child Gender Male
Female
Total
N % Child Gender % Buy for Themselves % of Total N % Child Gender % Buy for Themselves % of Total N % Child Gender % Buy for Themselves % of Total
Yes 108 70 54 36 93 64 46 31
201 67
100 67
No 46 30 46 15 53 36 54 18 99 33
100 33
Total 154 100
51 51
146 100 49 49
300 100 100 100
(X2=1.4, df=1,p=.24)
94

Table 64: Child Prefers to Purchase Products by Age
Child Age
8
10
11
Total
N % Child Age % Buy for Themselves % of Total N % Child Age % Buy for Themselves % of Total N % Child Age % Buy for Themselves % of Total N % Child Age % Buy for Themselves % of Total N % Child Age % Buy for Themselves % of Total N % Child Age % Buy for Themselves % of Total N % Child Age % Buy for Themselves % of Total
Yes 33 69 17 11 24 56 13 8
26 57 14 9
38 75 20 13 40 68 21 14 29 73 15 10
190 66
100 66
No 15 31 15 5
19 44 20 7
20 43 21 7
13 25 13 5
19 32 20 7
11 28 11 4
97 34
100 34
Total 48
100 17 17 43
100 15 15 46
100 16 16 51
100 18 18 59
100 21 21 40
100 14 14
287 100 100 100
(X2=6.49, df=5, p= .26)
Table 65: Parental Recall of Child's Desire to Purchase Products
N % Adult 17 9 Choice 12 6 Control 17 9 Get what they Want 31 16 Independent 22 11 Input 6 3 Preference 8 4 Responsible 6 3 Other 80 40 Total 199 100
95

Table 66: Child Asks to Purchase Advertised Items
Yes No Total
N 171 129 300
%
57 43
100
Table 67: Child Asks to Purchase Advertised Items by Gender
Child Gender Male
Female
Total
N % Child Gender % Buy Advertised Items % of Total N % Child Gender % Buy Advertised Items % of Total N % Child Gender % Buy Advertised Items % of Total
Yes 89 58 52 30 82 56 48 27
171 57
100 57
No 65 42 50 22 64 44 50 21
129 43
100 43
Total 154 100 51 51
146 100 49 49
300 100 100 100
(X2=.08, df=1,p=.78)
96

Table 68: Child Asks to Purchase Advertised Items by Age
Child Age 6
7
8
9
10
11
Total
N % Child Age % Buy Advertised Items % of Total N % Child Age % Buy Advertised Items % of Total N % Child Age % Buy Advertised Items 7o of Total N % Child Age % Buy Advertised Items % of Total N % Child Age % Buy Advertised Items % of Total N % Child Age % Buy Advertised Items % of Total N % Child Age % Buy Advertised Items % of Total
Yes 33 69 20 11 31 72 19 11 24 52 15 8
26 51 16 9
33 56 20 11 15 38 9 5
162 56
100 56
No 15 31 12 5
12 28 10 4
22 48 18 8
25 49 20 9
26 44 21 9
25 63 20 9
125 44
100 44
Total 48
100 17 17 43
100 15 15 46
100 16 16 51
100 18 18 59
100 21 21 40
100 14 14
287 100 100 100
(X2=14, df=5, p= .02)
97

CHAPTER VI
CONCLUSIONS
Review
Parents of children between the ages of 6-11 were surveyed to examine
the relationship between licensed characters and the influence of characters on
children's desire for endorsed merchandised products. The survey also explored
the degree of influence children have over the parental decision-making process
for products purchased speciflcally for them.
Children as a Market
The advertising and television industries perceive children as a potentially
profitable market (Seiter, 1993). Countiess products are created for them and
targeted to them by many businesses (Stoltman, 1999). They are viewed as a
primary market, a market of influencers, and a future market (McNeal, 1992).
Kids directly and indirectly influence billions of dollars annually (Stoltman, 1999).
McNeal (1992) estimates children directiy influence more than $130 billion in
household items and indirectly influence much more.
Children's spending doubled during the 1960s, 1970s, and 1980s. During
the 1990s, spending tripled (McNeal, 1999). Guber and Berry (1993) indicated
kids had an estimated $7.3 billion to spend in the market place during the early
1990s. Kids spent their money on clothes, candy, toys, and various other
98

products (McNeal, 1992). By 1997, children spent approximately $24.4 billion
and it is estimated by 2001 children will spend $35 billion on products (McNeal,
1999).
Influence of Licensed Character
The use of cartoon characters to sell toy products increased from 20
percent to 70 percent from 1977 to 1987 (Economist, 1996). Licensed
characters are not only used to solicit products, but also are a fundamental part
of the product (Pecora, 1998). Cartoon characters are created to sell products
such as clothing, cereals, and vitamins (Pecora, 1998). Children's reactions to a
television advertisement can be shaped by who is conveying the message. A
character representing a product can considerably influence the assessment of a
product based on the child's opinion of the character (Van Evra, 1990).
Theoretical Framework
Consumer socialization is deflned as "the gradual development of a broad
range of attitudes, knowledge, and skills which are related to consumption"
(Ward, Wackman, & Wartella, 1977, p. 18). Consumer socialization theory is a
sociological concept which focuses on the effects of social agents on children's
learning of consumer behavior, as well as where and what kids are able to learn
(McNeal, 1987).
99

This study speculated children used licensed programming characters as
a socialization agent (information source), which influenced them through
television commercials to want and desire character products or endorsed
products represented by licensed characters. Once the licensed character
influenced the child to desire the product, children then attempt to exert influence
on their parents to purchase the item.
Research Questions and Findings
Research Question 1
The first research question addressed whether parents of 6-to-11-year-old
children felt licensed characters from television advertising and programming had
a product demand influence on their children's consumption desires. This was
partially supported, but must be rejected due to lack of substantiating data.
Hypothesis 1
Hypothesis one indicated parents would report their child viewed products
advertised by licensed characters as more desirable. Four of seven questions
were statistically signiflcant. Yet when the hypothesis was asked directly, it was
not statistically significant the majority of parents reported their child perceived
advertised products as more desirable (Table 27; Table 28). The majority of
respondents agreed commercials made their 6 to 11-year-old child want
advertised items (X^=10.2, df=4, p= .04). Thirty-nine percent (n=111) of
100

respondents reported their child sometimes watches television programs
containing characters with merchandise toys and it was found statistically
significant that the majority of respondents reported their child, by age, watches
television shows with character toys some of the time (X^=22, df=8, p= .005). Of
those who reported their child sometimes watches shows with character toys, the
highest percentage had children between the ages of 6 and 9 (28%, n=80) in the
household.
The highest proportion, 39% (n=89) of respondents reported their child
sometimes asks for character toys. In relation to the child's gender and age, it
was statistically significant that the majority of respondents reported their child
sometimes asks for toys that are based on television show characters. A higher
percentage of parents had a male child in the household (16%, n=48) and
households with an 8- or 9-year-old had a child more likely to make requests for
such toys.
Sixty-five percent (n=196) of respondents indicated their child owns
licensed-character toys. According to the child's gender and age, it was
statistically significant that the majority of respondents indicated their child owns
toys related to television program characters.
The majority of respondents reported their child perceived advertised
items as more desirable (65%, n=196). Nonetheless, it was not statistically
significant that the majority of respondents reported their child perceived
advertised items as more desirable
101

The highest proportion of respondents who reported their child perceived
advertised items as more desirable were female parents (79%, n=155). Although
very close, it was not considered statistically significant (X^=3.6, df=1, p= .06).
Hypothesis one is partially supported, but overall, was rejected.
Hypothesis 2
Hypothesis two suggested parents would report their 6-11-year-old
children were more likely to want licensed character products if their children's
peers had the product. One of three questions was found to be statistically
significant.
The majority of respondents reported their kids would have no difficulties
playing with other children if their child did not have popular toys (59%, n=176).
However, it was not statistically significant in terms of gender or age.
The largest percentage of respondents (78%, n=235) reported their child
did not shop with a friend. However, it was not statistically significant in terms of
gender of child. Yet it was statistically significant that the majority of respondents
indicated their child, by age, does not shop and buy products with a friend
(X^=25.8, df=5, p= .00). Of the respondents who indicated their child did shop
with a friend, the majority reported their child allowed their friend to help decide
on types of products and what products to buy on a shopping trip (gender: 69%,
n=45; age: 65%, n=64 ). Nonetheless, gender and age was not statistically
significant.
102

The data showed that it was statistically significant that children between
the ages of 6-and-11 do not shop and buy products with a friend (X^=25.8, df=5,
p= .00), which does not support the hypothesis. The majority of data produced
results which were not statistically significant. As a result, hypothesis 2 is
rejected.
Hypothesis 3
Hypothesis three indicated parents would report their children would think
having licensed character products would bring great happiness to them through
ownership of such products. One out of 2 questions was found to be statistically
significant.
The majority or respondents indicated their child understood the content of
commercials (77%, n=231). By child's gender, it was not statistically significant
(X^= ZA, df=2, p= .18). Yet according to child's age, it was statistically significant
the majority of respondents agreed or strongly agreed their child understands the
intent of commercials (X^=11.5, df=4, p= .02).
The highest proportion of respondents indicated their child did not think
owning advertised items would make them happier (57%, n=171). In relation to
the child's age, it was not statistically significant that respondents indicated their
child did not think owning advertised items would make their child happier. It was
also not statistically significant that the of majority respondents with children ages
103
6-to-11 indicated their child did not think owning advertised items would make
them happier.
It was statistically significant that respondents reported they agreed or
strongly agreed their child understood the intent of commercials with their child's
age as a factor (X^=11.5, df=4, p= .02). Though close, it was not statistically
significant that respondents reported their child did not think owning advertised
items would make them happier (X2=3.3, df=1, p= .07), which does not support
the hypothesis. Hypothesis three is partially supported.
Research Question 2
Research question two addressed whether or not parents of 6-to-11-year-
olds felt their children exerted a major influence on the parental decision-making
process for products purchased speciflcally for their child's consumption.
The highest percentage of respondents indicated they asked their child
what their product preferences were when purchasing items (94%, n=281). Of
those who asked their child what their preferences were, 68% (n=204) asked
their child often and 26% (n=77) asked their child sometimes. However, it was
not statistically significant that the majority of respondents asked their child what
their product preferences were when purchasing something for them by gender.
The largest percentage of respondents indicated their child accompanied
them to the store instead of staying home (71%, n=213). Though close, it was
104

not statistically significant that the majority of respondents reported their child
went with them to the store as opposed to staying home by gender (X^=3.5, df=5,
p= .06).
In relation to child's gender, it was statistically significant that the majority
of respondents allowed their child to make product selections (X^=5.4, df=1, p=
.02). Of those respondents who let their child make product selections, 48%
(n=122) had a male child and 52% (n=130) had a female child. However, it was
not statistically significant according to the child's age.
The majority of respondents reported their child makes product
suggestions during store trips (86%, n=258). It was statistically significant that
the majority of respondents reported their child, by age, does make product
suggestions when they go to the store (X^=12.8, df=5, p= .03). Yet it was not
statistically significant according to child's gender.
The majority of respondents reported they purchased the "right" products
for their child, but it was not statistically significant (K^= .07, df=1, p= .79). Of
those respondents who bought the "right" items, 22% (n=67) were male and 69%
(n=206) were female.
The highest proportion of respondents indicated they asked their child's
opinion about product purchases (66%, n=199). Of those respondents who
asked their child's opinion, 54% (n=162) were female parents and 12% (n=37)
105

were male parents. It was statistically significant that the majority of respondents
asked their child's opinion about product purchases by gender (X^=10.6, df=1, p=
.001).
The majority of respondents reported their child preferred to buy products
for themselves (67%, n=201), but it was not statistically significant by gender and
age.
The highest proportion of respondents reported their child asks them to
buy advertised items (57%, n=171). In relation to child's gender, it was not
statistically significant that the majority of respondents indicated their child asks
them to buy advertised items. However, it was statistically significant that the
majority of respondents reported their child, ages 6-to-11, asks for advertised
products (X^=14, df=5, p= .02). The data yielded results which were both
statistically significant and not statistically significant.
Analysis of Findings
Testing of hypothesis one produced several statistically significant results
and was partially supported. The majority of parents agreed commercials made
their child want advertised items. Parents also reported their child sometimes
watches television programs featuring licensed characters, which have
character-related merchandise. Respondents also indicated their child
sometimes asks for toys related to the television program and 65% (n=196)
reported their child already owned television-based character toys. Though not
106

statistically significant, 65% (n=196) of parents also reported their child does
perceive advertised items as more desirable by gender.
The results support the idea that children generally want items advertised
in television commercials, which Ward, Wackman, and Wartella determined in
their study of children's spending behavior in 1977. Stipp and Goerlich (1995)
also said kids were more likely to consume products heavily advertised on
television.
Ward, Wackman, and Wartella (1977) also established commercials
targeted at children influenced what products they wanted, requested and ate.
The content of most television commercials targeted to children use animation,
jingles, slogans, visual effects or repetition to attract their attention (Van Evra,
1990; Seiter 1993). The use of animation within commercials infers licensed
characters' yield some influence on children's desires to own the endorsed
product or character toy.
This influence was not proven statistically and was not directiy measured,
but it also cannot be discounted. Though their effects on children's learning of
consumer behavior has not been directiy linked, licensed characters cannot be
ruled out as a socialization agent or information source for children. John said
children use television commercials as an information source for products such
as food, toys, and candy (1999). It cannot be said that children do not extend the
role of information source to licensed characters.
107
Hypothesis two testing suggested parents felt their child would have no
difficulty playing with other children if their child did not own popular toys. The
results also indicated the majority of children in this age group do not shop with
friends. Of those children who did shop with their friends, parents reported their
friends did influence their product choices. However, none of these were
statistically signiflcant. Hypothesis two was not supported. Parents did not
indicate their child was more likely to want licensed character products if their
peers had the product.
Yet children are said to be significantiy influenced by their own peer group
(Guber and Berry, 1993; McNeal, 1987). Guber and Berry (1993) also assert
kids use friends for information in areas from styles and entertainment to popular
trends and activities. Kids use products such as clothes, food, and toys to
identify themselves and their relationship with their peers (Guber and Berry,
1993).
The majority of children in this age group did not shop with friends, which
decreased the likelihood of influence of point-of-purchase product choices. This
obviously changes as children grow older and become more accessible to each
other and interested in spending time with one another at places such as a
shopping mall, movies, or restaurants. Parents also felt their child could interact
easily with other children without the aid of popular toys. Most of the toys listed in
the survey were merchandise products endorsed by licensed characters of
television shows or movies, but parents felt their child could interact fine with
108
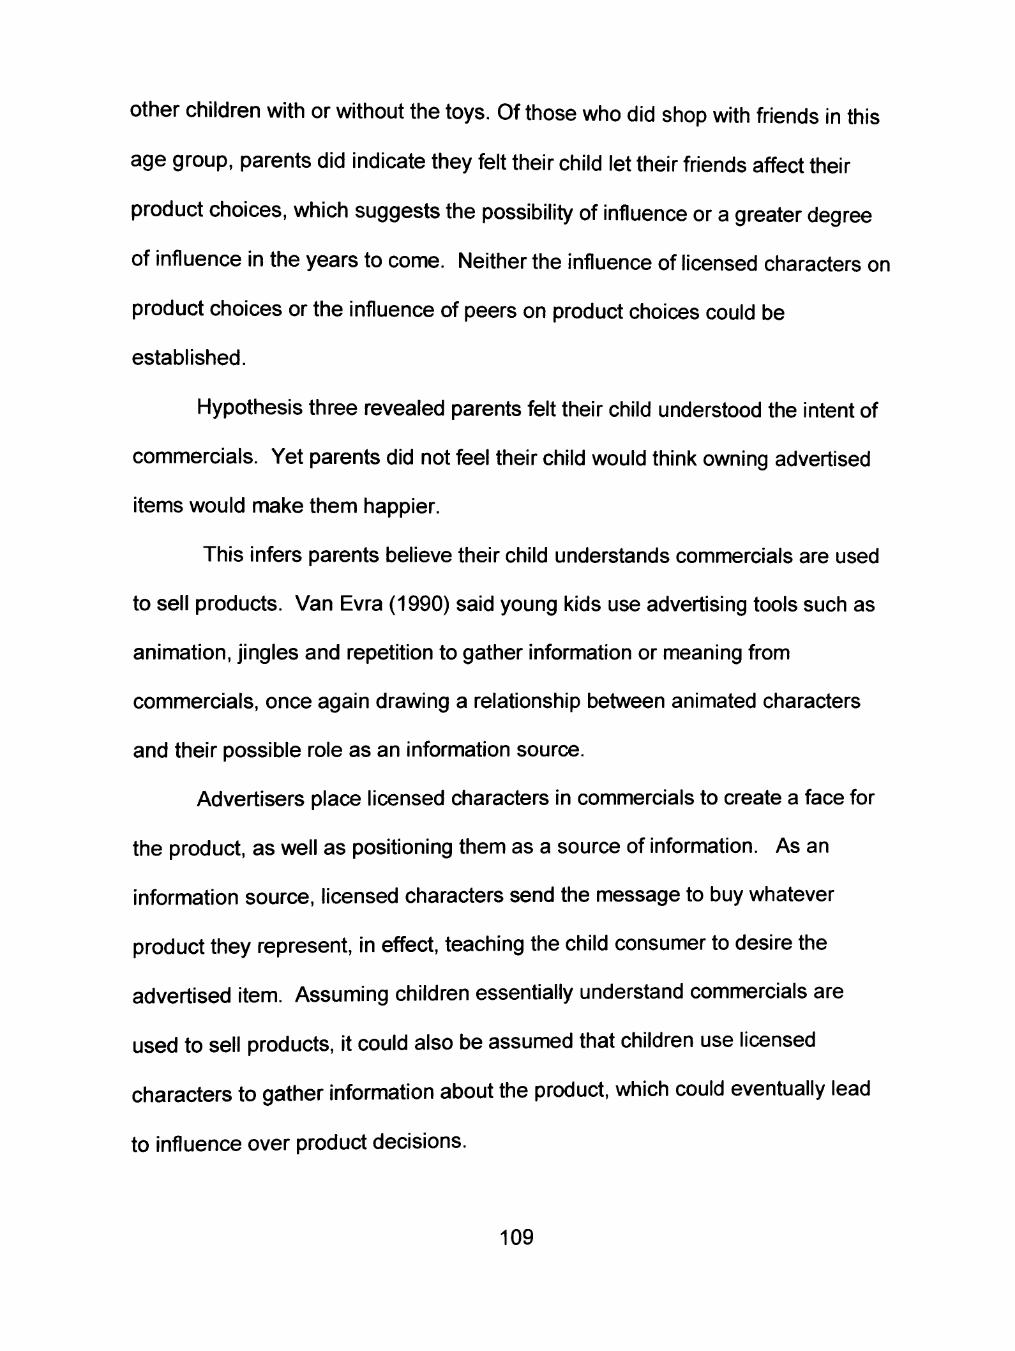
other children with or without the toys. Of those who did shop with friends in this
age group, parents did indicate they felt their child let their friends affect their
product choices, which suggests the possibility of influence or a greater degree
of influence in the years to come. Neither the influence of licensed characters on
product choices or the influence of peers on product choices could be
established.
Hypothesis three revealed parents felt their child understood the intent of
commercials. Yet parents did not feel their child would think owning advertised
items would make them happier.
This infers parents believe their child understands commercials are used
to sell products. Van Evra (1990) said young kids use advertising tools such as
animation, jingles and repetition to gather information or meaning from
commercials, once again drawing a relationship between animated characters
and their possible role as an information source.
Advertisers place licensed characters in commercials to create a face for
the product, as well as positioning them as a source of information. As an
information source, licensed characters send the message to buy whatever
product they represent, in effect, teaching the child consumer to desire the
advertised item. Assuming children essentially understand commercials are
used to sell products, it could also be assumed that children use licensed
characters to gather information about the product, which could eventually lead
to influence over product decisions.
109

Commercials created for children attempt to produce impressions, moods,
or images. Relevant information concerning the product at times is regarded as
unnecessary. These commercials try to sell more than the product.
Commercials try to sell lifestyles and social messages (Van Evra, 1990). Often
commercials will emphasize how much fun kids are having through the
ownership of the particular product (Signorielli, 1991). Showing kids having fun
with the product also indicates that kids are expressing positive emotions such as
happiness. This may influence the child to desire the advertised product to
achieve happiness. Yet the current study found parents did not feel their child
would think owning advertised items would make them happier. The majority of
parents in the study seem to assume their child was mature enough and
conscientious enough to realize happiness cannot be found through material
objects, which may or may not be accurate. Hypothesis three was not supported
in this instance. The majority of parents did not report their child thought owning
licensed character products would bring them great happiness.
Research question two did not offer hypotheses due to the inability to
attach a speciflc percent or number, if any, to a child's influence over his or her
parents' decision-making process concerning the purchasing of products.
Instead the survey was used as an instrument to gauge the parents' opinions of
their child's influence over product-purchasing decisions in their household.
Several results were found to be statistically significant. The majority of
parents allowed their child to make product selections. Most parents also
110

reported their child did make product suggestions when they shopped at a store.
Parents' also asked their child for their opinion concerning product purchases
and they indicated their child asked for advertised products.
There are several reasons why parents ask their child for input regarding
product purchases and why they allow their child to make product selections.
Due to the change in family dynamics and increased media targeted to children,
the 21st century has a more knowledgeable child consumer.
As stated earlier in the literature review, both two-parent and single-parent
homes place children in the consumerism role. Each type of household places
responsibilities on the child. Two-parent homes often have both parents in the
workforce. Though the family has more income, parents have less time with their
children. Parents then tend to spend more money on their children to alleviate
guilt (McNeal, 1992). Single parents are also faced with the issue of less time
with children due to increased workloads.
As parents have less time in the home, children become more of a partner
in the household, assigned chores to help around the house, which exposes
them to more responsibility, typical household products, and increased decision
making. This creates a more independent and media-savvy child.
The majority of parents may have allowed their child to make product
selections and asked their child's opinion about product purchases because their
child is now more capable of making purchase decisions, due to the change and
shift in family dynamics.
I l l

Parents also reported their kids make products suggestions when they
shop and indicated their child generally asks for advertised products. With both
parents at work or the only parent at work, children are now left alone more at
home. This increases their time with the television set, the radio, or the
computer. Increased media intake leads to more outside forces becoming
influential information sources. Children can use licensed characters from
commercials as an information source to tell them what to want and what to buy.
Licensed characters can become an intricate part of what they learn about
consumerism because they spend more time watching them.
Kids may make product suggestions because they are at home being
exposed to television and the plethora of commercials targeted to them. They
are aware of what brands and products are offered to them. Children not only
watch hours of programming, but they can now flip to their own networks created
to cater to them, where they are bombarded with commercials selling them snack
foods, toys and games. Today's kids are also exposed to family calling plans
and cell phones for kids. They are constantiy seeing products created for them.
The parents in the survey established their child influences their purchase
decisions by simply stating they asked their child's opinions about product
purchases. This was reinforced when the majority of parents indicated they allow
their child to make product selections. The degree of the influence is unknown
as the degree to which parents accepted their child's opinion was not measured.
112

but parents ask their child what they want and what they think, ultimately having
an affect on the final household purchase-decision.
This study posited children used licensed programming characters as a
socialization agent (information source), which influenced them through television
commercials to want and desire character products or endorsed products
represented by licensed characters. Once the licensed character influenced the
child to desire the product, children then attempted to exert influence on their
parents to purchase the item. However, it was not proven that children use
licensed characters as a socialization agent.
Future Implications and Research
This research project was based upon three previous research endeavors.
The project tied in different aspects of the previous research projects to update
previous information and produce new information within the fleld of children's
consumer research. Numerous research studies over the last 25 years have
investigated many topics involving children and advertising.
With the continued growth of technology and media in today's world,
children's research cannot help but to expand and continue investigating the role
children play in product purchase decisions within a family household or what
types of social agents or information sources can or could influence children to
desire particular products. As long as animated characters or licensed
characters appear in commercials and are used frequentiy to target children.
113
research must continue to explore the character's role in selling products.
Further research projects should also investigate their role as a conceivable
information source with the power to influence children to desire and buy
products, ultimately leading children to make product purchase requests of their
parents. Future research studies should focus on ways to measure the
influence of the licensed character and the influence children may have over theii
parents.
Limitations
The results of the study cannot be generalized to the population. A total of
300 respondents participated in the study. A larger number of respondents may
add more external validity to the study. The questionnaire was administered
during the summer and may have contributed to the low response rate. People
during the summer tend to be on vacation, outdoors, or at their children's sports
games instead of being at home in the evening.
Several scales used in the survey were collapsed in order to have the
minimum amount of observations in each cell. Increasing the number of
respondents interviewed in the survey may produce enough responses in each
cell so the scales would not need to be collapsed and their magnitude
diminished.
The survey itself was too broad. The two research questions, though
related to children's consumerism, were two completely different issues.
114

Focusing on one issue could have yielded more uniform and concise data. Also,
narrowing the focus may have produced more statistically significant data.
The open-ended questions yielded a large amount of information.
Creating and pre-determining categories for each question would have produced
more consistent data. A large number of respondents were alone in their
responses. Therefore, their responses were coded into a new category, other.
Also, including additional questions to measure Hypotheses 2 and 3 may have
also produced more relevant and accurate data.
Parents were used as proxies to represent their child's viewpoints. There
are many advantages to using parents instead of children but, nonetheless,
responses may not have accurately portrayed their child's opinion.
115

REFERENCES
Acuff, Dan S. & Reiher, Robert H. (1997). What Kids Buy and Why. New York: The Free Press.
Alexander, Alison Fae. (1979). Children's Consumer-Reguest Persuasive Strategies and Their Relationship to Social Cognitive Development and Interactional Environment. Unpublished dissertation, Ohio State University.
Alexander, Alison & Morrison, Margaret A. (1995). Electronic toyland and the structures of power: An analysis of critical studies on children as consumers. Critical Studies in Mass Communications, 12(3), 344-353.
Alexander, Alison, Benjamin, Louise M., Hoerrner, Keisha, & Roe, Darrell. (1998). We'll be back in a Moment: A Content Analysis of Advertisements in Children's Television in the 1950s. Journal of Advertising. 27(3). 1-9.
Arnett, Jeffrey Jenson. (1995). Adolescents' uses of media for self-socialization. Journal of Youth & Adolescence. 24(5). 519-533.
Bush, Alan J., Smith, Rachel, & Martin, Craig. (1999). The Influence of Consumer Socialization Variables on Attitude Toward Advertising: A Comparison of African-Americans and Caucasians. Journal of Advertising. 28(3). 13-24.
Carlson, Les & Grossbart, Sanford. (1988, June). Parental Style and Consumer Socialization of Children. Journal of Consumer Research. 15. 77-94.
Carlson, Les, Walsh, Ann, Laczniak, Russell N., & Grossbart, Sanford. (1994). Family Communication Patterns and Marketplace Motivations, Attitudes, and Behaviors of Children and Mothers. The Journal of Consumer Affairs. 28(1), 25-53.
Current Health. (1995, May). Saturday morning pyramid, p.2.
Economist. (1996, May 18). The power of suggestion, pp. S4-S5.
Fitzgerald, Kate. (1992, July 20). Toy Characters Starring on TV. Advertising Age. 63(29). 17.
116

Flint, Joe. (2000, March 2). Upfront Market for Kids' Programs softens Wall Street Journal. B18.
Guber, Selina S. and Berry, Jon. (1993). Marketing to and through Kids New York: McGraw-Hill Inc.
Heubusch, Kevin. (1997). Is it ok to sell to kids? American Demographics. 19(1V 55.
Jenkins, Roger L. (1979). The Influence of Children in Family Decision-Making: Parents' Perceptions. ACR. 6. 413-418. William L. Wilkie. (Ed).
John, Deborah Roedder. (1999). Through the Eyes of a Child. In M. Carole Macklin & Les Carlson. (Eds.), Advertising to Children: Concepts & Controversies (pp. 3-23). Thousand Oaks: Sage Publications.
Kline, Stephen. (1993). Out of the Garden. New York: Verso.
Lowery, Sharon A. & De Fleur, Melvin L (Eds.). (1983). Milestones in Mass Communication Research: Media Effects (2"^ ed.). New York: Longman.
McGrath, Emily M. (1998). Marketing to children: Where does your money go? Nutrition Health Review. 78. 17.
McNeal, James U. (1964). Children as Consumers. Marketing Study Series (no.9). Austin: Bureau of Business Research.
McNeal, James U. (1987). Children as Consumers: Insights and Implications. Lexington, MA: Lexington Books.
McNeal, James U. (1992). Kids as Consumers: A handbook of Marketing to Children. New York: Lexington Books.
McNeal, James U. (1999). Tapping the Three Kids' Markets. Marketing. 118-121. Guilford, CT: Dushkin/McGraw-Hill.
Moschis, George P. (1985, March). The Role of Family Communication in Consumer Socialization of Children and Adolescents. Journal of Consumer Research. 11. 898-913.
Nelson, James E. (1979). Children as Information Sources in the Family Decision to Eat Out. ACR. 6. 419-423. William L. Wilkie. (Ed).
117

Pecora, Norma. (1995). Children and television advertising from a social science perspective. Critical Studies in Mass Communication. 12(3), 354-354.
Pecora, Norma Odom. (1998). The Business of Children's Entertainment. New York: The Guilford Press.
Rose, Gregory M., Bush, Victoria D., Kahle, Lynn. (1998). The Influence of Family Communication Patterns on Parental Reactions Toward Advertising: A Cross-National Examination. Journal of Advertising. 27(4). 71-85.
Rossiter, John R. & Robertson, Thomas S. (1976). Canonical Analysis of Developmental, Social, and Experiential Factors in Children's Comprehension of Television Advertising. The Journal of Genetic Psychology. 129. 317-327.
Sabir, Nadirah Z. (1996, March). Ad execs to kids, "Buy this." Black Enterprise. 26 (8), 26.
Schroeder, Ken. (1997). Kids are U$. Education Digest. 63(1), 72-73.
Schneider, Cy. (1987). Children's Television. Illinois: NTC Business Books.
Seiter, Ellen. (1993). Sold Separately. New Brunswick, NJ: Rutgers University Press.
Signorielli, Nancy. (1991). A Sourcebook on Children & Television. New York: Greenwood Press.
Snyder, Robert J. (1995). First-year effects of the 1900 Children's Television Act on Saturday morning commercial time. Communications & the Law, 17(4), 67-74.
Stanley, TL. (1998, December 14). The big toon in. Brandweek, 39(47), 6.
Stoltman Jeffrey J. (1999). The Context of Advertising and Children: Future Research Directions. Advertising to Children: Concepts & Controversies. Thousand Oaks, CA: Sage Publications. M. Carole Macklin & Les Carlson. (Eds.).
Stipp, Horst & Goerlich, Bruce. (1995). Why youth rules. American Demographics. 17(5), 30-31.
118

Swan, Karen. (1998). Social Learning from Saturday Morning Cartoons. Social Learning from Broadcast Television. Karen Swan, Caria Meskill, & Steven De Maio. (Eds.). Cresskill, NJ: Hampton Press, Inc.
Van Evra, Judith. (1990). Television and Child Development. Hillsdale, NJ: Lawrence Eribaum Associates Inc.
Ward, Scott. (1976). Effects of Television Advertising on Children & Adolescents. In Ray Brown (Ed.), Children & Television (pp. 297-319). Beverly Hills, CA: Sage Publications.
Ward, Scott, Wackman, Daniel B., & Wartella, Ellen. (1977). How Children Learn to Buy: The Development of Consumer Information-Processing Skills. Beverly Hills, CA: Sage Publications, Inc.
Wartella, Ellen. (1995, February). The commercialization of youth: Channel One in context. Phi Delta Kappan. 76(6). 448-451.
Wolf, Aline D. (1998). Advertising and Children. America. 179(3). 13-18.
Wright-lsak, Christine. (1999). Advertising to Children in the Twenty-First Century: New Questions Within Familiar Themes. In M. Carole Macklin & Les Carlson. (Eds.). Advertising to Children: Concepts & Controversies. Thousand Oaks, CA: Sage Publications.
119

APPENDIX
QUESTIONNAIRE
120

QUESTIONNAIRE
• ntroduction: Hello, my name is and I'm calling from the institute for Communications Research at Texas Tech University. I'm not trying to sell you anything; we're just trying to get opinions from Lubbock residents about children's consumer behavior.
1. Do you have a child between the ages of 6-11 ?
Yes No
2. Do you presentiy have a television set?
Yes No
3. How many children do you have between the ages of 6-11 ?
1. One 2. Two 3. Three 4. Four 5. Five 6. Six 7. Seven 8. Eight 9. Nine and up
4. What are the ages of your children?
(Here we tell the parent to answer the survey questions with the oldest or youngest in mind in an alternating pattern)
• I am going to read two statements, please indicate if you agree or disagree with the statements by using: (Read aloud scale)
Scale 1=Strongly agree 2=Agree 3=Neutral 4=Disagree 5=Strongly Disagree
121

SA A N D SD
1. My child understands what commercials on children's shows are trying to do.
2. Commercials often make my child want the thing advertised.
• For the next few questions please indicate the frequency in which the situation occurs in your household using the following scale.
Scale 1=0ften 2=Sometimes 3=Rarely 4=Never
O S R N
3. Do you ask for your child what their preference is when you are buying something for them?
4. Does your child watch television?
• Using the choices given, please answer the question as it applies to your household.
Scale 1=Many 2=Some 3=Few 4=No
M S F N
5. Do you feel if your child does not have popular toys he/she will experience difficulties in playing with other children.
• For the next section, please answer the following question.
6. Some recent television programs have toys based on the show's characters, which you can buy in stores. What are some names of character toys associated with recent television programs?
• Using the previous scale, answer the next two questions accordingly. Scale
1=0ften 2=Sometimes 3=Rarely 4=Never
O S R N
7. Does your child watch any of these programs? _
122

8. Does your child ask for any of these toys?
• For the next section, please answer the following questions. Some answers may require a yes/no response.
9. Does your child have any of these toys? (If yes, skip to 9b)(lf no, skip to 10)
Yes No
9b. ff yes, which ones?.
10. When you go to the store, does your child wish to go with you or stay at home?
Yes No
11. Does your child make certain selections? (if yes, skip to 1 lb) (if no, skip to 12)
Yes No
11 b. If yes, for which products
12. Does your child make various suggestions? (if yes, skip to 12b) (if no, skip to 13)
Yes No
12b. If so, for what products
13. Do you ask for your child's opinion about purchases you make?
Yes No
14. When you buy things for your child, do you usually get the 'right' things? (if yes, skip to 15) (If no, skip to 14b)
123
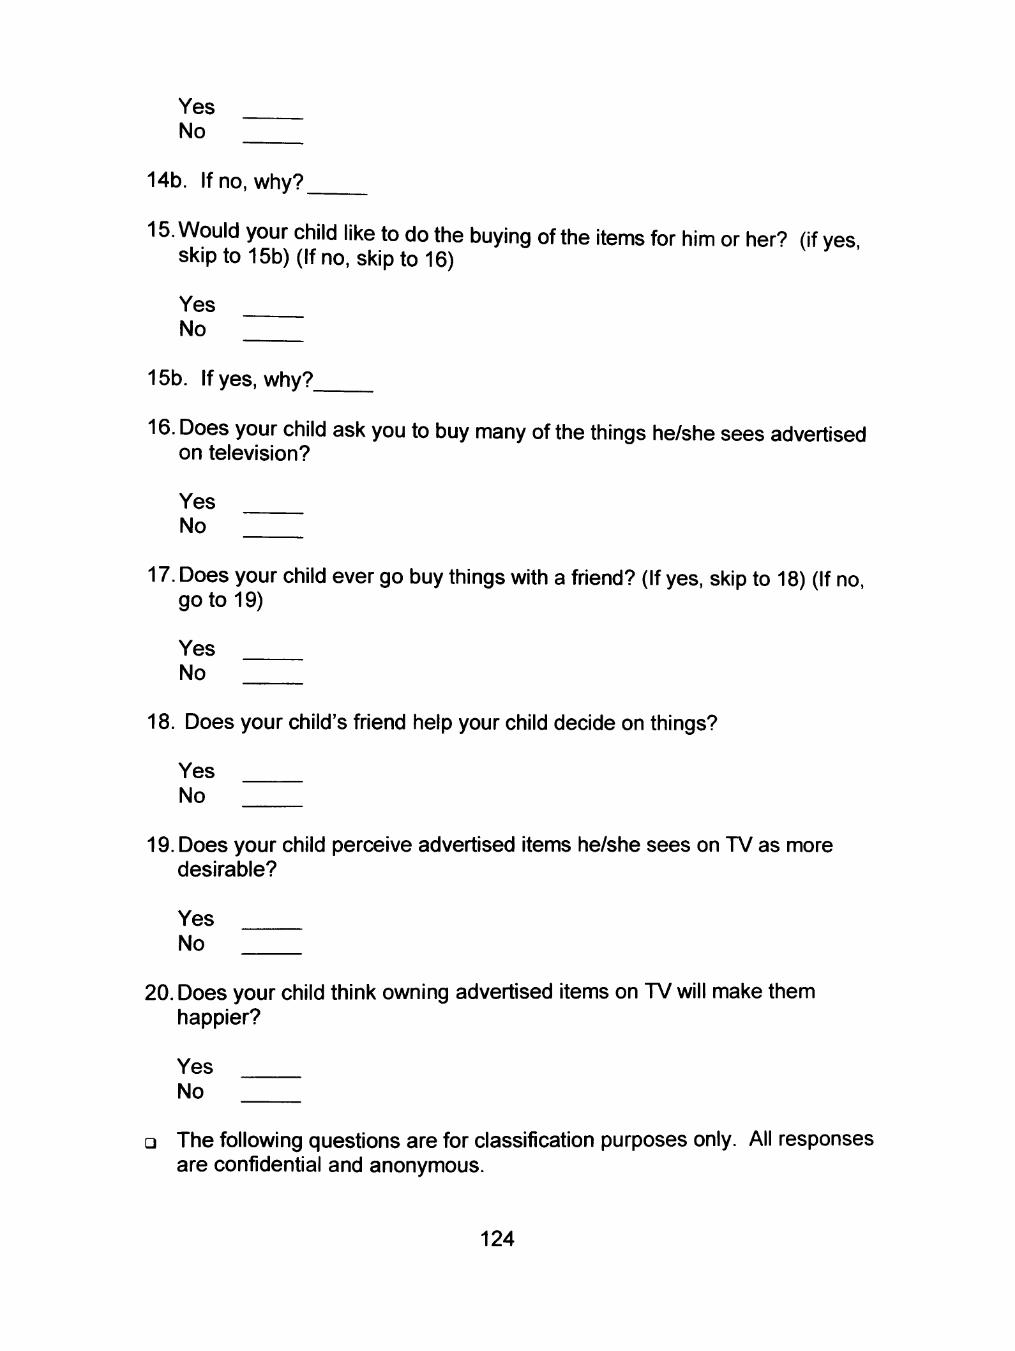
Yes No
14b. If no, why?
15. Would your child like to do the buying of the items for him or her? (if yes skip to 15b) (ff no, skip to 16)
Yes No
15b. ffyes, why?
16. Does your child ask you to buy many of the things he/she sees advertised on television?
Yes No
17. Does your child ever go buy things with a friend? (If yes, skip to 18) (If no, goto 19)
Yes No
18. Does your child's friend help your child decide on things?
Yes No
19. Does your child perceive advertised items he/she sees on TV as more desirable?
Yes No
20. Does your child think owning advertised items on TV will make them happier?
Yes No
• The following questions are for classification purposes only. All responses are confidential and anonymous.
124

21. Record parent's gender, do not ask.
Male Female
22. What is your child's gender?
Male Female
23. What is your age?
1-Under21 2-21-25 3-26-30 4-31-35 5-36-40 6-41-45 7-46-50 8-over 50 9-DK/Refused
24. What is your marital status?
1-Single 2-Married 3-DK/Refused
25. What is your education level?
1-GED 2-High school Diploma 3-Some college 4-Bachelor's Degree 5-Master's Degree 6-PhD 7-Vocational Training 8-other 9-DK/Refused
26. Do you have a VCR?
1-Yes 2-NO 3-DK/Refused
125

27. Do you have cable?
1-Yes 2-NO 3-DK/Refused
28. Do you have a V-chip in your TV?
1-Yes 2-NO 3-DK/Refused
29. What is your approximated total family income per year?
0-Under $10,000 1-$10,000-$14,000 2-$15,000-$19,000 3-$20,000-$24,000 4-$25,000-$34,000 5-$35,000-$39,000 6-$40,000-$44,000 7-$45,000-$49,000 8-$50,000 and above 9-Refused to answer
126

PERMISSION TO COPY
In presenting this thesis in partial ftilfillment of the requirements for a master's
degree at Texas Tech University or Texas Tech University Health Sciences Center, I
agree that the Library and my major department shall make it freely available for
research purposes. Permission to copy this thesis for scholarly purposes may be
granted by the Director of the Library or my major professor. It is understood that
any copying or publication of this thesis for financial gain shall not be allowed
without my further written permission and that any user may be liable for copyright
infringement.
Agree (Permission is granted.)
Disagree (Permission is not granted.)
Student Signature Date
Copyright © 2022 FDOKUMEN