Digital consumers
99
The information seeking behaviour of the digital consumer: case study the virtual scholar David Nicholas, Paul Huntington, Hamid R. Jamali and Tom Dobrowolski Summary This is a lynchpin chapter in that preceding chapters have provided the essential context for it and the following ones feed off it, and its relative significance is reflected by the greater space devoted to it. The massive exodus of the information user from the physical space to the virtual space and the opening up of information resources to millions of people who once had poor access to information resources requires us all to reflect on what this really means in information seeking terms. This chapter provides for this reflection by profiling and evaluating the information seeking behaviour of the digital information consumer. This is 1
Transcript of Digital consumers
The information seeking behaviour of the
digital consumer: case study the virtual
scholar
David Nicholas, Paul Huntington, Hamid R. Jamali and Tom
Dobrowolski
Summary
This is a lynchpin chapter in that preceding chapters
have provided the essential context for it and the
following ones feed off it, and its relative significance
is reflected by the greater space devoted to it. The
massive exodus of the information user from the physical
space to the virtual space and the opening up of
information resources to millions of people who once had
poor access to information resources requires us all to
reflect on what this really means in information seeking
terms. This chapter provides for this reflection by
profiling and evaluating the information seeking
behaviour of the digital information consumer. This is
1
largely undertaken by visiting the huge evidence base
that the CIBER research group have amassed over the years
during the Virtual Scholar research programme (2001-
2008), the biggest of its kind ever conducted. The
evidence base is formed from the millions of digital foot
prints that people leave behind them after a visit to a
digital resource. Using deep log analysis techniques
sense has been made of these data and they are stitched
together to create information seeking portraits for a
wide range of scholarly communities, including staff,
students and researchers. Via these portraits user
satisfaction and scholarly outcomes are investigated.
It has to be said that the characteristics of the
information seeking behaviour so uncovered comes as
something of a revelation, and is so different to what
might have been expected from reading the established
literature on information seeking. The behaviour
resembles more that of an e-shopper confronted by the
cornucopia of shopping opportunities offered by the web.
2
It is frenetic, promiscuous, volatile and viewing in
nature and, as such, requires us all to radically rethink
information provision and delivery to the digital
information consumer.
Background
The Internet has moved into all corners of our life,
online searching has become a daily activity for millions
and millions of people. A fundamental shift in the
information domain has occurred: science and the public
sector are no longer the biggest markets for online
services. In recognition of this CIBER1 has spent the
past seven years evaluating the information seeking
behaviour of a number of emergent, strategic digital
information communities, most notably those associated
with news (Nicholas et al. 2000), health (Nicholas et al.
2007c), voluntary and charitable work (Nicholas et al.
2004) and scholarly publishing. Despite the fact that
these communities are clearly very different in make-up
they have all be shown to demonstrate a very similar and
1 www.ucl.ac.uk/slais/research/ciber/
3
highly distinctive form of information seeking, something
due to the fact that they are all using a common
platform, the Internet, for domestic, leisure and work
purposes. This form of information seeking has more in
common with the behaviour of shoppers than with that of
traditional library users. This is because there is now a
huge, rich market for information and obtaining
information is part of the shopping experience. As a
shopper it is our duty to be a smart shopper who plays
the market. Nobody wants to spend too much time and money
and obtain the wrong things.
That is why we like to use the term digital information
consumers rather than users to remind ourselves of this;
and we believe that it is the very failure to recognise
this which is causing all the current professional angst
over the future of the information professions.
4
In this chapter we will describe and evaluate this
consumer form of information seeking by making reference
to a vast evidence bank generated by CIBER’s most recent
research programme, covering the information seeking
behaviour of hundreds of thousands of virtual scholars.
We shall also look at the implications of this form of
behaviour for information providers of all types,
libraries, publishers and academe. It is very, very
different form of behaviour that what one might have
expected to find from reading the classic information
seeking texts of Ellis and Haugan (1997) and Wilson
(1999). This is partly because we have undergone a
massive paradigm shift in information seeking behaviour
since they developed their ideas and partly because it
has only recently been possible to observe information
seeking behaviour on a huge scale and in minute detail.
The digital consumer revolution requires us to consign
much what we know about the information seeking behaviour
of the virtual scholar to the bin.
The methodology and evidence base
5
The evidence which informs our portrayal of the
information seeking behaviour of the virtual scholar
largely comes from the digital footprints (logs) that
millions of scholars left behind them when they visited
some of the world’s most important scholarly databases
like, ScienceDirect2, OhioLINK3, Synergy4, Oxford Open
Journals5, Oxford Scholarship Online6, Wiley
Interscience7, Intute8, and British Library Learning9.
These footprints have been collected and evaluated using
a procedure called ‘deep log analysis’ which converts the
data in the transactional logs held on the servers into
meaningful information seeking characteristics for
scholarly communities and then enables that data to be
related to academic satisfaction and outcomes. There are
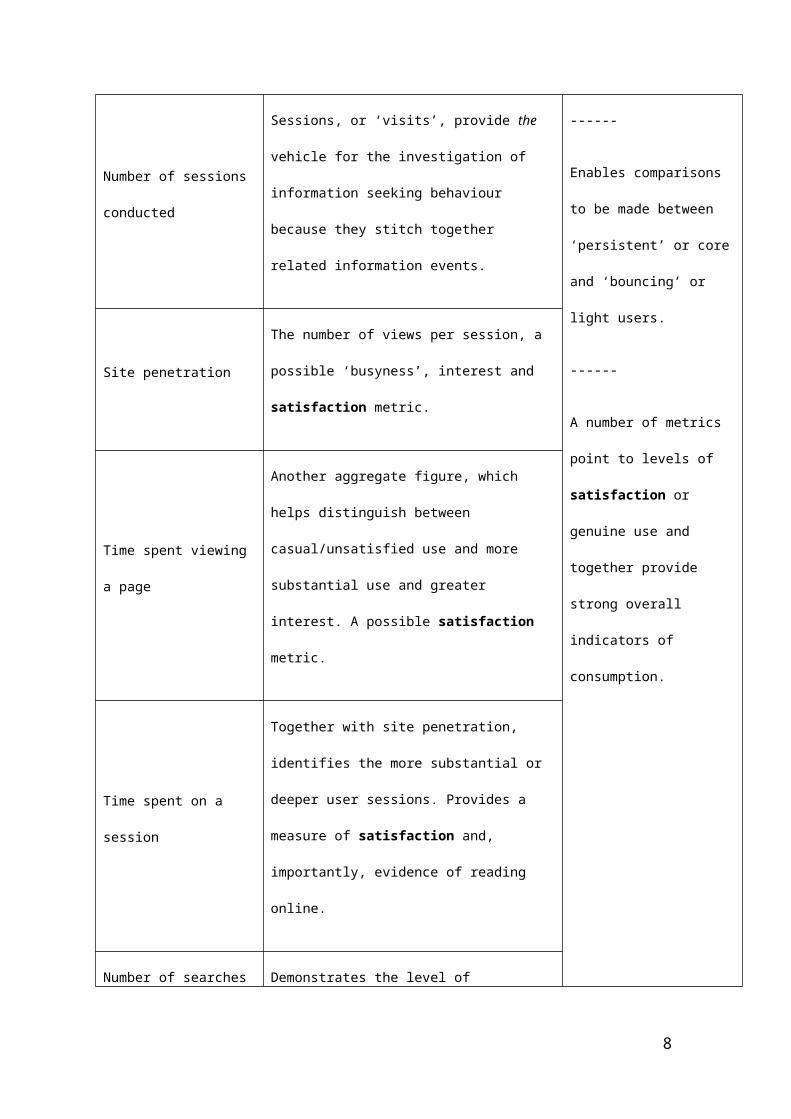
three types of data – activity or use data (Table 6.1),
information seeking characteristics (Table 6.2) and user
2 www.sciencedirect.com3 www.ohiolink.edu4 www.blackwell-synergy.com5 www.oxfordjournals.org/oxfordopen/6 www.oxfordscholarship.com7 www.interscience.wiley.com8 www.intute.ac.uk9 www.bl.uk/learning/
6
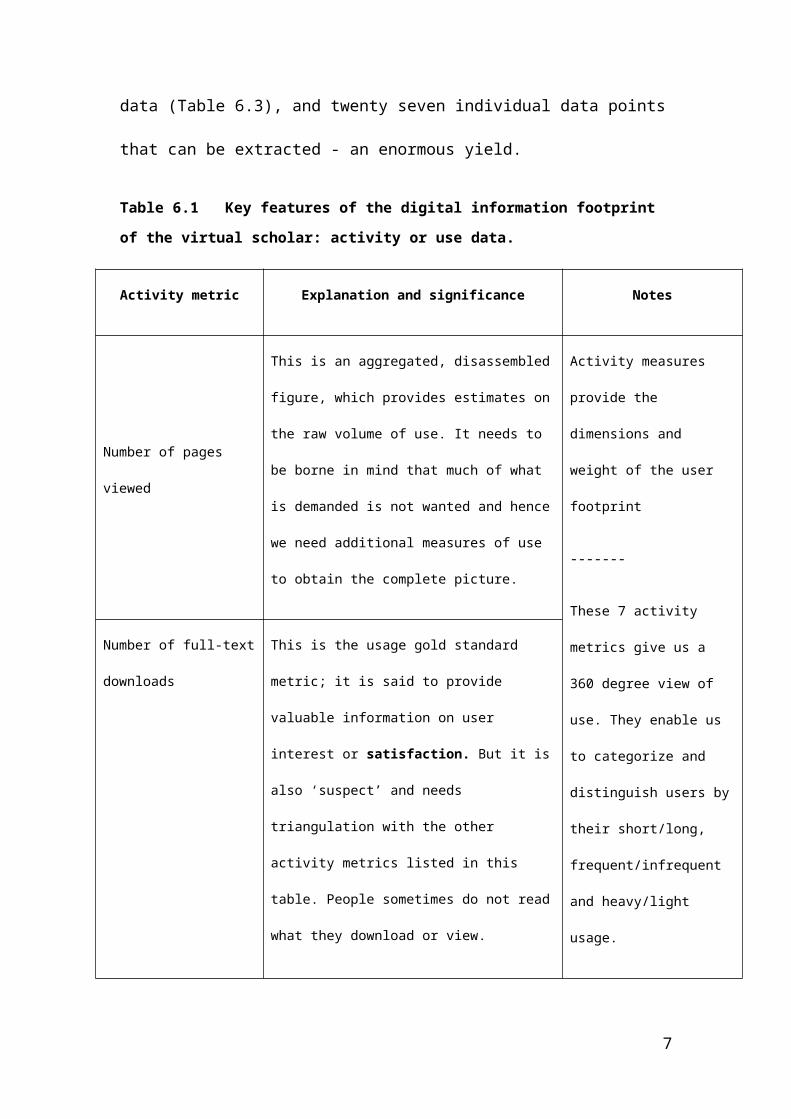
data (Table 6.3), and twenty seven individual data points
that can be extracted - an enormous yield.
Table 6.1 Key features of the digital information footprint
of the virtual scholar: activity or use data.
Activity metric Explanation and significance Notes
Number of pages
viewed
This is an aggregated, disassembled
figure, which provides estimates on
the raw volume of use. It needs to
be borne in mind that much of what
is demanded is not wanted and hence
we need additional measures of use
to obtain the complete picture.
Activity measures
provide the
dimensions and
weight of the user
footprint
-------
These 7 activity
metrics give us a
360 degree view of
use. They enable us
to categorize and
distinguish users by
their short/long,
frequent/infrequent
and heavy/light
usage.
Number of full-text
downloads
This is the usage gold standard
metric; it is said to provide
valuable information on user
interest or satisfaction. But it is
also ‘suspect’ and needs
triangulation with the other
activity metrics listed in this
table. People sometimes do not read
what they download or view.
7
------
Enables comparisons
to be made between
‘persistent’ or core
and ‘bouncing’ or
light users.
------
A number of metrics
point to levels of
satisfaction or
genuine use and
together provide
strong overall
indicators of
consumption.
Number of sessions
conducted
Sessions, or ‘visits’, provide the
vehicle for the investigation of
information seeking behaviour
because they stitch together
related information events.
Site penetration
The number of views per session, a
possible ‘busyness’, interest and
satisfaction metric.
Time spent viewing
a page
Another aggregate figure, which
helps distinguish between
casual/unsatisfied use and more
substantial use and greater
interest. A possible satisfaction
metric.
Time spent on a
session
Together with site penetration,
identifies the more substantial or
deeper user sessions. Provides a
measure of satisfaction and,
importantly, evidence of reading
online.
Number of searches Demonstrates the level of
8
undertaken in a
session.
interaction and is also another
‘busyness’ metric. It could also
point to problems in finding what
is wanted – repeated searching
showing frustration in finding what
is wanted. This is also a searching
metric, see below.
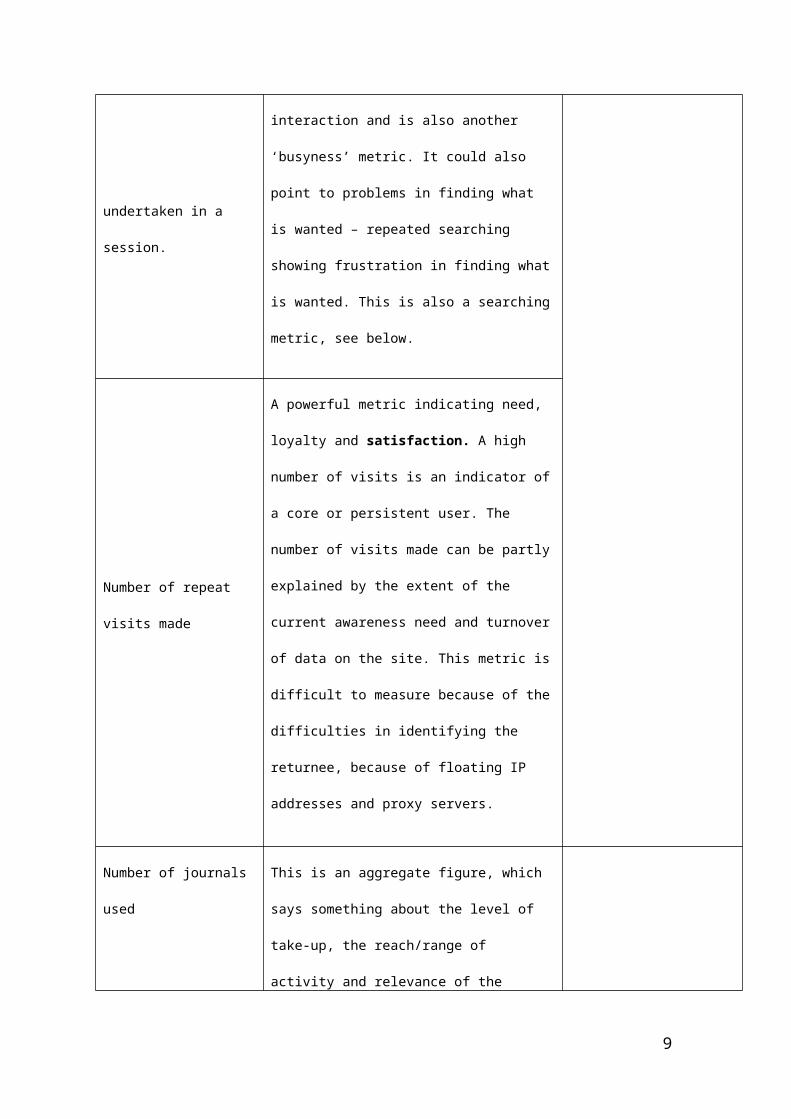
Number of repeat
visits made
A powerful metric indicating need,
loyalty and satisfaction. A high
number of visits is an indicator of
a core or persistent user. The
number of visits made can be partly
explained by the extent of the
current awareness need and turnover
of data on the site. This metric is
difficult to measure because of the
difficulties in identifying the
returnee, because of floating IP
addresses and proxy servers.
Number of journals
used
This is an aggregate figure, which
says something about the level of
take-up, the reach/range of
activity and relevance of the
9
service.
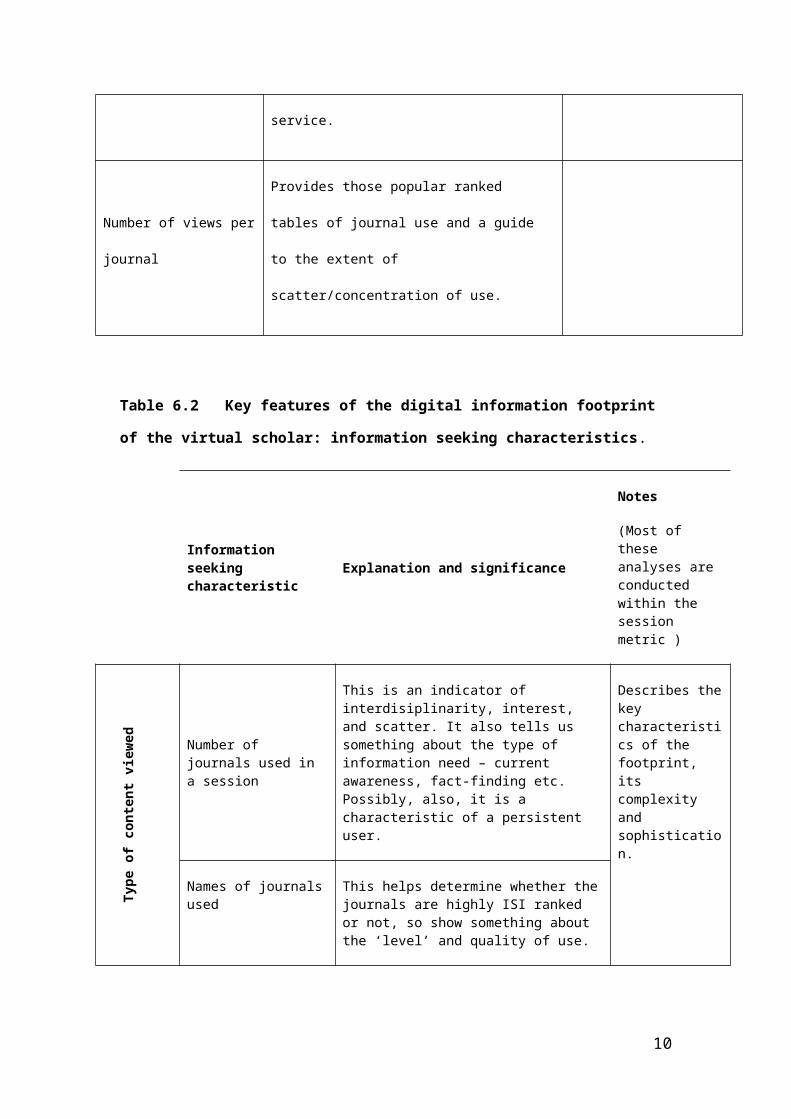
Number of views per
journal
Provides those popular ranked
tables of journal use and a guide
to the extent of
scatter/concentration of use.
Table 6.2 Key features of the digital information footprint
of the virtual scholar: information seeking characteristics.
Information seeking characteristic
Explanation and significance
Notes
(Most of these analyses are conducted within the session metric )
Type of content
viewed Number of
journals used in a session
This is an indicator of interdisiplinarity, interest, and scatter. It also tells us something about the type of information need – current awareness, fact-finding etc. Possibly, also, it is a characteristic of a persistent user.
Describes thekey characteristics of the footprint, its complexity and sophistication.
Names of journalsused
This helps determine whether thejournals are highly ISI ranked or not, so show something about the ‘level’ and quality of use.
10
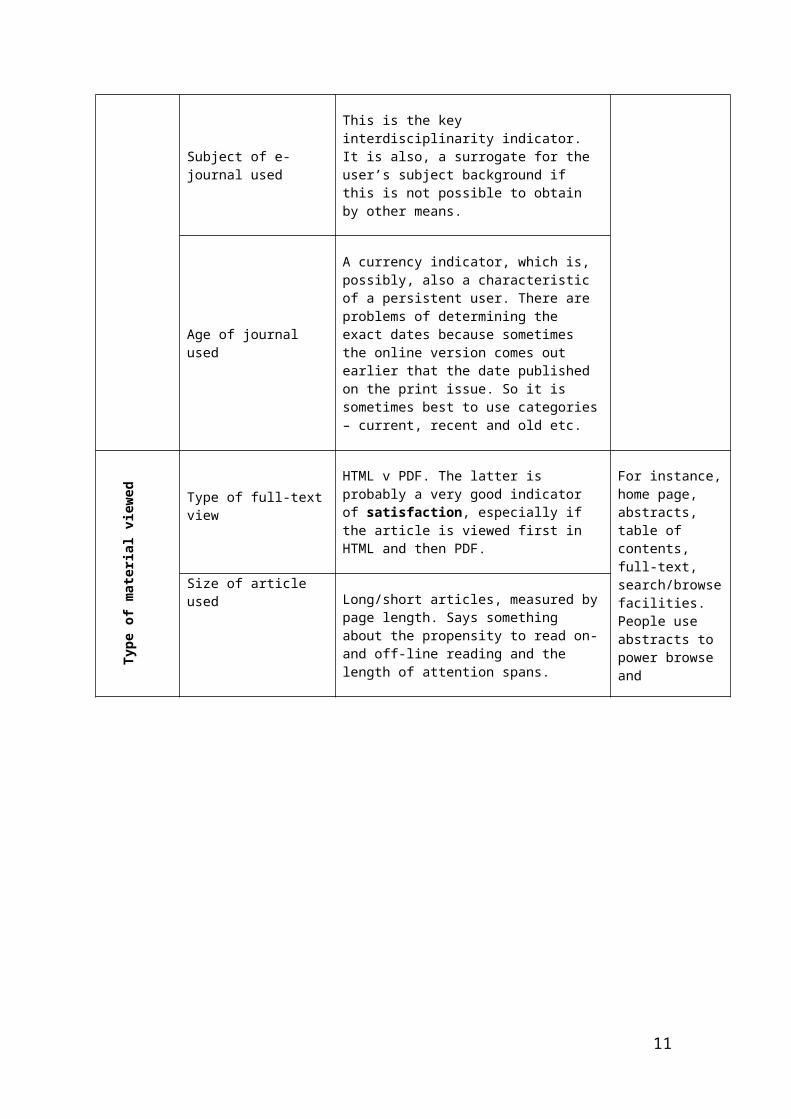
Subject of e-journal used
This is the key interdisciplinarity indicator. It is also, a surrogate for the user’s subject background if this is not possible to obtain by other means.
Age of journal used
A currency indicator, which is, possibly, also a characteristic of a persistent user. There are problems of determining the exact dates because sometimes the online version comes out earlier that the date published on the print issue. So it is sometimes best to use categories– current, recent and old etc.
Type of material viewed
Type of full-textview
HTML v PDF. The latter is probably a very good indicator of satisfaction, especially if the article is viewed first in HTML and then PDF.
For instance,home page, abstracts, table of contents, full-text, search/browsefacilities. People use abstracts to power browse and
Size of article used Long/short articles, measured by
page length. Says something about the propensity to read on-and off-line reading and the length of attention spans.
11
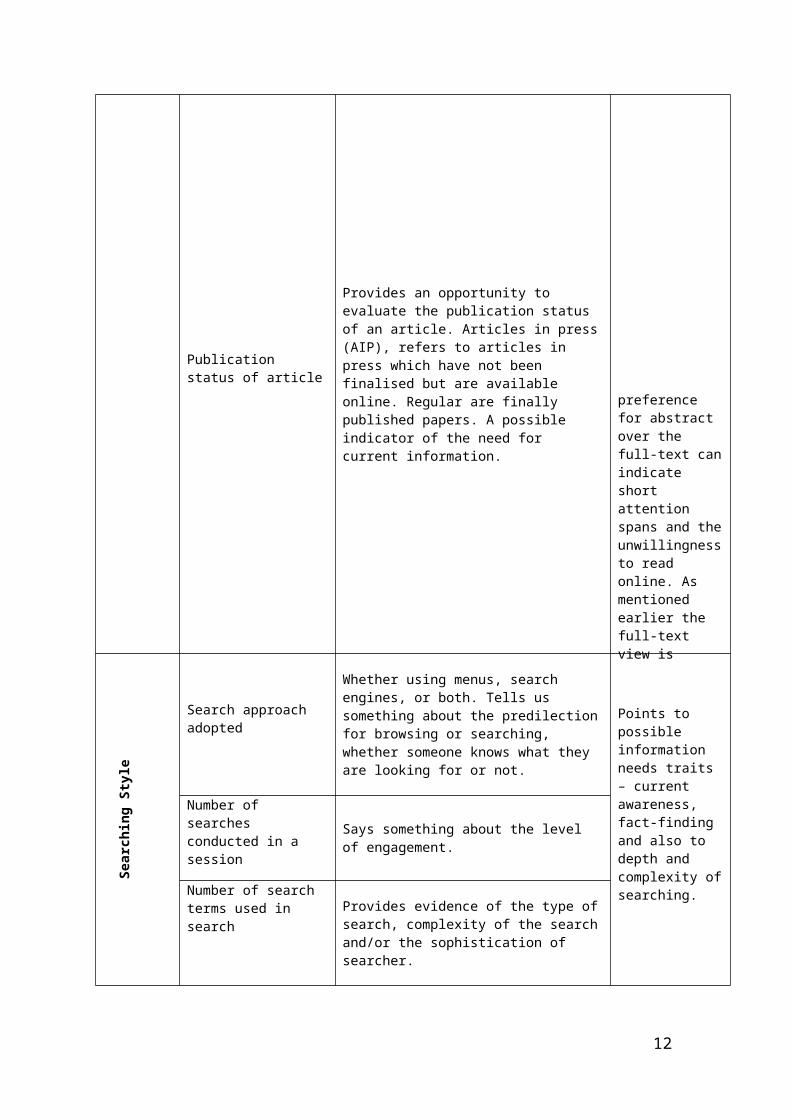
preference for abstract over the full-text canindicate short attention spans and theunwillingnessto read online. As mentioned earlier the full-text view is
Publication status of article
Provides an opportunity to evaluate the publication status of an article. Articles in press(AIP), refers to articles in press which have not been finalised but are available online. Regular are finally published papers. A possible indicator of the need for current information.
Searching Style
Search approach adopted
Whether using menus, search engines, or both. Tells us something about the predilectionfor browsing or searching, whether someone knows what they are looking for or not.
Points to possible information needs traits – current awareness, fact-finding and also to depth and complexity ofsearching.
Number of searches conducted in a session
Says something about the level of engagement.
Number of search terms used in search
Provides evidence of the type ofsearch, complexity of the searchand/or the sophistication of searcher.
12
Form of navigation
The referrer link used (or placefrom where the user came), for instance, search engine, librarylink, PubMed or similar. From this we can distinguish between home and work use.
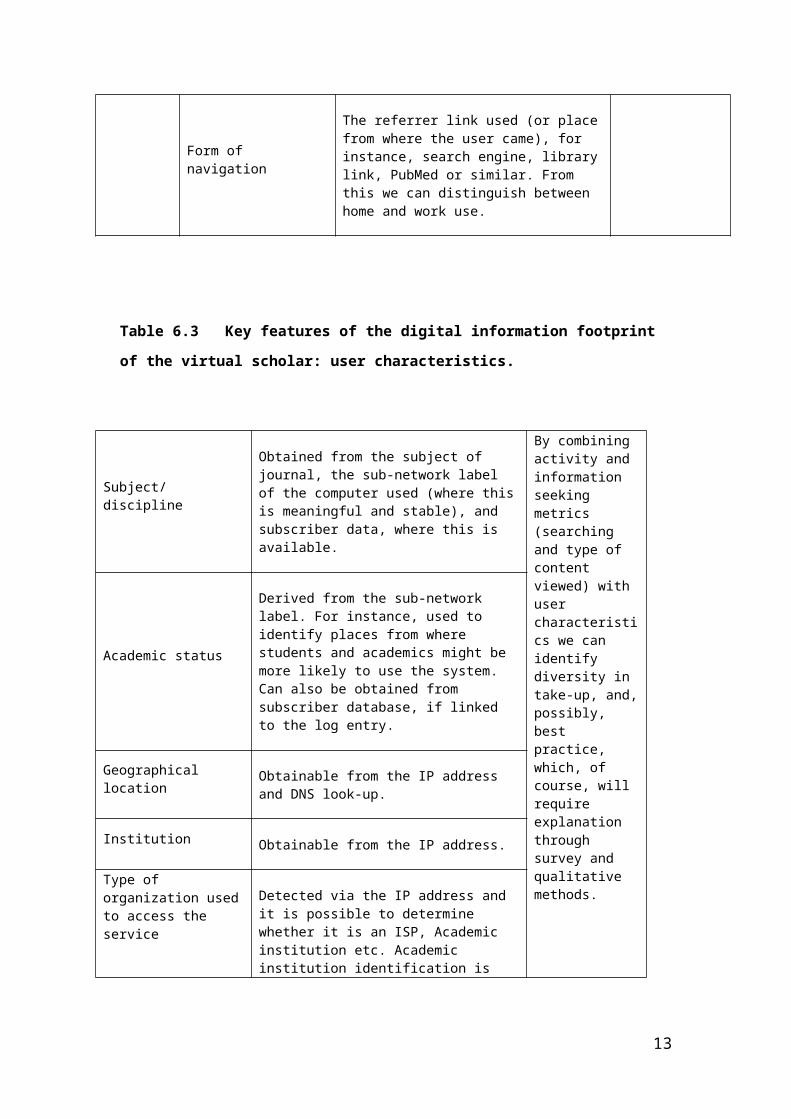
Table 6.3 Key features of the digital information footprint
of the virtual scholar: user characteristics.
Subject/discipline
Obtained from the subject of journal, the sub-network label of the computer used (where thisis meaningful and stable), and subscriber data, where this is available.
By combining activity and information seeking metrics (searching and type of content viewed) with user characteristics we can identify diversity in take-up, and,possibly, best practice, which, of course, will require explanation through survey and qualitative methods.
Academic status
Derived from the sub-network label. For instance, used to identify places from where students and academics might be more likely to use the system. Can also be obtained from subscriber database, if linked to the log entry.
Geographical location
Obtainable from the IP address and DNS look-up.
Institution Obtainable from the IP address.
Type of organization usedto access the service
Detected via the IP address and it is possible to determine whether it is an ISP, Academic institution etc. Academic institution identification is
13
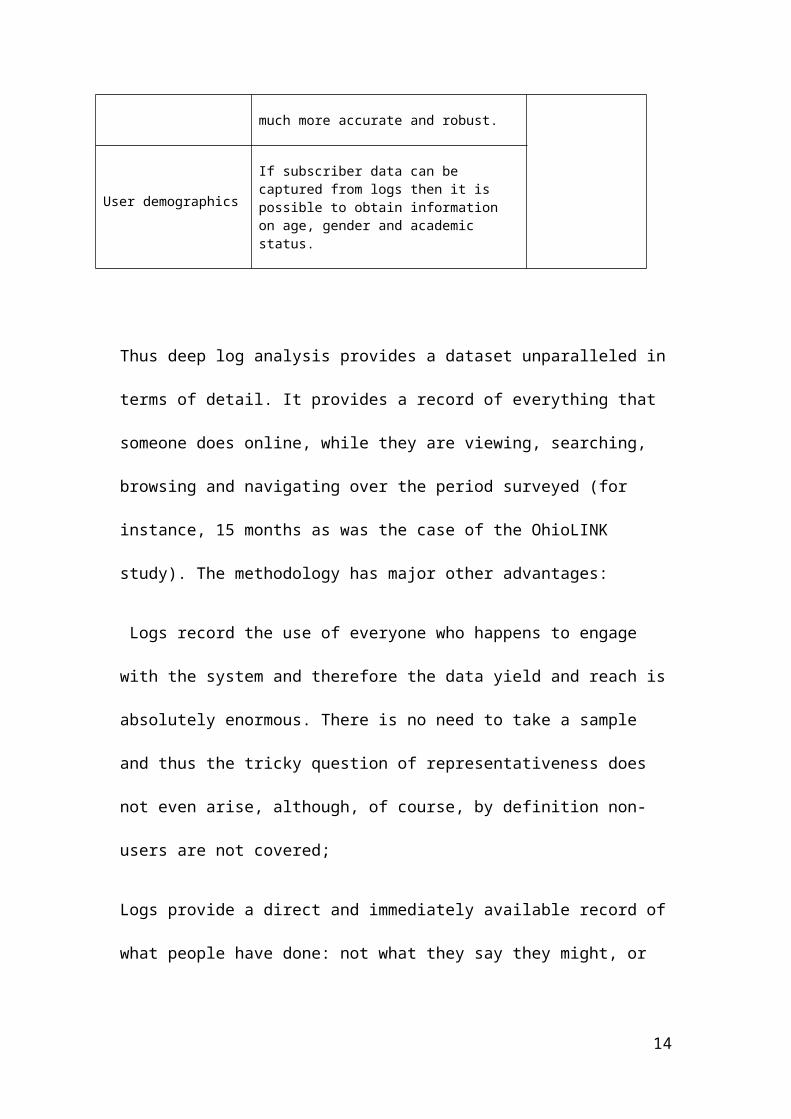
much more accurate and robust.
User demographics
If subscriber data can be captured from logs then it is possible to obtain information on age, gender and academic status.
Thus deep log analysis provides a dataset unparalleled in
terms of detail. It provides a record of everything that
someone does online, while they are viewing, searching,
browsing and navigating over the period surveyed (for
instance, 15 months as was the case of the OhioLINK
study). The methodology has major other advantages:
Logs record the use of everyone who happens to engage
with the system and therefore the data yield and reach is
absolutely enormous. There is no need to take a sample
and thus the tricky question of representativeness does
not even arise, although, of course, by definition non-
users are not covered;
Logs provide a direct and immediately available record of
what people have done: not what they say they might, or
14
would, do; not what they were prompted to say, not what
they thought they did. Logs do not rely on memory they
provide ‘honest’ data;
The data are collected routinely, automatically and quite
anonymously. There is no need to contact the user or
obtain their co-operation as the ‘users’ under
investigation are computers, not individuals.
Every methodology comes with its problems too and it
would only be right to present these here:
Web logs provide a user ‘trace’ – a computer, but not
real user or individual identification. Typically all
there is to work on is the Internet Protocol (IP) number,
which provides the name of the institution and country to
which the user belongs. It is only by means of deep log
analysis that we can add demographic data to the trace.
15
Logs provide a partial picture of user activity. A user
may well view a number of sites in collecting data to
meet an information need. With logs you are usually
looking at just one site option.
Robots account for a good deal of usage. Thousands, of
robots or agents harvest information on the World Wide
Web for a wide variety of purposes – indexing, caching
and data mining, for instance. Robots inflate usage
statistics by as much as 50%. Deep log analysis methods
enable a far more accurate identification of robot use.
Use counts are not a completely accurate because of:
Caching: This impacts on page view counts as some viewed
pages are not recorded or attributed to a user’s search
session, leading to more sessions being classified as
having viewed fewer pages. Caching is the storing of
previously viewed pages on to the client’s computer;
repeat in-session accesses to these pages are made from
16
the cache and are not requested from the web site’s
server and hence not recorded in the logs, something that
underestimates use.
Proxy connections: A proxy connection is one where a
number of computers are connected to the Internet via a
single IP number. In such cases, session details of the
connected computers are muddled together and it appears
that all use comes from the same ‘proxy’ user since users
are identified by IP numbers. This leads to an
underestimation of number of users and sessions.
Session definition: The way sessions are defined, which
can lead to variations in counting. Sessions are,
sometimes, identified in the logs by an identification
number. In such cases logs include a session-beginning
tag and a session-ending tag, which enables us to make
time calculations as well. Unfortunately, as far as the
logs are concerned, nobody logs off on the Web: they just
17
depart anonymously. Typically, then, to estimate a log
off – or a session end, and so define a session – a time
lapse of inactivity has to be assumed and the industry
standard tends to be 30min but CIBER use a much more
accurate (lower)estimation based on page viewing times,
which is more like 8-12 minutes.
Estimating time spent online: Page view time is estimated
by calculating the difference in time between one page
and the next page viewed. No estimate can be generated
for the last page viewed in a session because, as
previously mentioned, there is no log off recorded in the
logs.
Double counting: If someone views a full-text document in
HTML format and then goes on to view this item in PDF
proprietary software tends to count this as two views.
This particularly arises where the user comes in from a
gateway or third-party site and that site only indexes
18
the HTML version. Hence, when the user clicks through to
the article the user is served up with the HTML version.
To view the PDF version the user has to come out of the
HTML Full text version and load up the PDF format
version. This process results in the downloading of two
items rather than one and can considerably inflate the
gold standard full-text metric. CIBER analyses allow for
this by only counting this as one download if the PDF
view follows shortly after the HTML view.
These data provide us with a firm foundation for
forecasting the behaviour of the future virtual scholar
and a reality check against which to judge the veracity
of the floods of user research generated by the
ubiquitous questionnaire and focus group.
Information seeking
The scholarly world, like the news, health and shopping
worlds, has experienced an earthquake which has
registered at the top end of the Richter scale and we are
19
still experiencing the aftershocks, and will do for some
years to come. The earthquake being referred to is the
one triggered by the Internet which has led to the mass
migration of scholarly information seeking to the virtual
space, a process which is gaining considerable momentum
as a result of the two latest aftershocks – e-books and
social networking sites. After each aftershock new users
are brought into the scholarly net and changes occurs in
the information seeking behaviour of the population at
large. But we are talking here about evolutionary,
incremental and not revolutionary change. The fundamental
‘consumer’ characteristics of the information consumer,
as that of the e-shopper have already been laid down and
are now becoming widely known through the work of CIBER
(Naughton, 2008).
As mentioned earlier, thanks to the digital transition a
large and increasing amount of the information seeking
behaviour of scholars has become visible and can be
monitored comprehensively, remotely and in real-time. A
20
sea change has occurred and this should command
attention, not just because of what it tells us about the
world of the virtual scholar but also because it provides
information about aspects of information seeking
behaviour that have not previously been observable, and
about which people have guessed.
Scholarly information seeking today, like consumer
information seeking generally, has been shaped by a
number of factors, most notably: disintermediation (which
means, no mediation, serve yourself to information), easy
access to the product, the provision of massive choice,
reliance on search engine searching and a much wider
range of people being brought into the scholarly net, e-
Shoppers, for instance. This has created a consumer
market for scholarly information products and a very
distinctive ‘consumer’ form of behaviour, one that Chris
Russell has described in Chapter 3. For most people who
are presented with the realities of this form of
behaviour, it comes as something of a revelation, and,
21
for some, it is very disturbing too. In broad terms this
behaviour can be portrayed as being active (frenetic),
horizontal, bouncing, navigating/checking and viewing in
nature. It is also promiscuous, diverse and volatile.
Surprisingly, too, it is not just centred on the viewing
of full-text documents, supposedly the diamonds in the
scholarly mine, much navigating is undertaken, too. The
journey through cyberspace is either interesting in
itself (because of the interesting things you can find)
or its confusing, and people are having to trek all over
the place to find what they want. The truth is probably
both are true. Much of it is also robotic.
It is pretty obvious that this form of behaviour presents
serious challenges to traditional information providers,
nurtured in a hard-copy paradigm and, in many respects,
still tied to it. No one surely would have described
scholarly information seeking behaviour in these terms,
was it not thought to be staid, conservative and loyal;
far from it.
22
In the coming pages we shall examine thirteen key aspects
of digital information seeking behaviour: activity,
volatility, horizontal, navigating, viewing, diversity,
checking, access expectation, robotic, internationality,
currency, interdisciplinarity and scatter. Following the
information seeking analysis there is an examination of
the impacts on (and obstacles to) information seeking
(featuring Web 2.0 and open access publishing) and then a
consideration of the outcomes of information seeking.
1. Activity
Standard methods of calculating use, like so-called ‘hit’
or page counts, tend to exaggerate site activity because
they include robot use, count duplicate views (e.g. where
a PDF and HTML view to a document counts as two
downloads) and use which is clearly not positive (the
viewing of irrelevant pages served up in spades by a
search engine) but nevertheless, even using the much more
robust measures employed by CIBER log analysis (refer
back to Table 1) the levels of activity associated with a
23
scholarly site, as in the case of retail sites, are very
impressive indeed and seems to be rising inexorably.
Undoubtedly, scholarly information sites are
exceptionally popular. Two things make them popular and
are powering their growth: a) the existence of a huge
mass of non-subscribers coming in via search engines,
people who do not have full access rights, but who are
interested in the product and who by their sheer numbers
dwarf the site’s core audience; b) the fact that the core
audience can access the site anytime and anywhere thanks
to broadband, wireless, the Blackberry, mobile phone and
the like. Not only are more people being drawn into the
scholarly net, but existing users can search much more
freely and flexibly than ever before, so racking up their
use. Apart from time there appear to be few obstacles to
information seeking. The (pleasant) shock for many people
is how big an appeal there is for the product, which is
surely a huge relief to the information professions, when
there is so much else to worry them. A potted selection
of CIBER e-journal usage statistics illustrates the point
extremely well. Thus:
24
As far back as 2003 the Blackwell Synergy database10
attracted more than 500,000 people to its site a month,
and these people made 5 million views during their
visits; more recently (2005/6) on the OhioLINK service
2,250,000 pages were viewed and 339,000 sessions
conducted in 15 months;
In the case of OhioLINK11, an e-journal platform, which
provides access to the full-text of some 6000 journals,
in a single month in 2007 all bar 5 of the journals were
used, and so disproving the notion that much material
available is not being used and that authors are only
publishing for themselves (or their mothers!);
Two-thirds of visitors to EmeraldInsight12, an e-journal
site covering business and information management
journals, turned out to be non-subscribers, people who 10 www.blackwell-synergy.com11 www.ohiolink.edu12 www.emeraldinsight.com
25
did not have full-text rights and were simply happy with
an abstract or whatever full-text that was being offered
free at the time;
In the case of Nucleic Acids Research13, a highly specialist
journal, really only accessible to experienced
researchers in the field, usage increased by a 150% in
three years as a direct result of opening the site to
search engines;
Intute, a scholarly gateway site, that acts as a
validated signpost to scholarly web sites14 saw 6 million
pages viewed in a matter of just three months in 2007.
How does all this activity square with the concerns that
dominated the profession twenty years ago that the huge
availability of data would result in overload? Well, in
interviews we have conducted with academics in 2008 the
term rarely ever came up and when the interviewer
13 nar.oxfordjournals.org14 www.intute.ac.uk/
26
prompted the interviewees, they simply shrugged their
shoulders. They are resigned to it; it is just part of
the scenery or the academic assault course, and it is a
small price to pay for the unbelievable level of access
obtained. It is almost as they do not want to rock the
boat because that would sink it. They remembered the
‘bad’ times.
The results of CIBER’s Superbook study (Nicholas et al.
2007d) showed that e-books will surely be the next
scholarly publication success story, although if
anything, demand could be even more spectacular than what
we have seen with e-journals. After all, e-books have a
much wider and larger audience many of whom - students
and arts and humanities academics - have not fully
benefited from the e-journal revolution. Students will
lead the charge when they find that the supply of
textbooks has been finally unblocked.
27
It is indeed ironic that it should be during a period of
long and sustained growth in the provision and usage of
scholarly publications that many librarians feel
challenged and sidelined. The challenge for libraries
arises from the fact that, as the scholar flees the
physical space for the virtual space (and, as a result,
becomes more energised), they move closer to the
publisher and further from the library. As a direct
consequence they become more anonymous and removed from
the scene of scholarly information consumption, and
librarians become correspondingly less informed about the
behaviour of their users. So it is quite possible that
librarians will be the only stakeholder group that will
not benefit from a rapidly rising market for the
scholarly product. Whether this will indeed be the case
is being investigated by the authors on the JISC funded
UK National E-Books Observatory project15. Such worries
probably explain library moves to take the fight to
publishers by establishing institutional and subject
repositories.
15 For the details of the project visit: www.publishing.ucl.ac.uk/observatory.html
28
Of course, the danger with high usage figures is that it
engenders a high level of well-being and complacency; if
there is so much demand for the service, why should we
bother to change it or even investigate whether people
are indeed happy or satisfied with the service?
2. Volatility
Not only is there a lot of growth associated with
scholarly information services, there is also a good
degree of volatility associated with them. Use varies
enormously from year to year, term to term, month to
month, by day of the week and hour of the day. Table 6.4
shows the year to year usage figures for the Emerald
database for the period August 2001/January 2002 and
August 2002/January 2003 for 91 universities. There is a
huge see-sawing in use with the majority of
increases/decreases of the magnitude of 25% and over. In
fact, 11% of universities increased their usage by more
than a 100%.
29
Table 6.4 Volatility in Emerald database use expressed as a
percentage for 91 UK universities (2001/2 to 2002/3).
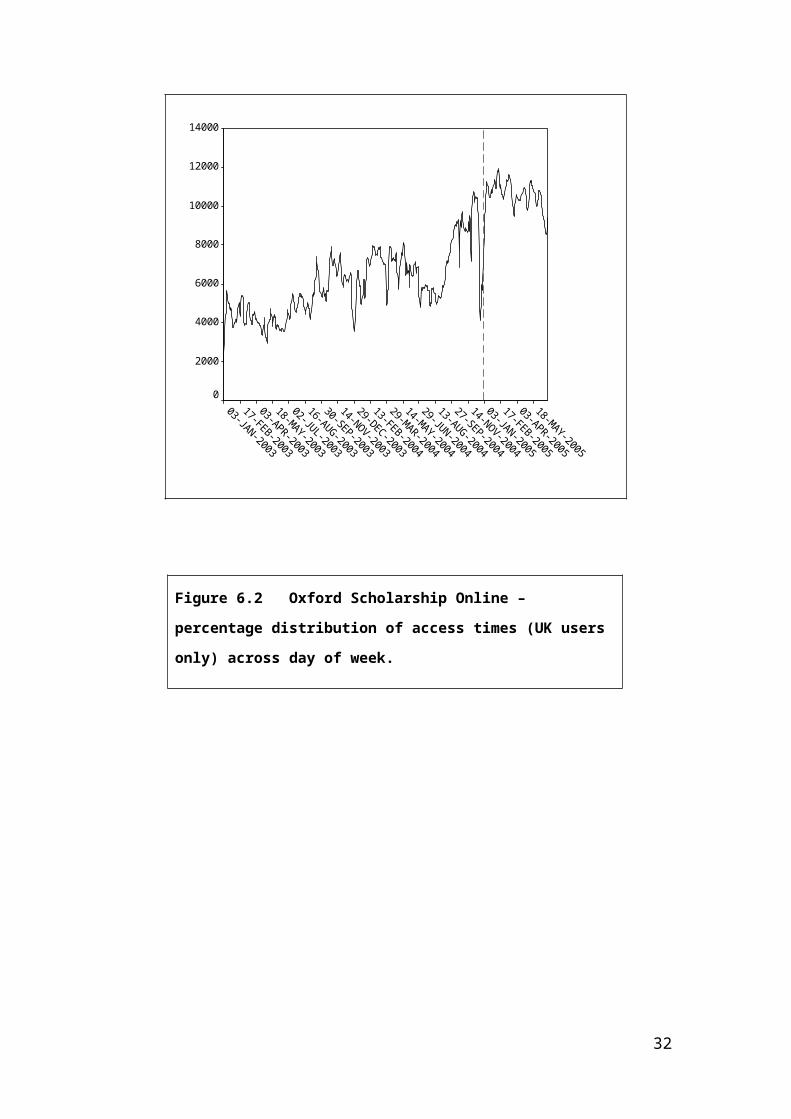
Although use is volatile it is often highly patterned.
Thus use tends to peak in the autumn and spring terms and
this is illustrated by reference to Figure 6.1 which
shows long-term usage patterns for the journal Nucleic
Acids Research. The Figure also demonstrates the strong
30
growth associated with most scholarly sites mentioned
earlier. The red dotted line denotes the date when the
journal went Open Access, triggering further growth. Use
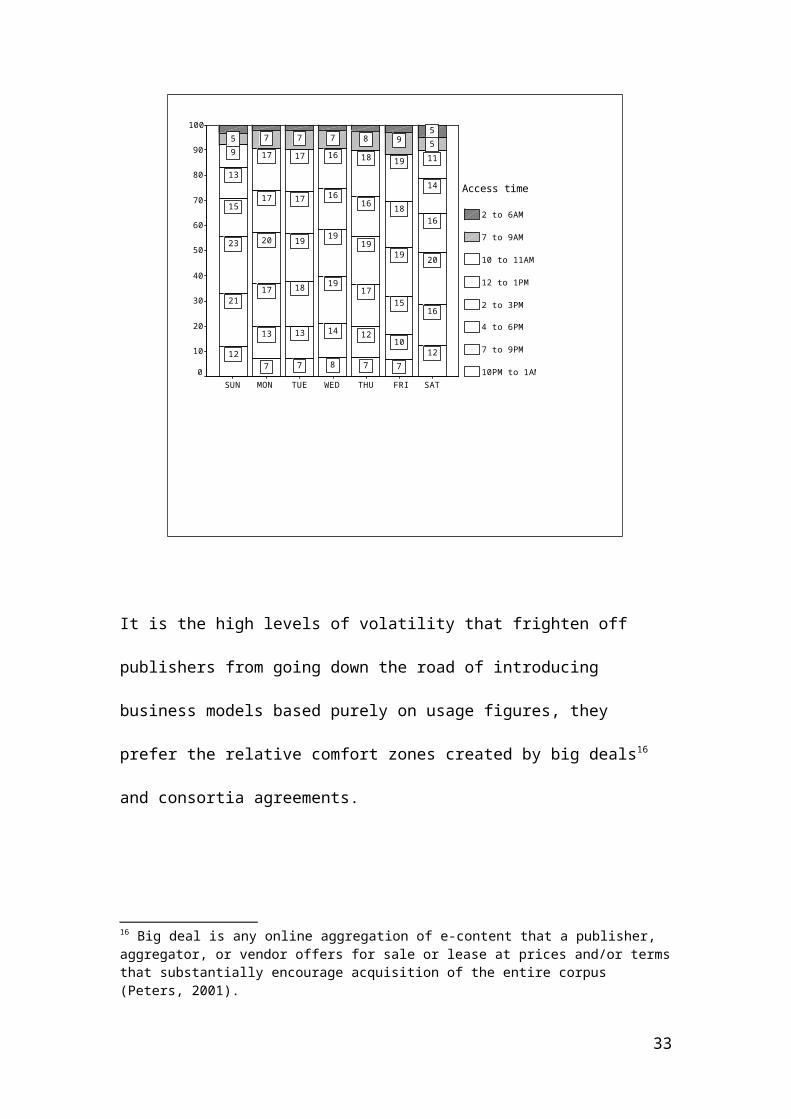
is also generally strong during the week, tends to be
highest on a Monday (as in the case of e-Shoppers) and
drops significantly over the weekend, with most use
occurring between about 11am – 4pm during the day. This
is shown in Figure 6.2 in regard to the usage of Oxford
Scholarship Online, an e-monograph platform.
Patterns of usage also vary with e-platform too, with e-
textbooks usage more likely to be tied to the rhythms of
the course/modules being studied.
Figure 6.1 Nucleic Acids Research: number of
articles viewed, smoothed*, by day - January 2003
- June 2005.
31
18-MAY-2005
03-APR-2005
17-FEB-2005
03-JAN-2005
14-NOV-2004
27-SEP-2004
13-AUG-2004
29-JUN-2004
14-MAY-2004
29-MAR-2004
13-FEB-2004
29-DEC-2003
14-NOV-2003
30-SEP-2003
16-AUG-2003
02-JUL-2003
18-MAY-2003
03-APR-2003
17-FEB-2003
03-JAN-2003
14000
12000
10000
8000
6000
4000
2000
0
Figure 6.2 Oxford Scholarship Online –
percentage distribution of access times (UK users
only) across day of week.
32
SATFRITHUWEDTUEMONSUN
100
90
80
70
60
50
40
30
20
10
0
Access time
2 to 6AM
7 to 9AM
10 to 11AM
12 to 1PM
2 to 3PM
4 to 6PM
7 to 9PM
10PM to 1AM
55987775
1119181617179
14
1816161717
13
16
1919
191920
15
20
1517
191817
23
16
1012141313
21
1277877
12
It is the high levels of volatility that frighten off
publishers from going down the road of introducing
business models based purely on usage figures, they
prefer the relative comfort zones created by big deals16
and consortia agreements.
16 Big deal is any online aggregation of e-content that a publisher, aggregator, or vendor offers for sale or lease at prices and/or termsthat substantially encourage acquisition of the entire corpus (Peters, 2001).
33
3. Horizontal
Arguably, the most important CIBER finding has been the
discovery of a widespread, pronounced and endemic form of
digital information seeking behaviour amongst scholars
which is best described as ‘bouncing’, although the
description ‘flicking’ would do equally. Bouncing is a
form of behaviour where users view only one or two web
pages from the vast numbers available to them and a
substantial proportion (usually the same ones) generally
do not return to the same website very often, if at all.
The actual figures regarding bouncing are well worth
reflecting upon.
All the CIBER studies showed that round 55-65% of e-
journal users typically view no more than three pages in
a visit and then left. The studies also showed around
half of all users did not return or only returned after a
prolonged gap.
34
Thus in the case of the two most recent CIBER scholarly
database evaluations, that of BL Learning and Intute
which were conducted as part of the Google Generation
project (CIBER, 2008), the figures for people viewing
just one page and leaving were almost identical,
respectively 57 and 58%. In regard to return visits the
ScienceDirect data is illustrative. Over a five month
period (January - May 2005) 40% just visited once, 24%
visited 2 to 5 times, 15% visited 6 to 15 and 21% visited
over 15 times.
This suggests, at best, a checking-comparing, dipping
sort of behaviour that is a result of being provided with
huge digital choice; search engines constantly refreshing
that choice and a shortage of time that results from so
much to look at. In this respect the behaviour is best
seen as being akin to television channel hopping using
the remote control – you flick around alighting on things
of interest and when the interest fails or wanes you
flick to something else. At worse, it points to possible
35
failures at the terminal as a result of poor information
literacy skills (significantly, the evidence also shows
that young people are more inclined to bounce), lazy
search engine searching, and poor content and poorly
designed websites. The following findings regarding
online viewing lend some weight to the ‘failure’
explanation.
In addition to younger people, search-engine users and
non-subscribers (often the same people) to a site are
more likely to bounce.
The significance of this for libraries and publishers is
threefold, they: 1) need to make their offerings suitable
for bouncing by making their contents digitally visible
and easily consumable by opening up their contents to
search engines, enticing them in via abstracts, keywords,
and other devices that feed the bouncing form of
behaviour; 2) they should abandon any notion of being a
36

one-stop shop, this is a fantasy in a world chock-full
with choice; 3) should accept the fact that much content
will be seldom or never be used, other than, maybe, as a
place from which to bounce (a stop on the way). With
increasing content choice and myriad routes to finding
content (via social network sites, for instance) one
might expect the bouncing rate to increase.
4. Navigating
Bouncing of course is partly a function of navigating
your way towards content (and relevance), via a rich
array of search and browse pathways, in a vast and
constantly changing virtual space. It has been shown time
and time again in CIBER studies of e-scholarly platforms,
whatever the specific audience, that the majority of
users (the proportion normally varies between about two-
thirds and three quarters) find the site through the use
of Google and other search engines. This is very
significant in a number of ways, as we shall go on to
point out. Probably, of most significance though, is the
fact that the user generally does not come in via the
37
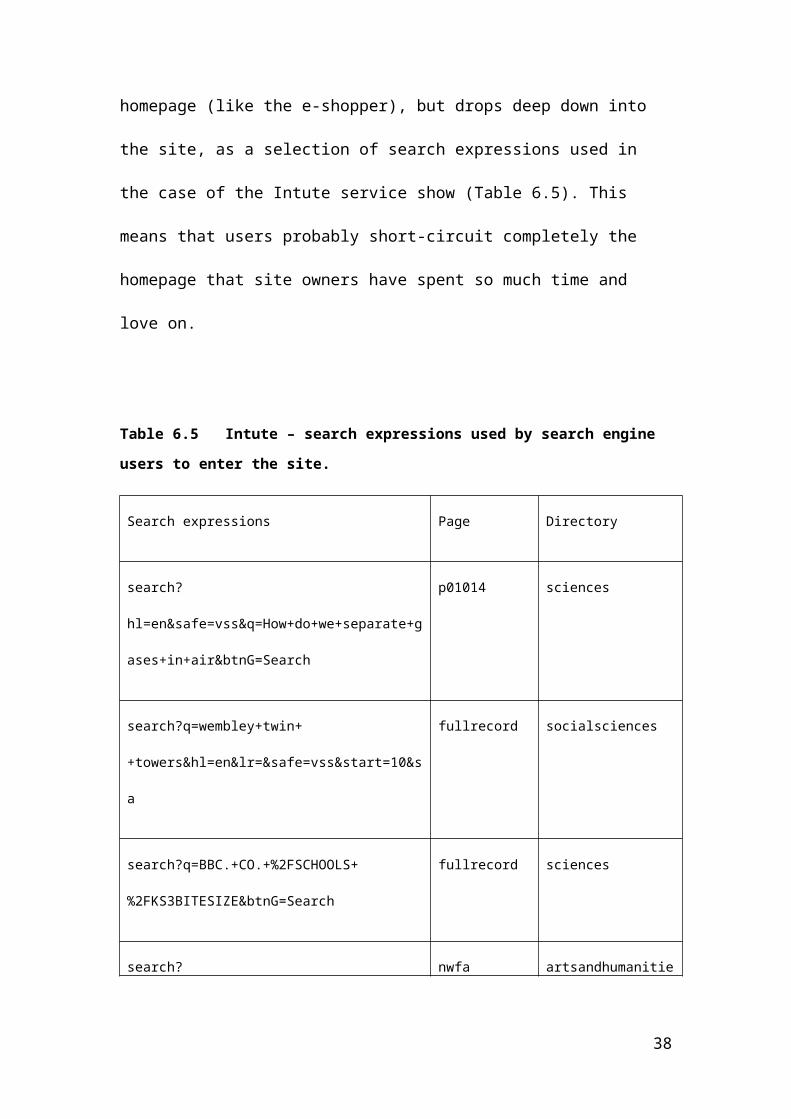
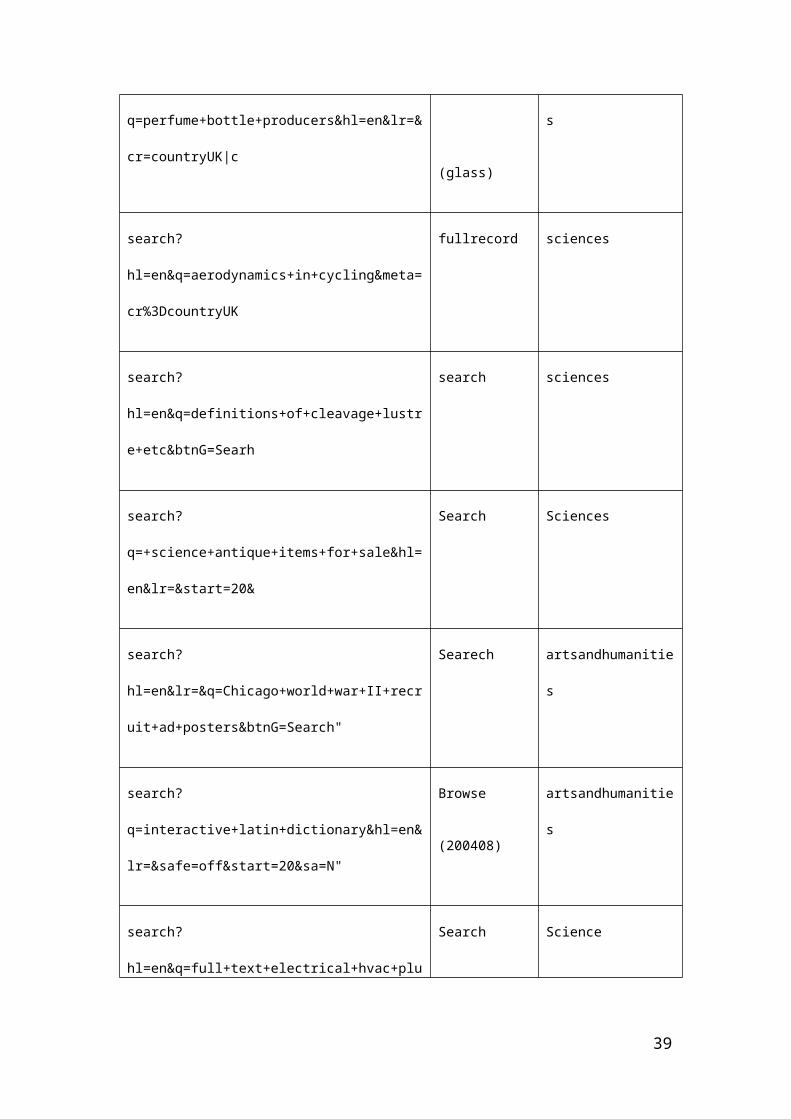
homepage (like the e-shopper), but drops deep down into
the site, as a selection of search expressions used in
the case of the Intute service show (Table 6.5). This
means that users probably short-circuit completely the
homepage that site owners have spent so much time and
love on.
Table 6.5 Intute – search expressions used by search engine
users to enter the site.
Search expressions Page Directory
search?
hl=en&safe=vss&q=How+do+we+separate+g
ases+in+air&btnG=Search
p01014 sciences
search?q=wembley+twin+
+towers&hl=en&lr=&safe=vss&start=10&s
a
fullrecord socialsciences
search?q=BBC.+CO.+%2FSCHOOLS+
%2FKS3BITESIZE&btnG=Search
fullrecord sciences
search? nwfa artsandhumanitie
38
q=perfume+bottle+producers&hl=en&lr=&
cr=countryUK|c (glass)
s
search?
hl=en&q=aerodynamics+in+cycling&meta=
cr%3DcountryUK
fullrecord sciences
search?
hl=en&q=definitions+of+cleavage+lustr
e+etc&btnG=Searh
search sciences
search?
q=+science+antique+items+for+sale&hl=
en&lr=&start=20&
Search Sciences
search?
hl=en&lr=&q=Chicago+world+war+II+recr
uit+ad+posters&btnG=Search"
Searech artsandhumanitie
s
search?
q=interactive+latin+dictionary&hl=en&
lr=&safe=off&start=20&sa=N"
Browse
(200408)
artsandhumanitie
s
search?
hl=en&q=full+text+electrical+hvac+plu
Search Science
39
mbing+book+manual+guide+online+free+&
btnG=Google+Search"
search?
q=librarian+costume&hl=en&lr=&start=6
0&sa=N"/
Browse
(artifact10
47)
artsandhumanitie
s
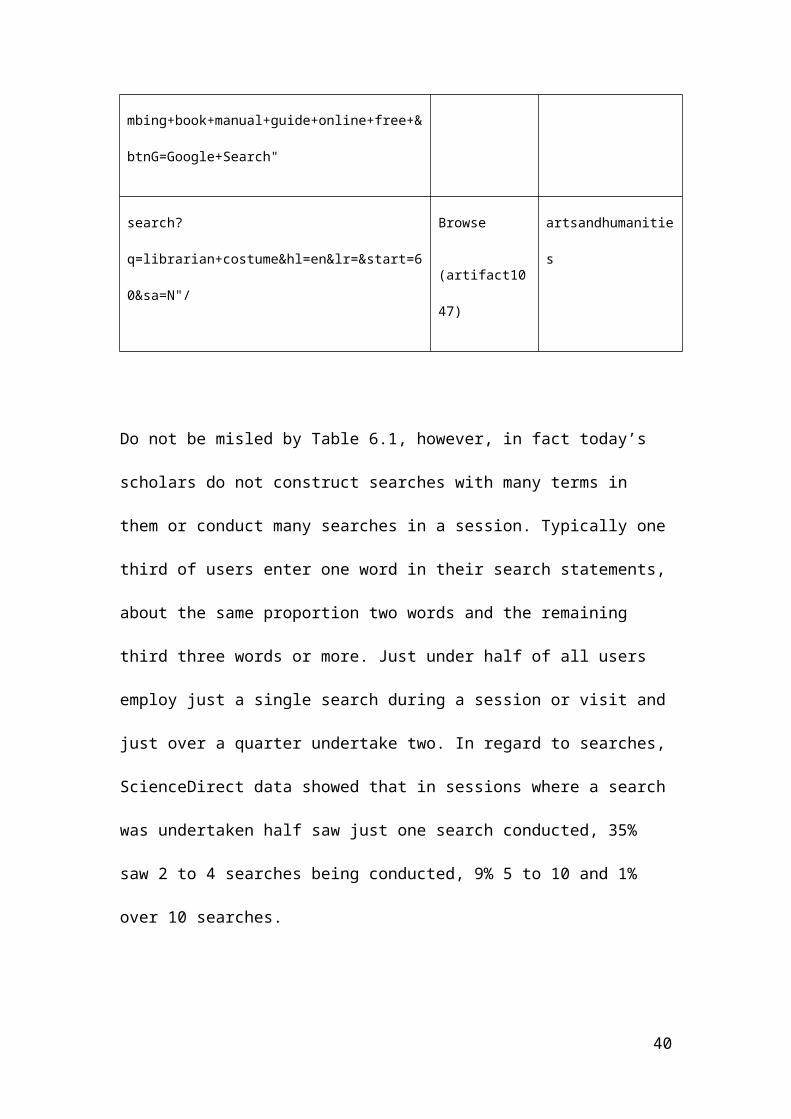
Do not be misled by Table 6.1, however, in fact today’s
scholars do not construct searches with many terms in
them or conduct many searches in a session. Typically one
third of users enter one word in their search statements,
about the same proportion two words and the remaining
third three words or more. Just under half of all users
employ just a single search during a session or visit and
just over a quarter undertake two. In regard to searches,
ScienceDirect data showed that in sessions where a search
was undertaken half saw just one search conducted, 35%
saw 2 to 4 searches being conducted, 9% 5 to 10 and 1%
over 10 searches.
40
Once into the site scholars begin to engage with the
myriad search and browse facilities provided. This can be
seen in Figure 6.3, which show the types of pages viewed
by users of the e-monograph package, Oxford Scholarship
Online (OSO), where just over half of all page views were
to actual book (content) pages; all the other page views
concerned browsing lists, inspecting contents pages,
employing keywords, using search engines and examining
abstracts for clues to content. There are many, many
routes to finding content on OSO; they do not fall neatly
into the browsing/search camps so favoured by librarians,
and clearly users take advantage of the full range of
these facilities.
Figure 6.3 Oxford Scholarship Online: percentage
frequency of type of page viewed.
41
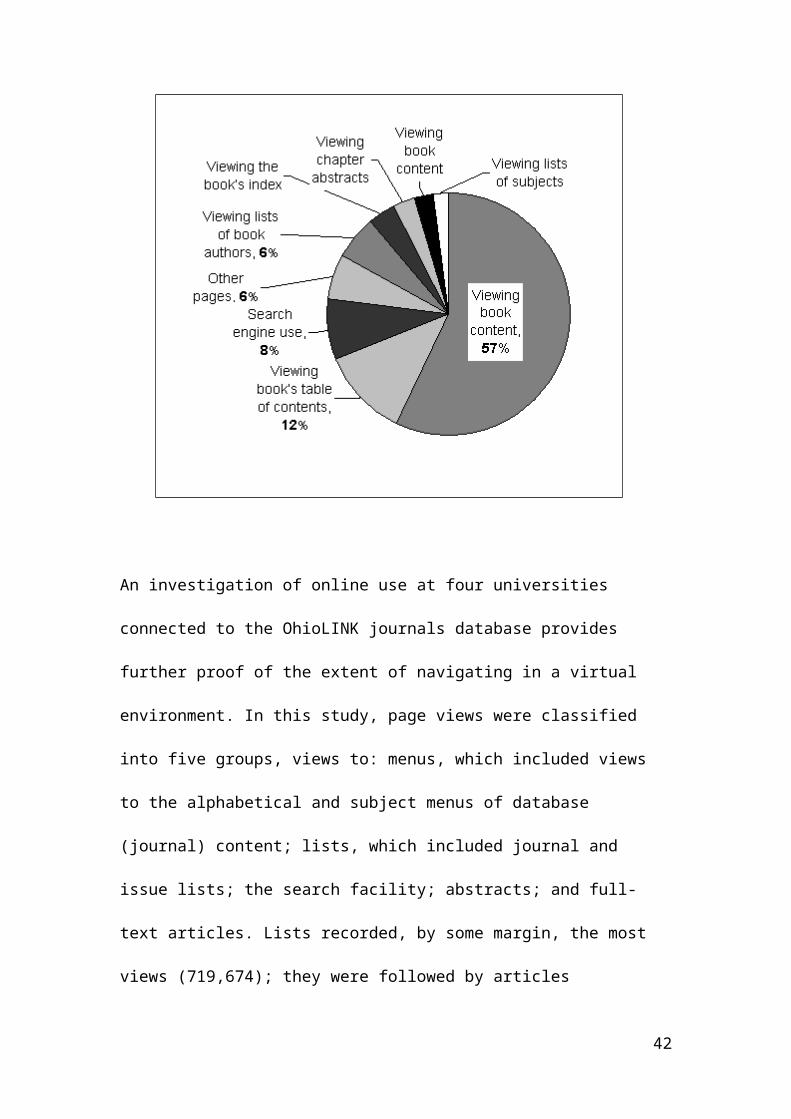
An investigation of online use at four universities
connected to the OhioLINK journals database provides
further proof of the extent of navigating in a virtual
environment. In this study, page views were classified
into five groups, views to: menus, which included views
to the alphabetical and subject menus of database
(journal) content; lists, which included journal and
issue lists; the search facility; abstracts; and full-
text articles. Lists recorded, by some margin, the most
views (719,674); they were followed by articles
42
(580,164), the search option (364,713) and abstracts
(258,772), with menu items accounting for 176,018 views.
The general result supports the earlier statement that
users undertake a wide range of actions online and
viewing full-text articles was just one of them and not
the most frequent one at that. Browsing and navigating
towards text was clearly a significant form of behavior
in the case of large digital libraries like OhioLINK.
Also, with more than a quarter of a million abstracts
viewed, this has to be a powerful testament of the
enduring popularity of abstracts – perfect, perhaps, for
making choices in a crowded digital information
environment, and this is especially significant in the
case of OhioLINK where users did not have to view an
abstract before they could view the full-text, which is
typically the case in other digital journal libraries.
The form of navigation adopted, perhaps not surprisingly,
leads to a very different usage patterns and outcomes.
Thus by using internal and external search engines users
43
are provided with a much wider and disparate view of what
is on offer and they are therefore forced to engage with
a wider range of material – more titles, older material,
from more subjects. This in turn leads inevitably to
higher bouncing rates, because much of the material
served-up by this form of wide-angled (shotgun) searching
will inevitably be irrelevant.
As mentioned previously, the younger the person the more
likely they are to use engines and this is partly
explained by the fact that search engines, unlike
browsing mechanisms like content, subject and alphabetic
lists, do not require you to have any prior knowledge of
the formal literature, its structure and hierarchy. This
might well mean that future users will bring with them
less knowledge of the scholarly system, of which
libraries are currently an important component. If you
reflect on the fact that most libraries were originally -
and still are - designed so their contents could be
44
browsed first this is quite a fundamental shift and not
yet reflected in information provision.
Interestingly, librarians have picked-up on the
popularity (and problems) of the search engine searching
and are developing their own engines to stop user flight.
The latest initiative and, maybe the last hurrah, is
federated retrieval, search software that searches across
all their resources (catalogues, digital journal
deals/collections and multi-media resources, possibly
also learning material). It is believed that this will
offer a trusted and effective searching environment
missing from the big search engines and Google Scholar.
With federated searching Librarians are bravely taking
Google and the Google generation head-on, believing
retrieval is home ground for them. The early signs are
quite promising.
45
5. Viewing
Bouncing can be construed to point to negative scholarly
outcomes (not finding what you want, short attention
spans etc), as does another piece of evidence, that
concerning online viewing – on average most people spend
only a few minutes on a visit to a website, insufficient
time to do much reading or obtain much understanding.
When put together with the bouncing data it would appear
that we are witnessing the emergence of a new form of
`reading’ with users `power browsing’ horizontally
through sites, titles, contents pages and abstracts in
their pursuit of quick wins.
This evidence raises particular questions about what has
been traditionally regarded as the ‘gold standard’ usage
metric, the download, which is used by both librarians
and publishers in value for money and user satisfaction
judgements. It is the e-shopping equivalent of the online
purchase. Thus in the case of Elsevier’s ScienceDirect
website users spent about 30-40 seconds viewing a full-
46
text article, insufficient time to read an article
online. The fact that people are not spending a lot of
time online reading content is supported by the fact that
the same study showed that people spent relatively more
time reading shorter articles online than longer ones.
There is a sense that people actually go online to avoid
reading, something which is supported by another finding:
that, as the length of a paper increases, there is a
greater likelihood that it will be viewed as an abstract
and there is less likelihood that the item will be viewed
in full text.
So if people are not reading much online then they must
be doing so offline? However, it would be a mistake to
believe that everything that is downloaded is actually
read or used. Much material is just squirreled away for
another day and that day never comes because of a
shortage of time and the amount of squirreling that has
been done. Also, the online information seeking process
dictates that you print or download first and then take
47
the decision about relevance later, so a good deal of
material will be rejected later. The answer to a question
that was asked in a CIBER study gave us an idea of the
scale on which this happens. Thus Nucleic Acids Researchers
were asked ‘Do you always read the full paper before you
cite it in your work’ and half of them said it depended
and a further 10% said no. These were probably the honest
ones! It might be the case that for many the only serious
reading that is conducted is of the recreational sort,
undertaken on holiday. All the evidence thus suggests
that full-text downloads do not actually represent an
accurate picture of the extent of reading.
Interestingly, students were shown to be more likely to
record long online sessions, those lasting more than 15
minutes, evidence of more substantial online reading,
something supported by accompanying questionnaire data.
This can be explained partly by personal and generational
preferences and partly to do with the print charges
students are faced with in many institutions.
48
The picture that is building about the virtual scholar is
that many of them view only a few pages during a visit –
a good deal of which are not content pages, a large
proportion do not return frequently and the average time
spent viewing actual contents indicates that nobody is
spending sufficient time online to undertake any
significant reading.
It could be said with a high degree of confidence that
many librarians and publishers do not design their
information systems around this form of user behaviour
and how to accommodate it represents their real
challenge. The way forward has to be via a flexible,
‘suck it and see’ model. Trying things out in the digital
space and then monitoring for impact and then adjusting
accordingly. This is an ongoing process which information
providers should have the capability to undertake but to
date have shied clear of this. Too many sites find
themselves stuck in some kind of digital concrete.
49
6. Diversity
The scholarly audience, always heterogeneous in make-up,
has become even more so as scholarly information has
become available at everybody’s desktop and as a
consequence a much wider range of people have been drawn
to its products, many of whom would have had very little
academic training. We know that even in the case of some
quite technical medical sites the informed patient
constitutes the majority user group. And we know that it
is these new or additional users who bounce more and read
less. Log studies also disclose very real differences
between the various communities of core users, not just
in areas where we might have expected it, like subject
field and academic status. Thus significant differences
have been found in information seeking according to
geographical location, gender, type of organisation
worked for, whether the user is an author or not, type of
university, and attitude towards scholarly communication
(Nicholas et al, 2007b). What log studies enable us to do
is finely gauge the differences in information seeking
50
behaviour between user communities meaning that we can
avoid hackneyed and simplistic observations of
information seeking behaviour, such as scientists use the
most recent material or prefer journal articles. Examples
of information seeking diversity follow taken from a
study of ScienceDirect:
Age of material viewed. Scholars from Economics (71%),
Engineering (71%), the Social Sciences (69%) and Computer
Science (70%) made most views to current (one-year old)
material in an online session, whereas Material Science
(51%) and Mathematics (52%) users made the least use.
There was even a geographical dimension with scholars
from East Europe (71%) and Asia (60%) conducting the
highest proportion of sessions just viewing current
material. By contrast only 19% of African views were to
current articles.
Number of journals consulted. Users from Material Science
(39%) and Mathematics (38%) were most likely to view 2 or
more journals in a visit. Those from Medicine (69%) and
51
Computer science (69%) were the most likely to view just
one journal.
Return visits (over 5 months). Mathematics users were the
most frequent visitors with 41% coming back 15 times or
more. Engineers made the least returns, with 54% only
making one visit. Repeat visits also increased with age
of the user and the number of articles they had
published.
Abstract use. The viewing of abstracts tended to increase
markedly with the age of the users. About 14% of those 36
to 45 just undertook an abstract only session but this
increased to 29% for those aged 56 to 65 and to 35% of
those 65 and over.
Format in which article viewed. Men were far more likely
to undertake a PDF only session (37% were so) than women
(22%). Chinese users recorded the highest use of PDFs and
students made the greatest use of full text (HTML)
articles, probably because its easier to copy and paste.
52
Searching. Eastern Europeans (47%) and Australians (82%)
recorded a high percentage of searches resulting in zero
returns. North Americans appeared to be ‘successful’
searchers - 74% of their searches resulted in one or more
matches. However, overall, Germans were the most
‘successful’ searchers in that they obtained more hits
and had less zero searches.
Level of activity. Chinese and Germans viewed the
greatest number of pages in a session. Students were much
more likely to view fewer pages than senior research
staff. The number of page views also increased with age.
The OhioLINK studies have shown differences between
individual universities and their usage and information
seeking behaviour. This was largely a function of
research activity and size of academic community – the
greater the research active and larger the university the
higher the activity level.
53
Much interest is currently focussed on one aspect of
diversity, that occasioned by age. The chapter on the
Future Scholar examines the information seeking behaviour
of young people in detail but here we shall look at some
of the CIBER findings regarding students, something that
adds to our understanding of the younger scholar, of
course. We have generally found that students constituted
the biggest users in terms of sessions and pages viewed,
even in the case of e-journal databases which one might
have thought were more appropriate to academic staff,
which is largely because they constitute the biggest
academic community. There were big subject differences
with staff accounting for a high proportion of Social
Science use but a very low proportion of Science use.
Overall, academic usage declined as academic status
increased, which again is unsurprising, given the greater
networking opportunities available to senior staff.
However, the likelihood of being a heavy user actually
increased with academic status. Thus the usage profile of
students is that they conduct many sessions but do not
view a lot of pages during a session. This is probably a
54
consequence of the directed nature of much of their
searching and their preference for using Internet search
engines, which produces many false links and this all
fits the picture of students as ‘bouncers’. However, it
has to be said that this finding is largely based on e-
journal use and it turned out not to be the case with e-
books, where students viewed more pages in a session than
staff. This is explained by the fact that e-books are a
more appropriate form of e-resource to students, so they
would naturally make more heavy use of the resource.
Students were more likely to record long online (reading)
sessions lasting more than 15 minutes, evidence, perhaps,
of substantial online reading, something which was borne
out by associated questionnaire data. Students were much
more likely to read online than other academic groups and
this is partly to do with personal preference and partly
to do with print charges students are faced with in many
institutions.
55
It is clear given the level of diversity that has been
demonstrated a one-size fits all policy from information
providers is not going to be effective and that there
exists as much (albeit, still largely unacknowledged)
diversity in the existing scholarly population as is
likely to exist between today’s scholars and tomorrow’s,
yet policy makers tend not to fret about this. Without
such detailed or niche information it is impossible to
target services and determine scholarly outcomes.
7. Checking
Much store is set by librarians in authority and trust,
with the belief that scholars need it and they and their
systems offer it – see for instance the marketing of
gateway sites, like Intute, which portray themselves as a
safe haven from the information wild west that is the
Web. However, in cyberspace authority is not easily
ascribed because there are so many players involved in
trust and authority judgements and it is not so easily
made. And here lies a very big problem for libraries.
Take the example of a virtual researcher searching from
56
their office in a university. They have conducted a
Google search, as increasingly large numbers of them do,
to find the Synergy database. On connection a cookie
identifies them and provides them with full text access.
Now that researcher used a Microsoft Browser, then
Google, then Synergy, then arrived at the Journal of
Computer-Mediated Communication and on inspection
alighted on an article by David Brown from City
University. Throw into the pot that they might or might
not have known that: a) the Library had paid the
subscription, so providing full-text access; b) that
Synergy was produced by Blackwell and that the journal
was published on behalf of the International
Communication Association. In these circumstances where
does the authority lie? This is very, very difficult to
determine.
The evidence in fact tell us that many users are
promiscuous, assess authority and determine trust very
quickly (in a matter of seconds) by cross-checking and
57
long experience (bouncing tells us this) and if they
notice kite marks, assurance labels and the like, they
only do this fleetingly. There are just not the strong
brand names there which help the eShopper. Furthermore,
the younger they are the less trusting (and more
promiscuous) they are, and less likely to recognize
traditional brand names. Indeed, for some, Google is a
far stronger virtual brand than Synergy and if they
thought that Synergy was in fact part of the Google
family they would probably trust it more than if they
knew it came from Blackwell and that it was a publisher.
Authority (and relevance) has to be won (and checked) and
at present, unfortunately, we have little evidence
regarding the authority a library possesses in
cyberspace, although the aforementioned study of BL
Learning appears to suggest that the BL is a recognised
information brand in the USA. Libraries, like the British
Library have set up camp on Facebook and other social
networking sites cognizant that if you are not certain of
your brand or presence it might be possible to obtain
this by association.
58
The walled-garden approaches being adopted by publishers,
like OUP, who have genuine brand and authority claims,
might prove more successful with the consumer. Thus with
e-textbooks, e-monographs, e-journals and e-reference
works being bundled together in some publisher’s
offerings it might be the publisher who will provide the
authoritative information experience, in the case of OUP,
the Oxford experience.
8. Access expectation
The SuperBook study highlighted a new feature of
scholarly information seeking, and that is the
differences in information seeking profile of on site and
off site users of the same service, in this case in
regard to Oxford Scholarship Online. Two-thirds of UCL
usage took place on-site. Off-site users differed from
on-site users in that they adopted a much more direct
approach by zeroing in on content, undertaking less
navigating. Thus three-quarters of their views were to
full-text pages; by comparison the figure for on-site
59
users was just over a half. Off-site viewers were also
more likely to view an e-book in a session (users could
just look at the homepage or help pages), with only 1 in
10 sessions not recording a view to a book, as compared
to 4 in 10 for on-site users – a significant difference.
The explanation for this could be that, in the relatively
early days of e-book access which they found themselves
in, external users did not expect to find the material
free; they had a negative access expectation, and were
eager to grab the opportunity to view or squirrel away
more pages. By contrast those people searching from
within UCL had a positive access expectation, which is
that they expected the service to be around for the
foreseeable future and there was no pressure to download
straightaway.
9. Robotic
What brings home more than anything else that huge
changes have occurred in the scholarly information
60
landscape is the fact that, for many websites, robots and
mechanical agents, used extensively to index web content,
account for around half of their usage. This was true of
both the BL Learning and Intute sites, and the Journal
Glycobiology. In the case of some more rarefied AHRC
funded websites the figure is closer to 90%! Proprietary
software tends to underestimate robot use because some
robots, in order to obtain extensive access to the site,
masquerade themselves as humans and do not present
themselves as robots – for instance, by moving slowly and
restricting the volume of information they viewed. Of
course, robot use while not being human can be a factor
in humans finding the site, as in the case of robots that
index sites for search engines. So we know that the robot
is the majority scholarly user, and that most sites
underestimate their usage, but beyond that we really do
not know what to do with this finding!
10. Internationality
There are no geographical boundaries in the virtual
information space and scholars seek out information (and
61
brands) internationally and UK brands appear to be in
high demand from overseas users in the scholarly field.
This could be to do with the perceived high quality of UK
education. We have also learned earlier that users from
different countries seek information often in very
different ways. This is what one might have expected but
perhaps the scale of it really surprising, and in some
cases possibly ‘embarrassing’ as we shall learn. This is
best illustrated by reference to CIBER studies of the
British Library’s Learning site for young scholars and
Intute, a JISC sponsored scholarly gateway site. In both
cases the UK audience was a minority one and US scholars
were the majority user group, as we found to be the case
in the case of The Times five years earlier. Thus in the
case of Intute the US accounted for 35% of sessions while
the UK accounted for 29%; Europe accounted for 10% and
Asia 12%. Clearly this has big implications for national
governments, in this specific case the UK government.
What will the tax payer say if they learn that Government
money is going to help the Americans become better and
more informed searchers?
62
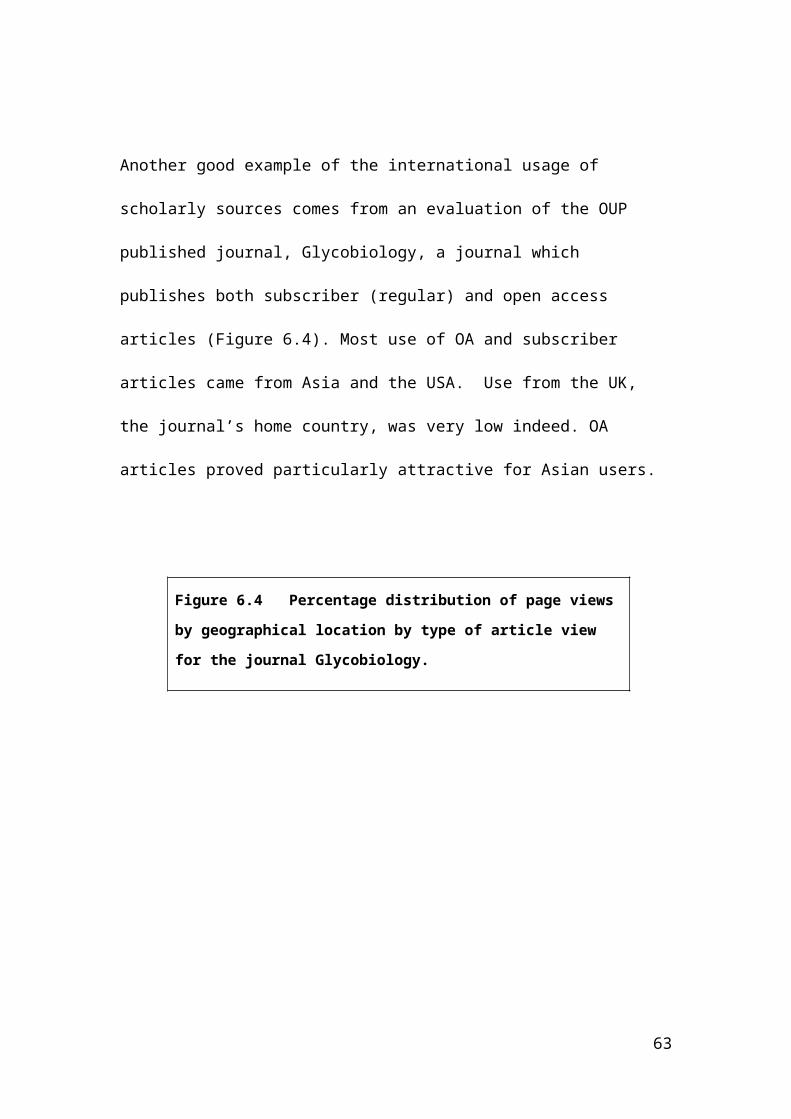
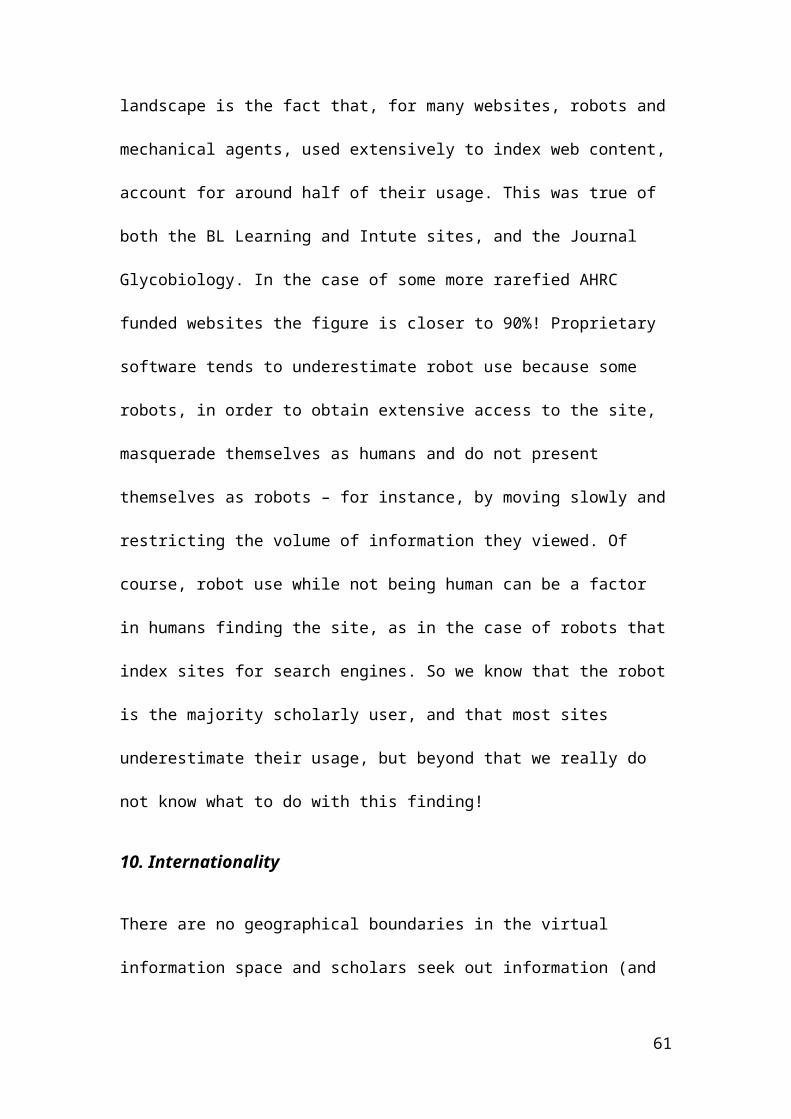
Another good example of the international usage of
scholarly sources comes from an evaluation of the OUP
published journal, Glycobiology, a journal which
publishes both subscriber (regular) and open access
articles (Figure 6.4). Most use of OA and subscriber
articles came from Asia and the USA. Use from the UK,
the journal’s home country, was very low indeed. OA
articles proved particularly attractive for Asian users.
Figure 6.4 Percentage distribution of page views
by geographical location by type of article view
for the journal Glycobiology.
63
YesNo
100
90
80
70
60
50
40
30
20
10
0
REGION
UK
US
S-America
Russia
N-America
Europe
E Europe
Australia/Ocean
Asia
Africa
4730
33
5 17
19
40
30
Open
access
11. Currency and current awareness
Clearly users are interested in the new but this has been
exaggerated by a number of factors. Older material was
always more difficult to access (back files are the last
things to go online) and the early retrieval systems like
that used by Dialog, prioritised the viewing of the most
recent first (a reverse chronological display was the
64
default) and all Google users know we make our selections
from the first few screens, which means that new material
is much more likely to be viewed. This is a powerful
example of the huge impact of digital visibility on usage
in a very large and crowded information space. This has
led to researchers reporting that the most recent year
(or two) of a journal accounts for the vast majority of
uses, despite the fact that journal might have a back
file of thirty years or more. However, massive
improvements in access to back files and search engines
that prioritise relevance over age has increased the
visibility of older material and this shows up quite
strongly in the logs. The figures are quite astonishing.
Thus in the case of OhioLINK, even in scientific areas,
where currency might be thought to be held at a high
premium, there was substantial use of the back file. Thus
articles older than five years of age accounted for 31%
of page views in Materials Science and Meteorology. The
figure was 33% in the case of Psychology and Psychiatry.
In fact, the only field in which the current year
attracted the majority of all use was in genetics, where
65
55% of use was accounted for by that year. This finding
has had publishers scurrying to buy back the rights to
their back files.
Of course, as expected, the picture for e-books shows
even less concentration in the new. Thus, in the case of
Oxford Scholarship Online, with strong coverage in the
arts, humanities and social sciences, the most recent 2
yrs accounted for just 17% of views (25% of the books
available were that old). The possible reasons for this
are: 1) students, a major user group for e-books, are not
so pre-occupied with new; 2) it takes time to become an
accepted textbook or monograph; 3) lecturers are poor at
updating readings; 4) social science/humanities titles do
not obsolesce as much.
This takes us nicely to the topic of current awareness
which so fascinated LIS researchers in the Sixties and
Seventies, partly because of the problems in dealing with
66
information overload which was the result of the
information explosion (another phrase nobody uses today).
SDI or selective dissemination of information, which was
a regular pushed information service based upon author-
supplied keywords that represented ongoing interests, was
thought to be the solution then. However, logs and focus
groups tell us that current awareness is no longer a
discrete or regular activity. Instead, people tend to
update themselves when the need arise; it is problem
driven and not time driven event anymore, if indeed, it
ever was. In fact, currency generally does not seem to
raise the concerns it might have done just ten years ago.
Presumably this is because currency is no longer a big
problem, the information tap is now always in the on-
position. Users do seem though to appreciate the benefits
of obtaining early intelligence through pre-prints and in
this respect ScienceDirect’s practice has been commended
by a number of people we have spoken to. Conference
attendance is also seen as an enjoyable and convenient
way of keeping up to date with key developments. Mention
67
has also made of the benefits of making working papers
available online because of the currency gains.
12. Interdisciplinary
Commentators and researchers in the information field
have long been interested in the extent to which
researchers used the literatures of other disciplines,
and whether subject literatures were self-contained or
not. The ScienceDirect investigation provided an
opportunity to explore this in more detail in the huge
virtual space where the opportunities for
interdisciplinary searching are greater, it being much
easier to range more widely in search of relevant
material. Figure 6.5 provides an analysis of the subject
of journals used by the self-proclaimed subject
credentials of the user. What it generally shows is that
researchers do range, quite widely, and with some
frequency. Physics proved to be the most ‘insular’ field,
with 71% of those describing themselves as physicists
having viewed physics journals during a search session.
Environmental and Computer Scientists were least likely
68
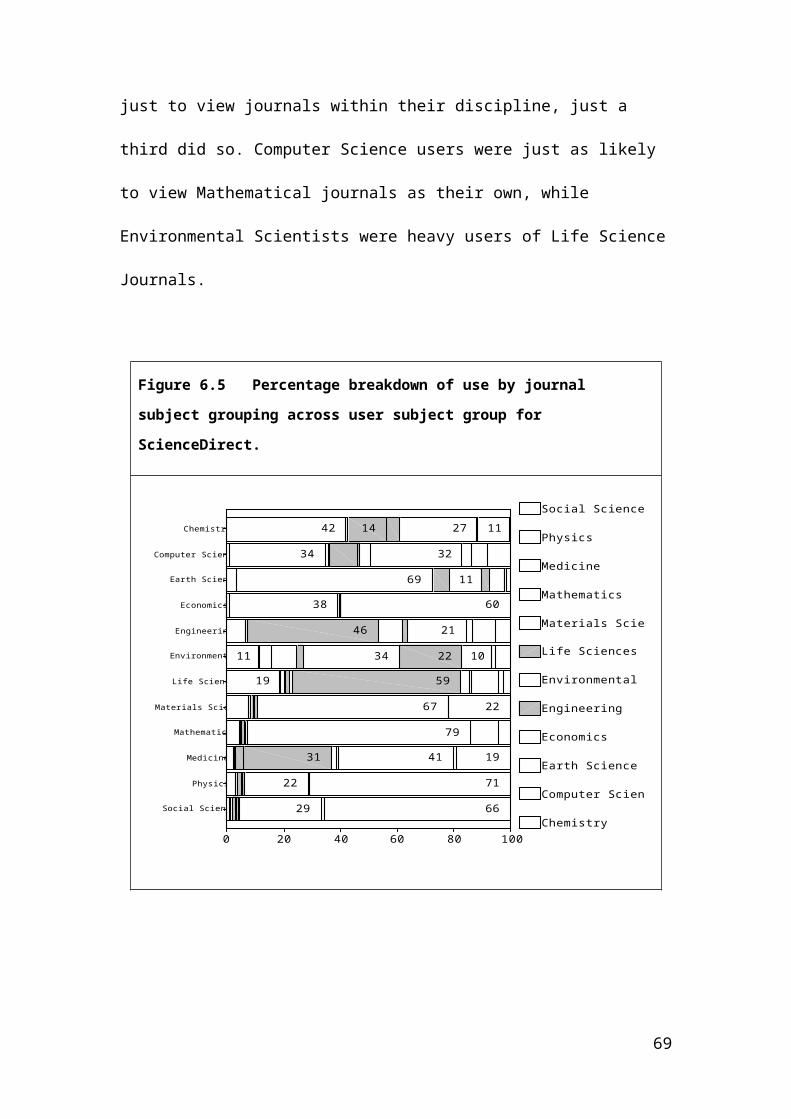
just to view journals within their discipline, just a
third did so. Computer Science users were just as likely
to view Mathematical journals as their own, while
Environmental Scientists were heavy users of Life Science
Journals.
Figure 6.5 Percentage breakdown of use by journal
subject grouping across user subject group for
ScienceDirect.
Chemistry
Computer Science
Earth Science
Economics
Engineering
Environmental
Life Sciences
Materials Science
Mathematics
Medicine
Physics
Social Sciences
100806040200
Social Sciences
Physics
Medicine
Mathematics
Materials Science
Life Sciences
Environmental
Engineering
Economics
Earth Science
Computer Science
Chemistry66
19
60
71
22
11
41
29
79
32
22
67
10
21
27
31
59
2234
11
46
14
38
69
34
19
11
42
69
E-book evidence from Oxford Scholarship Online study
proved equally illuminating. Users accessing via
Biochemistry and Gene sub-networks (another way that
subject of the user can be established) mainly looked at
Philosophy pages, which demonstrates how, when book
content is opened up, this encourages users from other
fields to take the mouth-size information bites that they
require. On the other hand, perhaps unsurprisingly, users
on the Philosophy sub-network viewed only Philosophy
titles.
13. Scatter
A long-known characteristic of information seeking
behaviour is that a relatively small number of the titles
available account for a relatively high proportion of
use. This is also true of the virtual environment but
what is different here is that the massive audience and
increased access has meant that for all titles usage is
boosted, so much so that titles once out of print are now
back in print, boosted by the ‘long user tail’ and print
on demand facilities. This is best illustrated in the
70
case of OhioLINK, where all bar 5 of the 6800 titles
available were used within the 15 month survey period.
Nevertheless there was the inevitable concentration in
use (Nicholas et al. 2006a, b). Thus, five percent of
journals accounted for well over a third (38 per cent) of
usage, 10 per cent accounted for approximately half of
usage (53 per cent), and half of all journals accounted
for about 93 per cent of use. We can conclude from this
that virtually all journals were used, but that half of
all journals accounted for only 7 percent of use.
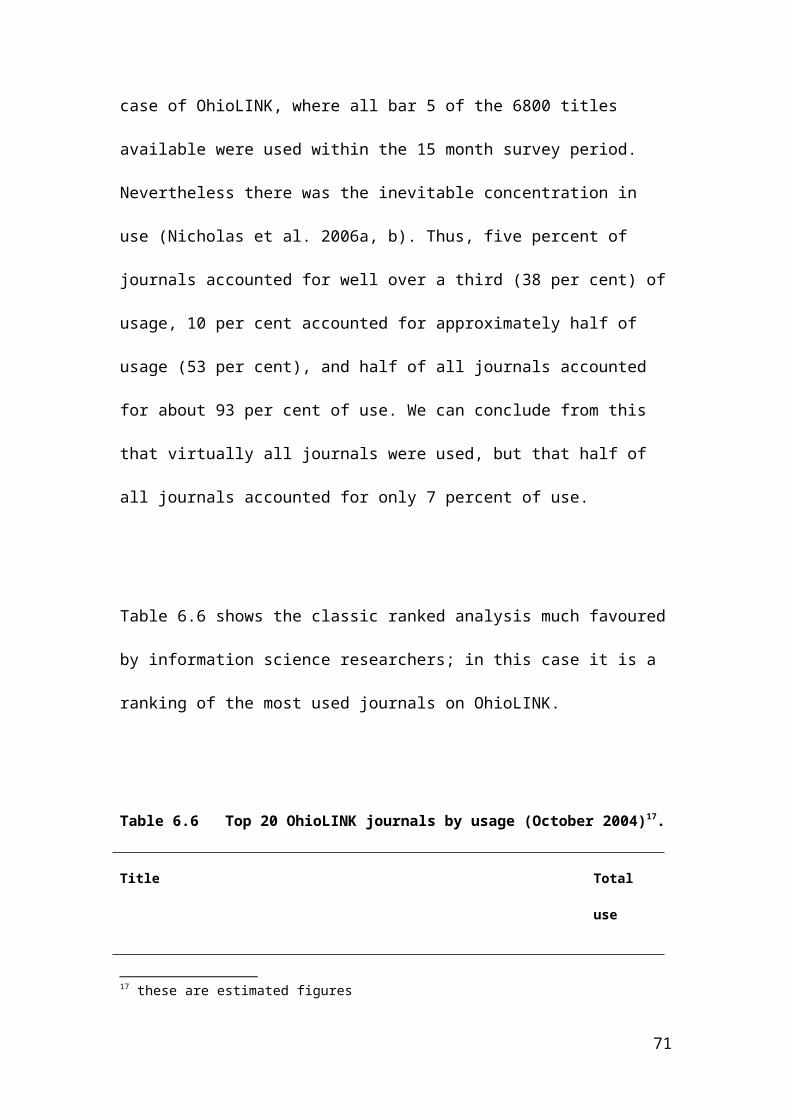
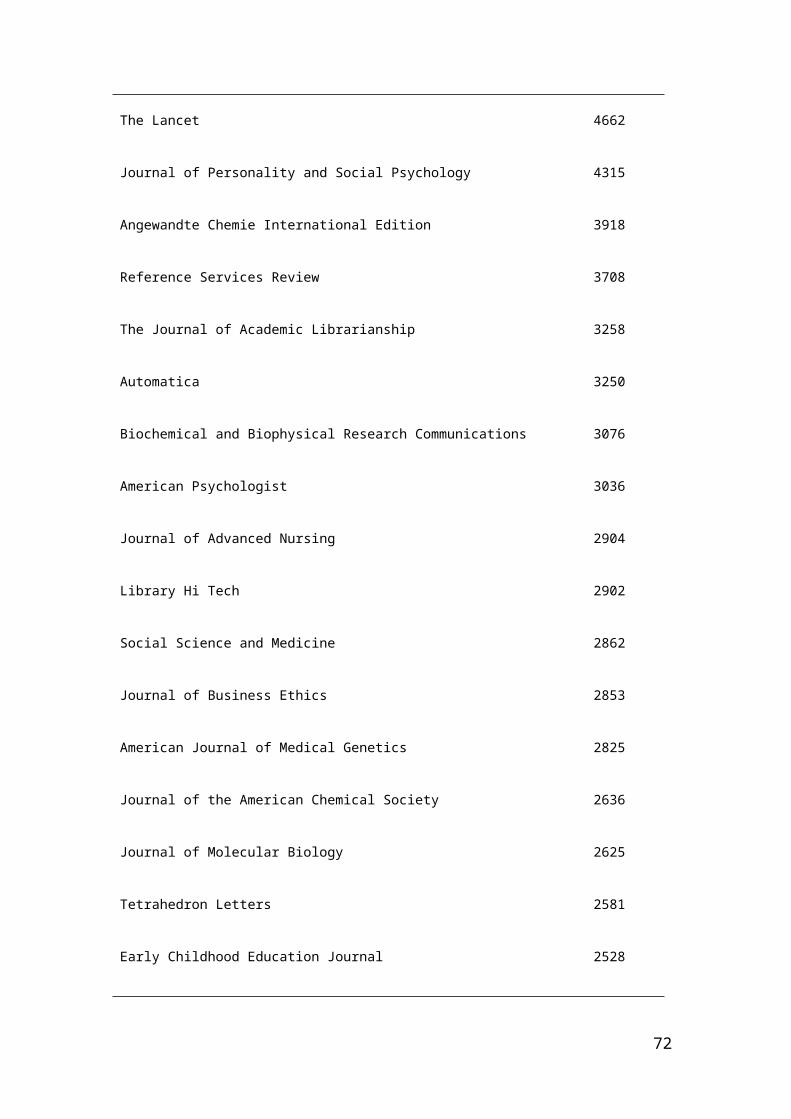
Table 6.6 shows the classic ranked analysis much favoured
by information science researchers; in this case it is a
ranking of the most used journals on OhioLINK.
Table 6.6 Top 20 OhioLINK journals by usage (October 2004)17.
Title Total
use
17 these are estimated figures
71
The Lancet
Journal of Personality and Social Psychology
Angewandte Chemie International Edition
Reference Services Review
The Journal of Academic Librarianship
Automatica
Biochemical and Biophysical Research Communications
American Psychologist
Journal of Advanced Nursing
Library Hi Tech
Social Science and Medicine
Journal of Business Ethics
American Journal of Medical Genetics
Journal of the American Chemical Society
Journal of Molecular Biology
Tetrahedron Letters
Early Childhood Education Journal
4662
4315
3918
3708
3258
3250
3076
3036
2904
2902
2862
2853
2825
2636
2625
2581
2528
72
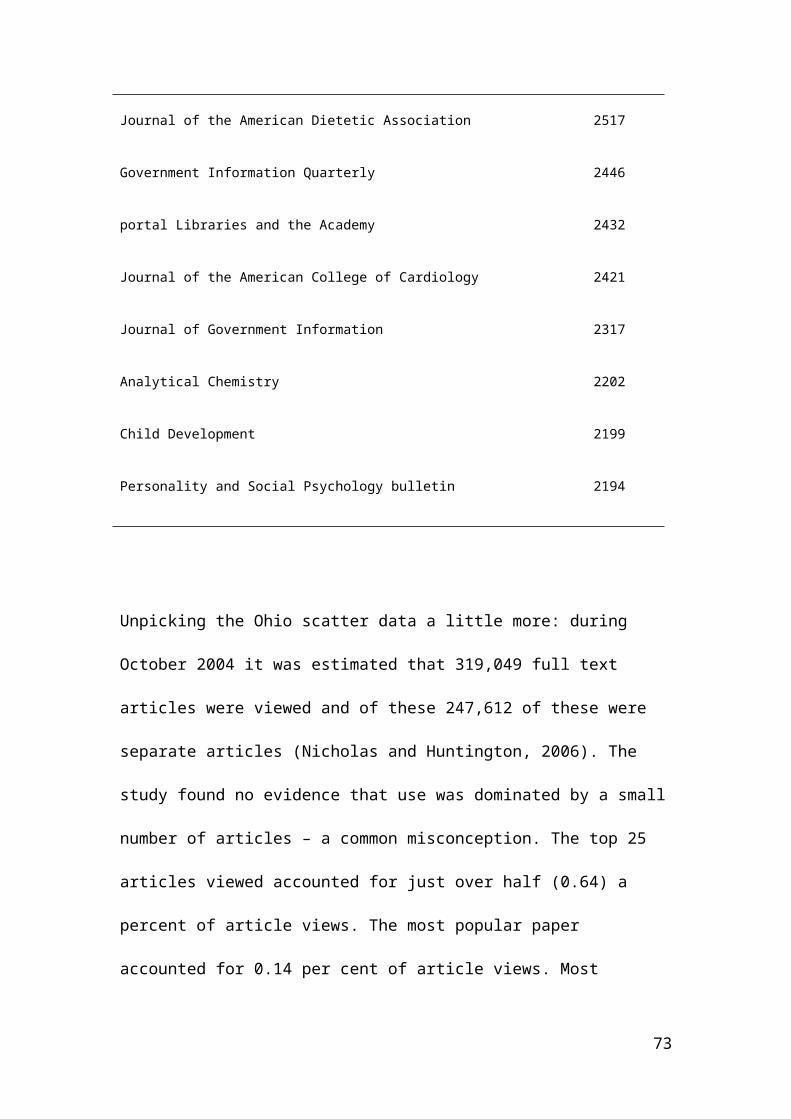
Journal of the American Dietetic Association
Government Information Quarterly
portal Libraries and the Academy
Journal of the American College of Cardiology
Journal of Government Information
Analytical Chemistry
Child Development
Personality and Social Psychology bulletin
2517
2446
2432
2421
2317
2202
2199
2194
Unpicking the Ohio scatter data a little more: during
October 2004 it was estimated that 319,049 full text
articles were viewed and of these 247,612 of these were
separate articles (Nicholas and Huntington, 2006). The
study found no evidence that use was dominated by a small
number of articles – a common misconception. The top 25
articles viewed accounted for just over half (0.64) a
percent of article views. The most popular paper
accounted for 0.14 per cent of article views. Most
73
articles were just viewed once. Nearly three-quarters (72
per cent) of articles were viewed once, 25 per cent were
viewed between 2 to 4 times, about one and half percent
were viewed between 5 to 10 times and just half a percent
of articles were viewed 11 or more times.
Impacts on information seeking
Access is not the barrier it once was, and open access
and institutional repositories initiatives are improving
things for the disenfranchised, those not part of academe
and big deal arrangements. Overload as mentioned earlier
is prevalent but users see it as an acceptable trade-off
for unbelievable levels of access - 24/7, and from
virtually anywhere thanks to wireless and Athens
authentication. The searching process, once delegated to
intermediaries is thought now to be easy, thanks to
Google and its like. However, the logs do point to enough
failure at the terminal, especially among the young and
non-core users, to suggest that search skills and levels
of digital literacy are a (unacknowledged) problem for
quite large numbers of people. Time is clearly a barrier
74
still, but the ability to be able to work from home or
the train has masked this somewhat. Here we shall
concentrate on the impacts that are on everybody’s lips
at this present moment, the hot topics, Web 2.0 and open
access publishing.
Chapter 7 on the Scholar of the Future has examined Web
2.0 in more detail as it is expected that Web 2.0
facilities will prove more attractive to the young user,
primed by their experiences of social network sites. Here
we shall just concentrate on its impact on information
seeking behaviour and test some of the assumptions being
made by Web 2.0 advocates.
Some commentators believe that there’ could be
generational disconnect with Facebook etc users in their
teens and twenties, whose brains are still going through
significant development and that this will have big
implications for scholarly information providers.
75
Facebook does seem to produce a genuinely different
perspective on trusted sources, the right of peers to
arbitrate social interactions and the frequency and
triviality of communication. Could this translate into a
fundamentally different hardwiring of the brain – as much
as such a thing can exist – once adulthood is reached.
This kind of collective brain remapping has happened
often in the past (moving from hunter gathering to
farming, farming to urban, industrial life etc), but
rarely with such rapidity’.
Cognizant of this and witnessing the astonishing success
of Facebook and YouTube with the young (and not so young)
and worried about their relevance of their ‘traditional’
services to the young, many librarians have gone down the
social network route. In an attempt to adapt to a
perceived change in information seeking behaviour sites
have set-up blogs and other kinds of social and
interactive facilities. It is clearly early days yet but
we have found that such services only account for a very
76
small proportion of use; most people very much
concentrate on mainstream, traditional bibliographic
activities. A no-frills service is what seems to be
required. Thus in the case of the Intute service, the
blog only accounted for about half a percent of pages
viewed. However this did represent 10, 000 views a month
and they did prove attractive to certain types of user.
Thus blogs had a special appeal for US users.
Interestingly at the very time we are writing this
chapter it is being reported that the number of (British)
Facebook users has fallen for the first time, monthly
unique visitors are down by 5% (Sherwin, 2008). This is
put down to a number of factors: 1) Facebook fatigue –
users are finding that managing their virtual life is too
demanding and that the sheer amount of information
updates causes strains; 2) ‘Social networking is as much
about who isn’t on the site as who is’. When libraries,
museums and the like start profiles its ‘cool’ brand is
devalued. MySpace and Bebo visits are down too.
77
Web 2.0 is generally a difficult subject to do justice to
because older researchers feel constrained in their
criticisms by the fact that these developments are
associated with the Google Generation, youth generally
and represent a dumbing down in information seeking. Thus
at a focus group attended by the authors, which was
comprised largely of senior researchers, the idea that an
e-journal database should adopt Web 2.0 facilities went
down like a lead balloon. They could not see the need for
this or how people had the time to indulge in what they
clearly thought were side-show activities. There is
enough to do without engaging in blogs, Wikis, RSS and
the like was the general message coming from the group.
Added value activities have always played a minor part in
the usage of databases as CIBER research has shown. This
is partly because the core service is so appreciated. It
is also partly because the percentages used mask the real
volumes of activity that are undertaken in regard to
78
added value services. Email alerts however do appear to
be widely appreciated.
Open access publishing (and institutional repositories)
is busy making the contents of journals more accessible
by making them free to the user. It would be expected
that this would lead to even higher volumes of journal
usage, because clearly there is a widespread belief that
cost is an obstacle to journal use. A study CIBER are
currently on behalf of OUP is testing this assertion.
Early data from the journal Glycobiology, which publishes
articles in both open access and subscriber form, appears
to support the assertion. Articles published in an open
access (OA) form attracted far more use, sometimes as
much as three times the usage of articles under
subscriber control. However, while the OA articles
attracted more views, they were viewed for a shorter
time. This could be due to what we have noticed
elsewhere, a squirreling form of behaviour. That is users
download the articles while they are free, just in case
79
this state is a temporary one. It could be of course that
the shorter time could signify that the articles are not
so highly rated. Interestingly, what distorts the picture
somewhat is the (widely prevalent) practice of self-use
of articles, authors and their institutions downloading
their own articles – something that is easier to do with
OA articles.
With the greater access afforded by OA it might also be
expected that more use would come from outside of
academe, where the Big Deals already provide
comprehensive access to journals. This proved to be the
case and users viewing OA articles were more likely to
come from Net-providers and Commercial organisations and
less likely to come from Academic organisations.
Outcomes
We have looked extensively at how people navigate and
view their way around the virtual scholarly space,
however as we know that is simply a means to an end, and
80
it is the end we should be concerned with, because that
is what concerns the consumer and those that provide and
finance the space in which they conduct their activities.
To begin with the benefits of online information access
were measured in terms of the extent of that access – the
more access the better. The medium was not just message
but also the outcome, but no longer, people are beginning
to question what all the activity means. There is loads
of activity, but maybe much of it is ‘drowning man
stuff’; terrain viewing rather than real reading and
learning. Lots of hits are just searchers passing
through; they put in the wrong word and got to wrong
place. This raises big questions about impacts and the
place of digital literacy.
In fact there is a dearth of information on the academic
outcomes of providing the academic community with
unprecedented levels of access to e-journals and e-books.
Whether, for instance, it has led to an improvement in
the research process and outcomes and how this varies for
81
types of institution and user. The assumption – made by
librarians, publishers and academics, is naturally that
increased and enhanced access is beneficial and that the
most research active researchers are also the most
proficient and effective users of the literature. To date
nobody has sought to establish this in an evidence-based
way, in regard to diverse subjects and institutions and
on a national scale. It might be because people fear the
answer. However, without these data it makes it very
difficult to persuade university vice chancellors and
provosts to continue spending, and in a world awash with
information which is easily accessible and perceived to
be free or cheap they are proving harder to convince.
CIBER are currently involved in a Research Information
Network18 study which seeks to attach outcomes to
information seeking behaviour for a selection of UK
universities and Government research laboratories. Usage
will be monitored and mapped for a select number of
18 For details of the project visit: www.publishing.ucl.ac.uk/ejournals.html
82
departments. For each of the case study departments, we
will create group productivity and citation impact
metrics and compare these with a range of information
behaviour indicators obtained from the deep log analysis
(e.g. levels of activity, search/navigational approach).
Online techniques are used to capture publications lists
(from Thomson ISI) for each department for the period
2006-2008 and then to generate production curves
(cumulative authors vs. cumulated papers) for each
department as well as for the discipline as a whole.
This will facilitate a simple visualization of the group
productivity of each department relative to its
disciplinary norm. From those curves will be generated an
indicator, a Herfindhal index, which will summarise a
department’s relative productivity: a value of 100 would
mean that the group is completely average for the
discipline: 120 that it is 20% more productive, and so
on.
83
Citation impact will be measured using another new CIBER
concept: the virtual impact factor. What this means is
that the entire output of a department will be treated as
though it were a `virtual journal’ in its own right, thus
enabling easy comparison with the discipline. This data
will again be presented as an index, with 100
representing average citation performance for the
discipline. The way these indicators are constructed mean
that valid comparisons can be made between different
disciplines.
This will prove to be a very useful exercise in terms of
starting to investigate what relationships there might be
between how researchers use online journals and the value
that this brings to their research. It will certainly
raise issues and questions for a qualitative research
strand which will seek to explain what we find in the
logs and output metrics. This would enable us to identify
best practice and start answering the question on many
people’s lips: whether top flight research groups use e-
84
journals differently (for example lower bouncing rates,
longer session averages).
Conclusions
This is the first time that we have presented a full and
complete description of our model of information seeking
in a digital environment. And one can see that this is a
very different model than those produced in a largely
pre-digital information environment, upon which many
people still base their information activities,
strategies and services. We shall now conclude by
examining the realities and challenges of what we have
discovered: a) the sheer enormity of the change that has
occurred to information seeking as a result of the
digital transition; b) the problems arising from the
change; c) the implications of the change for information
providers; d) the likely impact of e-books on information
seeking; e) the scholarly information marketplace; f) the
significance of the e-shopper.
85
The enormity of the change
What brings home the enormity of the changes that have
occurred is who would ever have thought, say ten years
ago even, that half of the users of any scholarly
information resource would be robots and of those that
were human, a majority would dip in and out in a matter
of seconds and that of those that did not a majority
would be foreign? Surely no one, these are salutary and
unusual times! Nor would we have expected to find that
the majority of academic staff in the sciences and social
science had deserted the library for their desktops, the
coffee bar or railway carriage. As one researcher said at
a recent focus group which was discussing the information
seeking of researchers ‘libraries are empty nowadays’.
They also said that they had not been near the place for
three years, and they said this with no sense of guilt,
just a sense of realism.
86
The digital transition has been a big success, but there are
casualties
Scholars appear to have taken to the new digital
information environment with some alacrity and have taken
full advantage of the huge digital choice that is offered
to them. And we can refute claims that it is simply the
author and his/her mother who are using the resource,
although we have come across cases where the author (and
colleagues) has clearly inflated their hit counts – in
the case of the journal Glycobiology, for instance. There
is, however, some possibly disturbing evidence that much
use appears to be passing and/or ineffectual, and could
possibly constitute a “dumbing down” in information
seeking behaviour; enough evidence to make us reflect on
the effectiveness information literacy strategy and
programmes. It would indeed be ironic if the Web that
provided for the enfranchisement of the user in
information terms also was guilty for the dis-
enfranchised whole swathes of the population because they
87
have not been able to take advantage of the information
deluge.
Implications for information providers.
Everything and everyone in the scholarly landscape is
changing at a rapid rate of knots and the various user
communities that inhabit the space are responding to this
in diverse ways. And the only way of keeping in touch and
relevant is by monitoring and evaluating their usage, but
the COUNTER data most libraries feed off only records the
use of material and not the types of people who are using
the material, and no university that we know has a
department devoted to this work, say, a department of
user studies. Yet we all know it is the consumer that is
calling the tune, so why keep them at arms length?
Fantastic access, huge digital choice and a common/multi-
function retrieval platform are changing everything;
scholars are now consumers in every sense of the world
and they are exercising their new found powers and wings
88
to take their custom to whomever they feel best meets
their needs. This is transforming their relationship with
all information providers, and most notably with that of
the library. Without the necessary user or market data
and general day-to-day contact with users the response of
libraries has tended to be a technological, rather than a
user one and this is looking as though this is going to
be a big, big mistake. How many commentators have said
this in the past and yet we are still saying it today?
However, the stakes are much higher now and the risks of
complete melt-down never more real. Forget technological
innovation for now, instead there needs to be a wholesale
questioning of the assumptions made about today’s
information-enfranchised scholar and, as we have
demonstrated in this chapter, a very good start can be
made through the collection and analysis of the user data
(logs) that are so abundantly being produced by digital
information systems, remotely and without massive effort.
The future is now and instead of looking ahead (almost as
an escape from current dilemmas) we should be looking at
89
what is happening now, employing the deep log tools so
readily on offer to do this.
E-books – a tipping point
Prospects might already be looking dim but the
introduction of e-books could be catastrophic for
librarians. Thus the expected popularity of e-books will
come with as yet an unknown price for university
libraries. Firstly, because they will mean that more
people will not have to visit the library. Academic
libraries tend to occupy an enormous amount of premium
space in universities and this space is largely filled by
books and students. Provide access to the relatively
small number of books that students need in their dorms,
bars and recreational space and who would bet against a
huge drop in library visits? Something, of course, which
will then lead to questions being asked about whether the
library needs all the space it occupies. Secondly, while
the advent of e-books in numbers will mean libraries will
become more remote from their users, it will also mean
that publishers will become ever closer, because they
90
will have all the knowledge as to how the user behaves -
the users’ footfalls take place increasingly in their
virtual space. Furthermore, they can offer the products
directly to the user. Indeed, with e-textbooks, e-
monographs, e-journals and e-reference works being
bundled together in some publisher’s offerings it might
be the publisher who will provide the e-library
experience. Sounds like the changing of the guard to us,
who would bet against this happening, publishers have the
brand and own content
There could be a difference here in regard to the Google
Generation, current scholars will have had long contact
with libraries and more likely to make the association
with libraries and information provision but the Google
generation will arrive on the scholarly scene without the
memory.
91
The scholarly information marketplace
The very strong consumer traits that operate in what was
once thought of as a conservative, staid scholarly
information market and the huge consumer demand for the
product has been clearly established by CIBER research.
There is now enough data – and confidence in the data –
to start asking where this should be taking information
professionals and how it can be used to improve the
scholarly communication system, which sometime resembles
a battleground. However, the moment we do this, we run
into a major obstacle and that is that we do not have a
true consumer market/mechanism, and this distorts,
frustrates and creates a myriad of problems for the user-
consumer (and information professional, for that matter).
What is really needed is a major market re-alignment to
take cognisance of the consumer revolution that has taken
place. Thus, while academic information consumers have a
choice, albeit partly dependent upon the wealth of their
own particular university, they do not really have a real
or free choice, because librarians largely make choices
92
for them, in that they determine which journals they get
for free and which ones they do not (and as we have
mentioned earlier many users are not aware of the choices
being made). It does not help either that librarians are
not always very effective at employing the available
usage data to ensure their choices are indeed the ones
the consumers would make themselves. Indeed, OhioLINK
data has shown that when consumers are given a choice
they often make different choices from the acquisition
librarians.
The market is in fact further distorted by the consumer.
Thus, in the case of the digital journals for which they
have free access, they are clearly not obliged to
exercise any discretion over what they consume
(download), in the way that shoppers are by the hit their
credit card takes. Librarians are not inclined to
intervene, as what they actually want is to show the big
deals and the like, which they pay upfront for, deliver
lots of downloads and they seem to do just that.
93
We have argued elsewhere (Nicholas et al, 2007a, 185)
that the best solution would be ‘to give consumers what
they actually want – full and largely unfettered choice;
let them make the decisions about what they want to spend
the money on, but at the same time make sure they are
responsible in their decision making. Thus, for instance,
they could be given so many download electronic credits
by the library (or similar agency) at the beginning of
each term, with a different tariff, maybe, for
postgraduates, science students, and professors. These
electronic credits could be accepted by any scholarly
journal vendors – e-commerce has long ago sorted out the
mechanics by which this can be done. Where the virtual
scholar chooses to spend them is up to them, they could –
and we have evidence already that they would – shop
around’.
The eShopper
We have made mentioned a number of times how the digital
information seeker behaves in a similar fashion to the e-
94
shopper and this is why we have an e-shopper chapter in
the book. This point could not have been made clearer
than in a study of Emerald where users exhibited what
could only be described as a sales mentality. In the way
that shoppers are easily swayed in their choice by
‘offers’, so too are database users. Thus on the Emerald
site once a week the articles from two journals were
offered for free. What happened was that for these two
journals - whatever they were - use jumped immediately
by a factor of ten, only to drop down again to pre-offer
levels once the promotion was over. Clearly it was not
just the fact that the journals were ‘free’ that fuelled
use but it also has something to do with the enhanced
digital visibility that these journals were given at the
time by the very fact they were part of a promotion. An
analysis of download times before and after free week
suggested that a squirreling (or access expectation)
behaviour was being witnessed; it transpired that
download times in free week were much shorter, suggesting
people were simply storing for a later day, rather than
95
‘reading’ at the time. This is the same behavioural trait
we have noted off- campus e-book users having.
The adage ‘we are all librarians now’ was once used to
highlight the fact that thanks to the Internet everyone
has access to vast stores of information. This adage
should however now be replaced by a far more pertinent
one, ‘we are all consumers now’ in recognition of the
fact that we have not adopted the behavioural traits of
the traditional librarian but that of the shopper.
References
CIBER (2008) The Behaviour of the Researcher of the Future,
www.publishing.ucl.ac.uk/download/GoogleGeneration.pdf
Ellis, D. and Haugan, M. (1997) Modelling the
information-seeking patterns of engineers and research
scientists in an industrial environment, Journal of
Documentation, 53 (4), 384-403.
96
Naughton J. (2008) Thanks, Gutenberg - but we're too
pressed for time to read, The Guardian, (27 January),
www.guardian.co.uk/media/2008/jan/27/internet.pressandpub
lishing
Nicholas, D. and Huntington, P. (2006) Electronic
journals: are they really used? Interlending and Document
Supply, 34 (2), 74-7.
Nicholas, D., Huntington, P. Dobrowolski, T. and
Rowlands, I. (2007a) Creating a consumer market for
scholarly journals, Interlending & Document Supply, 35 (4), 184-
6.
Nicholas, D., Huntington, P. and Jamali, H.R. (2007b)
Diversity in the information seeking behaviour of the
virtual scholar: institutional comparisons, Journal of
Academic Librarianship, 33 (6), 21-38.
Nicholas, D., Huntington, P. Jamali, H.R and Williams, P.
(2007c) Digital Health Information for the Consumer: evidence and policy
implications, Ashgate.
97
Nicholas, D., Huntington, P., Jamali, H.R. and Tenopir,
C. (2006a) Finding information in (very large) digital
libraries: a deep log approach to determining differences
in use according to method of access, Journal of Academic
Librarianship, 32 (2), 119-26
Nicholas, D., Huntington, P., Jamali, H.R. and Tenopir,
C. (2006b) OhioLINK – ten years on: what deep log
analysis tells us about the impact of Big Deals. Journal
of Documentation, 62 (4) July 2006, 482-508
Nicholas, D., Huntington, P., Lievesley, N. and Wasti, A.
(2000) Evaluating consumer Web site logs: case study The
Times/Sunday Times Web site, Journal of Information Science, 26
(6), 399-411.
Nicholas, D., Huntington, P., Rowlands I., Dobrowolski,
T. and Jamali, H. (2007d) Superbook: an action research
project, Online Information 2007 Proceedings, 50-7
Nicholas, D., Williams, P. and Dennis, K. (2004)
Improving websites in the voluntary sector. Library and
Information, Update: the magazine of the Chartered Institute of Library
and Information Professionals Magazine, 3 (3), 35-7.
98
Peters, T. A. (2001) What's the big deal?, Journal of
Academic Librarianship, 27 (4), 302-4.
Sherwin A. (2008) Web socialites succumb to Facebook
fatigue, The Times, (22 February), 10.
Wilson, T.D. (1999) Models in Information seeking
behaviour research, Journal of Documentation, 55 (3), 249-70.
99